Embed Size (px)
Citation preview

ACCEPTED MANUSCRIPT
-dependent sorting of miRNA to exosomesKRAS
Coffey, James G PattonBeckler, Alissa M Weaver, Kasey Vickers, Nirpesh Prasad, Shawn Levy, Bing Zhang, Robert J Diana J Cha, Jeffrey L Franklin, Yongchao Dou, Qi Liu, James N Higginbotham, Michelle Demory
http://dx.doi.org/10.7554/eLife.07197DOI:
Cite as: eLife 2015;10.7554/eLife.07197
Published: 1 July 2015Accepted: 29 June 2015Received: 26 February 2015
and proofing.formatted HTML, PDF, and XML versions will be made available after technical processing, editing, This PDF is the version of the article that was accepted for publication after peer review. Fully
elife.elifesciences.org at Sign up for alertsStay current on the latest in life science and biomedical research from eLife.

KRAS-Dependent Sorting of miRNA to Exosomes 1
2
Diana J. Cha1,2, Jeffrey L. Franklin1,6,7,9, Yongchao Dou3, Qi Liu3, James N. 3 Higginbotham6,7, Michelle Demory Beckler7, Alissa M. Weaver4,6,8, Kasey Vickers5, 4 Nripesh Prasad10, Shawn Levy10, Bing Zhang3, Robert J. Coffey6,7,9*, and James G. 5 Patton2,* 6 7 Departments of Biological Sciences2, Biomedical Informatics3, Cancer Biology4, 8
Cardiology5, Cell and Developmental Biology6, Medicine7, and Pathology, Microbiology 9
and Immunology8, Vanderbilt University Medical Center, Nashville, TN, 37235, Veterans 10
Affairs Medical Center9, Nashville, TN 37235, HudsonAlpha10, Huntsville, AL, and 11
Vanderbilt University, Nashville, TN 37235. 12
13 1 These authors contributed equally to this work. 14
15
*To whom correspondence should be addressed: 16
19
20

Abstract 21 22
Mutant KRAS colorectal cancer (CRC) cells release protein-laden exosomes that can 23
alter the tumor microenvironment. To test whether exosomal RNA also contribute to 24
changes in gene expression in recipient cells, and whether mutant KRAS might regulate 25
the composition of secreted miRNAs, we compared small RNAs of cells and matched 26
exosomes from isogenic CRC cell lines differing only in KRAS status. We show that 27
exosomal profiles are distinct from cellular profiles, and mutant exosomes cluster 28
separately from wild type KRAS exosomes. miR-10b was selectively increased in wild 29
type exosomes while miR-100 was increased in mutant exosomes. Neutral 30
sphingomyelinase inhibition caused accumulation of miR-100 only in mutant cells, 31
suggesting KRAS-dependent miRNA export. In Transwell co-culture experiments, 32
mutant donor cells conferred miR-100-mediated target repression in wild type recipient 33
cells. These findings suggest extracellular miRNAs can function in target cells and 34
uncover a potential new mode of action for mutant KRAS in CRC. 35
36

3
INTRODUCTION 37
An emerging paradigm in the study of cell signaling is the potential role for post-38
transcriptional gene regulation by extracellular RNAs. microRNAs (miRNAs) are 39
perhaps the best characterized class of small noncoding RNAs that have been detected 40
in extracellular fluids[1]. Mature miRNAs are 21-23 nucleotides in length and bind to 41
target mRNAs to inhibit their expression[2]. Because miRNAs imperfectly pair with their 42
mRNA targets, they can potentially regulate hundreds of transcripts within a genome[3]. 43
However, individual miRNAs exhibit exquisite tissue-specific patterns of expression[4], 44
control cell fate decisions[5], and are often aberrantly expressed in human cancers[6], 45
affording possible disease-specific signatures with diagnostic, prognostic and 46
therapeutic potential[7, 8]. 47
In addition to their intracellular roles, recent experiments have identified miRNAs 48
outside the cell in extracellular vesicles (EVs) including exosomes or larger vesicles[1, 49
9], in high density lipoprotein (HDL) particles[10], or in smaller complexes with 50
Argonaute 2 protein (AGO2)[11]. Exosomes are small 40-130nm vesicles of endosomal 51
origin that are secreted by all cells and can fuse and be internalized by recipient cells[1, 52
12-15]. It has been suggested that protein cargo transfer by exosomes between cells is 53
associated with tumor aggressiveness and metastasis[15-19]. With the discovery that 54
miRNAs and other RNAs can also be packaged into EVs, or exported by other 55
extracellular mechanisms, it remains unclear the extent to which RNA cargo is sorted 56
for export and how it is dysregulated in disease conditions, such as cancer. 57
Despite accumulating evidence that exosomes are biologically active, little is 58
known regarding how oncogenic signaling affects the repertoire of miRNAs or proteins 59

4
that are selected for secretion. Given the potential of cancer-derived secreted RNAs to 60
modulate the tumor microenvironment, elucidation of the potential mechanisms for 61
selective sorting of cargo into exosomes is critical to understanding extracellular 62
signaling by RNA. KRAS mutations occur in approximately 34-45% of colon 63
cancers[20]. We have previously shown that exosomes from mutant KRAS CRC cells 64
can be transferred to wild type cells to induce cell growth and migration[15, 21]. 65
Compared to exosomes derived from isogenically matched wild type cells, exosomes 66
derived from mutant KRAS cells contain dramatically different protein cargo[21]. Here, 67
we show that KRAS status also prominently affects the miRNA profile in cells and their 68
corresponding exosomes. Exosomal miRNA profiles are distinct from cellular miRNA 69
patterns and exosomal miRNA profiles are better predictors of KRAS status than 70
cellular miRNA profiles. Furthermore, we show that cellular trafficking of miRNAs is 71
sensitive to neutral sphingomyelinase inhibition in mutant, but not wild type, KRAS cells 72
and that transfer of miRNAs between cells can functionally alter gene expression in 73
recipient cells. 74
75
RESULTS 76
Small noncoding RNAs are differentially distributed in exosomes 77
Because small RNAs are thought to be sorted at endosomal membranes and 78
since KRAS signaling can also occur on late endosomes[7], we hypothesized that 79
oncogenic KRAS signaling could alter RNA export into exosomes. We prepared small 80
RNA libraries from both exosomes and whole cells using isogenically matched CRC cell 81
lines that differ only in KRAS status (Figure 1-source data 1)[22]. Exosomes were 82

5
purified using differential centrifugation and consisted of vesicles ranging in size from 83
40-130 nm[15, 21]. These preparations exclude larger microvesicles but contain 84
smaller lipoproteins and probably other small RNA-protein complexes (unpublished 85
observation). Comprehensive sequencing analyses of both cellular and exosomal small 86
RNAs from all three cell lines revealed that more than 85% of the reads from the cellular 87
RNA libraries mapped to the genome, compared to only 50-71% from the exosomal 88
libraries (Figure 1A). The non-mappable reads consisted largely of sequences that 89
contain mismatches to genomic sequences. 90
The global small RNA profiles identified reads from various classes of RNA, 91
including miRNAs, with differential enrichment of specific RNAs in both the cellular and 92
exosomal fractions. Compared to cellular RNA samples, which displayed an 93
enrichment of miRNA sequences (~70%), miRNA reads in exosomal samples 94
comprised a smaller percentage of the total small reads (5-18%) compared to other 95
ncRNA classes (e.g. tRNAs, rRNAs, snRNAs) (Figure 1B,C, Supplementary File 1). 96
Most of these reads appear to be fragments of larger RNAs, both cytoplasmic and 97
nuclear. It is not clear how these RNAs are associated with and/or deposited into 98
exosomes. 99
The size distribution of cellular small RNA matched that expected from miRNA-100
derived reads (21-23 nucleotides). However, the small RNA read distribution from 101
exosomes was much broader with many reads smaller than 22 nucleotides in length 102
(Figure 1- figure supplement 1). Given that these reads map to RNAs other than known 103
miRNAs, these data suggest that a large proportion of small exosomal RNA reads are 104
derived from processing of other RNAs, in addition to post-transcriptionally modified 105

6
miRNA reads that are apparently subject to editing, trimming, and/or tailing[23]. 106
Consistent with this, when read identity was restricted to miRNAs by mapping back to 107
known miRNA hairpin sequences, the length distribution of mappable reads was nearly 108
identical between cells and exosomes (Figure 1D). 109
110
miRNAs are differentially enriched in exosomes dependent on KRAS status 111
Focusing on mappable reads, we sought to ascertain whether miRNAs might be 112
differentially represented when comparing cells to their secreted exosomes. For this, 113
we quantified the relative abundance of individual miRNAs and made pairwise 114
comparisons between normalized miRNA reads. Spearman correlation analyses 115
demonstrated high correlation between replicates of individual cell lines (r=0.95-0.96) 116
and between cellular datasets differing only in KRAS status (r=0.92-0.96) (Figure 2- 117
figure supplements 1-3). In contrast, the miRNA profiles from exosomes compared to 118
their parent cells were less correlated (DKO-1 r=0.67-0.81, DKs-8 r=0.64-0.71, DLD-1 119
r=0.64-0.69) (Figure 2- figure supplements 1,2,4). 120
We next utilized Principal Component (PC) analysis to determine whether the 121
overall miRNA profiles could distinguish between cells and exosomes and/or between 122
wild type and mutant KRAS status. The miRNA profiles from the three cell lines all 123
clustered close to one another indicating that overall miRNA expression profiles are 124
fairly similar among the different cell types (Figure 2). In marked contrast, Principal 125
Component analysis revealed that exosomal miRNA profiles clearly segregate 126
according to KRAS status (Figure 2). Relatively minor differences between cellular 127
miRNA expression profiles become much more prominent when comparing exosomal 128

7
miRNA patterns (Figure 2- figure supplement 3). This indicates that the presence of a 129
mutant KRAS allele alters sorting of specific miRNAs to exosomes, a finding that has 130
potentially important implications for biomarker development. 131
To gain more insight into the relative abundance of miRNAs in cells versus 132
matched exosomes, we examined the most abundant miRNA species in the various 133
sequencing libraries (determined by mean reads of individual miRNAs). For many 134
miRNAs, exosomal abundance correlated with cellular abundance (Supplementary File 135
2). However, calculation of fold-changes among the three isogenic KRAS cell lines, and 136
exosomes released from these cells, showed that distinct subsets of miRNAs are 137
enriched in either exosomes or cells (Tables 1,2). For all three cell lines, 25 miRNAs 138
were consistently up-regulated in cells and 29 miRNAs were consistently up-regulated 139
in exosomes (Figure 3A,B). Additionally, the diversity of miRNAs was substantially 140
greater in mutant KRAS DKO-1 exosomes (94 unique miRNAs) compared to parental 141
DLD-1 or wild type KRAS DKs-8 exosomes (Figure 3B). A select subset of cell and 142
exosomally targeted miRNAs were validated separately by qRT/PCR (Figure 3C). 143
Collectively, these data indicate that the miRNA profiles observed in exosomes are 144
distinct from their parental cells with specific miRNAs preferentially overrepresented or 145
underrepresented in exosomes. We observed a mutant KRAS-specific pattern of 146
secreted miRNAs, consistent with the hypothesis that dysregulation of miRNA 147
metabolism is associated with tumorigenesis, a previously unrecognized feature of 148
mutant KRAS. 149
150
KRAS-dependent sorting of miRNAs 151

8
miR-100 152
Down regulation of miR-100-5p was observed in mutant KRAS DKO-1 and 153
parental DLD-1 cells compared to wild type KRAS DKs-8 cells (Table 1). This is 154
consistent with reports that have shown decreased miR-100 expression in metastatic 155
cancers[24, 25]. miR-100 has also been shown to negatively regulate migration, 156
invasion, and the epithelial-mesenchymal transition[26-28]. Interestingly, miR-100 was 157
enriched in exosomes derived from mutant KRAS cells (>8-fold and >3-fold enriched in 158
DKO-1 and DLD-1 exosomes, respectively; Supplementary File 2), suggesting that 159
decrease of miR-100 in cells is due to secretion in exosomes. This is in line with 160
findings that circulating levels of miR-100 are up-regulated in the plasma of mutant 161
KRAS-expressing mouse pancreatic cancer models and in pancreatic cancer 162
patients[29]. More broadly, the observation that miR-100-5p specifically accumulates in 163
exosomes suggests there may be sequence-specific requirements for the sorting of 164
certain miRNAs into exosomes. 165
166
miR-10b 167
Our RNA sequencing data identified miR-10b as preferentially secreted in 168
exosomes isolated from cells harboring a wild type KRAS allele (>3 fold-change and >2 169
fold-change enrichment in DKs-8 and DLD-1 exosomes, respectively), but retained in 170
mutant KRAS DKO-1 cells (~3 fold-change cell enrichment). miR-10b is referred to as 171
an oncomiR because it is frequently up-regulated during progression of various cancers, 172
including CRC[30]. 173
174

9
miR-320 175
miR-320 is aberrantly expressed in several types of cancer, including colon 176
cancer. It is expressed in the proliferative compartment of normal colonic crypts[31, 32]. 177
miR-320 members (miR-320b, -c, d, and -e) were abundant in both mutant KRAS 178
(DKO-1) and wild type KRAS (DKs-8) exosomes, but underrepresented in the matched 179
cells, indicating that some miRNAs are transcribed and predominantly exported into 180
exosomes, independent of KRAS status (Table 2, Supplementary File 1A). Of these 181
family members, miR-320a and -320b were the most abundant species represented in 182
exosomes by our RNA sequencing analyses (miR-320a in DKO-1 exosomes, and miR-183
320b in DKs-8 and DKO-1 exosomes). Interestingly, however, we observed the largest 184
enrichment for miR-320d (fold-changes >241 in DKs-8 and >229 in DKO-1) in 185
exosomes relative to cells, despite being ~4-fold less abundant than miR-320b levels. 186
Because the 3’-terminus may be important in regulating miRNA stability and turnover, 187
coupled to the fact that the sequences of miR-320a-d members differ only at their 3’-188
termini, enrichment of certain miRNAs in exosomes could be due to higher 189
turnover/decay rates in cells. 190
191
Exosomal secretion and strand selection 192
Because we observed differential export of specific miRNAs, we investigated 193
whether there might be miRNA sequence-specific sorting signals. Previous reports 194
have shown differential accumulation of 5p or 3p strands in exosomes compared to 195
parental cells[33]. Thus, we analyzed our data sets to test whether exosomes might be 196
preferentially enriched for one strand over the other. We were able to identify individual 197

10
miRNAs where the two strands differentially sorted between cells and exosomes. For 198
example, the -5p strands of miR-423 were overrepresented in DKO-1 exosomes but in 199
exosomes from DKs-8 cells, both strands were overrepresented compared to cells (data 200
not shown). This indicates that KRAS status may differentially affect selection of 201
passenger or guide strands for sorting into exosomes for select individual miRNAs. 202
Individual miRNAs often exist as populations of variants (isomiRs) that differ in 203
length and/or nucleotide composition generated by template- or non-template-directed 204
variation[34-36]. When we analyzed our sequencing data sets, we did not detect 205
differential accumulation of isomers with variable 5’ termini (data not shown). For 206
cellular miRNAs, most reads were full length with a slight enrichment in 3’ non-template 207
addition (NTA) of A-tailed miRNAs, regardless of KRAS status (Figure 4; Figure 4- 208
figure supplement 1). For exosomes, we observed a slight enrichment for C residues 209
added to the 3’ ends of miRNAs from wild type KRAS cells (Figure 4- figure supplement 210
1). We did not observe this in mutant KRAS exosomes, where instead, we noticed an 211
increase in 3’ trimming of miRNAs (Figure 4, Figure 4- figure supplement 2). Overall, it 212
remains to be determined whether such modifications constitute a global exosomal 213
sorting signal in these cells. 214
Consistent with published data, we have shown that miRNA expression patterns 215
vary between parental cells and their cognate exosomes (Tables 1,2, Figure 3A,B)[1, 216
13, 14, 37, 38]. Differential export suggests that specific signals must exist to sort 217
distinct miRNAs[39, 40]. We therefore conducted MEME analysis to attempt to identify 218
sequence motifs that might serve as targeting signals. When we examined all miRNA 219
reads detected in exosomes, we did not find any global enrichment for specific 220

11
sequences or motifs, including those reported to be bound by hnRNP A2B1 (GGAG or 221
U/CC)[40, 41](Figure 4- figure supplement 3). However, when we analyzed miR-320 222
because it is preferentially exported to exosomes independent of KRAS status, we were 223
able to identify the GGAG sequence contained within the 3’ end of the mature 224
sequence. Additionally, upon restricting our analysis to reads from the most 225
differentially expressed miRNAs when comparing exosomes to cells, we found a slight 226
enrichment for C residues, possibly alternating C residues in exosomal miRNAs (Figure 227
4- figure supplement 3). 228
229
Sphingomyelinase-dependent sorting of miRNAs to exosomes 230
Although little is understood regarding the molecular mechanisms for packaging 231
exosomal miRNAs, recent evidence suggests that the secretion of miRNAs in 232
exosomes is dependent on ceramide via its production by neutral sphingomyelinase 2 233
(nSMase2)[12, 13]. Inhibition of de novo ceramide synthesis by treatment with a neutral 234
sphingomyelinase inhibitor impaired exosomal miRNA release, apparently due to 235
decreased formation of miRNA-containing exosomes[12, 13]. To test the role of neutral 236
sphingomyelinase in miRNA secretion in our system, we treated CRC cells with the 237
nSMase inhibitor, GW4869. We determined the effect of this inhibitor on miR-10b since 238
it is preferentially found in wild type KRAS DKs-8 exosomes, miR-100 since it is 239
preferentially found in mutant KRAS DKO-1 and DLD-1 exosomes, and miR-320 which 240
sorts into exosomes regardless of KRAS status. For miR-10b, we did not observe 241
significant changes in its cellular levels after treatment with GW4869 in either wild type 242
KRAS DKs-8 or mutant KRAS DKO-1 cells (Figure 5C). In contrast, inhibition of neutral 243

12
sphingomyelinase caused a ~3-fold increase in intracellular levels of miR-100 in mutant 244
KRAS DKO-1 cells but remained unchanged in wild type DKs-8 KRAS cells (Figure 245
5A,B,C). Similarly, miR-320 levels were found to increase (~2.5 fold) only in GW4869-246
treated mutant KRAS DKO-1 cells (Figure 5C). These data are most consistent with the 247
hypothesis that impaired ceramide synthesis alters cellular accumulation of miRNAs 248
dependent on mutant KRAS and suggest that multiple biogenic routes exist for miRNA 249
secretion. 250
251
Extracellular transfer of miR-100 252
Several reports have found that extracellular miRNAs can be taken up by 253
recipient cells to mediate heterotypic cell-cell interactions and facilitate target repression 254
in neighboring cells[13, 38, 42]. To determine whether secreted miRNAs function in 255
recipient cells, we designed luciferase (Luc) constructs containing either 3 perfect miR-256
100 recognition elements (MREs) in the 3’ UTR (Luc-100-PT) or scrambled 3’ UTR 257
sequences that do not match any known miRNAs (Luc-CTL). These constructs were 258
expressed in wild type KRAS DKs-8 cells (recipient cells) in the presence or absence of 259
donor cells. Baseline repression of Luc in the absence of donor cells was first analyzed 260
to determine the levels of repression from endogenous miR-100 in DKs-8 cells. 261
Compared to the scrambled control (Luc-CTL), strong Luc repression in the absence of 262
donor cells was observed with perfect miR-100 recognition elements (miR-100-PT) 263
(Figure 6A). This supports our finding that miR-100 is expressed and retained in DKs-8 264
cells. 265

13
To determine whether secretion of miR-100 by mutant KRAS DKO-1 donor cells 266
could further augment miR-100 function in recipient wild type cells, Transwell co-culture 267
experiments were performed with DKs-8 recipient cells expressing the luciferase 268
reporters in the presence of DKO-1 donor cells (Figure 6). Significantly increased 269
repression of Luc was observed when the reporter construct containing three perfect 270
miR-100 sites was used (miR-100-PT)(Figure 6A). Because exosomes released from 271
DKO-1 cells contain abundant levels of miR-100, increased luciferase repression is 272
consistent with transfer of additional copies of miR-100. Two control experiments were 273
performed to test the hypothesis that additional copies of miR-100 are transferred 274
between donor and recipient cells. First, we treated donor cells with antagomirs that 275
block production of miR-100. Luc repression was almost completely reversed upon 276
pretreatment of DKO-1 donor cells with a miR-100 hairpin antagomir inhibitor (AI-100) 277
(Figure 6D). Second, we performed qRT/PCR to calculate the increase in miR-100 278
levels in recipient cells. Cells grown in the presence or absence of donor cells showed 279
an approximate 34% increase in the levels of miR-100 (Figure 6E and Figure 6- figure 280
supplement 2). 281
To further probe the repressive activity of miR-100, we performed co-culture 282
experiments in which the recipient Dks-8 cells express Luc fused to the 3’UTR of 283
mTOR, an endogenous miR-100 target[43-45]. As observed with miR-100-PT 284
repression, Luc-mTOR was significantly repressed in the presence of mutant KRAS 285
DKO-1, but not in the presence of wild type KRAS DKs-8 donor cells (Figure 6B). This 286
suggests that miR-100 repressive activity is specific to the presence of mutant KRAS 287
DKO-1 donor cells. To confirm these results, we mutated the miR-100 recognition 288

14
elements within the mTOR 3’UTR and assayed for miR-100 activity (Figure 6- figure 289
supplement 1). Mutation of individual sites did not show significantly different Luc 290
repression (data not shown). However, upon mutation of two MREs (MS2), we 291
observed a partial rescue of Luc expression (Figure 6C). This was further augmented 292
upon mutation of all three sites (MS3), with a complete rescue of miR-100-mediated 293
repressive activity (Figure 6C). 294
As a final test of miRNA transfer in the Transwell co-culture experiments, we 295
created vectors expressing Luc fused to a 3’ UTR containing perfect sites for miR-222 296
because miR-222 is not detectable in DKs-8 recipient cells, unlike miR-100. In this 297
case, silencing of Luc should be due to transfer of miR-222 and not due to unforeseen 298
changes in endogenous miRNA activity. We observed a greater than 2-fold repression 299
of the miR-222 Luc reporter in recipient cells (Figure 6- figure supplement 3). These 300
results support the hypothesis that miRNAs secreted by mutant KRAS cells can be 301
transferred to recipient cells. 302
303
DISCUSSION 304
In this study, we comprehensively examined the composition of small ncRNAs 305
from exosomes and cells of isogenic CRC cell lines that differ only in KRAS status. By 306
employing small RNA transcriptome analyses, we found that oncogenic KRAS 307
selectively alters the miRNA profile in exosomes and that ceramide depletion selectively 308
promotes miRNA accumulation in mutant KRAS CRC cells. Distinct miRNA profiles 309
between cells and their exosomes may be functionally coupled to mitogenic signaling. 310

15
KRAS status-specific patterns of secreted miRNAs supports the idea of using 311
exosomes as potential biomarkers in CRC. Our finding that miR-10b is preferentially 312
enriched in wild type KRAS-derived exosomes while miR-100 is enriched in mutant 313
KRAS-derived exosomes raises interesting questions regarding how they are selected 314
for secretion. miR-10b and miR-100 are both part of the miR-10/100 family and differ by 315
only one base in the seed region, allowing regulation of distinct sets of target 316
mRNAs[46]. Whether the accumulation or export of these miRNAs is a result or a 317
consequence of oncogenic signaling remains unknown. Preventing the export or 318
retention of certain miRNAs, such as miR-100 and miR-10b, may serve a therapeutic 319
role in reversing the tumorigenic effects seen with aberrant miRNA expression. 320
KRAS-dependent differential miRNA expression more prominently affected 321
miRNA expression patterns observed in exosomes than in the parent cells. This could 322
reflect a mechanism by cells to selectively export miRNAs so as to maintain specific 323
growth or gene expression states. This is consistent with a recent report that found that 324
the cellular levels of miR-218-5p could be maintained, despite changes in the 325
abundance of its target, likely through a “miRNA relocation effect” where unbound 326
miRNAs that are in excess have the potential to be sorted to exosomes[38]. Another 327
mechanism may be through sequence-specific motifs that direct miRNA trafficking by 328
interaction with specific chaperone proteins[40, 41]. Although we did not find any 329
globally significant motif overrepresented in exosomal miRNAs, we cannot rule out that 330
individual miRNAs might undergo sequence-specific export. miR-320 family members 331
all contain the GGAG motif that has been proposed to serve as an exosomal targeting 332
signal[40]. We found that members of the miR-320 family are preferentially enriched in 333

16
exosomes independent of KRAS status; however, the GGAG sequence was not found 334
in other miRNAs that are targeted to exosomes. It has been reported that the 335
biogenesis of miR-320 family members occurs by a non-canonical pathway that 336
requires neither Drosha[47] nor XPO5[48]. Instead, the 5’ ends contain a 7-methyl 337
guanosine cap that facilitates nuclear-cytoplasmic transport through XPO1[48]. XPO1 338
is present in DKO-1, DKs-8 and DLD-1 exosomes as detected by mass 339
spectrometry[21]. It will be interesting to investigate whether alternate processing 340
pathways and associated biogenic machinery contribute to the heterogeneity of 341
extracellular vesicle cargo and affect miRNA secretion. 342
It was recently demonstrated that miRNAs in B-cell exosomes display enriched 343
levels of nontemplate-directed 3’-uridylated miRNAs, while 3’-adenylated miRNA 344
species are preferentially cell-enriched[23]. In certain contexts, the addition of 345
nontemplated uridine residues to cognate miRNAs accelerates miRNA turnover[49, 50]. 346
Thus, it is possible that the stability/half-life of a miRNA affects whether it is retained or 347
secreted. While the exact functional significance of 3’-end modifications of miRNAs 348
detected in both cells and exosomes remains to be determined, it could be that 349
differential export of “tagged” miRNAs could allow cells to export specific miRNAs. 350
However, the lack of any apparent motif upon global analysis of miRNAs enriched in 351
exosomes, coupled to the finding that even untagged miRNAs are differentially 352
exported, suggests multiple strategies for loading of miRNAs into extracellular vesicles, 353
and that not all extracellular vesicles and exosomes contain identical cargo. This further 354
implies that different cell types secrete a heterogeneous population of vesicles. 355
Although the biological relevance of these findings remain to be determined, the specific 356

17
sorting of miRNAs into exosomes may enable cancer cells to discard tumor suppressive 357
miRNAs so as to increase their oncogenic potential, or perhaps modulate gene 358
expression in neighboring and distant cells to promote tumorigenesis. In support of this 359
hypothesis, miR-100, which we found to be enriched in mutant KRAS exosomes, was 360
found to down-regulate LGR5 in colorectal cancer cells and thereby inhibit migration 361
and invasion of such cells[28]. In this context, removal of miR-100 from the cell would 362
be a tumor-promoting event. 363
In other contexts, miR-100 can have contradictory activities, both inducing EMT 364
by down-regulating E-cadherin through targeting SMARCA5, and inhibiting 365
tumorigenicity by targeting HOXA1[26]. Thus, although miR-100 can function as a 366
tumor suppressor under normal conditions, augmenting its levels, for example by 367
extracellular vesicle uptake, could potentially promote EMT. In this regard, the role of 368
miR-100 in tumorigenesis would be two-fold, where its secretion in exosomes could 369
function to maintain low intracellular levels within mutant cells, while inducing EMT in 370
wild-type recipient cells. Along these lines, miR-100 is part of the miR-125b/let-7a-371
2/miR-100 cluster that is transcribed and expressed coordinately[51]. Interestingly, in 372
malignant colonic tissues from individuals with CRC, miR-100 levels were significantly 373
decreased while let-7a levels were strongly upregulated[52]. Based on our finding that 374
there is differential accumulation of individual miRNAs within this cluster between 375
mutant KRAS cells and exosomes, it will be interesting to determine whether cancer 376
cells down-regulate specific miRNAs by active secretion, while simultaneously 377
maintaining the levels of other miRNAs transcribed within the same cluster. 378

18
miRNAs are secreted from malignant breast epithelial cells after packaging into 379
vesicles larger than conventional exosomes that are enriched in CD44, whose 380
expression is linked to breast cancer metastasis[53]. Normal cells tend to release 381
miRNAs in more homogenous types of exosomes, suggesting that malignant 382
transformation may alter the formation of secreted vesicles that could alter miRNA 383
export and lead to differences in exosome content and morphology[53, 54]. In support 384
of this, it was recently shown that in exosomes from breast cancer cells, CD43 mediates 385
the accumulation of Dicer[54]. These exosomes also contain other RISC proteins and 386
pre-miRNAs, indicating that miRNA processing can occur in exosomes[54]. These 387
components were absent in exosomes derived from normal cells. It remains to be 388
determined whether components of the RISC loading complex assemble within 389
endosomes before their secretion as exosomes, or by the fusion of exosomes 390
containing heterogeneous cargo after they are secreted. The observation that cells can 391
selectively release miRNAs and also release a heterogeneous population of vesicles 392
raises the possibility that differential release of miRNAs is associated with different 393
classes of exosomes and microvesicles. 394
Recently, quantitative analysis of secreted miRNAs suggested that the levels of 395
extracellular miRNAs are limited and raise the question as to how such levels can alter 396
gene expression in recipient cells[55]. The results of our Transwell co-culture 397
experiments are most consistent with extracellular transfer of specific miRNAs to alter 398
expression of reporter constructs. Nevertheless, the level of exosomal transfer that is 399
needed to alter recipient cell gene expression in vivo remains an open question. Our 400
finding that mutant KRAS protein can be functionally transferred in exosomes indicates 401

19
that the full effect of exosomes on recipient cells can be due to a combination of both 402
RNA delivery and protein-based signaling[15]. This could include activation of Toll-like 403
receptors with possible downstream effects following NFKB or MAPK cascades[56, 57]. 404
The complexity of miR-100 function in the tumor microenvironment underscores this 405
argument by its potential for inhibiting mTOR expression which is required for 406
proliferation of Apc-deficient tumors in mouse models[59]. In tumors where some cells 407
have incurred activating mutations in KRAS, while others have not, miR-100 could 408
accumulate in wild-type KRAS tumor cells through exosomal transfer, inhibiting mTOR 409
and cell growth. Conversely miR-100 could be secreted from mutant KRAS cells giving 410
them a growth advantage. In this way exosomal transfer of miRNAs might act to select 411
for cells carrying specific tumor driver mutations. Our studies have direct implications for 412
CRC and, together with other studies, indicate that delivery of exosomes to recipient 413
cells can induce cell migration, inflammation, immune responses, angiogenesis, 414
invasion, pre-metastatic niche formation, and metastasis[19, 42, 54, 58]. 415
416

20
MATERIALS AND METHODS 417
Exosome isolation. Exosomes were isolated from conditioned medium of DKO-1, 418
Dks-8, and DLD-1 cells as previously described, with slight modification[15]. Briefly, 419
cells were cultured in DMEM supplemented with 10% bovine growth serum until 80% 420
confluent. The cells were then washed 3 times with PBS and cultured for 24 hr in 421
serum-free medium. The medium was collected and replaced with ionomycin-422
containing medium for 1 hr, after which ionomycin-containing medium was collected and 423
pooled with the previously collected serum-free medium. Pooled media was centrifuged 424
for 10 min at 300 X g to remove cellular debris, and the resulting supernatant was then 425
filtered through a 0.22-mm polyethersulfone filter (Nalgene, Rochester, NY, USA) to 426
reduce microparticle contamination. The filtrate was concentrated ~300-fold with a 427
100,000 molecular-weight cutoff centrifugal concentrator (Millipore, Darmstadt, 428
Germany). The concentrate was then subjected to high-speed centrifugation at 150,000 429
X g for 2 hr. The resulting exosome-enriched pellet was resuspended in PBS 430
containing 25 mM HEPES (pH 7.2) and washed by centrifuging again at 150,000 X g for 431
3 hr. The wash steps were repeated a minimum of 3 times until no trace of phenol-red 432
was detected. The resulting pellet was resuspended in PBS containing 25 mM HEPES 433
(pH 7.2) and protein concentrations were determined with a MicroBCA kit 434
(Pierce/Thermo, Rockford, IL, USA). The number of exosomes per μg of protein was 435
determined by means of nanoparticle tracking analysis (NanoSight, Wiltshire, UK). 436
Analysis was performed on three independent preparations of exosomes. 437
438

21
RNA purification. Total RNA from exosomes and cells was isolated using TRIzol (Life 439
Technologies/Thermo). In the case of exosomal RNA isolation TRIzol was incubated 440
with 100 ul or less of concentrated exosomes for an extended 15 min incubation prior to 441
chloroform extraction. RNA pellets were resuspended in 60 μl of RNase-free water and 442
were then re-purified using the miRNeasy kit (Qiagen Inc., Valencia, CA, USA). Final 443
RNAs were eluted with two rounds of 30 ul water extraction. 444
445
miRNA library preparation and sequencing. Total RNA from each sample was used 446
for small RNA library preparation using NEBNext Small RNA Library Prep Set from 447
Illumina (New England BioLabs Inc., Ipswich, MA, USA). Briefly, 3` adapters were 448
ligated to total input RNA followed by hybridization of multiplex SR RT primers and 449
ligation of multiplex 5’ SR adapters. Reverse transcription (RT) was performed using 450
ProtoScript II RT for 1 hr at 50°C. Immediately after RT reactions, PCR amplification 451
was performed for 15 cycles using LongAmp Taq 2X master mix. Illumina-indexed 452
primers were added to uniquely barcode each sample. Post-PCR material was purified 453
using QIAquick PCR purification kits (Qiagen Inc.). Post-PCR yield and concentration 454
of the prepared libraries were assessed using Qubit 2.0 Fluorometer (Invitrogen, 455
Carlsbad, California, CA, USA) and DNA 1000 chip on Agilent 2100 Bioanalyzer 456
(Applied Biosystems, Carlsbad, CA, USA), respectively. Size selection of small RNA 457
with a target size range of approximately 146-148 bp was performed using 3% dye free 458
agarose gel cassettes on a Pippin Prep instrument (Sage Science Inc., Beverly, MA, 459
USA). Post-size selection yield and concentration of libraries were assessed using 460
Qubit 2.0 Fluorometer and DNA high sensitivity chip on an Agilent 2100 Bioanalyzer, 461

22
respectively. Accurate quantification for sequencing applications was performed using 462
qPCR-based KAPA Biosystems Library Quantification kits (Kapa Biosystems, Inc., 463
Woburn, MA, USA). Each library was diluted to a final concentration of 1.25 nM and 464
pooled in equimolar ratios prior to clustering. Cluster generation was carried out on a 465
cBot v8.0 using Illumina’s Truseq Single Read (SR) Cluster Kit v3.0. Single End (SE) 466
sequencing was performed to generate at least 15 million reads per sample on an 467
Illumina HiSeq2000 using a 50-cycleTruSeq SBSHSv3 reagent kit. Clustered flow cells 468
were sequenced for 56 cycles, consisting of a 50-cycle read, followed by a 6-cycle index 469
read. Image analysis and base calling was performed using the standard Illumina 470
pipeline consisting of Real Time Analysis (RTA) version v1.17 and demultiplexed using 471
bcl2fastq converter with default settings. 472
473
Mapping of RNA reads. Read sequence quality checks were performed by FastQC 474
(Babraham Bioinformatics (http://www.bioinformatics.babraham.ac.uk/projects/fastqc/). 475
Adapters from the 3’ ends of reads were trimmed using Cutadpt with a maximum 476
allowed error rate of 0.1[60]. Reads shorter than 15 nucleotides in length were 477
excluded from further analysis. Reads were mapped to the human genome hg19 using 478
Bowtie version 1.1.1[61]. Mapped reads were annotated using ncPRO-seq[62] based 479
on miRbase[63], Rfam[64, 65] and RepeatMasker (http://www.repeatmasker.org/) and 480
expression levels were quantified based on read counts. Mature miRNA annotation 481
was extended 2 bp in both upstream and downstream regions to accommodate 482
inaccurate processing of precursor miRNAs. Reads with multiple mapping locations 483
were weighted by the number of mapping locations. 484

23
485
Principal Component analysis. DESeq Version 1.16.0 was used to perform Principal 486
Component analyses[66]. 487
488
Enrichment analysis. Differential expression was analyzed using DESeq Version 489
1.16.0[66]. Negative binomial distribution was used to compare miRNA abundance 490
between cells versus exosomes and wild type versus mutant KRAS status. The 491
trimmed mean of M values (TMM) method was used for normalization [67]. Differential 492
expression was determined based on log2 fold change (log2 fold change) and False 493
Discovery Rate (FDR) with |log2 Fold Change| >= 1 and FDR <= 0.001. 494
495
Trimming and tailing. Trimming and tailing analysis was based on miRBase 496
annotation[63, 68, 69]. Only high confidence miRNAs (544) and corresponding hairpin 497
sequences were used. Bowtie version 1.1.1 with 0 mismatch was used for mapping. 498
miRNA reads were first mapped to hairpin sequences with unmapped reads then 499
mapped to the human genome hg19. Remaining reads were trimmed 1 bp form the 3’ 500
end and remapped to hairpin sequences. The remapping process was repeated 10 501
times. Finally, all mapped reads were collected for further analysis. 502
503
qRT/PCR. Taqman small RNA assays (Life Technologies) (individual assay numbers 504
are listed below) were performed for indicated miRNAs on cellular and exosomal RNA 505
samples. Briefly, 10 ng of total RNA was used per individual RT reactions; 0.67 μl of 506
the resultant cDNA was used in 10 μl qPCR reactions. qPCR reactions were conducted 507

24
in 96-well plates on a Bio-Rad CFX96 instrument. All C(t) values were ≤ 30. Triplicate 508
C(t) values were averaged and normalized to U6 snRNA. Fold-changes were 509
calculated using the ΔΔC(t) method, where: Δ=C(t)miRNA-C(t)U6 snRNA, and ΔΔC(t)= 510
ΔC(t)exo-ΔC(t)cell, and FC=2-ΔΔC(t). Analysis was performed on three independent cell 511
and exosomal RNA samples. Taqman probe #: U6 snRNA: 001973; hsa-let-7a-5p: 512
000377; hsa-miR-100-5p: 000437; hsa-miR-320b: 002844; hsa-miR-320a: 002277. 513
514
Generation of miRNA standard curves 515
RNase-free, HPLC-purified 5’-phosphorylated miRNA oligoribonucleotides were 516
synthesized (Integrated DNA Technologies) for human miR-100-5p (5’-phospho-517
AACCCGUAGAUCCGAACUUGUG-OH-3’) and cel-miR-39-3p (5’-phospho-518
UCACCGGGUGUAAAUCAGCUUG-OH-3’). Stock solutions of 10μM synthetic 519
oligonucleotide in RNase-free and DNase-free water were prepared according to the 520
concentrations and sample purity quoted by the manufacturer (based on 521
spectrophotometry analysis). Nine 2-fold dilution series beginning with 50pM synthetic 522
oligonucleotide were used in 10ul RT reactions (Taqman small RNA assays) and qPCR 523
was performed. Each dilution was performed in triplicate from three independent 524
experiments. Linear regression was used to determine mean C(t) values plotted 525
against log(miRNA copies/ul). 526
527
miRNA in situ hybridizations and ceramide dependence. Cells were plated in 6-well 528
plates containing coverslips at a density of ~2.5x10⁵ cells and cultured in DMEM 529
supplemented with 10% bovine growth serum for 24 hr. The cells were then washed 3 530

25
times with PBS and cultured for 24 hr in serum-free medium containing either 5 μM 531
GW4869 (Cayman Chemicals # 13127, Ann Arbor, MI, USA) or DMSO. Medium was 532
removed and cells were washed 3 times with PBS and fixed with 4% PFA for ~15 min at 533
room temperature. After, cells were washed 3 times in DEPC-treated PBS and 534
permeabilized in 70% ethanol for ~4 hr at 4°C, and rehydrated in DEPC-treated PBS for 535
5 min. Pre-hybridization was performed in hybridization buffer (25% formamide, 0.05 M 536
EDTA, 4X SSC, 10% dextran sulfate, 1X Denhardts solution 1mg/ml E.coli tRNA) in a 537
humidified chamber at 60°C for 60 min. Hybridization buffer was removed and replaced 538
with 10 nM of probe (probe numbers are listed below) diluted in hybridization buffer and 539
incubated at either 55°C (miR-100 and miR-10b) or 57°C for scrambled and U6 probes 540
for 2 hr. Coverslips were then washed in series with pre-heated SSC at 37°C as 541
follows: 4X SSC briefly, 2X SSC for 30 min., 1x SSC for 30 min, and 0.1x SSC for 20 542
min. miRNA detection was conducted using Tyramide Signal Amplification (TSA) 543
(Perkin Elmer, # NEL741001KT, Waltham, MA, USA). Briefly, coverslips were blocked 544
in blocking buffer (0.1 M TRIS-HCl, pH 7.5, 0.15 M NaCl, 0.5% Blocking Reagent 545
[Roche, #11096176001, Basel, Switzerland]) at 4°C overnight. Blocking buffer was 546
replaced with anti-DIG-POD (Roche, # 11207733910) diluted 1:100 in blocking buffer 547
and incubated for 60 min. Coverslips were washed 3 times, 5 min per wash, in wash 548
buffer (0.1 M TRIS-HCl, pH 7.5, 0.15 M NaCl, 0.5% Saponin) followed by incubation 549
with 1X Fluorescein diluted in 1X amplification reagent for 5 min. Fluorescent coverslips 550
were then washed 2 times, 5 min per wash, in wash buffer. To preserve fluorescent 551
signals, coverslips were fixed with 2% PFA containing 2% BSA in 1X PBS for 15 min. 552
After fixation, coverslips were washed 2 times, 5 min per wash, in wash buffer, followed 553

26
by a final wash in 1X PBS for 5 min. Coverslips were then mounted in Prolong Gold 554
(Life Technologies) and visualized on a Zeiss LSM510 at 63X objective. 3’-DIG labeled 555
probes for in situ hybridizations- U6 snRNA: 99002-05; Scramble: 99004-05; miR-10b-556
5p: 38486-05; miR-100-5p: 18009-05 (Exiqon, Woburn, MA, USA). 557
558
Co-culture and luciferase reporter assays. Recipient cells were plated in 6-well 559
plates at a density of ~2.5x10⁵ cells and cultured in DMEM supplemented with 10% 560
bovine growth serum for 24 hr. Media was replaced and cells were co-transfected 561
(Promega, E2311, Madison, WI, USA) with 1.5 μg of Luc-reporter plasmid and 1.5 μg β-562
gal plasmid DNA/well. Donor cells were plated in 0.4 μm polyester membrane 563
Transwell filters (Corning, 3450, Corning, NY, USA) at ~2.5x10⁵ cells/well for 24 hrs. 564
Media from donor Transwells and recipient 6-well plates were removed and replaced 565
with DMEM without FBS. Co-culture of donor and recipient cells were conducted for 566
either 24 or 48 hrs before recipient cells were harvested. Lysates were prepared in 1X 567
Reporter lysis buffer (Promega, E2510) and luciferase assays were performed 568
according to the manufacturer’s protocol (Promega, E2510). β-gal expression was 569
simultaneously determined from the lysates according to the manufacturer’s protocol 570
(Promega, E2000). Differences in transfection efficiency were accounted for by 571
normalizing Luc expression to β-Gal expression (Luc/β-Gal). All assays were performed 572
on 3 biological replicates, each with 3 technical replicates. 573
574
Antagomir treatment. 575

27
Donor cells were plated in 0.4 μm polyester membrane Transwell filters (Corning, 3450, 576
Corning, NY, USA) at ~1.4x10⁴ cells/well for 24 hrs. Medum was replaced and donor 577
cells were transfected with either miR-100 hairpin antagomirs (# IH-300517-05, GE Life 578
Sciences) or negative control hairpin antagomirs corresponding to cel-miR-67 (# IN-579
001005-01, GE Life Sciences) to produce a final concentration of 100 nM of antagomir 580
for 24 hrs. Medium from donor Transwells and recipient 6-well plates was removed and 581
replaced with DMEM without FBS. Co-culture of donor and recipient cells was 582
conducted for 24 hrs before recipient cells were harvested for RNA isolation. 583
584
Plasmid construction. For the pLuc-mTOR construct, the 3’UTR of mTOR was PCR 585
amplified (primer sequences in Supplementary File 3) from genomic DNA isolated from 586
DKs-8 cells. The amplicon was cloned into pMiR-Report (Life Technologies) via 587
SpeI/HinDIII restriction sites. Mutation of miR-100 binding sites in mTOR 3UTR (MS) 588
was performed on pLuc-mTOR using forward or reverse primers targeting either all 589
three MRE’s, or MRE 2 & 3 with QuikChange Lightning Multi-Site Directed Mutagenesis 590
(Agilent, Santa Clara, CA, USA) according to manufacturer’s protocol. To create the 591
reporter construct containing three miR-100 perfect sites (miR-100-PT), 592
oligonucleotides (Supplementary File 3) were annealed to produce a synthetic fragment 593
containing the perfect sites with CTAGT and AGCTT overhangs. The fragment was 594
cloned into pMiR-report via SpeI/HinDIII restriction sites. All plasmids were sequence 595
verified (GeneWiz, South Plainfield, NJ, USA). 596
597

28
598 Author contributions 599
DJC and JLF designed most of the experimental work, acquired the data, and 600
participated in analysis and interpretation with help from JNH and MDB. NP and SL 601
designed the RNA library preparation and performed the sequencing analyses and 602
participated in data interpretation. YD, QL, and BZ performed all computational, 603
bioinformatics, and statistical analyses and participated in data interpretation. JGP, 604
RJC, AMW and KV conceived and directed all aspects of the project. DJC, JLF, RJC, 605
AMW, YD, BZ, and JGP wrote the manuscript with comments and final approval from all 606
authors. 607
608 609 Acknowledgements 610
This work was supported by grants from the National Institutes of Health, 611
U19CA179514, RO1 CA163563 and a GI Special Program of Research Excellence 612
(SPORE) P50 95103 to RJC, and a pilot in P30 DK058404 to JLF. Vanderbilt Digestive 613
Disease Research Center (P30 DK058404) and associated Cores.614

References 615 616
1. Valadi, H., Ekstrom, K., Bossios, A., Sjostrand, M., Lee, J.J., and Lotvall, J.O. (2007). 617 Exosome-mediated transfer of mRNAs and microRNAs is a novel mechanism of genetic 618 exchange between cells. Nat Cell Biol 9, 654-659. 619
2. Krol, J., Loedige, I., and Filipowicz, W. (2010). The widespread regulation of microRNA 620 biogenesis, function and decay. Nat Rev Genet 11, 597-610. 621
3. Bartel, D.P., and Chen, C.Z. (2004). Micromanagers of gene expression: the potentially 622 widespread influence of metazoan microRNAs. Nat Rev Genet 5, 396-400. 623
4. Wienholds, E., Kloosterman, W.P., Miska, E., Alvarez-Saavedra, E., Berezikov, E., de 624 Bruijn, E., Horvitz, H.R., Kauppinen, S., and Plasterk, R.H.A. (2005). MicroRNA 625 Expression in Zebrafish Embryonic Development. Science 309, 310-311. 626
5. Alvarez-Garcia, I., and Miska, E.A. (2005). MicroRNA functions in animal development 627 and human disease. Development 132, 4653-4662. 628
6. Thomson, J.M., Newman, M., Parker, J.S., Morin-Kensicki, E.M., Wright, T., and 629 Hammond, S.M. (2006). Extensive post-transcriptional regulation of microRNAs and its 630 implications for cancer. Genes & Development 20, 2202-2207. 631
7. Lu, J., Getz, G., Miska, E.A., Alvarez-Saavedra, E., Lamb, J., Peck, D., Sweet-Cordero, 632 A., Ebert, B.L., Mak, R.H., Ferrando, A.A., et al. (2005). MicroRNA expression profiles 633 classify human cancers. Nature 435, 834-838. 634
8. Volinia, S., Calin, G.A., Liu, C.G., Ambs, S., Cimmino, A., Petrocca, F., Visone, R., 635 Iorio, M., Roldo, C., Ferracin, M., et al. (2006). A microRNA expression signature of 636 human solid tumors defines cancer gene targets. Proc Natl Acad Sci U S A 103, 2257-637 2261. 638
9. Crescitelli, R., Lasser, C., Szabo, T.G., Kittel, A., Eldh, M., Dianzani, I., Buzas, E.I., and 639 Lotvall, J. (2013). Distinct RNA profiles in subpopulations of extracellular vesicles: 640 apoptotic bodies, microvesicles and exosomes. Journal of Extracellular Vesicles 2. 641
10. Vickers, K.C., Palmisano, B.T., Shoucri, B.M., Shamburek, R.D., and Remaley, A.T. 642 (2011). MicroRNAs are transported in plasma and delivered to recipient cells by high-643 density lipoproteins. Nat Cell Biol 13, 423-433. 644
11. Arroyo, J.D., Chevillet, J.R., Kroh, E.M., Ruf, I.K., Pritchard, C.C., Gibson, D.F., 645 Mitchell, P.S., Bennett, C.F., Pogosova-Agadjanyan, E.L., Stirewalt, D.L., et al. (2011). 646 Argonaute2 complexes carry a population of circulating microRNAs independent of 647 vesicles in human plasma. Proc Natl Acad Sci U S A 108, 5003-5008. 648
12. Kosaka, N., Iguchi, H., Yoshioka, Y., Takeshita, F., Matsuki, Y., and Ochiya, T. (2010). 649 Secretory mechanisms and intercellular transfer of microRNAs in living cells. J. 650 Biological Chemistry 285, 17442-17452. 651
13. Mittelbrunn, M., Gutierrez-Vazquez, C., Villarroya-Beltri, C., Gonzalez, S., Sanchez-652 Cabo, F., Gonzalez, M.A., Bernad, A., and Sanchez-Madrid, F. (2011). Unidirectional 653 transfer of microRNA-loaded exosomes from T cells to antigen-presenting cells. Nature 654 communications 2, 282. 655
14. Montecalvo, A., Larregina, A.T., Shufesky, W.J., Stolz, D.B., Sullivan, M.L., Karlsson, 656 J.M., Baty, C.J., Gibson, G.A., Erdos, G., Wang, Z., et al. (2012). Mechanism of transfer 657 of functional microRNAs between mouse dendritic cells via exosomes. Blood 119, 756-658 766. 659

30
15. Higginbotham, J.N., Demory Beckler, M., Gephart, J.D., Franklin, J.L., Bogatcheva, G., 660 Kremers, G.J., Piston, D.W., Ayers, G.D., McConnell, R.E., Tyska, M.J., et al. (2011). 661 Amphiregulin exosomes increase cancer cell invasion. Curr Biol 21, 779-786. 662
16. Hoshino, D., Kirkbride, K.C., Costello, K., Clark, E.S., Sinha, S., Grega-Larson, N., 663 Tyska, M.J., and Weaver, A.M. (2013). Exosome Secretion Is Enhanced by Invadopodia 664 and Drives Invasive Behavior. Cell Rep 5, 1159-1168. 665
17. Luga, V., Zhang, L., Viloria-Petit, A.M., Ogunjimi, A.A., Inanlou, M.R., Chiu, E., 666 Buchanan, M., Hosein, A.N., Basik, M., and Wrana, J.L. (2012). Exosomes mediate 667 stromal mobilization of autocrine Wnt-PCP signaling in breast cancer cell migration. Cell 668 151, 1542-1556. 669
18. Skog, J., Wurdinger, T., van Rijn, S., Meijer, D.H., Gainche, L., Sena-Esteves, M., Curry, 670 W.T., Jr., Carter, B.S., Krichevsky, A.M., and Breakefield, X.O. (2008). Glioblastoma 671 microvesicles transport RNA and proteins that promote tumour growth and provide 672 diagnostic biomarkers. Nat Cell Biol 10, 1470-1476. 673
19. Costa-Silva, B., Aiello, N.M., Ocean, A.J., Singh, S., Zhang, H., Thakur, B.K., Becker, 674 A., Hoshino, A., Mark, M.T., Molina, H., et al. (2015). Pancreatic cancer exosomes 675 initiate pre-metastatic niche formation in the liver. Nat Cell Biol 17, 816-826. 676
20. Wong, R., and Cunningham, D. (2008). Using predictive biomarkers to select patients 677 with advanced colorectal cancer for treatment with epidermal growth factor receptor 678 antibodies. J Clin Oncol 26, 5668-5670. 679
21. Demory Beckler, M., Higginbotham, J.N., Franklin, J.L., Ham, A.J., Halvey, P.J., 680 Imasuen, I.E., Whitwell, C., Li, M., Liebler, D.C., and Coffey, R.J. (2013). Proteomic 681 analysis of exosomes from mutant KRAS colon cancer cells identifies intercellular 682 transfer of mutant KRAS. Molecular & Cellular Proteomics : MCP 12, 343-355. 683
22. Shirasawa, S., Furuse, M., Yokoyama, N., and Sasazuki, T. (1993). Altered growth of 684 human colon cancer cell lines disrupted at activated Ki-ras. Science 260, 85-88. 685
23. Koppers-Lalic, D., Hackenberg, M., Bijnsdorp, I.V., van Eijndhoven, M.A., Sadek, P., 686 Sie, D., Zini, N., Middeldorp, J.M., Ylstra, B., de Menezes, R.X., et al. (2014). 687 Nontemplated nucleotide additions distinguish the small RNA composition in cells from 688 exosomes. Cell Rep 8, 1649-1658. 689
24. Gebeshuber, C.A., and Martinez, J. (2013). miR-100 suppresses IGF2 and inhibits breast 690 tumorigenesis by interfering with proliferation and survival signaling. Oncogene 32, 691 3306-3310. 692
25. Petrelli, A., Perra, A., Schernhuber, K., Cargnelutti, M., Salvi, A., Migliore, C., Ghiso, 693 E., Benetti, A., Barlati, S., Ledda-Columbano, G.M., et al. (2012). Sequential analysis of 694 multistage hepatocarcinogenesis reveals that miR-100 and PLK1 dysregulation is an early 695 event maintained along tumor progression. Oncogene 31, 4517-4526. 696
26. Chen, D., Sun, Y., Yuan, Y., Han, Z., Zhang, P., Zhang, J., You, M.J., Teruya-Feldstein, 697 J., Wang, M., Gupta, S., et al. (2014). miR-100 induces epithelial-mesenchymal transition 698 but suppresses tumorigenesis, migration and invasion. PLoS Genet 10, e1004177. 699
27. Wang, M., Ren, D., Guo, W., Wang, Z., Huang, S., Du, H., Song, L., and Peng, X. 700 (2014). Loss of miR-100 enhances migration, invasion, epithelial-mesenchymal transition 701 and stemness properties in prostate cancer cells through targeting Argonaute 2. Int. J. 702 Oncology 45, 362-372. 703

31
28. Zhou, M.K., Liu, X.J., Zhao, Z.G., and Cheng, Y.M. (2014). MicroRNA-100 functions as 704 a tumor suppressor by inhibiting Lgr5 expression in colon cancer cells. Molecular 705 Medicine Reports. 706
29. LaConti, J.J., Shivapurkar, N., Preet, A., Deslattes Mays, A., Peran, I., Kim, S.E., 707 Marshall, J.L., Riegel, A.T., and Wellstein, A. (2011). Tissue and serum microRNAs in 708 the Kras(G12D) transgenic animal model and in patients with pancreatic cancer. PloS 709 One 6, e20687. 710
30. Ma, L. (2010). Role of miR-10b in breast cancer metastasis. Breast cancer research : 711 BCR 12, 210. 712
31. Hsieh, I.S., Chang, K.C., Tsai, Y.T., Ke, J.Y., Lu, P.J., Lee, K.H., Yeh, S.D., Hong, T.M., 713 and Chen, Y.L. (2013). MicroRNA-320 suppresses the stem cell-like characteristics of 714 prostate cancer cells by downregulating the Wnt/beta-catenin signaling pathway. 715 Carcinogenesis 34, 530-538. 716
32. Schepeler, T., Reinert, J.T., Ostenfeld, M.S., Christensen, L.L., Silahtaroglu, A.N., 717 Dyrskjot, L., Wiuf, C., Sorensen, F.J., Kruhoffer, M., Laurberg, S., et al. (2008). 718 Diagnostic and prognostic microRNAs in stage II colon cancer. Cancer Res 68, 6416-719 6424. 720
33. Ji, H., Chen, M., Greening, D.W., He, W., Rai, A., Zhang, W., and Simpson, R.J. (2014). 721 Deep sequencing of RNA from three different extracellular vesicle (EV) subtypes 722 released from the human LIM1863 colon cancer cell line uncovers distinct miRNA-723 enrichment signatures. PloS One 9, e110314. 724
34. Burroughs, A.M., Ando, Y., de Hoon, M.J., Tomaru, Y., Nishibu, T., Ukekawa, R., 725 Funakoshi, T., Kurokawa, T., Suzuki, H., Hayashizaki, Y., et al. (2010). A 726 comprehensive survey of 3' animal miRNA modification events and a possible role for 3' 727 adenylation in modulating miRNA targeting effectiveness. Genome Res 20, 1398-1410. 728
35. Neilsen, C.T., Goodall, G.J., and Bracken, C.P. (2012). IsomiRs--the overlooked 729 repertoire in the dynamic microRNAome. Trends Genet 28, 544-549. 730
36. Newman, M.A., Mani, V., and Hammond, S.M. (2011). Deep sequencing of microRNA 731 precursors reveals extensive 3' end modification. RNA 17, 1795-1803. 732
37. Ekstrom, K., Valadi, H., Sjostrand, M., Malmhall, C., Bossios, A., Eldh, M., and Lotvall, 733 J. (2012). Characterization of mRNA and microRNA in human mast cell-derived 734 exosomes and their transfer to other mast cells and blood CD34 progenitor cells. J. 735 Extracellular Vesicles 1, 18389. 736
38. Squadrito, M.L., Baer, C., Burdet, F., Maderna, C., Gilfillan, G.D., Lyle, R., Ibberson, 737 M., and De Palma, M. (2014). Endogenous RNAs Modulate MicroRNA Sorting to 738 Exosomes and Transfer to Acceptor Cells. Cell Rep 8, 1432-1446. 739
39. Batagov, A.O., Kuznetsov, V.A., and Kurochkin, I.V. (2011). Identification of nucleotide 740 patterns enriched in secreted RNAs as putative cis-acting elements targeting them to 741 exosome nano-vesicles. BMC Genomics 12 Suppl 3, S18. 742
40. Villarroya-Beltri, C., Gutierrez-Vazquez, C., Sanchez-Cabo, F., Perez-Hernandez, D., 743 Vazquez, J., Martin-Cofreces, N., Martinez-Herrera, D.J., Pascual-Montano, A., 744 Mittelbrunn, M., and Sanchez-Madrid, F. (2013). Sumoylated hnRNPA2B1 controls the 745 sorting of miRNAs into exosomes through binding to specific motifs. Nature 746 communications 4, 2980. 747

32
41. Bolukbasi, M.F., Mizrak, A., Ozdener, G.B., Madlener, S., Ströbel, T., Erkan, E.P., Fan, 748 J.-B., Breakefield, X.O., and Saydam, O. (2012). miR-1289 and “Zipcode”-like Sequence 749 Enrich mRNAs in Microvesicles. Molecular Therapy — Nucleic Acids 1, e10. 750
42. Boelens, M.C., Wu, T.J., Nabet, B.Y., Xu, B., Qiu, Y., Yoon, T., Azzam, D.J., Twyman-751 Saint Victor, C., Wiemann, B.Z., Ishwaran, H., et al. (2014). Exosome transfer from 752 stromal to breast cancer cells regulates therapy resistance pathways. Cell 159, 499-513. 753
43. Ge, Y.Y., Shi, Q., Zheng, Z.Y., Gong, J., Zeng, C., Yang, J., and Zhuang, S.M. (2014). 754 MicroRNA-100 promotes the autophagy of hepatocellular carcinoma cells by inhibiting 755 the expression of mTOR and IGF-1R. Oncotarget 5, 6218-6228. 756
44. Grundmann, S., Hans, F.P., Kinniry, S., Heinke, J., Helbing, T., Bluhm, F., Sluijter, J.P., 757 Hoefer, I., Pasterkamp, G., Bode, C., et al. (2011). MicroRNA-100 regulates 758 neovascularization by suppression of mammalian target of rapamycin in endothelial and 759 vascular smooth muscle cells. Circulation 123, 999-1009. 760
45. Nagaraja, A.K., Creighton, C.J., Yu, Z., Zhu, H., Gunaratne, P.H., Reid, J.G., Olokpa, E., 761 Itamochi, H., Ueno, N.T., Hawkins, S.M., et al. (2010). A link between mir-100 and 762 FRAP1/mTOR in clear cell ovarian cancer. Mol Endocrinol 24, 447-463. 763
46. Tehler, D., Hoyland-Kroghsbo, N.M., and Lund, A.H. (2011). The miR-10 microRNA 764 precursor family. RNA Biol 8, 728-734. 765
47. Chong, M.M., Zhang, G., Cheloufi, S., Neubert, T.A., Hannon, G.J., and Littman, D.R. 766 (2010). Canonical and alternate functions of the microRNA biogenesis machinery. Genes 767 Dev 24, 1951-1960. 768
48. Xie, M., Li, M., Vilborg, A., Lee, N., Shu, M.D., Yartseva, V., Sestan, N., and Steitz, 769 J.A. (2013). Mammalian 5'-capped microRNA precursors that generate a single 770 microRNA. Cell 155, 1568-1580. 771
49. Baccarini, A., Chauhan, H., Gardner, T.J., Jayaprakash, A.D., Sachidanandam, R., and 772 Brown, B.D. (2011). Kinetic Analysis Reveals the Fate of a MicroRNA following Target 773 Regulation in Mammalian Cells. Current Biology 21, 369-376. 774
50. Wei, C., Salichos, L., Wittgrove, C.M., Rokas, A., and Patton, J.G. (2012). 775 Transcriptome-wide analysis of small RNA expression in early zebrafish development. 776 RNA 18, 915-929. 777
51. Emmrich, S., Rasche, M., Schoning, J., Reimer, C., Keihani, S., Maroz, A., Xie, Y., Li, 778 Z., Schambach, A., Reinhardt, D., et al. (2014). miR-99a/100~125b tricistrons regulate 779 hematopoietic stem and progenitor cell homeostasis by shifting the balance between 780 TGFbeta and Wnt signaling. Genes Dev 28, 858-874. 781
52. Tarasov, V.A., Matishov, D.G., Shin, E.F., Boyko, N.V., Timoshkina, N.N., Makhotkin, 782 M.A., Lomonosov, A.M., Kirpiy, A.A., Kit, O.I., and Maximov, A.Y. (2014). 783 Coordinated aberrant expression of miRNAs in colon cancer. Russ J Genet+ 50, 1090-784 1101. 785
53. Palma, J., Yaddanapudi, S.C., Pigati, L., Havens, M.A., Jeong, S., Weiner, G.A., Weimer, 786 K.M., Stern, B., Hastings, M.L., and Duelli, D.M. (2012). MicroRNAs are exported from 787 malignant cells in customized particles. Nucleic Acids Res 40, 9125-9138. 788
54. Melo, S.A., Sugimoto, H., O'Connell, J.T., Kato, N., Villanueva, A., Vidal, A., Qiu, L., 789 Vitkin, E., Perelman, L.T., Melo, C.A., et al. (2014). Cancer Exosomes Perform Cell-790 Independent MicroRNA Biogenesis and Promote Tumorigenesis. Cancer Cell 26, 707-791 721. 792

33
55. Chevillet, J.R., Kang, Q., Ruf, I.K., Briggs, H.A., Vojtech, L.N., Hughes, S.M., Cheng, 793 H.H., Arroyo, J.D., Meredith, E.K., Gallichotte, E.N., et al. (2014). Quantitative and 794 stoichiometric analysis of the microRNA content of exosomes. Proc Natl Acad Sci U S A 795 111, 14888-14893. 796
56. Fabbri, M., Paone, A., Calore, F., Galli, R., Gaudio, E., Santhanam, R., Lovat, F., Fadda, 797 P., Mao, C., Nuovo, G.J., et al. (2012). MicroRNAs bind to Toll-like receptors to induce 798 prometastatic inflammatory response. Proc Natl Acad Sci U S A 109, E2110-2116. 799
57. Chen, X., Liang, H., Zhang, J., Zen, K., and Zhang, C.Y. (2013). microRNAs are ligands 800 of Toll-like receptors. RNA 19, 737-739. 801
58. Kahlert, C., and Kalluri, R. (2013). Exosomes in tumor microenvironment influence 802 cancer progression and metastasis. Journal of Molecular Medicine 91, 431-437. 803
59. Faller, W.J., Jackson, T.J., Knight, J.R., Ridgway, R.A., Jamieson, T., Karim, S.A., 804 Jones, C., Radulescu, S., Huels, D.J., Myant, K.B., et al. (2015). mTORC1-mediated 805 translational elongation limits intestinal tumour initiation and growth. Nature 517, 497-806 500. 807
60. Martin, M. (2011). Cutadapt removes adapator sequences from high-throughput 808 sequencing reads. EMBnet.journal 17, 10-12. 809
61. Langmead, B., and Salzberg, S.L. (2012). Fast gapped-read alignment with Bowtie 2. Nat 810 Methods 9, 357-359. 811
62. Chen, C.J., Servant, N., Toedling, J., Sarazin, A., Marchais, A., Duvernois-Berthet, E., 812 Cognat, V., Colot, V., Voinnet, O., Heard, E., et al. (2012). ncPRO-seq: a tool for 813 annotation and profiling of ncRNAs in sRNA-seq data. Bioinformatics 28, 3147-3149. 814
63. Griffiths-Jones, S., Saini, H.K., van Dongen, S., and Enright, A.J. (2008). miRBase: tools 815 for microRNA genomics. Nucleic Acids Research 36, D154-158. 816
64. Burge, S.W., Daub, J., Eberhardt, R., Tate, J., Barquist, L., Nawrocki, E.P., Eddy, S.R., 817 Gardner, P.P., and Bateman, A. (2013). Rfam 11.0: 10 years of RNA families. Nucleic 818 Acids Res 41, D226-232. 819
65. Gardner, P.P., Daub, J., Tate, J., Moore, B.L., Osuch, I.H., Griffiths-Jones, S., Finn, R.D., 820 Nawrocki, E.P., Kolbe, D.L., Eddy, S.R., et al. (2011). Rfam: Wikipedia, clans and the 821 "decimal" release. Nucleic Acids Res 39, D141-145. 822
66. Anders, S., and Huber, W. (2010). Differential expression analysis for sequence count 823 data. Genome Biol 11, R106. 824
67. Robinson, M.D., and Oshlack, A. (2010). A scaling normalization method for differential 825 expression analysis of RNA-seq data. Genome Biol 11, R25. 826
68. Griffiths-Jones, S. (2010). miRBase: microRNA sequences and annotation. Current 827 protocols in bioinformatics / editoral board, Andreas D. Baxevanis ... [et al.] Chapter 12, 828 Unit 12 19 11-10. 829
69. Griffiths-Jones, S., Grocock, R.J., van Dongen, S., Bateman, A., and Enright, A.J. (2006). 830 miRBase: microRNA sequences, targets and gene nomenclature. Nucleic Acids Res 34, 831 D140-144. 832
833

Figure Legends 834
Figure 1-source data 1. Colorectal Cancer Cell Lines. 835
Small RNA sequencing libraries were prepared from three isogenic colorectal cancer 836
cell lines with the indicated alleles of KRAS. Table is based on work done in 21. 837
838
Figure 1. Small RNA Sequencing Analysis of Cellular and Exosomal RNAs from 839
CRC Cell Lines. 840
Shown are (A) total read numbers (y-axis) and the total percentage of mappable 841
reads (red), percentage of unique mappable reads (green), reads that map to multiple 842
genomic locations (dark blue), and those that could not be mapped (cyan). (B) The 843
majority of mappable small RNA reads were derived from noncoding RNAs in cells and 844
exosomes. In cells, the majority of small RNA reads mapped to miRNAs (miRbase 19) 845
whereas in exosomes, the majority of small RNA reads mapped to repetitive elements. 846
(C) The origin of repetitive reads from exosomal small RNA sequencing is shown. 847
Repeat reads were annotated based on RepeatMasker and Rfam classified into tRNAs, 848
rRNAs, snRNAs, and others. (D) The length distribution of reads mapping to miRNA 849
hairpins was determined for small RNA reads from the three CRC cell lines and their 850
purified exosomes. Colors represent nucleotide identify for the 5’ base, T (cyan), A 851
(red), G (green), and C (blue). Figure 1- figure supplement 1. 852
853
Figure 1-figure supplement 1. Length distribution of small RNA reads to genome. 854
The small RNA read length distribution from serum starved cells and from purified 855
exosomes was determined, as well as the 5’ nucleotide from each read. The pattern 856

35
from total cellular small RNA is consistent with primarily miRNA reads, the distribution 857
from exosomes is much broader, encompassing a number of small reads derived from 858
many sources (see Figure 1C,D). Colors represent nucleotide identify for the 5’ base, T 859
(cyan), A (red), G (green), and C (blue). 860
861
Figure 2. Small RNA Composition Segregates with KRAS Status. 862
Principal Component Analysis was performed comparing small RNA sequencing 863
data sets from CRC cells and exosomes. The small RNA composition from cells 864
differed significantly from exosomes. Nevertheless, clustering showed that mutant 865
KRAS status could be inferred from small RNA composition. Also see Figure 2- figure 866
supplements 1-4. 867
868
Figure 2-figure supplement 1. Spearman correlations between miRNA expression 869
profiles in cells and exosomes. Pairwise similarity between the RNA sequencing 870
data sets derived from cells and exosomes. Spearman correlations are shown between 871
the cell samples (R=0.93-0.96), between exosomes and cognate cells (R=0.64-0.83) 872
and between exosome samples (R=0.74-0.86). Results were generated using the 873
DESeq “pooled” method. 874
875
Figure 2-figure supplement 2. Spearman correlations between miRNA expression 876
profiles in cells and exosomes. Similar to Supplemental Figure 2A. Differential 877
analysis using the DESeq “per condition” method. 878
879

36
Figure 2-figure supplement 3. Spearman correlations between miRNA expression 880
profiles in cells (top) and exosomes (bottoms) in reads per million (RPM). 881
882
Figure 2-figure supplement 4. Spearman correlations comparing miRNA 883
expression profiles in exosomes to parent cell in RPM. 884
885
Table 1. Differential Expression of miRNAs in CRC Cells. 886
miRNAs expression patterns were compared between DKs-8, DKO-1, and DLD-1 887
cells. miRNAs were identified that were enriched in just one of the three cell types or 888
that overlapped between combinations of cells. For miRNAs, 25 were identified that are 889
expressed in all three cell types, 13 were enriched in DKs-8 cells, 15 in DLD-1 cells, and 890
39 were unique to DKO-1 cells. 891
892
Table 2. Differential Distribution of miRNAs in Exosomes. 893
miRNAs expression patterns were compared between exosomes purified from 894
DKs-8, DKO-1, and DLD-1 cells. miRNAs were identified that were enriched in 895
exosomes from just one of the three cell lines or that overlapped between combinations 896
of cell lines. 29 miRNAs were common between exosomes from all three cell lines. 94 897
were enriched in exosomes from DKO-1 cells, 10 in exosomes from DKs-8 cells, and 898
only 6 in exosomes from DLD-1 cells. 899
900
901
Figure 3. KRAS-dependent regulation of miRNAs in exosomes and cells. 902

37
Differentially distributed miRNAs in (A) cells and (B) exosomes from the three 903
CRC cell lines differing in KRAS status. C) qRT-PCR validation of selected miRs from 904
DKs-8 and DKO-1 cellular and exosomal RNA samples normalized to U6 snRNA. Fold 905
changes were calculated using the ΔΔC(t) method comparing exosomes to cells. 906
Negative fold changes indicate greater enrichment in cells and positive fold changes 907
indicate greater enrichment in exosomes. Also see Supplementary File 2. 908
909
Figure 4. Comparison of miRNA 3’ trimming and tailing between cells and 910
exosomes. 911
Data from the heat maps shown in Figure 4- figure supplement 2 were pooled to 912
illustrate overall changes in either 3’ nucleotide additions (tailing) or 3’ resection 913
(trimming) compared to full length miRNA sequences (intact). Overall, the patterns 914
between cells and between exosomes are very similar. A comparison of cells to 915
exosomes shows that exosomes display a slight increase in trimmed miRNAs. Also see 916
Figure 4- figure supplement 2. 917
918
Figure 4-figure supplement 1. Non-Templated Addition (NTA) of Nucleotides to 3’ 919
Ends of miRNAs. 3’ NTA of A-tailed miRNAs are enriched in cells independent of 920
KRAS status whereas NTA of C-residues are more abundant in wild type KRAS DKs-8 921
exosomes. miRNAs with read counts ≥ 500 reads in both cells and exosomes were 922
used in the analysis. Reads mapping to hairpin sequences were considered as 923
templated miRNAs (untrimmed). Reads ≥18 nucleotides that did not map to hairpin or 924
genome sequences were trimmed one nucleotide at the 3’-termini and mapped again to 925

38
hairpin sequences. This was repeated three times to account for NTA’s extending up to 926
three nucleotides from the 3’-terminus. miRNAs significantly enriched in exosomes or 927
cells are represented by red and blue circles, respectively. 928
929
Figure 4-figure supplement 2. Comparison of miRNA 3’ trimming and tailing 930
between cells and exosomes. Heat maps show the extent of either 3’ nucleotide 931
additions (tailing) or 3’ resection (trimming) compared to full length miRNA sequences 932
(intact). 933
934
Figure 4-figure supplement 3. MEME analysis of miRNA sequence in exosomes. 935
MEME analysis was performed to attempt to identify sequence motifs that might target 936
miRNAs for export into exosomes. The top most abundant motifs found in miRNAs in 937
Tables 1 and 2 are shown for both cells and exosomes from either DKO-1, DKs-8 or 938
DLD-1 cell lines. (Upregulated in DKO-1 exo: 51, 1.5e-009; Upregulated in DKO-1 cell: 939
28,1.5e-007; Upregulated in DKs-8 exo, 22, 1.7e-010; Upregulated in DKs-8 cell, 19, 940
7.6e-007; Upregulated in DLD-1 exo, 8, 2.3e-003; Upregulated in DLD-1 cell 941
23, 3.3e-012). 942
943
Figure 5. Ceramide dependent miRNA export into exosomes. 944
DKO-1 or DKs-8 cells were treated with an inhibitor of neutral shingomyelinase 2 945
(nSMase 2), GW4869. After treatment, in situ hybridization experiments were 946
performed with probes against miR-100 (A,B). (C) qRT-PCR for miR-10b, miR-100 and 947
miR-320a was performed on cells treated with GW4869 or DMSO and fold change in 948

39
expression was determined in treated versus untreated cells. In wild type KRAS cells 949
(DKs-8), inhibition of nSMase 2 had little or no effect on the cellular levels of these 950
miRNAs. In contrast, mutant KRAS cells (DKO-1) showed an increase in cellular 951
miRNA levels after inhibition of nSMAse 2. Data were derived from three biological 952
replicates and performed in technical triplicates for qRT-PCR. Significance was 953
determined by two-tailed, paired t-tests where * are p values ≤ 0.05 and ** ≤0.01. 954
955
Figure 6. Transfer of extracellular miRNAs by mutant DKO-1 cells promotes target 956
repression in wild type DKs-8 cells. 957
Transwell co-culture of DKs-8 recipient cells with or without DKs-8 or DKO-1 958
donor cells. Luciferase (Luc) expression was measured in DKs-8 recipient cells 959
transiently expressing (A) Luc fused to three perfectly complementary synthetic miR-960
100 target sites (miR-100-PT) or (B) Luc fused to the 3’UTR of mTOR, which harbors 3 961
endogenous target sites for miR-100. (C) Luc expression increased upon mutation of 962
two (MS2) sites with full expression upon mutation of all three sites (MS3). Luc-CTL 963
contains three random scrambled target sites that do not match any known miRNA 964
sequence. (D) Luc expression was restored in recipient cells expressing miR-100-PT 965
upon pre-treatment of donor DKO-1 cells with 100nM miR-100 antagomirs (AI-100) 966
compared to pre-treatment of donor DKO-1 cells with 100 nm control antagomirs (AI-967
CTL) targeting cel-miR-67. (E) Taqman qRT-PCR for miR-100. Compared to DKs-8 968
recipient cells grown without donor cells, mir-100 levels increased by approximately 969
34% in the presence of mutant DKO-1 donor cells pre-treated with AI-CTL compared to 970
an 8% increase in AI-100 pre-treated donor cells. Y axis is % increase in miR-100 = 971

40
(CPAI -CTL or CPAI-100 – CPno donor / CPno donor)*100, where CP= absolute copy number. All 972
Luc values were normalized to co-transfected vectors expressing β-galactosidase; n=3 973
independent experiments in A-C and n=4 in D,E. All Luc assays were performed in 974
technical triplicate. Significance was determined by two-tailed, paired t-tests where * 975
are p values ≤ 0.05 and ** ≤0.01. Also see Figure 6- figure supplements 1-3. 976
977
Figure 6-figure supplement 1. miR-100 binding sites in the mTOR 3’UTR. miR-100 978
binding sites within the mTOR 3’UTR. Mutated nucleotides indicated in red 979
(oligonucleotide sequences in Supplementary File 3). 980
981
Figure 6- figure supplement 2. Presence of mutant DKO-1 donor cells augments 982
miR-100 levels in DKs-8 recipient cells. Taqman qRT-PCR for miR-100. miR-100 983
levels increased by approximately 114 copies in recipient cells cultured with DKO-1 984
donor cells pre-treated with control antagomir (AI-CTL) compared to recipient cells 985
cultured without donor cells. Pre-treatment of mutant DKO-1 donor cells with miR-100 986
antagomir inhibitor (AI-100) attenuated this effect. Absolute levels of miR-100 987
determined by standard curve generation of synthetically derived miR-100 (see 988
Methods). Approximately 357.23±16.65, 442.58±12.59 and 329.48±13.62 copies of 989
miR-100 per input RNA were found in DKs-8 recipient cells cultured with DKO-1 donor 990
AI-100, DKO-1 donor AI-CTL and without donor cells, respectively. 991
992
Figure 6- figure supplement 3. Transfer of extracellular miRNAs by mutant DKO-1 993
cells promotes target repression in wild type DKs-8 cells. Transwell co-culture of 994

41
DKs-8 recipient cells with or without DKs-8 or DKO-1 donor cells. Luciferase (Luc) 995
expression was measured in DKs-8 recipient cells expressing Luc fused to three 996
perfectly complementary synthetic miR-222 target sites (miR-222-PT). 997
998
999
Supplemental File Legends 1000
Supplementary File 1. Read counts for (A) individual miRNA species and (B) repeat 1001
families. 1002
1003
Supplementary File 2. Abundant miRNAs. Normalized read counts (see methods) 1004
were used to determine the miRNAs with the highest number of reads (top 50) from cell 1005
and exosomal datasets. The top 50 most abundant miRNAs were compared between 1006
exosomes and cells for each cell line. Most abundant miRNAs in exosomes (blue), cells 1007
(orange), or both. 1008
1009
Supplementary File 3. Related to Experimental Procedures. Primers used for plasmid 1010
construction. 1011
Table 1. miRNAs enriched in cell* 1012 DKO-1 hsa-miR-548u hsa-miR-16-1-3p hsa-miR-33a-3p hsa-miR-33a-5p hsa-miR-31-5p hsa-miR-181b-3p hsa-miR-450a-5p hsa-miR-424-5p hsa-miR-9-5p hsa-miR-219-5p hsa-miR-190a hsa-miR-573 hsa-miR-30d-3p hsa-miR-204-5p hsa-miR-1226-3p hsa-miR-499a-5p hsa-miR-450b-5p hsa-miR-499b-3p hsa-miR-3662 hsa-miR-20a-3p hsa-miR-27b-5p hsa-miR-5701 hsa-miR-4677-3p hsa-let-7i-5p hsa-miR-331-3p hsa-miR-31-3p hsa-miR-651 hsa-miR-1306-5p hsa-miR-147b hsa-miR-3611 hsa-miR-1305 hsa-miR-148a-3p hsa-miR-27b-3p hsa-miR-1306-3p hsa-miR-374b-3p hsa-miR-1260b hsa-miR-3940-3p hsa-miR-200c-5p hsa-miR-548ar-3p

42
DKs-8 hsa-miR-132-5p hsa-miR-484 hsa-miR-374a-5p hsa-miR-1180 hsa-miR-1307-3p hsa-miR-200a-5p hsa-miR-548o-3p hsa-miR-149-5p hsa-miR-3615 hsa-miR-100-5p hsa-miR-197-3p hsa-miR-378a-5p hsa-let-7a-3p DLD-1 hsa-miR-141-3p hsa-miR-26b-5p hsa-miR-24-3p hsa-miR-3074-5p hsa-miR-15a-5p hsa-miR-27a-3p hsa-miR-3613-5p hsa-miR-30b-5p hsa-miR-29a-3p hsa-miR-301a-5p hsa-let-7i-3p hsa-miR-185-5p hsa-let-7g-5p hsa-miR-23b-3p hsa-miR-22-3p DKO-1 & DKs-8 hsa-miR-141-5p hsa-miR-582-5p DKO-1 & DLD-1 hsa-miR-556-3p hsa-miR-374a-3p hsa-miR-106b-5p hsa-miR-17-3p hsa-miR-24-1-5p hsa-miR-340-3p DLD-1 & DKs-8 hsa-miR-24-2-5p hsa-miR-106a-5p hsa-miR-30e-5p hsa-miR-107 hsa-miR-429 hsa-miR-98-5p hsa-miR-425-5p hsa-miR-140-5p hsa-miR-93-5p hsa-miR-210 hsa-miR-126-3p hsa-miR-194-5p hsa-miR-29b-3p hsa-miR-15b-5p hsa-miR-362-5p hsa-miR-27a-5p hsa-miR-454-3p hsa-miR-452-5p hsa-miR-196b-5p DKO-1, DLD-1 & DKs-8 hsa-miR-32-5p hsa-miR-582-3p hsa-miR-542-3p hsa-miR-96-5p hsa-miR-101-3p hsa-miR-18a-5p hsa-miR-3529-3p hsa-miR-7-5p hsa-miR-19a-3p hsa-miR-142-3p hsa-miR-20a-5p hsa-miR-32-3p hsa-miR-130b-5p hsa-miR-1278 hsa-miR-7-1-3p hsa-miR-590-3p hsa-miR-4473 hsa-miR-17-5p hsa-miR-103a-3p hsa-miR-103b hsa-miR-19b-3p hsa-miR-340-5p hsa-miR-200a-3p hsa-miR-34a-5p hsa-miR-372
1013 *miRNAs differentially enriched in cells when comparing mean reads in exosomes versus cell. 1014 1015
1016
Table 2. miRNAs enriched in exosomes * 1017 DKO-1 hsa-miR-139-5p hsa-miR-3178 hsa-miR-151b hsa-miR-125b-1-3p hsa-miR-193b-3p hsa-miR-935 hsa-miR-130b-3p hsa-miR-628-3p hsa-miR-139-3p hsa-let-7d-3p hsa-miR-589-3p hsa-miR-4532 hsa-miR-451a hsa-miR-6087 hsa-miR-151a-5p hsa-miR-940 hsa-miR-222-3p hsa-miR-766-5p hsa-miR-505-5p hsa-miR-3187-3p hsa-miR-125a-3p hsa-miR-3679-5p hsa-miR-4436b-3p hsa-miR-4787-3p

43
hsa-miR-2277-3p hsa-miR-361-5p hsa-miR-1293 hsa-miR-3183 hsa-miR-3162-5p hsa-miR-642a-3p hsa-miR-642b-5p hsa-miR-197-5p hsa-miR-324-3p hsa-miR-145-3p hsa-miR-3182 hsa-miR-3127-3p hsa-miR-3127-5p hsa-miR-4728-3p hsa-miR-3184-5p hsa-miR-125b-5p hsa-miR-186-5p hsa-miR-1 hsa-miR-100-5p hsa-miR-423-3p hsa-miR-766-3p hsa-miR-4753-5p hsa-miR-145-5p hsa-miR-4724-5p hsa-miR-373-3p hsa-miR-223-5p hsa-miR-1307-5p hsa-miR-1914-3p hsa-miR-3121-3p hsa-miR-3613-3p hsa-miR-205-5p hsa-miR-98-3p hsa-miR-23a-3p hsa-miR-3124-5p hsa-miR-3656 hsa-miR-3918 hsa-miR-4449 hsa-miR-378c hsa-miR-3138 hsa-miR-1910 hsa-miR-3174 hsa-miR-4466 hsa-miR-3679-3p hsa-miR-3200-5p hsa-miR-6511b-5p hsa-miR-1247-5p hsa-miR-22-3p hsa-miR-877-5p hsa-miR-4687-3p hsa-miR-1292-5p hsa-miR-181c-5p hsa-miR-6131 hsa-miR-6513-5p hsa-miR-3661 hsa-miR-132-3p hsa-miR-214-3p hsa-miR-574-3p hsa-miR-3190-3p hsa-miR-326 hsa-miR-3191-5p hsa-miR-3198 hsa-miR-3928 hsa-miR-629-3p hsa-miR-4489 hsa-miR-4700-5p hsa-miR-5006-5p hsa-miR-5088 hsa-miR-2110 hsa-miR-3911 hsa-miR-3146 DKs-8 hsa-miR-1224-5p hsa-let-7b-5p hsa-miR-155-5p hsa-let-7c hsa-let-7a-5p hsa-miR-146b-5p hsa-miR-4647 hsa-miR-4494 hsa-miR-711 hsa-miR-1263 DLD-1 hsa-miR-1226-5p hsa-miR-4745-5p hsa-miR-4435 hsa-miR-939-5p hsa-miR-409-3p hsa-miR-1304-3p DKO-1 & DKs-8 hsa-miR-146a-5p hsa-miR-4508 hsa-miR-224-5p hsa-miR-4429 hsa-miR-222-5p hsa-miR-629-5p hsa-miR-4492 hsa-miR-3653 hsa-miR-320a hsa-miR-1290 hsa-miR-1262 hsa-miR-5010-5p hsa-miR-204-3p hsa-miR-4461 hsa-miR-5187-5p DKO-1 & DLD-1 hsa-miR-483-5p hsa-miR-4658 hsa-miR-4758-5p hsa-miR-492 hsa-miR-5001-5p hsa-miR-371a-5p hsa-miR-1323 hsa-miR-371b-3p hsa-miR-501-3p hsa-miR-4446-3p hsa-miR-6511a-5p hsa-miR-30a-3p hsa-miR-4727-3p DLD-1 & DKs-8 hsa-miR-28-3p hsa-miR-3934-5p DKO-1, DLD-1 & DKs-8 hsa-miR-658 hsa-miR-320d hsa-miR-4792 hsa-miR-1246 hsa-miR-320e hsa-miR-4516 hsa-miR-320b hsa-miR-4488 hsa-miR-1291 hsa-miR-320c hsa-miR-4634 hsa-miR-3605-5p hsa-miR-4741 hsa-miR-3591-3p hsa-miR-122-5p hsa-miR-486-3p hsa-miR-184 hsa-miR-223-3p hsa-miR-3651 hsa-miR-486-5p

44
hsa-miR-3180 hsa-miR-3180-3p hsa-miR-3168 hsa-miR-4497 hsa-miR-423-5p hsa-miR-3184-3p hsa-miR-150-5p hsa-miR-664a-5p hsa-miR-182-5p 1018 *miRNAs differentially enriched in exosomes when comparing mean reads in exosomes versus cell. 1019 1020 1021
1022
1023

0
0.2
0.4
0.6
0.8
1
Fra
ctio
n o
f re
ads
unknowncoding generfamrepeatprecursor miRNA
DKO-1 Cell Exo
DKs-8 Cell Exo
DLD-1 Cell Exo
89%91%
89%
69%
68%72%
88%
89%
86%
56%53%57%
89%
87%
85%
59%52%56%
0
2e+07
4e+07
6e+07
Nu
mb
er o
f re
ads
Total reads (%)No matchesMultiple matches genomeUnique matches genome
DKO-1
Cell Exo
DKs-8
Cell Exo
DLD-1
Cell Exo
0
0.2
0.4
0.6
0.8
1
Fra
ctio
n o
f re
ads
alig
ned
on
Rep
eats rRNA
LINELTRSINEscRNADNAtRNAsnRNAother
DKO-1 Cell Exo
DKs-8 Cell Exo
DLD-1 Cell Exo
Read length
00.10.20.30.40.5
Per
cen
tag
e
DKO-1 cell
15 20 25 30 35
Read length
00.10.20.30.40.5
Per
cen
tag
e
DKO-1 exo
15 20 25 30 35
Read length
00.10.20.30.40.5
Per
cen
tag
e
DKs-8 cell
15 20 25 30 35
Read length
00.10.20.30.40.5
Per
cen
tag
e
DKs-8 exo
15 20 25 30 35
Read length
00.10.20.30.40.5
Per
cen
tag
e
DLD-1 cell
15 20 25 30 35
Read length
00.10.20.30.40.5
Per
cen
tag
e
DLD-1 exo
15 20 25 30 35
Figure 1 A B
C D

-30 -20 -10 0 10 20 30 40PC1
-20
-10
0
10
20
30
PC
2
DKs-8: Cell DKs-8: ExoDLD-1: Cell DLD-1: Exo
DKO-1: Cell DKO-1: Exo
WT KRAS
Mutant KRAS
Figure 2
DKs-8: Cell DKs-8: ExoDLD-1: Cell DLD-1: Exo
DKO-1: Cell DKO-1: Exo

DKO−1
DLD−1DKs−8
13 1519
39
2 6
25
DKO−1
DLD−1DKs−8
10 62
94
15 13
29
-6.00
-4.00
-2.00
0.00
2.00
4.00
6.00
8.00
10.00
12.00
miR-10b miR-100 miR-320a miR-320b
Fold
cha
nge
DKO-1 DKs-8
Exo
- en
riche
d C
ell-
enric
hed
DKO−1
DLD−1DKs−8
13 1519
39
2 6
25
DKO−1
DLD−1DKs−8
10 62
94
15 13
29
Exosomes Cells
Figure 3
C
A B

4 3 2 1 0Length of trimming
0
1
2
3
4
Len
gth
of
taili
ng
DKO-1 exo
4 3 2 1 0Length of trimming
0
1
2
3
4
Len
gth
of
taili
ng
DKs-8 cell
4 3 2 1 0Length of trimming
0
1
2
3
4
Len
gth
of
taili
ng
DLD-1 exo
4 3 2 1 0Length of trimming
0
1
2
3
4
Len
gth
of
taili
ng
DKs-8 exo
4 3 2 1 0Length of trimming
0
1
2
3
4
Len
gth
of
taili
ng
DLD-1 cell
4 3 2 1 0Length of trimming
0
1
2
3
4
Len
gth
of
taili
ng
DKO-1 cell
Figure 4

A
BDMSO GW4869
DKO-1
DMSO GW4869
DKs-8
miR-100
miR-100
DKO-1
DKs-8
A
B
C
miR
-100
miR
-100
0.00
0.50
1.00
1.50
2.00
2.50
3.00
3.50
miR-10b miR-100 miR-320a
Fo
ld c
ha
ng
e
(GW
tre
ate
d v
s C
TL
)
DKs-8
DKO-1
**
**
Figure 5
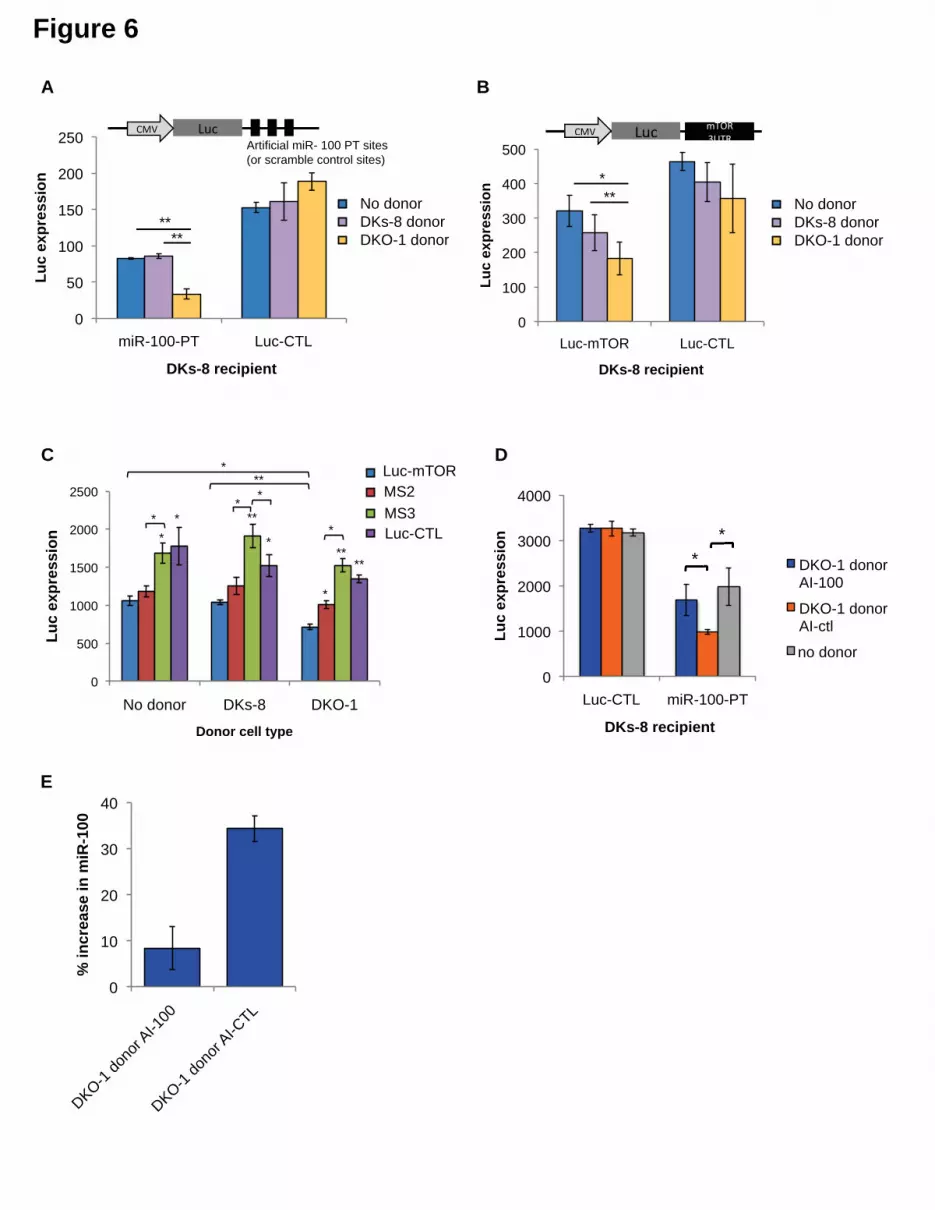
Figure 6
D
*
* ** *
*
0
1000
2000
3000
4000
Luc-CTL miR-100-PT
Lu
c e
xp
ressio
n
DKs-8 recipient
DKO-1 donor
AI-100
DKO-1 donor
AI-ctl
no donor
E
0
10
20
30
40
DKO-1
donor AI-100
DKO-1
donor AI-CTL
% i
ncrease i
n m
iR-1
00
** **
*
*
*
**
* *
*
*
*
**
*
0
500
1000
1500
2000
2500
No donor DKs-8 DKO-1
Lu
c e
xp
re
ss
ion
Donor cell type
Luc-mTOR
MS2
MS3
Luc-CTL
CLuc-mTOR
MS2
MS3
Luc-CTL
B
**
*
0
100
200
300
400
500
Luc-mTOR Luc-CTL
Lu
c e
xp
re
ss
ion
DKs-8 recipient
No donor
DKs-8 donor
DKO-1 donor
No donor
DKs-8 donor
DKO-1 donor
A
0
50
100
150
200
250
miR-100-PT Luc-CTL
Lu
c e
xp
re
ss
ion
DKs-8 recipient
No donor
DKs-8 donor
DKO-1 donor
**
**
Artificial miR- 100 PT sites
(or scramble control sites)
No donor
DKs-8 donor
DKO-1 donor


