Embed Size (px)
Citation preview
Final Report Key Findings from the Third Devon Workforce Skills Survey October 2015
Final Report Key Findings from the Third Devon Workforce Skills Survey
October 2015
SERIO A Plymouth University Centre of Expertise
Research and Innovation Plymouth University 9, Research Way Plymouth Science Park Plymouth PL6 8BT t 01752 588942 f 01752 588987 e [email protected] w www.serio.ac.uk
Key Findings from the 2015 Workforce Skills Survey
SERIO 1
Contents Section One: Executive Summary 3 1.1 Introduction 3 1.2 Business Characteristics and Experience of Training 3 1.3 Employee Retention, Skills and Qualifications 3 1.4 Assessing Supply and Demand 4 1.5 Recruitment 4 1.6 Cross-cutting Themes and Recommendations 4
Section Two: Introduction 7
2.1 Workforce Skills Research Programme 7 2.2 Outline of the Skills Survey 7 2.3 Report Overview and Structure 8
Section Three: Business Characteristics and Experience of Training
10
3.1 Introduction 10 3.2 Business Size and Turnover 10 3.3 Nature of Business and Membership 11 3.4 Attitudes Toward Innovation 12 3.5 Experience of and Attitudes Toward Training 12
Section Four: Employee Retention, Skills and Qualifications 14 4.1 Introduction 14 4.2 Employee Retention 14 4.3 Perceived Skills Related Challenges 15 4.4 Digital and Specialist Skills 15 4.5 Skills Proficiency 17 4.6 Cause of Lack of Proficiency and Business Impact 18 4.7 Actions Taken to Improve Proficiency 19 4.8 Skills Not Being Used 19
Section Five: Assessing Supply and Demand 20 5.1 Introduction 20 5.2 Training Demand and Mechanism of Delivery 20 5.3 Impact of Training on Business Growth and Productivity 21 5.4 Training Suppliers Used by Businesses 22 5.5 Experience of Training Suppliers 22 5.6 Important Factors when Choosing Training Suppliers 25 5.7 Anticipated Future Training Spend 25
Section Six: Recruitment 26 6.1 Introduction 26 6.2 Approaches to Staff Recruitment 26 6.3 Hard-to-fill Vacancies 28 6.4 Business Impact of Hard-to-fill Vacancies 30 6.5 Attitude Toward Employing Career Starters 31 6.6 Preparedness for Work 32 6.7 Attitudes Toward Apprenticeships 34 6.8 Knowledge of Apprenticeship Reform 36 6.9 Attitudes Toward Placements and Internships 37 6.10 Business Engagement 38
Key Findings from the 2015 Workforce Skills Survey
SERIO 2
Section Seven: Cross-cutting Themes and Recommendations 39 7.1 Introduction 39 7.2 Themes and Recommendations 39
Annex 1: Sampling Strategy 43 A1.1 Devon’s Sectoral Composition 43 A1.2 Confidence Level and Interval 43
Annex 2: Comparison of Key Findings 45
Key Findings from the 2015 Workforce Skills Survey
SERIO 3
1. Executive Summary 1.1 Introduction The ‘Workforce Skills Research Programme’ spans a three-year period from February 2013
to March 2016 and is led by SERIO based at Plymouth University. The overall aim of the programme is to produce a skills evidence base, supporting Devon County Council’s Employment and Skills Action Plan, to identify the issues and challenges facing businesses in relation to skills.
The annual Workforce Skills Survey is the central primary research component of the whole
programme. The survey is based on structured telephone interviews with 381 Devon-based businesses and is conducted on an annual basis from 2013 to 2015. This report discusses the findings from the third and final survey which took place between June and August 2015. It builds upon the two previous key findings reports, published in September 2013, and October 2014.
1.2 Business Characteristics and Experience of Training Levels of innovation were lower when compared to previous surveys. In 2015, 35% of
businesses had engaged in innovation activities over the three years prior to the survey, compared to 43% in both 2013 and 2014. Innovation activity predominantly related to the introduction of a new or significantly improved good, service or process (18%), or expenditure in areas such as internal research and development or the acquisition of external knowledge or machinery and equipment (12%).
Businesses were open to training with almost three-quarters (73%) having accessed some
sort of professional help or support for their business in the past three years. This broadly reflects the position from both 2014 (76%) and 2013 (67%). However, just one fifth of businesses in 2015 (22%) had a dedicated budget to meet training needs and to support development.
1.3 Employee Retention, Skills and Qualifications
Difficulties in employee retention were highlighted by 9% of businesses. Whilst this represents an increase of +5 percentage points from 2014 (4%), it is broadly in line with the level identified in 2013 (10%). As in 2013 and 2014, difficulties in retention were most commonly experienced in the occupational group of skilled trade. In common with the two preceding surveys, the biggest skills related challenges in 2015 were keeping up with the pace of technology and ICT development, and appropriate recruitment. Just 11% of businesses indicated that they did not require digital skills, in contrast to 28% two years previously (a difference of -17 percentage points), again underlining the increased importance placed upon this skillset. In terms of skills underuse, a fifth of businesses (22%) indicated having employees whose skills or qualifications were not utilised, compared to 16% in 2013 and 14% in 2014. Notably, a clear majority of these businesses (80%) were not taking any steps to address this issue at the point of survey, perceiving that the under-utilised skills were not relevant to their business.
Key Findings from the 2015 Workforce Skills Survey
SERIO 4
1.4 Assessing Supply and Demand Approximately three in five businesses (58%) had funded or arranged staff development activities for their employees over the past 12 months. This is broadly in line with levels from 2014 (60%), although a decrease of –7 percentage points from 2013 (65%). Whilst businesses favoured off-site training provided by an external organisation (74%); onsite training delivered through both existing staff (52%) and an external organisation (50%) were also commonplace. Two thirds of businesses (66%) anticipated the amount of money they spend on training to stay the same over the next 12 months, in contrast to 19% who anticipated an increase, 3% who expected a decrease, and 13% who were undecided. Those highlighting a likely reduction in spend attributed it to employees either having recently undertaken or completed training; the potential closure of the business; financial cuts; a reduction in the availability of relevant courses; or that a large investment in training had been made in the previous year.
1.5 Recruitment
Of the businesses that reported vacancies in 12 months prior to the survey, just under half (47%) experienced difficulty in filling them. This compares to 41% experiencing difficulties in the 2014 survey and may reflect a decline in unemployment in the wider economy, leading to increased competition among employers. Fifty percent of businesses in 2015 attributed their hard-to-fill vacancies to a lack of suitably skilled applicants. In terms of occupational group, the largest proportion of hard-to-fill vacancies were derived from skilled trade (30%), and professional occupations (18%). For skilled trade occupations, hard-to-fill vacancies were most prevalent with regard to construction, and wholesale and retail; whereas for professional, these were most commonly in professional, scientific and technical, and health. The survey found both low and declining levels of employment of those in their first job since leaving education. Findings from 2015 indicate that over the last 3 years, just 21% of businesses had employed someone in their first job since leaving school (32% in 2013, 24% in 2014), 18% since leaving FE college (31% in 2013, 24% in 2014) and 13% since leaving university (22% in 2013; 17% in 2014). With specific regard to apprenticeships, a fifth of businesses (20%) had employed staff undertaking apprenticeships over the last three years, with the largest proportion of these based within the broad industry groups of: construction; professional, scientific and technical, and wholesale and retail. Looking forward, a higher proportion of businesses stated a willingness to offer apprenticeships to those aged 25 or over, rising from 37% in 2014, to 53% in 2015. As would be expected, knowledge of the government’s apprenticeship reforms had increased with 45% indicating they were aware of them compared to 34% in 2014. However only 16 (9%) of those that would previously not have considered offering an apprenticeship would be encouraged to do so by the reforms.
1.6 Cross-cutting Themes and Recommendations
The report presents four cross-cutting themes emerging from the Workforce Skills Survey and suggests some early recommendations that could be considered by Devon County Council, relevant partners and stakeholders. Some themes and recommendations build upon those cited in the 2013 Workforce Skills Report, reflecting the parallels between the two surveys. These are summarised below and expanded upon fully in Section 7 of the report.
Key Findings from the 2015 Workforce Skills Survey
SERIO 5
Cross-cutting Theme 1: Recruitment and Retention Difficulties
Recommendations:
The economy is now returning to a sustained recovery. However, as outlined in each of the three Workforce Skills surveys, at a local level it is still characterised by hard-to-fill vacancies attributed, in part, to skills deficiencies in the available labour market. The survey also revealed the impact of skills deficiencies on businesses in Devon, through for example, increased operating costs, lost business or orders to competitors, and delayed development of new products or services. Consequently, there is still work to be done to ensure that the demand and supply of skills is increasingly aligned. As such, we recommend that:
Continued work is undertaken through, for example, the HotSW Local Growth Deal and its Skills and Employment Boards to articulate business needs to training providers and funding agencies.
Particular consideration is given toward strategies to address labour shortages in skilled trades. In the short-term, this could include a review of approaches to recruitment, such as supporting the increased use of Universal Jobmatch amongst employers (Section 6). Particular focus could be placed on the construction, wholesale and retail, production, and accommodation and food sectors.
Medium to longer-term strategies could include approaches to encourage young people (and informing parents) to consider careers in, for example, agriculture, health and social care, construction, and building trades through addressing negative stereotypes.
Cross-cutting Theme 2: The Digital Skills Challenge
Recommendations: The UK Digital Skills Taskforce report ‘Digital Skills for Tomorrow’s World’ suggests that businesses should take responsibility to ensure existing members of staff have access to digital skills training. In order to support the digital skills challenge we recommend:
Continued support for job seekers to enter or re-enter the labour market through digital skills training. This is exemplified by the Women in Broadband project, which aims to address the digital barriers preventing women from returning to the workplace.
That initiatives to further promote and signpost businesses toward support for digital skills development are considered (as outlined in the 2014 report), linked to national initiatives as appropriate. Where applicable this work should be undertaken alongside the activity of Connecting Devon and Somerset.
Cross-cutting Theme 3: Employment of Devon’s Young People and Career Starters
Key Findings from the 2015 Workforce Skills Survey
SERIO 6
Recommendations: Again, there is work to be done in promoting the business benefits of young people and early career starters to businesses in Devon. Businesses responding across all three survey waves indicated a preference for experienced employees, over career starters. As such, there is a requirement for increased support to enable young people to make the transition from education to the workplace through, for example stronger links between providers and businesses. In this context, we are aware of the recommendation contained within DCC’s Young People and Employment Task Group1 to encourage schools to work with Jobcentre Plus to increase students’ employability. Building upon this work, we recommend that:
Work is undertaken to encourage and support businesses in providing work experience and longer-term placements for young people in Devon. This could involve working with national initiatives, such as the government’s ‘We can’ campaign, launched in August 2015.
The business benefits of apprenticeships are increasingly promoted. To this end, business engagement could be encouraged through increased levels of awareness regarding the latest steps in apprenticeship reform such as direct control of funding; and additional incentive payments for apprentices aged 16-18.
Of particular pertinence to this theme is DCC’s Enterprise in Schools Grant which provides funding to schools in order to both work with the business community, and to deliver activity around enterprise and entrepreneurship. The Programme, now in its second year, was independently evaluated in September 2015 and found to be successful in developing entrepreneurial teaching and learning and generating relationships of mutual value between providers and the business community. As such, we recommend that:
DCC continue to support the development of enterprise education schemes in the county through initiatives such as the Enterprise in Schools Grant. Support should be reviewed on a regular basis both in order to identify possible areas for improvement, and to explore how the relationships developed with local businesses could be further enhanced and developed.
Cross-cutting Theme 4: Training and Skills Development
As evidenced through the survey, the provision of training will be critical to increasing productivity, which has been identified as a key challenge for the Devon labour market2. Reflecting the financial barriers to training and concerns regarding cost, as expressed by Devon businesses, we suggest that:
In line with the previous recommendation from the 2013 report, appropriate opportunities relating to skills development and funding should be communicated to businesses and representative organisations to support the cost of training.
1 Devon County Council Young People and Employment Task Group Final Report, Place Scrutiny Committee, June
2015: http://www.devon.gov.uk/loadtrimdocument?url=&filename=CS/15/9.CMR&rn=15/WD180&dg=Public 2 SQW, An Analysis of Devon’s Productivity Performance: Report to Devon County Council June 2015:
http://www.devonomics.info/sites/default/files/documents/Devon%20-%20productivity%20v8%20final.pdf
Key Findings from the 2015 Workforce Skills Survey
SERIO 7
2. Introduction 2.1 Workforce Skills Research Programme
Devon County Council (DCC) has commissioned a ‘Workforce Skills Research Programme’ spanning a three-year period from February 2013 to March 2016. The aim of the programme is to provide a skills evidence base, supporting the Council’s Employment and Skills Action Plan, to identify the issues and challenges facing businesses in relation to skills. The research is led by SERIO, a provider of social, economic and market research based at Plymouth University. Table 1 provides an overview of the core components of the research programme. Whilst the overall programme has been designed to be flexible and responsive to national policy change, research, and labour market conditions, the six listed components will be repeated on an annual basis.
2.2 Outline of the Skills Survey
The annual Workforce Skills Survey is the central primary research component of the whole programme. The survey is based on structured telephone interviews with 381 Devon-based businesses and is conducted on an annual basis from 2013 to 2015. This report is based on the findings from the third and final of the three surveys which took place between July and September 2015. It builds upon the 2013 and 2014 Workforce Skills key findings reports, which were published in September 2013 and October 2014 respectively. Similarly to the 2013 and 2014 Workforce Skills Surveys, the sampling strategy for this survey was designed to be statistically representative of Devon’s sectoral composition (IDBR Enterprise Data), with the sample size large enough to ensure a confidence level of 95% in the data (with a confidence interval of 5%). Annex 1 provides further detail on the sampling strategy used. The aim of the survey is to enable DCC to better understand the issues and challenges facing businesses in relation to skills, such as skills gaps amongst the current workforce or where skills shortages are constraining growth. It was structured around the following broad themes:
Employee skills and qualifications: Do all employees have the skills required for them to be fully proficient at their job; what actions are being taken to address this; and is any support required;
Training and development: What is the nature of the training and development activities arranged by businesses (if any); the key barriers to arranging training; and anticipated spend on training over the next 12 months; and,
Recruitment: Have businesses had any vacancies in the last 12 months; have they experienced any difficulties in filling these; what has been the impact of any hard-to-fill vacancies on the business; and what are the attitudes of business owners toward the recruitment of School, FE and HE leavers.
Key Findings from the 2015 Workforce Skills Survey
SERIO 8
2.3 Report Overview and Structure
This short report is intended to summarise the key findings from the Workforce Skills Survey and the skills mapping task (components 3 and 5 in Table x). Whilst predominantly based on the findings from the 2015 Workforce Skills Survey, it also references key findings from the 2013 and 2014 surveys to provide a comparison and an assessment of distance travelled. The report is structured as follows:
Section 3: provides an overview of respondent’s business characteristics and experience of training, including attitudes toward innovation and barriers to arranging training or development;
Section 4: discusses employee retention, skills and qualifications, with specific reference to skills related challenges, and the prevalence and cause of a lack of proficiency and associated business impact;
Section 5: uses the findings from the survey to assess the supply and demand of training. This encompasses a review of training demand and mechanisms for delivery; the training suppliers used by businesses and their experiences; and anticipated future spend on training;
Section 6: presents business views with specific regard to recruitment, such as the business impact of hard-to-fill vacancies; approaches to staff recruitment; and attitudes toward work placements and apprenticeships; and,
Section 7: draws together the cross-cutting themes from the previous sections of the report and makes recommendations for action by partners and stakeholders.
Key Findings from the 2015 Workforce Skills Survey
SERIO 9
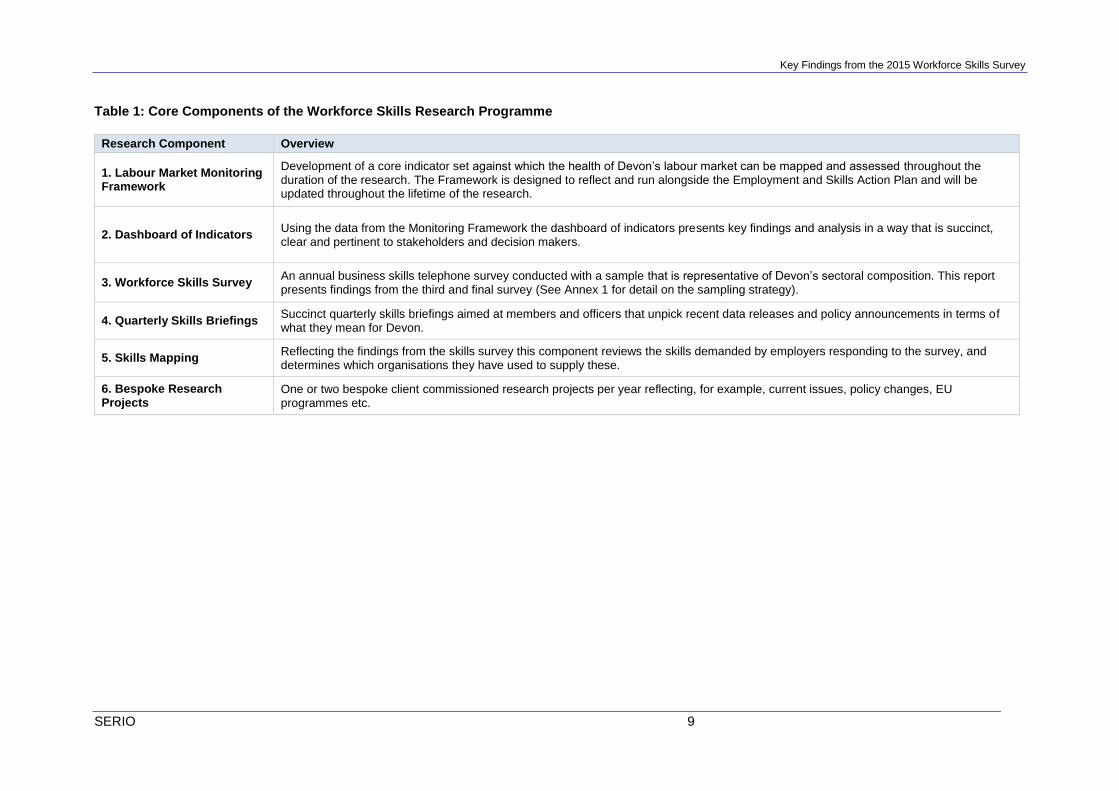
Table 1: Core Components of the Workforce Skills Research Programme
Research Component Overview
1. Labour Market Monitoring Framework
Development of a core indicator set against which the health of Devon’s labour market can be mapped and assessed throughout the duration of the research. The Framework is designed to reflect and run alongside the Employment and Skills Action Plan and will be updated throughout the lifetime of the research.
2. Dashboard of Indicators Using the data from the Monitoring Framework the dashboard of indicators presents key findings and analysis in a way that is succinct, clear and pertinent to stakeholders and decision makers.
3. Workforce Skills Survey An annual business skills telephone survey conducted with a sample that is representative of Devon’s sectoral composition. This report presents findings from the third and final survey (See Annex 1 for detail on the sampling strategy).
4. Quarterly Skills Briefings Succinct quarterly skills briefings aimed at members and officers that unpick recent data releases and policy announcements in terms of what they mean for Devon.
5. Skills Mapping Reflecting the findings from the skills survey this component reviews the skills demanded by employers responding to the survey, and determines which organisations they have used to supply these.
6. Bespoke Research Projects
One or two bespoke client commissioned research projects per year reflecting, for example, current issues, policy changes, EU programmes etc.
Key Findings from the 2015 Workforce Skills Survey
SERIO 10
3. Business Characteristics and Experience of Training 3.1 Introduction
This section provides an overview of the businesses that responded to the survey through summary statistics relating to size and turnover; the nature of the business and its membership with groups or associations; attitudes toward innovation; experience of and attitudes toward training; and any business barriers to arranging training or development.
Summary of Key Points:
Business Characteristics: Similarly to 2013 and 2014, businesses responding to the 2015 survey were predominantly micro in size (75%) employing less than 10, or small (21%) employing between 10 and 49. Responding businesses reported a range of turnover values, with the largest proportion (35%) registering a turnover between £100k and £500k.
Attitudes Toward Innovation: Levels of innovation were lower than in previous surveys. In 2015, 35% of businesses had engaged in innovation activities over the three years prior to the survey, compared to 43% in both 2013 and 2014. Innovation activity predominantly related to the introduction of a new or significantly improved good, service or process (18%), or expenditure in areas such as internal research and development or the acquisition of external knowledge or machinery and equipment (12%).
Experience of Training and Barriers: Businesses were found to be open to training with almost three-quarters (73%) having accessed some sort of professional help or support for their business in the past three years. This broadly reflects the position from both 2014 (76%) and 2013 (67%). However, just one fifth of businesses in 2015 (22%) had a dedicated training budget to meet training needs and to support development.
3.2 Business Size and Turnover
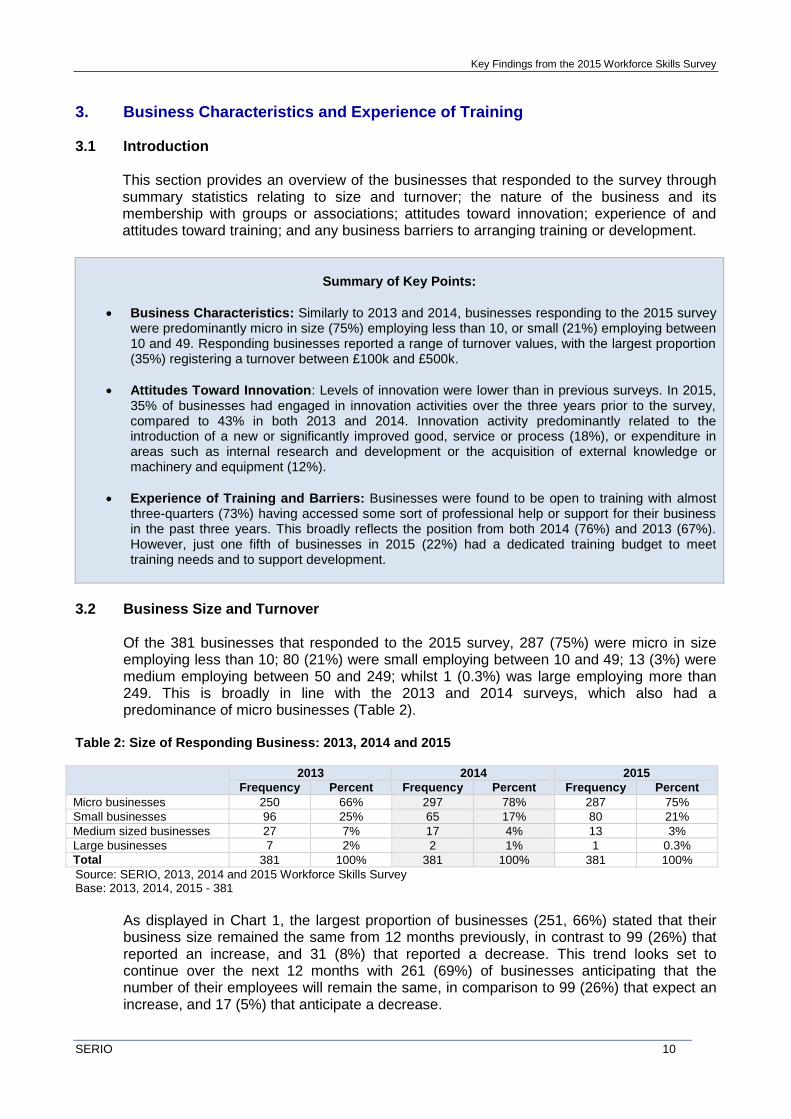
Of the 381 businesses that responded to the 2015 survey, 287 (75%) were micro in size employing less than 10; 80 (21%) were small employing between 10 and 49; 13 (3%) were medium employing between 50 and 249; whilst 1 (0.3%) was large employing more than 249. This is broadly in line with the 2013 and 2014 surveys, which also had a predominance of micro businesses (Table 2).
Table 2: Size of Responding Business: 2013, 2014 and 2015
2013 2014 2015
Frequency Percent Frequency Percent Frequency Percent
Micro businesses 250 66% 297 78% 287 75%
Small businesses 96 25% 65 17% 80 21%
Medium sized businesses 27 7% 17 4% 13 3%
Large businesses 7 2% 2 1% 1 0.3%
Total 381 100% 381 100% 381 100%
Source: SERIO, 2013, 2014 and 2015 Workforce Skills Survey Base: 2013, 2014, 2015 - 381
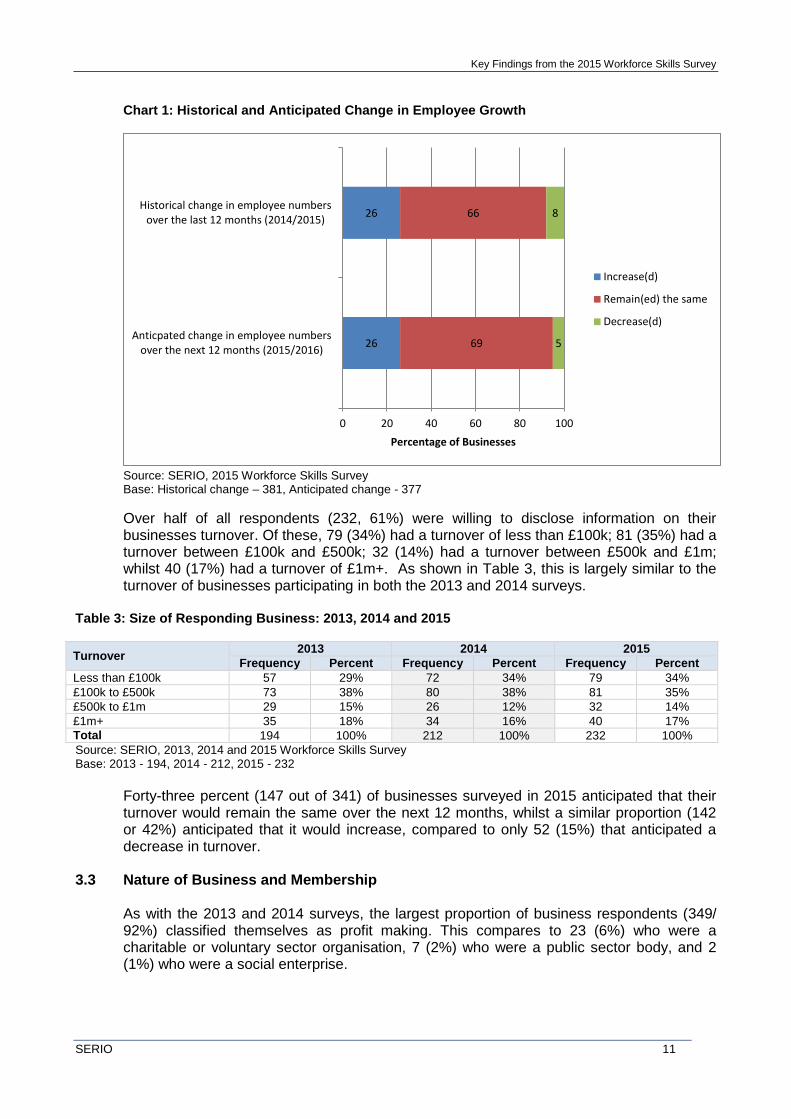
As displayed in Chart 1, the largest proportion of businesses (251, 66%) stated that their business size remained the same from 12 months previously, in contrast to 99 (26%) that reported an increase, and 31 (8%) that reported a decrease. This trend looks set to continue over the next 12 months with 261 (69%) of businesses anticipating that the number of their employees will remain the same, in comparison to 99 (26%) that expect an increase, and 17 (5%) that anticipate a decrease.
Key Findings from the 2015 Workforce Skills Survey
SERIO 11
Chart 1: Historical and Anticipated Change in Employee Growth
Source: SERIO, 2015 Workforce Skills Survey Base: Historical change – 381, Anticipated change - 377
Over half of all respondents (232, 61%) were willing to disclose information on their businesses turnover. Of these, 79 (34%) had a turnover of less than £100k; 81 (35%) had a turnover between £100k and £500k; 32 (14%) had a turnover between £500k and £1m; whilst 40 (17%) had a turnover of £1m+. As shown in Table 3, this is largely similar to the turnover of businesses participating in both the 2013 and 2014 surveys.
Table 3: Size of Responding Business: 2013, 2014 and 2015
Turnover 2013 2014 2015
Frequency Percent Frequency Percent Frequency Percent
Less than £100k 57 29% 72 34% 79 34%
£100k to £500k 73 38% 80 38% 81 35%
£500k to £1m 29 15% 26 12% 32 14%
£1m+ 35 18% 34 16% 40 17%
Total 194 100% 212 100% 232 100%
Source: SERIO, 2013, 2014 and 2015 Workforce Skills Survey Base: 2013 - 194, 2014 - 212, 2015 - 232
Forty-three percent (147 out of 341) of businesses surveyed in 2015 anticipated that their turnover would remain the same over the next 12 months, whilst a similar proportion (142 or 42%) anticipated that it would increase, compared to only 52 (15%) that anticipated a decrease in turnover.
3.3 Nature of Business and Membership As with the 2013 and 2014 surveys, the largest proportion of business respondents (349/ 92%) classified themselves as profit making. This compares to 23 (6%) who were a charitable or voluntary sector organisation, 7 (2%) who were a public sector body, and 2 (1%) who were a social enterprise.
26
26
69
66
5
8
0 20 40 60 80 100
Anticpated change in employee numbersover the next 12 months (2015/2016)
Historical change in employee numbersover the last 12 months (2014/2015)
Percentage of Businesses
Increase(d)
Remain(ed) the same
Decrease(d)
Key Findings from the 2015 Workforce Skills Survey
SERIO 12
Businesses were asked if they were a member of a business group or association. The analysis indicates that 205 businesses (54%) were members of at least one organisation, with the most commonly cited being the Federation of Small Businesses (34%); National Farmers Union (12%) and the Chamber of Commerce (12%). ‘Other’ business groups or associations were found to be wide ranging including the Association of International Accountancy, Institute of Directors, and the Energy Industries Council.
3.4 Attitudes Toward Innovation
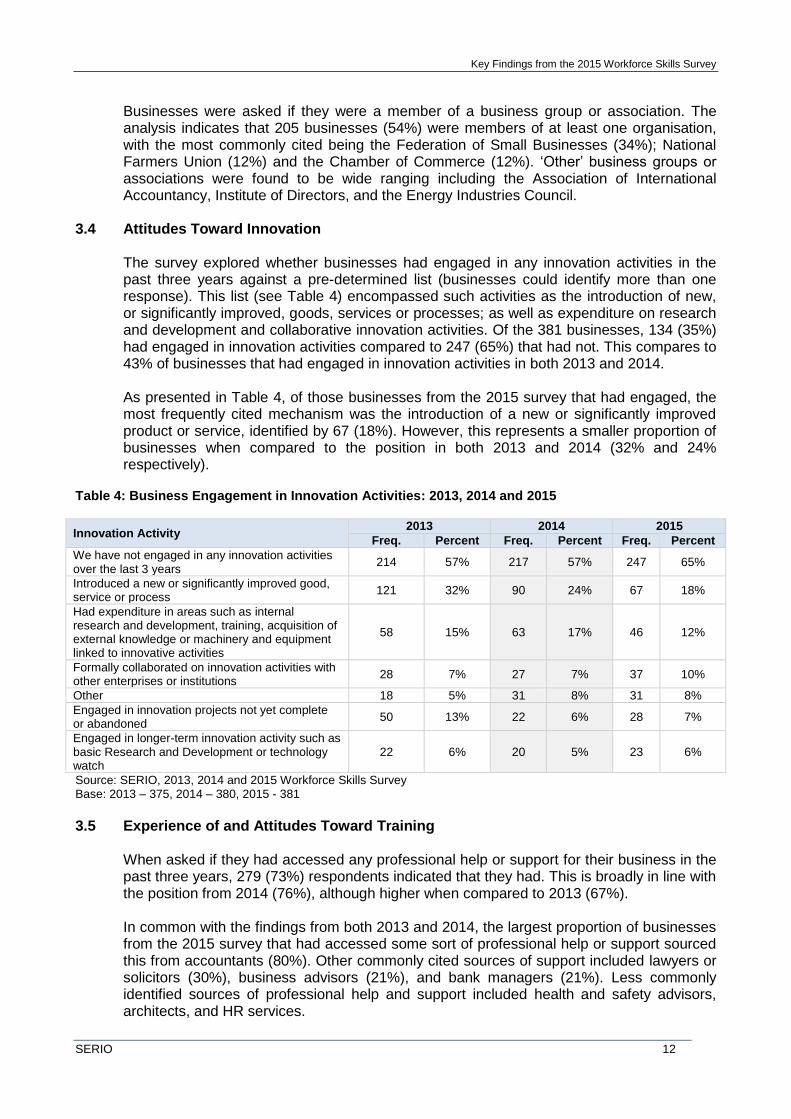
The survey explored whether businesses had engaged in any innovation activities in the past three years against a pre-determined list (businesses could identify more than one response). This list (see Table 4) encompassed such activities as the introduction of new, or significantly improved, goods, services or processes; as well as expenditure on research and development and collaborative innovation activities. Of the 381 businesses, 134 (35%) had engaged in innovation activities compared to 247 (65%) that had not. This compares to 43% of businesses that had engaged in innovation activities in both 2013 and 2014. As presented in Table 4, of those businesses from the 2015 survey that had engaged, the most frequently cited mechanism was the introduction of a new or significantly improved product or service, identified by 67 (18%). However, this represents a smaller proportion of businesses when compared to the position in both 2013 and 2014 (32% and 24% respectively).
Table 4: Business Engagement in Innovation Activities: 2013, 2014 and 2015
Innovation Activity 2013 2014 2015
Freq. Percent Freq. Percent Freq. Percent
We have not engaged in any innovation activities over the last 3 years
214 57% 217 57% 247 65%
Introduced a new or significantly improved good, service or process
121 32% 90 24% 67 18%
Had expenditure in areas such as internal research and development, training, acquisition of external knowledge or machinery and equipment linked to innovative activities
58 15% 63 17% 46 12%
Formally collaborated on innovation activities with other enterprises or institutions
28 7% 27 7% 37 10%
Other 18 5% 31 8% 31 8%
Engaged in innovation projects not yet complete or abandoned
50 13% 22 6% 28 7%
Engaged in longer-term innovation activity such as basic Research and Development or technology watch
22 6% 20 5% 23 6%
Source: SERIO, 2013, 2014 and 2015 Workforce Skills Survey Base: 2013 – 375, 2014 – 380, 2015 - 381
3.5 Experience of and Attitudes Toward Training
When asked if they had accessed any professional help or support for their business in the past three years, 279 (73%) respondents indicated that they had. This is broadly in line with the position from 2014 (76%), although higher when compared to 2013 (67%). In common with the findings from both 2013 and 2014, the largest proportion of businesses from the 2015 survey that had accessed some sort of professional help or support sourced this from accountants (80%). Other commonly cited sources of support included lawyers or solicitors (30%), business advisors (21%), and bank managers (21%). Less commonly identified sources of professional help and support included health and safety advisors, architects, and HR services.
Key Findings from the 2015 Workforce Skills Survey
SERIO 13
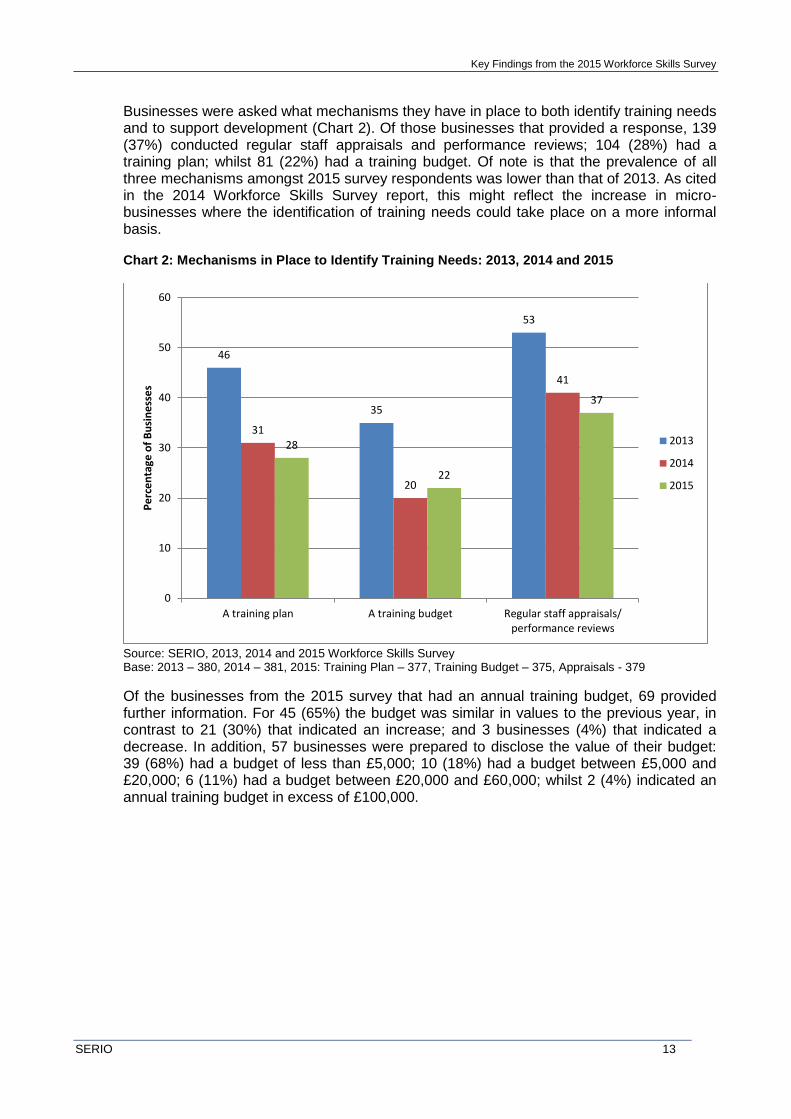
Businesses were asked what mechanisms they have in place to both identify training needs and to support development (Chart 2). Of those businesses that provided a response, 139 (37%) conducted regular staff appraisals and performance reviews; 104 (28%) had a training plan; whilst 81 (22%) had a training budget. Of note is that the prevalence of all three mechanisms amongst 2015 survey respondents was lower than that of 2013. As cited in the 2014 Workforce Skills Survey report, this might reflect the increase in micro-businesses where the identification of training needs could take place on a more informal basis.
Chart 2: Mechanisms in Place to Identify Training Needs: 2013, 2014 and 2015
Source: SERIO, 2013, 2014 and 2015 Workforce Skills Survey Base: 2013 – 380, 2014 – 381, 2015: Training Plan – 377, Training Budget – 375, Appraisals - 379
Of the businesses from the 2015 survey that had an annual training budget, 69 provided further information. For 45 (65%) the budget was similar in values to the previous year, in contrast to 21 (30%) that indicated an increase; and 3 businesses (4%) that indicated a decrease. In addition, 57 businesses were prepared to disclose the value of their budget: 39 (68%) had a budget of less than £5,000; 10 (18%) had a budget between £5,000 and £20,000; 6 (11%) had a budget between £20,000 and £60,000; whilst 2 (4%) indicated an annual training budget in excess of £100,000.
46
35
53
31
20
41
28
22
37
0
10
20
30
40
50
60
A training plan A training budget Regular staff appraisals/performance reviews
Pe
rce
nta
ge o
f B
usi
ne
sse
s
2013
2014
2015
Key Findings from the 2015 Workforce Skills Survey
SERIO 14
4. Employee Retention, Skills and Qualifications 4.1 Introduction
This section summarises business experiences of employee retention, and thoughts on the biggest skills related challenges facing their business over the next three years. Further, the section includes an analysis of business perceptions of skills proficiency amongst the workforce and the actions being taken, where required, to address this.
Summary of Key Points:
Employee Retention: In 2015, 9% of businesses experienced difficulties in the retention of their employees, an increase of +5 percentage points from 2014 (4%), although broadly in line with the level identified in 2013 (10%). As in 2013 and 2014, difficulties in retention were most commonly experienced in the occupational group of skilled trade, although the proportion of businesses reporting difficulties with this group had declined from 37% in 2013 to 18% in 2015.
Skills Challenges: Similarly to both 2013 and 2014 the biggest skills related challenges were perceived to be keeping up with the pace of technology and ICT development, and appropriate recruitment. Just 11% of businesses indicated that they did not require digital skills, in contrast to 28% two years previously (a difference of -17 percentage points). Aside from digital skills, the most commonly required specialist skill was the operation of machinery and equipment (22% of businesses).
Proficiency: Ninety-four percent of businesses felt that their employees had the skills required for them to be fully proficient at their job, compared to 95% in 2014. In line with findings from both 2013 and 2014, staff considered not to be fully proficient were predominantly based in skilled trade occupations (27%) – the occupational group that also experienced the most difficulties in staff retention. Approximately three-quarters of businesses in 2015 (77%) felt that a lack of proficiency had led to an increased workload for other staff, compared to just 26% and 20% of respondents in 2013 and 2014 respectively.
Under-utilised Skills: Over a fifth of businesses (22%/ 81) indicated having employees whose skills or qualifications were not utilised compared to 16% in 2013 and 14% in 2014. The underutilisation of employee skills was particularly prominent in the sectors of business administration and support services, accommodation and food services, and professional, scientific and technical. Notably, a clear majority of these businesses (80%) were not taking any steps to address this issue at the point of survey, perceiving that the under-utilised skills were not relevant to their business.
4.2 Employee Retention
Businesses responding to the 2015 survey experienced more difficulty in retaining their employees than those surveyed twelve months previously. In 2015, 34 (9%) reported experiencing difficulties, an increase of +5 percentage points from 2014. Of note, however, is that is still remains below 2013 levels where difficulties were experienced by 38 (10%).
Difficulties in retention were most commonly attributed to competition from other employers (10/ 29%), followed by limited opportunities for career progression (8/ 24%). Other difficulties cited by businesses reflected the terms and conditions of the post, such as shift work and unsociable hours (6/ 18%), and being based in a more remote location of the county with limited public transport (5/ 15%).
Key Findings from the 2015 Workforce Skills Survey
SERIO 15
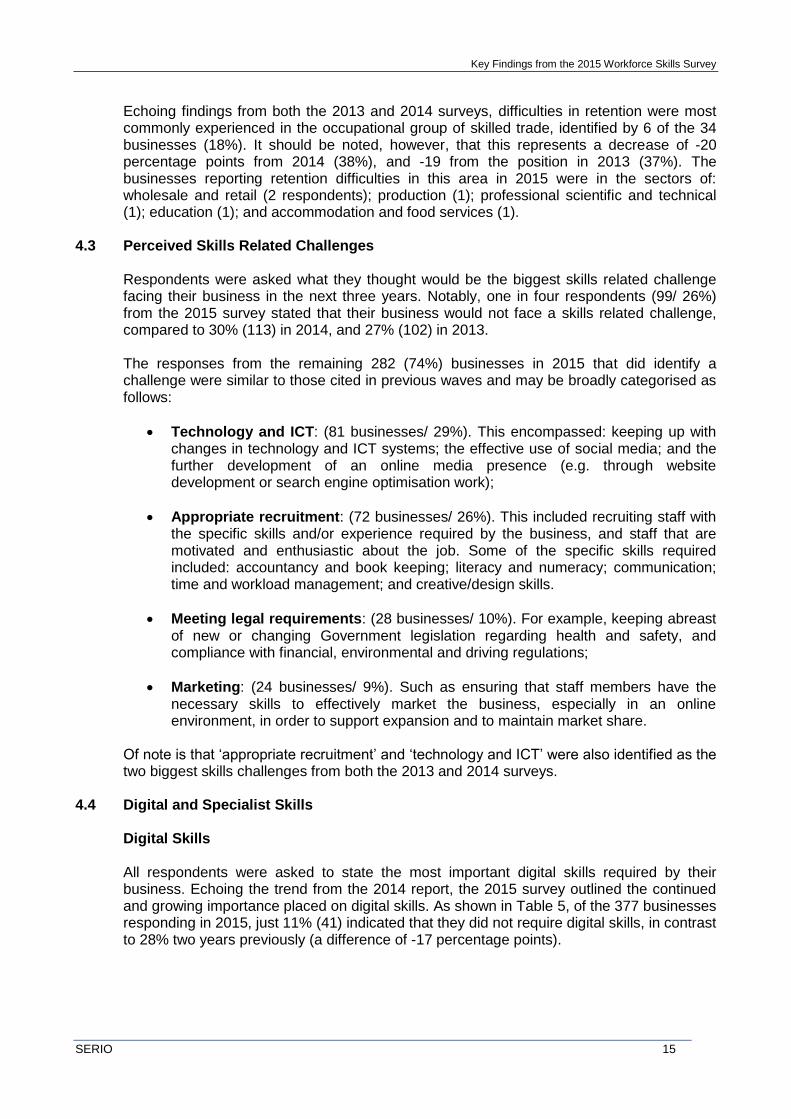
Echoing findings from both the 2013 and 2014 surveys, difficulties in retention were most commonly experienced in the occupational group of skilled trade, identified by 6 of the 34 businesses (18%). It should be noted, however, that this represents a decrease of -20 percentage points from 2014 (38%), and -19 from the position in 2013 (37%). The businesses reporting retention difficulties in this area in 2015 were in the sectors of: wholesale and retail (2 respondents); production (1); professional scientific and technical (1); education (1); and accommodation and food services (1).
4.3 Perceived Skills Related Challenges
Respondents were asked what they thought would be the biggest skills related challenge facing their business in the next three years. Notably, one in four respondents (99/ 26%) from the 2015 survey stated that their business would not face a skills related challenge, compared to 30% (113) in 2014, and 27% (102) in 2013. The responses from the remaining 282 (74%) businesses in 2015 that did identify a challenge were similar to those cited in previous waves and may be broadly categorised as follows:
Technology and ICT: (81 businesses/ 29%). This encompassed: keeping up with changes in technology and ICT systems; the effective use of social media; and the further development of an online media presence (e.g. through website development or search engine optimisation work);
Appropriate recruitment: (72 businesses/ 26%). This included recruiting staff with the specific skills and/or experience required by the business, and staff that are motivated and enthusiastic about the job. Some of the specific skills required included: accountancy and book keeping; literacy and numeracy; communication; time and workload management; and creative/design skills.
Meeting legal requirements: (28 businesses/ 10%). For example, keeping abreast of new or changing Government legislation regarding health and safety, and compliance with financial, environmental and driving regulations;
Marketing: (24 businesses/ 9%). Such as ensuring that staff members have the necessary skills to effectively market the business, especially in an online environment, in order to support expansion and to maintain market share.
Of note is that ‘appropriate recruitment’ and ‘technology and ICT’ were also identified as the two biggest skills challenges from both the 2013 and 2014 surveys.
4.4 Digital and Specialist Skills
Digital Skills All respondents were asked to state the most important digital skills required by their business. Echoing the trend from the 2014 report, the 2015 survey outlined the continued and growing importance placed on digital skills. As shown in Table 5, of the 377 businesses responding in 2015, just 11% (41) indicated that they did not require digital skills, in contrast to 28% two years previously (a difference of -17 percentage points).
Key Findings from the 2015 Workforce Skills Survey
SERIO 16
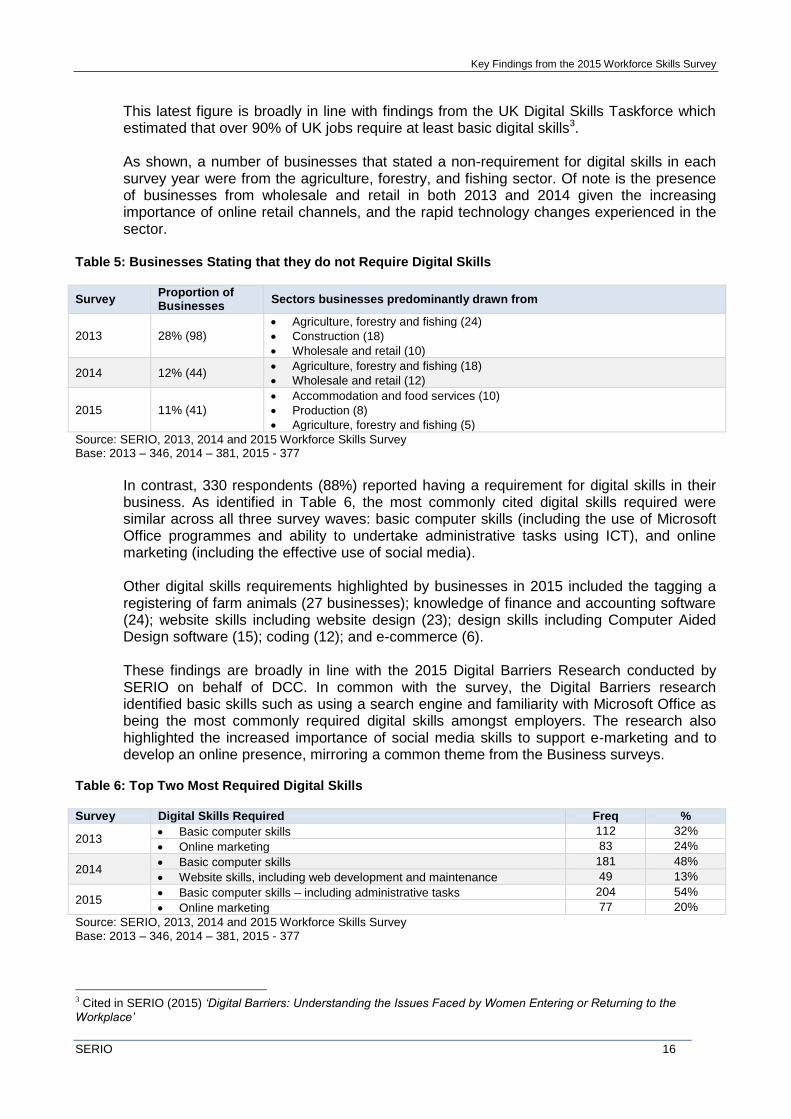
This latest figure is broadly in line with findings from the UK Digital Skills Taskforce which estimated that over 90% of UK jobs require at least basic digital skills3. As shown, a number of businesses that stated a non-requirement for digital skills in each survey year were from the agriculture, forestry, and fishing sector. Of note is the presence of businesses from wholesale and retail in both 2013 and 2014 given the increasing importance of online retail channels, and the rapid technology changes experienced in the sector.
Table 5: Businesses Stating that they do not Require Digital Skills
Survey Proportion of Businesses
Sectors businesses predominantly drawn from
2013 28% (98)
Agriculture, forestry and fishing (24)
Construction (18)
Wholesale and retail (10)
2014 12% (44) Agriculture, forestry and fishing (18)
Wholesale and retail (12)
2015 11% (41)
Accommodation and food services (10)
Production (8)
Agriculture, forestry and fishing (5)
Source: SERIO, 2013, 2014 and 2015 Workforce Skills Survey Base: 2013 – 346, 2014 – 381, 2015 - 377
In contrast, 330 respondents (88%) reported having a requirement for digital skills in their business. As identified in Table 6, the most commonly cited digital skills required were similar across all three survey waves: basic computer skills (including the use of Microsoft Office programmes and ability to undertake administrative tasks using ICT), and online marketing (including the effective use of social media). Other digital skills requirements highlighted by businesses in 2015 included the tagging a registering of farm animals (27 businesses); knowledge of finance and accounting software (24); website skills including website design (23); design skills including Computer Aided Design software (15); coding (12); and e-commerce (6). These findings are broadly in line with the 2015 Digital Barriers Research conducted by SERIO on behalf of DCC. In common with the survey, the Digital Barriers research identified basic skills such as using a search engine and familiarity with Microsoft Office as being the most commonly required digital skills amongst employers. The research also highlighted the increased importance of social media skills to support e-marketing and to develop an online presence, mirroring a common theme from the Business surveys.
Table 6: Top Two Most Required Digital Skills Survey Digital Skills Required Freq %
2013 Basic computer skills 112 32%
Online marketing 83 24%
2014 Basic computer skills 181 48%
Website skills, including web development and maintenance 49 13%
2015 Basic computer skills – including administrative tasks 204 54%
Online marketing 77 20%
Source: SERIO, 2013, 2014 and 2015 Workforce Skills Survey Base: 2013 – 346, 2014 – 381, 2015 - 377
3 Cited in SERIO (2015) ‘Digital Barriers: Understanding the Issues Faced by Women Entering or Returning to the
Workplace’
Key Findings from the 2015 Workforce Skills Survey
SERIO 17
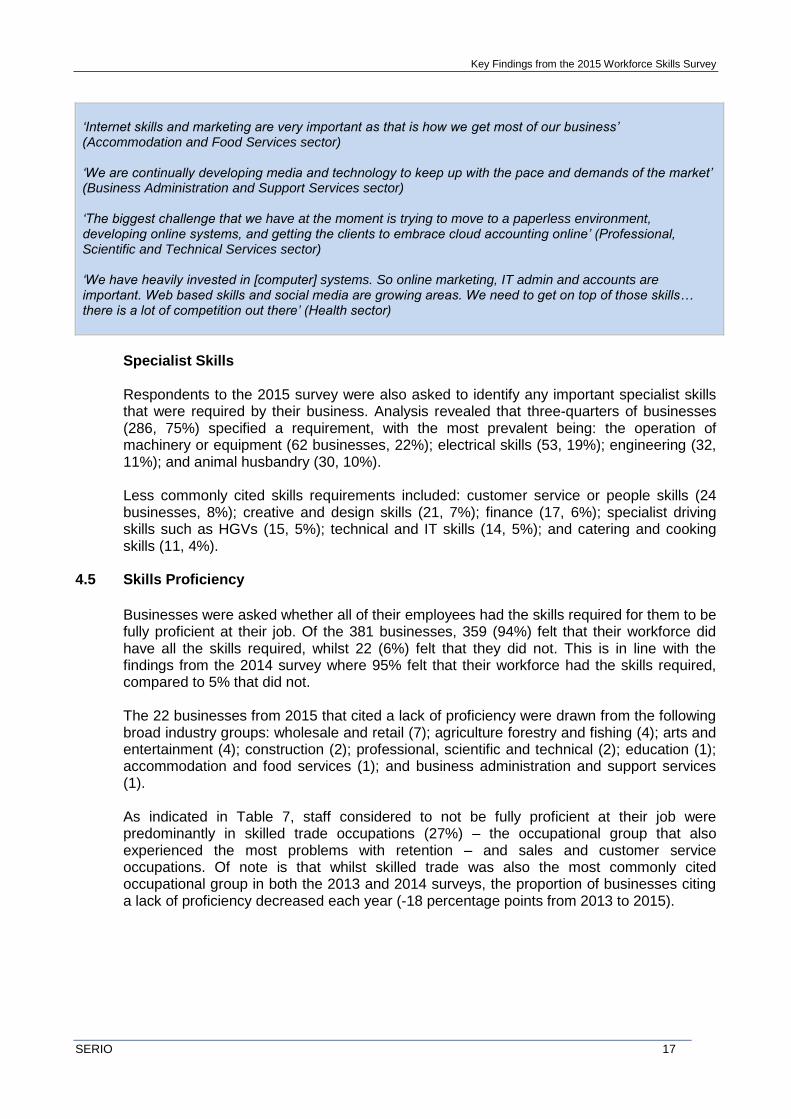
‘Internet skills and marketing are very important as that is how we get most of our business’ (Accommodation and Food Services sector) ‘We are continually developing media and technology to keep up with the pace and demands of the market’ (Business Administration and Support Services sector) ‘The biggest challenge that we have at the moment is trying to move to a paperless environment, developing online systems, and getting the clients to embrace cloud accounting online’ (Professional, Scientific and Technical Services sector) ‘We have heavily invested in [computer] systems. So online marketing, IT admin and accounts are important. Web based skills and social media are growing areas. We need to get on top of those skills… there is a lot of competition out there’ (Health sector)
Specialist Skills Respondents to the 2015 survey were also asked to identify any important specialist skills that were required by their business. Analysis revealed that three-quarters of businesses (286, 75%) specified a requirement, with the most prevalent being: the operation of machinery or equipment (62 businesses, 22%); electrical skills (53, 19%); engineering (32, 11%); and animal husbandry (30, 10%). Less commonly cited skills requirements included: customer service or people skills (24 businesses, 8%); creative and design skills (21, 7%); finance (17, 6%); specialist driving skills such as HGVs (15, 5%); technical and IT skills (14, 5%); and catering and cooking skills (11, 4%).
4.5 Skills Proficiency
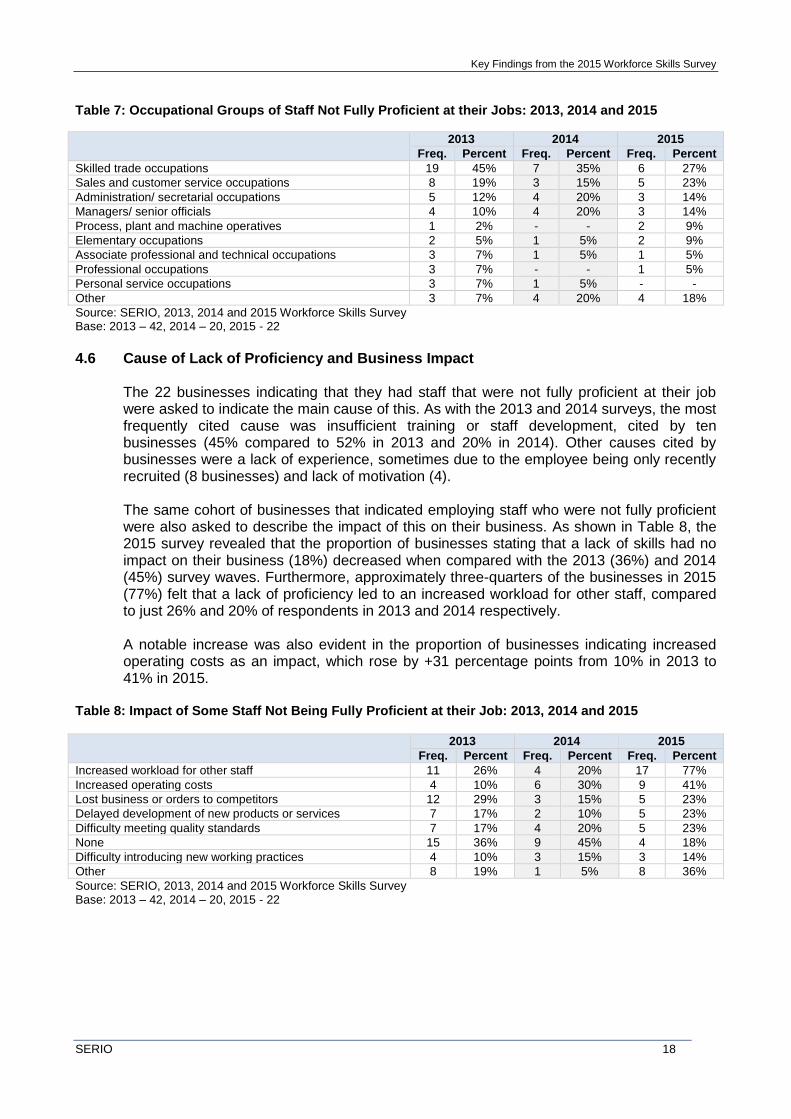
Businesses were asked whether all of their employees had the skills required for them to be fully proficient at their job. Of the 381 businesses, 359 (94%) felt that their workforce did have all the skills required, whilst 22 (6%) felt that they did not. This is in line with the findings from the 2014 survey where 95% felt that their workforce had the skills required, compared to 5% that did not. The 22 businesses from 2015 that cited a lack of proficiency were drawn from the following broad industry groups: wholesale and retail (7); agriculture forestry and fishing (4); arts and entertainment (4); construction (2); professional, scientific and technical (2); education (1); accommodation and food services (1); and business administration and support services (1). As indicated in Table 7, staff considered to not be fully proficient at their job were predominantly in skilled trade occupations (27%) – the occupational group that also experienced the most problems with retention – and sales and customer service occupations. Of note is that whilst skilled trade was also the most commonly cited occupational group in both the 2013 and 2014 surveys, the proportion of businesses citing a lack of proficiency decreased each year (-18 percentage points from 2013 to 2015).
Key Findings from the 2015 Workforce Skills Survey
SERIO 18
Table 7: Occupational Groups of Staff Not Fully Proficient at their Jobs: 2013, 2014 and 2015
2013 2014 2015
Freq. Percent Freq. Percent Freq. Percent
Skilled trade occupations 19 45% 7 35% 6 27%
Sales and customer service occupations 8 19% 3 15% 5 23%
Administration/ secretarial occupations 5 12% 4 20% 3 14%
Managers/ senior officials 4 10% 4 20% 3 14%
Process, plant and machine operatives 1 2% - - 2 9%
Elementary occupations 2 5% 1 5% 2 9%
Associate professional and technical occupations 3 7% 1 5% 1 5%
Professional occupations 3 7% - - 1 5%
Personal service occupations 3 7% 1 5% - -
Other 3 7% 4 20% 4 18%
Source: SERIO, 2013, 2014 and 2015 Workforce Skills Survey Base: 2013 – 42, 2014 – 20, 2015 - 22
4.6 Cause of Lack of Proficiency and Business Impact
The 22 businesses indicating that they had staff that were not fully proficient at their job were asked to indicate the main cause of this. As with the 2013 and 2014 surveys, the most frequently cited cause was insufficient training or staff development, cited by ten businesses (45% compared to 52% in 2013 and 20% in 2014). Other causes cited by businesses were a lack of experience, sometimes due to the employee being only recently recruited (8 businesses) and lack of motivation (4).
The same cohort of businesses that indicated employing staff who were not fully proficient were also asked to describe the impact of this on their business. As shown in Table 8, the 2015 survey revealed that the proportion of businesses stating that a lack of skills had no impact on their business (18%) decreased when compared with the 2013 (36%) and 2014 (45%) survey waves. Furthermore, approximately three-quarters of the businesses in 2015 (77%) felt that a lack of proficiency led to an increased workload for other staff, compared to just 26% and 20% of respondents in 2013 and 2014 respectively. A notable increase was also evident in the proportion of businesses indicating increased operating costs as an impact, which rose by +31 percentage points from 10% in 2013 to 41% in 2015.
Table 8: Impact of Some Staff Not Being Fully Proficient at their Job: 2013, 2014 and 2015
2013 2014 2015
Freq. Percent Freq. Percent Freq. Percent
Increased workload for other staff 11 26% 4 20% 17 77%
Increased operating costs 4 10% 6 30% 9 41%
Lost business or orders to competitors 12 29% 3 15% 5 23%
Delayed development of new products or services 7 17% 2 10% 5 23%
Difficulty meeting quality standards 7 17% 4 20% 5 23%
None 15 36% 9 45% 4 18%
Difficulty introducing new working practices 4 10% 3 15% 3 14%
Other 8 19% 1 5% 8 36%
Source: SERIO, 2013, 2014 and 2015 Workforce Skills Survey Base: 2013 – 42, 2014 – 20, 2015 - 22
Key Findings from the 2015 Workforce Skills Survey
SERIO 19
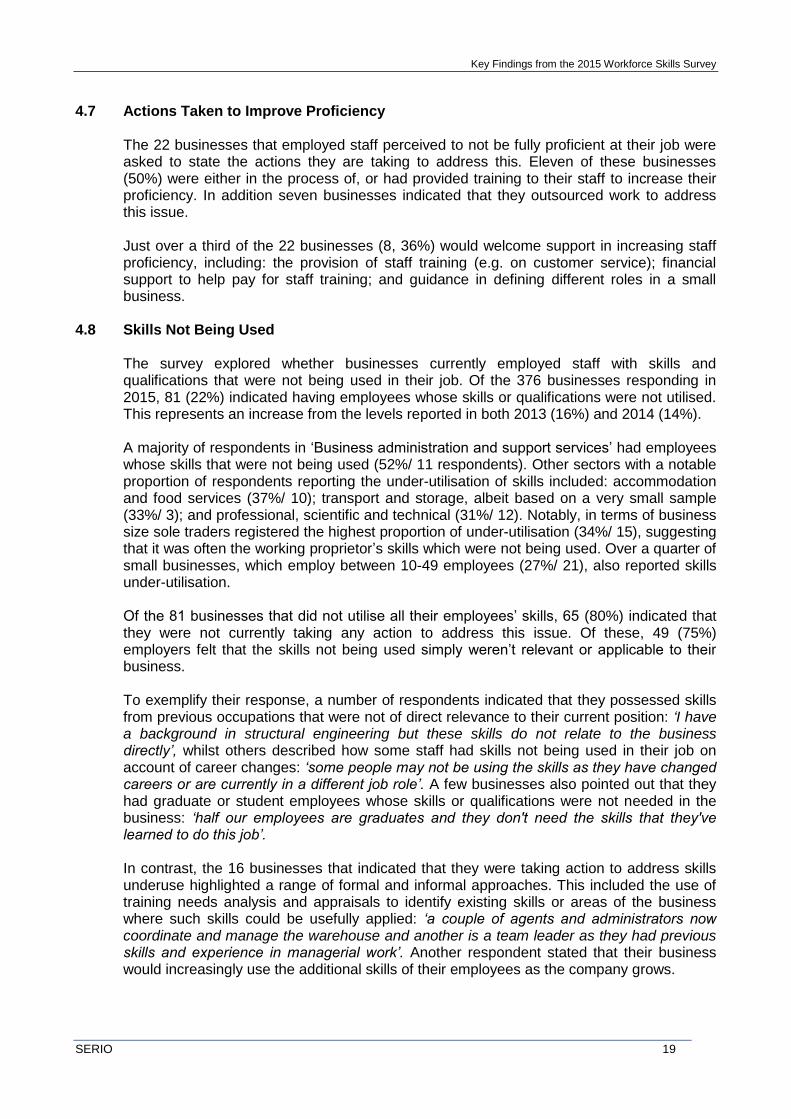
4.7 Actions Taken to Improve Proficiency
The 22 businesses that employed staff perceived to not be fully proficient at their job were asked to state the actions they are taking to address this. Eleven of these businesses (50%) were either in the process of, or had provided training to their staff to increase their proficiency. In addition seven businesses indicated that they outsourced work to address this issue. Just over a third of the 22 businesses (8, 36%) would welcome support in increasing staff proficiency, including: the provision of staff training (e.g. on customer service); financial support to help pay for staff training; and guidance in defining different roles in a small business.
4.8 Skills Not Being Used
The survey explored whether businesses currently employed staff with skills and qualifications that were not being used in their job. Of the 376 businesses responding in 2015, 81 (22%) indicated having employees whose skills or qualifications were not utilised. This represents an increase from the levels reported in both 2013 (16%) and 2014 (14%). A majority of respondents in ‘Business administration and support services’ had employees whose skills that were not being used (52%/ 11 respondents). Other sectors with a notable proportion of respondents reporting the under-utilisation of skills included: accommodation and food services (37%/ 10); transport and storage, albeit based on a very small sample (33%/ 3); and professional, scientific and technical (31%/ 12). Notably, in terms of business size sole traders registered the highest proportion of under-utilisation (34%/ 15), suggesting that it was often the working proprietor’s skills which were not being used. Over a quarter of small businesses, which employ between 10-49 employees (27%/ 21), also reported skills under-utilisation. Of the 81 businesses that did not utilise all their employees’ skills, 65 (80%) indicated that they were not currently taking any action to address this issue. Of these, 49 (75%) employers felt that the skills not being used simply weren’t relevant or applicable to their business. To exemplify their response, a number of respondents indicated that they possessed skills from previous occupations that were not of direct relevance to their current position: ‘I have a background in structural engineering but these skills do not relate to the business directly’, whilst others described how some staff had skills not being used in their job on account of career changes: ‘some people may not be using the skills as they have changed careers or are currently in a different job role’. A few businesses also pointed out that they had graduate or student employees whose skills or qualifications were not needed in the business: ‘half our employees are graduates and they don't need the skills that they've learned to do this job’. In contrast, the 16 businesses that indicated that they were taking action to address skills underuse highlighted a range of formal and informal approaches. This included the use of training needs analysis and appraisals to identify existing skills or areas of the business where such skills could be usefully applied: ‘a couple of agents and administrators now coordinate and manage the warehouse and another is a team leader as they had previous skills and experience in managerial work’. Another respondent stated that their business would increasingly use the additional skills of their employees as the company grows.
Key Findings from the 2015 Workforce Skills Survey
SERIO 20
5. Assessing Supply and Demand 5.1 Introduction
This section presents an outline of the key areas of skills demand from business respondents to the survey, and identifies the training suppliers used. In addition, the section also summarises business experience of training suppliers, the most important factors taken into consideration when choosing a supplier, and anticipated future spend on training.
Summary of Key Points:
Training Demand and Mechanism of Delivery: Almost three in five businesses (58%) had funded or arranged staff development activities for their employees over the past 12 months. This is broadly in line with levels from 2014 (60%), although a decrease of –7 percentage points from 2013 (65%). Whilst businesses favoured off-site training provided by an external organisation (74%); onsite training delivered through both existing staff (52%) and an external organisation (50%) were also commonplace.
Training Suppliers Used: Whilst some businesses were found to have used further education colleges (27%) or universities (7%) to supply their training or staff development, the largest proportion (87%) favoured delivery through ‘other’ providers. These encompassed general independent or charitable organisations, sector specific or specialist providers, or delivery through government agencies or local authorities.
Anticipated Future Training Spend: Two thirds of businesses (66%) anticipated the amount of money they spend on training to stay the same over the next 12 months, in contrast to 19% who anticipated an increase, 3% who expected a decrease, and 13% who were undecided. Those highlighting a likely reduction in spend attributed it to employees either having recently undertaken or completed training; the potential closure of the business; financial cuts the business needed to make; a reduction in the availability of relevant courses; or that a large investment in training had been made in the previous year.
5.2 Training Demand and Mechanism of Delivery
Over the past 12 months 221 (58%) businesses were found to have funded or arranged training or staff development activities for their employees, in contrast to 159 (42%) that had not. This is broadly in line with the findings from the 2014 survey (60%), although a decrease of -7 percentage points from 2013 (65%). In common with the findings from 2014, training and staff development activities over the last 12 months were found to be most prevalent in the broad industry groups of health, education, and public administration and defence (Table 9). In contrast, businesses in the broad industry groups of production; and agriculture, forestry and fishing registered the lowest levels of investment in training and staff development activities over the same period.
Key Findings from the 2015 Workforce Skills Survey
SERIO 21
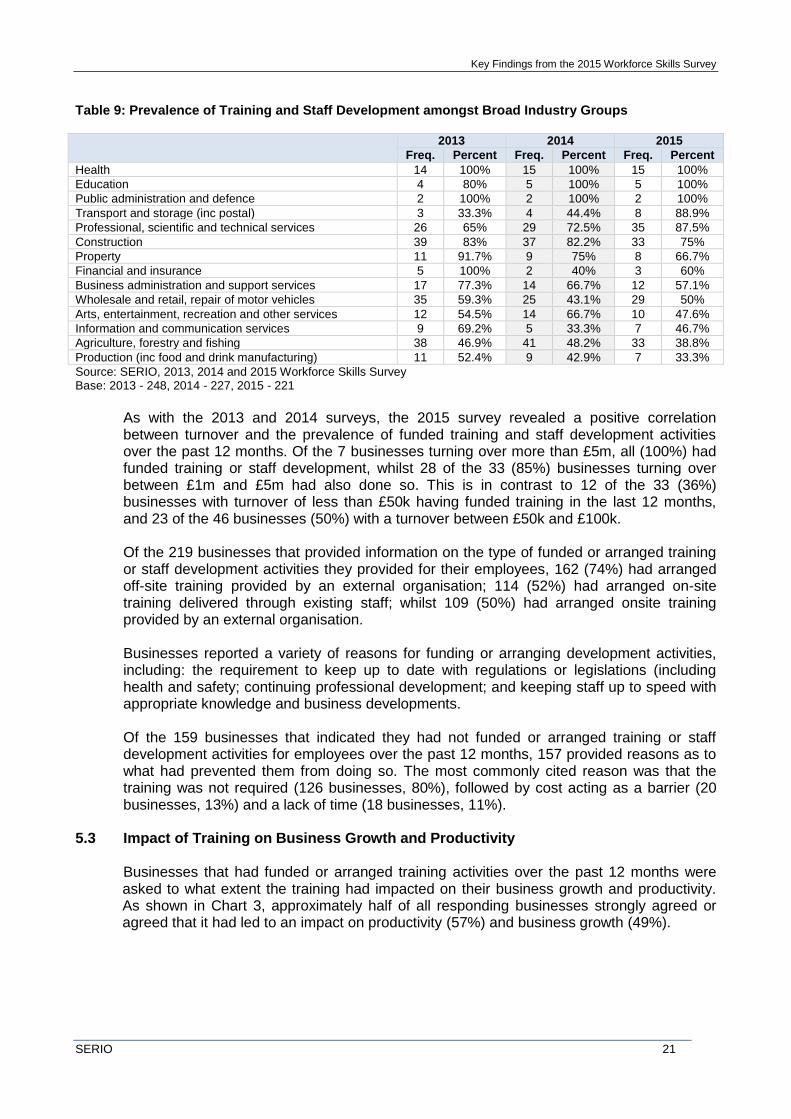
Table 9: Prevalence of Training and Staff Development amongst Broad Industry Groups
2013 2014 2015
Freq. Percent Freq. Percent Freq. Percent
Health 14 100% 15 100% 15 100%
Education 4 80% 5 100% 5 100%
Public administration and defence 2 100% 2 100% 2 100%
Transport and storage (inc postal) 3 33.3% 4 44.4% 8 88.9%
Professional, scientific and technical services 26 65% 29 72.5% 35 87.5%
Construction 39 83% 37 82.2% 33 75%
Property 11 91.7% 9 75% 8 66.7%
Financial and insurance 5 100% 2 40% 3 60%
Business administration and support services 17 77.3% 14 66.7% 12 57.1%
Wholesale and retail, repair of motor vehicles 35 59.3% 25 43.1% 29 50%
Arts, entertainment, recreation and other services 12 54.5% 14 66.7% 10 47.6%
Information and communication services 9 69.2% 5 33.3% 7 46.7%
Agriculture, forestry and fishing 38 46.9% 41 48.2% 33 38.8%
Production (inc food and drink manufacturing) 11 52.4% 9 42.9% 7 33.3%
Source: SERIO, 2013, 2014 and 2015 Workforce Skills Survey Base: 2013 - 248, 2014 - 227, 2015 - 221
As with the 2013 and 2014 surveys, the 2015 survey revealed a positive correlation between turnover and the prevalence of funded training and staff development activities over the past 12 months. Of the 7 businesses turning over more than £5m, all (100%) had funded training or staff development, whilst 28 of the 33 (85%) businesses turning over between £1m and £5m had also done so. This is in contrast to 12 of the 33 (36%) businesses with turnover of less than £50k having funded training in the last 12 months, and 23 of the 46 businesses (50%) with a turnover between £50k and £100k. Of the 219 businesses that provided information on the type of funded or arranged training or staff development activities they provided for their employees, 162 (74%) had arranged off-site training provided by an external organisation; 114 (52%) had arranged on-site training delivered through existing staff; whilst 109 (50%) had arranged onsite training provided by an external organisation. Businesses reported a variety of reasons for funding or arranging development activities, including: the requirement to keep up to date with regulations or legislations (including health and safety; continuing professional development; and keeping staff up to speed with appropriate knowledge and business developments. Of the 159 businesses that indicated they had not funded or arranged training or staff development activities for employees over the past 12 months, 157 provided reasons as to what had prevented them from doing so. The most commonly cited reason was that the training was not required (126 businesses, 80%), followed by cost acting as a barrier (20 businesses, 13%) and a lack of time (18 businesses, 11%).
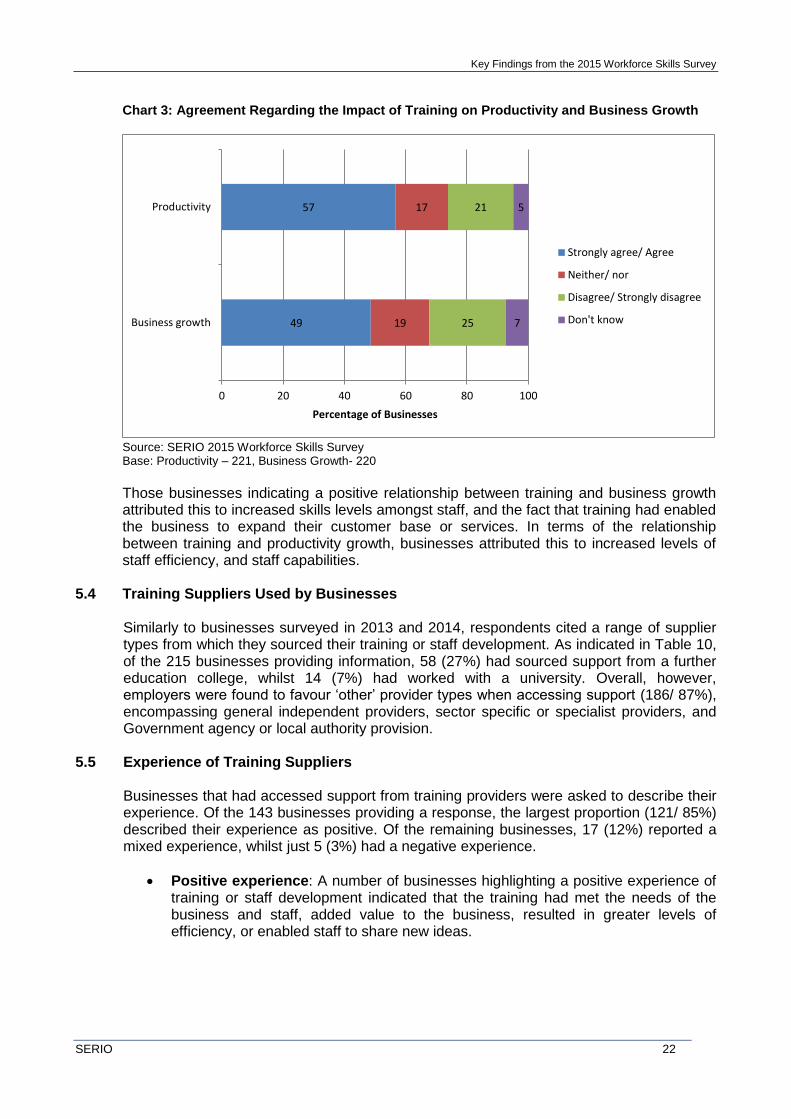
5.3 Impact of Training on Business Growth and Productivity
Businesses that had funded or arranged training activities over the past 12 months were asked to what extent the training had impacted on their business growth and productivity. As shown in Chart 3, approximately half of all responding businesses strongly agreed or agreed that it had led to an impact on productivity (57%) and business growth (49%).
Key Findings from the 2015 Workforce Skills Survey
SERIO 22
Chart 3: Agreement Regarding the Impact of Training on Productivity and Business Growth
Source: SERIO 2015 Workforce Skills Survey Base: Productivity – 221, Business Growth- 220
Those businesses indicating a positive relationship between training and business growth attributed this to increased skills levels amongst staff, and the fact that training had enabled the business to expand their customer base or services. In terms of the relationship between training and productivity growth, businesses attributed this to increased levels of staff efficiency, and staff capabilities.
5.4 Training Suppliers Used by Businesses
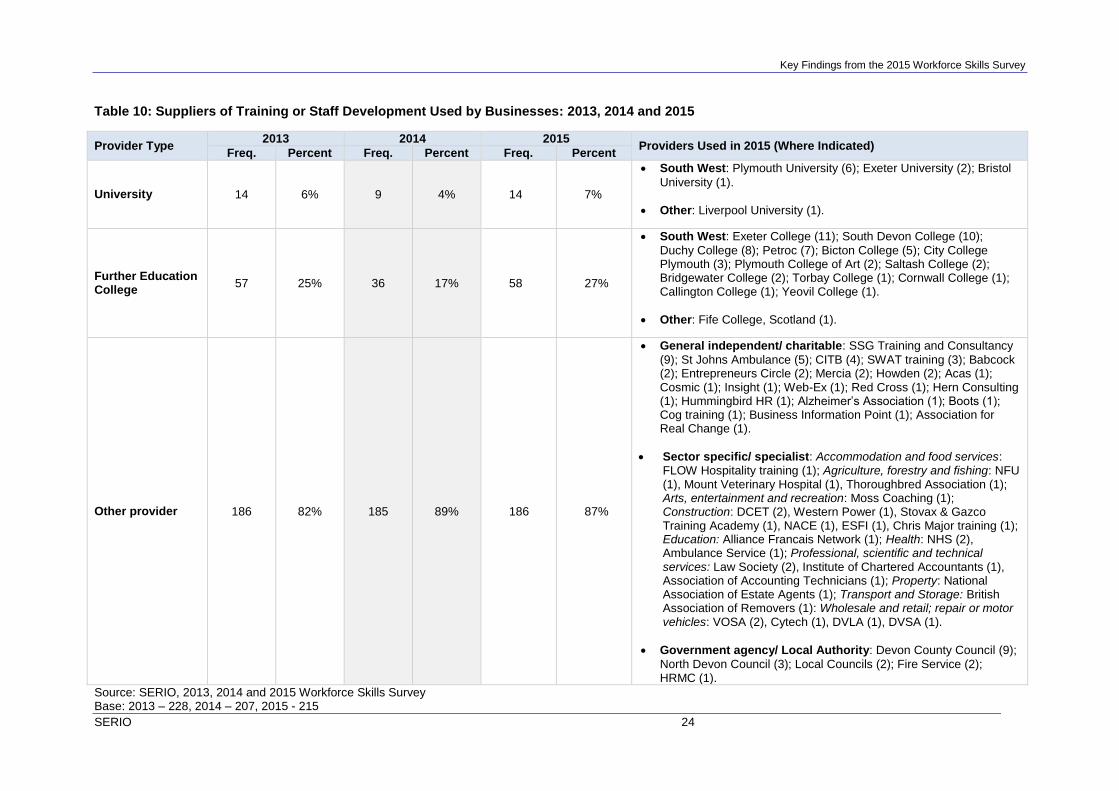
Similarly to businesses surveyed in 2013 and 2014, respondents cited a range of supplier types from which they sourced their training or staff development. As indicated in Table 10, of the 215 businesses providing information, 58 (27%) had sourced support from a further education college, whilst 14 (7%) had worked with a university. Overall, however, employers were found to favour ‘other’ provider types when accessing support (186/ 87%), encompassing general independent providers, sector specific or specialist providers, and Government agency or local authority provision.
5.5 Experience of Training Suppliers
Businesses that had accessed support from training providers were asked to describe their experience. Of the 143 businesses providing a response, the largest proportion (121/ 85%) described their experience as positive. Of the remaining businesses, 17 (12%) reported a mixed experience, whilst just 5 (3%) had a negative experience.
Positive experience: A number of businesses highlighting a positive experience of training or staff development indicated that the training had met the needs of the business and staff, added value to the business, resulted in greater levels of efficiency, or enabled staff to share new ideas.
49
57
19
17
25
21
7
5
0 20 40 60 80 100
Business growth
Productivity
Percentage of Businesses
Strongly agree/ Agree
Neither/ nor
Disagree/ Strongly disagree
Don't know

Key Findings from the 2015 Workforce Skills Survey
SERIO 23
Mixed experience: Those businesses highlighting more mixed experiences were generally pleased with the training received, but felt that the quality of provision varied. A common theme of feedback is that the training could have been made more relevant and/or bespoke to the needs of the business and their staff.
Negative experience: Businesses that had a negative experience attributed this to the training being either too complex or too simple for their needs. For example, some businesses reported that the requirement for delivery in plain English to make it easier to understand.
Key Findings from the 2015 Workforce Skills Survey
SERIO 24
Table 10: Suppliers of Training or Staff Development Used by Businesses: 2013, 2014 and 2015
Provider Type 2013 2014 2015
Providers Used in 2015 (Where Indicated) Freq. Percent Freq. Percent Freq. Percent
University 14 6% 9 4% 14 7%
South West: Plymouth University (6); Exeter University (2); Bristol
University (1).
Other: Liverpool University (1).
Further Education College
57 25% 36 17% 58 27%
South West: Exeter College (11); South Devon College (10);
Duchy College (8); Petroc (7); Bicton College (5); City College Plymouth (3); Plymouth College of Art (2); Saltash College (2); Bridgewater College (2); Torbay College (1); Cornwall College (1); Callington College (1); Yeovil College (1).
Other: Fife College, Scotland (1).
Other provider 186 82% 185 89% 186 87%
General independent/ charitable: SSG Training and Consultancy
(9); St Johns Ambulance (5); CITB (4); SWAT training (3); Babcock (2); Entrepreneurs Circle (2); Mercia (2); Howden (2); Acas (1); Cosmic (1); Insight (1); Web-Ex (1); Red Cross (1); Hern Consulting (1); Hummingbird HR (1); Alzheimer’s Association (1); Boots (1); Cog training (1); Business Information Point (1); Association for Real Change (1).
Sector specific/ specialist: Accommodation and food services: FLOW Hospitality training (1); Agriculture, forestry and fishing: NFU (1), Mount Veterinary Hospital (1), Thoroughbred Association (1); Arts, entertainment and recreation: Moss Coaching (1); Construction: DCET (2), Western Power (1), Stovax & Gazco Training Academy (1), NACE (1), ESFI (1), Chris Major training (1); Education: Alliance Francais Network (1); Health: NHS (2), Ambulance Service (1); Professional, scientific and technical services: Law Society (2), Institute of Chartered Accountants (1), Association of Accounting Technicians (1); Property: National Association of Estate Agents (1); Transport and Storage: British Association of Removers (1): Wholesale and retail; repair or motor vehicles: VOSA (2), Cytech (1), DVLA (1), DVSA (1).
Government agency/ Local Authority: Devon County Council (9);
North Devon Council (3); Local Councils (2); Fire Service (2); HRMC (1).
Source: SERIO, 2013, 2014 and 2015 Workforce Skills Survey Base: 2013 – 228, 2014 – 207, 2015 - 215
Key Findings from the 2015 Workforce Skills Survey
SERIO 25
5.6 Important Factors when Choosing Training Suppliers
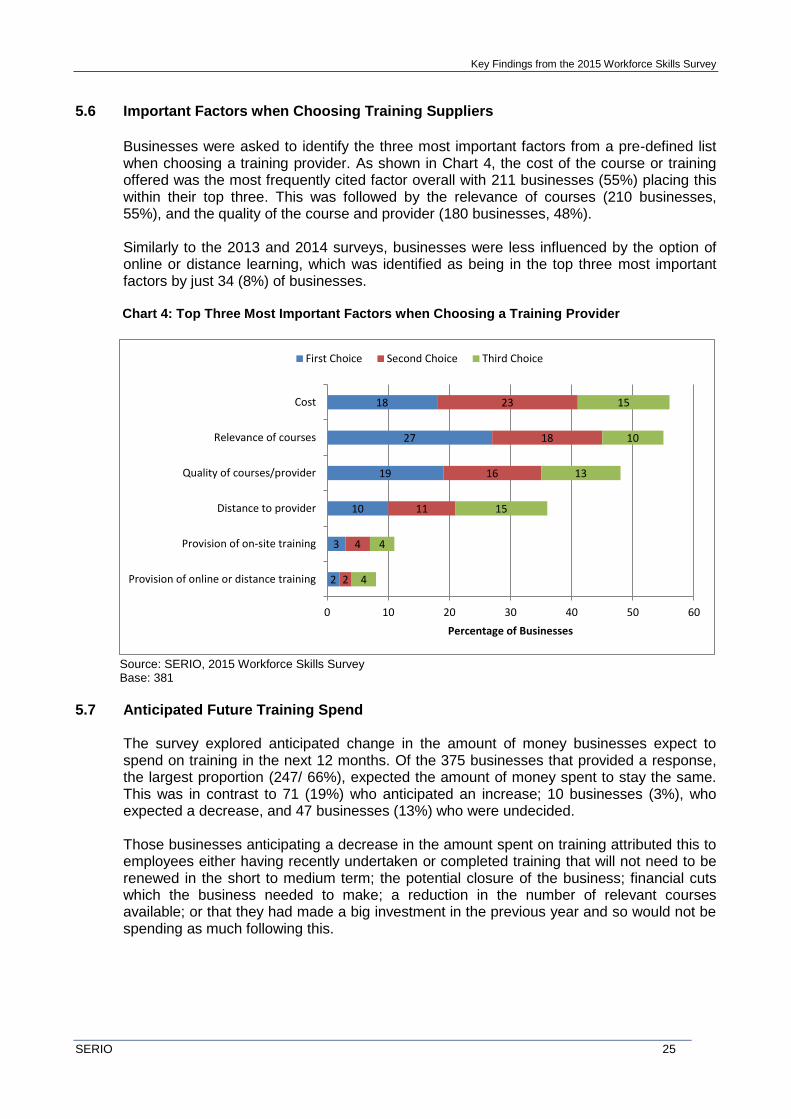
Businesses were asked to identify the three most important factors from a pre-defined list when choosing a training provider. As shown in Chart 4, the cost of the course or training offered was the most frequently cited factor overall with 211 businesses (55%) placing this within their top three. This was followed by the relevance of courses (210 businesses, 55%), and the quality of the course and provider (180 businesses, 48%).
Similarly to the 2013 and 2014 surveys, businesses were less influenced by the option of online or distance learning, which was identified as being in the top three most important factors by just 34 (8%) of businesses.
Chart 4: Top Three Most Important Factors when Choosing a Training Provider
Source: SERIO, 2015 Workforce Skills Survey Base: 381
5.7 Anticipated Future Training Spend
The survey explored anticipated change in the amount of money businesses expect to spend on training in the next 12 months. Of the 375 businesses that provided a response, the largest proportion (247/ 66%), expected the amount of money spent to stay the same. This was in contrast to 71 (19%) who anticipated an increase; 10 businesses (3%), who expected a decrease, and 47 businesses (13%) who were undecided. Those businesses anticipating a decrease in the amount spent on training attributed this to employees either having recently undertaken or completed training that will not need to be renewed in the short to medium term; the potential closure of the business; financial cuts which the business needed to make; a reduction in the number of relevant courses available; or that they had made a big investment in the previous year and so would not be spending as much following this.
2
3
10
19
27
18
2
4
11
16
18
23
4
4
15
13
10
15
0 10 20 30 40 50 60
Provision of online or distance training
Provision of on-site training
Distance to provider
Quality of courses/provider
Relevance of courses
Cost
Percentage of Businesses
First Choice Second Choice Third Choice
Key Findings from the 2015 Workforce Skills Survey
SERIO 26
6. Recruitment 6.1 Introduction
This section outlines employer’s views on recruitment with specific reference to the frequency and impact of hard-to-fill vacancies; and attitudes toward employing career starters from school, further education and higher education. The analysis also considers employer attitudes toward apprenticeships and work placements.
Summary of Key Points:
Approaches to Staff Recruitment: Websites (used by 41% of respondents) and word of mouth (38%) were the most commonly used means of recruitment from the pre-defined list, followed advertisements in the local paper (29%). In terms of the perceived effectiveness of these approaches, businesses favoured word of mouth and cited the importance of adding a personal touch when looking for future employees. Businesses also identified a range of ‘other’ approaches to staff recruitment, which commonly included the use of employment or recruitment agencies. Notably, less than a quarter of the businesses (22%) had used Jobcentre Plus’ Universal Job Match.
Hard-to-fill Vacancies: Of the businesses that reported vacancies in 12 months prior to the survey, just under half (47%) experienced difficulty in filling them. This compares to 41% experiencing difficulties in the 2014 survey and may reflect a decline in unemployment in the wider economy, leading to increased competition among employers. Fifty percent of businesses in 2015 attributed their hard-to-fill vacancies to a lack of suitably skilled applicants. In terms of occupational group, the largest proportion of hard-to-fill vacancies were derived from skilled trade (30%), and professional occupations (18%). Hard-to-fill vacancies were proportionally high in the sectors of transport and storage, information and communication, health, and professional, scientific and technical.
Attitudes Toward Career Starters: The survey found both low and declining levels of employment of those in their first job since leaving education. Findings from 2015 indicate that over the last 3 years, just 21% of businesses had employed someone in their first job since leaving school (32% in 2013, 24% in 2014), 18% since leaving FE college (31% in 2013, 24% in 2014) and 13% since leaving university (22% in 2013; 17% in 2014).
Attitudes Toward Apprenticeships: Over the last 3 years, a fifth of businesses (20%) had employed staff undertaking apprenticeships, with the largest proportion of these based within the broad industry groups of: construction; professional, scientific and technical, and wholesale and retail. Looking forward, a higher proportion of businesses stated a willingness to offer apprenticeships to those aged 25 or over, rising from 37% in 2014, to 53% in 2015. As would be expected, knowledge of the government’s apprenticeship reforms had increased with 45% indicating they were aware of them compared to 34% in 2014. However only 16 (9%) of those that would previously not have considered offering an apprenticeship would be encouraged to do so by the reforms.
6.2 Approaches to Staff Recruitment
The survey explored the routes through which businesses advertise vacancies, and which approaches are deemed to be the most effective. Of the 381 responding employers, 162 (43%) had vacancies in the 12 months prior to the survey. This is broadly in line with the proportion from 2014 (41%, 156), and 2013 (48%, 181).
Key Findings from the 2015 Workforce Skills Survey
SERIO 27
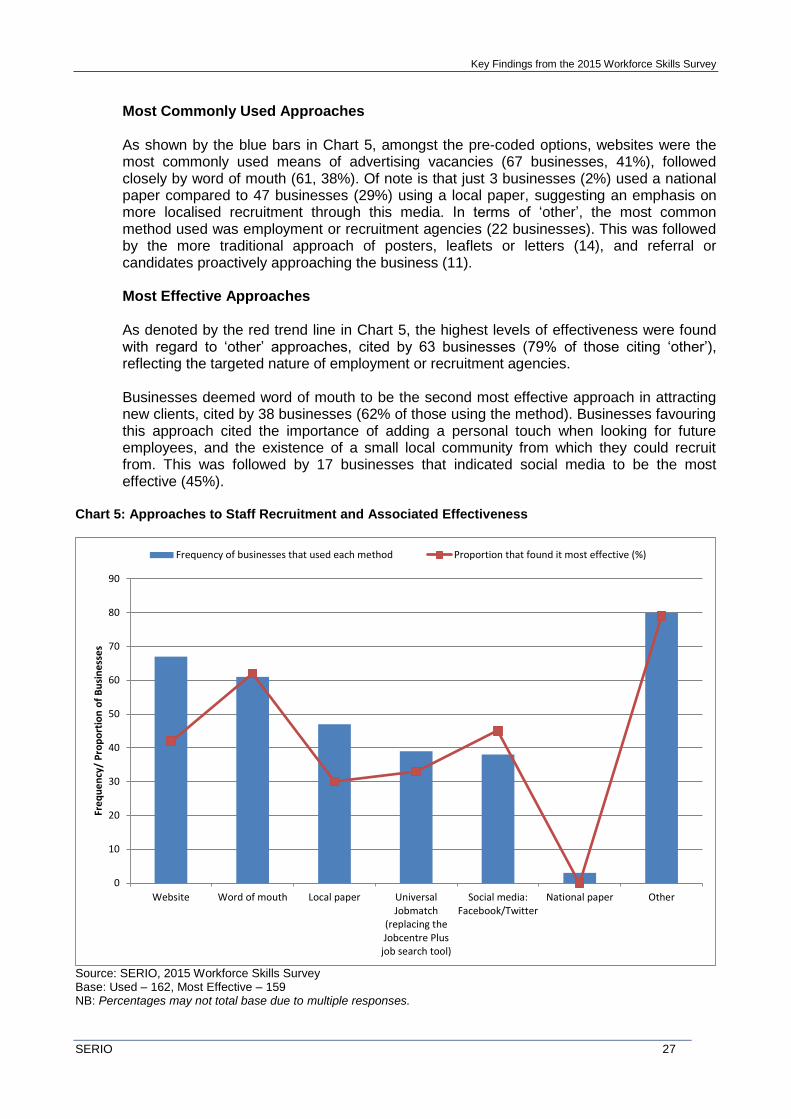
Most Commonly Used Approaches As shown by the blue bars in Chart 5, amongst the pre-coded options, websites were the most commonly used means of advertising vacancies (67 businesses, 41%), followed closely by word of mouth (61, 38%). Of note is that just 3 businesses (2%) used a national paper compared to 47 businesses (29%) using a local paper, suggesting an emphasis on more localised recruitment through this media. In terms of ‘other’, the most common method used was employment or recruitment agencies (22 businesses). This was followed by the more traditional approach of posters, leaflets or letters (14), and referral or candidates proactively approaching the business (11). Most Effective Approaches As denoted by the red trend line in Chart 5, the highest levels of effectiveness were found with regard to ‘other’ approaches, cited by 63 businesses (79% of those citing ‘other’), reflecting the targeted nature of employment or recruitment agencies. Businesses deemed word of mouth to be the second most effective approach in attracting new clients, cited by 38 businesses (62% of those using the method). Businesses favouring this approach cited the importance of adding a personal touch when looking for future employees, and the existence of a small local community from which they could recruit from. This was followed by 17 businesses that indicated social media to be the most effective (45%).
Chart 5: Approaches to Staff Recruitment and Associated Effectiveness
Source: SERIO, 2015 Workforce Skills Survey Base: Used – 162, Most Effective – 159 NB: Percentages may not total base due to multiple responses.
0
10
20
30
40
50
60
70
80
90
Website Word of mouth Local paper UniversalJobmatch
(replacing theJobcentre Plus
job search tool)
Social media:Facebook/Twitter
National paper Other
Fre
qu
en
cy/
Pro
po
rtio
n o
f B
usi
ne
sse
s
Frequency of businesses that used each method Proportion that found it most effective (%)
Key Findings from the 2015 Workforce Skills Survey
SERIO 28
As in previous years, the 2015 survey explored whether businesses tend to look for a particular candidate when recruiting for new staff. Of the 379 businesses providing a response the largest proportion, 146 (39%) stated that this differs for each vacancy, in contrast to 89 (24%) who tend to employ candidates with the required skills, and 57 (15%) who favour candidates that they can train to develop the required skills. In addition, 20 respondents (5%) indicated that they looked to recruit family members, while seven respondents (2%) looked for candidates with the right attributes (e.g. a positive attitude or common sense). All businesses, regardless of whether they had advertised for vacancies in the past 12 months, were asked whether they ever advertised through Jobcentre Plus Universal Job Match. Of the 362 businesses providing a response, less than a quarter (22%/ 80) indicated that they did so. This is broadly in line with the findings from 2014 where 24% (90) indicated that they advertised using Jobcentre Plus.
6.3 Hard-to-fill Vacancies
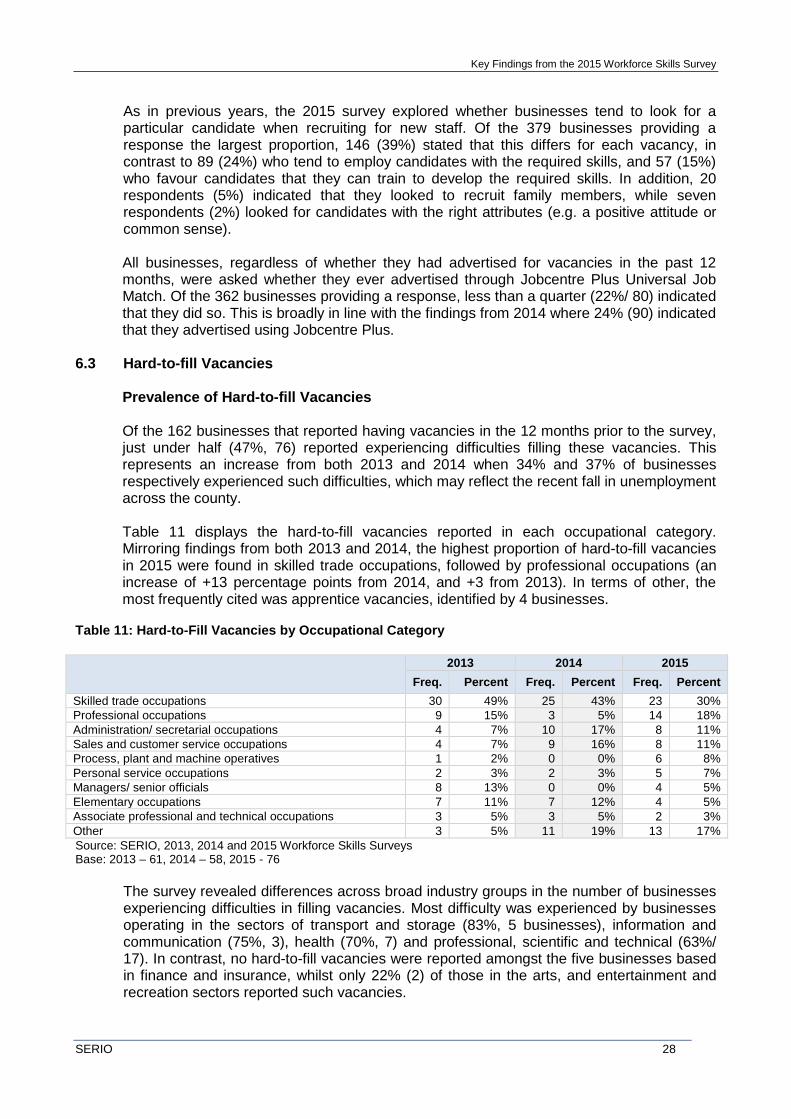
Prevalence of Hard-to-fill Vacancies Of the 162 businesses that reported having vacancies in the 12 months prior to the survey, just under half (47%, 76) reported experiencing difficulties filling these vacancies. This represents an increase from both 2013 and 2014 when 34% and 37% of businesses respectively experienced such difficulties, which may reflect the recent fall in unemployment across the county. Table 11 displays the hard-to-fill vacancies reported in each occupational category. Mirroring findings from both 2013 and 2014, the highest proportion of hard-to-fill vacancies in 2015 were found in skilled trade occupations, followed by professional occupations (an increase of +13 percentage points from 2014, and +3 from 2013). In terms of other, the most frequently cited was apprentice vacancies, identified by 4 businesses.
Table 11: Hard-to-Fill Vacancies by Occupational Category
2013 2014 2015
Freq. Percent Freq. Percent Freq. Percent
Skilled trade occupations 30 49% 25 43% 23 30%
Professional occupations 9 15% 3 5% 14 18%
Administration/ secretarial occupations 4 7% 10 17% 8 11%
Sales and customer service occupations 4 7% 9 16% 8 11%
Process, plant and machine operatives 1 2% 0 0% 6 8%
Personal service occupations 2 3% 2 3% 5 7%
Managers/ senior officials 8 13% 0 0% 4 5%
Elementary occupations 7 11% 7 12% 4 5%
Associate professional and technical occupations 3 5% 3 5% 2 3%
Other 3 5% 11 19% 13 17%
Source: SERIO, 2013, 2014 and 2015 Workforce Skills Surveys Base: 2013 – 61, 2014 – 58, 2015 - 76
The survey revealed differences across broad industry groups in the number of businesses experiencing difficulties in filling vacancies. Most difficulty was experienced by businesses operating in the sectors of transport and storage (83%, 5 businesses), information and communication (75%, 3), health (70%, 7) and professional, scientific and technical (63%/ 17). In contrast, no hard-to-fill vacancies were reported amongst the five businesses based in finance and insurance, whilst only 22% (2) of those in the arts, and entertainment and recreation sectors reported such vacancies.
Key Findings from the 2015 Workforce Skills Survey
SERIO 29
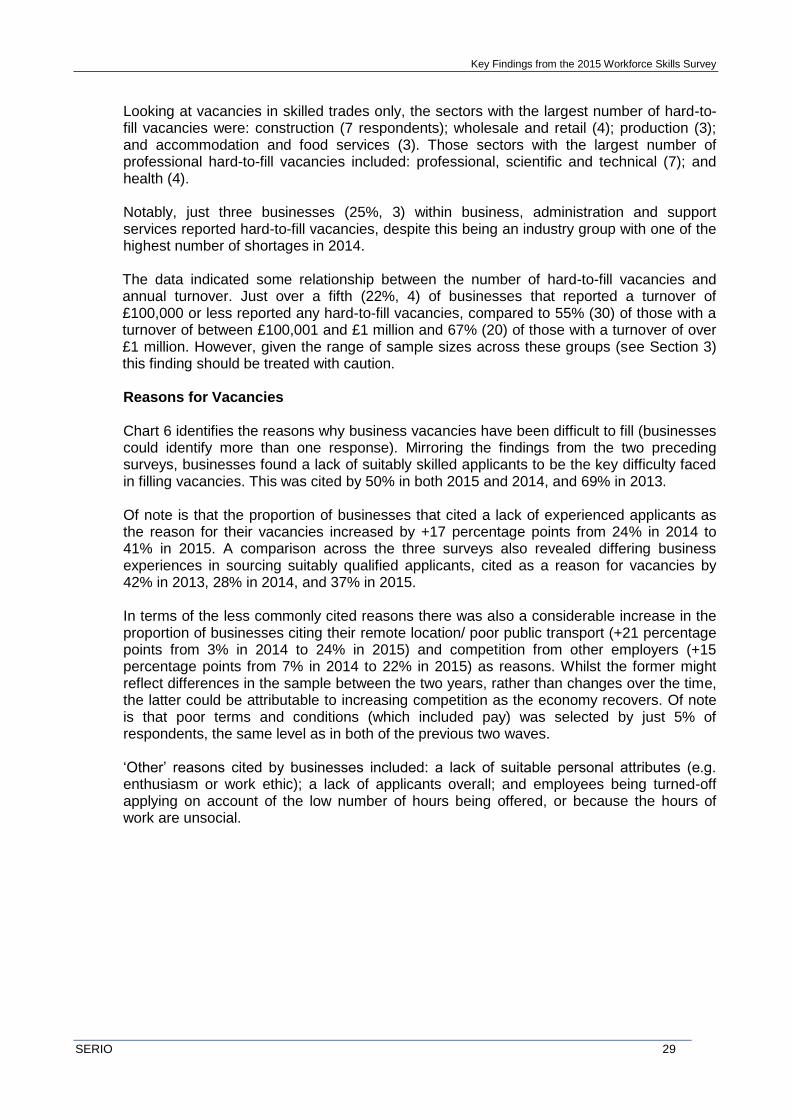
Looking at vacancies in skilled trades only, the sectors with the largest number of hard-to-fill vacancies were: construction (7 respondents); wholesale and retail (4); production (3); and accommodation and food services (3). Those sectors with the largest number of professional hard-to-fill vacancies included: professional, scientific and technical (7); and health (4). Notably, just three businesses (25%, 3) within business, administration and support services reported hard-to-fill vacancies, despite this being an industry group with one of the highest number of shortages in 2014. The data indicated some relationship between the number of hard-to-fill vacancies and annual turnover. Just over a fifth (22%, 4) of businesses that reported a turnover of £100,000 or less reported any hard-to-fill vacancies, compared to 55% (30) of those with a turnover of between £100,001 and £1 million and 67% (20) of those with a turnover of over £1 million. However, given the range of sample sizes across these groups (see Section 3) this finding should be treated with caution. Reasons for Vacancies Chart 6 identifies the reasons why business vacancies have been difficult to fill (businesses could identify more than one response). Mirroring the findings from the two preceding surveys, businesses found a lack of suitably skilled applicants to be the key difficulty faced in filling vacancies. This was cited by 50% in both 2015 and 2014, and 69% in 2013. Of note is that the proportion of businesses that cited a lack of experienced applicants as the reason for their vacancies increased by +17 percentage points from 24% in 2014 to 41% in 2015. A comparison across the three surveys also revealed differing business experiences in sourcing suitably qualified applicants, cited as a reason for vacancies by 42% in 2013, 28% in 2014, and 37% in 2015. In terms of the less commonly cited reasons there was also a considerable increase in the proportion of businesses citing their remote location/ poor public transport (+21 percentage points from 3% in 2014 to 24% in 2015) and competition from other employers (+15 percentage points from 7% in 2014 to 22% in 2015) as reasons. Whilst the former might reflect differences in the sample between the two years, rather than changes over the time, the latter could be attributable to increasing competition as the economy recovers. Of note is that poor terms and conditions (which included pay) was selected by just 5% of respondents, the same level as in both of the previous two waves. ‘Other’ reasons cited by businesses included: a lack of suitable personal attributes (e.g. enthusiasm or work ethic); a lack of applicants overall; and employees being turned-off applying on account of the low number of hours being offered, or because the hours of work are unsocial.
Key Findings from the 2015 Workforce Skills Survey
SERIO 30
Chart 6: Reasons why Vacancies have been Difficult to Fill
Source: SERIO, 2013, 2014 and 2015 Workforce Skills Survey Base: 2013 – 59, 2014 – 58, 2015 – 76
6.4 Business Impact of Hard-to-fill Vacancies
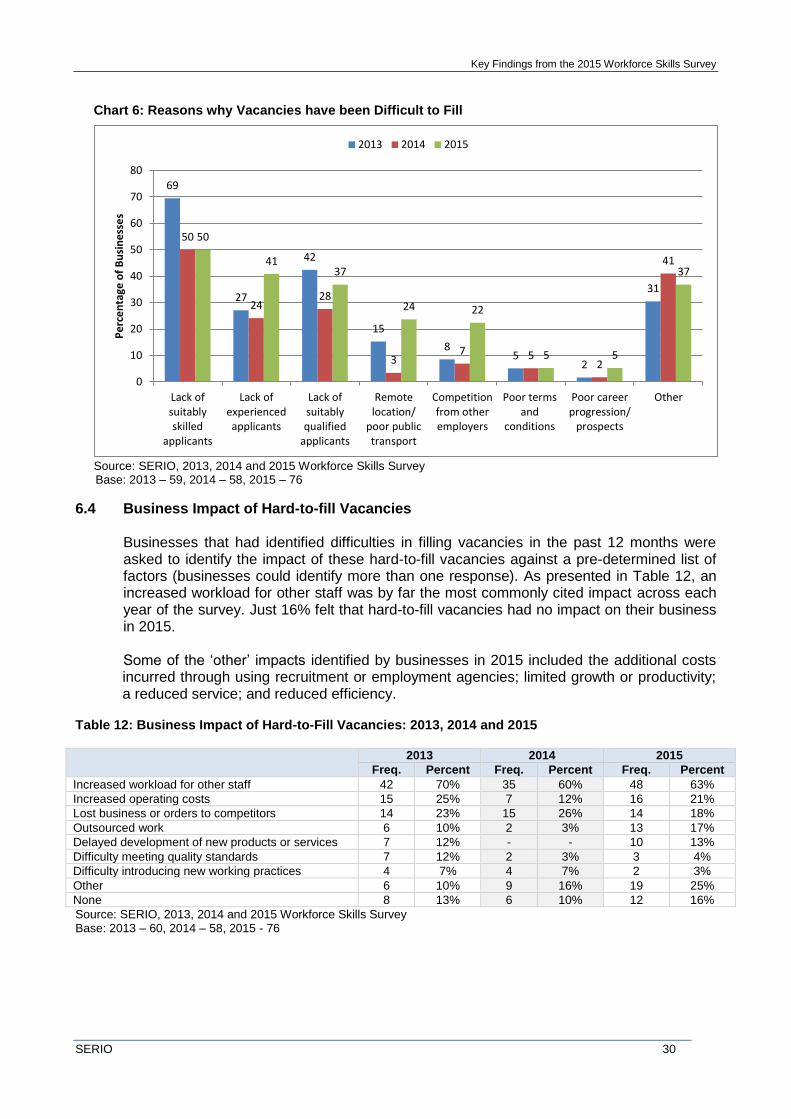
Businesses that had identified difficulties in filling vacancies in the past 12 months were asked to identify the impact of these hard-to-fill vacancies against a pre-determined list of factors (businesses could identify more than one response). As presented in Table 12, an increased workload for other staff was by far the most commonly cited impact across each year of the survey. Just 16% felt that hard-to-fill vacancies had no impact on their business in 2015. Some of the ‘other’ impacts identified by businesses in 2015 included the additional costs incurred through using recruitment or employment agencies; limited growth or productivity; a reduced service; and reduced efficiency.
Table 12: Business Impact of Hard-to-Fill Vacancies: 2013, 2014 and 2015
2013 2014 2015
Freq. Percent Freq. Percent Freq. Percent
Increased workload for other staff 42 70% 35 60% 48 63%
Increased operating costs 15 25% 7 12% 16 21%
Lost business or orders to competitors 14 23% 15 26% 14 18%
Outsourced work 6 10% 2 3% 13 17%
Delayed development of new products or services 7 12% - - 10 13%
Difficulty meeting quality standards 7 12% 2 3% 3 4%
Difficulty introducing new working practices 4 7% 4 7% 2 3%
Other 6 10% 9 16% 19 25%
None 8 13% 6 10% 12 16%
Source: SERIO, 2013, 2014 and 2015 Workforce Skills Survey Base: 2013 – 60, 2014 – 58, 2015 - 76
69
27
42
15
8 5
2
31
50
24 28
3 7 5
2
41
50
41 37
24 22
5 5
37
0
10
20
30
40
50
60
70
80
Lack ofsuitablyskilled
applicants
Lack ofexperiencedapplicants
Lack ofsuitablyqualified
applicants
Remotelocation/
poor publictransport
Competitionfrom otheremployers
Poor termsand
conditions
Poor careerprogression/
prospects
Other
Pe
rce
nta
ge o
f B
usi
ne
sse
s
2013 2014 2015
Key Findings from the 2015 Workforce Skills Survey
SERIO 31
6.5 Attitude Toward Employing Career Starters
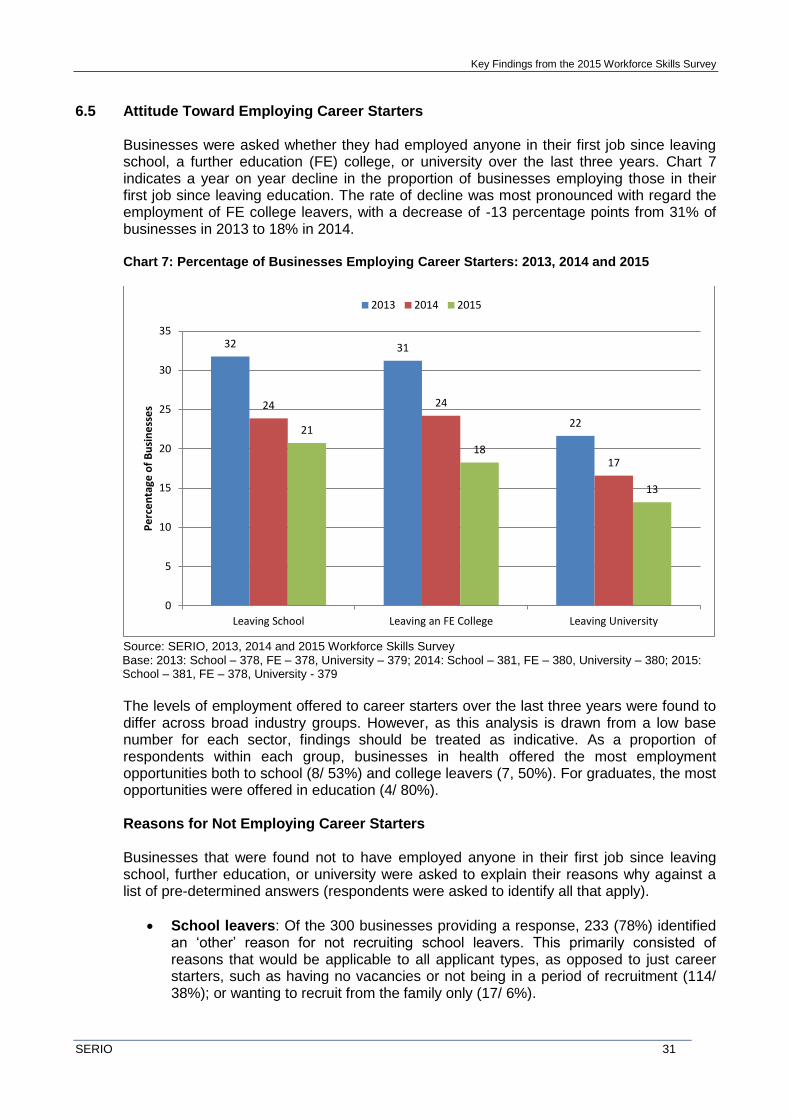
Businesses were asked whether they had employed anyone in their first job since leaving school, a further education (FE) college, or university over the last three years. Chart 7 indicates a year on year decline in the proportion of businesses employing those in their first job since leaving education. The rate of decline was most pronounced with regard the employment of FE college leavers, with a decrease of -13 percentage points from 31% of businesses in 2013 to 18% in 2014.
Chart 7: Percentage of Businesses Employing Career Starters: 2013, 2014 and 2015
Source: SERIO, 2013, 2014 and 2015 Workforce Skills Survey Base: 2013: School – 378, FE – 378, University – 379; 2014: School – 381, FE – 380, University – 380; 2015: School – 381, FE – 378, University - 379
The levels of employment offered to career starters over the last three years were found to differ across broad industry groups. However, as this analysis is drawn from a low base number for each sector, findings should be treated as indicative. As a proportion of respondents within each group, businesses in health offered the most employment opportunities both to school (8/ 53%) and college leavers (7, 50%). For graduates, the most opportunities were offered in education (4/ 80%). Reasons for Not Employing Career Starters Businesses that were found not to have employed anyone in their first job since leaving school, further education, or university were asked to explain their reasons why against a list of pre-determined answers (respondents were asked to identify all that apply).
School leavers: Of the 300 businesses providing a response, 233 (78%) identified an ‘other’ reason for not recruiting school leavers. This primarily consisted of reasons that would be applicable to all applicant types, as opposed to just career starters, such as having no vacancies or not being in a period of recruitment (114/ 38%); or wanting to recruit from the family only (17/ 6%).
32 31
22
24 24
17
21
18
13
0
5
10
15
20
25
30
35
Leaving School Leaving an FE College Leaving University
Pe
rce
nta
ge o
f B
usi
ne
sse
s
2013 2014 2015
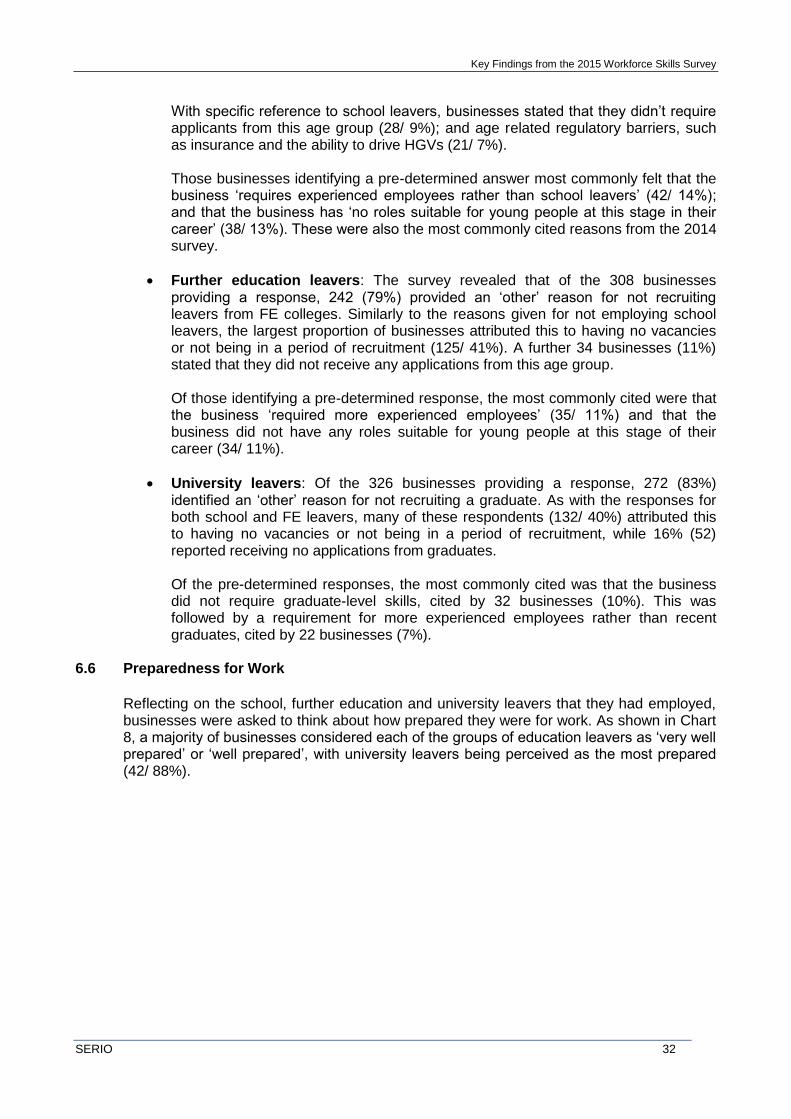
Key Findings from the 2015 Workforce Skills Survey
SERIO 32
With specific reference to school leavers, businesses stated that they didn’t require applicants from this age group (28/ 9%); and age related regulatory barriers, such as insurance and the ability to drive HGVs (21/ 7%). Those businesses identifying a pre-determined answer most commonly felt that the business ‘requires experienced employees rather than school leavers’ (42/ 14%); and that the business has ‘no roles suitable for young people at this stage in their career’ (38/ 13%). These were also the most commonly cited reasons from the 2014 survey.
Further education leavers: The survey revealed that of the 308 businesses providing a response, 242 (79%) provided an ‘other’ reason for not recruiting leavers from FE colleges. Similarly to the reasons given for not employing school leavers, the largest proportion of businesses attributed this to having no vacancies or not being in a period of recruitment (125/ 41%). A further 34 businesses (11%) stated that they did not receive any applications from this age group. Of those identifying a pre-determined response, the most commonly cited were that the business ‘required more experienced employees’ (35/ 11%) and that the business did not have any roles suitable for young people at this stage of their career (34/ 11%).
University leavers: Of the 326 businesses providing a response, 272 (83%) identified an ‘other’ reason for not recruiting a graduate. As with the responses for both school and FE leavers, many of these respondents (132/ 40%) attributed this to having no vacancies or not being in a period of recruitment, while 16% (52) reported receiving no applications from graduates. Of the pre-determined responses, the most commonly cited was that the business did not require graduate-level skills, cited by 32 businesses (10%). This was followed by a requirement for more experienced employees rather than recent graduates, cited by 22 businesses (7%).
6.6 Preparedness for Work
Reflecting on the school, further education and university leavers that they had employed, businesses were asked to think about how prepared they were for work. As shown in Chart 8, a majority of businesses considered each of the groups of education leavers as ‘very well prepared’ or ‘well prepared’, with university leavers being perceived as the most prepared (42/ 88%).
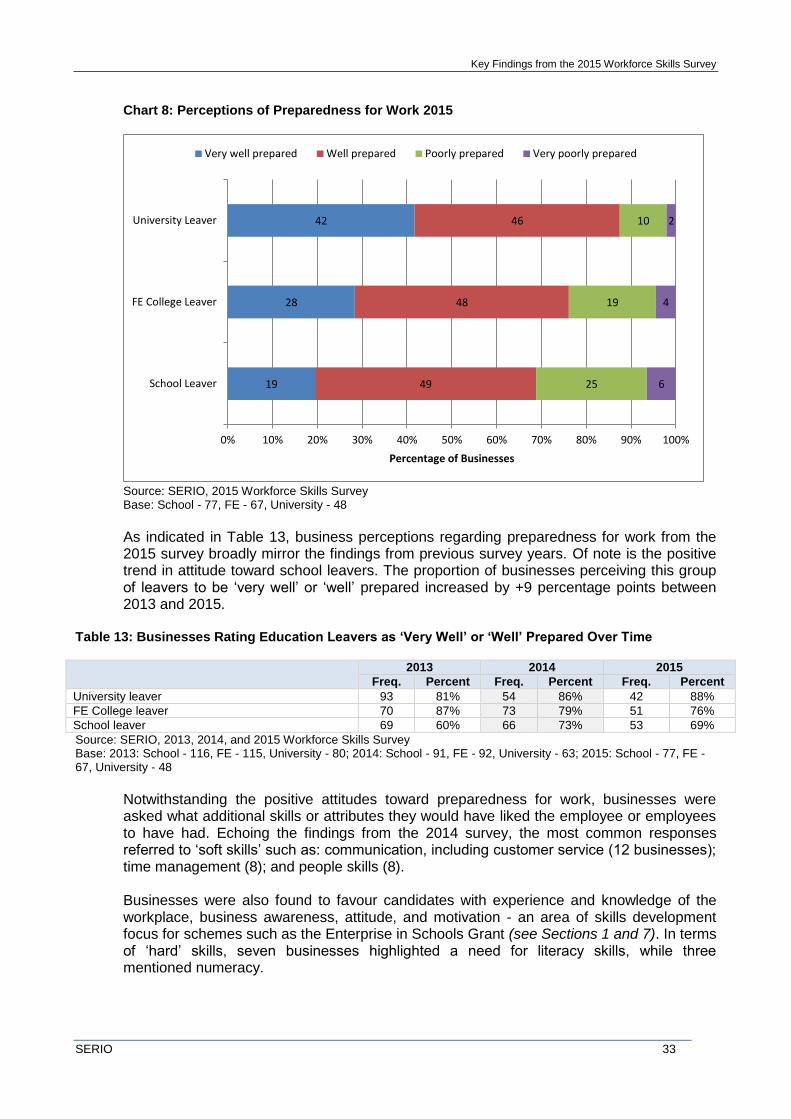
Key Findings from the 2015 Workforce Skills Survey
SERIO 33
Chart 8: Perceptions of Preparedness for Work 2015
Source: SERIO, 2015 Workforce Skills Survey Base: School - 77, FE - 67, University - 48
As indicated in Table 13, business perceptions regarding preparedness for work from the 2015 survey broadly mirror the findings from previous survey years. Of note is the positive trend in attitude toward school leavers. The proportion of businesses perceiving this group of leavers to be ‘very well’ or ‘well’ prepared increased by +9 percentage points between 2013 and 2015.
Table 13: Businesses Rating Education Leavers as ‘Very Well’ or ‘Well’ Prepared Over Time
2013 2014 2015
Freq. Percent Freq. Percent Freq. Percent
University leaver 93 81% 54 86% 42 88%
FE College leaver 70 87% 73 79% 51 76%
School leaver 69 60% 66 73% 53 69%
Source: SERIO, 2013, 2014, and 2015 Workforce Skills Survey Base: 2013: School - 116, FE - 115, University - 80; 2014: School - 91, FE - 92, University - 63; 2015: School - 77, FE - 67, University - 48
Notwithstanding the positive attitudes toward preparedness for work, businesses were asked what additional skills or attributes they would have liked the employee or employees to have had. Echoing the findings from the 2014 survey, the most common responses referred to ‘soft skills’ such as: communication, including customer service (12 businesses); time management (8); and people skills (8). Businesses were also found to favour candidates with experience and knowledge of the workplace, business awareness, attitude, and motivation - an area of skills development focus for schemes such as the Enterprise in Schools Grant (see Sections 1 and 7). In terms of ‘hard’ skills, seven businesses highlighted a need for literacy skills, while three mentioned numeracy.
19
28
42
49
48
46
25
19
10
6
4
2
0% 10% 20% 30% 40% 50% 60% 70% 80% 90% 100%
School Leaver
FE College Leaver
University Leaver
Percentage of Businesses
Very well prepared Well prepared Poorly prepared Very poorly prepared
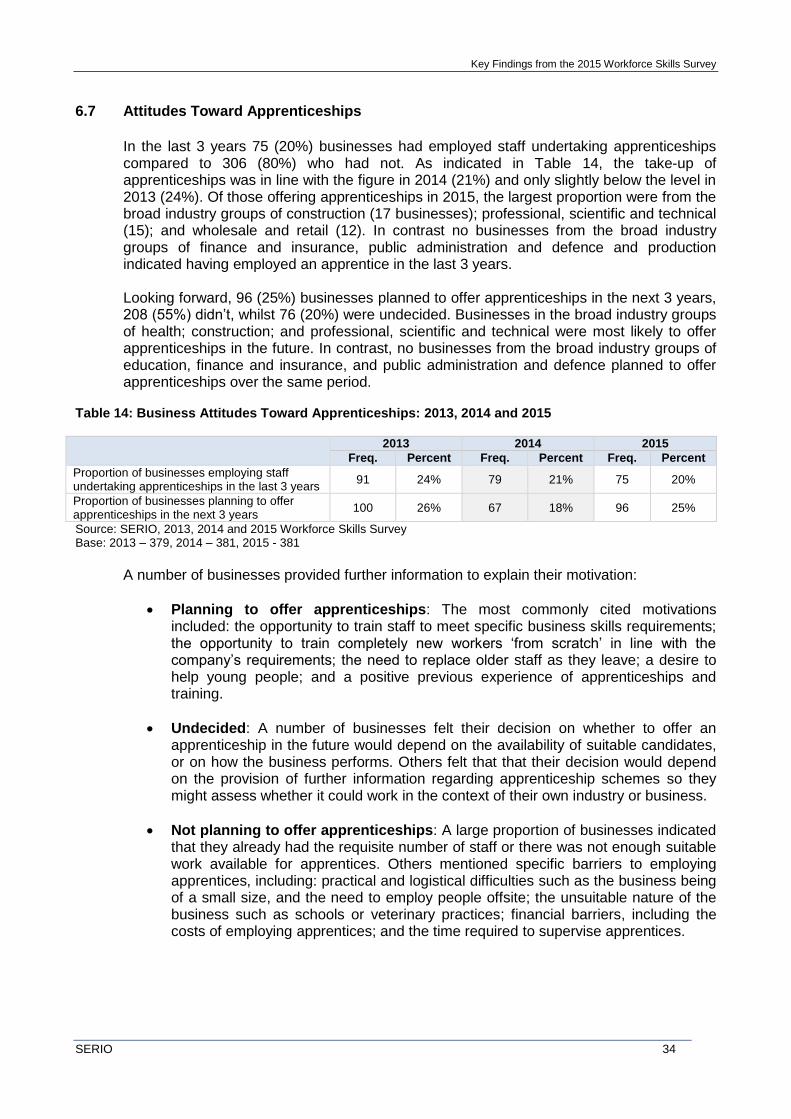
Key Findings from the 2015 Workforce Skills Survey
SERIO 34
6.7 Attitudes Toward Apprenticeships
In the last 3 years 75 (20%) businesses had employed staff undertaking apprenticeships compared to 306 (80%) who had not. As indicated in Table 14, the take-up of apprenticeships was in line with the figure in 2014 (21%) and only slightly below the level in 2013 (24%). Of those offering apprenticeships in 2015, the largest proportion were from the broad industry groups of construction (17 businesses); professional, scientific and technical (15); and wholesale and retail (12). In contrast no businesses from the broad industry groups of finance and insurance, public administration and defence and production indicated having employed an apprentice in the last 3 years. Looking forward, 96 (25%) businesses planned to offer apprenticeships in the next 3 years, 208 (55%) didn’t, whilst 76 (20%) were undecided. Businesses in the broad industry groups of health; construction; and professional, scientific and technical were most likely to offer apprenticeships in the future. In contrast, no businesses from the broad industry groups of education, finance and insurance, and public administration and defence planned to offer apprenticeships over the same period.
Table 14: Business Attitudes Toward Apprenticeships: 2013, 2014 and 2015
2013 2014 2015
Freq. Percent Freq. Percent Freq. Percent
Proportion of businesses employing staff undertaking apprenticeships in the last 3 years
91 24% 79 21% 75 20%
Proportion of businesses planning to offer apprenticeships in the next 3 years
100 26% 67 18% 96 25%
Source: SERIO, 2013, 2014 and 2015 Workforce Skills Survey Base: 2013 – 379, 2014 – 381, 2015 - 381
A number of businesses provided further information to explain their motivation:
Planning to offer apprenticeships: The most commonly cited motivations included: the opportunity to train staff to meet specific business skills requirements; the opportunity to train completely new workers ‘from scratch’ in line with the company’s requirements; the need to replace older staff as they leave; a desire to help young people; and a positive previous experience of apprenticeships and training.
Undecided: A number of businesses felt their decision on whether to offer an apprenticeship in the future would depend on the availability of suitable candidates, or on how the business performs. Others felt that that their decision would depend on the provision of further information regarding apprenticeship schemes so they might assess whether it could work in the context of their own industry or business.
Not planning to offer apprenticeships: A large proportion of businesses indicated that they already had the requisite number of staff or there was not enough suitable work available for apprentices. Others mentioned specific barriers to employing apprentices, including: practical and logistical difficulties such as the business being of a small size, and the need to employ people offsite; the unsuitable nature of the business such as schools or veterinary practices; financial barriers, including the costs of employing apprentices; and the time required to supervise apprentices.
Key Findings from the 2015 Workforce Skills Survey
SERIO 35
Planning to Offer Apprenticeships ‘[The] main reason is that we wanted to offer alternative opportunities for people rather than going through university. Our area of business tends to be focused on graduates but I don't think it needs to be’
‘If you take them from a young age and train them they would fit the company. However, the drawback is that you need the ability to drive so [that] would be a necessary requirement for any apprentice’
Undecided ‘If circumstance arose and our workforce increased then we would consider hiring an apprentice’
‘Possibly, it’s difficult. We would consider having an apprentice. However, I’m not sure you can get an apprenticeship in being an estate agent’
Not planning to offer apprenticeships ‘Apprenticeships wouldn't be relevant to our business, we are very small. The responsibility is probably too much for someone so young - I wouldn’t be comfortable sending them out to survey something’
‘Insurance and other limitations, we have a busy yard. [Its] difficult to take someone on as an apprentice’
Businesses that were either planning to offer apprenticeships in the next three years, or who were undecided were asked to which age groups they would consider providing the opportunities to: 16-18 year olds; 19-24 year olds; and those aged 25+.
Analysis revealed that a larger proportion of businesses in 2015 were prepared to offer apprentices to each of the three age groups than businesses in 2014. As indicated in Chart 9 the largest proportion of businesses (129/ 77%) would choose to target young people aged between 19 and 24, compared to 59% in 2014. Similarly 110 (65%) businesses would offer such opportunities to those aged between 16 and 18, compared to 59% in 2014. Although a smaller proportion of businesses (88/ 53%) were prepared to offer an apprenticeship to those aged 25 or over, this marked a notable increase of +16 percentage points when contrasted with the proportion prepared to do so in 2014 (37%).
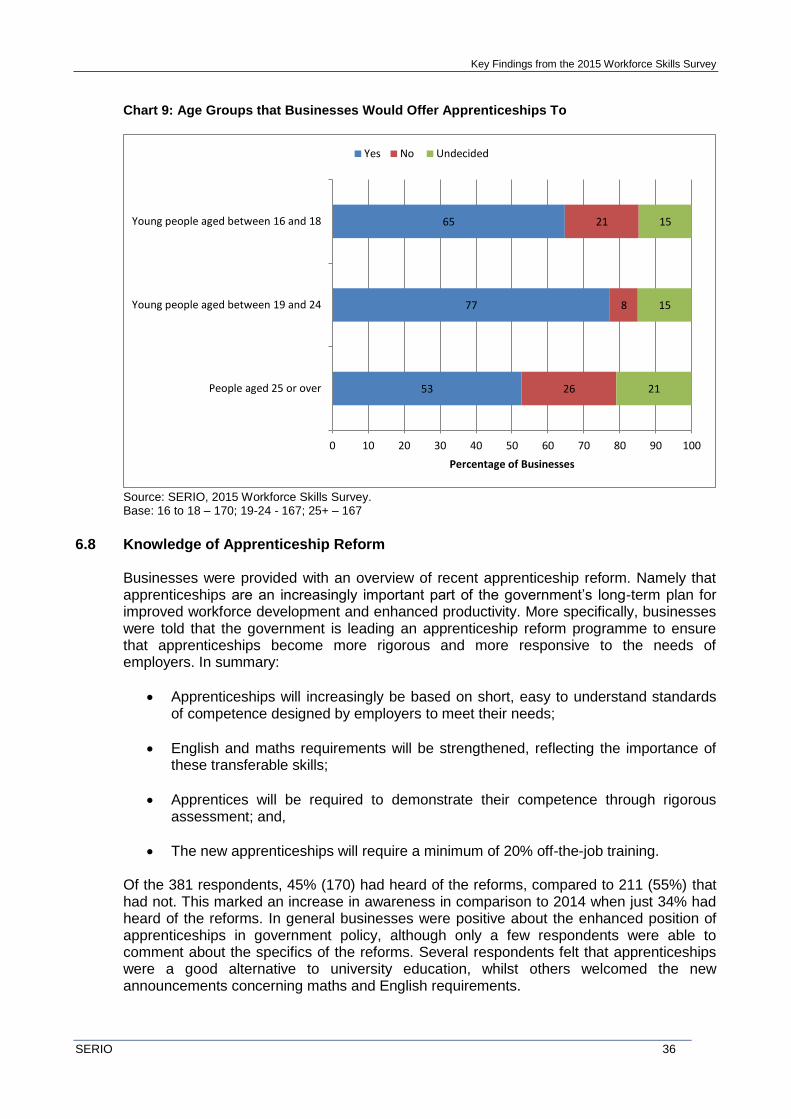
Key Findings from the 2015 Workforce Skills Survey
SERIO 36
Chart 9: Age Groups that Businesses Would Offer Apprenticeships To
Source: SERIO, 2015 Workforce Skills Survey. Base: 16 to 18 – 170; 19-24 - 167; 25+ – 167
6.8 Knowledge of Apprenticeship Reform
Businesses were provided with an overview of recent apprenticeship reform. Namely that apprenticeships are an increasingly important part of the government’s long-term plan for improved workforce development and enhanced productivity. More specifically, businesses were told that the government is leading an apprenticeship reform programme to ensure that apprenticeships become more rigorous and more responsive to the needs of employers. In summary:
Apprenticeships will increasingly be based on short, easy to understand standards of competence designed by employers to meet their needs;
English and maths requirements will be strengthened, reflecting the importance of these transferable skills;
Apprentices will be required to demonstrate their competence through rigorous assessment; and,
The new apprenticeships will require a minimum of 20% off-the-job training. Of the 381 respondents, 45% (170) had heard of the reforms, compared to 211 (55%) that had not. This marked an increase in awareness in comparison to 2014 when just 34% had heard of the reforms. In general businesses were positive about the enhanced position of apprenticeships in government policy, although only a few respondents were able to comment about the specifics of the reforms. Several respondents felt that apprenticeships were a good alternative to university education, whilst others welcomed the new announcements concerning maths and English requirements.
53
77
65
26
8
21
21
15
15
0 10 20 30 40 50 60 70 80 90 100
People aged 25 or over
Young people aged between 19 and 24
Young people aged between 16 and 18
Percentage of Businesses
Yes No Undecided
Key Findings from the 2015 Workforce Skills Survey
SERIO 37
The 245 businesses that had not employed staff undertaking an apprenticeship, and would either not consider, or who were undecided about offering apprenticeships in the future were asked whether the reform measures would encourage them to provide an apprenticeship in the future. Just 9% (16) of the 186 businesses indicating that they would not be considering employing an apprentice felt that the measures would encourage them. However, amongst the 59 businesses that were undecided about offering an apprenticeship nearly half (46%/ 27) indicated that the reforms would encourage them. Some of the perceived features of the apprenticeship reforms which businesses felt would encourage them to employ an apprentice included: the new English and maths requirements; the perception that the reforms are an improvement on the current system; and a belief that the standards and relevance of apprenticeships will be improved. In contrast, those businesses that indicated they would not be encouraged by the reforms felt that this was because apprenticeships were not appropriate for their business. Reasons for this included: apprenticeships not being perceived as relevant; the intention to close the business at some stage in the near future; the business being too small; and an apprentice not being needed.
6.9 Attitudes Toward Placements and Internships
The survey explored business attitudes toward work placements and internships, based on the following broad definitions:
A placement typically involves a student undertaking work experience in industry, usually as part of their course. This can last from a few weeks to a year.
An internship is a short-term paid work placement. These tend to be project-led and include an element of student development.
Table 15 presents the frequency and percentage of businesses that have taken on work placements or internships in the last three years, as well as the percentage of these work placements which were paid. In order to provide a comparison across time the results from the previous waves of the workforce skills survey have also been included. As shown:
Over a third of businesses in 2015 (36%) had taken on a pre-16 and and/or post-16 work placement over the last three years, 25% of whom provided paid placements. This compares to 40% of businesses offering placements in 2013, and 29% in 2014.
Internships and unemployed work placements were less prevalent across all three survey waves when compared to pre and post-16 placements. Just 3% of respondents from the 2015 survey offered these opportunities in their business, broadly in line with findings from 2014, but lower than 2013 levels.
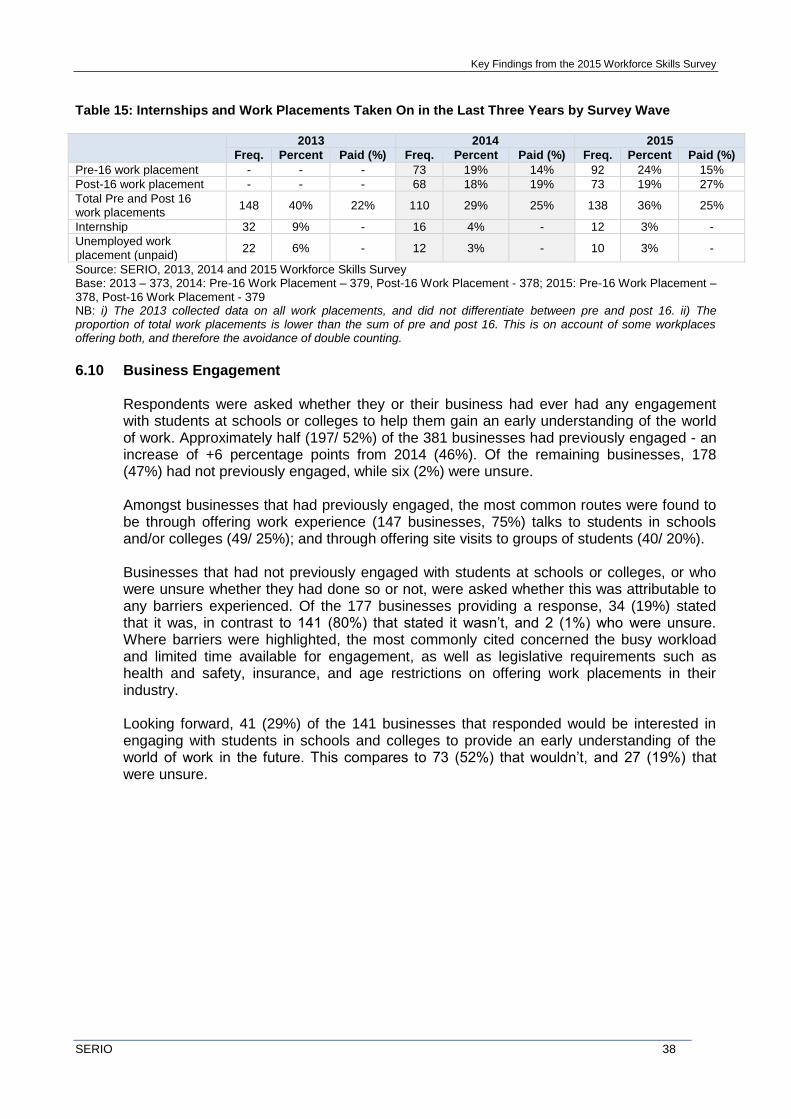
Key Findings from the 2015 Workforce Skills Survey
SERIO 38
Table 15: Internships and Work Placements Taken On in the Last Three Years by Survey Wave
2013 2014 2015
Freq. Percent Paid (%) Freq. Percent Paid (%) Freq. Percent Paid (%)
Pre-16 work placement - - - 73 19% 14% 92 24% 15%
Post-16 work placement - - - 68 18% 19% 73 19% 27%
Total Pre and Post 16 work placements
148 40% 22% 110 29% 25% 138 36% 25%
Internship 32 9% - 16 4% - 12 3% -
Unemployed work placement (unpaid)
22 6% - 12 3% - 10 3% -
Source: SERIO, 2013, 2014 and 2015 Workforce Skills Survey Base: 2013 – 373, 2014: Pre-16 Work Placement – 379, Post-16 Work Placement - 378; 2015: Pre-16 Work Placement – 378, Post-16 Work Placement - 379 NB: i) The 2013 collected data on all work placements, and did not differentiate between pre and post 16. ii) The proportion of total work placements is lower than the sum of pre and post 16. This is on account of some workplaces offering both, and therefore the avoidance of double counting.
6.10 Business Engagement
Respondents were asked whether they or their business had ever had any engagement with students at schools or colleges to help them gain an early understanding of the world of work. Approximately half (197/ 52%) of the 381 businesses had previously engaged - an increase of +6 percentage points from 2014 (46%). Of the remaining businesses, 178 (47%) had not previously engaged, while six (2%) were unsure. Amongst businesses that had previously engaged, the most common routes were found to be through offering work experience (147 businesses, 75%) talks to students in schools and/or colleges (49/ 25%); and through offering site visits to groups of students (40/ 20%). Businesses that had not previously engaged with students at schools or colleges, or who were unsure whether they had done so or not, were asked whether this was attributable to any barriers experienced. Of the 177 businesses providing a response, 34 (19%) stated that it was, in contrast to 141 (80%) that stated it wasn’t, and 2 (1%) who were unsure. Where barriers were highlighted, the most commonly cited concerned the busy workload and limited time available for engagement, as well as legislative requirements such as health and safety, insurance, and age restrictions on offering work placements in their industry. Looking forward, 41 (29%) of the 141 businesses that responded would be interested in engaging with students in schools and colleges to provide an early understanding of the world of work in the future. This compares to 73 (52%) that wouldn’t, and 27 (19%) that were unsure.
Key Findings from the 2015 Workforce Skills Survey
SERIO 39
7. Cross-cutting Themes and Recommendations 7.1 Introduction
This section presents four cross-cutting themes emerging from the Workforce Skills Survey and the analysis of supply and demand, and suggests some early recommendations that could be considered by Devon County Council, appropriate partners and stakeholders. Some themes and recommendations build upon those cited in the 2013 and 2014 Workforce Skills Reports, reflecting the parallels between the three surveys.
7.2 Themes and Recommendations
Cross-cutting Theme 1: Recruitment and Retention Difficulties
As outlined in Section 6, 47% of businesses that had vacancies in the past 12 months experienced difficulties filling them; a notable increase on the proportion from both 2013 (34%) and 2014 (41%). The survey also indicated an increase in the proportion of businesses attributing hard-to-fill vacancies to a lack of experienced applicants, increasing by +14 percentage points from 27% in 2013 to 41% in 2015. The identified reduction in experienced applicants may reflect the improved economic situation and the subsequent fall in unemployment (with the county rate falling from 4.9% in 2013 to 4.3% in 2014), thus reducing the supply of available labour. In support of this, survey analysis revealed the proportion of businesses attributing hard-to-fill vacancies to competition from other employers had risen from 7% in 2014 to 22% in 2015 – an increase of +15 percentage points. In addition to problems experienced in recruitment, the number of businesses experiencing difficulties in retention rose by +5 percentage points from 4% in 2014 to 9% in 2015. However, this still remains below 2013 levels where difficulties were experienced by 10% of businesses. Skilled Trades were notable for having the highest proportion of vacancy, retention and staff proficiency difficulties across all occupational groups.
Recommendations:
The economy is now returning to a sustained recovery. However, as outlined in each of the three Workforce Skills surveys, at a local level it is still characterised by hard-to-fill vacancies attributed, in part, to skills deficiencies in the available labour market. The survey also revealed the impact of skills deficiencies on businesses in Devon, through for example, increased operating costs, lost business or orders to competitors, and delayed development of new products or services. Consequently, there is still work to be done to ensure that the demand and supply of skills is increasingly aligned. As such, we recommend that:
Continued work is undertaken through, for example, the HotSW Local Growth Deal and its Skills and Employment Boards to articulate business needs to training providers and funding agencies.
Key Findings from the 2015 Workforce Skills Survey
SERIO 40
Particular consideration is given toward strategies to address labour shortages in skilled trades. In the short-term, this could include a review of approaches to recruitment, such as supporting the increased use of Universal Jobmatch amongst employers (Section 6)4.
Medium to longer-term strategies could include approaches to encourage young people (and informing parents) to consider careers in, for example, agriculture, health and social care, construction, and building trades through addressing negative stereotypes.
Cross-cutting Theme 2: The Digital Skills Challenge
As in previous survey waves, technology and ICT was identified as one of the foremost skills challenges facing Devon businesses over the next three years. In line with the 2015 Digital Barriers Research5, the digital skills most commonly required were basic computer skills and online marketing. The research also highlighted the increased importance of social media skills to support e-marketing and to develop an online presence, echoing a common theme from previous surveys. A number of local and national level schemes exist to support the development of digital skills amongst employees, businesses and the wider community. These include ‘Get up to Speed’ and the ‘Go On UK’ initiative, as cited in the 2014 report. Lastly, (and reflecting Devon’s business demography) the Government’s ‘Do More Online’ campaign, launched in 2014, provides support for microbusinesses and sole traders to help them find customers, and sell their goods and services online. Recommendations: The UK Digital Skills Taskforce report ‘Digital Skills for Tomorrow’s World’ suggests that businesses should take responsibility to ensure existing members of staff have access to digital skills training. In order to support the digital skills challenge we recommend:
Continued support for job seekers to enter or re-enter the labour market through digital skills training. This is exemplified by the Women in Broadband project, which aims to address the digital barriers preventing women from returning to the workplace.
That initiatives to further promote and signpost businesses toward support for digital skills development are considered (as outlined in the 2014 report), linked to national initiatives as appropriate. Where applicable this work should be undertaken alongside the activity of Connecting Devon and Somerset.
4 Evidence from the 2015 Business Survey indicates that particular focus should be placed on the construction,
wholesale and retail, production and accommodation and food sectors. 5 SERIO (2015) Digital Barriers: Understanding the Issues Faced by Women Entering or Returning to the Workplace
Key Findings from the 2015 Workforce Skills Survey
SERIO 41
Cross-cutting Theme 3: Employment of Devon’s Young People and Career Starters
The increased emphasis placed by Devon businesses on recruiting experienced employees (Section 6) may partly explain the apparent reluctance of many to employ career starters. The survey found that the proportion of businesses employing those leaving school, further education or university has decreased year on year since 2013, with common feedback reflecting the requirement for experience.
Whilst awareness of national apprenticeship reform had increased from 34% of businesses in 2014 to 45% in 2015, knowledge regarding the specifics of this and the implications for businesses remained limited. A fifth of businesses were undecided about whether they would offer apprenticeships in the future with some feeling that the decision would depend on them receiving further information regarding how apprenticeships might work in their particular industry. Recommendations: Again, there is work to be done in promoting the business benefits of young people and early career starters to businesses in Devon. Businesses responding across all three survey waves indicated a preference for experienced employees, over career starters. As such, there is a requirement for increased support to enable young people to make the transition from education to the workplace through, for example stronger links between providers and businesses. In this context, we are aware of the recommendation contained within DCC’s Young People and Employment Task Group6 to encourage schools to work with Jobcentre Plus to increase students’ employability. Building upon this work, we recommend that:
Work is undertaken to encourage and support businesses in providing work experience and longer-term placements for young people in Devon. This could involve working with national initiatives, such as the government’s ‘We can’ campaign, launched in August 2015.
The business benefits of apprenticeships are increasingly promoted. To this end, business engagement could be encouraged through increased levels of awareness regarding the latest steps in apprenticeship reform such as direct control of funding; and additional incentive payments for apprentices aged 16-18.
Of particular pertinence to this theme is DCC’s Enterprise in Schools Grant which provides funding to schools in order to both work with the business community, and to deliver activity around enterprise and entrepreneurship. The Programme, now in its second year, was independently evaluated in September 2015 and found to be successful in developing entrepreneurial teaching and learning and generating relationships of mutual value between providers and the business community. As such, we recommend that:
6 Devon County Council Young People and Employment Task Group Final Report, Place Scrutiny Committee, June
2015: http://www.devon.gov.uk/loadtrimdocument?url=&filename=CS/15/9.CMR&rn=15/WD180&dg=Public
Key Findings from the 2015 Workforce Skills Survey
SERIO 42
DCC continue to support the development of enterprise education schemes in the county through initiatives such as the Enterprise in Schools Grant. Support should be reviewed on a regular basis both in order to identify possible areas for improvement, and to explore how the relationships developed with local businesses could be further enhanced and developed.
Cross-cutting Theme 4: Training and Skills Development
Approximately one in two businesses that had funded or arranged training activities over the past twelve months agreed that it had led to positive impacts for their business in terms of productivity (57%) and business growth (49%). However, in common with previous surveys, formalised programmes of workforce development and training needs analysis were not widespread. Of particular note is the proportion of businesses with a training plan in place which decreased by -18 percentage points from 46% in 2013 to 28% in 2015. Financial considerations represent a key barrier to training and skills development. A lack of available funding was the second most commonly identified reason as to why businesses had not arranged training, whilst the cost of the training was deemed to be one of the most important factors when choosing a training provider. The recent decision by the government to reduce funding for the Skills Funding Agency by 17% (amounting to a 24% reduction in non-apprenticeship adult sills funding) may therefore have implications for future training provision.
Recommendations: As evidenced through the survey, the provision of training will be critical to increasing productivity, which has been identified as a key challenge for the Devon labour market7. Reflecting the financial barriers to training and concerns regarding cost, as expressed by Devon businesses, we suggest that:
In line with the previous recommendation from the 2013 report, appropriate opportunities relating to skills development and funding should be communicated to businesses and representative organisations to support the cost of training.
7 SQW, An Analysis of Devon’s Productivity Performance: Report to Devon County Council June 2015:
http://www.devonomics.info/sites/default/files/documents/Devon%20-%20productivity%20v8%20final.pdf
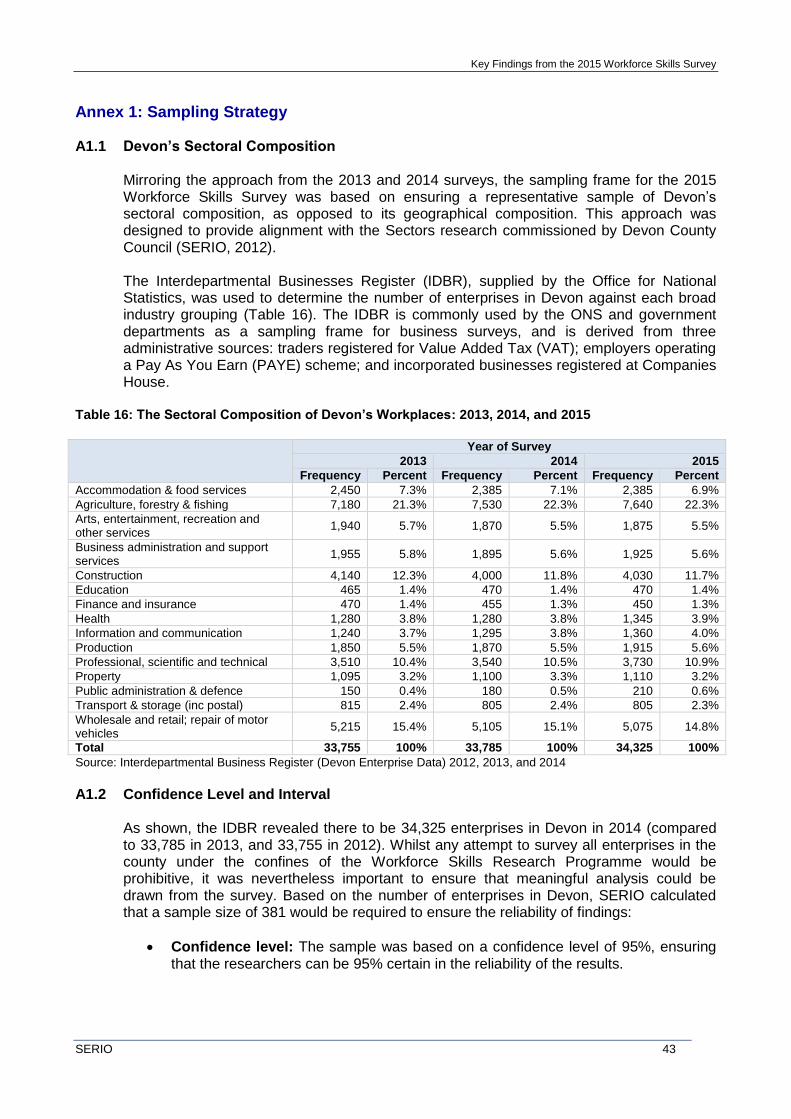
Key Findings from the 2015 Workforce Skills Survey
SERIO 43
Annex 1: Sampling Strategy A1.1 Devon’s Sectoral Composition
Mirroring the approach from the 2013 and 2014 surveys, the sampling frame for the 2015 Workforce Skills Survey was based on ensuring a representative sample of Devon’s sectoral composition, as opposed to its geographical composition. This approach was designed to provide alignment with the Sectors research commissioned by Devon County Council (SERIO, 2012).
The Interdepartmental Businesses Register (IDBR), supplied by the Office for National Statistics, was used to determine the number of enterprises in Devon against each broad industry grouping (Table 16). The IDBR is commonly used by the ONS and government departments as a sampling frame for business surveys, and is derived from three administrative sources: traders registered for Value Added Tax (VAT); employers operating a Pay As You Earn (PAYE) scheme; and incorporated businesses registered at Companies House.
Table 16: The Sectoral Composition of Devon’s Workplaces: 2013, 2014, and 2015
Year of Survey
2013 2014 2015
Frequency Percent Frequency Percent Frequency Percent
Accommodation & food services 2,450 7.3% 2,385 7.1% 2,385 6.9%
Agriculture, forestry & fishing 7,180 21.3% 7,530 22.3% 7,640 22.3%
Arts, entertainment, recreation and other services
1,940 5.7% 1,870 5.5% 1,875 5.5%
Business administration and support services
1,955 5.8% 1,895 5.6% 1,925 5.6%
Construction 4,140 12.3% 4,000 11.8% 4,030 11.7%
Education 465 1.4% 470 1.4% 470 1.4%
Finance and insurance 470 1.4% 455 1.3% 450 1.3%
Health 1,280 3.8% 1,280 3.8% 1,345 3.9%
Information and communication 1,240 3.7% 1,295 3.8% 1,360 4.0%
Production 1,850 5.5% 1,870 5.5% 1,915 5.6%
Professional, scientific and technical 3,510 10.4% 3,540 10.5% 3,730 10.9%
Property 1,095 3.2% 1,100 3.3% 1,110 3.2%
Public administration & defence 150 0.4% 180 0.5% 210 0.6%
Transport & storage (inc postal) 815 2.4% 805 2.4% 805 2.3%
Wholesale and retail; repair of motor vehicles
5,215 15.4% 5,105 15.1% 5,075 14.8%
Total 33,755 100% 33,785 100% 34,325 100%
Source: Interdepartmental Business Register (Devon Enterprise Data) 2012, 2013, and 2014
A1.2 Confidence Level and Interval
As shown, the IDBR revealed there to be 34,325 enterprises in Devon in 2014 (compared to 33,785 in 2013, and 33,755 in 2012). Whilst any attempt to survey all enterprises in the county under the confines of the Workforce Skills Research Programme would be prohibitive, it was nevertheless important to ensure that meaningful analysis could be drawn from the survey. Based on the number of enterprises in Devon, SERIO calculated that a sample size of 381 would be required to ensure the reliability of findings:
Confidence level: The sample was based on a confidence level of 95%, ensuring that the researchers can be 95% certain in the reliability of the results.
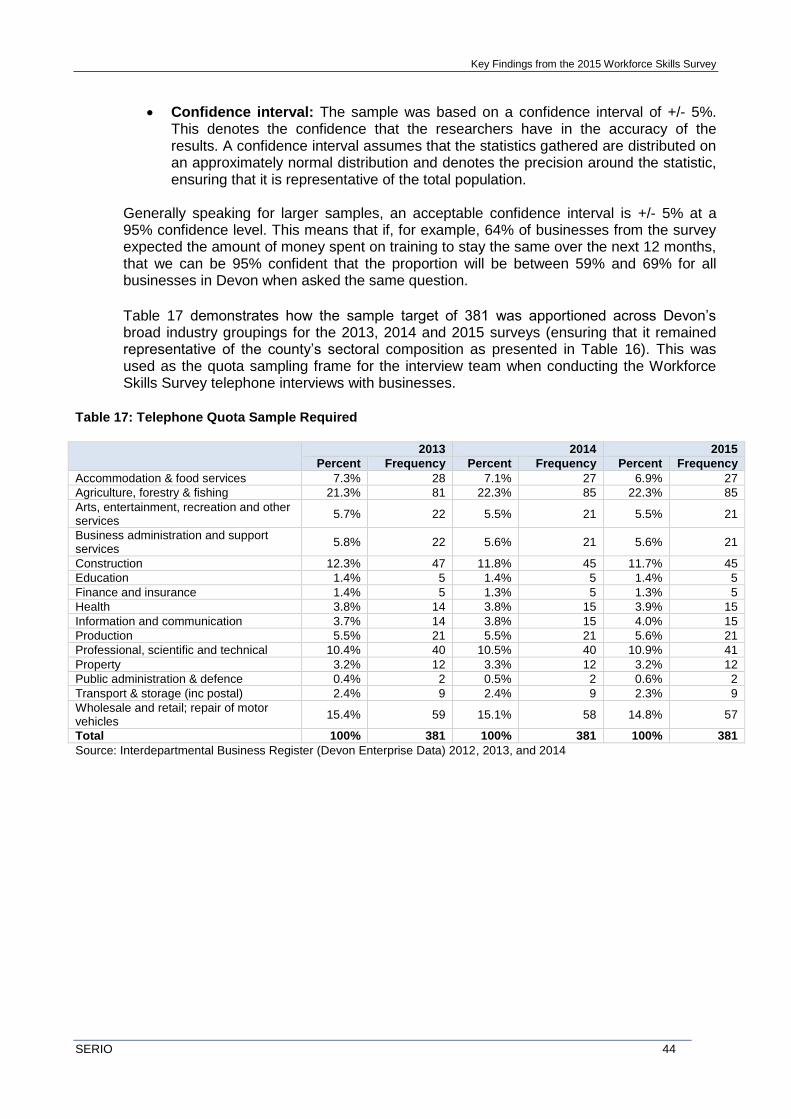
Key Findings from the 2015 Workforce Skills Survey
SERIO 44
Confidence interval: The sample was based on a confidence interval of +/- 5%. This denotes the confidence that the researchers have in the accuracy of the results. A confidence interval assumes that the statistics gathered are distributed on an approximately normal distribution and denotes the precision around the statistic, ensuring that it is representative of the total population.
Generally speaking for larger samples, an acceptable confidence interval is +/- 5% at a 95% confidence level. This means that if, for example, 64% of businesses from the survey expected the amount of money spent on training to stay the same over the next 12 months, that we can be 95% confident that the proportion will be between 59% and 69% for all businesses in Devon when asked the same question.
Table 17 demonstrates how the sample target of 381 was apportioned across Devon’s broad industry groupings for the 2013, 2014 and 2015 surveys (ensuring that it remained representative of the county’s sectoral composition as presented in Table 16). This was used as the quota sampling frame for the interview team when conducting the Workforce Skills Survey telephone interviews with businesses.
Table 17: Telephone Quota Sample Required
2013 2014 2015
Percent Frequency Percent Frequency Percent Frequency
Accommodation & food services 7.3% 28 7.1% 27 6.9% 27
Agriculture, forestry & fishing 21.3% 81 22.3% 85 22.3% 85
Arts, entertainment, recreation and other services
5.7% 22 5.5% 21 5.5% 21
Business administration and support services
5.8% 22 5.6% 21 5.6% 21
Construction 12.3% 47 11.8% 45 11.7% 45
Education 1.4% 5 1.4% 5 1.4% 5
Finance and insurance 1.4% 5 1.3% 5 1.3% 5
Health 3.8% 14 3.8% 15 3.9% 15
Information and communication 3.7% 14 3.8% 15 4.0% 15
Production 5.5% 21 5.5% 21 5.6% 21
Professional, scientific and technical 10.4% 40 10.5% 40 10.9% 41
Property 3.2% 12 3.3% 12 3.2% 12
Public administration & defence 0.4% 2 0.5% 2 0.6% 2
Transport & storage (inc postal) 2.4% 9 2.4% 9 2.3% 9
Wholesale and retail; repair of motor vehicles
15.4% 59 15.1% 58 14.8% 57
Total 100% 381 100% 381 100% 381
Source: Interdepartmental Business Register (Devon Enterprise Data) 2012, 2013, and 2014
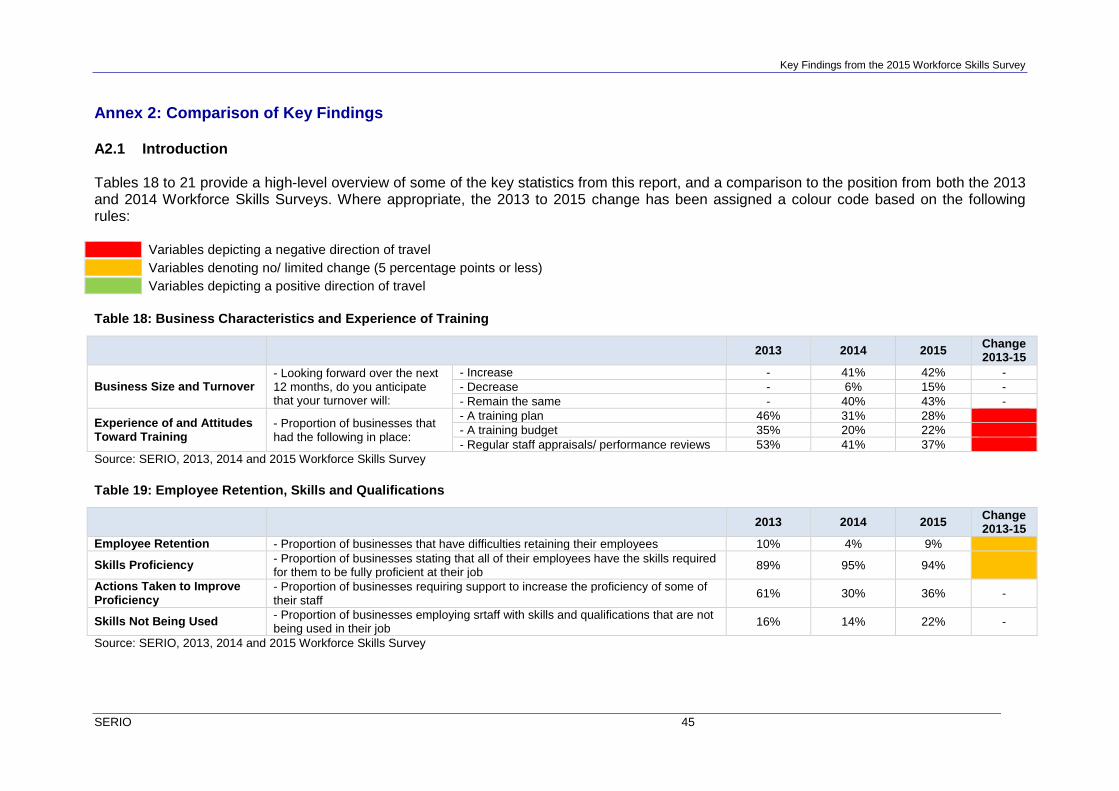
Key Findings from the 2015 Workforce Skills Survey
SERIO 45
Annex 2: Comparison of Key Findings A2.1 Introduction Tables 18 to 21 provide a high-level overview of some of the key statistics from this report, and a comparison to the position from both the 2013 and 2014 Workforce Skills Surveys. Where appropriate, the 2013 to 2015 change has been assigned a colour code based on the following rules: Variables depicting a negative direction of travel
Variables denoting no/ limited change (5 percentage points or less)
Variables depicting a positive direction of travel
Table 18: Business Characteristics and Experience of Training
Source: SERIO, 2013, 2014 and 2015 Workforce Skills Survey
Table 19: Employee Retention, Skills and Qualifications
Source: SERIO, 2013, 2014 and 2015 Workforce Skills Survey
2013 2014 2015 Change 2013-15
Business Size and Turnover - Looking forward over the next 12 months, do you anticipate that your turnover will:
- Increase - 41% 42% -
- Decrease - 6% 15% -
- Remain the same - 40% 43% -
Experience of and Attitudes Toward Training
- Proportion of businesses that had the following in place:
- A training plan 46% 31% 28%
- A training budget 35% 20% 22%
- Regular staff appraisals/ performance reviews 53% 41% 37%
2013 2014 2015 Change 2013-15
Employee Retention - Proportion of businesses that have difficulties retaining their employees 10% 4% 9%
Skills Proficiency - Proportion of businesses stating that all of their employees have the skills required for them to be fully proficient at their job
89% 95% 94%
Actions Taken to Improve Proficiency
- Proportion of businesses requiring support to increase the proficiency of some of their staff
61% 30% 36% -
Skills Not Being Used - Proportion of businesses employing srtaff with skills and qualifications that are not being used in their job
16% 14% 22% -
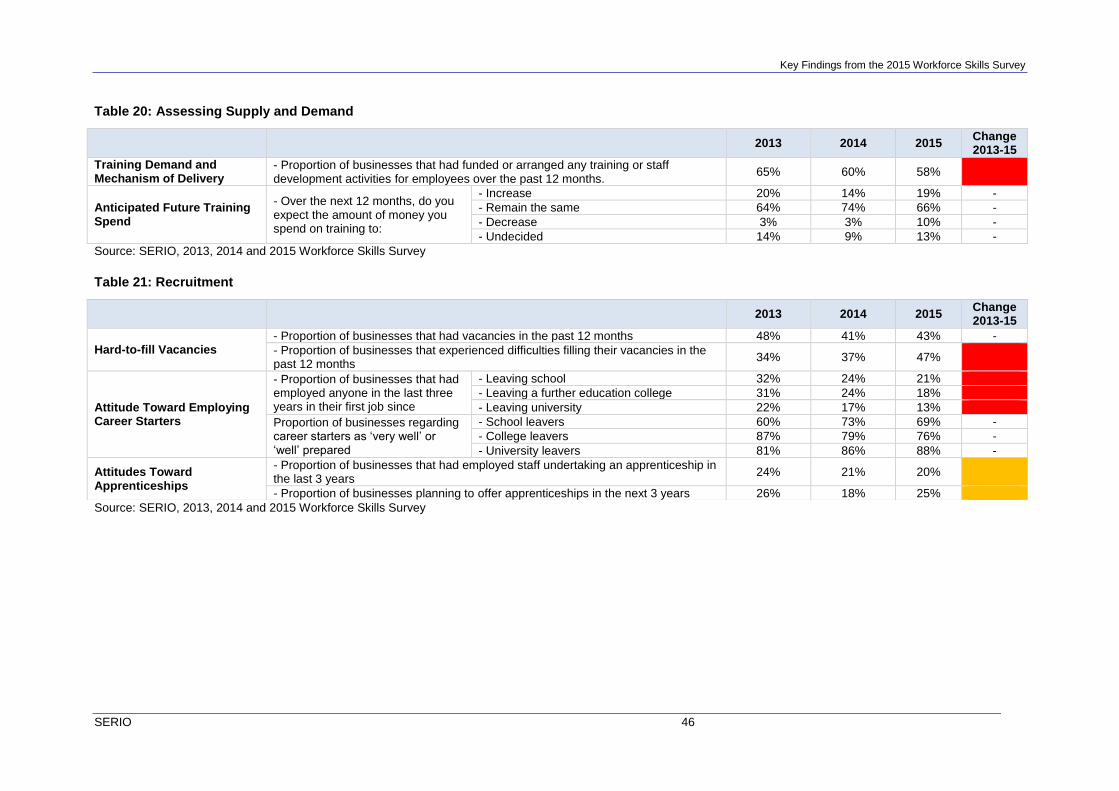
Key Findings from the 2015 Workforce Skills Survey
SERIO 46
Table 20: Assessing Supply and Demand
Source: SERIO, 2013, 2014 and 2015 Workforce Skills Survey
Table 21: Recruitment
Source: SERIO, 2013, 2014 and 2015 Workforce Skills Survey
2013 2014 2015 Change 2013-15
Training Demand and Mechanism of Delivery
- Proportion of businesses that had funded or arranged any training or staff development activities for employees over the past 12 months.
65% 60% 58%
Anticipated Future Training Spend
- Over the next 12 months, do you expect the amount of money you spend on training to:
- Increase 20% 14% 19% -
- Remain the same 64% 74% 66% -
- Decrease 3% 3% 10% -
- Undecided 14% 9% 13% -
2013 2014 2015 Change 2013-15
Hard-to-fill Vacancies - Proportion of businesses that had vacancies in the past 12 months 48% 41% 43% -
- Proportion of businesses that experienced difficulties filling their vacancies in the past 12 months
34% 37% 47%
Attitude Toward Employing Career Starters
- Proportion of businesses that had employed anyone in the last three years in their first job since
- Leaving school 32% 24% 21%
- Leaving a further education college 31% 24% 18%
- Leaving university 22% 17% 13%
Proportion of businesses regarding career starters as ‘very well’ or ‘well’ prepared
- School leavers 60% 73% 69% -
- College leavers 87% 79% 76% -
- University leavers 81% 86% 88% -
Attitudes Toward Apprenticeships
- Proportion of businesses that had employed staff undertaking an apprenticeship in the last 3 years
24% 21% 20%
- Proportion of businesses planning to offer apprenticeships in the next 3 years 26% 18% 25%

Research and Innovation Plymouth University 9, Research Way Plymouth Science Park Plymouth PL6 8BT t 01752 588942 f 01752 588987 e [email protected] w www.serio.ac.uk


![[Third Edition.]](https://img.dokumen.tips/doc/110x75/632515785c2c3bbfa8030477/third-edition-1678442782.jpg)


