Embed Size (px)
Citation preview
W O R L D R E S O U R C E S I N S T I T U T E
KEEPING OPTIONS ALIVE:The Scientific Basis forConserving Biodiversity
WALTER V. REID
KENTON R. MILLER
KEEPING OPTIONS ALIVE:The Scientific Basis forConserving Biodiversity
Walter V. ReidKenton R. Miller
W O R L D R E S O U R C E S I N S T I T U T E
A Center for Policy Research
October 1989
Library of Congress Cataloging-in-Publication Data
Reid, Walter V. C , 1956-Keeping options alive.
(World Resources Institute Report)Includes bibliographical references.1. Biological diversity conservation. I. Miller,
Kenton. II. Title. III. Series.QH75.R44 1989 333.9516 89-22697ISBN 0-915825-41-4
Kathleen CourrierPublications Director
Brooks ClappMarketing Manager
Hyacinth BillingsProduction Manager
Organization of American States; Mike McGahuey, World Bank photo/James PickerellCover Photos
Each World Resources Institute Report represents a timely, scientific treatment of a subject of public concern.WRI takes responsibility for choosing the study topics and guaranteeing its authors and researchers freedom ofinquiry. It also solicits and responds to the guidance of advisory panels and expert reviewers. Unless otherwisestated, however, all the interpretation and findings set forth in WRI publications are those of the authors.
Copyright © 1989 World Resources Institute. All rights reserved.Reprinted 1993
Contents
I. Introduction 1
II. Why is Biological Diversity Important? .. .3
The Role of Biodiversity in Ecosystems... 4Ecological Processes 4Ecological Dynamics 6
III. Where is the World's BiodiversityLocated? 9
General Patterns of SpeciesDistribution 9
Species Richness 10Commonness or Rarity 17
Species of Current Economic Value 22Food 23Medicines 27Industrial Uses 29
IV. Extinction: How Serious is theThreat? 31
Trends in Species Extinctions 31The Geography of Extinction 39
Freshwater Ecosystems 40Islands 41Mediterranean Climate Zones 43Temperate Regions 44Tropical Forests 45
Causes of Extinction 45Habitat Loss and Fragmentation 45Over-exploitation 50Species Introductions 51Pollution 52
Global Warming 52Cumulative Effects 55
V. What's Happening to AgriculturalGenetic Diversity? 57
Uses of Genetic Diversity 57In Situ Conservation 59Ex Situ Conservation 61
VI. Biodiversity Conservation: What are theRight Tools for the Job? 67
Land-use Zoning and Protected Areas .. 67Status of Protected Areas 69Potential Conservation Importance . . . . 70Reserve Size, Network Design, and
Transition Zones 78Ecological Restoration andRehabilitation 80Ex Situ Conservation 81
Zoos and Aquaria 82Botanic Gardens 84
VII. Summary and Recommendations 87
Appendices 99
1. Cascade Effects 992. Calculating Extinctions Due to
Deforestation 1023. Protected Area Objectives 1054. Glossary 106
References I l l
Foreword
A s the 21st Century approaches, theworld is being impoverished as itsmost fundamental capital stock—its
species, habitats, and ecosystems—erodes. Notsince the Cretaceous Era ended some 65 mil-lion years ago have losses been so rapid andgreat. If the trend continues, one quarter of theworld's species may be gone by 2050. Desertifi-cation, fisheries collapse, tropical deforestation-such losses already attest amply to how muchbiological impoverishment costs human beings.If we continue to borrow from the future, liter-ally eating our seed corn, those costs will rise.
An alarm has been sounded. In response,the number of international organizations,national governments, and non-governmentalorganizations concerned about biodiversity andthe breadth of their activities has increaseddramatically during the last decade. Undertheir wings, protected areas, zoos, botanicalgardens, aquaria, seed banks, and other sanc-tuaries and research stations have been set upto rescue and propagate endangered species.Some of the participants in this new movementare institutions working to demonstrate thecompatibility of ecosystem protection and eco-nomic development; others are integratingdevelopment planning and crafting an interna-tional convention for preserving biodiversity.Some development assistance agencies are con-sidering how their grants and loans affect bio-diversity, and various groups are exploringnew ways to finance the conservation of bio-logical diversity.
Still another reason for optimism is the rapidstrides now occurring in conservation biologyand landscape ecology. Scientists' understand-ing of how to maintain viable breeding popula-tions of species and provide sufficient habitatto support them has grown dramatically sincethe late 1970s, as has the availability of effec-tive conservation techniques. Worldwide, morepeople trained in forestry, ecology, conserva-tion biology, and other key fields are needed,but their ranks are beginning to grow.
For all these reasons, the chances of revers-ing the current trends in many ways look bet-ter now than they did only a few short yearsago. But agreement is universal that currentefforts are insufficient. What is needed is acoordinated attack on the problem at its roots,one that both makes use of the best modernscience and reflects concern for the humanwell-being of those most affected. Only when a"critical mass" of participants are cooperatingin a "critical mass" of initiatives within theframework of a common strategy will biologicaldiversity be saved. This cooperation mustinvolve an active participation among govern-mental and non-governmental organizations inboth developing and industrial countries.
In a way, Keeping Options Alive is a "how to"publication. Its timely premise is that the bio-logical sciences can help policy-makers identifythe threats to biodiversity, evaluate conserva-tion tools, and come up with successfulmanagement strategies to the crisis of biotic
v
impoverishment before it is full-blown. Tothese ends, Reid and Miller provide an over-view of where the world's species and geneticresources are located and why they are valu-able, a new analysis of species extinctions intropical forests that supports previous estimatesand reinforces the magnitude of the problemthat we face, and a survey of the most recentfindings of conservation biology. The authorsalso suggest how these findings can best beput to work for both in situ and ex situ conser-vation, and they add to evidence that the bio-diversity crisis is not restricted to tropicalforests, but threatens biological resources intemperate zones and marine ecosystems aswell. Finally, this report underscores theimportant interdependence between biologicaldiversity and human cultural diversity and thepolicy implications of this critical bond.
Ultimately, of course, the solution to the bio-diversity crisis will be political. It will requireboth improving planning and management andredressing the social inequities that force peo-ple and nations to use resources unsustainably.Indeed, many of the long-term actions thatReid and Miller call for in Keeping Options Alivewill not occur in the developing world unlessthe industrial countries provide their fair share
of the financing, technology, and knowledgeneeded to implement them. But creating adecision-making framework based on the mostcurrent and comprehensive scientific under-standing of the world's biological wealth isessential when so much of it has yet to beinventoried, much less evaluated, and whensome of the potentially most important speciesand ecosystems have few politically empow-ered constituents. Only by marrying scientificfact to political and economic reality—as Keep-ing Options Alive strives to help policymakersdo—can we hope to maintain the biologicalwealth on which long-term economic develop-ment depends.
WRI would like to express its great apprecia-tion to The Rockefeller Foundation, Inc., JohnD. and Catherine T. MacArthur Foundation,Town Creek Foundation, Inc., The PewCharitable Trusts, W. Alton Jones Foundation,Inc., The Moriah Fund, Waste Management,Inc., and HighGain, Inc., which have providedfinancial support for WRI's efforts in this area.
James Gustave SpethPresidentWorld Resources Institute
VI
Acknowledgments
W e are grateful to Mohamed El-Ashry, Nate Flesness, Tom Fox,Vernon Heywood, Dan Janzen,
Nels Johnson, Jeffrey McNeely, GordonOrians, Peter Raven, Ulysses Seal, DanSimberloff, Michael Soule, Mark Trexler, andGeerat Vermeij for their valuable comments onall or parts of the draft report. Our thanks toKathleen Courrier for skillfully editing thereport and to Hyacinth Billings, Allyn Massey,and Moira Connelly for their help preparingthe text and figures. Special thanks to DeeBoersma, Kai Lee, Jeffrey McNeely, GordonOrians, and Robert Paine for many invaluablediscussions on ecology, conservation, anddevelopment.
W.V.R.K.R.M.
VII
I. Introduction
O ur planet is a biologically impoverishedimage of the world that supportedhumanity in past generations. We can
no longer thrill to the sight of waves of migrat-ing passenger pigeons—extinct since 1914—andno tourist industry will be built around theCaribbean monk seal, the last of which died in1960. Losses of mangrove habitat in manySoutheast Asian nations have diminished theproductivity of their coastal fisheries, and thepotential to boost agricultural productivityworldwide has been reduced with the disap-pearance of crop varieties possessing uniquegenetic adaptations.
Today, we are depleting the world's biologi-cal wealth at an ever-increasing rate, and theloss and degradation of the world's biologicalresources are taking a toll on the well-being ofpeople in both industrialized and developingnations. The world entered the current era ofgeologic history with biological diversity closeto its all time high. But the exponential growthin human population and the even fastergrowth in consumption of the world's naturalresources have led to high rates of loss ofgenes, species, and habitats. An estimated 25percent of the world's species present in themid-1980s may be extinct by the year 2015 orsoon thereafter (Raven 1988a, b), and signifi-cant losses of genetic diversity of both wildand domestic species are expected over thissame period. Species of known and potentialfuture value as foods, medicines, or industrialproducts are disappearing. Various ecosystem
"services"—such as the regulation of waterdischarge and the absorption and breakdownof pollutants—are being degraded as compo-nent species vanish from these ecosystems oras natural habitats are converted to other landuses. The erosion of the genetic diversity ofagricultural, forestry, and livestock speciesdiminishes the potential for breeding programsto maintain and enhance productivity.
The diversity of life is an irreplaceable assetto humanity and to the biosphere. It providesboth immediate and long-term benefits, and itsmaintenance is essential to sustainable develop-ment worldwide. Those components of life thatvanish during the next decades will be goneforever; those that remain will provide futureoptions for humanity. Few question that con-serving biological diversity is a valuable under-taking. But how valuable? How threatened isbiodiversity? How should society decide whichcomponents of life most deserve conservationinvestments? And how can this task beaccomplished?
Keeping Options Alive poses these fundamentalquestions and recommends scientificallyinformed policies for conserving biological diver-sity. These policies are derived from currentknowledge of biogeography, conservation biol-ogy, genetics, and systematics, and from popu-lation, community, and landscape ecology.These sciences provide guidance for land-useplanning and management and afford insightsinto the relationship between biodiversity and
ecological processes; the nature and scale ofthe threats to species, genes, and habitats; thebasis for establishing conservation priorities;the potential effectiveness of various conserva-tion tools; and related topics of pressing con-cern. Knowledge in these fields is far fromcomplete, but it is sufficient to guide the quickaction needed to conserve the world's biologi-cal resources, and that guidance can be refinedas more information is obtained.
Keeping Options Alive does not address allaspects of biodiversity conservation. Indeed,such important considerations as the economicvaluation of biodiversity, the importance of cul-tural diversity, methods for financing conserva-tion projects, and the use of conservationstrategies are scarcely discussed. However, thepolicies recommended in this report do reflectthe broader social, political, and economic con-text in which biodiversity is threatened and inwhich its conservation must take place(McNeely et al. 1989). The complex root causesof the planet's biotic impoverishment areintertwined with the causes of poverty andpopulation growth, and they are linked to theinequitable distribution of resources, land, andwealth. Nations are suffering serious economiclosses, individual well-being is declining, andfuture generations are losing invaluable assetsas a result of legal and economic incentivestructures that favor unsustainable patterns of
resource use and discourage local adaptation toenvironmental conditions.
Considering that each nation's biologicaldiversity is a critical natural asset—for thatcountry and, in some cases, the world-developing strategies for maintaining, study-ing, and using biological resources sustainablyshould be national priorities. For that reason,the principles and guidelines set forth in thisreport must be applied in conjunction withchanges in local, national, and internationaleconomic and social policies that address theroot causes of biotic impoverishment. In partic-ular, new approaches to conservation financingthat don't place undue burdens on thedeveloping world are needed (WRI 1989).
Many of the policy and institutional reformsneeded to halt biotic impoverishment would bedifficult under any circumstances. With therelentless pressures of population growth andthe necessity of meeting people's immediateneeds for food and shelter, the challenge is allthe more daunting. But biotic impoverishmentnow is less advanced than it would have beenhad no action been taken in past decades tostem these losses, and a tremendous untappedpotential for further conservation exists. Manygenes and species are sure to be lost in thecoming decades, but which and how many arematters within humanity's control.
II. Why is Biological Diversity Important?
B iodiversity is the variety of the world'sorganisms, including their geneticdiversity and the assemblages they
form. It is the blanket term for the natural bio-logical wealth that undergirds human life andwell-being. The breadth of the concept reflectsthe interrelatedness of genes, species, andecosystems. Because genes are the componentsof species, and species are the components ofecosystems, altering the make-up of any levelof this hierarchy can change the others. There-fore, whether the goal is to obtain productsfrom individual species, services from eco-systems, or to keep ecosystems in a naturalstate for future generations, these linkagesmust be taken into account in managementpolicies. How biodiversity contributes to vari-ous products and ecological services andfigures in the dynamics of ecological systemsand how the biological sciences can helppolicy-makers set priorities for conserving bio-logical diversity are questions of growingimportance as threats to biodiversity mount.
Species are central to the concept of biodiver-sity. Individual species—Earth's various plants,animals, and microorganisms—provide the riceand fish we eat, the penicillin doctors use tosave lives, and other natural products. Theyalso provide options for addressing futurehuman needs, and invaluable aesthetic, spirit-ual, and educational benefits. Just as important,species provide more subtle benefits in theform of wide-ranging ecological services.Coastal wetland ecosystems formed from
various plant and animal species remove pollu-tants from the water and provide the spawningand rearing habitat for commercially importantfish and crustaceans. Similarly, forest ecosys-tems help regulate water discharge into rivers,which affects the frequency of floods and theavailability of water during dry seasons. Theseand other ecosystems also influence local cli-matic conditions or, in the case of a forestedarea as large as Amazonia, even global climate.In a sense, species and ecosystems are inte-grated service networks and the parts need tobe conserved to conserve the whole. Just ashabitats and ecosystems must be maintainedto conserve species, species must be conservedto maintain habitats and various ecologicalservices.
Each species' characteristics are determinedby genetic make-up. Management of thisgenetic diversity is particularly important insmall populations and in domestic species.Humanity has long recognized and utilizedgenetic diversity in the development of varie-ties of domesticated plants and animals for usein agriculture, forestry, animal husbandry, andaquaculture. In U.S. agriculture alone, crop-breeding programs drawing on genetic diver-sity add an estimated $1 billion annually to thevalue of production (OTA 1987). Another wayfarmers take advantage of genetic diversity isby planting numerous varieties of crops as ahedge against total crop failure. By plantingseveral varieties of potatoes, for example,Andean farmers can count on a successful
harvest almost regardless of what turns theweather takes.
The conservation of biodiversity is the manage-ment of human interactions with the variety of lifeforms and ecosystems so as to maximize the benefitsthey provide today and maintain their potential tomeet future generation's needs and aspirations. Thisdefinition of conservation, modelled after thatused in the World Conservation Strategy (WCS)(IUCN 1980), emphasizes that how people usespecies, manage the land, and invest in devel-opment will determine the ultimate success ofbiodiversity conservation. To many, the word"conservation" has a narrower meaning-maintenance or preservation. But "mainten-ance" or "preservation" seem most usefulwhen confined to practices that keep an ecosys-tem or population in its existing state. Thebroader definition used here, in contrast, entailsa variety of objectives. A national biodiversityconservation program, for instance, may involveefforts to remove exotic species harmful to natu-ral or agricultural ecosystems, maintain and uti-lize the genetic diversity present in crops andtheir wild relatives, maintain habitats that pro-vide services to humanity and to the biosphere,and save, study, and use the species native tothe country.
Seen in this way, the conservation of bio-diversity is an important objective for allnations, individually and collectively, and forlocal communities. The variety of species andgenes found in a nation, and the habitats andecosystems in which they occur, are criticalresources that should be utilized sustainably ineach country's development. Whether or not acountry is species-rich, the management of thehuman use of the nation's biological diversityshould be a national priority to ensure thatpeople's needs are met and that the nation'sglobal responsibility is fulfilled.
The Role of Biodiversity inEcosystems
Genes, species, and the other components ofthe world's biodiversity are inseparable from
the processes of life that the components giverise to—among them, production, consump-tion, and evolution. (See Figure 1.) Together,biodiversity (that is, the elements of life), andecological processes (the interactions among spe-cies and between species and their environ-ment) define Earth's living mantle—thebiosphere. For individuals and populations,these interactions include such mechanisms aspredation, competition, parasitism, and mutu-alism, while communities change through theprocess of succession. In yet another type ofinteraction, species influence their physicalenvironment—whether through primaryproduction (the transformation of solar energyto biomass through photosynthesis), decompo-sition (the breakdown of organic materials byorganisms in the environment), or participationin biogeochemical cycles (the movement ofnutrients, water, and other chemical elementsthrough living organisms and the physicalenvironment). Other important ecologicalprocesses include soil generation and the main-tenance of soil fertility, pest control, climateregulation and weather amelioration, and theremoval of pollutants from water, soil, and air.
Ecological Processes
No simple relationship exists between thediversity of an ecosystem and such ecologicalprocesses as productivity, water discharge, soilgeneration, and so forth. For example, speciesdiversity doesn't correlate neatly with biologicalproductivity. Species-rich tropical rain forestsare extremely productive, but so are coastalwetlands, which have relatively low speciesdiversity. Species diversity also does not corre-late closely with an ecosystem's stability—thatis, its resistance to disturbance and speed ofrecovery. For example, coastal salt marshes andArctic tundra are dominated by a handful ofspecies, and in some cases—such as Spartinasalt marshes—one species provides virtually allof the ecosystem's primary productivity (Teal1962); yet, there is no evidence that theseecosystems are in particular danger of speciesextinctions or wide population fluctuations inresponse to disturbances.
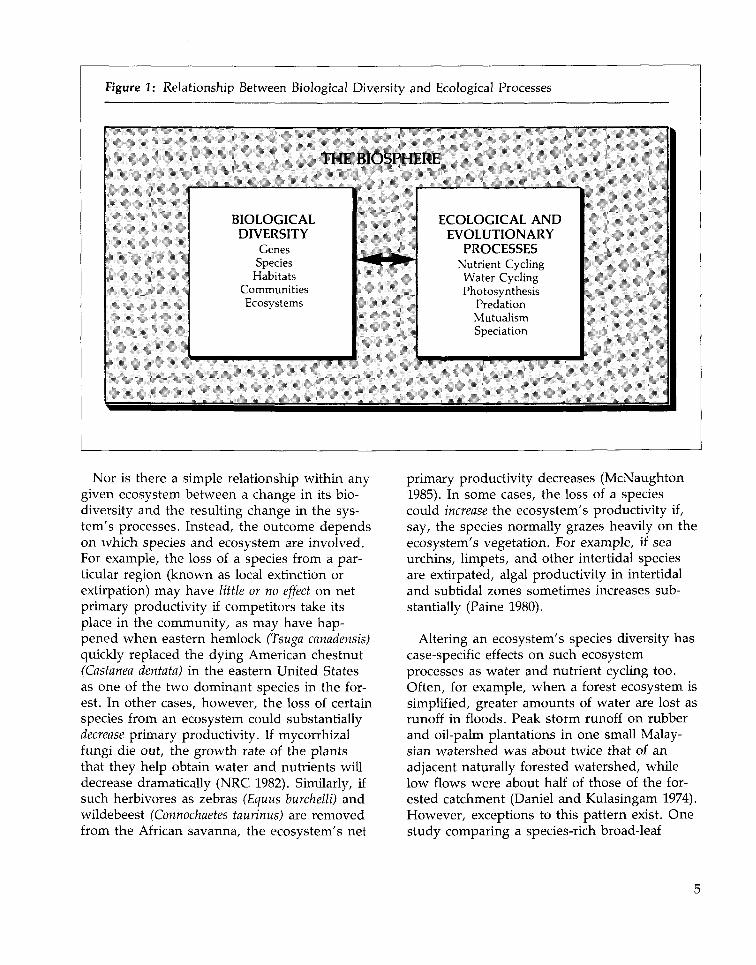
Figure 1: Relationship Between Biological Diversity and Ecological Processes
THE BIOSPHERE
BIOLOGICALDIVERSITY
GenesSpeciesHabitats
CommunitiesEcosystems
ECOLOGICAL ANDEVOLUTIONARY
PROCESSESNutrient CyclingWater CyclingPhotosynthesis
PredationMutualismSpeciation
Nor is there a simple relationship within anygiven ecosystem between a change in its bio-diversity and the resulting change in the sys-tem's processes. Instead, the outcome dependson which species and ecosystem are involved.For example, the loss of a species from a par-ticular region (known as local extinction orextirpation) may have little or no effect on netprimary productivity if competitors take itsplace in the community, as may have hap-pened when eastern hemlock (Tsuga canadensis)quickly replaced the dying American chestnut(Castanea dentata) in the eastern United Statesas one of the two dominant species in the for-est. In other cases, however, the loss of certainspecies from an ecosystem could substantiallydecrease primary productivity. If mycorrhizalfungi die out, the growth rate of the plantsthat they help obtain water and nutrients willdecrease dramatically (NRC 1982). Similarly, ifsuch herbivores as zebras (Equus burchelli) andwildebeest (Connochaetes taurinus) are removedfrom the African savanna, the ecosystem's net
primary productivity decreases (McNaughton1985). In some cases, the loss of a speciescould increase the ecosystem's productivity if,say, the species normally grazes heavily on theecosystem's vegetation. For example, if seaurchins, limpets, and other intertidal speciesare extirpated, algal productivity in intertidaland subtidal zones sometimes increases sub-stantially (Paine 1980).
Altering an ecosystem's species diversity hascase-specific effects on such ecosystemprocesses as water and nutrient cycling too.Often, for example, when a forest ecosystem issimplified, greater amounts of water are lost asrunoff in floods. Peak storm runoff on rubberand oil-palm plantations in one small Malay-sian watershed was about twice that of anadjacent naturally forested watershed, whilelow flows were about half of those of the for-ested catchment (Daniel and Kulasingam 1974).However, exceptions to this pattern exist. Onestudy comparing a species-rich broad-leaf
temperate forest to a species-poor pine planta-tion found that the pine plantation lost lesswater to runoff due to the increased intercep-tion of rain in the pine canopy and thus higherrates of evaporation (Vitousek 1986). Consider-ing this wide range of possible outcomes, land-use decisions cannot be based upon generali-ties about the effects of the loss of biodiversity,but rather must be made after careful study ofthe potential impacts of specific land-usechanges.
Ecological Dynamics
If the relationship between species diversityand ecological processes defies general rules,ecologists have at least identified many specificrelationships that allow them to assess howenvironmental changes will affect species diver-sity and how changes in species diversity willaffect certain ecological processes. A number ofrecent advances in ecology that detail suchrelationships provide decision-makers with aninvaluable picture of the mode and tempo ofchange in ecosystems, and, more important,provide managers with the information neededto wisely manage biodiversity.
First, regardless of how static they may appear,the mix of species making-up communities andecosystems changes continually (Graham 1988).For example, when the Pleistocene Era endedroughly 10,000 years ago, the flora and faunaof what is now Pennsylvania in the UnitedStates included pine and hemlock forests and,among many other species, the smokey shrew(Sorex fumeus), ground squirrel (Spermophilustridecemlineatus), and collared lemming(Dicrostonyx hudsonius). After the glaciersretreated, the ranges of these species shifted,but not together. Pine forest moved northwest,while hemlock moved northeast (Jacobson etal. 1987); S. tridecemlineatus and S. fumeus arestill found in or near Pennsylvania, but D. hud-sonius moved more than 1500 km to the north(Graham 1986). Elsewhere, armadillos (Dasypusnovemcinctus) and collard lemmings that co-existed during the Pleistocene today live morethan 1500 km apart. In the last few thousand
years, the location, composition, and extent oftropical forests have also changed significantly(Hunter et al. 1988).
Clearly, biological communities do not respondto environmental changes in congress. Instead,the species within communities respond indifferent fashions to environmental changes andthe mixture of species comprising a communityat any given time reflects these individualisticresponses. Given this fact, the objective of bio-diversity conservation should not be to maintainthe exact composition of communities that existtoday, but rather to maintain the species them-selves and to allow ecosystem changes to con-tinue. However academic this distinction mayappear, it is crucial in the design of policies torespond to such impacts as those of climatechange on biodiversity.
Second, species diversity increases as environ-mental heterogeneity—or the patchiness of a habitat-does, but though species richness can sometimes beincreased by increasing the diversity of habitatswithin an ecosystem, this intervention can be adouble-edged sword. (See Chapter IV.) Species thatthrive in early successional habitats and benefitfrom disturbance tend to be those least vulner-able to extinction, whereas those that requirelarge tracts of late-successional habitats may beat greatest risk (Foster 1980).
Third, habitat patchiness influences not only thecomposition of species in an ecosystem, but also theinteractions among species. This factor may con-trol the dynamics of predator-prey or host-parasite interactions in both natural and agro-ecosystems. In heterogeneous environments, atleast some members of prey or host species canescape from their predators and—it follows—extinction. For example, outbreaks of mange inthe rodent-like rock hyrax (Procavia johnstoni) inthe Serengeti may kill the entire population ofa single rocky outcrop, but the transmission ofthe disease between outcrops is too slow toendanger the entire population (Hoeck 1982).
Fourth, periodic disturbances play an importantrole in creating the patchy environments that foster
high species richness. Such disturbances mayactually appear rare, random, or unimportantfrom the vantage of human time. But"unusual" events, such as 100-year hurricanes,floods, or major fires may be "regular" if alonger view is taken. Forests that regularlyexperience fire or treefalls—even at intervals ofhundreds of years—may never reach equili-brium. In other words, succession will neverreach an endpoint, species composition willnever be fixed, and the relative abundance ofspecies will never be constant. Periodic distur-bances keep an array of habitat patches in vari-ous successional states. The spatial heter-ogeneity, in turn, contributes to the diversityof species and influences the interactionsamong species (Sousa 1984). Disturbancecaused by hurricanes may play a pivotal role inmaintaining the structure of coral reef commu-nities (Connell 1978), and fires are so commonin chaparral communities and jack pine foreststhat many species require fire to complete theirlife cycle (Biswell 1974, Cayford and McRae1983). In one Mediterranean shrub ecosystem,the prevention of grazing, fire, and cuttingreduced plant-species diversity by 75 percent(Naveh and Whittaker 1979).
Consequently, to maintain species diversitywithin a region, it is often necessary to allownatural patterns of disturbance to continue, orat least to manage the environment so as topreserve natural patterns of succession. Thisconclusion has led to a novel tropical forestmanagement technique known as "stripshelterbelt forestry" that attempts to mimic thenatural disturbance patterns in tropical forestsin order to maintain the maximum speciesdiversity while still allowing timber harvest(Hartshorn et al. 1987, Hartshorn 1989). In theUnited States, the important role of naturaldisturbance is recognized in the policy of notfighting natural fires on public lands unlessstructures or private property are threatened.Periodic fires prevent the build-up of brushand other fuel that would create conditions formore intense and devastating burns. However,following the highly publicized fires in Yel-lowstone National Park in the fall of 1988, the
U.S. placed a moratorium on this policy,thereby requiring suppression of all fires. Thischange is clearly misguided from an ecologicalstandpoint and will add significantly tomanagement costs on federal land.
Fifth, both the size and isolation of habitatpatches can influence species richness, as can theextent of the transition zones between habitats.Often these so-called "ecotones" support spe-cies that would not occur in continuoushabitats. In temperate zones, ecotones aremore species rich than continuous habitats,though the reverse may be true in tropicalforests—perhaps because climatic conditions inthe ecotones are stressful or because tropicalforest species have particularly narrow habitatrequirements (Lovejoy et al. 1986).
Sixth, certain species have disproportionateinfluences on the characteristics of an ecosystem. Atone extreme are "keystone" species whose losscould transform or undermine the ecologicalprocess or fundamentally change the speciescomposition of the community. At the otherare "redundant" species whose loss wouldhave little effect on a particular ecologicalprocess.
Obviously, management policies should focuson keystone species since changes in thesepopulations disproportionately affect other spe-cies in the community. In the worst case, thelocal extinction of one of these species maycause a "cascade effect" whereby other specieswithin the community dwindle in number orare extirpated themselves. (See Appendix 1.) Forexample, between 1741 and 1911, the sea otter(Enhydra lutris) was all but exterminated fromthe Aleutian Islands by fur traders. In theabsence of this dominant coastal predator, thepopulation size of its prey—sea urchins (Stron-gylocentrotus polyacanthus)—increased dramati-cally, which, in turn, dramatically decreasedthe abundance of kelp (Laminaria spp.)—a majorprey of urchins (Estes and Palmisano 1974,Estes et al. 1978). This loss redounded at manylevels. Kelp contributes substantially to thecoastal ecosystem's primary productivity and
provides physical structure for a highly diversenearshore fish community, and these fish sup-port seals, bald eagles (Haliaeetus leucocephalus),and many other populations. The near-extinction of otters in the Aleutians changedthe structure of the coastal marine ecosystemdramatically as kelp beds were replaced withhigh-density aggregations of urchins.
In contrast, other species losses have littleeffect on the remaining species. Around 1900,a chestnut tree fungus, native to China andJapan, was inadvertently introduced into theUnited States. The fungus all but wiped outthe American chestnut by 1950 (Burnham1988). Despite the loss of a species that oncecomposed 25 percent or more of the easternhardwood forest from Mississippi to Maine, thegeneral structure of the forest changed little.After roughly 25 years, the chestnut-oakassemblage was replaced by a hemlock-oakcommunity, ecosystem processes wereunchanged, and no extinctions of birds, mam-mals, or reptiles have been attributed to its loss(McCormick and Platt 1980, Pimm 1986).
The somewhat chaotic view of nature thatthese six ecological relationships reveal is atodds with the popular conception of a "bal-ance of nature," in which all species are inter-connected and ecological processes ensure thatecosystems move on successional trajectories toa steady state. Indeed, ecologists have longunderstood that the balance of nature is pre-carious at best. As early as 1930, Charles Eltonnoted:
"The simile of the clockwork mechanism is onlytrue if we imagine that a large proportion of thecog-wheels have their own mainsprings, whichdo not unwind at a constant speed. There is alsothe difficulty that each wheel retains the right toarise and migrate and settle down in another
clock, only to set up further trouble in its newhome. Sometimes, a large number of wheelswould arise and roll off in company, with noapparent object except to escape as quickly aspossible from the uncomfortable confusion inwhich they had been living." (Elton 1930)
With knowledge of the particular roles ofspecies within communities and the importantinfluences of disturbance and environmentalheterogeneity on species richness growing, it isincreasingly possible to use and manage landin ways that maintain the species within aregion and provide valuable ecosystem servicesto humanity. But recognizing the trade-offsinherent in various changes in an ecosystem'scharacteristic diversity—the pattern of distribu-tion and abundance of populations, species,and habitats—is essential to achieving sustain-able development worldwide. Characteristicdiversity can be increased by, for instance,adding exotic species or allowing moderate dis-turbances. It can be decreased through suchchanges as species loss or the prevention ofnatural patterns of disturbance and invasion.An ecosystem's characteristic diversity can bealtered to modify the services that the ecosys-tem provides to humanity. But in the quest toenhance one service, other essential ecosystemservices are often compromised. Establishingtimber plantations may increase timber produc-tivity, but reducing species diversity in thisway may increase the frequency of floods andsoil erosion or reduce water flows during dryseasons, and it obviously harms the speciesthat are removed (thereby diminishing theecosystem's "genetic library"). Since alteringthe ecosystem to enhance short-term produc-tivity causes multiple changes in other ecologi-cal processes, and since these changes mayultimately reduce long-term productivity, thefocus of management policies can't be limitedto only a small number of these effects.
III. Where is the World's BiodiversityLocated?
A s vitally important as the world's rainforests are, they should not be thesole focus of biodiversity conserva-
tion. Even in less species-rich ecosystems, theconservation of biodiversity is critical for meet-ing local people's needs. Moreover, the variousfoods, medicines, and industrial products thathumanity has obtained from the world's biotahave come from virtually all ecosystems andtaxonomic groups. Policies for conserving bio-diversity must be based on a broad under-standing of its distribution. Three questions inparticular should inform all conservationpolicy. First, knowledge of the world's biota—and especially of the identity and distributionof species—is far from complete, so howshould this knowledge gap influence prioritiesfor conservation? Second, do historical discov-eries of economically valuable species providethe basis for predicting where future discover-ies will occur? And, third, what special policiesare needed to protect species with limitedranges or small populations?
General Patterns of SpeciesDistribution
Some 230 years after Linnaeus began classify-ing the variety of life on earth, we still do notknow how many species exist—even to withina factor of ten. Of the estimated 10 million to30 million species on earth, only some 1.4 mil-lion have been named and at least brieflydescribed (May 1988, Wilson 1988a).
Our incomplete knowledge of the distributionand diversity of species is particularly strikingfor certain groups of organisms, such asinsects. For example, in a recent survey of just19 trees of the same species in a tropical forestin Panama, fully 80 percent of the more than950 species of beetles found are believed to bepreviously unknown to scientists (Erwin andScott 1980; T. Erwin, Smithsonian, personalcommunication, Feb. 1989). More detailedstudies of tropical insects are now expected toreveal millions of new species, perhaps eventens of millions (Erwin 1982). Moreover, nearlyevery animal species may be host to at leastone specialized parasitic species, only a smallfraction of which have been described (May1988). Even tropical vertebrates are far fromfully described. An estimated 40 percent of allfreshwater fishes in South America have notyet been classified (NRC 1980).
The deep sea floor is a similarly unstudiedregion that is proving to be extremely speciesrich, containing as many as a millionundescribed species (Grassle 1989, Grassleet al., in press). Consider the case of hydro-thermal marine vents. Discovered in themid-1970s along ridges on the ocean bottomwhere earth's crustal plates are spreadingapart, these vents are home to life forms thatare largely new to science. More than 20 newfamilies or subfamilies from these environ-ments, 50 new genera, and over 100 new spe-cies have been described (Childress et al. 1987,Grassle 1989).
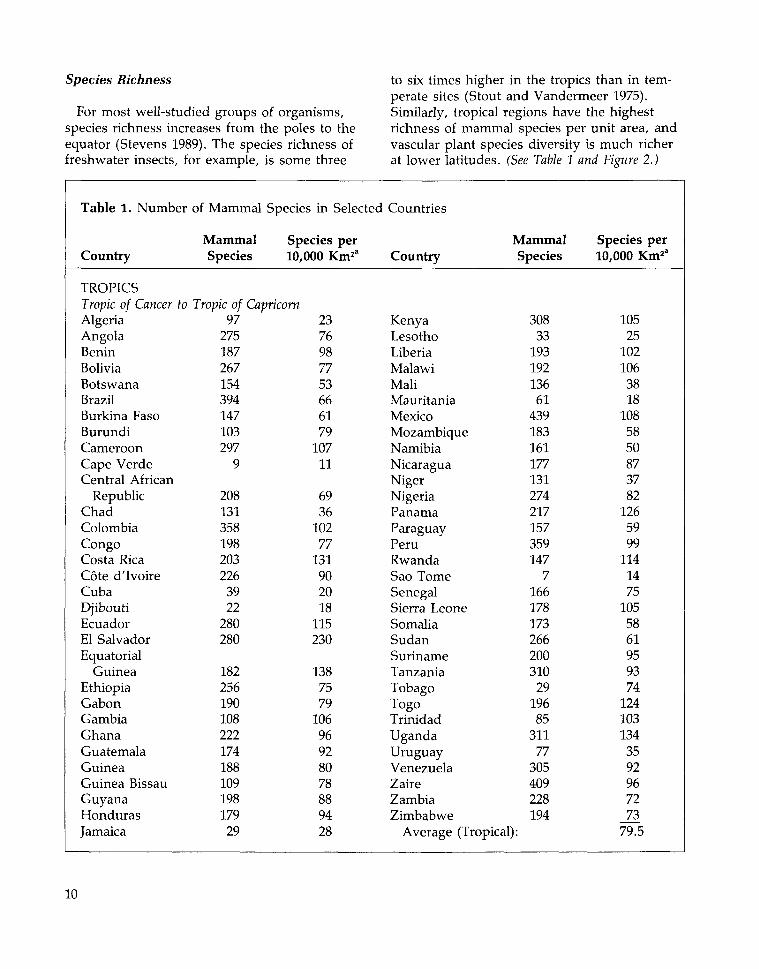
Species Richness
For most well-studied groups of organisms,species richness increases from the poles to theequator (Stevens 1989). The species richness offreshwater insects, for example, is some three
to six times higher in the tropics than in tem-perate sites (Stout and Vandermeer 1975).Similarly, tropical regions have the highestrichness of mammal species per unit area, andvascular plant species diversity is much richerat lower latitudes. (See Table 1 and Figure 2.)
Table 1. Number
Country
TROPICSTropic of Cancer toAlgeriaAngolaBeninBoliviaBotswanaBrazilBurkina FasoBurundiCameroonCape VerdeCentral African
RepublicChadColombiaCongoCosta RicaCote dTvoireCubaDjiboutiEcuadorEl SalvadorEquatorial
GuineaEthiopiaGabonGambiaGhanaGuatemalaGuineaGuinea BissauGuyanaHondurasJamaica
of Mammal Species in Selected
MammalSpecies
Species per10,000 Km1"
Tropic of Capricorn97
275187267154394147103297
9
208131358198203226
3922
280280
18225619010822217418810919817929
2376987753666179
10711
6936
10277
131902018
115230
1387579
10696928078889428
Countries
Country
KenyaLesothoLiberiaMalawiMaliMauritaniaMexicoMozambiqueNamibiaNicaraguaNigerNigeriaPanamaParaguayPeruRwandaSao TomeSenegalSierra LeoneSomaliaSudanSurinameTanzaniaTobagoTogoTrinidadUgandaUruguayVenezuelaZaireZambiaZimbabwe
MammalSpecies
30833
19319213661
439183161177131274217157359147
7166178173266200310
2919685
31177
305409228194
Average (Tropical):
Species per10,000 Km2'
10525
1021063818
1085850873782
1265999
1141475
1055861959374
1241031343592967273
79.5
10
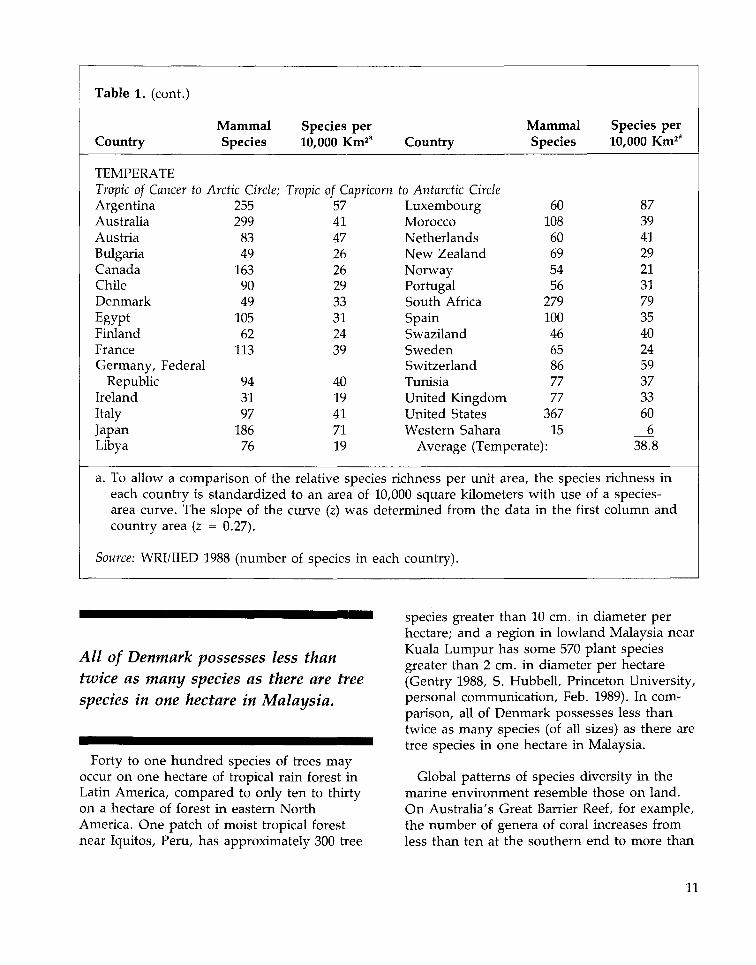
Table 1. (cont.)
Country
TEMPERATETropic of Cancer toArgentinaAustraliaAustriaBulgariaCanadaChileDenmarkEgyptFinlandFranceGermany, Federal
RepublicIrelandItalyJapanLibya
MammalSpecies
Arctic Circle;255299
8349
1639049
10562
113
943197
18676
Species per10,000 Km2' Country
Tropic of Capricorn to Antarctic Circle57414726262933312439
4019417119
LuxembourgMoroccoNetherlandsNew ZealandNorwayPortugalSouth AfricaSpainSwazilandSwedenSwitzerlandTunisiaUnited KingdomUnited StatesWestern Sahara
MammalSpecies
6010860695456
2791004665867777
36715
Average (Temperate):
a. To allow a comparison of the relative species richness per unit areaeach country isarea curve. Thecountry area (z
Source: WRI/IIED :
standardizedslope of the= 0.27).
L988 (number
to an area ofcurve (z) was
of species in
10,000 square kilometers, the specieswith use of
determined from the data in the first
each country).
Species per10,000 Km23
87394129213179354024593733606
38.8
richness ina species-column and
All of Denmark possesses less thantwice as many species as there are treespecies in one hectare in Malaysia.
Forty to one hundred species of trees mayoccur on one hectare of tropical rain forest inLatin America, compared to only ten to thirtyon a hectare of forest in eastern NorthAmerica. One patch of moist tropical forestnear Iquitos, Peru, has approximately 300 tree
species greater than 10 cm. in diameter perhectare; and a region in lowland Malaysia nearKuala Lumpur has some 570 plant speciesgreater than 2 cm. in diameter per hectare(Gentry 1988, S. Hubbell, Princeton University,personal communication, Feb. 1989). In com-parison, all of Denmark possesses less thantwice as many species (of all sizes) as there aretree species in one hectare in Malaysia.
Global patterns of species diversity in themarine environment resemble those on land.On Australia's Great Barrier Reef, for example,the number of genera of coral increases fromless than ten at the southern end to more than
11
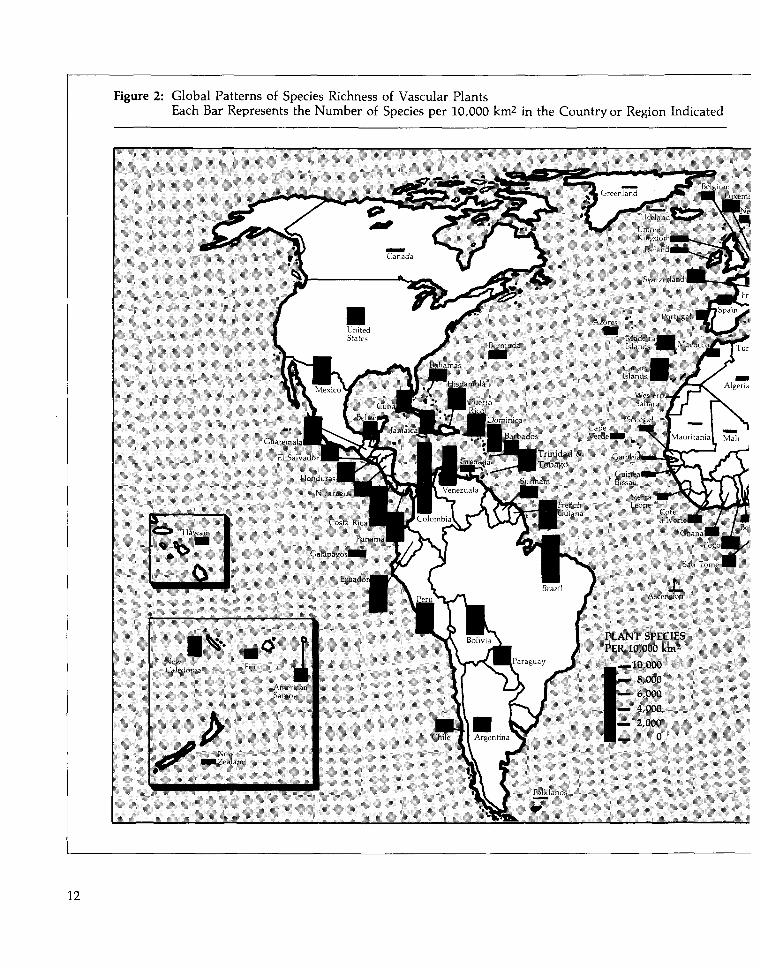
Figure 2: Global Patterns of Species Richness of Vascular PlantsEach Bar Represents the Number of Species per 10,000 km2 in the Country or Region Indicated
PLANT SPEC 11.5PER 10,000 knv"1
—10.000— 8.000— o,000— 4,000— 2,000
0
12
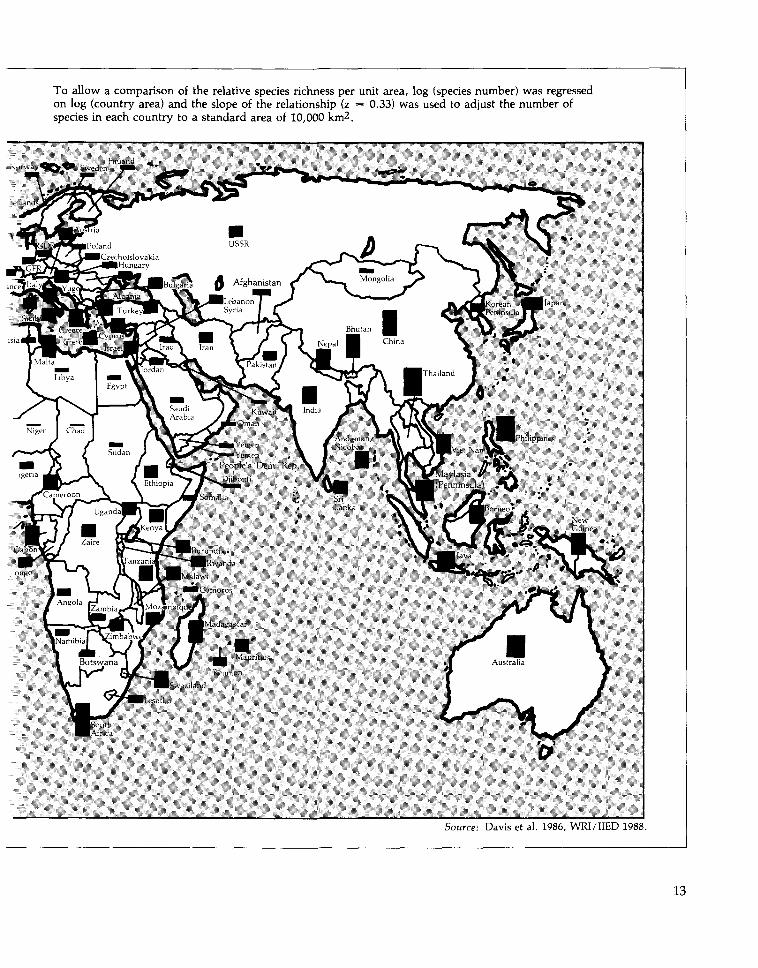
To allow a comparison of the relative species richness per unit area, log (species number) was regressedon log (country area) and the slope of the relationship (z = 0.33) was used to adjust the number ofspecies in each country to a standard area of 10,000 km2 .
Source: Davis et al. 1986, WRI/IIED 1988.
13
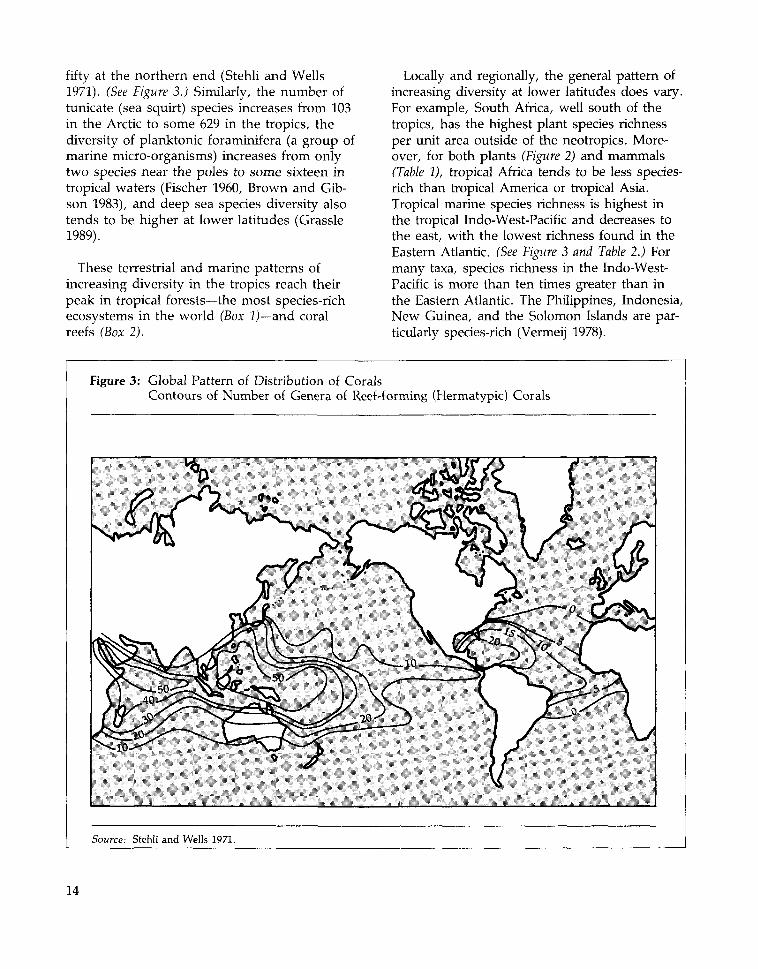
fifty at the northern end (Stehli and Wells1971). (See Figure 3.) Similarly, the number oftunicate (sea squirt) species increases from 103in the Arctic to some 629 in the tropics, thediversity of planktonic foraminifera (a group ofmarine micro-organisms) increases from onlytwo species near the poles to some sixteen intropical waters (Fischer 1960, Brown and Gib-son 1983), and deep sea species diversity alsotends to be higher at lower latitudes (Grassle1989).
These terrestrial and marine patterns ofincreasing diversity in the tropics reach theirpeak in tropical forests—the most species-richecosystems in the world (Box 2)—and coralreefs (Box 2).
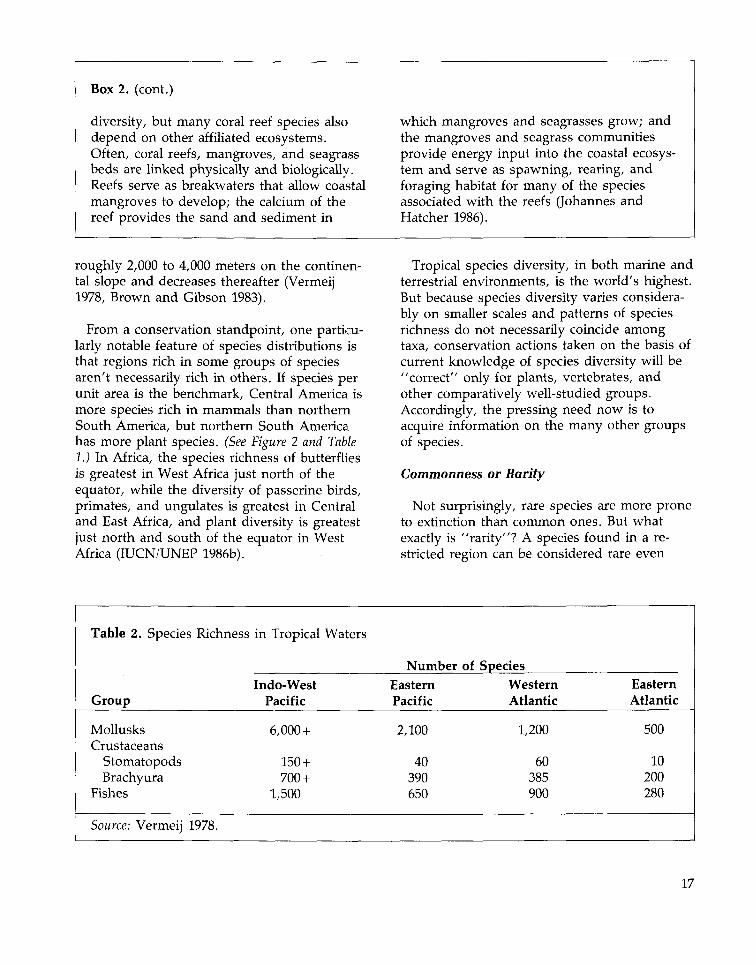
Locally and regionally, the general pattern ofincreasing diversity at lower latitudes does vary.For example, South Africa, well south of thetropics, has the highest plant species richnessper unit area outside of the neotropics. More-over, for both plants (Figure 2) and mammals(Table 1), tropical Africa tends to be less species-rich than tropical America or tropical Asia.Tropical marine species richness is highest inthe tropical Indo-West-Pacific and decreases tothe east, with the lowest richness found in theEastern Atlantic. (See Figure 3 and Table 2.) Formany taxa, species richness in the Indo-West-Pacific is more than ten times greater than inthe Eastern Atlantic. The Philippines, Indonesia,New Guinea, and the Solomon Islands are par-ticularly species-rich (Vermeij 1978).
Figure 3: Global Pattern of Distribution of CoralsContours of Number of Genera of Reef-forming (Hermatypic) Corals
Source: Stehli and Wells 1971.
14
Box 1. Tropical Forest Species Richness
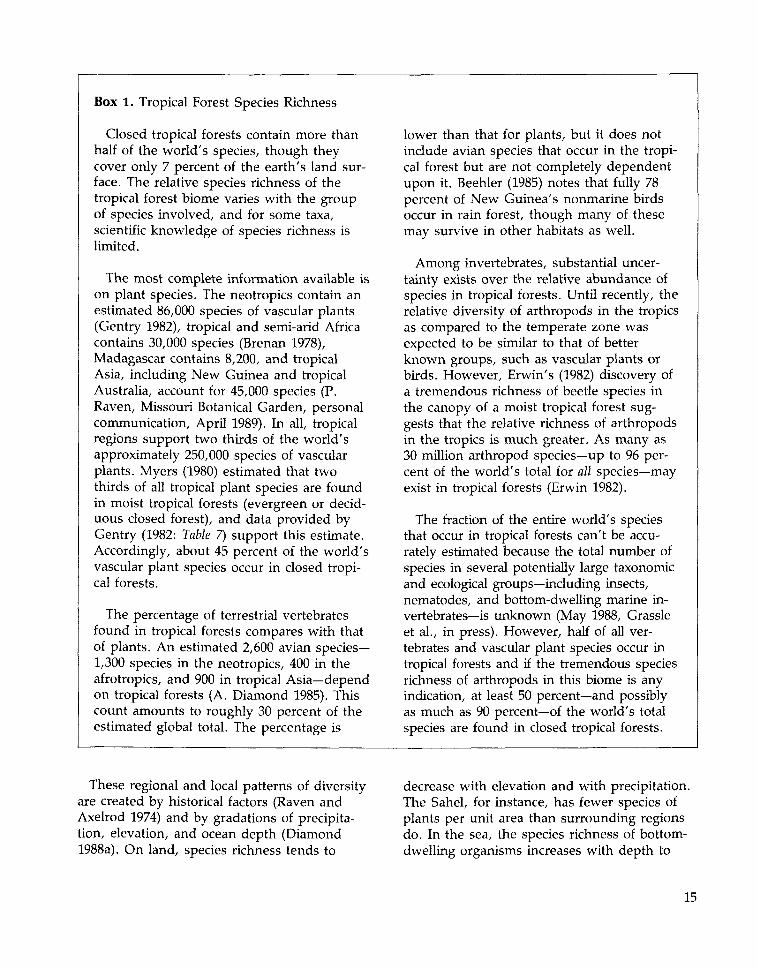
Closed tropical forests contain more thanhalf of the world's species, though theycover only 7 percent of the earth's land sur-face. The relative species richness of thetropical forest biome varies with the groupof species involved, and for some taxa,scientific knowledge of species richness islimited.
The most complete information available ison plant species. The neotropics contain anestimated 86,000 species of vascular plants(Gentry 1982), tropical and semi-arid Africacontains 30,000 species (Brenan 1978),Madagascar contains 8,200, and tropicalAsia, including New Guinea and tropicalAustralia, account for 45,000 species (P.Raven, Missouri Botanical Garden, personalcommunication, April 1989). In all, tropicalregions support two thirds of the world'sapproximately 250,000 species of vascularplants. Myers (1980) estimated that twothirds of all tropical plant species are foundin moist tropical forests (evergreen or decid-uous closed forest), and data provided byGentry (1982: Table 7) support this estimate.Accordingly, about 45 percent of the world'svascular plant species occur in closed tropi-cal forests.
The percentage of terrestrial vertebratesfound in tropical forests compares with thatof plants. An estimated 2,600 avian species—1,300 species in the neotropics, 400 in theafrotropics, and 900 in tropical Asia—dependon tropical forests (A. Diamond 1985). Thiscount amounts to roughly 30 percent of theestimated global total. The percentage is
lower than that for plants, but it does notinclude avian species that occur in the tropi-cal forest but are not completely dependentupon it. Beehler (1985) notes that fully 78percent of New Guinea's nonmarine birdsoccur in rain forest, though many of thesemay survive in other habitats as well.
Among invertebrates, substantial uncer-tainty exists over the relative abundance ofspecies in tropical forests. Until recently, therelative diversity of arthropods in the tropicsas compared to the temperate zone wasexpected to be similar to that of betterknown groups, such as vascular plants orbirds. However, Erwin's (1982) discovery ofa tremendous richness of beetle species inthe canopy of a moist tropical forest sug-gests that the relative richness of arthropodsin the tropics is much greater. As many as30 million arthropod species—up to 96 per-cent of the world's total for all species—mayexist in tropical forests (Erwin 1982).
The fraction of the entire world's speciesthat occur in tropical forests can't be accu-rately estimated because the total number ofspecies in several potentially large taxonomicand ecological groups—including insects,nematodes, and bottom-dwelling marine in-vertebrates—is unknown (May 1988, Grassleet el., in press). However, half of all ver-tebrates and vascular plant species occur intropical forests and if the tremendous speciesrichness of arthropods in this biome is anyindication, at least 50 percent—and possiblyas much as 90 percent—of the world's totalspecies are found in closed tropical forests.
These regional and local patterns of diversityare created by historical factors (Raven andAxelrod 1974) and by gradations of precipita-tion, elevation, and ocean depth (Diamond1988a). On land, species richness tends to
decrease with elevation and with precipitation.The Sahel, for instance, has fewer species ofplants per unit area than surrounding regionsdo. In the sea, the species richness of bottom-dwelling organisms increases with depth to
15
Box 2. Coral Reef Species Richness
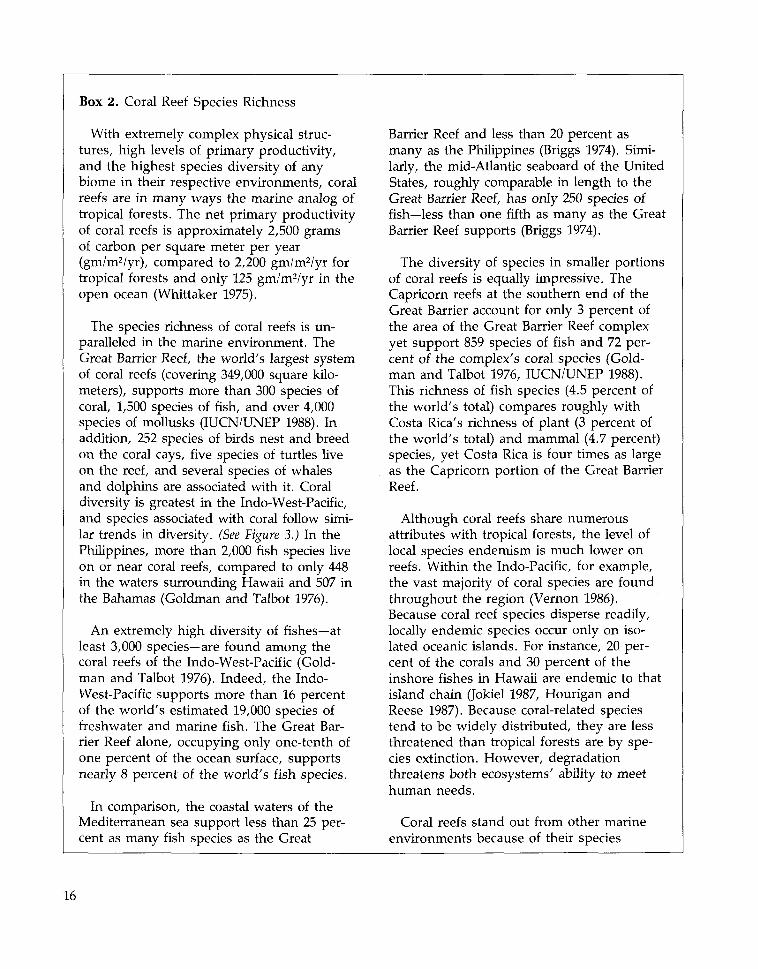
With extremely complex physical struc-tures, high levels of primary productivity,and the highest species diversity of anybiome in their respective environments, coralreefs are in many ways the marine analog oftropical forests. The net primary productivityof coral reefs is approximately 2,500 gramsof carbon per square meter per year(gm/m2/yr), compared to 2,200 gm/m2/yr fortropical forests and only 125 gm/m2/yr in theopen ocean (Whittaker 1975).
The species richness of coral reefs is un-paralleled in the marine environment. TheGreat Barrier Reef, the world's largest systemof coral reefs (covering 349,000 square kilo-meters), supports more than 300 species ofcoral, 1,500 species of fish, and over 4,000species of mollusks (IUCN/UNEP 1988). Inaddition, 252 species of birds nest and breedon the coral cays, five species of turtles liveon the reef, and several species of whalesand dolphins are associated with it. Coraldiversity is greatest in the Indo-West-Pacific,and species associated with coral follow simi-lar trends in diversity. (See Figure 3.) In thePhilippines, more than 2,000 fish species liveon or near coral reefs, compared to only 448in the waters surrounding Hawaii and 507 inthe Bahamas (Goldman and Talbot 1976).
An extremely high diversity of fishes—atleast 3,000 species—are found among thecoral reefs of the Indo-West-Pacific (Gold-man and Talbot 1976). Indeed, the Indo-West-Pacific supports more than 16 percentof the world's estimated 19,000 species offreshwater and marine fish. The Great Bar-rier Reef alone, occupying only one-tenth ofone percent of the ocean surface, supportsnearly 8 percent of the world's fish species.
In comparison, the coastal waters of theMediterranean sea support less than 25 per-cent as many fish species as the Great
Barrier Reef and less than 20 percent asmany as the Philippines (Briggs 1974). Simi-larly, the mid-Atlantic seaboard of the UnitedStates, roughly comparable in length to theGreat Barrier Reef, has only 250 species offish—less than one fifth as many as the GreatBarrier Reef supports (Briggs 1974).
The diversity of species in smaller portionsof coral reefs is equally impressive. TheCapricorn reefs at the southern end of theGreat Barrier account for only 3 percent ofthe area of the Great Barrier Reef complexyet support 859 species of fish and 72 per-cent of the complex's coral species (Gold-man and Talbot 1976, IUCN/UNEP 1988).This richness of fish species (4.5 percent ofthe world's total) compares roughly withCosta Rica's richness of plant (3 percent ofthe world's total) and mammal (4.7 percent)species, yet Costa Rica is four times as largeas the Capricorn portion of the Great BarrierReef.
Although coral reefs share numerousattributes with tropical forests, the level oflocal species endemism is much lower onreefs. Within the Indo-Pacific, for example,the vast majority of coral species are foundthroughout the region (Vernon 1986).Because coral reef species disperse readily,locally endemic species occur only on iso-lated oceanic islands. For instance, 20 per-cent of the corals and 30 percent of theinshore fishes in Hawaii are endemic to thatisland chain (Jokiel 1987, Hourigan andReese 1987). Because coral-related speciestend to be widely distributed, they are lessthreatened than tropical forests are by spe-cies extinction. However, degradationthreatens both ecosystems' ability to meethuman needs.
Coral reefs stand out from other marineenvironments because of their species
16
Box 2. (cont.)
diversity, but many coral reef species alsodepend on other affiliated ecosystems.Often, coral reefs, mangroves, and seagrassbeds are linked physically and biologically.Reefs serve as breakwaters that allow coastalmangroves to develop; the calcium of thereef provides the sand and sediment in
which mangroves and seagrasses grow; andthe mangroves and seagrass communitiesprovide energy input into the coastal ecosys-tem and serve as spawning, rearing, andforaging habitat for many of the speciesassociated with the reefs (Johannes andHatcher 1986).
roughly 2,000 to 4,000 meters on the continen-tal slope and decreases thereafter (Vermeij1978, Brown and Gibson 1983).
From a conservation standpoint, one particu-larly notable feature of species distributions isthat regions rich in some groups of speciesaren't necessarily rich in others. If species perunit area is the benchmark, Central America ismore species rich in mammals than northernSouth America, but northern South Americahas more plant species. (See Figure 2 and Table1.) In Africa, the species richness of butterfliesis greatest in West Africa just north of theequator, while the diversity of passerine birds,primates, and ungulates is greatest in Centraland East Africa, and plant diversity is greatestjust north and south of the equator in WestAfrica (IUCN/UNEP 1986b).
Tropical species diversity, in both marine andterrestrial environments, is the world's highest.But because species diversity varies considera-bly on smaller scales and patterns of speciesrichness do not necessarily coincide amongtaxa, conservation actions taken on the basis ofcurrent knowledge of species diversity will be"correct" only for plants, vertebrates, andother comparatively well-studied groups.Accordingly, the pressing need now is toacquire information on the many other groupsof species.
Commonness or Rarity
Not surprisingly, rare species are more proneto extinction than common ones. But whatexactly is "rarity"? A species found in a re-stricted region can be considered rare even
Table 2. Species Richness
Group
MollusksCrustaceans
StomatopodsBrachyura
Fishes
Source: Vermeij 1978.
in Tropical Waters
Indo-WestPacific
6,000 +
150 +700 +
1,500
Number ofEasternPacific
2,100
40390650
SpeciesWesternAtlantic
1,200
60385900
EasternAtlantic
500
10200280
17
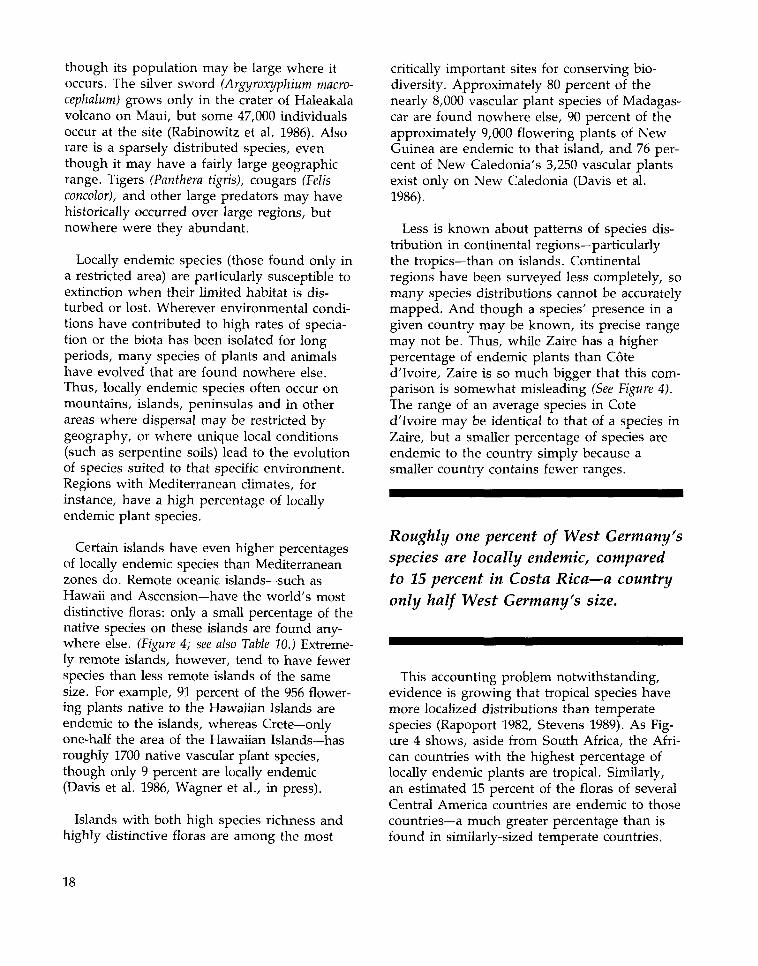
though its population may be large where itoccurs. The silver sword (Argyroxyphium macro-cephalum) grows only in the crater of Haleakalavolcano on Maui, but some 47,000 individualsoccur at the site (Rabinowitz et al. 1986). Alsorare is a sparsely distributed species, eventhough it may have a fairly large geographicrange. Tigers (Panthera tigris), cougars (Felisconcolor), and other large predators may havehistorically occurred over large regions, butnowhere were they abundant.
Locally endemic species (those found only ina restricted area) are particularly susceptible toextinction when their limited habitat is dis-turbed or lost. Wherever environmental condi-tions have contributed to high rates of specia-tion or the biota has been isolated for longperiods, many species of plants and animalshave evolved that are found nowhere else.Thus, locally endemic species often occur onmountains, islands, peninsulas and in otherareas where dispersal may be restricted bygeography, or where unique local conditions(such as serpentine soils) lead to the evolutionof species suited to that specific environment.Regions with Mediterranean climates, forinstance, have a high percentage of locallyendemic plant species.
Certain islands have even higher percentagesof locally endemic species than Mediterraneanzones do. Remote oceanic islands—such asHawaii and Ascension—have the world's mostdistinctive floras: only a small percentage of thenative species on these islands are found any-where else. (Figure 4; see also Table 10.) Extreme-ly remote islands, however, tend to have fewerspecies than less remote islands of the samesize. For example, 91 percent of the 956 flower-ing plants native to the Hawaiian Islands areendemic to the islands, whereas Crete—onlyone-half the area of the Hawaiian Islands—hasroughly 1700 native vascular plant species,though only 9 percent are locally endemic(Davis et al. 1986, Wagner et al., in press).
Islands with both high species richness andhighly distinctive floras are among the most
critically important sites for conserving bio-diversity. Approximately 80 percent of thenearly 8,000 vascular plant species of Madagas-car are found nowhere else, 90 percent of theapproximately 9,000 flowering plants of NewGuinea are endemic to that island, and 76 per-cent of New Caledonia's 3,250 vascular plantsexist only on New Caledonia (Davis et al.1986).
Less is known about patterns of species dis-tribution in continental regions—particularlythe tropics—than on islands. Continentalregions have been surveyed less completely, somany species distributions cannot be accuratelymapped. And though a species' presence in agiven country may be known, its precise rangemay not be. Thus, while Zaire has a higherpercentage of endemic plants than Coted'lvoire, Zaire is so much bigger that this com-parison is somewhat misleading (See Figure 4).The range of an average species in Coted'lvoire may be identical to that of a species inZaire, but a smaller percentage of species areendemic to the country simply because asmaller country contains fewer ranges.
Roughly one percent of West Germany'sspecies are locally endemic, comparedto 15 percent in Costa Rica—a countryonly half West Germany's size.
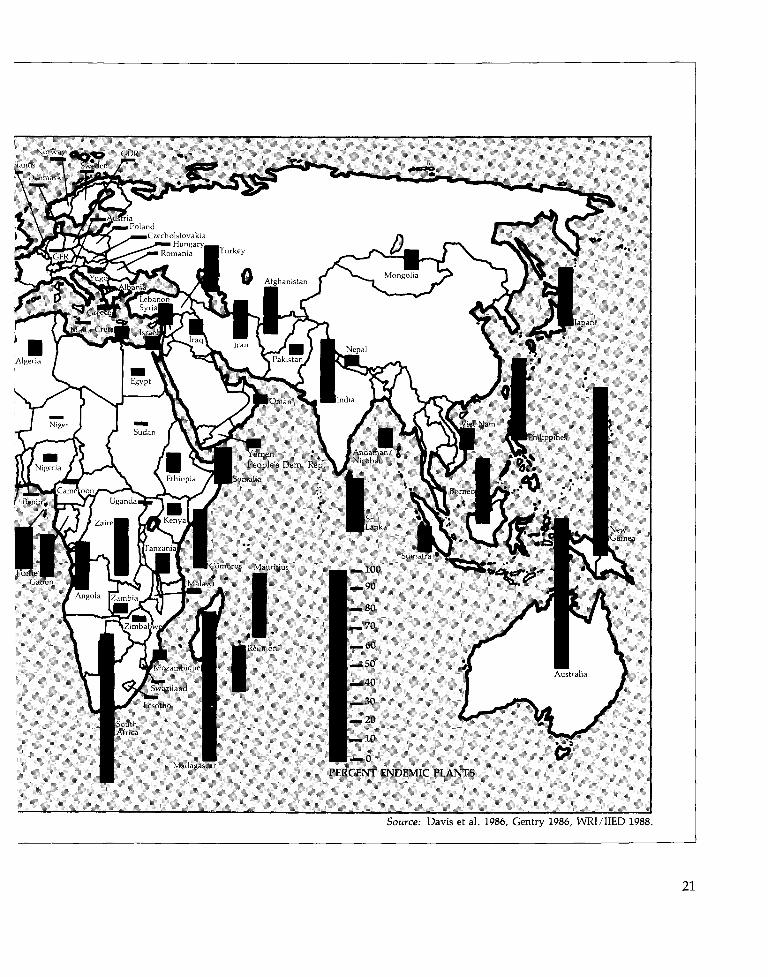
This accounting problem notwithstanding,evidence is growing that tropical species havemore localized distributions than temperatespecies (Rapoport 1982, Stevens 1989). As Fig-ure 4 shows, aside from South Africa, the Afri-can countries with the highest percentage oflocally endemic plants are tropical. Similarly,an estimated 15 percent of the floras of severalCentral America countries are endemic to thosecountries—a much greater percentage than isfound in similarly-sized temperate countries.
18
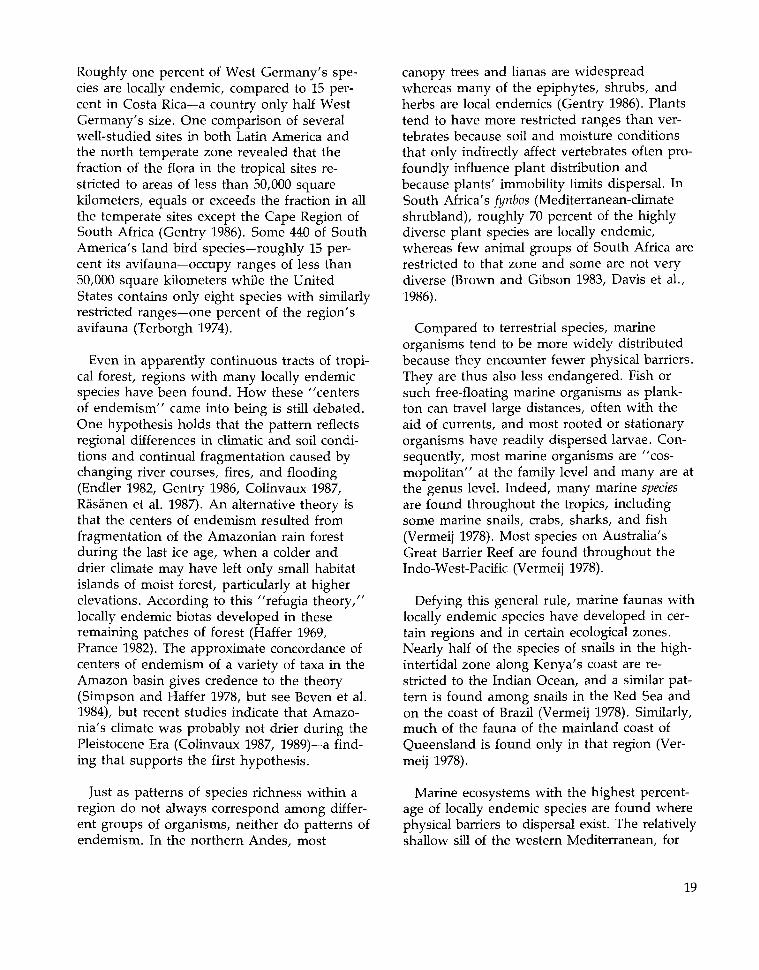
Roughly one percent of West Germany's spe-cies are locally endemic, compared to 15 per-cent in Costa Rica—a country only half WestGermany's size. One comparison of severalwell-studied sites in both Latin America andthe north temperate zone revealed that thefraction of the flora in the tropical sites re-stricted to areas of less than 50,000 squarekilometers, equals or exceeds the fraction in allthe temperate sites except the Cape Region ofSouth Africa (Gentry 1986). Some 440 of SouthAmerica's land bird species—roughly 15 per-cent its avifauna—occupy ranges of less than50,000 square kilometers while the UnitedStates contains only eight species with similarlyrestricted ranges—one percent of the region'savifauna (Terborgh 1974).
Even in apparently continuous tracts of tropi-cal forest, regions with many locally endemicspecies have been found. How these "centersof endemism" came into being is still debated.One hypothesis holds that the pattern reflectsregional differences in climatic and soil condi-tions and continual fragmentation caused bychanging river courses, fires, and flooding(Endler 1982, Gentry 1986, Colinvaux 1987,Rasanen et al. 1987). An alternative theory isthat the centers of endemism resulted fromfragmentation of the Amazonian rain forestduring the last ice age, when a colder anddrier climate may have left only small habitatislands of moist forest, particularly at higherelevations. According to this "refugia theory,"locally endemic biotas developed in theseremaining patches of forest (Haffer 1969,Prance 1982). The approximate concordance ofcenters of endemism of a variety of taxa in theAmazon basin gives credence to the theory(Simpson and Haffer 1978, but see Beven et al.1984), but recent studies indicate that Amazo-nia's climate was probably not drier during thePleistocene Era (Colinvaux 1987, 1989)—a find-ing that supports the first hypothesis.
Just as patterns of species richness within aregion do not always correspond among differ-ent groups of organisms, neither do patterns ofendemism. In the northern Andes, most
canopy trees and lianas are widespreadwhereas many of the epiphytes, shrubs, andherbs are local endemics (Gentry 1986). Plantstend to have more restricted ranges than ver-tebrates because soil and moisture conditionsthat only indirectly affect vertebrates often pro-foundly influence plant distribution andbecause plants' immobility limits dispersal. InSouth Africa's fynbos (Mediterranean-climateshrubland), roughly 70 percent of the highlydiverse plant species are locally endemic,whereas few animal groups of South Africa arerestricted to that zone and some are not verydiverse (Brown and Gibson 1983, Davis et al.,1986).
Compared to terrestrial species, marineorganisms tend to be more widely distributedbecause they encounter fewer physical barriers.They are thus also less endangered. Fish orsuch free-floating marine organisms as plank-ton can travel large distances, often with theaid of currents, and most rooted or stationaryorganisms have readily dispersed larvae. Con-sequently, most marine organisms are "cos-mopolitan" at the family level and many are atthe genus level. Indeed, many marine speciesare found throughout the tropics, includingsome marine snails, crabs, sharks, and fish(Vermeij 1978). Most species on Australia'sGreat Barrier Reef are found throughout theIndo-West-Pacific (Vermeij 1978).
Defying this general rule, marine faunas withlocally endemic species have developed in cer-tain regions and in certain ecological zones.Nearly half of the species of snails in the high-intertidal zone along Kenya's coast are re-stricted to the Indian Ocean, and a similar pat-tern is found among snails in the Red Sea andon the coast of Brazil (Vermeij 1978). Similarly,much of the fauna of the mainland coast ofQueensland is found only in that region (Ver-meij 1978).
Marine ecosystems with the highest percent-age of locally endemic species are found wherephysical barriers to dispersal exist. The relativelyshallow sill of the western Mediterranean, for
19
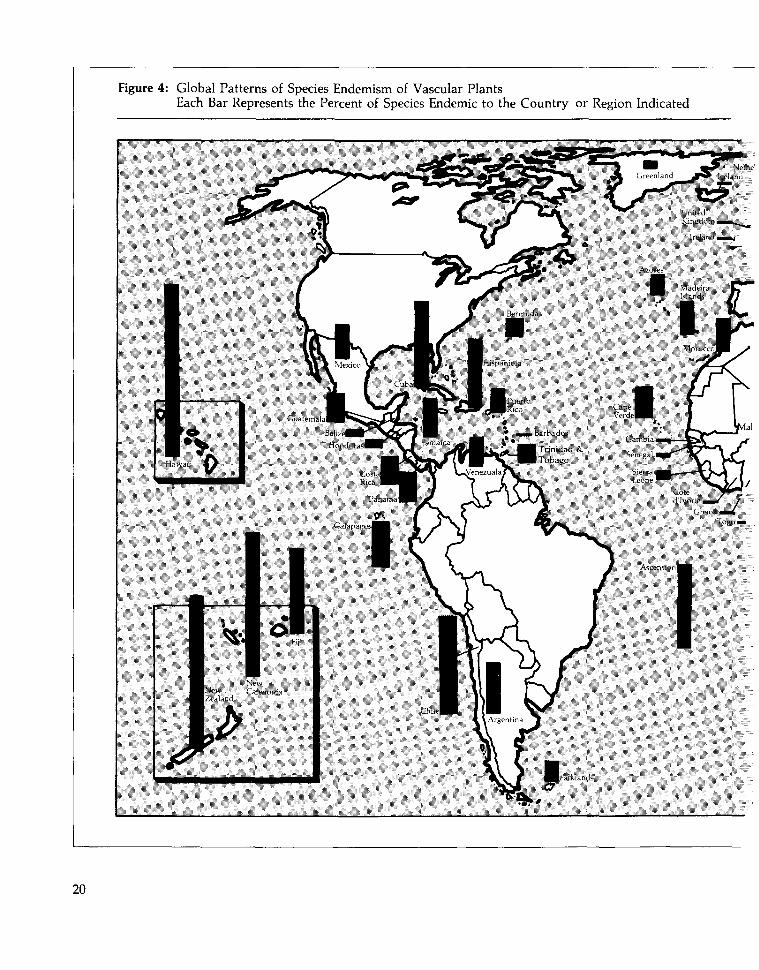
Figure 4: Global Patterns of Species Endemism of Vascular PlantsEach Bar Represents the Percent of Species Endemic to the Country or Region Indicated
20
— 0
PIRCTM r.\nr.Mic PLANTS
Source: Davis et al. 1986, Gentry 1986, WRI/IIED 1988.
21
example, has partially blocked dispersal andallowed the evolution of numerous speciesendemic to that sea. In a variety of invertebratetaxa in the Mediterranean, between 13 and 50percent of the species are locally endemic.Similarly, some 14 percent of the 362 species offish associated with Mediterranean shores arefound nowhere else (Briggs 1974). Fifteen per-cent of fish species in the Red Sea and 17 per-cent of fish in the Gulf of California are consid-ered endemic to those bodies of water (Briggs1974). Isolated oceanic islands and underseamountains also have many locally endemicmarine species. Some 30 to 40 percent of thefish species at Easter Island are locallyendemic. In the waters surrounding Hawaii,between 20 and 45 percent of a variety ofgroups of invertebrates and fish are foundnowhere else, and some 41 percent of thestony corals surrounding the Galapagos areendemic to those islands (Briggs 1974).
Besides patterns of endemism, the secondaspect of rarity, the abundance or scarcity of aspecies is also important from the standpointof biodiversity conservation. In contrast to localendemics, the primary threat to sparselydistributed species is generally not the loss ofall suitable habitat, but rather habitatfragmentation, which may so reduce thebreeding population within any fragment thatthe population can't survive. (See Chapter IV.)Among animals, species near the end of thefood chain—such as large cats, bears, sharks,and eagles—tend to be relatively scarce. Butgeneralizations about plants are harder tomake: in any region, some plant species mayoccur at quite low population densities whileothers may have large populations (Rabinowitzet al. 1986). In regions rich in plant species, thenumber of individuals of any given species isoften quite small (Hubbell 1979, Hubbell andFoster 1986). In one forested area in Panama,one third of the tree species account for lessthan one percent of the total number of trees(Hubbell and Foster 1986). Such sparselydistributed species are extremely susceptible tolocal extirpation or extinction caused by habitatfragmentation.
Strategies for maintaining biological diversitymust pay particularly close attention to rarespecies because of their susceptibility to extinc-tion. Indeed, the commonness or rarity ofspecies is often just as important as speciesrichness as a guideline for biodiversity conser-vation. But because rarity can result fromeither restricted distributions or sparse popula-tions, no single strategy will do the trick.Often, species with very restricted distributionscan be maintained by protecting the small areawhere they occur, but maintaining species withsparse populations may require protecting rela-tively large areas. As with species richness,however, the scientific knowledge regardingspecies ranges is far from complete, so effortsto increase knowledge of species identity anddistribution must accompany conservationactions.
Species of Current EconomicValue
Many of the world's most economicallyimportant species are found in areas wherespecies diversity is not especially great. Noneof the world's major food crops originated intropical rain forests, largely because thesespecies-rich regions were not traditional centersof human population when crops were firstdomesticated. For similar reasons, only twomajor crops grown in the United States—thesunflower and the Jerusalem artichoke—originated there.
Only two major crops grown in theUnited States—the sunflower and theJerusalem artichoke—originated there.
Understanding where species of current eco-nomic value originated and how they diversi-fied is important for several reasons. First,
22
regions possessing wild relatives of domesti-cated species and regions containing many var-ieties of a crop should be conservation priori-ties. If this supply of genetic materials is lost,breeding can't be used to enhance agriculturalproductivity. Second, knowledge of wherevaluable species originated can point us tolikely locations for future discoveries of speciesof direct economic value. No attempt is madehere to examine all of the current or potentialfuture uses of species. (See Myers 1979, 1983,Oldfield 1984, Prescott-AUen and Prescott-Allen1986, and OTA 1987.) Instead, the emphasis ison patterns of distributions of such species—onebasis of decisions on conservation priorities.
Food
Human beings have used about five thou-sand species of plants as food, but only 150 orso have entered world commerce and less thantwenty provide most of the world's food(Frankel and Soule 1981, Wilkes 1983). Justthree crops—wheat, rice, and maize—accountfor roughly 60 percent of the calories and 56percent of the protein that humans consumedirectly from plants (Wilkes 1985). Many of themost important food crops belong to just a fewplant families. The grass family—including suchcrops as wheat, rice, maize, barley, sorghum,millet, oats, and rye—provides some 80 percentof calories consumed by humans, and the leg-ume family has yielded soybeans, peanuts,common beans, peas, chickpeas, cowpeas, andother protein-rich crops. Forty percent of anestimated 2,300 species of cultivated plantsbelong to just four families: Graminae(grasses), Leguminosae (legumes), Rosaceae(apples, pears, etc.), and Solanaceae (potatoes)(Arora 1985). The remaining species belong toa diverse array of more than 160 families.
Like economically valuable species in general,many of the major food crops originated inregions that are not particularly species rich.Crops were domesticated in warm temperateand subtropical zones and in tropical moun-tainous regions. Wheat and barley were firstgrown in the steppes and woodlands of south
western Asia (Hawkes 1983), and the origin ofmaize has been traced to the seasonally drycentral highlands of Mexico (Wilkes 1979). Thehighlands of Peru contributed the tomato andpotato, though the tomato was probably firstcultivated in Mexico (Hawkes 1983, Wilkes1979).
Most important food crops appear to haveoriginated where seasons are pronounced, so itmakes sense to look there—and not in rainforests—for promising new crops. The cerealsof both the Old and New Worlds come fromregions with well-marked wet and dry seasons,while root and tuber agriculture, a mainstay oftropical regions, seems to have developed intropical lowlands with distinct dry periods(Hawkes 1983). As for why, scientists point inpart to the tendency of plants in seasonalenvironments to store nutrients during thegrowing season; often, these reserves are whathuman beings eat.
Several regions—known as Vavilov Centersof Diversity after N.I. Vavilov, the Russian bot-anist who first described the pattern—havebeen identified as locations of highly diversecrop genetic resources. (See Figure 5.) Thecenters of crop genetic diversity—including theMediterranean, the Mexican Highlands, CentralChina, and the Northern Andes—are character-ized by a long agricultural history, ecologicaldiversity, mountainous terrain, cultural diver-sity, and a lack of heavy forest cover (Harlan1975, Wood 1988). These centers may or maynot be located where the crop was first domes-ticated: wheat and barley were domesticated insouthwest Asia, but a current center of theirvarietal diversity is in Ethiopia (Wood 1988);the tomato originated in northwest Peru, butthe greatest domestic varietal diversity is inMexico (Isaac 1970).
Much of the world's agriculture is based onintroduced crops. In developing countries inthe Americas, only 32 percent of production,by value, is of crops of American origin (Wood1988). The comparable figure for Africandeveloping countries is 30 percent. Only in
23
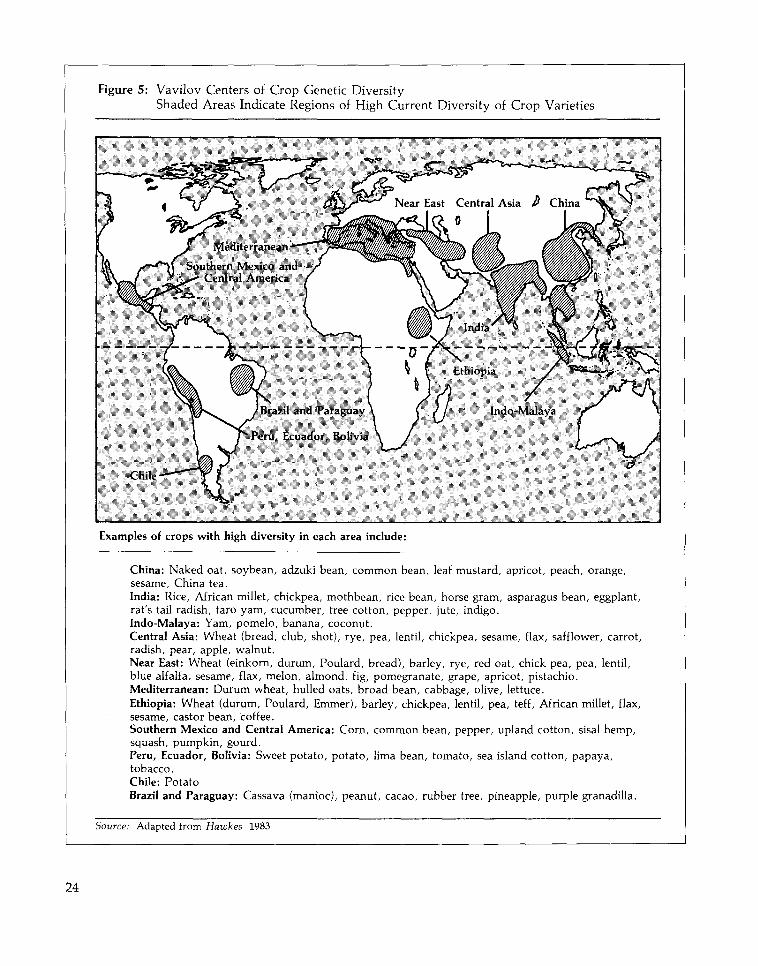
Figure 5: Vavilov Centers of Crop Genetic DiversityShaded Areas Indicate Regions of High Current Diversity of Crop Varieties
Southern Mexico and -•Central America
Brazil and Paraguay
Peru, Ecuador, Bolivia
Chile
Examples of crops with high diversity in each area include:
China: Naked oat, soybean, adzuki bean, common bean, leaf mustard, apricot, peach, orange,sesame, China tea.India: Rice, African millet, chickpea, mothbean, rice bean, horse gram, asparagus bean, eggplant,rat's tail radish, taro yam, cucumber, tree cotton, pepper, jute, indigo.Indo-Malaya: Yam, pomelo, banana, coconut.Central Asia: Wheat (bread, club, shot), rye, pea, lentil, chickpea, sesame, flax, safflower, carrot,radish, pear, apple, walnut.Near East: Wheat (einkorn, durum, Poulard, bread), barley, rye, red oat, chick pea, pea, lentil,blue alfalfa, sesame, flax, melon, almond, fig, pomegranate, grape, apricot, pistachio.Mediterranean: Durum wheat, hulled oats, broad bean, cabbage, olive, lettuce.Ethiopia: Wheat (durum, Poulard, Emmer), barley, chickpea, lentil, pea, teff, African millet, flax,sesame, castor bean, coffee.Southern Mexico and Central America: Corn, common bean, pepper, upland cotton, sisal hemp,squash, pumpkin, gourd.Peru, Ecuador, Bolivia: Sweet potato, potato, lima bean, tomato, sea island cotton, papaya,tobacco.Chile: PotatoBrazil and Paraguay: Cassava (manioc), peanut, cacao, rubber tree, pineapple, purple granadilla.
Source: Adapted from Hawkes 1983
24
Asian developing countries is most produc-tion—70 percent—by native species. Depen-dence on introduced species reaches itsextreme in Australia, the Mediterranean, north-ern Europe, northern Asia, and the UnitedStates and Canada. In these regions, morethan 90 percent of production is derived fromintroduced species. None of the world's twentymost important food crops are native to Aus-tralia or to North America north of Mexico(Kloppenburg and Kleinman 1987).
None of the world's twenty mostimportant food crops are native toAustralia or to North America north ofMexico.
Whether introduced or native, the mostimportant crops in any region of the worldoriginated or diversified in places with climatessimilar to those where they are now grown.The main crops grown in temperate zones arethus not the same as those of the tropicswhere most developing countries lay. Rice,which has origins in either India or China, isthe eighth most important crop in the devel-oped world (by weight) but by far—a factor oftwo—the leading crop in the developing world,and it is the most important source of calories
in tropical developing countries (Isaac 1970,Hawkes 1983, FAO 1987a). Similarly, cassava(also known as manioc)—native to tropicalAmerica—is not grown in developed countriesbut is the fourth most important crop in thedeveloping world (by weight) and providesmore than half of the caloric requirements forover 420 million people in twenty-six tropicalcountries (Cock 1982, Gulick et al. 1983). InAfrica, cassava is a fundamental subsistencecrop, and in tropical developing countries it isthe fourth most important dietary source ofcalories after rice, maize, and sugarcane.
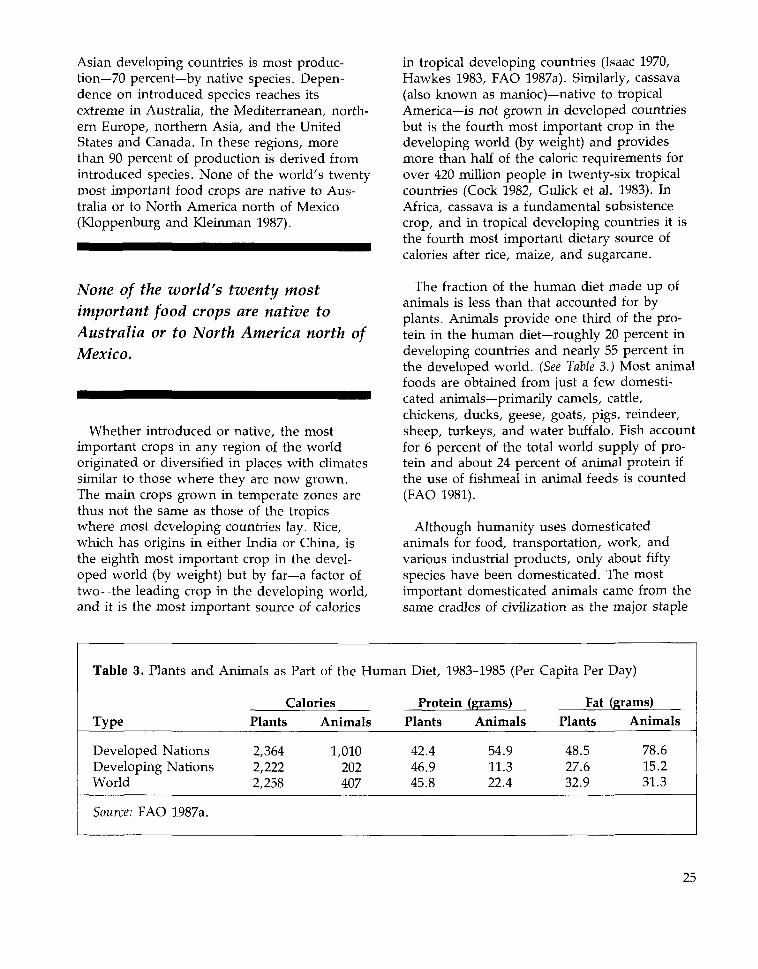
The fraction of the human diet made up ofanimals is less than that accounted for byplants. Animals provide one third of the pro-tein in the human diet—roughly 20 percent indeveloping countries and nearly 55 percent inthe developed world. (See Table 3.) Most animalfoods are obtained from just a few domesti-cated animals—primarily camels, cattle,chickens, ducks, geese, goats, pigs, reindeer,sheep, turkeys, and water buffalo. Fish accountfor 6 percent of the total world supply of pro-tein and about 24 percent of animal protein ifthe use of fishmeal in animal feeds is counted(FAO 1981).
Although humanity uses domesticatedanimals for food, transportation, work, andvarious industrial products, only about fiftyspecies have been domesticated. The mostimportant domesticated animals came from thesame cradles of civilization as the major staple
Table 3. Plants and
Type
Developed NationsDeveloping NationsWorld
Source: FAO 1987a.
Animals as Part of the Human Diet, 1983-1985 (Per
Calories Protein (grams)Plants
2,3642,2222,258
Animals
1,010202407
Plants
42.446.945.8
Animals
54.911.322.4
Capita Per
FatPlants
48.527.632.9
Day)
(grams)Animals
78.615.231.3
25
foods. Like crops, these animals have diversi-fied to form a variety of genetically distincttypes. For example, some 140 distinct breeds ofEuropean cattle (Bos taunts) can be foundthroughout the world, and most breeds com-prise genetically distinct populations. Eightbreeds of European cattle (the Criollos) occur intropical Latin America, and these form some 31distinct populations (de Alba 1987). Other cattle,such as the zebu cattle (Bos indicus) of India andthe banteng (Bos javanicus) of southeast Asia,are considered different species, though theycan be hybridized with European cattle.
Of the forty nations with the highestpercentage of animal protein suppliesderived from fish, thirty-nine aredeveloping countries.
Wild animals contribute only a small propor-tion of the human diet on a global basis, butboth regionally and locally, wild species'importance is often much greater. In at leastseven southeast Asian countries, more thanhalf of the animal protein consumed in themid-1970s was derived from fish (Darus 1983),and in one portion of the Peruvian Amazon,fish account for approximately 60 percent ofthe animal protein that local people eat(Dourojeanni 1985). In general, wild animalspecies play a greater role in the human diet indeveloping countries than in the developedworld. Of the forty nations with the highestpercentage of animal protein supplies derivedfrom fish, thirty-nine are developing countries(FAO 1984). (Japan is thirteenth.) Also, withindeveloping countries, the poor spend propor-tionately more of their household income onfish than on other meat products (FAO 1981,James 1984).
In many parts of the world, wild terrestrialanimals may contribute substantially to the
local economy. In South Africa, Zimbabwe,and Zambia, game ranching—the controlledharvest of wild or semi-domesticated animalsoften confined on fenced ranches—is becomingincreasingly popular. Some 8,200 landownersin South Africa earn between $28.6 million and$33.6 million annually through game ranching(Benson 1986).
Although the major food crops in use todaywere domesticated more than 2000 years ago,the potential for other species to play increas-ingly prominent roles in world agriculture isgreat (Vietmeyer 1986). Numerous locallyimportant species of wild and domesticatedplants could be cultivated and used much morewidely (NRC 1975, Arora 1985, Haq 1988). Forexample, quinua (Chenopodium quinoa), a staplegrain of the ancient Incas, is little known out-side of the highlands of Bolivia, Chile, Ecua-dor, and Peru, yet it is one of the world's mostproductive sources of plant protein (NRC1975). Its more widespread use in tropicalcountries could significantly increase grainproductivity and help alleviate the pressuresforcing continuing agricultural expansion ontomarginal lands. Similarly, several leguminouscrops that tropical and subtropical peopleshave cultivated for millennia are now beinginvestigated as "new" crops for harsh tropicalenvironments and marginal arid lands. Theseinclude yam bean (Pachyrhizus spp.), maramabean (Tylosema esculentum), bambara groundnut(Voandzeia subtermnea), jackbean and swordbean(Canavalia spp.), and winged bean (Psophocarpustetragonolobus) (NRC 1979). Many wild speciesof known value are also likely to become moreimportant as they become domesticated. Palmhearts, for example, are a valuable product stillharvested largely from wild species of thefamily Palmae in the neotropics; domesticatingthese species or developing sustainable extrac-tive harvesting systems could create valuableindustries in many tropical communities (NRC1975).
The size of the untapped store of locallyimportant food species that may play signifi-cant roles on wider scales in the future is
26
suggested by the number of wild species thatonly indigenous peoples eat. For example, onetribe in Brazil uses 38 different wild species oftrees for food (Prance et al. 1987). Often,knowledge of how to use specific species eludesscientists or even some groups within the localsociety. One survey in Sierra Leone found thatlocal women could name thirty-one productsgathered or made from wild species while themen could only name eight (FAO/SIDA 1987).
As with plants, the use of edible animal spe-cies can be expanded in two ways—by usingspecies of local importance more widely and bydomesticating wild species. In Asia, for exam-ple, many locally important domesticated spe-cies of cattle and pigs—including the banteng,mithan (Bos frontalis), yak (Bos grunniens), andSulawesi warty pig (Sus celebensis)—may bewell-suited to environmental conditions inother tropical and sub-tropical countries (NRC1983). Asia also contains several wild species ofpigs and cattle that could be valuable domesti-cates or—as in the case of the kouprey (Bossauveli) and the wild banteng (Bos javanicus)—breeding stock for already-domesticated species(NRC 1983). Several of these wild cattle, in-cluding the kouprey, currently face extinction.
Many other animals hold promise as semi-domesticated or domesticated species. In Cen-tral America, a semi-domesticated populationof the green iguana (Iguana iguana), endangeredin much of its range, has been established inPanama, and the Iguana Management Projectwill try to establish a similar population inCosta Rica (Chapin 1986, Ocana et al. 1988).Sustainably harvesting iguana could providevaluable protein to local communities and helpensure the survival of the tropical forest habitatthat the iguana requires.
Medicines
Many of the world's medicines contain activeingredients extracted from plants, animals, ormicroorganisms or synthesized using natural,chemicals as models. Tropical species have beenparticularly important sources of medicines, in
part because they contain a wide array of toxiccompounds that have evolved to hinder her-bivory or predation and many active medicalcompounds are derived from such toxins. Justthree of the many important medicinal tropicalplant species are serpent-wood Rauvolfia serpen-tina (anti-hypertensive drugs), Mexican yamsDioscorea composita (steroids), and the rosyperiwinkle Catharanthus roseus (anti-cancerdrugs).
The medical benefits of the world's biodiver-sity are not limited to plant compounds. Awealth of antimicrobial, antiviral, cardioactive,and neurophysiologic substances have beenderived from poisonous marine fauna (Ruggieri1976), and the venoms of various arthropodshave medicinal potential (Bettini 1978). Domes-ticated animals have provided humanity withhormones and enzymes, and animals have alsoplayed important roles in behavioral studiesand medical research. A long list of primates,including baboons (Papio spp.), chimpanzee(Pan troglodytes), and the African vervet mon-key (Cercopithecus aethiops) are invaluable forbiomedical research on AIDS and other dis-eases. Fungi and microbes have providedhumanity with such life-saving drugs as theantibiotics, penicillin and tetracycline, and theimmunosuppressant cyclosporin, which hasgreatly increased the survival rate for heart-and kidney-transplant patients (Byrne 1988).
New medicinal compounds are often derivedfrom species that have been used as folk reme-dies for centuries. In one study of 119 plant-derived drugs used in Western medicine, some77 percent were found to have been used infolkloric medicine by indigenous cultures (Farn-sworth 1988), and one of the most promisingnew anti-malarial drugs—qinghaosu—is the activeingredient of a Chinese herbal medicine usedfor centuries to treat malaria and rediscoveredonly in 1971 (Wyler 1983). Of course, some ofthe most threatening modern diseases, includ-ing AIDS and some types of cancer, havehistorically had little impact on traditional socie-ties; in such cases, traditional medicinal speciesmay have no more than other species to offer.
27
While it is reasonable to turn to species-richregions to find promising medicinal com-pounds, will that search be made? In the 1960sand 1970s, pharmaceutical companies becameincreasingly reliant on the chemical synthesisof drugs, and the search for natural chemicalsslowed. At the same time, efforts to locate nat-ural chemicals shifted from plants and animalsto microorganisms and fungi because they canbe collected, cultured, and screened cheaplyand easily and can be readily grown in labora-tories to produce commercial quantities ofactive compounds.
If they can't patent the use of a naturalcompound, companies have no incentiveto make the long-term investmentsrequired for screening and developingthem.
Private industry's declining interest in sam-pling plants and animals for natural medicinalcompounds may have been further weakenedby uncertainty over property rights for naturalmedicines (Farnsworth 1988, Sedjo 1989). Ifthey can't patent the use of a natural com-pound, companies have no incentive to makethe long-term investments required for screen-ing and developing them. Precedents do existfor such patents: Eli Lilly Co., for example, hasexclusive rights to the anti-cancer agent vin-cristine derived from the rosy periwinkle (Farn-sworth 1988). But synthetic products haveadvantages: clear property rights and securesupplies.
Despite these drawbacks, wild species remainvitally important to medicine's future. Aboutfour fifths of the people in developing coun-tries still rely on traditional medicines forhealth care (Farnsworth 1988). Even in thehigh-tech medical industries of developed
countries, wild species are unlikely to lose theirprominence, and natural compounds stillaccount for a significant portion of medicinesin developed countries. Between 1959 and1973, one fourth of all prescriptions dispensedin the United States contained active ingre-dients extracted from vascular plants (Principe,in press). Most of the synthetic drugs that havebecome increasingly important are modeledafter natural products, so their use should notslow the search for natural compounds.Indeed, very recently, interest in that searchhas revived (Sedjo 1989), thanks in part to newarrangements whereby pharmaceutical firms,collectors, and the nation of species origin canshare profits from the discovery and use ofmedicinal plants, animals, and microbes (Sedjo1989).
Finding new natural drugs is clearly in soci-ety's interest, and declining private investmenthas been partially offset in some countries byincreased public expenditure. The U.S. NationalCancer Institute, for example, launched an$8-million program in 1987 to screen 10,000natural substances each year for five yearsagainst one hundred cancer cell lines and theAIDS virus (Booth 1987). The People's Republicof China, Japan, India, the Federal Republic ofGermany, and other countries also have activeresearch programs directed at natural drugs(Farnsworth 1988).
The search for new medicines presents atremendous opportunity for tropical countries.Relatively low-cost facilities could be estab-lished in developing countries to initiallyscreen compounds (Eisner, in press). Suchfacilities would be labor-intensive and relyingon them would have several advantages overshipping materials to other countries: thechance of locating active compounds would beincreased since fresh materials could be tested;local industries would be developed; in-countryscientific expertise would be increased; andmedicines could be developed to treat the mosttroublesome regional diseases, such as malariaand schistosomiasis. Such local institutionscould help fill a gap left by biomedical research
28
in the developed world, which is tailoredtoward the needs of people in developedcountries.
Industrial Uses
Plants and animals are major industrial feed-stocks. Plants provide such products as naturalrubber, waxes, oils, fuelwood, timber, forage,fibers, resins, and they are also used forornamental purposes. Animals provide oils,fuel, silk, and feathers, and throughout theworld they are valued as pets. Everywhere,local species tend to be the primary source ofindustrial products important to the region,regardless of its relative species-richness. But,taking a global perspective, species-richecosystems will no doubt provide the mostproducts for the future use of collectivehumanity.
The most significant industrial uses of theworld's biota trace back to the world's forests.Global timber trade amounts to some $77 bil-lion annually (FAO 1989). In addition, almosthalf of the world's population, more than 2 bil-lion people, use wood as their primary sourceof energy (WRI/IIED 1988), while in sub-Saharan Africa wood accounts for 80 percent ofthe total energy consumed (WEC 1987). Non-timber forest products are also extremelyimportant in many countries, and their valuemay sometimes exceed that of traditional tim-ber products. In 1986, Indonesia earned $86million from exports of rattan (Vatikiotis 1989),and in various parts of the world bamboo, bra-zil nuts, rubber, and fruit are mainstays oflocal economies and significant exports. Thevalue of non-wood forest products is muchgreater than generally assumed. One recentstudy of a tropical forest in Peru found thevalue of non-wood forest products to be two tothree times that of the timber (Peter et al.1989).
Particularly in tropical countries, many of thebenefits derived from forests are threatened bythe loss or degradation of forest ecosystems.Between 1976 and 1980, an estimated 7.3
million hectares of closed tropical forest wasconverted to other land uses each year and anadditional 4.4 million hectares annually waslogged (Lanly 1982, Melillo et al. 1985). Con-serving these forest ecosystems is a high pri-ority from the standpoint of maintaining bio-logical diversity as well as from that of meetingthe needs of people who depend upon the for-est resources.
With rapid population growth in the tropicsand the loss and degradation of tropical forestresources, tree species are needed for intensiveforest cultivation to meet the growing demandfor tropical timber products, for fuelwoodproduction and agroforestry schemes in tropicalcountries, and for stabilizing and restoringdegraded tropical soils. Since the species thatwill fill these needs in tropical countries will beprimarily tropical in origin, the protection ofthe diversity of tropical species is of highpriority.
The combined potential of plants,animals, and microorganisms in thewar against hunger, disease, andeconomic stagnation is only beginningto be tapped.
Various locally important tropical species arenow being investigated for possible use overlarger regions of the tropics (Vietmeyer 1986).In particular, leguminous species have receivedspecial attention because they can fix nitrogenand this property is essential to agroforestryand land restoration. Leucaena (Leucaena leu-cocephala), which originated in Mexico and waswidely utilized and dispersed by the Mayanand Zapotec civilizations, is now beingintroduced into numerous tropical nations.Leucaena can produce nutritious forage, fire-wood, timber, and organic fertilizer, and it canbe used to revegetate degraded lands, establish
29

windbreaks, and provide shade (NRC 1977). or as plantation species (NRC 1979). The com-Similarly, such species as mesquite (Prosopis bined potential of plants, animals, and micro-spp.) and a variety of species of acacias are organisms in the war against hunger, disease,now being examined for use in rehabilitating and economic stagnation is only beginning to bedegraded lands, as a component of agroforestry, tapped.
30
IV. Extinction: How Serious is theThreat?
T he world's biological diversity has co-evolved with human culture. Human-ity has applied growing knowledge
and skills to order and manipulate nature tomeet changing human needs. In this process,people have hunted, fished, and gathered spe-cies for food, fuel, fiber and shelter. They haveeliminated competing or threatening species,domesticated plants and animals, cut forests,used fire to alter habitats, and recently evensignificantly changed hydrological and geo-chemical cycles. As a result, the landscape and,to a lesser extent, the sea, today reflect humanculture.
These various human impacts on the biotamay increase or decrease the genetic, species,and habitat diversity in a particular region. Butthe most profound—and irreversible—impact ofhuman activities on the biosphere is the sub-stantial acceleration of species extinction.Today, human beings use, divert, or wasteabout 40 percent of the total terrestrial net pri-mary productivity, or about 25 percent of theworld total (Vitousek et al. 1986). Not surpris-ingly, humanity's impact on the remainder ofthe world's biota is also substantial.
Trends in Species ExtinctionsHumanity's impact on species extinction rates
goes back several thousand years, but over thelast century the human factor has increaseddramatically. (See Box 3.) Written records ofextinctions are most complete for birds and
mammals. However, these data must be inter-preted with considerable caution. Althoughsome species listed as extinct may subsequentlybe rediscovered, recorded extinctions tend tounderestimate the true number of extinctionsbecause the status of many species, particularlyin tropical forests, is unknown (Diamond1988b). This problem notwithstanding, the rateof known extinctions of birds and mammalsincreased fourfold between 1600 and 1950. (SeeFigure 6.) By 1950, recorded extinction rateshad climbed to between one-half and one per-cent of birds and mammals per century. Since1600, some 113 species of birds and 83 speciesof mammals are known to have been lost. (SeeTable 4.) Between 1850 and 1950, the extinctionrate of birds and mammals averaged one spe-cies per year. The rapid growth in the rate ofspecies extinction is a telling measure of thestatus of the world's biodiversity.
Current rates of extinction among birdsand mammals are perhaps 100 to 1000times what they would be inunperturbed nature.
How does the current rate of extinction com-pare with average extinction rates in theabsence of human influences? For most groups
31
Box 3. A History of Extinction
Extinction rates have varied considerablyover the history of life on earth. Paleontolo-gists distinguish five episodes of "massextinctions"—relatively short (1 million to 10million year) periods during which a signifi-cant fraction of diversity in a wide range oftaxa went extinct. The most significant massextinction, at the end of the Permian (250million years ago), may have eliminated 77to 96 percent of species (Valentine et al.1978, Raup 1979). Even apart from thesemass extinctions, background rates of extinc-tion are not constant. For example, for thepast 250 million years, relatively high ratesof extinction have occurred nine times—atintervals of approximately 26 to 28 millionyears. Two of these nine episodes weremass extinctions, one in the late Triassic, 220million years ago, and one in the late Creta-ceous, 65 million years ago (Sepkoski andRaup 1986).
Global biological diversity is nowclose to its all time high.
Global biological diversity is now close toits all time high (Wilson 1988b). Floral diver-sity, for example, reached its highest levelever several tens of thousands of years ago(Knoll 1986). Similarly, the diversity ofmarine fauna has risen to a peak in the lastfew million years (Raup and Sepkoski 1982).
Humanity's first significant contribution tothe rate of global extinction may haveoccurred 15,000 to 35,000 years ago, whenhunting of large mammals apparently causedor contributed to significant extinctions inNorth and South America and Australia(Martin 1973, 1986). These three continents
lost 74 to 86 percent of the genera of"megafauna"—mammals greater than 44kg—at that time. While the cause of theseextinctions remains a matter of controversy(see Martin and Klein 1984), even if humanityis not wholly responsible, there is no doubtthat for millennia, people have significantlyaltered the landscape with untold effects onnative flora and fauna. For at least 50,000years, intentional burning has occurred inthe savannas of Africa (Murphy and Lugo1986). At least 5,000 years ago, in Europe,deforestation and the conversion of wild-lands to pasture began and there is evidencein North America that for as long as 4,000years indigenous peoples influenced thestructure of forest communities, providedopportunities for weedy species and suchherbivores as bison (Bison bison) to expandtheir ranges, and caused at least local spe-cies extinctions (Delcourt 1987). In CentralAmerica, forest had already been removedfrom large areas before the Spanish arrived(D'Arcy 1977).
The prehistoric colonization of islands byhuman beings and their commensals sub-stantially affected the diversity of island spe-cies. Fossil evidence suggests that 98 speciesof endemic birds were present in the Hawai-ian Islands in A.D. 400 when the islandswere first colonized by Polynesians. Aboutfifty of these species became extinct beforethe first European contact in 1778. Mostexperts believe that these extinctionsresulted from a combination of the clearingof extensive tracts of lowland forest foragriculture, predation and disturbance byintroduced species (the Polynesian rat,domestic pig, and domestic dog), and hunt-ing (Olson and James 1982, 1984; Vitousek1988; Olson 1989). Similarly, followinghuman colonization of New Zealand in A.D.1000, the introduction of the domestic dogand the Polynesian rate, combined with the
32
Box 3. (cont.)
deforestation of large areas by fire and inten-sive hunting of larger birds, led to theextinction of 13 species of moas (large flight-less birds) and 16 other endemic birds beforethe arrival of Europeans (Cassels 1984).Humanity is thought to have caused otherextinctions following the colonization ofMadagascar in A.D. 500 and the ChathamIslands in A.D. 1000. Early human coloniza-tion of oceanic islands may have led to theextinction of as many as one-quarter of thebird species that existed several millenniaago (Olson 1989).
In the 15th and 16th centuries, the globalspread of European cultures and their atten-dant livestock, crops, weeds, and diseasesincreased the loss of island flora and faunaand added to the threats to continental spe-cies (Crosby 1986). In later centuries, thegrowth of trans-oceanic human travel andcommerce led to the spread of a tremendousvariety of species to new regions of theworld and to the human colonization ofmany uninhabited islands. Between 1840and 1880, more than 60 species of verte-brates were released in Australia (K. Myers1986). Between 1800 and 1980, the numberof introduced insect species in the United
States grew from about 36 to more than 1200(Simberloff 1986b).
Many of the European introductions andcolonizations, like those of earlier colonizers,significantly influenced native flora andfauna. In Hawaii, the arrival of Europeanexplorers added cats, two new species ofrats, the barn owl, the small Indian mon-goose, and several avian diseases. In the nexttwo centuries, habitat degradation, disease,and predation caused the loss of 17 endemicbird species (Olson 1989), reducing theendemic avifauna to 31 percent of the diver-sity found in A.D. 400; several more speciesnow verge on extinction. Europeans firstvisited the uninhabited Mascarene islands(Mauritius, Reunion, and Rodrigues) in theearly 1500s and released pigs and monkeyson the islands. In the mid-1600s, the Dutchsettled the islands, and in the next 300 yearstwenty species of birds—including theDodo—and 8 species of reptiles were lost(Nilsson 1983). The extreme vulnerability ofisland endemics is exemplified by the fate ofthe flightless Stephen Island wren (Xenicuslyalli), driven to extinction by a single catowned by a lighthouse keeper on an islet offNew Zealand (Diamond 1984).
of organisms, the average "lifespan" of a spe-cies is on the order of 1 million to 10 millionyears (Raup 1978), so only 1 to 10 species outof the total current biota of some 10 million spe-cies would be expected to be lost each year.These estimates are most accurate for wide-spread species and particularly for marine spe-cies because their fossil record is most com-plete. But estimates for terrestrial mammalsalso fall within this range (1 million to 2 mil-lion years; Raup and Stanley 1978). Amongorganisms with restricted ranges, prehistoricextinction rates may have been higher than theaverages suggest, though it is safe to say that
for widespread species, the so-called back-ground extinction rate is extremely small,indeed close to zero. Among the approximately13,000 species of birds and mammals on earthtoday, an extinction would be expected onlyevery 100 to 1000 years. Current rates of extinc-tion among birds and mammals are thus per-haps 100 to 1000 times what they would be inunperturbed nature.
Besides birds and mammals, marine inver-tebrates are the only other group for which thedata in Table 4 present an even approximatelyaccurate representation of the true number of
33
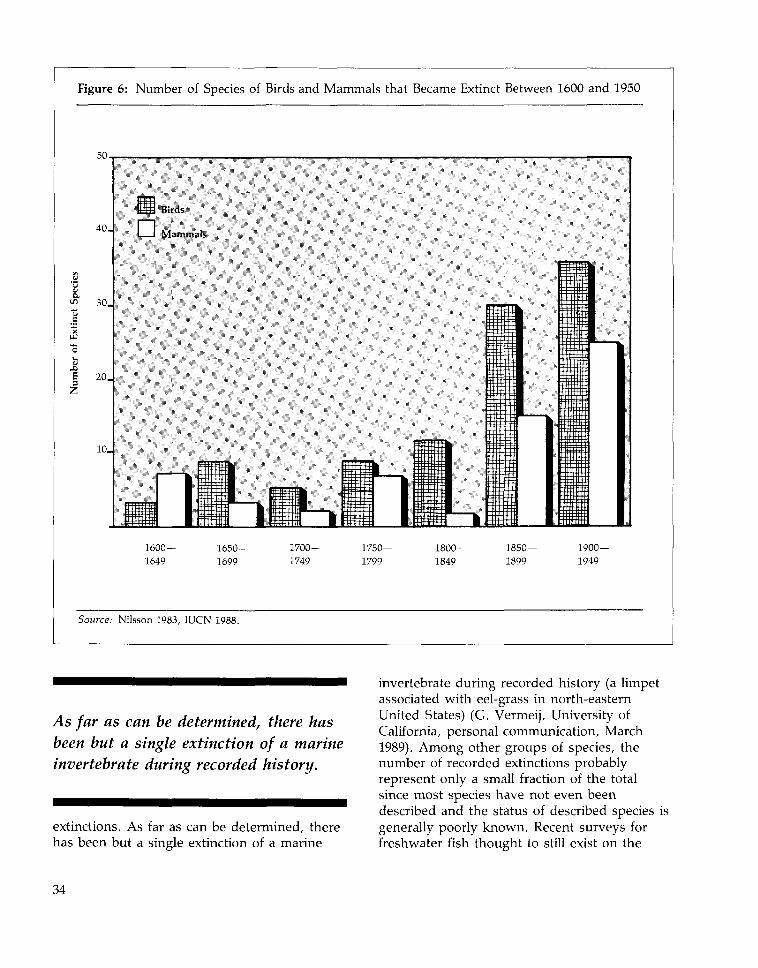
Figure 6: Number of Species of Birds and Mammals that Became Extinct Between 1600 and 1950
50.
40 .
30.
6 2 0 .
•Birds
Mammals
1600—1649
1650-1699
17001749
1750—1799
1800—1849
1850—1899
1900-1949
Source: Nilsson 1983, IUCN 1988.
As far as can be determined, there hasbeen but a single extinction of a marineinvertebrate during recorded history.
extinctions. As far as can be determined, therehas been but a single extinction of a marine
invertebrate during recorded history (a limpetassociated with eel-grass in north-easternUnited States) (G. Vermeij, University ofCalifornia, personal communication, March1989). Among other groups of species, thenumber of recorded extinctions probablyrepresent only a small fraction of the totalsince most species have not even beendescribed and the status of described species isgenerally poorly known. Recent surveys forfreshwater fish thought to still exist on the
34
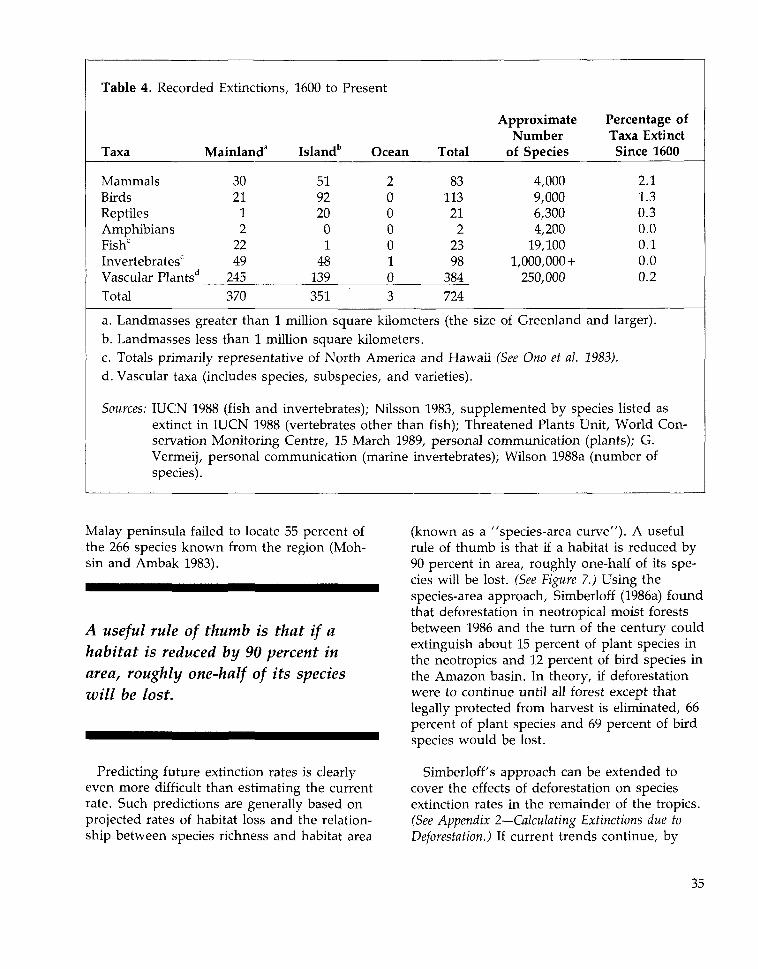
Table 4. Recorded Extinctions, 1600 to Present
Taxa Mainland3 Islandb ean
2000010
Total
8311321
22398
384
ApproximateNumber
of Species
4,0009,0006,3004,200
19,1001,000,000 +
250,000
Percentage ofTaxa ExtinctSince 1600
2.11.30.30.00.10.00.2
Mammals 30Birds 21Reptiles 1Amphibians 2Fishc 22Invertebrates0 49Vascular Plants'1 245Total 370
5192200148139
351 724
a. Landmasses greater than 1 million square kilometers (the size of Greenland and larger).
b. Landmasses less than 1 million square kilometers.c. Totals primarily representative of North America and Hawaii (See Ono et al. 1983).
d. Vascular taxa (includes species, subspecies, and varieties).
Sources: IUCN 1988 (fish and invertebrates); Nilsson 1983, supplemented by species listed asextinct in IUCN 1988 (vertebrates other than fish); Threatened Plants Unit, World Con-servation Monitoring Centre, 15 March 1989, personal communication (plants); G.Vermeij, personal communication (marine invertebrates); Wilson 1988a (number ofspecies).
Malay peninsula failed to locate 55 percent ofthe 266 species known from the region (Moh-sin and Ambak 1983).
A useful rule of thumb is that if ahabitat is reduced by 90 percent inarea, roughly one-half of its specieswill be lost.
Predicting future extinction rates is clearlyeven more difficult than estimating the currentrate. Such predictions are generally based onprojected rates of habitat loss and the relation-ship between species richness and habitat area
(known as a "species-area curve"). A usefulrule of thumb is that if a habitat is reduced by90 percent in area, roughly one-half of its spe-cies will be lost. (See Figure 7.) Using thespecies-area approach, Simberloff (1986a) foundthat deforestation in neotropical moist forestsbetween 1986 and the turn of the century couldextinguish about 15 percent of plant species inthe neotropics and 12 percent of bird species inthe Amazon basin. In theory, if deforestationwere to continue until all forest except thatlegally protected from harvest is eliminated, 66percent of plant species and 69 percent of birdspecies would be lost.
Simberloff's approach can be extended tocover the effects of deforestation on speciesextinction rates in the remainder of the tropics.(See Appendix 2—Calculating Extinctions due toDeforestation.) If current trends continue, by
35
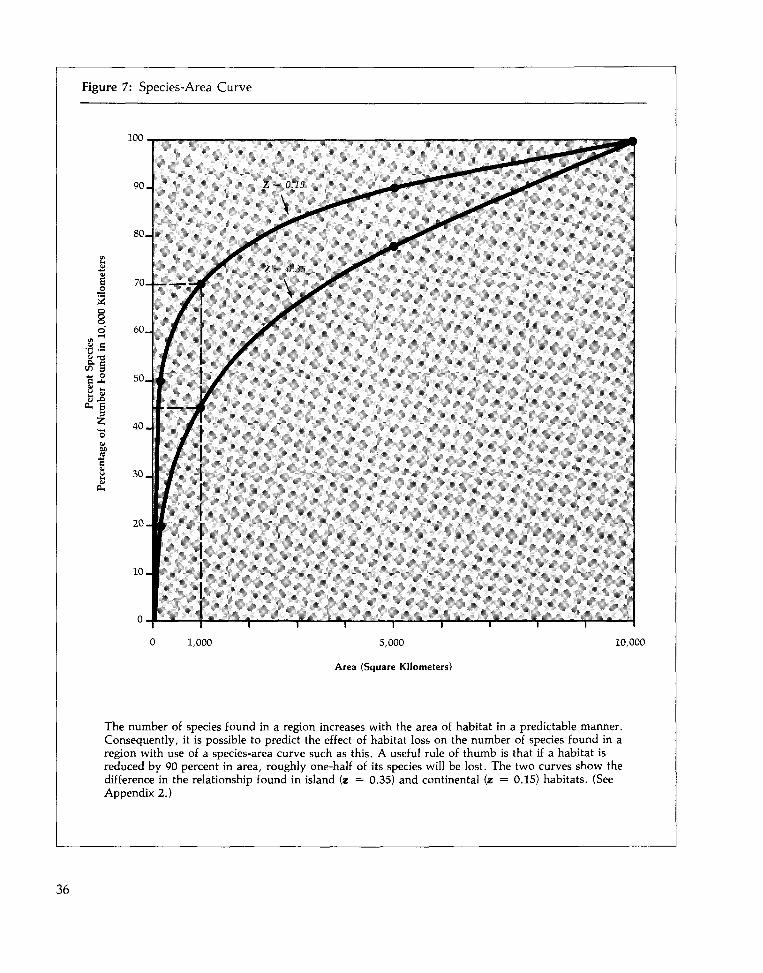
Figure 7: Species-Area Curve
i'ien 3S u.
Sis
10
1,000 5,000
Area (Square Kilometers)
10,000
The number of species found in a region increases with the area of habitat in a predictable manner.Consequently, it is possible to predict the effect of habitat loss on the number of species found in aregion with use of a species-area curve such as this. A useful rule of thumb is that if a habitat isreduced by 90 percent in area, roughly one-half of its species will be lost. The two curves show thedifference in the relationship found in island (z = 0.35) and continental (z = 0.15) habitats. (SeeAppendix 2.)
36
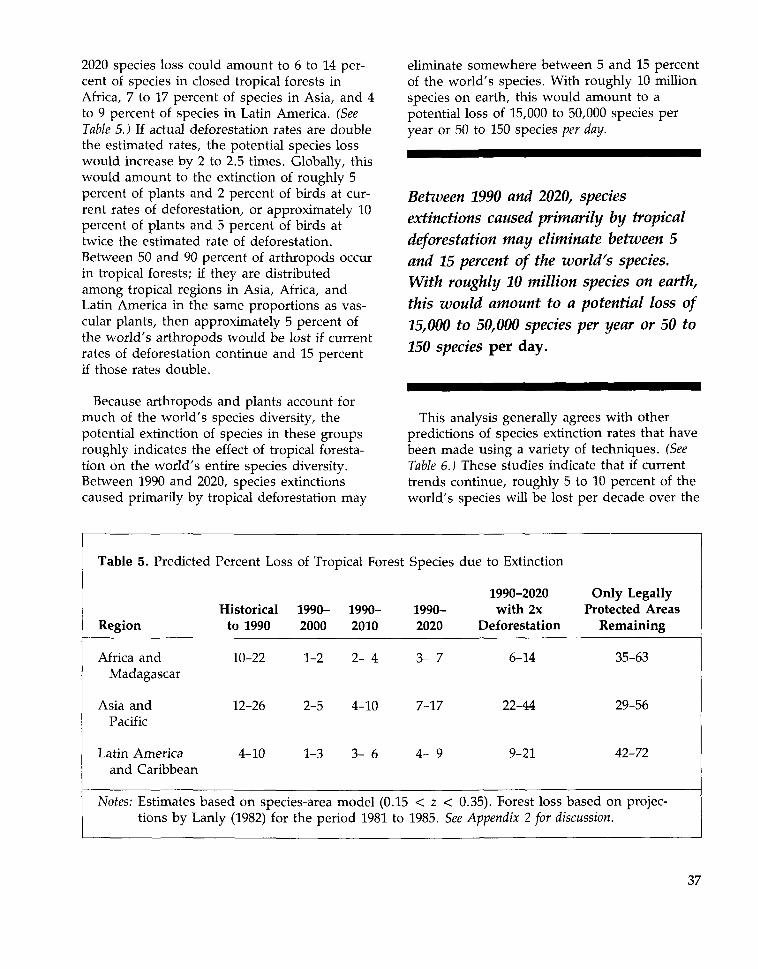
2020 species loss could amount to 6 to 14 per-cent of species in closed tropical forests inAfrica, 7 to 17 percent of species in Asia, and 4to 9 percent of species in Latin America. (SeeTable 5.) If actual deforestation rates are doublethe estimated rates, the potential species losswould increase by 2 to 2.5 times. Globally, thiswould amount to the extinction of roughly 5percent of plants and 2 percent of birds at cur-rent rates of deforestation, or approximately 10percent of plants and 5 percent of birds attwice the estimated rate of deforestation.Between 50 and 90 percent of arthropods occurin tropical forests; if they are distributedamong tropical regions in Asia, Africa, andLatin America in the same proportions as vas-cular plants, then approximately 5 percent ofthe world's arthropods would be lost if currentrates of deforestation continue and 15 percentif those rates double.
Because arthropods and plants account formuch of the world's species diversity, thepotential extinction of species in these groupsroughly indicates the effect of tropical foresta-tion on the world's entire species diversity.Between 1990 and 2020, species extinctionscaused primarily by tropical deforestation may
eliminate somewhere between 5 and 15 percentof the world's species. With roughly 10 millionspecies on earth, this would amount to apotential loss of 15,000 to 50,000 species peryear or 50 to 150 species per day.
Between 1990 and 2020, speciesextinctions caused primarily by tropicaldeforestation may eliminate between 5and 15 percent of the world's species.With roughly 10 million species on earth,this would amount to a potential loss of15,000 to 50,000 species per year or 50 to150 species per day.
This analysis generally agrees with otherpredictions of species extinction rates that havebeen made using a variety of techniques. (SeeTable 6.) These studies indicate that if currenttrends continue, roughly 5 to 10 percent of theworld's species will be lost per decade over the
Table 5. Predictec
Region
Africa andMadagascar
Asia andPacific
Latin Americaand Caribbean
[ Percent Loss
Historicalto 1990
10-22
12-26
4-10
of Tropical Forest
1990- 1990-2000 2010
1-2 2- 4
2-5 4-10
1-3 3- 6
Notes: Estimates based on species-area model (0.15tions by Lanly (1982) for the period 1981 to
Species
1990-2020
3- 7
7-17
4- 9
< 2 <
due to Extinction
1990-2020with 2x
Deforestation
6-14
22-44
9-21
Only LegallyProtected Areas
Remaining
35-63
29-56
42-72
0.35). Forest loss based on projec-1985. See Appendix 2 for discussion.
37
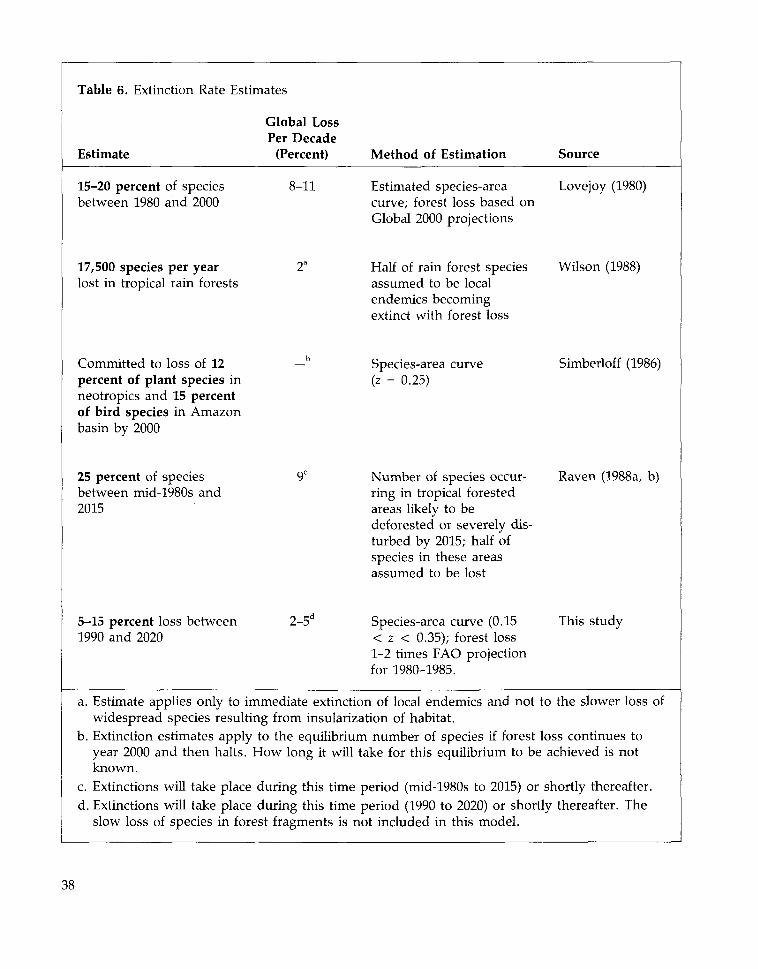
Table 6. Extinction Rate Estimates
Global LossPer Decade
Estimate (Percent)
15-20 percent of species 8-11between 1980 and 2000
17,500 species per year 2a
lost in tropical rain forests
Committed to loss of 12 —b
percent of plant species inneotropics and 15 percentof bird species in Amazonbasin by 2000
25 percent of species 9C
between mid-1980s and2015
5-15 percent loss between 2-5d
1990 and 2020
Method of Estimation
Estimated species-areacurve; forest loss based onGlobal 2000 projections
Half of rain forest speciesassumed to be localendemics becomingextinct with forest loss
Species-area curve(z = 0.25)
Number of species occur-ring in tropical forestedareas likely to bedeforested or severely dis-turbed by 2015; half ofspecies in these areasassumed to be lost
Species-area curve (0.15< z < 0.35); forest loss1-2 times FAO projectionfor 1980-1985.
Source
Lovejoy (1980)
Wilson (1988)
Simberloff (1986)
Raven (1988a, b)
This study
a. Estimate applies only to immediate extinction of local endemics and not to the slower loss ofwidespread species resulting from insularization of habitat,
b. Extinction estimates apply to the equilibrium number of species if forest loss continues toyear 2000 and then halts. How long it will take for this equilibrium to be achieved is notknown,
c. Extinctions will take place during this time period (mid-1980s to 2015) or shortly thereafter,d. Extinctions will take place during this time period (1990 to 2020) or shortly thereafter. The
slow loss of species in forest fragments is not included in this model.
38
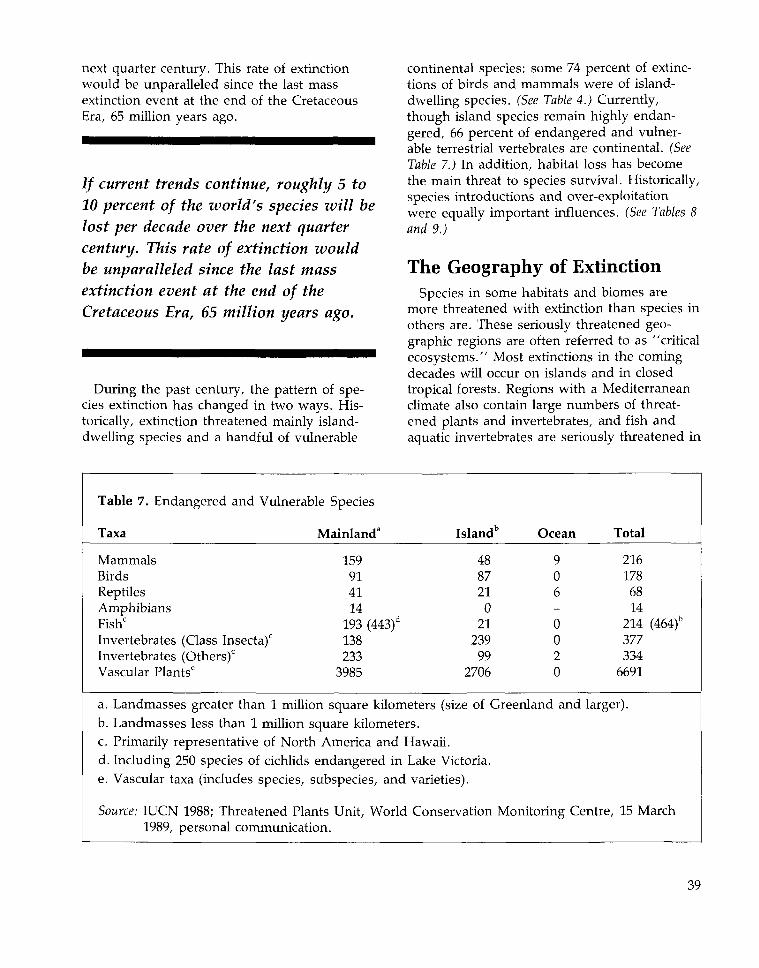
next quarter century. This rate of extinctionwould be unparalleled since the last massextinction event at the end of the CretaceousEra, 65 million years ago.
If current trends continue, roughly 5 to10 percent of the world's species will belost per decade over the next quartercentury. This rate of extinction wouldbe unparalleled since the last massextinction event at the end of theCretaceous Era, 65 million years ago.
During the past century, the pattern of spe-cies extinction has changed in two ways. His-torically, extinction threatened mainly island-dwelling species and a handful of vulnerable
continental species: some 74 percent of extinc-tions of birds and mammals were of island-dwelling species. (See Table 4.) Currently,though island species remain highly endan-gered, 66 percent of endangered and vulner-able terrestrial vertebrates are continental. (SeeTable 7.) In addition, habitat loss has becomethe main threat to species survival. Historically,species introductions and over-exploitationwere equally important influences. (See Tables 8and 9.)
The Geography of ExtinctionSpecies in some habitats and biomes are
more threatened with extinction than species inothers are. These seriously threatened geo-graphic regions are often referred to as "criticalecosystems." Most extinctions in the comingdecades will occur on islands and in closedtropical forests. Regions with a Mediterraneanclimate also contain large numbers of threat-ened plants and invertebrates, and fish andaquatic invertebrates are seriously threatened in
Table 7. Endangered and Vulnerable Species
Taxa Mainland3 Island6 Ocean Total
MammalsBirdsReptilesAmphibiansFishc
Invertebrates (Class Insecta)c
Invertebrates (Others)0
Vascular Plants6
159914114193 (443)d
1382333985
48872102123999
2706
906_0020
2161786814
214 (464)3773346691
a. Landmasses greater than 1 million square kilometers (size of Greenland and larger).b. Landmasses less than 1 million square kilometers.c. Primarily representative of North America and Hawaii.d. Including 250 species of cichlids endangered in Lake Victoria.e. Vascular taxa (includes species, subspecies, and varieties).
Source: IUCN 1988; Threatened Plants Unit, World Conservation Monitoring Centre, 15 March1989, personal communication.
39
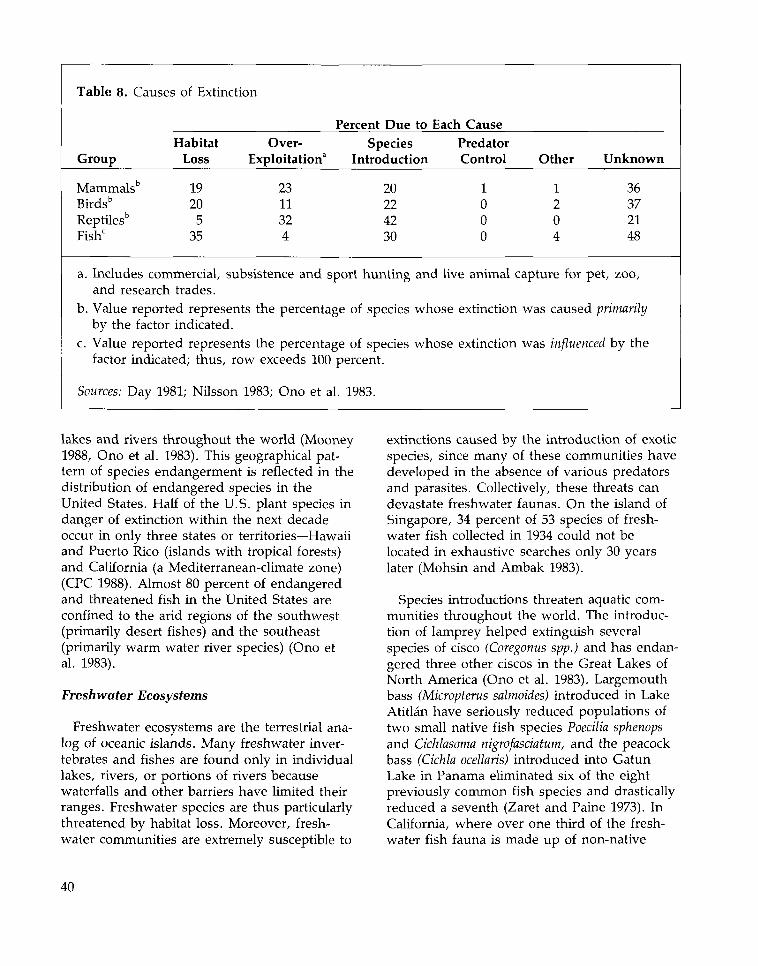
Table 8. Causes of Extinction
Percent Due to Each Cause
Group
Mammalsb
Birdsb
Reptilesb
Fishc
HabitatLoss
19205
35
Over-Exploitation3
2311324
SpeciesIntroduction
20224230
PredatorControl
1000
Other
1204
Unknown
36372148
a. Includes commercial, subsistence and sport hunting and live animal capture for pet, zoo,and research trades.
b. Value reported represents the percentage of species whose extinction was caused primarilyby the factor indicated.
c. Value reported represents the percentage of species whose extinction was influenced by thefactor indicated; thus, row exceeds 100 percent.
Sources: Day 1981; Nilsson 1983; Ono et al. 1983.
lakes and rivers throughout the world (Mooney1988, Ono et al. 1983). This geographical pat-tern of species endangerment is reflected in thedistribution of endangered species in theUnited States. Half of the U.S. plant species indanger of extinction within the next decadeoccur in only three states or territories—Hawaiiand Puerto Rico (islands with tropical forests)and California (a Mediterranean-climate zone)(CPC 1988). Almost 80 percent of endangeredand threatened fish in the United States areconfined to the arid regions of the southwest(primarily desert fishes) and the southeast(primarily warm water river species) (Ono etal. 1983).
Freshwater Ecosystems
Freshwater ecosystems are the terrestrial ana-log of oceanic islands. Many freshwater inver-tebrates and fishes are found only in individuallakes, rivers, or portions of rivers becausewaterfalls and other barriers have limited theirranges. Freshwater species are thus particularlythreatened by habitat loss. Moreover, fresh-water communities are extremely susceptible to
extinctions caused by the introduction of exoticspecies, since many of these communities havedeveloped in the absence of various predatorsand parasites. Collectively, these threats candevastate freshwater faunas. On the island ofSingapore, 34 percent of 53 species of fresh-water fish collected in 1934 could not belocated in exhaustive searches only 30 yearslater (Mohsin and Ambak 1983).
Species introductions threaten aquatic com-munities throughout the world. The introduc-tion of lamprey helped extinguish severalspecies of cisco (Coregonus spp.) and has endan-gered three other ciscos in the Great Lakes ofNorth America (Ono et al. 1983). Largemouthbass (Micropterus salmoides) introduced in LakeAtitlan have seriously reduced populations oftwo small native fish species Poecilia sphenopsand Cichlasoma nigrofasciatum, and the peacockbass (Cichla ocellaris) introduced into GatunLake in Panama eliminated six of the eightpreviously common fish species and drasticallyreduced a seventh (Zaret and Paine 1973). InCalifornia, where over one third of the fresh-water fish fauna is made up of non-native
40
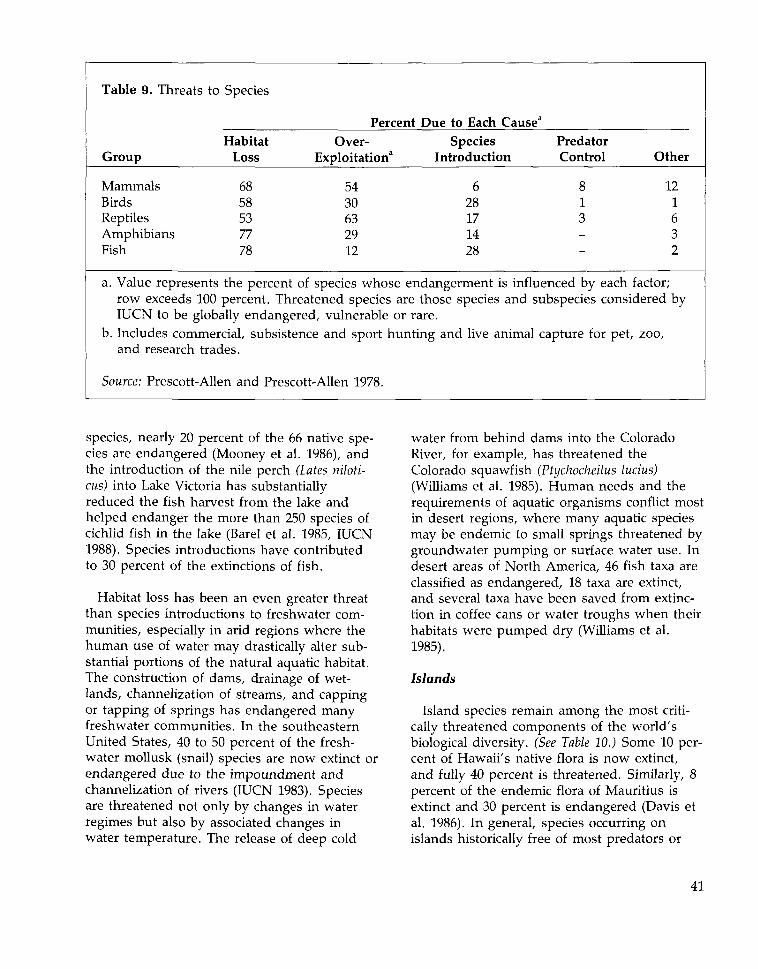
Table 9. Threats to Species
Percent Due to Each Cause3
GroupHabitat
Loss
6858537778
Over-Exploitation3
5430632912
SpeciesIntroduction
628171428
PredatorControl
813-_
Other
MammalsBirdsReptilesAmphibiansFish
121632
a. Value represents the percent of species whose endangerment is influenced by each factor;row exceeds 100 percent. Threatened species are those species and subspecies considered byIUCN to be globally endangered, vulnerable or rare.
b. Includes commercial, subsistence and sport hunting and live animal capture for pet, zoo,and research trades.
Source: Prescott-Allen and Prescott-Allen 1978.
species, nearly 20 percent of the 66 native spe-cies are endangered (Mooney et al. 1986), andthe introduction of the nile perch (Lates niloti-cus) into Lake Victoria has substantiallyreduced the fish harvest from the lake andhelped endanger the more than 250 species ofcichlid fish in the lake (Barel et al. 1985, IUCN1988). Species introductions have contributedto 30 percent of the extinctions of fish.
Habitat loss has been an even greater threatthan species introductions to freshwater com-munities, especially in arid regions where thehuman use of water may drastically alter sub-stantial portions of the natural aquatic habitat.The construction of dams, drainage of wet-lands, channelization of streams, and cappingor tapping of springs has endangered manyfreshwater communities. In the southeasternUnited States, 40 to 50 percent of the fresh-water mollusk (snail) species are now extinct orendangered due to the impoundment andchannelization of rivers (IUCN 1983). Speciesare threatened not only by changes in waterregimes but also by associated changes inwater temperature. The release of deep cold
water from behind dams into the ColoradoRiver, for example, has threatened theColorado squawfish (Ptychocheilus lucius)(Williams et al. 1985). Human needs and therequirements of aquatic organisms conflict mostin desert regions, where many aquatic speciesmay be endemic to small springs threatened bygroundwater pumping or surface water use. Indesert areas of North America, 46 fish taxa areclassified as endangered, 18 taxa are extinct,and several taxa have been saved from extinc-tion in coffee cans or water troughs when theirhabitats were pumped dry (Williams et al.1985).
Islands
Island species remain among the most criti-cally threatened components of the world'sbiological diversity. (See Table 10.) Some 10 per-cent of Hawaii's native flora is now extinct,and fully 40 percent is threatened. Similarly, 8percent of the endemic flora of Mauritius isextinct and 30 percent is endangered (Davis etal. 1986). In general, species occurring onislands historically free of most predators or
41
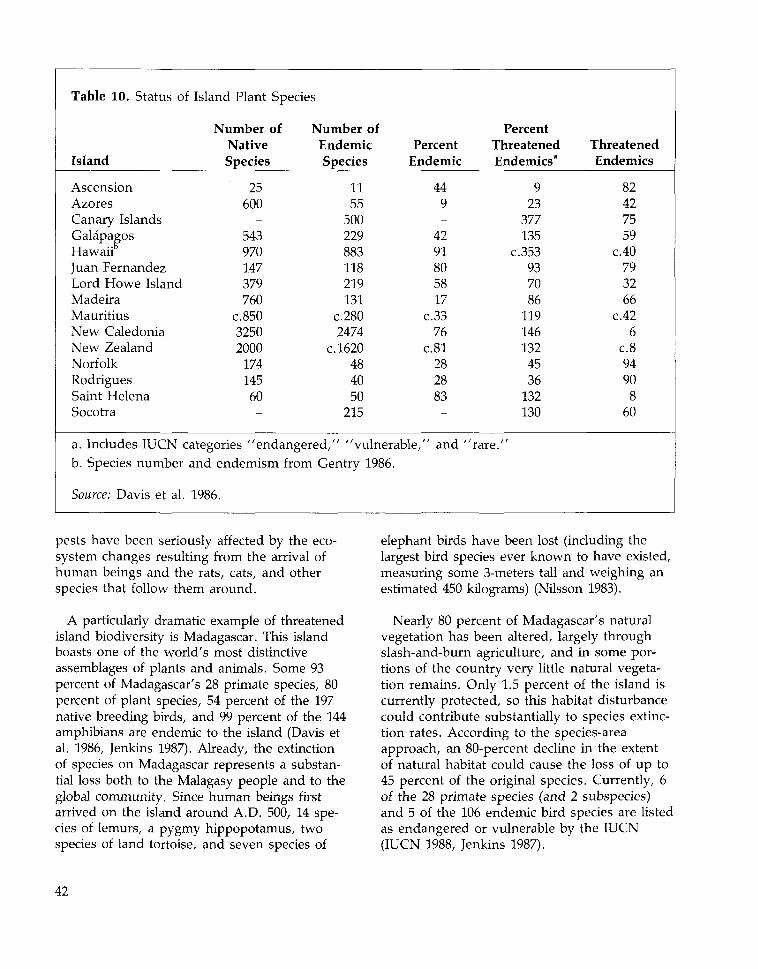
Table 10. Status of
Island
AscensionAzoresCanary IslandsGalapagosHawaiiJuan FernandezLord Howe IslandMadeiraMauritiusNew CaledoniaNew ZealandNorfolkRodriguesSaint HelenaSocotra
Island Plant Species
Number of Number ofNativeSpecies
25600
-543970147379760
c.85032502000
17414560-
EndemicSpecies
1155
500229883118219131
c.2802474
c.1620484050
215
PercentEndemic
449-
4291805817
c.3376
c.81282883-
a. Includes IUCN categories "endangered," "vulnerable," and 'b. Species number
Source: Davis et al.
and endemism from
1986.
Gentry 1986.
PercentThreatenedEndemics3
923
377135
c.353937086
1191461324536
132130
'rare."
ThreatenedEndemics
82427559
c.40793266
c.426
c.894908
60
pests have been seriously affected by the eco-system changes resulting from the arrival ofhuman beings and the rats, cats, and otherspecies that follow them around.
A particularly dramatic example of threatenedisland biodiversity is Madagascar. This islandboasts one of the world's most distinctiveassemblages of plants and animals. Some 93percent of Madagascar's 28 primate species, 80percent of plant species, 54 percent of the 197native breeding birds, and 99 percent of the 144amphibians are endemic to the island (Davis etal. 1986, Jenkins 1987). Already, the extinctionof species on Madagascar represents a substan-tial loss both to the Malagasy people and to theglobal community. Since human beings firstarrived on the island around A.D. 500, 14 spe-cies of lemurs, a pygmy hippopotamus, twospecies of land tortoise, and seven species of
elephant birds have been lost (including thelargest bird species ever known to have existed,measuring some 3-meters tall and weighing anestimated 450 kilograms) (Nilsson 1983).
Nearly 80 percent of Madagascar's naturalvegetation has been altered, largely throughslash-and-burn agriculture, and in some por-tions of the country very little natural vegeta-tion remains. Only 1.5 percent of the island iscurrently protected, so this habitat disturbancecould contribute substantially to species extinc-tion rates. According to the species-areaapproach, an 80-percent decline in the extentof natural habitat could cause the loss of up to45 percent of the original species. Currently, 6of the 28 primate species (and 2 subspecies)and 5 of the 106 endemic bird species are listedas endangered or vulnerable by the IUCN(IUCN 1988, Jenkins 1987).
42
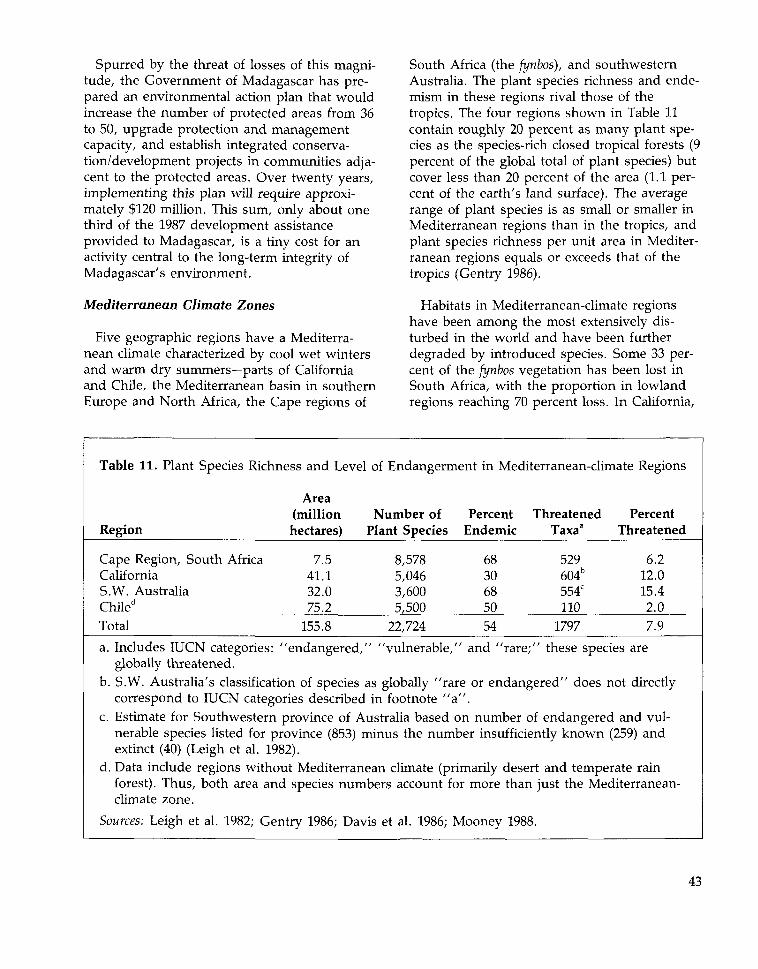
Spurred by the threat of losses of this magni-tude, the Government of Madagascar has pre-pared an environmental action plan that wouldincrease the number of protected areas from 36to 50, upgrade protection and managementcapacity, and establish integrated conserva-tion/development projects in communities adja-cent to the protected areas. Over twenty years,implementing this plan will require approxi-mately $120 million. This sum, only about onethird of the 1987 development assistanceprovided to Madagascar, is a tiny cost for anactivity central to the long-term integrity ofMadagascar's environment.
Mediterranean Climate Zones
Five geographic regions have a Mediterra-nean climate characterized by cool wet wintersand warm dry summers—parts of Californiaand Chile, the Mediterranean basin in southernEurope and North Africa, the Cape regions of
South Africa (the fynbos), and southwesternAustralia. The plant species richness and ende-mism in these regions rival those of thetropics. The four regions shown in Table 11contain roughly 20 percent as many plant spe-cies as the species-rich closed tropical forests (9percent of the global total of plant species) butcover less than 20 percent of the area (1.1 per-cent of the earth's land surface). The averagerange of plant species is as small or smaller inMediterranean regions than in the tropics, andplant species richness per unit area in Mediter-ranean regions equals or exceeds that of thetropics (Gentry 1986).
Habitats in Mediterranean-climate regionshave been among the most extensively dis-turbed in the world and have been furtherdegraded by introduced species. Some 33 per-cent of the fynbos vegetation has been lost inSouth Africa, with the proportion in lowlandregions reaching 70 percent loss. In California,
Table 11. Plant Species Richness and Level of Endangerment in Mediterranean-climate Regions
Region
Area(millionhectares)
Number ofPlant Species
PercentEndemic
ThreatenedTaxaa
PercentThreatened
Cape Region, South Africa 7.5California 41.1S.W. Australia 32.0Chiled 75.2Total 155.8
8,5785,0463,6005,500
68306850
529604b
554C
110
6.212.015.42.0
22,724 54 1797 7.9
a. Includes IUCN categories: "endangered," "vulnerable," and "rare;" these species areglobally threatened.
b. S.W. Australia's classification of species as globally "rare or endangered" does not directlycorrespond to IUCN categories described in footnote "a".
c. Estimate for Southwestern province of Australia based on number of endangered and vul-nerable species listed for province (853) minus the number insufficiently known (259) andextinct (40) (Leigh et al. 1982).
d. Data include regions without Mediterranean climate (primarily desert and temperate rainforest). Thus, both area and species numbers account for more than just the Mediterranean-climate zone.
Sources: Leigh et al. 1982; Gentry 1986; Davis et al. 1986; Mooney 1988.
43
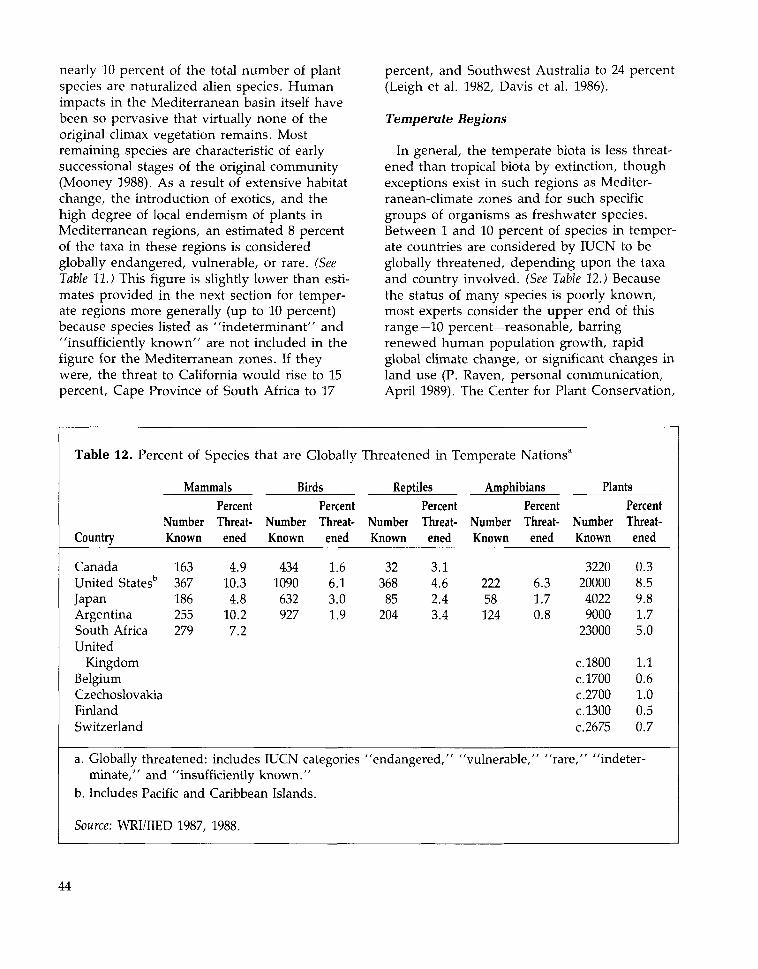
nearly 10 percent of the total number of plantspecies are naturalized alien species. Humanimpacts in the Mediterranean basin itself havebeen so pervasive that virtually none of theoriginal climax vegetation remains. Mostremaining species are characteristic of earlysuccessional stages of the original community(Mooney 1988). As a result of extensive habitatchange, the introduction of exotics, and thehigh degree of local endemism of plants inMediterranean regions, an estimated 8 percentof the taxa in these regions is consideredglobally endangered, vulnerable, or rare. (SeeTable 11.) This figure is slightly lower than esti-mates provided in the next section for temper-ate regions more generally (up to 10 percent)because species listed as "indeterminant" and"insufficiently known" are not included in thefigure for the Mediterranean zones. If theywere, the threat to California would rise to 15percent, Cape Province of South Africa to 17
percent, and Southwest Australia to 24 percent(Leigh et al. 1982, Davis et al. 1986).
Temperate Regions
In general, the temperate biota is less threat-ened than tropical biota by extinction, thoughexceptions exist in such regions as Mediter-ranean-climate zones and for such specificgroups of organisms as freshwater species.Between 1 and 10 percent of species in temper-ate countries are considered by IUCN to beglobally threatened, depending upon the taxaand country involved. (See Table 12.) Becausethe status of many species is poorly known,most experts consider the upper end of thisrange—10 percent—reasonable, barringrenewed human population growth, rapidglobal climate change, or significant changes inland use (P. Raven, personal communication,April 1989). The Center for Plant Conservation,
Table 12. Percent of <Species
Mammals
NumberCountry Known
Canada 163United States'5 367Japan 186Argentina 255South Africa 279United
KingdomBelgiumCzechoslovakiaFinlandSwitzerland
a. Globally threatened:
PercentThreat-ened
4.910.34.8
10.27.2
:hat are Globally
BirdsPercent
Number Threat-Known ened
434 1.61090 6.1632 3.0927 1.9
includes IUCN categoriesminate," and "insufficiently
b. Includes Pacific and
Source: WRI/IIED 1987,
known."Caribbean Islands.
1988.
Threatened in Temperate
Reptiles
PercentNumber Threat-Known ened
32 3.1368 4.685 2.4
204 3.4
"endangered," '
Nations
Amphibians
NumberKnown
22258124
PercentThreat-ened
6.31.70.8
a
Plants
NumberKnown
32202000040229000
23000
c.1800c.1700c.2700c.1300c.2675
PercentThreat-ened
0.38.59.81.75.0
1.10.61.00.50.7
vulnerable," "rare," "indeter-
44
for example, estimates that of the 25,000 spe-cies, subspecies, and varieties of plants nativeto the United States, approximately 3,000 (12percent) are at risk of extinction in their wildhabitats (CPC 1988).
Tropical Forests
Tropical deforestation will be the singlegreatest cause of species extinction in the nexthalf-century. (See Table 5.) With concerted con-servation action, it may be possible to consider-ably reduce this rate of extinction. But thesecalculations could prove to be conservative. Ifrates of forest loss increase significantly in thecoming decades, if the deforestation of largeareas fragments and degrades the natural foresthabitat that remains, or if global temperaturesrise rapidly, then extinction rates could greatlyexceed the estimated 5 to 15 percent of tropicalspecies by the year 2020. For example, Salatiand Vose (1983) have suggested that losing asubstantial portion of the Amazonian forestcould drastically alter the region's hydrologyand climate, potentially accelerating speciesloss.
Tropical deforestation will be the singlegreatest cause of species extinction inthe next half-century.
Causes of ExtinctionThe extinction of a species is generally due to
multiple causes. Consider, for example, whathappened to the heath hen (Tympanuchuscupido cupido). Once widespread in the easternUnited States, it had by 1890 been reduced byoverhunting to 200 birds on Martha's Vineyardand in 1896 the population numbered fewerthan 100. The establishment of a refuge on theisland in 1908 reversed the decline in the popu-lation, and 12 years later the population had
recovered to an estimated 2,000 individuals.But, a serious fire, a hard winter, an unusuallyhigh population of predators, and an intro-duced poultry disease during the next fiveyears sharply reduced the population size. By1920, the population had become so small thatgenetic deterioration resulted from inbreeding,and the population eventually died in 1932(Dawson et al. 1987).
Any factor that leads to a decline in thepopulation size of a species makes it more vul-nerable to extinction. While overhunting mayhave been the primary cause of the heathhen's demise, hunting alone was not sufficient.If more habitat had been available, if the exoticdisease had not been introduced, or if the nat-ural environmental fluctuations had been lesssevere, the heath hen could still be alive today.
The likelihood of extinction depends onwhich species and which threats are involved.As noted, species with small populations orrestricted ranges are among those at greatestrisk of extinction, though other characteristicsmay also increase species' susceptibility. (SeeBox 4.) Direct threats to species survival areposed by habitat loss, over-exploitation, theintroduction of exotic species, and pollution,but other threats examined below—globalwarming and cumulative effects—can alsocause extinctions.
Habitat Loss and Fragmentation
Habitat loss, degradation, and fragmentationare the most important influences upon speciesextinction rates. Some 67 percent of all endan-gered, vulnerable, and rare species of verte-brates (including fish) are threatened by habitatdegradation or loss (Prescott-Allen andPrescott-Allen 1978). These factors also posethe greatest threat to invertebrates (IUCN 1983)and plants (Lucas and Synge 1978). Habitatloss has accelerated so much that in manycountries relatively little natural or semi-naturalhabitat remains. In the Old World tropics, 49of 61 countries have lost more than 50 percentof their original wildlife habitat, and the
45
Box 4. Extinction-Prone Groups of Species
Human impacts on the environment—suchas habitat loss, over-exploitation, speciesintroductions, and pollution—do notthreaten all groups of species equally. Atgreatest risk are species with small popula-tion sizes, species whose populations varygreatly, and species with slow rates of popu-lation growth. More specifically, the follow-ing groups of organisms are particularly sus-ceptible to extinction:
Species at higher trophic levels. Species highin the food chain tend to be large, rareanimals with slow rates of populationgrowth. Particularly susceptible to over-exploitation or habitat loss, these speciesinclude the Caribbean monk seal, great auk(Alca impennis), Steller's sea cow (Hydro-damalis stelleri), thylacine (Thylacinus cynoce-phalus, also known as the Tasmanian wolf),and many endangered birds of prey, cats,wolves, foxes, and whales.
Local endemics. Species with restrictedranges are often threatened by habitat loss.For example, the entire natural habitat of theDevil's Hole pupfish (Cyprinodon diabolis)is a spring measuring roughly 3 by 15meters. Water development, pollution, orhabitat alteration could easily drive the spe-cies to extinction in the wild. The extremelyhigh rate of island species extinction furthertestifies to the threat that local endemicsface.
Species with chronically small populations.This category overlaps the first. Since manyspecies at higher trophic levels have sparselydistributed populations, habitat restriction orfragmentation may reduce their populationsto very small levels. However, the popula-tion sizes of species at lower trophic levelsmay also be extremely small in a given habi-tat or region. Many tropical forest tree spe-cies, for instance, have very low population
densities and are thus threatened by habitatloss and fragmentation.
Largest members of a guild. Whether or nota species is on the top trophic level, largespecies have high metabolic demands,require large habitats, and tend to occur inlow densities. Thus, the largest specieswithin a group of species sharing similarfood sources (a guild) tend to be at high riskof extinction. For example, all of the lemursthat have died out since Madagascar wascolonized by human beings were as large orlarger than the surviving species (Dewar1984).
Species with poor dispersal and coloniza-tion ability. As with local endemics, specieswith narrow habitat requirements and spe-cies that can't disperse easily to new habitatsare at high risk of extinction, even if theirpopulation is widespread. For example, inthe face of a warming climate, some of themost threatened species will be those thatcan't disperse as fast as suitable habitatmoves to higher elevations and latitudes.
Species with colonial nesting habits.Colonial nesting species are particularly sus-ceptible to over-exploitation or the loss ofbreeding habitat. Several species of marineturtles, for example, have been threatenedby the development of nesting beaches fortourism and other purposes. Similarly, thevulnerability of the extinct passenger pigeon(Ectopistes migratorius) to hunters wasincreased by the birds' tendency to nest inenormous colonies.
Migratory species. Migratory species dependupon suitable habitat in their summer andwinter range and along the course of theirmigratory route. Thus, the potential foradverse effects of habitat changes on migrantpopulations is high. In North America,
46
Box 4. (cont.)
Kirtland's warbler (Dendroica kirtlandi), Bach-man's warbler (Vermivora bachmanii), and theWhooping Crane (Grus americana) are endan-gered because habitat in both their breedingand wintering ranges has shrunk.
Species dependent on unreliable resources.These species' populations fluctuate greatly,so they face increased threats of extinctionwhen their population is low. Populations offrugivores and nectarivores, for example,may be reduced significantly during yearswhen fruit or nectar crops are low.
Species with little evolutionary experiencewith disturbances. In regions where humanbeings have a longstanding presence, the
species most sensitive to human disturbancehave already been lost and many of theremaining species have adapted to the addi-tional disturbance. In contrast, species areextremely vulnerable where human distur-bance has no historical precedent. Thus, theloss of the great auk, passenger pigeon, ele-phant birds, and moas, and the endanger-ment of the musk oxen (Ovibos moschatus)were all related to the introduction of apredator where none had existed before orto the introduction of a predator with a newmeans of hunting—say, the rifle—that theprey had not previously experienced.
Based on: Terborgh 1974, Pimm et al. 1988,and Orians and Kunin, in press.
amount lost reaches up to 94 percent in Bang-ladesh (IUCN/UNEP 1986a, b).
While less devastating than complete habitatloss, the fragmentation of habitat into patchescan gradually wipe out species whose surviv-ing individuals don't make up a minimum viablepopulation (MVP) of the species. At numbersbelow the MVP, populations face an increasedrisk of extinction due to a combination of thefollowing factors (Shaffer 1981, Soule and Sim-berloff 1986, Soule 1987):
• Demographic Chance—Chance variation insurvival and reproduction. In wild popula-tions, the chance variation in such demo-graphic characteristics as birth and deathrate and the sex ratio of offspring maythreaten populations, particularly thosesmaller than 100 individuals (Lande 1988).
• Environmental Chance and Natural Cata-strophes—Chance variation in weather, com-petitors, predators, and disease.
• Genetic Chance—Inbreeding, genetic drift,and loss of genetic variation. Inbreeding
will impede species survival in populationsthat are rapidly reduced to less than about50 breeding individuals. In populations ofless than roughly 500 breeding individuals,genetic variation may be reduced, eventu-ally diminishing the species' capacity toadapt to environmental change (Franklin1980, Soule 1980, Lande 1988).
• Social Dysfunction—Disruption of breeding,foraging, defense, thermoregulation, orother social behaviors in the absence ofsome critical number of individuals.
For small populations, sheer chance is a for-midable force in extinction. Demographicchance sealed the fate of the dusky seasidesparrow (Ammodramus maritimus nigrescens)when the population fell to six individuals—allof which happened to be male (Avise and Nel-son 1989). Environmental chance was partiallyresponsible for the loss of the heath hen. Simi-larly, hurricane Gilbert in the Gulf of Mexico in1988 devastated the only known breedingbeach of the already endangered Kemp's ridleysea turtle (Lepidochelys kempii). Genetic chance
47
may be contributing to the endangerment ofthe golden lion tamarin (Leontopithecus rosalia)where inbreeding has apparently caused a highincidence of a genetic defect of the diaphragm(Soule and Simberloff 1986). And social dys-function has contributed to the decline ofpopulations of wolves (Canis lupis), since hunt-ing success is reduced if pack size declines.
Populations below their minimum viable sizewill gradually disappear from islands unlessindividuals from outside recolonize it. Once thehabitat is fragmented, species richness shrinksto the number capable of persisting in thereduced habitat area. One example of this so-called relaxation effect is the loss of speciesfrom Barro Colorado Island in Panama, whichwas created around 1914 when the PanamaCanal was built and surrounding valleys weredammed. Of the approximately 200 land birdspecies known to have bred on Barro Colorado,47 had disappeared by 1981: 21 of these speciesare thought to have been lost because theisland was isolated from the formerly continu-ous habitat (Karr 1982); many of the remainderare believed to have been associated with earlysuccessional habitats that gradually disap-peared when the island was protected fromhuman disturbances.
For many wild populations, demographic fac-tors appear more immediately threatening thangenetic factors to the persistence of populations(Goodman 1987, Lande 1988). Habitat loss andfragmentation often seals a population's fatesimply by reducing individual survival andbreeding success before inbreeding or the lackof genetic variation begins to take its toll.When the U.S. Forest Service developed amanagement plan for the northern spotted owl(Strix occidentalis caurina) based on genetic con-siderations, a population of 500 individualsseemed sufficient to guarantee survival, but thehabitat allowed to preserve these 500 individ-uals would have been so fragmented andsparsely distributed that the population wouldprobably have become extinct as a result ofincreased juvenile mortality and decreasedreproductive success (Dawson et al. 1987,
Simberloff 1987, Lande 1988). Consequently,estimates of minimum viable population sizehave been revised upward, and close attentionis now being given by managers to the patternof forest fragmentation.
The species least affected by the loss ordegradation of habitat are those that are wide-spread or that disperse easily. In contrast, hab-itat loss or degradation is most threatening tohighly specialized species, species with res-tricted ranges, and species with chronically lowpopulation sizes. (See Box 4.) Thus, manyisland and locally endemic plants and animalswill be lost because of their susceptibility tohabitat loss, and extinctions among top carni-vores and large animals will be disproportion-ate because their population density is gener-ally low. A region of relatively natural habitatmay be large enough to maintain a small (7 kg)species such as a golden jackel (Canis aureus)with a home range of 7 square kilometers butfar too small to maintain a population of tigers(Panthera tigris; 110-150 kg) with home range of20 to 62 square kilometers.
Specific threatened habitats of particularvalue both for the species diversity that theycontain and for their provision of other servicesto humanity include temperate old-growthforests, tropical forests, wetlands, and coralreefs.
Temperate Forests. Conserving the biodiversityof temperate forests requires the maintenanceof all successional stages of the forest (Franklin1988). Unlike forests in early successionalstages, old-growth forests provide a uniquephysical structure and consequently a uniquehabitat for plants and animals. In the TongassNational Forest, a temperate coniferous rainforest in Alaska, old growth provides criticalwinter habitat for the Sitka black-tailed deer(Odocoileus hetnionus sitkensis) and importantbreeding habitat for the Canada Goose (Brantacanadensis fulva). Ecological processes also differamong successional stages. For example, nutri-ent losses from old-growth watersheds in thePacific Northwest of the United States are
48
lower than the losses from early successionalstages (Franklin 1988).
Excessive logging, conversion of forest to cityand farm, and pollution significantly threatenthe biodiversity of temperate forests. In partic-ular, old-growth forests have been eliminatedthroughout much of their native range, andsome of the last regions with extensive oldgrowth are now slated for timber harvest. Innorthern California, Oregon, and Washington,only 15 to 30 percent of the 19 million hectaresof old growth that existed in the 19th centuryremains (Booth 1989).
Tropical Forests. The extent of closed tropicalforest worldwide has been reduced by 23 per-cent from the estimated historic area, and 15percent of the remaining forest is in use fortimber production. (See Table 18.) Each year, atleast 7.4 million hectares of the remaining nat-ural forest is deforested or logged. Given thevast tropical forests remaining in the Amazonand Zaire, complete loss does not seem immi-nent, but both specific types of tropical forestand forested areas in certain regions are on theverge of disappearing. Brazil's Atlantic foresthas been reduced to less than 5 percent of itsoriginal 1 million square kilometers (Mori et al.1983, Myers 1988). In the state of MinasGerais, less than 7 percent of the original for-ested area has any cover remaining and virtu-ally all undisturbed forest is gone (Fonseca1985).
In parts of the tropics, the most threatenedforest type is the tropical dry forest. This forestappears where mean annual rainfall rangesfrom 250 to 2000 mm. Many such regions havea pronounced dry season, so a high proportionof tree species are deciduous. Dry forests havebeen extensively cleared because they arefound in climates well-suited to agriculture andgrazing. In five Central American countries,the average human population density in thedry forest biome is eight times that in the rainforest (Murphy and Lugo 1986). The Pacificcoast of central America contained 550,000square kilometers of dry forest at the time of
the arrival of Europeans; now, less than 2 per-cent is intact (Janzen 1988a).
Wetlands. The extent of both coastal (brackishor saline) and inland (freshwater) wetlands hasbeen significantly reduced by human activities.The United States has lost 54 percent of itswetlands since colonial times, Brittany has lost40 percent in the past 20 years, and almost 20percent of the internationally important wet-lands in Latin America are threatened by drain-age related to development activities (Maltby1988).
Mangroves are one of the world's mostproductive ecosystems: many producefar more charcoal, poles, and firewoodper hectare than inland forest does andall provide a barrier against coastalerosion.
One of the most threatened wetland types,particularly in light of its tremendous value tohumanity, is the mangrove ecosystem. A typeof forest found in tropical coastal wetlands,mangroves grow on muddy, saline, and oftenanaerobic sediments in areas with freshwaterrunoff. Mangroves cover some 240,000 squarekilometers of intertidal and riverine ecosys-tems, reaching their greatest extent along thecoasts of south and south-east Asia, Africa,and South America (WRI/IIED 1986). Theseforests support a moderate diversity of terres-trial animals and provide shelter and breedingplaces for many commercial species of prawnsand fish. In Fiji, roughly half of the catch ofcommercial and artisanal fisheries is of speciesthat depend on mangrove areas during at leastone critical stage of their life cycle. In easternAustralia, 67 percent of the commercial catch iscomposed of species dependent on mangrovecommunities (WRI/IIED 1986). Mangroves are
49
one of the world's most productive ecosys-tems: many produce far more charcoal, poles,and firewood per hectare than inland forestdoes and all provide a barrier against coastalerosion.
The rate of loss of mangrove forests isextremely high. Thailand has lost 22 percent ofits mangroves since 1961 and 8 percentbetween 1975 and 1979 alone (FAO 1985a). Vir-tually none of the remaining Thai mangroveforests are undisturbed (J. McNeely, IUCN,personal communication, March 1989). ThePhilippines have lost half of their mangrovessince the turn of the century and 24,000 hec-tares annually between 1967 and 1975 (FAO1982, 1985a). In peninsular Malaysia, 20 per-cent of mangrove area has been converted toother uses in the past 20 years.
Despite the value of mangroves to the fishingindustry in both Southeast Asia and LatinAmerica, one of the principal causes of the lossof this key resource has been aquaculturedevelopment. Many mangrove estuaries areconverted to brackish ponds for the culture ofshrimp and prawns. An estimated 1.2 millionhectares of mangrove in the Indo-Pacific regionis currently used for aquaculture, almost 15percent of the total (ESCAP 1985). Otherthreats to mangroves include the conversion torice fields (i.e., Senegal, Gambia, and SierraLeone) and coconut plantations, and over-harvesting for timber and fuelwood.
Coral Reefs. Coral reefs and their associatedcommunities cover an estimated 600,000 squarekilometers, mostly between the latitudes 30 °Nand 30°S (Smith 1978). (See Box 2.) Coral reefsextend to depths of 30 meters and cover 15percent of the world's coastline. Fish produc-tion on these reefs and on the adjacent con-tinental shelf could amount to nearly 10 per-cent of global fisheries production if fullyexploited (Smith 1978). Locally, coral reefs areeven more important as a food source.Throughout southeast Asia, coral reef fisheriesprovide 10 to 25 percent of the protein avail-able to people living along the coastlines
(McManus 1988). Coral reefs also protectcoastal areas from erosion. In the case of coralatolls, coral provides the foundation of theisland itself. In the Indian Ocean, 77 percent ofisolated islands and island archipelagoes arebuilt exclusively of reef depositions (Salm andClark 1984).
Unfortunately, sediment pollution resultingfrom erosion in upland watersheds, coral min-ing, thermal and chemical pollution, and theuse of dynamite for fishing have seriouslydegraded the productivity of reef ecosystemsthroughout the world. In the Philippines, some40 percent of all coral reef is in a poor state(Meith and Helmer 1983).
In response to the threats to reef communi-ties, some 101 countries have some form ofcoral reef protected areas, but many of thesesites have little or no financing for manage-ment or enforcement (Salm and Clark 1984).For example, 114 marine protected areas havebeen established in the Caribbean, but 27 per-cent of them have no management or enforce-ment capacity (OAS 1988).
Over-exploitation
Some 37 percent of all endangered, vulner-able, and rare species of vertebrates are threat-ened by over-exploitation (Prescott-Allen andPrescott-Allen 1978). Many fur-bearinganimals—including chinchilla (Chinchilla spp.),vicuna (Vicugna vicugna), giant otter (Pteronurabrasiliensis), many species of cats, and somespecies of monkeys—have declined to very lowpopulation sizes because their pelts are prized.Valuable timber species including populationsof the West Indies mahogany (Swieteniamahogoni) in the Bahamas and the Caoba"mahogany" (Persea theobromifolia) of Ecuadorhave been severely depleted, and the Lebanesecedar (Cedrus libani)—which once covered500,000 ha of Lebanon—has been reduced to afew scattered remnants of forest (Chaney andBasbous 1978, Oldfield 1984). On Mauritiusand Reunion islands, an excellent hard timberspecies, bois de prune blanc (Drypetes caustica),
50
was reduced almost to extinction; only 12 treesremain (Prance, in press). Several species ofsea turtles are seriously threatened by over-exploitation (for eggs, meat, shells, and oil)and the loss of nesting sites. African elephant(Loxodonta africana) populations in Africadeclined by 31 percent (from 1.2 million to764,000) between 1981 and 1987, largelybecause of the demand for ivory (IUCN 1987).
Uncontrolled commercial harvest of a speciestends to reduce its population to "commercialextinction." As the population size declines,the cost of capture increases until furtherexploitation becomes too expensive. If a speciesbecomes commercially extinct at a relativelyhigh population size, the species may be in nodanger of actual extinction. But if the commer-cial value of the species is extremely high orthe species is relatively easy to find and cap-ture, then overharvesting could lead toextinction.
Such is the case with the rhinoceros andpotentially with the elephant as well. The retailprice of rhinoceros horn in the Middle East andAsia ranges from $800 to $13,500 per pound(Sheeline 1987). Since the average rhino hornweighs roughly 3.3 pounds, each has a retailvalue of between $2,600 and $44,500, depend-ing on quality and the market. These highvalues create extremely high pressures on theremaining rhinoceros population. In 1986, itwas estimated that fewer than 50 individuals ofthe northern sub-species of the white rhinoc-eros (Cerathotherium simum cottoni) remainedalive in the wild. The last five white rhinos inKenya's National Parks were killed after heav-ily armed poachers overwhelmed armedrangers guarding the animals in Meru NationalPark (Ransdell 1989). The population of theblack rhinoceros (Diceros bicornis) of East Africahas dropped precipitously since 1970 (Hillman-Smith et al. 1986). Asian species of rhinos areeven more threatened. Only 700 individuals ofthe Sumatran rhino (Dicerorhinus sumatrensis)remain, and only 55 of the Javan rhinos (Rhi-noceros sondaicus) remain. For all five species ofrhinoceros in the world, the population has
declined by 84 percent since 1970 (Sheeline1987).
Over-exploitation is a more selective threat tospecies survival than is habitat loss. Whereashabitat loss threatens a wide range of taxa fromplants and invertebrates to vertebrates, over-exploitation primarily threatens vertebrates andcertain taxa of plants and insects. More specifi-cally, carnivores, ungulates, primates, sea tur-tles, showy tropical birds, and timber specieshave been overharvested. Many species of but-terflies and orchids have been overharvestedfor commercial interests too, and rare plantshave been threatened by collectors. Predator-control efforts have also significantly reducedthe population sizes of many vertebrates,including sea lions, birds of prey, foxes,wolves, various large cats, and bears. Becausesuch top-predators often play important rolesin structuring communities, predator-controlefforts are likely to deeply affect the popula-tions of other species in the ecosystems too.(See Appendix 1.)
Over-exploitation often acts synergisticallywith habitat loss or fragmentation to increasethe threat of species loss. Road construction,for example, not only fragments the existinghabitat but also allows increased access forhunting, collecting, and timber harvesting.
Species Introductions
Introduced species threaten 19 percent of allendangered, vulnerable, and rare species ofvertebrates (Prescott-Allen and Prescott-Allen1978). They also affect plants and invertebrates,particularly on islands. Some 86 of Hawaii's909 exotic plant species that are reproducing inthe wild are considered serious threats tonative ecosystems (Vitousek 1988, W. Wagner,Smithsonian, personal communication, April1989).
Exotic species can threaten native flora andfauna directly by predation or competition orindirectly by altering the natural habitat. Onthe Galapagos Islands, for example, black rats
51
(Rattus rattus) have reduced populations of thegiant tortoise (Geochelone elephantopus) and thedark-rumped petrel (Pterodroma phaeopygia) bypreying on eggs (Hoeck 1984), and have wipedout some rodent species on the islands. Otherexotic species on the Galapagos, such as cattle,goats, and feral pigs, have changed the vegeta-tion on some islands from highland forest intopampa-like grasslands and have destroyedstands of cactus (Hoeck 1984). Several speciesof trees on islands with many goats can't prop-agate because the goats eat the saplings, andhabitat changes caused by the goats havereduced populations of some races of tortoisesand land iguanas.
Pollution
Although pollution is not one of the primarycauses of species extinctions, pollution's harmto animal populations first catapulted the prob-lem of endangered species into high publicvisibility in 1962, when Rachel Carson broughtthe dramatic effects of DDT and other pesti-cides on wildlife populations to the public'sattention in Silent Spring. More important, bythe middle of the next century, pollution mayrival habitat loss as the most important threatto species if rapid global warming occurs.
By the middle of the next century,pollution may rival habitat loss as themost important threat to species ifrapid global warming occurs.
Both water and air pollution stress ecosys-tems and reduce populations of sensitive spe-cies. For example, air pollution has causeddeclines in several species of eastern pines inthe United States and has been linked to forestdiebacks in Europe (Bormann 1982, MacKenzieand El-Ashry 1988). After exposure to air pollu-tion and acid rain, forests can experience
outbreaks of insects and pests, populationdeclines of sensitive species, and reducedproductivity. As a result, their capacity to pro-vide immediate services to humanity isimpaired and the likelihood of species extinc-tions increased. Acid rain also harms fresh-water organisms sensitive to changes in wateracidity. With increasing industrialization andcontinued economic growth adding evergreater loads of pollutants to the land, air, andwater (Speth 1988), environmental pollutionwill become an increasing threat to biologicaldiversity in coming decades even apart fromthe effects of climate change.
Global Warming
How much pollution influences speciesextinction may change dramatically in the com-ing decades. During the next century, globalaverage surface temperatures are expected toincrease by 2° to 6 °C over current levels unlessgreenhouse gas emissions are reduced immedi-ately (Schneider 1989). Global warming has thepotential to significantly affect the world's bio-logical diversity: it could cause changes in thepopulation sizes and distributions of species,modify the species composition of habitats andecosystems, alter the geographical extent ofvarious habitats and ecosystems, and increasethe rate of species extinction.
In general, if temperatures rise, regions ofsuitable climate for given species will shifttoward the poles and toward higher elevations.In practice, however, the pattern of change willbe far more complex. In the wake of climatechange, patterns of precipitation, evaporation,and wind and the frequency of storms, fire,and other disturbances will all influence thelocation and suitability of habitats. Ecosystemsare not cohesive assemblages of species thatwill "migrate" as a unit in response to climatechange. Instead, the species in plant and ani-mal communities will probably dissociate as aresult of differences in thermal tolerances, habi-tat requirements, and dispersal capacity andthen reassemble in new configurations underthe new climate regime. How much green
52
house warming affects species diversity andthe composition, distribution, and extent ofhabitats and ecosystems will depend on themagnitude and rate of climate change and onthe species' differential capacity to respondthrough dispersal, colonization, and (particu-larly in the case of corals) growth.
In the temperate zone, both the magnitudeof forecasted warming and the rapid rate oftemperature change—somewhere between 10and 60 times higher than the average rate oftemperature rise after the last Ice Age(Schneider 1989)—suggest that impacts on bio-diversity may be severe. Temperate deciduousforests could experience range shifts of 500 to1,000 km if temperatures rise by 2° to 6 °C(Davis and Zabinski, in press). The rate of thepoleward shift in suitable habitat may exceednatural dispersal rates of many species by morethan an order of magnitude. During the post-Pleistocene warming, most North Americantrees migrated at rates of only 10 to 40 km percentury (Davis and Zabinski, in press). In trop-ical regions, differences in temperature andprecipitation may not be as large, but potentialchanges in the seasonal timing of rainfall or inthe frequency or intensity of such disturbancesas hurricanes or fires could have equally seri-ous effects on the species composition of tropi-cal ecosystems.
Although global climate models are not suffi-ciently accurate to allow detailed predictions ofregional patterns of temperature and precipita-tion, one consequence of global warming canbe predicted with greater accuracy: sea levelrise. When sea level rises slowly, coastal wet-lands that are not blocked by coastal develop-ment follow the rise by moving landward andvertically accumulating peat. (See Figure 8.) Ifsea level rises faster than wetland can buildup, however, substantial area may be lost(Smith and Tirpak 1988). It is estimated that aone-meter rise in sea level over the nextcentury—on average, what scientists are nowpredicting—would destroy 25 to 80 percent ofUnited States coastal wetlands (Smith andTirpak 1988). This figure could go higher if
wetlands' movement landward is blocked bycoastal development, bulkheads, and levees.
Both sea level rise and changing water tem-peratures may also threaten coral reef ecosys-tems (Buddemeier and Smith 1988). Currentrates of sea level rise are on the order of 3 mmper year (Ray et al., in press), well within themaximum potential of coral reefs to growupward, estimated to be 10 mm per year(Grigg and Epp 1989). However, a sea levelrise of 0.5 to 1.5 meters during the next cen-tury would entail an average yearly rise of 5 to15 mm and could drown coral reefs andthreaten the tremendous diversity of theirassociated species. The species composition ofreefs could also change because certain kindsof coral—branching corals—are capable of morerapid growth and may outcompete othercorals. Elevated water temperatures could fur-ther threaten coral reef ecosystems. Abnormallyhigh sea-water temperatures in 1982 and 1983,for instance, may have contributed to coral"bleaching"—the loss of the mutualistic pro-tozoans living with the coral—and death. Atany rate, coral reefs in the eastern Pacific hadlost an estimated 70 to 95 percent of their liv-ing coral to depths of some 18 meters by theend of 1983 (UNEP/IUCN 1988).
Species' capacity to shift their ranges inresponse to climate change will be hindered byhuman land-use practices that have fragmentedexisting habitats. Much of the world's speciesdiversity is contained in relatively small habitatpatches—parks, national forests, and other pro-tected areas—surrounded by agricultural orurban landscapes that many species can'tcross. And even when species have the capac-ity to disperse to new sites, suitable habitatmay not be available. In the case of globalwarming, alpine habitats will disappear frommany mountains and the use of levees, dikes,and sea-walls to protect coastal developmentagainst sea-level rises will decrease coastal wet-land habitat.
Human beings may pay a price in adaptingto climate change that exceeds the costs of
53
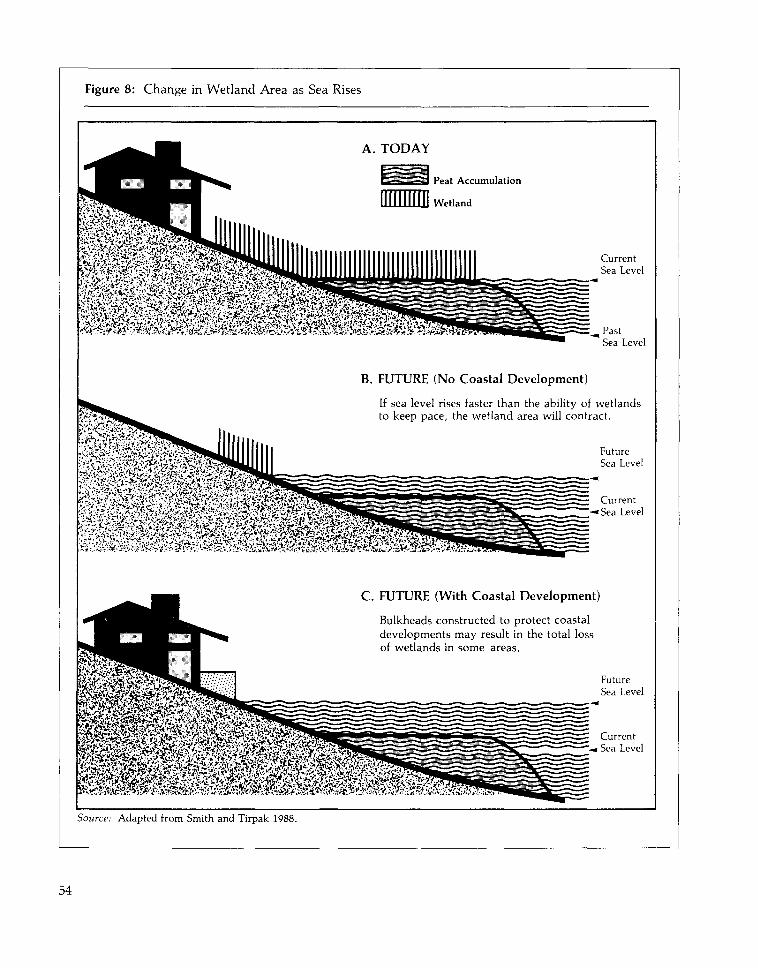
Figure 8: Change in Wetland Area as Sea Rises
A. TODAY
Peat Accumulation
Wetland
CurrentSea Level
,PastSea Level
B. FUTURE (No Coastal Development)
If sea level rises faster than the ability of wetlandsto keep pace, the wetland area will contract.
FutureSea Level
Current'-•Sea Level
C. FUTURE (With Coastal Development)
Bulkheads constructed to protect coastaldevelopments may result in the total lossof wetlands in some areas.
FutureSea Level
Current'-« Sea Level
Source: Adapted from Smith and Tirpak 1988.
54
losses of species and their associated ecosystemservices. For instance, as species shift ranges,the regional prevalence of certain human andagricultural diseases could increase. In tropicalregions, the range of the tsetse fly (Glossinaspp.) and the parasite that it transmits(Trypanosomiasis spp., which causes sleepingsickness in humans and the disease, nagana, indomestic animals) could shift (Dobson andCarper, in press). If it does, harm to humanpopulations currently outside of the tsetse flyrange can be expected, and some areas previ-ously off-limits to human exploitation would besettled, with commensurate losses of habitatsand many of their associated species.
Cumulative Effects
Human disturbances of ecosystems rarelyinvolve just a single impact. Far more commonis a pattern of repeated or simultaneous distur-bances. For example, the fragmentation of a for-est causes species extinctions, changes hydro-logical cycles, changes population sizes, andalters migratory patterns; at the same time, theforest may be independently disturbed by acidrain and climate change. Similarly, over-exploitation of one fish may be compounded byover-exploitation of another in the ecosystem,marine pollution, and loss of spawning habitat.
The cumulative effect of various disturbancescan seriously threaten a region's biodiversity.Even if the disturbances have only additiveeffects, small changes can add up to seriousimpacts (NRC 1986). Ehrlich and Ehrlich (1981)provide an apt analogy for this problem: a manprying rivets out of the wing of an airliner sothat he can sell the rivets sees no reason toworry about the consequences of his actionssince he has already removed numerous rivetsfrom the wing with no apparent ill effect.
The loss of wetland habitat dramatically illus-trates the potential cumulative impacts of rela-tively small environmental disturbances. Theloss of one coastal wetland would have littleeffect on fish populations dependent on wet-lands for one portion of their life cycle; but ifother wetlands in the region are also lost, theharm could be great. Between 1950 and 1970,Connecticut and Massachusetts lost about halfof their coastal wetlands. Hundreds of localdecisions were to blame, and no single deci-sion reflected the gravity of the cumulativeeffect. Odum (1982), following economistAlfred Kahn, refers to this process as the"tyranny of small decisions."
Even more troubling, some disturbances maybe synergistic rather than merely additive.Such interactions may have larger or moredamaging effects on ecosystems than additiveimpacts do (NRC 1986). For example, habitatfragmentation alone in a constant climaticregime, or climate change in a region with anunfragmented habitat, will have far less impacton species diversity than will the two factorscombined. Species that would have otherwisebeen able to migrate to suitable climatic zonesin a continuous habitat may be lost if physicalbarriers fragment the habitat. For instance, theheath hen described earlier was wiped out by asynergistic effect of habitat loss, over-exploita-tion, and unusual weather.
Resource management and land-use planningmust take account of cumulative effects.Indeed, without wide-ranging strategic deci-sions, seemingly disconnected small actionscould cumulatively degrade importantresources. In the worst case, rainforests, wet-lands, coral reefs, and other vast resourcescould be nickelled and dimed to death.
55
V. What's Happening to AgriculturalGenetic Diversity?
T he management of genetic diversity iscritical to the maintenance of all wildand captive populations, but its value
is particularly apparent in agriculture where ithas for millennia been used to enhance pro-ductivity. Tremendous advances have beenmade in the past 20 years to secure agriculturalgenetic diversity, but much more work remainsto be done. Currently, the conservation ofgenetic diversity and its utilization in thedevelopment and patenting of new life forms ishotly debated in North-South dialogues and byresource managers. (See Plucknett et al. 1987;Kloppenburg and Kleinman 1987; Kloppenburg1988a, b; Junta 1989.) And no consensus can beexpected until the distribution and status of thegenetic diversity of economically important spe-cies is widely understood.
Uses of Genetic DiversityIn agriculture and forestry, genetic diversity
can enhance production. Several varieties canbe planted in the same field to minimize cropfailure, and new varieties can be bred to max-imize production or adapt to adverse or chang-ing conditions. The Massa of northern Came-roon (who cultivate five varieties of pearlmillet), the Ifugao of the island of Luzon in thePhilippines (who identify more than 200 varie-ties of sweet potato by name), and Andeanfarmers (who cultivate thousands of clones ofpotatoes, more than 1,000 of which havenames) all use highly diversified farmingsystems—the first approach (Clawson 1985).
The second approach is also widely used. Inthe United States from 1930 to 1980, plantbreeders' use of genetic diversity accounted forat least one-half of a doubling in yields of rice,barley, soybeans, wheat, cotton, and sugar-cane; a threefold increase in tomato yields; anda fourfold increase in yields of corn, sorghum,and potato (OTA 1987).
In general, the easy gains in plant breedingcome first; then, the crop's response isless dramatic and increasingly greaterresearch and breeding are needed tosustain increased yields.
As important as genetic diversity is toincreasing yields, it is at least as important inmaintaining existing productivity. For example,crop yields can be increased by introducinggenetic resistance to certain insect pests, butsince natural selection often helps insectsquickly overcome this resistance, new geneticresistance has to be periodically introduced intothe crop just to sustain the higher productivity.Pesticides are also overcome by evolution, soanother important agricultural use of geneticdiversity has been to offset productivity lossesfrom pesticide resistance. Indeed, the recordshows that pesticides only temporarily conquer
57
pests. Over 400 species of pests now resist oneor more pesticides (May 1985), and the propor-tion of U.S. crops lost to insects has approxi-mately doubled—to 13 percent—since the 1940s,even though pesticide use has increased(Plucknett and Smith 1986). Even more signifi-cantly, as crop yields increase, so must effortsto sustain the gains (Plucknett and Smith1986). In general, the easy gains come first.
Until the advent of genetic engineering, thespectrum of genetic resources available forplant breeding ranged from other varieties ofthe crop to wild relatives of the species. Wildrelatives of crops have contributed significantlyto agriculture, particularly in disease resistance(Prescott-Allen and Prescott-Allen 1983).Thanks to wild wheats, domesticated wheatnow resists fungal diseases, drought, wintercold, and heat. Rice gets its resistance to twoof Asia's four main rice diseases from a singlesample of wild rice from central India (Prescott-Allen and Prescott-Allen 1983).
The spectrum of genetic resources availableto breeders is now expanding to still more dis-tantly related species, thanks to genetic engi-neering techniques. However, much morework remains to be done before the potentialsof these techniques are realized (Plucknett etal. 1987). Moreover, most new genetic engi-neering techniques will at least initially involvesingle-gene modifications of species, and inmany cases such modifications are less usefulthan the multiple-gene changes that result fromtraditional breeding programs. A transfer of asingle gene to a crop plant may confer resis-tance to a certain pest, but that resistance isoften relatively quickly overcome by the pest.In only one species—tobacco—has single-generesistance been useful for extended periods oftime (Prescott-Allen and Prescott-Allen 1986).
Genetic diversity has also been of signifi-cance in breeding programs for species otherthan edible plants. It is becoming increasinglyimportant in forestry and fisheries, and the useof genetic resources in livestock breeding hasmarkedly increased yields. The average milk
yield of cows in the United States has doubledover the past 30 years, and genetic improve-ment accounts for more than 25 percent of thisgain in at least one breed (Prescott-Allen andPrescott-Allen 1983).
Still, for several reasons, genetic diversity hasbeen less useful in livestock breeding than incrop breeding (Frankel and Soule 1981). First,whereas one major use of the genetic diversityof crops has been in the development of strainsresistant to specific pests and diseases, live-stock husbandry has relied largely on vaccinessince animals (unlike plants) can developimmunity to disease. Second, maintaining live-stock germplasm is tougher logistically thanmaintaining the genetic material of plants:since domesticated animals do not go throughdormant stages comparable to the seed stage ofplants, long-term storage is a problem. Finally,many of the closest relatives of domesticatedanimals are extinct, endangered, or rare, andthus unavailable for breeding (Prescott-Allenand Prescott-Allen 1983).
For different reasons, genetic improvement offorest species has also received less attentionthan crop improvement. Until recently, mosttimber harvested has been wild, so breedingprograms seemed unnecessary. In addition,because trees are so long-lived, the rate ofgenetic improvement of tree species is quiteslow. Tests and measurements of growthcharacteristics have been made for some 500species (primarily conifers) over the years, butless than 40 tree species are being bred(G. Namkoong, North Carolina State Univer-sity, personal communication, May 1989). Yet,impressive gains have been made with thesespecies. In intensive breeding programs, a 15to 25 percent gain in productivity per genera-tion has been attained for trees growing onhigh-quality sites without inputs of fertilizer,water, or pesticides (G. Namkoong, personalcommunication, May 1989).
Most of the fish that humanity eats or con-verts to livestock feed are wild, so breedinghas not been widely utilized in fisheries to
58
enhance yields either. An exception is aqua-culture. In one case, the domestic carp (Cypri-nus carpio) was bred with a wild carp in theSoviet Union to enhance the cold resistance ofthe domestic species and allow a range exten-sion to the north (Prescott-AUen and Prescott-Allen 1983).
The development of high-yielding varieties ofcrops has greatly benefitted some segments ofsociety, but some risks attend use of these newvarieties. With the advent of modern plantbreeding techniques, a trend toward geneticallymore uniform agriculture has developed inareas suited to the high-yielding, high-inputmodern varieties. Whereas traditional mixedfarming systems produce modest but reliableyields, planting a single modern crop varietyover a large area can result in high yields butthe crop may be extremely vulnerable to pests,disease, and severe weather. In 1970, forinstance, the U.S. corn crop suffered a 15-per-cent reduction in yield and losses worthroughly $1 billion when a leaf fungus (Helmin-thosporium maydis) spread rapidly through thegenetically uniform crop (Tatum 1971). Simi-larly, the Irish potato famine in 1846, the loss ofa large portion of the Soviet wheat crop to coldweather in 1972, and the citrus canker outbreakin Florida in 1984 all stemmed from reductionsin genetic diversity (Plucknett et al. 1987).
To stabilize production, breeders use one ofseveral tactics to maintain a genetically diversecrop array. Typically, varieties are replacedwith higher-yielding relatives after four to tenyears even if they still resist disease or pests.In effect, the spatial diversity of traditionalagriculture is replaced with a temporal diver-sity created by a continuous supply of new cul-tivars. In the United States, the average life-time of a cultivar of cotton, soybean, wheat,maize, oats, or sorghum is between 5 and 9years (Plucknett and Smith 1986). An exampleof a 10- to 12-year cycle of varieties of sugar-cane is shown in Figure 9.
Newer strategies for stabilizing productioninvolve the use of varietal blends (a mix of
strains sharing similar traits but based ondifferent parents) or multilines (varieties con-taining several different sources of resistance).In each case, the crop represents a geneticallydiverse array that can better withstand diseaseand pests (Plucknett et al. 1987). Despite theseefforts, genetic uniformity still places somecrops at risk of disease outbreaks and in someregions that risk is considerable. Some 62 per-cent of rice varieties in Bangladesh, 74 percentin Indonesia, and 75 percent in Sri Lanka arederived from one maternal parent (Hargrove etal. 1988).
In Situ ConservationMaintenance of plant and animal genetic
material in the wild (in situ) and maintenanceof wild or domesticated material in gardens,orchards, seed collections, or laboratories (exsitu) are both essential aspects of managing thehuman use of genetic diversity. In situ conser-vation maintains not only a variety's geneticdiversity but also the evolutionary interactionsthat allow it to adapt continually to shiftingenvironmental conditions, such as changes inpest populations or climate. In agriculture, insitu conservation is also the best way to main-tain knowledge of the farming systems inwhich the varieties have evolved.
One innovative technique that has been sug-gested for maintaining both genetic diversityand knowledge of farming systems wheretraditional varieties are being lost involves theuse of village-level "landrace custodians." At alimited number of key sites (perhaps between100 and 500) in areas where diseases, pests,and pathogens strongly influence the evolutionof local crop varieties, individuals could bepaid to grow a sample of the endangerednative landraces (Altieri et al. 1987; Wilkes, inpress[a]). These farms would backstop ex situconservation efforts, maintain the potential forfurther evolution in important landraces, pre-serve knowledge of traditional farming sys-tems, and provide regional education on theimportance of biodiversity conservation. If itseems economically inefficient to subsidize the
59
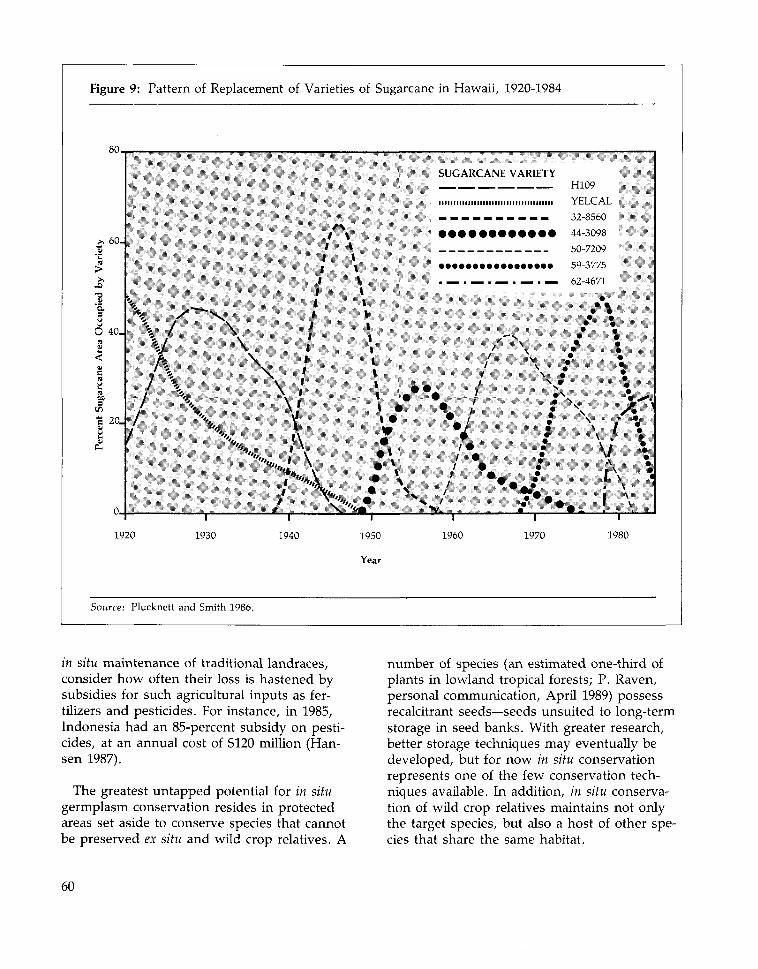
Figure 9: Pattern of Replacement of Varieties of Sugarcane in Hawaii, 1920-1984
6s<
an
60-
40.
20_
0
\ /
X/ \/
\ /\ /
. Vi
/ \
t \\ii
itiiiiiiiiii
•
••
w•
•••
1
\\\
SUC,ARC ANK VARIKH
• •
• • • • • • • • • • • •
• • • • • • • • • • • • • • • • a
/
/ • •/ • •
/ mmmj
i i
mo--1
MU.A1
, ##
• •• •
•
s\
\s .
\ (
# i
••
k•\\
1920 1930 1940 1950
Year
1960 1970 1980
Source: Plucknett and Smith 1986.
in situ maintenance of traditional landraces,consider how often their loss is hastened bysubsidies for such agricultural inputs as fer-tilizers and pesticides. For instance, in 1985,Indonesia had an 85-percent subsidy on pesti-cides, at an annual cost of $120 million (Han-sen 1987).
The greatest untapped potential for in situgermplasm conservation resides in protectedareas set aside to conserve species that cannotbe preserved ex situ and wild crop relatives. A
number of species (an estimated one-third ofplants in lowland tropical forests; P. Raven,personal communication, April 1989) possessrecalcitrant seeds—seeds unsuited to long-termstorage in seed banks. With greater research,better storage techniques may eventually bedeveloped, but for now in situ conservationrepresents one of the few conservation tech-niques available. In addition, in situ conserva-tion of wild crop relatives maintains not onlythe target species, but also a host of other spe-cies that share the same habitat.
60
The International Board for Plant GeneticResources (IBPGR) has identified numerousspecies whose wild relatives are prime candi-dates for in situ conservation. These includerelatives of groundnut, oil palm, banana, rub-ber, coffee, cocoa, members of the onionfamily, citrus fruits, mango, cherries, apples,pears, and many forage species. Some pilotefforts are now under way to develop such insitu conservation programs. A gene sanctuaryhas been established in India for Citrus species,two reserves have been established in Zambiato conserve Zambesi teak (Baikiaea plurijuga),and one has been set up in Canada for jackpine (Pinus banksiana) (FAO 1985b). The exist-ing 4,500 protected areas monitored by theWorld Conservation Monitoring Center can beexpected to harbor many wild relatives, thoughno actual field inventory has been conducted.
Little effort has been directed at conservingthe genetic diversity of forestry species. Anumber of populations of the two dozen spe-cies that have been intensively bred survive invarious types of protected areas, so it seemsunlikely that the genetic base of the specieswill shrink. However, several hundred wild orsemi-domesticated tree species of economicvalue throughout the world are at risk of beinglost in all or part of their ranges. In a review in1986, the FAO identified 86 such threatenedspecies (FAO 1986), and this list has length-ened since. Only about half of the populationsthreatened in 1989 are represented within pro-tected areas (G. Namkoong, personal commu-nication, May 1989).
Several hundred wild or semi-domesticatedtree species of economic value throughoutthe world are at risk of being lost in allor part of their ranges.
Wild forest species are particularly suscepti-ble to genetic erosion because of the practice of
high grading, whereby the best trees areremoved each harvest cycle and the less usefultrees become the breeding stock. This type ofgenetic erosion has reduced a number of oncevigorous timber-producing forests in Japan,Korea, Turkey, and the Himalayas to stands ofstunted and malformed trees (C. Miller 1987).The best defense against the erosion of forestgenetic diversity is a combination of in situ con-servation, ex situ storage, and the use of livingcollections of plants (known as ex situ fieldgene banks). How long the seeds of many treespecies will last in storage has not yet beentested; particularly among tropical species,long-term storage may be difficult and fieldgene banks necessary. In addition, even spe-cies whose seed can be stored in seedbankswill have to be regenerated periodically; giventhe long generation time of forest species, con-tinual maintenance in field gene banks will beneeded (Palmberg 1984).
The best defense against the erosion offorest genetic diversity is a mixture ofin situ conservation, ex situ storage,and the use of living collections ofplants.
Ex Situ ConservationGenetic diversity can be preserved ex situ
through various techniques. In plants, theseeds of many species with so-called "orthodoxseeds" can be stored in dry, low-temperature,vacuum containers (cryogenic storage). Forsome of these species, storage at extremely lowtemperatures, below -130°C, may extend thestorage life to more than a century. In contrast,species with recalcitrant seeds can be main-tained only in situ or in field collections,botanic gardens, and arboretums. Many specieswith recalcitrant seeds, particularly species thatcan be grown from cuttings, such as banana or
61
taro, can be maintained by growing plant tis-sue or plantlets under specific conditions inglass or plastic vessels (in vitro culture). Recentwork on cryogenic storage of in vitro culturesmay further enhance this technique's potential.Cryopreservation also holds considerable prom-ise for the long-term maintenance of livestocksemen and embryos. Semen from at least 200different species has been frozen, as haveembryos from at least ten mammalian species(OTA 1987).
The chief benefit of ex situ preservation is inproviding breeders with ready access to a widerange of genetic materials already screened foruseful traits. Ex situ preservation may also rep-resent a last resort for many species and varie-ties that would otherwise die out as their habi-tat is destroyed or modern varieties of plantsor animals take their place. In situ conservationis often less expensive than ex situ techniques(Brush 1989), it insures against loss of ex situcollections, and it allows the continuing evolu-tion of the crop varieties. In situ conservationalso preserves knowledge of the farming sys-tems with which local varieties evolved. Thus,the ex situ and in situ techniques complementeach other and must be used together.
Ex situ storage should be consideredpreservation rather than conservation.
While some ex situ technologies—such asseed storage—are now extensively utilized,many problems with their use persist. Even instandard seed banks, the long-term integrity ofthe germplasm remains in question. Inadver-tent selection or unintentional crossing withother varieties may occur, and plants stored invitro mutate at relatively high rates. Perhapsmost significantly, under any ex situ storageconditions, the evolution of the species is "fro-zen" so no further adaptation to pests orenvironmental changes can take place. For this
reason, ex situ storage should be consideredpreservation rather than conservation.
The initial spread of new high-yielding varie-ties during the Green Revolution was dramatic.For example, modern varieties were adoptedon 40 percent of Asia's rice farms within 15years of their release, and in certain countries,such as Indonesia, Sri Lanka, and the Philip-pines, the comparable figure is more than 80percent (Brush 1989). These threats to localcrop varieties led the Consultative Group onInternational Agricultural Research (CGIAR) toestablished IBPGR in 1974 to stimulate andcoordinate efforts to preserve the remaininggenetic diversity of crops for future use inbreeding programs. Since its inception, IBPGRhas catalyzed improvements in the status ofcrop genetic resources by establishing conserva-tion priorities, providing funds for exploration,and helping coordinate the seed-collectionactivities of the 13 CGIAR international agricul-tural research centers and 227 national seedbanks in 99 countries.
Thanks to these activities, the status of cropgenetic diversity has improved significantly inthe last two decades. Today, reasonably com-prehensive collections of the genetic diversityof most crops of importance in the temperatezone have been established, and the coverageof tropical crops is improving. (See Table 13.)For many of the major staple foods—includingwheat, corn, oats, and potatoes—more than 90percent of the landraces have now been pre-served in ex situ collections (Plucknett et al.1987). For many other globally important crops,the major part of the work involved in preserv-ing landraces will soon be completed (Plucknettet al. 1987).
Despite such heartening progress, manyobstacles remain in the quest to provide asecure source of germplasm. One is a lack ofinformation. For example, for nearly half of thetwo million "accessions" (collections of seedfrom a specific locality) to gene banks world-wide, the plant's characteristics and the loca-tion where it was collected aren't recorded
62
(Wilkes, in press[b]). Then too, the high cost ofex situ collections, particularly when seed isstored at very low temperatures, may forcesome seed banks to cut back or shut down. Ata minimum, high storage costs mean thatfunds for describing the germplasm present inthe banks—a necessity for making the germ-plasm useful to plant breeders—are scarce.
But the most serious problem associated withex situ collections involves gaps in coverage ofimportant species, particularly those of signifi-cant value in tropical countries. The most wor-risome gaps are in the coverage of species ofregional importance, species with recalcitrantseeds, wild species, and livestock.
Because many important subsistencecrops in developing countries are notwidely traded in world markets andbecause storing germplasm of manytropical species is difficult, manyregionally important crops are poorlyrepresented in germplasm banks.
Crops of Regional Importance. Germplasm collec-tion initially focused on food crops of greatestvalue in world commerce. Because many of themost important subsistence crops in developingcountries are not widely traded in world mar-kets and because many tropical species possessrecalcitrant seeds, many regionally importantcrops are poorly represented in germplasmbanks. Cassava and sweet potatoes are thefourth and fifth most important crops in thedeveloping world by weight; yet, fewer thanhalf of the landraces and fewer than 5 percentof the wild relatives are represented in ex situcollections. In addition, many species witheither industrial or medicinal value are under-represented in seedbanks. In 1987 the Food andAgriculture Organization of the U.N. noted that:
"[RJoots and tubers provide an important staplefood for more than 1,000 million people in thedeveloping world. Yet, unlike cereals, roots andtubers generally receive low priority—or no pri-ority at all—in the agricultural plans of develop-ing nations.... [The production of cassava,yams, sweet potato and taro] has suffered fromyears of neglect. Little of the research that hasbeen done on increasing yields or improvingstorage characteristics has yet been applied.Where harvests have improved, it is usuallybecause the area planted has been increased."(FAO 1987b)
The international seedbanks' priorities arebeginning to shift to respond to this need tostore germplasm from important species thataren't globally traded. In 1980, IBPGR initiateda major effort to conserve vegetable crop germ-plasm, for instance. Still, the coverage formany regionally important species falls dis-proportionately short of the coverage affordedto, say, cereal grains.
Species with Recalcitrant Seeds. Many importantcrops are poorly represented in ex situ collec-tions because their seeds are hard to store orbecause the species normally propagatesvegetatively. Crops such as rubber, cacao,palms, many tuber crops, and many tropicalfruits and other tree species can be conservedonly in situ or in ex situ field gene banks. Ofthe 6,500 potato accessions maintained at theInternational Potato Center (one of the CGIARinternational agricultural research centers) inPeru, 5,000 are clones that are planted eachyear (Plucknett et al. 1987). Because this proce-dure is so expensive, the potato is the onlyroot crop with more than 50 percent of itsdiversity in ex situ storage. The development oftissue culture techniques will improve thecoverage of species with recalcitrant seeds, butthe expense and difficulty of the techniquesuggests that these species will remain under-represented in ex situ collections.
Wild Species. The principal role of wild croprelatives has been as a source of genes confer-ring resistance to parasites and pests. More
63
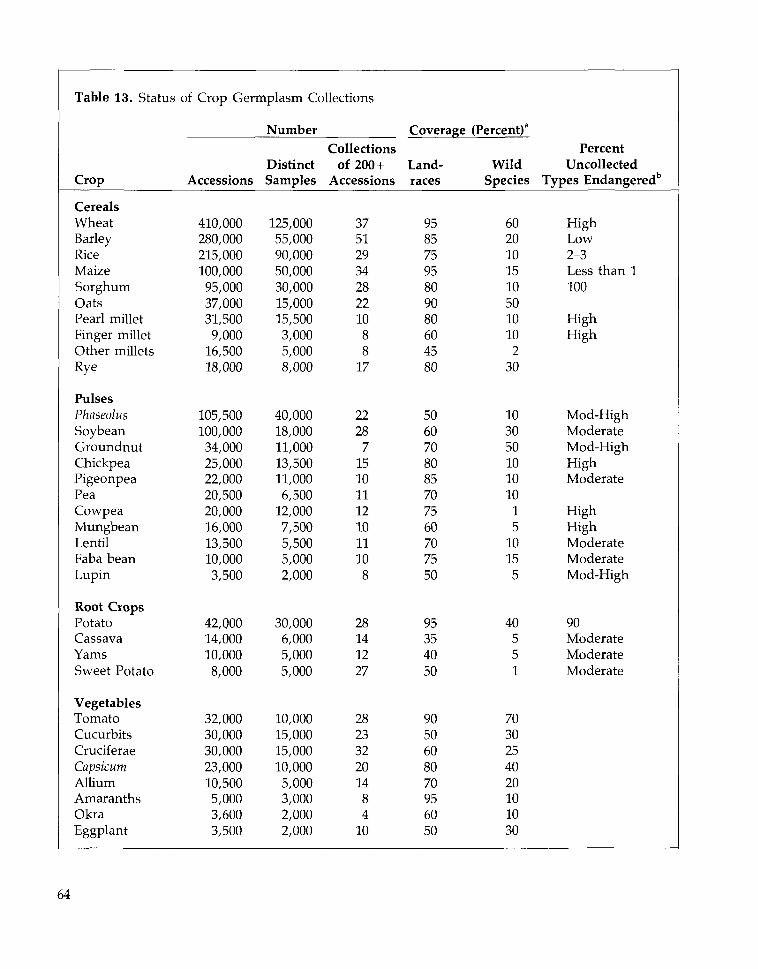
Table 13. Status
Crop
CerealsWheatBarleyRiceMaizeSorghumOatsPearl milletFinger milletOther milletsRye
PulsesPhaseolusSoybeanGroundnutChickpeaPigeonpeaPeaCowpeaMungbeanLentilFaba beanLupin
Root CropsPotatoCassavaYamsSweet Potato
VegetablesTomatoCucurbitsCruciferaeCapsicumAlliumAmaranthsOkraEggplant
of Crop Germplasm Collections
Accessions
410,000280,000215,000100,00095,00037,00031,5009,000
16,50018,000
105,500100,00034,00025,00022,00020,50020,00016,00013,50010,0003,500
42,00014,00010,0008,000
32,00030,00030,00023,00010,5005,0003,6003,500
Number
DistinctSamples
125,00055,00090,00050,00030,00015,00015,5003,0005,0008,000
40,00018,00011,00013,50011,0006,500
12,0007,5005,5005,0002,000
30,0006,0005,0005,000
10,00015,00015,00010,0005,0003,0002,0002,000
Collectionsof 200 +
Accessions
3751293428221088
17
2228
7151011121011108
28141227
282332201484
10
Coverage
Land-races
95857595809080604580
5060708085707560707550
95354050
9050608070956050
(Percent)3
WildSpecies
60201015105010102
30
103050101010
15
10155
40551
7030254020101030
PercentUncollected
Types Endangered1"
HighLow2-3Less than 1100
HighHigh
Mod-HighModerateMod-HighHighModerate
HighHighModerateModerateMod-High
90ModerateModerateModerate
64
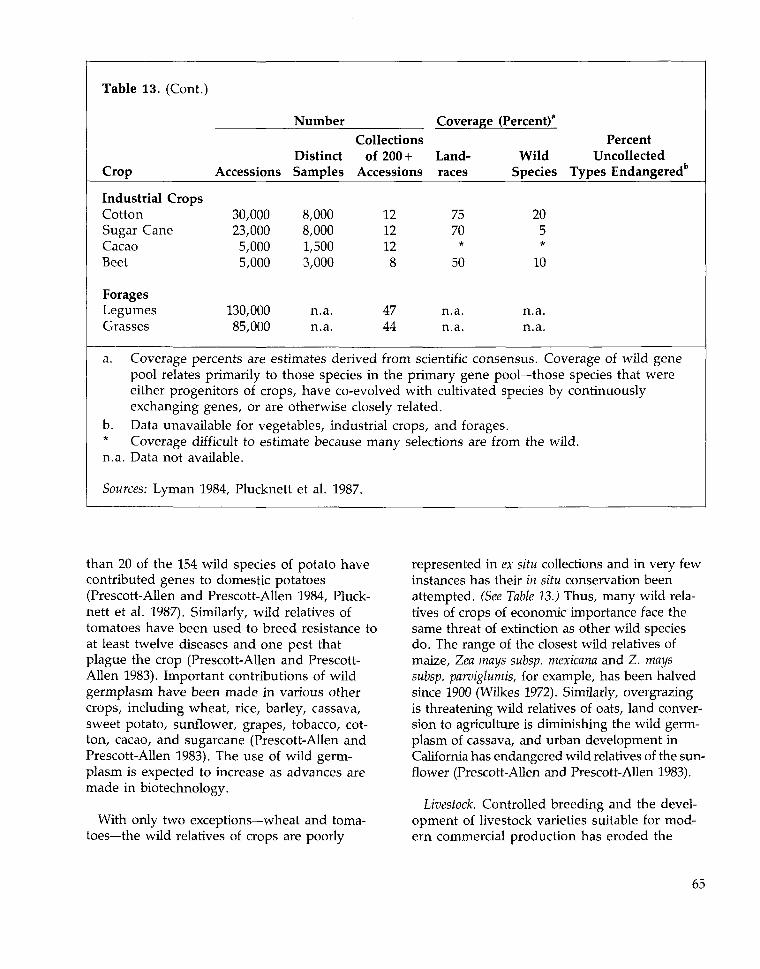
Table 13. (Cont.)
Number Coverage (Percent)8
Crop AccessionsDistinctSamples
Collectionsof 200 +
AccessionsLand-races
WildSpecies
PercentUncollected
Types Endangered13
Industrial CropsCotton 30,000 8,000 12 75Sugar Cane 23,000 8,000 12 70Cacao 5,000 1,500 12Beet 5,000 3,000 8 50
ForagesLegumes 130,000 n.a. 47 n.a.Grasses 85,000 n.a. 44 n.a.
205*
10
n.a.n.a.
a. Coverage percents are estimates derived from scientific consensus. Coverage of wild genepool relates primarily to those species in the primary gene pool—those species that wereeither progenitors of crops, have co-evolved with cultivated species by continuouslyexchanging genes, or are otherwise closely related.
b. Data unavailable for vegetables, industrial crops, and forages.* Coverage difficult to estimate because many selections are from the wild,n.a. Data not available.
Sources: Lyman 1984, Plucknett et al. 1987.
than 20 of the 154 wild species of potato havecontributed genes to domestic potatoes(Prescott-Allen and Prescott-Allen 1984, Pluck-nett et al. 1987). Similarly, wild relatives oftomatoes have been used to breed resistance toat least twelve diseases and one pest thatplague the crop (Prescott-Allen and Prescott-Allen 1983). Important contributions of wildgermplasm have been made in various othercrops, including wheat, rice, barley, cassava,sweet potato, sunflower, grapes, tobacco, cot-ton, cacao, and sugarcane (Prescott-Allen andPrescott-Allen 1983). The use of wild germ-plasm is expected to increase as advances aremade in biotechnology.
With only two exceptions—wheat and toma-toes—the wild relatives of crops are poorly
represented in ex situ collections and in very fewinstances has their in situ conservation beenattempted. (See Table 13.) Thus, many wild rela-tives of crops of economic importance face thesame threat of extinction as other wild speciesdo. The range of the closest wild relatives ofmaize, Zea mays subsp. mexicana and Z. mayssubsp. parviglumis, for example, has been halvedsince 1900 (Wilkes 1972). Similarly, overgrazingis threatening wild relatives of oats, land conver-sion to agriculture is diminishing the wild germ-plasm of cassava, and urban development inCalifornia has endangered wild relatives of the sun-flower (Prescott-Allen and Prescott-Allen 1983).
Livestock. Controlled breeding and the devel-opment of livestock varieties suitable for mod-ern commercial production has eroded the
65
genetic diversity in livestock. Throughout LatinAmerica, for instance, the once-dominantCriollo breed of cattle is being replaced byother varieties—in Brazil primarily by Zebu cat-tle; in Argentina by Angus and Herefords.Similarly, some 241 of the 700 unique strains ofcattle, sheep, pigs, and horses that have beenidentified in Europe are considered endangered(OTA 1987). Response to the threat of geneticerosion of livestock has been slow, partlybecause genetic improvement has been of lessimportance in livestock production than in crop
production, but also because the expense iscomparatively greater.
There is as yet no coordinated effort com-parable to the IBPGR for conserving thegenetic resources of livestock. Because farfewer species and varieties are involved, lesseffort than that needed to conserve cropgenetic resources is demanded, and though thecost per species will be higher than in plants,the long-term benefits that these geneticresources could provide will be substantial.
66
VI. Biodiversity Conservation: What arethe Right Tools for the Job?
T he tools that can be used to maintainbiodiversity—the protection of naturalor semi-natural ecosystems, the resto-
ration and rehabilitation of degraded lands,and such ex situ techniques as zoos, botanicgardens, aquaria, and seedbanks—all provideenormous benefits to humanity. These tools areessential elements of any response to the bioticimpoverishment of the planet. Each has itsplace in a comprehensive strategy for maintain-ing biodiversity, and their use must be inte-grated within a larger scheme of land-use plan-ning and management to ensure that themaximum number of species and genes aremaintained while meeting peoples' immediateneeds.
Land-use Zoning and ProtectedAreas
Natural and semi-natural ecosystems are theprimary reservoirs of the world's biodiversity.In a natural ecosystem, the impact of humanityis no greater than the impact of any other sin-gle biotic factor. In semi-natural ecosystems,moderate levels of human disturbance ormodification occur. (See Figure 10.) How mucha specific site can contribute to biodiversitymaintenance and which services humanityobtains from the site depends on just how"natural" an ecosystem is. In comparativelyunperturbed ecosystems, the characteristicdiversity, native species, and existing ecologicalprocesses and services can be preserved if thesite is large enough and well-managed. Where
human dominance is pronounced, certain serv-ices (timber production, for instance) may beenhanced while others (species conservation,say) are diminished.
If land is properly managed and zoned,humanity can utilize biological resources with-out diminishing the biota's capacity to meetfuture generations' needs. Certain areas can bemanaged in a natural or semi-natural state withthe primary objective of maintaining speciesdiversity and natural ecological processes;others can be managed in semi-natural statesprimarily for timber production, shifting culti-vation, or other services. Land or ocean zoninghas already been codified by IUCN and manynations in a system of "protected areas"—legally established areas, under either public orprivate ownership, where the habitat is man-aged to maintain a natural or semi-naturalstate.
Protected areas are among the most valuablemanagement tools for preserving genes, spe-cies, and habitats and for maintaining variousecological processes of importance to humanity.Such protected areas may or may not includehuman settlements, transportation systems,and subsistence or commercial use. All pro-tected areas require some intervention in theecosystem—whether boundary patrol or thesupervision of recreation, or resource extrac-tion. Various man-made components may beadded: research stations, monitoring devices,roads, or logging equipment.
67
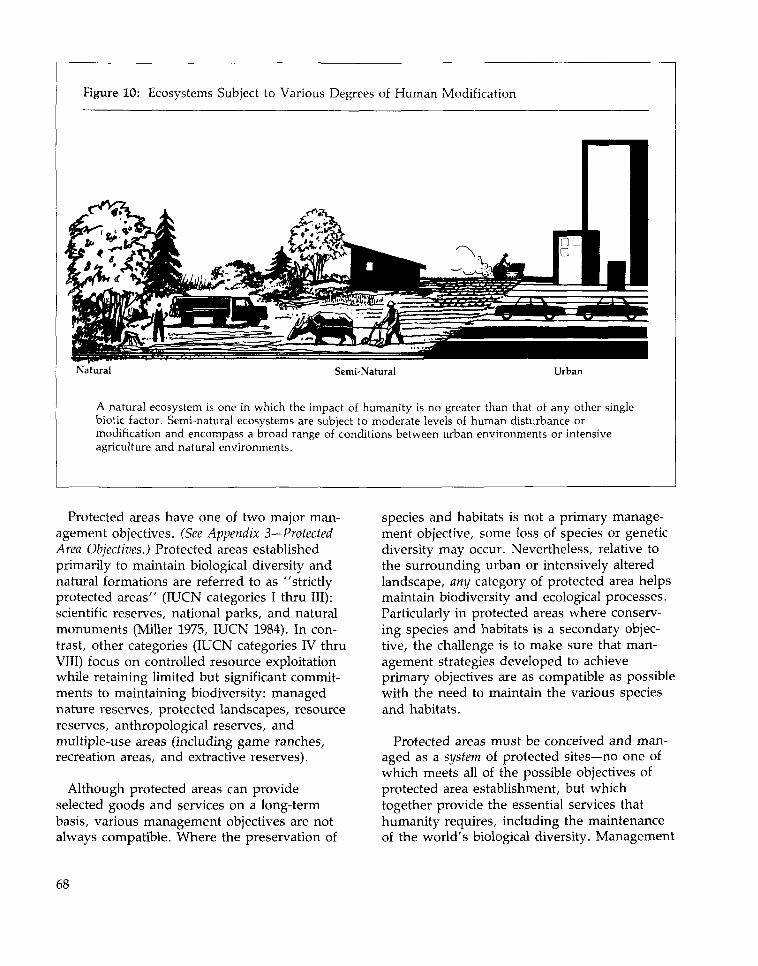
Figure 10: Ecosystems Subject to Various Degrees of Human Modification
Natural Semi-Natural Urban
A natural ecosystem is one in which the impact of humanity is no greater than that of any other singlebiotic factor. Semi-natural ecosystems are subject to moderate levels of human disturbance ormodification and encompass a broad range of conditions between urban environments or intensiveagriculture and natural environments.
Protected areas have one of two major man-agement objectives. (See Appendix 3—ProtectedArea Objectives.) Protected areas establishedprimarily to maintain biological diversity andnatural formations are referred to as "strictlyprotected areas" (IUCN categories I thru III):scientific reserves, national parks, and naturalmonuments (Miller 1975, IUCN 1984). In con-trast, other categories (IUCN categories IV thruVIII) focus on controlled resource exploitationwhile retaining limited but significant commit-ments to maintaining biodiversity: managednature reserves, protected landscapes, resourcereserves, anthropological reserves, andmultiple-use areas (including game ranches,recreation areas, and extractive reserves).
Although protected areas can provideselected goods and services on a long-termbasis, various management objectives are notalways compatible. Where the preservation of
species and habitats is not a primary manage-ment objective, some loss of species or geneticdiversity may occur. Nevertheless, relative tothe surrounding urban or intensively alteredlandscape, any category of protected area helpsmaintain biodiversity and ecological processes.Particularly in protected areas where conserv-ing species and habitats is a secondary objec-tive, the challenge is to make sure that man-agement strategies developed to achieveprimary objectives are as compatible as possiblewith the need to maintain the various speciesand habitats.
Protected areas must be conceived and man-aged as a system of protected sites—no one ofwhich meets all of the possible objectives ofprotected area establishment, but whichtogether provide the essential services thathumanity requires, including the maintenanceof the world's biological diversity. Management
68
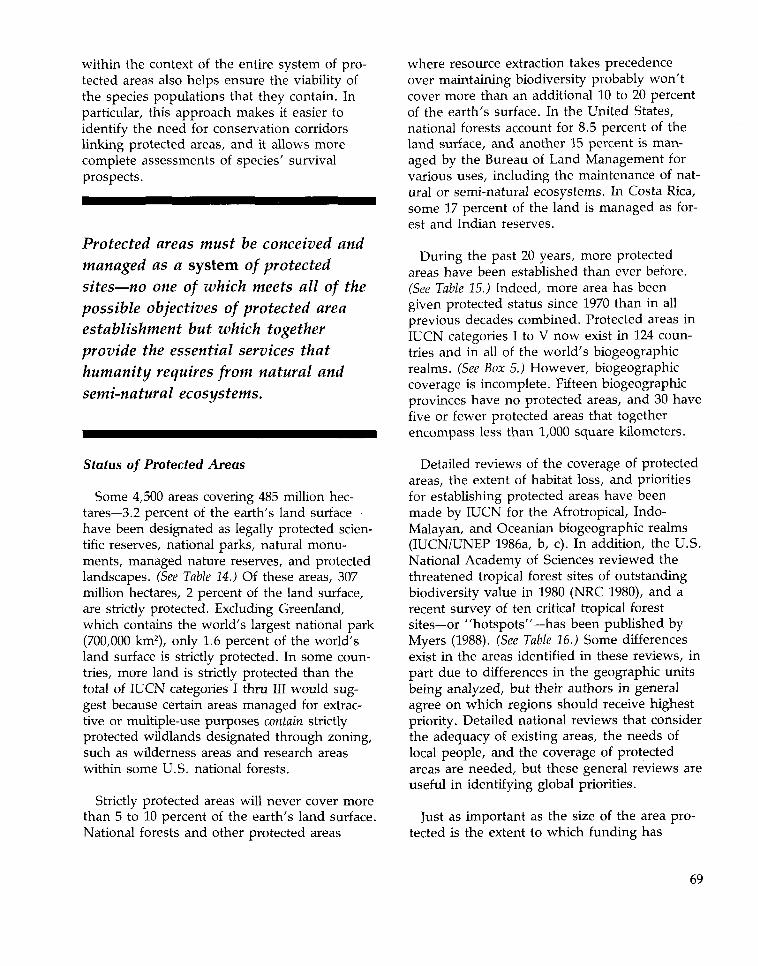
within the context of the entire system of pro-tected areas also helps ensure the viability ofthe species populations that they contain. Inparticular, this approach makes it easier toidentify the need for conservation corridorslinking protected areas, and it allows morecomplete assessments of species' survivalprospects.
Protected areas must be conceived andmanaged as a system of protectedsites—no one of which meets all of thepossible objectives of protected areaestablishment but which togetherprovide the essential services thathumanity requires from natural andsemi-natural ecosystems.
Status of Protected Areas
Some 4,500 areas covering 485 million hec-tares—3.2 percent of the earth's land surface-have been designated as legally protected scien-tific reserves, national parks, natural monu-ments, managed nature reserves, and protectedlandscapes. (See Table 14.) Of these areas, 307million hectares, 2 percent of the land surface,are strictly protected. Excluding Greenland,which contains the world's largest national park(700,000 km2), only 1.6 percent of the world'sland surface is strictly protected. In some coun-tries, more land is strictly protected than thetotal of IUCN categories I thru III would sug-gest because certain areas managed for extrac-tive or multiple-use purposes contain strictlyprotected wildlands designated through zoning,such as wilderness areas and research areaswithin some U.S. national forests.
Strictly protected areas will never cover morethan 5 to 10 percent of the earth's land surface.National forests and other protected areas
where resource extraction takes precedenceover maintaining biodiversity probably won'tcover more than an additional 10 to 20 percentof the earth's surface. In the United States,national forests account for 8.5 percent of theland surface, and another 15 percent is man-aged by the Bureau of Land Management forvarious uses, including the maintenance of nat-ural or semi-natural ecosystems. In Costa Rica,some 17 percent of the land is managed as for-est and Indian reserves.
During the past 20 years, more protectedareas have been established than ever before.(See Table 15.) Indeed, more area has beengiven protected status since 1970 than in allprevious decades combined. Protected areas inIUCN categories I to V now exist in 124 coun-tries and in all of the world's biogeographicrealms. (See Box 5.) However, biogeographiccoverage is incomplete. Fifteen biogeographicprovinces have no protected areas, and 30 havefive or fewer protected areas that togetherencompass less than 1,000 square kilometers.
Detailed reviews of the coverage of protectedareas, the extent of habitat loss, and prioritiesfor establishing protected areas have beenmade by IUCN for the Afrotropical, Indo-Malayan, and Oceanian biogeographic realms(IUCN/UNEP 1986a, b, c). In addition, the U.S.National Academy of Sciences reviewed thethreatened tropical forest sites of outstandingbiodiversity value in 1980 (NRC 1980), and arecent survey of ten critical tropical forestsites—or "hotspots"—has been published byMyers (1988). (See Table 16.) Some differencesexist in the areas identified in these reviews, inpart due to differences in the geographic unitsbeing analyzed, but their authors in generalagree on which regions should receive highestpriority. Detailed national reviews that considerthe adequacy of existing areas, the needs oflocal people, and the coverage of protectedareas are needed, but these general reviews areuseful in identifying global priorities.
Just as important as the size of the area pro-tected is the extent to which funding has
69
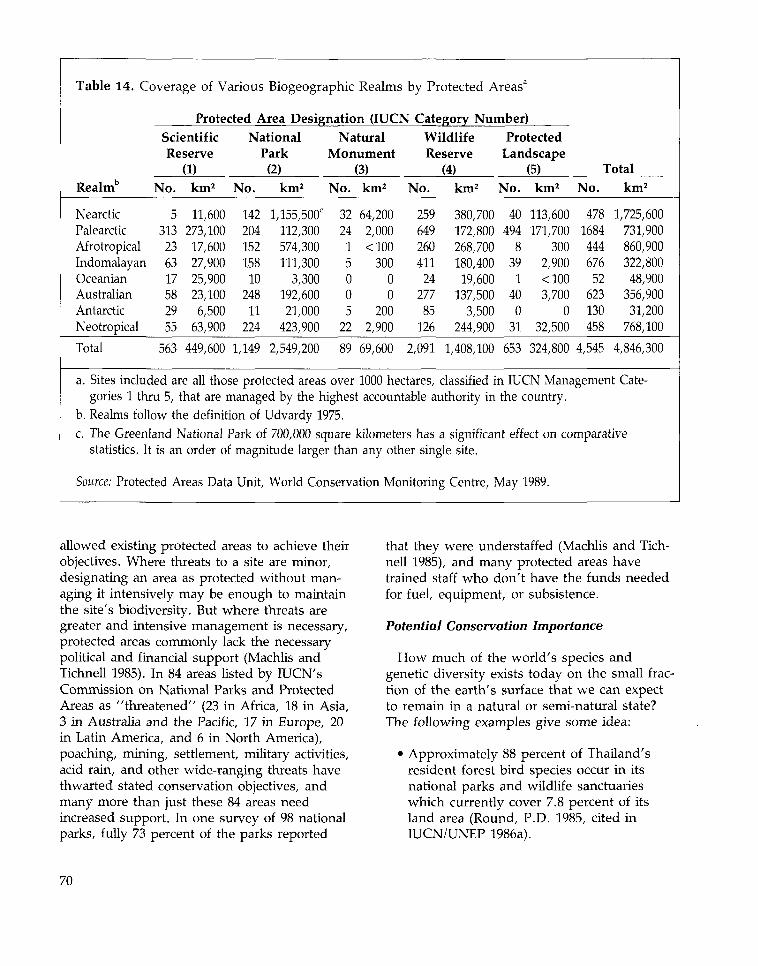
Table 14. Coverage of Various Biogeographic Realms by Protected Areas3
Protected Area Designation (IUCN Category Number)Scientific National Natural Wildlife ProtectedReserve Park Monument Reserve Landscape
(1) (2) (3) (4) (5) TotalRealmb No. km2 No. km2 No. km2 No. km2 No. km2 No. km2
NearcticPalearcticAfrotropicalIndomalayanOceanianAustralianAntarcticNeotropical
5 11,600313 273,10023 17,600
27,90025,90023,1006,50063,900
6317582955
14220415215810
24811
224
l,155,500c
112,300574,300111,3003,300
192,60021,000423,900
32 64,20024 2,000
<10030000
2002,900
1500522
2596492604112427785126
380,700172,800268,700180,40019,600137,500
3,500244,900
40 113,600494 171,700
3002,900<1003,700
032,500
839
1400
31
4781684444676
52623130458
1,725,600731,900860,900322,80048,900
356,90031,200
768,100
Total 563 449,600 1,149 2,549,200 89 69,600 2,091 1,408,100 653 324,800 4,545 4,846,300
a. Sites included are all those protected areas over 1000 hectares, classified in IUCN Management Cate-gories 1 thru 5, that are managed by the highest accountable authority in the country.
b. Realms follow the definition of Udvardy 1975.c. The Greenland National Park of 700,000 square kilometers has a significant effect on comparative
statistics. It is an order of magnitude larger than any other single site.
Source: Protected Areas Data Unit, World Conservation Monitoring Centre, May 1989.
allowed existing protected areas to achieve theirobjectives. Where threats to a site are minor,designating an area as protected without man-aging it intensively may be enough to maintainthe site's biodiversity. But where threats aregreater and intensive management is necessary,protected areas commonly lack the necessarypolitical and financial support (Machlis andTichnell 1985). In 84 areas listed by IUCN'sCommission on National Parks and ProtectedAreas as "threatened" (23 in Africa, 18 in Asia,3 in Australia and the Pacific, 17 in Europe, 20in Latin America, and 6 in North America),poaching, mining, settlement, military activities,acid rain, and other wide-ranging threats havethwarted stated conservation objectives, andmany more than just these 84 areas needincreased support. In one survey of 98 nationalparks, fully 73 percent of the parks reported
that they were understaffed (Machlis and Tich-nell 1985), and many protected areas havetrained staff who don't have the funds neededfor fuel, equipment, or subsistence.
Potential Conservation Importance
How much of the world's species andgenetic diversity exists today on the small frac-tion of the earth's surface that we can expectto remain in a natural or semi-natural state?The following examples give some idea:
• Approximately 88 percent of Thailand'sresident forest bird species occur in itsnational parks and wildlife sanctuarieswhich currently cover 7.8 percent of itsland area (Round, P.D. 1985, cited inIUCN/UNEP 1986a).
70
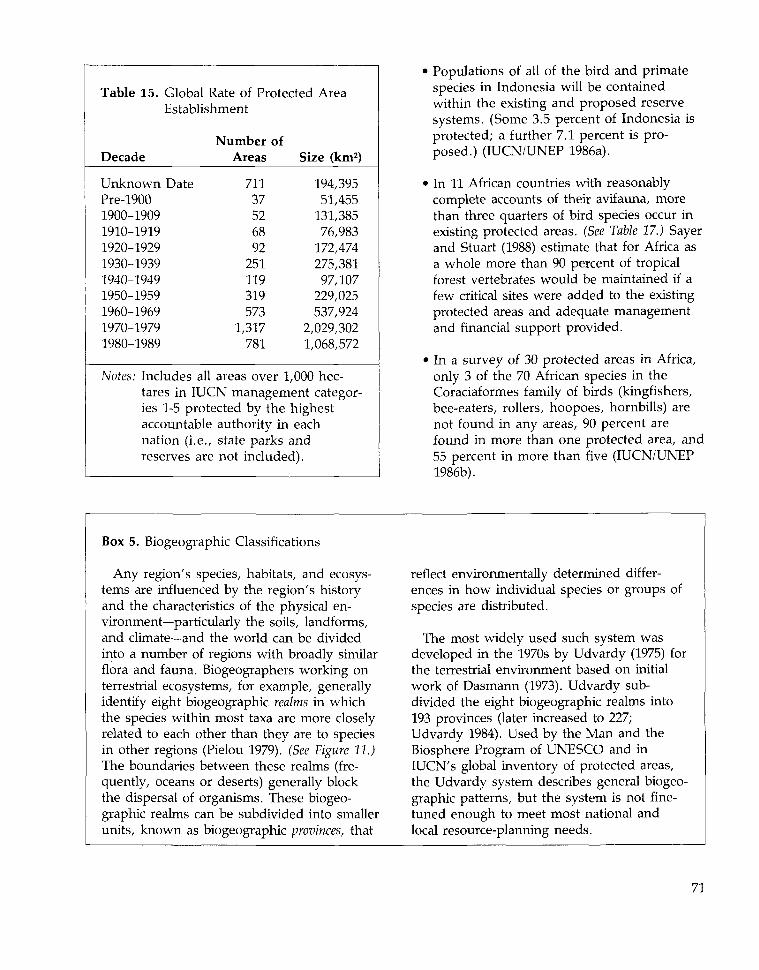
Table 15. Global Rate of ProtectedEstablishment
Decade
Unknown DatePre-19001900-19091910-19191920-19291930-19391940-19491950-19591960-19691970-19791980-1989
Notes: Includes all
Number of
Area
Areas Size (km2)
71137526892
251119319573
1,317 2,781 1,
areas over 1,000tares in IUCN management
194,39551,455
131,38576,983
172,474275,38197,107
229,025537,924029,302068,572
hec-categor-
ies 1-5 protected by the highestaccountablenation (i.e.,reserves are
authority in eachstate parks andnot included).
Populations of all of the bird and primatespecies in Indonesia will be containedwithin the existing and proposed reservesystems. (Some 3.5 percent of Indonesia isprotected; a further 7.1 percent is pro-posed.) (IUCN/UNEP 1986a).
1 In 11 African countries with reasonablycomplete accounts of their avifauna, morethan three quarters of bird species occur inexisting protected areas. (See Table 17.) Sayerand Stuart (1988) estimate that for Africa asa whole more than 90 percent of tropicalforest vertebrates would be maintained if afew critical sites were added to the existingprotected areas and adequate managementand financial support provided.
1 In a survey of 30 protected areas in Africa,only 3 of the 70 African species in theCoraciaformes family of birds (kingfishers,bee-eaters, rollers, hoopoes, hornbills) arenot found in any areas, 90 percent arefound in more than one protected area, and55 percent in more than five (IUCN/UNEP1986b).
Box 5. Biogeographic Classifications
Any region's species, habitats, and ecosys-tems are influenced by the region's historyand the characteristics of the physical en-vironment—particularly the soils, landforms,and climate—and the world can be dividedinto a number of regions with broadly similarflora and fauna. Biogeographers working onterrestrial ecosystems, for example, generallyidentify eight biogeographic realms in whichthe species within most taxa are more closelyrelated to each other than they are to speciesin other regions (Pielou 1979). (See Figure 11.)The boundaries between these realms (fre-quently, oceans or deserts) generally blockthe dispersal of organisms. These biogeo-graphic realms can be subdivided into smallerunits, known as biogeographic provinces, that
reflect environmentally determined differ-ences in how individual species or groups ofspecies are distributed.
The most widely used such system wasdeveloped in the 1970s by Udvardy (1975) forthe terrestrial environment based on initialwork of Dasmann (1973). Udvardy sub-divided the eight biogeographic realms into193 provinces (later increased to 227;Udvardy 1984). Used by the Man and theBiosphere Program of UNESCO and inIUCN's global inventory of protected areas,the Udvardy system describes general biogeo-graphic patterns, but the system is not fine-tuned enough to meet most national andlocal resource-planning needs.
71
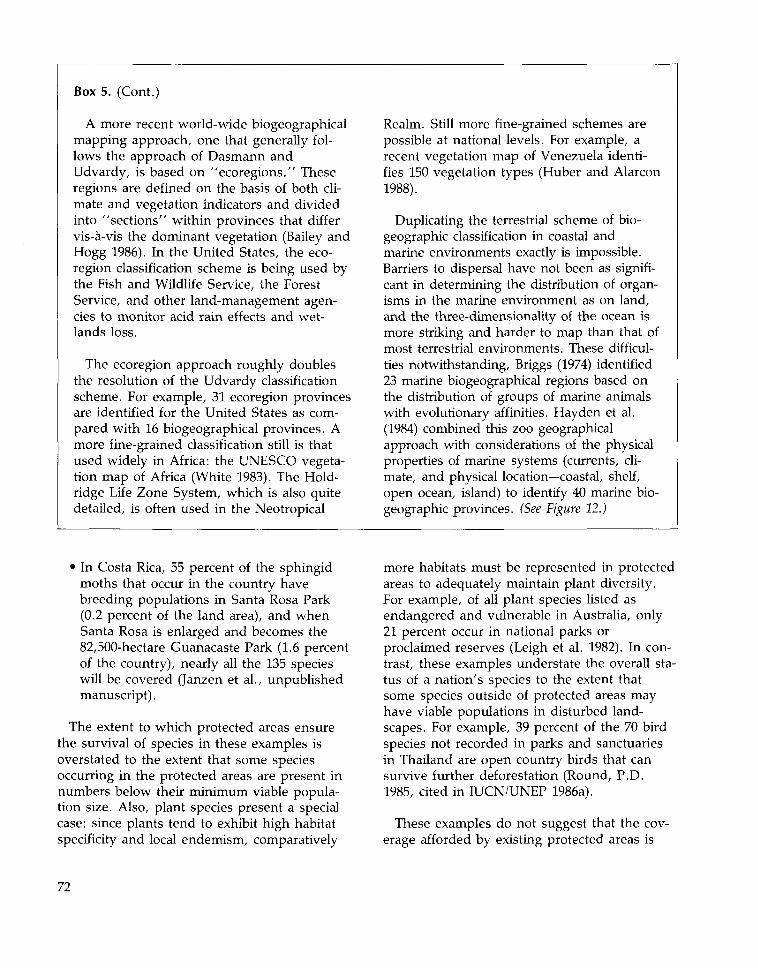
Box 5. (Cont.)
A more recent world-wide biogeographicalmapping approach, one that generally fol-lows the approach of Dasmann andUdvardy, is based on "ecoregions." Theseregions are defined on the basis of both cli-mate and vegetation indicators and dividedinto "sections" within provinces that differvis-a-vis the dominant vegetation (Bailey andHogg 1986). In the United States, the eco-region classification scheme is being used bythe Fish and Wildlife Service, the ForestService, and other land-management agen-cies to monitor acid rain effects and wet-lands loss.
The ecoregion approach roughly doublesthe resolution of the Udvardy classificationscheme. For example, 31 ecoregion provincesare identified for the United States as com-pared with 16 biogeographical provinces. Amore fine-grained classification still is thatused widely in Africa: the UNESCO vegeta-tion map of Africa (White 1983). The Hold-ridge Life Zone System, which is also quitedetailed, is often used in the Neotropical
Realm. Still more fine-grained schemes arepossible at national levels. For example, arecent vegetation map of Venezuela identi-fies 150 vegetation types (Huber and Alarcon1988).
Duplicating the terrestrial scheme of bio-geographic classification in coastal andmarine environments exactly is impossible.Barriers to dispersal have not been as signifi-cant in determining the distribution of organ-isms in the marine environment as on land,and the three-dimensionality of the ocean ismore striking and harder to map than that ofmost terrestrial environments. These difficul-ties notwithstanding, Briggs (1974) identified23 marine biogeographical regions based onthe distribution of groups of marine animalswith evolutionary affinities. Hay den et al.(1984) combined this zoo geographicalapproach with considerations of the physicalproperties of marine systems (currents, cli-mate, and physical location—coastal, shelf,open ocean, island) to identify 40 marine bio-geographic provinces. (See Figure 12.)
• In Costa Rica, 55 percent of the sphingidmoths that occur in the country havebreeding populations in Santa Rosa Park(0.2 percent of the land area), and whenSanta Rosa is enlarged and becomes the82,500-hectare Guanacaste Park (1.6 percentof the country), nearly all the 135 specieswill be covered (Janzen et al., unpublishedmanuscript).
The extent to which protected areas ensurethe survival of species in these examples isoverstated to the extent that some speciesoccurring in the protected areas are present innumbers below their minimum viable popula-tion size. Also, plant species present a specialcase: since plants tend to exhibit high habitatspecificity and local endemism, comparatively
more habitats must be represented in protectedareas to adequately maintain plant diversity.For example, of all plant species listed asendangered and vulnerable in Australia, only21 percent occur in national parks orproclaimed reserves (Leigh et al. 1982). In con-trast, these examples understate the overall sta-tus of a nation's species to the extent thatsome species outside of protected areas mayhave viable populations in disturbed land-scapes. For example, 39 percent of the 70 birdspecies not recorded in parks and sanctuariesin Thailand are open country birds that cansurvive further deforestation (Round, P.D.1985, cited in IUCN/UNEP 1986a).
These examples do not suggest that the cov-erage afforded by existing protected areas is
72
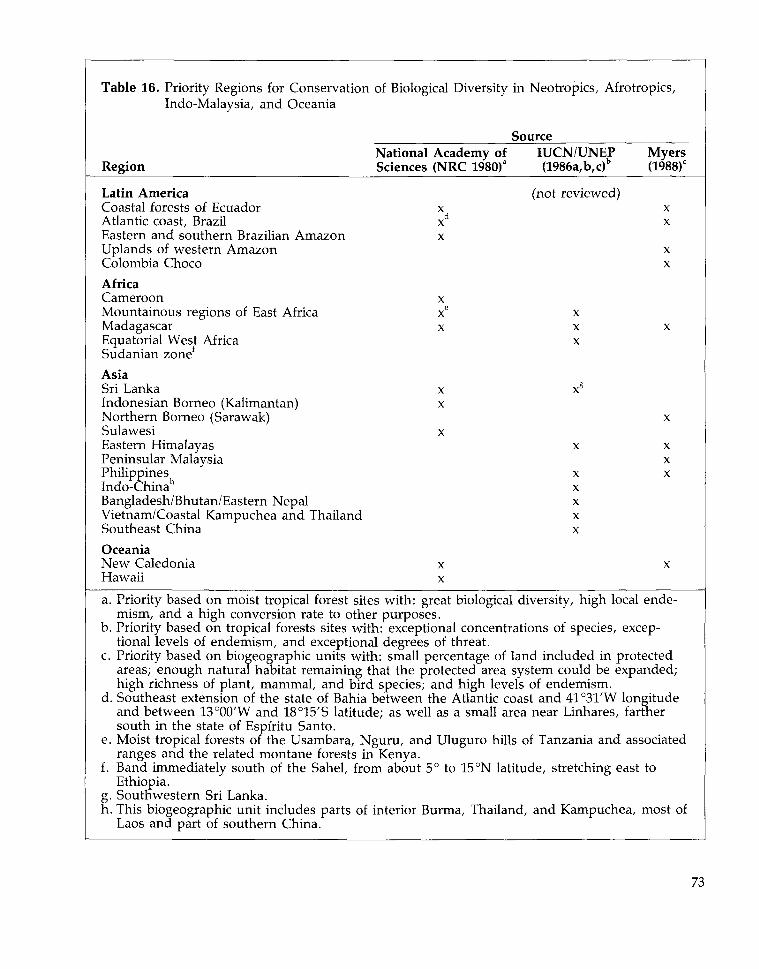
Table 16. Priority Regions for Conservation of Biological Diversity in Neotropics, Afrotropics,Indo-Malaysia, and Oceania
SourceNational Academy of IUCN/UNEP Myers
Region Sciences (NRC 1980)a (1986a,b,c)b (1988)c
Latin America (not reviewed)Coastal forests of Ecuador x xAtlantic coast, Brazil xd xEastern and southern Brazilian Amazon xUplands of western Amazon xColombia Choco x
AfricaCameroon xMountainous regions of East Africa xe xMadagascar x x xEquatorial West Africa xSudanian zoneAsiaSri Lanka x x8
Indonesian Borneo (Kalimantan) xNorthern Borneo (Sarawak) xSulawesi xEastern Himalayas x xPeninsular Malaysia xPhilippines x xIndo-Chinah xBangladesh/Bhutan/Eastern Nepal xVietnam/Coastal Kampuchea and Thailand xSoutheast China x
OceaniaNew Caledonia x xHawaii x
a. Priority based on moist tropical forest sites with: great biological diversity, high local ende-mism, and a high conversion rate to other purposes.
b. Priority based on tropical forests sites with: exceptional concentrations of species, excep-tional levels of endemism, and exceptional degrees of threat.
c. Priority based on biogeographic units with: small percentage of land included in protectedareas; enough natural habitat remaining that the protected area system could be expanded;high richness of plant, mammal, and bird species; and high levels of endemism.
d. Southeast extension of the state of Bahia between the Atlantic coast and 41°31'W longitudeand between 13°00'W and 18°15'S latitude; as well as a small area near Linhares, farthersouth in the state of Espiritu Santo.
e. Moist tropical forests of the Usambara, Nguru, and Uluguro hills of Tanzania and associatedranges and the related montane forests in Kenya.
f. Band immediately south of the Sahel, from about 5° to 15 °N latitude, stretching east toEthiopia.
g. Southwestern Sri Lanka.h. This biogeographic unit includes parts of interior Burma, Thailand, and Kampuchea, most of
Laos and part of southern China.
73
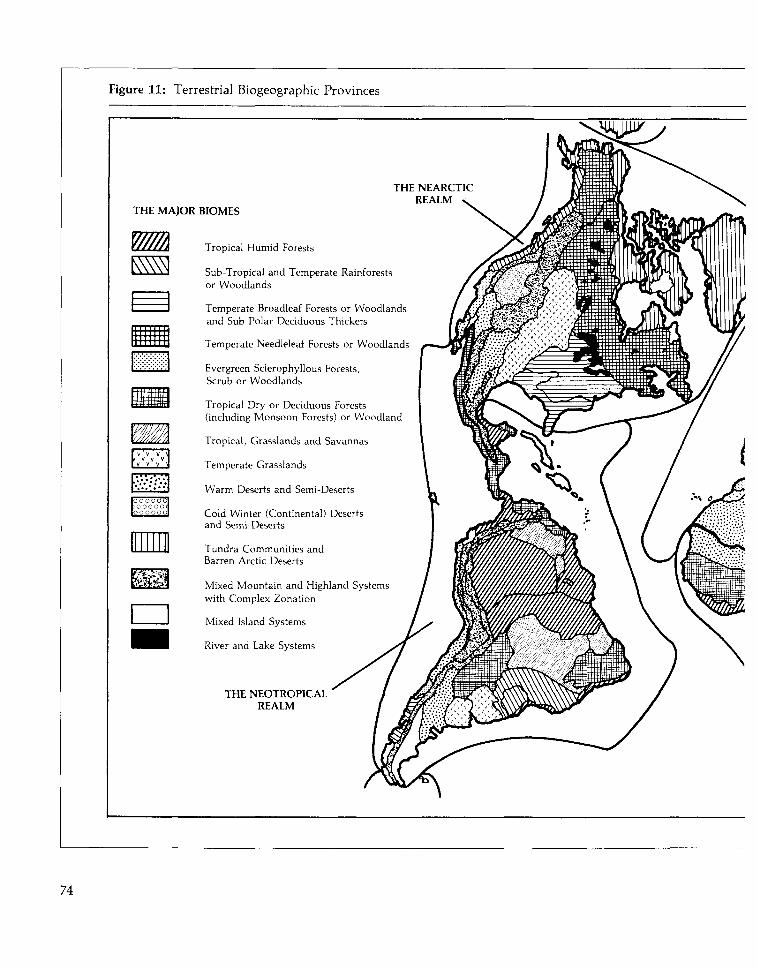
Figure 11: Terrestrial Biogeographic Provinces
THE MAJOR BIOMES
THE NEARCTICREALM
ESS3
tooooool O O O O Ooo oooo
Tropical Humid Forests
Sub-Tropical and Temperate Rainforestsor Woodlands
Temperate Broadleaf Forests or Woodlandsand Sub-Polar Deciduous Thickets
Temperate Needleleaf Forests or Woodlands
•Evergreen Sclerophyllous Forests,Scrub or Woodlands
Tropical Dry or Deciduous Forests(including Monsoon Forests) or Woodland
Tropical, Grasslands and Savannas
Temperate Grasslands
Warm Deserts and Semi-Deserts
Cold Winter (Continental) Desertsand Semi-Deserts
Tundra Communities andBarren Arctic Deserts
Mixed Mountain and Highland Systemswith Complex Zonation
Mixed Island Systems
River and Lake Systems
THE NEOTROPICALREALM
74
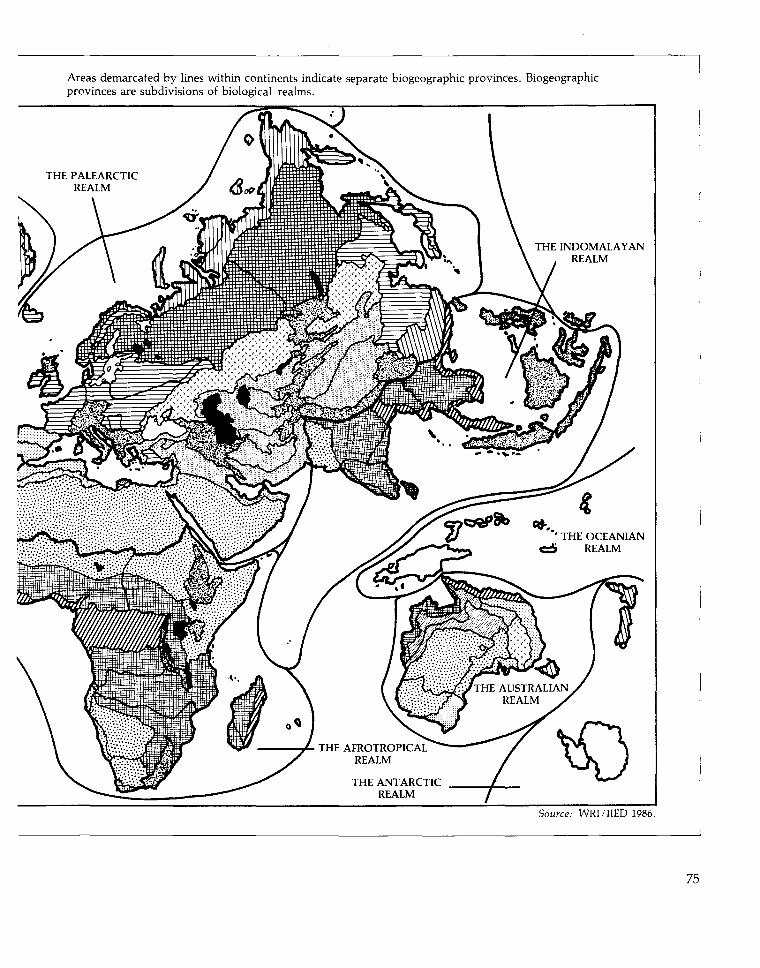
Areas demarcated by lines within continents indicate separate biogeographic provinces. Biogeographicprovinces are subdivisions of biological realms.
THE INDOMALAYANREALM
THE PALEARCTICREALM
THE AFROTROPICALREALM
Source: WRI/IIED 1986.
75
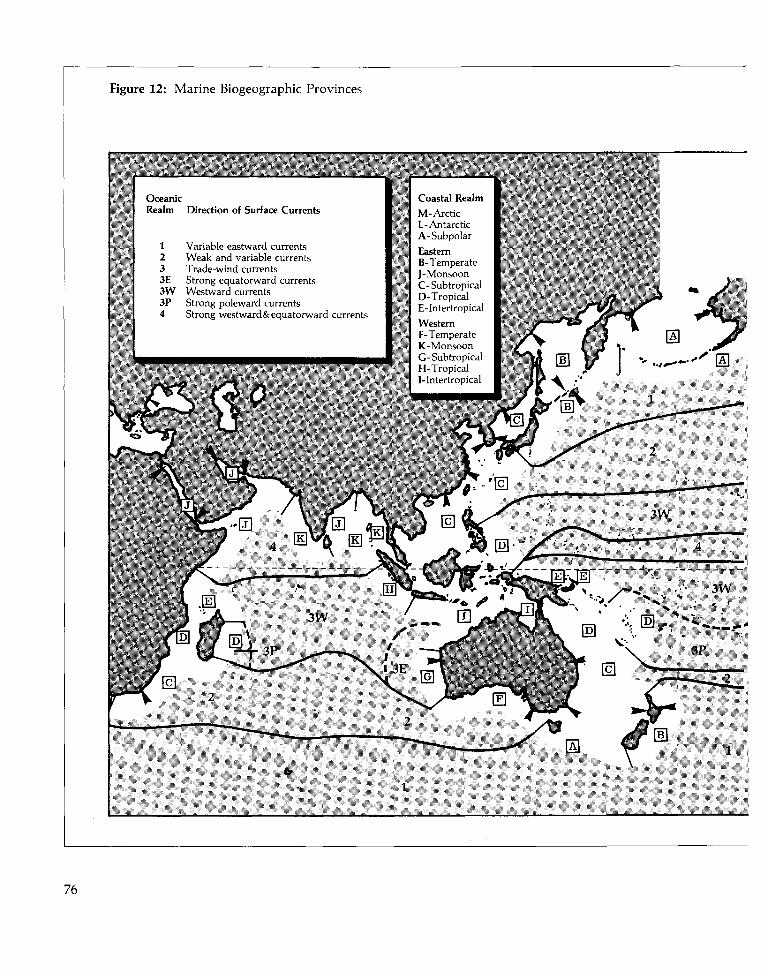
Figure 12: Marine Biogeographic Provinces
OieanRRealm
12331"3 \ \31'4
Direction of burfai
V.m.il'k W]-!'A,IH] I
\\i\iV .mil V.HMHI
I Mile '.M!ki I'.iiii'PtSlinri).. i\iu.il<<iv\.iiiV\f^U*.ti!(J i in:cnKNrnn>: pi'Uu.mi 11Ninn^ Mi'stuiiulii.
i1 t i n rents
'..HlTlls
< MII'll's
1 i i i i u - n ! -
iriMiK
i;-i. i:i<:u.iui i i : i : int- .
C oastal Kealm
M - \ u t i i
L- \p ' . . i i i lu
f jsturnB-rcipp
ii- ru'pu.iiI ' - ln l i ' i i i i 'p i i . i l
WesternI - IlMlJ'l'l.ltlK-\:..ps....p
76
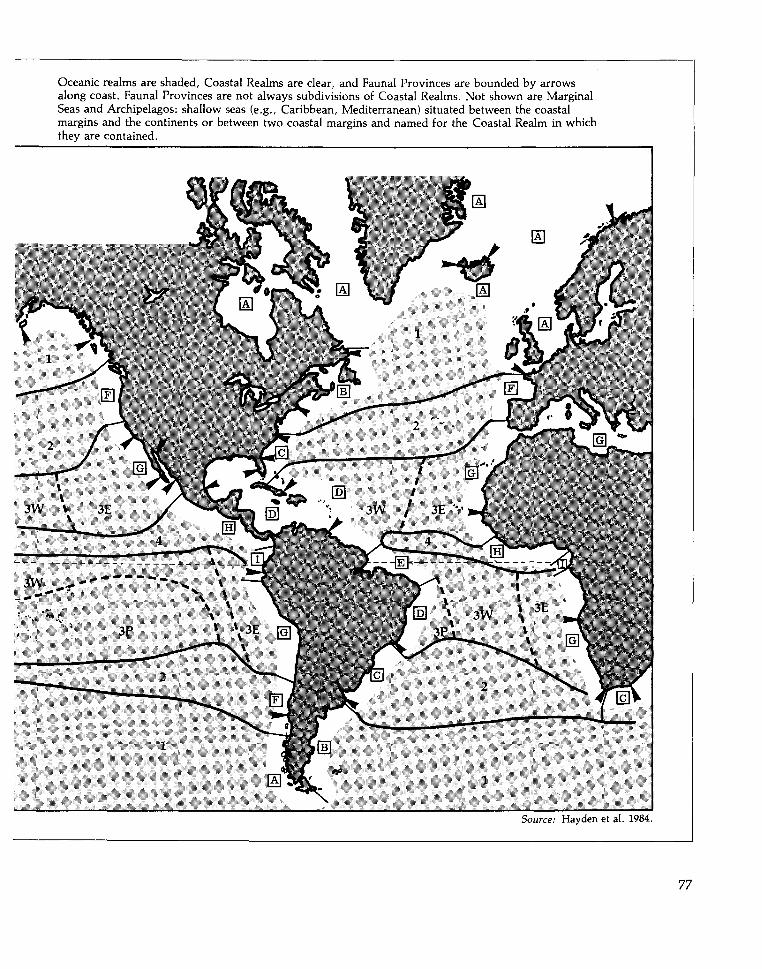
Oceanic realms are shaded, Coastal Realms are clear, and Faunal Provinces are bounded by arrowsalong coast. Faunal Provinces are not always subdivisions of Coastal Realms. Not shown are MarginalSeas and Archipelagos: shallow seas (e.g., Caribbean, Mediterranean) situated between the coastalmargins and the continents or between two coastal margins and named for the Coastal Realm in whichthey are contained.
Source: Hayden et al. 1984.
77
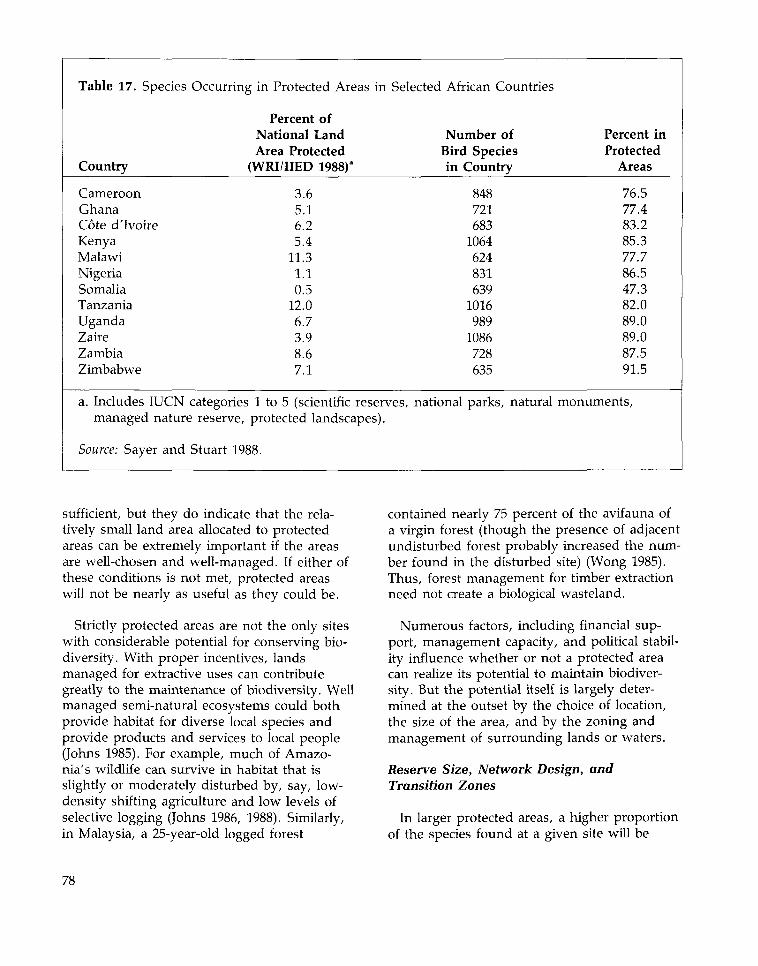
Table 17. Species
Country
CameroonGhanaCote d'lvoireKenyaMalawiNigeriaSomaliaTanzaniaUgandaZaireZambiaZimbabwe
a. Includes IUCN
Occurring in Protected Areas in
Percent ofNational LandArea Protected
(WRI/IIED 1988)a
3.65.16.25.4
11.31.10.5
12.06.73.98.67.1
Selected African Countries
Number ofBird Speciesin Country
848721683
1064624831639
1016989
1086728635
categories 1 to 5 (scientific reserves, national parks, naturalmanaged nature reserve, protected landscapes).
Source: Sayer andStuart 1988.
Percent inProtected
Areas
76.577.483.285.377.786.547.382.089.089.087.591.5
monuments,
sufficient, but they do indicate that the rela-tively small land area allocated to protectedareas can be extremely important if the areasare well-chosen and well-managed. If either ofthese conditions is not met, protected areaswill not be nearly as useful as they could be.
Strictly protected areas are not the only siteswith considerable potential for conserving bio-diversity. With proper incentives, landsmanaged for extractive uses can contributegreatly to the maintenance of biodiversity. Wellmanaged semi-natural ecosystems could bothprovide habitat for diverse local species andprovide products and services to local people(Johns 1985). For example, much of Amazo-nia's wildlife can survive in habitat that isslightly or moderately disturbed by, say, low-density shifting agriculture and low levels ofselective logging (Johns 1986, 1988). Similarly,in Malaysia, a 25-year-old logged forest
contained nearly 75 percent of the avifauna ofa virgin forest (though the presence of adjacentundisturbed forest probably increased the num-ber found in the disturbed site) (Wong 1985).Thus, forest management for timber extractionneed not create a biological wasteland.
Numerous factors, including financial sup-port, management capacity, and political stabil-ity influence whether or not a protected areacan realize its potential to maintain biodiver-sity. But the potential itself is largely deter-mined at the outset by the choice of location,the size of the area, and by the zoning andmanagement of surrounding lands or waters.
Reserve Size, Network Design, andTransition Zones
In larger protected areas, a higher proportionof the species found at a given site will be
78
maintained. But while habitat size is extremelyimportant, so is the choice of which habitats toprotect. Establishing more small protected areasin a variety of habitats may save more speciesthan establishing fewer larger protected areaswould, since the smaller areas will provide alarger sample of different assemblages oforganisms.
Several examples that demonstrate the needto consider both the size of a protected areaand the number of habitats covered in thedesign of a protected area network are foundin North America. The total number of largemammals present in three protected areas thatrepresent three different habitats (Redwood,North Cascades, and Big Bend national parks)exceeds the number in the single largest NorthAmerican park (Yellowstone National Park),even though the total area of the three is only57 percent that of Yellowstone (Quinn andHarrison 1988). Similarly, a greater diversity ofprairie plant species can be conserved in agroup of small sites in the mid-western UnitedStates than can be saved in a single large siteof the same total area (Simberloff and Gotelli1984). Conserving populations in several smallprotected areas rather than a single large areaalso reduces the risk of extinction caused by alocal environmental catastrophe, such as dis-ease, fire, or severe weather (Simberloff andAbele 1982, Quinn and Hastings 1987).
Considering that both land and funds forestablishing and managing protected areas arelimited, balancing the detrimental effect ofdecreased size of protected areas with thebeneficial effect of increased habitat coverageafforded by a larger number of smaller areas iscritical. This question of balance led to a heatedscientific debate in the late 1970s and early 1980s.Eventually, scientists agreed that a combinationof large and small protected areas would bestmeet the twin objectives of conserving biologicaldiversity and providing services important tohumanity (Soule and Simberloff 1986).
Protected areas need not become islands in asea of disturbed land. Corridors of natural or
semi-natural habitat can link protected areastogether and thereby increase the breedingpopulation size in one reserve by joining it to apopulation in an adjacent reserve (Simberloffand Cox 1987). Those with a north-south orien-tation or located along elevational gradientsfacilitate seasonal migration and may allowspecies distributions to shift in response toglobal warming. La Zona Protectora, a7,700-hectare stretch of forest 3 to 6 km widelinking Braulio Carillo National Park with LaSelva Biological Station in Costa Rica,preserves a migration corridor for approxi-mately 35 species of birds plus an unknownnumber of mammals and insects (Wilcove andMay 1986).
Protected areas need not becomeislands in a sea of disturbed land.
Conservation corridors have some potentialdrawbacks. First, populations linked by cor-ridors may be more susceptible to extermina-tion by disease or fires (Simberloff and Cox1987). Second, the economic cost of establish-ing and maintaining corridors can be high:developed land sometimes has to be purchasedand the high ratio of edge to area in the cor-ridor increases the management cost per unitarea. Consequently, scarce conservation fund-ing may often be more efficiently spent forother purposes, such as managing existing pro-tected areas better.
Within a context of regional land manage-ment, the interface between areas with differ-ing management objectives—for example,between a national park and agricultural land,or between a national park and a nationalforest—assumes considerable importance. Awell managed transition zone can safeguardthe lands surrounding a protected area fromsuch effects as damage caused by large animalsfeeding on the neighboring gardens and crops.
79
Proper management can also minimize poten-tially degrading disturbances, such as pesticiderun-off from surrounding lands. Yet, transitionzones are often neglected, usually because theydon't fall under the protected area manager'spurview nor that of the neighboring land-holder. This neglect diminishes the protectedarea's effectiveness and can create conflictsbetween adjacent land uses and protected areamanagement.
Historically, a transition zone was referred toas a "buffer zone" and considered a collar ofland managed to filter out inappropriate influ-ences from surrounding activities. Typically,neighboring lands—such as national forests-were expected to be managed to meet theneeds of the strictly protected area, but withlittle incentive for such management it hasrarely happened that way. Today, the chal-lenge is to incorporate the management oftransition zones into protected area planningand financing. For example, the Indonesianpark department has established tree planta-tions around segments of Baluran and UjungKulon national parks in Java to meet neighbor-ing people's fuel wood needs while minimizingdisturbance to the protected area.
Ecological Restoration andRehabilitation
The rehabilitation of degraded lands and therestoration of ecosystems have become increas-ingly important elements of resource conserva-tion throughout the world. Rehabilitation, whichaims to revive important ecological services ondegraded lands, is becoming particularlyimportant in mountainous regions, arid lands,and irrigated crop lands. In mountainous areas,the loss of forest and other vegetative coverhas often increased soil erosion. Arid landshave suffered declining soil fertility andincreased erosion as a result of agriculture andovergrazing. Resource productivity hasdeclined on an estimated 80 percent of range-lands and 60 percent of croplands in aridregions of developing countries, and irrigatedcroplands have been degraded by salinization,
waterlogging, and alkalinization (WRI/IIED1988).
More ambitiously, restoration attempts tobring lands modified by human use back totheir natural state. Because determining the"pre-disturbance" state of most ecosystems isdifficult and because ecosystems continuallychange, complete restoration is rarely a realisticgoal. But the approximate re-creation of naturalcommunities is becoming central to efforts tomaintain biodiversity and restore importantecological services.
Both restoration and rehabilitation make useof physical and biological interventions. Physi-cal means include drainage systems in water-logged lands and check dams or contour plow-ing to slow erosion rates, while biologicalinterventions include growing grasses to slowerosion, nitrogen-fixing trees to increase thenutrient content of soils, drought-adapted treesfor hillside reforestation, and so forth. Rehabili-tation often makes use of exotic species, sincethe primary goal is to restore critical ecologicalservices rather than the natural community. Incontrast, restoration attempts to restore thenatural complement of species.
Ecosystem restoration does not alwaysrequire interventions, however. Left to naturalprocesses, many ecosystems will return tosomething like their pre-disturbance conditionif populations of the original species still existnearby. How long natural recovery takesdepends upon the type of ecosystem and thetype of disturbance. In Brazil's caatinga forest,natural recovery of slash-and-burn agriculturalsites requires more than a century, but sitescleared by bulldozer may take 1,000 or moreyears to recover (Uhl et al. 1982). Similarly,sites in tropical lowland wet and dry forestrequire an estimated 1,000 and 150 years,respectively, to recover from timber harvest(Opler et al. 1977).
If an ecosystem has been physically trans-formed or if pre-disturbance species cannot dis-perse to the site, natural processes alone won't
80
restore it. Numerous lakes throughout theworld and the prairies of central NorthAmerica have been fundamentally changed byintroduced species and can't return to theirnatural states unless the exotic species areremoved. Elsewhere, soil erosion, salinization,or the loss of mycorrhizal mutualists haschanged ecological systems so radically thatnative species can't become established withoutsuch interventions as seeding, planting, inocu-lation of soils with mycorrhizal fungi, andweed, fire, or predator control (R. Miller 1987).
But even where communities and ecosystemsmight naturally revive after disturbance, resto-ration technologies can speed recovery. Inrecent years, for instance, the recovery (andcreation) of numerous coastal salt marshes hasbeen significantly accelerated by planting com-mon salt marsh species (Jordan et al. 1988).
As noted by Jordan et al. (1988), restorationecology falls in an "economic and psychologi-cal no-man's land, appealing to neither agricul-tural interests nor to environmentalists con-cerned with the preservation of pristine naturalareas." Yet, restoration ecology can enhance insitu conservation. Where existing protectedareas are too small to maintain certain species,ecological restoration can be used to enlargeareas of natural habitat or to establish conser-vation corridors between reserves.
The planned 800-km2 Guanacaste NationalPark in Costa Rica will be created largelythrough ecological restoration. The park islocated in a region formerly covered by tropicaldry forest—the most threatened of all majorlowland tropical forest habitats (Janzen 1986,1988b). Some 700 square kilometers is nowbeing restored from pasture and forest frag-ments. This restoration will help save many ofthe dry forest species from extinction, boost thelocal economy, and help re-establish the culturalties of the people to their land. The restorationwill rely primarily on natural processes becauseremaining remnants of forest can provide seedsto the restored sites; however, to speed theprocess, fires will be suppressed and some
cattle may be allowed to graze initially sincereducing grass height enhances tree seedlingsurvival (Janzen 1986, 1988b).
In Guanacaste Park, the remaining fragmentsof natural communities are big enough that theregion's native species are still present. But inmany restoration programs, in situ and ex situconservation efforts must be closely coordi-nated. Populations of endangered species areincreasingly being maintained in captivity onlyuntil suitable wild habitat has been restored.As part of the recovery program for the redwolf in the United States, an effort was madein the mid-1970s to capture all of the remainingwild wolves. Captive breeding populationswere then established while scientists lookedfor suitable habitat for the wolves in their natu-ral range. Since 1986, the wolves have gradu-ally been returned to one of these habitats(Phillips and Parker 1988).
Just as restoration helps conserve biodiversity,rehabilitation and restoration programs requirethe very species that biodiversity conservationseeks to maintain. For instance, rehabilitationprojects are benefiting from the more wide-spread use of species that can grow understressful environmental conditions, and bothrestoration and rehabilitation draw upon speciesmaintained in protected areas, zoos, botanicgardens, and seedbanks to establish populations.
This current focus on stressful environmentalconditions is not misplaced. As the threat of cli-mate change to biodiversity grows, ecologicalrestoration and rehabilitation will become increa-singly important. Along with habitat fragmen-tation, rapid climate change will prevent manyspecies from migrating to more suitable climates.Increasingly, restoration techniques will be usedto introduce species to new ranges and to accel-erate the re-establishment of such communities.
Ex Situ ConservationWhile the importance of in situ conservation
cannot be overemphasized, ex situ conservationin zoos, aquaria, botanic gardens, and germplasm
81
banks both complements in situ techniques andserves many other purposes—among them,maintaining viable populations of speciesthreatened in the wild, providing educationaland public awareness services, and serving assites for basic and applied research. Moreover,in some regions the threats to species survivalare so severe that no hope exists for their long-term in situ maintenance.
Zoos and Aquaria
There are roughly 500,000 mammals, birds,reptiles, and amphibians in captivity in zoosthroughout the world (Conway 1988). Zoos con-tribute in many ways to the conservation of bio-diversity. They propagate and reintroduceendangered species, they serve as centers forresearch to improve management of captive andwild populations, and they raise public aware-ness of biotic impoverishment (Foose 1983).
The contributions that zoos have alreadymade to the conservation of biodiversity aredramatic. Zoo populations are now the onlyrepresentatives of several species, including theCalifornia condor (Gymnogyps californianus) andpossibly the black-footed ferret (Musteknigripes), and at least 18 species have been rein-troduced into the wild after captive propaga-tion (Conway 1988). In at least six cases—PefeDavid deer (Elaphurus davidianus), Przewalskihorse (Equus przewalski), red wolf (Canis rufus),Arabian oryx (Oryx leucorx), American Bison(Bison bison), Guam kingfisher (Halcyon cinnamo-mina cinnamomina), and Guam rail (Rallusowstoni)—the species were extinct in the wild atthe time of reintroduction—extinct for some 800years in the case of the Pefe David deer! (U.Seal, Species Survival Commission IUCN, per-sonal communication, February 1989). Numer-ous other species not completely lost from thewild, such as the peregrine falcon (Falco peregri-nus) and the alpine ibex (Capra ibex ibex), havebeen reintroduced to portions of their rangefrom which they were extirpated.
The potential role of zoos as a site for pre-serving species over the long term is limited by
both space and expense, particularly in thecase of vertebrates. In the United States, zooscontain self-sustaining populations of a total ofonly 96 species (some of them threatened)(Rails and Ballou 1983). Even if roughly one-half of the spaces in all the world's zoos weresuitable for captive propagation of threatenedspecies and if 500 members of each species wasmaintained, only 500 species could be keptalive and healthy in captivity.
This sobering calculation aside, for two rea-sons the contribution of zoos to biodiversityconservation is likely to considerably exceedthis figure. First, zoo managers generally con-sider a smaller population—roughly 100 to 150individuals per species—enough for long-termcaptive propagation (Conway 1980). Deleteriousinbreeding effects are still reasonably rare atthis population size, and, with proper geneticmanagement, more than half of the geneticdiversity of the species can be preserved for atleast 100 generations. At these smaller popula-tion sizes, zoos could sustain roughly 900 spe-cies (Conway 1988). Second and more impor-tant, zoos with endangered species are shiftingtheir emphasis from long-term holding to thereturn of animals to the wild within two orthree captive generations (U. Seal, personalcommunication, March 1989). A number ofendangered species, including the black-footedferret, red wolf, Guam rail, Puerto Rican parrot(Amazona vittata), Mauritius pink pigeon(Nesoenas mayeri), and the whooping crane, arebeing managed through such programs.
Until recently, the role of aquaria in the cap-tive propagation of threatened species has beenless important than that of zoos. However,given the growing threats to freshwater spe-cies, the need to enhance the role of aquaria asex situ conservation tools is clear. Accordingly,the Captive Breeding Specialist Group of IUCNis mounting a major effort to develop captivebreeding programs for endangered fish species,starting with the fishes of Lake Victoria, thedesert fishes of North America, and Appala-chian stream fishes (Les Kaufman, NewEngland Aquarium, personal communication,
82
June 1989). In this program, natural habitat willbe restored and—to insure against the loss ofwild species and help educate the public onthreats to fishes—species will be propagated inaquaria.
Because the world stands to lose a higherproportion of large vertebrates than ofother taxa, some disproportionateexpenditure on their conservation isjustified.
Most captive propagation programs in zoosfocus on vertebrates, partly because zoos havehistorically been display facilities, but alsobecause the extinction threats to vertebrates arewell known. This seemingly lopsided focus ona small number of large vertebrates ("charis-matic megavertebrates") makes some senseeven though, comparatively, far more inver-tebrates face extinction. The current extinctioncrisis is almost exclusively terrestrial, and topcarnivores and large animals in general will belost out of proportion to their representation inthe biota. (See Box 4.) Because the world standsto lose a higher proportion of large vertebratesthan of other taxa, some disproportionateexpenditure on their conservation is justified.Consider too that large vertebrates often getthe public interested in general in protectinghabitats—with all of their attendant species.Still, the expense of propagating large verte-brates in captivity can be considerable, and thesame investment in in situ conservation couldmaintain a much larger number of smaller spe-cies of invertebrates and plants. The questionhere is whether public financial support forless "glamorous" species would even comeclose to that obtained for the large vertebrates.
The potential contribution of zoos to con-serving species and genetic diversity could beenhanced considerably if more research on
captive propagation and reintroduction tech-niques were carried out. Right now, zoos' suc-cess in maintaining populations of endangeredspecies is limited. Only 26 of 274 species ofrare mammals in captivity are maintaining self-sustaining populations (Rails and Ballou 1983).Fortunately, this state of affairs can improve.Ongoing research has already led to significantadvances in technologies for captive propaga-tion, including artificial insemination, embryotransfer, and the genetic management of smallcaptive populations (Dresser 1988). Germplasmstorage techniques, including long-term storageof embryos, have also improved considerably.Embryo transfer, in particular, has a tremen-dous potential for use in captive propagationsince it allows the introduction of new blood-lines into captive populations without trans-porting adults—and any diseases they mightcarry—between zoos or between wild popula-tions and zoos. Long-term cryogenic storage ofembryos has become almost routine for somespecies—including the mouse, rabbit, andcow—but the technology is only beginning tobe experimentally applied to captive species inzoos.
Other new findings and techniques also holdpromise. Improved management of the geneticsof small captive populations has also madepropagation easier by making headway againstsome of the problems associated with inbreed-ing, including decreased fertility and high juve-nile mortality (Rails and Ballou 1983). Advancesin the theory of population genetics andimproved data management are now improvingthe genetic management of captive popula-tions. In 1973, the computerized InternationalSpecies Inventory System (ISIS) was developedto catalog genealogical information on individ-ual animals in some 326 zoos (N. Flesness,Minnesota Zoological Garden/ISIS, personalcommunication, March 1989). Matings can thusbe arranged by computer to ensure that geneticdiversity is preserved and inbreeding isminimized.
These advances aside, the lack of detailedgenetic information on both captive and wild
83
populations bedevils zoo managers. In theearly 1980s, for example, the five remainingindividuals of the dusky seaside sparrow werecrossed with what was thought to be theirclosest relative—Scott's seaside sparrow—toproduce hybrids with genetic compositionsranging from 50 to 87.5 percent dusky. Butmitochondrial DNA analysis of the relationshipof the dusky seaside sparrow to other subspe-cies later showed that the Scott's seaside spar-row is a relatively distant relative while thedusky is extremely closely related to four othersubspecies (Avise and Nelson 1989). More thor-ough surveys of the genetic variation of bothcaptive and wild populations will make suchslip-ups in breeding programs in zoos andaquaria less common.
Botanic Gardens
It is much easier to maintain captive popula-tions of plants than of animals (Ashton 1988).Plants require less care than animals; their hab-itat requirements can generally be providedmore easily; caging is unnecessary; individualscan be crossed more readily; many can be self-pollinated or vegetatively propagated; andmost are bisexual, which means that only halfas many members of a species are needed tomaintain genetic diversity. Moreover, as men-tioned already, many plants can be readilypreserved during their dormant (seed) stage.For all these reasons, botanic gardens areextremely important tools for maintaining spe-cies and genetic diversity.
The world's roughly 1,500 botanic gardenstoday contain at least 35,000 plant species ormore than 15 percent of the world's flora, withestimates ranging as high as 70,000 to 80,000species (Raven 1981; IUCN/WWF 1989;P. Raven, personal communication, April 1989).The Royal Botanic Gardens of England (KewGardens) alone contains an estimated 25,000species of plants (10 percent of the world'sflora); and IUCN considers some 2,700 of thesespecies rare, threatened, or endangered(G. Prance, Royal Botanic Gardens, personalcommunication, May 1989).
Even if only 300 to 400 of the world'sbotanic gardens are able to hold majorconservation collections and only 250of these maintain seedbanks, it wouldstill be possible to save viablepopulations of up to 20,000 plantspecies from extinction through thebotanic garden system.
For specific taxa, the coverage afforded bybotanic gardens is even higher. One collectionin California contains 72 of the 110 known spe-cies of pines (Pinus spp.), one botanic gardenin South Africa contains roughly one quarter ofthe country's flora, and one garden in Califor-nia boasts one third of the state's native spe-cies (Raven 1981). In at least one case, a plantspecies extinct in the wild (Clarkia franciscana)has been preserved in a botanic garden andreintroduced to its native habitat in California(Raven 1976). Even if only 300 to 400 of theworld's botanic gardens can harbor major con-servation collections and only 250 of thesemaintain seedbanks, by one estimate it wouldstill be possible to save viable populations ofup to 20,000 plant species from extinction inthem (IUCN/WWF 1989).
Botanic gardens' potential role in the conser-vation of biodiversity is exemplified by a wide-spread network of 19 U.S. gardens workingwith the Center for Plant Conservation (CPC).The CPC estimates that 3,000 taxa native to theUnited States are threatened with extinction; ofthese, more than 300 are now cultivated in thenetwork of gardens (R. Stafford, CPC, personalcommunication, May 1989).
The contribution of botanic gardens to theconservation of species extends beyond thepreservation of species threatened in the wild.
84
Botanic gardens supply plants for research andhorticulture, thereby taking pressure off wildpopulations, and they are important educa-tional resources. Each year, an estimated 150million people visit botanic gardens(IUCN/WWF 1989).
The already important role of botanic gardenscould easily be expanded. To begin, the cur-rent geographical imbalance in the locations ofbotanic gardens could be remedied if moregardens were established in tropical countries.Today, tropical countries possess only 230 ofthe world's 1,500 botanic gardens (Heywood1987). While over 100 new gardens have beenopened or planned in the last decade andmany of these are in tropical regions, the geo-graphic imbalance persists, particularly con-sidering the greater species richness of tropicalregions.
Second, with further research into storagetechniques and with better data on wherespecimens were collected ("passport
information") and their breeding history,botanic gardens could become even moreimportant genetic repositories. The IUCNBotanic Gardens Conservation Secretariat isnow developing a computerized data base ofspecies occurrences in botanic gardens to helpgardens collect species that are absent orunderrepresented in captivity. The efforts ofbotanic gardens in germplasm conservation arebeing coordinated by the IUCN Botanic GardenConservation Strategy; in association with theIBPGR, IUCN is also putting together guide-lines for collecting germplasm of wild species.
Until recently, botanic gardens have beenunderutilized in the maintenance of threatenedspecies and the conservation of geneticresources. Even though they contain a largeproportion of the world's flora, the gardenshave traditionally not been integrated and theirholdings have been known only locally.Thanks to the efforts of numerous committedindividuals and institutions, their role in con-servation is growing rapidly.
85
VII. Summary and Recommendations
A t a time when humanity's needs forproductive biological resources aregreater than ever before, we are wit-
nessing the irreplaceable loss of the world'sfundamental capital stock—its species andgenes—and the deterioration of ecosystems'ability to meet human needs. As species disap-pear, humanity loses today's foods, medicines,and industrial products, as well as tomorrow's.As genetic diversity erodes, our capacity tomaintain and enhance agricultural, forest, andlivestock productivity decreases. And with thedegradation of ecosystems, we lose the valu-able services that natural and semi-natural sys-tems provide. Maintaining the potential of this"capital stock" to meet human needs must bea priority as we pursue sustainable develop-ment. But each day that these losses continue,the pursuit becomes increasingly difficult.
If we don't act immediately, extinctions inthe coming decades may represent the mostmassive loss of species since the end of theCretaceous Era, some 65 million years ago.Already, the rate of extinction of birds andmammals may be as much as 100 to 1000 timesthe background extinction rate. The singlegreatest cause of species extinction in the nexthalf-century will be tropical deforestation.Scientists concur that roughly 5 to 10 percentof closed tropical forest species will becomeextinct per decade at current rates of tropical for-est loss and disturbance. With more than 50percent of species occurring in closed tropicalforests and a total of roughly 10 million species
on earth, this amounts to the phenomenalextinction rate of more than 100 species perday.
The extinction crisis is not restricted to tropi-cal forests. Freshwater habitats are being dra-matically altered as rivers are impounded andexotic species introduced. In the southeasternUnited States, for instance, 40 to 50 percent offreshwater snails have been driven to or nearextinction as water impoundments were builtand rivers straightened, widened, and deep-ened. Oceanic islands, where most extinctionshave occurred in past centuries, also remainamong the most threatened ecosystems onearth. Some 60 percent of the plant speciesendemic to the Galapagos islands are threat-ened with extinction, as are 40 percent ofHawaii's endemic species and 75 percent of theendemic plant species of the Canary Islands.Mediterranean climate zones, with their highplant species richness and distinctive floras,face continuing threats of species loss throughhabitat conversion and species introductions.
Habitat loss and degradation are the mostimportant causes of the extinction crisis, butoverharvesting, species introductions, pollu-tion, and other causes also take a significanttoll. Global warming will exacerbate the lossand degradation of biodiversity by increasingthe rate of species extinction, changing popula-tion sizes and species distributions, modifyingthe composition of habitats and ecosystems,and altering their geographical extent. Even if
87
all human impacts on the biosphere were tocease immediately, species extinctions due tothe impacts that have already taken placewould continue for decades.
Genetic diversity, an invaluable tool used byfarmers since the dawn of agriculture, facesextinction threats just as great as those to spe-cies. Wild relatives of economically importantcrops, trees, and livestock—often carryingunique genes that can be used to breed resis-tance to pests or to improve yields—are disap-pearing, and crop cultivars that farmers haveplanted for centuries are being replaced withhigh-yielding varieties. Seed and germplasmbanks have been established and expanded inthe past two decades to deal with the threatsto genetic diversity, but significant problemsand gaps remain. For example, nearly half ofthe two million accessions currently stored ingene banks have not been described. More-over, while crops of global importance—such asrice and wheat—are well represented in seedbanks, such regionally important crops as cas-sava are not.
This report has shown how the basic compo-nents and processes of the biosphere are linkedto each other and to the goods and servicesthey provide to humanity. These multipleinterconnections make it clear that species can'tbe managed without managing their geneticdiversity and the habitats in which they occurand that optimal conservation priorities can'tbe set unless the connections between biodiver-sity and human needs are understood. Muchof biodiversity is used directly—as, say, thebasis for breeding programs or as foods andmedicines—but such ecological processes asproduction, decomposition, nutrient and watercycling, soil generation, erosion control, pestcontrol, and climate regulation are also essen-tial to human survival.
Considering the wide range of services thatecosystems provide, "biodiversity conserva-tion" cannot be considered synonymous with"endangered species preservation." Endan-gered species preservation is an essential
damage-control activity, one component of astrategy to conserve biodiversity and a usefulyardstick for judging success in conserving bio-diversity. But biodiversity conservation alsofocuses on species not yet threatened withextinction and on the habitats and assemblagesthey comprise. It is far easier to protect speciesthrough foresight while populations are stilllarge than it is to attempt to pull an endan-gered species back from the brink of extinction,and species conservation is best achievedthrough conserving habitats and ecosystems—not through heroic rescues of individualspecies.
A variety of tools, including both in situ andex situ techniques, play critical roles in the con-servation of biodiversity. In situ preservation ofgenes, species, and habitats ensures the main-tenance of areas in a natural or semi-naturalstate. Protected areas—ranging from thosewhere human use is minimized to areas desig-nated for, say, timber harvest—can both main-tain biodiversity and provide jobs andresource-based products. Dedicating a relativelysmall portion of the earth's land surface to pro-tected areas can save a substantial fraction ofthe world's species diversity. In situ conserva-tion of agricultural genetic diversity ensures themaintenance of both the genetic material andthe farming system with which it has evolvedand allows crop and livestock varieties to con-tinue to adapt to such changing environmentalconditions as increases in pest populations ortemperature.
Besides contributing to public education andbasic research, ex situ conservation comple-ments in situ techniques and must be closelycoordinated with in situ conservation in bothnatural and human-altered ecosystems. Zoos,aquaria, and botanic gardens are already play-ing significant roles in biodiversity conservationand their utility can be enhanced considerablywith further research and greater financial com-mitment to their activities. Ex situ preservationof agricultural genetic diversity through seedbanks and other techniques affords breedersready access to a wide range of genetic
materials and may be a precious last resort formany species and varieties that would other-wise become extinct as modern varietiesreplace them. The utility of ex situ conservationof genetic resources can be strengthened con-siderably by placing greater emphasis on con-serving and maintaining the genetic diversityof crops important in tropical countries, thewild relatives of economically important species(particularly using in situ techniques), thegenetic diversity of important forestry species,livestock's genetic diversity, and knowledge ofthe farming systems in which local crop andlivestock varieties evolved.
During the next few decades, the world willexperience the largest growth of human popu-lation in history. Increasing population, andeven more rapidly increasing demands for bio-logical resources, will strain the world'sremaining biological diversity. With growingpressures on biological resources, and withecosystem degradation increasingly hinderingpeople's ability to meet daily survival needs,the restoration and rehabilitation of ecosystemswill become a major conservation focus in com-ing decades. An important rationale for con-serving biodiversity is to maintain species ofpotential value for their use in restoring andrehabilitating degraded ecosystems—of particu-lar concern given global warming's probableimpacts on biological diversity.
Considering the gravity of the threat to theworld's biodiversity and the toll that the degra-dation of biological resources is exacting onindividuals and development efforts through-out the world, quick action is needed to haltthe loss of biodiversity. Such action mustaddress many of the root political, social, andeconomic causes of the loss and degradation ofbiological diversity, but it must also beinformed by the biological sciences.
The following recommendations for address-ing the biodiversity crisis reflect this all-important biological perspective. They alsocomplement proposals put forth elsewhere forincreasing the developed countries' financial
commitment to biodiversity conservation. TheInternational Conservation Financing Project ofthe World Resources Institute suggested thatunmet conservation financing needs indeveloping countries total as much as $20 bil-lion to $50 billion per year (1 to 2 percent ofthe Third World's GNP) (WRI 1989). The costto all countries of not addressing the biodiversitycrisis is, of course, far greater than this esti-mate, but it will not appear on current nationalincome accounts. Instead, the price will bepaid by future generations.
The response of developing countries to thethreat of biological impoverishment is particu-larly constrained by pressing social and eco-nomic issues and by the burden of interna-tional debt. Many actions that can be taken tostem the loss of biodiversity do provide short-term economic benefits—say, maintaining natu-ral forests so that wild species can be harvestedfor food, medicines, and industrial products orestablishing protected areas so that tourists willvisit, or downstream water developmentprojects won't clog with silt. But the long-termconservation actions needed will not be takenin the developing world unless developedcountries provide their fair share of the funds,technology, and knowledge needed to imple-ment them. All countries share responsibilityfor conserving biodiversity, and maintainingbiodiversity is in the interest of every nationand in the interest of the global community.
1. Enhance the Foundation for Decision-making
Scientists now know enough about the distri-bution of biological diversity, the threats that itfaces, and the conservation tools available tomaintain it so that current conservation effortscould be expanded considerably without fear ofwasting effort or money. But important remain-ing gaps in knowledge will continue to hinderconservation and limit the benefits that biologi-cal resources can provide to humanity unlessresearch programs are greatly strengthened.Indeed, as understanding of biodiversitygrows, so does recognition of the pressingneeds for further research.
89
The current financial commitment to bio-diversity research is extremely low. Only $16.7million was spent by U.S.-based organizations(governmental and non-governmental, includ-ing universities and museums) on biologicaldiversity research activities in developing coun-tries in 1987 (Abramovitz, in press). Thisamounts to only 0.2 percent of all foreignassistance provided by U.S. AID in that year.To make matters worse, only a small numberof qualified scientists are capable of conductingsuch research projects. No more than 1,500 orso professional systematists worldwide havebeen trained to carry out taxonomic researchon tropical species (NRC 1980).
Against this backdrop, the following researchis particularly urgent:
a. Accelerate inventory and systematics research.The number of experts in the taxonomyand distribution of the world's biodiversitymust be increased substantially, partly sothat biological inventories can be acceler-ated. To improve the foundation for estab-lishing conservation priorities, emphasisshould be placed on inventorying lesser-known taxa. In addition, more rapidmeans of predicting regions of high diver-sity or endemism are needed since basicconservation priorities will have to be setin the absence of detailed inventories. Forexample, soil, climate, and topographicalinformation alone can be used to roughlydelimit regions of probable value for bio-diversity conservation. This first-cut analy-sis can then be supplemented by informa-tion on plant or vertebrate diversity.Particularly in the tropics, scientists do notyet know how well this streamlinedapproach will conserve other groups oforganisms, such as insects. Comprehensivestudies of all taxa at several research siteswould begin to answer this importantquestion.
Until species are at least named anddescribed, whatever properties and traitsof potential use to humanity they might
possess can't be assessed. Thus, needs forincreased taxonomic research go hand-in-hand with needs for increased screening ofspecies for their potential value as medi-cines, foods, or industrial products. Giventhe small number of taxonomists available,the relatively high cost of this type ofresearch if undertaken by internationalorganizations, and the size of the chal-lenge, high priority should be given toenhancing the research and screeningcapacity of local institutions in developingcountries. Since species inventory and ini-tial screening at the local level are labor-intensive and inexpensive, trainingindividuals in developing countries toundertake this work will help build strongin-country capacity for studying and con-serving biological diversity and createsorely needed jobs.
b. Increase support for community and ecosystemecology research. Accelerated research isessential in four areas of community andecosystem ecology:
• The relationship between biodiversityand ecological processes is poorly under-stood. Further research on water andnutrient cycling, ecological energetics,ecosystem stability, soil formation, andother processes will help scientists pre-dict the consequences of extinctions orthe impact of changes in land-use onecological processes more accurately.Research on communities and ecosys-tems will help them find out which spe-cies are functionally redundant andwhich are keystone species whose loss islikely to reverberate throughout an eco-system. Management strategies for bio-logical resources could also benefitgreatly from such work.
• Research on the effects of fragmentationon biological diversity and ecologicalprocesses must be accelerated. Greaterunderstanding of how fragmentation af-fects natural and semi-natural ecosystems
90
will improve the design of protectedareas, help scientists develop manage-ment plans for individual species, andimprove predictions of fragmentation'simpacts on various ecological processes.Such research can also help conserva-tionists identify species at risk of extinc-tion due to fragmentation and managehabitat fragments in a "supersaturated"state—with, that is, greater species rich-ness than the area of the habitat wouldnaturally allow. Further studies of theecology of ecotones, edge effects, theeffects of fragmentation on dispersal,and the utility of conservation corridorsare also needed to aid in the design andmanagement of protected areas.
Community restoration and rehabilitationof degraded lands are quickly becomingtwo of the most important tools for con-serving biodiversity and for meeting peo-ple's needs for productive biologicalresources. Both techniques requiregreater knowledge than scientists nowhave of the ecology of the communitybeing restored, and rehabilitationrequires further knowledge of exotic spe-cies suitable for introduction. The poten-tial impacts of climate change on ecologi-cal systems add further urgency to theneed for this research. More particularly,the ability to predict the composition ofcommunities following climate changemust be enhanced so that restorationtechniques can be used in anticipation ofnew climatic conditions, and new tech-niques are needed to help establish spe-cies under climatic conditions that areexpected to become favorable to the spe-cies within several decades.
The monitoring of biodiversity and eco-logical processes, essential for decision-making, needs far greater researchemphasis. Monitoring schemes, as wellas sampling procedures for ecosystemand population data, must be redesignedto give the maximum information useful
to decision-makers at a minimum cost.Studies must be directed at easily moni-tored bellwether species that can revealchanges in the entire community or eco-system. Toward these ends, greater useof remote-sensing techniques for moni-toring should be encouraged in allcountries.
c. Boost research in population ecology. Themaintenance of biodiversity requires anunderstanding of the factors influencingthe persistence of populations ofindividual species. The approach known as"population viability analysis," whichattempts to determine the minimum viablepopulation of species, is proving extremelyvaluable in assessing land-managementoptions, management plans for single spe-cies, protected area designs, and ex situbreeding programs. Further research intothe demographic and genetic factorsinfluencing small populations and supportfor the development of better models forpopulation viability analysis are vital.
d. Integrate the study of cultural diversity intobiodiversity research. Biodiversity conserva-tion has traditionally focused on speciesand genes and ignored the human culturewith which biodiversity coevolved. Now,knowledge of human farming and resourceuse systems must be increased before it isirretrievably lost. Further, studies of tradi-tional methods of resource managementcan provide important insights into tech-niques for sustainable resource manage-ment in tropical regions (Oldfield andAlcorn 1987, Brush 1989).
Far from comprehensive, this list of particu-larly important research needs indicates thebreadth of research needed to lay a more firmfoundation for conservation decision-making.Although the focus here is on in situ conserva-tion, needs for research on ex situ conserva-tion—including the study of seed, sperm, andembryo-storage techniques, captive propagation,the genetic characterization of populations, and
91
techniques for reintroducing species into thewild—are pressing too. Since a major goal ofbiodiversity conservation is to increase thebenefits based in the world's living resources,in the decades ahead identifying and develop-ing new foods, medicines, and industrialproducts derived from species is also extremelyimportant. (More detailed reviews of researchneeds for the conservation of biodiversity areprovided in Wildt and Seal (1988) and Souleand Kohm (1989).)
2. Establish Biodiversity Conservation as aDevelopment Priority
While it is clear that long-term needs fordevelopment require the conservation of bio-diversity, people's short-term needs often leadto pressures on natural and semi-natural sys-tems that accelerate its loss. Biodiversity con-servation can't attain priority status amongdevelopment objectives until the conflictingpressures of short-term and long-term humanneeds are reconciled. Following are the twomost promising avenues toward this goal:
a. Expand the short-term utility of biodiversity.Increasing the flow of benefits that peoplederive from the world's biodiversity bothstrengthens the rationale for its short-termconservation and solves other pressingsocial and economic problems. Convincingdemonstrations of the potential for devel-oping new products, medicines, or foodsfrom wild species and the potential fordevelopment projects linking protected-area conservation with rural developmentare needed to realize this goal. Suchmodels would help build developing coun-tries' national capacity for research anddevelopment. So would research aimed atdefining the national and regional researchand development priorities and the institu-tional requirements for developing newproducts and services that contribute to anecologically sustainable future, generatenew sources of employment, and helplocal economies use local resources tobecome more self-sufficient. Specifically,
germplasm banks, enhanced inventories ofbasic species, crop and livestock breedingfacilities, medicinal screening facilities,agricultural research, and so forth can allboost biodiversity's contribution to humanwelfare.
b. Affix true economic values to biodiversity. Akey to making biological resource conser-vation a development priority is accuratelyassessing the economic values of biodiver-sity and the costs of degrading or mis-managing biological resources. The valuesof biodiversity fit poorly into mainstreameconomic evaluations. Establishing "exis-tence values" (the value of knowing that aspecies exists), exploring option values(the potential future value of a species ofno current economic importance), andaffixing value to irreplaceable items arenotoriously difficult undertakings, yet allare central to the economic valuation ofbiodiversity. Many of the immediatevalues of biodiversity—among them, thesupply of food, fuel, and medicines torural people—are also difficult to establishbecause few of these goods are traded out-side of local markets. It's also extremelydifficult to assign values to biologicaldiversity's role in ecosystem functioning. Ifbiodiversity conservation is undervaluedrelative to such activities as logging oragriculture, it will be short-shrifted whennational governments and multilateral andbilateral aid agencies make land-use deci-sions. To right this situation, resourceeconomists must evaluate both the directand indirect values of species, and theymust lower the discount rates they usewhen assessing irreplaceable resources.
3. Encourage Integrated Regional Planningand Cross-Sectoral Coordination
Institutions in most countries are ill-equippedto handle biodiversity conservation becausethey are organized along sectoral lines and bio-diversity conservation requires a broader view.Responsibility for managing the world's
92
biodiversity has been fragmented intoministries of agriculture, defense, education,fisheries, forestry, health, and parks. From abiological standpoint, the need for anintegrated regional approach to conservation isreadily apparent. Almost all ecosystems are"open," in the sense that they exchangeenergy, mineral nutrients, and organisms withother ecosystems. Consequently, biospheremanagement systems must be open too (Noss1983). Strategies for conserving the world'sbiological diversity cannot succeed if eachpatch of natural and semi-natural land ismanaged in isolation, or if these lands areconceptually isolated from planning andeconomic development.
Institutional fragmentation undermines eachsector's effectiveness in meeting biodiversity-conservation objectives. When range managers,agricultural experts, foresters, and fisheriesexperts make land-use decisions along sectorallines, the multiple ecological effects of deci-sions are often overlooked in the attempt tomaximize one form of production—be it headof cattle, bushels of wheat, board-feet of wood,or tons of fish. To end this Balkanization,institutional responsibilities for land-use plan-ning and management must be distributed sothat trade-offs involving more than one sectorare evaluated from more than one angle, andclose cooperation with the rural people who inmost cases manage the world's biologicalresources is essential. The regional integrationand coordination of resource planning andmanagement activities helps ensure that landsor seas managed for various objectives meetpeople's immediate needs while maintainingthe maximum possible biodiversity.
Following are two important steps towardachieving the inter-sectoral integration neces-sary for biodiversity conservation:
a. Explore innovative institutional managementarrangements. The potential for improvingthe capacity to maintain genes, species,and habitats through integrated planningand inter-sectoral coordination is great, but
such coordination has often proven diffi-cult to achieve. Still, recent initiatives inCosta Rica have successfully integratedpreviously separate land-managementactivities, partly to maintain biologicaldiversity. A new program for landmanagement places the various parks,forests and other reserves—which togethermake up 27 percent of Costa Rica's area—under seven regional authorities thatreport to the Minister of Mines and Natu-ral Resources. All agricultural, forest, andgrazing lands, and villages and townsfound within each region are under thejurisdiction of each regional unit, andthese units work both with protected areamanagement and with community-orienteddevelopment programs in which conserva-tion figures centrally. If these so-calledmega-reserves are properly managed, morethan 95 percent or so of the species thatexisted in Costa Rica before Europeansarrived could be maintained (D. Janzen,University of Pennsylvania, personal com-munication, Dec. 1988).
b. Establish appropriate management incentives.Developing appropriate conservationincentives for all managers of land orcoastal areas is one key to encouraginginter-sectoral coordination. Over the longterm, such sectors as forestry, fisheries,agriculture, tourism, and watershed man-agement will all benefit from biodiversityconservation, but short-term incentives toincrease timber harvest, fishery yield, cropproduction, or tourism revenues oftenwork against conservation efforts. Incen-tives for managers must therefore encour-age them to increase the emphasis on bio-diversity conservation while still meetingother resource use goals and to coordinateland-use and management objectives inter-sectorally. In particular, managers needincentives to develop management tech-niques that maximize the conservation ofbiodiversity in semi-natural lands dedi-cated mainly to meeting other land-useobjectives.
93
4. Establish a Strategy to Guide BiodiversityConservation Activities and Priorities
Each nation and institution has its own bio-diversity-conservation perspectives, values, andgoals, and no single set of priorities for bio-diversity conservation will ever be universallyaccepted. Trade-offs and value judgments con-cerning the distinctiveness of species, habitats,or ecosystems, their current or future utility,their local or global importance, and the sev-erity of threats to biodiversity will influencestrategies for halting biological impoverishment.(See Box 6.) Nevertheless, at all levels ofaction—from the grassroots to internationalorganizations—coordinating the various conser-vation activities will enhance biodiversity con-servation. Cooperative efforts to identify conser-vation priorities can maximize the amount ofinformation available to decision-makers, thecoverage of conservation actions, and financialsupport for conservation. The key to suchcooperation is identifying priorities for action,the roles of various institutions, financialrequirements, sources of financing, opportuni-ties for policy or institutional reform, publiceducation requirements, training needs forresource managers, policy analysts, andresource economists, and so forth. A coopera-tive strategy or action plan generally works bestwhen all institutions and individuals involved inand affected by resource management have ahand in shaping its content and implementing it.
One of the most important benefits of awidely supported global, national, or localstrategy for conserving biodiversity is that itcan ensure that immediate conservation needsare met while long-term work on many of theroot causes of biological resources degradationcontinues. It can also ensure that research andaction are not viewed as competitors for scarceresources, but rather as equally essential com-ponents of conservation—both of whichdeserve increased support.
The specific approach taken by various nationsto develop biodiversity conservation strategiesis likely to vary from the establishment of a
National Biodiversity Action Plan to moregeneral Environmental Action Plans or NationalConservation Strategies to local programsaddressing such specific issues as coastal zonemanagement. To encourage such planning atall levels and to help expand the conservationconstituency, identify opportunities foraddressing the root causes of the loss of bio-diversity, encourage the best use of modernscience, and help elevate biodiversity conserva-tion on the list of national priorities, WRI,IUCN, and UNEP are seeking to organize thedevelopment of a Global Strategy for Conserv-ing Biodiversity (McNeely et al. 1989, Miller etal. 1989). The program will be committed tothree inextricably linked pursuits: saving themaximum diversity of life, studying its potentialuse and its role in the biosphere, and using itin sustainable management systems. TheGlobal Strategy, to be developed over twoyears, would be implemented through adecade of intensive and sustained world-wideeffort by institutions and individuals.
5. Promote Biocultural Conservation
Humanity has long caused extinctions,altered succession, and modified the popula-tion size of other species. It has domesticatedspecies and even altered the genetic diversityof wild populations. These historic manipula-tions of the environment were probably no"wiser" than our current modifications; many,in fact, led to environmental catastrophes, asthe extinction of Hawaii's avifauna (Box 3) orthe desertification of the Indus River Valleyattest (Bryson and Murray 1977). Nevertheless,human culture's imprint on the world's bio-diversity and the close connections betweentraditional resource management systems andlocal biological diversity should not be over-looked since the maintenance of "natural"ecosystems may sometimes require the continu-ation of historic human disturbances. Then too,many of the resource management systemsthat human societies have developed representunique and often extremely useful methods ofresponding to local environmental conditions—potential models for further adaptation.
94
Box 6. Criteria for Setting Biodiversity Conservation Priorities
Given that some species and genes aresure to be lost and some natural habitatsconverted to other land uses in the comingdecades, how should scarce human andfinancial resources be spent to minimizebiotic impoverishment and maximize bio-diversity's contribution to human well-being? How can the most useful componentsof biodiversity be saved for current or futureuse? And how can such ethical considera-tions as our responsibility to other speciesand to future generations be incorporatedinto conservation priorities?
Clearly, these questions cannot be ans-wered with scientific information on thenature, distribution, and status of biodiversityalone. Such factors as awareness of the prob-lem and its solutions, perceived trade-offswith other basic human needs, and localpolitical considerations will all influence con-servation priorities. Nonetheless, three rulesof thumb derived from the biosciences canhelp scientists and policy-makers identify thevarious influential factors and evaluate thetrade-offs and value judgments made in set-ting priorities.
1. Distinctiveness: Numbers Aren't Everything.
To conserve the widest variety of theworld's life forms and the complexes inwhich they occur, the more distinctive ele-ments of this diversity should receive highpriority. For example, preserving an assem-blage of plants and animals is comparativelymore important if those species are foundnowhere else or are not included in pro-tected areas. Similarly, if the choice isbetween conserving a species with manyclose relatives or a species with few, themore distinctive species should be saved.
Maintaining the highest number of specieswithout considering their taxonomic position
makes little sense, as a comparison ofmarine and terrestrial environments shows.Terrestrial environments contain at least 80percent of the world's total species, mainlybecause vascular plants and insects are sonumerous on land—accounting for nearly 72percent of all described species in theworld—and so poorly represented in marineenvironments. However, the sea containsgreater proportions of higher taxonomicunits. Marine ecosystems contain representa-tives of some 43 phyla while terrestrialenvironments are home to only 28 phyla.The sea contains fully 90 percent of allclasses and phyla of animals (Ray 1988).Clearly, efforts to conserve the widest arrayof biodiversity must give attention to alllevels of the taxonomic hierarchy.
2. Utility: Global or Local, Current orFuture?
To some extent, utility is always a criterionin setting biodiversity conservation priorities.Nobody opposed the extinction of wildpopulations of the smallpox virus, and mostpeople would agree that it's more importantto conserve a subspecies of rice than asubspecies of a "weed." Similarly, maintain-ing forest cover in the watershed above avillage or irrigation project seems moreimportant than preserving a similar forest ina region where increased flooding or soilerosion would not affect human activitiesdownstream.
Of course, many decisions about whichspecies to save are much more difficult thanthe one governing smallpox's fate. Ingeneral, questions about the usefulness ofspecies, genes, or ecosystems can be compli-cated by two factors. One is the issue ofinter-generational equity—whether today'sneeds outweigh those of future generations.It seems reasonable enough to expect future
95
Box 6. (cont.)
generations to value the species most valuedtoday, but it is impossible to predict human-ity's exact needs, and many other species ofunknown value today are sure to becomemore important in the future. Amidattempts to conserve species prized today,some value has to be assigned to futuregenerations' needs.
How useful species, genes, or ecosystemsare depends on whether today's needsoutweigh those of future generationsand who gets the benefits.
Second, we must ask the question: "Util-ity for whom?" Biodiversity has obviousvalues to local communities, nations, andthe entire world, but the benefit is not iden-tical for each group. From a global perspec-tive, the conservation of a region's biodiver-sity might help to regulate climate, influencethe atmosphere's chemical composition, andprovide all of humanity with industrialproducts, medicines, and a source of genesfor crop breeding. Locally, conservation mayalso provide people with fuel, clean water,game, timber, aesthetic satisfaction, andimportant cultural symbols or resources.Because the conservation benefits receivedby the local and global communities are notcongruent, international and local prioritieswill also differ. To humanity at large, con-serving tropical forests matters more thanconserving semi-arid deserts since the forestscontain a tremendous variety of life andheavily influence global climate. Locally,
however, each region's biodiversity isequally valuable since it provides essentialecosystem services that local people relyupon. Neither perspective is necessarily the"correct" view of biodiversity; either—globalor local, current or future—reflects animplicit value judgment.
3. Threat: Saving the Most BeleagueredSpecies and Ecosystems First.
In general, the threat to biological diversityis influenced by how widespread speciesare, how common they are over their range,and by such human pressures as harvesting,land conversion, and environmental pollu-tion. The threats to species vary dramaticallyby region, and in each region some ecosys-tems are more threatened than others. Forinstance, Central America's tropical rainforests are less threatened than the remain-ing fragments of tropical dry forest in thatregion. In such cases, the dry forests shouldreceive the most attention even though therain forests contain more species.
These three factors—distinctiveness, utility,and threat—help make value judgmentsmore explicit as conservation priorities areset. If a strictly global perspective isadopted, then preserving the most species-rich sites in the world seems most impor-tant. Indeed, this global perspective has ledsome organizations to focus on conservationin the "megadiversity" countries—Brazil,Colombia, Indonesia, Madagascar, Mexico,Zaire, and others (see discussion in McNeely etal. 1989). In contrast, from a nationalist per-spective, each country's biodiversity is worthroughly what every other country's is. Simi-larly, if today's needs for genes, species, orecosystems are considered paramount,tomorrow's needs can't be too.
96
To maintain some "natural" ecosystems,we might have to continue disturbingthem.
The following actions will help promote abiocultural approach to conservation:
a. Ensure that human culture and knowledge isconserved as part of conserving biodiversity.Fraught with both success and failure, thehistory of human management of theenvironment contains important hard-bought lessons that could easily be lost.While 20th-century western civilizationcongratulates itself for the green revolu-tion, these "revolutionary" gains pale incomparison to the enhanced productivitythat resulted from the slow process ofdomestication that first turned weeds intoproductive crops. The seeds of domesti-cated crops that we seek to preserve ingermplasm banks are only one part of anagricultural technology developed as farm-ing systems and their crops coevolved.When these farming systems and seedsface extinction, ex situ storage of germ-plasm is essential and so is the preserva-tion of agricultural knowledge.
b. Enhance traditional systems of resource use,where appropriate, rather than replacing them.Indigenous systems of land managementare often technologically and institutionallywell adapted to local environmental condi-tions. In southern Para in Brazil, theKayapo people are practicing traditionalmethods of soil enrichment and croppingthat allow them to use cleared plots foreleven years with as little as a five-yearfallow period (S. Hecht, University ofCalifornia, Los Angeles, personal commu-nication; May 1988). In contrast, mostcolonists in the Amazon who have not
had long experience with farming findcleared plots unusable after two to threeyears.
Although many traditional community-based resource management systems havesucceeded, efforts to establish them whereno historical precedent existed have fre-quently suffered from the "tragedy of thecommons." In Nepal, community forestswere once successfully protected by forestguards with the power to prevent cuttingof protected areas, determine where treescould be cut, inspect firewood stocks inpeople's houses, and levy appropriatefines (von Furer-Haimendorf 1964).Modifying these traditional systems maymake far more sense than replacing them(McNeely 1989). Precedents for revivingage-old practices do exist: local villagerswere enticed to return to traditionalmethods of wildlife conservation in theLupande Game Management Area of theLuangwa Valley when a Wildlife Conser-vation Revolving Fund was created. Reve-nue generated from safari fees and thesale of meat and hides goes into the fundand supports both wildlife managementand local community development (Lewiset al. 1987).
6. Anticipate the Impacts of Global Warming
Although global warming will exacerbatebiotic impoverishment, society's response tothese impacts is likely to be severely con-strained by other pressing social needs thatwill arise if climate changes rapidly. Becauseneeds to mitigate impacts on agriculture, waterresources, and coastal development are sure totake precedence over steps to mitigate impactson biological diversity, the most effective wayto minimize the impacts of climate change onbiodiversity is to slow or halt climate change.
Of course, little is gained if actions to slowclimate change are detrimental to biodiversity.For example, one strategy for slowing carbon-dioxide buildup is to increase forests' carbon
97
sequestering role by replacing natural forests withplantations of fast-growing trees—a responsethat will take a significant toll on biologicaldiversity. A strategy more compatible with theneed to minimize negative impacts on biologicaldiversity would be to adopt agroforestryschemes, which can help increase carbon-dioxideuptake and offer people a ready supply of woodproducts, thereby lessening demands for woodand land from natural forests.
Uncertainty about climate change's specificeffects on biodiversity will persist, as will uncer-tainty about the nature and extent of climatechange. For this reason, the most desirable poli-cies for mitigating its impacts are those thatwould work under any probable scenario of cli-mate change and ecosystem response. For-tunately, many current biodiversity conservationefforts meet this criterion, including efforts tostrengthen and enlarge protected areas (espe-cially with poleward or up-slope additions),establish conservation corridors, enhance ex situconservation capacity, provide benefits from pro-tected areas to people in surrounding communi-ties, increase research on species taxonomy, dis-tribution, ecology, and conservation biology, andincrease agricultural productivity.
Apart from slowing the rate of climate changeand enhancing ongoing conservation efforts, themeasures that can be taken to mitigate effectson biodiversity include the following:
a. Increase land-use flexibility. As global climatechanges, many species distributions willchange. Current systems of land-use andland tenure make no allowance for thesedistributional shifts; they need to beadjusted so that options for converting
land to natural or semi-natural states areavailable should such conversion beneeded. For example, the potential effectsof global warming on coastal wetlandscould be exacerbated if upland sites thatwetland species could colonize as sea levelrises aren't available. Similarly, land owner-ship changes will sometimes be required tore-create plant and animal communitiesupslope or poleward of existing assem-blages. In the case of wetlands, it makessense to adjust the boundaries of protectedareas based on predicted sea-level contoursby purchasing development rights forinland areas and restricting coastaldevelopment.
b. Enhance response techniques. Both ex situpreservation and ecological restoration willbe needed to mitigate the impacts of green-house warming on biodiversity. But policy-makers must recognize that neither of thesetechnologies will be a panacea. Ex situpreservation cannot conserve habitats,ecosystems, or ecological processes, nor canit allow the continued evolution of species.Ecological restoration is expensive, particu-larly if undertaken on a large scale, andchancy since scientists cannot precisely pre-dict the community composition that islikely under future climatic regimes. Site-specific predictions won't be reliableenough to guide investment, so most con-servation responses to climate change mustbe reactive rather than anticipatory.Nevertheless, both of these techniques willbecome increasingly important under condi-tions of rapid climate change, and greaterresearch and investment is needed now toimprove them.
Walter V. Reid is an Associate with the WRI Program in Forests and Biodiversity. Before joiningWRI, Dr. Reid was a Gilbert White Fellow with Resources for the Future. He has also taught at theUniversity of Washington and worked as a wildlife biologist with the California and Alaska depart-ments of Fish and Game and with the U.S. Forest Service in Alaska. Kenton R. Miller is Directorof WRI's Program in Forests and Biodiversity. Prior to joining WRI, Dr. Miller served for five yearsas Director General of IUCN. Previously, he directed the Center for Strategic Wildland ManagementStudies at the University of Michigan and, before that, the U.N. Food and Agriculture Organiza-tion's wildlands management activities in Latin America and the Caribbean.
98
Appendices
Appendix 1: Cascade Effects
The loss of a species can have various effectson the remaining species in an ecosystem—what kind and how many depends upon thecharacteristics of the ecosystem and upon thespecies' role in its structure. Cascade effectsoccur when the local extinction of one speciessignificantly changes the population sizes ofother species, potentially leading to other extir-pations. Such cascade effects are particularlylikely when the lost species is a "keystonepredator," a "keystone mutualist," or the preyof a "specialist predator."
Keystone Predators
How much the loss of a predator affects itsprey population size depends on how muchthe predator limits the prey population. If thesize of the prey population is determined byfactors other than predation, it is said to bedonor-controlled. For example, such bottom-dwelling invertebrates as mussels or barnaclesconsume only a small fraction of the ocean'splankton; consequently, removing these inver-tebrates would not affect the plankton's popu-lation size much. Similarly, although the pas-senger pigeon (Ectopistes migmtorius), Carolinaparakeet (Conuropsis carolinensis), and wild tur-key (Meleagris gallopavo) were the dominantlarge seed-predators of eastern NorthAmerica's forests, the extinction of the firsttwo species and the near-extinction of the thirdapparently changed the forest little. The loss of
the bird species increased seed survival, butthis increase had no effect on the density oftrees because what limited the tree populationswas the availability of space, not seed preda-tion (Orians and Kunin, in press).
In a predator-controlled system, the size of theprey population is determined by predation. Insuch systems, the impact of the loss of thepredator can be substantial, especially if thepredator is relatively high in the food chain.So-called keystone predators affect not onlytheir prey's population size but also the com-munity's species diversity. By limiting thepopulation size of a species that would other-wise outcompete other species, keystone preda-tors can help maintain high species diversity.When the keystone predator Pisaster ochraceus(a starfish) is removed from the intertidal zonein the Pacific northwest of the United States,the intertidal community changes from onewith a high diversity of relatively large bottom-dwelling invertebrates to a virtual monocultureof the starfish's favorite prey—the mussel(Mytelus edulis) (Paine 1966).
Keystone predators represent a vexing prob-lem for conservation. Many keystone predators,such as sea otters, face a high risk of extinctionbecause they tend to be high in the food chainand relatively sparsely distributed. (See Box 4.)Yet, determining which species play keystoneroles in a community may be extremely difficult.
99
For example, the small moth Cactoblastis cacto-rum, introduced into Queensland from SouthAmerica, appears to be a minor component ofthe Queensland community since its populationsize and biomass aren't great. However, it is akeystone predator in Australia and probablyalso in South America. In the absence of themoth, Opuntia cactus (also introduced fromSouth America) covered 62,000 square kilome-ters of Queensland but in its presence Opuntiahas been reduced to small isolated patches(DeBach 1974). In general, determining whethera given species plays a keystone role requiresconsiderable study and experimentation.
Although certain species have much moreinfluence than others on an ecosystem's struc-ture, not all ecosystems include a single speciesthat exerts such a pervasive influence. In fact,most ecosystems are somewhat sensitive to theloss of any one of many species, though somelosses have greater impact on the system thanothers. Nevertheless, determining which spe-cies function as keystone predators in an eco-system can help managers fine-tune conservationactivities.
Mutualists and Keystone Mutualists
Species involved in mutualisms—mutuallybeneficial interactions such as pollination—aredeeply affected if their partner mutualists arelost. For example, the loss of a fruit-eating spe-cies may severely affect the plants whose fruitsit disperses. Similarly, rare tropical plantsdependent on specific species for pollinationwould be threatened with extinction by theloss of the pollinator (Orians and Kunin, inpress). Some orchids, for instance, rely on asingle species of euglossine bee for pollination;without the bee, the plant would becomeextinct (Dodson 1975, Gilbert 1980). By thesame token, pollinators that specialize on aspecific plant species could die out if the plantdoes. Most species of fig (Ficus spp.) are eachpollinated by a different species of wasp, andeach species of wasp pollinates only one fig(Janzen 1979), so the loss of a fig species couldwipe out one of the specialist wasps.
Maintaining plant-pollinator interactions intropical forests is of utmost importance sincetropical forests are much more sensitive toextinctions of pollinators than are temperateforests. Whereas less than 30 percent of treesin the northern United States are pollinated byanimals (as opposed to wind), more than 95percent of the trees in one dry forest in CostaRica are believed to rely on animal pollination(Regal 1982).
Certain species—keystone mutualists—involved in mutualistic interactions may some-times assume great importance in the commu-nity. For example, during the dry season in thetropical forest at the Cocha Cashu BiologicalStation in Manu National Park of southeasternPeru, only 12 of approximately 2,000 plant spe-cies support the entire fruit-eating communityof mammals and birds (Terborgh 1986a, 1986b).During this period, fruit production drops toless than 5 percent of the peak production, sothe food available to the fruit-eating species isseverely restricted. The 12 plant species stillproducing fruit and nectar meet the food needsof as much as 80 percent of the entire mammalcommunity and a major fraction of the avianspecies at the site. Clearly, the loss of one ormore of these "keystone mutualists" could sig-nificantly harm frugivore populations.
While the identification of keystone predatorsmay be extremely difficult, keystone mutualistscan generally be identified through non-experi-mental observations of the resources that thespecies use. Once identified, keystone mutu-alists can be managed to ensure the survival ofthe species dependent upon them. By increas-ing the abundance of the keystone mutualistsfor instance, it might be possible to increasepopulations of dependent species (Terborgh1986a).
Specialist Predators
In general, the loss of a species tends to havegreater impacts on its own predators if the spe-cies is relatively high in the food chain. Popu-lations of such species, including carnivores,
100
tend to be limited by the amount of prey avail-able, whereas species low in the food chain,such as herbivores, are more often limited bytheir predators or pathogens (Hairston et al.1960, Oksanen 1988). Consequently, the loss ofan herbivore tends to directly reduce the sup-ply of the factor (food) limiting the carnivorepopulation, while the removal of a plant spe-cies may have no effect on the herbivorepopulation.
One exception to this pattern occurs whenthe plant species removed is the prey of a
specialist predator—that is, a species with noalternative food source. For example, manyinsects eat just one species of plant becausethey have evolved mechanisms for detoxifyingthe plant's chemical defenses. If such a plantwere lost, the highly specialized insect wouldbe too. Widespread and common prey speciesare more likely to have specialist predatorsthan are rare or locally endemic species(Strong 1979, Orians and Kunin, in press),so the loss of common species would tendto have a large impact on species higher in thefood chain.
101
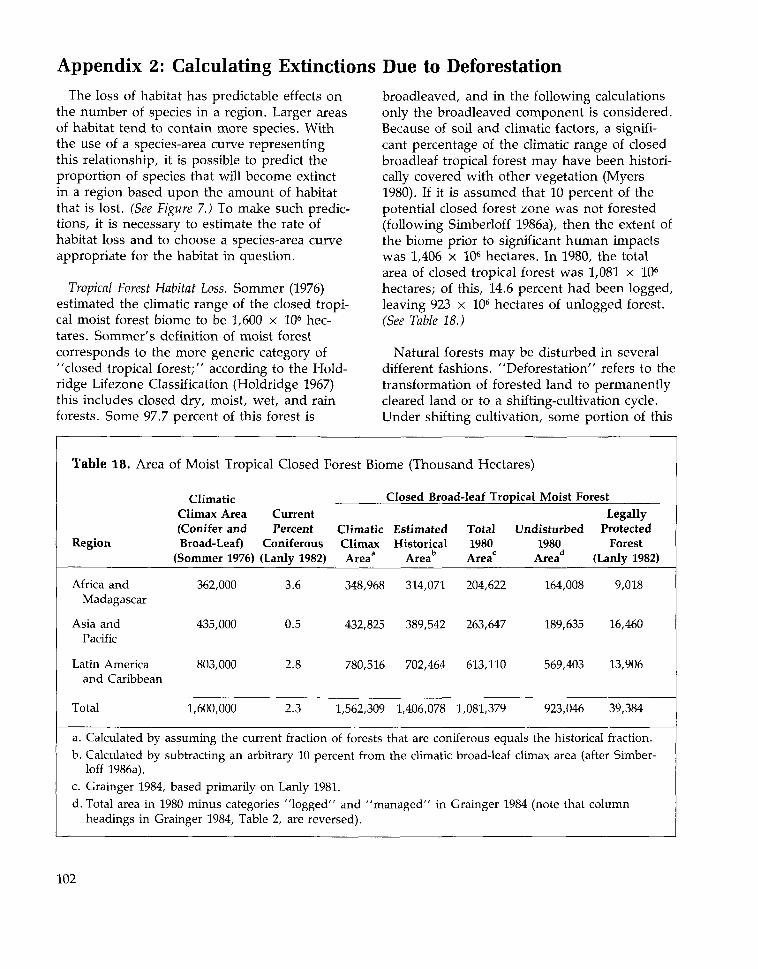
Appendix 2: Calculating Extinctions Due to DeforestationThe loss of habitat has predictable effects on
the number of species in a region. Larger areasof habitat tend to contain more species. Withthe use of a species-area curve representingthis relationship, it is possible to predict theproportion of species that will become extinctin a region based upon the amount of habitatthat is lost. (See Figure 7.) To make such predic-tions, it is necessary to estimate the rate ofhabitat loss and to choose a species-area curveappropriate for the habitat in question.
Tropical Forest Habitat Loss. Sommer (1976)estimated the climatic range of the closed tropi-cal moist forest biome to be 1,600 x 106 hec-tares. Sommer's definition of moist forestcorresponds to the more generic category of"closed tropical forest;" according to the Hold-ridge Lifezone Classification (Holdridge 1967)this includes closed dry, moist, wet, and rainforests. Some 97.7 percent of this forest is
broadleaved, and in the following calculationsonly the broadleaved component is considered.Because of soil and climatic factors, a signifi-cant percentage of the climatic range of closedbroadleaf tropical forest may have been histori-cally covered with other vegetation (Myers1980). If it is assumed that 10 percent of thepotential closed forest zone was not forested(following Simberloff 1986a), then the extent ofthe biome prior to significant human impactswas 1,406 x 106 hectares. In 1980, the totalarea of closed tropical forest was 1,081 x 106
hectares; of this, 14.6 percent had been logged,leaving 923 x 106 hectares of unlogged forest.(See Table 18.)
Natural forests may be disturbed in severaldifferent fashions. "Deforestation" refers to thetransformation of forested land to permanentlycleared land or to a shifting-cultivation cycle.Under shifting cultivation, some portion of this
Table 18. Area of Moist Tropical Closed Forest Biome (Thousand Hectares)
Region
ClimaticClimax Area(Conifer andBroad-Leaf)
CurrentPercent
Coniferous Climax Historical(Sommer 1976) (Lanly 1982) Area3 Area
Closed Broad-leaf Tropical Moist ForestLegally
Total Undisturbed Protected1980 1980 ForestAreac Aread (Lanly 1982)
Climatic Estimated
Africa andMadagascar
Asia andPacific
Latin Americaand Caribbean
Total
362,000 3.6 348,968 314,071 204,622 164,008 9,018
435,000 0.5 432,825 389,542 263,647 189,635 16,460
803,000 2.8 780,516 702,464 613,110 569,403 13,906
1,600,000 2.3 1,562,309 1,406,078 1,081,379 923,046 39,384
a. Calculated by assuming the current fraction of forests that are coniferous equals the historical fraction.b. Calculated by subtracting an arbitrary 10 percent from the climatic broad-leaf climax area (after Simber-
loff 1986a).c. Grainger 1984, based primarily on Lanly 1981.d. Total area in 1980 minus categories "logged" and "managed" in Grainger 1984 (note that column
headings in Grainger 1984, Table 2, are reversed).
102
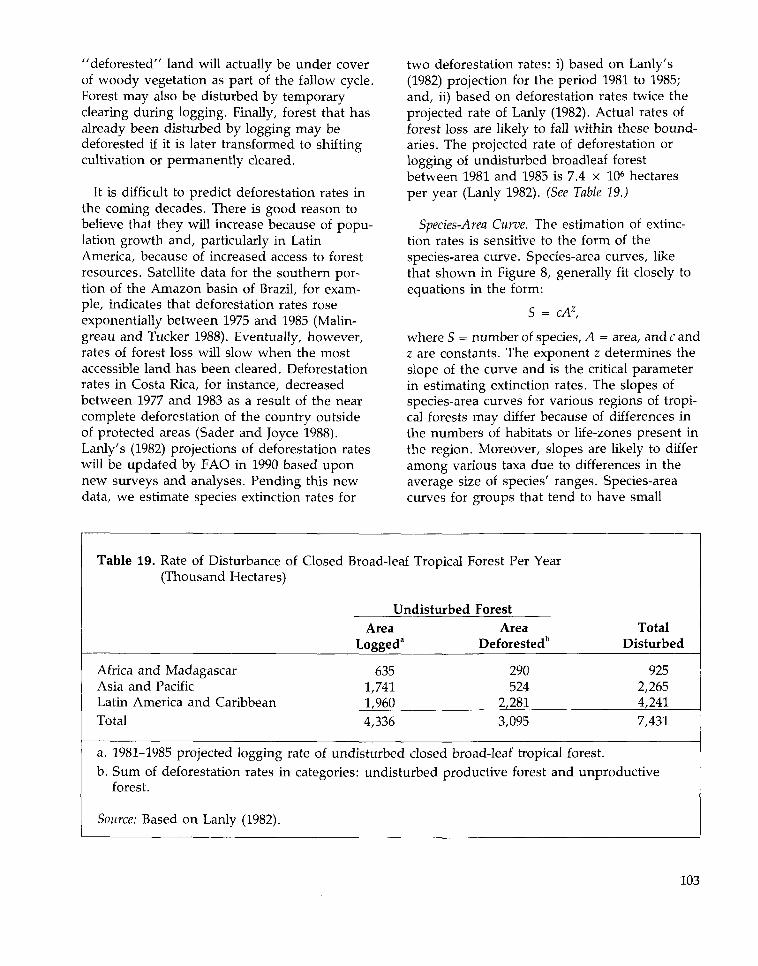
"deforested" land will actually be under coverof woody vegetation as part of the fallow cycle.Forest may also be disturbed by temporaryclearing during logging. Finally, forest that hasalready been disturbed by logging may bedeforested if it is later transformed to shiftingcultivation or permanently cleared.
It is difficult to predict deforestation rates inthe coming decades. There is good reason tobelieve that they will increase because of popu-lation growth and, particularly in LatinAmerica, because of increased access to forestresources. Satellite data for the southern por-tion of the Amazon basin of Brazil, for exam-ple, indicates that deforestation rates roseexponentially between 1975 and 1985 (Malin-greau and Tucker 1988). Eventually, however,rates of forest loss will slow when the mostaccessible land has been cleared. Deforestationrates in Costa Rica, for instance, decreasedbetween 1977 and 1983 as a result of the nearcomplete deforestation of the country outsideof protected areas (Sader and Joyce 1988).Lanly's (1982) projections of deforestation rateswill be updated by FAO in 1990 based uponnew surveys and analyses. Pending this newdata, we estimate species extinction rates for
two deforestation rates: i) based on Lanly's(1982) projection for the period 1981 to 1985;and, ii) based on deforestation rates twice theprojected rate of Lanly (1982). Actual rates offorest loss are likely to fall within these bound-aries. The projected rate of deforestation orlogging of undisturbed broadleaf forestbetween 1981 and 1985 is 7.4 x 10⁶ hectaresper year (Lanly 1982). (See Table 19.)
Species-Area Curve. The estimation of extinc-tion rates is sensitive to the form of thespecies-area curve. Species-area curves, likethat shown in Figure 8, generally fit closely toequations in the form:
S = cAz,
where S = number of species, A = area, and c andz are constants. The exponent z determines theslope of the curve and is the critical parameterin estimating extinction rates. The slopes ofspecies-area curves for various regions of tropi-cal forests may differ because of differences inthe numbers of habitats or life-zones present inthe region. Moreover, slopes are likely to differamong various taxa due to differences in theaverage size of species' ranges. Species-areacurves for groups that tend to have small
Table 19. Rate of Disturbance of Closed Broad-leaf Tropical Forest Per Year(Thousand Hectares)
Undisturbed Forest
Africa and MadagascarAsia and PacificLatin America and CaribbeanTotal
AreaLogged3
6351,7411,9604,336
AreaDeforested1"
290524
2,281
3,095
TotalDisturbed
9252,2654,241
7,431
a. 1981-1985 projected logging rate of undisturbed closed broad-leaf tropical forest.b. Sum of deforestation rates in categories: undisturbed productive forest and unproductive
forest.
Source: Based on Lanly (1982).
103
ranges should have steeper slopes. Because ofthese difficulties, we model species extinctionrates over a fairly broad range of slopes thatare typically found in empirical studies of thespecies-area relationship (0.15 < z < 0.35;Connor and McCoy 1979).
Interpretation. If current trends continue, spe-cies loss over the next 30 years could amountto 3 to 17 percent of species currently presentin closed tropical forests in Asia, Africa, andSouth America. (See Table 5.) If forest loss pro-ceeds at twice the estimated rate, 6 to 44 per-cent of species could be lost in various regions.Table 5 includes estimates of the proportion ofspecies that have already become extinct based onforest loss to date, but it must be remembered thatthese values are dependent upon an arbitraryestimate of the original extent of closed tropicalforest and thus are imprecise.
Like any model, the species-area model is anapproximation of reality that is based uponseveral assumptions. First, the model assumesthat deforestation and logging eliminate all spe-cies originally present in the forest. In fact,many species may persist in a managed forest
if logging intensity is not too high. Thus, theprojected extinction rates could be reducedthrough forestry practices that ensure themaintenance of species populations in managedforests.
Second, the model assumes that extinctionrates are unaffected by forest fragmentation. Inpractice, deforestation will convert many rela-tively continuous tracts of forest to a frag-mented array of smaller patches and many ofthe species present in the patches may be lostif their populations are reduced below theirminimum viable population size (Shaffer 1981).Exactly how fragmentation affects species rich-ness within a region depends upon whichareas remain under forest cover. Through thecareful choice of areas to remain under naturalforest cover, the potential loss of species withina region can be significantly reduced (Simber-loff and Abele 1982, Quinn and Harrison 1988).
Finally, the model assumes that habitat lossoccurs randomly among regions with variouslevels of species richness. Species loss could bereduced if species-rich regions are protectedfrom deforestation.
104
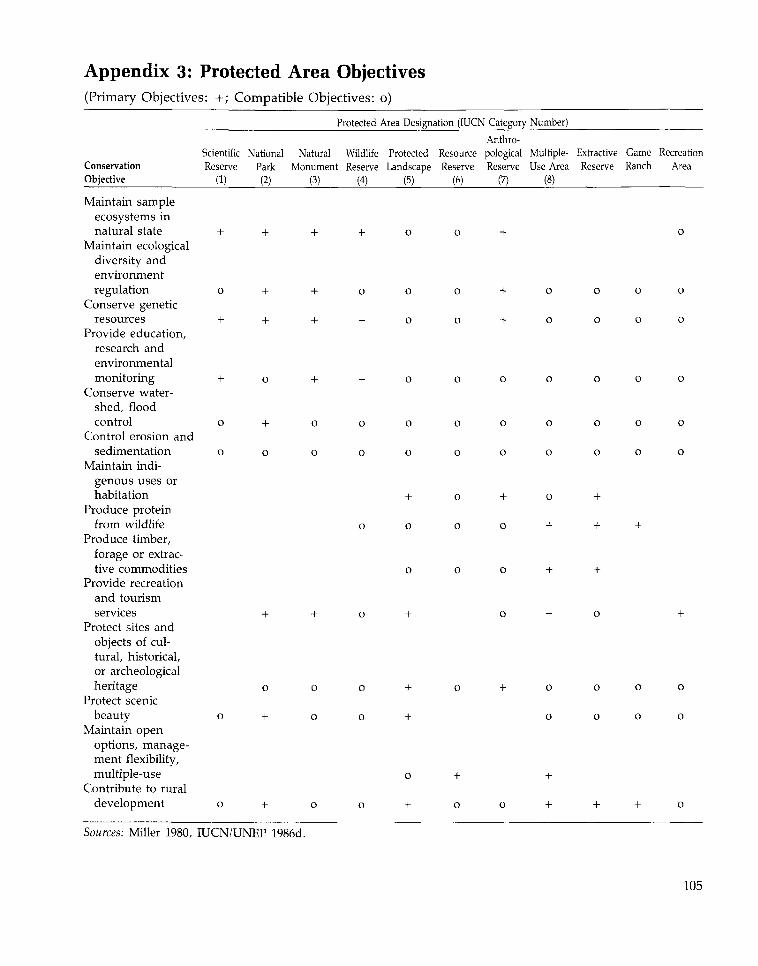
Appendix 3: Protected Area Objectives(Primary Objectives: +; Compatible Objectives: o)
Protected Area Designation (IUCN Category Number)
Anthro-Scientific National Natural Wildlife Protected Resource pological Multiple- Extractive Game Recreation
Conservation Reserve Park Monument Reserve Landscape Reserve Reserve Use Area Reserve Ranch AreaObjective (1) (2) (3) (4) (5) (6) (7) (8)
Maintain sampleecosystems innatural state + + + + 0 0 + o
Maintain ecologicaldiversity andenvironmentregulation 0 + + 0 0 0 + 0 0 0 0
Conserve geneticresources + + + + 0 0 + 0 0 0 0
Provide education,research andenvironmentalmonitoring + 0 + + 0 0 0 0 0 0 0
Conserve water-shed, floodcontrol 0 + o 0 0 0 0 0 0 0 0
Control erosion andsedimentation 0 0 0 0 0 0 0 0 0 0 0
Maintain indi-genous uses orhabitation + 0 + 0 +
Produce proteinfrom wildlife 0 0 0 0 + + +
Produce timber,forage or extrac-tive commodities o o o + +
Provide recreationand tourismservices + + 0 + 0 + 0 +
Protect sites andobjects of cul-tural, historical,or archeologicalheritage o o 0 + 0 + 0 0 0 0
Protect scenicbeauty 0 + 0 0 + 0 0 0 0
Maintain openoptions, manage-ment flexibility,multiple-use o + +
Contribute to ruraldevelopment 0 + o 0 + 0 0 + + + 0
Sources: Miller 1980, IUCN/UNEP 1986d.
105
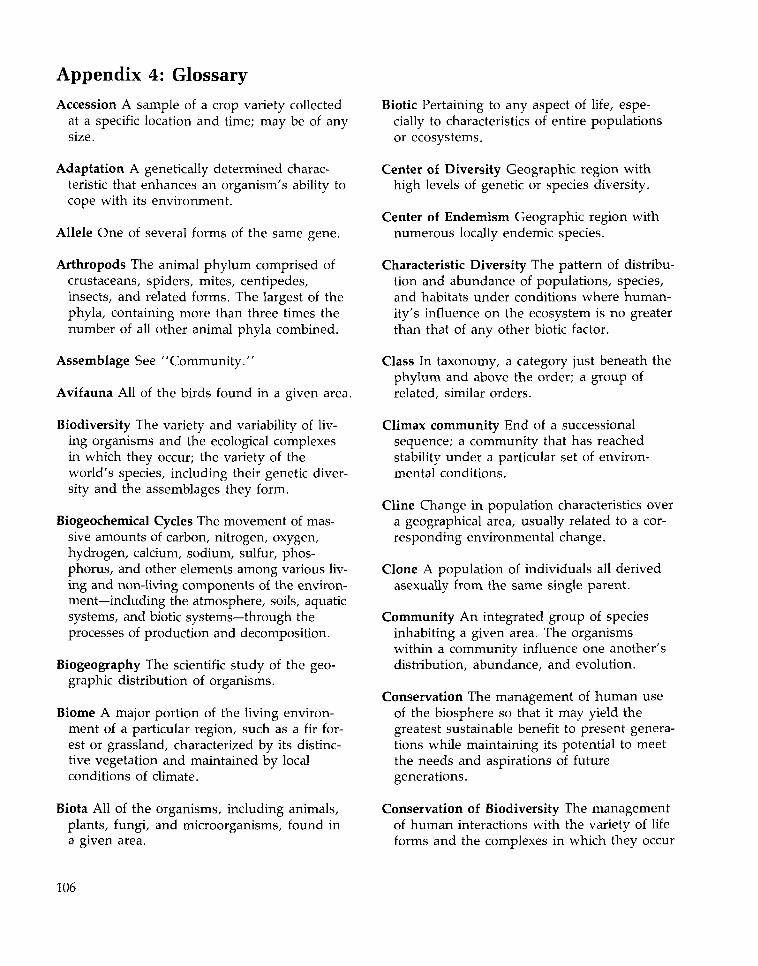
Appendix 4: GlossaryAccession A sample of a crop variety collected
at a specific location and time; may be of anysize.
Adaptation A genetically determined charac-teristic that enhances an organism's ability tocope with its environment.
Allele One of several forms of the same gene.
Arthropods The animal phylum comprised ofcrustaceans, spiders, mites, centipedes,insects, and related forms. The largest of thephyla, containing more than three times thenumber of all other animal phyla combined.
Assemblage See "Community."
Avifauna All of the birds found in a given area.
Biodiversity The variety and variability of liv-ing organisms and the ecological complexesin which they occur; the variety of theworld's species, including their genetic diver-sity and the assemblages they form.
Biogeochemical Cycles The movement of mas-sive amounts of carbon, nitrogen, oxygen,hydrogen, calcium, sodium, sulfur, phos-phorus, and other elements among various liv-ing and non-living components of the environ-ment—including the atmosphere, soils, aquaticsystems, and biotic systems—through theprocesses of production and decomposition.
Biogeography The scientific study of the geo-graphic distribution of organisms.
Biome A major portion of the living environ-ment of a particular region, such as a fir for-est or grassland, characterized by its distinc-tive vegetation and maintained by localconditions of climate.
Biota All of the organisms, including animals,plants, fungi, and microorganisms, found ina given area.
Biotic Pertaining to any aspect of life, espe-cially to characteristics of entire populationsor ecosystems.
Center of Diversity Geographic region withhigh levels of genetic or species diversity.
Center of Endemism Geographic region withnumerous locally endemic species.
Characteristic Diversity The pattern of distribu-tion and abundance of populations, species,and habitats under conditions where human-ity's influence on the ecosystem is no greaterthan that of any other biotic factor.
Class In taxonomy, a category just beneath thephylum and above the order; a group ofrelated, similar orders.
Climax community End of a successionalsequence; a community that has reachedstability under a particular set of environ-mental conditions.
Cline Change in population characteristicsa geographical area, usually related to a „ -responding environmental change.
Clone A population of individuals all derivedasexually from the same single parent.
Community An integrated group of speciesinhabiting a given area. The organismswithin a community influence one another'sdistribution, abundance, and evolution.
Conservation The management of human useof the biosphere so that it may yield thegreatest sustainable benefit to present genera-tions while maintaining its potential to meetthe needs and aspirations of futuregenerations.
Conservation of Biodiversity The managementof human interactions with the variety of lifeforms and the complexes in which they occur
over
106
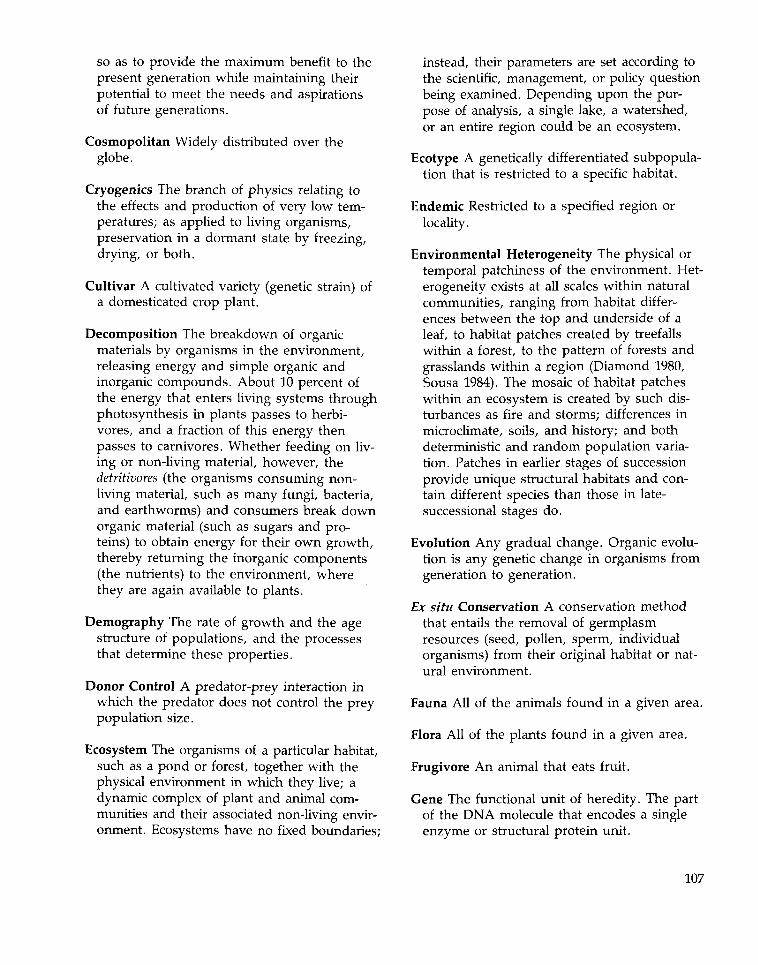
so as to provide the maximum benefit to thepresent generation while maintaining theirpotential to meet the needs and aspirationsof future generations.
Cosmopolitan Widely distributed over theglobe.
Cryogenics The branch of physics relating tothe effects and production of very low tem-peratures; as applied to living organisms,preservation in a dormant state by freezing,drying, or both.
Cultivar A cultivated variety (genetic strain) ofa domesticated crop plant.
Decomposition The breakdown of organicmaterials by organisms in the environment,releasing energy and simple organic andinorganic compounds. About 10 percent ofthe energy that enters living systems throughphotosynthesis in plants passes to herbi-vores, and a fraction of this energy thenpasses to carnivores. Whether feeding on liv-ing or non-living material, however, thedetritivores (the organisms consuming non-living material, such as many fungi, bacteria,and earthworms) and consumers break downorganic material (such as sugars and pro-teins) to obtain energy for their own growth,thereby returning the inorganic components(the nutrients) to the environment, wherethey are again available to plants.
Demography The rate of growth and the agestructure of populations, and the processesthat determine these properties.
Donor Control A predator-prey interaction inwhich the predator does not control the preypopulation size.
Ecosystem The organisms of a particular habitat,such as a pond or forest, together with thephysical environment in which they live; adynamic complex of plant and animal com-munities and their associated non-living envir-onment. Ecosystems have no fixed boundaries;
instead, their parameters are set according tothe scientific, management, or policy questionbeing examined. Depending upon the pur-pose of analysis, a single lake, a watershed,or an entire region could be an ecosystem.
licotype A genetically differentiated subpopula-tion that is restricted to a specific habitat.
Endemic Restricted to a specified region orlocality.
Environmental Heterogeneity The physical ortemporal patchiness of the environment. Het-erogeneity exists at all scales within naturalcommunities, ranging from habitat differ-ences between the top and underside of aleaf, to habitat patches created by treefallswithin a forest, to the pattern of forests andgrasslands within a region (Diamond 1980,Sousa 1984). The mosaic of habitat patcheswithin an ecosystem is created by such dis-turbances as fire and storms; differences inmicroclimate, soils, and history; and bothdeterministic and random population varia-tion. Patches in earlier stages of successionprovide unique structural habitats and con-tain different species than those in late-successional stages do.
Evolution Any gradual change. Organic evolu-tion is any genetic change in organisms fromgeneration to generation.
Ex situ Conservation A conservation methodthat entails the removal of germplasmresources (seed, pollen, sperm, individualorganisms) from their original habitat or nat-ural environment.
Fauna All of the animals found in a given area.
Flora All of the plants found in a given area.
Frugivore An animal that eats fruit.
Gene The functional unit of heredity. The partof the DNA molecule that encodes a singleenzyme or structural protein unit.
107
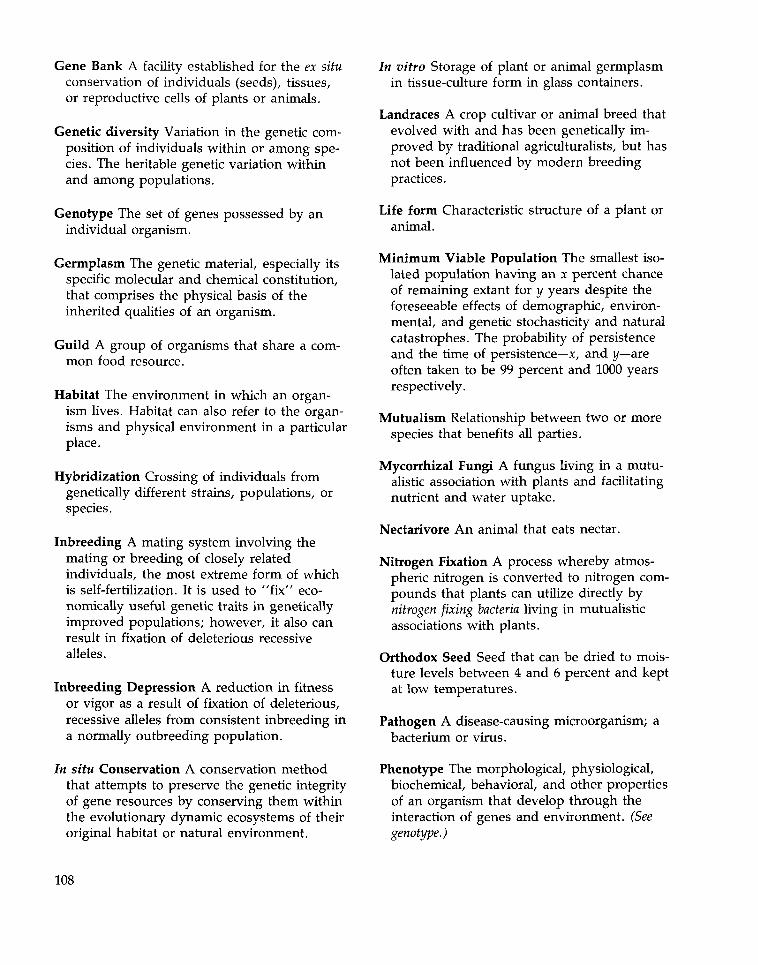
Gene Bank A facility established for the ex situconservation of individuals (seeds), tissues,or reproductive cells of plants or animals.
Genetic diversity Variation in the genetic com-position of individuals within or among spe-cies. The heritable genetic variation withinand among populations.
Genotype The set of genes possessed by anindividual organism.
Germplasm The genetic material, especially itsspecific molecular and chemical constitution,that comprises the physical basis of theinherited qualities of an organism.
Guild A group of organisms that share a com-mon food resource.
Habitat The environment in which an organ-ism lives. Habitat can also refer to the organ-isms and physical environment in a particularplace.
Hybridization Crossing of individuals fromgenetically different strains, populations, orspecies.
Inbreeding A mating system involving themating or breeding of closely relatedindividuals, the most extreme form of whichis self-fertilization. It is used to "fix" eco-nomically useful genetic traits in geneticallyimproved populations; however, it also canresult in fixation of deleterious recessivealleles.
Inbreeding Depression A reduction in fitnessor vigor as a result of fixation of deleterious,recessive alleles from consistent inbreeding ina normally outbreeding population.
In situ Conservation A conservation methodthat attempts to preserve the genetic integrityof gene resources by conserving them withinthe evolutionary dynamic ecosystems of theiroriginal habitat or natural environment.
In vitro Storage of plant or animal germplasmin tissue-culture form in glass containers.
Landraces A crop cultivar or animal breed thatevolved with and has been genetically im-proved by traditional agriculturalists, but hasnot been influenced by modern breedingpractices.
Life form Characteristic structure of a plant oranimal.
Minimum Viable Population The smallest iso-lated population having an x percent chanceof remaining extant for y years despite theforeseeable effects of demographic, environ-mental, and genetic stochasticity and naturalcatastrophes. The probability of persistenceand the time of persistence—x, and y—areoften taken to be 99 percent and 1000 yearsrespectively.
Mutualism Relationship between two or morespecies that benefits all parties.
Mycorrhizal Fungi A fungus living in a mutu-alistic association with plants and facilitatingnutrient and water uptake.
Nectarivore An animal that eats nectar.
Nitrogen Fixation A process whereby atmos-pheric nitrogen is converted to nitrogen com-pounds that plants can utilize directly bynitrogen fixing bacteria living in mutualisticassociations with plants.
Orthodox Seed Seed that can be dried to mois-ture levels between 4 and 6 percent and keptat low temperatures.
Pathogen A disease-causing microorganism; abacterium or virus.
Phenotype The morphological, physiological,biochemical, behavioral, and other propertiesof an organism that develop through theinteraction of genes and environment. (Seegenotype.)
108
Phylogenetic Pertaining to the evolutionary his-tory of a particular group of organisms.
Phylum In taxonomy, a high-level category justbeneath the kingdom and above the class; agroup of related, similar classes.
Population A group of individuals with com-mon ancestry that are much more likely tomate with one another than with individualsfrom another such group.
Predator Control A predator-prey interaction inwhich the predator controls the prey popula-tion size; that is, in which the predatorpopulation is the limiting factor for the preypopulation size.
Primary Productivity The transformation ofchemical or solar energy to biomass. Mostprimary production occurs through pho-tosynthesis, whereby green plants convertsolar energy, carbon dioxide, and water toglucose and eventually to plant tissue. Inaddition, some bacteria in the deep sea canconvert chemical energy to biomass throughchemosynthesis. Primary production refers tothe amount of material produced. Net primaryproduction is the measure of the actualaccumulation of biomass after some of theproducts of photosynthesis (or chemosynthe-sis) are expended for the plant's own main-tenance. Productivity, or the rate of produc-tion, is affected by various environmentalfactors, including the amount of solar radia-tion, the availability of water and mineralnutrients, and temperature.
Protected Areas Legally established areas,under either public or private ownership,where the habitat is managed to maintain anatural or semi-natural state.
Recalcitrant Seed Seed that does not survivedrying and freezing.
Rehabilitation The recovery of ecosystem ser-vices in a degraded ecosystem or habitat.
Restoration The return of an ecosystem or hab-itat to its original community structure andnatural complement of species.
Selection Natural selection is the differentialcontribution of offspring to the next genera-tion by various genetic types belonging tothe same populations. Artificial selection isthe intentional manipulation by man of thefitness of individuals in a population to pro-duce a desired evolutionary response.
Species A population or series of populationsof organisms that are capable of interbreed-ing freely with each other but not with mem-bers of other species.
Species Diversity A function of the distributionand abundance of species. Approximatelysynonymous with species richness. In moretechnical literature, includes considerations ofthe evenness of species abundances. An eco-system is said to be more diverse, accordingto the more technical definition, if speciespresent have equal population sizes and lessdiverse if many species are rare and someare very common.
Species Richness The number of species withina region. Commonly used as a measure ofspecies diversity, but technically only oneaspect of diversity.
Stability A function of several characteristics ofcommunity or ecosystem dynamics, includingthe degree of population fluctuations, thecommunity's resistance to disturbances, thespeed of recovery from disturbances, and thepersistence of the community's compositionthrough time.
Subspecies A subdivision of a species; a popu-lation or series of populations occupying adiscrete range and differing genetically fromother geographical races of the same species.
Succession The more or less predictablechanges in the composition of communities
109
following a natural or human disturbance.For example, after a gap is made in a forestby logging, clearing, fire, or treefall, theinitial (or "pioneer") species are often fast-growing and shade-intolerant. These speciesare eventually replaced by shade-tolerantspecies that can grow beneath the pioneers.If a community is not further disturbed, theoutcome of the successional sequence may bea so-called climax community whose composi-tion is unchanging. In practice, many com-munities are frequently disturbed and maynever reach a climax composition.
Systematics The study of the historical evolu-tionary and genetic relationships amongorganisms and of their phenotypic similaritiesand differences.
Taxon (pi. taxa) The named taxonomic unit(e.g. Homo sapiens, Hominidae, or Mammalia)to which individuals, or sets of species, areassigned. Higher taxa are those above thespecies level.
Taxonomy The naming and assignment oforganisms to taxa.
Trophic Level Position in the food chain,determined by the number of energy-transfersteps to that level.
Variety See Cultivar.
Vascular Plants Plants with a well-developedvascular system that transports water, miner-als, sugars, and other nutrients throughoutthe plant body. Excludes the bryophytes:mosses, hornworts, and liverworts.
110
References
Abramovitz, Janet N. In press. Report on thesurvey of U.S.-based efforts to research andconserve biological diversity in developingcountries. World Resources Institute,Washington, DC.
Altieri, Miguel A., and Laura C. Merrick. 1987.In situ conservation of crop genetic resourcesthrough maintenance of traditional farmingsystems. Economic Botany 41:86-96.
Altieri, Miguel A., and Laura C. Merrick. 1988.Agroecology and in situ conservation ofnative crop diversity in the third world. In:E.O. Wilson and Francis M. Peter (eds.), Bio-diversity, National Academy Press, Washing-ton, DC, pp. 361-369.
Altieri, Miguel A., M. Kat Anderson, andLaura C. Merrick. 1987. Peasant agricultureand the conservation of crop and wild plantresources. Conservation Biology 1:49-58.
Antonovics, Janis, A.D. Bradshaw, and R.G.Turner. 1971. Heavy metal tolerance inplants. Advances in Ecological Research 7:1-85.
Arora, R.K. 1985. Genetic resources of lessknown cultivated food plants. MonographNo. 9. National Bureau of Plant GeneticResources Science. New Delhi, India.
Ashton, Peter S. 1988. Conservation of biologi-cal diversity in botanical gardens. In: E.O.Wilson and Francis M. Peter (eds.), Biodiversity.
National Academy Press, Washington, DC,pp. 269-278.
Avise, John C. and William S. Nelson. 1989.Molecular genetic relationships of the extinctdusky seaside sparrow. Science 243:646-648.
Bailey, Robert G., and Howard C. Hogg. 1986.A world ecoregions map for resource report-ing. Environmental Conservation 13:195-202.
Barel, C.D.N., R. Dorit, P.H. Greenwood, G.Fryer, N. Hughes, P.B.N. Jackson, H.Kawanabe, R.H. Lowe-McConnell, M.Nagoshi, A.J. Ribbink, E. Trewavas, F. Witte,and K. Yamaoka. 1985. Destruction of fisher-ies in Africa's lakes. Nature 315:19-20.
Beehler, Bruce. 1985. Conservation of NewGuinea rainforest birds. In: A.W. Diamondand T.E. Lovejoy (eds.), Conservation of Tropi-cal Forest Birds. Technical Publication No. 4.International Council for Bird Preservation,Cambridge, U.K., pp. 233-247.
Bellrose, Frank C. 1976. Ducks, Geese and Swansof North America. Stackpole Books, Harris-burg, PA.
Benson, Delwin E. 1986. Game farming survey2: sources of income. Farmers Weekly, 11April: 10-11, South Africa.
Bettini, Sergio (ed.). 1978. Handbook of Experi-mental Pharmacology, Vol. 48: ArthropodVenoms. Springer-Verlag, New York, NY.
I l l
Beven, S., F. Connor, and K. Beven. 1984.Avian biogeography in the Amazon basinand the biological model of diversification.Journal of Biogeography 11:383-399.
Biswell, Harold H. 1974. Effects of fire onchaparral. In: T.T. Kozlowski and C.E.Ahlgren, (eds.), Fire and Ecosystems. Aca-demic Press, New York, NY, pp. 321-364.
Booth, William. 1987. Combing the earth forcures to cancer, AIDS. Science 237:969-970.
Booth, William. 1989. New thinking on oldgrowth. Science 244:141-143.
Bormann, F.H. 1982. The effects of air pollu-tion on the New England landscape. Ambio11:338-346.
Brenan, J.P.M. 1978. Some aspects of thephytogeography of tropical Africa. Annals ofthe Missouri Botanical Garden 65:437-478.
Briggs, John C. 1974. Marine Zoogeography.McGraw-Hill, New York, NY.
Brown, James H., and Arthur C. Gibson. 1983.Biogeography. C.V. Mosby Company, St.Louis, MO.
Brush, Stephen B. 1989. Rethinking cropgenetic resource conservation. ConservationBiology 3:19-29.
Bryson, Reid A., and Thomas J. Murray. 1977.Climates of Hunger. University of WisconsinPress, Madison, WI.
Buddemeier, R.W., and S.V. Smith. 1988.Coral reef growth in an era of rapidly risingsea level: predictions and suggestions forlong-term research. Coral Reefs 7:51-56.
Burnham, Charles R. 1988. The restoration ofthe American chestnut. American Scientist76:478-487.
Byrne, Gregory. 1988. Cyclosporin turns five.Science 242:198.
Cassels, Richard. 1984. The role of prehistoricman in the faunal extinctions of NewZealand and other Pacific islands. In: Paul S.Martin and Richard G. Klein (eds.), Quater-nary Extinctions: A Prehistoric Revolution.University of Arizona Press, Tucson, AZ, pp.741-767.
Cayford, J.H. and D.J. McRae. 1983. The eco-logical role of fire in jack pine forests. In:Ross W. Wein and David A. MacLean (eds.),The Role of Fire in Northern CircumpolarEcosystems. Scientific Committee on Problemsof the Environment (SCOPE) No. 18. JohnWiley and Sons, NY, pp. 183-199.
CPC (Center for Plant Conservation). 1988.CPC endangerment survey. CPC, 9 Decem-ber 1989, Jamaica Plain, MA.
Chaney, William R., and Malek Basbous. 1978.The cedars of Lebanon, witnesses of history.Economic Botany 32:118-123.
Chapin, Mac. 1986. The Panamanian iguanarenaissance. Grassroots Development 10(2):2-7.
Childress, James J., Horst Felback and GeorgeN. Somero. 1987. Symbiosis in the Deep Sea.Scientific American 256(5): 114-120.
Clawson, David L. 1985. Harvest security andintraspecific diversity in traditional tropicalagriculture. Economic Botany 39:56-67.
Cock, James H. 1982. Cassava: a basic energysource in the tropics. Science 218:755-762.
Colinvaux, Paul. 1987. Amazon diversity inlight of the paleoecological record. QuaternaryScience Reviews 6:93-114.
Colinvaux, Paul A. 1989. The past and futureAmazon. Scientific American 260(5):102-108.
Connell, Joseph H. 1978. Diversity in tropicalrain forests and coral reefs. Science199:1302-1310.
112
Connor, Edward F., and Earl D. McCoy. 1979.The statistics and biology of the species-arearelationship. American Naturalist 13:791-833.
Conway, William G. 1980. An overview of cap-tive propagation. In: Michael E. Soule andBruce A. Wilcox. 1980. Conservation Biology:An Evolutionary-Ecological Perspective. SinauerAssociates, Inc., Sunderland, MA, pp.199-208.
Conway, William G. 1988. Can technology aidspecies preservation? In: E.O. Wilson andFrancis M. Peter (eds.), Biodiversity. NationalAcademy Press, Washington, DC, pp.263-268.
Crosby, Alfred W. 1986. Ecological Imperialism:The Biological Expansion of Europe, 900-1900.Cambridge University Press, Cambridge,U.K.
D'Arcy, W.G. 1977. Endangered landscapes inPanama and Central America: the threat toplant species. In: Ghillean T. Prance andThomas S. Elias (eds.), Extinction is Forever.New York Botanical Garden, Bronx, NY, pp.89-104.
Daniel, J.G., and A. Kulasingam. 1974. Prob-lems arising from large-scale forest clearingfor agricultural use. Malaysian Forester37(3): 152-160.
Darus, Bahauddin. 1983. The management anddevelopment of southeast Asian small-scalefisheries and the example of the Bubuncoastal village development project, NorthSumatra Province, Indonesia. In: KennethRuddle and R.E. Johannes (eds.), The Tradi-tional Knowledge and Management of CoastalSystems in Asia and the Pacific. United NationsEducational, Scientific and Cultural Organiza-tion (UNESCO), Regional Office for Scienceand Technology for Southeast Asia, JakartaPusat, Indonesia, pp. 209-228.
Dasmann, R.F. 1973. A system for definingand classifying natural regions for purposes
of conservation. Occasional Paper 7. Interna-tional Union for Conservation of Nature andNatural Resources (IUCN), pp. 1-47.
Davis, Margaret B., and Catherine Zabinski.Changes in geographical range resulting fromgreenhouse warming: effects on biodiversityin forests. In: R.L. Peters and T.E. Lovejoy(eds.), Consequences of the Greenhouse Effect forBiological Diversity. Yale University Press,New Haven CT. In press.
Davis, Stephen D., Stephen J.M. Droop,Patrick Gregerson, Louise Henson, ChristineJ. Leon, Jane L. Villa-Lobos, Hugh Synge,and Jana Zantovska. 1986. Plants in Danger:What Do We Know? International Union forConservation of Nature and NaturalResources, Gland, Switzerland.
Dawson, William R, J. David Ligon, Joseph R.Murphy, J.P. Myers, Daniel Simberloff, andJared Verner. 1987. Report of the scientificadvisory panel on the spotted owl. Condor89:205-229.
Day, David. 1981. The Doomsday Book ofAnimals. Viking Press, New York, NY.
de Alba, Jorge. 1987. Criollo cattle of LatinAmerica. In: John Hodges (ed.), AnimalGenetic Resources: Strategies for Improved Useand Conservation. Animal Production andHealth Paper 66. United Nations Food andAgriculture Organization, Rome, pp. 19-43.
DeBach, Paul. 1974. Biological Control by NaturalEnemies. Cambridge University Press, NewYork, NY.
Delcourt, Hazel R. 1987. The impact of pre-historic agriculture and land occupation onnatural vegetation. Trends in Ecology and Evo-lution 2(2):39-44.
Dewar, Robert E. 1984. Extinctions in Madagas-car. In: Paul S. Martin and Richard G. Klein(eds.), Quaternary Extinctions: A PrehistoricRevolution. University of Arizona Press, Tuc-son, AZ, pp. 574-593.
113
Diamond, A.W. 1985. The selection of criticalareas and current conservation efforts intropical forest birds. In: A.W. Diamond andT.E. Lovejoy (eds.), Conservation of TropicalForest Birds. Technical Publication No. 4.International Council for Bird Preservation,Cambridge, U.K., pp. 33-48.
Diamond, Jared M. 1980. Patchy distributionsof tropical birds. In: Michael E. Soule andBruce A. Wilcox (eds.), Conservation Biology:An Evolutionary-Ecological Perspective. SinauerAssociates, Sunderland, MA, pp. 57-74.
Diamond, Jared M. 1984. "Normal" extinctionsof isolated populations. In: Matthew H.Nitecki (ed.), Extinctions. University ofChicago Press, Chicago, IL, pp. 191-246.
Diamond, Jared. 1988a. Factors controlling spe-cies diversity: overview and synthesis. Annalsof the Missouri Botanical Gardens 75:117-129.
Diamond, Jared M. 1988b. Red books or greenlists? Nature 332:304-305.
Dobson, Andrew, and Robin Carper. In press.Global warming and potential changes inhost-parasite and disease-vector relationships.In: R.L. Peters and T.E. Lovejoy (eds.), Con-sequences of the Greenhouse Effect for BiologicalDiversity. Yale University Press, New Haven,CT.
Dodson, Calaway H. 1975. Coevolution oforchids and bees. In: Lawrence E. Gilbertand Peter H. Raven (eds.), Coevolution ofAnimals and Plants. University of Texas Press,Austin, TX, pp. 91-99.
Dourojeanni, Marc J. 1985. Over-exploited andunder-used animals in the Amazon region.In: Ghillean T. Prance and Thomas E. Love-joy (eds.), Amazonia. Pergamon Press,Oxford, pp. 419-433.
Dresser, Betsy L. 1988. Cryobiology, embryotransfer, and artificial insemination in ex situanimal conservation programs. In: E.O.
Wilson and Francis M. Peter (eds.), Biodiver-sity. National Academy Press, Washington,DC, pp. 296-308.
ESCAP (Economic and Social Commission forAsia and the Pacific). 1985. Marine Environ-mental Problems and Issues in the ESCAPRegion. United Nations, ESCAP, Bangkok,Thailand.
Ehrlich, Paul R., and Anne H. Ehrlich. 1981.Extinction. Random House, New York, NY.
Ehrlich, Paul R., and Harold A. Mooney. 1983.Extinction, substitution, and ecosystem serv-ices. BioScience 33:248-254.
Eisner, Thomas. Chemical exploration ofnature: a proposal for action. In: Ecology, Eco-nomics, and Ethics: The Broken Circle. YaleUniversity Press, New Haven, CT. In press.
Elton, Charles. 1930. Animal Ecology and Evolu-tion. Clarendon Press, Oxford.
Endler, John A. 1982. Pleistocene forestrefuges: fact or fancy? In: Ghillean T. Prance(ed.), Biological Diversification in the Tropics.Columbia University Press, New York, NY,pp. 641-657.
Erwin, Terry L. 1982. Tropical forests: theirrichness in Coleoptera and other Arthropodspecies. Coleopterists Bulletin 36:74-75.
Erwin, Terry L., and Janice C. Scott. 1980. Sea-sonal and size patterns, trophic structure andrichness of Coleoptera in the tropical arborealecosystem: the fauna of the tree Luehea see-mannii Triana and Planch in the Canal Zoneof Panama. Coleopterists Bulletin 34(3):305-322.
Estes, James A., and John F. Palmisano. 1974.Sea otters: their role in structuring nearshorecommunities. Science 185:1058-1060.
Estes, James A., Norman S. Smith, and JohnF. Palmisano. 1978. Sea otter predation andcommunity organization in the western Aleu-tian Islands, Alaska. Ecology 59:822-833.
114
FAO (Food and Agriculture Organization of theUnited Nations). 1981. Utilization of fish andits role in human nutrition. Committee onFisheries, 14th Session, FAO, Rome.
FAO. 1982. Management and utilization ofmangroves in Asia and the Pacific. Environ-ment Paper 3. FAO, Rome.
FAO. 1984. Fish in nutrition. WFC/NF/84/2FAO, Rome.
FAO. 1985a. Mangrove management in Thai-land, Malaysia, and Indonesia. EnvironmentPaper 4. FAO, Rome.
FAO. 1985b. Status of in situ conservation ofplant genetic resources. Commission on PlantGenetic Resources, First Session, FAO,Rome.
FAO. 1986. Data book on endangered tree andshrub species and provenances. ForestryPaper 77. Forest Resources Division, FAO,Rome.
FAO. 1987a. 1986 FAO Production Yearbook. Vol.40. FAO, Rome.
FAO. 1987b. World Food Report 1987. FAO,Rome.
FAO. 1989. Forest Products Yearbook 1976-1987.FAO, Rome.
FAO/SIDA (FAO/Swedish International Devel-opment Authority). 1987. Restoring the Bal-ance: Women and Forest Resources. FAO, Rome.
Farnsworth, Norman R. 1988. Screening plantsfor new medicines. In: E.O. Wilson andFrancis M. Peter (eds.), Biodiversity. NationalAcademy Press, Washington, DC, pp. 83-97.
Fischer, Alfred G. 1960. Latitudinal variationsin organic diversity. Evolution 14:64-81.
Fonseca, Gustavo A.B. da. 1985. The vanishingBrazilian Atlantic forest. Biological Conservation34:17-34.
Foose, Thomas J. 1983. The relevance of cap-tive populations to the conservation of bio-diversity. In: Christine M. Schonewald-Cox,Steven M. Chambers, Bruce MacBryde, andW. Lawrence Thomas (eds.), Genetics andConservation. Benjamin/Cummings PublishingCo., Menlo Park, CA, pp. 374-401.
Foster, Robin B. 1980. Heterogeneity and dis-turbance in tropical vegetation. In: Michael E.Soule and Bruce A. Wilcox (eds.), Conserva-tion Biology: An Evolutionary-Ecological Perspec-tive. Sinauer Associates, Sunderland, MA,pp. 75-92.
Frankel, O.H., and Michael E. Soule. 1981.Conservation and Evolution. Cambridge Univer-sity Press, Cambridge, U.K.
Franklin, Ian Robert. 1980. Evolutionary changein small populations. In: Michael E. Souleand Bruce A. Wilcox. Conservation Biology: AnEvolutionary-Ecological Perspective. SinauerAssociates, Sunderland, MA, pp. 135-149.
Franklin, Jerry F. 1988. Structural and func-tional diversity in temperate forests. In: E.O.Wilson and Francis M. Peter (eds.), Biodiver-sity. National Academy Press, Washington,DC, pp. 166-175.
GAO (General Accounting Office of the UnitedStates). 1988. Endangered Species: ManagementImprovements Could Enhance Recovery Program.GAO, Washington, DC.
Gentry, Alwyn H. 1982. Neotropical floristicdiversity: phytogeographical connectionsbetween Central and South America, Pleisto-cene climatic fluctuations, or an accident ofthe Andean orogeny? Annals of the MissouriBotanical Garden 69:557-593.
Gentry, Alwyn H. 1986. Endemism in tropicalversus temperate plant communities. In:Michael E. Soule (ed.), Conservation Biology:The Science of Scarcity and Diversity. SinauerAssociates, Sunderland, MA, pp. 153-181.
115
Gentry, Alwyn H. 1988. Tree species richnessof upper Amazonian forests. Proceedings of theNational Academy of Sciences 85:156-159.
Gilbert, Lawrence E. 1980. Food web organiza-tion and the conservation of neotropicaldiversity. In: Michael E. Soule and Bruce A.Wilcox (eds.), Conservation Biology: AnEvolutionary-Ecological Perspective. SinauerAssociates, Sunderland, MA, pp. 11-33.
Goldman, Barry, and Frank Hamilton Talbot.1976. Aspects of the ecology of coral reeffishes. In: O.A. Jones and R. Endean (eds.),Biology and Geology of Coral Reefs Vol. 3. Aca-demic Press, New York, NY, pp. 125-154.
Goodman, Daniel. 1987. How do any speciespersist? Lessons for conservation biology.Conservation Biology 1:59-62.
Graham, Russell W. 1986. Plant-animal inter-actions and Pleistocene extinctions. In: D.K.Elliott (ed.), Dynamics of Extinction. JohnWiley and Sons, New York, NY, pp.131-154.
Graham, Russell W. 1988. The role of climaticchange in the design of biological reserves:the paleoecological perspective for conserva-tion biology. Conservation Biology 2:391-394.
Grainger, Alan. 1984. Quantifying changes inforest cover in the humid tropics: overcomingcurrent limitations. Journal of World ForestResource Management 1:3-63.
Grassle, J. Frederick. 1989. Species diversity indeep-sea communities. Trends in Ecology andEvolution 4(1): 12-15.
Grassle, J. Frederick, Nancy J. Maciolek, andJames A. Blake. Are deep sea communitiesresilient? In: George M. Woodwell (ed.), TheEarth in Transition: Patterns and Processes ofBiotic Impoverishment. Proceedings of a Con-ference held at Woods Hole Research Center,October 1986, Woods Hole, MA. In press.
Gregg, William P., Jr., and Betsy AnnMcGean. 1985. Biosphere reserves: their his-tory and their promise. Orion 4(3):40-51.
Grigg, Richard W., and David Epp. 1989. Criti-cal depth for the survival of coral islands:effects on the Hawaiian archipelago. Science243:638-641.
Gulick, P., C. Hershey, and J. Esquinas Alca-zar. 1983. Genetic Resources of Cassava and WildRelatives. International Board for PlantGenetic Resources 82/111, Rome.
Haffer, Jiirgen. 1969. Speciation in Amazon for-est birds. Science 165:131-137.
Hairston, Nelson G., F.E. Smith, and L.B.Slobodkin. 1960. Community structure,population control and competition. AmericanNaturalist 94:421-425.
Hansen, Michael. 1987. Alternatives to Pesticidesin Developing Countries. Institute for Con-sumer Policy Research, Mount Vernon, NY.
Haq, Nazmul. 1988. Planting the future. Inter-national Agricultural Development September/October.13-15.
Harlan, J.R. 1975. Crops and Man, AmericanSociety of Agronomy, Inc. and the CropScience Society of America, Inc., Madison,WI.
Hargrove, Thomas R., Victoria L. Cabanilla,and W. Ronnie Coffman. 1988. Twenty yearsof rice breeding. BioScience 38:675-681.
Hartshorn, Gary S., Robert Simeone, andJoseph A. Tosi, Jr. 1987. Sustained yieldmanagement of tropical forests: a synopsis ofthe Palcazu development project in the Cen-tral Selva of the Peruvian Amazon. In: J.C.Figueroa C , F.H. Wadsworth and S. Bran-ham (eds.), Management of the Forests of Tropi-cal America: Prospects and Technologies. Insti-tute of Tropical Forestry, Rio Piedras, PuertoRico, pp. 235-243.
116
Hartshorn, Gary S. 1989. Application of gaptheory to tropical forest management: naturalregeneration on strip clear-cuts in the Peru-vian Amazon. Ecology 70:567-569.
Hawkes, J.G. 1983. The Diversity of Crop Plants.Harvard University Press, Cambridge, MA.
Hayden, Bruce P., G. Carleton Ray, andRobert Dolan. 1984. Classification of coastaland marine environments. Environmental Con-servation 11:199-207.
Heywood, V[ernon] H. 1987. The changing roleof the botanic garden. In: D. Bramwell, O.Hamann, V. Heywood, and H. Synge (eds.),Botanic Gardens and the World ConservationStrategy. Academic Press, London, U.K., pp.3-18.
Hillman-Smith, Kes, Mankoto ma Oyisenzoo,and Fraser Smith. 1986. A last chance to savethe northern white rhino? Oryx 20:20-26.
Hoeck, H.N. 1982. Population dynamics, dis-persal and genetic isolation in two species ofHyrax (Heterohyrax brucei and Procavia john-stoni) on habitat islands in the Serengeti.Zeitschrift fur Tierpsychologie 59:177-210.
Hoeck, H.N. 1984. Introduced fauna. In: R.Perry (ed.), Key Environments: Galapagos. Per-gamon Press, Oxford, U.K., pp. 733-245.
Holdridge, L[eslie] R. 1967. Life Zone Ecology.Tropical Science Center, San Jose, Costa Rica.
Hourigan, Thomas F., and Reese, Ernst S.1987. Mid-ocean isolation and the evolutionof Hawaiian reef fishes. Trends in Ecology andEvolution 2(7): 187-191.
Huber, Otto, and Clara Alarcorn. 1988. Mapa deVegetacion de Venezuela. Ministerio delAmbiente y de los Recursos Naturales Renov-ables, Caracas, Venezuela.
Hubbell, Stephen P. 1979. Tree dispersion,abundance, and diversity in a tropical dryforest. Science 203:1299-1309.
Hubbell, Stephen P., and Robin B. Foster.1985. Biology, chance, and history, and thestructure of tropical forest tree communities.In: Jared Diamond and Ted J. Case (eds.),Community Ecology. Harper & Row, NewYork, NY, pp. 314-329.
Hubbell, Stephen P., and Robin B. Foster.1986. Commonness and rarity in a neotropi-cal forest: implications for tropical tree con-servation. In: Michael E. Soule (ed.), Conser-vation Biology: The Science of Scarcity andDiversity. Sinauer Associates, Sunderland,MA, pp. 205-231.
Hunter, Malcolm L. Jr., George L. Jacobson Jr.,and Thompson Webb III. 1988. Paleoecologyand the coarse-filter approach to maintainingbiological diversity. Conservation Biology2:375-385.
IUCN (International Union for Conservation ofNature and Natural Resources). 1980. WorldConservation Strategy. IUCN/UNEP/WWF,Gland, Switzerland.
IUCN. 1983. The IUCN Invertebrate Red DataBook. IUCN, Gland, Switzerland.
IUCN. 1984. Categories, objectives and criteriafor protected areas. In: Jeffrey A. McNeelyand Kenton R. Miller (eds.), National Parks,Conservation and Development. SmithsonianInstitution Press, Washington, DC, pp.47-53.
IUCN. 1985. United Nations List of National Parksand Protected Areas. IUCN, Gland, Switzer-land, and Cambridge, U.K.
IUCN. 1987. Elephant population estimates,trends, ivory quotas and harvests. AfricanElephant and Rhino Specialist Group, Reportto the Sixth Meeting of the Conference of theParties (CITES), July 1987, Ottawa, Canada.IUCN, Gland, Switzerland.
IUCN. 1988. 1988 IUCN Red List of ThreatenedAnimals. IUCN, Gland, Switzerland.
117
IUCN/UNEP (IUCN/United Nations Environ-ment Programme). 1986a. Review of the Pro-tected Areas System in the Indo-Malayan Realm.IUCN, Gland, Switzerland.
IUCN/UNEP. 1986b. Review of the ProtectedAreas System in the Afrotropical Realm. IUCN,Gland, Switzerland.
IUCN/UNEP. 1986c. Review of the ProtectedAreas System in Oceania. IUCN, Gland,Switzerland.
IUCN/UNEP. 1986d. Managing Protected Areas inthe Tropics. IUCN, Gland, Switzerland, andCambridge, U.K.
IUCN/UNEP. 1988. Coral Reefs of the World. 3Volumes. IUCN, Gland, Switzerland andCambridge, U.K./UNEP, Nairobi, Kenya.
IUCN/WWF (IUCN/Worldwide Fund forNature). 1989. The Botanic Gardens Conserva-tion Strategy. IUCN, Gland, Switzerland.
Isaac, Erich. 1970. Geography of Domestication.Prentice-Hall, Inc., Englewood Cliffs, NJ.
Jacobson, George L. Jr., Thompson Webb III,Eric C. Grimm. 1987. Patterns and rates ofvegetation change during the deglaciation ofeastern North America. The Geology of NorthAmerica: North America and Adjacent OceansDuring the Last Deglaciation Vol. K-3, Geologi-cal Society of America, Boulder, CO.
James, D. 1984. The future for fish in nutrition.Infofish Marketing Digest 4(84):41-44.
Janzen, Daniel H. 1979. How to be a fig.Annual Review of Ecology and Systematics10:13-51.
Janzen, Daniel H. 1986. Guanacaste NationalPark: Tropical Ecological and Cultural Restora-tion. Editorial Universidad Estatal a Distancia,San Jose, Costa Rica.
Janzen, Daniel H. 1988a. Tropical dry forests:the most endangered major tropical ecosys-tem. In: E.O. Wilson and Francis M. Peter(eds.), Biodiversity. National Academy Press,Washington, DC, pp. 130-137.
Janzen, Daniel H. 1988b. Management of habi-tat fragments in a tropical dry forest: growth.Annals of the Missouri Botanical Garden75:105-116.
Janzen, Daniel H., W. Hallwachs, W.A. Haber,I. Chacon, A. Chacon, M.M. Chaverria, M.Espinosa, E. Araya, and F.G. Stiles. Towarda definitive checklist of the Costa Ricanmoths in the family Sphingidae. Unpublishedmanuscript.
Jenkins, M.D. (ed.). 1987. Madagascar. AnEnvironmental Profile. International Union forthe Conservation of Nature and NaturalResources, Gland, Switzerland.
Johannes, R.E., and B.G. Hatcher. 1986. Shal-low tropical marine environments. In:Michael E. Soule (ed.), Conservation Biology:The Science of Scarcity and Diversity. SinauerAssociates Inc., Sunderland, MA, pp.371-382.
Johns, Andrew D. 1985. Selective logging andwildlife conservation in tropical rain-forest:problems and recommendations. BiologicalConservation 31:355-375.
Johns, Andrew D. 1986. Effects of Habitat Distur-bance on Rainforest Wildlife in Brazilian Amazon.Final report, World Wildlife Fund U.S.(WWF) project US-302. WWF, Washington,DC.
Johns, Andrew D. 1988. Economic develop-ment and wildlife conservation in BrazilianAmazonia. Ambio 17:302-306.
Jokiel, Paul L. 1987. Ecology, biogeography,and evolution of corals in Hawaii. Trends inEcology and Evolution 2(7):179-182.
118
Jordan, William R. Ill, Robert L. Peters II, andEdith B. Allen. 1988. Ecological restoration asa strategy for conserving biological diversity.Environmental Management 12:55-72.
Juma, Calestous. 1989. The Gene Hunters:Biotechnology and the Scramble for Seeds. Prince-ton University Press, Princeton, NJ.
Karr, J.R. 1982. Avian extinction on BarroColorado Island, Panama: a reassessment.American Naturalist 119:220-239.
Kloppenburg, Jack, Jr., and Daniel Lee Klein-man. 1987. The plant germplasm con-troversy. BioScience 37(3): 190-198.
Kloppenburg, Jack Ralph Jr. 1988a. First theSeed. Cambridge University Press, Cam-bridge, MA.
Kloppenburg, Jack R. Jr. 1988b. Seeds and Sover-eignty: Debate Over the Use and Control of PlantGenetic Resources. Duke University Press,Durham, NC.
Knoll, Andrew H. 1986. Patterns of change inplant communities through geological time.In: Jared Diamond and Ted J. Case (eds.),Community Ecology. Harper and Row, NewYork, NY, pp. 126-141.
Lande, Russell. 1988. Genetics and demogra-phy in biological conservation. Science241:1455-1460.
Lanly, Jean-Paul. 1981. Tropical Forest ResourcesAssessment Project (GEMS): Tropical Africa,Tropical Asia, Tropical America. (4 vols.).FAO/UNEP, Rome.
Lanly, Jean-Paul. 1982. Tropical forestresources. Forestry Paper No. 30, Food andAgriculture Organization of the UnitedNations, Rome.
Lawton J.H., and S.L. Pimm. 1978. Populationdynamics and the length of food chains.Nature 272:190.
Leigh, J.H., J.D. Briggs, and W. Hartley. 1982.The conservation status of Australian plants.In: R.H. Groves, and W.D.L. Ride (eds.),Species at Risk: Research in Australia, Springer-Verlag, New York, NY, pp. 13-25.
Lewis, D.M., G.B. Kaweche, and A. Mwenya.1987. Wildlife conservation outside protectedareas: lessons from an experiment in Zambia.Publication No. 4. Lupande Research Project,National Parks and Wildlife Service, Lusaka,Zambia.
Lovejoy, Thomas E. 1980. A projection of spe-cies extinctions. In: Council on Environmen-tal Quality (CEQ), The Global 2000 Report tothe President, Vol. 2. CEQ, Washington, DC,pp. 328-331.
Lovejoy, T[homas] E., R.O. Bierregaard Jr.,A.B. Rylands, J.R. Malcolm, C.E. Quintela,L.H. Harper, K.S. Brown Jr., A.H. Powell,G.V.N. Powell, H.O.R. Schubart, and M.B.Hays. 1986. Edge and other effects of isola-tion on Amazon forest fragments. In: MichaelE. Soule (ed.), Conservation Biology: TheScience of Scarcity and Diversity. SinauerAssociates, Sunderland, MA, pp. 257-285.
Lucas, Gren, and Hugh Synge. 1978. The IUCNPlant Red Data Book. International Union forthe Conservation of Nature and NaturalResources, Gland, Switzerland.
Lugo, Ariel E., and Samuel C. Snedaker. 1974.The ecology of mangroves. Annual Review ofEcology and Systematics 5:39-64.
Lyman, Judith M. 1984. Progress and planningfor germplasm conservation of major foodcrops. Plant Genetic Resources Newsletter60:3-21.
MacKenzie, James ]., and Mohamed T. El-Ashry. 1988. /// Winds: Airborne Pollution's Tollon Trees and Crops. World Resources Institute,Washington, DC.
119
Machlis, Gary E., and David L. Tichnell. 1985.The State of the World's Parks. Westview Press,Boulder, CO.
Malingreau, Jean-Paul, and Compton J. Tucker.1988. Large-scale deforestation in the south-eastern Amazon basin of Brazil. Ambio17:49-55.
Maltby, Edward. 1988. Wetland resources andfuture prospects: an international perspec-tive. In: John Zelazny and J. Scott Feierabend(eds.), Wetlands: Increasing Our WetlandResources. National Wildlife Federation,Washington, DC, pp. 3-14.
Martin, Paul S. 1973. The discovery ofAmerica. Science 179:969-974.
Martin, Paul S. 1986. Refuting late pleistoceneextinction models. In: D.K. Elliott (ed.),Dynamics of Extinction. John Wiley and Sons,New York, NY, pp. 107-130.
Martin, Paul S., and Richard G. Klein (eds.).1984. Quaternary Extinctions: a Prehistoric Revo-lution. University of Arizona Press. Tucson,AZ.
May, Robert M. 1981. Patterns in multi-speciescommunities. In: Robert M. May (ed.), Theo-retical Ecology: Principles and Applications 2ndEdition. Blackwell Scientific Publications,Oxford, U.K., pp. 197-227.
May, Robert M. 1985. Evolution of pesticideresistance. Nature 315:12-13.
May, Robert M. 1988. How many species arethere on earth? Science 241:1441-1449.
McCormick, J. Frank, and Robert B. Platt. 1980.Recovery of an Appalachian forest followingthe chestnut blight, or, Catherine Keever—you were right! American Midland Naturalist104:264-273.
McManus, John W. 1988. Coral reefs of theASEAN region: status and management.Ambio 17:189-193.
McNaughton, S.J. 1985. Ecology of a grazingecosystem: the Serengeti. Ecological Mono-graphs 55:259-294.
McNeely, Jeffrey A. 1988. Economics and Biologi-cal Diversity. International Union for the Con-servation of Nature and Natural Resources,Gland, Switzerland.
McNeely, Jeffrey A. 1989. Common propertyresource management or government owner-ship: improving the conservation of biologicalresources. Paper presented at Conference onIncentives and Constraints: MacroeconomicPolicy Impacts on Natural Resource Utiliza-tion. Smithsonian Institution, 12 May 1989,Washington, DC.
McNeely, Jeffrey A., Kenton R. Miller, WalterV. Reid, Russell A. Mittermeier and TimothyB. Werner. 1989. Conserving the World's Biolog-ical Diversity. World Resources Institute/Inter-national Union for Conservation of Natureand Natural Resources/Conservation Interna-tional/World Bank. Washington, DC, andGland, Switzerland.
Meith, Nikki, and Richard Helmer. 1983.Marine environment and coastal resources insoutheast Asia: a threatened heritage. In:Elisabeth Mann Borgese and Norton Gins-burg (eds.), Ocean Yearbook 4. University ofChicago Press, Chicago, IL, pp. 260-294.
Melillo, J.M., C.A. Palm, R.A. Houghton, andG.M. Woodwell. 1985. A comparison of tworecent estimates of disturbance in tropicalforests. Environmental Conservation 12:37-40.
Miller, Constance I. 1987. The California forestgermplasm conservation project: a case forgenetic conservation of temperate tree spe-cies. Conservation Biology 1:191-193.
Miller, Kenton R. 1975. Guidelines for themanagement and development of nationalparks and reserves in the American humidtropics. In: Proceedings of a Meeting on theUse of Ecological Guidelines for Develop-ment in the American Humid Tropics,
120
Caracas 20-22 February, 1974. InternationalUnion for Conservation of Nature and Natu-ral Resources, Morges, Switzerland, pp.94-105.
Miller, Kenton R. 1980. Planificacion de par-ques nacionales para el ecodesarrollo enLatinoamerica. Fundacion para la Ecologia ypara la Proteccion del Medio Ambiente,Madrid.
Miller, Kenton, Walter Reid, and JeffreyMcNeely. 1989. A global strategy for conserv-ing biodiversity. Diversity 5(l):4-7.
Miller, R. Michael. 1987. Mycorrhizae and suc-cession. In: William R. Jordan III, Michael E.Gilpin, and John D. Aber (eds.), RestorationEcology: A Synthetic Approach to EcologicalResearch. Cambridge University Press, Cam-bridge, U.K., pp. 205-219.
Mooney, H[arold] A., S.P. Hamburg, and J.A.Drake. 1986. The invasions of plants andanimals into California. In: H.A. Mooney andJ.A. Drake (eds.), Ecology of Biological Inva-sions of North America and Hawaii. EcologicalStudies #58. Springer-Verlag, New York, NY,pp. 250-272.
Mooney, Harold A. 1988. Lessons from Medi-terranean-climate regions. In: E.O. Wilsonand Francis M. Peter (eds.), Biodiversity.National Academy Press, Washington, DC,pp. 157-165.
Mohsin, A.K. Mohammad, and Mohd AzmiAmbak. 1983. Freshwater Fishes of PeninsularMalaysia. University Pertanian MalaysiaPress, Kuala Lumpur, Malaysia.
Mori, Scott A., Brian M. Boom, Andre M. deCarvalho and Talmon S. dos Santos. 1983.Southern Bahian moist forests. BotanicalReview 49:155-232.
Murphy, Peter G., and Ariel E. Lugo. 1986.Ecology of tropical dry forest. Annual Reviewof Ecology and Systematics 17:67-88.
Myers, K. 1986. Introduced vertebrates in Aus-tralia, with emphasis on the mammals. In:R.H. Groves and J.J. Burdon (eds.), Ecology ofBiological Invasions. Cambridge UniversityPress, Cambridge, U.K., pp. 120-136.
Myers, Norman. 1979. The Sinking Ark: A NewLook at the Problem of Disappearing Species. Per-gamon Press, Oxford, U.K.
Myers, Norman. 1980. Conversion of Tropical MoistForests. The National Research Council, Na-tional Academy of Sciences, Washington, DC.
Myers, Norman. 1983. A Wealth of Wild Species.Westview Press, Boulder, CO.
Myers, Norman. 1988. Threatened biotas: "hot-spots" in tropical forests. The Environmentalist8(3): 1-20.
Naveh, Zev, and R.H. Whittaker. 1979. Struc-tural and floristic diversity of shrublands andwoodlands in northern Israel and other Med-iterranean areas. Vegetatio 41:171-190.
Nilsson, Greta. 1983. The Endangered SpeciesHandbook. Animal Welfare Institute, Washing-ton, DC.
Norton, Bryan G. 1987. Why Preserve NaturalVariety? Princeton University Press, Prince-ton, NJ.
Noss, Reed F. 1983. A regional landscapeapproach to maintain diversity. BioScience33:700-706.
NRC (National Research Council). 1975.Underexploited Tropical Plants with PromisingEconomic Value. National Academy ofSciences, Washington, DC.
NRC. 1977. Leucaena: Promising Forage and TreeCrop for the Tropics. National Academy ofSciences, Washington, DC.
NRC. 1979. Tropical Legumes: Resources for theFuture. National Academy of Sciences,Washington, DC.
121
NRC. 1980. Research Priorities in Tropical Biology.National Academy of Sciences, Washington,DC.
NRC. 1982. Ecological Aspects of Development inthe Humid Tropics. National Academy Press,Washington, DC.
NRC. 1983. Little-Known Asian Animals with aPromising Economic Future. National AcademyPress, Washington, DC.
NRC. 1986. Ecological Knowledge and Environmen-tal Problem Solving. National Academy Press,Washington, DC.
OAS (Organization of American States),Government of Peru, and United NationsEnvironment Programme. 1987. MinimumConflict: Guidelines for Planning the Use ofAmerican Humid Tropic Environments. OAS,Washington, DC.
OAS. 1988. Inventory of Caribbean Marine andCoastal Protected Areas. OAS, Washington,DC.
O'Brien, S.J., M.E. Roelke, L. Marker, A.Newman, C.A. Winkler, D. Meltzer, L.Colly, J.F. Evermann, M. Bush, and D.E.Wildt. 1985. Genetic basis for species vulner-ability in the cheetah. Science 227:1428-1434.
Ocana, Gilberto, Ira Rubinoff, NicholasSmythe, and Dagmar Werner. 1988. Alterna-tives to destruction: research in Panama. In:E.O. Wilson and Francis M. Peter (eds.), Bio-diversity. National Academy Press, Washing-ton, DC, pp. 370-376.
Odum, William E. 1982. Environmental degra-dation and the tyranny of small decisions.BioScience 32:728-729.
Oksanen, Lauri. 1988. Ecosystem organization:mutualism and cybernetics or plain Darwin-ian struggle for existence? American Naturalist131:424-444.
Oldfield, Margery L. 1984. The Value of Conserv-ing Genetic Resources. U.S. Department ofInterior, National Park Service, Washington,DC.
Oldfield, Margery L., and Janis B. Alcorn.1987. Conservation of traditional agroeco-systems. BioScience 37:199-208.
Olson, Storrs L. 1989. Extinction on islands:man as a catastrophe. In: M. Pearl, and D.Western (eds.). Conservation Biology for theNext Century. Oxford University Press,Oxford, pp. 50-53.
Olson, Storrs L., and Helen F. James. 1982.Fossil birds from the Hawaiian Islands: evi-dence for wholesale extinction by man beforewestern contact. Science 217:633-635.
Olson, Storrs L., and Helen F. James. 1984.The role of Polynesians in the extinction ofthe avifauna of the Hawaiian Islands. In:Paul S. Martin and Richard G. Klein (eds.),Quaternary Extinctions: a Prehistoric Revolution.University of Arizona Press, Tucson, AZ, pp.768-780.
Ono, R. Dana, James D. Williams, and AnneWagner. 1983. Vanishing Fishes of NorthAmerica. Stone Wall Press, Inc., Washington,DC.
Opler, Paul A., and Herbert G. Baker, andGordon W. Frankie. 1977. Recovery of tropi-cal lowland forest ecosystems. In: J. Cairns,Jr., K.L. Dickson, and E.E. Herricks (eds.),Recovery and Restoration of Damaged Ecosystems.University Press of Virginia, Charlottesville,VA, pp. 379-421.
Orians, Gordon H., and William Kunin. Eco-logical uniqueness and loss of species.Proceedings of the Lake Wilderness Confer-ence on the Conservation of GeneticResources. University of Washington Press,Seattle, WA. In press.
122
OTA (Office of Technology Assessment, U.S.Congress). 1987. Technologies to Maintain Bio-logical Diversity. OTA-F-330. U.S. Govern-ment Printing Office, Washington, DC.
Paine, Robert T. 1966. Food web complexityand species diversity. American Naturalist100:65-75.
Paine, Robert T. 1980. Food webs: linkage,interaction strength and community infras-tructure, journal of Animal Ecology 49:667-685.
Palmberg, Christel. 1984. Genetic resources ofarboreal fuelwood species for the improve-ment of rural living. In: Christopher W. Yeat-man, David Kafton, and Garrison Wilkes(eds.), Plant Genetic Resources: A ConservationImperative. AAAS Selected Symposium #87.Westview Press, Boulder, CO, pp. 223-239.
Phillips, Michael K., and Warren T. Parker.1988. Red wolf recovery: a progress report.Conservation Biology 2:139-141.
Pielou, E.C. 1979. Biogeography. John Wiley &Sons, New York, NY.
Pimentel, David, E. Garnick, A. Berkowitz, S.Jacobson, S. Napolitano, P. Black, S. Valdes-Cogliano, B. Vinzant, E. Hudes, and S. Litt-man. 1980. Environmental quality and natu-ral biota. BioScience 30:750-755.
Pimm, Stuart L. 1986. Community stability andstructure. In: Michael E. Soule (ed.), Conser-vation Biology: The Science of Scarcity and Diver-sity. Sinauer Associates Inc., Sunderland,MA, pp. 309-329.
Pimm, Stuart L., H. Lee Jones, and Jared Dia-mond. 1988. On the risk of extinction. Ameri-can Naturalist 132:757-785.
Plucknett, Donald L., and Nigel J.H. Smith.1986. Sustaining agricultural yields. BioScience36:40-45.
Plucknett, Donald L., Nigel J.H. Smith, J.T.Williams, N. Murthi Anishetty. 1987. GeneBanks and the World's Food. Princeton Univer-sity Press, Princeton, NJ.
Prance, Ghillean T. (ed.). 1982. Biological Diver-sification in the Tropics. Columbia UniversityPress, New York, NY.
Prance, Ghillean T. Changes in the world flora.In: B.L. Turner II, W.C. Clark, R.W. Kates,J.F. Richards, J.T. Mathews, W.B. Meyer(eds.), Earth as Transformed by Human Action.Cambridge University Press, New York, NY.In press.
Prance, G[hillean] T., W. Balee, B.M. Boom,R.L. Carneiro. 1987. Quantitative ethno-botany and the case for conservation inAmazonia. Conservation Biology 1:296-310.
Prescott-Allen, Christine, and Robert Prescott-Allen. 1986. The First Resource. Yale Univer-sity Press, New Haven, CT.
Prescott-Allen, Robert, and Christine Prescott-Allen. 1978. Sourcebook for a world conser-vation strategy: threatened vertebrates.General Assembly Paper GA.78/10 Adden-dum 6. International Union for Conservationof Nature and Natural Resources, Gland,Switzerland.
Prescott-Allen, Robert, and Christine Prescott-Allen. 1983. Genes from the Wild. InternationalInstitute for Environment and Development,London, U.K.
Prescott-Allen, Robert, and Christine Prescott-Allen. 1984. In Situ Conservation of Wild PlantGenetic Resources: A Status Review and ActionPlan. Forest Resources Division, ForestryDepartment, Food and Agriculture Organiza-tion of the United Nations, Rome.
Principe, Peter P. The economic significance ofplants and their constituents as drugs. In:Economic and Medicinal Plant Research. Vol. 3,Academic Press, New York, NY. pp. 1-17. Inpress.
123
Quinn, James F., and Susan P. Harrison. 1988.Effects of habitat fragmentation and isolationon species richness: evidence from biogeo-graphic patterns. Oecologia 75:132-140.
Quinn, James F., and Alan Hastings. 1987.Extinction in subdivided habitats. ConservationBiology 1:198-208.
Rabinowitz, Deborah, Sara Cairns, and TheresaDillon. 1986. Seven forms of rarity and theirfrequency in the flora of the British Isles. In:Michael E. Soule (ed.), Conservation Biology:The Science of Scarcity and Diversity. SinauerAssociates, Sunderland, MA, pp. 182-204.
Rasanen, Matti E., Jukka S. Salo, Risto J. Kal-liola. 1987. Fluvial perturbance in the westernAmazon basin: regulation by long-term sub-Andean tectonics. Science 238:1398-1401.
Rails, Katherine, and Jonathan Ballou. 1983.Extinction: lessons from zoos. In: ChristineM. Schonewald-Cox, Steven M. Chambers,Bruce MacBryde, and W. Lawrence Thomas(eds.), Genetics and Conservation. Benjamin/Cummings Publishing Co., Menlo Park, CA,pp. 164-184.
Ransdell, Eric. 1989. Heavy artillery for hornsof plenty. U.S. News and World Report, 20February:61-64.
Rao, Y.S. 1988. Flash floods in southern Thai-land. Tiger Paper 15(4): 1-2.
Rapoport, E. 1982. Areography. Pergamon Press,Oxford, U.K.
Raup, David M. 1978. Cohort analysis ofgeneric survivorship. Paleobiology 4:1-15.
Raup, David M. 1979. Size of the Permo-Triassic bottleneck and its evolutionary impli-cations. Science 206:217-218.
Raup, David M., and J. John Sepkoski Jr. 1982.Mass extinctions in the marine fossil record.Science 215:1501-1503.
Raup, David M., and Steven M. Stanley. 1978.Principles of Paleontology. 2nd Edition, W.H.Freeman & Co., San Francisco, CA.
Raven, Peter H. 1976. Ethics and attitudes. In:J.B. Simmons, R.I. Beyer, P.E. Brandham,G.LI. Lucas, and V.T.H. Parry (eds.), Conser-vation of Threatened Plants. Plenum Press,New York, NY, pp. 155-179.
Raven, Peter H. 1981. Research in botanicalgardens. Bot. Jahrb. Syst. 102:53-72.
Raven, P.H. 1988a. Biological resources andglobal stability. In: S. Kawano, J.H. Connell,and T. Hidaka (eds.), Evolution and Coadapta-tion in Biotic Communities. University of TokyoPress, Tokyo, pp. 3-27.
Raven, Peter H. 1988b. Our diminishing tropi-cal forests. In: E.O. Wilson and Francis M.Peter (eds.), Biodiversity. National AcademyPress, Washington, DC, pp. 119-122.
Raven, Peter H., and Daniel I. Axelrod. 1974.Angiosperm biogeography and past continen-tal movements. Annals of the Missouri Botani-cal Garden 61:539-673.
Ray, G. Carleton. 1988. Ecological diversity incoastal zones and oceans. In: E.O. Wilson andFrancis M. Peter (eds.), Biodiversity. NationalAcademy Press, Washington, DC, pp. 36-50.
Ray, G. Carleton, Bruce P. Hay den, Arthur J.Bulger Jr., and M. Geraldine McCormick-Ray. Effects of global warming on marinebiodiversity. In: R.L. Peters and T.E. Lovejoy(eds.), Consequences of the Greenhouse Effect forBiological Diversity. Yale University Press,New Haven, CT. In press.
Regal, Philip J. 1982. Pollination by wind andanimals: ecology of geographic patterns.Annual Review of Ecology and Systematics13:497-524.
Round, P.D. 1985. The Status and Conservation ofResident Forest Birds in Thailand. Associationfor the Conservation of Wildlife, Bangkok.
124

Ruggieri, George D. 1976. Drugs from the sea.Science 194:491-496.
Sader, Steven A., and Armond T. Joyce. 1988.Deforestation rates and trends in Costa Rica,1940 to 1983. Biotropica 20:11-19.
Salati, Eneas, and Peter B. Vose. 1983. Deple-tion of tropical rain forests. Ambio 12:67-71.
Salm, Rodney V., and John R. Clark. 1984.Marine and Coastal Protected Areas: A Guide forPlanners and Managers. International Unionfor the Conservation of Nature and NaturalResources, Gland, Switzerland.
Sayer, Jeffrey A., and Simon Stuart. 1988. Bio-logical diversity and tropical forests. Environ-mental Conservation 15:193-194.
Schneider, Stephen H. 1989. The greenhouseeffect: science and policy. Science 243:771-781.
Schwartzman, S[tephen], and M.H. Allegretti.1987. Extractive Production in the Amazon andthe Rubber Tappers' Movement. EnvironmentalDefense Fund, Washington, DC.
Seal, Ulysses S. 1988. Intensive technology inthe care of ex situ populations of vanishingspecies. In: E.O. Wilson and Francis M. Peter(eds.), Biodiversity. National Academy Press,Washington, DC, pp. 289-295.
Sedjo, Roger A. 1989. Managing geneticresources in sub-Saharan Africa: policy andinstitutional options. Report to the AfricaBureau, 24 February, U.S. Agency for Inter-national Development, Washington, DC.
Sepkoski, J. John Jr, and David M. Raup. 1986.Periodicity in marine extinction events. In:D.K. Elliott (ed.), Dynamics of Extinction. JohnWiley and Sons, New York, NY, pp. 3-36.
Shaffer, Mark L. 1981. Minimum populationsizes for species conservation. BioScience31:131-134.
Sheeline, Lili. 1987. Is there a future in thewild for rhinos? Traffic (U.S.A.) 7(4): 1-6.
Simberloff, Daniel. 1986a. Are we on the vergeof a mass extinction in tropical rain forests?In: D.K. Elliott (ed.), Dynamics of Extinction.John Wiley & Sons, New York, NY, pp.165-180.
Simberloff, D. 1986b. Introduced insects: a bio-geographic and systematic perspective. In:H.A. Mooney and J.A. Drake (eds.), Ecologyof Biological Invasions of North America andHawaii. Ecological Studies 58. Springer-Verlag, New York, NY, pp. 3-26.
Simberloff, Daniel. 1987. The spotted owlfracas: mixing academic, applied, and politi-cal ecology. Ecology 68:766-772.
Simberloff, Daniel, and James Cox. 1987. Con-sequences and costs of conservation cor-ridors. Conservation Biology 1:63-71.
Simberloff, Daniel, and Lawrence G. Abele.1982. Refuge design and island biogeographictheory: effects of fragmentation. AmericanNaturalist 120:41-50.
Simberloff, Daniel, and Nicholas Gotelli. 1984.Effects of insularisation on plant species rich-ness in the prairie-forest ecotone. BiologicalConservation 29:27-46.
Simpson, Beryl B., and Jurgen Haffer. 1978.Speciation patterns in the Amazonian forestbiota. Annual Review of Ecology and Systematics9:497-518.
Smith, Joel B., and Dennis A. Tirpak (eds.).1988. The Potential Effects of Global ClimateChanges on the United States Vol. 2. U.S.Environmental Protection Agency, Washing-ton, DC.
Smith, S.V. 1978. Coral-reef area and contribu-tions of reefs to processes and resources ofthe world's oceans. Nature 273:225-226.
Sommer, Adrian. 1976. Attempt at an assess-ment of the world's tropical moist forest.Unasylva 28(112 + 113):5-24.
125
Soule, Michael E. 1980. Thresholds for sur-vival: maintaining fitness and evolutionarypotential. In: Michael E. Soule and Bruce A.Wilcox (eds.), Conservation Biology: AnEvolutionary-Ecological Perspective. SinauerAssociates, Sunderland, MA, pp. 151-169.
Soule, Michael E. (ed.). 1987. Viable Populationsfor Conservation. Cambridge University Press,Cambridge, U.K.
Soule, Michael E., and Daniel Simberloff. 1986.What do genetics and ecology tell us aboutthe design of nature reserves? Biological Con-servation 35:19-40.
Soule, Michael E., and Kathryn A. Kohm(eds.). 1989. Research Priorities for ConservationBiology. Island Press, Covelo, CA.
Sousa, Wayne P. 1984. The role of disturbancein natural communities. Annual Review ofEcology and Systematics 15:353-391.
Speth, James Gustave. 1988. Environmentalpollution. In: Harm J. De Blij (ed.), Earth '88:Changing Geographic Perspectives. NationalGeographic Society, Washington DC, pp.262-283.
Stehli, Francis G., and John W. Wells. 1971.Diversity and age patterns in hermatypiccorals. Systematic Zoology 20:115-125.
Stern, Klaus, and Laurence Roche. 1974.Genetics of Forest Ecosystems. EcologicalStudies Vol. 6. Springer-Verlag, New York,NY.
Stout, Jean, and John Vandermeer. 1975. Com-parison of species richness for stream-inhabiting insects in tropical and mid-latitudestreams. American Naturalist 109:263-280.
Strong, Donald R., Jr. 1979. Biogeographicdynamics of insect-host plant communities.Annual Review of Entomology 24:89-119.
Tatum, L.A. 1971. The southern corn leafblight epidemic. Science 171:1113-1116.
Teal, John M. 1962. Energy flow in the saltmarsh ecosystem of Georgia. Ecology43:614-624.
Terborgh, John. 1974. Preservation of naturaldiversity: the problem of extinction pronespecies. BioScience 24:715-722.
Terborgh, John. 1986a. Keystone plantresources in the tropical forest. In: Michael E.Soule (ed.), Conservation Biology: The Science ofScarcity and Diversity. Sinauer Associates,Sunderland, MA, pp. 330-344.
Terborgh, John. 1986b. Community aspects offrugivory in tropical forests. In: A. Estradaand T.H. Fleming (eds.), Frugivores and SeedDispersal. Dr. W. Junk Publishers, Dordrecht,pp. 371-384.
Terborgh, John, and Blair Winter. 1980. Somecauses of extinction. In: Michael E. Soule andBruce A. Wilcox (eds.), Conservation Biology:an Evolutionary-Ecological Perspective. SinauerAssociates, Sunderland, MA, pp. 119-133.
Terborgh, John, and Blair Winter. 1983. Amethod for siting parks and reserves withspecial reference to Colombia and Ecuador.Biological Conservation 27:45-58.
Udvardy, Miklos D.F. 1975. A classification ofthe biogeographical provinces of the world.Occasional Paper 18. International Union forConservation of Nature and NaturalResources, Gland, Switzerland.
Udvardy, Miklos D.F. 1984. A biogeographicalclassification system for terrestrial environ-ments. In: Jeffrey A. McNeely and Kenton R.Miller (eds.), National Parks, Conservation, andDevelopment. Smithsonian Institution Press,Washington, DC, pp. 34-38.
Uhl, Christopher, Carl Jordan, Kathleen Clark,Howard Clark, and Rafael Herrera. 1982.
126
Ecosystem recovery in Amazon caatinga for-est after cutting, cutting and burning, andbulldozer clearing treatments. Oikos38:313-320.
United Nations Population Fund. 1989. TheState of the World Population 1989. UnitedNations Population Fund, New York, NY.
Valentine, James W., Theodore C. Foin, andDavid Peart. 1978. A provincial model ofPhanerozoic marine diversity. Paleobiology4:55-66.
Vatikiotis, Michael. 1989. Whither the vine? FarEastern Economic Review 13 April:50.
Vermeij, Geerat J. 1978. Biogeography and Adap-tation: Patterns of Marine Life. Harvard Univer-sity Press, Cambridge, MA.
Vernhes, Jane Robertson. 1989. Biospherereserves: the beginnings, the present, andthe future challenges. In: William P. Gregg,Jr., Stanley L. Krugman, and James D.Wood, Jr. (eds.), Proceedings of the Sympo-sium on Biosphere Reserves, September11-18, 1987, Estes Park, CO. U.S. NationalPark Service, Atlanta, GA, pp. 7-20.
Vernon, J.E.N. 1986. Corals of Australia and theIndo-Pacific. Angus and Robertson, LondonU.K.
Vietmeyer, Noel D. 1986. Lesser-known plantsof potential use in agriculture and forestry.Science 232:1379-1384.
Vitousek, P[eter] M. 1986. Biological invasionsand ecosystem properties: can species make adifference? In: H.A. Mooney and J.A. Drake(eds.), Ecology of Biological Invasions of NorthAmerica and Hawaii. Ecological Studies 58.Springer-Verlag, New York, NY, pp. 163-176.
Vitousek, Peter M. 1988. Diversity and biologi-cal invasions of oceanic islands. In: E.O. Wil-son and Francis M. Peter (eds.), Biodiversity.National Academy Press, Washington, DC,pp. 181-189.
Vitousek, Peter M., Paul R. Ehrlich, Anne H.Ehrlich, and Pamela A. Matson. 1986.Human appropriation of the products ofphotosynthesis. BioScience 36:368-373.
von Fiirer-Haimendorf, Christoph. 1964. TheSherpas of Nepal. University of CaliforniaPress, Berkeley, CA.
Wagner, Warren L., Derral R. Herbst, andS.H. Sohmer. Manual of the Flowering Plants ofHawaii. University of Hawaii Press andBishop Museum Press, Honolulu, HI. Inpress.
WEC (World Energy Conference). 1987. Energy:Needs and Expectations. Proceedings of the13th Congress of the World Energy Confer-ence, Cannes, October 5-llth, 1986. WEC,London.
White, F. 1983. The Vegetation of Africa: ADescriptive Memoir to Accompany theUnesco/AETFAT/UNSO Vegetation Map ofAfrica. UNESCO, Paris.
Whittaker, Robert H. 1975. Communities andEcosystems (2nd ed.). MacMillan PublishingCo., Inc., New York, NY.
Wilcove, David S. 1988. National Forests: Policiesfor the Future, Vol. 2: Protecting BiologicalDiversity. The Wilderness Society, Washing-ton, DC.
Wilcove, David S., and Robert M. May. 1986.National park boundaries and ecological reali-ties. Nature 324:206-207.
Wildt, David E., and Ulysses S. Seal (eds.).1988. Research priorities for single speciesconservation biology. Proceedings of a Work-shop at the National Zoological Park,Washington, DC, 13-16 November 1988.
Wilkes, H. Garrison. 1972. Maize and its wildrelatives. Science 177:1071-1077.
127
Wilkes, H. Garrison. 1979. Mexico and CentralAmerica as a centre for the origin of agricul-ture and the evolution of maize. CropImprovement 6:1-18.
Wilkes, Garrison. 1983. Current status of cropplant germplasm. CRC Critical Reviews inPlant Science 1(2): 133-181.
Wilkes, Garrison. 1985. Germplasm conserva-tion toward the year 2000: potential for newcrops and enhancement of present crops. In:Christopher W. Yeatman, David Kafton, andGarrison Wilkes (eds.), Plant GeneticResources: A Conservation Imperative. AmericanAssociation for the Advancement of ScienceSelected Symposium #87. Westview Press,Boulder, CO, pp. 131-164.
Wilkes, Garrison, (a). Teosinte in Mexico as amodel for in situ conservation: the challenge.Maydica. In press.
Wilkes, Garrison, (b). Germplasm preservation:objectives and needs. Proceedings of theBeltsville Symposium XIII Biotic Diversityand Germplasm Preservation: Global Impera-tive. U.S. Department of Agriculture, Wash-ington, DC. In press.
Williams, Jack E., David B. Bowman, James E.Brooks, Anthony A. Echelle, Robert J.Edwards, Dean A. Hendrickson, and Jerry J.Landye. 1985. Endangered aquatic ecosys-tems in North American deserts with a list ofvanishing fishes of the region. Journal of theArizona-Nevada Academy of Science 20(1): 1-61.
Williams, J.T. 1984. A decade of crop geneticresources research. In: J.H.W. Holden andJ.T. Williams (eds.), Crop Genetic Resources:Conservation and Evaluation. Allen and Unwin,London, U.K., pp. 1-17.
Wilson, E[dward] O. 1988a. The current stateof biological diversity. In: E.O. Wilson and
Francis M. Peter (eds.), Biodiversity. NationalAcademy Press, Washington, DC, pp. 3-18.
Wilson, E[dward] O. 1988b. The diversity oflife. In: Harm J. De Blij (ed.), Earth '88:Changing Geographic Perspectives. NationalGeographic Society, Washington, DC, pp.68-78.
Wong, Marina. 1985. Understory birds as indi-cators of regeneration in a patch of selec-tively logged west Malaysian rainforest. In:A.W. Diamond and T.E. Lovejoy (eds.), Con-servation of Tropical Forest Birds. TechnicalPublication No. 4. International Council forBird Preservation, Cambridge, U.K., pp.249-263.
Wood, D. 1988. Introduced crops in developingcountries. Food Policy 13(2): 167-177.
World Bank. 1988. World Development Report1988. World Bank, Washington, DC.
WRI (World Resources Institute). 1989. NaturalEndowments: Financing Resource Conservationfor Development. WRI, Washington, DC.
WRI/IIED (WRI/International Institute forEnvironment and Development). 1986. WorldResources 1986. Basic Books, NY.
WRI/IIED. 1987. World Resources 1987. BasicBooks, NY.
WRI/IIED. 1988. World Resources 1988-1989.Basic Books, NY.
Wyler, David J. 1983. Malaria—resurgence,resistance, and research. New England Journalof Medicine 308:875-878.
Zaret, Thomas M., and R.T. Paine. 1973. Spe-cies introduction in a tropical lake. Science182:449-455.
128
World Resources Institute
1709 New York Avenue, N.W.Washington, D.C. 20006, U.S.A.
WRI's Board of Directors:Matthew NimetzChairmanRoger W. SantVice ChairmanJohn H. AdamsKazuo AichiRobert O. AndersonManuel ArangoRobert O. BlakeJohn E. BrysonJohn E. CantlonPamela G. CarltonWard B. ChamberlinEdwin C. CohenLouisa C. DuemlingAlice F. EmersonJohn FirorShinji FukukawaCynthia R. HelmsCurtis A. HesslerMartin HoldgateMaria Tereza Jorge PaduaJonathan LashThomas E. LovejoyC. Payne LucasAlan R. McFarland, Jr.Robert S. McNamaraScott McVayPaulo Nogueira-NetoSaburo OkitaRonald L. OlsonRuth PatrickAlfred M. Rankin, Jr.Stephan SchmidheinyBruce SmartJames Gustave SpethMaurice StrongM.S. SwaminathanMostafa K. TolbaRussell E. TrainAlvaro UmanaVictor L. UrquidiGeorge M. Woodwell
Jonathan LashPresidentJ. Alan BrewsterSenior Vice PresidentWalter V. ReidVice President for ProgramDonna W. WiseVice President for Policy AffairsJessica T. MathewsVice PresidentRobert RepettoVice President and Senior EconomistWallace D. BowmanSecretary-Treasurer
The World Resources Institute (WRI) is a policy researchcenter created in late 1982 to help governments,international organizations, and private business address afundamental question: How can societies meet basichuman needs and nurture economic growth withoutundermining the natural resources and environmentalintegrity on which life, economic vitality, and internationalsecurity depend?
Two dominant concerns influence WRI's choice ofprojects and other activities:
The destructive effects of poor resource managementon economic development and the alleviation of povertyin developing countries; and
The new generation of globally importantenvironmental and resource problems that threaten theeconomic and environmental interests of the UnitedStates and other industrial countries and that have notbeen addressed with authority in their laws.
The Institute's current areas of policy research includetropical forests, biological diversity, sustainable agriculture,energy, climate change, atmospheric pollution, economicincentives for sustainable development, and resource andenvironmental information.
WRI's research is aimed at providing accurateinformation about global resources and population,identifying emerging issues, and developing politicallyand economically workable proposals.
In developing countries, WRI provides field services andtechnical program support for governments and non-governmental organizations trying to manage naturalresources sustainably.
WRI's work is carried out by an interdisciplinary staff ofscientists and experts augmented by a network of formaladvisors, collaborators, and cooperating institutions in 50countries.
WRI is funded by private foundations, United Nationsand governmental agencies, corporations, and concernedindividuals.