Embed Size (px)
Citation preview

International Journal of Computer Science
& Information Security
© IJCSIS PUBLICATION 2016 Pennsylvania, USA
IJCSIS Vol. 14 No. 6, June 2016 Part 3ISSN 1947-5500

Indexed and technically co‐sponsored by :

IJCSIS
ISSN (online): 1947-5500
Please consider to contribute to and/or forward to the appropriate groups the following opportunity to submit and publish original scientific results. CALL FOR PAPERS International Journal of Computer Science and Information Security (IJCSIS) January-December 2016 Issues The topics suggested by this issue can be discussed in term of concepts, surveys, state of the art, research, standards, implementations, running experiments, applications, and industrial case studies. Authors are invited to submit complete unpublished papers, which are not under review in any other conference or journal in the following, but not limited to, topic areas. See authors guide for manuscript preparation and submission guidelines. Indexed by Google Scholar, DBLP, CiteSeerX, Directory for Open Access Journal (DOAJ), Bielefeld Academic Search Engine (BASE), SCIRUS, Scopus Database, Cornell University Library, ScientificCommons, ProQuest, EBSCO and more.
Deadline: see web site Notification: see web siteRevision: see web sitePublication: see web site
For more topics, please see web site https://sites.google.com/site/ijcsis/
For more information, please visit the journal website (https://sites.google.com/site/ijcsis/)
Context-aware systems Networking technologies Security in network, systems, and applications Evolutionary computation Industrial systems Evolutionary computation Autonomic and autonomous systems Bio-technologies Knowledge data systems Mobile and distance education Intelligent techniques, logics and systems Knowledge processing Information technologies Internet and web technologies Digital information processing Cognitive science and knowledge
Agent-based systems Mobility and multimedia systems Systems performance Networking and telecommunications Software development and deployment Knowledge virtualization Systems and networks on the chip Knowledge for global defense Information Systems [IS] IPv6 Today - Technology and deployment Modeling Software Engineering Optimization Complexity Natural Language Processing Speech Synthesis Data Mining

Editorial Message from Editorial Board
It is our great pleasure to present the June 2016 issue (Volume 14 Number 6 Part 1, 2 & 3) of the International Journal of Computer Science and Information Security (IJCSIS). High quality research, survey & review articles are proposed from experts in the field, promoting insight and understanding of the state of the art, and trends in computer science and technology. It especially provides a platform for high-caliber academics, practitioners and PhD/Doctoral graduates to publish completed work and latest research outcomes. According to Google Scholar, up to now papers published in IJCSIS have been cited over 6390 times and the number is quickly increasing. This statistics shows that IJCSIS has established the first step to be an international and prestigious journal in the field of Computer Science and Information Security. There have been many improvements to the processing of papers; we have also witnessed a significant growth in interest through a higher number of submissions as well as through the breadth and quality of those submissions. IJCSIS is indexed in major academic/scientific databases and important repositories, such as: Google Scholar, Thomson Reuters, ArXiv, CiteSeerX, Cornell’s University Library, Ei Compendex, ISI Scopus, DBLP, DOAJ, ProQuest, ResearchGate, Academia.edu and EBSCO among others.
On behalf of IJCSIS community and the sponsors, we congratulate the authors and thank the reviewers for their outstanding efforts to review and recommend high quality papers for publication. In particular, we would like to thank the international academia and researchers for continued support by citing papers published in IJCSIS. Without their sustained and unselfish commitments, IJCSIS would not have achieved its current premier status.
“We support researchers to succeed by providing high visibility & impact value, prestige and excellence in research publication.” For further questions or other suggestions please do not hesitate to contact us at [email protected]. A complete list of journals can be found at: http://sites.google.com/site/ijcsis/ IJCSIS Vol. 14, No. 6, June 2016 Edition
ISSN 1947-5500 © IJCSIS, USA.
Journal Indexed by (among others):
Open Access This Journal is distributed under the terms of the Creative Commons Attribution 4.0 International License (http://creativecommons.org/licenses/by/4.0/), which permits unrestricted use, distribution, and reproduction in any medium, provided you give appropriate credit to the original author(s) and the source.

Bibliographic Information ISSN: 1947-5500
Monthly publication (Regular Special Issues) Commenced Publication since May 2009
Editorial / Paper Submissions: IJCSIS Managing Editor ([email protected])
Pennsylvania, USA Tel: +1 412 390 5159

IJCSIS EDITORIAL BOARD IJCSIS Editorial Board IJCSIS Guest Editors / Associate Editors Dr. Shimon K. Modi [Profile] Director of Research BSPA Labs, Purdue University, USA
Dr Riktesh Srivastava [Profile] Associate Professor, Information Systems, Skyline University College, Sharjah, PO 1797, UAE
Professor Ying Yang, PhD. [Profile] Computer Science Department, Yale University, USA
Dr. Jianguo Ding [Profile] Norwegian University of Science and Technology (NTNU), Norway
Professor Hamid Reza Naji, PhD. [Profile] Department of Computer Enigneering, Shahid Beheshti University, Tehran, Iran
Dr. Naseer Alquraishi [Profile] University of Wasit, Iraq
Professor Yong Li, PhD. [Profile] School of Electronic and Information Engineering, Beijing Jiaotong University, P. R. China
Dr. Kai Cong [Profile] Intel Corporation, & Computer Science Department, Portland State University, USA
Professor Mokhtar Beldjehem, PhD. [Profile] Sainte-Anne University, Halifax, NS, Canada
Dr. Omar A. Alzubi [Profile] Al-Balqa Applied University (BAU), Jordan
Professor Yousef Farhaoui, PhD. Department of Computer Science, Moulay Ismail University, Morocco
Dr. Jorge A. Ruiz-Vanoye [Profile] Universidad Autónoma del Estado de Morelos, Mexico
Dr. Alex Pappachen James [Profile] Queensland Micro-nanotechnology center, Griffith University, Australia
Prof. Ning Xu, Wuhan University of Technology, China
Professor Sanjay Jasola [Profile] Gautam Buddha University
Dr . Bilal Alatas [Profile] Department of Software Engineering, Firat University, Turkey
Dr. Siddhivinayak Kulkarni [Profile] University of Ballarat, Ballarat, Victoria, Australia
Dr. Ioannis V. Koskosas, University of Western Macedonia, Greece
Dr. Reza Ebrahimi Atani [Profile] University of Guilan, Iran
Dr Venu Kuthadi [Profile] University of Johannesburg, Johannesburg, RSA
Dr. Dong Zhang [Profile] University of Central Florida, USA
Dr. Zhihan lv [Profile] Chinese Academy of Science, China
Dr. Vahid Esmaeelzadeh [Profile] Iran University of Science and Technology
Prof. Ghulam Qasim [Profile] University of Engineering and Technology, Peshawar, Pakistan
Dr. Jiliang Zhang [Profile] Northeastern University, China
Prof. Dr. Maqbool Uddin Shaikh [Profile] Preston University, Islamabad, Pakistan
Dr. Jacek M. Czerniak [Profile] Casimir the Great University in Bydgoszcz, Poland
Dr. Musa Peker [Profile] Faculty of Technology, Mugla Sitki Kocman University, Turkey
Dr. Binh P. Nguyen [Profile] National University of Singapore
Dr. Wencan Luo [Profile] University of Pittsburgh, US
Professor Seifeidne Kadry [Profile] American University of the Middle East, Kuwait
Dr. Ijaz Ali Shoukat [Profile] King Saud University, Saudi Arabia
Dr. Riccardo Colella [Profile] University of Salento, Italy
Dr. Yilun Shang [Profile] Tongji University, Shanghai, China
Dr. Sedat Akleylek [Profile] Ondokuz Mayis University, Turkey
Dr. Sachin Kumar [Profile] Indian Institute of Technology (IIT) Roorkee

Dr Basit Shahzad [Profile] King Saud University, Riyadh - Saudi Arabia
Dr. Sherzod Turaev [Profile] International Islamic University Malaysia
ISSN 1947 5500 Copyright © IJCSIS, USA.

TABLE OF CONTENTS
1. PaperID 31051608: ESSPI: Exponential Smoothing Seasonal Planting Index, a New Algorithm for Prediction Rainfall (pp. 1-9) Kristoko D. Hartomo, Faculty of Information Technology, Satya Wacana Christian University, Salatiga, Indonesia Subanar, Faculty of Mathematics and Natural Sciences, GadjahMada University, Yogyakarta, Indonesia Edi Winarko, Faculty of Mathematics and Natural Sciences, GadjahMada University, Yogyakarta, Indonesia Abstract — Exponential smoothing algorithm is a prediction algorithm recommended by the Food and Agriculture Organization. The weakness of exponential smoothing prediction algorithm is low accuracy for the prediction of long-term and ineffective in determining the value of smoothing to minimize error. The proposed research is to build a model rainfall prediction using a new algorithm Seasonal Planting Index (ESSPI). By using the algorithm planting seasonal index, rainfall prediction model will generate higher accuracy. The results showed seasonal planting method is the dominant index (5 of 6 test size) have an average accuracy is better than the method of exponential smoothing. Index planting seasonal prediction accuracy of 95.73% better than the exponential smoothing α = 0.1 by 56.55%, and exponential smoothing of α = 55.53. Novelty of this research is new algorithms for classifying data based on seasonal planting index, a new algorithm for determining the smoothing (value), the new fitting algorithm using seasonal planting index, and new algorithms using seasonal rainfall prediction planting index for the determination of the growing season. Keywords—exponential; smoothing; algorithm; seasonal planting index; predictions; accuracy; rainfall; novelty 2. PaperID 31051609: A New MultiPathTCP Flooding Attacks Mitigation Technique (pp. 10-15) Adwan Yasin, Department of Computer Science, Arab American University, Jenin, Palestine Hamzah Hijawi, Department of Computer Science, Arab American University, Jenin, Palestine Abstract — MPTCP is a new protocol proposed by IETF working group as an extension for standard TCP, it adds the capability to split the TCP connection across multiple paths. It provides higher availability and improves the throughput between two multi-address endpoints. Many Linux distributions have been developed to support MPTCP, most of them are open source which can be modified and compiled to support different experimental scenarios. Splitting the single path TCP connection across multiple paths adds new challenges in paths management and raises new security threats. Some of these threats include flooding and hijacking attacks performed by on-path and offpath attackers. In this article, we propose a new algorithm to mitigate the flooding and hijacking attacks in MPTCP, the proposed method allows a stateful processing of the initial SYN message and it’s following SYN_JOIN messages. Keywords — TCP, MPTCP, flooding, hijack, on-path, off-path, flooding, DoS 3. PaperID 31051613: Temporal Performances Evaluation of Multi-Robot Demining System Inspired by Ant Behavior (pp. 16-24) Riadh SAAIDIA, Mohamed Sahbi BELLAMINE, Abdessattar BEN AMOR Computer Laboratory for Industrial Systems (LISI), National Institute of Applied Sciences and Technology (University of Carthage), INSAT, TUNISIA Abstract — In this paper we adopt a cooperative strategy based on ACO (Ant Colony Optimization) algorithms to coordinate a Multi Robots System (MRS). Our principal objective is to evaluate temporal performances for this system by choosing demining operations as a benchmark problem. In this work, we try to adapt the ACO algorithm parameters for different mine distribution in order to reduce time demining operations. In particular, we report effects of evaporation pheromone rate model and minefield configuration on temporal performances.

Index Terms— ACO algorithms, multi-robot system (MRS), evaporation pheromone rate, demining system. 4. PaperID 31051614: Towards Developing a Cost Effective Solution for Environmental Monitoring (pp. 25-28) Muhammad Soban Khan, Ans Ali Raza, Zeeshan Musawar, Shoaib Hassan, Taimoor Hassan Department of Computer Science, COMSATS Institute of Information Technology, Sahiwal, COMSATS Road off GT road, Sahiwal 57000, Pakistan Abstract - Environment refers to everything that surrounds a person. Environment contains many types of pollution. Most dangerous pollution is air pollution. Most important factor that causes human health is air pollution. Many countries are suffering from air pollution. There are many factors that cause air pollution. Some major factors are smoke, carbon monoxide and high temperature. Many developing countries are creating solutions for detecting and analyzing the air pollution. The main idea of our research is based on proposing a cost effective solution for environmental detection. Our system is a connection between sensors, Raspberry Pi, Microsoft Azure and Android Mobiles. Raspberry Pi gets environmental values with help of Raspberry Pi and sends the data to Microsoft Azure through API, form where Android Mobile gets those values with the help of HTTP request. Our proposed system successfully detected temperature, humidity, hydrogen, methane, propane, carbon monoxide and air level. The results show that our system is most cost effective, secure and easy to use. It will helpful in saving lives. Keywords: Environment Pollution, Environmental monitoring system, Raspberry Pi, Air pollution 5. PaperID 31051615: AV Encryption Algorithm to Protect Audio visual Content for IPTV (pp. 29-39) Muhammad Akram, C. A. Rahim, Amjad Hussain Zahid The Institute of Management Sciences (PAK-AIMS), 54660 Lahore, Pakistan Abstract — Crypt analytical techniques for multimedia technologies particularly audio visual applications have shown some existing flaws while maintaining the security and computational time. This case study is a representative algorithm especially for protection of IPTV contents. The network's reliability and security of contents is the major issue in IPTV media business. The proposed algorithm is the Audio Video MPEG file encryption technique in which the synchronization between audio and video and the frame sequence is shuffled before the transmitting end or vertical device. . The shuffling process is guided by input key frames to point out frame positions. The MPEG video frames are first extracted via spatial pyramid kernel. It divides the stream into regions over different scales and to find out the frame similarity while on merging of AV frames. Then ciphers are implemented to locate the shuffled frames and further genetic algorithm such as AES is used to encrypt. By this way, AV contents of IPTV can be secure from malicious users. Keywords— MPEG, IPTV, CAS, DRM, DES, AES 6. PaperID 31051616: Secure Speaker Biometric System using GFCC with Additive White Gaussian Noise and Wavelet Filter (pp. 40-47) Gaganpreet Kaur, Deptt. of CSE, I.K. Punjab Technical University, Punjab, India Dr. Dheerendra Singh, Deptt. of CSE, Chandigarh College of Engineering and Technology, Sector-26, Chandigarh, India Abstract — Speaker Identification (SI) aims to identify the speaker’s identity from the given list of speakers. Speaker identification is efficient under the clean training and testing environment conditions. In real environment application, there occurs mismatch between training and testing environments due to background noise, which degrades the system’s performance and security. So, robust speaker identification is the important issue in research. This paper

describes the recently used front end algorithm based on Gammatone Frequency Cepstral Coefficients (GFCC) along with speech detection algorithm and Cepstral mean normalization (CMN). System makes model using Gaussian Mixture Model (GMM) Classifier, which uses iterative Expectation Maximization (EM) Algorithm to estimate the Gaussian model parameters. Training data is taken in clean environment and all test utterances are corrupted by adding White Gaussian Noise (AWGN). This paper aims to improve the robustness of speaker identification even when additive noise is added during testing phase. For improvement Wavelet Filter is implemented to de-noise the speech signal. Experiment is carried out in real database oriented and stored database oriented relative to the Attendance System application. Experiment is carried on 100 speakers saying phrases like ‘Yes mam’ “present mam”, ‘Yes sir’, ‘present sir’ with 4 types of utterances for each phrase (so database includes 400 utterances). Experiment results obtained shows better performance in noisy environment. The results for stored database oriented experiment show that the algorithm gives 85% of Correct Recognition Rate (CORR) while using wavelet filter and 73% without using the filter. The results for real database oriented experiment shows 74% of identification rate while using wavelet filter and 45% without using the filter. Keywords — Gammatone Frequency Cepstral Coefficients (GFCC); Gaussian Mixture Model (GMM); Cepstral mean normalization (CMN); Robust Speaker Identification, Additive White Gaussian Noise (AWGN); Wavelet Filter. 7. PaperID 31051620: A Novel Algorithm for Load Balancing using HBA and ACO in Cloud Computing Environment (pp. 48-52) Seyed Majid Mousavi, University of Debrecen, Faculty of Informatics, Debrecen, Hungary Fazekas Gábor, University of Debrecen, Faculty of Informatics, Debrecen, Hungary Abstract — Cloud computing is an emerging technology and new trend for computing based on virtualization of resources. Scheduling of tasks to reach load balancing is a challenge in cloud environment. Load balancing is the process of distribution of the load among VMs in order to efficiently utilize of resources and avoiding the situation where some VMs are overloaded or idle. Load balancing of non-preemptive tasks is one of the critical issues in task scheduling in clouds environment. To improve throughput at cloud resources, an intelligent and dynamic load balancing can significantly increase cloud’s performance and minimize the costs. Although, many algorithms, strategies and methods have been proposed, but load balancing is still one of the challenging issues in resource allocation in cloud computing environment. In this paper we propose a novel load balancing strategy using Honey Bees and Ant Colony behavior algorithms in cloud environment. The proposed algorithm strives to balance the load of the virtual machines, trying to minimize the completion time of given tasks and reduce response time in cloud infrastructure. Keywords: load balancing, ant colony, honey bee, cloud computing. 8. PaperID 31051621: Route Optimization in MANET Using Hopfield Neural Networks: MANET-HOP (pp. 53-59) Sanjeev Gangwar, Department of Computer Application, V. B. S. Purvanchal University, Jaunpur, India Dr. Krishan Kumar, Department of Computer Science, Gurukul Kangri University, Haridwar, India Abstract — As we know that Mobile Ad Hoc Network is the combination of nodes having unstable setup which usually formed instantly in independent manner. It does not have any centralized administration. Moreover they don’t have any permanent setup and routers. In such situations routing becomes the responsibility of individual nodes and also routing is equally important to realize the practical benefits of MANET. Traditional protocols of MANET: DSR, AODV, DSDV, OLTP work well but still need improvements time-to-time as per the new issues like QoS provisioning and routing. Above protocols mainly depends on hop count measurement. In this paper we have implemented a specific problem of six nodes situated at different locations with primary goal to find the shortest route visiting each node at least once which is based on the concept of Travelling Salesman Problem using Feedback/Hopfield Neural Network. And we found that Hopfield networks are suitable to find the shortest route.

Keywords- Mobile ad-hoc network, Hopfield neural network, Travelling salesman problem, Route optimization 9. PaperID 31051629: A Modified Black hole-Based Task Scheduling Technique for Cloud Computing Environment (pp. 60-67) Fatemeh Ebadifard, Department of computer, Iran University of science and technology, Tehran, Iran Zeinab Borhanifard, Department of computer,Qom University, Qom, Iran Ahmad Akbari, Department of computer, Iran University of science and technology, Tehran, Iran Abstract — The issue of scheduling is one of the most important ones to be considered by providers of the cloud computing in the data center. Using a suitable solution lets the providers of cloud computing use the available resources more. Additionally, the satisfaction of clients is met through provision of service quality parameters. Most of the solutions for this problem aim at one of the service quality factors and in order to achieve this goal, variety of methods are used. Using the algorithm of modified black hole in this paper, a proper solution is presented to tackle the problem of scheduling the affairs in cloud environment. The proposed method reduces makespan, increases degree of load balancing, and improves the resource`s utilization by considering the capability of each virtual machine. We have compared the proposed algorithm with existing task scheduling algorithms. Simulation results indicate that the proposed algorithm makes a good improvement regarding the makespan and amount of resource utilization compared to schedulers based on Random assignment and particle swarm optimization Algorithms. Keywords- cloud computing; task scheduling; Black hole; makespan; resource utilization. 10. PaperID 31051631: A Multicast Routing Protocol Based on ODMRP with Stable link in Mobile Ad Hoc Networks (pp. 68-75) Ebrahim Asadi, Department of Computer Engineering, Shabestar Branch,Islamic Azad University, Shabestar, Iran Ali Ghaffari, Department of Computer Engineering, Shabestar Branch,Islamic Azad University, Shabestar, Iran Abstract — Mobile ad hoc networks are more flexible than tradition networks since they do not require fixed infrastructure and allow all nodes move in a random trajectory, which leads frequent rerouting and degrades network performance. So, an important issue in mobile computer network research is routing in mobile ad hoc networks. Multicast sending is one of the methods used for routing in mobile ad hoc networks because of its group activities. However, some problems exist in multicast sending. For example, when receiver nodes attempt to send acknowledgments or path repetition packets simultaneously, crashes may occur, which leads to packet loss. On the other hand, link expiration is another reason for packet loss. In this study, a multicast routing protocol is offered, which uses a combination of two parameters of the received signal's power and the remaining energy to estimate the stability of the link. SINR is used at each node in conjunction with various transmitters to determine a reliable path that reduces link failure and end-to-end delay. The aim is to find the best link with probability of the highest life cycle for each path. Simulation results of the proposed method using NS-2 simulator indicate the good performance of IMP-ODMRP measures in packet delivery rate, end-to-end delay, packet loss rate, and packet collision rate. Keywords-Mobile ad hoc networks; multicast; routing; IMP-ODMRP protocol; Standard ODMRP; Stable Link. 11. PaperID 31051639: A Survey on Human Social Phenomena inspired Algorithms (pp. 76-81) Thanh Tung Khuat, My Hanh Le DATIC Laboratory, IT Faculty, University of Science and Technology – The University of Danang, Vietnam Abstract — The problem of seeking the optimal solution in the field of science and engineering has been becoming complex and challenging due to the explosion of dimensions and the interdependence of variables. Over the past few decades, a variety of new concepts, techniques and computational applications inspired from nature have been proposed and used to deal with a wide range of optimization problems in diverse fields. Many of nature-inspired algorithms generate high-quality solutions for real-world optimization tasks. Nevertheless, the majority of these

methods are inspired by either biological phenomena or social behaviors of mainly animals and insects. There are few works relied on social phenomena of human being used to form optimization algorithms. This paper aims at presenting an adequate review of most predominant and successful groups of optimization approaches based on human social phenomena. Index Terms—Human Social Phenomena, Society Civilization Algorithm, Cultural Algorithms. Teaching-learning-based Optimization, Social Learning Algorithm, Alliance Formation based Algorithms, Social Emotional Optimization Algorithm, Social Labeling. 12. PaperID 31051641: Mammogram Classification Using Selected GLCM Features and Random Forest Classifier (pp. 82-87) Vibhav Prakash Singh, Ayush Srivastava, Devang Kulshreshtha, Arpit Chaudhary, Rajeev Srivastava Department of Computer Science & Engineering, Indian Institute of Technology (BHU), Varanasi, Uttar Pradesh-221005, India Abstract - Early diagnosis of breast cancer can improve the survival rate by detecting the cancer at initial stage. Mammogram is a low dose X-ray image of the breast region, used to diagnose the breast cancer at early stage. In this paper, an efficient computer added diagnosis (CAD) system is proposed, automatically detects the normal and abnormal images of mammogram. The proposed pre-processing steps include, cropping of mammograms (for avoiding the pectoral muscle, unwanted tags) and suppression of Gaussian noise. Further, gray level co-occurrence matrix (GLCM) based statistical texture feature from different distances of neighboring and angles are extracted. Furthermore, most relevant features are also examined using AdaBoost feature selection method. Finally, normal and abnormal mammograms are classified using Random forest (RF) classifier. Experiments on benchmark mammography image analysis society (MIAS) database confirm the effectiveness of this work. Keywords-CAD; Mammography; GLCM features; Feature selection; Random forest classifier. 13. PaperID 31051643: Enhancement of Intrusion-Detection System in MANETs with the Digital Signature via Elliptic Curve Cryptosystem (pp. 88-94) K. Spurthi, T. N. Shankar, S. Sabari Giri Murugan Computer Science & Engineering, KL University, AP, India Abstract- The watchdog scheme is popular in MANET to defend the malicious attacks, but the major pitfall of this method is unable to detect some destructive actions. The technique Enhanced adaptive acknowledgment EAACK is designed to handle some weaknesses as false misbehavior, limited transmission power, and receiver collision of the watchdog scheme that is not fully efficient to resolve all the problems. This paper focuses intrusion detection system on MANETs with the collaboration of three IDS approach and with the techniques ACK, 2-ACK, and misbehavior report identification MRI. This paper proposes digital signature with Elliptic Curve Cryptosystem to avoid forging acknowledgment packets from attackers. Keywords: DSR, MANET, AOMDV, watchdog, ACK, 2-ACK, MRI. 14. PaperID 31051644: P-Method: Improving AODV Routing Protocol for Against Network Layer Attacks in Mobile Ad-Hoc Networks (pp. 95-103) Shahram Zandiyan, Department of Computer Engineering, Ardabil branch, Islamic Azad University, Ardabil, Iran Reza Fotohi, Department of Computer Engineering, Germi branch, Islamic Azad University, Germi, Iran Marzieh Koravand, Department of Computer Engineering, Germi branch, Islamic Azad University, Germi, Iran

Abstract — Mobile ad hoc networks are regarded as a group of networks consisted of wireless systems which developing together a network with self-arrangement capability. no constant communication infrastructure and use central nodes to communicate with other nodes. Despite lots of advantages, these networks face severe security challenges, since their channels are wireless and each node is connected to central node. One of these concerns is the incidence of network layer attacks (Black and worm hole attack) is one kind of routing disturbing attacks and can bring great damage to the network. In this attack, an attacker cheats nodes, absorbs their packets and then deletes them. Hence, black hole and wormhole disrupts communication, or even makes it impossible in some cases. In this paper, we proposed P-Method for against network layer attacks in mobile Ad-Hoc networks based on hop count and RTT test. The proposed algorithm is implemented in ns2.35 environments and is compared with AODV And DSR under attacks, and improved AODV in different scenarios. Simulation results revealed that the (P-method), is better than AODV And DSR under attack in terms of packet dropped, packet loss, throughput, and jitter. Keywords- Mobile ad hoc networks, AODV and DSR routing protocol, Black hole attack, Worm hole, P-Method. 15. PaperID 31051653: Check the Use of Raise in Wireless Sensor Networks Based on Heuristic Algorithms Along with Soft Computing Approach (pp. 104-119) Abolfazl Akbari, Department of Computer Engineering, Ayatollah Amoli Branch, Islamic Azad University, Amol, Iran Pourya Khodabandeh, Marlik Higher Education Institute, Nowshahr, Iran Ali Khosrozadeh, Department of Computer Engineering, Ayatollah Amoli Branch, Islamic Azad University, Amol, Iran Abstract - The use of Wireless Sensor Networks (WSNs) has grown dramatically in recent decades, and the use of these networks in the areas of military, health, environment, business, etc. increases every day. A wireless sensor network consists of many tiny sensor nodes with wireless communications and work independently. In applications of such sensor nodes, hundreds or even thousands of low-cost sensor nodes are dispersed over the monitoring area, in which each sensor node periodically reports its sensed data to the base station (sink). Due to limitations in the communication range, sensor nodes transmit their sensed data through multiple hops. Each sensor node acts as a routing element for other nodes for transmitting data. One of the most important challenges in designing such networks is the management of energy consumption of nodes; because replacing or charging the batteries of these nodes are usually impossible. One of the main characteristics of these networks is that the network lifetime is highly related to the route selection. Unbalanced energy consumption is an inherent problem in WSNs characterized by the multi-hop routing and many-to-one traffic pattern. This uneven energy dissipation in many routing algorithms can cause network partition because some nodes that are part of the efficient path are drained from their battery energy quicker. To efficiently route data through transmission path from node to node and to prolong the overall lifetime of the network, In this thesis we proposed three new routing algorithms using a combination of both Fuzzy approach and A-star algorithm seeks to investigate the problems of balancing energy consumption and maximization of network lifetime for WSNs :A-Star with 3 parameters fuzzy system (A*3F), A-Star with 3 fuzzy system with 2 parameters using majority vote (A*3FMV) and A-Star with 3 fuzzy system with 2 parameters using simple additive weighting (A*3FSAW). The new methods is capable of selecting optimal routing path from the source node to the sink by favoring the highest remaining energy, minimum number of hops, lowest traffic load and energy consumption rate. We evaluate and compare the efficiency of the proposed algorithms with each other methods under the same criteria in four different topographical areas. Simulation results show that A*3PFSAW and A*3PFMV balances the energy consumption well among all sensor nodes and achieves an obvious improvement on the network lifetime that randomly scattered nodes and flat routing. Keywords: Wireless Sensor Networks, A-Star algorithm, Fuzzy logic, Network lifetime, Multi-hop routing. 16. PaperID 31051654: Allocation Algorithm based on CAC Scheme for LTE Network (pp. 120-127) Radhia Khdhir, LETI Laboratory, ENIS, University of Sfax, Tunisia

Kais Mnif, LETI Laboratory, ENETCOM, University of Sfax, Tunisia Khitem Ben Ali, LETI Laboratory, ENIS, University of Sfax, Tunisia Lotfi Kammoun, LETI Laboratory, ENIS, University of Sfax, Tunisia Abstract — To reduce network congestion and to guarantee a certain level of Quality of Service (QoS) for service requests, Call Admission Control (CAC) as a part of Radio Resource Management (RRM) aims to accept or reject a call based on available resources. In this paper, we proposed new CAC and resources allocation schemes for Long Term Evolution (LTE). The proposed CAC scheme gives the priority of Handoff Calls (HC), without totally neglecting the requirements of a New Calls (NC). The main objective of this approach is to provide QoS and to prevent network congestion. Simulation results show that the call admission control scheme leads to increased session establishment success and resource utilization compared with existing admission control and resources allocation schemes. Moreover, the resources allocation scheme achieves a considerable gain in the system throughput and fairness. Keywords — Call admission control; QoS; Scheduling; LTE; Uplink; Throughput. 17. PaperID 31051657: A Facebook Identical Data Detection and Deletion Algorithm (pp. 128-134) Harshita Shukla, Dept. of Computer Engineering and Applications, National Institute of Technical Teachers’ Training and Research (NITTTR), Bhopal (M.P), India. Shailendra Singh, Senior Member IEEE, Dept. of Computer Engineering and Application, National Institute of Technical Teachers’ Training and Research (NITTTR), Bhopal (M.P), India. Abstract — Facebook is becoming very popular as millions of users are sharing their thoughts by using various data formats. The motive behind its launch was to find old friends and relatives and make new friends. All Social Networks need to meet the increasing user demands of data storage and retrieval. The Social Networks are based on cloud to deal with dynamic speed of data generation. The success of Facebook has resulted in increased user traffic and large amount of data is continuously generated by its users’. It requires novel ways of storing data and removal and removal of duplicates as much as possible while maintaining the speed of responding to a query. In this paper, an attempt is made for the identification of data duplication and its removal. Social networking sites need dynamic data management by identifying duplicate data and its deletion technique. The removal of duplicate data is necessary, not only to reduce runtime, but also to improve search accuracy and efficiency. The implementation of this method reduces the indexing time to a great extent by decreasing the collection length, resulting in the reduction of the amount of hardware required to support the system. Keywords- Hashing; indexing; similarity checking; unique documents; detecting replicate; data duplicity; web mining; Facebook. 18. PaperID 31051660: Rule Generation for Proton Pump Inhibitor Regimen Using Learning Vector Quantization and C4.5 (pp. 135-140) Anifuddin Azis, Department of Computer Science and Electronics, Gadjah Mada University, Yogyakarta, Indonesia Sri Hartati, Department of Computer Science and Electronics, Gadjah Mada University, Yogyakarta, Indonesia Edi Winarko, Department of Computer Science and Electronics, Gadjah Mada University, Yogyakarta, Indonesia Zullies Ikawati, Department of Pharmacy, Gadjah Mada University, Yogyakarta, Indonesia Abstract — The excessive or irrational use of drugs categorized as Proton Pump Inhibitor (PPI) was indicated in Baptis Hospital of Kediri, Indonesia. In the PPI-based drug regimen among patients with digestive disorders from December 2009 to February 2010, many cases that the PPI-based drug regimen was not in accordance with the prevailing procedures were found, i.e. the drug regimen among patients who should not be given it. In this study, a method was developed to generate the PPI-based drug regimen rule. Data on the PPI-based drug regimen were trained using Learning Vector Quantization (LVQ) algorithm. The results of LVQ were stored as new data, which were extracted into IF-THEN rule with C4.5 algorithm. Based on the test, eighteen rules were generated for the PPI-based drug regimen with an accuracy rate of 82.5% on test data.

Keywords—PPI-based drug regimen; rule generation; LVQ; C4.5 19. PaperID 31051661: APMS: Construction and Assessment of Hospital Process for Outpatients Process Analysis (pp. 141-147) Mohammad Taha Khan, Suresh Gyan Vihar University JaipurRajasthan India, email: [email protected] Dr. Shamimul Qamar, College of Computer Science, King Khalid University Abha KSA, email: Dr. Ripu Ranjan Sinha, Suresh Gyan Vihar University Jaipur India Abstract - Management Information Systems is the process of transforming the accumulated data into useful and helpful information systems. This paper work is on design and construction of Advanced Pathology Management System (APMS). The objectives of the APMS is to i) Well-secured login system ii) Simple and easy patient registration form iii) Better test processing system i.e scheduling for the test and tracking the reports iv) Efficient Report Management system i.e, creation, searching and verification of the required reports v) Well-defined privacy management systems. The developed APMS is tested over Urgent care hospital, New Delhi. The event logs of outpatients are accumulated from the hospital and preprocessed using process mining approaches. Performance indices such as wait time for consultation wait time for test and the aggregate time spent on the outpatient care are analyzed. Experimental results prove the efficiency of the developed Advanced Pathology Management System (APMS). Keywords: Management Information Systems, Clinical Pathology, Report Management, Outpatients and Process mining approaches. 20. PaperID 31051666: Anonymity of Base Station in Wireless Sensor Network via Backup Base Station (pp. 148-154) Faisal Taj (1), Shahzad Anwar (2), Muhammad Imran (1), Irshad Ullah (1) (1) Department of Computer Science, Iqra National University, Peshawar Pakistan (2) Institute of Mechatronics, University of Engineering and Technology Peshawar, Pakistan Abstract - Sensor nodes covers surrounding area and report any events to a base station over multi-hop communication. The base station plays a key role in the network. The adversary, wants to disrupt network operation, would excitedly look for the base station and target it with attacks in order to inflict maximum damage. To avoid maximum damage a novel approach is proposed for boosting the anonymity of the base station. In the proposed research the numbers of base stations are increased from one to many (such as 2 to 5) in the network operation. The purpose is to divert the adversary attention about the base station and adversary considers the base station as a sensor node. Experimentation results suggest that the approach provide a backup facility in case if one of the base stations is failed due to adversary or due to energy failure. Therefore enhances network security. Keywords – Anonymity, Base Station, Backup Base Station, Wireless Sensor Network 21. PaperID 31051668: Neural Feed Forward Fault Tolerant Backbone Tree Construction to Increase the Lifetime of Wireless Sensor Network (pp. 155-159) K. Vimal Kumar Stephen, Mathivanan V. Computer Science and Engineering Department, AMET University, Chennai, India. Abstract - In the recent times, the demands of Wireless Sensor Networks (WSN) increase the challenges in terms of scalability and energy efficiency. One of the key challenges in the wireless sensor network is how to prolong the lifetime of the network. To improve the lifetime of the sensor, static and movable mobile sinks are deployed. Movable sinks are used to receive sensed data from the sensor where it is located. The static mobile sinks act as a trusted third party for computing and distributing keys between sensor nodes and the clusters. It is not necessary to chose new

cluster head often because of trusted third party sink, performs all the computations of cluster head. The energy is retained when computation is reduced in cluster head thereby increases the life time of the particular cluster. Feed forward Back propagation algorithm is proposed using adaptive learning in neural networks followed by link aware routing. This algorithm deals with fault tolerant backbone tree construction for data transmission whereas it produces optimal path for the sink to transmit data. Since the optimal path is established, the life of the sink also to be prolonged thereby increase the overall network lifetime. Result shows that the lifetime of the network is improved and energy depletion is reduced. Keywords – Sensor Networks, mobile sink, clusters 22. PaperID 31051669: An Efficient Neural Network Model for Software Effort Estimation (pp. 160-167) Nesa Khandoozi GholiAbad, Islamic Azad University, Gorgan branch, Iran Sanaz Khandoozi GholiAbad, Islamic Azad University, Sari branch, Iran Abstract — Software development effort estimation is the process of predicting the effort required to develop a software system. Estimating development effort accurately in the early stage of software life cycle plays a crucial role in effective project management. Effort estimation is a key factor for software project success, defined as delivering software of agreed quality and functionality within schedule and budget. Traditionally effort estimation has been used for planning and tracking project resources. It has become an important task. This paper proposed a neural network model for software effort estimation. This model has 3 layers. The train, validation and test data used are from COCOMO data set. Inputs and targets data randomly divided in train (60 %), validation (20%) and test (20%) group. When the number of neurons in hidden layer was 20, Number of training samples was 37, number of validation samples was 13 and number of testing samples was 13, the network has best performance. In this case, the value of training, validation and testing MSE was 0.01044, 0.0475 and 0.0375 respectively and value of training, validation and testing R was 0.9167, 0.7741 and 0.7410 respectively. Keywords- Software Engineering, Effort Estimation, Artificial Neural Network 23. PaperID 31051674: An Efficient Approach for Digital Image Splicing Detection Using Adaptive SVM (pp. 168-173) Gurleen Kaur, Baljit Singh Khehra, Department of Computer Science and Engineering, Baba Banda Singh Bahadur Engg. College Fatehgarh Sahib, India Abstract — Forgery detection is the most important task in our national judicial system and criminal investigation procedure. Today digital images have become powerful source of communication. With the advancement of technology, it becomes very easy to change the content of digital images. Due to which these images are no more taken as a proof of authenticity or legitimacy. In this paper, we deal with the widely used form of image tampering known as image composition(or image splicing).We demonstrate an effective algorithm to detect the spliced images based on illumination inconsistencies present in images. An adaptive support vector machine (a-SVM) is used to classify the given images as either genuine or forged. Keywords—Digital image forensic, forgery detection, image splicing, Adaptive SVM. 24. PaperID 31051675: Comparison and Analysis of Image Splicing Detection Using Artificial Neural Networks (pp. 174-178) Lovepreet Kaur, Dr. Baljit Singh Khehra Department of CSE & IT, BBSBEC, Fatehgarh Sahib, India

Abstract — Due to advancement in technology it is easy to modify the digital images and the discovery of modified images can be the difficult task as the images are the very powerful source of communication in every field. So, one of the major issue in today’s world regarding digital images is the authenticity of given images. Therefore, digital image forgery detection is a growing research field with important implication for ensuring the credibility of digital images. In this research, we proposed a credible method to detect image splicing based on illuminant color. Artificial neural network techniques are implemented as a classifier to detect the tampered images. The results describe that artificial neural network is effective to detect tampered images. Keywords— Forgery Detection, Image splicing, Illuminant color, Artificial Neural network. 25. PaperID 31051676: Efficient Random Sampling Statistical Method to Improve Big Data Compression Ratio and Pattern Matching Techniques for Compressed Data (pp. 179-184) Dr. Nishad P M, Department of Computer Applications, Mar Athanasios College for Advanced Studies Tiruvalla Kerala, India. Syam Sankar, Department of Computer Science & Engineering, NSS College of Engineering Palakkad, Kerala, India Abstract - This paper surveys various possibilities for pattern matching in compressed big data volume. Although various compression standards are available for compressing data, entire volume decompression is compelled before pattern matching, this in turn leads to increase in computational complexity as well as the space complexity. Some compressions algorithms give better compression ratio, at the same time, they are inefficient in decompression required for pattern matching. This paper evaluates the possibilities of pattern matching after compression without decoding. Also this paper experiments and proposes how the random sampling and its statistics will help to make better compression ratio in big data. The another objective of this work is to investigate the possibilities of pattern matching in big data without decoding and some of the standards are suggested based on this study and survey. Keywords - Compression, Encoding, Decoding, Big data, compression ratio, computational complexity, space complexity, random sampling. 26. PaperID 31051686: A New Dynamic Data Replication Algorithm to Improve Execution Time in Data Grid (pp. 185-190) Soheila Malmoli Abbasi, * Mohammadreza Noorimehr Department of Computer Engineering, Khouzesan Science and Research Branch, Islamic Azad University, Ahvaz, Iran Department of Computer, Ahvaz Branch, Islamic Azad University, Ahvaz, Iran Abstract — Data grids provide large-scale geographically distributed data resources for data intensive applications. These applications handle large data sets that need to be transferred and replicated among different grid sites so availability and efficient access are the most important factors affecting the performance. It is obvious that, managing the volume of data is very important. Data replication is an important technique to reduces data access time which improves the performance of the system by creating identical replicas of data files and distributing them on grid sites. In this paper, we propose a novel dynamic data replication strategy called DRPF (Dynamic Replication of Popular File), which is based on access history and file’s popularity. As grid sites within a virtual organization(VO) have similar interest of files, the basic idea of DRPF is to improve locality in accesses through increasing the the number of replicas in the VO. DRPF first selects the popular files that are needed to be copied to other nodes, then tries to find the best places for placement of new replicas by taking into account parameters such as the number of demands per site for files and bandwidth between replication sites. The algorithm is simulated using a data grid simulator, OptorSim. The simulation results show that our proposed algorithm has better performance in comparison with other algorithms in terms of job execution time and effective network usage. Keywords-Data grid; replication; popular file; placement

27. PaperID 31051687: Image Steganography Method for Concealing Secret Data into Coefficients Based on High Scalable Sub-Bands of Integer Wavelet Transform (pp. 191-197) Yahya E. A. Al-Salhi, Songfeng Lu School of Computer Science, Huazhong University of Science and Technology, Wuhan 430074, PR china Abstract — In information security, an image steganography technique uses one of the most popular transforms; either a spatial domain or the frequency domain to conceal the secret information. In this paper, an image steganography system using the spatial domain technique to conceal secret information in the frequency domain is proposed to conceal secret image information in another cover image. The Integer Wavelet Transform (IWT) used to obtain high scalable sub bands for each LL, LH, HL and HH of the cover image file. Then, the steganography approach is used to conceal the secret information in the wavelet coefficients for all sub bands. The results show high quality of stego image, and the stego image is analyzed for different attacks. It is found that the technique is robust, and it can withstand the attacks. The quality of the stego image is measured by Peak Signal to Noise Ratio (PSNR), Structural Similarity Index Metric (SSIM), and Universal Image Quality Index (UIQI). The quality of extracted secret image is measured by Signal to Noise Ratio (SNR) and Squared Pearson Correlation Coefficient (SPCC). 28. PaperID 31051693: Managing and Tracking Alumni in Saudi Universities (pp. 198-204) Dr. Amr Jadi, Department of Computer Science and Engineering, College of Computer Science and Engineering, University of Hail, Hail, Saudi Arabia Abstract — Managing Alumni System is one of the greatest challenges in the present market of Saudi Arabia. An alumni system is a channel between different universities and labor market to deliver various services to students as per the merit and priorities. There is no constructive method in present system of Labor office to monitor job requests from the students and communicate them with potential changes of market policies. This research aims to provide an architecture building a Functional Alumni System in Saudi Universities. The loop holes of current alumni system are highlighted and a consolidated methodology is implemented to develop a unique approach for increasing challenges. To overcome these deficiencies between Alumni Systems and Labor Market, the preset research provides a runtime monitoring system based on Labor policies to attain quality and manageability. The requests placed by students, applications executed by labor office and job requests in pending can be monitored and processed with a flexible approach by using this method. In turn lot of financial wastage can be avoided by reducing the complexity between job seekers and providers by the proposed approach. Keywords - Runtime Monitoring, Policy, Alumni System, Saudi Universities, Labor Office, Integration 29. PaperID 31051694: Secured Data Transmission in Wireless Sensor Networks (pp. 205-215) S. Suresh, Department of Information Technology, SRM University, Kattankaluthur Campus, Kancheepuram District, TamilNadu, India Giridhar R., Department of Information Technology, SRM University, Kattankaluthur Campus, Kancheepuram District, TamilNadu, India Abstract — Security is one crucial requirement in Wireless Sensor network. To overcome this issue, security protocol called Didrip was developed for flat based network which allows for distributed data discovery and dissemination. But in terms of clustering approach which is most efficient one in terms of energy conservation, there are lot of security vulnerability i.e. checking the cluster head for vulnerability to the network. In addition sensor nodes joining the cluster head during user joining phase is also not secure as the nodes can be vulnerable too. These two are most vulnerable security issues which are not addressed in existing security protocol of WSN including the one mentioned which is Didrip. The above said problems for clustering approach in WSN are overcome with a Cluster-based Certificate Authority (CA) scheme which is combination of voting and Nonvoting schemes towards detecting malicious node.

We also use digital signature to sign all the nodes present in the network. These are simulated using standard network simulator ns-2 and results analysed in terms of packet delivery, network life time and energy efficiency. Keywords - Didrip, WSN, CA, ns-2 30. PaperID 31051696: A Multi-step Method to Calculate the Equilibrium Point of the Continuous Hopfield Networks: Application to the Max-stable Problem (pp. 216-221) Mohammed El ALAOUI (1), Karim EL MOUTAOUAKIL (2) and Mohamed ETTAOUIL (1) (1) Modelling and Scientific Computing Laboratory, University Sidi Mohammed ben Abdellah, Fez, MOROCCO (2) National school of applied sciences Al-Hoceima (ENSAH) BP 03, Ajdir Al-Hoceima Abstract — The Continuous Hopfield Networks (CHN) is a neural network tools which can be used to solve many problems like auto-memory and optimization problems. The dynamics of the CHN is described by differential equations system which is hard to solve analytically. That is why, the researchers use the Euler Cauchy method to calculate the CHN equilibrium point. Unfortunately, this method suffers from several problems, especially quality of the decision for a large step, sensibility to the slope function parameters and to the initial conditions. In this work, we use the well-known multi-step numerical method called Adams–Bashforth method, which is strong in terms of stability and performance, to calculate the equilibrium point of the CHN associated with the max stable problem. This method introduces an intermediary step to improve the Euler Cauchy method precision. The experimental results show that the (CHN+Adams-Bashforth) method produce a large max stable sets in comparison with the (CHN+Euler-Cauchy) method. Keywords: - Continuous Hopfield Networks, Euler Cauchy method, Adams–Bashforth method, max-stable problem. 31. PaperID 31051699: An Event Grouping Based Algorithm for University Course Timetabling Problem (pp. 222-229) Velin Kralev, Radoslava Kraleva, Borislav Yurukov, Department of Informatics, South West University "Neofit Rilski", Blagoevgrad, Bulgaria Abstract — This paper presents the study of an event grouping based algorithm for a university course timetabling problem. Several publications which discuss the problem and some approaches for its solution are analyzed. The grouping of events in groups with an equal number of events in each group is not applicable to all input data sets. For this reason, a universal approach to all possible groupings of events in commensurate in size groups is proposed here. Also, an implementation of an algorithm based on this approach is presented. The methodology, conditions and the objectives of the experiment are described. The experimental results are analyzed and the ensuing conclusions are stated. The future guidelines for further research are formulated. Keywords – university course timetabling problem; heuristic; event grouping algorithm 32. PaperID 300416114: Digital Image Watermarking Using DCT and DWT to Improve Robustness (pp. 230-234) Priyanka Rani, Anupam Singh, Computer Science and Engineering, Shri Ramswaroop Memorial University, Lucknow, India Avinash Kumar Singh, Computer Science and Engineering, Shri Ramswaroop Memorial University, Lucknow, India Abstract — Watermarking is the concept that provides protection in digital multimedia. This paper uses Discrete Wavelet Transform (DWT), Singular Value Decomposition (SVD) and Discrete Cosine Transform (DCT) concept for watermarking and extraction purpose. In result analysis we analyze extracted image from watermarked image after applying different attacks (like rotation, Gaussian noise, average filter attack, low pass filter, high pass filter, salt and

pepper, Histogram Equalization etc). We find that this concept is robust against these types of attacks and provide high security. Keywords- Discrete Cosine Transform (DCT), Discrete Wavelet Transform (DWT), Singular Value Decomposition (SVD), Cover Image, Watermark Message. 33. PaperID 310316102: A New Efficient two tire secure protocol (pp. 235-240) Rehan Ullah, IT Department Hazara University, Mansehra, Pakistan Noor ul Amin, IT Department Hazara University, Mansehra, Pakistan Faisal Bahadur, IT Department Hazara University, Mansehra, Pakistan Abdul Hakeem, IT Department Hazara University, Mansehra, Pakistan Insaf Ullah, IT Department Hazara University, Mansehra, Pakistan Abstract — Signcrypion is a cryptographic method in which signature and encryption apply on message in a single step. On other hand image steganography is a strongest technique for hiding data or information. Therefore Communication through insecure channel is challengeable task for an organization. Recently two tier security gain popularity because most of the business organizations wants maximum security of data/information. In this paper we design a new scheme using cryptographic and stenographic techniques at once on the basis of image steganography and elliptic curve cryptography. In proposed design scheme we use both of the steganography as well as cryptography. The cryptographic technique encrypts the data by using Elliptic curve cryptography in such a manner that third party not understands the original message contents. Stenographic technique is used to hide the text in image and then we take hash as well as signature. It also assures the security properties like message confidentiality, message integrity, message non repudiation and also message authentication. Keywords-component Cryptography, Steganography, Signcrypion, Elliptic curve cryptography. 34. PaperID 310516111: Formal Model of Smart Traffic Monitoring and Guidance System (pp. 241-252) Umber Noureen Abbas, Farhan Ullah, Nazir Ahmad Zafar Department of Computer Science, COMSATS Institute of Information Technology Sahiwal COMSATS Road off GT road, Sahiwal 57000, Pakistan Abstract — Emergency Services Rescue 1122 and Smart Sticker components of our proposed Smart traffic monitoring and guidance system model are presented in this paper to provide smart emergency services and to identify vehicles to develop advanced transportation system. It involves the Wireless Sensors and actors to communicate with the system. The proposed components require fewer resources in terms of sensors and actors. Further, Sensors component identifies vehicles through Smart Stickers and it is readable through sensors from its barcode and barcode consists of vehicles details in terms of vehicles registration, model, engine and color. Secondly, Emergency Services Rescue 1122 component provides emergency services as it locates the vehicles through sensors and informs the local authority for providing emergency services. Third, violation of rules detects intruders on roads to provide smooth flow of traffic. Fourth, to avoid congestion, traffic signals are configured and communicated with sensors to update the system if congestion occurs. The proposed components of our model are implemented by developing formal specification using VDM-SL. VDM-SL is a formal specification language used for analysis of complex systems. The developed specification is validated, verified and analyzed using VDM-SL Toolbox. 35. PaperID 310516113: Anonymous and Secure Routing Protocol for Multi-hop Cellular Networks (pp. 253-258) Salwa Othmen (1), Faouzi Zarai (1), Aymen Belghith (2), Lotfi Kamoun (1) (1) LETI laboratory, University of Sfax, Tunisia (2) Saudi Electronic University (SEU), Computer Science Departement, Saudi Arabia

Abstract — In single cellular networks, the mobile stations cannot communicate directly with each other. All communications are relayed through the base stations. Such topology suffers from many limitations such as congestion problem when a large number of users are communicating in the same time to a base station. In this context, the device-to-device communications have been proposed to overcome the limitations of the conventional cellular architecture. Indeed, a mobile station can allow two nearby stations to communicate with each other without involving a base station. However, security becomes an important challenge that must be taken into consideration as the mobile stations participate in routing data between each other. In this paper, we propose a secure routing protocol for Multi-hop Cellular Networks (MCNs). Our goal is to discover a secure and short route between the source and the destination. To evaluate this proposed protocol, we perform some simulations using Network Simulator (NS-2). The simulation results show that it provides acceptable performance in terms of throughput and routing overhead as comparing with Secure Ad hoc on demand Distance Vector (SAODV). Keywords-component; single cellular networks, base stations, Device-to-device, secure routing protocol, MCNs, NS-2; 36. PaperID 310516118: Performance Analysis of Heterogeneous Data Normalization with a New Privacy Metric (pp. 259-264) J. Hyma (†), PVGD Prasad Reddy (††), and A. Damodaram (†††) (†) Department of CSE,GIT, GITAM University, Visakhapatnam, INDIA (††) (†) Department of CS&SE, AU College of Engineering, Andhra University, Visakhapatnam, INDIA (†††) Department of CSE, Sri Venkateswara University, Tirupathy, INDIA Abstract - Investigation on privacy preserving data mining is in extensive need to the present day technological situation. Storage of the data and its usage through various computational processes is becoming very easy and efficient. At the other end the primary concern or sometimes can be termed as limitation to this extensive data analysis is privacy. There are existing privacy preserving techniques that solve this problem and also guarantee privacy as well as data utility. But these techniques have to be updated in parallel to the expansion of digital technology. In view of this, the part of research in this paper analyses various normalization techniques with heterogeneous data distortion. The experimental consideration is done with the comparison of various statistical measures on the distorted data and their preservation with respect to the original data. We evaluated the performance of heterogeneous data distortion with three types of transformations namely Min-Max Normalization, Z-Score Normalization and Decimal Scaling. The performance is evaluated with various data distortion measures and privacy measures. Keywords: Privacy Preserving Data Mining (PPDM), Data Normalization, Privacy, Data utility. 37. PaperID 310516121: Image Compression using Clustering Algorithms (pp. 265-268) Lale Fathi Ajirlou, Department of Computer, Germi Branch, Islamic Azad University, Germi, Iran Seyed Naser Razavi, Department of Computer, Tabriz Branch, Islamic Azad University, Tabriz, Iran Abstract — There is a correlation between pixels in each image so that each pixel value of adjacent pixels can be guessed. By removing these dependencies can be compressed images. Our goal is to reduce the amount of compressed image data needed to display the digital images and therefore reduce the cost of transmission and storage. Compression has a key role in many important applications. These applications include image database, transmission of images, remote sensing, medical imaging, military and space equipment remote control and so on. In addition to the compression, image coding, there's talk. That after quantization matrix should be coded range of conversions. In reconstruction after decoding to achieve our desired image obtained with the difference that the picture is far less than the original image. What we've done in this thesis using a fractal method utilizes a Kohonen neural networks and clustering to increase the compression ratio and reduction coding and decoding the image. We have implemented three methods based on fractal coding. The first method is simple fractal coding. In the second method to create the codebook of multiple tree fractal coding is used. In the second method of vector quantization LBG algorithm for

Kohonen neural network-based clustering algorithm and code book for coding image is used. Results in the second method show faster encoding. The method is simple fractal compression rate is higher than other methods. Keyword: image compression; clustering; vector quantization 38. PaperID 310516122: A Joint Duty Cycle and Optimal Energy Adaptation Algorithm for the Body Area Sensor Networks (pp. 269-274) Ali Raza, Dept. of computer science, City University of Science & Information Technology, Peshawar, Pakistan Arshad Farhad, Dept. of computer science, COMSATS, Sahiwal, Pakistan Wajid Ullah Khan, Dept. of computing, Abasyn University, Peshawar, Pakistan Muhammad Arif, Dept. of computer science, City University of Science & Information Technology, Peshawar, Pakistan Abstract — IEEE 802.15.4 standard is widely adapted for Body Area Sensor Networks (BANs) due to its low duty cycle and low power operation. However, IEEE 802.15.4 recommends the use of fixed duty cycle operation which results in high energy consumption and end-to-end delay. Therefore, an efficient algorithm is needed to adapt duty cycle operation to overcome the end-to-end delay and energy consumption. In this paper, we propose a Joint Duty Cycle algorithm (JDCA) for the BAN to enhance the network lifetime, throughput and decrease the end-to-end delay. Dynamic duty cycle can be adapted by the two MAC parameters: Beacon Order (BO) and Super frame Order (SO). However, these parameters are set by the network administrator before the network deployment. During simulation, JDCA algorithm is capable of adapting dynamic duty cycle at run time based on traffic load. Furthermore, simulation results shows enhanced network lifetime, network throughput and less end-to-end delay when compared with IEEE 802.15.4. Index Terms — Dynamic duty cycle, IEEE 802.15.4, Body area sensor networks, Wireless personal area network. 39. PaperID 310516124: Performance Evaluation of High Performance Data Transfer in Grid Environment over Broadband Hybrid Satellite Constellation Communication System (pp. 275-279) Anupon Boriboon, Vincent Mary School of Science and Technology, Assumption University of Thailand, Bangkok, Thailand Siriwhaddhanah Pongpadpinit, Department of Business Information System, Martin de Tours School of Management and Economics, Assumption University of Thailand, Bangkok, Thailand Abstract — This paper presents the evaluation performance of broadband hybrid satellite constellation communication system (BHSCCS) networks which provides high performance data transfer in grid network environment based on TCP protocols. The evaluated hybrid satellite network uses the COMMStellationTM constellation topology on lower orbital. We adopt the GridFTP to improve network performance. GridFTP is a high-performance, reliable data transfer protocol optimized for high-speed Internet to suitable WAN networks. The simulation results show the network performance of GridFTP which different AQMs, TCPs, PERs, over BHSCCS networks. Keywords: COMMStellationTM; GridFTP; Hybrid Satellite; Queue; TCP 40. PaperID 310516127: A Lasso-LTS Method for DNA Sequence Classification Based on Beta Wavelet Networks (pp. 280-292) Abdesselem DAKHLI, Department of Computer Science, REGIM, University of Gabes, Tunisia Wajdi BELLIL, Department of Computer Science, REGIM University of Gafsa 2110 Gafsa, Tunisia Chokri BEN AMAR, Department of Computer Science, REGIM University of Sfax 3018,Sfax, Tunisia

Abstract — Wavelet Neural Network (WNN) is attracting interest in field of classification system, because they are universal approximations, particularly due to rapid and accurate representation of nonlinear dynamic systems. The satisfying performance of the WNN depends on an appropriate determination of the Wavelet Neural Network structure. In this paper we provide a new method to solve this problem based on the Least Absolute Shrinkage and Selection Operator (LASSO). At first, the scale of WNN is managed by using the time-frequency locality of wavelet. Furthermore, the unconstrained optimization problem (LASSO) is used to solve the structure and learning of the WNN. This optimization problem can be solved efficiently using the iteratively reweighted least squares (IRLS) and the Least Trimmed Square (LTS) methods to enhance the ineffectiveness; they are applied to train the wavelet neural network. The advantage of the method lies in the oracle properly of the LASSO can guarantee the optimal structure of the WNN. The proposed method has been able to optimize the wavelet neural network and this method is able to classify the DNA sequences. Our goal is to construct predictive models that are highly accurate. In fact, the proposed method permits to avoid the complex problem of form and structure in different clusters of organisms. The empirical results and their classification performances are compared with other methods. We compared the WNN-Lasso model with the other five alignment-free models, i.e., k-tuple, DMK, TSM, AMI, and CV, on several large-scale DNA datasets on the DNA classifying application by means of the K-means method. The experimental results have shown that the WNN-Lasso model outperformed the other models in terms of both the classifying results and the running time. Evenly, in this study, we present our approach consists of three phases. The first one, which is called transformation, is composed of two sub steps; binary codification of the DNA sequences and the Signal Processing of the DNA sequences. The second phase step is the approximation; it is empowered by the use of the Multi Library Wavelet Neural Networks (MLWNN). Finally, the third section, which is the classification of the DNA sequences, is realized by applying the algorithm of k-means classification. Index Terms— LASSO, LTS, Wavelet Neural Networks, DNA sequences, MLWNN, IRLS. 41. PaperID 310516129: Sindhi Morphological Analysis: An Algorithm for Sindhi Word Segmentation into Morphemes (pp. 293-302) Waqar Ali Narejo, Javed Ahmed Mahar, Shahid Ali Mahar, Farhan Ali Surahio, Awais Khan Jumani Department of Computer Science, Shah Abdul Latif University, Khairpur Mir’s, Sindh, Pakistan Abstract- Morphological analysis is the process of constructing and deconstructing the words of a language, the process is based on the basic grammatical units which are stem, prefixes, suffixes and infixes. Sindhi is rich in morphological features with a great variety of affixes. The problem for Sindhi to come into computerization is the large number of variants in its morphology. This complexity is created due to different positions of prefixes, suffixes and stems in the words. The automatic word segmentation system normally faces such embedded hurdles in Sindhi language. An algorithm is required with a capability of dealing with such issues for the segmentation of Sindhi words. In this paper, an algorithm is designed and implemented to resolve the problem of segmenting Sindhi complex and compound words into possible morphemes. The developed words segmentation system has been tested on a list of 109 compound words, 179 prefix words, 1343 suffix words and 50 prefix-suffix words. The cumulative segmentation error rate of 5.02% is calculated. This system can also be used as pre-requisite in various Sindhi language and speech processing applications. Keywords — Sindhi Morphology; Morphological Analysis; Word Segmentation; Morphemes 42. PaperID 310516130: A New Secret Sharing Scheme Using Rational Interpolation (pp. 303-307) Ali Nakhaei Amroudi, Department of Mathematics and Cryptography, Malek Ashtar University of Technology, Isfahan, Iran Ali Zaghian, Department of Mathematics and Cryptography, Malek Ashtar University of Technology, Isfahan, Iran, Mahdi Sajadieh, Department of Electrical Engineering, Islamic Azad University, Isfahan (Khorasgan) Branch, Isfahan, Iran
Abstract — Most of the existing secret sharing schemes are based on polynomial interpolation. In other word, they use polynomial functions in their schemes. In this paper, we solve the problem of creating a secret sharing scheme based on rational interpolations. We show that if * support points have the same width then the rational interpolation of the support points, which is called ( )( ), has pole points. Finally, we give an example for the accuracy of the proposed scheme. Keywords-component; Secret Sharing Scheme; Shamir’s Scheme; Polynomial Interpolation; Rational Interpolation, Pole Points. 43. PaperID 310516133: A Novel Face Recognition System based on Skin Detection, HMM and LBP (pp. 308-316) Mejda Chihaoui, Akram Elkefi, Wajdi Bellil, Chokri Ben Amar REGIM: Research Groups on Intelligent Machines, University of Sfax National School of Engineers (ENIS), Sfax, 3038, Tunisia. Abstract — Although there are various biometric techniques, like fingerprints, iris scan as well as hand geometry, the most efficient and widely-used one is face recognition because it is inexpensive, non-intrusive and natural. In our paper, we present an approach aiming at implementing a full architecture which represents an efficient system of face recognition. For this, an attempt is proposed for each system stage. At the beginning, we develop a novel approach to detect faces existing in 2D color image. This approach focuses mainly on how to implement a selection of skin color before using neural networks and Gabor filters. This approach represents an improvement of existing approach especially because it aims to minimize the computation time. Indeed, the skin detection step avoids wrong detection and to help the system detect the face in the right areas and minimize the research time and subsequently the Gabor filter will be applied only on the localized skin space. Later, the face features obtained by the Gabor filter represent the input of the neural network classifier to decide whether an input image pixel is a face pixel or not. For 2D face recognition, we propose likewise a novel approach that we call HMMLBP (a combination of the two tools Hidden Markov Models HMM and Local Binary Pattern LBP). It allows classifying a given 2D face image through utilizing an LBP tool to extract features. In order to validate our whole system performance, we show experimental results obtained when applying our proposed algorithm on benchmark face databases, respectively AT&T, Yale and Feret. 44. PaperID 310516134: Energy Efficiency Techniques in Cloud Computing (pp. 317-323) Altaf Ur Rahman, Fiaz Gul Khan, Waqas Jadoon Department Computer Science, COMSATS Institute of Information Technology, University Road Tobe Camp, Abbottabad Abstract — Cloud computing gaining popularity at enormous rate since from its emergence. CC changed the way that computing services are provided. On demand platform (PaaS), infrastructure as a service (Iaas) and software (SaaS) as a service through internet. Consumer use third party services instead of building his own infrastructure which need up-front investment and expertise. Cloud computing becoming popular for unlimited computing power, availability, nice pricing, on demand services and quality of service. For availability and computing power the service provider expands their resource capacity to handle user requirements. This expansion in resources capacity lead to high energy demand. Two big issues for cloud computing is energy demand and security/privacy requirements. In this survey we will give a review on the latest techniques for energy efficiency in cloud computing. The main focus is on software base energy efficiency techniques in which we will explain the workload consolidation and resource management in detail. Index Terms — cloud computing, data center, energy efficiency techniques. 45. PaperID 310516135: Service Level Agreement in Cloud Computing: A Survey (pp. 324-330)

Usman Wazir, Dr. Fiaz Gul Khan, Dr. Sajid Shah Department of Computer Science, COMSATS Institute of Information Technology, University Road Tobe Camp, Abbottabad, Pakistan Abstract — Cloud computing provides distributed resources to the users globally. Cloud computing contains a scalable architecture which provides on-demand services to the organizations in different domains. However, there are multiple challenges exists in the cloud services. Different techniques has been proposed for different kind of challenges exists in the cloud services. This paper reviews the different models proposed for SLA in cloud computing, to overcome on the challenges exists in SLA. Challenges related to Performance, Customer Level Satisfaction, Security, Profit and SLA Violation. We discuss SLA architecture in cloud computing. Then we discuss existing models proposed for SLA in different cloud service models like SaaS, PaaS and IaaS. In next section, we discuss the advantages and limitations of current models with the help of tables. In the last section, we summarize and provide conclusion. Index Terms— Service Level Agreement (SLA), Cloud Computing. 46. PaperID 310516136: Blind Watermarking Algorithm for 3D Multiresolution Meshes based on Spiral Scanning Method (pp. 331-342) Ikbel Sayahi, Akram Elkefi, Chokri Ben Amar REGIM-Lab.: REsearch Groups in Intelligent Machines, University of Sfax, ENIS, Sfax,3038 Tunisia Abstract — 3D mesh is a new data type appeared in the last decades. Since its emergence, it has been used in several areas which raise major security problems. As a solution, we propose a blind watermarking algorithm for 3D meshes. For doing spiral scanning method decomposes the mesh into GOTs (a Group of Triangles). At each time, only one GOT will be uploaded into memory. It undergoes a wavelet transform to generate vector of wavelet coefficients. This latter undergoes modulation then embedding steps using data coded with BCH code. Once watermarked, the next GOT will be uploaded. This process stopped when the entire mesh is watermarked. Experimental tests show that the quality of meshes is kept despite the high insertion rate and that memory consumption is reduced. As for robustness, our algorithm overcomes the following attacks: translation, rotation, smoothing, uniform scaling, coordinate quantization, noise addition, simplification and compression. Index Terms — Digital watermarking, 3D meshes, Multiresolution, Wavelet transform, Spiral scanning, Attacks, Compression. 47. PaperID 310516141: Towards the Development of an Efficient and Cost Effective Intelligent Home System Based on the Internet of Things (pp. 343-350) A. Imtar Chaudary, Dept. of Computer Science, CIIT, Sahiwal, Pakistan Muhammad Usman, Dept. of Computer Science, CIIT, Sahiwal, Pakistan Arshad Farhad, Dept. of Computer Science, CIIT, Sahiwal, Pakistan Wajid Ullah Khan, Dept. of Computing and Technology, Abasyn University, Peshawar, Pakistan Abstract — Internet of Things (IoT) is an emerging technology which is covering everyday things from industrial machinery to consumer goods in order to exchange information and complete tasks while involved in other work. IoT based smart home automation system is a system that uses PCs, mobile phones or remote devices to control basic operations for home automatically from anyplace around the world using internet. The proposed intelligent home automation system differs from existing systems as it allows the user to operate the system from anywhere around the world by using internet connection along with intelligent nodes that can take decisions according to the environmental conditions. We implemented a home automation system using sensor nodes that are directly connected to Arduino microcontrollers. Microcontroller is programmed so that it can perform some basic operations on the basis of sensors data. e.g. fan is controlled on basis of temperature value and light is controlled on the basis of occurrence of motion in the room etc. Furthermore Arduino board is connected to the internet using Wi-Fi module. An extra feature this system provides is to monitor power consumption of different home appliances. The designed system provides the

user remote control of numerous appliances locally as well as outside the home. This designed system is expandable, allowing multiple devices to be controlled. The objective of the proposed system is to provide a low cost and efficient solution for home automation system by using IoT. Results show that the proposed system is able to handle all controlling and monitoring of home. Keywords—Internet of Things (IoT), Wireless Sensor Network, Home Automation System, Energy Monitoring. 48. PaperID 310516142: A Threshold-Based Predictive Scheme for Mobile Subscribers in Publish/Subscribe Systems (pp. 351-357) Fatma Abdennadher, Maher Ben Jemaa National School of Engineers of Sfax, University of Sfax, ReDCAD Laboratory, B.P.1173, 3038 Sfax, Tunisia Abstract — In this paper, we present our strategy adopted to deal with the mobility into publish/subscribe. Specifically, we focus on the management of the mobile users from one broker to another. In fact, the topic of mobility into publish/subscribe systems may cause many problems such as the increasing of the traffic into the network and the messages loss. To overcome these problems, we have created a selective scheme on the basis of an accurate selection. In fact, a threshold value is devoted to be the criterion for the selection of caching points. On the basis of this principle, we apply various network settings to explore the effectiveness of our approach. Hence, we extract the improvement of our approach on the messages loss, the caching cost and the propagation cost in function of buffer size, publication rate, period of disconnection and connect time. Keywords-Distributed Networks; Mobile Computing; Publish/-Subscribe; Prediction Management; Performance Efficiency. 49. PaperID 310516147: A Novel Protocol Stack for Improving QoS in Vehicular Networks (pp. 358-367) Mohammadreza Pourkiani, Department of Information Technology Science and Research Branch, Islamic Azad University, Tehran, Iran Sam Jabbehdari, Department of Computer Engineering, Tehran North Branch, Islamic Azad University, Tehran, Iran Ahmad Khademzadeh, Department of National and International Cooperation, Iran Telecommunication Research Center, Tehran, Iran Abstract — Intelligent Transportation Systems are defined as those systems utilizing synergistic technologies and systems engineering concepts to develop and improve transportation systems of all kinds. Vehicular Ad-hoc Network (VANETs) which is an application of Mobile Ad-hoc Networks (MANETs) play an important role in ITS and emerged to provide Vehicle to Vehicle, Vehicle to Roadside and Vehicle to Infrastructure communications, aiming to improve safety on roads, exchange data between vehicles and provide different services to the users. According to special characteristics of VANETs like bandwidth limitation, high mobility, signal fading and real-time data communications, QoS provisioning in these networks is a challenging task. In this paper, we introduce an architecture for vehicular networks and a protocol stack which aims to reduce the processing overhead, make routing easier and provide Quality of Service in vehicular networks. Finally, after designing protocols and headers of the mentioned protocol stack, we will simulate our proposed idea in a vehicular environment and after simulation process, we will compare the achieved results with another scenario in which regular TCP/IP protocols are used. Keywords-component; VANETs; ITS; QoS; Protocol Stack 50. PaperID 310516149: Performance Analysis of VoIP over IPV4, IPv6 and 6-to-4 Tunneling Networks (pp. 368-372)

Muhammad Fawad (1), Syed Irfan Ullah (2), Haseena Noureen (3), Arbab Wajid Khan (4), Zar Khitab (5), Shahab Khan (6), Abdus Salam (7), Muazzam A. Khan (8) (1,2,4,6,7) Department of Computing & Technology, Abasyn University Peshawar KP Pakistan (3) Faculty of Computer Science & IT, University of Malakand Dir(L) Malakand KP Pakistan (5) Faculty of Electrical Engineering, APCOMS Rawalpindi, Pakistan (8) NUST College of EME, National University of Sciences & Technology, Islamabad Pakistan Abstract — Transition from IPv4 to IPv6 is a cumbrous process because of their irreconcilability with each other and coexists during the transition period. This work examines the behavior of transition mechanisms that involve communication among IPv4 and IPv6 in various scenarios and traffic conditions. A network analyst faces variable traffic and data rates at different nodes in such a heterogeneous network, that requires more attention to make it able to work with stable network flow and data rate. We analyse an end-to-end delay of VOIP data packets in IPv4 and IPv6 homogeneous and heterogeneous networks using 6 to 4 tunneling techniques. This work shows that IPv6 has better performance than IPv4 and IPv6-to-IPv4 tunneling. The tunneling technique improves the network throughput and queuing delay over the intermediate nodes of the heterogeneous network. Keywords: IPv4, IPv6, VoIP, 6- to-4 tunneling, DSTM 51. PaperID 310516151: Investigation of Collusion Attack Detection in Android Smartphones (pp. 373-379) M. Kireet, Dept of CSE, JNTUH, Hyderabad, India Dr. Meda Sreenivasa Rao, JNTUSIT, Hyderabad Abstract — Today as Android is used by majority of the smartphone users it has become one of the effortless platform for the malware-writers to introduce their malicious activities into smartphone world through this android mobile applications. The main loophole in Android applications is permission based security control. The User unawareness of accepting every permission as a mandatory requirement by an app is making more and more convenient for the hackers to extract the users’ private data. In this paper we have analysed all the leakages which are done by using permissions required by an app. We carefully made an investigation to detect collusion attacks .We analyzed the present detection methods of inter-permission leaks especially on Collusion attacks and mentioned the areas where the enhancements are needed with limitations that existed in present detection methods. Keywords - Collusion attacks, inter-permission leaks 52. PaperID 310516152: A Hybrid Machine Learning Model for Selecting Suitable Requirements Elicitation Techniques (pp. 380-391) Nagy Ramadan Darwish, Department of Computer and Information Science, Institute of Statistical Studies and Research, Cairo University, Egypt Ahmed Abdelaziz Mohamed, Department of Information Systems, Higher Technological Institute, Cairo, Egypt Abdelghany Salah Abdelghany, Department of Information Systems, Higher Technological Institute, Cairo, Egypt Abstract — Requirements elicitation is the first and the most critical phase of Requirements Engineering (RE). Many techniques have been proposed to support the elicitation process. Each technique has its strengths and weaknesses. This variety makes the selection of technique or combination of techniques for a specific project a difficult task. Mostly techniques are selected based on personal preferences rather than on attributes of project, technique, and stakeholders. In this paper, the researchers propose a three-component approach for elicitation techniques selection. First, a literature review is conducted to identify the attributes affecting techniques selection and common elicitation techniques. Second, a multiple regression model is built to analyze these attributes in order to find the critical attributes influencing techniques selection. Finally, an Artificial Neural Network (ANN) based model for selecting adequate elicitation techniques for a given project is proposed. The ANN model helps reduce the human involvements in this process. It was implemented using Neural Network Fitting Tool in MATLAB. The network has accuracy of 81%. The ANN model was empirically validated by conducting a case study in a software company.

Keywords: Requirements Engineering, Requirements Elicitation, Multiple Regression Analysis, Neural Network. 53. PaperID 310516155: A Comparison of Proxy Re-Encryption Schemes – A Survey (pp. 392-397) Anum Khurshid, Fiaz Gul Khan, Abdul Nasir Khan Department of Computer Science, COMSATS Institute of /information Technology, Abbottabad, Pakistan Abstract — Proxy Re-Encryption has been used since the need for forwarding an encrypted message to a party for whom it was not encrypted was highlighted in the form of delegation rights by Blaise, Bleumer and Strauss. Various Proxy Re-Encryption schemes have been introduced till today mainly focusing on demonstrating features like transitivity and collusion-resistance to ensure minimal trust on the proxy and maximum key-privacy. This survey highlights some major schemes introduced, classifies them based on their directionality, brings to light their major advantages and disadvantages, and provides a detailed comparative study based on the key features a Proxy Re-Encryption Scheme must possess in order for its widespread. Index words— bilinear maps, CCA secure, collusion resistance, CPA secure, delegation rights, Deffie-Hellman key exchange, DBDH assumptions, Proxy Re-Encryption; transitivity. 54. PaperID 310516163: Energy Efficient Routing Protocols in Wireless Sensor Networks: A Survey (pp. 398-406) Owais Khan, Fiaz Gul Khan, Babar Nazir, Usman Wazir Department of Computer Science, COMSATS Institute of Information Technology, University Road Tobe Camp, Abbottabad, Pakistan Abstract — WSN is an evolving technology since last ten years. As wireless nodes work have less power supply in the form of a battery, it is necessary for the nodes to work for maximum time. Different techniques are adopted to achieve better energy optimization. This paper presents a survey on energy efficient routing techniques, which will help in understanding the factors which affect energy efficiency and other performance parameters and will help to analyse the techniques for further optimizations. Index Terms — Wireless Sensor Networks, Energy optimization, Topology. 55. PaperID 310516166: Improved Face Recognition Rate Using Face Partitioning in Eigen and Fisher Feature Based Algorithms (pp. 407-417) Harihara Santosh Dadi, Gopala Krishna Mohan Pillutla Abstract — Face partitioning technique is presented in this paper. Instead of directly giving the face to the face recognition system, first the face is partitioned in to different face parts using face partitioning technique. The face parts are namely mouth, left eye, right eye, head, eye pair and nose. Eigen and Fisher features based algorithms are considered for experimental purpose. These face part features are given to the SVD classifiers individually. The outputs of the classifiers are again given to the decision making algorithm. Based on the maximum likely hood principle, this decision making algorithm outputs a face. ORL data base is used for evaluating the performance of this new technique. The first two faces of all the 40 people in the data base are considered for testing and the remaining eight faces are used for training purpose. Results are separately calculated with and without face partitioning technique. Results show that face recognition rate is increased by using the combination of face partitioning technique and basic face recognition algorithm. The new algorithm is also verified on 8 different data sets. Experimental results show that this face partitioning is improving the face recognition rate both Eigen and Fisher feature based algorithms.

Index Terms—Face Partitioning, Facial features, Recognition engine, Support Vector Machine, Decision making algorithm. 56. PaperID 310516168: Elastic Extension Tables for Multi-tenant Cloud Applications (pp. 418-431) Haitham Yaish (1, 2, 3), Madhu Goyal (1, 2), George Feuerlicht (2, 4) (1) Centre for Quantum Computation & Intelligent Systems (2) Faculty of Engineering and Information Technology,University of Technology, Sydney P.O. Box 123, Broadway NSW 2007, Australia (3) Faculty of Engineering, American University of the Middle East, Kuwait (4) Faculty of Information Technology, University of Economics, Prague, Czech Republic Abstract — Software as a service (SaaS) is a Cloud Computing service model that exploits economies of scale for SaaS service providers by offering a single configurable software and computing environment for multiple tenants. This contemporary multi-tenant service requires a multi-tenant database that accommodates data for multiple tenants using a single database schema. In general, traditional Relational Database Management Systems (RDBMS) do not support multi-tenancy and require schema extensions to provide multi-tenant capabilities. This paper proposes a multi-tenant database schema called Elastic Extension Tables (EET), which is highly flexible in enabling the creation of database schemas for multiple tenants by extending a preexisting business domain database, or by creating tenant business domain database from the scratch at runtime. The empirical results presented in this paper indicate that the EET schema has potential to be used for implementing multi-tenant databases for multi-tenant SaaS applications. Index Terms— Cloud Computing, Software as a Service, Multi-tenancy, Elastic Extension Tables, Multi-tenant Database. 57. PaperID 310516174: Triangle Area Based MCA Technique and Anomaly Based Detection Technique for Detecting DOS Attacks (pp. 432-440) Varsharani Dudhande, Sharmila Wagh Modern Education Society’s College of Engg., Computer Department, Savitribai Phule Pune University, India Abstract — The availability of network services are being menaced by the increasing number of Denial-of-Service (DoS) attacks. The availability of such interconnected systems is severally degraded by increasing number of DOS attacks. Denial-of-Service (DoS) attacks cause serious impact on these computing systems such as router, host or entire network. DoS attack detected using Multivariate Correlation Analysis (MCA) technique. Multivariate correlation analysis employs for accurate network traffic characterization by extracting the geometrical correlations between network traffic features. The proposed system uses the Multivariate Correlation Analysis (MCA) technique for accurate characterization also uses the anomaly based detection technique in attack recognition. Anomaly based detection makes system capable of detecting seen and unseen attacks. Moreover, a triangle area based technique is planned to reinforce and increases performance of MCA. The impact of each non-normalized information and normalized information on the performance of the proposed detection system is tested. Keywords — Denial- of- Service attack, network traffic characterization, multivariate correlations, triangle area. 58. PaperID 310516176: Proposed Hybrid Model to Detect and Prevent SQL Injection (pp. 441-448) Mrs. Teresa K. George, Dr. Rekha James, Dr. Poulose Jacob Dept. of Computer Science, CUSAT, Cochin Abstract - SQL Injection vulnerability takes advantages of the poorly coded web application and exploits the sensitive and critical information stored in an application’s database by compromising the authentication logic of the database server. In Most of the web applications user inputs in the dynamic web pages are the vulnerable points for SQL

injection attack. A Single detection tool cannot handle the sophisticated injection attacks by the intelligent hackers. The proposed hybrid model with SQLI-Rejuvenator on an Application Program Interface is tested and proved as an efficient technique to detect and prevent SQL injection. In this architecture, the malicious queries are blocked and an alert message is generated if the injection is detected. Only the benign query is allowed to access the data from the backend database server. The Unique identity created by the template creator application, the Rejuvenator module and evaluation engine are significant features of the proposed model to prevent the Injection attack and can facilitate better availability of the application. Keywords – Authentication; Injection; Vulnerability; Hackers; Detection; Rejuvenation; 59. PaperID 310516179: Hand Gesture Recognition System (pp. 449-453) ABBES Zeineb, CHIBANI Chaala Dept of industrial computing. Higher Institute of Computer and Multimedia, Gabes, Tunisia Tarek Frikha, Abir Hadriche CES Lab, REGIM Lab, Sfax, Tunisia Abstract - In this article, we will propose a real-time human hand gesture recognition system which will perform translations from the sign language to the common French language. The processes is composed by three basic steps: The detection and extraction of the hand pattern characteristics during the image stream acquisition, which is obtained from an integrated camera. The analysis process, in which the obtained characteristics are classified as either a recognized sign language gesture or an unclassified hand movement. Preset characteristics of each effective hand gesture are stored locally. The message-assembling phase: at the end of cycle of each iteration of the two previous steps, the obtained result is either neglected or concatenated with the assembled message so far. The message is then displayed. Keywords: human-machine communication, gestural interaction, French sign language, linked gesture recognition. 60. PaperID 310516180: An Optimization Technique for Brain Tumor Recognition (pp. 454-464) Dr. D. Rajya Lakshmi, CSE Dept in JNTUK Vizianagaram Shaik Salma Begum, CSE Dept in Gudlavalleru Engineering College Abstract - In this paper, we have proposed a robust technique to detect and classify the tumour part from medical brain images. In recent times, a number of image segmentation and detections techniques have been proposed in the literature. But, the detection of brain tumour through the help of classification technique has received significant interest among the research community. By considering the above issue, here, we combine three different techniques such as, cuckoo search, neural network and fuzzy classifier to detect the tumour part effectively. Our proposed approach consists of four phases, such as, pre-processing, region segmentation, feature extraction and classification. In the pre-processing phase, the anisotropic filter is used for reducing the noise and in the segmentation process; K-means clustering technique is applied. For the feature extraction, the parameters such as contrast, energy and gain are extracted. In classification, a modified technique called Cuckoo-Neuro Fuzzy (CNF) algorithm is developed and applied to detection of tumour region. In the modified algorithm, cuckoo search algorithm is employed for training the neural network and the fuzzy rules are generated according to the weights of the training sets. Then, classification is done based on the fuzzy rules generated. Experimental results shows that the proposed technique achieved the accuracy of 79.49% but existing technique achieved only 76.92%. Keywords: CNF, contrast, energy, entropy, K-Means, anisotropic filter, sensitivity, specificity, accuracy 61. PaperID 310516183: Permission Based Android Malware Detection System using Machine Learning Approach (pp. 465-470)

Mayuri Magdum, Computer Engineering, Modern Education Society’s College of Engineering, Pune, India Prof. Sharmila K. Wagh, Computer Engineering, Modern Education Society’s College of Engineering, Pune, India Abstract — Mobile computing has grown and developed in recent years with huge popularity. Gadgets like Smart phones, Tablets, etc have become trendy by the ease of use. Android is more famous platform and turned out to be the most important target of Malware developers in precedent years. The malware hazard for cellular telephones is evaluated to increment security and usefulness of smartphones. Hackers and malware program developers are benefitted by the limited capabilities and lack of standard security mechanism of Android. Nowadays smart phones are omnipresent, i.e. they fill numerous needs such as data storage, personal mobile communication, multimedia and entertainment etc. therefore, implementing secure mobile connections is challenging. As a result, it becomes essential to have some valuable and probabilistic detection along with preventive mechanisms. Many preventive tools are available in market but current trend for malware security is before installing the app user should be able to identify possible threats. Hence we propose permission based mobile malware detection system. It has 3 components in it 1) Client 2) Server 3) Signature Database. In the whole analysis process, Server plays important role and user is warned at the end of analysis process whether the requested app contains malware or not. Keywords- Mobile, Android, Malware, Security, Machine Learning, Static Analysis. 62. PaperID 310516190: Analysis of Decision Making Factors for Automated Intrusion Response System (AIRS): A Review (pp. 471-478) Dileep Kumar Singh, Praveen Kaushik Dept of CSE, MANIT Bhopal, India Abstract — Increasing amount of dependability on computer networks and internet services are also increasing intrusions. Intrusion Detection System (IDS) tools detect the intrusions and produce alerts. An automated Intrusion Response System (AIRS) is required to analyze the alert and trigger appropriate response to mitigate the intrusion without delay. In this paper, cost evaluation methods and response decision making capabilities of various AIRS models are analyzed. Various decision making factors that are involved in the response selection process are also identified and then categorized in response, attack and system level factors. Index Terms—Intrusion Response System, AIRS, Response selection, Response factors, Response cost. 63. PaperID 310516192: SQL Injection Prevention using Query Dictionary Based Mechanism (pp. 479-485) Adwan F. Yasin, Nael Zidan Department of Computer Science, Arab American University, Jenin, Palestine. Abstract — SQL Injection Attack (SQLIA) is a technique of code injection, used to attack data driven applications especially front end web applications, in which heinous SQL statements are inserted (injected) into an entry field, web URL, or web request for execution. “Query Dictionary Based Mechanism” which help detection of malicious SQL statements by storing a small pattern of each application query in an application on a unique document, file, or table with a small size, secure manner, and high performance. This mechanism plays an effective manner for detecting and preventing of SQL Injection Attack (SQLIA), without impact of application functions and performance on executing and retrieving data. In this paper we proposed a solution for detecting and preventing SQLIAs by using Query Dictionary Based Mechanism. Index Terms—SQL Injection Attack, SQL Injection Attack Detection, SQL Injection Attack Prevention, Query Dictionary.

64. PaperID 310516195: An Optimized Approach toward Intrusion Detection Using Cluster-Like Behavior of Attacks (pp. 486-490) Aliakbar Tajari Siahmarzkooh, Jaber Karimpour, Shahriar Lotfi Faculty of Mathematical Sciences, Department of Computer Science, Iran, Tabriz, University of Tabriz Abstract — Most of intrusion detection researches suffer from the following drawbacks: Dependencies between network nodes and cluster-like behavior of anomalies. Hence, this paper proposes a cluster-based approach in which the anomalies are detected using a new criterion related to the behavior of attacks. In addition, we provide a cluster-based data set which uses the flow-based data and graph properties to model the network traffic over time. The data set is built over the DARPA. Moreover, the anomalies are revealed by means of a criterion which is computed from internal and external weight of clusters. Finally, the proposed approach is evaluated and compared to other approaches. The evaluation results show the preference of our approach relative to other ones. Keywords- Anomaly; DARPA data set; flow; graph clustering; intrusion detection 65. PaperID 310516197: A Comparative Study of Smoothing a Vehicle’s Trajectory which is calculated by an Evolutionary Algorithm (pp. 491-496) B.A. Buran is with the Department of Basic Sciences, Turkish Air Force Academy, Istanbul, Turkey. S.H. Caglar is with the Department of Mathematics and Computer Science, Istanbul Kultur University, Istanbul, Turkey. O.K. Sahingoz is with the Department of Computer Engineering, Turkish Air Force Academy, Istanbul, Turkey Abstract — Determining a vehicle’s trajectory is a complex and hard to solve type problem in the literature and it is identified as a NP-Hard optimization problem which is studied in different engineering disciplines such as computer, electrical and industrial engineering. It has been observed that such complex problems can be solved by using various approaches and lots of them are focused on the usage of Evolutionary Algorithms especially in case of a large number of controls points which are needed to be visited. Although these algorithms provide near optimal solutions, in the real world, vehicles are not able to follow this determined path (trajectory) without any deviation. Because vehicles are moving objects and each one moves with a certain speed. Therefore it is impossible for a vehicle to make a sharp turn after visiting control points. These vehicles need to make smoothed turns over these points. Therefore there will be a certain difference between the calculated path and the real path. It is needed to determine the real path by using necessary mathematical solutions for smoothing these paths. To ensure the motion continuity of vehicles, they need to follow paths determined according to a certain criterion. In this study, the most common smoothing methods which are used to ensure these continuities (Bezier, B-Spline and Dubins) have been compared and it is aimed to show the different approaches in an application area of path planning problems as a comparative study. Keywords — Unmanned Aerial Vehicle, Path Planning Evolutionary Algorithm, Bezier Curves; B-Spline Curves, Dubins Path. 66. PaperID 310516200: Location-Based Routing Protocols GAF and its enhanced versions in Wireless Sensor Network a Survey (pp. 497-504) Hanane AZNAOUI, Said RAGHAY & Layla AZIZ Laboratory (LAMAI), Faculty of sciences and technology, University Cadi Ayyad Marrakech, Morocco Full Text: PDF [Academia.edu | Scopus | Scribd | Archive | ProQuest] Abstract - Since the last two centuries, humanity has made scale steps in this attraction to innovation and technological progress. The emergence of global networks of computers corresponding to Wireless Sensor network WSN is one of those great steps that man could do. WSN is an advanced technology that occur in response to overcome user needs. It resolves many problem such as, controlling phenomena, monitoring places, and diagnostic. Nevertheless, this

advanced technology still incomplete in order to different constraints such as energy consumption, routing, aggregated data and security, also routing information represents a critical issue in it. For that, great researches designed. In this paper, we present a survey of GAF and their enhanced versions as Location-Based routing protocols in WSN, which allows reducing the consumed energy in the network and prolonging the network lifetime. Keywords: WSN, routingprotocols, location-based, GAF. 67. PaperID 310516201: Comparison of RC2 and AES Using Windows Azure for Data Security in Cloud (pp. 505-509) Muhammad Inaam ul haq, Department of Computer Science COMSATS, Institute of Information Technology, Sahiwal, Pakistan Muhammad Umar, Department of Computer Science COMSATS, Institute of Information Technology, Sahiwal, Pakistan Syed Muhammad Owais, Department of Computer Science COMSATS, Institute of Information Technology, Sahiwal, Pakistan Abstract - Cryptography is a very useful tool to protect the properties of data like integrity, privacy, confidentiality in any environment. This paper explores some useful aspects of cryptography in cloud computing environment. There are different types of encryption algorithms used in order to ensure the data security. These algorithms are of different types like symmetric, a symmetric and hashing algorithms. The objective of this paper is performance analysis of selected set of algorithms on the basis of different parameters, so that the best out of all these options is chosen or combinations of some of them can be utilized to secure data in cloud computing environment. The algorithms included in this study are RC2 and AES. The parameters which are used for performance analysis are running time of the algorithm, data encryption capacity. These are the performance parameters which are calculated for every algorithm in cloud based environment i.e. windows azure simulator by utilizing visual studio IDE and profiler services by integrating windows azure SDK. The interpretation of these results are done by using various graphs which shows trend of a particular algorithms on basis of time of encryption and decryption. Keywords: Cryptography, Cloud Security, RC2, AES, Windows Azure 68. PaperID 31011659: Optimized and Secure Authentication Proxy Mobile IPv6 (OS-PMIPv6) Scheme for Reducing Packet Loss (pp. 510-515) Arun Kumar Tripathi, Department of Computer Science and Engineering, KIET Group of Institutions,Ghaziabad, India R. Radhakrishnan, Department of Computer Science and Engineering, ABES Engineering College, Ghaziabad, India J.S. Lather, Department of Electrical Engineering, National Institute of Technology, Kurukshetra, India Abstract — Due to continuous evolution in hand handled mobile devices such as Smartphones, Laptops, tablets and Personal Digital Assistants (PDAs) have increases the volume of traffic on Internet radically. To provide seamless Internet services and perpetual mobility to these devices, Internet Engineering Task Force (IETF) has proposed various mobility management protocols such as MIPv6, HMIPv6, and PMIPv6. MIPv6 is a host-based mobility management protocol and suffers from handover latency, packet loss etc. Recently the IETF proposed network-based mobility management protocol, known as Proxy Mobile IPv6 (PMIPv6). PMIPv6 sufficiently reduces signaling overhead but still have long authentication latency during handover and packet loss issues. To resolve these issues, an optimized and secure authentication mechanism for handover management scheme for PMIPv6 networks is proposed in this paper. Due to less authentication delay, the proposed scheme reduces the setup time and as a result has low handover latency. Subsequently, decreases the amount of packet loss during handover. The proposed scheme provides higher security infrastructure than the basic PMIPv6 protocol and additionally reduces the handover latency to contemporary protocols. The performance and results are mathematically analyzed. Numerical results show that the proposed scheme

gives better performance than the existing MIPv6 in terms of signaling delay and provide higher security than PMIPv6 protocol. 69. PaperID 31051605: Design for ALL: Catering for Culturally Diverse Users (pp. 516-524) Mahdi H. Miraz (1,2), Maaruf Ali (2), Peter S. Excell (1) (1) Department of Computing, Glyndŵr University, Wrexham, UK (2) Department of Computer Science & Software Engineering, University of Hail, KSA Abstract — Due to mass global migration and increased usage of the Internet, it is now very important to address the cultural aspects of the usability problems of any Information and Communication Technology (ICT) products such as software, websites or applications (apps) whether to be used on PCs, Laptops, Smartphones, Tablets, Smart TVs or any other devices. To augment the “Design for All” concept, this research demonstrates the need to cater for culturally diverse users while designing user interfaces. This has been achieved, by investigating ICT products and conducting an extensive literature survey. The study concludes that it is very important to work on cross-cultural usability problems and bring these issues under focus. Index Terms — Human Computer Interaction (HCI), Universal Usability, Cross-cultural Usability, User Interface (UI) Design, Design for All, Users’ Behaviour. 70. PaperID 31051611: Urban Traffic Control with Pedestrian Handling (pp. 525-534) Ayesha Shahid, Wilayat Ali Khan, Nazish Naheed, Salman Hafeez, Syeda Nuzhat Subi Naqvi, Aihab Khan Department of Software Engineering, Foundation University Rawalpindi Campus Abstract - Over the years road traffic flow has seen pedestrian crossing as a major issue in the society, particularly in urban areas where there is no control for pedestrian road crossing. In mixed traffic conditions pedestrian road crossing behavior is a serious hazard for pedestrians crossing uncontrolled bi-intersection localities. Due to increase in motor vehicle growth there is an increase in the regulation of motor vehicles only and the regulation of pedestrian is completely neglected in urban area. An increase the uncontrolled road crossing behavior of pedestrian is raises different safety and economic concerns. This paper employs computational modeling to regulate the traffic flow across a two way intersection. It is caters how pedestrians can cross a bi-intersection traffic signal without disrupting the traffic flow. Existing computational models that have been presented by other authors are discussed which gives more understanding how to control traffic flow for vehicles and pedestrians handling. This study deals three scenarios of real environment for control of traffic flow for pedestrians; with no turns, with turns and with turns. All scenarios provides proper notation for ‘on states’ and ‘off states’ of signal. Experimental result demonstrates that the proposed method achieved waiting time for vehicles 143.35 seconds and 200.23 seconds for pedestrians respectively. Furthermore, result shows the decrement of time and economical resources that are used in the daily commute. Index Terms— Pedestrian, Bi-intersection, uncontrolled traffic, Computational Modeling, Traffic Control System 71. PaperID 31051625: New Image Encryption Technique Based on Wavelet / DCT Transforms Using Lorenz Chaotic Map (NIETWDL) (pp. 535-547) (1) Abdullah M. Awad, (2) Rehab F. Hassan, (1) Ali M. Sagheer (1) University of Anbar, Ramadi, Iraq (2) University of Technology, Baghdad, Iraq Abstract - In communication networks, the data encryption has been used to safe the security of information. There are different encryption techniques that can be used to protect the data from unauthorized third person to access. This paper deals with chaos image encryption environment to hide the secret information and make communication undetectable. In this paper integer wavelet transform (IWT) and discrete cosine transform are used for increasing

hiding pixel distribution. The work uses IWT and DCT as a decorrelation stage for adjacent pixels. The performance evaluation for the proposed algorithm has been done by measuring the application using a series of tests. The tests include histogram analysis and visual test, correlation analysis encryption quality, information entropy, randomness test, sensitivity analysis and differential analysis. The proposed cipher algorithm experimental results show satisfactory security and efficiency levels for image encryption. Keywords: Chaotic Encryption; AES; RC4; Statistical Analysis 72. PaperID 31051626: Stability Analysis of Reliable Ensemble Classifiers (pp. 548-557) Zeinab Khatoun Pourtaheri, Seyed Hamid Zahiri, Seyed Mohammad Razavi Department of Electrical and Computer Engineering, University of Birjand, Birjand, Iran Abstract - In this paper, Multi-Objective Inclined Planes Optimization (MOIPO) algorithm, as a novel multi-objective technique, is used to design ensemble classifiers with high reliability and high diversity. It is noteworthy that sometimes, the reliability in decision of a classifier is more important than its recognition rate. Security and military applications are obvious instances to show the importance of this measure. In addition to reliability, diversity, as a main issue in ensemble classifiers, is considered as objective function. So, designing heuristic ensemble classifiers with high reliability and also, high diversity has a special importance but the basic point is that the applied heuristic algorithm has a stochastic nature and hence, stability analysis of this system is necessary. In this research, statistical method is used to do stability analysis of designed ensemble classifier. 73. PaperID 31051628: Design an Adaptive Kalman Filter for INS/GPS based Navigation for a Vehicular System (pp. 558-567) Mohammad Nasiri, Department of Electrical Engineering, Faculty of Engineering, University of Birjand, Iran Seyed-Hamid Zahiri, Department of Electrical Engineering, Faculty of Engineering, University of Birjand, Iran Ramezan Havangi, Department of Electrical Engineering, Faculty of Engineering, University of Birjand, Iran Abstract — Kalman filter is a very effective approach for data fusion. But, the definition of process, measurement noises, and the matrices Q, R have a great impact on the filter performance. Research works show that adjustment of matrices Q, R during the prediction process is very useful to reduce the estimation errors. So, in this paper, we attempt to increase the accuracy of Kalman filter used in INS/GPS integration algorithm by estimating measurement covariance matrix, R, based on measurement data from GPS. Our objective is to show a performance enhancement of a conventional extended Kalman filter used in an INS/GPS integrated navigation system by adjusting adaptively measurement noise covariance matrix R. This adaptive adjustment is necessary. Because, environment conditions in many systems usually are not constant and change continually. Index Terms— Integrated navigation, Extended Kalman filter, Adaptive Kalman filter 74. PaperID 31051642: Efficient Image Enhancement Using Image Mining and Hadoop MapReduce (pp. 568-575) M. Anand, V. Mathivanan AMET University, Kanathur - 603 112 Chennai, India Abstract - Multimedia has become part of our day today life especially when it comes as images. Many studies have proved that images are the most efficient way of expressing our feelings rather than a page of paragraphs. An example we can state here is the smileys we use in our messages for expressing our thoughts. The ultimate rise of social websites like Google+, Twitter and Facebook, playing major role in the Internet World has proved it wright since these websites are rich in content and huge number of images shared. The revolutionary technology development in the mobile industry is also playing the major role in using such multimedia content. Since the images are being shared in different

ways, people start compressing the images to reduce the huge amount of memory space. This compression leads to data loss (pixel) in images which affects the quality of the images. Many solutions have been identified to solve the issues. One such system uses one dimensional approach in all four directions (Row, Column, Diagonal and Inverse Diagonal); the recovery process is performed by considering the edge pattern of the existing image adjacent to the damaged data (pixel). The system also uses the method of determining the weighted sum [1] of selected point functions. Many more techniques followed like enhancement performed using: Spatial and Time domain [1], Frequency Domain Techniques [1], Brightness Preserving Bi-Histogram Equalization (BBHE) [2]. Keywords: Image Enhancement, Data Loss, Recovery process 75. PaperID 31051646: An Efficient Image Encryption Technique by Using Cascaded Combined Permutation (pp. 576-588) Muslim Mohsin Khudhair Department of Computer Information Systems, College of Computer Science & Information Technology, University of Basrah, Basrah, IRAQ Abstract - In this paper, a new simple encryption technique is proposed for gray scale image encryption. The current technique, Cascaded Combined Permutation (CCP), is a simple technique based on the primary well known 2-D permutation algorithms. The application at the permutations is performed on three steps: (1) one permutation algorithm is applied on the image; (2) the image that resulting from the first step is decomposed into four quarters. Pixels in each quarter image are then permuted with one of the permutation algorithms. The resulting encrypted quarters are combined as one image; (3) the encrypted image resulting from the second step is further encrypted by performing another permutation algorithm. Experimental results show efficient encryption that is simple in implementation and has high degree of security. It has several key points of strength such as the sequence in which the primary permutation algorithms are applied. Keywords: Permutation, Image Encryption, Image Decryption, correlation. 76. PaperID 31051658: Component Based Face Recognition using Feature Matching through Hu Moment Invariants (pp. 589-604) Sushil Kumar Paul, Mohammad Shorif Uddin Department of Computer Science and Engineering, Jahangirnagar University, Dhaka-1342, Bangladesh Saida Bouakaz, LIRIS Lab, University Claude Bernard Lyon1, 69622 Villeurbanne Cedex, France Abstract — In this paper, a Face Recognition Algorithm using Hu moment invariants (HMIs) is described for identifying human faces based on the facial component-features (FCFs). Algorithm is adopted by Viola Jones detector which is applied the concept on the AdaBoost algorithm for detecting the face from a face database having diverse illuminations and expressions with complex background. Then only the face region is cropped and illumination correction is done using histogram equalization technique. Finally, face is converted into binary image by applying cumulative distribution function (CDF) with adaptive thresholding. Three types of statistical pattern matching tools such as Standard deviation of Hu moment invariants (StdDevHMI), absolute difference of probability of white pixels (AbsDiffPWP) and pixel brightness values (PBVs) through L2 norms are determined using five facial components such as two eyes, nose, mouth and whole face for both binary and gray level images, respectively. Lastly, face recognition is carried out by taking these statistical pattern matching tools with logical and conditional operators along with appropriate threshold values. Experimental studies are performed on the BioID database and algorithm shows a better result as compare to the existing popular methods. Keywords -- Cumulative distribution function, adaptive thresholding, probability of white pixels, facial component-features, shape matching, Hu moment invariants, pixel brightness values.

77. PaperID 31051664: A Robust and Efficient Optical Flow Analysis Based Vehicle Detection and Tracking System for Intelligent Transport System (pp. 605-613) S Sri Harsha, Department of IT, VR Siddhartha Engineering College, Vijayawada, Andhra Pradesh, India K. R. Anne, Director Academics, Veltech University, Chennai, Tamilnadu, India Abstract - In this paper, an enhanced optical flow analysis based moving vehicle detection and tracking system has been developed. A novel multidirectional brightness-intensity constraints (MBIGC) estimation and fusion based optical flow analysis (MDFOA) technique has been proposed that performs simultaneous pixel’s intensity and velocity estimation in a moving frame for detecting and tracking the moving vehicle. The conventional Lucas Kanade and Horn Schunck optical flow analysis algorithms have been enhanced by incorporating a multidirectional BIGC estimation, which has been further enriched with a non-linear adaptive median filter based denoising. Such novelties have significantly enhanced the video segmentation and detection. A vector magnitude threshold based MDOFA algorithm has been developed for motion vector retrieval that eventually enables swift and precise moving vehicle segmentation from the background frame. A heuristic filtering based blog analysis has been applied for vehicle tracking. The MATLAB based simulation reveals that MDFOA-HS outperforms LK in terms of execution time and detection accuracy. In addition, the accurate traffic density estimation affirms robustness of the proposed system to be used in intelligent transport system. Keywords: Multidirectional brightness-intensity constraint Optical flow analysis, intelligent transport system, Lucas Kanade, Horn Schunck. 78. PaperID 31051681: Area Efficient Digital Logic Circuits based on 5-input Majority Gate Using QCA (pp. 614-623) D. Ajitha, JNTUA, Ananthapuramu, India A. Harika, SITAMS, Chittoor, India Abstract - Quantum-dot Cellular Automata (QCA) is one of the most significant technology among the Nano devices for computing at the Nanoscale. The key logic elements in QCA are majority gate and inverter. The majority gates are 3-input majority gate and 5-input majority gate. In earlier designs all the digital logic circuits are implemented using 3-input majority gate based on 2:1 multiplexer. The limitations of the 3-input majority gate are it requires the number of cells for constructing large architectures involves high complexity, connectivity is difficult, laborious and low reliability. Hence, the design of digital circuits in this paper is implemented with 5-input majority gate based 2:1 multiplexer. The 5-input majority gate reduces cell counts, the number of clocks required and area compared to existing designs. The proposed designs such as XOR gate, XNOR gate, D-latch, D flip-flop, T-latch, and T flip-flop have significant improvements regarding the number of gates, cell count, and delay. The proposed circuits are simulated with QCADesigner and results were included to verify the functionality. Keywords: Quantum-dot Cellular Automata (QCA), Five-input Majority gate, Multiplexer, Logic gates, Sequential logic. 79. PaperID 31051689: Human Emotion Recognition and Prediction Using Socialism Media (pp. 624-633) Dr. Tanvir Ahmed, Tamoor Khan Lahore Leads University, Pakistan, Department of Computer Science Abstract - Humans are unpredictable; there is no exact way or definition of emotion prediction. Detection of human emotion is difficult because when we want to observe people’s behavior then they behave in normal way or better than abnormal behavior. May be another way where people want to collaborate with others to share their emotions, their daily basis problems, where they feel easy to share their expression without any fear. Maximum people are not agreeing to share their emotion due to shame and fear. We need a platform where people can share their actual problem (which they are internally facing) and release their frustration. Many people want solution without sharing of their

problems to anyone. In order to solve this problem, social media is a best way where people can share their emotional behavior without any fear and we can detect their emotion as silent observer through social media. In this paper we will analyze their posted data on social media and we have provided the suggestion to solve their problems; also we detected the emotion of people through social media. We collected data from social website (Twitter .etc.) where people have shared their thoughts or feelings. Meanwhile, we designed an algorithm which takes data from that social website and on the basis of that data; application provides the result as previous emotional state of a person. A systematic approach was used to detect the emotion of people through social media data. This is a better way where a person wants to collaborate with other to share his emotions, his daily basis problems and he feels easy to share his expression without getting panic. This Emotional based approach described things in a new way, where all predictions can be measured according to the subject environment and application can provide better results in decision making. This approach has used the data from social portals like Twitter etc. where peoples are posting their data in form of emotions. Prediction and recognition of emotions is a better way to analyze the emotion of people as silent observers. Keywords — Emotion, Silent Observer, Parts of Speech (POS), Social Media(SM), Adjective 80. PaperID 31051690: Using Adaptive Filters for Object Tracking and Improving the Method Using Metaheuristic (pp. 634-640) Farzad Khadem Mohtaram, Majid Mohammadi Department of Computer, Buin-Zahra Branch, Islamic Azad University, Buin-Zahra, Iran Abstract - The video detection based on the image sequence of the area of interest has attracted considerable attention. Particles filtration is one of the most development algorithms particularly in restoration of probability density function of goal state. Accordingly, the main objective of present study is utilization of adaptive algorithm for detection of inflexible objects. The simulation method was applied and data analysis is done by MATLAB software. The results represent that, filtration of the suggested particle achieved better performance than filtration of the standard particle in terms of prediction error of status, detection of video error, and the number of significant particles. It revealed that, the particle filtering enhanced the number of significant particles by IGA and, forced the collection of particles to better expression of actual status. This could enhance the accuracy of status prediction and reduced the error. Keywords: adaptive algorithm, inflexible, objects detection, particle filtration 81. PaperID 31051695: Agile Practicing and Outsourcing (pp. 641-648) Muhammad Sarfraz (1), Maria Ramzan (2), Akhter Rasheed (3), Fateh Ali (1) (1) Department of Mathematics and Statistics, Riphah International University Islamabad, Pakistan (2) Govt. Post Graduate College for Women Satellite Town Rawalpindi, Pakistan (3) Department of Mathematics, COMSATS Institute of Information Technology Abbottabad, Pakistan Abstract - The software industry can be widely seen as a key driver for business improvement. Outsourcing of software development tasks has become a major issue for large software enterprises. Software outsourcing has been progressively increasing. However significant outsourcing failure rates have also been reported. Therefore, outsourcing occurred by the wrong decision can cause major technological and economic setbacks. The objective of this research is to develop a model for outsourcing in order to improve outsourcing process and to help out the organizations to overcome barriers (communication, coordination & quality) that may have a negative impact on software outsourcing as well as to improve their success rate. Literature is consulted to highlight various issues of outsourcing. A case study is conducted to validate the effectiveness of our proposed model. The purposed model contains different practices of agile which provide an effective way to improve coordination, quality assurance and reduces communication gaps in outsourcing. Index Terms- Agile, Outsourcing.

82. PaperID 310516101: Model Driven Architecture for Secure Software Development Life Cycle (pp. 649-661) Muhammad Asad, Shafique Ahmed National University of Sciences and Technology, Islamabad Abstract – Secure Software Development is an important issues for the software industry for couple of years as security issues in the software development life cycle are not easy to handle. Success of a software deeply depends on the fact that it is not easily vulnerable to security threats and breaches. Many organizations have made security guidelines to cope with these challenges to bring them in an organized and secure way. Besides so much advancements in the field, securing the software from vulnerabilities in not achieved in all modules of software development life cycle. The guidelines and methods designed for the secure software development have put a lot contributions but they are so verbose that these measures are nearly not implementable. In this paper a model is proposed for secure software development life cycle in model driven architecture level (MDA-SDLC). In the proposed model, modeling methods and approaches are used to ensure the advances in secure model driven architecture with simplified integrity of security modules in security critical software’s development lifecycles. Keywords — Model Driven Architecture, Security, SDLC, UML, 83. PaperID 310516108: Social Relation Based Recommendation System For Information Overloaded Social Networks (pp. 662-671) S. Uma Shankari, Bhararthyiar University, Coimbatore Dr. M. Chidambaram, Rajah serofiji College, Thanjavur Abstract - Social persuade plays vital part in the product marketing. Though, it’s seldom been regarded in traditional Recommender systems (RS). This paper provides new paradigm RS which can exploit data in the social networks, with general approval of items, user preferences, and persuade from the social friends. The probabilistic representation is improved to build personalized recommendations like data. In world e-marketing, new commerce representations are normally introduced, new tendency started to materialize. Latest trend is the social networking websites, several of which concerned not only huge number of visitors and users, however online advertise company to put their ads on sites. This paper discovers online social networking like new e-marketing trend. We first inspect online social network like new web-based services, also evaluate social networks by other delegate web-based service. We extort information from real online social network, also our investigation of this huge dataset expose that friends contain tendency to choose similar items and provide similar ratings. The experimental outcome on the dataset illustrates that proposed scheme not only progress prediction accuracy RS but gives solution cold-start and data sparsity problems intrinsic in the collaborative filtering. Moreover, we recommend improving system performance by concern social networks semantic filtering, and authenticate its improvement through class project research. In this research we reveal how related friends may be choose for deduction based on the semantics friend relations and finer-grained customer ratings. Such technologies may be organized by mainly content providers. Keywords: Recommender systems, collaborative filtering, social network 84. PaperID 310516109: Software Reengineering - A Frame of Reference (pp. 672-678) A. Cathreen Graciamary, Bhararthyiar University, Coimbatore Dr. Chidambaram, Rajah Serofiji College, Thanjavur Abstract — Now day development of software is describe by immediate process. Old systems have to take on the recent technologies; It can be achieved by changing or finding the features, I.e, Reengineering. Our proposed paper clarifies about the reengineering process of software. It also explains the efficient and better process in reengineering. There are two type common reengineering objectives. Improved feature: the existing software system will be of minimum quality, because of more changing during the time course. The main objective of reengineering is to increase

software quality and to provide present working documentation. A higher quality degree is needed to enhance reliability, to minimize the maintenance cost, to develop maintainability, and to make for functional improvement. Keyword- Software Reengineering, Reverse Engineering, Enhanced Reengineering, SVM classification, Software component. 85. PaperID 310516137: Analyzing Virtualization based Energy Efficiency Techniques in Cloud Data Centers (pp. 679-686) Beenish Gul, Fiaz Gul Khan, Iftikhar Ahmed Department of Computer Science, COMSATS Institute of Information Technology, Abbottabad, Pakistan Abstract - Cloud computing provides IT services to users worldwide, Data centers in Clouds consume large amount of Energy leading to highly effective costs. Therefore green energy computing is solution for decreasing operational costs. This survey presents efficient resource allocation and Scheduling algorithm/Techniques analyzed on different network parameters without compromising network performance and SLA constraints. Results are analyzed on different measures, providing a significant cost saving and improvement in Energy Efficiency. Keywords: Data Centers, Virtualization, Consolidation, Virtual Machines, SLA 86. PaperID 310516145: Image Share Pane Tool: Image Sending Approach to Mobile via Bluetooth Device (pp. 687-690) Farhan Ali Surahio, Awais Khan Jumani, Javed Ahmed Mahar, Hidayatullah Shaikh Department of Computer Science, Shah Abdul Latif University, Khairpur Mirs, Sindh, Pakistan Abstract — Nowadays, Microsoft Word is commonly used in various areas including industries and academia. Microsoft word has introduced great user friendly features, for instance, Screenshot and Screen Clipping, Smart lookup, Tell Me and others. Among them, Layout option button has given us to set objects with line in text. Furthermore, Different types of panes have provided for various tasks. Microsoft Word has given us a facility to greet with thumbnail image of every window you have opened at the moment. Many users while working on document need to insert or capturing images with Screenshot and Screen Clipping, they want to share inserted images to mobile via Bluetooth But, Users are disappointed because there is no any tool provided to accomplish that task and user takes a long procedure to apply for sharing images to mobile through the Bluetooth. This paper provides an application which helps users to send an inserted image via Bluetooth while working on Microsoft word and they do not to switch any window. By adding it into existing Microsoft Word it will helpful for people living across the world. Keywords- Screen Clipping; Layout Option; Share Option Button; Share Image Pane; Image capture format type 87. PaperID 310516154: An Optimal Approach for Securing the Data in Cloud Storage using Block Division and Predicate Encryption (pp. 691-696) P. Vijaya Bharati, Department of Computer Science & Engineering, Vignan’s Institute of Engineering for Women Kapujaggarajupet, Visakhapatnam Prof. (Dr.) T. Sita Mahalakshmi, Department of Computer Science & Engineering, Gitam college of Technology Gitam University, Visakhapatnam Abstract — The “pay-as-you-go” cloud computing model is an efficient alternative to store the data at a cheaper cost. Ensuring data security in cloud computing platforms is critical and has become one of the most significant concerns in the emerging field of cloud computing. The location of the servers where the data is stored and being accessed are not known to the end user. There are many numbers of different security models and algorithms which are applied to secure the data stored in the cloud. While these techniques are very nice, we cannot really always tell that they are

“unhackable”. Given enough time, brains and tools any technique might be breakable because the techniques are not fine grained. The existing algorithms have their own flaws and so in this paper we proposed a method that is been improved in such a way that the data stored on the cloud is secured. The proposed method initially uses a lossless block division which divides the data into blocks and then division is applied storing the remainder and the group to which it belongs to separately and later we apply predicate encryption scheme on the data to be stored (remainder data) in which the keys correspond to predicates and cipher texts are associated with attributes. The public key PK with an attribute ‘x’ is used to encrypt the text and the secret key SKf corresponding to predicate f can be used to decrypt a cipher text with attribute ‘x’ if and only if f(x)=1. Keywords: Block Division, Predicate Encryption, Predicates, Attributes, Secret Key 88. PaperID 310516164: A Collaboration between Two Readers for Clustering and Identification in RFID systems (pp. 697-706) OUAKASSE Fathia, Applied Mathematics and Computer Science Laboratory (LAMAI) Cadi Ayyad University Marrekesh, Morocco. RAKRAK Said, Applied Mathematics and Computer Science Laboratory (LAMAI) Cadi Ayyad University Marrekesh, Morocco. Abstract - Radio Frequency Identification RFID is one of the most important technologies used in the internet of things. It is increasingly used in various applications because of their high quality as well as their low costs; however the avoidance of collision of tags during the identification process represents a great challenge, especially when the number of tags is too large. In this paper we propose a new mechanism, based on Progressive Scanning Algorithm, to group tags in the interrogation zone of a reader. The proposed mechanism consists in the deployment of two readers having the same interrogation zone. Simulated results show that the proposed mechanism can appropriately achieve higher performance compared to other existing algorithms in terms of the number of time slots allowing identifying tags and effectively in terms of total time required to do this. 89. PaperID 310516177: Web Page Classification based on Context’s Semantic Correlation (pp. 707-713) Mehrdad Ranjbar-Khadivi (1), Mohammad-Reza Feizi-Derakhshi (2) (1) Department of Computer, East Azerbaijan Science and Research Branch, Islamic Azad University, Tabriz, Iran (1) Department of Computer Engineering, Tabriz Branch, Islamic Azad University, Tabriz, Iran. (2) Department of Computer Engineering, University of Tabriz, Tabriz, Iran. Abstract - Automatic web pages' classification is one way to deal with the increasing range of the World Wide Web. Considering that most of the content of web pages is text, so classification based on text is seems to be an efficient solution. The methods used for text classification are usually based on the key words. But if illusive keywords appear within the web page, then the class of the webpage will not be properly diagnosed. Therefore, rather than paying attention to the words, it is needed to be given to content and words meaning. In this paper, a method based on content semantic correlation has been proposed. A text consists of paragraphs, sentences and words. In this study at first text is divided into its components and stop words is removed. Then, in order to forms the basis of the words, it will be needed to find the root of the words. The Hypernyms Tree of words can be extracted by using FARSNET. By using this method not only is the meaning of the terms considered but also there is no need to clarify the words. After extracting the Hypernyms Tree for all keywords, text feature vector is created. Then the similarity of the text to each of the available categories measured. Finally, KNN classification algorithm is used to recognize the right class of the webpage. The results show that by using this method, classification accuracy is increased by 0.17 in compared with other methods. 90. PaperID 310516178: Relevance Feedback in XML Retrieval Based on Classification of Elements (pp. 714-734)

Inès KAMOUN FOURATI, Mohamed TMAR, Abdelmajid BEN HAMADOU Multimedia, InfoRmation systems and Advanced Computing Laboratory, SFAX, TUNISIA Abstract - Unlike classical information retrieval systems, the systems that treat structured documents include the structural dimension through the document and query comparison. Thus, the relevant results are all elements that match the user needs rather than the entire document. In such a case, the document and query structure should be taken into account in the retrieval process as well as during the reformulation. Query reformulation should also include the structural dimension. In this paper, we propose an approach of query reformulation based on structural relevance feedback. We start from the original query and the fragments judged as relevant by the user. The analysis of the structure of document fragments and textual content of elements enables identify elements that match the user query and rebuild it during the relevance feedback step. The main goal of this paper is to show the impact query reformulation based on an analysis of the structure and content of each relevant element retrieved by an initial search process. Some experiments have been undertaken into a dataset provided by INEX to show the effectiveness of our proposals. Keywords: Information retrieval; XML document; relevance feedback; Line of descent matrix; Classification. 91. PaperID 310516181: An Access Fairness Resource Provisioning of Services for Energy Efficiency in Wireless Cellular Ad-hoc Network (pp. 735-747) Sridhara S. B., Assistant professor Department of Electronic and Communication, Rajiv Gandhi Institute of Technology, VTU, Bangalore, India Dr. Ramesh B., Professor Department of Computer Science and Engineering, Malnad College of Engineering, VTU, Hassan, India Abstract - The recent growth and development of smart phone technology have resulted in the growth of production of low cost smart phone devices. Due to the availability of low costs smart devices have resulted in increasing in the number of application and its user. The users in cellular network are mobile in nature and varied application services is been used such as FTP (File Transfer Protocol), VoIP (Voice over Internet Protocol), Multimedia services etc…which requires different data rate for each services. To assure a QoS (Quality of Services) for this kind of user application dynamic requirement and is a challenge that exists in existing wireless cellular adhoc network that need to be addressed. To achieve an efficient QoS & D2D (Device to Device) architecture is required. Many existing work based on D2D on cellular network have been proposed in recent times but they are not efficient in term of access fairness for varied traffic classes and it induces high cost of deployment since it require new infrastructure. To overcome this here the author adopts a cost effective D2D multicast communication based on pre-processed cellular infrastructure graph and admission control strategy for selectivity of services of varied traffic size in order achieve an efficient access fairness that reduces the packet drop rate and improves the overall packet delivery ratio of the network. The simulation outcomes show that the proposed model reduces the packet drop rate and improves the packet delivery ratio of the cellular ad-hoc network. Keyword: Admission control, cellular network, graph pre-processing, d2d, routing. 92. PaperID 310516188: Decision Supporting Technique and Conventional Approaches – A Review (pp. 748-769) Dr. S. Manju, Department of Computer Science, Sri Ramakrishna College of Arts and Science for Women, Coimbatore Abstract - Brainstorming is a technique for generating a large number of ideas for creative problem solving. The generation of new ideas, especially high quality creative ideas is important for a problem. It is a popular method of group interaction in both educational and business sectors. Brainstorming engenders synergy i.e., an idea from one participant can trigger a new idea in another participant. Brainstorming must been recognized as an effective group decision supporting approach. This paper discusses about some of the variations of Brainstorming techniques and

previous approaches carried out to improve the quantity and quality of ideas, significance of creative thinking, target to increase productivity, requirement of group brainstorming and effectiveness of E-Brainstorming. Keywords: Brainstorming, Decision Support System, Creativity, Management Information System. 93. PaperID 310516191: A Neural Network Model for Predicting Insulin Dosage for Diabetic Patients (pp. 770-777) Bilal M. Zahran, Department of Computer Engineering, Faculty of Engineering Technology, Al-Balqaa Applied University, Jordan Abstract - Diabetes Mellitus is a chronic metabolic disorder. Normally, with a proper adjusting of blood glucose levels (BGLs), diabetic patients could live a normal life without the risk of having serious complications that normally developed in the long run. However, blood glucose levels of most diabetic patients are not well controlled for many reasons. Although the traditional prevention techniques such as eating healthy food and conducting physical exercise are important for the diabetic patients to control their BGLs, however taking the proper amount of insulin dosage has the crucial rule in the treatment process. In this paper we have proposed a model based on artificial neural network (ANN) to predict the proper amount of insulin needed for the diabetic patient. The proposed model was trained and tested using several patients' data containing many factors such as weight, fast blood sugar and gender. The proposed model showed good results in predicting the appropriate amount of insulin dosage. Keywords: Diabetes, Artificial Neural Network (ANN), Blood Glucose Levels (BGLs) 94. PaperID 310516193: An Optimum Dynamic Time Slicing Scheduling Algorithm Using Round Robin Approach (pp. 778-798) Mohammad Salman Hafeez & Farhan Rasheed Department of Software Engineering, Foundation University Islamabad, Pakistan Abstract - Process Management is one of the primary tasks achieved by the Operating Systems. The system’s performance sententiously depends upon CPU scheduling algorithms. Round Robin, contemplated as the most extensively endorsed CPU scheduling algorithm, is an optimal solution for the timeshared systems. In timeshared systems, selection of the time quantum plays a pivotal role in performance of CPU. In Round Robin, the static nature of the time quantum emerges some problems directly related to the quantum size which decreases the performance of CPU. In this paper, selection of time quantum is reviewed and a new algorithm for CPU scheduling, Optimum Dynamic Time Slicing Using Round Robin (ODTSRR) is proposed for timeshared systems. The proposed algorithm is based upon dynamic time quantum. Round Robin algorithm is redressed in this paper, ODTSRR also contains the advantages of RR (Round Robin) CPU scheduling algorithm have less chances of starvation. Performance of proposed algorithm is compared with RR and other shades of RR and the results revealed that the proposed algorithm is better in response time & waiting time, context switch rates, turnaround time and throughput hence resulting in optimized CPU performance. Keywords: Operating System, Scheduling, Round Robin CPU scheduling algorithm, Time Quantum, Context switching, Response time,, Turnaround time, Waiting time, fairness. 95. PaperID 310516194: Profile Screening and Recommending using Natural Language Processing (NLP) and Leverage Hadoop Framework for Bigdata (pp. 799-811) Mrs. D.N.V.S.L.S. Indira, Dr. R. Kiran Kumar Dept. of Computer Science, Krishna University, Machilipatnam,

Abstract - Recommendation has been a major area that any recruiter would look for on a given job description. Increase in digital communication has made things easy to upload resumes and make it available for recruiters; on the other hand increase in technologies would make any recruiter difficult to scan it manually. Here we introduce an application which processes text data, understands sentence behavior unlike conventional keyword search applications and gives out required resume as per job description provided to application. This application makes use of Natural Language Processing (NLP) which helps in data training and feature extraction of the text data. Using NLP methods, semi structured text data is converted to structured format with required extracted features. To make this application scalable to any size of data we propose this implementation on Hadoop framework, which can handle any number of resumes or even more than petabytes of data, termed as bigdata. Keywords: BigData, Attribute Tagger, NLP Methods, Named Entity Recognition (NER), Map-Reduce, Hadoop, HBase, Hive 96. PaperID 310516199: Real Time Variable Voltage Scaling to Design Energy Efficient Systems (pp. 812-820) Ankita Soni & Praveen Kaushik Department of Computer science and Engineering, Maulana Azad National Institute of Technology, Bhopal, India Abstract - With the immense increase in the processing power over the past few decades, battery life has proved to be a crucial resource. Since energy varies quadratically with voltage in the CMOS based processors, Dynamic Voltage Scaling (DVS) offers a solution to conserve the battery power by lowering the supply voltage. However, reducing the voltage increases the execution time and therefore, real time scheduling has to be combined with DVS so as to provide the deadline guarantee. This paper presents an algorithm, Recurring Variable Voltage Scheduling(RVVS) to extend the battery life using a combination of variable voltage and a real time scheduling algorithm (Earliest Deadline First). The paper also mathematically proves that if two voltage levels are used such that one is twice the other, up to 50% energy can be saved. Mathematical proof of delay increment due to voltage reduction has also been presented. RVVS has been optimized in order to reduce the overall energy dissipated by switching by introducing a factor ‘n’ that denotes the number of time units after which the voltage switch can occur. RVVS has been applied to task sets having different number of tasks providing an average energy saving of 27%. This significant amount of energy saving helps extending the battery life to a remarkable extent and proves the worth of RVVS in the field of real time DVS. Keywords: Dynamic Voltage Scaling; Earliest Deadline First; Real time scheduling; Voltage switching; Energy efficiency; Variable voltage 97. PaperID 310516202: Design and Detection of Network Covert Channel - An Overview (pp. 821-828) R. Rajamenakshi, Department of Computer Science, Avinashilingam Deemed University, Coimbatore, India Dr. G. Padmavathi, Department of Computer Science, Avinashilingam Deemed University, Coimbatore, India Abstract - Sensitive information leakage is increasing due to wide spread use of internet and technology. The attackers find new ways to exfiltrate data that pose threat to data security and privacy. Here our focus is on the covert information leakage over the network that exploits the various network protocols and their behavior. Information leak over covert channels exploit a variety of protocols of network protocols including Wireless, mobile and virtualized cloud platforms etc. Current network security solutions like IDS, IPS, firewalls etc. are not designed to handle these type of attacks. These type of attacks are dynamic in nature and mimics the legitimate traffic behavior, there by posing a challenge to detect and prevent. This article presents comprehensive review of the network covert channel, design, detection and mitigation. We have reviewed the classification of covert channels based on the attacks. 98. PaperID 31051678: Generalized Intuitionistic Fuzzy Interior Ideals of Semigroups (pp. 829-836) Muhammad Sajjad Ali Khan, Muhammad Shakeel, Khaista Rahman Department of Mathematics, Hazara University, Mansehra, Pakistan

Saleem Abdullah, Department of Mathematics, Abdul Wali Khan University, Mardan, KPK, Pakistan Abstract — In this paper we introduce and study a new sort of intuitionistic fuzzy interior -hyperideals of a -semihypergroup, called (, )-intuitionistic fuzzy interior -hyperideals by using the combined notions of belongingness and quasicoincidence of intuitionistic fuzzy points and intuitionistic fuzzy sets and some interesting properties are investigated. We show that an IFS A = ⟨A, A⟩ is an (∈, ∈∨q)-intuitionistic fuzzy interior -hyperideal of H if and only if U(t, s) =x ∈ H: x(t, s) ∈A for all t ∈ (0,0.5] and s ∈ [0.5, 1) is interior Γ-hyperideal of H. Moreover, we show that an IFS A = ⟨A, A⟩ is an (∈, ∈∨q)- intuitionistic fuzzy interior -hyperideal of H if and only if [A](t, s) =x ∈ H: x(t, s) ∈ ∨qAfor all t ∈ (0, 1] and s ∈ [0, 1) is an interior -hyperideal of H. These showed that (∈, ∈∨q)-intuitionistic fuzzy interior -hyperideals of H are generalization of existence of intuitionistic fuzzy interior Γ-hyperideal of H. Keywords: Semigroup, Intuitionistic fuzzy point; Intuitionistic fuzzy sets; (, )-Intuitionistic fuzzy interior ideal. 99. PaperID 310516138: Pythagorean Fuzzy Hybrid Geometric Aggeration Operator and Their Applications to Multiple Attribute Decision Making (pp. 837-854) Khaista Rahman, Muhammad Sajjad Ali Khan, Muhammad Shakeel Department of Mathematics, Hazara University, Mansehra, KPK, Pakistan Saleem Abdullah, Department of Mathematics, Abdul Wali Khan University, Mardan, KPK, Pakistan Abstract: There are many aggregation operators and its applications have been developed up to date, but in this paper, we develop the Pythagorean fuzzy hybrid geometric (PFHG) operator, and also study some properties, such as monotonicity, idempotency, and boundedness of the proposed operator. Pythagorean fuzzy hybrid geometric operator is the generalization of the Pythagorean fuzzy weighted geometric (PFWG) operator and the Pythagorean fuzzy ordered weighted geometric (PFOWG) operator. Finally, we apply the Pythagorean fuzzy hybrid geometric (PFHG) operator to deal with multiple attribute decision making (MADM) problems under Pythagorean fuzzy information. Using Pythagorean fuzzy hybrid geometric aggregation operator, we also develop an algorithm for multiple attribute decision making (MADM) problems. Lastly we construct an example for multiple attribute decision making MADM problems. Key words: Pythagorean fuzzy sets, Pythagorean fuzzy hybrid geometric PFHG operator. Decision making problems. 100. PaperID 310516143: Cultural Factors Affecting ICT Acceptance Case Study: Industries Located in Science and Technology Park, Tehran (pp. 855-865) Mina Babazadeh Farokhran (*1), Behrouz Eskandarpour (2), Hossein Eskandarpour (3), Rogaye Rezaee Giglo (1), (1) Young Researchers and Elite Club, Germi Branch, Islamic Azad University, Germi, Iran (2) Department Of Management Payamenoor University (Pnu) Iran, (3) Zanjan Islamic Azad University, Zanjan, Iran Abstract - Application of new technologies is considered as a key factor for the development of companies in recent years. This puts emphasis on the importance of reviewing factors influencing the acceptance of information technology culture. This study has been done aiming to identify factors influencing the information technology acceptance in companies located in the Tehran science and technology park. 80 companies from industries based in science and technology parks in Tehran were selected of these, 72 questionnaires have been evaluated and Cronbach's alpha was used to measure the reliability and validity of measurement tools. The reliability coefficient of the questionnaire is 0.86, which indicates high reliability of the applied questionnaire and content validity was confirmed by instructors. The research data is analyzed by SPSS which uses the correlation analysis along with significance levels and in the following, t and f tests have been used to study the research additional hypotheses. The results of this study showed that the usefulness and ease of use and subjective norms affect the information technology acceptance through

behavior intent and using independent ttest, it was found that looking at research indicators is alike among men and women. Based on the f statistics, attitude to these indices among different education levels is different and the respondents' education has an impact on attitudes to these indicators. Keywords: cultural factors, Information Technology, technology acceptance, TAM, UTA

Location-Based Routing Protocols GAF and its enhanced
versions in Wireless Sensor Network a Survey
Hanane AZNAOUI, Said RAGHAY, and Layla AZIZ
Laboratory(LAMAI),Faculty of sciences and technology, University Cadi Ayyad Marrakech, Morocco
Summary Since the last two centuries, humanity has made scale steps in
this attraction to innovation and technological progress. The
emergence of global networks of computers corresponding to
Wireless Sensor network WSN is one of those great steps that
man could do. WSN is an advanced technology that occur in
response to overcome user needs. It resolves many problem
such as, controlling phenomena, monitoring places, and
diagnostic. Nevertheless, this advanced technology still
incomplete in order to different constraints such as energy
consumption, routing, aggregated data and security, also
routing information represents a critical issue in it. For that,
great researches designed. In this paper, we present a survey of
GAF and their enhanced versions as Location-Based routing
protocols in WSN, which allows reducing the consumed energy
in the network and prolonging the network lifetime.
Key words: WSN, routing protocols, location-based, GAF.
1. Introduction
Due to latest technological progresses, WSN is widely
considered as one of the most essential technologies.
In recent years, it has received specific attention from
both industry and academia around the world. A WSN
usually contains a huge vast number of nodes deployed,
communicate over short distance using a wireless
medium and cooperate to complete a collective job, for
example, military surveillance, environmental
monitoring, and industrial control.
When events arrived data collected by the sensors sent
directly or through other sensors to base station called
sink, which transfer aggregated data to treatment center,
this process shown at figure 1.
Fig. 1. WSN architecture.
WSNs applied in all areas as shown at Table 1 and in
many of them; nodes are randomly scattered and
organizing themselves using wireless communication.
These sensor nodes should work for a great length and
powered by battery, but in the majority of cases, it is very
difficult and also even impossible to recharge or change
batteries. For that matter, to optimize energy constraints
of vast deployed sensor nodes, it necessitates a set of
routing protocols to implement various network
management functions and control like synchronization
of transmitting data, localization position, and
aggregation also network security.
The traditional routing protocols consume several
shortcomings when applied to WSNs, Nevertheless,
several routing protocols are invented [1] [2] [3] [4] [5]
and are in fact classified according to three families
data-centric routing, hierarchical routing and location
based routing protocols.
Data-centric (DC) routing [6]., in this family, the base
station sends questions to certain areas of interest and
waits for request data from sensors responsible for
collecting data in the regions selected.
International Journal of Computer Science and Information Security (IJCSIS), Vol. 14, No. 6, June 2016
497 https://sites.google.com/site/ijcsis/ ISSN 1947-5500

Specifying type and properties of data in this kind of
routing protocols is necessary, in order to know which
data is being sent by queries from one source to
destination, the process of DC is based on the objective
of eliminating repetitive data in network by using
aggregation, so that reducing transmissions, saving
energy and extending the network lifetime. As opposed
to traditional routing protocol called end-to-end, DC
routing catches routes from several sources to destination,
which allows in-network integration of redundant arrived
data, Figure 2 shows the principal process of DC routing.
Hierarchical: The key goal of hierarchical routing is
based on the objective of efficiently conserve the energy
consumption of nodes during transmitting data. This
process is by dividing the network into clusters and in
each one electing one manager, which called Cluster
Head (CH) responsible for applying aggregation in data
received from sensor nodes and transmit it to the BS. In
order to diminution the number of transmitted messages
to the sink. So that prolonging the network lifetime,
Figure 3 shows the principal process of Hierarchical
routing. Clustering can make available higher network
performance due to the minimize number of sensor
nodes which sends data to the BS directly in the other
kind of routing protocols.
Location-based [ ]: in this architecture kind of network,
sensor nodes are deployed in random way in area of
interest, nodes are regularly known by the geographic
position where they are scattered. They are located
mostly by means of GPS (Global Positioning System),
where the distance from node to another expected by the
signal received from those nodes, coordinates data
calculated by exchanging information between
neighboring nodes. This approach optimize the energy
consumption, which prolong the network lifetime due to
uses of location.
Table 1. Classification of routing protocols
Classification Protocol
Data-centric
DD, RR, SPIN, COUGAR,
AQUIRE
Hierarchical
LEACH, PEGASIS, TEEN,
APTEEN
Location based
MECN, SMECN, GAF, GEAR
Our paper is organized as two sections, the first one
contains the related work especially GAF protocol and
its improved versions, and the second one contains the
comparative study of GAF and its enhanced versions.
2. GAF: Geographic Adaptive Fidelity
Protocol
Different location based protocols are proposed in order
to reduce the energy consumption in wireless sensors
network [7] [8] [9].
GAF protocol is location-based protocol, which
improves the energy consumed by sensors nodes.
(GAF) [10] Geographic Adaptive Fidelity, first proposed
for MANETs; however, it also used for WSNs. It
organizes sensors into equal groups based on their
positions geographic using GPS, or other localization
systems.
Despite of the location system used, it is impossible to
find equivalents sensors in terms of transmission
between the sensors.
The algorithm and the operating principle of GAF is
based on the model of virtual grid, which allows to
divide the network into virtual zones called square grids,
in each grid sensors can talks with each sensor in the
neighboring grid. In addition, each sensor node can be in
three modes: Active, Discovery and sleeping as shown in
figure 2. This concept resolve the problem of finding
equivalents sensors for transmission. The dimension of
the grid squares is taken based on the fact that any two
farthermost sensors in whichever adjacent grids can be
able to communicate with each other. As presented in
Figure 3, it showed that in each grid only one sensor is
full of life, which is responsible to transmit packets to a
sensor located in the neighboring grid, while the others
are in sleep state, which allows prolonging the network
lifetime.
Fig. 2. Transition state in GAF.
International Journal of Computer Science and Information Security (IJCSIS), Vol. 14, No. 6, June 2016
498 https://sites.google.com/site/ijcsis/ ISSN 1947-5500

Fig. 3. Architecture of GAF protocol.
GAF is a totally distributed algorithm, which allows
the apparition of many improved versions such as DGAF,
T-GAF, B-GAF, H-GAF, HEX-GAF and optimized
GAF….
The benefits of the GAF protocol are represented by the
use of the transition states to allow prolonging the
network lifetime.
GAF can significantly increase the lifetime of the
network. Indeed, only one node in each grid remains in
the active state by passing the other nodes of the grid to
the sleep state for a certain period while ensuring the
function of the routing.
However, this protocol has many drawbacks as
follows:
Even though GAF protocol aimed to solve the critical
problem of energy, it does not consider the remaining
energy of nodes during the active node selection.
GAF protocol accepts only neighboring
communication between active nodes. Consequently,
during routing data a high number of active nodes
participate in this function, which consume more energy
in the architecture of GAF.
Due to this, GAF consume more energy and.
In fact, there is many signal propagation problems such
as the presence of obstacles, which causes the direct
unreachability of the BS from nodes. On the other hand,
the active node have the same capabilities as regular
sensor nodes. Consequently, GAF is not suitable for large
networks.
In order to overcome these limitations of GAF protocol,
new versions appeared:
3. Improved versions of GAF protocol
3.1 DGAF protocol:
DGAF: Diagonal GAF [11] it is an improved version of
GAF that permits communication between two diagonal
grids in a direct way. Moreover, that comes to avoid the
drawback of basic GAF, where forwarding data take
place only in two direction: horizontal and vertical. The
size of the virtual grid hinge on transmission in order to
allow to two farthest sensors in whichever adjacent grids
to communicate with each other.
As showed in Figure 4, n0 and n1 are two farthest
sensors in two adjacent grids. The size of the square
grids is 𝑟 units and the transmission range is 𝑅 units. In
order to meet the definition of virtual grid, distance
between any two sensors in adjacent grids must not be
larger than transmission range 𝑅. Thus for traditional
GAF:
5)2( 222 R
rRrr
Diagonal GAF (DGAF):
22)2()2( 222 R
rRrr
Fig. 4. Virtual grid in GAF and DGAF.
3.2 TGAF protocol:
T-GAF: Authors in [12] propose an improved
version of GAF protocol called T-GAF. This new
version aims to optimize the hop count of the
traditional GAF. T-GAF reduces the number of
sensors participating in routing significant
information from the sender to the desired
destination. This protocol represents a new
optimized scheme for WSNs, which allow the
communication between a sensor nodes and
neighbors localized in the adjacent grids in their
transmission range like the original GAF. Moreover,
International Journal of Computer Science and Information Security (IJCSIS), Vol. 14, No. 6, June 2016
499 https://sites.google.com/site/ijcsis/ ISSN 1947-5500

this novel scheme permits the direct communication
to neighbors of adjacent grids, which mean that it
uses two levels for routing data: member nodes of
the adjacent grids of the source and the neighbors of
the adjacent grids. Hence, this enhanced version
minimizes the hop count comparatively to GAF.
This efficient scheme improves the selection of grids
coordinators, which are chosen, based on their
residual energy. The sensors with the highest
residual energy are the most preferred for the
coordinator selection. The same idea is also applied
in D-GAF protocol, as shown at Fig 5.
Fig. 5. Example of two-level neighbor sharing
scheme
3.3 B-GAF:
B-GAF: Authors in [13] design a new improved protocol
of GAF named as B-GAF for sensor networks. The new
protocol is based on three-dimensional structure by
dividing the network into different number of cubes
having the same volume. The formed cubes represent the
clusters, each cluster defines its cluster Head, which is
selected, based on the highest residual energy and the
distance separates it from the sink.
The probability for selecting the CHs combines both
energy and distance parameters. It is calculated by :
Wi = w1 Ci +w2 /di
w1 +w2 = 1
the preferred values correspond to the highest values of
Ci and the smaller values of di
In this new scheme, only Cluster Heads are active and
responsible for routing data while the remaining nodes
are in sleep mode. To avoid the excessive energy
consumed by the CHs, B-GAF defines a node with
maximal residual energy which play the role of an
intermediate between CHs and the sink.
3.4 HEX-GAF protocol:
HEX-GAF: Authors in [14] proposed a new version of
GAF called Hexagonal GAF.
The operating principle of this version aims at dividing
the network on hexagonal grid [15]. Therefore, the
hexagon structure replace the square grid in basic GAF.
The conception model of HEX-GAF in figure 6 showed
that cell O has six cells as neighbors, covering
destinations from all directions.
A Hexagon cell in GAF-HEX is defined as, for two
adjacent cell O and B, all nodes in cell A can
communicate with all nodes in cell B and vice versa. The
hexagon mesh
has the nice property that for a cell O, all of its six
adjacent cells are at next hop. They have the same
maximum distance to cell O. In the square grid
architecture there are eight neighboring cells (four
diagonal, two vertical and two horizontal cells) but only
four (vertical and horizontal two each) are at next hop
distance while the hexagon cell covers all six possible
next hop cells with a single maximum distance due to its
symmetry property. Therefore, all of the next hop cells
for cell O are equally reachable by definition.
Fig. 6. Hexagon Architecture
3.5. HGAF protocol
HGAF: Hierarchical GAF [16] protocol represents an
enhanced version of GAF protocol. It improves the
traditional GAF using a layered structure for the
selection of active nodes in the preformed cells. The
main improvement of this new approach is keeping the
connectivity between coordinators of the grids. This is
done by limiting the active nodes positions in cells and
synchronize these positions using a sub-cells distribution.
Selecting the active nodes hierarchically (cells and
sub-cells) as shown in figure 7 and that guaranties the
communication between the adjacent cells.
International Journal of Computer Science and Information Security (IJCSIS), Vol. 14, No. 6, June 2016
500 https://sites.google.com/site/ijcsis/ ISSN 1947-5500

Fig. 7. A cell divided into N2 sub-cells
3.6. GAF&CO protocol:
Authors in [17] proposed a new version of GAF, called
GAF&Co: GAF with COnnectivity-awareness, based on
GAF protocol, where the network is separated into
hierarchical and hexagonal cells as an alternative of
rectangular cells in basic GAF. The essential objective of
this management architecture shown in figure 8 is that,
one node is kept as active node in every single hexagonal
cell, in order to transfer information and sensing
activities during time of routing which helps on saving
energy consumed comparatively to basic GAF.
Due to this architecture, this protocol can be deployed as
algorithm in several strategies, such as sleeping
approaches and clustering.
Fig. 8. GAF&CO Architecture
3.7. OPTIMIZED GAF:
Authors in [18] proposed a new version of basic GAF,
based on improving the discovery phase of states of
transition as shown at Figure 6. Optimized GAF also
based on three states of transition Discovery, Active and
sleep, same as the basic version, however its process is
different.
Discovery phase: Where a sequence of nodes
are selected to become active nodes assigned to
the nodes having maximum remaining energy.
This phase will be executed once time just for
finding the sequence of actives nodes.
Active Phase: After Ta Node will become
active without entering in discovery phase.
Sleep Phase: After Ts, next node will become
active node.
Fig. 9. Transition state in Optimized GAF
4. Comparison and discussion of the
GAF based protocols
Respectively to various parameters of GAF and all
enhanced versions based on it, Table2 and Table3 below
provide a comparison of all of them. The different
parameters selected for discussion are hop count, energy
efficiency, and active node selection. In addition, the
advantages and the disadvantages of all the GAF based
protocols are listed in Table3.
To overcome the problem of neighbour communication
in basic GAF, DGAF invented with a diagonal
communication, which allows communication between
two diagonal grids and permits for two farthest sensor
node to communicate.
For controlling distance in WSN, T-GAF optimize the
hop count, which reduce the number of node
participating in routing.
To minimize energy consumption Optimized GAF, is
invented to reduce more energy comparatively to GAF
International Journal of Computer Science and Information Security (IJCSIS), Vol. 14, No. 6, June 2016
501 https://sites.google.com/site/ijcsis/ ISSN 1947-5500

using a selection of active nodes based on maximum
remaining energy.
Several parameters and methods are included for the
improvement of GAF protocol such as the way of
dividing the network and the delay of receiving
messages.
In addition, researchers should take into account
aggregation of data and security to guarantee that all data
received. In order to design more protocols that are
efficient, which will be used in different wireless sensor
network applications.
Table 2: Comparative study of GAF and its enhanced versions
Act
ive
no
des
Sel
ecti
on
Protocols GAF DGAF TGAF TDGAF BGAF HGAF HEX-GAF Optimized
GAF
Co&GAF
Randomly + + + + +
Residual
energy
+
+ + + + +
Distance to BS
and residual
energy
+
Distance
parameter +
Tra
nsi
tion s
tate
Return to
discovery state + + + + + + + +
Execution of
Discovery state
one time
+
International Journal of Computer Science and Information Security (IJCSIS), Vol. 14, No. 6, June 2016
502 https://sites.google.com/site/ijcsis/ ISSN 1947-5500

Table 3: Advantages, Inconvenient of GAF, and its enhanced versions
Protocol Advantages inconvenient
GAF - location-based protocol
- aimed to solve the critical problem of energy
- sensor node can be in three modes: Active, Discovery and
sleeping
- does not consider the remaining energy of
nodes during the active node selection.
- accepts only neighboring communication
(horizontal and vertical).
- high number of active nodes participate in
this function
- the active node have the same capabilities as
regular sensor nodes
DGAF -permits communication between two diagonal grids in a
direct way
sensor node can be in three modes: Active, Discovery and
sleeping
less overhead of coordinator election based on the residual
energy of sensors
- does not optimize the hop count
- does not consider distance parameter.
T-GAF -optimize the hop count of the traditional GAF
- reduces the number of sensors participating in routing
significant information from the sender to the desired
destination
- Active nodes selected based on their highest residual
energy
- does not consider distance parameter for
selecting the active nodes.
B-GAF - based on three-dimensional structure
- active node selected based on highest residual energy and
the distance separates it from the sink
- B-GAF defines a node with maximal residual energy
which play the role of an intermediate between CHs and
the sink
- does not reduce the number of nodes
participating in the network communication.
HEX-GAF -the hexagon structure replace the square grid in basic
GAF
- covering destinations from all directions
- does not optimize the number of nodes
participating in routing packets.
HGAF -keeping the connectivity between coordinators of the
grids
-sub-cells distribution. Selecting the active nodes
hierarchically (saves power by
increasing the size of GAF cell)
- guaranties the communication between the adjacent cells
- inefficient selection of the active nodes
GAF&CO protocol - network is separated into hierarchical and hexagonal cells
- one node is kept as active node in every single hexagonal
cell
- saving energy consumed comparatively to basic GAF
- does not optimize the number of hops.
OPTIMIZED GAF improving the discovery phase of states of transition
a sequence of nodes are selected to become active nodes
assigned to the nodes having maximum remaining energy.
This phase will be executed once time just for finding the
sequence of actives nodes
-helps saving energy comparatively to GAF
- does not consider distance parameter for
selecting the active nodes
- does not optimize the number of hops.
International Journal of Computer Science and Information Security (IJCSIS), Vol. 14, No. 6, June 2016
503 https://sites.google.com/site/ijcsis/ ISSN 1947-5500

5. Conclusion
The Wireless technology attracts the majority of
researches, As a result, it is exploited in different fields
such as social and military fields. The main challenge of
this developed technology is the consumption of the
energy resources efficiently because the sensor energy is
very limited.
The energy of sensors is more consumed by the
operations of data transmission and reception. The main
objective of routing protocol design is extending the
network’s lifetime by keeping the individual sensors
operating for a long time. Consequently the network’s
lifetime will be increased. GAF protocol is designed first
for Magnet, consume less energy by using three state of
sensor node, this approach improves the network lifetime
but it has many drawbacks which offer the opportunity to
several protocols to be emerged in order to solve these
serious problems. In this paper, we have presented
different extended versions of GAF protocol in WSNs.
We have also discussed the improvement of each GAF
version. Furthermore, we have deeply compared these
different approaches based on various metrics. Finally, A
detailed table summarizes the advantages, disadvantages,
assumptions and active nodes selection criteria for each
protocol.
Several versions of GAF are appeared for improving the
original GAF. However, It is necessary to integrate the
node mobility and study the node security in GAF.
Additionally, more work should be done for optimizing
the number of nodes which participate in routing packets.
Also, it is necessary to handle the various QOS
requirements in order to design more efficient routing
protocols.
ACKNOWLEDGMENT I acknowledge the suppot provided by my supervisors :
Pr. Said RAGHAY and the members of (Laboratory of
Mathematics Applied and Informatics) of the Faculty of
Science and Technology-Cadi embers of the laboratory
LAMAI Ayyad University-Marrakesh
References [1] K. Akkaya and M. Younis, “A survey on routing protocols
forwireless sensor networks,” Ad Hoc Networks, vol. 3,
no. 3, pp.325–349, 2005.
[2] D. Goyal and M. R. Tripathy, “Routing protocols in
wirelesssensor networks: a survey,” in Proceedings of the
2nd International Conference on Advanced Computing
and Communication Technologies (ACCT ’12), pp.
474–480, Rohtak, India, January 2012. [3] J. Zheng and A. Jamalipour, Wireless Sensor Networks: A
Network Perspective, JohnWiley & Sons, Chichester, UK,
2009.
[4] I. F. Akyildiz and M. C. Vuran, Wireless Sensor Networks,
John Wiley & Sons, Chichester, UK, 2010.
[5] H. Aznaoui, S. Raghay, L. Aziz and A. Ait-Mlouk, "A
comparative study of routing protocols in WSN," 2015 5th
International Conference on Information &
Communication Technology and Accessibility (ICTA),
Marrakech, 2015, pp. 1-6.
[6] K.Akkaya and M.Younis, "A Survey on Routing Protocols
for Wireless Sensor Networks", Department of Computer
Science and Electrical Engineering, University of
Maryland, Baltimore County.
[7] Y. Xu, J. Heidemann, and D. Estrin, “Geography-informed
energy conservation for ad hoc routing,” in Proceedings of
the 7th Annual International Conference on Mobile
Computing and Networking (MobiCom ’01), pp. 70–84,
Rome, Italy, July 2001.
[8] A. Baggio and K. Langendoen, “Monte Carlo localization
for mobile wireless sensor networks,” Ad Hoc Networks,
vol. 6, pp. 718–733, 2008.
[9] E. Niewiadomska-Szynkiewicz, “Localization in wireless
sensor networks: Classification and evaluation of
techniques,” Int. J. Appl. Math. Comput. Sci., vol. 22, pp.
281–297, 2012.
[10] J. Heidemann, D. Estrin, and Y. Xu, “Geography-informed
Energy Conservation for Ad Hoc Routing,” Ll, pp. 70–84,
2001.
[11] F. Shang and J. Liu, “Multi-hop topology control algorithm
for wireless sensor networks,” Journal of Networks, vol. 7,
no. 9, pp.1407–1414, 2012.
[12] V. Soni and K. Mallick, “A Novel Scheme to Minimize
Hop Count for GAF in Wireless Sensor Networks:
Two-Level GAF,” Journal of Computer Networks and
Communications, vol. 2015, Article ID 527594, 9 pages,
2015. doi:10.1155/2015/527594
[13] G. Liu and W. Wen, “A improved GAF clustering
algorithm for three-dimensional underwater acoustic
networks,” in Computer Communication Control and
Automation (3CA), 2010 International Symposium on,
2010, vol. 1, pp. 508–512.
[14] I. Stojmenovic, “ Honeycomb Networks: Topological
Properties and Communication Algorithms”, IEEE
Transaction on Parallel and Distributed System, vol 8,
no. 9, October 1997.
[15] R. Ping, G.Rogers, and S.Zhou, “Honeycomb Architecture
for Energy Conservation in Wireless Sensor Networks ”
I.EEE Globecom, pp 1-5,2006.
[16] T.Inagaki and S.Ishihara, “HGAF:A Power Saving Scheme
for Wireless Sensor Networks”, Information Processing
Society of Japan Journal, Volume 50, Issue 10, pp.
2520-2531, October 2009.
[17] J. You, D. Lieckfeldt, J. Salzmann and D. Timmermann,
“GAF&Co: Connectivity aware topology management for
sensor networks”, PIMRC. 2009.
[18] J. Grover, Shikha and M. Sharma, "Optimized GAF in
Wireless Sensor Network," Reliability, Infocom
Technologies and Optimization (ICRITO) (Trends and
Future Directions), 2014 3rd International Conference on,
Noida, 2014, pp. 1-6.
International Journal of Computer Science and Information Security (IJCSIS), Vol. 14, No. 6, June 2016
504 https://sites.google.com/site/ijcsis/ ISSN 1947-5500

Comparison of RC2 and AES using Windows
Azure for data security in cloud
Muhammad Inaam ul haq , Muhammad Umar
and
Syed Muhammad Owais
Department of Computer Science
Comsats Institute of Information Technology
Sahiwal, Pakistan
ABSTRACT: Cryptography is a very useful tool to
protect the properties of data like integrity, privacy,
confidentiality in any environment. This paper explores
some useful aspects of cryptography in cloud computing
environment. There are different types of encryption
algorithms used in order to ensure the data security.
These algorithms are of different types like symmetric, a
symmetric and hashing algorithms. The objective of this
paper is performance analysis of selected set of
algorithms on the basis of different parameters, so that
the best out of all these options is chosen or combinations
of some of them can be utilized to secure data in cloud
computing environment. The algorithms included in this
study are RC2 and AES. The parameters which are used
for performance analysis are running time of the
algorithm, data encryption capacity. These are the
performance parameters which are calculated for every
algorithm in cloud based environment i.e. windows azure
simulator by utilizing visual studio IDE and profiler
services by integrating windows azure SDK. The
interpretation of these results are done by using various
graphs which shows trend of a particular algorithms on
basis of time of encryption and decryption.
KEYWORDS: Cryptography, Cloud Security, RC2,
AES, Windows Azure
I. INTRODUCTION
Cloud computing is very complex in
nature. It uses different techniques which are not
visible on front end. Virtualization technology is used
to achieve high performance computing in cloud
computing concept. Virtualization is used for the
optimize utilization of resources to gain performance.
In this technique multiple VMs called virtual
machines are set up on single server performing
different tasks. In this way less number of servers is
used but ratio of tasks to be performed is increased on
single server. This technique has lot of advantages for
cloud provider e.g.; he can save cost that can be used
for buying more servers and has to be spent on
maintenance of existing servers. So cost is saved and
optimum resource utilization is also achieved [1] Data
security i.e. data privacy, data integrity and
confidentiality are the main concern of any small or
large organization before moving to cloud
technologies. The owner of any firm when think of
shifting towards cloud trend he has lot of questions in
mind but security of its data is the first and most
important concern. This is basically a big hurdle in
shifting towards cloud. When a company using cloud
all its data is stored on cloud servers.[2] The data is
travelling via internet the first risk is started from this
node as data packet are being sent from the company
network to cloud the data packet has to take different routes to go to the destination servers on cloud.
During this path any intruder can temper this data if he
is successful then data become useless for the
organization [3].
II. LITERATURE REVIEW
In cloud computing there are three delivery
models i)Software as Service(SAAS) ii) Platform as a
Service(PAAS) iii) Infrastructure as a
Service(IAAS).In SAAS : in this case cloud provider
manage all setup like software middle ware i.e.
platform and infrastructure in other words complete
running application[4]. End User of the system pays to
the cloud provider for usage of the system on basis of
time i.e. number of hours he utilized the cloud
services. The responsibility to provide the services,
cloud maintenance and security of data and other
things is on cloud provider and he is bound according
to different acts like SOX, HIPAA etc. In second
scenario as mention PAAS, cloud provider provides
the middle ware (plat farm as service) e.g. common
International Journal of Computer Science and Information Security (IJCSIS), Vol. 14, No. 6, June 2016
505 https://sites.google.com/site/ijcsis/ ISSN 1947-5500

runtime environment, end user of the system has to
pay to the person or Organization providing the user
SAAS and for middle ware he pays to cloud provider.
Organization providing SAAS to End user pay to
cloud provider for infrastructure i.e. for hardware
usage and End User pay to SAAS provider for
services.
In cloud computing there are four deployment model
i) private cloud ii) community cloud iii) public cloud
iv) Hybrid Cloud. In private cloud scenario, single
organization like multinational having the power to
bear all cost maintains its own cloud called private
cloud it is most restricted and secure mechanism e.g.
the data center of an organization. Small or medium
size organizations cannot afford this type of cloud.
Group of organization having common goals like
banks, cooperate organizations, enterprise business
units combine together to form a community. The
cloud used by the same interest group is called
community cloud. Public cloud is the cloud setup
which is formed for public usage for the common
people from security point of view this is least secure
cloud environment. Hybrid cloud are developed
according to custom requirement of people or
organization in which two cloud deployment strategies
are merged together to form a hybrid philosophy [5].
Cloud provider has lot of servers when data sent from
client end to cloud server a lot of data mining activity
is done to store the data because cloud provider has
data of so many organizations to store on specific
space on the server. In this activity it is possible that
the integrity of the data compromised. So there is risk
of losing the data integrity. The data of any
organization like banks or any other multinationals is
highly confidential. It contains customer information
like their bank account details in case of banks data.
Every organization has some type of data which is
highly confidential on which base of business strongly
depends. If due any reason confidently of data is
compromised it is harmful for business. The
suggestions for using different security algorithms are
given in [6] to resolve security concern of cloud
computing environment The problem faced by cloud
provider discussed in [7]and solution to overcome
those problems is also given. Windows Azure is used
as a platform as a service to develop applications that
can be deployed in Microsoft cloud computing
environment, data centers. It is very feature rich
environment for developing enterprise level
applications. Windows Azure provides cloud
computing emulator to debug, run, test and check the
performance of the code which ultimately runs in
cloud computing environment. If application
successfully tested on this environment then it is sure
that it will be run on real environment without any
issues. In this way time, human effort and resources
could be saved and speed of application development
enhanced. [8]
III. PROBLEM
In order to provide data security which is best option
from RC2 and AES to use in cloud computing
environment.[9]
IV.METHOD
Visual studio 2010 and windows azure SDK is used to
design the application to test the different parameters
of RC2 and AES for comparison. The screen given
below (Figure 1) shows a browse button at start, user
can browse files of different sizes and select algorithm
from dropdown list and press execute button to run the
process. An option is given below to specify number
of key bits. In this way time, we can get all data on
cloud environment and finalized results. [14]
Figure 1: RC2 and AES Windows Azure Simulation
International Journal of Computer Science and Information Security (IJCSIS), Vol. 14, No. 6, June 2016
506 https://sites.google.com/site/ijcsis/ ISSN 1947-5500

V.RC2
The table of values is taken by running the application
developed on cloud environment. It shows the
different readings of encryption and decryption time
against different file size for RC2.
Table 1
File
Size
RC2-
Encryption
Time(ms)
RC2-
Decryption
Time(ms)
RC
2 E
ncry
ptio
n an
d D
ecryp
tion T
ime
200 Kb 16 108
400 Kb 29 233
600 Kb 59 320
800 Kb 64 537
1 Mb 80 541
2 Mb 174 1153
3.85 Mb 540 3001
VI. RC2 Performance Graph
The graph is plotted between file size and decryption
time of RC2. It shows that if file size is increased the
time to decrypt the data is also increased.
Figure 2: Graph between RC2 Decryption Time and File Size
The graph is plotted between encryption time of RC2
and file size. It shows that time encrypt the large file is
less as compared to decryption time of RC2.
Figure 3: Graph between RC2 Encryption Time and File Size
VII. AES
There are three types of AES version are available
these are AES-128, AES-192 and AES-256.But the
focus of this study is AES-256.The block size in any
version of AES is fixed and it is of 128 bits. The table
given below gives the statistics about the AES-256
version in cloud simulator (cloud computing
environment)
Table 2
File size AES-256
Encryption
Time
(ms)(Average)
AES-256
Decryption
Time
(ms)(Average)
AE
S E
ncry
ptio
n an
d D
ecryptio
n T
ime
200 6 7
400 11 13
600 20 30
800 29 34
1 Mb 74 85
2 Mb 83 97
3 Mb 129 183
International Journal of Computer Science and Information Security (IJCSIS), Vol. 14, No. 6, June 2016
507 https://sites.google.com/site/ijcsis/ ISSN 1947-5500

VIII. AES Performance Graph
The graph given below gives the relationship between
file size of input data and corresponding values of
decryption time taken by AES-256.The graph shows
that as the size of input file increases the
corresponding decryption time also increases but not
in linear fashion The AES decryption time is higher as
compared to encryption time. For large data input files
it is more as compared to small data KB files. The
trend rapidly increased if we feed large size file as
input to this algorithm.
Figure 4: Graph between AES Decryption Time and File Size
The graph is plotted between file size and encryption
time of RC2. It shows that if file size is increased the
time to encrypt the data is also increased. But in case
of decryption the time value is much greater as
compared to encryption.
Figure 5: Graph between AES Encryption Time and File Size
VIII. CONCLUSION
There are different types of algorithm which are
available for providing data security. In this paper two
symmetric algorithms AES and RC2 are selected to
find the best one to provide data security in cloud
computing environment. The performance of all these
algorithms analyzed by using different parameters like
data encryption capacity, strength on basis of key, data
encryption and decryption time. The environment
used for this purpose is windows azure. It provides
PAAS and IAAS. The analysis process after
comparing all these parameters that are analyzed
through simulator developed using windows azure
SDK concludes that AES is best option because it is
fast as compared to RC2 required more time to
encrypt and decrypt the data.
IX. FUTURE WORK
In future a complete system i.e. security model for
cloud computing environment can be developed which
cover following features:
i. All possible encryption algorithms which best
suitable for cloud computing environment are
implemented in the system.
ii. The encryption and decryption option for every
suitable user can be given before sending its data to
cloud.
iii. A feature in which user can able to encrypt data
with key with one algorithm and then able encrypt key
by some different algorithm is provided.
iv. Authentication mechanism can be adopted so that
only valid user able accesses the system for encryption
and decryption of data
International Journal of Computer Science and Information Security (IJCSIS), Vol. 14, No. 6, June 2016
508 https://sites.google.com/site/ijcsis/ ISSN 1947-5500

REFERENCES
[1] Dong Xu, “Cloud Computing: an Emerging Technology”,
International Conference On Computer Design And Applications (ICCDA 2010), Volume-1, Pgs (100-104).
[2] Pearson, S., Benameur, A., Privacy, Security and Trust Issues Arises from Cloud Computing, Cloud Computing Technology and Science (CloudCom), IEEE Second International Conference 2010, On page(s): 693-702.
[3] Iankoulova, I.; Daneya, M., Cloud computing security requirements: A systematic review, Research Challenges in Information Science (RCIS), Sixth International Conference on, 2012, On page(s): 1 - 7.
[4] Radhika G, Satyanarayana K. V, Tejaswi A (2013).”Efficient Framework for Deploying Information in Cloud Virtual Datacenters with Cryptography Algorithms”. International journal of computer trends and technology.
[5] Radhika G, Satyanarayana K. V, Tejaswi A (2013).”Efficient Framework for Deploying Information in Cloud Virtual Datacenters with Cryptography Algorithms”. International journal of computer trends and technology.
[6] Kaur M, Mahajan M. (2013). “Using encryption Algorithms to enhance the Data Security in Cloud”. International journal of communication and computer technologies.
[7] Arora R, Parashar A (2013). “Secure User Data in Cloud Computing Using Encryption”.
[8] Padhy R, P Patra, M. R., &Satapathy, S. C. (2012). “WINDOWS AZURE PAAS CLOUD : AN Overview”. International Journal of Computer Application.
[9] Zotos K., Litke A. “Cryptography and Encryption”
[10] Subashini S, Kavitha V. (2011). “A survey on security issues in service delivery models of cloud computing”. Journal of Network and Computer Applications
[11] Jose N, A C K (2013).”Data Security Model Enhancement in Cloud Environment”. IOSR Journal of Computer Engineering(IOSR-JCE)
[12] Wei Lu, Jared Jackson, and Roger Barga,“AzureBlast: A Case Study of Developing Science Applications on the Cloud”, Proceedings of the 1st Workshop on Scientific Cloud Computing (Science Cloud 2010), Association for Computing Machinery, Inc., 21 June 2010.
[13] A. Velte, T. Velte, and R. Elsenpeter, Cloud computing: a practical approach, New York:McGraw-Hill, 2010.
[14] Madhurima, Vandana, Madhulika “Windows Azure Platform: an Era for Cloud Computing”, International Journal of Computer Science and Information Technologies, Vol. 2 (2), 2011, 621-623. Amit Chauhan, et.al. Int. J. EnCoTe, v01012011, 11-17 Available.
[15] Rimal, B., Choi, E., and Lumb, I. (2009). A Taxonomy and Survey of Cloud Computing Systems In Fifth International Joint Conference on INC, IMS and IDC, pages 44–51. IEEE.
[16] N. Saravanan, A. Mahendiran, N. Venkata ,Subramanian and N. Sairam “An Implementation of RSA Algorithm in Google Cloud using Cloud SQL” Research Journal of Applied Sciences,Engineering and Technology 4(19): 3574-3579,2012.
[17] H. Jin, S. Ibrahim, T. Bell, L. Qi, H. Cao, S. Wu, and X. Shi, “Tools and technologies for building clouds”, in Cloud Computing:Principles, Systems and Applications, N.Antonopoulos and L.Gillam, Eds, London:Springer, 2010.
AUTHORS PROFILE
Muhammad Inaam ul haq: Lecturer in department of computer
science at COMSATS Institute of Information Technology,
Sahiwal Campus, Pakistan. He worked as Senior Executive (Senior Software Engineer) in Software Engineering department (Network
Engineering division) in Wateen Telecom Lahore Pakistan. He also worked as software Engineer in
MACROSOFT Pakistan SMC Pvt Ltd Lahore
Pakistan. He has done M.Phil (CS) from Lahore Leads University (LLU), Lahore Pakistan. He
has done BSCS from National University of
Computer and Emerging sciences FAST, Islamabad. He qualified for Full Bright
Scholarship sponsored by Ministry of IT and Telecom Division
Government of Pakistan. PTCL Pakistan awarded Merit
Certificate for this achievement. He has 4+ years of professional
experience of software Industry and 1+ year of academic
experience. He has developed application on business automation particularly telecom sectors using Microsoft .Net Technologies
including Share Point. His research areas include, Web
Engineering, Software Engineering, Cloud Computing, Stegnography, and Cryptography.
Muhammad Umar: Lecturer in department of computer science at
COMSATS Institute of Information Technology, Sahiwal Campus,
Pakistan. He has done MS (CS) from Pir Mehr Ali Shah Arid Agriculture University, Rawalpindi, Pakistan .He has done his
BS(CS) from (CIT) College of information technology
Rawalpindi. He has 6+ years of academic’s experience, and 1+ year of professional
experience of software industry. His research
areas include, Computer Networks, Cloud
Computing, Steganography, Body area network
and cryptography.
Syed Muhammad Owais: Lecturer in department of computer
science at COMSATS Institute of Information Technology,
Sahiwal Campus, Pakistan. He obtained M.S (CS) and BS (CS) from Bahria University, Islamabad, Pakistan. His
research areas include, Computer Networks,
Cloud Computing. He worked as lecturer in department of computer sciences in national
college of business administration and
economics, he also work as IT instructor in College of tourism and hotel management and he
also worked as Instructor in Government College of technology in
IT department.
International Journal of Computer Science and Information Security (IJCSIS), Vol. 14, No. 6, June 2016
509 https://sites.google.com/site/ijcsis/ ISSN 1947-5500

(IJCSIS) International Journal of Computer Science and Information Security, Vol. 14, No.06, June 2016
Optimized and Secure Authentication Proxy Mobile IPv6 (OS-PMIPv6) Scheme for reducing packet loss
Arun Kumar Tripathi
Department of Computer Science and Engineering, KIET Group of Institutions,
Ghaziabad, India
R. Radhakrishnan Department of Computer Science and
Engineering, ABES Engineering College, Ghaziabad, India
J.S. Lather Department of Electrical Engineering,
National Institute of Technology, Kurukshetra, India
Abstract—Due to continuous evolution in hand handled mobile devices such as Smartphones, Laptops, tablets and Personal Digital Assistants (PDAs) have increases the volume of traffic on Internet radically. To provide seamless Internet services and perpetual mobility to these devices, Internet Engineering Task For`ce (IETF) has proposed various mobility management protocols such as MIPv6, HMIPv6, and PMIPv6. MIPv6 is a host-based mobility management protocol and suffers from handover latency, packet loss etc. Recently the IETF proposed network-based mobility management protocol, known as Proxy Mobile IPv6 (PMIPv6). PMIPv6 sufficiently reduces signaling overhead but still have long authentication latency during handover and packet loss issues. To resolve these issues, an optimized and secure authentication mechanism for handover management scheme for PMIPv6 networks is proposed in this paper. Due to less authentication delay, the proposed scheme reduces the setup time and as a result has low handover latency. Subsequently, decreases the amount of packet loss during handover. The proposed scheme provides higher security infrastructure than the basic PMIPv6 protocol and additionally reduces the handover latency to contemporary protocols. The performance and results are mathematically analyzed. Numerical results show that the proposed scheme gives better performance than the existing MIPv6 in terms of signaling delay and provide higher security than PMIPv6 protocol.
Keywords-component; formatting; style; styling; insert (key words)
I. INTRODUCTION The rapid development in electronic industry and
communication technology has affected life of human being significantly. Now a day’s, social human life is dependent on moveable devices such as cellular phones, personal digital assistants (PDAs), laptop. To provide uninterrupted services these devices Internet Engineering Task Force (IETF) proposed Mobile IP version 4 (MIPv4) [1]. But due to rapid increase of Internet users the current IP version 4 is becoming exhausted. To overcome from address spaces problem of IPv4 IETF has proposed Mobile IP version 6 (MIPv6) [2]. In MIPv6 is a host based mobility management protocol and Mobile Node (MN) is responsible for maintain the connectivity to the Internet while moving between different subnets. MIPv6 suffers from problems such as packet loss, signaling overhead, handover latency etc. To overcome from mentioned problems extended host based mobility management protocols such as Hierarchal
Mobile IPv6 (HMIPv6) [4], Fast Hierarchal Mobile IPv6 (FHMIPv6) [3] etc. are proposed. These protocols reduce handover latency up to some extents. Recently IETF has proposed, Network based Localized Mobility Management (NETLMM) protocol, Proxy Mobile IPv6 (PMIPv6) [5] that reduces handover latency significantly but still suffers from security issues. In PMIPv6, all the signaling overhead is managed by network entities. This paper proposes a new scheme known as Optimized and Secure Authentication scheme in Proxy Mobile IPv6 (OS-PMIPv6) for handover management. This scheme is more secure than basic PMIPv6 and less handover latency than contemporary protocols. The proposed scheme eventually also decreases the packet loss during handover process.
For mobility management evaluation, various analytical models categorized as Teletraffic theory based models, random-walk through models, fluid flow mobility models, simple numerical calculation based approaches, stochastic models and Markov based models. In this paper, simple numerical calculation based approach [6] is used for analyzing the results on proposed model. Further, the paper explores the activities for developing network-based mobility support protocol. Then, we proposed a secure OS-PMIPv6 scheme for handover management.
The rest of the paper is organized as follows. Section 2 deals with related previous work followed by proposed scheme in section 3. The quantitative analysis of optimized authentication scheme is discussed in Section 4. The section 5 deals with result analysis among existing and proposed scheme. The paper is concluded in section 6.
II. RELATED WORK The handover latency is categorized as layer-2 handover
latency and layer-3 handover latency. Layer 2 handover delay is the time spends in scanning the link layer in order to retrieve the Received Signal Strength (RSS) disseminated by Point of Attachment (PoA). While, Layer 3 handover delay is the time spend in address configuration by MN after completion of layer-2 handover and moment when MN start receiving data packet after attaching to new AR. Handover latency is the principal reason of packet losses. For real-time applications the handover latency should be slightest.
510 https://sites.google.com/site/ijcsis/ ISSN 1947-5500

(IJCSIS) International Journal of Computer Science and Information Security, Vol. 14, No.06, June 2016
In this section basic host based MIPv6 and secure network-based mobility protocol PMIPv6 are discussed.
A. Mobile IPv6 (MIPv6) The MIPv6 is a global mobility management protocol. The
mobility of MN within home subnet is managed by a special router, known as Home Agent (HA). The MN requests to HA for registration and HA responses back to MN by sending 64-bits network prefix. MN configures a unique address by adding 64-bits suffix, this address is known as Home Address (HoA). The HA intercepts all packets from Correspondent Node (CN) and redirects them to MN. As MN crosses the boundary of HN and moves to another network, known as Foreign Network (FN), a special Access Router (AR) assigns 64-bits suffix of visited network to MN. Now, MN configures a Temporary Care of Address (TCoA) and performs Duplicate Address Detection (DAD) process to ensure the uniqueness of TCoA by broadcasting the configured address. Once the uniqueness is verified, the TCoA is assigned as permanent address, known as Care of Address (CoA), in visited network. Once CoA is assigned to MN, it sends a Binding Update (BU) message to HA to notify about current location and registration. So that HA makes an entry in its Binding Cache Entry (BCE) about CoA. After successful registration, HA acknowledges to MN by sending Binding Acknowledgement (BA) message. Data packets from CN firstly intercepted by CN and then forwarded to CoA. This forms triangular path from CN to CoA. To overcome from the inefficiency of triangular routing MN sends two messages Home-address Test-Init (HoTI) via HA and Care-of address Test-Init (CoTI) directly to CN. The HoTI message contains home-init cookie and requests for a home keygen token from CN. Similarly, CoTI message contains care-of init cookie and requests for a care-of keygen token from CN. The CN responses to MN by sending Home-address Test (HoT) message via HA and Care-of address Test (CoT) message directly to MN in response HoTI and CoTI respectively. The HoT contains home keygen token, home init cookie and home nonce index. Similarly, the CoT contains care-of keygen token, care-of init cookie and care-of nonce index. After receiving HoT and CoT messages, MN generates Binding Update (BU) message with the help of keygen tokens. The BU message is used by MN to notify the current binding to CN. As CN receives the BU from MN, it immediately updates its BCE with CoA and acknowledges to MN about update by sending Binding Acknowledgement (BA). After receiving BA message, the MN sends packets directly to CN without involving HA in communication.
The MIPv6 is host-based mobility management protocol and MN is responsible for all signalling overhead. For this, MN must be upgraded to install network protocol stack on it. This process will increase not only complexity but also operational overhead. Therefore, MIPv6 and its subsequent protocols are not implemented till yet.
B. Proxy Mobile IPv6 (PMIPv6) PMIPv6 [5], [7], [8] reuses basic concept of standard
MIPv6. It enables IP mobility within Localized Mobility
Domain (LMD) without participation of MN in any mobility related signaling. PMIPv6 doesn’t need any enhancement in the basic MIPv6.
The basic network entities in PMIPv6 are Mobile Access Gateway (MAG) and Local Mobility Anchor (LMA). The MAG has same responsibilities as AR in MIPv6 with some additional capabilities. It is accountable for commencement mobility related signaling and keeps track movement of the MN within LMD. LMA works as topological anchor point for LMD. On the other hand, the LMA in PMIPv6 is similar to the HA in MIPv6 with some additional capabilities required to support PMIPv6. A special network entity known as Authentication, Authorization, Accounting (AAA) server used for authorization and authentication of MN and MAG within LMD. After successful authentication from AAA, a bi-directional tunnel between MAG and LMA is established. LMA allocates Home Network prefix (HNP) to MN and maintains a Binding Cache Entry (BCE), which binds the MN’s IP address with the Proxy-Care-of-Address (Proxy-CoA). The Proxy-CoA is the global address configured on MAG interface of bi-directional tunnel endpoint. The MN can send or receive data traffic through Proxy-CoA
Fig.1 Movement of Mobile Node in PMIPv6
All traffic sent from the LMA gets routed to MN through the established tunnel. MAG also maintains a Binding Update List (BUL) that contains information about the all attached MNs to that MAG. Figure 1 shows the movement of MN in PMIPv6.
1) Signaling flow in PMIPv6: Figure 2 shows the message or signal flow in PMIPv6. The description of each step is as follows: Step 1: As MN enters into a new LMD or power on in LMD. The MAG detects the attachment of MN. Step 2: After detecting attachment MAG is responsible for MN’s authentication. For authentication, the MAG sends the MN-Identifier (MN-ID) to AAA server to verify the identity of MN. If MN is authenticated successfully, AAA server responds back to MAG by sending MN’s profile containing MN-ID, the LMA address (LMAA), supported addresses for configuration and other information stored on AAA server.
511 https://sites.google.com/site/ijcsis/ ISSN 1947-5500

(IJCSIS) International Journal of Computer Science and Information Security, Vol. 14, No.06, June 2016
Fig. 2 Message Flow in PMIPv6
Step 3: Now, the MAG communicates Proxy Binding Update (PBU) message to the LMA for registration of MN. The PBU includes information such as MN-ID, Proxy-CoA, binding life time etc. Step 4: On receiving PBU, the LMA requests to AAA server for verification of authenticity of PBU sender. Step 5: Based on reply from AAA server, the LMA accepts the PBU if MAG is trusted otherwise rejects the PBU. Step 6: On successful authentication from AAA server, the LMA sends a Proxy Binding Acknowledgment (PBA) message to the MAG containing the MN’s Home Network Prefix (HNP) and also creates new record in its BCE. Step 7: After receiving PBA from the LMA, the MAG setup up a bi-directional tunnel between MAG and LMA. All the traffic from MN is routed through established tunnel. The MAG also informs to MN about success binding by sending Router Advertisement (RA) message.
Fig. 3 Redundant signaling overhead in PMIPv6 during authentication
PMIPv6 provides an efficient handover mechanism as
compared to the MIPv6 in intra-domain handover. PMIPv6 reduces handover latency significantly with respect to MIPv6. But still suffers from latency or handover delay in real time applications due to signaling. Figure 3 shows the redundant signaling overhead during authentication.
III. RELATED WORK AN OPTIMIZED AND SECURE AUTHENTICATION SCHEME IN PMIPV6 (OS-PMIPV6) In PMIPv6, the handover latency mainly depends on
switching delay, authentication delay, registration delay etc. In the proposed scheme, the authentication delay is reduced
significantly as compared to PMIPv6 proposed in [7] by removing redundant signaling messages.
To provide more secured and optimized infrastructure in proposed scheme, the MAG sends an authentication message containing MN-ID to AAA server and after successful authentication the AAA server responses to MAG with MN profile and at the same time AAA server also sends a message to LMA containing MN-ID and MAG-ID with authentication. Because of this the LMA has no need to check authenticity of MAG from AAA server. This reduces the authentication delay significantly. Figure 4 shows the movement of MN in OS-PMIPv6.
Fig. 4 Movement of Mobile Node in OS-PMIPv6
The message flow in proposed scheme is shown Figure 5. The steps in proposed scheme are discussed as follows: Step 1: As soon as, MN enters into a new LMD or power on in LMD the MAG establish link layer attachment via a point- to-point connection.
Fig. 5 Signaling Flow in OS-PMIPv6
Setp2: To verify authenticity of MN, the MAG sends the MN’s MAC address as MN-ID to AAA server and wait for response. Step 3: Meanwhile, the MN may send Router Solicitation (RS) message. The MN can send RS message to MAG at any moment after attachment and has no strict ordering relation with the other messages in the call flow. Step 4: After successful authentication, AAA server sends PBU message about successful authorization of MN and MAG to LMA with MN’s profile containing MN-ID, MAG-ID, supported address configuration mode etc. By this technique, MAG has no need to send PUB message to LMA explicitly.
512 https://sites.google.com/site/ijcsis/ ISSN 1947-5500

(IJCSIS) International Journal of Computer Science and Information Security, Vol. 14, No.06, June 2016
Figure 6 shows the optimized authentication signaling in OS-PMIPv6.
Fig. 6 Optimized signaling in OS-PMIPv6 during authentication
Step 5: After receiving PBU, the LMA assigns a Mobile Node-Home Network Prefix (MN-HNP) and binds it with address of MAG through Binding Cache Entry (BCE). The BCE contains MN-ID, Proxy-CoA and prefix assigned to MN. The LMA also response back to MAG via sending Proxy Binding Acknowledgment (PBA) message. The message includes MN-HNP and triggers the establishment of a bidirectional tunnel between the LMA and the MAG. Step 6: After getting the PBA message, MAG establish a route over the tunnel and sends Router Advertisement (RA) message to MN.
IV. QUANTITATIVE ANALYSIS OF SECURE AND OPTIMIZED AUTHENTICATION SCHEME IN PMIPV6 (OS-PMIPV6)
In next-generation All-IP mobile networks, the signaling overhead is basic cause for handover latency. In this paper, the handover latency is defined as the time duration after layer-2 handover completes and the moment when MN start receiving data packets after attaching to new AR [7]. This section deals with qualitative analysis of the OS-PMIPv6 scheme with basic MIPv6 [1] and PMIPv6 [7] based on reference model [7] as shown in Figure 7. For analysis, this paper includes basic assumptions as proposed in [7], [9].
In PMIPv6, the LMD is considered as mobility domain. The MN may send RS message at MAG at any point of time after attachment to the MAG. Therefore its affect is not taken into consideration during analysis. The MinRtrAdvInterval (RAImin) and MaxRtrAdvInterval (RAImax) denote the minimum and maximum amount of time to wait between sending unsolicited multicast advertisements.
As suggested in [1], the mean time between unsolicited RA messages may be expressed as (MinRtrAdvInterval + MaxRtrAdvInterval)/2. In MIPv6, the Movement Detection (MD) is responsible for detecting Layer-3 handover and the movement detection delay (TMD) can be expressed as TMD = (RAImin + RAImax) / 4.
Fig. 7 Analytical Model for performance Analysis
A. Analysis of Handover Latencies Handover latency in MIPv6 and its extension is the basic cause of packet loss and one of challenge in research world. The handover latencies of basic MIPv6, PMIPv6 and OS-PMIPv6 are discussed as follows:
1) Handover latency in MIPv6: In MIPv6 the handover latency can be represented by sum of Movement Detection (MD) delay, Duplicate Address Detection (DAD) delay, authentication (TAAA) delay and registration (TReg) delay. The handover latency in terms of signaling overhead in MIPv6 can be represented as follows: = + + (1) = + +
(2)
Here, _ = 2( + + ) (3) _ = 2( + + (4) _ _ _ = 2( + + + ) (5) Now equation (1) becomes = + + 6( + ) + 4 + 2( + ) (6)
2) Handover latency in PMIPv6: In PMIPv6, the authentication for MN is required only when it boots up first for the time in LMD. The handover latency in PMIPv6 can be calculated as summation of the authentication delay (TAAA) from AAA server, binding cache entry (registration delay) between the MAG and LMA, and the packet transmission delay between the MAG and the MN. For registration in PMIPv6 total two packets, one for PBU and one for PBA are transmitted. For authentication in PMIPv6 total 4 packets are transmitted, two packets for authentication request (one from MAG and one from LMA) and two authentication response packets are transmitted one to MAG and another one to LMA. Finally, the handover latency LMD can be represented as follows: = + + + (7) = 2 (8) = 2 ∗ 2 (9) Now equation (7) becomes
513 https://sites.google.com/site/ijcsis/ ISSN 1947-5500

(IJCSIS) International Journal of Computer Science and Information Security, Vol. 14, No.06, June 2016
= 4 + 2 + + (10)
3) Handover latency in OS-PMIPv6: The proposed OS-PMIPv6 scheme reduces the authentication delay. For registration in PMIPv6 total two packets, one for PBU and one for PBA are transmitted. For authentication in PMIPv6 total three packets are transmitted, one packet for authentication request and two authentication response packets are transmitted one to MAG and another one to LMA. Finally, the handover latency in LMD can be represented as follows: = + + + (11) = (12) = 2 (13) Now equation (11) becomes, T = 2T +T +T +T (14)
V. RESULT ANALYSIS In this section, the results of MIPv6, PMIPv6 and OS-
PMIPv6 schemes are analyzed and compiled based on assumptions in section 4 and Table-1[7]. The communication link may be wired or wireless in between MN and CN. The handover latency is directly proportional to signaling overhead. Figure 9 shows the impact of wireless link delay on handover latency. Similarly, Figure 10 shows impact of delay between MN and on handover latency.
Table. 1 Parameters and Numerical values
Symbol Meaning Value
(In msec.)
Tmr Delay to send the data packet between MN and AP over wireless link
10
Tra Delay to send the data packet between AP and AR/MAG over wired link
2
Tam Delay to send the data packet between AR/MAG and HA/LMA over wired link
10
Tah Delay to send the data packet between HA/LMA and FA/LMA
20
Tac Delay to send the data packet directly between AR/MAG and CN, not via HA
20
Thc Delay to send the data packet from HA and CN 10
Ta Authentication Delay 3
TDAD Delay in Duplicate Address Detection(DAD) 1000
TMD Mean value of Movement Detection (MD) 25 RAImin Minimum Router Advertisement Interval 30
RAImax Maximum Router Advertisement Interval 70
A. Impact of wireless link delay on handover latency The handover latency directly is proportional to signaling overhead. In MIPv6 largest number of messages are exchange over wireless link during communication than PMIPv6 or OS-PMIPv6. The message flow on wireless link in MIPv6 includes duplicate address detection process, binding update and binding acknowledgment to HA, the return routability procedure, and the binding update and binding acknowledgement to the CN. In PMIPv6 and OS-PMIPv6, all
the signaling overheads are carried out by network entities, least suffer from wireless link. The OS-PMIPv6 reduces the authentication signaling overhead as compared to PMIPv6. Hence, OS-PMIPv6 has less handover latency. Figure 8 depicts impact of wireless link delay on handover latency in MIPv6, PMIPv6 and OS-PMIPv6 schemes.
Fig. 8 Impact of wireless link delay on handover latency
B. Impact of delay between MN and CN Figure 10 shows the impact of delay between MN and CN on handover latency. The handover latency linearly depends on delay between MN and CN represented as (Tmr + Tra + Tac). Figure 9 shows that the proposed optimized authentication scheme has better performance than the existing MIPv6 [5] and secure PMIPv6 protocol [7]. In MIPv6, whenever MN changes its subnet to other it must register itself with new CN that causes higher handover latency. While in case of PMIPv6 and OS-PMIPv6 the MN is free to move within LMD without registration overhead with CN.
Fig. 9 Impact of delay between MN and CN on handover latency
C. Impact of movement detection delay on handover latency As discussed earlier, movement detection is responsible for layer-3 handover. MIPv6 is a global mobility management protocol and the movement detection encounters wherever the MN crosses the boundaries of a subnet. Each time MN has to configure a CoA in new subnet, which is a time consuming process. The movement detection results higher handover latency and subsequently greater packet loss. While PMIPv6 and OS-PMIPv6 are localized mobility management protocol
514 https://sites.google.com/site/ijcsis/ ISSN 1947-5500

(IJCSIS) International Journal of Computer Science and Information Security, Vol. 14, No.06, June 2016
which don’t involves movement detection within LMD. In PMIPv6 and OS-PMIPv6, as MN enters into LMD, a 64-bits prefix is assigned by LMA and remains fixed during movement in LMD. The migration of MN from one MAG to another doesn’t affect the 64-bits prefix. Figure 10 shows the effect of movement detection delay on handover latency in MIPv6, PMIPv6 and OS-PMIPv6 schemes.
Fig. 10 Impact of movement detection delay on handover latency
D. Analysis of Packet Loss (PL) in Wireless medium In the proposed scheme it assumed that processing
time of AR, HA, MAG, LMA and AAA server is negligible. Also, there is no buffering mechanism is assumed in of AR, HA, MAG, LMA and AAA server. Therefore, the packet loss is directly proportional to the Handover Latency (HL). If session arrival mean rate to an MN is expressed as λs, then packet arrival rate to the MN and it can be expressed as PL = λs .HL (15)
Figure 11 shows the number of packet loss due to delay in wireless medium.
Fig. 11 Packet loss due to delay in wireless medium
VI. CONCLUSION For seamless mobility in IPv6 network, a number of
protocols are proposed by researchers. The host-based mobility management protocol i.e. MIPv6 and its subsequent protocols have higher signaling overhead than the network-
based mobility protocol i.e. PMIPv6. But basic PMIPv6 was not completely secure.
In the paper, a secure and optimized authentication scheme to reduce handover latency in PMIPv6 is proposed. For analytical evaluation, the numerical calculation based approach is considered. The OS-PMIPv6 is more secure than basic PMIPv6 and has less authentication delay than the contemporary protocol [7]. The OS-PMIPv6 shows better performance in terms of handover latency. In future, the handover latency analysis can be used for packet loss analysis in OS-PMIPv6. Further, the LMD may have multiple LMA organized in hierarchical fashion. This will improve efficiency of OS-PMIPv6.
References:
[1] C. Perkins, “IP Mobility Support for IPv4,” IETF RFC 3344,
Aug. 2002. [2] D. Johnson, C. Perkins, and J. Arkko, “Mobility Support in
IPv6,” IETF RFC 3775, June 2004. [3] R. Koodli, “Mobile IPv6 Fast Handovers”, IETF RFC 4068, July
2009. [4] H. Soliman, C. Castelluccia, K. ElMalk, L. Bellier, “Hierarchical
Mobile IPv6 (HMIPv6) Mobility Management”, IETF RFC 5380, October 2008.
[5] S. Gundavelli, K. Leung, V. Devarapalli, K. Chowdhury, B. Patil, “Proxy Mobile IPv6”, IETF RFC 5213, August 2008.
[6] Guan, J., Zhou, H., Xu, C., Zhang, H., & Luo, H., “The performance analysis of the multicast extension support for Proxy MIPv6”. Wireless Personal Communications, 2011, Volume 61, Issue 4, 657–677.
[7] Ki-Sik Kong, Wonjun Lee ; Youn-Hee Han ; Myung-Ki Shin ; HeungRyeol You, “ Mobility management for all-IP mobile networks: mobile IPv6 vs. proxy mobile IPv6”, IEEE Wireless Communications, 2008, Vol-15, Issue-2, 36-45.
[8] Sanchez, M.I., Uruena, M.; de la Oliva, A.; Hernandez, J.A. ; Bernardos, C.J., “ On providing mobility management in WOBANs: integration with PMIPv6 and MIH”, 2013, Vol-51, Issue-10, Pages 36-45, 172-181.
[9] H. Faithi and R. Prasad, “Mobility Management for VoIP in 3G Systems: Evaluation of Low-Latency Handoff Schemes,” IEEE Wireless Communications, 2005, Vol-12, Issue- 2, Pages 96–104.
515 https://sites.google.com/site/ijcsis/ ISSN 1947-5500

Design for All: Catering for Culturally Diverse Users
Mahdi H. Miraz1,2, Maaruf Ali3 and Peter S. Excell1
1Department of Computing, Glyndŵr University, Wrexham, UK (m.miraz||p.excell)@glyndwr.ac.uk
2Department of Computer Science and Software Engineering, University of Hail, KSA [email protected]
3Department of Computer Science, University of East London, London, UK [email protected]
Abstract—Due to mass global migration and increased usage of the Internet, it is now very important to address the cultural aspects of the usability problems of any Information and Communication Technology (ICT) products such as software, websites or applications (apps) whether to be used on PCs, Laptops, Smartphones, Tablets, Smart TVs or any other devices. To augment the “Design for All” concept, this research demonstrates the need to cater for culturally diverse users while designing user interfaces. This has been achieved, by investigating ICT products and conducting an extensive literature survey. The study concludes that it is very important to work on cross-cultural usability problems and bring these issues under focus.
Index Terms—Human Computer Interaction (HCI), Universal Usability, Cross-cultural Usability, User Interface (UI) Design, Design for All, Users’ Behaviour.
I. INTRODUCTION
Today, computing power continues to increase at a rate in line with that predicted by Moore’s Law [1] [2] [3]. In
contrast, the costs to access computing, internet and networking equipment such as PCs, laptops, net pads, tablets,
handheld devices, smartphones, internet modems, internet data bundles and so forth are decreasing at an inverse
rate. As a result, the usage of computing devices and the Internet, by people from different cultures, beliefs, ethnicity
and geographical diversity is increasing at an unabated rate. In addition to that, contributions of different charity
programs and government policies to enable ICT to reach the ‘last mile’ have geared up the process. As a result, it
has now become essential to cater for culturally diverse users when designing any ICT products such as software,
websites or applications (“apps”). This study presents a review of the research and commercial products, trends in
technology, applications and usability from the cultural point of view. Finding the next direction of cross-cultural
usability is the main focus of this review study.
This paper reports an on-going research effort on usability engineering, focusing on cross-cultural Information
System (IS) Issues and users’ behavior. It was conducted jointly between Wrexham Glyndŵr University (UK) and
the University of Ha’il (KSA).
II. DESIGN FOR ALL
The pioneer researchers in the field of Universal Usability and Assistive Technology have long ago suggested the
concept of “Design for All”. These include the works of key researchers such as: Constantine Stephanidis [4] in
Greece, Alan Newell [5] in the United Kingdom, Gregg Vanderheiden [6] [7] and Neil Scott [8] both from North
America. The initial survey focused on disabled users, however, this was later extended to cover the elderly and
young users and those with limiting technologies such as users with small screens, no screens and slow network
International Journal of Computer Science and Information Security (IJCSIS), Vol. 14, No. 6, June 2016
516 https://sites.google.com/site/ijcsis/ ISSN 1947-5500

connections [9]. More recent research on usability analysis of a gesture-controlled user interface, to be used by the
elderly and disabled users, was conducted by Bhuiyan et al. [10]. The new study reported here is novel, as far as is
known by the authors, as it includes cultural aspects of universal usability.
As far back as 1993, Newell [11] was a pioneer in recognizing the need to cater for the full spectrum of users,
especially the disabled and aging demographics, in designing an effective human-computer interface (HCI). In a
paper [5] published nine years later, Newell sees “enormous opportunities for the human-computer interface design
community” due to the “significant changes in the social, legal, demographic, and economic landscape over the past
10–15 years”. However, due to continued mass global migrations and the opening up of the world economy, it has
now become pertinent to address the cultural issues as well [12] [13] [14].
III. THE NEED FOR CROSS-CULTURAL USABILITY
The Web has become a commodity that everyone has to have and everyone needs to use because it is built upon
the most important commodity of the new millennium, that is, information. With the passing of time, people are also
very quickly moving towards adoption of the general concept of the Information System. Not only does it let them
use the information available on the Web by adding more flexibility but also some applications are fundamentally
based on the Internet, without which socially-connected lifestyles cannot be imagined today [15]. The increasing
demand for access to the Information System to access multimedia and Internet applications and services over the
last few years has created new interest among existing and emerging operators to explore new technologies and
network architectures, offering such services at low cost to operators and end users [16] [17] [18]. It has now
became extremely difficult in the 21st century to ignore the need to address the Information System (IS) issues
relating to cultural differences, ethics, communication barriers and different Human-Computer Interaction (HCI)
principles, together with user behavior, socio-economic circumstances and similar factors.
Web technology is changing rapidly and the Internet has become a lifestyle for people all over the world [19]. The
power of the Web has changed the way people communicate and do business. The increasing field of website
design, especially the study of what a user wants from a website, has become an important field of interest because
many businesses in various sectors are increasingly exploiting the Internet as a medium to market products and
services, and more generally to communicate with the customers [20] [21]. However, this introduces hazards of the
disclosure of personal and confidential information and the possibility of unwanted promotional activities [22] [23].
Li and Kirkup [24] stated that most (89%) of Websites are in the English language and American-dominated. So it
is no surprise that language is one of the vital cross-cultural issues affecting attitudes towards Internet usage.
Although Tian and Lan [25] noted the rapid increase of non-English Internet Web pages, they still consider them to
be a “minor section” in Internet culture. They also identified an important phenomenon, in that although some of
these non-English sites are extremely popular, they are mostly non-commercial.
Chattratichart and Brodie [26] carried out a survey with 326 mobile phone owners of different age groups, from
diverse geographic and socioeconomic backgrounds (29 countries, 35+ occupations and ranging from 13 to over 74
years old) that studied their needs and preferences. However only call-making and address book functions received
International Journal of Computer Science and Information Security (IJCSIS), Vol. 14, No. 6, June 2016
517 https://sites.google.com/site/ijcsis/ ISSN 1947-5500

high votes from all the groups. This research suggests that national boundaries, culture and socioeconomic
background might have affected the respondents’ opinions of the use of functions.
Findings on cultural influences on website design, related structural design criteria, basic conditions, and
complementary criteria for culturally appropriate websites are discussed by Hermeking [27] and these may impact
the future of the Digital Divide. Hermeking [27] [28] is of the opinion that “consumption research” is an essential
precondition for appropriate product design. It tries to uncover how much, by whom, where, at what time, for what
purpose, and according to whose preferences the Internet typically is used, as well as how it is used, if used at all.
Comparisons of websites of various global companies and brands in different countries according to these structural
design criteria show a frequent lack of adaptation and appropriateness to specific cultural communication styles.
Although an increasing number of websites reveal some cultural adaptation to a moderate degree, too many websites
are still characterized by a dominant ‘Low-context’ style (e.g., rational, text-heavy, deeply structured contents),
which is preferred worldwide by only relatively few “information elites.” These websites are strongly standardized
and globally dispersed, regardless of the prevailing ‘High-context’ communication preferences (e.g. for
transformational, visual-heavy, less structured contents) in many target countries. He stated that, by analogy with
product design, website design can be described as a specific set of instrumental, technical, economic, social,
aesthetic and symbolic attributes or qualities of a website that contribute to its users’ satisfaction, which in turn
depends on the users’ cultural habits and values.
Hermeking’s findings seem to verify the cultural relevance of the website design criteria introduced; thus they
may be taken as an operational basis for more intensive cultural adaptations of the Web. Since technical conditions
are becoming increasingly favorable to such adaptations, this could make the Internet a truly world-wide medium in
the future. However, the present discussion is based on a small, probably not truly representative sample of websites
(out of many millions), so its conclusions should be regarded as preliminary. This highly complex subject matter
richly deserves further investigation.
Recently there has been a heightened awareness of the need to design products and services for social diversity.
This awareness is encapsulated in the concept of ‘inclusive design’ or ‘design for all’ principles. Designing for ‘all’
seeks to ensure products and services are conveniently usable by as many people as possible [29].
Sinkovics, Yamin and Hossinger [30] conducted a study exploring 100 German companies’ regional (Domestic,
US, UK and Latin American) websites and employed a cultural value analysis in e-commerce and Internet
Marketing. They suggested that in order to engage better with their customers and to also reach better cultural
congruency, companies needed to work harder on developing culturally adapted websites.
Lazar [31] and Shneiderman [32] suggest that Human-Computer Interaction (HCI) researchers and usability
professionals’ focus for the next decades will be on spreading the early successes to a broader community of users.
Proponents of this view believe that they can enable every person to benefit from information and communication
technologies. Advocates of universal usability claim that this principle can stimulate innovative advantages.
Progress towards universal usability is measured by the steadily increasing percentage of the world’s population that
has convenient, low-cost access to communication and Internet services. Unfortunately, however, there still exist
International Journal of Computer Science and Information Security (IJCSIS), Vol. 14, No. 6, June 2016
518 https://sites.google.com/site/ijcsis/ ISSN 1947-5500

many forgotten users, especially low-income citizens in every country and many residents of developing nations
[33].
Cross-cultural usability will be needed in dealing with the difficult societal challenges that are likely to define the
future of Human-Computer Interaction research and IS services need to be re-shaped to accommodate a wide range
of diverse users. Miraz et al. [34] recently conducted a survey among IS users in the United Kingdom and
Bangladesh, to find out how cultural and socio-economic circumstances are being reflected in the behavior of such
users across different national boundaries and the effect on the diffusion of mobile broadband technology (including
Internet-based services) due to this. The study outlined many issues affecting the IS users’ behavior, including age,
economic capacity, education and gender.
Gesteland [35] stated that there are two “Great Divides” between business cultures: Relationship Focus (RF) and
Deal Focus (DF). Markets in the Middle East, most of Africa, Latin America and the Asia/Pacific region are
relationship-oriented. Instead of doing business with strangers, people from these regions prefer to get things done
through intricate networks of personal contacts. These business cultures have a great impact on on-line shopping and
e-business.
A study was undertaken by Miraz et al. [36] [37] to determine the important usability factors (UF) applying in the
English and the non-English version of a major website. The important usability factors were determined, based on a
detailed questionnaire used in an international survey among 168 participants. Analysis of the questionnaire found
inequalities in the user satisfaction and a general dissatisfaction with the non-English version of the website. The
study concluded that more care should be taken in creating the text, taking into account the cultural and linguistic
backgrounds of the users and the use of graphics in multilingual websites. As internationalization of services is
continuing at an unabated rate, the researchers also argued that, for any multinational or even nowadays any national
website, it has to cater to an audience whose mother tongue is frequently not English. Experience strongly suggests
that how people interact with these websites can have a significant impact on the success and reputation of the
business.
Due to the adoption of Web 2.0 technologies, social media, which is also referred to as user-generated content
(UGC) or consumer-generated media (CGM) [38] has become very popular nowadays in the global boundaryless
Internet world. Exploring the Cross-cultural IS issues thus now bears significant importance due to the cultural
diversity of the users of social media.
Cross-cultural IS issues represent a branch of Human Computer Interaction (HCI). Although many researches
have been conducted on the broader aspects of HCI, not enough attention has been given to the cross-cultural issues
relating to the Information System and its usage. It is thus very important to work on this and bring these issues
under focus.
IV. CROSS-CULTURAL USABILITY PROBLEMS
Due to cultural diversity, IS users experience a wide range of usability problems. The factors which contribute to
cross-cultural usability problems include: Color, Navigation, Page Layout, Text Orientation and Font Size,
Translation, Abbreviation, Keywords, Localized and Globalized contents, Language Selection, Graphics and
International Journal of Computer Science and Information Security (IJCSIS), Vol. 14, No. 6, June 2016
519 https://sites.google.com/site/ijcsis/ ISSN 1947-5500

Placement of Texts and Images, etc. In this section, some such real life problems due to cultural diversity are
presented.
A. Language Selection
Figure 1. Language Selection problem at Skype website.
Automated selection of language might be sometimes frustrating, especially for immigrant website visitors. For
example, Skype.com automatically detects the IP (Internet Protocol) address and diverts the user accordingly.
However, if a non-Arabic speaker resident of Saudi Arabia wants to visit the Skype website (shown in Fig. 1),
because they are automatically directed to the Arabic version and the option to navigate to the English/other version
is presented in Arabic, there is no easy way of doing that for anyone unable to read Arabic. Such scenarios may be
circumvented by allowing the visitors to choose their region and then language upon initial interaction with the
website application. This can be really effective for websites that are going global. Being able to choose Saudi
Arabia and then select Bangla or English, for example, can make a brand seem niche and unique for the visitor. Thus
local content can be provided in a language of the user’s own choice. Usability of the website can be increased by
making it even easier for the visitors. IP can be tracked to select the region and then auto-detection of the browser
language could take place so that the website could be automatically served in that language. A ‘change back’ option
should always be present to facilitate the visitor’s preference, in case the user wishes to visit pages of some other
regions or languages or even if they relocate (periodically).
International Journal of Computer Science and Information Security (IJCSIS), Vol. 14, No. 6, June 2016
520 https://sites.google.com/site/ijcsis/ ISSN 1947-5500

B. Language Inconsistency
Figure 2. Language inconsistency of the “Islamic Calendar” app for iPhone.
Designers are not necessarily the users. A designer is probably more IT-literate and can be considered as an expert
user but not a “real” user. A “real” user might have a little knowledge or no knowledge about the system. Culturally
biased designers, knowingly or unknowingly, might have influence on the design of the products which could create
bigger problems for the “real” users. Fig. 2 displays an app, named Islamic Calendar, designed for the iPhone. The
app is a calendar to convert Gregorian to Hijri dates and vice-versa. Although the app has been installed with an
English language package, the pop-up window to rate the app is in Arabic. Anyone not knowing Arabic will
definitely be puzzled at the sudden appearance of the pop-up window and will not know which button to select for a
safe exit. This has happened because the designer might have forgotten the fact that not necessarily all Muslims are
Arabic speakers or even that the app might be used by non-Muslim users residing or dealing in Arab countries.
V. FUTURE STUDY
Rana and Miraz [39] conducted a case study in the Kingdom of Saudi Arabia to examine several cross-cultural
issues, including ethical issues, online shopping, linguistic issues and religious issues and their impact on the IS
users’ behavior. The resultant analysis suggested that further work is needed to address other cross-cultural IS issues
affecting people from different parts of the world. The research requires expansion of the user population to include
people from other regions of the world and also will focus on more IS issues than those mentioned above. An
extensive international user survey will be conducted to identify the cross-cultural usability problems. Based on the
initial findings, a culturally independent prototype, considering the identified cross-cultural usability aspects, will be
designed to test the theories that the research will develop. Design considerations include adequate attention to
individual and cultural differences among users, improved communication, support of social structures, provision of
access by illiterate users and appropriate user-controlled adaptation. Research is currently in progress on the
feasibility of considering Artificial Intelligence (AI) based adaptive user interface techniques to be implemented
within the prototype.
International Journal of Computer Science and Information Security (IJCSIS), Vol. 14, No. 6, June 2016
521 https://sites.google.com/site/ijcsis/ ISSN 1947-5500

This prototype will then be tested and evaluated by the user cohorts. The results and other findings shall
contribute knowledge in the domain.
VI. CONCLUSION
There exist so many cultures in the world and each culture has their own uniqueness. It is thus impossible (and
undesirable) to eliminate this individuality of different cultures for the sake of Web designers’ convenience but
people from different cultures and nations can be brought under one IS umbrella if special care can be given to their
specific needs and ways of using the IS system.
The paper has reviewed relevant IS products and presented an extensive literature survey within the knowledge
domain. The findings of these product and literature surveys have suggested ideas and factors for developing future
IS products, aimed to be used by a wide range of users from across the world, having user interfaces with cross
cultural usability. The researchers put forward that Usability Engineering may play a vital role in achieving the
“Design for All” concept including culturally diverse users.
REFERENCES
[1] Gordon E. Moore, "Cramming more components onto integrated circuits," Electronics, vol. 38, no. 8, pp. 114-117, April 1965. [Online]. http://download.intel.com/museum/Moores_Law/Articles-Press_Releases/Gordon_Moore_1965_Article.pdf
[2] Gordon E. Moore, "Progress in Digital Integrated Electronics," IEEE Solid-State Circuits Society Newsletter, vol. 20, no. 3, pp. 36 - 37, September 2006. [Online]. http://ieeexplore.ieee.org/xpl/articleDetails.jsp?arnumber=4804410
[3] Gordon E. Moore, "Lithography and the Future of Moore's Law," IEEE Solid-State Circuits Society Newsletter, vol. 11, no. 5, pp. 37 - 42, September 2006. [Online]. http://ieeexplore.ieee.org/xpl/articleDetails.jsp?arnumber=4785861
[4] Constantine Stephanidis, Ed., User Interfaces for all: Concepts, Methods, and Tools. Hillsdale, NJ, USA: Lawrence Erlbaum Associates Inc., 2000.
[5] Alan F. Newell and Peter Gregor, "Design for older and disabled people – where do we go from here?," Universal Access in the Information Society, vol. 2, no. 1, pp. 3-7, November 2002. [Online]. http://link.springer.com/article/10.1007%2Fs10209-002-0031-9
[6] Gregg Vanderheiden, "Fundamental principles and priority setting for universal usability," in Proceedings of the ACM 2000 conference on Universal Usability (CUU '00), New York, NY, USA, 2000, pp. 32-38. [Online]. http://dl.acm.org/citation.cfm?id=355460.355469&coll=DL&dl=GUIDE&CFID=334880249&CFTOKEN=28517507
[7] Gregg Vanderheiden, "Everyone interfaces," in User Interfaces for All: Concepts, Methods, and Tools, Constantine Stephanidis, Ed. Hillsdale, NJ, USA: Lawrence Erlbaum Associates Inc, 2000, pp. 115-133.
[8] John Perry, Elizabeth Macken, Neil Scott, and Janice L. McKinley, "Disability, inability and cyberspace," in Human values and the design of computer technology, Batya Friedman, Ed. Cambridge, United Kingdom: CSLI Publications & Cambridge University Press, 1997, pp. 65 - 89.
[9] Ben Shneiderman, "Promoting Universal Usability with Multi-Layer Interface Design," ACM SIGCAPH Computers and the Physically Handicapped, no. 73-74, pp. 1-8, June-September 2002. [Online]. http://dl.acm.org//citation.cfm?id=957205.957206&coll=DL&dl=ACM&CFID=334880249&CFTOKEN=28517507
[10] Monir Bhuiyan, Rich Picking, Mahdi H. Miraz, and Md.Emran Hossain, "USABILITY ANALYSIS OF A GESTURE CONTROLLED USER INTERFACE," in the proceeding of the fourth international conferences on Internet Technologies and Applications (ITA 11), Wrexham, UK, 2011, pp. 500-506.
[11] Alan F. Newell, "Interfaces for the Ordinary and Beyond," IEEE Software, vol. 10, no. 5, pp. 76-78, September
International Journal of Computer Science and Information Security (IJCSIS), Vol. 14, No. 6, June 2016
522 https://sites.google.com/site/ijcsis/ ISSN 1947-5500

1993. [Online]. http://www.computing.dundee.ac.uk/staff/afn/pdf/Ord%20&%20Eord%20-%20IEEE%201993.tif
[12] Maaruf Ali and Mahdi H. Miraz, "The Cultural Impact of Diffusion of IT Innovation in World Society," in Proceedings of the International Conference on Recent Advances in Computer Systems (RACS 2015), Ha'il, Saudi Arabia, 2015, pp. 114-118. [Online]. http://www.atlantis-press.com/php/download_paper.php?id=25847792
[13] Mahdi H. Miraz, Peter Excell, and Maaruf Ali, "Aligning Digital Media Technologies with Non-Western Linguistic and Cultural Sensitivities," in Glyndŵr University & Staffordshire University Joint Researcher Development Conference, Wrexham, United Kingdom, 28th May 2014.
[14] Mahdi H. Miraz, Sajid Khan, Moniruzzaman Bhuiyan, and Peter Excell, "Mobile Academy: A Ubiquitous Mobile Learning (mLearning) Platform," in Proceedings of the International Conference on eBusiness, eCommerce, eManagement, eLearning and eGovernance (IC5E 2014), University of Greenwich, London, UK, 30-31 July, 2014, pp. 89-95. [Online]. http://edlib.asdf.res.in/2014/ic5e/ic5e2014014.pdf
[15] Mahdi H. Miraz, Maaruf Ali, Peter Excell, and Picking Rich, "A Review on Internet of Things (IoT), Internet of Everything (IoE) and Internet of Nano Things (IoNT)," in the Proceedings of the Fifth International IEEE Conference on Internet Technologies and Applications (ITA 15), Wrexham, UK, 2015, pp. 219 - 224. [Online]. http://ieeexplore.ieee.org/xpl/articleDetails.jsp?arnumber=7317398
[16] Etemad Kamran, "Overview of Mobile WiMAX Technology and Evolution," Communications Magazine, vol. 40, no. 10, pp. 31-40, October 2008.
[17] Maaruf Ali and Mahdi H Miraz, "Cloud Computing Applications," in Proceedings of the International Conference on Cloud Computing and eGovernance - ICCCEG 2013, Internet City, Dubai, United Arab Emirates, 19-21 June, 2013, pp. 1-8. [Online]. http://www.edlib.asdf.res.in/2013/iccceg/paper001.pdf
[18] Maaruf Ali and Mahdi H. Miraz, "Recent Advances in Cloud Computing Applications and Services," International Journal on Cloud Computing (IJCC), vol. 1, no. 1, pp. 1-12, February 2014. [Online]. http://asdfjournals.com/ijcc/ijcc-issues/ijcc-v1i1y2014/ijcc-001html-v1i1y2014/
[19] Jengchung V. Chen, Chinho Lin, David C. Yen, and Kyaw-Phyo Linn, "The interaction effects of familiarity, breadth and media usage on web browsing experience," Journal of Computers in Human Behavior, vol. 27, no. 6, pp. 2141-2152, November 2011.
[20] Tino Fenech and Aron O’Cass, "Internet users’ adoption of Web retailing: user and product dimensions," Journal of Product & Brand Management, vol. 10, no. 6, pp. 361 - 381, 2001.
[21] Dennis A. Pitta and Danielle Fowler, "Internet community forums: an untapped resource for consumer marketers," Journal of Consumer Marketing, vol. 22, no. 5, pp. 265 - 274, 2005.
[22] Joseph Alba et al., "Interactive home shopping: Consumer, retailer, and manufacturer incentives to participate in electronic markets," Journal of Marketing, vol. 61, no. 3, pp. 38-53, 1997.
[23] Sirrka L. Jarvenpaa and Peter A. Todd, "Consumer reactions to electronic shopping on the World Wide Web," International Journal of Electronic Commerce, vol. 1, no. 2, pp. 59-88, 1997.
[24] Nai Li and Gill Kirkup, "Gender and cultural differences in Internet use: A study of China and the UK," Computers & Education, vol. 48, no. 2, pp. 301-317, February 2007.
[25] Robert Guang Tian and Xuehua Lan, "E-Commerce Concerns: Cross-Cultural Factors in Internet Marketing," in International Conference on Electronic Commerce and Business Intelligence, Washington DC, USA, 2009, pp. 83-86.
[26] Jarinee Chattratichart and Jacqueline Brodie, "Envisioning a mobile phone for 'all' age," in INTERACT '03: IFIP TC13 International Conference on Human-Computer Interaction, Zurich, Switzerland, 2003, pp. 725-728.
[27] Marc Hermeking, "Culture and Internet consumption: Contributions from cross-cultural marketing and advertising research," Journal of Computer-Mediated Communication, vol. 11, no. 1, p. 10, October 2005.
[28] Marc Hermeking, "The cultural influence on international product development," International Management and Business Culture, vol. 7 (5), pp. 8-13, 2000.
[29] Tony Shipley and John Gill. (2000, December) PhoneAbility. [Online]. http://www.tiresias.org/phoneability/wireless.htm
[30] Rudolf R. Sinkovics, Mo Yamin, and Matthias Hossinger, "CULTURAL ADAPTATION IN CROSS
International Journal of Computer Science and Information Security (IJCSIS), Vol. 14, No. 6, June 2016
523 https://sites.google.com/site/ijcsis/ ISSN 1947-5500

BORDER E-COMMERCE: A STUDY OF GERMAN COMPANIES," Journal of Electronic Commerce Research, vol. 8, no. 4, pp. 221-235, 2007.
[31] Jonathan Lazar, Ed., Universal Usability: Designing User Interfaces for Diverse Users, 1st ed. New York, USA: John Wiley & Sons, 2007.
[32] Ben Shneiderman, "Universal Usability: Pushing Human-Computer Interaction Research to Empower Every Citizen," Communications of the ACM, vol. 43, no. 5, pp. 84-91, 2000.
[33] Ben Shneiderman and Catherine Plaisant, Designing the User Interface : Strategies For Effective Human-Computer Interaction, 5th ed., Michael Hirsch and Stephanie Sellinger, Eds. Boston, USA: Pearson Higher Education, 2010.
[34] Mahdi H Miraz, Monir Bhuiyan, and Md. Emran Hossain, "Impacts of Culture and Socie-Economic Circumstances on Users' Behavior and Mobile Broadband Technology Diffusion Trends," in the proceedings of the Fourth International Conference on Internet Technologies and Applications (ITA 11), Wrexham, UK, 2011, pp. 473-479.
[35] Richard R. Gesteland, Cross-Cultural Business Behavior: Marketing. Negotiating and Managing Across Cultures, 2nd ed. Copenhagen, USA: Copengagen Business School Press, 1999.
[36] Mahdi H. Miraz, Maaruf Ali, and Peter Excell, "Multilingual Website Usability Analysis Based on an International User Survey," in the proceeding of the fourth international conferences on Internet Technologies and Applications (ITA 13), Wrexham, United Kingdom, 2013, pp. 236-244.
[37] Mahdi H. Miraz, Peter S. Excell, and Maaruf Ali, "User Interface (UI) Design Issues for Multilingual Users: A Case Study," International Journal of Universal Access in the Information Society (UAIS), December 2014. [Online]. http://link.springer.com/article/10.1007%2Fs10209-014-0397-5
[38] Pierre R. Berthon, Leyland F. Pitt, Kirk Plangger, and Daniel Shapiro, "Marketing meets Web 2.0, social media, and," Business Horizons, vol. 55, no. 3, pp. 261-271, 2012.
[39] Mukhtar M. Rana, Mahdi H Miraz, Mohammed Fakrudeen, and Harima Mubeen, "CROSS-CULTURAL INFORMATION SYSTEM ISSUES AND USERS’ BEHAVIOUR: A CASE STUDY IN THE KSA," in the proceeding of The 6th IASTED International Conference on Human Computer Interaction (HCI 2011), Washington, DC, USA, 2011. [Online]. http://www.actapress.com/PaperInfo.aspx?paperId=451917
International Journal of Computer Science and Information Security (IJCSIS), Vol. 14, No. 6, June 2016
524 https://sites.google.com/site/ijcsis/ ISSN 1947-5500

Urban Traffic Control with Pedestrian Handling
Ayesha Shahid, Wilayat Ali Khan, Nazish Naheed, Salman Hafeez, Syeda Nuzhat Subi Naqvi, Aihab Khan Department of Software Engineering
Foundation University Rawalpindi Campus
Abstract - Over the years road traffic flow has seen pedestrian crossing as a major issue in the society, particularly in urban areas where there is no control for pedestrian road crossing. In mixed traffic conditions pedestrian road crossing behavior is a serious hazard for pedestrians crossing uncontrolled bi-intersection localities. Due to increase in motor vehicle growth there is an increase in the regulation of motor vehicles only and the regulation of pedestrian is completely neglected in urban area. An increase the uncontrolled road crossing behavior of pedestrian is raises different safety and economic concerns. This paper employs computational modeling to regulate the traffic flow across a two way intersection. It is caters how pedestrians can cross a bi-intersection traffic signal without disrupting the traffic flow. Existing computational models that have been presented by other authors are discussed which gives more understanding how to control traffic flow for vehicles and pedestrians handling. This study deals three scenarios of real environment for control of traffic flow for pedestrians; with no turns, with turns and with turns. All scenarios provides proper notation for ‘on states’ and ‘off states’ of signal. Experimental result demonstrates that the proposed method achieved waiting time for vehicles 143.35 seconds and 200.23 seconds for pedestrians respectively. Furthermore, result shows the decrement of time and economical resources that are used in the daily commute.
Index Terms— Pedestrian, Bi-intersection, uncontrolled traffic, Computational Modeling, Traffic Control System
I. INTRODUCTION In modern era, it is predicted that passenger utilized over 600 million cars and roughly every year this is increasing by 50 million in numbers. With the increments of vehicles, there is no such rule for pedestrian safety and time route for crossing the road [1]. There are many factors, including lack in traffic rule public awareness, irrational traffic infrastructures and poor planning that are responsible for pedestrian and traffic problems. The major factors which effect the existing urban traffic signal control (TSC) system does not sufficiently follow optimal traffic control and management role [1].In addition, many others factors also involved in urban traffic control, numbers of vehicles, travelers and weather, which makes the traffic system complex nonlinear stochastic systems and pose many problems. Besides the TSC human behaviors also effect the implementation of pedestrian control system for traffic signal [2]. Therefore, it cannot achieve the optimal usage of resources: time and space of the whole intersection. A considerable amount of research have been devoted to the vehicular traffic modelling, but pedestrian traffic modelling didn’t received much attention. It is until recent that a little attention have been given to modelling pedestrian traffic. Studying the urban traffic with the help of computational modeling to find the solutions which can give us better use of resources involved in the daily commute in means of time and operational cost of a vehicle as it play a very vital role for travelers [3]. As the safety and cost are major concern so, we solve this issue by using computational modeling. It is study of complex problems by using computer science and simulates all variables which are involved in this process. To achieve this purpose, creates an artificial environment in which complex problems are characterized, so we able to drive a suitable solutions.
The objective of this study is to optimize the traffic flow, reduce the time spent by pedestrians and lessen traffic jam by minimizing the time spent by a vehicle and a pedestrian on a traffic signal. In return, lower the operational cost of a vehicle and save the time of a by stander. Simulation of model has been implemented in C++ which helps to reduce traveler time and operational cost in means of waiting time of pedestrian or vehicle.
This paper is organized as per following sections; related work is described in section II, preliminaries are explained in section III, Framework overview described in section IV, experiment results are demonstrated in section V and in section VI, we arrive at conclusion and future work. References placed at the end of all sections.
International Journal of Computer Science and Information Security (IJCSIS), Vol. 14, No. 6, June 2016
525 https://sites.google.com/site/ijcsis/ ISSN 1947-5500

II. RELATED WORK
Walking is the most fundamental mean of transportation [6]. A Chinese proverb “walking also constitutes the first and last part of practically any trip” is literally true in every mean. Predicting how an individual pedestrian behave is a matter of describing its destination and preferences regarding the route choice to its destination [4]. Pedestrian road crossings have become a major issue in road traffic flow, especially in urban areas. The modeling of pedestrian’s movement in the urban traffic flow has become an important area for many researchers [4]. Over the years, different efficient and optimum models have been proposed to regulate the traffic flow in account of pedestrians. Some of them are mentioned below:
Alina Chertock’s presents “Pedestrian Flow Models slowdown Interactions” which introduces and investigates one-dimensional models for the mannerism of pedestrians in a narrow street or path [5]. At the beginning, the microscopic levels by framing stochastic cellular automata model with unambiguous instructions for pedestrian’s movement in reverse direction. A coarse-grained microscopic and macroscopic analog is the resultant of leads to the attached system of PDEs for the density of the pedestrian traffic. The achieved PDE system assorted hyperbolic-elliptic category and consequently, meticulously get higher-order nonlinear diffusive corrections for the macroscopic PDE model. Numerical experiments are performed, which are compared and distinguished to the manners of the microscopic stochastic model and the coarse-grained PDEs are resulted. The CA formalism is that it allows for a systematic derivation of the coarse-grained dynamics is an advantage of presented model. The drawback of proceeding model it only works for one-dimensional in a narrow street or corridor and not works for control of bi-dimensional with pedestrian handling [5]. In addition, Fredrik Johansson is the first who provides a platform of micro-simulation for pedestrian traffic by incorporating microscopic modeling and simulation of pedestrian traffic. Their Traffic Simulation Platform (PTSP) scheme is based on the Social Force Model which is later evaluated [6]. In this article possible existing models which are proposed for pedestrian e.g. microscopic, social fore, waiting pedestrian, preferred velocity, preferred position, adapting preferred position models and importance of modeling waiting behaviors are briefly discussed. The basic attributes of traffic flow is also part of this research, e.g. number of pedestrians passing a cross section per unit time, width of the cross section, average density in an area and traffic the mean speed of the vehicles on a link serves and related issues with these basic attributes are described gently [6]. B Raghuram Kadali and P Vedagiri model the pedestrian road crossing behavior under mixed traffic condition [7]. The pedestrian behavioral aspects are considered at the microscopic level which includes variables such as observation duration at curb and median, number of observations at curb and median, observation duration while crossing, number of observations while crossing, speed change condition, crossing path change condition, frequency of attempt and rolling gap. In their research, they investigated the pedestrian road crossing behavior of uncontrolled traffic. Traffic flow is varied to observe the best variation of behaviors of the pedestrians. Their behavior of road crossing has been modeled by the size of vehicles gaps accepted by walker using the multiple linear regression technique. A choice of model is presented which has been developed to depict the decision making process of pedestrian i.e., whether to accept or reject vehicular gaps based on the discrete choice theory [7]. This scheme has some limitation like, pedestrian’s age, video coverage section (40m) is limited, speed of the vehicle, overlooked due to visibility complications, pedestrian speed change and path change. Pedestrians may walk faster or may reduce their speed in various situations (e.g., in rolling gap condition pedestrian may reduce or increase their speed according to the available gap and there are multiple path change conditions). So, it is need to evaluate the pedestrian road crossing behavior with individual specific speed as well as path change conditions. Moreover, this model complies only for midblock road cross and does not talk about traffic control on signal area and dimensional of road clearly[7].
Besides previous model, motorway traffic models for traffic has been proposed by Tom Ballemans et al [8] predictive control approach for ramp metering is evaluated in model on the basis of its selected features. As traffic on the motorways is fast and dynamic in nature, the control actions are required to be updates on regular basis for accounting purposes of traffic change scenarios. Additionally, use of loop detector which is a device that counts the number of vehicles works as loop in the road surface and an electronic device that monitors the changes of inductance of the loop as vehicles are passing over it [8].
Modeling Behavior in Vehicular and Pedestrian Traffic Flow by Michael J. Markowski investigates the design and analysis of vehicular and pedestrian models. A new vehicular model is developed for vehicle behavior modeling as well as to use as a
International Journal of Computer Science and Information Security (IJCSIS), Vol. 14, No. 6, June 2016
526 https://sites.google.com/site/ijcsis/ ISSN 1947-5500

tool to create an even more complex behavioral model of pedestrian movement. The model is developed to support the changes in multiple lanes and contribute to improve four points [9]. Initially, it investigates the purely behavioral studies and engineering modeling of urban area traffic and then in constant of single lane it works for multiple lanes at a time. At next, an algorithmic model of pedestrian movement is created which support groups and simple social interaction. In last, software is designed to using an object-oriented approach in conjunction with agent based modeling [9]. This model specify for shopping centers or parks area for pedestrian handling and it creates by using cellular automaton instead of computational model.
Serge Hoogendoorn in his paper presents that having insights into the pedestrian flow process and evaluation tools for pedestrian walking speeds &comfort is vital in development and geometric design of infrastructural amenities, and for management of pedestrian flows under standard and safety-critical situations. It is observed that pedestrians are independent prognostic controllers that lessen the one-sided predicted cost of walking. Pedestrians to see the behavior of other pedestrians on the basis of their observations of the current state in addition to predictions of the future state, given the implicit walking strategy of other pedestrians in their direct neighborhood. [10]. ZhaoWei Qu at el [11] presents a survey paper where briefly focuses on different traffic signal control systems (TSC). Such as, traffic signal control, Reasons of Computational Intelligence for Traffic Signal Control, computational intelligence for traffic signal control in surface network, Fuzzy System, Artificial Neural Network Evolutionary Computation and Swarm Intelligence and computational intelligence for traffic signal control in freeway network with coordination of urban traffic control and its assignment. All system has own pros and corns respectively.
After having a detail review of existing system, we come at this point; no one provides a clear solution for pedestrian; how they move and control in bi-direction traffic flow. We proposed a solution which based on computational modeling to safe the time and resources of vehicles and pedestrian in urban traffic flow. A computational model can provides insight into behavior of a phenomenon, or by reconciling seemingly contradictory phenomena. It deal with complexity by producing satisfying explanations of what would otherwise just be vague hand-wavy arguments and explicit about your assumptions and about exactly how the relevant processes actually work. In addition it is more stringent test of a theory and encourages parsimony and also enables one to relate two seemingly disparate phenomena by understanding them in light of a common set of basic principles [12].
III. PRELIMINARIES
The measure used to describe the traffic situation is naturally dependent on the level of detail with which the traffic can be observed [6]. Traffic signals gives clear understanding of traffic movement on the road, especially in busy and idle hours with their implication. It helps drivers to avoid risks and also guide them to how to keep safe driving by following these rules. Signals are placed at vantage points on the sides of the roads and overhead along the high streets. It is anticipate to road users vigilant and warn them in places where there are corners, slopes and animals.
Moreover, signals guide drivers the names of cities, regions, places, and aid stations. Each light colors have a specific meaning; as red light means “stop” and if the light is red as you approach, you must not go beyond the zebra crossing. A green light means you may go if the road is clear and should proceed with caution. In last, amber light indication of move on if you are close to the stop line but when this light first appears then stopping would be dangerous.
Traffic signal helps us to make sure that pedestrian and bicyclists obtain reasonable share of the road. It is usually life threatening to cross a hectic neighborhood and crosswalks may significantly lower the danger. Here is an explanation of how traffic signals work:
• with no turns • with turns • with turns and pedestrians
WHEN NO TURNS: This postulates deals with two scenarios in which no turns are introduced in the traffic flow. First, traffic flows in the horizontal and the second is in the vertical direction. Fig.1 gives the overview of the two way (Bi) intersection.
International Journal of Computer Science and Information Security (IJCSIS), Vol. 14, No. 6, June 2016
527 https://sites.google.com/site/ijcsis/ ISSN 1947-5500

Figure 1: Bi-intersection road with no turn
Decision statement: The first statement as depicted in Fig 2 deals with the movement of traffic horizontally. This statement can be written as P1:S1’ S3’ S2 S4 which tells that traffic flows when signal-1 and signal-2 are ‘on’ whereas rest of the signal-3 and signal-4 are in the ‘off’ state. The second statement deals with the movement of traffic vertically. This statement can be written as P2:S2’ S4’ S1 S3 which tells that traffic flows when signal-2 and signal-4 are ‘on’ whereas rest signal-1 and signal-3 are in the ‘off’ state as shown in Fig.3.
Figure 2: P1:S1:S3:S2:S4 Figure 3: P2:S2:S4:S1:S3
WITH TURNS: This scenario deal with traffic flow with all possible turns as illustracted in Fig 4.
Figure 4: Bi-intersection with all possible turns
Decision statement: The first statement deals with the movement of traffic horizontally rightwards and turning right. This statement can be written as P1:S1’ R1’ S2 R2 S3 R3 S4 R4, as shown in Fig.5. The behavior of traffic flow when signal-1 and right signal-1 are ‘on’ whereas rest signal-2, rightsignal-2, signal-3, rightsignal-3, signal-4 and rightsignal-4 are in the ‘off’ state can be noted.
International Journal of Computer Science and Information Security (IJCSIS), Vol. 14, No. 6, June 2016
528 https://sites.google.com/site/ijcsis/ ISSN 1947-5500

Figure 5: P1:S1’ R1’ S2 R2 S3 R3 S4 R4 Figure 6: P2: S2’ R2’ S3 R3 S4 R4 S1 R1
The second statement deals with the movement of traffic vertically rightwards and turning right. This statement can be written as P2: S2’ R2’ S3 R3 S4 R4 S1 R1, which tells that traffic flows when signal-2 and rightsignal-2 are ‘on’ whereas rest signal-3, rightsignal-3, signal-4, rightsignal-4, signal-1 and rightsignal-1 are in the ‘off’ state as explained in Fig 6.
The third statement deals with the movement of traffic horizontally leftwards and turning right. This statement can be written as P3: S3’R3’ S4 R4 S1 R1 S2 R2 which tells that traffic flows when signal-3 and rightsignal-3 are ‘on’ whereas rest signal-4, rightsignal-4, signal-1, rightsignal-1, signal-2 and rightsignal-2 are in the ‘off’ state as described in Fig 7.
Figure 7: P3: S3’R3’ S4 R4 S1 R1 S2 R2 Figure 8: P4: S4’R4’ S1 R1 S2 R2 S3 R3
The fourth statement deals with the movement of traffic vertically upwards and turning right. This statement can be written as P4: S4’R4’ S1 R1 S2 R2 S3 R3 which tells that traffic flows when signal-4 and rightsignal-4 are ‘on’ whereas rest signal-1, rightsignal-1, signal-2, rightsignal-2, signal-3 and rightsignal-3 are in the ‘off’ state. Figure 8 explains the fourth statement of signal control. WITH TURNS AND PEDISTRIANS: Fureig.9 shows that the all possible crossings where pedestrian can make on a two way intersection crossing.
International Journal of Computer Science and Information Security (IJCSIS), Vol. 14, No. 6, June 2016
529 https://sites.google.com/site/ijcsis/ ISSN 1947-5500

Figure 9: All possible pedestrian crossing (M)
Decision Statement: The first statement deals with the movement of traffic horizontally rightwards, turning right and also the turning left (L4) as shown in Fig 10. This statement can be written as P1: (M1)’ (M2)’ S1’R1’ L4’ S2 R2 S3 R3 S4 R4 L1 L2 L3 which tells that when pedestrians (M1) and (M2) want to cross the road, the traffic will flow along the signal1, rightsignal1 and leftturn-4 will be ‘on’ whereas rest signal-2, rightsignal-2, signal-3, rightsignal-3,signal-4, rightsignal-4,leftturn-1, leftturn-2 and leftturn-3 will be in ‘off’ state.
Figure 10: P1: (M1)’ (M2)’ S1’R1’ L4’ S2 R2 S3 R3 S4 R4 L1 L2 L3 Figure 11: P2: (M3)’ (M4)’ S2’R2’L’ S1 R1 S3 R3 S4 R4 L2 L3 L4
The second statement as shown in Fig11 deals with the movement of traffic vertically rightwards, turning right and also turning left (L1). This statement can be written as P2: (M3)’ (M4)’ S2’ R2’ L1’ S1 R1 S3 R3 S4 R4 L2 L3 L4 which tells that when pedestrians (M3) and (M4) want to cross the road, the traffic will flow along the signal-2, rightsignal-2 and leftturn-1 will be ‘on’ whereas rest signal-1, rightsignal-1, signal-3, rightsignal-3, signal-4, rightsignal-4, leftturn-2, leftturn-3 and leftturn-4 will be in ‘off’ state. The third statement as shown in Fig 12 deals with the movement of traffic horizontally, turning right and also the turning left (L2). This statement can be written as P3: (M5)’ (M6)’ S3’ R3’ L2’S1 R1 S2 R2 S4 R4 L1 L3 L4 which tells that when pedestrians (M5) and (M6) want to cross the road, the traffic will flow along the signal-3, rightsignal-3 and leftturn-2 will be ‘on’ whereas rest signal-1, rightsignal-1,signal-2, rightsignal-2, signal-4, rightsignal-4, leftturn-1, leftturn-3 and leftturn-4 will be in ‘off’ state as Fig 12 explained in below lines.
Figure 13: P3: (M5)’ (M6)’ S3’ R3’ L2’S1 R1 S2 R2 S4 R4 L1 L3 L4 Figure 13: P4: (M7)’ (M8)’ S4’ R4’ L3’S1 R1 S2 R2 S3 R3 L1 L2 L4
The fourth statement deals with the movement of traffic vertically, turning right and also the turning left (L3). This statement can be written as P4: (M7)’ (M8)’ S4’ R4’ L3’S1 R1 S2 R2 S3 R3 L1 L2 L4 which tells that when pedestrians (M7) and (M8) want to cross the road, the traffic will flow along the signal-4, rightsignal-4 and leftturn3, so these will be ‘on’ whereas rest of the signal-1, rightsignal-1, signal-2, rightsignal-2, signal-3, rightsignal-3, leftturn-1, leftturn-2 and leftturn-4 will be in ‘off’ state as demonstrated in Fig 13.
International Journal of Computer Science and Information Security (IJCSIS), Vol. 14, No. 6, June 2016
530 https://sites.google.com/site/ijcsis/ ISSN 1947-5500

IV. FRAMEWORK OVERVIEW
The logical framework of the methodology is presented in tabular forms by giving ‘on’ and ‘off’ state of each signal direction as when no turns, turns and with turns and pedestrians respectively:
Table 1: When no turns
STATE P1:S1’ S3’ S2 S4 P2: S2’ S4’S1 S3
ON S1 S3 S2 S4
OFF S2 S4 S1 S3
Table 1 describes the movement of pedestrian how they cross the bi-intersectional signal ‘when no turn’ statement has been implemented. When S1 and S3 is ‘on’ state then pedestrian used S2 & S4 at ‘off’ state which can be used for signal crossing and when S2 & S2 is ‘on’ state S1 & S3 are ‘off’ state and it can be used for signal crossing respectively.
Table 2: When turns
STATE P1:S1’ R1’ S2 R2 S3 R3 S4 R4 P2: S2’ R2’ S3 R3 S4 R4 S1 R1
ON S1 R1 S2 R2
OFF S2 R2 S3 R3 S4 R4 S1 R1 S3 R3 S4 R4
Table 2 describes the movement of pedestrian how they cross the bi-intersectional signal ‘when turn’ statement has been implemented. When S1 and R1 is ‘on’ state then pedestrian used S2 R2 S3 R3 S4 R4 for signal crossing and when S2 & R2 is ‘on’ state S3 R3 S4 R4 S1 R1 are used for signal crossing respectively.
Table 3: When turns
STATE P3: S3’R3’ S4 R4 S1 R1 S2 R2 P4: S4’R4’ S1 R1 S2 R2 S3 R3
ON S3 R3 S4 R4
OFF S4 R4 S1 R1 S2 R2 S1 R1 S2 R2 S3 R3
Table 3 describes the movement of pedestrian how they cross the bi-intersectional signal ‘when turn’ statement has been implemented. When S3 and R3 is ‘on’ state then pedestrian used S4 R4 S1 R1 S2 R2 for signal crossing and when S4 & R4 is ‘on’ state S1 R1 S2 R2 S3 R3 are used for signal crossing respectively.
Table 4: With turns and pedestrians
STATE P1: (M1)’ (M2)’ S1’R1’ L4’ S2 R2 S3 R3 S4 R4 L1 L2 L3
P2: (M3)’ (M4)’ S2’ R2’ L1’ S1 R1 S3 R3 S4 R4 L2 L3 L4
PEDESTRINAS WALKING M1 M2 M3 M4
ON S1 R1 L4 S2 R2 L1
OFF S2 R2 S3 R3 S4 R4 L1 L2 L3 S1 R1 S3 R3 S4 R4 L2 L3 L4
Table 4 describes the movement of pedestrian, how they cross the bi-intersectional signal ‘with turns and pedestrian’ statement has been implemented. When S1, R1 and L4 is ‘on’ state then pedestrian used M1 & M2 for signal crossing and when S2, R2 and L1 is ‘on’ state M3 & M4 are used for signal crossing respectively.
International Journal of Computer Science and Information Security (IJCSIS), Vol. 14, No. 6, June 2016
531 https://sites.google.com/site/ijcsis/ ISSN 1947-5500

Table 5: With turns and pedestrians
STATE P3: (M5)’ (M6)’ S3’ R3’ L2’S1 R1 S2 R2 S4 R4 L1 L3 L4
P4: (M7)’ (M8)’ S4’ R4’ L3’S1 R1 S2 R2 S3 R3 L1 L2 L4
PEDESTRINAS WALKING M5 M6 M7 M8
ON S3 R3 L2 S4 R4 L3
OFF S1 R1 S2 R2 S4 R4 L1 L3 L4 S1 R1 S2 R2 S3 R3 L1 L2 L4
Table 5 describes the movement of pedestrian how they cross the bi-intersectional signal ‘with turns and pedestrian’ statement has been implemented. When S3, R3 and L2 is ‘on’ state then pedestrian used M5 & M6 for signal crossing and when S4, R4 and L3 is ‘on’ state M7 & M8 are used for signal crossing respectively.
V. EXPERIMENTATION AND RESULTS The experiment of the integrated models has been performed by using C++. To depicting the behavior of the pedestrians four random inputs (0 or 1) are generated simultaneously. On respective of four sides of the intersection, pedestrian have pushed the button, which tells the system that they are willing to cross the road. Once an input is received from any of the four sides, the traffic of that particular side is stopped after 20 second and the pedestrians are given a green light to cross the road. Meanwhile, the possible traffic from the other side is also given a green signal.
Fig.14. Input Signal
The total simulation time of the model is 6000.425 seconds in which the total number of cars and pedestrians are 500 each. The average waiting time for a car at any side of the intersection is 143.35 seconds, whereas the average waiting time for a pedestrian is 200.23 seconds. For a car at position “x” on an intersection, the waiting time is given as;
Wt = 4x + 143.35seq. (1)
On average 24 cars and 20 pedestrians cross the intersection from any side. Fig.14. is an example of the signal generated for the pedestrians when they press the button to cross the road.
-0.5
0
0.5
1
1.5
0 20 40 60 80 100
Input Signal Input…
International Journal of Computer Science and Information Security (IJCSIS), Vol. 14, No. 6, June 2016
532 https://sites.google.com/site/ijcsis/ ISSN 1947-5500

Fig.15. Traffic control model.
Figure15. shows that the model for the traffic control shows a consistent pattern of operation.
Fig.16. Pedestrian crossing incorporated with traffic control model.
Now, we incorporate the model of pedestrian crossing with the traffic control model in Fig.16.
VI. CONCLUSION AND FUTURE WORK
Traffic handling is a serious issue in urban area as pedestrian also part of traffic flow. It is necessary to avoid road accident mange vehicles and pedestrian equivalently by saving the time and resources. Our proposed computational model is framework for developing countries like Pakistan to compute the phenomenon of pedestrian handling in urban traffic. It deal with complexity by producing experiments which shows this proposed model practically implement in urban area and it will save time and cost of vehicles and pedestrian in bi-direction flow of traffic. Model deals with three scenarios to regulate the traffic flow which include traffic flow with not turns, with turns and with turns and pedestrian flow.
In future work, this proposed computational model implement in real time sensors and will monitor its advantages that are claimed in computational model. In addition, result calculate in quantitatively form that how much time and cost has saved due to efficient handling of pedestrian on road.
0%
10%
20%
30%
40%
50%
60%
70%
80%
90%
100%
CLOSE OPEN CLOSE OPEN CLOSE OPEN CLOSE OPEN CLOSE OPEN CLOSE OPEN CLOSE
R4
L4
S4
R3
L3
S3
R2
L2
S2
R1
L1
S1
International Journal of Computer Science and Information Security (IJCSIS), Vol. 14, No. 6, June 2016
533 https://sites.google.com/site/ijcsis/ ISSN 1947-5500

REFERENCES
[1] Dongbin Zhao, “Computational Intelligence in Urban Traffic Signal Control: A Survey” IEEE TRANSACTIONS ON
SYSTEMS, MAN, AND CYBERNETICS—PART C: APPLICATIONS AND REVIEWS, VOL. 42, NO. 4, JULY 2012
[2] Charles V. Zegeer and Max Bushell, “ Pedestrian Crash Trends and Potential Countermeasures from Around the World” University of North Carolina Highway Safety Research Center 730 MLK, Jr. Blvd. Chapel Hill, N.C. 27599-3430 November 30, 2010
[3] Esser and m. Schreckenberg , “MICROSCOPIC SIMULATION OF URBAN TRAFFIC BASED ON CELLULAR AUTOMATA” International Journal of Modern Physics C, Vol. 8, No. 5 (1997) 10251036 World Scientific_ Publishing Company, Revised 2 June 1997
[4] Jolyon J. Fariaa, Stefan Krauseb and Jens Krausec, “Collective behavior in road crossing pedestrians: the role of social information” Oxford Journals, Science & Mathematics, Behavioral Ecology, Volume 21, Issue 6 , Pp. 1236-1242., Revision received July 27, 2010. and Accepted August 2, 2010
[5] A Chertock, A Kurganov, “Pedestrian flow models with slowdown interactions” Mathematical Models and Methods in Applied Sciences , Volume 24, Issue 02, February 2014
[6] Fredrik Johansson “Microscopic Modeling and Simulation of Pedestrian Traffic” Printed by LiU Tryck, Linköping, Sweden 2013, http://liu.diva-portal.org/smash/get/diva2:665191/FULLTEXT02.pdf
[7] B Raghuram Kadali , P Vedagiri “ Modeling pedestrian road crossing behavior under mixed traffic condition” European Transport \ Transport Europe (2013) Issue 55, Paper n° 3, ISSN 1825-3997
[8] T. Bellemans, B. De Schutter, and B. De Moor, “Models for traffic control”, Models for traffic control Journal, A, vol. 43, no. 3–4, pp. 13–22, 2002.
[9] Michael J. Markowski, “modeling behavior in vehicular and pedestrian traffic flow” udel.edu/~mm/traffic/amble/dissertation.pdf
[10] Serge P. Hoogendoorn, “Experimental Research of Pedestrian Walking Behavior” Daamen, W, & Hoogendoorn, SP (2003). Experimental research of pedestrian walking behaviour, Transportation Research, Record 1828, pp. 20-30
[11] ZhaoWei Qu, Yan Xing, XianMin Song, “A Study on the Coordination of Urban Traffic Control and Traffic Assignment” Hindawi Publishing Corporation Discrete Dynamics in Nature and Society, Volume 2012, Article ID 367468, 12 pages, doi:10.1155/2012/367468
[12] Nicolas Roussel, Mette Geiker, Fr_ed_eric Dufour, Lars N. Thrane, Peter Szabo, “Computational modeling of concrete ow : Generaloverview.” https://hal.archives-ouvertes.fr/hal-00333870
International Journal of Computer Science and Information Security (IJCSIS), Vol. 14, No. 6, June 2016
534 https://sites.google.com/site/ijcsis/ ISSN 1947-5500

New Image Encryption Technique Based on
Wavelet / DCT Transforms Using Lorenz
Chaotic Map (NIETWDL)
Abdullah M. Awad Rehab F. Hassan Ali M. Sagheer University of Anbar University of Technology University of Anbar Ramadi, Iraq Baghdad, Iraq Ramadi, Iraq
ABSTRACT- In communication networks, the data encryption has been used to safe the security of information. There are different encryption techniques that can be used to protect the data from unauthorized third person to access. This paper deals with chaos image encryption environment to hide the secret information and make communication undetectable. In this paper integer wavelet transform (IWT) and discrete cosine transform are used for increasing hiding pixel distribution. The work uses IWT and DCT as a decorrelation stage for adjacent pixels. The performance evaluation for the proposed algorithm has been done by measuring the application using a series of tests. The tests include histogram analysis and visual test, correlation analysis encryption quality, information entropy, randomness test, sensitivity analysis and differential analysis. The proposed cipher algorithm experimental results show satisfactory security and efficiency levels for image encryption.
KEY WORDS: Chaotic Encryption; AES; RC4; Statistical Analysis
I. INTRODUCTION
Due to increasing of multimedia applications, encryption is important for the storage of images to ensure
security. There are many techniques for Image encryption that try to convert original image to another type that
is in other word hard to understand. The image must be kept confidentially between users, that nobody knows the
message content without a key for decryption. The security is very important in digital images for storage and
transmission in many applications, as medical imaging, military image online video conferences, personal
photograph, etc. There are many proposed image encryption methods .In this paper a secure, fast and simple
encryption algorithm is proposed for image using wavelet and discrete cosine transforms and chaotic encryption.
This method is very sensitive to any changes in key. The paper is organized as follows: section 2, the related
Works, in section 3, the image transform is described, in section 4, the Lorenz attractor the most prominent three-
dimensional chaotic attractions is briefly introduced, then in Section 5, the proposed technique is explained, next
in section 6, the security of the proposed image cipher and evaluate its performance through various tests such as
statistical analysis, differential analysis, key sensitivity analysis, etc and compare the results are discussed, finally,
some conclusions are given in section 7.
II. RELATED WORKS
There are many researches of some prominent researchers in the chaotic image encryption field. Explanation
and a short description of various types of techniques used for chaos image Encryption are presented.
H.H. Nien and C.K. Huang in 2009 proposed a new method for the image encryption based on multi chaotic
with pixel shuffle technique systems. There are many proposed algorithms combined with four chaotic systems
and pixel shuffle can fully spread the original image, disorders of RGB levels for the distributive characteristics,
International Journal of Computer Science and Information Security (IJCSIS), Vol. 14, No. 6, June 2016
535 https://sites.google.com/site/ijcsis/ ISSN 1947-5500

New Image Encryption Technique Based on Wavelet / DCT Transforms
and the probability of exhaustive attacks dramatically decreases [17]. Baojun Zhang, Xiang Ruan and Chenghang
Yu in 2011 presented the chaotic image encryption features of trigonometric function and new proposed algorithm
based on this function as secure method and fast image encryption [18]. Sonal Belani and Komal D Patel in 2011
proposed image encryption method by adding two chaotic systems based on the Rössler chaotic system and the
Lorenz chaotic system. By the experimental tests and analysis, they demonstrate that the new image encryption
method has the useful advantages of high-level security, large key space, high speed and high obscure level [19].
III. IMAGE TRANSFORM
The scientific concept of a transformation is an active tool in numerous areas and can likewise serve as a way
to deal with many applications in image processing such as compression, segmentation, and encryption. An image
can be processed by changing its pixels (which are correlated) to a representation where they are de-corresponded
or de-correlated.
The term de-correlated implies that the transformed values are autonomous of each other. Thus, they can be
encrypted independently, which makes it more suitable to develop a statistical model [8].
The image data representation in the domain of transformation depends upon the specific transform used in the
coding plan. The DCT is still the most predominant transform, giving a frequency domain field representation.
In the reverse transformation, the spatial domain manipulation will be spread over the whole blocks of spatial
domain on which the transform was performed (ordinarily 8×8).
With the 2D-DWT, a sub-band representation is given. The degree of the manipulated domain’s spread into the
spatial domain depends on the bandwidth or the frequency resolution for the manipulated sub-band. When
Heisenberg is applied the uncertainty principle application [22], the representation of sub-bands that have a high
frequency resolution (narrow frequency band) will cause in more spread for spatial domain. For the dyadic 2D-
DWT, the sub-bands with lower frequency offer more spatial domain spread and high frequency resolution [1].
IV. LORENZ ATTRACTOR
The Lorenz attractor is standout amongst the most prominent three-dimensional chaotic attractors; it was
analyzed and presented by Edward Lorenz in 1963. He demonstrated that a small change in the starting states or
initial conditions of a climate model could give high differences in the subsequent or resulting weather. This
implies that a slight contrast in the start state condition will affect the output of the whole system, which is called
sensitive system depending to the initial stats. The non-linear dynamical system is sensitive to the initial value
and is related the periodic behavior system [9].
Lorenz's non-linear dynamic system introduces a chaos attractor, while the word chaos is regularly used to
explain the difficult manner of non-linear dynamical systems. Chaos theory produces obviously arbitrary conduct
yet in the meantime is totally deterministic, as shown in Figure 1. The Lorenz attractor is characterized as follow:
dx/dt = a (y − x) (1)
dy/dt = rx − y − xz (2)
dz/dt = xy − bz (3)
International Journal of Computer Science and Information Security (IJCSIS), Vol. 14, No. 6, June 2016
536 https://sites.google.com/site/ijcsis/ ISSN 1947-5500

Figure 1. A plot of the trajectory of the Lorenz system.
V. THE PROPOSED TECHNIQUE
The proposed image encryption algorithm has been set ahead by using and mixing Discrete Cosine Transform
DCT and 2D-IWT with Lorenzo chaotic theory. The proposed method is shown in Figures 2 and 3 that clarify the
encryption and decryption methods. Encryption process is started with transform the image by utilizing Forward
2D-IWT and Discrete Cosine transform. At that time, the DCT coefficients values are chosen to encrypt using
AES and the high frequency are encrypted with the RC4.
Figure 2. The Proposed Image Encryption Model (NIETWDL).
After that the chaotic sequence is generated using Lorenzo map method to encrypt the image. Finally, the output
of these two encryption operations is merges by swapping its values to get encryption image.
The inverse of each operation is done in the decryption model to decrypt each block and inverse transform to
get the reconstructed image.
Figure 3. The Proposed Image Decryption Model (NIETWDL)
Original
Image
Image
summing
LH, HL, HH
Coefficient
Chaotic
Encryption
FDCT LL
2D-IWT
AES Encry.
FDCT LL
Chaotic
Generator
Chaotic
Sequence
RC4 Encryption
Process
Secret Key
Encrypted
Image
Decrypted Image
Chaotic Sequence
Encrypted Image
Secret Keys
Chaotic Generator
Chaotic Image
Decryption
RC4 LH, HL, HH
2D-IWT Decryption
AES LL 2D-IWT
Decryption
IDCT Transform
2D-IDWT Transform
International Journal of Computer Science and Information Security (IJCSIS), Vol. 14, No. 6, June 2016
537 https://sites.google.com/site/ijcsis/ ISSN 1947-5500

New Image Encryption Technique Based on Wavelet / DCT Transforms
A. Description of the Chaotic Encryption
Algorithm (1) shows the main steps for encryption operations. The top left quarter is denoted by LL cofficient
as a lowest frequency block and the other LH,HL,HH coefficients 2D-IWT are called high frequency.
The LL block is encrypted by the AES and the LH,HL,HH frequency are encrypted by using RC4 . The chaotic
technique according Lorenz map chaotic sequence are generated according the following :
bzxydtdz
xzyrxdtdy
xyadtdx
/
/
)(/
where, initial X0 , Y0 ,Zo and a , b and r also inputs as secret values, these values are converted into integer
values to generate secret chaotic sequence (X ,Y, Z) . Now,the encrypted image is encrypted second time, by the
chaiotic sequence.There are three keys genereted by the lornz map (X,Y,Z) .
Algorithm (1) : (NIETWDL)
Input: Original Image I , Parameters and Secret Choatic Keys
(a, b, r, X0, Y0, Zo) where a, b and r are constants.
Output: Encoded Image C.
Step-1 Compute of Forward DWT for Image I.
(LL, LH, HL, HH) = DWT(I)
LL = lowest frequency part
HL = High Low frequency parts.
LH = Low High frequency parts.
HH = High High frequency parts.
Step-2 Compute of Forward DCT for Image for LL part.
(DC, AC) = DCT (LL part)
DC = lowest frequency part
AC = High frequency parts.
Step-3
Step-4
The LL part is encrypted by using AES:
The LH, HL, HH part are encrypted by using RC4
Step-5 Generate Chaotic Sequence according Lorenz map:
bzxydtdz
xzyrxdtdy
xyadtdx
/
/
)(/
Step-6 Convert the sequences Xi ,Yi,Zi into integer value.
International Journal of Computer Science and Information Security (IJCSIS), Vol. 14, No. 6, June 2016
538 https://sites.google.com/site/ijcsis/ ISSN 1947-5500

Step-7 -Encrypt the red colore by Xi.
-Encrypt the green colore by Yi.
-Encrypt the blue colore by Zi.
Step-8 Spread each pixel in LL into each block of the LH,HL,HH according the following chaotic
swapping:
C=Chaotic_Swap(LL,(LH,HL,HH) )
Step-9 Output C.
The X key is used to encrypt the red colore in image: CERI i = ERIi Xi
The Y key is used to encrypt the green colore in image : CEGI i = EGIi Yi
The Z key is used to encrypt the blue colore in image: CEBI i = EBIi Zi
The final operation of encoding is merging of CDCT and CLH,CHL,CHH by spread each pixel in CDCT into
the blocks of the CLH,CHL,CHH according the following chaotic swapping:
C = Chaotic_Swap[CDCT ,( CLH,CHL,CHH)].
The chaotic swapping parameter are:
Ir= X0 × 8
Ic= Y0 × 8
where Ir and Ic represent the location shifting index of row r and column c for each pixel CDC(i, j).
The CAC is separated into blocks of 8×8 pixels, the first pixel of CDC is swapped with pixel of the first 8×8
block of CAC of indexes Ir and Ic. Suppose CAC represent the first block of AC, then, the first pixel CDC(0, 0)
is swapped as follows:
Swap(CDC(0, 0), CAC1( Ir , Ic))
Swap(CDC(0, 1), CAC2( Ir , Ic))
And so on for other CDC pixels. This process is image encryption which is sent to receiver.
B. Description of the Chaotic Decryption.
The inverse operation of encryption must be used in the receiver side . Algorithm (2) shows the decryption
operations:
Algorithm )2) : (CIDLDW).
Input: Encryption Image C and Secret Choatic Keys (a, b,r, X0, Y0, Zo ),
where a ,b and r are constants.
Output: The Reconstructed Image (RI)
Step-1 Separate pixel of C into lowet pixel in CDCT and ( CLH,CHL,CHH) accordingly, the
invers chaotic swapping:
[CDCT ,( CLH,CHL,CHH)] = Chaotic_Swap (C).
International Journal of Computer Science and Information Security (IJCSIS), Vol. 14, No. 6, June 2016
539 https://sites.google.com/site/ijcsis/ ISSN 1947-5500

New Image Encryption Technique Based on Wavelet / DCT Transforms
Step-2 Generate Chaotic Sequence according Lornz map:
bzxydtdz
xzyrxdtdy
xyadtdx
/
/
)(/
Step-3 Convert the sequence Xi , Yi and Zi into integer value.
Step-4 -Decrypt the red colore by Xi.
-Decrypt the green colore by Yi.
-Decrypt the blue colore by Zi.
Step-5 Decrypt CDCT using AES by Secret Key X:
CDCT = AES_Decryption
(CDCT, X)
Step-6 Decrypt ( CLH,CHL,CHH) using RC4 by Secret Key Y:
(CLH,CHL,CHH) =
RC4_Decryption(( CLH,CHL,CHH), Y)
Step-7 Comput the inverse of DCT
Step-8 Comput the inverse of DWT
Step-9 Output RI.
The received enciphered image is isolated into lowest frequency parts CDCT and (CLH,CHL,CHH) according
inverse of chaotic swapping.
[CDCT and ( CLH,CHL,CHH) ] = Chaotic_Swap (C).
With swapping parameter
Ir= X0 × 8
Ic= Y0 × 8
Convert the sequence Xi, Yi and Zi into integer value:
The X key is used to decrypt the red color in image:
CDERI i = DERIi Xi
The Y key is used to decrypt the green color in image :
CDEGI i = DEGIi Yi
The Z key is used to decrypt the blue colore in image.
CDEBI i = DEBIi Zi
The CDCT will be decrypted using AES decryption and the (CLH,CHL,CHH) are decrypted by using RC4 .
The inverse of The reconstruction of original image can be implemented when the result of decryption is processed
with inverse IDCT transform for the LL part of DWT and the inverse Wavelet is used to recconstruct the original
image.
International Journal of Computer Science and Information Security (IJCSIS), Vol. 14, No. 6, June 2016
540 https://sites.google.com/site/ijcsis/ ISSN 1947-5500

VI. NIETWDL ALGORITHM IMPLEMENTATION AND TESTING
The chaotic image encryption based on Wavelet/DCT transforms and Lorenzo map (NIETWDL):
The chaotic image encryption method including the following steps:
Five Keys are used for encryption.
Compute of Forward DWT for Image I and Compute of Forward DCT for Image for LL part.
The LL part is encrypted by using AES andThe LH,HL,HH part are encrypted by using RC4
Generate Chaotic Sequence according Lorenz map and encrypt the red color by Xi, the green color by Yi
and the blue color by Zi.
This system has been implemented and tested many times for three images (Lena, Elephants and Temple).
Figures 4, 5 and 6 show the encryption image and the histogram for the encrypted and original images. The
encryption image appears as scramble image. Also the histogram don’t indicate any information for the image,
after encryption these randomness covered. The distribution of pixels for original and encrypted images is shown
in three dimensions horizontal, vertical and diagonal for three colors.
The reconstructed image is computed by decrypting the encryption image by inverse of each operation in the
encryption. There is small difference between original image and reconstructed as shown in the histogram.
Figure 4. Lena image based on NIETWDL
International Journal of Computer Science and Information Security (IJCSIS), Vol. 14, No. 6, June 2016
541 https://sites.google.com/site/ijcsis/ ISSN 1947-5500

New Image Encryption Technique Based on Wavelet / DCT Transforms
Figure 5. Elephants image based on NIETWDL
Figure 6. Temple image based on NIETWDL
International Journal of Computer Science and Information Security (IJCSIS), Vol. 14, No. 6, June 2016
542 https://sites.google.com/site/ijcsis/ ISSN 1947-5500

Table 1 shows the peak signal to noise ratio (PSNR), the value more than 28 is acceptable and all values are more
than 49 as shown in Figure 7.
TABLE I
PEAK SIGNAL TO NOISE RATIO OF THREE TESTED IMAGE
Image PSNR Rec. PSNR Encr.
Lena 49.4995 4.3175
Elephants 49.7131 4.3117
Temple 49.50 4.3215
Figure 7. Peak Signal to Noise Ratio of three tested image (NIETWDL)
Table 2 shows the mean of execution time of each operation in the encryption and decryption stages. The time
execution is computed by mille seconds. The execution time of inverse of discrete cosine transform always less than
foreword cosine transform due to its operations. Also, the execution time of most decryption operation is less than
encryption operation.
TABLE II
EXECUTION TIME FOR THREE TESTED IMAGE
Image Image Transform Time Image Enc-Dec. Time
IWT-DCT IIWT-IDCT Encry. Decry.
Lena 0.1570 0.1321 0.0048 0.0049
Elephant 0.1883 0.1308 0.0051 0.0057
Temple 0.1640 0.2502 0.0059 0.0054
Figure 8. Execution time for three tested image (NIETWDL)
International Journal of Computer Science and Information Security (IJCSIS), Vol. 14, No. 6, June 2016
543 https://sites.google.com/site/ijcsis/ ISSN 1947-5500

New Image Encryption Technique Based on Wavelet / DCT Transforms
TABLE III
CORRELATION COEFFICIENT BETWEEN ADJACENT PIXELS.
Image Direc. Image Type Red Green Blue
Lena
Hori. O. image 0.9572 0.9432 0.92845
E.image 0.0031 0.0011 0.0006
Vert. O. image 0.9788 0.9713 0.9559
E.image 0.0045 -0.0043 0.0013
Diag. O. image 0.9338 0.9193 0.9006
E.image -0.0054 -0.0013 -0.0020
Elephant
Hori. O. image 0.91388 0.9013 0.9100
E.image 0.0043 -0.0022 -0.0002
Vert. O. image 0.9275 0.9156 0.9208
E.image 0.0035 -0.0048 -0.0011
Diag. O. image 0.8753 0.8571 0.8682
E.image -0.0059 -0.0013 -0.0022
Temple
Hori. O. image 0.9479 0.9429 0.9668
E.image 0.0015 -0.0022 0.0011
Vert. O. image 0.9391 0.9324 0.9609
E.image 0.0053 -0.0059 -0.0006
Diag. O. image 0.8998 0.8899 0.9360
E.image -0.0028 -0.0020 -0.0033
Figure 9. Correlation coefficient between adjacent pixels (NIETWD)
Table 4 refers to entropy analysis and the values are very good. The ideal value of entropy is eight and all values
comparable to eight as shown in Figure 10.
TABLE IV
ENTROPY ANALYSIS
Information Entropy Analysis
Images Plain images Cipher images
Lena 7.2417 7.9971
Elephants 7.7086 7.9965
Temple 7.4032 7.9971
International Journal of Computer Science and Information Security (IJCSIS), Vol. 14, No. 6, June 2016
544 https://sites.google.com/site/ijcsis/ ISSN 1947-5500

Figure 10. Entropy Analysis (NIETWDL)
The high values in Table 5 means this method is best than the other methods because the high values of MSE.
TABLE V
MEAN SQUARE ERROR
Image Mean Square Error
Lena 20326.7379
Elephants 19282.3562
Temple 20310.0080
Figure 11. Mean Square Error (NIETWDL)
TABLE VI
NPCR AND UACI OF DIFFERENT COLOR COMPONENTS
Image Attack Resistant Red Green Blue
Lena NPCR 99.478 99.517 99.513
UACI 33.557 33.453 33.388
Elephants NPCR 99.459 99.549 99.501
UACI 33.522 33.500 33.337
Temple NPCR 99.504 99.574 99.494
UACI 33.539 33.488 33.351
International Journal of Computer Science and Information Security (IJCSIS), Vol. 14, No. 6, June 2016
545 https://sites.google.com/site/ijcsis/ ISSN 1947-5500

New Image Encryption Technique Based on Wavelet / DCT Transforms
Figure 12. NPCR and UACI of different color components (NIETWDL)
VII. CONCLUSION
In this paper, a chaotic image encryption based on combination of integer wavelet, discrete cosine transforms and
Lorenz chaotic map has been proposed. Experimental and theoretical results indicate that the entropy measured and
the cipher-image histogram distribution of the proposed method is equal to the ideal value. The histogram uniformity
was justified by the chi-square test. The NIST randomness tests have been used and the image encrypted has no defect
and pass all the statistical tests with high P-values. The quality of encryption has been tested and showed that the
proposed algorithm has a good encryption quality as denoted in the result. Correlation analysis between adjacent
pixels showed that correlation coefficients in the plain-image are significantly decreased after applying encryption
function. To quantify the difference between encrypted image and corresponding plain-image, three measures have
been used: Entropy, Peak Signal to Noise Ratio, Mean Square Error, NPCR and UACI. Differential analysis showed
that a swiftly change in the original image will result in a negligible change in the ciphered image.
REFERENCES [1] Karl Martin ,"Secure Wavelet-Based Coding of Images, and Application to Privacy Protected Video Surveillance", A thesis submitted
in conformity with the requirements for the degree of Doctor of Philosophy Graduate Department of The Edward S. Rogers Sr. Dept.
of Electrical and Computer Engineering University of Toronto Copyright c_ 2010 by Karl Martin.
[2] Rahma, A.S. and Yacob, B. Z, Real-Time Partial Encryption of Digital Video Using Symmetric Dynamic Dual Keys Algorithm
(SDD), Eng.& Tech. Journal ,2012, 30(5).
[3] Rahma, A.S. and Ali, M. A., To Modify the Partial Audio Cryptography for Haar Wavelet Transform by Using AES Algorithm, Eng.
& Tech. Journal, 2014, 32(1).
[4] Norman L. Biggs"Codes: An Introduction to Information Communication and Cryptography" Springer-Verlag London Limited 2008.
[5] Jeffrey Hoffstein, Jill Pipher, Joseph H. Silverman "An Introduction to Mathematical Cryptography" 2008 Springer Science +Business
Media.
[6] Jonathan Katz, Yehuda Lindell “Introduction to Modern Cryptography" CRC Press Taylor & Francis Group 6000 Broken Sound
Parkway NW, Suite 300 Boca Raton, FL 33487-2742.
[7] Jiu Chao Feng, Chi Kong Tse "RECONSTRUCTION OF CHAOTIC SIGNALS WITH APPLICATIONS TO CHAOS-BASED
COMMUNICATIONS" Copyright © 2008 by Tsinghua University Press and World Scientific Publishing Co. Pte. Ltd.
[8] Salomon, D., 2007, "Data Compression, The Complete Reference ", Springer; United Kingdom, London, 4th Edition, Text book.
[9] Musheer Ahmad, Hamed D. Alsharari, Munazza Nizam "Security Improvement of an Image Encryption Based on Pixel-Chaotic-
Shuffle and Pixel-Chaotic-Diffusion"
International Journal of Computer Science and Information Security (IJCSIS), Vol. 14, No. 6, June 2016
546 https://sites.google.com/site/ijcsis/ ISSN 1947-5500

[10] LEI Li-hong ,BAI Feng-ming, HAN Xue-hui(2013)," New Image Encryption Algorithm Based on Logistic Map and Hyper-chaos",
International Conference on Computational and Information Sciences. [11] G. Chen, Y. Mao and C. Chui, "A symmetric image encryption scheme based on 3D chaotic cat maps," Chaos, Solitons and Fractals,
vol. 21, pp. 749-761, 2004.
[12] Wang, C.-E., Cryptography in Data Compression. CodeBreakers Journal, 2005.
[13] S. Behnia, A. Akhshani, H. Mahmodi, and A. Akhavan, "A novel algorithm for image encryption based on mixture of chaotic maps,"
Chaos, Solitons and Fractals, vol. 35, pp. 408-419, 2008.
[14] Grangetto, M., E. Magli, and G. Olmo, Multimedia selective encryption by means of randomized arithmetic coding. IEEE Trans.
Multimedia, 2006. 8(5): p. 905–917.
[15] L. Zhang, X. Liao, and X. Wang, "An image encryption approach based on chaotic maps," Chaos, Solitons & Fractals, vol. 24, pp.
759-765, 2005.
[16] Wong, K., Q. Lin, and J. Chen, Simultaneous Arithmetic Coding and Encryption Using Chaotic Maps. IEEE Transactions on Circuit s
and Systems: Express Briefs, 2010.
[17] H.H. Nien and C.K. Huang."Multi chaotic systems for image encryption based on pixel shuffle", 2009.
[18] Baojun Zhang, Xiang Ruan and Chenghang Yu. "Use of Image Encryption based on the Chaotic Feature of Trigonometric Function",
2011.
[19] Sonal Belani, Komal D Patel.”Image Encryption Based on the General Approach for Multiple Chaotic Systems", 2011.
International Journal of Computer Science and Information Security (IJCSIS), Vol. 14, No. 6, June 2016
547 https://sites.google.com/site/ijcsis/ ISSN 1947-5500

Stability Analysis of Reliable Ensemble
Classifiers
Zeinab Khatoun Pourtaheri, Seyed Hamid Zahiri, Seyed Mohammad Razavi
Department of Electrical and Computer Engineering,University of Birjand, Birjand, Iran
Abstract- In this paper, Multi-Objective Inclined Planes Optimization (MOIPO) algorithm, as a novel multi-objective
technique, is used to design ensemble classifiers with high reliability and high diversity. It is noteworthy that sometimes,
the reliability in decision of a classifier is more important than its recognition rate. Security and military applications are obvious instances to show the importance of this measure. In addition to reliability, diversity, as a main issue in ensemble classifiers, is considered as objective function. So, designing heuristic ensemble classifiers with high reliability and also,
high diversity has a special importance but the basic point is that the applied heuristic algorithm has a stochastic nature and hence, stability analysis of this system is necessary. In this research, statistical method is used to do stability analysis of designed ensemble classifier.
I. INTRODUCTION
An ensemble classifier includes a group of individually trained classifiers (base classifiers) whose decisions are
combined when classifying new samples [1]. It's worth noting that the designer should employ a set of
complementary base classifiers which can cover the weakness of each other by making independent and
supplementary decisions. There are two strategies when dealing with ensemble classifiers: fusion and selection. In
decision fusion, it's supposed that each member of the ensemble is trained on the whole feature space but in
classifier selection each member will be devoted to learn some of the features. Therefore, in fusion strategy, the final
decision is made by taking into account all members' decisions but in selection strategy, final decision is the
consequence of one or some of classifiers' decisions. There are also combination methods that stand between two
aforesaid approaches; among them, it can be cited to Overproduce and Choose Strategy (OCS) [2].
The ultimate aim of designing an ensemble classifier can be different in various situations. For example, diversity
among the members of an ensemble classifier has been recognized as a key topic in classifier combination and many
researches have been addressed this issue; reference [3] operates first by constructing an initial population of
classifiers where each of them is created by randomly using a different subset of features. Then genetic operators
(crossover and mutation) are applied on the feature subsets to create new candidate classifiers. The most qualified
base classifiers constitute a population which create ensemble. A combination of accuracy and diversity is used as
objective function. In [4], considered objective functions, to meliorate overfitting, are error rate and diversity
measure. In [5], five heuristic optimization algorithms are employed to choose the most relevant subset of
classifiers; these algorithms are three multi-objective GA and Single objective GA and PSO. Three objective
functions, error rate, ensemble size and diversity measure, are used to guide multi-objective algorithms but they are
not combined together and instead two pairs of objective functions are used: diversity and error rate, ensemble size
and error rate.
On the other hand, reliability is an important criterion which is more important than the recognition rate in some
applications (Automatic Target Recognition, ATR, system is a clear example). Nevertheless, most studies have been
International Journal of Computer Science and Information Security (IJCSIS), Vol. 14, No. 6, June 2016
548 https://sites.google.com/site/ijcsis/ ISSN 1947-5500

negligent of this important criterion. So, in this research, for the first time reliability addition to diversity, as two
important objective functions, are considered to design ensemble classifier using Multi-Objective Inclined Planes
Optimization (MOIPO) algorithm.
An important issue in the literatures of heuristic algorithms application is stability which means how much the
changes of structural parameters influence the output of heuristic methods. Hence, stability analysis of designed
ensemble classifier is the main aim of this paper. It's worth mentioning that the stability of reliable and diverse
ensemble classifier is established in this paper for the first time.
The rest of this paper is organized as follows: In section 2, the statistical analysis of stability, which is used in this
research, is explained. Section 3 provides a review of the employed multi-objective heuristic algorithm. Section 4
determines how to design reliable ensemble classifiers and implement the stability analysis of it. Section 5 discusses
the results and finally Section 6 is devoted to conclusions.
II. STATISTICAL ANALYSIS OF STABILITY
A set of mathematical and statistical methods beneficial for developing, improving, and optimizing processes is
called Response Surface Methodology (RSM). The most extensive applications of RSM are in the situations where
several input variables potentially affect some performance measure or quality characteristic of the process which is
called the response. The input variables are sometimes named independent variables and they are subject to the
control of the scientist or engineer, at least for goals of a test or an experiment.
In general, assume that the experimenter is concerned with a process involving a response y that pertains on the
controllable input variables ξ1, ξ2, …, ξk. The relationship is specified in (1):
),...,,( 21 kfy (1)
Where the shape of the true response function f is unknown and possibly very complex, and is a term that
indicates other sources of variability not considered in f. is treated as a statistical error, often assuming it to have a
normal distribution with mean zero and variance σ2. So the response function is indicated as:
),...,,()(),...,,()( 2121 kk fEfEyE (2)
In much RSM work it is appropriate to convert the controllable input variables to coded variables x1, x2, …, xk,
which are usually determined to be dimensionless with mean zero and the same standard deviation. In terms of the
coded variables, the true response function (2) is now described as (3):
),...,,( 21 kxxxf (3)
The form of the true response function f must be estimated because it is unknown. In fact, prospering use of RSM
is critically dependent upon the experimenter‟s ability to develop a proper approximation for f.
It's worth noting that there is a close relationship between RSM and linear regression analysis. For example,
consider the model shown in (4):
kk xxxy ...22110 (4)
The β‟s are a collection of unknown parameters. To assess the amount of these parameters, one must gather data
on the system under study. Regression analysis is a branch of statistical model building that applies these data to
International Journal of Computer Science and Information Security (IJCSIS), Vol. 14, No. 6, June 2016
549 https://sites.google.com/site/ijcsis/ ISSN 1947-5500

estimate the β‟s. In general, polynomial models are linear functions of the unknown β‟s, so the approach is
mentioned as linear regression analysis.
A. Linear Regression Models
The practical application of RSM needs develop an approximating model for the true response surface. The
approximating model is based on observed data from the process or system and is an empirical model. Multiple
regression is a set of statistical techniques useful for constructing the types of empirical models required in RSM.
Equation (5) shows a first-order response surface model which is a multiple linear regression model with two
independent variables.
22110 xxy (5)
Sometimes, β1 and β2 are named partial regression coefficients, because β1 measures the expected change in y per
unit change in x1 when x2 is kept constant, and β2 measures the expected change in y per unit change in x2 when x1 is
maintained constant.
Models which are more complicated in appearance than (5) may often still be analyzed by multiple linear
regression techniques. As an example, considering adding an interaction term to the first-order model in two
variables as shown in (6):
211222110 xxxxy (6)
Let x3=x1x2 and β3= β12, then (6) can be written as (7) which is a standard multiple linear regression model with
three variables:
3322110 xxxy (7)
In general, any regression model which is linear in the β-values is a linear regression model, irrespective of the
shape of the response surface that it produces.
The technique of least squares is usually used to assess the regression coefficients in a multiple linear regression
model.
B. Test for Significance of Regression
In multiple linear regression problems, certain tests of hypotheses about the model parameters are beneficial in
measuring the utility of the model.
The test for significance of regression is a test to specify if there is a linear relation between the response variable
y and a subset of the variables x1, x2, ..., xk. The appropriate hypotheses are shown in (8):
joneleastatfor:H
...:H
j
k
0
0
1
210
(8)
Rejection of H0 in (8) pointed that at least one of the variables x1, x2, ..., xk contributes significantly to the model.
One could use the P-value approach to hypothesis testing and hence, reject H0 if the P-value for the statistic F0 is
less than α which is level of significance. This test method is named an analysis of variance (ANOVA).
The coefficient of multiple determination R2 is a measure of the amount of reduction in the variability of y
achieved by using the variables x1, x2, ..., xk in the model. From inspection of the analysis of the variance, it's clear
that R2 varies between 0 and 1. However, a large value of R
2 does not necessarily imply that the regression model is
International Journal of Computer Science and Information Security (IJCSIS), Vol. 14, No. 6, June 2016
550 https://sites.google.com/site/ijcsis/ ISSN 1947-5500

good one. Adding a variable to the model will always enhance R2, regardless of whether the extra variable is
statistically important or not.
Because R2 always increases by adding terms to the model, some regression model builders prefer to employ an
adjusted R2 statistic described as (9):
)R(pn
nRadj
22 11
1
(9)
Where n is the number of observations and p is the number of β‟s in the model [6].
It's worth mentioning that, the impact of each variable is determined according to the measured β which is related
to it.
III. MULTI-OBJECTIVE INCLINED PLANES OPTIMIZATION ALGORITHM
Heuristic technique is a strategy that dissembles some of information to make decisions rapidly with maximum
savings in time and with more precision than complex approach [7]. This method ensures greater probability to
reach optimal solutions because it uses a population to explore the problem space [8].
Searching operation in multi-objective heuristic algorithms is performed in parallel; means a set of agents search
the problem space. So, they can find Pareto-optimal solutions with a single simulation run. These algorithms can
save time and also flee from local optimum with special schemes and converge to global optimum.
In multi-objective optimization unlike single-objective optimization, a single solution cannot be introduced as the
best solution. In such problems, a set of solutions, which complies each objective function with a passable level, is
specified as optimal solutions [9].
IPO algorithm, which is a heuristic optimization algorithm, mimics the dynamic motion of spherical objects along
frictionless inclined plane. All of these objects have tendency to reach to the lowest points. In this algorithm, the
agents are some small balls which explore the problem space to acquire optimal solutions. The main idea of IPO is
to impute height to each ball, regarding to its objective function. These heights are estimations of the potential
energy of each agent that should be converted to kinetic energy by assigning suitable acceleration. In fact, agents
tend to tine their potential energy and to reach the minimum point(s) [10].
Position, height and angles made with other agents, are three specifications of each agent in the search space. The
position of each ball is a possible solution in the problem space and their heights are acquired using a fitness
function.
In a system with N balls, the position of the i-th ball is defined by (10):
N,1,2,ifor,x,,x,,xx ni
di
1ii
(10)
Where, dix is the position of i-th ball in the d-th dimension in an n dimensional space. At a given time t, angle
between the i-th ball and j-th one in dimension d, i.e. dijφ , is calculated using (11):
jiN,,1,2,ji,andn,1,dfor
,txtx
tftftantiφ d
jdi
ij1dj
(11)
International Journal of Computer Science and Information Security (IJCSIS), Vol. 14, No. 6, June 2016
551 https://sites.google.com/site/ijcsis/ ISSN 1947-5500

Where, tfi is the height (value of objective function) for the i-th ball in time t. Because a specific agent tends
moving toward the lowest heights on the inclined plane, only agents with lower heights (fitness) are used in
acceleration calculating.
The amplitude and direction of acceleration for the i-th ball at time t and in dimension d, is measured using (12):
tiφsin.tftfUta dj
N
1jij
di
(12)
In which, )U( is the Unit Step Function:
Finally, (13) is used to update the position of the balls:
txΔt.t.vrand.k
Δt.ta..randk1tx
di
di22
2di11
di
(13)
rand1 and rand2 are two random weights distributed uniformly on the interval [0,1]. tvdi is the velocity of i-th
ball in dimension d, at time t. To control the search process of algorithm, two essential parameters named k1 and k2
are used. These control parameters of IPO are described as functions of time (t) by using (14) and (15):
11
11
1 scaleshifttexp
ctk
(14)
22
22
1 scaleshifttexp
ctk
(15)
Where c1, c2, shift1, shift2, scale1 and scale2 are constants which are determined for each function, experimentally.
tvdi is shown in (16):
Δt
txtxtv
di
dbestd
i
(16)
In the above equation, dbestx is employed in numerator to determine the ball desire to reach the best position in any
iteration.
The main structure of the Inclined Planes Optimization algorithm should be modified to use it in multi-objective
problems. The main steps of multi-objective IPO are as follows:
1- Initialize the population, a repository for non-dominated solutions and evaluation.
2- Separate non-dominated members and store them in the repository.
3- Generate hypercube of the objective space.
4- Each search agent moves according to (13).
5- Update the IPO parameters.
6- Add non-dominated members of present population to the repository.
7- Delete dominated members from repository.
8- Delete additional members if the size of repository is more than the specified capacity.
9- End if the end conditions are established otherwise go back to step 3.
International Journal of Computer Science and Information Security (IJCSIS), Vol. 14, No. 6, June 2016
552 https://sites.google.com/site/ijcsis/ ISSN 1947-5500

IV. DESIGN AND STABILITY ANALYSIS OF MULTI-OBJECTIVE HEURISTIC ENSEMBLE CLASSIFIERS
The purpose of this paper is to perform stability analysis of heuristic ensemble classifiers with high reliability and
high diversity which is not addressed in recent researches. So, at first, a heuristic ensemble classifier with these two
important objective functions (diversity and reliability) is designed by using MOIPO algorithm and then, the
stability analysis of designed ensemble classifier is done by using statistical procedure. In the following subsections,
the way of designing ensemble classifiers and analyzing the stability is explicated.
A. Design Step
In the design step, the MOIPO algorithm is looking for the best subset of classifiers, in terms of reliability and
diversity, among an initial pool of classifier. It is worth noting that in design step, all parameters of the applied
algorithm are constant.
Random subspace method is used to create the initial pool of classifiers and k-Nearest Neighbors (kNN)
classifiers are the base classifiers.
10-fold cross-validation strategy is used in the experiments; in K-fold cross-validation, K-1folds are used for
training and the last fold is used for evaluation. This process is replicated K times, leaving one different fold for
evaluation each time.
Iris and Glass datasets are utilized as a representative of simple data and overlapped data respectively. The
characteristics of these datasets, summarized in the following:
Iris: 150 samples, 4 features and 3 classes.
Glass: 214 samples, 9 features and 2 classes.
In all experiments, population size and number of iterations are considered 20 and 200 respectively.
Three important issues should be defined properly when employing heuristic algorithms for optimization:
objective function, search agents and combination technique.
Evaluation of each member of the population is done by objective (fitness) function calculation. In this paper,
reliability and diversity measure are considered as objective functions to design multi-objective heuristic ensemble
classifiers. It's expected these functions will be optimized by using multi-objective heuristic algorithms.
1) Reliability
There are several important criteria for ensemble classifier evaluation. Reliability is an obvious example of these
measures that may have more importance than traditional criteria. Reliability on a certain class means how many
samples which have been labeled a particular class belong to that class really. It is one of the main standards for
performance evaluation of ensemble classifiers but less attention has been paid to it. However, in some classifiers,
reliability is more important than the recognition rate. For instance, in an automatic target recognition system, the
reliability of final decision is more significant than error rate. Sometimes, a classifier can detect all training samples
of a special class but the reliability of final decision decreases due to sample entrance from the other classes to the
assumed class.
Reliability of each class ( iR ) is defined in (17) in which Ti is the number of correct classified samples in the i-th
class and T is the number of total samples in this class region [11].
International Journal of Computer Science and Information Security (IJCSIS), Vol. 14, No. 6, June 2016
553 https://sites.google.com/site/ijcsis/ ISSN 1947-5500

T
TR i
i
(17)
An effective objective function to optimize this index in ensemble classifier can be defined as multiplication of
the reliability of each class; this objective function is specified in (18):
n
iitotal RR
1
(18)
Where, Rtotal , Ri and n are the reliability of ensemble classifier, reliability of each classifier and number of
classes respectively.
In this paper, the reverse of mentioned multiplication is considered as one of the objective functions. So, if this
function minimized, the reliability will be maximized.
2) Diversity
Diversity among the members of an ensemble classifier has been recognized as a key issue in classifier
combination. Notwithstanding the popularity of the idiom diversity, there is no single definition and measure of it.
Although several measures have been proposed to demonstrate the diversity and are optimized explicitly in different
ensemble learning algorithms, none of these measures is proven premier to the others [12].
In this research, the Q statistic is used as a diversity measure and is defined according to [13] in the following.
Let Z=z1, ..., zNbe a labeled dataset. The output of a classifier Di can be represented as an N-dimensional binary
vector yi =[y1,i ,... ,yN,i]T, such that yj,i =1 if Di distinguishes correctly zj and 0 otherwise, i =1,...,L.
Yule‟s Q statistic for two classifiers Di and Dk is shown in (19):
10010011
10010011
NNNN
NNNNQ k,i
(19)
Where Nab
is the number of elements zj of Z for which yj,i =a and yj,k =b (see Table I). TABLE I
A 2×2 TABLE OF THE RELATIONSHIP BETWEEN A PAIR OF CLASSIFIERS
Dk correct (1) Dk wrong (0)
Di correct (1) N11 N10
Di wrong (0) N01 N00
Total, N=N00+N01+N10+N11.
For an ensemble of L classifiers, the averaged Q statistic over all pairs of classifiers is computed using (20):
1
1 11
2L
i
L
ik
k,iav QLL
Q (20)
It's worth mentioning that the diversity is greater if the Q statistic is lower [14].
As mentioned before, another important issue in heuristic algorithms is search agents; in this paper, agents'
dimensions are considered twice the size of primary pool of classifiers. Since the primary pool contains 50
classifiers, considered dimensions for search agents will be 100. Dimensions 1 to 50 are coded in binary; „1‟ means
the classifier is selected and „0‟ means the classifier is not selected. Other dimensions specify coefficients related to
each classifier; these coefficients are used in classifier combination process.
International Journal of Computer Science and Information Security (IJCSIS), Vol. 14, No. 6, June 2016
554 https://sites.google.com/site/ijcsis/ ISSN 1947-5500

When a subset of classifiers is found, a combination technique should be applied. Weighted voting is used in this
paper as combination rule. The weight of each classifier is characterized by the search agent. If a classifier is
selected, its relevant coefficient should be used in combination process.
B. Stability Analysis Step
After designing reliable ensemble classifier with high diversity, stability analysis starts. To obtain required data
for this phase, the algorithm's parameters, which were constant in design step, change in the range of 50% and the
algorithm is replicated as many as the number of necessary observations.
For stability analysis, six parameters (c1, c2, shift1, shift2, scale1 and scale2) are considered as variables (coded to
x1 to x6, respectively) and two points of Pareto front (ensemble with maximum reliability and ensemble with
maximum diversity) are selected for response value (y). Then four regression models are checked by using F-test
meanwhile α=0.05. These models are linear, quadratic, cubic and power regressions which are determined in (21) to
(24) respectively:
66110 x...xy (21)
2666
211166110 x...xx...xy
(22)
36666
31111
2666
211166110 x...xx...xx...xy
(23)
61610
x...xy
(24)
To convert nonlinear power model to a linear model, (25) is used.
66110 xLn...xLnLnyLn (25)
V. EXPERIMENTAL RESULTS AND DISCUSSION
Table II, summarizes the qualitative results of stability analysis regard to the value of R2; means which model is
good in each case.
TABLE II
QUALITATIVE RESULTS OF STABILITY ANALYSIS Dataset Model Result
Glass
Linear No
Quadratic No
Cubic No
Power Yes
Iris
Linear No
Quadratic No
Cubic No
Power Yes
According to above Table, power model is the only acceptable model for both datasets. Now the results of F-test
for this model are reported in Table III.
International Journal of Computer Science and Information Security (IJCSIS), Vol. 14, No. 6, June 2016
555 https://sites.google.com/site/ijcsis/ ISSN 1947-5500

TABLE III
F-TEST RESULTS FOR BEST MODEL
Dataset
Power model (60 observations)
Measure Result
Q Reliability
Glass
R2 0.315 0.228
adjusted R2 0.237 0.141
P-value 0.002 0.027
Iris
R2 0.434 0.241
adjusted R2 0.370 0.155
P-value 0.000 0.0191
According to Table III, this model is eligible for both datasets and both objective functions because the obtained
P-values are smaller than 0.05 meanwhile the value of adjusted R2 is acceptable. This model can be stated using (26)
and (27), for Glass and Iris, respectively (Where, y1 is Q statistic and y2 is multiplication reverse of reliabilities.):
003006
002005
012304
002103
003102
0056012
030206
041505
319804
015403
297202
0839011
00010
53470
......
......
xxxxxx.y
xxxxxx.y
(26)
001606
009605
006404
000803
007502
0025012
019806
039405
123604
013503
074402
0269011
00020
84021
......
......
xxxxxx.y
xxxxxx.y
(27)
Due to the linear model related to above equations, the important parameters can be specified. For Glass, shift2 is
more important for both objective functions because its pertaining coefficient is larger. For the same reason, it can
be concluded that shift2 and scale1 have the most importance in diversity and reliability, respectively when using
Iris.
VI. CONCLUSION
Reliability and diversity are two important issues in ensemble classifiers and sometimes they are more important
compared to other objective functions; reliability is a significant topic because in practice, there may be situations
where reliability is more important than the recognition rate and possibly in some cases, contrary to the high rate of
recognition, reliability will be low. Also, about the importance of diversity, it is sufficient to mention that diversity
is a main point in achievement of ensemble classifier systems. So, in this paper, MOIPO is employed in order to
design ensemble classifiers with high reliability and high diversity. Due to the random nature of applied algorithm,
stability analysis of designed ensemble is essential. So, in the next step, stability analysis of obtained ensemble
classifier is performed for two datasets and in each situation, four regression models are investigated to acquire the
appropriate model and also, relevant coefficients using statistical method.
REFERENCES [1] T.G. Dietterich, “Ensemble methods in machine learning,” Proceedings of the First International Workshop on Multiple Classifier
Systems, Cagliari, pp. 1–15, 2000.
[2] S. Masoudnia and R. Ebrahimpour, “Mixture of experts: a literature survey,” Artificial Intelligence Review, vol. 42, no. 2, pp. 275-293,
2014. [3] D. W. Opitz, “Feature selection for ensembles,” Proceedings of 16th National Conference on Artificial Intelligence AAAI/IAAI, pp. 379-
384, 1999.
[4] E. M. Dos Santos, R. Sabourin and P. Maupin, “Overfitting cautious selection of classifier ensembles with genetic algorithms,” Information Fusion, vol. 10, no. 2, pp. 150-162, 2009.
[5] E. M. Dos Santos, “Evolutionary algorithms applied to classifier ensemble selection,” 44th Brazilian Operations Research Symposium /
16th Latin Ibero American Conference on Operations Research (XLIV SBPO/XVI CLAIO), 2012.
International Journal of Computer Science and Information Security (IJCSIS), Vol. 14, No. 6, June 2016
556 https://sites.google.com/site/ijcsis/ ISSN 1947-5500

[6] R. H. Myers, D. C. Montgomery and C. M. Anderson-Cook, Response surface methodology: process and product optimization using
designed experiments, 3rd Ed. New Jersey, USA: John Wiley & Sons, 2009. [7] G. Gigerenzer and W. Gaissmaier, “Heuristic decision making,” Annual Review of Psychology, vol. 62, pp. 451–482, 2011.
[8] S. J. Nanda and G. Panda, “A survey on nature inspired metaheuristic algorithms for partitional clustering,” Swarm and Evolutionary
Computation, vol. 16, pp. 1-18, 2014. [9] E. Zitzler, Evolutionary algorithms for multi-objective optimization: methods and applications, Phd Thesis, Swiss Federal Institute of
Technology, Zurich, Switzerland, 1999.
[10] M. H. Mozaffari, H. Abdy and S. H. Zahiri, “Application of inclined planes system optimization on data clustering,” IEEE Conf. on Pattern Recognition and Image Analysis, Birjand, pp. 1-3, 2013.
[11] S. H. Zahiri, S. A. Seyedin, “Using Multi-Objective Particle Swarm Optimization for Designing Novel Classifiers,” in Swarm Intelligence
for Multi-Objective Problems in Data Mining, vol. 242, C. C. Coello, S. Dehuri and S. Ghosh, Ed. 2009, pp. 65-92. [12] E. K. Tang, P. N. Suganthan and X. Yao, “An analysis of diversity measures,” Machine Learning, vol. 65, no. 1, pp. 247-71, 2006.
[13] G. Yule, “On the association of attributes in statistics”, Phil. Transanctions, vol. 194, pp. 257–319, 1900.
[14] L. I. Kuncheva and C. J. Whitaker, “Measures of diversity in classifier ensembles and their relationship with the ensemble accuracy,” Machine Learning, vol. 51, no. 2, pp. 181-207, 2003.
International Journal of Computer Science and Information Security (IJCSIS), Vol. 14, No. 6, June 2016
557 https://sites.google.com/site/ijcsis/ ISSN 1947-5500

Abstract— Kalman filter is a very effective approach for data fusion. But, the definition of process, measurement noises,
and the matrices Q, R have a great impact on the filter performance. Research works show that adjustment of matrices Q,
R during the prediction process is very useful to reduce the estimation errors. So, in this paper, we attempt to increase the
accuracy of Kalman filter used in INS/GPS integration algorithm by estimating measurement covariance matrix, R, based
on measurement data from GPS. Our objective is to show a performance enhancement of a conventional extended Kalman
filter used in an INS/GPS integrated navigation system by adjusting adaptively measurement noise covariance matrix R.
This adaptive adjustment is necessary. Because, environment conditions in many systems usually are not constant and
change continually.
Index Terms— Integrated navigation, Extended Kalman filter, Adaptive Kalman filter
I. INTRODUCTION
N many applications such as military cases or land vehicle navigation systems the accuracy of positioning system
is very vital. In such cases suddenly or unexpected changes in the motion path for example fast rotation can increase
the complicity of modeling [1]. The positioning data usually are provided by sensor systems such as global positioning
system (GPS) or/and inertial navigation system (INS) [2-6]. This data usually are fused by Kalman filter because its
optimality in fusing data has been proved [2-7].The Kalman filter has been defined for linear systems with zero-mean
white noise. So the performance of this filter can be degraded due to environmental conditions or system dynamics
changes [10], [14-15]. Several estimation algorithms have been used in the past to integrated GPS and INS data. Upto
now simple/extended/unscented Kalman filter (SKF/EKF/UKF) and their different types have been popular and
interest in developing the algorithms has continued to the present [13]. However, an important problem in designing
SKF/EKF/UKF is incomplete a priori knowledge of the process noise covariance matrix, Q and measurement noise
covariance, R. In most practical cases, these matrices are initially estimated or even unknown. The problem here is
that the optimality of the estimation in the filter is closely connected to the quality of a priori information about the
Q, R matrices. It has been shown that insufficiently known a priori filter statistics can reduce the precision of the
estimated filter states. In addition, incorrect a priori information can lead to practical divergence of the filter [13], [16-
18].To overcome this problem, adaptive techniques have been presented. In these methods usually filter parameters
especially process and measurement noise covariance matrices, Q and R, are determined with respect to time variable
conditions. This concept is due to this fact that initial knowledge of correct values of Q and R is necessary [11].
I
Design an Adaptive Kalman Filter for
INS/GPS based navigation for a vehicular
system
Mohammad Nasiri
Department of Electrical
Engineering, Faculty of
Engineering, University of
Birjand, Iran P.O. Box: 97175-376
Telephone: +98-915-3039214
Seyed-Hamid Zahiri Department of Electrical
Engineering, Faculty of
Engineering, University of
Birjand, Iran P.O. Box: 97175-376
Telephone: +98-561-2227044
Ramezan Havangi Department of Electrical
Engineering, Faculty of
Engineering, University of
Birjand, Iran P.O. Box: 97175-376
Telephone: +98-561-2227044
International Journal of Computer Science and Information Security (IJCSIS), Vol. 14, No. 6, June 2016
558 https://sites.google.com/site/ijcsis/ ISSN 1947-5500

We used an adaptive filtering method based on available observations from GPS data to estimate and compensate
the error of the filter. In other words, by selecting a window with the proper length of measured data by GPS and
creating innovation sequence, the measurement noise covariance matrix R is adaptively estimated and replaced with
its pervious value. So, we don’t use an overall constant value for matrix R that is common in a conventional Kalman
filter. In other words, matrix R is properly updated and as a result, the accuracy of filter in estimating navigation states
is increased.
The structure of this paper is organized as follows. In section II, the modeling of integrated INS/GPS system and
the problem explanation are given. In section III, adaptive adjustment of Kalman filter is first extended for an
integrated INS/GPS system and based on this, an algorithm of adaptive Kalman filter tuning is obtained for INS/GPS
integrated systems. In section IV, simulation results for a given path is brought to illustrate the effectiveness of our
proposed method. Finally, a conclusion is given in section V.
Notation. The vectors will be denoted by boldface symbols and super case letters. The superscripts ‘-1’ and ‘T’ stand
for the inverse and transpose of a matrix, respectively. ˆ[.] denotes the estimate of [.].
II. INTEGRATED INS/GPS SYSTEM MODEL
The dynamic time continuous model of vehicle and measured observations model are shown in (1), (2), respectively
[13]:
(𝑡) = 𝑭(𝑿(𝑡)) + 𝑾(𝑡) (1)
𝒁(𝑡) = 𝑯(𝑿(𝑡)) + 𝑽(𝑡) (2)
Where X(t) is the navigation state vector of vehicle at time t and defined as:
𝑿(𝑡) = [𝐿, 𝑙, ℎ, 𝑣𝑁 , 𝑣𝐸 , 𝑣𝐷 , 𝜓, 𝜑, 𝜃]𝑇 (3)
Where L, l, h, 𝑣𝑁, 𝑣𝐸 , 𝑣𝐷, 𝜓, 𝜑 and 𝜃 are latitude, longitude, height, speed in the north direction, speed in the east
direction, speed in the down direction, yaw angle, roll angle and pitch angle of vehicle at time t, respectively. In this
system model, F and H are both continuous functions defined as state transition and observation transition matrices,
respectively. W(t), V(t) are process and measurement noise vectors at time t.
State equations of navigation system in the body frame of the vehicle is defined as below [9]:
=𝑣𝑁
𝑅0+ℎ (4)
𝑙 =𝑣𝐸
𝑅0+ℎ𝑠𝑒𝑐𝐿 (5)
ℎ = −𝑣𝐷 (6)
𝑣 = 𝑓𝑁 − 2Ω𝑣𝛦𝑠𝑖𝑛𝐿 +𝑣𝑁𝑣𝐷−𝑣𝐸
2𝑡𝑎𝑛𝐿
𝑅0+ℎ (7)
𝑣 = 𝑓𝐸 + 2Ω(𝑣𝛮𝑠𝑖𝑛𝐿 + 𝑣𝐷𝑐𝑜𝑠𝐿) +𝑣𝐸
𝑅0+ℎ(𝑣𝐷 + 𝑣𝑁𝑡𝑎𝑛𝐿) (8)
𝑣 = 𝑓𝐷 − 2Ω𝑣𝛦𝑐𝑜𝑠𝐿 −𝑣𝑁
2 +𝑣𝐸2
𝑅0+ℎ+ 𝑔 (9)
= (𝜔𝑦𝑠𝑖𝑛𝜑 + 𝜔𝑧𝑐𝑜𝑠𝜑)𝑠𝑒𝑐𝜃 (10)
= (𝜔𝑦𝑠𝑖𝑛𝜑 + 𝜔𝑧𝑐𝑜𝑠𝜑)𝑡𝑎𝑛𝜃 + 𝜔𝑥 (11)
= 𝜔𝑦𝑐𝑜𝑠𝜑 − 𝜔𝑧𝑠𝑖𝑛𝜑 (12)
International Journal of Computer Science and Information Security (IJCSIS), Vol. 14, No. 6, June 2016
559 https://sites.google.com/site/ijcsis/ ISSN 1947-5500

The acceleration vector of vehicle in the navigation frame 𝒇𝑛 is [9]:
𝒇𝑛 = [𝑓𝑁𝑓𝐸𝑓𝐷]𝑇 = 𝑪𝑏𝑛𝒇𝑏 (13)
Where 𝒇𝑏 = [𝑓𝑥𝑓𝑦𝑓𝑧]𝑇 is the acceleration vector in the body frame and 𝑪𝑏
𝑛 is the direction cosine matrix, DCM, is
used to translate acceleration values from body to navigation frame [9]:
𝑪𝑏𝑛 = [
𝑐𝑜𝑠𝜃𝑐𝑜𝑠𝜓 −𝑐𝑜𝑠𝜑𝑠𝑖𝑛𝜓 + 𝑠𝑖𝑛𝜑𝑠𝑖𝑛𝜃𝑐𝑜𝑠𝜓 𝑠𝑖𝑛𝜑𝑠𝑖𝑛𝜓 + 𝑐𝑜𝑠𝜑𝑠𝑖𝑛𝜃𝑐𝑜𝑠𝜓𝑐𝑜𝑠𝜃𝑠𝑖𝑛𝜓 𝑐𝑜𝑠𝜑𝑐𝑜𝑠𝜓 + 𝑠𝑖𝑛𝜑𝑠𝑖𝑛𝜃𝑠𝑖𝑛𝜓 −𝑠𝑖𝑛𝜑𝑐𝑜𝑠𝜓 + 𝑐𝑜𝑠𝜑𝑠𝑖𝑛𝜃𝑠𝑖𝑛𝜓−𝑠𝑖𝑛𝜃 𝑠𝑖𝑛𝜑𝑐𝑜𝑠𝜃 𝑐𝑜𝑠𝜑𝑐𝑜𝑠𝜃
] (14)
With linearization, discretization and considering the estimation errors as state variable, the prediction equations
of Kalman filter is as below [12]:
X(k+1) = FkδX(k) (15)
Pk+1 = FkPkFkT + GkQGk
Tdt (16)
Where dt is the sampling period and δX is the state estimation error vector is in the form [12]:
δX=[δ𝐿, δ𝑙, δℎ, δ𝑣𝑁 , δ𝑣𝐸 , δ𝑣𝐷]𝑇 (17)
Pk is a posteriori estimation error covariance matrix. Fk is also the discrete state error transition matrix and can be
calculated from continuous state error transition matrix F and discretization by equations (18), (19) [12]:
Fk = I + Fdt (19)
Where I is the unique matrix 6×6 and G is calculated as below:
𝐺 = [0 0 0 0 0 0 𝐶𝑏
𝑛 0 0 0
] (20)
𝑭 =
[ 0 0 −
𝑣𝑁
(𝑅0 + ℎ)2
1
(𝑅0 + ℎ) 0 0
𝑣𝐸𝑡𝑎𝑛𝐿
(𝑅0 + ℎ)𝑐𝑜𝑠𝐿 0 −
𝑣𝐸
(𝑅0 + ℎ)2𝑐𝑜𝑠𝐿 0
1
(𝑅0 + ℎ)𝑐𝑜𝑠𝐿 0
0 0 0 0 0 − 1
−2Ω𝑣𝐸𝑐𝑜𝑠𝐿 +𝑣𝐸
(𝑅0 + ℎ)𝑐𝑜𝑠2𝐿 0
(𝑣𝐸2𝑡𝑎𝑛𝐿 − 𝑣𝑁𝑣𝐷)
(𝑅0 + ℎ)2
𝑣𝐷
(𝑅0 + ℎ) − 2Ω𝑠𝑖𝑛𝐿 +
𝑣𝐸𝑡𝑎𝑛𝐿
(𝑅0 + ℎ)
𝑣𝐸
(𝑅0 + ℎ)
2Ω(𝑣𝑁𝑐𝑜𝑠𝐿 − 𝑣𝐷𝑠𝑖𝑛𝐿) +𝑣𝑁𝑣𝐸
(𝑅0 + ℎ)𝑐𝑜𝑠2𝐿 0 −
𝑣𝑁(𝑣𝐸𝑡𝑎𝑛𝐿 + 𝑣𝐷)
(𝑅0 + ℎ)2 2Ω𝑠𝑖𝑛𝐿 +
𝑣𝐸𝑡𝑎𝑛𝐿
(𝑅0 + ℎ)
𝑣𝑁𝑡𝑎𝑛𝐿 + 𝑣𝐷
(𝑅0 + ℎ)
2Ω𝑐𝑜𝑠𝐿 + 𝑣𝐸
(𝑅0 + ℎ)
2Ω𝑣𝐸𝑠𝑖𝑛𝐿 0 𝑣𝑁
2 + 𝑣𝐸2
(𝑅0 + ℎ)2 −
2𝑣𝑁
(𝑅0 + ℎ) −
2(Ω𝑐𝑜𝑠𝐿 + 𝑣𝐸)
(𝑅0 + ℎ) 0
]
(18)
International Journal of Computer Science and Information Security (IJCSIS), Vol. 14, No. 6, June 2016
560 https://sites.google.com/site/ijcsis/ ISSN 1947-5500

III. ADAPTIVE ADJUSTMENT OF KALMAN FILTER
Two basic methods for adaptive Kalman filter (AKF) have been presented in researches, multi-model adaptive
estimating (MMAE) and innovation adaptive estimating (IAE) [13]. Although, implementation of these two methods
is completely different but, both of them are common in use of new statistical information based on innovation
sequence. In both two methods, Innovation sequence Innk at sampling time k is the difference between actual
measured values reached to the filter, Zk, and estimated values by filter, 𝑘.
In MMAE method, a bank of Kalman filters with different statistical models for matrices Q, R works in parallel.
Based on statistical information from innovation and by using a proper selection algorithm, one of them is selected as
the navigation filter to estimate the state of navigation system at each time. But, in IAE method by evolution the
measured values in time, matrices Q and R themselves are adapted [13]. In this paper, we developed a method based
on IAE to estimate measurement noise covariance matrix R from innovation sequence.
Start
Initialize kalman filter parameters (Q0, R0)
INS mechanization
GPS data
received?
Update innovation sequence (Innk)
Number of
samples reached
adapting window
length?
Update Rk
Yes
No
Yes
No
Fig. 1. Adaptive tuning of measurement noise covariance matrix R
International Journal of Computer Science and Information Security (IJCSIS), Vol. 14, No. 6, June 2016
561 https://sites.google.com/site/ijcsis/ ISSN 1947-5500
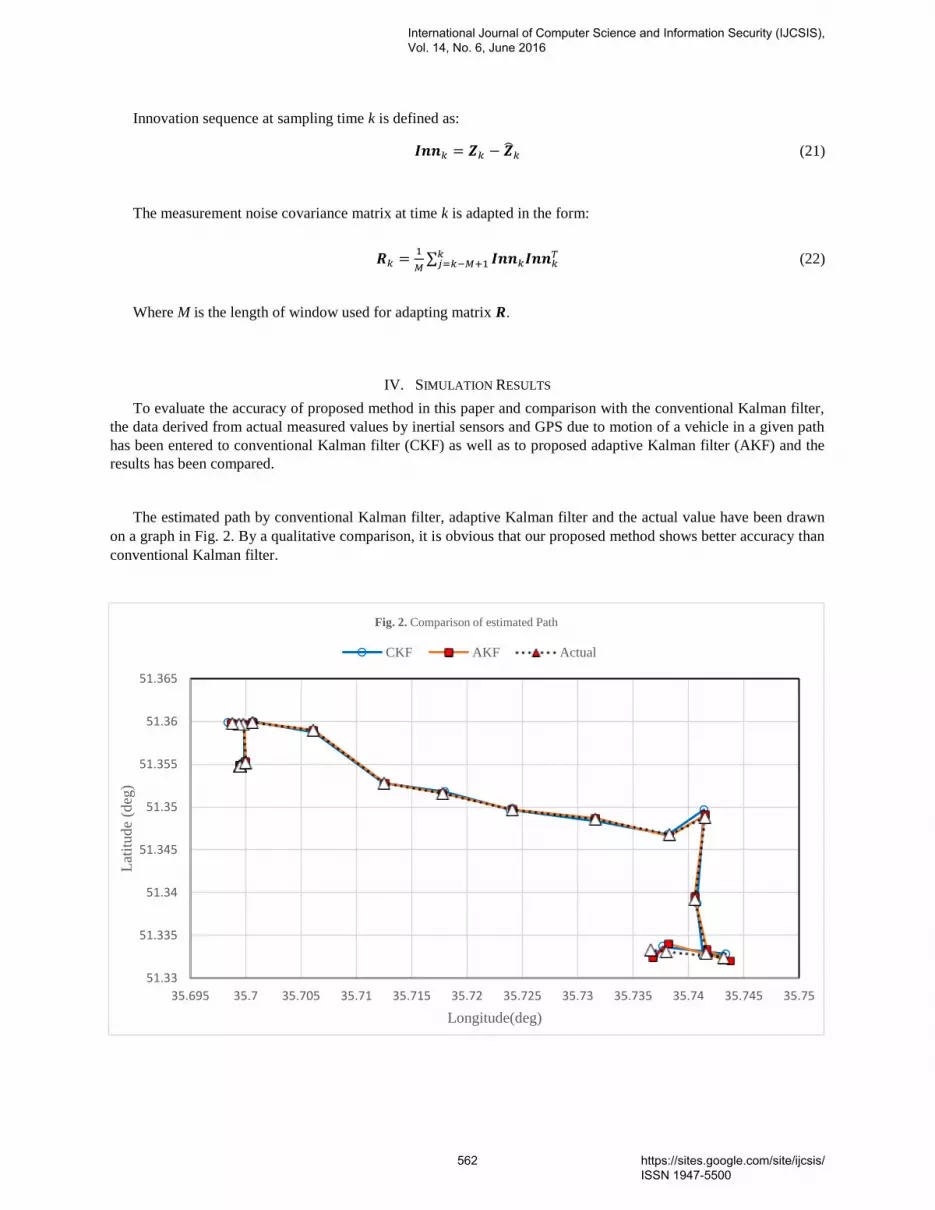
Innovation sequence at sampling time k is defined as:
𝑰𝒏𝒏𝑘 = 𝒁𝑘 − 𝑘 (21)
The measurement noise covariance matrix at time k is adapted in the form:
𝑹𝑘 =1
𝑀∑ 𝑰𝒏𝒏𝑘𝑰𝒏𝒏𝑘
𝑇𝑘𝑗=𝑘−𝑀+1 (22)
Where M is the length of window used for adapting matrix R.
IV. SIMULATION RESULTS
To evaluate the accuracy of proposed method in this paper and comparison with the conventional Kalman filter,
the data derived from actual measured values by inertial sensors and GPS due to motion of a vehicle in a given path
has been entered to conventional Kalman filter (CKF) as well as to proposed adaptive Kalman filter (AKF) and the
results has been compared.
The estimated path by conventional Kalman filter, adaptive Kalman filter and the actual value have been drawn
on a graph in Fig. 2. By a qualitative comparison, it is obvious that our proposed method shows better accuracy than
conventional Kalman filter.
51.33
51.335
51.34
51.345
51.35
51.355
51.36
51.365
35.695 35.7 35.705 35.71 35.715 35.72 35.725 35.73 35.735 35.74 35.745 35.75
Lat
itud
e (d
eg)
Longitude(deg)
Fig. 2. Comparison of estimated Path
CKF AKF Actual
International Journal of Computer Science and Information Security (IJCSIS), Vol. 14, No. 6, June 2016
562 https://sites.google.com/site/ijcsis/ ISSN 1947-5500

Fig. 3 shows estimated latitude by CKF, AKF and the actual value together. With a glance on this figure it is found
that our proposed AKF gives a nearly better accuracy than CKF.
Fig. 4 also shows estimated longitude by CKF, AKF and the actual longitude together. This figure also shows that
the proposed AKF gives a comparatively better accuracy than CKF.
51.33
51.335
51.34
51.345
51.35
51.355
51.36
51.365
0 200 400 600 800 1000 1200
Lo
ngit
ud
e (d
eg)
Time (s)
Fig. 4. Comparison of estimated Longitude
CKF AKF Actual
35.695
35.7
35.705
35.71
35.715
35.72
35.725
35.73
35.735
35.74
35.745
35.75
0 200 400 600 800 1000 1200
Lat
itud
e (d
eg)
Time (s)
Fig. 3. Comparison of estimated Latitude
CKF AKF Actual
International Journal of Computer Science and Information Security (IJCSIS), Vol. 14, No. 6, June 2016
563 https://sites.google.com/site/ijcsis/ ISSN 1947-5500

Fig. 5 shows estimated height by CKF, AKF and the actual height together. With a qualitative comparison of this
figure it is illustrated that our proposed AKF gives very better accuracy than CKF.
We also drew a comparison between our proposed adaptive filter’s performance and that of conventional extended
Kalman filter based on their estimation errors. The estimated latitude, longitude and height errors obtained by these
two filters are shown in Fig. 6, Fig. 7 and Fig. 8, respectively. With a glance, it is clear that our proposed method
shows a significant enhancement in accuracy of estimation in compare with conventional extended Kalman filter.
1150
1200
1250
1300
1350
1400
0 200 400 600 800 1000 1200
Hei
ght
(m)
Time (s)
Fig. 5. Comparison of estimated height
CKF AKF Actual
International Journal of Computer Science and Information Security (IJCSIS), Vol. 14, No. 6, June 2016
564 https://sites.google.com/site/ijcsis/ ISSN 1947-5500

-0.001
-0.0008
-0.0006
-0.0004
-0.0002
0
0.0002
0.0004
0.0006
0.0008
0.001
0.0012
0 200 400 600 800 1000 1200
Lo
ngit
ud
e er
ror
(deg
)
Time (s)
Fig. 7. Comparison of estimated Longitude error
CKF AKF
-0.0005
-0.0004
-0.0003
-0.0002
-0.0001
0
0.0001
0.0002
0.0003
0.0004
0.0005
0 200 400 600 800 1000 1200
Lat
itud
e er
ror
(deg
)
Time (s)
Fig. 6. Comparison of estimated Latitude error
CKF AKF
International Journal of Computer Science and Information Security (IJCSIS), Vol. 14, No. 6, June 2016
565 https://sites.google.com/site/ijcsis/ ISSN 1947-5500

The RMS of the errors in estimated latitude, longitude and height after the convergence is listed in Table I. It can
be easily seen that the proposed method yields smaller RMS in state estimation than the conventional Kalman filtering
method.
TABLE I
RMS OF THE ESTIMATION’S ERRORS
Algorithms Latitude (deg) Longitude (deg) Height (m)
Adaptive Kalman Filter 0.0000021 0.0000032 2.89
Conventional Kalman Filter 0.0000027 0.0000044 9.41
V. CONCOLUSION
The state estimation problem of INS/GPS navigation system for a vehicular system has been studied in this paper.
At first, the navigation system error model is derived, and then the proposed adaptive Kalman filter is developed to
improve the accuracy of navigation system. The proposed filter adopts a covariance matching technique to adjust the
measurement noise statistics. The simulation results show that our adaptive filter is more robust and accurate than
conventional Kalman filter, indicating that it can be suitable for practical application.
REFERENCES
[1] F. Montorsi, F. Pancaldi and G. M. Vitetta, Design and Implementation of an Inertial Navigation System for Pedestrians Based on aLow-Cost MEMS IMU, IEEE International Conference on communications 2013.
[2] S. Sadhu, M. Srinivasan, S. Bhaumik, T.K. Ghoshal, Central difference formulation of risk-sensitive filter, IEEE Signal Processing Letters,
vol. 14, no. 6, 2007, pp. 421–424. [3] P. Setoodeh, A.R. Khayatian, E. Farjah, Attitude estimation by divided difference filter-based sensor fusion, The Journal of Navigation, vol.
60, 2007, pp. 119–128.
[4] J. Rezaie, B. Moshiri, B.N. Araabi, A. Asadian, GPS/INS Integration using Nonlinear Blending Filters, SICE Annual Conference, Kagawa University, Japan, September 2007, pp. 1674–1680.
-30
-20
-10
0
10
20
30
0 200 400 600 800 1000 1200
Hei
ght
erro
r(m
)
Time (s)
Fig. 8. Comparison of estimated Height error
CKF AKF
International Journal of Computer Science and Information Security (IJCSIS), Vol. 14, No. 6, June 2016
566 https://sites.google.com/site/ijcsis/ ISSN 1947-5500

[5] J. S. Kim, S. K. Yoon, D. R. Shin, A state-space approach to multiuser parameter estimation using central difference filter for CDMA systems,
Wireless Personal Communication, vol. 40, 2007, pp. 457–478. [6] Y. L. Zhang, F. Gao, L. Tian, INS/GPS integrated navigation for wheeled agricultural robot based on sigma-point Kalman filter, ‖7th
International Conference on System Simulation and Scientific Computing, October 2008, pp. 1425–1431.
[7] M. F. Abdel-Hafez, On the development of an inertial navigation error-budget system, Journal of the Franklin Institute, Vol. 348, No. 1, 2011, pp. 24-44.
[8] L. Teslic, I. Skrjanc, and G. Klancar, Using a LRF sensor in the Kalman-fitering-based localization of a mobile robot, ISA Transactions, vol.
49, no. 1, 2010, pp. 145-153. [9] D. Titterton and J. Weston, Strapdown Inertial Navigation Technology 2nd ed.: AIAA, 2005.
[10] E. Pulido Herrera, H. Kaufmann, Adaptive Methods of Kalman Filtering for Personal Positioning Systems, 23rd International Technical
Meeting of the Satellite Division of The Institute of Navigation, Portland, OR, September 21-24, 2010. [11] Pulido Herrera E., "Improving Data Fusion in User Positioning Systems, Ph.D. Dissertation", University Jaume I, 2009.
[12] J.F.W. Georgy, "Advanced Nonlinear Techniques for Low Cost Land Vehicle Navigation" ,PhD. Thesis, Department of Electrical and
Computer Engineering, Queen's University Kingston, Ontario, Canada, 2010. [13] D. Loebis, R. Sutton, J. Chudley, W. Naeem, Adaptive tuning of a Kalman filter via fuzzy logic for an intelligent AUV navigation system,
Elsevier Control Engineering Practice 12 (2004) 1531–1539
[14] Q. Yi, L. Z. Ming, and L. E. Chao, ―Fault detection and diagnosis fornon-Gaussian stochastic distribution systems with time delays via RBF neural networks, ISA Transactions, vol. 51, no. 6, 2012, pp.786-791.
[15] A. Noureldin, A. El-Shafie and M. Bayoumi, "GPS/INS integrationutilizing dynamic neural networks for vehicular navigation", Information
Fusion, vol. 12, 2011, pp. 48-57. [16] Congwei Hu, Wu Chen, Yongqi Chen and Dajie Liu, "Adaptive Kalman Filtering for Vehicle Navigation," Journal of Global Positioning
Systems, vol. 2, No, I, 2003, pp. 42-47.
[17] C.Hu,Y.Chen and W.Chen, "Adaptive Kalman Filtering for DGPS Positioning," in Proc. International Symposium on Kinematic Systems inGeodesy, Geomatics and Navigation (KIS), Banff, Canada, 2001, pp.348-353.
[18] CAO Juan-juan, FANG Jian-cheng, SHENG Wei, GFMIMU/GPS Integrated Navagation System Data Fusion, Journal of
SystemSimulation,2008,20(2): pp. 391-394.
International Journal of Computer Science and Information Security (IJCSIS), Vol. 14, No. 6, June 2016
567 https://sites.google.com/site/ijcsis/ ISSN 1947-5500

Abstract - Multimedia has become part of our day today life especially when it comes as images. Many studies have proved that images
are the most efficient way of expressing our feelings rather than a page of paragraphs. An example we can state here is the smileys we
use in our messages for expressing our thoughts. The ultimate rise of social websites like Google+, Twitter and Facebook, playing major
role in the Internet World has proved it wright since these websites are rich in content and huge number of images shared. The
revolutionary technology development in the mobile industry is also playing the major role in using such multimedia content. Since the
images are being shared in different ways, people start compressing the images to reduce the huge amount of memory space. This
compression leads to data loss (pixel) in images which affects the quality of the images. Many solutions have been identified to solve the
issues. One such system uses one dimensional approach in all four directions (Row, Column, Diagonal and Inverse Diagonal); the
recovery process is performed by considering the edge pattern of the existing image adjacent to the damaged data (pixel). The system
also uses the method of determining the weighted sum [1] of selected point functions.
Many more techniques followed like enhancement performed using:
Spatial and Time domain [1].
Frequency Domain Techniques [1].
Brightness Preserving Bi-Histogram Equalization (BBHE) [2].
Key words: Image Enhancement, Data Loss, Recovery process
I. INTRODUCTION
Image processing is an area branded by need for extensive new work to establish the feasibility of proposed solutions to the set of
given problems. Image processing technology is used in almost all the area and few of them are engineering, medical and
planetarium. One of part of the image processing is the image enhancement. Image Enhancement is the technique to improve the
Interpretability or Acuity of information in images for the users and to be intact for the human eyes [3]. In many applications it
becomes mandatory to improve the image quality so that the resultant image quality is finer than the original image.
The main reason of image enhancement is to bring out the detail that is hidden in an image or to increase or decrease the contrast
in a low or high contrast image respectively. Whenever an image is transformed from one type to other such as digitizing the image, some form of degradation in pixel occurs at output.
In addition, for any given application, an image enhancement algorithm that performs well for one type of images may not perform
same as well for other types of image.
II. ENHANCEMENT TECHNIQUES
There are many enhancement techniques have been discovered under global and local image enhancement techniques. The efficiency of various methods has emerged out from the respective output image. The results obtained are sufficient enough to
prove the efficiency and effectiveness of all these techniques in image enhancement field.
There are many spatial and frequency domain methods are available to achieve the same. One of the method used to improve the
dynamic pixel range by modifying the image histogram called as "Histogram Equalization [4]". It is believed that the information
that a certain image tends to convey, is in need of the possibility of amount of pixels of the different gray levels. By re-distributing
this prospect in a uniform manner, the perceptibility of the image details improves.
The global histogram equalization (GHE) technique consists of a transformation of the histogram of the entire image. The method
is simple and operative in terms of employment. It is important to note that even though the global method is appropriate for overall
enhancement, it is also necessary to enhance details constrained to a certain area of the image.
Efficient Image Enhancement Using Image
Mining and Hadoop MapReduce
M. ANAND Mr. V. Mathivanan AMET UNIVERSITY AMET UNIVERSITY
Kanathur - 603 112 Chennai, India Kanathur - 603 112 Chennai, India
International Journal of Computer Science and Information Security (IJCSIS), Vol. 14, No. 6, June 2016
568 https://sites.google.com/site/ijcsis/ ISSN 1947-5500

The histogram can be calculated over a window centered at each pixel of the image to achieve better attention to local detail. The window can then be moved from pixel to pixel. The histogram of each pixels in the window is computed and the transformation
function is applied to the pixel centered in that frame or area [5]. This technique is known as local histogram equalization (LHE).
However it is witnessed that all these approaches often produce outcomes that leave a lot to be anticipated. Alternatively for
enhancing the image using the image histogram directly, we can use some arithmetical parameters attainable directly from the
histogram. So the application for every method comes as per the necessity of the image. It is also important to note that sometime
global method forget the enrichment of small regions while local enhancement method takes care about it.
Few of Enhancement techniques have been explained below:
A. Contrast Stretching [6]
This method is best suited for enhancing the low contrast images. Most of the pixels in a low contrast image will have same
intensity value and hence most of the specific details are difficult to determine on these images. Contrast stretching solves this
problem by increasing the lighter pixels to a higher intensity level, and darker pixels will be decreased to lower intensity level.
Contrast stretching is applied to an image to stretch a histogram to fill the full dynamic range of the image. To enhance the images
that have low contrast this will be a useful technique. The General Equation is:
B. Histogram Equalization [4]
The histogram of an image can be increased dynamically using the Histogram equalization techniques. The intensity values for
each pixels will be assigned in the input image resulting that the output image comprises a uniform dissemination of intensities.
This helps in improving the contrast of the image. The major aim of histogram equalization is to obtain a uniform histogram.
Histogram Equalization technique can be used on an image as whole part or just on a part inside an image.
C. Spline Approach [7]
This enhancement technique of Spline Approach implement enhancement at four directions using 1D approach. Recovery Process
by calculating Weighted Sum of Selected Point functions. Edge direction is first found out by using the pixels adjacent to the
damaged block and cardinal spline is applied to the selected direction. Selection of edge direction is based on (N+4)x(N+4) [7]
pixel pattern. Recovered block data is calculated by:
III. IMAGE MINING AND MAPREDUCE
Image mining deals with the extraction of inherent knowledge, that is, image data relationship or other patterns not explicitly stored
in the images. Image mining is not just an extension of data mining to the image domain but it is more than that. The major role of
image mining is to determine the means of an effective processing of low-level pixel representations, contained in a raw image or
sequence of images, to attain a high-level spatial objects and relationships [8][9].
The motivation of image mining is on the pulling out of patterns from a large collection of images. In general though it seems to
be something in common between image mining and content-based retrieval since both deal with large collections of images,
image mining goes beyond the problem of recovering relevant images. In image mining, the goal is to determine image patterns
that are substantial in a given group of images and the related alphanumeric data [8]. The ultimate challenge in image mining is to
disclose out how low-level pixel representation fenced in a raw image or in Sequence of images can be processed to recognize high-level image objects and relationships. The following Figure-3.1 illustrates the typical Image Mining Process.
International Journal of Computer Science and Information Security (IJCSIS), Vol. 14, No. 6, June 2016
569 https://sites.google.com/site/ijcsis/ ISSN 1947-5500

A. Image Mining Techniques
1) Classification: Classification is a technique for analyzing multimedia data which relies on its own given set of data which are
divided into predefined class labels. Logically, categorizing images by content is an important way to mine appreciated information
from large set of image collections.
Parametric classifier and Non-Parametric classifier are the two major types of classifiers. Data classification can be achieved
through the following two step process:
Describing the predefined data types or Establishing classifiers or concept sets,
Using models to classify data [10].
Commonly used classification tools are neural networks, rule-based classification, Naive Bayes classification, decision tree
classification method, support vector machines etc.
2) Clustering: Images are grouped into meaningful clusters on the basis of similarity is known as Image Clustering. The important
point to note is the grouping will not be done on the basis of known structures or tags. The problem here is without a previous
knowledge of predefined data types we need to find groups and structures which are similar, which is why clustering can also been
called as ‘unsupervised classification’. The data object will be decomposed or divided into multiple clusters or classes, so that the
same class of data objects has a high resemblance, but it should be different from other types of data to the maximum possibilities.
A cluster is also a collection of data objects for analysis. While classification make use of predefined data types derived from class
labels of training data sets [10], clustering wouldn’t.
B. MapReduce from Hadoop
Hadoop is the most widely used open source cloud computing programming platform in recent times. It is a framework to work
with application programs on the cluster which runs using large database, and it also has the support of MapReduce distributed scheduling model to implement the scheduling, virtualization management and sharing of resources [14].
MapReduce is basically a programming model which is used for processing of large amount of data. For the processing of huge
amount of data parallel computing technique will be adopted usually. MapReduce will work by breaking a logically complete
larger task into subtasks and then based on the information of the tasks, the system assigns the different tasks to different resource
nodes for their execution using appropriate strategies. The complete large task is said finished when all the subtasks have been
finished processing. Finally, the processing result is sent to the user [12]. Based on the key value output by Map, each Map task
calculates the data assigned and then maps the result data to the corresponding Reduce task. In the Reduce phase, each Reduce
task carries on the further gathering processing of the data received and obtains the output results.
Figure 3.1: Image Mining Process.
International Journal of Computer Science and Information Security (IJCSIS), Vol. 14, No. 6, June 2016
570 https://sites.google.com/site/ijcsis/ ISSN 1947-5500

IV. ENHANCEMENT OF IMAGE USING MAPREDUCE
We have already discussed few enhancement techniques in our discussion above and stated the issues related to each of the
techniques; let us now consider the spline approach that we stated in 2.3, this approach Uses Single Dimensional Approach Cardin
al Spline is applied for the (N+4) x (N+4) block which is not going to have a similar pixel density of (NxN) pixel and More
interestingly the RGB ((N+4) x (N+4)) will also be not similar to (NxN) pixel. Hence the result obtained by this technique will
result better for some images and it will not give the better for other types of images.
Let us consider the following image (Figure-4.1) of a tomato vegetable. As we notice that the image is enriched with the green
color from left top corner to right bottom corner. Precisely as we see that the RGB value will be (255, 15, 0) throughout the picture.
When the image quality was lost due to various means of compression, the spline enhancement technique will be very effective to
improve the quality of the image.
Now then let us consider another image (Figure-4.2) of rainbow. One can clearly understand the image is rich in various colors
unlike our image of tomato. When the image (Figure-4.2) is being enhanced using Spline approach, it is sure that we will get only
the average result and definitely not the best.
A. Algorithm for Image Retrieval
Image storage is the foundation of the automatic image retrieval, and it is a data-intensive computing process. The using of the
traditional method to put the image into HDFS is very time-consuming, thus the distributed processing method of MapReduce is
applied to upload the image to HDFS. The specific situation is as follows:
Map phase: Use the Map function to read the required image every time, and extract the color and texture feature of the image.
Reduce phase: The extracted feature data of the image is stored in HDFS. HBase is a column-oriented distributed database, thus
the table form of it is used for the image of HDFS.
The steps of MapReduce based image retrieval are as follows:
(1) Collect the images and extract the corresponding features. Store the features into HDFS.
(2) With the user’s submission of search requests, extract the Brushlet features and LBP features of the images waiting for
retrieval.
(3) The similarity matching between the features of the images waiting for retrieval and the features of images in HBase will be
conducted in the Map Phase. The output of the map is the key value of <similarity, image ID>. (4) Conduct the ranking and redistricting of the whole key value of <similarity, image ID > output by map, according to the size
of the similarity, and then input them into the reducer.
(5) In the Reduce phase, collect all the key-value pairs of <similarity, image ID >, then conduct the similarity sorting of these
key values, and write the first N keys into the HDFS.
(6) Output the ID of those images that are the most similar to the medical images waiting for retrieval, and the user gets the final
result of the image retrieval.
The function of Map and Reduce is as follows:
Map(key,RetValue)
//read the features of the images waiting for retrieval CharSearch=Read Search Character ();
// read the data in the feature library
AvDatabase=RetValue;
Figure 4.1 Tomato Figure 4.2 Rainbow
International Journal of Computer Science and Information Security (IJCSIS), Vol. 14, No. 6, June 2016
571 https://sites.google.com/site/ijcsis/ ISSN 1947-5500

// read the image path in the image library ImgPath= Get Figure Path(RetValue);
// calculate the similarity between the features of Brushlet domain and the features of LBP
SimByBrushlet=CompareByLBP(CharSearch,AvDatabase);
SimByLBP=CompareByBrushlet(CharSearch,AvDatabase);
// calculate the similarity of matching between images, among which wbf1 and wlbf2 respectively represents the similarity weight
of the Brushlet features and LBP features.
SimMatch = (wbf1 * SimByBrushlet) + (wlbf2 * SimByLBP);
Commit(SimMatch,ImgPath);
Reduce(key,RetValue)
// conduct the ranking of the retrieval images
Sort(key,RetValue);
// Here key refers to the similarity value and RetValue refers to the path of the similar images to be retrieved
Commit(key,RetValue);
B. Sharpening
Sharpening is one of the most frequently used alterations that can be applied to an image for enhancement purposes, and there are
many ways to do sharpening techniques but it is possible to use the ordinary methods of sharpening to bring out the image details
that were not deceiving before. Image sharpening is used to enhance both the edge and the intensity of the image in order to obtain
the apparent image.
The sharpening method is implemented using convolution, which is an operation that calculates the required pixel by comparing
the source pixel and its neighbors by a convolution kernel using the formulae (1). The kernel is an undeviating operator that
explains how a stated pixel and its neighboring pixels affect the value computed in the destination pixel of the image due to a
filtering operation. Specifically, the kernel used in this sharpening technique is characterized by matrixes with magnitudes 4x4
through decimal point numeric value. When the convolution operation is performed, this 4 × 4 matrix is used as a sliding mask to operate on the pixels of the source image. To calculate the result of the convolution for a pixel located at x and y coordinates in
the source image, the midpoint of the kernel is located with respective to the coordinates. To calculate the value of the destination
pixel at x and y coordinates, a comparison is performed on the kernel values with their equivalent color values in the source image.
The source image is then be updated with the following over operation performed on it:
𝑃𝑜 =𝑃𝑎 ∝𝑎+ 𝑃𝑏 ∝𝑏 (1 −∝𝑎)
∝𝑎+∝𝑏 (1 −∝𝑎) (1)
Where,
Po is the resultant pixel value of the destination image after performing over operation with source and destination image.
∝𝑎 , ∝𝑏 are the alpha of pixels in source and destination image.
C. Reducers
Translating many small size files into one large size file is necessary to decrease the number of tasks and then process technique
is implemented on this single large file. For merging many small size files Hadoop supports SequenceFile mechanism [21]. To
solve the small file problem in HDFS SequenceFile is the most common solution. Many small files are gathered as a single large
size file containing small size files as indexed elements in <key, value> format. File index information is the Key and the file data is the value. The conversion is done by performing a conversion job that gets small files as input value and produce SequenceFile
as output. Although general performance is increased with SequenceFile usage, it’s very much important to make note that the
image formats of the input images will not be preserved their after merging. For each addition of new input image set Preprocessing
is also required. SequenceFile cannot directly access the SequenceFile and hence whole SequenceFile has to be processed to obtain
an image data as single element [22].
Next, combining set of images as one InputSplit technique is implemented to optimize small size image processing in Hadoop
Distributed File System. HDFS CombineFileInputFormat mechanism can combine multiple files and create InputSplits from this
set of files. In addition to that, files which are in the same cluster or node to be combined as InputSplit using
International Journal of Computer Science and Information Security (IJCSIS), Vol. 14, No. 6, June 2016
572 https://sites.google.com/site/ijcsis/ ISSN 1947-5500
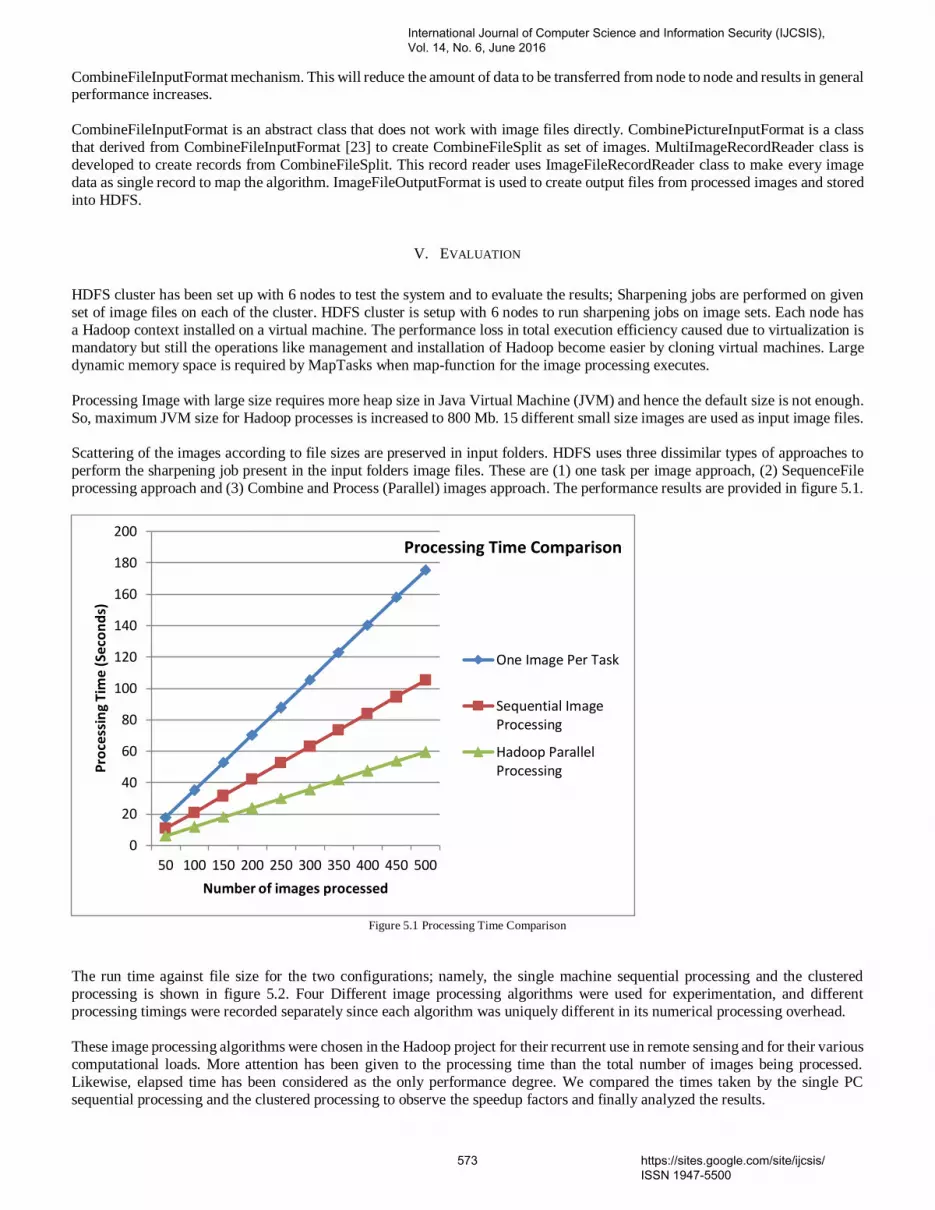
CombineFileInputFormat mechanism. This will reduce the amount of data to be transferred from node to node and results in general performance increases.
CombineFileInputFormat is an abstract class that does not work with image files directly. CombinePictureInputFormat is a class
that derived from CombineFileInputFormat [23] to create CombineFileSplit as set of images. MultiImageRecordReader class is
developed to create records from CombineFileSplit. This record reader uses ImageFileRecordReader class to make every image
data as single record to map the algorithm. ImageFileOutputFormat is used to create output files from processed images and stored
into HDFS.
V. EVALUATION
HDFS cluster has been set up with 6 nodes to test the system and to evaluate the results; Sharpening jobs are performed on given
set of image files on each of the cluster. HDFS cluster is setup with 6 nodes to run sharpening jobs on image sets. Each node has
a Hadoop context installed on a virtual machine. The performance loss in total execution efficiency caused due to virtualization is
mandatory but still the operations like management and installation of Hadoop become easier by cloning virtual machines. Large
dynamic memory space is required by MapTasks when map-function for the image processing executes.
Processing Image with large size requires more heap size in Java Virtual Machine (JVM) and hence the default size is not enough.
So, maximum JVM size for Hadoop processes is increased to 800 Mb. 15 different small size images are used as input image files.
Scattering of the images according to file sizes are preserved in input folders. HDFS uses three dissimilar types of approaches to
perform the sharpening job present in the input folders image files. These are (1) one task per image approach, (2) SequenceFile
processing approach and (3) Combine and Process (Parallel) images approach. The performance results are provided in figure 5.1.
Figure 5.1 Processing Time Comparison
The run time against file size for the two configurations; namely, the single machine sequential processing and the clustered
processing is shown in figure 5.2. Four Different image processing algorithms were used for experimentation, and different
processing timings were recorded separately since each algorithm was uniquely different in its numerical processing overhead.
These image processing algorithms were chosen in the Hadoop project for their recurrent use in remote sensing and for their various
computational loads. More attention has been given to the processing time than the total number of images being processed.
Likewise, elapsed time has been considered as the only performance degree. We compared the times taken by the single PC
sequential processing and the clustered processing to observe the speedup factors and finally analyzed the results.
0
20
40
60
80
100
120
140
160
180
200
50 100 150 200 250 300 350 400 450 500
Pro
cess
ing
Tim
e (
Seco
nd
s)
Number of images processed
Processing Time Comparison
One Image Per Task
Sequential ImageProcessing
Hadoop ParallelProcessing
International Journal of Computer Science and Information Security (IJCSIS), Vol. 14, No. 6, June 2016
573 https://sites.google.com/site/ijcsis/ ISSN 1947-5500

Figure 5.2 Comparison - Time Consumption vs Image Size
VI. CONCLUSION
Our Proposed system helps in recover the data loss (pixel) by combining the concept of data mining techniques and image mining
to enhance the quality of images. The major difference between the existing and our proposed system is: most of the existing
system used the same image which has been already compressed but in our proposed method we are going to examine the similar
pattern of image (which is not compressed) with the help of data mining concept. The data mining approach used for the
enhancement vibrant image offers a unique way of introducing additional high-pass spatial information into the luminance
component of vibrant images. It can produce satisfied contrast and improved sharpness enhancement. The goal of the research
reported here is to realize the adaptive satiety response by using data mining algorithms and Hadoop MapReduce method. So that the vibrant image rich in colors enhancement approach becomes more practical. At the same time, it should be noted that the
performance measure proposed in this paper is not the best because of image quality acuity and valuation are independent and the
human visual system is very complex. In general it is very difficult to find the "best" performance measure that can exactly respond
to any of the actual image quality and match the characteristics of the human visual system. If some new and better performance
measures are found, then we can include the new and better performance measures so that the performance of the proposed
approach will be improved accordingly.
REFERENCES
[1] Image Enhancement and Its Various Techniques, Snehal O.Mundhada Prof. V. K. Shandilya.
[2] Yeong-Taeg Kim , “Contrast Enhancement using Brightness Preserving Bi- Histogram equalization”.
[3] Raman Maini and Himanshu Aggarwal, “A Comprehensive Review of Image Enhancement Techniques”, Journal of Computing, Vol. 2, Issue 3, March 2010,
ISSN 2151-9617.
[4] Rajesh Garg, Bhawna Mittal, Sheetal Garg, “Histogram Equalization Techniques for Image Enhancement”, IJECT Vol. 2, Issue 1, March2011, ISSN 2230-
9543.
[5] Ian T. Young, Jan J. Gerbrands, Lucas J.van Vliet, “Fundamentals of Image Processing”, Paperback, 1995 .
[6] http://bme.med.upatras.gr/improc/enhancement_point_processing.htm
[7] Adaptive Recovery of Image Blocks Using Spline Approach Jong-Keuk Lee Ji-Hong Kim Jin-Seok Seo.
[8] C. Amitkumar Bhatt, Mohan S. Kankanhalli, “Multimedia data mining : state of the art and challenges,” Multimedia Tools and Applications, Springer, vol.
no. 51, issue 1,2011, pp. 35-76.
[9] Hsu Wynne, Lee Mong Li, Zhang Ji, “Image Mining: Trends and Developments” Journal of Intelligent Information Systems, Springer Netherlands, vol. 19,
issue 1, 2002, pp. 7-23.
[10] Yang Changchun, Yi Li, "A Data Mining Model and Methods Based on Multimedia Database," Internet Technology and Applications, 2010 IEEE
International Conference on, vol., no., pp.1-4, 20-22 Aug. 2010.
[11] Pieter Adriaans, Dolf Zantinge, “Data Mining”, Addison Wesley, 2012.
0
100
200
300
400
500
600
700
800Ti
me
Re
qu
ire
d (S
eco
nd
s)
Image Size (MB)
Comparison - Time Consumption vs Image Size
Seqential Processing
Clustered Processing
International Journal of Computer Science and Information Security (IJCSIS), Vol. 14, No. 6, June 2016
574 https://sites.google.com/site/ijcsis/ ISSN 1947-5500

[12] Krishna K. Pandey, N. Mishra, H. Sharma, “Enhanced of colour matching algorithm for image retrieval”, IJCSIInternational Journal of Computer Science
Issues, Vol. 8, Issue 3, No. 2, 2011, pp. 529-532.
[13] T. N. Manjunath, R. S. Hegadi, and G. K. Ravikumar, “A Survey on Multimedia Data Mining and Its Relevance Today” , Journal of Computer Science, vol.
10, no. 11, 2010, pp. 165-170.
[14] JEFFREY D, SANJAY G. Mapreduce: a flexible data processing tool. Communications of the ACM 2010, 53(1) pp. 72-77.
[15] FACEBOOK, 2010. Facebook image storage.
a. http://blog.facebook.com/blog.php?post=206178097130.
[16] D. Sudipto, S. Yannis, S.B. Kevin, G. Rainer, J.H. Peter, and M. John, Ricardo: Integrating R and Hadoop. Paper presented at the 2010 international
conference on Management of data, Indianapolis, USA, June 6-11, 2010.
[17] S. Chris, L. Liu, A. Sean, and L. Jason, HIPI: A hadoop image processing interface for image-based map reduce tasks, B.S. Thesis. University of Virginia,
Department of Computer Science, 2011.
[18] W. Keith, C. Andrew, K. Simon, G. Jeff, B. Magdalena, H. Bill, K. YongChul, and B. Yingyi, Astronomical image processing with hadoop. Paper presented
at Astronomical Data Analysis Software and Systems XX, Boston, USA, November 7-11, 2010.
[19] http://hadoop.apache.org/.
[20] Berlinska J, M. Drozdowski (2011), Scheduling Divisible MapReduce Computations, Journal of Parallel and Distributed Computing, 71(3): 450-459.
[21] Dean J, S. Ghemawat (2010), MapReduce: A Flexible Data Processing Tool, Communications of the ACM, 53(1): 72 -77.
[22] Dean J, S. Ghemawat (2008), MapReduce: Simplified Data Processing on Large Clusters, Communications of the ACM, 51(1): 1 -13.
[23] Ghemawat S, H. Gobioff, S. T. Leung(2003), The Google File System, Proceedings of the 19th ACM Symposium on Operating System Principles, NY, USA:
ACM, DOI:10.1145/945445.945450.
[24] Dong B et al. (2012); An Optimized Approach for Storing and Accessing Small Files on Cloud Storage, Journal of Network and Computer Applications,
35(6): 1847-1862.
[25] Dong B et al. (2010); A Novel Approach to Improving the Efficiency of Storing and Accessing Small Files on Hadoop: a Case Stu dy by PowerPoint Files,
IEEE International Conference on Services Computing (SCC), Florida, USA: IEEE, DOI:10.1109/SCC.2010.72.
[26] Krishna, M.; et al. (2010); Implementation and Performance Evaluation of a Hybrid Distributed System for Storing and Processing Images from the Web,
2nd IEEE International Conference on Cloud Computing Technology and Science, Indianapolis, USA: IEEE, 762-767, DOI:10.1109/CloudCom.2010.116.
[27] Bakshi, K. (2012) Considerations for Big Data: Architecture and Approach. Aerospace Conference-Big Sky, MT, 3-10 March 2012.
[28] Kelly, J. (2012) Big Data: Hadoop, Business Analytics and Beyond. Wikibon Whitepaper, 27 August 2012.
http://wikibon.org/wiki/v/Big_Data:_Hadoop,_Business_Analytics_and_Beyond
[29] Bajcsy, P., Vandecreme, A., Amelot, J., Nguyen, P., Chalfoun, J. and Brady, M. (2013) Terabyte-Sized Image Computations on Hadoop Cluster Platforms.
2013 IEEE International Conference on Big Data, Silicon Valley, 6-9 October 2013, 729-737.
[30] Storm Project. http://storm.incubator.apache.org/
[31] Samza Project. http://samza.incubator.apache.org/
[32] http://bme.med.upatras.gr/improc/enhancement_point_processing.h
[33] Rajesh Garg, Bhawna Mittal, Sheetal Garg, “Histogram Equalization Techniques for Image Enhancement”, IJECT Vol. 2, Issue 1, March2011, ISSN 2230-
9543.
[34] Adaptive Recovery of Image Blocks Using Spline Approach Jong-Keuk Lee Ji-Hong Kim Jin-Seok Seo.
[35] http://wiki.apache.org/hadoop/SequenceFile
[36] Liu, X.; et al. (2009), Implementing WebGIS on Hadoop: A Case Study of Improving Small File I/O Performance on HDFS, IEEE International Conference
on Cluster Computing and Workshops, Louisiana USA: IEEE, 1-8, DOI:10.1109/CLUSTR.2009.5289196.
[37] https://hadoop.apache.org/docs/current/api/org/apache/hadoop/mapred/lib/ Combine-FileInputFormat.html
International Journal of Computer Science and Information Security (IJCSIS), Vol. 14, No. 6, June 2016
575 https://sites.google.com/site/ijcsis/ ISSN 1947-5500

An Efficient Image Encryption Technique by Using Cascaded Combined Permutation
Muslim Mohsin Khudhair
Department of Computer Information Systems, College of Computer Science & Information Technology, University of Basrah,
Basrah, IRAQ
Abstract
In this paper, a new simple encryption technique is proposed for gray scale image encryption. The current technique, Cascaded Combined Permutation (CCP), is a simple technique based on the primary well known 2-D permutation algorithms. The application at the permutations is performed on three steps: (1) one permutation algorithm is applied on the image; (2) the image that resulting from the first step is decomposed into four quarters. Pixels in each quarter image are then permuted with one of the permutation algorithms. The resulting encrypted quarters are combined as one image; (3) the encrypted image resulting from the second step is further encrypted by performing another permutation algorithm. Experimental results show efficient encryption that is simple in implementation and has high degree of security. It has several key points of strength such as the sequence in which the primary permutation algorithms are applied. Keywords: Permutation, Image Encryption, Image Decryption , correlation.
1. Introduction
With the rapid development of multimedia and network technologies, the transmission of multimedia data takes place more and more frequently. Consequently, the security of multimedia data is becoming more and more important [1, 2]. Encryption is one of the ways used to ensure security and protection of secure data from any misuse and forgery. Images have been widely used in our daily life and is an important data class. It may contain diagrams, diagrams of banks, building construction or important data captured by military satellite [3]. Original images are referred as plain images. Encryption is a process that transforms the plain image to cipher image (encrypted image) which is hard to be understood. Decryption is the reverse of the encryption process to produce the original image from encrypted image [4]. Most of the algorithms specifically designed to encrypt digital images are proposed in the mid-1990s. There are two major groups of image encryption algorithms [l]: (a) Non-chaos selective methods; and (b) Chaos-based selective or non- selective methods. Most of these algorithms are image encryption using block-based permutation transformation algorithm. Mohammad et al. [5] were proposed a permutation process based on the combination of the image permutation, the
International Journal of Computer Science and Information Security (IJCSIS), Vol. 14, No. 6, June 2016
576 https://sites.google.com/site/ijcsis/ ISSN 1947-5500

transformation process will be used a pixel permutation. Mitra et al. [6] have proposed a random combinational image encryption approach with pixel and block permutations.
This paper is a step forward in this regards. The rest of this paper is organized as follows: Section 2, will discuss the fundamentals of permutation and the transformation mapping. Section 3, the current technique (CCP) for the verification of authenticity of transmitted images through the Internet. Section 4, will explain the experimental and results. Section 5, concludes of the current paper.
2. Permutation
The permutation techniques are very useful in the encryption process, because the advantages of using the permutation in cryptography (simple implementation speed, and universality for most image formats). The permutations will not change the coefficients values but their locations [7]. A permutation (rearrangement) can be described by assigning successive number to the objects to be permuted and then giving the order of the objects after the permutation is applied [8]. 2.1 Fundamentals of Permutation
A permutation process of degree n refers to the operation of replacing an arrangement pi: i=1, 2,…, n, pi ϵ S by a second an arrangement qi: i=1, 2, ..., n, qi ϵ S and is represented as [6, 8]: )1(,
....,,....,,
21
,21
⎟⎟⎠
⎞⎜⎜⎝
⎛=Φ
n
n
qqqppp
where n! such permutations are possible and S denotes any non-empty set. The reverse of this permutation process is specified as:
)2(,....,,
....,,
21
211⎟⎟⎠
⎞⎜⎜⎝
⎛=Φ −
n
n
pppqqq
which retrieves the original arrangement. The above method is formally defined as follows [6]: 2.2 The Basic Permutation Algorithms for Images Encryption
In the image encryption, mainly there are three basic permutation techniques [8, 9, 10]:
International Journal of Computer Science and Information Security (IJCSIS), Vol. 14, No. 6, June 2016
577 https://sites.google.com/site/ijcsis/ ISSN 1947-5500

A. Bit Permutation
An image can be seen as a 2D array of pixels, each with eight bits for 256 gray levels. In the bit permutation technique, bits in each pixel taken from the image are permuted with the key chosen from the set of keys by using the pseudo random index generator. The entire array of these permuted pixels forms the encrypted image. The encrypted image obtained from the bit permutation technique is transmitted to the receiver through the insecure channel. At the receiver, the encrypted image is decrypted using the same set of keys and same pseudo random index generator. As pixel is eight bits, we also take the key length equal to eight. The number of permutations obtained with eight bits is 8! (i.e. 40320). B. Pixel Permutation (PR)
In this technique, each group of pixels is taken from the image. The pixels in the group are permuted using the key selected from the set of keys. The encryption and decryption procedure is the same as the bit permutation technique. The size of the pixel group is the same as the length of the keys, and all the keys have the same length. If the length of the keys is more than the size of pixel group, the perceptual information reduces.
C. Block Permutation
In this technique, image can be decomposed into blocks. A group of blocks is taken from the image and these blocks are permuted same as previous permutations. For better encryption, the block size should be lower. If the blocks are very small then the objects and its edges do not appear clearly. Definition 1:
Permutation is a one-to-one mapping of any non-empty set S onto S. The set containing all such mappings is denoted by Sn with n! members, if S has n elements. Note that every group under consideration is isomorphic to a group of permutations. Based upon this definition, the cryptography process, with the help of permutation operation, can be defined as follows.
Definition 2:
If any data matrix X is transformed to a cipher-matrix Ψz=ɸz(X) where Ψz is any permutation operation, then the original matrix X can be obtained again from Ψz with the inverse operation of ɸz on it, i.e. ɸz-1(Ψz)=ɸz-1(ɸz(X))=X, as ɸz-1and ɸz forms an identity operator.
International Journal of Computer Science and Information Security (IJCSIS), Vol. 14, No. 6, June 2016
578 https://sites.google.com/site/ijcsis/ ISSN 1947-5500

2.3 Permutation Methods
The proposed method is Baker, Cat, Henon, Duffing and Kaplan map for constructing the new approach that are described as follows [11-14]:
2.3.1 Baker’s Map The classical map acts on the square (1, N-1) * (1, N-1) and maps points (q, p) according to following equations: )3(,)mod(21 NXX nn =+
⎣ ⎦ )4(,)mod()2(1 NXYY nnn +=+ where denotes to largest integer ≤ X. 2.3.2 Cat’s Map
The classical Arnold Cat’s map is a two–dimensional invertible map described by:
)5(,)mod(1 NaYXX nnn +=+
)6(,)mod()1(1 NYabbXY nnn ++=+ where , is the pixel position in the N×N image and , 0, 1, 2, … , − 1 ; , is the transfer position after apply the Cat map; a and b are two control parameters positive integers. The Cat map preserves area since the determinant of its linear transformation matrix is equal 1, it is a one-to-one mapping, i.e. each point in the matrix can be transformed to another point uniquely. The two parameters a and b are the key of the Cat map. 2.3.3 Henon’s Map
A particularly simple example of a two-dimensional map is the Henon map. The map iterates the point , via the equations:
)7(,)(mod1 2
1 NaXYX nnn −+=+ )8(,)(mod1 NbXY nn =+ with initial point ),( 00 YX . The pair , is the two dimensional state of the system. The method is a one- to-one mapping, a and b are the key of the Henon’s method.
International Journal of Computer Science and Information Security (IJCSIS), Vol. 14, No. 6, June 2016
579 https://sites.google.com/site/ijcsis/ ISSN 1947-5500

2.3.4 Duffing Map
This map is reminiscent of the Duffing equation and it is defined by the equations:
)9(,)(mod1 NYX nn =+
)10()(mod31 NYaYbXY nnnn −+−=+
2.3.5 Kaplan–Yorke Map
The Kaplan-Yorke map is defined by equations:
),11...()(mod1 NaXX nn =+
)12...()(mod)2cos(1 NXbYY nnn π+−=+
In each method, the pixel’s positions of plain image are transformed into new locations according to the mapping methods, so as, to obtain the encrypted image and the decrypted image also get it by applying the same mapping methods to the encrypted image. An image is taken and each map is applied on it. The encrypted and decrypted image for each method of permutation are shown in Figure (1).
(a) (b) (c) Baker’s Map
(a) (b) (c) Cat’s Map
International Journal of Computer Science and Information Security (IJCSIS), Vol. 14, No. 6, June 2016
580 https://sites.google.com/site/ijcsis/ ISSN 1947-5500

3. The Current Technique
The current technique is updated new permutation based on the combination of the mapping transformations which are discussed in the previous section.
The current technique is applied on six grayscale images labelled image 1 to image 6 as shown in Figure (2). The results are collected after applying encryption and decryption on each image and computing the mean square error (MSE) and correlation (Cor.).
(a) (b) (c) Henon’s Map
(a) (b) (c) Kaplan’s-Yorke Map
(a) (b) (c) Duffing’s Map
Figure (1): Image encryption and decryption for methods above. (a) Original Image. (b) Encrypted Image. (c) Decrypted image.
International Journal of Computer Science and Information Security (IJCSIS), Vol. 14, No. 6, June 2016
581 https://sites.google.com/site/ijcsis/ ISSN 1947-5500

For encryption process, the permutation is performed through three stages:
• In the first stage, pixel's position of the plain image (original) Figure (3) (a) is transformed by baker's map (section 2.3.1).
• In second stage, the generated image Figure (3) (b) is decomposed into four quarters block, each one contain as number of pixels (N/2×N/2) Figure (3) (c). The permutation technique works as follows: The pixels position of each block [first block (1-128, 1-128), second block (1-128, 129-256), third block (129-256, 1-128), and fourth block (129-256, 129-256)] are transformed by Cat's, Duffing's, Henon's, and Kaplan's map (section 2.3) respectively as shown in Figure (3) (d).Then the four blocks are composed to obtain an encrypted image with (N×N pixels) as shown in Figure (3) (e).
• To increase the security and hide the edges of four blocks, third stage is used. In this stage, the pixels position of the image Figure (3) (e) is permute and transformed by cat's map (section 2.3.2) to obtain the final encrypted image Figure (3) (f). For simplicity, in this paper the coefficients a and b are selected by trial and error techniques as 21 and 39 respectively.
At the receiver side, the original image can be reproduced by the inverse permutation with reverse order of these process as shown in Figure (4). The multistage encryption system was proposed as a solution to provide a higher security level than the one map.
Figure (2): Test Images
(1) (2) (3)
(4) (5) (6)
(1) (2) (3)
International Journal of Computer Science and Information Security (IJCSIS), Vol. 14, No. 6, June 2016
582 https://sites.google.com/site/ijcsis/ ISSN 1947-5500

Figure (3): The current method (CCP) for encryption stage:
(a) Original image. (b) Encrypted image (first stage). (c-e) Second stage
(f) Final encrypted image.
(a) (b) (c)
(d) (e) (f)
(d) (e) (f)
(a) (b) (c)
Figure (4): The current method (CCP) for decryption stage:
(a) Encrypted image. (b) Decrypted image (third stage). (c-e) Second stage
(f) Final decrypted image (fist stage).
International Journal of Computer Science and Information Security (IJCSIS), Vol. 14, No. 6, June 2016
583 https://sites.google.com/site/ijcsis/ ISSN 1947-5500

4. Experimental and Results
Pixel permutation (mapping method) was implemented with (MATLAB 2012) package. The implementation was done on a PC (DELL laptop) with 2.1 GHz core 2 due processor and 2GB main memory running with windows 7 operating system. The permutation process was applied on greyscale image that has the size of (256×256 pixels). For the proposed method, the encryption and decryption processes are shown in Figure (3) and Figure (4) respectively. The correlation value (cor.) is computed for each case between original image and both encrypted and decrypted images according to the equation is [15, 16]:
)13(,])),(([])),((
),(()),((
1 12
2212
11
1 )22111
∑ ∑∑∑
∑∑
= =
−
=
−
=
=
−−
=
−−
−−=
M
c
M
c
N
r
N
r
M
c
N
r
IcrIIcrI
IcrIIcrIcor
where:
:),(1 crI is the value of pixel at (r, c) of the original image.
1I : is the mean of the original image ),(1 crI that
∑ = ∑ == N
rMc crI
NMI 1 1 )14(,),(1*
11
where:
:),(2 crI is the value of pixel at (r, c) of the reconstructed (or cipher) image.
2I : is the mean of the reconstructed (or cipher) image that
∑ = ∑ ==− N
rMc crI
NMI 1 1 )15(,),(2*
1
where:
M: height of the image.
N: the width of the image.
r and c: row and column numbers.
The mean square error (MSE) is used as metric to measure the distortion between both the resulting encrypted and decrypted image, and the original image [17, 18].
The equation that evaluating the MSE is:
International Journal of Computer Science and Information Security (IJCSIS), Vol. 14, No. 6, June 2016
584 https://sites.google.com/site/ijcsis/ ISSN 1947-5500

)16...(,)],(),([*1
12
1∑∑ =
−
=
−= M
c
N
rcrIcrI
NMMSE
where:
I : is the plain image. I : is the mean of the reconstructed (or encrypted) image .
M: height of the image. N: the width of the image. The peak signal to noise ratio (PSNR) is computed between the original image and decrypted images according to the equation [19, 20]:
)17(],/)255[(log.10 210 MSEPSNR =
The measurement unit for the PSNR is measured in dB. For the encryption stage, Table (1) presents the correlation values and Table (2) presents the encryption-decryption execution time values for different images. From Table (1), the correlation values are decreased after each stage. For the decryption stage, the correlation between the plain image and the decrypted one, these values of correlation is exactly 1. Table (3) presents the PSNR values. We note higher value of PSNR is, the more the similarity between original image and decrypted images.
By referring to the figures and tables we notice that the second level of the encryption process increased by large amount. And usually, the third level is the best encryption with respect to the second stage.
Image No.
Correlation for Encryption Stage
Between Original and first stage
encryption
Between Original and second stage
encryption
Between Original and third stage encryption
1 0.0330 0.0065 0.0030 2 0.0414 0.0063 0.0224 3 0.0288 0.0081 0.0290 4 0.0533 0.0122 0.0029 5 0.0373 0.0040 0.0270 6 0.0251 0.0056 0.0032
Table (1): Correlation values for different images for CCP.
International Journal of Computer Science and Information Security (IJCSIS), Vol. 14, No. 6, June 2016
585 https://sites.google.com/site/ijcsis/ ISSN 1947-5500

5. Conclusions
The proposed CCP technique results in efficient encryption that is simple in implementation and has high security. The current technique is based on the primary permutation algorithms. The level encryption result has several key points of strength such as the sequence in which the primary permutation algorithms are applied. For example, which is used for the first stage, in the third stage, and which is used for the middle stage. Also, in the middle stage, which technique is used for each quarter of image. Another key points are the coefficient a and b for each permutation algorithm, correlation provides good result of proposed encryption technique. The decrypted image is an exact replica of original image as shown by correlation that gives perfect reconstruction. Also the results show that the value of PSNR is high & the value of MSE is low that means our technique is effective.
Image
No.
Execution Time (sec.)
Encryption Stage
Decryption Stage
Total Time
1 1.857158 1.834571 3.691729 2 1.728500 1.834272 3.562772 3 1.691041 1.772538 3.463579 4 1.780760 1.812432 3.593192 5 1.619547 1.881191 3.500738 6 1.751264 1.873303 3.624567
Image No. PNSR (dB)
1 32.6091570 2 31.7501683 3 33.5867451 4 34.8535835 5 32.5689651 6 26.2351177
Table (2): Execution time values for different images for CCP.
Table (3): PSNR values between Original image & Decrypted image for CCP
International Journal of Computer Science and Information Security (IJCSIS), Vol. 14, No. 6, June 2016
586 https://sites.google.com/site/ijcsis/ ISSN 1947-5500

References:
1) Trees-Juen Chuang, and Ja-Chen Lin, “ New Approach to Image Encryption”, Journal of Electronic Imaging, Vol.7, No.2, pp.350-356, 1998.
2) N.K. Pareek, Vinod Patidar, and K.K. Sud, "Image Encryption Using Chaotic
Logistic Map", Image and Vision Computing 24, pp.926-934, 2006. 3) Y. Yang., V. Stankovic, and Z. Xiong ”Image Encryption and Data Hiding:
Duality and Code Designs”, ITW 2007, Lake Tahoe California, pp. 295-300, 2007.
4) Ismat Qzturk, and Ibrahim Sogukpinar, “Analysis and Comparison of Image
Encryption Algorithms”, International Journal of Information Technology Vol. 1, No. 2, pp. 64-67, 2004.
5) Mohammad Ali Bani Younes, and Aman Jantan, “An Image Encryption
Approach Using a Combination of Permutation Technique Followed by Encryption”, International Journal of Computer and Network Security (IJCNS), Vol.8, No.4, pp. 191-197, 2008.
6) Mitra, Y. V. Subba Rao, and S. R. M. Prasanna, “A New Image Encryption
Approach Using Combinational Permutation Techniques”, International Journal of Electrical and Computer Engineering, pp. 127-131, 1:2, 2006.
7) Z. Hrytskiv, and S. Voloshynovsky, “Cryptography and Steganography of
Video Information in Modern Communications”, FACTA Universities (NIS) Series: Electronics and Energetic, Vol.11, No. 1, pp. 115-125, 1998.
8) Shujun Li, Chengqing Li, Guanrong Chen, Nikolaos G. Bourbakis, and Kwok- Tung Lo, " A General Quantitative Cryptanalysis of Permutation-only
Multimedia Ciphers Against Plaintext Attacks", Signal Processing: Image Communication 23, pp. 212–223, 2008.
9) Y. Hilewitz, and Z. Shi, “Comparing Fast Implementation of Bit Permutation
Instruction”, In Proceeding of the 38th Annual Asilomar Conference on Signals, Systems, and Computers, pp. 1856-1863, 2004.
10) Zhi-liang Zhu, Wei Zhang, Kwok-wo Wong, and Hai Yu, "A Chaos-Based Symmetric Image Encryption Scheme Using A Bit-level Permutation",
Information Sciences 181, pp. 1171–1186, 2011. 11) Kh. Singh, “Verification of Authenticity of Transmitted Images”, International
Journal of the Computer, Vol. 17, No.3, pp. 47-56, September-December 2009.
International Journal of Computer Science and Information Security (IJCSIS), Vol. 14, No. 6, June 2016
587 https://sites.google.com/site/ijcsis/ ISSN 1947-5500

12) Alireza Jolfaei, Abdolrasoul Mirghadri, “An Image Encryption Approach
Using Chaos and Stream Cipher”, Journal of Theoretical and Applied Information Technology, Vol. 4, No. 1, pp. 117-125, 2010.
13) Mayank Mishra, Prashant Singh, and Chinmay Garg, “A New Algorithm of Encryption and Decryption of Images Using Chaotic Mapping”, International Journal of Information and Computation Technology, Vol. 4, No. 7, pp. 741-746, 2014.
14) Guanrong Chen, Yaobin Mao, and Charles K. Chui, “A Symmetric Image Encryption Scheme Based on 3D Chaotic Cat Maps”, Chaos, Solitons and Fractals, Vol. 21, No. 3, pp. 749-761, 2004.
15) Kevin Murphy, Rasmus M. Birn, Daniel A. Handwerker, Tyler B. Jones, and
Peter A. Bandettini, "The Impact of Global Signal Regression on Resting State Correlations: Are Anti-Correlated Networks Introduced?", Neuroimage 44, pp. 893–905, 2009.
16) B. Dhanasekar, N. Krishna Mohanb, Basanta Bhaduri, and B. Ramamoorthy,
"Evaluation of Surface Roughness Based on Monochromatic Speckle Correlation Using Image Processing", Precision Engineering 32, pp. 196–206, 2008.
17) K. S. Srinivasan, and D. Ebenezer, “A New Fast and Efficient Decision-Based Algorithm for Removal of High-Density Impulse Noises”, IEEE Signal Processing Letters, Vol. 14, No. 3, pp. 189–192, 2007.
18) Narendra Singh, and Aloka Sinha, " Gyrator Transform-Based Optical Image Encryption, Using Chaos", Optics and Lasers in Engineering 47, pp. 539–546, 2009.
19) Alexander Tanchenko, "Visual-PSNR Measure of Image Quality", Journal of Visual Communication and Image Representation, Vol. 25, Issue 5, pp. 874–878, 2014.
20) Yu-Kumg Chen, Fan-Chieh Cheng, and Pohsiang Tsai, "A Gray-leve Clustering Reduction Algorithm with the Least PSNR", Expert Systems with Applications, Vol. 38, Issue 8, pp. 10183–10187, 2011.
International Journal of Computer Science and Information Security (IJCSIS), Vol. 14, No. 6, June 2016
588 https://sites.google.com/site/ijcsis/ ISSN 1947-5500

Component Based Face Recognition using
Feature Matching through Hu Moment
Invariants
Sushil Kumar Paul1, Mohammad Shorif Uddin
1
1Department of Computer Science and Engineering
Jahangirnagar University, Dhaka-1342, Bangladesh
Saida Bouakaz2
2LIRIS Lab, University Claude Bernard Lyon1,
69622 Villeurbanne Cedex, France
Abstract— In this paper, a Face Recognition Algorithm using Hu moment invariants (HMIs) is described for
identifying human faces based on the facial component-features (FCFs). Algorithm is adopted by Viola Jones
detector which is applied the concept on the AdaBoost algorithm for detecting the face from a face database having
diverse illuminations and expressions with complex background. Then only the face region is cropped and
illumination correction is done using histogram equalization technique. Finally, face is converted into binary image
by applying cumulative distribution function (CDF) with adaptive thresholding. Three types of statistical pattern
matching tools such as Standard deviation of Hu moment invariants (StdDevHMI), absolute difference of probability
of white pixels (AbsDiffPWP) and pixel brightness values (PBVs) through L2 norms are determined using five facial
components such as two eyes, nose, mouth and whole face for both binary and gray level images, respectively. Lastly,
face recognition is carried out by taking these statistical pattern matching tools with logical and conditional
operators along with appropriate threshold values. Experimental studies are performed on the BioID database and
algorithm shows a better result as compare to the existing popular methods.
Keywords -- Cumulative distribution function, adaptive thresholding, probability of white pixels, facial component-
features, shape matching, Hu moment invariants, pixel brightness values .
I. Introduction
Face recognition is an extremely demandable task due to the importancy for security purpose in the real world’s
diverse applications for identification, authentication and tracking. It is not an intrusive technique (i.e. not carry
any health risks) and it does not need to touch anything during the acquisition level. On the other hand, face is also
a rich source of nonverbal information about human behavior. We can tell a lot regarding the other person and his or
International Journal of Computer Science and Information Security (IJCSIS), Vol. 14, No. 6, June 2016
589 https://sites.google.com/site/ijcsis/ ISSN 1947-5500

her feelings just by seeing his or her face because human has an outstanding competency to memorize and
recognize different patterns and faces in diverse situations. On the other hand machines are still dependent on ideal
face images and recognition performance will decrease when there are variations in illumination, expression,
background, pose, occlusion, etc. So, the problem of automatic face recognition is a very challenging and
complicated work [1].
As a statistical pattern matching methods for component-feature extraction based on Hu moment invariants have
been developed for classification and recognition tasks because of their invariance properties. A facial component-
feature (FCF) will be invariant if it’s binary image feature value becomes constant to changes in scale, translation,
rotation, or/and reflection in each component image because of having different face shapes for different people but
the same shape of all images of each individual and it does not need any prior information about the face model and
also shows computationally efficient for achieving better performance [2].
Face recognition can be broadly divided into two main groups: Appearance based and Model based. In appearance-
based category, extraction of both holistic- and components-feature information plays the vital roles for the
classification and recognition of faces. Holistic descriptions may not be used if the accurate component-features
extraction is possible [3].
Different holistic methods are Principal Component Analysis (PCA) [4], Linear Discriminant Analysis (LDA) [5],
Independent Component Analysis (ICA) [6], Discrete Cosine Transform (DCT) [7], Moment Invariants [2] etc. On
the other hand, component based methods are depicted by facial components with multiple concepts such as
components with support vector machine (SVM) [8], LDA [9] and 3D models [10] etc.
As a model based, Weyrauch et al. developed component-features algorithm built on 3D morphable models
extracted fourteen component-features but used nine components due to computational complexity [10]. Bonnen et
al. proposed a component based approach utilizing heterogeneous concepts which is too much complicated [11].
Matthew Turk and Alex Pentland used Eigenfaces [4] but it cannot include additional training data into an existing
PCA projection matrix and not robust to change in shape, pose and expression [12], [13]. Rajiv Kapoor and Pallavi
Mathur employed three kinds of moment invariants including Hu moment invariants and achieved poor result [14].
Nabatchian et al. applied nine different types of moment invariants (MIs) with medium size database and got poor
results except Pseudo Zernike Moment Invariants (PZMI) [2].
The above mentioned holistic- and model-based techniques are not suitable due to variations in shape and texture of
a human face image and need high computational cost. Therefore, it is very much crucial to establish a low
computation cost component-based face recognition algorithm that is able to conclude similarity decision if any one
facial component of a test face is matched with corresponding facial component of reference database in order to
overcome pose variation, extreme illumination conditions, severe expression changes or occlusions.
International Journal of Computer Science and Information Security (IJCSIS), Vol. 14, No. 6, June 2016
590 https://sites.google.com/site/ijcsis/ ISSN 1947-5500

The purpose of this study is to identify faces using three statistical pattern matching tools such as Standard
deviation of Hu moment invariants (StdDevHMI), absolute difference of probability of white pixels (AbsDiffPWP)
and pixel brightness values (PBVs) through L2 norms [15].
The rest of the proposed work is arranged by the following six sections. The preprocessing and processing tasks are
done in section II and section III, respectively. In section IV, three types of statistical pattern matching tools are
described. The comparision and recognition activities are accomplished in section V. In section VI, implemention
and results are carried out and finally, concusions are drawn in section VII.
II. Preprocessing
Face detection, normalization, discarding forehead portion and illumination correction activities are included in this
stage. Face detection [16] is a process of localizing and cropping the exact face region from the complex
background. Since the detected faces are not of same size, hence it is necessary to convert all images into same size
(normalization) for uniformity. The entire proposed tasks are shown in figure 1.
Figure 1: Overview of Face Recognition Algorithm
Test Face
Reference Face Database if ((StdDevHMI<=THMI_StdDev
)&&(any one out of five
values of AbsDiffPWPi
<=THMI_AbsDiffPWP ) &&
(any one out of five values
of PBVi < THMI_PBV))?
Yes
Recognized
Faces
Input
Images Pre-
Processing Processing Determination
Statistical Pattern
Matching Tools
Comparison Recognition
Face
Database
(Reference)
1. To detect face,
2. To extract only face area
from complex background,
3. To construct all faces are
same size,
4. To discard forehead portion,
5. Conditionally, Illumination
Correction is done
To
determine
Statistical
Pattern
Matching
Tools: StdDevHMI,
AbsDiffPWP
& PBVs
1. To convert binary image
2. To extract binary eyes,
nose and mouth
components
3. To extract gray level eyes,
nose and mouth
components.
1. To detect face,
2. To extract only face area
from complex background,
3. To construct face with
same size,
4. To discard forehead portion,
5. Conditionally, Illumination
Correction is done
1. To convert binary image
2. To extract binary eyes,
Nose and mouth
components,
3. To extract gray level eyes,
nose and mouth
components.
International Journal of Computer Science and Information Security (IJCSIS), Vol. 14, No. 6, June 2016
591 https://sites.google.com/site/ijcsis/ ISSN 1947-5500

There is no information (i.e. no connected component of white pixels) is available in the forehead region during
binary image conversion process. So, it is imperative to discard forehead portion for achieving better performance
(see figure 2(d)).
A. Illumination Correction using Histogram Equalization Technique
Face image having poor illumination can be decreased the recognition performance. So, illumination correction is
essential in the preprocessing stage. Histogram equalization is a kind of illumination correction technique. Its
purpose is to improve the quality of low contrast images for better subjectively appearance. It is one of the most
important issues in low-level image processing. Usually, histogram equalization can enhance the bad quality images
and cannot be guaranteed that the good quality image will remain as good. Hence we have done illumination
correction of a face image if its mean pixel intensity value is less than 170 (see Figure 2(e)) [15], [17].
III. Processing
Binary image conversion and ROIs (region of interest) cropping are the main activities in the processing section.
Cumulative distribution function with adaptive thresholding (i.e Otsu’s thresholding) is the core concept to convert
grayscale to binary image. Four ROIs such as two eyes, nose and mouth components are extracted by taking both
binary and grayscale face image for constructing the classification tools (see figure 2) [15].
The binary image conversion technique is done by using the following mathematical concepts [15]. These are:
𝑝𝑘
(𝐼𝑔𝑟𝑎𝑦 𝑢 ,𝑣, =𝑘)=
𝑛𝑘
𝑁… 1
𝑊𝑒𝑟𝑒, 0 ≤ 𝑘 ≤ 𝐿 − 1, 𝑎𝑛𝑑 𝐿 = 256
𝑐𝑑𝑓𝑘𝐼𝑔𝑟𝑎𝑦 (𝑢 ,𝑣)
= 𝑝𝑖
𝐼𝑔𝑟𝑎𝑦 (𝑢 ,𝑣) … (2)
𝑘
𝑖=0
𝐼𝑏𝑖𝑛𝑎𝑟𝑦 𝑢, 𝑣 = 255 𝑖𝑓 𝑐𝑑𝑓𝑘𝐼𝑔𝑟𝑎𝑦 (𝑢 ,𝑣)
≤ 𝜃𝑂𝑡𝑠𝑢
0 𝑂𝑡𝑒𝑟𝑤𝑖𝑠𝑒 … (3)
Igray (u, v) = Input gray scale face image discarding forehead portion,
𝑝𝑘
𝐼𝑔𝑟𝑎𝑦 𝑢 ,𝑣 = Probability function having pixel value k (0≤ k ≤L-1),
N = image size,
𝑛𝑘 =Total number of pixels with the same pixel value k,
𝑐𝑑𝑓𝑘𝐼𝑔𝑟𝑎𝑦 (𝑢 ,𝑣)
= Cumulative distribution function up to the intensity value k
𝐼𝑏𝑖𝑛𝑎𝑟𝑦 𝑢, 𝑣 = Binary image and
International Journal of Computer Science and Information Security (IJCSIS), Vol. 14, No. 6, June 2016
592 https://sites.google.com/site/ijcsis/ ISSN 1947-5500

𝜃𝑂𝑡𝑠𝑢 = Otsu’s threshold value.
Figure 2 exhibits the step by step activities of our proposed algorithm [15].
In some faces, information is not present in nose region because nostrils have minimum numbers of low intensity
pixels of original gray level face image compare to eyes and mouth regions. So CDF method is applied on nose ROI
to get the nostrils information (see Figure 3) [18].
A. Shape Matching using Hu Moment Invariants
Shape descriptors are an influential tool used in many applications in computer vision, image processing and pattern
recognition fields such as object matching, classification, recognition and identification. Recognition is largely
based on the matching of descriptions of shapes. Many shapes description methods were developed, such as scalar
features (dimension, area, number of corners etc.), moment invariants etc. Moments can provide characteristics of an
object that uniquely express its shape. Invariant shape matching is achieved by classification in the multidimensional
moment invariant feature space. The basic concept of moment invariants is to explain the objects by a group of
features which deal discrimination power to identify objects from different groups. Actually, moments are scalar
quantities used to characterize a function and to obtain its significant features [2]. 2D geometric moment invariants
were firstly introduced by Hu [19] in 1962. These consists of seven nonlinear functions involving translation,
scaling, and rotation .
Two dimensional traditional geometric moments of order (p+q) of a digital image I(u, v) of size M×N are defined
as:
𝑚𝑝𝑞 = 𝐼 𝑢, 𝑣 𝑢𝑝𝑣𝑞
𝑁−1
𝑣=0
𝑀−1
𝑢=0
… … … 4
𝑤𝑒𝑟𝑒, 𝑝, 𝑞 = 0,1,2 …… …
The double integrals are to be considered over the whole area of the image including its boundary.
International Journal of Computer Science and Information Security (IJCSIS), Vol. 14, No. 6, June 2016
593 https://sites.google.com/site/ijcsis/ ISSN 1947-5500

Yes
No No
Yes
(h)Crop Eyes, Nose
and Mouth Areas
(Binary Images)
(g)Crop Eyes, Nose
and Mouth Areas
(Gray Level Images)
(e)Apply Histogram
Equalization
(c)Normalize
Face Size
Figure 3.2:
Simplified
flow
diagram of
the
proposed
face
recognition
algorithm
e Size
(a)Input Image
Is Human Face?
(Apply Face Detection
Algorithm)
(b)Localize and Crop Face Area
(d)Removal Forehead Portion
Is Average
Intensity (Face
DFP) <170?
(f) Apply CDF Method
(i)Compute StdDevHMI, AbsDiffPWP and PBV
International Journal of Computer Science and Information Security (IJCSIS), Vol. 14, No. 6, June 2016
594 https://sites.google.com/site/ijcsis/ ISSN 1947-5500

(c)
Figure 2: Step by step procedures of proposed algorithm : (a) input image, (b) detected and extracted the face area ,
(c) normalized face sise (Size: X1×Y1=128×128 pixels), (d) Discarded forehead portion(DFP) (size=X2×Y2=
0.75X1×0.60Y1=96×76 pixels), (e) applied illumination correction technique, (f) conversion of image (d) or (e) to
binary, (g) Extracted eyes, nose and mouth ROIs of gray scale face image (h) Extracted eyes, nose and mouth ROIs
of binary face image,(i) computed statistical tools such as StdDevHMI , AbsDiffPWP and PBV.
𝑐𝑑𝑓 =
Figure 3: Conversion of binary image only on gray scale nose ROI: (a) No information is present on binary nose ROI, (b)
Applied CDF on Gray scale nose ROI, (c) Result: Nostrils (Binary Image)
To normalize for translation in the image plane, the image centroids are used to define the central moments. The
central moment of order (p q) is defined as:
𝜇𝑝𝑞 = 𝐼 𝑢, 𝑣 𝑢 − 𝑢 𝑝 𝑣 − 𝑣 𝑞
𝑁−1
𝑣=0
𝑀−1
𝑢=0
… … … 5
𝑤𝑒𝑟𝑒, 𝑢 =𝑚10
𝑚00, 𝑎𝑛𝑑 𝑣 =
𝑚01
𝑚00
These central moments are origin independent and therefore they are translation invariant. But these moments are
not invariant to scale or rotation in their original form. When a scaling normalization is applied then the central
moments become:
ѱ𝑝𝑞 =𝜇𝑝𝑞
𝜇00
(𝑝+𝑞+2
2)… … … (6)
Hu’s [19], seven values, determined by normalizing central moments through order three, that are invariant to object
scale, position, and orientation. In terms of the central moments, the seven moments are expressed by Eqs. (7-13):
1 = ѱ20 + ѱ02 …… … (7)
2 = (ѱ20 − ѱ02)2 + 4ѱ112 … … … (8)
3 = (ѱ30 − 3ѱ12)2 + (3ѱ21 − ѱ03)2 … … … (9)
4 = (ѱ30 + ѱ12)2 + (ѱ21 + ѱ03)2 … … … (10)
5 = ѱ30 − 3ѱ12 ѱ30 + ѱ12 ( ѱ30 + ѱ12 2 − 3 ѱ21 + ѱ03)2 +
3ѱ21 − ѱ03 ѱ21 + ѱ03 (3 ѱ30 + ѱ12)2 − ѱ21 + ѱ03 2 … … … (11)
6 = ѱ20 − ѱ02 ( ѱ30 + ѱ12 2 − (ѱ21 + ѱ03)2) +
(a) (b)
International Journal of Computer Science and Information Security (IJCSIS), Vol. 14, No. 6, June 2016
595 https://sites.google.com/site/ijcsis/ ISSN 1947-5500

4ѱ11 ѱ30 + ѱ12 ѱ21 + ѱ03 … …… (12)
7 = 3ѱ21 − ѱ03 ѱ21 + ѱ03 3 ѱ30 + ѱ12 2 − ѱ21 + ѱ03 2
− ѱ30 − 3ѱ12 ѱ21 + ѱ03 3 ѱ30 + ѱ12 2 − ѱ21 + ѱ03 2 … … … (13)
These seven invariant moments, hz,1 ≤ 𝑧 ≤ 7(Eqs. (7) – (13), are independent of scale, translation, and rotation. We
have applied these on five binary images (four ROIs such as right eye, left eye, nostrils and mouth and face image
discarding forehead portion i. e. five components) for both test and reference images.
IV. Statistical Tools
The three types of statistical pattern matching tools such as Standard deviation of fifteen Hu moment invariants
(StdDevHMI) using three types of moment invariants (MIs) methods , absolute difference of probability of white
pixels (AbsDiffPWP) and pixel brightness values (PBVs) through L2 norms are used for recognition decision.
These tools are determined by five facial component-features (FCFs) such as two eyes, nose, mouth and face
discarding forehead portion for test face and refernce images [15].
A. Standard deviation of fifteen Hu moment invariants (StdDevHMI)
The three types of HMI invariant values such as ei, fi and gi are computed using the following equations (14-18):
𝒆𝒊 𝑰𝑹𝒆𝒇𝒊 𝒖, 𝒗 , 𝑰𝑻𝒆𝒔𝒕𝒊
𝒖, 𝒗 = 𝟏
𝒎𝒛𝑹𝒆𝒇
−𝟏
𝒎𝒛𝑻𝒆𝒔𝒕
𝒛=𝟏…𝟕
… … … (𝟏𝟒)
𝒇𝒊 𝑰𝑹𝒆𝒇𝒊 𝒖, 𝒗 , 𝑰𝑻𝒆𝒔𝒕𝒊
𝒖, 𝒗 = 𝒎𝒛𝑹𝒆𝒇
− 𝒎𝒛𝑻𝒆𝒔𝒕
𝒛=𝟏…𝟕
… … … (𝟏𝟓)
𝒈𝒊 𝑰𝑹𝒆𝒇𝒊 𝒖, 𝒗 , 𝑰𝑻𝒆𝒔𝒕𝒊
𝒖, 𝒗 = 𝒎𝒛
𝑹𝒆𝒇− 𝒎𝒛
𝑻𝒆𝒔𝒕
𝒎𝒛𝑹𝒆𝒇
𝒛=𝟏…𝟕
… … … (𝟏𝟔)
Where, i=1, 2,3,4,5,
𝑚𝑧𝑅𝑒𝑓
= 𝑠𝑖𝑔𝑛 𝑧𝑅𝑒𝑓
. log 𝑧𝑅𝑒𝑓
… … … 17 ,
𝑚𝑧𝑇𝑒𝑠𝑡 = 𝑠𝑖𝑔𝑛 𝑧
𝑇𝑒𝑠𝑡 . log 𝑧𝑇𝑒𝑠𝑡 … … … (18)
𝑧
𝑅𝑒𝑓and 𝑧
𝑇𝑒𝑠𝑡 are the Hu moment invariants (HMIs) for test and reference images, respectively. It is invariant to
scale, rotation, and reflection [19].
So, the Standard deviation of fifteen Hu moment invariants (StdDevHMI) taking ei, fi and gi is:
𝑺𝒕𝒅𝑫𝒆𝒗𝑯𝑴𝑰 𝑰𝒃𝒊𝒏𝒂𝒓𝒚−𝒓𝒆𝒇 𝒖, 𝒗 , 𝑰𝒃𝒊𝒏𝒂𝒓𝒚−𝒕𝒆𝒔𝒕 𝒖, 𝒗 = (𝒅𝒋 − 𝒅 )𝟐𝟏𝟓
𝒋=𝟏
𝟏𝟓… (𝟏𝟗)
Where,
International Journal of Computer Science and Information Security (IJCSIS), Vol. 14, No. 6, June 2016
596 https://sites.google.com/site/ijcsis/ ISSN 1947-5500

𝑑𝑗=1,2,….,15 = 𝑒𝑖=1,2,..,5, 𝑓𝑖=1,2,…,5, 𝑔𝑖=1,2,…,5 ;
𝑑 is the mean value of dj’s (j= 1,2,3,….,15)
B. Absolute difference of probability of white pixels (AbsDiffPWP)
Absolute difference of probability of white pixels (AbsDiffPWP) between the binary test and reference images is
shown in the following Eq. (20).
𝑨𝒃𝒔𝑫𝒊𝒇𝒇𝑷𝑾𝑷𝒊 𝑰𝒃𝒊𝒏𝒂𝒓𝒚−𝒓𝒆𝒇 𝒖, 𝒗 , 𝑰𝒃𝒊𝒏𝒂𝒓𝒚−𝒕𝒆𝒔𝒕 𝒖, 𝒗
= 𝑷𝒓𝒆𝒇(𝑰𝒃𝒊𝒏𝒂𝒓𝒚−𝒓𝒆𝒇(𝒖, 𝒗)) − 𝑷𝒃𝒊𝒏𝒂𝒓𝒚_𝒕𝒆𝒔𝒕(𝑰𝒕𝒆𝒔𝒕(𝒖, 𝒗)) … (𝟐𝟎)
Where,
𝑃 =𝑁𝑜 𝑜𝑓 𝑤𝑖𝑡𝑒 𝑝𝑖𝑥𝑒𝑙𝑠
𝐼𝑚𝑎𝑔𝑒 𝑆𝑖𝑧𝑒 , Pref(Ibinary-ref(u,v)) and Ptest (Ibinary-test(u,v)) are probability of white pixels
(PWPs) of test and reference images, respectively.
C. Pixel brightness values (PBVs)
The gray scale pixel brightness values (PBVs) between the test and reference database images using L2 norms is
determined by the following Eq (21).
𝑷𝑩𝑽𝒊 𝑰𝒈𝒓𝒂𝒚−𝒓𝒆𝒇(𝒖, 𝒗), 𝑰𝒈𝒓𝒂𝒚−𝒕𝒆𝒔𝒕(𝒖, 𝒗) = (𝑰𝒈𝒓𝒂𝒚−𝒓𝒆𝒇
(𝒖, 𝒗) − 𝑰𝒈𝒓𝒂𝒚−𝒕𝒆𝒔𝒕(𝒖, 𝒗))𝟐𝒖,𝒗
𝑿 × 𝒀… (𝟐𝟏)
Where, X Y = image size.
V. Comparison and Recognition
Recognition decision results from the concept of matching in any one facial component-feature (FCF) of a test face
is same as corresponding facial component-feature (FCF) of reference database using three classification tools such
as StdDevHMI, AbsDiffPWP and PBV with the help of logical and conditional operators and appropriate threshold
values.
If the value of StdDevHMI is less than or equal to the threshold value, THMI_StdDev AND any one out of five values of
AbsDiffPWPi is less than or equal to the threshold value, THMI_AbsDiffPWP AND any one out of five values of PBVi is
less than the threshold value, THMI_PBV, then the reference and the test images are the same image (using Eqs. 19-21).
i.e.
if ((StdDevHMI<=THMI_StdDev )&&(any one out of five values of AbsDiffPWPi <=THMI_AbsDiffPWP ) && (any one out
of five values of PBVi < THMI_PBV))
The reference and the test images are the same images;
International Journal of Computer Science and Information Security (IJCSIS), Vol. 14, No. 6, June 2016
597 https://sites.google.com/site/ijcsis/ ISSN 1947-5500

VI. Implementation and Results
The implementation and experimental results of the recommended face recognition algorithm are elucidated with
graphical, tabular and pictorial forms. Experimental results are compared with component based as well as Hu
moment invariants approaches.
A. Face Database
A BioID grayscale frontal face database having diverse illuminations, expressions, complex background, different
face areas and locations of 25 different people consists of 1521images with a resolution of 384×286 pixels are used in
this experiment. Total 1306 images are detected by the face detector and rest of the images is not considered due to
difficulty to locate exact face area [15-16].
B. Results
The recommended work is implemented and examined by c/c++ and GNU GCC compiler with Code::Blocks the
open source, cross-platform. Face detection and localization, extraction of exact face area, face size normalization
and matching shape activities are determined by OpenCV library functions [15].The threshold values THMI_StdDev for
StdDevHMI , THMI_AbsDiffPWP for AbsDiffPWPi and THMI_PBV for PBVi are taken as 0.08, 0.005 and 1.0, respectively
for BioID database. Figures 4-5 are shown the performance and classification accuracy curves, respectively. Some
true recognition results are shown in figure 6.
Table 1 shows the detail experimental data for twenty five best results such as false positive + false negative (FP +
FN), false positive + true negative (FP + TN), true positive (TP), false positive (FP), true positive rate (TPR), false
positive rate (FPR) and accuracy. Table 2 shows the comparison results of some well-known existing methods and it
is confirmed that our result has achieved better performance.
International Journal of Computer Science and Information Security (IJCSIS), Vol. 14, No. 6, June 2016
598 https://sites.google.com/site/ijcsis/ ISSN 1947-5500

Figure 4: Performance Curves
Figure 5: Classification Accuracy Curve
International Journal of Computer Science and Information Security (IJCSIS), Vol. 14, No. 6, June 2016
599 https://sites.google.com/site/ijcsis/ ISSN 1947-5500

Table 1: Mean recognition rate of the best twenty five results
Person No Total
No. Of
Images
of Each
Person
Image
File
Name
/File
Number
No of
( FP +
FN)
Accuracy
=
(1306-
Column4)
*100/
1306(%)
No
of
TP
TPR
=
Column6/
Column2
No of
FP
No of
(FP+TN)
=(1306-
Column2)
FPR
=Column8/
Column9
1 2 3 4 5 6 7 8 9 10
Person1 25 16 65 95.0229709
18 0.72 58 1281 0.04528 Person2 27 54 43 96.70750
38 25 0.92593 41 1279 0.03206
Person3 67 101 278 78.7136294
34 0.50746 245 1239 0.19774 Person4 74 226 132 89.89280
25 23 0.31081 81 1232 0.06575
Person5 98 303 77 94.1041348
58 0.59184 37 1208 0.03063 Person6 46 385 28 97.85604
9 23 0.5 5 1260 0.00397
Person7 84 445 127 90.2756508
49 0.58333 92 1222 0.07529 Person8 59 488 237 81.85298
62 33 0.55932 211 1247 0.16921
Person9 46 595 119 90.8882083
37 0.80435 110 1260 0.0873 Person10 36 620 34 97.39663
09 25 0.69444 23 1270 0.01811
Person11 102 705 118 90.9647779
62 0.60784 78 1204 0.06478 Person12 89 867 119 90.88820
83 53 0.59551 83 1217 0.0682
Person13 130 922 131 89.9693721
68 0.52308 69 1176 0.05867 Person14 30 1057 131 89.96937
21 21 0.7 122 1276 0.09561
Person15 49 1094 146 88.820827
29 0.59184 126 1257 0.10024 Person16 71 1167 99 92.41960
18 43 0.60563 71 1235 0.05749
Person17 48 1265 222 83.0015314
26 0.54167 200 1258 0.15898 Person18 34 1279 47 96.40122
51 23 0.67647 36 1272 0.0283
Person19 36 1325 102 92.1898928
25 0.69444 91 1270 0.07165 Person20 39 1387 92 92.95558
96 23 0.58974 76 1267 0.05998
Person21 46 1417 202 84.532925
25 0.54348 181 1260 0.14365 Person22 18 1462 122 90.65849
92 18 1 122 1288 0.09472
Person23 46 1502 103 92.1133231
34 0.73913 91 1260 0.07222 Person24 4 1514 147 88.74425
73 4 1 147 1302 0.1129
Person25 2 1519 112 91.424196
2 1 112 1304 0.08589
Mean Recognition Rate =90.71%
International Journal of Computer Science and Information Security (IJCSIS), Vol. 14, No. 6, June 2016
600 https://sites.google.com/site/ijcsis/ ISSN 1947-5500

Table 2: Comparisons Recognition accuracy
Algorithms Classification Rate
HMI[14] 53.33%
HMI[2] 61.00%
Component Based[10] 88.00%
HMI(Ours) 90.71%
International Journal of Computer Science and Information Security (IJCSIS), Vol. 14, No. 6, June 2016
601 https://sites.google.com/site/ijcsis/ ISSN 1947-5500

Figure 6: Some true recognition results
International Journal of Computer Science and Information Security (IJCSIS), Vol. 14, No. 6, June 2016
602 https://sites.google.com/site/ijcsis/ ISSN 1947-5500

VII. Conclusions
The propose work is a fully statistical pattern matching concepts to extract facial component-features (FCFs) using
binary image as well as texture concepts. Illumination correction overcomes the lighting variations using a selective
equalization technique. Two efficient classification tools such as StdDevHMI using HMIs and AbsDiffPWP are
computed from binary FCFs concept and the third tool - PBV is computed from grayscale FCFs through L2 norms.
Similarity decision is taken on the basis of in any one FCF of a test face is same as corresponding FCF of the
reference database image on the basis of logical and conditional operations along with appropriate threshold values
We achieved mean classification rate 90.71%.
Future concentration will be focus on improving TPR as well as classification rate by accommodating both Chi-
Square and HMIs concepts with facial feature points.
References
[1] Wiliem, Arnold and Madasu, Vamsi Krishna and Boles, Wageeh W. and Yarlagadda, Prasad K.D.V., A
feature based face recognition technique using Zernike moments, in Proc. RNSA Security Technology
Conference 2007, pages pp. 341-355, Melbourne, Australia.
[2] A. Nabatchian, E. Abdel-Raheem, M. Ahmadi, Human Face Recognition Using Different Moment
Invariants: A Comparative Study, Image and Signal Processing, 2008. CISP '08. Congress on, 27‐30 May
2008, China
[3] W. Zhao, R. Chellappa, P. J. Phillips, and A. Rosenfeld, ―Face Recognition: A Literature Survey,‖ ACM
Computing Surveys, Vol. 35, No. 4, December 2003.
[4] Matthew Turk and Alex Pentland. Eigenfaces for recognition. Journal of cognitive neuroscience, 3(1):71–
86, 1991.
[5] P.N. Belhumeour, J.P. Hespanha, and D.J. Kriegman. Eigenfaces vs. Fisherfaces: Recognition using class
specific linear projection. IEEE Transactions on Pattern Analysis and Machine Intelligence, 19(7):711–
720, 1997.
[6] Comon, P., Independent component analysis; A new concept? Signal Processing, 1994, 36(3): p. 287-314.
[7] H.K.Ekenel, R. Stiefelhagen, "Local Appearance based Face Recognition Using Discrete Cosine
Transform", In Proc. of 13th European Signal Processing Conference (EUSIPCO 2005), Antalya, Turkey,
September 2005.
[8] B. Heisele, T. Serre, and T. Poggio, ―A component-based framework for face detection and identification,‖
International Journal of Computer Vision, vol. 74, no. 2, 2007.
[9] W. Zhang, S. Shan, W. Gao, Y. Chang, and B. Cao, ―Component-based cascade Linear Discriminant
Analysis for face recognition,‖ Advances in Biometric Person Authentication Lecture Notes in Computer
Science,vol. 3338, pp. 19–79, 2005.
[10] B. Weyrauch, et al, ―Component-based Face Recognition with 3D Morphable Models,‖ 2004 IEEE
Computer Society Conference on Computer Vision and Pattern Recognition Workshop (CVPRW’04), June
27- July 2, 2004, Washington DC, USA.
[11] K. Bonnen, B. Klare, and A. K. Jain, "Component-Based Representation in Automated Face Recognition",
IEEE Transactions on Information Forensics and Security, Vol. 8, No. 1, pp. 239-253, January 2013.
[12] P.N. Belhumeour, J.P. Hespanha, and D.J. Kriegman. Eigenfaces vs. Fisherfaces: Recognition using class
specific linear projection. IEEE Transactions on Pattern Analysis and Machine Intelligence, 19(7):711–
720, 1997.
[13] Haitao Zhao, Pong Chi Yuen, and James T. Kwok, Member, ―A novel incremental principal component
analysis and its application for face recognition‖, IEEE Transactions on Systems, Man, and Cybernetics—
Part B:Cybernetics, vol. 36, no. 4, pp. 872-886, Aug. 2006.
International Journal of Computer Science and Information Security (IJCSIS), Vol. 14, No. 6, June 2016
603 https://sites.google.com/site/ijcsis/ ISSN 1947-5500
[14] Rajiv Kapoor and Pallavi Mathur, Face Recognition Using Moments and Wavelets, International Journal of
Engineering Research and Applications (IJERA) ISSN: 2248-9622 Vol. 3, Issue 4, Jul-Aug 2013, pp. 82-
95, http: www.ijera.com
[15] Sushil Kumar Paul, Mohammad Shorif Uddin and Saida Bouakaz, ―Face Recognition using Eyes, Nostrils
and Mouth Features‖, Proceedings of the 16th
International Conference on Computer and Information
Technology, ICCIT2013, 08-10 March 2014, Khulna, Bangladesh, pp. 117-120.
[16] P. Viola and M. J. Jones, ―Robust Real-time Object Detection‖, International Journal of Computer Vision,
Vol. 57, No.2, p.137-154, 2004.
[17] Kim YT, ―Contrast Enhancement Using Brightness Preserving Bi-Histogram Equalization‖, Consumer
Electronics, IEEE Transactions on, (1997), vol. 43, no.1, pp.1-8.
[18] Sushil Kumar Paul, Mohammad Shorif Uddin and Saida Bouakaz ―Extraction of Facial Feature Points
using Cumulative Histogram,‖IJCSI International Journal of Computer Science Issues, Vol. 9, Issue 1, No.
3, pp. 44-51, January 2012, http://www.IJCSI.org
[19] M. Hu, ―Visual pattern recognition by moment invariants,‖ IRE Trans. Inf. Theory, vol. 8, no. 2, pp. 179–
187, Feb. 1962.
International Journal of Computer Science and Information Security (IJCSIS), Vol. 14, No. 6, June 2016
604 https://sites.google.com/site/ijcsis/ ISSN 1947-5500

A Robust and Efficient Optical Flow Analysis
Based Vehicle Detection and Tracking System
for Intelligent Transport System
1S Sri Harsha, 2K. R. Anne 1Research Scholar, Acharya Nagarjuna University,Nagarjuna Nagar, Guntur,
1Assistant Professor, Department of IT, VR Siddhartha Engineering College,Vijayawada, Andhra
Pradesh, India 2Professor, Director Academics, Veltech University, Chennai, Tamilnadu, India,
ABSTRACT-In this paper, an enhanced optical flow analysis based moving vehicle detection and tracking system has been
developed. A novel multidirectional brightness-intensity constraints (MBIGC) estimation and fusion based optical flow
analysis (MDFOA) technique has been proposed that performs simultaneous pixel’s intensity and velocity estimation in a
moving frame for detecting and tracking the moving vehicle. The conventional Lucas Kanade and Horn Schunck optical
flow analysis algorithms have been enhanced by incorporating a multidirectional BIGC estimation, which has been further
enriched with a non-linear adaptive median filter based denoising. Such novelties have significantly enhanced the video
segmentation and detection. A vector magnitude threshold based MDOFA algorithm has been developed for motion vector
retrieval that eventually enables swift and precise moving vehicle segmentation from the background frame. A heuristic
filtering based blog analysis has been applied for vehicle tracking. The MATLAB based simulation reveals that MDFOA-
HS outperforms LK in terms of execution time and detection accuracy. In addition, the accurate traffic density estimation
affirms robustness of the proposed system to be used in intelligent transport system.
Keywords: Multidirectional brightness-intensity constraint Optical flow analysis, intelligent transport system, Lucas Kanade, Horn
Schunck.
I. INTRODUCTION
The exponential rise in technologies and associated applications has motivated researchers to develop certain efficient
solution for a better living and security. On the other hand, low cost and efficient hardware availability has also
introduced transition in computer vision based monitoring and control systems. Considering high pace rise in vehicle
counts, traffic density and related concerns, a new scientific paradigm named intelligent transport system (ITS) has
came into existence that intends to amplify the depth and width of vision based traffic surveillance system. The motion
analysis and video processing based computer vision has emerged as a vital technique for real time traffic surveillance
and timely reactive measures by security agents [1-5]. In addition, vision based vehicle detection, tracking, traffic
density, vehicle speed, and classification can be of paramount significance for ITS decision process.
The accidents caused due to high speed vehicle during overtaking have been alarming to strengthen ITS by enabling
better vehicle detection, tracking and speed estimation systems. In last few years, numerous efforts have been made
for video based vehicle detection and tracking. References [6, 7] examined various techniques for moving vehicle or
object detection. However, their suggestions based on conventional background subtraction confines effectives of the
solution with varying traffic conditions, such as traffic density, number of vehicles, background features, vehicle color
and geometry etc. Such feature complexity in real time traffic significantly influences the accuracy of moving vehicle
detection and tracking. Background subtraction based approaches perform vehicle region segmentation based on the
feature differences of the moving vehicle and background surfaces. On contrary, with the situations like night time,
light condition or illumination, different weather conditions and non-linear road profile, spatiotemporal background
variations (non-uniform background texture, illumination and wind speed) can significantly influence the detection
accuracy. Majority of the existing approaches are not sufficient to deal with such situations because of high noise,
disturbances, and occlusion. These approaches typically performs moving vehicles detection schemes operates based
on the temporal difference between two consecutive frames [8,9], background subtraction [10] and optical flow
estimation [11]. Researchers in [8] have applied optical flow analysis for vehicles navigation and object tracking [8].
International Journal of Computer Science and Information Security (IJCSIS), Vol. 14, No. 6, June 2016
605 https://sites.google.com/site/ijcsis/ ISSN 1947-5500

The ability to perform moving pixel intensity detection makes optical flow analysis a potential alternative for moving
object detection in complicate application scenarios. Optical flow analysis has emerged as a potential approach for
video processing and motion analysis, especially for moving object detection. Optical flow analysis generates a 2D
vector field that represents the motion field representing velocity and directions at each point of moving image
sequence [12]. A number of constraints get introduced in between the frames to perform optical flow based motion
analysis. These constraints function based on the image features such as pixel velocity and brightness. Predominantly,
supposition of inter-frame image brightness dependability is one of the prime constraints. The implementation of
optical flow analysis technique can be significant to alleviate the issues of occlusion and object overlapping that can
enhance moving vehicle detection and tracking [13]. Conventional Lucas Kanade scheme was applied in [14] for
moving object detection and suggested for further optimization. Researches [15, 16] dealt with stationary or dynamic
object detection. Researcher [17] suggested for reduction in angular error caused in optical flow vectors of consecutive
video frames. In this paper, an enhanced optical flow analysis based vehicle detection; tracking and density estimation
system has been developed. Unlike conventional approaches, the proposed scheme introduces multi-directional
brightness-intensity constraint (MDBIC) estimation and fusion based optical flow analysis (MDFOA) technique for
vehicle detection and tracking. The performance of the MDBIC based Horn-Schunck (MDBIC-HS) algorithm has
been applied for moving vehicle detection. To further enhance the performance, a non-linear adaptive median filter
has been applied to denoise video input. IT has significantly helped in highly accurate moving vehicle segmentation
and detection accuracy. Additional, adaptive threshold based segmentation has been performed, which has been
followed by heuristic filtering based blob analysis and vehicle tracking. In addition to the vehicle detection, the traffic
density estimation has been performed.
The remaining sections of this paper are; Section II represents the MDFOA-HS and Lukas Kanade based
optical flow analysis for vehicle detection and tracking. Section III discusses the results obtained, which has been
followed by the discussion of conclusion and future scopes in Section IV. The references used in this research are
given at the end of the manuscript.
II. OUR CONTRIBUTIONS
Considering the requirements of efficient vehicle detection and tracking system for ITS applications, various
approaches have been proposed, in which background subtraction and optical flow analysis schemes are the
predominant techniques. The proposed MDFOA based Horn-Schunck optical flow analysis technique has been
developed for motion vector retrieval, which has been further used for moving vehicle detection. In addition, the
conventional Lukas Kanade scheme has also been applied for vehicle detection and tracking. Unlike conventional
Lukas Kanade and Horn-Schunck based optical flow analysis, we have used an adaptive median filter for speckle
noise component’s elimination. Then, vector magnitudes thresholding based segmentation has been performed for
detecting the moving vehicle in the video data. To further enhance the detection and tracking accuracy the blog analysis
has been performed that remove the irrelevant pixels, thus enabling most accurate vehicle detection and tracking. The
overall proposed System is illustrated in Figure 1.
A. Video Data Acquisition
In this research work, we have used the urban traffic surveillance video data to evaluate the performance of the
proposed system. To perform vehicle detection the real time video traffic data has been obtained from a static camera
placed at the road side. In our real time video retrieval, a static camera with auto pixel adjustment capability was
mounted on the top of road. The input RGB video has been further processed into gray images to perform video
processing and intended vehicle tracking.
International Journal of Computer Science and Information Security (IJCSIS), Vol. 14, No. 6, June 2016
606 https://sites.google.com/site/ijcsis/ ISSN 1947-5500

Traffic Video Data Acquisition
Pre-processing (RGB to Gray)
Mean Estimation
Multi-Directional Fusion Based Optical Flow Analysis (MDFOA)
Adaptive Median Filtering Based Denoising
Heuristic Filtering Based Blob Analysis
Vehicle Tracking
Vehicle Segmentation
Vehicle Density Estimation
Figure 1: Multi-directional brightness-intensity constraint estimation and fusion based optical flow analysis (MDFOA) technique for vehicle detection, tracking and density estimation
B. Image Pre-Processing
The quality of video data and its appropriateness in terms of noise free input, and machine level data availability is of
great significance. To meet these requirements, at first we have performed pre-processing of the input video data that
enables input traffic data ready to process further. The initial processing has been performed by converting RGB to
gray conversion and the initial process parameters such as the number of frames, frame rate, colour format, frame size
etc have been obtained. Unlike majority of existing approaches where the prior dimensional declaration such as frame
size and number of frames, etc is required, our proposed system performs automatic dimensional extraction that
enables it to perform feature extraction and analysis with any input data. Due to the dynamic change in intensity and
auto white balance feature of the camera, the mean of each video frame has been estimated on gray-scale format,
which has been followed by optical flow analysis using our proposed MDFOA –HS and Lukas Kanade schemes for
moving vehicle detection.
C. Multi-Directional Brightness-Intensity Constraint Estimation and Fusion Based Optical Flow Analysis
In general, optical flow analysis characterizes the trajectory and time rate of pixels in a time sequence of two
consequential frames. Our proposed optical flow analysis technique operates with two dimensional velocity vectors
(2D-V2) carrying significant information such as directional and velocity features in horizontal as well as vertical
directions at certain point in an image (video frame). Since, in the proposed model, the directional filtered features
such as brightness-intensity and velocity constraints are amalgamated together to characterize the pixels in the image,
the proposed approach has been named as multi-directional fusion based optical flow analysis (MDFOA) scheme. The
information retrieved from MDFOA are fused together to characterize certain point in terms of its intensity, velocity
and brightness factors. In our proposed method, the 2D-V2 vectors have been applied on each pixel of the video data.
The novelty of the proposed approach is its ability to perform information retrieval in horizontal and vertical directions
simultaneously in the given image sequences. In our proposed model, the real time three dimensional (3D) input has
been converted into equivalent two dimensional (2D) objects. Thus, estimating the 2D dynamic brightness functions,
we have performed vehicle detection and tracking in the moving video. We the 2D functions have been applied to
International Journal of Computer Science and Information Security (IJCSIS), Vol. 14, No. 6, June 2016
607 https://sites.google.com/site/ijcsis/ ISSN 1947-5500

perform brightness and velocity at certain location and distinct time instant𝐼(𝑥, 𝑦, 𝑡). The assumption that in the
neighbourhood of an emigrant pixel, the variations in brightness and relative intensity doesn’t occur all along the
motion field has been applied to estimate the brightness intensity function. Mathematically,
𝐼(𝑥, 𝑦, 𝑡) = 𝐼(𝑥 + 𝛿𝑥, 𝑦 + 𝛿𝑦, 𝑡 + 𝛿𝑡)
Now, applying Taylor series on𝐼(𝑥 + 𝛿𝑥, 𝑦 + 𝛿𝑦, 𝑡 + 𝛿𝑡), the intensity vector has been obtained as
𝐼(𝑥 + 𝛿𝑥, 𝑦 + 𝛿𝑦, 𝑡 + 𝛿𝑡) = 𝐼(𝑥, 𝑦, 𝑡) +𝜕𝐼
𝜕𝑥𝜕𝑥 +
𝜕𝐼
𝜕𝑦𝜕𝑦 +
𝜕𝐼
𝜕𝑡𝛿𝑡 + 𝐻𝑖𝑔ℎ𝑒𝑟 𝑜𝑟𝑑𝑒𝑟 𝑡𝑒𝑟𝑚
(2)
Assuming Higher Order Term≈ 0 in (1) and (2), we get
𝜕𝐼
𝜕𝑥𝜕𝑥 +
𝜕𝐼
𝜕𝑦𝜕𝑦 +
𝜕𝐼
𝜕𝑡𝛿𝑡 = 0
(3)
Now dividing (3) by𝛿𝑡, we get
𝜕𝐼
𝜕𝑥(𝜕𝑥/𝛿𝑡) +
𝜕𝐼
𝜕𝑦(𝜕𝑦/𝛿𝑡) +
𝜕𝐼
𝜕𝑡= 0
(4)
In other way,
𝜕𝐼
𝜕𝑥(𝑣𝑥) +
𝜕𝐼
𝜕𝑦(𝑣𝑦) +
𝜕𝐼
𝜕𝑡= 0
(5)
Thus, the multidirectional brightness and intensity constraint at certain time instance 𝑡 can be obtained as:
𝐼𝑥 . 𝑣𝑥 + 𝐼𝑦 . 𝑣𝑦 = −𝐼𝑡 (6)
In terms of the gradient constraints, the BIGC constraint has been derived as follows:
𝛻𝐼. = −𝐼𝑡 (7)
where 𝛻𝐼 represents the spatial gradient of the brightness intensity factor and signifies the velocity vector of the
optical flow of the image pixel. The variable 𝐼𝑡 represents the time derivative of the brightness intensity gradient
constraints (BIGC). In MDFOA based optical flow analysis techniques, the above derived equation (7) has been used
to perform optical flow estimation. Equation (7) represents the BIGC that characterizes two unknown quantities using
single function or equation. The concept that the gradient constraints function can significantly be used to perform
optical flow based object detection and tracking, has been considered to perform vehicle detection and tracking. In
this paper, we have applied the proposed MDFOA scheme with two different optical flow analysis methods; Lucas-
Kanade (LK) and Horn-Schunck (HS), where these algorithms estimate the optical flow estimates. In our model, LK
and HS algorithm only estimates brightness intensity function (1) and gradient constraints (7). A brief discussion of
the proposed brightness intensity and gradient constraints (BIGC) schemes is given in the following sections.
a) Lucas-Kanade Model Based Vehicle Detection and Tracking
Win our proposed MDFOA and BIGC estimation, Lucas-Kanade (LK) method has been applied that introduces an
error factor 𝜌𝐿𝐾 for individual pixel in the video- frame [12]. To estimate the error factor, the sum of the weighted
least squares (WLS) of the gradient constraint (7) has been applied on each neighbouring pixels. Mathematically,
𝜌𝐿𝐾has been obtained by:
𝜌𝐿𝐾 = ∑ 𝑊2(𝑥, 𝑦)[𝛻𝐼(𝑥, 𝑦, 𝑡) + 𝐼𝑡(𝑥, 𝑦, 𝑡)]
𝑥,𝑦∈𝛺
2
(8)
International Journal of Computer Science and Information Security (IJCSIS), Vol. 14, No. 6, June 2016
608 https://sites.google.com/site/ijcsis/ ISSN 1947-5500

where 𝛺 represents the neighbouring pixels in the video frame; 𝑊(𝑥, 𝑦) represents the weights of each neighbouring
pixels (𝛺) in the moving frame. To ensure minimal error𝜌𝐿𝐾𝑀𝑖𝑛, the error factor 𝜌𝐿𝐾 has been estimated by each
elements of the velocity vector while keeping result as zero. Finally, the optical flow output has been obtained in terms
of a matrix given by
= [𝐴1𝑊2𝐴]−1𝐴𝑇𝑊2 (9)
Further, to estimate the values of𝐴, W and𝑏 for 𝑁 neighbouring pixels (𝑛 × 𝑛) neighbouring pixels (i.e. neighbour
pixels ofΩ, where𝑁 = 𝑛2) and (𝑥𝑖 , 𝑦𝑖) ∈ 𝛺 at certain time instant𝑡, the following mathematical functions have been
applied:
𝐴 = [𝛻𝐼(𝑥𝑖 , 𝑦𝑖), … , 𝛻𝐼(𝑥𝑁 , 𝑦𝑁)] (10)
𝑊 = 𝑑𝑖𝑎𝑔 [𝑊(𝑥𝑖 , 𝑦𝑖), … , 𝑊(𝑥𝑁 , 𝑦𝑁)] (11)
= − [𝐼𝑡(𝑥𝑖 , 𝑦𝑖), … , 𝐼𝑡(𝑥𝑁 , 𝑦𝑁)] (12)
Now, putting the respective values of𝐴, 𝑊and𝑏 the velocity for each pixel in the frame has been obtained (12). Unlike
conventional summing up based optical flow analysis methods [13], in this paper Gaussian or the differential temporal
gradient filter (DTGF) based convolution technique has been used. This approach significantly reduces the
computational complexities in fusing the BIGC at different instants. Applying the (DTGF) based convolution
technique the multi-directional fusion has been done. Unlike conventional Lukas Kanade (LK) based in this paper a
dual error function based method called Horn-Schunck (HS) has been used. In order to evaluate the performance of
the proposed MDFOA based optical flow analysis, in this paper the proposed MDBIC has been applied with both LK
algorithm as well as HS optical analysis scheme [14]. Unlike LK based scheme, a dual error function based HS method
has been applied with the proposed MDFOA approach. A brief discussion of the proposed scheme is given as follows:
b) Horn-Schunck Model Based Vehicle Detection and Tracking
LK optical analysis method applies a single error function𝜌𝐿𝐾 to estimate BIGCs, but considering high dynamicity
caused due to fast moving vehicles, it is found confined. In addition, it becomes time consuming. Therefore, to deal
with such issues, in this paper, the proposed MDFOA based HS scheme has been applied that introduces an additional
error factor called “global smoothing factor”. It enables our proposed system to deal with extreme dynamism and
variations in the optical flow vector elements (𝑣𝑥 , 𝑣𝑦) in the neighbouring pixels𝛺. In order to reduce the total error
ρHSof the proposed MDFOA-HS approach, the following mathematical equation has been applied:
𝜌𝑀𝐷𝐹𝑂𝐴_𝐻𝑆 = ∫(𝛻𝐼. + 𝐼𝑡) + 𝜆2 [(𝜕𝑣𝑥
𝜕𝑦)
2
+ (𝜕𝑣𝑥
𝜕𝑥)
2
+ (𝜕𝑣𝑦
𝜕𝑥)
2
+ (𝜕𝑣𝑦
𝜕𝑦)
2
]
𝐷
𝑑𝑥𝑑𝑦
(13)
where 𝐷 represents the complete frame region or complete region in each image of the surveillance video, λ states for
relative effect factor of the second introduced error term. Here, 𝜆 = 1.0 has been considered. Thus,
deriving𝜌𝑀𝐷𝐹𝑂𝐴_𝐻𝑆, it becomes feasible to apply Jacobian model or the Gauss-Seidel iterative methods [15] to model
the system for performing optical flow analysis based vehicle detection and tracking. This is the fact, that conventional
HS approach delivers higher accuracy even with the higher vehicle density conditions and extreme movement (here it
is important because in highway traffic model, there can be very fast moving vehicles), but it requires more iterations
to perform overall BIGC estimation, and hence it is relatively slower as compared to LK scheme. The HS method has
been applied for BIGC estimation between current frame and nth frame of frame sequences that enables robust
functioning and accurate tracking of vehicle. Once performing BIGC estimation and optical flow analysis in each
frame of the traffic surveillance videos, the noise filtering has been applied using non-linear adaptive median filter. A
brief of the noise filtering process is given as follows.
International Journal of Computer Science and Information Security (IJCSIS), Vol. 14, No. 6, June 2016
609 https://sites.google.com/site/ijcsis/ ISSN 1947-5500
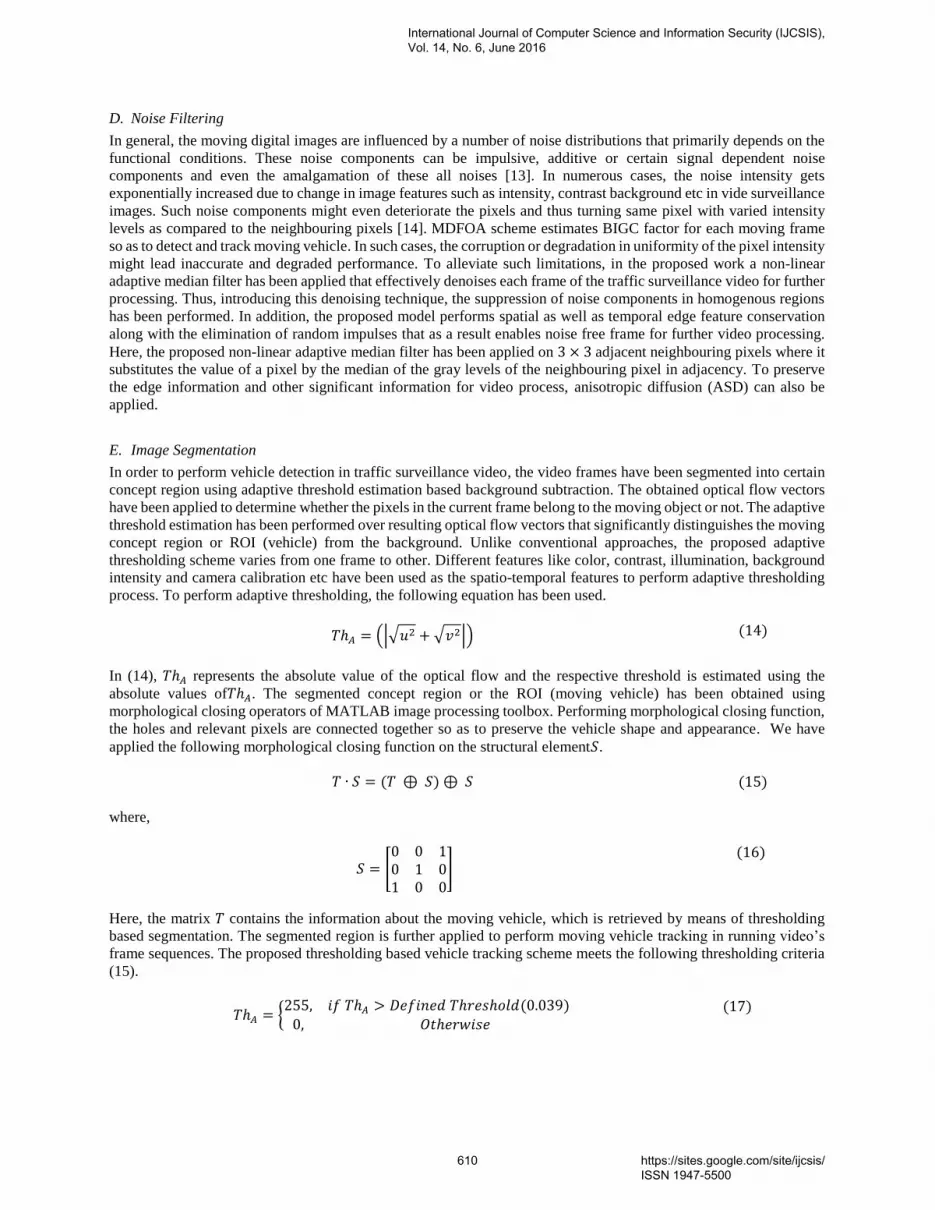
D. Noise Filtering
In general, the moving digital images are influenced by a number of noise distributions that primarily depends on the
functional conditions. These noise components can be impulsive, additive or certain signal dependent noise
components and even the amalgamation of these all noises [13]. In numerous cases, the noise intensity gets
exponentially increased due to change in image features such as intensity, contrast background etc in vide surveillance
images. Such noise components might even deteriorate the pixels and thus turning same pixel with varied intensity
levels as compared to the neighbouring pixels [14]. MDFOA scheme estimates BIGC factor for each moving frame
so as to detect and track moving vehicle. In such cases, the corruption or degradation in uniformity of the pixel intensity
might lead inaccurate and degraded performance. To alleviate such limitations, in the proposed work a non-linear
adaptive median filter has been applied that effectively denoises each frame of the traffic surveillance video for further
processing. Thus, introducing this denoising technique, the suppression of noise components in homogenous regions
has been performed. In addition, the proposed model performs spatial as well as temporal edge feature conservation
along with the elimination of random impulses that as a result enables noise free frame for further video processing.
Here, the proposed non-linear adaptive median filter has been applied on 3 × 3 adjacent neighbouring pixels where it
substitutes the value of a pixel by the median of the gray levels of the neighbouring pixel in adjacency. To preserve
the edge information and other significant information for video process, anisotropic diffusion (ASD) can also be
applied.
E. Image Segmentation
In order to perform vehicle detection in traffic surveillance video, the video frames have been segmented into certain
concept region using adaptive threshold estimation based background subtraction. The obtained optical flow vectors
have been applied to determine whether the pixels in the current frame belong to the moving object or not. The adaptive
threshold estimation has been performed over resulting optical flow vectors that significantly distinguishes the moving
concept region or ROI (vehicle) from the background. Unlike conventional approaches, the proposed adaptive
thresholding scheme varies from one frame to other. Different features like color, contrast, illumination, background
intensity and camera calibration etc have been used as the spatio-temporal features to perform adaptive thresholding
process. To perform adaptive thresholding, the following equation has been used.
𝑇ℎ𝐴 = (|√𝑢2 + √𝑣2|) (14)
In (14), 𝑇ℎ𝐴 represents the absolute value of the optical flow and the respective threshold is estimated using the
absolute values of𝑇ℎ𝐴. The segmented concept region or the ROI (moving vehicle) has been obtained using
morphological closing operators of MATLAB image processing toolbox. Performing morphological closing function,
the holes and relevant pixels are connected together so as to preserve the vehicle shape and appearance. We have
applied the following morphological closing function on the structural element𝑆.
𝑇 ∙ 𝑆 = (𝑇 ⊕ 𝑆) ⊕ 𝑆 (15)
where,
𝑆 = [0 0 10 1 01 0 0
] (16)
Here, the matrix 𝑇 contains the information about the moving vehicle, which is retrieved by means of thresholding
based segmentation. The segmented region is further applied to perform moving vehicle tracking in running video’s
frame sequences. The proposed thresholding based vehicle tracking scheme meets the following thresholding criteria
(15).
𝑇ℎ𝐴 = 255, 𝑖𝑓 𝑇ℎ𝐴 > 𝐷𝑒𝑓𝑖𝑛𝑒𝑑 𝑇ℎ𝑟𝑒𝑠ℎ𝑜𝑙𝑑(0.039)
0, 𝑂𝑡ℎ𝑒𝑟𝑤𝑖𝑠𝑒
(17)
International Journal of Computer Science and Information Security (IJCSIS), Vol. 14, No. 6, June 2016
610 https://sites.google.com/site/ijcsis/ ISSN 1947-5500

During this process, the predominant intricacies observed was the segmentation of the pixel blocks having very minute
size that creates ambiguity to be or not to be a part of ROI concept region. To alleviate these issues, the blob analysis
has been performed that significantly suppresses the irrelevant blobs to ensure optimally segmentation.
F. Heuristic Filtering Based Blob Analysis
In order to eliminate the irrelevant and insignificant blobs from each video frame, we have applied an additional
heuristic filtering that encompasses two constraints. These heuristic constraints remove the blobs containing no vehicle
regions. The first constraint filters out all very small isolated segmented regions or blobs, where a defined region has
been considered as reference for each blob. In this paper, 3 pixel connectivity based blob analysis has been performed,
where for individual frame, the statistics of the neighbouring connected components (3x3 pixels) have been obtained.
It is then followed by the generation of 4 × N matrix representing the bounding box coordinates. Similarly, a matrix
of 2 × N has been generated to represent the centroid coordinates, where N states the number of blobs. Furthermore,
image arithmetic functions such as image addition and subtraction have been applied to achieve a binary image with
only centroid. Finally, the output video has been converted into frames, which has been further processed to retrieve
the matrix with 2D centroid coordinates. In this research, to further simplify the blob analysis, we selected the blobs
with the fixed dimension of 300 × 3000 pixel. It has enabled our system efficient to perform detection with any
geometric dimensions. Meanwhile, the second constraint performs filtering of those particular blobs having relatively
very small width than corresponding heights. This is because, in real application scenarios, height can’t be more than
length or width of the vehicle. In such manner, the vehicle concept region or the ROI has been identified for further
tracking purposes.
G. Boundary Boxes Generation And Tracking
Performing the blobs analysis, the detected vehicle has been enclosed within a boundary box. Here, four pairs of the
boundary box coordinates along with a centroid coordinate have been applied to represent the subsequent blobs
representing vehicle in the running video. To make detection more precise, visible and road condition adaptive, the
large boxes such as borders, highway dividers etc have been ignored and an additional adaptive padding has been
introduced that makes our approach more effective for moving vehicle detection and tracking.
III. RESULTS AND ANALYSIS
In this paper, the proposed MDFOA based optical flow analysis based vehicle detection and tracking system has been
developed using MATLAB/SIMULINK software with image processing and Vision toolbox. To evaluate the
performance of the proposed systems, different traffic surveillance videos data have been used. Initially the input raw
videos have been converted from RGB to gray image, which has been further processed for BIGC estimation and
MDFOA based optical flow estimation. Here, the proposed MDFOA scheme was applied with Horn Schunk based
optical flow analysis algorithm. It was then followed by the processes such as non-linear adaptive median filter based
filtering, adaptive threshold based segmentation and heuristic based blob analysis. To compare the performance the
proposed MDFOA-HS and LK was also developed for moving vehicle detection. The developed models have been
simulated on Windows-7 OS with Dual core processor, 4 GB RAM, and 1.8 GHz processor. The comparative
performance of the proposed MDFOA-HS and LK based scheme is summarised in Table 1.
TABLE 1 PERFORMANCE ANALYSIS FOR FUNCTIONAL COMPONENTS
Performance
parameters
LK Based
Vehicle detection
(Second)
MDFOA-HS Based
Vehicle detection
(Second)
Total recorded time 13.856 12.76
BIGC and optical flow
estimation 2.343 3.968
Threshold estimation 0.400 0.109
Morphological closing 0.265 0.265
Blob analysis 0.156 0.078
Velocity 0.140 0.078
Median filter 0.812 0.843
International Journal of Computer Science and Information Security (IJCSIS), Vol. 14, No. 6, June 2016
611 https://sites.google.com/site/ijcsis/ ISSN 1947-5500

Accuracy 93.81% (91/97
vehicles) 98.96% (96/97 vehicles)
Observing Table 1, it can be found that the proposed MDFOA-HS based vehicle detection and tracking system
performs better than conventional Lukas Kanade (LK) optical flow analysis algorithm. These results have been
obtained for a defined and equal simulation period. Figure 2 represents the original traffic surveillance video frame,
which has been further processed with MDFOA-HS approach. The results obtained for motion vectors is presented in
Figure 3. Figure 4 represents the adaptive threshold based segmentation. Here, the robustness of the proposed adaptive
filtering and heuristic based blob analysis can be observed easily. The bounding box based vehicle detection and
tracking can be found in Figure 5. To perform accuracy analysis, the number of vehicles detected by the proposed
algorithms has been compared with the manual calculation. The results reveal that MDFOA-HS based vehicle
detection outperforms conventional Lukas Kanade (LK) based optical flow analysis in terms of detection accuracy.
Interestingly, it has been observed that the MDFOA-HS based scheme takes bit higher time in computation. It can be
because of the computational overheads caused due to multidirectional filtering and fusion based BIGC estimation as
well as due to double error factor estimation. In addition, the proposed system has been examined for its effectiveness
in estimating the traffic density, where the proposed system has outperformed conventional LK based vehicle detection
and tracking system. Thus, the overall results reveal that the proposed MDFOA-HS scheme can perform better for
vehicle detection and tracking than its counterparts.
MDFOA -HS Optical Flow Analysis based Vehicle Detection and Tracking
Figure 2. Original video frame Figure 3. MDFOA based BIGC and horizontal and vertical
motion vector estimation
Figure 4. Adaptive threshold based Segmentation Figure 5. Optical flow based Vehicle tracking
IV. CONCLUSION
Considering, the requirement of novel vehicle detection and tracking system for intelligent transport system (ITS), in
this paper, a novel and robust multidirectional filtering and fusion based optical flow analysis (MDFOA) scheme has
been developed, which ahs been implemented with Horn Shunck (HS) optical flow algorithm. The proposed scheme
encompasses varied novelties in terms of enhanced brightness and intensity gradient constraints (BIGC) estimation,
non-linear adaptive noise filtering, heuristic filtering based blog analysis adaptive threshold based segmentation and
bounding box generation for vehicle tracking. The implementation of simultaneous velocity and intensity estimation
International Journal of Computer Science and Information Security (IJCSIS), Vol. 14, No. 6, June 2016
612 https://sites.google.com/site/ijcsis/ ISSN 1947-5500

at each pixel enables the proposed system efficient. Retrieving the BIGC features, the motion and velocity vector
components have been obtained which has been further applied to perform adaptive thresholding based segmentation.
This novelty has enabled the proposed system to deliver optimal detection of moving vehicle. The heuristic filtering
based blob analysis has exhibited efficient performance in reducing unwanted blobs from the video frame, and thus
resulting into enhanced vehicle detection and tracking accuracy, even at high speed vehicle movement. Performing
the boundary box generation, the tracking of the vehicle has been done. In addition, the vehicle density estimation too
has been done based on their crossing frequency through a defined area in the frame. The comparative results between
MDFOA-HS and Lukas Kanade based vehicle detection affirms better results by the proposed system. The detection
accuracy of 98.96%, with relatively appreciable time efficiency affirm that the proposed MDFOA-HS based scheme
can be used for high speed moving vehicle detection and hence can be a potential technique for ITS utilities. In future,
the effectiveness of the proposed scheme can be examined for night time vehicle detection and tracking and even
certain vehicle classification model can also be explored.
REFERENCE
[1] J. L. Barron et al., “Systems and experiment performance of optical flow techniques,” International Journal of Computer Vision, vol.12, 1, pp. 43–77, Feb. 1994.
[2] J. Xiao et al., “Bilateral filtering-based optical flow estimation with occlusion detection,” ECCV, pp. 211–224, 2006.
[3] T. Brox et al., “High accuracy optical flow estimation based on a theory for warping,” ECCV, pp. 25–36, 2004. [4] C. L. Zitnick et al., “Consistent segmentation for optical flow estimation,” IEEE ICCV, pp. 1308–1315, 2005.
[5] M. J. Black, “The robust estimation of multiple motions: Parametric and piecewise-smooth flow fields,” Computer Vision. Image Understanding,
vol. 63, no. 1, pp. 75–104, Jan. 1996. [6] J. Xiao et al.,“Bilateral filtering-based optical flow estimation with occlusion detection,” ECCV, pp. 211–224, 2006.
[7] C. L., Zitnick et al., “Consistent segmentation for optical flow estimation,” IEEE ICCV, pp. 1308–1315.
[11] Zhan et al., "Algorithm Research on Moving Vehicles Detection," Procedia Engineering, vol. 15, pp. 5483-5487, 2011. [12] D. H. Ballard, "Generalizing the Hough transform to detect arbitrary shapes," Pattern recognition, vol. 13, no. 2, pp. 111-122, 1981.
[13] Illingworth et al., "A survey of the Hough transform," Computer vision, graphics, and image processing, vol. 44, no. 1, pp. 87-116, 1988.
[14] X. Shi, "Research on Moving Object Detection Based on Optical Flow Mechanism." University of Science and Technology of China, pp. 6-14, 2010.
[15] S. Rakshit et al., "Computation of optical flow using basis functions," Image Processing, IEEE Transactions, vol.6, no.9, pp.1246-1254, Sep
1997. [16] Q. Pei, “Moving Objects Detection and Tracking Technology based Optical Flow”, North China University of Technology, pp. 11-14, 2009.
[17] A. Fonseca et al., “Design and Implementation of an Optical Flow-Based Autonomous Video Surveillance System, Florida Atlantic University,
2008. [18] G. Catalano et al., Optical Flow, March 23, 2009
[19] J. L. Barron et al., “Performance of Optical Flow Techniques, IJCV 12:1, pp 43-77, 1994
[20] T. Camus, Real-Time Optical Flow, PHD thesis, Department of computer science Brown university, September 24, 1994.
International Journal of Computer Science and Information Security (IJCSIS), Vol. 14, No. 6, June 2016
613 https://sites.google.com/site/ijcsis/ ISSN 1947-5500

Area Efficient Digital Logic Circuits Based
On 5-Input Majority Gate Using QCA
D. Ajitha, Research Scholar, JNTUA, Ananthapuramu, India. A. Harika, SITAMS, Chittoor, India.
Abstract-Quantum-dot Cellular Automata (QCA) is one of the most significant technology among the Nano devices for
computing at the Nanoscale. The key logic elements in QCA are majority gate and inverter. The majority gates are 3-input majority gate and 5-input majority gate. In earlier designs all the digital logic circuits are implemented using 3-
input majority gate based on 2:1 multiplexer. The limitations of the 3-input majority gate are it requires the number of cells for constructing large architectures involves high complexity, connectivity is difficult, laborious and low reliability. Hence, the design of digital circuits in this paper is implemented with 5-input majority gate based 2:1 multiplexer. The 5-
input majority gate reduces cell counts, the number of clocks required and area compared to existing designs. The proposed designs such as XOR gate, XNOR gate, D-latch, D flip-flop, T-latch, and T flip-flop have significant improvements regarding the number of gates, cell count, and delay. The proposed circuits are simulated with
QCADesigner and results were included to verify the functionality.
Keywords: Quantum-dot Cellular Automata (QCA), Five-input Majority gate, Multiplexer, Logic gates, Sequential logic.
I. INTRODUCTION
Due to present serious challenges existing in conventional transistor technology, researchers are pointed to find
an alternative to this technology. Among these new technologies, quantum-dot cellular automata (QCA) are a
suitable alternative technology that offers unique features such as small feature size and ultra low power
consumption and can operate at THz frequencies and room temperature [1, 2]. The essential elements in QCA are
cells; each cell is composed of two mobile electrons that are located in opposite corners according to columbic
energy, resulting in two possible Polarizations (= +1, = −1) as shown in Fig. 1(a) [3]. Up to this time, many methods
for fabrication of QCA basic cells are suggested such as metal island [4], magnetic [5], semiconductor, and
molecular QCA [6]. As is discussed in [4-6], metal dot implementations have proven to be the most successful
material systems which are based on ‘single-electron transistors’ fabrication techniques. Cowburn's group firstly
proposes the magnetic implementation and extended by the Porod group and the Bokar group. In the physical
semiconductor implementation, the Cavendish group of Smith et al. proved QCA operation in GaAs/AlGa As hetero
structures with confining top-gate electrodes and the group of Kern et al. demonstrated a silicon QCA cell by
employing an etching technique to form the dots.
Furthermore, based on [7], the Fehlner and Lapinte groups have performed successful molecular synthesis in
creating molecules that show the essential bistability. According to the columbic interaction between electrons in
neighboring cells, the basic logic gates in QCA circuits (inverter and majority gates) are constructed as shown in
Fig. 1(b) and 1(c), respectively [8–11]. The logical functions of three-input majority gate and five-input majority
gate are given in (1) and (2).
M (A, B, C) = AB+AC+BC (1)
M (A, B, C, D, E) = ABC+ABD+ABE+ACD+ACE+ADE+BCD+BCE+BDE+CDE (2)
International Journal of Computer Science and Information Security (IJCSIS), Vol. 14, No. 6, June 2016
614 https://sites.google.com/site/ijcsis/ ISSN 1947-5500

Figure 1: Basic logic cells and gates in QCA: (a) Two possible polarizations, (b) Inverter, (c) Three-input majority gate, and (d) The five-input
majority gate [8].
Clocking used in QCA for the purpose of controlling the data flow and supply of power to the weak signal. QCA
have four clocks namely switch phase, hold phase, release phase, and final phase or relax phase. In switch phase, the
inter dot barrier is slowly and linearly raised. In hold phase, the inter-dot barrier is very high, and cells retain
polarity and acts as inputs to neighbor cells. In release phase, the barrier is slowly lowered, and the electrons are
slowly started to be delocalized. In the final phase, the electrons are completely delocalized and lose its polarization.
There are two possible crossovers are available in QCA circuit design named as coplanar and multilayer crossovers.
In the co-planar crossover, only one layer is used with normal and rotated cells, while in the multi- layer crossover,
it uses two additional layers similar to conventional Integrated Circuit [12].
2:1 Multiplexer and 5-input majority gate are the most critical components in logical systems, so the proposed
circuits are optimized using the 5-input majority gate rather than the 3-input majority gate method. This paper
presents a new methodology to design efficient QCA circuits that reduces the cell count and the number of majority
gates when compared to previously reported circuits. The remainder of this paper is arranged as follows. In Section
II, a review of existing designs is to be provided. Section III introduces the new approach to implementing QCA-
based structures and proposes efficient and sufficient digital logic circuits. In Section IV, performance analysis and
simulation results obtained from QCADesigner tool to prove the functional correctness of the proposed designs and
finally Section V concludes the paper.
II. EXISTING DESIGNS
2.1. Realization of Logic Gates Using QCA Multiplexer
Although many Researchers are concentrated to implement the logic gates and sequential elements [13-20]. Most
of the existing structures are constructed with 3-input majority gates and inverters. Meanwhile, only a few designs
are presented based on 5-input majority gate [8, 10, 15]. Whereas, the Multiplexers have a significant role in the
(a) (b)
(c) (d)
International Journal of Computer Science and Information Security (IJCSIS), Vol. 14, No. 6, June 2016
615 https://sites.google.com/site/ijcsis/ ISSN 1947-5500

digital systems which permit us to select one of the inputs from many inputs for transmitting to the output. In the
existing work the XOR gate and XNOR gates are implemented by using 3-input majority gate based 2:1 multiplexer
as shown below [13]. The QCA schematics and cell layouts of XOR and XNOR gate are displayed in Fig. 2 and Fig.
3. The construction of XOR gate requires three 3-input majority gates and 40 cells and 3 clock zones as shown
below. In the same way, XNOR gate also requires a similar number of majority gates, cells and clock zones for its
building as shown in Fig. 3.
(a) (b)
Figure 2. (a) Schematic diagram (b) cell layout of XOR gate using 3-input majority gate based on QCA multiplexer.
(a) (b)
Figure 3. (a) Schematic diagram (b) Cell layout of XNOR gate using 3-input majority gate based on QCA multiplexer.
2.2. Design of Sequential Logic Based on Multiplexer
The following figures show schematic and cell layout diagrams of D-flip-flop, D-latch, and T-latch [13]. D-flip-
flop requires three 3-input majority gates and 30 cells for its construction as shown in Fig. 4. D-latch requires three
3-input majority gates and 42 cells for its construction as shown in Fig. 5. The T-latch requires three 3-input
majority gates and 41 cells for its construction shown in Fig. 6. The D-flip-flop, D-latch, and T-latch require 3 clock
zones delay to produce the output.
(a) (b)
Figure 4. (a) Schematic diagram (b) Cell layout of D flip-flop using 3-input majority gate based on QCA multiplexer.
International Journal of Computer Science and Information Security (IJCSIS), Vol. 14, No. 6, June 2016
616 https://sites.google.com/site/ijcsis/ ISSN 1947-5500

(a) (b)
Figure 5. (a) Schematic diagram (b) Cell layout of D-latch using 3-input majority gate based on QCA multiplexer.
(a) (b)
Figure 6. (a) Schematic diagram (b) Cell layout of T-latch using 3-input majority gate based on QCA multiplexer.
III. PROPOSED DESIGNS
Due to the limitations of 3-input majority gate, the five input majority gate is introduced. The following digital
logic circuits are implemented by using five input majority based on multiplexer [15]. The proposed designs attain
reduced number of gates and cell count and also achieve reduced number of clocks compared with 3-input majority
gate designs.
3.1 Realization of Logic Gates Using 5-Input Majority Gate Based on QCA Multiplexer
The 2:1 multiplexer is the primary element in all FPGA structures. Hence, all the logic functions can be built by
using multiplexers. The Proposed XOR and XNOR gates in QCA can be implemented by using 5-input majority
gate based on multiplexer is shown below. XOR has a significant role among the logic gates because of its
functionality. It is most widely used in many applications such as error detection in the telecommunication OSI
standard networks (data link layer) and TCP/IP in the network, comparators, etc. The QCA schematics and layouts
of an XOR gate [15], and the proposed XNOR gate are shown in Fig. 7 and 8.
(a) (b)
Figure 7. (a) Schematic diagram (b) Cell layout diagram and of XOR gates using 5-input majority gate based on QCA multiplexer
International Journal of Computer Science and Information Security (IJCSIS), Vol. 14, No. 6, June 2016
617 https://sites.google.com/site/ijcsis/ ISSN 1947-5500

.
(a) (b)
Figure 8. (a) Schematic diagram (b) Cell layout diagram of a proposed XNOR gates using 5-input majority gate based on QCA multiplexer.
The realization of 2:1 multiplexer is clearly explained in [15]. The advantage of proposed design is simple in
structure compared to the 3-input majority gate existing designs. It requires one 3-input majority gate and one 5-
input majority gate, and it requires only 28 cells for its construction. The 30% reduction in the number of cells is
achieved by implementing circuit with 5-input majority gate based on 2:1 multiplexer. The proposed XNOR is the
first design implemented with 5-input majority gate based 2:1 multiplexer. The conventional design of XNOR
structure constructed with basic gates requires three gates and two inverters. Whereas, the proposed XNOR gate
requires one 3-input majority gate, one 5-input majority gate, and two inverters.
3.2. Design of Sequential Logic Using 5-Input Majority Gate Based on Multiplexer
The Flip-flops are the primary element in memories. As a first time, the proposed sequential logic elements are
tried to realize with 5-input Majority gate based 2:1 multiplexer. The below Fig. 9, 10 and 11 show the schematics
and layout diagrams of a D-latch, D-flip-flop, and T-Latch using 5-input Majority gate based on multiplexer. All the
D-latch is a device it just transfers data from input to output when the enable is activated. D flip-flop is formed by
using the D-latch. The D Flip-flop is widely used in various registers and counters. D-Flip-flop also used as a
memory element in a serial adder to store the carry as well as in serial comparator [21, 22]. It is also known as a
"data" or "delay" flip-flop. The proposed D-latch requires 39 cells instead of 42 cells used in existing D-latch, and
also it requires fewer clocks compared to existing one. The cost of circuits depends on Area and Delay [23]. Hence,
the cost of proposed design is less with reduced cells and delay compared to previous designs. The D-latch is shown
in Fig. 9 is implemented by the following expression (3).
)1,out),0,out,d(3M),0,out,d(3M,d(5Mout (3)
(a) (b)
Figure 9. (a) Schematic diagram (b) Cell layout diagram of a proposed D-latch using 5-input majority gate based on QCA multiplexer.
The D flip-flop captures the value of the D-input at a particular portion of the clock cycle (such as the rising edge
of the clock) and the same appears as the Q output. Further, the remaining part of the clock the output Q does not
International Journal of Computer Science and Information Security (IJCSIS), Vol. 14, No. 6, June 2016
618 https://sites.google.com/site/ijcsis/ ISSN 1947-5500

change. The D flip-flop can be viewed as a memory cell, a zero-order hold, or a delay line. The D flip-flop requires
25 cells instead of 30 cells used in existing design, and also it requires two clock zones instead of 4 clock zones used
in existing D flip-flop. Equation (4) is used to implement the D flip-flop as shown in Fig. 10.
)1,out),0,c,d(3M),0,c,d(3M,c(5Mout (4)
(a) (b)
Figure 10. (a) Schematic diagram (b) Cell layout diagram of a proposed D Flip-flop using 5-input majority gate based on QCA multiplexer.
A latch has exactly two stable states. A T-latch is very similar to T Flip-flop, but it is not synchronous with the
clock. T-latch has a feedback path so that the stored information toggles. T-latch schematic and layout using (5) is as
shown in Fig. 11. The T flip-flop is also known as Toggle flip-flop. T flip-flop is extensively used in synchronous
and asynchronous counters. Whenever, the clock input is high, the T flip-flop changes state ("toggles"). If the clock
input is low, the flip-flop holds the earlier value. This functionality is described by the characteristic equation (6).
)1,out),0,out,t(3M),0,out,t(3M,t(5Mout (5)
QTQTQTQnext (6)
(a) (b)
Figure 11. (a) Schematic diagram (b) Cell layout diagram of a proposed T-latch using 5-input majority gate based on QCA multiplexer.
The T flip-flop realization regarding majority gates using (7) and its layout is shown in Fig. 12.
)1,t),0,t,c(3M),0,t,c(3M,c(5Mout (7)
(a) (b)
Figure 12. (a) Schematic diagram (b) Cell layout diagram of a proposed T Flip-flop using 5-input majority gate based on QCA multiplexer.
International Journal of Computer Science and Information Security (IJCSIS), Vol. 14, No. 6, June 2016
619 https://sites.google.com/site/ijcsis/ ISSN 1947-5500

The proposed T-latch requires 34 cells instead of 41 cells used in existing T-latch and it requires three clock zones
only for its construction. As seen from the schematic and layout diagrams, the proposed sequential logic elements
require only two gates i.e. one 3-input and one 5-five input majority gates instead of three 3-input majority gates in
the existing structures.
IV. PERFORMANCE ANALYSIS
All the proposed designs layouts are constructed with the help of QCADesigner tool [24-26]. The simulation
results are obtained with Bistable simulation Engine in QCADesigner tool. The following Table I gives the
performance review of proposed designs compared with existing designs. Table I gives the clear idea about the
number of majority gates, cell count, and clock zones required by the proposed designs regarding recent existing
designs. Due to the limitation of space, the area is not included. But, as the number of cells decreases automatically
the area occupied by the QCA circuit also reduces.
TABLE I
COMPARISION OF 3-INPUT AND 5-INPUT MAJORITY GATES
S.No
Implemented Structures
Recent existing Designs Using 3-Input
Majority Gate[13]
Proposed Design Using 5-Input
Majority Gate
No.of
Gates
No.of Cells No.of
Clock
Zones
No.of
Gates
No.of
Cells
No.of
Clock
Zones
1 XOR 3 40 3 2 28 3
2 XNOR 3 40 3 2 30 3
3 D-Latch 3 42 4 2 39 3
4 T-Latch 3 41 4 2 34 2
5 D Flip-Flop 3 30 4 2 25 2
6 T Flip-Flop Not
available
Not
available
Not
available
2 27 2
In the comparison table, only the recent existing designs paper [13] is taken into consideration. Even though
recently the D flip-flop is proposed in [27], but this design requires 33 cells and five clock zones. Therefore, after
analyzing the various existing designs, the digital logic circuits proposed in [13] are efficient and different existing
designs are also compared in [13]. Hence, here the proposed designs comparison provided with [13] only. The
proposed design uses five input majority gate based 2:1 multiplexer [15]. The main advantage of five input majority
gate is we can configure the input according to our requirement, particularly in complex logic function applications
and this advantage is most useful to reduce the number gates.
As seen from the table the XOR gate have 33.33% reduction in gate count, 30% decrease in the cell count with the
same delay compared to existing design [XOR gate] because the existing design requires three majority gates and
the proposed design requires only two majority gates for its construction. The similar improvements can be achieved
in XNOR gate. Both logic gates have a delay of 3 clock zones similar to previous designs with reduced gates and
cells. Similarly, in D-latch gate count is reduced by 33.33% and 25% improvements in clock zones and a lesser
International Journal of Computer Science and Information Security (IJCSIS), Vol. 14, No. 6, June 2016
620 https://sites.google.com/site/ijcsis/ ISSN 1947-5500

improvement in cell count can be achieved compared to existing design [D-latch]. The T-latch has 33.33% reduced
gate count, 17% in cell count, and 25% in clock zones can be achieved compared to existing design [T-latch].
Likewise, the D flip-flop also has same gate count similar to D-latch, 16% reduction in cell count and 50%
improvements in clock zones can be achieved compared to existing design [D flip-flop].
The simulation results of XOR gate is shown in Fig. 13. In QCA circuit, one complete clock cycle contains four
clock zones titled as clock 0, clock 1, clock 2, and clock 3. As seen from the Fig. 13, it is evidently shown that the
functionality of XOR gate and XNOR gate is correct, and the exact output appears in third clock zone (clock 2).
(a) (b)
Figure 13. Simulation results (a) XOR gate (b) XNOR gate.
(a) (b)
Figure 14. Simulation results (a) D-latch (b) D flip-flop.
International Journal of Computer Science and Information Security (IJCSIS), Vol. 14, No. 6, June 2016
621 https://sites.google.com/site/ijcsis/ ISSN 1947-5500

Fig. 13(a) displays that the output of XOR gate is at logic ‘1’ when two inputs differ, whereas the XNOR output is
the complement of XOR gate as shown in Fig. 13(b). Fig. 14(a) shows that the D-latch handles the stored
information without any change because of the feedback path provided from the output, and the significant output
appears at third clock zone (clock 2). It is clearly noticed from the Fig. 14(b) the input value available at D terminal
appears at the output only, when the c (clock) is high. In other words, it can be specified that the D flip-flop passes
the input, and it retains the same during control pulse transition only.
(a) (b)
Figure 15. Simulation results (a) T-latch (b) T flip-flop.
Fig. 15(a) and Fig. 15(b) clearly displays the difference between T-latch and T flip-flop. In both the results the
significant output appears during the second clock zone (clock 1). Fig. 15(a) clearly displays that, the input value
toggles continuously and appears in the output. Whereas, the T flip-flop results shown in Fig 15(b) clearly show that
input at T terminal toggles only during the c signal transition only. From the obtained simulation results and
performance parameters it is clearly evident that the proposed designs are efficient to construct the QCA circuits.
One more vital factor is the cost of the QCA circuits depends on the number of majority gates, delay, and the
number of crossovers [28]. All the proposed designs are implemented with less number of gates, optimized delay,
and without using crossovers, i.e., in a single layer only. Therefore, finally, it can be stated as the proposed designs
are cost efficient also.
V. CONCLUSION
In this paper, the Five-input majority gate is introduced for designing of QCA based digital logic circuits. This
method is based on the new configuration of five-input majority gate that leads to attaining significant Boolean
function such as X+ YZ. It is estimated that the method presented in this paper will produce efficient QCA-based
digital logical circuits. These proposed circuits give advantages compared to earlier designs regarding gate count,
the number of clocks required, and cell count. The decrease in the number of cells and clock zones required are
International Journal of Computer Science and Information Security (IJCSIS), Vol. 14, No. 6, June 2016
622 https://sites.google.com/site/ijcsis/ ISSN 1947-5500

achieved by using 5-input majority gate based on 2:1 multiplexer. Furthermore, the great advantage of the presented
approach is that it leads to the implementation of these structures in a single layer without any cross-overs.
REFERENCES [1] J.M. Seminario, P. A. Derosa, L. E. Cordova, and B. H. Bozard, “A molecular device operating at terahertz frequencies: theoretical
simulations,” IEEE Transactions on Nanotechnology, vol. 3, no. 1, pp. 215–218, 2004. [2] R. P. Cowburn and M. E. Well and, “Room temperature magnetic Quantum Cellular Automata,” Science, vol. 287, no. 5457, pp. 1466–
1468, 2000.
[3] C. S. Lent, P. D. Tougaw,W. Porod, and G. H. Bernstein, “Quantum Cellular Automata,” Nanotechnology, vol. 4, no. 1, pp. 49–57, 1993. [4] G. H. Bernstein, A. Imre, V. Metlushko et al., “Magnetic QCA systems,” Microelectronics Journal, vol. 36, no. 7, pp. 619–624, 2005.
[5] G. L. Snider, A.O. Orlov, I.Amlani et al.,“Experimental demonstration of Quantum-Dot Cellular Automata,” Semiconductor Science and
Technology, vol. 13, no. 8, pp.A130–A134, International Scholarly Research Notices 9, 1998. [6] P.D. Tougaw, Quantum Cellular Automata: computing with quantum dot molecules [Ph.D. thesis], University of Notre Dame, 1996.
[7] N.G.Anderson and S. Bhanja, Field-Coupled Nano computing Paradigms, Progress, and Perspectives,vol 8280, Springer, Heidelberg,
Germany, 2014. [8] K. Navi, R. Farazkish, S. Sayedsalehi, and M. RahimiAzghadi, “A New Quantum-Dot Cellular Automata full-adder,” Microelectronics
Journal, vol. 41, no. 12, pp. 820–826, 2010.
[9] P. D. Tougaw and C. S. Lent, “Logical devices implemented using Quantum Cellular Automata,” Journal of Applied Physics, vol. 75, no. 3, pp. 1818–1825, 1994.
[10] K. Navi, S. Sayedsalehi, R. Farazkish, and M. R. Azghadi, “Five input majority gate, a new device for Quantum-dot Cellular Automata,”
Journal of Computational and Theoretical Nano science, vol. 7, no. 8, pp. 1546–1553, 2010. [11] F. A. Mohammad RafiqBeigh, Mohammad Mustafa, "Performance evaluation of efficient xor structures in Quantum-Dot Cellular Automata
(QCA)," Journal of scientific research, vol. 4, pp. 147-156, 2013.
[12] Walus, Konrad, and Graham A. Jullien. "Design tools for an emerging SoC technology: Quantum-Dot Cellular Automata." Proceedings of the IEEE 94, no. 6, 1225-1244, 2006.
[13] Goswami, Mausumi, Bijendra Kumar, Harsh Tibrewal, and Subhra Mazumdar. "Efficient realization of digital logic circuit using QCA
multiplexer." In Business and Information Management (ICBIM), 2nd International Conference on, pp. 165-170. IEEE, 2014. [14] Dutta, Paramartha, and Debarka Mukhopadhyay. "New architecture for flip flops using Quantum-Dot Cellular Automata." In ICT and
Critical Infrastructure: Proceedings of the 48th Annual Convention of Computer Society of India-Vol II, pp. 707-714. Springer International
Publishing, 2014. [15] Chabi, Amir Mokhtar, Samira Sayedsalehi, Shaahin Angizi, and Keivan Navi. "Efficient QCA Exclusive-or and Multiplexer Circuits Based
on a Nanoelectronic-Compatible Designing Approach." International Scholarly Research Notices, 2014.
[16] S. Y. L. A. Lim, A. Ghazali and C. C. Fat, "Sequential circuit design using Quantum-Dot Cellular Automata (QCA)," 2012 IEEE International Conference on Circuits and Systems (ICCAS), pp. 162-167, Oct 3, 2012.
[17] X. C. L. XIAO and S. YING, "Design of dual-edge triggered flip-flops based on Quantum-Dot Cellular Automata," Journal of Zhejiang
University SCIENCE (Computers and Electronics), vol. 13, no. 5, pp. 385-392, 2012. [18] V. D. A.Vetteth, K. Walus and G. Jullien, "Quantum- dot Cellular Automata of flip-flops," pp. N.W., CaJgary, Alberta, Canada T2NIN4,
2003.
[19] S. Hashemi and K. Navi, "New robust QCA d flip-flop and memory structures," Microelectronics Journal, vol. 43, no. 12, pp. 929-940,2012.
[20] S. K. Bahniman Ghosh, Shoubhik Gupta and A. Salimath, "Novel design of combinational and sequential logical structures in Quantum Dot
Cellular Automata," Journal of Nano Structure in Chemistry, pp. 147-156, 2013. [21] Lakshmi, S. Karthigai, and G. Athisha., Design and Analysis of Adders Using Nanotechnology Based Quantum Dot Cellular Automata,
Journal of Computer Science 7 (7): 1072-1079, 2011.
[22] B. Lampreht, L. Stepancic, I. Vizec, and B. Zankar, Quantum-dot cellular automata serial comparator, in Proc. EUROMICRO Conf. Digital Syst.Design Architectures, Methods Tools, pp. 447–452, 2008.
[23] C. D. Thompson, Area-time complexity of VLSI, in Proc. 7th Annual ACM Symp. Theory of Computing, pp. 81–88, 1979.
[24] K. WaJus, T. Dysart, G. A. Jullien, and R. Budiman, "QCADesigner: a rapid design and simulation tool for Quantum-Dot Cellular Automata,"Trans. Nanotechnology, vol. 3, no. 1, pp. 26-29, March 2004.
[25] QCADesigner Documentation, http://www.qcadesigner.ca/.
[26] K. Kim, K.Wu, and R. Karri, “Quantum-dot Cellular Automata design guideline,” IEICE Transactions on Fundamentals of Electronics, Communications and Computer Sciences, vol. E89-A, no. 6, pp. 1607–1614, 2006.
[27] Reshi, Javeed Iqbal, M. Tariq Banday, and Farooq A. Khanday. "Sequential Circuit Design Using Quantum dot Cellular Automata (QCA)."
2015 International Conference on Advances in Computers, Communication and Electronic Engineering, Mar 2015. [28] Weiqiang Liu, Liang Lu, M´aire O’Neill, and Earl E. Swartzlander Jr., A First Step Towards Cost Functions for Quantum-dot Cellular
Automata Designs, IEEE Transactions On Nanotechnology, TNANO.2014. Pp 1-13.
International Journal of Computer Science and Information Security (IJCSIS), Vol. 14, No. 6, June 2016
623 https://sites.google.com/site/ijcsis/ ISSN 1947-5500

HUMAN EMOTION RECOGNITION AND
PREDICTION USING SOCIALISM MEDIA Dr. Tanvir Ahmed1, Tamoor Khan1
1Lahore Leads University, Pakistan, Department of Computer Science
Email ID: [email protected]
Abstract-Humans are unpredictable; there is no exact way or definition of emotion prediction. Detection of human
emotion is difficult because when we want to observe people’s behavior then they behave in normal way or better than
abnormal behavior. May be another way where people want to collaborate with others to share their emotions, their daily
basis problems, where they feel easy to share their expression without any fear. Maximum people are not agreeing to
share their emotion due to shame and fear. We need a platform where people can share their actual problem (which they
are internally facing) and release their frustration. Many people want solution without sharing of their problems to
anyone. In order to solve this problem, social media is a best way where people can share their emotional behavior
without any fear and we can detect their emotion as silent observer through social media. In this paper we will analyze
their posted data on social media and we have provided the suggestion to solve their problems; also we detected the
emotion of people through social media. We collected data from social website (Twitter .etc.) where people have shared
their thoughts or feelings. Meanwhile, we designed an algorithm which takes data from that social website and on the
basis of that data; application provides the result as previous emotional state of a person. A systematic approach was used
to detect the emotion of people through social media data. This is a better way where a person wants to collaborate with
other to share his emotions, his daily basis problems and he feels easy to share his expression without getting panic. This
Emotional based approach described things in a new way, where all predictions can be measured according to the subject
environment and application can provide better results in decision making. This approach has used the data from social
portals like Twitter etc. where peoples are posting their data in form of emotions. Prediction and recognition of emotions
is a better way to analyze the emotion of people as silent observers.
Keywords — Emotion, Silent Observer, Parts of Speech (POS), Social Media(SM), Adjective
I. INTRODUCTION
Emotion detection is a method in software that allows the program to read the emotion of human [1]. M.
Murugappan et al author proposed emotion detection method and the main objective of this method is to compare
the efficacy and classification of human emotions using two discrete wavelet transform based feature extraction [2].
R. J. Dolan discussed human emotions especially he focused on memory and reasoning. The psychological
significances and mechanisms underlying the emotional modulation of cognition provide the purpose of this paper
[3]. Roddy Cowie et al author discussed the basic issue of recognize people‘s emotion and main focus of this article
is to develop a hybrid system which is capable of using information from face and voice to recognize emotions [4].
N Fragopanagos et al authors developed to construct an emotion recognizing system. In this article authors provided
guideline for psychological studies of emotion [5]. Jerritta Selvaraj et al authors presented a review on emotion
recognition using physiological signals. In this paper, they present a review on basis of emotion recognition. Authors
discussed about different theories on emotion and current research on emotion [6]. S. Morris et al authors used
functional neuroimaging to test emotion [7]. K. H. Kim et al in this article authors developed a novel related to
methods for emotion recognition system based on the processing of physiological signals [8]. Feng Yu et al authors
discussed emotion for speech and developed application and describe an experimental study on the detection of
emotion for speech [9, 10]. Caifeng Shan, et al authors beyond facial expression, they investigate affective body
gesture analysis in video sequence, a relatively understudied problem. Spatial temporal features are exploited for
International Journal of Computer Science and Information Security (IJCSIS), Vol. 14, No. 6, June 2016
624 https://sites.google.com/site/ijcsis/ ISSN 1947-5500

modeling of body gestures. They also present to fuse facial expression and body gesture at the feature level using
canonical correlation analysis [11]. D. M. Gavrila author conducted survey, indefinites application and also
provided overview of recent developments in emotion recognition [12]. The rest of paper is organized as flows.
Section II gives a brief review of purpose algorithm and working of algorithm. Section III gives a brief review of
experimental result and discussion. Finally, conclusions are drawn in Section IV.
II. PROPOSED ALGORITHM
We have developed an application which analyzes the text of social media websites like ―Twitter, Facebook
etc.‖ In this application we used data of Twitter as a data sample set and we used NLP (Natural Language
Processing) mechanism. On the basis of Twitter user‘s posted data, the algorithm performs analysis and provides the
result of such types Like Happy, Sad etc. The following steps are taken in our proposed method [12, 13, 14, 15].
A. Research Model
In figure 1, User login in to the application and after successfully login, user get the access of local application
database then system synchronize the local application database with social media database. Here we have taken the
example of Twitter database. System retrieved the required information from social media database and save the
fetched information in our local database. Then the system worked in local working memory and performed analysis
on it as the saved data was initially tokenized the text. After that POS (Parts of Speech) tagging is performed to
identify different parts of speech. System filtered the required information especially ‗Adjective‘ and compare the
new data with existing data and concludes an emotion word. We also compared these words with emotion dictionary
in database and provide the result as a detection of human emotion. These are the main steps of our purposed
method like login module, information retrieval from social media database, working memory, decision and decision
send to the user.
Figure 1
B. Algorithm Steps
The purposed algorithm has seven steps as mentioned below. First is the user login step and after login, application
read the inputs on the bases of algorithm input, tokenize the post emotion like ―[I] [am] [happy]‖. The second step is
POS tagging which identifies the part of speech like ―[Noun][Adjective][Verb]‖. The third step of our proposed
method is identifying the main parts of sentence. In step four, mental frame of human is identified. On the bases of
mental frame, our method makes decision either person is happy or sad etc. In the sixth step, system shows results in
form of graphs and in step seven, system sends an email to the twitter user about the nature now a days you are
feeling like happy or sad etc.
User input ‗User ID‘ and date range then application reads inputs and tokenizes the text existing in
database between the date ranges.
International Journal of Computer Science and Information Security (IJCSIS), Vol. 14, No. 6, June 2016
625 https://sites.google.com/site/ijcsis/ ISSN 1947-5500

Example: I am happy
[I] [am] [happy]
POS Tagging is performed to identify different parts of speech.
[I] [am] [happy]
[Noun][Adjective][Verb]
System identifies the main parts of a sentence like Object, Subject, verbs and adjective.
System extracted the information. Adjective are major tool for identification of mental frame of
human.
The final step is producing the decision (emotion of people) like happy, sad, frustration, and then it is suggested to the peoples that what they have emotions go through, which will be helpful in decision
making in their daily lifestyle.
System will display end result (decisions) through different charts like bar chart etc.
Decision detail will be sent to user through email. It can be suggested by some other way which
depends on subject‘s nature or it can be sent to any psychologist for analysis.
C. System Flow Diagram- Level 1
In the system flow diagram the first step is user login into application. If user successfully login in to the
application then a new window will be opened. The use enter user id, date range and submit the request. After
submitting the request, application fetches the tweets from twitter database between the dates that provided by user
and save the data in local database and tokenize the text data and POS tagging will be performed on it and filter the
required information e.g. Adjective and after analysis, system provides the result as ―Detection of emotion words‖.
The user can send this result to any other person as emotion report.
D. Description of System Flow Diagram- Level 1
In figure 2 here is a user name ―admin‖ and user try to login. In our proposed methods user can only attempts
login three times and after three attempts system generates an error message. The user cannot login after three wrong
attempts.
Figure 2
In figure 2 admin user is login successfully and the main window is opened which is shown in figure 3.
International Journal of Computer Science and Information Security (IJCSIS), Vol. 14, No. 6, June 2016
626 https://sites.google.com/site/ijcsis/ ISSN 1947-5500

Figure 3
Once main window is opened, system requires an id of social media and user provided social media id of a
twitter user. In figure 4 here is a user with id ―Tamoor_k‖ and the user also provided date range from 5/12/2016 to
5/12/2016. After providing this information, user submitted it.
Figure 4
In figure 5 the user ―Tamoor_k‖ has total three tweets and first tweet is ―my all friends are angry with me but I
do not know why they are angry with me‖, second tweet is ―I am angry with my parents because they ignore me at
any events‖. The last tweet is ―I am feeling happy today‖. After successful submission, system has fetched the last
yellow highlighted tweet ―I am feeling happy today‖ as this tweet was falling in above provided date range.
International Journal of Computer Science and Information Security (IJCSIS), Vol. 14, No. 6, June 2016
627 https://sites.google.com/site/ijcsis/ ISSN 1947-5500

Figure 5
In figure 6 the system retrieved the post (text) ‗I am feeling happy today‘ against that SM User Id ―Tamoor_k‖
from social media (Tweeter) database. The system saved the user ―Tamoor_k‖ tweet in to the local database.
Figure 6
In figure 7 the system generated parts of Speech (POS) tagging and abbreviations will be used for POS tagging.
In this stage system generated adjective of posted tweet.
International Journal of Computer Science and Information Security (IJCSIS), Vol. 14, No. 6, June 2016
628 https://sites.google.com/site/ijcsis/ ISSN 1947-5500

Figure 7
III. EXPERIMENTAL RESULTS AND DISCUSSIONS
We conducted three different type of analysis which is based on five days, ten days and forty five days. On the
bases of these analyses, we presented the results which show the emotion of user. Here we took example of Twitter
and experiment performed to detect emotions of a tweeter user, based on his five days tweets in following order.
A. Case 1:
The user posted the three tweets between the date range ‗08 May 2016‘ to ‗12 May 2016‘. These tweets are
―My all friends are angry with me but i don't know why?‖ and ―I am angry with my parents because they ignore me
at any events‖ and ―I am feeling happy today‖. These tweets retrieved by system from Tweeter database. The system
first tokenizes the twitter text that is retrieved by application from twitter database and then POS tagging is
performed. After POS tagging, system filter out the adjective words from above three tweets . In figure 8 results
shown of posted tweets in the form of ajective.
Figure 8
In the figure 9 the status of user ―Tamoor_k‖ posted tweets in the form of a result. In our proposed application
we also have an option to view the analysis of emotion states of user. In the figure 9 the user ―Tamoor_k‖ posted
2
1
0
0.5
1
1.5
2
2.5
Angree Happy
International Journal of Computer Science and Information Security (IJCSIS), Vol. 14, No. 6, June 2016
629 https://sites.google.com/site/ijcsis/ ISSN 1947-5500

three tweets and the system generated their adjective of three tweets ―anger‖, ―anger‖ and ―happy‖. System analyzed
the tweets and result shown in figure 9. The figure 9 shows that two time user posted tweets with angery emotion
and one time he was happy.
In figure 9 the systems show the maximum tweets is related to the anger. The system shows that 66.66% result
of tweets is negative and 33.33 % tweets is positive so over all the result of user ―Tamoor_k‖ tweets is negative it
mean user have some problem and he is not feeling well in last five days. Our application generated a report to
share the analysis. The report calculated the number of emotional words and it provided a decision based on the
count of those emotional words. For example, if a user has large number of ―Angry‖ words in his\her tweets then decision will be provided as emotion status ―Anger‖.
Figure 9
B. Case 2:
Here system analyzed the ten days tweets, first of all system fetched the tweets that are posted by user in ten
days between the date range ‗20 April 2016‘ to ‗30 April 2016‘. The user posted ―118‖ tweets with ten days. The
adjective of these tweets is ―185‖ which are found after tagging.
From the above mentioned tweets, following 185 adjectives are found after POS tagging. Initially system tokenizes
the twitter text that is retrieved by application from twitter database and then POS tagging is performed. After POS
tagging, system filter out the adjective words. From above tweets , No. of adjective founded are mentioned in below
table.
International Journal of Computer Science and Information Security (IJCSIS), Vol. 14, No. 6, June 2016
630 https://sites.google.com/site/ijcsis/ ISSN 1947-5500

Figure 10
After analysis of mentioned emotion adjective words in figure 10, system shows the result in form of graph in
figure 11. Bar chart option is also available in application to view the analysis of emotion states for a user. Below
mentioned graph shows the no of adjective words lies in emotion words catagories.
Figure 11
After the analysis of above tweets, system shows that user posted maximum tweets related to happy emotion
category. So according to above result we can say that person is happy in 10 days. Application will generate a report
to share the analysis. This report will calculate the number of emotional words and will provide a decision based on
the count of those emotional words. For example, if a user has large number of ―Happy‖ words in his\her tweets, and
decision will be provided as emotion status ―Happy‖.
C. Case 3:
System has performed analysis on forty-five days of posted tweets. System fetched the tweets that are posted by
user in 45 days between the date range ‗01 April 2016‘ to ‗15 May 2016‘. There are 121 total no. of tweets. All the
tweets that are retrived by system are mentioned in below table.
1 1 2 1 1 1 1
2 4
1
4 5
1 1 2 1 1 1 1 1
2 1 1 1 1 1 1 1 1 1 1 1 1 1 1
3 1 1 1 1 1
2 1 1 1 1 1 1 1 1 1
14
1 2
9
1 1 1 1 1 1 1 1 1 1 1 3 1 1 1 1 1 1 1 1 1 1 1 1 1 1 1
2 4
1 1 1 2 1 2 1 1 1 1 1 1 1
2 1 1
2 1 1 1 1 1 1 1 1 1 1 1
2 1 1 1 1 1 1 1 1 1 1 1 1 1 1 1 1 1 1 1
2 1
02468
10121416
5th
argum
enta
tive
bad
bla
ckli
st
cheap
confi
den
tial
cooper
ativ
e
dai
ly
dif
ficu
lt
easy
equal
final
Fu
rth
er
gra
tefu
l
hel
pfu
ll
horr
ific
ind
ecis
ive
joyous
man
ipula
tive
new
oth
er
ple
ased
pro
duct
ive
reso
urc
eful
safe
sever
e
smart
star
tlin
g
sure
tire
d
unco
mfo
rtab
le
unsu
re
West
ern
wro
ng
Adjective
International Journal of Computer Science and Information Security (IJCSIS), Vol. 14, No. 6, June 2016
631 https://sites.google.com/site/ijcsis/ ISSN 1947-5500

System performed POS tagging and find the below mentioned 217 adjective words from the above mentioned
tweets. System first tokenizes the twitter text that is retrieved by application from twitter database and then POS
tagging is performed. After POS tagging, system filter out the adjective words. From above tweets , no. of adjectives
founded are mentioned in below table.
Figure 12
Graph shows the emotion words that are filtered from user posted tweet on tweeter website. User posted 7%
words related to curiosity, 3% Urgency, 13% Confusion, 11% Anger, 13% Satisfied,18% Happy, 16% Inspired, 9%
Peaceful.
After analysis from above emotion adjective words, system shows the result in following graph. Bar chart option
is also available in application to view the analysis of emotion states for a user. After performing analysis on these
tweets, system shows the emotion status in below mentioned graph.
Figure 13
After the analysis of tweets, system shows that user twitter posts are maximum related to happy emotion
category. So according to result we can say that person is happy in 45 days. Application will generate a report to
share the analysis. This report will calculate the number of emotional words and will provide a decision based on the
count of those emotional words. For example, if a user has large number of ―Happy‖ words in his\her tweets, and
then decision will be provided as emotion status ―Happy‖.
1 1 2 1 2 1 1 1 2 4 1 4 5
1 1 2 1 1 1 1 1 2 1 1 1 1 1 1 1 1 1 1 1
30
1 1 3 1 1 1 1 1 2 1 1 1 1 1 1 1 1 1
14
1 2
10
1 1 1 1 1 1 1 1 1 1 1 3 1 1 1 1 1 1 1 1 1 1 1 1 1 1 1 2
4 1 1 1 2 1 2 1 1 1 1 1 1 1 2 1 1 2 1 1 1 1 1 1 1 1 1 1 1 2 1 1 1 1 1 1 1 1 1 1 1 1 1 1 1 1 1 1 1 2 1 0
5
10
15
20
25
30
35
5th
An
gry
Bes
t
Cen
sore
d
Com
mo
n
Cult
ura
l
Dif
fcu
lt
Du
e
Fair
Fri
ned
Go
od
Hea
lth
y
Ho
no
red
Joy
ful
Lo
ng
Mu
ch
Op
en
Pers
on
al
Sad
Sere
ne
Sm
all
Sp
eed
ing
Th
ird
Un
stab
le
Ver
y
Adjective
International Journal of Computer Science and Information Security (IJCSIS), Vol. 14, No. 6, June 2016
632 https://sites.google.com/site/ijcsis/ ISSN 1947-5500

IV. CONCLUSION
In this article, analysis is performed on human emotion by reading and analyzing the given text from the
database of social websites (English language). The designed system can find out the text and operations using an
artificial intelligence technique such as natural language processing (NLP). Under the scope of our project, software
will retrieve the text, will perform a complete analysis and then system will take a decision on it related to mental
frame (Happy, Sad etc.) of different people. We need to improve text analysis algorithms to read pictures and
videos. For text reading, it can be enhanced up to 95% by improving the algorithms and inducing the ability of
learning in the system. We need to build a system which has ability to performed text analysis on multiple social
websites.
ACKNOWLEDGEMENT
The authors are grateful to department of computer science, Lahore Leads University, Pakistan for supporting and
cooperation.
REFERENCES
[1]. https://www.techopedia.com/definition/30819/emotion-recognition
[2]. Murugappan M, Rizon M, Nagarajan R, Yaacob S, Hazry D, Zunaidi I. Time-frequency analysis of EEG signals for human emotion
detection. In4th Kuala Lumpur International Conference on Biomedical Engineering 2008 2008 (pp. 262-265). Springer Berlin Heidelberg.
[3]. Dolan RJ. Emotion, cognition, and behavior. science. 2002 Nov 8;298(5596):1191-4.
[4]. Cowie R, Douglas-Cowie E, Tsapatsoulis N, Votsis G, Kollias S, Fellenz W, Taylor JG. Emotion recognition in human-computer interaction.
Signal Processing Magazine, IEEE. 2001 Jan;18(1):32-80.
[5]. Fragopanagos N, Taylor JG. Emotion recognition in human–computer interaction. Neural Networks. 2005 May 31;18(4):389-405.
[6]. Jerritta S, Murugappan M, Nagarajan R, Wan K. Physiological signals based human emotion recognition: a review. InSignal Processing and
its Applications (CSPA), 2011 IEEE 7th International Colloquium on 2011 Mar 4 (pp. 410-415). IEEE.
[7]. Morris JS, Friston KJ, Büchel C, Frith CD, Young AW, Calder AJ, Dolan RJ. A neuromodulatory role for the human amygdala in processing
emotional facial expressions. Brain. 1998 Jan 1;121(1):47-57.
[8]. Kim KH, Bang SW, Kim SR. Emotion recognition system using short-term monitoring of physiological signals. Medical and biological
engineering and computing. 2004 May 1;42(3):419-27.
[9]. Yu F, Chang E, Xu YQ, Shum HY. Emotion detection from speech to enrich multimedia content. InAdvances in Multimedia Information
Processing—PCM 2001 2001 Oct 24 (pp. 550-557). Springer Berlin Heidelberg.
[10]. Iqbal, Muhammad Shahid, Muhammad Sadiq, Abdul Rehman, and Tamoor Khan. "Framework for the Development of Automated
Inspection Tools."International Journal of Computer Science and Network Security (IJCSNS)16, no. 1 (2016): 16.
[11]. Shan C, Gong S, McOwan PW. Beyond Facial Expressions: Learning Human Emotion from Body Gestures. InBMVC 2007 Sep (pp. 1-10).
[12]. Sadiq, M., Iqbal, M. S., Naveed, K., & Sajad, M. (2016). MOBILE DEVICES FORENSICS INVESTIGATION: PROCESS MODELS
AND COMPARISON.ISJ Theoretical & Applied Science, 1(33), 164-168.
[13]. Sajad, Muhammad, Muhammad Sadiq, Khawar Naveed, and Muhammad Shahid Iqbal. "Software Project Manageme nt: Tools assessment,
Comparison and suggestions for future development." International Journal of Computer Science and Network Security (IJCSNS) 16, no. 1
(2016): 31.
[14]. Sadiq, Muhammad, Muhammad Shahid Iqbal, Amizah Malip, and Wan Ainun Mior Othman. "A Survey of Most Common Referred
Automated Performance Testing Tools." (2011).
[15]. Iqbal, Muhammad Shahid, et al. "Assessment of Inspection Tools with Standard, Management Review, Technical Review, Inspection and
Walkthroughs.
International Journal of Computer Science and Information Security (IJCSIS), Vol. 14, No. 6, June 2016
633 https://sites.google.com/site/ijcsis/ ISSN 1947-5500

International Journal of Computer Science and Information Security (IJCSIS),
Vol. 14, No. 6, June 2016
Using Adaptive Algorithm for Inflexible
Object Tracking
Farzad Khadem Mohtaram1, Majid Mohammadi
2*
1, 2* Department of Computer, Buinzahra Branch, Islamic Azad University, Buinzahra, Iran
Corresponding Author: Majid Mohammadi
Abstract: The video detection based on the image sequence
of the area of interest has attracted considerable attention.
Particles filtration is one of the most development algorithms
particularly in restoration of probability density function of
goal state.
Accordingly, the main objective of present study is
utilization of adaptive algorithm for detection of inflexible
objects. The simulation method was applied and data analysis
is done by MATLAB software.
The results represent that, filtration of the suggested
particle achieved better performance than filtration of the
standard particle in terms of prediction error of status,
detection of video error, and the number of significant
particles. It revealed that, the particle filtering enhanced the
number of significant particles by IGA and, forced the
collection of particles to better expression of actual status.
This could enhance the accuracy of status prediction and
reduced the error.
Keywords: adaptive algorithm, inflexible, objects
detection, particle filtration
I. Introduction
As a result of microelectronic industry development in
preparation of cheap and qualified visual sensors, the
considerable amounts of videos have been production daily
in order to visual monitoring or similar application.
Analyzing and investigating of these videos are time
consuming and expensive.
One of the main properties of a machine is its ability of
identifying and detecting objects for visioning,
understanding and reacting in environment. The process of
predicting a position of object in video during time is called
video detection.
In detection, the position of an object is always required.
This object is the intended object. The definition of
intended object depends on its application. In object
detection, the intended object can be any interesting thing
to further analyze.
https://sites.google.com/site/ijcsis/
ISSN 1947-5500
634

For instance, boats in sea, fishes in an aquarium,
vehicles in roads, airplanes in sky, and pedestrians in walk
side, a tumor in a body or a bubble floating on water are a
collection of objects which can be subjected in a particular
ground [1].
To raise detection efficiency and increase the
undercover area it is necessary to use several semi
overlapping cameras.
As a result, the detection system should detect the
target by observations from sensors. Besides, current
reductions in camera expenses and the advantages of
development utilization of cameras lead to an increase in
utilization of expanded camera network [5]. Varieties of
algorithms have been proposed for automating of object
monitoring in a video file; however, identification and
detection of object is a challenge subjected in watching of
computer videos [4]. Visual detection of object in
monitoring employment is important for watching
computer videos.
Some of options and object visual feature are include of
color, resolution, shape and predominant spots[12]. This
study aimed at utilization of adaptive algorithm to detection
of inflexible objects. Inflexible objects are a objects which
is disable to deformation or flexibility. The adaptive
algorithm can use the network status data to choose several
alternative pathways. It should be ensured that, the
packages haven’t blocked the external unavailable port
sand, these ports don’t orienting around the occurred
disorganization of topology. Entirely adaptive navigational
algorithm allowed each package to use every short pathway
located between sources to target. A partial adaptive
algorithm only allowed a package to use from one sub
group of optimized pathway [11].
In this study, the intended algorithm is an adaptive
correlation filter algorithm for detecting the objects.
Whenever system parameters or signals status are changing
and filter should be set so that off setting the changes, the
adaptive filters are used necessarily [7]. Accordingly, this
research investigated the utilization of adaptive algorithm
to detect inflexible objects.
II. Adaptive Filters
Mostly, the adaptive filters are applying, once system
parameters and signals status are changing and the filter
should be set so that offsetting the changes. In the
correlation typical filters such as finite impulse response
(FIR) and infinite impulse response (IIR) some process
parameters are certain distinguishably. It is possible that
filter parameters change with time; however, the
constitution of these changes is predictable.
In most of scientific issues about uncertainty system
parameters, an effectiveness of unpredictable signals and a
lack of adequate data about system either have been
presented. In these cases, although some of parameters
should change during time, the constitution of these
changes is unpredictable. A filter is demanded so that have
benefit from a type of auto-learning and can adapt itself
with current condition of system.
The adaptive filter is a countable block intends to model
the proportions of two signals against each other real-timely
and iteratively. These filters sometimes establishing on an
accountable processor such as micro controllers or/and
DSPs as a number of instructions and sometimes observing
as logical block on field-programmable gate arrays (FPGA)
or/and very large scale integration (VLSI).
Mostly, the adaptive filters are employing, once system
parameters and signals status are changing and the filter
should be set so that offsetting the changes. There are
varieties of methods to establish of updated algorithm for
filter coefficients, amongst them, three types are mentioned
here: Latest mean squares (LMS) method: these types of
adaptive filters change filter coefficients so that minimizing
the mean squares error (the difference between input signal
and demanded signal).
https://sites.google.com/site/ijcsis/
ISSN 1947-5500
635

The stochastic gradient descent method is used by this
filter for adapting so that with aware of current amount of
error merely, changes the coefficient. This filter innovated
in the Stanford University by Bernard Widrow in
Recursive least squares (RLS) method: in this method
the filter coefficient recursively determine as the cost
function of error squares rich minimum. It's in controversy
to LMS method which the latest mean square is considered.
In RLS method, there is a certain input hypothetically,
while, in LMS method the input consider randomly.
LMS method converges so fast in comparison to RLS
method and carries complicated and excessive computing.
Multi-delay block frequency domain: In fact, this method
is an establishment based on block frequency domain
LMS filters. In this method filter updated in blocky form in
frequency domain. Through the aid of FFT
signals transmission to frequency domain. The computing
reduced enormously by the aid of blocky computing.
LMS algorithm is almost simple because of
dependency in computing correlation and inverting the
matrixes either, and would be appropriate
undercover systems [10].
A. Detection
Objects detection is a representation of changes in
position of an object and following that in a sequence of
videos with especial purpose which should be performed
accurately.
Although the objects detection refers to military
these days due to great application of object detection in
different fields such as traffic control, identifying unusual
movement in security cameras, this issue and its belongings
turn lots of attention [3]. Detecting of mobile objects is
generally divided to two methods: detecting
identification, and detecting based on mobility
based on mobility comprised of four main steps include
video recording, object extraction, noise elimination, and
detecting respectively. Currently, this method is used more
than detecting based on identifying. Most detecting system
have performed as a close ring, which the system
the existing objects by continuing of this process and
camera movements [2].
stochastic gradient descent method is used by this
filter for adapting so that with aware of current amount of
the coefficient. This filter innovated
in 1960.
method: in this method
the filter coefficient recursively determine as the cost
rich minimum. It's in controversy
latest mean square is considered.
hypothetically,
while, in LMS method the input consider randomly. The
so fast in comparison to RLS
excessive computing.
delay block frequency domain: In fact, this method
uency domain of
in blocky form in
. Through the aid of FFT alteration,
. The computing
reduced enormously by the aid of blocky computing. The
s almost simple because of its in
correlation and inverting the
either, and would be appropriate option in
Objects detection is a representation of changes in
in a sequence of
videos with especial purpose which should be performed
military issues,
object detection in
different fields such as traffic control, identifying unusual
this issue and its belongings
mobile objects is
ng based on
and detecting based on mobility. Detecting
based on mobility comprised of four main steps include
video recording, object extraction, noise elimination, and
Currently, this method is used more
than detecting based on identifying. Most detecting systems
the system can detect
of this process and
Figure. 1. The detection system components
The purpose of object detecting
following of a movement in video. This technology can be
used for visual monitoring system in cities and important
places, besides it can be used in large scales.
This process is a frame to frame detection of
direction of object in a video. In follow, some
of object detecting are mentioned.
Auto-monitoring: monitoring the
suspicious activities and unpredictable occurrence.
Identification based on movement: like human
identifying based on the type of walking, auto
identification of an object etc.
Interaction between human and computer: face
identification, trough looking to computer screen and
identifying the statement of a person
to the computer.
Video Indexing: automatic margin writing and
retrieving the videos in multiple databases
Object navigation: programming the directions and
ignoring to hit the obstacles and moving in determined
way.
https://sites.google.com/site/ijcsis/
ISSN 1947
detection system components
The purpose of object detecting is a frame to frame
This technology can be
used for visual monitoring system in cities and important
be used in large scales.
is a frame to frame detection of the
In follow, some applications
monitoring: monitoring the scene to find
suspicious activities and unpredictable occurrence.
Identification based on movement: like human
the type of walking, auto
Interaction between human and computer: face
ough looking to computer screen and
of a person for inputting data
automatic margin writing and
databases.
Object navigation: programming the directions and
obstacles and moving in determined
https://sites.google.com/site/ijcsis/
ISSN 1947-5500
636

Accordingly, we aimed at presenting an approach in
which mobile objects were detected by utilization of
movement based on edge and removing background.
Traffic:
online aggregating of traffic data to conduct the
traffic flow and, the number of viewer in a place.
Detecting method has been elaborated by different
factors which complicated the detection methods.
Camera movement: when camera is mobile all of
existing objects achieving a relative motion in relation
to camera movement. Thereby, discovering of mobile
object is complicated in this videos and it is impossible
without inducing some hypothesizes about camera
movement or/and object movement.
Modifications of environmental brightness: the main
source of information to discovery and object detection
of a mobile object is brightness modifications of video
spots. Thus, once these modifications are due to another
factor, the detection methods gain problem [8].
Noise: since the mobile object detection processes is
a spatial-temporal processes, existing of noise and its
modifications during time is another factor which can
disorder the detection process.
A number of powerful detection strategies have
predicted which tolerating the modifications in object
presence and detecting the object trough complicated
movement. New techniques include: incremental visual
tracking (IVT), fragments-based tracking (frag track),
graphic based on discrimination learning and, MIL
Track learning. These techniques are effective not
simple nevertheless. Those are usually included models
which are complicated apparently or optimization.
algorithm and as a result they attempt to be connected in
every second through 25 to 30 produced structures by huge
number of modern cameras [6].
III. Research Method
This study purpose is a type of practical research and the
research method performed by following a simulation
method through employment of software. The suggested
method in this study is a Kernel base method where
adaptive correlation filter is applied.
Moreover, analyzing data performed through MATLAB
software. The kernel tracking method refers to shape of
object for showing.
For instance the kernel can be rectangular or oval with
seamless histogram. The objects are detected by computing
kernel movement in sequential frame.
The Kernel movement is usually like a parametrical
transformation such as transitional movement, orbiting or
affine. Algorithms difference is in the utilization of number
of objects and movement estimation methods. In this
article, we suggested a new method that re-adds the safe
genetic procedure before sampling in order to guarantee the
variations of particles. The suggested algorithm, inducing
the safe optimization procedure before re-sampling which
entirely use safe system mechanism includes promoting and
eliminating the anti-body concentration, crossed mutation,
memory etc. this not only can guarantee high weight
particle in memory unit, but also regulate the concentration
of anti-bodies. High frequency mutation and crossed
practice of particle can separate the collection of primary
particles and based on that, obtaining new particles which
possess better variation.
A. Evolutionary particle filter assessment with safe
genetic algorithm
The effectiveness of suggested algorithm can be
observed from practical detection procedure which is the
estimation of non-stationary economic modifications of a
variable.
https://sites.google.com/site/ijcsis/
ISSN 1947-5500
637

The estimated results by standard particle filter and
optimized particle filter represented in figure 2. Whenever a
sudden jump situation appeared the particle filter with IGA
gained less error than the standard filter which can be seen
in the box of figure 2.As a result of that, there is not any
particle near the actual situation after situation jump and all
particles possess zero measure of probability. In the other
hand the suggested algorithm with attempt to promote
crossed practice, mutation and other performances creating
numerous new samples. This new samples can obviously
enhance the number of significant particles after re-
sampling.
Accordingly, the detection performance ofparticle filter
with IGA got promotion. It can be speculated that, IGA can
modify the particle filter performance and as a sequel of
that, the variation and effectiveness of particle will be
modified.
Figure. 2. estimation of the special situation by the standard filter and
the particle filter with IGA
B. Object detection in a video surveillance scenario
This experiment involved two video, one of them is
typical video and another achieved from actual surveillance
camera in which the selected mobile object should be
detected. There is a remote control aircraft and a controller
in the first video. Two people crossing stationary camera in
second video.
The weighted color distribution of pixel in the oval,
represent the mobile object which should be detected. The
target normalized color histogram of second video for the
object characteristics can be observed in figure 3.
Besides, it can be used to possess probability
distribution of object observation. After that the weights of
significant particle were achieved. The main problems of
the video sequences include: I) the color feature of
selected object is as similar as the video background, II) the
color is as similar as the color of the passer in the
background and, III) when the passer cross the object, an
almost calm blockage takes place.
Figure. 3. The normalized color histogram of target features
In addition, a particle filter with IGA was compared to
standard particle filter in term of strength of detecting by
this research.
According to detection results it can be observed that,
standard particle filter can successfully detect the object at
the beginning.
However, when controller crosses behind the object or
in front of it, due to similarity in color features, the
identification between object and controller could not be
accurate, consequently, leads to wrong detection.
In these cases, the particles of standard particle filter are
severely under attenuation and becoming overlap in most of
the time. Therefore, when the passer cause blockage,
probably particles trap into a maximum of wrong place and
once the object appear again, the particles can't be
recovered from the failure.
https://sites.google.com/site/ijcsis/
ISSN 1947-5500
638

Efficiency of detection is another aspect which can
reveal the particle filter with IGA is better than standard
particle filter. The numbers of significant particles are in
accordance with figure 4. Difference between the numbers
of significant particles can be seen in two algorithm of
object detection of second video.
After the utilization of crossed practice, mutation and
other performances, the suggested algorithm repeats the
particle selection which can indicate the object feature in a
collection of new particle better.
Accordingly, after several cycle, situation of the mobile
object is expressed more accurate by the collection of
ultimate particle. Moreover, it can lead to more significant
particles and less sample attenuation. This is the alternative
way to show the suggested filter with IGA gained better
performance.
Figure. 4. Comparison of the significant particles of two algorithms
IV. Conclusion
Currently, identification and detection of objects have
significant role in different part of industry such as
monitoring, security control, rescue operation, traffic
control and even in defense industry. Lots of current
techniques involve excessive computing and storage cost
and they are not often automatic. Detection of mobile
object is one of the important applications of machine
vision which plays a significant role in high level vision
system such as traffic control, monitoring system,
interaction between human and computer, automatic
navigation and recognizing based on movement
information.
In this research, for video detection, new types of
evolutionary particle filter with IGA are presented. New
algorithm has focused on attenuation of sample caused by
re-sampling. We added IGA as the anti-bodies of security
system, before re-sampling and observing the particles. The
regulation mechanism of anti-bodies (particles) such as
raise or silence guaranteed the diversity of particles
collection and enhanced the number of significant particles.
Based on estimating of standard model and detecting
mobile object in complicated ground, it is conformed that,
suggested particle filter gained better performance in
comparison to standard particle filter in terms of errors in
estimation of situation, video error detection, and the
number of significant particles.
This revealed that, the particle filter with IGA enhanced
the number of significant particles, and dictates the
collection of particles to represent actual situation better.
This can raise the accuracy of estimate of situation and
reduce error.
https://sites.google.com/site/ijcsis/
ISSN 1947-5500
639

References
[1] Casey, S. D. Adaptive Signal Processing. In Excursions
in Harmonic Analysis, Vol. 4, 261-290, 2015.
[2] Challa, S. Fundamentals of object tracking. Cambridge
University Press, 2011.
[3] Deljuo, Y; Ebrahimi E. Tracking moving objects in
video using a cost function based on the modeling sparse
describes using HOG, Proceedings of the Nineteenth
Annual National Conference of Computer Society of Iran,
1390.
[4] Gupta, R. K. Object detection and tracking in video
image (Doctoral dissertation), 2014.
[5] Khalili, A., H. Tracking moving objects in not set in a
network of cameras, Artificial Intelligence master's thesis
trends, Sharif University of Technology, 2007.
[6] Mazinan, A. H; Amir-Latifi, A. Improvement of mean
shift tracking performance using a convex kernel function
and extracting motion information. Computers & Electrical
Engineering, 38(6), 1595-1615, 2012.
[7] Moallem, P; Memar M, A; Ashourian, M. Robust and
fast tracking algorithm in video sequences by adaptive
window sizing using a novel analysis on spatiotemporal
gradient powers. Journal of Circuits, Systems, and
Computers, 16(02), 305-317, 2007.
[8] Moslem, H. Tracking moving objects in video images
Kalman filter, 2011.
[9] Pourhaghighat A, H. Visual tracking of objects of
arbitrary shape in environments without limitation. A
dissertation of Sharif University, 2013.
[10] Radke, R. J; Andra, S; Al-Kofahi, O; Roysam, B.
Image change detection algorithms: a systematic survey.
Image Processing, IEEE Transactions on, 14(3), 294-307,
2005.
[11] Yilmaz, A; Javed, O; Shah, M. Object tracking: A
survey. ACM computing surveys (CSUR), 38(4), 2006.
[12] Zhu, C. Video object tracking using SIFT and mean
shift, 2011.
https://sites.google.com/site/ijcsis/
ISSN 1947-5500
640

Agile Practicing and Outsourcing
Muhammad Sarfraz 1, Maria Ramzan 2, Akhter Rasheed 3, Fateh Ali 1
1Department of Mathematics and Statistics, Riphah International University Islamabad, Pakistan
2Govt. Post Graduate College for Women Satellite Town Rawalpindi, Pakistan 3Department of Mathematics, COMSATS Institute of Information Technology Abbottabad, Pakistan
Abstract- The software industry can be widely seen as a key driver for business improvement. Outsourcing of software
development tasks has become a major issue for large software enterprises. Software outsourcing has been progressively
increasing. However significant outsourcing failure rates have also been reported. Therefore, outsourcing occurred by the
wrong decision can cause major technological and economic setbacks. The objective of this research is to develop a model
for outsourcing in order to improve outsourcing process and to help out the organizations to overcome barriers
(communication, coordination & quality) that may have a negative impact on software outsourcing as well as to improve
their success rate. Literature is consulted to highlight various issues of outsourcing. A case study is conducted to validate
the effectiveness of our proposed model. The purposed model contains different practices of agile which provide an
effective way to improve coordination, quality assurance and reduces communication gaps in outsourcing.
Index Terms- Agile, Outsourcing.
I. INTRODUCTION
Rapidly growing industry of Information Technology (IT) is changing every aspect of human life. Many nations
have identified their areas of comparative advantage and developed policies and guidelines that have enabled them
to derive maximum benefits from those areas [1].
Our selected research area Agile practices and Outsourcing basically originates from software engineering. Agile
software development is a group of software development methods based on iterative and incremental development
where requirements and solutions develop through Mutual Corporation between self-managed cross functional
teams. Agile itself is like an umbrella which includes many techniques such as scrum, XP, DSDM etc. to improve
outsourcing.
Whereas, Outsourcing is the contracting out of a business process used by different organizations to reduce cost by
transferring part of work to third party rather than completing it within the organization [2]. This process increases
budget, time and efforts so organizations act as a team with other companies to minimize these issues [3] .Increment
rate of IT outsourcing spending would increase from $268 billion in 2009 to $325billion by 2013 [4]. According to
the research, main reasons that an organization face in outsourcing decisions are: language differences,
1 Corresponding Author: Muhammad Sarfraz, Riphah International University Islamabad, Pakistan.
Email: [email protected]
International Journal of Computer Science and Information Security (IJCSIS), Vol. 14, No. 6, June 2016
641 https://sites.google.com/site/ijcsis/ ISSN 1947-5500

geographical, and socio-cultural distances [5]. However there is still a need to resolve these above mentioned
problems and to provide a well-structured and organized framework to develop better quality software. For this
purpose we have to use different Agile practices, agile practices are a popular alternative in outsourcing to resolve
different problems.
Objective of this research paper is to develop a model for outsourcing process. This model can improve outsourcing
process by using different agile practices and to help out the outsourcing organizations to overcome barriers that
may have a negative impact on software outsourcing as well as to improve their success rate. The paper is organized
as follows: Section 1 provides introduction. Sections 2 provide a literature review that gives insight for existing
models and practices. Section 3 comprises of proposed model. Section 4 elaborate results that will tell the
effectiveness of proposed model and at the very last section we will conclude our findings and loop holes for future
research.
II. LITERATURE REVIEW
This paper argued that globally distributed projects are more interesting and challenging than even complex in house
projects [6]. According to Herbsleb, there is a strong evidence of survey showing that development tasks take much
longer time than co-located tasks and communication, coordination, Quality, are mainly accounted as a reason [7].
The dispersed team member’s set-up in projects has different effect on the development of software at many levels
[7]. The globally distributed software development involves different stakeholders in terms of national and
organizational cultures; separate location and time-zones, and intensive use of information and communication
technologies [8]. The difference in geographical, temporal and cultural aspects are found to have great effect on how
dispersed team members work together; such conditions actually introduce challenges in relation to Quality,
communication and coordination [9].Developing products and services in outsourcing, quality assurance is any
systematic process of checking to see whether a product or service being developed is meeting specified
requirements and is said to increase customer confidence as well as enable a company to better compete with others
[10]. Machinery failure is another important reason because problems associated with machinery are lack of
maintenance, lack of new technology needed to produce the goods or improper setup. Furthermore, most industrial
centers lack capital, which is needed for updated technology in order to meet the product requirements [11].
Management and control are essential factors for quality assurance, hence additional supervision such as detail
reports about the product design, its production process, representations and warranties regarding the product quality
as well as specifications of product design, its prototypes and samples need to be established [12]. An essential part
of any business is to clarify the requirements and manufacturing processes that depends on the quality and
production of the final goods. To achieve this, close relationship between manufacturing and management has to be
established and constant communication is required. However, when companies outsourced the time difference,
distance and language barriers become the biggest issues to communicate [13]. Communication becomes an issue
and can result in a quality fade, if the supplier does not speak international language or does not fully understand the
requirements [14]. Due to the fact that global development consists of distributed team, the context of
communication has to take a technology-mediated form and thus limited one [15]. It is evident that using those
technology-mediated communication tools over temporal distance creates significant delays in communication [16].
International Journal of Computer Science and Information Security (IJCSIS), Vol. 14, No. 6, June 2016
642 https://sites.google.com/site/ijcsis/ ISSN 1947-5500

Furthermore, some issues cannot be solved by communicating through phone or email and hence it has to be solved
on site, however due to the distance this option becomes limited and can lead to further complications. Due to
reliance on communication through phone or email may result in lower productivity, choice of poor raw material
quality or incorrect manufacturing processes [17]. Coordination is the act of integrating tasks that reside in different
organizational units, so that all units contribute to the general objective. [18]. There is always a coordination
problem when two individuals have a common goal to achieve and when the action of one depends on the action of
the other [19]. Coordination problem amplifies when the development activity is done with distributed team, across
cultural border and over time and space [20]. The distance also damages the feeling of ‘teamness’ as team members
may not be fully aware of each other [21].We have to solve the above mentioned problems through agile principles.
Agile project method on the one hand is mostly about delivering more value to customers through regular
collaboration and frequent feedback which ultimately leads to achieving competitive advantage [22].Agile give first
priority to satisfy the customer through early and continuous delivery of valuable software. It welcomes changing
requirements, even late in development. Agile processes harness change for the customer's competitive advantage.
We also solve the problem mentioned in [16] through agile because agile focused on Continuous attention to
technical excellence and good design enhances agility. III. PROPOSED WORK
Our proposed model consists four phases these are:
A: Assessment
B: Decision and Negotiation
C: Implementation
D: Optimization and Refactoring
3.1 Assessment
The first activity of to be done in outsourcing is defining strategically objectives for internal assessment. Prior to
outsourcing, strategically objective definition supports in establishing the answer “whether the activity is responsible
for competitive advantage or not?
Figure 1: Proposed Model
International Journal of Computer Science and Information Security (IJCSIS), Vol. 14, No. 6, June 2016
643 https://sites.google.com/site/ijcsis/ ISSN 1947-5500

The expectations set in this phase become difficult to change later so it’s important to be more focused while
defining objectives.
Major reason of project failure is poor planning; companies should know what should be outsourced and what
should not be. The results of assessment phase help the enterprise with much of the information required for
decision phase and management. This phase is completed without interference by vendors; however, external factors
may involve determining current trends, successful sourcing strategies.
3.1.1 Active Team Member Communication
In agile methodologies, rich, effective and highly saturated team member Communication is very important for
successful development. The proposed framework enforces effective communication between development team by
prescribing a set of frequently repeating meetings like sprint planning meeting, daily stand up meeting, sprint review
and retrospectives meeting.
3.1.2 Retrospective
Team reviews his own work and determines what could be altered to make the next Sprint more productive and
effective. Each team member gets a chance to identify what went well and what can be improved. It helps to identify
conflicts and dealt with.
3.1.3 Feasibility Report
This report contains all the parameters including organizational & people issues required to access the suitability of
the system. And global outline plan which provides the details of system development plan and risk log.
3.2 Decision and Negotiation
The nature of the activity to be outsource has an impact on the location and mode of transaction that’s why we have
sequentially arranged the major questions of decision making what, why, where, whom. The critical phase in
outsourcing Lifecycle that covers the details of activities to be outsourced as well as details of vendors are also
considered by using a request for proposal processes and request for information processes and finally the “best-fit”
vendor is selected. This phase commences the formal meeting with vendors and detailed requirements are defined to
ensure a smooth handover without risks.
3.2.1 Active Stakeholder Participation
It is clear that all stakeholders must actively work with the development team to develop successful software. Active
stakeholder involvement helps to reflect their actual needs and to make timely decision. Stakeholders must actively
involve in finalizing the project charter, sprint planning and sprint review to get demos of working software and to
provide timely feedback.
3.2.2 Requirements Prioritization
It is very critical activity to make good decisions at initial level of project planning and helps to improve customer
satisfaction and lower downs the risk of project cancellation [req. prior]. The proposed model initially prioritized the
requirements into essential, useful, desirable and least critical requirements
3.2.3 Early and Iterative Estimation
Early estimate provides relatively better and predictable development schedule to the customer. Iterative
International Journal of Computer Science and Information Security (IJCSIS), Vol. 14, No. 6, June 2016
644 https://sites.google.com/site/ijcsis/ ISSN 1947-5500

development helps to get feedback from customers at very regular intervals and it helps the developers to learn more
about their estimating errors. In proposed model, each user story is roughly estimated through story points at the
beginning and after iteration if team feels that there is need to re-estimate the story, they get an opportunity to re-
estimate the story and this re-estimation provides them more details about their work to be done in the next iteration.
3.2.4 Business Case Document
It is very important document that is initially developed. Its main contents are: Executive Summary, Problem
Statement, Feasible Solution, Recommendations and Implementation approach.
Executive Summary outlines the main problem or opportunity, the major considerations, the key resources required
to complete the project, the expected outcome and the predicted ROI (Return on Investment).
Problem Statement provides the generic description of the domain area where the issues are needed to be addressed
and reasons why it exists and all the factors which are responsible for creating it including people, process and
technology.
Feasible Solution provides best possible solutions to the problem are explored and described with their advantages,
costs & funding plan, feasibility, risks, assumptions and dependencies.
Recommendations make a comparison of all characteristics of each solution option and suggest a suitable solution
for the project.
Implementation Approach provides an overview of proposed model undertaken to develop the project from project
initiation to project closure.
3.3 Implementation
3.3.1 Coding Standard
The implementation and use of coding standards can enable companies to deliver higher quality software in a
manner that is cost-effective and efficient. Using coding standards, you can reduce costs, and improve productivity;
however, most importantly, you can automate the prevention of errors throughout the software lifecycle. This not
only leads to direct savings in time and cost, but also leads to overall productivity gains that will impact revenue and
profitability.
3.3.2 Continuous Integration
After passing unit test, code is integrated. Our proposed framework suggests continuous integration to fix integration
bugs at an early stage and provides rapid feedback to developers about their work. Our proposed model not only
suggests simple software design but it applies this approach from planning to development. Everyone in the team
must think before practically implementing anything “Is there any other simple way to plan or design or code the
functionality”. Simplicity in software development maximizes the better maintainability and extensibility of the
system.
3.3.3 Flexible Architecture& KISS Design
Our proposed model not only suggests simple software design but it applies this approach from planning to
development. Everyone in the team must think before practically implementing anything “Is there any other simple
way to plan or design or code the functionality”. Simplicity in software development maximizes the better
maintainability and extensibility of the system.
International Journal of Computer Science and Information Security (IJCSIS), Vol. 14, No. 6, June 2016
645 https://sites.google.com/site/ijcsis/ ISSN 1947-5500

3.3.4 Small Releases
Small and frequent releases help to provide feedback to the development team whether or not the project under
development addresses their requirements. Customers also gain confidence that team is developing right thing for
them.
3.4 Optimization and Renegotiation
This phase contains two activities for monitoring performance and renegotiating contract. Termination Performance
depicts a certain level to which vendors meet pre-agreed service level agreements. Optimization emphasis on those
activities which ensures the management and improvement of outsourced arrangements. Renegotiation Service
providers are more focused on efficient and high quality services. Contract management is a backbone of
outsourcing and once organizations have gone through a detailed assessment of their contract they can surely move
ahead to renew, renegotiation or rebidding.
3.4.1 Customer Acceptance Test
It verifies that the solution is working properly for the users and performed by customers. This is final test to
discover defects which remained uncover in previous testing techniques.
3.4.2 Code Review
In this process, one developer reviews the piece of code developed by another developer of the team with the
intension of finding design errors and bugs to get quality code at an early stage. This review also helps to enforce
coding standards and to get a well-structured code.
3.4.3 Code Refactoring
The proposed model suggests code refactoring process in order to maximize code readability and maintainability. It
also reduces the code complexity and makes the simple.
IV CONCLUSION
For the past decade, agile methods have proved beneficial and helping Information Technology (IT) software teams
to deliver software on schedule with high quality that satisfies stakeholder needs. The purpose of this research was
to suggest a suitable framework to software industry to overcome the barriers (communication, coordination and
Quality) faced during outsourcing. For this purpose, we have used different agile practices because we need a
process that can respond efficiently to change to the product under development. We believe that the adoption of this
framework will help the software industry to enhance the productivity of a team, reduce the communication gaps
and to develop quality products. This research is only limited to resolve the problems related to communication,
coordination and quality and remaining practices that are not used during outsourcing like project management,
engineering and productivity are not considered. Future research will apply principles of agile methodology with
proposed framework to resolve problems mentioned above.
International Journal of Computer Science and Information Security (IJCSIS), Vol. 14, No. 6, June 2016
646 https://sites.google.com/site/ijcsis/ ISSN 1947-5500

REFERENCES
[1] Sultana, S., Motla, Y. H., Asghar, S., Jamal, M., & Azad, R. (2014, February). A hybrid model by
integrating agile practices for pakistani software industry. In Electronics, Communications and Computers
(CONIELECOMP), 2014 International Conference on (pp. 256-262). IEEE.
[2] Skjoett-Larsen, T. (2000). Third party logistics-from an interorganizational point of view. International
journal of physical distribution & logistics management, 30(2), 112-127.
[3] Holmström, H., Fitzgerald, B., Ågerfalk, P. J., & Conchúir, E. Ó. (2006). Agile practices reduce distance in
global software development. Information Systems Management, 23(3), 7-18.
[4] Harris, J., Hale, K., Brown, R. H., Young, A., & Morikawa, C. (2009). Forecast: Outsourcing worldwide
forecast database, 2000-2013. Gartner, Stamford, CT.
[5] Karolak, D. W. (1999). Global software development: managing virtual teams and environments. IEEE
Computer society press.
[6] Herbsleb, J. D., & Moitra, D. (2001). Global software development. Software, IEEE, 18(2), 16-20.
[7] Holmström, H., Ågerfalk, P. J., & Fitzgerald, B. (2006, October). Exploring the assumed benefits of global
software development. In Global Software Engineering, 2006. ICGSE'06. International Conference on (pp.
159-168). IEEE.
[8] Ågerfalk, P. J., Fitzgerald, B., Olsson, H. H., & Conchúir, E. Ó. (2008). Benefits of global software
development: the known and unknown. In Making Globally Distributed Software Development a Success
Story (pp. 1-9). Springer Berlin Heidelberg.
[9] Campbell, J. D. (1995). Outsourcing in maintenance management: a valid alternative to self-provision.
Journal of Quality in Maintenance Engineering, 1(3), 18-24.
[10] Ågerfalk, P. J. (2004). Investigating actability dimensions: a language/action perspective on criteria for
information systems evaluation. Interacting with Computers, 16(5), 957-988.
[11] Gordon, A., Lozada, H. R., & Hunter, R. (2010). A MANAGERIAL GUIDE TO AVOIDING THE
PRODUCT LIABILITY TRAP IN DEALING WITH THE PEOPLE'S REPUBLIC OF CHINA. Mustang
Journal of Law and Legal Studies, 1, 28.
[12] Fremlin, G. P. (2008). Careful contracts reduce risk. The China Business Review, 35(1), 34-39.
[13] Carmel, E., & Agarwal, R. (2001). Tactical approaches for alleviating distance in global software
development. Software, IEEE, 18(2), 22-29.
[14] Campbell, J. D. (1995). Outsourcing in maintenance management: a valid alternative to self-provision.
Journal of Quality in Maintenance Engineering, 1(3), 18-24.
[15] Ågerfalk, P. J. (2004). Investigating actability dimensions: a language/action perspective on criteria for
information systems evaluation. Interacting with Computers, 16(5), 957-988.
[16] Agerfalk, P. J., Fitzgerald, B., Holmstrom Olsson, H., Lings, B., Lundell, B., & Ó Conchúir, E. (2005). A
framework for considering opportunities and threats in distributed software development.
International Journal of Computer Science and Information Security (IJCSIS), Vol. 14, No. 6, June 2016
647 https://sites.google.com/site/ijcsis/ ISSN 1947-5500

[17] Sekaran, U. (2006). Research methods for business: A skill building approach. John Wiley & Sons.
[18] Carmel, E., & Agarwal, R. (2001). Tactical approaches for alleviating distance in global software
development. Software, IEEE, 18(2), 22-29.
[19] Clark, H. H. (1996). Using language. Cambridge university press.
[20] Agerfalk, P. J., Fitzgerald, B., Holmstrom Olsson, H., Lings, B., Lundell, B., & Ó Conchúir, E. (2005). A
framework for considering opportunities and threats in distributed software development.
[21] Battin, R. D., Crocker, R., Kreidler, J., & Subramanian, K. (2001). Leveraging resources in global
software development. Software, IEEE, 18(2), 70-77.
[22] Boehm, B. (2002). Get ready for agile methods, with care. Computer, 35(1), 64-69.
International Journal of Computer Science and Information Security (IJCSIS), Vol. 14, No. 6, June 2016
648 https://sites.google.com/site/ijcsis/ ISSN 1947-5500

Model Driven Architecture for Secure
Software Development Life Cycle Muhammad Asad, Shafique Ahmed
National University of Sciences and Technology, Islamabad
Abstract – Secure Software Development is an important issues for the software industry for couple of years
as security issues in the software development life cycle are not easy to handle. Success of a software deeply
depends on the fact that it is not easily vulnerable to security threats and breaches. Many organizations have
made security guidelines to cope with these challenges to bring them in an organized and secure way. Besides
so much advancements in the field, securing the software from vulnerabilities in not achieved in all modules of
software development life cycle. The guidelines and methods designed for the secure software development
have put a lot contributions but they are so verbose that these measures are nearly not implementable. In this
paper a model is proposed for secure software development life cycle in model driven architecture level (MDA-
SDLC). In the proposed model, modeling methods and approaches are used to ensure the advances in secure
model driven architecture with simplified integrity of security modules in security critical software’s
development lifecycles.
Keywords — Model Driven Architecture, Security, SDLC, UML,
1. Introduction
Technological advances are currently improving many aspects related to the development and design of software
systems, thus entailing an increase in the complexity of enterprise security architectures. This in turn brings about a
rise in the number of attacks [1]. In the past few years tremendous efforts are made to secure the systems form
vulnerabilities and security breaches but failed to stop incidents. Main reason behind is that in order to integrate
security in the systems requires special skill sets, expertise, collaborations, training and experience among the security
experts, developers and other related stakeholders. Despite of the expert solutions and system testing, many of the
systems are vulnerable and are certainly attacked. Reasons behind such flaws lies in a fact that in most cases surety
requirement are tested after the deployment phase, which make it too difficult to handle security issues as well as
make it much costly remedial of such security flaws and issues which results in insecure delivery and release of
software to potential users [2]. After the release attackers breaches the security gaps and move inside the secure data.
Attackers are most of the time wanting sensitive data which they use to blackmail the organizations as the data is
directly or indirectly important to the users or the organization itself [3].
In the recent time, in accordance to the formal models, a new technology is introduced for specifications and
interoperability. OMG named it as MDA- the Model Driven Architecture. Default MDA specified models (CIM, PIM,
and PSM) [4] define different viewpoint which can be better described as abstraction layers at different level.
Computation Independent Model (CIM) represents the business model as it describes the working of the system. But,
CIM doesn’t shows the detailed details of system environment, technology used or other related requirements. The
Platform-Independent Model (PIM), as the name indicates, is platform independent and this property is achieved by
implementing some abstraction techniques. Technical details of the system are then realized by using platform specific
mod l (PSM). UML design constructed by PIM is now converted to PSM, the Platform Specific Model by using formal
methods and policies [5].
International Journal of Computer Science and Information Security (IJCSIS), Vol. 14, No. 6, June 2016
649 https://sites.google.com/site/ijcsis/ ISSN 1947-5500

1.1. Security Requirements
While taking about security requirements, a question arises that, what are risks regarding security within the
application? The answer is quite interesting and explains the main risks like, what type of information the application
will handle, company size, end users, level of impact the application cause to other organizations etc. therefore while
designing the application these requirements are kept in mind for establishing security needs for organizations
standards.
1.2. Application Security Requirements Tailoring
The question comes in mind that how we can secure the software? How to start implementing security to software?
The answer comes that’s we can ask for the security to the developers, get the copyright policies. For this purpose we
can start with the generic security like including generic security requirements, all security mechanisms, addressing
all common vulnerabilities, taking care of can be use or misuse cases, tailoring the examples for security,
authentications working, defining access control policies, Validation rules and finally working on logging approaches
[6].
Fig.1 Comprehension of Model Driven Architecture
Since prevention is often more economical than remediation, empirical security knowledge such as common attacks
and vulnerabilities are made public and available for practitioners through web-based portals such as NVD, CWE,
OWASP. Security standards, such as PCI DSS or ISO provide high level guidelines and impose several compliance
requirements to application developers [7].
International Journal of Computer Science and Information Security (IJCSIS), Vol. 14, No. 6, June 2016
650 https://sites.google.com/site/ijcsis/ ISSN 1947-5500

Fig.2. 3-Tier Flow of Security in applications
No doubt by applying security requirements in the software, we can secure them to some extents but only if these
requirements are asked to be implemented. But the studies reveal that most of the times software developers are not
asked to implement clear security requirements which results in absolute failure of SDLC. For this purpose we should
focus on the goal to provide one who can influence the software security, like stakeholders, developers, managers,
QA, release management, server configuration etc. training to them and awareness about the fact may lead to
successful delivery of secured systems.
1.3. Testing Most of the time, security is ensured at the testing phase in SDLC. Many software developers does not bother to
consider security issues during rest of the phases but latterly it will cost the clients as well as the development team.
In the testing phase it is ensured that security standards are met and the security testing performed is in accordance to
the design and security requirements. J. Manico et al. [6] described that it is important to consider security from the
very first step in the SDLC, if it is not, then at the testing phase it may cause much cost to the stakeholders because at
the testing phase penetration testing, infrastructure assessment and other sign off are deployed to the production
environment. C. Jones [8] have shown that the cost of security increases to 200% after the post release security
implementation. It is clear from the fig. 3 below. J. Manico et al. have mentioned that during the constructions it is
30-60 times more costly to introduce security then at the design phase. [6].
Fig.3 Cost of Software Bugs
International Journal of Computer Science and Information Security (IJCSIS), Vol. 14, No. 6, June 2016
651 https://sites.google.com/site/ijcsis/ ISSN 1947-5500

2. Related work
2.1. Model Driven Security & Model Driven Engineering
In the early 2000s Model Driven Security has emerged as a specialized Model-Driven Engineering methodology for
supporting security-critical systems development [9]. MDE comprises of tools and loose systematic methodologies to
develop a quality software. The claim behind MDE is the abstractions used to represent a system or module belonging
to the system. The depiction of the system in requirement specification phase gives the overall picture of how exactly
the component engineering or system engineering process has to be carried out to develop an error free system. MDE
helps to improve the design by ensuring security into the component development phase by using COTS
[10](Commercial off the Shelf)
There arises a problem that how to use MDE tools [9] and other related development kits for developing vulnerability
and threat free system which is also immune to the security issues. J. Poole wrote that security attacks and attempts of
breaches are often unexpected and can be malicious if no proper monitoring and care in taken, these attacks can be on
the basis of system vulnerability rate, no of users using the system or application and the availability of computational
resources. When we talk about MDE, we should be familiar with three keywords i.e. model, meta-model and model
transformation [11].
The core of MDE is a model. Model is process of simplifying the given problem using relevant specification and
design languages. For example, In case of a car analogy, if an engineer wishes to have a computational model of a car
for 3D visualization, a language such as the one defined by a Computer Assisted Design (Cad) tool will be necessary
to express a particular car design [11]. In the computing world several such languages – called meta-models and model
transformation allows passing of relevant information from one formalism to other.
2.2. Approaches for Model Driven Security
In order to deal with security issues, organizations and different standard institutions have made list of “to-dos”, which
includes actions and best-practices from methodological point of view at organizational level. Our purposed model
driven secure development lifecycle (MDA-SDLC) combines inflexible modeling methods with efficient development
skills and process oriented SDLC guidelines grown from model-driven security for production of organized, concrete,
and proficient systems using SDLC security engineering practices [12]. Before moving forward, lets describe the
previous approaches which were designed to cope with security flaws in early secure software development life cycle.
Previous researches mainly focus on two approaches i.e. extending UML and the second is Formal methods. Formal
method approach is bit difficult even after expert training, however extending UML is relatively easier as it is a
modeling language most commonly used and understood to developers. There are many UML security profiles are in
practice for extended UML security models [2].
These promising approaches applies security model of security engineering for gaining more focused views at the
abstraction level and during software’s development lifecycle to support experts to device security in an accurate &
proficient way. In the below fig 4, overview of securing software at SDLC level in shown.
International Journal of Computer Science and Information Security (IJCSIS), Vol. 14, No. 6, June 2016
652 https://sites.google.com/site/ijcsis/ ISSN 1947-5500

Fig.4 Overview of Security in the SDLC
A security methodology provides tools, techniques and processes during the SDLC which guides the process of
security implementation and assurance and is thus engrossed on improving the state-of-the-practice in developing
secure software [13]. But there are no such surveys available that can deal with real time systems [14], distributed
systems [13], web applications [15] and mobile applications [16] at enterprise level. However overall implementation
of security methodology at a deeper level is shown in the figure 2.
Fig.5 Security in the SDLC with more deep
2.3. Model Driven Architecture The MDA provides substantial inferences [11] by introducing non-functional requirements i.e. reusability, portability
and interoperability [4] during SDLC Metamodeling and Adaptive Object Models (AOMs) [11]. Model Driven
Architectures are built on Meta Object Facility (MOF). MOF, according to OMG [17], provides metadata framework
[18] for defining modeling language syntax [17], UML [19], and Query-View-Transformation standard (QVT), are
defined by MOF [9].
There are three main abstractions layers, i.e. CIM, PIM & PSM of MDA which uses the modeling languages, as
showed in Fig.6. Software platform (J2EE & NET) and hardware platform independent system designs and business
logic are specified by PIM, the Platform Independent Model. In a similar way, functional requirements are described
by CIM, the Computation Independent Model, using use case diagrams. Finally, Platform Specific Model (PSM)
specifies the design, implementation and deployment [4] details. In this way upper level models defines the
abstractions at the lower level models [2].
International Journal of Computer Science and Information Security (IJCSIS), Vol. 14, No. 6, June 2016
653 https://sites.google.com/site/ijcsis/ ISSN 1947-5500

Fig. 6. Foundational MDA [5]
Within the model driven architecture, core MDA standards forms the foundation for comprehensible structures for
authorizing, authenticating, reproducing and management models [11]. OMG standards build the MDA idea. These
standards (UML, MOF, XMI, and CWM) helps MDA to build state of the art architecture. MDA streamlines the
process of integration with emerging technologies by rapid development of system requirements [4]. So we can say
that MDA provides interoperability and portability specifications in a structured way.
Fig. 7. Pyramidal Construction of MDA Approach
J. Poole [11]shows that Adaptive Object Models and Metamodeling has implications for MDA. He also said that Meta
Data modelling also requires metamodeling which is primary source of specifications and requirements. In the similar
way, metadata helps in achieving the interoperability and usability standard of MDA via metadata which is shared for
understanding overall automated implementation, design, testing, deployment and maintenance of the model. On the
other hand dynamic system performance is delivered by the AOM centered on run-time interoperability mechanism.
For better understanding of MDA, highly supportive design pattern is building on Java platform (mapping PIM design
to PSM design) [11]. In MDA mapping, while translating XML in UML design, we need to perform the actual
translating in MDA technical space [20].
International Journal of Computer Science and Information Security (IJCSIS), Vol. 14, No. 6, June 2016
654 https://sites.google.com/site/ijcsis/ ISSN 1947-5500

Fig. 8. Relationship between Different Standards in MDA
Here it become obvious that MDA transformation needs MOF which parses XML in the technical space instance of
the Meta model. J. Mellor et al. says that in MDA, platform is related to the realization of the model which represents
the specification implementations of the platform [21]. Figure below shows the model, Meta model and platform
mapping of MDA realization in UML
Fig. MDA Model, Meta-model and Platform Realization
Wie can hence say that MDA is multiplatform environment for present days IT atmosphere [22].
3. MDA for Secure SDLC (MDA-SDLC)
3.1. Security in SDLC R. Kissel et al. [23] discussed the implementation of security at SDLC. In each phase security
requirements are kept under consideration. Below are the details:
Initiation Phase
In this phase key security activities includes:
o Confidentiality, integrity & availability checking in accordance to baseline requirements
o Privacy requirements.
Development Phase
International Journal of Computer Science and Information Security (IJCSIS), Vol. 14, No. 6, June 2016
655 https://sites.google.com/site/ijcsis/ ISSN 1947-5500

Following are the security activities for this phase [23]:
o Risk assessment
o baseline security controls supplementation
o Security requirements analyzing
o Performing security & functional testing
o Documentation for accreditation.
o Design architecture for security.
Implementation Phase
Following are the security activities for this phase [23]:
o Information system integration
o Synchronous activities for security controls testing along with Planning and conducting
system certification.
o Activities regarding system accreditation.
Maintenance & operations Phase
Following are the security activities for this phase [23]:
o Operational readiness conduction
o Configuration management
o IS security assurance.
o Authentication.
Disposal Phase
Following are the security activities for this phase [23]:
o Building and Executing Disposal/Transition Plan
o Archiving critical information for future use
o Refining media files
o And finally disposing software & hardware.
3.2. Security Tactics
Security Tactic Security Mechanism
Authentication Digital Signature, Authentication Exchange,
passwords, one-time passwords, biometric
identification
Authorize Users Access control lists, define classes of users based
on user roles, or by lists of individuals
Data Confidentiality Routing Control, Traffic Padding
Data Integrity MACs, Digital Signature
Non repudiation Digital Signature, Notarization
Limit Access Firewalls, Proxies
Detecting Attacks Intrusion Detection System
Auditing Maintaining audit trails
International Journal of Computer Science and Information Security (IJCSIS), Vol. 14, No. 6, June 2016
656 https://sites.google.com/site/ijcsis/ ISSN 1947-5500

3.3. Architecture of MDA-SDLC In the fig 9. A proposed architecture for MDA security in SDLC has been given. It entails security
requirements and security models along with system requirements and modeling throughout the DSLC
phases. Project environment illustrates the main roles and responsibilities along with technical and
environment requirements. Software model requirement model contains business processes and roles
assigned to and by the users from business process model. Threat model shows the expected vulnerabilities
and security requirements in the domain of system architecture design. Security model defines security
patterns and other security concepts and security requirements. System artifacts in different phase
represents system modules synchronization, configuration and management and at disposal level it
represents archived information.
Fig. 9 Architecture over view of MDA-SDLC
In the given fig. 10 UML for implementing security in the system model is designed. It defines the surveys along with
other system security requirements, standards, implementations and vulnerabilities.
International Journal of Computer Science and Information Security (IJCSIS), Vol. 14, No. 6, June 2016
657 https://sites.google.com/site/ijcsis/ ISSN 1947-5500

Fig.10. UML for MDA Security [7]
Fig. 11. SSD for Security Model
International Journal of Computer Science and Information Security (IJCSIS), Vol. 14, No. 6, June 2016
658 https://sites.google.com/site/ijcsis/ ISSN 1947-5500

Fig. 12 Security Model Platform
4. Conclusion
In the paper we introduced an approach for model driven architecture with secure software development
lifecycle. This approach will definitely help in secure software development with practical
implementations, extensible description, reproductive security solutions and integrated security model for
diverse security-critical software systems and projects. In future we are hoping to devise a security design
pattern that will cater the security needs of critical systems. That design pattern will help to introduce
security features at design level, implementation level as well as at testing and deployment level.
Evaluations and expert opinions will be used to make improvements in the approach devised for MDA-
SDLC.
5. References
[1] Santiago Moral-García, Santiago Moral-Rubio, Eduardo B. Fernández, Eduardo Fernández-Medina,
"Enterprise Security Pattern: A Model-Driven Architecture Instance," Computer Standards &
Interfaces, 2013.
[2] Xucheng Tang, Beijun Shen, "Extending Model Driven Architecture with Software Security
Assessment," in Third IEEE International Conference on Secure Software Integration and
Reliability Improvement, Shanghai, 2009.
[3] Sahba Kazerooni, Daniel Cuthbert, Andrew van der Stock, Sahba Kazerooni, Daniel Cuthbert,
Krishna Raja, "Application Security Verification Standard," The Open Web Application Security
Project (OWASP), 2014.
[4] F. Truyen, "The Fast Guide to Model Driven Architecture; The Basics of Model Driven
Architecture," Cephas Consulting Corp , 2006.
[5] S. S. Alhir, "Understanding Model Driven Architecture( MDA)," Methods & Tools, vol. 11, no. 3,
pp. 17-24, 2003.
International Journal of Computer Science and Information Security (IJCSIS), Vol. 14, No. 6, June 2016
659 https://sites.google.com/site/ijcsis/ ISSN 1947-5500

[6] Eoin Keary, Jim Manico, "Secure Development Lifecycle," in OWASP, Hamburg.
[7] Golnaz Elahi, Tom Aratyn, Ramanan Sivaranjan, Rohit Sethi, Eric Yu, "SD Elements: A Tool for
Secure Application Development Management," in CAISE, 2011.
[8] C. Jones, Applied Software Measurement: Assuring Productivity and Quality, Mcgraw-Hill, 1996.
[9] Robert France, Bernhard Rumpe, "Model-driven Development of Complex Software: A Research
Roadmap," in IEEE Computer Society, Future of Software Engineering, Washington, 2007.
[10] I. Somerville, Software Engineering, 9th Edition, Boston: Addison-Wesley, 2011.
[11] J. D. Poole, "Model-Driven Architecture: Vision, Standards And Emerging Technologies," in
ECOOP, Workshop on Metamodeling and Adaptive Object Models, 2001.
[12] Zhendong Ma, Christian Wagner, Arndt Bonitz, Thomas Bleier, "Model-driven Secure
Development Lifecycle," International Journal of Security and Its Applications, vol. 5, no. 2, pp.
443-448, 2012.
[13] Anton V. Uzunov, Eduardo B. Fernandez, Katrina Falkner , "Engineering Security into Distributed
Systems: A Surveyof Methodologies," Journal of Universal Computer Science, vol. 18, no. 20, pp.
2920-3006, 2012.
[14] Jin hyun Kim, Jin Young Choi, Inhye Kang, Insup Lee, , "UML B ehavior Mo dels o f R eal-Time
E mb edded Software for Model -Driven Architecture," Journal of Universal Computer Science,
vol. 16, no. 17, pp. 2415-2434, 2010.
[15] Eoin Keary, Jim Manico, "Secure Development Lifecycle," in OWASP, Hamburg, 2009.
[16] NARSIMHA KAMATHA, AKSHEY BHAN, "Securing Mobile Applications Using Model Driven
Architecture," IPASJ International Journal of Computer Science, vol. 2, no. 5, pp. 41-48, 2014.
[17] OMG Adopted Specification Version, "The Meta Object Facility (MOF) Core Specification 2.0,"
http://www.omg.org..
[18] J. Overbeek, "Meta Object Facility (MOF) investigation of the state of the art," University of
Twente , 2006 .
[19] The Object Management Group, "UML 2.0: Superstructure Specification. Version 2.0," OMG,
2005.
[20] Tom Mens, Pieter Van Gorp, "A Taxonomy of Model Transformation," Electronic Notes in
Theoretical Computer Science, vol. 152, p. 125–142, 2006.
[21] Stephen J. Mellor, Kendall Scott, Axel Uhl, Dirk Weise, "Model-Driven Architecture".
[22] Anneke G. Kleppe, Jos B. Warmer, Wim Bast, MDA Explained: The Model Driven Architecture :
Practice and Promise, Boston: Pearson Inc., 2003.
International Journal of Computer Science and Information Security (IJCSIS), Vol. 14, No. 6, June 2016
660 https://sites.google.com/site/ijcsis/ ISSN 1947-5500

[23] Richard Kissel, Kevin Stine , Matthew Scholl , Hart Rossman , Jim Fahlsing , Jessica Gulick,
"Security Considerations in the System Development Life Cycle," National Institute of Standards
and Technology , Gaithersburg, 2008 .
International Journal of Computer Science and Information Security (IJCSIS), Vol. 14, No. 6, June 2016
661 https://sites.google.com/site/ijcsis/ ISSN 1947-5500

Social Relation Based Recommendation
System For Information Overloaded Social
Networks
S.Uma Shankari, Research Scholar, Bhararthyiar University, Coimbatore
Dr. M. Chidambaram , Asst prof, Rajah serofiji College, Thanjavur.
Abstract - Social persuade plays vital part in the product marketing. Though, it’s seldom been regarded in traditional
Recommender systems (RS). This paper provides new paradigm RS which can exploit data in the social networks, with
general approval of items, user preferences, and persuade from the social friends. The probabilistic representation is
improved to build personalized recommendations like data. In world e-marketing, new commerce representations are
normally introduced, new tendency started to materialize. Latest trend is the social networking websites, several of which
concerned not only huge number of visitors and users, however online advertise company to put their ads on sites. This
paper discovers online social networking like new e-marketing trend. We first inspect online social network like new web-
based services, also evaluate social networks by other delegate web-based service. We extort information from real online
social network, also our investigation of this huge dataset expose that friends contain tendency to choose similar items and
provide similar ratings. The experimental outcome on the dataset illustrates that proposed scheme not only progress
prediction accuracy RS but gives solution cold-start and data sparsity problems intrinsic in the collaborative filtering.
Moreover, we recommend improving system performance by concern social networks semantic filtering, and authenticate
its improvement through class project research. In this research we reveal how related friends may be choose for
deduction based on the semantics friend relations and finer-grained customer ratings. Such technologies may be
organized by mainly content providers.
Keywords: Recommender systems, collaborative filtering, social network
I. INTRODUCTION
Recently the social networks are very well-liked, because of explosive participatory media content growth like as
blogs, podcasts online and videos. Important examples contain image, text and video distribution sites like YouTube
and Flicker, social tagging sites like Delicious and micro blogging sites like as LinkedIn Facebook and Twitter as in
[1] [2]. Millions of the users become energetic daily on the social network sites to facilitate sharing and creating
information with any others online. Wide diversity of applications such buying products, wikis and Customer
Review Sites are emerging on Internet. Social networking popularity sites with users results in enormous online
volumes information and therefore significant poses challenge in conditions of data overload. The Information
overloaded through tags, blogs, knowledge-sharing sites, item reviews, user ratings and online gaming frequently
overcome online users exiting them by poor results. A RS is a proficient software tool to recommend users to obtain
popular items without overwhelmed with not related information as in [3]. The RS classifies user‟s neighbors like to
target user‟s profile data and proposes user target product that neighbors frequently liked in past. The proposals
International Journal of Computer Science and Information Security (IJCSIS), Vol. 14, No. 6, June 2016
662 https://sites.google.com/site/ijcsis/ ISSN 1947-5500

aspire to recommend diverse decision-making online users process like as buying best products, watching good
movies or downloading best games. The RS becomes obligatory e-commerce component sites like as Amazon, E-
bay and Netflix for product suggestion as in [3][4][5]. For illustration, when user search keyword „computer‟ at
Amazon website, it proceeds 11,100,260 products, but RS gives computers list preferred in past. Recommenders
employed to give ratings on the subject domains like as music, books, movies, sports, web pages and news. The RS
engage millions of items and users, but usually obtained users rated items. The personal RS recommends or
advertises an appliance to aim exacting user with esteem to user profile data. The user profile information contains
products obtained in past, specific products ratings and demographic information. Furthermore, social networking
user profile websites mentioning and maintain an explicit, self-crafted neglected of their zeal and interest, using
natural language.
The RS is confidential into content-based and collaborative recommendation. The collaborative RS utilizes
information extorted from user profiling, social relationships and machine learning. Though, content-based RS
information retrieval and filtering is utilize to gives proposal nearer to user‟s needs and preferences. User profile
signifies acquiring process and extracting users‟ interest. The main disadvantage is information sparseness that
describes incapability to users recommend because of insufficient overlap with target neighbors and user. New user
may start among blank profile with no rating or selecting any items most important to the data sparseness.
Furthermore, producing modified recommendations not simple enormous task context volume of data shared during
the social networks. Lately RS utilizes information with restricted significance to producing user profiles, easy to
create quality recommendations. Though, challenging assignment in existing scheme as in [6]. The major thing is to
create the scheme more forceful to the data sparseness which simply friends contain few general ratings facilitating
eminence recommendations.
A. APPLICATIONS OF THE RECOMMENDATION SYSTEM IN SOCIAL NETWORKS
The RS online be an effectual method to propose novel products to the users and helpful in diversity of
applications as in [7] [8]. Well-known instance are books, movies, research articles, products and social tags. Few
applications are conversed in the section.
E-COMMERCE RECOMMENDATION APPLICATIONS
Converting Browsers into Buyers: Website viewers frequently explore products online devoid of
purchasing anything. RS aids users to establish products so they desire to buy
Increasing Cross Sell: RS propose further products like to user‟s interest toward improves and purchase
cross-sell
SOCIAL NETWORK RECOMMENDER APPLICATIONS
The RS plays very important role in signifying movie, books, music and extra things termed on relevant
friends' judgment shared on the Facebook. Intended for the case, Happy movie in Facebook appliance that
suggests good movies to group users. The RS is also utilized in personalized recommending documents,
newspapers, e-learning applications, Web pages and e-mail filters.
HEALTH-CARE RECOMMENDER APPLICATIONS
International Journal of Computer Science and Information Security (IJCSIS), Vol. 14, No. 6, June 2016
663 https://sites.google.com/site/ijcsis/ ISSN 1947-5500

Providing adapted diet suggestion service for patients in the health care examination can avert and
administrate coronary heart diseases. By considering family history diseases, food partiality according to period and
promoting intakes for patients progress consumers living habit.
B. SIGNIFICANCE OF RECOMMENDER SYSTEM IN SOCIAL NETWORKS
Social media improves user‟s relations with their colleagues, family members, and friends and social activities. It
gives a way to users to share their opinions and ideas with neighbour and friends. Due to the marvelous growth of
media content like as blogs, podcasts and videos there is require to produce personalized RS to recommend valuable
content to users. Owing to increasing social websites user RS signifies new products effectual. Most online vendors
like as Netflix and Amazon allowing customer to buy products. For example, bookstore collects all data about books
in dissimilar domains in databases, but RS utilizes user ratings on the product and exhibits only most well-liked
books.
II. SURVEY OF RECOMMENDATION SYSTEM
The RS (Recommendation system) classifies user preference for the latest products depending over similar
products user‟s ratings in past or user friend rating on same product as in [9]. Content-based recommendation,
hybrid recommendation and Collaborative filtering are the main methods. Content-based method utilizes similarity
quantity for recommended item by target user dislikes or likes in past as in [10] [11]. Collaborative filtering
technique based on the social network as in [12] [13] gives preference for user friends rather than with similar
anonymous users group.
RECOMMENDATION SYSTEMS IN SOCIAL NETWORKS
The RS based matrix factorization as in [14] control social relationship extorted from network. It considers
friends influence recommend target user to obtain the products as in [15] [16] [17]. Collaborative filtering based RS
suggests some items in dissimilar domains such products, tags, people and communities as in [18]. The sources
classifying recommended items aren‟t only restricted to the online social relations. It also regard obtainable data in
the social networks such as tagging as in [19], user clicks and user interactions as in [20], than traditional RS as in
[21] [22] [23]. Collaborative filtering system may be categorizied into two types like as based memory based and
model system.
Memory-based collaborative system utilizes moreover sample items or user-item matrix, and it‟s further
separated into item or user based recommendation. Evaluating user-user interaction in the social networks along
with millions online users are complex. Cosine similarity calculation is recommended to hold this issue. The RS
produces model to give rating for products bought by employs and user machine learning system to discover
patterns from information. Compared to the memory based RS, model-based collaborative method assists in casing
concealed factors that explicate experimental rating on the new products. Collaborative filtering based RS conquer
the content-based RS problems. For request, this system utilizes domain independent and rating information; it may
recommend any items.
International Journal of Computer Science and Information Security (IJCSIS), Vol. 14, No. 6, June 2016
664 https://sites.google.com/site/ijcsis/ ISSN 1947-5500

On the web base social networks, user specifies their friends or followers; however they also sustain an explicit zeal
and interest, by natural language as in [24]. The RS in [25] intends at discovering factors that persuade user
preferences also relating user modeling method with its associated content or news. This kind system reflects on
appropriate reasons to comprehend user‟s preference. The approach in [26] current SNRS (social network-based
recommender system) that recommends service or product based user‟s preference, friend‟s influence and general
acceptance. It also recommends model for discovering correlations among immediate friends along with histogram
friend‟s rating difference. It recovers prediction accuracy, using fine-grained users rating and semantics friend
relationships.
The trust-aware scheme for adapted user recommendation in the social network is suggested in [27]. It
mostly relies on trust amid users to supports users in community to build decision about same community
individuals. This RS presents users through personalized negative or positive recommendations that may be worn to
found distrust relationships or new trust in social network. Depends on the reputation system that users rates by past
experiences, observations, also considers other users opinion as in [28] [29]. The trust properties like as
personalization, transitivity, and context used to calculate the individual reputation. It‟s significant to examine user
interest, like it supports in recommending products or service to users. Existing systems aren‟t precise in user‟s
opinion predicting.
PROBLEM STATEMENT
Many collaborative RS suffer data sparsity and cold-start problems. Collaborative RS utilizes the available data
from machine learning, social relationships and user profiling. New user establish blank profile devoid of item
rating. The memory-based collaborative filtering method causes data sparsity issues. Due to user‟s profile scarcity
data, related ratings are not obtainable for prediction. Graph-based method proposed to solve data sparsity problem.
RESEARCH GAP
Due to participatory media content growth, RS achieve increasing interest. The majority RS works focus on
user-based memory-based Recommendation model. Memory-based representation tunes few parameters utilized to
discover user interest or ratings in product. Instinctively, user-based approaches simply discover popular products or
items, based on ratings. User based scheme not maintain new items or unpopular. In instances, item-based RS gives
better performance. Nevertheless, both approaches lacking in data sparsity issue in principled manner. The RS
challenge is, recommend both unpopular and popular items with the data sparsity problems. Combination of user
and item based method is fresh research way that opens novel potentials to RS.
III. PROPOSED METHODOLOGY
A) GENERAL RECOMMENDER SYSTEM
In proposed method, Movie Lens users are considered like source. The recommender system overall
functional blocks for ratings of Movie in the social network are exposed in Figure 1. The Figure 1 explicates how
network employs RS to provide movie or item ratings. It occupies two major steps: (i) Measuring and creating
similarity between every User-Movie Matrix. (ii) Determining conditional possibility for unidentified movie ratings
derived from prophecy extracted from every user pair and movies that decrease data sparsity issues. To overcome
International Journal of Computer Science and Information Security (IJCSIS), Vol. 14, No. 6, June 2016
665 https://sites.google.com/site/ijcsis/ ISSN 1947-5500

data sparsity issue in RS, probabilistic generative representation that utilizes the data obtainable in matrix of user
movie. It delicacy every rating in user movie matrix like prediction for unidentified test ratings then, it combines all
ratings by extrapolative value for recommendation. For every prediction, proposed RS calculates assurance based on
similarity procedures towards test user also test movie. Individual average ratings multiply by its assurance level is
considered like an overall prediction. It progress the probability evaluation for unidentified counters and movie
ratings the data sparsity problem successfully.
Tools/Technologies
Dataset: MovieLens Dataset [30]
Mineset: It is a tool to visualize the data
Wega: To examine mining algorithms collection and its conservatory using Java
B) PROPOSED METHODOLOGY: SOCIAL RELATION BASED RECOMMENDER SYSTEM
LIMITATIONS OF GENERAL RECOMMENDER SYSTEM IN A SOCIAL NETWORK
The General RS (Recommender system) becomes inexpert in the social network as they disregard user‟s
reaction patterns and social relative data. The wide-range of RS only regard as every user ratings on items, but they
imagine that all users offer rating on every inspected items. It accidentally choose user‟s rating over missing item
also disregard key factor, users‟ retort patterns. Furthermore, large-scale social network might weaken user-movie
factorization of matrix computational ability in RS. Thus, it increases the training phase computational cost.
Although users share reviews on item along with their friends on social network, general RS can fail to suggest
exact items which they desire to buy. So, it is necessary to enlarge the common RS, combined with social relations,
wealthy social knowledge, response model. It also consist interpersonal influence and individual preference that
increase the RS efficiency in social network.
International Journal of Computer Science and Information Security (IJCSIS), Vol. 14, No. 6, June 2016
666 https://sites.google.com/site/ijcsis/ ISSN 1947-5500
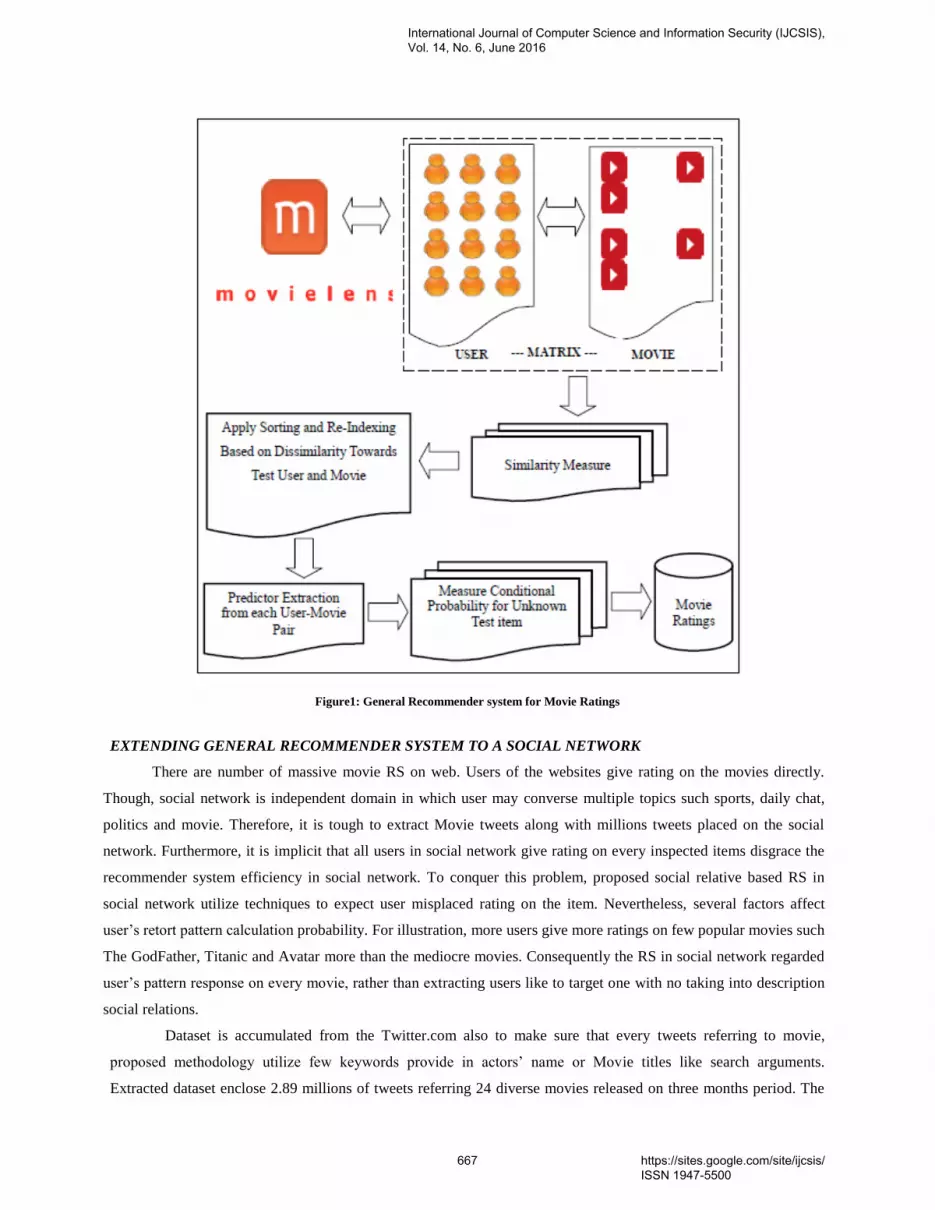
Figure1: General Recommender system for Movie Ratings
EXTENDING GENERAL RECOMMENDER SYSTEM TO A SOCIAL NETWORK
There are number of massive movie RS on web. Users of the websites give rating on the movies directly.
Though, social network is independent domain in which user may converse multiple topics such sports, daily chat,
politics and movie. Therefore, it is tough to extract Movie tweets along with millions tweets placed on the social
network. Furthermore, it is implicit that all users in social network give rating on every inspected items disgrace the
recommender system efficiency in social network. To conquer this problem, proposed social relative based RS in
social network utilize techniques to expect user misplaced rating on the item. Nevertheless, several factors affect
user‟s retort pattern calculation probability. For illustration, more users give more ratings on few popular movies such
The GodFather, Titanic and Avatar more than the mediocre movies. Consequently the RS in social network regarded
user‟s pattern response on every movie, rather than extracting users like to target one with no taking into description
social relations.
Dataset is accumulated from the Twitter.com also to make sure that every tweets referring to movie,
proposed methodology utilize few keywords provide in actors‟ name or Movie titles like search arguments.
Extracted dataset enclose 2.89 millions of tweets referring 24 diverse movies released on three months period. The
International Journal of Computer Science and Information Security (IJCSIS), Vol. 14, No. 6, June 2016
667 https://sites.google.com/site/ijcsis/ ISSN 1947-5500

proposed method named like social relation RS contains both interpersonal influence and individual preference. This
method factorizes user movie matrix into user-movie preference and user-movie influence matrices as illustrate in
figure 2. The historical data, with user-user interactions and user-item, these two concealed matrices are considered.
From these matrices, proposed methodology able to calculate user rating on the movies also categorize movies into
refused and interested ones concurrence to users and user followers‟ behaviors.
Tools/Technologies
Dataset: MovieTweetings [31]
Wega: To examine mining algorithms collection and its extension by Java
Figure 2: Recommender system for Movie Ratings in Social Networks
IV. RESULT AND DISCUSSION
PERFORMANCE METRICS:
Accuracy Prediction: Prediction of user ratings accuracy performance calculated. It is predicted by
evaluating selected items along with obtainable relevant items
Mean Absolute Error: It procedures the standard deviation among user‟s true rating and predicted rating.
Precision: It is ratio among total items selected and relevant items selected.
International Journal of Computer Science and Information Security (IJCSIS), Vol. 14, No. 6, June 2016
668 https://sites.google.com/site/ijcsis/ ISSN 1947-5500

Recall: It is ratio among relevant items obtainable and relevant items chosen.
ACCURACY PERFORMANCE
Figure 3: Accuracy Performance
The Fig.3 is presenting a proposed method Memory Based Collaborative system overall accuracy performance that
generating better output when compare to existing method.
TIME CONSUMPTION
Figure 4: Time Consumption
The figure 4 is presenting time consumption for process completion, when compare to existing method the proposed
method Memory based collaborative system consumes less time.
USER ACTIVITY GRAPH
0102030405060708090
100
Memory Based Collaborative System Proposed Existing
Acc
ura
cy P
erfo
rma
nce
Techniques
0
10
20
30
40
50
Memory Based
Collaborative System
Proposed
Existing
Tim
e C
on
sum
pti
on
Techniques
International Journal of Computer Science and Information Security (IJCSIS), Vol. 14, No. 6, June 2016
669 https://sites.google.com/site/ijcsis/ ISSN 1947-5500

Figure 5: User Activity Graph
The figure 5 is presenting user activity through sharing post within more number of users. Shared posts are
expressing user‟s activity.
V. CONCLUSION
The RS (recommender system) has become necessary social networks feature. This work gives a complete
impression of problems in both item and User based method. The proposed RS with combining notion the item and
user based methods solves data sparsity issues on social network. Similar user‟s items‟ rating is measured as
predictions that increase memory-based collaborative RS accuracy in the social network.
VI. REFERENCES
[1] T. Andrew, Yang, Vishal Dhalwani and Dan J. Kim, "SOCIAL NETWORKING AS A NEW TREND IN E-MARKETING" RPIEIS II.
Springer US, pages.847-856, 2008
[2] Morten, et al, Falch, "BUSINESS MODELS IN SOCIAL NETWORKING" CMI International Conference on Social Networking and
Communities, 2009.
[3] Rokach, L., Shapira, B, Ricci, F., “INTRODUCTION TO RECOMMENDER SYSTEMS HANDBOOK”, pages. 1–35, 2011
[4] Godoy, D.L., Amandi, A.A, Armentano, M.G.: “A TOPOLOGY-BASED APPROACH FOR FOLLOWEES RECOMMENDATION IN
TWITTER”, In: 9th workshop on intelligent techniques for web personalization and recommender systems, 2011
[5] Nairn, R., Chen, J., Nelson, L., Chi, E, Bernstein, M.: “SHORT AND TWEET: EXPERIMENTS ON RECOMMENDING CONTENT
FROM INFORMATION STREAMS”, In: The 28th international conference on human factors in computing systems, page.1185-1194, 2010
[6] Johann, Stan, Christine Largeron and Fabrice Muhlenbach,. "RECOMMENDER SYSTEMS USING SOCIAL NETWORK ANALYSIS:
CHALLENGES AND FUTURE TRENDS." encyclopedia of social network analysis and mining. springer, pages.1522-1532, 2014
[7] J. Ben, Schafer, John Riedl and Joseph A. Konstan,. "E-COMMERCE RECOMMENDATION APPLICATIONS." applications of data
mining to electronic commerce. springer , pages.115-153, 2001
[8] T. Ryan, et al., Hoens, "Reliable MEDICAL RECOMMENDATION SYSTEMS WITH PATIENT PRIVACY" ACM TIST, Volume.4,
Number.4, 2013
[9] Song, Chen, Liang Zhou and Samuel Owusu,. "SOCIAL NETWORK BASED RECOMMENDATION SYSTEMS: A SHORT SURVEY."
IEEE international conference on social computing (socialcom), pages.882-885, 2013.
[10] Long, B., Yang, S.H., Sadagopan, N., Smola, A., Zha, H, Zheng, Z.: “LIKE LIKE ALIKE: JOINT FRIENDSHIP AND INTEREST
PROPAGATION IN SOCIAL NETWORKS”, ACM proceedings of the 20th international conference on world wide web, pages. 537–546, 2011
0
100
200
300
400
500
600
700
800
25 50 75 100125150175200225250275300325350375400
Nu
mb
er o
f U
sers
Number of Shared Posts
International Journal of Computer Science and Information Security (IJCSIS), Vol. 14, No. 6, June 2016
670 https://sites.google.com/site/ijcsis/ ISSN 1947-5500

[11] Gunasekar, S., Ghosh, J., Raghavan, S.: “REVIEW QUALITY AWARE COLLABORATIVE FILTERING”. In: Pro. of the sixth ACM
conference on recommender systems, pages. 123–130. ACM (2012)
[12] M. Bain, X. Cai, A. Krzywicki, Y. S.Kim, W. Wobcke, A. Mahidadia, and P. Compton, “COLLABORATIVE FILTERING FOR PEOPLE
TO PEOPLE RECOMMENDATION IN SOCIAL NETWORKS”, In Australasian conference on artificial intelligence, pages.476-485, 2010
[13] H. J. Lee, and F. Liu “USE OF SOCIAL NETWORK INFORMATION TO ENHANCE COLLABORATIVE FILTERING
PERFORMANCE”, Expert systems with applications, Volume.37, Number.7, pages. 4772-4778, 2010.
[14]Ma, Hao, et al. "RECOMMENDER SYSTEMS WITH SOCIAL REGULARIZATION." Pro of the fourth ACM international conference on
web search and data mining, pages.287-296, 2011
[15] Cong, F., YPan, Y., Yu, Y, & Chen, K., “DIFFUSION-AWARE PERSONALIZED SOCIAL UPDATE RECOMMENDATION”, In Pro of
the 7th ACM conference on recommender systems (pages. 69-76), 2013
[16] Charles Elkan Aditya Krishna, and Menon. "LINK PREDICTION VIA MATRIX FACTORIZATION." machine learning and knowledge
discovery in databases. springer berlin heidelberg, pages.437-452, 2011
[17] Davis, D., Chawla, N.V., Lichtenwalter, R.,: “SUPERVISED METHODS FOR MULTI-RELATIONAL LINK PREDICTION”, social
network analysis and mining, volume.3, number.2, pages. 127–141, 2013
[18] Bharadwaj, K Agarwal, V..: “A COLLABORATIVE FILTERING FRAMEWORK FOR FRIENDS RECOMMENDATION IN SOCIAL
NETWORKS BASED ON INTERACTION INTENSITY AND ADAPTIVE USER SIMILARITY”, social network analysis and mining,
volume.3, number.3, pages. 359–379, 2013
[19] Zhou, T.C., Ma, H., King, I, Lyu, M.R.: “IMPROVING RECOMMENDER SYSTEMS BY INCORPORATING SOCIAL CONTEXTUAL
INFORMATION”, ACM transactions on information systems, Volume.29, Number.2, 2011
[20] Cui, P., Jiang, M., Yang, Q., Liu, R., Wang, F., Yang, S, Zhu, W.: “SOCIAL CONTEXTUAL RECOMMENDATION”, In Pro of the 22th
ACM international conference on information and knowledge management, pages.45-54, 2012
[21] Iwata, T, Au Yeung, C.,: “STRENGTH OF SOCIAL INFLUENCE IN TRUST NETWORKS IN PRODUCT REVIEW SITES”, In: Pro of
the fourth ACM international conference on web search and data mining, pages. 495–504. 2011
[22] Gao, H., Liu, H, Tang, J.: “MTRUST: DISCERNING MULTI-FACETED TRUST IN A CONNECTED WORLD”, In: Pro of the fifth ACM
international conference onWeb search and data mining, pages. 93–102. 2012
[23] Jyoti, et al , Pareek,. "SNETRS: SOCIAL NETWORKING IN RECOMMENDATION SYSTEM." advances in computing and information
technology. springer berlin heidelberg, pages. 195-206, 2013
[24] Liu, Pattie Maes and Hugo. "INTERESTMAP: HARVESTING SOCIAL NETWORK PROFILES FOR RECOMMENDATIONS." beyond
personalization-iui, 2005
[25] Aaditeshwar, and Seth "DESIGN OF A SOCIAL NETWORK BASED RECOMMENDER SYSTEM FOR PARTICIPATORY MEDIA
CONTENT." manuscript, university of waterloo, 2008
[26] Wesley W. Chu, and Jianming He “A SOCIAL NETWORK-BASED RECOMMENDER SYSTEM (SNRS)” data mining for social network
data- annals of information system, pages. 47-74, 2010
[27] Magdalini, Eirinaki, Iraklis Varlamis and Malamati D. Louta. "A TRUST-AWARE SYSTEM FOR PERSONALIZED USER
RECOMMENDATIONS IN SOCIAL NETWORKS." IEEE transactions on systems, man, and cybernetics, Volume.44, Number.4, pages.409-
421, 2014
[28] C. Prem, Sankar, K. Satheesh Kumar. and R. Vidyaraj, "TRUST BASED STOCK RECOMMENDATION SYSTEM–A SOCIAL
NETWORK ANALYSIS APPROACH." elseiver procedia computer science 46, pages. 299-305, 2015
[29] Shuiguang, Deng, Guandong Xu, and Longtao Huang, "SOCIAL NETWORK-BASED SERVICE RECOMMENDATION WITH TRUST
ENHANCEMENT." expert systems with applications, volume. 41, number.18, pages. 8075-8084, 2014
[30] http://datahub.io/dataset/movielens
International Journal of Computer Science and Information Security (IJCSIS), Vol. 14, No. 6, June 2016
671 https://sites.google.com/site/ijcsis/ ISSN 1947-5500

Software Reengineering - A Frame Of
Reference
A.Cathreen Graciamary, Research Scholar, BhararthyiarUniversity, Coimbatore
Dr.Chidambaram, Asst prof, Rajah serofiji College, Thanjavur.
Abstract—Now day development of software is describe by immediate process. Old systems have to take on the recent
technologies; It can be achieved by changing or finding the features, I.e, Reengineering. Our proposed paper clarifies
about the reengineering process of software. It also explains the efficient and better process in reengineering. There
are two type common reengineering objectives. Improved feature: the existing software system will be of minimum
quality, because of more changing during the time course. The main objective of reengineering is to increase software
quality and to provide present working documentation. A higher quality degree is needed to enhance reliability, to
minimize the maintenance cost, to develop maintainability, and to make for functional improvement.
Keyword- Software Reengineering, Reverse Engineering, Enhanced Reengineering, SVM classification, Software
component.
I. INTRODUCTION
The name re-engineering absorb the procedure of obtaining existing inheritance software that turn into exclusive
to keep or whose architecture of system or accomplishment are longer used, and redoing it by present hardware
and software technology or, in technically, it is the inspection analysis, and existing software system
modification to organize it in better and latest system. The complicated part lies at understanding the old system.
In more cases the needs, code documentation and design will not be available longer, or it will be expired data,
so really it is not clear which function needs to be moved. Commonly the system would have functions that will
not be needed longer, and these type of functions won’t be change position to fresh system. In software
engineering change is significant of few “constants “. At the same organizing this type of changes is very
critical for all software-intensive of organization, organizing modification becomes more complicated when
organization make product-lines. Recycle assist organize modification across product-line most efficiently,
organizing modification for particular element become extra difficult. When organization guarantee reuse of
software, the requires to organize modify for components develop because to the lengthened usage and solutions
frequently in an enlarged software asset life-cycle. These modifications require to be handle in a synchronized
style. Technology of object oriented may be used to accomplish a higher maintainability level and to minimize
costs. Reliability of software must be incorporate in the entire life series, in the way to enhance the software
reliability the no of mistakes wants to be minimized. Few traditional mechanism of re-engineering are not
succeed to check the individual functionality performance in old software that enhance the difficulty in process
of reengineering. For reducing the difficulties in re-engineering of software, our suggested system develops
novel method name enhanced mechanism of re-engineering. Process of software reengineering is used to
modifying and reorganizing old software system to create them well maintainable. That is rewriting or
restructuring a component or all inheritance system without modifying its functionality. Process reengineering
absorb adding try to create them more easier sustain, the system might be re-documented and restricted.
The main reengineering purpose is to update the existing system on fresher one. Unreliable and aging
International Journal of Computer Science and Information Security (IJCSIS), Vol. 14, No. 6, June 2016
672 https://sites.google.com/site/ijcsis/ ISSN 1947-5500

components of system, when system turn into outages frequently. Changing the existing system to business
process turns into more difficult, complex and more costly to execute. Solutions are minimum expensive than
inheritance maintenance. The main reengineering advantages are decreased risk at decreased cost. The process
of reengineering may also deal different kind of risks like software engineering. Identification of risk is as art.
Identification of risk is significant for efficient risk analysis, risk management and analysis. In suggested work,
the possible risks are examined and classified. A process of monitoring is clarified for the classified risks. This
will assist a reengineering process in the direction of easiness of cost benefit and maintenance with decreased
risk at minimum cost. Our suggested method introduce a which is stated as, before running the re-construct
process a developer checks the significant function functionality in the existing system. Then, the performance
of function is evaluate with suggested algorithm. Related on the evaluation process only the process of rebuild
wants to be taken out. Lastly our suggested methods minimize the software re-engineering complexity.
II. RELATED WORK
Usually Re-engineering is considered as “business process change”. Such modify requires new needs
on systems as in [1]. In Ref.[3] author contains re-engineering in business type process change not only modify
over time inside one organization but also condition presenting more of the similar issues in which a method
developed for one organization and to be utilized in another. Specialist in re-engineering are more exponential
than the specialist in design and more engineers do not contain better research experience in this region. The
issues with inheritance has caused all over in world. In Ref. [4] author describe inheritance system like one that
particularly refuse evolution and modification to meet up fresh and continually modifying business
requirements in spite of the skill utilized to achieve it. The system of inheritance is substitute by a fresh system
with similar or enhanced functionality as in [2]. In Ref.[5] author suggests an Iterative legacy reengineering
function defines a gradual reengineering process of the procedural element of legacy system. The suggested
technique allow the legacy system to be steadily emptied into re-engineering system , without containing the
requirement to either second copy the legacy system or chill it. The process contains of developing the
component of legacy system firstly in the direction of a re-establish system and then in the direction of the re-
engineered system. In the mean time, the system of legacy can exit together with both the reengineered and
restored parts. Through the process end, a one system will be subsistence that is re-engineered one. The system
has been used to re-engineer a actual system and shows its capability to: maintain gradual reengineering, sustain
the system in work throughout the process, then reduce the requires to chill request of maintenance, renovate the
operative surrounding of the re-engineered system with high opinion to the system of legacy. And, at last,
remove all the aging system symptoms. In Ref.[6] Dual Spiral model of re-engineering suggested for legacy
system, which achieves cyclic method. The important in Dual spiral model of re-engineering system needs two
system (target and legacy) work jointly, and forward the functionality from legacy to target system through the
step by step process, as in model of spiral. Throughout the whole process, the legacy system of active
functionality is in pattern of decree-mental, and active functionality of new targer system is in patter of
incremental.
International Journal of Computer Science and Information Security (IJCSIS), Vol. 14, No. 6, June 2016
673 https://sites.google.com/site/ijcsis/ ISSN 1947-5500

III. PROPOSED SYSTEM
Our proposed mechanism introduces 2 novel idea, before executing the re- build process the developer
verifies the performance of particular function in existing system. After that, the function performance is
compared with proposed algorithm. Based on the comparison process, various influencing factors are evaluated.
Using the results of the factors, the rebuild process is being carried out. Finally our proposed mechanism
reduces the complexities in software re-engineering. In this research work, it combines data mining and software
re-engineering process in which the data is converted into byte and stored in a separate file. Data mining
approach, classification is used with the stored data set to prove efficiency and enhancement of Software Re-
engineering in engineering.
A. REENGINEERING- A PERSPECTIVE
The legacy system alteration and modernization is re compose into new one is called as reengineering
process. The important aim of reengineering is demonstrate in below figure 1, which assist to recognize the
previous software system, then to discover the analysis of SRA in the old and actual system, to perform the
needed changes that obtain place later than the system has been reverse engineered, restructured, re-documented,
converted and moves engineered into new system among added subsystem.
Figure 1: Re-engineering Process
The analysis of SRA, it needs to discover the difference and factor between the present and desired
state. There are various stages to discover the SRA in our suggested system.
Requirements system and Feasibility Study
To design a restructured requirements.
Comparison is prepared to reform the code.
Implication of it
Suggestion has been prepared if suggested method is improved than existing.
Our suggested system is a better re-engineering method for reducing the difficulty in process of software re-
engineering. First step of our proposed system is trends, then activate the suggested method, identify the
possible gaps, through the functionalities performance of previous software with new software functionalities
then identified gaps. Related on the evaluation process of performance, restructure process can be accepted out,
then re-testing is achieved, lastly it is executed.
Existing
System New
System Modernization and
Alternation
Software Requirement
Application (SRS) Analysis
International Journal of Computer Science and Information Security (IJCSIS), Vol. 14, No. 6, June 2016
674 https://sites.google.com/site/ijcsis/ ISSN 1947-5500

Figure 2: Enhanced re-engineering Mechanism
B. DESCRIPTION
Improved re-engineering system is a process of re-engineering that utilizes not just a one, but grouping
of modification methods and abstraction levels to evolution an existing to objective system. As revealed in
figure 2, process of reverse engineering is take place in which we begin from the implementation stage and
changing in the way to coding, requirement and design system. Process of forward engineering gives downward
abstraction by needs to the functioning area. In the above figure shows the reverse and forward engineering
process simultaneously. At initial stage, the study of feasibility is being prepare i.e. verifying system requests,
After the possibility is achieved needs are re-indicate based on the user requirement. The specification of
software requirements, an requirement of output stage matters a more because it contains all the needs in the
form of written and is authorized document. In the way to re-identify the needs we want to map these by the
specification of system requirements. After that first stage is move in the direction of next state i.e plotting of
reorganized system requirement arrangement to the plan. The backtracking one stage to other stage is feasible in
above figure and indicated by arrow of bi-directional. In this stage the plotting of reordered specification of
system requirement to the plan document is being achieved i.e. mixing of specification of new system needs to
design in the way the redesigned document that is the result of this stage. Since SRS modifies the structure of
design containing of Diagram of Entity Relationship/ Diagram of Data flow/ Diagram of unified modelling
Feasibility study
and
requirements
Redesign to Code
Restructured
requirements for
to design
Implementation
Software
Component
Library
Restructured System
Requirement Specification
Re -Design
Re- Testing
Implementation of
proposed Technology
Performance evolution of
New and Existing System
Rebuild if Proposed
Technology is better than
Existing System
International Journal of Computer Science and Information Security (IJCSIS), Vol. 14, No. 6, June 2016
675 https://sites.google.com/site/ijcsis/ ISSN 1947-5500

languages want to be modified based on the amount of modified requirements. After the stage of second a
document of redesigned as an result we forward to the next stage. i.e. Create document to recode where coding
area is being changed based on the modify being completed in the plan document to create efficient modified
requirements. The above figure 2 shows the way how improved re-engineering method is working. Here we can
back down from this stage to second stage and respectively if need related on that. The result of this state directs
to reintegration and retesting of the different software units to execute the accurate functionality. In this phase,
we compare the performance of functionalities of existing software with the functionalities of new software. For
performance evaluation, we utilize the metrics like running time, memory usage and system configuration. After
that, the function performance is compared with proposed algorithm. Based on the comparison process only
rebuild process should be carried out. If everything is perfect so integration is being done among various
modules or part of software system to act as a single system. After the integration of various modules is being
done, there is a need to implement the modified system and get the target system which is required by the user.
The full process or the stages as explained above tends to word re-engineering where in the system of existing is
being obtained off executing the process of reverse engineering, forward engineering and thus the system of
target after the alteration being achieved at each stage. The important benefit of the reengineering is that it
minimizes effort, money & time as software is not implemented from scratch. In addition the benefits of
reengineering, there are a few restriction as there are no metrics obtainable for measurement of quantitative. A
additional efficient and sophisticated method of re-engineering exists named as improved re-engineering system.
Improved re-engineering method is an idea in which system part which is reasoning issue is planned again and
remaining is set aside as it.
IV. EXPERIMENTAL REQUIREMENTS
This section explains the materials required to evaluate the effectiveness of the proposed methodology.
A. DATASET
Table 1 Dataset and its Attributes
S.No Dataset Name Attributes Class
1. breast-cancer 09 02
2. Diabetes 08 02
3. Heart Disease 13 02
B. SOFTWARE REQUIREMENTS
Processor: Intel i3(R) CPU G2020
RAM: 2GB
Processor Speed :2.90 GHz
Operating System :Windows 7
Front End: JAVA
Back End: MySQL .
International Journal of Computer Science and Information Security (IJCSIS), Vol. 14, No. 6, June 2016
676 https://sites.google.com/site/ijcsis/ ISSN 1947-5500
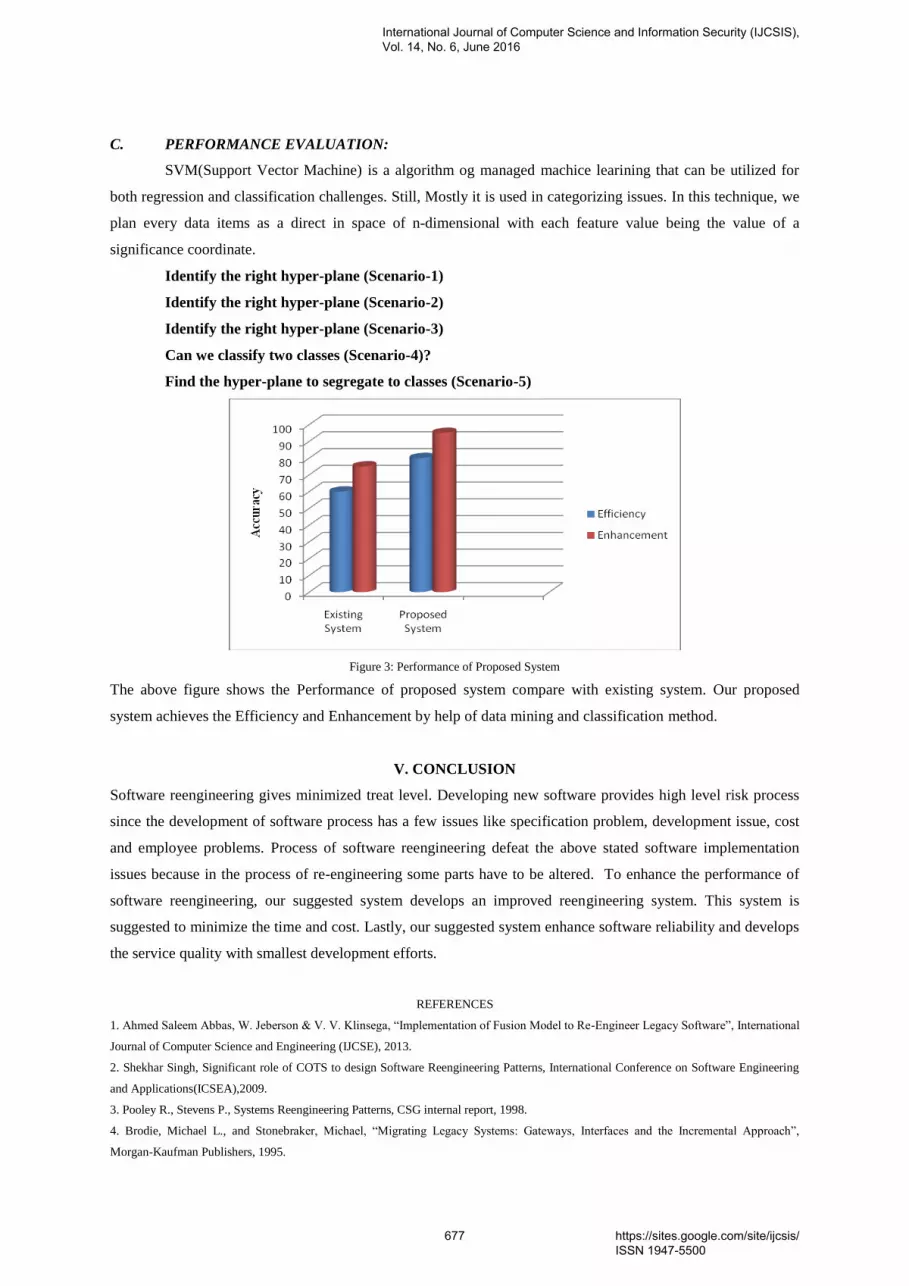
C. PERFORMANCE EVALUATION:
SVM(Support Vector Machine) is a algorithm og managed machice learining that can be utilized for
both regression and classification challenges. Still, Mostly it is used in categorizing issues. In this technique, we
plan every data items as a direct in space of n-dimensional with each feature value being the value of a
significance coordinate.
Identify the right hyper-plane (Scenario-1)
Identify the right hyper-plane (Scenario-2)
Identify the right hyper-plane (Scenario-3)
Can we classify two classes (Scenario-4)?
Find the hyper-plane to segregate to classes (Scenario-5)
Figure 3: Performance of Proposed System
The above figure shows the Performance of proposed system compare with existing system. Our proposed
system achieves the Efficiency and Enhancement by help of data mining and classification method.
V. CONCLUSION
Software reengineering gives minimized treat level. Developing new software provides high level risk process
since the development of software process has a few issues like specification problem, development issue, cost
and employee problems. Process of software reengineering defeat the above stated software implementation
issues because in the process of re-engineering some parts have to be altered. To enhance the performance of
software reengineering, our suggested system develops an improved reengineering system. This system is
suggested to minimize the time and cost. Lastly, our suggested system enhance software reliability and develops
the service quality with smallest development efforts.
REFERENCES
1. Ahmed Saleem Abbas, W. Jeberson & V. V. Klinsega, “Implementation of Fusion Model to Re-Engineer Legacy Software”, International
Journal of Computer Science and Engineering (IJCSE), 2013.
2. Shekhar Singh, Significant role of COTS to design Software Reengineering Patterns, International Conference on Software Engineering
and Applications(ICSEA),2009.
3. Pooley R., Stevens P., Systems Reengineering Patterns, CSG internal report, 1998.
4. Brodie, Michael L., and Stonebraker, Michael, “Migrating Legacy Systems: Gateways, Interfaces and the Incremental Approach”,
Morgan-Kaufman Publishers, 1995.
International Journal of Computer Science and Information Security (IJCSIS), Vol. 14, No. 6, June 2016
677 https://sites.google.com/site/ijcsis/ ISSN 1947-5500

5. Alessandro Bianchi et al, "Iterative Reengineering of Legacy Functions", IEEE International Conference on ISBN: 07695118 Year: 2001
Pages: 632-641 Provider: IEEE Publisher: IEEE.
6. Xiaohu Yang et al, "A Dual-Spiral Reengineering Model for Legacy System", TENCON 2005 - 2005 IEEE Region 10 Conference ISBN:
0780393112 Year: 2005 Pages: 1-5 Provider: IEEE Publisher: IEEE.
7. Press, William H.Teukolsky, Saul A,Vetterling William T, Flannery B.P,(2007), ”Section 16.5 Support Vector Machines”, Numerical
Recipes: The Art of Scientific Computing (3rd ed.). New York: Cambridge University Press. ISBN: 978-0-521-88068-8.
International Journal of Computer Science and Information Security (IJCSIS), Vol. 14, No. 6, June 2016
678 https://sites.google.com/site/ijcsis/ ISSN 1947-5500

Analyzing Virtualization based Energy Efficiency
Techniques in Cloud Data Centers Beenish Gul
, Fiaz Gul Khan
, Iftikhar Ahmed
Department of Computer Science
COMSATS Institute of Information Technology, Abbottabad, Pakistan
Abstract Cloud computing provides IT services to users worldwide, Data centers in Clouds consume large amount of
Energy leading to highly effective costs. Therefore green energy computing is solution for decreasing operational costs.
This survey presents efficient resource allocation and Scheduling algorithm/Techniques analyzed on different network
parameters without compromising network performance and SLA constraints. Results are analyzed on different
measures, providing a significant cost saving and improvement in Energy Efficiency.
Key Words: Data Centers, Virtualization, Consolidation, Virtual Machines, SLA
1. Introduction:
Cloud Computing is an efficient dynamic way for allocating resources besides meeting power challenges. Demand for
computational power is growing rapidly (Web Applications & other network services) though led to create data centers in large
scale which results in huge amount of network power consumption. Data centers networks are Tree-based network topology
having three switches layers interconnected to each other by a core layer, connected to internet as well. DCN Architectures has
problem in virtualized Environments like service fragmentation, and failure resilience we can observe the characteristics of
virtualization in DCN architecture. With advantages of proliferation of cloud services of it system data centers are also
experiencing variety of bottlenecks, such as connecting servers (one-to-one), simple point failure, lack of mobility, less
scalability. [1]. DCN architectures are classified as hierarchical and flat architectures, to overcome the challenges in DCNs later
on contrary all servers are organized on same level and intercommunicated with in network topology. Computer servers cooling
systems are main power consuming aspects as well as network elements are also part of power consumption Ten to Twenty
Percent of the total power without completing overall performance of network. For better performance of data network centers
reduction of cost, flexibility, high agility, virtualization is focused on workload is consolidated to minimum number of servers,
With this technology data Centers can have cost benefit as well as efficiency of network. Virtualization-based approach is one
of the best approach for limiting data center’s network power cost. This idea of virtualization-based approach named as
VMPlanner, core idea of VMplanner is to manage power by making use of some element active process approach puts
unneeded (Idle) elements to lowering down state or sleeping state. This approach consists of step by step well known set of
algorithms which optimizes the virtual machine placement and routing flow. In virtualization centralized server design has
interference problems both the computing and network resources of local machine are shared with virtual machine. End node
problem is another challenge for affecting the performance of DCN. Green data centers are also one of the aspects for reducing
network power by chip multiprocessing, dynamic frequency scaling, however to optimize traffic flow routing network traffic
distribution and network elements scheduling can help in optimization. Stated approach is flexible enough in order to optimize
network power cost and traffic flow routing in modern data centers as technology is purely based on network architecture and
the traffic running on it. With all the advantages of afore cited approach it has also some limitations regarding total number of
International Journal of Computer Science and Information Security (IJCSIS), Vol. 14, No. 6, June 2016
679 https://sites.google.com/site/ijcsis/ ISSN 1947-5500

Energy [VALUE]
Electricity and Heat [VALUE]
Manufacturing and Construction [VALUE]
[VALUE] Waste [VALUE]
Industrial Process [VALUE]
Transportation [VALUE]
fule [VALUE] Agriculture
[VALUE]
%age Contribution of Energy in GHG emission
energy
Electricity and heat
Manufacturing and Construction
Bunker Fuels
waste
Industrial Process
Transportation
other fuel combustion
Agriculture
VMs attached. Rapid increase in number of VMs is proportional to the entire cost of the network i-e increased the VMs
increased will be the network power cost. For this purpose improvement of VMs is required to be resolved. In ToR switching
scenario if at a time main switch/domain fails to process or terminate working all the processes will go lost so task should
correspond to across the topology. Overhead is another problem due to redundant links which results in network failure. To
overcome the problems in DCN Virtualization multi-tier transaction system is used (FiConn and fat-tree). FiConn are closely
connected to each other and are able to communicate efficiently. But still with hierarchical layout has problem of traffic
overloading which affects the performance. Virtualized architectures do not have the advantage of locality. Problem of traffic
overloading is somehow mitigated in flat layout, where all servers are at same level of Communication.
A. Motivation for conducting the survey
Motivation for conducting this survey was to analyze the problems faced for raise in energy consumption by stating the
overview of Cloud Computing for accomplishing energy efficiency. In order to overcome increased energy efficiency problems
high energy demands have been noticed. Different energy efficiency techniques measured up till now have been analyzed
considering Service Level Agreement for minimizing energy consumption. SLA violation has been resolved in this survey using
different energy efficiency techniques. Different energy efficiency techniques have been discussed also to analyze the rapidly
growth of energy consumption. This paper presents the over view of existing technologies and necessary measures for
introducing upgraded techniques making the sense of hybridization resulting in more useful manners than existing techniques
taking advantage from recent studies of the existing techniques. Article has been divided into five sections (including
subsections). Section 2 elaborates the historical development of Energy Efficiency in Data Centers; section 3 is the elaboration
of background and broad picture of Cloud Computing. Comprehensive explanation and comparison of energy efficiency
techniques (Server Level Techniques) has been described in Section 4 while last section summarizes the conclusion and future
work in this field.
B. Historical View of Energy Efficiency in Cloud Data Centers
This section reports the raise in Energy Efficiency and investigates the impact of increasing energy consumption in data centers.
Further this section analyzes different energy efficiency measures implemented up till now for minimizing energy consumption
in Cloud Data Centers.
C. Rise of Energy Consumption in Data Center
Energy consumption became a problem after growth in of ICT Sector. Keeping in view the different reports presented in
previous study of energy consumption ICT industry considered to be the main contributor of raise in power costs in DCN
networks subsequently with the advent of Internet resulted in IT Boomed tend to simplified network access (Communication).
Internet servers were de-centrally confined subsequently Internet Data Centers (IDCs) were constructed centralized. Sudden rise
in electricity increased the Energy Consumption. On of these reports work on aggregation of data of each server measured the
power gained by each server report presented a broader view of energy trends in ICT industry.
International Journal of Computer Science and Information Security (IJCSIS), Vol. 14, No. 6, June 2016
680 https://sites.google.com/site/ijcsis/ ISSN 1947-5500

D. Influence of Growing Energy Consumption Levels
Increasing power consumption is one of the major culprit from different industries and sectors resulting in effect on GHG
emission in to the environment. Present energy consumption and co2 emission are increasingly high tends to climate changes.
Increasing rate of GHG is a threat to the environmental sustainability as a GHG emission is greater than overall growth
emission. According to the report presented in previous study emission will be increased by 30 percent while emission produced
by the ICT industry will be reach up to 180 percent from 2002 to 2020. Power consumed by ICT industry is usually considered
to be the power by computers, network equipment’s, and electrical devices excluding servers. It has also been observed that
consumption is not only due the computations by processors but also by the servers hosted data centers. These servers are
mostly the idle servers i-e the servers underutilization that not only increases the consumption but also the expenses. Expansion
in energy consumption also results in increase of Total Cost of Operation (TCO). Cooling infrastructure results in wastage of
energy. Besides increasing power demands rise in energy also affects the economic budget of service providers. Energy saving
techniques are only possible solution to overcome the increasing energy consumption and the network power costs.
E. Cloud Computing and Energy Efficiency
A scalable and virtualized environment designed for users based on cloud service models. Software-as-Service (SaaS) model
provides facility of accessing applications via simple interface over the internet to users. Another model named as Platform-as-
Service (PaaS) provide an environments (hosting) for application created by users while (IaaS) model provides support for
actual physical infrastructure. Cloud computing can possibly have three models like wise in public clouds service providers
want all resources available to users over network in private clouds organization control over its data while hybrid model is a
combination of both public and private clouds. Cloud Computing is capable to be more efficient it has been discovered that
cloud computing can reduce GHG emission up to 28% by 2020. For abstracting an unlimited resources from wide shared group
of resources i-e from shared pool virtualization is widely utilized in clouds paradigm resulting in high energy utilization and
saving energy costs. The energy efficiency support provided by the virtualization and consolidation. Besides virtualization and
VM consolidation energy efficiency can be achieved by efficient resource scheduling. Efficient resource scheduling helps to
overcome the problem of underutilization and over utilization. Resources that are underutilized or over utilized results in more
energy consumption because the resources that are underutilized stay idle for long time and over utilized resources operates
over the capacities. Major causes tends to increase the consumption are both the underutilization and over utilization of
resources. Various scheduling techniques can be used to control the above cited problem in large data Centers.
F. Virtualization based Energy Efficiency Techniques in Cloud Computing
Virtualization is the process of physical resource sharing a very useful part of cloud computing for energy efficiency in
virtualization based allocation. VM encapsulation and VM migration are main focuses for reducing energy consumption. One of
the ways to attain energy efficiency is the scheme that works on centralized online clustering system. This process is based on
VM based resources allocation. Jobs with same properties are submitted to same host systems and subsystems that are
unnecessary are turned off. This process tends to minimize the over location and reallocation cost. Virtualization can be
done at hardware level, Server level or application. In this survey Server level implementation is focused and sectioned below:
Virtualization Techniques
H. W Level Application Level Server Level
International Journal of Computer Science and Information Security (IJCSIS), Vol. 14, No. 6, June 2016
681 https://sites.google.com/site/ijcsis/ ISSN 1947-5500

II. Virtual Machine Allocation and Scheduling Based Techniques
A. Single Server Optimization
Li et al. [6,7] proposed an Ena-Cloud technique with the advantages of dynamic and live placement of application, keeping in
consideration energy consumption of the application it is simulated as a bin packing problem.
Resource provisioning scheme designed by Rodero et al. [8] for efficient energy algorithm followed by centralized online
clustering, built on VM allocation and resource organization. Similar jobs were assigned to similar host system, subsystems or
other components with lower energy consumption were turned off. In addition to this conscious energy system was introduced
by lowering the cost of reallocation and over-allocation.
Beloglazov and Buyya [3,4] developed a technique that dynamically consolidated VMs based on adjustable utilization threshold
satisfying service-level-agreement. Amoretti et al. described another SLA based for threshold utilization adjustable
(automatically) analyzing historical data gathered from the lifetime of VMs statistically. Selection of VMs to be migrated is
optimized with help of this technique.
Fig: Single Server Level Optimization
B. Multiple Server Optimizations
Liao et al. [10] technique discussed the energy consumption problem. Technique known as energy resource provisioning
technique offers energy optimization using scheduling algorithm. Technique basically works on SLA constraints, appropriate
VM scheduling, periodically resource monitoring, resource finding, and task scheduler. An algorithmic approach is used for
allocating resources onto minimized physical machines.
Li et al. [6] [7] explains different versions of VM workflow scheduling and offers a new hybrid energy-efficient scheduling
approach technique based on pre-power plan and least load first algorithm. It provides suitable way out for two main problems
besides workload balancing and reduces incoming request’s response time. Suitable VM machine are assigned number of
incoming requests. However workload distribution takes place through migration process if requests allocation goes beyond the
capacity.
Deore et al. [11] Energy Efficient Scheduling Scheme (EESS) developed based on minimum FCFS and hybrid energy efficient
scheduling algorithms. Technique works routing incoming VM request to the appropriate VMs.
Quan et al. [12] [13] proposed a mechanism based on collecting statistics and network data, of servers operating in data center.
Algorithm lowers rate of energy consume based on the data collected, by servers and Co2 emission migration of heavily loaded
Single Sever
Host Level Guest OS Level OS Level
Modified Best-Fit
Decreasing (MBFD) algorithm
Energy-aware
Heuristic algorithm
Reallocation algorithm
for VM selection
International Journal of Computer Science and Information Security (IJCSIS), Vol. 14, No. 6, June 2016
682 https://sites.google.com/site/ijcsis/ ISSN 1947-5500

VMs to servers with best co2 emission values or highest computational power takes place. Process purely constituted for on the
basis of Power usage effectiveness and Carbon Usage Effectiveness.
Kessaci et al. [14] [15] proposed algorithm based heuristics for energy management in cloud by using traditional computational
approach this algorithm is implemented on cloud9 Open-Nebula-based), which provides geographically disseminated cloud
topology for lowering power consumed. Scheduler works as multi-start local search heuristics to reduce energy by dispatching
incoming VMs based on energy consumption values. Host information and their usage is saved by manger and also the
hardware usage details as they influence the amount of energy consumed. To find the best Scheduling problem information of
each host available VM manager is used by algorithm.
Qaun et al. [13] proposed an energy efficiency resources allocation technique. Idea is based on reallocating resources at run time
by exploring techniques of VM live migration. Key idea is VM consolidation and rearrangement of allocation in order to
manage energy consumption. Locating the nodes with lowest energy can be done via single algorithm by migrating energy load
from least traffic servers in to heavy loaded servers to free underutilized server (s) unnecessarily consuming power. Next step is
to move VM from old servers to modern servers. Old servers can be freed and put into low state and more efficient new servers
are held responsible for handling their workload.
Another two approaches using VM migration are able to manage infrastructure workload. This technique was introduced by
Kauth and Fetzer [16] in this technique VM instances in the data centers are scheduled. Technique introduces OptSched, which
uses the stipulated time for requests for optimization of VMM. Main focus is on optimizing number of servers and reducing the
cumulative Machine uptime it directly reduces the energy consumed.
Paya and Marinscu proposed approach that works on (IaaS) environment. It ensures that less number of servers goes beyond
their capacities. It works on application migration from low-loaded servers to other servers and turning them off servers for
avoidable power consumption.
Comparison of Virtualization-Based Energy Efficiency Techniques
S# Scheduling Techniques Basis Benefits Drawbacks
1 Li et al a bin-packing problem concept energy consumption control
No cost
optimization
2 Redero et al centralized clustering Provision of QoS
No cost
optimization
3 Beloglazov and Buyya
Based on Dynamic VM consolidation
with the help adaptive utilization
thresholds
Operational costs and SLA Violation
constraints management
No count for power consumed
by Network elements
4 Liao et al
Works on choosing VMs with the shortest response time for service
level agreement
energy efficient resource provisioning and guaranteed service level
agreement
No support for VM live
Migration
No count of power consumption by the network,
I/O devices and GPU
5 Li et al
Multi objective scheduling on private
cloud environment
Saves more time and energy
Achieves a high level of load
balancing
Slightly complex and
challenging to accomplish
multiple objectives
6 Deore et al
Applies VM migration for workload
distribution and uses a lease
management system
Aims to minimize the number of VMs
Distributes workloads evenly among
VMs
High response time and low
workload utilization level
7 Quan et al
Based on the traditional made of
computation for reducing the power consumed and carbon emission
Follows SLAs
Reduces energy consumption and carbon emission.
complexity of implementation and operation
International Journal of Computer Science and Information Security (IJCSIS), Vol. 14, No. 6, June 2016
683 https://sites.google.com/site/ijcsis/ ISSN 1947-5500

8 Beloglazov and Buyya
Uses minimization of migration or
highest potential growth or random choice policies for selecting VMs for
migration
Works well with a heterogeneous
infrastructure and VMs
Does not depend on workload type
Lacks implementation on a
real-world cloud platform
9 Kessaci et al
Based on IaaS cloud model and
multistart local search heuristic
Offers the desired QoS and minimizes
the energy consumed
More complex
Does not consider GHG
emission
10 Quan et al Focuses on IaaS Enhances performance No cost optimization involve
11 Knauth and Fetzer Handles IaaS Workload Efficiently handles the data center and VM heterogeneity and timed instances
Lacks implementation on publicly available workload
12 Pay and Marinescu
Operates in IaaS environment comprising a clustered cloud
organization
Applicable to SaaS and PaaS as well as Private and hybrid clouds
Applicable to processors using DVFS
techniques
Communication Complexity
System not able to handle
sudden increase in workload
Fig: Multiple Server Level Techniques
Resource Level
Energy-aware
Scheduler OptSch
Server Application management algorithms
SLA-based Resource constraint VM scheduling
Multiple Servers
Clustering algorithm
Energy-efficient scheduling
Cloud Global Optimizer
Least-load-first algorithm
Global optimization Algo
Multistate local search
algorithm
Multiple Servers
International Journal of Computer Science and Information Security (IJCSIS), Vol. 14, No. 6, June 2016
684 https://sites.google.com/site/ijcsis/ ISSN 1947-5500

III. Conclusion and Future Work
This survey comprehensively analyzes and reviews the techniques regarding energy efficiency in cloud computing. Survey
presents that software based techniques can easily be incorporated by modifying independent of location transitions. Primary
focus is to explore the software techniques one of the best software solutions is energy aware job scheduling to appropriate
resources. Techniques attained a desired level of performance Based on different metrics. Virtualization is inherent in cloud
computing it provides hardware and software heterogeneity and allows several OSs on identical platform minimizing the
physical machines. An efficient resource scheduling effectively exploit virtualization and consolidation. Future studies can
analyze the impact of different energy efficiency techniques on performance and QoS. Technique that collectively handles
energy efficiency and gives economic benefits can be developed. Technique must be design to control the energy wastage due
to saving large amount of data. Therefore handling such amount of large data can reduce energy wasted. An efficient energy
technique that considerably handles the management of such large data is desired.
REFERENCES
[1] Fang, dW., Liang, X., Li, S., Chiaraviglio, L., & Xiong, N. VMPlanner: Optimizing virtual machine placement and
traffic flow routing to reduce network power costs in cloud data centers. Volume 57 Issue 1, Page 179–1960, 2013.
[2] Zhang, Y., Su, A.-J., & Jiang, G. (2011). Understanding data center network architectures in virtualized. Computer
Networks, 2196–2208. 2014
[3] Anton Beloglazov and Rajkumar Buyya, Adaptive threshold-based approach for energy-efficient consolidation of
virtual machinesin cloud Data Centers.In Proceedings of the 8th
International Workshop on Middleware for Grids,
Clouds and e-Science. ACM, 4. 2010.
[4] Anton Beloglazov and Rajkumar Buyya, "Energy efficient allocation of virtual machines in cloud data centers. 10th
IEEE/ACM International Conference on Cluster, Cloud and Grid Computing (CCGrid’10), Page 577–578, 2010.
[5] Anton Beloglazov and Rajkumar Buyya, Optimal online deterministic algorithms and adaptive heuristics for energy
and performance efficient dynamic consolidation of virtual machines in Cloud data centers. Concurrency and
Computation: Practice and Experience, Page 1397–1420, 2012.
[6] Bo Li, Jianxin Li, Jinpeng Huai, Tianyu Wo, Qin Li, and Liang Zhong, EnaCloud: An energy-saving application live
placement approach for cloud computing environments. IEEE International Conference on Cloud Computing
(CLOUD’09). 17–24, 2009.
[7] Jiandun Li, Junjie Peng, Zhou Lei, and Wu Zhang, An energy-efficient scheduling approach based on private clouds.
Journal of Information and Computational Science Volume 8, Issue 4, Page 716–724, 2011
[8] Ivan Rodero, Juan Jaramillo, Andres Quiroz, Manish Parashar, Francesc Guim, and Stephen Poole, Energy-efficient
application-aware online provisioning for virtualized clouds and data centers. Interna- tional Green Computing
Conference, Page 31–45, 2010
[9] Ivan Rodero, Hariharasudhan Viswanathan, Eun Kyung Lee, Marc Gamell, Dario Pompili, and Manish Parashar,
Energy-efficient thermal-aware autonomic management of virtualized HPC cloud in- frastructure. Journal of Grid
Computing Volume 10 Issue 3, Page 447–47, 2012
International Journal of Computer Science and Information Security (IJCSIS), Vol. 14, No. 6, June 2016
685 https://sites.google.com/site/ijcsis/ ISSN 1947-5500

[10] Jian-Sheng Liao, Chi-Chung Chang, Yao-Lun Hsu, Xiao-Wei Zhang, Kuan-Chou Lai, and Ching- Hsien Hsu, Energy-
efficient resource provisioning with SLA consideration on cloud com- puting. 41st International Conference on Parallel
Processing Workshops (ICPPW’12), Page 206–211, 2012.
[11] Shailesh S. Deore, Ashok N. Patil, and Ruchira Bhargava, Energy-efficient scheduling scheme for virtual machines
incloud computing. International Journal of Computer Application, Volume 56 Issue 10, 2012.
[12] Dang Minh Quan, Robert Basmadjian, Hermann De Meer, Ricardo Lent, Toktam Mahmoodi, Domenico Sannelli,
FedericoMezza, LuigiTelesca, and CorentenDupont, Energyefficientresourceallocation strategy for cloud data centres.
In Computer and Information Sciences, Page 133–141, 2012.
[13] Dang Minh Quan, Federico Mezza, Domenico Sannenli, and Raffaele Giafreda, T-Alloc: A practical energy efficient
resource allocation algorithm for traditional data centers. Future Generation Computer Systems Volume 18 Issue 28,
Page 791–800, 2012.
[14] Yacine Kessaci, Mohand Mezmaz, Nouredine Melab, El-Ghazali Talbi, and Daniel Tuyttens, Paral- lel evolutionary
algorithms for energy aware scheduling. Intelligent Decision Systems in Large-Scale Distributed Environments,
Studies in Computational Intelligence, Vol. 362, Springer, Berlin, Page 75–100, 2011.
[15] Yacine Kessaci, Nouredine Melab, and El-Ghazali Talbi, An energy-aware multi-start local search heuristic for
scheduling VMs on the OpenNebula cloud distribution. International Confer- ence on High Performance Computing
and Simulation (HPCS). Page 112–118. 2012.
[16] Thomas Knauth and Christof Fetzer, Energy-aware scheduling for infrastructure clouds. 4th In- ternational Conference
on Cloud Computing
Technology and Science (CloudCom’12). IEEE, Page 58–65. 2012.
[17] T. Kaur and I. Chana Lei Chai, Qi Gao, and Dhabaleswar K. Panda, Understanding the impact of multi-core architec-
ture in cluster computing: A case study with Intel dual-core system. 7th IEEE International Sympo- sium on Cluster
Computing and the Grid (CCGRID’07). IEEE, Page 471–478, 2007.
[18] Lskrao Chimakurthi and S. D. Madhukumar, Towards energy-aware VMscheduling in IaaS clouds through empirical
studies. MSc Thesis, Power efficient resource allocation for clouds using ant colony framework. 2011.
[19] Tharam Dillon, Chen Wu, and Elizabeth Chang. Cloud computing: Issues and challenges. 24th IEEE International
Conference on Advanced Information Networking and Applications (AINA). Page 27–33, 2010.
[20] Gregor von Laszewski, Lizhe Wang, Andrew J. Younge, and Xi He, Power-aware scheduling of virtual machines in
DVFS-enabled clusters. International Conference on Cluster Computing and Workshops (CLUSTER’09). IEEE, Page
1–10, 2011.
International Journal of Computer Science and Information Security (IJCSIS), Vol. 14, No. 6, June 2016
686 https://sites.google.com/site/ijcsis/ ISSN 1947-5500

Image Share Pane Tool: Image Sending Approach to Mobile via Bluetooth Device
Farhan Ali Surahio, Awais Khan Jumani, Javed Ahmed Mahar, Hidayatullah Shaikh
Department of Computer Science, Shah Abdul Latif University,Khairpur Mirs, Sindh,Pakistan
Abstract— Nowadays, Microsoft Word is commonly used in various areas including industries and academia. Microsoft word has introduced great user friendly features, for instance, Screenshot and Screen Clipping, Smart lookup, Tell Me and others. Among them, Layout option button has given us to set objects with line in text. Furthermore, Different types of panes have provided for various tasks. Microsoft Word has given us a facility to greet with thumbnail image of every window you have opened at the moment. Many users while working on document need to insert or capturing images with Screenshot and Screen Clipping, they want to share inserted images to mobile via Bluetooth But, Users are disappointed because there is no any tool provided to accomplish that task and user takes a long procedure to apply for sharing images to mobile through the Bluetooth. This paper provides an application which helps users to send an inserted image via Bluetooth while working on Microsoft word and they do not to switch any window. By adding it into existing Microsoft Word it will helpful for people living across the world.
Keywords- Screen Clipping; Layout Option; Share Option Button; Share Image Pane; Image capture format type
I. INTRODUCTION
People have been using different word processing software to creating documents including king Soft writer, WordStar, Atlantis word processor and so on. But Microsoft Word is one of the most common word processing applications for windows users. Part of the Microsoft Office 2013 suit of programs, it is sophisticated and helps users quickly and efficiently write, format, and publish all the business and personal documents including letters, flyers, and reports [1]. Microsoft Word introduced several enhanced features including the ability to create and collaborate on documents online.
Microsoft Word 2013 has the main component called Ribbon that contains different commands according to relative tabs, also provides formatting applying styles, inserting images, printing documents and getting help. Moreover, Screenshot and Screen Clipping has been providing capability to receive with thumbnail image of each window users have opened instantly and use Layout option button to set object with text wrapping [1].
II. SCREENSHOT AND SCREEN CLIPPING TOOL
These days, many people rely on the Internet as a source of the
information they use in their daily lives. Sometimes that
information is given through images that would also be useful
in a Word documents. Word 2013 included a screen clipping
tool that user can use to capture an image that is visible on
computer screen. The sample image is depicted in “Fig.1.”.
User simply display the content, want to include in a
document, open the document, and click the Screenshot button
in the Illustrations group on the Insert tab. You can then insert
a screen clipping in one of two ways: (1) Click a window
thumbnail in the Screenshot gallery inserts a picture of that
window into the document at the cursor. (2) Click Screen
clipping below the gallery enables you to drag across the part
of the screen you want to capture, so that only that part is
inserted as a picture into the document [1]. Each picture has its
own format type such as JPEG, PNG, GIF, Windows Bitmap,
and Tag Image File Format [8], the shooting method of getting
picture is also different for these formats [9].
Figure.1. While choosing screen clipping
III. LAYOUT OPTION BUTTON
Once a picture inserted into current document only Layout
option button appears automatically from the right side of a
picture or whenever a picture is selected which is already
encircled as shown in “Fig.2. By Clicking Layout option
button, it will display a menu that provides the quick format
position without accessing the ribbon.
Figure.2. after Image insertion
International Journal of Computer Science and Information Security (IJCSIS), Vol. 14, No. 6, June 2016
687 https://sites.google.com/site/ijcsis/ ISSN 1947-5500

IV. TYPES OF PANES
Microsoft Word has given many facilities to the users in the
shape panes. User can perform several tasks by using these
pans. The induction of most common pans like Reviewing
pane, Navigation pane, Translation pane and Task pane are
given below.
A. Reviewing PaneReviewing pane used to compare two documents and mark
the differences or Sometime Word does not display complete text of a comment in a balloon with the use of reviewing pane we can see complete comments [7]. Reviewing pane is also record the track changes action and indicate us to what happen with your document while in your absence it keep action which has done by someone such as edit, format, and deleted paragraphs.
B. Navigation PaneNavigation pane helps us to find the pages with thumbnails as
well as included headings and indicate us to where you are. It
also provides to search any paragraph on results tab and
showing highlighted text as a result. A small thumbnail
displays for each existence discovered for the word or phrase
entered. Word or phrase is provisionally highlighted on the
screen, as well, allowing you to quickly spot the text for which
you are searching [1].
C. Translation PaneTranslation pane is one of the best tools which enable user to
translate selected or whole document from one language to
another. Microsoft Translator service has provided free
service. Once selected text send to translation process,
webpage will display translated text into required language
such as English [1].
D. Task PaneTask pane is used to show or hide ribbon. Each window has
different task pane options use to perform different tasks such
as move, size, close the window. It is also store copied text
into the clipboard for paste into the document. In startup task
pane user can create new document, save, close, open and
print documents [1].
V. RELATED WORK
Lot of work has been done and published in the literature
pertain to sending the data and different types of files from
one device to another or one network to another network. But,
only little work has been observed for sending image to
mobile via Bluetooth and others while creating Microsoft
Word Document. Different media files can be share and
uploaded via Smartphone [2]. Mahapadi [3] identified that
existing peer to peer system was used for data transmission but
there were some limitations with Data transmission through
Bluetooth, author proposed application through which data,
files, images can share without the facility of internet. On the
other side, Tripathy [4] discussed that due to diversification of
system and their operating environment it is some time
impossible to transfer data from one system to another. He
developed a Microchip and described that if the Bluetooth
microchip embedded on the pen drive then data can be transfer
easily. Moreover, he also mentioned that through this
technique over all speed of system may be reduce but the
developed technique is useful enough for the sending files.
Jadhav [5] presented a framework to annotate and search files
on mobile devices, semantic file annotation were used with
different context. Jeon [6] proposed a mechanism for sharing
the different seamless files for android devices which are
connected with different Networks and operating systems.
This paper provides an application which can send captured image via Bluetooth during create Microsoft Word document without swapping window and they do not essential to take a time consuming process. We have proposed an application and experiment based on .Net framework using object oriented programming methods. The significance of this research users who has no flash drive and user has captured lot of images while working on document using screen clipping tool from websites and wants to send those images to mobile without document saving and switching different windows it can do it easily.
VI. PROPOSED WORK
In our proposed work, we have used Visual C# built-in Class
named Share Image Pane, some buttons which is based on
methods and open and save Dialog box classes were used to
retrieve images from computer drives and save pictures with it
file format type, checkbox button is used for selecting more
than one images. Once user inserts an image into current
document by using open dialog box class, Share option button
will appear which is beneath the layout option button”
“Fig.3.” shows an image having share option button.
Figure.3. shows share option button beneath layout option button
In “Fig.3.” which is based on two buttons representing
different functions, the first one is layout option button which
we have already discussed that it is already introduced by
Microsoft Word. The second one is our proposed share option
International Journal of Computer Science and Information Security (IJCSIS), Vol. 14, No. 6, June 2016
688 https://sites.google.com/site/ijcsis/ ISSN 1947-5500

button which helps to call a class named share image pane and
it is a simple form class used to accomplish experiment. It
detects active Bluetooth devices after saving image.
Furthermore, this class contains on one Label which retrieves
the location of stored picture, two major buttons and its
description is given below.
A. Save ButtonIt is Visual C# .Net framework built-in tool which helps user
to save captured image into any particular Computer drive
while working on current document. It calls a save dialog box
for choosing location and selecting image file format type.
Once it is stored on given location the next button will enable
and share image class will detect active Bluetooth along with
captured image. “Fig.4.” illustrates share image pane before
saving any captured image.
Figure.4. Share Image Pane before saving an image
In “Fig.4.” shows share image pane which contains on two
standard buttons.
B. Share Button
It helps user to send an image with different detected
Bluetooth. It is grounded with some built-in methods
provided by visual studio. It applies traditional file sending
technique via Bluetooth. Moreover, it uses namespace and
common Application Programming Interface (API) for
sending pictures to mobiles. Share Image pane also uses
namespace for importing its method. We have used integrated
development environment of Visual C# where all objects are
available and these are predefined controls. This button
identifies the location where the file actually stored which is
contain on Share images pane Label beneath the save button.
By clicking on checkbox button, users can select more than
one image simultaneously. It provides a process for checking
and un-checking images more than one among the retrieved
pictures into Share Image form. The graphical representation
of proposed application is depicted in”Fig.5.”
Figure.5. Share Image pane after saving image
In “Fig.5.” shows detected Bluetooth devices of different
smart phone and a picture has selected with checkbox button
for sending to required Bluetooth depends on user where to
send image.
VII. DISCUSSION
Microsoft Word has been introduced lot of features including
storing file into the cloud via internet; share that link with
different users. Tell me feature which retrieves exact
information which is requires by user. Screen Clipping is also
an effective tool of Microsoft Word used to capture image
from any active window. Users can save that picture by right
click on image area. It appears a popup menu consist a list of
commands, by choosing a save picture command user can
easily store it into computer drive. If a user wants to send that
captured image to mobile with the help of Bluetooth device it
takes a long procedure to do it because, there is no any
command available for sending that image through the
Bluetooth device while working on document. It cannot send
an image until it reaches to stored file location. Many steps are
taken by a user for sending images to mobile via Bluetooth
Device such as closing current document, jumps to stored file
path, right clicking on required image, selecting Bluetooth
option from popup menu, etc.
We have presented an application which prevents to take a
long procedure for sending an image. Users do not need to
close current document and follow above mentioned steps.
Once a user inserted an image, share option button will
appears beneath the layout option but which is already
introduced by Microsoft word. We have placed that button as
a prototype. Share option button is a part of our proposed
International Journal of Computer Science and Information Security (IJCSIS), Vol. 14, No. 6, June 2016
689 https://sites.google.com/site/ijcsis/ ISSN 1947-5500

application which calls the share image pane class. It is
designed in Visual C# using object oriented programming. It
contains on two buttons. Save button is used to store an image
and share button is used for sending an image to mobile via
Bluetooth device without closing document. It enables user to
send an image at the same time.
CONCLUSION
Microsoft Word provided various facilities and features to the
users including the image capturing with Screenshot and
Screen Clipping process. Some users need to share their
inserted images to mobile via Bluetooth. But users are
dissatisfied due to the unavailability of the tool that can
provide such facility. This paper presented an application
which uses Share Option Button and Share Image Pane with
for sharing images to mobiles via Bluetooth. The execution
process of proposed application is also described and
presented. By adding this part of an application into existing
Microsoft Word users can send images without switching from
one window to another and it will be beneficial and useful for
users.
REFERENCES
[1] Lambert, J., Cox, J., Step by Step Microsoft Word 2013.
Microsoft Press, Division of Microsoft Corporation,
Washington, 2013, pp. 11-12.
[2] Vasudevan, S. K., Vivek, C., An Intelligent Attempt to
Export Files into Cloud in Handheld Devices through
Gesture Recognition. Indian Journal of Science and
Technology, 2015, 8(34), pp. 1-8.
[3] Mahapadi, A. A., Soumitra, D., F-Share for Hand held
Devices using Wi-Fi Bluetooth Network. International
Research Journal of Engineering and Technology, 2015,
2(3), pp.1312-1315.
[4] Tripathy, K. B., Sharma, A., Goyal, P., Sharma, A.,
Upmanu, V., A Concept of Data Transfer via Bluetooth in
Pen Drive. Journal of Globe Research in Computer
Science, 2013, 4(4), pp.86-91.
[5] Jadhav, M. B., Patil, B. M., File Annotation and Sharing
on Mobile Devices in Pan via Bluetooth. International
Journal of Scientific and Research Publications, 2013,
3(6) pp.1-4.
[6] Jeon, M., Kim, S. K. Yoon, J., jo, J., Yang, S., Seamless
File Sharing for Android Devices. Yonsei University
Seoul, Korea, 2014, IEEE World Forum on Internet of
Things (WF-IoT).
[7] Taylor, J., The Microsoft Office Ribbon-What does this
Button do?. Downloaded from
arkhhull.files.wordpress.com/2011/10/microsoft-word-
2010-the-ribbon-what-does-this-button-do.pdf.
[8] Stelmaszewska, H., Fields, B., Blandford, A., The Roles
of Time, Place, Value and Relationships in Collocated
Photo Sharing with Camera Phones. British Computer
Society, 2008, pp.141-150.
[9] Kang, M., Kim, S., Choi, E. J., A Study on Smart Phone-
based Shooting Device of 3D Stereoscopic Image. Indian
Journal of Science and Technology, 2015, 8(19), pp. 1-8.
International Journal of Computer Science and Information Security (IJCSIS), Vol. 14, No. 6, June 2016
690 https://sites.google.com/site/ijcsis/ ISSN 1947-5500

A Optimal Approach for Securing the Datain Cloud Storage using Block Division and
Predicate EncryptionP.Vijaya Bharati, Asst. Professor
Department of Computer Science & EngineeringVignan’s Institute of Engineering for Women
Kapujaggarajupet, Visakhapatnam
Prof. and Dr. T.Sita MahalakshmiDepartment of Computer Science & Engineering
Gitam college of TechnologyGitam University, Visakhapatnam
Abstract— The “pay-as-you-go” cloud computing model is an efficient alternative to store the data at a cheaper
cost. Ensuring data security in cloud computing platforms is critical and has become one of the most significant
concerns in the emerging field of cloud computing. The location of the servers where the data is stored and being
accessed are not known to the end user. There are many numbers of different security models and algorithms which
are applied to secure the data stored in the cloud. While these techniques are very nice, we cannot really always tell
that they are “unhackable”. Given enough time, brains and tools any technique might be breakable because the
techniques are not fine grained. The existing algorithms have their own flaws and so in this paper we proposed a
method that is been improved in such a way that the data stored on the cloud is secured. The proposed method
initially uses a lossless block division which divides the data into blocks and then division is applied storing the
remainder and the group to which it belongs to separately and later we apply predicate encryption scheme on the
data to be stored( remainder data) in which the keys correspond to predicates and cipher texts are associated with
attributes. The public key PK with an attribute ‘x’ is used to encrypt the text and the secret key SKf corresponding to
predicate f can be used to decrypt a cipher text with attribute ‘x’ if and only if f(x)=1.
Keywords: Block Division, Predicate Encryption, Predicates, Attributes, Secret Key
I. INTRODUCTION
There are many number of encryption algorithms which are extremely used in which a sender sends the
encrypted message M with public key PK. The resulting cipher text can be recovered into a message only by the
legitimate user with the associated private key. These algorithms are secure with respect to peer-to-peer
communication where the data to be sent is only for one intended user who is known to the sender. But in
today’s world, where the Internet and more number of applications are evolving, the data is more complex and
stored in distributed environments. One such is cloud storage, where the data is stored at a remote place in an
unknown server. In the cloud environment where storage-as-a-service is provided the users data should be given
the accessibility to corresponding users. Other users should not learn about that data. In this type of environment
existing cryptographic mechanisms are not sufficient, but we need more fine-grained control over access to
encrypted data. In this paper we initially are compressing the data using block division and later implementing
predicate encryption scheme mechanisms on the compressed data.
II. RELATED WORK
There are few algorithms with fine grained capabilities, they are Identity-Based Encryption (IBE) [22,
6, 12] and Attribute-Based Encryption [21,17, 15, 3, 11, 16]. Identity-Based Encryption is a public key
encryption in which the public key is the unique information about the identity of the user [22] i.e., the cipher
International Journal of Computer Science and Information Security (IJCSIS), Vol. 14, No. 6, June 2016
691 https://sites.google.com/site/ijcsis/ ISSN 1947-5500

text is associated with a certain attribute or identity, I, and a user can decrypt the underlying encrypted data M if
and only if there is an equality match between the attribute assigned to the user’s private key and that of the
cipher text. Attribute-Based Encryption is also a public key encryption in which the secret key and cipher text
are dependent on attributes [21]. One limitation of IBE and ABE systems is that they fall into a class of
encryption systems that informally refer to as “attribute revealing”. Attribute-revealing encryption systems
guarantee that secret keys SKf1 , . . . , SKfm and given a cipher text associated with the attribute ‘x’ learns
nothing about the underlying plaintext whenever f1(x) = · · · = fm (x) = 0.
However, the adversary may learn ‘x’ itself. More generally, an attribute-revealing scheme offers no
protection of x whatsoever; typical constructions satisfying this notion reveal x. In the context of, e.g., identity-
based encryption, a attribute-revealing scheme corresponds to the standard notion of security. And in attribute-
based encryption there are two varied forms. The first is Ciphertext-Policy ABE (CP-ABE) in which keys are
associated with set of attributes and the second is Key-Policy ABE (KP-ABE) in which messages are encrypted
under set of attributes. Predicate Encryption is similar to Key-Policy ABE. Song, Wagner, and Perrig [20] and
Goldreich and Ostrovsky [14] gave the first such encryption systems for equality predicates in the symmetric
setting and Boneh et al. [5] showed how to compute equality in the public key environment. Subsequently,
Boyen and Waters [9] proposed the first such Anonymous IBE scheme that had a hierarchical structure without
using random oracles. Gentry [13] proposed a method for removing random oracles. Boneh and Waters [8]
showed how to construct predicates that were a conjunction over subset of fields, specified by the private key
that was used to realize subset and range queries. Shi et al. [19] showed how to do more efficient queries over a
small number of ranges, but in a weaker security model where the decryptor learns extra information when the
predicate evaluates to true. In other work researchers have looked at issues of correctness definitions in
anonymous IBE [1] and security versus efficiency tradeoffs in equality predicates [2].
III. PROPOSED WORK
The limitations of the work carried before is that existing techniques for constructing attribute-hiding
techniques are limited. The existing cryptographic mechanism using predicate encryption had certain issues
between the private key components and the cipher text components. If a certain field in the cipher text doesn’t
match with the corresponding field in the private key, then the decryptor will evaluate the predicate to false, as
the result is random. Previously, if a particular cipher text field does not match a private key field, then the
evaluation depends upon the next field and not just sent to a random group element.
A. Proposed Method:
Our main result is a construction of a scheme which is optimal and can be made standard upon two assumptions.
Block Division:
Initially, the data to be stored in the cloud is to be transmitted on the network. We divide that data into blocks.
And then block division is applied to avoid the attack of chosen cipher text before applying the encryption
algorithm. We divide the data into blocks of size 128. Then each bit is divided into 16 different groups. The
groups are found by dividing the bit value by 8 and remainder from the new bit value. The ranges of these
groups are Group 1: 0-7, Group 2: 8-15, Group 3: 16-23, Group 4: 24-31, Group 5: 32-39, Group 6: 40-47,
Group 7: 48-55, Group 8: 56-63, Group 9: 64-71, Group 10: 72-79, Group 11: 80-87, Group 12: 88-95, Group
13: 96-103, Group 14: 104-111, Group 15: 112-119, Group 16: 120-127. We have considered 128 because; we
have only 128 ASCII values from 0-127. Consider table 1 which consists of ASCII values of all 128 characters.
International Journal of Computer Science and Information Security (IJCSIS), Vol. 14, No. 6, June 2016
692 https://sites.google.com/site/ijcsis/ ISSN 1947-5500
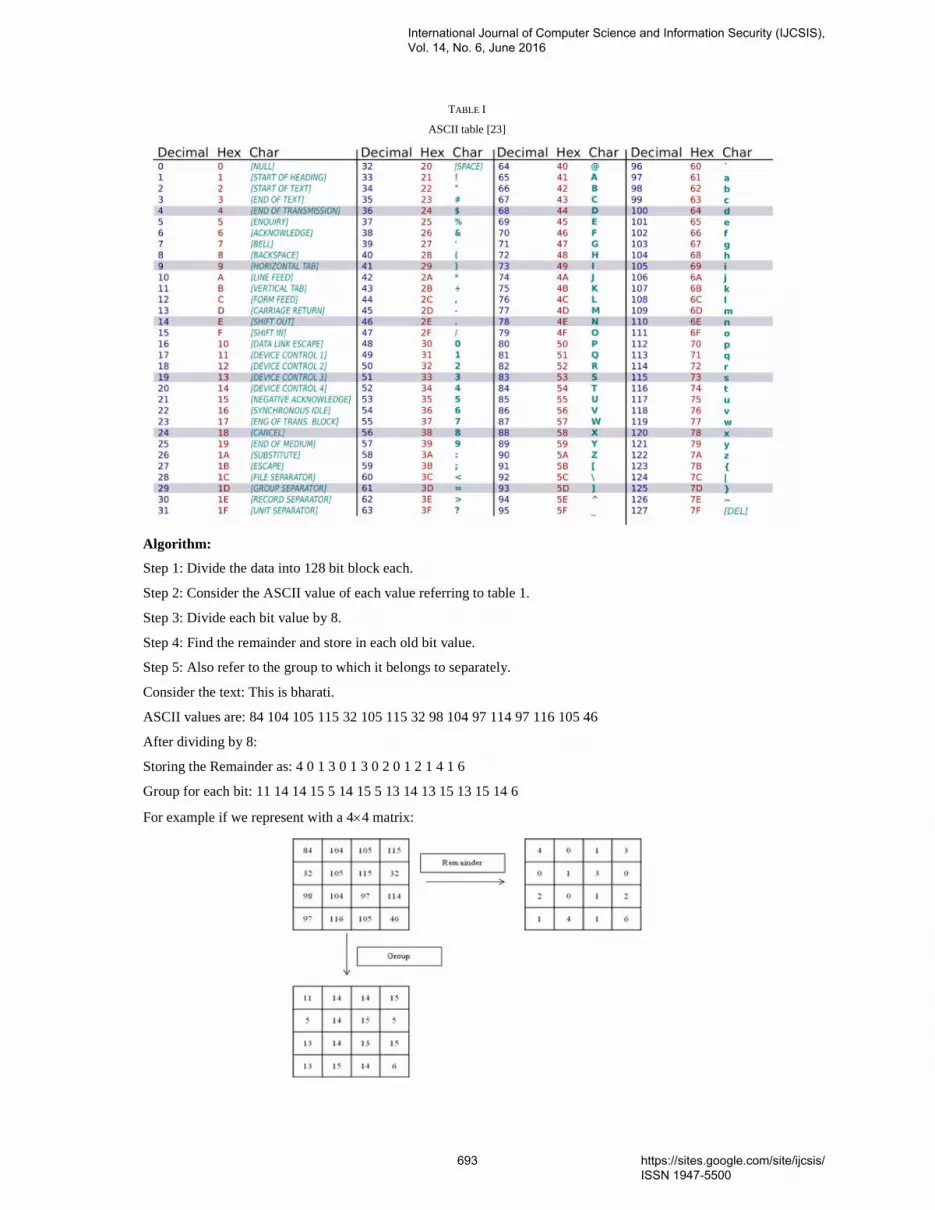
TABLE I
ASCII table [23]
Algorithm:
Step 1: Divide the data into 128 bit block each.
Step 2: Consider the ASCII value of each value referring to table 1.
Step 3: Divide each bit value by 8.
Step 4: Find the remainder and store in each old bit value.
Step 5: Also refer to the group to which it belongs to separately.
Consider the text: This is bharati.
ASCII values are: 84 104 105 115 32 105 115 32 98 104 97 114 97 116 105 46
After dividing by 8:
Storing the Remainder as: 4 0 1 3 0 1 3 0 2 0 1 2 1 4 1 6
Group for each bit: 11 14 14 15 5 14 15 5 13 14 13 15 13 15 14 6
For example if we represent with a 44 matrix:
International Journal of Computer Science and Information Security (IJCSIS), Vol. 14, No. 6, June 2016
693 https://sites.google.com/site/ijcsis/ ISSN 1947-5500

Predicate Encryption:
In this paper we construct a predicate encryption scheme that supports polynomial evaluation. Let us consider Zn
which is a set of attributes and predicates corresponds to polynomials over Zn. A predicate evaluates to 1, if and
only if the corresponding polynomial evaluates to 0 on the attribute in question.
Attributes are subsets of A=1,2,………,land predicates take the form f s,t | SA where f s,t (S’) = 1 IFF
SS’ = t. This is very much useful in hiding both the encrypted values and the attribute. We denote as
arbitrary set of attributes and F denotes an arbitrary set of predicates over [20].
Definition:
A predicate encryption schema for a set of predicates F over set of attributes has four algorithms.
1) Setup (1n) PK, SK which takes the security parameter 1n as input and outputs a public key PK and a
secret key SK.
2) KeyGen (SK,f)TKf
It takes secret key SK as input and a predicate f F and outputs TKf
3) Encrypt(PK,M,X) )CT
It takes the public key PK, message M , an attribute X as input and retrieves a cipher text CT.
4) Decrypt (TKf,CT)M
It takes TKf the secret key and the cipher text CT as input and outputs a message M if f(X)=1 or a
distinguished symbol otherwise ie.,
If f(X)=1 then Decrypt TKf (EncryptPK(X,M)) =M
If f(X)=0 then Decrypt TKf (EncryptPK(X,M)) =
A variant to the existing is that
If f(X)=1 then Decrypt TKf (EncryptPK(X)) =1
If f(X)=0 then Decrypt TKf (EncryptPK(X)) = 0
But we also assured that attribute hiding is also possible along with the cipher text. If the predicates are
f1,f2,….,fm F the corresponding keys are such that either (EncryptPK(X0,M0)) or (EncryptPK (X1,M1)) for
attributes I0,I1 then fi(X0)=fi(X1) i [24].
Also if M0M1 then it is required that (fi(X0) = fi(X1) i
The condition to be applied are as follows:
Notations :
F - a set of predicates
- a set of attributes to be hidden
A - adversaries Xi
n - the security parameter
1. A(1n) outputs X0,X1
2. Setup (1n) generates PK,SK and the adversary is given by PK.
3. On request of keys for predicates f1,f2,….,fm F t the restriction is fi(X0)=fi(X1) i. If A is given by
correcting keys KeyGen(SK,fi)TKfi
4. A outputs two-equal length messages M0, M1. If there is an I for which fi(X0)=fi(X1) =1, then it is required
that M0 = M1. A bit ‘b’ is randomly chosen and A is the cipher text
International Journal of Computer Science and Information Security (IJCSIS), Vol. 14, No. 6, June 2016
694 https://sites.google.com/site/ijcsis/ ISSN 1947-5500

EncryptPK(Xb,Mb))CT
5. A can output a bit b’ if and only if b’= b.
IV. SCHEME EVALUATION
We evaluate the security of the proposed scheme to say that the result is originated and serves the purpose of
cloud storage:
Setup (1n) The setup algorithm first runs G (1n) where G is a group of composite order N which is a product
of two primes.
Let G be an algorithm which takes input as 1n and outputs a tuple (p, q, r, G, GT, e^) where p, q, r are
distinct primes, G and GT are two cyclic groups of order N=p, q, r and e^: GG GT is
Bilinear: u, v G, a, b Z, e^ (ua, vb) = e^(u, v)ab.
Non-degenerate: g G such that e^ (g, g) has order N in GT .
G and GT are generators of groups G and GT. Also Gp, Gq,Gr are the subgroups of G having order p, q, r i.e., G =
Gp GqGr
If G is generator of G, then
(i) The element gpq is generator of Gr
(ii) The element gpr is generator of Gq
(iii) The element gqr is generator of Gp
We also compute gp, gq and gr as generators of Gp, Gq,Gr respectively. Choose a random r Gr and h Gp
uniformly at random [24]. The public parameters include (N = pqr,G,GT , ˆe) along with:
PK = (Gp, Gr, Q=gq . r, h)
And the master secret key SK is (p, q, r, gq, h)
V. PERFORMANCE ANALYSIS
In our experiment the process is implemented on a workstation with an Intel Core i3 3217U running at
1.80GHz, RAM of 4.00GB Single-Channel DDR3 @ 798MHz. The cloud server side process is implemented in
Amazon EC2 with 4 instances, 2GB memory and 1000 GB instance storage. All algorithms are purely
implemented in java.
TABLE II
Performance under different types of sampled blocks for assurance of 95% security and attribute hiding
Our scheme [16]Sampled Blocks c 460 300 460 300Server Computation Time (ms) 330.17 219.27 339.23 245.9Communication Cost (Bytes) 160 160 40 40
VI. CONCLUSION
Our proposed method is an optimal approach that has strategic value to those who are using or connecting with
cloud computing because its addresses concerns such as privacy and security. Our work explores the security of
data that focus on the protection of data confidentiality such that it is possible to realize the concept of self-
protecting data. It is of so much importance today, especially with the shift of cloud computing, where large
amount of data can be stored, accessed and processed anywhere, anytime securely implementing the
methodology proposed. The data confidentiality method proposed enables a high end protection without the
need of portioning the application into trusted and untrusted party.
International Journal of Computer Science and Information Security (IJCSIS), Vol. 14, No. 6, June 2016
695 https://sites.google.com/site/ijcsis/ ISSN 1947-5500

REFERENCES
[1] M. Abdalla, M. Bellare, D. Catalano, E. Kiltz, T. Kohno, T. Lange, J. Malone-Lee, G. Neven, P. Paillier, and H. Shi. Searchable
encryption revisited: Consistency properties, relation to anonymous IBE, and extensions. In Advances in Cryptology — Crypto 2005.
[2] M. Bellare, A. Boldyreva, and A. O’Neill. Deterministic and efficiently searchable encryption. In CRYPTO, pages 535–552, 2007.
[3] J. Bethencourt, A. Sahai, and B. Waters. Ciphertext-policy attribute-based encryption. In
IEEE Symposium on Security and Privacy, pages 321–334, 2007.
[4] D. Boneh, X. Boyen, and H. Shacham. Short group signatures. In Advances in Cryptology
Crypto 2004.
[5] D. Boneh, G. Di Crescenzo, R. Ostrovsky, and G. Persiano. Public-key encryption with keyword search. In Advances in Cryptology —
Eurocrypt 2004.
[6] D. Boneh and M. Franklin. Identity-based encryption from the Weil pairing. SIAM J. Computing, 32(3):586–615, 2003.
[7] D. Boneh, E.-J. Goh, and K. Nissim. Evaluating 2-DNF formulas on ciphertexts. In J. Kilian, editor, Proc. 2nd Theory of Cryptography
Conference, volume 3378 of LNCS, pages 325–342. Springer, 2005.
[8] D. Boneh and B. Waters. Conjunctive, subset, and range queries on encrypted data. In Theory of Cryptography Conference, 2007.
[9] X. Boyen and B. Waters. Anonymous hierarchical identity-based encryption (without random oracles). In Advances in Cryptology —
Crypto 2006.
[10] R. Canetti, S. Halevi, and J. Katz. A forward-secure public-key encryption scheme. In Advances in Cryptology — Eurocrypt 2003.
[11] M. Chase. Multi-authority attribute based encryption. In TCC, pages 515–534, 2007.
[12] C. Cocks. An identity based encryption scheme based on quadratic residues. In Proc. IMA Intl. Conf. on Cryptography and Coding,
2001.
[13] C. Gentry. Practical identity-based encryption without random oracles. In EUROCRYPT, pages 445–464, 2006.
[14] O. Goldreich and R. Ostrovsky. Software protection and simulation by oblivious rams. JACM, 1996.
[15] V. Goyal, O. Pandey, A. Sahai, and B. Waters. Attribute-based encryption for fine-grained access control of encrypted data. In ACM
Conf. Computer and Comm. Security, 2006.
[16] R. Ostrovsky, A. Sahai, and B. Waters. Attribute-based encryption with non-monotonic access structures. In ACM Conf. on Computer
and Communications Security, 2007.
[17] A. Sahai and B. Waters. Fuzzy identity-based encryption. In Advances in Cryptology —
Eurocrypt 2005. [18] E. Shi, J. Bethencourt, H. T.-H. Chan, D. X. Song, and A. Perrig. Multi-dimensional range queries over encrypted
data. In IEEE Symp. Security and Privacy, pages 35–0–364, 2007.
[19] D. Song, D. Wagner, and A. Perrig. Practical techniques for searches on encrypted data. In Proceedings of the 2000 IEEE symposium
on Security and Privacy (S&P 2000), 2000.
[20] https://www.cs.umd.edu/~jkatz/papers/ec08.pdf
[21] https://en.wikipedia.org/wiki/Attribute-based_encryption
[22] https://en.wikipedia.org/wiki/ID-based_encryption
[23] https://simple.wikipedia.org/wiki/ASCII
[24] www.cs.ucdavis.edu/franklin/ecs228/pubs/predicate_encryption.pdf
International Journal of Computer Science and Information Security (IJCSIS), Vol. 14, No. 6, June 2016
696 https://sites.google.com/site/ijcsis/ ISSN 1947-5500

A collaboration between two readers for
clustering and identification in RFID systems
OUAKASSE Fathia*; Applied Mathematics and Computer Science Laboratory (LAMAI) Cadi Ayyad University Marrekesh,Morocco.
RAKRAK Said; Applied Mathematics and Computer Science Laboratory (LAMAI) Cadi Ayyad University Marrekesh,Morocco.
*corresponding author
Abstract-Radio Frequency Identification RFID is one of the most important technologies used in the internet of things.
It is increasingly used in various applications because of their high quality as well as their low costs; however the
avoidance of collision of tags during the identification process represents a great challenge, especially when the number of
tags is too large. In this paper we propose a new mechanism, based on Progressive Scanning Algorithm, to group tags in
the interrogation zone of a reader. The proposed mechanism consists in the deployment of two readers having the same
interrogation zone. Simulated results show that the proposed mechanism can appropriately achieve higher performance
compared to other existing algorithms in terms of the number of time slots allowing identifying tags and effectively in
terms of total time required to do this.
I. INTRODUCTION
RFID Radio frequency identification is a technology used to identify an object, follow its path and know its
characteristics remotely using a label (RFID tag) attached or incorporated in the object as described in [1].
The vast majority of RFID tags have no power supply. This type of chips is powered from the reader via the
antenna tag; the reader sends an electromagnetic signal to the tag, and provides it with enough power to
communicate with him.
RFID tags come to replace barcodes, and have several advantages compared with these latters;
RFID tags can be read from a greater distance than barcodes.
RFID tags don’t need to be positioned in a line of sight with the scanner.
RFID tags can be read at a faster rate than barcodes.
RFID tags are read/write devices.
RFID tags carry large data capabilities.
However, one of the largest disadvantages in RFID system is its low tag identification efficiency due to the
problem of tag collision. In this context, several anti-collision algorithms have been proposed. However, it was
proved that conventional collision avoidance algorithms such us (FDMA, TDMA, CDMA and SDMA) are not
efficient on a large scale to solve the problem of collision between RFID tags as mentioned in [2].
International Journal of Computer Science and Information Security (IJCSIS), Vol. 14, No. 6, June 2016
697 https://sites.google.com/site/ijcsis/ ISSN 1947-5500

RFID anti-collision algorithms are classified according to two major protocols: ALOHA based protocols as
described in [3] and TREE based protocols as studied in [4].
In this paper, we present a new mechanism for clustering using two readers having the same frequency range to
identify tags in their interrogation zone. The first reader works as an intermediary between the second reader and the
tags. i.e. in one hand, the first reader collects IDs from tags present in his interrogation zone and grouped into
clusters; tags grouping is based on the algorithm of progressive scanning PS. And in the other hand, the second
reader receives IDs from the first reader and communicates directly with tags to retrieve data.
The remainder of this paper will be organized as follows: the second section presents Aloha-based algorithms, in
particular, three algorithms used for grouping tags. The third section focuses on the details of the proposed
collaborative mechanism. Then, in the fourth section the simulated results are evaluated. Finally conclusions and
future work are presented in the fifth section.
II. STATE OF THE ART
When multiple tags are within the frequency range of a single reader, communications are confused by the
simultaneous tags activity. Tag collisions decelerate the process of identification, especially when there is a large
amount of tags in the interrogation zone of a reader. Therefor several algorithms were proposed to resolve this issue
using different approaches based in clustering, frame size, tags number and time slot. In the following we will
present an overview of these algorithms and how they manage to reduce the collision number in the identification
process, then we will sum up this section with a comparative table of reviewed algorithms.
A. ALOHA based algorithms
As mentioned above collision problem can be solved using different approaches; the most used is Aloha-based
protocol. This protocol can be grouped into six algorithms as analyzed in [5]. The first one is Basic ALOHA
algorithms. In this algorithm there is probability of collision if two or more tags transmit their IDs simultaneously.
The efficiency of this method decreases when there are a huge number of tags or the size of required data on each tag
is too large [6], [7]. However, in Slotted Aloha Algorithm, the identification process is done via a set of time
intervals called time slots. Thus, SA improves the efficiency of the identification process by synchronizing time
between tags and reducing the probability of collision. As the Basic Aloha, The efficiency of this method decreases
when the number of tags increases [8]. In Framed Slotted Aloha Algorithm, the identification process is done via a
set of frames that contain a set of time slots. Unlike BA and SA which include only one read cycle, in FSA, the
identification process can be enlarged to more than one read cycle.
The FSA algorithm performs better then basic aloha and SA algorithms but the challenge in this algorithm is to set
a frame size appropriately with the number of tags in the interrogation range of the reader. Unlike FSA which use the
same frame size until the end of the identification process, DFSA consists in changing the frame size accordingly to
the number of tags within the read round. Schoute affirms that the DFSA achieved great performance if the frame
size is exactly equal to the number of tags in the reader identification area [9]. However, if the number of tag is too
large, it is impossible to increase the frame size indefinitely because of limited memory capacity on the tags. Thus,
the problem of time slots allocation arises when the number of tag is huge. The difference between DFSA and
ADFSA consists in adjusting the size of the new frame. In ADFSA, the adjustment of the frame size is based on the
International Journal of Computer Science and Information Security (IJCSIS), Vol. 14, No. 6, June 2016
698 https://sites.google.com/site/ijcsis/ ISSN 1947-5500

estimated number of tags using different estimation methods such as those proposed by [10], [11], [12], [13], [14],
[15]… he estimates the number of tags, then he adjusts the frame size approximately the same as the number of tags
estimated as mentioned in [16]. However the problem of the maximal frame size persists when to the number of tag
is too large.
All algorithms mentioned above aim to develop the performance of the identification system, while obtaining high
efficiency requires a grouping of tags especially if the number of these is too large. As a result, during the last years,
there has been a trend towards a new paradigm for RFID tag identification which proposes to distribute the RFID
tags on regions often called clusters such as studies mentioned in [17], [18]. Others propose to modify the centralized
paradigm for RFID networks by introducing a new component called cluster-head. This cluster-head allows creating
micro-zones or clusters, which permit to reduce collisions between tags as mentioned in [19], [20] propose to confine
the number of tags in smaller groups in order to adjust the frame size accordingly with the number of tags and reduce
the probability of collision between them. This technic is presented in the sixth type of ALOHA based algorithm
called Enhanced dynamic frame slotted aloha.
In the following we will review the EDFSA algorithm in details, the Progressive Scanning Algorithm (PS) and
Sector and Power based Grouping (SPG).
B. Enhanced Dynamic Framed Slotted Aloha Algorithm
As the efficiency of the system is maximal when the number of tags is the same as the number of time slots (the
frame size), once the number of tags becomes larger than the frame size, the probability of tag collision increases
according to [21]. This problem can be solved by adjusting the number of time slots approximately the same as the
number of tags.
In this sense, the frame has a size maximal and cannot be increased indefinitely, thus when the number of unread
tags is too large, EDFSA algorithm proposes to restrict the number of unread tags in order to achieve high system
efficiency.
The principal steps of EDFSA algorithm can be described as follows:
Step 1: the reader proceeds to the estimation of the unread tags number.
Step 2: If the number of tags is much larger than the maximal frame size, EDFSA divides the unread tags
into a number of groups and allows only one group of tags to respond.
Step 3: Once the grouping is done, the number of tags that should respond is determined, and a ratio of the
responding tags to the total unidentified tags is calculated in order to make requests from the reader to all
unidentified tags.
Step 4: in every read cycle, the reader estimates the number of unread tags and calculates the number of
groups that gives the maximum throughput during the next read cycle. When the number of estimated tags
is below a threshold, the reader adjusts the frame size without grouping tags. i.e. the reader broadcasts a
query with a frame size to all tags in his interrogation range. After each read cycle, the reader estimates the
number of unread tags and adjusts its frame size accordingly.
Step 5: step 4 is repeated until all tags are identified.
International Journal of Computer Science and Information Security (IJCSIS), Vol. 14, No. 6, June 2016
699 https://sites.google.com/site/ijcsis/ ISSN 1947-5500

As a result, grouping the large amount of tags in EDFSA allows increasing the efficiency of the algorithm 100%
compared with FSA algorithm and 85% compared with DFSA algorithm according to [20].
C. Progressive Scanning Algorithm
This algorithm aims to increase the performance of data collection for RFID systems under the constraints of time
delay, throughput, and finally, the working distance.
The PS algorithm divides the number of tags in the interrogation zone of the reader into small groups as in the
EDFSA algorithm introduced in [20], but based on a regulation of energy which will be transmitted to tags by the
reader.
In the following we will present a detail description of the PS algorithm.
Step 1: Using the regulation, the reader transmits with an energy minimal (Pr = Pmin) in order to prevent
tags that are far from him to respond and allow only the nearest tags to reply. Thus tags located in the area
reached by the transmitted power, become energized, and reply using the FSA protocol.
Step 2: the reader increases the power level by a coefficient k (Pr = Pmin + k). All new tags reached by the
energy in the interrogation zone of the reader reply. Tags recognized in the previous scanning are
programmed not to reply to the reader’s command. This can be accomplished if the reader transmits a
command in the header that informs the tags, which have already transmitted once, not to reply until the
next cycle.
Step 3: the procedure explained in step 2 above continues using Pr = Pmin + i * k with the increment of I
values (i =1, 2, 3 . . .).
Step 4: in the last scanning, the reader transmits with the energy maximal Pr = Pmax.
Step 5: at the end of the first cycle of the PS algorithm, which consists of n = [(Pmax - Pmin) / k]
transmissions, a new cycle with multiple scans begins and the whole procedure is repeated until there are no
more tags unidentified in the interrogation zone as discussed in [22].
The PS algorithm is an alternative and simplex method to divide the tags in the interrogation zone into small
groups like in EDFSA, without any involvement from the tags and without adding any new component.
Consequently, PS algorithm decreases the complexity of the tags.
D. Sector and Power based Grouping Algorithm
As in EDFSA and PS algorithms, this algorithm consists in dividing tags in the interrogation zone of a reader into
a set of groups in order to minimize the collision probability.
The principal of this mechanism consists in the use of a directional antenna in order to group tags with different
direction. Furthermore, based on the PS algorithm, SPG algorithm split further tags in different zone with different
direction. Consequently, in this algorithm the reader takes the advantage of the directional beam forming antenna
systems which divides tags into different sectors according to [23]. After the formation of sectors, it takes advantage
of the PS algorithm to form different groups of tags at different power levels. This algorithm is the combination of
these two mechanisms of making sectors and powers levels.
International Journal of Computer Science and Information Security (IJCSIS), Vol. 14, No. 6, June 2016
700 https://sites.google.com/site/ijcsis/ ISSN 1947-5500

For example, if we assume that the interrogation zone is divided into I sectors and J power levels then I * J small
interrogation zones (groups) are formed. Thus the reader has to interrogate I * J groups sequentially. If we assume
that i is within the interval from 1 to I sectors and j is within another interval from 1 to J power levels, so the reader
will start the identification process from the first sector (i = 1) and the first power level (j = 1) which form the first
group. We can’t skip to the next power level until we have identified all the tags within the first group. After the
identification of all the tags in the first group (i=1, j=1), tags are put into sleep state in order to prevent them to reply
for the reader command. Afterward, the reader starts to communicate with tags in the next power level within the
same sector by increasing its power. For i = 1 the interrogation continues until j = J. After the identification of all the
tags in all the power levels of the same sector, the reader steers its beam towards the next sector. Then the reader
starts the interrogation process with the second group in the next sector by regulating the power level from 1 to J.
This process continues until the reader interrogates the tags inside the I sectors and its J power levels. An example of
the mechanism with three sectors with three power levels is illustrated in Fig. 1.
Figure 1. Sector and power based grouping mechanism.
This mechanism brings a fundamental approach which consists in forming the groups sequentially and starts the
identification process by recognizing group by group. The reader can’t skip to the next power level until it had
identified all the tags within the current group.
On the other hand, to resolve collisions that may occur inside each group, SPG algorithm employs an FSA
algorithm and executes one or more read frames to interact with the tags. The use of FSA algorithm helps to reduce
the complexity of tags as well as to prevent introducing new operation command for tags. The SPG algorithm
achieves significant performance improvement in the RFID system.
E. Summary
A comparison between different anti-collision algorithms is drawn in table I. We analyze them according to their
efficiency in reducing collision based on four metrics clustering, frame size, tags number and time slot.
International Journal of Computer Science and Information Security (IJCSIS), Vol. 14, No. 6, June 2016
701 https://sites.google.com/site/ijcsis/ ISSN 1947-5500

TABLE I COMPARISON BETWEEN ALOHA BASED ANTI-COLLISION ALGORITHMS
Clustering Frame size Tags number Time slot
BA X X X
SA X X
FSA X X
DFSA X
ADFSA X
EDFSA
PS X
SPG X
III. THE PROPOSED COLLABORATIVE MECHANISM
In this paper we propose a new mechanism which allows going from the centralized approach to the distributed
one. The principle consists on using two readers having the same interrogation range to identify a set of tags;
The first reader plays the role of a cluster-head and collects IDs from tags present in his interrogation zone.
These tags are grouped into clusters in order to minimize the risk of collision. Tag’s grouping will be
conducted using the progressive scanning algorithm (PS) mentioned in [20], which consists in grouping tags
according to energy levels. i.e. the reader begins the transmission with the minimum power level to the
maximum level allowed by regulation and identifies tags group by group.
The second reader communicates with the first reader and receives IDs collected by this latter. Then the
second reader starts directly communication with tags to retrieve data from them.
In Fig. 2, we present a detailed scheme of the proposed mechanism. The scheme contents a set of tags within the
frequency range of reader 1(R1) and assumes that this set of tags can be grouped into three groups (three energy
levels) according to progressive scanning algorithm.
On the other hand, at the arrival of the second reader or once this latter is activated, he will retrieve directly the IDs
of tags from the first redaer, then start communicating with tags within the interrogation range of reader 1 which is as
well its interrogation range. Consequently tags will respond by sending the data to reader as the process of
identification had been already done by the first reader.
Figure 2. A scheme of the proposed mechanism.
International Journal of Computer Science and Information Security (IJCSIS), Vol. 14, No. 6, June 2016
702 https://sites.google.com/site/ijcsis/ ISSN 1947-5500

The principal steps of the proposed mechanism are as follows:
Step 1: tags present in the interrogation zone of the reader, are grouped into clusters around a single cluster-
head (reader 1), using the algorithm of progressive scanning (PS).
Step 2 : the first reader estimates the number of tags in his interrogation zone and as the throughput of the
system is maximal when the number of tags is approximately the same as the number of time slots, as
shown in Fig. 3, he adjusts the frame size appropriately.
Step 3: the first reader starts identifying tags in different groups (cluster by cluster). If a collision occurs, the
resolution will be done using one of the algorithms proposed in the literature. Therefore, at the end of this
step, the reader 1 will have collected all IDs of tags in different clusters in his interrogation field.
Step 4: at the arrival of the second reader (reader 2), this latter communicates with the reader 1, via a
wireless network such as ZigBee, to retrieve IDs collected.
Step 5: once the second reader (reader 2) has received all IDs collected from reader 1, he sends requests of
acknowledgments ACK to the tags identified, and these latters respond by sending to him the data stored in
their memories.
Figure 3. Throughput of RFID system vs number of tags.
Therefore, the reader 2 will receive data from tags directly and without wasting time to resolve collision problems
as the resolution of collisions will be done by the first reader.
Fig. 4 shows the synchronization of the different steps of the proposed mechanism.
International Journal of Computer Science and Information Security (IJCSIS), Vol. 14, No. 6, June 2016
703 https://sites.google.com/site/ijcsis/ ISSN 1947-5500

Figure 4. The synchronization of the different steps of the proposed mechanism.
As a result, the first reader is responsible for collecting IDs from tags and resolving collisions that may occur.
Whereas, once present, the principal reader (reader 2) will directly communicate with tags to recover data stored in
their memories.
IV. SIMULATED RESULTS
To evaluate the performance of our proposed mechanism, we perform, in this section, simulations in order to
compare the improvements added by our proposition with EDFSA and DFSA algorithms. This comparison is
performed in terms of the number of time slots required to identify a set of tags, i.e. when the number of tags varies
from 20 to 500 in the interrogation zone of a reader.
In order to simulate the different aspects of our proposition, we assume that the communication between reader 1
and tags is accomplished in the absence of reader 2 or when this latter is inactive. As a result the time needed for the
resolution of collision is not to be considered.
Consequently, we assume that the number of time slots proposed in the frame by reader 2 i.e. the frame size, is
approximately the same as the number of tags present in the frequency range of reader 2. The adjustment of the
frame size is done after reader 2 had received the IDs of tags, so he counts the number of IDs and gets the number of
tags present in his interrogation range.
Fig.5 shows the total number of slots used to identify all tags according to a set of tags when using the proposed
mechanism to finish identifying all the tags.
The number of slots needed for our mechanism and DFSA to read the tags is less than that used in EDFSA when
the number of tags is very small. However, EDFSA algorithm begins to show superior performance when the
number of tags is over 120.
After that, the three algorithms have almost the same average curve variation, but the proposed mechanism present
less slots number than the two others algorithms.
International Journal of Computer Science and Information Security (IJCSIS), Vol. 14, No. 6, June 2016
704 https://sites.google.com/site/ijcsis/ ISSN 1947-5500

Figure 5. The total number of slots comparison.
This collaborative mechanism allows increasing the efficiency of the identification process by reducing the time
needed to identify all tags, thanks to the deployment of two readers. It also allows reducing the number of collided
tags thanks to tag’s grouping based on PS.
Finally, we can conclude that our mechanism can appropriately achieve higher performance compared to the
EDFSA and DFSA algorithms in terms of the number of time slots allowing identifying tags and effectively in terms
of total time required to do this.
V. CONCLUSION
Radio Frequency Identification RFID is increasingly used in various applications because of their high quality as
well as their low costs, however there are some limitations that can hinder the proper functioning of this technology,
for example, if several tags are located in the interrogation zone of the same reader, they might collide with each
other during the process of identification and thus their time slots will be canceled, thereby causing a waste in slots.
Consequently, in the process of tags identification, the challenge that emerges for RFID systems, where the presence
of multiple tags in the field of the reader, is to maximize the number of tags identified, while minimizing the time
required doing this. This is in order to make them accessible for information and to perform read / write operations.
In this paper we proposed a new mechanism permitting to increase the efficiency of the identification process and
the performance of data collection for RFID systems. The mechanism uses two readers having the same interrogation
range to identify a set of tags. Simulated results have shown that our mechanism has achieved higher performance
compared with existing algorithms in terms of number of time slots allowing identifying tags. Future works will
consist in applying the idea of the paper to tags in a mobile environment in order to evaluate its performance in such
environment.
International Journal of Computer Science and Information Security (IJCSIS), Vol. 14, No. 6, June 2016
705 https://sites.google.com/site/ijcsis/ ISSN 1947-5500
ACKNOWLEDGMENT
I acknowledge the suppot provided by my supervisor: Pr. Said RAKRAK and the members of the laboratory
LAMAI (Laboratory of Mathematics Applied and Informatics) of the Faculty of Science and Technology-Cadi
Ayyad University-Marrakesh
REFERENCES [1] Honbo Zhou. (2013) The Internet of Things in the cloud A Middleware Perspective online].
http://www.ittoday.info/Articles/Middleware_IoT.pdf. (Accessed 24 March 2016).
[2] Sylvain Cherrier. (2013) Architecture et protocols applicatifs pour la chorégraphie de services dans l'Internet des objets. Unpublished PhD thesis, PARIS-EST University Ecole doctorale MSTIC, France.
[3] Jongho Park, Min Young Chung and Tae-Jin Lee. (2006), ‘Identification of RFID Tags in Framed-Slotted ALOHA with Tag Estimation and
Binary Splitting’.Proceedings of IEEE International Conference on Communications and Electronics, ICCE '06, Hanoi, Vietnam, pp. 368 – 372.
[4] Kamineni, N. and Xinrong Li. (2010), ‘Analysis of anti-collision multi-tag identification algorithms in passive RFID systems’. Proceedings
of IEEE international conference on Computing Communication and Networking Technologies (ICCCNT),Karur, Tamil Nadu , pp. 1- 8. [5] Shakiba, M., Zavvari, A. and Sundararajan, E. (2011), ‘Fitted Dynamic Framed Slotted ALOHA Anti- Collision Algorithm in RFID
Systems’. Proceedings of IEEE International Conference on Information Technology and Multimedia (ICIM), Kuala Lumpur, Malaisy, pp.1-
6. [6] Abramson, N. (1970), ‘THE ALOHA SYSTEM: another alternative for computer communications’. Proceedings of the November 17-19, Fall
joint computer conference, New York, NY, USA, pp. 281-285.
[7] Abramson, N. (1985), ‘Development of the ALOHANET’. Proceedings of IEEE Transactions on Information Theory, vol. 31, issue 2, pp. 119-123.
[8] Roberts, L. G. (1975), ‘ALOHA packet system with and without slots and capture’. Published in Newsletter ACM SIGCOMM Computer
Communication Review,Vol. 5 Issue 2, pp. 28-42. [9] Schoute, F.C. (1983), ‘Dynamic frame length ALOHA’ Proceedings of IEEE Transactions on Communications, vol. 31, issue 4, pp. 565-
568. [10] Bonuccelli, M. A., Lonetti, F. and Martelli, F. (2007), ‘Instant collision resolution for tag identification in RFID networks’. V Elsevier Ad
Hoc Networks, vol.5, pp. 1220–1232.
[11] Jae-Ryong Cha and Jae-Hyun Kim. (2005), ‘Novel anti-collision algorithms for fast object identification in RFID systems’. Proceedings of
IEEE International Conference on Parallel and Distributed Systems, Fukuoka, Japan, vol. 2, pp. 63–67.
[12] Klair, D. K., Chin, K. and Raad, R. (2007), ‘On the accuracy of RFID tag estimation functions’. Proceedings of IEEE International
Symposium on Communications and Information Technologies, Sydney, Australia, pp. 1401–1406. [13] Vogt, H. (2002), ‘Multiple object identification with passive RFID tags’. Proceedings of IEEE International Conference on Systems, Man
and Cybernetics, vol. 3.
[14] Wen-Tzu Chen. (2009), ‘An accurate tag estimate method for improving the performance of an RFID anti-collision algorithm based on dynamic frame length ALOHA’. Proceedings of IEEE Transactions on Automation Science and Engineering, vol. 6, issue 2, pp. 9–15.
[15] Zhonghua Li , Chunhui He and Hong-Zhou Tan. (2011), ‘An enhanced tag estimation method applied to tag anti-collision algorithm in RFID
systems’. Proceedings of IEEE International Conference on Information Science and Technology (ICIST), Nanjing, China, pp. 703–708. [16] Alotaibi, M., Postula, A. and Portmann, M. (2009), ‘Tag anti-collision algorithms in RFID systems: a new trend’. WSEAS Transactions on
Communications, Greece, vol. 8,Issue 12, pp. 1216-1232.
[17] Ali, K., Hassanein, H. and Taha, A.-E. (2007), ‘RFID anti-collision protocol for dense passive tag environments’. Proceedings of IEEE Local Computer Network (LCN), Dublin, Irland, pp. 819-824.
[18] Alsalih, W., Ali, K. and Hassanein, H. (2008), ‘Optimal distance-based clustering for tag anti-collision in RFID systems’. Proceedings of
IEEE Local Computer Networks (LCN), Montreal, Que ,Canada, pp. 266–273. [19] Ali, K. and Hassanein, H. (2009), ‘Distributed receiving in RFID systems’. Procedings of IEEE Local Computer Networks (LCN), Zurich,
pp. 69–76.
[20] Lee, S., Joo, S. and Lee, C. (2005), ‘An Enhanced Dynamic Framed Slotted ALOHA Algorithm for RFID Tag Identification’. Proceedings of IEEE International conference on Mobile and Ubiquitous Systems: Networking and Services, MobiQuitous 2005. pp. 166-172.
[21] Wieselthier, J.E., Ephremides, A. and Michels, L.A. (1989), ‘An Exact Analysis and Performance Evaluation of Framed ALOHA with
Capture’. Proceedings of IEEE Transactions on Communications, vol.37, issue 2, pp.125-137. [22] Weilian, S., Alchazidis, N. and Ha, T.T. (2010), ‘Multiple RFID Tags Access Algorithm’ Proceedings of IEEE Transactions on Mobile
Computing, vol.9, issue 2, pp.174-187.
[23] Dhakal, S. and Seokjoo, S. (2013), ‘A Sequential Reading Strategy to Improve the Performance of RFID Anti-collision Algorithm in Dense Tag Environments’. Proceedings of IEEE International Conference on Ubiquitous and Future Networks (ICUFN), Da Nang, Vietnam,
pp.531-536.
International Journal of Computer Science and Information Security (IJCSIS), Vol. 14, No. 6, June 2016
706 https://sites.google.com/site/ijcsis/ ISSN 1947-5500

Web Page Classification based on context’s semantic correlation
Mehrdad Ranjbar-Khadivi 1, Mohammad-Reza Feizi-Derakhshi *2
1 Department of Computer, East Azerbaijan Science and Research Branch Islamic Azad University, Tabriz, Iran
1 Department of Computer Engineering, Tabriz Branch, Islamic Azad University, Tabriz, Iran.
2 Department of Computer Engineering, University of Tabriz, Tabriz, Iran.
Abstract- Automatic web pages' classification is one way to deal with the increasing range of the World Wide Web. Considering that most of the content of web pages is text, so classification based on text is seems to be an efficient solution. The methods used for text classification are usually based on the key words. But if illusive keywords appear
within the web page, then the class of the webpage will not be properly diagnosed. Therefore, rather than paying attention to the words, it is needed to be given to content and words meaning. In this paper, a method based on content semantic correlation has been proposed. A text consists of paragraphs, sentences and words. In this study at first text
is divided into its components and stop words is removed. Then, in order to forms the basis of the words, it will be needed to find the root of the words. The Hypernyms Tree of words can be extracted by using FARSNET. By using this method not only is the meaning of the terms considered but also there is no need to clarify the words. After
extracting the Hypernyms Tree for all keywords, text feature vector is created. Then the similarity of the text to each of the available categories measured. Finally, KNN classification algorithm is used to recognize the right class of the webpage. The results show that by using this method, classification accuracy is increased by 0.17 in compared with
other methods.
I. INTRODUCTION
Due to an increase in the number of webpages and their text content, it has become difficult to search among these web pages. One method that can be useful, is to classify these pages. Considering that, most of the webpages' content are text, it seemed that classification based on the text is a more useful method. Existing methods for classification are based on key words. But some of webpage's admins use illusive keywords in order to increase their page's ranking. However, these keywords are not usually visible to their visitors. Thus, it become difficult to classify webpages based on keywords. Therefore, a method must be devised to detect and discard such words. In this article, semantic relationships between words and the meaning of words will be considered in order to classify the webpages. A text consists of paragraphs, sentences and words which are proposing a unit meaning together. However, illusive keywords are discrete terms which have separate meaning. To do so as well as extracting feature vector, text of a web page will be extracted with HTML Tag Tree and it will be divided to several sections. By using FarsNet, a Hypernyms Tree(HT) for each words will be extracted and a corresponding feature vector for that web page will be created. Then using a similarity measuring method, the similarity of each document to available categories will be evaluated. At the end, the category of the document will be determined using KNN classification algorithm.
A. Web page classification definition
Web page classification, also known as web page categorization, may be defined as the task of determining whether a web page belongs to a category or categories. Formally, let C = c1, ..., cK be a set of predefined categories, D = d1, ..., dN be a set of web pages to be classified, and A = D × C be a decision matrix. In this matrix, each entry aij (1 ≤ i ≤ N, 1 ≤ j ≤ K) represents whether web page di belongs to category cj or not. Each aij ∈ 0, 1 where 1 indicates web page di belongs to category cj, and 0 for not belonging [1].
International Journal of Computer Science and Information Security (IJCSIS), Vol. 14, No. 6, June 2016
707 https://sites.google.com/site/ijcsis/ ISSN 1947-5500

B. Using Ontology
In order to process the natural language, ontology or semantic vocabulary sets are the main sources [2]. Ontology can reveal the relations between words and replace terms by concepts. Replacing concepts instead of words that are related to each other, leads to an increase in the weight of the meaning of the text and as a result, improves the accuracy of weighting system [3]. This is one means to reduce the high dimensionality of sample space model. In fact, it can be said that the ontology is prior knowledge that can be used to extract concepts [4].
C. Semantic similarity measurement
A lot of measures have been proposed for determining the similarity between two vectors. The Kullback-Leibler divergence [5] is a non-symmetric measure of the difference between the probability distributions associated with the two vectors. Euclidean distance [6] is a well-known similarity metric taken from the Euclidean geometry field. Manhattan distance [6], similar to Euclidean distance and also known as the taxicab metric, is another similarity metric. The Canberra distance metric [6] is used in situations where elements in a vector are always non-negative. Cosine similarity [7] is a measure taking the cosine of the angle between two vectors. The Bray-Curtis similarity measure [8] is a city-block metric which is sensitive to outlying values. The Jaccard coefficient [9] is a statistic used for comparing the similarity of two sample sets, and is defined as the size of the intersection divided by the size of the union of the sample sets. The Hamming distance [9] between two vectors is the number of positions at which the corresponding symbols are different. The extended Jaccard coefficient and the Dice coefficient [10] retain the sparsity property of the cosine similarity measure while allowing discrimination of collinear vectors. An information-theoretic measure for document similarity, named IT-Sim, was proposed in [10]. Chim et al. [11] proposed a phrase-based measure to compute the similarity based on the Suffix Tree Document (STD) model.
A new method that used for similarity measure, is the method that Lin et al. was proposed in reference [5] named SMTP. As the Lin et al. claimed and the experiences confirms, this method has better results than other ones. In order to extract the feature vector, Lin et al. used term frequency and tf-idf. However, this method classifies right but does not pay attention to the meaning of the words. Then if two synonym words appear in a document, SMTP consider these words as two different words. This cause Sample space to be too large. So, in order to extract the meaning and pay attention to the concept of the terms and words, a Persian Word Net named FARSNET can be used.
D. Using Word Net
WordNet is a network of terms and words with a wide range. Words are stablished in different classes of parts of speech such as nouns, verbs, adverbs and adjectives. Each of the synonym sets represent a corresponding concept of that set. Concepts are linked together by various relationships. In Persian, some attempts have been made in order to identifying the relationships between words. One of the important work carried out names FARSNET [6]. FARSNET is a Persian term ontology that tries to implement a set like WordNet in Persian language.
E. FARSNET
FARSNET is a term ontology in Persian language [7]. FARSNET is a set of Persian words with their relationships. This ontology consists of 10,000 synonym sets and 18,000 Persian words. Words that exist in FARSNET includes nouns, verbs and adjectives. FARSNET ontology relationships include synonymous, the generalizability, conflict, specific ways of expression and divisible. Each word has a set of synonym that each of them contains a set of words that has the same meaning [2].
II. PROPOSED METHOD
The first step of web pages' classification is to transform a web page which is usually contains a string of characters, links, images and html tags to a vector of features. Therefore, less important information has to be removed and the main features must be highlighted. To do this, several steps which are described below are required.
International Journal of Computer Science and Information Security (IJCSIS), Vol. 14, No. 6, June 2016
708 https://sites.google.com/site/ijcsis/ ISSN 1947-5500

A. extracts text from web pages
Data mining is the process of extracting relevant information from the mass of data, such as text, databases and semi-structured documents and multi-media. On the issue of web categorization (classification based on the text), an approach is needed to convert the available resources in HTML web pages, which are a kind of semi-structured data, to a text which can be processed. In this article, HTML Tag Tree is used to describe a web page, so that HTML tags are considered as nodes in the tree. In this tree, text nodes are not parent of any nodes [1].
B. Text preprocessing
A text contains paragraphs. Each paragraph contains sentences and phrases that are semantically coherent and solidarity imply a certain concept. Also, each of these sentences contains several vocabularies which have various-grammatical function such as nouns, verbs, adjectives, and adverbs. As a result, a word is the smallest unit of structure of a text. In addition to the items listed, a phrase may also contain some additional words such as prepositions to link words to each other. So, at first the text in terms of structural and semantic integrity were processed and it confirmed that its following the rules of grammar.
Stop words such as prepositions, adverbs and adjectives, some verbs, conjunctions and etc. are repeated often in the context. These words usually have no influence on the content and meaning of the text. These words often take more weight than other words which are important for meaning but not as common. This prevent meaning of text being extracted correctly. So it is advisable to remove these words. After this, in order to get the correct meaning of the words, parts of speech tagging system is used and the words are tagged. At the end, roots operation is performed in order to restore words to their roots. This leads to a reduction of the feature space. At this point all the additional to word like symptoms, property and etc. are removed.
C. Feature vector extraction
Unlike existing works which classify texts based on counting the number of keywords, this study uses ontology extraction and therefore the classification’s reliability, efficiency and accuracy is increased. Ontology can explore the relationships between words and replace the words by its concepts. This can reduce the search space, weight gain and increase the accuracy of weighing systems and thus increase the efficiency and accuracy of the classification system.
In order to pay attention to ontology, in this article the Hypernyms Tree(HT) of each word are extracted. HT uses synonym and hypernym relations in order to expand keywords. To do so, a Persian term ontology named FARSNET is used. The root node of HT is the General term and the child node is a partial phrase. An example of this tree is shown in Figure 1.
For feature vector extraction, after preprocess phase and while extracting words, HT will be created and been compared with other HT in keywords set. In this article, the concept of scrolling and then compare tree is used. The distance between the current word and the tree root is calculated and stored in a vector. Finally, taking the tree concepts and sets of values as feature vectors will be used to perform the classification.
D. Similarity
After feature extracting and producing feature vector, the similarity between two documents is measured and depending on which category the exciting document is similar to, the class of the document is selected. In this article in order to measure the similarity a method proposed by Lin et al. named SMTP is used [2]. Suppose d1, d2 be two document presented as vectors d1=<d11, d12, …, d1m> and d2=<d21, d22, …, d2m>. the SMTP similarity of d1 and d2 is
( 1) 𝑆𝑆𝑀𝑇𝑃(𝑑1, 𝑑2) =𝐹(𝑑1, 𝑑2) + 𝜆
1 + 𝜆
International Journal of Computer Science and Information Security (IJCSIS), Vol. 14, No. 6, June 2016
709 https://sites.google.com/site/ijcsis/ ISSN 1947-5500

Function F is declared as below:
( 2) 𝐹(𝑑1, 𝑑2) =∑ 𝑁∗(𝑑1𝑗 , 𝑑2𝑗)𝑚𝑗=1
∑ 𝑁∪(𝑑1𝑗 , 𝑑2𝑗)𝑚𝑗=1
In which:
( 3) 𝑁∗(𝑑1𝑗 , 𝑑2𝑗) =
0.5 (1 + 𝑒𝑥𝑝 −(
𝑑1𝑗 − 𝑑2𝑗
𝜎𝑗)
2
) , 𝑖𝑓𝑑1𝑗𝑑2𝑗 > 0
0, 𝑖𝑓 𝑑1𝑗 = 0 𝑎𝑛𝑑 𝑑2𝑗 = 0
−𝜆, 𝑜𝑡ℎ𝑒𝑟𝑤𝑖𝑠𝑒
and
( 4) 𝑁∪(𝑑1𝑗 , 𝑑2𝑗) = 0, 𝑖𝑓 𝑑1𝑗 = 0 𝑎𝑛𝑑 𝑑2𝑗 = 0
1, 𝑜𝑡ℎ𝑒𝑟𝑤𝑖𝑠𝑒
As Lin et al. Claimed and experiments approved, this measure takes into account the following three cases: a) The feature considered appears in both documents, b) the feature considered appears in only one document, and c) the feature considered appears in none of the documents. For the first case, a lower bound is set 0.5 and decrease the similarity as the difference between the feature values of the two documents increases, scaled by a Gaussian function as shown in ( 3) where σj is the standard deviation of all non-zero values for feature wj in the training data set. For the second case, a negative constant −λ applied disregarding the magnitude of the non-zero feature value. For the last case, the feature has no contribution to the similarity.
E. Classification
After the semantic similarity, measured between data sets, the last step is to determine the category or class of each test documents. The aim of this research is to single label the documents. One of the single-label classification method is KNN. In this type of classification, a document will belong to only one subject. In This classification method, the subject of an unknown document is determined by comparing it with its K near neighbors in training set.
III. EXPERIMENTAL RESULTS
In this section the effectiveness of the proposed method is investigated. The method for similarity measurement is compared with usual method of similarity measure such as Euclidean and Cosine. As well as, the proposed method to extract feature vector and the proposed method to extract meaning of text is compared with equivalent methods in Persian language because the focus of this article is on Persian webpages. In order to implement this method a computer with Intel Core-i5 processor 3.6GHz, 8GB RAM is used. Also, the programming language is C# which is used in Visual Studio 2013 environment.
Corps – Horticultural Products
Vegetables Fruit – Edible fruits
Apple
Figure 1: An Example of Hypernyms Tree
International Journal of Computer Science and Information Security (IJCSIS), Vol. 14, No. 6, June 2016
710 https://sites.google.com/site/ijcsis/ ISSN 1947-5500

A. Data Sets
The dataset used in this study are derived from the collection of news agencies. It should be noted that the testing data are totally separate from the training data. Table 1 is a summary of the information given about this data set. These documents were classified manually on a variety of topics. These documents are divided randomly into train and test subsets. Of the 3938 document, 70% of the documents with count 2757 are used for the training phase and the remaining 30 percent with the number 1181 is considered as a test phase.
B. evaluation
According to the ( 1), first step is to determine the amount of λ. As Lin et al. plea and this article’s experimental results show(as in Figure 2), the highest accuracy of the system occurs with the λ = 1. Lin et al. explain this that in classification, individual patterns are compared one to one. Of the same category being compared, the case that one feature appears in one pattern but does not appear in the other pattern occurs less often than the case that one feature appears in both patterns. With a high value of λ, the former case is allowed to contribute as significantly
to the similarity as the latter case. Therefore, high λ values are better for classification. So the setting λ = 1.0 is
used for SMTP to compare with other measures on testing accuracies [5].
In this experiment, the performance is evaluated by the classification accuracy. Accuracy compares the predicted label of each document with that provided by the document set. The accuracy is the number of correct predictions (TP + TN) to the total predictions which is expressed according to the following equation
( 5) FNTNFPTP
TNTP
Accuracy
The accuracy of the proposed system for different k compared with other methods shown in Figure 3.
IV. CONCLUSION
Web page classification is the process of assigning a web page to one or more pre-defined labeled groups. Classification of Web pages, can also be defined as a task to determine whether a web page belongs to a topic/topics or not. Available methods, uses the key words to choose the class of web pages, but often existence of not relevant pages, make this operation difficult. The difficulty comes from the fact that pages admins in order to increase the number of visitors and improve the ranking of their pages, curtaining these keywords to their pages' background, so classification based on keyword is inefficient. Therefore, a method that can recognize these irrelevant words from the chain of words within the text is required. The proposed classification method pays attention to the relationship between the semantic meaning of the words.
Figure 2: the impact of λ on accuracy
0.65
0.7
0.75
0.8
0.85
0.9
0.95
0.01 0.05 0.1 0.2 0.5 0.8 1
Accuracy
λ
k=1 k=3 k=5 k=7
k=9 k=11 k=13 k=15
International Journal of Computer Science and Information Security (IJCSIS), Vol. 14, No. 6, June 2016
711 https://sites.google.com/site/ijcsis/ ISSN 1947-5500

A text includes words, sentences and paragraphs that together and in general imply a special meaning. A text is consist of paragraphs, sentences and words. Each words have different meanings which in combination with each other they make sentences that convey a same meaning. By connecting sentences, paragraphs are made and by connecting them to each, text exists. As a result, it is important to pay attention to meaning of text than to the words individual.
One way to consider the meaning of the text is ontology. It can discover relationships between words and can supersede the words by concepts. In order to extract the meaning, Hypernyms Tree is used in this article. To do so, at first web page is parsed by HTML Tag Tree and text of that web page is obtained. Then text is divided in to its' constitutive paragraphs, sentences and words. Then stop words are removed from the content. Afterward, the part of speech tag of each words is specified and the words are returned to there's roots. Thereupon, by using FARSNET the Hypernyms Tree of each tree is obtained. By these Hypernyms Trees, the feature vector of the document is extracted. The SMTP similarity measure uses this vector to compare similarity with train data set and at last by using KNN algorithm the class of unknown document will be predicted. The proposed method is compared with similar methods and results shows that classification accuracy is increased on average 0.17%. also The Hypernyms Tree extraction, reduces the sample space.
Future works can focus on other relations between words other than hypernym. Eke, n-grams can be used to determine the affiliation between words. In addition, combining the methods of similarity measurement can be useful. Furthermore, by considering that most of webpage are not only contain text, finding a relation between the text of a webpage and its other content such as pictures can be improving the classification effectiveness.
REFERENCES [1] B. Choi and Z. Yao, "Web Page Classification," Studies in fuzziness and soft computing, vol. 180, pp. 221-274, 2005.
[2] H. Hoseinpour and S. Sadat-madani, "an improvement in Automatic persian document classification system using Persian ontology FarsNet (published in Persian)," Soft Computing and information technology, vol. 1, pp. 44-54, 2014-2015.
[3] B. B. a. K. K. A. Khan, "Efficient Feature Selection and Domain Relevance Term Weighting Method for Document Classification," Computer Engineering and Applications, pp. 398-403, 2010.
[4] A. M. a. S. S. A. Hotho, "Ontology-based Text Document Clustering," KÜNSTLICHE INTELLIGENZ, vol. 2, pp. 1025-1031, 2004.
[5] S. K. a. R. A. Leibler, "On information and sufficiency," Annu. Math. Statist, vol. 22, pp. 79-86, 1951.
[6] T. W. S. a. G. Madey, "Evaluation of measurement techniques for the validation of agent-based simulations against streaming data," in ICCS, Kraków, Poland, 2008.
Table 1: a summary of the DataSet
Number of documents Train set Test set Number of features Number of classes
3938 2757 1181 6587 8
Figure 3: the Accuracy of the proposed method in campare with others
13579111315
Euclidean 0.87990.89080.88720.87850.88210.88310.87990.8762
Cosine 0.91370.92650.93190.92870.92740.92780.92460.9296
SMTP 0.93380.94110.94210.94470.94610.94660.94340.9443
SMTP (HT) 0.93480.94350.94480.94550.94690.94720.94550.9468
0.84
0.86
0.88
0.9
0.92
0.94
0.96
Accuracy
International Journal of Computer Science and Information Security (IJCSIS), Vol. 14, No. 6, June 2016
712 https://sites.google.com/site/ijcsis/ ISSN 1947-5500

[7] J. H. a. M. Kamber, "Data Mining: Concepts and Techniques," in ed. San Francisco, CA, USA: Morgan Kaufmann; Boston, MA, USA: Elsevier, 2006.
[8] M. G. Michie, "Use of the bray-curtis similarity measure in cluster analysis of foraminiferal data," Math. Geol., vol. 14, pp. 661-667, 1982.
[9] W. B. J. a. A. L. V. R. C. G. González, "Density of closed balls in real-valued and autometrized boolean spaces for clustering applications," 19th Brazilian Symp. Artif. Intell, pp. 8-22, 2008.
[10] M. S. a. V. K. P.-N. Tan, "Introduction to Data Mining," 2006.
[11] J. A. A. a. M. Frost, "An information-theoretic measure for document similarity," 26th SIGIR, pp. 449-450, 2003.
[12] H. C. a. X. Deng, "Efficient phrase-based document similarity for clustering," IEEE Trans. Knowl. Data Eng., vol. 20, pp. 1217-1229, 2008.
[13] Y.-S. Lin, J.-Y. Jiang and S.-J. Lee, "A Similarity Measure for Text Classification and Clustering," IEEE TRANSACTIONS ON
KNOWLEDGE AND DATA ENGINEERING, vol. 26, pp. 1575-1590, 2014.
[14] M. ShamsFard and e. al., "Semi automatic development of Farsnet: the persian wordnet," in 5th Global WordNet Conference, Mumbai, India, 2010.
[15] M. ShamsFard, "Towards Semi Automatic Construction of a Lexical Ontology for Persian," in 6th International Conference on
Language Resources and Evaluation, 2008.
[16] X. Ji, J. Zeng, S. Zhang and C. Wu, "Tag tree template for web information and schema extraction," Expert System with
Application, vol. 37, pp. 8492-8498, 2010.
International Journal of Computer Science and Information Security (IJCSIS), Vol. 14, No. 6, June 2016
713 https://sites.google.com/site/ijcsis/ ISSN 1947-5500

Relevance Feedback in XML Retrieval Based
on Classification of Elements Inès KAMOUN FOURATI
Mohamed TMAR Abdelmajid BEN HAMADOU
Multimedia, InfoRmation systems and Advanced Computing Laboratory, SFAX, TUNISIA
Abstract - Unlike classical information retrieval systems, the systems that treat structured documents include the
structural dimension through the document and query comparison. Thus, the relevant results are all elements that
match the user needs rather than the entire document. In such a case, the document and query structure should be
taken into account in the retrieval process as well as during the reformulation. Query reformulation should also include
the structural dimension. In this paper, we propose an approach of query reformulation based on structural relevance
feedback. We start from the original query and the fragments judged as relevant by the user. The analysis of the
structure of document fragments and textual content of elements enables identify elements that match the user query
and rebuild it during the relevance feedback step. The main goal of this paper is to show the impact query reformulation
based on an analysis of the structure and content of each relevant element retrieved by an initial search process. Some
experiments have been undertaken into a dataset provided by INEX to show the effectiveness of our proposals.
Keywords: Information retrieval; XML document; relevance feedback; Line of descent matrix; Classification.
I. Introduction
The goal of information retrieval systems (IRS) is to satisfy the information needs of a user. These needs are
expressed by a query to be matched with all the documents in the corpus to select those that could answer the
user's needs. Because of the ambiguity and the incompleteness of his query, the user is, in most cases, not satisfied
with the returned results. To overcome this problem, there can be alternatives to the initial query so as to improve
the results. Among the most popular patterns in information retrieval (IR), we cite the relevance feedback (RF)
which has become a crucial phase in the IR. The RF is based on the judgments of relevance of the documents
found by the IRS, after an initial search process intended to re-express the information need from the initial query
in order to find more relevant documents.
Due to the great importance of structured information, XML documents cover a big part not only on the web,
but also on modern digital libraries, and essentially on Web service oriented software [19]. This standardization
of the Web to XML schema raises new problems and hence new needs for customized information access. Being
a very powerful and often unavoidable tool to customized access to information of all kinds, information retrieval
systems arise at the forefront of this issue. However, the traditional IRS do not exploit this structure of documents,
including the RF function. Furthermore, a structured document is characterized by a content and a structure. This
International Journal of Computer Science and Information Security (IJCSIS), Vol. 14, No. 6, June 2016
714 https://sites.google.com/site/ijcsis/ ISSN 1947-5500

structure possibly completes the semantics expressed by the content and becomes a constraint with which IRS
must comply in order to satisfy the user's information needs. Indeed, the user can express his need by a set of
keywords, as in the traditional IRS, and can add structural constraints to better target the sought semantics. Thus,
taking into account the structure of the documents and that of the query by the information retrieval systems,
handling structured documents is necessary in the feedback process. Many initiatives of relevance feedback have
been proposed to rewrite the user's query. The majority of these approaches are content-based, which means that
only the query terms are updated, and relatively re-weighted to improve the result.
Only a few approaches modify the query structure. In this paper, we propose an approach of structure-based
relevance feedback. We assume that the query structure could be reformulated based on the structure of the
document elements judged as relevant. This paper is organized as follows: in the second section, we give a survey
on the works related to the XML relevance feedback. We present, in the third section, our approach of query
reformulation, based on the structure relevance feedback. In the fourth section, we present the experiments and
the obtained results. The fifth section concludes.
II. Related work
Many initiatives of XML query reformulation have been proposed. In most cases, RF approaches have been
adapted in order to take into account the structural dimension.
Villatoro-Tello and al. described in [18] a system developed by the Language and Reasoning Group of UAM
for the Relevance Feedback track of INEX 2012. The system focuses with the problem of ranking documents in
accordance to their relevance. It is mainly based on different hypotheses such as that current IR machines are able
to retrieve relevant documents for most of the general queries, but they cannot generate a pertinent ranking and
therefore focused relevance feedback could provide more and better elements for the ranking process than isolated
query terms. The authors aim to demonstrate that using some query-related relevance feedback is possible to
improve the final ranking of the retrieved documents.
Balog and al. propose a general probabilistic framework for entity search to evaluate and provide insight in the
many ways of using these types of inputs for query modeling [2]. These authors focus on the use of the category
information and demonstrate the effectiveness of category-based expansion using example entities.
Schenkel and Theobald [17] describe two approaches which focus on the incorporation of structural aspects in
the feedback process. Their first approach re-ranks results returned by an initial keyword-based query using
structural features derived from results with known relevance. Their second approach involves expanding
traditional keyword queries into content-and-structure queries. The official results evaluated using the INEX 2005
[6] assessment method based on rank-freezing show that re-ranking outperforms the query expansion method on
these data.
Mihajlovic et al. [12] extended their database approach to include what they refer to as structural relevance
feedback. They assume that knowledge of component relevance provides implicit structural hints which may be
used to improve performance. Their implementation is based first on extracting the structural relevance of the top-
ranked elements and then restructuring the query and tuning the system based on RF information. They argue that
if a component is assessed as relevant for a given topic, the document to which it belongs is apt to contain similar
information, so the document name is used to model structural relevance.
Based on the structural information and assessments associated with the relevant elements, the query is rewritten
and evaluated.
International Journal of Computer Science and Information Security (IJCSIS), Vol. 14, No. 6, June 2016
715 https://sites.google.com/site/ijcsis/ ISSN 1947-5500

In [11], two experiments are described. The first analyzes the effects of assigning different weights to the
structural information found in the top 20 elements. And the second seeks to determine which of the two types of
structural information is more useful in this context.
Sauvagnat and al. [8], describe their experiments in relevance feedback as follows: the structure-oriented
approach first seeks to identify the generic structure shared by the largest number of relevant elements and then
they use this information to modify the query. A second method, called content-oriented, utilizes terms from
relevant elements for feedback. A third method involves a combination of both approaches. Official results show
improvement in some cases but are not consistent across the query types.
Crouch and al [3], implemented relevance feedback in a conventional information retrieval environment based
on the Vector Space Model. Their approach of flexible retrieval helps the system retrieve relevant information at
the element level. The paragraph is selected as the basic indexing unit, and the collection is indexed on paragraphs.
A simple experiment in relevance feedback is performed as follows: the top 20 paragraphs retrieved from an initial
search are examined for relevance. A feedback query is constructed based on Rocchio's algorithm [15]. The result
of the feedback iteration is another list of rank-ordered paragraphs. Flexible retrieval is performed on this set to
produce the associated elements. Again, small increases in average recall-precision were produced.
Mass and Mandelbrod [10] proposed an approach that determines the types of the most informative items or
components in the collection (articles, sections, and paragraphs for INEX) and creates an index for each type. The
automatic query reformulation process is based on identifying its best elements from an ordered list to select the
most relevant ones. The scores in the retrieved sets are normalized to make the comparison across indices possible
and scaled by a factor related to the score of the containing article. The authors use the Rocchio algorithm [15]
associated with the lexical affinity.
Hanglin [13] proposed a framework for feedback-driven XML query refinement and addressed several building
blocks including reweighting of query conditions and ontology-based query expansion. He pointed out to the
issues that arise specifically in the XML context and cannot be simply addressed by straight forwarding use of
traditional IR techniques, and present approaches toward tackling them. He presented in [14] a demonstration that
shows this approach for extracting the user's information needs by relevance feedback, maintaining more
intelligent personal ontologies, clarifying uncertainties, reweighting atomic conditions, expanding query, and
automatically generating a refined query for the XML retrieval system XXL [16].
Among these approaches, only a few consider that RF in the query structure is necessary. It is common to
rewrite the query based on its structure, and the content of the relevant elements, without any modification of the
query structure itself.
In our approach, we consider that the structural RF is necessary, particularly if the XML retrieval system takes
into account the structural dimension in the matching process. Since we use an XML retrieval system that matches
the structure in addition to the content [1], we assume that the structure reformulation could improve the retrieval
performance.
III. Structural-based relevance feedback
In our approach, we focus essentially on the structure of the original query and on that of the elements deemed
to be relevant to the user. In figure 1, we present an example of a relevant elements taken from the INEX collection.
We consider that the set of elements belonging to the same document as a relevant fragment. In our context a
fragment is an XML tree or XML sub-tree belonging to the same XML document. Figure 2 represents relevant
International Journal of Computer Science and Information Security (IJCSIS), Vol. 14, No. 6, June 2016
716 https://sites.google.com/site/ijcsis/ ISSN 1947-5500

elements of document so/2001/s1022 and the corresponding fragment for the document from the relevant elements
of figure 1.
1) /article[1]/bdy[1];an/2002/a3002
2) /article[1]/bdy[1]/sec[2];so/2001/s1022
3) /article[1]/bdy[1];so/2001/s1046
4) /article[1]/bdy[1]/sec[3];so/2001/s1038
5) /article[1];so/1997/s4021
6) /article[1]/bdy[1]/sec[4];so/2001/s1022
7) /article[1];co/1996/r2029
8) /article[1]/bdy[1]/sec[3]/p[1];so/2001/s1022
9) /article[1]/bdy[1];mu/2002/u4047
10) /article[1];ts/1999/e0438
11) /article[1]/bdy[1]/sec[3]/ss1[4];so/2001/s1022
12) /article[1];an/2002/a3056
13) /article[1]/bdy[1]/sec[4]/p[1];so/2001/s1022
14) /article[1]/bdy[1]/sec[2]/p[2];so/2001/s1022
15) /article[1]/bdy[1]/sec[2];an/2002/a2071
Fig. 1. Example of classification of elements generated by an XML information retrieval system
We note that the original query can be considered as a fragment and we therefore could be called the fragment
of original query.
Indeed, this study helps us reinforce the importance of these structures in the reformulated query to better
identify the user's needs. The analysis of structures enables us to identify the most relevant elements and the
involved relationships.
The content of these fragments and those of the initial query are also taken into account. Their analysis helps
us select the most relevant terms that will be injected in the elements of the new query.
Our approach is based on two major parts. The first aims at reformulating the query structure based on the query
structure and the judged relevant fragments. The second (detailed is the next section) aims to reformulate the
structure and content of the initial request based on the textual content of the relevant elements.
According to most approaches of relevance feedback, the query construction is done by building a
representative pattern for relevant objects and another pattern for irrelevant ones, and then build a representation
close to the first and far from the second. For example, the Rocchio's method [15] considers a representative
pattern of a document set by their centroid. A linear combination of the original query and the centroids of the
relevant documents and irrelevant ones can be assumed as a potentially suitable user's need. Although being
simplistic, the Rocchio's method is the most widespread. Its simplicity is due to the nature of the manipulated
objects. Indeed, Rocchio's method is adapted to the case where documents are full text, in such case, each
document is expressed by a vector (generally a vector of weighted terms), where the documents embody structural
relations, and the vector representation becomes simplistic. This results in a significant loss of structural contrast
and therefore the reconstruction of a unified impossible structure. We believe that the structure is an additional
dimension. A unique dimension is not enough to encode the structural information (one dimension vector), thus
International Journal of Computer Science and Information Security (IJCSIS), Vol. 14, No. 6, June 2016
717 https://sites.google.com/site/ijcsis/ ISSN 1947-5500

we need to encode all the documents into two dimensions, by using matrices rather than vectors. That reasoning
has led us to represent the documents and the query in a matrix format instead of a weighted term vector. Those
matrices are enriched by values calculated from a transitive relationship function. Then, the representative
structure of query and the judged relevant fragments (that we call S) are constructed under a matrix form. We
consider that each XML document or XML fragment can be represented by "line of descent matrix".
A. Line of descent matrix (LDM)
We consider that each XML document or XML fragment can be represented by a line of descent matrix. In our
approach, we build, for each initial query and relevant fragments line of descent matrices (LDM). Each matrix
must show all existing ties of relation between different elements belonging to the fragments that represents. This
representation should also reflect the positions of the various elements in the fragments as they are also important
in the structural relevance feedback [4]. We consider all the elements having the same tag name as one.
For a fragment f, we associate the matrix defined by Mf : [ , ] = → → ∈ ∶ ℎ 0 ℎ
Where → is the number of occurrence of parent of , and are and elements of
the fragment f.
Note that no complexity analysis is needed here because of the low number of relevant judged documents
compared to the corpus size. In our experiments, we undertake the relevance feedback in a pseudo-feedback way
on the top 20 ranked fragments resulting from the first round retrieval. Moreover, the total number of tags is over
160 in all the collection (INEX'05 collection) and about 5 in a single fragment, so the matrix size cannot exceed
25.
Consider the relevant fragment f shown in figure 2.
Fig. 2. Structure of fragment document so/2001/s1022.xml
This fragment is represented by the line of descent matrix in figure 3. The elements sec[2], sec[3] and sec[4]
(resp. p[1] and p[2])are considered as one since they have the same tag name sec (reps. p).
artic
le
bdy
sec
p ss1
article 0 1 0 0 0
bdy 0 0 3 0 0
sec 0 0 0 3 1
article[1]
bdy[1]
sec[2] sec[4] sec[3]
p[2] p[1] p[1] ss1[4]
International Journal of Computer Science and Information Security (IJCSIS), Vol. 14, No. 6, June 2016
718 https://sites.google.com/site/ijcsis/ ISSN 1947-5500

p 0 0 0 0 0
ss1 0 0 0 0 0
Fig. 3: Example of line of descent matrix
B. Setting the relationships between an element and its descendants
XML retrieval is usually done in a vague way. A fragment can be returned even if the structural conditions of
the query are not entirely fulfilled. This means that if a fragment of an XML document is similar but not identical
to the query, it can be returned. The XML retrieval system has to query with tolerated differences (a few missing
elements or more additional ones) between the query structure and the document. Consequently, we believe that
the most effective way to bring this tolerance is to make sure that one element is not only connected to its child
elements, but to all its descendants. A relationship between elements in the same line of descent is weighted by
their distance in the XML fragment f.
Therefore, we use the transitive relationship function F on the weights of the element edges with a common
ancestor. The resulted value will be added to the weight of the edge itself in the LDM as follows: ∀ , , , , ← , + ( , , , ) Where , and are elements in the fragment f and Mf is its LDM, and F is a function defined by the
following: : ℝ → ℝ ( , ) ⟼ ( , ) F(x, y) should be less than the values of x and y because of transitivity (the weight of the relationship decreases).
Furthermore, the F function must be increasing: the higher the weight edges are, the more important the descent
link is: ∀ , > 0,0 ≤ ( , ) ≤ min( , )∀ , , , ≥ 0, ( , ) < ( + , + ) We use the following function as a meeting of these criteria: ( , ) = ∗+
After setting the relationships between elements of fragment of figure 2 the line of descent matrix shown in
figure 3 became the matrix shown in figure 4.
Arti
cle
bdy
sec
p ss1
article 0 1 2.121 1.732 0.577
bdy 0 0 3 2.121 0.707
sec 0 0 0 3 1
p 0 0 0 0 0
ss1 0 0 0 0 0
Fig. 4: Line of descent matrix after transitive relationship
International Journal of Computer Science and Information Security (IJCSIS), Vol. 14, No. 6, June 2016
719 https://sites.google.com/site/ijcsis/ ISSN 1947-5500

C. Matrix S construction
The matrix S is a single structure representing all the relevant fragments and the fragment of the initial query.
However, these fragments can contain similar elements, i.e. elements having the same tag name. Actually we
consider that two similar elements must be represented by one element in the matrix S.
Thus, we construct the matrix S from different LDMs of the relevant fragment and the initial query. We propose
a linear combination of different DLM of each fragment. Moreover, we also propose to strengthen the weight of
the initial query following the principle used in the Rocchio's method which uses reformulation parameters having
different effects (1 for the initial query, α for the relevant document centroid and β for the non-relevant document
centroid where0 ≤ ≤ 1and −1 ≤ ≤ 0).
Let's consider:
• Nf: number of relevant fragments,
• NEfi: number of elements in fragment fi,
• NQ: number of elements in initial query Qinit,
And consider:
= ⋃ ⋃ , = ⋃ , = ∪
The dimension of S at this step is |E|2, and the matrix S is defined as:
, = , + [ , ] (1)
The matrix S represents all the relevant elements considered to construct the new query.
If a column in S contains several low values, then, the element will tend to appear as a leaf element in the
reformulated query. However, if one row contains several low values, then the element will tend to be seen as a
root element in the reformulated query if, in addition, the corresponding column contains several high values,
otherwise, the element will tend to appear as an internal element. Thus, in order to build the new query structure,
we can determine the new root.
D. Query rewriting
1. Root identification
The structure query construction starts by identifying its root. The root is characterized by a high number of
child elements and a weak number of parents. For example, to find the root, we simply return the element R,
which has the greatest weight in the rows of matrix S and the lowest weight in its columns. The root R is then
such that: = argmax∈ [ , ]. ∑ [ , ]∈∑ [ , ]( , )∈ + 1∈
The maximization argument shows that the candidate elements to represent the root should have as maximal
low values as possible in the relative row and as minimal low values as possible in the column relatively to the
total sum of the matrix values.
International Journal of Computer Science and Information Security (IJCSIS), Vol. 14, No. 6, June 2016
720 https://sites.google.com/site/ijcsis/ ISSN 1947-5500

2. Building the new query structure
Once the root is established from matrix S, we proceed to the recursive development phase of the tree
representing the structure of the new query. The development of the tree starts by the root R, and then by
determining all the child elements of R, then the same operation is performed recursively for the child elements
of R until reaching the leaf elements.
Each element e is developed by attributing to it its potentially child elements ei ( ≠ ) whose
S[e,ei]>Thresholde, calculated from the mean average and the standard deviation of its relative child
elements. Indeed, the mean average and the standard deviation will illustrate the probability that an element is an
actual child-element of the current element e.
This threshold is defined as follows: ℎ ℎ = + ∗ , = 1| | [ , ]∈ , = 1| | ( [ , ] − )∈
If the value of is relatively high, the tree outcome will tend to be shallow and ramified and vice versa. In fact,
value of γ helps with the estimation of each element of the number of child elements. The objective of this interval
is to reconstruct a tree as wide and deep as the XML fragments from which the query should be inferred. This
value is then experimentally defined.
E. Correction
Correction aims to apply some modifications on reformulated query. It's based on the structure of pertinent
fragments and that of the query. Indeed, if we consider the fragment of figure 5 relevant, the corresponding
descending matrix represents the relationship between each element and [ , ] ≠ 0, [ , ] ≠ 0 and [ , ] ≠0 with [ , ] < [ , ] per transitivity.
Fig. 5: Example of fragment for correction
Thus, during the construction of the new query structure, if elements A, C and X are judged as relevant, element
X can be assigned to the first element A and, then, we obtain the reformulated query represented in figure 6.
Fig. 6: Reformulated query with correction
As a consequence, we propose to review the assignment of items to the elements having the same tag name. The
correction process is based on three steps: locating, descendant matrix construction, modification of the structure.
• Locating: To correct the structure of the reformulated query, we have to identify, in relevant fragments
A
C
A
X
A
AC X
International Journal of Computer Science and Information Security (IJCSIS), Vol. 14, No. 6, June 2016
721 https://sites.google.com/site/ijcsis/ ISSN 1947-5500

and initial query, the different elements having the same tag name. These elements are confusing when assigning
the relevant elements in the relationship "father-son". These elements are those where [ , ] ≠ 0. In other words,
there are two elements in relation and have the same tag name. The S matrix merges these two elements and
represents them in a same element.
• Descendant matrix construction: After identifying elements confusing i, we propose to build a descent
matrix on this element. This matrix is built on the relevant fragments and the original query. This descending
matrix called Mi represents only the fragments having element i as a root.
• Modification of the structure: Elements which are assigned to the second element i are the elements j
as > ∗ [ , ] where is constant ( < 0.5). reflects the threshold from which an element would be
assigned to its "real" father. The correction is then carried out by updating the weights of the relationship in the
matrix S:
[ , ] ← [ , ] − [ , ] This correction of the query structure can be resolved otherwise, based on the content of the elements.
Indeed, two different elements of the same name (tag name) can be differentiated by their content. This idea will
be detailed in the next section.
F. Tag weighting
During the reformulation phase, the system must be able to differentiate between different types of elements. It
will therefore recognize if an element is a semantic meaning for the structure of the document or just a part of the
layout of the document. As a result, the system will remove all the formatting tags while keeping their textual
content that may be highly relevant to the user.
As shown in figure 7, if <p> is a tag having semantic meaning and <a> a formatting tag that contains the terms
t1, t2 and t3, the system must then consider that the structure is shown in figure 8.
Fig. 7: Example of structure
Fig. 8: Considered structure
We noticed that the formatting tags are very specific properties: they typically do not have child elements. If a tag
is often seen as a leaf tag, it will tend to become a formatting tag. Thus, we propose to consider the "weight of
tag", and its importance in the structure of the document or query. In fact, the higher the weight is, the less it
reveals the structure of the document. We define the weight of a tag B by w (B) calculated as follows:
<a> <p> t1, t2, t3 </p>
</a>
<a> <p> t1, t2, t3 </p>
</a>
International Journal of Computer Science and Information Security (IJCSIS), Vol. 14, No. 6, June 2016
722 https://sites.google.com/site/ijcsis/ ISSN 1947-5500

( ) = 1 − ( )( )
Where ( ) the number of times is the tag B appears as a leaf element and ( ) is the total number of
occurrences of the tag B.
The weight of the tag is therefore the probability of occurrence as a leaf element of document in the
collection ( )( ) . The weight of the tags is in the range of [0, 1], where the value 0 is the weight of all the tags
that always appear as leaf elements.
To highlight the weighting of tags, we integrate this weight during the structure processing in two phases:
document-query matching and reformulation.
However, the structure S is constructed from the matrix of the different descent and includes all the elements of
the fragments considered relevant by the user. These fragments are usually judged on their textual content, and
can contain elements that are irrelevant to the structural need of the user, as the elements of layout or formatting.
Thus, we consider, in the rewriting of the structure of the query, the weights of the tags presented previously. To
do so, during the recursive development of the query's structure, we attribute to the element A (under
development), the element B as a son if S [A, B]> ThresholdA and w(B)> thresholdweight, where thresholdweight
is a constant determined by experimentation that represents the threshold from which an element is considered
important.
IV. Relevance feedback based on structure and content
The reformulation of the query structure is not completely independent of the content. Indeed, each relevant
element necessarily contains text which can be the source of judgment of relevance.
On the one hand, the elements that constitute the path of considered relevant fragment contain the text that might
be relevant. On the other hand, the comparison of the elements cannot focus only on the name of the tag, but also
on the textual content. In this context, we propose an approach to reformulate the query structure based on the text
content of each relevant element. This approach is based on the matrix representation presented in the previous
section. It also helps select the most relevant terms that are injected in o new built query. For that, we first explain
how to represent the content (set of terms) of the relevant elements in the line of the descent matrix. Then, we
detail how to compare the elements based on their content and how we represent two or more similar elements in
LDM.
A. Representation of structure and terms in LDM
The content of each relevant elements constituting the path of the relevant elements represented in LDM must be
taken into account [5]. Therefore, we propose to integrate terms of each element in LDM. Each element n in LDM
is characterized by a tag name and a set of weighted terms:
ni=(tagi,(t1,w(t1,ni),(t2,w(t2,ni))… (tm,w(tm,ni)))
International Journal of Computer Science and Information Security (IJCSIS), Vol. 14, No. 6, June 2016
723 https://sites.google.com/site/ijcsis/ ISSN 1947-5500

Where:
• tagi: tag name of element ni,
• tk: kth term in ni,
• w(tk,n,i): weight of term tk in element ni (detailed in the next section),
• m: number of terms.
In LDM, we no longer consider elements having the same tag name as one, as in the previous section, but we
consider them as different until their set of terms is compared. Consequently, for fragment f, we associate the
matrix defined by Mf:
, = → → ∈ ∶ ℎ 0 ℎ
The weight w(t,ni) of a term t in the ith element n is calculated based on "term frequency" or on a "statistical
calculation".
The term frequency weight is based on the frequency of this term in the element that contains it. The frequent
the term is, the higher the weight is. To highlight the weight of a term, we attribute a weight calculated from its
frequency and its importance in the collection, as in the idf measure. ( , ) = ( ) ∗ ( , ) Where ( ) = , tf(t,e) is the frequency of the term t in the element e, N is the number of all collection
elements and Nt is the number of all collection elements containing the term t.
The statistical weight is based on statistical calculation. We adopt the strategy proposed for classical retrieval
information replacing the notion of document by element. We can define four types of weights based on:
• N: the number of all collection elements,
• R: the number of relevant elements for the query,
• Nt: the number of elements containing the term t,
• Rt: the number of relevant elements containing the term t.
( ) = , ( ) = −− , ( ) = −− ,= −−− − +
We can use one of these weight to assign a weight for a term.
The hierarchical structure of XML tree is semantically rich. If an XML tree T contains fragments → and →
International Journal of Computer Science and Information Security (IJCSIS), Vol. 14, No. 6, June 2016
724 https://sites.google.com/site/ijcsis/ ISSN 1947-5500

then the element A has a family relationship with C element. This relationship also concerns the content of the
elements. Indeed, if a term t belongs to C it can be seen as belonging to A, but the weight of t in C will be stronger
than the weight of t in A. It is the role of the propagation of the content defined in the following paragraph.
B. Propagation of content
The relevant elements generally the elements that contain terms. In addition, the ancestors of a relevant element
may also be considered relevant. For this reason, the content of each element represented by a weighted value
vector is propagated to the ancestors of this element while reducing the weight of terms according to the distance
covered during the propagation. In addition, an element can receive the content from multiple elements that are
descendants. The particular root element of the relevant fragment (which is usually the root of the document)
receives the contents of all the elements of that fragment. Assuming that the same term t can belong to several
elements, the final weight associated with t belonging to an element e, represented in a LDM, will be the sum of
all the weights received by the element descendants of e:
( , ) = ( , )( , ) + 1∈ ( )
Where w(t, et) is the weight of the term t in the element et. et contains the term t and the descendant of e. distance
(e, et) is the distance between e and et.
Thus, the root element contains original terms and all terms of descendants elements which corresponding weight
decreases with the distance between the root and the original element. Therefore, the weight of a spread term
decreases the propagation. Indeed, this weight is divided by distance (e, et) between the elements to which the
term will be propagated.
The matrix structure integrating the content elements is established for each relevant document fragment. As
consequence, we build for each fragment an LDM carrying the vector of terms of each item. These terms are
initially weighted according to both the techniques presented and propagated to the ancestor elements.
International Journal of Computer Science and Information Security (IJCSIS), Vol. 14, No. 6, June 2016
725 https://sites.google.com/site/ijcsis/ ISSN 1947-5500

Subsequently, and following the example of the method of Rocchio, we propose a linear combination of these
LDMx. This combination, as it was presented in the previous section, provides a representative structure involving
all the relevant structural information.
C. Linear combination of LDMx and classification of the elements
1. principles
After the representation of structural and textual information carried by the relevant elements as an LDMx, we
propose to linearly combine these matrices. The obtained representation, which we named S, will bring together
all the relevant information (structural and textual) of the query. It also helps to generate, on the one hand, the
structure of the new query, and on the other hand, the relevant content that will be injected into this structure.
The linear combination shown above is based on a comparison between the different elements from two different
relevant fragments or even a single fragment. According to this construction, we consider two elements are similar
if they have just the same tag name:
sim(e1,e2)=1 if e1 and e2 having the same tag name
For example, if Mf1 [article,bdy]=1 and Mf2[article,bdy] =1 then in the structure S, we consider that
S[article,bdy]=2.
In addition, we assume that the element article (resp. bdy) from fragment f1 is similar to the element article (resp.
bdy) from fragment f2.
This assumption is correct if the items are without content, so the comparison can only relate the tag names. The
context of the content reformulation of an element is characterized, except by name, by a weighted value vector.
We propose to enrich the process of linear combination as it was presented in the previous section to integrate
textual dimension. In this combination, we use another similarity between two items based not only on their tag
names but also on their content. Thus, we explain how to represent the matrix S with two or more similar items.
For this reason, we propose an approach based on the classification of the elements (with the same tag name)
according to their content.
2. Hierarchical classification of elements
In general, the purpose of the classification is to group sets of objects into homogeneous subsets. In our context,
we aim to classify a set of XML elements judged pertinent. Each element is characterized by a tag name and a
weighted value of the vector representing the text contained in the element. The homogeneity character is the
similarity between these texts belonging to the elements to classify.
The most appropriate method for our context is the ascending classification. This method applies a succession of
groups of objects to be classified to produce a single group containing all the objects considered. In our context,
International Journal of Computer Science and Information Security (IJCSIS), Vol. 14, No. 6, June 2016
726 https://sites.google.com/site/ijcsis/ ISSN 1947-5500

the calculation of the similarities of objects (detailed later) is based on the calculation of distances between the
vectors of terms of the elements to be classified. Elements which have similar term vectors are then grouped
International Journal of Computer Science and Information Security (IJCSIS), Vol. 14, No. 6, June 2016
727 https://sites.google.com/site/ijcsis/ ISSN 1947-5500

together and represented by a class of elements.
In addition, we define the similarity between an element and class of elements and the similarity between two
classes of elements according to an aggregation technique. We recalculate the similarities to group more elements
or the closest classes. At each level of aggregation, we define three types of inertia:
• Inter-class inertia: measures the inertia between the classes reflecting their differences.
• Intra-class inertia: measures the inertia that reflects the character of homogeneity between the elements
of this class.
• Total inertia: is the sum of the inertia inter-class and intra-class inertia.
We consider a classification C1...CK of k classes. Each class contains respectively n1... nk objects. Initially, each
Ci represents an element among those to be classified.
We consider g1, g2... gk as the centers of gravity of these classes, (G is the cloud center of gravity). The inter-class,
intra-class and total inertia are defined as follows:
= ∑ ( , ), = ∑ ∑ ∈ ( , ) , = ∑ ( , ) In fact, for a good partitioning, we aim to minimize intra-class inertia to obtain the most homogeneous classes and
maximize the inter-class inertia to obtain well-differentiated subsets without reaching the end of the clustering
process. At the end of the clustering process, all the elements will be represented by a single class. Therefore, the
clustering process stops at a level where it leads to a loss of the maximum of inter-class inertia.
3. Similarity between two items: measure of distance
The similarity measure between two elements is based not only on tag names, but also on the comparison of the
terms they contain. Thus, if two elements are considered similar then their tag names are identical and their
contents are similar. At this level, we propose to define the similarity between two elements e1 and e2 as follows:
( , ) = = 0 ℎ ℎ ≥ 0 ℎ
In addition, the similarity between two elements depends on the distance between vectors of terms they contain.
Thus, the similarity between two elements with the same tag name is calculated from the distance between the
two vectors of terms. When the distance between two vectors decreases, the vectors become similar.
( , ) = = 0 ℎ ℎ 1 − , ℎ
Four distances can be considered to measure the similarity between two vectors of terms:
• Euclidean distance: Generally this distance is defined between two vectors and as ( , ) =
International Journal of Computer Science and Information Security (IJCSIS), Vol. 14, No. 6, June 2016
728 https://sites.google.com/site/ijcsis/ ISSN 1947-5500

‖ − ‖ = ∑ ( − ) . In our context the Euclidean distance between two vectors of weighted terms is
based on the same principle.
• Cosinus distance: is one of the most commonly used similarity measures. Let and be two vectors
of weighted terms, the Cosinus distance between the two vectors is: , = ∑ ( , )∗ ( , )∑ ( , ) ∗∑ ( , )
where Nt is the number of terms of the whole collection.
• Jaccard distance: In our context, vectors and represent two sets which includes weight terms.
Thus, if the set is composed of weights w(ti,1) and the set is composed of weights w(ti,2), then: = ∑ ( , )∗ ( , )∑ ( , ) ∑ ( , ) ∑ ( , )∗ ( , ) 4. Similarity between two classes of elements: aggregation method
At some level of the hierarchical classification of the elements, we evaluate the similarity between two classes of
elements. Elements of a class represent a set of elements of which tag names are identical, and their contents are
similar. There are several aggregation methods for comparing two classes of elements C1 and C2, among which
we mention:
• Minimum link: ( , ) = min ( , ), ∈ , ∈ • Maximum link: ( , ) = max ( , ), ∈ , ∈ • Distance between gravity centers: ( , ) = ( , ) • Distance of Ward: ( , ) = ∗ ( , ) where n1 (resp. n2) is the number of items of
C1 (resp. C2) and G1 (resp. G2) is the gravity center of C1 (resp. C2).
Note that the distance cited in these methods of aggregation is one of the distances defined above. The gravity
center of a class of elements is an element characterized by common name tags of the elements it represents, and
a term vector calculated based on the vectors of the represented terms.
5. Weighting of terms of class of elements
A class of elements represents a set of elements having the same name and similar vectors of terms. Each class of
elements is characterized by a center of gravity from which inter-class and intra-class inertia are calculated.
Let k be similar elements e1...ek with the same tag name where = ( , ). The gravity center of these
elements, in the general case, is the element: = ( , ). Where = ∑ .
In our approach, we assume that a class of elements can represent a set of elements from relevant fragments and
initial query. Like the method of Rocchio, we propose that the terms of gravity center are weighted to attribute
more importance to the terms from the original query. For this purpose, we propose that the vector of terms of
International Journal of Computer Science and Information Security (IJCSIS), Vol. 14, No. 6, June 2016
729 https://sites.google.com/site/ijcsis/ ISSN 1947-5500

gravity center is calculated as:
=1 ∈ + ∉
With Q is the initial query, α and β are the same parameters of equation (1).
6. Structural representation between classes of elements
Indeed, in the S structure, a class of elements will be represented by a single element. This element must
consolidate the structural information of all the elements it represents. Thus, the linear combination shown in
equation (1) becomes:
[ , ] = [ , ] + [ , ]∈∈ + [∈ , ] + [ , ]∈∈∈
With Ci is the class representing the item labeled by the row and column i. Q is the request, and F the set of
different fragments f deemed relevant.
7. Building the new query
As we have previously reported, building the new query structure is based on a recursive process on the elements
represented in the S structure. The process already presented is enhanced by the addition of terms to each element
(or a class of elements) developed in this process to build the new query.
Thus, for each class of elements, the terms of the vector that it characterizes are sorted according to their weight.
Only the terms with the highest weight will be injected into the element that will be included in the new query.
To translate the concept of "terms with the highest weight", we propose two strategies:
• Thresholding strategy: we select, for injection into an element, only the terms having a weight greater
than a threshold determined experimentally.
• Strategy based on number of terms: we select for injection into an element only the first X terms of
each element. The value of X is a variable.
V. Experiments and results
Our experiments have been undertaken into INEX'05 dataset which contains 16819 articles taken from IEEE
publications in 24 journals. The INEX metrics used for evaluating the systems are based on two dimensions of
relevance (exhaustivity and specificity) which are quantized into a single relevance value. We distinguish two
International Journal of Computer Science and Information Security (IJCSIS), Vol. 14, No. 6, June 2016
730 https://sites.google.com/site/ijcsis/ ISSN 1947-5500

quantization functions:
• A strict quantization to evaluate whether a given retrieval approach is able to retrieve highly exhaustive
and specific document components: ( , ) = 1 ( , ) = (2,1)0 ℎ
• A generalized quantization to evaluate document components according to their degree of relevance: ( , ) = ∗
Official metrics are based on the extended cumulated gain (XCG) [9]. The XCG metrics are a family of metrics
that considers the dependency of XML elements within the evaluation. The XCG metrics include the user-oriented
measures of normalized extended accumulated gain (nXCG) and the system-oriented effort-precision/gain-recall
measures (ep/gr). The xCG metric accumulates the relevance scores of retrieved documents along a ranked list.
For a given rank i, the value of nxCG[i] reflects the relative gain the user accumulates up to that rank, compared
to the gain he could have attained if the system had produced the optimum best ranking. For any rank, the
normalized value of 1 represents the ideal performance. The effort-precision ep is defined as: ( ) = where
eideal is the rank position at which the cumulated gain of r is reached by the ideal curve, and erun is the rank position
at which the cumulated gain of r is reached by the system run. A score of 1 reflects the ideal performance where
International Journal of Computer Science and Information Security (IJCSIS), Vol. 14, No. 6, June 2016
731 https://sites.google.com/site/ijcsis/ ISSN 1947-5500

the user needs to spend the minimum necessary effort to reach a given level of gain.
When making an evaluation, we use the interpolated mean average effort-precision denoted as MAep which is
calculated as the average of the effort-precision values measured at each natural gain-recall point.
1. Assessments of structural-based relevance feedback
To carry out our experiments, we only considered the VVCAS [6] (topics the relevance of which vaguely depends
on the structural constraints) query type because the need for reformulation of the query structure is appropriate
to the task. We only present the results of the generalized quantization function which is te most suitable for
VVCAS queries (10 queries proposed by INEX).
Table 1 presents a comparison between the values obtained before (BRF) (Results obtained from XIVIR a research
system based on tree matching [1] )and after RF (ARF). AI is the absolute improvement of the relevance feedback
run over the original base run proposed by INEX.
Table 1: Comparative results before (BRF) and after (ARF) structural RF
Run nxCG[10] nxCG[10] nxCG[10] MAep
BRF 0.1225 0.1104 0.083 0.0509
ARF 0.2643 0.2348 0.2093 0.0784
AI 115.75% 112.681% 152.16% 54.027%
In our experiments, we assume that the top k fragments are relevant. Table 2 shows the results obtained from
different numbers of the relevant fragments.
Table 2: Results from different number of relevant fragments
Run nxCG[10] nxCG[10] nxCG[10] MAep
k=5 47.08% 57.38% 56.76% -1.63%
k=10 49.15% 59.78% 58.92% 1.52%
k=20 47.47% 57.38% 60.57% 23.87%
k=30 47.02% 57.05% 57.82% 22.31%
k=50 46.97% 56.71% 56.74% 22.29%
We chose to carry out our experiments on 20 relevant fragments. We can see, through our experiments, that our
RF approach significantly improves the results. During these experiments, we reformulate only the query
structures without changing their original content. Therefore, we believe that this reformulation has brought an
evolution that could be accentuated by the reformulation of the content.
2. Assessments of relevance feedback based on structure and content
To evaluate our approach of the reformulation of the query based on the structure and text content, we first evaluate
the impact classification of the relevant elements. For this reason, we compare the different distances proposed in
International Journal of Computer Science and Information Security (IJCSIS), Vol. 14, No. 6, June 2016
732 https://sites.google.com/site/ijcsis/ ISSN 1947-5500

the previous section. Table 3 shows the impact of the choice of the distance on the values of the relative
improvements after the reformulation.
Table 3: Comparatives results of distances between class of terms
Distance nxCG[10] nxCG[25] nxCG[50] MAep
Euclidean 0.001% 22.563% 47.231% 33.264%
Cosinus 0.082% 36.594% 75.904% 65.815%
Jaccard 0.07% 21.284% 52.348% 42.165%
We can see that the Cosinus distance is more appropriate to our context. This can be justified by the vector
representation chosen to represent a set of weighted terms, as has been detailed in the proposed approach.
Therefore, in our approach, we use this distance to calculate the similarity between two elements or classes of
elements.
In our approach, we propose two strategies for the choice of terms to be injected into the new query: thresholding
strategy and strategy based on the number of terms.
In figure 9, we present the evolution of the absolute improvement depending on the choice of the threshold on the
weights of the terms.
We note that for the thresholds between 2.8 and 3.6, the value of the relative improvement is maximum for
nxCG[10], nxCG[25], nxCG[50] and MAep. We choose these values for our experiments.
VI. Conclusions and Future Work
We have proposed in this paper an approach of structural relevance feedback in XML retrieval. According to
which the original query and relevant fragments are presented under a matrix form. The strategy of the
reformulation is based on this matrix representation of the XML trees deemed to be relevant to the fragments and
Fig. 9: Thresholding strategy to choose terms in new query
Threshold
Impr
ouve
men
t
International Journal of Computer Science and Information Security (IJCSIS), Vol. 14, No. 6, June 2016
733 https://sites.google.com/site/ijcsis/ ISSN 1947-5500

the original query. To compare relevant elements, we compared both their content and their terms. We have
proposed an approach of classification of the relevant elements. Each obtained class of elements is represented in
a global structure S. After processing, calculating and analyzing on the obtained matrix, we have been able to
identify the most relevant elements and the relationships that connect them. We also have been able to select the
most relevant terms that have been injected in the new query. The obtained results show that the relevance
feedback contributes to the improvement of the XML retrieval. Note that this representation preserves the original
links of descent and the transformations achieved are suitable for the retrieval flexibility.
As future work, we believe that our approach could be easily integrated in the domain of semantic web. Indeed,
ontologies which are based on semantic data can be represented and manipulated by our proposed model for the
representation of queries and documents.
REFERENCES [1] Mohamed Ben Aouicha, Une approche algebrique pour la recherche d’information structur ´ ee´ , Ph.D. thesis, Universite Paul Sabatier,
2009. [2] Krisztian Balog, Marc Bron, and Maarten De Rijke, Query modeling for entity search based on terms, categories, and examples, ACM
Trans. Inf. Syst. 29 (2011), no. 4, 22:1–22:31. [3] Carolyn J. Crouch, Aniruddha Mahajan, and Archana Bellamkonda, Flexible retrieval based on the vector space model, in Fuhr et al. [7],
pp. 292–302. [4] Ines Kamoun Fourati, Mohamed Tmar, and Abdelmajid Ben Hamadou, Structural relevance feedback in XML retrieval, Flexible Query
Answering Systems, 8th International Conference, FQAS 2009, Roskilde, Denmark, October 26-28, 2009. Proceedings (Troels Andreasen, Ronald R. Yager, Henrik Bulskov, Henning Christiansen, and Henrik Legind Larsen, eds.), Lecture Notes in Computer Science, vol. 5822, Springer, 2009, pp. 168–178. November 2014
[5] , Structural-based relevance feedback in XML retrieval, Web Technologies and Applications - 16th Asia-Pacific Web Conference, APWeb 2014, Changsha, China, September 5-7, 2014. Proceedings (Lei Chen, Yan Jia, Timos Sellis, and Guanfeng Liu, eds.), Lecture Notes in Computer Science, vol. 8709, Springer, 2014, pp. 461–468.
[6] Norbert Fuhr, Mounia Lalmas, Saadia Malik, and Gabriella Kazai (eds.), Advances in xml information retrieval and evaluation, 4th international workshop of the initiative for the evaluation of xml retrieval, inex 2005, dagstuhl castle, germany, november 28-30, 2005, revised selected papers, Lecture Notes in Computer Science, vol. 3977, Springer, 2006.
[7] Norbert Fuhr, Mounia Lalmas, Saadia Malik, and Zoltan Szl ´ avik (eds.), ´ Advances in xml information retrieval, third international workshop of the initiative for the evaluation of xml retrieval, inex 2004, dagstuhl castle, germany, december 6-8, 2004, revised selected papers, Lecture Notes in Computer Science, vol. 3493, Springer, 2005.
[8] L. Hlaoua, M. Torjmen, K. P. Sauvagnat, and M. Boughanem, Xfirm at inex 2006. ad-hoc, relevance feedback and multimedia tracks, International Workshop of the Initiative for the Evaluation of XML Retrieval (INEX), Dagstuhl, Allemagne, 18/12/2006-20/12/2006 (2007), 373–386.
[9] Gabriella Kazai and Mounia Lalmas, INEX 2005 evaluation measures, in Fuhr et al. [6], pp. 16–29. [10] Yosi Mass and Matan Mandelbrod, Relevance feedback for xml retrieval, in Fuhr et al. [7], pp. 303–310. [11] V. Mihajlovic, G.
Ramirez, T. H. W. Westerveld, D. Hiemstra, H. E. Blok, and A. P. de Vries, Tijah scratches inex 2005: Vague element selection, image search, overlap, and relevance feedback, Advances in XML Information Retrieval and Evaluation (Berlin), Lecture Notes in Computer Science, vol. 3977, Springer, June 2006, pp. 72–87.
[12] Vojkan Mihajlovic, Georgina Ram´ırez, Arjen P. de Vries, Djoerd Hiemstra, and Henk Ernst Blok, Tijah at inex 2004 modeling phrases and relevance feedback, in Fuhr et al. [7], pp. 276–291.
[13] Hanglin Pan, Relevance feedback in XML retrieval, Current trends in database technology, EDBT 2004 Workshops : EDBT 2004 Workshops PhD, DataX, PIM, P2P DB, and ClustWeb (Heraklion, Crete, Greece) (Wolfgang Lindner, Marco Mesiti, Can Turker, Yannis Tzitzikas, and Athena Vakali, eds.), ¨ Lecture Notes in Computer Science, vol. 3268, IEEE Computer Society, Springer, 2004, Acceptance ratio 1:4, pp. 187–196.
[14] Hanglin Pan, Anja Theobald, and Ralf Schenkel, Query refinement by relevance feedback in an XML retrieval system (demo), Conceptual modeling, ER 2004 : 23rd International Conference on Conceptual Modeling (Shanghai, China) (Paolo Atzeni, Wesley Chu, Hongjun Lu, Shuigeng Zhou, and Tok Wang Ling, eds.), Lecture Notes in Computer Science, vol. 3288, Springer, 2004, Acceptance ratio 1:5, pp. 854–855.
[15] J. Rocchio, Relevance feedback in information retrieval, englewood cliffs, nj ed., Prentice Hall Inc., 1971. [16] Ralf Schenkel, Anja Theobald, and Gerhard Weikum, XXL @ INEX 2003, Proceedings of the Second INEX Workshop (Dagstuhl,
Germany) (Norbert Fuhr, Mounia Lalmas, and Saadia Malik, eds.), INEX, 2004, pp. 59–66. [17] Ralf Schenkel and Martin Theobald, Relevance feedback for structural query expansion, in Fuhr et al. [6], pp. 344–357. [18] Esau Villatoro-Tello, Christian Sanchez-Sanchez, Hector Jim ´ enez-Salazar, Wulfrano Arturo Luna- Ramirez, and Carlos Rodriguez-
Lucatero, Uam at inex 2012 relevance feedback track: Using a probabilistic method for ranking refinement., CLEF (Online Working Notes/Labs/Workshop) (Pamela Forner, Jussi Karlgren, and Christa Womser-Hacker, eds.), 2012.
[19] W3C, Extensible markup language (xml) 1.0, (1998).
International Journal of Computer Science and Information Security (IJCSIS), Vol. 14, No. 6, June 2016
734 https://sites.google.com/site/ijcsis/ ISSN 1947-5500

An Access Fairness Resource Provisioning of
Services for Energy Efficiency in Wireless
Cellular Ad-hoc Network Sridhara S.B., Assistant professor Department of Electronic and Communication, Rajiv Gandhi Institute
of Technology, VTU, Bangalore, India
Dr. Ramesh B., Professor Department of Computer Science and Engineering, Malnad College of
Engineering, VTU, Hassan, India.
Abstract-The recent growth and development of smart phone technology have resulted in the growth of production of low
cost smart phone devices. Due to the availability of low costs smart devices have resulted in increasing in the number of
application and its user. The users in cellular network are mobile in nature and varied application services is been used
such as (File Transfer Protocol), (Voice over Internet Protocol), Multimedia services etc… which requires
different data rate for each services. To assure a QoS (Quality of Services) for this kind of user application dynamic
requirement and is a challenge that exists in existing wireless cellular adhoc network that need to be addressed. To
achieve an efficient a (Device to Device) architecture is required. Many existing work based on on cellular
network have been proposed in recent times but they are not efficient in term of access fairness for varied traffic classes
and it induces high cost of deployment since it require new infrastructure. To overcome this here the author adopts a cost
effective multicast communication based on pre-processed cellular infrastructure graph and admission control
strategy for selectivity of services of varied traffic size in order achieve an efficient access fairness that reduces the packet
drop rate and improves the overall packet delivery ratio of the network. The simulation outcomes show that the proposed
model reduces the packet drop rate and improves the packet delivery ratio of the cellular ad-hoc network.
Keyword: Admission control, cellular network, graph pre-processing, d2d, routing.
I. INTRODUCTION
As telecom provider finding difficulty in providing efficient service to the ever growing demand of end user and
its application services. Due to availability of low cost smart phone and gadget had led to the growth of increased
application that required high bandwidth for provisioning resource. To address this the 4 wireless cellular
technologies such as − (Long Term Evolution) [5] and [6] has been developed which has good
(medium access control) and physical layer performance is yet not able to address the current demand of smart
phone user and it induces high deployment cost. The current researcher is working toward a designing a cost
effective 2 architecture in wireless cellular network. In cellular network by integrating the 2 architecture
resembles an ad-hoc structure.
International Journal of Computer Science and Information Security (IJCSIS), Vol. 14, No. 6, June 2016
735 https://sites.google.com/site/ijcsis/ ISSN 1947-5500

Wireless cellular ad-hoc network infrastructure [1] is a progressively re-configurable infrastructure with no
settled network structure. In such a network a node may join and leave a network and the user are mobile in nature.
In these infrastructure the user smart devices behaves as a router as well as a host for routing of packet. This
network architecture in recent times has drawn huge attention due its advantage of flexible network deployment and
cost effective solution to improve of network [7]. The essential objective of this technique is to provide an
energy efficient routing between the devices with least overhead with improved bandwidth utilization.
The existing cellar network adopt a technique were communication among devices is achieved through base
station even if both devices are in communication range. To overcome this in [8] designed a multihop based
communication by adopting 2 structure for cellular network. In [9-12] they investigated the potential benefit of 2 architecture to improve energy proficiency, throughput and access fairness for cellular network.
In [13] the 3 (Third Generation Partnership Project) and have worked toward analysing the fesability
sudy of 2 architecture for cellular network and brief standardization was presented in [14] considering the
security [15] of one to many high data rate correspondence. To achieve high data rate for multimedia based
application many technique adopting 2 have been proposed [16-21] though they improved throughput of the
cellular network but they could not attain energy efficiency and guarantee to its end users. To address this in
[22] [23] they adopted a multicasting technique to guarantee QoS but the access fairness ratio is not efficient which
resulted in increasing of packet drop in network.
To overcome the above mentioned shortcoming here the author propose an access fairness resource
provisioning for wireless cellular network by adopting an efficient 2 multi casting routing mechanism by
adopting the infrastructure graph pre-processing [1] considering different data rate application services [2] and adopt
a technique in [3]to estimate load variation on each link and propose a access fairness resource provisioning
admittance control strategy to reduce the packet drop and improve packet delivery ratio of the network .
This paper presents an access fairness resource provisioning model for varied services by adopting pre-
processed infrastructure graph based admittance control scheme. The organization of the paper is as follows.
Literature survey is presented in the section 2. The section 3 explains the proposed access fairness resource
provisioning routing model. In Section 4 the experimental analysis are presented. The paper concludes with the last
section 5.
II. LITTERATURE SURVEY
A cellular 2 network is collection of varied devices such as user mobile devices or personal computers, Tabs
or laptops etc… that form a network with or without any centralized architecture that exhibits an ad-hoc nature. The
connection can be either wired or wireless but in general they are wireless in nature. The users in the wireless ad-hoc
network are mobile in nature and they move rapidly over network which result in difficulties in establishing
connection with user for information routing. The demand for application dynamic such as YouTube, skype etc…of
user requirement and achieving QoS for these a multimedia based service is difficult task since it requires high
International Journal of Computer Science and Information Security (IJCSIS), Vol. 14, No. 6, June 2016
736 https://sites.google.com/site/ijcsis/ ISSN 1947-5500

bandwith with low jitter rate connection. To address this various protocol and strategy have been proposed in recent
times which are surveyed below.
In [24] they presented a model that form an ad-hoc network and presented a routing methodology for the ad-hoc
infrastructure. Here they worked toward finding an efficient path selection model among source and destination
devices. The main aim of their approach is to reduce the time of transmission. Their routing model achieved less
overhead and bandwidth for route selection but it requires prior knowledge of node position information which
induces high cost and they did not consider multicast transmission.
In [25] they presented a model to improve the energy efficiency of cellular network. They adopted a
multicasting based routing technique by adopting a Time Reservation based Adaptive strategy for Energy efficiency.
They adopted a cross layer design for − (Modified Multicasting through Time Reservation using
Adaptive Control for Excellent Energy efficiency) model by optimizing the information from and network
layer are processed to form solitary combined layer design. The simple proposal of the infrastructure is to form and
retain a dynamic multicast tree enclosed by a passive mesh inside a mobility base ad-hoc infrastructure.
In [26] they presented an interference model to address the channel interference among user. They adopted an
interference detection model by considering location of user position. They considered that each user is dedicated a
channel for transmission. The user communicate using this channel and calculate the signal to noise ratio by
defining predefine threshold. A user whose threshold is greater than the predefined is given the channel access else
discarded. Their approach is an cost effective approach but they did not consider any prioritization of services and
they did not consider the path loss and channel fading effects which affect the channel slot allocation to user to
overcome this in [27] they presented a similar model as [26], but the D2D user inform base station about received
power so that the base station can optimize the slot allocation but interfence when due node dynamic is not
considered.
In [28] they proposed a model for device selection and power allocation propose an algorithm for power
allocation and mode selection for communication in cellular network that adopts a 2 architecture. They consider
power efficiency that considers energy proficiency and data transmission rate consider the user to be in either in
cellular or in D2D mode. Once the power proficiency is obtained, each user prefers the mode that has high
efficiency. The setback of this strategy is that overhead caused to controller for search modes of user in the network.
To overcome this in [29] they adopted a scheme were two devices communicates over D2D channel by considering
a path loss strategy i.e. when a path loss is lower than the path loss among the user their outcome shows they obtain
better result than [28]. The authors in [30] [31] have evaluated that the issues related to power allocation and joint
mode selection through linear programming which is proven to be NP-Hard (Nondeterministic polynomial) in a
strong sense.
In [32] they adopted resource allocation scheme base on graph-based approach for wireless cellular networks
with by adopting a correspondence. They analytically proved the optimal resource allocation as a non-linear
problem which is NP-Hard. To address this here the authors proposed an approach based on suboptimal graph that
consider load dynamic and interference in cellular network. The adopted graph, each vertex represents a link (D2D
or cellular) and each edge connecting two vertices shows the potential interference between the two links. Their
International Journal of Computer Science and Information Security (IJCSIS), Vol. 14, No. 6, June 2016
737 https://sites.google.com/site/ijcsis/ ISSN 1947-5500

outcomes show that their approach obtained the near optimal throughput for resource allocation. The drawback of
their scheme is they did not consider optimal solution for varied service environment.
It is seen and from literature that the technique that adopt a D2D architecture improves the throughput of the
network but fails in addressing the energy efficiency of cellular ad-hoc network and the technique that adopted
multicast and graph based improves the energy efficiency but it finds difficulty in achieving efficiency of resource
allocation due NP-Hard issues.
It is observed and quiet evident from the literature that the access fairness for varied service is not addressed
and multicast routing and traffic engineering by adopting a D2D architecture is an efficient way in achieving
requirement for cellular network. To achieve this a new routing mechanism needs to be developed that must be
robust, exploit packet delivery ratio and adapt vigorously to changes in load in traffic in wireless cellular network
environment that achieves good access fairness. Here the author proposes a access fairness resource provisioning
scheme based on infrastructure graph pre-processing by adopting 2 based multicast routing methodology packet
delivery ratio and reduces the drop rate of network.
III. PROPOSED SYSTEM:
Here the author adopts a pre-processing of infrastructure graph as in [1], for admittance control strategy by
categorizing the link by following strategy. Firstly, categorize the high and low data transfer associations. As in [1]
the pre-processing of cellular infrastructure graph is processed, were few link are chosen as best link and rest of the
link are considered to be normal links. For transmission of high data rate application the best link are chosen and
given admittance. To obtain the current status of link and user application data requirement the author adopts the
following strategy for access fairness.
Let = , , , … . , be the selectivity vector weight, where the mean selectivity weight considering
service type is represent as = . Therefore the long-run selectivity weight mean for a given strategy is
expressed as follows = .∀ ∈ , (1)
Where the likelihood of steady state is represented as when network is in state. Based on the Eq (1) the
access fairness for selective weight is computed. To obtain a productive selectivity weight policy it is necessary
to utilize bandwidth properly i.e. allocation of bandwidth resource properly considering different selectivity of
varied application need and to guarantee it needs to allocate high productivity for the best connection. Now the
analytical data transmission rate is defined for strategy based on Eq (1) can be defined as follows
= . , (2)
International Journal of Computer Science and Information Security (IJCSIS), Vol. 14, No. 6, June 2016
738 https://sites.google.com/site/ijcsis/ ISSN 1947-5500

Where is the data rate requirement vector.
Then the access fairness of strategy is obtained as follows = 1 = 1 . . (3)
To obtain a productive access fairness strategy as strategy that can attain max access fairness, considering
varied service type have identical selectivity gain = = = ⋯ = , is identical to . A trade-off must be set among selectivity gain and access fairness in order to obtain suitable admittance control
strategy for cellular infrastructure graph pre-processing and it is called the access fairness inhibited selectivity
weight strategy . Here the access fairness inhibited selectivity weight strategy must be greater than =, where 0 1 is the access fairness lower bound factor, is access fairness lower bound and
is the access fairness of . To obtain , , and the author adopt technique [2] [3]. Especially to obtain
the long-run mean selectivity weight of all probable strategy has to compute by using Eq. (1). Similarly to obtain
, the access fairness of all probable strategy has to compute by using Eq. (2). In order to obtain the both the
access fairness of every probable strategy and mean selectivity weight has to be computed.
To evaluate the performance capability of proposed access fairness strategy based on cellular ad-hoc
infrastructure graph pre-processing, let consider the link access fairness deviation that defines the overall load
distributed in the cellular ad-hoc network.
= − 2 ∈ , (4)
Where , represent the access fairness of link , is the pre-processed graph, is number of links in the pre-
processed graph and is the mean access fairness of all links in the cellular ad-hoc infrastructure. To obtain
the effective access fairness among low and high data rate association (links) in the cellular ad-hoc infrastructure is
expressed as follows
= − , (5)
Where, depicts the mean delaying likelihood of low data rate association and depicts the mean
delaying likelihood of high data rate association. The Eq. (2). Depicts that when is max it achieves better access
fairness for pre-processing network graph. To evaluate the performance of access fairness of the proposed approach
the author consider four types of traffic classes and consider the drop rate and the packet delivery ratio as a network
International Journal of Computer Science and Information Security (IJCSIS), Vol. 14, No. 6, June 2016
739 https://sites.google.com/site/ijcsis/ ISSN 1947-5500

performance and is compared with existing system [4] that adopted a D2D architecture. In next section the authors
conduct simulation study and evaluate the performance in term of drop rate and the packet delivery ratio.
IV. SIMULTION RESULT AND ANALYSIS:
The experimental setup considered in this work is as follows. The operating system used is 64-bit windows
8.1 enterprises with − 5class Intel processor and 16 . Authors have used dot net general purpose
simulator using dot net framework 4.5 visual studios 2015 and conducted experimental analysis on access fairness
by considering performance of successful packet transmission, packet retransmission, drop rate and packet delivery
ratio for varied user considering application traffic dynamic. The application traffic load type considered are as
follows which require real-time service flows that generate packet of variable size on a periodic basis (for
e.g., multimedia based application services such as YouTube). is intended to provision non-real-time
provision flows that require variable data size grant burst types on a regular basis example high data rate file transfer
protocol. which require constant bit rate traffic example voice over internet protocol such as voice over
internet protocol, and lastly Type D that supports facilities that do not require guarantees of example Web and
email data. The performance of proposed approach is compared with existing approach [4] by varying the number of
user in the cellar ad-hoc network to check the robustness and scalability.
i. Packet transmission succesfull analysis: In figure 1 below, the experimental outcomes shows that the
proposed approach improves the packet transmission over existing approach by 18.33%, 25.53%, 12.35%
and 14.56% for varied user as 10, 20 40 and 80 respectively. The graph in figure 1 shows that when the
number of user in network is increased the packet transmission also increases and each cases the proposed
method outperform the existing approach. The average succesfull packet transmission improvement of
proposed approach achieved over existing is 16.78% which is shown in figure 2.
International Journal of Computer Science and Information Security (IJCSIS), Vol. 14, No. 6, June 2016
740 https://sites.google.com/site/ijcsis/ ISSN 1947-5500

Figure 1: Packet transmission successful for varied user
Figure 2: Average packet transmitted successful
ii. Packet Retransmission analysis: In figure 3 below, the experimental outcomes shows that the proposed
approach reduces the packet retransmission over existing approach by 19.89%, 18.75%, 19.71% and
23.23% for varied user as 10, 20 40 and 80 respectively. The graph in figure 3 shows that the when the
number of user in network is increased the packet retransmission also increases and each cases the
proposed method outperform the existing approach due to efficient 2 multicasting technique adopted.
0
500
1000
1500
2000
2500
3000
3500
4000
10 20 40 80
Num
ber o
f pac
ket t
rans
mitt
ed
Number of user
Number of packet transmitted successfully
packet transmissionsuccessful-ES
packet transmissionsuccessful-PS
0
500
1000
1500
2000
2500
packet transmissionsuccessful-ES
packet transmissionsuccessful-PS
Num
ber o
f pac
ket t
rans
mitt
ed
Algorithm
Average packetet transmitted successful
International Journal of Computer Science and Information Security (IJCSIS), Vol. 14, No. 6, June 2016
741 https://sites.google.com/site/ijcsis/ ISSN 1947-5500

The average packet retransmission reduction of proposed approach achieved over existing is 21.27% which
is shown in figure 4.
Figure 3: Packet retransmission for varied user
Figure 4: Average packet Retransmission
iii. Packet drop analysis: In figure 5 below, the experimental outcomes shows that the proposed approach
reduces the packet drop over existing approach by 56.66%, 43.86%, 40.16% and 47.84% for varied user as
10, 20 40 and 80 respectively. The graph in figure 5 shows that as number of user in network increased the
packet drop also increases and each case the proposed method reduces packet drop and outperform the
0100200300400500600700800900
1000
10 20 40 80
Pack
et re
trans
mis
sion
Number of user
Packet Retransmission
Packet Retrnsmission-ES
Packet Retrnsmission-PS
0
100
200
300
400
500
600
700
Packet Retrnsmission-ES Packet Retrnsmission-PS
Num
ber o
f pac
ket r
etra
nsm
issi
on
Algorithm
Average packet retransmission
International Journal of Computer Science and Information Security (IJCSIS), Vol. 14, No. 6, June 2016
742 https://sites.google.com/site/ijcsis/ ISSN 1947-5500

existing approach due to proposed access fairness technique adopted. The average packet drop reduction of
proposed approach achieved over existing is 45.68% which is shown in figure 6.
Figure 5: Total number of packet dropped for varied user
Figure 6: Average packet dropped
iv. Packet delivery ratio analysis: In figure 7 below, the experimental outcomes shows that the proposed
approach improves the packet delivery ratio over existing approach by 17.18%, 12.22%, 11.07% and
12.17% for varied user as 10, 20 40 and 80 respectively. The average packet delivery ratio improvement of
proposed approach achieved over existing is 12.28% which is shown in figure 8.
0100200300400500600700800
10 20 40 80
Pack
et d
ropp
ed
Number of user
Total number of packet dropped
Total Packet Droped-ES
Total Packet Droped-PS
050
100150200250300350400450
Total Packet Droped-ES Total Packet Droped-PS
Num
ber o
f pac
ket d
ropp
ed
Algorithm
Average packet dropped
International Journal of Computer Science and Information Security (IJCSIS), Vol. 14, No. 6, June 2016
743 https://sites.google.com/site/ijcsis/ ISSN 1947-5500

Figure 7: Packet delivery ratio for varied user
Figure 8: Average packet delivery ratio
V. CONCLUSION:
Here the author proposed an efficient routing model to achieve access fairness for varied application
services. To achieve this access fairness the author adopt an pre-processing infrastructure graph for discovering and
00.10.20.30.40.50.60.70.80.9
1
10 20 40 80
Pack
et d
eliv
ary
ratio
Number of users
Packet delivery ratio
Packet delivery ratio-ES Packet delivery ratio-PS
00.10.20.30.40.50.60.70.80.9
1
Packet delivery ratio-ES Packet delivery ratio-PS
Pack
et d
eliv
ary
ratio
Algorithm
Average packet delivery ratio
Packet delivery ratio-ES Packet delivery ratio-PS
International Journal of Computer Science and Information Security (IJCSIS), Vol. 14, No. 6, June 2016
744 https://sites.google.com/site/ijcsis/ ISSN 1947-5500

categorizing link as high and low data rate link for admittance control by adopting access fairness inhibited
selectivity weight strategy for varied traffic type. Experiments are conducted to evaluate the access fairness achieved
by proposed method over existing method for successful packet transmission, packet retransmission, packet drop
rate and packet delivery ratio by varying the users. The outcome show that the proposed model improves the packet
transmission by 16.78%, reduce the packet retransmission by 21.27%, reduces the drop rate by 45.68% and improve
the packet delivery ratio by 12.28% for varied user over existing 2 approach. The simulation outcome shows that
the proposed model achieves effective access fairness and it is robust and scalable. In future proposed access
fairness model will be tested in heterogeneous and very large network to further analyse the scalability of this
model.
REFERENCES:
[1] Sridhara S.B, Dr. Ramesh B., “QoS Provisioning for Energy Efficiency in Mobile Ad-Hoc Network”, Global
Journal of Computer Science and Technology: E Network, Web & Security, Volume 15, Issue 5, and Version 1.0,
2015.
[2] Sridhara S.B, Dr. Ramesh B., “Energy efficient QOS multicast routing for varied services in wireless cellular ad-
hoc network”, International Journal of Engineering Technology and Computer Research (IJETCR), Volume 3; Issue
6; Page No. 14-24, 2015.
[3] S. B. Sridhara and B. Ramesh, "An adaptive multicast routing for varied services in wireless cellular ad-hoc
network," 2015 IEEE International Conference on Computational Intelligence and Computing Research (ICCIC),
Madurai, pp. 1-5, 2015.
[4] S. Andreev, A. Pyattaev, K. Johnsson, O. Galinina and Y. Koucheryavy, "Cellular traffic offloading onto
network-assisted device-to-device connections," in IEEE Communications Magazine, vol. 52, no. 4, pp. 20-31, April
2014.
[5] IEEE, “Standard 802.16e-2005. part16: Air interface for fixed and mobile broadband wireless access systems
amendment for physical and medium access control layers for combined fixed and mobile operation in licensed
band,” 2005.
[6] Third Generation Partnership Project (3GPP), “Physical layer procedures (Release 10) for Evolved Universal
Terrestrial Radio Access (EUTRA),” 3GPP TS 36.213 v 10.5.0, 2012.
[7] Luo Junhai and Ye Danxia, “A survey of multicast routing protocols for Mobile ad-hoc networks”, IEEE
Communication surveys & Tutorials, vol.11, no.1, pp.78-90, 2009.
[8] B. Kaufman and B. Aazhang, “Cellular networks with an overlaid device to device network,” in Proceedings of
Asilomar Conference on Signals, Systems and Computers, 2008, pp. 1537–1541.
[9] T. Peng, Q. Lu, H. Wang, S. Xu, and W. Wang, “Interference avoidance mechanisms in the hybrid cellular and
device-to-device systems,” in Proceedings of IEEE PIMRC, 2009, pp. 617–621.
International Journal of Computer Science and Information Security (IJCSIS), Vol. 14, No. 6, June 2016
745 https://sites.google.com/site/ijcsis/ ISSN 1947-5500

[10] K. Doppler, M. Rinne, C. Wijting, C. Ribeiro, and K. Hugl, “Deviceto- device communication as an underlay to
LTE-advanced networks,” IEEE Communications Magazine, vol. 47, no. 12, pp. 42–49, 2009.
[11] A. Osseiran, K. Doppler, C. Ribeiro, M. Xiao, M. Skoglund, and J. Manssour, “Advances in device-to-device
communications and network coding for IMT-Advanced,” ICT Mobile Summit, 2009.
[12] K. Doppler, M. P. Rinne, P. Janis, C. Ribeiro, and K. Hugl, “Device to-device communications; functional
prospects for LTE-Advanced networks,” in Proceedings of IEEE ICC Workshops, pp.1–6, 2009.
[13] 3GPP TR 22.803, “Feasibility study for Proximity Services (ProSe) (Release 12),” v. 12.2.0, June, 2012.
[14] X. Lin, J. G. Andrews, A. Ghosh, and R. Ratasuk, “An overview of 3GPP device-to-device proximity services,”
IEEE Communications Magazine, 2013.
[15] 3GPP TR 23.703, “Study on architecture enhancements to support proximity services (ProSe) (Release 12),” v.
1.0.0, 2013.
[16] L. Lei, Z. Zhong, C. Lin, and X. Shen, “Operator controlled deviceto- device communications in LTE-advanced
networks,” IEEE Wireless Communications, vol. 19, no. 3, pp. 96–104, 2012.
[17] X. Bao, U. Lee, I. Rimac, and R. R. Choudhury, “DataSpotting: offloading cellular traffic via managed device-
to-device data transfer at data spots,” ACM SIGMOBILE Mobile Computing and Communications Review, vol. 14,
no. 3, pp. 37–39, 2010.
[18] J. C. Li, M. Lei, and F. Gao, “Device-to-device (D2D) communication in MU-MIMO cellular networks,” in
Proceedings of IEEE GLOBECOM, 2012, pp. 3583–3587.
[19] N. Golrezaei, A. F. Molisch, and A. G. Dimakis, “Base-station assisted device-to-device communications for
high-throughput wireless video networks,” in Proceedings of IEEE ICC, pp. 7077–7081, 2012.
[20] N. K. Pratas and P. Popovski, “Low-rate machine-type communication via wireless device-to-device (D2D)
links,” arXiv preprint arXiv: 1305.6783, 2013.
[21] N. Golrezaei, A. G. Dimakis, and A. F. Molisch, “Device-to-device collaboration through distributed storage,”
in Proceedings of IEEE GLOBECOM, pp. 2397–2402, 2012.
[22] B. Zhou, H. Hu, S.-Q. Huang, and H.-H. Chen, “Intracluster deviceto- device relay algorithm with optimal
resource utilization,” IEEE Transactions on Vehicular Technology, vol. 62, no. 5, pp. 2315–2326, 2013.
[23] J. Du, W. Zhu, J. Xu, Z. Li, and H. Wang, “A compressed HARQ feedback for device-to-device multicast
communications,” in Proceedings of IEEE VTC-Fall, pp. 1–5, 2013.
[24] G. Santhi and Dr. Alamelu nachiappan, “Adaptive QoS Multicast Routing with Mobility Prediction in
MANETs”, International Journal of Ad Hoc, Sensor & Ubiquitous Computing, 2010.
[25] Sankar M and Suganthi “ENERGY EFFICIENT MULTICAST ROUTING IN MANET”, International Journal
of Computer Science, Engineering & Informa, Vol. 2 Issue 3, p59, 2012.
[26] S. Xu, H. Wang, T. Chen, Q. Huang, and T. Peng, “Effective interference cancellation scheme for device-to-
device communication underlaying cellular networks,” in Proceedings of IEEE VTC-Fall, pp. 1–5, 2010.
[27] P. Janis, V. Koivunen, C. Ribeiro, J. Korhonen, K. Doppler, and K. Hugl, “Interference-aware resource
allocation for device-to-device radio underlaying cellular networks,” in Proceedings of IEEE VTC Spring, pp. 1–5,
2009.
International Journal of Computer Science and Information Security (IJCSIS), Vol. 14, No. 6, June 2016
746 https://sites.google.com/site/ijcsis/ ISSN 1947-5500

[28] M. Jung, K. Hwang, and S. Choi, “Joint mode selection and power allocation scheme for power-efficient
device-to-device (D2D) communication,” in Proceedings of IEEE VTC-Spring, pp. 1–5, 2012.
[29] S. Hakola, T. Chen, J. Lehtomaki, and T. Koskela, “Device-to-device (D2D) communication in cellular
network-performance analysis of optimum and practical communication mode selection,” in Proceedings of IEEE
WCNC, pp. 1–6, 2010.
[30] M. R. Gary and D. S. Johnson, “Computers and intractability: A guide to the theory of np-completeness,” 1979.
[31] M. Belleschi, G. Fodor, and A. Abrardo, “Performance analysis of a distributed resource allocation scheme for
D2D communications,” in Proceedings of IEEE GLOBECOM Workshops, pp. 358–362, 2011.
[32] R. Zhang, X. Cheng, L. Yang, and B. Jiao, “Interference-aware graph based resource sharing for device-to-
device communications underlaying cellular networks,” in Proceedings of IEEE WCNC, pp. 140– 145, 2013.
International Journal of Computer Science and Information Security (IJCSIS), Vol. 14, No. 6, June 2016
747 https://sites.google.com/site/ijcsis/ ISSN 1947-5500

Decision Supporting Technique and Conventional Approaches – A Review
Dr. S. Manju M.Sc., M.Phil, Ph.D
Assistant Professor
Department of Computer Science
Sri Ramakrishna College of Arts & Science for Women
Coimbatore-641044
Abstract: Brainstorming is a technique for generating a large number of ideas for creative problem solving.
The generation of new ideas, especially high quality creative ideas is important for a problem. It is a
popular method of group interaction in both educational and business sectors. Brainstorming engenders
synergy i.e., an idea from one participant can trigger a new idea in another participant. Brainstorming must
been recognized as an effective group decision supporting approach. This paper discusses about some of the
variations of Brainstorming techniques and previous approaches carried out to improve the quantity and
quality of ideas, significance of creative thinking, target to increase productivity, requirement of group
brainstorming and effectiveness of E-Brainstorming.
Keywords: Brainstorming, Decision Support System, Creativity, Management Information System.
1. Introduction
Brainstorming is a creativity technique of generating ideas to solve a problem.
Brainstorming is a process which can help organizations in generating innovative ideas and
decisions through teamwork. Brainstorming was discovered by Alex F. Osborn (1953) in a
book called Applied Imagination. Other methods of generating ideas are individual ideation and
the morphological analysis approach.
Brainstorming is the most well-known creativity promoting approaches. For several
years, it has been evidenced that Brainstorming is an actual approach to generate ideas in group
creativity or for an individual (Fan et al 2008). The main result of a brainstorming session may
be a complete solution to the problem, a group of ideas for a method to a subsequent solution,
or a group of ideas resulting in a plan to find a solution. The generation of new ideas, especially
high quality creative ideas is important for a problem. It is a popular method of group
interaction in both educational and business sectors. Brainstorming engenders synergy i.e., an
idea from one participant can trigger a new idea in another participant.
Brainstorming has been recognized as an effective group decision supporting approach.
Lin (2009) developed brainstorming based multifunctional system which supports collaboration
tasks on creative activity and decision making. Brainstorming produced 44% new valuable
ideas than individuals thinking up suggestions without the benefit of group discussion.
International Journal of Computer Science and Information Security (IJCSIS), Vol. 14, No. 6, June 2016
748 https://sites.google.com/site/ijcsis/ ISSN 1947-5500

Brainstorming is a method for developing creative solutions to problems. It does tasks by
focusing on a problem, and then intentionally coming up with as many unusual solutions as
possible and by pushing the ideas as far as possible. One approach to brainstorming is to 'seed'
the session with a word pulled randomly from a dictionary. This word as a starting point is the
process of generating ideas. During the brainstorming session there is no criticism of ideas. The
idea is to bring up as many possibilities as possible and break down preconceptions about the
limits of the problem.
Brainstorming and Lateral Thinking
The oral ideas can be changed and improved into ideas that are useful, and often
stunningly original. During brainstorming sessions there should not be any criticism of ideas, it
means we are trying to open up possibilities and break down wrong assumptions about the
limits of the problem. Decisions and study at this stage will stunt idea generation. Ideas must
only be evaluated at the end of the brainstorming session. The solution could be explored
further using conventional approaches. If our ideas begin to dry up, we can seed the session
with a random word (as sample).
The gathering of ideas can be managed by using different forms of techniques to boost
productivity of brainstorming. The following are some of the variations of Brainstorming
technique.
2. Brainstorming Techniques
• Nominal Group Technique
This technique encourages all participants to have an equal say in the process (Halil
Ozmen 2006). Each idea is voted by the group. This process is called distillation. In this
method the participants do not experience the potential synergy that comes from the ideas of
others and also they do not experience production blocking.
Fig: 1.1 Sample image for Nominal Group Technique
International Journal of Computer Science and Information Security (IJCSIS), Vol. 14, No. 6, June 2016
749 https://sites.google.com/site/ijcsis/ ISSN 1947-5500

The effects on evaluation apprehension and social loafing depend on how the session
is structured. If the ideas are submitted anonymously then evaluation apprehension could be
decreased, but social loafing can be increased. Nominal groups are considered to be superior
to brainstorming in which group members interact verbally. This technique includes lack of
opportunity during the process for cross fertilization and convergence of ideas.
• Team Idea Mapping Method
This method works by association. It may improve collaboration, increase the
quantity of ideas and is designed in a manner where all attendees participate and no ideas are
rejected.
Fig: 1.2 sample image for idea mapping
The process begins with a definite topic. Every participant brainstorms individual and
then all the ideas are merged on to one large idea map. The ultimate result of idea mapping is
that it enables us to advance in to the minutes of details about any topic. This gives the
perspective which needs to come up with extremely precise approaches to the problem that
are all encompassing and truly addressing all facts of our problem.
The hierarchical thinking of idea mapping, on the other hand opens up new
opportunities for success that could not be arrived at in any other way. Idea mapping
technique is extremely versatile and it generates and synthesizes ideas more quickly.
• Group Passing Technique
Each person in a group writes down one idea and then passes the piece of paper to the
next person in a clockwise direction, if someone adds some thoughts. This continues until
everybody gets his or her original piece of paper back. Within that, it is likely that the group
will have extensively elaborated on each idea.
International Journal of Computer Science and Information Security (IJCSIS), Vol. 14, No. 6, June 2016
750 https://sites.google.com/site/ijcsis/ ISSN 1947-5500

Fig: 1.3 Sample image for Group passing technique
The group may also have an “Idea Book” and the distribution list. The initial person
to receive the book lists for his or her ideas and then routes the book to the next person on the
distribution list. The second person could log new ideas or add to the ideas of the previous
person. This proceeds until the distribution list is exhausted.
A follow-up “read out” meeting is then held to discuss the ideas logged in the book.
This technique proceeds longer and it allows individuals to think deeply about the problem.
The maximum basic principle of group brainstorming achieves quantity not quality. This
technique is a complex social activity that requires a strong facilitator, perfect ground rules,
suspension of verbal criticism and sometimes even “homework” to act as a catalyst for ideas.
• Individual Brainstorming
“Individual Brainstorming is a use of brainstorming on a solitary basis. It classically
comprises techniques like free writing, free speaking and word association. This technique is
valuable in creative writing and has been proved to be superior to traditional group
brainstorming.
Fig: 1.4 Sample image for Individual Brainstorming technique
Individuals are more productive than groups for initial creative idea generation. This
method is done before and after group sessions. Alex Faickney Osborn (1993) popularized
brainstorming, which is still sound, “Creativity” comes from a blend of individual and
International Journal of Computer Science and Information Security (IJCSIS), Vol. 14, No. 6, June 2016
751 https://sites.google.com/site/ijcsis/ ISSN 1947-5500

collective “ideation”. Individual brainstorming has a limit to think about some topic and may
not be creative towards some topics.
• Free Writing
It refers to the act of writing quickly for a set time from ten to fifteen minutes, just
placing down whatever is in the mind, without passing and worrying about what words to use
and without going back to modify what has been written.
The power of free writing is realized in its focus on the process of learning and discovering
through on-going thinking and writing. This technique provides effective writing strategies. As
a “Writing-thinking-discovery” tool, focused free writing can be used to promote critical
thinking in disciplinary learning. Free writing is unique of the dependable versatile prewriting
techniques.
Fig: 1.5 (a) Sample image1 for free writing technique Fig: 1.5 (b) Sample image2 for free
writing technique
• Cubing
The prewriting activity is an information gathering technique. Cubing is the difficulty-
solving technique, which supports thinking about the topic and accumulates a sufficient
amount of words on paper.
International Journal of Computer Science and Information Security (IJCSIS), Vol. 14, No. 6, June 2016
752 https://sites.google.com/site/ijcsis/ ISSN 1947-5500

Fig: 1.6 Sample image for cubing technique
Creativity or divergent thinking is becoming a popular issue raised in various fields.
There is not any doubt that it is an important ability for us to improve the quality and quantity
of our knowledge. The procedures for enhancing this ability, such as lateral thinking had been
proposed for several years.
Cubing elements are (i) Describe it (ii) Compare it (iii) Associate it (iv) Analyse it (v)
Apply it and (vi) Argue for or against it. Cubing is an outstanding tool for rapidly exploring a
topic. It discloses quickly what you know and what you don’t know and it may alert you to
decide to narrow or expand your topic. Cubing requests to examine a topic in an unusual way
and this may prove frustrating to some writers.
• Random Word Technique
The Random word technique is where we can use a random word to generate new
ideas. By receiving a random word as a prompt and forcing our self to use it to solve our
problem we are practically guaranteed to attack the problem from different direction to
regular e.g. Lateral thinking.
Fig: 1.7(a) Sample image1 for random word technique Fig: 1.7(b) Sample image2 for
random word technique
International Journal of Computer Science and Information Security (IJCSIS), Vol. 14, No. 6, June 2016
753 https://sites.google.com/site/ijcsis/ ISSN 1947-5500

To trigger new thoughts and ideas or solutions to a problem we can use a random word
to get going. Lateral thinking is a word defined by Edward Debono (1970). It involves several
steps in order to come up with ideas and solutions. (i) Check your assumptions: make sure
that an open mind approach is applied when there is a new problem or new situation. (ii) Ask
the right questions: The true leadership is about knowing which questions to ask. This is
similarly true when it comes to lateral thinking. (iii) Creativity: In order to solve a problem,
the problem should be approached from an unconventional angle. (iv)Logical thinking:
logical thinking is needed to analyse the ideas.
The greatest thing by far is to be a master of metaphor. “It is a representation of genius,
since a good metaphor implies an intuitive perception of the similarity in dissimilar” said
Aristotle. There are numerous ways to use the idea metaphor. One example is the random
word association technique.
• Electronic Brainstorming Technique
Electronic Brainstorming generates more ideas than verbal groups. Electronic
Brainstorming is a computerized version of the manual brain writing technique. It could be
done via e-mail. It replaces the verbal communication and combines both verbal and nominal
groups.
The participants may experience synergy by building on the ideas of others to create
new ideas. This method is inherently malleable; user can adopt and use them in ways not
intended by their designers. It see to not directly change the way in which users interact, but
rather offers a set of potential social structures from which users can choose. In this method
all participants can contribute ideas at the same time and can effectively eliminate production
blocking and reduces social loafing.
The productivity of electronic brainstorming groups was higher than that of non-
electronic brainstorming (or) traditional groups. In the electronic groups, performance
increase substantially with group size. The dissimilar forms of E-Brainstorming prompts are
varied to produce different levels of creativity within those productivity results.
This technique reduces evaluation apprehension. Professor Oliver Toubia of Columbia
University has conducted extensive research in the field of idea generation and had concluded
that incentives are extremely valuable within the brainstorming context. E-Brainstorming
tools represent plausible solutions to improve the e-research community activities with respect
to processes regarding idea generation and idea selection.
The productivity of Electronic Brainstorming groups was higher than that of non-
Electronic Brainstorming (or) traditional groups. In the electronic groups, performance
International Journal of Computer Science and Information Security (IJCSIS), Vol. 14, No. 6, June 2016
754 https://sites.google.com/site/ijcsis/ ISSN 1947-5500

increases substantially with group size. The diverse forms of E-Brainstorming prompts are
varied to produce different levels of creativity within those productivity results. In general, e-
brainstorming generates more ideas than verbal brainstorming groups (Gallupe .R.B et al
1991). This enhancement of E-Brainstorming over the conventional brainstorming method
comes from factors such as production blocking and evaluation apprehension (Dennis .A.R et
al 2004).
Fig: 1.8(a) Sample image1 for E-Brainstorming Fig: 1.8(b) Sample image2 for E-Brainstorming
Electronic Brainstorming can be used in any business areas such as, advertising
campaigns, marketing strategy and methods, research and development procedures, consumer
research, management methods and investment decisions. E-Brainstorming will increase the
creativity and productivity of ideas generated by the organizations. It too supports
organizations to take appropriate decisions in critical situations (For e.g. making decisions on
investment).
The following sections discusses about the previous approaches carried out to improve
the quantity and quality of ideas, significance of creative thinking, target to increase
productivity, requirement of group brainstorming and effectiveness of E-Brainstorming.
3. Quantity and Quality of Idea Generation
Quantity and Quality of idea generation is very important in the aspect of productive
outcome of ideas. Quality idea means the valuable ideas or valuable solutions given to a
problem. Quantity implies the maximum amount of solution or ideas generated to a problem
provided maximum range of ideas will not only contribute creative idea generation. Production
blocking problem could be reduced by improving the quantity of ideas.
Most ideation research either implicitly or explicitly assumes Osborn’s conjecture that if
people generate more ideas, at that point they will produce more good ideas. Osborn reported
International Journal of Computer Science and Information Security (IJCSIS), Vol. 14, No. 6, June 2016
755 https://sites.google.com/site/ijcsis/ ISSN 1947-5500

confirmation that people generate more good ideas in the second half of a brainstorming session
than during the first half. Some studies must have reported that certain ideation protocols can
elevate both idea quantity and idea quality.
The understanding boundary indicated that the relationship between the number of good
ideas and the total number of ideas becomes a curvilinear function with a positive but
decreasing slope once an understanding of the task has been achieved. The cognitive boundary
signified that, due to the lack of additional external stimuli to activate a new part of the group
memory, people incline to think inside the box, causing subsequent contributions to
progressively become similar to previous contributions, by yielding fewer new good ideas (that
is, the declining ratio of good ideas to the total ideas over time produces an ideation function
with a positive but decreasing slope).
The endurance boundary indicated that when an individual’s mental and physical
abilities diminished with effort over time, ideation abilities would decline as ideation proceeded
(i.e., if the ideation process were to continue for a sufficiently long time and the participants
might lose the ability to generate good ideas which leads to falling ratio of good ideas to the
total ideas overtime and yields an ideation function with a positive but decreasing slope). But
previous works reported no relationship between idea quality and idea quantity. i.e., preceding
ideation literatures were inconsistent in the arguments (Yuan and Chen 2008).
Briggs and Reining (2007) provided a theoretical explanation (Bounded Ideation Theory)
to clarify the relationship between idea quantity and idea quality, and they suggested guidance
for the development of ideation techniques for improving the quality of ideas. A noble idea was
defined as one that is feasible to implement and would attain the goal.
John R. Rossiter and Gary L. Lilien (1994) presented six new principles emerged from
four decades of academic and industry research on the generation of high-quality creative ideas
by “brainstorming”. The ethics are: (a) brainstorming instructions are necessary and must
emphasize, paradoxically, number and not quality of ideas; (b) an exact, challenging target
should be set for the number of ideas; (c) individuals, not groups, should produce the initial
ideas; (d) groups must be used to amalgamate and enhance the ideas; (e) individuals must
provide the final ratings to pick the best ideas, which will raise commitment to the selected
ideas and (f)the time required for effective brainstorming should be kept extraordinarily short.
By following these principles, brainstorming could reliably produce high quality and creative
outcomes.
Robert C. Litchfield (2008) have proposed goal setting as a mechanism for linking
brainstorming research to administrative creativity in the hope that a goal based view might
support to produce outputs. A considerable quantity of research offers the hope that objectives
may increase both the quantity and targeting of ideas. Using the huge body of literature on
International Journal of Computer Science and Information Security (IJCSIS), Vol. 14, No. 6, June 2016
756 https://sites.google.com/site/ijcsis/ ISSN 1947-5500

brainstorming as a sample, proposed model contributed organizational creativity and innovative
research with goal-based view of involvement in idea generation.
Karan Girotra et al (2009) have examined the effectiveness of two creative problem
solving methods for such tasks, where the crowd works together as a team (the team process),
and the new individuals first work unaccompanied and then work together (the hybrid process).
He defined effectiveness as the quality of the best ideas recognized by the group. They related
formerly observed group actions to four different variables that illustrate the creative problem
solving procedure.
Olga Goldenberg and Jennifer Wiley (2011) has reviewed realistic literature on
brainstorming and recommended that, Osborn was right about numerous but not all of his
perceptions. The literature discussed the potential benefits of cognitive stimulation, and
possible drawbacks of conformity or fixation, due to coverage of others’ ideas. Even though
Osborn suggested “withholding criticism,” the potential rewards of conflict in interrelating
problem-solving groups were also discussed.
The existing research works tried to elevate quantity and quality of ideas produced. Even
though quantity and quality was considerably improved, Production blocking was the major
problem noticed among the previous methods. The proposed method focuses on production
blocking problem to elevate productivity and to improve the quality of ideas.
4. Approaches to advance Creative Thinking
Creative thinking is very essential to give innovative solution to a problem.
Brainstorming was noticed as effective method for creative thinking process. This topic shows
the effectiveness of innovation in previous methods.
Scott G. Isaksen (1998) identified that brainstorming as an effective tool for creative
thinking. Many experimental studies have been conducted concerning the effectiveness of this
method to group idea generation. Previous reviews have ignored a few fundamental issues
outlined by the inventor of the tool. This condition has led to unsuccessful misconceptions
about brainstorming. The article provided a review of 50 studies done from 1958 to 1988.
Rodney McAdam and John McClelland (2002) aimed to critique and review the part of
individuals and teams in idea generation as portion of the overall administrative creativity and
innovation process. Key objects were to determine structural development needs and research
schedules in the area. Organizations remain to emphasize the need for enlarged creativity and
innovation within their employees and markets. Rafael Holzhacker (2005) has believed
Innovation as a key feature for bearable effectiveness and idea generation in investigation and
Development fields. The current studies focuses on a specific procedure that plans to inhibit
some dysfunctional actions occurring in team work schemes for idea generation -namely free
ride, evaluation apprehension and production blocking. Joachim Burbiel (2009) has discussed
International Journal of Computer Science and Information Security (IJCSIS), Vol. 14, No. 6, June 2016
757 https://sites.google.com/site/ijcsis/ ISSN 1947-5500

the literature review in the field of work place originality, with distinct attention given to R&D
environments. Current theoretical creativity models were debated and a literature review of the
impact of (i) inspiration, (ii) interaction within work groups and between group leaders and
supporters, and (iii) structural culture and environment on creativity was undertaken. Real-
world guidance was derived from literature conclusions wherever possible.
Thomas Gegenhuber and Marko Hrelja (2012) have found that the brainstorming
literature provided the way for selection of excellent ideas and it also needed further
investigation. Several Organizations were using broadcast search to identify new avenues of
innovation. Research on innovation contests provided perceptions on why exceptional ideas are
produced in a broadcast search. Fredric M. Jablin and David R. Seibold (2009) have attempted
a review and serious examination of brainstorming as assistance to creative problem solving in
groups. The review presented: (i) a conversation of the history of brainstorming and its
practice; (ii) an analysis of experimental studies of brainstorming; and (iii) an investigation of
hypothetical clarifications for greater brainstorming performance by individuals as contrary to
that of groups.
Ricardo Sosa and John S. Gero (2012) have made a study of creative ideation which
showed that individual brainstorming in isolation tend to produce more and improved ideas
than groups. But current studies depicted a more complex picture, supporting the need to better
understand individual and group ideation. They presented results from a multi-agent simulation
of the part of group impact in brainstorming groups. Even though, the existing brainstorming
techniques provided creative solutions. In the decision making and multi-agent environment
systems there is a great challenge for creativity.
5. Methods targeted to Enrich Productivity in Brainstorming
Productivity is a major factor to conduct brainstorming session. When productivity
increases the quality of ideas will also increase. The following section discusses about the
prevailing methods which tried to achieve maximum of productivity.
Laxmi R. Iyer et al (2009) has analyzed differential special effects of relevant and
irrelevant primes on throughput of idea generation in specific problem/task contexts.
Simulations used in this model were inappropriate primes which could offer an uncertain
productivity improvement in contexts that are familiar or similar accustomed contexts, but there
was no advantage when the context is unfamiliar. They also referred brainstorming as the
method of generating ideas for a specific task.
Nicholas W. Kohn and Steven M. Smith (2010) have examined experiments that,
whether passion effects happened in brainstorming as a purpose of accepting ideas from others.
Swapping ideas in a group reduced the number of areas of ideas that were discovered by
International Journal of Computer Science and Information Security (IJCSIS), Vol. 14, No. 6, June 2016
758 https://sites.google.com/site/ijcsis/ ISSN 1947-5500

participants. Moreover, ideas given by brainstorms followed ideas recommended by other
participants. Kevin Byron (2012) has said that, brainstorming is the default technique for idea
generation in organizations and broadly applied in higher education by students, academicians
and staffs. Its popularity was generally attributed to an ambiguous belief that groups working
together could be more productive than individuals working separately.
Diehl, Michael et al (1987) have conducted four experiments to consider free riding,
evaluation apprehension, and production blocking as explanations of the modification in
brainstorming productivity typically observed between real and nominal groups. In the first
experiment, they deployed assessment expectations in group and individual brainstorming.
Aaron U. Bolin (2003) has presented a study to decide the personality configuration of an
interactive brainstorming group which had an influence on the group procedures and
subsequent productivity.
The existing methods concentrated on improving productivity to eliminate production
blocking caused from brainstorming participants.
6. Prevailing approaches of Group Brainstorming
This section discusses about the efficiency of group brainstorming over individual
brainstorming. Group support is very much needed to attain active and creative environment.
Alan R. Dennis (1999) found that GSS (Group Support System) could be used to support
group brainstorming. It reported the results of a research that operated task structure and time
structure. Groups electronically brainstormed on complete tasks (where all fragments of the
tasks were presented to the groups). The period in which groups worked were either one 30
minute time period or three 10 minute time periods.
Gert-Jan de Vreede (2000) has investigated in a case study that, which brainstorming
model would be more productive and result in advanced levels of participant satisfaction.
Consistent with the assumptions, Relay groups appeared to be more productive than Decathlon
groups, in particular in terms of explanations to aforementioned contributions.
Vincent R. Brown and Paul B. Paulus (2002) outlined a literature review on group
brainstorming and found it to be less effective than individual brainstorming. However, an
intellectual perspective recommends that group brainstorming could be an operative technique
for generating creative ideas. Computer replications of an associative memory model of idea
generation in sets suggest that groups have the potential to produce ideas than individuals
brainstorming. Jurgen Wegge and S. Alexander Haslam (2005) have conducted an experiment
with 30 groups (n = 120) solved brainstorming tasks under four different group goal conditions
such as, Do Your Best (DYB), Directive Group Goal Setting (DGGS), Participative Group
Goal Setting (PGGS), and PGGS in combination with individual goal setting (PGGS + IGS).
International Journal of Computer Science and Information Security (IJCSIS), Vol. 14, No. 6, June 2016
759 https://sites.google.com/site/ijcsis/ ISSN 1947-5500

As projected result, all groups with explicit and difficult group objectives performed better than
DYB control groups. It was hypothesized that the positive properties of group objective setting
on brainstorming performance increased because of group goal setting counters enthusiasm
losses such as social loafing.
Paul B. Paulus and Vincent R. Brown (2007) have discussed that in many meetings and
work sessions group members discussed ideas in order to come up with novel, creative answers
for complications and to engender ideas for future innovations. Susan M. Stevens et al (2007)
has proposed an experiment, which compared the efficiency of individual versus group
brainstorming while addressing difficulties and real world challenges. Earlier research in
electronic brainstorming has mostly been limited to laboratory experiments using lesser groups
of students answering questions inappropriate to an industrial setting. The projected experiment
attempted to extend current findings to real-world workers and organization-relevant tasks.
Bruce A. Reinig and Robert O. Briggs (2008) have made a research to develop methods
and techniques to improve group ideation. Most of the research emphasizes on techniques for
increasing the quantity of ideas generated during ideation less attention have been given to the
quality of the ideas produced. The focus shoots from the widely held quantity quality
conjecture, that, all else being equal provide more good ideas.
H.T Lin (2009) has made a study to present a brainstorming based multi-functional
system to support collaborating works on creative activity and decision making. In his study
brainstorming has been recognized as an effective group decision supporting approach.
Nicholas W. Kohn (2011) has conducted two experiments to explore the process of
constructing ideas in brainstorming. In his experiment individual and groups produced ideas
which were subsequently presented to the same individuals and groups to associate and shape
on for additional ideas, either as groups or individuals.
Wolfgang Strobe & Michael Diehl (2011) has reviewed the evidence for the productivity
loss in brainstorming groups and then assessed the numerous hypothetical explanations for his
findings in the light of experimental research. The evidence recommended that the productivity
loss in idea-creating groups caused mutual production blocking due to the restriction on groups
that the group members could talk only in their turn. They have conversed about various
approaches that have been developed to overcome the disrupting effects of production
blocking.
Coskun and HamitIn (2011) have conducted a series of experiments which subjected to
expose two-minute typing speed test which was unnoticed in the earlier studies in electronic
brainstorming. In the first experiment the effects of the group size (4, 6, and 8 person groups),
in the second experiment that of group size (4, 6, 8, 10, and 12 person groups) with the memory
education, and in the third experiment that of group size (4 and 10 person groups) with two
dimensions of brainstorming session (15 and 25 minutes) were investigated on the
International Journal of Computer Science and Information Security (IJCSIS), Vol. 14, No. 6, June 2016
760 https://sites.google.com/site/ijcsis/ ISSN 1947-5500

brainstorming performance. Clive Boddy (2012) has presented and discussed a technique called
the Nominal Group Technique (NGT) for potential use in the kinds of marketing research and
management research to generate desirable ideas as possible. The payback of the NGT was
researched in a literature review.
Xiaofeng Wang (2013) has presented a paper about the
research-in-advancement on brainstorming while walking and which was a practice built upon
the relationship between thinking and walking. The objective was to better understand how to
conduct group brainstorming successfully. K. Nordland (2006) have discussed about the recent
developments in brainstorming that group dynamics could disturb the effectiveness of
brainstorming. While rules tried to minimize the criticism of crazy ideas, the panic of making
out of the box proposals among co-workers could shrink the number of proposals made. Many
sources agreed that groups do not have the creative power than individuals.
7. Approaches to demonstrate Effectiveness of E- Brainstorming
Electronic Brainstorming is a computerized version of the manual brain writing
technique. It could be done via e-mail. It replaces the verbal communication and combines both
verbal and nominal groups. The participants will experience synergy by building on the ideas of
others to create new ideas. This method is inherently malleable; user can adopt and use them in
ways not intended by their designers. It directly does not change the way in which users
interact, but rather offers a set of potential social structures from which users can choose. In this
method all participants can contribute ideas at the same time and can effectively eliminate
production blocking and reduces social loafing. The outcome of electronic brainstorming
groups was higher than that of non-electronic brainstorming (or) traditional groups. In the
electronic groups, performance increases substantially with group size. The several forms of E-
Brainstorming prompts are varied to produce different levels of creativity within those
productivity results. This method reduces evaluation apprehension. Electronic Brainstorming
generated more ideas than verbal groups (Gallupe Bastianutti and Copper 1991).
William H. Cooper et al (1990) associated electronic and non-electronic brainstorming
groups in two studies and found that electronic brainstorming groups produced additional non-
redundant ideas than non-electronic brainstorming groups in both studies. They also found that
the electronic brainstorming groups really outperformed individuals working by themselves.
R. B. Gallupe et al (1994) have recognized the supremacy of electronic brainstorming to
number of factors, with the technology's ability to reduce production blocking. In the article,
the authors employed production blocking in three experiments and evaluated the performance
of congested and unblocked electronic brainstorming groups (EBGs) and verbal brainstorming
International Journal of Computer Science and Information Security (IJCSIS), Vol. 14, No. 6, June 2016
761 https://sites.google.com/site/ijcsis/ ISSN 1947-5500

groups. When normal EBGs were associated with verbal brainstorming groups, EBGs were
found to be considerably more productive, which simulated earlier research results.
Gail Kay (1995) has addressed the vital issue of effective meetings in organizations. He
compared and contrasted the transformations between traditional brainstorming and electronic
brainstorming (EBS) in meetings. An investigation of EBS and its practices would furnish
organizations with a vision of the powerful technology. Groups frequently meet in order to
produce ideas, to share facts, and to start action. The group meeting was not always effective..
V. Srinivasan Rao and Alan R. Dennis (2000) have proposed group support systems
which suggested task, technology, group and individual features may explain experimental
effects. Task, technology and group characteristics have been studied to some extent.
Appearances of individual participants have acknowledged fewer attentions. In his article, the
outcomes of an experimental analysis on the equality of uncommunicativeness in groups on
idea generation were stated.
K Tsukamoto and A Sakamoto (2001) have conducted an experiment to investigate
comparative efficiency of three electronic brainstorming systems, associated with a control, and
found perceptive variables that mediated its effectiveness. Hundred undergraduate women, in
groups of four, participated in the research. The number and quality of unique ideas produced
by electronic brainstorming groups of three demonstration systems, random, sequential and
sequence-emphasized were compared with the nominal group.
Thomas Kratschmer and Michael Kaufmann (2002) have made a study on Electronic
Brainstorming and he stated that, Group brainstorming is a very standard technique for the
creation of ideas, even though the state of the art in psychological research backs from the
method of brainstorming. Electronic brainstorming overwhelms some of the shortcomings and
regains certain value. Nicolas Michinov and Corine Primois (2005) have extended the findings
of synchronous room-based electronic brainstorming about the influence of social evaluation
process on productivity and creativity in a web-based context of asynchronous electronic
brainstorming. Social evaluation was manipulated with a reaction informing group members of
their individual contributions on the electronic brainstorming task through a collective bench
frequently updated by an originator. Deng Hui (2008) has noticed that very few studies have
observed the dynamic changes in the development of idea generation in electronic
brainstorming, which helped a facilitator to succeed a brainstorming session. This study
reported the outcomes of an experimental view that investigated the relationship between the
number of ideas produced and the time taken while groups were performed a single electronic
brainstorming task within a single time period.
Thomas Herrmann and Alexander Nolte (2010) have made experimental basis of
research which consists of a sequence of workshops which were entangled with the
International Journal of Computer Science and Information Security (IJCSIS), Vol. 14, No. 6, June 2016
762 https://sites.google.com/site/ijcsis/ ISSN 1947-5500

uninterrupted improvement of socio-technical design including the method of facilitation and
the technical structures of brainstorming tools
Mike Gartrell et al (2010) have stated that online resources such as Google, Wikipedia,
Facebook, and other sites could be integrated into electronic brainstorming applications. They
have presented their vision for a brainstorming application that practices session context and
personal context to facilitate the brainstorming procedure by commending new ideas to users.
Lorea Lorenzo et al (2011) have stated that, Innovation is a key instrument to start a
transformational procedure based on collaboration. It is essential for organizations and
institutions to have well defined approaches. In the framework, brainstorming sessions and e-
brainstorming tools are operative techniques to put together and associate draft ideas. He
introduced the practice of Social and Semantic Web technologies to support e-brainstorming.
Lassi A. Liikkanen (2011) has examined a research literature, which indicated the
strengths of electronic brainstorming over face-to-face work. His work explored how to
enhance outdated, collocated brainstorming in to feasible electronic brainstorming accessible
with web-based technology. He introduced an electronic brainstorming application model and
justified its design principles Javadi.E (2011) have said that the universal use of electronic
media for group brainstorming, investigation and working out presented that electronic
brainstorming systems (EBSs) have created an illusion of productivity as they seem to offer
limited benefits in terms of quantity or quality of the ideas generated by individuals during
brainstorming. Javadi E (2011) has examined the effects of idea visibility on idea integration
and how that relationship was qualified by information diversity. His workshop experiment
exposed that the elementary level of idea integration i.e. simple reference to partners’ ideas
enlarged when visibility increased, higher levels of idea integration reduced as visibility
increased.
Lauren E. Arditti (2011) have said that Electronic brainstorming is a technique developed
to take benefit of the positive special effects of combined ideation, such as cognitive
stimulation, while reducing production blocking and social loafing. To counter the possible
source of production loss, the need of folders has been developed. Elahe Javadi et al (2011)
have introduced an attention based view of idea integration that highlights the importance of
user interface design. The postulation was that the presented ideas via user interface plays a key
role in permitting and motivating idea integration in electronic brainstorming (EBS), and thus
advanced productivity. Constructing cognitive Network Model of Creativity and ability
motivation framework, their attention based theory focused on two major characteristics of user
interface, visibility and prioritization. Alan R. Dennis et al (2012) have developed a Web-based
computer game that was considered to improve creativity through supraliminal briefing, a form
of preparing in which users are aware of the briefing, but not aware of its purpose. Participants
International Journal of Computer Science and Information Security (IJCSIS), Vol. 14, No. 6, June 2016
763 https://sites.google.com/site/ijcsis/ ISSN 1947-5500

were exposed to a priming game and then functioned as members of a team to produce ideas on
a creativity task.
In their paper, authors presented a study which examined the effect of achievement
preparing on the electronic brainstorming (EBS) performance of a team. They found that teams
produced meaningfully more unique ideas after the attainment preparing condition.
Paul B. Paulus et al (2013) have said that number of studies on electronic brainstorming
have found that large electronic groups could assist the number of ideas produced relative to
control groups of comparable numbers of private performers (nominal groups). So far there was
no clear indication for the basis of this facilitative effect. The most possible explanation was
that group member’s benefit from exposure to the wide range of ideas in large groups. The
previous studies have showed the significance of Electronic Brainstorming over the
conventional brainstorming. It also demonstrated the disadvantages of traditional methods and
the future directions of E-Brainstorming.
8. Complications of Existing E-Brainstorming Methods
Alan R. Dennis & Bryan A. Reinicke (2004) has argued that much of the past research
on electronic brainstorming has been slightly biased. For example, Sony focused on the quality
of the picture on its Beta format, but the researchers have focused on the number of ideas
produced as the leading measure of electronic brainstorming effectiveness. In spite of the
convincing research on its performance welfares, electronic brainstorming must not yet
displaced or even combined to verbal brainstorming as a broadly used idea generation
technique.
Production blocking problem occurs when something prevents a participant from
verbalizing their ideas as they occur. It is closely related to number of participants in a group,
it is a greater problem for large teams than small ones Edward de Bono (2009). The previous
ideation literatures were inconsistent in the arguments (Yuan and Chen 2008). A study
conducted by the Wharton School of the University of Pennsylvania and Instead Business
School revealed that traditional group brainstorming sessions yield ideas that are both inferior
in quality and quantity. Rigidity of ideation map construction was found in existing method.
Diverging ideas and relationships were too complex (Yuan and Chen 2008).
Social networks provided minimum privacy settings such as granting privileges to all
people belonging to one’s social graph to access the information. The importance of
protecting data does not only mean granting full access or not, but in certain instances fine-
grained access control mechanisms are required to restrict fragments of information. Linked
Data infrastructure currently lacks mechanisms for creating fine-grained privacy preferences
that define which data can be accessed by whom. This might discourage Web users to publish
sensitive data such as user’s personal information contained in FOAF (Friend of a Friend)
International Journal of Computer Science and Information Security (IJCSIS), Vol. 14, No. 6, June 2016
764 https://sites.google.com/site/ijcsis/ ISSN 1947-5500

profiles. The existing Web Access Control (WAC) vocabulary restricts RDF (Resource
Description Framework) documents to specified users. It does not provide fine-grained
privacy measures which specify complex restrictions to access the data (Sacco Passant 2011).
The scope of ideation ontology was confined and structure of ontology specification was
complex (Yuan and Chen 2008).
9. Discussion & Conclusion
The previous electronic brainstorming approaches lacks flexibility in idea mapping
between ideas and privacy measures among the participants. Previous works suggested that
traditional Brainstorming was a technique for generating a large number of ideas for creative
problem solving. Starting from the initial verbal brainstorming groups to electronic
brainstorming groups the motive was to improve the quality and quantity of idea generation.
Innovative ideas were considered as the important outcomes of the brainstorming sessions.
The prevailing methods tried to eradicate the major problem noticed in traditional
brainstorming (production blocking). Considering the ineffectiveness of verbal brainstorming,
quality and quantity of ideas, importance of group brainstorming and drawbacks of electronic
groups, the proposed research work focuses on improving the electronic brainstorming
through the intelligent agent based mechanism.
References
1. Aaron U. Bolin (2003) Personality, Process, and Performance in Brainstorming Groups, 49th Annual
Convention of the South western Psychological Association.
2. Alan R. Dennis, Jay E. Aronson, William G. Heninger and Edward D. Walker (1999) Structuring time and
task in electronic brainstorming, MIS Quarterly- Special issue on intensive research in information systems
Vol 23 issue 1 pp: 95-108.
3. Alan R. Dennis and Bryan A. Reinicke (2004) Beta versus VHS and the acceptance of electronic
brainstorming technology, Journal MIS Quarterly Volume 28 Issue 1, pp: 1-20 Society for Information
Management and The Management Information Systems Research Center Minneapolis, USA.
4. Alan R. Dennis, Randall K. Minas and Akshay Bhagwatwar (2012) Sparking Creativity: Improving
Electronic Brainstorming with Individual Cognitive Priming, 45th Hawaii International Conference on
System Sciences pp: 139-148, DOI 10.1109/HICSS.2012.541.
5. Briggs R.O and B.A. Reinig (2007) Bounded Ideation Theory: A New Model of the Relationship between
Idea-Quantity and Idea-Quality during Ideation, Proc. 40th Ann. Hawaii Int’l Conf. System Sciences
(HICSS ’07).
6. Bruce A. Reinig and Robert O. Briggs (2008) On The Relationship Between Idea-Quantity and Idea-
Quality During Ideation, Group Decision Negotiation pp:403–420 DOI 10.1007/s10726-008-9105-2,©
Springer Science Business Media B.V. 2008.
International Journal of Computer Science and Information Security (IJCSIS), Vol. 14, No. 6, June 2016
765 https://sites.google.com/site/ijcsis/ ISSN 1947-5500

7. Clive Boddy (2012)The Nominal Group Technique: an aid to Brainstorming ideas in research, Qualitative
Market Research 6-18.
8. Coskun and Hamit (2011) The Effects of Group Size, Memory Instruction, and Session Length on the
Creative Performance in Electronic Brainstorming Groups, Educational Sciences: Theory and Practice, vol
11 No1 pp: 91-95.
9. Diehl, Michael Stroebe and Wolfgang (1987) Productivity loss in brainstorming groups: Toward the
solution of a riddle, Journal of Personality and Social Psychology, Vol 53(3), pp: 497-509.
10. Deng Hui, Zhang Pengzhu and Sun Jingle (2008) An Empirical Study on Dynamic Process of Electronic
Brainstorming, DOI: 10.1109.
11. Dennis A.R. and B. Reinicke (2004), Beta vs. VHS and the Acceptance of Electronic Brainstorming
Technology, MIS Quarterly, vol. 28, no. 1, PP: 1-20.
12. De Bono Edward (2009) Latest news on Six Thinking Hats and Innovation.
13. Elahe Javadi and Wai-Tat Fu (2011) Idea Visibility, Information Diversity, and Idea Integration in
Electronic Brainstorming, Foundations of Augmented Cognition. Directing the Future of Adaptive Systems
- 6th International Conference, FAC 2011, Held as Part of HCI International, Orlando, FL, USA.
14. Fan, S.C., Q.P. Shen and J. Kelly (2008) Using group decision support system to support value
management workshops. Journal of Computational Civil Engg 22: PP: 100-113.
15. Fredric M. Jablin and David R. Seibold (2009) Implications for problem‐solving groups of empirical
research on ‘brainstorming’: A critical review of the literature, pp: 327-356, DOI:
10.1080/10417947809372391.
16. Gallupe R.B, L.M. Bastianutti, and W.H. Copper (1991), Unblocking Brainstorming, J. Applied
Psychology, vol. 76, no. 21, PP: 137-142.
17. Gail Kay (1995) "Effective meetings through electronic brainstorming", Journal of Management
Development, Vol. 14 Issue: 6, pp: 4-25.
18. Gert-Jan de Vreede, Robert O. Briggs, Ron van Duin and Bert Enserink (2000) Asynchronous Electronic
Brainstorming in Very Large Groups.
19. Goldenberg, Olga and Wiley, Jennifer (2011) "Quality, Conformity, and Conflict: Questioning the
Assumptions of Osborn’s Brainstorming Technique," The Journal of Problem Solving: Vol. 3:
Iss.2, Article 5. DOI: 10.7771/1932-6246.1093.
20. Halil Özmen (2006) Creative Problem Solving.
21. Jürgen Wegge and S. Alexander (2005) Haslam Improving work motivation and performance in
brainstorming groups: The effects of three group goal-setting strategies,European Journal of Work and
Organizational Psychology Volume 14, Issue 4, pp: 400-430.
22. John R. Rossiter and Gary L. Lilien (1994) New Brainstorming Principles, Australian Journal of
Management, pp: 61-72.
23. Joachim Burbiel (2009) Creativity in research and development environments: A practical review, Int.
Journal of Business Science and Applied Management, Volume 4, Issue 2.
International Journal of Computer Science and Information Security (IJCSIS), Vol. 14, No. 6, June 2016
766 https://sites.google.com/site/ijcsis/ ISSN 1947-5500

24. Karan Girotra, Idea Generation and the Quality of the Best Idea Journal: Management Science Scholar One,
375 Greenbrier Drive, Charlottesville, VA, 22901 pp: 1-56.
25. Kevin Byron (2012) Creative reflections on brainstorming, London Review of Education Special Issue:
Creativity in education challenging the assumptions, Volume 10, Issue 2, pp: 201-213.
26. Laxmi R. Iyer, Ali A. Minai, Vincent R. Brown, Paul B. Paulus and Simona Doboli (2009) Effects of
Relevant and Irrelevant Primes on Idea Generation: A Computational Model, Proceedings of International
Joint Conference on Neural Networks.
27. Lin H.T (2009) A Multifunctional system for supporting collaborating works and decision making,
Information technology journal ISSN1812-5638 pp: 49-56, Asian network for scientific information.
28. Lorea Lorenzo, Osane Lizarralde, Igor Santos and Alexandre Passant (2011) Structuring E-Brainstorming
to Better Support Innovation Processes, Association for the Advancement of Artificial Intelligence
(www.aaai.org).
29. Lassi A. Liikkanen (2011) Next step in electronic brainstorming: collaborative creativity with the web,
Proceeding of ACM CHI EA '11 Systems Pages 2029-2034 ISBN: 978-1-4503-0268-5.
30. Lauren E. Arditti (2011) Effect of number of ideas and folders on idea generation in groups, Master
dissertation submitted to the University of Texas at Arlington.
31. Mike Gartrell, Aaron Beach, Jai Ramanarayanankrishnaniyer, Xinyu Xing, Richard Han, Qin Lv, Shiva
Kant Mishra and Karim Seada (2010) Integrating Wikipedia and Facebook Context into Collaborative E-
Brainstorming, Department of Computer Science, University of Colorado at Boulder, Technical Report CU-
CS-1073-10.
32. Nicholas W. Kohn (2010) Collaborative fixation: Effects of others’ ideas on brainstorming, Applied
Cognitive Psychology.
33. Nicholas W. Kohn, Paul B. Paulus and YunHee Choi (2011) Building on the ideas of others: An
examination of the idea combination process, Journal of Experimental Social Psychology, DOI: 10.1016.
34. Nicholas W. Kohn and Steven M. Smith (2011) Collaborative fixation: Effects of others' ideas on
brainstorming, Applied Cognitive Psychology journal, Volume 25, Issue 3, PP: 359–371,
DOI: 10.1002/acp.1699.
35. Nicolas Michinov and Corine Primois (2005) Improving productivity and creativity in online groups
through social comparison process: New evidence for asynchronous electronic brainstorming, Computers in
Human Behavior DOI: 10.1016.
36. Nordland. K (2006) Brainstorming Tools Literature Review and Introduction to Code Development.
37. Osborn, A.F. (1953) Applied imagination: Principles and procedures of creative problem solving.
38. Osborn A.F. (1993) Applied Imagination: Principles and Procedures of Creative Problem-Solving, Creative
Education Foundation, third revised.
39. Owen Sacco and Alexandre Passant (2011) A Privacy Preference Ontology (PPO) for Linked Data,
LDOW2011.
International Journal of Computer Science and Information Security (IJCSIS), Vol. 14, No. 6, June 2016
767 https://sites.google.com/site/ijcsis/ ISSN 1947-5500

40. Paul B. Paulus and Vincent R. Brown (2007) Toward More Creative and Innovative Group Idea
Generation: A Cognitive-Social-Motivational Perspective of Brainstorming, Social and Personality
Psychology pp: 248–265.
41. Paul B. Paulus ,Nicholas W. Kohn,Lauren E. Arditti and Runa M. Korde(2013) Understanding the Group
Size Effect in Electronic Brainstorming, Small Group Research June 2013 vol. 44 no. 3 pp: 332-352.
42. Rafael Holzhacker (2005) Applying Impact Based Incentives for Idea Generation in R&D Projects,
Massachusetts Institute of Technology Libraries.
43. Ricardo Sosa and John S. Gero (2012) Brainstorming in Solitude and Teams: A Computational Study of
Group Influence, International Conference on Computational Creativity.
44. Rodney McAdam and John McClelland (2002) Individual and team based idea generation within
innovation management: organisational and research agendas, European Journal of Innovation Management
Volume 5 Number 2 pp. 86-97 MCB UP Limited ISSN 1460-1060.
45. Robert c. Litchfield “Brainstorming reconsidered: A goal based view”, Academy of management review,
2008, Vol 33, No 3, PP: 649-668.
46. Scott G. Isaksen (1998) A Review of brainstorming research six critical issues for inquiry, Creative
problem solving group.
47. Susan M. Stevens, George S. Davidson, Courtney C. Dornburg and James C. Forsythe (1978) Assessing the
Effectiveness of Electronic Brainstorming in an Industrial Setting: Experimental Design Document
Southern Speech Communication Journal Volume 43, Issue 4.
48. Srinivasan Rao.V and Alan R. Dennis (2000) Equality of Reticence in groups and idea generation: An
empirical, Indiana University journal of Information Technology Management, Volume XI, Numbers 3-4
ISSN #1042-1319.
49. Thomas Gegenhuber and Marko Hrelja (2012) Broadcast search in innovation contests: case for hybrid
models, proceedings of 45th Hawaii International Conference on System Sciences.
50. Thomas Kratschmer and Michael Kaufmann (2002) Electronic Brainstorming with graphical structures of
ideas, ECIS.
51. Tsukamoto K and A Sakamoto (2001)The productivity of electronic brainstorming: a comparison of three
systems with a control, Graduate School of Humanities and Sciences, Ochanomizu University, The
Japanese journal of psychology pp: 19-28.
52. Thomas Herrmann and Alexander Nolte (2010) The Integration of Collaborative Process Modeling and
Electronic Brainstorming in Co-located Meetings, International workshop on groupware CRIWG 10 LNCS
6257, Springer Berlin Heidelberg, PP: 145-160.
53. Vincent R. Brown and Paul B. Paulus (2002) Making Group Brainstorming More Effective:
Recommendations from an Associative Memory Perspective, Current Directions in Psychological Science
vol. 11 no. 6. pp: 208-212.
54. Wolfgang Stroebe and Michael Diehl (2011) Why Groups are less effective than their Members: On
Productivity Losses in Idea-generating Groups, pages 271-303.
International Journal of Computer Science and Information Security (IJCSIS), Vol. 14, No. 6, June 2016
768 https://sites.google.com/site/ijcsis/ ISSN 1947-5500

55. William H. Cooper, R. Brent Gallupe and Lana M. Bastianutti (1990) Electronic VS. Non-Electronic
Brainstorming, Academy of management proceedings.
56. Xiaofeng Wang, Daniel Graziotin, Juha Rikkilä and Pekka Abrahamsson (2013) Traverse the landscape
of the mind by walking: an exploration of a new brainstorming practice, DOI: 10.7287.
57. Yuan S.T and Y.C. Chen (2008) Semantic ideation learning for agent-based E-brainstorming, IEEE
Trans. Knowledge Data Eng. , vol. 20, no 2, PP: 261-275.
International Journal of Computer Science and Information Security (IJCSIS), Vol. 14, No. 6, June 2016
769 https://sites.google.com/site/ijcsis/ ISSN 1947-5500

A NEURAL NETWORK MODEL FOR PREDICTING INSULIN DOSAGE FOR DIABETIC
PATIENTS
Bilal M. Zahran
Department of Computer Engineering
Faculty of Engineering Technology
Al-Balqaa Applied University, Jordan
Abstract- Diabetes Mellitus is a chronic metabolic disorder. Normally, with a proper adjusting of blood
glucose levels (BGLs), diabetic patients could live a normal life without the risk of having serious
complications that normally developed in the long run. However, blood glucose levels of most diabetic
patients are not well controlled for many reasons. Although the traditional prevention techniques such as
eating healthy food and conducting physical exercise are important for the diabetic patients to control
their BGLs, however taking the proper amount of insulin dosage has the crucial rule in the treatment
process. In this paper we have proposed a model based on artificial neural network (ANN) to predict the
proper amount of insulin needed for the diabetic patient. The proposed model was trained and tested
using several patients' data containing many factors such as weight, fast blood sugar and gender. The
proposed model showed good results in predicting the appropriate amount of insulin dosage.
Keywords: Diabetes, Artificial Neural Network (ANN), Blood Glucose Levels (BGLs)
I. INTRODUCTION
Diabetes mellitus, commonly referred to as diabetes, is a group of metabolic diseases characterized by high
blood glucose concentrations resulting from defects in insulin secretion, insulin action or both. Diabetes has
been classified into two major categories, namely, type 1 and type 2. Type 1 diabetes, which accounts for only
5-10% of those with diabetes, is caused by the cell-mediated autoimmune destruction of the insulin producing β-
cells in the pancreas leading to absolute insulin deficiency. On the other hand, type 2 diabetes is a more
prevalent category (i.e. accounts for ~90-95% of those with diabetes) and is a combination of resistance to
insulin action and an inadequate compensatory insulin secretion [1].
In addition to the general guidelines that the patient follows during his daily life, several diabetes management
systems have been proposed to further assist the patient in the self-management of the disease. One of the
essential components of a diabetes management system concerns the predictive modeling of the glucose
metabolism. It is evident that the prediction of glucose concentrations could facilitate the appropriate patient
reaction in crucial situations such as hypoglycemia. Thus, several recent studies have considered advanced data-
driven techniques for developing accurate predictive models of glucose metabolism [2].
The fact that the relationship between input variables (i.e. medication, diet, physical activity, stress etc.) and
glucose levels is nonlinear, dynamic, interactive and patient-specific, necessitates the application of non-linear
regression models such as artificial neural networks, support vector regression and Gaussian processes[3].
International Journal of Computer Science and Information Security (IJCSIS), Vol. 14, No. 6, June 2016
770 https://sites.google.com/site/ijcsis/ ISSN 1947-5500

ANNs are non-linear mapping structures that are inspired by the function of the human brain and are considered
powerful modeling tools especially for data with unknown underlying relationships. ANNs consist of
computational elements called neurons, operating in parallel and connected by links with variable weights which
are typically adapted during the learning process (Fig.1). In our model, ANNs are trained using a
backpropagation(BP)algorithm that provides a way to calculate the gradient of the error function efficiently
using the chain rule of differentiation, moreover, the weights are tuned along the negative gradient of the
performance function [4, 5, 6].
The rest of this paper is organized as follows: Section 2 presents some of the related works, Section 3 presents
the data and the proposed ANN model, Section 4 discusses the results, and finally, Section 5 concludes the
paper.
II. LITERATURE REVIEW
In this section, a brief review of recent ANN approaches to BGL prediction studies is presented. In [7] the
researchers have experimented and suggested an Artificial Neural Network (ANN) based classification model
for classifying diabetic patients into two classes. For achieving better results, genetic algorithm (GA) was used
for feature selection. The GA was used for optimally finding out the number of neurons in the single hidden
layered model. Further, the model was trained with Backpropagation (BP) algorithm and GA and classification
accuracies are compared. The designed models are also compared with the Functional Link ANN (FLANN) and
several classification systems like NN (nearest neighbor), kNN(k-nearest neighbor), BSS( nearest neighbor with
backward sequential selection of feature, MFS1(multiple feature subset) , MFS2( multiple feature subset) for
Data classification accuracies. In [8], the paper investigated the use of a recurrent artificial neural network for
predicting blood glucose levels (BGLs), and presents preliminary results for two insulin dependent diabetic
females. In this study two patients regularly monitored and recorded, in a diary, their BGLs, insulin regime, diet
and exercise activity for a ten day period.
In [9] the research aimed at predicting the chances of diabetes in a person that whether or not is he/she prone to
it. The researchers have used certain parameters namely: number of pregnancies, glucose, BP, skin fold, insulin,
body mass index, pedigree and age. The database of 768 patients with these parameters each was taken from
National Institute of Diabetes and Digestive and Kidney Diseases. Using neural network feed forward prediction
model in conjunction with back propagation algorithm, and given training data set, they predicted whether a
subject was likely to have diabetes.
In this pilot study [10], Elman recurrent artificial neural networks (ANNs) were used to make BGL predictions
based on a history of BGLs, meal intake, and insulin injections. Twenty-eight datasets (from a single case
scenario) were compiled from the freeware mathematical diabetes simulator, AIDA. It was found that the most
accurate predictions were made during the nocturnal period of the 24 hour daily cycle.
International Journal of Computer Science and Information Security (IJCSIS), Vol. 14, No. 6, June 2016
771 https://sites.google.com/site/ijcsis/ ISSN 1947-5500

Figure.1. Artificial Neural network (ANN) layers
III. DATA AND THE PROPOSED MODEL
A. Data
We collected our data for 180 patients (Table 1). These data include: length for patient (cm), weight for patient
(kg), fast blood sugar reading for patient (mmol/l), gender of patient (female/male) and the insulin dosage for
that patient. The data was divided into two parts: the first part includes 120 reading and was used for training the
NN; the other part includes 60 reading and was used for testing the proposed model.
TABLE1
SAMPLE OF PATIENTS DATA
Gender
(f/m)
Blood sugar
(mmol/l)
Weight (kg) Length (cm)
0 8.3 60 165
1 11.1 60 165
0 13.8 60 165
1 16.6 60 165
0 19.4 60 165
1 8.3 80 165
0 11.1 80 165
1 13.8 80 165
0 16.6 80 165
1 19.4 80 165
0 8.3 100 175
1 11.1 100 175
0 13.8 100 175
1 16.6 100 175
0 19.4 100 175
1 8.3 120 175
0 11.1 120 175
1 13.8 120 175
0 16.6 120 175
1 19.4 120 175
0 8.3 80 185
1 11.1 80 185
International Journal of Computer Science and Information Security (IJCSIS), Vol. 14, No. 6, June 2016
772 https://sites.google.com/site/ijcsis/ ISSN 1947-5500

0 13.8 80 185
1 16.6 80 185
0 8.3 140 185
1 11.1 140 185
0 13.8 140 185
1 16.6 140 185
0 19.4 140 185
B. The proposed model
It is clear that the insulin dosage do not follow any specific pattern. As a result, simple prediction methods such
as linear regression are not applicable. So we built an ANN based model that is trained using backpropagation.
Fig. 2 illustrates the steps of training and testing the proposed ANN model:
Figure.2. The proposed model for prediction of insulin dosage.
The steps of the proposed algorithm are explained here:
Step 1: input data pre-processing:
The input data for our model are: length for patient (cm), weight for patient (kg), fast blood sugar reading for
patient (mmol/l) and gender of patient (female/male). The output is the suitable insulin dosage for the patient.
All input data are normalized in the range (0.0 to 1.0).
Step 2: ANNs model construction:
Two thirds of the data are selected to train the model and the other third is used to test it. The proposed
prediction algorithm is constructed, it consists of 3 layers: an input layer, a single hidden layer and an output
layer. The hidden and output layers use sigmoid activation function.
Step 3: ANNs model training and parameter tuning:
ANNs model testing
Prediction of insulin dosage
Input data pre-processing
ANNs model construction
ANNs model training and parameters tuning
International Journal of Computer Science and Information Security (IJCSIS), Vol. 14, No. 6, June 2016
773 https://sites.google.com/site/ijcsis/ ISSN 1947-5500

In the proposed 3-layer neural network, the number of nodes in the input layer is set to 4, the number of nodes in
the hidden layer is varied from 5 to 10 and the learning rate is varied from 0.1 to 0.9. The number of neurons of
the hidden layer is set to 7, the learning rate is set to 0.5, and the number of neurons in the output layer is set to
1, as a result, this proposed ANNs model achieves the best performance. The best ANNs model with the suitable
number of nodes is selected accordance to the minimum prediction error.
Step 4: ANNs model testing:
One third of the data are used to test the accuracy of the proposed prediction model.
Step 5: prediction of insulin dosage:
After training and tuning the proposed prediction algorithm, it can be used to predict new unknown insulin
dosage suitable for the patients. MATLAB R2011software was used for the implementation of the proposed
model.
Two performance measures related to the prediction errors (PE) were computed. PE is calculated using the
following error equation: PE = |Arv − Prv|Arv (1) Where PE is the prediction error, Arv is the actual insulin dosage value, Prv is the predicted insulin dosage
value, and || is the absolute value. Moreover, the prediction accuracy is defined as follows: PA = (1 − PE)x100%(2) Where PA is the prediction accuracy.
IV. RESULTS
In Fig.3 we see that our neural network reaches the target performance in 19 epochs. The curve shows how in
each epoch the mean square error get decrease until it reach the target.
Figure.3. Learning curve for NN
In Fig.4 we see that how the data is very close and around the fit line.
International Journal of Computer Science and Information Security (IJCSIS), Vol. 14, No. 6, June 2016
774 https://sites.google.com/site/ijcsis/ ISSN 1947-5500

.
Figure.4. comparison between the target and the output in NN
Table 2 shows the results of experiments of the proposed model in predicting the insulin dosage and the
performance of the model.
TABLE 2
ACTUAL, PREDICTED DATA AND PERFORMANCE
Actual data Predicted data PE PA
38 33 0.13 86.8
45 44 0.02 97.8
58 55 0.05 94.8
66 66 0.00 100.0
79 79 0.00 100.0
92 90 0.02 97.8
46 48 0.04 95.7
59 65 0.10 89.8
76 81 0.07 93.4
94 97 0.03 96.8
131 131 0.00 100.0
58 63 0.09 91.4
79 85 0.08 92.4
102 106 0.04 96.1
126 128 0.02 98.4
149 150 0.01 99.3
173 172 0.01 99.4
73 78 0.07 93.2
102 105 0.03 97.1
128 132 0.03 96.9
156 158 0.01 98.7
184 185 0.01 99.5
215 212 0.01 98.6
International Journal of Computer Science and Information Security (IJCSIS), Vol. 14, No. 6, June 2016
775 https://sites.google.com/site/ijcsis/ ISSN 1947-5500

91 94 0.03 96.7
125 126 0.01 99.2
155 157 0.01 98.7
188 189 0.01 99.5
223 221 0.01 99.1
254 253 0.00 99.6
33 31 0.06 93.9
41 41 0.00 100.0
49 52 0.06 93.9
62 63 0.02 98.4
73 74 0.01 98.6
85 85 0.00 100.0
43 45 0.05 95.3
64 61 0.05 95.3
78 76 0.03 97.4
88 92 0.05 95.5
104 107 0.03 97.1
121 123 0.02 98.3
52 59 0.13 86.5
72 80 0.11 88.9
98 100 0.02 98.0
116 120 0.03 96.6
139 141 0.01 98.6
162 162 0.00 100.0
67 74 0.10 89.6
95 99 0.04 95.8
117 124 0.06 94.0
146 149 0.02 97.9
173 175 0.01 98.8
202 200 0.01 99.0
81 88 0.09 91.4
111 118 0.06 93.7
143 148 0.03 96.5
175 178 0.02 98.3
209 208 0.00 99.5
243 239 0.02 98.4
The average prediction error was 4% (and thus the average accuracy is 96.5%). It is clear that the proposed
prediction algorithm can successfully predicting insulin dosage suitable for the patients.
V. CONCLUSION
This paper was aimed at modeling neural network for the prediction of amount of insulin dosage suitable for
diabetic patients. A model based on ANN trained with BP was used. The model uses four input information
about each patient its length, weight blood sugar, and gender. Many experiments were conducted on 180
patient's data. The ANN model converged fast and gave results with high performance.
International Journal of Computer Science and Information Security (IJCSIS), Vol. 14, No. 6, June 2016
776 https://sites.google.com/site/ijcsis/ ISSN 1947-5500

REFERENCES [1] American Diabetes Association. Diagnosis and Classification of Diabetes Mellitus. Diabetes Care, Vol. 31, No. 1, 2008, 55-60, 1935-
5548.
[2] I. Eleni Georga, C. Vasilios Protopappas and I. Dimitrios Fotiadi,. "Glucose Prediction in Type 1 and Type 2 Diabetic Patients Using
Data Driven Techniques," Knowledge-Oriented Applications in Data Mining, InTech pp 277-296, 2011.
[3] V. Tresp,, T. Briegel, and J. Moody, "Neural-network models for the blood glucose metabolism of a diabetic," IEEE Transactions on
Neural Networks, Vol. 10, No. 5, 1999, 1204-1213, 1045-9227.
[4] C. M. Bishop, . Pattern Recognition and Machine Learning, Springer, 2006, New York
[5] S. Haykin, Neural networks and learning machines. Pearson 2008.
[6] W.D. Patterson, Artificial Neural Networks- Theory and Applications, Prentice Hall , Singapore. 1996.
[7] M. Pradhan and R. Sahu, "Predict the onset of diabetes disease using Artificial Neural Network (ANN)," International Journal of
Computer Science & Emerging Technologies, 303 Volume 2, Issue 2, April 2011.
[8] W, Sandham, D,Nikoletou, D.Hamilton, K, Paterson, A. Japp and C. MacGregor, "BLOOD Glucose Prediction for Diabetes THERAPY
USING A RECURRENT Artificial Neural Networks ", EUSIPCO, Rhodes, 1998, PP. 673-676
[9] M, Divya, R. Chhabra, S. Kaur and S. , "Diabetes Detection Using Artificial Neural Networks & Back-Propagation Algorithm",
International Journal of Scientific & Technology Research". V 2, ISSUE 1, JANUARY 2013.
[10] G, Robertson, E. Lehmann, W. Sandham, and D. Hamilton Blood, "Glucose Prediction Using Artificial Neural Networks Trained with
the AIDA Diabetes Simulator: A Proof-of-Concept Pilot Study". Journal of Electrical and Computer Engineering , V 2011 (2011), Article
ID 681786, 11 pages.
Originality:
I claim that this paper has been neither published nor submitted for publication elsewhere, in whole or
in part, either in a serial, professional journal or as a part in a book which is formally published and
made available to the public.
Dr. Bilal Zahran
International Journal of Computer Science and Information Security (IJCSIS), Vol. 14, No. 6, June 2016
777 https://sites.google.com/site/ijcsis/ ISSN 1947-5500

An Optimum Dynamic Time Slicing Scheduling Algorithm Using
Round Robin Approach
Mohammad Salman Hafeez, Farhan Rasheed
Department of Software Engineering
Foundation University Islamabad, Pakistan
,
Abstract:
Process Management is one of the primary tasks achieved by the Operating Systems. The system’s
performance sententiously depends upon CPU scheduling algorithms. Round Robin, contemplated as the
most extensively endorsed CPU scheduling algorithm, is an optimal solution for the timeshared systems.
In timeshared systems, selection of the time quantum plays a pivotal role in performance of CPU. In
Round Robin, the static nature of the time quantum emerges some problems directly related to the
quantum size which decreases the performance of CPU. In this paper, selection of time quantum is
reviewed and a new algorithm for CPU scheduling, Optimum Dynamic Time Slicing Using Round
Robin (ODTSRR) is proposed for timeshared systems. The proposed algorithm is based upon dynamic
time quantum. Round Robin algorithm is redressed in this paper, ODTSRR also contains the advantages
of RR (Round Robin) CPU scheduling algorithm have less chances of starvation. Performance of
proposed algorithm is compared with RR and other shades of RR and the results revealed that the
proposed algorithm is better in response time & waiting time, context switch rates, turnaround time and
throughput hence resulting in optimized CPU performance.
Keywords: Operating System, Scheduling, Round Robin CPU scheduling algorithm, Time Quantum,
Context switching, Response time,, Turnaround time, Waiting time, fairness.
1. Introduction
Operating systems today, are moving towards multitasking environments. In uni-processor system, only
one process can be executed at a time, any other process/processes must wait until the CPU becomes
free. The primary objective of multiprogramming is to maximize CPU utilization by having some
processes running all the time. For multiprogramming systems, scheduling becomes an elemental
activity of the operating system. Imprudent use of the CPU can dwindle the efficiency of system in
multiprogramming environments. More than one processes are being kept in memory to achieve
maximum CPU utilization. CPU scheduling controls which processes will execute when there are
multiple executable processes. CPU scheduling is imperative because it can have immense impact on
CPU utilization and inclusive performance of the system. Scheduling requires conscientious
consideration to ensure fairness and avert process starvation in the CPU. This allocation involves a
scheduler and dispatcher.
Operating System may feature up to 3 different kind of schedulers:
I. Long-Term Scheduler
The long-term scheduler also known as admission scheduler choose which processes are to be admitted
to the ready queue. This scheduler determines what process are to run on a system and controls the
degree of multiprogramming. [1]
II. Mid-Term Scheduler
The mid-term scheduler is responsible for temporarily removing process/ processes from Main Memory
and put them on Secondary Memory or Vice Versa. Commonly referred to as “swapping of processes in”
or “swapping out”. [1]
International Journal of Computer Science and Information Security (IJCSIS), Vol. 14, No. 6, June 2016
778 https://sites.google.com/site/ijcsis/ ISSN 1947-5500

III. Short-Term Scheduler
The short-term scheduler commonly referred to as CPU scheduler decides which of the processes in the ready
queue are to be executed by CPU. The short-term scheduler make scheduling decisions more frequently than mid-
term and long-term scheduler. The CPU scheduler can be preemptive or non-preemptive. [1]
The dispatcher is a piece of code (software) that gives control of the CPU to the process which is selected by the
short-term scheduler.
1.2 Scheduling Criteria
Before going into the details of scheduling algorithm, it is necessary to be familiar with different
scheduling terminologies defined below: [2]
i. Ready Queue: The processes which resides in Main Memory and waiting for the CPU time are put
in a queue called ready queue.
ii. Blocked Queue: The processes which are suspended due to I/O wait or for some other reason by the
CPU are placed in a queue called blocked queue.
iii. Burst Time: The time for which a process needs CPU for its complete execution is called its burst
time. We usually estimate the burst time of a process.
iv. CPU Utilization: It is defined as the amount of time CPU is in use. Maximizing CPU utilization is
usually the aim of any scheduling algorithm.
v. Context Switch: Context switch is a process of keeping and restoring context of a pre-empted
process, so the execution can be carried on from the same position at later time. Context switching is
wastage of time and memory which results in increase in overhead of the scheduler.
vi. Throughput: It is defined as the total no. of processes completed in a given period of time. Context
switches and throughput are inversely proportional to each other.
vii. Turnaround Time: It is defined as the total time which is used to complete the process, from
entering in to the ready queue till its complete execution.
viii. Waiting Time: It is defined as the total amount of time a process waits in ready queue.
ix. Response Time: It is defined as the time consumed by the system to give first response to a
particular process.
x. Fairness: Avoid the process from starvation. All the processes must be given equal opportunity to
execute.
xi. Overhead: It is the amount of time when CPU remain idle.
xii. Starvation: It means the long process block the way of short process vice versa and the higher
priority process out run the lower priority processes.
xiii. Priority: Give preferential treatment to processes with higher priorities.
Characteristics of good scheduling algorithms are: [3] [4]
a. Minimum no. of Context switches.
b. Minimum waiting time.
International Journal of Computer Science and Information Security (IJCSIS), Vol. 14, No. 6, June 2016
779 https://sites.google.com/site/ijcsis/ ISSN 1947-5500

c. Minimum turnaround time.
d. Maximum CPU utilization.
e. Maximum throughput
f. Fairness
g. Minimize overhead
h. Avoid indefinite blocking or starvation
i. Enforcement of priorities
A number of scheduling algorithms have been developed to address one, many or all parameters given above.The
Scheduling algorithms can be divided into two groups w.r.t how they deal with clock interrupts. Preemptive
scheduling states to a new process even when the current process does not want to give up the CPU. In this
category short jobs are made to wait by longer jobs but the overall conduct of all processes is fair, the response
times are more foreseeable because incoming process with high priorities cannot displace already waiting
processes. A scheduler executes processes, when a process switches from running state to the waiting state and
when a process terminates.Non-preemptive scheduling only schedule a new process when the current running
process want CPU no more. This approach of allowing processes that are logically runnable to be momentarily
suspended is called Preemptive Scheduling and it is opposite to the run till completiontechnique.
Some CPU scheduling algorithms enforces the priorities. Instead of guaranteeing optimal solution, these
techniques intention is to find reasonable solutions in a comparatively short time. Although they are suboptimal
algorithms, yet the most frequently used for solving scheduling problem in real world because of the easiness of
implementation and their lower time complexity.
There are such scheduling algorithm which schedule processes on the basis of length. Scheduling of processes
with respect to burst time. Some algorithms are developed to achieve the fairness, some only focus on
performance. The aim of every scheduling algorithm is to achieve the above mentioned characteristics as many as
possible in order to boost up the performance of scheduling process.
Round Robin, the simplest, fairest and most widely used scheduling technique used in timeshared systems. The
original version of the Round Robin algorithm has a static time quantum which remain unchanged for all the
processes. Which was the biggest issue in performance of the algorithm. Later many modification has been made
to the RR, researcher mainly focus on the setting the time quantum dynamically in order to eradicate the problems
raised by the static nature of the Time Quantum. There are various methods to define the time quantum
dynamically. Using the mean, median, statistical formulas, heuristics, use of artificial intelligence, genetic
algorithms.
In this paper, we have proposed a new version of RR algorithm with dynamic time quantum, to solve the
problems arose due to the static time quantum. In the algorithm time quantum is set according to median
value, and all the process in the ready queue will get the time slice set by the median value plus the
innovation in this algorithm is we have introduced continuity of execution of processes if its remaining
burst time is lesser than the time quantum.
In Section 2 the literature review related to scheduling algorithms is discussed. A new algorithm is
proposed in Section 3pseudo code and our proposed ODSTRR algorithm is presented. Section 4 shows
the experimentation results and comparisons with other algorithms.
2. Literature Review
Scheduling is the core of any computer system since it involves decision of allocating resources between
possible processes. Optimal resource sharing depends on the resourceful scheduling of contesting users
and system processes for the processor, which renders process scheduling an important characteristicof a
multiprogramming environments. As the processor is the most imperative resource,scheduling of
processes, which is also called CPU scheduling, becomes the most important aspect.Many objectives
must be kept in mind while designing a scheduling algorithm. In particular, a scheduler must consider an
improvement in efficiency, fairness, throughput,response time, turnaround time, resource utilization etc.
some of these goals depends on the system and the environment in which they are operating. [1]
International Journal of Computer Science and Information Security (IJCSIS), Vol. 14, No. 6, June 2016
780 https://sites.google.com/site/ijcsis/ ISSN 1947-5500

2.1 FCFS
First Come First Serve (FCFS) or also known as First in First out (FIFO) is the simplest and the most
fundamental technique used in CPU scheduling. In CPU scheduling, FCFS policy manages the jobs
based on their arrival time, which means that the first job will be processed first without other biases or
preferences.Meanwhile context switches only occur upon process termination, and no restructuring of
the process queue is required, scheduling overhead is minimal.Throughput can be low, since long
processes can hold the CPU. Waiting time, response time and turnaround time can be high. No priorities
can be assigned, thus this system has problem completing task on time [1]
2.2 Shortest Job First
The notion behind the Shortest Job First algorithm is to select the small process that needs to be done,
get it out of the way first, and then pick the next smallest fastest job to do next.Precisely this algorithm
picks a process based on the next shortest CPU burst, not the overall process time.Shortest Job First can
be sustained as one of fastest scheduling algorithm, but it agonizesfrom one important problem a not
knowing the next CPU burst time all the time. Can’t implement “real” Shortest Job First there is no way
to know we can know theexact length of the CPU burst, we can estimate length, but that’s challenging.
Shortest Job First gives best average waiting time of any algorithm, preemptive or non-preemptive as if
you have selected the “smallest” job, remaining jobs will have to wait lesser amount of time.
Problem with Shortest Job First is it is biased against long processes, they’ll have to wait much longer
than short processes, especially challenging if new, shorter processes continue to arrive while long
processes sits in queue.Shortest Job First can be either preemptive or non-preemptive. Preemption occurs
when a new process arrives in the ready queue that has a predicted burst time shorter than the time
remaining in the process whose burst is currently on the CPU. Preemptive Shortest Job First is
sometimes referred to as shortest remaining time first scheduling. [1]
2.3 Earliest Deadline First
Earliest Deadline First is a scheduling technique that schedule all the incoming jobs according to the
stated due date. Incoming processes will be put in the queue based on the sequence of events that
indicated by the due date. The process with the earliest due date will be placed first in the processing
queue. [15]
2.4 Longest Job First
Longest Job First having the opposite behavior of Shortest Job First.According to Abraham [14] will
minimize the make span time, shortest job is believed that it will reduce the response time. However,
Longest Job First will be suffering due to slightly increase in the response time. [15]
2.5 Earliest Release Date
Earliest Release Date put the utmost priority to the process that has the earliest release date in the ready
queue. Release date is the starting time of every process and it can be same or different. If there are two
or more processes that have the matching release date, First Come First Serve rule will be applied.
Studies have also shown that if there is only a few numbers of processes in the queue, the Earliest
Release Dateperformance will be similar to First Come First Serve but when the number of processes
increases, the results will be different. [15]
2.6Shortest Remaining Time
International Journal of Computer Science and Information Security (IJCSIS), Vol. 14, No. 6, June 2016
781 https://sites.google.com/site/ijcsis/ ISSN 1947-5500

Shortest Remaining Time (SRT) is a preemptive version of Shortest Job First (SJF). Preemption based
on arrival of novel processes, not on quantum cessation. Preempt, current process when new process
attains. Use remaining burst time, for comparison. If new process has lower burst time, it is dispatched.
If new process has large runtime, the current process will be dispatched again. Guaranteed to have lowest
burst time of all processes in the system. Responds better to arrival of jobs than Shortest Job First. Still
suffers from postponement of long jobs. [13]
2.7 Priority Based Scheduling
Each process is assigned a priority. Process with highest priority is to be executed first and so
on.Processes with same priority are executed on first come first serve basis.Priority can be decided based
on memory requirements, time requirements or any other resource requirement.Priority scheduling is a
more general case of SJF, in which each job is assigned a priority and the job with the highest priority
gets scheduled first. SJF uses the inverse of the next expected burst time as its priority - The smaller the
expected burst, the higher the priority. Priorities can be internal derived from process behavior or
external input from user (i.e., from outside the scheduler). Priorities can be Static, assigned once when
process enters the system never changed, and dynamic in which it is recalculated periodically; can vary
with process behavior. Problem with priority based scheduling low priority processes may never execute.
Solution to this problem is to add aging factor to the processes as time progresses, increase the priority.
[16]
2.8 Round Robin Scheduling
Round Robin is the simplest, fairest and most widely used scheduling technique in timeshared systems.
Use a fixed time slice for scheduling also known as time quantum. It choose process from head of ready
queue and run that process for at most 1 time slice, and if it is not completed, add it to the end of the
ready queue. If that process terminates or blocks before its time slice is completed, choose another
process from the head of the ready queue, and run that process for at most 1 timeslice.It achieves the
fairness of resource allocation and also result in minimized response time as compared to the Shortest
Job First and First Come First Serve algorithms. But, due to the static time quantum concept it increases
theturnaround time and waiting timeresulting in dilapidation of system performance.Preemptive at end of
time slice. Response time is good for short processes, while long processes may have to wait: number of
other processes * length of the time slice. Throughput is dependent of the size of the time slice. If too
small there will be many context switches. Fairness factor which penalizes I/O-bound processes (may
not use full time slice). Starvation is not possible in round robin scheduling as every process is getting
the equal share of time, and the CPU Overhead is low. [16]
Assorted variations to Round Robin CPU scheduling algorithm have been proposed by a number of
authors.
Manish kumar Mishra et al. [5] proposed Improvement in simple round robin technique through an
algorithm named An Improved Round Robin CPU SchedulingAlgorithm with Varying Time Quantum.
IRR selects the 1st process from the ready queue and allocates CPU for the time interval up to 1 unit of
time quantum. After completion of the time quantum, it checks the remaining CPU burst time of the
process currently in execution, if the remaining CPU burst time of the currently running process is less
than the time quantum, the CPU is again allocated to the currently running process for its remaining
required CPU burst time.
Aashna Bisht et al. [6] proposed Enhanced Round Robin algorithm (ERR). ERR allocates CPU to a
process for designated time quantum after the completion of which, it checks the remaining CPU burst
time of the process currently in execution, if the remaining CPU burst time of the currently running
process is less than (average burst time/time quantum) value, then CPU is again allocated to the currently
running process for remaining CPU burst time.
International Journal of Computer Science and Information Security (IJCSIS), Vol. 14, No. 6, June 2016
782 https://sites.google.com/site/ijcsis/ ISSN 1947-5500

Rami J. Matarneh et al. [7] proposed an algorithm named “Self- Adjustment Time Quantum in Round
Robin Algorithms Depending on Burst Time of the Now Running Processes algorithm the time quantum
is repetitively adjusted according to the burst time of the currently running processes using Median.
Lalit Kishor & Dinesh Goyal [8] proposed median based round robin algorithm. This algorithm is a blend of two
techniques, the processes are arranged in ascending order first, and then the time quantum is set according to the
value of median.
H.S. Behera & Brajendra Kumar Swain [10] proposed an algorithm named “A New proposed precedence
based Round Robin with dynamic time quantum scheduling algorithm for soft real time systems”in
which precedence value is allocated to all the processes according to their priority and burst time. RR
algorithm is then applied on the processes on the basis of their precedence. This Proposed algorithm is
developed by taking dynamic mean time quantum in to account. Time quantum is computed dynamically
by taking the mean of priority values and burst times.
Ali Jbaeer Dawood et al. [11] proposed an algorithm” Improved Efficiency of Round Robin Scheduling
Using Ascending Quantum and Minumium-Maxumum Burst Time” in which processes were arranged in
ascending order with shortest remaining burst time and calculated the time quantum by multiplying the
average summation of minimum and maximum burst time by (80) percentage. The (80) percentage is
chosen depending to two reasons: First, if the TQ calculated depending only on the summation the
algorithm is become as the Short Job First (SJF). Second, the rule of thumb is that 80 percent of the CPU
bursts should be shorter than the time quantum.
In this paper we proposed an algorithm which might be considered as modified form of existing dynamic
round robin scheduling algorithm. The time quantum is the proposed algorithm is determined
dynamically median and the continuity of the execution of a process with the remaining burst time lesser
than the time quantum set by the median value. Hence overcoming the problems raised by the static
nature of time quantum are removed. We noticed by the experimentation results that number of context
switches and the turnaround time get positive results. The fairness factor, achievingmaximum CPU
utilization, throughput increased, reducing CPU overhead, average waiting time, average turnaround
time are also improved.
3. Optimum Dynamic Time Slicing Using Round Robin Scheduling Algorithm
The proposed scheduling algorithm is a modification in round robin algorithm. The time quantum is
calculated dynamically using the median. The process ready for the execution are placed in a ready
queue. At first processes are arranged in ascending order with the shortest remaining CPU burst time.
After sorting, it calculates the value of median (middle) and set the time quantum equals to the value of
median. If the process is in its execution state and consumed its time slice and its remaining CPU burst
time is lesser than the time quantum, the CPU will continue its execution till it finishes, Otherwise the
process will be placed at the end of the ready queue. After all the processes in the ready queue are at
least once attended by the CPU, it will again sort the process in ascending order with shortest remaining
burst time. If a process is suspended by CPU for I/O wait it will be placed in a blocked queue and will
stay there until its I/O wait is over. There is a FLAG variable which checks after each execution, whether
some process is arrived from the blocked queue to ready queue. If the FLAG value is TRUE, it will
again sort all the processes in ascending order with remaining CPU burst time. If the FLAG value is
FALSE, next process in the ready queue will get the CPU.
3.1 Algorithm
International Journal of Computer Science and Information Security (IJCSIS), Vol. 14, No. 6, June 2016
783 https://sites.google.com/site/ijcsis/ ISSN 1947-5500

In this algorithm the processes are arranged in ascending order according to their burst time’sexistent in the ready
queue. Instead of using static time we use dynamic time slicing.
For finding an optimal time quantum, median is used. Formula for finding the median is given in equation ….[12]
Courtesy: formulas.tutorvista.com
PSEUDO Code:
Begin
1. Initialize, Ready Queue.
2. While (Ready_queue!=NULL)
3. For, Sort Elements in Ascending Order
CalculateMedian_Value
If (Odd)
Select Middle;
If (Even)
Select Middle+1;
4. SetTQ=Median_Value;
5. Start Execution // Ready Queue
6. For, all Processes Entering CPU
IF(Remaining Burst Time< Time Quantum)
Time Slice = TQ + Remaining Burst Time // Continued Execution of the process
Else END of Iteration.
Place the process at the End of the Ready Queue.
7. Check FLAG
IF(True)
Repeat step 2 to 6
IF (False)
Repeat step 5 to 6
EndofIF
End ofFor
Endof WHILE
End
Step 1: Initialize the Ready Queue, the processes are placed in the ready queue by the Long term
scheduler.
International Journal of Computer Science and Information Security (IJCSIS), Vol. 14, No. 6, June 2016
784 https://sites.google.com/site/ijcsis/ ISSN 1947-5500

Step 2: In the 2nd step the algorithm defines a loop for a check whether the Ready Queue is empty or
not. If the Ready Queue is not empty perform the following tasks.
Step 3: Sort all the processes present in the ready queue in Ascending Order with respect to their
CPU burst time. Calculate Median value. If the number of processes are Odd, simply select the
middle value. In case the number of processes are Even select Middle+1 value.
Step 4. Set the Time Quantum equals to Median Value.
Step 5. Start the execution of the processes in the Ready Queue, the first process in the queue will
get the CPU.
Step 6.For all processes entering the CPU will get the time slice defined by the Median value, after
getting the time slice, if the remaining CPU burst time is lesser than the Median value CPU will
continue its execution till its completion.
Else the process will free the CPU and will be placed at the end of the queue, and the next process
inline will get the CPU.
Step 7.At the End of each iteration the algorithm will check the FLAG value, If True means some
process has come from the blocked queue to the ready queue, in this case it will arrange the
processes in ascending order with respect to their burst time. And again new median value will be
calculated. And the time quantum will be set according to new median value.
In case the FLAG value is false, it will continue its execution till all the processes are completed.
3.2 Illustration
To demonstrate the above algorithm let’s consider 7 processes with their CPU burst time, and arrival
time.P1, P2, P3, P4, P5, P6, P7.
Input Table
Process ID Arrival Time CPU burst time
P1 0 20
P2 0 12
P3 0 15 P4 0 60 P5 0 42
P6 0 9
P7 0 19
A ready queue with seven processes P1, P2, P3, P4, P5, P6 and P7 has been considered for illustration
purpose. The processes are arriving at time 0 with burst time 20, 12, 15, 60, 42, 9, and 19 respectively.
The processes P1, P2, P3, P4, P5, P6 and P7 are arranged in the ascending order of their burst time in the
ready queue which gives the sequence P6, P2, P3, P7, P1, P5 and P4. The time quantum value is set
equal Median Value of the processes in the ready queue i.e. 19 CPU is allocated to the processes P6, P2,
P3, P7, P1, P5 and P4 from the ready queue for a time quantum of 19 milliseconds (ms). After first
cycle, the remaining burst time for the processes P6, P2, P3, and P7 will be exactly equal to zero. It
means 4 P6, P2, P3, and P7 processes will be completed without any context switch, completing in 9, 12,
15, 19 ms respectively. Now its P1 turn, P1 CPU burst time is 20 and the allotted time slice is 19 which
means it need 1 ms to complete its execution and it is lesser than the time quantum i.e. 19 CPU will
continue its execution till it finishes, it will take 1 ms more and its execution will be completed. Next
process in the ready queue is P5 its CPU burst time is 60ms, 19 ms will be allotted to P5, the remaining
burst time for P5 will be 60-19 = 41, which is greater than the time quantum i.e. 19, CPU will stop its
execution after the 19 ms and place it at the end of the ready queue. Next process in the ready queue is
P4, its CPU burst time is 41 ms, 19 ms will be allotted to P4, and the remaining burst time will be 42-19
= 23, which is not less than equal to 19, the process P4 will be placed at the end of the queue.
One cycle it completed. Now the processes in the ready queue will be sorted in ascending order with
respect to their remaining CPU burst time. There are only two process left in the ready queue, P5, P4
International Journal of Computer Science and Information Security (IJCSIS), Vol. 14, No. 6, June 2016
785 https://sites.google.com/site/ijcsis/ ISSN 1947-5500

with their remaining burst time 23, 41 respectively. After sorting the order will be P5 and P4 same in this
case as P5 remaining burst time is lesser than that of P4. Time quantum will be set to 41 after taking the
median. Now the process at the front of ready queue is P5 with its remaining CPU burst time 23 ms,
time quantum 41 ms will be allotted to the process P5 and it will complete its execution and leave CPU
after 23 ms. Now there is only one process remaining in the ready queue P4 with its remaining burst time
41 ms, time quantum 41 ms will be allotted to P4 and it will complete its execution.
Gantt chart:
P6 (9) P2(12) P3(15) P7(19) P1(20) P5 (19) P4 (19) P5(23) P4(41)
0 9 21 36 55 75 94 113 136 177
Average Response time:28 ms
Average waiting time: 46.57 ms
Average turnaround time: 72.71 ms
No of Context switches:3
Fairness: Yes
Starvation: No
4. Experimental Analysis
4.1 Assumptions:
All the processes are assumed to be independent. Time slice is assumed to be not more than the
maximum burst time. All the attributes like burst time, number of processes and the time slice of all the
processes are known before submitting the processes to the processor. All processes are CPU bound. No
processes are I/O bound.
4.2 Experimental Framework
Our experiment consists of a number of input and output parameters. The input parameters consist
ofBurst Time<BT>, arrival time<AT>,Time Quantum<TQ> andtotal number of processes (Pn). The
output parameters consist of average response time, average waiting time, average turnaround time and
number of context switches, fairness factor, throughput and CPU overhead.
4.3 Results Obtained
Our proposed algorithm can work effectively with large number of data. We have compared our
proposed algorithm with the state of the art algorithms and the latest variations in RR on the basis of
average response time, average waiting time, average turnaround time and number of context switches,
fairness factor, throughput and CPU overhead. In order to prove the supremacy of our proposed
algorithm the idea is to compare the result of each algorithm with the data set they used in their
experimentation, the data set used for comparison with each algorithm is different.
4.4 Comparative Analysis
The comparison between the state of the art algorithms and the new shades of the Round Robin
algorithms are shown below.
1. First Come First Serve VS. ODTSRR
International Journal of Computer Science and Information Security (IJCSIS), Vol. 14, No. 6, June 2016
786 https://sites.google.com/site/ijcsis/ ISSN 1947-5500

Let 5 Processes P1, P2, P3, P4 and P5 with the burst time of 24, 3, 4, 6, and 17respectively.
Input Table
Process ID Arrival Time CPU burst time
P1 0 24
P2 0 3
P3 0 4
P4 0 6
P5 0 17
Gantt chart: FCFS
P1(24) P2 (3) P3 (4) P4 (6) P5 (17)
0 24 27 31 37 54
ODTSRR:
P2 (3) P3 (4) P4 (6) P5 (6) P1 (6) P5 (11) P1 (18)
Comparison Table
Name Average
Turnaround
Time
Average
Response
Time
Context
Switches
Average
Waiting
Time
Fairness Throughput
(50 ms)
CPU
Overhead
Starvation
FCFS 34.6 ms 23.8 ms Nil 23.8 ms No 4 Yes Important
Processes
get stuck
behind un
important
ODTSRR 22.6 ms 8.4 ms 2 10.6 ms Yes 4 No No chance
of
starvation
The data set was imported for the paper “Operating System Concepts, 8th Ed” [1] it shows that the
parameter we use determine the performance of our algorithms in this case our algorithm’s
performance is far better than FCFS the average waiting time, average turnaround time, no of
context switching and average response time is less. Throughput is same but there is a chance of
starvation in FCFS. Hence proved that our algorithm is far much better than FCFS scheduling
algorithm.
International Journal of Computer Science and Information Security (IJCSIS), Vol. 14, No. 6, June 2016
787 https://sites.google.com/site/ijcsis/ ISSN 1947-5500

2. Shortest Job First (non-preemptive) VS. ODTSRR
Let 5 Processes P1, P2, P3, P4 and P5 with the burst time of 7, 4, 1, 11, and 17 respectively.
Input Table
Process ID Arrival Time CPU burst time
P1 0 7
P2 0 4
P3 0 1
P4 0 11
P5 0 17
Gantt chart: SJF (non-preemptive)
P3 (1) P(4) P1(7) P4(11) P5(17)
0 1 5 12 23 40
ODTSRR:
P3 (1) P(4) P1(7) P4(11) P5(7) P5 (10)
0 1 5 12 23 30 40
Comparison Table
Name Average
Turnaround
Time
Average
Response
Time
Context
Switches
Average
Waiting
Time
Fairness Throughput
(30 ms)
CPU
Overhead
Starvation
SJF 16.2 ms 8.2 ms 0 8.2 ms No 4 Yes Longer
Jobs will
starve
ODTSRR 16.2 ms 8.2 ms 0 8.2 ms yes 4 No No chance
of
starvation
The data set was imported for the paper “Operating System Concepts, 8th Ed” [1] it shows that the
parameter we use determine the performance of our algorithms in this case our algorithm’s
performance is looks little better due to the fairness factor than SJF the average waiting time,
average turnaround time, no of context switching and average response time is almost same. The
CPU overhead is imminent. Throughput is same but in case of SJF starvation is possible as small
process may hold the long processes which are important. Overall the performance of our algorithm
is better as it targeted the maximum factor for optimization of scheduling process. It is observed
that the situation might be different with generalized data set.
International Journal of Computer Science and Information Security (IJCSIS), Vol. 14, No. 6, June 2016
788 https://sites.google.com/site/ijcsis/ ISSN 1947-5500

3. Shortest Job First (Preemptive) VS ODTSRR
Let 5 Processes P1, P2, P3, P4 and P5 with the burst time of 25, 6, 4, 11, and 18 respectively.
Input Table
Process ID Arrival Time CPU burst time
P1 0 25
P2 0 6
P3 0 4
P4 0 8
P5 0 18
Gantt chart:
SJF (preemptive)
P3 (4) P2 (6) P4 (4) P5 (10) P1 (10) P4 (5) P1(15) P5(8)
0 4 10 13 23 33 38 53 61
ODTSRR
P3 (4) P2 (6) P4 (8) P5 (8) P1 (8) P5 (10) P1 (17)
0 4 10 18 26 34 44 61
Comparison Table
Name Average
Turnaround
Time
Average
Response
Time
Context
Switches
Average
Waiting
Time
Fairness Throughput
(30 ms)
CPU
Overhead
Starvation
SJF
(preemptive)
33.2 ms 10 ms 3 21 ms No 2 Yes For longer
processes
ODTSRR 27.4 ms 11.6 ms 2 13.2 ms Yes 3 No No chance
of
starvation
The data set was imported for the paper “Operating System Concepts, 8th Ed” [1] it shows that the
parameter we use determine the performance of our algorithms in this case our algorithm’s
performance is far better than SJF (preemptive)algorithm the average waiting time, average
turnaround time, no of context switching and average response time is less. Throughput is higher
and there is no chance of starvation. Hence proved that our algorithm is far much better than SJF
scheduling algorithm.
International Journal of Computer Science and Information Security (IJCSIS), Vol. 14, No. 6, June 2016
789 https://sites.google.com/site/ijcsis/ ISSN 1947-5500

4. Round Robin VS. ODTSRR
Let 5 Processes P1, P2, P3, P4 and P5 with the burst time of 53, 17, 68, 24, and 10 respectively.
Input Table
Process ID Arrival Time CPU burst time
P1 0 53
P2 0 17
P3 0 68
P4 0 24
P5 0 10
Gantt chart:
Round Robin: Time Quantum = 20 ms
P1(20) P2(17) P3(20) P4(20) P5(10) P1(20) P3(20) P4(4) P1(13) P3(20) P3(8)
0 20 37 57 77 87 107 127 131 144 164 172
ODTSRR:
P5(10) P2(17) P4(24) P1(24) P3(24) P1(29) P3(44)
0 10 27 51 75 99 128 172
Comparison Table
Name Average
Turnaround
Time
Average
Response
Time
Context
Switches
Average
Waiting
Time
Fairness Throughput
(70 ms)
CPU
Overhead
Starvation
Round Robin
TQ=20ms
106.8 ms 38.5 ms 6 86.8 ms Yes 2 Yes Less
chances of
Starvation
ODTSRR 77.6 ms 32.6 ms 3 49 ms Yes 3 No No chances
of
Starvation
The data set was imported for the paper “Operating System Concepts, 8th Ed” [1] it shows that the
parameter we use determine the performance of our algorithms in this case our algorithm’s
performance is far better than RR the average waiting time, average turnaround time, no of context
switching and average response time is less. Throughput is higher and there is no chance of
starvation. Hence proved that our algorithm is far much better than RR scheduling algorithm.
International Journal of Computer Science and Information Security (IJCSIS), Vol. 14, No. 6, June 2016
790 https://sites.google.com/site/ijcsis/ ISSN 1947-5500

5. EDRR VS. ODTSRR
Consider five processes named A, B, C, D,and Ewith their CPU burst time.
Process Name CPU burst Time
A 20
B 25
C 35
D 50
E 80
F 90
G 120
Gantt chart:
EDRR:
Time Quantum = Median value (50)
Processes are selected on the difference between the time quanta. The least difference the early the
process will get its execution.
D (50) C (35) B (25) E (50) A(20) F (50) G (50) E (30) F(40) G(50) G(20)
0 50 85 110 160 180 230 280 330 370 420 440
ODTSRR:
A B C D E F G G
0 20 45 80 130 210 300 350 420
Comparison Table
Name Average
Turnaround
Time
Average
Response
Time
Context
Switches
Average
Waiting
Time
Fairness Throughput
(100 ms)
CPU
Overhead
Starvation
EDRR 223.57 ms 116.42 ms 6 160.71 ms Yes 2 No Less
Chances
ODTSRR 172.14 ms 112.14 ms 1 112.14 ms Yes 3 No No chances
of
Starvation
The data set was imported for the paper “An Enhanced Dynamic Round Robin Scheduling
Algorithm” it shows that the parameter we use determine the performance of our algorithms in this
case our algorithm’s performance are better than EDRR the average waiting time, average
turnaround time, no of context switching and average response time is less than EDRR. Hence
proved that our algorithm is much better than EDRR scheduling algorithm
International Journal of Computer Science and Information Security (IJCSIS), Vol. 14, No. 6, June 2016
791 https://sites.google.com/site/ijcsis/ ISSN 1947-5500

6. Improved Round Robin (IRR) VS. ODTSRR
Input Table
Gantt chart: IRR
TQ = 20 ms
P1(20)
P2(20) P3(20) P3(15) P4(20) P4(2) P5(11) P1(20) P2(20) P2(12) P1(20) P1(20)
0 20 40 60 75 95 97 108 128 148 160 180 200
ODTSRR:
P1 (11) P4(22) P3(35) P2(52) P5(35) P5(45)
0 11 33 68 120 155 200
Comparison Table
Name Average
Turnaround
Time
Average
Response
Time
Context
Switches
Average
Waiting
Time
Fairness Throughput
(100 ms)
CPU
Overhead
Starvation
IRR 128 ms 46.4 ms 6 92 ms Yes 2 No No
Starvation
ODTSRR 86.4 ms 46.4 ms 1 46.4 ms Yes 3 No No chance
of
Starvation
The data set was imported for the paper “An Improved Round Robin Scheduling Algorithm” it shows
that the parameter we use determine the performance of our algorithms in this case our algorithm’s
performance is far better than IRR the average waiting time, average turnaround time, no of context
switching, average response time is low, and throughput is better than IRR scheduling algorithm.
Hence proved that our algorithm is far much better than IRR scheduling algorithm.
PROCESS ARRIVAL
TIME
BURST
TIME P1 0 11
P2 0 52
P3 0 35
P4 0 22
P5 0 80
International Journal of Computer Science and Information Security (IJCSIS), Vol. 14, No. 6, June 2016
792 https://sites.google.com/site/ijcsis/ ISSN 1947-5500

7. Self-Adjusted Round Robin (SARR) VS. ODTSRR
Input Table
Gantt chart: SARR
Time Quantum= median value (35)
P1(11) P4(22) P3(35) P2(35) P5(35) P2(17) P5(35) P5(10)
0 11 33 68 103 138 155 190 200
ODTSRR:
P1 (11) P4(22) P3(35) P2(52) P5(35) P5(45)
0 11 33 68 120 155 200
Comparison Table
Name Average
Turnaround
Time
Average
Response
Time
Context
Switches
Average
Waiting
Time
Fairness Throughput
(100 ms)
CPU
Overhead
Starvation
SARR 93.4 ms 42.2 ms 4 50 ms Yes 3 No Less
chances of
Starvation
ODTSRR 86.4 ms 46.4 ms 1 46.4 ms Yes 3 No No chance
of
Starvation
The data set was imported for the paper “Self-Adjusted Round Robin Scheduling Algorithm” it
shows that the parameter we use determine the performance of our algorithms in this case our
algorithm’s performance is far better than SARR the average waiting time, average turnaround time,
no of context switches are less. Hence proved that our algorithm is far much better than SARR
scheduling algorithm.
PROCESS ARRIVAL
TIME
BURST
TIME P1 0 11
P2 0 52
P3 0 35
P4 0 22
P5 0 80
International Journal of Computer Science and Information Security (IJCSIS), Vol. 14, No. 6, June 2016
793 https://sites.google.com/site/ijcsis/ ISSN 1947-5500

8. Priority Base Round Robin (PBRR static) VS. ODTSRR
Input Table
Gantt chart: PBRR
Time Quantum = 15
Name Average
Turnaround
Time
Average
Response
Time
Context
Switches
Average
Waiting
Time
Fairness Throughput
(100 ms)
CPU
Overhead
Starvation
PBRR 315.25 ms 33.37 ms 34 257.62 ms Yes 1 No Yes less
important
might block
important
ones
ODTSRR 185.87 ms 128.25 ms 0 185.87 ms Yes 3 No chance
of
starvation
The data set was imported for the paper “Priority Based Round Robin Scheduling Algorithm” it
shows that the parameter we use determine the performance of our algorithms in this case our
algorithm’s performance is far better than PBRR the average waiting time, average turnaround time,
no of context switching are less. Hence proved that our algorithm is far much better than PBRR
scheduling algorithm.
Processes Arrival
Time
Burst
Time
User
priority
P1 0 7 8
P2 0 20 1
P3 0 36 6
P4 0 53 3
P5 0 69 2
P6 0 82 5
P7 0 94 4
P8 0 100 7
International Journal of Computer Science and Information Security (IJCSIS), Vol. 14, No. 6, June 2016
794 https://sites.google.com/site/ijcsis/ ISSN 1947-5500

9. Improved Efficiency of Round Robin Scheduling Using Ascending Quantum
and Minumium-Maxumum Burst Time VS. ODTSRR
Input Table
Process Arrival Time Burst Time
P1 0 13
P2 0 35
P3 0 40
P4 0 63
P5 0 97
Gantt chart: AQMMRR
Time Quantum = 88 ms
P1 P2 P3 P4 P5 P5
0 13 48 88 151 239248
ODTSRR:
Time Quantum = 40 ms
P1(13) P2(35) P3(40) P4 (63) P5 (40) P5 (57)
0 13 48 88 151 191 248
Name Average
Turnaround
Time
Average
Response
Time
Context
Switches
Average
Waiting
Time
Fairness Throughput
(100 ms)
CPU
Overhead
Starvation
AQMMRR 113.2 ms 60 ms 5 62.4 ms Yes 3 No Might be
possible
due to
larger time
quantum
ODTSRR 113.2 ms 60 ms 1 62.4 ms Yes 3 No No chance
of
starvation
The data set was imported for the paper “Improved Efficiency of Round Robin Scheduling
Using Ascending Quantum and Minumium-Maxumum Burst Time” it shows that the
parameter we use determine the performance of our algorithms in this case is the same
Because the data set suits both the algorithm, it shows that the performance of our algorithm
is not by any bit lesser than that of AQMRR.
International Journal of Computer Science and Information Security (IJCSIS), Vol. 14, No. 6, June 2016
795 https://sites.google.com/site/ijcsis/ ISSN 1947-5500
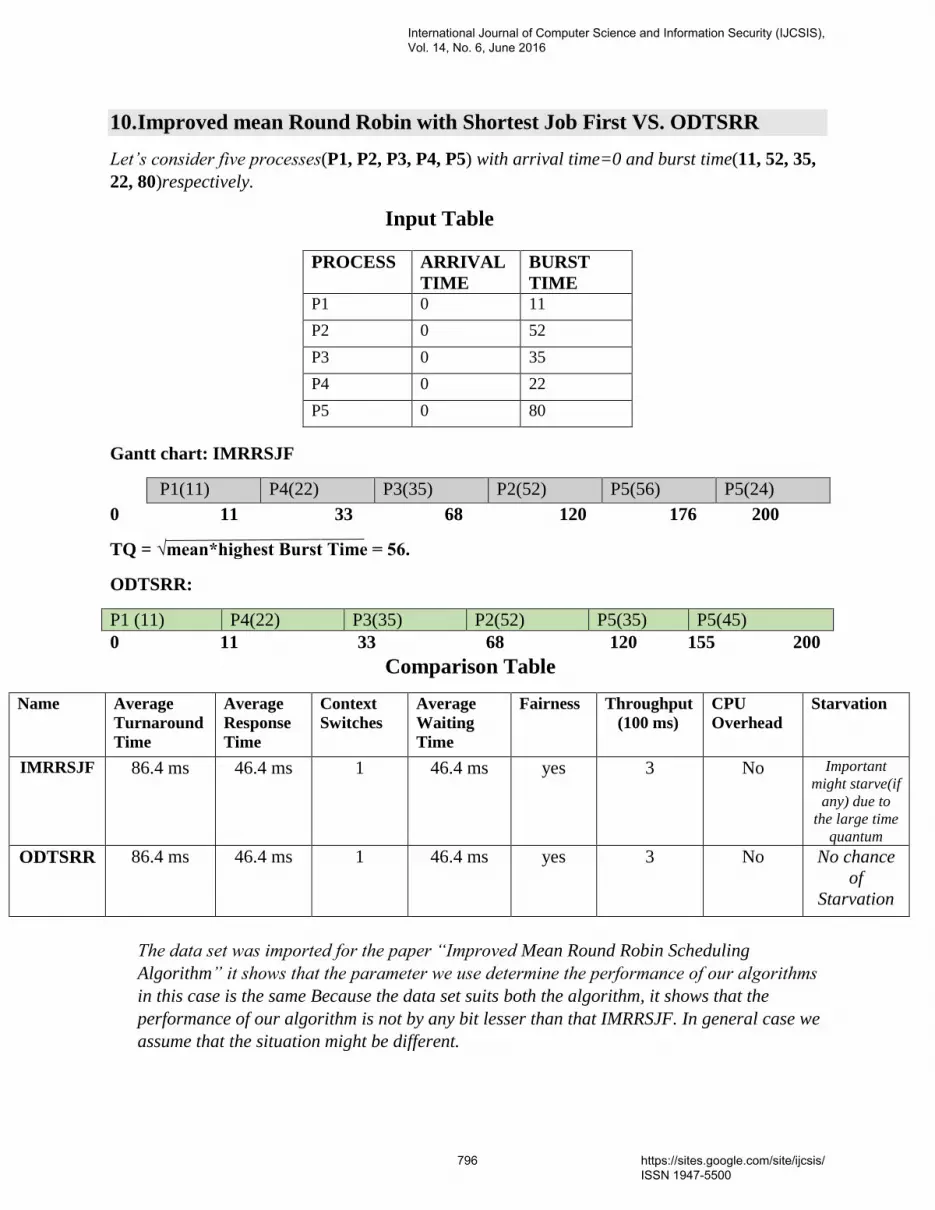
10. Improved mean Round Robin with Shortest Job First VS. ODTSRR
Let’s consider five processes(P1, P2, P3, P4, P5) with arrival time=0 and burst time(11, 52, 35,
22, 80)respectively.
Input Table
Gantt chart: IMRRSJF
P1(11) P4(22) P3(35) P2(52) P5(56) P5(24)
0 11 33 68 120 176 200
TQ = √mean*highest Burst Time = 56.
ODTSRR:
P1 (11) P4(22) P3(35) P2(52) P5(35) P5(45)
0 11 33 68 120 155 200
Comparison Table
Name Average
Turnaround
Time
Average
Response
Time
Context
Switches
Average
Waiting
Time
Fairness Throughput
(100 ms)
CPU
Overhead
Starvation
IMRRSJF 86.4 ms 46.4 ms 1 46.4 ms yes 3 No Important
might starve(if
any) due to
the large time
quantum
ODTSRR 86.4 ms 46.4 ms 1 46.4 ms yes 3 No No chance
of
Starvation
The data set was imported for the paper “Improved Mean Round Robin Scheduling
Algorithm” it shows that the parameter we use determine the performance of our algorithms
in this case is the same Because the data set suits both the algorithm, it shows that the
performance of our algorithm is not by any bit lesser than that IMRRSJF. In general case we
assume that the situation might be different.
PROCESS ARRIVAL
TIME
BURST
TIME P1 0 11
P2 0 52
P3 0 35
P4 0 22
P5 0 80
International Journal of Computer Science and Information Security (IJCSIS), Vol. 14, No. 6, June 2016
796 https://sites.google.com/site/ijcsis/ ISSN 1947-5500

5. Conclusion In this paper a new algorithm has been proposed which is the modified version of Round
Robin algorithm. Experimentation and comparative analysis shows that the performance of
our proposed algorithm is better than algorithm which are compared in the above section.
The comparison shows that the proposed algorithm is better in average response time,
average waiting time, the no. of context switches, and the throughput has always shown
better results. The fairness factor is achieved so that there won’t be any chance of
starvation. CPU overhead is reduced. Hence, we can say that the proposed algorithm is
better alternative to all of the above compared algorithm for the timeshared systems
6. References
[1] Operating System Concepts, 8th Ed., Abraham Silberschatz, Peter B. Galvin, Grege
Gagne .ISBN 978-81-265-2051-0.
[2] E.O. Oyetunji, A. E. Oluleye,” Performance Assessment of Some CPU Scheduling
Algorithms”, Research Journal of Information Technology,1(1): pp 22-26, 2009
[3] Ajit Singh, Priyanka Goyal, Sahil Batra,” An Optimized Round Robin Scheduling
Algorithm for CPU Scheduling”, (IJCSE) International Journal on Computer Science and
Engineering Vol. 02, No. 07, 2383-2385, 2010.
[4] Ishwari, S. R and Deepa, G (2012): A Priority based Round Robin CPU Scheduling
Algorithm for Real Time Systems, International Journal of Innovations in Engineering
and Technology (IJIET), Vol. 1 Issue 3, pp 1-11.
[5] Manish kumar Mishra, “Improved Round Robin CPU Scheduling Algorithm”,
Journal of Global Research in computer science, ISSN - 2229-371X, vol. 3,No. 6, June
2012
[6] Aashna Bisht, “ Enhanced Round Robin Algorithm for process scheduling using varying
quantum precision”, IRAJ International Conference-proceedings of ICRIEST-
AICEEMCS,29th Dec 2013,pune India. ISBN: 978-93-82702-50-4.
[7] Rami J Matarneh, “Self- Adjustment Time Quantum in Round Robin Algorithms
Depending on Burst Time of the Now Running Processes”, American Journal of Applied
Sciences, ISSN 1546-92396, (10):1831-1837, 2009.
[8] Lalit Kishor & Dinesh Goyal, “Time Quantum Based Improved Scheduling Algorithms”,
International Journal of Advanced Research in Computer science and Software
Engineering, ISSN: 2277-128X, Volume 3, Issue 4, April 2013)
[9] P.Surendra Varma, “A Best possible Time quantum for Improving Shortest Remaining
Burst Round Robin (SRBRR) algorithms”, International Journal of advanced Research in
computer science and software Engineering, ISSN: 2277 128X, Vol. 2, ISSUE 11,
November 2012.)
International Journal of Computer Science and Information Security (IJCSIS), Vol. 14, No. 6, June 2016
797 https://sites.google.com/site/ijcsis/ ISSN 1947-5500

[10] H.S. Behera & Brajendra Kumar Swain, “ A New proposed precedence based Round
Robin with dynamic time quantum Scheduling algorithm for soft real time systems”,
International Journal of advanced Research in computer science and software
Engineering, ISSN:2277- 128X, Vol. 2, ISSUE 6, June 2012.
[11] Ali Jbaeer Dawood, “Improved Efficiency of Round Robin Scheduling Using Ascending
Quantum and Minumium-Maxumum Burst Time”, Journal of university of anbar for pure
science, ISSN: 1991-8941, Vol. 6, No. 2, 2012.
[12] Rami J. Matarneh.“Self-Adjustment Time Quantum in Round Robin Algorithm
Depending on Burst Time of Now Running Processes”, American J. of Applied Sciences
6(10): 1831-1837, 2009.
[13]Zafril Rizal M Azmi1 “Performance Comparison of Priority Rule Scheduling
Algorithms Using Different Inter Arrival Time Jobs in Grid Environment” International
Journal of Grid and Distributed Computing Vol. 4, No. 3, September, 2011
[14]A. Abraham, R. Buyya, B. and Nath, Nature‟s heuristics for scheduling jobs on
computational Grids, Proceedings of the 8th International Conference on Advanced
Computing and Communications, Tata McGraw-Hill, India, 2000, pp. 45–52.
[15] A. Rasooli, M. Mirza-Aghatabar and S. Khorsandi. Introduction of Novel Rule Based
Algorithms for Scheduling in Grid Computing Systems; Second Asia International
Conference on Modeling & Simulation, 2008.
[16] 4003-440/4003-713 Operating Systems I Warren R. Carithers ([email protected]) Rob
Duncan ([email protected])
International Journal of Computer Science and Information Security (IJCSIS), Vol. 14, No. 6, June 2016
798 https://sites.google.com/site/ijcsis/ ISSN 1947-5500

Profile Screening and Recommending using Natural Language
Processing (NLP) and leverage Hadoop framework for Bigdata
Mrs. D.N.V.S.L.S.Indira #1
, Dr. R. Kiran Kumar #2
1
Research Scholar, Dept. Of Computer Science, Krishna University, Machilipatnam, AP, India - 521001
2
HOD, Dept. Of Computer Science, Krishna University, Machilipatnam, AP, India - 521001
ABSTRACT:
Recommendation has been a major area that any recruiter would look for on a given job description. Increase in digital communication has made things easy to upload resumes and make it available for recruiters; on the other hand increase in technologies would make any recruiter difficult to scan it manually. Here we introduce an application which processes text data, understands sentence behavior unlike conventional keyword search applications and gives out required resume as per job description provided to application. This application makes use of Natural Language Processing (NLP) which helps in data training and feature extraction of the text data. Using NLP methods, semi structured text data is converted to structured format with required extracted features. To make this application scalable to any size of data we propose this implementation on Hadoop framework, which can handle any number of resumes or even more than petabytes of data, termed as big-data. KEYWORDS: BigData, Attribute Tagger, NLP Methods, Named Entity Recognition
(NER), Map-Reduce, Hadoop, HBase, Hive
1. INTRODUCTION
All key businesses today are motivated by technology. Companies are broadcasting more and more statistics about every feature of their corporate and progress. It’s becoming very difficult for recruiters to hire a person with correct skill set. They receive multiple applications from job-portals, consulting companies, e-mails. Resumes[15] acquired from such miscellaneous sources are difficult to process and store in an integrated database format. Since resumes are structured documents containing information based on the applicants skill set they can be created in multiple formats like txt, pdf, doc. This makes information extraction highly complicated, to provide a best or better match for a particular job description provided by recruiter.
The objective of this paper is to propose an algorithm that provides a list of applicants with appropriate experience and then present the high-points of each selected resume, unlike the conventional way of applying filters and manually scanning resumes. This approach aims to order the resumes, by intelligently reading job description as an input and comparing the resumes which falls into the category of given Job Description. It provides a ranking after
International Journal of Computer Science and Information Security (IJCSIS), Vol. 14, No. 6, June 2016
799 https://sites.google.com/site/ijcsis/ ISSN 1947-5500

filtering and recommends the better resume for a given textual job description. Major contributions would be
• Providing a ranking-based approach after filtering
• Framework to highlight skills of a resume
• Comparison of features of resumes with job description by understanding the sentence behavior
Information extraction is done using natural language processing on the job description as well as resumes. Considering lot of resumes and lot of processing, Hadoop framework would be a well suited option which can process any kinds of format like txt, Doc, PDF using Map-Reduce programming and stored in Hive warehouse which would be helpful in batch processing. Using different Hadoop ecosystem services like Oozie, HBase, Hive and Map-Reduce, this application can focus on very good performance throughput
2. EXISTING WORK Extraction of the required information and recommending the useful resumes for the given job description is an important area for any organizations. Increase in digital communication made things easy for all the applicants, amount of time it takes to upload the resume or send it via email is very less compared to time taken by the recruiter to manually scan it.
Most of the online portals provide key-word search mechanism[14] to screen out the resumes which are not of use or which are not present in the given criteria. In this kind of scenarios resumes are classified based on skill types or experience. This approach parses resumes for the given keyword, irrespective of what a sentence mean in the resume, once the keyword is found that resume is recommended to the recruiter by this application. This way might just eliminate very few resumes which are not in the required technology stack. Upgrading this keyword search to multiple keyword searches at different levels or structuring the resume and writing a query to retrieve recommended resumes has been the way that’s been followed.
Few published studies tried to learn the information extraction rules for resumes written in English using an adaptive transformation toolkit called “Learning Pinocchio”[5]. this system performs information extraction using XML tags to identify key attributes namely email, name, street, Province, etc.
Another approach applied concept of Information Extraction from online Chinese resumes where regular expression and text automatic classification were used to extract basic information from a resume while fuzzy logic algorithm was used to extract the complex algorithm [6].
International Journal of Computer Science and Information Security (IJCSIS), Vol. 14, No. 6, June 2016
800 https://sites.google.com/site/ijcsis/ ISSN 1947-5500

Another related approach extracted required information by keyword matching and normalisation to map a job requirement with prospective candidates.[7]
Problem with existing approaches is
• These algorithms just cut down a maximum of 10% manual effort.
• Applying multiple filters on resumes would leave a confusion on which filter to be applied first
• When the required number of resumes that needs to be scanned goes beyond a limit, application fails
Keeping these things in mind and to provide a better recommendation to recruiter, we propose a design which can understand a sentence behavior of the job criteria and selecting the resume which would match to the given criteria, thereby replacing the conventional key word search approach.
3. PROPOSED WORK This algorithm has been designed to recommend the best candidate profiles considering given job criteria. This requires application to intelligently know the behaviour of sentences in natural or human language and extract the feature in it. Technically feature extraction can be done using natural language processing which has ability to use natural languages as effectively as humans do[1].
To perform natural language processing on larger sets of data and different types of data, we chose Hadoop framework which can be scaled to any kind or any volume of data. Latter part of this section talks about technical concepts used in this research and architectural explanation of the algorithm.
3.1 Technical Aspects:
Text Mining:
As there is lot of variety in structuring a resume, extracting right amount of information of these text documents is a major research area. Extraction of useful patterns out of textual resources is known as Text Mining.[2].
• Natural Language Processing (NLP)
NLP is analysis of natural languages so that computer can understand them.[2] Natural language, whether spoken, written, or typed, is the most natural means of communication between humans, and the mode of expression of choice for most of the documents they produce[1]. It can perform Parts of Speech (POS) Tagging, Named Entity Recognition (NER), Training Data models.
International Journal of Computer Science and Information Security (IJCSIS), Vol. 14, No. 6, June 2016
801 https://sites.google.com/site/ijcsis/ ISSN 1947-5500

• Named Entity Recognition (NER)
A Named Entity Recognition (NER)[16] system is a significant tool in natural language processing (NLP) research since it allows identification of proper nouns in open-domain (i.e., unstructured) text[3]. NER also known as entity extraction is a subtask of information extraction that seeks to locate and classify elements in text into predefined categories like names of persons, organizations, locations, etc. Using NER the necessary attributes from the resume can be extracted by training samples of data. Key role of NER in our study is to find the how the same token was tagged in different parts of the same document.
3.2 Hadoop Ecosystem: The Hadoop environment supports for big data processing up to terabytes to petabytes. Hadoop is a free, Java based programming framework that supports the processing of large datasets in a distributed computing environment. Its key components in architecture can be broadly divided into storage(HDFS) and processing unit (Map-Reduce)[13][20]. As part of algorithm implementation,
Data is stored in Hadoop distributed file system.
Hive data warehouse is used to store the structured data for easier querying
MapReduce is for data ingestion process and to provide a structure to the resume using NLP techniques
•HBase:
Apache HBase is the Hadoop database, a distributed database derived from BigTable [4] atop a distributed file system HDFS derived from the Google File System. Its majorly used when random, realtime read or write access is needed for BigData.[19]
HDFS triply replicates data in order to provide availability and tolerate failures. These properties free HBase to focus on higher- level database logic. Because HBase stores all its data in HDFS, the same machines are typically used to run both HBase and HDFS servers, thus improving locality. These clusters have three main types of machines: an HBase master, an HDFS NameNode, and many worker ma- chines. Each worker runs two servers: an HBase Region- Server and an HDFS DataNode. HBase clients use the HBase master to map row keys to the one RegionServer responsible for that key. Similarly, an HDFS NameNode helps HDFS clients map a pathname and block number to the three DataNodes with replicas of that block.
Hence for a faster querying we recommend Hive and HBase integration, by which GUI requests can be responded via HBase.
International Journal of Computer Science and Information Security (IJCSIS), Vol. 14, No. 6, June 2016
802 https://sites.google.com/site/ijcsis/ ISSN 1947-5500

4. IMPLEMENTATION
4.1 Design
Fig 1: Architecture -Explains multiple stages of Implemented Algorithm
•Different Inputs : Refers to different kinds of documents that this application can process (PDF, Doc, Docx)
•Processes and tags data: Refers to implementing “Attribute tagger algorithm” defined below for tagging data. This requires data training of samples of resumes using Maximum Entropy model and thereby using NER for entity tagging , Information extraction
•Inventory: Information extracted from the below module is stored and maintained in data warehouse
•Input Criteria: Refers to job description which would be provided as an input to the application. Application searches for it in the inventory and displays results in UI.
4.2 Three Phases of Algorithm
Proposed algorithm is broadly divided into three phases.
Phase 1 : Data Gathering
Resumes gathered from different sources like e-mail, Online portals, third party vendors etc., are pushed to Hadoop distributed file system.
Resumes can be in any format like .pdf, .docx and .txt which would be converted into text format using map-reduce processing engine.
International Journal of Computer Science and Information Security (IJCSIS), Vol. 14, No. 6, June 2016
803 https://sites.google.com/site/ijcsis/ ISSN 1947-5500

Data is ingested into map reduce using Whole file input format as input file format. Once the data is available as text file, this text file is used for processing using NLP data tagging.
Phase 2 : Data processing
This phase deals with extracting required information and necessary attributes from the text file provided by Data Gathering layer. Defined an attribute tagger algorithm in order to find out the necessary fields to structures the resume
Phase 3 : Attribute Tagger
1.Initial Screening
At this level, algorithm works on retrieving Name of the candidate, Email-Id, Phone number, Known skills, experienced skills and tools, Experience, Previous organization he/she worked in.
a.Extracting Candidate Name:
Using Stanford NLP we retrieve Parts of Speech (POS) tagging from the text file. Header section of text file is looked for Nouns and it would be tagged as NN, NNP. The best POS classifiers are based on classifiers trained on windows of text, which are then fed to a bidirectional decoding algorithm during inference.[9]
For Example: Time , the/DT largest/JJS newsweekly/NN , had average circulation of below te $ 2.29 billion value United Illuminating places/VBZ on its bid Correct: places/VBZ Rowe also noted that political concerns also worried/VBD New England Electric . Correct: worried/VBD Commonwealth Edison now faces an additional court-ordered refund on its sum- mer/winter rate differential collections that/VBD the Illinois Appellate Court has estimated at $ 140 million . Joseph/NNP M./NNP Blanchard/NNP , 37 , vice president , engineering ; Malcolm/NNP A./NNP Hammerton/NNP
Considering existing POS taggers, Stanford NLP libraries has some advancements in moving the probability of finding a better POS tagging from 97% to 100%.[8]
b. Extracting mail ID:
Using Regular Expressions, Email id would be extracted from the text document from the header or footer section.
c. Extracting Years of Experience, Known Skills, Experienced skills, Previous organization, Qualification:
To extract these attributes, Named Entity Recognition (NER) libraries of Stanford NLP is used. Elements in the sentence are tagged by NER labels such as “YEARS”, “KNOWN_SKILL”, “EXP_SKILL”, “COMPANY” etc. To tag the text file with NER, it requires data training.
International Journal of Computer Science and Information Security (IJCSIS), Vol. 14, No. 6, June 2016
804 https://sites.google.com/site/ijcsis/ ISSN 1947-5500

Words in the text file are chunked and each word is assigned a tag prefixed by an indicator. We use supervised learning algorithm known as Maximum Entropy model.
d. Extracting Applicants Age:
Applying POS tagging on the document and list all the SYM tagged values. Apply Regular Expressions on SYM values for Date of birth, date of birth if specified in the resume is extracted. This would check for DD(-/)MM(-/)YYYY, MM(-/)DD(-/)YYYY, DD(-/)MMM(-/)YY format.
If multiple dates are retrieved oldest date is considered as date of birth.
This age would be calculated as
(Date when Attribute tagger run on the Resume) – (Date of birth)
Maximum Entropy Model:
Given a set of features and training data, the model directly learns the weight for discriminative features for classification Maximum entropy models, objective is to maximize the entropy of the data, so as to generalize as much as possible for the training data. In ME[1] models each feature is associated with parameter λi. Conditional probability is thus obtained as follows:
Fig 2: Formula for Maximum Entropy
Maximizing the entropy ensures that for every feature gi, the expected value of gi, according to M.E. model will be equal to empirical expectation of gi in the training corpus.
Once the sample resumes are trained, we convert this into serialize files and use it for NER tagging on the resumes.
2. Exclusive Screening:
This level of screening helps in increasing the intensity of skill weight.
Sentences with the skill tagging are identified and POS tagging is applied on the same. Depending on the adjectives (ADJ) tagging skill weight would be increased in terms of ranking given to the resume. These sentences are made as high-points of the resume and displayed along with resume
International Journal of Computer Science and Information Security (IJCSIS), Vol. 14, No. 6, June 2016
805 https://sites.google.com/site/ijcsis/ ISSN 1947-5500

a.Resume Rating:
Every resume holds default rankings depending on the qualification levels. Default rating starts at 1 to 5 rating. This rating would be generated automatically by the algorithm.
System-Rating Algorithm:
-If an applicant holds Post Graduation or above qualification , that resume holds 4 and if his CGPA scored is greater than 8 , its rated as 4.5
-If an applicant holds Graduation or equivalent qualification , that resume holds 3 and if his CGPA scored is greater than 8, its rated as 3.5
-Anything not falling into other categories of education holds 2 and if his aggregate scored is greater 80%, its rated as 3.5
-If the applicant scores 90 or above percentage in all his educational qualifications and received any excellence awards(if experienced) then that resume would be 5 rated
This structured data retrieved as multiple attributes is stored in Hive Data warehouse.
4.3 Processing Job Description:
Input of the application is job description pasted in UI from a text-box. In order to extract necessary information from the text, Initial screening phase of Attribute tagging algorithm is used to tag : good to have skills, necessary skills, location, years of experience.
These attributes are maintained in a separate table in Hive along with recruiter name as one of the column.
4.4 Work-Flow Scheduling:
Apache Oozie is an open source project based on Java™ technology . It simplifies the process of creating workflows and managing coordination among jobs and offers the ability to combine multiple jobs sequentially into one logical unit of work.
Once the complete algorithm is implemented, it is triggered automatically with a frequency of Daily, Weekly or Bi-Weekly, Monthly etc. Once the workflow is triggered, attribute tagging algorithm is initiated which runs on new set of resumes to extract required information and then store in Hive warehouse.
4.5 Data Storage:
Hive is used as data storage in storing the structured data retrieved from above step.
-A table is created with the columns named as tag categories. Each tag retrieved from the above step is stored in hive table along with the path of the resume.
-Another table for Job Description is created and respective attributes are stored
International Journal of Computer Science and Information Security (IJCSIS), Vol. 14, No. 6, June 2016
806 https://sites.google.com/site/ijcsis/ ISSN 1947-5500

Data retrieval is done by performing join operation on Skill columns of Job Description table and skill columns of structured resume table. Output is retrieved as an descending order of rating
Hive[ table is created integrating with HBase, whenever a record is ingested into hive, parallely data is ingested into respective column families and columns which are defined during table creation.
Hbase[17][18][20] is used in connecting the data to UI, as being a NOSQL column oriented database, it retrieves data faster than any SQL compliant data warehouses.
5. PROPOSED ALGORITHMS AND BLOCK-DIAGRAM OF ALGORITHM Algorithm 1 : NER (Named Entity Recognition)
Given:
T : A set of trained data
R : A raw unlabelled data
Loop till end of unlabelled data(n iterations)
Step1 : Train a classifier C based on T for a given label using Maximum entropy model[11]
Step2 : Extract required attributes A based on C
Algorithm 2 : Attribute Tagger
Given::
R : Text data of Resume;
N : NER Algorithm
NNP : Proper Noun, Singular;
CD : Cardinal Number;
SYM : Symbol
JJR : Adjective, comparative ;
JJS : Adjective, superlative
Step 1: For a given R , apply POS tagging algorithm [12]
Step 2: Extract NNP as Name , CD as Phone Number, SYM as E-mail ID and validate with regular expression
Step 3: Apply Regex on Email ID retrieved on Step2 to re-verify it
Step 4: Apply N on R and extract information like Known skills, Experienced skills and tools, Experience, Previous organization
Step 5: Extract SYM tags and validate with regular expression for date as date of
International Journal of Computer Science and Information Security (IJCSIS), Vol. 14, No. 6, June 2016
807 https://sites.google.com/site/ijcsis/ ISSN 1947-5500

birth. If multiple dates are found oldest date is considered.
Step 6: Apply POS tagging algorithm on the sentence having KnownSkills and Experienced Skills tag
Step 7: Sentences containing JJR or JJS POS tagging are considered as High-Points
Fig 3: Block Diagram of Proposed Work.
6. EXPERIMENTAL RESULTS
Screen Shot 1: Extracted required Attributes form user Profiles.
International Journal of Computer Science and Information Security (IJCSIS), Vol. 14, No. 6, June 2016
808 https://sites.google.com/site/ijcsis/ ISSN 1947-5500

Training
Data P/R
(Experience) P/R
(Skill) P/R
(Exp.Skills)
30 Docs 88.5/81 83.5/79 81/78
70 Docs 89.5/82 84/80 82/79.5
100 Docs 92.5/88 85/81.5 84/81
200 Docs 94.5/89 91.5/87 91/87.5
Table 1: Shows the precision and recall of Information Extraction Vs. Data Training. More the data trained, more the accuracy gained by the attribute tagger algorithm.
Although we have multiple labels that needs to be extracted on a given resume, experiments has been done on retrieving three different tags namely; Years of Experience, Known Skills and Experienced skills. This experiment has been done on different quantity of training sets of data and clearly found increase in the count of training data increased the accuracy levels of extracting information.
Graph 1 : Key Word Search Vs Attribute Tagger
Graph1 depicts the precision of keyword search and proposed attribute tagger algorithm. X axis is termed as tags and Y axis is termed as precision scale from 0 to 10. The above graph says our proposed algorithm gives better result than key word search.
Graph 2:
This graph depicts performance achieved when X axis is plotted with number of resumes to be processes in order to find a tag and Y axis with number of seconds it took to process and give the set of resumes as result for a given Job description
International Journal of Computer Science and Information Security (IJCSIS), Vol. 14, No. 6, June 2016
809 https://sites.google.com/site/ijcsis/ ISSN 1947-5500

6. CONCLUSION AND FUTURE WORK Proposed algorithm has a potential for development and other necessary features depending on the requirement can be added like certifications, Interests, extracurricular activities. Ranking methodology can be synced with manual ratings too.
Recommendations play a good role in saving the time to find a better result .Assuming there are recruiters recruiting for different levels of people with different skill sets, suggesting a recruiter few set of aligned resumes depending on his/her previous searches would be an add-on that can be provided to this algorithm.
7. REFERENCES 1. Adwait Ratnaparkhi. 1996. A maximum entropy model for part-of-speech tagging. In Eric Brill and Kenneth Church, editors, Proceedings of the Conference on Empirical Meth- ods in Natural Language Processing, pages 133–142. Asso- ciation for Computational Linguistics. 2. Ranveer Kaur and Shruti Aggarwal, “Techniques for Mining Text Documents” , International Journal of Computer Applications (0975 – 8887) , Volume 66– No.18, March 2013. 3. Khaled Shaalan and Hafsa Raza “NERA: Named Entity Recognition for Arabic”, Journal of The American Society For Information Science And Technology, 60(8):1652–1663, 2009.
4. Tyler Harter, Dhruba Borthakur , Siying Dong , Amitanand Aiyer, Liyin Tang, Andrea C. Arpaci-Dusseau, Remzi H. Arpaci-Dusseau, “ Analysis of HDFS Under HBase: A Facebook Messages Case Study” , University of Wisconsin—Madison, Presented at the 12th USENIX Conference on File and Storage Technologies, Feb 17, 2014.
5. F. Ciravegna and A. Lavelli. “Learning Pinocchio: adaptive information extraction for real world applications”. Nat. Lang. Eng., 10(2):145 165, 2004.
6. Z. Jiang, C. Zhang, B. Xiao and Z. Lin “Research and Implementation of Intelligent Chinese Résumé Parsing,” Proceedings of the 2009 WRI international Conference on Communications and Mobile Computing, vol. 3, 2009.
7. Charul Saxena, “Enhancing Productivity of Recruitment Process Using Data mining & Text Mining Tools” (2011), Master's Projects. Paper 324. 8. Christopher D. Manning. 2011. Part-of-Speech Tagging from 97% to 100%: Is It Time for Some Linguistics? In Alexander Gelbukh (ed.), Computational Linguistics and Intelligent Text Processing, 12th International Conference, CICLing 2011, Proceedings, Part I. Lecture Notes in Computer Science 6608, pp. 171--189. Springer.
International Journal of Computer Science and Information Security (IJCSIS), Vol. 14, No. 6, June 2016
810 https://sites.google.com/site/ijcsis/ ISSN 1947-5500

9. Ronan Collobert, Jason Weston, L eon Bottou, Michael Karlen, Koray Kavukcuoglu, Pavel Kuksa, “Natural Language Processing (almost) from Scratch” , Journal of Machine Learning Research 1 (2000) 1-48. 10. Rahul Sharnagat ,”Named Entity Recognition: A Literature Survey”, 11305R013, June 30, 2014. 11. Kamal Nigam, John Lafferty, Andrew McCallum, “Using Maximum Entropy for Text Classification”, 12. Daniel Jurafsky & James H. Martin, “Part-of-Speech Tagging”, Stanford University, Chapter 9, Draft of February 19, 2015. 13. https://en.wikipedia.org/wiki/Apache_Hadoop 14. Y. Chen, W. Wang, Z. Liu, et al. Keyword search on structured and semi-structured data. In SIGMOD Conference, pages 1005–1010, 2009. 15. Vinaya R. Kudatarkar, Manjula Ramannavar, Dr.Nandini S. Sidnal, “ An Unstructured Text Analytics Approach for Qualitative Evaluation of Resumes”, International Journal of Innovative Research in Advanced Engineering (IJIRAE) ISSN: 2349-2163 Issue 8, Volume 2 (August 2015). 16.Radu Florian. 2002. Named entity recognition as a house of cards: classifier stacking. In Proceedings of the 6th conference on Natural language learning - Volume 20, COLING-02. 17. Lars George, "HBase: The Definitive Guide", 1st edition, O'Reilly Media, September 2011, ISBN 9781449396107. 18. Mehul Nalin Vora, "Hadoop-HBase for large-scale data," Computer Science and Network Technology (ICCSNT), 2011 International Conference on, Harbin, 2011,pp.601-605.doi: 10.1109/ICCSNT.2011.6182030 19. Poonam S. Patil and Rajesh. N. Phursule, “Survey Paper on Big Data Processing and Hadoop Components ”, International Journal of Science and Research (IJSR), Volume 3 Issue 10, October 2014 20. Taylor, R., ”An Overview of the Hadoop/MapReduce/HBase Framework and its Current Applications in Bioinformatics,” in Bioinformatics Open Source Conference, 2010.
International Journal of Computer Science and Information Security (IJCSIS), Vol. 14, No. 6, June 2016
811 https://sites.google.com/site/ijcsis/ ISSN 1947-5500

Real Time Variable Voltage Scaling to Design
Energy Efficient Systems
Ankita Soni, Praveen Kaushik
Department of Computer science and Engineering
Maulana Azad National Institute of Technology, Bhopal, India
Abstract-With the immense increase in the processing power over the past few decades, battery life has proved to be a
crucial resource. Since energy varies quadratically with voltage in the CMOS based processors, Dynamic Voltage Scaling
(DVS) offers a solution to conserve the battery power by lowering the supply voltage. However, reducing the voltage
increases the execution time and therefore, real time scheduling has to be combined with DVS so as to provide the
deadline guarantee. This paper presents an algorithm, Recurring Variable Voltage Scheduling(RVVS) to extend the
battery life using a combination of variable voltage and a real time scheduling algorithm (Earliest Deadline First). The
paper also mathematically proves that if two voltage levels are used such that one is twice the other, up to 50% energy can
be saved. Mathematical proof of delay increment due to voltage reduction has also been presented. RVVS has been
optimized in order to reduce the overall energy dissipated by switching by introducing a factor ‘n’ that denotes the
number of time units after which the voltage switch can occur. RVVS has been applied to task sets having different
number of tasks providing an average energy saving of 27%. This significant amount of energy saving helps extending
the battery life to a remarkable extent and proves the worth of RVVS in the field of real time DVS.
Keywords: Dynamic Voltage Scaling; Earliest Deadline First; Real time scheduling; Voltage switching; Energy efficiency;
Variable voltage
1. INTRODUCTION
Non-conventional computing platforms like sensors, portable processors and automated systems have
significantly gained importance over the recent years. Most of these devices are designed having the maximization
of battery life as one of the important design goals. System performance and power consumption are directly
proportional. Thus improving the performance decreases the battery life considerably. So a trade-off is needed
between these two very important factors. The microprocessors today are based on CMOS logic in which maximum
operational frequency depends on the voltage. Power utilization in such circuits varies quadratically with the
supplied voltage (P∝V2). Therefore, at a reduced voltage, the system can perform at a lower frequency and hence
consumes less power. This feature can be exploited to extend the battery life using the concept of Dynamic Voltage
Scaling (DVS). Power utilization In CMOS circuits is given by:
PCMOS ∝ CVDD2F (1)
Where, PCMOS is power consumed, C is the circuit capacitance, VDD is the supply voltage and F is the frequency.
International Journal of Computer Science and Information Security (IJCSIS), Vol. 14, No. 6, June 2016
812 https://sites.google.com/site/ijcsis/ ISSN 1947-5500

Reducing the supply voltage introduces delays as the operating frequency decreases. As a result more number of
cycles is required to complete the task and the overall time needed to finish a task may increase. This delay (D) as
given by[1]:
D=CVDD / (K(VDD-VT)α) (2)
Where, K is a constant which depends on gate size, VT is the threshold voltage and „α‟ varies between 1 and 2.
Energy ∝ Power* time (3)
Energy gives quadratic gains on decreasing the voltage while the delay varies linearly. Hence DVS can effectively
be used to conserve power by reducing the supply voltage. But in systems where we have deadlines, this can be the
condition to hold us back from meeting the defined deadlines. Therefore, DVS is usually used with Real time
scheduling algorithms [2].
The paper presents an algorithm called Recurring Variable Voltage Scheduling (RVVS) towards power
conservation in real time systems using variable voltage along with Earliest Deadline First(EDF) real time
scheduling algorithm. RVVS algorithm is inspired by the LEDF algorithm by V. Swaminathan and K. Chakrabarty
[3] and uses Cycle conserving concept by P. Pillai and K.G. Shin [2]. It works for non-preemptive periodic task sets
by adjusting the supply voltage while executing a task on a unicore processor.
The next section presents some of the research contributions in the field of RT-DVS. Mathematical discussion on
energy and delay variation due to the voltage change is shown in Section 3 followed by the proposed
algorithm(RVVS) in section 4. The experimental set up and results have been discussed in section 5 before we
conclude in section 6.
2. RELATED WORK
DVS has emerged as one of the key techniques in the field of energy conservation in battery powered devices. A
class of real time DVS (RT-DVS) have been presented in [2]. Online RT-DVS, Low Energy Earliest Deadline First
(LEDF) algorithm for non-preemptive task sets was proposed in [3]. Most of the algorithms developed with respect
to RT-DVS use Earliest Deadline First(EDF) to give optimal results. EDF has been used effectively with DVS for
preemptive [4] as well as non-preemptive [5] task sets.
W.H. Zhao and F. Xia[6] have developed a strategy which explores a combination of time triggered and event
triggered mechanisms focused on the workload variability. DVS schemes have been developed for sporadic tasks
along with the periodic tasks in real time environment [7]. T. Pering, T. Burd and R. Brodersen [8] have gracefully
elaborated the simulation and evaluation of various DVS algorithms. A number of methods for controlling the
voltage on the basis of feedback strategy have also been introduced. Most of these methods do not focus on the
deadline characteristics and are directed only towards adjusting the voltage and frequency on the basis of historical
patterns of computational load experienced.
3. ENERGY, DELAY VARIATION IN A 2 VOLTAGE LEVELS SYSTEM
In this work, an example system operating on two voltages such that, VH=2*VL is taken. Reducing the voltage
causes the system to be slow by a factor slow(v) which is assumed to be 2 in this case as in [1]. Thus the system
International Journal of Computer Science and Information Security (IJCSIS), Vol. 14, No. 6, June 2016
813 https://sites.google.com/site/ijcsis/ ISSN 1947-5500

takes twice the time at VL as it takes at VH. The energy and execution time formulae are used as used by T. Ishihara
and H. Yasuura in [9].
Statement 1: Energy can be conserved up to 50% by using a system with 2 voltages such that one is twice the other,
as compared to a system using a single high voltage level.
Constraints: X1 ≤ X, where X: time taken for executing entire tasks in a task set at VH in a system using a single
voltage level VH.
X1: time for which the system (using 2 voltage levels) operates at VH. The remaining tasks are executed at VL.
To Prove: Energy2 level system ≤ Energy1 level system
Proof:
Energy1 level system = VH2X
Energy2 level system= VH2X1 + VL
2*2(X-X1)
(i)
(ii)
Substituting VL=VH/2 we get,
Energy2 level system = VH2X1 + VH
2*(X-X1) /2
=> VH2(X + X1) / 2 (iii)
Since, X1<X, the value in (i) is certainly greater than value of (iii) and hence energy is conserved.
Case 1: If all the tasks are operated at VL, then X1=0. Hence (ii) can be rewritten as:
Energy2 level system= VL2*2(X) (iv)
=> VH2X / 2 (v)
Hence, 50% energy efficiency is achieved.
Case 2: If all the tasks are operated at VH, then X1=X and no task is scheduled at VL.
Energy2 level system= VH2*(X) (iv)
Hence, the energy consumed by both the systems is same.
Thus choosing a wise voltage allocation can guarantee up to 50% efficiency in 2 voltage level systems. Even if
the 2 voltage level system is operated at VL only for a few time units, we can make the system energy efficient.
Statement 2: Delay increases on reducing the voltage.
Constraints: same as the constraints for statement 1.
To Prove: ET2 level system ≥ ET1 level system, where ET is the total execution time.
Proof:
ET1 level system= VHX/ (VH-VT)α
ET2 level system= VHX1 /(VH-VT)α + VL*2(X-X1) /( VL -VT)
α
(i)
(ii)
International Journal of Computer Science and Information Security (IJCSIS), Vol. 14, No. 6, June 2016
814 https://sites.google.com/site/ijcsis/ ISSN 1947-5500

Since VT is constant, we can assume VT=0 for calculation purpose. Substituting VL=VH/2 in (ii) and simplifying it
we get,
Case 1: α=1, then
ET1 level system=X (iii)
ET2 level system=2X-X1 (iv)
As X1≤X, then ET2 level system ≥ ET1 level system. Hence delay increases.
Case 2: α=2, then
ET1 level system=X/VH (v)
ET2 level system=(4X-3X1)/VH (vi)
As X1≤X, ET2 level system ≥ ET1 level system. Hence delay increases.
4. RVVS ALGORITHM
RVVS works for variable voltage and is a modified version of LEDF from [3] with cycle conserving technique
[2]. In LEDF algorithm, once a task is scheduled on a specific voltage level, the level cannot be changed until the
task is completely executed. RVVS introduces an idea of varying the voltage level while executing a task at higher
voltage i.e. when a task is under execution at a high voltage; a check is made after each time unit if the remaining
part of this task can be completed at lower voltage. If yes, the system can shift to lower voltage level for the
remaining execution time of this task.
Assumptions:
1. All tasks are independent
2. System is assumed to have two voltage levels VH and VL such that,
a. VH =2*VL
3. It considers the scenario where tasks take lower than the worst case execution time. The extra cycles are
used for the execution of other tasks.
RVVS algorithm uses a combination of variable voltage and EDF scheduling methods and considers that voltage
and frequency are not static for a task set. It suggests two possible stages for voltage change:
1. While scheduling a new task.
2. Within the execution time of current task when the current task is already scheduled at high voltage.
RVVS sorts the tasks based on the closest deadline first. While scheduling each task Ti, a check is made to
determine if the task can be completed at VL using (4). If yes, schedule Ti at VL. If not, schedule Ti at VH.
WCETi *2 ≤ Di - Ci (4)
Where WCETi is the worst case execution time of task Ti, Di is the deadline of the task Ti and Ci is the current
time on the timeline.
International Journal of Computer Science and Information Security (IJCSIS), Vol. 14, No. 6, June 2016
815 https://sites.google.com/site/ijcsis/ ISSN 1947-5500

Table 1 shows an example task set having 10 tasks along with their deadlines, worst case execution time (WCET)
and actual execution time (AET) in terms of time units. Fig. 1 shows the corresponding voltage–time graph
generated for this task set following the RVVS algorithm. The two voltage levels represent VH and VL. The pictorial
depictions of time for which tasks operate at these two different voltage levels are shown by each of the voltage time
graph in this paper.
TABLE 1 COMPUTATION REQUIREMENTS FOR AN EXAMPLE TASK SET
Task Deadline WCET AET
T1 25 10 9
T2 116 14 12
T3 6 3 3
T4 74 16 15
T5 8 2 1
T6 29 4 2
T7 48 8 8
T8 10 1 1
T9 88 8 6
T10 34 6 6
According to the RVVS algorithm, when a task is scheduled at a lower voltage level, it can easily complete its
entire execution at this lower voltage. But in the case of task scheduled at higher voltage, there is a need to check
after each time unit whether the remaining execution time of the task can be completed at lower voltage. This
increases the computational complexity and the frequency of voltage switching in our algorithm.
The above algorithm can be optimized by introducing some minimum number of time units „n‟ such that n>1,
after which the check is made. Thus instead of checking after each time unit, we will check at regular intervals of
more than a time unit. This helps in increasing the performance in the following two ways:
1. It eliminates the scheduling overhead of tasks having very small execution time. Tasks having very small
execution time i.e. execution time less than n, have no significant effect on the overall energy
consumption. Hence they can be scheduled on higher voltage.
2. It reduces the overall computational complexity because instead of checking after each time unit, we
check after each n time units (n>1).
Let's select n=3. Now, when a task is scheduled on a higher voltage, a check is made after each 3 units of time
instead of checking after each single time unit. The voltage-time graph plotted for task set (Table 1) following the
RVVS algorithm for n=1 is shown in Figure 1.a and for n=3 is shown in Figure 1.b. Introducing n=3 results in 20%
decrease in the frequency switching for the task set in Table 1.
Function (Task Set)
Begin
(Repeat till we have tasks in ready state)
International Journal of Computer Science and Information Security (IJCSIS), Vol. 14, No. 6, June 2016
816 https://sites.google.com/site/ijcsis/ ISSN 1947-5500

1. Sort the tasks in ascending order of deadline;
2. Select the task with the closest deadline;
3. Check if the deadline can be met at the lower voltage;
3.1. If yes, schedule the task on the lower voltage;
3.2 If no, check if the task can be completed at the higher voltage;
3.2.1 If yes, schedule it on the higher voltage;
4. If the task is scheduled at higher voltage, check after each time unit/n time units, whether the remaining time of
the task can be completed at lower voltage;
4.1 If yes, schedule on a lower voltage till task completion;
4.2 If no, continue on high voltage and go to step 4;
5. If task cannot be completed even at a higher voltage, call the exception handler;
End
RVVS algorithm
(a) (b)
Figure 1: Voltage-time graph for task set (Table 1) following RVVS algorithm. (a). at n=1, (b). at n=3
5. ANALYTICAL RESULTS
The algorithm can be applied to any of the real time system and processor. However for experimental purpose, a
processor is assumed to have two voltage levels such that VH=5V and VL=2.5V. RVVS with n=4 has been applied to
the example task sets in Table 1, Table 2 and Table 3. The results are compared with the overall energy consumption
for the same task sets when no DVS algorithm is followed.
International Journal of Computer Science and Information Security (IJCSIS), Vol. 14, No. 6, June 2016
817 https://sites.google.com/site/ijcsis/ ISSN 1947-5500

TABLE 2 COMPUTATION REQUIREMENTS FOR AN EXAMPLE TASK SET
Task Deadline WCET AET
T1 10 5 5
T2 18 6 5
T3 25 8 7
T4 33 7 7
T5 43 9 9
Fig. 2 shows the time units with the corresponding voltage level for task set (Table 1) when RVVS (n=4) is
followed and is compared to a case where DVS is not followed. The time units operating at high voltage should be
taken into consideration as they greatly affect the energy consumption. The mathematical results show that 19 time
units operate on a high voltage, while the rest of the time units operate on a lower voltage following the RVVS. In
case of scheduling the tasks without DVS, all the tasks operate at a higher voltage for a total of 63 time units.
RVVS with n=4 has been applied to three task sets with different number of tasks. Table 4 compares the number
of time units for which the processor operates at high voltage and low voltage for the task sets in Table 1, Table 2
and Table 3 having 10, 5 and 15 tasks respectively under two cases: RVVS(n=4) and without DVS. It also shows the
%energy saving obtained. Fig. 3 gives the pictorial depiction of voltage change for task set(Table 2) following
RVVS and without DVS.
TABLE 3 COMPUTATION REQUIREMENTS FOR AN EXAMPLE TASK SET
Task Deadline WCET AET
T1 5 3 2
T2 18 9 7
T3 21 3 3
T4 29 5 3
T5 41 8 7
T6 48 5 4
T7 57 6 6
T8 72 7 6
T9 89 14 13
T10 102 8 8
T11 106 3 2
T12 130 15 15
T13 153 15 15
T14 160 6 5
T15 184 4 3
International Journal of Computer Science and Information Security (IJCSIS), Vol. 14, No. 6, June 2016
818 https://sites.google.com/site/ijcsis/ ISSN 1947-5500
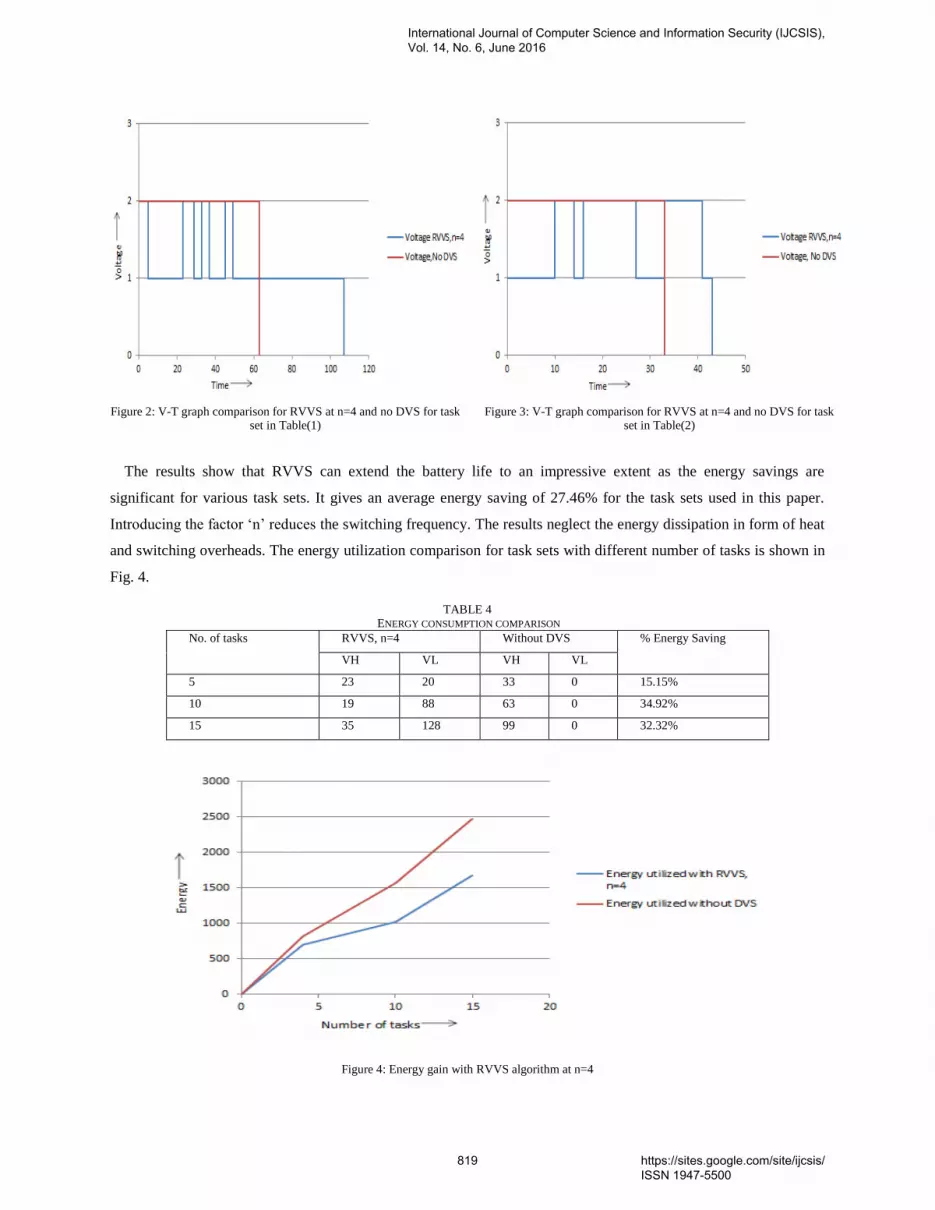
Figure 2: V-T graph comparison for RVVS at n=4 and no DVS for task set in Table(1)
Figure 3: V-T graph comparison for RVVS at n=4 and no DVS for task set in Table(2)
The results show that RVVS can extend the battery life to an impressive extent as the energy savings are
significant for various task sets. It gives an average energy saving of 27.46% for the task sets used in this paper.
Introducing the factor „n‟ reduces the switching frequency. The results neglect the energy dissipation in form of heat
and switching overheads. The energy utilization comparison for task sets with different number of tasks is shown in
Fig. 4.
TABLE 4 ENERGY CONSUMPTION COMPARISON
No. of tasks RVVS, n=4 Without DVS % Energy Saving
VH VL VH VL
5 23 20 33 0 15.15%
10 19 88 63 0 34.92%
15 35 128 99 0 32.32%
Figure 4: Energy gain with RVVS algorithm at n=4
International Journal of Computer Science and Information Security (IJCSIS), Vol. 14, No. 6, June 2016
819 https://sites.google.com/site/ijcsis/ ISSN 1947-5500

6. CONCLUSION AND FUTURE DIRECTIONS
Being a critical resource in the life time of a sensor node and other processing devices, battery life has to be used
wisely. The paper proves that energy can be saved up to 50% when two voltage levels are used such that one is
twice the other. It also presents a scheduling algorithm (RVVS) which couples dynamic voltage scaling and real
time scheduling to save a significant amount of energy. The RVVS algorithm has been presented with optimizations
in order to conserve energy further. The numerical results for the task sets clearly show the efficacy of the RVVS
and indicate that an average of 27.46% energy is conserved. The frequency switching has also been reduced
considerably by introducing the minimum number of checks. The work has been reciprocated for two voltage levels
and can easily be modified to handle the situations dealing with multiple voltage levels while keeping the cost of
switching into consideration.
RVVS can be applied to a wide variety of real time processing devices. As most of the modern processing devices
are battery driven, the significant energy savings can remarkably extend their life. In future the work can be
extended beyond the periodic tasks towards sporadic and aperiodic tasks while dealing with multiple voltage levels.
REFERENCES [1]. C. M. Krishna , Yann-Hang Lee, “Voltage-Clock-Scaling Adaptive Scheduling Techniques for Low Power in Hard Real-Time Systems”,
Proceedings of the Sixth IEEE Real Time Technology and Applications Symposium (RTAS 2000), p.156, 2000
[2] P. Pillai and K.G. Shin. “Real-Time Dynamic Voltage Scaling for Low Power Embedded Operating Systems”, Proc. 18th ACM symposium
on Operating Systems Principles, (89-102),2001.
[3] V.Swaminathan , K. Chakrabarty ,” Real-time task scheduling for energy-aware embedded systems”, In Proceedings of the IEEE Real-Time Systems Symp. (Work-in-Progress Session), 2000.
[4] C.L. Liu, J. Layland, “Scheduling algorithms for multiprogramming in a hard real-time environment”,J. ACM 20, 46–61,1973.
[5] K. Jeffay, D.F. Stanat, C.U. Martel, “On non-preemptive scheduling of periodic and sporadic tasks with varying execution priority”,
Proceedings of the IEEE Real-Time Systems Symposium, December, pp. 129–139,1991.
[6] W.H. Zhao and F. Xia ,“An Efficient Approach to Energy Saving in Microcontrollers‟, Proc. Asia Pacific Computer Systems Architecture
Conf., Lecture Notes in Computer Science, vol. 4186, pp. 595-601,2006 [7] A. L. Mohan, A. S. Pillai, “Dynamic voltage scaling for power consumption reduction in real-time mixed task model”, Int. conference on
Computer Science Engineering and Applications, 2011.
[8] T. Pering, T. Burd, R. Brodersen, “The simulation and evaluation of dynamic voltage scaling algorithms”, Proceedings of International Symposium on Low Power Electronics and Design ISLPED‟98, , pp.76–81,1998.
[9] T. Ishihara and H. Yasuura, “Voltage scheduling problem for dynamically variable voltage processors”. In Proceedings of the 1998
International Symposium on Low Power Electronics and Design (ISLPED ‟98, 197–202. 1998.
International Journal of Computer Science and Information Security (IJCSIS), Vol. 14, No. 6, June 2016
820 https://sites.google.com/site/ijcsis/ ISSN 1947-5500

Design and Detection of Network Covert Channels-An Overview
R.RajamenakshiDepartment of Computer Science
Avinashilingam Deemed University, Coimbatore ,[email protected]
Dr.G.PadmavathiDepartment of Computer Science
Avinashilingam Deemed University, Coimbatore ,[email protected]
Abstract
Sensitive information leakage is increasing due to wide spread use of internet and technology. The attackers find new ways toexfiltrate data that pose threat to data security and privacy. Here our focus is on the covert information leakage over the networkthat exploits the various network protocols and their behavior. Information leak over covert channels exploit a variety of protocolsof network protocols including Wireless, mobile and virtualized cloud platforms etc. Current network security solutions like IDS,IPS, firewalls etc. are not designed to handle these type of attacks. These type of attacks are dynamic in nature and mimics thelegitimate traffic behavior, there by posing a challenge to detect and prevent. This article presents comprehensive review of thenetwork covert channel, design, detection and mitigation. We have reviewed the classification of covert channels based on theattacks
I. INTRODUCTION
Sensitive data leakage over the networked environment is on the rise with the increasing network traffic. With attackersfinding new ways to exfiltrate data, there is a threat to security and privacy of sensitive data irrespective of the storage.Steganography and cryptography have become the techniques of the past that used to image, audio or video files etc.to embedinformation. Inadvertent data leak arising due to human errors and application flaws, malicious data leak due to insider actions,stealthy software and covert channels, legitimate information flow give rise to information leak.Network Covert channels are class of attacks where the attackers exploit the network protocol entities that are not intended forcarrying information between any two ends, leaks sensitive information over the media. Here the attackers optimally select orcontrol the entities of the exploited channel that the communication between the two ends appears normal and there by evadessecurity. Lubacz [3]details on the security breaches and the data compromise over the network in the year 2011.Most of these attacks are command and control attacks over the network. Here the host machines were compromised eitherby phishing attacks or implanting a malware on the victim computer. [1],[2] discusses sensitive data leakage of the defenseand Justice departments in US and ’Operation Twins’ in the last decade leading to data and financial loss. Zander et.al [15]presents a comprehensive survey of the possible protocol exploits both in LAN and Wireless networks. This type of attackdemonstrates the extent to which the protocol structure, features and their behavior be exploited for staging information leakattacks.Lampson, the first to use the term covert channel defines it as a channel that are neither designed not intended to transferinformation. Cabuk [5] defines it as a communication channel that violates a security policy by using a shared resource inways for which they were not initially designed. Covert communication happens when an attacker finds and exploits a sharedresource that is not designed to be a communication mechanism.Cabuk [5] described it as a subclass of information hiding technique where the sensitive information is hidden in a media thatare neither designed nor intended to transfer information.[1] emphasizes the threat posed by these channels pose in a trusteddistributed systems that allows leak of confidential information. Network covert shells are used by the attackers to communicateto with compromised hosts. Researchers are exploring various possibilities to detect, identify, prevent and mitigate both storageand timing channels. The primary focus of this work is to study and understand the network covert channels, design, anddetection and further the challenges.Lubacz [3] coined the word Network steganography that focuses on embedding information using network protocols andbehavior. The choice of the carrier for embedding and hiding information depends on the popularity, capacity and robustnessof the carrier. Network steganography utilizes control elements and their basic functionalities of the communication protocolsto transmit secret data over a network that appears as legitimate transmissions. In this kind of transmission, both the senderand the receiver need to agree on a mechanism using which the data is sent over the network.Lampson referred this communication channel that was established to transmit or leak the information as covert channel; asthese channel are not intended for communication. Here the covert channel and protocol steganography are interchangeablyused terms meaning the same. The information leak over covert channels are on the rise due to the following reasons:
• There is no limitation on the amount of data that can be hidden,
International Journal of Computer Science and Information Security (IJCSIS), Vol. 14, No. 6, June 2016
821 https://sites.google.com/site/ijcsis/ ISSN 1947-5500
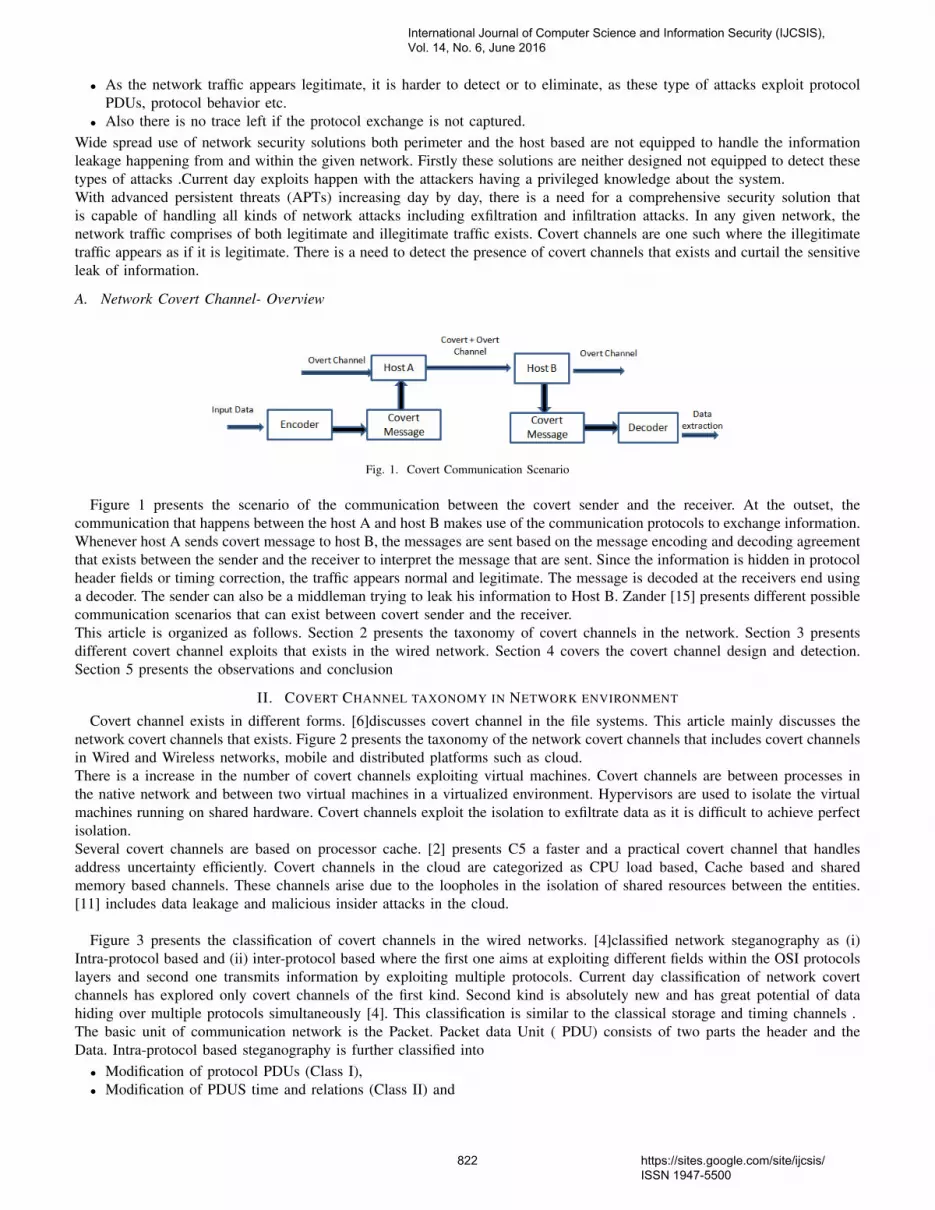
• As the network traffic appears legitimate, it is harder to detect or to eliminate, as these type of attacks exploit protocolPDUs, protocol behavior etc.
• Also there is no trace left if the protocol exchange is not captured.Wide spread use of network security solutions both perimeter and the host based are not equipped to handle the informationleakage happening from and within the given network. Firstly these solutions are neither designed not equipped to detect thesetypes of attacks .Current day exploits happen with the attackers having a privileged knowledge about the system.With advanced persistent threats (APTs) increasing day by day, there is a need for a comprehensive security solution thatis capable of handling all kinds of network attacks including exfiltration and infiltration attacks. In any given network, thenetwork traffic comprises of both legitimate and illegitimate traffic exists. Covert channels are one such where the illegitimatetraffic appears as if it is legitimate. There is a need to detect the presence of covert channels that exists and curtail the sensitiveleak of information.
A. Network Covert Channel- Overview
Fig. 1. Covert Communication Scenario
Figure 1 presents the scenario of the communication between the covert sender and the receiver. At the outset, thecommunication that happens between the host A and host B makes use of the communication protocols to exchange information.Whenever host A sends covert message to host B, the messages are sent based on the message encoding and decoding agreementthat exists between the sender and the receiver to interpret the message that are sent. Since the information is hidden in protocolheader fields or timing correction, the traffic appears normal and legitimate. The message is decoded at the receivers end usinga decoder. The sender can also be a middleman trying to leak his information to Host B. Zander [15] presents different possiblecommunication scenarios that can exist between covert sender and the receiver.This article is organized as follows. Section 2 presents the taxonomy of covert channels in the network. Section 3 presentsdifferent covert channel exploits that exists in the wired network. Section 4 covers the covert channel design and detection.Section 5 presents the observations and conclusion
II. COVERT CHANNEL TAXONOMY IN NETWORK ENVIRONMENT
Covert channel exists in different forms. [6]discusses covert channel in the file systems. This article mainly discusses thenetwork covert channels that exists. Figure 2 presents the taxonomy of the network covert channels that includes covert channelsin Wired and Wireless networks, mobile and distributed platforms such as cloud.There is a increase in the number of covert channels exploiting virtual machines. Covert channels are between processes inthe native network and between two virtual machines in a virtualized environment. Hypervisors are used to isolate the virtualmachines running on shared hardware. Covert channels exploit the isolation to exfiltrate data as it is difficult to achieve perfectisolation.Several covert channels are based on processor cache. [2] presents C5 a faster and a practical covert channel that handlesaddress uncertainty efficiently. Covert channels in the cloud are categorized as CPU load based, Cache based and sharedmemory based channels. These channels arise due to the loopholes in the isolation of shared resources between the entities.[11] includes data leakage and malicious insider attacks in the cloud.
Figure 3 presents the classification of covert channels in the wired networks. [4]classified network steganography as (i)Intra-protocol based and (ii) inter-protocol based where the first one aims at exploiting different fields within the OSI protocolslayers and second one transmits information by exploiting multiple protocols. Current day classification of network covertchannels has explored only covert channels of the first kind. Second kind is absolutely new and has great potential of datahiding over multiple protocols simultaneously [4]. This classification is similar to the classical storage and timing channels .The basic unit of communication network is the Packet. Packet data Unit ( PDU) consists of two parts the header and theData. Intra-protocol based steganography is further classified into
• Modification of protocol PDUs (Class I),• Modification of PDUS time and relations (Class II) and
International Journal of Computer Science and Information Security (IJCSIS), Vol. 14, No. 6, June 2016
822 https://sites.google.com/site/ijcsis/ ISSN 1947-5500

Fig. 2. Covert Channel Taxonomy
• Hybrid based (Class III)Storage channels exploit the unused fields (usually header fields) of the protocol specification and the altering the packet
payload. These unused fields are usually ignored by the current day implementations of IDS, IPS and firewalls and there byevading security and these packets would appear normal. In the case of modification of PDUs time and relations, manipulatesthe inter packet delays and reordering of the packets.
III. RELATED WORK
Covert channel of the recent times exists in virtual environments, cloud, mobile computing environments. Covert Channelsin Wireless LAN exploit AODV protocol fields specifically route requests, source sequence number, and life time field anddestination id. Recently there are also exploits in protocols other than TCP/IP like SCTP, Skype etc. Covert channels are difficultto design and implement. Once designed, it is very difficult to detect. Storage covert channels are easy to implement thantiming channels, but timing channels are hard to detect. This section provides covert channel exploits specific to Transport andthe Network layer of the TCP/IP protocol stack. Table 1 and 2 provides the exploits in Type 1 and 2 respectively correspondingto the covert channel taxonomy as given in figure 3
A. Storage Channel exploits
Storage covert channels exploits the header fields both used and unused fields. Table I summarizes the exploits underdifferent protocols.
In addition to the above there are also exploits at the application layer protocols such as HTTP, SSH, FTP and DNS. [40]presents the covert channels in Dynamic source routing(DSR) in ad-hoc routing protocols. The information is encoded in DSRrouting requests. Li et.al [34] presents a number of covert channels in AODV( Adhoc On-Demand Distance Vector) protocol.[38] [39] presents covert channels in Wireless LAN networks. Mazurczyk [35] proposed a covert channel In VoIP streams.Lucene et.al [36] propose a CC for SSH and Zou et.al [37] proposed embedding covert channel in FTP
B. Timing Channel exploits
Timing Channel exploits the inter-packet timing delays and packet sequences. Table II summarizes the exploits of the sameirrespective of the protocols.
IV. COVERT CHANNEL- DESIGN AND DETECTION
A. Covert timing Channel Design
There is a good amount of literature available on the design and implementation of covert timing channels. Over thetime, covert timing channels (CTC) such as IPCTC, TRCTC, MBCTC, FXCTC (Fixed short and long time delay based CTC),Jitterbugs that range from simple to complex have evolved. Cabuk [7] designed the first simple CTC, where the sender transmits
International Journal of Computer Science and Information Security (IJCSIS), Vol. 14, No. 6, June 2016
823 https://sites.google.com/site/ijcsis/ ISSN 1947-5500

Fig. 3. Covert Channel Classification in Wired network
binary information with on/off by sending packets during the interval. Later Yao et.al categorized them into deterministic andnon-deterministic channel based on the inter packet delay distribution.Cabuk [8] designed a CTC called Traffic-Replay channel (TRCTC) where the pre-recorded sequence is divided in to twobased on the cut-off value agreed between the sender and the receiver beforehand. TRCTC is difficult to detect. [9] proposed aModel-Based CTC (MBCTC) that introduces random inter-packet delays which is computed based on the delays in the delaysin the legitimate traffic. There are CTC based on other application protocols like keyboard jitterbug that leaks information withdifferent time delays based on the sum of time delays in the keystrokes and its application environment such as FTP, SSH,telnet, instant messaging etc.
[16] presents the complete analysis of hiding in SCTP protocol used in multi-streaming and multi-homing and is a candidatefor TCP and UDP in future IP networks. [15] discussed the design of a packet length based covert channels with temperatureresistance and time efficient to achieve high bandwidth in network protocols. In general covert channels are designed in such away that it exhibits high degree of stealthiness, reliability and low bandwidth utilization. The efficiency of the covert channellies in the choice of carrier and algorithm used for hiding information.[18] presents a covert channel by reordering the packets by making specific permutation. [17] presents a retransmissionmethod on the protocols like TCP that use retransmission mechanisms. [14] presents a predictable and quantifiable approachto designing a covert communication system capable of effectively exploiting various layers of the network. Liu [19] presentsa novel technique to adjust the inter-packet delay of the covert channel close to the legitimate traffic that evades detectionthat is similar to the MBCTC. This method suffers from more computations at both ends to get the original sequence and todecode the message.
B. Covert timing Channel Detection
[10] [12] Methods to detect covert timing channels can be classified into two classes namely (i) Shape tests and the regularitytests. Shape tests include Kolmogrov Smirnov tests and the entropy based tests that include first order entropy test, Correctedconditional entropy tests, Kullback-Leibler (KL) divergence test etc. The regularity tests include test that include second andhigher order statistics. Figure 4 present the classification of covert channel detection technique
Cabuk [5] implements and presents TRCTC and IPCTC detection based on the entropies on the inter packet delay. Steven[13] presents the application of entropy and corrected conditional entropy on TRCTC, MBCTC and Jitterbug and presentedthe results. Combining entropy and corrected conditional entropy methods detects only typical CTCs. However these do not
International Journal of Computer Science and Information Security (IJCSIS), Vol. 14, No. 6, June 2016
824 https://sites.google.com/site/ijcsis/ ISSN 1947-5500

TABLE IMODIFICATION OF PDU’S
Category Protocol Layer Protocol Nature of Exploit Exploited FieldI-B Transport
LayerTCP Unused Header Field TCP Urgent Pointer [22]
TCP Reset Flag [24]TCP Timestamp Field [25]
Header field TCP Initial Sequence Number(ISN) Field [26] [27]
CheckSum field TCP header Checksum fieldUDP Checksum Field UDP header Checksum fieldSCTP Different header fields of SCTP
I-B Network Layer IP Unused header field IP Header Type ofservice(ToS)[20]IP Dont fragment (DF) bit [20]IP Id field [26]
Checksum Field IP header Checksum fieldModulating TTL Field IP TTL Field [28]Modulating address and Packetlengths
IP Source and Destination fields[29]IP length of link layer frame-sIP/TCP/UDP packet as well
I-B Network Layer IP V6 Unused header field Various Covert channels in IPv6header fields traffic class and flowlabel [23]
Modulating TTL Field IPv6 HopField Limit [30] [23]Header Extensions and Padding IPv6 Destination option headers
[32]IPv6 hop-by-hop, routing, frag-ment, authentication, encapsulatingsecurity payload extension headersand IP route record option headers[23]
I-A ICMP Payload tunneling ICMP Tunneling [33] and others
TABLE IIMODIFICATION OF PDUS TIME AND DELAY
Category Nature of Exploit ExploitII-C Packet Rate Timing Channels On or off timing channel Cabuk [8]
Presence or absence of a bit in a time interval [29]Based on encoding information directly in inter-packet delays of Consecutive packets [31]- no senderreceiver sync is required
Message Sequence Timing Modulating CTS-RTS signals of serial port commu-nication [20]Indirect timing channel Hintz [22]
II-A Packet Loss and Packet sorting Kundar [21] CC through Packet sortingReordering of packets Galatenko [41]
support detection of complex covert channels.[10] proposes new techniques using Wavelet transformation and SVM. Here the wavelet transformation is used to extract thefeatures of maximum entropies at different levels and SVM is used to train the model for automatic identification. They havepresented a detailed analysis of the detecting various covert channels and their accuracy. The accuracy of using SVM andwavelets for detecting FXCTC, TRCTC, MBCTC is 100% for FX and TRCTCs and 96% for MBCTC.Rennie [12] proposed a new shape test based on Welchs t-test and compared the results with the existing detection methods.Welchs test outperforms the CCE tests. Further by using the SVM classifier, the classification rate for MBCTC increased from0.67 to 0.94.Valentino [11] discusses a class of statistical analysis techniques that have been proposed to detect the presence of behavioralanomalies rising in covert channels. Table III summarizes the detection mechanisms of covert timing channel
Cabuk et.al [8] observed a regularity in the covert transmissions that can be used as a key in identify the existence ofsuch channel. It is also observed that the entropy is uniform when the covert communication takes place. This occurs due tothe agreement that exists between the sender and the receiver. They also performed experiments with the noiseless and noisychannels. Attackers may also use multiple channels to transmit covert information. NZIA-II data set and DARPA99 (for telnetand HTTP traffic) were used for the analysis of these channels.
International Journal of Computer Science and Information Security (IJCSIS), Vol. 14, No. 6, June 2016
825 https://sites.google.com/site/ijcsis/ ISSN 1947-5500

Fig. 4. Covert Channel Detection
TABLE IIICOVERT TIMING CHANNEL DETECTION
CovertChannel Implementation DetectionIPCTC [5] Presence of a packet in a time period is
taken as a bit 1 and absence as 0Entropy based [5]
TRCTC [8] Prerecorded data sequence into two and thedata is sent through two channels, based onthe agreement between the sender and thereceiver
Entropy [5]and Corrected Condi-tional Entropy [13], Wavelet andSVM [10]
MBCTC Inter-packet delay is not fixed and is ran-domly generated
Corrected Conditional Entropy[13], Welchs test [12], Waveletand SVM [10]
Berk [31] Proposed method based on statistical analysis of inter-arrival times using histograms. Sohn [42] proposed SVMBased approach for detecting ICMP tunneling and IP ID or TCP ISN fields. Pack et.al proposed behavior profiles of trafficflows for detecting HTTP tunnels. Tamoian [43] proposed a Neural Network based with 99% accuracy to detect TCP ISNfields and observed that any ISN sequence numbers not matching any prediction model indicates covert channel. Hintz [22]detected the presence of TCP Timestamp channel by computing the ratios of different timestamps used and the total numberof timestamps.
V. GAPS AND CHALLENGES
Network anomaly detection of the present day are signature based that classifies the traffic as normal or abnormal based onthe predefined pattern. Although other statistical and machine learning techniques are being devised, they have not taken thestage to capture all types of attacks both known and unknown.Covert channels that are established imitates the legitimate traffic and evades all these solutions. It is difficult to identify andunderstand the understanding that exists between the sender and the receiver. It may not simple and it could be a function ofa variety of factors to make it complex. Also the sender may study the network traffic and based on which the communicationmay happen. The sender may transmit information only when the traffic is at its maximum and refrain from sending duringthe odd hours.Currently, the network anomaly detection are netflow or packet based analysis. We need to analyse the network traffic frommultiple dimensions to detect the presence of these channels. We need to analyse the most frequently connections and theduration of such connections. We also have to look at the threats and vulnerabilities posed by the host with which these attacks
International Journal of Computer Science and Information Security (IJCSIS), Vol. 14, No. 6, June 2016
826 https://sites.google.com/site/ijcsis/ ISSN 1947-5500

are staged.The current day detection techniques and methods do not address problem as a whole. and presents solution in parts specificto objective under study. It is also evident from the above study that only the entropy based and their variation techniqueshave been explored. There is a huge scope for exploring computational and bio- inspired algorithms to solve the problem asa whole that can mitigate the covert communications.
VI. CONCLUSION
This article presented the comprehensive review of the network covert channels exploits, design and detection. We havepresented the missing gaps and challenges that exists. It is very evident that with the increase in the network attacks atvarious platforms, there is a need for a comprehensive solution that is capable of detecting and prevent the information leakagehappening over the network or from devices. The design of the network security solutions can be relooked upon for handlingvarious attacks emanating from both inside and outside to tackle both the attackers from inside and the external world.With regard to the covert channels, it is a challenge to detect and break the agreement that the sender and the receiver holdsfor transmitting information. Hence there is a need to understand the problem and to device solutions that address the problemdomain. We need a comprehensive solution that handles the covert channels emanating in the network irrespective of theproblem.
REFERENCES
[1] Steffen Wendzel, et.al , Hidden and Uncontrolled On the Emergence of Network Steganographic Threats, ISSE 2014 Securing Electronic BusinessProcesses: Highlights of the Information Security Solutions Europe 2014 Conference, pp 123-133.
[2] Zieliska, E., Mazurczyk, W., Szczypiorski, K., Development Trends in Steganography, In: Communications of the ACM, 57(2), pp. 86-95, March 2014[3] J. Lubacz, W. Mazurczyk, K. Szczypiorski - Principles and Overview of Network Steganography, IEEE Communication Magazine, April 2014[4] B. Jankowski, W. Mazurczyk, K. Szczypiorski - PadSteg: Introducing Inter-Protocol Steganography, Telecommunication Systems: Modeling, Analysis,
Design and Management, Telecommun Systems (2013) 52:11011111, DOI 10.1007/s11235-011-9616-z[5] Serdar Cabuk, IP Covert Channel Detection, ACM transactions on Information and Systems security, Vol 122, No.4 Article 22, Apr 2009[6] Hassan Khan, Mobin Javed, Syed Alii Khayam, Fauzan Mirza, Designing a cluster based covert channel to evade disk investigation and forensics,
Computers and Security, Vol 30 Issue 1 Jan 2011 Pg 35-49[7] S.Cabuk, C., Brodley, C. E., and Shields, T. C., IP Covert Timing Channels- An initial exploration, ACM Conference on Computer and communications,
2004[8] Serdar Cabuk, Carla E. Brodley, Clay Shields, IP Covert Timing Channels: Design and Detection, ACM Conference on Computer and Communications
Security - CCS , pp. 178-187, 2004[9] GIanvecchio S, Wang.H, Wikesekera D, Jajodia S, Model based covert timing channel: automated modeling and evasion, In proceedings of Symposium
on recent advances in Intrusion detection:2008, p 211-30[10] Sheng Mou, Zhiwen Zhaoa, Sisi Jiang, Zushun Wu, Jiaojiao Zhu, Feature extraction and classification algorithm for detecting complex covert timing
channel, Computers and Security, Vol 31, Issue 1, Feb 2012, pg 70-82[11] Valentino Crespi, George Cybenko, Annarita gian, Engineering Statistical Behaviors for attacking and defending Covert channels, IEEE Journal of
selected topics in signal processing, Vol 7,No 1, Feb 2013[12] Rennie Archibald, Dipak Ghosal, A comparative analysis of detection metrics for covert timing channels, Computers and Security, Vol 45, Sep 2014,
pg 284-292[13] Steven Gianvecchio and Haining Wang, An Entropy-Based Approach to Detecting Covert Timing Channels, IEEE transactions on Dependable and Secure
Computing ,Volume 8, Issue 6 Nov-Dec 2011 pg 785-797[14] Ronald W. Smith, Scott G. Knight, Predictable Three parameter design of network covert communication systems, IEEE transaction on information
forensics and security Vol6, No.1 March 2011[15] Sebastian Zander, GrenVille Armitage, Philip Branch, A survey of covert channels and counter measures in computer network protocols, IEEE
communications surveys and tutorials, 3rd Quarter 2007, Vol 9, No.3, pp 44-57[16] W.Fraczek, W.Mazurczyk, Krzysztof Szczypiorski, Hiding information in a stream Control transmission protocol, Journal Computer Communications,
Volume 35 Issue 2, January, 2012, pp159-169[17] W.Fraczek, W.Mazurczyk, Krzysztof Szczypiorski, Retransmission steganography and its detection, Springer Soft computing Nov 2009[18] Adel El-Atawy, Ehab-Al-Shaer, Building covert channels over the packet reordering phenomenon, IEEE INFOCOM 2009[19] Y. Liu, C. Corbett, K. Chiang, R. Archibald, B. Mukherjee, D. Ghosal, SIDD: A Framework for Detecting Sensitive Data Exfiltration by an Insider
Attack, Proceedings of the 42st Annual Hawaii International Conference on System Sciences, pp.1-10, Jan., 2009[20] T. Handel and M. Sandford ”Hiding Data in the OSI Network Model”, Proc. 1st Intl. Wksp. Information Hiding, pp.23 38 1996[21] D. Kundur and K. Ahsan ”Practical Internet Steganography: Data Hiding in IP”, Proc. Texas Wksp. Security of Information Systems, 2003[22] Drew Hintz, Covert Channels in TCP and IP Headers, 2003[23] N. B. Lucena , G. Lewandowski and S. J. Chapin ”Covert Channels in IPv6”, Proc. Privacy Enhancing Technologies (PET), pp.147 -166 2005[24] G. Fisk ”Eliminating Steganography in Internet Traffic with Active Wardens”, Proc. 5th Intl. Wksp. Information Hiding, 2002[25] J. Giffin ”Covert Messaging Through TCP Timestamps”, Proc. Privacy Enhancing Technologies Workshop (PET), pp.194 -208 2002[26] C. H. Rowland ”Covert Channels in the TCP/IP Protocol Suite”, First Monday, 1997[27] J. Rutkowska ”The Implementation of Passive Covert Channels in the Linux Kernel”, Proc. Chaos Communication Congress, 2004[28] E. Jones , O. Le Moigne and J.-M. Robert ”IPTraceback Solutions Based on Time to Live Covert Channel”, Proc. 12th IEEE Intl. Conf. Networks
(ICON), pp.451-457 2004[29] M. A. Padlipsky , D. W. Snow and P. A. Karger Limitations of End-to-End Encryption in Secure Computer Networks, 1978[30] H. Qu , P. Su and D. Feng ”A Typical Noisy Covert Channel in the IP Protocol”, Proc. 38th Annual Intl. Carnahan Conf. Security Technology, pp.189
-192 2004[31] V. Berk , A. Giani and G. Cybenko Detection of Covert Channel Encoding in Network Packet Delays, 2005[32] T. Graf Messaging over IPv6 Destination Options, 2003 [online] Available:http://gray-world.net/papers/messip6.txt[33] ”LOKI2: The Implementation”, Phrack Magazine, vol. 7, no. 51, 1997[34] S. Li and A. Ephremides ”A Network Layer Covert Channel in Adhoc Wireless Networks”, Proc. 1st IEEE Conf. Sensor and Ad Hoc Commun. and
Networks (SECON), pp.88 -96 2004
International Journal of Computer Science and Information Security (IJCSIS), Vol. 14, No. 6, June 2016
827 https://sites.google.com/site/ijcsis/ ISSN 1947-5500

[35] W. Mazurczyk and Z. Kotulski ”New VoIP Traffic Security Scheme with Digital Watermarking”, Proc. Intl. Conf. Computer Safety, Reliability, andSecurity (SafeComp), pp.170 -181 2006
[36] N. Lucena ”Syntax and Semantics-Preserving Application-Layer Protocol Steganography”, Proc. 6th Information Hiding Wksp., 2004[37] X. Zou ”The Research on Information Hiding Based on Command Sequence of FTP Protocol”, Proc. 9th Intl. Conf. Knowledge-Based Intelligent Info,
and Engineering Systems, pp.1079 -1085 2005[38] L. Butti and F. Veysset ”Wi-Fi Advanced Stealth”, Proc. Black Hat US, 2006 [online] Available:http://www.blackhat.com/presentations/ bh-usa-06/BH-
US-06-Veyssett.pdf[39] C. Kratzer ”WLAN Steganography: a First Practical Review”, Proc. 8th ACM Multimedia and Security Wksp., 2006[40] M. Marone Adaptation and Performance of Covert Channels in Dynamic Source Routing, 2003 [online] Available:http://zoo.cs.yale.edu/ classes/cs490/03-
04a/michael.marone/paper.pdf[41] A. Galatenko ”Statistical Covert Channels Through PROXY Server”, Proc. 3d Intl. Wksp. Mathematical Methods, Models, and Architectures for Computer
Network Security, pp.424 -429 2005[42] T. Sohn , J. Seo and J. Moon ”A Study on the Covert Channel Detection of TCP/IP Header Using Support Vector Machine”, Proc. 5th Intl. Conf. Info.
and Commun. Security, pp.313 -324 2003[43] E. Tumoian and M. Anikeev Detecting NUSHU Covert Channels Using Neural Networks, 2005
International Journal of Computer Science and Information Security (IJCSIS), Vol. 14, No. 6, June 2016
828 https://sites.google.com/site/ijcsis/ ISSN 1947-5500

Generalized Intuitionistic Fuzzy Interior Ideals of Semigroups
Muhammad Sajjad Ali Khan
Department of Mathematics, Hazara University, Mansehra, KPK,
Pakistan
Saleem Abdullah
Department of Mathematics, Abdul Wali Khan University, Mardan,
KPK, Pakistan
Muhammad Shakeel
Department of Mathematics, Hazara University, Mansehra, KPK,
Pakistan
Khaista Rahman
Department of Mathematics, Hazara University, Mansehra, KPK,
Pakistan
.
Abstract— In this paper we introduce and study a new sort of
intuitionistic fuzzy interior -hyperideals of a -
semihypergroup, called ( , )-intuitionistic fuzzy interior -
hyperideals by using the combined notions of belongingness and
quasicoincidence of intuitionistic fuzzy points and intuitionistic
fuzzy sets and some interesting properties are investigated. We
show that an IFS A = ⟨ A, A⟩ is an (∈, ∈∨q)-intuitionistic fuzzy
interior -hyperideal of H if and only if U(t, s) =x ∈ H: x(t, s) ∈
A for all t ∈ (0,0.5] and s ∈ [0.5, 1) is interior Γ -hyperideal of
H. Moreover, we show that an IFS A = ⟨ A, A⟩ is an (∈, ∈∨q)-
intuitionistic fuzzy interior -hyperideal of H if and only if
[A](t, s) =x ∈ H: x(t, s) ∈ ∨qAfor all t ∈ (0, 1] and s ∈ [0, 1) is an
interior -hyperideal of H. These showed that (∈, ∈∨q)-
intuitionistic fuzzy interior -hyperideals of H are generalization
of existence of intuitionistic fuzzy interior Γ -hyperideal of H.
Keywords: Semigroup, Intuitionistic fuzzy point; Intuitionistic
fuzzy sets; ( , )-Intuitionistic fuzzy interior ideal.
1. Introduction Marty has defined a new novel concept so called hyperstructure in
1934, when he introduced the notion of a hypergroup based on a
hyperoperation [29]. In the last few decades and nowadays the
scientist introduced so many different types of algebraic
hyperstructure. They studied these hyper structures from the
theoretical point of view, and also studied their applications to many
subjects of pure and applied mathematics. In a classical algebraic
structure, the composition of two elements is an element, while in an
algebraic hyperstructure; the composition of two elements is a set.
Different authors have written many books on such algebraic
structures [13, 10, 11, 34]. Application of hyperstructures have
found in lattices, rough set theory, probability, coding theory, binary
relations, graphs, hypergraphs automata and geometry [11]. A detail
study of the theory of semihypergroups can be found in [14, 8].
Anvariyeh, et. al. in [33], defined the notion of a -semihypergroup
and the notion of -hyperideal, bi- -hyperideal and quasi- -
hyperideal of a -semihypergroup. A -semihypergroup is a
generalization of the notions of a semigroup, semihypergroup and a
-semigroup. Heidari et. al. further extended the theory of a -
semihypergroup. They introduced the notions of prime -hyperideal,
extension of a -hyperideal in -semihypergroups. They proved
some results in respect and present many examples of -
semihypergroup. Also, they studied the notions of a quotient -
semihypergroup by using a congruence relation, and gave the
concept of right Noetherian -semihypergroups [20]. In [21],
Heidari and Davvaz studied further the notion of semiprime
hyperideals in a -semihypergroup and also, they defined the
concept of -hypergroups and closed -subhypergroups. Finally,
they studied the concept of -semihypergroups associated to binary
relations. They gave necessary and sufficient conditions on a set of
binary relations on a non-empty set H such that H becomes a -
semihypergroup or a -hypergroup. In 2011 [3], Abdullah et. al.
introduced the concept of M-hypersystems and N-hypersystems of a
-semihypergroup and they studied different relations of M-
hypersystems and N-hypersystems with quasi-prime hyperideals of a
-semihypergroup. Mirvakili et. al [30], provided more canonic
properties and confronted various examples of -semihypergroups.
Hil et. al., presented many interesting examples and obtained a
several characterizations of a -semihypergroups [24, 2].
After the introduction of the concept of fuzzy sets by Zadeh, several
researches conducted the researches on the generalizations of the
notions of fuzzy sets with huge applications in computer, logics and
many branches of pure and applied mathematics. In 1971, Rosenfeld
[31] defined the concept of fuzzy group. Since then many papers
have been published in the field of fuzzy algebra. Recently fuzzy set
theory has been well developed in the context of hyperalgebraic
structure theory. A recent book [11], contains a wealth of
applications. In [16], Davvaz introduced the concept of fuzzy
hyperideals in a semihypergroup. Recently in [23], Hila and Gani
have studied the structure of semihypergroups through fuzzy sets. A
several papers are written on fuzzy sets in several algebraic
International Journal of Computer Science and Information Security (IJCSIS), Vol. 14, No. 6, June 2016
829 https://sites.google.com/site/ijcsis/ ISSN 1947-5500

hyperstructures. But in fuzzy sets theory, there is no means to
incorporate the hesitation or uncertainty in the membership degrees.
As an important generalization of the notion of fuzzy sets on a non-
empty set X, in 1984, Atanassov introduced in [6, 7], the concept of
intuitionistic fuzzy sets on a non-empty set X which give both a
membership degree and a non-membership degree. The relations
between intuitionistic fuzzy sets and algebraic structures have been
already considered by many mathematicians. In [18], using
Atanassov idea, Davvaz established the intuitionistic fuzzification of
the concept of hyperideals in a semihypergroup and investigated
some of their properties. Recently, in [4, 22], Abdullah et. al,
initiated a study on intuitionistic fuzzy sets in -semihypergroups.
D. Coker and M. Demirci in [9], introduced the notion of
intuitionistic fuzzy point. Y. B. Jun [25], introduced the notion of
),( ΨΦ -intuitionistic fuzzy subgroup where ΨΦ, are any two of
qqq ∧∈∨∈∈ ,,, with q∧≠∈Φ , and related properties are
investigated. Recently, in [1], M. Aslam and S. Abdullah introduced
the concept of ( , )-intuitionistic fuzzy ideals of hemirings by
using the intuitionistic fuzzy point and intuitionistic fuzzy set.
The orginal contribution of the authors: We introduce a new
generaization of intuitionistics fuzzy interior -hyperideals of -
semihypergroups. We define ( , )-intuitionistic fuzzy interior -
hyperideals of -semihypergroups. We shows by an example the
present concept of this paper is a generalization of an ordinary
intuitionistic fuzzy interior -hyperideals of -semihypergroups.
Our aim in this paper is to introduce and study a new sort of
intuitionistic fuzzy interior -hyperideals of a -semihypergroup is
called ( , )-intuitionistic fuzzy interior -hyperideals by using the
combined notions of belongingness and quasicoincidence of
intuitionistic fuzzy points and intuitionistic fuzzy sets and some
interesting properties are investigated. We show that an IFS A = ⟨ A, A⟩ is an ),( q∨∈∈ -intuitionistic fuzzy interior -hyperideal of H if
and only if U(t, s) =x ∈ H: x(t, s) ∈ A for all t ∈ (0,0.5] and s ∈ [0.5, 1) is interior -hyperideal of H . Moreover, we show that an
IFS A = ⟨ A, A⟩ is an ),( q∨∈∈ -intuitionistic fuzzy interior -
hyperideal of H if and only if [A](t, s) =x ∈ H: x(t, s) ∈ ∨qAfor all t ∈ (0, 1] and s ∈ [0, 1) is an interior -hyperideal of H. These
showed that ),( q∨∈∈ -intuitionistic fuzzy interior -hyperideals of
H are generalization of existence of intuitionistic fuzzy interior -
hyperideal of H.
2. Basic Concepts
A hyperoperation o on H is a map ).(: HHH ∗℘→×o This mean
that a hyperoperation is different from a binary operation. A non-
empty set H with hyperoperation is called hyperstructure and
denoted by ),( oH , also ),( oH is called hypergroupoid. Let P and Q
be non-empty subsets of a hypergroupoid H . Then, hyperproduct of
P and Q is denoted by P Q and define as:,p P q Q
P Q p q∈ ∈
=o oU
a P a P=o o and .P a P a=o o
A hyperstructure ),( oH is called a semihypergroup if ),( oH holds
associative property, i.e.,
( ) ( ) .,, allfor Hzyxzyxzyx ∈= oooo
A γ -hyperoperation on H, is mapping from HH ×Γ× to )(H∗℘
i.e. for every Γ∈γ and Hyx ∈, such that Hyx ⊆γ .
Let H and be two non-empty sets. We denote the English alphabet
is the elements of H and the letters of the Greek alphabet is the
elements of . Then H is called a -semihypergroup if
1) Mba ⊆γ , for all Hba ∈, and Γ∈γ .
2) )()( cbacba βαβα = for all Hcba ∈,, and for all Γ∈βα , .
3) If Γ∈∈ 214321 ,,,,, γγHmmmm such that 2131 , γγ == mm and
42 mm = , then 423211 mmmm γγ = .
H is called a -hypergroupoid if only the assertions (1) and (3) are
satisfied in the above definition. An element e in a -
semihypergroup H is called left(right) identity if for all Hx ∈ and
Γ∈γ such that x e xγ∈ )( exx γ∈ . An element e in a
semihypergroup is called identity if e is a left identity and a right
identity. An element e of a -semihypergroup is called scalar left
(right) identity if xex γ= )( exx γ= for all Hx ∈ and .Γ∈γ A -semihypergroups with identity e is called -hypermonoid. If
a -semihypergroup holds reproduction axiom, xHHx γγ = for all
Hx ∈ and Γ∈γ is said to be a -hypergroup. Also, H is called
a -hypergroup if for each Γ∈γ , ( )γ,H is a hypergroup. A -
semihypergroup is called commutative if xyyx γγ = for all
Hyx ∈, and Γ∈γ .
Let P and Q be subsets of Γ -hypergroupoid and γ any
element of Γ . Then, we define ,
,p P q Q
P Q p qγ γ∈ ∈
= U , a P a Pγ γ=
P a P aγ γ= and P Q P Qγ
γ∈Γ
Γ =U
Let K be a non-empty subset of a Γ -semihypergroup H . Then, K
is called a sub- -semihypergroup of S if Kba ⊆γ for all Kba ∈,
and Γ∈γ .
Let ( )11,ΓH be a 1Γ -semihypergroup and ( )22 ,ΓH a 2Γ -
semihypergroup. A function 21: HH →Ψ is said to be a
homomorphism. If we have a bijective function 21: Γ→Γg such
that for all 1, Hba ∈ and ,1Γ∈γ ( ) ( ) ( ) ( )bgaba ΨΨ⊆Ψ γγ .
A non-empty subset A of a -semihypergroup H is called a right
(left) -hyperideal of H IyxIx ⊆⇒∈ γ )( IxyIx ⊆⇒∈ γ for all
Hy ∈ and Γ∈γ . A hyperideal I is a non-empty subset of a Γ -
semihypergroup H such that IyxIx ⊆⇒∈ γ and IxyIx ⊆⇒∈ γ
for all Hy ∈ and .Γ∈γ
Definition 2.1: [6] Let X be a nonempty fixed set. An intuitionistic
fuzzy set (briefly, IFS) A is object having the form
:)(),(,( XxxxxA AA ∈= γμ
Where the functions ]1,0[: →XAμ and ]1,0[: →XAγ denote
the degree of membership (namely )(xAμ ) and the degree of
International Journal of Computer Science and Information Security (IJCSIS), Vol. 14, No. 6, June 2016
830 https://sites.google.com/site/ijcsis/ ISSN 1947-5500

nonmembership (namely )(xAγ ) of each element Xx ∈ to the set A ,
respectively, and 1)()(0 ≤+≤ xx AA γμ for all Sx ∈ for the sake of
simplicity, we use the symbol ),( AAA γμ= for the IFS
:)(),(,( XxxxxA AA ∈= γμ .
Definition 2.2: [9] Let c be a point in a non-empty set X. If
]1,0(∈t and )1,0[∈s are two real numbers such that 10 ≤+≤ st ,
then the IFS
⟩−⟨= −st ccxstc 11,,),(
is called an intuitionistic fuzzy point (IFP for short) in X , where t
(resp, s ) is the degree of membership (resp, nonmembership) of
),( stc and Xc ∈ is the support of ),( stc . Let ),( stc be an IFP in X.
and let ⟩⟨= AAxA λμ ,, be an IFS in X . Then ),( stc is said to belong
to A, written Astc ∈),( if tcA ≥)(μ and scA ≤)(λ . We say that
),( stc is quasi-coincident with A, written qAstc ),( , if 1)( >+ tcAμ
and 1)( <+ scAλ .To say that qAstc ∨∈),( (resp. qAstc ∧∈),( )
means that Astc ∈),( or qAstc ),( (resp, Astc ∈),( and qAstc ),( ).
3. ( , )-Intuitionistic Fuzzy Interior -
hyperideals Definition 3.1: An IFS A = ⟨ A, A⟩ in -semihypergroup H is said
to be an ( , )-intuitionistic fuzzy interior -hyperideal of H, where
βα , are any two of qqq ∧∈∨∈∈ ,,, with q∧≠∈α , if the
following are hold.
(IFI1) Hyx ∈∀ ,( and ]5.0,0(,(, 21 ∈Γ∈ ttγ , and ))1,5.0[, 21 ∈ss or
]1,5.0(,( 21 ∈tt and )))5.0,0[, 21 ∈ss If Astx α),( 11 and
AssMttmzAsty βα ),,,)((),( 2121122 ⇒ for all yxz γ∈1 .
(IFI1) Hyax ∈∀ ,,( and ,, Γ∈δγ ( ]1,5.0(∈t and )1,5.0[∈s ) or
(0.5,1]t ∈ and [0,0.5)))s ∈ If AstzAsta βα ),)((),( 2⇒ for all
yaxz δγ∈1 .
Theorem 3.2: Let A = ⟨ A, A⟩ be a non-zero ( , )-intuitionistic
fuzzy interior -hyperideal of a -semihypergroup H. Then, the set
( ) ( ) 1 and 0: <>∈= xxSxI AA λμ is an interior -hyperideal of H .
Proof: Let Iyx ∈, and Hγ ∈ . Then, ( ) 0>xAμ and ( ) 1<xAλ ,
( ) 0>yAμ and, ( ) 1<yAλ . Assume that ( ) 0=zAμ and ( ) 1=zAλ for
all yxz γ∈ . If q∨∈∈∈ ,α , then ( ) ( )( ) Axxx AA αλμ , and
( ) ( )( ) Ayyy AA αλμ , but for each yxz γ∈ , ( ) ( ) ( ) ,,( yxmz AA μμ
( ) ( ) AyxM AA βλλ ), for every qqq ∨∈∧∈∈∈ ,,,β , which is a
contradiction. Since ( )qAx 0,1 and ( )qAy 0,1 but for each yxz γ∈ ,
( )( ) Az β0,11 for every qqq ∨∈∧∈∈∈ ,,,β , which is a
contradiction. Hence, for each yxz γ∈ , ( ) 0>zAμ and ( ) 1<zAλ .
This implies that Iz ∈ . Thus, Iyx ⊆γ . Now, let Syx ∈, , Ia ∈
and H∈δγ , . Then, assume that, ( ) 0=zAμ and ( ) 12 =zAλ for each
yaxz δγ∈ . If q∨∈∈∈ ,α , then ( ) ( )( ) Aaaa AA αλμ , but for all
yaxz δγ∈ , ( ) ( ) ( )( ) Aaaz AA βλμ , for every qqq ∨∈∧∈∈∈ ,,,β ,
which is a contradiction. Since ( )qAa 0,1 but for all yaxz δγ∈ ,
( )( ) Az β0,1 for every qqq ∨∈∧∈∈∈ ,,,β , which is a
contradiction. Hence, for each yaxz δγ∈ , ( ) 0>zAμ and
( ) 1<zAλ . This implies that Iz ∈ for each yaxz δγ∈ . Thus,
Iyax ⊆δγ and ( ) ( ) 1 and 0: <>∈= xxSxI AA λμ is an interior -
hyperideal of H .
Corollary 3.3: Let A = ⟨ A, A⟩ be a non-zero ( , )-intuitionistic
fuzzy interior -hyperideal of a -semihypergroup H. Then, the sets
( ) 0:1 >∈= xSxI Aμ and ( ) 1:2 <∈= xSxI Aλ are interior -
hyperideals of H .
Theorem 3.4: Let H be a strong right(resp, left) zero -
semihypergroup and A = ⟨ A, A⟩ be a non-zero ),( qq -intuitionistic
fuzzy interior -hyperideal of H. Then, A = ⟨ A, A⟩ is constant on I.
Proof: Let w be an element of H such that ( ) ( ) xw AHxA μμ ∈= sup
and ( ) ( ) xw AHxA λλ ∈= inf . Then Iw∈ . Suppose that there exist x ,
Iw∈ such that ( ) ( ) wAAx twxt =≠= μμ and
( ) ( ) wAAx swxs =≠= λλ . Then wx tt < and wx ss > . Choose
t1 , t2 0,1 and s1 , s2 0,1 such that
1 tw t1 1 t x t2 and 21 11 ssss xw >−>>− . Then
( )qAstw 11, and ( )qAstx 22 , but ( ) ( ) =2121 ,,, ssMttmxwγ
( )( ) Aqstx 11, ( ) ( ) ( )( )( )AqstxssMttmwx 112121 ,,,, resp, =γ
because H is a strong right ( )left resp, zero, which is a contradiction.
Hence, ( ) ( )ex AA μμ = and ( ) ( )ex AA λλ = . Therefore ( ) ( )eAxA = for
all .x I∈
Definition 3.5: An IFS A = ⟨ A, A⟩ in a -semihypergroup is said
to be an (∈, ∈∨q)-intuitionistic fuzzy interior -hyperideal of H if
the following conditions hold.
(IFI3) ]5.0,0(,(,,( 21 ∈∈∀ ttSyx and ))1,5.0[, 21 ∈ss or
]1,5.0(,( 21 ∈tt and )))5.0,0[, 21 ∈ss If Astx ∈),( 11 and
qAssMttmzAsty ∨∈⇒∈ ),,,)((),( 2121122 for each .1 yxz γ∈
(IFI4) ]1,5.0((,,,( ∈∈∀ tSyax and )1,5.0[∈s ) or ( ]1,5.0(∈t
and )))5.0,0[∈s If qAstzAsta ∨∈⇒∈ ),)((),( 2 for each
zyxz δγ∈2 .
Theorem 3.6: Let A = ⟨ A, A⟩ be an IFS in a -semihypergroup
H. Then, A = ⟨ A, A⟩ is an (∈, ∈∨q)-intuitionistic fuzzy interior -
hyperideal of H if and only if the following conditions hold;
( ) ( ) ( ) ( ) ( ) ( )
( ) ( ) ( ) ( ) ,5.0,maxsup ,5.0,mininf
5.0,,maxsup5.0,,mininf
22
11
11
11
azaz
yxz ,yxz
AAyaxz
AAyaxz
AAAyxz
AAAyxz
λλμμ
λλλμμμ
δγδγ
γγ
≤≥
≤≥
∈∈
∈∈
for all Hyax ∈,, and , Γ∈δ ]5.0,0(,( 21 ∈tt and
))1,5.0[, 21 ∈ss or ]1,5.0(,( 21 ∈tt and ))5.0,0[, 21 ∈ss .
Proof Since given that A = ⟨ A, A⟩ is an (∈, ∈∨q)-intuitionistic
fuzzy interior -hyperideal of a -semihypergroup H. Suppose that
( ) ( ) ( ) ( ) ( ) ( ) .5.0,,maxsup and 5.0,,mininf 1111
yxzyxz AAAyxz
AAAyxzλλλμμμ
γγ><
∈∈
Choose ]1,0(∈t and )1,0[∈s such that
( ) ( ) ( ) ( ) ( ) ( ) .5.0,,maxsup and 5.0,,mininf 1111
yxszyxtz AAAyxz
AAAyxzλλλμμμ
γγ>><<
∈∈
International Journal of Computer Science and Information Security (IJCSIS), Vol. 14, No. 6, June 2016
831 https://sites.google.com/site/ijcsis/ ISSN 1947-5500

If ( ) ( ) 5.0,min <yx AA μμ and ( ) ( ) 5.0,max >yx AA λλ , then
( ) ( ) ( ) 1
1inf min ,A A Az x yz t x y
γμ μ μ
∈< < and
( ) ( ) ( ) 1
1sup max , .A A Az x y
z s x yγ
λ λ λ∈
> >
Then Astx ∈),( and Asty ∈),( but for each yxz γ∈1 ,
Aqstz ∨∈),)(( 1 , which is a contradiction.
If ( ) ( ) 5.0,min ≥yx AA μμ and ( ) ( ) 5.0,max ≤yx AA λλ , then
( ) ( ) .5.0sup and 5.0inf 1111
>><<∈∈
sztz Ayxz
Ayxzλμ
γγSince Ax ∈)5.0,5.0(
and Ay ∈)5.0,5.0( , but for each yxz γ∈1 , Aqz ∨∈)5.0,5.0)(( 1 ,
which is a contradiction.
If ( ) ( ) 5.0,min <yx AA μμ and ( ) ( ) 5.0,max <yx AA λλ , then
( ) ( ) ( ) ( ) .5.0sup and ,mininf 1111
>><<∈∈
szyxtz Ayxz
AAAyxzλμμμ
γγ
Thus, x t, s A and y t, s A but for each z1 x y ,
1( )( , )z t s A∈ . Also, ( )1 1inf 0.5 0.5 1z x y A z tγ μ∈ + < + = and
supz1 x y A z1 s 0.5 0.5 1 . This implies for each
z1 x y , Aqstz ),)(( 1 . Hence, for each yxz γ∈1 , Aqstz ∨∈),)(( 1 ,
which is contradiction. Hence,
( ) ( ) ( ) ( ) ( ) ( ) .,maxsup and ,mininf 1111
yxzyxz AAAyxz
AAAyxzλλλμμμ
γγ≤≥
∈∈
b Suppose that
infz1 x a y
A z1 min A a , 0.5 and supz1 x a y
A z1 max A a , 0.5 .
Choose ]1,0(∈t and )1,0[∈s such that
( ) ( ) ( ) ( ) .5.0,maxsup and 5.0,mininf 1111
aszatz AAyxz
AAyaxzλλμμ
γδγ>><<
∈∈
If ( ) 5.0<aAμ and ( ) 5.0>aAλ , then
( ) ( ) ( ) ( ).sup and inf 1111
aszatz AAyxz
AAyaxzλλμμ
γδγ>><<
∈∈
Then, a t, s A but for each z1 x a y , z1 t, s qA ,
which is a contradiction.
If A a 0.5 and A a 0.5 , then
infz1 x a y
A z1 t 0.5 and supz1 x a y
A z1 s 0.5.
Since Aa ∈)5.0,5.0( but for each yaxz δγ∈1 , Aqz ∨∈)5.0,5.0)(( 1
, which is a contradiction.
If ( ) 5.0≤aAμ and ( ) 5.0≤aAλ , then
( ) ( ) ( ) .5.0sup and inf 1111
>><<∈∈
szatz Ayaxz
AAyaxzλμμ
δγδγ
Thus, Asta ∈),( but for each yaxz δγ∈1 , Astz ∈),)(( 1 . Also,
( ) 15.05.0inf 11=+<+∈ tzAyaxz μδγ and
( ) 15.05.0sup 11=+>+∈ szAyaxz λδγ . This imply for each yaxz δγ∈1 ,
Aqstz ),)(( 1 . Thus, for each yaxz δγ∈1 , Aqstz ∨∈),)(( 1 , which is a
contradiction. Hence,
( ) ( ) ( ) ( ) ( ) ( ) .5.0,,maxsup and 5.0,,mininf 1111
yxzyxz AAAyaxz
AAAyaxzλλλμμμ
δγδγ≤≥
∈∈
Conversely, assume that A = ⟨ A, A⟩ satisfies ( )a and ( )b . Let
Syx ∈, and ]5.0,0(,( 21 ∈tt and ))1,5.0[, 21 ∈ss or
]1,5.0(,( 21 ∈tt and ))5.0,0[, 21 ∈ss such that Astx ∈),( 11 and
( ) 122 ),( txAsty A ≥⇒∈ μ and ( ) 1sxA ≤λ , ( ) 2tyA ≥μ and
( ) 2syA ≤λ . Then,
( ) ( ) ( ) ( ) ( ) ( )
( ) ( ) 5.0,,maxsup and 5.0,,mininf
5.0,,maxsup and 5.0,,mininf
211211
11
11
11
sszttz
yxzyxz
Ayxz
Ayxz
AAAyxz
AAAyxz
≤≥
≤≥
∈∈
∈∈
λμ
λλλμμμ
γγ
γγ
Then we have the following case's
1 5.0,min 21 >tt and 5.0,max 21 <ss
2 5.0,min 21 ≤tt and 5.0,max 21 ≥ss
Case 1 If 5.0,min 21 >tt and 5.0,max 21 <ss , then
( ) 5.0inf 11≥∈ zAyxz μγ and ( ) 5.0sup 11
≤∈ zAyxz λγ . This implies that
( ) 1,mininf 2111>+∈ ttzAyxz μγ and ( ) 1,max 21 <+ ssxyAλ . So, for
each yxz γ∈1 , qAssMttmz ),,,)(( 21211 .
Case 2 if 5.0,min 21 ≤tt and 5.0,max 21 ≥ss , then
( ) 211 ,mininf1
ttzAyxz ≥∈ μγ and ( ) 211 ,maxsup1
sszAyxz ≤∈ λγ . This
implies that for each yxz γ∈1 AssMttmz ∈),,,)(( 21211 .
Therefore,
qAssMttmz ∨∈),,,)(( 21211
Let Sayx ∈,, and ]1,5.0(( ∈t and ))1,5.0[∈s or ]1,5.0(( ∈t
and ))5.0,0[∈s such that ( ) txAsta A ≥⇒∈ μ),( and ( ) sxA ≤λ .
Then,
( ) ( ) ( ) ( )
( ) ( ) 5.0,maxsup and 5.0,mininf
5.0,maxsup and 5.0,mininf
11
11
11
11
sztz
azaz
Ayaxz
Ayaxz
AAyaxz
AAyaxz
≤≥
≤≥
∈∈
∈∈
λμ
λλμμ
δγδγ
δγδγ
Then we have the following case's
3 5.0>t and 5.0<s
4 5.0≤t and 5.0≥s
Case 3 If 5.0>t and 5.0<s , then ( ) 5.0inf 11≥∈ zAyaxz μδγ
and ( ) 5.0sup 11≤∈ zAyaxz λδγ . This implies that
( ) 1inf 11>+∈ tzAyaxz μδγ and ( ) 1sup 11
<+∈ szAyaxz λδγ . Then, for each
qAstz ),)(( 1 .
Case 4 If t 0.5 and s 0.5 , then ( ) tzAyaxz ≥∈ 11inf μδγ and
( ) szAyaxz ≤∈ 11sup λδγ . This implies that Astz ∈),)(( 1 . Therefore,
for each ,1 yaxz δγ∈ qAstz ∨∈),)(( 1 .
Remark 3.7: Every intuitionistic fuzzy interior -ideal of a -
semihypergroup H is an (∈, ∈∨q)-intuitionistic fuzzy interior -
hyperideal of H. But the converse is not true.
Example 3.8: Let 5,4,3,2,1=S be -semihypergroup with the
following Cayley table.
5,35,35,3115
54,34,31144,34,34,3113
11111211111154321
535,31155,45,43114
33311311111211111154321 δγ
International Journal of Computer Science and Information Security (IJCSIS), Vol. 14, No. 6, June 2016
832 https://sites.google.com/site/ijcsis/ ISSN 1947-5500

Let A = ⟨ A, A⟩ be IFS in Γ -semihypergroup S define by
( ) ( ) ( ) ,8.0421 === AAA μμμ ( ) ,7.03 =Aμ ( ) ,6.05 =Aμ and
( ) ( ) ( ) ,1.0421 === AAA λλλ ( ) ,2.03 =Aλ ( ) 3.05 =Aλ . Then A = ⟨ A, A⟩ is an (∈, ∈∨q)-intuitionistic fuzzy interior -hyperideal of
S but not intuitionistic fuzzy interior -hyperideal.
Proposition 3.9: Let H be a -semihypergroup and A = ⟨ A, A⟩ be an (∈, ∈∨q)-intuitionistic fuzzy -hyperideal of H. Then, A = ⟨ A,
A⟩ is an (∈, ∈∨q)-intuitionistic fuzzy interior -hyperideal .
Proof Let Hyx ∈, . Then,
( ) ( ) ( ) ( )( ) ( ) ( ) ( ) .5.0,,max5.0,maxsup and
5.0,,min5.0,mininf
1
1
1
1
yxyz
yxyz
AAAAyxz
AAAAyxz
λλλλ
μμμμ
γ
γ
≤≤
≥≥
∈
∈
Now, let Hyax ∈,, . Then
( ) ( ) ( ) ( )( ) ( )( ) ( ) ( ) ( )
( ) ( ) .5.0,maxsup
5.0,max5.0,5.0,max5.0,supmaxsup
and 5.0,mininf
5.0,min5.0,5.0,min5.0,infmininf
1
1
1
1
1
1
1
1
az
aatz
az
aatz
AAyaxz
AAAaxt
Ayaxz
AAyaxz
AAAaxtAyaxz
λλ
λλλλ
μμ
μμμμ
δγ
γδγ
δγ
γδγ
≤
=≤≤
≥
=≥≥
∈
∈∈
∈
∈∈
By Theorem saleem1, A = ⟨ A, A⟩ is an (∈, ∈∨q)-intuitionistic fuzzy
interior -hyperideal of H.
Theorem 3.10: If Λ∈iA is family of (∈, ∈∨q)-intuitionistic fuzzy
interior -hyperideals of H. Then, ii
A∈Λ∧ is an (∈, ∈∨q)-
intuitionistic fuzzy interior -hyperideal of S , where
,i i
i ii A Ai
A μ λ∈Λ ∈Λ∈Λ
∧ ∨= ⟨ ⟩∧ .
Proof Let x, y S . Then we have
( ) ( ) ( ) ( ) ( )( ) ( )
( ) ( ) ( )
( ) ( ) ( ) ( ) ( )( ) ( )
( ) ( ) ( )⎭⎬⎫
⎩⎨⎧ ⎟
⎠⎞⎜
⎝⎛ ∨⎟
⎠⎞⎜
⎝⎛ ∨≤⎟
⎠
⎞⎜⎝
⎛∨
∨∨=
∨≤⎟⎠
⎞⎜⎝
⎛∨=⎟
⎠
⎞⎜⎝
⎛⎭⎬⎫
⎩⎨⎧ ⎟
⎠⎞⎜
⎝⎛ ∧⎟
⎠⎞⎜
⎝⎛ ∧≥⎟
⎠⎞⎜
⎝⎛ ∧
∧∧=
∧≥⎟⎠⎞⎜
⎝⎛∧=⎟
⎠⎞⎜
⎝⎛ ∧
Λ∈Λ∈∈Λ∈
Λ∈Λ∈
Λ∈∈Λ∈∈
Λ∈Λ∈∈Λ∈
Λ∈Λ∈
Λ∈∈Λ∈∈Λ∈
5.0,,maxsup
5.0,,max
5.0,,maxsupsup and
5.0,,mininf
5.0,,min
5.0,,mininfinf
1
11
1
11
1
11
1
11
yxz
yx
yxzz
yxz
yx
yxzz
iii
ii
iiii
iii
ii
iiii
Ai
Ai
Ayxzi
Ai
Ai
AAi
Ayxzi
Ayxz
Ai
Ai
Ayxzi
Ai
Ai
AAi
AyxziAyxzi
μμμ
μμ
λλλμ
μμμ
μμ
μμμμ
γ
γγ
γ
γγ
Now, let for any Sayx ∈,, . The we have
( ) ( ) ( ) ( )( )
( ) ( )
( ) ( ) ( ) ( )( )
( ) ( )⎭⎬⎫
⎩⎨⎧ ⎟
⎠⎞⎜
⎝⎛ ∨≤⎟
⎠
⎞⎜⎝
⎛∨
∨=
∨≤⎟⎠
⎞⎜⎝
⎛∨=⎟
⎠
⎞⎜⎝
⎛∨
⎭⎬⎫
⎩⎨⎧ ⎟
⎠⎞⎜
⎝⎛ ∧≥⎟
⎠⎞⎜
⎝⎛ ∧
∧=
∧≥⎟⎠⎞⎜
⎝⎛∧=⎟
⎠⎞⎜
⎝⎛ ∧
Λ∈∈Λ∈
Λ∈
Λ∈∈Λ∈∈Λ∈
Λ∈∈Λ∈
Λ∈
Λ∈∈Λ∈∈Λ∈
5.0,maxsup
5.0,max
5.0,maxsupsup
5.0,mininf
5.0,min
5.0,mininfinf
1
11
1
11
1
11
1
11
az
a
azz
az
a
azz
ii
i
iii
ii
i
iii
Ai
Ayaxzi
Ai
Ai
Ayaxzi
Ayaxzi
Ai
Ayaxzi
Ai
Ai
AyaxziAyaxzi
μμ
μ
λλμ
μμ
μ
μμμ
δγ
δγδγ
δγ
δγδγ
Hence, ⟩∨∧⟨= Λ∈Λ∈Λ∈ii AiAii
i A λμ , is an (∈, ∈∨q)-intuitionistic
fuzzy interior -hyperideal of H .
Remark 3.11: The union of two (∈, ∈∨q)-intuitionistic fuzzy
interior -hyperideals of S is not necessary to an (∈, ∈∨q)-
intuitionistic fuzzy interior -hyperideal of S .
Example 3.12: Let dcbaS ,,,= and δγ ,=Γ be two non-
empty sets. Then, ( )Γ ,S is a -semihypergroup with the following
multiplication tables:
11114
1111314,2112111114321
111141111314,1112111114321 δγ
Let ⟩⟨= AAA λμ , and ⟩⟨= BBB λμ , be two IFSs of S such that
( ) ( ) ( ) ( )( ) ( ) ( ) ( )( ) ( ) ( ) ( )( ) ( ) ( ) ( ) .8.04 ,6.03 ,8.02 ,6.01
,04 ,4.03 ,02 ,4.01 and8.043 ,6.021 ,043 ,4.021
========
========
BBBB
BBBB
AAAA
AAAA
λλλλμμμμ
λλλλμμμμ
Then both ⟩⟨= AAA λμ , and ⟩⟨= BBB λμ , are ),( q∨∈∈ -
intuitionistic fuzzy interior -hyperideals of S , but
⟩∧∨⟨=∪ BABABA λλμμ , is not an ),( q∨∈∈ -intuitionistic fuzzy
interior -hyperideal of S . Since
( )( ) ( ) ( )( )( ) ( )( )
( )( ) ( )( ) ( )( ) ( )( ) ( )( )
( )( ) ( )( ) ( )( ) ( )( ) ( )( ) 5.0,,max32
5.0,,max6.08.0
5.0,,min32inf5.0,,min4.0
and inf4032
cbcb
bcdcbcb
z
BABABA
BABA
BABA
BABABA
BABA
BAzBA
λλλλγλλλλλλ
λλλλμμμμγμμμμμμ
μμμμγ
∧∧>∧∧∧=
∧=∧=∨∨<∨∨∨=
⎟⎠⎞⎜
⎝⎛ ∨=∨=
∈
The following theorem can be obtained if we present a sufficient
condition.
Theorem 3.13: If Λ∈iiA is a family of (∈, ∈∨q)-intuitionistic
fuzzy interior -hyperideals of H such that ji AA ⊆ or ij AA ⊆
for all i, Ij ∈ , then ⟩∧∨⟨= Λ∈Λ∈Λ∈ ii AiAiii A λμ ,U is an (∈, ∈∨q)-
intuitionistic fuzzy interior -hyperideal of S .
Proof For all Syx ∈, and μ , we have
( ) ( ) ( ) ( )[ ]( ) ( )
( ) ( )
( ) ( ) ( ) ⎥⎦⎤
⎢⎣⎡ ∧⎟
⎠⎞⎜
⎝⎛ ∨∧⎟
⎠⎞⎜
⎝⎛ ∨≥⎟
⎠⎞⎜
⎝⎛ ∨
⎥⎦⎤
⎢⎣⎡ ∧⎟
⎠⎞⎜
⎝⎛ ∨∧⎟
⎠⎞⎜
⎝⎛ ∨=
⎥⎦⎤
⎢⎣⎡ ∧∨∧∨=
∧∧∨≥⎟⎠⎞⎜
⎝⎛∨=⎟
⎠⎞⎜
⎝⎛ ∨
Λ∈Λ∈∈Λ∈
Λ∈Λ∈
Λ∈Λ∈
Λ∈∈Λ∈∈Λ∈
5.0inf
5.0
5.0
5.0infinf
1
11
1
11
yxz
yx
yx
yxzz
iii
ii
ii
iiii
Ai
Ai
Ayxzi
Ai
Ai
Ai
Ai
AAi
AyaxziAyxzi
μμμ
μμ
μμ
μμμμ
γ
δγγ
It is clear that
( ) ( )[ ] ( ) ( ) .5.05.0 ⎥⎦⎤
⎢⎣⎡ ∧⎟
⎠⎞⎜
⎝⎛ ∨∧⎟
⎠⎞⎜
⎝⎛ ∨≤∧∧∨
Λ∈Λ∈Λ∈yxyx
iiii Ai
Ai
AAi
μμμμ
Assume that
( ) ( )[ ] ( ) ( ) ⎥⎦⎤
⎢⎣⎡ ∧⎟
⎠⎞⎜
⎝⎛ ∨∧⎟
⎠⎞⎜
⎝⎛ ∨≠∧∧∨
Λ∈Λ∈Λ∈5.05.0 yxyx
iiii Ai
Ai
AAi
μμμμ
Then there exist t such that
( ) ( )[ ] ( ) ( ) ⎥⎦⎤
⎢⎣⎡ ∧⎟
⎠⎞⎜
⎝⎛ ∨∧⎟
⎠⎞⎜
⎝⎛ ∨<<∧∧∨
Λ∈Λ∈Λ∈5.05.0 yxtyx
iiii Ai
Ai
AAi
μμμμ
Since ji AA μμ ⊆ or
ij AA μμ ⊆ for all ,i Ij ∈ , so exists Ik ∈
International Journal of Computer Science and Information Security (IJCSIS), Vol. 14, No. 6, June 2016
833 https://sites.google.com/site/ijcsis/ ISSN 1947-5500

such that ( ) ( ) 5.0∧∧< yxtkk AA μμ . On other hand
( ) ( ) tyxii AA <∧∧ 5.0μμ for all Ii ∈ , a contradiction. Hence
( ) ( )[ ] ( ) ( ) ⎥⎦⎤
⎢⎣⎡ ∧⎟
⎠⎞⎜
⎝⎛ ∨∧⎟
⎠⎞⎜
⎝⎛ ∨=∧∧∨
Λ∈Λ∈Λ∈5.05.0 yxyx
iiii Ai
Ai
AAi
μμμμ
Now,
( ) ( ) ( ) ( )[ ]
( )( ) ( )( )
( ) ( )
( ) ( ) ( ) ⎥⎦⎤
⎢⎣⎡ ∨⎟
⎠⎞⎜
⎝⎛ ∧∨⎟
⎠⎞⎜
⎝⎛ ∧≤⎟
⎠
⎞⎜⎝
⎛∧
⎥⎦⎤
⎢⎣⎡ ∨⎟
⎠⎞⎜
⎝⎛ ∧∨⎟
⎠⎞⎜
⎝⎛ ∧=
⎥⎦⎤
⎢⎣⎡ ∨∧∨∧=
∨∨∧≤⎟⎠
⎞⎜⎝
⎛∧=⎟
⎠
⎞⎜⎝
⎛∧
Λ∈Λ∈∈Λ∈
Λ∈Λ∈
Λ∈Λ∈
Λ∈∈Λ∈∈Λ∈
5.0sup
5.0
5.0
5.0supsup
1
11
1
11
yxz
yx
yx
yxzz
iii
ii
ii
iiii
Ai
Ai
Ayxzi
Ai
Ai
Ai
Ai
AAi
Ayxzi
Ayxzi
λλλ
λλ
λλ
λλλλ
γ
γγ
It is clear that
( ) ( )[ ] ( ) ( ) .5.05.0 ⎥⎦⎤
⎢⎣⎡ ∨⎟
⎠⎞⎜
⎝⎛ ∧∨⎟
⎠⎞⎜
⎝⎛ ∧≥∨∨∧
Λ∈Λ∈Λ∈yxyx
iiii Ai
Ai
AAi
μλλλ
Assume that
( ) ( )[ ] ( ) ( ) ⎥⎦⎤
⎢⎣⎡ ∨⎟
⎠⎞⎜
⎝⎛ ∧∨⎟
⎠⎞⎜
⎝⎛ ∧≠∨∨∧
Λ∈Λ∈Λ∈5.05.0 yxyx
iiii Ai
Ai
AAi
λλλλ
Then there exist s such that
( ) ( )[ ] ( ) ( ) ⎥⎦⎤
⎢⎣⎡ ∨⎟
⎠⎞⎜
⎝⎛ ∧∨⎟
⎠⎞⎜
⎝⎛ ∧>>∨∨∧
Λ∈Λ∈Λ∈5.05.0 yxsyx
iiii Ai
Ai
AAi
λλλλ
Since ji AA λλ ⊆ or
ij AA λλ ⊆ for all ,i Ij ∈ , there exist Ik ∈
such that ( ) ( ) 5.0∧∧> yxskk AA μμ . On other hand
( ) ( ) syxii AA >∧∧ 5.0μμ for all Ii ∈ , a contradiction. Hence
( ) ( )[ ] ( ) ( ) ⎥⎦⎤
⎢⎣⎡ ∧⎟
⎠⎞⎜
⎝⎛ ∧∧⎟
⎠⎞⎜
⎝⎛ ∧=∧∧∧
Λ∈Λ∈Λ∈5.05.0 yxyx
iiii Ai
Ai
AAi
λλλλ
Let Syax ∈,, . Then
( ) ( ) ( )[ ]( )
( )
( ) ( ) ⎥⎦⎤
⎢⎣⎡ ∧∧⎟
⎠⎞⎜
⎝⎛ ∨≥⎟
⎠⎞⎜
⎝⎛ ∨
⎥⎦⎤
⎢⎣⎡ ∧∧⎟
⎠⎞⎜
⎝⎛ ∨=
⎥⎦⎤
⎢⎣⎡ ∧∨=
∧∧∨≥⎥⎦⎤
⎢⎣⎡∨=⎟
⎠⎞⎜
⎝⎛ ∨
Λ∈∈Λ∈
Λ∈
Λ∈
Λ∈∈Λ∈∈Λ∈
5.0inf
5.0
5.0
5.0infinf
1
11
1
11
az
a
a
azz
ii
i
i
iii
Ai
Ayaxzi
Ai
Ai
Ai
AyaxziAyaxzi
μμ
μ
μ
μμμ
δγ
δγδγ
and
( ) ( ) ( )[ ]
( )( )
( )
( ) ( ) ⎥⎦⎤
⎢⎣⎡ ∨⎟
⎠⎞⎜
⎝⎛ ∧≤⎟
⎠
⎞⎜⎝
⎛∧
⎥⎦⎤
⎢⎣⎡ ∨⎟
⎠⎞⎜
⎝⎛ ∧=
⎥⎦⎤
⎢⎣⎡ ∨∧=
∨∧≤⎟⎠
⎞⎜⎝
⎛∧=⎟
⎠
⎞⎜⎝
⎛∧
Λ∈∈Λ∈
Λ∈
Λ∈
Λ∈∈Λ∈∈Λ∈
5.0sup
5.0
5.0
5.0supsup
1
1
1
11
az
a
a
axayz
ii
i
i
iii
Ai
Ayaxzi
Ai
Ai
Ai
Ayaxzi
Ayaxzi
λλ
λ
λ
λλλ
δγ
δγδγ
Hence ⟩∧∨⟨= Λ∈Λ∈Λ∈ ii AiAiii A λμ ,U is an −∨∈∈ ),( q intuitionistic
fuzzy interior -hyperideal of S .
Theorem 3.14: An IFS A = ⟨ A, A⟩ in a -semihypergroup H is
an (∈, ∈∨q)-intuitionistic fuzzy interior -hyperideal of S if and
only if the non-empty sets ( )tU A ,μ and ( )sL A ,λ are interior -
hyperideals of H for all ]5.0,0(∈t and )1,5.0[∈s , where
( ) ( ) txSxtU AA ≥∈= μμ : , and ( ) ( ) sxSxtL AA ≤∈= λλ : , .
Proof Let A = ⟨ A, A⟩ be an (∈, ∈∨q)-intuitionistic fuzzy interior -
hyperideal of H and the sets ( )tU A ,μ and ( )sL A ,λ are non-
empty for any ]5.0,0(∈t and )1,5.0[∈s . Let ( )tUyx A ,, μ∈ .
Then, ( ) txA ≥μ and ( ) tyA ≥μ . Since
( ) ( )ttt
yxz AAAyxz
=∧∧≥
∧∧≥∈
5.0
5.0)(inf 11
μμμγ
This implies that ( )tUz A ,1 μ∈ for each yxz γ∈1 . Thus,
( )tUyx A ,μγ ⊆ . Now let ( )tUa A ,μ∈ and Syx ∈, . Then
( ) taA ≥μ . Since
( )tt
az AAyaxz
=∧≥
∧≥∈
5.0
5.0)(inf 11
μμδγ
This implies that ( )tUz A ,1 μ∈ for each yaxz δγ∈1 . Thus,
( )tUyax A ,μδγ ⊆ . Therefore, ( )tU A ,μ is an interior -hyperideal
of H. Similarly, we can prove ( )sL A ,λ is an interior -hyperideal
of H.
Conversely, let ⟩⟨= AAA λμ , be an IFS in H such that ( )tU A ,μ
and ( )sL A ,λ are interior -hyperideals of H . If there exist
Hyx ∈, such that ( ) ( ) 5.0)(inf 11∧∧<∈ yxz AAAyxz μμμγ and
( ) ( ) 5.0)(sup 11∨∨>∈ yxz AAAyxz λλλγ , then there exist ]1,0(∈t and
)1,0[∈s such that ( ) ( ) 5.0)(inf 11∧∧<<∈ yxtz AAAyxz μμμγ and
( ) ( ) 5.0)(sup 11∨∨>>∈ yxsz AAAyxz λλλγ . This implies that
( )tUyx A ,, μ∈ and ( )sLyx A ,, λ∈ but ( )otUyx A ,μγ ⊆/ and
( )sLyx A ,λγ ⊆/ , which is a contradiction. Hence
( ) ( )( ) ( ) 5.0)(sup and
5.0)(inf
1
1
1
1
∨∨≤
∧∧≥
∈
∈
yxz
yxz
AAAyxz
AAAyxz
λλλ
μμμ
γ
γ
Also, if there exist Hayx ∈,, such that
( ) 5.0)(inf 11∧<∈ az AAyaxz μμδγ and ( ) 5.0)(sup 11
∨>∈ az AAyaxz λλδγ ,
then choose ]1,0(1 ∈t and )1,0[1 ∈s such that
( ) 5.0)(inf 111∧<<∈ atz AAyaxz μμδγ and
( ) 5.0)(sup 111∨>>∈ asz AAyaxz λλδγ . This implies that ( )1 , tUa Aμ∈
and ( )1 , sLa Aλ∈ but ( )tUyax A ,μδγ ⊆/ and ( )sLyax A ,λδγ ⊆/ ,
which is a contradiction. Hence,
( )( ) 5.0)(sup and
5.0)(inf
1
1
1
1
∨≤
∧≤
∈
∈
az
az
AAyaxz
AAyaxz
λλ
λμ
δγ
δγ
Therefore, ⟩⟨= AAA λμ , is an (∈, ∈∨q)-intuitionistic fuzzy interior
-hyperideal of H .
Theorem 3.15: Every ),( qq ∨∈∨∈ -intuitionistic fuzzy interior -
hyperideal of a -semihypergroup H is an (∈, ∈∨q)-intuitionistic
fuzzy interior -hyperideal of H .
Every ),,( ∈∈ -intuitionistic fuzzy interior -hyperideal of -
semihypergroup H is an (∈, ∈∨q)-intuitionistic fuzzy interior -
hyperideal of H .
Now we give the condition for (∈, ∈∨q)-intuitionistic fuzzy interior
International Journal of Computer Science and Information Security (IJCSIS), Vol. 14, No. 6, June 2016
834 https://sites.google.com/site/ijcsis/ ISSN 1947-5500

-hyperideal to be an ),,( ∈∈ -intuitionistic fuzzy interior -
hyperideal of S .
Theorem 3.16: Let A = ⟨ A, A⟩ be (∈, ∈∨q)-intuitionistic fuzzy
interior Γ -hyperideal of S such that ( ) 5.0<xAμ and
( ) 5.0>xAλ . Then ⟩⟨= AAA λμ , be ),( ∈∈ -intuitionistic fuzzy
interior -hyperideal of S .
Theorem 3.17: An IFS A = ⟨ A, A⟩ is an (∈, ∈∨q)-intuitionistic
fuzzy interior -hyperideal of S if and only if
( ) AstxSxU st ∈∈= ),(:, for all ]5.0,0(∈t and )1,5.0[∈s is
an interior -hyperideal of S .
Proof Its follows from Theorem AS2.
For any intuitionistic fuzzy set A = ⟨ A, A⟩ in S and ]1,0(∈t ,
)1.0[∈s , we denote
( ) ( ) [ ]( ) ( ) .,: and ,: ,, qAstxSxAqAstxSxA stst ∨∈∈=∈=
Obviously, [ ]( ) ( ) ( )ststst UAA ,,, ∪= . Where ( )stU , , ( )stA , and
[ ]( )stA , are called ∈ -level set, q -level set and q∨∈ -level set of
⟩⟨= AAA λμ , , respectively.
Theorem 3.18: An IFS A = ⟨ A, A⟩ in a -semihypergroup S is
an (∈, ∈∨q)-intuitionistic fuzzy interior -hyperideal of S if and
only if [ ]( )stA , is an interior -hyperideal of S for all ]1,0(∈t ,
)1.0[∈s .
Proof Let [ ]( )stAayx ,,, ∈ . Then, ( ) taA ≥μ and ( ) saA ≥λ or
( ) 1>+ taAμ and ( ) 1<+ saAλ . We have ( ) taA ≥μ and
( ) saA ≤λ or ( ) 1>+ taAμ and ( ) 1<+ saAλ . If ( ) taA ≥μ and
( ) saA ≤λ , then by Theorem saleem1 )(a , implies that
( ) ( )⎩⎨⎧
≤>
=≥≥∈ 5.0 if
5.0 if 5.05.0,min5.0,mininf
ttt
taz AAyaxzμμ
δγ
and
( ) ( )⎩⎨⎧
≥<
=≤≤∈ 5.0 if
5.0 if 5.05.0,max5.0,maxsup
sss
saz AAyaxz
λλδγ
and so ( ) 15.05.0inf =+>+∈ tzAyaxz μδγ and
( ) ,15.05.0sup =+<+∈ szAyxz λγ i.e. , for each yaxz δγ∈ ,
( )( )qAtsz , , or ( )stAz ,∈ . Therefore, ( ) ( ) [ ]( )ststst AAUyax ,,, =∪⊆δγ
. Suppose that ( ) 1>+ taAμ and ( ) 1<+ saAλ . Then 5.0>t and
5.0<s or 5.0≤t and 5.0≥s . Thus,
( ) ( ) ( )⎩⎨⎧
>−>≤−>
=≥∈ ,5.0 if 1
,5.0 if 15.05.0,mininf
ttatt
azA
AAyaxz μμμ
δγ
and
( ) ( ) ( )⎩⎨⎧
<−<≥−<
=≥∈ ,5.0 if 1
,5.0 if 15.05.0,maxsup
ssass
azA
AAyaxz λ
λλδγ
Hence, ( ) ( ) [ ]( )ststst AAUz ,,, =∪∈ for all yaxz δγ∈ . Therefore,
( ) ( ) [ ]( )ststst AAUyax ,,, =∪⊆δγ .for 5.0>t and 5.0<s . Suppose
that 5.0≤t and 5.0≥s . Then, 5.01 ≥− t and 5.01 ≤− s . If
( ) ( )yx AA μμ ≤5.0,min and ( ) ( )yx AA λλ ≥5.0,max , then
( ) ( )( ) ( ) sxz
txz
AAyxz
AAyxz
≤≤
≥≥
∈
∈
5.0,maxsup
and 5.0,mininf
λλ
μμ
γ
γ
and if ( ) ( )yx AA μμ >5.0,min and ( ) ( ),5.0,max yx AA λλ < then
( ) ( ) tyz AAyxz −>≥∈ 1inf μμγ and ( ) ( ) syz AAyxz −<≤∈ 1sup λλγ .
Thus, ( ) ( ) [ ]( )ststst AAUz ,,, =∪∈ for all yxz γ∈ . Therefore,
( ) ( ) [ ]( )ststst AAUyx ,,, =∪⊆γ for 5.0≤t and 5.0≥s . We have
similar result for the case ).(iii For final case, if 5.0>t and
,5.0<s then 5.01 <− t and 5.01 >− s . Hence,
( ) ( ) ( )( ) ( )
( ) ( ) ( ) ( ) ⎩⎨⎧
<−>≥−>
=
≥∈
,5.0,min if 1,min,5.0,min if 15.0
5.0,,mininf
yxtyxyxt
yxz
AAAA
AA
AAAyxz
μμμμμμ
μμμγ
and
( ) ( ) ( )
( ) ( ) ( ) ( ) ( ) ( ) ⎩
⎨⎧
>−<≤−<
=
≤∈
,5.0,max if 1,max,5.0,max if 15.0
5.0,,maxsup
yxsyxyxs
yxz
AAAA
AA
AAAyxz
λλλλλλ
λλλγ
and so ( ) [ ]( )stst AAyx ,, ⊆⊆γ . If 5.0≤t and ,5.0≥s then
5.01 ≥− t and 5.01 ≤− s . Thus,
( ) ( ) ( )( ) ( )
( ) ( ) ( ) ( ) ⎩⎨⎧
<−>≥≥
=
≥∈
,5.0,min if 1,min,5.0,min if 5.0
5.0,,mininf
yxtyxyxt
yxz
AAAA
AA
AAAyxz
μμμμμμ
μμμγ
and
( ) ( ) ( )
( ) ( ) ( ) ( ) ( ) ( ) ⎩
⎨⎧
>−<≤≤
=
≤∈
,5.0,max if 1,max,5.0,max if 5.0
5.0,,maxsup
yxsyxyxs
yxz
AAAA
AA
AAAyxz
λλλλλλ
λλλγ
Which implies that ( ) ( ) [ ]( )ststst AAUyx ,,, =∪⊆γ .
Conversely, suppose that A = ⟨ A, A⟩ is an IFS in H such that
[ ]( )stA , is a sub -semihypergroup of H . Suppose that A = ⟨ A, A⟩ is not an (∈, ∈∨q)-intuitionistic fuzzy sub -semihypergroup of H .
Then, there exist Hyx ∈, such that
( ) ( ) ( ) ( ) ( ) ( ) .5.0,,maxsup and 5.0,,mininf yxzyxz AAAyxz
AAAyxzλλλμμμ
γγ><
∈∈
Let
( ) ( ) ( )
( ) ( ) ( ) .5.0,,maxsup21
and 5.0,,mininf21
⎥⎦⎤
⎢⎣⎡ +=
⎥⎦⎤
⎢⎣⎡ +=
∈
∈
yxzs
yxzt
AAAyxz
AAAyxz
λλλ
μμμ
γ
γ
Then,
( ) ( ) ( )( ) ( ) ( ) .5.0,,maxsup
and 5.0,,mininf
yxsz
yxtz
AAAyxz
AAAyxz
λλλ
μμμ
γ
γ
>>
<<
∈
∈
this imply that [ ]( )stAyx ,, ∈ and ( ) [ ]( )stAyx ,⊆γ . Hence,
( ) tzAyxz ≥∈ μγinf and ( ) szAyxz ≤∈ λγsup or ( ) 1inf >+∈ tzAyxz μγ
and ( ) 1sup <+∈ szAyxz λγ , which is a contradiction. Therefore, we
have
( ) ( ) ( ) ( ) ( ) ( ) .5.0,,maxsup and 5.0,,mininf yxzyxz AAAyxz
AAAyxzλλλμμμ
γγ≤≥
∈∈
Thus, A = ⟨ A, A⟩ is an ),( q∨∈∈ -intuitionistic fuzzy sub -
International Journal of Computer Science and Information Security (IJCSIS), Vol. 14, No. 6, June 2016
835 https://sites.google.com/site/ijcsis/ ISSN 1947-5500

semihypergroup of H.
References [1] S. Abdullah, B. Davvaz, M. Aslam, (α, β)-intuitionistic fuzzy
ideals of hemirings. Comput Math Appl 62 (2011), 8, 3077-3090
[2] S. Abdullah, K. Hila and H. Khan, On bi- -hyperideals of a -
semihypergroups, UPB Scientific Bulletin, Series A: Applied
Mathematics and Physics, 74 (2012), 4, 79-90.
[3] S. Abdullah, M. Aslam and T. Anwar, A note on M-hypersystems
and N-hypersystems in -semihypergroups, Quasigroups and
Related Systems 19 (2011), 169-172.
[4] M. Aslam, S. Abdullah and K. Hila, Interval valued intuitionistic
fuzzy sets in Γ -Semihypergroups, Accepted.
[5] M. Aslam, S. Abdullah, B. Davvaz and N. Yaqoob, Rough M-
hypersystems and fuzzy M-hypersystems in -semihypergroups,
Neural Comput. Applic., 21, 1, (2012), 281-287.
doi:10.1007/s00521-012-0812-x
[6] K. Atanassov, Intuitionistic fuzzy sets, Fuzzy Sets and Systems
20 (1986), 87-96.
[7] K. Atanassov, New operations defined over the intuitionistic
fuzzy sets, Fuzzy Sets and Systems 61 (1994), 137-142.
[8] P. Bonansinga and P. Corsini, On semihypergroup and
hypergroup homomorphisms, Boll. Un. Mat. Ital. B (6) 1(2) (1982),
717-727.
[9] D. Coker and M. Demirci, On intuitionistic fuzzy points, Notes
IFS, 1(2)(1995), 79--84.
[10] P. Corsini, Prolegomena of hypergroup theory, Second edition,
Aviani editor, 1993.
[11] P. Corsini and V. Leoreanu, Applications of hyperstructure
theory, Advances in Mathematics, Kluwer Academic Publishers,
Dordrecht, 2003.
[12] P. Corsini, M. Shabir, and T. Mahmood, Semisipmle
semihypergroups in terms of hyperideals and fuzzy hyperideals,
Iranian J. Fuzzy Systems Vol. 8, No. 1, (2011), pp. 47.
[13] B. Davvaz and V. Leoreanu-Fotea, Hyperring theory and
applications, International Academic Press, USA, 2007.
[14] B. Davvaz and N.S. Poursalavati, Semihypergroups and S -
hypersystems, Pure Math. Appl. 11(1) (2000), 43-49.
[15] B. Davvaz, Extensions of fuzzy hyperideals in Hv -semigroups,
Soft Computing, 11(9) (2007), 829-837.
[16] B. Davvaz, Fuzzy hyperideals in semihypergroups, Italian J.
Pure Appl. Math. 8 (2000), 67-74.
[17] B. Davvaz and V. Leoreanu-Fotea, Structures of fuzzy -
hyperideals of a -semihypergroups, accepted by J. Multiple-Valued
Logic and Soft Computing, 2010.
[18] B. Davvaz, Intuitionistic hyperideals of semihypergroups, Bull.
Malays. Math. Sci. Soc. (2) 29(1) (2006), 203-207.
[19] B.A. Ersoy, B. Davvaz, Atanassov's intuitionistic fuzzy -
hyperideals of a -semihypergroups, J. Intell. Fuzzy Systems, 25
(2013), 463-470.
[20] D. Heidari, S. O. Dehkordi and B. Davvaz, Γ -
semihypergroups and their properties, U.P.B. Sci. Bull., Series A,
72 (2010), 197-210.
[21] D. Heidari and B. Davvaz, Γ -hypergroups and Γ -
semihypergroups associated to binary relations, Iranian Journal of
Science & Technology, (2011) A2: 69-80.
[22] K. Hila and S. Abdullah, A study on intuitionistic fuzzy sets in
-semihypergroups, J. Intell. Fuzzy Systems, 26 (2014), 1695-1710.
[23] K. Hila and A. Gilani, On fuzzy subsets in -semihypergroup
through left operator semihypergroup, International Conference on
Applied Analysis and Algebra (ICAAA2011), 29-30 June and 1-2
July 2011 in Istanbul, Turkey.
[24] K. Hila, B. Davvaz and J. Dine, Study on the structure of a -
semihypergroups, Commun. Algebra, 40 (2012), 2932--2948.
[25] Y. B. Jun, on ),( ΨΦ -intuitionistic fuzzy subgroups,
KYUNGPOOK Math. J. 45(2005), 87-94.
[26] K. H. Kim and Y. B. Jun, Intuitionistic fuzzy interior ideals of
semigroups, Int. J. Math. Math. Sci., 27(5)(2001), 261-267.
[27] K. H. Kim and Y. B. Jun, Intuitionistic fuzzy ideals of
semigroups, Indian J. Pure Appl. Math., 33(4)(2002), 443-449.
[28] K. H. Kim, J. G. Lee, On intuitionistic fuzzy bi-ideals of
semigroups, Turk. J. Math, 29 (2005) , 201-210.
[29] F. Marty, Sur une generalization de la notion de group, 8th
Congres Math. Scandinaves, Stockholm, (1934), 45-49.
[30] S. Mirvakili, S. M. Anvariyeh and B. Davvaz, Γ -
Semihypergroups and Regular Relations, Journal of Mathematics,
2013, Article ID 915250, 1-7.
[31] A. Rosenfeld, Fuzzy groups, J. Math. Anal. Appl. 35 (1971),
512--517.
[32] M. K. Sen and N. K. Saha, On -semigroup-I, Bull. Cal. Math.
Soc. 78 (1986), 180-186.
[33] S. M. Anvariyeh, S. Mirvakili, B. Davvaz, On -hyperideals in
Γ -semihypergroups, Carpathian J. Math. 26 (2010), No. 1, 11-23.
[34] T. Vougiouklis, Hyperstructures and their representations,
Hadronic Press, Florida, 1994.
[35] X.-Y. Xie, Fuzzy ideal extension of semigroups, Soochow J.
Math. 27(2) (2001), 125-138.
[36] L. A. Zadeh, Fuzzy Sets, Inform. and Control 8 (1965), 338-
353.
International Journal of Computer Science and Information Security (IJCSIS), Vol. 14, No. 6, June 2016
836 https://sites.google.com/site/ijcsis/ ISSN 1947-5500

Pythagorean Fuzzy Hybrid Geometric Aggregation Operator and
Their Applications to Multiple Attribute Decision Making
Khaista Rahman
Department of Mathematics, Hazara
University, Mansehra, KPK, Pakistan
Saleem Abdullah
Department of Mathematics, Abdul Wali
Khan University, Mardan, KPK, Pakistan
Muhammad Sajjad Ali Khan
Department of Mathematics, Hazara
University, Mansehra, KPK, Pakistan
Muhammad Shakeel
Department of Mathematics, Hazara
University, Mansehra, KPK, Pakistan
Abstract: There are many aggregation
operators and its applications have been
developed up to date, but in this paper,
we develop the Pythagorean fuzzy hybrid
geometric ( )PFHG operator, and also
study some properties, such as
monotonicity, idempotency, and
boundedness of the proposed operator.
Pythagorean fuzzy hybrid geometric
operator is the generalization of the
Pythagorean fuzzy weighted geometric
( )PFWG operator and the Pythagorean
fuzzy ordered weighted geometric
( )PFOWG operator. Finally, we apply
the Pythagorean fuzzy hybrid geometric
( )PFHG operator to deal with multiple
attribute decision making ( )MADM
problems under Pythagorean fuzzy
information. Using Pythagorean fuzzy
hybrid geometric aggregation operator,
we also develop an algorithm for
multiple attribute decision making
( )MADM problems. Lastly we construct
an example for multiple attribute
decision making MADM problems.
Key words: Pythagorean fuzzy sets,
Pythagorean fuzzy hybrid geometric
PFHG operator. Decision making
problems.
1: INTRODUCTION
In 1965, L. A. Zadeh introduced the
concept of fuzzy set [14]. In 1986,
Atanassov presented the idea of
intuitionistic fuzzy set, which is the
generalization of the fuzzy set [5]. The
International Journal of Computer Science and Information Security (IJCSIS), Vol. 14, No. 6, June 2016
837 https://sites.google.com/site/ijcsis/ ISSN 1947-5500

intuitionistic fuzzy set has gotten
increasingly consideration since its
development [5, 6, 7, 8, 9, 10, 11]. Chen
and Tan [20] and Hong and Choi [1]
characterized some fundamental standards
multi-criteria fuzzy decision making
problems based on vague sets. Bustince
and Burillo [3] demonstrated that vague
sets are intuitionistic fuzzy sets. De et al
[21] defined concentration, dilation and
normalization of intuitionistic fuzzy sets.
He additionally demonstrated some
recommendations in this field. Bustince et
al. [4] introduced the notion of
intuitionistic fuzzy generators and also
studied the complementary of an
intuitionistic fuzzy set from the
intuitionistic fuzzy generators. Yager
[18,19] introduced the notion of
Pythagorean fuzzy set categorized by a
membership degree and nonmembership
degree which holds the condition that the
square sum of its membership degree and
nonmembership degree is equal to or less
than one. Xu [26] developed some basic
arithmetic aggregation operators, such as
the intuitionistic fuzzy weighted averaging
( )IFWA operator, the intuitionistic fuzzy
ordered weighted averaging ( )IFOWA
operator and the intuitionistic fuzzy hybrid
averaging ( )IFHA operator. Xu and
Yager [25] developed some basic
geometric aggregation operators, such as
intuitionistic fuzzy weighted geometric
( )IFWG and the intuitionistic fuzzy
ordered weighted geometric ( )IFOWG
operator and the intuitionistic fuzzy hybrid
geometric ( )IFHG operator. They also
applied them to multiple attribute decision
making ( )MADM based on intuitionistic
fuzzy sets ( )IFSs . Wei [2] introduced the
notion of some induced geometric
aggregation operators with intuitionistic
fuzzy information and also applied them to
group decision making. Liu [22]
introduced the notion of intuitionistic
fuzzy Einstein weighted geometric
( )IFWGε operator, and the intuitionistic
fuzzy Einstein ordered weighted geometric
( )IFOWGε operator, and also applied the
intuitionistic fuzzy Einstein weighted
geometric ( )IFWGε operator to multiple
attribute decision making ( )MADM
problems. Bellman and Zadeh [15]
presented the theory of fuzzy sets in the
multiple attribute decision making
( )MADM problems. intuitionistic fuzzy
sets ( )IFSs have been mostly applied in
real-life multiple attribute decision making
( )MADM problems, and the studies of
both methods and applications of multiple
attribute decision making ( )MADM
problems with intuitionistic fuzzy sets
International Journal of Computer Science and Information Security (IJCSIS), Vol. 14, No. 6, June 2016
838 https://sites.google.com/site/ijcsis/ ISSN 1947-5500

( )IFSs have got great focus
[12,16,17,21,22,27,28]. In 2015, X. Peng
and Y. Yang [24] introduced the notion of
the Pythagorean fuzzy weighted averaging
( )PFWA operator, Pythagorean fuzzy
weighted power averaging ( )PFWPA
operator, and the Pythagorean fuzzy
weighted power geometric ( )PFWPG
operator. K. Rahman et al [13] developed
the Pythagorean fuzzy weighted geometric
( )PFWG operator and the Pythagorean
fuzzy ordered weighted geometric
( )PFOWG operator and their basic
properties. They also applied them on
multiple attribute decision making
( )MADM problems.
This paper consists of five section. In
section 2, we give some basic definitions
and results which will be used in later
sections. In section 3, we develop
Pythagorean fuzzy hybrid geometric
( )PFHG operator and also study various
properties such as monotonicity,
idempotency, and boundedness of this
proposed operator. Actually Pythagorean
fuzzy hybrid geometric ( )PFHG
operator is the generalization of the
Pythagorean fuzzy weighted geometric
( )PFWG and the Pythagorean fuzzy
ordered weighted geometric ( )PFOWG
operators. In section 4, we apply the
Pythagorean fuzzy hybrid geometric
( )PFHG operator to deal with multiple
attribute decision making ( )MADM
problems under Pythagorean fuzzy
information. In section 5, we have
conclusion.
2: PRELIMINERS
Definition 2.1: [5] Let Q be a fixed
set, then an intuitionistic fuzzy set ( ) ,IFS
C in Q can be defined as:
( ) ( ), ( ), ( ) | , 1C CC q q q q Qμ η= ∈
where ( )C qμ and ( )C qη are mappings
from Q to [0,1] , also 0 ( ) 1,C qμ≤ ≤
0 ( ) 1,C qμ≤ ≤ and
0 μC q C q 1, for all q Q∈ .
Let ( ) 1 ( ) ( )C C Cq q qπ μ η= − − , then it is
called intuitionistic fuzzy index of element
q Q∈ to set C, representing the degree of
indeterminacy of q to C . Clearly
0 ( ) 1C qπ≤ ≤ for every .q Q∈
Definition 2.2: [18] Let Q be a fixed
set, then a Pythagorean fuzzy set
( ) ,PFS L in
Q can be defined as:
( ) ( ) , ( ), ( ) | , 2L LL q q q q Qμ η= ∈
where ( )L qμ and ( )L qη are
mappings from Q to [0,1] , also
0 ( ) 1,0 ( ) 1L Lq qμ η≤ ≤ ≤ ≤ and
International Journal of Computer Science and Information Security (IJCSIS), Vol. 14, No. 6, June 2016
839 https://sites.google.com/site/ijcsis/ ISSN 1947-5500

( )2 20 ( ) 1,L Lq qμ η≤ + ≤ for all q Q∈ .
Let 2 2( ) 1 ( ) ( )L L Lq q qπ μ η= − − , then it
is called Pythagorean fuzzy index of
element q Q∈ to set L , representing
the degree of indeterminacy of q to L.
Clearly 0 ( ) 1L qπ≤ ≤ for every .q Q∈
Definition 2.3: [23] Let ( ),e ee μ η= ,
( )1 11 ,e ee μ η= and ( )2 22 ,e ee μ η= be the
three Pythagorean fuzzy values ( ) ,PFVs
then
( ) ( )( ) ( )
( ) ( ) ( )( )( )
( ) ( ) ( )
( ) ( ) ( ) ( )
1 2 1 2
1 2 1 2
2 2 2 2
1 2 1 2 1 2
2 2 2 2
1 2 1 2 1 2
1 2
1 2
1 2
1 2
2
2
1 max , , min , ,
2 min , , max , ,
3 , ,
(4) , ,
(5) , ,
6 1 1 , , 0,
7 , 1 1 , 0.
e e e e
e e e e
ce e
e e e e e e
e e e e e e
e e
e e
e e
e e
e
e e
e e
e
e
μ μ η η
μ μ η η
η μ
μ μ μ μ η η
μ μ η η η η
μ η
μ η
ϒ ϒ
ϒϒ ϒ
∪ =
∩ =
=
⊕ = + −
⊗ = + −
⎛ ⎞ϒ = − − ϒ >⎜ ⎟⎝ ⎠⎛ ⎞= − − ϒ >⎜ ⎟⎝ ⎠
Definition 2.4: [23] Let ( ),e ee μ η= be
the Pythagorean fuzzy number ( )PFN ,
then the score function of e can be
defined as:
( ) ( )2 2 , 3e eS e μ η= −
where ( ) [ ]1,1S e ∈ − .
Definition 2.5: [23] Let ( ),e ee μ η=
be the Pythagorean fuzzy number ( )PFN ,
then the accuracy degree of e can be
defined as:
( ) ( )2 2 , 4e eH e μ η= +
where ( ) [ ]0,1H e ∈ .
Definition 2.6: [23] Let ( )1 11 ,e ee μ η=
and 2 22 ( , )e ee μ η= be the two Pythagorean
fuzzy numbers ( )PFNs . Then
( ) 2 2
1 11 eS e αμ η= − , ( ) 2 2
2 22 e eS e μ η= − be
the scores function of ē1 and ē2 , and
H ē1 ē12
ē12 , H ē2 ē2
2ē22
be the accuracy degrees of ē1 and ē2
respectively. Then
1 If 1 2( ) ( ),S e S e< then 2e is
greater than 1e denoted by 1 2 ,e e<
2 If 1 2( ) ( ),S e S e= then
a If 1 2( ) ( ),H e H e= then 1e and
2e having the same information, i.e.,
1 2e eμ μ= and 1 2e eη η= denoted by
1 2.e e=
b If 1 2( ) ( )H e H e< then 2e is
greater than 1e denoted by 1 2.e e<
Definition 2.7: [25] Let ( ),j jj e ee μ η=
(j=1, 2, …, n) be a collection of
intuitionistic fuzzy values ( )IFVs , and let
: ,nIFWG Ψ → Ψ and define as
following:
( )( ) ( ) ( ) ( )1 2
1 2
1 2
, ,...,
... . 5n
w n
w w wn
IFWG e e e
e e e= ⊗ ⊗ ⊗
Then IFWG is called intuitionistic fuzzy
International Journal of Computer Science and Information Security (IJCSIS), Vol. 14, No. 6, June 2016
840 https://sites.google.com/site/ijcsis/ ISSN 1947-5500

weighted geometric ( )IFWG operator of
dimension n , where ( )1 2, ,..., Tnw w w w=
is the weighted vector of ( )1,2,...,je j n=
with [ ]0,1jw ∈ and 1
1.n
jj
w=
=∑
Especially, if ( )1 1 1, ,..., Tn n nw = , then
intuitionistic fuzzy weighted geometric
( )IFWG operator is reduced to an
intuitionistic fuzzy geometric ( )IFG
operator of dimension n which is defined
as follows:
( ) ( ) ( )1
1 2 1 2, ,..., ... . 6nn nIFG e e e e e e= ⊗ ⊗ ⊗
Definition 2.8: [25] Let ( ),j jj e ee μ η=
(j=1, 2 . . . n) be a collection of
intuitionistic fuzzy values ( )IFVs . Then
an intuitionistic fuzzy ordered weighted
geometric ( )IFOWG operator of
dimension n is a mapping
: ,nIFOWG Ψ → Ψ that has an
associated vector ( )1 2, ,..., ,Tnw w w w=
such that [ ]0,1jw ∈ and 1
1.n
jj
w=
=∑
Furthermore,
( )
( )( ) ( )( ) ( )( ) ( )1 2
1 2
1 2
, ,...,
... , 7n
w n
w w w
n
IFOWG e e e
e e eσ σ σ= ⊗ ⊗ ⊗
where ( ) ( ) ( )( )1 , 2 ,..., nσ σ σ is a
permutation of ( )1, 2,..., n such that
( ) ( )1j je eσ σ− ≥ for all j. Especially, if
( )1 1 1, ,..., Tn n nw = . Then intuitionistic
fuzzy ordered weighted geometric
( )IFOWG operator is reduced to
intuitionistic fuzzy geometric ( )IFG
operator of dimension n.
Definition 2.9: [25] An intuitionistic
fuzzy hybrid geometric ( )IFHG operator
of dimension n is a mapping
: ,nIFHG Ψ → Ψ which has an
associated vector ( )1 2, , ,..., ,Tnw w w w=
and also [ ]0,1jw ∈ and 1
1.n
jj
w=
=∑
Furthermore,
( )
( ) ( ) ( ) ( )1 2
, 1 2
1 2
, ,...,
.... , 8n
w w n
w w w
n
IFHG e e e
e e eσ σ σ⋅ ⋅ ⋅⎛ ⎞ ⎛ ⎞ ⎛ ⎞= ⊗ ⊗ ⊗⎜ ⎟ ⎜ ⎟ ⎜ ⎟
⎝ ⎠ ⎝ ⎠ ⎝ ⎠
where ( )je σ⋅
is the jth largest of the
weighted intuitionistic fuzzy values
( )IFVs ( ) ( ) ( ) jnwj j je e eσ σ
⋅ ⋅⎛ ⎞=⎜ ⎟⎝ ⎠
where
( )1 2, ,..., Tnw w w w= is the weighted
vector of ( )1,2,..., ,je j n= such that
[ ]( )0,1 1,2,...,jw j n∈ = , 1
1,n
jj
w=
=∑ and
n is the balancing coefficient, which
plays a role of balance, if the vector
( )1 2, ,..., Tnw w w approaches ( )1 1 1, ,..., ,T
n n n
then the vector ( ) ( ) ( )( )1 2
1 2, , ..., nTnw nw nw
ne e e
International Journal of Computer Science and Information Security (IJCSIS), Vol. 14, No. 6, June 2016
841 https://sites.google.com/site/ijcsis/ ISSN 1947-5500

approaches ( )1 2, ,..., .Tne e e
Definition 2.10: [13] Let ( ),j jj e ee μ η=
(j=1,2,…,n) be a collection of Pythagorean
fuzzy values ( )PFVs , and let
: ,nPFWG Ψ → Ψ if
( )( ) ( ) ( ) ( )1 2
1 2
1 2
, ,...,
... . 9n
w n
w w wn
PFWG e e e
e e e= ⊗ ⊗ ⊕
Then PFWG is called Pythagorean
fuzzy weighted geometric ( )PFWG
operator of dimension n, where
( )1 2, ,..., Tnw w w w= is the weighted vector
of ( )1,2,...,je j n= with [ ]0,1jw ∈
and 1
1.n
jj
w=
=∑ Especially, if
( )1 1 1, ,..., Tn n nw = . Then Pythagorean fuzzy
weighted geometric ( )PFWG operator
is reduced to a Pythagorean fuzzy
geometric ( )PFG operator of dimension
n which is defined as follows:
( ) ( ) ( )1
1 2 1 2, ,..., ... . 10nn nPFG e e e e e e= ⊗ ⊗ ⊗
Definition 2.11:[13] Let ( ),j jj e ee μ η=
(j=1,2,…,n) be a collection of
Pythagorean fuzzy values ( )PFVs .
Then Pythagorean fuzzy ordered weighted
geometric ( )PFOWG operator of
dimension n is a mapping
: ,nPFOWG Ψ → Ψ which has an
associated vector ( )1 2, ,..., ,Tnw w w w=
and also [ ]0,1jw ∈ and 1
1.n
jj
w=
=∑
Furthermore,
( )
( )( ) ( )( ) ( )( ) ( )1 2
1 2
1 2
, ,...,
... , 11n
w n
w w w
n
PFOWG e e e
e e eσ σ σ= ⊗ ⊗ ⊗
where ( ) ( ) ( )( )1 , 2 ,..., nσ σ σ
is a permutation of ( )1, 2,..., n
such that ( ) ( )1j je eσ σ− ≥ for all j
Especially, if ( )1 1 1, ,..., Tn n nw = . Then
Pythagorean fuzzy ordered weighted
geometric ( )PFOWG operator is
reduced to a Pythagorean fuzzy geometric
( )PFG operator of dimension n .
3: Pythagorean Fuzzy Hybrid
Geometric Aggregation Operator and
Their Properties Definition 3.1: A Pythagorean fuzzy
hybrid geometric ( )PFHG operator of
dimension n is a mapping
: ,nPFHG Ψ → Ψ which has an
associated vector ( )1 2, ,..., ,Tnw w w w=
such that [ ]0,1jw ∈ and 1
1.n
jj
w=
=∑
Furthermore,
( )
( ) ( ) ( ) ( )1 2
, 1 2
1 2
, ,...,
... , 12n
w w n
w w w
n
PFHG e e e
e e eσ σ σ⋅ ⋅ ⋅⎛ ⎞ ⎛ ⎞ ⎛ ⎞= ⊗ ⊗ ⊗⎜ ⎟ ⎜ ⎟ ⎜ ⎟
⎝ ⎠ ⎝ ⎠ ⎝ ⎠
where ( )je σ⋅
is the jth largest of the
International Journal of Computer Science and Information Security (IJCSIS), Vol. 14, No. 6, June 2016
842 https://sites.google.com/site/ijcsis/ ISSN 1947-5500

weighted Pythagorean fuzzy values
( )PFVs
( ) ( ) ( ) ( )1 2, , ,...,jnw Tj j j ne e e w w w wσ σ
⋅ ⋅⎛ ⎞= =⎜ ⎟⎝ ⎠
is the weighted vector of
( )1, 2,..., ,je j j= such that [ ]0,1jw ∈
(j=1,2,…,n), 1
1,n
jj
w=
=∑ and n is the
balancing coefficient, if the vector
( )1 2, ,..., Tnw w w goes to ( )1 1 1, ,..., ,T
n n n
then the vector
( ) ( ) ( )( )1 2
1 2, ,..., nTnw nw nw
ne e e goes to
( )1 2, ,..., .Tne e e
Theorem 3.2: Let ( ),j jj e ee μ η=
(j=1,2,…,n) be a collection of
Pythagorean fuzzy values PFVs , then
their aggregated value by using the
Pythagorean fuzzy hybrid geometric
( )PFHG operator is also a Pythagorean
fuzzy value ( )PFV , and
( )
( ) ( )( )2
, 1 2
1 1
, ,...,
, 1 1 , 13j
w j
j j
w w n
wn n
e ej j
PFHG e e e
σ σ
μ η⋅ ⋅
= =
⎛ ⎞⎛ ⎞⎜ ⎟= − −⎜ ⎟⎜ ⎟⎝ ⎠⎝ ⎠∏ ∏
where ( )1 2, ,..., Tnw w w w= is the
weighted vector of ( )1,2,...,je j n=
with [ ]0,1jw ∈ and 1
1.n
jj
w=
=∑
Proof : By mathematical induction we
show that equation (13) true for all n .
First we show that equation (13) true for
2.n = Since
( )( ) ( )
( )( ) ( )
1121
1 1
2222
2 2
1
2
, 1 1
, 1 1
w
w
ww
e e
ww
e e
e
e
σ σ
σ σ
σ
σ
μ η
μ η
⋅ ⋅
⋅ ⋅
⋅
⋅
⎛ ⎞⎛ ⎞⎛ ⎞ ⎜ ⎟= − −⎜ ⎟ ⎜ ⎟⎜ ⎟⎝ ⎠ ⎝ ⎠⎝ ⎠⎛ ⎞⎛ ⎞⎛ ⎞ ⎜ ⎟= − −⎜ ⎟ ⎜ ⎟⎜ ⎟⎝ ⎠ ⎝ ⎠⎝ ⎠
So
( ) ( ) ( )1 2
1 2, 1 2,w w
w wPFHG e e e eσ σ⋅ ⋅⎛ ⎞ ⎛ ⎞= ⊗⎜ ⎟ ⎜ ⎟
⎝ ⎠ ⎝ ⎠
( ) ( ) ( ) ( )
1 22 21 2
1 1 2 2
, 1 1 , 1 1w w
w w
e e e eσ σ σ σ
μ η μ η⋅ ⋅ ⋅ ⋅
⎛ ⎞ ⎛ ⎞⎛ ⎞ ⎛ ⎞⎜ ⎟ ⎜ ⎟= − − ⊗ − −⎜ ⎟ ⎜ ⎟⎜ ⎟ ⎜ ⎟⎝ ⎠ ⎝ ⎠⎝ ⎠ ⎝ ⎠
( ) ( )
( ) ( )
( ) ( )
( ) ( )
1 2
1 2
1 22 2
1 2
1 22 2
1 2
2
2 2
2 2
2 2
1 1
,
1 1 1 1
1 1 1 1
, 1 1 .
w w
jw j
j j
e e
w w
e e
w w
e e
w
e ej j
σ σ
σ σ
σ σ
σ σ
μ μ
η η
η η
μ η
⋅ ⋅
⋅ ⋅
⋅ ⋅
⋅ ⋅
= =
⎛ ⎞⎜ ⎟⎜ ⎟
⎛ ⎞ ⎛ ⎞⎜ ⎟⎛ ⎞ ⎛ ⎞⎜ ⎟ ⎜ ⎟− − + − −⎜ ⎟⎜ ⎟ ⎜ ⎟⎜ ⎟ ⎜ ⎟= ⎝ ⎠ ⎝ ⎠⎜ ⎟⎝ ⎠ ⎝ ⎠⎜ ⎟⎜ ⎟⎛ ⎞ ⎛ ⎞⎛ ⎞ ⎛ ⎞⎜ ⎟⎜ ⎟ ⎜ ⎟− − − − −⎜ ⎟ ⎜ ⎟⎜ ⎟ ⎜ ⎟⎜ ⎟⎝ ⎠ ⎝ ⎠⎝ ⎠ ⎝ ⎠⎝ ⎠⎛ ⎞⎛ ⎞⎜ ⎟= − −⎜ ⎟⎜ ⎟⎝ ⎠⎝ ⎠∏ ∏
Thus equation ( )13 true for 2.n = Let
us suppose that equation ( )13 true for
.n k=
( )
( ) ( )( )2
, 1 2
1 1
, ,...,
, 1 1 . 14j
w j
j j
w w k
wk k
e ej j
PFHG e e e
σ σ
μ η⋅ ⋅
= =
⎛ ⎞⎛ ⎞⎜ ⎟= − −⎜ ⎟⎜ ⎟⎝ ⎠⎝ ⎠∏ ∏
Suppose equation ( )13 true for n k= .
Then we show that equation ( )13 true
for 1.n k= +
International Journal of Computer Science and Information Security (IJCSIS), Vol. 14, No. 6, June 2016
843 https://sites.google.com/site/ijcsis/ ISSN 1947-5500

( )
( ) ( )
( )
2
121
1 1
, 1 2 1
1 1
, ,...,
, 1 1
, 1 1
j
j j
kwk
k k
w w k
w wk k
e ej j
w
e e
PFHG e e e
σ σ
μ η
μ η
⋅ ⋅
++
⋅ ⋅+ +
+
= =
⎛ ⎞⎛ ⎞ ⎛ ⎞⎜ ⎟= − −⎜ ⎟ ⎜ ⎟⎜ ⎟⎝ ⎠ ⎝ ⎠⎝ ⎠⎛ ⎞
⊗ − −⎜ ⎟⎜ ⎟⎝ ⎠
∏ ∏
( )
( )
( )
( )
( )
( )
1
1
2
12
1
2
12
1
1
2
1
2
2
1
2
1
1 1
. ,
1 1
1 1
1 1
1 1
, 1
w wj k
j k
j
j
k
k
j
j
k
k
w j
j
k
e ej
wk
ej
w
e
wk
ej
w
e
k k
ej j
σ
σ
σ
σ
μ μ
η
η
η
η
μ
+⋅ ⋅
+
⋅
+
⋅+
⋅
+
⋅+
⋅
=
=
=
+
= =
⎛ ⎞⎜ ⎟⎜ ⎟⎜ ⎟
⎛ ⎞⎜ ⎟⎛ ⎞⎜ ⎟− − +⎜ ⎟⎜ ⎟⎜ ⎟⎝ ⎠⎜ ⎟⎝ ⎠⎜ ⎟⎜ ⎟⎛ ⎞
− − −⎜ ⎟⎜ ⎟⎜ ⎟⎜ ⎟⎝ ⎠⎜ ⎟
⎛ ⎞⎜ ⎟⎛ ⎞⎜ ⎟⎜ ⎟− −⎜ ⎟⎜ ⎟⎝ ⎠⎜ ⎟⎝ ⎠⎜ ⎟⎜ ⎟⎛ ⎞⎜ ⎟− −⎜ ⎟⎜ ⎟⎜ ⎟⎝ ⎠⎝ ⎠
= −
∏
∏
∏
∏( )
21
1j
j
w
eσ
η ⋅
+⎛ ⎞⎛ ⎞⎜ ⎟−⎜ ⎟⎜ ⎟⎝ ⎠⎝ ⎠∏
Thus equation ( )13 true for n= k+1.
Thus equation ( )13 true for n.
Example 3.3: Let ( )1 0.4,0.8e =
( )2 0.5,0.7 ,e = ( )3 0.6,0.6e =
( )4 0.7,0.6e = be the four Pythagorean
fuzzy values ( )PFVs . Let
( )0.1,0.2,0.3,0.4 Tw = . Then
( ) ( )
( ) ( )( )( )
( ) ( )
( ) ( )( )( )
1 12
1 1
2 22
2 2
1
4 0.1 4 0.1
2
4 0.2 4 0.2
, 1 1
0.4 , 1 1 0.64
0.6931,0.5791 .
, 1 1
0.5 , 1 1 0.49
0.5743,0.6452 .
nw nw
e e
nw nw
e e
e
e
μ η
μ η
⋅
× ×
⋅
× ×
⎛ ⎞= − −⎜ ⎟⎝ ⎠
= − −
=
⎛ ⎞= − −⎜ ⎟⎝ ⎠
= − −
=
( ) ( )
( ) ( )( )( )
( ) ( )
( ) ( )( )
3 32
3 3
4 42
4 4
4 0.42
4 4
3
4 0.3 4 0.3
4
4 0.4
, 1 1
0.6 , 1 1 0.36
0.5717,0.6438 .
, 1 1
, 1 1
0.5651,0.7143 .
nw nw
e e
nw nw
e e
e e
e
e
μ η
μ η
μ η×
⋅
× ×
⋅
×
⎛ ⎞= − −⎜ ⎟⎝ ⎠
= − −
=
⎛ ⎞= − −⎜ ⎟⎝ ⎠⎛ ⎞
= − −⎜ ⎟⎝ ⎠
=
Now we calculate the scores of
( )1,2,3,4 .je j⋅
=
( ) ( )
( ) ( )
( ) ( )
( ) ( )
2 21
2 22
2 23
2 24
0.6931 0.5791 0.145,
0.5743 0.6452 0.086,
0.5417 0.6438 0.121,
0.5651 0.7143 0.190.
S e
S e
S e
S e
⋅
⋅
⋅
⋅
⎛ ⎞ = − =⎜ ⎟⎝ ⎠⎛ ⎞ = − = −⎜ ⎟⎝ ⎠⎛ ⎞ = − = −⎜ ⎟⎝ ⎠⎛ ⎞ = − = −⎜ ⎟⎝ ⎠
Since
1 2 3 4 .S e S e S e S e⋅ ⋅ ⋅ ⋅⎛ ⎞ ⎛ ⎞ ⎛ ⎞ ⎛ ⎞> > >⎜ ⎟ ⎜ ⎟ ⎜ ⎟ ⎜ ⎟
⎝ ⎠ ⎝ ⎠ ⎝ ⎠ ⎝ ⎠
Thus
International Journal of Computer Science and Information Security (IJCSIS), Vol. 14, No. 6, June 2016
844 https://sites.google.com/site/ijcsis/ ISSN 1947-5500

( ) ( )
( ) ( )
( ) ( )
( ) ( )
1
2
3
4
0.6931,0.5791 ,
0.5743,0.6452 ,
0.5417,0.6438 ,
0.5651,0.7143 .
e
e
e
e
σ
σ
σ
σ
⋅
⋅
⋅
⋅
=
=
=
=
Hence
( )
( ) ( )
2
, 1 2 3 4
4 4
1 1
, , ,
, 1 1j
w j
j j
w w
w
e ej j
PFHG e e e e
σ σ
μ η⋅ ⋅
= =
⎛ ⎞⎛ ⎞⎜ ⎟= − −⎜ ⎟⎜ ⎟⎝ ⎠⎝ ⎠∏ ∏
( ) ( ) ( ) ( )( ) ( ) ( ) ( )
( )( )
0.1 0.2 0.3 0.4
0.1 0.2 0.3 0.4
0.6931 0.5743 0.5417 0.5651 ,
1 0.6647 0.5838 0.5856 0.4898
0.5713, 0.4481
0.5713,0.6694 .
⎛ ⎞⎜ ⎟=⎜ ⎟−⎝ ⎠
=
=
Theorem 3.4: Let ( ),j jj e ee μ η=
(j=1,2,…,n) be a collection of
Pythagorean fuzzy values ( )PFVs and
( )1 2, ,..., Tnw w w w= is the weighted
vector of ( )1, 2,...,je j n= with
[ ]0,1jw ∈ and 1
1.n
jj
w=
=∑ If all
( ) ( )1,2,...,jee j nσ⋅
⋅= are equal, i.e.,
( ) ,jee eσ⋅
⋅ ⋅= for all j . Then
( ) ( ), 1 2 3, , ,..., . 15w w nPFHG e e e e e⋅
=
Proof: Since
( )
( ) ( ) ( )
1 2
1 2
, 1 2, ,...,
...n
n
w w n
w w w
e e e
PFHG e e e
e e eσ σ σ⋅ ⋅ ⋅
⋅ ⋅ ⋅⎛ ⎞ ⎛ ⎞ ⎛ ⎞= ⊗ ⊗ ⊕⎜ ⎟ ⎜ ⎟ ⎜ ⎟⎝ ⎠ ⎝ ⎠ ⎝ ⎠
Let
( ) ( )1, 2,3,..., .jee j n eσ⋅
⋅ ⋅= =
Then
( )1 2 3
1
, 1 2, ,...,
...
.
n
n
j
j
w w n
w w w w
w
PFHG e e e
e e e e
e
e
=
⋅ ⋅ ⋅ ⋅
⋅
⋅
⎛ ⎞ ⎛ ⎞ ⎛ ⎞ ⎛ ⎞= ⊗ ⊗ ⊗ ⊕⎜ ⎟ ⎜ ⎟ ⎜ ⎟ ⎜ ⎟⎝ ⎠ ⎝ ⎠ ⎝ ⎠ ⎝ ⎠
⎛ ⎞= ⎜ ⎟⎝ ⎠
=
∑
Theorem 3.5: Let ( ),j jj e ee μ η=
(j=1,2,…,n) be a collection of Pythagorean
fuzzy values ( )PFVs and
( )1 2, ,..., Tnw w w w= is the weighted vector
of ( )1,2,...,je j n= with [ ]0,1jw ∈
and 1
1.n
jj
w=
=∑ If
( ) ( )
( ) ( )
min
max
min ,max ,
max , min .
j j
j j
j je e
jj e e
e
e
σ σ
σ σ
μ η
μ η
⋅ ⋅
⋅ ⋅
⋅
⋅
⎛ ⎞⎛ ⎞ ⎛ ⎞= ⎜ ⎟ ⎜ ⎟⎜ ⎟⎝ ⎠ ⎝ ⎠⎝ ⎠⎛ ⎞⎛ ⎞ ⎛ ⎞= ⎜ ⎟ ⎜ ⎟⎜ ⎟⎝ ⎠ ⎝ ⎠⎝ ⎠
Then
( ) ( )min max, 1 2, ,..., , for all . 16w w ne PFHG e e e e w⋅ ⋅
≤ ≤
Proof: Since
( ) ( ) ( )( )
( ) ( ) ( )( )
min max , 17
min max . 18
j j j
j j j
j je e e
j je e e
σ σ σ
σ σ σ
μ μ μ
η η η
⋅ ⋅ ⋅
⋅ ⋅ ⋅
⎛ ⎞ ⎛ ⎞≤ ≤⎜ ⎟ ⎜ ⎟⎝ ⎠ ⎝ ⎠⎛ ⎞ ⎛ ⎞≤ ≤⎜ ⎟ ⎜ ⎟⎝ ⎠ ⎝ ⎠
From equation ( )17 , we have
International Journal of Computer Science and Information Security (IJCSIS), Vol. 14, No. 6, June 2016
845 https://sites.google.com/site/ijcsis/ ISSN 1947-5500

( ) ( ) ( )
( ) ( ) ( )
( ) ( ) ( )1 1 1
min max
min max
min max
j j j
j j j
j j j
j j j
j j j
j je e e
w w w
j je e e
w w wn n n
j je e ej j j
σ σ σ
σ σ σ
σ σ σ
μ μ μ
μ μ μ
μ μ μ
⋅ ⋅ ⋅
⋅ ⋅ ⋅
⋅ ⋅ ⋅
= = =
⎛ ⎞ ⎛ ⎞⇔ ≤ ≤⎜ ⎟ ⎜ ⎟⎝ ⎠ ⎝ ⎠
⎛ ⎞ ⎛ ⎞ ⎛ ⎞⇔ ≤ ≤⎜ ⎟ ⎜ ⎟ ⎜ ⎟⎝ ⎠ ⎝ ⎠ ⎝ ⎠
⎛ ⎞ ⎛ ⎞ ⎛ ⎞⇔ ≤ ≤⎜ ⎟ ⎜ ⎟ ⎜ ⎟⎝ ⎠ ⎝ ⎠ ⎝ ⎠
∏ ∏ ∏
( ) ( ) ( )
( ) ( ) ( )( )
1 1
1
1
min max
min max . 19
n n
j j j
j j
j j j
j
j j j
w w wn
j je e ej
wn
j je e ej
σ σ σ
σ σ σ
μ μ μ
μ μ μ
= =⋅ ⋅ ⋅
⋅ ⋅ ⋅
=
=
⎛ ⎞ ⎛ ⎞ ⎛ ⎞⇔ ≤ ≤⎜ ⎟ ⎜ ⎟ ⎜ ⎟⎝ ⎠ ⎝ ⎠ ⎝ ⎠
⎛ ⎞ ⎛ ⎞ ⎛ ⎞⇔ ≤ ≤⎜ ⎟ ⎜ ⎟ ⎜ ⎟⎝ ⎠ ⎝ ⎠ ⎝ ⎠
∑ ∑∏
∏
Now from equation (18) we have
( ) ( ) ( )
( ) ( ) ( )
2
2
2 2
2 2
1 max 1 1 min
1 max 1 1 min
j j j
j jj
j j j
jj e e e
w ww
jj e e e
σ σ σ
σ σ σ
η η η
η η η
⋅ ⋅ ⋅
⋅ ⋅ ⋅
⎛ ⎞ ⎛ ⎞⇔ − ≤ − ≤ −⎜ ⎟ ⎜ ⎟⎝ ⎠ ⎝ ⎠
⎛ ⎞ ⎛ ⎞⎛ ⎞ ⎛ ⎞ ⎛ ⎞⇔ − ≤ − ≤ −⎜ ⎟ ⎜ ⎟⎜ ⎟ ⎜ ⎟ ⎜ ⎟⎜ ⎟ ⎜ ⎟⎝ ⎠ ⎝ ⎠ ⎝ ⎠⎝ ⎠ ⎝ ⎠
( ) ( )
( )
( ) ( )
( )
( )
2
1 2
1
2
1 1
2
1
2
1
2
2
1 max 1
1 min
1 max 1
1 min
1 max
j j
j j
j
j
n
j jj
j j
n
j
j
j
j
w wn n
j e ej j
wn
j ej
w wn
j e ej
w
j e
j e
σ σ
σ
σ σ
σ
σ
η η
η
η η
η
η
⋅ ⋅
⋅
=
⋅ ⋅
=
⋅
⋅
= =
=
=
⎛ ⎞⎛ ⎞ ⎛ ⎞⇔ − ≤ −⎜ ⎟⎜ ⎟ ⎜ ⎟⎜ ⎟⎝ ⎠ ⎝ ⎠⎝ ⎠
⎛ ⎞⎛ ⎞≤ −⎜ ⎟⎜ ⎟⎜ ⎟⎝ ⎠⎝ ⎠
⎛ ⎞⎛ ⎞ ⎛ ⎞⇔ − ≤ −⎜ ⎟⎜ ⎟ ⎜ ⎟⎜ ⎟⎝ ⎠ ⎝ ⎠⎝ ⎠
⎛ ⎞⎛ ⎞≤ −⎜ ⎟⎜ ⎟⎜ ⎟⎝ ⎠⎝ ⎠
⎛ ⎞⇔ − ≤⎜ ⎟⎝ ⎠
∏ ∏
∏
∑∏
∑
( )
( )
( ) ( )
( )
( ) ( )
( )
2
2
2
1
2
2
1
2
1
1
1 min
1 1 min 1 1
1 1 max
min 1 1
max .
j
j
j
j
j j
j
j
j j
j
wn
ej
j e
wn
j e ej
j e
wn
j e ej
j e
σ
σ
σ σ
σ
σ σ
σ
η
η
η η
η
η η
η
⋅
⋅
⋅ ⋅
⋅
⋅ ⋅
⋅
=
=
=
⎛ ⎞−⎜ ⎟⎝ ⎠
⎛ ⎞≤ − ⎜ ⎟⎝ ⎠
⎛ ⎞⎛ ⎞ ⎛ ⎞⇔ − − ≤ − −⎜ ⎟⎜ ⎟ ⎜ ⎟⎜ ⎟⎝ ⎠ ⎝ ⎠⎝ ⎠
⎛ ⎞⎛ ⎞≤ − −⎜ ⎟⎜ ⎟⎜ ⎟⎝ ⎠⎝ ⎠
⎛ ⎞ ⎛ ⎞⇔ ≤ − −⎜ ⎟ ⎜ ⎟⎝ ⎠ ⎝ ⎠
⎛ ⎞≤ ⎜ ⎟⎝ ⎠
∏
∏
∏
( ) 20
Let
( ) ( )( ) ( )
( ), 1 2, ,..., , . 21j j
jw w ne e
PFHG e e e eσ σ
σ μ η⋅ ⋅
⋅ ⎛ ⎞= = ⎜ ⎟⎝ ⎠
Then
( )( ) ( )
( ) ( )
( )
2 2
2 2
max
max min
. 22
j j
j j
je e
jj e e
S e
S e
σ σ
σ σ
σ μ η
μ η
⋅ ⋅
⋅ ⋅
⋅
⋅
⎛ ⎞ = −⎜ ⎟⎝ ⎠
⎛ ⎞ ⎛ ⎞≤ −⎜ ⎟ ⎜ ⎟⎝ ⎠ ⎝ ⎠
⎛ ⎞= ⎜ ⎟⎝ ⎠
From equation ( )22 , we have
( ) ( )max . 23jS e S eσ⋅ ⋅⎛ ⎞ ⎛ ⎞≤⎜ ⎟ ⎜ ⎟
⎝ ⎠ ⎝ ⎠
Again
( )( ) ( )
( ) ( )
( )
2 2
2 2
min
min max
. 24
j j
j j
je e
j je e
S e
S e
σ σ
σ σ
σ μ η
μ η
⋅ ⋅
⋅ ⋅
⋅
⋅
⎛ ⎞ = −⎜ ⎟⎝ ⎠
⎛ ⎞ ⎛ ⎞≥ −⎜ ⎟ ⎜ ⎟⎝ ⎠ ⎝ ⎠
⎛ ⎞= ⎜ ⎟⎝ ⎠
Thus from equation ( )24 , we have
( ) ( )min . 25jS e S eσ⋅ ⋅⎛ ⎞ ⎛ ⎞≥⎜ ⎟ ⎜ ⎟
⎝ ⎠ ⎝ ⎠
From equation ( )23 and equation
( )25 , if
( ) ( )max . 26jS e S eσ⋅ ⋅⎛ ⎞ ⎛ ⎞<⎜ ⎟ ⎜ ⎟
⎝ ⎠ ⎝ ⎠
And
( ) ( )min . 27jS e S eσ⋅ ⋅⎛ ⎞ ⎛ ⎞>⎜ ⎟ ⎜ ⎟
⎝ ⎠ ⎝ ⎠
Then from equation ( )26 , and equation
( )27 , we have
( ) ( )min max, 1 2, ,..., . 28w w ne PFHG e e e e⋅ ⋅
< <
International Journal of Computer Science and Information Security (IJCSIS), Vol. 14, No. 6, June 2016
846 https://sites.google.com/site/ijcsis/ ISSN 1947-5500

Again using equation ( )23 , If
( ) ( )max . 29jS e S eσ⋅ ⋅⎛ ⎞ ⎛ ⎞=⎜ ⎟ ⎜ ⎟
⎝ ⎠ ⎝ ⎠
Then from equation ( )29 , we have
( ) ( ) ( ) ( )
( ) ( ) ( ) ( )
( ) ( ) ( ) ( )
2 2
2 2
2 2
2 2
max min
max , min
max , min .
j j j j
j j j j
j j j j
jje e e e
jje e e e
jje e e e
σ σ σ σ
σ σ σ σ
σ σ σ σ
μ η μ η
μ μ η η
μ μ η η
⋅ ⋅ ⋅ ⋅
⋅ ⋅ ⋅ ⋅
⋅ ⋅ ⋅ ⋅
⎛ ⎞ ⎛ ⎞⇔ − = −⎜ ⎟ ⎜ ⎟⎝ ⎠ ⎝ ⎠
⎛ ⎞ ⎛ ⎞⇔ = =⎜ ⎟ ⎜ ⎟⎝ ⎠ ⎝ ⎠⎛ ⎞ ⎛ ⎞⇔ = =⎜ ⎟ ⎜ ⎟⎝ ⎠ ⎝ ⎠
Since
( )( ) ( )
( ) ( )
( )
2 2
2 2
max
max min
. 30
j j
j j
je e
jj e e
H e
H e
σ σ
σ σ
σ μ η
μ η
⋅ ⋅
⋅ ⋅
⋅
⋅
⎛ ⎞ = +⎜ ⎟⎝ ⎠
⎛ ⎞ ⎛ ⎞= +⎜ ⎟ ⎜ ⎟⎝ ⎠ ⎝ ⎠
⎛ ⎞= ⎜ ⎟⎝ ⎠
From equation ( )30 , we have
( ) ( )max, 1 2, ,..., . 31w w nPFHG e e e e⋅
=
Again using equation ( )25 , If
( ) ( )min . 32jS e S eσ⋅ ⋅⎛ ⎞ ⎛ ⎞=⎜ ⎟ ⎜ ⎟
⎝ ⎠ ⎝ ⎠
Then from equation ( )32 , we have
( ) ( ) ( ) ( )
( ) ( ) ( ) ( )
( ) ( ) ( ) ( )
2 2
2 2
2 2
2 2
min max
min , max
min , max .
j j j j
j j j j
j j j j
j je e e e
j je e e e
j je e e e
σ σ σ σ
σ σ σ σ
σ σ σ σ
μ η μ η
μ μ η η
μ μ η η
⋅ ⋅ ⋅ ⋅
⋅ ⋅ ⋅ ⋅
⋅ ⋅ ⋅ ⋅
⎛ ⎞ ⎛ ⎞⇔ − = −⎜ ⎟ ⎜ ⎟⎝ ⎠ ⎝ ⎠
⎛ ⎞ ⎛ ⎞⇔ = =⎜ ⎟ ⎜ ⎟⎝ ⎠ ⎝ ⎠⎛ ⎞ ⎛ ⎞⇔ = =⎜ ⎟ ⎜ ⎟⎝ ⎠ ⎝ ⎠
Since
( )( ) ( )
( ) ( )
( )
2 2
2 2
min
min max
. 33
j j
j j
je e
j je e
H e
H e
σ σ
σ σ
σ μ η
η μ
⋅ ⋅
⋅ ⋅
⋅
⋅
⎛ ⎞ = +⎜ ⎟⎝ ⎠
⎛ ⎞ ⎛ ⎞= +⎜ ⎟ ⎜ ⎟⎝ ⎠ ⎝ ⎠
⎛ ⎞= ⎜ ⎟⎝ ⎠
From equation ( )33 , we have
( ) ( )min, 1 2, ,..., . 34w w nPFHG e e e e⋅
=
Thus from equation ( )28 , ( )31 and
( )34 , we have
( )min max, 1 2, ,..., , for all .w w ne PFHG e e e e w⋅ ⋅
≤ ≤
Theorem 3.6: Let ( ),j jj e ee μ η= and
( )( ), 1, 2,...,j j
j e ee j nμ η∗ ∗
∗ = = be the two
collection of Pythagorean fuzzy values
( )PFVs . If ( ) ( )j je eσ σ
μ μ⋅ ⋅∗
≤ and
( ) ( )
.j je eσ σ
η η⋅ ⋅∗
≥ Then
( ) ( ) ( ), 1 2 1 2, ,..., , ,..., . 35w w n nPFHG e e e PFHG e e e∗ ∗ ∗≤
Proof: Since, ( ) ( )j je eσ σ
μ μ⋅ ∗⋅≤ and
( ) ( )
.j je eσ σ
η η⋅ ∗⋅≥ Then
( ) ( ) ( ) ( )( )
1 1
. 36w w w wj j j j
j jj j
n n
e ee ej jσ σσ σ
μ μ μ μ⋅ ∗ ⋅ ∗⋅ ⋅= =
≤ ⇔ ≤∏ ∏
( ) ( )
( ) ( )
( ) ( )( )
2 2
2 2
2 2
1 1
1 1
1 1
1 1
1 1 1 1 . 37
j j
jj
j j
j j
jj
e e
wwn n
e ej j
w wn n
eej j
σ σ
σ σ
σσ
η η
η η
η η
⋅ ⋅∗
⋅ ⋅∗
⋅ ⋅∗
= =
= =
⇔ − ≤ −
⎛ ⎞⎛ ⎞⇔ − ≤ −⎜ ⎟⎜ ⎟⎝ ⎠ ⎝ ⎠
⎛ ⎞ ⎛ ⎞⇔ − − ≤ − −⎜ ⎟ ⎜ ⎟⎝ ⎠⎝ ⎠
∏ ∏
∏ ∏
Let
International Journal of Computer Science and Information Security (IJCSIS), Vol. 14, No. 6, June 2016
847 https://sites.google.com/site/ijcsis/ ISSN 1947-5500
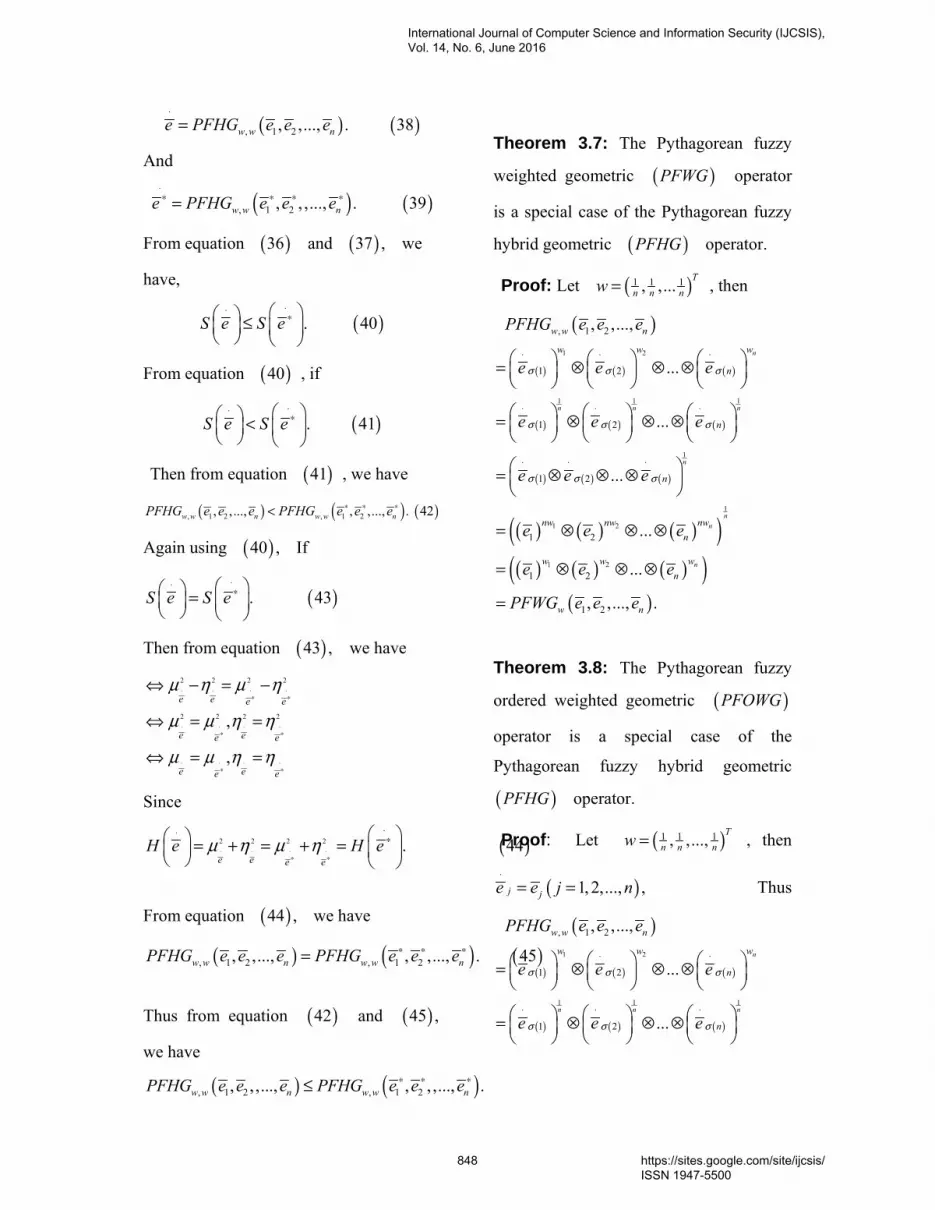
( ) ( ), 1 2, ,..., . 38w w ne PFHG e e e⋅
=
And
( ) ( ), 1 2, , ,..., . 39w w ne PFHG e e e⋅∗ ∗ ∗ ∗=
From equation ( )36 and ( )37 , we
have,
( ). 40S e S e⋅⋅∗⎛ ⎞⎛ ⎞ ≤⎜ ⎟ ⎜ ⎟⎝ ⎠ ⎝ ⎠
From equation ( )40 , if
( ). 41S e S e⋅⋅∗⎛ ⎞⎛ ⎞ <⎜ ⎟ ⎜ ⎟⎝ ⎠ ⎝ ⎠
Then from equation ( )41 , we have
( ) ( ) ( ), 1 2 , 1 2, ,..., , ,..., . 42w w n w w nPFHG e e e PFHG e e e∗ ∗ ∗<
Again using ( )40 , If
( ). 43S e S e⋅⋅∗⎛ ⎞⎛ ⎞ =⎜ ⎟ ⎜ ⎟⎝ ⎠ ⎝ ⎠
Then from equation ( )43 , we have
2 2 2 2
2 2 2 2,
,
e e e e
e ee e
e ee e
μ η μ η
μ μ η η
μ μ η η
⋅ ⋅ ⋅ ⋅∗ ∗
⋅ ⋅ ⋅ ⋅∗ ∗
⋅ ⋅ ⋅ ⋅∗ ∗
⇔ − = −
⇔ = =
⇔ = =
Since
( )2 2 2 2 . 44e e e e
H e H eμ η μ η⋅ ⋅ ⋅ ⋅∗ ∗
⋅⋅∗⎛ ⎞⎛ ⎞ = + = + =⎜ ⎟ ⎜ ⎟⎝ ⎠ ⎝ ⎠
From equation ( )44 , we have
( ) ( ) ( ), 1 2 , 1 2, ,..., , ,..., . 45w w n w w nPFHG e e e PFHG e e e∗ ∗ ∗=
Thus from equation ( )42 and ( )45 ,
we have
( ) ( ), 1 2 , 1 2, , ,..., , , ,..., .w w n w w nPFHG e e e PFHG e e e∗ ∗ ∗≤
Theorem 3.7: The Pythagorean fuzzy
weighted geometric ( )PFWG operator
is a special case of the Pythagorean fuzzy
hybrid geometric ( )PFHG operator.
Proof: Let ( )1 1 1, ,... Tn n nw = , then
( )
( ) ( ) ( )
( ) ( ) ( )
( ) ( ) ( )
( ) ( ) ( )( )( ) ( ) ( )( )
( )
1 2
1 1 1
1
1
1 2
1 2
, 1 2
1 2
1 2
1 2
1 2
1 2
1 2
, ,...,
...
...
...
...
...
, ,..., .
n
n n n
n
nn
n
w w n
w w w
n
n
n
nw nw nwn
w w wn
w n
PFHG e e e
e e e
e e e
e e e
e e e
e e e
PFWG e e e
σ σ σ
σ σ σ
σ σ σ
⋅ ⋅ ⋅
⋅ ⋅ ⋅
⋅ ⋅ ⋅
⎛ ⎞ ⎛ ⎞ ⎛ ⎞= ⊗ ⊗ ⊗⎜ ⎟ ⎜ ⎟ ⎜ ⎟⎝ ⎠ ⎝ ⎠ ⎝ ⎠
⎛ ⎞ ⎛ ⎞ ⎛ ⎞= ⊗ ⊗ ⊗⎜ ⎟ ⎜ ⎟ ⎜ ⎟⎝ ⎠ ⎝ ⎠ ⎝ ⎠
⎛ ⎞= ⊗ ⊗ ⊗⎜ ⎟⎝ ⎠
= ⊗ ⊗ ⊗
= ⊗ ⊗ ⊗
=
Theorem 3.8: The Pythagorean fuzzy
ordered weighted geometric ( )PFOWG
operator is a special case of the
Pythagorean fuzzy hybrid geometric
( )PFHG operator.
Proof: Let ( )1 1 1, ,..., Tn n nw = , then
( )1, 2,..., ,j je e j n⋅
= = Thus
( )
( ) ( ) ( )
( ) ( ) ( )
1 2
1 1 1
, 1 2
1 2
1 2
, ,...,
...
...
n
n n n
w w n
w w w
n
n
PFHG e e e
e e e
e e e
σ σ σ
σ σ σ
⋅ ⋅ ⋅
⋅ ⋅ ⋅
⎛ ⎞ ⎛ ⎞ ⎛ ⎞= ⊗ ⊗ ⊗⎜ ⎟ ⎜ ⎟ ⎜ ⎟⎝ ⎠ ⎝ ⎠ ⎝ ⎠
⎛ ⎞ ⎛ ⎞ ⎛ ⎞= ⊗ ⊗ ⊗⎜ ⎟ ⎜ ⎟ ⎜ ⎟⎝ ⎠ ⎝ ⎠ ⎝ ⎠
International Journal of Computer Science and Information Security (IJCSIS), Vol. 14, No. 6, June 2016
848 https://sites.google.com/site/ijcsis/ ISSN 1947-5500

( ) ( ) ( )
( )( ) ( )( ) ( )( )( )( ) ( )( ) ( )( )
( )
1
11 2
1 2
1 2
1 2
1 2
2
...
...
...
, ,..., .
n
nn
n
n
nw nw nw
n
w w w
n
w n
e e e
e e e
e e e
PFOWG e e e
σ σ σ
σ σ σ
σ σ σ
⋅ ⋅ ⋅⎛ ⎞= ⊗ ⊗ ⊗⎜ ⎟⎝ ⎠
⎛ ⎞= ⊗ ⊗ ⊗⎜ ⎟⎝ ⎠⎛ ⎞= ⊗ ⊗ ⊗⎜ ⎟⎝ ⎠
=
4: An Approach to Multiple Attribute
Decision Making Based on Pythagorean
Fuzzy Information
In this section, we introduce the multiple
attribute decision making ( )MADM
problems based on the Pythagorean fuzzy
hybrid geometric aggregation operator in
which the weights of attribute take the
form of real numbers, and the attribute
values take the form of Pythagorean fuzzy
numbers.
Algorithm: Let ( )1 2, ,..., mA A A A= be
the set of m alternatives and
( )1 2, ,..., nZ Z Z Z= be the set of n
attributes. Let w w1 ,w2 , . . . , wnT
be the weighted vector of attributes,
( )1,2,..., ,jZ j n= such that [0,1]jw ∈
and 1
1.n
jj
w=
=∑ Let us suppose that,
( ) ( ),m n
m n ij ij ijm nD d μ η
×× ×
= = be the
Pythagorean fuzzy decision matrix, where
ijμ indicates the degree that the
alternative iA satisfies the attribute jZ
given by the decision maker and ijη
indicate the degree that the alternative iS
does not satisfies the attribute jZ given
by the decision maker. also
( )2 20 1 1,2,3,..., , 1, 2,3,..., .ij ij i m j nμ η≤ + ≤ = = In the following, we apply the
Pythagorean fuzzy hybrid geometric
aggregation operator to multiple attribute
decision making ( )MADM problems
based on the Pythagorean fuzzy
information. This method contains the
following steps:
Step 1: In this step we use the given
decision information in matrix .D
Step 2: In this step we apply the
Pythagorean fuzzy hybrid geometric
( )PFHG operator to derive the overall
preference values of ( )1, 2,...,id i m= of
the corresponding alternatives,
( )1,2,...,iA i m= . Where
( )1 2, ,..., Tnw w w w= be the weighted
vector of attributes ( )1,2,...,jZ j n= ,
such that [0,1]jw ∈ and 1
1.n
jj
w=
=∑
Step 3: In this step we compute
S di i 1,2, . . . , m . If two or more than
two scores values are same then we have
must to calculate the accuracy degrees.
Step 4: In this step we give rank to the
given alternatives according to their scores
function (or accuracy degrees)
International Journal of Computer Science and Information Security (IJCSIS), Vol. 14, No. 6, June 2016
849 https://sites.google.com/site/ijcsis/ ISSN 1947-5500

Step 5: End.
Example 4.1: Suppose an investor
wants to invest his money, for this the
investor has four possible options (1) A₁: TV company (2) A₂: Car company (3) A₃: Food company (4) A₄: Chemical company.
There are many factors that must be
considered while selecting the most
suitable company, but here, we have
consider only the following four criteria,
whose weighted vector is
w=(0.1,0.2,0.3,0.4)T.
1 Z1 : is the risk analysis ,
2 Z2 : is the growth analysis,
3 Z3 : is the social--political impact
analysis,
4 Z4 : is the environmental impact
analysis.
Step 1: The decision makers give his
decision in the following table.
( )( ) ( ) ( ) ( )( ) ( ) ( ) ( )( ) ( ) ( ) ( )( ) ( ) ( ) ( )
1 2 3 4
1
4 4 2
3
4
Table 1: Pythagorean Fuzzy Decision Matrix
0.4,0.6 0.5,0.7 0.3,0.8 0.4,0.70.6,0.7 0.4,0.6 0.4,0.7 0.5,0.60.6,0.6 0.4,0.7 0.4,0.8 0.5,0.70.4,0.7 0.5,0.6 0.3,0.7 0.4,0.6
ij
Z Z Z ZA
D a AAA
× =
Using ( ) j
ij
nwije e
⋅= , we have
( ) ( )
( ) ( )
( ) ( )
( ) ( )
( ) ( )
11 12
13 14
21 22
23 24
31 32
33
0.6931,0.4043 , 0.5743,0.6453
0.2358,0.8405 , 0.2308,0.8120
0.8151,0.4859 , 0.4804,0.5479
0.3330,0.7444 , 0.3298,0.7143
0.8151,0.4043 , 0.4804,0.6453
0.3330,0.8
e e
e e
e e
e e
e e
e
⋅ ⋅
⋅ ⋅
⋅ ⋅
⋅ ⋅
⋅ ⋅
⋅
= =
= =
= =
= =
= =
= ( ) ( )
( ) ( )
( ) ( )
34
41 42
43 44
405 , 0.3298,0.8120
0.6931,0.4859 , 0.5743,0.5479
0.2358,0.7444 , 0.2308,0.7143
e
e e
e e
⋅
⋅ ⋅
⋅ ⋅
=
= =
= =
Now we find
( )1, 2,3, 4, 1, 2,3,4 .ijS e i j⋅⎛ ⎞ = =⎜ ⎟
⎝ ⎠
International Journal of Computer Science and Information Security (IJCSIS), Vol. 14, No. 6, June 2016
850 https://sites.google.com/site/ijcsis/ ISSN 1947-5500

( ) ( )
( ) ( )
( ) ( )
( ) ( )
( ) ( )
( ) ( )
2 211
2 212
2 213
2 214
2 221
2 222
0.6931 0.4043 0.3169
0.5743 0.6453 0.0865
0.2358 0.8405 0.6508
0.2308 0.8120 0.6060
0.8151 0.4859 0.4282
0.4804 0.5479
S e
S e
S e
S e
S e
S e
⋅
⋅
⋅
⋅
⋅
⋅
⎛ ⎞ = − =⎜ ⎟⎝ ⎠⎛ ⎞ = − = −⎜ ⎟⎝ ⎠⎛ ⎞ = − = −⎜ ⎟⎝ ⎠⎛ ⎞ = − = −⎜ ⎟⎝ ⎠⎛ ⎞ = − =⎜ ⎟⎝ ⎠⎛ ⎞ = −⎜ ⎟⎝ ⎠
( ) ( )
( ) ( )
( ) ( )
( ) ( )
( ) ( )
( )
2 223
2 224
2 231
2 232
2 233
34
0.0694
0.3330 0.7444 0.4432
0.3298 0.7143 0.4014
0.8151 0.4043 0.5009
0.4804 0.6453 0.1856
0.3330 0.8405 0.5955
0.3298
S e
S e
S e
S e
S e
S e
⋅
⋅
⋅
⋅
⋅
⋅
= −
⎛ ⎞ = − = −⎜ ⎟⎝ ⎠⎛ ⎞ = − = −⎜ ⎟⎝ ⎠⎛ ⎞ = − =⎜ ⎟⎝ ⎠⎛ ⎞ = − = −⎜ ⎟⎝ ⎠⎛ ⎞ = − = −⎜ ⎟⎝ ⎠⎛ ⎞ =⎜ ⎟⎝ ⎠
( )
( ) ( )
( ) ( )
( ) ( )
( ) ( )
2 2
2 241
2 242
2 243
2 244
0.8120 0.5505
0.6931 0.4859 0.2442
0.5743 0.5479 0.0296
0.2358 0.7444 0.4985
0.2308 0.7143 0.4559
S e
S e
S e
S e
⋅
⋅
⋅
⋅
− = −
⎛ ⎞ = − =⎜ ⎟⎝ ⎠⎛ ⎞ = − =⎜ ⎟⎝ ⎠⎛ ⎞ = − = −⎜ ⎟⎝ ⎠⎛ ⎞ = − = −⎜ ⎟⎝ ⎠
Thus
( ) ( )
( ) ( )
( ) ( )
( ) ( )
( ) ( )
( ) ( )
( ) ( )
( ) ( )
( ) ( )
( ) ( )
( )
11
12
13
14
21
22
23
24
31
32
33
0.6931,0.4043
0.5743,0.6453
0.2308,0.8120
0.2358,0.8405
0.8151,0.4859
0.4804,0.5479
0.3298,0.7143 ,
0.3330,0.7444
0.8151,0.4043 ,
0.4804,0.6453
0.
e
e
e
e
e
e
e
e
e
e
e
σ
σ
σ
σ
σ
σ
σ
σ
σ
σ
σ
⋅
⋅
⋅
⋅
⋅
⋅
⋅
⋅
⋅
⋅
⋅
=
=
=
=
=
=
=
=
=
=
= ( )
( ) ( )
( ) ( )
( ) ( )
( ) ( )
( ) ( )
34
41
42
43
44
3298,0.8120
0.3330,0.8405
0.6931,0.4869
0.5743,0.5479
0.2308,0.7143
0.2358,0.7444
e
e
e
e
e
σ
σ
σ
σ
σ
⋅
⋅
⋅
⋅
⋅
=
=
=
=
=
( )
( ) ( ) ( ) ( )( ) ( ) ( ) ( )( )
1 2 3 4
1
2
3
Table 2:Pythagorean Fuzzy Hybrid Decision Matrix
0.6931,0.4043 0.5743,0.6453 0.2308,0.8120 0.2358,0.84050.8151,0.4859 0.4804,0.5479 0.3298,0.7143 0.3330,0.74440.8151,0.4043 0.4804
aije
Z Z Z ZA
D AA
σ⋅⎛ ⎞
⎜ ⎟⎝ ⎠
=( ) ( ) ( )
( ) ( ) ( ) ( )4
,0.6453 0.3298,0.8120 0.3330,0.84050.6931,0.4869 0.5743,0.5479 0.2308,0.7143 0.2358,0.7444A
Step 2: Using Pythagorean fuzzy hybrid
geometric ( )PFHG operator, whose
weighted vector is ( )0.1,0.2,0.3,0.4 .Tw =
we have
( )( )( )( )
1
2
3
4
0.3118,0.7803
0.3907,0.6858
0.3907,0.7803
0.3147,0.6858
d
d
d
d
=
=
=
=
Step 3: In this step we calculate
International Journal of Computer Science and Information Security (IJCSIS), Vol. 14, No. 6, June 2016
851 https://sites.google.com/site/ijcsis/ ISSN 1947-5500

S dj j 1,2,3,4
S d1 0. 3118 2 0. 7803 2 0.5116
S d2 0. 3907 2 0. 6858 2 0.3176
S d3 0. 3907 2 0. 7803 2 0.4562
S d4 0. 3147 2 0. 6858 2 0.3712
Step 4: Since d2 d4 d3 d1 .
Thus A2 A4 A3 A1 . Thus A2 :
Car Company is the best option for an
investor to invest his money.
Step 5: End.
5: Conclusion
In this paper, we have defined the
Pythagorean fuzzy hybrid geometric
( )PFHG operator, which is the
generalization of the Pythagorean fuzzy
weighted geometric ( )PFWG operator
and the Pythagorean fuzzy ordered
weighted geometric ( )PFOWG
operator. The Pythagorean fuzzy hybrid
geometric ( )PFHG operator make the
decision results more and more accurate
and realistic when applied to decision
making based on Pythagorean fuzzy
information. Lastly, the Pythagorean fuzzy
hybrid geometric ( )PFHG operator
applied to multiple attribute decision
making ( )MADM problem, based on
Pythagorean fuzzy information and also
constructed an example.
References
[1] D. H. Hong and C. H. Choi.
Multicriteria fuzzy decision-making
problems based on vague set theory.
Fuzzy Sets Syst. (2000)114,103--113.
[2] G. W. Wei. Some induced geometric
aggregation operators with
intuitionistic fuzzy information and
their application to group decision
making. Appl Soft Comput (2010) 10,
423--431.
[3] H. Bustince and P. Burillo. Vague sets
are intuitionistic fuzzy sets. Fuzzy Sets
Syst (1996) 79, 403--405.
[4] H. Bustince, J. Kacprzyk and V.
Mohedano. Intuitionistic fuzzy
generators: application to intuitionistic
fuzzy complementation. Fuzzy Sets
Syst (2000) 114, 485--504.
[5] K. Atanassov. Intuitionistic fuzzy sets.
Fuzzy Sets Syst (1986) 20, 87--96.
[6] K. Atanassov. More on intuitionistic
fuzzy sets. Fuzzy Sets Syst (1989) 33,
37--46.
[7] K. Atanassov and G. Gargov. Interval
valued intuitionistic fuzzy sets. Fuzzy
Sets Syst (1989) 31, 343--349.
[8] K. Atanassov. New operations defined
over the intuitionistic fuzzy sets. Fuzzy
Sets Syst (1994a) 61,137--142.
[9] K. Atanassov. Operators over interval
valued intuitionistic fuzzy sets. Fuzzy
Sets Syst (1994b) 64, 159--174.
[10] K. Atanassov. Intuitionistic Fuzzy
International Journal of Computer Science and Information Security (IJCSIS), Vol. 14, No. 6, June 2016
852 https://sites.google.com/site/ijcsis/ ISSN 1947-5500

Sets: Theory and Applications,
Heidelberg: Physica-Verlag (1999).
[11] K. Atanassov. Two theorems for
intuitionistic fuzzy sets. Fuzzy Sets
Syst. (2000) 110, 267--269.
[12] K. Atanassov, G. Pasi and R. R.
Yager. Intuitionistic fuzzy
interpretations of multi-criteria
multiperson and multi-measurement
tool decision making. Int J Syst Sci
(2005) 36, 859--868.
[13] K. Rahman, S. Abdullah and M.
Sajjad Ali Khan. Geometric
aggregation operators based on
Pythagorean fuzzy numbers and their
application to group decision making.
Submitted.
[14] L. A. Zadeh. Fuzzy sets. Information
and Control. (1965) 8, 338--353.
[15] R. E. Bellmanand and L, A. Zadeh.
Decision-making in a fuzzy
environment. Manage Sci (1970)
17:B-141--B-164
[16] R. R. Yager. OWA aggregation of
intuitionistic fuzzy sets. Int J Gen Syst
(2009) 38, 617-- 641.
[17] R. R. Yager. Level sets and the
representation theorem for
intuitionistic fuzzy sets. Soft Comput
(2010) 14, 1--7.
[18] R. R. Yager. Pythagorean fuzzy
subsets,In Proc. Joint IFSA World
Congress and NAFIPS Annual
Meeting, Edmonton, Canada (2013)
57--61.
[19] R. R. Yager. Pythagorean
membership grades in multi-criteria
decision making. IEEE Trans Fuzzy
Syst (2014) 22, 958--965.
[20] S. M. Chen and J. M. Tan. Handling
multicriteria fuzzy decision-making
problems based on vague set theory.
Fuzzy Sets Syst. (1994) 67,163--172.
[21] S. K. De, R. Biswas and A. R. Roy.
Some operations on intuitionistic fuzzy
sets. Fuzzy Sets Syst. (2000) 114,
477--484.
[22] X. W. Liu. Intuitionistic Fuzzy
Geometric Aggregation Operators
Based on Einstein Operations. (2011)
26,1049-1075.
[23] Xu. Zhang and Z. S. Xu. Extension of
TOPSIS to Multiple Criteria Decision
Making with Pythagorean Fuzzy Sets
(2014) 29, 1061-1078.
[24] X. Peng and Y. Yang. Some Results
for Pythagorean Fuzzy Sets.
INTERNATIONAL JOURNAL OF
INTELLIGENT SYSTEMS (2015) 30,
1133--1160.
[25] Z. S. Xu and R. R. Yager. Some
geometric aggregation operators based
on intuitionistic fuzzy sets. Int J Gen
Syst (2006) 35, 417--433.
[26] Z. S. Xu. Intuitionistic fuzzy
aggregation operators. IEEE Trans
Fuzzy Syst (2007)15, 1179-1187.
ᘀ 27] Z. S. Xu and R. R. Yager. Dynamic
International Journal of Computer Science and Information Security (IJCSIS), Vol. 14, No. 6, June 2016
853 https://sites.google.com/site/ijcsis/ ISSN 1947-5500

intuitionistic fuzzy multi-attribute
decision making. Int J Approx Reason
(2008) 48, 246--262.
[28] Z. S. Xu and R. R. Yager.
Intuitionistic fuzzy Bonferroni means.
IEEE Trans Syst Man Cybern (2011)
41, 568--578.
International Journal of Computer Science and Information Security (IJCSIS), Vol. 14, No. 6, June 2016
854 https://sites.google.com/site/ijcsis/ ISSN 1947-5500

Cultural Factors Affecting ICT Acceptance
Case Study: Industries Located in Science and Technology Park, Tehran
Mina babazadeh farokhran* 1 behrouz eskandarpour2 Hossein eskandarpour 3 Rogaye rezaee giglo4
1Young Researchers and Elite Club, Germi Branch, Islamic Azad University, Germi, Iran 2 department of management payamenoor university(pnu)iran,
3 zanjan Islamic Azad University, zanjan, Iran
4 Young Researchers and Elite Club, Germi Branch, Islamic Azad University, Germi
Abstract
Application of new technologies is considered as a key factor for the development of companies in recent years. This puts emphasis on the importance of reviewing factors influencing the
acceptance of information technology culture. This study has been done aiming to identify factors influencing the information technology acceptance in companies located in the Tehran science and technology park.
80 companies from industries based in science and technology parks in Tehran were selected of these, 72 questionnaires have been evaluated and Cronbach's alpha was used to measure the reliability and validity of measurement tools. The reliability coefficient of the questionnaire is 0.86, which indicates high reliability of the applied questionnaire and content validity
was confirmed by instructors. The research data is analyzed by SPSS which uses the correlation analysis along with significance levels and in the following, t and f tests have been used to study the research additional hypotheses. The results of this study showed that the usefulness and ease of use and subjective norms affect the
information technology acceptance through behavior intent and using independent t-test, it was found that looking at research indicators is alike among men and women.
Based on the f statistics, attitude to these indices among different education levels is different and the respondents' education has an impact on attitudes to these indicato
Keywords: cultural factors, Information Technology, technology acceptance, TAM, UTA
International Journal of Computer Science and Information Security (IJCSIS), Vol. 14, No. 6, June 2016
855 https://sites.google.com/site/ijcsis/ ISSN 1947-5500

1.Introduction:
One of the opportunities and challenges facing organizations today is the use of technology. [1] New technologies are an integral part of our daily life. They affect every aspect of our lives and become a part of people. New technologies are all suggestive, unlimited and unstoppable, but it is important to steer the ship of changes and effects of this technology [2]According to increased investment of organizations in the use of information technology in recent decades, a concern is if the exorbitant costs spent in this way, could bring benefits to the
organizations’ managers. At least some of this concern is related to the acceptance of technology by the user. Human resource management professionals are interested to understand the factors influencing technology acceptance by users, and then design and implement a model for the reduction of staff strength [3].Of course, identification of factors affecting the acceptance of new technologies can help change management in the organization and increase IT acceptance by the users.
It is for decades that the acceptance of information technology by users has attracted the attention of researchers and practitioners and it seems that understanding users’ decision-making for the acceptance of information technology is one of the most important challenges in the implementation of projects and their management issues [4]. It should be noted that factors that affect the acceptance of different technologies are different in terms of technology, the studied users, and the prevailing conditions.
Several theories have been proposed about the acceptance of technologies that one of the most famous one is the Rogers theory about the release of innovation. However, this theory examines the issue of
technology acceptance at the community level and less speaks about the individual processes of acceptance. A model that can examine technology individual acceptance is called Technology Acceptance Model (TAM). TAM has been especially designed for modeling acceptance of information systems by the users and has been widely used in applied research of information systems [5].
Several studies which have been done using TAM model, have increased the validity of this model . Due to the high reliability and use of the TAM model in organizations, in this study, TAM developed model is used to study the factors affecting the acceptance of IT culture.
2.1-Cultural issues of IT acceptance Cultural factor is raised both at the national and the international level. From the first
point of view, no transfer of technology, including information technology, can be done apart from cultural considerations
. This phenomenon, either as resistance to change or indifference to it, faces the realization of the main effort, i.e. development, with a major problem, which however, requires change. Therefore, in formulating development strategy in any field, the condition for attainment is the
public acceptance using different advertising, educational, religious and ideological methods. This concept also applies to the development of the technological level of an organization, and for example, any computer information system in strategy framework and the
macro technological development model of the country expresses its own culture and set of human factors. From the second
perspective, regional culture is true in neighboring countries and nations that have more or less similar cultural conditions. Thus, although the economic - industrial and social – cultural development strategy
International Journal of Computer Science and Information Security (IJCSIS), Vol. 14, No. 6, June 2016
856 https://sites.google.com/site/ijcsis/ ISSN 1947-5500

of each country is different, but their common need for a certain type of technology, along with somehow common culture can provide a positive convergence. Thus, in some cases we can speak of a regional model. One of the cultural issues that in websites is referred to is the cultural views to the time. International people and traders who are accustomed with faster steps of works, have to come up with multiple and apparent layers of formalities. They are often disappointed with the lack of response, and lack of urgency by the partners. Meanwhile, local traders often consider their foreign partners as brash people who are constantly harassing them. This can lead to a lack of mutual understanding and exchanges failure. Another point which is raised in the field of telework, but is not irrelevant to IT cultural issues is that many employees like to work in an office environment [6].
2.1.1-Technology acceptance and culture
Culture is one of the factors affecting the acceptance of information technology. The effect of culture on behavior is absolute and decisive [7] and researches on information systems have considered cultural differences in explaining matters related to information technology. Subcultures within an organization can influence the failure of information technology applied projects. Other subcultures may consider high importance and value for IT, this duality leads to conflict, because culture forms people understanding from their environment and affects their behavior. Cultural and national differences in information technology acceptance affect the perceived performance, use and
perceived ease of use and effect of these structures on each other.
2.2-Technology Acceptance Model (TAM)
TAM is especially used for modeling the acceptance of information systems by users and is widely used in applied research of information systems. Of course, this model is considered as a base model for studies in the field of acceptance of systems like cell phones, intranets and provision of electronic services. [8]
TAM shows IT acceptance with the assumption that the perceived usefulness and ease of use are the two determinants of behavioral intention, and thus determines the actual use of information technology. Attitude is expected to have an impact on people belief. Intention to use a system is determined by people approach tendency to application and perceived performance. Behavioral intention is specified through the actual use of the system. TAM model assumes that the more the perceived ease of use and perceived efficiency of users, his tendency will be more. Perceived performance and positive attitude leads to a higher rate of behavioral intention and thus, the actual use of the system will be obtained [9].Therefore, it is expected that higher levels of perceived usefulness and ease of use leads to a higher level of actual use, actual level of use or diversification of use. In addition, it is expected that a
relationship be between usefulness and perceived ease of use. Figure 1 shows the relationships between the main TAM constructions.
International Journal of Computer Science and Information Security (IJCSIS), Vol. 14, No. 6, June 2016
857 https://sites.google.com/site/ijcsis/ ISSN 1947-5500

Figure 1. Relationship between components in the original model of TAM
Source: Davis 2003
The tendency to use a system is jointly resulting from the attitude of a person to use it and considering its usefulness. Behavioral intention to use technology determines the actual degree of use of the system. This model assumes that however the users know usefulness and ease of use of the system more, they will have a better attitude to it. The degree of usefulness and relevant attitude results in increased behavioral tendency and so the user will resort to the actual use of the system. Thus, it is expected to observe a high degree of perceived usefulness and ease of use in people, in an area that have widely used system. In these cases, typically a criteria such as time, frequency of using system, the amount of application or diversity of application are used [10].
TAM model is the first model that includes psychological factors of technology acceptance and it is empirically proven that this model is able to explain the behavior of users in a wide range of end users of the computer technologies and at the same time can be both frugal and theoretically convincing. TAM determines the normal relations between perceived efficiency, perceived ease of use, attitudes to the use of computers and behavioral intention to use technology [11].
2.2.1-Technology Acceptance Extended Model or TAM2 and UTAUT
Davis et al., (2000) have developed the primary Technology Acceptance Model and introduced the TAM2 model. They developed the first model to include features related to the perceived usefulness (including subjective norms, labor relations, output quality and visible results). In addition, the voluntary nature and previous experience have been added to it as moderating factors related to subjective norms. This model showed that it describes more than 60 percent of the differences in perceived usefulness [11]New model includes other factors that affect the acceptance of electronic services include these subjective norms. Subjective norms suggest how the important people think about the use or non-use of new technology by the user; in other words, what the idea of people who are important for person is to the use or non-use of
technology by individuals [12]. If the modified TAM model is empirically supported, it will have many advantages. One of these advantages is that this model addresses pre- and post-applied beliefs and behaviors separately and its other advantage is its accuracy and perceived ease of use. Perceived shortcomings of TAM2 model is its inability to determine the barriers to technology acceptance and its simplicity, that leads to its excessive application and designing other models. Due to the low level of prediction
External
variable
Perceived
usefuln
Attitude
Behavioral
tendency
Behavior
(using Perceived
ease of
International Journal of Computer Science and Information Security (IJCSIS), Vol. 14, No. 6, June 2016
858 https://sites.google.com/site/ijcsis/ ISSN 1947-5500

in TAM2 model, researchers look for better technology acceptance models. The researchers want a model that combines the social and human factors, so the next step in the development of TAM is the unified theory of acceptance and use of technology (UTAUT) which was presented and tested by Venkatesh, Morris et al., in 2003.
The model was developed in a review of the constructions related to eight behavioral models of using information systems. According to this model, intention to use IT is a key four-constructed function (usefulness, ease of use, subjective norm or social influence and facilitating conditions). The four factors directly determines the tendency to use a system and form people behavior for actual use. It is expected that factors such as gender, age and experience to moderate the impact of four constructions of intention and behavior of system implementation [13]. It is stated that UTAUT model explains seventy percent of differences in intention to use the system. According to Raitoharju, this model has been used in several studies. UTAUT assumes that the four concepts of perceived efficiency, perceived ease of use, subjective norms and facilitating conditions act as determinants of behavioral intentions and behavior of use. [14]
1. Usefulness Usefulness, given from TAM2 model, is defined as the degree to which a person believes that the use of technology helps him achieve advantages in job performance. In previous studies of technology acceptance, usefulness structure is a solid predictive for intention to use. In a business environment, usefulness plays an important role in decision making and acceptance of technology and can directly and indirectly affect behavioral intention through approach factors.
Adopting usefulness in the field of information technology acceptance means that in terms of users, IT is useful because
it helps them in searching for information and performing other tasks as quickly as possible, flexibility and efficiency of access to different services.
2. Ease of use Ease of use is defined as the degree of ease that is associated with the system application. There is no doubt that the ease of using a computer affects its application and increasing this amount should be considered equal to increased behavioral intention to use computer.
2.3-Subjective norms (Social influence)
Subjective norm refers to the perceived social pressure by person to perform or failure to perform the target behavior. People often act based on their perceptions of what others (friends, family, colleagues, etc.) think they should do and their intention to accept behavior is potentially affected by those closely associated with them [15] .TAM2 introduces the subjective norm as one of the factors that affects the people exposure to technology and its acceptance or rejection. Subjective norm is a direct determinant of behavioral intention and rationale for its direct impact on behavioral intention is that people - even if they do not intend a behavior or
its consequences - may show that behavior. Their behavior can be affected by behavior of important people and their thinking style. So a person shows behaviors in following the behavior of others.
2.4Facilitating conditions
It is a degree to which a person believes that there is an organization and technical infrastructure to support the system. Facilitating condition is assumed as a direct precedent of behavioral and applied intention and expects the impact of facilitating conditions (IT facilitating conditions) to inform the managers about the possible barriers to use. Determining
International Journal of Computer Science and Information Security (IJCSIS), Vol. 14, No. 6, June 2016
859 https://sites.google.com/site/ijcsis/ ISSN 1947-5500

factor of facilitating conditions was identified insignificant according to research conducted in predicting intention to use, but it is important in determining the application. [16] There are evidences that reveal the insignificance of facilitating conditions in predicting behavioral intention. Of course, this proposal is in circumstances that both usefulness and ease of use exist in the model. However,
findings indicate the effect of facilitating conditions on the behavior of actual use .In terms of UTAUT, it was said that the relationship between facilitating and behavior of use in culture with high legitimacy should be firm. There is the argument that increased levels of facilitating conditions must be used to reduce the annoying levels of uncertainty in the application of computers.
Conceptual model
3-Main hypotheses Cultural factors have a significant positive effect on the acceptance of information technology in workers of industries based in Tehran Science and Technology Park.
3.1Sub-hypotheses
Hypothesis 1: Usefulness of information technology has a significant positive impact on behavioral intention of user.
Hypothesis 2: Ease-of-use of information technology has a significant positive impact on behavioral intention.
Hypothesis 3: Subjective norm to use information technology has a positive and significant impact on user behavioral intention.
Hypothesis 4: facilitating conditions to benefit from IT has a significant positive effect on acceptance of technology culture.
4-Methodology
This study was done aiming at identifying the factors influencing the acceptance of information technology in companies located in the park of science and technology in Tehran. 80 companies have been selected of these from industries based in science and technology park of Tehran, out of which 72 questionnaires have been
Cultural criteria
Usefulness
Subjective norm
Ease of use
Facilitating conditions
Behavioral Intention
Technology Acceptance
(usage behavior)
International Journal of Computer Science and Information Security (IJCSIS), Vol. 14, No. 6, June 2016
860 https://sites.google.com/site/ijcsis/ ISSN 1947-5500

evaluated and to assess reliability and validity of measurement tools, Cronbach's alpha was used. The questionnaire reliability coefficient is 0.86, which indicates high reliability of the questionnaire and the validity of research is type content validity and is confirmed by instructors. The data is analyzed by SPSS which uses correlation analysis along with significance levels and in the following, t-
and f- tests have been used to study research additional assumptions.
Hypothesis 1: Usefulness of information technology has a significant positive impact on intention to use. H1
Pearson's correlation coefficient was used to evaluate the above hypothesis that the test results are listed in Table 1.
Table 1: Pearson correlation test results of the first hypothesis variables
Indicators Variables
Pearson's correlation r
Coefficient of determination r2
Significance level. Error level Number
Usefulness and behavioral intention 0.533 0.284 0.000 0.01 61
Findings of the above table show that the correlation coefficient 0.533 with significance level P = 0.000 < 0.01 is significant, and with 99% confidence level (0.01 error level), it can be said that a relationship exists between these two variables. In other words, H0 is rejected and H1 is confirmed. Consequently, given that the factor is positive, it can be said that usefulness to enjoy information technology
has a positive relationship with the intention of using computer.
Sub-hypothesis 2: Ease-of-use of information technology has a significant positive impact on usage behavioral intention. H1
Pearson's correlation coefficient was used to evaluate the above hypothesis that the test results are listed in Table2.
Table 2. Pearson correlation test results of the second hypothesis variables
Indicators Variables
Pearson's correlation r
Coefficient of determination r2
Significance level. Error level Number
Ease of use and behavioral intention 0.546 0.298 0.000 0.01 61
Findings of the above table show that the correlation coefficient 0.546 with significance level
P = 0.000 < 0.01 is significant, and with 99% confidence level, it can be said that a significant relationship exists between these two variables. In other words, H0 is rejected and H1 is confirmed. Consequently, given that the factor is
positive, it can be said that ease of use to ease-of-use of information technology has a positive relationship with the intention of using computer.
International Journal of Computer Science and Information Security (IJCSIS), Vol. 14, No. 6, June 2016
861 https://sites.google.com/site/ijcsis/ ISSN 1947-5500

Sub-hypothesis 3: Subjective norm to use information technology has a significant positive effect on consumer behavioral intention. H1
Pearson's correlation coefficient was used to evaluate the above hypothesis that the test results are listed in Table 3.
Table 3. Pearson correlation test results of third hypothesis variables
Indicators Variables
Pearson's correlation r
Coefficient of determination r
Significance level
Error level Number
Subjective norm and behavioral intention 0.341 0.116 0.000 0.01 61
Findings of the above table show that the correlation coefficient 0.341 with significance level P = 0.000 < 0.01 is significant, and with 99% confidence level, it can be said that a relationship exists between these two variables. In other words, H0 is rejected and H1 is confirmed. Consequently, given that the factor is positive, it can be said that subjective norm has a positive relationship with the intention of using computer.
Sub-hypothesis 4: Facilitating conditions to benefit from IT has a significant positive impact on technology culture acceptance. H1
Pearson correlation coefficient was used to evaluate the above hypothesis and the test results are listed in Table 4
.
Table 4. Pearson correlation test results of fourth hypothesis variables
Indicators Variables
Pearson's correlation r Significance level Error level Number
Facilitating conditions and use behavior 0.097 0.138 0.05 61
Findings of the above table show that the correlation coefficient 0.097 with significance level P = 0.138 < 0.05 is not significant, and with 95% confidence level, it can be said that no relationship exists between these two variables. In other words, H0 is not rejected and H1 is rejected. That is no positive relationship was observed between the facilitating conditions and behavior of using computer.
4.1-F-test to determine the different approaches to research indices in terms of education There is a significant difference between the attitudes to research indicators in terms of respondents' education. In other words, the average of respondents' views with various academic education level is not identical in attitudes toward research indices. H0 and H1 are written as follows. H0: Means are equal to each other. H1: At least one mean is different from the others
. Table 5: F-test to determine the different approaches to research indices in terms of education
Indicators f-statistic Significance level
International Journal of Computer Science and Information Security (IJCSIS), Vol. 14, No. 6, June 2016
862 https://sites.google.com/site/ijcsis/ ISSN 1947-5500

Usefulness 6.64 0.001 Ease of use 24.34 0.002
Subjective norm 23.48 0.000
Facilitating conditions 17.15 0.000
The results in Table 95 indicate that, based on the quantity F and that the significance levels for all indicators, is less than 5% error, therefore, the null hypothesis is rejected and the claim is confirmed and attitude to these indicators differs among different levels of education and education of respondents has an impact on attitudes to these indicators.
4.2-T-test to determine the different approaches to research indices in terms of gender
There is a significant difference between the attitudes to research indices in terms of gender of respondents. In other words, the average of men and women respondents' views in attitude to research indices is not identical. If μ1is the mean of men responses, and μ2 is the mean women responses, H0 and H1 are written as follows.
H0: μ =μ
H1:μ ≠ μ Table 6: T-test to determine the different approaches to research indices in terms of gender
Indicators t-Statistics Significance level
Usefulness -0.534 0.598
Ease of use -0.048 0.962
Subjective norm 0.198 0.845
Facilitating conditions 1.21 0.27
The results in Table 6 indicates that, based on the quantity t and that significant levels for all indicators of research is not less than the error level 5%, then the null hypothesis is not rejected and the claim is not confirmed, and the attitude to research indicators is identical among the men and women respondents. We can say that respondents' gender does not influence attitudes to research indices
International Journal of Computer Science and Information Security (IJCSIS), Vol. 14, No. 6, June 2016
863 https://sites.google.com/site/ijcsis/ ISSN 1947-5500
.
5-Conclusions
This study was done aiming at identifying factors influencing the information technology acceptance in companies located in the park of science and technology in Tehran. The nature of this research is applied and data analysis method is Pearson correlation, t-test and f-test. Findings of show that the correlations coefficient with significance level P = 0.000 < 0.01 is significant, and with 99% confidence level (0.01 error level), it can be said that a relationship exists between these two variables. In other words, H0 is rejected and H1 is confirmed. Consequently, given that the factor is positive, it can be said that usefulness to enjoy information technology, Ease-of-use of information technology and Subjective norm to use information technology have a positive relationship with the intention of using computer,but Findings of Sub-hypothesis 4 show that the correlation coefficient 0.097 with significance level P = 0.138 < 0.05 is not significant, and with 95% confidence level, it can be said that no relationship exists between these two variables. In other words, H0 is not rejected and H1 is rejected. That is no positive relationship was observed between the facilitating conditions and behavior of using computer.
So Results of this research showed that the usefulness, ease of use and subjective norms affect information technology acceptance through behavioral intent and using independent t test, it was determined that attitude to research indicators among men and women is alike. And based on the F-statistics of attitudes to these indices is different among different education levels and the respondents’ educaton has an impact on attitudes to these indicat.
6-References
[1]Ahmadi, Iraqi, Sheragim (2003), "Information technology and its applications", Tolid Danesh publications.
[2] Movahedi Masoud, (2004), "cultural barriers to the deployment of e-commerce in Iran", published by the National Center for Marking Goods & Services, quoted by Snyder and Barroso pp. 231-230.
[3]Dillon A. 2001, "User Acceptance of Information Technology", Indiana University.
[4]King, W, R. He, J.(2006), "A Meta analysis of the technology acceptance model", information and management, VOL. 43, PP. 740-755.
[5] Legris, P., Ingham, J., & Collerette, P, 2003. "Why do people use information technology?".A critical review of the
technology acceptance model, Information and Management, vol 40, NO:3, PP.191–204.
[6]Straub, D., (2002), toward a theory-based measurement of culture, Journal of Global
Information Management. vol.10,NO:1, PP. 324–332.
[7]Rose, G. Gefen, D. - Warkentin, M. - Pavlou, P. (2005) "Cultural diversity and trust in IT adoption": A comparison of potential a-voters in the USA and South Africa. Journal of Global Information Management Vol. 13,
No: 1, PP. 154-178
[8] Venkatesh, V, Morris, MG, Davis, GB & Davis, FD (2003), "User acceptance of
International Journal of Computer Science and Information Security (IJCSIS), Vol. 14, No. 6, June 2016
864 https://sites.google.com/site/ijcsis/ ISSN 1947-5500

Information Technology": toward a unified view', MIS Quarterly, vol. 27, no. 3, PP. 425-481.
[9] Parboteeah, D. V. - Parboteeah, K. P.
(2005) "Perceived usefulness of information technology": A cross-national model. Journal of Global Information Technology
Management Vol. 8, No: 4, PP. 129-148.
[10] Lee, Y. - Kozar, K. A. - Larsen, K. R. T. (2005) "The technology acceptance model"past, present, and future.
Communications of the AIS Vol. 12, No: 1 PP.752-780.
[11]King, W, R. He, J.(2006), "A Meta analysis of the technology acceptance model", information and management, VOL. 43, PP. 740-755.
[12] Moon.J.W, Kim, Y.G.(2001), "Extending the TAM for World Wide Web context", information and management, VOL 38, NO:
4, PP. 217-230
[13] Venkatesh, V & Morris, MG (2000), "Why don't men ever stop to ask for directions? Gender, social influence, and their role in technology acceptance and usage behavior" . MIS Quarterly, vol. 24, no:1, PP. 115-139.
[14] Fishbein, M & Ajzen, I (1975), Belief, attitude, intention, and behavior: "an introduction to theory and research",
Addison-Wesley series in social psychology. Addison-Wesley Pub. Co, Reading, Mass, PP.
132-153.
[15]Loch, K. - Straub, D. - Kamel, S. (2003) Diffusing the Internet in the Arab world: "The role of social norms and technological coloration". IEEE Transactions on
Engineering-Management Vol. 50, No: 1, PP. 145-163
[16]Taylor, S., Todd, P.A.,(1995), "Understanding information technology usage": a test of competing models,
Information Systems Research 6 (2), PP. 144–176
International Journal of Computer Science and Information Security (IJCSIS), Vol. 14, No. 6, June 2016
865 https://sites.google.com/site/ijcsis/ ISSN 1947-5500

(IJCSIS) International Journal of Computer Science and Information Security, Vol. 14 No. 6, June 2016
IJCSIS REVIEWERS’ LIST Assist Prof (Dr.) M. Emre Celebi, Louisiana State University in Shreveport, USA
Dr. Lam Hong Lee, Universiti Tunku Abdul Rahman, Malaysia
Dr. Shimon K. Modi, Director of Research BSPA Labs, Purdue University, USA
Dr. Jianguo Ding, Norwegian University of Science and Technology (NTNU), Norway
Assoc. Prof. N. Jaisankar, VIT University, Vellore,Tamilnadu, India
Dr. Amogh Kavimandan, The Mathworks Inc., USA
Dr. Ramasamy Mariappan, Vinayaka Missions University, India
Dr. Yong Li, School of Electronic and Information Engineering, Beijing Jiaotong University, P.R. China
Assist. Prof. Sugam Sharma, NIET, India / Iowa State University, USA
Dr. Jorge A. Ruiz-Vanoye, Universidad Autónoma del Estado de Morelos, Mexico
Dr. Neeraj Kumar, SMVD University, Katra (J&K), India
Dr Genge Bela, "Petru Maior" University of Targu Mures, Romania
Dr. Junjie Peng, Shanghai University, P. R. China
Dr. Ilhem LENGLIZ, HANA Group - CRISTAL Laboratory, Tunisia
Prof. Dr. Durgesh Kumar Mishra, Acropolis Institute of Technology and Research, Indore, MP, India
Dr. Jorge L. Hernández-Ardieta, University Carlos III of Madrid, Spain
Prof. Dr.C.Suresh Gnana Dhas, Anna University, India
Dr Li Fang, Nanyang Technological University, Singapore
Prof. Pijush Biswas, RCC Institute of Information Technology, India
Dr. Siddhivinayak Kulkarni, University of Ballarat, Ballarat, Victoria, Australia
Dr. A. Arul Lawrence, Royal College of Engineering & Technology, India
Dr. Wongyos Keardsri, Chulalongkorn University, Bangkok, Thailand
Dr. Somesh Kumar Dewangan, CSVTU Bhilai (C.G.)/ Dimat Raipur, India
Dr. Hayder N. Jasem, University Putra Malaysia, Malaysia
Dr. A.V.Senthil Kumar, C. M. S. College of Science and Commerce, India
Dr. R. S. Karthik, C. M. S. College of Science and Commerce, India
Dr. P. Vasant, University Technology Petronas, Malaysia
Dr. Wong Kok Seng, Soongsil University, Seoul, South Korea
Dr. Praveen Ranjan Srivastava, BITS PILANI, India
Dr. Kong Sang Kelvin, Leong, The Hong Kong Polytechnic University, Hong Kong
Dr. Mohd Nazri Ismail, Universiti Kuala Lumpur, Malaysia
Dr. Rami J. Matarneh, Al-isra Private University, Amman, Jordan
Dr Ojesanmi Olusegun Ayodeji, Ajayi Crowther University, Oyo, Nigeria
Dr. Riktesh Srivastava, Skyline University, UAE
Dr. Oras F. Baker, UCSI University - Kuala Lumpur, Malaysia
Dr. Ahmed S. Ghiduk, Faculty of Science, Beni-Suef University, Egypt
and Department of Computer science, Taif University, Saudi Arabia
Dr. Tirthankar Gayen, IIT Kharagpur, India
Dr. Huei-Ru Tseng, National Chiao Tung University, Taiwan
Prof. Ning Xu, Wuhan University of Technology, China
Dr Mohammed Salem Binwahlan, Hadhramout University of Science and Technology, Yemen
& Universiti Teknologi Malaysia, Malaysia.
Dr. Aruna Ranganath, Bhoj Reddy Engineering College for Women, India
Dr. Hafeezullah Amin, Institute of Information Technology, KUST, Kohat, Pakistan

(IJCSIS) International Journal of Computer Science and Information Security, Vol. 14 No. 6, June 2016
Prof. Syed S. Rizvi, University of Bridgeport, USA
Dr. Shahbaz Pervez Chattha, University of Engineering and Technology Taxila, Pakistan
Dr. Shishir Kumar, Jaypee University of Information Technology, Wakanaghat (HP), India
Dr. Shahid Mumtaz, Portugal Telecommunication, Instituto de Telecomunicações (IT) , Aveiro, Portugal
Dr. Rajesh K Shukla, Corporate Institute of Science & Technology Bhopal M P
Dr. Poonam Garg, Institute of Management Technology, India
Dr. S. Mehta, Inha University, Korea
Dr. Dilip Kumar S.M, Bangalore University, Bangalore
Prof. Malik Sikander Hayat Khiyal, Fatima Jinnah Women University, Rawalpindi, Pakistan
Dr. Virendra Gomase , Department of Bioinformatics, Padmashree Dr. D.Y. Patil University
Dr. Irraivan Elamvazuthi, University Technology PETRONAS, Malaysia
Dr. Saqib Saeed, University of Siegen, Germany
Dr. Pavan Kumar Gorakavi, IPMA-USA [YC]
Dr. Ahmed Nabih Zaki Rashed, Menoufia University, Egypt
Prof. Shishir K. Shandilya, Rukmani Devi Institute of Science & Technology, India
Dr. J. Komala Lakshmi, SNR Sons College, Computer Science, India
Dr. Muhammad Sohail, KUST, Pakistan
Dr. Manjaiah D.H, Mangalore University, India
Dr. S Santhosh Baboo, D.G.Vaishnav College, Chennai, India
Prof. Dr. Mokhtar Beldjehem, Sainte-Anne University, Halifax, NS, Canada
Dr. Deepak Laxmi Narasimha, University of Malaya, Malaysia
Prof. Dr. Arunkumar Thangavelu, Vellore Institute Of Technology, India
Dr. M. Azath, Anna University, India
Dr. Md. Rabiul Islam, Rajshahi University of Engineering & Technology (RUET), Bangladesh
Dr. Aos Alaa Zaidan Ansaef, Multimedia University, Malaysia
Dr Suresh Jain, Devi Ahilya University, Indore (MP) India,
Dr. Mohammed M. Kadhum, Universiti Utara Malaysia
Dr. Hanumanthappa. J. University of Mysore, India
Dr. Syed Ishtiaque Ahmed, Bangladesh University of Engineering and Technology (BUET)
Dr Akinola Solomon Olalekan, University of Ibadan, Ibadan, Nigeria
Dr. Santosh K. Pandey, The Institute of Chartered Accountants of India
Dr. P. Vasant, Power Control Optimization, Malaysia
Dr. Petr Ivankov, Automatika - S, Russian Federation
Dr. Utkarsh Seetha, Data Infosys Limited, India
Mrs. Priti Maheshwary, Maulana Azad National Institute of Technology, Bhopal
Dr. (Mrs) Padmavathi Ganapathi, Avinashilingam University for Women, Coimbatore
Assist. Prof. A. Neela madheswari, Anna university, India
Prof. Ganesan Ramachandra Rao, PSG College of Arts and Science, India
Mr. Kamanashis Biswas, Daffodil International University, Bangladesh
Dr. Atul Gonsai, Saurashtra University, Gujarat, India
Mr. Angkoon Phinyomark, Prince of Songkla University, Thailand
Mrs. G. Nalini Priya, Anna University, Chennai
Dr. P. Subashini, Avinashilingam University for Women, India
Assoc. Prof. Vijay Kumar Chakka, Dhirubhai Ambani IICT, Gandhinagar ,Gujarat
Mr Jitendra Agrawal, : Rajiv Gandhi Proudyogiki Vishwavidyalaya, Bhopal
Mr. Vishal Goyal, Department of Computer Science, Punjabi University, India
Dr. R. Baskaran, Department of Computer Science and Engineering, Anna University, Chennai

(IJCSIS) International Journal of Computer Science and Information Security, Vol. 14 No. 6, June 2016
Assist. Prof, Kanwalvir Singh Dhindsa, B.B.S.B.Engg.College, Fatehgarh Sahib (Punjab), India
Dr. Jamal Ahmad Dargham, School of Engineering and Information Technology, Universiti Malaysia Sabah
Mr. Nitin Bhatia, DAV College, India
Dr. Dhavachelvan Ponnurangam, Pondicherry Central University, India
Dr. Mohd Faizal Abdollah, University of Technical Malaysia, Malaysia
Assist. Prof. Sonal Chawla, Panjab University, India
Dr. Abdul Wahid, AKG Engg. College, Ghaziabad, India
Mr. Arash Habibi Lashkari, University of Malaya (UM), Malaysia
Mr. Md. Rajibul Islam, Ibnu Sina Institute, University Technology Malaysia
Professor Dr. Sabu M. Thampi, .B.S Institute of Technology for Women, Kerala University, India
Mr. Noor Muhammed Nayeem, Université Lumière Lyon 2, 69007 Lyon, France
Dr. Himanshu Aggarwal, Department of Computer Engineering, Punjabi University, India
Prof R. Naidoo, Dept of Mathematics/Center for Advanced Computer Modelling, Durban University of Technology,
Durban,South Africa
Prof. Mydhili K Nair, Visweswaraiah Technological University, Bangalore, India
M. Prabu, Adhiyamaan College of Engineering/Anna University, India
Mr. Swakkhar Shatabda, United International University, Bangladesh
Dr. Abdur Rashid Khan, ICIT, Gomal University, Dera Ismail Khan, Pakistan
Mr. H. Abdul Shabeer, I-Nautix Technologies,Chennai, India
Dr. M. Aramudhan, Perunthalaivar Kamarajar Institute of Engineering and Technology, India
Dr. M. P. Thapliyal, Department of Computer Science, HNB Garhwal University (Central University), India
Dr. Shahaboddin Shamshirband, Islamic Azad University, Iran
Mr. Zeashan Hameed Khan, Université de Grenoble, France
Prof. Anil K Ahlawat, Ajay Kumar Garg Engineering College, Ghaziabad, UP Technical University, Lucknow
Mr. Longe Olumide Babatope, University Of Ibadan, Nigeria
Associate Prof. Raman Maini, University College of Engineering, Punjabi University, India
Dr. Maslin Masrom, University Technology Malaysia, Malaysia
Sudipta Chattopadhyay, Jadavpur University, Kolkata, India
Dr. Dang Tuan NGUYEN, University of Information Technology, Vietnam National University - Ho Chi Minh City
Dr. Mary Lourde R., BITS-PILANI Dubai , UAE
Dr. Abdul Aziz, University of Central Punjab, Pakistan
Mr. Karan Singh, Gautam Budtha University, India
Mr. Avinash Pokhriyal, Uttar Pradesh Technical University, Lucknow, India
Associate Prof Dr Zuraini Ismail, University Technology Malaysia, Malaysia
Assistant Prof. Yasser M. Alginahi, Taibah University, Madinah Munawwarrah, KSA
Mr. Dakshina Ranjan Kisku, West Bengal University of Technology, India
Mr. Raman Kumar, Dr B R Ambedkar National Institute of Technology, Jalandhar, Punjab, India
Associate Prof. Samir B. Patel, Institute of Technology, Nirma University, India
Dr. M.Munir Ahamed Rabbani, B. S. Abdur Rahman University, India
Asst. Prof. Koushik Majumder, West Bengal University of Technology, India
Dr. Alex Pappachen James, Queensland Micro-nanotechnology center, Griffith University, Australia
Assistant Prof. S. Hariharan, B.S. Abdur Rahman University, India
Asst Prof. Jasmine. K. S, R.V.College of Engineering, India
Mr Naushad Ali Mamode Khan, Ministry of Education and Human Resources, Mauritius
Prof. Mahesh Goyani, G H Patel Collge of Engg. & Tech, V.V.N, Anand, Gujarat, India
Dr. Mana Mohammed, University of Tlemcen, Algeria
Prof. Jatinder Singh, Universal Institutiion of Engg. & Tech. CHD, India

(IJCSIS) International Journal of Computer Science and Information Security, Vol. 14 No. 6, June 2016
Mrs. M. Anandhavalli Gauthaman, Sikkim Manipal Institute of Technology, Majitar, East Sikkim
Dr. Bin Guo, Institute Telecom SudParis, France
Mrs. Maleika Mehr Nigar Mohamed Heenaye-Mamode Khan, University of Mauritius
Prof. Pijush Biswas, RCC Institute of Information Technology, India
Mr. V. Bala Dhandayuthapani, Mekelle University, Ethiopia
Dr. Irfan Syamsuddin, State Polytechnic of Ujung Pandang, Indonesia
Mr. Kavi Kumar Khedo, University of Mauritius, Mauritius
Mr. Ravi Chandiran, Zagro Singapore Pte Ltd. Singapore
Mr. Milindkumar V. Sarode, Jawaharlal Darda Institute of Engineering and Technology, India
Dr. Shamimul Qamar, KSJ Institute of Engineering & Technology, India
Dr. C. Arun, Anna University, India
Assist. Prof. M.N.Birje, Basaveshwar Engineering College, India
Prof. Hamid Reza Naji, Department of Computer Enigneering, Shahid Beheshti University, Tehran, Iran
Assist. Prof. Debasis Giri, Department of Computer Science and Engineering, Haldia Institute of Technology
Subhabrata Barman, Haldia Institute of Technology, West Bengal
Mr. M. I. Lali, COMSATS Institute of Information Technology, Islamabad, Pakistan
Dr. Feroz Khan, Central Institute of Medicinal and Aromatic Plants, Lucknow, India
Mr. R. Nagendran, Institute of Technology, Coimbatore, Tamilnadu, India
Mr. Amnach Khawne, King Mongkut’s Institute of Technology Ladkrabang, Ladkrabang, Bangkok, Thailand
Dr. P. Chakrabarti, Sir Padampat Singhania University, Udaipur, India
Mr. Nafiz Imtiaz Bin Hamid, Islamic University of Technology (IUT), Bangladesh.
Shahab-A. Shamshirband, Islamic Azad University, Chalous, Iran
Prof. B. Priestly Shan, Anna Univeristy, Tamilnadu, India
Venkatramreddy Velma, Dept. of Bioinformatics, University of Mississippi Medical Center, Jackson MS USA
Akshi Kumar, Dept. of Computer Engineering, Delhi Technological University, India
Dr. Umesh Kumar Singh, Vikram University, Ujjain, India
Mr. Serguei A. Mokhov, Concordia University, Canada
Mr. Lai Khin Wee, Universiti Teknologi Malaysia, Malaysia
Dr. Awadhesh Kumar Sharma, Madan Mohan Malviya Engineering College, India
Mr. Syed R. Rizvi, Analytical Services & Materials, Inc., USA
Dr. S. Karthik, SNS Collegeof Technology, India
Mr. Syed Qasim Bukhari, CIMET (Universidad de Granada), Spain
Mr. A.D.Potgantwar, Pune University, India
Dr. Himanshu Aggarwal, Punjabi University, India
Mr. Rajesh Ramachandran, Naipunya Institute of Management and Information Technology, India
Dr. K.L. Shunmuganathan, R.M.K Engg College , Kavaraipettai ,Chennai
Dr. Prasant Kumar Pattnaik, KIST, India.
Dr. Ch. Aswani Kumar, VIT University, India
Mr. Ijaz Ali Shoukat, King Saud University, Riyadh KSA
Mr. Arun Kumar, Sir Padam Pat Singhania University, Udaipur, Rajasthan
Mr. Muhammad Imran Khan, Universiti Teknologi PETRONAS, Malaysia
Dr. Natarajan Meghanathan, Jackson State University, Jackson, MS, USA
Mr. Mohd Zaki Bin Mas'ud, Universiti Teknikal Malaysia Melaka (UTeM), Malaysia
Prof. Dr. R. Geetharamani, Dept. of Computer Science and Eng., Rajalakshmi Engineering College, India
Dr. Smita Rajpal, Institute of Technology and Management, Gurgaon, India
Dr. S. Abdul Khader Jilani, University of Tabuk, Tabuk, Saudi Arabia
Mr. Syed Jamal Haider Zaidi, Bahria University, Pakistan

(IJCSIS) International Journal of Computer Science and Information Security, Vol. 14 No. 6, June 2016
Dr. N. Devarajan, Government College of Technology,Coimbatore, Tamilnadu, INDIA
Mr. R. Jagadeesh Kannan, RMK Engineering College, India
Mr. Deo Prakash, Shri Mata Vaishno Devi University, India
Mr. Mohammad Abu Naser, Dept. of EEE, IUT, Gazipur, Bangladesh
Assist. Prof. Prasun Ghosal, Bengal Engineering and Science University, India
Mr. Md. Golam Kaosar, School of Engineering and Science, Victoria University, Melbourne City, Australia
Mr. R. Mahammad Shafi, Madanapalle Institute of Technology & Science, India
Dr. F.Sagayaraj Francis, Pondicherry Engineering College,India
Dr. Ajay Goel, HIET , Kaithal, India
Mr. Nayak Sunil Kashibarao, Bahirji Smarak Mahavidyalaya, India
Mr. Suhas J Manangi, Microsoft India
Dr. Kalyankar N. V., Yeshwant Mahavidyalaya, Nanded , India
Dr. K.D. Verma, S.V. College of Post graduate studies & Research, India
Dr. Amjad Rehman, University Technology Malaysia, Malaysia
Mr. Rachit Garg, L K College, Jalandhar, Punjab
Mr. J. William, M.A.M college of Engineering, Trichy, Tamilnadu,India
Prof. Jue-Sam Chou, Nanhua University, College of Science and Technology, Taiwan
Dr. Thorat S.B., Institute of Technology and Management, India
Mr. Ajay Prasad, Sir Padampat Singhania University, Udaipur, India
Dr. Kamaljit I. Lakhtaria, Atmiya Institute of Technology & Science, India
Mr. Syed Rafiul Hussain, Ahsanullah University of Science and Technology, Bangladesh
Mrs Fazeela Tunnisa, Najran University, Kingdom of Saudi Arabia
Mrs Kavita Taneja, Maharishi Markandeshwar University, Haryana, India
Mr. Maniyar Shiraz Ahmed, Najran University, Najran, KSA
Mr. Anand Kumar, AMC Engineering College, Bangalore
Dr. Rakesh Chandra Gangwar, Beant College of Engg. & Tech., Gurdaspur (Punjab) India
Dr. V V Rama Prasad, Sree Vidyanikethan Engineering College, India
Assist. Prof. Neetesh Kumar Gupta, Technocrats Institute of Technology, Bhopal (M.P.), India
Mr. Ashish Seth, Uttar Pradesh Technical University, Lucknow ,UP India
Dr. V V S S S Balaram, Sreenidhi Institute of Science and Technology, India
Mr Rahul Bhatia, Lingaya's Institute of Management and Technology, India
Prof. Niranjan Reddy. P, KITS , Warangal, India
Prof. Rakesh. Lingappa, Vijetha Institute of Technology, Bangalore, India
Dr. Mohammed Ali Hussain, Nimra College of Engineering & Technology, Vijayawada, A.P., India
Dr. A.Srinivasan, MNM Jain Engineering College, Rajiv Gandhi Salai, Thorapakkam, Chennai
Mr. Rakesh Kumar, M.M. University, Mullana, Ambala, India
Dr. Lena Khaled, Zarqa Private University, Aman, Jordon
Ms. Supriya Kapoor, Patni/Lingaya's Institute of Management and Tech., India
Dr. Tossapon Boongoen , Aberystwyth University, UK
Dr . Bilal Alatas, Firat University, Turkey
Assist. Prof. Jyoti Praaksh Singh , Academy of Technology, India
Dr. Ritu Soni, GNG College, India
Dr . Mahendra Kumar , Sagar Institute of Research & Technology, Bhopal, India.
Dr. Binod Kumar, Lakshmi Narayan College of Tech.(LNCT)Bhopal India
Dr. Muzhir Shaban Al-Ani, Amman Arab University Amman – Jordan
Dr. T.C. Manjunath , ATRIA Institute of Tech, India
Mr. Muhammad Zakarya, COMSATS Institute of Information Technology (CIIT), Pakistan

(IJCSIS) International Journal of Computer Science and Information Security, Vol. 14 No. 6, June 2016
Assist. Prof. Harmunish Taneja, M. M. University, India
Dr. Chitra Dhawale , SICSR, Model Colony, Pune, India
Mrs Sankari Muthukaruppan, Nehru Institute of Engineering and Technology, Anna University, India
Mr. Aaqif Afzaal Abbasi, National University Of Sciences And Technology, Islamabad
Prof. Ashutosh Kumar Dubey, Trinity Institute of Technology and Research Bhopal, India
Mr. G. Appasami, Dr. Pauls Engineering College, India
Mr. M Yasin, National University of Science and Tech, karachi (NUST), Pakistan
Mr. Yaser Miaji, University Utara Malaysia, Malaysia
Mr. Shah Ahsanul Haque, International Islamic University Chittagong (IIUC), Bangladesh
Prof. (Dr) Syed Abdul Sattar, Royal Institute of Technology & Science, India
Dr. S. Sasikumar, Roever Engineering College
Assist. Prof. Monit Kapoor, Maharishi Markandeshwar University, India
Mr. Nwaocha Vivian O, National Open University of Nigeria
Dr. M. S. Vijaya, GR Govindarajulu School of Applied Computer Technology, India
Assist. Prof. Chakresh Kumar, Manav Rachna International University, India
Mr. Kunal Chadha , R&D Software Engineer, Gemalto, Singapore
Mr. Mueen Uddin, Universiti Teknologi Malaysia, UTM , Malaysia
Dr. Dhuha Basheer abdullah, Mosul university, Iraq
Mr. S. Audithan, Annamalai University, India
Prof. Vijay K Chaudhari, Technocrats Institute of Technology , India
Associate Prof. Mohd Ilyas Khan, Technocrats Institute of Technology , India
Dr. Vu Thanh Nguyen, University of Information Technology, HoChiMinh City, VietNam
Assist. Prof. Anand Sharma, MITS, Lakshmangarh, Sikar, Rajasthan, India
Prof. T V Narayana Rao, HITAM Engineering college, Hyderabad
Mr. Deepak Gour, Sir Padampat Singhania University, India
Assist. Prof. Amutharaj Joyson, Kalasalingam University, India
Mr. Ali Balador, Islamic Azad University, Iran
Mr. Mohit Jain, Maharaja Surajmal Institute of Technology, India
Mr. Dilip Kumar Sharma, GLA Institute of Technology & Management, India
Dr. Debojyoti Mitra, Sir padampat Singhania University, India
Dr. Ali Dehghantanha, Asia-Pacific University College of Technology and Innovation, Malaysia
Mr. Zhao Zhang, City University of Hong Kong, China
Prof. S.P. Setty, A.U. College of Engineering, India
Prof. Patel Rakeshkumar Kantilal, Sankalchand Patel College of Engineering, India
Mr. Biswajit Bhowmik, Bengal College of Engineering & Technology, India
Mr. Manoj Gupta, Apex Institute of Engineering & Technology, India
Assist. Prof. Ajay Sharma, Raj Kumar Goel Institute Of Technology, India
Assist. Prof. Ramveer Singh, Raj Kumar Goel Institute of Technology, India
Dr. Hanan Elazhary, Electronics Research Institute, Egypt
Dr. Hosam I. Faiq, USM, Malaysia
Prof. Dipti D. Patil, MAEER’s MIT College of Engg. & Tech, Pune, India
Assist. Prof. Devendra Chack, BCT Kumaon engineering College Dwarahat Almora, India
Prof. Manpreet Singh, M. M. Engg. College, M. M. University, India
Assist. Prof. M. Sadiq ali Khan, University of Karachi, Pakistan
Mr. Prasad S. Halgaonkar, MIT - College of Engineering, Pune, India
Dr. Imran Ghani, Universiti Teknologi Malaysia, Malaysia
Prof. Varun Kumar Kakar, Kumaon Engineering College, Dwarahat, India

(IJCSIS) International Journal of Computer Science and Information Security, Vol. 14 No. 6, June 2016
Assist. Prof. Nisheeth Joshi, Apaji Institute, Banasthali University, Rajasthan, India
Associate Prof. Kunwar S. Vaisla, VCT Kumaon Engineering College, India
Prof Anupam Choudhary, Bhilai School Of Engg.,Bhilai (C.G.),India
Mr. Divya Prakash Shrivastava, Al Jabal Al garbi University, Zawya, Libya
Associate Prof. Dr. V. Radha, Avinashilingam Deemed university for women, Coimbatore.
Dr. Kasarapu Ramani, JNT University, Anantapur, India
Dr. Anuraag Awasthi, Jayoti Vidyapeeth Womens University, India
Dr. C G Ravichandran, R V S College of Engineering and Technology, India
Dr. Mohamed A. Deriche, King Fahd University of Petroleum and Minerals, Saudi Arabia
Mr. Abbas Karimi, Universiti Putra Malaysia, Malaysia
Mr. Amit Kumar, Jaypee University of Engg. and Tech., India
Dr. Nikolai Stoianov, Defense Institute, Bulgaria
Assist. Prof. S. Ranichandra, KSR College of Arts and Science, Tiruchencode
Mr. T.K.P. Rajagopal, Diamond Horse International Pvt Ltd, India
Dr. Md. Ekramul Hamid, Rajshahi University, Bangladesh
Mr. Hemanta Kumar Kalita , TATA Consultancy Services (TCS), India
Dr. Messaouda Azzouzi, Ziane Achour University of Djelfa, Algeria
Prof. (Dr.) Juan Jose Martinez Castillo, "Gran Mariscal de Ayacucho" University and Acantelys research Group,
Venezuela
Dr. Jatinderkumar R. Saini, Narmada College of Computer Application, India
Dr. Babak Bashari Rad, University Technology of Malaysia, Malaysia
Dr. Nighat Mir, Effat University, Saudi Arabia
Prof. (Dr.) G.M.Nasira, Sasurie College of Engineering, India
Mr. Varun Mittal, Gemalto Pte Ltd, Singapore
Assist. Prof. Mrs P. Banumathi, Kathir College Of Engineering, Coimbatore
Assist. Prof. Quan Yuan, University of Wisconsin-Stevens Point, US
Dr. Pranam Paul, Narula Institute of Technology, Agarpara, West Bengal, India
Assist. Prof. J. Ramkumar, V.L.B Janakiammal college of Arts & Science, India
Mr. P. Sivakumar, Anna university, Chennai, India
Mr. Md. Humayun Kabir Biswas, King Khalid University, Kingdom of Saudi Arabia
Mr. Mayank Singh, J.P. Institute of Engg & Technology, Meerut, India
HJ. Kamaruzaman Jusoff, Universiti Putra Malaysia
Mr. Nikhil Patrick Lobo, CADES, India
Dr. Amit Wason, Rayat-Bahra Institute of Engineering & Boi-Technology, India
Dr. Rajesh Shrivastava, Govt. Benazir Science & Commerce College, Bhopal, India
Assist. Prof. Vishal Bharti, DCE, Gurgaon
Mrs. Sunita Bansal, Birla Institute of Technology & Science, India
Dr. R. Sudhakar, Dr.Mahalingam college of Engineering and Technology, India
Dr. Amit Kumar Garg, Shri Mata Vaishno Devi University, Katra(J&K), India
Assist. Prof. Raj Gaurang Tiwari, AZAD Institute of Engineering and Technology, India
Mr. Hamed Taherdoost, Tehran, Iran
Mr. Amin Daneshmand Malayeri, YRC, IAU, Malayer Branch, Iran
Mr. Shantanu Pal, University of Calcutta, India
Dr. Terry H. Walcott, E-Promag Consultancy Group, United Kingdom
Dr. Ezekiel U OKIKE, University of Ibadan, Nigeria
Mr. P. Mahalingam, Caledonian College of Engineering, Oman
Dr. Mahmoud M. A. Abd Ellatif, Mansoura University, Egypt

(IJCSIS) International Journal of Computer Science and Information Security, Vol. 14 No. 6, June 2016
Prof. Kunwar S. Vaisla, BCT Kumaon Engineering College, India
Prof. Mahesh H. Panchal, Kalol Institute of Technology & Research Centre, India
Mr. Muhammad Asad, Technical University of Munich, Germany
Mr. AliReza Shams Shafigh, Azad Islamic university, Iran
Prof. S. V. Nagaraj, RMK Engineering College, India
Mr. Ashikali M Hasan, Senior Researcher, CelNet security, India
Dr. Adnan Shahid Khan, University Technology Malaysia, Malaysia
Mr. Prakash Gajanan Burade, Nagpur University/ITM college of engg, Nagpur, India
Dr. Jagdish B.Helonde, Nagpur University/ITM college of engg, Nagpur, India
Professor, Doctor BOUHORMA Mohammed, Univertsity Abdelmalek Essaadi, Morocco
Mr. K. Thirumalaivasan, Pondicherry Engg. College, India
Mr. Umbarkar Anantkumar Janardan, Walchand College of Engineering, India
Mr. Ashish Chaurasia, Gyan Ganga Institute of Technology & Sciences, India
Mr. Sunil Taneja, Kurukshetra University, India
Mr. Fauzi Adi Rafrastara, Dian Nuswantoro University, Indonesia
Dr. Yaduvir Singh, Thapar University, India
Dr. Ioannis V. Koskosas, University of Western Macedonia, Greece
Dr. Vasantha Kalyani David, Avinashilingam University for women, Coimbatore
Dr. Ahmed Mansour Manasrah, Universiti Sains Malaysia, Malaysia
Miss. Nazanin Sadat Kazazi, University Technology Malaysia, Malaysia
Mr. Saeed Rasouli Heikalabad, Islamic Azad University - Tabriz Branch, Iran
Assoc. Prof. Dhirendra Mishra, SVKM's NMIMS University, India
Prof. Shapoor Zarei, UAE Inventors Association, UAE
Prof. B.Raja Sarath Kumar, Lenora College of Engineering, India
Dr. Bashir Alam, Jamia millia Islamia, Delhi, India
Prof. Anant J Umbarkar, Walchand College of Engg., India
Assist. Prof. B. Bharathi, Sathyabama University, India
Dr. Fokrul Alom Mazarbhuiya, King Khalid University, Saudi Arabia
Prof. T.S.Jeyali Laseeth, Anna University of Technology, Tirunelveli, India
Dr. M. Balraju, Jawahar Lal Nehru Technological University Hyderabad, India
Dr. Vijayalakshmi M. N., R.V.College of Engineering, Bangalore
Prof. Walid Moudani, Lebanese University, Lebanon
Dr. Saurabh Pal, VBS Purvanchal University, Jaunpur, India
Associate Prof. Suneet Chaudhary, Dehradun Institute of Technology, India
Associate Prof. Dr. Manuj Darbari, BBD University, India
Ms. Prema Selvaraj, K.S.R College of Arts and Science, India
Assist. Prof. Ms.S.Sasikala, KSR College of Arts & Science, India
Mr. Sukhvinder Singh Deora, NC Institute of Computer Sciences, India
Dr. Abhay Bansal, Amity School of Engineering & Technology, India
Ms. Sumita Mishra, Amity School of Engineering and Technology, India
Professor S. Viswanadha Raju, JNT University Hyderabad, India
Mr. Asghar Shahrzad Khashandarag, Islamic Azad University Tabriz Branch, India
Mr. Manoj Sharma, Panipat Institute of Engg. & Technology, India
Mr. Shakeel Ahmed, King Faisal University, Saudi Arabia
Dr. Mohamed Ali Mahjoub, Institute of Engineer of Monastir, Tunisia
Mr. Adri Jovin J.J., SriGuru Institute of Technology, India
Dr. Sukumar Senthilkumar, Universiti Sains Malaysia, Malaysia

(IJCSIS) International Journal of Computer Science and Information Security, Vol. 14 No. 6, June 2016
Mr. Rakesh Bharati, Dehradun Institute of Technology Dehradun, India
Mr. Shervan Fekri Ershad, Shiraz International University, Iran
Mr. Md. Safiqul Islam, Daffodil International University, Bangladesh
Mr. Mahmudul Hasan, Daffodil International University, Bangladesh
Prof. Mandakini Tayade, UIT, RGTU, Bhopal, India
Ms. Sarla More, UIT, RGTU, Bhopal, India
Mr. Tushar Hrishikesh Jaware, R.C. Patel Institute of Technology, Shirpur, India
Ms. C. Divya, Dr G R Damodaran College of Science, Coimbatore, India
Mr. Fahimuddin Shaik, Annamacharya Institute of Technology & Sciences, India
Dr. M. N. Giri Prasad, JNTUCE,Pulivendula, A.P., India
Assist. Prof. Chintan M Bhatt, Charotar University of Science And Technology, India
Prof. Sahista Machchhar, Marwadi Education Foundation's Group of institutions, India
Assist. Prof. Navnish Goel, S. D. College Of Enginnering & Technology, India
Mr. Khaja Kamaluddin, Sirt University, Sirt, Libya
Mr. Mohammad Zaidul Karim, Daffodil International, Bangladesh
Mr. M. Vijayakumar, KSR College of Engineering, Tiruchengode, India
Mr. S. A. Ahsan Rajon, Khulna University, Bangladesh
Dr. Muhammad Mohsin Nazir, LCW University Lahore, Pakistan
Mr. Mohammad Asadul Hoque, University of Alabama, USA
Mr. P.V.Sarathchand, Indur Institute of Engineering and Technology, India
Mr. Durgesh Samadhiya, Chung Hua University, Taiwan
Dr Venu Kuthadi, University of Johannesburg, Johannesburg, RSA
Dr. (Er) Jasvir Singh, Guru Nanak Dev University, Amritsar, Punjab, India
Mr. Jasmin Cosic, Min. of the Interior of Una-sana canton, B&H, Bosnia and Herzegovina
Dr S. Rajalakshmi, Botho College, South Africa
Dr. Mohamed Sarrab, De Montfort University, UK
Mr. Basappa B. Kodada, Canara Engineering College, India
Assist. Prof. K. Ramana, Annamacharya Institute of Technology and Sciences, India
Dr. Ashu Gupta, Apeejay Institute of Management, Jalandhar, India
Assist. Prof. Shaik Rasool, Shadan College of Engineering & Technology, India
Assist. Prof. K. Suresh, Annamacharya Institute of Tech & Sci. Rajampet, AP, India
Dr . G. Singaravel, K.S.R. College of Engineering, India
Dr B. G. Geetha, K.S.R. College of Engineering, India
Assist. Prof. Kavita Choudhary, ITM University, Gurgaon
Dr. Mehrdad Jalali, Azad University, Mashhad, Iran
Megha Goel, Shamli Institute of Engineering and Technology, Shamli, India
Mr. Chi-Hua Chen, Institute of Information Management, National Chiao-Tung University, Taiwan (R.O.C.)
Assoc. Prof. A. Rajendran, RVS College of Engineering and Technology, India
Assist. Prof. S. Jaganathan, RVS College of Engineering and Technology, India
Assoc. Prof. (Dr.) A S N Chakravarthy, JNTUK University College of Engineering Vizianagaram (State University)
Assist. Prof. Deepshikha Patel, Technocrat Institute of Technology, India
Assist. Prof. Maram Balajee, GMRIT, India
Assist. Prof. Monika Bhatnagar, TIT, India
Prof. Gaurang Panchal, Charotar University of Science & Technology, India
Prof. Anand K. Tripathi, Computer Society of India
Prof. Jyoti Chaudhary, High Performance Computing Research Lab, India
Assist. Prof. Supriya Raheja, ITM University, India

(IJCSIS) International Journal of Computer Science and Information Security, Vol. 14 No. 6, June 2016
Dr. Pankaj Gupta, Microsoft Corporation, U.S.A.
Assist. Prof. Panchamukesh Chandaka, Hyderabad Institute of Tech. & Management, India
Prof. Mohan H.S, SJB Institute Of Technology, India
Mr. Hossein Malekinezhad, Islamic Azad University, Iran
Mr. Zatin Gupta, Universti Malaysia, Malaysia
Assist. Prof. Amit Chauhan, Phonics Group of Institutions, India
Assist. Prof. Ajal A. J., METS School Of Engineering, India
Mrs. Omowunmi Omobola Adeyemo, University of Ibadan, Nigeria
Dr. Bharat Bhushan Agarwal, I.F.T.M. University, India
Md. Nazrul Islam, University of Western Ontario, Canada
Tushar Kanti, L.N.C.T, Bhopal, India
Er. Aumreesh Kumar Saxena, SIRTs College Bhopal, India
Mr. Mohammad Monirul Islam, Daffodil International University, Bangladesh
Dr. Kashif Nisar, University Utara Malaysia, Malaysia
Dr. Wei Zheng, Rutgers Univ/ A10 Networks, USA
Associate Prof. Rituraj Jain, Vyas Institute of Engg & Tech, Jodhpur – Rajasthan
Assist. Prof. Apoorvi Sood, I.T.M. University, India
Dr. Kayhan Zrar Ghafoor, University Technology Malaysia, Malaysia
Mr. Swapnil Soner, Truba Institute College of Engineering & Technology, Indore, India
Ms. Yogita Gigras, I.T.M. University, India
Associate Prof. Neelima Sadineni, Pydha Engineering College, India Pydha Engineering College
Assist. Prof. K. Deepika Rani, HITAM, Hyderabad
Ms. Shikha Maheshwari, Jaipur Engineering College & Research Centre, India
Prof. Dr V S Giridhar Akula, Avanthi's Scientific Tech. & Research Academy, Hyderabad
Prof. Dr.S.Saravanan, Muthayammal Engineering College, India
Mr. Mehdi Golsorkhatabar Amiri, Islamic Azad University, Iran
Prof. Amit Sadanand Savyanavar, MITCOE, Pune, India
Assist. Prof. P.Oliver Jayaprakash, Anna University,Chennai
Assist. Prof. Ms. Sujata, ITM University, Gurgaon, India
Dr. Asoke Nath, St. Xavier's College, India
Mr. Masoud Rafighi, Islamic Azad University, Iran
Assist. Prof. RamBabu Pemula, NIMRA College of Engineering & Technology, India
Assist. Prof. Ms Rita Chhikara, ITM University, Gurgaon, India
Mr. Sandeep Maan, Government Post Graduate College, India
Prof. Dr. S. Muralidharan, Mepco Schlenk Engineering College, India
Associate Prof. T.V.Sai Krishna, QIS College of Engineering and Technology, India
Mr. R. Balu, Bharathiar University, Coimbatore, India
Assist. Prof. Shekhar. R, Dr.SM College of Engineering, India
Prof. P. Senthilkumar, Vivekanandha Institue of Engineering and Techology for Woman, India
Mr. M. Kamarajan, PSNA College of Engineering & Technology, India
Dr. Angajala Srinivasa Rao, Jawaharlal Nehru Technical University, India
Assist. Prof. C. Venkatesh, A.I.T.S, Rajampet, India
Mr. Afshin Rezakhani Roozbahani, Ayatollah Boroujerdi University, Iran
Mr. Laxmi chand, SCTL, Noida, India
Dr. Dr. Abdul Hannan, Vivekanand College, Aurangabad
Prof. Mahesh Panchal, KITRC, Gujarat
Dr. A. Subramani, K.S.R. College of Engineering, Tiruchengode

(IJCSIS) International Journal of Computer Science and Information Security, Vol. 14 No. 6, June 2016
Assist. Prof. Prakash M, Rajalakshmi Engineering College, Chennai, India
Assist. Prof. Akhilesh K Sharma, Sir Padampat Singhania University, India
Ms. Varsha Sahni, Guru Nanak Dev Engineering College, Ludhiana, India
Associate Prof. Trilochan Rout, NM Institute of Engineering and Technlogy, India
Mr. Srikanta Kumar Mohapatra, NMIET, Orissa, India
Mr. Waqas Haider Bangyal, Iqra University Islamabad, Pakistan
Dr. S. Vijayaragavan, Christ College of Engineering and Technology, Pondicherry, India
Prof. Elboukhari Mohamed, University Mohammed First, Oujda, Morocco
Dr. Muhammad Asif Khan, King Faisal University, Saudi Arabia
Dr. Nagy Ramadan Darwish Omran, Cairo University, Egypt.
Assistant Prof. Anand Nayyar, KCL Institute of Management and Technology, India
Mr. G. Premsankar, Ericcson, India
Assist. Prof. T. Hemalatha, VELS University, India
Prof. Tejaswini Apte, University of Pune, India
Dr. Edmund Ng Giap Weng, Universiti Malaysia Sarawak, Malaysia
Mr. Mahdi Nouri, Iran University of Science and Technology, Iran
Associate Prof. S. Asif Hussain, Annamacharya Institute of technology & Sciences, India
Mrs. Kavita Pabreja, Maharaja Surajmal Institute (an affiliate of GGSIP University), India
Mr. Vorugunti Chandra Sekhar, DA-IICT, India
Mr. Muhammad Najmi Ahmad Zabidi, Universiti Teknologi Malaysia, Malaysia
Dr. Aderemi A. Atayero, Covenant University, Nigeria
Assist. Prof. Osama Sohaib, Balochistan University of Information Technology, Pakistan
Assist. Prof. K. Suresh, Annamacharya Institute of Technology and Sciences, India
Mr. Hassen Mohammed Abduallah Alsafi, International Islamic University Malaysia (IIUM) Malaysia
Mr. Robail Yasrab, Virtual University of Pakistan, Pakistan
Mr. R. Balu, Bharathiar University, Coimbatore, India
Prof. Anand Nayyar, KCL Institute of Management and Technology, Jalandhar
Assoc. Prof. Vivek S Deshpande, MIT College of Engineering, India
Prof. K. Saravanan, Anna university Coimbatore, India
Dr. Ravendra Singh, MJP Rohilkhand University, Bareilly, India
Mr. V. Mathivanan, IBRA College of Technology, Sultanate of OMAN
Assoc. Prof. S. Asif Hussain, AITS, India
Assist. Prof. C. Venkatesh, AITS, India
Mr. Sami Ulhaq, SZABIST Islamabad, Pakistan
Dr. B. Justus Rabi, Institute of Science & Technology, India
Mr. Anuj Kumar Yadav, Dehradun Institute of technology, India
Mr. Alejandro Mosquera, University of Alicante, Spain
Assist. Prof. Arjun Singh, Sir Padampat Singhania University (SPSU), Udaipur, India
Dr. Smriti Agrawal, JB Institute of Engineering and Technology, Hyderabad
Assist. Prof. Swathi Sambangi, Visakha Institute of Engineering and Technology, India
Ms. Prabhjot Kaur, Guru Gobind Singh Indraprastha University, India
Mrs. Samaher AL-Hothali, Yanbu University College, Saudi Arabia
Prof. Rajneeshkaur Bedi, MIT College of Engineering, Pune, India
Mr. Hassen Mohammed Abduallah Alsafi, International Islamic University Malaysia (IIUM)
Dr. Wei Zhang, Amazon.com, Seattle, WA, USA
Mr. B. Santhosh Kumar, C S I College of Engineering, Tamil Nadu
Dr. K. Reji Kumar, , N S S College, Pandalam, India

(IJCSIS) International Journal of Computer Science and Information Security, Vol. 14 No. 6, June 2016
Assoc. Prof. K. Seshadri Sastry, EIILM University, India
Mr. Kai Pan, UNC Charlotte, USA
Mr. Ruikar Sachin, SGGSIET, India
Prof. (Dr.) Vinodani Katiyar, Sri Ramswaroop Memorial University, India
Assoc. Prof., M. Giri, Sreenivasa Institute of Technology and Management Studies, India
Assoc. Prof. Labib Francis Gergis, Misr Academy for Engineering and Technology (MET), Egypt
Assist. Prof. Amanpreet Kaur, ITM University, India
Assist. Prof. Anand Singh Rajawat, Shri Vaishnav Institute of Technology & Science, Indore
Mrs. Hadeel Saleh Haj Aliwi, Universiti Sains Malaysia (USM), Malaysia
Dr. Abhay Bansal, Amity University, India
Dr. Mohammad A. Mezher, Fahad Bin Sultan University, KSA
Assist. Prof. Nidhi Arora, M.C.A. Institute, India
Prof. Dr. P. Suresh, Karpagam College of Engineering, Coimbatore, India
Dr. Kannan Balasubramanian, Mepco Schlenk Engineering College, India
Dr. S. Sankara Gomathi, Panimalar Engineering college, India
Prof. Anil kumar Suthar, Gujarat Technological University, L.C. Institute of Technology, India
Assist. Prof. R. Hubert Rajan, NOORUL ISLAM UNIVERSITY, India
Assist. Prof. Dr. Jyoti Mahajan, College of Engineering & Technology
Assist. Prof. Homam Reda El-Taj, College of Network Engineering, Saudi Arabia & Malaysia
Mr. Bijan Paul, Shahjalal University of Science & Technology, Bangladesh
Assoc. Prof. Dr. Ch V Phani Krishna, KL University, India
Dr. Vishal Bhatnagar, Ambedkar Institute of Advanced Communication Technologies & Research, India
Dr. Lamri LAOUAMER, Al Qassim University, Dept. Info. Systems & European University of Brittany, Dept. Computer
Science, UBO, Brest, France
Prof. Ashish Babanrao Sasankar, G.H.Raisoni Institute Of Information Technology, India
Prof. Pawan Kumar Goel, Shamli Institute of Engineering and Technology, India
Mr. Ram Kumar Singh, S.V Subharti University, India
Assistant Prof. Sunish Kumar O S, Amaljyothi College of Engineering, India
Dr Sanjay Bhargava, Banasthali University, India
Mr. Pankaj S. Kulkarni, AVEW's Shatabdi Institute of Technology, India
Mr. Roohollah Etemadi, Islamic Azad University, Iran
Mr. Oloruntoyin Sefiu Taiwo, Emmanuel Alayande College Of Education, Nigeria
Mr. Sumit Goyal, National Dairy Research Institute, India
Mr Jaswinder Singh Dilawari, Geeta Engineering College, India
Prof. Raghuraj Singh, Harcourt Butler Technological Institute, Kanpur
Dr. S.K. Mahendran, Anna University, Chennai, India
Dr. Amit Wason, Hindustan Institute of Technology & Management, Punjab
Dr. Ashu Gupta, Apeejay Institute of Management, India
Assist. Prof. D. Asir Antony Gnana Singh, M.I.E.T Engineering College, India
Mrs Mina Farmanbar, Eastern Mediterranean University, Famagusta, North Cyprus
Mr. Maram Balajee, GMR Institute of Technology, India
Mr. Moiz S. Ansari, Isra University, Hyderabad, Pakistan
Mr. Adebayo, Olawale Surajudeen, Federal University of Technology Minna, Nigeria
Mr. Jasvir Singh, University College Of Engg., India
Mr. Vivek Tiwari, MANIT, Bhopal, India
Assoc. Prof. R. Navaneethakrishnan, Bharathiyar College of Engineering and Technology, India
Mr. Somdip Dey, St. Xavier's College, Kolkata, India

(IJCSIS) International Journal of Computer Science and Information Security, Vol. 14 No. 6, June 2016
Mr. Souleymane Balla-Arabé, Xi’an University of Electronic Science and Technology, China
Mr. Mahabub Alam, Rajshahi University of Engineering and Technology, Bangladesh
Mr. Sathyapraksh P., S.K.P Engineering College, India
Dr. N. Karthikeyan, SNS College of Engineering, Anna University, India
Dr. Binod Kumar, JSPM's, Jayawant Technical Campus, Pune, India
Assoc. Prof. Dinesh Goyal, Suresh Gyan Vihar University, India
Mr. Md. Abdul Ahad, K L University, India
Mr. Vikas Bajpai, The LNM IIT, India
Dr. Manish Kumar Anand, Salesforce (R & D Analytics), San Francisco, USA
Assist. Prof. Dheeraj Murari, Kumaon Engineering College, India
Assoc. Prof. Dr. A. Muthukumaravel, VELS University, Chennai
Mr. A. Siles Balasingh, St.Joseph University in Tanzania, Tanzania
Mr. Ravindra Daga Badgujar, R C Patel Institute of Technology, India
Dr. Preeti Khanna, SVKM’s NMIMS, School of Business Management, India
Mr. Kumar Dayanand, Cambridge Institute of Technology, India
Dr. Syed Asif Ali, SMI University Karachi, Pakistan
Prof. Pallvi Pandit, Himachal Pradeh University, India
Mr. Ricardo Verschueren, University of Gloucestershire, UK
Assist. Prof. Mamta Juneja, University Institute of Engineering and Technology, Panjab University, India
Assoc. Prof. P. Surendra Varma, NRI Institute of Technology, JNTU Kakinada, India
Assist. Prof. Gaurav Shrivastava, RGPV / SVITS Indore, India
Dr. S. Sumathi, Anna University, India
Assist. Prof. Ankita M. Kapadia, Charotar University of Science and Technology, India
Mr. Deepak Kumar, Indian Institute of Technology (BHU), India
Dr. Dr. Rajan Gupta, GGSIP University, New Delhi, India
Assist. Prof M. Anand Kumar, Karpagam University, Coimbatore, India
Mr. Mr Arshad Mansoor, Pakistan Aeronautical Complex
Mr. Kapil Kumar Gupta, Ansal Institute of Technology and Management, India
Dr. Neeraj Tomer, SINE International Institute of Technology, Jaipur, India
Assist. Prof. Trunal J. Patel, C.G.Patel Institute of Technology, Uka Tarsadia University, Bardoli, Surat
Mr. Sivakumar, Codework solutions, India
Mr. Mohammad Sadegh Mirzaei, PGNR Company, Iran
Dr. Gerard G. Dumancas, Oklahoma Medical Research Foundation, USA
Mr. Varadala Sridhar, Varadhaman College Engineering College, Affiliated To JNTU, Hyderabad
Assist. Prof. Manoj Dhawan, SVITS, Indore
Assoc. Prof. Chitreshh Banerjee, Suresh Gyan Vihar University, Jaipur, India
Dr. S. Santhi, SCSVMV University, India
Mr. Davood Mohammadi Souran, Ministry of Energy of Iran, Iran
Mr. Shamim Ahmed, Bangladesh University of Business and Technology, Bangladesh
Mr. Sandeep Reddivari, Mississippi State University, USA
Assoc. Prof. Ousmane Thiare, Gaston Berger University, Senegal
Dr. Hazra Imran, Athabasca University, Canada
Dr. Setu Kumar Chaturvedi, Technocrats Institute of Technology, Bhopal, India
Mr. Mohd Dilshad Ansari, Jaypee University of Information Technology, India
Ms. Jaspreet Kaur, Distance Education LPU, India
Dr. D. Nagarajan, Salalah College of Technology, Sultanate of Oman
Dr. K.V.N.R.Sai Krishna, S.V.R.M. College, India

(IJCSIS) International Journal of Computer Science and Information Security, Vol. 14 No. 6, June 2016
Mr. Himanshu Pareek, Center for Development of Advanced Computing (CDAC), India
Mr. Khaldi Amine, Badji Mokhtar University, Algeria
Mr. Mohammad Sadegh Mirzaei, Scientific Applied University, Iran
Assist. Prof. Khyati Chaudhary, Ram-eesh Institute of Engg. & Technology, India
Mr. Sanjay Agal, Pacific College of Engineering Udaipur, India
Mr. Abdul Mateen Ansari, King Khalid University, Saudi Arabia
Dr. H.S. Behera, Veer Surendra Sai University of Technology (VSSUT), India
Dr. Shrikant Tiwari, Shri Shankaracharya Group of Institutions (SSGI), India
Prof. Ganesh B. Regulwar, Shri Shankarprasad Agnihotri College of Engg, India
Prof. Pinnamaneni Bhanu Prasad, Matrix vision GmbH, Germany
Dr. Shrikant Tiwari, Shri Shankaracharya Technical Campus (SSTC), India
Dr. Siddesh G.K., : Dayananada Sagar College of Engineering, Bangalore, India
Dr. Nadir Bouchama, CERIST Research Center, Algeria
Dr. R. Sathishkumar, Sri Venkateswara College of Engineering, India
Assistant Prof (Dr.) Mohamed Moussaoui, Abdelmalek Essaadi University, Morocco
Dr. S. Malathi, Panimalar Engineering College, Chennai, India
Dr. V. Subedha, Panimalar Institute of Technology, Chennai, India
Dr. Prashant Panse, Swami Vivekanand College of Engineering, Indore, India
Dr. Hamza Aldabbas, Al-Balqa’a Applied University, Jordan
Dr. G. Rasitha Banu, Vel's University, Chennai
Dr. V. D. Ambeth Kumar, Panimalar Engineering College, Chennai
Prof. Anuranjan Misra, Bhagwant Institute of Technology, Ghaziabad, India
Ms. U. Sinthuja, PSG college of arts &science, India
Dr. Ehsan Saradar Torshizi, Urmia University, Iran
Dr. Shamneesh Sharma, APG Shimla University, Shimla (H.P.), India
Assistant Prof. A. S. Syed Navaz, Muthayammal College of Arts & Science, India
Assistant Prof. Ranjit Panigrahi, Sikkim Manipal Institute of Technology, Majitar, Sikkim
Dr. Khaled Eskaf, Arab Academy for Science ,Technology & Maritime Transportation, Egypt
Dr. Nishant Gupta, University of Jammu, India
Assistant Prof. Nagarajan Sankaran, Annamalai University, Chidambaram, Tamilnadu, India
Assistant Prof.Tribikram Pradhan, Manipal Institute of Technology, India
Dr. Nasser Lotfi, Eastern Mediterranean University, Northern Cyprus
Dr. R. Manavalan, K S Rangasamy college of Arts and Science, Tamilnadu, India
Assistant Prof. P. Krishna Sankar, K S Rangasamy college of Arts and Science, Tamilnadu, India
Dr. Rahul Malik, Cisco Systems, USA
Dr. S. C. Lingareddy, ALPHA College of Engineering, India
Assistant Prof. Mohammed Shuaib, Interal University, Lucknow, India
Dr. Sachin Yele, Sanghvi Institute of Management & Science, India
Dr. T. Thambidurai, Sun Univercell, Singapore
Prof. Anandkumar Telang, BKIT, India
Assistant Prof. R. Poorvadevi, SCSVMV University, India
Dr Uttam Mande, Gitam University, India
Dr. Poornima Girish Naik, Shahu Institute of Business Education and Research (SIBER), India
Prof. Md. Abu Kausar, Jaipur National University, Jaipur, India
Dr. Mohammed Zuber, AISECT University, India
Prof. Kalum Priyanath Udagepola, King Abdulaziz University, Saudi Arabia
Dr. K. R. Ananth, Velalar College of Engineering and Technology, India

(IJCSIS) International Journal of Computer Science and Information Security, Vol. 14 No. 6, June 2016
Assistant Prof. Sanjay Sharma, Roorkee Engineering & Management Institute Shamli (U.P), India
Assistant Prof. Panem Charan Arur, Priyadarshini Institute of Technology, India
Dr. Ashwak Mahmood muhsen alabaichi, Karbala University / College of Science, Iraq
Dr. Urmila Shrawankar, G H Raisoni College of Engineering, Nagpur (MS), India
Dr. Krishan Kumar Paliwal, Panipat Institute of Engineering & Technology, India
Dr. Mukesh Negi, Tech Mahindra, India
Dr. Anuj Kumar Singh, Amity University Gurgaon, India
Dr. Babar Shah, Gyeongsang National University, South Korea
Assistant Prof. Jayprakash Upadhyay, SRI-TECH Jabalpur, India
Assistant Prof. Varadala Sridhar, Vidya Jyothi Institute of Technology, India
Assistant Prof. Parameshachari B D, KSIT, Bangalore, India
Assistant Prof. Ankit Garg, Amity University, Haryana, India
Assistant Prof. Rajashe Karappa, SDMCET, Karnataka, India
Assistant Prof. Varun Jasuja, GNIT, India
Assistant Prof. Sonal Honale, Abha Gaikwad Patil College of Engineering Nagpur, India
Dr. Pooja Choudhary, CT Group of Institutions, NIT Jalandhar, India
Dr. Faouzi Hidoussi, UHL Batna, Algeria
Dr. Naseer Ali Husieen, Wasit University, Iraq
Assistant Prof. Vinod Kumar Shukla, Amity University, Dubai
Dr. Ahmed Farouk Metwaly, K L University
Mr. Mohammed Noaman Murad, Cihan University, Iraq
Dr. Suxing Liu, Arkansas State University, USA
Dr. M. Gomathi, Velalar College of Engineering and Technology, India
Assistant Prof. Sumardiono, College PGRI Blitar, Indonesia
Dr. Latika Kharb, Jagan Institute of Management Studies (JIMS), Delhi, India
Associate Prof. S. Raja, Pauls College of Engineering and Technology, Tamilnadu, India
Assistant Prof. Seyed Reza Pakize, Shahid Sani High School, Iran
Dr. Thiyagu Nagaraj, University-INOU, India
Assistant Prof. Noreen Sarai, Harare Institute of Technology, Zimbabwe
Assistant Prof. Gajanand Sharma, Suresh Gyan Vihar University Jaipur, Rajasthan, India
Assistant Prof. Mapari Vikas Prakash, Siddhant COE, Sudumbare, Pune, India
Dr. Devesh Katiyar, Shri Ramswaroop Memorial University, India
Dr. Shenshen Liang, University of California, Santa Cruz, US
Assistant Prof. Mohammad Abu Omar, Limkokwing University of Creative Technology- Malaysia
Mr. Snehasis Banerjee, Tata Consultancy Services, India
Assistant Prof. Kibona Lusekelo, Ruaha Catholic University (RUCU), Tanzania
Assistant Prof. Adib Kabir Chowdhury, University College Technology Sarawak, Malaysia
Dr. Ying Yang, Computer Science Department, Yale University, USA
Dr. Vinay Shukla, Institute Of Technology & Management, India
Dr. Liviu Octavian Mafteiu-Scai, West University of Timisoara, Romania
Assistant Prof. Rana Khudhair Abbas Ahmed, Al-Rafidain University College, Iraq
Assistant Prof. Nitin A. Naik, S.R.T.M. University, India
Dr. Timothy Powers, University of Hertfordshire, UK
Dr. S. Prasath, Bharathiar University, Erode, India
Dr. Ritu Shrivastava, SIRTS Bhopal, India
Prof. Rohit Shrivastava, Mittal Institute of Technology, Bhopal, India
Dr. Gianina Mihai, Dunarea de Jos" University of Galati, Romania

(IJCSIS) International Journal of Computer Science and Information Security, Vol. 14 No. 6, June 2016
Assistant Prof. Ms. T. Kalai Selvi, Erode Sengunthar Engineering College, India
Assistant Prof. Ms. C. Kavitha, Erode Sengunthar Engineering College, India
Assistant Prof. K. Sinivasamoorthi, Erode Sengunthar Engineering College, India
Assistant Prof. Mallikarjun C Sarsamba Bheemnna Khandre Institute Technology, Bhalki, India
Assistant Prof. Vishwanath Chikaraddi, Veermata Jijabai technological Institute (Central Technological Institute), India
Assistant Prof. Dr. Ikvinderpal Singh, Trai Shatabdi GGS Khalsa College, India
Assistant Prof. Mohammed Noaman Murad, Cihan University, Iraq
Professor Yousef Farhaoui, Moulay Ismail University, Errachidia, Morocco
Dr. Parul Verma, Amity University, India
Professor Yousef Farhaoui, Moulay Ismail University, Errachidia, Morocco
Assistant Prof. Madhavi Dhingra, Amity University, Madhya Pradesh, India
Assistant Prof.. G. Selvavinayagam, SNS College of Technology, Coimbatore, India
Assistant Prof. Madhavi Dhingra, Amity University, MP, India
Professor Kartheesan Log, Anna University, Chennai
Professor Vasudeva Acharya, Shri Madhwa vadiraja Institute of Technology, India
Dr. Asif Iqbal Hajamydeen, Management & Science University, Malaysia
Assistant Prof., Mahendra Singh Meena, Amity University Haryana
Assistant Professor Manjeet Kaur, Amity University Haryana
Dr. Mohamed Abd El-Basset Matwalli, Zagazig University, Egypt
Dr. Ramani Kannan, Universiti Teknologi PETRONAS, Malaysia
Assistant Prof. S. Jagadeesan Subramaniam, Anna University, India
Assistant Prof. Dharmendra Choudhary, Tripura University, India
Assistant Prof. Deepika Vodnala, SR Engineering College, India
Dr. Kai Cong, Intel Corporation & Computer Science Department, Portland State University, USA
Dr. Kailas R Patil, Vishwakarma Institute of Information Technology (VIIT), India
Dr. Omar A. Alzubi, Faculty of IT / Al-Balqa Applied University, Jordan
Assistant Prof. Kareemullah Shaik, Nimra Institute of Science and Technology, India
Assistant Prof. Chirag Modi, NIT Goa
Dr. R. Ramkumar, Nandha Arts And Science College, India
Dr. Priyadharshini Vydhialingam, Harathiar University, India
Dr. P. S. Jagadeesh Kumar, DBIT, Bangalore, Karnataka
Dr. Vikas Thada, AMITY University, Pachgaon
Dr. T. A. Ashok Kumar, Institute of Management, Christ University, Bangalore
Dr. Shaheera Rashwan, Informatics Research Institute
Dr. S. Preetha Gunasekar, Bharathiyar University, India
Asst Professor Sameer Dev Sharma, Uttaranchal University, Dehradun
Dr. Zhihan lv, Chinese Academy of Science, China
Dr. Ikvinderpal Singh, Trai Shatabdi GGS Khalsa College, Amritsar
Dr. Umar Ruhi, University of Ottawa, Canada
Dr. Jasmin Cosic, University of Bihac, Bosnia and Herzegovina
Dr. Homam Reda El-Taj, University of Tabuk, Kingdom of Saudi Arabia
Dr. Mostafa Ghobaei Arani, Islamic Azad University, Iran
Dr. Ayyasamy Ayyanar, Annamalai University, India
Dr. Selvakumar Manickam, Universiti Sains Malaysia, Malaysia
Dr. Murali Krishna Namana, GITAM University, India
Dr. Smriti Agrawal, Chaitanya Bharathi Institute of Technology, Hyderabad, India
Professor Vimalathithan Rathinasabapathy, Karpagam College Of Engineering, India

(IJCSIS) International Journal of Computer Science and Information Security, Vol. 14 No. 6, June 2016
Dr. Sushil Chandra Dimri, Graphic Era University, India
Dr. Dinh-Sinh Mai, Le Quy Don Technical University, Vietnam
Dr. S. Rama Sree, Aditya Engg. College, India
Dr. Ehab T. Alnfrawy, Sadat Academy, Egypt
Dr. Patrick D. Cerna, Haramaya University, Ethiopia
Dr. Vishal Jain, Bharati Vidyapeeth's Institute of Computer Applications and Management (BVICAM), India
Associate Prof. Dr. Jiliang Zhang, North Eastern University, China
Dr. Sharefa Murad, Middle East University, Jordan
Dr. Ajeet Singh Poonia, Govt. College of Engineering & technology, Rajasthan, India
Dr. Vahid Esmaeelzadeh, University of Science and Technology, Iran
Dr. Jacek M. Czerniak, Casimir the Great University in Bydgoszcz, Institute of Technology, Poland
Associate Prof. Anisur Rehman Nasir, Jamia Millia Islamia University
Assistant Prof. Imran Ahmad, COMSATS Institute of Information Technology, Pakistan
Professor Ghulam Qasim, Preston University, Islamabad, Pakistan
Dr. Parameshachari B D, GSSS Institute of Engineering and Technology for Women
Dr. Wencan Luo, University of Pittsburgh, US
Dr. Musa PEKER, Faculty of Technology, Mugla Sitki Kocman University, Turkey
Dr. Gunasekaran Shanmugam, Anna University, India
Dr. Binh P. Nguyen, National University of Singapore, Singapore
Dr. Rajkumar Jain, Indian Institute of Technology Indore, India
Dr. Imtiaz Ali Halepoto, QUEST Nawabshah, Pakistan
Dr. Shaligram Prajapat, Devi Ahilya University Indore India
Dr. Sunita Singhal, Birla Institute of Technologyand Science, Pilani, India
Dr. Ijaz Ali Shoukat, King Saud University, Saudi Arabia
Dr. Anuj Gupta, IKG Punjab Technical University, India
Dr. Sonali Saini, IES-IPS Academy, India
Dr. Krishan Kumar, MotiLal Nehru National Institute of Technology, Allahabad, India
Dr. Z. Faizal Khan, College of Engineering, Shaqra University, Kingdom of Saudi Arabia
Prof. M. Padmavathamma, S.V. University Tirupati, India
Prof. A. Velayudham, Cape Institute of Technology, India
Prof. Seifeidne Kadry, American University of the Middle East
Dr. J. Durga Prasad Rao, Pt. Ravishankar Shukla University, Raipur
Assistant Prof. Najam Hasan, Dhofar University
Dr. G. Suseendran, Vels University, Pallavaram, Chennai
Prof. Ankit Faldu, Gujarat Technological Universiry- Atmiya Institute of Technology and Science
Dr. Ali Habiboghli, Islamic Azad University
Dr. Deepak Dembla, JECRC University, Jaipur, India
Dr. Pankaj Rajan, Walmart Labs, USA
Assistant Prof. Radoslava Kraleva, South-West University "Neofit Rilski", Bulgaria
Assistant Prof. Medhavi Shriwas, Shri vaishnav institute of Technology, India
Associate Prof. Sedat Akleylek, Ondokuz Mayis University, Turkey
Dr. U.V. Arivazhagu, Kingston Engineering College Affiliated To Anna University, India
Dr. Touseef Ali, University of Engineering and Technology, Taxila, Pakistan
Assistant Prof. Naren Jeeva, SASTRA University, India
Dr. Riccardo Colella, University of Salento, Italy
Dr. Enache Maria Cristina, University of Galati, Romania
Dr. Senthil P, Kurinji College of Arts & Science, India

(IJCSIS) International Journal of Computer Science and Information Security, Vol. 14 No. 6, June 2016
Dr. Hasan Ashrafi-rizi, Isfahan University of Medical Sciences, Isfahan, Iran
Dr. Mazhar Malik, Institute of Southern Punjab, Pakistan
Dr. Yajie Miao, Carnegie Mellon University, USA
Dr. Kamran Shaukat, University of the Punjab, Pakistan
Dr. Sasikaladevi N., SASTRA University, India
Dr. Ali Asghar Rahmani Hosseinabadi, Islamic Azad University Ayatollah Amoli Branch, Amol, Iran
Dr. Velin Kralev, South-West University "Neofit Rilski", Blagoevgrad, Bulgaria
Dr. Marius Iulian Mihailescu, LUMINA - The University of South-East Europe
Dr. Sriramula Nagaprasad, S.R.R.Govt.Arts & Science College, Karimnagar, India
Prof (Dr.) Namrata Dhanda, Dr. APJ Abdul Kalam Technical University, Lucknow, India
Dr. Javed Ahmed Mahar, Shah Abdul Latif University, Khairpur Mir’s, Pakistan
Dr. B. Narendra Kumar Rao, Sree Vidyanikethan Engineering College, India
Dr. Shahzad Anwar, University of Engineering & Technology Peshawar, Pakistan
Dr. Basit Shahzad, King Saud University, Riyadh - Saudi Arabia
Dr. Nilamadhab Mishra, Chang Gung University
Dr. Sachin Kumar, Indian Institute of Technology Roorkee
Dr. Santosh Nanda, Biju-Pattnaik University of Technology
Dr. Sherzod Turaev, International Islamic University Malaysia
Dr. Yilun Shang, Tongji University, Department of Mathematics, Shanghai, China
Dr. Nuzhat Shaikh, Modern Education society's College of Engineering, Pune, India
Dr. Parul Verma, Amity University, Lucknow campus, India
Dr. Rachid Alaoui, Agadir Ibn Zohr University, Agadir, Morocco
Dr. Dharmendra Patel, Charotar University of Science and Technology, India
Dr. Dong Zhang, University of Central Florida, USA
Dr. Kennedy Chinedu Okafor, Federal University of Technology Owerri, Nigeria

CALL FOR PAPERS International Journal of Computer Science and Information Security
IJCSIS 2016 ISSN: 1947-5500
http://sites.google.com/site/ijcsis/ International Journal Computer Science and Information Security, IJCSIS, is the premier scholarly venue in the areas of computer science and security issues. IJCSIS 2011 will provide a high profile, leading edge platform for researchers and engineers alike to publish state-of-the-art research in the respective fields of information technology and communication security. The journal will feature a diverse mixture of publication articles including core and applied computer science related topics. Authors are solicited to contribute to the special issue by submitting articles that illustrate research results, projects, surveying works and industrial experiences that describe significant advances in the following areas, but are not limited to. Submissions may span a broad range of topics, e.g.: Track A: Security Access control, Anonymity, Audit and audit reduction & Authentication and authorization, Applied cryptography, Cryptanalysis, Digital Signatures, Biometric security, Boundary control devices, Certification and accreditation, Cross-layer design for security, Security & Network Management, Data and system integrity, Database security, Defensive information warfare, Denial of service protection, Intrusion Detection, Anti-malware, Distributed systems security, Electronic commerce, E-mail security, Spam, Phishing, E-mail fraud, Virus, worms, Trojan Protection, Grid security, Information hiding and watermarking & Information survivability, Insider threat protection, Integrity Intellectual property protection, Internet/Intranet Security, Key management and key recovery, Language-based security, Mobile and wireless security, Mobile, Ad Hoc and Sensor Network Security, Monitoring and surveillance, Multimedia security ,Operating system security, Peer-to-peer security, Performance Evaluations of Protocols & Security Application, Privacy and data protection, Product evaluation criteria and compliance, Risk evaluation and security certification, Risk/vulnerability assessment, Security & Network Management, Security Models & protocols, Security threats & countermeasures (DDoS, MiM, Session Hijacking, Replay attack etc,), Trusted computing, Ubiquitous Computing Security, Virtualization security, VoIP security, Web 2.0 security, Submission Procedures, Active Defense Systems, Adaptive Defense Systems, Benchmark, Analysis and Evaluation of Security Systems, Distributed Access Control and Trust Management, Distributed Attack Systems and Mechanisms, Distributed Intrusion Detection/Prevention Systems, Denial-of-Service Attacks and Countermeasures, High Performance Security Systems, Identity Management and Authentication, Implementation, Deployment and Management of Security Systems, Intelligent Defense Systems, Internet and Network Forensics, Large-scale Attacks and Defense, RFID Security and Privacy, Security Architectures in Distributed Network Systems, Security for Critical Infrastructures, Security for P2P systems and Grid Systems, Security in E-Commerce, Security and Privacy in Wireless Networks, Secure Mobile Agents and Mobile Code, Security Protocols, Security Simulation and Tools, Security Theory and Tools, Standards and Assurance Methods, Trusted Computing, Viruses, Worms, and Other Malicious Code, World Wide Web Security, Novel and emerging secure architecture, Study of attack strategies, attack modeling, Case studies and analysis of actual attacks, Continuity of Operations during an attack, Key management, Trust management, Intrusion detection techniques, Intrusion response, alarm management, and correlation analysis, Study of tradeoffs between security and system performance, Intrusion tolerance systems, Secure protocols, Security in wireless networks (e.g. mesh networks, sensor networks, etc.), Cryptography and Secure Communications, Computer Forensics, Recovery and Healing, Security Visualization, Formal Methods in Security, Principles for Designing a Secure Computing System, Autonomic Security, Internet Security, Security in Health Care Systems, Security Solutions Using Reconfigurable Computing, Adaptive and Intelligent Defense Systems, Authentication and Access control, Denial of service attacks and countermeasures, Identity, Route and

Location Anonymity schemes, Intrusion detection and prevention techniques, Cryptography, encryption algorithms and Key management schemes, Secure routing schemes, Secure neighbor discovery and localization, Trust establishment and maintenance, Confidentiality and data integrity, Security architectures, deployments and solutions, Emerging threats to cloud-based services, Security model for new services, Cloud-aware web service security, Information hiding in Cloud Computing, Securing distributed data storage in cloud, Security, privacy and trust in mobile computing systems and applications, Middleware security & Security features: middleware software is an asset on its own and has to be protected, interaction between security-specific and other middleware features, e.g., context-awareness, Middleware-level security monitoring and measurement: metrics and mechanisms for quantification and evaluation of security enforced by the middleware, Security co-design: trade-off and co-design between application-based and middleware-based security, Policy-based management: innovative support for policy-based definition and enforcement of security concerns, Identification and authentication mechanisms: Means to capture application specific constraints in defining and enforcing access control rules, Middleware-oriented security patterns: identification of patterns for sound, reusable security, Security in aspect-based middleware: mechanisms for isolating and enforcing security aspects, Security in agent-based platforms: protection for mobile code and platforms, Smart Devices: Biometrics, National ID cards, Embedded Systems Security and TPMs, RFID Systems Security, Smart Card Security, Pervasive Systems: Digital Rights Management (DRM) in pervasive environments, Intrusion Detection and Information Filtering, Localization Systems Security (Tracking of People and Goods), Mobile Commerce Security, Privacy Enhancing Technologies, Security Protocols (for Identification and Authentication, Confidentiality and Privacy, and Integrity), Ubiquitous Networks: Ad Hoc Networks Security, Delay-Tolerant Network Security, Domestic Network Security, Peer-to-Peer Networks Security, Security Issues in Mobile and Ubiquitous Networks, Security of GSM/GPRS/UMTS Systems, Sensor Networks Security, Vehicular Network Security, Wireless Communication Security: Bluetooth, NFC, WiFi, WiMAX, WiMedia, others This Track will emphasize the design, implementation, management and applications of computer communications, networks and services. Topics of mostly theoretical nature are also welcome, provided there is clear practical potential in applying the results of such work. Track B: Computer Science Broadband wireless technologies: LTE, WiMAX, WiRAN, HSDPA, HSUPA, Resource allocation and interference management, Quality of service and scheduling methods, Capacity planning and dimensioning, Cross-layer design and Physical layer based issue, Interworking architecture and interoperability, Relay assisted and cooperative communications, Location and provisioning and mobility management, Call admission and flow/congestion control, Performance optimization, Channel capacity modeling and analysis, Middleware Issues: Event-based, publish/subscribe, and message-oriented middleware, Reconfigurable, adaptable, and reflective middleware approaches, Middleware solutions for reliability, fault tolerance, and quality-of-service, Scalability of middleware, Context-aware middleware, Autonomic and self-managing middleware, Evaluation techniques for middleware solutions, Formal methods and tools for designing, verifying, and evaluating, middleware, Software engineering techniques for middleware, Service oriented middleware, Agent-based middleware, Security middleware, Network Applications: Network-based automation, Cloud applications, Ubiquitous and pervasive applications, Collaborative applications, RFID and sensor network applications, Mobile applications, Smart home applications, Infrastructure monitoring and control applications, Remote health monitoring, GPS and location-based applications, Networked vehicles applications, Alert applications, Embeded Computer System, Advanced Control Systems, and Intelligent Control : Advanced control and measurement, computer and microprocessor-based control, signal processing, estimation and identification techniques, application specific IC’s, nonlinear and adaptive control, optimal and robot control, intelligent control, evolutionary computing, and intelligent systems, instrumentation subject to critical conditions, automotive, marine and aero-space control and all other control applications, Intelligent Control System, Wiring/Wireless Sensor, Signal Control System. Sensors, Actuators and Systems Integration : Intelligent sensors and actuators, multisensor fusion, sensor array and multi-channel processing, micro/nano technology, microsensors and microactuators, instrumentation electronics, MEMS and system integration, wireless sensor, Network Sensor, Hybrid

Sensor, Distributed Sensor Networks. Signal and Image Processing : Digital signal processing theory, methods, DSP implementation, speech processing, image and multidimensional signal processing, Image analysis and processing, Image and Multimedia applications, Real-time multimedia signal processing, Computer vision, Emerging signal processing areas, Remote Sensing, Signal processing in education. Industrial Informatics: Industrial applications of neural networks, fuzzy algorithms, Neuro-Fuzzy application, bioInformatics, real-time computer control, real-time information systems, human-machine interfaces, CAD/CAM/CAT/CIM, virtual reality, industrial communications, flexible manufacturing systems, industrial automated process, Data Storage Management, Harddisk control, Supply Chain Management, Logistics applications, Power plant automation, Drives automation. Information Technology, Management of Information System : Management information systems, Information Management, Nursing information management, Information System, Information Technology and their application, Data retrieval, Data Base Management, Decision analysis methods, Information processing, Operations research, E-Business, E-Commerce, E-Government, Computer Business, Security and risk management, Medical imaging, Biotechnology, Bio-Medicine, Computer-based information systems in health care, Changing Access to Patient Information, Healthcare Management Information Technology. Communication/Computer Network, Transportation Application : On-board diagnostics, Active safety systems, Communication systems, Wireless technology, Communication application, Navigation and Guidance, Vision-based applications, Speech interface, Sensor fusion, Networking theory and technologies, Transportation information, Autonomous vehicle, Vehicle application of affective computing, Advance Computing technology and their application : Broadband and intelligent networks, Data Mining, Data fusion, Computational intelligence, Information and data security, Information indexing and retrieval, Information processing, Information systems and applications, Internet applications and performances, Knowledge based systems, Knowledge management, Software Engineering, Decision making, Mobile networks and services, Network management and services, Neural Network, Fuzzy logics, Neuro-Fuzzy, Expert approaches, Innovation Technology and Management : Innovation and product development, Emerging advances in business and its applications, Creativity in Internet management and retailing, B2B and B2C management, Electronic transceiver device for Retail Marketing Industries, Facilities planning and management, Innovative pervasive computing applications, Programming paradigms for pervasive systems, Software evolution and maintenance in pervasive systems, Middleware services and agent technologies, Adaptive, autonomic and context-aware computing, Mobile/Wireless computing systems and services in pervasive computing, Energy-efficient and green pervasive computing, Communication architectures for pervasive computing, Ad hoc networks for pervasive communications, Pervasive opportunistic communications and applications, Enabling technologies for pervasive systems (e.g., wireless BAN, PAN), Positioning and tracking technologies, Sensors and RFID in pervasive systems, Multimodal sensing and context for pervasive applications, Pervasive sensing, perception and semantic interpretation, Smart devices and intelligent environments, Trust, security and privacy issues in pervasive systems, User interfaces and interaction models, Virtual immersive communications, Wearable computers, Standards and interfaces for pervasive computing environments, Social and economic models for pervasive systems, Active and Programmable Networks, Ad Hoc & Sensor Network, Congestion and/or Flow Control, Content Distribution, Grid Networking, High-speed Network Architectures, Internet Services and Applications, Optical Networks, Mobile and Wireless Networks, Network Modeling and Simulation, Multicast, Multimedia Communications, Network Control and Management, Network Protocols, Network Performance, Network Measurement, Peer to Peer and Overlay Networks, Quality of Service and Quality of Experience, Ubiquitous Networks, Crosscutting Themes – Internet Technologies, Infrastructure, Services and Applications; Open Source Tools, Open Models and Architectures; Security, Privacy and Trust; Navigation Systems, Location Based Services; Social Networks and Online Communities; ICT Convergence, Digital Economy and Digital Divide, Neural Networks, Pattern Recognition, Computer Vision, Advanced Computing Architectures and New Programming Models, Visualization and Virtual Reality as Applied to Computational Science, Computer Architecture and Embedded Systems, Technology in Education, Theoretical Computer Science, Computing Ethics, Computing Practices & Applications Authors are invited to submit papers through e-mail [email protected]. Submissions must be original and should not have been published previously or be under consideration for publication while being evaluated by IJCSIS. Before submission authors should carefully read over the journal's Author Guidelines, which are located at http://sites.google.com/site/ijcsis/authors-notes .

© IJCSIS PUBLICATION 2016 ISSN 1947 5500
http://sites.google.com/site/ijcsis/


