Embed Size (px)
Citation preview
STATISTICS OF INCOME 0 0 0 1959
0 0
J)fld~ibid~z(al
INCOME, TAX'
RETURNS,
i
t
I
for 19591" L---- L
c
-I
I
F-7~~ r"f, - -
I
U . S . TREASURY DEPARTMENT - INTERNAL REVENUE SERVICE
Statistics of Income / 1959
IndividualINCOME TAX
RETURNS
fo r 1959
6
U. S . TREASURY DEPARTMENT
Prepared under the direction of the
Commissioner of Internal Revenu e
by the Statistics Division
Internal Revenue Service 9 Publication No . 79 (9-61)
INTERNAL REVENUE SERVICE
MORTIMER M . CAPLIN, Commissioner
BERTRAND M . HARDING, Deputy CommissLme r
WILLIAM H . SMITH, Assistant Commissiorier (Planning and Research)
Statistics Division :ERNEST J . ENGQUIST, JR., DirectorJAMES M. JARRETT, Assistant Directo r
HELEN F. DEMOND, Chief, Income, Finance, and Wealth BranchSTAUNTON K. CALVERT, StatiStiCiar, ,
UNITED STATES
GOVERNMENT PRINTING OFFICE
WASHINGTON : 1 .961
For sale by the Superintendent of Documents, U.S . Government Printing Office, Washington 25. D.C. - Price $1
1k
LETTER OF TRANSMITTAL
TREASURY DEPARTMENT,
OFFICE OF COMMISSIONER OF INTERNAL REVENUE ,
Washington, D . C., September 29, 1961 .
DEAR MR. SECRETARY :
I am transmitting the Statistics of Income-1959, Individual IncomeTax Returns . This report was prepared in partial fulfillment of therequirements of section 6108 of the Internal Revenue Code of 1954,whichprovides that statistics be published annually with respect to theoperation of the income tax laws .
The documents from which the data were assembled are individualincome tax returns, Forms lQ40, 104OW, and 1040A, filed during the year1960 . Sources of income, total itemized deductions, taxable income,taxes, and other data are distributed by size of adjusted gross income .
Significant classifications are marital status of taxpayers, typesof tax and tax credits, patterns of income, taxpayments and overpay-ments, types of exemptions, and States . For the first time, selectedsources of income, taxable income, and the income tax are presented forthe 100 largest metropolitan areas .'
-A.
Commissioner of Internal Revenue .
HON . DOUGLAS DILLON,Secretary of the Treasury .
III
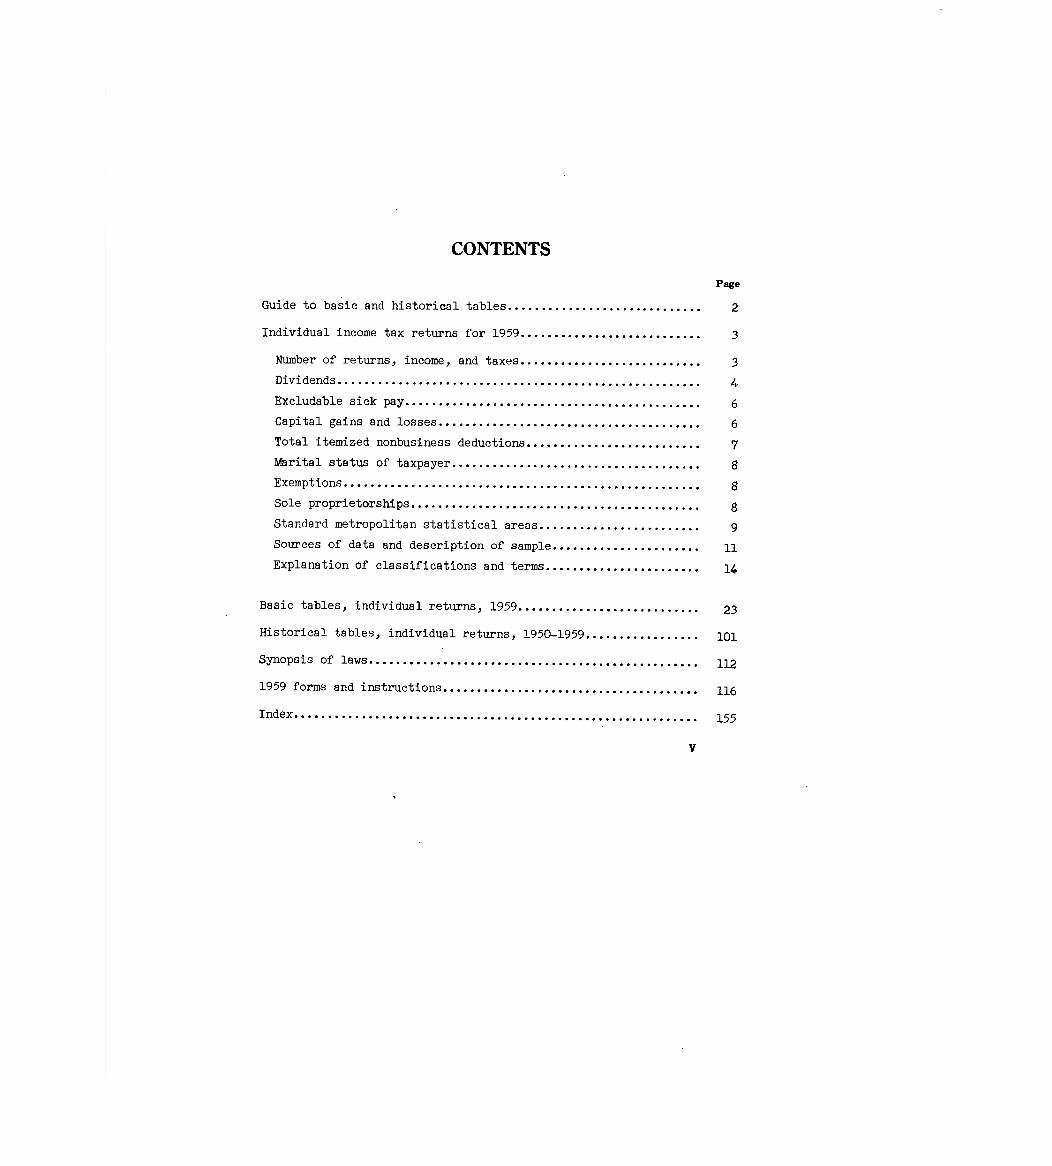
CONTENTS
Page
Guide to basic and historical tables . . . . . . . . . . . . . . . . . . . . . . . . . . . . . 2
Individual income tax returns for 1959. . . . . . . . . . . . . . . . . . . . . . . . . . . 3
Number of returns, income, and taxes . . . . . . . . . . . . . . . . . . . . . . . . . . . 3
Dividends . . . . . . . . . . . . . . . . . . . . . . . . . . . . . . . . . . . . . . . . . . . . . . . . . . . . . . 4
Excludable sick pay . . . . . . . . . . . . . . . . . . . . . . . . . . . . . . . . . . . . . . . . . . . . 6
Capital gains and losses . . . . . . . . . . . . . . . . . . . . . . . . . . . . . . . . . . . . . . . 6
Total itemized nonbusiness deductions . . . . . . . . . . . . . . . . . . . . . . . . . . 7
I&rital status of taxpayer . . . . . . . . . . . . . . . . . . . . . . . . . . . . . . . . . . . . . 8
Exemptions . . . . . . . . . . . . . . . . . . . . . . . . . . . . . . . . . . . . . . . . . . . . . . . . . . . . . 8
Sole proprietorships . . . . . . . . . . . . . . . . . . . . . . . . . . . . . . . . . . . . . . . . . . . 8
Standard metropolitan statistical areas . . . . . . . . . . . . . . . . . . . . . . . . 9
Sources of data and description of sample . . . . . . . . . . . . . . . . . . . . . . 11
Explanation of classifications and terms . . . . . . . . . . . . . . . . . . . . . . . 14
Basic tables, individual returns, 1959 . . . . . . . . . . . . . . . . . . . . . . . . . . . 23
Historical tables, individual returns, 1950-1959 . . . . . . . . . . . . . . . . . 101
Synopsis of laws . . . . . . . . . . . . . . . . . . . . . . . . . . . . . . . . . . . . . . . . . . . . . . . . . 112
1959 forms and instructions . . . . . . . . . . . . . . . . . . . . . . . . . . . . . . . . . . . . . . 116
Index . . . . . . . . . . . . . . . . . . . . . . . . . . . . . . . . . . . . . . . . . . . . . . . . . . . . . . . . . . . . 155
V
Individual
Income Tax
Returns
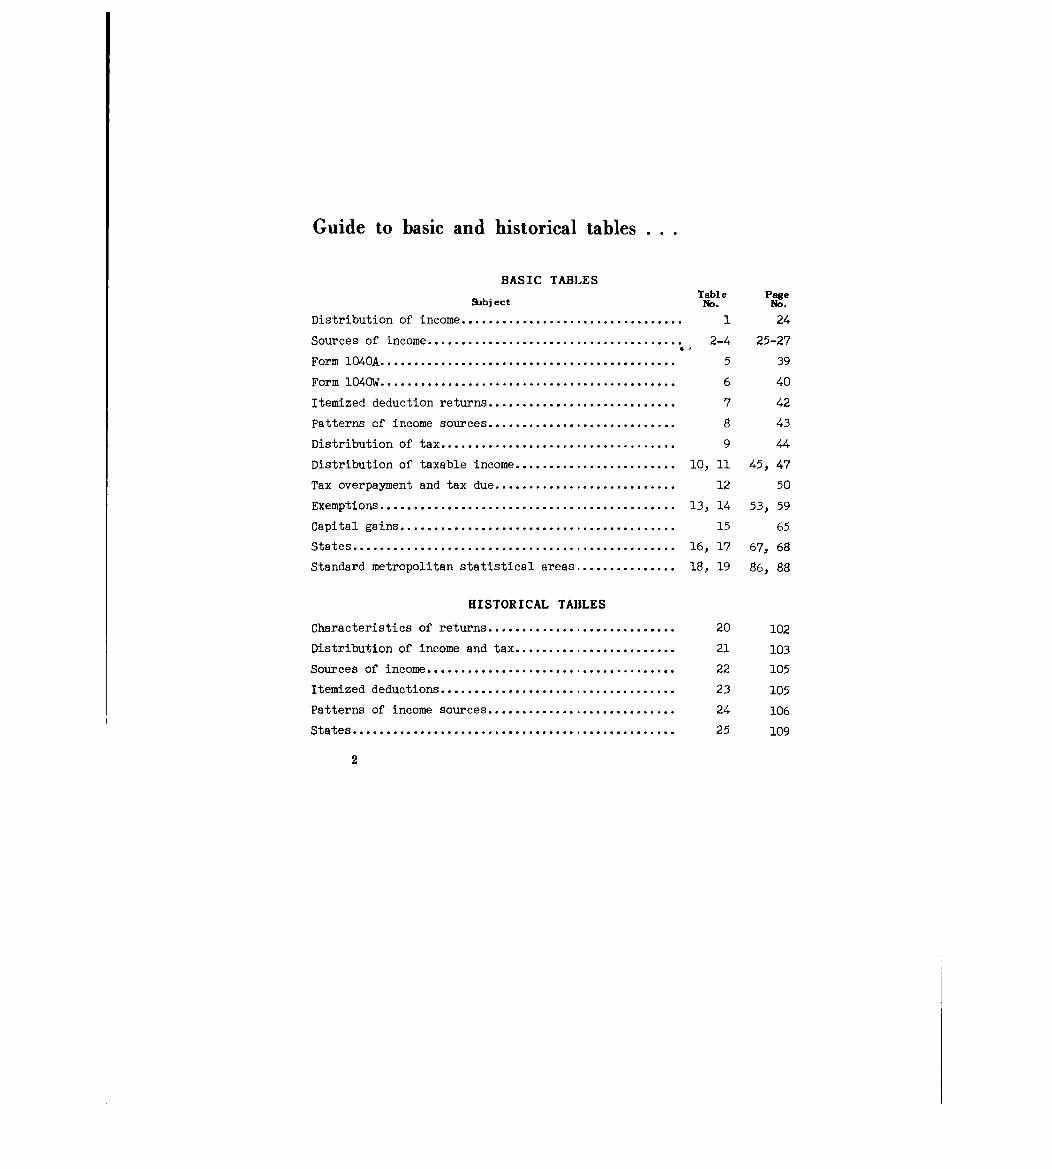
Guide to basic and historical tables . . .
BASIC TABLESTable Page
Subject No. No.
Distribution of income . . . . . . . . . . . . . . . . . . . . . . . . . . . . . . . . . 1 24
Sources of income . . . . . . . . . . . . . . . . . . . . . . . . . . . . . . . . . . . . . . 2-4 25-27
Form 1040A . . . . . . . . . . . . . . . . . . . . . . . . . . . . . . . . . . . . . . . . . . .. 5 39
Form 1040W . . . . . . . . . . . . . . . . . . . . . . . . . . . . . . . . . . . . . . . . . . . . 6 40
Itemized deduction returns . . . . . . . . . . . . . . . . . . . . . . . . . . .. 7 42
Patterns of income sources . . . . . . . . . . . . . . . . . . . . . . . . . . . . 8 43
Distribution of tax . . . . . . . . . . . . . . . . . . . . . . . . . . . . . . . . . . . 9 44
Distribution of taxable income . . . . . . . . . . . . . . . . . . . . . . . . 10, 11 45, 47
Tax overpayment and tax due . . . . . . . . . . . . . . . . . . . . . . . . . . . 12 50
Exemptions . . . . . . . . . . . . . . . . . . . . . . . . . . . . . . . . . . . . . . . . . . . . 13, 14 53, 59
Capital gains . . . . . . . . . . . . . . . . . . . . . . . . . . . . . . . . . . . . . . . . . 15 65
States . . . . . . . . . . . . . . . . . . . . . . . . . . . . . . . . . . . . . . . . . . . . . . . . 16" 17 67, 68
Standard metropolitan statistical areas . . . . . . . . . . . . . . . 18, 19 86, 88
HISTORICAL TABLES
Characteristics of returns . . . . . . . . . . . . . . . . . . . . . . . . . . . . 20 102
Distribution of income and tax . . . . . . . . . . . . . . . . . . . . . . . . 21 103
Sources of income . . . . . . . . . . . . . . . . . . . . . . . . . . . . . . . . . . . . . 22 105
Itemized deductions . . . . . . . . . . . . . . . . . . . . . . . . . . . . . . . . . . . 23 105
Patterns of income sources . . . . . . . . . . . . . . . . . . . . . . . . . . . . 24 106
States . . . . . . . . . . . . . . . . . . . . . . . . . . . . . . . . . . . . . . . . . . . . . . . . 25 109
2
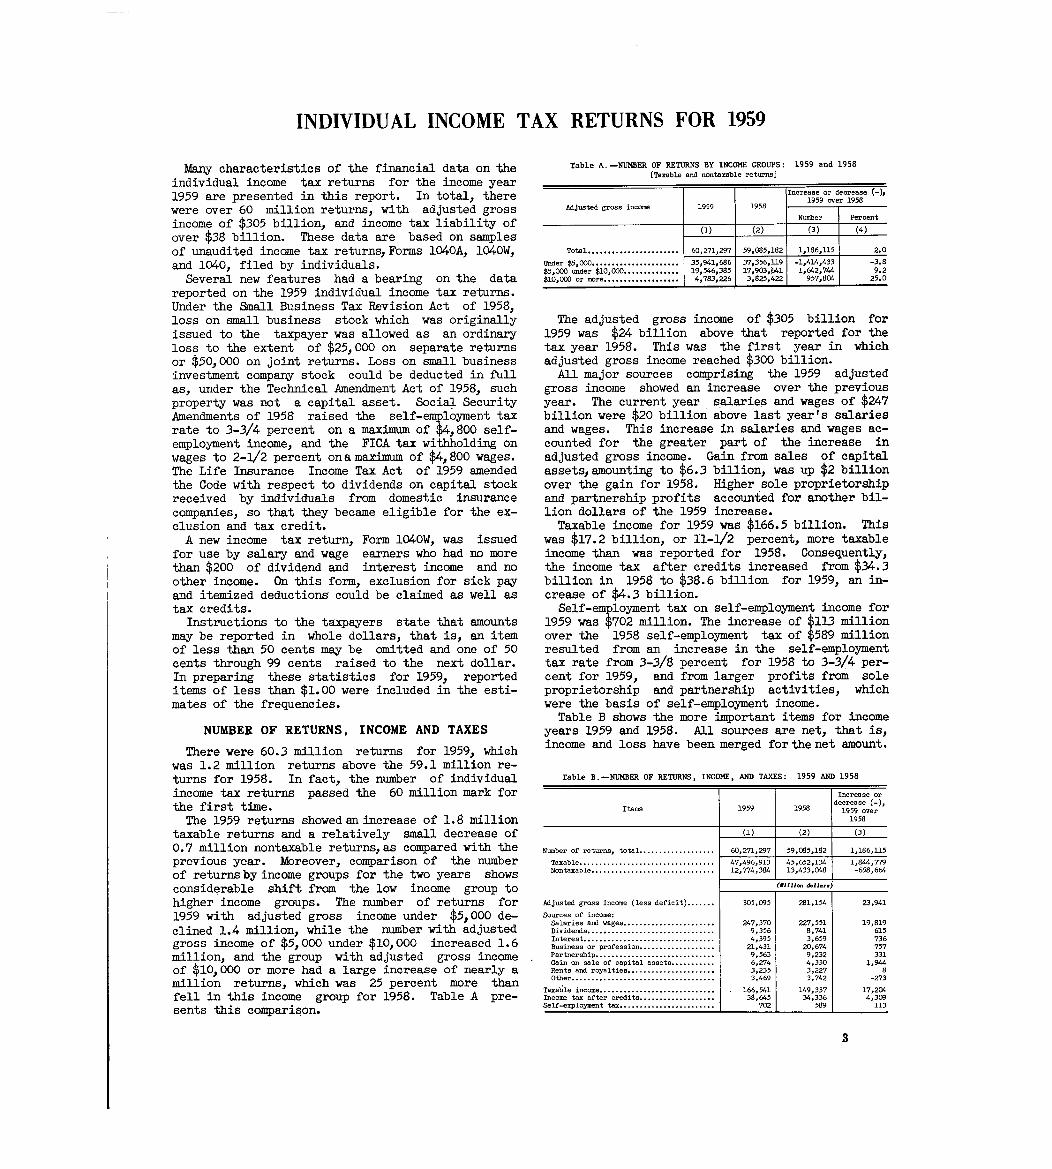
INDIVIDUAL INCOME TAX RETURNS FOR 1959
Many characteristics of the financial data on theindividual income tax returns for the income year1959 are presented in this report . In total, therewere over 60 million returns, with adjusted grossincome of $305 billion, and income tax liability ofover $38 billion. These data are based on samplesof unaudited income tax returnsForms 1040A, 104OW,and 1040, filed by individuals .Several new features had a bearing on the data
reported on the 1959 individual income tax returns .Under the Small Business Tax Revision Act of 1958,loss on small business stock which was originallyissued to the taxpayer was allowed as an ordinaryloss to the extent of $25,000 on separate returnsor $50,000 on joint returns . Loss on small businessinvestment company stock could be deducted in fullas, under the Technical Amendment Act of 1958 ' suchproperty was not a capital asset. Social SecurityAmendments of 1958 raised the self-employment taxrate to 3-3/4 percent on a maximum of $4,800 self-employment income, and the FICA tax withholding onwages to 2-1/2 percent ona max!= of $4,800 wages .The Life Insurance Income Tax Act of 1959 amendedthe Code with respect to dividends on capital stockreceived by individuals from domestic insurancecompanies, so that they became eligible for the ex-clusion and tax credit .A new income tax return, Form 104OW, was issued
for use by salary and wage earners who had no morethan $200 of dividend and interest income and noother income. On this form, exclusion for sick payand itemized deductions could be claimed as well astax credits .
Instructions to the taxpayers state that amountsmay be reported in whole dollars, that is, an itemof less than 50 cents may be omitted and one of 50cents through 99 cents raised to the next dollar .In preparing these statistics for 1959, reporteditem of less than $1.00 were included in the esti-mates of the frequencies .
NUMBER OF RETURNS, INCOME AND TAXES
There were 60.3 million returns for 1959, whichwas 1.2 million returns above the 59 .1 million re-turns for 1958 . In fact, the number of individualincome tax returns passed -the 60 million mark forthe first time .The 1959 returns showed an increase of 1. 8 million
taxable returns and a relatively small decrease of0 .7 million nontaxable returns,as compared with theprevious year . Moreover, comparison of the numberof returnsby income groups for the two years showsconsiderable shift from the low income group tohigher income groups . The number of returns for1959 with adjusted gross income under $5,000 de-clined 1 .4 million, while the number with adjustedgross income of $5,000 under $10,000 increased 1.6million, and the group with adjusted gross incomeof $10,000 or more had a large increase of nearly amillion returns, which was 25 percent more thanfell in this income group for 1958 . Table A pre-sents this comparison .
Table A . -NUMBER OF RETURNS BY INCOME GROUPS : 1959 and 1958
[Taxable and nontaxable returns]
Increase or decrease W,
1 19581959
over195 8
Adjusted gross incone 959
Nmber Percent
(2) (3) (4 )
Total . . . . . . . . . . . . . . . . . . . . . . . 60,271,297 59,085,182 1,186,115 2. 0
Under $5,000 . . . . . . . . . . . . . . . . . . . . . . 35 941 68 6
o 1
37 356,119 -1,414,433 -3. 8
$5,000 under $10,000 546191 1385
1
17 :903 ~41 1,642 744 9 2$10,000 or mre . . . . . 4,783,226 . 3o825:422 957o8C4 25: 0
The adjusted gross income of $305 billion for1959 was $24 billion above that reported for thetax year 1958 . This was the first year in whichadjusted gross income reached $300 billion .
All major sources comprising the 1959 adjustedgross income showed an increase over the previousyear. The current year s
'alaries and wages of $247
billion were $20 billion above last year's salariesand wages . This increase in salaries and wages ac-counted for the greater part of the increase inadjusted gross income. Gain from sales of capitalassets,amounting to $6.3 billion, was up $2 billionover the gain for 1958 . Higher sole proprietorshipand partnership profits accounted for another bil-lion dollars of the 1959 increase .Taxable income for 1959 was $166 .5 billion. This
was $17 .2 billion, or 11-1/2 percent, more taxableincome than was reported for 1958 . Consequently,the income tax after credits increased from $34 .3billion in 1958 to $38.6 billion for 1959, an in-crease of $4.3 billion.
Self-employment tax on self-employment income for1959 was $702 million. The increase of 113 millionover the 1958 self-employment tax of 1589 millionresulted from an increase in the self-employmenttax rate from 3-3/8 percent for 1958 to 3-3/4 per-cent for 1959, and from larger profits from soleproprietorship and partnership activities, whichwere the basis of self-employment income .Table B shows the more important items for income
years 1959 and 1958. All sources are net, that is,income and loss have been merged for the net amount .
Table B .-NUMBER OF RETURNS, INCOME, AND TAXES : 1959 AND 195 8
Item
N-ber of returns, total . . . . . . . . . . . . . . . . . . .
Taxable. . . . . . . . . . . . . . . . . . . . . . . . . . . . . . . . . .
Nontaxable. . . . . . . . . . . . . . . . . . . . . . . . . . . . . . .
Adjusted gross incom (less deficit) . . . . . . .
Sources of incom :Salaries and wages. . . . . . . . . . . . . . . . . . . . . . .
Dividends . . . . . . . . . . . . . . . . . . . . . . . . . . . . . . . .
Interest. . . . . . . . . . . . . . . . . . . . . . . . . . . . . . . . .
Business or profession . . . . . . . . . . . . . . . . . . .
Partnership . . . . . . . . . . . . . . . . . . . . . . . . . . . . . .
Gain on sale of capital assets . . . . . . . . . . .
Rents and royalties . . . . . . . . . . . . . . . . . . . . . .
Other . . . . . . . . . . . . . . . . . . . . . . . . . . . . . . . . . . . .
Taxa~le incom . . . . . . . . . . . . . . . . . . . . . . . . . . . . .Incone tax after credits . . . . . . . . . . . . . . . . . . .
Self-employmnt tax . . . . . . . . . . . . . . . . . . . . . . . .
195 9
(1 )
60,271,297
47,496,91312,774,384
305,095
247,3709,3564,395
21,4319,5636,2743,2353,469
166,54138,645
702
1958
(2 )
59,085,182
45,652,13413,433,048
(N1111- d.11. .. )
281,154
227,5518,7413,659
20,6749,2324,3303,2273,742
149,33734,336
589
Increase ordecrease (-) ,
1959 o er195 8
(3)
1,186,115
1,844,~~-658,664
23,941
19,819615736757331
1,9448
-273
17,2(Y.4,309
113
3
4 INDIVIDUAL INCOME TAX RETURNS FOR 1959
Income tax withheld from wagesamounting to $30.8billion, was reported on 50.5 million returns for1959 and payments on declaration of estimated taxof $8.6 billion were reported an 5. 1 million returns.Nevertheless,year-end taxpayment status showed thattax of $5 .1 billion was due on 19 .1 mi-Ilion returns,but that overpayments of $5 .1 billion were reported
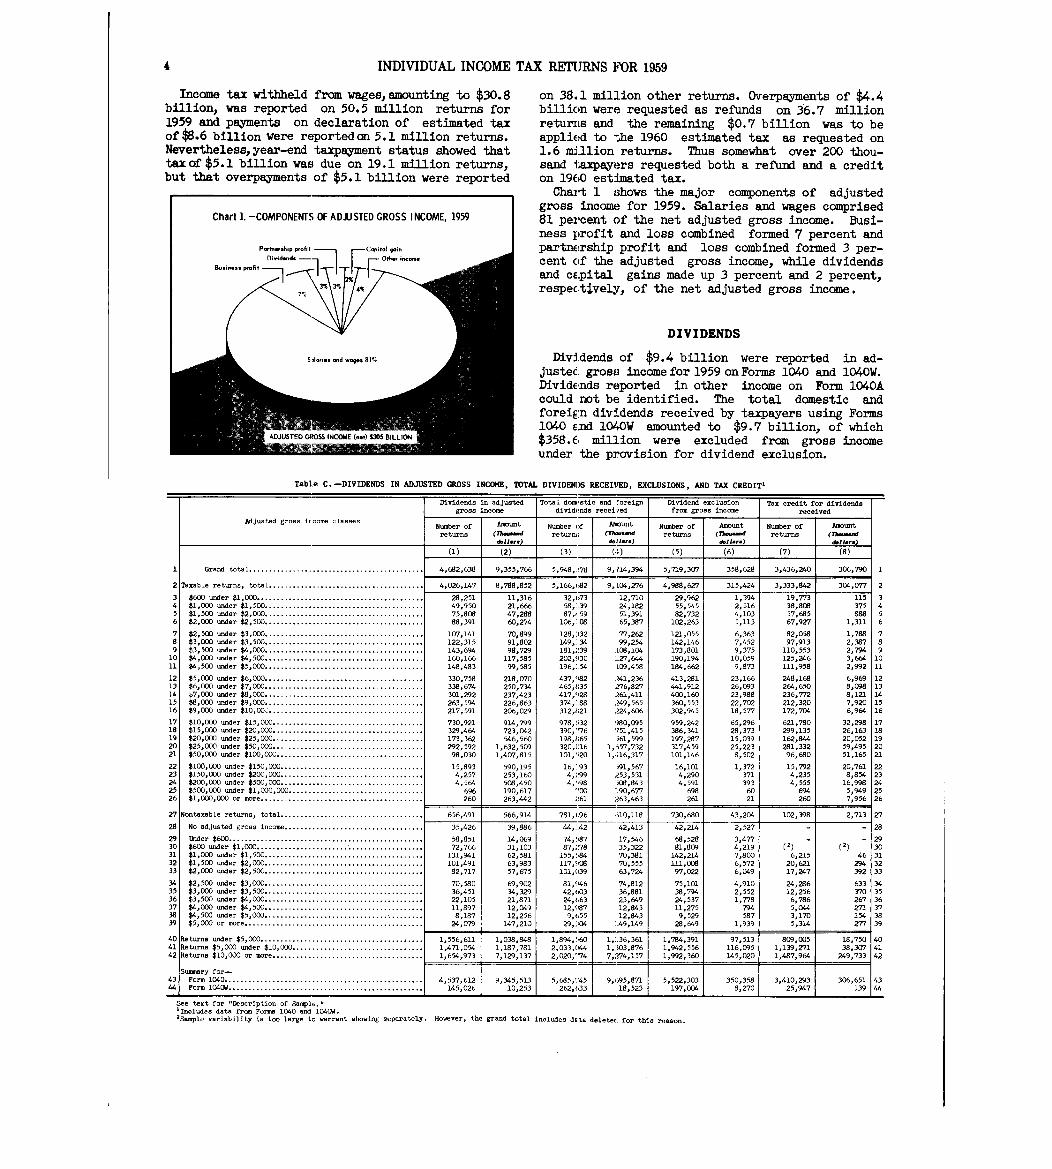
Chart 1 . -COMPONENTS OF A DJUSTED GROSS INCOME, 195 9
Pai,tn. .J,iP "all I Capital gain
0i,nal-al. GO- i.-Susi ... s pmfit 11T_FTF--,,-,,<-' \ 31\ 3-
7;4%
on 38 .1 million other returns . Overpayments of $4.4billicin were requested as refunds on 36.7 millionreturILs and the remaining $0.7 billion was to beapplied to the 1960 estimated tax as requested on1.6 million returns. Thus somewhat over 200 thou-sand I;axpayers requested both a refund and a crediton 1960 estimated tax .
Chart 1 shows the major components of adjustedgross income for 1959. Salaries and wages comprised81 percent of the net adjusted gross income . Busi-ness profit and loss combined formed 7 percent andpartnership profit and loss combined formed 3 per-cent of the adjusted gross income, while dividendsand cEpital gains made up 3 percent and 2 percent,respectively, of the net adjusted gross income .
DIVIDENDS
War- and ogiis 81%
7~_,~ 411Y)~T'~ , CPF)SS INCOME (-) S)0~ BILLI()N i
*1%
Dividends of $9 .4 billion were reported in ad-justec. gross income for 1959 on Forms 1040 and 1040W .
DividE!nds reported in other income on Form 1040A
could not be identified. The total domestic andforeiE~n dividends received by taxpayers using Forms1040 end 104OW amounted to $9 .7 billion, of which$358.6 million were excluded from gross incomeunder the provision for dividend exclusion .
Table C . -DIVIDENDS IN ADJUSTED GROSS INCOME, TOTAL DIVIDEN)S RECEIVED, EXCLUSIONS, AND TAX CREDIT '
Dividends in adjusted Total d stic and Coreign Dividend exclusion Tax credit for dividend sgross income divid, ~nds received from gross income received
Adjusted gross ircome classesNumber of Amount Number of Amount Number of Amount Number of Amountreturns (Th--d returni ; (rh--d returns (Th-d returns (Thaisiiiinat
d.11. .. dallAr.) &U-0
T- (3) (5) (6) (7) ( 8 )
I Grand total . . . . . . . . . . . . . . . . . . . . . . . . . . . . . . . . . . . . . . . . . . . . 4,682,638 9,355,766 5,948,~178 9,714,394 5,719,30`7 358,628 3,436,240 306,790 1 1
2 Taxable returns, total . . . . . . . . . . . . . . . . . . . . . . . . . . . . . . . . . . . . . . . 4,026,147 8,788,852 5,166,(A2 9,104,276 4,988,627 315,424 3,333,942 304,077 2
3 $600 under $1,000 . . . . . . . . . . . . . . . . . . . . . . . . . . . . . . . . . . . . . .. .
25128 11,316 32,03 12,710 29,962 1,394 19,773 115 34 $1 000 und r $1,500 . . . . . . . . . . . . . . . . . . . . . . . . . . . . . . . . . . . . . . 49 950: 21,666 58,:39 24,182 55,545 2,516 38,908 375 45 $1 :500 under $2,000 . . . . . . . . . . . . . . . . . . . . . . . . . . . . . . . . . . . . . . . . 75,808 47 288 87 59
,
51 391 82 732,
4 103 57 685 888 56 $2,000 under $2,500 . . . . . . . . . . . . . . . . . . . . . . . . . . . . . . . . . . . . . . . . 88,391 60 :274 :08106 : 65 :387 102 263 5 :113 67 :927 1,311 6
7 $2 500 under $3 000 . . . . . . . . . . . . . . . . . . . . . . . . . . . . . . . . . . . . . . . . 107,141 70,899 128, :132 77,262 121,055 6,363 82,058 1,788 78
a
$3 :000 und,r $3 :500 . . . . . . . . . . . . . . . . . . . . . . . . . . . . . . . . . . . . . . . . 122,315 91,802 149,:34 99,254 142,146 7,452 97,913 2,387 8
9 $3 500 under $4,000 . . . . . . . . . . . . . . . . . . . . . . . . . . . . . . . . . . . . . . . . 143,694 98,729 181,;!39 108,10~ 173,801 9,375 110,553 2,794 910 $4,000 under $4,500 . . . . . . . . . . . . . . . . . . . . . . . . . . . . . . . . . . . . . . . . 160,166 117,585 202,030 127,644 190,194 10,059 125,246 3,664 1011 $4,500 under $5,000 . . . . . . . . . . . . . . . . . . . . . . . . . . . . . . . . . . . . . . . . 148,483 99,585 196,:54 109,458 184,662 9,873 111,958 2,992 11
12 $5,000 under $6,000 . . . . . . . . . . . . . . . . . . . . . . . . . . . . . . . . . . . . . . . . 330,758 218,0170 437,~i82 241,236 413,281 23,166 248,168 6,969 1213 $6,000 under $7,000 . . . . . . . . . . . . . . . . . . . . . . . . . . . . . . . . . . . . . . . . 338,674 250,734 465,l ;35 Z76,827 441,912 26,093 264,650 8,098 1314 ~7,000 under $8,000 . . . . . . . . . . . . . . . . . . . . . . . . . . . . . . . . . . . . . . . . 301,292 237,423 417,928 261,411 400,160 23,988 236,772 8,121 1415 $8,000 under $9,000 . . . . . . . . . . . . . . . . . . . . . . . . . . . . . . . . . . . . . . . . 263,594 226,863 374,: .88 249,565 360,553 22,702 212,320 7,920 1516 $9,000 under $10,DD,3 . . . . . . . . . . . . . . . . . . . . . . . . . . . . . . . . . . . . . . . 217,591 206,029 312,f ;21 224,606 302,945 18,577 172,704 6,964 16
17 $10,000 under $15,000 . . . . . . . . . . . . . . . . . . . . . . . . . . . . . . . . . . . . . . 730,921 914,799 978,!,32 980,095 959,242 65,296 621,780 32,298 1718 $15,000 under $20,000 . . . . . . . . . . . . . . . . . . . . . . . . . . . . . . . . . . . . . . 329,4&4 723,042 390,'76 '751,415 386,341 28,373 299,135 26,163 IS19 $20,000 under $25,000 . . . . . . . . . . . . . . . . . . . . . . . . . . . . . . . . . . . . . . 173,362 546,560 198,l :65 ~561,599 197,287 15,039 162,844 20,052 1920 $25,000 under $50,000 . . . . . . . . . . . . . . . . . . . . . . . . . . . . . . . . . . . . . . 292,592 1,632,509 320,016 1,657,732 317,459 25,223 281,332 59,495 2021 $50,000 under $100,000 . . . . . . . . . . . . . . . . . . . . . . . . . . . . . . . . . . . . . 98,030 1,40`7,815 101o'-20 1,416,317 101,146 8,502 96,680 51,165 21
22 $100,000 under $150,000 . . . . . . . . . . . . . . . . . . . . . . . . . . . . . . . . . . . . 15,893 590,195 16, :93 ~591,567 16,101 1,372 15,792 20,761 2223 $150,000 under $200,000 . . . . . . . . . . . . . . . . . . . . . . . . . . . . . . . . . . . . 4,257 253,160 4, ;-.99 253,531 4,290 371 4,235 8,854 2324 $200,000 -der $500,000 . . . . . . . . . . . . . . . . . . . . . . . . . . . . . . . . . . . . 4,564 508,450 4,',98 508,843 4,591 393 4,555 16,998 2425 $500,000 under $1,000,000 . . . . . . . . . . . . . . . . . . . . . . . . . . . . . . . . . . 696 190,617 190,677 698 60 694 5,9149 2526 $1,000,000 or more . . . . . . . . . . . . . . . . . . . . . . . . . . . . . . . . . . . . . . . . . 260 263,442 261 263,463 261 21 260 7,956 26
27 Nontaxable returns,, total . . . . . . . . . . . . . . . . . . . . . . . . . . . . . . . . . . . . 656,491 566,914 781,06 U0,118 730,680 43,204 102,398 2,713 27
28 No adjusted gross income . . . . . . . . . . . . . . . . . . . . . . . . . . . . . . . . . . . 35,426 39,886 44, :42 42,413 42,214 2,527 - - 28
29 Under $600 . . . . . . . . . . . . . . . . . . . . . . . . . . . . . . . . . . . . . . . . . . . . . . . . . 58,851 14,069 74,!-87 17,546 68,528 3 477 - - 2930 $600 under $1,000 . . . . . . . . . . . . . . . . . . . . . . . . . . . . . . . . . . . . . . . . . . 72,766 31,103 87,278 35,322 81,809 4:219
(2)(1) 30
31 $1,000 under $1,500 . . . . . . . . . . . . . . . . . . . . . . . . . . . . . . . . . . . . . . . . 131,941 62,581 155,'-84 70,381 142,214 7,800 6,215 46 3132 $1,500 under $2,000 . . . . . . . . . . . . . . . . . . . . . . . . . . . . . . . . . . . . . . . . 101,491 63,983 117,908 70,555 111,008 6,572 20,621 294 3233 $2,000 under $2,500 . . . . . . . . . . . . . . . . . . . . . . . . . . . . . . . . . . . . . . . . 82,717 57,675 101,039 63,724 97,022 6,049 17,Z47 392 33
34 $2,500 under $3,000 . . . . . . . . . . . . . . . . . . . . . . . . . . . . . . . . . . . . . . . . 70,580 69,902 81,CV.6 74,812 75,101 4,910 24,286 633 3435 $3,000 under $3,,500 . . . . . . . . . . . . . . . . . . . . . . . . . . . . . . . . . . . . . . . . 36,451 34,329 42,(iQ3 36,881 38,794 2,552 12,256 370 3536 $3,500 under $4,000 . . . . . . . . . . . . . . . . . . . . . . . . . . . . . . . . . . . . . . . . 22,105 21,871 24,t,63 23,649 24,537 1,778 6,786 267 3637 $4,000 under $4,500 . . . . . . . . . . . . . . . . . . . . . . . . . . . . . . . . . . . . . 11 897 12,049 12,~~87 12,843 11,275 794 5,044 271 3738 $4,500 under $5,,000 . . . . . . . . . . . . . . . . . . . . . . . . . . . . . . . . . . . . . 8 :187 12,256 9o( .55 12,843 9,529 587 3,170 154 3839 $5,000 or more . . . . . . . . . . . . . . . . . . . . . . . . . . . . . . . . . . . . . . . . . . . . . 24,079 147,210 29, :,04 ~,49,149 28,649 lo939 5,314 277 39
40 Returns under $5,000 . . . . . . . . . . . . . . . . . . . . . . . . . . . . . . . . . . . . . . . . . 1,556,611 1,038,848 1,894,'60 1, :,36,361 1,784,391 97,513 809,005 18,750 4041 Returns $5,000 under $10,000 . . . . . . . . . . . . . . . . . . . . . . . . . . . . . . . . . 1,471,054 1,187,781 2,033,(" 1,303,876 1,942,556 116,095 1,139,271 38,30`7 4142 Returns $10,000 or more . . . . . . . . . . . . . . . . . . . . . . . . . . . . . . . . . . . . . . 1,654,973 7,129,137 2,020,774 7,274,157 1,992,360 145,020 1,487,964 249,733 42
Summary for-43 Form 1040 . . . . . . . . . . . . . . . . . . . . . . . . . . . . . . . . . . . . . . . . . . . . . . . . . . 4,537,612 9,345,513 5,685,-~45 9,i~95,871 5,522,303 350,358 3,410,293 306,651 4344
1Form 1040W . . . . . . . . . . . . . . . . . . . . . . . . . . . . . . . . . . . . . . . . . . . . . . . . . 145,026 10,253 262,633 18,523 197,004 8,270 25,947 139 44
See text for "Description of Sample ."lIncludes data from Forms; 1040 and 10" .2Sample variability is too large to warrant showing separately . However, the grand total includes dEta deleted for this reason .
INDIVIDUAL INCOME TAX RE`rURNS FOR 1959 5
Table C provides frequencies and amounts of divi-dends in adjusted gross income, total dividendsreceived, exclusions, and tax credit for dividendsreceived on the 1959 returns, Forms 1040 and 1040W .Only a small portion of the total of any item wascontributed by Form 1040W. This simplified form didnot show a distinction between foreign and domesticdividends nor between qualifying and nonqualifyingdomestic dividends . Therefore, dividends on Form104OW could not be classified as dividends eligibleand ineligible for exclusion nor as dividends eli-gible for tax credit .Dividends in adjusted gross income and the tax
credit for dividends received are described in theexplanation of terms later in this report . Thesedescriptions apply to dividends on both Forms 1040and 1040W .Total domestic and foreign dividends received in-
cluded all domestic dividends, whether or not qual-ifying for the dividend exclusion, as well as theforeign dividends . These dividends, on Form 1040,included distributions of entrepreneurial and part-nership enterprises that elected to be taxed ascorporations . So-called dividends from mutual sav-ings or cooperative banks, savings and loan orbuilding and loan associations, Federal savings andloan associationsP and Federal credit unions were
reported as interest for income tax purposes and arenot included .
Dividend exclusion of the first $50 of qualifyingdomestic dividends was allowed in determining theamount of dividends to be included in adjustedgross income . If husband and wife filed jointly,each was entitled to apply the $50 exclusion againsthis respective qualifying dividends . When a tax-payer received less than $50 of qualifying dividends,the exclusion equaled the amount received .
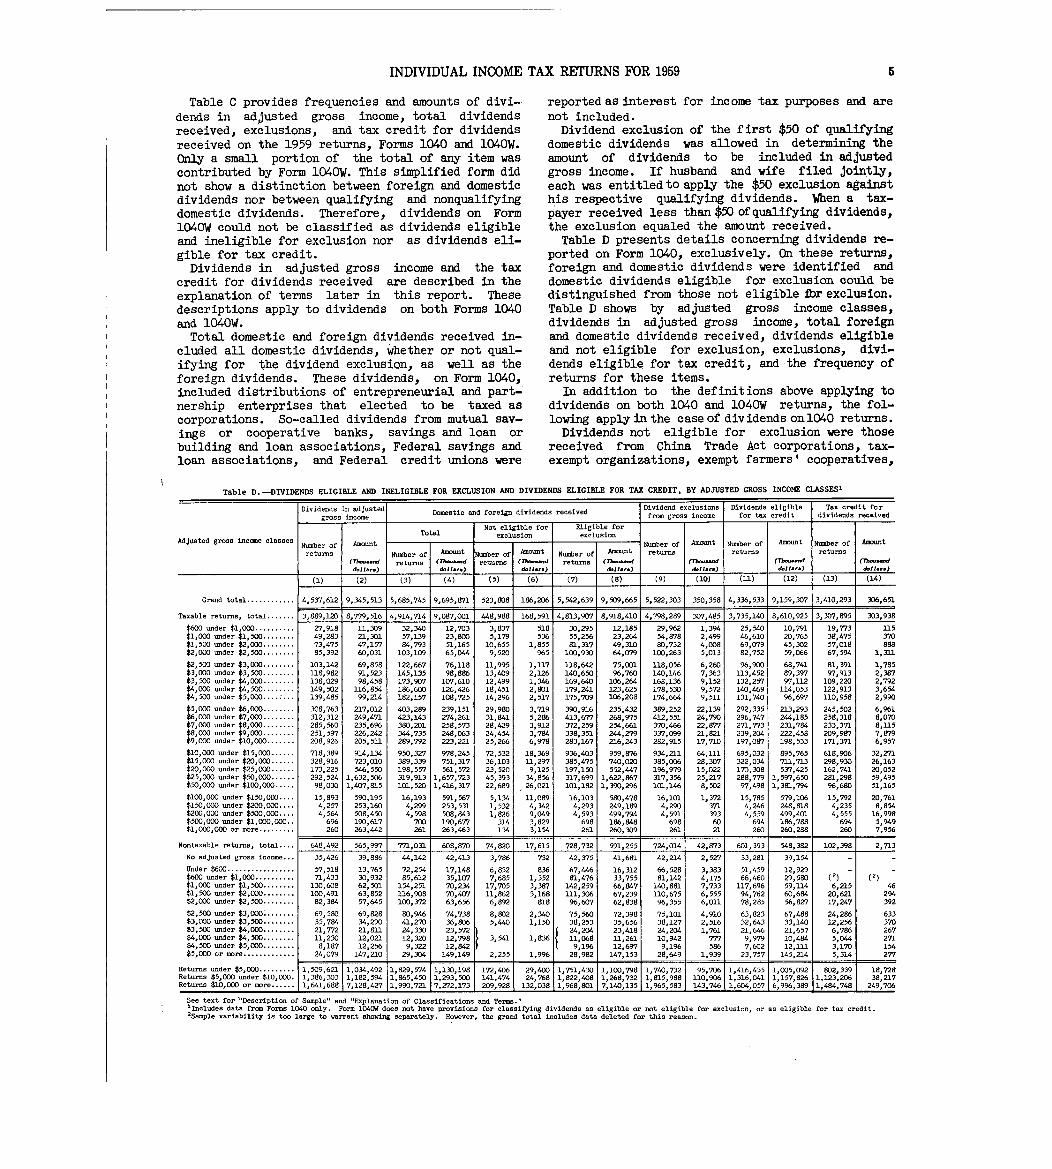
Table D presents details concerning dividends re-ported on Form 1040, exclusively . On these returns,foreign and domestic dividends were identified anddomestic dividends eligible for exclusion could bedistinguished from those not eligible ibr exclusion .
Table D shows by adjusted gross income classes,dividends in adjusted gross income, total foreignand domestic dividends received, dividends eligibleand not eligible for exclusion, exclusions, divi-dends eligible for tax credit, and the frequency ofreturns for these items .
In addition to the definitions above applying todividends on both 1040 and 1040W returns, the fol-lowing apply in the case of dividends on 1040 returns .Dividends not eligible for exclusion were those
received from China Trade Act corporations, tax-exempt organizations, exempt farmers' cooperatives,
Table D . -DIVIDENDS ELIGIBLE AND INELIGIBLE FOR EXCLUSION AND DIVIDENDS ELIGIBLE FOR TAX CREDIT, BY ADJUSTED GROSS INCOME CLASSES '
Dividends in adjustedDomestic and foreign dividends received
Dividend exclusion si
Dividends eligible
f t dit
Tax credit forei ~di ide d dgross income from gross ncome or ax cre
ev n s re e
Not eligible for Eligible for
Kdjusted ross income classesTotal exclusion exclus ion
tgNumber of Amount Number of Amount Number of
0Amount Number of A-
returns Number of Amount Number of Amount Number of A-t returns return . returns
(rh--.d returns (72-d returns (Th-d returns (Th-2--d (Th--d (Tl-...d (Th--dd.1 I ... d.11. .. d.11 .. . d.11 ... d.11 .. d.1J.. . d.11 .. .
(2) (4) (5) (6) (7) (8) (9) (10) (1-1) (12) (13) (14)
Grand total . . . . . . . . . . . . 4,537,612 9,345,513 5,685,745 9,695,871 523,808 186,206 5,542,639 9,509,665 5,522,303 350,358 4,336,533, 9,159,307 3,410,293, 306,65 1
Taxable returns, total . . . . . . . 3,889,120 8,779,516 4,914,714 1 9,087,001 448,988 168,591, 4,813,907 8,918,410 4,798,289 307,485 3,735,140 8,610,925 3,307,895 1 303,938
$600 under $1,000 . . . . . . . . . . 27,918 11,309 32,340 12,703 3,837 518 30,295 12,185 29,962 1,394 25,540 10,791 19,773 11 5$1,000 under $1,500 . . . . . . . . 49,283 21,301 57,139 23,800 5,179 536 55,256 23,264 54,878 2,499 46,610 20,765 38,475 370$1,500 under $2,000 . . . . . . . . 73,475 47,157 84,793 51,165 10,655 1,855 81,317 49,310 8D,732 4,008 69,079 45,302 57,018 888$2,000 -der $2,500 . . . . . . . . 85,392 60,031 103,109 65,044 9,520 965 100,930 64,079 100,263 5,013 82,752 59,066 67,594 1,31.1
$2,500 under $3,000 . . . . . . . . 103,142 69,858 122,667 76,118 11,995 1,117 118,642 75,001 118,056 6,260 96,900 68,741 81,391 1,785$3,000 under $3,500 . . . . . . . . 118,982 91,523 145,135 98,886 13,409 2,126 140,650 96,760 140,146 7,363 113,452 89,397 97,913 2,397$3,500 under $4,000 . . . . . . . . 138,029 98,458 173,907 107,610 12,499 1,346 169,640 106,264 168,136 9,152 132,257 97,112 109,220 2,792$4,000 under $4,500 . . . . . . . . 149,502 116,854 186,600 126,426 18,451 2,801 179,241 123,625 178,530 9,572 140,469 114,053 122,913 3,654$4,500 under $5,000 . . . . : . . . 139,485 99,214 182,157 108,725 14,296 2,517 175,709 106,208 174,664 9,511 131,740 96,697 110,958 2,990
$5,000 under $6,000 . . . . . . . . 308,763 217,012 403,289 239,151 29,980 3,719 390,916 235,432 389,252 22,139 292,335 213,293 245,502 6,%l$6,000 under $7,000 . . . . . . . . 312,312 249,471 423,143 274,261 31,841 5,286 413,677 268,975 412,551 24,790 296,747 244,185 258,318 8,070$7,000 -der $8,000 . . . . . . . . 285,560 235,696 380,201 258,573 28,429 3,912 372,259 254,661 370,466 22,877 271,773 231,784 233,371 8,U 5$8,000 -der $9,000 . . . . . . . . 251,597 226,242 344,735 248,063 24,454 3,784 338,351 244,279 337,099 21,821 239,204 222,458 209,987 7,879$9,000 under $10,000 . . . . . . . 208,926 205,51.1 289,792 223,221 25,266 6,978 283,167 216,243 282,915 17,710 197,087 198,533 171,371 6,957
$10,000 under $15,000 . . . . . . 7)8,389 914,134 950,327 978,245 72,532 18,369 936,403 959,876 934,211 64,111 695,032 895,765 618,906 32,271$15,000 under $20,000 . . . . . . 328,916 723,010 389,339 751,317 36,103 1-1,297 385,475 740,020 385,006 28,307 322,034 711,713 298,930 26,163$20,000 under $25,000 . . . . . . 173,225 546,550 198,557 561,572 23,520 9,125 .197,150 552,447 1%,979 15,022 170,308 537,425 162,741 20,052$25,000 under $50,000 . . . . . . 292,524 1,632,506 319,913 1,657,723 45,393 34,856 317,699 1,622,867 317,356 25,217 288,779 1,597,650 281,298 59,495$50,000 under $100,000 . . . . . 98,030 1,407,815 101,520 1,416,317 22,689 26,021 101,182 1,390,296 101,146 8,502 97,498 1,381,794 96,680 51,165
$100,000 under $150,000 . . . . 15,893 590,195 16,193 591,567 5,134 11,089 16,103 580,478 16,101 1,372 15,785 579,106 15,792 20,761$150,000 under $200,000 . . . . 4,257 253,160 4,299 253,531 1,532 4,342 4,293 249,189 4,290 371 4,246 248,818 4,235 8,854$200,000 -der $500,000 . . . . 4,564 508,450 4,598 508,943 1,826 9,049 4,593 499,794 4,591 393 4,559 499,401 4,555 16,998$500,000 under $1,000,000 . . 696 190,617 700 190,677 314 3,829 698 186,848 698 60 694 186,788 694 5,949$1,000,000 or more . . . . . . . . . 260 263,442 261 263,463 134 3,154 261 260,309 261 21 260 260,288 260 7,956
Nontaxable returns, total . . . . 648,492 565,997 771,031 608,870 74,8W 17,615 728,732 591,255 724,014 42,873 601,393 548,382 102,398 2,71 3
No adjusted gross income . . . 35,426 39,886 44,142 42,413 3,786 732 42,375 41,681 42,214 2,527 33,281 39,154 - -
Under $600 . . . . . . . . . . . . . . . . . 57,518 13,765 72,254 17,148 6,852 836 67,446 16,312 66,528 3,383 51,459 12,929 - -$600 under $1,000 . . . . . . . . . . 71,433 30,932 85,612 35,107 7,685 1,352 81,476 33,755 81,142 4,175 66,460 29,580
(2)(1 )
$1,000 under $1,500 . . . . . . . . 130,608 62,501 154,251 70,234 17,705 3,387 142,259 66,947 140,881 7,733 117,696 59,114 6,215 46$1,500 under $2,000 . . . . . . . . 100,491 63,852 116,908 70,40`7 11,862 3,168 12-1,306 67,239 110,675 6,555 94,762 60,684 20,621 294$2,000 under $2,500 . . . . . . . . 82,384 57,645 100,372 63,656 6,892 818 96,607 62,838 96,355 6,011 78,285 56,827 17,247 392
$2,500 under $3,000 . . . . . . . 69,580 69,828 80,946 74,738 8,802 2,340 75,560 72,398 75,101 4,910 63,823 67,488 24,286 633$3,000 under $3,500 : . . . . . . . 35,784 34,290 41,270 36,806 5,440 1,150 38,253 35,656 38,127 2,516 32,643 33,140 12,256 370$3,500 under $4,000 . . . . . . . . 21,772 21,811 24 330 23 572 24 204 23 418 24 204 1,761 21 646 21,657 6,796 267$4,000 under $4,500 . . . . . . . . 11,230 1.2,02.1 12:320 12:798 3,541
1,836 :11 068
:U 261 10"942 777
,9 979 10,484 5,044 271
$4,500 under $5,000 . . . . . . . . 8,187 12,256 9,322 12,842 9,196 12,697 9,196 586 7,602 12,111 3,170 154$5,000 or more . . . . . . . . . . . . . 24,079 147,210 29,304 149,149 2,255 1,996 28,982 147,153 28,649 1,939 23,757 145,214 5,314 277
Returns under $5, 6', '', 1 "
492' 0
1,829 574 1 130, 8t~ 172 406
,
29 1 751,411 11 91l 7 1 1 12 91 706 1 416 43 5 5
0
2
1 ' 9
2 339'
18,728Returns $5,000 1 386 03
1111 ,182,594
5:45()1,96
:1 293, I41,474 24 768
2,.":1 82
I 1:26.: 732 1 1: : .815 98
1 0: 61, 11 : 1316:.
:261 1 : 157 . 1 1, 123: 206 38,217
Returns $10,000 or more . . . . . . 1,641,688 7,128,427 1,99 09,928 132,038 1,96 965,58 057 6,996,389 1,484,748 249,706
See text for"'Description of Sample" and "Explaration of Classifications and Terms . "'Includes data from Forms 1040 only . Form 104OW does not have provisions for classifying dividends as eligible or not eligible for exclusion, or as eligible for tax credit .2Sample variability is too large to warrant showing separately . However, the grand total includes data deleted for this reason .
6 INDIVIDUAL INCOME TAX RETTJRNS FOR 1959
certain corporations doing business in possessionsof the United States, foreign corporations, andregulated investment companies unless specificallydesignated by the company to be taken into accountfor exclusion and tax credit .Dividends eligible for the exclusion were those
from fully taxable qualifying domestic corporations,such as the regular industrial, mercantile, andcommercial corporations, whether received directlyor through shares of fiduciary income or untaxedpartnership profit . Also eligible for exclusionwere the dividends on nonwithdrawal capital stockof building and loan associations or similar organ-izations, the true dividends from regulated invest-ment companies, and the distributions from entre-preneural and partnership enterprises that electedto be taxed as corporations .Dividends eligible for tax credit were the qual-
ifying dividends in adjusted gross income, that is,dividends eligible for exclusion less the applicabledividend exclusion .
EXCLUDABLE SICK PAY
Individuals who received sick pay under a wagecontinuation plan for periods of absence because ofsickness or injury were allowed an excludable sickpay deduction from gross salaries and wages re-
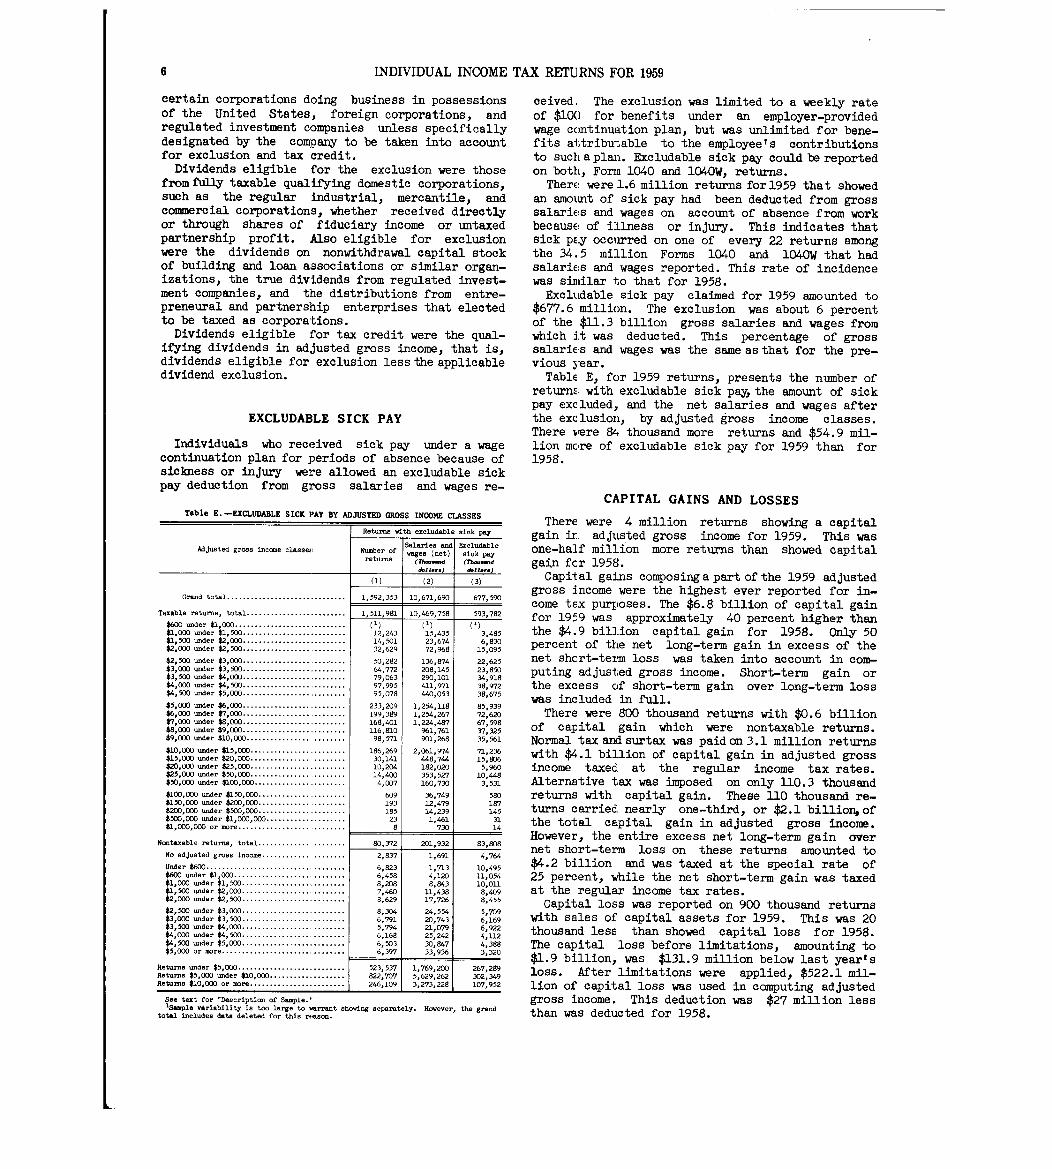
Table E . -EXCLUDABLE SICK PAY BY ADJUSTED GROSS INCOME CLASSES
Returns with excludable sick pay
Adjusted gross income classef ; Number ofSalaries andwages (net)
Excludabl esick pay
returns (Th-..d (Mo-d&11. .. ) d.11 ...
W (2) (3 )
Grand total . . . . . . . . . . . . . . . . . . . . . . . . . . . . . . 1,592,353 10,671,690 677,590
Taxable returns, total . . . . . . . . . . . . . . . . . . . . . . . . . 1,511,981 IG,469,758 593,782
$600 =der $1,000 . . . . . . . . . . . . . . . . . . . . . . . . . . . . (1) (1) (1 )$1,0W under $1,500 . . . . . . . . . . . . . . . . . . . . . . . . . . 12,243 15,435 3 , 48 5$1,500 under $2,000 . . . . . . . . . . . . . . . . . . . . . . . . . . 14,501 23,674 6 , 830$2,000 under $2,500 . . . . . . . . . . . . . . . . . . . . . . . . . . 32,629 72,968 15,09 5
$2,500 under $3,000 . . . . . . . . . . . . . . . . . . . . . ... . . . 50,282 136,874 22,62 5$3,000 under $3,500 . . . . . . . . . . . . . . . . . . . . . . . . . . 64,772 208,145 23 850$3,500 under $4,000 . . . . . . . . . . . . . . . . . . . . . . . . . . 79,063 290,101 34 :91 8$4,000 -der $4, 500 . . . . . . . . . . . . . . . . . . . . . . . . . . 97,995 411,971 38,97 2$4,500 -der $5,000 . . . . . . . . . . . . . . . . . . . . . . . . . . 95,078 440,053 38,67 5
$5,000 under $6,000 . . . . . . . . . . . . . . . . . . . . . . . . . . 233,209 1,254,118 85 93 9$6vOOO under $7,000 . . . . . . . . . . . . . . . . . . . . . . . . . . 199,389 1,254,267 72 :620$7,000 under $8,000 . . . . . . . . . . . . . . . . . . . . . . . . . . 168,401 1,224,487 67 59 8$8,000 under $9,000 . . . . . . . . . . . . . . . . . . . . . . . . . . 116,810 %1,761 37 :32 5$9,000 under $10,000 . . . . . . . . . . . . . . . . . . . . . . . . . 98,571 901,268 35,561
$10,000 under $15,000 . . . . . . . . . . . . . . . . . . . . . . . . 186,269 2,061,974 71,236$15,000 under $20,000 . . . . . . . . . . . . . . . . . . . . . . . 30,141 448,744 15 SD6$20,000 under $25,000 . . . . . . . . . . . . . . . . . . . . . . . . 10,204 182,020 5 :960$25,000 under $50,000 . . . . . . . . . . . . . . . . . . . . . . . . 14,400 353,527 10 448$50,000 under $100,000 . . . . . . . . . . . . . . . . . . . . . . . 4,007 160,730 3 :531
$100,000 under $150,000 . . . . . . . . . . . . . . . . . . . . . . 609 36,749 580$150,000 under $200,000 . . . . . . . . . . . . . . . . . . . . . . 193 12,479 187$200,000 under $500,000 . . . . . . . . . . . . . . . . . . . . . . 185 14,239 14 5$500,000 under $1,000,000 . . . . . . . . . . . . . . . . . . . . 23 1,461 31$1,000,000 or more . . . . . . . . . . . . . . . . . . . . . . . . . . . 8 730 14
Nontaxable returns, total . . . . . . . . . . . . . . . . . . . . . 80,372 201,932 83,808
No adjusted gross income . . . . . . . . . . . . . . . . . . . . 2,837 1,691 4,764
Under $600 . . . . . . . . . . . . . . . . . . . . . . . . . . . . . . . . . . . 6,823 1,713 10,49 5$600 under $1,000 . . . . . . . . . . . . . . . . . . . . . . . . . . . . 6,458 4,120 11,054$1,000 under $1,500 . . . . . . . . . . . . . . . . . . . . . . . . . . 8,208 8,843 10,011$lo500 under $2,000 . . . . . . . . . . . . . . . . . . . . . . . . . . 7,460 11,438 8,409$2,000 under $2,500 . . . . . . . . . . . . . . . . . . . . . . . . . . 8,629 17,726 8,45 5
$2,500 -der $3,000 . . . . . . . . . . . . . . . . . . . . . . . . . . 8,304 24,554 5,709$3,000 urider $3,500 . . . . . . . . . . . . . . . . . . . . . . . . . . 6,791 20,743 6,169$3,500 under $4,000 . . . . . . . . . . . . . . . . . . . . . . . . . . 5,794 21,079 6,922$4,000 under $4,500 . . . . . . . . . . . . . . . . . . . . . . . . . . 6,168 25,242 4,112$4,500 under $5,000 . . . . . . . . . . . . . . . . . . . . . . . . . . 6,503 30,947 4,388$5,000 or more . . . . . . . . . . . . . . . . . . . . . . . . . . . . . . . 6,397 33,936 3,320
Returns under $5,000 . . . . . . . . . . . . . . . . . . . . . . 523,537 1,769,200 267,289Returns $5,000 under $10,000 . . . . . . . . . . . . . . 822,707 5,629,262 302,349Returns $10,000 or more . . . . . . . . . . . . . . . . . . . . . . . . 246,109 3,273,228 l(Y7,952
See tax t for "Description of Sample . "1Sample variability is too large to warrant showing separately . However, the grand
total includes data deleted for this reason .
ceived, The exclusion was limited to a weekly rateof $100 for benefits under an employer-providedwage continuation plan, but was unlimited for bene-fits attributable to the employee's contributionsto SUCIL a plan . Excludable sick pay could be reportedon both, Form 1040 and 104OW, returns .
TherE! were 1 .6 million returns for 1959 that showedan amount of sick pay had been deducted from grosssalariE!s and wages on account of absence from workbecause of illness or injury. This indicates thatsick pE.y occurred on one of every 22 returns amongthe 34 .5 million Forms 1040 and 104OW that hadsalariE:s and wages reported . This rate of incidencewas similar to that for 1958 .Excludable sick pay claimed for 1959 amounted to
$677 .6 million. The exclusion was about 6 percentof the $11 .3 billion gross salaries and wages fromwhich it was deducted . This percentage of grosssalariEs and wages was the sameasthat for the pre-vious year .
TablE E, for 1959 returns, presents the number ofreturnE with excludable sick pay, the amount of sickpay excluded, and the net salaries and wages afterthe exclusion, by adjusted gross income classes .There vere 84 thousand more returns and $54 .9 mil-lion mcre of excludable sick pay for 1959 than for1958 .
CAPITAL GAINS AND LOSSES
There were 4 million returns showing a capitalgain ir adjusted gross income for 1959 . This wasone-half million more returns than showed capitalgain fcr 1958 .
Capital gains composing apart of the 1959 adjustedgross income were the highest ever reported for in-come tax purposes . The $6.8 billion of capital gainfor 1959 was approximately 40 percent higher thanthe $4 .9 billion capital gain for 1958. Only 50percent of the net long-term gain in excess of thenet shcrt-term loss was taken into account in com-puting adjusted gross income . Short-term gain orthe excess of short-term gain over long-term losswas included in full .
There were 800 thousand returns with $0.6 billionof capital gain which were nontaxable returns .Normal tax and surtax was paid on 3 . 1 million returnswith $4 .1 billion of capital gain in adjusted grossincome taxed at the regular income tax rates .Alternative tax was imposed on only 110 .3 thousandreturns with capital gain . These 110 thousand re-turns carried nearly one-third, or $2 .1 billionofthe total capital gain in adjusted gross income .However, the entire excess net long-term gain overnet short-term loss on these returns amounted to$4 .2 billion and was taxed at the special rate of25 percent, while the net short-term gain was taxedat the regular income tax rates .Capital loss was reported on 900 thousand returns
with sales of capital assets for 1959 . This was 20thousand less than showed capital loss for 1958 .The capital loss before limitations, amounting to$1 .9 billion, was $131.9 million below last year'sloss . After limitations were applied, $522 .1 mil-lion of capital loss was used in computing adjustedgross income . This deduction was $27 million lessthan was deducted for 1958 .
L_
INDIVIDUAL INCOME TAX RETURNS FOR 1959
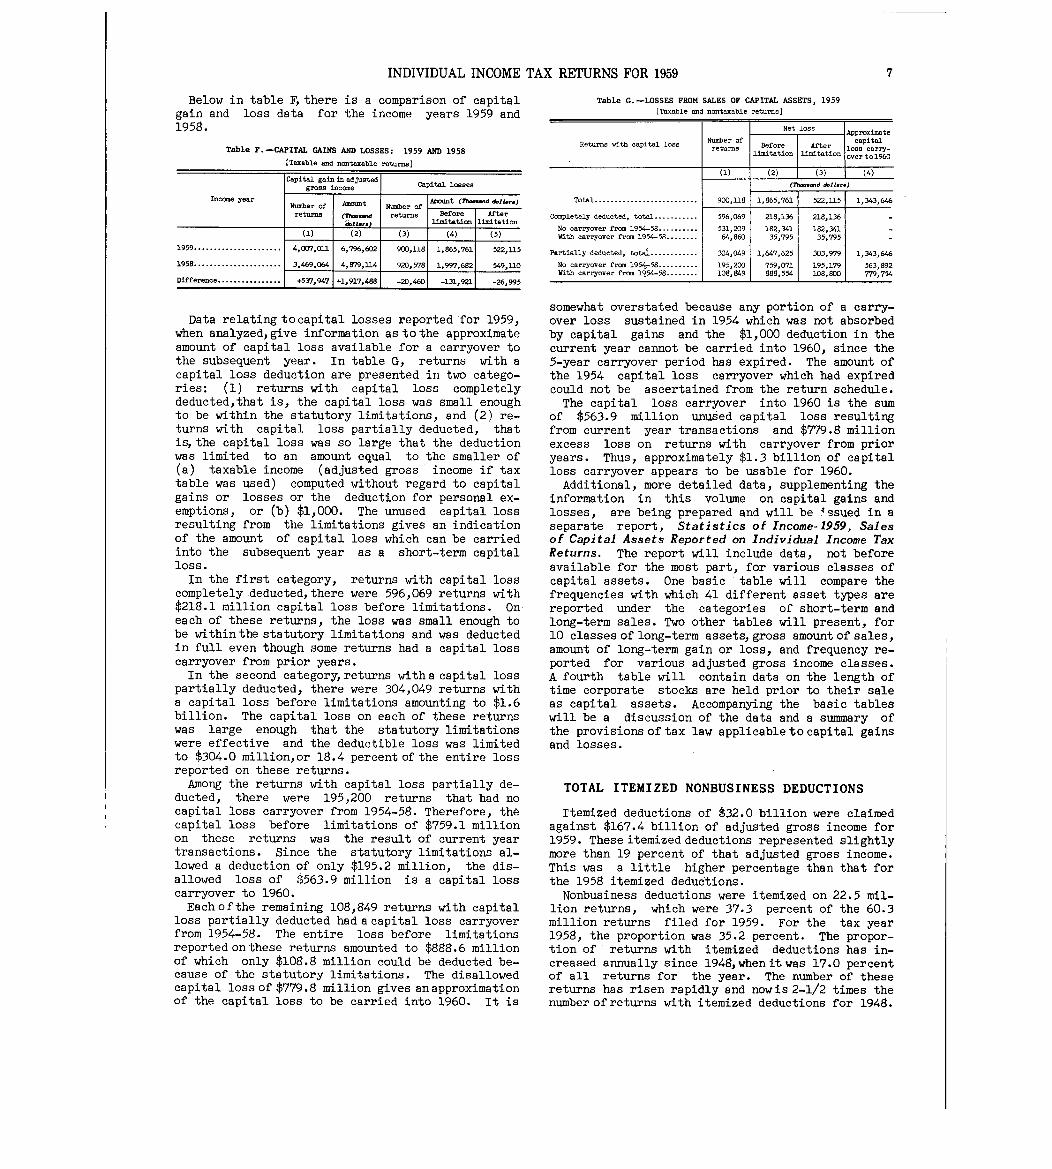
Below in table Fthere is a comparison of capitalgain and loss data for the income years 1959 and1958 .
Table F. -CAPITAL GAINS AND LOSSES : 1959 AND 1958
[Taxable and nontaxable returns ]
Income yea r
1959 . . . . . . . . . . . . . . . . . . . . . .
1958 . . . . . . . . . . . . . . . . . . . . . .
Difference . . . . . . . . . . . . . . . .
Capital gain in adjustedgross income
Number of
returns
Amount
(1 )
4,007,011
3,469,064
+537,9471
(2 )
6,7%,602
4, M, 114
+1,917o488
Capital losses
Number ofreturns
(3 )
900,118
920,578
Amount (rh~d dllara)
erlimitation limitation
(4) 1 (5 )
1,865,761
1,997,682
-20,460 -131,921
522,115
549,110
-26,995
Data relating tocapital losses reported for 1959,when analyzed,give information as tothe approximateamount of capital loss available for a carryover tothe subsequent year . In table G, returns with acapital loss deduction are presented in two catego-ries : (1) returns with capital loss completelydeducted,that is, the capital loss was small enoughto be within the statutory limitations, and (2) re-turns with capital loss partially deducted, thatis,the capital loss was so large that the deductionwas limited to an amount equal tothe smaller of(a) taxable income (adjusted gross income if taxtable was used) computed without regard to capitalgains or losses or the deduction for personal ex-emptions, or (b) $1,000 . The unused capital lossresulting from the limitations gives an indicationof the amount of capital loss which can be carriedinto the subsequent year as a short-term capitalloss .In the first category, returns with capital loss
completely deducted,there were 596,069 returns with$218 .1 million capital loss before limitations . Oneach of these returns, the loss was small enough tobe within the statutory limitations and was deductedin full even though some returns had a capital losscarryover from prior years .In the second categoryreturns witha capital loss
partially deducted, there were 304,049 returns witha capital loss before limitations amounting to $1 .6billion. The capital loss on each of these returnswas large enough that the statutory limitationswere effective and the deductible loss was limitedto $304 .0 million,or 18 .4 percent of the entire lossreported on these returns .Among the returns with capital loss partially de-
ducted, there were 195,200 returns that had nocapital loss carryover from 1954-58 . Therefore, th4~capital loss before limitations of $759 .1 millionon these returns was the result of current yeartransactions . Since the statutory limitations al-lowed a deduction of only $195 .2 million, the dis-allowed loss of $563 .9 million is a capital losscarryover to 1960 .Each ofthe remaining 108,849 returns with capital
loss partially deducted had acapital loss carryoverfrom 1954-58 . The entire loss before limitationsreported onthese returns amounted to $888 .6 millionof which only $108 .8 million could be deducted be-cause of the statutory limitations . The disallowedcapital loss of $779 .8 million gives an approximationof the capital loss to be carried into 1960 . It is
Table G. -LOSSES FROM SALES OF CAPITAL ASSETS, 1959
[Taxable and nontaxable returns ]
Total . . . . . . . . . . . . . . . . . . . . . . . . . .
Completely deducted, total . . . . . . . . . . .
11o ca~ryover from 1954-58 . . . . . . . . . .With carryover from 1954-58 . . . . . . . .
Partially deducted, total . . . . . . . . . . . .
No carryover from 195-~-58 . . . . . . . . . .
With carryover from 1954-58 . . . . . . . .
Number ofreturn s
(1 )
900,118
596,069
531,20964,860
304,049
195,200108,849
Net los s
Beforelimitation
(2)
Afterlimitation
(3)
7
Approximatecapital
loss carry-over to 1960
(4 )
(rh-.-d &II.-
522,1151,865,761
218,136
182,34135,795
1,647,625
759,071888,554
218,136
182,34135,795
303,979
195,179108,800
1,343,646
1,343,646
563,892779,754
somewhat overstated because any portion of a carry-over loss sustained in 1954 which was not absorbedby capital gains and the $1,000 deduction in thecurrent year cannot be carried into 1960, since the5-year carryover period has expired . The amount ofthe 1954 capital loss carryover which had expiredcould not be ascertained from the return schedule .The capital loss carryover into 1960 is the sum
of $563 .9 million unused capital loss resultingfrom current year transactions and $779 .8 millionexcess loss on returns with carryover from prioryears . Thus, approximately $1 .3 billion of capitalloss carryover appears to be usable for 1960 .Additional, more detailed data, supplementing the
information in this volume on capital gains andlosses, are being prepared and will be 49sued in aseparate report, Statistics of Income-1959, Salesof Capital Assets Reported on Individual Income TaxReturns . The report will include data, not beforeavailable for the most part, for various classes ofcapital assets . One basic table will compare thefrequencies with which 41 different asset types arereported under the categories of short-term andlong-term sales . Two other tables will present, for10 classes of long-term assets, gross amount of sales,amount of long-term gain or loss, and frequency re-ported for various adjusted gross income classes .A fourth table will contain data on the length oftime corporate stocks are held prior to their saleas capital assets . Accompanying the basic tableswill be a discussion of the data and a summary ofthe provisions of tax law applicable to capital gainsand losses .
TOTAL ITEMIZED NONBUSINESS DEDUCTION S
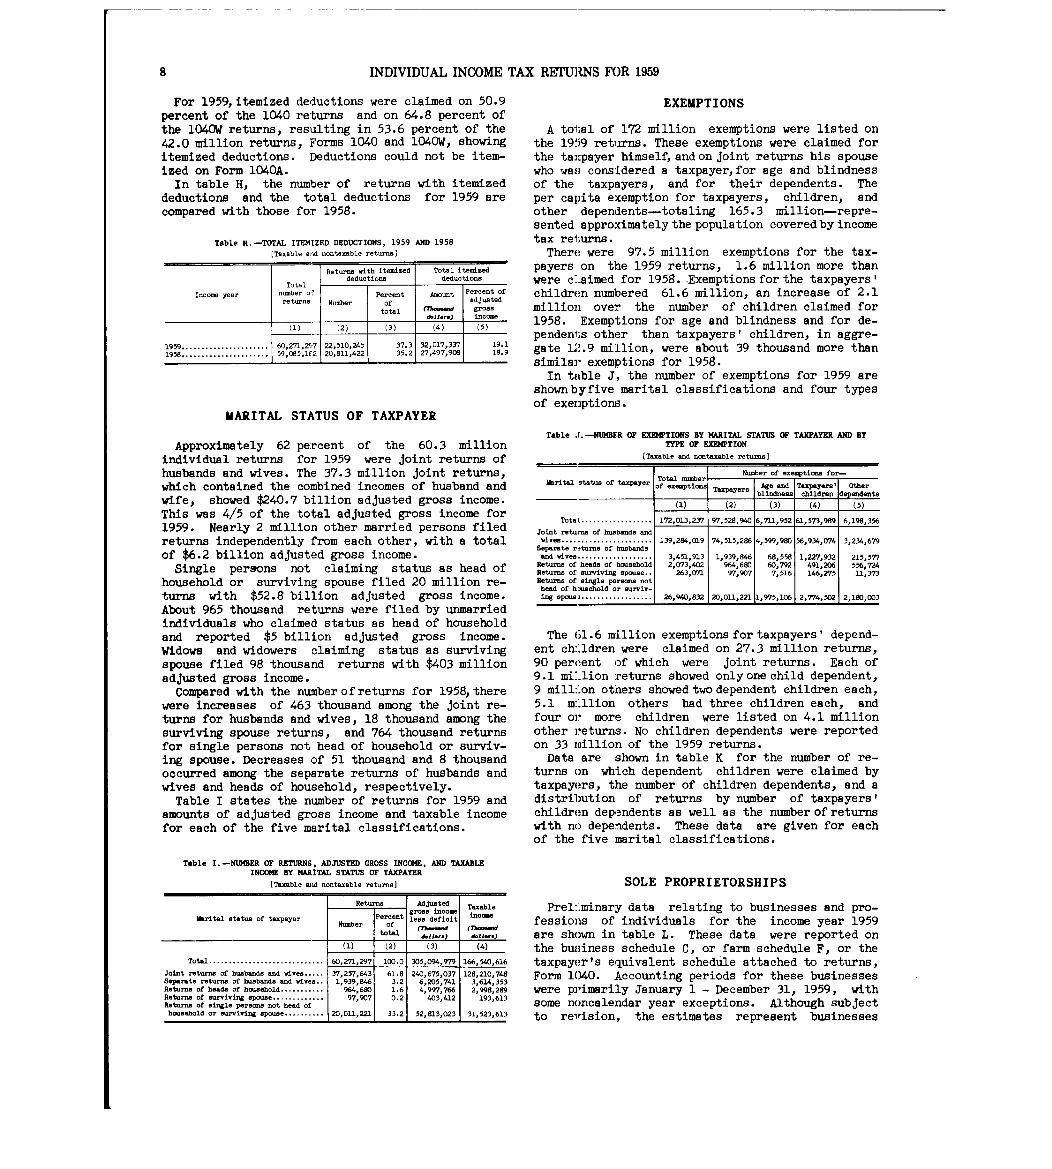
Itemized deductions of $32 .0 billion were claimedagainst $167.4 billion of adjusted gross income for1959 . These itemized deductions represented slightlymore than 19 percent of that adjusted gross income .This was a little higher percentage than that forthe 1958 itemized deductions .Nonbusiness deductions were itemized on 22.5 mil-
lion returns, which were 37 .3 percent of the 60 .3million returns filed for 1959 . For the tax year1958, the proportion was 35 .2 percent . The propor-tion of returns with itemized deductions has in-creased annually since 1948,when it was 17.0 percentof all returns for the year . The number of thesereturns has risen rapidly and nowis 2-1/2 times thenumber ofreturns with itemized deductions for 1948 .
8 INDIVIDUAL INCOME TAX RETURNS FOR 1959
For 1959,itemized deductions were claimed on 50.9percent of the 1040 returns and on 64 .8 percent ofthe 104OW returns, resulting in 53 .6 percent of the42 .0 million returns, Forms 1040 and 104OW, showingitemized deductions . Deductions could not be item-ized on Form 1040A .In table H, the number of returns with itemized
deductions and the total deductions for 1959 arecompared with those for 1958.
Table H. -TOTAL ITEMIZED DEDUCTIONS, 1959 AND 1958
(Taxable and nontaxable returns )
Returns with itemized Total itemized
T l
t
deductions deductions
Income year
oa
number.
r Percent AmountPe cant of
returns Number of adjusted
total (7hou"ad
~
gross
-
d.11.. .)
P
incCU e
(1) (2) (3) (4) 5 )
1959 . . . . . . . . . . . . . . . . . . . . . . 60,2'n,297 22,510,245 37.3 32,017Z,3~3~7 19 1
1956 . . . . . . . . . . . . . . . . . . . . . . 59,085,162 20,811,422 35 .2 27,497,908 18:9
EXEMPTIONS
A total of 172 million exemptions were listed onthe 1959 returns . These exemptions were claimed forthe taxpayer himself, and on joint returns his spousewho was considered a taxpayer,for age and blindnessof the taxpayers, and for their dependents . Theper capita exemption for taxpayers, children, andother dependents-totaling 165 .3 million-repre-sented approximately the population covered by incometax returns .
There were 97.5 million exemptions for the tax-payers on the 1959 returns, 1 .6 million more thanwere c--aimed for 1958 . Exemptions for the taxpayers Ichildren numbered 61 .6 million, an increase of 2 .1million over the number of children claimed for1958 . Exemptions for age and blindness and for de-pendents other then taxpayers' children, in aggre-gate 12 .9 million, were about 39 thousand more thansimilar exemptions for 1958 .
In table J, the number of exemptions for 1959 areshownbyfive marital classifications and four typesof exeriptions .
MARITAL STATUS OF TAXPAYER
Approximately 62 percent of the 60 .3 millionindividual returns for 1959 were joint returns ofhusbands and wives . The 37 .3 million joint returns,which contained the combined incomes of husband andwife, showed $240.7 billion adjusted gross income .This was 4/5 of the total adjusted gross income for1959 . Nearly 2 million other married persons filedreturns independently from each other, with a totalof $6 .2 billion adjusted gross income .Single persons not claiming status as head of
household or surviving spouse filed 20 million re-turns with $52 .8 billion adjusted gross income .About 965 thousand returns were filed by unmarriedindividuals who claimed status as head of householdand reported $5 billion adjusted gross income .Widows and widowers claiming status as survivingspouse filed 98 thousand returns with $403 millionadjusted gross income .Compared with the numberofreturns for 1958,there
were increases of 463 thousand among the joint re-turns for husbands and wives, 18 thousand among thesurviving spouse returns, and 764 thousand returnsfor single persons not head of household or surviv-ing spouse . Decreases of 51 thousand and 8 thousandoccurred among the separate returns of husbands andwives and heads of household, respectively .
Table I states the number of returns for 1959 andamounts of adjusted gross income and taxable incomefor each of the five marital classifications .
Table r . -NUMBER OF EXEMPTIONS By MARITAL STATUS OF TAXPAYER AND BYTYPE OF EXEMPTIO N
(Taxable and nontaxable returns ]
Marital status of taxpayer
Tota L . . . . . . . . . . . . . . . . . .
Joint ratu .~ of husbands andwives
. . . " . ** . ****'**' . ***Sep.raie -turns of husbands
and wives . . . . . . . . . . . . . . . . . . .Return of heads of householdReturn: of surviving spouse . .Returns of single persotne nothead of hmsehold or surviv-
ing ep one . . . . . . . . . . . . . . . . . . .
Total numberof exemptions
(1 )172,013,237
139,284,019
3,451,9132,073,402
263,071
26,940,832
Number of exemptions for-
Taxpayers
(2)
77, 528, 940
74,515,286
1,939,946964,68097,907
20,011,221
Age and
blindness
(3)
6,711,952
4,599,980
68,55860,7927,51 6
11,975,106
Taxpayerschildren
(4)
61,573,989
56,934,074
1,227,932491,2D61",275
2,774,502
Otherdependents
(5 )
6,198,356
3,234,679
215,577556,724
1.1,373
2,180,003
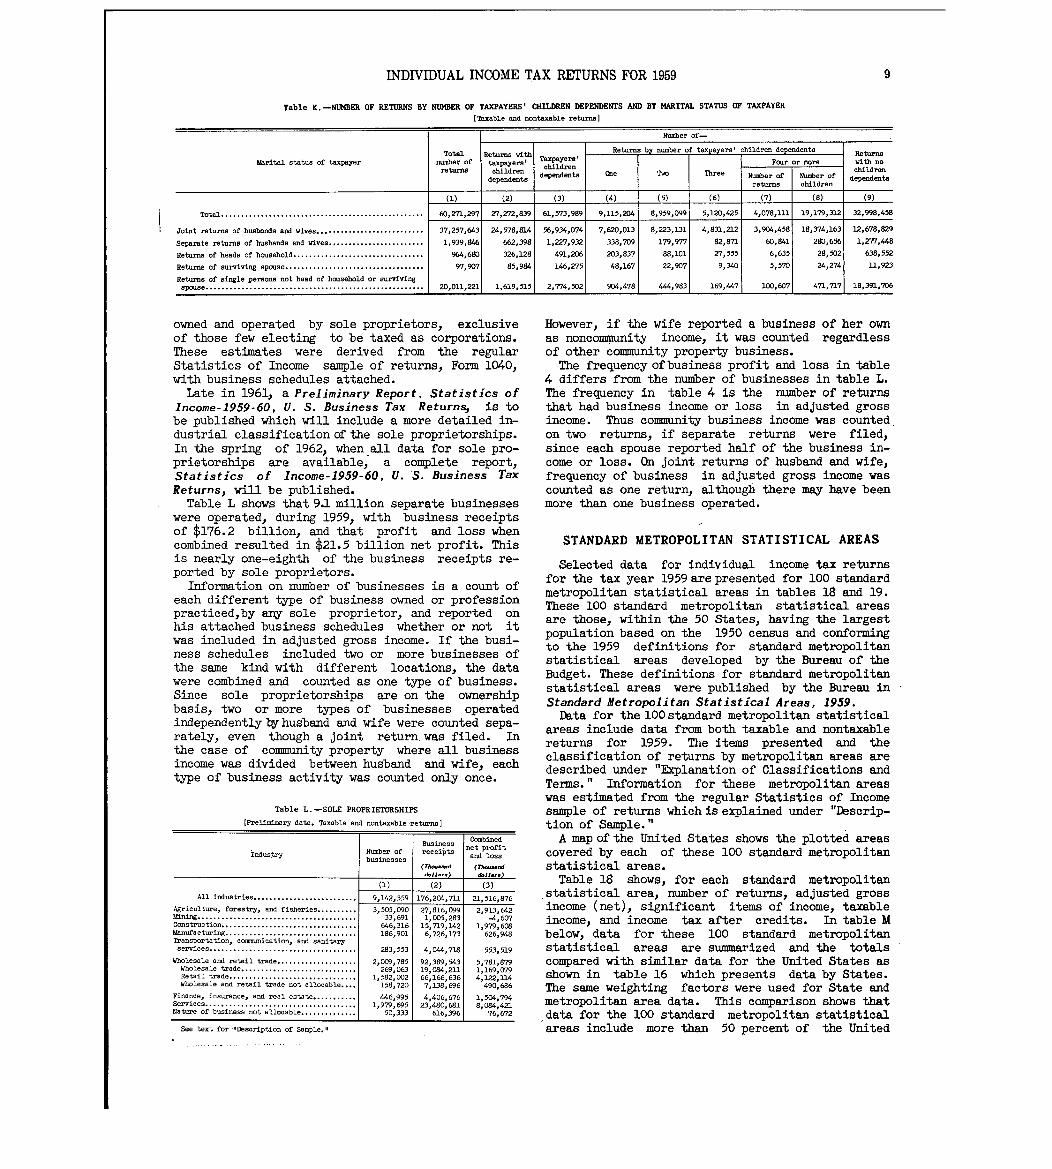
The 61 . 6 million exemptions for taxpayers I depend-ent ch-.1dren were claimed on 27 .3 million returns,90 percent of which were joint returns . Each of9 . 1 mi'-lion returns showed only one child dependent,9 mill:' 'on others showed two dependent children each,5 .1 m:
.
.1lion others had three children each, andfour or more children were listed on 4 .1 millionother returns . No children dependents were reportedon 33 Taillion of the 1959 returns .Data are shown in table K for the number of re-
turns on which dependent children were claimed bytaxpayers, the number of children dependents, and adistribution of returns by number of taxpayers'children dependents as well as the number of returnswith no dependents . These data are given for eachof the five marital classifications .
Table 1 . -NUMBER OF RETURNS, ADJUSTED GROSS INCOME, AND TAXABLEINCOME BY MARITAL STATUS OF TAXPAYER
[Taxable and nontaxable returns I
Rat a Adjusted Taxable
Marital status of taxpayer Percentgross ineoneless deficit
incomeNumber of
(Th--,dtotal d.11 ..)
(1) (2) (3) (4)
Total . . . . . . . . . . . . . . . . . . . . . . . . . . . . . 60,271,297 100 .0 305,094,979 166,540,616
Joint returns of husbands and wives . . . . . 37,257,643 61 .8 240,675,037 128,210,748Separate returns of husbands and wives . . 1,939,846 3 .2 6,205,741 3,614,353Returns of heads of household . . . . . . . . . . . 9" , 680 1 6 4,9cy7,766 2,998,289Returns of surviving spouse . . . . . . . . . . . . . 97,907 0 :2 403,412 193,613Returns of single persons not head of
1
household or surviving spouse . . . . . . . . . . 20,03.1,221 33 .2 52,813,023 31,523,613
SOLE PROPRIETORSHIP S
Prel-.minary data relating to businesses and pro-fessions of individuals for the income year 1959are shown in table L . These data were reported onthe business schedule C, or farm schedule F, or thetaxpayer's equivalent schedule attached to returns,Form 1040. Accounting periods for these businesseswere primarily January 1 - December 31, 1959, withsome noncalendar year exceptions . Although subjectto revision, the estimates represent businesses
INDIVIDUAL INCOME TAX RETURNS FOR 1959
Table K . -NUMBER OF RETURNS BY NUMBER OF TAXPAYERS' CHILDREN DEPENDENTS AND BY MARITAL STATUS OF TAXPAYER
[Taxable and nontaxable returns]
9
Number of-
Total ithReturns by number taxpayers' hildren dependents
ReMarital status of taxpayer number of
Returns wtaxpayers I Taxpayers '
iFour or more with no
returns childrendependents
ch ldrendependents One
I
TWO Three Numbs f Ir 0 Number ofchildren
dependentstore
mechildre n
(1) (2) (3) (4) (5) (6) (7) (8) (9)
Total . . . . . . . . . . . . . . . . . . . . . . . . . . . . . . . . . . . . . . . . . . . . . . . . . . . 60,Z71,297 27,272,839 61,573,989 9,115,204 8,959,099 5,120,425 4,078,111 19,179,312 32,998,458
Joint returns of husbands and wives . . . . . . . . . . . . . . . . . . . . . . .
. . . .
37,257,643 24,578,814 56,934,074 7,620,013 8,223,131 4,831,212 3,904,458 18,374,163 12,678,829
Separate returns of husbands and wives . . . . . . . . . . . . . . . . . . . . . . . . 1,939,846 662,398 1,227,932 338,709 179,777 82,871 60,841 280,656 1,277,448
Returns of heads of household . . . . . . . . . . . . . . . . . . . . . . . . . . . . . . . . . %4,680 326,128 491,206 203,837 88,101 27,555 6,635 28,502 638,552
Returns of surviving spouse . . . . . . . . . . . . . . . . . . . . . . . . . . . . . . . . . . . 97,907 85,984 146,275 48,167 22,907 9,340 5,570 24,274 1-1,923
Returns of single persons not head of household or survivingspouse . . . . . . . . . . . . . . . . . . . . . . . . . . . . . . . . . . . . . . . . . . . . . . . . . . . . . . . 20,011,221 1,619,515 2,774,502 , 9G4,4781 444,983 , 169,447 , 100,607 , 471,717 16,391,706
owned and operated by sole proprietors, exclusiveof those few electing to be taxed as corporations .These estimates were derived from the regularStatistics of Income sample of returns, Fom 1040,with business schedules attached .Late in 1961, a Preliminary Report, Statistics of
Income-1959-60, U . S . Business Tax Returns, is tobe published which will include a more detailed in-dustrial classification of the sole proprietorships .In the spring of 1962, when .all data for sole pro-prietorships are available, a complete report,Statistics of Income-1959-60, U. S . Business Tax
Returns, will be published .Table L shows that 9.1 million separate businesses
were operated, during 1959, with business receiptsof $176 .2 billion, and that profit and loss whencombined resulted in $21.5 billion net profit . Thisis nearly one-eighth of the business receipts re-ported by sole proprietors .
Information on number of businesses is a count ofeach different type of business owned or professionpracticed,by amy sole proprietor, and reported onhis attached business schedules whether or not itwas included in adjusted gross income . If the busi-ness schedules included two or more businesses ofthe same kind with different locations, the datawere combined and counted as one type of business .Since sole proprietorships are on the ownershipbasis, two or more types of businesses operatedindependently ty husband and wife were counted sepa-rately, even though a joint return.was filed . Inthe case of commulity property where all businessincome was divided between husband and wife, eachtype of business activity was counted only once .
Table L . -SOLE PROPRIETORSHIPS
[Prelimin ry date . Taxable and nontaxable returns
BusinessCombined
Industry Number of receiptsnet profitand lose
businesses(Th--d (rh-- .d
d.11 ... d.1Z .. .
(2) (3 )
All industries . . . . . . . . . . . . . . . . . . . . . . . . . . 9,142,359 176,2G4,711 21,516,876
Agriculture, forestry, and fisheries . . . . . . . . . . 3,505,090 27,816,099 2,913,64 2Mining. . . . . . . . . . . . . . . . . . . . . . . . . . . . . . . . . . . . . . . . 33,691 1,005,283 -4,607Construction. . . . . . . . . . . . . . . . . . . . . . . . . . . . . . . . . . 646,316 15,719,142 1,979,608Man
'e,i-- - - . . .- . . . . . . . . . . . . .186,901 6,726,173 626,948Tra
sp orta ti o n: ~ .;;L;i~. tion, and sa ni ta ryservices . . . . . . . . . . . . . . . . . . . . . . . . . . . . . . . . . . . . . 283,553 4,044,718 553,51 9
Wholesale and retail trade. . . . . . . . . . . . . . . . . . . . 2,009,785 92,389,543 5,781,879Wholesale trade . . . . . . . . . . . . . . . . . . . . . . . . . . . . . 269,063 19,084,211 1, 169, U79.a il trade . . . . . . . . . . . . . . . . . . . . . . . . . . . . . . . . 1,582,002 66,166,636 4,122,114Wholesale and retail trade not allocable . . . . 158,720 7,138,696 490,68 6
Finance, insurance, and real estate . . . . . . . . . . . 446,995 4,406,676
1 ,
504 794Services . . . . . . . . . . . . . . . . . . . . . . . . . . . . . . . . . . . . . . 1,979,695 23,480,681 81G94 :42 1Nature of business not allocable. . . . . . . . . . . . . . 50,333 616,396, 76,67 2
See text for "Description of Sample ."
However, if the wife reported a business of her ownas noncompunity income, it was counted regardlessof other community property business .The frequency ofbusiness profit and loss in table
4 differs from the number of businesses in table L .The frequency in table 4 is the number of returnsthat had business income or loss in adjusted grossincome. Thus community business income was countedon two returns, if separate returns were filed,since each spouse reported half of the business in-come or loss . On joint returns of husband and wife,frequency of business in adjusted gross income wascounted as one return, although there may have beenmore than one business operated .
STANDARD METROPOLITAN STATISTICAL AREAS
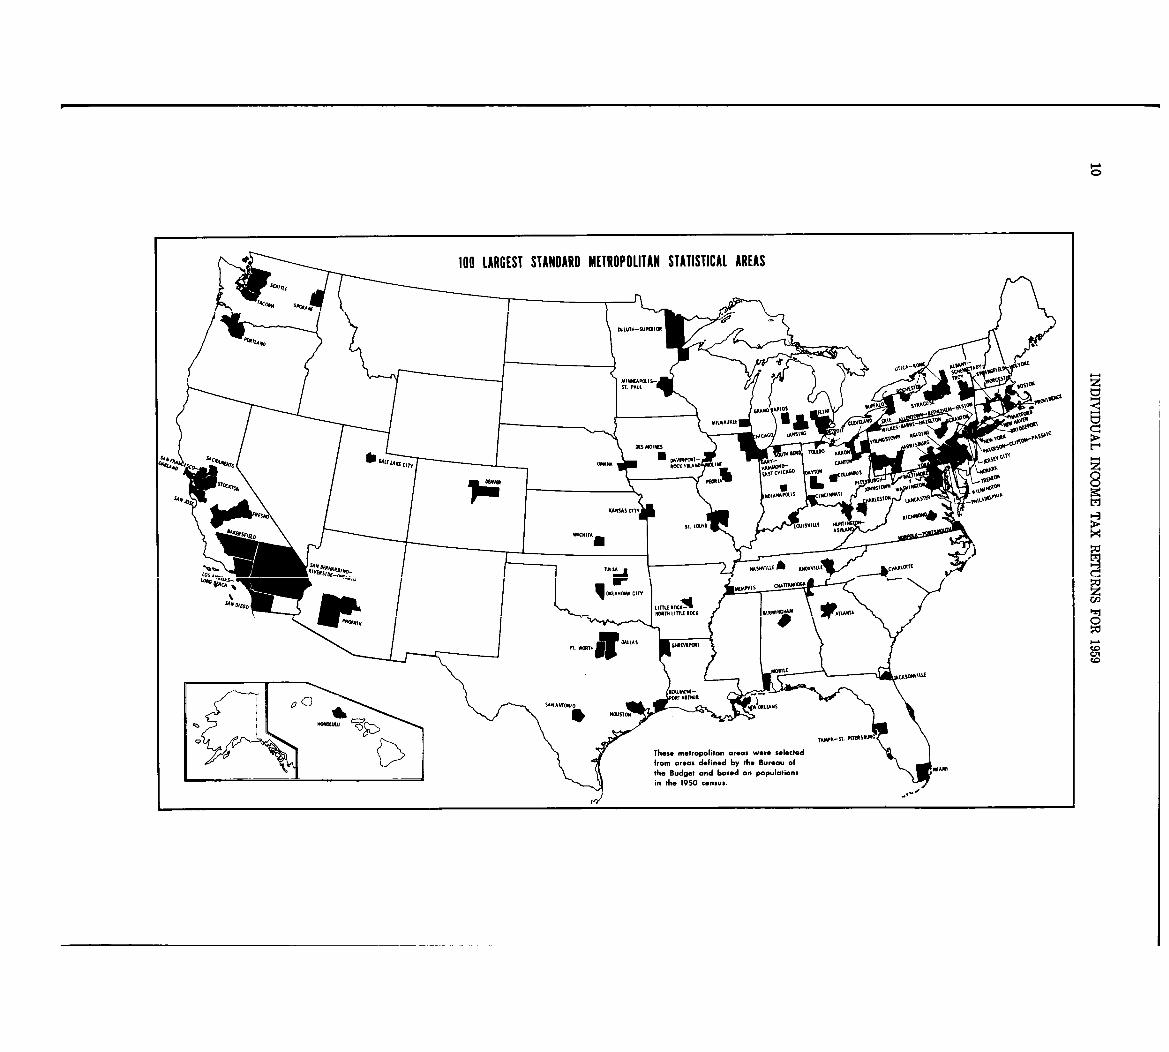
Selected data for individual income tax returnsfor the tax year 1959 are presented for 100 standardmetropolitan statistical areas in tables 18 and 19 .These 100 standard metropolitan statistical areasare those, within the 50 States, having the largestpopulation based on the 1950 census and conformingto the 1959 definitions for standard metropolitanstatistical areas developed by the Bureau of theBudget. These definitions for standard metropolitanstatistical areas were published by -the Bureau inStandard Metropolitan Statistical Areas, 1959 .Data for the 100standard metropolitan statistical
areas include data from both taxable and nontaxablereturns for 1959 . The items presented and theclassification of returns by metropolitan areas aredescribed under "Explanation of Classifications andTerms." Information for these metropolitan areaswas estimated from the regular Statistics of Incomesample of returns which isexplained under "Descrip-tion of Sample . "A map of the United States shows the plotted areas
covered by each of these 100 standard metropolitanstatistical areas .
Table 18 shows, for each standard metropolitan.statistical area, number of returns, adjusted grossincome (net), significant items of income, taxableincome, and income tax after credits. In table Mbelow, data for these 100 standard metropolitanstatistical areas are summarized and the totalscompared with similar data for the United States asshown in table 16 which presents data by States .The same weighting factors were used for State andmetropolitan area data. This comparison shows that,data for the 100 standard metropolitan statisticalareas include more than 50 percent of the United
l'-A
100 LARGEST STANDARO METROPOLITAN STATISTICAL AREA S114 rq,
NCINIM
OULUTH-SUPERIOR
UTICA-9 NLIA kam LotS
MINNEAPOLIS- C&C,ST. PAUL z
t=11-4
GRAND AP10S VOAUIA-,P%jo%%
I'Ll'a set
MILWAUKEE & 110,10) WE 10% %AHL tv
LANSING OIT 'MillREAD
-,*tow
DES MOINES "ICAGO IVOU"Ail
$4,, S4AVLAOK
"FR4 C#44WO SALT LAKE City DAYINPONT Ck" 1-4110 OMAHA MOCK ISLA Its
ARY CANT -OSV
PEEMA "00%
,locoo, a L
344, NDIANK POLIS INCINMAIIMILLESION
ES KANSAS CITY4
4491. LOUIS LOUISVILLE HUNTI
SFIIED WICHITAASHLAX
TUL= NASHVILLE 011 "W"OVILLE
Los .--Loft 4~'Qll or14 MMPHIS C"An
% I
OKLAHOMA CITY
SAAF OIW0 LITTLE ROCK-4NORTH LITTLE ROCK *ATIANTI` 1%j
0
~0
FT. WDRTI
CKSOMILIAL
BEAUMCWI-POWRT ARTHU R
SANAMTONNO LEANS
HONOLULU
Z>TXMPh-ST- PETERS&UNG
These metropolitan areas wore sele d
from orow defined by the Bureau octe
Low;= The Budget and based on populations
'MIAMI
in t * 1950 census.
INDIVIDUAL INCOME TAX RETURNS FOR 1959
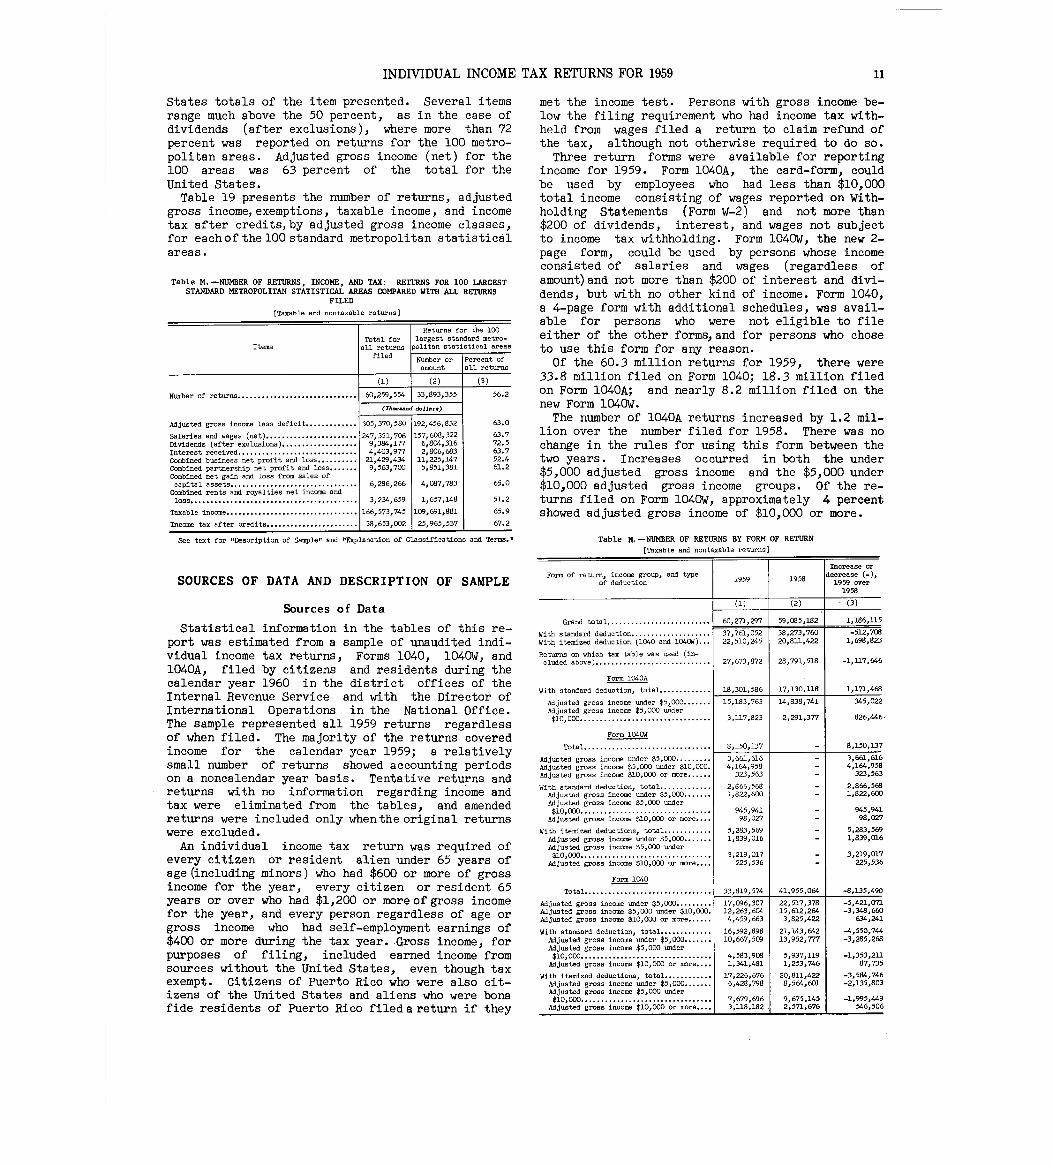
States totals of the item presented . Several itemsrange much above the 50 percent, as in the case ofdividends (after exclusions), where more than 72percent was reported on returns for the 100 metro-politan areas . Adjusted gross income (net) for the100 areas was 63 percent of the total for theUnited States .
Table 19 presents the number of returns, adjustedgross income,exemptions, taxable income, and incometax after credits,by adjusted gross income classes,for each of the 100 standard metropolitan statisticalareas .
Table M. -NUMBER OF RETURNS, INCOME, AND TAX: RETURNS FOR 100 LARGESTSTANDARD METROPOLITAN STATISTICAL AREAS COMPARED WITH ALL RETURNS
FILED
[Taxable and nontaxable returns ]
Its-
Number of returns . . . . . . . . . . . . . . . . . . . . . . . . . . . . . .
Adjusted gross income less deficit . . . . . . . . . . . . .
Salaries and wages (net) . . . . . . . . . . . . . . . . . .
Dividends (after exclusions) . . . . . . . . . . . . . .
Interest received . . . . . . . . . . . . . . . . . . . . . . . . . . . . . .Combined business net profit and loss . . . . . . . . . .Combined partnership net profit and loss . . . . . . .
Combined net gain and loss from sales o fcapital assets. . . . . . . . . . . . . . . . . . . . . . . . . . . . . . . .
Combined rents and royalties net income andloss . . . . . . . . . . . . . . . . . . . . . . . . . . . . . . . . . . . . . . . . . .
Taxable income . . . . . . . . . . . . . . . . . . . . . . . . . . . . . . . . .
Income tax after credits . . . . . . . . . . . . . . . . . . . . . . .
Total fora 11 returns
filed
(1 )60,259,554
Returns for the 100largest standard metro-politan statistical areas
Number oramount
(3 )(2 )
33,893,355
Percent ofall returns
56 . 2
(Th- .-d doll. .. )
305,370,580
247,351,7069,384,1774,403,97,21,429,4349,563,700
192 '
456' 832
157 , 6 .8 , 32 2
6, " 3162 806
11,225,14 75,851,38 1
6,286,26 6
3,234,659
166,573,74 5
38,653,002
63 .0
63 .772 .563 .752 .461 . 2
4,087,783
1,657,14 8
109,691,881
25,965,537
65 .0
51 .2
65 .9
67. 2
See text for aDescription of Sample" and flExplanation of Classifications and Terms .11
SOURCES OF DATA AND DESCRIPTION OF SAMPLE
Sources of Data
Statistical information in the tables of this re-port was estimated from a sample of unaudited indi-vidual income tax returns, Forms 1040, 1040W, and1040A, filed by citizens and residents during thecalendar year 1960 in the district offices of theInternal Revenue Service and with the Director ofInternational Operations in the National Office .The sample represented all 1959 returns regardlessof when filed . The majority of the returns coveredincome for the calendar year 1959; a relativelysmall number of returns showed accounting periodson a noncalendar year basis . Tentative returns andreturns with no information regarding income andtax were eliminated from the tables, and amendedreturns were included only whenthe original returnswere excluded .An individual income tax return was required of
every citizen or resident alien under 65 years ofage(including minors) who had $600 or more of grossincome for the year, every citizen or resident 65years or over who had $1,200 or moreofgross incomefor the year, and every person regardless of age orgross income who had self-employment earnings of$400 or more during the tax year .-Gross income, forpurposes of filing, included earned income fromsources without the United States, even though taxexempt . Citizens of Puerto Rico who were also cit-izens of the United States and aliens who were bonafide residents of Puerto Rico fileda return if they
1 1
met the income test . Persons with gross income be-low the filing requirement who had income tax with-held from wages filed a return to claim refund ofthe tax, although not otherwise required to do so .Three return forms were available for reporting
income for 1959 . Form 1040A, the card-form, couldbe used by employees who had less than $10,000total income consisting of wages reported on With-holding Statements (Form W-2) and not more than$200 of dividends, interest, and wages not subjectto income tax withholding . Form 1040W, the new 2-page form, could be used by persons whose incomeconsisted of salaries and wages (regardless ofamount)and not more than $200 of interest and divi-dends, but with no other kind of income . Form 1040,a 4-page form with additional schedules, was avail-able for persons who were not eligible to fileeither of the other forms,and for persons who choseto use this form for any reason .Of the 60 .3 million returns for 1959, there were
33 .8 million filed on Form 1040; 18.3 million filedon Form 1040A; and nearly 8 .2 million filed on thenew Form 1040W .The number of 1040A returng increased by 1.2 mil-
lion over the number filed for 1958 . There was nochange in the rules for using this form between thetwo years . Increases occurred in both the under$5,000 adjusted gross income and the $5,000 under$10,000 adjusted gross income groups . Of the re-turns filed on Form 1040W, approximately 4 percentshowed adjusted gross income of $10,000 or more .
Table N. -NUMBER OF RETURNS BY FORM OF RETURN
[Taxable and nontaxable returns]
Increase O rForm of return, income group, and type
1959 1958decrease -) ,
of deduction 1959 over1958
(1) (2) (3 )
Grand total. . . . . . . . . . . . . . . . . . . . . . . . . . 60,271,297 59,085,182 1,186,11 5
With standard deduction. . . . . . . . . . . . . . . . . . . . 37,761,052 38,273,760 -512,M08
With itemized deduction (1040 and 104OW) . . . 22,510,245 20,811,422 1,698,823
Returns on which tax table was used (in-cluded above) . .
.. . .
.. . . . . . . . . . . . . . . . . . . . . . 27,673,872 28,791,518 -1,117,64 6
Form 1040
With standard deduction, total . . . . . . . . . . . . . 18,301,586 17,130,119 1,171,468
Ad justed gross income under $5,000 . . . . . . . 15,183,763 14,838,741 345,022
Adjusted gross income $5,000 under$10,000 . . . . . . . . . . . . . . . . . . . . . . . . . . . . . . . . . 3,117,823 2,291,377 826,446
Form 104OW
Total . . . . . . . . . . . . . . . . . . . . . . . . . . . . . . . . 8,150,137 - 8,150,137
Adjusted gross income under $5,000. . . . . . . . . 3,661,616 - 3,661,616
Ad jested gross income $5,000 under ~10,000 . 4,164,958 - 4,164,958
Adjusted gross income $10,000 or more . . . . . . 323,563 - 323,563
With standard deduction, total. . . . . . . . . . . . . 2,866,568 - 2,866,568
Adjusted gross income under $5,000. . . . . . . 1,822,600 - 1,822,60C
Adjusted gross income $5,000 unde r$10,000 . . . . . . . . . . . . . . . . . . . . . . . . . . . . . . 945,941 - 945,941
Adjuated gross income $10 or more . . . . 98,027 - 98,021
With itemized deductions~ total . . . . . . . . . . . . 5,283,569 - 5,283,569
Adju~sted gross income under $5,000. . . . . . . 1,839,016 - 1,839,01 C
Adjuated gross income $5,000 unde r
$10,000. . . . . . . . . . . . . . . . . . . . . . . . . . . . . . . . . 3,219,017 - 3,219,01-o
Adjusted gross income $10,000 or more . . . . 225,536 - 225,53 E
Form 104 0
Total. . . . . . . . . . . . . . . . . . . . . . . . . . . . . . . . 33,819,574 41,955,064 -8,135,49C
Adjusted gross income under $5,000 . . . . . . . . . 17,096,307 22,517,378 -5,421,071
Adjusted gross income $5,000 under $10,000 . 12,263,604 15,612,264 -3,348,66C
Adjusted gross income $10,000 or more. . . . . . 4,459,663 3,825,422 634,24 1
With standard deduction, total . . . . . . . . . . . . . 16,592,898 21,143,642 -4,550,744
Adjusted gross income under $5,000 . . . . . . . 10,667,509 13,952,777 -3,285,26E
Adjusted gross income $5,000 under$10,000 . . . . . . . . . . . . . . . . . . . . . . I . . . . . . . . . . 4,583,908 5,937,119 -1,353,21 3
Adjusted gross income $10,000 or more . . . . 1,341,481 1,253,746 87,73!
With itemized deductions, total . . . . . . . . . . . . 17,226,676 20,811,422 -3,5a4,74 (Adjusted gross income under $5,000 . . . . . . . 6,428,798 8,564,601 -2,135,80--
Adjusted gross income $5,000 under$10,000 . . . . . . . . . . . . . . . . . . . . . . . . . . . . . . . . . 7
'679696 _4'9 675-1,995,44S
Adjwted gross income $10,000 or more . . . . 3,11., .1.2 2:571,676 546,50
r
12 INDIVIDUAL INCOME TAX RE'rURNS FOR 1959
The total number of Form 1040 returns for 1959showed a decrease of 8 .1 million as compared withthose for the previous year . This decrease resultedfrom the use of the new return,Form 104OW, of which8 .2 millions were filed .Of the returns for 1959, there were 22 .5 million
on which deductions were itemized and 37.8 millionon which the standard deduction was used . One-halfmillion fewer returns had the standard deductionthen for 1958 .Taxpayers used the tax table on 27 .7 million
returns with adjusted gross income under $5,000 for1959 . This was 77 percent of the returns with ad-justed gross income under $5,000, but only 46percent of the total returns filed for 1959 .
Table N shows a re'sume*'of the number of returnsby form of return, adjusted gross income groups,andtype of deduction for the years 1959 and 1958 .
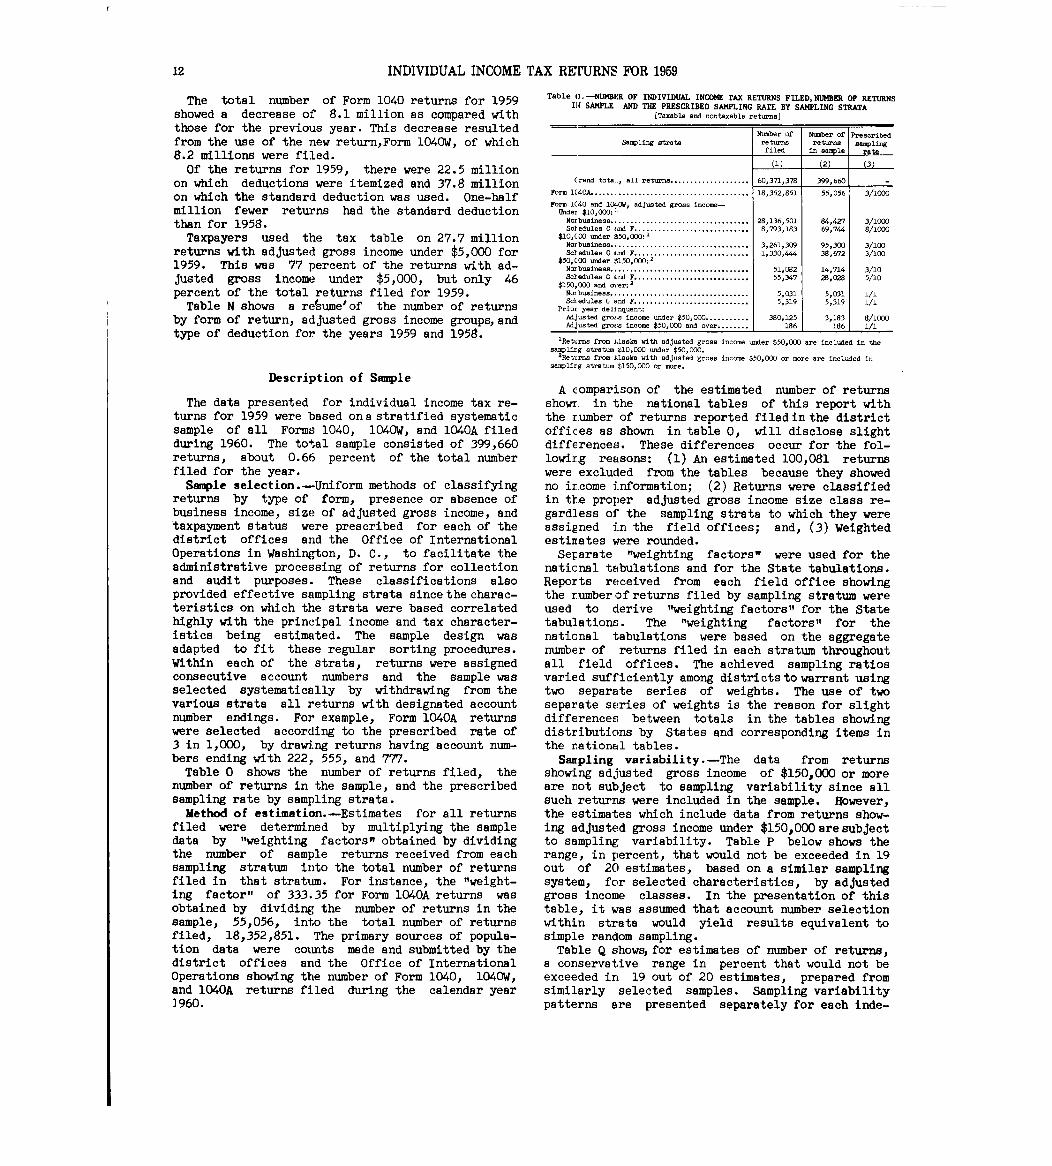
Tablejl), . -NUMBER OF INDIVIDUAL INCOME TAX RETURNS FILED,NUMBER OF RETURNSSAMPLE,, AND THE PRESCRIBED SAMPLING RATE BY SAMPLING STRATA
(Taxable and nontaxable returns ]
Number of~
r
of
Number of Prescribe dSampling strata -eturns returns samplin g
filed in sample rate
(1) (2) (3 )
(rand tota]_~ all returns . . . . . . . . . . . . . . . . . . . . 60,371,3718 399,660 -
Form lC40A . . . . . . . . . . . . . . . . . . . . . . . . . . . . . . . . . . . . . . .
l
18,352,851 55,056 3/1000
Form 1(40 and 1(~LOW, adjusted gross income-Undex $10,000 :1
. . . . . . . . . . . . . . . . . . . . . . . . . . . . . . . . .No,business . 28,136,501 84,427 311000;.Scl edules C nd F . . . . . . . . . . . . . . . . . . . . . . . . . . . . . 8,793,183 69,744 8/1000
$10~COO under $50,000 : 1Norbusinese . 3,261,309 95,300 3/100Scledules
C
1,330,"4 38,672 3/100$50,COO under $150,000 : 2
Norbusiness . . . . . . . . . . . . . . . . . . . . . . . . . . . . . . . . . . . 51,082 14,714 3110Scledul a C and F . . . . . . . . . . . . . . . . . . . . . . . . . . . . . 55,347 28,028 5/1050,000 1 m,er . 2
No~business . . . . . . . . . . . . . . . . . . . . . . . . . . . . . . . . . . . 5,031 5,031 1/1Sc~ ad ules C and F . . . . . . . . . . . . . . . . . . . . . . . . . . . . . 5,319 5,319 1/1
Pri.r year delinquent :Adjusted gro~a income under *50,000 . . . . . . . . . . . 380,125 3,183 8/loooAdjusted grove income $50,000 and over . . . . . . . . . 186 186 . 1/1
'Ret~rns from Alaska with adjusted gross income under $50,000 are included in the
sam lirg tr tum~10,000 under $50,00D .
a2PRetLms f2~ Alaska with adjusted gross income $50,000 or more are included insampling stratum $150,000 or more.
Description of Sampl e
The data presented for individual income tax re-turns for 1959 were based ona stratified systematicsample of all Forms 1040, 1040W, and 1040A filedduring 1960 . The total sample consisted of 399,660returns, about 0 .66 percent of the total numberfiled for the year .Sample selection .-Uniform methods of classifying
returns by type of form, presence or absence ofbusiness income, size of adjusted gross income, andtaxpayment status were prescribed for each of thedistrict offices and the Office of InternationalOperations in Washington, D. C ., to facilitate theadministrative processing of returns for collectionand audit purposes . These classifications alsoprovided effective sampling strata since the charac-teristics on which the strata were based correlatedhighly with the principal income and tax character-istics being estimated . The sample design wasadapted to fit these regular sorting procedures .Within each of the strata, returns were assignedconsecutive account numbers and the sample wasselected systematically by withdrawing from thevarious strata all returns with designated accountnumber endings . For example, Form 1040A returnswere selected according to the prescribed rate of3 in 1,000, by drawing returns having account num-bers ending with 222, 555, and 777 .
Table 0 shows the number of returns filed, thenumber of returns in the sample, and the prescribedsampling rate by sampling strata .Method of estimation.-Estimates for all returns
filed were determined by multiplying the sampledata by "weighting factors" obtained by dividingthe number of sample returns received from eachsampling stratum into the total number of returnsfiled in that stratum . For instance, the "weight-ing factor" of 333.35 for Form 1040A returns wasobtained by dividing the number of returns in thesample, 55,056, into the total number of returnsfiled, 18,352,851 . The primary sources of popula-tion data were counts made and submitted by thedistrict offices and the Office of InternationalOperations showing the number of Form 1040, 104OW,and 1040A returns filed during the calendar year1960 .
A comparison of the estimated number of returnsshown in the national tables of this report withthe rumber of returns reported filedin the districtoffices as shown in table 0, will disclose slightdifferences . These differences occur for the fol-lowirg reasons : (1) An estimated 100,081 returnswere excluded from the tables because they showedno income information; (2) Returns were classifiedin the proper adjusted gross income size class re-gardless of the sampling strata to which they wereassigned in the field offices ; and, (3) Weightedestinates were rounded .Separate "weighting factors" were used for the
national tabulations and for the State tabulations .Reports received from each field office showingthe rumber of returns filed by sampling stratum wereused to derive "weighting factors" for the Statetabulations . The "weighting factors" for thenational tabulations were based on the aggregatenumber of returns filed in each stratum throughoutall field offices . The achieved sampling ratiosvaried sufficiently among districts to warrant usingtwo separate series of weights . The use of twoseparate series of weights is the reason for slightdifferences between totals in the tables showingdistributions by States and corresponding items inthe rational tables .
Sanpling variability .-The data from returnsshowing adjusted gross income of $150,000 or moreare rot subject to sampling variability since allsuch returns were included in the sample . However,the estimates which include data from returns show-ing adjusted gross income under $150,000 are subjectto sampling variability. Table P below shows therange, in percent, that would not be exceeded in 19out of 20 estimates, based on a similar samplingsystem, for selected characteristics, by adjustedgross income classes. In the presentation of thistable, it was assumed that account number selectionwithin strata would yield results equivalent tosimple random sampling .
Table Q showsfor estimates of number of returns,a conservative range in percent that would not beexceeded in 19 out of 20 estimates, prepared fromsimilarly selected samples . Sampling variabilitypatterns are presented separately for each inde-
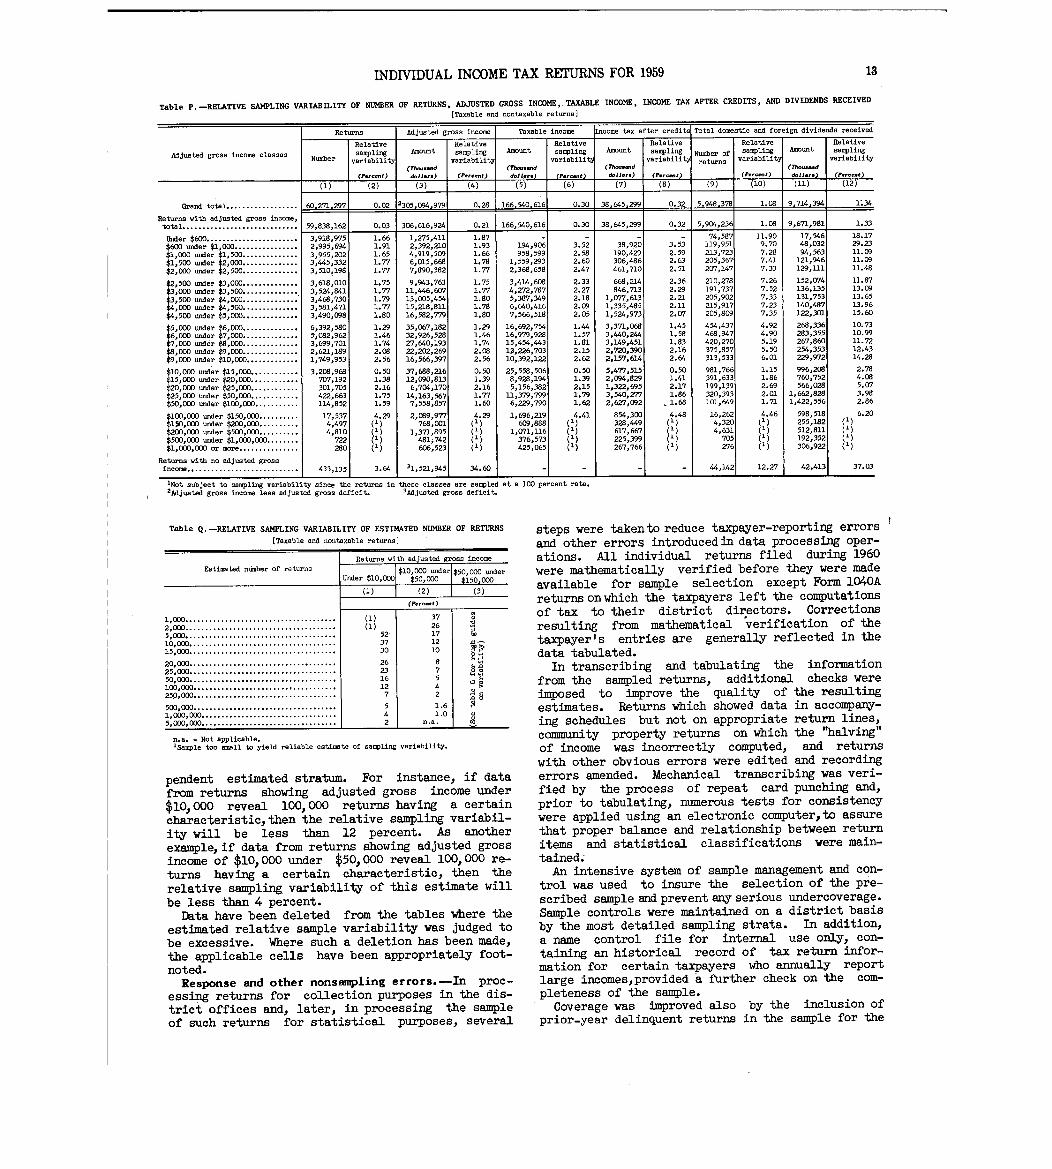
INDIVIDUAL INCOME TAX RETURNS FOR 1959 1 3
Table P.-RELATIVE SAMPLING VARIABILITY OF NUMBER OF RETURNS, ADJUSTED GROSS INCOME, .TAXABLE INCOME, INCOME TAX AFTER CREDITS, AND DIVIDENDS RECEIVED
[Taxable and nontaxable returns )
Returns Adjusted gross income Taxable income Income tax after credits Total domestic and foreign dividends received
Relative Relati a Relative Relati a Relative Relative
Adjusted gross income classes sampling Amount sampling Amount sampling Amount sampling Numb r ofsampling unt sampling
Number variability variability variabilit~
~
variability returns variability variability
(rhm...d (Th-.-d (7b-.-d (A--d(P.-t) d.11
)
(P.,.-t) d.11... (P.,.-t) (Percmt)_ ,)_!tzj (P ..mt)-
(1) (2) (37 R) (5) (6) (7) (8) (9) (10)
7(17
(12~
Grand total . . . . . . . . . . . . . . . . . . 60,271,297 0 .02 2305,094,979 0.28 166,540,616 0.30 38,645,299 0.32 5,948,378 1 .08 9,714,394 1*. 34
Returns with adjusted gross income,total . . . . . . . . . . . . . . . . . . . . . . . . . . . . . 59,838,162 0.03 306,616,924, 0.21 166,540,616 0.30 38,645,299 0.32 5,9C4,236 1 .08 9,671,981 1 .33
Under $600. . . . . . . . . . . . . . . . . . . . . . . 3,918,975 1 .66 1,275,411 1.87 -
-
- - 74,587 11 .90 17,546 18 .17
$600 under $1,000. . . . . . . . . . . . . . . . 2,995,694 1.91 2,392,210 1 .93 194,906 3 .52 38,920 3 .53 119,951 9 .70 48,032 29 .23
$1,000 under $1,500. . . . . . . . . . . . . . 3,955,202 1 .65 4,919,509 1.66 958,599 2.58 190,429 2 .59 213,723 7 .28 94,563 11 .09
$lp50D under $2,000. . . . . . . . . . . . . . 3,445,332 1 .77 6,015,669 1.78 1,559,293 2.60 306,486 2.63 205,367 7.41 121,946 11 .09
$2,000 under $2,500. . . . . . . . . . . . . . 3,510,198 1 .77 7,890,382 1 .77 2,368,658 2.47 461,710 2.51 2(Y7,147 7.33 129,ni 11 .48
$2,500 under $3,000. . . . . . . . . . . . . . 3,618,010 1 .75 9,943,763 1.75 3,414,608 2.33 668,214 2.36 210,278 7.26 152,074 11 .8 7
$3,000 under $3,500. . . . . . . . . . . . . . 3,524,841 1 .77 11,446,6(Y7 1 .77 4,Z72,787 2.27 846,713 2 .29 191,737 7.52 136,135 13 .09
$3,500 under $4,000. . . . . . . . . . . . . . 3,468,730 1 .79 13,005,454 1 .80 5,387,349 2.18 1,077,613 2 .21 205,902 7.33 131,753 13 .65
$4,000 under $4,500. . . . . . . . . . . . . . 3,581,471 1.77 15,218,811 1 .78 6,640,416 2.09 1,335,485 2 .11 215,917 7.23 140,487 13 .9 6
$4,500 under $5,000. . . . . . . . . . . . . . 3,490,098 1.80 16,582,779 1 .80 7,566,518 2.05 1,524,973 2X7 205,809 7.35 122,3M 15.60
$5,000 under $6,000. . . . . . . . . . . . . . 6,392,580 1.29 35,067,182 1 .29 16,692,754 1.44 3,371,068 1 .45 454,437 4 .92 268,336 10.73
$6 000 under $7,000. . . . . . . . . . . . . . 5,082,962 1.46 32,926,528 1 .46 16,979,928 1.57 3,440,244 1 .58 468,947 4 .90 283,355 10 .99
$7:000 under $8,000. . . . . . . . . . . . . . 3,699,701 1.74 27,640,193 1 .74 15,454,443 1.81 3,149,451 1 .83 420,270 5 .19 267,860 11.72
$8,000 under $9,000. . . . . . . . . . . . . . 2,621,189 2.08 22,202,269 2 .08 13,226,703 2 .15 2,720,390 2 .16 375,857 5 .50 254,353 12 .43
$9,000 under $10,000 . . . . . . . . . . . . . . 1,749,953 2.56 16,566,397 2 .56 10,392,122 2 .62 2,157,614 2 .64 313,533 6 .01 229,972 14 .28
$10,000 under $15,000. . . . . . . . . . . . 3,208,968 0 .50 37,688,216 0 .50 25,558,506 0 .50 5,477,515 0 .50 981,766 1 .15 996,208 2 .78
$15,000 under $20,000. . . . . . . . . . . . 707,192 1 .38 12,090,813 1 .39 8,928,194 1 .39 2,094,829 1 .41 391,633 1 .86 760,752 4 .08
$20,000 under $25,000 . . . . . . . . . . . . 301,705 2 .16 6,704,170 2 .16 5,156,382 2 .15 1,322,695 2 .17 199,139 2 .69 566,028 5X7
$25,000 under $50,000 . . . . . . . . . . . . 422,663 1 .75 14,163,567 1 .77 1-1,379,799 1 .79 3,540,277 1 .86 320,393 2 .01 1,662,828 3 .98
$50,000 under $100,000 . . . . . . . . . . . 114,852 1 .59 7,558,857 1 .60 6,229,790 1 .62 2,627,092 1 .68 101,649 1 .71 1,422,556 2 .86
$100,000 under $150,000 . . . . . . . . . . 17 537 4 .29 2,089 977 4 .29 1,696,219 4 .41 854,3DO 4 .48 16,262 4 .46 598,518 6 .20
$150,000 under $200,000 . . . . . . . . . . 4 :497
(1
768 :001 (1) 609,888
(1
328,449 (1) 4 320 (1) 255,182 (1 )
$200,000 under $500,000 . . . . . . . . . . 4 , 810 1) 1,371 895
1
1,071,116 617,667 4 631 512,811
$500,000 under $1,000,000 . . . . . . . . 722 (1) 742481 : 376,573 225,399 705 192,35 2
$1,000,000 or more . . . . . . . . . . . . . . . 280 (1) 606 , 523 425,065 267,766 276 (1) 306,922
Returns with no adjusted gross
1
income . . . . . . . . . . . . . . . . . . . . . . . . . . . . 433,135 3 .64 31,521,945 34 .60 - 44,142 12 .271
42,413 37 .03
'Not subject to sampling variability since the returns in these classes are sampled2Adjusted gross income less adjusted gross deficit. 3Adjusted gross deficit.
at a 100 percent rate .
Table Q .-RELATIVE SAMPLING VARIABILITY OF ESTIMATED NUMBER OF RETURNS
[Taxable and nontaxable returns ]
Estimated number of returns
11000 . . . . . . . . . . . . . . . . . . . . . . . . . . . . . . . . . . . . . .
2,000 . . . . . . . . . . . . . . . . . . . . . . . . . . . . . . . . . . . . . .5,000 . . . . . . . . . . . . . . . . . . . . . . . . . . . . . . . . . . . . . .10,000. . . . . . . . . . . . . . . . . . . . . . . . . . . . . . . . . . . . .15,000. . . . . . . . . . . . . . . . . . . . . . . . . . . . . . . . . . . . .
20,000. . . . . . . . . . . . . . . . . . . . . . . . . . . . . . . . . . . . .
25,000. . . . . . . . . . . . . . . . . . . . . . . . . . . . . . . . . . . . .50,000. . . . . . . . . . . . . . . . . . . . . . . . . . . . . . . . . . . . .100,000. . . . . . . . . . . . . . . . . . . . . . . . I . . . . . . . . . .
259,000. . . . . . . . . . . . . . . . . . . . . . . . . . . . . . . . . : . .
500,000. . . . . . . . . . . . . . . . . . . . . . . . . . . . . . . . . . . .1,000,000. . . . . . . . . . . . . . . . . . . . . . . . . . . . . . . . . .5,000,000. . . . . . . . . . . . . . . . . . . . . . . . . . . . . . . . . .
Returns with adjusted gross inco
Under $10,000$10,000 under $50,000 under
$50,000 $150,000
(2) (3 )
n.a . - Not applicable.ISample too small to yield reliable estim to of
52'3730
262316127
542
(P.-t )
3726171210
87
sampling variability.
pendent estimated stratum . For instance, if datafrom returns showing adjusted gross income under$10,000 reveal 100,000 returns having a certaincharacteristic,then the relative sampling variabil-ity will be less than 12 percent . As anotherexample,if data from returns showing adjusted grossincome of $10,000 under $50,000 reveal 1000000 re-
turns having a certain ch~Lracteristic, then therelative sampling variability of this estimate willbe less than 4 percent .
Data have been deleted from the tables where theestimated relative sample variability was judged tobe excessive . Where such a deletion has been made,the applicable cells have been appropriately foot-noted.Response and other nonsmpling errors .-In proc-
essing returns for collection purposes in the dis-trict offices and, later, in processing the sampleof such returns for statistical purposes, several
steps were takento reduce taxpayer-reporting errorsand other errors introducedin data processing oper-ations . All individual returns filed during 1960
were mathematically verified before they were madeavailable for sample selection except Form 1040Areturns onwhich the taxpayers left the computationsof tax to their district directors . Correctionsresulting from mathematical verification of thetaxpayer's entries are generally reflected in thedata tabulated .In transcribing and tabulating the information
from the sampled returns, additional checks wereimposed to improve the quality of the resultingestimates . Returns which showed data in accompany-ing schedules but not on appropriate return lines,community property returns on which the "halving"of income was incorrectly computed, and returnswith other obvious errors were edited and recordingerrors amended . Mechanical transcribing was veri-fied by the process of repeat card punching and,prior to tabulating, numerous tests for consistencywere applied using an electronic computer,to assurethat proper balance and relationship between returnitems and statistical classifications were main-tained .-An intensive system of sample management and con-
trol was used to insure the selection of the pre-scribed sample and prevent any serious undercoverage .Sample controls were maintained on a district basisby the most detailed sampling strata . In addition,a name control file for internal use only, con-taining an historical record of tax return infor-mation for certain taxpayers who annually reportlarge incomes,provided a further check on the com-pleteness of the sample .
Coverage was improved also by the inclusion ofprior-year delinquent returns in the sample for the
14 INDIVIDUAL INCOME TAX RE'PURNS FOR 195 9
purpose of estimating data for 1959 returns thatwere filed after December 31, 1960 . It was feltthat the characteristics of 1959 returns filed toolate to be included could best be represented by asample of previous year delinquent returns filedduring 1960. As can be seen in table 0, the numberof delinquent returns filed during 1960 was 380thousand .However, the controls maintained over the selec-
tion of the sample and the processing of the sourcedata in the field offices did not completely elim-inate the possibility of error. Also, practicaloperating considerations necessitated allowance ofreasonable tolerance in controlling the processing,of these data within the Statistics Division .
EXPLANAXION OF CLASSIFICATIONS AND TERMS
Classifications
Data are classified by adjusted gross incomeclasses.,taxable and nontaxable status, returnswith standard or itemized deductions, size of tax-able income., marital status of taxpayer, number ofdependents, types of tax, taxpayment status andtypes of taxpayments, selected patterns of income,States, and metropolitan areas .Adjusted gross income classes . -The amount of
adjusted gross income reported by the taxpayer onhis return was the basis for classifying data forthe size of adjusted gross income . Adjusted grossdeficit and breakeven in adjusted gross income wereclassified as "No adjusted gross income." Wherevertaxable and nontaxable data are combined, the non-taxable data are distributed by class according tothe amount of adjusted gross income shown on thereturn, although when shown separately, data fromnontaxable returns with adjusted gross income of5,000 or more are grouped in the nontaxable class,5,000 or more .Taxable and nontaxable returns .-Taxable and mn-
taxable classifications were dependent upon thepresence or absence of an income tax after creditsallowed against this tax, and the self-employmenttax was disregarded. In the case of returns onForm 104OW, the income tax after credits was com-puted for each return since it was not a requireditem on the return itself. Tax status was deter-mined from the computed amount .Taxable returns had an income tax left after
credits against this tax were deducted . When theincome tax after credits was less than $1.00, thereturn was classified as a taxable return. Lastyear such a return was classified as nontaxable .Nontaxable returns were without an income tax
after credits . Some of these returns had incometax before credits which was eliminated by the taxcredits .Returns with standard deduction or with itemized
deductions.-Returns with standard deduction in-cluded (1) Form 1040A returns, (2) Form 1040 and104OW returns with adjusted gross income under$5,000 on which the income tax was determined fromthe tax table, (3) Form 1040 and 104OW returnswith adjusted gross income of $5,000 or more onwhich the standard deduction was elected by thetaxpayer, and (4) returns with no adjusted grossincome.
Returns with itemized deductions were returns,Form 1040 and 104OW, with adjusted gross incomeagain3t which itemized nonbusiness deductions wereclaimed by the taxpayer in the computation of histaxable income, However, a relatively few separatereturns of married persons who had no deductions(standard or itemized) were classified as itemizeddeduction returns .Taxable income classes.-This classification was
applied to the amount of positive taxable incomeupon which the income tax was based . The class in-terva:-s coincide with the taxable income bracketsof the three income tax rate schedules applying to(1) joint returns and returns of surviving spouse,(2( separate returns of husbands and wives and re-turns of single persons not head of household orsurviiring spouse, and (3) returns of head of house-hold . Taxable income was reported on all itemizeddeduc-~ion returns regardless of the amount ofadjus-;ed gross income, and on standard deductionreturns with adjusted gross income of $5,000 ormore, Forms 1040 and 1040W. It was mechanicallyCOMPU7~ed for all returns where the tax table wasused tmd for returns, Form 1040A, with total in-come $5,000 under $10,000.Types of tax.-Returns were classified for the
type of income tax reported, that is, the regularnormal . tax and surtax combined, or the alternativetax. In this classification, the self-employmenttax WELS ignored .Returns with normal tax and surtax were those
showing the regular normal tax and surtax computedaccording to the tax rate schedules, and also in-cludecl returns on which the tax was determined fromthe t&x table. Normal tax and surtax occurred onall types of returns except those with long-termcapitE.1 gain on which the alternative tax was lessthan the regular tax .
Returns with alternative tax were returns withincome that contained an excess of net long-term
capitELl gain over net short-term capital loss andon which the tax computed by the alternative methodwas less than the regular normal tax and surtax onstatutory taxable income . The alternative tax didnot occur on returns under $18,000 taxable income .Patterns of income.-For a frequency distribution
of patterns of income, four selected sources are
presented singly and in combination . The sourcesselected were: salaries and wages, business or
profeEsion, partnership, and rents and royalties .Each E ource was a component of adjusted gross income,
as deEcribed in the "Sources Comprising AdjustedGross Income." No distinction was made as to
whether profit or loss occurred among the last
three sources, the presence of either being con-
sidered a source whenever present . These fourselected sources gave rise to 15 patterns and aregrOUPEd as having one, two, three, or four of the
selected sources. In any of these patterns, there
may have been also income from sources outside the
four Eelected sources .
Taxpayment status.-Returns were segregated into
three groups for this classification : (1) returns
with tax overpayment, (2) returns with tax due at
time cf filing, and (3) returns with neither over-
paymert nor tax due. Returns, Form 1040A, were
classified after the tax had been computed by thedistrict director but for this purpose tax item
INDIVIDUAL INCOME TAX RETURNS FOR 1959 15
were regarded as having been reported by the tax-payer . Overpayment and tax due bear the samemeaning as described under "Tax Items ., ,Returns with tax overpayment were those where
the sum of the income tax credits, tax withheld,and payments on declaration exceeded the combinedincome tax and self-employment tax, and there re-mained either a refund or a credit on estimated taxfor the subsequent year . Some returns had both re-fund and credit .Returns with tax due at time of filing were those
on which the sum of income tax credits,tax withheldfrom wages, and payments on declaration was lessthan the combined income tax and self-employmenttax . The amount of tax due was paid when the returnwas filed .Returns with neither overpayment nor tax due at
time of filing were returns on which the taxpayerreported that the sum of income tax credits, taxwithheld, and payments on declaration was equal tohis combined income and self-employment taxes .Sometimes these returns are called breakeven intax status, because there is neither overpaymentnor balance due .Types of taxpayment.-Taxpayers made prepayments
toward their total tax liability through tax with-held from wages and payments on declaration, thenpaid any balance due when the return was filedafter the close of the income year. Some taxpayershad no prepayments . Returns were separated intofour categories according to the prepayments : (1)only tax withheld, (2) tax withheld and payments ondeclaration, (3) only payments on declaration, and(4) neither tax withheld nor payments on declara-tion. Thesc taxpayments are described under "TaxItems .1 1Marital status of taxpayer . -Marital status was
determined by the taxpayer as of the last day ofhis tax year or the date of the death of a spouse .The five marital classifications-joint returns ofhusbands and wives, separate returns of husbandsand wives, returns of heads of household, returnsof surviving spouse, and returns of other singlepersons-were based on the marital condition in-dicated by the taxpayer with regard to name (ornames) of taxpayer, joint signatures, exemptionfor the taxpayer or for himself and spouse, checkmark denoting status as head of household or sur-viving spouse, and any other relevant data .Joint returns of husbands and wives were those on
which a married couple reported their combined in-come, or returns of married couples only one ofwhich had income but, nevertheless, exemptions forboth could be claimed .Separate returns of husbands and wives were re-
turns of married persons, each of whom filed areturn independent of his spouse and reported onlyhis own income, exemptions, and tax . Returns withcommunity income divided between husband and wifewere given this classification .Returns of heads of household were returns on
which the taxpayer signified this status . Head ofhousehold is an unmarried person (or one marriedto a nonresident alien) who furnished more thanhalf the maintenance of a home which was his resi-dence and which he shared with any related personfor whom he was entitled to the deduction for an
exemption (except multiple support), or shared withhis unmarried child, grandchild, or stepchild eventhough not a dependent, or who paid over half thecost of maintaining a household which was theprincipal abode of his parents, if either of themqualified as a dependent .Returns of surviving spouse were returns of wid-
ows and widowers who indicated this status . Asurviving spouse is a taxpayer whose spouse diedduring either of two preceding tax years and whohad not remarried, but who had maintained as hishome a household which was also the principal abodeof his child or stepchild for whom the taxpayerwas entitled to the deduction for exemption .Returns of single persons not head of household
or surviving spouse were those of unmarried indi-viduals who did not claim status as head of house-hold or surviving spouse . rNumber of dependents .-This year frequency dis-
tributions of returns have been based on the numberof taxpayers' children and also on the number ofdependents other than taxpayers' chilVen . Eachis an independent distribution .The number of taxpayers' children was reported
on the return and included sons, daughters, adoptedchildren, and stepchildren for whom the taxpayerscould claim the $600 exemption. The frequency ofreturns is shown in each marital status for nochildren, for one child through three children,and for four or more children .The number of dependents other than taxpayers'
children was reported on the returns also. Thesedependents included parents, near relatives, andpqrsons living in the taxpayer's household, eachof whom met the dependency qualifications thatallowed the taxpayers to claim the $600 exemption .Distribution of returns is shown in each maritalstatus for no such dependents, for one, two, andthree or more of these dependents .
States .-Classification by States was based onthe district in which the returns were filed . In-ternal revenue districts, or groups of districts,are identical with State boundaries, except thatthe two States of Washington and Alaska were inthe Seattle, Washington, Internal Revenue Districtand the District of Columbia was a part of theBaltimore, Maryland, Internal Revenue District .Returns having an address in the District ofColumbia or Alaska were classified independentlyfrom other returns filed in the respective districts -The Office of International Operations had chargeof returns with addresses outside the 50 States .These returns included those from Puerto Rico,Virgin Islands, Panama Canal Zone, and returns withforeign addresses, all of which were classified asOther areas .Standard metropolitan statistical areas .-The
taxpayer's county, when stated, and his post-officeaddress were the criteria upon which the returnwas classified for inclusion in a standard metro-politan statistical area . An elaborate systemwhich included all possible post offices within adefined standard metropolitan statistical area wasdeveloped whereby each area could be identified, orassembled from parts, even though the metropolitanarea crossed internal revenue districts or Stateboundaries .
16 INDIVIDUAL INCOME TAX RETURNS FOR 195 9
Sources Comprising Adjusted Gross Income
Salaries and wages (net) were amounts of compen-sation reported in adjusted gross incoW, exceptfor small amounts of wages (not over,$200 per re-turn) included in other income on Form 1040A re-turns . Net salaries and wages excluded salariesearned abroad which were tax exempt and receiptscovering absence from work because of sickness orinjury. Also, travel, transportation, educational,and other expenses connected with employment hadbeen deducted by the taxpayer if they were deducti-ble in computing adjusted gross income as statedin that definition . Prior to these adjustments,salaries and wages comprised the full amount ofwages, salaries, fees, commissions, tips, bonuses,and other forms of payment for services performedfor the employer including the value of merchandiseor property received in payment, as well as reim-bursed expenses received by the employee from hisemployer .
Dividends (after exclusions) were the domesticand foreign dividends reported in adjusted grossincome, exclusive of dividends (not more than $200per return) in other income on Forms 1040A . Suchdividends comprised :
1. Qualifying domestic dividends consisting of-a . Dividends from fully taxable corporations
received directly, or as a beneficiary of incomefrom estates and trusts, or as a partner's shareof untaxed partnership net profit, together with
b . The entire net profit of an entrepreneurwho elected to be taxed as a corporation, and theentire share of net profit from a partners-hip thatelected to be so taxed, the total of which was re-duced by an exclusion not exceeding $50, and
2 . Nonqualifying dividends, foreign and domestic,from which no exclusion was allowed .On joint returns, if both husband and wife re-
ceived qualifying dividends, each excluded up to$50 against his respective dividends . Nonqualifyingdividends were those from China Trade Act corpora-tions, tax-exempt organizations, certain corpora-tions doing business in possessions of the UnitedStates, and foreign corporations .Dividends did not include the so-called dividends
on deposits or withdrawal accounts in mutual savingsbanks, cooperative banks, domestic building andloan or savings and loan associations, Federalsavings and loan associations, and Federal creditunions . All such income was considered interestfor income tax purposes .
Interest received was that reported in adjustedgross income with the exception of small amounts(not more than $200 per return) in other income onForm 1040A returns . This item included interestfrom bonds, debentures, notes, mortgages, and per-sonal loans, interest received or credited on bankdeposits, savings accounts, and deposits in organi-zations listed above, as well as partially tax-exempt interest and interest from tax-free covenantbonds received directly or through partnerships andfiduciaries .Business net profit or net loss was reported by
individuals who were sole proprietors ofa business,farm, or profession, and who did not elect to betaxed as a corporation. When there were two or more
sole proprietorship businesses operated during theyear, the single amount of profit or loss includedin adjuE:ted gross income represented the combinedprofits and losses from all business activities .The solE! proprietor was required to exclude divi-dends from the business receipts and to report themwith dividend income for the purpose of dividendexclusion and tax credit .
Business expenses deductible from business receiptsincluded such items as cost of goods sold, salariesand wages paid employees, interest on business in-debtedness,taxes on business and business property,bad debts arising from sales or services, deprecia-tion including additional first-year depreciation,obsolescence, depletion, casualty losses on busi-ness propertyrent, repairs, supplies, advertising,selling expense, insurance, and other costs ofoperating the business . Compensation of the soleproprietor was not allowed as a business deductionand the net operating loss deduction was not re-ported among the business expenses .Partnership net profit or net loss was reported
by persons who were members of a partnership,syndicate, joint venture, or association that did
not eleet to be taxed as a corporation. The part-
ner's P3'Ofit or loss from such a partnership washis slutre of the ordinary income or loss of the
enterprLse and payments made to him as salary orfor the use of capital . If the individual was amember of more than one partnership, the singleamount of partnership profit or loss reported in
adjusted gross income was the combination of allhis shares, whether actually received or not . The
ordinar,,r income of the partnership did not includedividends qualifying for the exclusion, net short-and loi4-term capital gain or loss, interest on
tax-free covenant bonds, nor partially exempt in-terest . The partner's share of each of these itemswas reported in its respective source .Net gain from sales of capital assets included in
adjusted gross income was the amount of gain fromsales or exchanges of property treated as capitalassets . In computing this gain, the net short-termgain or loss was combined with the net long-termgain o:, loss after which the net .long-term gainor the excess of net long-term gain over net short-term 1013S was reduced 50 percent. For the deter-mination of net short- and long-term gain and loss,the taxpayer included with his personal, current-year t:-ansactions, his 5-year capital loss carry-over as a short-term loss, and his share of (1) netshort- and long-term gain received through fiduci-aries, (2) net short- and long-term gain and lossfrom pa:~tnerships,(3) distributed and undistributedlong-te:-m gain from regulated investment companies,and (4) the excess net long-term gain over netshort-ti~rm loss distributed by small business cor-porations that elected not to be taxed as such .The amo-int of capital gain in adjusted gross incomeconform,3 to one of several conditions, namely, (1)50 peroant of the excess net long-term gain overnet short-term loss occurring on certain returns,(2) on :returns with only a net long-term gain, 50percent thereof,(3) on returns with both net short-and lon.7-term gain, the entire amount of net short-term gain combined with 50 percent of the netlong-term gain, (4) on returns with only a net
INDIVIDUAL INCOME TAX RETURNS FOR 1959
short-term gain, the entire net gain, and (5) theentire excess of net short-term gain over net long-term loss on other returns.Net loss from sales of capital assets reported as
a component of adjusted gross income was the deduc-tible loss resulting from sales or exchanges ofproperty treated as capital assets . To determinethe deductible loss, all short-term gains andlosses were merged with the long-term gains andlosses, and the excess loss was allowed to the ex-tent of the smallest of (1) amount of capital loss,(2) taxable income (adjusted gross income if taxtable was used) computed without regard to capitalgains and losses and the deduction for personal ex-emptions or (3) $1, 000 . In merging the capital gainsand losses, the taxpayer combined his current-yeargains and losses and his 5-year capital loss carry-over with his share of (1) net short- and long-termgain received through fiduciaries, (2) net short-and long-term gain and loss from partnerships, (3)distributed and undistributed long-term gain fromregulated investment companies, and (4) the excessnet long-term gain over net short-term loss clistri-buted by small business corporations that electednot to be taxed as such. ArW part of the capitalloss incurred in the current year which was not de-ductible because of the limitation, may be carriedforward for 5 succeeding years as a short-termcapital loss to the extent that it has not been ab-sorbed by capital gains and the capital loss deduc-ti.on in the intervening years. If a capital losscarryover is not eliminated in the 5-year period,the remaining loss cannot be used .Short-term applied to gains and losses from sales
or exchanges of assets held six months or less andtreated as capital assets . Such gains and lossesfor the current year and the capital loss carryoversfrom the 5 preceding years (used as short-termlosses) were combined to obtain the net short-termgain or loss. In this combination, the net short-term capital gain or loss from partnerships and thenet short-term capital gain from fiduciaries werealso included.Long-term applied to gains and losses from sales
or exchanges of assets held more than six monthswhich were treated as capital assets . Such currentgains and losses,taken into account at 100 percent,were combined with the net long-term capital gainor loss received through partnerships and the netlong-term capital gain received through fiduciariesto obtain the net long-term gain or loss for theyear.
Capital loss carryover from 1954-58 was that por-tion of the net capital loss sustained in this 5-year period which the taxpayer had been unable tooffset against his capital gains, or the $1,000 de-d.uction allowed for capital loss in computing ad-justed gross income in tax years subsequent to theyear in which the capital loss arose. The carryoverwas reported with and tr~ated as a short-term capi-tal loss in the current year .Net loss from sales of capital assets before lim-
itation was the entire loss, resulting from salesof property treated as capital assets, which wasreported on returns having a capital loss in adjustedgross income~ The loss was a combination of currentyear short-term gains and losses,the 5-year capital
17
loss carryover, and the current year long-term gainsand losses, and was without regard to the statutorylimitation on -the deductible capital loss .
Net long-term capital gain in excess of net short-term capital loss was the entire excess of netlong-term capital gain over net short-term capitalloss reported on returns with alternative tax . Onlyone-half of this excess long-term gain was includedin adjusted- gross income, however, the entire ex-cess was the basis for the special 25 percent rateon capital gains .
One-half excess long-term gain was 50 percent ofthe excess net long-term capital gain over netshort-term capital loss reported on returns withalternative tax . This was the am u of long-termcapital gain that was included in adjusted grossincome, but was deducted from statutory taxable in-come to obtain taxable income for partial tax whenthe alternative tax was paid .Net gain or loss from sales of property other than
capital assets in adjusted gross income resultedfrom sales or exchanges of property which was nottreated as a capital asset . The entire amount ofnet gain from these transactions was included andthe net loss fully deducted, in computing adjustedgross income. Losses on sales or exchanges ofsmall-business investment company stock were ordi-nary losses rather than capital losses . Also,losses on small business stock were ordinary lossesto the original holders. However, the ordinary losswas limited to $25,000 on separate returns and to$50,000 on joint returns .
Pensions and annuities were the taxable portion ofamounts received during the year . These taxablereceipts were reported under two methods : (15 thegeneral rule,referred to as life expectancy method,and (II) the 3-year method. The revised scheduleplaced noncontributory annuities and pensions underthe 3-year method, whereas they were formerly underthe general rule .The life expectancy method included the taxable
portion of receipts from contributory pensions andannuities if the cost would not be recovered within3 years. Receipts from contributory pensions andannuities were included in adjusted gross income tothe extent that they exceeded an amount, represent-ing .cost, computed according to the actuarial for-mula provided by the Income Tax Regulations . Oncethe excludable cost has been determined it generallyremains constant throughout the annuitant's life-time . Contributory pensions and annuities werethose where the employee contributed to the cost orwas previously taxed on his employer's contributionand those received, for a reason other than deathof the insured, under an annuity, endowment, orinsurance contract .The 3-year method included the entire receipts
from noncontributory annuities and pensions,thatis, where the employee contributed none of thecost. This method also included taxable receiptsfrom contributory pensions and annuities, but onlyif the employer as well as the employee contributedto the cost and the employee's cost would be re-turned in 3 years or less. If both conditionswere met, all receipts were excluded from gross in-come until the employee recovered the amount contri-buted by him plus contributions made by his employer
r
18 INDIVIDUAL INCOME TAX RETU"INS FOR 1959
upon which the employee was previously taxed .Thereafter, all amounts received became taxable .This method also applied to receipts by an employee I sbeneficiary if the employee died before receivingany annuity or pension payments .Net income or net loss from rents and royalties
comprising a part of adjusted gross income was re-ported as a single item in the schedule providedfor this purpose on the return. Therefore, the netincome or loss represented a combination of the in-come from both types of investments . Rents includednot only rental from real estate but also amountsreceived from renting any other kind of propertyand farm rentals received in cash or crop shares .Room rental and other space rentals for which serv-ices were rendered to the occupant were reportedin business income (schedule C), as also wererentals received by persons engaged in the businessof selling real estate . Royalties included revenuesfrom copyrights, patents, trademarks, formulas,natural resources under lease, and the like. De-ductions against the gross receipts received fromthese investments were claimed for maintenance,repairs, interest, taxes, depreciation and deple-tion., obsolescence, and other expenses pertainingto the respective income .
Income or loss from estates and trusts was thetaxpayer's share of fiduciary income from any es-tate or trust under which he- was a beneficiary .Income from estates and trusts included amountsrequired to be distributed and amounts credited tothe beneficiary's account from current year fiduci-ary income, whether or not actually received byhim, as well as amounts paid to him . It alsoincluded his share of any accumulation distribu-tion made by the fiduciary of a complex trust whichdistributed income accumulated in prior tax years .The beneficiary's share of these distributions fromestate and trust income was reduced by his share ofdepreciation before reporting the amount as part ofhis adjusted gross income . The taxpayer excludedfrom his fiduciary income his share of capital gain,dividends qualifying for the exclusion, and par-tially exempt interest, each of which was reportedin its respective source . A loss from estates andtrusts was distributed to the beneficiary onlyupon termination of a trust or an estate which hada net operating loss carryover, or a capital losscarryover, or for its last tax year had deductions(other than exemption and charitable deduction) inexcess of gross income .Other sources of income included such items as
alimony received, prizes, awards, sweepstakes win-nings, gambling profits, recovery of bad debts an
- dtaxes deducted in a prior year, insurance receivedas reimbursement for medical expenses taken in aprevious year, the taxpayer's share of distributedor undistributed current year taxable income (ex-clusive of long-term capital gain) received from asmall business corporation which elected not to betaxed as a corporationand any other income subjectto tax for which no entry was provided on the returnform. Also included was a total of $63,313,000consisting of interest, dividends after exclusions,and wages not subject to income tax withholding .,not exceeding a total of $200 per return, reportedon 915,378 returns, Form 1040A . For the purpose of
a balan,.ed adjusted gross income on returns, Form1040, w-iere a net operating loss deduction wasclaimed in computing adjusted gross income, theamount of other sources was reduced by the netoperating loss deduction .Income attributable to several tax years which
was reported by the taxpayer in his current-yearreturn -was included in its entirety, even thoughthe income was earned over a period of time in-volving prior income years and thereby affordedspecial tax treatment. Earned income attributableto several tax years originated from (a) back payreceived for work performed in a previous year, ifthe back pay exceeded 15 percent of gross incomefor the current year ; (b) inventions or artisticworks, the creation of which required not less than24 montas and for which income received in the cur-rent yeir was at least 80 percent of the aggregategross income received for the work; and (c) compen-sation received for long-term services performed byan individual or a partner over a period of 36months or more, if the amount received within thecurrent year was at least 80 percent of the totalcompensition received for the services . For incometax pur~poses, such income was spread over specifiedperiods, and the tax on the amount received in thecurrent year was limited to the additional taxesthat waild have been paid for the years involvedif the -.ompensation had been included ratably inincome :)ver the period of the services .Two other types of income had tax treatment that
spread 3r averaged the income over a period ofyears. Gain realized from lump-sum payment atmaturity of endowment or life insurance contractswas spread one-third in the current year and eachof the two preceding years to determine the mininumincome tax. An accumulation distribution from acomplex trust was thrown back to the tax year inwhich t~ie income was det-m d to have been receivedby the trust, if this method resulted in a lowerincome tax to the recipient taxpayer . Regardlessof these adjustments, the entire amount of suchincome reported by the taxpayer was included in thesource indicated by him.In addition, the net operating loss deduction has
the effect of averaging business income over aperiod Df years and of imposing tax on only thatpart of the current year income which is not offsetby losses in the years just preceding or years justsubsequent thereto . However, statistics can onlyreflect the carryover loss from preceding yearsthat was deducted on the current year return, whichis only a portion of the averaging process.
Total Itemized Deductions
Only the total of nonbusiness deductions, allowedagainst adjusted gross income and itemized on 1040and 104DW returns ., is presented this year. TotaldeductiDns included contributions, interest paid,taxes,medical deduction, and other authorized de-ductions for which no specific line or schedulewas provided on the return form, such as casualtylosses, loss from theft, alimony payments, childcare, and amortization of bond premium; expensesconnected with the taxpayer's employment, for
INDIVIDUAL INCOME TAX RETURNS FOR 1959
example, dues to unions or professional societies,cost of tools for the job, and fees to employmentagencies ; allowable expenses of the taxpayer inconneetion with his employer's business which werein excess of the reimbursed amounts deducted fromgross salaries; and expenses, in excess of theemployer's reimbursement, incurred for educationundertaken to maintain or improve skills requiredto perform duties in present employment status .
Exemptions
In computing taxable income, exemptions wereallowed for taxpayers and their dependents and
there were additional exemptions for age and blind-ness . The per capita exemption was $600 for thetaxpayer, his wife on a joint return, and for eachson or daughter (including stepchild and adoptedchild) who was under 19 years of age, or who was astudent regardless of ageif the taxpayer furnishedmore than half the support . If the child was 19 or,pver and not a student, exemption was allowed onlyif the child had less than $600 gross income forthe 'year and the taxpayer met the support test .Per capita exemption of $600 was allowed, also, for
each dependent, listed below, who had less than$600 gross income and who received more than halfof his support from the taxpayer . To qualify as adependent, the individual must have been either acitizen or resident of the United States ;a residentof Canada, Mexico, the Republic of Panama, or theCanal Zone ; or an alien child adopted by and livingwith a-United States citizen abroad .Additional exemptions of $600 for age 65 or over
and $600 for blindness were allowed for the tax-payer and, if a joint return was filed, the tax-payer's spouse . Additional exemptions were notallowed for dependents .
If the income and dependency qualifications andthe support test were met, an exemption of $600was allowed for the following dependents : parent,grandparent, or other direct ancestor; grandson,granddaughter, or other direct descendant; brother,sister,half brother, half sister; stepfather, step-mother, stepsister, stepbrother ; mother-in-law,father-in-law, brother-in-law, sister-in-law, son-in-law, daughter-in-law; uncle, aunt, nephew, orniece if related by blood; and any person who livedin the taxpayer's home for the entire year and whowas a member of his household, whether or not re-lated to the taxpayer .
Birth or death during the year did not eliminatethe dependent, if the support and other tests weremet for the part of the year during which the de-pendent lived .
An exception to the support test for a dependentprovided that where an individual was supported byseveral persons none of whom contributed more thanhalf, anyone of the group who had contributed morethan 10 percent of the total support could claimthe exemption, if each of the others who had con-tributed more than 10 percent declared in writingthat he would not claim the exemption for the year .The number of exemptions and amount claimedshown
in this report, contain exemptions from all returnsand include the exemptions automatically allowedthrough use of the tax table . There is some dupli-cation of exemptions because (a) dependents with
1 9
less than $600 gross income containing wages subjectto income tax withholding filed a return to claimrefund of tax, and (b) children dependents under19 years of age and dependent children studentsover 19 years, who had gross income of $600 or morefiled a return since their income met the filingrequirement . Exemptions claimed on returns filedby these dependents are included, as well as exemp-tions for the same dependents reported on returnsof taxpayers rightfully claiming the dependents .
Measures of Individual Income
Adjusted gross income was gross income from allsources that are subject to income tax minus (a)ordinary and necessary expenses of operating atrade or business, (b) deductions attributable torents and royalties, (c) expenses of outside sales-men attributable to earning salary or other com-pensation, (d) expenses of travel, meals, andlodging while away from home over night paid by anemployee with respect to services rendered, (e)transportation cost related to the performance ofservices as an employee, (f) expenses for educationrequired to maintain salary, status, or employment,(g) expenses paid or incurred in connection withservice as an employee under a reimbursed or otherexpense allowance arrangement with the employer,(h) exclusion of sick pay if the sick pay was in-cluded in gross salary, (i) depreciation and deple-tion allowed life tenants and income beneficiariesof property held in trust, (j) deductible lossesfrom sales of capital assets and other property,(k) deduction equal to 50 percent of the excess ofnet long-term capital gain over net short-term cap-ital loss, and (1) net operating loss deduction .Adjusted gross deficit occurred in the event that
the deductions allowed for the compensation of ad-justed gross income, as stated above, exceeded thegross income .
Taxable income was adjusted gross income minusdeductions, standard or itemized, and personalexemptions . The amount of taxable income shownthroughout this report includes (a) the taxable in-come reported on Forms 1040 and 1040W by taxpayerswho itemized their nonbusiness deductions, regard-less of the amount of adjusted gross income, and bytaxpayers with $5,000 or more adjusted gross incomewho used the standard deductionall of whom enteredtheir taxable income on the return.,and (b)a mechan-ically computed amount of taxable income for tax-payers who were not required to enter the amount oftaxable income on the return. Taxpayers who didnot enter taxable income on the return itself were(1) those with adjusted gross income under $5,000who used the tax table, whether they filed on Form1040, 1040W, or 1040A, and (2) those with adjustedgross income of $5,000 under $10,000 who filedForm 1040A and computed the income tax, using thestandard deduction and regular tax rates in a taxcomputation schedule which they retained . The tax-able income was not required to be transferred tothe card-form itself .In order that so significant an item as the tax
base be presented for all taxpayers, the taxableincome was computed for each return which lackedthis item . Taxable income for taxpayers who em-
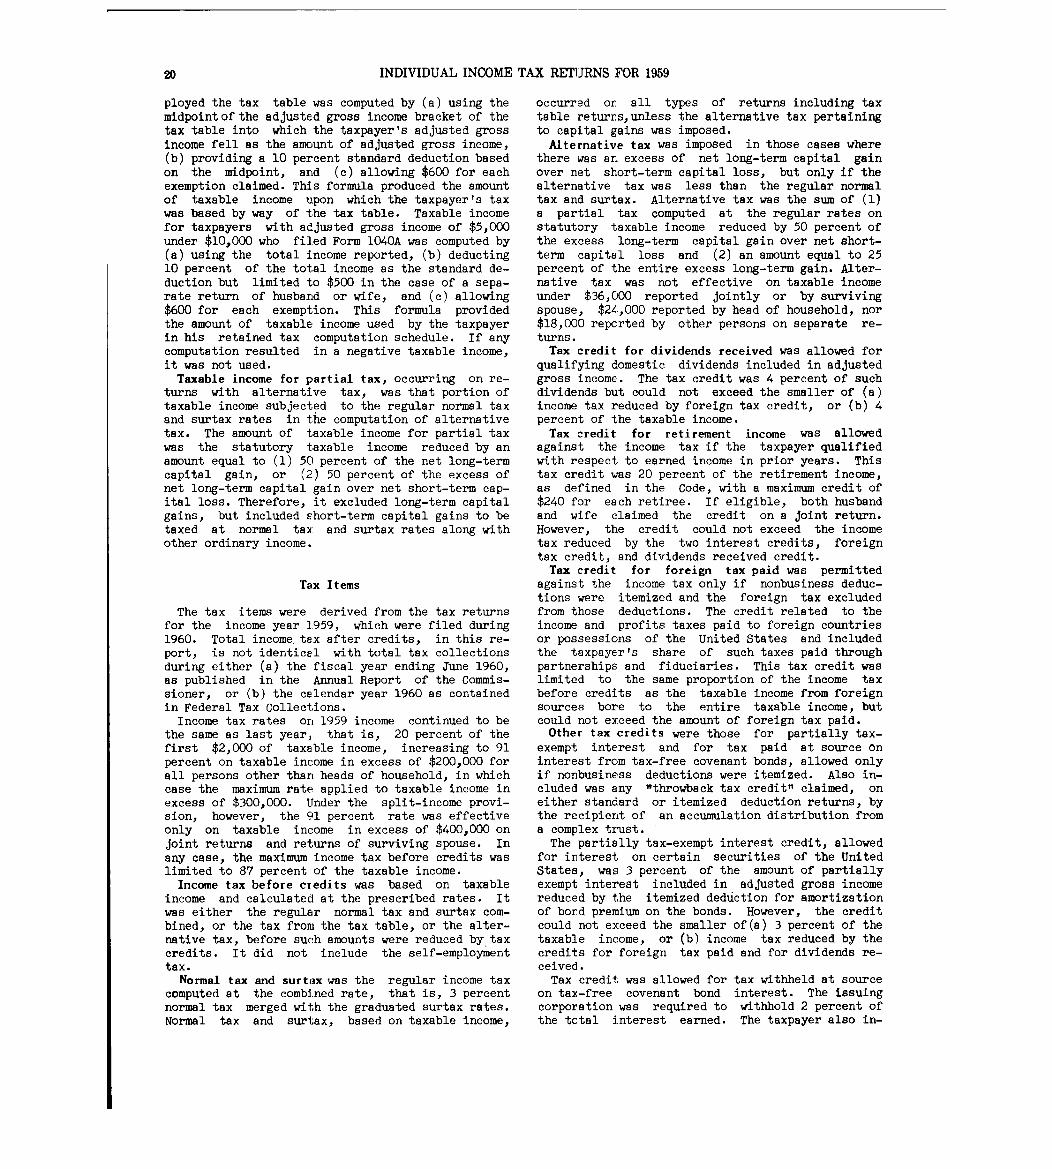
20 INDIVIDUAL INCOME TAX RE71JRNS FOR 1959
ployed the tax table was computed by (a) using themidpointof the adjusted gross income bracket of thetax table into which the taxpayer's adjusted grossincome fell as the amount of adjusted gross income,(b) providing a 10 percent standard deduction basedon the midpoint, and (c) allowing $600 for eachexemption claimed . This formula produced the amountof taxable income upon which the taxpayer's taxwas based by way of the tax table . Taxable incomefor taxpayers with adjusted gross income of $5,000under $10,000 who filed Form 1040A was computed by(a) using the total income reported, (b) deducting10 percent of the total income as the standard de-duction but limited to $500 in the case of a sepa-rate return of husband or wife, and (c) allowing$600 for each exemption . This formula providedthe amount of taxable income used by the taxpayerin his retained tax computation schedule . If anycomputation resulted in a negative taxable income,it was not used .Taxable income for partial tax, occurring on re-
turns with alternative tax, was that portion oftaxable income subjected to the regular normal taxand surtax rates in the computation of alternativetax . The amount of taxable income for partial taxwas the statutory taxable income reduced by anamount equal to (1) 50 percent of the net long-termcapital gain, or (2) 50 percent of the excess ofnet long-term capital gain over net short-term cap-ital loss . Therefore, it excluded long-term capitalgains, but included short-term capital gains to betaxed at normal tax and surtax rates along withother ordinary income .
Tax Items
The tax items were derived from the tax returnsfor the income year 1959, which were filed during1960 . Total income,tax after credits, in this re-port, is not identical with total tax collectionsduring either (a) the fiscal year ending June 1960,as published in the Annual Report of the Commis-sioner, or (b) the calendar year 1960 as containedin Federal Tax Collections .Income tax rates on 1959 income continued to be
the same as last year, that is, 20 percent of thefirst $2,000 of taxable income, increasing to 91percent on taxable income in excess of $200,000 forall persons other than heads of household, in whichcase the maxirmi rate applied to taxable income inexcess of $300,000 . Under the split-income provi-sion, however, the 91 percent rate was effectiveonly on taxable income in excess of $400,000 onjoint returns and returns of surviving spouse . Inany case, the maximum income tax before credits waslimited to 87 percent of the taxable income .Income tax before credits was based on taxable
income and calculated at the prescribed rates . Itwas either the regular normal tax and surtax com-bined, or the tax from the tax table, or the alter-native tax, before such amounts were reduced by taxcredits . It did not include the self-employmenttax .
Normal tax and surtax was the regular income taxcomputed at the combined rate, that is, 3 percentnormal tax merged with the graduated surtax rates .Normal tax and surtax, based on taxable incomeY
occurred or. all types of returns including taxtable returns,unless the alternative tax pertainingto capital gains was imposed .
Alternative tax Was imposed in those cases wherethere was an excess of net long-term capital gainover net short-term capital loss, but only if thealternative tax was less than the regular normaltax and surtax . Alternative tax was the sum of (1)a partial tax computed at the regular rates onstatutory taxable income reduced by 50 percent ofthe excess long-term capital gain over net short-term capital loss and (2) an amount equal to 25percent of the entire excess long-term gain . Alter-native tax was not effective on taxable incomeunder $36,000 reported jointly or by survivingspouse, $24,000 reported by head of household, nor$18,000 reported by other persons on separate re-turns .Tax credit for dividends received was allowed for
qualifying domestic dividends included in adjustedgross income . The tax credit was 4 percent of suchdividends but could not exceed the smaller of (a)income tax reduced by foreign tax credit, or (b) 4percent of the taxable income .Tax credit for retirement income was allowed
against the income tax if the taxpayer qualifiedwith respect to earned income in prior years . Thistax credit was 20 percent of the retirement income,as defined in the Code, with a maxiimi credit of$240 for each retiree . If eligible, both husbandand wife claimed the credit on a joint return .However, the credit could not exceed the incometax reduced by the two interest credits, foreigntax credit, and dividends received credit .Tax credit for foreign tax paid was permitted
against the income tax only if nonbusiness deduc-tions were itemized and the foreign tax excludedfrom those deductions . The credit related to theincome and profits taxes paid to foreign countriesor possessions of the United States and includedthe taxpayer's share of such taxes paid throughpartnerships and fiduciaries . This tax credit waslimited to the same proportion of the income taxbefore credits as the taxable income from foreignsources bore to the entire taxable income, butcould not exceed the amount of foreign tax paid .Other tax credits were those for partially tax-
exempt interest and for tax paid at source oninterest from tax-free covenant bonds, allowed onlyif nonbusiness deductions were itemized . Also in-cluded was any "throwback tax credit" claimed, oneither standard or itemized deduction returns, bythe recipient of an accumulation distribution froma complex trust .The partially tax-exempt interest credit, allowed
for interest on certain securities of the UnitedStates, was 3 percent of the amount of partiallyexempt interest included in adjusted gross incomereduced by the itemized dedtiction for amortizationof bord premium on the bonds . However, the creditcould not exceed the smaller of(a) 3 percent of thetaxable income, or (b) income tax reduced by thecredits for foreign tax paid and for dividends re-ceived .Tax credit was allowed for tax withheld at source
on tax-free covenant bond interest . The issuingcorporation was required to withhold 2 percent ofthe tctal interest earned . The taxpayer also in-
INDIVIDUAL INCOME TAX RETURNS FOR 1959 2 1
eluded his share of this credit allotted to himthrough partnerships and fiduciaries .The throwback tax credit was the recipient's
pro rata share of taxes paid by a complex trust inpreceding tax years which would not have been pay-able by the trust had the trust in fact made dis-tributions of income currentlyto the beneficiaries .Income tax paid on accumulation distributions deemeddistributed in prior years was not refunded to thetrust but was allowed as a credit against the totaltax liability of the recipients . Credit in excessof the total tax was an overpayment and as such wasrefundable .Income tax after credits was the amount of income
tax liability, exclusive of the self-employmenttax. It was after the deduction for income taxcredits., but prior to the year-end adjustments fortax withheld from wages and payments on declarationof estimated tax which determined the overpaymentor tax due status . Income tax after credits wasthe criterion for classifying taxable and nontax-able returns .Self-employment tax was reported by each individ-
ual who had self-employment income derived fromsolely owned trade or business and from his shareof partnership profits even though these enter-prises elected to be taxed as a corporation . Cer-tain types of income and deductions were notallowed in computing self-employment earnings, suchas investment income, capital gain or loss, netoperating loss deduction, and casualty losses .The maxiimim amount subject to social security self-employment tax was $4,'800, although this maximum
amount was reduced by the amount of wages receivedon which the social security employee tax had beenwithheld by an employer . No exemption was allowedagainst the self-employment income subject to taxand the tax rate for 1959 was 3-3/4 percent . Thistax was paid regardless of the taxpayer's age andeven though social security benefits were receivedby the taxpayer .Tax withheld was the income tax withheld from
salaries and wages, but it also included the creditfor tax paid by regulated investment companies onundistributed capital gain, and the excess with-holding of social security employee tax . Theseamounts are taxpayments. Income tax withheld byemployers from wages subJect to income tax with-holding was prescribed in withholding tables orwas increased by agreement between employer and em-ployee . Income tax on capital gain retained by aregulated investment company was paid by the com-pany and the taxpayer allotted his proportionateshare of the tax paid. Excess social security taxis described below . If these taxpayments exceededthe total tax liability, the excess was refundable .Excess social security tax, shown separately for
the first time this year, was the overwithholdingof social security employee tax which occurred in
I
some cases when the employee worked for more thanone employer during the year. The employee socialsecurity tax rate was 2-1/2 percent on $4,800 ofwages, with a ma iimim of $120 tax. The amountwithheld in excess of the $120 mFixiim1m tax was re-ported with the income tax withheld and used by theemployee as a payment on tax liability and to theextent not used was refundable .Payments on 1959 declaration of estimated income
tax were reported only on Forms 1040 and 104OW . Pay-
ments ondeclaration also included the credit for anoverpayment of the 1958 total tax. Whether or nota taxpayer made payments on a declaration dependedon the balance of estimated tax due after deductinghis (1) estimated income tax to be withheld and(2) credit for prior-year tax overpayment. Manydeclarations would show the estimated tax to bezero. Others had no balance of estimated tax dueafter deducting the estimated income tax to bewithheld. Still others had a balance of estimatedtax due after deducting the estimated income taxto be withheld, but this balance was less than theprior-year tax overpayment credit. None of thesetaxpayers made payments on the declaration, al-though in the last instance, the taxpayer carriedhis prior-year overpayment credit to his income taxreturn, and therefore it is included in the pay-ments on declaration as stated above .
On declarations where a balance of estimated taxdue remained after deducting (1) estimated incometax to be withheld and (2) credit for prior-yeartax overpayment, the taxpayer made payments on thedeclaration and reported the amount on his incometax return together with the credit for prior-yeartax overpayment .Tax due at time of filing was reported on returns
where the tax withheld and the payments on declara-tion (together with other items reported with them)plus all current-year income tax credits were in-sufficient to cover the total of both the incometax before credits and the self-employment tax .The balance of tax due was paid when the return wasfiled .Overpayment of tax occurred when the sum of tax
credits against current-year income tax, tax with-held, and payments on declaration exceeded the com-bined income tax before credits and self-employmenttax. Overpayment on Form 1040A returns gave rise toa refund . On Forms 1040 and 104OW,overpayment couldbe requested as a refund or a credit on the subse-quent year's estimated tax,or could be requested aspart refund and part credit on the estimated tax .
Refund of tax included the portion of overpaymentrequested as refund by taxpayers filing Forms 1040and 1040W., and all overpayments on Form 1040A .
Credit on 1960 tax, shown on Forms 1040 and 104OW,was that part of the overpayment of 1959 tax whichthe taxpayer specifically requested to be creditedon his estimated income tax for 1960 .
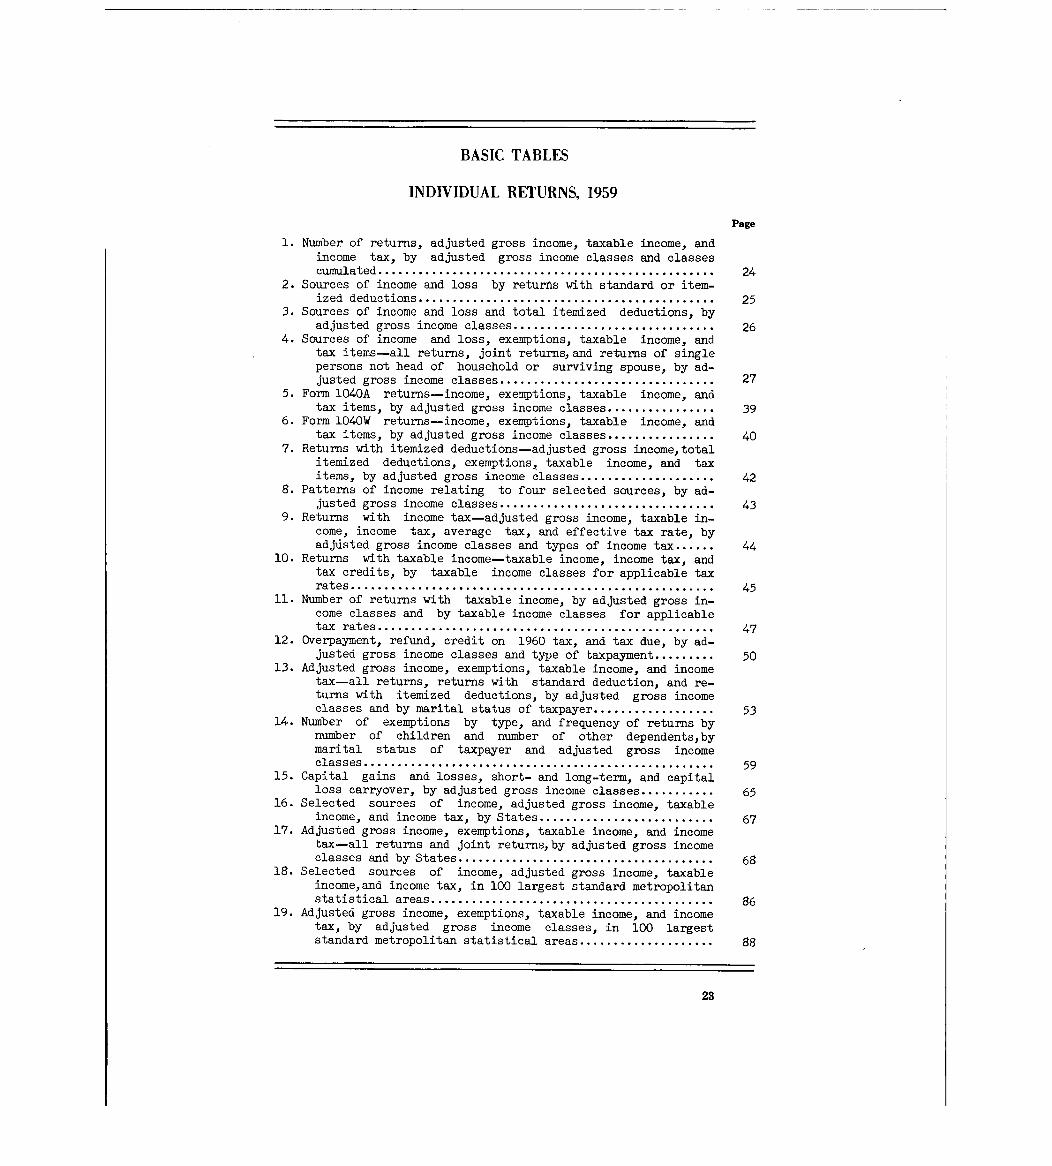
BASIC TABLE S
INDIVIDUAL RETURNS, 1959
Page
1 . Number of returns, adjusted gross income, taxable income, andincome tax, by adjusted gross income classes and classescumulated . . . . . . . . . . . . . . . . . . . . . . . . . . . . . . . . . . . . . . . . . . . . . . . . . . 24
2 . Sources of income and loss by returns with standard or item-ized deductions . . . . . . . . . . . . . . . . . . . . . . . . . . . . . . . . . .
. **'**'*** 253 . Sources of income and loss and total itemized deductions, byadjusted gross income classes . . . . . . . . . . . . . . . . . . . . . . . . . . . . . . 26
4 . Sources of income and loss, exemptions, taxable income, andtax items-all returns, joint returnsland returns of singlepersons not head of household or surviving spouse, by ad-justed gross income classes . . . . . . . . . . . . . . . . . . . . . . . . . . . . . . . . 27
5 . Form 1040A returns-income, exemptions, taxable income, andtax items, by adjusted gross income classes . . . . . . . . . . . . . . . . 39
6 . Form 1040W returns-income, exemptions, taxable income, andtax items, by adjusted gross income classes . . . . . . . . . . . . . . . . 40
7 . Returns with itemized deductions-adjusted gross income,totalitemized deductions, exemptions, taxable income, and taxitems, by adjusted gross income classes . . . . . . . . . . . . . . . . . . . . 42
8 . Patterns of income relating to four selected sources, by ad-justed gross income classes . . . . . . . . . . . . . . . . . . . . . . . . . . . . . . . . 43
9 . Returns with income tax-adjusted gross income, taxable in-come, income tax, average tax, and effective tax rate, byadjdsted gross income classes and types of income tax . . . . . . 44
10 . Returns with taxable income-taxable income, income tax, andtax credits, by taxable income classes for applicable ta xrates . . . . . . . . . . . . . . . . . . . . . . . . . . . . . . . . . . . . . . . . . . . . . . . . . . . . . . 45
11 . Number of returns with taxable income, by adjusted gross in-come classes and by taxable income classes for applicabletax rates . . . . . . . . . . . . . . . . . . . . . . . . . . . . . . . . . . . . . . . . . . . . . . . . . . 47
12 . Overpayment, refund, credit on 1960 tax, and tax due, by ad-justed gross income classes and type of taxpayment . . . . . . . . . 50
13 . Adjusted gross income, exemptions, taxable income, and incometax-all returns, returns with standard deduction, and re-turns with itemized deductions, by adjusted gross incomeclasses and by marital status of taxpayer . . . . . . . . . . . . . . . . . . 53
14 . Number of exemptions by type, and frequency of returns bynumber of children and number of other dependents,bymarital status of taxpayer and adjusted gross incomeclasses . . . . . . . . . . . . . . . . . . . . . . . . . . . . . . . . . . . . . . . . . . . . . . . . . . . . 59
15 . Capital gains and losses, short- and long-term, and capitalloss carryover, by adjusted gross income classes . . . . . . . . . . . 65
16 . Selected sources of income, adjusted gross income, taxableincome, and income tax, by States . . . . . . . . . . . . . . . . . . . . . . . . . . 67
17 . Adjusted gross income, exemptions, taxable income, and incometax-all returns and joint returns,by adjusted gross incomeclasses and by States . . . . . . . . . . . . . . . . . . . . . . . . . . . . . . . . . . . . . . 68
18. Selected sources of income, adjusted gross income, taxableincome,and income tax, in 100 largest standard metropolitanstatistical areas . . . . . . . . . . . . . . . . . . . . . . . . . . . . . . . . . . . . . . . . . . 86
19 . Adjusted gross income, exemptions, taxable income, and incometax, by adjusted gross income classes, in 100 largeststandard metropolitan statistical areas . . . . . . . . . . . . . . . . . . . . 88
23
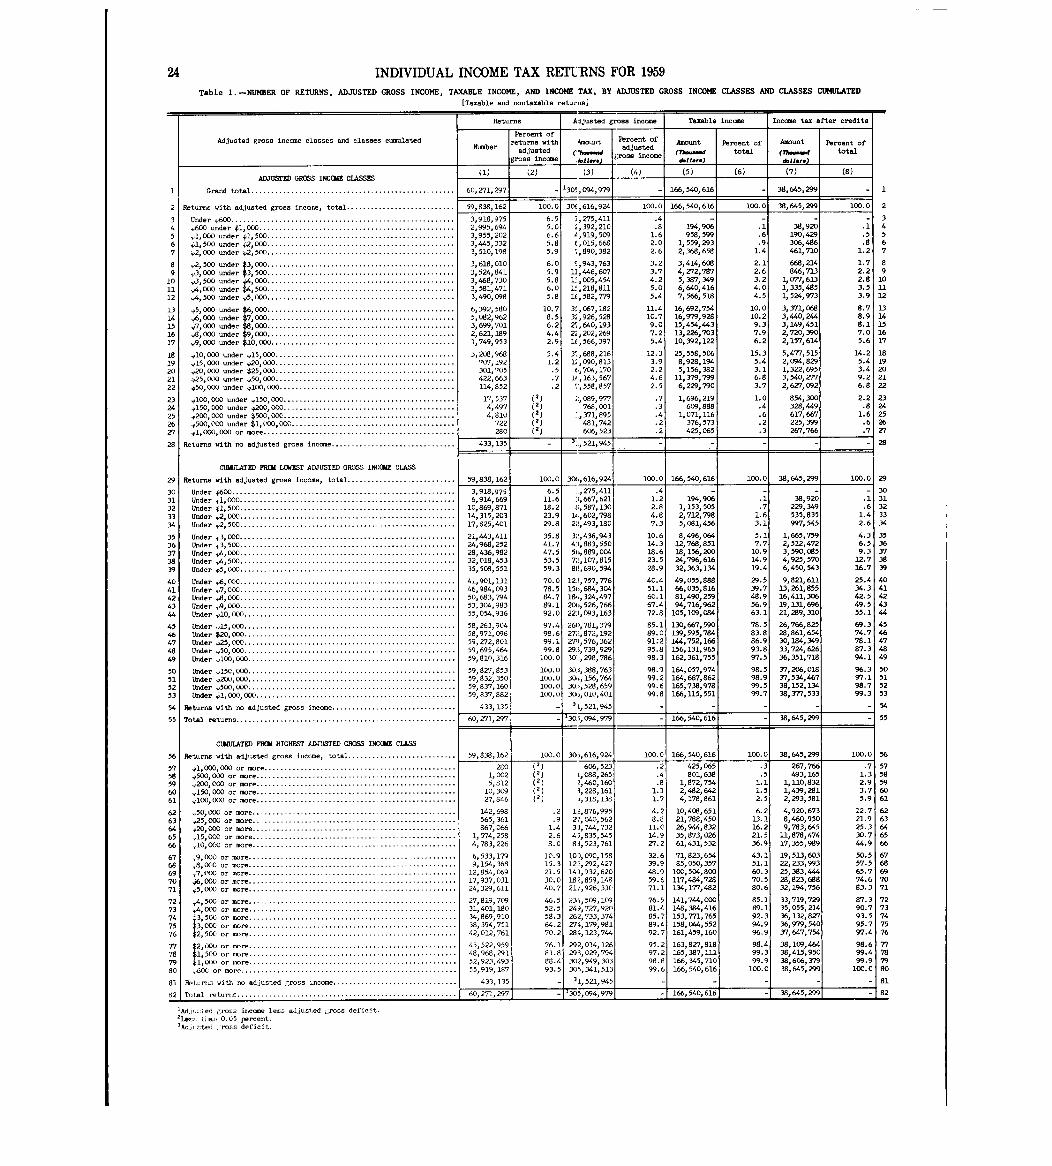
24 INDIVIDUAL INCOME TAX RM'RNS FOR 1959
Table 1 . -NUMBER OF RETURNS, ADJUSTED GROSS INCOME, TAXABLE INCOME, AND INCOME TAX, BY ADJUSTED GROSS INCOME CLASSES AND CLASSES CUMULATED
[Taxable and nontaxable returns )
Returns Aijusted gross income Twmble income Income tax after credit s
Adjusted gross income classes and classes cumulatedPercent o f
return with amount Percent ofAmount Percent of Amount Percent o f
Numberadju :ted 7-nd
adjustediToss income
(7b--d total (Th--d totalgross income .1.1 1
(1) (2 )ADJUSTED GROSS INCCWE CLASSES
1 Grand total . . . . . . . . . . . . . . . . . . . . . . . . . . . . . . . . . . . . . . . . . . . . . . . . . . . 60,Z71,297 - '30!,094,979 - 166,540,616 - 38,645,299
2 Returns with adjusted gross incane, total . . . . . . . . . . . . . . . . . . . . . . . . . . . 59,838,162 100.0 30E,616,92,4 100.0 166,540,616 100.0 38,645,299 100.0 2
3 Under y6OO . . . . . . . . . . . . . . . . . . . . . . . . . . . . . . . . . . . . . . . . . . . . . . . . . . . . . . . . 3,918,975 6 .5 1,275,411 .4 - - - - 3
4 ~600 under 41,000 . . . . . . . . . . . . . . . . . . . . . . . . . . . . . . . . . . . . . . . . . . . . . . . . . 2,995,694 5 .0 ;,392,210 .8 194,906 .1 38,920 .1 4
5 1,000 -der ~1,500 . . . . . . . . . . . . . . . . . . . . . . . . . . . . . . . . . . . . . . . . . . . . . . . 3,955,202 6.6 4,919,509 1 .6 958,599 .6 190,429 .5 5
6 ~1,500 under ~2,000 . . . . . . . . . . . . . . . . . . . . . . . . . . . . . . . . . . . . . . . . . . . . . . . 3,445,332 5 .8 E,015,668 2 .0 1,559,293 .9 306,486 .8 6
7 ~V2,000 under ~p2,500 . . . . . . . . . . . . . . . . . . . . . . . . . . . . . . . . . . . . . . . . . . . . . . . 3,510,198 5 .9 -,,890,382 2 .6 2,368,658 1.4 461,710 1.2 7
8 2,500 under ~3,000 . . . . . . . . . . . . . . . . . . . . . . . . . . . . . . . . . . . . . . . . . . . . . . . 3,618,010 6.0 S,943,763 3 .2 3,414,608 2.1 668,214 1.7 8
9 y3,000 under ~3,500 . . . . . . . . . . . . . . . . . . . . . . . . . . . . . . . . . . . . . . . . . . . . . . . 3,524,841 5 .9 13,446,607 3 .7 4,Z72,787 2.6 846,713 2.2 9
1 03' 500 -der 0,000 . . . . . . . . . . . . . . . . . . . . . . . . . . . . . . . . . . . . . . . . . . . . . . .CO 4 00
3,468,73 0581 47 13
5 . 86 0
L, 005,45 4lf 218 811
4. 25 0
5,387,34 96 640 416
3 . 24 0
1,077,6131 335 485
2. 8
3.5
10
1111 4, O der $ ,5 . . . . . . . . . . . . . . . . . . . . . . . . . . . . . . . . . . . . . . . . . . . . . . .12 4,500 under y5,000 . . . . . . . . . . . . . . . . . . . . . . . . . . . . . . . . . . . . . . . . . . . . . . .
,,3,490,098
.
5 .8
, ,
1(,582,779
.5 .4
, ,7,566,518
.4.5
, ,1,524,973 3.9 12
L3 5,000 -der . . . . . . . . . . . * . . . . . . . . . . .1~'
6,392,580 10.7 3!,067,182 2-1 .4 16,692,754 10.0 3,371,068 8 .7 1.3
L4 . . . . . . . . . . . . . . . . . . . . . . . . . . . . . . . . .0,000 under 5,082,962 8 .5 3;,926,528 10.7 16,979,928 10.2 3,440,244 8.9 14
15 y7~000 under . . . . . . . . . . . . **,** .***,,*,*,,** . . . 3,699,7Cl 6.2 7,640,193 9 .0 15,454,443 9.3 3,149,451 8.1 15
16 6,000 under rg" . . . . . . . . . . . . . . . . . . . . . . . . . . . . . . . . . 2,621,189 4.4 2,,202,269 7 .2 13,226,703 7.9 2,720,390 7.0 16117 9,000 under 10,000 . . . . . . . . . . . . . . . . . . . . . . . . . . . . . . . . . . . . . . . . . . . . . . 1,749,953 2.9 lf,566,397 5 .4 10,392,122 6.2 2,157,614 5.6 17
18 +10,000 under +15,000 . . . . . . . . . . . . . . . . . . . . . . . . . . . . . . . . . . . . . . . . . . . . . 3,208,968 5 .4 3-.,688,216 12.3 25,558,506 15.3 5,477,515 14 .2 18
19 y15,000 under *20,000 . . . . . . . . . . . . . . . . . . . . . . . . . . . . . . . . . . . . . . . . . . . . . 7017,192 1.2 1;,090,813 3.9 8,928,194 5.4 2,094,829 5.4 19
20 20,000 under 425,000 . . . . . . . . . . . . . . . . . . . . . . . . . . . . . . . . . . . . . . . . . . . . . 301,705 .5 (,704,170 2.2 5,156,382 3.1 1,322,695 3.4 20
21 ~p25,000 under +50,000 . . . . . . . . . . . . . . . . . . . . . . . . . . . . . . . . . . . . . . . . . . . . . 422,663 .7 1~,163,567 4.6 11,379,799 6.8 3,540,Z77 9.2 21
22 +50,000 under +100,000 . . . . . . . . . . . . . . . . . . . . . . . . . . . . . . . . . . . . . . . . . . . . 114,852 .2 ',,558,857 2.5 6,229,790 3.7 2,627,092 6.8 22
23 100,000 under 150,000 . . . . . . . . . . . . . . . . . . . . . . . . . . . . . . . . . . . . . . . . . . . 17,537 (1) ;,089,977 .7 1,696,219 1.0 854,300 2.2 23
24 yl5O,OOO under 200,000 . . . . . . . . . . . . . . . . . . . . . . . . . . . . . . . . . . . . . . . . . . . 4, 497 (2) 768,001 .3 609,888 .4 328, "9 .8 2425 +200,000 under 500 OOC
1 1 *1 11 11 -* 1*1* *, ** *, *, ** * * -* 11 , " 1~,810
'
(2) ,371 895
'
.4 1,071,116 .6 617,667 1.6 25
26 500,000 under . . . . . . . . . . .: 722 (1) ,742481 .2 376,573 .2 225,399 .6 2627 ~1,000,000 or mom . . . . . . . . . . . . . . . . . . . . . . . . . . . . . . . . . . . . . . . . . . . . . . . . 280 (2) 606,523 .2 425,065 .3 267,766 .71 2?
W Returns with no adjusted gross income . . . . . . . . . . . . . . . . . . . . . . . . . . . . . . . 433,135 - ':,521,945 - - - - - 28
CUMULATED FROd LOWEST ADJUSTED GROSS IWCNE CLASS
29 Returns with adjusted gross income, total . . . . . . . . . . . . . . . . . . . . . . . . . . . 59,838,162 100 .0 306,616,924 100 .0 166,540,616 100 .0 38,645,299 100 .0 29
30 Under 4,600 . . . . . . . . . . . . . . . . . . . . . . . . . . . . . . . . . . . . . . . . . . . . . . . . . . . . . . . . 3,918,975 6 .5 :~,275,411 .4 - - - - 3C
31 Under W1,000. . . . . . . . . . . . . . . . . . . . . . . . . . . . . . . . . . . . . . . . . . . . . . . . . . . . . . 6,914,669 11 .6 :~,667,621 1 .2 194,906 .1 38,920 .1 3 1
32 Under +1,500. . . . . . . . . . . . . . . . . . . . . . . . . . . . . . . . . . . . . . . . . . . . . . . . . . . . . . 10,869,871 18 .2 k ;,587,130 2 .8 1,153,505 .7 229,349 .6 3 2
33 Under w2,000. . . . . . . . . . . . . . . . . . . . . . . . . . . . . . . . . . . . . . . . . . . . . . . . . . . . . . 14,315,203 23 .9 1,,602,798 4 .8 2,712,798 1 .6 535,835 1 .4 33
34 Under V2,500. . . . . . . . . . . . . . . . . . . . . . . . . . . . . . . . . . . . . . . . . . . . . . . . . . . . . . 17,825,401 29 .8 2;11493,180 7 .3 5,081,456 3 .1 997,545 2 .6 34
35 Under 3,000. . . . . . . . . . . . . . . . . . . . . . . . . . . . . . . . . . . . . . . . . . . . . . . . . . . . . . 21,443,411 35 .8 3;!,436,943 10 .6 8,496,064 5 .1 1,665,759 4 .3 3 5
36 Under 3,500. . . . . . . . . . . . . . . . . . . . . . . . . . . . . . . . . . . . . . . . . . . . . . . . . . . . . . 24,968,252 41 .7 43,883,550 14 .3 12,768,851 7 .7 2,512,472 6 .5 36
37 Under 4,000. . . . . . . . . . . . . . . . . . . . . . . . . . . . . . . . . . . . . . . . . . . . . . . . . . . . . . 28,436,982 47 .5 5(,,889,GO4 18 .6 18,156,200 10 .9 3,590,085 9 .3 n
38 Under 4,500. . . . . . . . . . . . . . . . . . . . . . . . . . . . . . . . . . . . . . . . . . . . . . . . . . . . . . 32,018,453 53 .5 7;!,107,815 23 .5 24,796,616 14 .9 4,925,570 12 .7 3 6
39 Under ~p5, 000. . . . . . . . . . . . . . . . . . . . . . . . . . . . . . . . . . . . . . . . . . . . . . . . . . . . . . 35,508,551 59 .3 811,690,594 28 .9 32,363,134 19 .4 6,450,543 16 .7 39
40 Under 6,(.. . . . . . . . . . . . . . . . . . . . . . . . . . . . . . . . . . . . . . . . . . . . . . . . . . . . . 41,901,131 70 .0 lZ1,757,776 40 .4 49,055,888 29 .5 9,821,611 25 .4 4 C
41 Under y7,000. . . . . . . . . . . . . . . . . . . . . . . . . . . . . . . . . . . . . . . . . . . . . . . . . . . . . . 46,984,093 78 .5 151,,684,304 51 .1 66,035,816 39 .7 13,261,855 34 .3 4 3
42 Under ~8,000. . . . . . . . . . . . . . . . . . . . . . . . . . . . . . . . . . . . . . . . . . . . . . . . . . . . . . 50,683,794 84 .7 18,,324,497 60 .1 81,490,259 48 .9 16,411,306 42 .5 42
43 Under +9,000. . . . . . . . . . . . . . . . . . . . . . . . . . . . . . . . . . . . . . . . . . . . . . . . . . . . . . 53,304,983 89 .1 206,526,766 67 .4 94,716,962 56 .9 19,131,696 49 .5 43
44 Under ~10,000 . . . . . . . . . . . . . . . . . . . . . . . . . . . . . . . . . . . . . . . . . . . . . . . . . . . . . 55,054,936 92 .0 22J,093,163 72 .8 105,109,084 63 .1 21,289,310 55 .1 44
45 Under .,15,00() . . . . . . . . . . . . . . . . . . . . . . . . . . . . . . . . . . . . . . . . . . . . . . . . . . . . . 58,263,904 97 .4 260,781,379 85 .1 1.30,667,590 76 .5 26,766,825 69 .3 45
46 Under $20,000 . . . . . . . . . . . . . . . . . . . . . . . . . . . . . . . . . . . . . . . . . . . . . . . . . . . . . 58,971,096 98 .6 Z7 ; 872, 192 89 .0 139,595,794 83 .8 28,861,654 74 .7 44E
47 Under ~2%LOC . . . . . . . . . . . . . . . . . . . . . . . . . . . . . . . . . . . . . . . . . . . . . . . . . . . . . 59,272,801 99 .1 V~ 576,362 91 .2 1", 752, 166 86 .9 30,184,349 78 .1 4 1
48 Under ~50,000 . . . . . . . . . . . . . . . . . . . . . . . . . . . . . . . . . . . . . . . . . . . . . . . . . . . . . 59,695,464 99 .8 293,739,929 95 .8 256,131,965 93 .8 33,724,626 87.3 4E
49 Under ylOO,OOO. . . . . . . . . . . . . . . . . . . . . . . . . . . . . . . . . . . . . . . . . . . . . . . . . . . . 59,810,316 100 .0 3Q_,298,786 98 .3 162,361,755 97 .5 36,351,718 94 .1 49
50 Under 150,000 . . . . . . . . . . . . . . . . . . . . . . . . . . . . . . . . . . . . . . . . . . . . . . . . . . . . 59,827,853 100 .0 30 .1,388,763 98 .9 164,057,974 98 .5 37,206,018 %.3 5(
51 Under ~200,000 . . . . . . . . . . . . . . . . . . . . . . . . . . . . . . . . . . . . . . . . . . . . . . . . . . . . 59,832,350 100 .0 3C~,,156,764 99 .2 164,667,862 98 .9 37,534,467 97 .1 51
52 Under ~500,000 . . . . . . . . . . . . . . . . . . . . . . . . . . . . . . . . . . . . . . . . 59,837,160 100 .0 30i,528,659 99 .6 165,738,978 99 .5 3438, 152, L 98 .7 5,
53 Under ~1,000,000 . . . . . . . . . . . . . . . . . . . . . . . . . . . . . . . . . . . . . . . . . . . . . . . . . . 59,837,882 100 .0 30i,010,401 99 .8 166,115,551 99 .7 38,37?,533 99 .3 51
54 Returns with no adjusted gross income . . . . . . . . . . . . . . . . . . . . . . . . . . . . . . . 433,135 - 3 L, 521, 945 - - - 5A
55 Total returns . . . . . . . . . . . . . . . . . . . . . . . . . . . . . . . . . . . . . . . . . . . . . . . . . . . . . . . 60,271,297 - 130:i,094,979 - 1,66,540,616 - 38, 645, F99 5,1
CWULATED FROM HIGHEST ADJUSTED GROSS INCCWE CLASS
56 Returns with adjusted gross income, total . . . . . . . . . . . . . . . . . . . . . . . . . . . 59,838,162 100 .0 1 30~,616,924 10O.C 166,540,616 100.0 38,645,299 100 .0 56
57 pl,000,000 or more . . . . . . . . . . . . . . . . . . . . . . . . . . . . . . . . . . . . . . . . . . . . . . . . 280 (2) 606,523 .2 425,065 .3 267,766 .7 57
58 +500,000 or more . . . . . . . . . . . . . . . . . . . . . . . . . . . . . . . . . . . . . . . . . . . . . . . . . . 1,002 (2) L, 088, 265 .4 801,638 .5 493,165 1 .3 5859 200,COO or more . . . . . . . . . . . . . . . . . . . . . . . . . . . . . . . . . . . . . . . . . . . . . . . . . . 5,812 (1) ?,460,160 .8 1,872,754 1.1 1,110,832 2 .9 59
60 ,150,000 or more . . . . . . . . . . . . . . . . . . . . . . . . . . . . . . . . . . . . . . . . . . . . . . . . . . 10,309(2) 3,228,161 1 .1 2,482,642 1.5 1,439,261 3 .7 60
61 ~100'000 or mom . . . . . . . . . . . . . . . . . . . . . . . . . . . . . . . . . . . . . . . . . . . . . . . . . 27,846(2) 5,318,138 1.7 4,178,861 2.5 2,293,581 5 .9 61
62 1.50,000 or more . . . . . . . . . . . . . . . . . . . . . . . . . . . . . . . . . . . . . . . . . . . . . . . . . . . 142,698 .2 1?,876,995 4 .2 10,408,651 6.2 4,920,673 12 .7 62
63 ~25,000 or more . . . . . . . . . . . . . . . . . . . . . . . . . . . . . . . . . . . . . . . . . . . . . . . . . . . 565,361 .9 27, 040,562 8 .8 21,788,450 13.1 8,460,950 21 .9 63
64 20,000 or mom . . . . . . . . . . . . . . . . . . . . . . . . . . . . . . . . . . . . . . . . . . . . . . . . . . 867,066 1 .4 33,744,732 11 .0 26,944,832 16.2 9,783,645 25 .3 64
65 '15'0()0 or mom . . . . . . . . . . . . . . . . . . . . . . . . . . . . . . . . . . . . . . . . . . . . . . . . . . . 1,574,258 2 .6 45,835,545 14 .9 35,873,026 21.5 11,878,474 30 .7 65
66 1OOCO or mom . . . . . . . . . . . . . . . . . . . . . . . . . . . . . . . . . . . . . . . . . . . . . . . . . . . 4,783,226 8 .0 83,523,761 27 .2 61,431,532 36 .9 17,355,989 ".9 66
67 '9' OLO or mom . . . . . . . . . . . . . . . . . . . . . . . . . . . . . . . . . . . . . . . . . . . . . . . . . . . 6,533,179 10 .9 10),090,158 32 .6 71,823,654 43 .1 19,51-3,603 50 .5 67
68 8,OCG or mom . . . . . . . . . . . . . . . . . . . . . . . . . . . . . . . . . . . . . . . . . . . . . . . . . . . . 9,154,368 15 .3 12?,292,427 39 .9 85,050,357 51 .1 22,233,993 57 .5 68
69 7,CCk or mom . . . . . . . . . . . . . . . . . . . . . . . . . . . . . . . . . . . . . . . . . . . . . . . . . . . . 12,854,069 21 .5 14),932,620 48 .9 100,504,800 60 .3 25,383,"4 65 .7 69
70 ~6,000 or mom . . . . . . . . . . . . . . . . . . . . . . . . . . . . . . . . . . . . . . . . . . . . . . . . . . . 17,937,031 30 .0 182,859,148 59 .6 117,484,728 70 .5 28,823,688 74 .6 70
71 5, 000 or mom . . . . . . . . . . . . . . . . . . . . . . . . . . . . . . . . . . . . . . . . . . . . . . . . . . . . 24,329,611 40 .7 217,926,330 71 .1 134,177,482 80 .6 32,194,756 83 .3 7
72 A,500 or mom . . . . . . . . . . . . . . . . . . . . . . . . . . . . . . . . . . . . . . . . . . . . . . . . . . . . 27,819,709 46 .5 23 .,509,109 76 .5 341) 7", 000 85 .1 33,719,729 87 .3 7
73 4,000 or mom . . . . . . . . . . . . . . . . . . . . . . . . . . . . . . . . . . . . . . . . . . . . . . . . . . . . 31,401,180 52 .5 24),727,920 81 .4 148,384,416 89 .1 35,055,214 90 .7 7
74 '3,500 or mom . . . . . . . . . . . . . . . . . . . . . . . . . . . . . . . . . . . . . . . . . . . . . . . . . . . . 34,869,910 58 .3 262,733,374 85 .7 153,771,765 92 .3 36,132,827 93 .5 74
75 J3,COO or mom . . . . . . . . . . . . . . . . . . . . . . . . . . . . . . . . . . . . . . . . . . . . . . . . . . . . 38,394,751 64 .2 27, 179,981 89 .4 158,044,552 94 .9 36,979,540 95 .7 7
76 2 , 500 or mom . . . . . . . . . . . . . . . . . . . . . . . . . . . . . . . . . . . . . . . . . . . . . . . . . . . . 42,012,761 70 .2 28,123,744 92 .7 161,459,160 %.9 37,647,754 97 .4 76
2,01011 or mom . . . . . . * . . . ** . . . . . * . . . . . . . . * . . . . . * . . . . *,,** . . . . . . * -77 45,522,959 ?6 .1 292,014,126 95 .2 163,M,818 98 .4 38,109, 98 .6 7t76 1,500 or more . . . . . . . . . . . . . . . . . . . . . . . . . . . . . . . . . . . . . . . . . . . . . . . . . . . . 48,968,291 81 .8 293,029,794 97 .2 165,387,111 99 .3 36,415,950 99 .4 78
79 ~1,0(k or - . . . . . . . . . . . . . . . . . . . . . . . . . . . . . . . . . . . . . . . . . . . . . . . . . . . . 52,923,493 88 .4 302,949,303 98 .8 166,345,710 99 .9 38,606,379 99 .9 79
80 60( or mor. . . . . . . . . . . . . . . . . . . . . . . . . . . . . . . . . . . . . . . . . . . . . . . . . . . . . . 55,919,187 93 .5 305,341,513 99 .6 166,540,616 100 .0 38,645,299 100 .0 81
81 R~ti :-o with no adjusted Cross income . . . . . . . . . . . . . . . .
.
33,13
'~
- 31,521,945 - - - - 8
. . . . . . . . . . . . . . . . .82 Total ret-n- . . . . . . . . . . . . . . . . . . . . . .
~T_
-2
, ~~
7111, __1 J 3-05,094,9791
166,540,616 , - _38,645,299 1
7
8
IAd,o-lied Cross income less adjusted Lm--s deficit .
'Lou- thaii 0.0 percent.3Ad,;i --ted ; ross deficit .
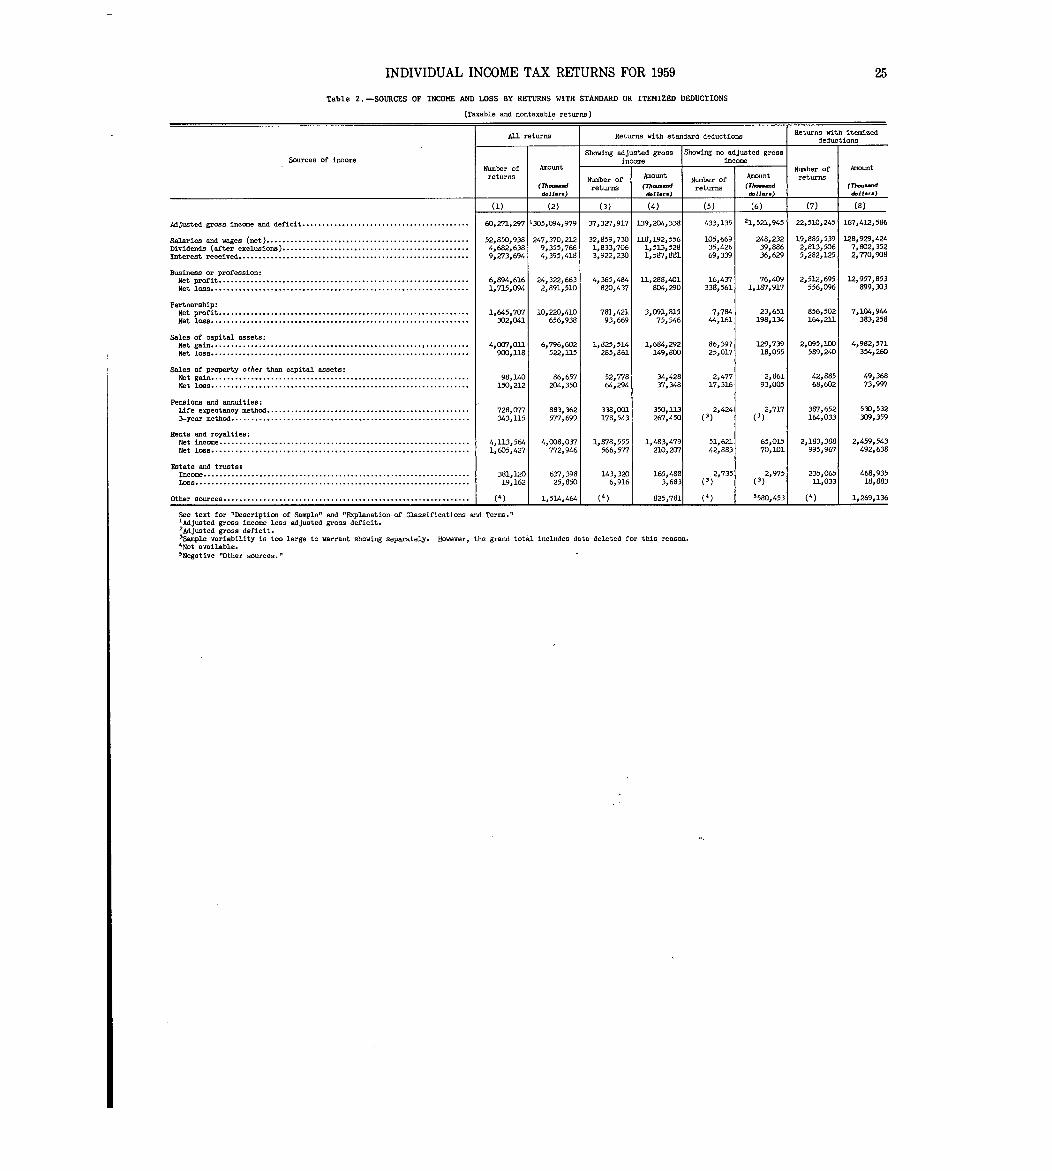
INDIVIDUAL INCOME TAX RETURNS FOR 1959
Table 2 . -SOURCES OF INCOME AND LOSS BY RETURNS WITH STANDARD OR ITEMIZED DEDUCTION S
(Taxable and nontaxable returns )
25
All returns Returns with standard deductions Returns with itemize ddeductions
Showing adjusted gross Showing w adjusted gros sSources of income income income
Number of Amount
-_
Number of Amountreturns bar f]
~
AmountNumber of
Amount returns(7h-nd
etur.~(n--d returns (Th- . d (M--d
d.11 .. d.11... doll... d.11 .. .
(2) (3) (4) (5) (6) (7) (8)
Adjusted gross income and deficit . . . . . . . . . . . . . . . . . . . . . . . . . . . . . . . . . . . . . . . . . . 60,Z71,297 1305,094,979 37,3Z7,917 139,204,338 433,135 11,521,945 22,510,245 167,412,586
Salaries and wages (net) . . . . . . . . . . . . . . . . . . . . . . . . . . . . . . . . . . .. . . . . . . . . . . . . . . . . 52,850,938 247,370,212 32,859,730 118,192,556 105,669 248,232 19,885,539 128,929,424
Dividends (after exclusions) . . . . . . . . . . . . . . . . . . . . . . . . . . . . . . . . . . . . . . . . . . . . . . . 4,682,638 9,355,766 1,833,706 1,513p528 35,426 39,886 2,81,3,506 7,802,352
Interest received . . . . . . . . . . . . . . . . . . . . . . . . . . . . . . . . . . . . . . . . . . . . . . . . . . . . . . . . . . 9,Z73,694 4,395,418 3,922,230 1,587,881 69p339 36,629 5,282,125 2,770,908
Business or profession :Net profit . . . . . . . . . . . . I . . . . . . . . . . . . . . . . . . . . . . . . . . . . . . . . . . . . . . . . . . . . . . . . . . 6,894,616 24,322,663 4,365,484 3-1,288,401 16,437 76,409 2,512p695 12,957,853
Net loss . . . . . . . . . . . . . . . . . . . . . . . . . . . . . . . . . . . . . . . . . . . . . . . . . . . . . . . . . . . . . . . . . 1,715,094 2,891,510 820,437 804,290 338,561 1,187,917 556,096 899,303
Partnership :Net profit . . . . . . . . . . . . . . . . . . . . . . . . . . . . . . . . . . . . . . . . . . . . . . . . . . . . . . . . . . . . . . . 1,645,707 10,220,410 781,421 3,091,815 7,784 23,651 856,502 7,104,944
Net loss . . . . . . . . . . . . . . . . . . . . . . . . . . . . . . . . . . . . . . . . . . . . . . . . . . . . . . . . . . . . . . . . . 302,041 656,938 93,669 75,546 44,161 198,134 164,21.1 383,258
Sales of capital assets :Net gain. . . . . . . . . . . . . . . . . . . . . . . . . . . . . . . . . . . . . . . . . . . . . . . . . . . . . . . . . . . . . . . . . 4,007,011 6,796,602 1,825,514 1,664,292 86,397 129,739 2,095,100 4,982,571
Net loss . . . . . . . . . . . . . . . . . . . . . . . . . . . . . . . . . . . . . . . . . . . . . . . . . . . . . . . . . . . . . . . . . 900,118 522,115 285,861 149,800 25,017 18,055 589,240 354,260
Sales of property other than capital assets :Net gain . . . . . . . . . . . . . . . . . . . . . . . . . . . . . . . . . . . . . . . . . . . . . . . . . . . . . . . . . . . . . . . . . 98,140 86,657 52,778 34,428 2,477 2,861 42,885 49,368
Net loss . . . . . . . . . . . . . . . . . . . . . . . . . . . . . . . . . . . . . . . . . . . . . . . . . . . . . . . . . . . . . . . . . 150,212 204,350 64,294 37,348 17,316 93,005 68,602 73,9917
Pensions and annuities :Life expectancy method . . . . . . . . . . . . . . . . . . . . . . . . . . . . . . . . . . . . . . . . . . . . . . . . . . . 728,0`77 883,362 338,001 350,11.3 2,424 2,717 36?,652 530,532
3-year method . . . . . . . . . . . . . . . . . . . . . . . . . . . . . . . . . . . . . . . . . . . . . . . . . . . . . . . . . . . . 343,1.15 577,699 178,543 267,450 (3) (3) 164,033 309,359
Rents and royalties ;Net income . . . . . . . . . . . . . . . . . . . . . . . . . . . . . . . . . . . . . . . . . . . . . . . . . . . . . . . . . . . . . . . 4,113,564 4,008,037 1,878,555 1,483,479 51,621 65,015 2,183,388 2,459,54 3Net loss . . . . . . . . . . . . . . . . . . . . . . . . . . . . . . . . . . . . . . . . . . . . . . . . . . . . . . . . . . . . . . . . . 1,605,427 772,946 566,577 210,207 42,883 70,101 995,967 492,63 8
Estate and trusts &Income . . . . . . . . . . . . . . . . . . . . . . . . . . . . . . . . . . . . . . . . . . . . . . . . . . . . . . . . . . . . . . . . . . . 381,120 637,398 143,320 165,488 2,735 2,975 235 065 468,93 5Loss . . . . . . . . . . . . . . . . . . . . . . . . . . . . . . . . . . . . . . . . . . . . . . . . . . . . . . . . . . . . . . . . . . . . . 19,162 25,850 6,916 3,683 (1) (1) 11,033 18,88 3
Other sources . . . . . . . . . . . . . . . . . . . . . . . . . . . . . . . . . . . . . . . . . . . . . . . . . . . . . . . . . . . . . . 1 (4) 1 1,514,464 1 (4) 1 825,781 (4) 1 5580,453
1
1 4 1,269,13 6
See text for "Description of Sample-' and "Explanation of Classifications and Term ."'Adjusted gross income less adjusted gross deficit .2Adjusted gross deficit .3sample variability is too large to warrant showing separately. However, the grand total includes data deleted for this reason .4Not available .
Negative "Other sources ."
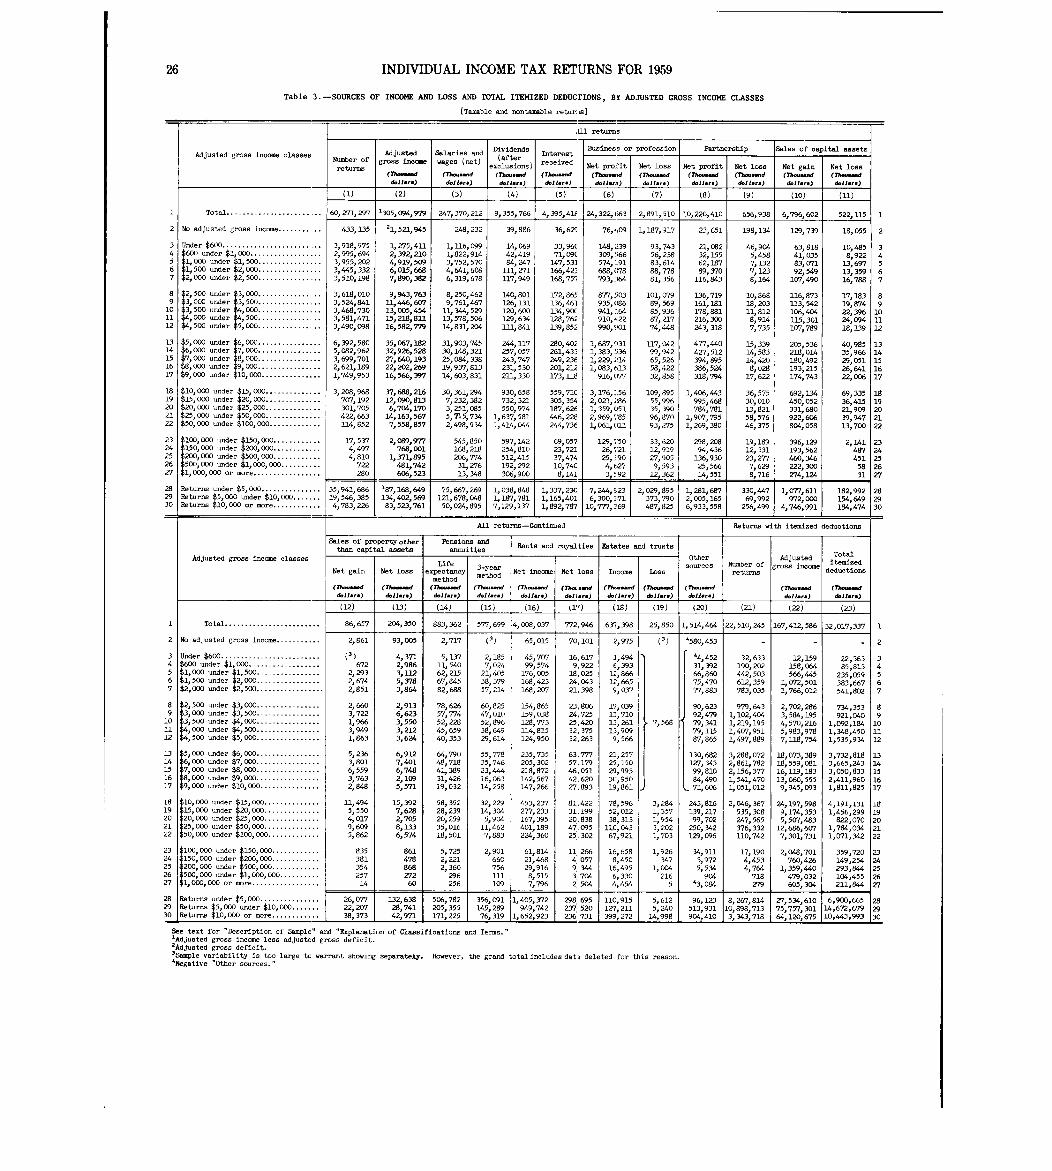
26 INDIVIDUAL INCOME TAX RETURNS FOR 1959
Table 3 . -SOURCES OF INCOME AND LOSS AND TOTAL ITEMIZED DEDUCrIONS, BY ADJUSTED GROSS INCOME CLASSES
[Taxable and nontaxable returi~ ]
,Lll returns
Adjusted gross income classesDividends Interest Business or profession Partnership Sales of capital assets
Adjusted Salaxies and(afte r
Number of gross income wages (net) x receive dreturns e clusions Net profit Net loss Net profit Met loss Net gain Net loss
(77--.d (Th-.-d (Th--.d (Th-.-d (Th--,d (Th ..d (Th-.-d (Th-d (n-..w (Thm.- dd,il,r,) d.1 I. .. d.11 . .. &II- .) doll... d.11 .,.) d.11., .) C61 1-) &11. .. d.1 I. ..
W (2) (3) (4) (5) (6) (7) (8) (9) (10) (11 )
1 Total . . . . . . . . . . . . . . . . . . . . . . . . 60,271,297 1305,094,979 247,370,212 9,355,766 4,395,41E 24,322,663 2,891,510 10,220,410 656,938 6,796,602 522,11.5 1
2 No adjusted gross income. . . . . . . . . . . 433,135 21,521,945 248,232 39,886 36,62~ 76,09 1,187,917 23,651 198,134 129,739 18,055 2
3 Under $600 . . . . . . . . . . . . . . . . . . . . . . . . . 3,918,975 1,275,411 1,116,099 14,069 33,96C 148,239 93,743 21,082 46,904 63,818 10,485 34 600 under $1 ' 000
. . . . .. . 2,995,694 2,392,210 1,822,914 42,419 71,09( 309,566 56,238 32,155 5,458 41,035 8,922 4
511,000 und "
Z:r3,955,202 4,919,509 3,752,570 84,247 147,531 574, :-91 83,614 62,187 7,132 83,071 13,697 5
6 1,500 d :l 12,
--3,445,332 6,015,668 4,641,608 1U, 271 166,42~ 688, 0`78 88,778 89,370 7,123 92,549 13,359 6
7 2,000 -der 2,500 . . . . . . . . . . . . . . . . 3,510,198 7,890,382 6,319,678 117,949 168,751, 793, 364 81,356 116,943 8,164 I(Y7,490 16,788 7
8 121.500 under ~3 1 3, 618, .10 9,943,763 8,250,462 140,801 172,86,- 877,503 101,079 136,719 10,868 116,873 17,183 89
:der
33, COO un 3,52,4,841 1-1, 446, 6U7 9,761,467 126,131 136,461 935,086 89,569 161,181 18,203 113,542 19,874 90
1t :3, 500 und r . . . . .~~ : : : : : : : : : : . 3,4M, 730 13,005,454 11,344,529 120,600 134,90C 941,164 85,936 178,881 11,812 106,404 22,396 10
11d ,
000 un . . . . . .~;
3,581,471 15,218,811 13,578,506 129,634 128,762 910,422 87,217 216,300 8,914 115,301 24,094 1112 500 under 5, 000 . . . . . . . . . . . . . . . . 3,490,098 16,582,779 14,831,204 1-11,941 139,852 990,901 74,448 243,318 7,735 107,789 18,139 12
13 5,000 under 6,000 . . . . . . . . . . . . . . . . 6,392,580 35,067,182 31,903,745 244,117 280,402 1, 687, 931 117,042 477,440 15,339 205,536 40,985 1314
7
6, 000under , 000 . . . . . . . . . . . . . . . . 5, 082,962 32,926,528 30,148,321 257,057 261,433 1,383,536 99,942 427,512 14,583 218,014 35,966 14
15
1 1
7,000 under 8, 000 . . . . . . . . . . . . . . . . 3,699,701 27,640,193 25,084,338 243,747 249,236 1, 229, 214 65,526 394,895 14,420 180,492 29,051 1516 8,000 under 9,000 . . . . . . . . . . . . . . . . 2,621,189 22,202,269 19,937,813 231y530 201,212 1,083,613 58,422 386,524 8,028 193,215 26,641 1617 9,000 under 10,000 . . . . . . . . . . . . . . . 1,749,953 16, 566, 397 14,603,831 211,330 173,118 916,077 32,858 318,794 17,622 174,743 22,006 17
18 10,000 under 15,000 . . . . . . . . . . . . . . 3,208,968 37,688,216 30,361,294 930,658 559,71C 3,176,156 109,895 1,406,443 36,575 692,134 69,335 1819 15,000 under 20,000 . . . . . . . . . . . . . . 707,192 1-2,09-0,81-3 7,232,382 732,321 305,354 2,021,286 55,996 995,468 30,010 450,052 36,415 1920
1 1
20,000 under 25,000 . . . . . . . . . . . . . . 301,705 6,704,170 3,251,085 550,974 187,626 1,359,051 35,390 784,781 1-3,821 331,680 21,909 2021 25,000 under 50,000 . . . . . . . . . . . . . . 422,663 14,163,567 5,715,734 1,637,581 446,228 2,969,785 96,870 1,907,795 58,576 922,606 39,947 2 122 50,000 under 100,000 . . . . . . . . . . . . . 114,852 7,558,857 2,498,934 1,414,044 244,736 1, 061, 011 93,275 1,269,380 46,375 804,058 L3,700 2 2
23 100,000 under 150,000. . . . . . . . . . 17,537 2,089,977 545,850 597,142 69,057 129, 750 33,620 298,208 19,189 396,129 2,141 2324
1150,000 -der 200,000 . . . . . . . . . . 4,497 768,001 168,218 254,810 23,721 26, 721 12,919 94,436 12,331 193,562 487 24
25
1
200,000 under 500,000 . . . . . . . . . . . . 4,810 1,371,895 206,774 512,415 37,474 25, 390 27,905 136,930 23,277 460,346 451 2526 500,000 under 1,000,000 . . . . . . . . . . 722 481,742 31, Z76 192,292 10,74C 4,627 9,593 25,566 7,629 222,300 58 2 627 1,000,000 or more. . . . . . . . . . . . . . . . . 280 606,523 13,348 306,900 8,141 3_592 12,362 14,551 1 8,716 274,124 1 31 1 27
28 Returns under $5,000 . . . . . . . . . . . . . . . 3 161'
6491'
75,667,269 1,038,848 1,337,23C 7,, 23
?
2,11,P5l'2'1
330'447 1,077,611
2 '_2
2 829 Returns ~5,000 under $10,000 . . . . . . . 19,546, 5
, ..2 5 121,678,048 1,187,781 1,165,401
r.71
3".73 2,005, 65;1 69,992 972,000
9
7~29
30 Returns ~10,000 or more . . . . . . . . . . . . 4)78 50,024,895 7,129,137 1,892,787 69 487,825 6,933,558 2 991 14,414 3 0
All returns-Continued ---THeturns with itemized deductions
Sales of propert3, other Pensions and Rentsand royalties Estates and trusts
than capital assets annuitie sAdjusted gross income classes
- othe rLife
Tota lAdjusted itemi
.e dNumber of,
sourc eNet gain Net loss expectancy 3-year Net income Met loss lna~ Losemethod
gross incomereturns deductions
method(7~-d (Th--d (M-nd (Thmnd (Thmaand (7W= mand (Th-ad (Th-d (7),-d (21-d (Th.....d
d.11 ... d.11 . . dbil .r .) d.11... ) d.11. .. )_ d.11 ... ) d.11.. . ) bll... ) d.11. .. ) d.11. .. d.11...
(12) (13) (14) (15) (16) (r) (18) (19) (20) (21) (22) (23 )
1 Total . . . . . . . . . . . . . . . . . . . . . . . . 86,657 204,350 883,362 577,699 4,008,037 772,946 631,398 25,850 1,514,464 22,510,245 167,412,586 32,017,337 1
2 No adjusted gross income . . . . . . . . . . . 2,861 93,005 2,717 (3) 65,015 70,101 2,975 (3) '580~453 - - - 2
3 Under $600 . . . . . . . . . . . . . . . . . . . . . . . . . (3) 4,37-1 5,137 2,185 45,707 16,617 2,494 44,452 32,633 12,159 22,363 34 600 under $1,000 . . . . . . . . . . . . . . . . . 672 2,986 11,540 7,024 99,574 9,922 6,393 31,392 190,202 158,064 85,813 45
1 :1,000 under $1,500 . . . . . . . . . . . . . . . 2,293 3, M 62,215 21,405 176,005 18,025 12,866 66,M 442,503 566,445 235,059 5
6 11500 under $21 000 . . . . . . . . . . . . . . . . 2,674 5,378 67,845 38,379 168,423 24,043 12,665 75,470 612,359 1, U72, 501 383,667 67 $2,000 under $21500 . . . . . . . . . . . . . . . . . 2,851 3,864 92,688 57,214 168,207 21 .398 9,037 77,883 783,035 1,766,012 541,802 7
s 500 und:r ~3 1 : ~ ~ : : : : . . . . . 2,660 2,913 78,626 60,825 154,865 23,806 17,039 90,623 979,643 2,?02,286 734,353 89
: , 3: : : :000 und 3,722 6,623 57,774 47,010 159,038 24 .725 11,710 92,479 1,102,404 3,584,195 921,040 9
i
0
[
500 -der 000 . . . . . . . . . . . 1,966 3,550 52,228 52,896 128,773 25,420 13,261 7,568 79,341 1,219,195 4,570,216 1,092,184 1011
~:, 000 under 500 . . . . . . . . . . . . . . . . 3,949 3,212 45,659 38,649 114,815 32,375 13,909 79,115 1,407,951 5,983,978 1,348,450 11
12 1500 -der 5 000 . . . . . . . . . . . . . . . . 1,863 3,624 40,353 29,614 124,950 32,263 9,566 87,865 1,497,889 7,118,754 1,535,934 U
'
-der 6, . . . . . . . . . .' = P
5,236 6,912 64,790 55,778 235,735 63,777 22,257 130,682 3,288,072 18,073,389 3,732,818 1314
. er:6 d . . . . . . . . . . . . . 3,801 7,401 48,718 35,746 205,302 57,179 25,150 127,343 2,861,782 18,559,081 3,665,243 14
51 ~7 000 -der. . . . . .
6,559 6,748 41,389 23,444 218,872 46 051 29,993 99,810 2,156,377 16,119,183 3,050,833 1516
:000 -der . . . . . . 3,763 2,109 31,426 16,063 142,567 42 .620 30 1 950 84,490 1,541,470 13,060,555 2,411,960 16
17 9, 000 under 10,000 . . . . . . . . . . . . . . . 2,848 5,571 19,032 14,258 147,266 27,e93 19,861 71,606 1,051,012 9,945,093 1,811,825 17
8'
~~ : : : . . . . . .
r ~l -5
,
1 0' 0')0 ' d'
11,494 15,392 58,352 32,229 453,237 81 422 78,596 3,294 243,816 2,046,367 24,197,598 4,191,131 1819
O' : : : : :15 , 000 u.d.r 2 . . . . . . 5,550 7,628 28,239 14,304 277,233 31 199 52,012 1,357 1-39,217 535,308 9,174,353 1,456,299 19
20120, ~1 25 ~~ : . . . . . . . . . . . . . 4,017 2,705 20,259 5,904 167,395 20 838 38,313 1,954 99,702 247,565 5,507,483 822,070 20
21. 150:5,
. . . . . . . . . . . .2 9,609 8,133 35,016 11,462 401,189 47 095 110,043 3,202 250,342 376,332 12,666,607 1,784,034 2122 50,000 under 100,000 . . . . . . . . . . . . . 5,862 6,574 18,501 7,883 224,360 25,302 67,921 1,703 129,096 110,742 7,301,731 1,071,342 22
3!
150,OOO . . . . . . . . . . . .- - -dc1 '~~ '
835 861 5,725 2,901 61,814 11 266 16,658 1,926 34,911 17,190 2,048,701 359,720 232 4
J.,1 10 O nd.~ 000. . . . . . . . . . . . 381 478 2,221 660 21,468 4, 057 8,450 347 3,972 4,453 760,426 149,254 24
251
2 500,000 . . . . . . . . . . . . 354 868 2,360 756 29,916 9. 344 16,495 1,004 5,534 4,764 1,359,440 293,844 2526 5 11000,000. . . . . . . . . . 257 Z72 296 ill 8,515 3,704 6,330 216 904 718 479,032 104,455 2627 l1OOOoOOO or mom . . . . . . . . . . . . . . . . .
114
160 1 256 109 1 7,796 1 504 41454
5 1'3,084
1279 1 605,304 1 211,944 I Z7
28 Returns under $5, 26N
132,638 506,78235 ~'_l
1,405,1 298 695 110,915 5,612
t
96,123 8; 26" 'l' '
5 6 0
' 16 9- 665 28
e t-Z 15, 0 un~
I
22,207
I
28,741
1
5205,35 145,21 ~
9,94 742
1
23i 520'
Z7, 211 245, 0 ~ 13,9319
:8 8,113 110;
1
. 171 75 3
: : 1791,4 672 6 9t~. 10
or ... . . . . . . . . . . . . 38,373 42,971 171,225 763
6
~,9
8
14, 998.
904,410 3 5, ,
10 443 9
;
See text for "Description of Sample" and "Erplanation of Classifications and Terms.'Adjusted gross income less adjusted gross deficit .2Adjusted gross deficit.3Sample variability is too large to warrant showing separately . However, the grand total includes dati deleted for this reason .4Negative "Other sources. "
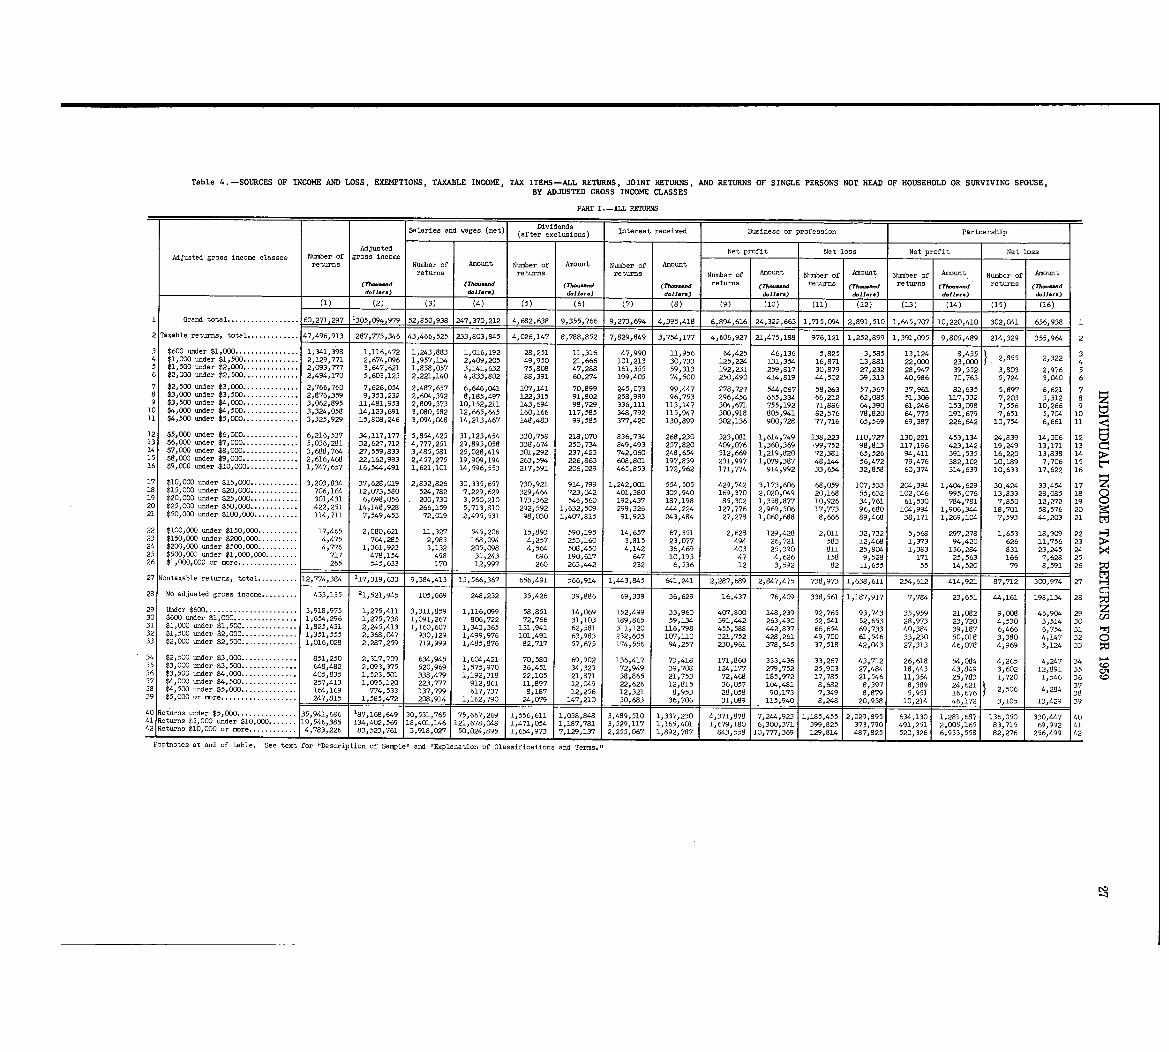
Table 4 . -SOURCES OF INCOME AND LOSS, EXEMPTIONS, TAXABLE INCOME, TAX ITEMS-ALL RETURNS, JOINT RETURNS, AND RETURNS OF SINGLE PERSONS NOT READ OF HOUSEHOLD OR SURVIVING SPOUSE,BY ADJUSTED GROSS INCOME CLASSE S
PART I .-ALL RETURNS
Salaries and wages (net) ( .rteDividend sr exclusions) Interest received Business or profession Partnership
Adjusted Net profit Net loss Net profit Net lossAdjusted gross income classes Number of gross income
returns Number of Amount Number of Amount Number of Amoun treturns returns returns Number of Amount Number of Amon` ~ Number of A~O~t, Number of Amount
(Th...d (n--d (rh-.-d (Th- . ..d returns (Th--.d returns (Th-.-d re turns (Th ..d returns (77--dd.11. .. d.11... ) d.11... ) doJ1.. . ) d.J1.1.) d.11 .. . ) d.11. . . ) d.11...
(2) (3) (4) (5) (6) (7) (a) 1 (9) - (10) (11) (12) (13) (14) (15) (16 )
1 Grand total . . . . . . . . . . . . . . . . . . 60,271~297 1305,094,979 52,850,938 247,370,212 4,682,638 1 9,355,766 9,273,694 4,395,418 6,894,616 24,322,6631 1,715,094 2,891,510 1,645,707 10,220,410 302,041 656,938 1
2 Taxable returns, total . . . . . . . . . . . . . 47,496,913 287,775,346 43,466,525 233,803,845 4,026,147 8,788,852 7,829,849 3,754,177 4,606,927 21,475,188 976,121 1,252,899, 1,391,095 9,805,489 214,329 1 355,964 2
3 $600 under $1,000 . . . . . . . . . . . . . . . . 1,341,398 1,116,472 1,243,883 1,016,192 28,251 1 1,316 47,990 11,956 64,425 46,136 5,825 3,585 13,124 8,435 2,855 2,322 34 $1,000 under $1,500 . . . . . . . . . . . . . . 2,129,771 2,674,096 1,957,134 2,409,205 49,950 21,666 101,213 30,733 125,224 131,354 16,871 13,881 22,000 23,000 45 $1,500 under $2,000 . . . . . . . . . . . . . . 2,093,777 3,647,621 1,858,057 3,141,632 75,808 47,288 161,355 59,313 192,231 259,817 30,879 27,232 28,947 39,352 3,803 2,976 56 $2,000 under $2,500 . . . . . . . . . . . . . . 20494,170 5,603,123 2,2210140 4,833,802 880391 60,274 199,405 74,500 250,490 4140819 ", 502 .39,313 400986 70,765 5,724 3,040 67 $2,500 under $3,000 . . . . . . . . . . . . . . 2,766,760 7,626,054 2,487,657 6,646,041 107,141 70,899 245,073 99,447 2780727 544,067 58,263 57,367 37,961 82,635 5,897 6,621 78 t3,000 under $3,500 . . . . . . . . . . . . . . 2,876,359 90353,232 2,604,392 8,185,497 122,315 91,802 258,989 96,753 296,456 655,334 66,212 62,085 51,306 117,332 7,203 5,312 89 $3,500 under $4,000 . . . . . . . . . . . . . . 3,062,895 11,481,953 2,809,373 10,152,211 143,694 98,729 . 336,111 113,147 304,671 755,192 71,886 64,390 61,246 153,098 7,556 10 266 9
10 $4,OGO -der $4,500 . . . . . . . . . . . . . . 3,324,058 14,123,691 3,060,582 12,665,645 160,166 117,585 348,792 115,947 300,918 805,941 82,576 78,820 64,775 191,679 7,651 5 :704 10 tl11 $4,500 under $5,000 . . . . . . . . . . . . . . 3,325,929 15,808,246 3,094,048 14,213,467 148,483 99,585 377,420 130,899 302,136 900,728 77,716 65,569 69,387 226,642 10,754 6,661 11
12 $5,000 under $6,000. . . . . . . . . . . . . . 6,216,537 34,117,177 5,854,425 31,123,454 330,758 218,070 836,734 268,230 523,081 1,614,749 138,223 110,727 130,221 453,134 24,839 14,006 1213 $6,000 -der $7,000. . . . . . . . . . . . . . 5,036,281 32,627,712 4,777,251 29,895,058 338,674 250,734 849,493 257,820 409,076 1,360,369 -99,752 98,813 117,196 423,142 19,249 13,171 1 314 $7,000 =der $8,000. . . . . . . . . . . . . . 3,688,764 27,559,833 3,485,581 25,028,419 301,292 237,423 742,060 248,654 312,669 1,219,820 72,381 65,526 94,411 391,535 16,220 13,838 14 >.15 $8,000 under $9,000. . . . . . . . . . . . . . 2,616,468 22,162,993 2,457,275 19,909,194 263,594 226,863 608,801 197,839 231,997 1,079,387 48,1" 56,472 79,476 382,102 10,189 7,706 15 t1416 $9,000 under $10,000. . . . . . . . . . . . . 1,747,657 16,5",491 1,621,101 14,596,553 217,591 206,029 465,853 172,962 171,774 914,992 33,654 32,858 60,374 314,639 10,633 17,622 16
17 $10,000 -der $15,000. . . . . . . . . . . . 3,203,834 37,628,019 2,832,826 30,335,657 730,921 914,799 1,242,001 554,505 429,742 3,173,606 68,059 107,533 204,394 1,404,629 30,424 33,454 17 z18 $15,000 -der $20,000. . . . . . . . . . . . 706,164 12,073,580 524,782 7,229,629 329,464 723,042 401,380 302,940 169,370 2,020,049 20,168 55,632 102,046 995,076 13,833 28,085 18 019 $20,000 =der $25,000. . . . . . . . . . . . 301,431 6,698,056 . 2GO,730 3,250,210 173,362 546,560 192,437 187,198 85,302 1,358,877 10,926 34,761 61,530 784,781 7,850 12, 272 19 020 $25,000 -der $50,000. . . . . . . . . . . . 422,251 14,148,928 266,159 5,713,810 292,592 1,632,509 299,326 44-4,224 127,776 2,969,506 17,773 96,680 104,994 1,906,344 18,701 58,576 2 021 $50,G00 under $100,000. . . . . . . . . . . 114,711 7,549,453 72,019 2,495,531 98,030 1,407,815 91,923 243,484 27,278 1,060,688 8,666 89,468 38,171 1,269,104 7,593 44,203 21
22 $100,000 -der $150,000 . . . . . . . . . . 17,465 2,080,621 11,327 545,206 15,893 590,195 14,657 67,351 2,628 129,428 2,011 32,732 5,568 297,278 1,653 18,909 2223 $150,000 under $200,000 . . . . . . . . . . 4,475 764,285 2,983 168,094 4,257 253,160 3,815 23,077 494 26,721 583 12,468 1,373 94,420 626 11,756 2324 $200,000 -der $500,000 . . . . . . . . . . 4,776 1,361,923 3,132 205,098 4,564 508,450 4,142 36,469 403 25,390 811 25,804 1,383 136,294 831 23,245 2425 $500,003 -der $1,000,000 . . . . . . . . 717 478,154 498 31,243 696 190,617 647 10,193 47 4,626 158 9,528 171 25,563 166 7,628 2526 $1,000,000 or more . . . . . . . . . . . . . . . 265 545,633 170 1 12,997 260 263,"2 1 232 6,536 1 12 3,592 82 11,655 55 14,520 79 8,591 26
27 Nontaxable returns, total . . . . . . . . . . 12,774,384 '17,319,633 9,384,413 13,566,367 656,491 566,914 l,"3,845 641,241 2,287,689 2,847,475 738,973 1,638,611 254,612 414,921 87,712 300,974 27
- C28 No adjusted gross income . . . . . . . . . 433,135 21,521,945 105,669 248,232 35,426 39,886 69,339 36,629 16,437 76,409 338,561 1,187,917 7,784 23,651 44,161 198,134 28 ~d29 Under $600. . . . . . . . . . . . . . . . . . . . . . . 3,918,975 1,275,411 3,311,859 1,116,099 58,851 14,069 152,499 33,960 407,800 148,239 92,765 93,743 35,959 21,082 9,008 46,904 29 t430 $600 under $1,000 . . . . . . . . . . . . . . . . 1,654,296 1,275,738 1,091,267 806,722 72,766 31,103 189,865 59,134 391,442 263,430 52,541 52,653 28,973 23,720 4,530 3,514 30 UD31 $1,000 under $1,500 . . . . . . . . . . . . . . 1,825,431 2,245,413 1,160,607 1,343,365 131,941 62,581 311,120 116,798 455,588 4-42,837 66,654 69,733 40,384 39,187 6,466 6,754 31 ITJ32 $1,500 under $2,000 . . . . . . . . . . . . . . 1,351,555 2,368,047 930,129 1,499,976 101,491 63,963 232,605 107,110 321,752 428,261 49,700 61,546 33,230 50,018 3,380 4,147 3233 $2,000 under $2,500 . . . . . . . . . . . . . . 1,016,028 2,287,259 719,999 1,485,876 82,717 57,675 174,556 94,257 230,961 378,545 37,518 42,G43 27,313 46,078 4,969 5,124 33
34 $2,500 under $3,000. . . . . . . . . . . . . . 851,250 2,317,709 634,945 1,604,421 70,580 69,902 136,417 73,418 171,860 333,436 33,267 43,712 26,618 54,084 4,265 4 247 3435 $3,000 under $3,500. . . . . . . . . . . . . . 648,482 2,093,375 520,969 1,575,970 36,451 34,329 72,949 39,708 124,177 279,752 25,903 27,484 18,443 43,849 3,602 12:891 35 toC;136 $3,500 under $4,000. . . . . . . . . . . . . . 405,835 1,523,501 338,479 1,192,318 22,105 21,871 38,865 21,753 72,468 185,972 17,785 21,546 11,354 25,783 1,720 1,546 36 ~.c3? $4,000 =der $4,500 . . . . . . . . . . . . . . 257,413 1,095,120 223,777 912,861 11,897 12,049 22,626 12,615 36,057 104,481 8,682 8,397 8,389 24,621 2,506 4,284 3738 $4,500 under $5,000. . . . . . . . . . . . . . 164,169 774,533 137,799 617,737 8,187 12,256 12,321 8,953 28,058 90,173 7,349 8,879 5,951 16,676 3839 $5,000 or more . . . . . . . . . . . . . . . . . . . 247,815 1,585,472 208,914 1,162,790 24,079 147,210 30,683 36.706 31.089 115 .940 8.248 20 .958 10.214 46 .172 3 .105 13 .4:)g 31)
40 Returns under $5,000. . 35,94 686 187,168,649 30,531,765 75,667,26~9 5 6 :611 1:,138 848 3 4 ' 0 1,337 230 4,371,878 7 2",923 1'1'3
1:,415 2,021 913'
1 281,687 136 , 330 44,7 401,1 , 01 0 ,0., 1 1 9 3:8 0501",134,402,569 18,401,146 121,678 1 ' 1 0 1 1 9:1 37 39 79
041 Ret-ns $5,000 under 6 :385 1- :47 54 87:78 315829 _117 6 :4 1,679,18 6, 125 37 491',1251 2,005,165 83 715 69 992 4142 Returns $10,000 or more . . . . . . . . . . .. -87,825 520,326 6,933,558 82 , 276 256,499 421 1 4,783,226 83,523,761 3,918,027 50,024,895 1,654 97 2 255,067 1 1,892,787 843,558 10,777,369 129,8141
4
Footnotes at end of table . See text for "Description of Sample" and "Explanation of Classifications and Terms .'$
IND
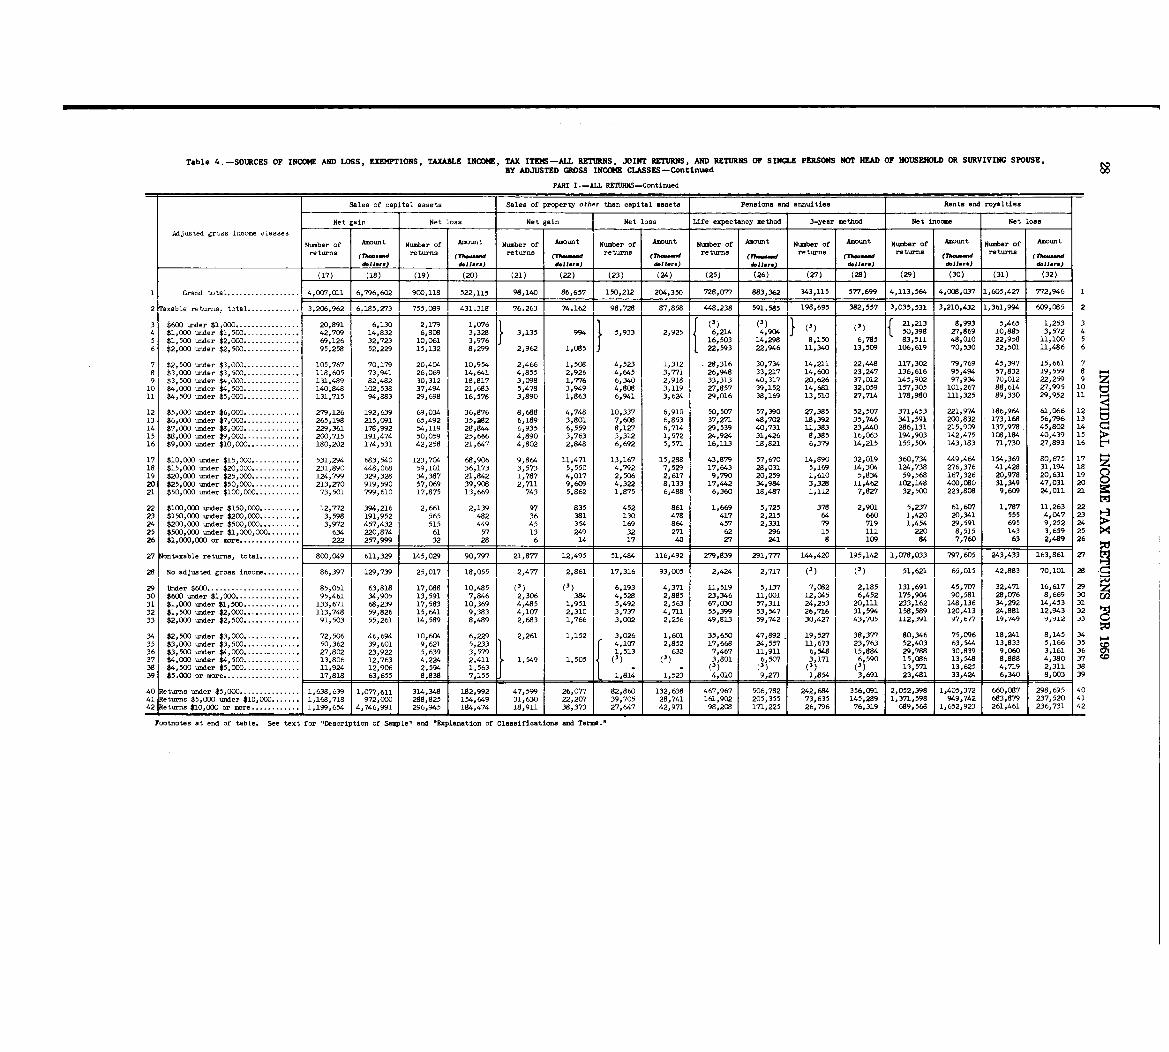
Table 4-SOURCES OF INCOME AND LOSS, EXEMPTIONS, TAXABLE INCOME, TAX ITEMS-ALL RETURNS, JOINT RETURNS, AND RETURNS OF SINGLE PERSONS NOT HEAD OF HOUSEHOLD OR SURVIVING SPOUSE,BY ADJUSTED GROSS INCOME CLASSES-Continue d
PART I .-ALL RETURNS-Continued
Sales of capital assets Sales of property other than capital assets Pensions and annuities Rents and royaltie s
Net gain Net loss Net gain Net loss Life expectancy method 3-year method Met income Net loss
Adjusted gruss iixom classes
Number of Amount Number of Amount Number of Amount Number of Amount Number of Amount Number of AMDUrt Number of Amount Number of Amountreturns (7)1--d returns (Th ....w returns (Th__W returns (Th-d returns (ni.-d returns (71t-eand rettirna (~ raturris (77--W
d.IJ. .. d.11... dolJara) d.JW .) d.11. .. d.11. .. d.IJ.1.) d.11...
(17) (18) (19) (20) (21) (22) (23) (24) (25) (26) (27) (28) (29) (30) (31) (32)
1 Grand total . . . . . . . . . . . . . . . . . . 4,007,011 6,796,602 900,118 522,115 99,140 86,657 150,212 204,350 728,077 883,362 1 343,115 577,699 4,113,564 4,008,037 1,605,427 772,946 1
2 Taxable returns, total . . . . . . . . . . . . . 3,206,962 6,185,273 755,089 1 431 .318 1 76 .263 74,162 98,728 87,858 "8,238 591,585 198,695 382,537 3,035,531 3,210,432 1,361,994 609,085 2
3 $600 under $1,000 . . . . . . . . . . . . . . .. 20,891 6,130 2,179 3) (3) (3) (3) 21: 213 8,993 5,465 1,253 34 50 398 27,869 10,885 3,572 44 $1,000 under $1,500 . . . . . . . . . . . . . . 42,709 14,832 6,808 328 3,135 994 5,933 2,9125 6 .4 904 1
5 $1,500 under $2,000 . . . . . . . . . . . . .. 69,126 32,723 10,061 3,976 16:503 14 :298 8,150 6,785 83,511 48,010 22,958 11,100 5
6 $2,000 under $20500 . . . . . . . . . . . . . . 95,258 52,229 15,132 8,299 2,962 1,085 22,593 22,946 11,340 13,509 106,619 70,530 32,501 11,486 6
7 $2,500 under $3,000 . . . . . . . . . . . . . . 105,767 70,179 20,404 10,954 2,466 1,508 4,523 1,312 28,316 30,734 14i2ll 22,"8 117,302 79,769 45,3197 15,661 7
8 $3,000 under $3,500 . . . . . . . . . . . . . . 118,605 73,941 26,069 14,641 4,855 2,926 4,645 3,771 26,948 33,217 14,600 23,247 136,616 95,494 57,832 19,559 89 $3,500 under $4,000 . . . . . . . . . . . . . . 131,489 82,482 30,312 18,817 3,098 1,?76 6,340 20918 33,313 40,317 20,626 37,012 145,902 97,934 70,012 22,259 9
10 $4,DDO under $4,500 . . . . . . . . . . . . . . 140,848 102,538 37,494 21,683 5,478 3,949 4,808 3,119 27,857 39,152 14,661 32,059 157,305 101,267 88,614 27,995 1011 $4,500 under $5,000 . . . . . . . . . . . . . . 131,715 94,883 29,698 16,576 3,890 1,863 6,941 3,6Z4 29,016 38,169 13,510 27,714 178,980 111,325 89,330 29,952 11
12 $5,000 under $6,000 . . . . . . . . . . . . . . 279,126 192,639 69,034 36,876 8,688 4,748 10,337 6,910 50,507 57,390 27,385 52,507 371,453 221,974 186,964 61 066 1213 $6,000 under $7,000 . . . . . . . . . . . . . . 265,198 215,091 65,492 35,282 60189 3,801 7,608 60853 37,271 48,702 18,392 35,746 341,591 200,832 173,168 56:796 1314 $7,000 under $8, 000 . . . . . . . . . . . . . . 229,361 178,992 54,119 28,844 6,935 6,559 8,127 6,714 290539 40,731 11,383 23,"0 286,131 215,909 137,978 45,802 1415 $8,000 under $9,000 . . . . . . . . . . . . . . 200,715 191,474 50,059 25,666 4,890 3,763 5,312 1,572 Z4,924 31,426 8,385 16,063 194,903 142,475 106,184 400439 1516 $9,000 under $10,000. . . . . . . . . . . . . 180,202 174,531 42,258 21,647 4,802 2,848 6,692 5,571 16,113 16,821 6,379 14,215 155,504 143,183 71,730 27,893 16
817 $10,000 under $15,000 . . . . . . . . . . . . 531,294 683,540 123,704 68,906 9,864 11,471 13,167 15,288 43,M 57,670 14,890 32,019 360,734 449,464 154,369 0 , 675 17318 $15,000 under $20,000. . . . . . . . . . . . 231,890 "S, 066 59,101 36,173 3,573 5,550 4,792 70529 17,643 28,031 5,169 14,304. 124,738 276,376 41,428 1,194 is219 $20,000 under $25,000. . . . . . . . . . . . 124,799 329,328 34,387 21,842 1,787 4,017 2,506 2,617 9,790 20,259 1,610 5,834 59,568 167,326 20,978 0,631 19420 $25,000 under $50,000. . . . . . . . . . . . 213,270 919,590 57,069 39,906 2,711 9,609 4,322 8,133 17,442 34,984 3,328 11,462 102,148 400,080 31,349 7,031 202421 $50,000 -der $100,000. . . . . . . . . . . 73,501 799,610 17,875 13,669 743 5,862 1,675 6,488 60360 18,487 1,112 7,827 32,500 223,808 9,609 '011 21
22 $100,ODO under $150,000. . . . . . . . . . 12,772 394,216 2,661 2,139 97 835 452 861 1,669 5,725 378 2,901 5,237 61,607 1,787 11,263 2223 $150,0D0 under $200,000. . . . . . . . . . 3,598 191,952 565 482 36 381 130 478 417 2,215 64 660 1,420 20,341 555 4,047 2324 $200,000 under $500,000. . . . . . . . . . 3,972 457,432 515 "9 45 354 169 864 457 2,331 79 719 1,454 29,591 695 9,252 2425 $500,000 under $1,000,000. . . . . . . . 634 220,874 61 57 13 249 32 271 62 296 15 ill 220 8,515 143 3,659 2526 $1,000,000 or more. . . . . . . . . . . . . . . 222 257,999 32 28 6 14 17 40 27 241 a 109 84 7,760 63 2, 2 6
al . . . . . .. 291,777 144 163,8~ 2727 Nontaxable returns, tot . . . r8 049 611,329 145,029 90,797 21,877 12,495 51,484 1160492 279,839 412. 195,142 1,0178,033 797,605 243 3
28 No adjusted gross income. . . . . . . . . 397 129,739 25,017 18,055 2,477 2,861 17,316 93, 005 2,424 2,717 (3) (3) 51,621 65,015 42,883 70,10 2886 iq29 Under $600 . . . . . . . . 85,051 63 818 17,088 10,485 (3) (3) 6:193 4,371 11: 519 5013,7 7 082 2 185 131 691 45,7(Y7 32,471 16,617 29
95 ,461 34' 3846 11 GD ,
30 W under $1,000.i : : : : : : : : : : : : : : 1905 13,591 7,846 2,306 4 528 2 885 23 34 12"045 6 452 175 904 90,581 28,076 8,669 30
31 $1,000 under $1,5W . . . . . . . . . . . . . . 133,671 68,239 17,583 10,369 4,485 10951 5,492 2,563 67,030 57,311 24,253 20,111 233,162 148,136 34,292 14,453 31
32 $1,500 under $2,000 . . . . . . . . . . . . . . 113,748 59,826 15,641 9,383 4,107 2,310 3,737 4,711 55,399 53,547 26,716 31,594 158,589 120,413 24,881 12,943 32
33 $2,DDO under $2,500 . . . . . . . . . . . . . . 91,503 55,261 14,589 8,489 2,683 1,766 3,002 2,256 49,813 59,742 30,427 43,7U5 112,39 9 brl 19,/49 9,912 -13
34 $2,500 under $3,000. . . . . . . . . . . . . . 72,506 46,694 10,604 6,229 2,261 1,152 3,026 1 , 601 35,650 470892 19,5v 38,377 80,346 75,096 18,Z41 8 145 34
35 $3, 000 under $3,500 . . . . . . . . . . . . . . 50,362 39,601 9,621 5,233 4 :1(Y7 21852 17,668 24,557 11,673 23,763 52,403 63,544 13,833 5 :166 3536 $30500 =der $4,000. . . . . . .. . . . . . . . 27,802 23,922 5,639 3,579 1 513 632 7,467 11,911 6,548 15,884 29,788 30,839 9,060 3,161 3637 $4,000 under $4,500. . . . . . . . . . . . . . 13,806 12,763 4,224 2,411 1,549 1,505 3) (1) 3 801 6 3 171 6,590 15,086 13,548 8,888 4,380 3738 $4,500 under $5,000 . . . . . . . . . . . . . . 11,924 12,906 2,594 1,563 - - (3i (3i, (33 (3) 13,571 13,625 4,719 2,311 3839 $5 .000 or more . . . . . . . . . . . . . . . . . . . 17,818 63,655 8,838 7,15 1,814 1,523 4,010 9,271 1,854 3,691 23,481 33,424 6,340 8,003 39
401 :tturn : und 1,638,639 1,077,611 314 348 182,992 47,599 26,077 82,860 132,638 467, 967 506,782 242,684 356,091 2,052,398 1,405,3722 6' 117 198 695 40urn $5, ;;0$5,000. . . . . . . . . . . . . . . r , 1 1 161 , 'M .4 tinder $10,000. . . . . . . 1,1~AI,7 72 288 :825 154,649 31,630 22,207 39,705 28 74 1902 205,355 73,635 145,299 1,371,598 949,74 3 7:520 4142 ~eturns $10,000 or more . . . . . . . . . . . . . 1,19', " 611 1,9746 :
1
296,945 184,474 1 18~911 38,373 27,647 42,971 98,208 , 171,225 1 26,796 76,319 , 689,568 , 1,652,92 731 42
Footnotes at end of table . See text for "Description of Sample" and "Explanation of Classifications and Terms ."
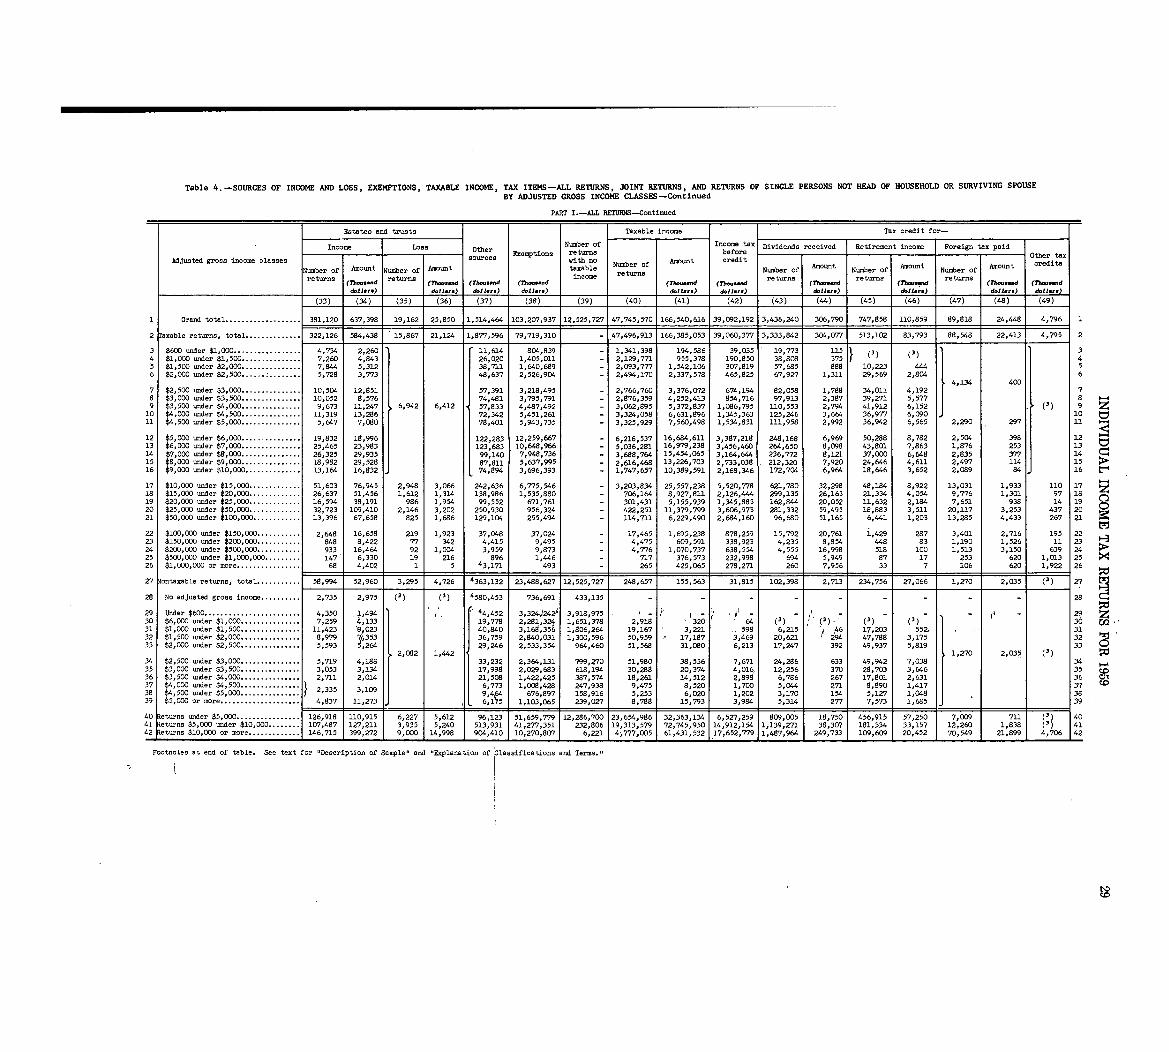
Table 4 . -SOURCES OF INCOME AND LOSS, EXEMPTIONS, TAXABLE INCOME, TAX ITEMS-ALL RETURNS, JOINT RETURNS, AND RETURNS OF SINGLE PERSONS NOT HEAD OF HOUSEHOLD OR SURVIVING SPOUSE
BY ADJUSTED GROSS INCOME CLASSES-Continue d
PART I .-ALL RETURNS-Continue d
Estates and trusts Taxable income Tax credit for-
Income Loss Other Number of Income tax Dividends received Retirement income Foreign tax pai d
Adjusted gross income classes source
. Exemptions returns before Other taxwith no Amount credit
Number of AmOu~t Number of Amount taxable Number of Number of Amount Number of Amount Number fAmount credits
returns 0returns (7)--.-d returns (rhoumd (rhausmd (Th--dincome
(Th-..d (7h-. ..dreturns
(77-ndreturns
(Th-"ndreturns
(Th-d (Th-- dd.11. .. ) d.11. .. d.11-I-) d.11... ) 'bilars) d.11.r.) 611 .. ) d.11... ) d.11...
(33) (34) (35) (36) (37) (38) (39) (40~ (41) (42) (43) (44) - (45) (46) (47) (48) (49 )
1 Grand total . . . . . . . . . . . . . . . . . . . 381,120 637,398 19,162 25,850 11,514,464 103,207,937 12,525,727147,745,570 166,540,616 39,092,192 13,436,240 306,790 747,858 110,859 89,818 24,448 4,796 1Of
2 raxable returns, total . . . . . . . . . . . . . . 322,126 . 584,438 15,867 21,124 1,877,596 79,719$310 - 47,496,913 166,385,053 39,060,377 3,333,842 304,077 513,102 83,793 88,548 22,413 4,795 2
3 $600 under $1,000 . . . . . . . . . . . . . . . . . 4,734 2,260 11$614 804,839 - 1,341,398 194,566 39,035 . 19,773 115 (1) (3) 34 $1,000 under $1,500 . . . . . . . . . . . . . . . 7,260 4,843 26,020 1,405,011 - 2,129,771 955,378 190,850 38,808 375 45 $1,500 under $2,000 . . . . . . . . . . . . . . . 7,844 5,312 38,711 1,640,689 - 2,093,777 1,542,106 307,819 57,685 888 10,223 444 56 $2,000 under $2,500 . . . . . . . . . . . . . . 5,728 3,773 48,637 2,526,904 - 2,494,170 2,337,578 465,825 67,927 1,311 29,569 2,804 6
7 $2,500 under $3,000. . . . . . . . . . . . . . . 10,504 12,851 57,391 3,218,495 - 2,766,760 3,376,072 674,194 82,058 1,788 34,011 4,192 4,134 400 78 $3,000 under $3,500. . . . . . . . . . . . . . . 10,052 8,576 74,481 3,795,791 - 2,876,359 4,252,413 854,716 970913 2,387 39,271 5,577 a9 $3,500 under $4,000. . . . . . . . . . . . . . . 9,673 11,247 6,942 6,412 1 57,833 4,487,492 - 3,062,895 5,372,837 1,086,795 110,553 2,794 41,912 6,152 9 z
10 $4,000 under $4,500. . . . . . . . . . . . . . . 11,319 13,286 72,342 5,451,261 - 3,324,058 6,6310896 1,345,363 125,246 3,664 36,977 6,090 1011 $4,500 under $5,000. . . . . . . . . . . . . . . 5,647 7,080 78,401 5,943,735 - 3,325,929 7,560,498 1,534,831 111,958 2,992 36,942 6,565 2,290 297 11
12 $5,000 under $6,000. . . . . . . . . . . . . . . 19,832 18,996 122 283 12,259,667 - 6,216,537 16 684 611 3,387,218 248,168 6,969 50,288 8,782 2,504 398 12 0-1
13 $6,DOO under $7,000. . . . . . . . . . . . . . . 25,465 23,983 123:683 100648,966 - 5,036,281 16:979 :238 3,456,460 264,650 8,098 43,801 7,863 1,876 253 1314 $7,000 under $8,000. . . . . . . . . . . . . . . 26,325 29,935 99,140 7,948,736 - 3,688,764 15,454,065 3,164,644 236,772 8,121 370000 6,648 2,835 377 1415 $8,000 under $9,000. . . . . . . . . . . . . . . 18,982 29,528 87,811 5,637,995 - 2,616,468 13,2260703 2,733,038 212,320 7,920 24,646 4,611 2,497 114 1516 $9,000 under $10$000 . . . . . . . . . . . . . . 13,164 16,832 74,894 3,696,393 - 1,747,657 10,389,591 2,168,346 172,704 6,964 18,646 3,652 2,089 84 16
17 $10,000 under $15,000. . . . . . . . . . . . . 51,603 76,945 2,948 3,066 242,636 6,775,546 - 3,203,834 25,557,238 5,520,778 621,780 32,298 48,184 8,922 13,031 1,933 110 1718 $15,000 under $20,000. . . . . . . . . . . . . 26,637 51,456 1,612 10314 138,986 1,535,880 - 706,164 8,927,811 2,126,444 299,135 26,163 21,334 4,054 9,776 1,301 97 1819 $20,000 under $25$000. . . . . . . . . . . . . 16,594 38,191 986 10954 99,552 671,761 - 301,431 5,1550939 1,345,883 162,8" 20,052 11,632 2,184 7s651 938 14 1920 $25,000 under $50,000. . . . . . . . . . . . . 32,723 109,410 2,146 3,202 250,930 956,324 - 422,251 11,379,799 3,606,973 281,332 59,495 18,883 3,511 20,117 3,253 437 2021 $50,000 under $100,000. . . . . . . . . . . . 13,396 67,658 825 1,686 129,lG4 255,494 - 114,711 6,229,490 20684,160 96,680 51,165 6,441 1,203 13,285 4,433 267 21
22 $100,000 under $150,000. . . . . . . . . . . 2,648 16,658 219 1,923 37,048 37,024 - 17,465 1,695,238 878,259 15$792 20,761 i,429 28? 3,401 2,716 195 2223 $150,000 under $200,000. . . . . . . . . .. 848 8,422 77 342 4,415 9,495 - 4,475 609,591 338,923 4,235 8,854 448 83 1,190 1,526 11 23 ~J24 $200,000 under $500,000. . . . . . . . . .. 933 16,464 92 1,004 3,959 9,873 - 4,776 1,070,737 638$554 4,555 16,998 518 100 1,513 3,150 639 2425 $500,000 under $1,000,000. . . . . . . . . 147 6,330 19 216 896 l,"6 - 717 376,573 232,998 694 5,949 87 17 253 620 1,013 2526 $1,000,000 or more . . . . . . . . . . . . . . .. 68 4,402 1 5 43$171 493 - 265 425,065 278,271 260 7,956 33 7 106 620 1,922 26
27 gontaxable returns, total . . . . . . . . . . . 58,994 52,960 3,295 4,726 4363,132 23,488,627 12,525,727 248,657 155,563 31$815 102,398 2,713 234,756 27,066 1,270 2,035 (3) 27
28 No adjusted gross income . . . . . . . . . . 2,735 2,975 (3) (3) 4580,453 736,691 433,135 28
29 Under $600 . . . . . . . . . . . . . . . . . . . . . . . . 4,350 .1,494 44,452 3,324.~242)i 3,918,975 2?30 $6,000 under $1,000 . . . . . . . . . . . . . . . 7,259 4,133 19 778 2 281,3"1 1,651,378 2,918 320*( 64 (3) (3), (3) (3) 3031 $1,000 under $1,500 . . . . . . . . . . . . . . . 11,423 8 023 40 :840 3:168,356 1,806,264 19,167 3,221 598 6,215 ~6 17,203 552, 3132 $1,500 under $2sOOO . . . . . . . . . . . . . . . 8,979 353 36,759 2,840,031 1,300,596 50,959 17,187 3,469 20,621 294 47,788 3,175 3233 $2,000 under $2,500 . . . . . . . . . . . . . . . 5$593 Y1264 29,246 2,533,354 964,460 51,568 31,080 6,213 17,247 392 49,937 5,819 33
21082 1,442 1,270 2,035 (3)1,34 $2,500 under $3,000 . . . . . . . . . . . . . . . 5,719 4181 33,232 2,364,131 799,270 51,980 38,536 7,671 24,286 633 49,942 7,038 34
35 $3,000 under $3,500 . . . . . . . . . . . . . . . 3,~53 3,134 17 $ 998 2,029,683 618,194 30,288 20,374 4,01~ 12,256 370 28,703 3$646 35 to36 $3,500 under $4,000 . . . . . . . . . . . . . . . 2,711 2,014 21,508 1,422,425 387,574 18,261 14,512 2,898 6,786 267 17$801 2,631 36 CA37 $4,000 under $4,500 . . .
2,335 3,109 6,773 1,008,428 247,938 9,475 8$520 1$700 5,044 271 8,890 1,417 3738 $4,500 under $5,000 . . . 9,4,64 676,897 158,916 5,253 6,020 1,202 3,170 154 5sl27 1 048 3839 $5,000 or ore . . . . . . . . . . . . . . . . . . . . 4,837 11,273 6 :175 10103,065 1 239,027 8,788 15,793
43,994 5,314 277 7,573 1,685 39
1 atur~: $5,~~0$5,000 . . . . . . . . . . . . . . . . : 140 eturn und 126,918 110,915 6,227 5,612 96; 13 51 ' 659 779 12,286,700 23,654,986 32 363, 1' 11,6,527,259 "9"5 18,750 456,915 57,250 7,009 711 (3) 404 under $10,000 . . . . . . . . 10`7,487 127,211 3,935 5,240 513, 9,1 4, 277 , 351 232,806 19,313,579 72,745 1150 "912
1. 1,139,27, 38,307 181,334 33,157 12,260 1,838 (1) 41
4 or more . . . . . . . . . . . . . 146,715 399,272 9 ~n 14,998 904,410 lOs270,8071 6,221 4~777,005 61,431,532 17,652,779 11,487,964 1 249,733 109,609 200452 70,549 21,899 4,706 42
Footnotes at end of table . See text for t'Description of Sample" and "Explanation of lassifications and Term . 11
t"De=
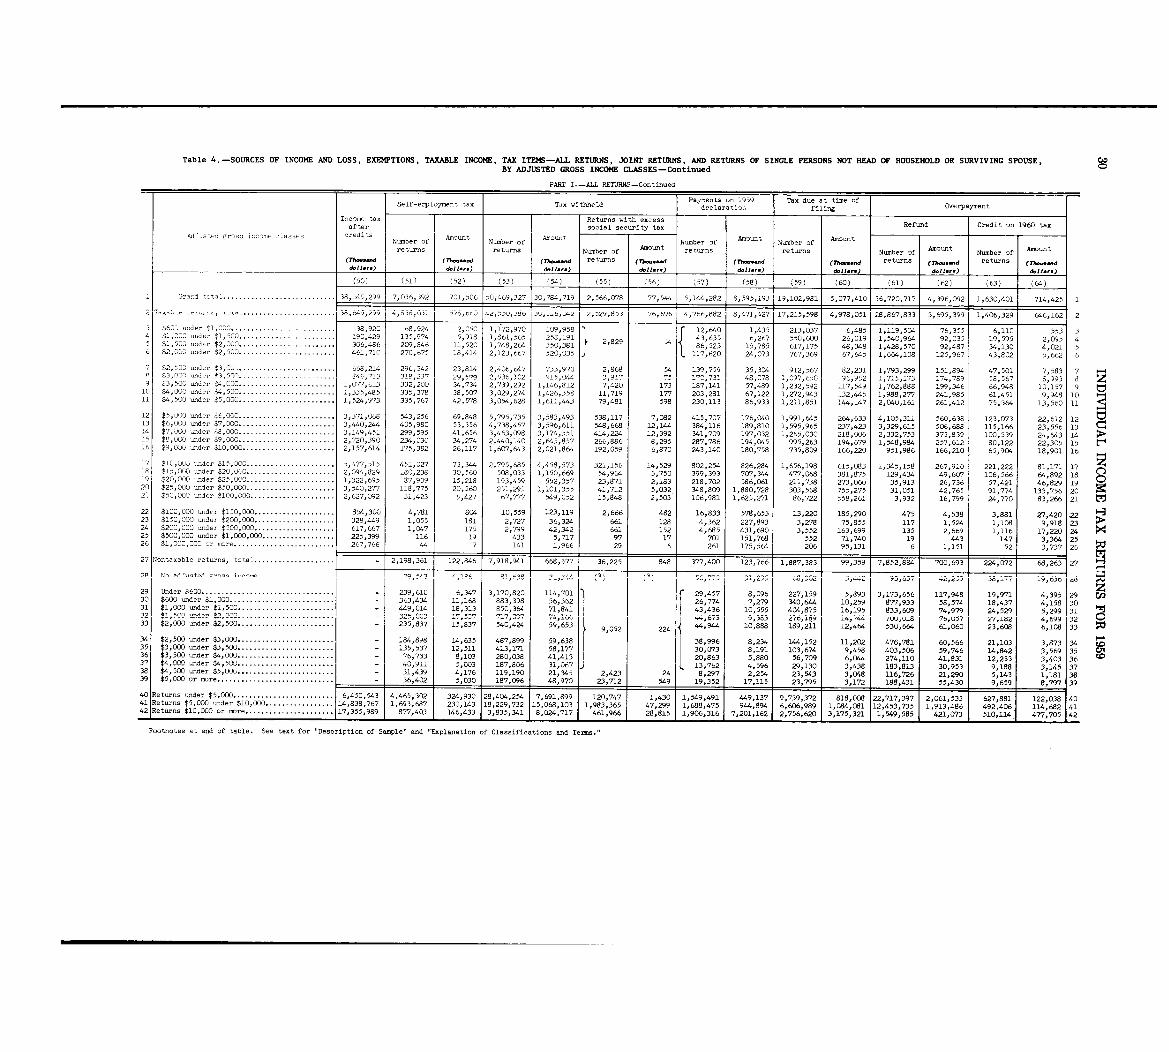
Table 4 . -SOURCES OF INCOME AND LOSS, EXEMPTIONS, TAXABLE INCOME, TAX ITEMS-ALL RETURNS, JOINT RETURNS, AND RETURNS OF SINGLE PERSONS NOT HEAD OF HOUSEHOLD OR SURVIVING SPOUSE, coBY ADJUSTED GROSS INCOME CLASSES-Continued
PART I .-ALL RETURNS-Continued
Self-e-ploymebt t.. Psyme.ts on 1959 Tax due at time ofT,x ithheld declaratL. filing Overpayment
Inco- t.. Ret-s with excessafter social secerity tax Ref=d Credit on 1960 tax
Ad,-~cd g,-- in-- _,edits A-unt A-t Amount Amount
ret-s returns Number of Am=t retUrns re t-s N-ber of Am'~t Number of Amo'etr.
d. I I—)
Ne,mber of
d.11.,.)
Nmber of
d.11 .. . ) -I -d.11.. . )
Nmber of
d.11.. . )
N-ber of
d.11... d.11 .. . doll-)(Th--d s (77-. ..d (7h-.-d (7h-.-d reterns (77--d ret- (Th--d
(5&~ (51) (52) (53) (54) (55) (56) (57) (58) (59) (60) (61) (62) (63) (64 )
1 Gr-d . . . . . . . . . . . . . . . . . . . . . . . . . . . . . 38,45,299 7,036,392 701,5C6 50,469,327 30,784,719 2,566,078 77,544 5,144,282 8,595,193 .19,102,981 5,077,410 36,720,717 4,396,092 1,630,401 714,425 1
. . . . . . . . . . . . . . . . . . . . . . . . . . . . . .. "c-'- -o'c" julllb,LA2 1 21~2918~_j '16,696 1 417661882 8,471,427 j 17,215,598 4,978,051 28,867,833 3,695,399 1,406,329 646,162 2
3 $60', -der $1,000 . . . . . . . . . . . . . . . . . . . . . . . . . . 38,920 68,924 2,050 l,f72,970 109,958 12,640 1,435 213,037 6,485 1,119,534 76,355 6,110 553 3~1,500 . . . . . . . . . . . . . . . . . . . .
.. . . 190,429 135,9?4 5,918 1,861,565 258,19 43,635 6,267 550,600 26,019 1,540,964 92,035 19,595 2,095 44 $1,300 -der
, 1 2,829 54 15 $1,500 ~der $2,000 . . . . . . . . . . . . . . . . . . . . . . . . 306,486 209,846 11,520 1,?48,264 350,381 86,523 15,785 617,175 48,348 1,428,570 92,487 34,130 4,021 56 $2, 3CC) -der $2,500 . . . . . . . . . . . . . . . . . . . . . . . . 461,710 270,675 18,414 2,123,6C? 520,035 117,620 24,073 767,369 67,645 1,664,108 125,967 43,802 5,662 6
7 ~2,~00 -der $3,00 . . . . . . . . . . . . . . . . . . . . . . . . . 668,214 29t,342 23,814 2,406,647 733,970 2,868 54 139,?59 35,334 912,567 82,231 1,793,299 151,894 47,501 7 583 7 ~_41 ~~ 3, ,der t3,90(), ~ . . . . . . . . __ . . . . . . . . . . 81,1,713 31-,237 29,579 2,53-,102 915,044 3,917 75 17C,731 48,078 1,097,65-C 96,9,2 1,71,-,173 174,769 58,567 6,993 89 '43,501 -der z~4,030 . . . . . . . . . . . . . . . . . . . . . .. 1 ~4* 1,077,613 332,230 34,734 2,739,292 1,146,812 7,420 173 187,141 57,489 1,232,592 117,549 1,762,888 199,346 66,948 10,157 9 tl10 $4,000 ~der ~U, 500 . . . . . . . . . . . . . . . . . . . . . . . . 1,335,485 335,378 38,507 3,029,274 1,426,358 11,719 177 203,281 67,122 1,272,943 132,445 1,988,277 241,985 61,451 9 948 10 ~4
11 84, 500 onder $5,000 . . . . . . . . . . . . . . . . . . . . . . . . 1,524,973, 1,611,443 79,4611
,335,767 42,578 3,054,628 598 230,113 86,933 1,211,851 144,147 2,040,161 261,412 75,364 31560 1 1
12 $ ~, 000 =der ~6,003. . . . . . . . . . . . . . . . . . . . . . . . 3,371,068 543,256 69,848 5,?95,735 3,583,493 538,117 7,082 415,707 176,C40 1,991,645 264,633 4,105,311 560,638 123,073 22 , 612 12 tv13 $E,000 .,der $7,000. . . . . . . . . . . . I . . . . . . . . . . . 3,440,244 405,980 53,356 4,738,457 3,596,611 548,668 12,144 384,116 189,810 1,595,965 237,423 3,329,615 506,688 115,166 23,556 13 C-414 $7,000 -der '8,000. . . . . . . . . . . . . . . . . . . . . . . . 3,149,451 299,595 41,656 3,463,098 3,174,551 414,224 12,392 341,?09 197,032 1,265,030 218,006 2,332,753 373,639 100,539 24 643 1415 $8,OCC -der ~9,03G. . . . . . . . . . . . . . . . . . . . . . . . 2,?20,390 234,030 34,274 2,440,140 2,645,857 266,886 8,295 287,786 194,045 995,263 194,679 1,548,984 257,612 80,122 22 :305 1516 $9,030 -d- $10,000 . . . . . . . . . . . . . . . . . . . . . . . 2,157,614 175,382 26,117 1,607,643 2,021,864 192,059 6,870 243,140 180,758 735,809 166,220 951,986 166,210 65,904 18,901 16
17 $1C,00D ~dcr $1~,000. . . . . . . . . . . . . . . . . . . . . . 5,477,515 451,027 73,344 2,795,685 4,458,573 321,156 14,529 802,254 826,284 1,656,198 615,083 1,345,158 267,910 221,222 81,171 1?18 $15,000 -d,, $20,0(,0. . . . . . . . . . . . . . . . . . . . . . 2,094,829 180,238 30,560 508,033 1,150,669 54,964 3,750 399,393 707,344 477,068 381,875 129,434 49,607 106,566 64,892 1 819 $20,000 -der $25,001. . . . . . . . . . . . . . . . . . . . . . 1,322,695 87,939 15,218 193,459 552,357 23,871 2,183 218,702 586,061 211,738 273,060 35,913 26,736 57,421 46,829 19 C)20 $25,000 -der $50,000 . . . . . . . . . . . . . . . . . . . . . . 3,540,277 118,775 20,560 251,291 1,101,355 41,712 5,032 348,809 1,880,728 303,568 755,275 31,051 42,765 91,774 133,7 56 2 021 $50,000 ~der $lCO,000 . . . . . . . . . . . . . . . . . . . . . 2,627,392 31,423 5,427 67,77? 549,052 15,848 2,503 106,981 1,625,271 86,722 558,261 3,932 16,799 24,770 83,266 21
22 $100,000 -der $150,000. . . . . . . . . . . . . . . . . . . . 854,300 4,781 804 10,559 123,119 2,666 482 16,833 578,653 13,220 185,290 475 4,538 3,881 27 '420 .2223 $150,000 -der $200,000 . . . . . . . . . . . . . . . . . . . . 328,449 1,055 181 2,727 36,324 661 128 4,362 227,893 3,278 75,855 117 1,524 1,108 9,918 2324 $200,000 -der $500,000 . . . . . . . . . . . . . . . . . . . . 617,667 1, 047 175 2,799 42,342 661 152 4,685 431,690 3,552 163,699 135 2,669 1,116 17,220 2425 $500,000 ~dcr $1,0G0,000 . . . . . . . . . . . . . . . . . . 225,399 116 19 433 5,717 97 17 701 151,768 552 71,740 19 443 147 3,3 226 tl,000,000 - -re . . . . . . . . . . . . . . . . . . . . . . . . . 267,766 44 7 141 1,966 29 6 261 175,564 206 95,131 6 1 1,151 1 52
13,737 2
27 Nontaxable returns, total . . . . . . . 2,198,361 22,846 7,918,941 123,766 1,887,383 99,359 7,852,884 700,693 224,072 68, 2~3_ 2
29 Under $600. . . . . . . . . . . . . . . . . . . . . . . . . . . . . . . . . - 239,610 6,347 3,170,820 114,701 29,457 8,096 227,159 5,893 3,173,656 117,948 19,91, 4 29.. . . . . ":39530 $600 =der $1,000 . . . . . . . . . . . . . . . . . . . . . . . . . . - 363,434 11168 883,398 56,362 26,774 7,279 340,644 0,259 877,933 58,574 18,437 4,158 3031 $1,000 -der $1,500 . . . . . . . . . . . . . . . . . . . . . . . . - 449,014 18,313 850,364 71,841 43,436 10,555 404,8 5 16,195 833,609 74,979 24,529 5,299 3112 'k, 'n, '00 . . . . . . . . . . . . . . . . . . . . . . . . 325, 11 673 9,383
4'c"c' t-
7ou'aa 7t), u~0 2'/, idz 4,699 3233 i21000 ender $2,500 . . . . . . . . . . . . . . . . . . . . . . . . - 235,837 15,837 .540,424 59,653 9,052 224 944 10'888 189,211 12,464 530,664 61,060 23,608 6,108 33"'16 C
34 $2,500 under $3,000 . . . . . . . . . . . .. - 194,896 14,635 487,899 59,638 38,99(5 8,234 144,152 11,202 476,781 60,566 21,103 3 873 3435 $3,000 -der $3,500. - 135,537 12,511 413,171 58,177 30,073 8,191 103,674 9,458 403,506 59,746 14,842 3 :569 35 CXq36 $3,500 mder $4,000 . : . . . - 76,733 8,103 280,038 41,413 20,863 5,880 56,709 6,044 274,110 41,831 12,233 3,403 36 cc37 $4, 000 -der $4,50-. . . . . . . . . . . . . . . . . . . . . . . . - 40,911 5,003 187,806 31,067 _j 13,762 4,596 29,130 3,438 183,813 30,953 9,188 3,145 3 738 $4,500 -der $5,000 . . . . . . . . . . . . . . . . . . . . . . . . - 31 439 4,176 119,190 21,345 2,423 24 S,_~97 2,254 23,543 3,048 116,726 213,290 5,143 1,1831 3839 $5,000 or more . . . . . . . . . . . . . . . . . . . . . . . . . . . . . - .36:402 5,030 187,096 48,970 23,712 549 19,352 17,115 23,795 3,172 188,431 55,430 9,659 8,797 39
F40 Reterns under $5,000 . . . . . . . . . . . . . . . . . . . . . . . 6 51 3 4,4 5,302 324 3 21 :2 7,0191:899 230:3747 1 :54,9, 37 9 7369 :,372 1 81 22 7 317 2 6 53 8111 122
0'8 4
91 "9 1 , 6:. " 1 :
" :453' 3: 0
... 1 1 , 1:4 40611,
:6 ~R t r $10,000. . . . . . . . . . . . . . . . 9 '
1" :4' 10:4'15 944,8 9 C84,.1 2 :7
9138, 041 a -ns $5
1000 ucde : 4,83 717 693 687 23 143 229 12 5 3 98 c5 417:42399 !2 41
42 Ret-s $10,00C) or more . . . . . . . . . . . . . . . . . . . ... 17,355,989 877,403 146,433 . 8 7 461,966 28,815 1,906,316 7,201,162 2,756,620 3 175,321 1,549,585 421,073 510:114 477,705 42
Footnotes at end of table . See text for "Description of Sample" and "Explanation of Classifications ~d Terms
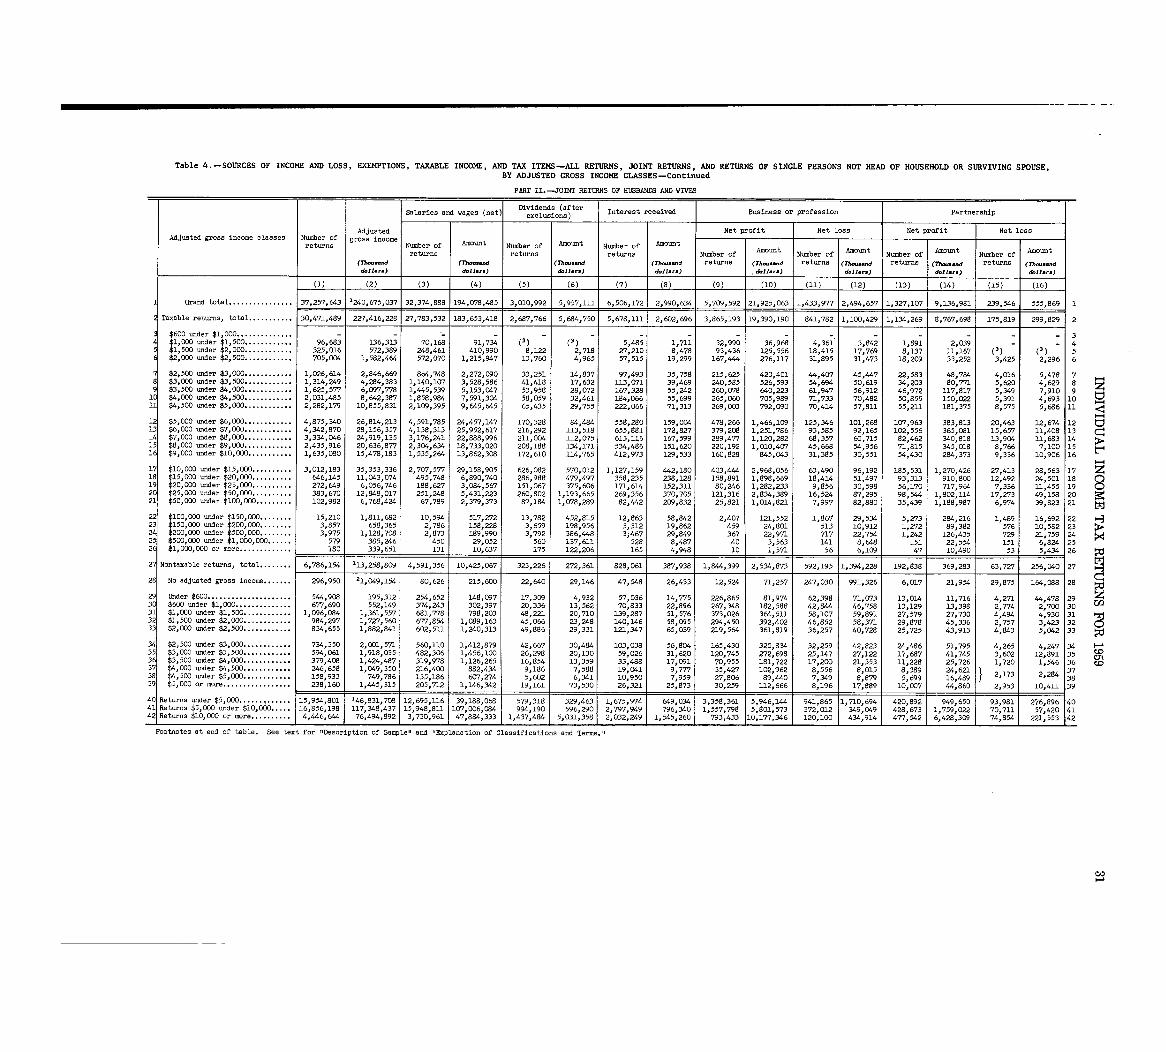
Table 4 . -SOURCES OF INCOME AND LOSS, EXEMPTIONS, TAXABLE INCOME, AND TAX ITEMS-ALL RETURNS, JOINT RETURNS, AND RETURNS OF SINGLE PERSONS NOT READ OF HOUSEHOLD OR SURVIVING SPOUSE,BY ADJUSTED GROSS INCOME CLASSES-Continue d
PART II. -JOINT RETTMNS OF HUSBANDS AND WIVES
Salaries and ~ages (net) Dividends (after Interest received Business or profession Partnershipexclusions )
Adjusted Net profit Net loss Net profit Net lossAdjusted gross income classes Number of gross income
returns Number of Amount Number of Amount Number of Amoun t
return. returns returns Number of Amount Number of Amount Number of Amount Number of Amount(7ho-d (Th-d (Th... d (rh-.-d returns (Th... d returns (Th--d returns (7?-- ..d returns (7h-.-d
d.11. .. doll-) d.11. .. d.11.1.) d.11 . .. d.11...
(2) (3) (4) (5) (6) (7) (9) (10) (11) (12) (13) - (14) (15) (16)
2 Grand total . . . . . . . . . . . . . . . . 37,257 643 1240,675,037 32,374,888 194,078,485 3,010,992 5,957,111 6,506,172 2,990,634 5,709,592 21,925,063 1,433,977 2,494,657 1,327,107 9,136,981 2.39,546 555,869 1
2 Taxable returns, total . . . . . . . . . . . 30,471,489 227,416,228 27,783,532 183,653,418 2,687,766 5,684,750 5,678,111 2,602,696 3,865,193 19,390,190 841,782 1,100,429 1,134,269 8,767,698 175,819 299,829 2
3 $600 -der $1,000 . . . . . . . . . . . . .. - - - - - - - - - - - - - - - 34 $1,000 -der $1,500 . . . . . . . . . . .. 96,683 136,313 70,168 91,734 (3) (3) 5,485 1,711 32,990 36,968 4,361 3,842 1,691 2,039 - - 45 $1,500 under $2,000 . . . . . . . . . . . . 325,016 572,389 248,461 410,990 8,122 2,718 27,210 8,478 93,436 125,556 18,415 17,769 8,137 11,167 (1) (3) 56 $2,000 under $2,500 . . . . . . . . . . . . 705,004 1,582,464 572,070 1,215,947 13,760 4,965 57,515 19,299 167,444 276,117 31,895 31,473 18,209 33,252 3,425 2,296 6
7 $2,500 under $3,000 . . . . . . . . . . . . 1,026,614 2,846,669 8o4,748 2,272,090 33,251 14,837 97,493 35,758 215p625 420,401 44,40`7 45,447 22,583 48,794 4,016 5,478 7 ~48 $3,000 under $3,500 . . . . . . . . . . . . 1,314,249 4,284,383 1,140,107 3,528,586 41,418 17,632 113,071 39,469 240,585 526,593 54,694 50,619 34,203 80,771 5,620 4,629 89 $3,500 under $4,000 . . . . . . . . . . . . 1,625,577 6,097,778 1,445,539 5,153,047 53,958 28,072 167,328 55,242 260,078 640,223 61,947 56,912 46,972 117,817 5p349 7 910 9
10 $4,OGO under $4,500 . . . . . . . . . . . . 2,031~485 8,642,387 1,858,984 7,591,304 58,059 32,461 184,066 55,699 265,060 705,989 71,733 70,482 50,855 150,022 5,391 4:693 10 tl11 $4,500 under $5,000 . . . . . . . . . . . . 2,282,179 10,855,831 2,109,395 9,645,645 65,435 29,755 222,066 71,313 269,003 792,090 70,414 57,811 55,211 181,375 8,575 5,686 11
12 $5,000 under $6,000 . . . . . . . . . . . . 4,875,340 26,814,213 4,591,785 24,457,147 170,328 84p484 558,280 159,004 478,266 1,466,109 125p346 101,268 107,963 383,813 20,463 12,674 1213 $6,000 under $7,000 . . . . . . . . . . . . 4,342,870 28,156,357 4,138,313 25,952,617 216,292 113,518 655,881 172,827 379,208 1,251,786 93,585 92,165 102,556 365,081 15,657 11,408 1314 $7,000 under $8,000 . . . . . . . . . . . . 3,334,046 24,919,135 3,176,241 22,888,996 211,004 112,0175 613p116 167,599 289,477 1,120,282 66,357 60,715 82,462 340,818 13,904 11,683 1415 $8,000 under $9,000 . . . . . . . . . . . . 2,435,916 20,636,877 2,304,634 18,733,020 208,188 134,171 534,486 151,620 220,192 1,010,40`7 45,668 54,956 71,815 345,018 8,766 7,100 1 516 $9,000 =der $10,000 . . . . . . . . . . . lp635,080 15,478,183 1,535,264 13,862,308 172,610 114,765 412,973 129,533 160,828 845,C643 31,385 30,551 54,430 284,373 9,336 10,906 16 t7'
1? $10,000 -der $15,000 . . . . . . . . . . 3,012,183 35,353,336 2,707,577 29,158,905 626,082 570,012 1,127,159 442,180 403,"4 2,968,056 63,490 96,192 185,531 1,270,426 27,413 28,563 17 z18 $15,000 =der $20,000. . . . . . . . . . 646,145 11,043,074 495,748 6,890,740 286,988 479,497 358,235 238,128 158,891 1,898,669 18,414 51,497 93,313 910,800 12,492 24,501 18 n19 $20,000 under $25,000 . . . . . . . . . . 272,649 6,056,746 188,627 3,084,567 151,067 375,606 171,614 152,311 80,246 1,282,233 9,856 30,598 56,170 717,964 7,336 11,455 19 C)20 $25,000 under $50,000. . . . . . . . . . 383,670 12,848,017 251,248 5,431,223 260,802 1,193,665 269,356 370,705 121,316 2,834,389 16,524 87,295 98, 5" 1,802,114 17,273 49,158 2021 $50,000 under $100,000. . . . . . . . . 102,982 6,768,424 67,789 2,379,373 87,184 1,078,289 82,442 209,832 25,821 1,014,821 7,997 82,880 35,439 1,188,987 6,974 39,823 21
22 $100,000 under $150,000. . . . . . . . 15,210 1,811,682 10,594 517,272 13,782 452,815 12,863 58,842 2,407 121,552 1,867 29,534 5,273 284,216 1,469 16,692 22 ~_323 $150,000 under $200,GOO. . . . . . . . 3,857 658,365 2,786 158,228 3,659 198,956 3,312 19,862 459 24,801 513 10,912 1,272 89,382 576 10,582 2324 $200,000 under $500,000. . . . . . . . 3,975 1,128,708 2,873 189,990 3,792 386,448 3i467 29,849 367 22p971 717 22,754 1,242 126p435 729 21,759 2425 $500,000 under $1,000,000. . . . .. 579 385,246 450 29,052 560 137,611 528 8,487 40 3,563 141 8p648 151 22,554 151 6,824 252E $1,000,000 or more . . . . . . . . . . . .. 180 339,651 131 10,637 175 122,206 165 4,948 10 1,571 56 6,109 47 10,490 53 5,434_ 26
2? Nontaxable returns, total . . . . . . . . 6p786,154 113,258,809 4~591,356 10,425,067 323,226 272,361 828,061 387,938 lpB44,399 2,534,873 592pl95 1,394,228 192,838 369,283 63,727 256,040 27
28 No adjusted gross income . . . . . . . 296,950 11,049,154 80,626 215,600 22,640 29,146 47,548 26,433 12,524 71,257 247oO3O 991,326 6,017 21,954 29,875 164,088 28
29 Under $600 . . . . . . . . . . . . . . . . . . . . . 544,908 195,312 254,652 148,097 17,309 4,932 57,036 14,775 226,865 81p974 62,398 71,073 13,014 11,716 4,271 44,478 2930 $600 -der $1,000 . . . . . . . . . . . . . . 677,690 552,149 374,243 302,397 20,336 13,562 70,833 22,896 267,348 182,588 42,944 46,758 13,129 13,398 2,774 2,700 3031 $1,000 under $1,500 . . . . . . . . . . . . 1,096,084 1,361,557 681,778 798,203 48,221 20,710 139,287 51,576 373oO26 364,511 56,107 59,891 27,579 27,730 4,494 4,930 31 It32 $1,500 =der $2,000 . . . . . . . . . . . . 984,297 1,727,560 677,854 1,089,163 45,066 23,248 140,146 58,095 294,450 392,402 46,852 58,371 29,678 45,336 2,757 3,423 32 033 $2,ODO under $2,500 . . . . . . . . . . . . 834,655 1,882,841 602,511 1,240,313 49,886 29,331 121,347 65,039 219,564 361,819 36,257 40,728 25,725 43,913 4,843 5,042 33 It
34 $2,500 =der $3,000 . . . . . . . . . . . . 734,350 2,001,571 560,110 lp412,879 42,667 30p484 103,038 56,804 165,430 320,834 32,259 42,823 24,486 51,795 4,265 4o247 3435 $3,000 -der $3,500 . . . . . . . . . . . . 594,061 1,918,035 482,306 1,456,100 26,298 20,130 59,026 31,620 120,745 272,698 25,147 27,122 17,687 41,745 3,602 12,891 35 1036 $3,500 uader $4,000 . . . . . . . . . . . . 379p4O8 1,424,487 319,978 1,126,265 16,854 13,359 33,488 17,091 70,955 181,722 17,200 21,353 11,228 25,726 1,720 1,546 36 Cn
CD37 $4,000 under $4,500 . . . . . . . . . . . . 246,658 1,049,350 216,400 882,434 9,186 7,588 19,041 9,777 35,427 102,962 8,556 8,015 8 389 24 621 21173 2,284 3738 $4,500 under $5,000 . . . . . . . . . . . . 158,933 749,786 135,186 607,274 5,602 6,341 10,950 7,959 27,806 89,440 7,349 8,879 5:699 16:489 3839 $5,000 or more . . . . . . . . . . . . . . . . . 238,160 11 5,315 205,712 1,146,342 19,161 73,530 26,321 1 25,873 1 30,259 1 112,666 8,196 1 17,889 10,007 1 44,860 1 2,953 1 10,411 139
401 Re tT und 5 15,954,801 146,831,708 12,695,116 39pl88,068 579,318 329,463 1,67! 71, 3 35 946:1 94 165 1, 7.1G, 611 42280,112 949,6" 93 981 276 89 6 4., ~: g~~O$
. 1 5587:118 5, 72 2 4 7 22 7 7 57 :420 41016,856,198 117,348,437 -1 107,006,094 994,190 596,290 2,79~59 9 '9"' 361 8.1 573 3 1:.1 673 9,0
41 d 15,948,81 1,94 796,1. :42 Returns $10,000 or a 4,446 644 76,494,892 3,730,961 47,884,333 1,437,484 5,031,358 2,032,249 1,545,260 793,433 10,177,346 120,100 434,914 477,542 6,42 221,5
Footnotes at end of table . See text for "Description of Sample" and "Explanation of Classifications and Terms .
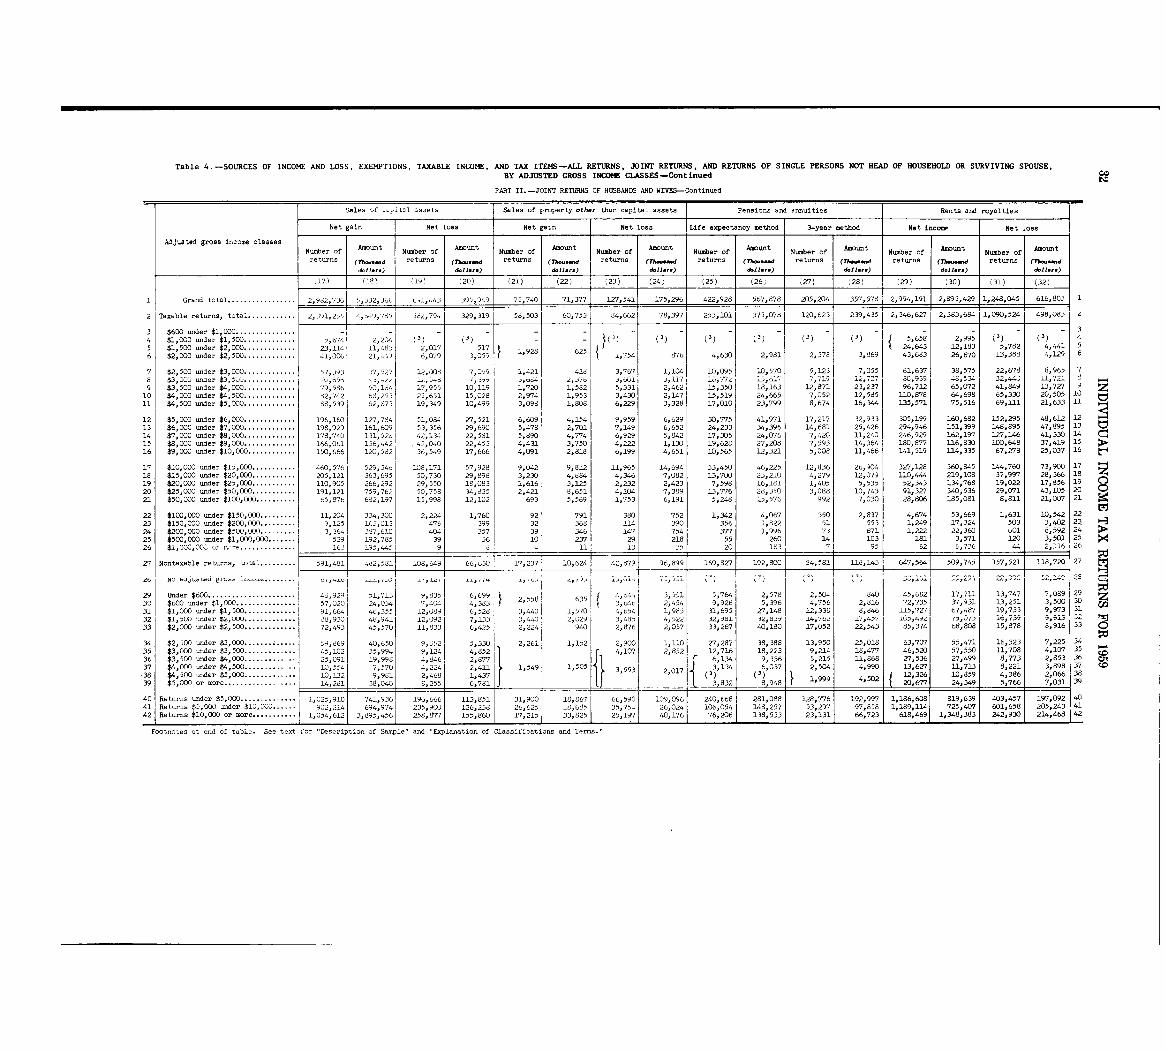
Table 4 . -SOURCES OF INCOME AND LOSS, EXEMPTIONS, TAXABLE INCOME, AND TAX ITEMS-ALL RETURNS, JOINT RETURNS, AND RETURNS OF SINGLE PERSONS NOT READ OF HOUSEHOLD OR SURVIVING SPOUSE ,BY ADJUSTED GROSS INCOME CLALSSES-Continued w
PART 1I .-JOINT RETURNS OF HUSBANDS AND WIVES-Continued
Sales of cupital a-ts Sales of property other than capital assets Pensions and annuities Rents and royaltie s
Net gain Net loss Net gain Net loss Life expectancy method 3-year method Net incom~ Net loss
Adjusted gross income classes Number of Amount Number of Amount Number of Amount Number of Amount Number of Amount Number of Amount Number of Amount Number of Amount
returns returns returns returns returns re turns return s.etwns (A-.-d (Th-.-d (Th ..d ff~-d (Th-..w (7h-- .W (7h-d (Th--d~11 . .. ) d.11 . .. ) d.11 .1 .) d.11. .. ) d.11.. . ) d.11.r .) d.11. .. ) d.11. ..
j7) (19) ~19) (2W (21) (22) ~23) (24) (25) (26~ ~27) '28) ~29) (30) (31) (32 )
1 Grand total . .. - 175,296i 122,92 567,878 205,204 357, - - 2,893,429 1,248,045 616,803 1. . . . . . . . . . . . . . 2,9o2,'/3(,,l 32,3661 -1,,43 395,9,9 75,740 71, 177 IZ7,541 578 2,994,191
2 Taxable returns, total . . . . . . . . . . . . 2,~'jl,255 562,794 329,319 58,503 1 60,753 84,6621 78,397 253,101 315,0178 1 120,623 239,43,5 2,346,6Z7 2,383,684 1,0%,524 498,083
3 $600 -der $1,L)CO . . . . . . . . . . . . . .
. - -
(3 - (3) - (3) - - (3) - (3)- - -
(3) - (3) -3
4 $1,000 under $1,500 5 2 2 (1) 658 2 995 4
$1,500 -der $2,000: : : :* . . . . . 6"4 C 4 643 2 183 5,782 4,441 55 Z3,114 11'. 1~3 2:017 517 - 25: 1 :1 1 5 1,928 625 37 3,869 43,683 26 , 670 13,388 4,129 66 $2, OGO under $2,500. . . . . . . . . . . . . 41,ooc 21,~4) 6 Cf79 3,0 9 1,754 -6 4,630 2,981 2,37 8
7 $2,500 -der $3,000. . . . . . . . . . . . . 7_193 37, ~ 27 12,jQ3 7,059 1,421 41d 3,767 1,104 10,095 10,570 5,123 7,055 61,637 38,575 22,678 8,965 78 $3, 00ounaer $3,5- 1 1 . 3,631 j,117 lv,772 - --- - -119 12,707 30,93') 48-34 32,"C 11,721 2
17,955 10 8 1~' , 1~,671 23,237 96,712 65,072 41,849 l3o727 99 2 1 5 2 5,331 2,462 15,350I '- " -' 'a- 'J'. I$3,500 -der $4,OOC):'. : : :'* I'ZI '119 1 7 0 1 z10 $4,000 under $4,500. . . . . . . . . . . . . 6 25,651 15,028 2,174 1,953 3,430 2,147 15,519 24,665 7,052 12,585 110,878 64,698 65,330 20,505 1011 $4,500 under $5,000. . . . . . . . . . . . . 8, 19,349 10,499 3,098 1,808 6,229 3,328 17,010 23,799 8,674 16,344 1-35,571 75,516 69,1_11 21,633 11
12 $5,000 under $6,000. . . . . . . . . . . . . 196,160 121,111.. ..
. 2?,521 6,609 4,154 9,959 6,629 30,775 41,971 17,217 32,933 3()5,199 160,682 152,295 48,612 1-213 $6,000 under $7,000. . . . . . . . . . . . . 198,929 lo".9 13,316 29,690 5,478 2,701 7,149 6,652 24,233 34,396 14,681 25,426 294,946 151,3199 148,895 47,895 13 C114 $7,000 under $8, DOC. . . . . . . . . . . . . 178,740 131,D2~ 42,134 22,581 5,890 4,774 6,929 5,842 17,305 24,076 7,420 11,240 246,929 162,197 127,146 41,330 1415 $8,000 under $9, 000. . . . . . . . . . . . . 166,C)"I 1,6,,~42 45:040 22 453 4,431 3,750 4,222 1,130 19,628 27,208 7,593 14,364 180,877 1-16,830 100,648 37 419 1516 $9,000 under $10,000. . . . . . . . . . . . 150,666 120,582 36 549 17 :666 4,G91 2,818 6,199 4,651 10,565 12,321 5,008 12,466 141,519 114,335 67,Z78 25:037 16
17 $10,000 under $15,000. . . . . . . . . . . 460,57f, 529,34. 1013,171 57,928 9,042 9,81.2 11,965 14,694 33,450 46,225 12,836 26,904 327,128 360,845 144,760 73,900 17is $15,000 under $20,000 . . . . . . . . . . . 205,121 363 695 50,730 29,898 3,230 4,884 4,346 7,082 13,700 23,210 4,279 12 079 110,444 219,108 37,997 28,366 1819 $20,000 under $25,000 . . . . . . . . . . . 110,90' 266:292 29,550 18,083 1,616 3,125 2,232 2,423 7,598 16,181 1,405 5:535 52,343 134,768 19,022 17,856 1920 $25,000 under $50,000 . . . . . . . . . . . 191,121 759 , 762 50,758 34,835 2,421 3,651 4,104 7,389 13,776 28,350 3,088 10,743 91,3Z7 340,536 29,071 43plO5 20 0
21 $50,000 under $100,000. . . . . . . . . . 65,876 662,197 15P998 12,102 693 5,569 1,753 6,191 5,248 15,576 992 7,030 28,806 185,081 8,811 21,0017 21
22 $100,000 under $150,000 . . . . . . . . . 11,204 334,300 2,224 1,?60 92 791 380 752 1,342 4,067 350 2,837 4,674 53,669 1,631 10,54223 $150,000 under $200,000 . . . . . . . . . 3,125 163,013 476 399 32 368 114 390 356 1,822 51 553 1,249 17,324 503 3 402 2~24 $200,DO0 under $500,000 . . . . ., . . . 1 3, ~6,~ 387,610 404 357 39 346 147 754 377 1,996 /1 6?1 1,222 22,360 601 8:592 24 ;t-25 $500,000 under $1,00,0,000 . . . . . . . 519 192 78~ 39 36 10 237 29 218 55 260 14 103 181 3,571 120 3,501 25
. . . . . . . . . . 0 . 183 1 1 95 62 6,736 44 2,116 2626 $1, 000, Oc,~ a, wre. 1 -6-,3.
95 44- 9 8 4 11 131 35 2 7 i
27 Nontaxable returns, total . . . . . . . . . 591,48'- p 5 81 108,649 66,b3O 17,237 io,624 42, 879 96,d991 169,827 1 192,300 84,5811 118,143 647,5641 509,745 157,521 118,720 27
`J216,92q 51,7 5 4 ll :'7. 13'7:1 7 S9'3 :'~' :71 2 5,1,t~l ?429 1 16 . . . . . . . . . . . . . . 4"_ 13 9 cl'35 6:6Z 5~8 6 4
,644 2, z0 $,~glund~. ji : ~~
. 1 2 P2,5 72,735 37,931 13,251 309411 9 :3 1:7 2,"Ilt) 3 5003 1 51,0201 24 034 7 404 4,383 3,646$1,000 under $1 .
.. . . .. 973 3131 91 W, ~e 355 2,089 6,~28 3,440 1, 570 4 6541 1:985 391,695 27,148 12,338 8,846 115,727 67,487 19,733 9 :
3 41, z", U29 3,4d-5 4o!l 2 3;2,6 .3~0 J.4, / b,~ 1~( 232 ~1 : .5w iloder %Z, Lx.)u . . . . . . . . . . . . 33,93 48,97401 12,0921 7 13333 ~2 49C3) 45 , 5
11,8336' 257 33,267 40,180 17,052 22 543 85,374 68,808 15 878 8,916 ~3$2 000 under $2,500 . . . . . . . . . . . . 1425 21224 940 2,876 2,0
"1
34 $2,500 under $3,000 . . . . . . . . . . . . . -),669 40,650 9,352 5,330 2,261 1,152 2,900 1,110 27,287 38,388 13,950 25,018 63,70`7 55,471 16,323 7,225 3435 $3,000 under $3,500 : :,* :* : : :,, :* 4-1,111 35 :994 9,124 4,8 2 4,107 2,1152 12 716 18,223 9,214 16,477 46,520 57,550 1-1,708 4,1017 35 ~-A
to8?7 1 9,336 5,215 11,868 Z7,536 27,499 8,773 2,853 36 CA361 $3,500 under $4,000 -5 091 998 4,846 2,
37 $4 000 under $4 500 . . . . . . . . . . . . . 10,554 7,570 4,224 2,41.1 1,549 "'0, 3,134 6 037 2,504 4,990 1.3,6Z7 11,713 8,221 3,898 37 to1 1-1 3,553 2,017 6 1343.1 $4 :500 under '5 :000 . . . . . . . . . . . . . 9,981 2,466 1,437 111) (a), '26 10,859 4,386 2,066 38
'a 1,999 4,502 1-~;39 $5, 000 or mor . . . . . . . . . . . . . 1~ :2'811 8,040 . 8,255 6,781 3,832 8,948 20, 24,349 5,766 7,031 39
40 Ke!, .~ns under $5,000 . . . . . . . . . . . . 1 1 029 0 74'
936 196 666 113,851 31,9C 161 66,590 109,P96 240,668 281128,
'776 192,997 1,186,6081 119,639 403,457 1917,092 40*U : . . . . . 1 .5 :2114 "14,97fl 235 : 900 12 231 .5 75-1 06,054 111:'211 53 97,858 I'lS', 114 725 , 407 601,658 205,243 4141 Re ns $5,000 under $10,00
'5F111'1' 35 26,024 1 1
29742 1,054,612 3,895,456 258,877 1 B. 197 40,176 76,206 1 .1 66,72 3iReturns $10,000 or more . . . . . . . . . . .
.I I 11 55: 1 11 215 33,825 25, 138 618,469 1,348,383 1 242,930 1 214,468 '42
Footnotes at end of table . See text for "Description of Sa~mplall and "Explanation of Classifications and Tano.s .-I
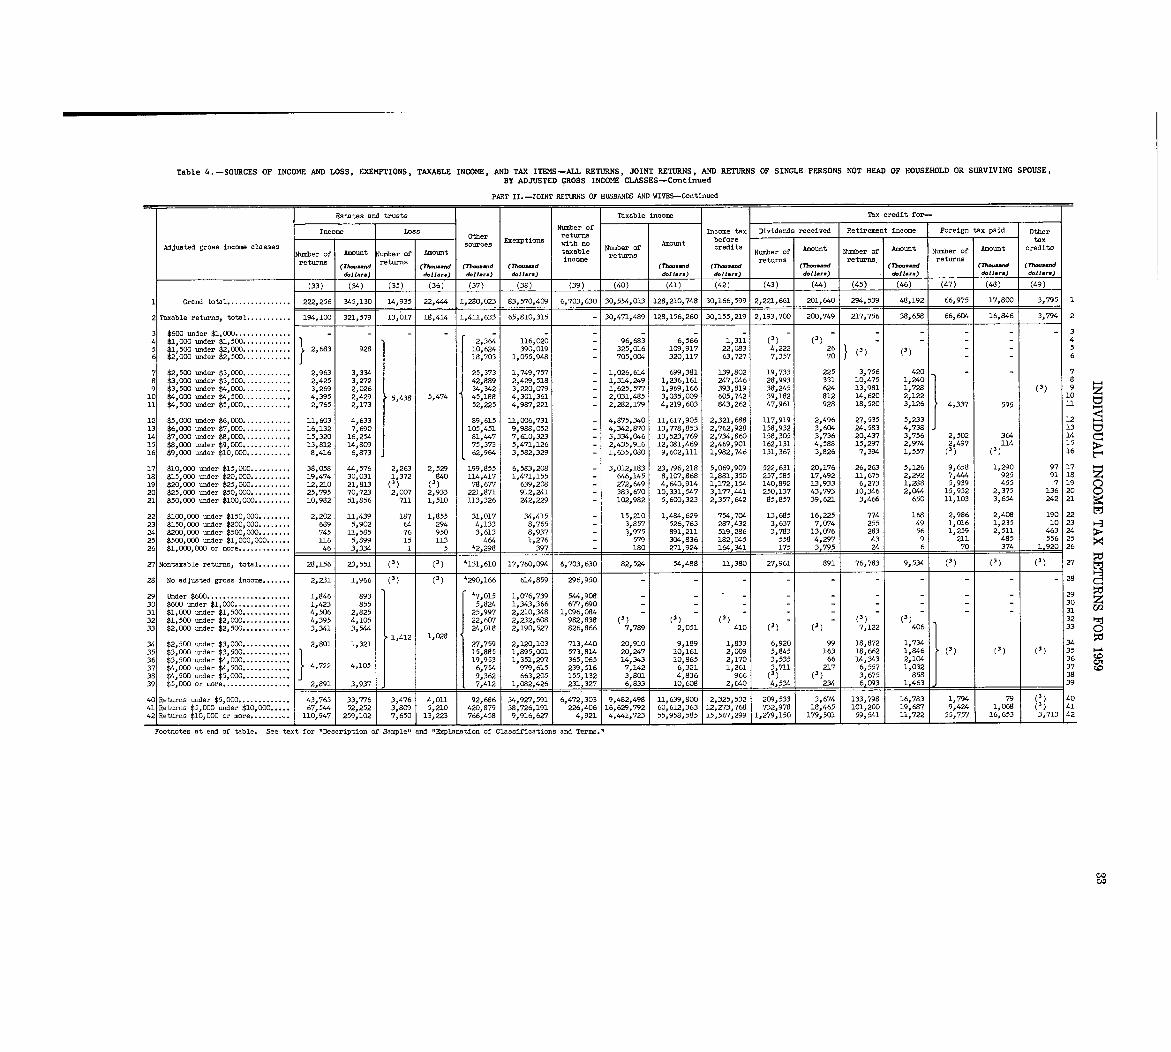
Table 4 . -SOURCES OF INCOME AND LOSS, EXEMPTIONS, TAXABLE INCOME, AND TAX ITEMS-ALL RETURNS, JOINT RETURNS, AND RETURNS OF SINGLE PERSONS NOT READ OF HOUSEHOLD OR SURVIVING SPOUSE,BY ADJUSTED GROSS INCOME CLASSES-Continue d
PART II.-JOINT RETURNS OF HUSBANDS AND WIVES-Continue d
Estates and trusts Taxable income Tax credit for-
Income Loss Number ofOther Exemptions returns Income tax Dividends received Retirement income Foreign tax paid Other
Adjusted gross income classes ces with no Number of Amount before tax
Number of Amount Number c~f t taxable credits _;~e; Amount Number of Amount Number of Amount creditsincome returns t, ofreturns (Th-.-d returns (8.--d (A-d (Th- .-d (Th- -d
nj. (n-..
.d returns .(Th- ...d
returns(Th-W (77-d
d.11. .. d.11-) d.11. .. ) d.11. .. ) 6.11-) d.11 . .. ) &11... ) I d.11.,.) d.11 .,.) d.11 . .. ) i
(33) _(34) (35) (36) (37) (38) (39) (40) (41) (42) (43) (44) (45) (46) (47) (48) (49)_
I Grand total . . . . . . . . . . . . . . . . 222,256 345,130 1 14,935 22,444 1,280,023 83,570,409 6,703,630 30,554,013 1 128,210,748 30,166,599 2,221,661 201,640 2914,539 48,192 66,975 17,800 3,7951 1
2 Taxable returns, total . . . . . . . . . . . 194,100 321,579 13,617 18,414 1,411,633 65,810,315 30,471,489 128,156,260 30,155,219 2,193,700 200,749 217,756 1 38,658 66,604 1 16,846 3,794 2
3 $600 under $1,000 .. 34 $1,000 under $1,500 . . . . . . . . . . . . 21364 116,020 96,683 6,566 1,311 (3) (3) - - - 4
5 tl,,500 under ~2,O01 : : : : . : : . : :_ : 2,683 928 10 624 390,019 325,016 109,917 22,083 4,222 26 (3) (1) - 56 2 000 under 2 , 500 . . . 1 18:703 1,055,948 705,OG4 320,117 63,727 7,357 70 - 6
7 $2,500 -der $3,000 . . . . . . . . . . . . 2,963 3,334 25,373 1,749,757 1,026,614 699,381 139,802 19,733 225 3,756 420 - 78 $3,000 under $3,500. . . . . . . . . . . . 2,425 3,272 42,889 2,429,518 1,314,Z49 1,236,161 247,046 28,993 331 10,475 1,240 8
9 $3,500 under $4,000. . . . . . . . . . . . 3,269 2,026 34,342 3,220,M 1,625,577 1,969,166 393,819 38,245 624 13,981 1,728 (3) 9
10 $4,000 under $4,500 . . . . . . . . . . . . 4,395 2,429 5,438 5,474 45,186 4,301,361 2,0310485 3,035,009 605,742 39,182 812 14,620 2,122 10 z
11 $4,500 under $5,000 . . . . . . . . . . . . 2,765 2,173 52,225 4,987,221 2,282,179 4,219,603 843,262 47,961 928 18,520 3,126 4,337 595 11 C~
12 $5,000 -der $6,000. . . . . . . . . . . . 11,603 4,633 89 615 11,006,731 4,875,340 11,617,905 2,321,688 1.17,919 2,496 27,535 5,233 12
13 $6,000 under $7,000. . . . . . . . . . . . 16,132 7,690 105 :451 9,988,052 4,342,870 13,778,853 2,762,928 158,932 3,604 24,583 4,738 13 C)14 $7,000 under $8,000. . . . . . . . . . . . 15,320 16,254 81,447 7,610,323 3,334,046 13,523,769 2,734,860 158,305 3,736 20,437 3,756 2,502 364 14
15 $8,000 -der $9,000. . . . . . . . . . . . 13,812 14,809 75,373 5,471,126 2,435,916 12,081,469 2,469,901 162,131 4,588 15,297 2,974 2
,
497 114 15
16 $9,000 under $10,000 . . . . . . . . . . . 8,416 6,873 62,964 3,582,329 1,635,080 9,602,111 1,982,746 131,367 3,826 7,394 1,557 (3) (3) 16t-4
17 $10,000 under $15,000. . . . . . . . . . 38,058 44,576 2,263 2,529 199,855 6,583,208 3,012,183 23,796,218 5,069,909 522,631 20,176 26,263 5,126 9,658 1,290 97 17 "18 $15,000 under $20,000. . . . . . . . . . 19,474 30 031 1,372 840 114,417 1,471,155 - 64.6,145 8,107,868 1,881,350 257,585 17,492 11,675 2,292 7,444 925 91 18 z
19 $20,000 under $25,000. . . . . . . . . . 12,210 21:813 (3) (1) 78,677 639,208 - 272,649 4,640,914 1,172,154 140,892 13,933 6,273 1,288 5,939 455 7 19 0
20 $25,000 under $50,000. . . . . . . . . . 25,795 70,723 2, 007 2,933 221,871 912,241 - 383,670 10,331,547 3,177,441 250,137 43,793 10,346 2,044 15,952 2,375 136 20 021 $50,000 =der $100,000 . . . . . . . . . 10,982 51,856 711 1,510 113,326 242,229 - 102,982 5,600,323 2,357,642 85,857 39,621 3,466 650 11,103 3,654 242 21 ~4
22 $100,000 under $150,000. . . . . . . . 2,202 11,439 187 1,855 31,017 34,415 - 15,210 1,484,629 754,704 13,685 16,225 774 168 2,986 2,408 190 22
23 $150,000 under $200,000. . . . . . . . 669 5,902 64 294 4,133 8,765 - 3,857 526,763 287,432 3,637 7,0174 255 49 1,016 1,235 10 2324 $200,000 under $500,000. . . . . . . . 745 11,585 76 950 3,613 8,937 - 3,975 691,211 519,286 3,783 13,076 283 56 1,259 2,511 463 24
25 $500,000 under $1,000,000 . . . . . . 116 5,899 15 113 464 1,276 - 579 3G4,836 182,045 558 4,297 43 9 211 485 556 25
26 $1,000,000 or more . . . . . . . . . . . . . 46 3,3 .34 1 5 42,298 397 - ISO 271,924 164,341 175 3,795 24 6 70 374 1,920 26
27 Nontaxable returns, total. . . . . . . . 28,156 23,551 (1) (3) 4131,610 17,760,094 6,703,630 82,524 54,488 11,380 27,961 891 76,783 9,534 (3) (1) (3) 27
28 No adjusted gross income . . . . . . . 2,231 1,966 (3) (3) 4290,166 614,859 296,950 - - - - - - - - - - 28
29 Under $600 . . . . . . . . . . . . . . . . . . . . . 1,846 893 47,015 1,076,739 544,908 - - - - - - 29
30 $600 under $1,000. . . . . . . . . . . . . . 1,423 855 5,824 1,343,366 677,690 - - - - - 30 z
31 $1,000 under $1,500. . . . . . . . . . . . 4,506 2,825 25,997 2,210,348 1,096 , 084 - - - - - - - 31 M
32 $1,500 under $2,000. . . . . . . . . . . . 4,395 4,105 22, 60`7 2,232,608 982,838 (3) (3) (3) - - (3) (3) 32 13133 $2,000 under $2,500. . . . . . . . . . . . 3,341 3,544 2
1,02824,018 2,190,527 826,866 7,789 2,051 410 (3) (3) 7,122 406 33 0
34 $2,500 under $3,000. . . . . . . . . . . . 2,801 1 321 1'41 27,759 2,120,103 713,440 20,910 9,189 1,833 6,920 99 18,872 1734 3415,885 1,895,001 573,814 20,247 10,161 2,009 5,845 163 18,662 11846 (3) (3) (3) 3535 $3,000 under $3,500 0
36 $3,500 under $4,000. . . 19 953 1,351 297 365,065 14,343 10,865 2,170 3,535 66 14,343 2,104 36~ 4, 2 105 6,754 979,615 239,516 7,142 6,321 1,261 3,711 217 6,557 1,032 3737 $4, COO =der $4,5004 . . . . . . . . . . . 7 2 4
38 $4,5DO -der $5, COO. . . . . . . . . . . . 9,362 663,205 155,132 3,801 4,836 966 (3) (3) 3,675 858 3839 $5,000 or more . . . . . . . . . . . . . . . . . . 2,891 3,937 7,412 . 1,082,426 231,327 6,833 10,608 2,640 4,534 234 6,093 1,463 139
40 Returns under $5,000. . . . . . . . . . . . 43,71 33,16 3,47 59 6,472,3013 :48,2:49'
11 639,800 2,325 ' 532 209 , 533 3 674 133 798 16,783 1,79479 13)
4052 ,~O, 9
,41 Returns $5,000 -der $10,000. . .. 1 6S6 3
26,46 62 2 1 (3)252 3,80 4 01 2:879 184 :'7 2276' 1911 2 196 79 60'612,363 12,273,768 732 978 18 465 101:200 19,687 9,424 1,068 4167' ~61 5:21. 492.
42 Returns $10,000 or more . . . . . . . . .. . 110,947 1 259,102 1 7,650 13,223 766,458 9,916,627 4,921 4,441,723 55,958,585 15,567,299 1,279,150 179,501 59,541 11,722 55,757 16,653 13,713
142_
Footnotes at end of table . See text for "Description of Sample" and "Explanation of Classifications and Terms ."
CIDCAD
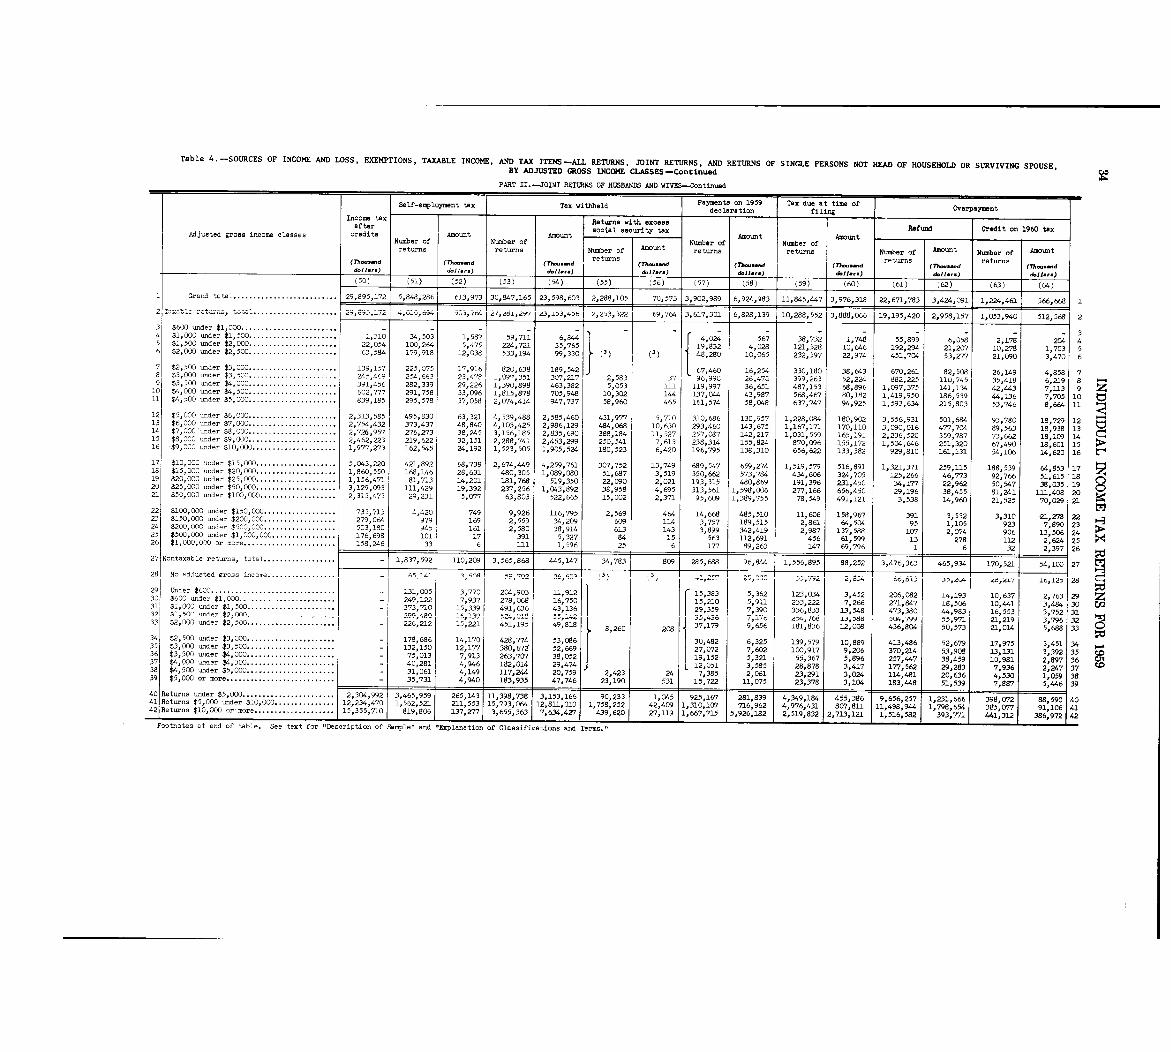
Table 4-90URCES OF INCOME AND LOSS, EXEMPTIONS, TAXABLE INCOME, AND TAX ITEMS-ALL RETURNS, JOINT RETURNS, AND RETURNS OF SINGLE PERSONS NOT HEAD OF HOUSEHOLD OR SURVIVING SPOUSE ,BY ADJUSTED GROSS INCOME CLASSES-Continued
52PART II . -JOINT RETURNS OF HUSBANDS AND WIVES-Continue d
Self-employment tax Tax withheld Payments on 1959 Tax due at time of OverpaymentI declaration filing
Income tax Returns with excess Refund Crediton 1960 taxafter social security ta xAdjusted gross income classes credits Number of Amount Number of Amount Number of Amount Number
ofAmount
returns returns 17Z7er .f Amount returns returns Number of Amount Number of Amount(M-.-d (Th-.-d __a (Th--d (Th_~
returns(T?k-d
returns(7h-.-d
d.1111.) d.11.. . dW1... dbil.. . d.11.. .(50) (51) (52) (53) (54) (55) (56) (57) (58) (59) (60) (61) (62) (63) (64)
I Grand total . . . . . . . . . . . . . . . . . . . . . . . . . . 29,895,172 5,848,286 613,973 30,847,165 23,598,603 2,288,105 70,5?3 3,902,989 6,924,983 11,845,447 3,976,318 22,671,783 3,424,091 1,224,461 566,668 12 Tcxcblc returns, t3tal . . . . . . . . . . . . . . . . . . . . . . -,- 691 -,764 2_t,d6i,29/ 23,i_~_3,4~6 2,2o3,322 69,764 3,617,301 6,828,139 10,288,552 3,888,066 19,195,420 2,958,157 1,053,940 512,568 23 $600 under $1,000 . . . . . . . . . . . . . . . . . . . . .. 34 $1,000 -der $1,500 . . . . . . . . . :*. . . . . . . . . . . . 1,310 34,503 1,587 59,711 6,944 4,024 567 38,732 1,748 55,899 6,058 2,178 204 45 $1,500 -der $2,000 . . . . . . . . . . . . . . . . . . . . . . 22,054 100,264 5,475 224,721 35,765 19,832 4,028 121,528 10,646 192o294 21,207 10,278 1,703 56 $2,000 =der $2,500 . . . . . . . . . . . . . . . . . . . . . . (,3,584 179,918 12,038 533,194 99,330 '1) (3) 48,280 10,065 232,597 22,974 451,704 53,277 21,090 3,470 6
7 $2,500 -der $3,000 . . . . . . . . . . . . . . . . . . . . . . 139,157 225,075 17,916 820,638 189,542 67,460 16,254 330,180 38,643 670,261 82o5O8 26ol49 4,858 78 t3,000 under $3,500 . . . . . . . . . . . . . . . . 241'419 2-14,663 23o476 1,091,311 307, 21', 2,113 37 96,110 26,470 399,263 52,224 882,225 11U,745 35,418 6,219 8$3,500 under $4,000 . . . . . . . . . . . . . . . . . .
. 391 4"212,339 29,226 1,390,898 463,382 5,053 ill 119,997 36,651 487,153 68,896 1,C)97,375 141,134 42,443 7,113 9 z0 $4,000 under $4,500 . . . . . . . . . . . . . . . . . . 1.2, 777 291"5~ 33,096 1,615,878 705,948 10,302 144 137,044 43,987 568,467 80,182 1,419,950 186,539 44,136 7,705 1 011 $4,500 -der $5,000 . . . . . . . . . . . . . . . . .. 839,185 295,578 37,058 2,074,414 947,737 56,960 465 161,574 58,G48 637,747 94,925 1,593,634 215,803 53,746 8,664 1119 ~
12 $5,000 -der $6,000 . . . . . . . . . . . . . . . . . . . . . . 2,313,585 495,830 63,321 4,539,488 2,585,460 431,977 5,710 310,686 130,957 1,228,084 180,902 3,556o931 501,684 93,780 18 729 1213 $6,000 -der $7,000 . . . . . . . . . . . . . . . . . . . . . . 2,754,432 373,437 48,840 4,103,425 2,986,129 484,068 10,630 293,460 143o675 1,167ol7l 170,110 3,090,016 477,704 89,563 18:938 1314 $7,000*=der $8,000 . . . . . . . . . . . . . . . . . . . . . . 2,726,957 276,273 38,245 3ol56,185 2,835,690 388,184 11,527 257,C67 142,217 1,031,559 165,191 2,236,520 359,787 73,662 18:.1 D9 14 C_15 $8,000 -der $9,000 . . . . . . . . . . . . . . . . . . . . . . 2,462,223 219,622 32,151 2,288,741 2,453,299 250,541 7,613 238,314 155,824 870,096 155,172 1,504,646 251,320 67,490 18 601 15 ~P_16 $9, 006 under $10,000 . . . . . . . . . . . . . . . . . . . . . 1,977,273 162,545 24,192 1,523,505 1,905,524 180,523 6,420 196,795 138,310 656,622 133,382 929,810 161,131 54,106 14,620 16
17 $10,000 under $15,000. . . . . . . . . . . . . . . . . . . . 5,043,220 421,892 68,738 2,674,449 4,259,761 307,752 13,749 689,547 659,274 1,519,579 516,691 1,321,371 259,115 188,539 64,853 1718 $15,000 ander $20,000. . . . . . . . . . . . . . . . . . . . 1,860,550 168,146 28,631 480,305 1,089,080 51,687 3,519 350,662 573,784 434,606 324,705 125,266 46,773 92,766 51 615 1819 $20,000 under $25,000. . . . . . . . . . . . . . . . . . . . 1,156,471 81,713 14,201 181,768 519,350 22,090 2,021 193,315 480,869 191,396 231,450 34,177 22,962 50,547 38 :035 1 920 $25,000 -der $50,000. . . . . . . . . . . . . . . . . . . . 3ol29,093 111,429 19,392 237,256 1,043,892 38,958 4,695 313,561 1,598,006 277,166 656,450 29,196 38,455 81,241 ill 408 20 021 $50,000 -der $100,000 . . . . . . . . . . . . . . . . . . . 2,313,475 29,231 5,077 63,803 522,665 15,002 2,371 95,609 1,389,755 78,549 491,121 3,538 14,960 21,525 70:029 2122 $100,000 -der $150,000. . . . . . . . . . . . . . . . . . 735,713 4,420 749 9,926 116,795 2,569 464 14,668 485,510 11,606 158,967 391 3,532 3,310 21,278 2223 $150,000 under $200,000. . . . . . . . . . . . . . . . . . 279,064 979 169 2,559 34,209 609 114 3,757 189,515 2,861 64,534 95 1,105 923 7,890 2324 $200,000 -der $500,000. . . . . . . . . . . . . . 113 180 941, 161 2o58C 38,914 613 143 3,899 342,419 2,987 137,588 107 2, D74 906 13,506 2425 $500,000 -der $1,000,000. . . . . . . . . . . . 176 698.' :* : 101 17 391 5,327 84 15 563 112,691 456 6lo599 13 279 112 2
,624 2526 $1,00C,0,M on ore . . . . . . . . . . . . . . . . . . . . . 158,246 33 1 6 1 ill 1 1,596 1 25 6 171 89,263 147 69,796 1 6 32 2,397 26
27 Nontaxable returns, total . . . . . . . . . . . . . . . . .. - 1,837,592 110,209 3 809 285,688 96,844 1,556,895 88,252 3,476,363 465,934 170,521 54,100 2728 No d.1-t.d ~r-n in . .. . . . . . . . . . . . . . . . . . - ~9 ILI 1 119 1. 7-1 3,
29Under $600 . . . . . . . . . . . . . . . . . . . . . . . . . . . . . .. 3'770
2-9.3 .11 12 2131,005 ":11 ; : ;8-1 5 6 1-3,034 3,452 2.6 .2 12 'c 'o:7Z 14 11 O:'6~17 2 63 2930 $600 under $1,000 . . . . . . . . . . . . . . . . . . . . . . . - 249,122 7,937 278 o 0. 16,750 15,210 5,911 233 222 7 266, 271,847 18,506 10,441 3,494 303 $1,000 -der $1,500 . . . . . . . . . . . . . . . . . . . . . . - 373,710 15,339 491,636 43,1 6 29,359 7,390 336,833 13,548 473,380 44,983 16,553 3,752 31312 $1,50(l und e, $2,noo----- - 299"'ec') 11 1- "1 - - 1~1 -1 1-1 - - - - i3, .~88 ~U4,799 55,971 21,219 3,796 321 1 __1 z-, tto33 $2,000 under $2,500 . . . . . . . . . . . . . . . . . . . . .. - 226,212 15 , 221 451,195 49,818 8,260 3~"; 9:65'6' 181,836 12,006 436,804 50,573 21,014 5,688 3321
34 $2,500 under $3,000 . . . . . . . . . . . . . . . . . . . . . . - 178,686 14,170 428 4 53,08 1 30,482 6,325 139,579 10,869 413,486 52,67980:77 2,6, l7o975 3,451 3435 $3,000 under $3,500 . . . . . . . . . . . . . . . . . . . . . . - 132,150 12,177 3 679 5 ~q 27oO72 7,602 100,917 9,206 370,214 53,908 13,131 3,392 35 to36 $3,500 =der $4,OCO . . . . . . . . . . . . . . . . . . . . . . - 75,013 7,913 263,707 3 19,152 5,321 55,367 5,896 257,447 38,459 10,981 2,897 3 637 $4,000 lunder $4,500 . . . . . . . . . . . . . . . . . . .. - 40,281 4,946 182,014 2 12,051 3,585 28,878 3,417 177,562 29,283 7,936 2o247 3738 $4,500 under $5,000._ . . . . . . . . . . . . . . .. . . - 31,061 4,149 117,244 2u,~159 2,423 24 7o385 2,061 2-1,291 3,024 114,481. 20,636 4,530 1,059 3839 $5oOOC or more . . . . . . . . . . . . . . . . . . . . . . . . . . . - 35,731 4,940 183,935 47,746 23,190 531 15,722 1 11, 0`?5 23,378 3,104 1 3,448 1 51,539 ~~7 5,4461 3940~RetUrns undero$5~000 . ; . 2 3
:''0 1 ,2 31 92 3,465 :,19 2 98 731 3,153,166 90 15 925 67 218 :83 4 349 184 455,386 9,65 7 66 398 CY72 88 :590 401 "l. 1"
"
'9 59 65;' 1.41 R t ns $5,00 1 00. . . . . . . . . . . . . 2,2
.41 1, 562 , 211 151 15 l2o8ll,OlO 6, 31 80`7,811e under ':4 07521 :7 3: 1,758,212 42,409 1 31 7 7 6 962 4 97 4 11,498 385 '4'
11 9 0,"3 1' :1 1 9 6:~4 1 7918, 661 077 91 106 4112
'2
42 Returns $10,000 or more . . . . . . . . . . . . . . . . . . 15,355,710 819,806 137,2771
3o655,36317,634,427 439,620 27,119 1 667,715
15,926ol82 2,519,832 2,713,121
11,516,582 393,771 441 386,972 42
Footnotes at end of table . See text for "Description of Sample" and "Explanation of Classifications and Terms .
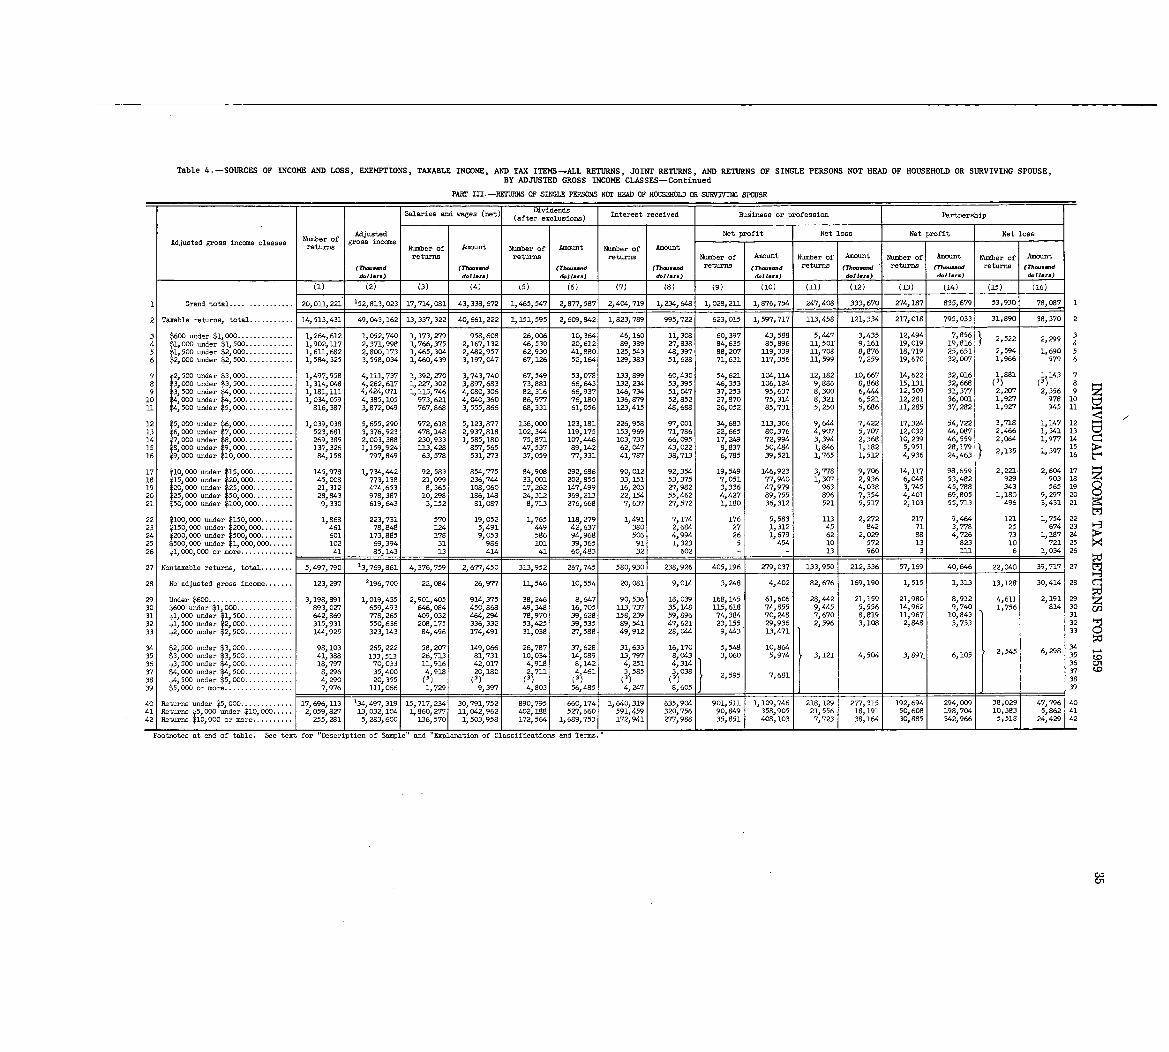
Table 4 . -SOURCES OF INCOME AND LOSS, EXEMPTIONS, TAXABLE INCOME, AND TAX ITEMS-ALL RETURNS, JOINT RETURNS, AND RETURNS OF SINGLE PERSONS NOT HEAD OF HOUSEHOLD OR SURVIVING SPOUSE,BY ADJUSTED GROSS INCOME CLASSES-Continue d
PART III .-RETURNS OF SINGLE PERSONS NOT HEAD OF HOUSEHOLD OR SURVIVING SPOUSE
Salaries and wages (net) Dividends Business or profession Partnership(after exclusions) Interest received
Number of Adjusted Net profit Net loss Net profit Net lose
Adjusted gross income claeses returns gross income Number of Amount Number of Amount Number of Amoun t
returns returns returns Number of Amount Number of Amount Number of Amount Number of Amount(rh-. ..d (rh-- .d (Th-...d returns (Th- . returns (77.-..d returns (Th-.-d(Th-.-d d .1 1.~d (Th--.d returns
6.11-) &11-) d.11 ... d.11. .. ) ) 1 &11. .. ) , d.11 . .. d.11-)
(2) (3) (4) (5) (6) (7) (9) (10) (11) (12) (13) (14) (15) (16)
,587 2,404,719 1,234,648 1,028,211 1,876,754 247,408 333,670 274,187 835,679 78,087 11 Grand total . . . . . . . . . . . . . . . . 20,011,221 152,81-3, 023 17,714,0811 43,338,672 1,465,547 2,8877??,587 2,404,719 53,93 0
2 Taxable returns, total . . . . . . . . . . . 14,513,431 49,043,162 13,337,322 40,661,222 1,151,595 2,609,642 1,823,789 995,722 623,015 1,597,717 113,458 121,334 217,018 795,033 1 31,890 38,370 2
3 $600 under $1,000 . . . . . . . . . . . . . . 1,264,612 1,052,740 1,173,279 958,608 26,006 10,364 46,160 11,308 60,397 43,588 5,447 3,435 12,494 7,856 2,522 2,299 34
. . . . . . . . .. 1,902,117 2,371,998 1,766,375 2,167,132 46,530 20,612 89,389 27,838 84,635 85,996 11,502: 9,161 19,019 19,816 4
- r 121,' (5)00 . . . . . . . . . . 1,465,304 2,482,957 62,930 41,880 88,207 1.19,339 11,708 8,876 18,719 25,651 2,594 1,690 5- 00:: 1,611,682 2,800,173 125,543 48,397~1' Z5 1,500 MdZp2, 000 =der 2,500 . . . . . . . . . . . . 1,564,325 3,558,034 1,460,439 3,197,047 67,126 52,164 129,383 51,628 71,631 117,356 11,599 7,259 19,670 32,0017 1,966 579 6
7 2,500 =der t3,000 . . . . . . . . . . . . 1,497,958 4,111,737 1,392,270 3,743,740 67,549 53,078 333,899 60,430 54,621 104,114 12,182 10,667 14,622 32,016 1 881 1 143 7a 3
": . . . . . . . . . . .1,314,048 4,262,617 1,227,302 3,897,683 73,881 66,643 2.32,234 53,395 46,353 106,124 9,886 8,868 15,131 32,668 (3 ; ?) 8
0 . . . . . . . . . . . 1,181,111 4,424,071 1,115,746 4,080,306 82,316 66,937 146,7.34 51,047 37,253 95,637 8,300 6,444 12,509 31,377 2,207 2,356 99 ~3: 5. d :~' " =10 1000 under 500 . . . . . . . . . . . . 1,034,059 4,385,105 973,621 4,040,360 86,977 76,180 136,879 52,852 27,870 75,314 8,321 6,521 12,281 36,001 1,927 978 1011 $4,500 under ~5, 000. . . . . . . . . . . . 816,387 3,872,049 767,868 3,555,866 68,331 61,056 123,415 48,688 26,052 85,731 5,250 5,686 11,285 37,282 1,927 945 11
12 er ~6, 11 1,039,038 5,655,290 972,618 5,123y877 136,000 123,181 226,958 97,001 .34,683 113,306 9,644 7,422 17,324 54,722 3,718 1,147 12,6, ~~ ~2dder 7 ..0 : :44,087 2,466 1,341 1313 . . . . . . . . . . 523,681 3,376,923 478,148 2,937,818 102,344 119,175 153,969 71,796 22,665 80,376 4,907 5,707 12,032
14 7,011 ~nd 8,11 269 385 2,003,388 230,933 1,585,180 75,871 107,446 103,735 66,095 17,249 72,994 3,394 2,368 10,239 46,559 2,064 1,977 14~0 .d :r
1 1 2 135 1,397 1-515 8,0 , 19, 137,326 1,159,924 113,428 857,565 47,537 89,142 62,047 43,022 8,837 50,484 1,846 1,182 5,951 28,17916 ~9,000 -der 10,000. . . . . . . . . . . 84,158 797,849 63,578 531,273 37,059 77,331 41,787 38,713 6,785 39,521 1,765 1,512 4,936 24,463 16
17 o 00rd r 5yOOO. . . . . . . . . . 145,978 1,734,442 92,583 854,775 84,908 292,686 90,012 92,354 19,549 146,923 3,778 9,706 14,117 98,659 2,221 21604 17, :r ~l ,00 .
45,008 773,138 21,099 236,744 33,001 202,855 33,151 53,375 7,051 77,94018 ~15, ~O 2 . . . . . . . . .. 1,307 2,936 6,048 53,482 929 903 1819 2
'00d :rr 250, 0000. . . . . . . . . . 21,312 474,653 8,365 108,060 17,262 147,499 16,203 27,982 3,336 47,979 963 4,038 3,745 45,788 343 565 19
'. 0' , 00 28,843 978,387 10,298 186,148 24,312 369,213 22,154 55,462 4,4Z7 89,755 896 7,354 4,401 69,805 1,180 9,297 2020 ~25,.0 Q 15 . . . . . . . . .21 ~5 .,000 under 100,000' . . . . . . . . . 9,330 619,643 3,152 81,087 8,713 276,668 7,637 27,572 1,180 36,312 521 5,517 2,103 55,713 496 3,431 21
22~ 00 00
d :r'0' 00'0 . . . . . . .
. 1,868 223,731 570 19,052 1,765 118,279 1,491 7,174 176 5,583 113 2,272 217 9,464 121 1,754 22$1 '0
r71 3,779 25 674 2323 15 ., . nd 2 . .,. 461 78,848 124 5,491 449 42,637 380 2,684 27 .11312 45 842
24 500,000 . . . . . . . . 601 173,885 178 9,053 586 94,968 506 4,994 26 1,679 62 2,029 88 4,726 73 11187 2425 11, ooo, 000. . . . . . 102 69,394 31 986 101 39,365 91 1,323 5 454 10 572 13 823 10 721 2526 ylj 000, 000 or more . . . . . . . . . . . . . 41 85,143 . 13 414 41 60,483 32. 602 - 13 960 . 3 ill 6 . 1,034 . 26
27 Nontaxable returns, total . . . . . . . . 5,497,790 13,769,861 4,376,759 2,677,450 313,952 267,745 580,930 238,926 405,196 279,037 133,950 212,336 57,169 40,646 22,040 39,717 2 7
28 No adjusted gross income . . . . . . . 123,297 2196,700 22,084 26,977 11,546 10,554 20,081 9,014 3,248 4,402 82,676 169,190 1,515 1,313 13,128 30,414 28 CI
~d29 Under $600 . . . . . . . . . . . . . . . . . . . . . 3,198,891 1,019,435 2,901,405 914,375 38,246 8,647 90,536 18,039 168,145 61,606 28,442 21,159 21,980 8,912 4,611 2,191 29 t430 $600 under $1 000 . . . . . . . . . . . . . . 893,027 659,493 646, 084 450,868 49,348 16,705 113,737 35,148 115,618 74,855 9,445 5,556 14,962 9,740 1,756 814 30 CO31 ~1,000 under $1,500 . . . . . . . . . . . . 642,869 778,265 409,032 464,294 78,970 39,628 158,239 59,896 74,384 70,248 7,670 8,819 11,967 10,843 3 132 ~1,500 under ~2,000 . . . . . . . . . . . . 315,931 550,636 208,175 336,332 53,425 39,535 89,541 47,621 23,155 29,936 2,596 3,108 2,848 3,733 3233 Y2,000 under $2,500 . . . . . . . . . . . . 144,925 323,143 84,496 174,491 31,038 27,588 49,912 28,044 9,443 2-3,471 33
34 ~32,,51 und:r $3, 0 .1 : . . . . . . . 98,103 265,222 58,207 149,066 26,787 37,628 31,633 16,170 5,548 10,864 3435 0
. un , 3,5
. . . .. 41,388 133,513 26,713 81,731 10,0_34 14,089 13,797 8,043 3,060 5,9?4 3,121 4,504 3,897. 6,105 2,545 6,298 3 5
4,,5- 000 . . . . . 18,797 70,033 11,916 Cn36 0. nder 4' . . . . -
42,017 4,918 8,142 4,251 4,31' 3 637 de 4,500 . . . . . 8,296 35,400 4,918 20,180 2,711 4,461 3 585 3'038 2595 7,681 3738 500 under 15,000 . . . . . . . . 4,290 20,355 (1) (3) (3) (3) (3) (3) 38
000 or more . . . . . . . . . . . . . . . . . 7,976 1,729 9,397 4,803 56,485 4,247 . 8,605 3939 t5,
47, 416 218,119 277 7 640 Returns under $5, 000 . . . . . . . . . . . . . 17 696,113 '34,497,319 15,717,2.34 30,791,752 890,795 660,174 1,640, 35 901,511 1,109,7 31 92 694 14'29 "6--- 319 0 '9'
5 21",6 18,191 1 . ' US 19 0'":3 3 5 862 4141 Returns 5 000 und r $10,000 . . . . . 2',059,827 13, 032y 104 1,860,277 11,042,962 402,188 527,660 591,459 32 756 90,849 358,90 5 6 8' 704 10 8
42 Returns ~1'0,000 or more . . . . . . . . . . 255,281 5,283,600 136,570 1,503,958 172,564 1,689,753 172,941 277,988 35,851 408,103 7,723 38,164 30,885 342,966 5,518 24,429 4.2
Footnotes at end of table . See text for "Description of Sample" and "Explanation of Classifications and Terms .
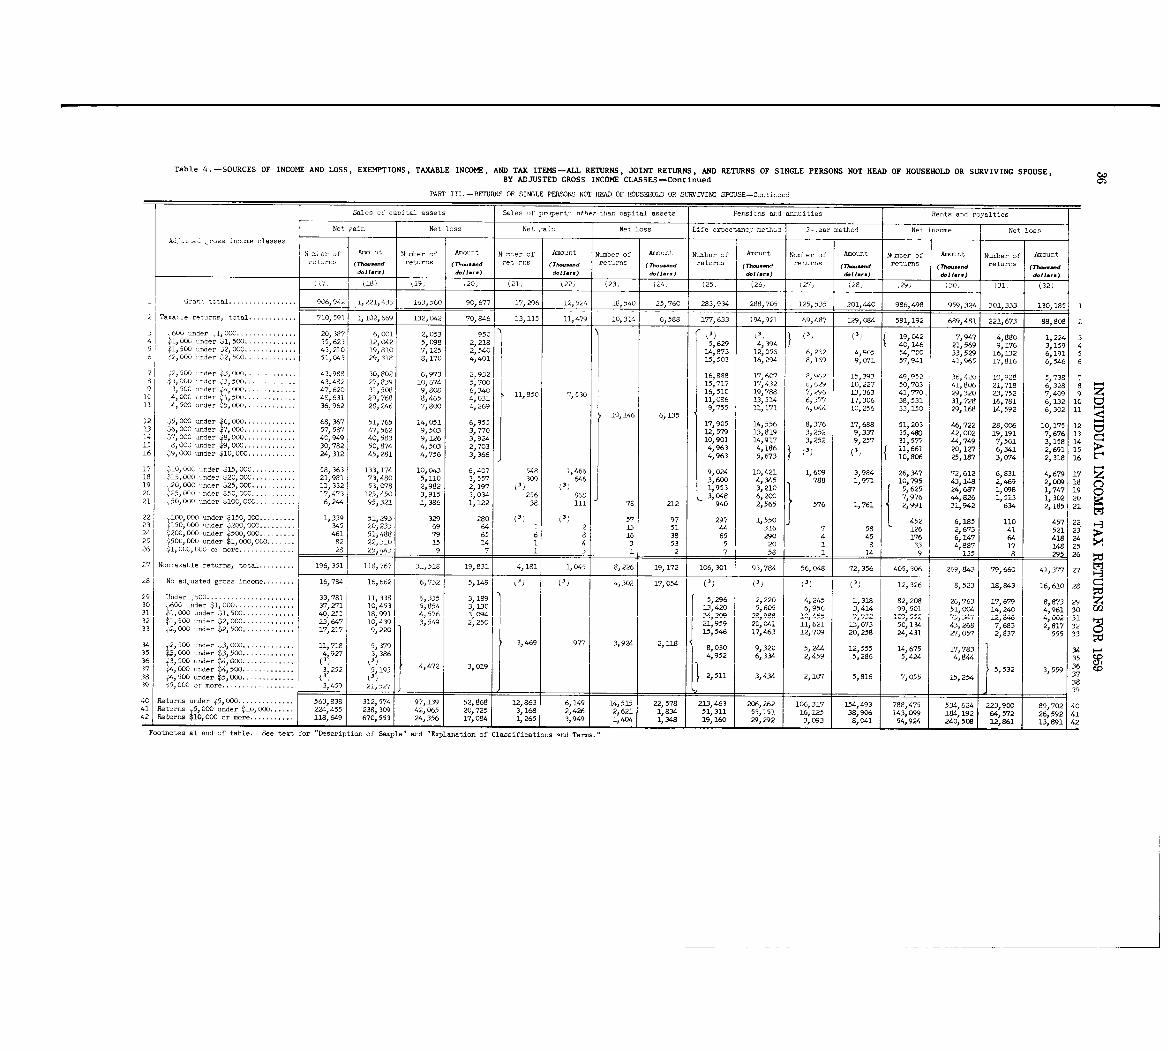
Table 4 . -SOURCES OF INCOME AND LOSS, EXEMPTIONS, TAXABLE INCOME, AND TAX ITEMS-ALL RETURNS, JOINT RETURNS, AND RETURNS OF SINGLE PERSONS NOT HEAD OF HOUSEHOLD OR SURVIVING SPOUSE, wBY ADJUSTED GROSS INCOME CLASSES -Continue d
PART III .-RFrURNS OF SIWLE PERSONS NOT HEAD OF HOUSEHOLD OR SURVIVINC, SPOUSE-C-tii :_p ~
Sales ~_' capital assets Sales of propert: other than capital assets Pansi .- and annuities Rerts and royalties
Net ~~ain Net loss Net -ai, Net loss Life . .pcctanc,- -th,d 3-,.ear method Net income Net lc,,A_stsJ ross classes
N .~! er Df Amo,rit 11mber of A . . nt R_ er of Ao,rt N-ber of Amc-t N~mbpr of Am-t W.1 er of A.,,,,.t M-ba, of Amount Nu~ber of Amountet-,,.s ff~-d et,,- (7h-...d ret-ns (Th- .-d ret...
z (n. ..-d at,,- (Th--d returns (rh--d rct,-s (Th-...d returns (Tb- .-dd.11 .,.) d.11. .. d.11. .. d.1j-) ~11... &11.. . 6.11. .. d.11.,. )
(18) (19, 20, (21, k22~ (23, (24, (25; (26, 27, ~28, 29, (30~ (31, (32~
. . . . . . . . . . . . . . . . . 1, 221,4361 163,560 90,677 17,296 12,524 18,540 25, 71=5.283, 934 288,705 125,535 201,440 986,498 959,324 301,333 1-30,185 1
2 Taxahle returns, total . . . . . . . . . . . . 710,591 1,102,6691 132,042 70,846 13,1151 11,479 10,3141 6,588 177,633 194,921 69,487 129,084 581,192 689,481 221,673 88,8 2
3 ,600 under 1,clx . . . . . . . . . . . . . . . 2C,387 6,001 2,053 950 ~3) ~3) (3) (3) 042 7,947 4,880 1,224 34 yl,000 under ~1,500 . . . . . . . . . . . . . 35,623 12, 0142 5, 098 2,218 5,629 4,394 4-0: 146 21,569 9,176 3,159 45 ~1,50C under ~2,OOC . . . . . . . . . . . . . 43,210 19,810 7,125 2,540 14,873 12,056 6,2,12 4, QC,5 54, -00 33,529 16,132 6,191 56 ~2, COC iu~dc, ~2,500 . . . . . . . . . . . . . 51, 1~43 29,318 8,170 4,401 15,503 16,294 8,169 9,071 57,941 41,965 17,816 6,546 6
7 ~2,500 -nder 1-3,000 . . . . . . . . . . . . . 43,986 30,802 6,973 2,932 16,888 17,6M 'I, .,~ I 'I q, 49,Q52 16,420 19,928 5,738 7d ~3, OW -nder ~, 3, 43,482 Z7,839 10,674 5,700 15,717 17,432 6, t29 10,227 50,703 41,806 21,718 6,328 83,500 -der ~4,. 1 7,40947,620 31,508 9,808 6,340 6 510 19,788 7,296 L3,363 41,770, 29,320 23,752 9 z
ic 4,000 ~,ndc, 4, 4~,631 29,768 8,465 4,031 850 7,530 11'08613,514 6,377 17,306 38,531 31,728 16,781 6,132 101 1 4,500 under ~5, 36,962 28,246 7,800 4,269 9,751 1 "1, 4,044 'C,256 33,150 29,168 14,592 6,302 11
10j 146 6,13 512 ~5,000 under t, COO . . . . . . . . . . . . . 66,367 51,765 14,051 6,955 17,905 14,556 8,376 17,688 51,203 46,722 28,006 10,175 12 tv13 y6 , DOC under ~p7, OOC . . . . . . . . . . . . . 57,587 47,562 9,503 3,770 12,579 13,819 3,252 9,337 35,480 42,002 19,191 7,676 13 (::414 ~7 000 under 8
1 000 11. . . . . . . . . . . 40,949 40,583 9,126 3,924 10,901 14,917 3,252 9,257 31,577 44,749 7,501 3,158 1415 8 COO -der 9,000 . . . . . . . . . . . . . 30,782 50,874 4,503 2,703 4,963 4,186 11 661 2 127 6,341 2 691 151 (1) (1~ 06 91000 under zp10, 000 . . . . . . . . . . . . 24,312 45,281 4,756 3,366 4,963 5,673 10,1806 25,187 3, 074 2,318 16
17 ~IC,GOC ~~der $15,000 . . . . . . . . . . . 58,363 133,174 10,043 6,407 548 1,466 9,024 10,421 1,609 3,984 26,347 72,612 6,831 4,679 1 718 ~15,000 -.der J20,000 . . . . . . . . . . . 21,981 ?3,480 5,110 3,557 309 646 3,600 4,345 788 1,971 10 ' 795 43'148 2 469 2,009 18 019 _20,00C .der ,25,OOC . . . . . . . . . . . 11,332 53, 078 2,982 2,197 kl) ~1) 1,953 3,210 , 5,625 24,687 1'098 1,747 19
20~25,OCO nder $50,00C . . . . . . . . . . . 17,473 125,450 3,915 3,034 256 868 3,048 6,200 7,976 44,826 1,513 11302 2021 , 50,OOC under $100, OOG . . . . . . . . . . 6,244 95,321 1,386 1,122 38 ill 78 212 940 2,565 576 1,761 2,991 31,942 634 2,185 21
22 100,000 nde, 1150,000 . . . . . . . . . 1,339 51,293 329 280 (3) (3) 57 97 297 1,550 452 6,185 110 457 2223 ~150,000 ~nder ~200,000 . . . . . . . . . 345 20,233 69 64 1 2 13 51 44 316 7 58 126 2,673 41 521 2324 1~2 00 nder '500 000 . . . . . . . 461 51,488 79 65 6 8 16 38 65 290 4 45 176 6,147 64 418 2400 0 k25 150~'OOC under ;1,~,Ccc . . . . . . . 82 22,310 15 14 1 4 3 53 5 20 1 8 33 4,887 17 148 2526 'l, OOC, 000 or mo . . . . . . . . . . . . . . . . 2 25,443, 9 7 1, 3 1 2 7 1 58 1 1 1 14 1 9 1 135 1 8 1 295 26
27 Nontaxable returns, total . . . . . . . . . 1=9 61 3t51 118,?6? 31,518 19,831 4,1811 1 93,784 1 56,048 1 72,356 405,306 2~3 19, 61. 41,377 27
328 No ad'usted gross income . . . . . . . . 16, 7" 16, 61`2 6 732 5,1149 3) (3) 4,302 1.7, 054 (3) 12,326 1,,,523 178, 843 16:,61: 2298
29Under .,600 . . . . . . . . . . . . . . . . . . . . . . 33,7,1 ", 338 6,335 3, _ 5,296 2,220 4,245 1,318 82,208
" 6, 1 679
8
"
3 600 -der $1, 000 . . . . . . . . . . . . . . . 37,271 10,453 5,854 3,130 13 420 5,605 6,956 3,414 99,501 51 OC64 14,240 4,961 30301 2000 under $1,500 . . . . . . . . . . . . . 40 .251 L8.991 4.576 3_Oq 432 $1 ' 500 u.nder $2,000 . . . . . . . . . . . . 23'647 10,1439 3,549 2,250 21,959 20,041 1 21 13, 2 7 3233 2,000 -der $2,500 . . . . . . . . . . . . . 17,1217 9,220
3,469 977 3,924 2,118
15,546 17,463 112'709 201258 24,431 27,057 2,837 '555 33
34 2,11 -,Ier 3,111 : : : . . . . . . . . 11,118 1,319 8,030 9,320 5,244 12, 555 14,675 17,783 3435 C. under 3,5 .
. . . . . . . . 41927 3 386 4,952 6,334 2,459 5,286 5,424 4,844 35 1036 500 under S4,000 . . . . . . . . . . . . 3) 3,4,472 3,019 33? ~4,000 rder ~4,500 . . . . . . . . . . . . . 3 "193 5,532 3,559
252 5 2,511 3,434 2,1 -1, U55 15,254 36138 ~4, ~LKJ under ~5,000 . . . . . . . . . . . . . 3, 07 5,81639 1. ) 38~5,OOC or more . . . . . . . . . . . . . . . . . . 3,459 21,527 39
4 Returns -der ~5,000 . . . . 563,838 312,574 9"' 139 52,868 12,863 6, 149 14,515
221,518 213,4163 251,2562 106,317 154,493 788,475 534,624 223,900 8 79.2 401 Returns ~,5,000 unde 224,455 238, 5 8. 1 3 104 r ~10, 3 42, 5 20,72 3 2,426 2,621 51,3 'l 16' , 125 38,906 143,099 184,192 64,572 2672 414 2 Returns $10,000 or moi 118,649 670,553 24,356 17,084 1,265 3,949 1,404 1,348 19,160 29,292 3,093 8,041 54,924 240,508 . 12,861 1 '
.1
3' 42
Footnotes at end of table . See text for "Description of Sample" and "Explanation of Classifications ~nd Tenns ."
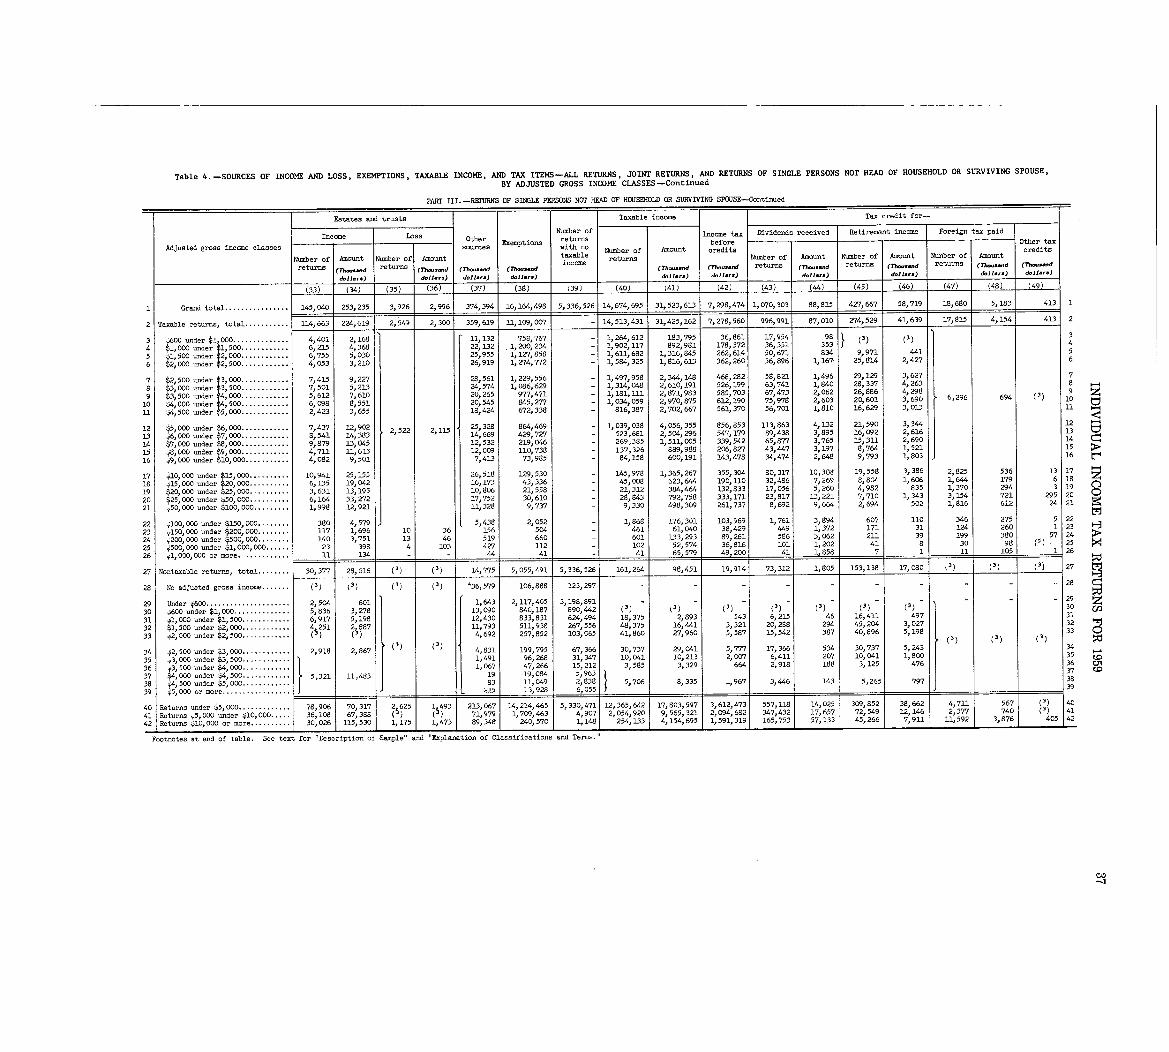
Table 4 . -SOURCES OF INCOME AND LOSS, EXEMPTIONS, TAXABLE INCOME, AND TAX ITEMS-ALL RETURNS, JOINT RETURNS, AND RETURNS OF SINGLE PERSONS NOT HEAD OF HOUSEHOLD OR SURVIVING SPOUSE,
BY ADJUSTED GROSS INCOME CLASSES -Continued
PART III . -RETURNS OF SINGLE PERSONS NOT HEAD OF HOUSEHOLD OR SURVIVING SPOUSE-Continued
Estates and trusts Taxable income Tax credit for-
income Loss Other Number of Inc. e tax Dividends received Retirement income Foreign tax paid. Exemptions returns bemo Other tax
Adjusted gross income classes source ith no Number of Amount orediZ creditsNumber of Amount Number of Amount taxable returns Number f
Amount Number ofAmount Nurber of Amount
income 0 returns returns (7h-.-dreturns (n--d returns (Th...d (Thwsend (71-d (Th-...d (Th .... nd returns (Th- ...d (Fh-.-d (Th..-d
6.11 . .. d.11.,.) d.11 .. . d.11.. . ) d.11.1 .) d.11-0 d,11 . .. ) dollar .) doll.. . doll-)_
(33) (34) (35) (36) (37) (38) ~39) (40) (41) (42) (43) (44) (45) (46) (47) (48)
8151 Grand total . . . . . . . . . . . . . . . . 145,040 253,235 3,926 2,996 374,394 16,164,498 5,336,526 14,674,695 1 31,523,613 7,298,474 1,070,303 88 427,667 58,719 18,680 5,183 413 1
2 Taxable returns, total . . . . . . . . . . . 114,663 224,619 2, .549 2,300 359,619 11,109,007 - 14,513,431 31,425,162 7,278,560 996,991 87,010 Z74,529 41,639 17,81-5 4,154 13 2
3 under $1,000 . . . . . . . . . . . . . . 4,401 2,168 11,132 758,767 - 1,264,612 183,795 36,861 17,954 98 e) e) 3
4 Z5 1 6,215 4,366 22,132 1,200,234 - 1,902,117 892,981 178,372 36,351 353 4
5 5. Md.,
112:000: :
:- . . . . . . 6,755 5,030 25,955 1,127,858 - 1,611,682 1,316,845 262,614 50,671 834 9,971 441 5
6 ;2,000 under 2,500 . . . . . . . . . . . . 4,053 3,210 26,919 1,274,772 - 1,594,325 1,816,613 362,260 56,896 1,167- 25,814 2,427 6
7 J,2,511 r 3,,000 . . . . . . 7,415 9,227 28,561 1,229,556 - 1,497,958 2,344,148 468,282 58,821 1,496 29,129 3,627 7,:r . . : : : . . .CO. ~2d - 4,2638 L3 . . . . . . . . . 7,501 5,213 24,574 1,086,629 - 1,314,048 2,610,191 526,199 63,741 1,840 28,337
4,2988
9 3,500 under 000. . . . . . . . . . . . 5,612 7,610 20,265 977,471 1,181,111 2,871,983 585,703 67,473 2,062 26,886 91 1 6,296 694 (3) z
10 ~4 00 under $4,500. . . . . . . . . . . . 6,098 8,551 20,545 845,2?7 - 1,034,059 2,970,875 612,190 75,978 2,603 20,601 3,690 10
11 ~115000 under $5,000. . . . . . . . . . . . 2,423 3,655 18,424 672,338 - 816,387 2,702,667 561,370 56,701 1,810 16,629 3,013 11
12 $5,000 under ~6,000. . . . . . . . . . . . 7,437 12,902 2,522 2,115 25,328 864,469 - 1,039,038 4,056,355 856,853 113,863 4,132 21,590 3,344 12
3.3 6 000 under 7 ' 000 . . . . . . . . . . . 8,541 14,383 14,669 429,7Z7 - 523,681 2,504,296 547,179 89,438 3,895 16,092 2,616 13
0.. -a 9,879 13,045 12,532 219,046 - 269,385 1,511,005 339,542 65,M 3,765 15,311 2,69 014 ~7114
4,71-1 11,613 12,009 110,738 - 889,988 206,827 43,447 3,197 8,764 1,521 154 er9 ~00 137,32615 000 und r
16 ~9,000 under 10,000 . . . . . . . . . . . 4,082 9,501 7,413 73,985 - 84,158 600,191 143,478 34,474 21648 9,793 1,803 16 t7"'
17.
. 0"'~2dor 5,000 : . . . . . . . . . 10,941 25,155 26,518 129,530 - 145,978 1,365,267 355,304 80,317 10,308 19,558 3,386 2,825 536 13 17
~1 or 0,000 6,135 19,042 6,173 43,336 - 45,008 623,644 190,110 32,486 7,269 8,804 1,606 1,644 179 6is 15,000 ~12 . . . . . . . .. 1 18 z
19 20,000 -der 25,000 . . . . . . . . . . 3,631 1-3,195 10,806 21,558 - 21,312 384,464 1.32,833 17,056 5,260 4,982 835 1,370 294 3 19 n
20 f25,000 =der ~50,000 . . . . . . . . . . 6,164 33,272 17,752 30,610 - 28,843 792,758 333,171 23,817 13,221 7,710 1,343 3,154 721 295 20 C)
21 y50, 000 under $10b,000 . . . . . . . . . 1,998 12,921 11,328 9,737 - 9,330 498,309 261,737 8,692 9,664 2,694 502 1,816 612 24 21
22 '80 4,579 5,438 2,052 - 1,868 176,301 103,969 1,761 3,894 607 110 346 275 5 22
Y100'000 u':r 000 . . . . . . . . 117 1,696 10 36 156 504 - 461 61,040 38,429 449 1,372 171 31 124 260 1 2323 ~150, .00 . r 200,24 ~200,000 under 500,000 . . . . . . . . 140 3,751 13 46 519 660 - 601 133,293 89,261 586 3,062 211 39 199 380 57 24
25 ~500,000 under 11, 000, 000 . . . . . . 23 398 4 103 427 112 102 52,574 36,816 101 1,202 41 8 30 98 (1) 25
26 4,000,000 or more . . . . . . . . . . . . 11 134 - 44 41 65,579 49,200 41 . 11858 7 1 11 105 1 26
27 Nontaxable returns, total . . . . . . . . 30,377 28,616 (1) (3) 14,775 5,055,491 5,336,526 161,264 98,451 19,914 153,138 17,080 (1) (3) (1) 27
28 No adjusted gross income . . . . . . . (1) (1) (3) (1) '36,579 106,888 123,297 - - - - - - - - - 28
29 Under ~600 . . . . . . . . . . . . . . . . . . . . . 2,504 601 1,643 2,117,405 3,198,891 - - - -(3) - (3) - (3) - - 29 z
30 ~600 under $1,000 . . . . . . . . . . . . . . 5,836 3,278 13,090 840,187 890,442 (1) 0) (1) ~1) 30 Cn
31 ~.l, 000 -der $1,500 . . . . . . . . . . . . 6,917 5,198 12,430 833,831 624,494 18,375 2,893 543 6,215 46 16,411 497 31
32 1 500 under ',2 000 4 251 2 887 11,793 511,938 267,556 48,375 16,441 3,321 20,288 294 45,204 3,027 32 It
33 4',000 -der ~2,5OO-'. .' :- : : : : : (5) (5) 4,692 257,852 103, 065 41,860 27,960 5,587 15,542 387 40,896 5,198 33 0
34 ~2,500 -der 3 , 000. . . . . . . *-
. 2,918 21867 (3) (3) 4,831 199,795 67,366 30,737 29,041 5,777 17,366 534 30,737 5,243 34
-,,500. . . . . . . . . . . . 1,491 96,268 31,347 10,041 10,21-3 2,007 6,411 207 10,041 1,800 35 to35 y3,000 unde r36 500 under ~4,C 1,067 47,266 15,212 3,585 3,329 664 2,918 188 3,125 476 36 01
37 P, 000 under 5,321 11,483 19 19,114"93 3
7
38 ~4,500 under $5,000 . . . . . . . . . . .. 83 11 '.9 1,838 5,706 8,335 ,967 3,446 143 5,265 797 38
39 z~p5, 000 or more . . . . . . . . . . . . . . . . . ;~15 13,928 6,055. ~ 11 1 - - 1 39
5"9557 2 :(56 '0 , . 9, l40 Returns under $5, 000 . . . . . . . . . . . . . 78,906 70,31.7 2 25 1 5493 213,067 14,214,465 5,330,47 365,'2
11, 603, 59~7 3,6 12,47 557,118 14,025 309 02 38,662 4,7 67 4012 54 565,32 2 4 682 432 17, f 2 11 5
741 Returns y5,000 under ~10,000 . . . . . 36,108 67,38 71,979 1,709,463 4,9.7 92 1 146 2, 377 ,T74(~~ 41589,348 240,570 13 342 1 Returns ~10,000 r more . . . . . . . . . .
.30,026 115,5 4.73 1,148 254 4,154,69 753 57 7 876 405] 42
Footnotes at end of table . See text for "Description of Semple" and "Explanation of Classifications and Terms ."
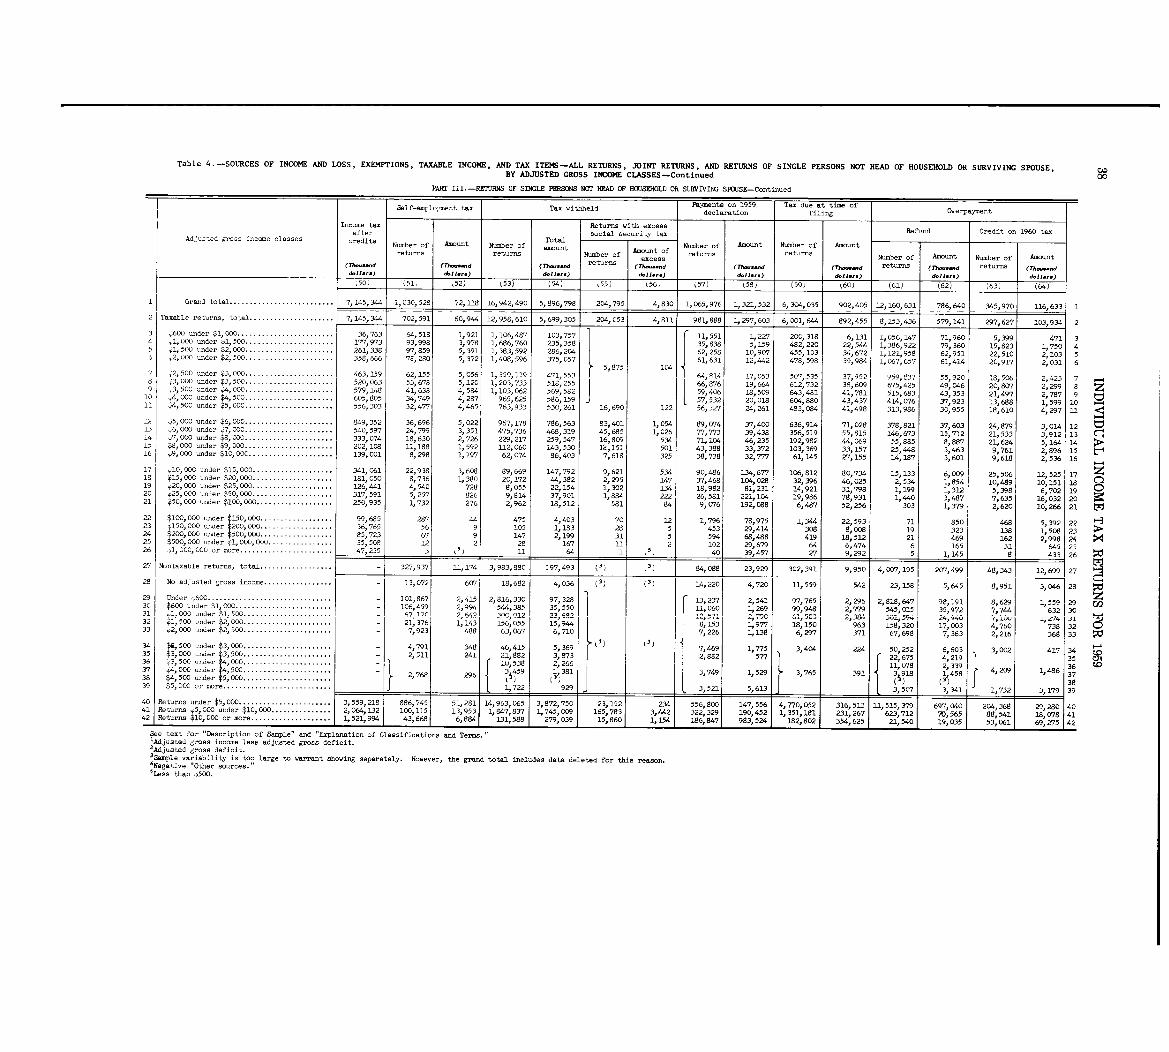
Table 4 . -SOURCES OF INCOME AND LOSS, EXEMPTIONS, TAXABLE INCOME, AND TAX ITEMS-ALL RETURNS, JOINT RETURNS, AND RETURNS OF SINGLE PERSONS NOT HEAD OF HOUSEHOLD OR SURVIVING SPOUSE ,BY ADJUSTED GROSS INCOME CLASSES-Continued 00
PART III . -RETURNS OF SIWLE PERSONS NOT HEAD OF HOUSEHOLD OR SURVIVING SPDUSE-Continue d
Self-empl.:-t tax Tax withheld Payments on 1959 Tax due at time o fdeclaration filing Overpayment
Income tax Returns with exces safter social security tax Refund Credit on 1960 tax
Adl-ted Eross income classes credits Number of Amount TotalNumber of amount Amount of Number of Amount Number of Amoun t
returns returns Number of returns returns Number of Amount Number of Amou~ttu excess(T?-.-d (Th--d (77-. ..d re - (Th-.-d (Th-~ (Th--d returns (77-.-d returns (Th-.-dd.11 . .. ) d.11.. . ) d.1111.) I d.11. .. ) d.11. .. ) 6.11 .. . ) d.11 . . . ) d.11 ...
50) (51, ~52) (53) (54) 155) 56) (57) 58) (59) (60) (61) (62) (63) (64 )
1 Grand total . . . . . . . . . . . . . . . . . . . . . . . . . . 7,145,344 1,030,528 72,118 . 16,942,490 5,896,798 204,795 4,830 1,065,976, 1,321,532 902,405 12,160,631 786,640 345,970 116,633 1
2 Taxable returns, total . . . . . . . . . . . . . . . . . . . . . 7,145,344 702,591 60,944 12,958,610 5,699,305 204,053 4,811 981,888 1,297,603 6,001,644 892,455 8,153,436 579,141 297,627 103,934 2
3 y600 under $1,000 . . . . . . . . . . . . . . . . . . . . . . . . 36,763 64,518 1,921 1,106,487 103,757 11,551 1,227 200,318 6,131 1,056 147 71,960 5,399 471
.
34 1,000 -der ~1,500 . . . . . . . . . . . . . . . . . . . . . . 177,973 93,998 3,978 1,686,760 235,358 35,838 5,159 482,220 22,544 1,386922 79,360 15,823 1,750 45 1,500 under $2,000 . . . . . . . . . . . . . . . . . . . . . . 261,338 97,859 5,391 1,383,592 286,204 62,258 10,907 455,103 34,672 1,121,958 62,951 22,510 2,1031 56 2100C under $2,50U . . . . . . . . . . . . . . . . . . . . . . 358,666 78,280 5,372 1,408,596 375,057 5,875104
61,631 12,442 478,598 39,984 1,067,657 61,414 20,917 2,031 6
7 2,500 under ~3, COO. . . . . . . . . . . . . . . . . . . . . . 463,159 62,155 5,056 1,359,119 471,553 64,814 i7, 053 507,535 37,952 959,S3? 55,92C 18,506 2,423 78 ~3,000 under ~3,500 . . . . . . . . . . . . . . . . . . . . . . 520,063 53,678 5,120 1,203,733 511,;1855 66,876 19,664 612,732 38,609 675,425 49,046 20,807 2,299 a z9 ,3,500 -der ~4,000 . . . . . . . . . . . . . . . . . . . . . . 579,148 41,638 4,584 1,103,062 "g,;?
59,406 18,509 643,481 41,781 515,683 43,353 21,497 2,787 19 C110 4,000 under ~4,500 . . . . . . . . . . . . . . . . . . . . . . 605,805 -34,749 4,287 965,625 586,159 57,532 20,018 604,880 43,437 414,076 37,923 13 688 1,599 011 ~4, 500 under ~5,000 . . . . . . . . . . . . . . . . . . . . . . 556,303 32,477 4,465 763, c)33 510, 261 116,690 12-1 56,327 24,261 483,084 41,498 313,986 30,955 18'610 4,297 11 -C!0-412 $5,000 under $6,000 . . . . . . . . . . . . . . . . . . . . . . 849,352 36,696 5,022 967,178 786,563 83,401 1,054 89,074 37,400 636,914 71,028 378,821 37,603 24,879 3, 014 12 tz~13 6,000 under 7,000 . . . . . . . . . . . . . . . . . . . . . . 540,597 24,799 3,351 475,736 468,319 45,685 1,026 77;773 39,438 356,519 55,815 146,673 1-5,712 21,533 3,912 13 cl14 7,000 under $8,000 . . . . . . . . . . . . . . . . . . . . . . 333,074 18,630 2,726 229,217 259,547 16, " 534 71,104 46,235 192,982 44,069 55,885 8,887 21,624 5,164 1415 ~8 1 000 under ~'9,000 . . . . . . . . . . . . . . . . . . . . . . 202,108 11,188 1,592 112,060 143,530 12,151 501 43,388 33,372 103,369 33,157 25,448 3,463 9,761 2,896 1516 '91 DOO under ~10,000 . . . . . . . . . . . . . . . . . . . . . 139,001 8,298 1,197 62,074 86,403 7,618 325 38,738 32,777 61,145 27,155 14,187 3,601 9,618 2,536 16
17 y10,000 under 'T15,000 . . . . . . . . . . . . . . . . . . . . .341,061 22,938 3,608 89,669 147,792 9,621 534 90,486 134,677 106,812 80,734 15,133 6,009 25,506 12,525 17 z18 45 000 d 20 000 181,050 8,736 1,380 20,172 44,382 2,295 147 37,468 104,028 32,396 46,025 2,534 1,854 10,489 10,151 18, un :rl ' . . . . . . . . . . . . . . . . . .19 y2c, ~O .d 25, -1, ~ ~ 126,441 4,540 728 8,055 22,154 1,302 134 18,982 81,231 14,921 31,798 1,199 1,312 5,398 6 702 192C ~25,(,-el
'. I
.. . . . . . . . . . . . . . . . . . . . 317,591 5,257 826 9,814 37,901 1,884 222 26,581 221,104 19,986 78,931 1,440 3,487 7,635 1~,' 032 2021 ~50,000 -der 1100,000 . . . . . . . . . . . . . . . . . .. 250,935 1,732 276 2,962 18,512 581 84 9,076 192,088 6,487 52,256 303 1,379 2,620 .10,266 21
22 $100,000 under 150,000 . . . . . . . . . . . . . . . . .. 99,685 287 44 475 4,403 70 12 1,796 78,975 1,344 22,593 71 850 468 5,392 2223 t150,000 under 200,000 . . . . . . . . . . . . . . . . . . 36,765 56 9 105 1,183 28 5 453 29,414 308 8,008 19 323 138 1,508 2 324 M01000 under 1500,000 . . . . . . . . . . . . . . . . . . 85,723 67 9 147 2,199 31 5 594 68,488 419 18,512 21 469 162 2,998 24 >125 500, 000 under ~pl, 000, 000 . . . . . . . . . . . . . . . . 35,508 12 2 28 167 11 2 102 29,679 64 6,474 6 165 31 645 2 526 1~ 1, 000, 000 or more . . . . . . . . . . . . . . . . . . . . . . . . 47,235 3, 11 1 64 1 11 ~1) 1 40, 39,457 1 27 1 9,292 5 1,145 1 81 433 26
27 Nontaxable returns, total . . . . . . . . . . . . . . . . . . 27,937 11,1741 3,983,880 197,4931
(3) 1 (3) 84,0881 7,195 1 207,499 1 48,3431 12;699 27
28 No ad~usted gross income . . . . . . . . . . . . . . . . . 13,072 607 18,682 4,036 (1) 14,220 4,720 11,559 542 23,158 5 45 3,046 28
97,328 2,541
9 : 6
29 Under y600 . . . . . . . . . . . . . . . . . . . . . . . . . . . . . . . 101,867 2,415 2,816,330 13,237 97,765 2,296 2,818,647 8 '9, 1,559 29 0230 600 ..der $1,000 . . . . . . . . . . . . . . . . . . . . . . . . 106,459 2,994 544,385 35,550 11,060 1,269 99,948 2,779 545,015 35,972 7,744 632 3031 !1.000 -der k .500 . . . . . . . . . . . . . . . . . . . . . . 67~170 2, r,42 I 1 11 - -1 - - __ _
- -(~3,012 2-11 2,790 G1,50 2,384 301,594 ~- 11 1 J ., d'14 il 1XJ32 ~Pl; 500 under ~2;000 . . . . . . . . .. 21,376 11143 156,055 15,944
-
;1 1,977 18,150 963 158,320 17,003 4"?6_0 738 32 C33 2,000 -der $2,500 . . . . . . . . .. 7,923 488 63,067 6,710 7,226 1,138 6,297 371 67,698 7,363 2,216 368 3 3
34 500 ..der 3 4,791 348 46,415 5,369. . . . . . . . . .. 7,469 1,775 3,404 224 50,252 6,603 3,002 417 340 -der 'O0O : : : : : : : : :~ : . . . . . . . . . .. 577 22,675 4,35 r3'
, 00~3,500 2,511 241 21,882 3,873 2,882 219 35 CA
36 y3, 500 under n00 . . . . . . . . . . . . . . . .. 10,538 2266 11, 078 2,339 367 ~4,000 under ~4,500 . . . . . . . . . . . . . . . . . . .. 918 4,209 1,4863 2,768 29 3 459 1,381 3,749 1,529 3,765 391 3 1 458 3~38 500 -der $5,000 . . . . . . . . . . . . . . . . . . . . .. 15 (3) 389 rl, 000 or more . . . . . . . . . . . . . . . . . . . . . . . . . .. 9 1 L 3,5213 1,7)22 29 5,613 3,507 3,3141 1,732 3,179 39
4 Returns under $5,000 . . . . . . . . . . . . . . . . . . . . . . . 3,559,218 886,745 51,28 14, 3 3, 72,750 23,152 234 556,800 147,556 4,770,052 316,513 11,5 3 691,10 204,368 29 28 4_'O ' 0 02,064,132 100,115 1, 9' ' N 1, 5 009 165,783 3,442 322,329 190,452 1,351,181 231,267 6.,7 '56
545'000
-der $10,000 . . . . . . . . . . . . . . .13 93
847,837 14~J
12 88,541 18,078 4142 Retur99 1 1 1
1 Retur~~ ~10,000 or more . . . . . . . . . . . . . . . . . . . . . 1~ 521, 4 43,668 6,'~84 1 131,588 279,'039 1 15, 60, 1,154 186,847 983,524 182,802 354,625 21,540 19,035 53,061 69,275 42
See text for "Description of Samiple" and "Explanation of Clazsificatiors~ and Terms .'Adjusted gross income less adjusted gross deficit .2Adjusted gross deficit.3S=ple variabIlity is too large to warrant showing separately . However, the grand total includes data deleted for this mason.4Negative "Other sources . "'less than ~500 .
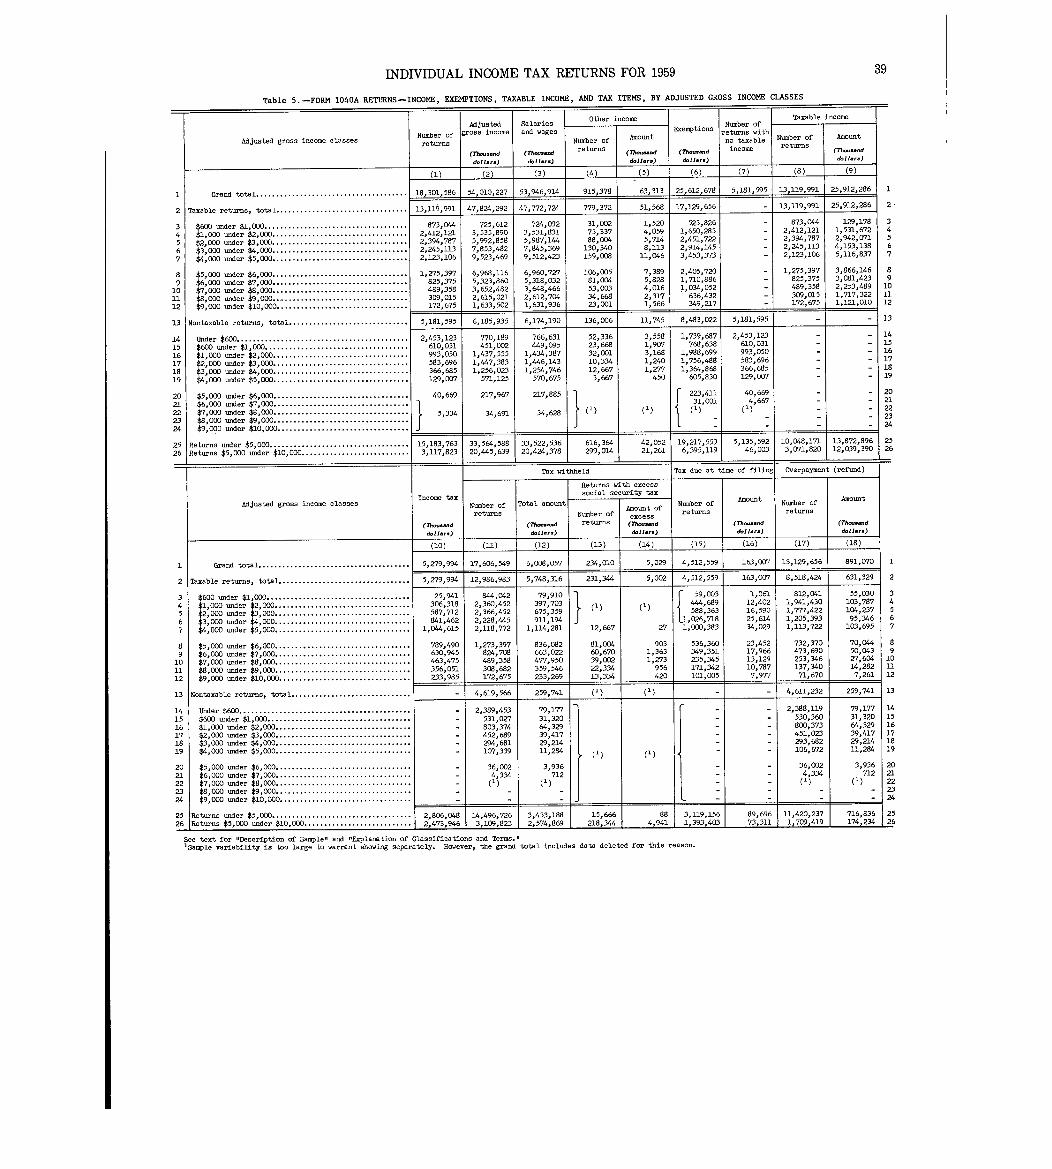
INDIVIDUAL INCOME TAX RETURNS FOR 1959
Table 5 . -FORM 1040A RETURNS-INCOME, EXEMPTIONS, TAXABLE INCOME, AND TAX ITEMS, BY ADJUSTED GROSS INCOME CLASSES
39
S l ir income
fTaxable income
Numberof
Adjustedgross income
a ar e sand wages Amount Exemptions
Number oreturns with
Number of AmountAdjusted gross income classes returns no taxable
returns(rh-
income (Th-...d
doll d.11. .. d.11. .. d.11 .,.) d.1 I. ..
-(2) (3) (4) (5) (6) (7) (9 )
1 Grand total. . . . . . . . . . . . . . . . . . . . . . . . . . . . . . . . . . . . . . 18,301,586 54,010,227 53,946,914 915,378 63,313 25,612,678 5,181,595 1 13,119,991 25,912,286 1
2 Taxable returns, total . . . . . . . . . . . . . . . . . . . . . . . . . . . . . . . . . 13,11§,991 47,824,292 47,772,724 779,372 51,568 17,129,656 - 13,119,991 25,912,286 2
3 000. . . . . . . . . . . . . . . . . . . . . . . . . . . . . . . . . . . .$600 under $1
.
873,044 725,612 724,092 31,002 1,520 523,826 - 873,0" 129,178 3
4,
000 . . . . . . . . . . . . . . . . . . . . . . . . . . . . . . . . . .000 under $2$1 2,412,121 3,535,890 3,531,831 73,337 4,059 1,650,283 - 2,412,121 1,531,67 2`
4
5, ,000 under $3,000. . . . . . . . . . . . . . . . . . . . . . . . . . . . . . . . . .$2 2,394,787 5,992,858 5,987,144 88,GC4 5,714 2,451,722 - 2,394,787 2,942,0 71 5
6,
000 . . . . . . . . . . . . . . . . . . . . . . . . . . . . . . . . . .00C under $4$3 2,245,113 7,853,482 7,845,369 130,340 8,113 2,914,145 - 2,245,113 4,153,138 6
7,,
$4,000 under $5,000 . . . . . . . . . . . . . . . . . . . . . . . . . . . . . . . . . . 2,123,106 9,523,469 9,512,423 159,008 11,046 3,453,373 - 2,123,106 5,116,837 7
8 000 under $6,000 . . . . . . . . . . . . . . . . . . . . . . . . . . . . . . . . . .$5 1,275,397 6,968,116 6,960,727 106,005 7,389 2,405,720 - 1,275,397 3,866,146 8
9,000 under $7,000 . . . . . . . . . . . . . . . . . . . . . . . . . . . . . . . . . .$6 825,375 5,323,860 5,318,032 81,OC4 5,828 1,710,886 - 825,375 3,081,423 9
LO,000 under $8,000 . . . . . . . . . . . . . . . . . . . . . . . . . . . . . . . . . .$7 489,358 3,652,482 3,648,466 53,003 4,016 11,034,052 - 489,358 2,253,489 10
Ll,
$8,000 under $9,000 . . . . . . . . . . . . . . . . . . . . . . . . . . . . . . . . . . 309,015 2,615,021 2,612,704 34,668 2,317 636,432 - 309,015 1,717,322 11
L2 $9,000 under $10,000 . . . . . . . . . . . . . . . . . . . . . . . . . . . . . . . . . 172,675 1,633,502 1,631,936 1 23,001 1,566 349,217 - 172,675 1,121,010 12
L3 Nontaxable returns, total . . . . . . . . . . . . . . . . . . . . . . . . . . . . . . 51181,595 6,185,935 136,006 11,745 8,483,022 5,181,595 - - 13
L4 Under $600 . . . . . . . . . . . . . . . . . . . . . . . . . . . . . . . . . . . . . . . . . . . 2,453pl23 770,189 766,631 52,336 3,558 1,739,687 2,453,123 - - 14
L5 $600 under $1,000 . . . . . . . . . . . . . . . . . . . . . . . . . . . . . . . . . . . . 610,031 451,002 449,095 23,668 1,907 768,638 610,031 - - 15
L6 000 under $2,000 . . . . . . . . . . . . . . . . . . . . . . . . . . . . . . . . . .$1 993,050 1,437,555
M1,434,387 32,001 3,168 1,988,699 993,050 - - 16
17,
000. . . . . . . . . . . . . . . . . . . . . . . . . . . . . . . . . .000 under $ 3$2 583,696 1,447,383 1,446,143 10,334 1,240 1,756,488 583,696 - - 17
18,,
$3,000 -der $4,000. . . . . . . . . . . . . . . . . . . . . . . . . . . . . . . . . . 366,685 1,256,023 1,254,746 12,667 1,277 1,364,868 366,685 - - 18
19 $4,000 under $5,000. . . . . . . . . . . . . . . . . . . . . . . . . . . . . . . . . . 129,007 571,125 570,675 3,667 450 605,830 129, OCY7 - - 19
20 $5,000 under $6,000. . . . . . . . . . . . . . . . . . . . . . . . . . . . . . . . . . 40,669 217,967 217,885 223,411 40,669 - - 2 C
21 $6,000 under $7,000. . . . . . . . . . . . . . . . . . . . . . . . . . . . . . . .
. (1) (1)
1, ..l
(1)
4,667 - --
22
22 $7,000 under $8,000 . . . . . . . . . . . . . . . . . . . . . . . . . . . . . . .::
5,334 34,691 34,628 - Z,23 . . . . . . . . . . . . . . . . . . . .$8,000 under $9,000. . . . . . . . . . . .
2 424 $9,000 under $10,000 . . . . . . . . . . . . . . . . . . . . . . . . . . . . . . . .
25 Returns under $5,000 . . . . . . . . . . . . . . . . . . . . . . . . . . . . . . . . . . . 15,183o763 33,564,588 33,522,536616 ,
364 42,052 5,135,592 10,048,171 13,872,896 1 2f
26 Returns $5,000 under $10,000 . . . . . . . . . . . . . . . . . . . . . . . . . . . 3,117,823 20,445,639 20,424,378 299,014 21,261 46,003 3,071,820 12,039,390L!
Tax withheld Tax due at time of filing Overpsymen (refund )
Returns with exces s
Income tax
socia1 security tax
A tAdjusted gross income classes Number of Total amount
Amount ofNumber of
Amount Number ofmoun
returns Number of excessreturns return s
(n... d (Th--.d returns (rh--d (7h--d (Th-.- d
d.11.. . ) d.1l-) d.11 .. . ) d.11.,.) _ d.11.,. )
(10) (11) (12) (13) (14) (15) (16) (17) (18 )
1 Grand total . . . . . . . . . . . . . . . . . . . . . . . . . . . . . . . . . . . . . . 5,279,994 17,606,549 6pOO8,057 234,010 5,029 4,512,559 163,007 13,129,656 891,0701
2 Taxable ret=s, total. . . . . . . . . . . . . . . . . . . . . . . . . . . . . . . . . 5,Z79,994 12,986,983 5,748,316 231,344 5,002 4,512,559 163,007 8,518,424 631,32 9
3 $600 under $1,000. . . . . . . . . . . . . . . . . . . . . . . . . . . . . . . . . . . .
_
25,941 944,C42 79,910 00359 0611 812,041 55,03 0
4 $1,000 under $2,000. . . . . . . . . . . . . . . . . . . . . . . . . . . . . . . . . . 306,318 2,360,452 397,703
1 (1) (1) 1 :444 689
1 ,2 402 1,941,430 103,787
5 $2,000 under $3,000. . . . . . . . . . . . . . . . . . . . . . . . . . . . . . . . . . 587,712 2,366,452 675,359 588,363 16,590 1,777,422 lC4,237
6 $3,000 under $4,000. . . . . . . . . . . . . . . . . . . . . . . . . . . . . . . . . . 841,462 2,228,445 911,194
1
026,718 25,614 1,205,393 95,34 6
7 $4,000 under $5,000. . . . . . . . . . . . . . . . . . . . . . . . . . . . . . . . . . 1,044,615 2,118,772 1,114,281 12,667 27 1,000,383 34,029 1,113,722 103,695
8 $5,000 -der $6,000 . . . . . . . . . . . . . . . . . . . . . . . . . . . . . . . . . . 789,490 1,273,397 836,082 81,OG4 903 536,360 23,452 732,370 70,G44
9 $6,000 under $7,000 . . . . . . . . . . . . . . . . . . . . . . . . . . . . . . . . . . 630,945 824,7GS 663,022 60,670 1,363 349,351 17,966 473,690 50,(Y0
10 $7,000 under $8,000 . . . . . . . . . . . . . . . . . . . . . . . . . . . . . . . . . . 463,475 489,358 477,950 39,002 1,273 235,345 13,129 253,346 27,604 1
11 $8,000 under $9,000 . . . . . . . . . . . . . . . . . . . . . . . . . . . . . . . . . . 356,051 308,682 359,546 22,334 956 171,342 10,787 137,340 14,282 L
12 $9,000 under $10,000 . . . . . . . . . . . . . . . . . . . . . . . . . . . . . . . . . 233,985 172,675 233~269 1 13,334 420 101,005 7,977 71,670 7,261 1
13 Nontaxable returns, total . . . . . . . . . . . . . . . . . . . . . . . . . . . . . . 4,619,566 259,741 (1) (1) - - 4,611o232 259,741 1
14 Under $600 . . . . . . . . . . . . . . . . . . . . . . . . . . . . . . . . . . . . . . . . . . . 2,389,453 79,177 - 2,388,119 79,177 1
15 $600 under $1,000 . . . . . . . . . . . . . . . . . . . . . . . . . . . . . . . . . . . . 531,027 31,320 - 530,360 31,320 1
16 $1,000 under $2,000 . . . . . . . . . . . . . . . . . . . . . . . . . . . . . . . . . . 803,374 64,329 - 800,373 64,329 1
17 $2,000 under $3,000 . . . . . . . . . . . . . . . . . . . . . . . . . . . . . . . . . . 452,689 39,417 - 451,023 39,417 1
is $3,000 under $4,000 . . . . . . . . . . . . . . . . . . . . . . . . . . . . . . . . . . - 2914,681 29,214 - 293,682 29,214 1
19 $4,000 under $5,000. . . . . . . . . . . . . . . . . . . . . . . . . . . . . . . . . . - l(Y7,339 llo284 - 106,672 11,294 1
20 $5,000 under $6,000. . . . . . . . . . . . . . . . . . . . . . . . . . . . . . . . . . - 36,002 3,936 36,002 3,936 2
21 $6,000 -der $7,000. . . . . . . . . . . . . . . . . . . . . . . . . . . . . . . . . . - 4 334 712 - 4 3-34 712 2
22 $7,000 -der $8,000. . . . . . . . . . . . . . . . . . . . . . . . . . . . . . . . . . - 2
23 $8,000 under $9,000. . . . . . . . . . . . . . . . . . . . . . . . . . . . . . . . . . - 2
24 $9,000 under $10,000. . . . . . . . . . . . . . . . . . . . . . . . . . . . . . . . . I -2
25 Returns under $5,000. . . . . . . . . . . . . . . . . . . . . . . . . . . . . . . . . . 1 2,806,048 14,496,726 3,433,188 15,66689'
696 11 420,-7 1 716,836 2
26:
Returns $5,000 under $10,000. . . . . . . . . . . . . w***ev*e9w94* 2,473,946 3,109,823 2,574,869 218 , 344 4,9 73,311 1,709 , 419 174
,234
3
See text for "Description of Sample" and "Explanation of Classifications and Terms .--ISample variability is too large to warrant showing separately . However~ the grand total includes data deleted for this reason .
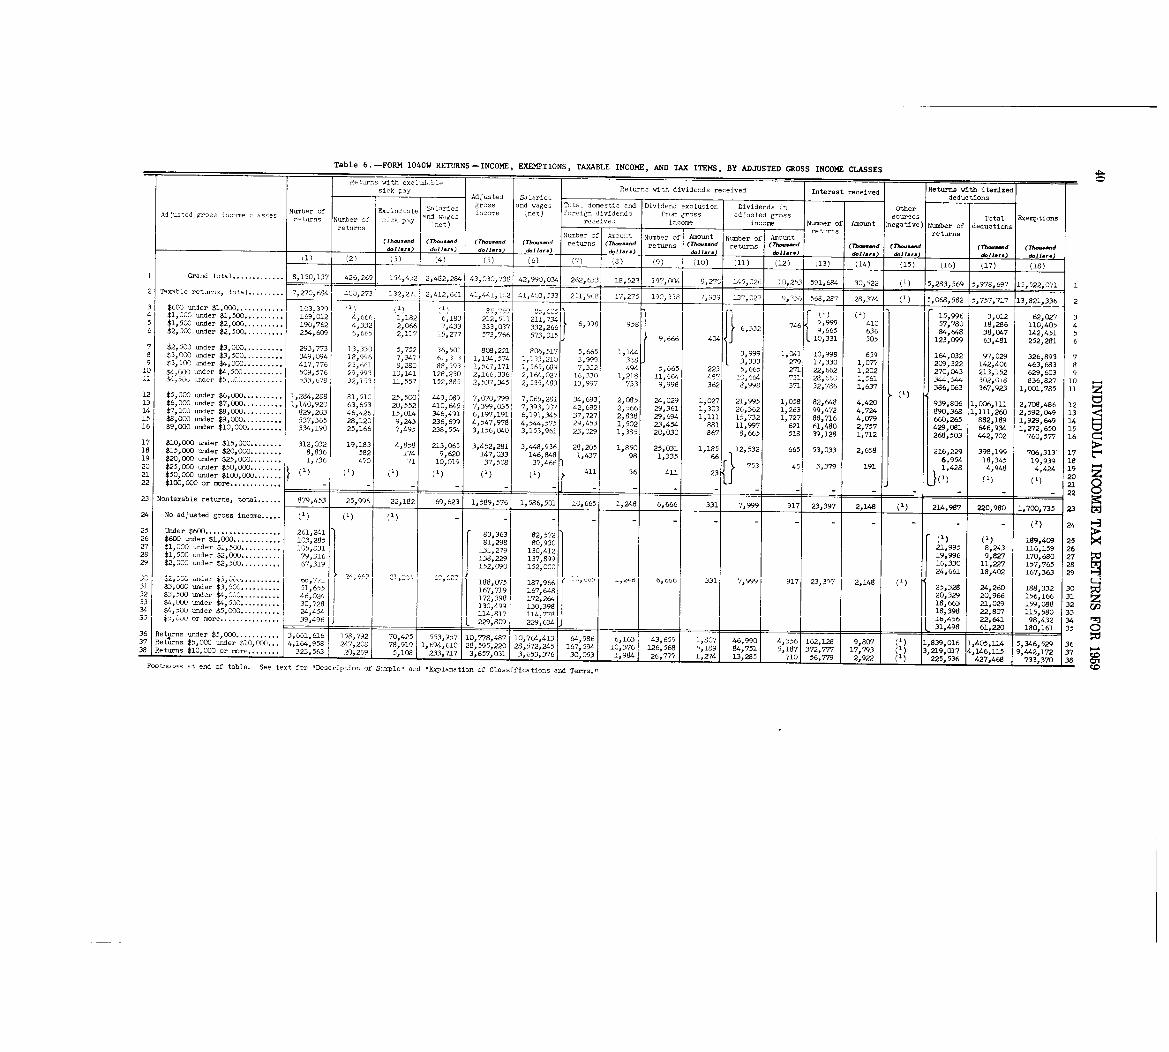
Table 6 . -FORM 1040W RETURNS-INCOME, EXEMPTIONS, TAXABLE INCOME, AND TAX ITEMS, BY ADJUSTED GROSS INCOME CLASSES 41~
Return, wlth . .Ilu~~,b'_,sink pay Returcc with dividends received Interest received Ret~ with itemized
Adjuat,d Sal-i- deductionsries ~roas and wages Total domestic and Dividenj exclusion Divide d in Other
Ad 'ustel g-so in2cmte Number ofc 'rSe I' -11ome 'net) f~rign dividenda f- gross ad~uaten gsross sourcesreturns N-ber nd Total Exemptions
returns on t) income income Number of Amount (negative) N=ber of deductionsnetNumber of Amount Number of Amount Number of Amount returns return s
(n-.-d (7h-.-d (7~1-d urns (Th--d returns (Th-. ..d returns (Th ..d (T)--d (7)..-d (Th--d- - d.11. .. d.11., .) d-11-I-) ~11-) _ d~ll . .. d.11 . . . ) _ d.11.. . d.11 .,.) &11-) 1 d6llara )~1) (2) (3) (4) (5) (8) (9) (11) (12) 13) (14) ~15) ~16) (17) (18)'10)
1 Grand total . . . . . . . . . . . . . 8,150,137 426,269 154,452 2,482,284 43,030,738 42,990,034 212,633 18,~21 197, n34 10,253 591,684 30,522 5,283,569 5,978,697 15,522,071 12 Taxable ret-, total . . . . . . . . . 7,27u,684 4~,0,273 2,412,661 41,441,!C,2 41,403,,33 251,9',-- 17,275 19L,338 9,336 568,287 28,374 5, 068, 582 5,757,717 13,821,336 23 $600 under $1,000 . . . . . . . . . . . . 103,37 94 $1,000 -der $1,500 . . . . . . . . . . 169,012 666 l,'182 '6,'183 21 15,996 3,012 62,027 3
.a 9 9 410 57,780 18,286 110,405 45 $1,500 under $2,000 . . . . . . . . . . 19CJ,?62 4,332 2,066 7,433 33-3 037 332,266 6,998 1,332 1469:6695 636 84,648 38,047 142o451 56 $2, DOO -der $2,500. . . . . . . . . . 254,609 6,665 2,117 15,277 573,766 573,015 1 9,.6 4. 10,331 505 123,099 63,481 252,281 6
7 $2,500 -der $3,000. . . . . . . . . . 293,773 13,330 5,752 36,501 808,221 806,517 5,665 1,144 3,999 1,C41 10,998 659 164,032 97,029 326,893 78 $3,aOC ,der $3,500. . . . . . . . . . 349,094 18"'96 7,34-,' 61,313 1,134,574 1,133,213 3,999 368 3,333 279 17,330 1,077 209,322 142,406 463,683 819 $3,500 -der $4,000 . . . . . . . . . . 417,776 23,ull 8,280 88,593 1,567,171 1,565,689 7,332 494 5,665 223 5,665 271 22,662 1,202 270,043 213,152 629,603 9'0 DOC) nroc, $4,500 . . . . . . . . . . 509,576 29,993 10,141 128,230 2,166,336 2,164,027 16,13n 1,219 11 , , r." 4-7 11,164 ?31 28,660 1-61 344,544 3G2,U,8 836,827 10. . . . . . . . . . 3j,~78 32_03 11,557 152,885 2,537,345 2,535,483 13,997 733 9,998 362 8,998 371 32,786 1,637 3116,063 367,923 1, .1, 7sl 1.1 Z12 $5,000 under $6,DOO . . . . . . . . . . 1,284,288 81,510 25,500 "9,089 7,070,799 7,065,281 34,693 2,085 24,029 1,027 21,995 1,058 82,648 4,420 939,806 1,006,111 2,708 486 12 0-413 $6,000 -der $7,000 . . . . . . . . . . 1,140 920 63,653 20,552 410,645 ?,399,035 7,31)1, On 4_1,692 "'66 29,361 1,303 26,362 1,263 99,472 4,7 _C~- _? 24 890o368 1,111,260 2,592 049 1314 $?,000 under $8,000 . . . . . . . . . . 829,203 46,426 15,014 346,491 6,19?,191 6,191,345 37,727 2, 838 29,694 1,111 15,732 1,727 88,716 4,079 660,265 882,189 1,929,649 14 1-415 $8,000 under $9,000 . . . . . . . . . . 537,365 28,120 9,243 236,699 4,547, 978 4,5",575 29,453 1,502 23,454 881 11,997 621 61,480 2,757 429,081 646,934 1,272,650 1 51 6 $9, COO =der $10,000 . . . . . . . . . 334,190 25,166 7,495 238,554 3, 156, 040 3,153,961 23,029 1,365 20,030 867 8,665 518 39,128 1,712 268,503 442,702 760,577 1 617 $10,000 under $15,000. . . . . . . . 312,032 19,183 4,858 213,065 3,452,281 3,"8,936 28,205 1,850 25,03 1,185 12,532 665 53,033 2,658 216 229 398,199 706,313 17 t_1Is $15,DOO under $20,000. . . . . . .. 8,836 582 174 9,620 147,033 146,848 11437 98 1,331 66 6 954 18,345 19:939 1 819 $20,000 -der $25,000 . . . . . . . . 1,736 470 71 10,019 37,508 37,466 5 753 45 3,379 191 1 428 4,948 4 424 1 920 $25,000 =der $50,000 . . . . . . .. 1) L411 36 411 23 20 Z21 $50,000 under $100,000 . . . . . . . (1) (1) (1) (1) (1)22 $100,000 or more . . . . . . . . . . . .. - - - - - - 21- 2223 Nontaxable returns, total . . . . . . 879,453 25,996 22,182 69,623 1,589,576 1,586,501 10,665 1,248 6,666 331 7,999 917 23,397 2,148 214,997 220,980 1,700,735 2324 No adjwted gross income . . . .. (1) (1) (1) - - (17)
2425 Under $600. . . . . . . . . . . . . . . . . . . 261 :24,1 83,363 82,572
189,409 2526 $600 under $1,000. . . . . . . . . . .. 103 2,5 81,298 80,930 21,9958,243 116,159 2627 $1,000 under $1 500. . . . . . . . .. 105,831 131 279 130 412 19,996 9,827 170,680 27$1,500 -der $2 :D 138,229 137 899
2800*-- . . .. 79,316 1 16,330 11,227 157,765 2829 $2,OGO under $2,500 . . . . . . . . . . 67,319 152,090 152,000
24,661 18,402 167,363 2967: 1188 171~ 117 6~1 (1, 60b :331 7,999~ 917~ 23,317 2,148
25,32s 24,2660 181,13326,
2 . 6 5,~~d"er 3 51)0' : : : : 11:61 5$$3 $ 167:719 1
20_ '9 1 ~, 66 '1
32 3,500 under$ 172,398 1722' is 663 21 029 159,088 3233 $4 '000 -der $ 130,499 130'398 18 398
22 807 115,580 33$4,500 under $34 114.817 114 .77811 1$5,000 or more . . . . . . . . . . . . . . . 39,496 311 229,8D9 16,4 6 22,641 98 4_2229,634 j 31-49'8 r1l 99n 1AW
711 236 Retur a unde $5,000. . . . . . . . . . . 3 661,616 4 70,425 553,957 10,778,487 10,764,413 64,9861 63 43 659 1,8 7 46 0 4, 561 162,126 9 SW 839 01 - 529 363 no $', COO under $10,000. . . 41164,958 1" :1'~2,7,23
7 78,919 1,694,610 28,595,220 28,572 2 5 167,5 4 1' :1376 126 :568 1,189 94,751 5:187 372 777 7,793 7 4,4146 1 .11 42 172 37
r
0 9 , '9974 '99 3 ]1'8 oAQ 5,108 3 219 01 -5:1- 5:4607 1 (, 1 )) I' :
turns $1C, 000or more. . . .
- - 233,717 3,657,031 31653:376 0 0 26,777 1,2 10 56.779 2,9227 '(1) 225,53, 370 383 Re
3 14T 28Footnotes at end of table . See text for "Description of Sample" and "Explanation of Classifications and Terms .11
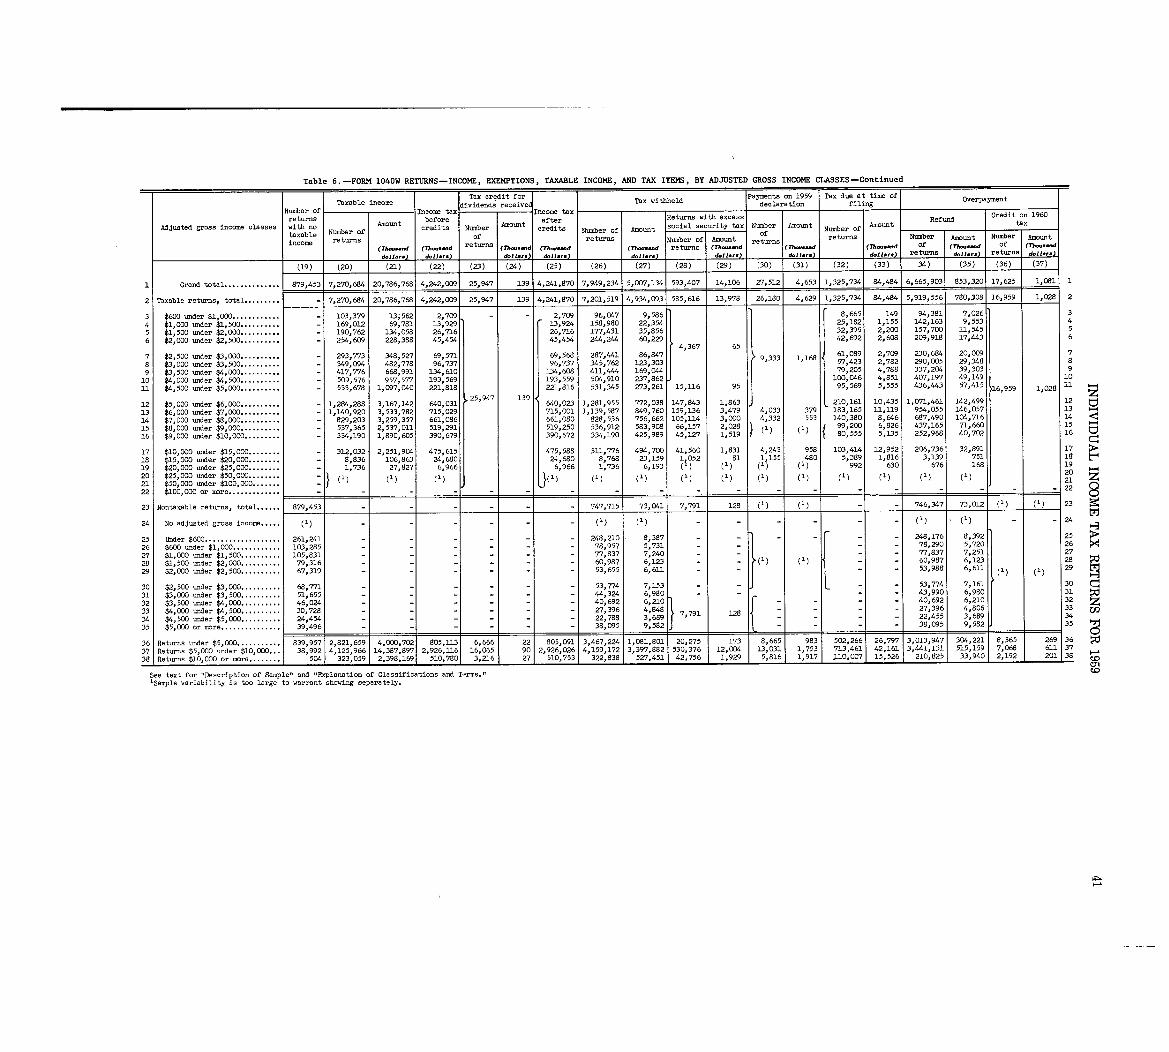
Table 6 . -FORM 1040W RETURNS-INCOME, EXEMPTIONS, TAXABLE INCOME, AND TAX ITEMS, BY ADJUSTED GROSS INCOME CLASSES -Continued
Tax credit for ents on 1959 1 Tax due at time of OverpaymentTax withheld payneel filingTaxable income dividends received d arationNumber of Income tax Income tax Credit on 1960returns before after Returns with excess Refund
Adjusted gross income classes with no Number of Amount credits Number Amount credits Number of Amount social security tax Number Amount Number of Amount tax
taxable returns of returns of tof returns Number Amount Number Amount
income Number returns of of (Th- ...d(T)-- ..W (7h- .-d returns (Th ..d (Th- .-d (77-d returns (rh- ..d (Th-.-d (Th-d dd.11 ., .) d.11-) d.11 ... ) d.11.. . d.11 .,.) d.11., .) d.11-) d.11.1.) returns doll . .. ) returns d.11 .. . j
(19) (20) (21) (22) (23) (24) (25) (26) (27) (28) (29) ~30) (31) (32) (33) 34) (35) (36) (37)
1,081I Grand total. . . . . . . . . . . . . . 879,453 7,270,684 20,786,768 4,242,009 25,947 139 4,241,870 7,949,234 5,007,134 593,407 14,106 27,512 4,653 1,325,7-34 84,484 6,665,903 853,320 17,62 5
2 Taxable returnsy total . . . . . . . . . - 7,270,684 20,786,768 4,242,009 25,947 139 4,241,870 7,201,519 4,934,093 585,616 13,978 26,180 4,629 1,325,7-341 84,484 5,919,556 780,308 16,959 1,028 2
3 $600 under $1,000 . . . . . . . . . . . . - 103,379 13;562 2,701) 2,709 96,047 9,586 8,665 149 94,381 7,026 3
4 $1,000 under $1,500 . . . . . . . . . . - 169,012 69,781 13,929 13,924 158,980 22,354 25,182 1,155 142,163 9,553 4
5 $1,500 under $2,000 . . . . . . . . . . - 190,762 134,058 26,716 26,716 177,431 35,856 32,395 2,200 157,700 11,545 5
6 $2,000 under $2,500 . . . . . . . . . . - 254,609 228,388 45,454 45,454 244,24460,229 4,367 65
42,692 2,608 209,918 17,443 6
7 $2,500 under $3,000 . . . . . . . . . . - 293,773 348,527 69,571 69,568 287,441 86,847 9,333 1,168 61 089 2 709 230,684 20,009 7
8 $3,000 under $3,500 . . . . . . . . . . - 349,094 482,778 96,737 96,737 345,762 123,303 57:423 2:782 290,005 29,348 8
9 $3 500 under $4,000 . . . . . . . . . . - 417,776 668,991 134,610 134,608 411,444 169,044 79,205 4,788 337,204 39,303 9
10 $4 :000 under $4,500 . . . . . . . . . . - 509,576 957,577 193,569 193,559 504,910 237,862 9 100,046 4,851 407,197 49,149 10
11 $4,500 under $5,000 . . . . . . . . . . - 533,678 1,0970040 221,818 25,947 139 221,816 531,345 273,261 15,116 5 95,569 5,555 436,443 57,415 6,959 1,028 11 z
12 $5,000 under $6,000 . . . . . . . . . . - 1,284,288 3,167,142 640,031 640,023 1,281,955 7720038 147,843 1,863 210,161 10,435 1,M,461 142,499 12 C1
13 $6,000 under $7,000. - 1,140,920 3,533,782 715,029 715,001 1,139,587 849,760 159,136 3,479 4,033 379 183,165 11,119 954,055 146,057 13 ~4
14 $7,000 under $8,000 . : : : : : : : : : - 829,203 3,259,357 661,086 661,080 828,536 756,662 105,114 3,000 4 332 553 140,380 8,646 687,490 104,716 14 -i
15 $8,000 under $9,000 . . . . . . . . . . - 537,365 2,537,011 519,291 519,250 536,912 583,908 66,157 2 028 1 (1 99 200 6 826 437 165 71 660 .15116 $9,000 under $10,000 . . . . . . . . . - 334,190 1,890,605 390,679 390,672 334,190 425,989 45,127 11519 80:555 5,135 252,1968 40 :702 16
17 $10,000 under $15,000 . . . . . . . . - 312,032 2,251,904 475,615 475,588 311,776 494,700 41,560 1,831 4,243 958 103,414 12,952 206,736 32,891 17
18 $15,000 under $20,000 . . . . . . . . - 8,836 106,863 24,680 24,680 8,768 23,159 1 052 81 1 155 480 5,389 1,816 3,139 751 is t7'1) (1 1' 992 630 676 168 1919 $20,000 under $25,000 . . . . . . . . - 1,736 27,827 6,966 6,966 1,736 6,19 3
20 $25,000 under $50,000 . . . . . . . . 20
21 $50,000 under $100,000 . . . . . . . 21. z
22 $100,000 or more . . . . . . . . . . . .. - - - - ji - ----- 22 00
23 Nontaxable returns, total . . . . .. 879,453 747,715 73,041 7,791 128 (1) (1) 746,347 73,012 (1) (1) 23
24 No adjusted gross income . . . .. (1) - - - (1) (1) - - - (1) (1) 24
25 Under $600 . . . . . . . . . . . . . . . . . . . 261,241 - - - 248,210 8,387 - - - 248,176 8,392 25
26 $600 -der $1,000 . . . . . . . . . . .. 103,285 - - - 78,957 5,731 - - 78,290 5,720 2627 $1,000 under $1,500 . . . . . . . . .. 105,831 - - - 77,837 7,240 - - 77,837 7,251 27
28 $1,500 under $2,000 . . . . . . . . .. 79,316 - - - 60,987 6,123 - - 60,987 6,123 28
29 $2,000 under $2,500 . . . . . . . . .. 67,319 - 53,655 6,611 - - 53,988 6,611 29
30 $2,500 under $3,000 . . . . . . . . .. 68,771 - 53,774 7,153 - - 53,774 7,161 30
31 $3,OD0 under $3,500 . . . . . . . . .. 51,655 - - - 44,324 6,980 - - 43,990 6,980 31
32 $3,500 under $4,000 . . . . . . . . . . 46,024 - - - 40,6926 1
210 40,692 6,,21. 32 z
33 $4,000 under $4,500. . . . . . . . .. 30,728 - - - 27,396 41W7,791 128 27 396 4806 33
34 $4,500 under $5,000. . . . . . . . . . 24,454 - - - 22,788 3,689 22,455 3,689 34
35 $5, ODO or more . . . . .. 39,496 38, 5 1 9,582 1 38,095 9,582 35
36 R turns under $5,000. . : : : : : : : : : 839 17 2 821,659 4 7 21 820,5 13 6 666 22 34,4697:2,1 1 :311,101 8:665 983 502,266 26 :7 7 3,947 3G4,221 8:365 269 36992 2",66 ~:l3g: 9
4,1 _0' 0 80':0 'l, 21 3 97,8S2
2' 2751
713 , 461, 1 9 1 13
Ol 1 1 515,159 7 068 611 3737 Returns $5,000 under $10,000. .. 14:387,897 2,9116 1 6
: 065 go 2,926 0'216 1 530 :376 l2jZ31 3,031 753 2 6 3,44 3
38 1 Returns $10,000 or more . . . . . . . . 5041 323,059 2,398,169 510,7801 1 5 816 1 917 J.10, 007 15,526 210,8251 33,940 2,192 2 33,216 2 8 C~o
See text for "Description of Sample" and "Explanation of Classifications and Term . "'Sample variability is too large to warrant showing separately .
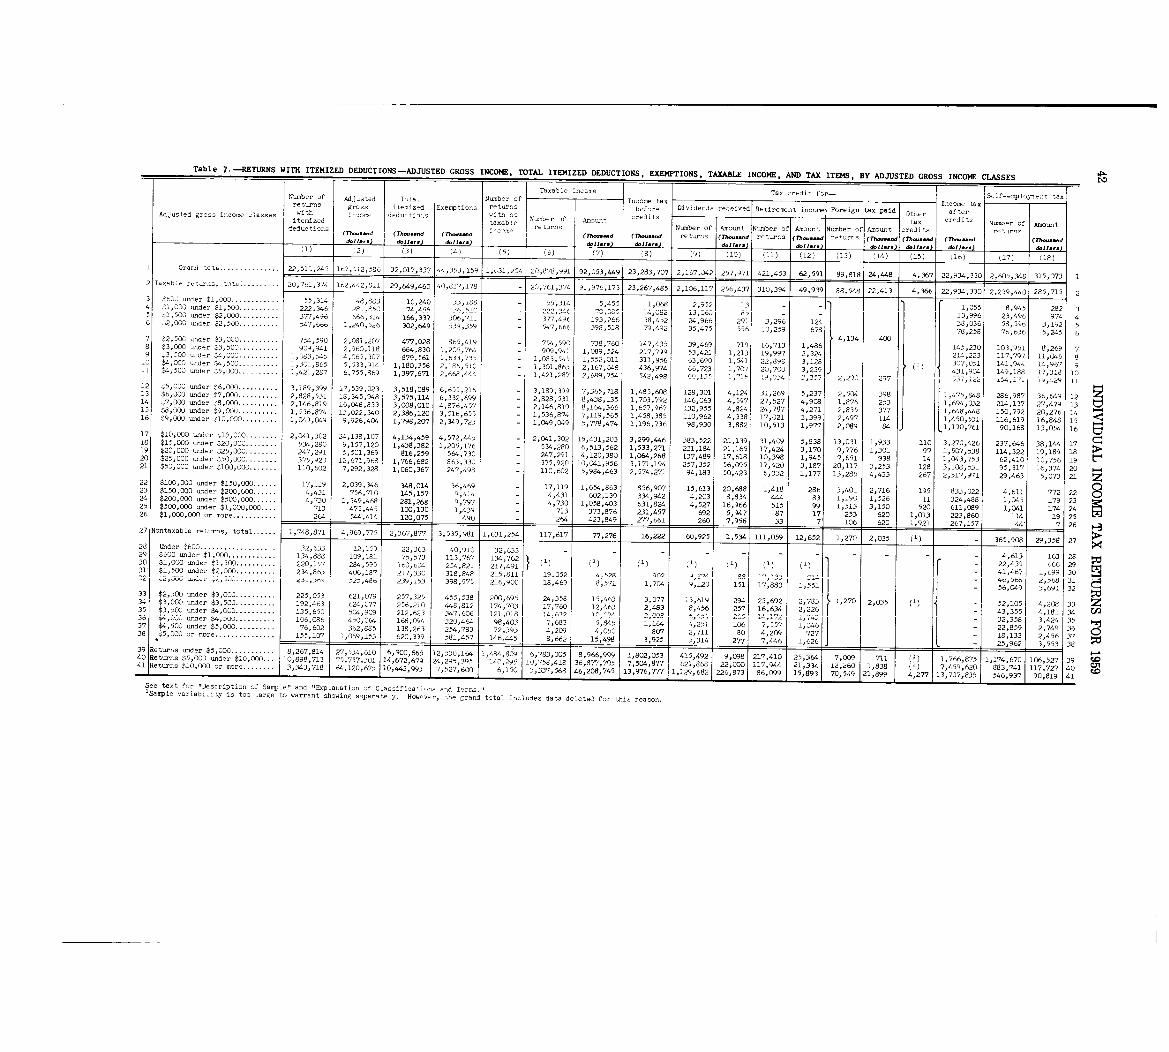
Table 7 . -RETURNS WITH ITEMIZED DEDUCTIONS -ADJUSTED GROSS INCOME, TOTAL ITEMIZED DE-DU-CTIONS, EXEMPTIONS, TAXABLE INCOME, AND TAX ITEMS, BY ADJUSTED GROSS INCOME CLASSE S
Number f Adjusted I't .- Numbc, of Ta-b- in-e Income tax Tax credit f~r- Inco- ta -,.xreturns gross itemized Exempti-s - turns b,f'r- DividenJo received Rcti-ment income Foreign tax paid It- afte rAd"usted gross income -'asses with in-,ome deductio- with - Nu.,1h., f Amount Wx ~r,clits Numb,r of Amount4 tc .i .,d .x .b I ,
deductions(Th-d (Th--.d (Th- .-d
returns Number of Amount Number of A-urt Numbcr of Amount credit. returns(Th- .-d (Th ..~d returns (Th-d r-urr's (7h-d returns (7-h~...d (rh-..W (Th--d (7h- -dd.11-) d.11 . . . d.11.. . ) ~11... d.11 . .. d.11.. . d.11.. . ) I d.11 .1.1 d.11 .-) d.11.. .(3) ~4) (5) (6) (7) ~8) (10) (12) l13) (14) (15) ~16) (17) (18 )1 G,s,,d ttt . :
.
. . . . . . . . . . . .
.
22,51'j,245 1~7,412,58, 32,017,337 44,353,159,1,,,31,254 20,878,991 92,053,449 23,283,707 2,167,,)42 257,971 421,453 62,591 89,818 24,448 4,367 22,934,330 . 2,60~,348 315,0731 12 Taxab, rel-ri t, t
.
..
.
. . . . . . .
.
20,7tl,~74 i,2,442,8_~ 29, 9,460 40,817,178 20,761,374 91,~)76,173 23,267,485 2,106,127 256,437 310,394 49,939 88,54,g 22,413 4,366 22,934,330 2,239,"0 285,715 23 . . . . . . . . . .'60,~ under T 0 -5,314 48,883 10,240 33,188 55,314 5,455 1,068 2,952 13 - -
. . . . . .
. 222,316 13,99623,496 974 4
1 1,055 8,945 282 34 ~i,000 under $ 50,) . . 222 .346 281 .P,50 7L,45S I- "I - - - 70 14,082 13,0 .1 - - -5 ~1,500 under $2,000 . . . . . . . . . . 377,496 666 314 166,337 306,711 377,496 193,266 38,452 24,966 291 3,296 124 38,036 58,596 3,192 56 ~2,000 under $2,500 . . . . . . . . . . 547,666 1,240 :52E, 302,649 539,359 547,666 398,518 79,492 35,475 556 10,259 678 78,258 76,636 5,245 67 Z2,5X under ~3, 000 . . . . . . . . . . 754,590 2,081,207 477,028 865,419 754,590 738,760 147,435 39,469 719 16,713 1
48" 4,134 400 145,230103,951 8,269 78 ~3,000 under ~3, 500 . . . . . . . . . . 909,941 2,9bO,ll8 664,830 1,205,764 909,941 1,089,524 217,71)1) 53,421 1,213 19 997 2 : 2 21-4,223 117,797 11,L)46 8'3,500- under 30 -1 . . . . . . . . . . 1,083,~4~ 4,065,307 879,561 1,6J3,735 - 1,083,545 1,552,011 311,956 63,690 1,541 22,898 3
:
128(1 )
1 307,051 ~41,9" 14,967 910 $4,000 under $4,500 . . . . . . . . . . 1,301,865 5,533,914 1,180,356 2,18b,510 - 1,301,865 2,167,048 436,974 66,723 1, 717 21, 703 3 239~ 431,904 149,188 17,318 1011 $4,500 under 1~5,000 . . . . . . . . . . 1,421,287 6,755,869 1,397,671 2,6b8,444 - 1,421,287 2,68q,754 542,499 -9 34 I'l- 2,22-C 217 --- il,121 1 112 z~5,000 order $6,Ojo . . . . . . . . . . 3,189,399 1?,539,023 3,516,089 6,655,216 - 3,189,399 7,365,718 1,485,608 128,301 4,124 31,269 5,237 2,504 398 1,475,848 286,98? 36,649 12 z13 $6,000 under t?,000 . . . . . . . . . . 2,828,531 18,34,,948 3,575,114 6,332,699 - 2,828,531 3,438,135 1,703,792 14 )6 5~7 27,527 4,908 1,8?6 253 1,694,032 214,137 27,479 1314 7,000 order ~8, 000 . . . . . . . . . . 2,146,819 16,M 833 3,008,010 4,876,457 - 2,146,819 A,164,366 1 . . . . .. 6' ~: - -- - __ ~ 1 -3 5, 4 824 24,76, 4,2,1 2,835 377 i,648,"B 150,792 20,276 1415 $8,000 under $9,00u . . . . . . . . . . 1,536,874 13,022,340 2,386,120 3,516,655 - 1,536,874 7 119 565 1,456,385 110 962 4 338 17 021 3,399 2,497 114 1,450,531 116,619 16 848 1516 ~9,000 under ~10,000 . . . . . . . . . 1,C49,049 9,926,404 1,798,207 2,349,723 - 1,C649,049 5 :778,1474 1,196 , 736 98 :930 3,882 10,513 1,977 2,089 84 ~1,190,761 90,168 13:054 16 tv17 $10,000 under 15,000 . . . . . . . . 2,041,302 24,136,107 4,134,459 4,572,44~ - 2,041,302 15,431,203 3,299,446 383,522 21,139 31,409 5,638 13,031 1,933 110 3,270,426 237,646 38,144 1 7is $15,000 under $20,000 . . . . . . . . 534,280 9,157,120 1,438,382 1,205,176 - 534,280 6,513,562 1,533,271 231,184 21,165 17,424 3,170 9,776 1,301 97 1,507,538 114,322 19 189 1819 ~20,000 order ~~25,000 . . . . . . . . 247,291 5,501,369 816,259 564,730 - 247,291 4,120,380 1,064,268 137,489 17,618 10,398 1,945 7,651 938 14 1,343,753 62,410 10 '20 $25,000 under ~50,000 . . . . . . . . 375,920 12,6?1,968 - 041,956 '756 191,766,682 863,330 375,920 10,L 3,171,194 257,352 56,095 17,420 3,187 20,117 3,253 128 3,108,531 95,317 16,374 2021 $50,000 under $100,000 . . . . . . . 110,602 7,292,328 1,060,367 247,498 - 110,602 5,984,463 2,574,271 94,183 50,423 6,332 1,177 13,285 4,433 267 2,517,971 29,463 5,073 2122 $100,000 under $150,000 . . . . . . 17,119 2,039,346 348,014 36,469 - 17,119 1,654,863 856,907 15,613 20,688 1,418 286 3,401 2,716 195 833,022 4,til 772 2223 $150,000 -dcr 200,000 . . . . . . 4,431 756,710 145,157 9,414 - 4,431 602,139 334,942 4,203 8,834 444 83 1,190 1,526 li 324,488 I,CV.5 179 2324 $200,000 under $500,000 . . . . . . 4,730 1,349,468 281,268 9,797 - 4,730 1,058,403 631,824 4,527 16,966 515 99 1,513 3,150 520 611,089 1,041 174 2425 $500,000 under $1,000,000 . . . . 713 475,"5 100,130 1,439 - 713 3?3,876 231,457 692 5,947 87 17 253 620 1,013 223,860 114 19 2526 $1,000,000 or more . . . . . . . . . . . 264 544,414 120,075 490 - 1 264 277,661 260 7,9561 33 7 106 620 1,921 267,157 4427 Nontaxab-e returns, total . . . . . . 1,748,871 4,969,775 2,367,877 3,535,981 1,631,254 117,617 77,276 16P222 60,925 1,534 111, IP270 2,035 365,908 29,35 2728 Under 4600. . . . . . . . . . . . . . . . . 32,633 12,1,59 22,363 40,910 32,633 - - -
4,613 163 28
tl~ 11 59 12,652
29 $600 under $1,000 . . . . . . . . . . . . 134,886 1C,9,181 75,573 113,767 134 '16222,43 930 $1,000 under $1,500 . . . . . . . . . . 220,1,7 284,595 160,604 254,821 217 :49 1,666 29
$1,500 under $2,000 . . . . . . . . . . 234,863 406,187 217,330 318,848 215.8111 19.052 4528 qn~ -1 41 467 699 30
4 9 120 5 ":~~q '~
: 641
6 o"6 'i1,4 ?3 398 75 2
9
." '8,469 1,571 1 Ill32
9"" 5
: 9
3-~ $2,500 under $3,000 . . . . . 2
53"
15,4 3 3,6196 171 ' :1 24 358
6, 1
:077 1 2941 23,692 1 2,783 53 221 ~53 2 57,121 45 211.)91 ~,270 2,035 33 z734 $3,000 undcr $3,500 . . . . . . . . . . 192,463 624,077 256,210 448,812 174,703 17:760 12,463 2,483 8,456 2571 1 4 34~5 $3,500 under $4,000 . . . . . . . . . . 135,650 5G4,909 212,623 347,606 121 .018 ~4 632 io n7L 1 11
4 32 358 3 424 35,- wu unrer z~4,~uo . . . . . . 6,?~6 450,064 168,094 ~,2 :4 403 7,683 5,845 1,1(A 4- ,$4 500 under $5,000 . . . . .. 7 0'~;~ 22,859 2 74 36:3 3 209 4 050 80 21' 0
'8 '37 362,885 138,263 4 71'13 12
' 94 2,711 801 4,209 727 18,133 2,4596 37
9'
,
~5 000 or more . . . . . . . 155,107 1,069,153 620,339 ~4 14 "45 8,662 15 , 498 3,928
36~81, 57 146, 5,314 277 7,"6 1,626 25,962 3,553 3
9 1 , _ , , 1
,9.3 Returns under $5,00 8 217,11114~261 30 1,44 8 9 15 492 9 410 25,364 7,009 71 10 . . . 0~l 6 90 665 12,5 164 1,4 4 809 6,783pDC5 671,91)1 1,102 :,1573 4 217 (1) 1,766,875 1,174,670 106,527 397"0 Returns $5,000 und r $1 0 14:6 11 2 5
"C' 7,5. 68 2 117,944 01
89 3 71,7 34 0 oco . . . 1 8 _"i 3 71 :7 ' 3
0'7(2),67 24,295 395 18 6 8 62i :8 2 21,334 12,260 1,8343 (1)41 R 3
"18"1
20 , 6154
1
2
9 '~I, 3do :000 7,459,620 883,741 117 727 40 CD20eturn . $10,000 or more . . . . . . . . 3,343,718 64, i~, 6?5 10,443,993 7,527,600 9 , 6821 226,LIL 15,893 70,549 21,899 4,277 13,707,635 546,937, 90 819 41
See text for "Description of Sample" and "Exp anation of CloscificattiDns and Tcnris .~ ,1'.mple ariability is too arge to warrant showing separately . However, the grand total includes data deleted for this reason .
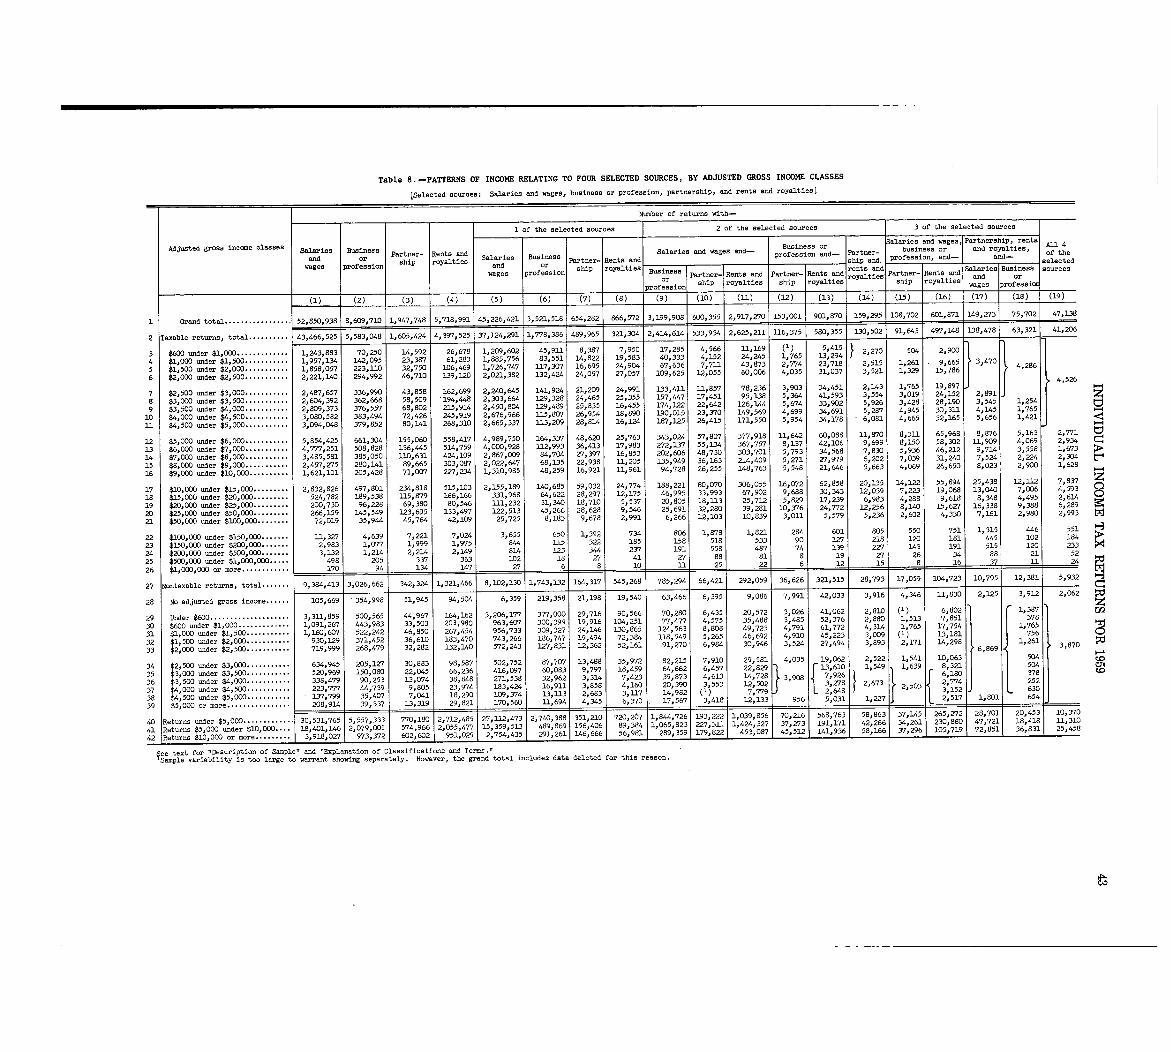
Table 8 . -PATrERNS OF INCOME RELATING TO FOUR SELECTED SOURCES, BY ADJUSTED GROSS INCOME CLASSES
[Selected sources : Salaries and wages, business or profession, partnership~ and rents and royalties ]
Number of returns with-
I of the selected sources 12 of the selected sources 3 of the selected sources
, aSel,
ies and- Busi ass or alaries and wages, Partnership, rents All 4le a and wagearc~
"
T
a
.
14b1ner
Adjusted gross income classes Business Partner- Rentsand Salaries Business Salaries
and wages profession and- Partner- business or and royalties, of ther.fe. _on, and-
R. t
.
'd
u 8 'and or Partner- Rents and profession, and- and-wages profession ship royalties and or ship
and. selected( 1
6
wages profession ship royalties-~~.ness Pa~h rents and Salaries Business sources-
tner- Rents and Partner-11.1ents and royalties and ornap
3
. ..
. 70
aprofeasionj
p
royalties ship royalties wages professior
(1) _ (2) (3) (4) (5) (6) (7) (8) (9) 1 (10) (11) (12) (13) (14) (15) 1 (16) (17) (18) (19)
art1 Grand total . . . . . . . . . . . . . . . . . 52,850,938 8,609,710 1,947,748 5,718,991 45,226,421 3,521o518 654,282 866,572 3,199,908 600,355 2, 917, Z70 153,001 901,870 159,295 108,702 601,a7l 149, Z73 75,7 2 47,138ll,
22 Taxable returns, total . . . . . . . . . . 43,466,525 5,583,M 1,605,424 4,397,525 37,124,291 1,778,386 489,965 321,304 2,414,614 533,934 2,625,211 326,375 580,355 130,502 91,643 497,148 138,478 63,3211 41,206
3 $600 under $1,000 . . . . . . . . . . . . . 1,243,883 70,250 14,592 26,6783 1,209,602 45,911 8p387 7,950 17,285 4,566 11,169 (1) 5,415 2,270 504 2,900
4 $lpOOO under $1,500 . . . . . . . . . . . 1,957pl34 142,095 23,387 61,283 IpS65,756 83,551 14,822 19p583 40,333 4,152 24,245 1,765 13,294h
5 $1,500 under $2,000 . . . . . . . . . . . 1,858,057 223,110 32,750 106,469 1 o 726,747 2.17,307 16,695 24,904 67,636 7,711 43,873 2p774 23,718 2,515 lp261 9p665 3,470 4,286r-
6 $2,000 under $2,500 . . . . . . . . . . . 2,221,140 294,992 46,710 139,120 2,021,382 132,424 24,057 27oO57 109,625 12,055 60,006 4,035 31,037 3,521 1,329 15,7864,526
7 $2,500 under $3,000 . . . . . . . . . . . 2,487,657 336p990 43,858 162,699 2,240,645 141,924 21,209 24,991 133,411 11,857 78,236 3,903 34,451 2,143 1,765 19,697 0-4
8 $3,ODO under $3,500 . . . . . . . . . . . 2,604,392 362,668 58,509 194,44s 2,303o664 3.29,328 24o465 25,355 157,447 17,451 95,138 5,364 41,593 3,554 3,019 24,152 2,891 z
9 $3,500 under $4,000 . . . . . . . . . . . 2,809,373 376,557 68,802 215,914 2,450,804 129,489 25,835 16,455 174,122 22,642 126,144 5,674 33,902 5,926 3,428 28o190 3,545 1,25 4
10 $4,000 under $4,500 . . . . . . . . . . . 3,080,582 383,494 72,426 245,919 2,676,966 115, 80`7 26,954 18,890 190,015 23,370 149,569 4,699 34,691 5,287 4,945 3Oo3ll 4,145 1,76 5
11 $40500 under $5,000 . . . . . . . . . . . 3,094,048 379,652 80,141 268,310 2,665,337 3 .13,209 28,814 16,124 187,125 26,415 171,550 5,954 34pl78 6,081 4,665 32,165 5,656 1,421 _,4
12 $5,000 under $6,000 . . . . . . . . . . . 5,854,425 661,304 155,060 558,417 4,989,750 1640337 48,620 25,763 343,024 57,8(Y7 377,918 11,642 60,088 1.1,870 8,311 65,968 8,876 5,163 2,771
3 .3 $6,000 -der $7,000 . . . . . . . . . . . 4,777,251 508,828 1-36,445 514,759 4,000,928 112,993 36,413 17,983 272,137 55,134 367p757 8,137 42,106 9,699 8,150 58p302 11,909 4,069 2 934
14 $7,000 under $8,000 . . . . . . . . . . . 3,485,581 385,050 110,631 424,109 2,867,009 84,704 27,397 16,853 202,606 48,730 303,701 5,793 .34,568 7,830 5,936 46,212 9,714 3,558 1:673 >
15 $80000 under $9,000 . . . . . . . . . . . 2,457,Z75 280,141 89,665 3030087 2,0220647 68,135 22,938 11,205 135,949 36,163 214,409 5,Z71 Z7,979 6,202 7,039 31,240 7,524 2,224 2,3G4
16 $9,000 under $10,000 . . . . . . . . . . 10621,101 205,428 71,00`7 227,234 1,310,985 48,259 16,921 11,961 94,728 26,255 148,763 5,548 21,646 5,663 4pO69 26,650 8,023 2,900 1,62 8
17 $10,000 under $15,000 . . . . . . . . . 2,832,826 497,801 2 .34,818 515,103 2,155,189 1400685 59,032 24,774 188,221 80,070 306,055 16,072 62,858 20,135 14,122 550894 25,438 12,112 7 ' 837 z
18 $15,000 under $20,000 . . . . . . . . . 524,782 189,538 115,879 166,166 331,968 64,622 28,297 12,175 46,995 33,993 67,902 9,688 30,343 12,039 7,223 19,068 13,040 7,006 4 593 n
19 $20,000 under $25,000 . . . . . . . . . 200,730 96,228 69,380 80,546 111, 232 31,340 18,710 5,537 20,805 18,113 25,712 5,829 17,239 6,983 4,288 9,618 8,348 4,495 2 :614 C)
20 $25,000 -der $50,000 . . . . . . . . . 266,159 145,549 123,695 133,497 3.22,513 45,266 28,628 9,546 25,691 32,280 39,281 10,376 24,772 12,256 8,140 1-5,6Z7 16,338 9,388 6 1 28 9
21 $50,000 under $100,000 . . . . . . . . 72,019 35,944 45,764 42,109 25,725 8,183 9,678 2,991 6,266 12,103 10,839 3,01 .1 5,579 5,236 2,602 4,330 7,161 2,980 21993
22 $100,000 under $150,000 . . . . . . . 11,3Z7 4,639 7,221 7,024 3,655 650 1,392 734 806 1,878 1,821 284 601 805 550 751 1,315 446~ 551
23 $150,000 under $200,000 . . . . . . . 2,983 1,077 1,999 1,975 844 115 322 185 3-58 518 533 90 1Z7 218 120 181 445 102 184
24 $200,000 -der $500,000 . . . . . . . 3,132 1,214 2,214 2,149 82A 123 344 237 191 558 487 74 139 227 143 191 515 120 233
25 $500,000 under $1,000,000 . . . . . 498 205 337 363 102 is V 41 Z7 88 81 8 19 27 26 34 88 21 52
26 $1,000,000 or more . . . . . . . . . . . . 170 94 134 147 Z? 6 8 10 1 11 25 22 6 1-2 8 16 37 11 24
27 . . . . . . 9,384,413 3,026,662 342,324 1,321,466 8,102,130 1,743,132 164,317 545,268 785,294 66,421 292,059 =36,626 321,515 28,793 17,059 104,723 10,795 1.2,381 5,932Nontaxable returns~ total . 1
28 No adjusted gross income . . . . . . 105,669 - 354,998 51,945 94,504 6,359 219,358 21,198 19,540 63,466 6,395 9 086 7,991 42,033 3,916 4,346 110830 20125 3,912 2,062z
29 Under $600 . . . . . . . . . . . . . . . . . . . . 3,312,859 500,565 44,967 164,162 3,206,177 377, GOD 29,716 90,566 70,280 6,435 20,572 3,026 41,062 2,810 (1) 6,802 1,387
30 $600 under $1,000 . . . . . . . . . . . . . 10091,267 443,983 33,503 203,980 963,607 300,399 19,916 104,251 77,477 4,575 35,488 3,485 52,376 2,880 1,513 7,851 378
31 $1,000 under $1,500 . . . . . . . . . . . 1,160,607 522,242 46,850 267,454 956,733 309,327 24,146 1.30,865 3-24,563 8,808 49,723 4,791 61,772 4,314 1,765 17,754 1,765
32 $1,500 under $2, DOC) . . . . . . . . . . . 930,129 371,452 36,610 183,470 743,266 186,747 190494 72,384 118,549 5,265 46,692 4,910 45,223 3,009 (1) 3-3,181 756 0
33 $2,000 under $2,500 . . . . . . . . . . . 719,999 268,479 32,282 132,140 572,243 127,831 12,362 52,161 91,270 6,984 30,946 3,524 27,494 30893 2 171 14,298 6,%9 1,261 3,870 ~d
34 $2,500 under $3,000 . . . . . . . . . . . 634,945 205,IZ7 30,883 98,587 502,752 87,707 13,488 35,972 82,215 70910 29,581 4,035 19,062 2,522 1,541 10,063 504 ~C-D_
35 $3,000 under $3,500 . . . . . . . . . . . 520,969 150,080 22,045 66,236 416,097 60,083 9,797 18,459 64,662 6,457 22" 3' 610
1,549 39 8,321 504 C"
36 $3 500 -der $4,000 . . . . . . . . . . . 338,479 90,253 1-3,074 38,848 271,538 32,962 3,314 7,423 39,873 4,613 14:128 3,91 17,926 6:180 378W
14 25 2
37 $4,000 -der $4,500 . . . . . . . . . . . 223,777 44,739 9,805 23,974 183,424 16,913. 3,858 4,160 20,390 3,553 12,502 3 278 2,673 2,503 2 77
38 $4,500 -der $5,000 . . . . . . . . . . . 137,799 35,407 7,041 18,290 109,374 13,113 2,683 3,117 14,982 (1) 7,779 2 648 11 1,6 3,152 630
39 $5,000 or more . . . . . . . . . . . . . . . . 1 208,914 1 _ 39,337 1 3,319 29,821 170,560 1 11,6941 4_345 6,370 17,567 3,418 12,133 956 5,031 1,227 2,517 1,801 654 1
8,7 4 3 1-0,370210 720,2- 1 E144 3,222 3 56 7 216 161,76T35 16 337~45~2_1,lT i 4S9,869
is, is ii,66 99,33.6 6,1 6'_Z72 01' , '1 1 S
.40 Returns under $5,000 . . . . . . . . . . F3O,531,765 5,557,333 770 180 2,712,485 27, 473 2,71,311 351
__72019sl91" OZ 1,93,6 1 '
S,. '91, 142 266 4,26 230, 47,7219 ' 1 -740T
'7 9'1,7171 2,19 1:' 307 3 173 T426 6is'.1'l.2 '079 0 5 3 - 41
3 0.1 1 065 823 227 3 1 424,32 726 =' 6 B :'3 0 "41 Returns $5,000 =der $10,000-
0'
0 9,0.5 574,966 2,055,477 15
010 lo
, , 9 - 601 2 951,029 2,754,435 291,26136,13 F25,4 8
42 Returns $10,000 or more . . . . . . . . . 3, 73 3' 1 1 6 661
~ee text for "Description of Semple" and "Explanation of Classifications and Terms .11Sample variability is too large to warrant showing separately . However, the grand total includes data deleted for this reason .
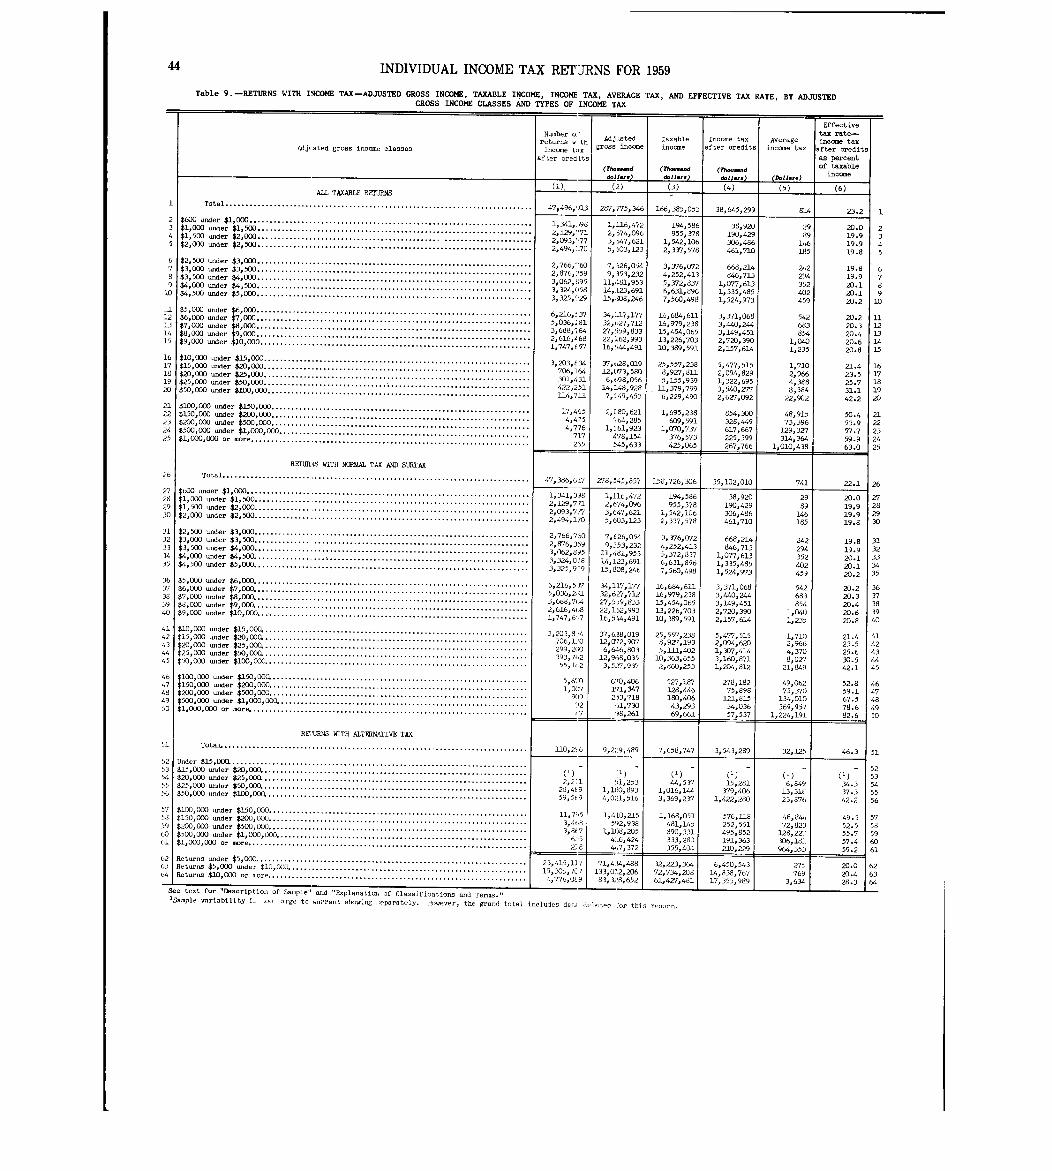
44 INDIVIDUAL INCOME TAX RET'JRNS FOR 1959
Table 9 .-RETURNS WITH 11COME TAX-ADJUSTED GROSS INCOME, TAXABLE INCOME, INCOME TAX, AVERAGE TAX, AND EFFECTIVE TAX RATE, BY ADJUSTEDGROSS INCOME CLASSES AND TYPES OF INCOME TAX
Effectiv eNumber o . '
rat-8 w thAdj asted e Income tax Average
tax rate -I.
ta xAdjusted gross income classes income t~tx gross income income after credits income tax after credit s
after credits as percent
(Tho-d (?'h--.d (7h- .-d of taxabl e
d.11&r.) d.11., .) *11 ) (D.11 ) incom e
ALL TAXABLE RETURNS(3) (4) (5) (6 )
1 Total . . . . . . . . . . . . . . . . . . . . . . . . . . . . . . . . . . . . . . . . . . . . . . . . . . . . . . . . . . . . . . . . . . . . . . . . . . . . . 47,496,')13 287,775,346 166,-.85,053 38,645,299 814 23 . 22 $600 under $1,000 . . . . . . . . . . . . . . . . . . . . . . . . . . . . . . . . . . . . . . . . . . . . . . . . . . . . . . . . . . . . . . . . . . . . .3 $1,000 under $,1,500 . . . . . . . . . . . . . . . . . . . .
1,341,,198 1,116,472 194,586 38,920 29 20 .0. . . . . . . . . . . .4 $1, 500 under $2,000 . . . . . . . . . . . . . . . . . . . . . . . .
2,129,"71 2,~74,096 955,378 190,429 89 19 . 9. . . . . . . . . . . . . .. : : . . . . . . . .5 $2,000 under $2,500 . . . . . . . . . . . . . . . . . . . . 2,093,"77 3,647,621 1,542,106 306,486 146 19 . 9. . . .. . . . . . . . . . . . . . . . .. . . . . . . . . . . . . . . . . . . . . 2,494, :-70 5,603,123 2,337,578 461,710 185 19 . 8
6 $2,500 under $3,000 . . . . . . . . . . . . . . . . . . . . . . . . . . . . . . . . . . . . . . . . . . . . . . . . . . . . . . . . . . . . . . . . . . . . .7 $3,000 under $3,500 . . . . . . . . . . . . . . . . . . .
2,766,"60 7,626,0j4 3,376,072 668,214 242 19 . 8. . . . . . . . . . . . . . . . . . . . . . . . . . . . . . . . . . . . . . . . . . . . . . . . . .8 $3,500 -der $4,000 . . . . . . . . . . . . . . . . . . . .
2,876, :~59 9,353,232 4,252,413 846,713 294 19 . 9. . . . . . . . . . . . . . . . . . . . . . . . . . . . . . . . . . . . . . . . . . . . . . . . .9 $4,000 under $4,500 . . . . . . . . . . . . . . . . . . . . . . 3,062,~ ;95 11,481,953 5,372,837 1,077,613 352 20 . 1. . . . . . . . . . . . . . . . . . . . . . . . . . . . . . . . . . . . . . . . . . . . . . .LO $4,500 -der $5,000 . . . . . . . . . . . . . . . . . . . . . 3,324,(,58 14,123,691 6,631,896 1,335,485 402 20 . 1. . . . . . . . . . . . . . . . . . . . . . . . . . . . . . . . . . . . . . . . . . . . . . . .
3,325,~29 15,308,246 '7,560,498 1,524,973 459 20.2 1Ll $5,000 under $6,000 . . . . . . . . . . . . . . . . . . . . . . . . . . . . . . . . . . . . . . . . . . . . . . . . . . . . . . . . . . . . . . . . . . . . .L2 $6,000 -der $7,000 . . . . . . . . . . . . . . . . . . . . . . .
6,216,'37 _34,117,177 16,684,611 3,371,068 542 20.2 1. . . . . . . . . . . . . . . . . . . . . . . . . . . . . . . . . . . . . . . . . . . . . .J $7,000 -der $8,000 . . . . . . . . . . . . . . . . . . . . . . .
5,036, ;81 32,627,712 16,9179,238 3,440,244 683 20.3 1 ,. . . . . . . . . . . . . . . . . . . . . . . . . . . . . . . . . . . . . . . . . . . . . .-4 $8,OW -der $9,000 . . . . . . . . . . . . . . . . . . . . . . .
3,688,-,64 Z7,559,83 3:
15,454,065 3,149,451 854 20 .4 L. . . . . . . . . . . . . . . . . . . . . . . . . . . . . . . . . . . . . . . . . . . . . ..5 $9jO()O under $10,000 . . . . . . . . . . . . . . . . . .
2,616,~68 62,99 322,-
13,226,703 2,720,3910 1,040 20 .6 1,. . . . . . . . . . . . . . . . . . . . . . . . . . . . . . . . . . . . . . . . . . . . . . . . . .1,747,657 16"44,491 10,389,591 2,157,614 1,235 20 .8 L
6 $10,000 under $15,000. . . . . . . . . . . . . . . . . . . . . . . . . . . . . . . . . . . . . . . . . . . . . . . . . . . . . . . . . . . . . . . . . . .7 $15,000 under W,000 . . . . . . . . . . . . . . . . . . 3,203,E34 37,628,019 25,557p236 5,477,515 1,710 21 .4 1. . . . . . . . . . . . . . . . . . . . . . . . . . . . . . . . . . . . . . . . . . . . . . . . .8 $20,000 under $25,000 . . . . . . . . . . . . . . . . . . 706,164 1.2,C)?3,580 3,927,811 2,094,829 2,966 23 .5 1. . . . . . . . . . . . . . . . . . . . . . . . . . . . . . . . . . . . . . . . . . . . . . . . .9 $25,000 under $50,000 . . . . . . . . . . . . . . . . . . . . . 301,431 6,698,056 5,155,939 1,322,695 4,368 25 .7 1. . . . . . . . . . . . . . . . . . . . . . . . . . . . . . . . . . . . . . . . . . . . . . .0 $50,000 under $100, 000 . . . . . . . . . . . . . . . . . . . . . . 422,251 14,148,928 1-1, 3r79,799 3,540,Z77 8,384 31 .1 1. . . . . . . . . . . . . . . . . . . . . . . . . . .
114,711 ?,,'49,453 6,229,490 2,627,092 22,902 42.2 201 $100,000 under $150,000 . . . . . . . . . . . . . . . . . . . . . . . . . . . . . . . . . . . . . . . . . . . . . . . . . . . . . . . . . . . . . . . . .
2 $150,000 under $200,000 . . . . . . . . . . . . . . . .17,455 2,080,621 1,695,238 854,300 48,915 50.4 2:. . . . . . . . . . . . . . . . . . . . . . . . . . . . . . . . . . . . . . . . . . . . . . . . .
3 $200,000 under $500,000 . . . . . . . . . . . . . . . . . . . . . . . 4,415 ?64,285 609,591 328,449 73,396 53 .9 2;. . . . . . . . . . . . . . . . . . . . . . . . . . . ..4 $500,000 under $1,000,000 . . . . . . . . . . . . . . . . . . . . . . 4,776 1,--61,923 1,(Y10,737 617,667 129,3Z7 57 .7 Z. . . . . . . . . . . . . . . . . . . . . . . . . . . . . . . . .
5 $1,000,000 or more 717 478,154 376,573 225,399 314,364 59 .9 212~5 .545,633 425,065 267,766 1,010,438 63 .0 2 '
REMIS WITH NQR)AAL TAX AND SLRTAX
6 Total. . . . . . . . . . . . . . . . . . . . . . . . . . . . . . . . . . . . . . . . . . . . . . . . . . . . . . . . . . . . . . . . . . ..
. . .. . . . . . 47,386,6L7 278,545,857 1 .58,726,306 35,102,010 741 22.1 2 ~
17 $600 -der $1,000. . . . . . . . . . . . . . . . . . . . . . . . . . . . . . . . . . . . . . . . . . . . . . . . . . . . . . . . .8 $1,000 under $1,500. . . . . . . . . . . . . . . . . . .
1 ,
341,3)8 1,116,472 194,586 38,920 29 20 .0 2r,. . . . . . . . . . . . . . . . . . . . . . . . . . . . . . . . . . . . .9 $1,500 under $2,000. . . . . . . . . . . . . . . . . . . . 21129 :7 11 2 (574,096 955,378 190,429 89 19,9 2 E. . . . . . . . . . . . . . . . . . . . . . . . . . . . . . . . . .0 $2,000 under $2,500. . . . . . . . . . . . . .
,2 , 093 7 7 3 647,621 1,542,106 306,486 146 19 .9 2~. . . . . . . . . . . . . . . . . . . . . . . . . . . . . . . . . . . . . . . . . . . . . . . .
.2
,494
,170 5,603,123 2,337,578 461,710 185 19.8 3C
1 $2,500 under $3,000. . . . . . . . . . . . . . . . . . . . . . . . . . . . . . . . . . . . . . . . . . . . . . . . . . . . . . . . . . . . . . . . . . . . .2 $3,000 under $3,500. . . . . . . . . . . . . . . . . 2,766,750 7,E26,054 3,376,072 668,214 242 19 8 31. . . . . . . . . . . . . . . . . . . . . . . . . . . . . . . . . . . . . . . . . . . . . . . . . . .
3 $3,500 under $4,000. . . . . . . . . . . . . . . . . . . .2,876,359 9,353,232 4,252,413 846,713 294
.
19 9 3;. . . . . . . . . . . . . . . . . . . . . . . . . . . . . . . . . . . . . . . . . . . . . . . . .4 $4,000 under $4,500 . . . . . . . . . . . . . . . . . . .. . . .
3,062,8)5 11,481,953 5,372,837 1,077,613 352.
2o 1 3-'. . . . . . . . . . . . . . . . . . . . . . . . . . . . . . . . . . . . . . . . . . . . . . .5 $4,500 under $5,000 . . . . . . . . . . . . . . . . .
3,324,058 14,123,691 6, 631, 896 1,335,485 402.1 3420. . . . . . . . . . . . . . . . . . . . . . . . . . . . . . . . . . . . . . . . . . . . . . . . . . . .
3,325,9~9 15,808,246 7,560,498 1,524,973 45).
20-2 3 56 $5,000 under $6,000 . . . . . . . . . . . . . . . . . . . . .. . . . . . . . . . . . . . . . . . . . . . . . . . . . . . . . . . . . . . . . . . . . . . . .7 $6,000 under $7,000 . . . . . . . . . . . . . . . . 6,216,5~7 34,117,177 16,684,611 3,371,068 542 20 .2 3E. . . . . . . . . . . . . . . . . . . . . . . . .8 $7,000 under $8,000 . . . . . . . . . . . 5,036,Z~l 32,627,712 16,979,238 3,440,244 683 20 .3 3",. . . . . . . . . . . . . . . . . . . . . . . . . . . . . . . . . . . . . . . . . . . . . . . . . . . . . . . . .
9 $8,000 under $9,000 . . . . . . . . . . . . . . . . . . . . . . 3,688,7,,4 27,559,833 15,454,065 3ol49,451 854 20 .4 3E. . . . . . . . . . . . . . . . . . . . . . . . . . . . . . . . . . . . . . . . . . . . .0 $9,000 -der $10,000 . . . . . . . . . . . . . . . . 2,616,41,8 22,1,52,993 1-3,226,703 2,720,390 1,040 20.6 39. . . . . . . . . . . . . . . . . . . . . . . . . . . . . . . . . . . . . . . . . . . . . . . . . . .
1,747,6',7 16,544,491 10,389,591 2,157,614 1,235 20 .8 4C
1 $10,000 -der $15,000 . . . . . . . . . . . . . . . . . . . . . . . . . . . . . . . . . . . . . . . . . . . . . . . . . . . . . . . . . . . . . . . . . .2 $15,000 -der $20,OOC . . . . . . . . . . . . . . . . . . . . . .
3,203,8_4 37,628,019 25 1 557,238 5,477,51.5 1,710 21.4 41. . . . . . . . . . . . . . . . . . . . . . . . . . . . . . . . . . . . . . . . . . . .3 $20,000 ..der $25,OM . . . . . . . . . . . . . . . . . . . . . . .
706,1 C 12,072,907 8P927p193 2,094,620 2,966 23 .5 42. . . . . . . . . . . . . . . . . . . . . . . . . . . . . . . . . . . . . . . . . . .$25,000 -der $50,000 . . . . . . . . . . . . . . . . . . . . . . . . . . .
299,200 6,646,803 5,111,402 1,307,414 4,370 25 .6 4 3. . . . . . . . . . . . . . . . . . . . . . . . . . . . . . . . . . . . . . .5 $50,000 -der ",000 . . . . . . . . . . . . . . . . . . . . . . .
393,762 12,968,035 10,363,655 3,160,871 8,02-7 30 .5 4 4. . . . . . . . . . . . . . . . . . . . . . . . . . . . . . . . . . . . . . . .55,1,2 3,5~~7,937 2,860,253 1,204,812 21,849 42.1 4 5
6 $100,000 under $150,000 . . . . . . . . . . . . . . . . . . . . . . . . . . . . . . . . . . . . . . . . . . . . . . . . . . . . . . . . . . . . . . . .7 $150,000 under $200,000 . . . . . . . . . . . . . . . .
5,6-,0 6"0,406 527,187 49,062 52 .8 4 6. . . . . . . . . . . . . . . . . . . . . . . . . . . . . . . . . . . . . . . . . . . . . . . .8 $200,000 under $500,000. . . . . . . . . . . . . . . . . . . . .
1,0(17 171, 347 128,446 75,898 75,370 59 .1 4 7. . . . . . . . . . . . . . . . . . . . . . . . . . . . . . . . . . . . . . . . . . .9 $500,000 under $1,000,000. . . . . . . . . . . . . . . . .
909 2.53,718 180,406 121,815 134,010 67 .5 4 8. . . . . . . . . . . . . . . . . . . . . . . . . . . . . . . . . . . . . . . . . . . . . .0 $1,000,000 or more. . . . . . . . . . . . . . . . . .
112 61,?30 43,293 34,036 369,957 78 .6 4 9. . . . . . . . . . . . . . . . . . . . . . . . . . . . . . . . . . . . . . . . . . . . . . . . . . . .7 98,261 69,661 57,537 1,224,191 82.6 50
RE]'URNS WITH ALTERNATIVE TAX
71 Total. . . . . . . . . . . . . . . . . . . . . . . . . . . . . . . . . . . . . . . . . . . . . . . . . . . . . . . . . . . . . . . . . . . . . . . . . . . . . 110,2~6 9,229,489 7,658,747 r3,543, 289 32,125 46 .3 5 12 Under $15,000 . . . . . . . . . . . . . . . . . . . . . . . . . . . . . . . . . . . . . . . . .. . . . . . . . . . . . . . . . . . . .3 $15,000 under $20,000 . . . . . . . . . . . . . . . . . . . . . . . . . . . . . . . . . . . . . . . . . . . . . . . . . . . . . *, :**"* . . . . .. . . . . . . . . . . .
-
(1)
-1 )1
-(1)
(1)
-
(1) -(1)5 2
(1) 53-4 $20,000 under $25,000 . . . . . . . . . . . . . . . . . . . . . . . . . . . . . . . . . . . . . . . . . . . . . . . . . . . . . . . . . . . . . . . . . .5 $25,000 -der $50,000 . . . . . . . . . 2,2_1 '~1,253 44,537 1-5,281 6,849 34 .3 5 4. . . . . . . . . . . . . . . . . . . . . . . . . . . . . . . . . . . . . . . . . . . . . . . . . . . . . . . . .6 $50,000 -der $100,000 . . . . . . . . . . . . . . .
28,4~9 1, 1~! 0: 893 1,016,144 379,406 13, 318 37 .3 5 5. . . . . . . . . . . . . . . . . . . . . . . . . . . . . . . . .. . . . . . . . . . . . . . 59,5C9 4,021 516 3,369,237 1,422,280 23,376 42 .2 5 6
7 $100,000 =der $150,000. . . . . . . . . . . . . . . . . . . . . . . . . . . . . . . . . . . . . . . . . . . . . . . . . . . . . . . . . . . . . . . . .8 $150,000 under $200,000 . . . . . . . . . . . . . . . . . . . . . .
11,T,5 1,410,215 1,168,051 576,118 48,844 49 .3 5 7. . . . . . . . . . . . . . . . . . . . . . . . . . . . . . . . . . . . . . . . . .9 $200,000 under $500,000 . . . . . . . . . . . . . . . . . . . . . 3,4(8 592,938 481,145 252p551 72,823 52.5 5 8. . . . . . . . . . . . . . . . . . . . . . . . . . . . . . . . . . . . . . . . . . . .
$500,ODO under $1,000,000. . . . . . . . . . . . . . . . . . . . . . 3,8( 7'
1,108,205 890,331 495,852 128,2Z' 55 .7 5 9. . . . . . . . . . . . . . . . . . . . . . . . . . . . . . . . . . . . . . . . .1 $1,000,000 or more. . . . . . . . . . . . . . . . . . . . . . 6, 5 416,424 333,280 191,363 306,181 57 .4 60. . . . . . . . . . . . . . . . . . . . . . . . . . . . . . . . . . . . . .
. . . . . . . . . . 2J 4,17,372 355,404 210,229 964,353 59.2 612 Ret-s under $5,00o. . . . . . . . . . . . . . . . . . . . . . . . . . . . . . . . . . . . . . . . . . . . . . . . . . . . . . . . . . . . . . . . . . .3 Returns $5,000 -der $10,000 . . . . . . . . . . . . . . 23,415,
' 7 4 8"32
22"3646 45 54 3
''-
-27 1
'520 .0 62. . . . . . . . . . . . . . . . . . . . . . . . . . . . . . . . . . . . . . .
4 Returns $10,COO or mo~ . . . . . . . . . . . . .19,305, 711 :1133 1~.2 : .6 2 :71,201
::70714 838,7 7 6
2() .4 63. . . . . . . . . . . . . . . . . . . . . . . . . . . . . . . . . . . . . . . . . . . . . . . . . . . . .
See text for "Desc i ti f
4,776,0~9 83,328,652 61,4Z7,481
9,~q
17,35 3, 4
7
28 .3 64
22222
2
223
333
3
33334
4
4
4
44
4
4144
5
60
6
r p On 0 Sample and Explanation Of Cl-a-ifications and Terms
I
2345
'S . .pl, variability is too large to warrant showing eparntely . However, the grand total includes datf deleted 'or this reason .
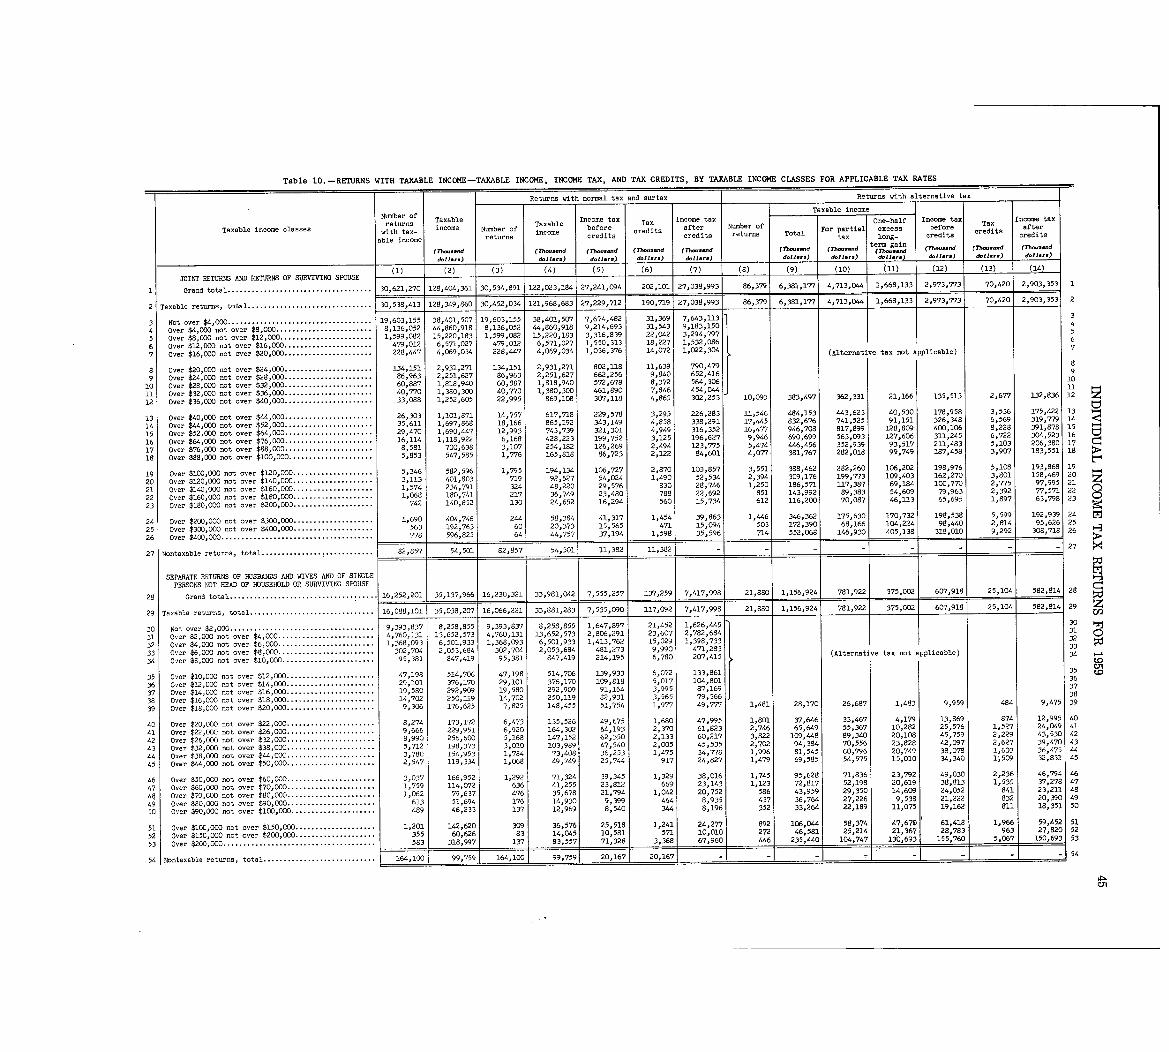
Table 10 . -RETURNS WITH TAXABLE INCOME-TAXABLE INCOME, INCOME TAX, AND TAX CREDITS, BY TAXABLE INCOME CLASSES FOR APPLICABLE TAX RATE S
Returns with normal tax and surtax Returns with alternative tax
Number of Taxable income -returns Taxable Taxable Tncome tax Tax Income.tax al one- half Income tax Tax Income tax
Taxable income classes ith tax- income N=ber of income before credits afte Nwber of For parti excess before credits aft rable income return,s credits credits returns Total tax long- credits credits
(Th-...d (Th--.d (Th- .d (Th- --d(Th-. ..d (T'h-...d (rt-d (Thou-d (7h-. ..d (rh ..d (Th-.-d term gain
d0l.-) d.11 . .. &1la-) d.11 . .. d.1 1-0 d.11.. . d.11. . . doll.'
.) 6.11 : d.11 ...
JOINT RETURNS AND RETURNS OF SURVIVING SPOUSE (1)(2) (3) (4) (5) (6) (7) (8) (9) (10) (11) (12) (13) 14 )
1 Grand total . . . . . . . . . . . . . . . . . . . . . . . . . . . . . . . . . . . . 30,621,270 128,404,361 30,534,891 122,023,184 27,241,094 202,101 27,038,9931 86,379 6,381,177 4,713,044 1,668,133 2,973,773 70,420 2,903,353 11 .
8 '
404036
1
2 Taxable returnst total . . . . . . . . . . . . . . . . . . . . . . . . . . . . . . . 30,538,413 12 8,349,860 30,452,034 121,968,683 27,229,712 190,719 27,038,9931 86,379 6,381,177 4,713,044 1,668,133 2,973,773 70,420 2,903,353 2
674
,
4H
23 Not over $4,000 . . . . . . . . . . . . . . . . . . . . . . . . . . . . . . . . . . . . 19,603,155 38,401,507 19,603,155 38,401,507 7,674,482 31,369 7,643,113 3S4 over $4,000 not over $8,000 . . . . . . . . . . . . . . . . . . . . . . . . 8,136,052 r44,860,918 8,136,052 ",860,918 9,214,693 31,543 9,183,150 42 14
69
3
5 Over $8,000 not over $12,000 . . . . . . . . . . . . . . . . . . . . . . . 1,599 082 15,220,183 1,599,082 15,220,183 3,316,839 22,042 3,294,797 5
6 Over $12,000 not over $16,000 . . . . . . . . . . . . . . . . . . . . . . 479 :012 6,571,027 479,012 6,571,027 1,550,313 18,227 1,532,086 6
7 Over $16,000 not over $20,000 . . . . . . . . . . . . . . . . . . . . . . 228,447 4,069,034 228,447 4,069,034 1,036,376 14,072 1,022,304 (Alternative tax not applicable)7
8 Over $20,000 not over $24,000 . . . . . . . . . . . . . . . . . . . . . . 134,151 2,931,271 134,151 2,9310271 802,118 11 1 639 790 479 8
9 Over $24,000 not over $28,000 . . . . . . . . . . . . . . . . . . . . . . 86,963 2,251,627 86,963 2,251,627 662,256 91840 652:416 9
10 Over $28,000 not over $32,000 . . . . . . . . . . . . . . . . . . . . .. 60,887 1,818,940 60,887 1,818,940 572,678 8,372 564,306 10
11 Over $32,000 not over $36,000 . . . . . . . . . . . . . . . . . . . . . . 40,770 1,380,300 40,770 1,380,300 461,890 7,846 454,044j 11 0-4
12 Over $36,000 not over $40,000 . . . . . . . . . . . . . . . . . . . . . . 33,088 1,252,605 22,995 869,108 307,118 4,865 302,253 10,093 383,497 362,331 21,166 135,513 2,677 132,83612 z
tj
13 Over $40,000 not over $44,000 . . . . . . 26,303 1,101,871 14,757 6170718 2290578 3,295 226,283 11,546 484,153 4430623 40,530 178,958 30536 175,422 13
14 Over $44,000 not over $52,000 . . . . .. 35,611 1,697,868 18,166 865,192 343,149 4,858 338,291 17,"5 832,676 741,525 91,151 326,348 6,569 319,77914
15 Over $52,000 not over $64,000 . . . . . . . . . . . . . . . . . . . . . . 29,470 1,690,447 12,993 743,739 3210301 4,949 316,352 160477 946,708 817,899 128,809 400,106 8,228 391,978 15 P-4
16 Over $64,000 not over $76, 000 . . . . . . . . . . . . . . . . . . . . . . 16,114 1,118,922 6,168 428,223 199,752 3,125 196t627 9,946 690,699 563,093 127,606 311,245 6,?22 304,523 16 C1
17 Over $76,000 not over $88,000 . . . . . . . . . . . . . . . . . . . . . . 8,581 700,638 30107 254,182 126,269 2,494 123,775 5,474 4460456 352,939 93,517 211,483 5,103 2G6,380 17 cl
18 Over $88,000 not over $100,000 . . . . . . . . . . . . . . . . . . . . . 5,853 547,585 1,776 165,818 86,723 2,122 84,601 4,077 381,767 282,018 99,749 187,458 3,907 183,551 1 8
19 Over $100,000 not over $120,000. . . . . 5,346 582,596 1,795 194,134 106,727 2,870 103,857 3,551 388,462 282,260 106,202 198,976 5,108 193,868 19
20 Over $120,000 not over $140,000 . . . .. 3,113 401,803 719 92,627 54,024 1,490 52,534 2,394 309,176 199,773 109,403 162,270 3,801 158,469 20
21 Over $140,000 not over $160,000 . . . . . . . . . . . . . . . . . . . . 1,574 234,791 324 48,220 29,576 830 28,746 1,250 186,571 117,387 69,184 100,770 2,775 97,995 21
22 Over $160, GOO not over $180,000 . . . . . . . . . . . . . . . . . . . . 1,068 180,741 217 36,749 23,480 788 22,692 851 143,992 89,383 54,609 79,963 2,392 77,571 22
23 Over $180,000 not over $200,=) . . . . . . . . . . . . . . . . . . . . 742 140,852 130 24,652 16,294 560 15,734 612 116,200 70,087 46,113 65,695 1,897 63,798 23
24 Over $200,000 not over $300,000 . . . . . . . . . . . . . . . . . . . . 1,690 404,746 244 58,384 41,317 1,454 39,863 1,446 346,362 175,630 170,732 198,538 5,599 192,939 249
25 Over $300,000 not over $400,000 . . . . . . . . . . . . . . . . . . . . 563 192,763 60 20,373 15,565 471 15 503 172,390 68,166, 1 224 98,440 2,814 95,626 25
26 Over $400,000 . . . . . . . . . . . . . . . . . . . . . . . . . . . . . . . . . . . . . . 778 596,825 64 44,757 37,194 1,598 35 :59 714 552,068 1.46,930 405,138 318,010 9,292 308,7181 26
27 Nontaxable returns, total . . . . . . . . . . . . . . . ! . . . . . . . . . . . . 82,857 54,501 82,857 54,501 11,382 11,382 27
51 37'
19
4
0 11 ' 3S
2
SEPARATE RETURNS OF HUSBANDS AND WIVES AND OF SINGLE
1 7 55:5 257 07 ~25,104PERSONS NOT HEAD OF HOUSEHOLD OR SURVIVING, SPOUSE
0728 Grand total . . . . . . . . . . . . . . . . . . . . . . . . . . . . . . . ! . . . . . 16,252,201 35,137,966 16,230,321 330981,042 7,555,257 137,259 7,417,998 21,880 1,156,924 781,922 375,002 607,918 25,104 582,814 282
91"!6 7:91129 Taxable returns, total . . . . . . . . . . . . . . . . . . . . . . . . . . . . . . . 16,088,101 35,038,207 16,066,221 33,881,283 7,535,090 117,092 7,417,998 21,880 1,156,924 781,922 375,002 607,918 25,104 582,814 29 z
30 Not over $2,OOG . . . . . . . . . . . . . . . . . . . . . . . . . . . . . . . . . . . . 9,393,837 8,258,855 9,393,837 8,258,855 1,647,897 21,452 1,626,445 30 1%j
31 Over $2,000 not over $4,000 . . . . . . . . . . . . . . . . . . . . . . . . 4,760,131 13,652,573 4,760,131 13,652,573 2,806,291 23,607 2,782,684 3 1
32 Over $4,000 not over $6,000 . . . . . . . . . . . . . . . . . . . . . . . . 1,368,093 6,501,933 1,368,093 6,501,933 1,413,762 15,029 1,398,733 32
33 Over $6,000 not over $8,000 . . . . . . . . . . . . . . . . . . . . . . . . 302,704 2,053,664 302,704 2,053,684 481,273 9,990 471,283 33
34 Over $8,000 not over $10,000 . . . . . . . . . . . . . . . . . . . . . . . 95,381 847,419 95,381 847,419 214,195 6,780 207,415 (Alternative tax not applicable) 34
35 Over $10) COO not over $12,000 . . . . . . . . . . . . . . . . . . . . . . 47,198 514,706 47,198 514,706 139,933 6,072 133,861 35
36 Over $12,000 not over $14,000 . . . . . . . . . . . . . . . . . . . . . . 29,101 376,170 29,101 376,170 109,818 5,017 104,801 36
37 Over $14, GOO not over $16,000 . . . . . . . . . . . . . . . . . . . . . . 19,580 292,909 19,580 292,909 91,164 3,995 87,169 37
38 Over $16,000 no t over $18,000 . . . . . . . . . . . . . . . . . . . . . . 14 702 250,119 14,702 250,119 82,931 3,565 79,366 38
39 over $18,000 not over $20,000 . . . . . . . . . . . . . . . . . . . . . . 9:306 176,625 7,825 148,455 51,754 1,977 49,777 1,481 28,170 26,687 1,483 9,959 484 9,475 39
40 Over $20,000 -not over $22,000 . . . . . . . . . . . . . . . . . . . . . . 8 274 173,172 6,473 135,526 49,675 1,680 47,995 1,801 37,646 33,467 4,179 13,869 874 12,995 40
41 Over $22,00C not over $261000 . . . . . . . . . . . . . . . . . . . . . . 9:666 229,951 6,920 164,302 64,193 2,370 61,823 2,746 65,649 55,367 10,282 25,576 1,527 24,049 41
42 Over $26,000 not over $32,000 . . . . . . . . . . . . . . . . . . . . . . 8 990 256,600 5,168 147,152 62,350 2,133 60,217 3,822 109,448 89,340 20,108 45,759 2,229 43,530 42
43 Over $32,000 not war $38,000 . . . . . . .. 5:712 198,373 3,010 103,989 47,540 2,005 45,535 2,702 94,384 70,556 23,828 42,097 2,627 39,470 43
44 Ojer $38,000 not over $44,000 . . . . . . . . 3,780 154,953 1,784 73,408 36,253 1,475 34,778 1,996 81,545 60,796 20,749 38,078 1,603 36,475 44
45 Over $44,000 not over $50)000 . . . . . . . .. . . . . .
2,547 119,334 1,068 49,749 25,74.4 917 24,827 1,479 69,585 54,575 15,010 34,340 1~509 32,831 45
46 Over $50,C)CO not over $60,000 . . . . . . . . . . . . . . . . . . . . . . 3,037 166,952 1,292 71,324 39,345 1,329 38,016 1,745 95,628 71,836 23,792 49,030 2,236 46,794 46
47 Over $60,GCO not over $70,000 . . . . . . . . . . . . . . . . . . . . . . 1,759 114,072 636 41,255 23,812 669 23,143 1,123 72,817 52,198 20,619 38,813 1,535 37,278 47
4~ Over $70,000 not over $80,000 . . . . . . . . . . . . . . . . . . . . . . 1,062 79,637 476 35,678 21,794 1,042 20,752 586 43,959 29,350 14,609 24,052 841 23,211 48
49 Over $90,000 not over $90,000 . . . . .. 613 51,694 176 14,930 9t399 464 8,935 437 36,764 27,226 9,538 21,222 832 20,390 49
50 Over $90,000 not over $100,000 . . . . . 489 46,233 137 12,969 8,540 3" 8,196 352 33,264 22,189 11,075 19,162 811 18,351 50
51 Over $100,000 not over $150,000 . . . . . . . . . . . . . . . . . . . . 1,201 142,620 309 36,576 25,518 1,241 24,277 892 106, 0" 58,374 47,670 61,418 1,966 59,452 51
52 Over $150,DOO nct over $200,000 . . . . . . . . . . . . . . . . . . . . 355 60,626 83 14,045 10 581 571 10,010 272 46,581 25,214 21,367 28,783 963 27,820 52
53 Over $200,000 . . . . . . . . . . . . . . . . . . . . . . . . . . . . . . . . . . . . . . 583 318,997 137 83,557 71 :328 3,3681 67,9601 4"1
235,4401 104,7471 1~0,6931 155,760 5,067 53
54 Nontaxable returns, Total . . . . . . . . . . . . . . . . . . . . . . . . . . . . 164,100 99,759 i 164,100 99,7591 20,1617 1 20,1671 -1 - 77!n 54
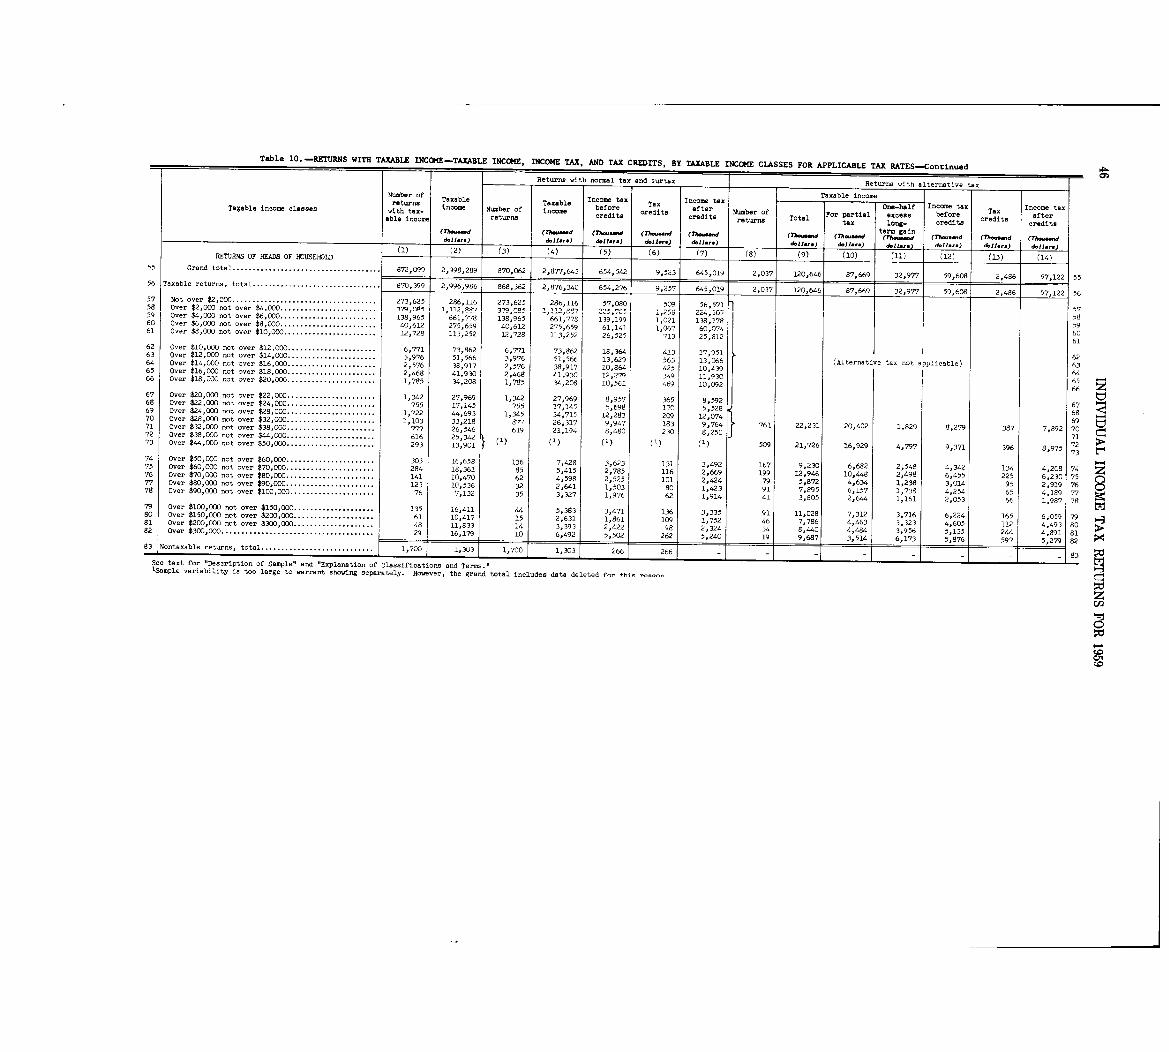
Table 10 . -RETURNS WITH TAXABLE INcOME-TAXAZLE INCOME, INCOME TAX, AND TAX CREDITS, BY TAXABLE INCOME CLASSES FOR APPLICABLE TAX RATES-Continued
Returns with normal tax and surtax Returns with alternative tax
Number of Taxable incoreturns Taxable Taxable Income tax Income ta x
Ta*able income classes with tax- income Number of income before Tdxt . after Number of0,half Incom tax Tax Income tax
returns credits ere i For partial excess before credits afterable income redits returns Total tax long- credits credits
term gai n(71~--d (Th--d (7hwaand (7h.-d (?h--d (Th-d (lh--.d (rh-d (rhm-d (Tho-d (771-dd.11. .. d.11. .. doll-) d.11 ., .) doll-) d.11 .. d0l .r.) d.11. .. d.11 .1.) &II-) d.11-)(1) 12) (3) __F4 _) _(5) _(6) _(7) (8) (9) (10) (11)RETURNS OF HEADS OFHOUSEHOLD - --- ~12) (13) (14 )
55 Grand total . . . . . . . . . . . . . . . . . . . . . . . . . . . . . . . . . . . . . 872,099 2,998,289 870,062 2,877,643 654,542 9,523 645,019 2,037 120,646 37,669 32,977 59 608 2,486 57,122 5556 Taxable returns , total . . . . . . . . . . . . . . . . . . . . . . . . . . . . . . . . 8-0,399 2,996,986 868,362 2,876,340 654,276 9,257 645,019 17T 11 .,,1 87,669 2,486 57,122 5657 Not over $2,COC. . . . . . . . . . . . . . . . . . . . . . . . . . . . . . . . . . . . 273,625 286,116 273,625 286,116 57,080 509 56,571 5758 Over $2,000 not over $4,000 . . . . . . . . . . . . . . . . . . . . . . . . 379,nR5 1,112,9 7 3- 081 . . . .. . 8. 11. -1. - I I258 224,507 5859 Over $4,000 not over $6,000 . . . . . . . . . . . . . . . . . . . . . . . . 138,965 661,778 138 965 661 778 1,021 138,178 560 Over $6,000 net over $8,000 . . . . . . . . . . . . . . . . . . . . . . . . 40,612 275,659 40 :612 275 :659 61,141 1,067 60,074 69061 Over $8,000 not over $10,000 . . . . . . . . . . . . . . . . . . . . . . . 12,728 113,252 12,728 113,252 26,525 713 25,812 61
62 Over $10,000 over $12,000 . . . . . . . . . . . . . . . . . . . . . . 6,771 73,962 6,771 73,862 18,364 413 17,951 6263 Over $12,000 not over $14,000 . . . . . . . . . . . . . . . . . . . . . . 3,976 51,566 3,976 51,566 13,629 563 13,066 (Alternative tax no )plicable) 6364 Over $14,COO not over $16,000 . . . . . . . . . . . . . . . . . . . . . . 2,576 38,917 2,576 38,917 10,864 425 10,439665 Over $16,000 not over $18,000 . . . . . . . . . . . . . . . . . . . . . . 2,468 41,930 2,468 41,930 12,27q 349 11,93o 64566 Over $18,000 not over $20,000 . . . . . . . . . . . . . . . . . . . . . . 1,?85 34,208 1,785 34,208 10,561 469 10,092
6667 Over $20,000 not over $22,000 . . . . . . . . . . . . . . . . . . . . . . 1,342 27,969 1,342 27,969 8,957 365 8,592 6768 Over $22,000 not over $24,000 . . . . . . . . . . . . . . . . . . . . . . 755 17,145 755 17,145 5,698 170 5,528 686 Over $24,000 not over $28,000 . . . . . . . . . . . . . . . . . . . . . . 1,722 44,693 1,345 34,715 12,283 209 12,074970 Over $28,000 not over $32,000 . . . . . . . . . . . . . . . . . . . . . . 1,103 33,218 877 26,317 9,947 183 9,764 761 22,231 20,402 1,829 8,279 387 7 892 7071 Over $32,000 not over $38,OrO . . . . . . . . . . . . . . . . . . . . . . 777 26,546 619 21,194 8,480 230 8,250 7172 Over $38,000 not over $44,000 . . . . . . . . . . . . . . . . . . . . . . 616 25,342 173 Over $44,000 not over $50,000 . . . . . . . . . . . . . . . . . . . . .. 293 13,901 (1) (1) (1) (1) (1) 509 21,726 16,929 4,797 9,371 396 8,975 72
7374 Over $50,000 not over $60,000 . . . . . . . . . . . . . . . . . . . . . . 303 16,658 136 7,428 3,623 131 3,492 167 9,230 6,682 2,548 4,342 134 4 2CS 7475 Over $60,000 not over $70,000 . . . . . . . . . . . . . . . . . . . . . . 284 18,361 85 5,415 2,785 116 2,669 1919 12,946 10'"s 2,498 6,455 225 6:230 7576 Over $701000 not over $80,000 . . . . . . . . . . . . . . . . . . . . . . 141 10,470 62 4,598 2,525 101 2,424 79 5,872 4,634 1,236 3,014 95 2 : 919 7677 Over $80,000 not over $90,000 . . . . . . . . . . . . . . . . . . . . . . 123 10,536 32 2,641 1,503 80 1,423 91 7,895 6,157 1,738 4,254 65 4 169 77 C)78 over $90,000 not over $100,000 . . . . . . . . . . . . . . . . . . . . . 76 7,132 35 3,327 1,976 62 1,914 41 3,805 2,644 1,161 2,053 66 1,987 7 879 Over $100,000 not over $150,000 . . . . . . . . . . . . . . . . . . . . 135 16,411 44 5,383 3,471 136 3,335 91 11,028 7,312 3,716 6,224 165 6;059 79so Over $150,000 not over $200,000 . . . . . . . . . . . . . . . . . . . . 61 10,417 15 2,631 1,861 109 1,752 46 7,786 4,463 3,323 4,605 112 4 493 8081 Over $200 OGO not ever $300,000 . . . . . . . . . . . . . . . . . . . . 48 11,833 14 3,393 2,422 98 2,324 34 8,440 4,484 3,956 5,135 244 4:891 8182 Over $300 :ODO . . . . . . . . . . . . . . . . . . . . . . . . . . . . . . . . . . . . .. 16, 262 5,240 19 1 ~1 . 87b 597
6;~w 5',- o - 9,687 >48 ~Nontaxable returns , total . . . . . . . . . . . . . . . .
. .
. . . . . . . . . . I , 7 WO 1,303 1,700 1,303 ~11
See text for "Description of Sample" and "Explanation of Classifications and Terms .-1Sample variability is too large to warrant showing separately . However, the grand total includes data deleted for thi .~
0
to01
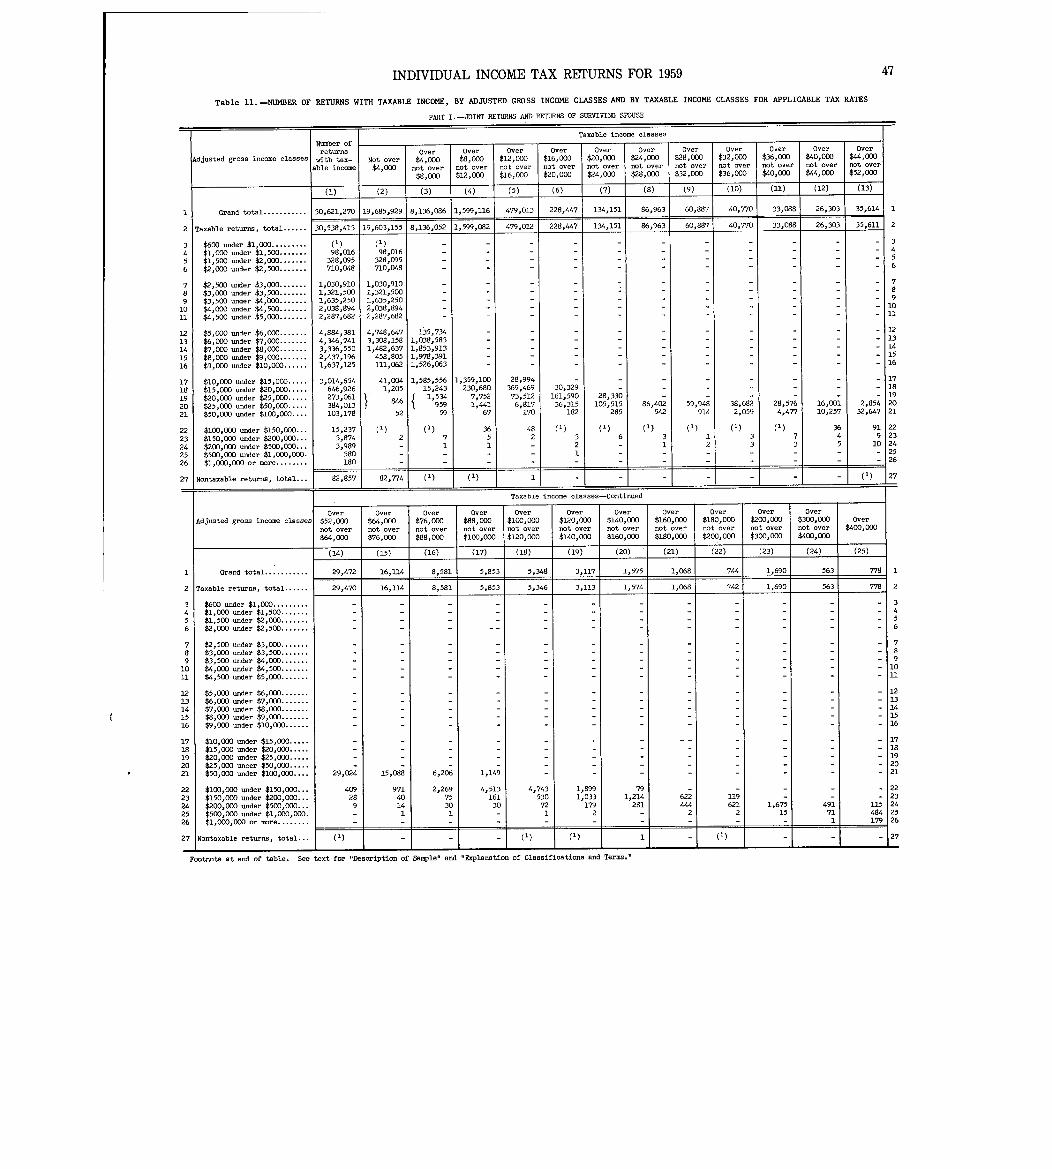
INDIVIDUAL INCOME TAX RETURNS FOR 1959
Table II .-NUMBER OF RETURNS WITH TAXABLE INCOME, .BY ADJUSTED GROSS INCOME CLASSES AND BY TAXABLE INCOME CLASSES FOR APPLICABLE TAX RATES
PART I .-JOINT RETURNS AND RETURNS OF SURVIVING SPOUSE
47
Taxable income classes
Number ofreturns Over Over ver0 Over Over over Over Over Over Over Over
Adjusted gross income classes th tax- Not over$4,
000 $8,000 $12,000 $16,000 $20,000 $24,000 $28,000 $32,000 $36,000 $40,000 $44,000
able income
$41
000
not over$8,000
not over$12,000
not over$16,000
not over
$20,000
not over$24,000
not over$28,000
not over
$32,000
not ove r
$36,000
not ove r
$40,000
net over
$44,000
net over$52,000
(2) (3) (4) (5) (6) (7) (8) (9) (10) (11) (12) (13 )
1 Grand total . . . . . . . . . . . 30,621,270 19,685,929 8,136,086 1,599,116 479,013 228,447 134,151 86,963 60,887 40,770 33,088 26,303 35,614 1
2 Taxable returns , total . . . . . . 30~538,413 19,603,155 8,136,052 1~599,082 479,012 228,447 134,151 86,963 60,887 40,770 33,088 26,303 35,611 . 2
3 $600 under $1,000 . . . . . . . . . (1)(1) - - - - - - - - - -
---
34
4 $1,000 under $1,500. . . . . . . 98,016 98,016- - 5
5 $1,500 under $2,000 . . . . . . . 328,095 328,095-
6 $2,000 under $2,500 . . . . . . . 710,W 710,048 - - - - - - - - 6
7 $2,500 under $3,000. . . . . . . 1,030,910 1,030,910 - - - - - - - - - 7
8 $3,000 under $3,500 . . . . . . . 1,321,500 1,321,500 - - - - - - - - - 8
9 $3,500 -der $4,000. . . . . . . 1,635,250 1,635,250 - - - - - - - - - 9
LO $4,000 -der $4,500 . . . . . . . 2,038,894 2,038,894 - - - - - - - - - 10
Ll $4,500 under $5,000. . . . . . . 2,287,682 2,287,682 - - - - - - - - - - 1 1
L2 $5,000 under $6,000. . . . . . . 4,884,381 4,748,647 135,734 - - - - - - - - - - 12
L3 $6,000 -der $7,000. . . . . . . 4,346,741 3,308,158 1,038,583 - - - - - - - - - - 1 3
L4 $7,000 under $8,000. . . . . . . 3,336,550 1,482,637 1,853,913 - - - - - - - - 14
L5 $8,000 under $9,000. . . . . . . 2,437,196 458,805 1,978,391 1 5
L6 $9,000 under $10,000 . . . . . . 1,637,125 111,062 1,526,063 - - 16
L7 $10,000 under $15,000 . . . . . 3,014,654 41,004 1,585,556 1,359,100 28,994 - 1 7
L8 $15,000 under $20,000 . . . . . 646,926 1,205 15,243 230,680 369,469 30,329 - i s
L9 $20,000 under $25,000 . . . . . 273,061846
1,534 7 752 73,512 161,590 28,330 1 9
20 $25,000 under $50,000 . . . . . 384,013 959 1 :441 6,817 36,315 105,515 86,402 59,948 38,682 28,576 16,001 2,854 2 0
?1 $50,000 under $100,000 . . . . 103,178 52 59 67 170 182 285 542 914 2,059 4,477 10,257 32,647 2 1
22 $160,000 under $150,000 . . . 15,237 (1) 36 48 (1) (1) (1) (1) (1) (1) 36 91 2 2
?3 $150,000 -der $200,000 . . . 3,874 2 7 5 2 3 6 3 1 3 7 4 9 2 3
24 $200,000 under $500,000 . . . 3,989 - 1 1 - 2 - 1 2 3 3 5 10 2 4
?5 $500,000 under $1,000,000 . 580 - I - - - - - - 25
26 $1,000,000 or more . 180 --
,,26
27 Nontaxable re total . . .turns, 82,857 82,774 T77) :1 27
Taxable income classes-Continued
Over Over Over Over Over Over Over Over Over Over Ov r
Adjusted gross income classes $52~000 $64,000 $76,000 $88,000 $100,000 $120,000 $140,000 $160,000 $180,000 $200,000 $300,OD0 Over
not over not over not over not over not over not over not over not over not over not over not over $400,000
$64,000 $76,000 $88,000 $100,000 $120,000 $140,000 $160,000 $180,000 $200,000 $300,000 $400,000
(14) (15) (16) (17) (18) (19) (20) (21) (22) (23) (24) (25 )
1 Grand total . . . . . . . . . . . 29,472 16,114 8~581 5,853 5,348 3,117 1,575 1,068 744 1,690 563 778 1
2 Taxable returns, total . . . . . . 29,470 16,114 8,581 5,853 5,346 1 3,113 1,5741
1,068 742 1,690 563 778 1 2
3 $600 under $1,000 . . . . . . . . . - - - - - - - - - - - - 3
4 $1,000 under $1,500 . . . . . . . - - 4
5 $1,500 under $2,000 . . . . . . . - - - 5
6 $2,000 under $2,500 . . . . . . . - - - - - - - 6
7 $2,500 under $3,000. . . . . . . - - - - - - - - - - - - 7
8 $3,000 -der $3,500 . . . . . . . - - - - - - - - - - - - 8
9 $3,500 -der $4,000. . . . . . . - - - - - - - - - - - - 9
10 $4,000 under $4,500. . . . . . . - - - - - - - - - - - - 1 0
11 $4,500 under $5,000. . . . . . . - - - - - - - - - - - - 11
12 $5,000 under $6, OQO. . . . . . . - - - - - - - - - - - - 1 2
13 $6,000 under $7,000. . . . . . . - - - - - - - - - - - - 13
14 $7,ODO under $8,000 . . . . . . . - - - - - - - - - - - - 14
15 $8,000 under $9,000 . . . . . . . - - - - - - - - - 15
16 $9,000 under $10,000 . . . . . . - - - - - - - - - 16
17 $10,000 under $15,000 . . . . . - - - - - - - I?
18 $15,000 -der $20,000 . . . . . - - - - - - - 18
19 $20,000 under $25,000 . . . . . - - - - - - - 19
20 $25,000 uncer $50,000 . . . . . - - - - - - - 2C
21 $50,000 under $100,000 . . . . 29,024 15,088 6,206 1,149 - - - 21
22 $100,000 under $150,000 . . . 409 971 2,269 4,513 4,743 1,899 79 22
23 $150,000 under $200,000 . . . 28 40 75 161 530 1,033 1,214 622 119 - - - 23
24 $200,000 under $500,000 . . . 9 14 30 30 72 179 281 444 621 1,675 491 115 24
25 $500,000 under $1,000,000 . - 1 1 - 1 2 - 2 2 15 71 484 25
26 $1,000,000 or more . . . . . . . . - 1 179 26
27 Nontaxable returns, total . . . 1 (1) 1 - - I - 1211
Footnote at end of table . See text for "Description of Sample'- and "Explanation of Classifications and Te=."
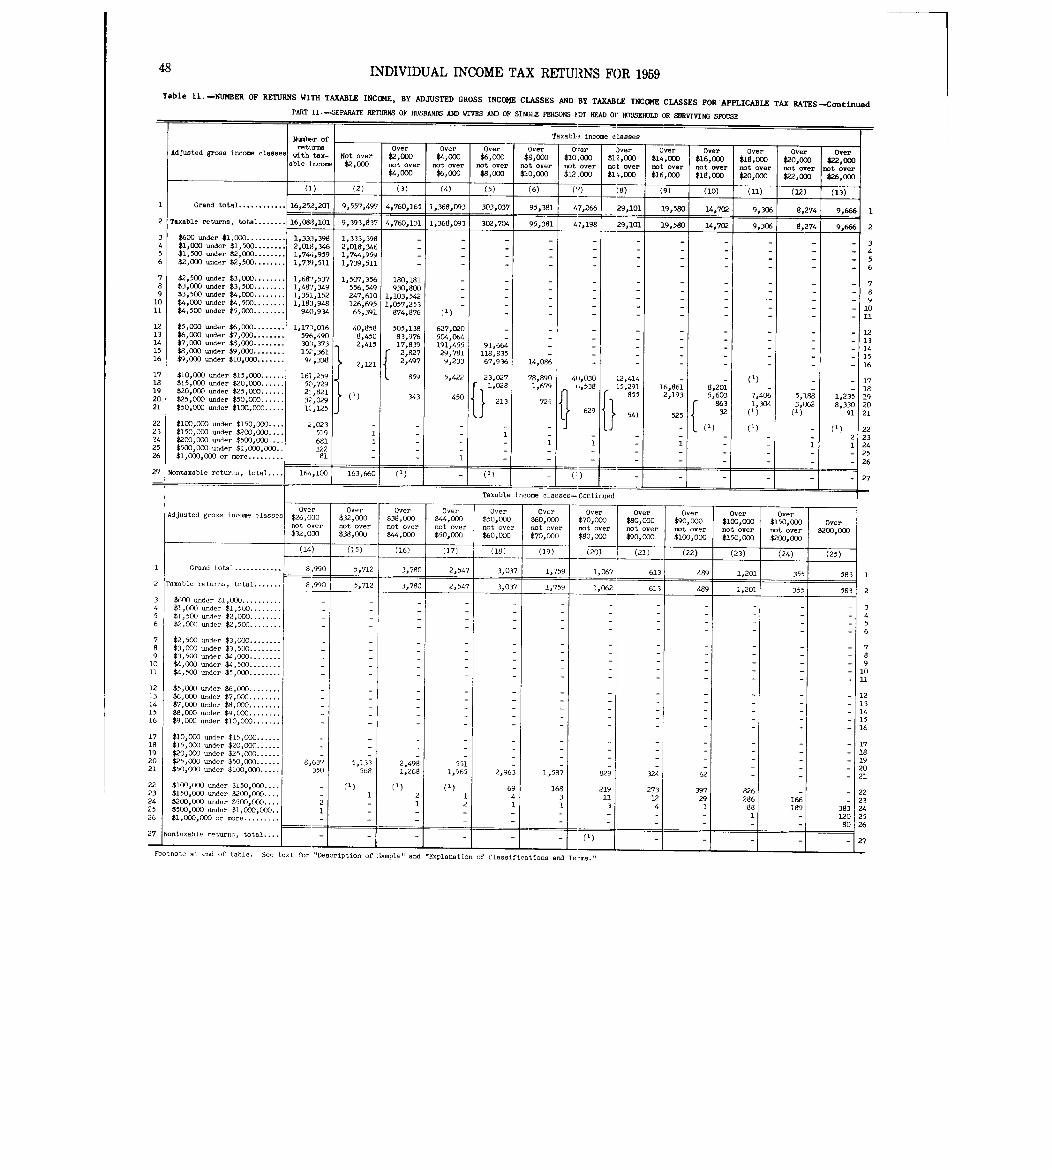
48 INDIVIDUAL INCOME TAX RETURNS FOR 1959
Table 11 . -NUMBER OF RETURNS WITH TAXABLE INCOME, BY ADJUSTED GROSS INCOIJE CLASSES AND BY TAXABLE INCOME CLASSES FOR APPLICABLE TAX RATES -CantinuedPART II .-SEPARATE RETURNS OF HUSBANDS AND WIVES AND OF SINGLE PERSONS ?OT HEAD 01' HOUSEHOLD OR SURVIVING SPOUSE
Number of Taxabl, income classe s
Adjusted gross income classes"t'
.."
with tax- Not over
Ov r
$2,00o
Ove r$4,000
Ove r$6,000
Over$8,000
OI r$10 000
$10ve r~2,000
Ove r$14,ooo
Over$16,000
Ove r$18,000
Ove r$20,000
Over$22 000
able income $2,000 not ove r$4 1 000
-
not ove r
$6 , 000
-
not ove r$8,000
-
not ove r$10POOO not ove r$12 000 no t ove r
$14,000
not over
$16,000
not wa r
$l8oOO0
not ove r
$20,000
not war
$22,000
,
not ove r
$26,000
(3) (2) (3) (4) (5) -(6) ___F___8) -(9) _(IO) (11) (12) (13 )
1 Grand total . . . . . . . . . . . . l6o252o201 9o557,497 4,760,165 1,368,093 303,037 95,381 47,266 29,101 19,580 l4o702 9,306 8,274 9,666 1
2 Taxable rat-s, total . . . . . . . 16,088,101 9,393,837 4,760,131 1,368,093 302,704 95p381 47,198 29,101 19,580 l4o702 9o3O6 8,274 9o666
3 $600 under $1,000 . . . . . . . . . . lo33 :3,398 1,333,398 - - - - -4 $1,000 under $1,500 . . . . . . . . 2,0113,346 2,018,346
-
5 $1,500 under $2,000. . . . . . . . 1,744,959 1,744,9596 $2,000 under $2,500 . . . . . . . . 1,739,511 1,739,511 - - - - - - - - - -
7 $2,500 =der $3,000 . . . . . . . . 1,68-7,537 1,507,356 180,181 - - - - - -8 $3,000 under $3,500 . . . . . . . . 1,487,349 556,549 930,800 - - - - - -
-
-
- -
9 $3,500 under $4,000 . . . . . . . . 1,351,152 247,610 1,103,542 - - - - - - -- -
10 $4,000 under $4,500 . . . . . . . . 1,18 :3,948 126,695 1,057,253 - - - - -
- -
11 $4,500 under $5,000 . . . . . . . . 940,934 65,391 874 876 (1) - -- - - -
, - - - - - -
12 $5,000 under $6,DOO . . . . . . . . 1,173,016 40,858 505,138 627,020 - - - - - - - -13 $6,000 umder $7,000 . . . . . . . . 596,490 8,450 83,976 504,064 - - - - - - - -14 $7,000 under $8,000 . . . . . . . . 30:1,373 2,415 17,839 191,455 91,664 - - - - - - -15 $8,000 under $9,000 . . . . . . . . 152,361 2 '27 29,781 118,835 - - - -16 $9,000 -der $10,000. . . . . . . 94,338
2,121 2 :4,17 9,233 67,936 14,086 - - -
-
-
-
-
-
17 $10,00D under $15,000 . . . . . . 161,259 859 5,422 23,027 78,890 40,030 12,414 - -
(1 )
1 8
19$15,000 under $20,000. . . . . .$20,000 -der $25,000 . . . . . .
50,72
92-; 8211'028
1,61 ,,538 15,291 16 :ftl 11 201
- -20 $25,000 under $50,000 . . . . . .
, .
32,029 343 450213 725
855 2 193 5 603 7,406 5,188 1,235 I~
21 $50,000 under $100,000 . . . . . 10,125 629
f
86 3
32
1 304 3 062 8,330 2(
1
541 525 91
3
2
22 $100,000 under $150,000 . . . . 2,023 - - - (1) 2223 $150,000 under $200,000 . . . . 519-24 $2DO,000 wder $500,000 . . . . 681
2 2
25 $500,000 under $1,ODO,000 . . 1221 2
~26 $1,000,000 or more . . . . . . . . . 81 - 2
- 2f
27 Nontaxable retwnq, ~164,100 163,660 (1)- 21,
Taxable income classes- Continue d
Adjusted grosa income 11 . . . a-
Ove r
$26,000Ove r
$32,000
Ove r
$38,0()0
Ove r
$44,000
Ove r
$50,000
Ove r
$60,000
Ove r$70,000
Ove r
$80,000
Ove r
$90,000Ove r
$100,0000 e r
$150,000 Ove rno t ove r
$32 000
_
not ove r
$38,000
not ove r
$44,000not ove r
$50,000
not ove r
$60,000
not ove r
$70,000not ove r$80,000
not ove r
$90,000
not ove r
$100,000
not ove r
$150,000
not ove r
$2OO,ODO
$200,000
(14~ (15) (16) (17) (18) (19) _F20) (21) (22) (23) (24) (25 )
1 Grand total . . . . . . . . . . . . 8 ,,990 ',712 3,780 2,547 3,037 1,759 1,067 613 489 1,201 355 583 1
2 Taxable returns, total . . . . . . . 8,990 5,712 3,780 2,547 3,037 1,759 1,062 613 489 1,201 355 563 2
3 $600 =der $1,000 . . . . . . . . . . - -4 $1,000 under $1,500 . . . . . . . .
-3
5 $1,500 -d,, $2,000 . . . . . . . . - 4
6 $2,000 und- $2,500 . . . . . . . . - 5
6
7 $2,500 -d,, $3,000 . . . . . . . . -
8 $3,000 =d- $3,500 . . . . . . . . - 79 $3,500 und- $4,000 . . . . . . . . - 80 $4,000 under $4,500 . . . . . . . . - 9
1 $4,500 =der $5,000 . . . . . . . . - 10
11
2 $5,000 under $6,000 . . . . . . . . -
3 $6,000 =der $7,000 . . . . . . . . - 12
4 $7,000 =da, $8,000 . . . . . . . . - 13
5 $8,000 under $9,000 . . . . . . . . - 1 4
6 $9,000 under $10,DOO . . . . . . . - - 15
- 1 6
7 $10,000 =der $15,000 . . . . . . - -
8 $15,000 under $20,000 . . . . . . - -- - 1 7
9 $20,000 under $25,000 .
' - - -
-- - 1 8
0 $25,000 under $50,000 . : . . 1 8,637 5,133 2,498 -551
- -
- -- - 19
1 $50,000 under $100,000 . . . . . 350 568 1,268 1,965 2 963 5871 829 324
- - - 20, , 62 - - - 21
2 $100,CM =der $150,000 . . . . - (1) (1) (1) 69 168 219 273 397 8263 $150,GGO -der $200,000 . . . . - 1 2 1 4 3 11 12 29 28
- - 22
4 $200,000 -der $500,000 . . . . 2 - 1 2 1 1 3 4
6 166 - 23
5 $500,000 -der $l,ODO,OOO. . 1 - - -1 88 199 383 24
6 $1,000,000 or more . . . . . . . . .-
-
- - - - 1 - 120 25
- - -
80 267 Nont .-bl~ -turns, total . . . .
22222
2
Footnote at end of table . S,,e text for "Description of ,ample" and "Explanation of Classifications and Te,ms ."
1
2
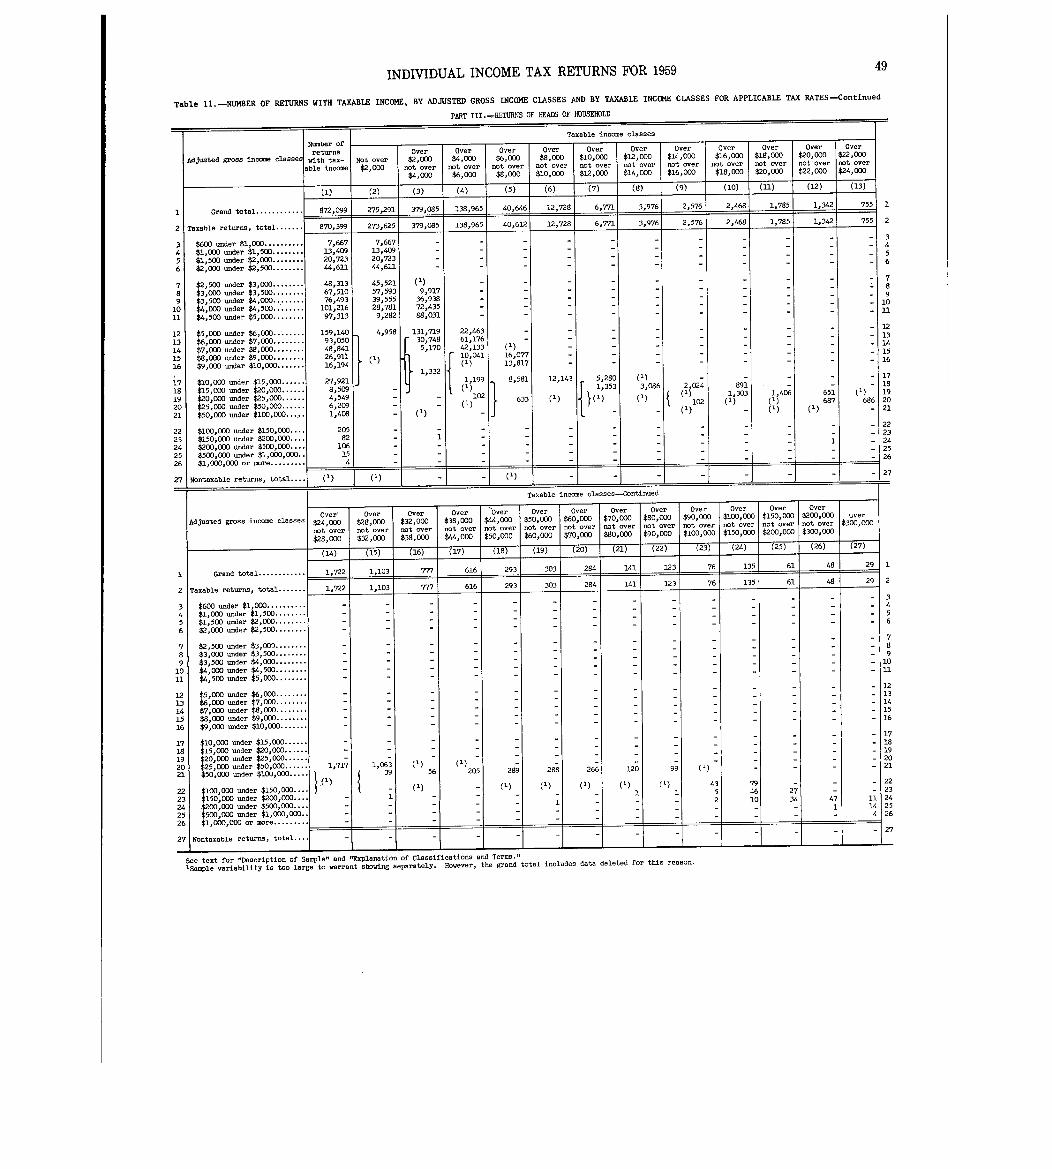
INDIVIDUAL INCOME TAX RETURNS FOR 1959 49
Table 11 . -NUMBER OF RETURNS WITH TAXABLE INCOME, BY ADJUSTED GROSS INCOME CLASSES AND BY TAXABLE INCOME CLASSES FOR APPLICABLE TAX RATES-Continued
PART III_RETURNS OF BEADS OF HOUSEHOL D
Taxable income classes
aAdjusted gross income classe
Nember ofreturns~ith tax-
-
Over Over $ Over Over Over Ov r Over Over Overver Over0 $6,000 10, $121000
$1'~ ~ 0,000 $22,000$2,000 $4,000
$8,000 000 000 $16,000 $18,000 $2Not over
able income
I, ~
$2 ODD not over not over not over not over not over not over not over not over not over not over not ove r
$4,000 $6,000 $8,000 $10,000 $1.2,000 $14,000 $16,000 $18,000 $20,000 $22,000 $24,000
(1) (2) (3) (4) (5) (6) (7) (8) (9) (10) (11) (12) (13 )
1 Grand total. . . . . . . . . . . . 872,099 275,291 379,085 138,965 40,646 12,728 6,771 3,976 2,576 2,468 1,785 1,342 755, 1
2 Taxable returns , total . . . . . . . 870,399
399
273,625 379,085 138,965 40,612 12,728 6,771 3,976 2,576 2, 785 1,342 755 2
3 $600 under $1,ODO . . . . . . . . . . 7
.
77,667 7,667 - - - - - -
4 $1,000 under $1,500 . . . . . . . . 13,40913
4097
13,409 - - - - - -
5 $1,500 under $2,000 . . . . . . . . 20,723
20
7,3 20,723 - - - - - -
6 $2,000 under $2,500 . . . . . . . . 44,62-14 64 44,611 - - - - - -
7 $2,500 ander $3,000 . . . . . . . . '8 31
,
48,313 45,521 (1) - - - - - 78
a $3,000 under $3,500 . . . . . . . . 67,510 57,593 9,917 - - - - -9
9 $3,500 under $4,000 . ... . . . . . 76,493 39,555 36,938 - - - - -10
LO $4,000 under $4,500 . . . . . . . . 101,216 28,781 72,435 - - - - n11 $4,500 under $5,000 . . . . . . . . 97,313 9,282 88,031 - - - -
12 $5,000 under $6,000. . . . . . . . 159,140 4,951 131,719 22,461 1213
13 $6,ODO under $7,000. . . . . . . . 93,050 30,748
5 170
61,17642 133 -(1)
1414 $7,000 under $8,000. . . . . . . . 48 84i
,
, ,15
15 $8,000 under $9,000. . . . . . . . 26 9111 (1)10 04 1
1 1
16 07716
16 $9,000 under $10,000 . . . . . . . 16,194(
) 13 817 - - -
i7 $10,000 under $15,000 . . . . . . 27,921509
1,3321 199
f ( 1 1)
8,581 12,14:3 5,280
1,353(1 )3,086 2,024 891 - -
17- 18
18 $15,000 under $20,000 . . . . . . 8,
-
102 (1) 1 303 1,406 651 (1) 1919 $20,000 under $25,000 . . . . . . 4,549
20
- -
- (1)633 102 687 686 2C
20 $25,000 ander $50,000 . . . . . . 6, 9 -- 2 1
21 $50,000 under $100,000 . . . 1,408 -
22 $100,000 under $150,000 . . . . 205 - ---
- 22- 2 3
23 $150 ;ODO under $200,000 . . . . 82 - 1 - -1 - 2 4
24 $200,000 under $500,000 . . . . 106 - - - -- - 2 5
25 $500,OD0 and r $1 000 000 15 - - - -
-
2 f26 $1,ODO,000 or mor . . . . : . . . 4 - - - -
27 urns, total . . . .Nontaxable ret m -2 5
Taxable income classes-,;..tiued
Adjusted gross income classesOver
$24 000Ove r
$28 000
Over
$32,000
Over$38,000
Over
$44,000 $Over50,000
Over
$60,000
Over$70,000
Over$100,000
Ove r$150,000t
over$200,000ot over
uver
$300 000,
not over
00028
,not ove r$32 000
not ove rOD0$38
not ove r$44 000
not over n
$50,000
ot over
$60,000
not over
$70,000
not over
$80,000
not over$150,000
overno$200,000
n$300,000
,
,$
(1-4)
,
(15)
,
(16) - -
,
7-17) _71-8) -7-19) -7-20) (21) -T24) -725) -T26) (27)
I Grand total . . . . . . . . . . . . 1,722 1,103 777 616 293 303 284 141 123 76 135 61 48 29 1
2 Taxable returns~ total . . . . . . . 1,722 1,103 777 616 293 303 284 141 123 76 135 61 48 29 2
- - 3
3 $600 ander $1,000 . . . . . . . . . . - - - - - --
--
-- - - 4
4 $1,000 ander $1,500 . . . . . . . . - - - - -- - - - 5
5 $1,500 under $2,000 . . . . . . . . - - - - - -- - - - - 6
6 $2,000 under $2,500 . . . . . . . . - - - - -
- - ?7 $2,500 under $3, OCY) . . . . . . . . - - - - - - - - 88 $3,000 under $3,500 . . . . . . . . - -
- 99 $3,500 =der $4,000 . . . . . . . . - - -
ic
10 $4,000 under $4,500 . . . . . . . . - - -1 1
11 $4,500 under $5,000. . . . . . . . - - -
12
12 $5,000 under $6,000 . . . . . . . . - - - 12
13 $6,000 under $7,000 . . . . . . . . - - - 14
14 $7,000 ander $8,000 . . . . . . . . - - - 11
15 $8,ODO under $9,000 . . . . . . . . - - - 1~
16 $9,000 under $10,00c) . . . . . . . - - -
ill
17 $10,000 under $15,000 . . . . . . - - - 1E
18 $15,000 =der $20,000 . . . . . . - - -is
19 $20,000 =der $25,000 . . . . . .-
-
06 31
-
(1)2120 $25,000 under $50,000 . . . . . . 1,717 ,
39 56 205 289 288 266 120 99 2 ,21 $50,000 under $10U,000 . . . . .
22 $100,000 under $150,000 . . . .435
749 -
6 27
-
-
- 2
-
2
23 $150,ODO under $200,000 . . . . 2 10 34 47 11 2
24 $200,000 under $500,000 . . . . - - - 1 14 2
25 $500,000 der $1,000,000 . .
an
4 2
26 $1,000,000 or more . . . . . . . . .2
27 Nontaxable returns, total . . . .
23456
7
See text for "Description of Sample" and "Explanation of Classifications and Terms .1 1
ISample variability is too large to warrant showing separately . However, the grand total includes data deleted for this reason .
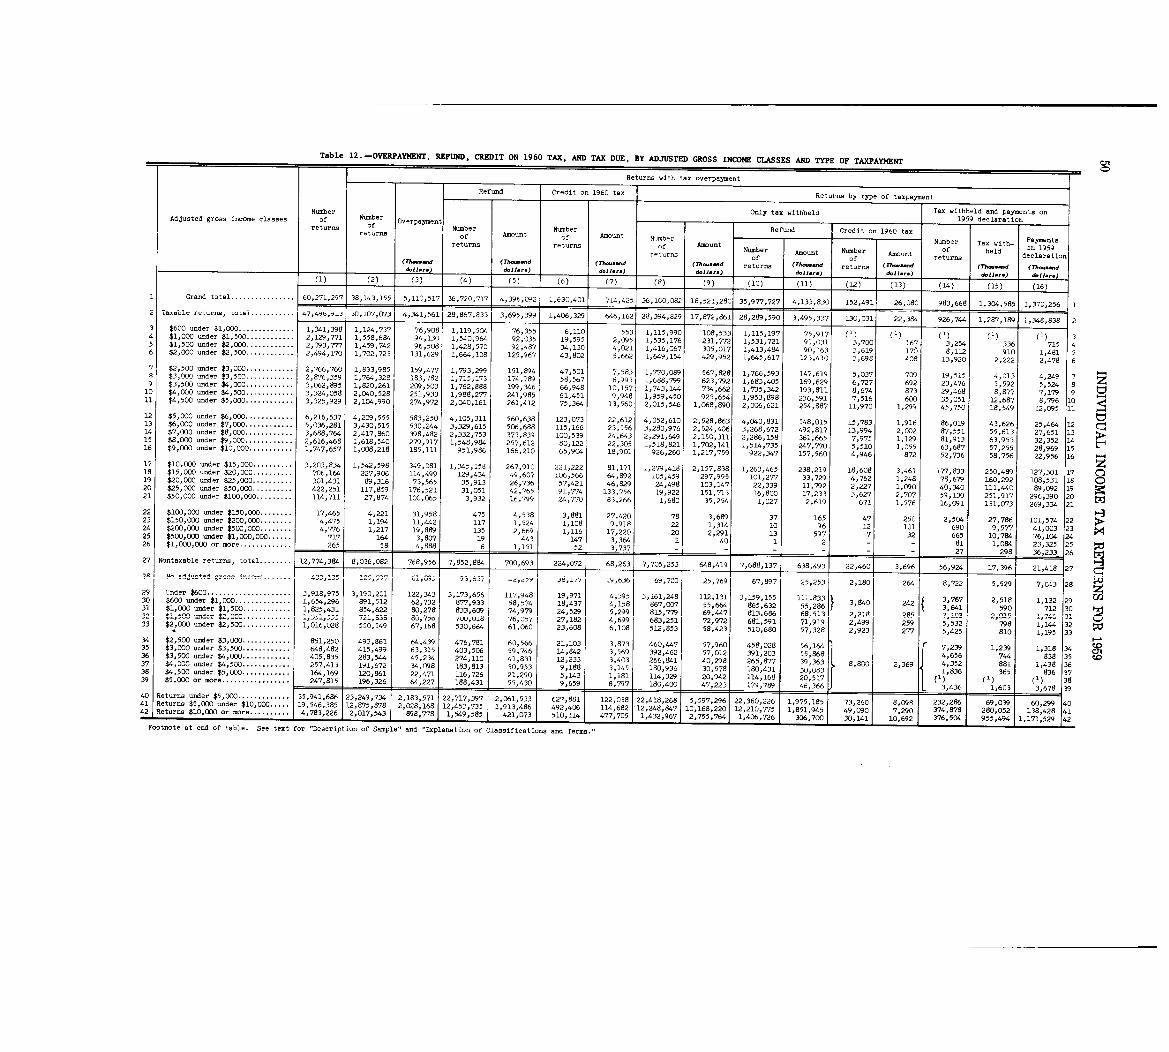
Table 12 . -OVERPAYMENT, REFUND, CREDIT ON 1960 TAX, AND TAX DUE, BY ADJUSTED GROSS INCOME CLASSES AND TYPE OF TAXPAYMENT
Returns with tax overpaymen t
Refund Credit on 1960tax Returns by type of taxpayment
Number Only tax withheld Tax withheld and payments onAdjusted gross income classes of Number Overpayment 1959 declaration
returns of Number Number Refund Credit on 1960 taxreturns of Amount of Amount Number Number Tax with- Paymentsof on 1959returns returns of
Amount Number Number held declarationreturns
of
Amountof Amount returns(rh- ...d (Th-d (T)-.-d (lh-.-d returns (Th-..d returns (Th-.-d (Th-.-d (Th--d&11.. . ) I d.11.. . ) I d.11.,.) d.11. .. )_ d.1i . .. ) d.11-) d~ll .. . ) &II-)
(1) (2)- (3) (4) (5) (6) (7) (8) (9) (1()) (11) (12) (13) (14) (15) (16 )
1 Grand total . . . . . . . . . . . . . . . . 60,271,297 38,143,155 5,110,517 36,720,717Z4]3~1~-~2 1,63( ,100,082 18,521,280 35,977,727 4,133,830 152,491 26,080 983,668 1,304,5851 1,370,256 12 T-ble returns, t .. . 1 . . . . . . . . . . . 47,4V6,9iJ J0,107,073 4,341,561 28,867,8331 3,695,399 1,406,329 646,162 28,394,829 17,872,8611 28,289,590 . 3,495,337 130,031 22,384 926,744 1,287,189 1,348,838 23 $600 under $1,000 . . . . . . . . . . . . . . 1,341,398 1,124,737 76,908 1,119,504 76,355 6,110 553 1,115,990 108,533 1' 115 , 197 75,917 (1) (1) (1) (1) (1) 34 $1,000 under $1,500 . . . . . . . . . . . . 2,129,771 1,558,684 94,130 1,540,964 92,035 19,595 2,095 1,535,176 231,772 1,531,721 91,031 3,700 167 3,254 336 715 45 $1,500 under $2, 000 . . . . . . . . . . . . 2,093,777 1,459,742 96,508 1,428,570 92,487 34,130 4,021 1,416,067 305,017 1 , 413
,484 90,163 3,619 170 8,112 910 1,481 56 $2,000 under $2,500 . . . . . . . . . . . . 2,494,170 1,702,723 131,629 1,664,108 125,967 43,802 5,662 1,649,154 429,952 1,645,617 123,410 3,698 408 13,920 2,222 2,478 6
7 $2,500 under $3,000 . . . . . . . . . . . . 2,766,760 1,833,985 159,477 1,793,299 151,894 47,501 7,583 1,770,089 567,828 1,766,593 147,619 5,03? 709 19,515 4,013 4,249 7A $3,000 under $3,500 . . . . . . . . . . . . 2,876,359 1,764,328 193,792 1,715,173 1774,789 58,567 8,993 ,688,799 623,792 1,683,405 169,629 6,727 692 23,476 5,592 5 524 99 $3,500 under $4,000 . . . . . . . . . . . . 3,062,895 1,820,261 209,503 1,762,888 199,346 66,948 10,157 1,743,1" 734,662 1,735,342 193,811 8,674 873 29,468 8,877 7: 179 910 $4,000 under $4,500 . . . . . . . . . . . . 3,324,058 2,040,528 251,933 1,988,277 241,985 61,451 9,948 1,959,450 925,654 1,953,898 236,591 7,516 600 35,051 12,687 8,796 1011 $4,500 under $5,000 . . . . . . . . . . . . 3,325,929 2,104,990 274,972 2,040,161 261,412 75,364 13,560 2,015,546 1,068,890 2,006,621 254,887 11,970 1,29q 49,750 18,549 12,095 11
t=112 $5,000 under $6,000 . . . . . . . . . . . . 6,216,537 4,209,555 583,250 4,105,311 560,638 123,073 22,612 4,052,610 2,528,863 4,040,831 548,015 15,783 1,916 96 , 019 43, 626 25,464 U ci13 $6,000 under $7,000 . . . . . . . . . . . . 5,036,281 3,430,515 530,244 3,329,615 506,688 115,166 23,556 3,280,976 2,524,406 3,268,672 492,817 13,994 2,002 37 , 551 55,613 27,651 13 --14 $7,000 under $8,000 . . . . . . . . . . . . 3,688,764 2,417,960 396,482 2,332,753 373,839 100,539 24,643 2,291,649 2,150,311 2,286,158 361,665 7,975 1,129 81,913 63 , 953 32,352 1415 $8,000 under $9,000 . . . . . . . . . . . . 2.,616,468 1,618,540 279,917 1,548,984 257,612 80,122 22,305 1,518,821 1,702,141 1,514,735 247,770 5,510 1,055 63,687 57 255 28,969 1516 $9,000 under $10,000 . . . . . . . . . . . 1,747,657 1,008,218 185,111 951,986 166,210 65,904 18,901 926,260 1,217,759 922,347 157,560 4,946 872 52,736 58:756 22,956 16
t417 $10,000 under $15,000 . . . . . . . . . . 3,203,834 1,542,598 349,081 1,345,158 267,910 221,222 81,171 1,279,418 2,157,838 1,263,465 238,219 18,608 3,461 ~77,833 250,489 127 301 17 nis $15,000 under $20,000 . . . . . . . . . . 706,164 227,906 114,499 129,434 49,607 1D6,566 64,892 105,459 297,995 101,277 33,729 4,762 1,248 78,679 160,292 108,531 18 019 $20,000 under $25,000 . . . . . . . . . . 301,431 89,316 73,565 35,913 26,736 57,421 46,829 24,498 103,147 22,339 11,792 2,227 1,090 40,340 ill'"o 89 092 1920 $25,000 under $50,000 . . . . . . . . . . 422,251 117,859 176,521 31,051 42,765 91,774 133,756 19,922 151,713 16,800 17,233 3,627 2,707 59,130 251,917 296 :390 2021 $50,000 under $100,000 . . . . . . . . . 114,711 27,874 100,065 3,932 16,799 24,770 83,266 1,68C 35,254 1,027 2,619 671 1,576 16,091 131,073 269,334 2122 $100,000 under $150,000 . . . . . . . . 17,465 4,221 31,958 475 4,538 3,881 27,420 78 3,689 37 165 47 250 2,504 27,786 101,574 2223 $150,000 under $200,OOC . . . . . . . . 4,475 1,194 11,442 117 1,524 1,108 9,918 22 1,314 10 96 12 101 690 9,577 41,003 2324 $200,000 under $500,000 . . . . . . . . 4,776 1,217 19,889 135 2,669 1,116 17,220 20 2,291 13 597 7 32 665 10,784 76,104 2425 $500,000 under $1,000,000 . . . . . . 717 164 3,807 19 443 147 3,364 1 40 1 2 - - 81 1,064 23,325 2526 $1,000,000 or more . . . . . . . . . . . . . 265 58 4,888 6 1,151 52 1 3,7371 - 1 -1 - 1 -1 - - 27 298 36,233 2627 Nontaxable returns , total . . . . . . . . 394 8,036,C82 7679576 7,705,2531 648,4191 638,493 22,46011
1 1
-_ r~7,85111- 700,693 224,072 68,263i - 7,688,137 3 696 56,924 17,396 21,418 ~27------- ... . . .. 21:719 6,7,1197 25: 5:~J 2,180 264 8,722 5,529 7,043 28 W
. . . . . . . . . . . . 3,918,975 3,190,201 122,343 3,173,656 117,948 19 155 ~l Wn9 "')o z29 Under $600 . . . . . . . . . .. . . . . . . . :971 4 3)91' 3,161 :24s 3 15 :33,840 242 3 767 2,518 1,132 2930 $600 under $1,000 . . . . . . . . . . . . . . 1,654,296 891,512 62,732 877,933 58,574 18,437 4,158 867,007 55,664 865,632 55,286 f 3 :641 590 712 3~31 $1,000 under $1,500 . . . . . . . . . . . . 1,925,431 854,622 80,278 833,609 74,979 24,529 5,299 815,779 69,447 813,686 68.513 2,218 289 7,1 - , 2,0115 1, 74-6 3., dcr $2,00C . . . . . . . . . . .. 3 681,591-1,50C 351,555 721,838 80, 756 700, O-L8 '16, 057 27,182 4,699 683,251 72,972 71'919 2,499 259 5 532 798 1,144 3233 $~, 000 under $2,500 . . . . . . . . . . . . ~:016,028 550,549 67,168 530,664 61,060 23,608 6,108 512,853 58,423 510,680 57,328 2,923 277 5,425 SID 1,195 33
34 $2,500 under $3,000 . . . . . . . . . . . . 851,250 493,861 64,439 476,781 60,566 21,103 3,873 460,447 57,960 458,028 16 64 7:239 1,239 1,318 3435 $3,000 under $3,500 . . . . . . . . . . . . 648,482 415,499 63,315 403,506 59,746 14,842 3,569 392,462 57,012 391,203 5'&8
4 656 744 38 3536 $3,5DO under $4,000 . . . . . . . . . . . . 405,635 283,544 45,234 274,110 41,831 12,233 3,403 266,841 40,298 265,877 39 363 8, 8C)o 2,369 4 352 881 1,438 3637 $4,000 under $4,500 . . . . . . . . . . . . 257,413 191,672 34,098 183,813 30,953 9,188 3,145 180,936 30,578 180,431 30,083 1:836 365 836 3738 $4,500 under $5,000 . . . . . . . . . . . 164,169 120,861 22 411 116 726 21,290 5,143 1,181 114,329 20,942 114,168 20,517 (1) (1) (1) 3839 $5,000 or more . . . . . . . . . . . . . . . . . 247,815 196,326 64 :22'7 198:~31 55,430 9,659 8,797 180,400 47,223 179, 789 46,366 3,436 1,603 33,66778 .3940 Returns under $5,000 . . . . . . . . . . . . . 35,941,6 6 23 :,24,9 :734 2: 3 57811 22,,717 397 2 D61 533 Z2 7: 1 ~ 8.1 1~; 1 2,4 8,268 5,597 :29 : 2 ~126 751 73,26CI 8,098 2;1,2 :28
0' 6 '299
".0
49922,4'14 4 :6. ' 8
1:41 Returns $5,000 under $10,000 . . . . . 19,546,3115 117111 2 ('12 6 2 53,'735 1:913 :4864. 1
3 78 26W 1 8: 8 1
S: 1 1 4~12 21 10,168 22 5 1,.5 945 49,090 7,290S 1'9 '1 38,428 .4i, . .9 : .5,2 3' 42942 lReturns $10,000 or more . . . . . . . . . . 4,783, 1543 585 1 421 073 510,114 471i : 2,755,76! 30,141 10,692 1 3 7 5 4
51GT
'76,504 955,494 1,171,529 2Footnote at end of table . See text for "Description of Sample" and "Explanation of Classifications and Term .
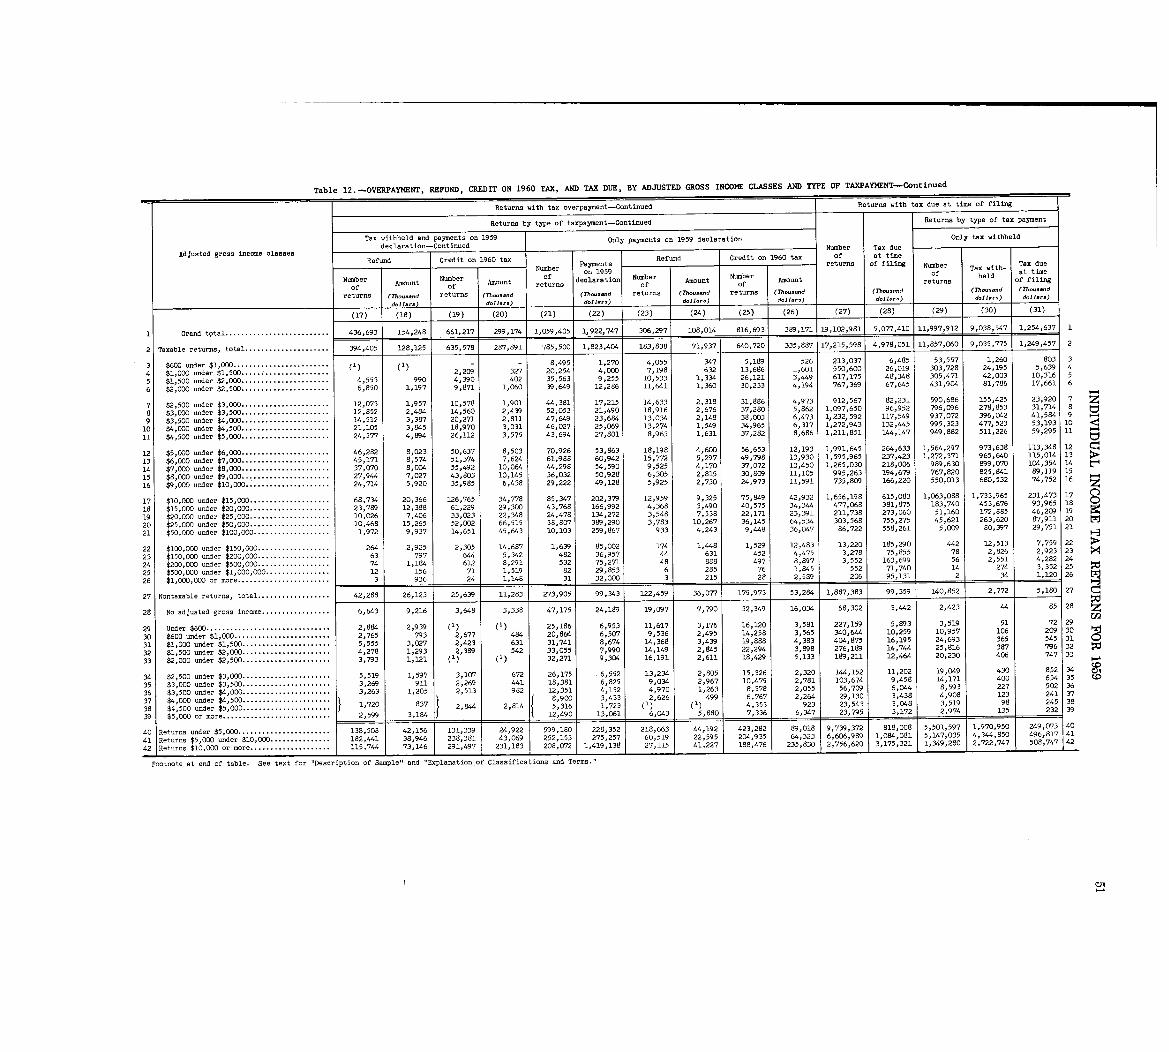
Table 12 . -OVERPAYMENT, REFUND, CREDIT ON 1960 TAX, AND TAX DUE, BY ADJUSTED GROSS INCOME CLASSES AND TYPE OF TAXPAYMENT-Continued
Returns witb tax overpayment-Continued Returns witb tax due at time of filin g
Returns by type of taxpayment-Continued Returns by type of tax payment
Tax witbheld and payments on 1959 Only payments on 1959 declaration Only tax ithheld
Adjusted gross income classesdeclaration-Continued Number Tax du e
Refund Credit on 1960 tax Refund Credit on 1960 tax ofat t i
e
- Number Payments returns of filing Number ax due
Number Number on 1959 Numb r f Tax w itb- t imeof Number beld a t
ofAmount of
Amount returns declaration of Amount ofAmount reourns of filing
returns (77--d returns (7'h-. ..d (Th-:,,d returns (Th~:-d returns (Th .. .. .d (Th--d d
(
2[d 27d,llars) d.11. d.11 d.11 d.] I.. . d.11-) d.11-) d.11 . ..
(17) (18) (19) (20) (21) (22) (23) (24) (25) (26) (27) 1 (28) (29) (30) (31)
o
f
a '
u
1 Grand t9tal . . . . . . . . . . . . . . . . . . . . . . . . . . 436,693 154,248 661,217 299,174 1,059,405 1,922,747 306,297 108,014 816,693 389,171 19,102,981 5,077,410 11,997,912 1 9,038,547 1,254,637 1
81(
1029 8
1
2 Taxable returns , total . . . . . . . . . . . . . . . . . . . . . 394,405 128,125 635,578 287,891 785,500 1,823,404 183,838 71,937 640,720 335,887 17,215,598 4,978,051 11,857,060 9,035,775 1,249,457 2
3 $600 under $1,000 . . . . . . . . . . . . . . . . . . . . . . . . (1) - - 8,495 1,270 4,055 347 5,189 526 213,037 6,485 53,557 1,260 803 3
4 $1,000 under $1,500 . . . . . . . . . . . . . . . . . . . . . (1) 2,209 327 20,254 4,000 7,198 632 13,686 1,601 .550,600 26,019 303,728 24,195 5,639 4
5 $1,500 under $2,000. . . . . . . . . . . . . . . . . . . . . 4,553 990 4,390 402 35,563 9,255 10,533 1,334 26,121 3,449 617,175 48,348 305,471 42,003 10,316 5
6 $2,000 under $2,500 . . . . . . . . . . . . . . . . . . . . . . 6,850 1,197 9,871 1,060 39,649 12,286 11,641 1,360 30,233 4,194 767,369 67,645 431,904 81,786 17,661 6
7 $2,500 under $3,000. . . . . . . . . . . . . . . . . . . . . . 12,073 1,957 10,578 1,901 44,381 17,215 14,633 2,318 31,886 4,973 912,567 82,231 590,686 155,425 23,920 7 z
8 $3,000 under $3,500. . . . . . . . . . . . . . . . . . . . . . 12,852 2,484 14,560 2,439 52,053 21,490 18,916 2,676 37,280 5,862 1,097,650 96,952 796,096 278,853 31,714 8 C)
9 $3,500 under $4,000 . . . . . . . . . . . . . . . . . . . . . . 14,512 3,387 20,271 2,811 47,649 23,684 13,034 2,148 38,003 6,473 1,232,592 117,549 937,072 396,042 41,584 9
10 $4,000 under $4,500 . . . . . . . . . . . . . . . . . . . . . . 21,105 3,845 18,970 3,031 46,027 25,069 13,274 1,549 34,965 6,317 1,272,943 132,445 995,323 477,523 53,193 10
11 $4,500 under $5,000 . . . . . . . . . . . . . . . . . . . . . . 24,577 4,894 26,112 3,575 43,694 27,801 8,963 1,631 37,282 8,686 1,211,851 144,147 949,882 511,226 59,295 11 ~4tZI
12 $5,000 under $6,000 . . . . . . . . . . . . . . . . . . . . . . 46,282 8,023 50,637 8,503 70,926 53,863 18,198 4,600 56,653 12,193 1,991,645 264,633 1,564,297 973,638 113,348 12
13 $6,000 under $7,000 . . . . . . . . . . . . . . . . . . . . . . 45,171 8,574 51,374 7,624 61,988 60,942 15,772 5,297 49,798 13,930 1,595,965 237,423 1,272,371 965,640 115,014 13
14 $7,000 under $8,000 . . . . . . . . . . . . . . . . . . . . . . 37,070 8,004 55,492 10,064 ",298 54,590 9,525 4,170 37,072 13,450 1,265,030 218,006 989,630 899,070 104,354 14
15 $8,000 under $9,000 ., . . . . . . . . . . . . . . . . . . . 27,944 7,027 43,803 10,145 36,032 50,928 6,305 2,815 30,809 11,105 995,263 194,679 767,820 825,841 89,119 15
16 $9,000 under $10,000 . . . . . . . . . . . . . . . . . . . . . 24,714 5,920 35,985 6,438 29,222 49,128 5,925 2,730 24,973 11,591 735, 166,220 550,013 680,532 74,752 16 z
17 $10,000 under $15,000 . . . . . . . . . . . . . . . . . . . . 68,734 20,366 126,765 34,778 85,347 202,379 12,959 9,325 75,949 42,932 1,656,198 615,083 1,063,088 1,733,965 231,473 17 0
18 $15,000 under $20,000 . . . . . . . . . . . . . . . . . . . . 23,789 12,368 61,229 29,300 43,768 166,992 4,368 3,490 40,575 34,344 477,068 381,875 183,740 453,676 93,965 18 0
19 $20,000 under $25,000 . . . . . . . . . . . . . . . . . . . . 10,026 7,406 33,023 22,348 24,478 134,2?2 3,548 7,538 22,171 23,391 211,738 273,060 51,160 172,885 46,20919
20 $25,000 under $50,000 . . . . . . . . . . . . . . . . . . . . 10,468 15,265 52,002 66,515 38,807 389,290 3,783 10,267 36,145 64,534 303,568 755,275 45,621 263,620 87,911 20
21 $50,000 under $100,000 . . . . . . . . . . . . . . . . . . . 1,972 9,937 14,651 45,643 10,103 259,867 933 4,243 9,448 36, 047 86,722 558,261 5, 009 60,397 29,751 21
22 $100,000 under $150,000 . . . . . . . . . . . . . . . . . . 264 2,925 2,305 14,687 1,639 85,002 174 1,448 1,529 12,483 13,220 185,290 442 12,513 7,759 2 2
23 $150,000 under $200,000 . . . . . . . . . . . . . . . . . . 63 797 644 5,342 482 36,957 44 631 452 4,475 3,278 75,855 78 2,826 2,923 23 >4
24 $200,000 under $500,000 . . . . . . . . . . . . . . . . . . 74 1,184 612 8,291 532 75,271 46 888 49? 8,897 3,552 163,699 56 2,551 4,282 2 4
25 $500,000 under $1,000,000 . . . . . . . . . . . . . . . . 12 156 71 1,519 82 29,853 6 285 76 1,945 552 71,740 14 274 3,352 25
26 $1,000,000 or more . . . . . . . . . . . . . . . . . . . . . . . 3 936 24 1,148 31 32,000 3 215 28 2,539 206 95,131 2 34 1,120 2 6
27 Nontaxable returns, total . . . . . . . . . . . . . . . . . . 42,288 26,123 25,639 11,283 273,905 99,343 122,459 36,077 175,973 53,284 1,887,383 99,359 140,852 2,772 5,180 27 cl
6,643 9,216 3,648 3,338 47,175 24,189 19,097 7,790 32,349 16,034 68,302 3,442 2,423 44 85 28 z28 No adjusted gross income . . . . . . . . . . . . . . . .
. ~d
29 Under $600 . . . . . . . . . . . . . . . . . . . . . . . . . . . . . . . 2,884 2,939 (1) (1) 25,186 6,953 11,617 3,176 16,120 3,581 227,159 5,893 3,519 51 72 2 9
30 $600 under $1,000 . . . . . . . . . . . . . . . . . . . . . . . . 2,765 793 2,677 484 20,864 6,507 9,536 2,495 14,258 3,565 340,644 10,259 10,957 106 209 30
31 $1,000 under $1,500 . . . . . . . . . . . . . . . . . . . . . . 5,555 3,027 2,423 631 31,741 8,674 14,368 3,439 19,888 74,383 404,875 16,195 24,693 365 545 31
32 $1,500 under $2,000 . . . . . . . . . . . . . . . . . . . . . . 4,278 1 293 2,389 542 33 055 7 990 14 149 2,845 22,294 3,898 276,189 14,744 25,816 387 796 32
33 $2,000 under $2,500 . . . . . . . . . . . . . . . . . . . . . . 3,793 1 :121 (1 32,271 9,1304 16:191 2,611 18,429 5,133 169,211 12,464 20,230 406 747 33
34 $2,500 under $3,000 . . . . . . . . . . . . . . . . . . . . . . 5,519 1,597 3,107 672 26,175 6,552 13,234 2,805 15,326 2,320 144,152 11,202 19,049 430 852 34 CA
35 $3,000 under $3,500 . . . . . . . . . . . . . . . . . . . . . . 3,269 911 2,269 441 18,381 6,825 9,034 2,967 10,475 2,781 103,674 9,458 14,171 400 654 35 CD
36 $3,500 under $4,000. . . . . . . . . . . . . . . . . . . . . . 3,263 1,205 2,513 982 12,351 4,132 4,970 1,263 8,378 2,055 56,709 6,044 8,593 227 502 36
37 $4,000 under $4,500. . . . . . . . . . . . . . . . . . . .. 1 8,900 3,433 2,626 499 6,767 2,264 29,130 3 438 4,908 123 241 37
2,814 1 , 723 (1) (1) 4,353 923 23,543 3 :048 3,519 99 245 3838 $4,500 under $5,000 1,720 837 2,8" 5 316
39 $5,000 or more . . . .. 21599 3184 12,490 1 13,061 1 6,043 5,880 7,336 1 6,347 23,795 3,172 2,974 135 232 39
840 Returns under $5,000 . . . . . . . . . . . . . . . . . . . . . 13 5 42 56 131,339 24,922 599,18( 221 312 2618.:163 44 192 1 423,28~2 7039:372t 8148,001 5 501,597 1,970 950 249,073 40
, " " 'l 75:25 "1' 9'2 22 595 6 989 0 5 14 035 412,441 38,946 519 5 ,323 6,6 1,
41 Returns $5,000 under $10,000. . . . . . . . . 1 238,381 43,069 252,15 :, 20493 '081
344,850 496,817 41
115,744 73,146 291,497 231,183 208,072 419,138 27,115 41 227 188,476 235,830 2,756 , 620 3 175,321 1,349,280 2722 747 508,747 142
42 Returns $10,000 or more . . . . . . . . . . . . . . .
Footnote at end of table . See text for "Description of Sample" and "Explanation,of Classifications and Terms ."
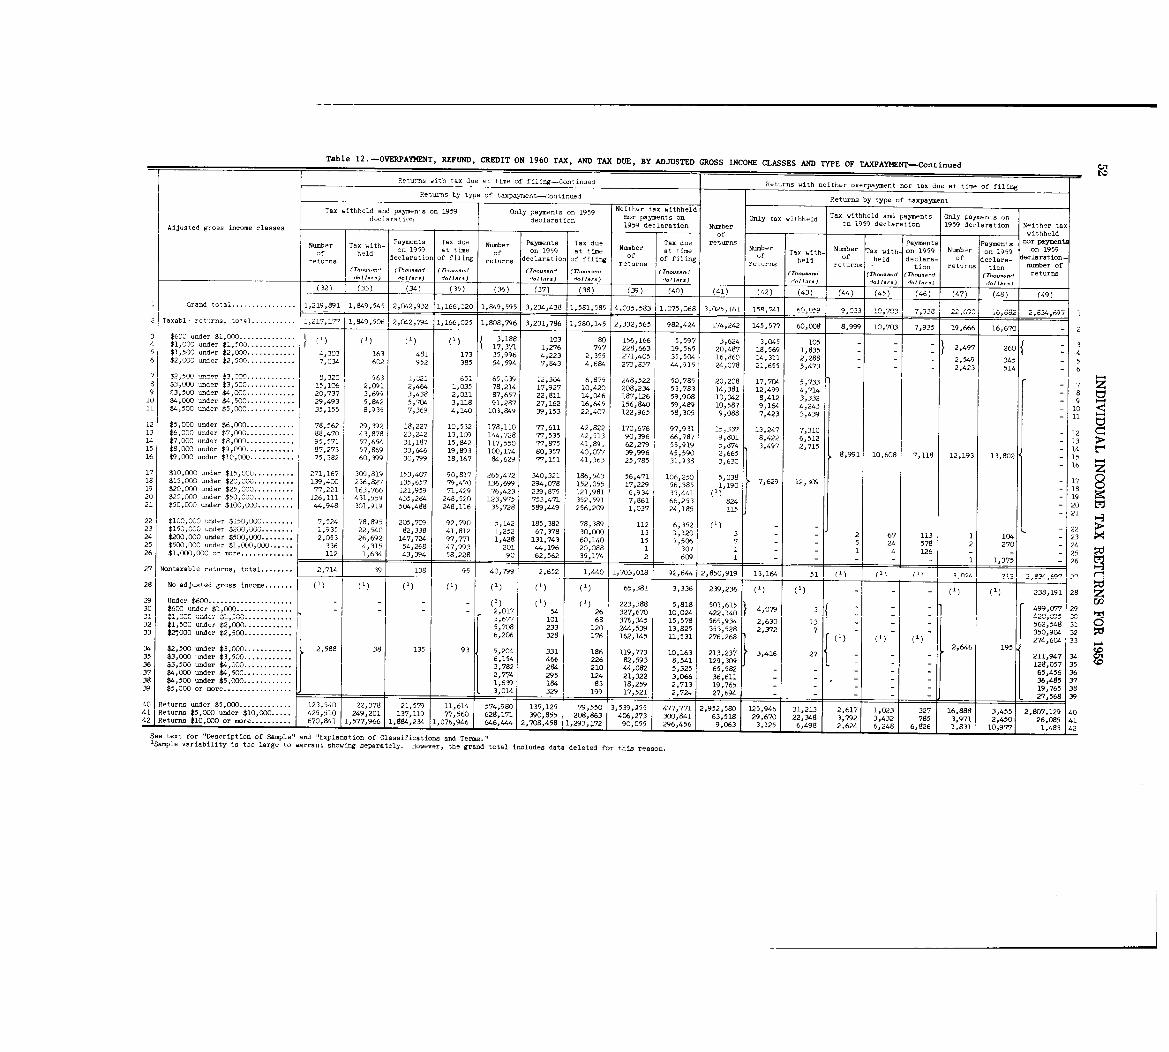
Table 12 . -OVERPAYMENT, REFUND, CREDIT ON 1960 TAX, AND TAX DUE, BY ADJUSTED GROSS INCOME CLASSES AND TYPE OF TAXPAYMENT-Continued C"
Returns with tax due at time of filing-Continued Returns with neither overpayment nor tax due at time of filingReture-s by type of taxpayment-Continued Returns by type of taxpayment
Only payments on 1959 Neither tax withhel dwithheld and payments on 1959Tax withheld and payments Only paym-ts ondeclaration declaration nor payments on Only tax withheld c
1959 declaration Number n 1959 declaration 1959 declaration Neither taxAdjusted g. .. a ir-.a classesof withheldreturns Payments Payments nor paymentsNumber Tax with- .'Ym"t' Tax du, Number Payments Tax due Tax due Number Number Tax with~ on
1959 Number on 1959h~ld on 1959 at time of on 1959 ~ .t imu lumber at time Tax with- on 1959ofd-l .r .ti. . of filing declaration
f f
-f ofheld declare-
ofdeclare- declaration-return. returns il'rg -turns of filing rc7frns held
returns tio returns tion number ofTh . .. . -' (Th-,-d (T~--d Th-- I (Th-...1 (Th~... ~d (Th-d returns
d.f I-)d.11 . .. ) d.1I-) d.1 M- )
(32) (33) (34) (35) (36) (37) (38) (39) (40) (41) (42) (43) (49)(45) (46) (47) (48 )
i Grand total . . . . . . . . . . . . . . . . . 1,219,891 1,849,545 2,04.2,932 1,166,120 1,849,595 3,234,438 1,581,585 4,035,583 1 .075,068 3~025,161 159,741 1 60,059 9,0331 10,7C3 7,938 22,690 16,8821 2,834,69 72 Taxabl returns, total . . . . . . . . . . . 1,217,17? 1,849,506 2,042,794 1,166,025 1,808,796 3,231,786 1,580,145 2,332,565 982,424 174,242 145,577 60,008 8, g% 10,703 7,935 19,666 16,670 - 23 $600 under $1,000 . . . . . . . .. IC3 80 156,166 5,597 3,624 3,G45 105 2,497 26 04 $1,000 under $1,50*0 . . . . . . .
. 13:188 1, - - - - 37 371 276 797 228,663 19,565 20,467 18,569 1,835 - - - - 45 $1,500 u .d- $2,000- . . . . . . . . . 4,303 163 481 173 35,996 4,223 2,355 271,405 35,504 16,860 14,311 2,288 - - - 2,549 345 - 56 $2,003 under $2,500 . . . . . . . . . . . . 7,034 602 952 385 54,594 7,843 4,684 273,837 ",915 24,078 21,655 5,473 - - - 2,423 514 - 6
7 $2,50n under $3,11X . . . . . . . . . . . . 6,32C 963 l,c2l 65i 65,339 12,3&4 b,875 248,522 50,785 20,208 17,704 5,733 - 7 z8 $3,000 =der $3,500 . . . . . . . . . . . . 15, 106 2,091 2,464 1,035 78,214 17,927 10,420 208,234 53,793 14,381 12,499 4,714 - 8 C19 t3,500 under $4, OCO . . . . . . . . . . . . 20,737 3,699 3,436 2,011 87,657 22,811 14,046 167,126 59,908 10,042 8,412 3,332 -10 $4 0 under $4,500 . . . . . . . . . . . . 29,493 5,842 5, 704 3,118 91,287 27,162 16,645 156,840 59,489 10,587 9,164 4,243 - 11$4,5~~C under $5,00C . . . . . . . . . . . . 35,155 8,935 7,369 4,140 103,849 39,153 22,407 122,965 58,305 9,088 7,423 3,439 - -12 $5,000 under $6,000 . . . . . . . . . . . . 78,562 29,392 18,227 10,532 178,110 77,611 42,822 170,676 97,931 15,337 13,247 7,310 - 12 C11113 $6,000 under $7, 000. . . . . . . . . . . . 88,470 43,878 23,242 13,109 144,728 77,535 42,513 90,396 66,787 9,801 8,422 6,512 - 13 >14 $7,000 under $8,000 . . . . . . . . . . . . 95,571 57,654 31,187 15,842 117,550 77,875 41,891 62,279 55,919 5,874 3,497 2,715 - 14 t~15 $8,000 ..der $9,000 . . . . . . . . . . . . 87,273 57,869 33,646 19,893 100,174 80,357 40,077 39,996 45,590 2,665 8,991 10,608 7,118 12,193 13,802 - 1 516 $9,DOO under $10,000 . . . . . . . . . . . 75,382 60,399 30,799 18,167 84,629 77,151 41,363 25,785 31,938 3,630 - 16
2~17 $10,000 under $15,OOC . . . . . . . . . . 271,167 309,819 153,407 90,817 265,472 340,321 186,543 56,471 106,250 5 , 038 7,629 12,309 - 17 018 $15,000 under $20,000 . . . . . . . . . . 139,400 236,827 135,657 ?9,470 136,699 294,078 152,055 17,229 56,385 1,190 - 18 C)19 $20,000 under $25,000 . . . . . . . . . . 77,221 163,766 121,959 ?1,429 76,423 239,875 121,981 6,934 33,441 ( 1 ) - 1920 $2,000 under $50,000 . . . . . . . . . . 126,111 431,559 435,284 248,520 123,975 753,471 352,591 7,861 66,253 824 - 2021 $50,000 under $100,000 . . . . . . . . . 44,948 301,919 504,488 248,116 35,728 589,"9 256,209 1,037 24,185 115 - 2 122 $100,C)OC) under $150,000 . . . . . . . . 7,524 78,895 205,709 92,790 5,142 185,382 78,389 112 6,352 (1) - - 22 >23 $150,000 under $200,~)OG . . . . . . . . 1,935 22,540 82,338 41,812 1,252 67,376 30,000 13 1,120 3 - - 2 67 113 1 104 - 2 324 $200,000 ~nder $500,000 . . . . . . . . 2,053 26,692 147,724 97,771 1,428 131,743 60,140 15 1,506 7 - - 5 24 578 2 270 - 2425 $500,300 under $1,000,000 . . . . . . 336 4,315 54,266 47,993 201 44,196 20,088 1 307 1 - - 1 4 126 - - - 2526 $1,000,000 or more . . . . . . . . . . . . . 112 1,614 43,314 58,228 901 62,562 1 35,174 2 609 1 1 1,375 - 2627 Nontaxable returns , total . . . . . . .. 40,799 2,652 1,440 1,703,018 92,644 2,850,919 13,164 51 (1) ~1) q nq~ I'll o .11 -
28 No adjusted gross income . . . . . .. (1) (1) (1) (1) 1, 65,381 3,336 2.39 2:- 238,191 281) 1
:6
29 Under $600. (1) 223,388 5,818 5 49~O~ under 1,000 . . . . . . . . . . . . . . 2, 26 327,670;*----* 017 54 10,024 422,140 71 3 1 1 -urder $1-0. . . . . . . . . . . . . J,677 101 68 376 345 15 578 565 934 2,630 13 -32 under $2,DOO . . . . . . . . . . .. 5,708 233 20 244 :539 13:825 353:528 2,372 7 - 350,904 3233 $2',000 under $2,500 . . . . . . . . . . .. 6,206 328 176 162,145 11,53 l 276 268 274,604 3300 1
2,646 19534 $2,500 under $3, COO . . . . . . . . . . . . 2,588 38 135 93 5,204 331 186 119,773 10,153 213 37 3,416 27 211,947 34 CXq35 $3,000 under $3,500 . . . . . . . . . . . . 6,154 466 226 92,593 8,541 129,309 128,057 3536 $3,500 under $4,000 . . . . . . . . . . .. 782 234 210 " 082 5 325 65,582 - - 65,456 3637 $4,000 -der $4 ;50n . ~ :7111 295 1.24 21:322 3:066 36,611 - - 36,485 3738 $4 500 under $5,000. :,.,. .-.' .' : .*.- 1 639 184 83 is 259 2 713 19 765 - - 19,765 3839 $5:000 or more . . . . . . . . . . . . . . . . IL 3:014 329 199 1 17,521 1 2 :724 27:694 - - 27,568 3940 Returns under $5,000 . . . . . . . . . . . . . 123,540 22,378 21,57,9 6 74,980 135,125 71 :855 1 3,5 477 77 2,952 1:, i : :i i6 3 2 3 71 23 327 1 16,888 3,455 2,820~7 129 4041 Returns $ OGO under $10,000. . . . . 425,510 24 17 615 9,201 137 11: 6. 628,171 390,855 2.
.D 4. 273 300'841 7 11 5 ~2 5
1'5 63:
11, , 39
:~ 22 8 8 3 97 2,450 6 085 4Returns $10,000 or more . . . . . . . . . . . 670,841 1,577,966 1,884 2 444 2,708,456 1,29, 296,456 9,06 5 6
9
i X 8 6 1 831 30,977 1,483 4242
1 1 1112 5 6,498 6 2See text for "Description of Sample" and "Explanation of Classifications and Terms'Sample variability is too large to warrant showing separately . However, the grand total includes data deleted for this reason .
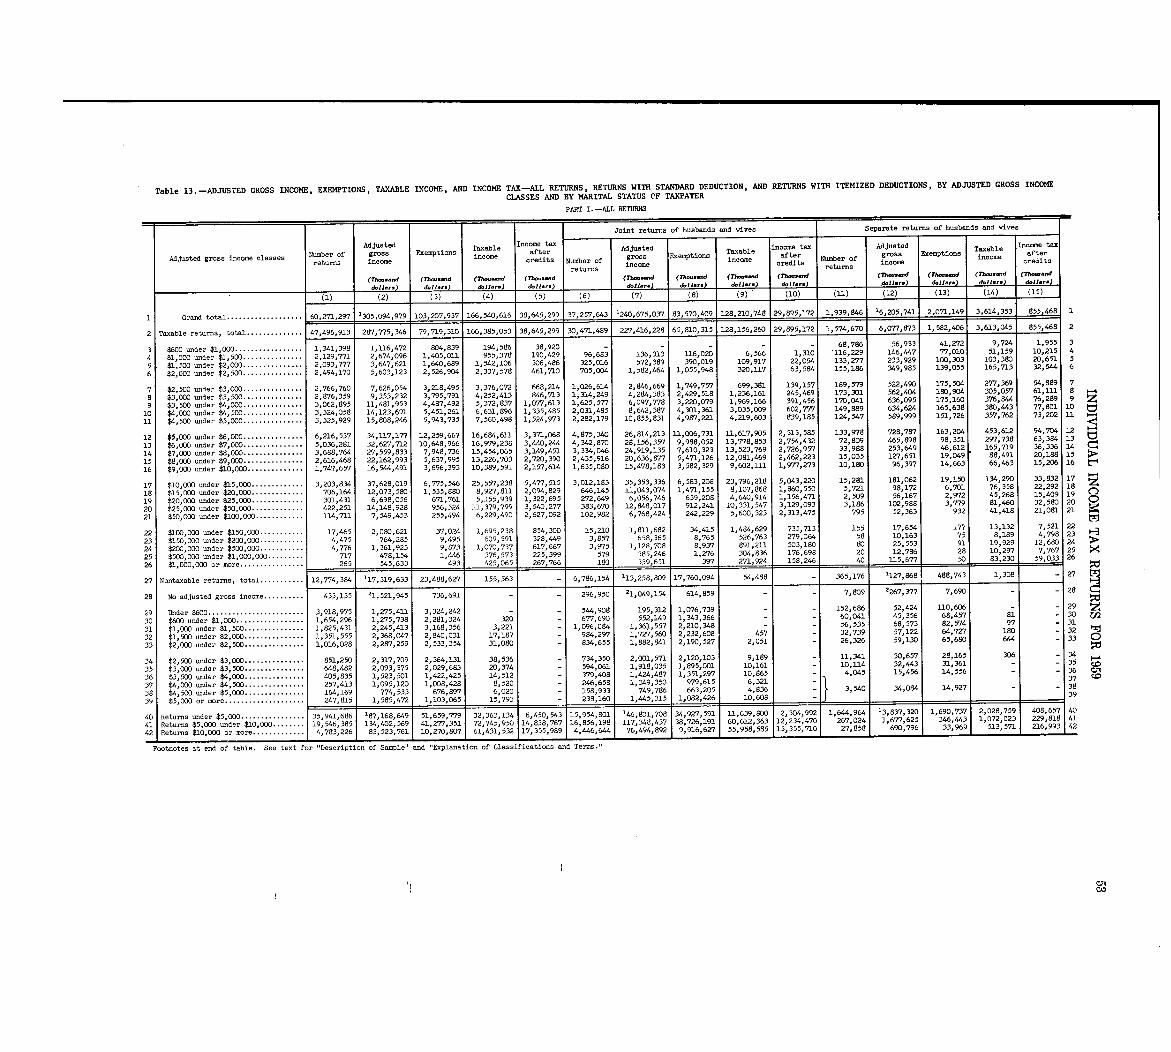
Table 13 . -ADJUSTED GROSS INCOME, EXEMPTIONS, TAXABLE INCOME, AND INCOME TAX-ALL RETURNS, RETURNS WITH STANDARD DEDUCTION, AND RETURNS WITH ITEMIZED DEDUCTIONS, BY ADJUSTED GROSS INCOME
CLASSES AND BY MARITAL STATUS (IF TAXPAYE R
PART I . -ALL RETURNS
Joint returns of husbands and wives Separate returns of husbands and wives
Adjusted Taxable Income tax Adjusted Taxable Taxabl eNumber of gross
Exemptions after Income tax Adjusted Income tAdjusted gross income classes income gross Exemptions afte gross Exemptions after
returns income credits Number of income ir Numbe Of income cincome red t. tur income reditsreturns re Me
(Thm-nd (7h--d (Th--d (77-d (77-d (Th-nd (Th-d (Tb- ..d (Tb-.-d (77m,md (Thm-d (77-d
d.11 ... d.11 .. . &II-) d.11 .,.) dlllr,) d.11. .. d.11... d.11.. . ~d.11-) d.11... d.11 . .. ) d.11 . ..
(1) (2) (3) (4) (5) (6) (7) (8) (9) (10) (11) (12) (13) (14) (15 )
1 Grand total . . . . . . . . . . . . . . . . . . . 60,271,297 1105,094,979 103,207,937 166,540,616 38,645,299 137,257,643 1240,675,037 83,570,409 1 128,210,748 29,895,172 1,939,846 1 16,205,741 2,071,149, 3,614,353 __L55,468 1
2 Taxable returns, total . . . . . . . . . . . . . . 47,496,913 287,775,346 79,719,310 166,385,053 38,645,299 30,471,489 227,416,228 65,810,315 128,156,260 29,895,172 1,574,670 6,077,873 1,582,406 3,613,045 855,468 2
3 $6GO under $1,000 . . . . . . . . . . . . . . . . . 1,341,398 1,116,472 804,839 194,586 38,920 - - - - - 68,786 56,933 41,272 9,724 1,955 3
4 $1 000 =der $1,500 . . . . . . . . . . . . . . . 2,129,771 2,674,096 1,405,011 955,378 190,429 96,683 136,313 116,020 6,566 1,310 '116,229 146,447 77,010 51,159 10,215 4
5 $1:5GO under $2,000 . . . . . . . . . . . . . . . 2,093,777 3,647,621 1,640,689 1,542,106 306,486 325,016 572,389 390,019 109,917 22,054 133,277 233,929 1GO,303 103,380 20,651 5
6 $2,000 under $2,500 . . . . . . . . . . . . . . . 2,494,170 5,603,123 2,526,904 2,337,578 461,710 705,004 1,582,464 1,055,948 320,117 63,584 155,186 349,985 139,055 165,713 32,544 6
7 $2,500 under $3,000 . . . . . . . . . . . . . . . 2,766,760 7,626,054 3,218,495 3,376,072 668,214 1,026,614 2,846,669 1,749,757 699,381 139,157 189,579 522,490 175,504 277,369 54,889 7
8 $3 000 under $3,500 . . . . . . . . . . . . . . . 2,876,359 9,353,232 3,795,791 4,252,413 846,713 1,314,249 4,294,383 2,429,518 1,236,161 245,469 173,301 562,404 180,904 305,057 61,111 8 ~_4
9 $3:500 under $4,000 . . . . . . . . . . . . . . . 3,062,895 11,481,953 4,487,492 5,372,837 1,077,613 1,625,577 6,097,778 3,220,079 1,969,166 391,456 170,041 636,095 175,160 376,844 76,289 9 Z
10 $4 , 000 under $4,500 . . . . . . . . . . . . . . . 3,324,058 14,123,691 5,451,261 6,631,896 1,335,485 2,031,485 8,642,387 4,301,361 3,035,009 602,777 149,889 634,624 165,638 380,443 77,801 10 C~
11 $4,500 under $5,000 . . . . . . . . . . . . . . . 3,325,929 15,808,246 5,943,735 7,560,498 1,524,973 2,282,179 10,855,831 4,987,221 4,219,603 839,185 124,547 589,999 151,726 357,762 73,202 11 1- 4-4
12 $5,000 under $6,000 . . . . . . . . . . . . . . . 6,216,537 34,117,177 12,259,667 16,694,611 3,371,068 4,875,340 26,814,213 1 .1,006,731 11,617,905 2,313,585 133,978 728,787 163,204 453,612 94,704 12
13 $6,000 under $7,000 . . . . . . . . . . . . . . . 5,036,281 32,627,712 10,648,966 16,979,238 3,440,244 4,342,870 28,156,357 9,988,052 13,778,853 2,754,432 72,809 465,898 98,351 297,738 63,394 13
14 $7 , 000 under $8,000 . . . . . . . . . . . . . . . 3,688,764 27,559,833 7,948,736 15,454,065 3,149,451 3,334,046 24,919,135 7$610,323 13,523,769 2,726,957 33,988 253,649 46 612 165,719 36,336 14 C .'
15 $8,000 -der $9,000 . . . . . . . . . . . . . . . 2,616,468 22,162,993 5,637,995 13,226,703 2,720,390 2,435,916 20,636,877 5,471,126 12,081,469 2,462,223 15,035 127,651 19:049 88,491 20,188 15 ~>
16 $9,000 -der $10,000 . . . . . . . . . . . . . . 1,747,657 16,544,491 3,696,393 10,389,591 2,157,614 1,635,080 15,478,183 3,582,329 9,602,111 1,977,273 10,180 96,397 14,663 66,463 15,206 16 t74
17 $10,000 =der $15,000 . . . . . . . . . . . . . 3,203,834 37,628,019 6,775,546 25,55?,238 5,477,515 3,012,183 35,353,336 6,583,208 23,796,218 5,043,220 15,281 181,062 19,150 134,290 33,832 17 1 1
18 $15,000 under $20,000 . . . . . . . . . . . . . 706,164 12,073,580 1,535,880 8,927,811 2,094,829 646,145 11,043,074 1,471,155 8,107,868 1,860,550 5,721 98,172 6,701 76,358 22,292 18 z
19 $20,000 under $25,000 . . . . . . . . . . . . . 301,431 6,698,056 671, 761 5,155,939 1,322,695 272,649 6,056,746 639,208 4,640,914 1,156,471 2,509 56,167 2,972 45,268 15,409 19 0
20 $25,000 under $50,000 . . . . . . . . . . . . . 422,251 14,148,928 956,324 11,379,799 3,540,277 383,670 12,848,017 912,241 10,331,547 3,129,093 3,186 102,988 3,779 81,460 32,580 20 0
21 $50,000 under $100,000 . . . . . . . . . . . . 114,71-1 7,549,453 255,494 6,229,490 2,627,092 102,982 6,768,424 242,229 5,600,323 2,313,475 795 52,363 932 41,418 21,081 2 1
22 $100,000 -der $150,000 . . . . . . . . . . . 17,465 2,080,621 37,024 1,695,238 854,300 15,210 1,811,682 34,415 1,484,629 735,713 155 17,654 177 13,132 7,521 22
23 $150,000 under $200,000 . . . . . . . . . . . 4,475 764,285 9,495 609,591 328,449 3,857 658,365 8,765 526,763 279,064 58 10,163 75 8,189 4,798 23
24 $200,000 under $500,000 . . . . . . . . . . . 4,776 1,361,923 9,873 1,070,737 617,667 3,975 1,128,708 8,937 891,211 503,180 80 25,553 91 19,929 12,68024
25 $500,000 under $1,000,000 . . . . . . . . . 717 478,154 1,446 376,573 225,399 579 385,246 1,276 304,836 176,698 20 12,786 28 10,297 7,767 25
26 $1,000,000 or more . . . . . . . . . . . . . . . . 265 545,633 493 1 425,065 267,766 ISO 339,651 397 271,924 158,246 40 115,677 50 . 83,230 59,033 26
27 Nontaxable returns, total . . . . . . . . . . . 12,774,384 117,319,633 23,488,627 155,563 - 6,786,154 113,258, 9 17,760,094 54,488 - 365,176 1127,868 488,743 1,308 - 27
28 No adjusted gross income . . . . . . . . . . 433,135 21,521,945 736,691 - - 296,950 21,049$154 614,859 - - 7,809 1267,377 7,690 - - 28
29 Under $600 . . . . . . . . . . . . . . . . . . . . . . . . 3,918,975 1,275,411 3,324,242 - - 544,908 195,312 1, 076,739 - - 152,686 52,424 110,606 - - 29 z
30 $600 under $1,000 . . . . . . . . . . . . . . . . . 1,654,296 1,275,738 2,281,324 320 - 677,690 552,149 1,343,366 - - 60,041 45,356 68,457 81 - 30 En
31 $1 000 =der $1,500 . . . . . . . . . . . . . . . 1,825,431 2,245,413 3,168,356 3,221 - 1,096,094 1,361,557 2,210,348 - - 56,535 68,573 82,574 97 - 31
32 $1:500 under $2,000 . . . . . . . . . . . . . . . 1,351,555 2,368,047 2,840,031 17,187 - 984,2917 1,M,560 2,232,608 457 - 32,739 57,122 64,727 ISO - 32 It
33 $2,000 undev $2,500 . . . . . . . . . . . . . . . 1,016,028 2,287,259 2,533,354 31,080 - 834,655 1,882,841 2,190,527 2,051 - 26,326 59,130 65,680644 - 33 Q
~d
34 $2,500 under $3,000 . . . . . . . . . . . . . . . 651,250 2,317,709 2,364,131 38,536 - 734,350 2,001,571 2,120,103 9,189 - 11,341 30,657 28,165 306 - 34
35 $3,000 -der $3,500 . . . . . . . . . . . . . . . 648,482 2,093,375 2,029,683 20,374 - 594,061 1,918,035 1,895,001 10,161 - 10,114 32,443 31,361 - - 35
36 $3,500 under $4,000 . . . . . . . . . . . . . . . 405,835 1,523,501 1,422,425 14,512 - 379,408 1,424,487 1,351,297 10,865 - 4,045 15,456 14,556 - 36 CX1
37 $4,000 under $4,500 . . . . . . . . . . . . . . . 257,413 1,095,120 1,008,428 8,520 - 246,658 1,049,350 979,615 6,321 - 37
38 $4,500 under $5,000 . . . . . . . . . . . . . . . 164,169 774,533 676,897 6,020 - 158,933 749,786 663,205 4,836 - 3,540 34,084 14,927 - 38
39 $5,000 or more . . . . . . . . . . . . . . . . . . . . 247,815 1,585,472 1,103,065 15,793 L 238,160 1 1,445,315 1 1,082,426 1 10,608 1 - 39
40 Returns under $5,000. 35 941 6861 '87,168,64 51, 3 6,45 3 14 27,591 1 1 639 800 1,2,304,992 1,644 964 13 837 320 1,690 737 2, 28,75 408:657 10
41 Returns $5,000 under 19 546585 134,402,569 41,"9' 1" '831 70"1 334 :9 0,612,363 2 234,470 267,024 1:67?:625 346 :443 1,0 936 138~:7 16, 9856 :19111 1 1 1
. 1
277,3'51 7227431,91'0 14 67 lil,~14378 726,191 6 690,796 33,969 5 72 023
2 8 8 41
42 Returns $10,000 or more . . . . . . . . . . . . . 4 783,226 83,523 761 10,270,807 61,431,532 17,355,989 1 4,446,6~ 9,916,627 55 958,585 15,355,710 27,858 42
Footnotes at end of table . See text for "Description of Sample" and "Explanation of Classifications and Terms
01
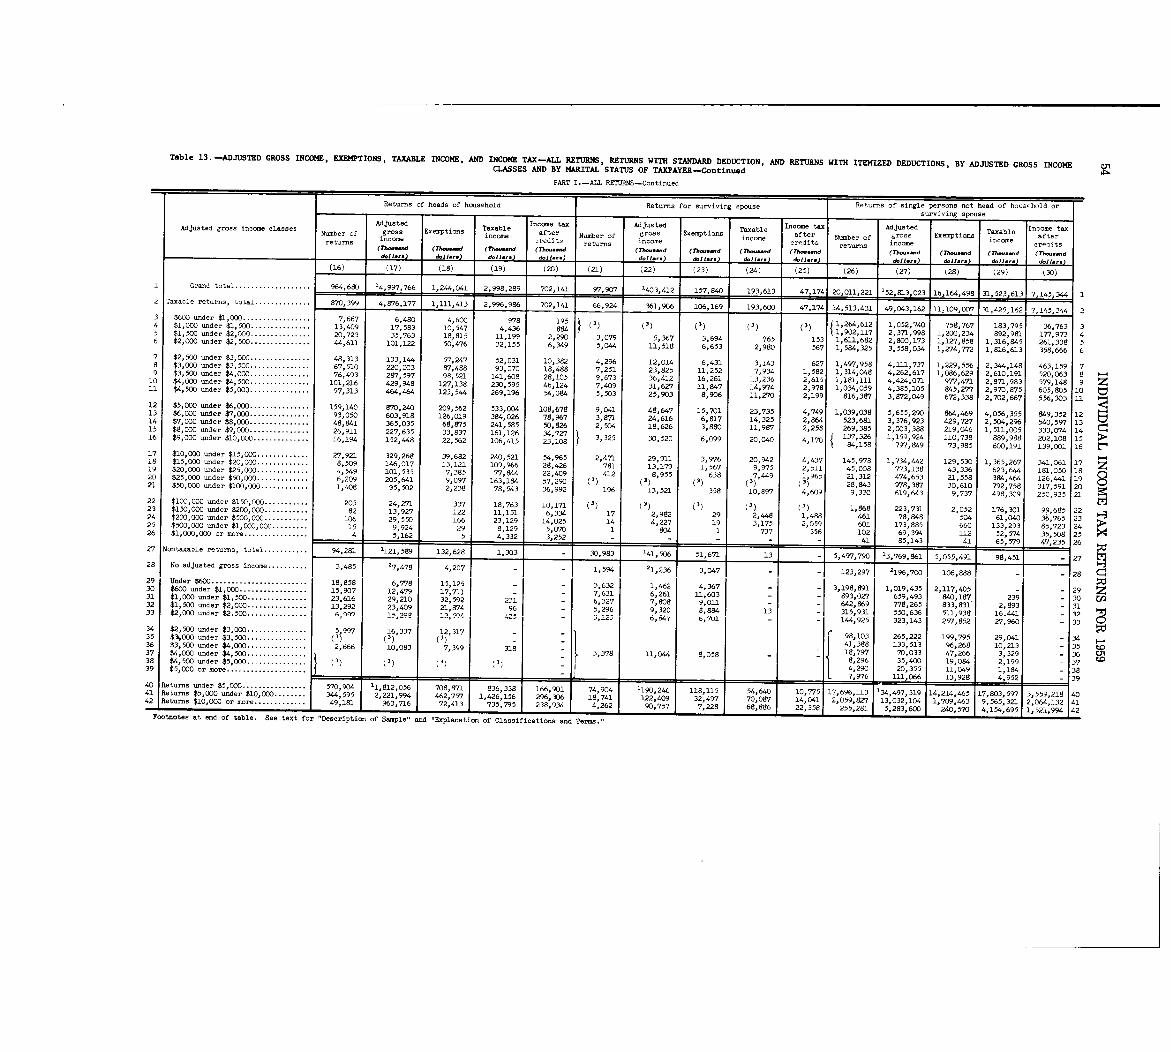
Table 13 . -ADJUSTED GROSS INCOME, EXEMPTIONS, TAXABLE INCOME, AND INCOME TAX-ALL RETURNS, RETURNS WITH STANDARD DEDUCTION, AND RETURNS WITH ITEMIZED DEDUCTIONS, BY ADJUSTED GROSS INCOMECLASSES AND BY MARITAL STATUS OF TAXPAYER-Continue d
PART I .-ALL RETURNS-Continued
Returns of heads of household Returns for surviving spouse Returns of single persons not head of hous, .hold orsurviving spous e
Adjusted gross income classes Adjusted Taxable Income tax Adjusted Taxable Income taxAdjusted Taxable Income tax
Number of gross Exemptions income after Number of gross Exemptions income after Number of ~;ross Exemptions income afterreturns income redits returns income
c-.dits returns income c -dit s(Th-d (7~-d (711-...d (Th-...d (Th--d (Th-.-d (Th-.-d (77,- .. .d (Th-.-d (77- .-d (A- .-d (Th--dd,11... d,11. .. d,11 . .. d,11-I-) d.11. . . d.11 . .. d.1 I .. . d,11.. . ) dollars) d,]J,r,) dll,,,) dll,,,)
(16) (17) (18) (19) (20) (21) (22) (23) (24) (25) (26) (27) (28) (29) ( .30 )
1 Grand total . . . . . . . . . . . . . . . . . . . 964,680 14,997,766 1,244,041 2,998,289 702,141 97,907 1403,412 157,840 193,613 47 174 20,011,221 152,813,023 16,164,498 31,523,613 . 7 .145,344 12 Taxable returns, total . . . . . . . . . . . . . . 870,399 4,676,177 1,111,413 2,996,986 702,141 66,924 361, 906 106,169 193,600 47,174 14 .513,431 49,043,162 11,109,C)07 11,425,10521 7,145,31.4 23 $600 -der $1,000 . . . . . . . . . . . . . . . . . 7,667 6,480 4,600 978 195 (3) (3) (3) 1 264 612 1 052,740 758,767 183,795 36,763 34 $1,000 under $1,500 . . . . . . . . . . . . . . . 13,409 17,583 IC,547 4,436 894 (1) (1) ~ 1:902:117 2:371,998 1,200,234 892,981 177,973 45 $1,500 under $2,000 . . . . . . . . . . . . . . . 20,723 35,763 18,815 11,199 2,290 3,079 5,367 3,694 765 153 1,611,682 2,800,173 1,127,858 1,316,845 261,338 56 $2,000 under $2,500 . . . . . . . . . . . . . . . 44,611 101,122 50,476 32,155 6,349 5,044 11,518 6,653 2,980 567 1,584,325 3,558,034 1,274,772 1,816,613 358,666 67 $2,500 -der $3,000 . . . . . . . . . . . . . . . 48,313 133,144 57,247 52,031 10,382 4,296 12,014 6,431 3,143 627 1,497,958 4,111,737 1,229,556 2,344,148 463,159 7a $3,000 -der $3,50C . . . . . . . . . . . . . . . 67,510 220,003 87,488 93,070 18,488 7,251 23,825 11,252 7,934 1,582 1,314,048 4,262,617 1,086,629 2,610,191 520 063 89 $3,500 under $4,000 . . . . . . . . . . . . . . . 76,493 287, 597 98,521 141,608 28,IC5 9,673 36,412 16,261 13,236 2,61 .5 1,181,111 4,424,071 977,471 2, M 983 579:148 9io $4,000 under $4,500 . . . . . . . . . . . . . . . 101,216 429,948 127,138 230,595 46,124 7,409 31,627 11,847 14,974 2,978 1,034,059 4,385,105 845,277 2,970,875 605,805 10 tv11 $4,500 under $5,003 . . . . . . . . . . . . . . . 97,313 464,464 123,544 269,196 54,084 5,503 25,903 8,906 11,270 2,199 816,387 3,872,049 672,338 2,702,667 556,303 13 .
-.:i12 $5,000 under $6,000 . . . . . . . . . . . . . . . 159,140 870, 240 209,562 333,004 108,678 9,041 48,647 15,701 23,735 4,749 1,039,036 5,655,290 664,469 4,056,355 849,352 12 "13 $6,000 under $7,000 . . . . . . . . . . . . . . . 93,050 603,918 126,019 384,026 78,%7 3, SM 24,616 6,817 14,325 2,864 523,681 3,376,923 429,727 2,504,296 540,577 13 tv14 $7,000 under $8,0D0 . . . . . . . . . . . . . . . 48,841 365,035 68,875 241,585 50,826 2,504 18,626 3,880 11,987 2,258 269,385 2,003,3811 219,046 1,511,005 333,074 14 cl15 $8,000 =der $9,000 . . . . . . . . . . . . . . . 26,911 227,635 33,837 161,126 34,727 137 , 326 1,159,924 110,738 889,988 202,108 15 ~r--16 $9,000 under $10,000 . . . . . . . . . . . . . . 16,194 152,448 22,562 106,415 23,108 3,325 30,520 6,099 20,040 4,17084,158 797,849 73,985 600,191 139,001 16
17 $10,000 under $15,000 . . . . . . . . . . . . . 27,921 329,268 39,682 240,521 54,965 2,471 29,911 3,976 20, c)42 4,437 145,978 1,734,442 129,530 1,365,267 341 061 1718 $15,000 under $20,DOC . . . . . . . . . . . . . 8,509 146,017 13,121 109,966 28,426 781 13,179 1,567 9,975 2,511 45,008 773,138 43,336 623,644 181 :050 1819 $20,000 under $25,000 . . . . . . . . . . . . . 4,549 101,535 7,385 77,844 22,409 412 8,955 638 7,449 1 965 21 312 474,653 21,558 384,464 126,441 1920 $25,000 -der $50,000 . . . . . . . . . . . . . 6,209 205,641 9,097 163,194 57,290 (1) (3) (1) (3) (31) 28:843 978,387 30,610 792,758 317,591 2021 $50,000 under $100,000 . . . . . . . . . . . . 1,408 95,502 2,238 78,543 36,992 196 13,521 358 10,897 4,609 9,330 619,643 9,737 498,309 250, 935 2122 $100,000 under $150,000 . . . . . . . . . . . 205 24,271
337 18,763 10,171 (1) (1) (1) (1) (3) 1,868 223,731 2,052 176,301 99 685 2223 $150,000 =der $200,000 . . . . . . . . . . . 82 13,927 122 11,151 6,334 17 2,982 29 2,448 1,488 461 78,848 504 61,040 36,765 2324 $200,000 under $500,000 . . . . . . . . . . . 106 29,550 166 23,129 14,025 14 4,227 19 3,175 2,059 601 173,885 660 133,293 85,723 2425 $500,000 -der $1,000,000 . . . . . . . . . 15 9,924 29 8,129 5,070 1 804 1 737 356 102 69,394 112 52,574 35, 508 2526 $1,000,000 or more . . . . . . . . . . . . . . . . 4 5,162 5 4 .332 3 .252 41 85,143 41 65,579, 4-7 235 2627 Nontaxable returns, total . . . . . . . . . . . 94,281 1121,589 132,62L[ 1_303 30,983 141, 506 51,671 13T=- 5 3 , 769,861 1 5,055,491 98,4511 2728 No adjusted gross income . . . . . . . . .
. ~1 96, 700 106,888 1283,417 27,478 4,207 1,594 21,236 3, 047
29 Under $600 . . . . . . . . . . . . . . . . . . . . . . .. 18,858 6,778 15,125 3,632 1,462 4,367 - 3,198,891 1,019,435 2,117,405 29 z30 $600 under $1,000 . . . . . . . . . . . . . . . . . 15,907 12,479 17,711 - 7,631 6,261 11,603 - 893,027 659,493 840 187 239 30 Cn31 $1,000 under $1,500 . . . . . . . . . . . . . .. 23,616 29,210 32,592 231 6,327 7,908 9,011 - - 642,869 778,265 833:831 2,893 3132 $1,500 -der $2,000 . . . . . . . . . . . . . . . 13,292 23,409 21,874 96 5,296 9,320 8,884 13 - 315,931 550,636 511,938 16 .441 32 It33 $2,000 -der $2 .500 . . . . . . . . . . . . . . . 6, QQ7 1112-2 11,194 425 3,12~ 6,847 b, -lui - - 144,925 323,143 257,852 27,960 33 034 $2,500 =der $3,000 . . . . . .
. 5 997 (16,337 12,317 - 98,103 265,222 199,795 29,041 343 3) 3 )35 $3~000 under $3,500 . . . . . .. ( ~ - 41 388 133 513 96 268 10,213 3536 $3,500 -der $4,ODO . . . . . . . . . . . . . . . 2,666 10,083 7,399 31837 $4,000 under $4,500 . .. 3,378 11,0" 8,058 18:797 70:033 47:266 3,329 36(3) 8,296 35,400 19,084 2,199 3738 $4,500 under $5,000 . . . . . . . . (3) (3) (3)
4,290 20,355 11,049 1,184 3839 $5,000 or mom . . . . .. . .
. ..
. . .
. .
.7,976 11.1,066 13,928 4,952, ____139
40 Returns under $5,000 . . . . . . . . . . . . . . . . 570,904 '1,812,056 7 8 83 66,901 74,904 '190,246 2 10,775 17,696,113 134 497 :31-9 114 4 46_5 17,803,597 3,559,218] 401:2 941 Return. $5,000 und 33'9
":4 14,041er $10,000 . . . . . . . . -344,595 2,221,9 462:757 .1,126 16 2 6 18 741 122,409 1 :46
,0 6:1 -12 97 70:9'87 2,059,827 13:032 104 70 9,565,321 2,064,132 4142 Returns $10,000 or more . . . . . . . . . . . . . 1 49,181 963,716 72,413 735,795 238,934 1 4:269 gn-757 L 7,228 68,886 22,358 25 281 5,~ 4,154,695 1,521,9 42I I I ITFootnotes at and of table . See text for "Description of Sample" and "Explanation of Classificatiom and Terms ."
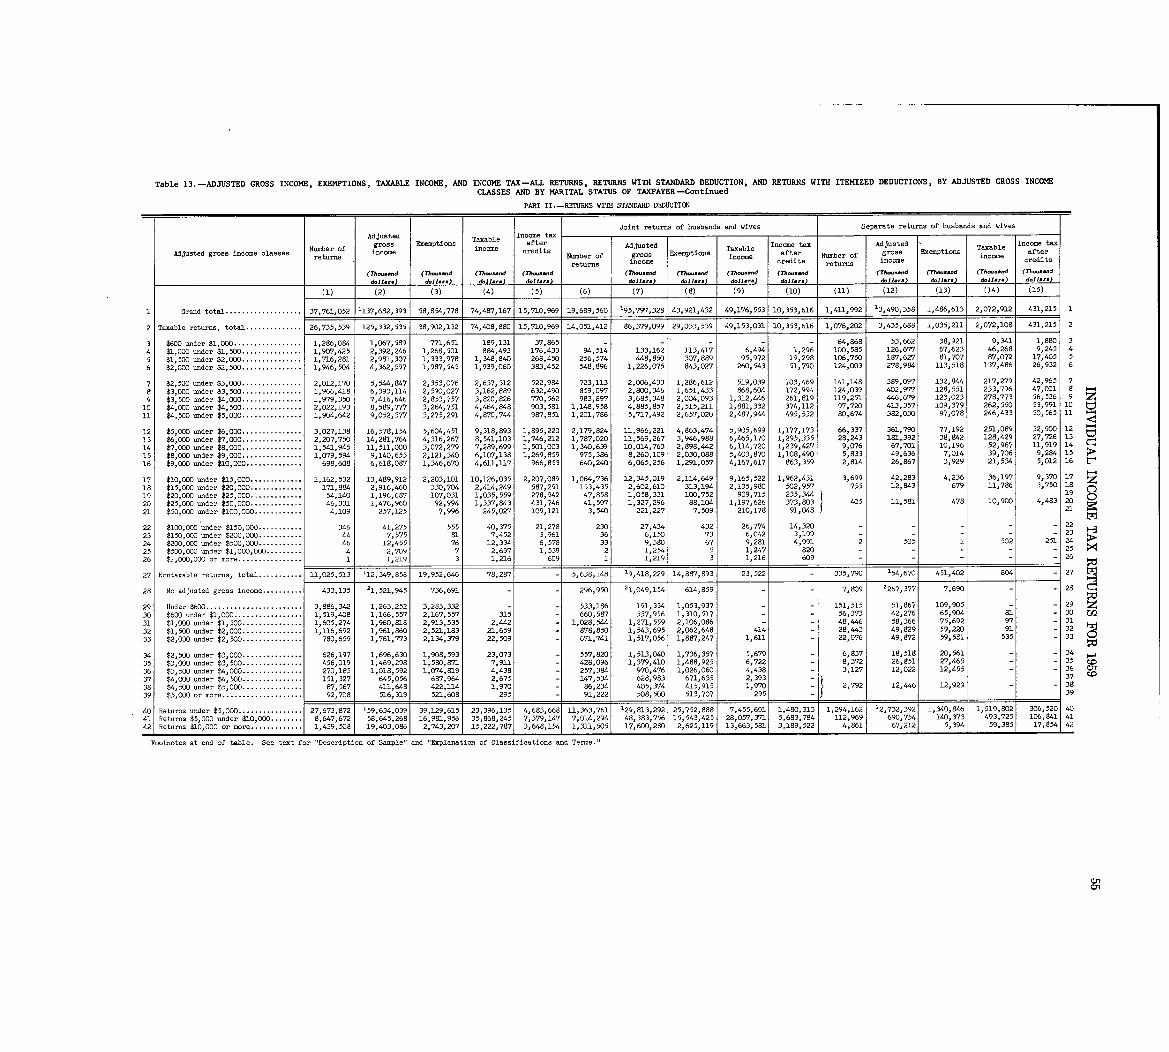
Table 13 .-ADJUSTED CROSS INCOME, EXEMPTIONS, TAXABLE INCOME, AND INCOME TAX-ALL RETURNS, RETURNS WITH STANDARD DEDUCTION, AND RETURNS WITH ITEMIZED DEDUCTIONS, BY ADJUSTED CROSS INCOMECLASSES AND BY MARITAL STATUS OF TAXPAYER-Continue d
PART II .-RETURNS WITH STANDARD DEDUCTION
Joint returns of husbards and wives Separate returns of husbands and wivesAdjusted
gross Exemptions Taxable Income tax
Number of income after Adjusted Income tax Adjusted Taxable Income taxAdjusted gross income classes income credits Number of ~ Exemptions Taxable after Number of gross Exemptions af er
returns gross income income treturns income credit. returns income cred t.
(7'h-.. .d (n-d (T~- .d (Th-. .nd (7~ . ..nd (rh-.-d (7b-. ..d (7h-.-d -(Th-.-d (Th-.-d (Th-...d (Th-.-dd.11... d.1 I—) &II .,.) d.11.,.) d.11.. . d.11 ... doll-) d.11 .,.) 6.11. .. do]]-) doll-) doll...
(1) (2) (3) (4) (5) (6) (7) (8) (9) (10) (11) (12) (13) (14) (15)
1 Grand total . . . . . . . . . . . . . . . . . . . 37,761,052 1137,682,393 58,854,778 1 74,487,167 15,710,969 19,689,560 195,797,328 43,921,432 49,176,553 10,353,616 1,411,992 13,490,358 1,486,613, 2,072,912 431,215 1
2 Taxable returns, total . . . . . . . . . . . . . . 26,735,539 125,332,535 38,902,132 74,408,880 15,710,969 14,051,412 86,379,099 29,033,539 49,153,031 10,353,616 1,076,202 3,435,688 1,035,211 2,072,108 431,215 2
3 $600 -der $1,000 . . . . . . . . . . . . . . . . . 1,286,084 1,067,589 771,651 189,131 37,865 - - 64,868 53,662 38,921 9,341 1,880 3
4 $1,000 under $1,500 . . . . . . . . . . . . . . . 1,907,425 2,392,246 1,268,501 884,493 176,433 94,514 133,162 113,417 6,494 1,296 100,585 126,677 67,623 46,268 9,245 4
5 $1,500 under $2,000 . . . . . . . . . . . . . . . 1,716,281 2,981,307 1,333,978 1,348, M 268,450 256,574 448,850 307,889 95,972 19,298 106,750 187,627 81,707 87,072 17,405 5
6 $2,OD0 -der $2,500 . . . . . . . . . . . . . . . 1,946,504 4,362,597 1,987,545 1,939,060 383,452 548,896 1,226,075 843,027 260,543 51,790 124,GO3 278,984 113,518 137,486 26,932 6
7 $2,500 under $3,000 . . . . . . . . . . . . . . . 2,012,170 5,544,847 2,353,076 2,637,312 522,984 723,113 2,006,433 1,286,612 519,039 103,469 141,148 389,097 132,844 217,279 42,965 7
a $3,000 under $3,500 . . . . . . . . . . . . . . . 1,966,418 6,393,114 2,590,027 3,162,689 632,490 859,097 2,800,346 1,651,433 868,604 172,994 124,039 402,977 128,551 233,796 47,001 8 o--4
9 $3,500 under $4,000 . . . . . . . . . . . . . . . 1,979,350 7,416,646 2,853,?57 3,820,826 770,562 983,897 3,685,348 2,004,093 1,312,446 261,819 119,251 446,679 123,023 278,773 56,536 9 Z
10 $4,000 -der $4,500 . . . . . . . . . . . . . . . 2,022,193 8,589,777 3,264,751 4,464,848 903,581 1,148,958 4,885,857 2,515,211 1,881,332 374,112 97,720 413,357 109,379 262,550 53,991 10
11 $4,500 -der $5, COO . . . . . . . . . . . . . . . 1,904,642 9,052,377 3,275,291 4, 870,744 987,851 1,201,786 5,717,492 2,657,020 2,487,944 495,532 80,674 382,030 97,078 246,433 50,565 11
12 $5,000 under $6, COO . . . . . . . . . . . . . . . 3,027,138 16,578,154 5,604,451 9,318,893 1,895,220 2,179,824 11,966,221 4,863,474 5,905,699 1,177,173 66,337 361,790 77,192 251,089 52,900 12 1.4
13 $6,000 under $7,000 . . . . . . . . . . . . . . . 2,207,750 14,281,764 4,316,267 8,541,103 1,746,212 1,787,020 11,569,267 3,946,988 6,465,170 1,295,335 28,243 181,392 38,942 128,429 27 726 1 3
14 $7,000 under $8, COO . . . . . . . . . . . . . . . 1,541,945 11,511,000 3,072,279 7,289,699 1,501,003 1,340,639 10,014,763 2,898,442 6,114,720 1,239,427 9,076 67,701 10,196 52,967 11:919 14
15 $8,000 under $9,000 . . . . . . . . . . . . . . . 1,079,594 9,140,653 2,121,340 6,107,138 1,269,859 975,386 8,260,109 2,030,088 5,403,870 1,108,490 5,833 49,636 7,014 39,706 9,284 15
16 $9,000 under $10,000 . . . . . . . . . . . . . . 698,608 6,618,087 1,346,670 4,611,117 966,853 640,240 6,065,256 1,291,057 4,167,617 863,359 2,814 26,867 3,929 21,534 5,012 16
17 $10,000 under $15,000 . . . . . . . . . . . . . 1,162,532 13,489,912 2,203,101 10,126,035 2,207,089 1,064,736 12,345,019 2,114,649 9,165,522 1,962,431 3,699 42,283 4,236 36,197 9,370 17
is $15,000 under $20,000 . . . . . . . . . . . . . 171,884 2,916,460 330,704 2,414,249 587,291 153,435 2,602,610 313,194 2,135,980 502,957 755 12,643 679 11,786 3,750 18
19 $20,000 =der $25,000 . . . . . . . . . . . . . 54,140 1,196,687 107,031 1,035,559 278,942 47,858 1,058,331 100,752 909,715 235,344 19
20 $25,000 under $50,000 . . . . . . . . . . . . . 46,331 1,476,960 92,994 1,337,843 431,746 41,597 1,327,296 88,104 1,197,626 373,803 405 11,581 478 10,900 4,483 20
21 $50,000 =der $100,000 . . . . . . . . . . . . 4,109 257,125 7,996 245,027 109,121 3,540 221,227 7,509 210,178 91,048 21
22 $100,000 under $150,000 . . . . . . . . . . . 346 41,275 555 40,375 21,278 230 27,434 432 26,774 14,320 2223 $150,000 -der $200,000 . . . . . . . . . . . 44 7,575 81 7,452 3,961 36 6,150 73 6,042 3,199 2324 $200,ODO -der $500,000 . . . . . . . . . . . 46 12,455 76 12,334 6,578 33 9,380 67 9,281 4,991 2 505 1 502 251 24
25 $500,000 under $1,000,000 . . . . . . . . . 4 2,709 7 2,697 1,539 2 1,254 5 1,247 820 - - - - - 25
26 $1,000,000 or nor. . . . . . . . . . . . . . . . . 1 1,219 31 1,216 609 11 1,219 3 1,216, 609 - - - - - 26
27 Nontaxable returns, total . . . . . . . . . . . 11,025,513 112,349,858 19,952,646 78,287 - 5,638,148 19,418,229 14,887,693 23,522 - 335,790 154,670 451,402 604 - 27
28 No adjusted gross income . . . . . . . . . . 433,135 21,521,945 736,691 - - 296,950 21,049,154 614,859 - - 7,809 2267,377 7,690 - - 28 C_~~0
29 Under $600 . . . . . . . . . . . . . . . . . . . . . . . . 3,886,342 1,263,252 3,283,332 - - 533,186 191,334 1,053,937 - - 151,515 51,867 109,905 - - 29 ~430 $600 under $1,000 . . . . . . . . . . . . . . . . . 1,519,408 1,166,557 2,167,557 315 - 660,587 537,956 1,310,517 - - 56,373 42,276 65,904 81 - 30 U)
31 $1,000 under $1,500 . . . . . . . . . . . . . . . 1,605,274 1,960,818 2,913,535 2,442 - 1,028,544 1,271,559 2,106,086 - - 48,446 58,366 75,692 97 - 31
32 $1,500 under $2,000 . . . . . . . . . . . . . . . 1,116,692 1,961,860 2,521,183 21,659 - 878,850 1,543,695 2,062,648 414 - 28,443 49,829 59,220 91 - 32
33 $2,000 under $2,500 . . . . . . . . . . . . . . . 780,659 1,761,773 2,134,379 22,509 - 671,741 1,517,056 1,887,247 1,611 - 22,076 49,872 59,581 535 - 33
34 $2,500 -der $3,000 . . . . . . . . . . . . . . . 626,197 1,696,630 1,908,593 23,073 - 557,820 1,513,040 1,736,357 5,679 - 6,837 18,518 20,561 - - 34
35 $3,000 -der $3,500 . . . . . . . . . . . . . . . 456,019 1,469,298 1,580,871 7,911 - 428,096 1,379,410 1,488,925 6,722 - 8,372 26,851 27,465 - 35
36 $3, 500 under $4,000 . . . . . . . . . . . . . . . 270,185 1,018,592 1,074,819 4,438 - 257,384 970,476 1,026,060 4,438 - 3,127 12,022 12,455 - 36 01
37 $4,000 under $4,500 . . . . . . . . . . . . . . . 151,327 645,056 687,964 2,675 - 147,534 628,983 671,635 2,393 3767,567 1,970 86,234 405,374 415,915 1 2,792 12,446 12,929 - 3838 $4,500 under $5,000 . . . . . . . . . . . . . . . 411,648 422,114 - 970
39 $5,000 or more . . . . . . . . . . . . . . . . . . . . 92,708 516,319 521,60 295 - 91,222 508,500 513,707 25 - 39
27 159,634,039 39,129,615 23:316,13, 4 83,646 78 11,363,761 129,813,292 25,752,888 7,455,601 1,480,310 1,294,162 12,7 34.0 ,40 Returns under $5,000 . . . . . . . . . . . . 8:6773,6872'20 40
72 8,245 7:1 32:7 ":7 '6: 8392 SO41 Returns $5,000 under $10,000 . . . . : : : : 58,645,268 16,981,956 35 86 379,1 7,014,294 48,383,756 15,543,425 28,057,371 5,683,784 112,969 690 14 73~ 4113 225~ 1. 41 41
42, Returns $10,000 or more . . . . . . . . . . . . . 1,439,508 19,403,086 2,743,207 15,222,787 3,648,154 1,311,505 17,600,280 2,625,119 13,663,581 3,189,522 4,861 67,212 5,394 2
Footnotes at end of table . See text for 'tDescription of Sample" and "Explanation of Classifications and Term~s
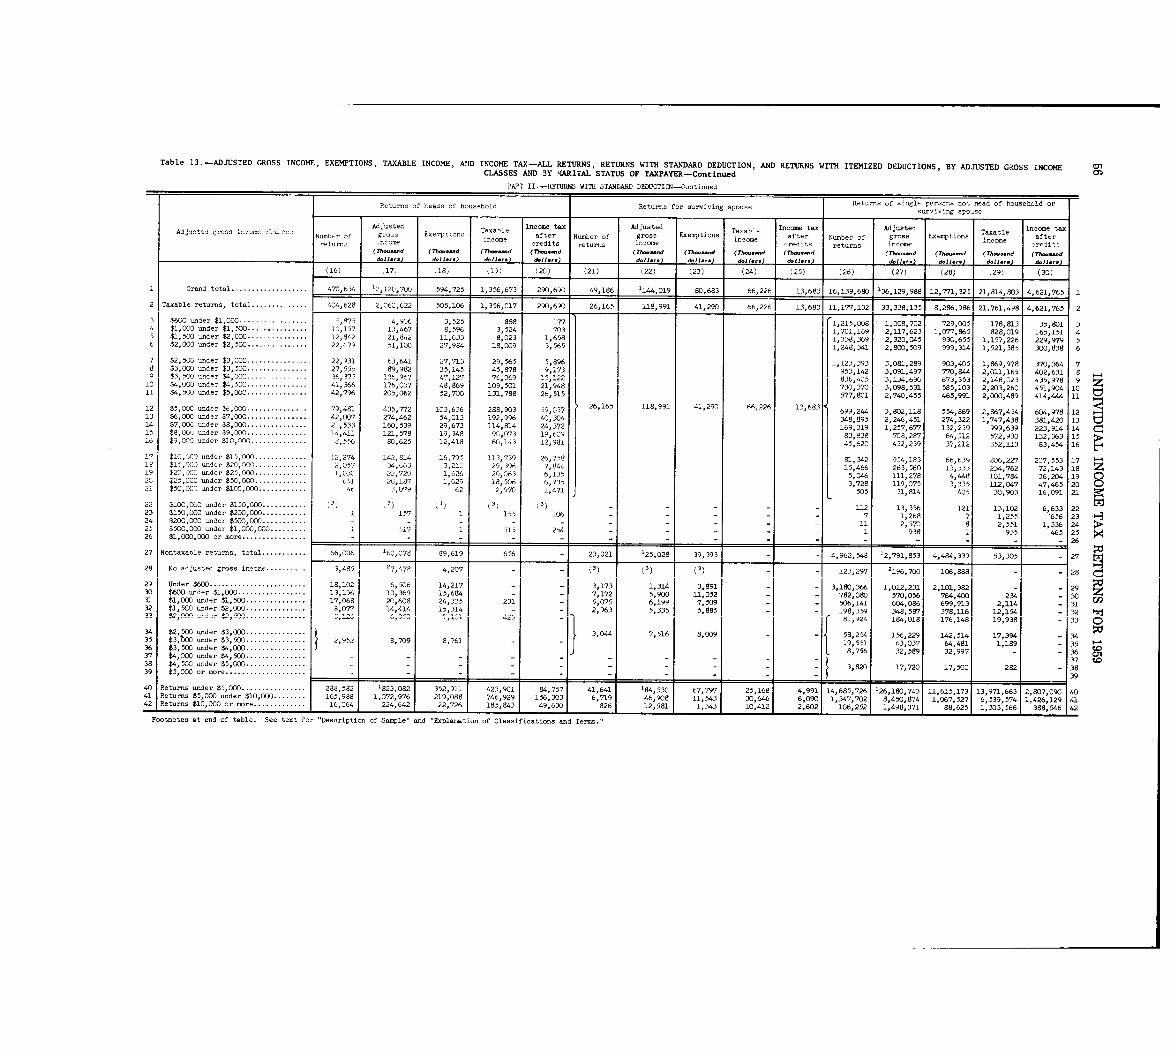
Table 13 . -ADJUSTED GROSS INCOME, EXEMPTIONS, TAXABLE INCOME, AND INCOME TAX-ALL RETURNS, RETURNS WITH STANDARD DEDUCTION, AND RETURNS WITH ITEMIZED DEDUCTIONS, BY ADJUSTED GROSS INCOME 01CLASSES AND 3Y ILARITAL STATUS OF TAXPAYER-Continue d
PART II .-RErURNS WITH STANDARD bFDUCTI0N-0 .ntiuad
Returns of heads of household Returns for su~iving spouse Ret~. of s4ngle per3ons not head of household ors-iving p-se
Adjusted gross income claEses Adjusted Taxable I-- tax Adjusted -ble Income tax Adjusted Taxable Income taxN-be- of income after N-ber of 5rose Eeptins I cafter Number of gro . . Exemptions income IfItel-retu- credits returns income redits returns income -1 .
(Th--d (Th-d (T~-d (Th ..d (Th--.d (T)-...d (Th- .. .d (TO.-d (TI.....d (Th- .-d (7h- ...d (Th--dd.11. .. d.11 .. . d. II-) d.11.. . d,11... d.11 .,.) d.11.. . d.11 ., .) &II-) ~11.. .)
(16) ~17, 119) ~20) (21) (22) ~23) (24) ~25) (26) (27) (28) ~,29) (30)
I Grand total . . . . . . . . . . . . . . . . . . . 470,634 12,120,70C, 594,725 1,356,673 290,690 49,186 '144,019 30,683 66,226 13,683 16,139,680 136,129,988 12,771,325 21,814,803 4,621,765 1
2 Taxable returns, total . . . . . . . . . . . . . . 404,628 2,060,622 505,106 1,356,017 290,690 26,165 118,991 41,290 66,226 13,683 11,177,132 33,338,135 8,286,986 21,761,~98 4,621,765 2
3 k600 under $1,000 . . . . . . . . . . . . . . . . . 5,375 4,90C 3,525 888 177 1,215,008 1,008,702 729,005 178,813 35,8DI 34 $1,000 under $1,500 . . . . . . . . . . . . . . . 10,157 13,467 8,596 3,524 703 1,701,169 2,117,623 1,077,865 828,019 165,151 45 $1,500 under $2,OOC . . . . . . . . . . . . . . . 12,842 21,842 11,633 8,023 1,658 1,338,369 2,320,045 930,655 1,157,226 229,979 56 $2,000 under $2,500 . . . . . . . . . . . . . . . 22,(,79 51,100 27,984 18,009 3,565 1,248,341 2,800,509 999,314 1,521,385 300,638 6
7 $2, 5CC und .r $3,OW . . . . . . . . . . . . . .. 22,931 63,641 27,713 29,565 5,896 1,123,393 3,081,289 903,405 1,869,978 37C,364 713 $3,000 under $3,500 . . . . . . . . . . . . . . . 27,555 89,982 35,145 45,878 9,173 953,142 3,091,497 770,844 2,011,165 402,631 8 19 $3, 500 -,nq-r $4, 0(y) . . . . . . . . . . . . . 3E,375 13C,967 47,127 76,C69 15,122 836,405 3, 1~4, 6 90 67J,35-i 2,148,023 435 978 9 Z10 $4,OGO under $4,5CO . . . . . . . . . . . . . . . 41_366 176,037 48,869 109,501 21,948 730,370 3,098,531 585,103 2,203,260 4.51 :904 10 cj11 $4,500 under $5,000 . . . . . . . . . . . . .. 42,796 205,062 52,700 131,788 26,515 577,801 2,740,455 465,991 2,000,489 414,444 1 1
12 $55,000 und- $t,00C . . . . . . . . . . . . . . . 79,481 435,772 103,636 288,9033 59,037 26,165 118,991 41,29r. Af,, 226 13,683699,244 3,802,118 554,869 2,867,454 604,978 1213 $6,000 =der $7,000 . . . . . . . . . . . . . . . 42,007 274,462 54,013 192,9% 40,304 348 895 2 246,451 274,322 1,747,438 381,420 1314 $7,000 under $8,000 . . . . . . . . . . . . . . . 21,533 160,539 29,673 114,814 24,372 169:319 1,257,677 132,239 999,639 223,914 1415 $8, 001) =der $9,000 . . . . . . . . . . . . . . . 14,411 121,578 19,348 9G,073 19,609 83 , 838 708,287 64,512 572,930 132 363 1 5
16 $9,000 under $10,000 . . . . . . . . . . . . . . 8,556 80,625 12,418 60,143 12,981 45 , 620 432,239 37,212 352,113 83 :454 16 t7.
17 $10,~:C~l under $15,000 . . . . . . . . . . . . . 12,274 142,814 16,795 113,739 26,75g 81,342 954,183 66,639 806,227 207 553 17I o $15,000 under $20,000 . . . . . . . . . . . . . 2,057 34,,D~3 3,213 29,_~96 7,846 15,466 263,560 13,333 234,762 72 :143 1819 $20,000 under $25,000 . . . . . . . . . . . . . 1, 030 22,720 1,626 20,063 6,135 5,046 111,278 4,448 101,784 36,204 1 9K $25,000 under $50,000 . . . . . . . . . . . . . 651 2C,la7 1,029 18,506 6,735 3,72S 119:071 3,115 112,-7 47,465 20 021 $5C,001 under $10C,000 . . . . . . . . . . . . 46 3,079 62 2,970 1,471J 50 5 31 814 405 30,903 16,091 21
22 $100,000 under $150,000 . . . . . . . . . . . (1) (1) (3) (1) (3) 112 13,336 121 13,102 6,633 2223 $150,000 =der $200,000 . . . . . . . . . . . i 157 1 155 106 7 1,268 7 1,255 -656 23 -324 $200,000 under $500,000 . . . . . . . . . .. - - - - 11 2,570 8 2,551 1,336 242 5 $500,0~ under $1,000,00. . . . . . . . . . i ~i7 i 515 254 1 938 1 935 465 2526 $1,000,000 or more I - I - I - I - I - I -1 -1 -1 -1 - 26
27 Nontaxable returns, 1,., 656 23,021 2,791,8531i
1 66,006 ~60,078 89,619 ~25,028 39,393 4,962,548 1 1 4,484,339 53,305 - 27
28 No adiusted gross i "come
. . . . . . . .
.. 1
3,485 27,479 4,207 (3) (3) (1) -1 123,297 1 '196,7001 106,8881 -1 - 28
29 Under $600 . . . . . 8,102 14,217 3,173 1,314 3,891 - 3,180,366 1,012,231 2,101,382 291.,369 1 5 , 6
.130 $600 =der$1,D 13,196 7,172 5,900 1,052 - 782,080 570,056 764,400 234 - 30
31 $1,000 =der $1,500 . . . . . . . . . . . . . . . 17,068 20,608 24,335 231 5,075 6,199 7,509 - 506,141 604,086 699,913 114 - 31 0232 $1, 5CO under $2,000 . . . . . . . . . . . . . . . 14,414 - - 1 48,077 15,3 4 2,963 5,335 5,885 198,359 348,587 378,116 2 15- 32 1%J$2,000 cn $2,50C . . . . . . . . . . . . . . . 6i,Y24 184,018 176,148 19,938 33
34 $2,500 under $3,000 . . . . . . . . . . . . . . . 3,044 7,516 8,009 58 254 156 229 142 514 17,394 3435 $3,tO() under $3,500 . . . . . . . . . . . . . .. 2,952 8,709 8,761 19:551 63:037 64:481 1,189 3536 $3,500 under $4,000 . . . . . . . . . . . . . .. 8,756 32,589 32,997 - 3637 $4,000 under $4,500 . . . . . . . . . . . . . .. 37 tO38 $4,500 ander $5,000 . . . . . . . . . . . . . .. 3,820 17,720 17,500 282 3839 $5,000 or more . . . . . . . . . . . . . . . . . . . .. 39
40 Returns under $5,000 . . . . . . . . . . . . . . . . 82 '823,082 3152,9 423, 84,757 41,641 184,530 67,797 25,168 4,991 14,685 726 26 11 4 1~1. : 6. 7,3 3 971 663 2,807,090 4041 Returns $5,000 under $1 '000 . . . . . . .. l ,, 88 146 1129 6,719 30,646 6,090 1, 871 7 52 : :0 . . : ;'88 1,072,976 2 9, C) 1' 901 156,303 46,908 11,543 347:702 8:4.:7 1':l 6 539 574 1 426,129 4142 Returns $10,000 or more . . . . . . . . . . . . . 1 16,064 224,642 1 22,726 185,843
1 49,6301 826 12,581 1 1,3431
10,412 1 2,602 1 106,252 1,498,3711 88,625 1 1 1 , 303, 5 388,546 42
Footnotes at end of table . See text for "Description of Sample" and "Explanation of Classifications and Terms
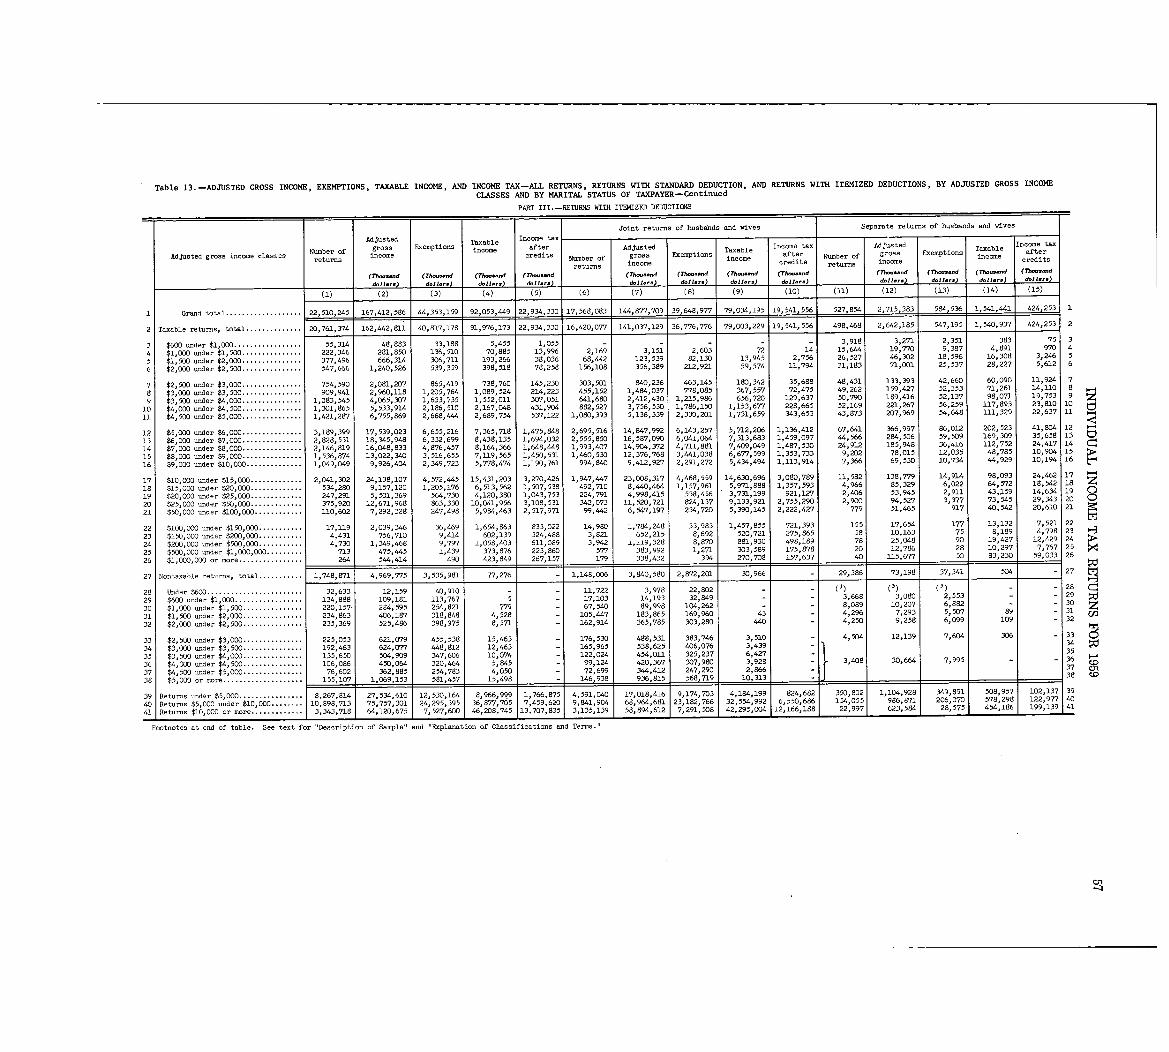
Table 13,-ADJUSTED GROSS INCOME, EXEMPTIONS, TAXABLE INCOME, AND INCOME TAX-ALL RETURNS, RETURNS WITH STANDARD DEDUCTION, AND RETURNS WITH ITEMIZED DEDUCTIONS, BY ADJUSTED GROSS INCOMECLASSES AND BY MARITAL STATUS OF TAXPAYER-Continue d
PART III .-RETURNS WITH ITEMIZED DEDUCTIONS
Joint returns of husbands and ~ives Separate returns of husbands and wives
Adjusted Taxable Income ax
Number of gross Exemptions in.o after Adjusted Taxable Income tax Adjusted Taxable Income taxAdjusted gross income clas6es returns income credits Number of gross Exemptions income after Number of gross Exemptions income caf er
returns income credits returns income redits
(Th .. .-d (Yh--.d (77--.d (Th-...d (77,-...d (7?-. .d (Th-. ..d (rh-.d (7~-d (Th-. ..d (Th...-d (771- .- .d
d.11 ., .) d.11... d.11.. . d.11. . . d.11 .,.) doll" d.11.. . ) doll ... d,11-) d.11., .) d.11...
(2) (3) (4) (6) (7) (8) (9) (10) (11) (12) (13) (14) (15 )
1 Grand total . . . . . . . . . . . . . . . . . . . 22,510,245 167,412,586 44,353,159 92,053,449 22,934,330 17,568,083 144,877,709 39,648,977 79,034,195 19,541,556 527,854 2,715,383 584,536 1,541,441 424,253 1, ' 536
(13)2 Taxable returns, total . . . . . . . . . . . . . . 20,761,374 162,442,811 40,817,178 91,976,173 22,934,330 16,420,077 141,037,129 3. 6,776,776 79,003,229 19,541,556 498,468 2,642,185 M547,195 1,540,937 424,253 2
3 $600 under $1,000 . . . 55,314 48,883 33,188 5,455 1,055 - - - - - 3,918 3,271 2,351 383 753
4 $1,000 under $l,500 . :- :* :, : : : :- 222,346 281,850 13-6,510 70,885 13,996 2,169 3,151 2,603 72 14 15,644 19,770 9,387 4,891 970 4
5 $1 500 under $2,000 . . . . . . . . . . . . . . . 377,496 666,314 306,711 193,266 38,036 68,442 123,539 82,130 13,945 2,756 26,527 46,302 18,596 16,308 3,246 5
$2,28,227 5,612 6
6 1000 under $2,500 . . . . . . . . . . . . . . . 547,666 1,240,526 539,359 398,518 78,258 156,108 356,389 212,921 59,574 11,794 31,183 71,001 25,53 7
7 $2,500 -der $3,000 . . . . . . . . . . . . . . . 754,590 2,081,207 865,419 738,760 145,230 303,501 840,236 463,145 180,342 35,688 48,431 133,393 42,660 60,090 11,924 7
8 $3,000 under $3,500 . . . . . . . . . . . . . . . 909,941 2,960,118 1,205,764 1,089,524 214,223 455,152 1,484,037 778,085 367,557 72,475 49,262 159,427 52,353 71,261 14,110 8
9 $3,500 under $4, 000 . . . . . . . . . . . . . . . 1,083,545 4,065,307 1,633,735 1,552,011 307,051 641,680 2,412,430 1,215,986 656,720 129,637 50,790 189,416 52,137 98,071 19,753 9 Z
10 $4,000 under $4,500 . . . . . . . . . . . . . . . 1,301,865 5,533,914 2,186,510 2,167,048 431,904 882,527 3,756,530 1,786,150 1,153,677 228,665 52,169 221,267 56,259 117,893 23,810 10 cl
11 $4,500 -der $5,000 . . . . . . . . . . . . . . . 1,421,287 6,755,869 2,668,444 2,689,754 537,122 1,080,393 5,138,339 2,330,201 1,731,659 343,653 43,873 207,969 54,648 111,329 22,637 11
12 $5,000 -der $6,000 . . . . . . . . . . . . . . . 3,189,399 17,539,023 6,655,216 7,365,718 1,475,848 2,695,516 14,947,992 6,143,257 5,712,206 1,136,412 67,641 366,997 86,012 202,523 41,804 12
13 $6,000 -der $7,000 . . . . . . . . . . . . . . . 2,828,531 18,345,948 6,332,699 8,438,135 1,694,032 2,555, 00 16,587,090 6,041,064 7,313,683 1,459,097 44,566 284,506 59,509 169,309 35,658 13
14 $7,000 under $8,000 . . . . . . . . . . . . . . . 2,146,819 16,048,833 4,876,457 8,164,366 1,648,448 1,993,407 14,904,372 4,7-11,881 7,409,049 1,487,530 24,912 185,948 36,416 112,752 24,417 14
15 $8,000 under $9,000 . . . . . . . . . . . . . . . 1,536,874 13,022,340 3,516,655 7,119,565 1,450,531 1,460,530 12,376,768 3,441,038 6,677,599 1,353,733 9,202 78,015 12,035 48,785 10,904 1 5
16 $9,000 under $10,000 . . . . . . . . . . . . . . 1,049,049 9,926,404 2,349,723 5,778,474 1,190,761 994,840 9,412,927 2,291,272 5,434,494 1,113,914 7,366 69,530 10,734 44,929 10,194 16 t7'
17 $10,000 under $15,000 . . . . . . . . . . . . . 2,041,302 24,138,107 4,572,"5 15,431,203 3,270,426 1,947,447 23,008,317 4,468,559 14,630,696 3,080,789 11,582 138,779 14,914 98,093 24,
462 17 "
18 $15,000 -der $20,000 . . . . . . . . . . . . . 5.34,280 9,157,120 1,205,176 6,513,562 1,507,538 492,710 8,440,464 1,157,961 5,971,888 1,357,593 4,966 85,329 6,022 64,572 18,542 18 z
19 $20,000 under $25,000 . . . . . . . . . . . . . 247,291 5,501,369 564,730 4,120,380 1,043,753 224,791 4,998,415 538,456 3,731,199 921,127 2,406 53,945 2,911 43,159 14,634 19 0
20 $25,000 -der $50,000 . . . . . . . . . . . . . 375,920 12,671,968 863,330 10,041,956 3,108,531 342,073 11,520,721 824,137 9,133,921 2,755,290 2,900 94,527 3,377 73,545 29,343 20 0
21 $50,000 -der $100,000 . . . . . . . . . . . . 110,602 7,292,328 247,498 5,994,463 2,517,971 99,442 6,547,197 234,720 5,390,145 2,222,427 779 51,465 917 40,542 20,610 2 1
22 $100,000 -der $150,000 . . . . . . . . . . . 17,119 2,039,346 36,469 1,654,863 833,022 14,980 1,784,248 33,983 1,457,855 721,393 155 17,654 177 13,132 7 521 22
23 $150,000 -der $200,000 . . . . . . . . . . . 4,431 756,710 9,414 602,139 324,488 3,821 652,215 8,692 520,721 275,865 58 10,163 75 8,189 4 :798 23
24 $200,000 -der $500,000 . . . . . . . . . . . 4,730 1,349,468 9,797 1,058,403 611,089 3,942 1,119,328 8,M 881,930 498,189 78 25,048 90 19,427 12,429 24 ~P-
25 $500,000 =der $1,000,000 . . . . . . . . . 713 475,445 1,439 373,676 223,860 577 383,992 1,271 303,589 175,678 20 12, 786 28 10,297 7,767 25
26 $1,000,000 or more . . . . . . . . . . . . . . . . 264 5",414 490 423,849 267,157 179 338,432 394 270,708 1 157,637 40 . 115,677 50 83,230 59,033 26
27 Nontaxable returns, total . . . . . . . . . . . 1,748,871 4,969,775 3,535,981 77,276 - 1,148,006 3,840,580 2,672,201 30,966 - 29,386 73,198 37,341 504 - 27
28 Under $600 . . . . . . . . . . . . . . . . . . . . . . . . 32,633 12,159 40,910 - - 11,722 3,978 22,802 - - (3) (1) (3) - - 28 C_~
29 $600 -der $1,000 . . . . . . . . . . . . . . . . . 134,888 109,181 113,767 5 - 17,103 14,193 32,849 - 3,668 3,080 2,553 - 29 ~d
30 $1,000 under $1,500 . . . . . . . . . . . . . . . 220,157 264,595 254,821 779 - 67,540 89,998 104,262 - - 8,089 10,207 6,882 - - 30 z
31 $1,500 under $2,000 . . . . . . . . . . . . . . . 234,863 406,187 318,848 4,528 - 105,447 183,865 169,960 43 - 4,296 7,293 5,507 89 - 31 UD
32 $2,000 under $2,500 . . . . . . . . . . . . . . . 235,369 525,486 398,975 8,571 - 162,914 365,785 303,280 440 - 4,250 9,258 6,099 109 - 32It
33 $2,500 under $3,00,0 . . . . . . . . . . . . . . . 225,053 621,079 455,538 15,463 - 176,530 488,531 383,746 3,510 - 4,504 12,139 7,604 306 - 33 C)
34 $3,000 under $3,500 . . . . . . . . . . . . . . . 192,463 624,077 448,812 12,463 - 165,965 538,625 406,076 3,439 34
35 $3,500 =der $4,000 . . . . . . . . . . . . . . . 135,650 504,909 347,606 10,074 - 122,024 454,01 .1 325,237 6,427 - 35
36 $4,000 under $4, 500 . . . . . . . . . . . . . . . 106,086 450,064 320,464 5,945 - 99,124 420,367 307,980 3,928 - 3,408 30,664 7,995 - - 36CA
37 $4,500 =der $5,000 . . . . . . . . . . . . . . . 76,602 362,885 254,783 4,050 - 72,699 344,412 247,290 2,866 - 37to
38 $5,000 or more . . . . . . . . . . . . . . . . . . . . 155,107 1 1,069,153 581, 57 1 15,498 - 146,938 936,815 568,719 10,313 - 38 CD
39 Returns under $5,000 . . . . . . . . . . . . . . . . 8,2~967 040 1 '0 8,416 9,174,703 4,184,199 824,682 350,802 1,104 928 8 571~1,957 2 137 3 96 : 66,9~ 9S :,111427"' 10 12'53"l 1 9 1,766,875
4591 , 7 1 '9' , 'l
29S10 9,
40 Returns $5,000 under $10,000 . . . . . . . . 10,E 71,757:63.1 24,211,36145 3 877,705 7,459,620 9 :841,904 68 964,681 23,182,766 32,554,992 6,550,686 154,055 986, 206,)70 5 122 : 7]
41 Returns $10,000 or more . . . . . . . . . . . . . 3,343,718 1 64,120,675 208,745 13,707,835 3,135,139 58,894,612_ 7,291,508 42,295,004 12,166,188 22,997, 62 4
Footnotes at end of table . See text for "Description of Sample" and "Explanation of Classifications and Terms .
01
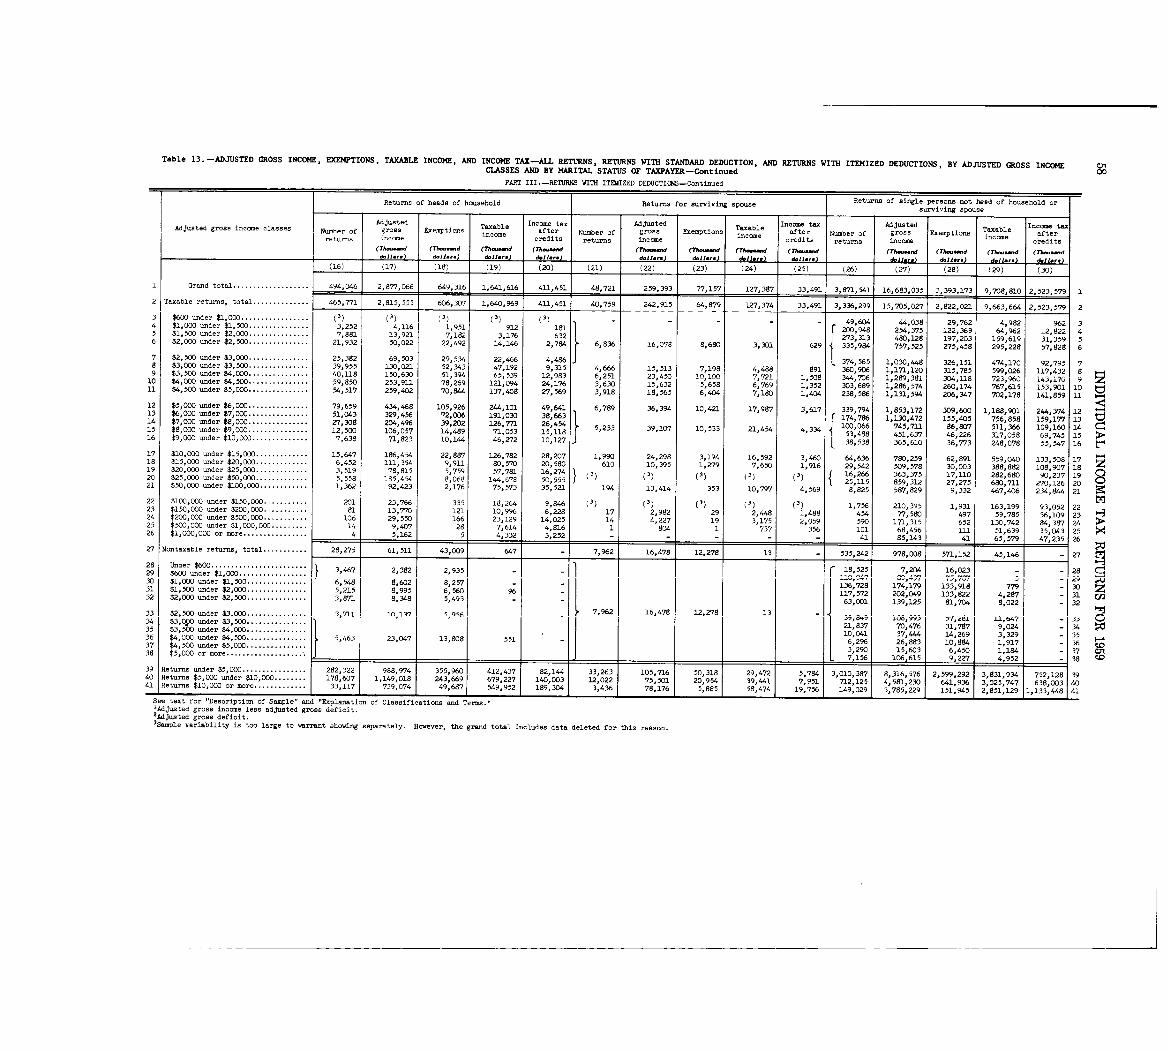
Table 13 . -ADJUSTED GROSS INCOME, EXEMPTIONS, TAXABLE INCOME, AND INCOME TAX-ALL RETURNS, RETURNS WITH STANDARD DEDUCTION, AND RETURNS WITH ITEMIZED DEDUCTIONS, BY ADJUSTED GROSS INCOME C;nCLASSES AND BY MARITAL STATUS OF TAXPAYER-Continued 00
PART III .-RETURNS WITH ITWZED DEDUCTICKS-Continue d
Returns of heads of household Returns for surviving spouse Returns of single persons not head of household orsurviving spous e
Adjusted Income tax Adjusted Taxable Income tax Adjusted Income taxAdjusted gross income classes Number of gross Exemptions Taxable Taxableincome after Number of gross Exemptions income after Number of gross Exemptions income afterreturns income credits returns ineme
credits returns income
0redits
(Thoo-d (7~--d (Th--d (rhooood (Th-aad (Th--W (Thoa.. .d (Tl,--.d (Thwaand (77-sood (Th--d (Th--dd.11 . .. doll. . . dollar.) doll .. . J doll ... dall.. . dollar .) doll ... dollar .) dollar .) doll. .. ) dall.. .
(16) (17) (18) (19) (20) (21) (22) (23) (24) (25) (26) (27) (28) (29) (30)
1 Grand total . . . . . . . . . . . . . . . . . . . 494,C,46 2,877,G66 649,316 1,641,616 41.1,451 48,721 259,393 77,157 127,387 33,491 3,971,541 . 16,683,035 3,393,173 9,?08,810 2,523,579 1
2 Taxable returns, total . . . . . . . . . . . . . . 465,771 2,81-5,555 606,307 1,640,969 411,451 40,759 242,915 64,879 127,374 33,491 3,336,299 15,705,027 2,822,021 9,663,664 2,523,579 2
3 $600 under $1,000 . . . . . . . . . . . . . . . . . (3) (1) (1) (1) (1) - - - - - 49,604 44,038 29,762 4,982 962 34 $1,000 -der $1,500 . . . . . . . . . . . . . . . 3,252 4,116 1,951 912 181 1 200,948 254,375 122,369 64,962 12,822 45 $1,500 under $2,000 . . . . . . . . . . . . . . . 7,881 13,921 7,182 ~,176 632 273 , 313 480,128 197,203 159,619 31,359 56 $2,000 under $2,500 . . . . . . . . . . . . . . . 21,932 50,022 22,492 14,146 2,784 6,836 16,078 8,680 3,301 629 335,984 757,525 275,458 295,228 57,828 6
7 $2,500 under $3,000 . . . . . . . . . . . . . . . 25,382 69,503 29,534 22,466 4,486 374,565 1,030,448 326,151 474,170 92,795 7a $3,000 under $3,500 . . . . . . . . . . . . . . . 39,955 130,021 52,343 47,192 9,315 4,666 15,513 7,198 4,488 891 360,906 1,171,120 315,785 599,026 117,432 8 ~_49 $3,500 under $4,000 . . . . . . . . . . . . . . . 40,118 150,630 51,394 65,539 12,983 6,251 23,450 10,100 7,721 1, 508 344,706 1,289,381 304,118 723,960 143,170 9 Z10 $4,000 under $4,500 . . . . . . . . . . . . . . . 59,850 253,911 78,269 121,094 24,176 3,630 15,632 5,658 6,769 1,352 303,689 1,286,574 260,174 767,615 153,901 1011 $4,500 under $5,000 . . . . . . . . . . . . . . . 54,517 259,402 70,844 137,408 27,569 3,918 18,565 6,404 7,180 1,4G4 238,586 1,131,594 206,347 702,178 141,859 11
12 $5,000 under $6,000 . . . . . . . . . . . . . . . 79,659 434,468 105,926 244,101 49,641 6,789 36,394 10,421 17,987 3,617 319,794 1,1153,172 309,600 1,181,901, 244,374 1213 $6, 000 under $70 000 . . . . . . . . . . . . . . . 51,043 329,456 72,006 191, 3 '3 174,786 1,130,472 155,405 756,858 159,177 1314 $7,000 under $8,000 . . . . . . . . . . . . . . . 27,308 204,496 39,202 126 , 2:,454 5,233 39,107 10,533 21,454 4,334 100,066 745,711 86,807 511,366 109,160 1 415 $8,000 under $9,000 . . . . . . . . . . . . . . . 12,500 106,057 14,489 71,053 15,118 53,488 451,637 46,226 317,058 69,745 15 ~0-16 $9,000 under $10, 000 . . . . . . . . . . . . . . 7,638 71,823 10,144 46,272 10,127 38,538 365,610 36,773 248,078 55,547 1617 $10,000 under $15,000 . . . . . . . . . . . . . 15,647 186,454 22,887 126,782 28,207 1,990 24,298 3,194 16,592 3,460 64,636 780,259 62,891 559,040 133,508 1 718 $15,000 -der $20,000 . . . . . . . . . . . . . 6,452 111,354 9,911 80,570 20,580 610 10,395 1,279 7,650 1,916 29,542 509,578 30,003 388,882 108,907 1 8
z19 $20,000 =der $25,D00 . . . . . . . . . . . . . 3,519 78,815 5,759 57,781 16,274 (3) (3) (1) (3) (3) 16 266 363 375 17,310 282,680 90,237 1 920 $25,000 -der $50,000 . . . . . . . . . . . . . 5,558 185,454 8,068 144,678 50,555 25,115 859:312 27,275 680,711 270 126 2021 $50,000 under $100,000 . . . . . . . . . . . . 1,362 92,423 2,176 75,573 35,521 194 13,414 353 10,797 4,569 8,825 587,829 9,332 467,406 234 844 21
22 $100,000 -der $150,000 . . . . . . . . . . . 201 23,766 335 18,264 9,846 (3) (3) (3) (3) (3) 1,756 210,395 1,931 163,199 93 052 2223 $150,000 -der $200,000 . . . . . . . . . . . 81 13,770 121 10,996 6,228 17 2,992 29 2,448 1,488 454 77,580 497 59,785 316 109 23 0-324 $200,000 -der $500,000 . . . . . . . . . . . 106 29,550 166 23,129 14,025 14 4,227 19 3,175 2,059 590 171,315 652 130,742 84 387 2425 $500,000 under $1,000,000 . . . . . . . . . 14 9,407 28 7,614 4,816 1 804 1 737 356 101 68,456 ill 51,639 35 043 2526 $1,000,000 or more . . . . . . . . . . . . . . . . 4 J 5,162 1 51 4,332 1 3.252 1 - - I - I - I - ~.l 1 85,143 41 65,579 47,235 26
27 Nontaxable returns, total . . . . . . . . . . . 28,275 61, 51~ 43,0091 647 7,962 16,478 1 12,278 1 13 j j 535,242 j 97 571,1172 45,1 - 27
28 Under $600 . . . . . . . . . .. _L3 28 C-'29 $600 under $1,000 . . . : . . . . . . . . . 3,467 2,382 1 2,9351 - I - 11 1 1 1 1 0 1 - iwv
30 $1,000 under $1, 6,548 8,602 8,257 1 77~ - 3031 $1,500 under $2, 5 215 8 995 6,560 96 - _3~'~2~ t4117 572 202,049 133,822 4,287 - 3132 $2,000 under $2,500
. . . . . . . . . . . . . .. 3:871 8,348 5,493 - - 63:001 139,125 81,704 8,022 - 32
33 $2,500 under $3,000 . . . . . . . . . . . . . .. 7,962 16,478 12,278 1334
3,711 1 n. 1 v
9 " :649 108,-93 57 - -- il, t~47 - .3-4 C,
21 837 70,476 31 787 9,024 - 34$3,0,00 under $3,500 . . . . . . . . . . . . . . .
()4
1 ':68 551 2 883 10,884 1:917 - 36
35 $3,500 under $4,000 . . . . . . . . . . . . . . . 10,041 37 444 14 269 3,329 - 3536 $4,000 under $4,500 . .. 5,463 23, 7 31 6, 96 26: CD: "' u37 $4,500 under $5,000 . .. 3,290 15,603 6 450 1 194 - 37 CTI38 $5,000 or more . . . . . . . . . . . . . . . . . . .. 7,156 106 615 9,227 4,952 - 3 8
39 Returns under $5,000 . . . . . . . . . . . . . . . . 282 322 988,974 355: .11 4 2,437 82,1" 33,263 105, 16 50,318 29,4725?94 3,010
3'1 316,576 2,599,292 3: Ill 941 7352 1 1 3940 Returns $5,000 under $10,000 . . . . . . . . 178:607 1,149,018 .3 9 6179, 227 140,003 12,022 75,7501 20,954 39,441 7,951 712:. 5 1,581,230 641,936 3 25
:7 7 6 :~34041 Returns $10,000 or more . . . . . . . . . . . . .
. L
33 , 117 739,074 49,687 549,952 189,304 3,436 78 58,474 1 756 149,029 3,785,229 151,945 2,851,129 1,133,448 41t text for "Description of Sample" , . ,
an`71anation of Classifications and Terms
'Adjwted gross income less adjusted gross deficit .
2Adju-ted gross deficit .3S,.ple variability is too large to warrant showing separately . However, the grand total includes data deleted for this reason .
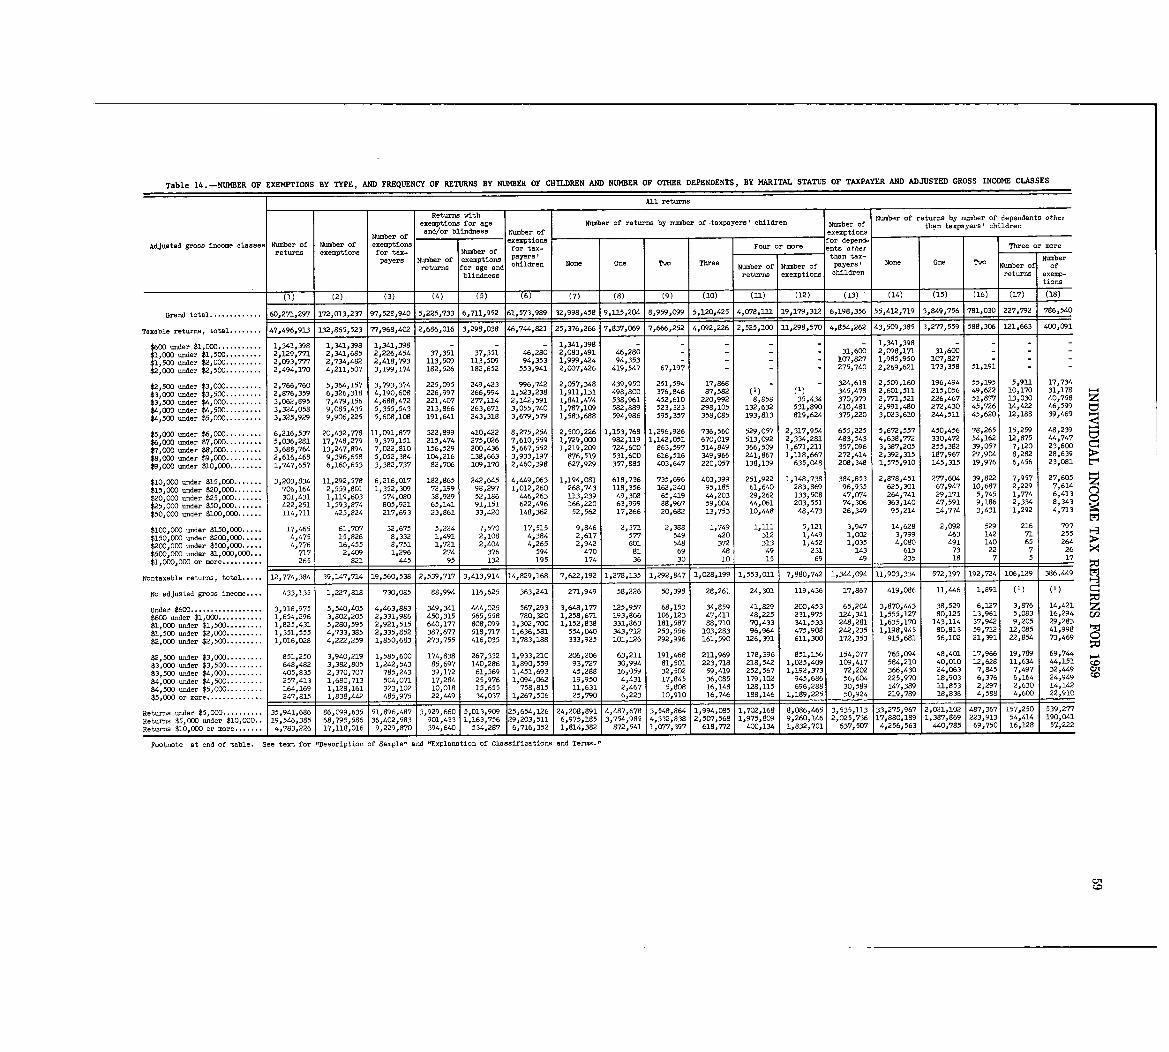
Table 14 . -NUMBER OF EXEMPTIONS BY TYPE, AND FREQUENCY OF RETURNS BY NUMBER OF CHILDREN AND NUMBER OF OTHER DEPENDENTS, BY MARITAL STATUS OF TAXPAYER AND ADJUSTED GROSS INCOME CLASSES
All returns
Returns wit hexemptions for age Number of returns by number of-taxpayers' children Number of returns by number of dependents otherand/or blindnes Number of than taxpayers' childre n
Number of Number of exemptions
Adjusted gross income classes Number of Number of exemptions exemptions for depend-returns exemptiors for tax- Number of for tax- Four or more ents other Three or more
payers Number of exemptions Payers' then tax- barreturns for age and children None One T~ Three Number of Number of payers- None One TWO Nrbe~ucfj o f
blindness returns exemptions children stur exmp-
Itions
(2) (3) (4) (5) (6) (7) (9) (10.) (11) (12) (13) (14) (15) (16) (17) (18 )
Grand total . . . . . . . . . . . . . 60,271,297 172,013,237 97,528,940 15,225,733 6,711,952 61,573,989 32,998,458 9,115,204 8,959,099 5,120,425 4,0178,111 19,179,312 6,198,356 55,412,719 3,849,756 .781,030 227,792 786,540
Taxable returns , total . . . . . . . . 47,496,913 3.32,865,523 77,968,402 2,686,016 3,298,038 46,744,821 25,376,266 7,837,069 7,666,252 4,092,226 2o525,100 11,298,570 4,854,262 43,509,385 3,277,559 588,306 121,663 400,091
$600 under $1,000 . . . . . . . . . . . 1,341,398 1,341,398 1,341,398 - - - 1,341,398 - - - - - 1,341,398 - - - -$1,000 under $1,500 . . . . . . . . . 2,129,771 2,341,685 2,226,454 37,351 37,351 46,280 2,083,491 46,280 - 31,600 2,098,171 31,600 - - -
$1,500 under $2,000 . . . . . . . . . 2,093,777 2,734,482 2,418,793 113,509 113,509 94,353 1,999,424 94,353 - - 107,827 1,985,950 107,827 - - -
$2,000 under $2,500 . . . . . . . . . 2,494,170 4,211,507 3,199,174 182,526 182,652 553,941 2oOO7o426 419,547 67,197 - - 275,740 2,269,621 .173,358 51,191 - -
$2,500 u,nder $3,000 . . . . . . . . . 2,766,760 5,364,157 3,793,374 225,095 249,423 996,742 2,057,348 439,950 251,594 17,868 - - 324,618 2,509,160 196,494 55,195 5,911 17,734
$3,000 under $3,500 . . . . . . . . . 2,876,359 6,326,318 4,190,608 226,997 266,994 1,523,238 1,911,131 498,800 376,846 87,582 (1) (1) 345,478 2,601,511 215,056 49,622 10,170 31,178 ~4
$3,500 under $4,000 . . . . . . . . . 3,062,895 7,479,156 4,688,472 221,40`7 277,114 2,142,591 1,841,474 538,961 452,610 220,992 8,658 35,434 370,979 2,771,521 226o467 51,877 13,030 40,758 t4
$4,000 under $4,500 . . . . . . . . . 3,324,058 9,085,435 5,355,543 213,866 263,671 3,055,740 1,787,109 582,889 523,323 298,105 132,632 531,890 410,481 2,991,480 272,430 45,726 14,422 46,599
$4,500 under $5,000 . . . . . . . . . 3,325,929 9,906,225 5,608,108 191,641 243,318 3,679,579 1,583,688 594,986 595,357 358,085 193,813 819,624 375,220 3,023,610 244,511 45,620 12,188 39,469
$5,000 under $6,000 . . . . . . . . . 6,216,537 20,432,778 11,091,877 322,899 410,422 8,275,254 2,500,226 1,153,768 1,296,926 736,560 529,057 2,317,954 655,225 5,672,557 450,456 78,265 15,259 48 239
$6,000 under $7,ODO . . . . . . . . . 5,036,281 17,748,279 9,379,151 215,474 275,026 7,610,559 1,729,000 982,119 1,142,051 670,019 513,092 2,334,281 483,543 4,638,772 330,472 54)162 12,875 44 :747
$7,000 under $8,000 . . . . . . . . . 3,688,764 13,247,894 7,022,810 156,529 200,436 5,667,552 1,219,209 724,600 863,597 514,849 366,509 1,671,211 357,096 3,387,205 255,382 39,057 7,120 23 600
$8,000 under $9,000 . . . . . . . . . 2,616,468 9,396,658 5,052,384 104,216 138,663 3,933,197 876,519 531,600 616,516 349,966 241,867 1,118,667 272,414 2,392,315 187,967 27,904 8,282 28 :639
$9~000 under $10~000 . . . . . . . . 1,747,657 6,160,653 3,382,737 82,706 109,170 2,460,398 627,929 357,885 403,647 220,057 138,139 635,046 208,348 1,575,910 145,315 19,976 6,456 23,081
$10 000 under $15,000 . . . . . . . 3,203,834 11,292,578 6,216,017 182,865 242,645 4,449,063 1,194,081 618,736 735,696 403,399 251,922 1,148,738 384,853 2,878,451 277,604 39,822 7,957 27,60 5
I z$15,000 under $20,000 . . . . . . . 706,164 2,559,801 1,352,309 72,199 98,297 1,012,260 268,743 118,356 162,240 95,185 61,640 283,869 96,935 625,301 67,947 10,687 2,229 7 61 4
$20 000 under $25,000 . . . . . . . 301,431 1,119,603 574,080 38,929 52,186 446,263 113,239 49,308 65,419 44,203 29,262 133,508 47,074 264,741 29,171 5,745 1,774 6 , 413
$25 :000 under $50,000 . . . . . . . 422,251 1,593,874 805,921 65,141 91,151 622,496 166,220 63,999 88,967 59,004 44,061 203,551 74,306 363,140 47,591 9,186 2,334 81343 0
$50,000 under $100,000 . . . . . . 114,711 425,824 217,693 23,861 33,420 148,362 52,562 17,266 20,682 13,753 10,448 48,473 26,349 95,214 14,774 3,431 1,292 4 , 713
$100,000 under $150,000 . . . . . 17,465 61,707 32,675 5,224 7,570 17,515 9,846 2,371 2o388 1,749 1,111 5,121 3,947 14,628 2,092 529 216 797
$150,000 under $200,000 . . . . . 4,475 15,826 8,332 1,491 2,108 4,384 2,617 577 549 420 312 1,449 1,002 3,799 463 142 71 255
$200 000 -der $500,000 . . . . . 4,776 16,455 8,751 1,721 2,404 4,265 2,942 601 548 372 313 1,452 1,035 4,080 491 140 65 264
$500:000 under $1,000,000 . . . 717 2,409 1,296 274 376 594 470 81 69 48 49 231 143 615 73 22 7 26
$1,000,000 or more . . . . . . . . . . 265 821 445 1 95 132 195 174 36 30 10 15 69 49 235 18 7. 5 17
Nontaxable returns, total . . . . . 12,774,384 39,147,714 19,560,538 2,539,717 3,413,914 14,829,168 7,622,192 1,278,135 1,292,847 1,028,199 1,553,011 7,880,742 1,344,094 11,903,334 572,197 192,724 106,129 386,44 9
No adjusted gross income . . . . 433,135 1,227,818 730,085 88,994 116,625 363,241 271,949 58,226 50,398 28,261 24,301 119,436 17,867 419,086 11,446 1,891 (1) (1) C_~~d
Under $600 . . . . . . . . . . . . . . . . . . 3,918,975 5,540,405 4,463,883 349,341 4",025 567,293 3,648,177 125,957 68,153 34,859 41,629 200,453 65,204 3,870,443 38,529 6,127 3,876 14,421 z$600 under $1,000 . . . . . . . . . . . 1,654,296 3,802,205 2,331,986 450,315 565,558 780,320 1,258,671 193,866 106,123 47,411 48,225 231,975 124,341 lp555,127 80,125 13,961 5,083 16,294 Cn
$1,000 =der $1,500 . . . . . . . . . 1,825,431 5,280,595 2,921,515 640,177 608,099 1,302,700 1,152,838 331,863 181,587 88,710 7Q,433 341,533 248,281 1,635,170 143,114 37,942 9,205 29 , 283
$1,500 under $2,000. . . . . . . . . 1,351,555 4,733,385 2,335,852 387,677 518,717 1,636,581 554,040 343,712 253p556 103,283 96,964 475,908 242,235 1,198,945 80,813 59,712 12,085 41,998
$2,000 =der $2,500 . . . . . . . . . 1,016,028 4,222,259 1,850,683 273,755 416,035 1,783,188 333,925 101,126 292,996 161,590 126,391 611,300 172,353 915,681 56,102 21,391 22p854 73 , 469
$2,500 under $3,000 . . . . . . . . . 851,250 3,940,219 1,585,600 174,8.38 267,332 1,933,210 206,206 63,211 191,468 211,969 178,396 851,156 154,077 765,094 48,401 17,966 19,799 69 744
$3,000 under $3,500 . . . . . . . . . 648,482 3,382,805 1,242,543 85,697 140,286 1,890,559 93,727 30,994 81,501 223,718 218,542 1,025,409 109,417 584,210 40,010 12,628 11,634 44 :151
$3,500 under $4,000. . . . . . . . . 405,835 2,370,707 785,243 39,172 61,569 1,451,693 45,288 16,059 32,502 59,419 252,567 1,192,373 72,202 366,430 24,063 7,845 7,497 32,449 Cn
$4,000 -der $4,500 . . . . . . . . . 257,413 1,680,713 504,071 17,284 25,976 1,094,062 19,950 4,431 17,845 36,085 179,102 945,686 56,604 225,970 18,903 6,376 6,164 24,949
$4,500 under $5,000 . . . . . . . . . 164,169 1,128,161 323,102 10,018 15,655 758,815 11,631 2,467 5,808 16,148 128,115 696,288 30,589 147,389 11,853 2,297 2,630 14,142
$5,000 or more . . . . . . . . . . . . . . 247,815 1 1,838 442 465,975 22,449 34,037 1,267,506 25,790 6,223 10,910 16,746 188,146 1,189,225, 50,924 219,789 18,838 4,5 4,600 22,910
Returns =der $5,000 . . . .
.
35 :94 686 86,099,635 51,896,4 7 1,9929 66 3,9 8 4:487,678 3 548 864 94 5 1,7 161 8 16,461 3: 35 : 1 3 33,275 :967 2,021,102 48?,367 157:25 19390 :277
a 68,795,586. ' S 1,9 "8. 9
:206."'. ' 0 1 9 1 1
36,402,'9
4,332 838 1 :' :56 2 025 7136 17 88 387,869 223,913 54 414 041R turns $5,000 under$10,( lq 8 GI :4 :75 :'181 3 1 :46 3 5 58831 9 33 1:163 7 7 4 85 25 75p 80Returns $10,000 or more . . . 4,783,226 17,118,016 9,229,870 394,640 534,2 :14,382 872,541 1,077,397 1
618,772 400,134 1,832,701 1 637,507 4,256,563 440,785 69,750 16,128 57i222
Footnote at end of table . See text for "Description of Sample" and "Explanation of Clasaifications and Terms
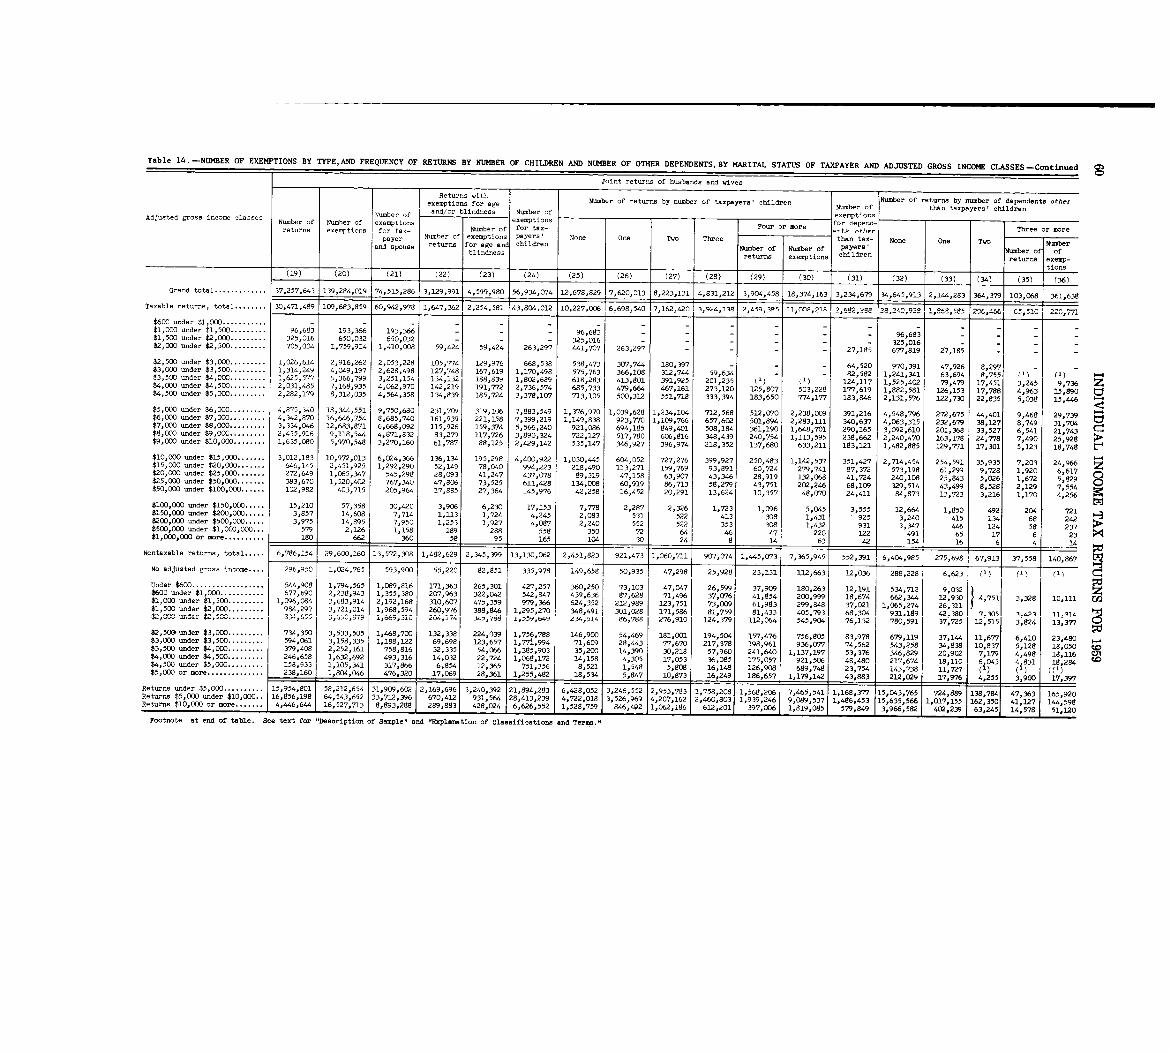
Table 14 . -NUMBER OF EXEMPTIONS BY TYPE, AND FREQUENCY OF RETURNS BY NUMBER OF CHILDREN AND NUMBER OF OTHER DEPENDENTS, BY MARITAL STATUS OF TAXPAYER AND ADJUSTED GROSS INCOME CLASSES-Continued
Joint returns of husbands and wive s
Returns with Number of returns by number of dependents otherexemptions for age Number of returns by number of taxpayers' children Number of than taxpayers' childre nAdjusted gross income cla,9ses Number of and/or blindness Number of exemption s
Number of Number of exemptions - -exemptions Four or more for depend- Three or morereturns exemptions for tax- Number of for tax- ents othe r
payer 11=ber of exemptions payers, None One 11.0 Three than tax- None One Two be,.Tfttururns a,t,and spouse returns for age and children Number of Number of payers'
f 7f
blindness returns exemptions children
na
exemp-tions
(19) (20) (21) ~22) (23) (24) (25) (26) (27) (28) (29) (30) (31) (32) (33) (34) (35) (36 )
Grand total . . . . . . . . . . . . . 37,257,643 139,284,019 86 3,12 991 4 599 980 56,934,074 12,678,829 7,620,013 8,223,131 4,831,212 3,904,458 18,374,163 3$234,679 34,645,913 2,144,283 .364,379 103,068 361,638
Taxable returns, total . . . . . . . . 30,471,499 109,683,859 60,942 978 1,64 43,8014.012 10 .227,006 6~698 .540 7,162 ..420 3,1)24,138 2,49c),385 11,MA,218 2,682,268 128,21,0,92e 1,868,585 296,466 65,510 220,771$600 urder $1,000 . . . . .. - - - - - - - - - -$1,ODO =der $1,500 . . .. 96,683 193,366 193,366 - 96,683 - 96,683$1,500 under $2,000 . . . . . . . . . 325,016 650,032 650,032 - 325,016 - - - 3250016$2,000 under $2,500 . . . . . . . . . 705,004 1,759,914 1,410,008 59,424 59,424 263,297 441,707 263$297 - - 27,185 677,819 27,185 -
$2,500 -der $3,000 . . . . . . . . . 1,026,614 2,916,262 2,053,228 105,774 129,976 668,538 538,473 307,744 180,397 - - 64,520 970,391 47,926 8,297$3,000 under $3$500 . . . . . . . . . 1,314,249 4,049,197 2,628,498 127,748 167,619 10170,498 575,763 366,108 312,744 59,634 - - 82,582 1,241,341 63,694 8,755 (1) (1) 0-4$3,500 under $4, 000 . . . . . . . . . 1,625,577 5,366,799 3,251,154 134,132 188,839 1,802,689 618,283 413,801 391,925 201,235 ~1) (1) 124,117 1,525,402 79,479 17,451 3,245 9,736 z$4,000 -der $4,500 . . . . . . . . . 2,031,485 7,168,935 4,062,970 142,219 191,772 2,736,574 685,733 479,664 467,161 2730120 125,807 503,228 177,619 1,882,581 126,153 17,788 4,963 15,890 tv$4,500 under $5,000 . . . . . . . . . 2,282,179 8,312,035 4,564,358 134,839 185,724 3,378,107 713,105 500,312 551,718 333,394 183,650 774,177 183,846 2,131,576 122,730 22,835 5,038 15,446 ~_4_ti$5,000 under $6,000 . . . . . . . . . 4,875,340 18,344,551 9,750,680 231,709 319,106 7,863,549 1,376,970 1,039,628 1,234,104 712,568 512,(Y70 2,238,009 391,216 4,548,796 272,675 44,401 9 468 29 739$6,000 under $7,000 . . . . . . . . . 4,342,870 16,646,754 8,685,740 161,939 221,158 7,399,219 1,149,838 923,770 1,109,766 657,602 501,894 2,283,111 340,637 4,063,315 232,679 38,127 8:749 31:704$7,ODO under $8,000 . . . . . . . . . 3p334,046 12,683,971 6,668,092 115,926 159,374 5,566,240 921,086 694,185 849,401 508,184 361,190 1,648,701 290,165 3,092,610 201,368 33,527 6,541 21 743 C"i$8, GOO =der $9,000 . . . . . . . . . 2,435,916 9,118,544 4,871,832 83,279 117,726 3,690,324 722,127 517,780 606,816 348,439 240,754 1,113,595 238,662 2,240,470 163,178 24,778 7,490 25:928 ~P.$9,000 under $10,000 . . . . . . . . 1,635,080 5,970,548 3,270,160 61,787 88,125 2,429,142 535,147 3146,927 396,974 218,352 137,680 633,211 183,121 1,482,885 129,771 17,301 5,123 18,748
$10,000 under $15,000 . . . . . . . 3,012,183 10,972,013 6,024,366 136,134 195,298 4,400,922 1,030,"5 604,052 727,276 399,927 250,483 1,142,537 351,427 2,714,454 254,591 35,935 7,203 24 966$15,000 =der $2C,000 . . . . . . . 646,145 2,451,925 1,292,290 52,149 78,040 994,223 218,490 113,271 159,769 93,891 60,724 279,741 87,372 573,198 61,299 9,728 1,920 6 :617$20,000 under $25,000 . . . . . . . 272,649 1,065,347 545,298 28,093 41,247 437,078 89,319 47,158 63,907 43,346 28,919 132,068 41,724 240,108 25,843 5,026 1,672 5 829$25,000 under $50,000. . . . . . . 383,670 1,520,402 767,340 47,806 ?3,525 611,428 134,008 60,919 86,713 58,279 43,751 202,246 68,109 329,514 43,499 8,528 2,129 7:554$50,000 under $100,000 . . . . . . 102,982 403,715 205,c)64 17,885 27,364 145,976 42,258 16,452 20,291 13,624 10,357 48,070 24,411 84,873 13,723 3,216 lpl70 4 , 25 6$100 000 under $150,000 . . . . . 15,210 57,358 30,420 3,906 6,230 17,153 7,778 2,287 2,326 1,723 1,096 5,045 3,555 12, 664 1,850 492 204 721$150:000 under $200,000 . . . . . 3,857 14,608 7,714 1,113 1,724 4,245 2,083 531 522 413 308 1,431 925 3,240 415 134 68 242$200,000 under $500,000 . . . . . 3,975 14,895 7,950 1,253 1,927 4,087 2,240 552 522 353 308 1,432 931 3,347 446 124 58 237$500,DOO under $1,000,000 . . . 579 2,126 1,158 189 288 558 350 72 64 46 47 220 122 491 65 17 6 23 >4$1,000,000 or -re . . . . . . . . . . 180 662 360 58. 95 165 104 30 24 81 141 631 42 1 1:5i4 16 1 61 4 1 1~
Nontaxable returns , total . . . . .1 6,786,154 29,600,160 13,572,308 1,482,629 2,345,399 13,130,062 2,451,823 921,473 1,060,711 907,0174
11,"5,073
17,3650945 1 552,391
6,404,9
5 275,698 67,9131 37,558 140,867
No adjusted gross income . . . . 1 296,950 1,024,765 593,900 55,220 82,851 335,978 149,658 50,935 47,298 1 25,9281 23,131 1 112,663 1 12,036 288,228 6,623 (1 )
Under $600. . . . . . . . . . . . . . . . . . 544,908 1,794,565 1 089,816 171,363 265,301 427,257 360 250 73 :.11~3 417 7 26:,5 3:7,91 :263 12 191 534 712 :112 z6 7 :4.
17 '16"854 2
.999 _'O$600 under $1,000 . . . . . . . . . . . 677,690 2,238,943 1 355,380 207,963 322,042 542,847 439 6 4 18,674 662,344 12 9 4,751 3,328 10,111 W$1,000 under $1,500 . . . . . . . . . 1,096,084 3,683,914 2,192,168 310,607 475,359 979,366 624,352 212,989 123,751 73,009 61,983 299,848 37,021 1,065,274 26,31 1$1,500 under $2,000 . . . . . . . . . 984,297 3,721,014 1,968,594 260p976 388,846 1,295,270 348,491 301,028 171,586 81,759~ 8lo433 405,793~ 68,304 931 .189 42 .380 7.3J 1_421 11 ;-4149under P , 5 0-0 . . . . . . . . . 834,655 3,650,8-- -74 345,768 !,~59,b4v Z_34,~14 86,788 276,910 124,379 112,064 545,904 76,132 780,591 37-,725 12',515 3 ;824 13, 3
$2,500, under $3,000 . . .. 734:3511 3,533,505 1 468,700 132 338 1 756,788 146,900 54,469 181,001 194,504 157,476 756,805 83,978 679,119 37,144 11,677 6 410 23 4224 () 80$3,000 under $3,500 . . . . 594 061 3,158,335 1,188,122 69,698 123 :63597 1:771,994 71,609 280443 77,670 217,378 198,961 936,077 74,562 543,258 34,838 10,837 5 :128 18:050 to$3,500 =der $4,000. . . . . . . . . 379,408 2,252,161 758,816 32,335 54,066 1,385,903 35,200 14,390 30,218 57,960 241,640 1,137,197 53,376 346,829 20,902 7,179 4,498 18,116 01$4,DOO under $4,500. . . . . . . . . 246,658 1,632,692 493,316 14,032 22,724 1,068,172 14,158 4,305 17,053 36,085 175,057 921, 506 48,480 217,674 18,110 6 043 4 831 18,284$4,500 under $5,000 . . . . . . . . . 158,933 1,105,341 317,866 6,854 12,365 751,356 8,521 1,548 5,808 16,148 126,908 689,748 23,754 143,738 11,727t5,000 or . re . . . . . . . . . . . . . . 238,160 1,804,046 476,320 17,069 28,361 1,255,482 18,534 5,847 10,873 16,249 186,657 1,179,142 43,883 212,029 17,976 4,255 3, 900 17p397
Returns under $5,000 . . 954:8'1 58:212,654 31 9' 6' 2,169,696 3,240,392 21,894,283 6,428,052 3,246,552 2,953 783 1 758 208 1,566,206 7,465,541 1,168,377 15,043 7651 1,724:889 .138 :784 47 363 165,920R 16 16 9 8eturns $5,000 under$ , 1
64543,6,2 '3
:712 , 396 670,412 931,564 28,413,239 4,722,018 3,526,969 4,207:162 2 :460 :803 1,939,246 9,089,537 1,486,453 15:635 :566 017 155 162 350 41:127 144,598Re urns $10,000 or mor~ 16,527,713 8,893,288 1 289,883 1 428,024 1 6,626,552 1 1,528,759 1 846,492 1 062,186 612,20, 397,006 1,819,095 579,849 3 966,582 402,239 63,245, 14,578 510120
Footnote at end of table . See text for "Description of Sample" and "Explanation of Classifications and Termp ."
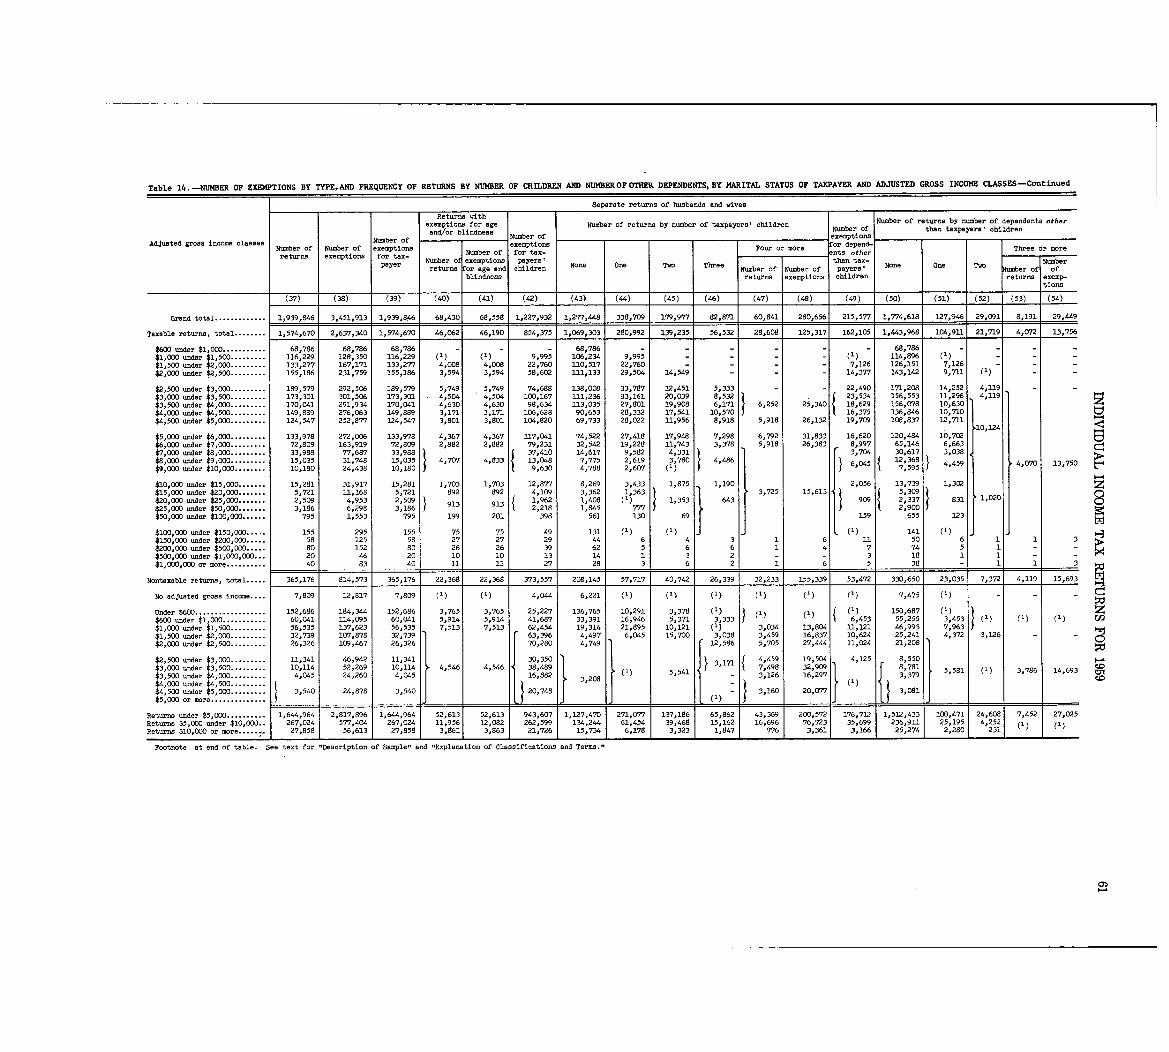
Table 14 . -NUMBER OF EXEMPTIONS BY TYPE, AND FREQUENCY OF RETURNS BY NUMBER OF CHILDREN AND NUMBER OF OTHER DEPENDENTS, BY MARITAL STATUS OF TAXPAYER AND ADJUSTED GROSS INCOME CLASSES-Continued
Separate returns of husbands and wives
Returns withexemptions for age Number of returns by number of taxpayers' children Number of returns by numb:r of dependents otherand/or blindness Number of than taxpayer
,children
Adjusted gross income classes Number of Number of exemptionsNumber of Number of exemptions exemptions for depend-returns exemptions for tax- Number of for tax- Four or more ants other Three or re
fpayer Number of exemptions payers' None One TWO Three Number of Number than tax- Two Numberreturns for age and children of payers' None One t:;o~f,
tt tio
J~tb~f
Num
f
blindness returns exemptions children 0re FexetionsRions
(37) (38) (39) (40) (41) (42) (43) (44) (45) (46) (47) (48) (49) j (50) (51) (52) (53) (54 )
Grand total . . . . . . . . . . . . . 19939,846 3,451,913 1,939,846 68,4301 68,558 1,227,932 1,277,448 338,709 179,977 1 82,871 60,841 280,656 215,577 1,774,618 127,9461 29,091 8,191 29,"9
Taxable returns, total . . . . . . . . ls574,670 2,637,340 1,574,670 46,062 46,190 854,375 1,069,303 280,992 139,235 56,532 28,608 125,317 162,105 1,443,968 104,91.1 21,719 4,0,72 13,756
$600 under $1,000 . . . . . . . . . .. 68,786 68,786 68,786 - - - 68,786 - - - - - - 68,786 - - - -$1 000 under $1,500 . . . . . . . .. 116,229 128,350 116,229 (1) 0) 9,995 106,234 9,995 (1) 114,896 (1 )$1 :500 under $2,000 . . . . . . . . . 133,277 167,171 133,277 4,008 4,008 22,760 3.10,517 22,760 - 7,126 126,151 7,126$2,000 under $2,500 . . . . . . . . . 155,186 231,759 155,186 3,594 3,594 58,602 111,133 29,504 14,549 - 14,377 143,142 9,711
$2,500 under $3,000 . . . . . . . . . 199,579 292,506 189,579 5,749 5,749 74,688 138,008 33,787 12,451 5,333 22,490 171,208 14,252 4,119$3 000 under $3~500. . . . . . . . . 173,301 301,506 173,301 4,504 4,504 100,167 111,236 33,161 20,039 8,532 13 :534 3.56,553 11,296 4,119 0-4$3 :500 under $4,000. . . . . . . . . 170,041 291,934 170,041 4,630 4,630 98,634 113,035 27,801 19,908 6,171 6,252 25,340 18 629 156,078 10,630 z$4 000 under $4,500. . . . . . . . . 149,889 276,063 149,889 3,171 3,171 106,628 90,653 28,332 17,541 10,570 16,375 136,646 10,710 U$4 :500 under $5,000. . . . . . . . . 124,547 252,877 124,547 3,801 3,801 104,820 69,733 28,022 11,956 8,918 5,918 26,132 19,709 108,837 12,711
10,124$5,000 under $6,000 . . . . . . . . . 133,978 272,006 133,978 4,367 4,367 13 .7,041 74,522 27,418 17,948 7,298 6,792 31,833 16,620 120,484 10,702$6,000 under $7,000 . . . . . . . . . 72,809 163,919 72 809 2 :882 2:882 79,231 32,542 19,228 11,743 3:378 5,918 26,383 8,997 65,146 6,663
33,988 77,687 33,1
under $8,000 . . . . . . . .. 1988 37,410 14,617 9,582 4,331 3:704 30:617 3:1138 C_$8, 000 under $9,000 . . . . . . . .. 15,035 31,748 15,035 4 707 4 833 13 o 048 7 775 2,619 3,780 4 486 12 368$9,000 under $10,000. . . . . . . . 10,180 24,438 10,180 9,630 4,768 2,6(Y7 (1) 6 045 7,595 4 459 4,070 13,750 t_1
$10 000 under $15,000. . . . . .. 15,281 31,917 15,281 1,703 1,703 12,877 8,269 3 :433 1,875 1,190 2,056 13 739 1,3021000 under $20,000. . . . . .. 5,721
1$15, 11,168 5,721 892 892 4 :109 3,362 1 363 3,725 15 613 5:309$20 : 000 under $25,000. . . . . .. 2,509 4 953 2:509 9 1 962 1,408 1) 1,353 643 909 2,337 831 1,020
$25 000 under $50,000. . . . . .. 3,186 6:298 3 186 913 13 2,218 1,845 777 2,900 C)$50~000 under $1008000 . . . . .. 795 1,553 795 199 201 398 561 130 69 159 655 123
$100,000 under $150,000 . . . . . 155 295 155 75 75 49 131 1) (1) L (1) 141 (1 )
$150,ODO -der $200,000 . . . . . 58 125 58 27 27 29 44 6 4 3 1 6 11 50 6 1 1 3$200,000 under $500,000. . . .. 80 152 80 26 26 39 62 5 6 6 1 4 7 74 5 1 - -
$500,000 under $1,000,0DO. . . 20 46 20 10 10 13 14 1 3 2 - - 3 18 1 1 -$1,000,000 or more . . . . . . . . . . 40 83 40 11 11 27 28 3 6 2 1 6 5 38 - 1 1
Nontaxable returns , total . . . . . 365,176 814,573 365,176 22,368 22,368 373,557 208,145 57,717 40,742 26,339 32,233 155,339 53,472 330,650 23,035 7,372 4,119 15,693
No adjusted gross income . . .. 7,809 12,817 7,809 (1) (1) 4,044 6,221 (1) (1) (1) (1) (1) (1) 7,475 (1) - - -
Under $600 . . . . . . . . . . . . . . . . . . 152,686 184,344 152,686 3,765 3,765 25,227 136,765 10,291 3,378 (1) (1) (1) 150,687 (1) z$600 under $1,000 . . . . . . . . . . . 60,041 114,095 60,041 5,914 5,914 41,687 33,391 16,946 5,371 3,33.3 (1) 6,453 55,255 3,453 (1) (1) (1 )$1,000 under $1,500 . . . . . . . .. 56,535 137,623 56,535 7,513 7,513 62,454 19,314 21,895 10,121 (1) 3,034 13,804 11,121 46,993 7,963 ~$1,500 under $2,000 . . . . . . . .. 32,739 107,878 32,739 63,196 4,497 6,045 15,700 3,038 3,459 16,837 10,624 25,241 4,372 3,126 - -$2,000 under $2,500 . . . . . . . .. 26,326 109,467 26,326 70,280 4,749 12,586 5,705 27,444 11,024 21,208
$2)500 under $3,000 . . . . . . . . . 11,341 46,942 11,341 1,351 4 459 19 504 4,125 8 55036 3,171$3,000 under $3,500 . . . . . . . . . 10,114 52,269 10,114 4,546 4,546 38,4_ 7:498 32:909 81,781
$3,500 under $4,000 . . . . . . . . . 4,045 24,260 4,045 1 (1) 5,541 5,581 (1) 3,786 14,693
$4,000 under $4,500 . .. 3,208 - 3,126 16,297 3,379
$4,500 under $5,000 : : : : : : 3,540 24,878 3,540 20,748 - 3,160 20,077 (1) 3,081$5,000 or more . . . . . : : : . . . . . . (1 )
Returns under $5,ODO. . . . . 1,644 964 2,817,896 1,644:964 52:6 52,613 41,6197 1, 7,470 271,077 137,186 65 86 13 396 200,5721 176 712 1,512,433 100 47 24,61 81 7,452 27 025Returns $5~000 under $10, 267:024 577,404 267
021.9 1' 9. , 9 1 1 9 11 25 1 15 1 4,2 ~56 '082 2 5 134,244 61,454 39 468 15,1622 6:6 6 76 723 35:699 236,9 5)2
Returns $10,000 or more . . . . . ... 27,858 56,613 27,858 3,861 3.863 15,734 6,178 3 323 1,847 776 3 361 3,166 1 25,274 2,2980 231 (1)
Footnote at end of table . See text for "Description of Sample" and "Explanation of Classifications and Terms
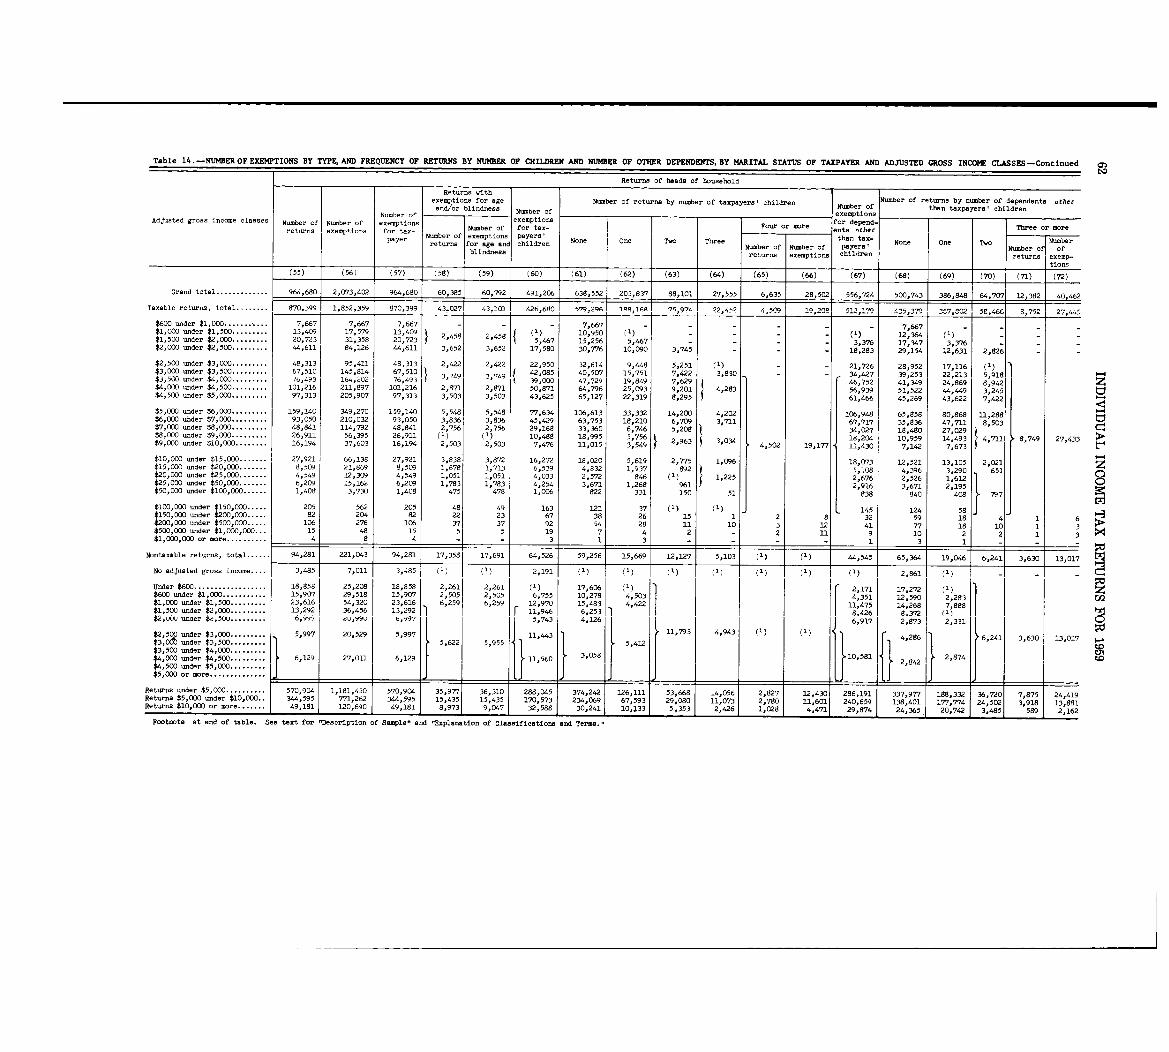
Table 14 . -NUMBER OF EXEMPTIONS BY TYPF, AND FREQUENCY OF RETURNS BY NUMBER OF CHILDREN AND NUMBER OF OTHER DEPENDENTS, BY MARITAL STATUS OF TAXPAYER AND ADJUSTED GROSS INCOME CLASSES -Continued M
Returns of heads of househol d
Returns it hexemptions for age Number of returns by number of taxpayers I children Number of returns by number of dependents otherand/or blindness Number of than taxpayers' children
Number Number of exemptionsAdjusted gross income classes of exemptionsNumber of Number of exemptions for depend-
returns exemptions for tax- Number of for tax- Fouror more ents other Three or
payer Number of exemptions payers, None One T~ Three than tax- One TWO
-
i .returns for age and children payers' None -bartblindness
of tber of ofions children returns exemp-t t ti,
ons(55) (56) (57) (58) (59) (60) (61) (62) (63) (64) (65) (66) (67) (68) (69) (70) (71) (72)
Grand total . . . . . . . . . . . . . 964,680 2,073,402 964,680 1 60,3851 60,792 491,206 638,552 203,837 88,101 27,555 6,635 28,502 556,724 500,743 386,848 64,707, 12,382 _402462
Taxable returns , total . . . . . . . . 870.399 1,852,359 870,399 1 43.0271 43,101 426,680 571),21)6 198,jr AI - 75,974 22,452 -1,,5r)g 19,208 51-1,179 4_35,37- 59,466 8,752 27,445
$600 under $1,000 .. - 7,-7 7,667 7,667 - - - 7,667 - - - - - 7,667 - - -$1,000 under $1,500 : : : : :, :, : 13
,409 17,579 13 09 2,458 2,458 (1) 10,950 (1) (1) 12,364$1,500 under $2,000. . . . . 20,723 31,358 20:'723 5,467 15,256 5,467 - 3,376 17,347 3,376$2,000 under $2,500. . . . . . . . . 44,611 84,126 44,611 3,652 3,652 17,580 30,776 10,090 3,745 18,283 29,154 12,631 2,826
$2,500 under $3,000. . . . . . . . . 48,313 95,411 48,313 2,422 2,422 22 950 32,614 9,448 5,251 21,726 28,952 17,116 (1)$3,000 under $3,500. . . . . . . . . 67,510 145,814 67 510 3,749 3,749 42:085 40,507 15,751 7,422 3,830 34,427 39,253 22,213 5,K8$3,500 under $4,000. . . . . . . . . 7~,493 164,20; 76:493 39,000 47,729 19,849 7,629 46 752 41 349 24 869 8 942$4,000 =der $4,500. . . . . . . . . 101,216 211,897 101,216 2,871 2,971 50,871 64,796 25,093 9 , 20 4,283 56:939 51:522 44:449 3,1245 tV$4,500 under $5,000. . . . . . . . . 97,313 205,907 97,313 3,503 3,503 43,625 65,127 22,319 812915 61 ,466 45, 269 43,622 7,422
$5,000 under $6,000 . . . . . . . . . 159,140 349,270 159,140 5,548 5,548 77,634 106,613 33,332 14,200 4,202 106,948 65,858 80,868 11,288 0-4$6,000 under $7,000 . . . . . . . .. 93,050 210,032 93,050 3,836 3,836 45p429 63,753 18,210 6 709 3,71 1$7,000 urider $8,000 . . . . . . . .. 67 717 35,836 47,711 8,50348,841 114,792 48,841 2,756 2,756 29,168 33,360 6,746 5:208 341,027 11:4 7 :$8,000 urider $9,000 . . . . . . . .. 26,911 56~395 26,911 (1) (1) 10,488 18,995 5,756 18 204 1 '916,194 37,603 3,034 59 14 193 4,711 8,749 27,433$9,000 under $lOpOOO . . . . . . .. 2,963
9
16,194 2,503 2,503 7,476 11,015 3,549 4,502 19,177 11:430 7,142 7,673
$10,000 under $15,000 . . . . . . . 27,921 66,138 27,921 3,838 3,872 16,272 18,020 5,619 2,775 1,096$15,000 under $20,000 . . . . . .. 8,509 21,869 8,509 18 073 12,521 13,105 2,021
1,678 1,713 6,539 4,832 1,937 992 5 108 4$20,000 under $25,DOO . . . . . . . 4,549 12,309 4,549 1,051 1,051 4,033 2,572 ( 1 ) 396 3:290 651846 1,225 2 , 676 2, 526 1 612$25,000 under $50,000 . . . . . . . 6,209 15,162 6,209 1,783 1,783 4,254 3,671 1,268 961
P
$50,000 under $lOO,OD0 . . . . . . 1,408 3,730 1,408 2916 3,671 2,19 5
475 478 1,006 822 331 150 51 838 840 408 797
$100,000 under $150,000 . . . . . 205 562 205 48 49 163 121 37 (1) (1) 145 124 58$150,000 under $200,000 . . . . . 82 204 82 22 23 67 38 26 15 1 2 8 32 59 18 4$200,000 under $500,000 . . . . . 106 276 106 37 37 92 54 28 1 611 10 3 12 41 77 18 10 1 3$500,000 under $1,000,000 . . . 15 48 15 5 5 19 7 4 2 - 2 ll 9 10 2 2 1 3$1,000,000 or more . . . . . . . . . . 4 8 4 - - 3 1 3 1 3 1
94,281 221,:041 -1
1 17,691 59,256 15,669 12,127 5,103Nontaxable returns, total . . . . .. 17,358 44,545 65,364 19,046 6,2411 3,630 13,017
No adjusted gross income . . . . 3,485 7,011 3,485 1 (1) 1 (1 )1 2,191 2,861 (1)
Under $600 . . . . . . . .. 18:8 25,208 18,851 2,2 695 G 2,26 107:6 (1)12 5 5 25)5 6 17 17
:272$600 under $1,000 .. 15 07 29,518 15,907 1 '$1, 000 under $1,500 . . . . . . . . . 23,616 54,320
1 (~~755 278 4,5032 1
$1,500 under $2,000 . . . . . . . .. 13,292 36,456 23,616 6,259 6,259 12 70 15483 4,422 4
,351 12 590 2,283 z
13,292 r 11:9 6:25311,475 14,2
co
$2, OW under $2,5W . . . . . . . . .946
68 7 888
."vt zu,99c) 6,yg-/ 5,743 4,126 8,4268.372 ( 1)
$2,500 under $3,000 . . . . . . . 5,997 20,529 5,997 1 11,793 4,943
(1) 6o917 2,873 2,331
$3 ,A under $3,500 . .. 5,622 5,9551,443J (1)
$3 500 under $4 000 : ::* ~J
5,412 4,286 6,241 3,630 13,017
$4,000 under $4 500 : : : . . . *:' 1 3,0586,129 27,011 6,129$4,500 under $5,000 . . . . . . . .
. 1,560 10,591 2,874 c7q
$5,000 or more . . . . . . . . . . . . . .
2,842 w
Returns under $5,000 . . . . . . . . . . 570,904 1,181,450 570,904
1
Returns $5oOOO under $10 15 772-
1 91135,977 36,310 288,045 374,242 126,111 53,668 14,056 2,827 12,430 286,191 337,977 188
236,1502 3918 3 S8
9.9 :5 15 :9473351 195 :4.4375 1,720:"73 1 2,34 0469 607:593 1
Returns $10,000 or more .
720~ 7 : .75 4 -1
81 1 12.,610 8 8332 2 4
91:471 240:659
Ol1 1
2, '74 177 :7745 3,3 426 1 : 788 :2 1 1 '33 29:080 121:073 2 11,0 114 6011
_'8 3 485 589 2,162
Footnote at end of table . See text for -Description of Sample" and "Explanation of Classifications and Terms .1,
24:411 21 , 712
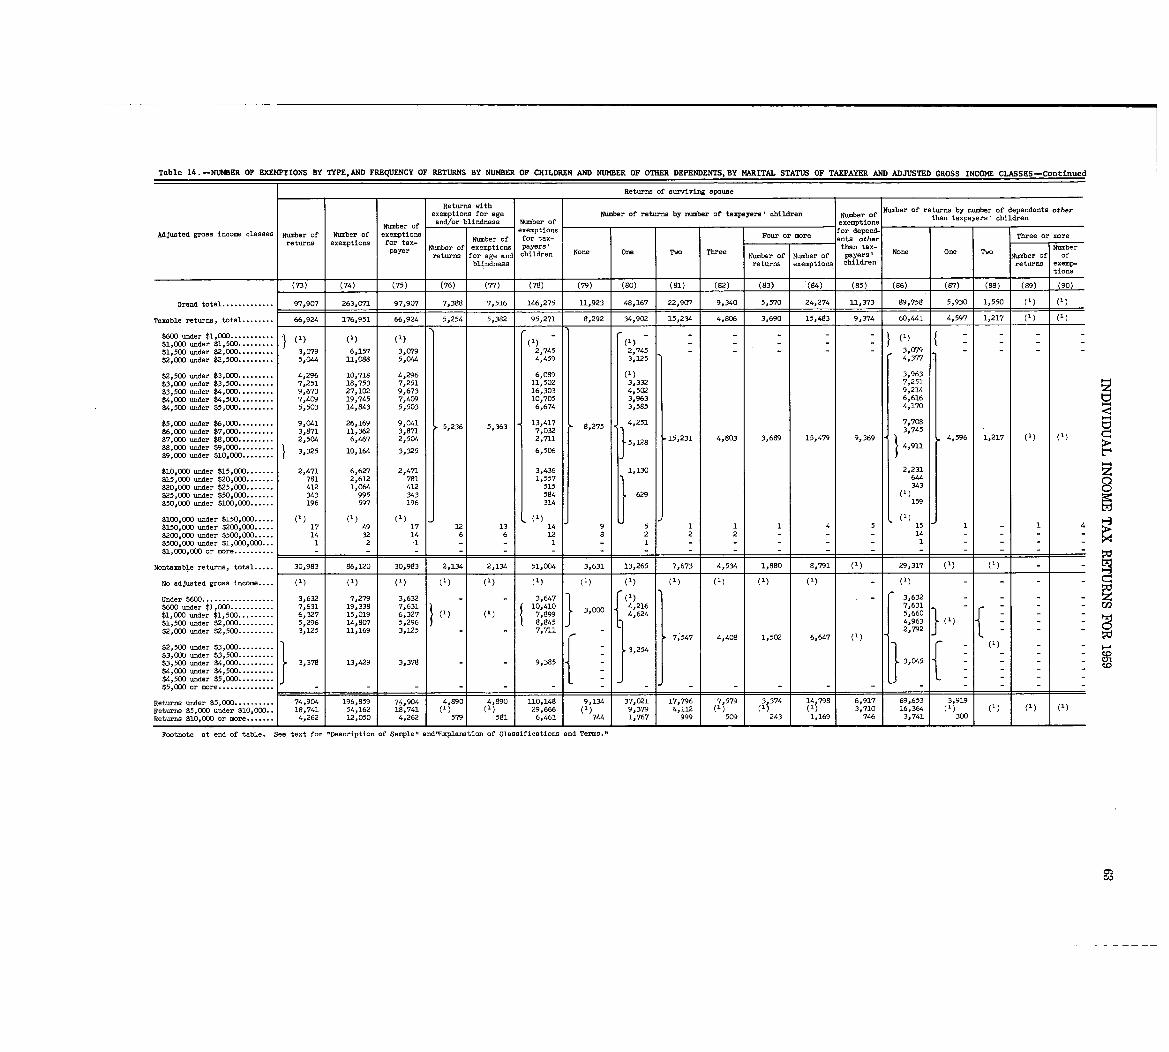
Table 14 . -NUMBER OF EXEMPTIONS BY TYPE, AND FREQUENCY OF RETURNS BY NUMBER OF CHILDREN AND NUMBER OF OTHER DEPENDENTS, BY MARITAL STATUS OF TAXPAYER AND ADJUSTED GROSS INCOME CLASSES-Continued
Returns of aur~i~ing spouse
Returns vith Number of returns by number of dependents otherexemptions for age Number of returns by number of taxpayers- children Number of than taxpayers' childre nand/or blindness Number of exemptionsNumber fexemptions for depend-Adjusted gross income classes Number of Number of exemptions Number
offor tax- Four or more ents other Three or more
returns exemptions for tax- than tax- Numbepayer Number of exempti None One 1140 Three None One Tvoreturns for = ffleM'n tgTr of payers, Number of ofb of a
ag Fe=bMp
bl~=ess tions children returns exa.p-tions
(73) (74) (75) (76) (77) (78) (79) (80) (81) (82) (83) (84) (85) (86) (87) (88) (89) (90 )
Grand total . . . . . . . . . . . . . 97,907 263,071 97,90`7 7,388 7,516 146,275 11,923 48,167 22,907 9,340 5,570 24,274 11,373 89,758 5,930 1,550 (1) (1)
Taxable returns , total . . . . . . . . 66,924 176,951 66,924 5,254 5,382 95,271 8,292 34,902 15,234 4,806 3,690 15,483 9,374 60,441 4,597 1,217 (1) (1)
$600 under $1,000 . . . . .$1,000 under $1,500$1,500 under $2,000 : : : . . . . .. 3,079 6,157 3,079 2,745 2,745 3,079$2 , 000 under $2,500 . . . . . . . . . 5,044 ll, 088 5,044 4,459 3,125 4,377
$2,500 under $3,000 . . . . . . . . . 4,296 10,718 4o296 6,099 (1) 3o963
$31000 under $3,500 . . . . . . . .. 7,251 18,753 7,251 11,502 3,332 7,251$3 1 500 under $4,000 . . . . . . . .. 9,673 27,102 9,673 16,303 4,502 9,214$4,000 under $4,500 . . . . . . . . . 7,409 19,745 7,409 10,705 3,963 6,616$4,500 under $5,000 . . . . . . . . . 5,503 14,843 5,503 6,674 3o585 4,170
$5 000 under $6oOOO . . . . . . . . . 9,041 26,169 9,041 5,236 5,363 13 417 8,275 4,251 7,708
$6,000 under $7,000 . . . . . . . . . 3,871 11,362 3,871 7:032 3,745
$7,000 under $8,000 . . . . . . . . . 2,504 6,467 2,504 2,711 5,128 .15,231 4,803 3,689 15,479 9,369 4,596 1,217
$8,000 under $9,000 . : : : : : : :*4,91 1
) 3,325 10,164 3,325 6,506$9,000 under $10,000
$10,000 =der $15,000 . . . . . . . 2,471 6,627 2,471 3,436 1,130 2,231$15,000 under $20,000. . . . . .. 781 2,612 781 1,557 644
$20 000 under $25,000. . . . . . . 412 1,064 412 515 343
$25 :000 under $50,000. . . . . . . 343 995 343 584 629 (1)$50,000 under $100,000 . . . . .. 196 597 196 314 159
$100,000 under $150,000. . . .. (1) (1) (1) (1)$150,000 under $200,000. . . .. 17 49 17 12 13 14 9 5 1 1 1 4 5 15 1 1 4
$200,000 under $500,000 . . . . . 14 32 1.4 6 6 12 8 2 2 2 - - - 14 - - -
$500,000 under $1,000,000. .. 1 2 1 - - I - 1 - - 1$1,000,000 or mor . . . . . . . . . .. - - - - - - - - - - - - -
Nontaxab~e returns) total . . . . . 30,983 86,120 30,983 2,134 2,134 51,004 3,631 13,265 7,673 4,534 1,880 8,791 29,317 (1)
No adjusted gross income . . .. (1) (1) (1) (1) (1) (1) (1) (1) (1 )
Under $600 . . . . . . . . . . . . . . . . .. 3,632 7,279 3,632 - - 3,647 (1) 3,632$600 under $1,000 . . . . . . . . . .. 7,631 19,338 7 62317 10 410 3,000 4216 7 631
$1,ODO under $1,500 . . . . . . . .. 6,327 15,019 6:3 (1) (1) 7:899 4 :624 5:660
$1,500 under $2,000 . . . . . . . .. 5,296 14,807 5,296 8,845 4 : 963
$2,ODO under $2,500 . . . . . . . .. 3,125 llo169 3,125 - 7,711 - 2 7927,547 4,408 1,502 6,647 (1 )
$2,500 under$3,000 - 3,254$3,000 under $3,500: : . .. - to
9,385 - 3,045$3,500 under $4,000 . . :---.-. : : : 3,378 13,429 3,378 CD$4, 000 under $4,500 -
$4,500 under $5,000 : : : : : : : : : -
$5,000 or more . . . . . . . . . . . . .. - - - J
Returns under $5,000- 74 4 6,85 7~:904 4 4 890 11 9 134 37 :021 17 796 7 579 35374 14,798 6:917 69 653 3,9191 1
9 311 1 3 710 16 36. 11'8 53:904 54 162Returns $5,000 under $1 187 18 74 29,666 i 79 41112 : 4
1 19 , 1
. 890Returns $10,000 or mor( 4,262 12,050 4
,262 579 581 6,461 744 1
,
767 999 509 243 1,169 746 3,741 300
Footnote at end of table . See text for -Description of Sample" and"Explanation of Classifications and Terms ."
CAD
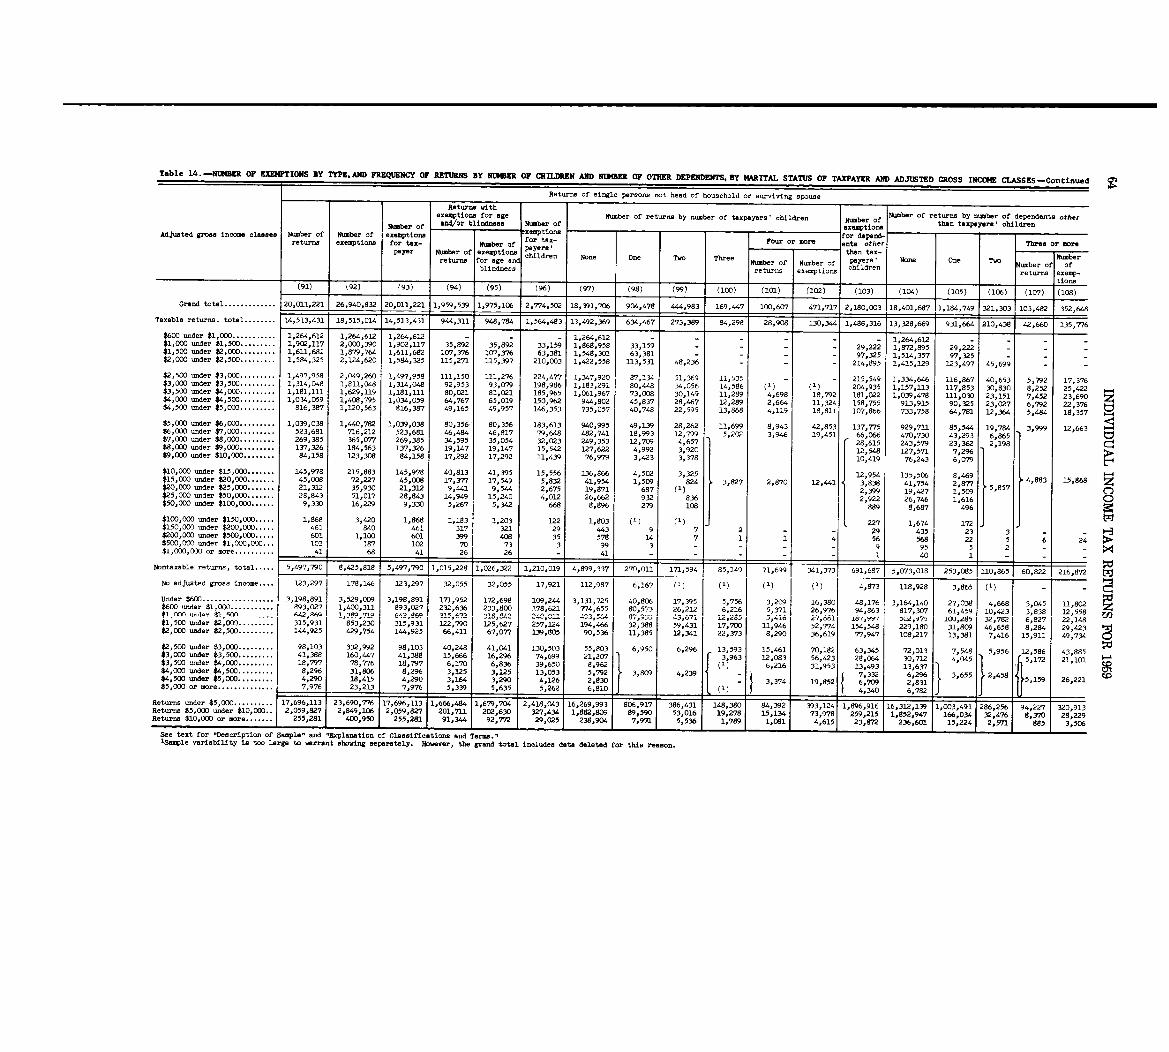
Table 14 . -NUMBER OF EXEMPTIONS BY TYPE. AND FREQUENCY OF RETURNS BY NUMBER OF CHILDREN AND NUMBER OF OTHER DEPENDENTS, BY MARITAL STATUS OF TAXPAYER AND ADJUSTED GROSS INCOME CLASSES -Continued
Returns of single persons not head of household or surviving spous eReturns with
exemptions for age Number of returns by number of taxpayers' children Number of Number of returns by number of dependents otherNumber of and/or blindness Number of exemptions than taxpayers' childre n
Adjusted gross income classes Number of Number of exemptions exempti M for depend-returns exemptions for tax- for tax- Four or mom ents other Three or moreNumber of
p.yer Number of exemptions payers then tax- fl Numberreturns for age and children None One TWO Three Number of Number of Payers, None one Two her of
blindness returns exemptions children Nr=eturns ex0emp-I tions
(91) (92) (93) (94) (95) (96) (97) (98) (99) (100) (101) (102) (103) (104) (105) (106) (107) 1(108)
Grand total . . . . . . . . . . . . . 120,011,221 26,940,832 20,011,221 1,959,539 11,975,106 2,774,502 18,391,706 904,478 1 "4,983 169,447 100,607 471,717 2,180,003 18,401,687 11,184,749 321,303 103,482 352,648
Taxable returns, total . . . . . . . . 14,513,431 19, 515, 014 14,513,431 944,311 948,784 1,564,483 13,492,369 634,467 273,389 84,298 28,908 130,344 1,488,316 13,328,669 931,664 210,438 42,660 135,776$600 under $1,000 . . . . . . . . . . . 1,264,612 1,264,612 1,264,612 - - - 1,264,612 - - - - - - 1,264,612 - - - -$1,000 under $lp5OO . . . . . . . . . 1,902,117 2,000,390 1,902,117 35,e92 35,892 33,159 1,868,958 33,159 29p222 1,872,895 29,222 -$1~500 under $2,000. . . . . . . . . 1,611,682 1,879,764 1,611,682 107,376 107, .376 63,381 1,548,301 63,381 - 97,325 1,514,357 97,325 -$2,000 under $2,500 . . . . . . . . . 1,594,325 2,124,620 1,584,325 115,271 115,397 210,003 1,422,558 113,531 48,236 - 214,895 1,415,129 123,497 45,699
$2,500 under $3,000. . . . . . . . . 1,497,958 2,,!)49,260 1,497,958 111,150 111,276 224,477 1,347,920 87,134 51,369 11,535 215,549 1,334,646 116,867 40,653 5,792 17,376$3,000 under $3,500. . . . . . . . . 1,314,048 1,811,M 1,314,048 92,953 93,079 198,986 1,183,291 80,448 34,056 14,586 204,935 1,157,113 117,853 30,830 8,252 25,422$3)500 under $4,000. . . . . . . . . 1,181,111 1,629,119 1,181,111 80,021 81,021 185,965 IpO61,967 73,008 30,149 11,289 4,698 18,792 181,022 1,039,478 111,030 23,151 7,452 23 69 0$4,000 under $4,500. . . . . . . . . 1,034,059 1,408,795 1,034p059 64,767 65,019 150,962 944,802 45,837 28,467 12,289 2,664 11,324 158,755 913,915 90,325 23,027 6,792 22 :376 tv$4,500 under $5,000. . . . . . . . . 816,3V 1,120,563 816,387 49,165 49,957 146,353 735,057 40,746 22,595 13,868 4,119 18,811 107,866 733,758 64,781 12,364 5,484 18 , 357 ~4_ti$5,000 under $6,000 . . . . . . . . . 1,039,038 1,440,782 1,039,038 80,356' 80p356 183,613 940,995 49,139 28,262 11,699 8,943 42,853 137,775 929,711 85,544 19,784 3,999 12,66 3$6,000 under $7,OD0 . . . . . . . . . 523,681 716,212 523,681 46,484 46,817 79,648 482,741 18,993 12,799 5,202 3,946 19,451 66,066 470,730 43,293 6,865 tj$7,000 under $SpOOO . . . . . . . . . 269,385 365,077 269,385 34,595 35,054 32,023 249,353 12,709 4,657 28 615 243,5 23,362 2,198$8,000 under $9,OOC . . . . . . . . . 137,326 184,563 137,326 19,147 19,147 15,542 127,622 4,992 3,920 12 :548 127,571 7,296$9,ODO under $10,000 . . . . . . . . 84,158 123,308 84,158 17,292 17,292 11,439 76,979 3,423 3,378 10,419 76,243 6,079
$10,000 under $15,000 . . . . . . . 145,978 215,883 145,978 40,813 41,395 15,556 136,866 4,502 3,325 12,954 135,506 8 469 4,883 15,868$15,000 under $20,000 . . . . . . . 45,009 72,227 45,008 17,377 17p549 5,832 41,954 1,509 824 3,827 2,870 12,441 3,838 41,754 21877 5,857 z$200000 under $25,000 . . . . . . . 21,312 35,930 21,312 9,"l 9, 5" 2,675 19,871 687 (1) 2,399 19,427 1 , 509$25,000 under $50,000 . . . . . . . 28,843 51,017 28,843 14,949 15,240 4,012 26,662 932 836 2,922 26,746 1,616 0$500000 under $100,000 . . . . . . 9,330 16,229 9,330 5,267 5,342 668 8,896 279 108 899 8,687 496
$100,000 under $150,000 . . . . . 1,968 3,420 1,868 lp183 1,203 122 1,803 (1) (1) 227 1,674 172$150,000 under $200,000 461 940 461 317 321 29 "3 9 7 2 - - 29 435 23 3 - - 0-3$200,000 under $5OO .OC)O : : : : * 11 00 601 399 408 35 578 14 7 1 1 4 56 w 22 5 6 24 ;P.$500,000 =der $1,000,000 . . : 187 102 70 73 3 99 3 - - - - 9 95 5 2 - -$1,000,000 or more . . . . . . . . . . 68 41 26 26 - 1 41 - I - I - I - I -I 1 40 1 1 - I - -
Nontaxable returns, total . . . . . 8,425,81851f!1_!!0_J
lpO15,228 1,026,322 1,210,019 4,899,337 270,011 171,594 85,349 1 71,699 1 341,3731 691,687 1 51073,018 1 253,085 1110,8651 60,82
No adjusted gross income . . . . 123p297 178,146 123,297 32,055 32,055 17,921 112,987 6,267 (1) (1) (1) (1) 4,873 118,928 3,865 (1) - - C-1
Under $60C . . . . . . . . . . . . . . . . . . 3,198,891 3,529,009 3,198,891 171,952 172,698 109,244 3,131,725 40,806 17,395 5,756 3,209 16,380 48,176 3,164,140 27,038 4,668 ~ 3,045 11 802 ~0$600 under $1,000 . . . . . . . . . . . 893,027 1,400,311 893,027 232,636 233,800 1.78,621 774,655 90,573 26,212 6,216 5,371 26,976 94,863 817,307 61,459 0,423 3,838 12 :558 z
18,842 1 564 - - 27,881 - co$I ;rM un-d-r r,42,A6Q 1,3eg,719 6~2,869 315,672 3 240,01 493,, 8,,,3:3 43,671 12,285 50416 18/,997 D02,97~ 10U,285 32,792 6,827 22 148$1,500 under $2,000 . . . . . . . . . 315,931 853,230 315,931 122,7910 125,627 257,124 194,466 32,388 59,431 17,700 11,946 52,774 154,548 229,180 31," 46,658 8,294 29 :423 1~$2,000 under $2,500 . . . . . . . . . 144,925 429,754 1",925 66,411 67,077 139,805 90,536 11,385 12,341 22,373 8,290 36,619 77,947 108,217 13,381 7,416 15,911 49 734<
$2,500 under $3,000 . . . . . . . . . 98,103 332,992 98,103 40,248 41,041 130,503 55 803 6,950 6 296 13,593 15,461 70,182 63,345 72,013 7,548 5,956 12,586 43 88 5$3,000 under $3,500 . . . . . . . . . 41,388 160,447 41,388 15,666 16,296 74,699 21:207 3 963 12, 083 56,423 28,064 30,712 4:045 21
:101$3,500 under $4,000 . . . . . . . . . 18,797 78,776 18,797 6,170 6,836 39,650 8,962 6,216 31,953 13,493 13,6Y7$4pOOO under $4,500 . . . . . . . . . 8,296 31,806 8,296 3,125 3,125 13,053 5,792 3,809 4,239 - 1 7,332 6,296 3 65, 2,458 5,159 26,221$4,500 under $5,000 . . . . . . . . . 4,290 18,415 4,290 3,164 3,290 4,126 2,830 - 1 3,374 1 19,8521 6 , 709 2,831 ~5,17
2
$5,ODO or more . . . . . . . . . . . . . . 6,810 (1) 4,340 1 6,782
Returns under $5,000 . . . . . . . . . . 17,696,113 23,690,776 17,696,113 1,666,484 1,679,704 2,411 13 16,269,993 806,917 30
84 392 39 24 6 16 16 312 139 1,003,491 286 256 94,227 320,913Re 630.7:4.
1 1' 9 9 1 1761 ,$5,000 under $10,000 . . 2,059,927 2,649,106 2,059 827 201 73 .1 202 1,882,809 89,590, '5-61 :041361 '~'-11,'278 15,134 71' :978 2'1 :2 5 :852 :947 166,034 32 :4 8 370 28,2299
Rett=rna $10,000 or more . . . . . . . 255,281 400,950 255 :281 91 :3" 92:772 29,025 238,9041
7,971 5,536 1 1,78q 1 081 4,6151
23,872 1 236 .601 15,224 2 571 985 3,506
See text for -Description of Sample- and "Explanation of Classifications and Terms .-ISample variability is too large to wrrant showing separately. However, the grand total includes data deleted for this reason .
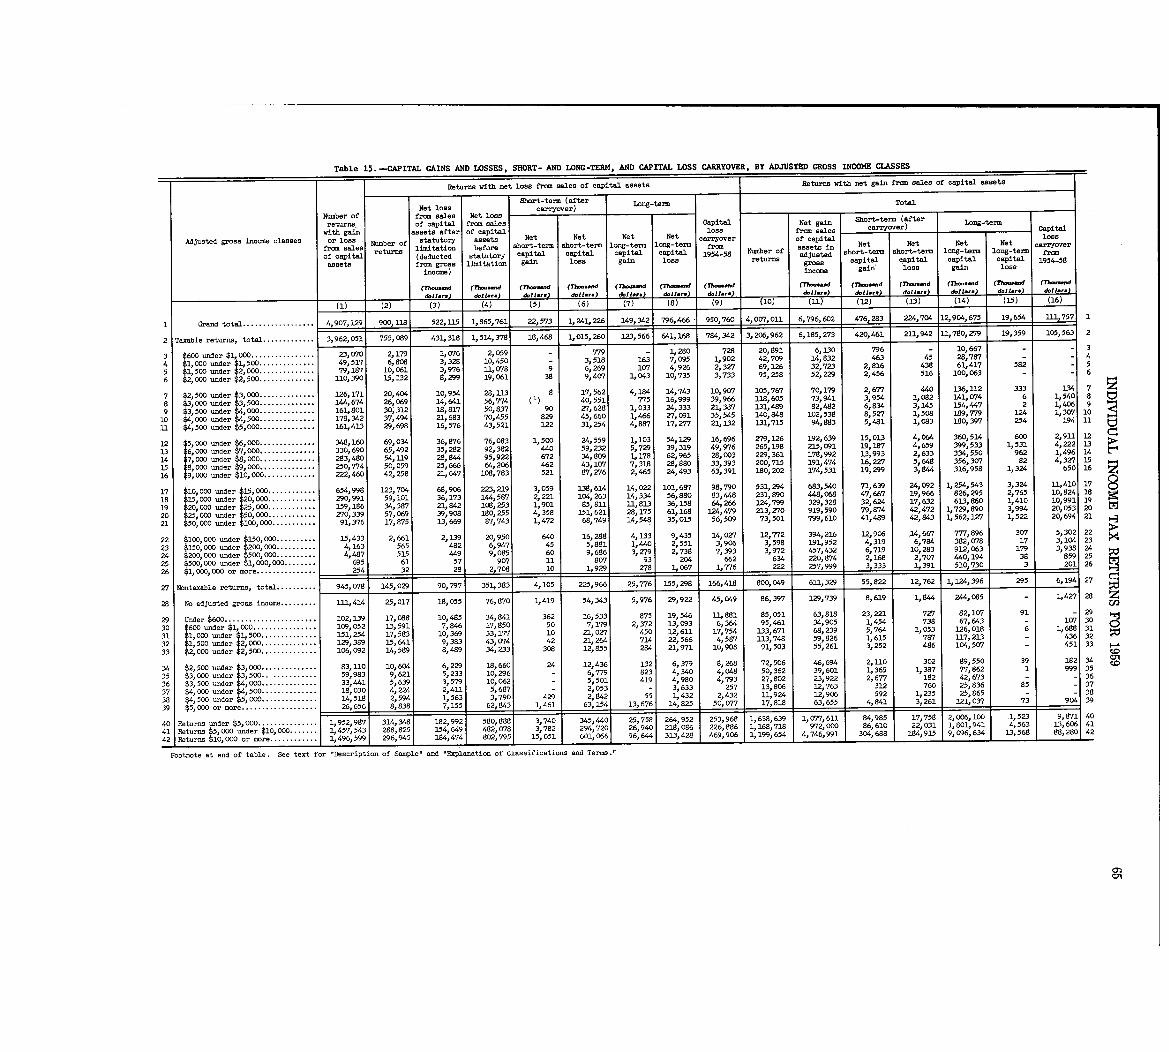
Table 15 .---WITAL GAINS AND :VOSSES, SHORT- AND LONG-TERM, AND CAPITAL LOSS CARRYOVER, BY ADJUSTED GROSS INCOME CLASSES
Returns with net loss from miss of capital assets Returns with net gain from sales of capital assets
Short-tern (after Long-term Total
Number of Netlose carryover)
from sales Net losereturns of capital from sales Capital Net ain Short-tem (after Long-te m
9 carryov Capitalvith gain assets after of capital loss from ales er)
Adjusted gross income classes or loss statutory as ts Net Net Net Net carryaver of capital lossNumber of Be term Net Net Net Netfrom sales limitation before short-tem short-term long-term long- from assets in carryover
of capital returns (deducted statutory capital capital capital capital 1954-58 Number of adjusted short-terin short-term. long-tem long-term from
assets from gross limitation gain loss gain loss returns gross capital capital capital capital 1954-58
income) income gain' loss gain loss
(Th-.-d (lh-...d (rh-.-d (rh-.-d (Thou..d (7h-.-d (Th-.-d (Th-...d (Th--d (Th.-d. (n-.-d (rh-d
doll.,.) d.11. .. d.11... dll.-) d.1l .r.) d.11 ... ~bll... ) d.11. .. d.11. .. bll. .. I d.11... d.11 . . .
W (2) (3) (4) (5) (6) (7) (8) (9) (10) (11)-(12) (13) (14) (15) (16)
950,760 2211 Grand total . . . . . . . . . . . . . . . . . . 4,9(Y7,329 900,3_18 522,115 1,865,761 22,573 1,241,226 149,342 796,466 4,007,011 6,796,602 476,283 224,704 12,904,675 19,654 11.1,757 1
784,342 21
,
2 Taxable returns, total . . . . . . . . . . . . . 3,962,051 755,089 431,318 1,514,378 18,468 1,015,260 123,566 641,168 3,206,962 6, 185, Z73 420,461 211, 942 11, 780, Z79 19,359 105,563 2
3 600 under $1,000 . . . . . . . . . . . . . . . . 23,070 2,179 1,076 21059 - 779 - 1,280 20,891 6,130 796 - 10,667 - - 3728 -6
4 1,000 und:; J21,51 : : : : : : : : : : : . . . 49,517 6,8o8 3,328 10,450 - 3,518 163 7,095 1,902 42,709 14,832 463 45 28787 - - 4
5 1,500 und . . . 79,187 10,061 3,976 11,078 9 6,269 107 4,926 2,327 69,126 32,723 r2,816 438 61,417 582 - 5
6 12,000 under 2,500 . . . . . . . . . . . . . . 310,390 15,132 8,299 19,061 38 9, 407 1,043 10,735 3,733 95,258 52,229 2,456 516 100,063 - - 6
7 500 und:r ~3,0000 : : : : : : : : : : : . . . 126,11 2,1 10,954 28,13-3 8 17,562 4,184 14,743 10, 9(Y7 105,767 70,179 2,677 440 136,112 333 134 7 z
1000 undr 3,50
. . . 144,674 26,069 14,641 56,774 775 16,999 39,966 118,605 73,941 3,954 1,082 141,074 6 1,540 88 1 (1) 40,55 1
9 ~3,511 fdl:r 161,801 30,'312 18,817 507837 90 27,628 1,033 24,333 21,387 131,499 82,482 6,834 3,145 154,447 2 1,406 9
10 500 5140,848 102,538 8,527 1,508 189,779 124 1,3 10
0. r
ooo : : : : : . . . . . 178,342 37,494 21,683 70,455 829 45,660 1,466 27,091 35,54 07
11 500 under ~5; 94,8835,481 1,083 180,397 254 194 3.1
1000 . . . . . . . . . 161,413 29,698 16,576 43,521 122 31,254 4,887 17, Z77 21,132 131,715
12 5,= ~,.nd :; ~6, 348,160 69 034 36,876 76,083 1,500 24,559 1,103 54,129 16,696 Z79, 126 192,639 3 .5,013 4,064 360,514 600 2,911 127, 1,49
13 6 330,690 65,492 35,282 92,382 440 59,232 5,729 39,319 49,976 265,198 215,091 19,187 4,659 399,533 lo531 4,222 1.3 ;P_
14 7,r d:r 1, . . . . . . . . . . . 2113,18. 54,119 28,S" 95,922 672 34,809 1,178 62,965 28,003 229,361 178,992 13,993 2,633 334,550 962 6 14
158 , '). M r 9,~~: :
: 250,774 50,059 25,666 64,206 462 43,107 7,318 28,880 33,393 200,73.5 191,474 16,2Z7 5,648 356,3017 82 4,327 15
1 110,000. . . . . . . . . . . . . 21,647 108,783 521 87,276 2,465 24,493 63,391 180,202 174,531 19,299 3,844 316,958 1,324 650 16
n16 9,000 under 222,460 42,258 z
1 110,000 under 000000 : : : : : : : : : : : : 654 18 123,704 68,906 223,219 3,059 3.38,614 14,022 101, 68`7 98,790 531,294 683,540 71,639 24,092 1,254,543 3,324 11,410 17 0
15, 000 under~15 56,880 83,448 231,890 448,068 47,667 19,966 826,295 1818
2.,290,991 59,101 36,173 144,587 2,221 104,263 14,334 2,765 10,824
19 20,000 under 25,000 159,186 34,387 21,842 108,253 1,9ol 85,83 .1 3-1,W 36,158 64,266 124,799 329,328 32,624 17,632 613,860 1,410 10,991 19
20 25,000 under 50j000 : :-.'. .* . . . . 270,339 57,069 39,908 180,255 4,358 151,621 28,175 61,168 124,479 213, Z70 919,590 79,974 42,472 11729,890 3,994 20,053 20
21 50, 000 under 100,000 . . . . . . . . . . . 91,376 17,875 13,669 87,743 1,472 68,749 14,548 35,015 56,509 73,501 799,610 41,489 42,843 1, 562, 1V 1,522 20,694 21 _3
22 100,~WOI und:rr 1,433 2,.1 2,139 20,950 640 16,288 4,133 9,435 14,OZ7 12,772 394,216 12,906 14,667 777,896 30`7 5 302 2215.,
und 2. 382, V78 17 3'
23 4,163 565 482 6,947 45 5,881 1,440 2,551 3,906 3,598 191,952 4,319 6,784 104 23
24 200,000 und 500,000 . . . . . . . . . 4,487 515 449 9,085 60 9,686 3, Z79 2,738 7,393 3,972 457,432 6,719 10,283 912,063 179 3,938 24
25 500,000 und 11,000,000 . . . . . . . . 695 61 57 907 11 807 93 204 662 634 220,874 2,168 2,707 "0, 194 38 859 25
26 111 000,ooo or more . . . . . . . . . . . . . . . 254 32 28 2,708 10 1 1,929 Z78 1,067 1,776 222 257,999 3,333 1,391 _ 510,730 3 201 26
27 Nontaxable returns, total . . . . . . . . . . 945, 078 145,029 90,7971 351,383 225,966 25,776 155,298 166,418 80o,049 611,329 55,822 12,762 1,124,396 295 6,194 27
28 No adjusted grow income . . . . . . . . . 112,414 25,017 18,055 76,870 1,419 54,343 5,976 29,922 45,049 86,397 129,739 8,619 1,844 244,085 - 1,427 28 z1,4 U2
10
5
29 Under $600 . . . . . . . . . . . . . . . . . . . . . . . 102,139 17,088 10,485 34,841 362 16,533 875 19,546 U, 881 85,051 63,818 23,221 7Z7 82, 107 91 - 2936217,850 0 95,461 34,905 1,454 738 67,643 - 107 30 It
30 600 under $1,000 . . . . . . . . . . . . . 109,052 13,591 7,846 50 7,179 2,372 13,093 6,364 0
1
9
Id:r 1,500. . . . . . . . . . . 151,254 17,583 10,369 33,177 10 21,027 450 12,63.1 17,754 133,671 68,239 5,764 1,053 126,018 6 1,688 31r 3-17,213 - 436 32:32 1,50. 2,000. . . . . . . . . . . . . . 129,389 15,641 9,383 43, Y74 42 21,264 714 22,566 4,587 113,748 59,826 1,615 787
33 12,000 under 12,500. . . . . . . . . . . . . . 106,092 14,589 8,489 34,233 308 12,855 284 21,971 10~908 91,503 55,261 3,252 486 104,507 - 451 33to
89,550 39 182 34 C"34 2;50oo f ~33,000 : : . . . . . . . . . . . . 83, 10,604 6,229 18,660 24 12,436 132 6,379 8,268 72,506 46,694 2,110 302 tD.0 d :r 1 999 3535 3 r 5
.. . . . . . . . . . . 59,983 9,621 5,233 10,296 - 6,779 823 4,340 4,048 50,362 39,601 1,365 1,387 77,862
q16 3,500 ~~der 14,-0 . . . . . . . . . . . . . . 33,441 5,639 3,579 10,062 - 5,501 419 4,980 4,793 27,802 23,922 2,677 182 42,673 - - 3637 de
500 . . . . . . . . . . . . . . 18,030 4,224 2,411 5,687 - 2,053 - 3,633 257 13,806 12,763 312 760 25,836 85 - 371 59 2
38 500 ur~der r1,235 25,865 - - 38
"ooo . . . . . . . . . . . . . . 14,518 2,594 1,563 3,790 429 2,842 55 17432 2,432 11,924 12,906
39 5jOOO or more . . . . . . . . . . . . . . . . . . . 26,656 8,8381 7,1551 62,843 1,461 1 63,1541 13,6761 14,825 1 50, 1 177818 1 63,655 1 4jS41 1 3,261 121,037 73 904 39
81 3,740 145,44.01 265,,97.51 1 264,,95 981 17,758 2,006,100 1,523 93 8 'S 10.40 Returns -der $5, ooo . . . . . . . . . . . . . . . 11952,987 314,348 182,9921 580,888 2 253,91 1,638 639 1 11077,611 871 40
"941 Retu -der 110,~C : : : : : : : 1,457,543 288,825 154,649 482, W
'782294,72 2
218. 6 226 86 1,168,718 972,000 86,610 22,031 1,801,941 4,563 13,606 4 1
2 t.Z 15 991 3o4,688 184,915 9,096,634 13,568 88,280 424
J.M or more . . . . . . . . . . . . 1,496,599 296,945 184,474 802,79 601,0661 96,6441 313,428 469,906 1,199,654 4,746,
Footnote at end of table . See text for "Description of Sample" and "Explanation of Classifications Bud Terms
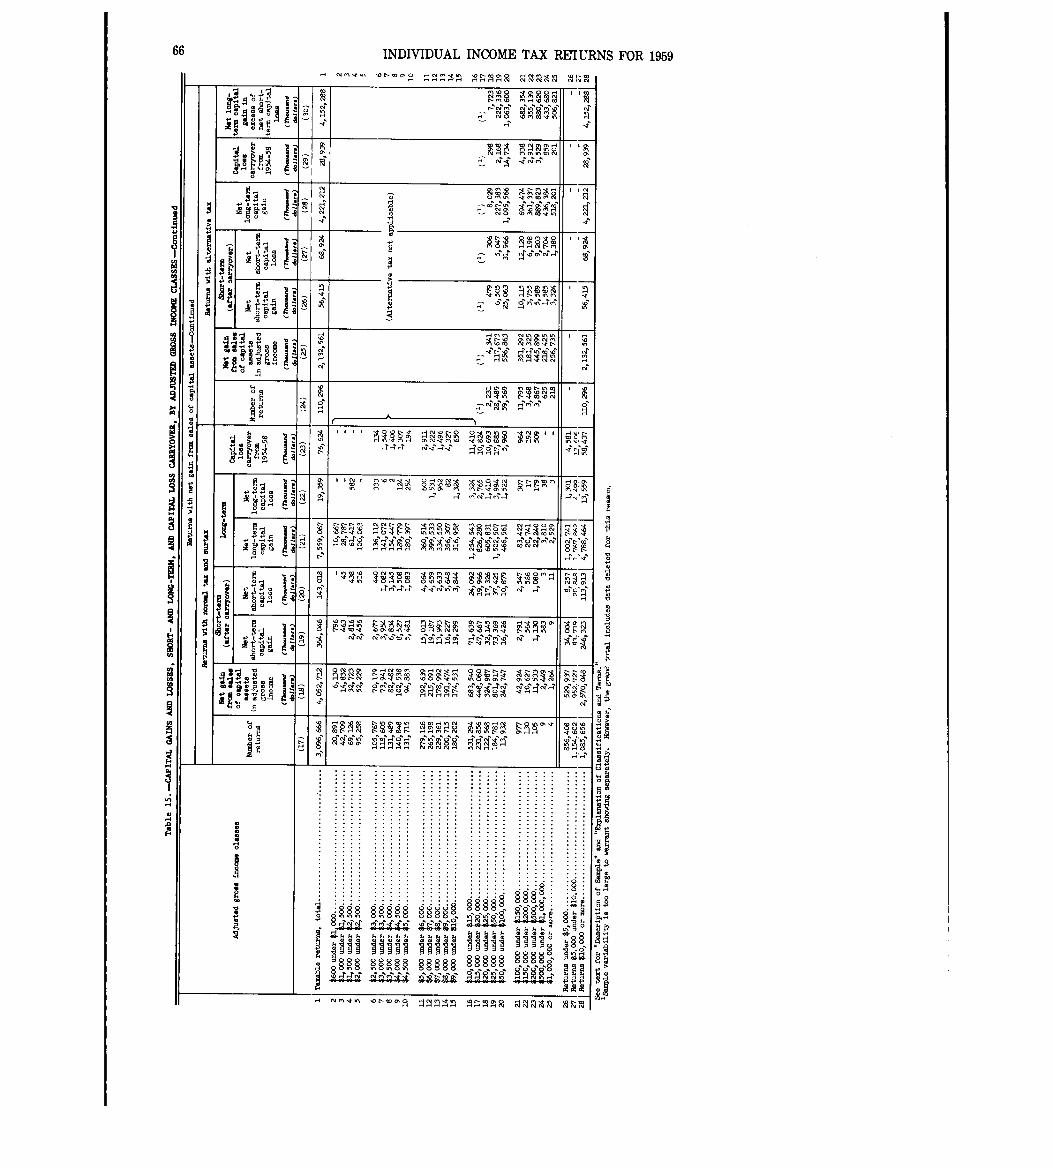
66
NAMAP ANTAR Almon gi~
oil Amu-pqg goes,
RAWMAY j
AH Mii
'01
OR
ral lual ggg maim- a I -n
yy y
I N f wa wo few H01 d1l" 91 1
q Ai 19W 9HIA 9ME Rig'' M
2
004,
9 Mi Mwi 20H by yar Ago,4 an assan !!ill
way to g
lips0 H-01 HIM 19155 211DR 1113A HI N
oij,
lul l10
"I6141
117;~Pf~g wagg gigM Off!
oI 9M MH QQJ
n; Now
. . . . . . . . . . . . . . . .
.. . . . . . . .
. . . . . . .
NO W
4
gooo ~~
HNN M~~:
Akkk k
11 . . . . . oil stil lI I I itsU
MH nn§ HH§U p
.... wan" HIS SM WHO fi v
AM A
INDIVIDUAL INCOME TAX REvIURNS FOR 1959.0 .0
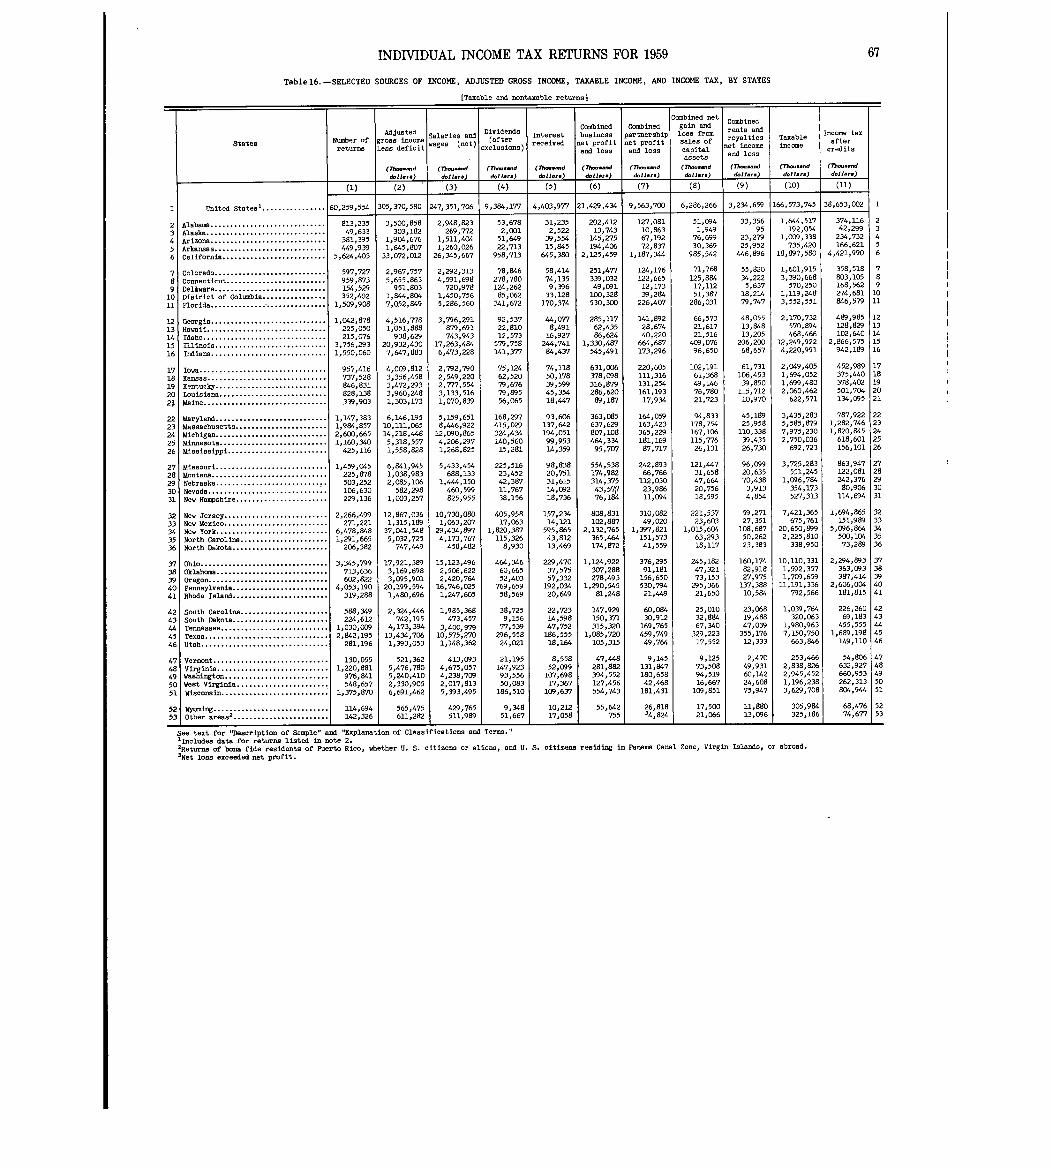
INDIVIDUAL INCOME TAX RETURNS FOR 1959
Table16 . -SELECTED SOURCES OF INCOME, ADJUSTED GROSS INCOME, TAXABLE INCOME, AND INCOME TAX, BY STATES
[Taxable and nontaxable returns]
67
Combined netCombine d
Adjusted Salaries andDividends
InterestCombined
businessCombinedpartnership
gain andloss from
rents and Income tax
States Number of gross income wages (net)(after
received net profit net profit sales of royaltie st income
Taxabl eincome
afterreturns less deficit exclusions)
and loss and loss capitalne credit s
assetsand los s
(7Y-.-d (Th--d (rh . . d (r)-aad (Th-...d (Thooaad (Th-d (Th--.d (Th-oad (Th- . ..d
doll... dollar.) dollar.) dollar .) doll .. . dollar.) dollar.) doll... doji. .. dollar.)
(2) (3) (4) (5) (6) (7) (8) 1 (9) (10) (11)1
1 United States' . . . . . . . . . . . . . . . . 60,259,554 1 305,370,580 247,351,706 1 9,384,177 4,403,977 21,429,434 9,563,700 6,286,266 1 3,234,659 166,573,745 38,653,002 1
2 Alabama . . . . . . . . . . . . . . . . . . . . 813,235 3,500,858 2,948,823 53,678 31,235 202,41-2 127,081 51,094 33,356 1,644,517 374,116 2
3 Ala ke . . . . . . . . . . . . . . . . . . . . . 49.,633 303,182 269,772 2,001 2,522 13,743 10,863 1,949 95 192,054 42,299 3
4 Ario. . . . . . . . . . . . . . . . . . . . . . . . . . . . .zone
381,395 1,904,676 1,511,404 51,649 39,554 145,275 67,192 76,699 23,279 1,009,338 234,732 4
5 Arkansas . . . . . . . . . . . . . . . . . . . . . . . . . . . . 449,939 1,645,807 1,260,026 22,713 15,845 194,406 72,837 30,369 25,952 735,420 166,621 5
6 California . . . . . . . . . . . . . . . . . . . . . . . . . . 5,624,403 33,072,012 26,345,667 958,713 645,380 2,125,459 1,187,344 985,542 446,896 18,897,580 4,421,990 6
7 Colorado. . . . . . . . . . . . . . . . . . . . . . . . . . . . 597,727 2,967,757 2,292,313 78,846 58,414 251,477 124,176 71,768 55,820 1,601,915 358,518 7
8 Connecticut . . . . . . . . . . . . . . . . . . . . . . . . . 959,873 5,655,863 4,591,698 278,780 74,135 339,032 122,665 125,884 34,222 3,390,668 803,105 8
9 Doliware. . . . . . . . . . . . . . . . . . . . . . . . . . . . 154,529 951,803 720,978 124,262 9,396 49,091 12,173 17, 112 5,637 570,250 168,562 9
10 District of Columbia . . . . . . . . . . . . . . . . 352 1402 1,844,804 1,450,756 85,062 33, US 100,328 39,284 51,387 18,214 1,119,248 274,681 10
11 Florida . . . . . . . . . . . . . .. . . . . . . . . . . . . . . . 1,509,908 7,052,849 5,286,560 341,672 170,374 530,300 226,407 286,031 79,747 3,552,551 846,579 1 1
12 Georgia . . . . . . . . . . . . . . . . . . . . . . . . . . . . . 1,042,878 4,516,778 3,796,291 92,537 ",077 285,117 141,892 66,573 48,055 2,170,732 489,985 1 2
13 Hawaii . . . . . . . . . . . . . . . . . . . . . . . . . . . . . . . 225,050 1,051,888 879,691 22,810 8,491 62,435 28,674, 21,617 13,848 570,894 128,829 13
14 Idaho . . . . . . . . . . . . . . . . . . . . . . . . . . . . . . . 215,076 938,629 743,943 12,573 16,927 86,624 40,220 21,516 13,205 468,466 102,640 14
15 Illinois . . . . . . . . . . . . . . . . . . . . . . . . . . . . 3,756,293 20,932,430 17,263,484 579,758 244o741 1,330,487 664,687 409,076 206,200 12,249,922 2,866,575 15
16 Indiana . . . . . . . . . . . . . . . . . . . . . . . . . . . . . 1,550,060 7,647,883 6,473,228 141,377 84,437 545,491 173,296 96,650 68,657 4,220,991 942,189 1 6
17 Iowa . . . . . . . . . . . . . . . . . . . . . . . . . . . . . . . . 957,416 4,009,812 2,792,790 75,124 74,118 631,006 220,605 102,191 61,731 2,049,405 452,989 17
18 Kansas . . . . . . . . . . . . . . . . . . . . . . . . . . . . . . 737,528 3,356,458 2,549,220 62,520 50,178 378,098 111,316 61,368 106,453 1,694,052 375,"0 18
19 Kentucky . . . . . . . . . . . . . . . . . . . . . . . . . . . . 846,831 3,472,293 2,777,554 79,676 39,599 316,879 131,254 49,146 39,850 1,699,480 378o4O2 19
20 Loulsisna . . . . . . . . . . . . . . . . . . . . . . . . . . . 828,138 3,960,248 3,133,516 79,895 45,354 286,620 161,193 76,780 115,712 2,060o462 501,704 20
21 Maine . . . . . . . . . . . . . . . . . . . . . . . . . . . . . . . 339,903 1,303,173 1,070,839 56,065 18,"7 89,187 17,934 21,723 10,970 622,571 1341,095 21
22 Maryland . . . . . . . . . . . . . . . . . . . . . . . . . . . . 1,147,383 6,146,195 5,159,651 168,297 93,606 363,085 164,059 94,833 45,189 3,435,283 787,922 22
23 Massachusetts . . . . . . . . . . . . . . . . . . . . . . . 1,984,857 10,111,065 8,446,922 415,029 .137,642 637,629 163,423 178,754 25,958 5,585,879 1,282,746 23
24 Michigan. . . . . . . . . . . . . . . . . . . . . . . . . . . . 2,600,665 14,218,448 12,090,865 324,434 194,051 80,7,108 365,229 167,106 110,338 7,975,230 1,820,845 24
25 Minnesota . . . . . . . . . . . . . . . . . . . . . . . . . . . 1,160,340 5,318,557 4,206,297 140,560 99,953 464,334 181,169 115,776 39,435 2,750,036 618,601 25
26 Mississippi . . . . . . . . . . . . . . . . . . . . . . . . . 425,116 1,558,828 1,268,825 15,281 14,359 95,707 87,717 26,131 26,730 692,723 156,101 26
27 Missouri. . . . . . . . . . . . . . . . . . . . . . . . . . . . 1,459,045 6,841,945 5,433,454 225,516 98,838 554,538 242,693 121,447 96,099 3,725,283 863,947 27
28 Montana . . . . . . . . . . . . . . . . . . . . . . . . . . . . . 225,878 1,038,983 688,133 23,452 20,751 174,982 66,766 31,658 20,635 551,245 122,081 2 8
29 Nebraska . . . . . . . . . . . . . . . . . . . . . . . . . . ! . 503,252 2,085,106 1,444,150 42,387 31,615 314,375 112,030 47,664 70o438 1,096,784 242,376 29
30 Nevada . . . . . . . . . . . . . . . . . . . . . . . . . . . . . . 106,630 582,298 460,599 11,767 14,092 43
, 5
23,986 20,756 3,913 354,173 80,906 3 0
31 New Hampshire . . . . . . . . . . . . . . . . . . . . . . . 229,136 1,003,257 825,955 38,156 18,7346 7611 11,094 18,595 4,854 527,313 114,694 3 1
32 New Jersey . . . . . . . . . . . . . . . . . . . . . . . . . . 2,266,499 12,867,036 10,730,080 405,958 157,234 808,831 310,082 221,537 59,271 7,421,365 lo694,865 3 2
33 New Mexico . . . . . . . . . . . . . . . . . . . . . . . . . . 271,221 1,315,189 1,063,207 17,063 14, 121 102o887 49,020 23,603 27,351 675,761 151,989 3 3
34 New York . . . . . . . . . . . . . . . . . . . . . . . . . . . . 6,478,848 37,041,548 29,434,897 1,820,387 595,865 2,132,765 1,397,821 1,015,604 108,687 20,650,899 5,096,864 34
35 North Carolina . . . . . . . . . . . . . . . . . . . . . . 1,291,665 5,032,725 4,173,767 115,326 43,8U 365,464 151,573 63,293 50,262 2,225,810 500,104 35
36 North Dakota . . . . . . . . . . . . . . . . . . . . . . . . 206,382 747,449 458,482 8,930 13,469 174,872 41,559 18,117 23,383 338,950 73,289 36
37 Ohio . . . . . . . . . . . . . . . . . . . . . . . . . . . . . . . . 3,345,799 17,921,389 15, 123,496 464,346 229,470 lol24,922 376,295 245,182 160,174 10,110,331 2,294,893 37
38 Oklahoma . . . . . . . . . . . . . . . . . . . . . . . . . . . . 713,636 3,169,698 2,506,622 60,665 37,575 307,288 91,181 47,321 82,918 1,592,357 363,093 38
39 Oregon . . . . . . . . . . . . . . . . . . . . . . . . . . . . . . 602,922 3,095,901 2,420,764 52,403 57,332 278,493 156,650 73,153 27,975 1,709,659 387,414 39
40 Pennsylvania . . . . . . . . . . . . . . . . . . . . . . . . 4,053,190 20,199,594 16,746,025 769,659 192,034 1,290,545 530,794 295,366 137,388 11,191,336 2,606,004 40
41 Rhode Island . . . . . . . . . . . . . . . . . . . . . . . . 319,288 1,480,696 1,247,605 58,569 20,649 81,248 21,449 21,650 10,584 792,566 181,815 41
42 South Carolina . . . . . . . . . . . . . . . . . . . . . . 598,349 2,324,446 1,985,368 38,725 22,723 147,929 60,084 25,010 23,068 1,039,764 226,260 42
43 South Dakota . . . . . . . . . . . . . . . . . . . . . . . . 224,612 742,195 473,457 9,156 14,598 150,371 30,912 32,894 19,488 320,063 69,183 43
44 Tennessee . . . . . . . . . . . . . . . . . . . . . . . . . . . 1,030,009 4,173,394 3,400, 979 77o539 47,752 315,320 169,765 67,340 47,039 1,980,963 455,555 44
45 Texas . . . . . . . . . . . . . . . . . . . . . . . . . . . . . . . 2,842,195 13,434,706 10,575o270 296,558 186,555 1,085,720 459,749 329,223 355,176 7,150,750 1,689,198 45
46 Utah . . . . . . . . . . . . . . . . . . . . . . . . . . . . . . . . 281,196 1,393,053 1,148,362 24,021 18,164 105,315 49,764 17,552 12,333 663,846 149,110 46
47 Vermont . . . . . . . . . . . . . . . . . . . . . . . . . . . . . 130,055 521,362 413,0?3 21,195 8,558 47,448 9,145 9,125 2,470 253,466 54,806 47
48 Virginia . . . . . . . . . . . . . . . . . . . . . . . . . . . . 1,220,881 5,476,780 4,675,057 147,923 52,099 281,882 131,947 73,508 49,931 2,838,826 632,927 48
49 Washington . . . . . . . . . . . . . . . . . . . . . . . . . . 976,841 5,240,410 4,238,709 93,556 107,698 394,552 180,658 94,519 60,142 2,945,452 660,953 49
50 West Virginia . . . . . . . . . . . . . . . . . . . . . . . ~ 548,657 2,330,905 2,017,813 50,083 17,367 127,456 42,468 16,667 24,608 1,196,238 262,313 50
51 Wisconsin. . . . . . . . . . . . . . . . . . . . . . . . . . . 1,375,870 6,691,462 5,393,495 186,510 109,637 554,743 181,431 109,851 75,947 3,629,708 804.,944 5 1
52. . . . . . . . . . . . . . . . . . . . .
114,694 565,475 429,765 9,348 10,212 55,642 26,818 17,500 11,880 305,984 68,476 52
53 =re.. . . . . . . . . . . . . . . . . . . . . . 1 142,326 1 611,282 1 511,989 1 51,667 17,058 1 755 34 ,1
824 1 21,066 1 13,096 1 325,1861
74,6771
5 3
See text for "Deacr iption of Sample" and 'Txplans,tion of Classifications and Terms ."
lIncludes data for r turns listed in note 2 .2Returns of bona fid: residents of Puerto Rico, whether U . S . citizens or aliens, and U . S . citizens residing in Panama Canal Zone, Virgin Islands, or abroad .
3Net loss exceeded net profit .
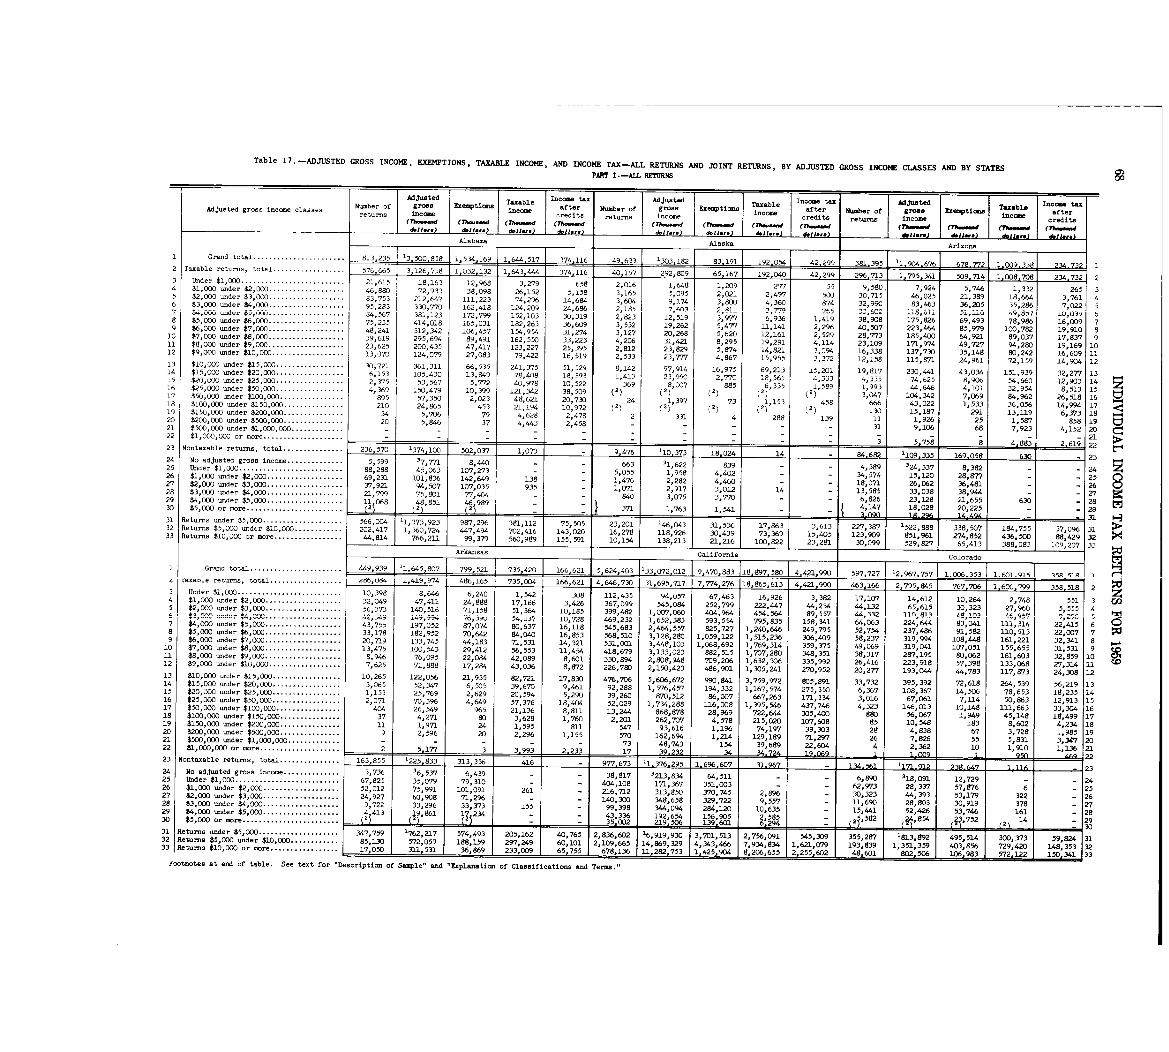
Table 17 . -ADJUSTED GROSS INCOME, EXEMPTIONS, TAXABLE INCOME, AND INCOME TAX-ALL RETURNS AND JOINT RETURNS, BY ADJUSTED GROSS INCOME CLASSES AND BY STATESPART I .-ALL RETURNS
Adjusted Taxable Income tax
td
Taxable Income tax AdjuatedTaxable I owe taxNumber of gross Exemptione after Number of Exemptions after Number Of gross Exemptioms afterAdjusted gross income classes returns income income credit
. returns e income credits returns income inecoe cred its(7h-"a (n-w (Th-d (7h-- (rh--d (7h-..W (TA.L.-d (Th---dd.11. .. d.11. .. d.11.1., ~11-) W .) d.11- 1Alabans, Alaska Arizona
1 Grand total . . . . . . . . . . . . . . . . . . . . . . . 813,235 '3,500,858 1,534,169 1,644,517 374,116 49,633 1.303,182 83,191 192, =2 .299 381,395 '1 .904 .676 678.772 1 9 12 Taxable returns, total . . . . . . . . . . . . . . . . . . 576,665 3,126,758 1,032,132 1,643,444 374,116 40,157 292,809 65,167 192,040 42.299 296,713 1,795,341 9 71" 1 00 ; 708 234 .732 2
1 S
9
3 Under $1,0D0 . . . . . . . . . . . . . . . . . . . . . . . . . . 21,615 18,163 12,968 3,279 658 2,016 1,648 1,209 277 55 9 580. 7 924 5,:746 ll ' 332 265 3461'r4 $1,000 -der $2,000 . . . . . . . . . . . . . . . . . . . 46,880 72,933 38,098 26,152 5,158 3,165 5,095 2,021 2,497 500 30:715 46,025 2 3S9 8:664 3 761 4,r
1 '- 209 l' 1 _'5 -5 $2,000 -der $3,000 . . . . . . . . . . . . . . . . . . . $3,753 212,C47 111,223 74,296 14,684 3,604 9,174 3,800 4,360 974 32,990 83,463 36,205 31 95,286 7 022 56 $3,000 under $4,000 . . . . . . . . . . . . . . . . . . . 95,283 330,770 162,418 124,209 24,686 2 185 7,An3 2,811 3,?79 765 -602 118,611
5' "u49,8 7 iu,039 61 $4,000 under $5,000 . . . . . . . . . . . . . . . . . . . 84,567 381,123 172,799 152,103 30,319 2: 9 :49 78,L6 16,009 7823 12,519 3,977 6,936 1,419 38,908 175,826 69'~93
9u8 $5, 000 under $6,000 . . . . . . . . . . . . . . . . . . . 75,235 414,018 165,031 182,263 .36,609 3 , 532 19,262 5,477 11,141 2,296 40,507 223,464 85,979 100,782 19,910 89 $6,000 under $7,000 . . . . . . . . . . . . . . . . . . . 48,241 312,342 lG6,457 154,954 31,274 3,127 20,268 5,620 12,161 2,529 28,773 185,400 64,921 89,037 17,837 910 $7,000 =der $8,000 . . . . . . . . . . . . . . . . . . . 39,619 295,694 89,491 162,550 33,223 4,206 31,421 8,295 19,291 4,114 23,109 171,974 49,727 94,280 19,169 1011 $8,000 under $9,000 . . . . . . . . . . . . . . . . . . . 23,625 200,435 47,417 123,227 25,395 2,812 23,829 5,874 14,821 3,094 16,338 137,730 35,148 80,242 16,609 1112 $9,ODO =der $10,000 . . . . . . . . . . . . . . . . . . 113,070 124,079 27,083 79,422 16,519 2,533 23,777 4,867 15,955 3,372 12,158 115,871 24,961 72,159 14,904 1213 $10,000 -der $15,DOG . . . . . . . . . . . . . . . . . 30,721 361,311 66,535 241,375 51,529 8,142 97,914 16,975 69,213 15,201 19,817 230,441 43,034 151,939 32,277 13 ~4
14 $15,000 under $20,000 . . . . . . . . . . . . . . . . . 6,153 105,430 13,849 78,4n8 18,193 1,413 23,990 2,770, 18,565- 4,333 4,335 74,625 8,906 54,660 12,903 14i~ $20,000 -der $25,000 . . . . . . . . . . . . . . . . . 2,375 53,567 5,772 40,978 1C,522 369 8 007 885 6,335 1,589 1,993 44,646 4,101 32,954 8,513 1516 $25,000 -der $50,000 . . . . . . . . . . . . . . . . . 4,369 150,479 10,399 121,342 38,509 (2) (2)' (2) (2 ) (2) 3,047 104,342 7, 069 84,%2 26,518 1617 $50,000 under $100,000 . . . . . . . . . . . . . . . . 895 57,350 2,023 48,621 20,730 24 1,397 73 ~,153 458 666 43,022 1,533 36,056 14,99 4is $100,000 =der $150,000 . . . . . . . . . . . . . . . 210 24,865 453 1,1- -0,972 'z' (2 (2) (2 (2) 17I ~ 130 15,187 291 13,119 6,373 1819 $150,000 under $200,000 . . . . . . . . . . . . . . . 34 5,706 79 4,628 2,478 2 331 4 288 139 11 1,926 25 1,587 858 19 tl20 $200,000 -der $500,000 . . . . . . . . . . . . . . . 20 5,846 37 4,443 2,458 - - - - - 31 9,106 68 7,923 4,152 2 021 $500,000 -der $1,0D0,000 . . . . . . . . .. - - - - - - - - ("i22 $1,000,000 or more . . . . . . . . . . . . . . . .
. 3 1 5,75821
;p.8 1 4~883 2 .619 2 223 Nontaxable returns, total . . . . . . . . . . . . . . . 236,570 '374,100 502,037 1,073 - 9.476 ~10,373 18,024 14 84,682 1109,335 169,058 630 - 2 324 No adjusted gross income . . . . . . . . . . . . . . 5,599 37,771 6,440 - - 663 3l, 622 839 - - 4,389 324,337 8,382 - - 24 z25 Under $1,000 . . . . . . . . . . . . . . . . . . . . . . . . . . 88,288 45,063 107,273 - - 5,055 1,958 4, 402 - 34,574 15,120 28,877 - - 2 526 $1,000 under $2,000 . . . . . . . . . . . . . . . . . . . 69,231 101,836 142,649 136 - 1,476 2,282 4,460 - - 18,071 26,062 36,481 - - 2627 $2,000 under $3,000 . . . . . . . . . . . . . . . . . . . 37,921 94,507 107,035 935 - 1, 071 2,917 3,012 14 - 13,585 33,038 38,944 - - 2728 $3,000 under $4,000 . . . . . . . . . . . . . . . . . . . 21,799 75,801 77,404 - - 840 3 075 3,770 - - 6 826 23 128 21,655 630 - 2829 $4,000 =der $5,000 . . . . . . . . . . . . . . . . . . . 11,068 (4S 851 46,999- 371 1:763 1,541 - 1 :028 20,225 -30 $5,000 or more . . . . . . . . . . . . . . . . . . . . . . . 2~ 4 147 18 - 29
3 nqn 19,296 14 494 - 31 ~_g31 Returns under $5,000 . . . . . . . . . . . . . . . . . . . 566 004 11:373 :92243 9487 2996 381 112 75,505 23,201 146, 043 F31,536 ~13 227,387 152 33 755 37 096 31202 417 1 360 74 7:4 4
88 429 3232 Returns $5,D00 und- $10,000 . . . . . . . . . . . . 702:416 143,020 16,278 118,926 :43 ~)5 123,909 8521:.1 274 2 436:33 Returns $10,000 or more . . . . . . . . . . . . . . . . . 44 814 766,211 99,379 560,989 155,591 1 L 138,213 2 6 3 388 r3
10,1541
30,099 529,827 65,41 09,207 33Arkansas I California Colorado
I Grand total . . . . . . . . . . . . . . . . . . . . . . . . ~449939 ~11645,807 799,521 1 5,624,403 1'- ~3 118,897,580 1 4 .421 .990 597,727 '2 .967 .757 1 .006 .353 1 .601915 1 19A 919 1
a" I "
t total . . . . . . . . . . . . . . 1,419, j 486,165 735,004 166,621 4,646, .30 31,695,717 7,774,276 18,865,613 4,421,990 463.166 21795,845 767,706 1,600,799 358,518 23 . . . . . . . . . . . . . . . . . . . . 10,398 S'a624' t4
1,12 308 112 4 16 926 3 382 17 107 14 612 10,264 2,748 551 3 U34 $1,000 under $2,000 . . . . . . . . . . . . . . . . 32,049 47 411 24,1188 7,166 13 426 367:099 545 :084 2612' :76911 222:447 44:234 44 :132 65:615 30,323 27,960 51555 4$2, 000 =der $3,000 . . . . . . . . . . . . . . .. 1 ,
5 5 373 140,516 71,158 51,364 0 185 399,482 007,D60 404,964 454.564 89,557 44,332 ll(),813 48,103 46,957. . . . . . . . . . . . . . 149,994 ilt 728 469 3 224,644 83,041 111,314 22, :,-,I., 1~ 14,U 1(), 5:2332 1:=,311 193,51 795,835 158,341 64,06
91,592 2 7$5,000 . . . . . . . . . . . . . . . .. '5574 :660 Z, 197,05 2'~5 87,074 80,637 16,118 54
68 2825,727 1,240,646 249,795 52,754 237,A496 110,513 2 007$5,000 under 000 . . . . . . . . . . . . . . 33,178 382,952 70,642 84,040 16,853 568,510 3,128 :21 11 598 1292 1,515,236 .,409 58,237 319,994 108,"8 161,221 32,341 8
448 10, : 19 $6,000 under $7,000 . . . . . . . . . . . . . . . . . . . 20,719 133,745 44,183 71,531 14,321 531,001 3,. :6 2
1,769,314 359,375 49,069 319,041 107,051 155,655 31,531 910 $7,000 -der $8,000 . . . . . . . . . . . . . . . . . . . 13,475 100,543 29,412 56,553 11,454 418,679 3:1,33 :12,3 11,2 '15 1,707,280 348,351 38,317 287,195 80,062 161,603 32 859 1011 $8,000 =der $9,000 . . . . . . . . . . . . . . . . . . . 8,946 76,095 22,084 42,089 8,601 330,894 2 8. M'
:2.
1,632,306 335,992 26,416 223,918 57,398 133,068 27:314 1.112 $9,000 -der $10,OW . . . . . . . . . . . . . . . . . . 7,625 71,888 17,284 43,036 8,872 226,780 2,150,423 486,901 1,305,241 270,952 20,277 193,044 44,783 117,973 24,308 1213 $10,OW -d- $15,OW . . . . . . . . . . . . . . . . . 10,265 122,056 21,935 92,721 17,830 476,706 5,606,672 990,841 3,759,972 805,891 33,732 395,392 72,618 264,539 56,219 1314 $15,000 -der $20,000 . . . . . . . . . . . . . . . . . 3,065 52,347 6,505 39,670 9,461 92,288 1,576,457 194,332 1,167,574 275,350 6,367 108,367 14,506 78,653 18,235 1415 $20,000 -der $25,000 . . . . . . . . . . . . . . . .. 1,153 25,769 2,629 20,594 5,290 39,260 870,512 86,007 667,263 171,334 3,016 67,061 7,114 50,863 12,913 1516 $25,000 under $50,000 . . . . . . . . . . . . . . . . . 2,071 70,396 4,649 57,376 18,404 52,029 1,734,288 116,008 1,395,546 437,746 4,323 146,013 10,148 1.11,663 33,304 1617 $50,000 under $100,000 . . . . . . . . . . . . I . . . 404 26,549 965 21,136 8,811 13,244 868,678 28,969 722,644 305,400 880 56,067 1,949 45,148 18,499 1718 $100,000 =der $150,000 . . . . . . . . . . . . . . . 37 4,271 80 3,628 1,760 2,201 262,707 4,578 215,020 107,608 85 10,548 183 8,602 4,234 1819 $150,000 under $200,000 . . . . . . . . . . . . . . . 11 1,971 24 1,595 811 547 93,616 1,196 74,197 39,303 28 4,838 67 3,728 1,985 1920 t200, OW =der $500,000 . . . . . . . . . . . . . . . 9 2,596 20 2,296 1,155 570 162,694 1,214 129,189 71,297 26 7,826 55 5,831 3,347 2021 $500,000 under $1,000,000 . . . . . . . . . . . .. - - - - - 73 48,743 154 39,689 22,604 4 2,362 10 1,9101
136 2122 $1,000,000 or more . . . . . . . . . . . . . . . . . . . . 2 5,177 3 3.993 1 2 .233 17 1 39232 34 34-724 19.069 1 1-009 1 95r) 2223 Nontaxable returns, total . . . . . . . . . . . . . . . 163,855 1225,833 313,356 416 977.673 'l .376.295 1,696,607 31,967 134,561 1171,912 239 647 - - - 2324 No adjusted gross income . . . . . . . . . . . . . . 3,736 36,537 6,439 - - 38,817 3213,834 64,511 - - 6,890 318,091 12,729 2425 Under $1,000 . . . . . . . . . . . . . . . . . . . . . . . . . . 67,825 35,079 79,310 - - 404,108 171,367 351,003 - - 62,973 28,337 57,876 6 - 2526 $1,000 =der $2,000 . . . . . . . . . . . . . . . . . .. 52,012 75,991 101,091 261 - 216,712 313,850 -370,745 2,896 - 30,323 44,393 53,179 322 - 2627 $2,000 under $3,000 . . . . . . . . . . . . . . . . . . . 24,927 60,908 71,296 - - 140,300 348,658 329,722 9,557 - 11,690 28,803 30,919 378 - 2728 $3,000 under $4,000 . . . . . . . . . . . . . . . . . .. 9,722 33,296 33,373 155 - 99,398 344,094 294,120 10,635 - 15,"l 52,426 53,746 161 - 2829 $4,000 under $5,000 . . . . . . . . . . . . . .. . -
4 413 9,861 11 2 - - 43 336 192 654 156,905 2 585 - 582 34,854 752 14 - 12930 $5,000 or more . . . . . . . . . . . . . . . . . . . . . . . . (2~ (2) - - 35 002 219'506 6294 - __i!E!L ( 33 - - 13031 Returns under $5,000 . . . . . . . . . . . . . . . 17 ' 719 762,217 574,493 205,162 40,765 2,836 602 16,919,930 3,701,513 2,756,091 545,309 355,287 '813,892 495,514 373 59,824 3132 Returns $5,000 under $10,000 . . . . . . . 5, 572,059 188,159 297,249 60,101 2,109 :665 14,869,329 4,343,466 7,934,834 1,621,079 193,839 1,351,359 403,856 729,420 148,353 3233 Returns $10,000 or more . . . . . . . . . . . . 131L, 531_~ 36,869 233,009 65,755 678,136 11,282,753 1,425,904 8,206,655 2,255,602 . 481601 1 802,506 106,983 572-122 1 33rootnotes at end of table . See text for "Description of Sample" and "Explanation of Classifications and Terms
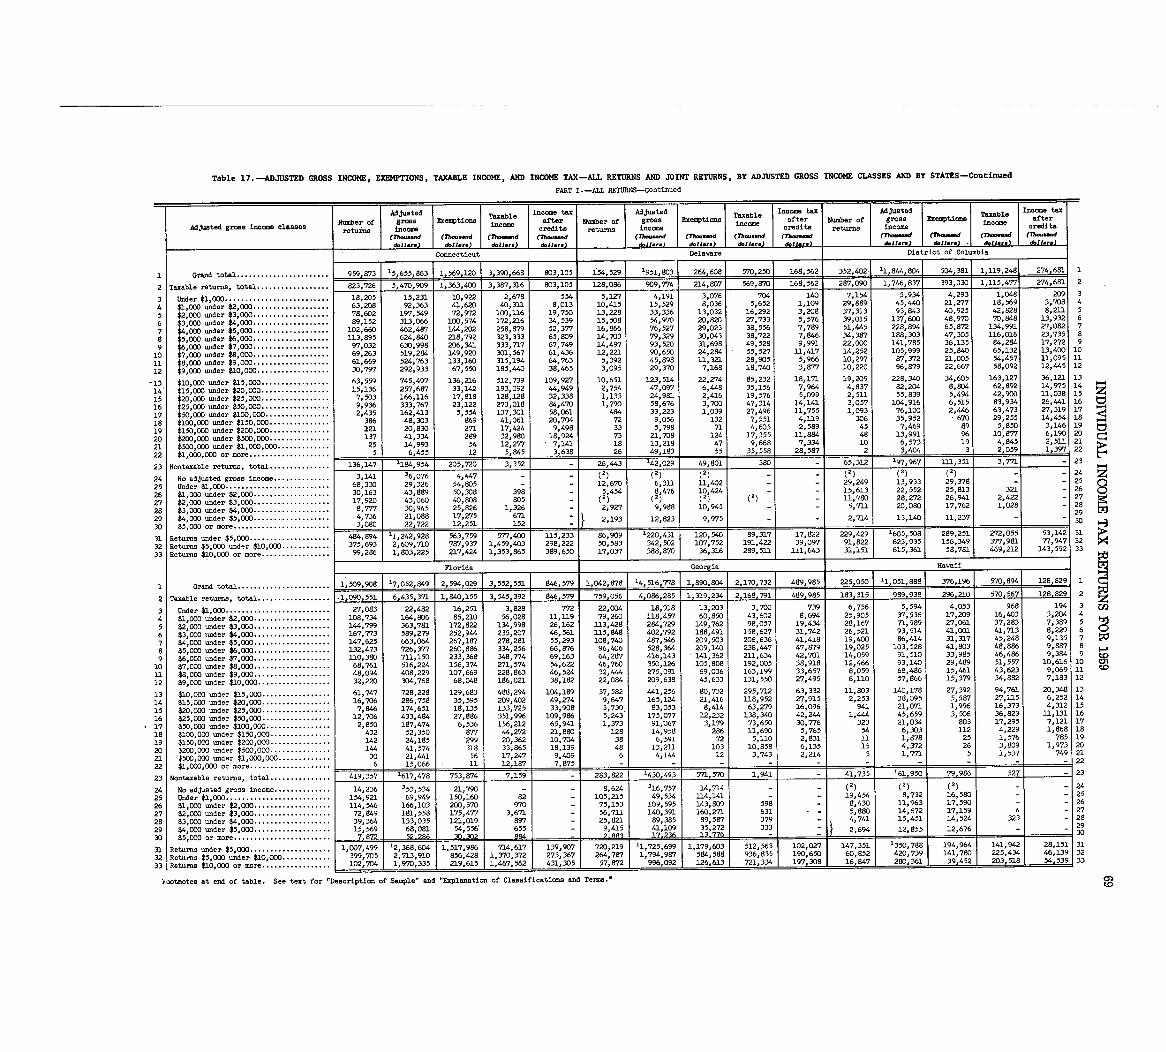
Table 17 . -ADJUSTED GROSS INCOME, EXEMPTIONS, TAXABLE INCOME, AND INCOME TAX-ALL RETURNS AND JOINT RETURNS, BY ADJUSTED GROSS INCOME CLASSES AND BY STATES -Continued
PART I .-ALL RETUMS-Continue d
Adjusted Taxable Income tax Adjusted Taxable Income tax Adjusted Taxable IncomeNumber of gross Exemptions income after gross Exemptions after Number of gross Exemptions after
Adjusted gross income classes tu Number of income income creditsre ins income credits returns income credits returns income
(7-t-d (Th-...d (7h--d (711--d (Thou,md (Th--d (rh--d (Th-.-,d (T).. .." (M-d (Th ...~d (7h--d&11... ) d.11.r.) d.11.,.) d.11 . .. d.11. .. ) d.11.. . J &JI.I.) d-11-I-) d.11.. . ) - d,11-3 d,11-)
Connecticut Delaware District of Colwbia
1 Grand total . . . . . . . . . . . . . . . . . . . . . . . 959,873 15,655,863 1,569,120 3,390,668 803,105 1.54,529 1951,803 _264,608 570,250 168,562 352,402 . 11,844,804 504,381 1,119,248 1
2 Taxable returns, total . . . . . . . . . . . . . . . . . . 823,726 5,470,909 1,363,400 3,387,316 803,105 128,086 909,774 214,807 569,870 168,562 287,090 1,746,837 393,030 1,115,477 274,681 2
3 Under $1,000 . . . . . . . . . . . . . . . . . . . . . . . . . . 18,205 15,231 10,922 2,678 554 5,127 4,191 3,076 704 140 7,154 5,934 4,293 1,048 209 3
4 1,000 under 2,000 . . . . . . . . . . . . . . . . . . . 63,208 92,363 41,620 40,311 8,013 10,/.15 15,529 8,036 5,652 1,109 29,889 45,440 21,277 18,569 3,708 4
5 $2,000 under 3,ODO . . . . . . . . . . . . . . . . . . . 78,602 197,549 72,972 100,116 19,750 13,228 33,336 13,032 16,292 3,208 37,313 93,843 40,925 42,828 8,211 5
6 $3 000 under $4,0W . . .. 89,152 313,066 100,574 172,216 34,539 15,508 54,970 20,820 27,733 5,576 39,015 137,600 48,9170 70,848 13,932 6
7 $4:000 under $5,000 . . .. 102,660 462,487 144,202 258,M 52,377 16,866 76i527 29,023 38,556 7,789 51,445 228,894 65,872 134,991 27,082 7
8 $5 000 uoder $6,000 . . . . . . . . . . . . . . . . . . . 113,895 624,840 218,792 323,333 65,809 14,703 79,329 30,043 38,722 7,846 . 34,387 188,303 47,305 116,016 23,735 8
9 $6:000 under $7,000 . . . . . . . . . . . . . . . . . . . 97,032 630,998 206,341 333,717 67,749 14,4917 93,520 31,698 49,528 9,991 22,000 141,785 36,135 84,284 17,272 9
10 $7,000 under $8,000 . . . . . . . . . . . . . . . . . . . 69,263 519,284 149,920 301,567 61,436 12,221 90,650 24,294 55,527 1-1,417 14,252 105,999 25,840 65,132 13,400 10
11 $8,000 under $9,000 . . . . . . . . . . . . . . . . . . . 61,669 524,763 133,160 315,194 64,763 5,392 45,898 11,321 28,905 5,966 10,297 87,372 21,005 54,457 11,095 11
12 $9,000 under $10,000 . . . . . . . . . . . . . . . . . . 30,797 292,933 67,550 185,440 38,465 3,095 29,370 7,168 18,740 3,877 10,220 96,879 22,667 58,092 12,445 12
*13 $10,000 under $15,000 . . . . . . . . . . . . . . . . . 63,559 745,497 136,216 512,739 109,927 10,651 123,514 22,274 85,232 18,171 19,209 228,340 34,605 163,127 36,121 13
14 $15,0D0 under $20,000 . . . . . . . . . . . . . . . . . 15,136 257,687 33,142 193,092 44,949 2,754 47,097 6,"8 35,156 7,964 4,837 82,204 8,804 62,892 14,975 14 1-.4
15 $20,000 under $25,000 . . . . . . . . . . . . . . . . . 7,503 166,116 17,818 128,128 32,338 1,133 24,981 2,416 19,576 5,099 2,511 55,839 5,494 42,900 11,038 15 z
16 $25,000 under $50,000 . . . . . . . . . . . . . . . . . 9,936 333,767 23,122 273,018 84,470 1,790 58,676 3,700 47,314 14,141 3,057 104,916 6,515 83,934 26,441 16
17 $50,000 under $100,000 . . . . . . . . . . . . . . . . 2,435 162,413 5,554 137,301 58,061 484 33,223 1,039 27,496 11,755 1,093 76,100 2,446 63,473 27,319 17
18 $100,ODO under $150,000 . . . . . . . . . . . . . . . 386 48,303 969 41,061 20,704 72 9,056 132 7,551 4,119 306 35,952 670 29,255 14,454 18
19 $150,000 under $200,000 . . . . . . . . . . . . . . . 121 20,830 271 17,424 9,498 33 5,798 71 4,605 2,589 45 7,469 89 5,850 3,146 19
20 $200 000 under $500,000 . . . . . . . . . . . . . . . 137 41,334 299 32,980 18,924 73 21,708 124 17,355 11,884 48 13,991 96 10,877 6,190 20
21 $500:000 under $1,000,000 . . . . . . . . . . . . . 25 14,993 54 12,277 7,141 18 13,218 47 9,668 7,334 10 6,573 19 4,845 2,511 21
22 $1,000,001) or more . . . . . . . . . . . . . . . . . . . . 6,455 12 5,845 3,638 26 49,183 55 35,558 . 28,587 2 3,404 3 2,059 1,397 22
3,352 26, "3 142,029 49,801 380 65,312 197,967 111,351 3,771 2323 Nontaxable returns, total . . . . . . . . . . . . . . . 136,147 184,954 205,720 - - -
24 No adjusted gross income . . . . . . . . . . . . . 3,141 36,076 4,447 - - (2) (2) (2) - - (1)(2) (2) - - 24
25 Under $1,000 . . . . . . . . . . . . . . . . . . . . . . . . : . 68,330 29,326 54,605 - - 12,670 6,311 11,402 - - 29,249 13,933 29,378 - - 2 5
26 $1 000 under $2,000 . . . . . . . . . . . . . . . . . . . 30,163 43,889 50,308 398 - 5 454 8 476 10,424 - - 15,613 22,552 25,813 321 - 26 0
27 $2:000 under $3,000 . . . . . . . . . . . . . . . . . . . 17,920 43,060 40,808 805 - (2i (2i (1) (2) - 11,780 28,272 26,941 2,422 - 27
26 $3 000 under $4,000 . . . . . . . . . . . . . . . . . .. 8,777 30,945 25,826 1,326 - 2,927 9,988 10,945 - - 5,711 20,080 17,762 1,028 - 28
29 $4 :000 =der $5,000 . . . . . . . . . . . . . . . . . .. 4,736 21,088 17,275 671 - 29
30 $5,000 or more . . . . . . . . . . . . . . . . . . . . . . . . 3,02,722 12,251 152 - 2,193 12,823 9,975 - 2,714 13,140 11,237 - - 30
31 Returns under $5,000 . . . . . . . . . . . . . . . . . 484,894 11,2Z-2-,928 563,759 577,400 1-15,233 86,909 1220 41 7 2 229,429 1605, 289 251 272,055 53,142 3 1
2,609,710 787,937 1,459,403 298,222 50,583 342 502 1 317 1 :827 91,822 1'.91
77,947375,693 '9 :4 3 56 377,98132 Returns $5,000 under $10,000 . . . . . . . . . .: 1 .7 : ;~2 .91 22 39 09 62 935 32
33 Returns $10,000 or more . . . . . . . . . . . . . . ..
99,286 1,803,225 217,424 1,353,865 389,650 17,037 388,870 36,316 289,511 111,643 31,151 61 469,2121 143,592 33
Florida Georgia Hawaii
1 Grand total . . . . . . . . . . . . . . . . . . . . . . . 1,509,908 17,052,849 2,594,029 3,552,551 846,579 1,042,878 14,516,778 1,690,804 2,170,732 489,985 225,050 11,051,888 376,196 570,894 128,829 1
2 Taxable returns, total . . . . . . . . . . . . . . . . . . .1,090,551 6,435,371 1,840,155 3,545,392 846,579 759,056 4,086,285 1,319,234 2,168,791 489,985 183,315 989,938 296,210 570,567 128,829 2
22,482 16,251 3,828 772 22,004 18,918 13,203 3,700 739 6,756 5,594 4,053 968 194 33 Under $1,000 . . . . . . . . . . . . . . . . . . . . . . . . .. 27,083 z4 $1,000 under $2,000 . . . . . . . . . . . . . . . . . . . 108,734 164,806 85,210 56,028 11,119 79,260 118,457 60,850 43,602 8,694 25,905 37,536 17,209 16,403 3,204 4
5 $2,000 ander $3,003 . . . . . . . . . . . . . . . . . . . 144,799 363,781 172,822 134,998 26,162 113,428 284,729 149,762 98,057 19,434 28,167 71,989 27,061 37,283 7,389 5
6 $3,000 under $4,000 . . . . . . . . . . . . . . . . . . . 167,773 589,279 252,944 235,207 46,561 115,848 402,792 188,491 158,627 31,742 26,521 93,514 41,001 41,713 8,229 6
7 $4,000 under $5,000 . . . . . . . . . . . . . . . . . . . 147,625 663,064 267,187 278,281 55,293 108,740 487,546 209,503 206,636 41,418 19,400 86,414 31,317 45,248 9,135 7
8 $5,000 =der $6,000 . . . . . . . . . . . . . . . . . . . 132,473 726,377 260,886 334,256 66,876 96,406 528,364 209,140 238,"7 47,879 19,025 103,528 41,803 48,886 9 887 8
9 $6 000 under $7,000 . . . . . . . . . . . . . . . . . . . 110,380 711,150 233,368 348,774 69,163 64,287 416,143 141,362 211,634 42,701 14,059 91,510 33,985 46,486 9:364 9 to
10 $7 :000 under $8,000 . . . . . . . . . . . . . . . . . . . 68,761 516,224 156,374 271,574 54,622 46,760 350,126 105,808 192,005 38,918 12,466 93,140 29,489 51,557 10,616 10 C."
11 $8,000 under $9,000 . . . . . . . . . . . . . . . . . . . 48,094 408,229 107,669 228,863 46,524 32,444 275,091 69,036 163,199 33,657 8,059 68,486 15,461 43,623 9,069 11
12 $9,000 under $10,000 . . . . . . . . . . . . . . . . . . 32,220 304,768 68,048 186,021 38,182 22,084 209,638 45,633 131,550 27,495 6,110 57,866 15,379 34,882 7,183 12
13 $10,000 under $15,000 . . . . . . . . . . . . . . . . . 61,747 728,228 129,683 468,294 104,189 37,582 41,256 80, 732 295,712 63,332 11,803 140,178 27,392 94,761 20,348 13
14 $15,000 under $20,000 . . . . . . . . . . . . . . . . . 16,706 286,758 35,595 209,402 49,274 9,647 165,124 21,416 118,952 27,915 2,253 38,095 5,587 27,13.5 6,252 14
15 $20,000 under $25,000 . . . . . . . . . . . . . . . . . 7,846 174,651 18,135 133,725 33,908 3,730. 83,053 8,414 63,279 16,096 941 21,071 1,996 16,373 4,312 15
16 $25,000 under $50,000 . . . . . . . . . . . . . . . . . 12,706 433,484 27,886 351,996 109,986 5,243 175,077 12,232 138,340 42,244 1,444 45,659 3,506 36,823 11,131 16
17 $50,000 under $100,ODO . . . . . . . . . . . . . . . . 2,850 187,474 6,536 156,212 65,941 1,373 91,067 3,179 73,650 30,776 323 21,034 803 17,295 7,121 17
18 $100,GW under $150,000 . . . . . . . . . . . . . . . 432 52,350 877 44,272 21,880 128 14,958 286 11,690 5,765 54 6,303 112 4,229 1,868 18
19 $150,000 under $200,000 . . . . . . . . . . . . . . . 142 24,185 299 20,362 10,704 38 6,591 72 5,110 2,831 11 1,878 25 1,576 785 19
20 t200,OOO under $500,000 . . . . . . . . . . . . . . . 1" 41,574 318 33,865 18,139 48 13,211 103 10,858 6,135 15 4,372 26 3,909 1,973 20
21 $500,000 =der $1,000,000 . . . . . . . . . . . . . 30 21,"1 56 17,247 9,409 6 4,1" 12 3,743 2,214 3 1,771 5 1,537 749 21
22 $1,000,000 or more . . . . . . . . . . . . . . . . . . . . 6 15,066 11 12,187 7,875 - - I - -. - -. - - - - 2 2
--Zl-9,357 1617,478 753,874 7,159 - - 571,570 1,941 41,735 61,950 79,986 327 2323 Nontaxable returns, total . . . . . . . . . . . . . .. 283,822 1430,49 3
24 No adjusted gross income . . . . . . . . . . . . . . 14,236 353,534 21,790 - - 8,624 316,757 14,714 - (2) (2) (1) - 24
25 Under $1,000 . . . . . . . . . . . . . . . . . . . . . . . . . . 154,921 69,949 150,160 82 - 105,215 49,534 114,141 - 19,454 8,732 16,590 - 25
26 $1,000 under $2,000 . . . . . . . . . . . . . . . . . . . 114,546 166,103 200,570 970 - 75,153 109,595 143,809 598 8,430 11,963 17,590 - - 26
27 $2,000 under $3,000 . . . . . . . . . . . . . . . . . . . 72,849 191,558 175,477 3,671 - 56,711 140,391 160,271 631 5,880 14,672 17,159 4 - 27
28 $3,000 under $4,000 . . . . . . . . . . . . . . . . . . . 39,364 133,035 121,019 897 - 25,821 89,385 89,597 379 4 741 15,451 14,524 323 28
29 $4,000 under $5,000 . . . . . . . . . . . . . . . . . . . 15,569 68,081 54,556 655 - 9,415 41,109 35,272 333 2 :694 12,855 12,676 - 2930 $5,000 or more . . . . . . . . . . . . . . . . . . . . . . . . 7.872 22,286 30,302 894
-
;"RAI 1 3 . 776 - 30
31 Returns under $5,000 . . . . . . . . . . . . . . . . . F,-,O-07 .499 12,36~ 1,517 96 714 139 7 720, 219 11, 13 1 102,027 147,351 1350,788 194,964 141,942 28,151 31
32 Returns $5,000 under $10,000 . . . . . . . . . :, : 399,70 2,71 :3:=O .56 :428 371)'6317'2 1 271:'.7 264,787 1, :35 190,650 60,852 420,739 141,780 225,434 46,139 32
33 Returns $10,000 or more . . . . . . . . . . . . . . . : . 1 102,70 1,970,335 219,615 L11 :467,562 431,305 57,872 34 197,308 16,847 280,361 39,452 . 203,518 54,539 33
rootnotes at end of table . See text for "Description of Sample" and "Explanation of Classifications and Terms .
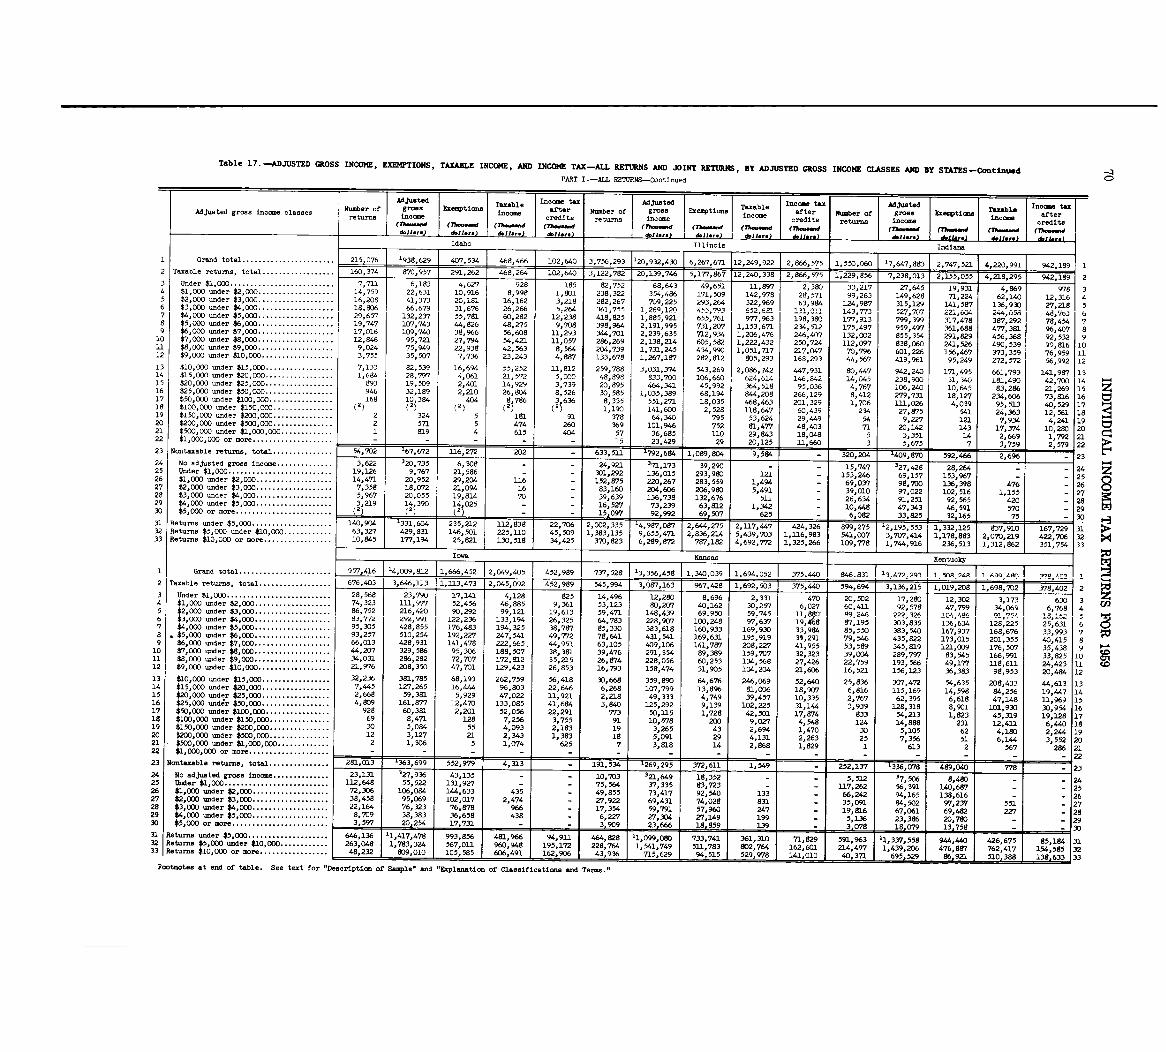
Table 17 . --ADJUSTED GROSS INCOME, EXENPTIONS, TAXABLE INCOME, AND INCOME TAX-ALL RETURNS AND JOINT RETURNS, By ADJUSTED GROSS INCOME CLASSES AND BY STATES -ContinuedPART I .-ALL n"rURNS-Continue d
Adjusted Taxable Income tax justed Taxable Income tax Adjusted Income taxAdjusted gross income classes Number of gross Exemptions income after Number of gross Exemptions income after Number of gross Exemptions Taxable fte rc
income areturns income redits mturne income credits ret~ income credits(7h-...d (Iho .-d (Th...-d (rhm-d (Th--.d (7h. ...d (7hm-.d (Tho-d (7b-.-d (Th...-dd.11... 3 d.11.,.) d.11. .. d.IJ . .. d.11.,.) d.11ar.) d,11-3Idaho Illinois Indiana
1 Grand total . . . . . . . . . . . . . . . . . . . . . . . 215,076 1938,629 407,534 468,466 102,640 3,756,293 120,932,430 7267,~67112,249,922 2,866,575 1,550,060 '7,647,883 2,747,521 4,220,991 942,189 12 Taxable -turns, total . . . . . . . . . . . . . . . . . . 160,374 SM,957 291,262 8,264 102,640 3,122,782 20,139,7" 5,177,867 12,240,338 866,575 229,856 7,238,013 2,155,055 4,218,295 942,189 23 Under $1,000 . . . . . . . . . . . . . . . . . . . . . . . . . . 7,711 6,183 4,627 928 185 82,752 68,643 49,651 1.1,897 2,390 33,217 27,645 19,931 4,869 978 34 $1,000 under $2,000 . . . . . . . . . . . . . . . . . . . 14,759 22,631 10,916 8,998 1,801 238,322 354,486 171,509 142,978 28,571 99,263 149 628 71,224 62,140 12,316 45 $2,000 under $3,000 . . . . . . . . . . . . . . . . . . . 16,208 41,373 20,181 16,162 3,218 282,267 709,225 293,264 322,%9 63,984 124,987 ~15 :129 141,587 136,930 27,218 56 $3,000 under $4,000 . . . . . . . . . . . . . . . . . . . 18,806 66.679 31,676 26,266 5,264 361,799 1,269,120 453,793 652,691 131,011 149,773 27 707 221,604 244,058 48,763 67 $4,000 under $5,000 . . . . . . . . . . . . . . . . . . . 29,657 132,237 55,782. 60,282 12,238 418,925 1,885,921 655,761 977,963 198,380 177,913 ;99:399 317,478 387,292 78,454 78 $5,000 under $6,000 . . . . . . . . . . . . . . . . . . . 19,747 107,743 44,826 48,275 9,708 398,964 2,191,995 731,207 1,153,671 234,512 175,497 959,497 361,688 477,381 96,407 89 $6,000 under $7,000 . . . . . . . . . . . . . . . . . . . 17,016 109,740 38,966 56,608 11,293 344,701 2,239,635 712,934 1,206,476 246,407 132, 002 855,354 291,829 456,368 92,532 910 $7,000 under $8,000 . . . . . . . . . . . . . . . . . . . 12,946 95,721 27,794 54,421 11,057 286,269 2,138,214 605,582 1,222,432 250,724 112,097 838,060 241,526 490,539 9~), 816 1011 $8,000 under $9,000 . . . . . . . . . . . . . . . . . . . 9,024 75,949 22,938 42,563 8,564 204,739 1,731,245 434,990 1,051,717 217,047 70,796 601,226 156,467 373,359 76,959 1112 $9,000 -der $10,000 . . . . . . . . . . . . . . . . . . 3,755 35,507 7,736 23,243 4,887 133,678 1,267,187 282,812 805,293 168,293 44,567 419,961 95,249 272,572 56,992 12
13 $10,000 -der $15,000 . . . . . . . . . . . . . . . . . 7,133 82,539 16,694 55,252 11,812 259,788 3,031,374 543,269 2,086,742 447,931 80,447 942,240 171,495 661,793 141,987 1 314 $15,000 -der $20,000 . . . . . . . . . . . . . . . . . 1,684 28,797 4,061 21,572 5,000 48,898 833,700 106,660 624,614 146,842 14,045 238,900 31,340 181,490 42 , 700 14 1-415 $20,000 under $25,000 . . . . . . . . . . . . . . . . . 993 19, 509 2,401 14,929 3,739 20,895 464,341 45,992 364,518 95,036 4,767 106,240 10,645 83,286 21,269 15 z16 $25,OOC under $50,000 . . . . . . . . . . . . . . . . . 9" 32,189 2,210 26,804 8,526 30,585 1,035,389 68,194 8",208 266,129 8,412 279,731 18,127 234,606 73,816 16 tl17 $50,000 under $100,000 . . . . . . . . . . . . . . . . 168 10,384 404 8 786 3,636 8,335 551,271 18,035 468,"3 201,329 1,706 13 .1,026 4,039 95,513 40,529 1 72, 2)18 $100,000 under $150,000 . . . . . . . . . . . . . . . (2) (2) (2) 1,190 141,600 2,528 118,647 60,439 2364 27,875 541 24,363 12,561 1819 $150,000 under $200,000 . . . . . . . . . . . . . . . 2 324 5 181 91 378 64,340 795 53,624 29,449 54 9,227 121 7,934 4,241 1920 $200,000 under $500,000 . . . . . . . . . . . . . . . 2 571 5 474 260 369 101,946 752 81,477 48,403 71 20,142 143 17,374 10,280 2021 $500,000 =der $1, 000, 000 . . . . . . . . . . . .. 1 819 4 615 404 57 36,685 110 29,843 18,048 5 3,351 14 2,669 1,792 2122 $1,000,000 or more . . . . . . . . . . . . . . . . . . . . - - - - - 15 1 23,429 29 20,125 11,660 3 1 5,675 7 1 3,759 2,579 2223 Nontaxable returns, total . . . . . . . . . . . . . . . 54,702 2 t---T67,672 116,272 202 - 6T3-,-511 __T;i~2_,684 1,089,804 9,584 - 3503,204 __TZ9,_8M 592,466 2,696 - 324 No adjusted gross income . . . . . . . . . . . . .. 3,622 120,735 6,308 - - 24,921 '71,173 39,290 - 15,747 '27,428 28,264 - - 24
"
z25 Under $1,000 . . . . . . . . . . . . . . . . . . . . . . . . . . 19,126 9,767 21,586 - - 301,292 136,015 293,980 121 - 153,246 69,157 153,967 - 2527 42
'
26 $1,000 under $2,000 . . . . . . . . . . . . . . . . . . . 14,471 20,952 29,204 116 - 152,875 220,267 283,559 1,494 - 69,037 98,700 136,398 476 2627 $2,000 under $3,000 . . . . . . . . . . . . . . . . . . . 7,358 18,072 21,094 16 - 83,160 204,606 206,980 5,491 - 39,010 97,022 102,516 1,155 2728 $3,000 under $4,000 . . . . . . . . . . . . . . . . . . . 5,967 20,055 19,814 70 - 39,639 136,738 132,676 511 - 26,634 91,251. 92,565 420 28
9 ''
M
29 $4,000 under $5,000 . . . . . . . . . . . . . . . . . . 3 219 14,390 14,025 - - 16,527 73,239 63,812 1,342 - 10, "a 47,343 46,591 570 292 (2)30 $5,000 or more . . . . . . . . . . . . . . . . . . . . . . . : ( i (1) - 15,097 92,992 1 69.507 625 1 - 6,082 33,825 32.165 75 3031 Returns under $5,000 . . . . . . . . . . . . . . . . . . . 140,904 331, 212 )6 2,002,335 14,9 2 1 27 2 4 326 899,275 2 195,553 1,332,125 837,910 167,729 31'0 ,,432 Returns $5,000 under $10,000 . . . . . . . . . . . 63,327 429,831 146,501 )9 1,383,135 9,65'1:401'7 2'
.:.4 4379,7.3 1'.6 : 9 .3 541 007 3 07 414 17 15" " :70 178,883 2,070,219 422,706 32~5 370 ,33 Returns $10,GOO or mo re . . . . . . . . . . . . . . . . . 5 177,194 1 25,821 823 6,289,M 787,182 4,692,772 1,325,266 109:778 1 744 :916 236,513 1,312,862 351,754 133
Iowa Kansas Kentuck-j
I Grand total . . . . . . . . . . . . . . . . . . . . . . . 957,416 ~4, .09, 812 11,666,452 12,049,4051 375. 6.831 1 ~3472_293 1 A AQQ452,989 737 528 13,356,458 1 1,340,039 1 .694.052 4-40 __;4~ -in 4A2 Taxable returns, total . . . . . . . . . . . . . . . . . . 676,403 3,6",113 1,113,473 1 2,045,092 452,989 545,994 3,087,163 967,428 1 1,692,503 375,440 594,694 3,136,215 1,019,208- -1-,698,-702 378,402 2 ~d3 Under $1,000 . . . . . . . . . . . . . . . . . . . . . . . . . . 28,568 23,790 17,141 4,128 825 14:496 12:280 8,696 2,331 470 20 502 17 280 12,302 3,173 630 3 co
z4 1, 000 under $2,000 . . . . . . . . . . . . . . . . . . . 74,323 1.11,977 52,456 46,885 9,361 53 123 80 207 40,162 30,257 6,027 60 :411 92:579 47,799 34,069 6,768 45 2,000 under $3,000 . . . . . . . . . . . . . . . . . . . 86,752 216,420 90,292 99,121 19,6fl 59,471 148,439 69,950 59,745 1-11 89 246 222,32A 104,486 91,754 18,162 56 $3,000 under $4,000 . . . . . . . . . . ;eqz, 991 122,236 133,194 26,325 64,783 228,907 100 248 97,637 19 r11 97,195 303 835 136 634 128,225 25,631 6 87 $4,000 under $5,000 . . . . . . . . . 95,305 428,855 176,483 194,325 38,787 85,330 383,618 160:933 169 930 33:984 85,550 383:540 167:937 168,676 33,993 78 $5,000 under $6,000 . . . . . . . . . . . . . . . . . 93,257 510,254 192,227 247,541 49,772 78,641 431,541 169,631 195 919 319,291 79,546 435,822 173,015 201,355 40 415 89 $6,000 under $7,000 . . . . . . . . . . : . . . . . . . . 66,013 428,931 141,478 222,665, ",951 63,105 409,106 141,787 208,227 41,955 53,589 345,819 121,009 176,507 35,438 910 $7,000 under $8,000 . . . . . . . . . . . . . . . . . . . 44,207 329,586 95,306 188,507 38,381 39,476 291,354 89,389 159,707 32,323 39,004 289,797 83,545 166,991 33,825 1011 $8,000 under $9,ODO . . . . . . . . . . . . . . . . . . . 34,031 286,282 72,707 172,83.2 35,215 26,874 228,056 60,253 134,568 27,426 22,759 193,566 49,177 118,611 24,423 ll12 $9,000 under $10,000 . . . . . . . . . . . . . . . . . . 21,976 208,350 47,701 129,423 26,853 16,793 158,474 31,905 104,204 21,606 16,521 156,123 -36,383 98,953 20,484 1213 $10,000 under $15,000 . . . . . . . . . . . . . . . . . 32,236 381,785 68,193 262,759 56,418 30,668 359,8% 64,676 246,069 52,640 25,836 307,472 54,635 208,433 44,613 1314 $1%000 under $20,000 . . . . . . . . . . . . . . . . . 7,"5 127,265 16,444 96,803 22,646 6,268 107,799 13,896 81,006 18,907 6,816 115,169 14,598 84,256 19,447 1415 $20,000 under $25,000 . . . . . . . . . . . . . . . .. 2,668 59,381 5,929 47,022 1.1,921 2,218 49,333 4,749 39,457 10,335 2,767 62,395 6,618 47,148 11,969 1516 $25,000 undgr $50,000 . . . . . . . . . . . . . . . . . 4,809 161,8W 12,470 133,085 41,684 3,840 125,292 9,139 102,225 31,144 3,939 128,318 8,901 101,930 30,954 1617 $50,000 under $100,000 . . . . . . . . . . . . . . . . 928 60,381 2,201 52,056 22,291 773 50,115 1,728 42,501 17,874 833 54,213 1,823 45,319 19,128 17is $100,000 under $150,000 . . . . . . . . . . . . . . . 69 8,471 128 7,256 3,755 91 10,578 200 9,027 4,548 124 14,888 231 12,411 6,440 1819 $150,000 under $200,000 . . . . . . . . . . . . . . . 30 5,084 55 4,093 2,183 19 3,265 43 2,694 1,470 30 5,105 62 4,180 2,244 1920 $200,000 under $500,000 . . . . . . . . . . . . . . . 12 3,127 21 2,343 1,383 is 5,091 29 4,131 2,263 25 7,356 51 6,144 3,552 2021 $500,000 under $1,000,000 . . . . . . . . . . . . . 2 1,306 5 1,074 625 7 3,818 14 2,868 1,829 1 613 2 567 286 2.122
$1, OC)0,000or more . . . . . . . . . . . . . . . . . . ** - - - . - - - . - - I - - - I - - - I - 22
23 Nontaxable returns, total . . . . . . . . . . . . . . . __F8_1,013 '363,699 552,979 4,313 - I T1, 53-4 _72-6-9,295 372,611 1,549 252,T3-7- 1336, 78 489,040 778 2324 No adjusted groas income . . . . . . . . . . . . . . 23,131 327,936 43,135 - - 10,703 321,649
18,352 - - 5,512 17,506 8,480 - 2425 Under $1,000 . . . . . . . . . . . . . . . . . . . . . . . . . . 112,648 55,522 131,927 - - 75,564 37,335 83,723 - - 117,262 56,391 140,687 2526 $1,000 under $2,000 . . . . . . . . . . . . . . . . . . . 72,306 106,084 1", 633 435 - 49,855 73,417 92,540 133 - 66,242 94,165 138,616 - 2627 $2,000 under $3,000 . . . . . . . . . . . . . . . . . . . 38,458 95,069 102,017 2,474 - 27,922 69,431 74,028 831 - 35,091 84,502 97,2Y7 551 2728 $3,000 under $4,000 . . . . . . . . . . . . . . . . . . . 22,164 76,323 76,978 966 - 17,354 59,791 57,960 247 - 19,816 67,061 69,482 227 2829 $4,000 under $5,000 . . . . . . . . . . . . . . . . . .. 8,709 38,383 36,658 438 - 6,227 27,304 27,149 199 - 5,136 23,386 2D,780 - 2930 $5,000 or more . . . . . . . . . . . . . . . . . . . . . . .. 3,597 20,254 171,731 - - 9 23 666 18 859 139 - -.1 7,31 Returns under $5,000 . . . . . . . . . . . . . . . . . . . 111 :417,478 993,856 481, 94,911 464,828 11,099,08D 733,74.1 361,310 71,829 591,963 11,337,558 944,440 426,675 85,184 3132 Returns $5,000 under $10,000 . . . . . . . . . . 31 567, Oil 960,948 195,172 228,764 11541,749 52.1,783 802,764 162,601 214,497 1,4395:16 476;11 762 .417 154,585 3233 Returns $10,000 or more . . . . . . . . . . . . . . . 232 aLL_LO5,585_L 606,491 1 162,906 1 43 .936 1 715,629 94,515 529,978 141,010 40,373. 69
'29 921 510,38 . 133
Footnotes at end of table . See text for "Description of Sample" and "Explanation of Classifications and Terms .
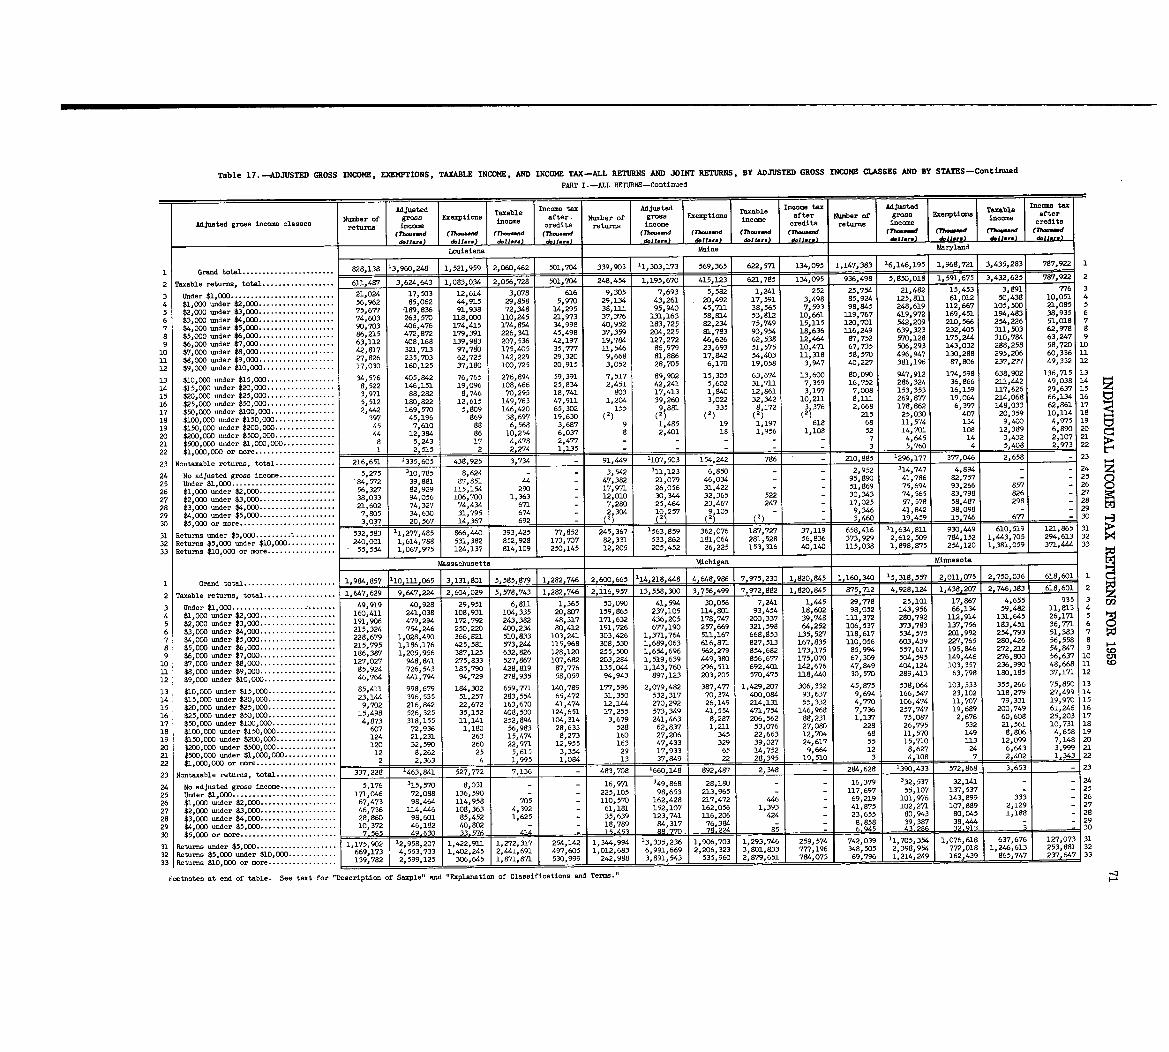
Table 17 . -ADJUSTED GROSS INCOME, EXEMPTIONS, TAXABLE INCOME, AND INCOME TAX-ALL RETURNS AND JOINT RETURNS, BY ADJUSTED GROSS INCOME CLASSES AND BY STATES -Continued
PART I .-ALL RETURNS-Continue d
Adjusted Taxable Income Adj ted Taxable Income Adjusted Taxable Income
Number of gross Exempt ons after . Number of gross Exemptions after Number of gross Exempticma afterAdjusted gross income classes returns income income credits returns income income redita returns income income credits
(Th-.-d (TY-sand (71-sand (7hoosood (Thoo-d (Th-.-d (Thousand (Th-..W (7hoasaad (rhoussod (Th ....d (7)-,-d
dollars) dDll.-) doll .. . dollar.) dollars) dollars) doll. . . doli ... abll.r dollar.) dollar,) dJl. ..
Louisiana Maine Maryland
I Grand total . . . . . . . . . . . . . . . . . . . . . . . 828,138 13,960,248 1,521,959 2,060,452 501,704 .339i9O3 11,303,173 569,365 622,571 134,095 1,147,383 16,146,195 1,968,721 3,435,283 787,922 1
2 Taxable returns, total . . . . . . . . . . . . . . . . . . 611,487 3,624,643 1,083,034 2,056,728 501,704 248,454 1,195,670 415,123 621,785 134,095 936,498 5,850,018 1,591,675 3,432,625 7F,922 2
3 Under $1,000 . . . . . . . . . . . . . . . . . . . . . . . . . . 21,024 17,503 12,614 3,078 616 9,305 7,693 5,582 1,241 252 25,754 21,482 15,453 3,891 776 3
4 $1,000 under $2,000 . . . . . . . . . . . . . . . . . . . 56,962 85,062 44,915 29,858 5,970 29,134 43,261 20,492 17,591 3,498 85,924 125,811 61,012 50,438 10,051 4
5 $2 000 under $3,000 . . . . . . . . . . . . . . . . . . . 75,677 -199,836 91,938 72,348 14,295 38,- 95,940 45,711 38,565 7,593 98,845 248,619 2.12,667 105,500 21,085 5
6 $3,000 uoder $4,000 . . . . . . . . . . . . . . . . 74,603 263,570 118,000 110,245 21,973 37,376 131,163 58,814 53,812 10,661 1.19,767 419,972 169,451 194 483 38,935 6
7 $4 000 under $5,000 . . . . . . . . . . : : : 90,703 406,476 174,415 174,854 34,998 40,952 183,72~ 82,234 75,749 15,115 120,701 542,209 210,566 254,226 51,018 7
8 $5:000 under $6,000 . . . . . . . . . . : :*.*. : : . . . 86,2_15 472,972 179,391 226,341 45,498 37,359 204,225 81,783 93,954 18,636 116,249 639,323 232,405 311,503 62,978 8
9 $6 000 under $7,000 . . . . . . . . 63,112 408,168 139,983 207,536 42,197 19,784 127,272 46,626 62,538 12,464 87,752 570,128 175,244 310,784 63,247 9
10 $7 :0()0 uoder $8,000 . . . . . . . . 42,817 321,713 97,780 175,405 35,777 11,546 86,979 23,693 51,575 10,471 67,735 506,293 143,032 288,258 58,720 10
11 $8 000 under $9,000 . . . . . . . 27,826 235,703 62,725 142,229 29,320 9,668 81,886 17,842 54,403 11,318 58,570 496,947 130,288 295,206 60,336 11
12 $9 :000 uoder $10,000 . . . . . . 17,030 160,125 37,180 100,725 20,915 3,052 28,705 6,170 19,058 3,94740,227 381,196 87,806 237,277 49,332 12
13 $10,000 under $15,000. 34,576 405,842 76,765 276,894 59,391 7,517 89,902 15,305 63,674 13,600 80,090 947,912 174,598 638,902 136,715 13
14 $15,000 under $20,000 . : : : :-*'.* .-**'.'. 8,522 146,151 19,096 108,466 25,834 2,451 42,241 5,602 31,711 7,359 16,752 286,324 36,866 211,442 49 038 14
15 $20,ODO under $25,000 . . . . . . . . . . . . . . . . . 3,971 88,282 8,746 70,295 18,741 803 17,413 1,840 12,861 3,197 7,008 153,353 16,159 117,626 29 :637 15 z
16 $25,000 under $50,000 . . . . . . . . . . . . . . . . . 5,512 180,822 12,615 149,763 47,911 1,204 39,260 3,022 32,342 10,211 8,111 269,877 19,064 214,068 66 134 16 tl
17 $50,000 under $100,000 . . . . . . . . . . . . . . . . 2,442 169,570 5,809 146,420 65 302 155 9 881 335 8 172 3 376 2,668 178 862 6,397 148,033 62 :861 17
397 45,196 869 38,697 19 630 (1) i ( i 215 25, 114 1818 $100,000 under $150,000 . . . . . . . . . . . . . . .
(2) 2 2 2 '030 407 20,359 10,
19 $150,000 under $200,000 . . . . . . . . . . . . . . . 45 7,610 88 6,568 3,687 9 1,485 19 1,197 618 68 11,574 134 9,400 4,975 19
20 $200,000 under $500,000 . . . . . . . . . . . . . . . 44 12,384 86 10,254 6,037 8 2,401 18 1,956 1,108 52 14,701 108 12,389 6,890 20
21 $500,000 under $1,000,000 . . . . . . .. 8 5,243 4478 2,477 - - - - - 7 4,645 14 3,432 2,107 21
22 $1,000,000 or wre . . . . . . . . . . . . . . . 1 2,515 2 :274 1,135 - 3 5.760 4 5,4081 21973 222 t-1023 Nontaxable returns, total . . . . . . . . . . . . . . . 216,651 1335,605 '8 925 3,734 - 91,449 1107,503 786 210,885 '296,177 377,046 2,658 - 23
6- 91
449 242
10 "8
5
24 No adjusted gross income . . . . . . . .. 5,275 310,785 8,624 - - 3,542 311,123 6,850 - 2,952 314,747 4,894 - - 24
5 '6
9
8-3
,
542 2
'9
5 2
25 Under $1,000 . . . . . . . . . . . . . . . . . . . .. 84,572 39,881 87,851 44 - 47,382 21,079 46,034 95,890 41,786 82,757 - - 25
1 '
1
26 $1,000 =der $2,000 . . . . . . . . . . . . . . . . . . . 56,327 82,929 115,154 290 - 17,971 26,056 31,422 - 51,869 75,694 93,266 857 - 26
27 $2,000 under $3,000 . . . . . . . . . . . . . . . . . . . 38,033 94,056 106,700 1,363 - 12,010 30,344 32,365 522 30,343 74,565 83,798 826 - 27
2!8 $3,000 =der $4,000 . . . . . . . . . . . . . . . . . . . 21,602 74,327 74,434 67.1 - 70280 25,464 23,467 247 17,025 57,578 58,487 298 - 28S
29 $4,000 =der $5,000 . . . . . . . . . . . . . . . . . .. 'l ,
. ~? 10
9,346 41,842 38,098 -7,805 34,630 31,795 674 2,304 11 9 105 - - 291
(~~257 2~ (2)
0
30 $5,000 or more . . . . . . . . . . . . . . . . . . . . . . . . 3.037 20,567 14,367 692 3 460 19,459 1 15,746. 677 - 30
31 Returns under $5,000 . . . . . . . . ... . . . . . . . . 532,583 11,177 :485 393,425 77,852 245,367 1563,859 362,076 187,727 37,119 658,416 11634 811 1 930 449 610 519 121 865 31
1 6:'312 1612 509 784:152 294 :613 32240 001 61, ' :32 Returns $5,000 under $10,000 .. 7 5631 852,928 173,707 82,331 533,862 181,064 281,528 56,836 373,929 2
33 Returns $10,000 or mom . . . . . . . . . . . 55:554 1:067,975 124,137 814,109 250,145 12,205 205,452 26,225 153,316 1 40,140 115,038 1 1,898,875 254,120 371,444 33
MAssachuBetts Michigan Minnesota
1 Grand total . . . . . . . . . . . . . . . . . . . . . . . 1,984,857 110,111,065 3,131,801 5,585,879 1,282,746 2,600 665 114,218,448 4,648,986 7,975,~30_ 1,820,845 1,160,340 15,318,557 2.011,075 2,750,L36 1
2 Taxable returns, total . . . . . . . . . . . . . . . . . . 1,647,629 9,647,224 2,604,029 5,578,743 1,282,746 2,1116,957 13,558,300 3,756,499 7,972,882 1,820pS45 r875,712 4,928,124 1,438,207 2,746,383 618,601 2
3 Under $1,000. . . . . . . . . . . . . . . . . . . . . . . : . . 49,919 40,928 29,951 6,811 1,365 50,090 41,594 30,056 7,241 1,445 29,778 25,101 17,867 4,655 :935 3 W
4 $1,000 under $2,000 . . . . . . . . . . . . . . . .. .
160,411 241,038 108,931 104,335 20,807 159,865 237,105 114,801 93,454 18,602 98,052 143,956 66,134 59,482 11 813 4
5 $2,000 under $3,000 . . . . . . . . . . . . . . . . ... 191,906 479,294 172,792 243,382 48,317 171,632 436,205 178,747 200,337 39,748 111,372 280,792 112,914 131,645 26 171 5
6 $3,000 under $4,000 . . . . . . . . . . . . . . . . . . . 215,324 754,246 250,220 400,234 80,412 191,726 677,190 257,669 321,598 64,252 106,537 373,783 137,756 183,451 36 771 6 4~d
7 $4,000 under $5 000 . . . . . . . . . . . . . . . . . . . 228,679 1,028,490 366,821 510,833 103,241 303,426 1,371,764 511,167 668,853 135,527 118,617 534,575 201,992 254,793 51:383 7
8 $5,000 under $6'000 . . . . . . . . . . . . . . . . . . . 215,795 1,186,176 425,581 573,244 115,968 308,530 1,689,063 616,871 827,513 167,835 110,056 603,439 227,765 280,426 56,558 8
186,387 1,205,956 387,125 632,826 128,120 255,500 1,654,696 562,279 854,682 173,175 85,994 557,617 195,846 272,212 54 847 99 $6,000 under $7 000 . . . . . . . . . . . . . . . . . . . CD
10 $7,000 under $8,000 . . . . . . . . . . . . . . . . . . 127,027 948,841 275,833 527,867 107,682 203,284 1,519,639 449,380 856,677 175,070 67,309 504,595 149,446 276,800 56:637 10 Cn
11 $8,000 under $9,000 . . . . . . . . . . . . . . : . . . . 85,924 726,543 185,790 428,819 87,776 135,0" 1,143,760 296,511 692,401 142,676 47,849 404,124 103,357 236,990 48, 668 11 co
12 $9,000 =der $10,000 . . . . . . . . . . . . .. . . . .
46,764 441,794 94,729 278,935 58,059 94,943 897,123 203,205 570,475 118,440 30,570 289,413 63,798 180,185 37,171 1 2
13 $10,000 -der $15,000 . . . . . . . . . . . . . . . . . 85,411 998,679 184,302 659,771 140,789 177,596 2,079,482 387,477 lp429,207 306,332 45,875 538,064 103,333 355,266 75,850 13
14 $15,000 -der $20,000 . . . . . . . . . . . . . . . . . 23,144 396,535 51,257 283,554 65,472 31,350 532,317 70,374 400,084 93,637 9,694 166,547 23,102 118,279 27,499 14
15 $20,000 =der $25,000 . . . . . . . . . . . . . . . . . 9,702 216,842 22,672 163,670 41,474 12,144 270,292 26,149 214,131 55,332 4,770 106,474 11,707 79,331 19,970 15
16 $25,000 under $50,000 . . . . . . . . . . . . . . . . . 15,498 526,325 35,152 408,530 124,651 17,255 573,349 41,554 471,754 146,968 7,736 257,747 19,689 200,749 61,246 16
17 $50,000 -der $100,000 . . . . . . . . . .. 4,873 318,155 11,141 252,894 104,314 3,679 241,463 8,287 206,562 88,231 1,137 75,087 2,676 60,608 25,203 17
18 $100,000 under $150,000 . . . . . . . . . . 607 72,936 1,180 56,983 28,633 528 62,837 1,211 53,076 27,080 228 26,795 532 21,561 10,731 18
19 $150,000 -der $200,000 . . . . . . . . . .. . . .
124 21,231 263 15,474 8,273 160 27,206 345 22,663 12,704 68 11,570 149 8,806 4,658 19
20 t200,OOO under $500,000 . . . . . . . . . . : . . . . 120 32,590 260 22p971 12,955 163 47,433 329 39,027 24,617 55 15,710 113 12,099 7,148 20
21 $500,000 =der $1,000,000 . . . . . . . .. . . . .
12 8,262 25 5,615 3,354 29 17,933 65 14,752 9,664 12 8,627 24 6,643 3,999 218
22 $1,000,000 or mom . . . . . . . . . . . . . . . . . . . . 2 2,363 4 1,995 1,084 13 37,849 22 28,395 19,510 3 4,108 1 7 ===&=-=2=J== 1 . 2~3 22
43323 Nontaxable returns, total . . . . . . . . . . . . . . . 373-7,228 __'r4_6__3,84l 527,772 7,136 - S3, 708 1660,148 892,487 2,348 - 284,628 1390,433 572,868 3,653 - 23
024 No adjusted gross income . . . . . . . . . . . . .. 5,176 315,570 8,031 - 16,971 349,868 28,180 - 16,379 332,537 32,141 - 24
13
25 Under $1,000 . . . . . . . . . . . . . . . . . . . . . . . . . . 171,046 72,088 136,590 - - r225,105 98,653 213,965 - - 117,697 55,107 137,537 - - 25
26 $1,000 under $2,OD0 . . . . . . . . . . . . . . . . . . . 67,473 98,464 114,958 705 - 110,570 162,428 217,472 446 - 69,219 101,976 143,899 333 - 26
27 $2,000 under $3,000 . . . . . . . . . . . . . . . . . . . 46,736 114,446 108,363 4,392 - 61,181 152,107 162,05§ 1,393 - 41,875 102,271 107,889 2,129 - 27
0 1 3
9
28 $3,000 under $4,000 . . . . . . . . . . . . . . . . . .. 28,860 98,601 85,452 1,625 - 35,639 123,741 116,206 424 - 23,655 80,943 80, 045 1,188 - 2839,31
29 $4,000 under $5,000 . . . . . . . . . . . . . . . . . . . 10,372 46,182 40,802 - - 18,789 84 317 76 384 - - 8,858 ;2 38,444 - - 29
7.565 1 49,630 4141 IS 451 AA'77() 1 78224 85 4 a 3030 $5,000 or more . . . . . . . . . . . . . . . . . . . . . . . .
1931 Returns under $5,000 . . . . . . . . . . . . . . . . . [7,175,?~2 "2,958,207 1,422,911 1,272 317 1 254,1 335 236 1 1 :906:703 10293,746 259,574 742,039 11,705,354 1,076,618 637,676 127 7
553,733 1,402,245 2:441 691 497,( 991:669 2 206 323 3,801,833 777,196 348,505 2,398,954 772,018 1,246,613 25 S81 3 2
32 Returns $5,000 under $10,000 . . . . . .. '
9
2 879691 784,075 69,796 1,
1 , 9
033 Returns $10,000 or mom . . . . . . . . . . . . 139,782 1 2,599,125 1 306,645 1 871,871 530,~ 891 543 535,960 214,249 . 162,439 865,74 7
iootnotes at end of table . See text for "Description of Sample" and "Explanation of Classification. and Tema .
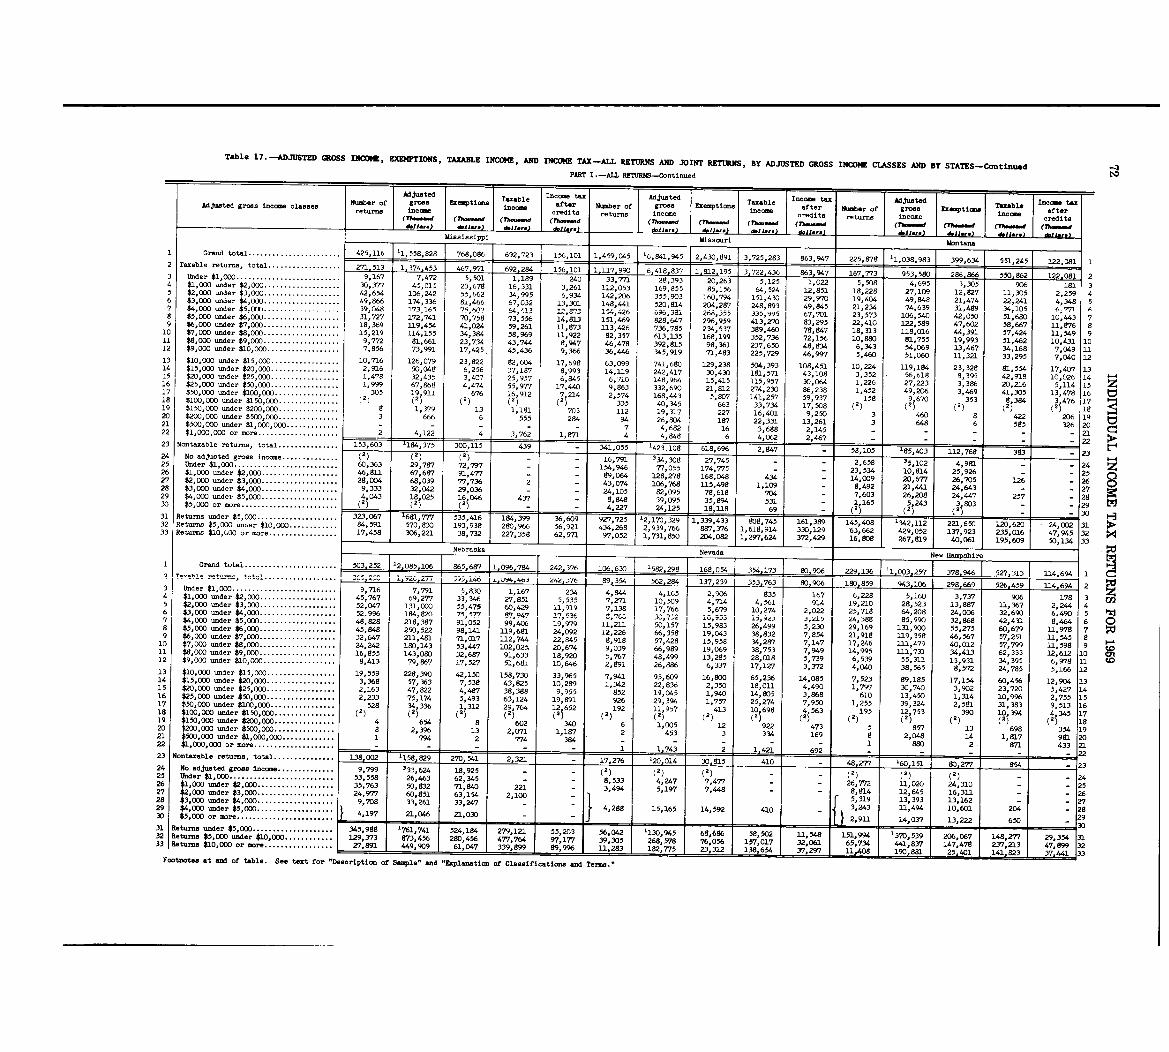
Table 17 . -ADJUSTED GROSS DUMM, ZX12VTIONS, TAXABLE INCOME, AND INCOME TAX-ALL RETURNS AND JOINT RETURNS, BY ADJUSTED GROSS INCOME CLASSES AND BY STATES -ContinuedPART I .-ALL RE7URNS-Continue d
Adjusted income tax Adjusted Income tax Adjusted Income taxNumber of gross Exemptions Taxable Taxable TaxableAdjusted gross income classes imcow after Number of groas Exemptions after Number of grows Exampticne aft rreturns income redits returns income income credits returns income income credits(77~-d (7~-And (Thoa-d (Th-d (7h-.-d (Th-.-,d (Th- ..w (rh .. ...d (7h--d (Th-...d (Th...-d (lb-dd.11-.) d.11.. . ) d.11.. . d.11.,.) d.11-) d.11... d.11... 1 -1- 1Mississippi Mis~ouri Montane
1 Grand total . . . . . . . . . . . . . . . . . . . . . . . 425,116 11,558,828 768,086 692,723 156, lCl 1,459,045 '6,841,945 2,430,891 3,725,283 863 ' 947 225,878 11,038,983 399,634 551,245 122,081 12 Taxable returns, total . . . . . . . . . . . . . . . . . . 271,513 _I 374 .453 467 .9171 692,284 156,101 1,117,990 6,418,837 1,812,195 3,722,436 863,947 167,773
-953,580 _286.866 550 .862 122 081 29,167 7,472 5,501 1,189 240 33,771 28,393 20,26 3
3 Under $1,000 . . . . . . . . . . . . . . . . . . . . . . . .. 5,125 1,022 5,508 4,695 3,305 906 181 34 $1,000 under $2,000 . . . . . . . . . . . . . . . . . . . 30,377 45,015 23,678 16,331 3,261 112,053 169,855 85,156 64,524 12,851 18,228 27,109 12,827 11,305 2,259 45 $2,000 under $3,000. . . . . . . . . . . . . . . . . . . 42,654 106,242 55,662 34,995 6,934 142,206 355,903 160,794 151,430 29,970 19,404 49,848 21,474 T22,2414,348 56 $3,0D0 under $4,000 . . . . . . . . . . . . . . . . . . . 49,866 174,336 81,466 67,032 13,301 148,441 520,814 204,287 248,893 49,945 21,234 74,639 31,489 34,105 6~7p A7 $4,000 under $5, O(Y) . . . . . . . . . . . . . . . . . . ?9,048 173,165 7%60? 64,1~13 154,26 696,381 268,355 335,995 67,701 23,573 106,540 42,050 51,680 10,443 78 $5,000 under $6,000 . . . . . . . . . . . . . . . . . . . 31,727 172,741 70,758 73,556 14,82.3 151,"9 828,647 296,959 413,270 83,295 22,410 122,589 47,602 58,667 11,876 89 $6,000 under $7,000 . . . . . . . . . . . . . . . . . . . 18,369 119,454 41,024 59,261 11,873 113,426 736,785 234,537 389,460 78,847 18,313 118,016 44,391 57,424 11,549 910 $7,000 under $8,000 . . . . . . . . . . . . . . . . . . . 15,219 114,155 34,384 58,969 11,922 92,357 613,135 168,199 352,736 72,156 10,880 81,755 19,993 51,"2 10,431 1011 $8,000 under $9,000 . . . . . . . . . . . . . . . . . . . 9,772 81,661 23,734 43,744 8,947 ",478 392,815 98,361 237,650 48,834 6,343 54,069 13,467 34,168 7,049 1112 $9,000 =der $10,000 . . . . . . . . . . . . . . . . . . 7,856 73,991 17,425 45,436 9,366 36,446 345,919 71,483 225,729 46,997 5,460 51,060 11,321 33,295 7,040 1213 $10,000 under $15,000 . . . . . . . . . . . . . . . . . 10,716 126,079 23,822 82,604 17,698 63,099 741,680 129,238 504,393 108,451 10,224 119,184 23,328 81,554 17,407 1314 $15,000 under $20,0D0 . . . . . . . . . . . . . . . . . 2,916 50,048 6,256 37,187 8,993 14,119 242,417 30,430 182,571 43,108 3,352 56,618 8,395 42,918 10 026 1415 $20,000 under $25,000 . . . . . . . . . . . . . . . . . 1,478 32,4355 3,407 25,957 6,845 6,710 148,964 15,415 115,957 30,064 1,226 27,223 3,386 20,216 5 :114 1516 $25,000 under $50,000 . . . . . . . . . . . . . . . .. 1,999 67,868 4,474 55, 977 17,440 9,863 332,690 21,812 274,230 86,238 1,452 49,206 3,469 41,305 13,478 1617 $50,000 -der $100,000 . . . . . . . . . . . . . . .. 305 19 911 )676 16 912 7 214 2,574 168 443 5,3D7 141,257 59,937 158 9,670 353 8 384 3,476 1718 $100,000 under $150,000 . . . . . . . . . . . . . . . (2) (2; (2 (2 (2 335 40 :345 663 33,734 17,508 (1) (2) (2) (2~ (2) is19 $150,000 under $200,000 . . . . . . . . . . . . . . . 8 1,379 13 1,181 703 112 19,317 227 16,401 9,250 3 460 8 422 206 1920 $200,000 under $500,000 . . . . . . . . . . . . . . . 3 666 6 555 284 94 26,804 187 22,331 13,261 3 648 6 585 326 2021 $500,000 =der $1,000,000 . . . . . . . . . . . .. - - - - - 7 4,682 16 3,688 2,145 - - - - - 2122 $1,000,000 or more . . . . . . . . . . . . . . . . . . . . 2 4,122 4 3,762 1,871 4 4,848 6 4,062 2,467 - - - - - .2223 Nontaxable returns, total . . . . . . . . . . . . . . . 153,603 1184,375 300,115 439 1423 .108 618,696 2,~7__ 58,105 185,40-3 112,768 393 2324 No adjusted gross income . . . . . . . . . . . . . . (2) (2) 334,308-16,791 27 745 2,658 35,102 4,981 2425 Under $1,000 . . . . . . . . . . . . . . . . . . . . . . . . . . 60,363 29,797 72,797 - 154,946 77,055 174:775 - 23,534 10,814 25,926
-2526 $1,000 -der $2,000 . . . . . . . . . . . . . . . . . . . 46,811 67,687 91,477 - - 89, 064 128,278 1681G48 434 14,OC)g 20,677 26,705 126] 2627 $2,000 under $3,000 . . . . . . . . . . . . . . . . . . . 28,OG4 68,039 77,736 2 - 43,074 106,768 U5,498 1,109 8,492 21,"1 24 643 2728 $3,000 under $4,000 . . . . . . . . . . . . . . . . . . . 9,333 32,042 29,036 - - 24,105 82,D95 78,618 704 7,603 26,208 24 :"7 257 2829 $4,000 under $5,000 . . . . . . . . . . . . . . . . . . . 4,043 18 025 16 437 - 8,848 39,095 35,8% 531 1 165 5 243 3 803 - - 2930 $5,000 or mo re . . . . . . . . . . . . . . . . . . . . . . .
.
(2) (2~ (2'), , - I - 4,227 24,125 18'U8 69 (2 (2 2) - - 30535,416 184,399 36 8
31 Returns under $5,000 . . . . . . . . . . . . . . . . . . . 609 927,725 =22,170,329 1,339,433 so 745 161, ]3 45 1342:12 2,1:61 11 620 24,002 3132 Returns $5,000 und .r $10,000 . . . . . . . . . . . . 84,591 570,830 193,938 280,966 56 921 434,268 2,939,766 887,376 1,618,914 330 9 63 429 052 1 9232"
:5 016 47 945 3233 Returns $10,(,00 or more . . . . . . . . . . . . . . . . . 17,458 306,221 38,732 227,358 62,571 97,052 1,731,850 204,082 1,2 :429 19 597,624 372 16,808 267,819 40,061 1609 50:134 33Nebraska Nevada Ne . Hampshire
1 Grand total . . . . . . . . . . . . . . . . . . . . . . . -%3,252 112,085,106 1 865 .687 11,096.7 242,376 6- 1582,298 1 168,054 354.173 80 .906 1 229_136 11,003,257 378,946 527-313 1 114 694 19 T .-I . . . . . . . . . .
-
-1-'-1 "1.- ~
~J
e4ve,S16 89,354 562,284 137,239 353,763 80,906 180.859 943.106 298.L6~~~~ 23 Under $1,000 . . . . . . . . . . . . . .. 9
96 7 791 5,830 1,167 234 4,844 4,165 2 906 167 6,22 3,737 906 178 3854 $1,000 =der $2, 000 . . . . . . .. 45:767 69,277 33,346 Z7,851 5,535 7, Z71 10,509 4:714 4 561 14 19 210 28 523 13, 8V 11,367 2, 2" 45 $2,000 =der $3, DDO . . . . . . . . . . . . . . . . . . . 52,047 131,000 55,475 60,429 11,919 7,138 17,766 5,679 10 :274 2,922 25:718 5'10 64208 24,006 32,690 6 .490 56 $3,000 under $4,000 . . . . . . . . . . . . . . . . . . . 52.996 184,820 75,977 87,Q47 2.7,536 _'N ZI 24,388 85,990 32,868 42,431 8 464 630, 752 -7 '4 -der
*5:000 . . . . . . . . . . . . . . . . . . . 48 828 218,387 91,052 99,406 19,979 11,211 50,157 15 :983 26,499 5,230 29,169 131,900 55,275 60,679 11:978 78 $5:= der
$6 000 . . . . . . . . . . . . . . . . . . . 45:848 250 , 522 98,141 119,681 24,092 12,226 66,358 19,043 38,832 7,854 21,918 119,358 46,567 57,251 ll 545 89 $6:~T Mder $87 : 000000 . . . . . . . . . . . . . . . . .
. . 32,647 211,481 71,017 112,744 22,845 8,918 57,428 15,958 34,287 7,147 17,246 111,479 40,012 57,799 11:598 910 $7 cr $ . . . . . . . . . . . . . . . . . . . 24,242 180,143 53,447 102,025~ 20,674 9,039 66,989 19,069 38,753 7, S49 14,995 111,731 34,413 62,333 12,612 1011 $8,000 uoder $9,000 . . . . . . . . . . . . . . . . . . . 16,855 143,080 32,697 91,633 18,920 5,767 48,499 13,285 28,018 5,739 6,539 55,311 1-3,931 34,395 6,978 1112 $9,000 under $10,000 . . . . . . . . . . . . . . . . . . 8,413 79,867 17,527 51,681 10,646 2,891 26,886 6,337 17,127 3,372 4,040 38,565 8,572 24,785 5,166 1213 $10,000 under 19,559 228,390 42,150 158,730 33,965 7,941 93,609 16,800 65,236 14,085 7,523 89,185 17,154 60,456 12,904 1314 $15,000 under W,000 . . . . . . . . . . . . . . . . . 3,368 57,363 7,538 43,825 10,289 1,342 22,836 2,350 18,OU 4,490 1,797 30,740 3,902 23,720 5,427 1415 $20,000 under $25,000 . . . . . . . . . . . . . . . . . 2,163 47,822 4,487 38,388 9,955 852 19,045 1, 940 14,805 3,868 610 13,450 1,314 10,996 2,755 1516 $25,000 =der $50,000 . . . . . . . . . . . . . . . . . 2,233 75,174 5,493 63,124 19,891 926 29,394 1,757 25,274 7,950 1,255 39,324 2,581 31,383 9,513 1617 $50,000 =der $100,000 . . . . . . . . . . . . . . . . 528 34 336 1 312 29 764 12,652 192 11 957 413 10,698 4,563 195 12 753 390 10,394 4,345 1718 $100,000 under $150,000 . . . . . . . . . . . . . . . (1) (2; 2~ (2i (2) (2) (21) (2) (2)(1) (1) (2
1) (2) (2) (2) 1819 $150,000 under $200,000 . . . . . . . . . . . . . . . 4 654 8 602 340 6 li005 12 922 473 5 857 13 698 354 1920 t2W,OOO under $500,000 . . . . . . . . . . . . . . . 8 2,396 13 2,071 1,187 2 453 3 334 169 8 2, 048 14 1,817 981 2021 $500,000 under $1,000,000 . . . . . . . . . . . . . 1 794 2 774 384 - - - - - 1 880 2 871 433 2122 $1,000,000 or more . . . . . . . . . . . . . . . . . . .. - - - I - - 1 1.743 2 1 1 .421 692 - - - - 2223 Nontaxable returns, total . . . . . . . . . . . . . . . 138,002 1158,829 270 .541 1 2,321 17,276 120,014 30 .815 410 - 48,277 160,151 80,277 854 2324 No adjusted gross income . . . . . . . . . . . . . . 9,799 333,624 18,925 - - (1) (2)(1) - - (2) (2) (2) - 2425 Under $1,000 . . . . . . . . . . . . . . . . . . . . . . . . .. 53,558 26,"3 62,345 - - 8,533 4,247 7,477 - 26,772 11, 020 24,310 2526 $1,000 under $2,000 . . . . . . . . . . . . . . . . . . . 35,763 50,832 71,840 221 - 3,494 5,197 7,448 - - 8,814 12,645 16,311 2627 $2,000 under $3,000 . . . . . . . . . . . . . . . . . . . 24,977 60,851 63,154 2,100
5 319 13 393 13,162 - 2728 $3,000 under $4,000 . . . . . . . . . . . . . . . . 9,708 33,261 33,247 - -4,288 1 15,165 14,592 410 - 3:243 11:494 10,601 204 - 12829 $4,000 under $5,000 . . . . . . . . . . . . . . . . 4,197 21,046 21,030 - 2,911 14,037 13,222 650 2930 $5,000 or more . . . . . . . . . . . . . . . . . . . . . . .. - I - f - 30
31 Returns under $5,000 . . . . . . . . . . . . . . . . . . 5, 1761,1 51,1. 279,121 J 55, 3 56, 30,945 68,696 51: .12 151,994 1370 3 206 7 29,354 318 8 12 Returns $5,000 under $10,000 . . . . . . . . . . 9, "7 561 2 456 76,0563 :12Z9373 7 3'~~ 8 7 14
: .97"'3
477,764 77 177 39, l' UX "l: 1137 7:,'17 237 211 47,8W 3265,734 ' 9 14':2-33 Returns $10,000 or more . . . . . . . . . . . . . . . . . : _ 610 7 - I 'LO8
,
.1 "g ~q 339,899 89,996__ 11, 312 1 11 25 37, "l 33Footnotes at end of table . See text for "Description of Sample- and "Explanation of Classifications and Terms
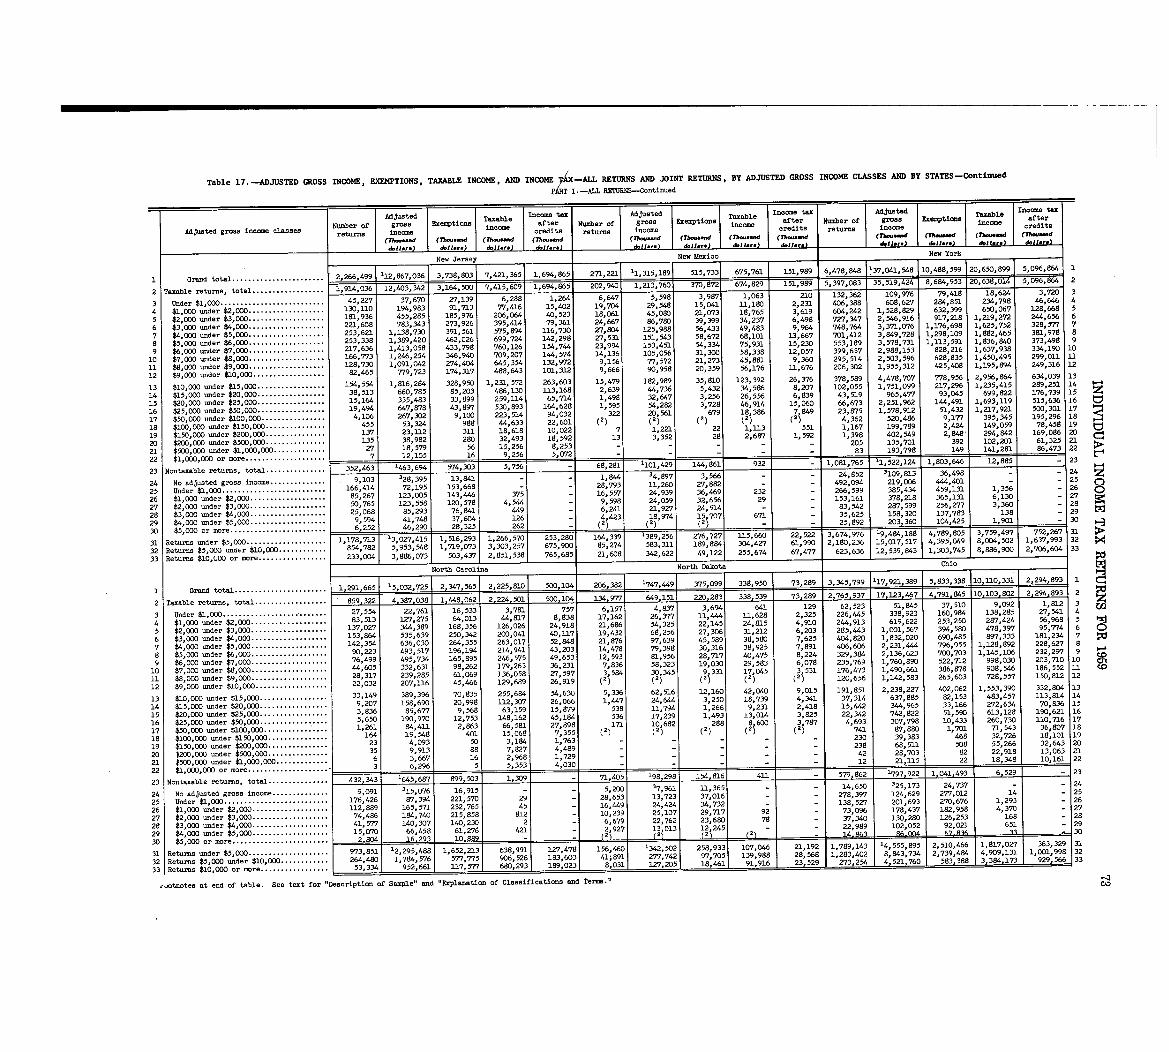
Table 17-ADJUSTED GROSS INCOME, EXEMPTIONS, TAXABLE INCOME, AND INCOME TAX-ALL RETURNS AND JOINT RETURNS, BY ADJUSTED GROSS INCOME CLASSES AND BY STATES-Continued
PART I . -ALL RTfURNS-Continue d
Adjusted T Income tax Adjusted Taxable income tax Adjusted Taxable ame tax
Numberof gross Exemptions able after Number of gross Exemptions after Number of gross Exemptions Inilfter
tetu income income i income
d gross income classes re roB income credits returns income cred ts returns income credits
(T~-d (7ho-d (Th-d (7ho-d (Th--d (7h-.-d (Th--d (Th--d (71-W (n--d (Th....W (7h-d
d.11-) d.11 .1 .) 6.11 .. . d.IJ-) d.11. ..2 d.11 .r.) d.11.r.) d6ij . .. 4.11 ... d.11. .. ) d0l .-L- dWI-)
New Jersey New Mexico New York
Grand total . . . . . . . . . . . . . . . . . . . . . . . 2,266,4991 '12,867,036 3,738,8031 7,421,365 1,694,865271, 221 11, 315~ 189 515,733 675,761 151,989 6,478,848 137,041,548 110,488,599 20,650,899 5,096,864 1
1
2 Taxable returns, total . . . . . . . . . . . . . . . . . . 12,403,342 3,164,500 7,415,609 1;694,865 202,940 1,213,760 37-0,872 674,829 35,519,424 8,684,953 20,638,014 96,864 2
3 Under $1,000 . . . . . . . . . . . . . . . . . . . . . . . . . . 45,227 37,670 27,139 6,288 1,264 6,647 5,598 3,987 1,063 210 132,362 109,976 79,418 18,624 3,720 3
4 $1,000 under 2,000 . . . . . . . . . . . . . . . . . . . 130,110 194,983 91,713 77,416 15,402 19,704 29,548 15,041 1.1,180 2,231 406,388 608,627 284,851 234,798 46,646 4
5 $2, 000 under $3,000 . . . . . . . . 181,936 455,285 185,976 206,064 40,523 18,061 45,080 21,073 18,765 3 619 604,242 1,528,829 632,399 650,067 128,668 5
6 $3,000 under $4,000 . .. 22.1,608 783,343 273,926 395,414 79,361 24,667 86,78D 39,399 34,237 6:498 727,347 2,546,916 917,218 :1,219,272 244,656 6
7 $4,000 under $5,000 . . . . . . . 253,621 1,138,730 391,561 575,894 116,730 27,804 125,988 56,43349,483 9,964 748,764 3 371,076 1,176,698 1 625,752 328,577 7
8 $5 000 under $6,000 . . . . . . . . . . . . . . . . . .. 1 1,389,420 462,026 699,724 142,298 27,531 151,543 58,672 68,101 13,667 701,412 31849,728 1,298,109 1:882,465 3" 978 8253,338 81,
$6 000 under $7,000 . . . . . . . . . . . . . . . . . 217,636 1,413,058 433,798 760,126 154,744 23,9914 153,451 54,334 75,931 15,230 553,189 3,578,731 1,113,591 1,836,840 3773,498 99 828,216 1,637,938 334,190 10
10 $7 000 under $8,000 . . . . . . . . . . . . . . . . . 166,773 1,246,254 346,940 709,207 144,574 14,136 105,056 31,3DO 58,338 12,057 399,637 2,988,153
$8,000 under $9,000 . . . . . . . . . . . . . . . . . . 128,730 1,091,042 274,404 645,354 132,972 9,156 77,572 21,273 45,881 9,360 295,514 2,503,5% 628,835 1,450,495 299,011 3.1
11 1 56,176 11,676 206,302 1,955,312 425,408 1,195,894 249,316 12
12 $9,000 under $10,000 . . . . . . . . . . . . . . . . . 82,465 779,723 174,317 488,643 101,312 9,666 90,958 20,359
13 10,000 under $1.5,000 . . . . . . . . . . . . . . . . . 154,554 1,816,284 328,950 1,231,572 263,603 15,479 182,989 35,810 123,392 26,376 378,589 4,478,707 778,956 2,956,864 634,039 1 3
14 5,000 under $20,000 . . . . . . . . . . . . . . . . . 38,513 660,785 85,203 486,130 1.13,168 2,63944,736 5,432 34,586 8,207 102,055 1,751,099 217,296 1,235,415 289,251 14 ~_4
15 $20,000 =der $25,000 . . . . . . . . . . . . . . . . . 15,164 335,483 33,899 259,114 65,714 1,498 32,647 3,256 26,556 6,839 43,519 965,477 93,045 699,822 176,739 15 z
16 $25,000 under $50,000 . . . . . . . . . 19,494 647,878 43,897 530,893 1E 62 595 54,282 3,728 46,914 15,060 66,673 2 251,962 144,491 1,693,119 515,636 . 16
17 $50,000 under $100,000 . . . . . . . . . . . 267,302 9,100 223,514 S' '0 ' 1 ' 561 679 18,386 7,849 23 875 11578,912 51,432 1,217,921 500,301 174,106 14 32 3221 20
is $100,000 under $150,000 .. . . . . .
455 53,324 988 44,633 22 :601 (2 (2~ (1)(2) (2) 4:362 520 486 9,177 395,345 195,296 18
137 23,112 311 18,618 1 7 1,221 22 1,113 551 1,167 199, 149, 059 78,458 1919 $150,000 under $200,000 . : : : : : :* : . . . . .. 0
022 1789 2,424
20 $200,000 under $500,000 ..
. . . . . : . . . . . . . 135 38,982 280 32,493 1 3,352 28 2,687 1,592 1,398 402,549 2, 848* 294,842 169,086 20C-1
21 $500,ODO under $1,000,000 . . . . I . . . . . : : : 27 18,579 56 15,256 - - - - 205 135,701 392102,201 61,325 21
$1,000,0DO or more . . . . . . . . . . . . . . . .. 7 12,105 16 9,2561 - - 83 193,798 149 141,281 86,473 22
22-
1,091,765 -1,522,124 1 ,23 Nontaxable returns, total . . . . . . . . . . . . . . . 352,463 1463,694 574,303 5,7561 - 68,281 1101,429 144,8611 932 803,646 12,885 - 23
24 No adjusted gross income . . . . . . . . . . . . . . 9,103 328,395 13,841 - - 1,844 34,897 566 - 24,852 3109,813 36,498 - - 24
Under $1,000 . . . . . . . . . . . . . . . . . . . . . . . : 72,195 28,793 11,260 3:1 1 492,094 219,006 444,401 - 25
25 166,414 153,668 - - 27 82 - -
26 $1,000 under $2,000 . . . . . . . . . . . . . . . . 85,267 123,005 143,446 375 - 16,557 24,939 36,469 232 266,599 385,434 459,131 1,356 - 26
27 $2 000 under $3,000 . . . . . . . . . . . . . . . . . . . 50,765 123,558 120,578 4,544 - 9,598 24,059 32,656 29 153,161 378,218 365,131 6 130 - 27
- 21,927 24000 =der $4,000 . . . . . . . . . . . . . . . . . . . 25,068 85,293 76,841
449 6,241 514 - 83,542 287,599 256,277 31360 - 28
28 $3: - 4 423 18,974 15,707 671 35,625 158,320 137,783 138 - 2929 $4,000 under $5,000 . . . . . . . . . . . . . . . . . . . 9,594 41,748 37,604 126 2 2) (2) 203~361014,425 1,901 -30 $5,000 or more . . . . . . . . . . . . . . . . . . . . . . . . 6,2521 46,2901 28,3251 262 - 25,892
0
30
3,759,497 __T5_2l31 Returns under $5,000 . . . . . . . . . . . . . . . . . . . . 1,178,713 13,027,415 1 516,293 1,266,570 253,280 164 339 89,256 276 727 __Z5_,660 22,522 -3,674,976 4 4
_L
.8 4,789, -5 267 31
32 Returns $5,000 -der $10,000 . . . . . . . . . . . . 8 '9 3,548 1 719,073 3,303,257 675,900 85 274 583,311 189 884 304,427 61,990 21180,236 7,517 4, 395 , -9
8,004,502 1,637,993 3 2
1' , 01 1, 2,706,604 3354,782 5
9
33 Returns $10,G00 or more . . . . . . . . . . . . . . . . . 233,004 3,89E,073~ 503,437 2,851,538 765,685 21,608 P342,622 49 122 255,674 67,477 623,636 12 53 745 8,886,900
North Carolina North Dakota Ohio
1 1,291,6651 15,032,725 2,347,5651 2,225,810 500,104 206,382 1747,449 375,0991 338,950 73,289 3,345,799 117,921,389 5p833,338 10,110,331 , 2,294,893 1
Grand total . . . . . . . . . . . . . . . . . . . . . - 91 6655
' 099
r338,
2 Taxable returns, total . . . . . . . . . . . . . . . . . . * 859 322 4,3 .038 1 . 224,501 500,104 134 .977 649,151 220, 283 338,539 73,289 2,765,937 17,123,467 4,791,845 10,103,802 2,294,893 2
6,157 4,837 3,694 641 129 62,523 51,845 37,510 9,092 1,812 3 z
3 Under $1,000 . . . . . . . . . . . . . . . . . . . . . . . . r27,554 22,761 16,533 3,781 757 1 11 , co
41 24
,
4 $1,000 under $2,000 . . . 83,513 127,275 64,013 44,817 8,838 17,162 26,377 11,444 11,628 2,325 226,445 338,923 160,994 138,285 27,541 4
3 31
,
5 $2,000 under $3,000 . . . : : :*. : : : : : : : :*.*. . . 137,027 344,389 168,356 126,026 24,918 21,686 54,325 22,145 24,815 4,910 2", 913 619,622 253,250 287,424 .56,968 5 "Xi22'
rl
'9
6 $3,000 under $4,000 . . . . . . . . . . . . . . . . . . . 153,864 535,639 250,342 200,041 40,117 19,432 68,256 Z7,306 31,212 6,203 285,"3 1,001,567 394,580 478,397 95 , 774 6 0
7 $4 000 under $5,000 . . . . . . . . . . . . . . . . . . . 142,3754 636,030 264,355 263,017 52,848 21,876 97,639 45,589 38,580 7,625 404,820 1,832,020 690,485 897,333 181,234 7
$5,000 under $6,000 . . . . . . . . . . . . . . . . . . . 90,223 493,517 196,194 214,941 43,203 14,478 79,398 30,316 38,925 7,891 406,606 2,231,444 796,955 1,128,892 228,627 8
8 1 , '.99 53 12,593 81,956 28,717 40,475 8,224 329,384 2,136,623 700,703 1,145,106 232 297 9
9 $6 000 under $7,000 . . . . . . . . . . . . . . . . . . . 76,499 495,734 165,895 246,575 49, 6
000 under $8,000 . . . . . . . . . . . . . . . . . . . 44,605 332,631 98,262 179,263 36,231 7,836 58,323 19,030 29,583 6,078 235,769 1,760,890 522,712 998,030 203,710 10 two
10 $7: 386,978 908,546 186,552 11 to
11 $8 000 under $9,000 . . . . . . . . . . . . . . . . . . . 28,317 239,285 61,069 136,058 27 5973,584 30 345 9 331 17 045 3,531 176,473 1,490,661
12 $9 :000 under $10,0DO . . . . . . . . . . . . . . . . . . 22,032 207,116 45,466 129,689 26:919 (1) (2i (2i (2i (2) 120,656 1,142,583 265,603 728,557 150,812 12
13 0,000 unde $15,ODO . . . . . . . . . . . . 33,149 389,396 70,835 255,684 54,630 5,336 62,516 12,160 42,040 9,015 191,851 2,238,227 402,062 1,553,390 332,804 13
14 $15,000 under $20,000 . . . . . . . . . . . . 9,207 158,690 20,998 112,307 26,066 1,447 24,644 3,250 18,739 4,341 37,314 637,885 82,153 483,457 113,814 14
15 $20,000 under $25,000 . . . . . . . . . . . .. . . . . 3,836 85,677 9,568 63,159 15,879 538. 11,794 1,266 9,231 2,418 15,442 -344,965 33,166 272,634 70,836 15
16 $25,000 under $50,ODO . . . . . . . . . . . 5,650 190,970 12,753 148,162 45,184 536 17,239 1,493 13,014 3,825 22,342 742,822 51,590 613,128 190,621 16
17 $50,000 under $100,000 . . . . . : :**. : : . . . . . 1,261 84,43 .1 2,863 66,581 27 898 171 10 682 288 a 3 787 4,693 307,798 10,433 260,730 110,716 17
18 $100 000 under $150,000 . . 164 19,548 401 15,068 7:355 (2) (2~ (2) 2i 741 87,880 1,701 71,543 36,807 18
19 $150:000 under $200,00D . . : : : :*.--- 23 4,093 50 3,184 1,763 - - - 230 39,383 468 32,726 18,101 19
20 t200 000 under $500,000 . . . . . . . . . . . . . . . 35 9,913 88 7,8274,489 - 238 68,511 508 55,266 32,643 20
21 $500 :000 under $1,000,000 . . . . . . . . . . . .. 6 3,667 16 2,968 1,729 -42 28,703 82 22,918 13,063 21
22 $1,000,ODO or more . . . . . . . . . . . . . . . . . . . . . 3 6,296 5 5,353 4,030 - 12 21,115 22 1 18,348 10,161 22
23 Nontaxable returns, total . . . . . . . . . . . . . . . 432,3431 1645.687 1,309 - 71,405 198,298 154,816 411 - 579 862 1797,922 1,041,493 6,529 - 2332 34
3
0 3124 No adjusted gross income . . . . . . . . . . . .. 9,091 5,076 16,915 - - 5,200 37,961 11,365 - -
14,650 325,173 24,737 - - 24
25 Under $1,000 . . . . . . . . . . . . . . . . . . . . . . . . . 176,426 87,394 221,570 29 - 28,653 13,723 37,016 - 278,397 124,629 277,012 14 - 25
26 $1,000 under $2,000 . . . . . . . . . . . . . . . . . . . 112,889 165,571 232,765 45 - 16,449 24,424 34,732 - - 138,527 201,693 270,676 1,293 - 26
27 $2,000 under $3,000 . . . . . . . . . . . . . . . . . . . 74,486 184,740 215,858 812 - 10,239 25,107 29,717 92 - 73,096 178 , 437 182,958 4, 374D - 27
28 $3 000 under $4,000 . . . . . . . . . . . . . . . . . . . 41,577 140,307 140 230 2 - 6,679 22,762 23,680 78 - 37,340 130,280 126,253 168 - 28(~) 1 (2,245
29 $4 :000 under $5,000 . . . . . . . . . . . . . . . . . . . 15,070 66,458 61,276 421 - 2 927 13,013 12 - - 22,989 102,052 92,021 651 - 29
30 $5,000 or more . . . . . . . . . . . . . . . . . . . . . . . . 2 - - (2)
'031 Returns under $5,000 . . . . . . . . . . . . . . . . . . . . 973,851 12,295,488 1,652,2131 127,478 156 460 1 .342 502 258,933 107 046 21, 92 1,789,143 14,555,895 2,510,466 11817,127 13,329 'l
32 Returns $5,000 under $10,000 . . . . . . . . . . 264 1,784,576 577,775 906 526 183,603 41';891 277:742 97,705 139 :988 28,~116, 1,283,402 8,843 734 2,739,484 4,909,1311' .l,998 32
53:~l5L,661 I 1 1 1 L2~18~J__117,577j_ 680 293 189,023 8,031 7 205 18,461 91 916 23, 583,388
33 Returns $10,000 or more . . . . . . . . . . . . . . .9
2 4 .521 760 4 17
,.~otnotes at end of table . See text for "Description of Sample" and "Explanation of Classifications and Terms ." W
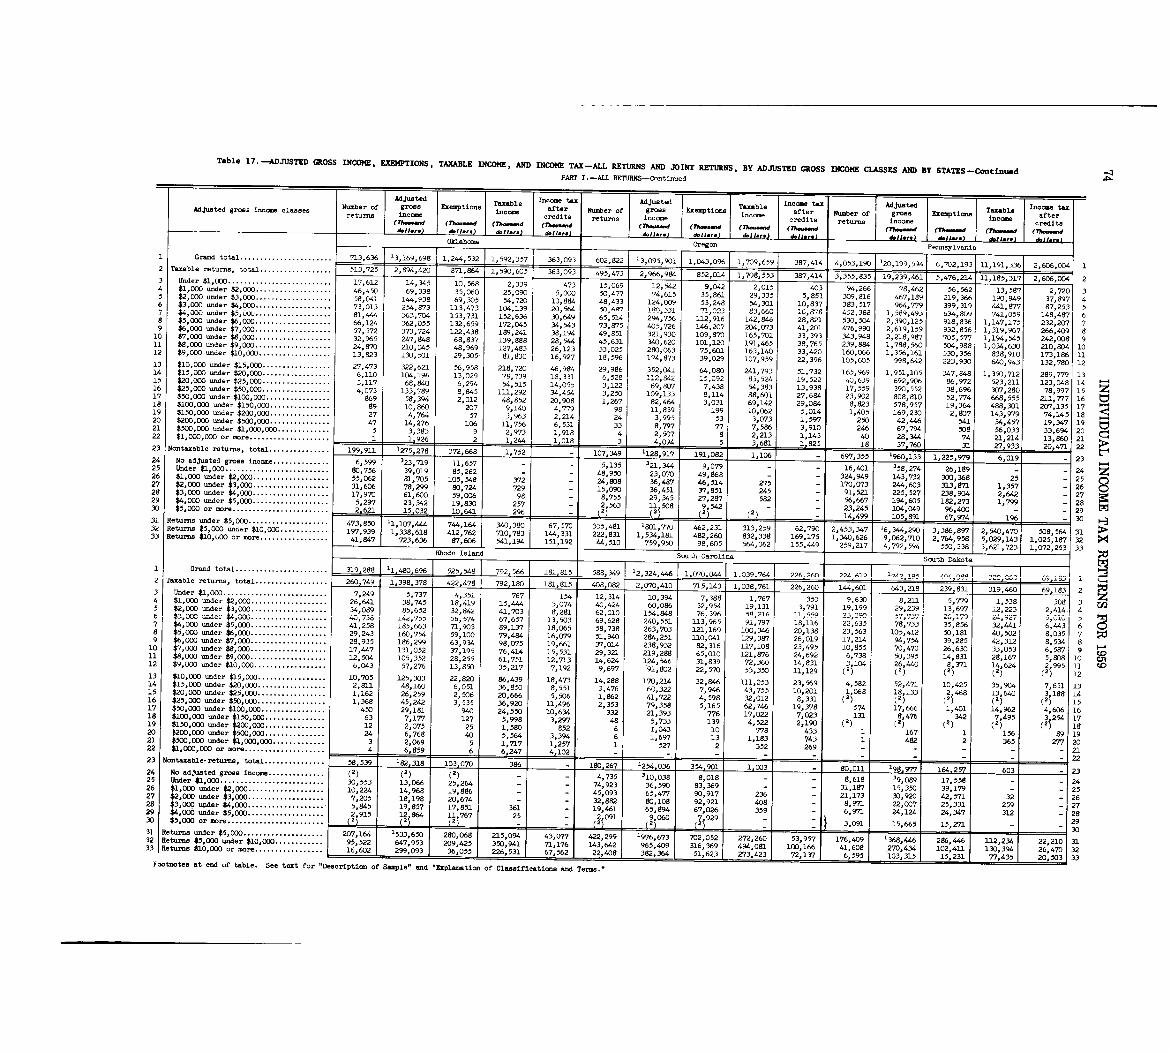
Table 17 . -ADJUSTED GROSS INCOME, EXEMPTIONS, TAXABLE INCOME, AND INCOME TAX-ALL RETURNS AND JOINT RETURNS, BY ADJUSTED GROSS INCOME CLASSES AND By STATES -Continued --IPART I . -ALL RFfURNS-Continued A:..
Adjusted come Adjusted Taxable FAj~;tedTaxableNumber of gross Exemptions Taxable Income tax Adjusted Income taxAdjusted gross income classes income after Number of gross Rxemptions i-ome :1,fter Number of
g ~oesExemptions afteracLLit
. t, incomereturns income redits return. income re it. returns income redits(M-W (7~-md (7h-.-d (YY-.-d (Th-d (71--d (Tb--.d (rh.....d (rt....w (Th-dd .11.. . ) &11... ) d.11., .) - doll . .. d.IJ... d.JJ. .. ) d,11.. . IOklahoma Oregon Pennsylvania
1 Grand total . . . . . . . . . . . . . . . . . . . . . . . 713,636 13,169,698 1,244,532 1,592,357 363,093 602,822 '3,095,901 1,043,096 1,709,659 38-7,414 4,053,190 120,199,594 6,702,1' 93 11,191,336 2,606,004 12 Taxable returnB, total . . . . . . . . . . . . . . . . . . 513,725 2,894,420 871,864 T-590,605 ___5~3_,093 495,473 2,966,984 852,014 1,708,553 387,414 3,355,835 19,239,461 5,4796,214 11,185,317 21606,004 23 Under $1,000 . . . . . . . . . . . . . . . . . . . . . . . . . . 17,612 14,345 10,568 2,339 473 15,069 12,542 9,042 2,015 403 94,266 78,462 56,562 13,587 2,720 34 000 ander $2,ODO . . . . . . . . . . . . . . . . . . . 46,450 69,338 35,D60 25,090 5,000 50,477 74,615 35,861 29,335 5,851 309,816 467,189 219,366 190,949 37,897 45 000 =der $3,000 . . . . . . . . . . . . . . . . . . . 58,041 144,938 69,305 54,720 10,884 48,433 124,009 53,248 54,301 10,837 383,517 964,779 399,319 441,877 87,253 56 3,000 under $4,000 . . . . . . . . . . . . . . . . . . . 73,013 254,873 113,473 104,139 20,564 50~697 1~ 131 71,023 83,660 ir,878 452,388 1,589,493 634 809 741,059 148 497 67 $4, OW under $5,CW . . . . . . . . . . . . . . . . . . . 81,444 363,704 153,731 152,636 30,649 65,514 2;4,_756 112,916 142,846 28,821 530,504 2,390,125 918:836 1,147,175 232:207 78 $5,000 under $6,000 . . . . . . . . . . . . . . . . . . . 66,124 362,055 132,659 172,045 34,543 73 875 405,726 146,207 204,073 41,201 476,990 2,619,159 932,856 1,319,967 266,409 89 $6,ODO =der $7,000 . . . . . . . . . . . . . . . . . . . 57,572 373,724 122,438 189,241 38,194 49:851 321,930 109,870 165,701 33,393 343,948 2,218,987 ?05,577 1,194,545 242,008 910 $7,ODO under $8,000 . . . . . . . . . . . . . . . . . . . 32,965 247,848 68,837 139,888 28,544 45, 631 340,620 101,120 191,465 38,765 239,884 1,788,560 504,988 1,034,630 210,804 1011 $8,000 =der $9,000 . . . . . . . . . . . . . . . . . . . 24,870 210, 045 48,969 127,483 26,123 33 , 025 280,063 75,601 163,140 33,420 160,066 1,356,161 330,356 838,910 173,186 1112 $9,000 under $10,000 . . . . . . . . . . . . . . . . . . 13,823 130,501 29,305 81,830 16,927 18,596 174,873 39,029 107,959 22,396 105,605 998,642 223,930640,943 132,780 1213 $10,000 under $15,000 . . . . . . . . . . . . . . . . . 27,473 322,621 56,958 218,720 46,984 29,986 352,041 64,080 241,793 51,732 165,969 1,951,105 347,848 1,350,712 289,779 1314 $15,000 under $20,000 . . . . . . . . . . . . . . . . . 6,110 104,196 13,029 78,739 18,331 6,528 112,842 15,392 83,524 19,522 40,639 692,906 86,972 523,211 123,048 1 415 $20,000 under $25,000 . . . . . . . . . . . . . . . . . 3,117 68,840 6,294 54 , 515 14,055 3,122 69,807 7,438 54,383 13,938 17,559 390,552 38,696 307,280 78,997 15 z16 $25,000 under $50,000 . . . . . . . . . . . . . . . . . 4,073 133,789 8,845 111,292 34,454 3,250 109,133 8,114 88,601 27,684 23,902 808,810 52,774 668,555 211,777 1617 $50,000 under $100,000 . . . . . . . . . . . . . . . . 869 58,394 2,012 48,852 20,908 1,267 82,464 3,031 69,142 29,084 8,823 578,957 19,364 488,301 207,135 1718 $100,000 under $150,000 . . . . . . . . . . . . . . . 89 10, 86c) 207 9,140 4,779 98 11,839 199 10,062 5,014 1,405 169,230 2,807 143,979 74,145 1819 $150,000 under $200,000 . . . . . . . . . . . . . . . 27 4,764 57 3,963 2,214 24 3,995 53 3,073 1,597 250 42,446 541 34,457 19,347 19 tv
20 $200,000 under $500,000 . . . . . . . . . . . . . . . 47 14,276 106 11,756 6,531 33 8,797 77 7,586 3,910 246 67,794 508 56,033 33,694 2021 $500,000 under $1,000,000 . . . . . . . . . . . . . 5 3,383 9 2,973 1,918 4 2,507 8 2 213 1 143 40 28,344 74 21,214 13,860 2122 $1,000,000 or more . . . . . . . . . . . . . . . . . . . . 1 1 .926 2 1,244 3 4 .094 5 3:681 1:825 18 37,760 31 27,933, 20,471 2223 Nontaxable returns, total . . . . . . . . . . . . . . . 199,911 1275,278 372,668 1,752 - -
-
107,349 1128,917 191,082 1,106 697~355 '960,133 1,225,979 6,019 - 2324 No adjusted gross income . . . . . . . . . . . . . . 6,599 123,719 11,657 5,135 321,344 9,079 - - 16,401 358,274 26,189 - - 2425 Under $1,000 . . . . . . . . . . . . . . . . . . . . . . . . . . 80,756 39,019 85,262 - - 48,950 23,070 49,868 - - 324,949 143,732 300,368 25 - 2526 $1,000 under $2,000 . . . . . . . . . . . . . . . . . . . 55,062 81,705 105,548 372 - 24,808 36,487 46,514 275 - 170,073 244,603 313,871 1,357 - 2627 $2,000 under $3,000 . . . . . . . . . . . . . . . . . . . 31,606 78,299 80,724 729 - 15,090 36,451 37,851 245 - 91,521 225,527 238,904 2,642 - 2728 $3,000 =der $4,000 . . . . . . . . . . . . . . . . . . . 17,970 61,600 59,006 98 - 8,755 29,345 27,287 582 - 56,667 194,605 182,273 1,799 - 2829 $4,000 under $5,ODO . . . . . . . . . . . . . . . . . . . 5,297 23,342 19,830 257 - 2 23,245 104,049 96,400~~563 11,508 9 - - - - 2930 $5,000 or more . . . . . . . . . . . . . . . . . . . . . . . . 2,621 15 032 10 641 1 296 1 - 2) (11542 (2) - 14,499 105 891 67,974 1% - 3031 Returns under $5,000 . . . . . . . . . . . . . . . . . . . . 473 7 340,380 67,570 335,481 '801,770 462 231 3 :2 62,790 2,453,34(~6,2900 -3 386, 897~ 2 4 508,564 319:~, 291 :3S
:931, 1 3 832 Returns $5,ODO und~r $10,000 . . . . . . . . . . . . 197 412 762 710 783 131 1 534 181 482:2 -12' 33s 169,175 1,340,626 =2 : 71044,331 222,E 1 '712 764,9 5 : r29, 43 1,025,187 32,~2733 Returns $10,600 or more . . . . . . . . . . . . . . . . . 41,847 72 87,606
541 194
92 44,510 759,950 98,605 564,062 155,"9 259,217
4 2 594
550, 1,072,253 33151,1
3 1, 723110
3,636
Rhodp Island South Carolina South DakotaI - Al~ I 1_
--1 Grand total . . . . . . . . . . . . . . . . . . . . . . . ~319 288~11 4&, 5~1 : u : 792,566 181,815 1070 .044 1 1 .039.764 226 ;16024;2~9726,641 is 9tal . . . . . . . . . . . . . . . . . . 2620:7449~ 3 378~422,478 792,180 181,815 408,082 ~::22,~:OF70,41 1,038,761 226,260 144,601 643,218 239,831 319,460 69- 2
7,T
z
0 715,143 ,183l b':;t7 97d to3 . . . . . . . . . . . . . . . . . . . . . . . . . 5,737 4,351 . 767 154 12,314 10,394 7,388 1,767 353 9 630 8,211 5,779 1,538 308 393'74 4 32 , 9-
4 $1,000 =der $2,000 . . . . . . . . . . . . . . . . . . . 26,641 38,745 18,419 15,444 3,074 40,424 60,086 32,954 19,131 3 791 19:199 29,239 13,6917 12,223 2,414 45 2,000 under $3,000 . . . . . . . . . . . . . . . . . . . 34,089 85,652 32,842 41,703 8,281 62,010 154 .848 76.396 1 58,21A 11,559 23,- 2-179 24,927 5, 010 5 Imi6 DW -der $4,000 . . . . . . . . . . . . . . 142,75~ Do ~174 67 657 13,503 69,628 240,551 113 965 91 797 18,116 22,635 78,733 35,856 32,441 6,443 6 08 185,663 71 903 89 137 18,065 58,738 263,703 121 :169 1 :7 $4,Z :dd .r *5 .. . . . . . . . . . . . . . . 41 :2-5' 00 346 20,138 23,563 105,412 50,181 40,502 8,035 7s 5, er
$6,000 . . . . . . . . . . . . . . .. : . . . 29,243 160,754 59,100 79,484 16,079 51,940 284,251 110, 041 129,387 26,019 17,214 94,754 39,285 42,312 8,534 819 $6 ' 000 under $7,000 . . . . . . . . . . . . . . . . . . . 28,935 186,299 63,934 98,075 19,661 37,014 238,932 82, 316 117,108 23,495 10,855 70,470 26,630 33,053 6,587 190 $7,000 under $8,000 . . . . . . . . . . . . . . . . . . . 17,447 131,052 37,195 76,414 15,531 29,321 219,288 65,010 121,876 24,692 6,738 56,395 14,831 28,167 5, 808 011 $8 , 000 under $9,000 . . . . . . . . . . . . . . . . . . . 12,504 105,352 28,255 61,751 12,713 14,624 124,546 31,839 72,360 14,831 3 104 26 440 8,371 14,624 2,995 11 to12 $9,000 under $10,000 . . . . . . . . . . . . . . . . . . 6,043 57,276 13,850 35,217 7,192 9,697 91,802 22,570 53,350 11,129 1)1 2(2 (2 2) (2) (2)
13 $10,000 under $15,00L) . . . . . . . . . . . . . . . . . 10,705 125,303 22,820 86,439 18,473 14,288 170,214 32,846 111,053 23,569 4,582 52,471 10 425 35,904 7,651 1314 $15,000 under $20,000 . . . . . . . . . . . . . . . . . 2,811 48,160 6,051 36,850 8,551 3,476 60,322 7,946 43,755 10,201 1 068 18 133 2'468 13 640 3 188 1415 $20,000 under $25,000 . . . . . . . . . . . . . . . . . 1,162 26,259 2,506 20,666 5,506 1,862 41,722 4,598 32,012 8,331 (2; (2 (2i (2~ 2; 1516 $25,000 =der $50,000 . . . . . . . . . . . . . . . . . 1,368 45,242 3,535 36,920 11,496 2,353 79,358 5,165 62,746 19,378 574 17,666 1,401 14,962 4,6G6 1617 $50,000 =der $100,000 . . . . . . . . . . . . . . . . 450 29,181 940 24,550 10,634 332 21,393 776 17,022 7,023 131 8 476 342 7,495 3,254 17is $100,000 under $150,000 . . . . . . . . . . . . . . . 63 7,177 127 5,998 3,297 48 5,733 139 4,522 2,190 (2) (2; (2) (2) (2) is19 $150,000 under $200,000 . . . . . . . . . . . . . . . 12 2,075 25 1,580 852 6 1,043 10 778 433 1 167 1 156 89 1920 000,000 under $500,000 . . . . . . . . . . . . . . . 24 6,768 40 5,564 3,394 6 1,697 13 1,183 743 1 482 2 365 277 2021 $500,000 under $1,000,000 . . . . . . . . . . . . . 3 2, 069 5 1,717 1,257 1 527 2 352 269 - - - - - 2122$1,000,000
or more . . . . . . . . . . . . . . . . . . .. 6 859 6 6,247 ____L,1022223 Nontaxable- returns, total . . . . . . . . . . . . . . . 58,539 182,318 103,070 386 180,267 1254,036 354,901 1, 003 90,011 198,977 164,257 603 - 2324 No adjusted gross income . . . . . . . . . . . . . . (2) (2) (2)
- - 4,735 110,038 8,018 - - 8,618 39,ogg 17,558 - - 2425 Under $1,000 . . . . . . . . . . . . . . . . . . . . . . . . .. 30,553 13,066 25,264 - - 74,923 .36,590 83,369 - - 31,187 15,350 39,179 - - 2526 $1,000 under $2,000 . . . . . . . . . . . . . . . . . . . 10,224 14,968 19,886 - - 45,093 65,477 90,917 236 - 21,173 30,920 42,571 32 - 2627 $2,000 under $3,000. . . . . . . . . . . . . . . . . . . 7 205 a8,198 20,674 - - 32,882 80,108 92,921 408 - 8,971 22,007 25,331 25 - 2728 $3,000 under,$4,000 . . . . .. 5:845 19,857 17,851 361 - 19,461 65,894 67,026 359 - 6,971 24,124 24,347 3192 - 2829 $4,000 under $5,000 . . . 2 915 12 864 7 25 - 2091 9 060 7,929 - 2930 $5,000 or more . . . . . . . . . . . . . . : . . . . . . .. 15,665 15,2712' 2) 2 12, 2) 3,091 - -( ) I ( - i - __ 1 30
31 Returns under $5,000 . . . . . . . . . . . . . . . . . . . . 207 15'3:6' 80,06 82 77 422,2 702,052 272,260 53,957 176,409 1368,446 286,446 112,234 22,210 3132 Returns $5,000 under $10,000 . . . . . . . . . . .. 95 209,425 76 316,369 494,081 100,166 41,608 270,434 102,42-1 130,394 26,470 3233 Returns $10,000 or mo re . . . . . . . . . . . . . . . . . 16:'122 .7 953
62 51,623 273,423 , 72,137 6,595 103,315 1 15,231 1 77,435 1 20,5031 33rootnotes at end of table . See text for "Description of Sample" and "Explanation of Classifications and Terms .1'
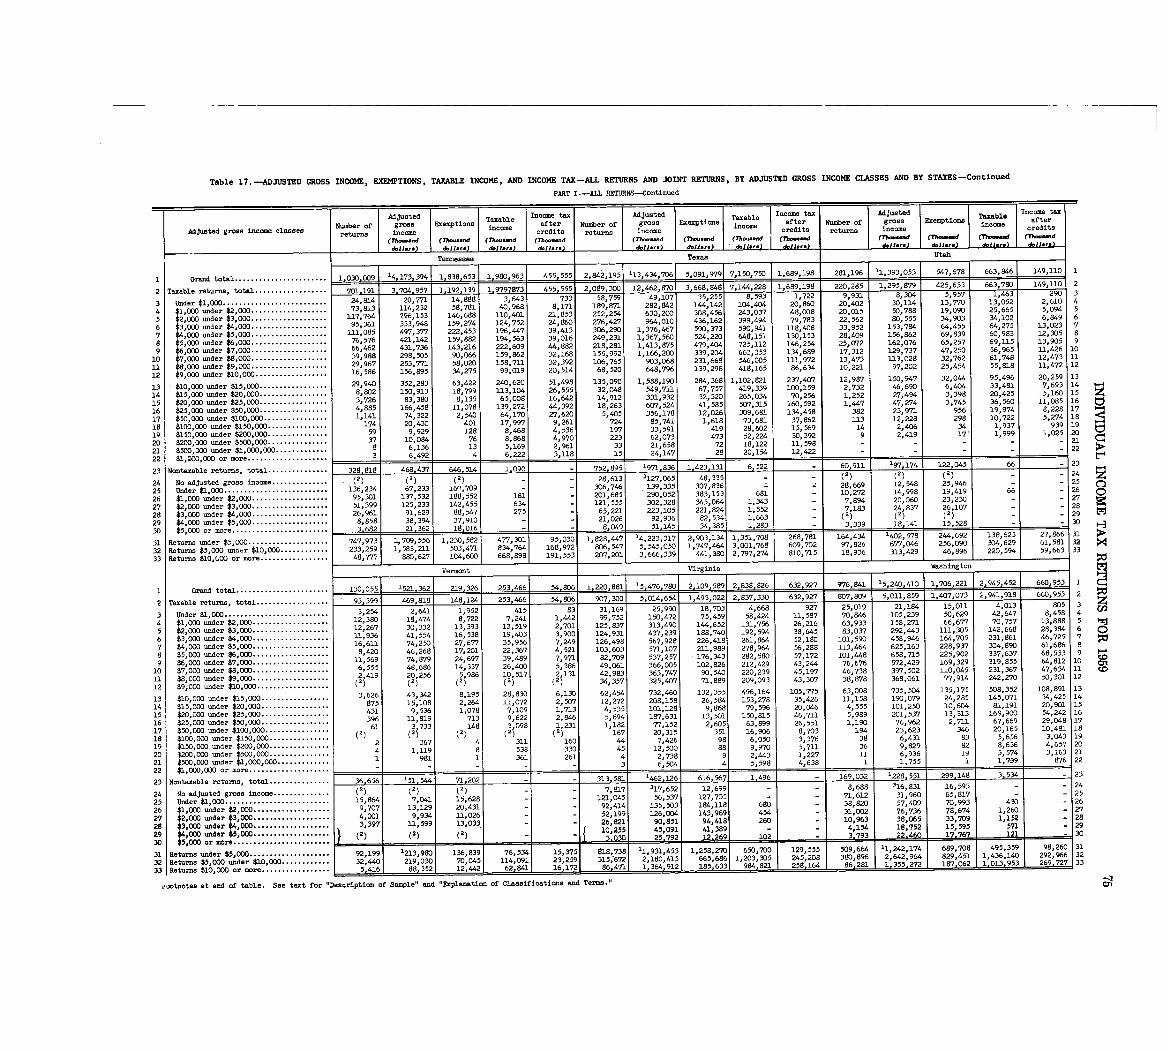
Table 17--ADJUSTED GROSS INCOME, EXEMPTIONS, TAXABLE INCOME, AND INCOME TAX-ALL RETURNS AND JOINT RETURNS, BY ADJUSTED GROSS INCOME CLASSES AND BY STATES-Continued
PART I .-ALL RE7URNS-Continued
Adjusted Taxable Income tax Adjusted Taxable Income tax a Taxabl eNumber of gross Exemptions after Number of gross Exemptions after gross Exemptions after
Adjusted gross income classes income income Number of income creditsreturns income redits returns income credits returns income
(771- ...d (7?--d (77.-.-d (Th-.-d (rh-.-d (Th (71--d (Th--d (Th--d (77-..d (7~--d
d.11-.) d.11... d.11.. . &II.r .) d.11-) &11.. . d.1 d.11.,.) dv11-) d.11.. . ) d.11.,,)
Tennessee Texas Utah
1 Grand total . . . . . . . . . . . . . . . . . . . . . . . 1 .030 .009 '4,173,394 1 .838,653 1,980,963 455,555 2,84~,195 113,4-34,706 5,091,979 7,150,750 1,689,198 281,196 11,393,053 547,678 663,846 149,110 1
2 Taxable returns, total . . . . . . . . . . . . . . . . . . 701,191 3,704,957 1,192,139 1,9797873 455,555 2,089,300 12,462,870 3.,668,848 7,144,228 1,689,198 220,285 1,295,879 425,633 663,780 149,110 2
3 er $1,000 . . . . . . . . . . . . . . : : : . . . . . . . . . 24,814 20,771 14,888 3,643 733 58,759 49,107 35,255 8,593 1,722 9,931 8 304 5,957 1,463 290 3
4 1,000 under 2,000 . . . . . . . . . . . . . . . . 73,813 114,232 58,781 40,968 8,171 189,871 282,842 144,142 104,404 20,860 20,402 30 :114 13,770 13,052 2,610 4
5 $2,000 under 3,000 . . . . . . . . . . . . . . . 117,764 ?96,153 146,688 110,401 21,853 252,254 630,200 308,456 243,037 48,008 20,015 50,788 19,090 25,665 5,094 5
6 $3,000 under $4,000 . . . . . . . . . . . . . . . 95,361 333,948 159,274 124,752 24,860 276,427 964,010 436,162 399,494 79,783 22,562 1 80,555 34,903 34,102 6,849 6
7 $4,000 under $5,000 . . . 111,085 497,377 222,453 196,447 39,413 306,290 1,376,467 590,373 590,941 118,408 33,952 53,784 64,455 64,275 13,023 7
8 $5 000 under $6,000 . . . 76,576 421,142 159,882 194,563 39,016 249,231 1,367,560 524,220 648,151 130,153 28.409 156,862 69,839 60,983 12,305 8
66,462 431,736 143,216 222,609 44,882 218,281 1,413,875 479,4()4 725,112 146,254 25,072 162,076 65,257 69,115 13,905 99 $6:000 under $7,000 . . . . . . . . . . . . . . . . . .. 663,353 134,689 17,312 129,737 47,250 56,965 11,426 1010 $7 000 under $8,000 . . . . . . . . . . . . . . . . . . . 39,988 298,505 90,066 159,862 32,168 155,992 1,166,200
339,204
$8, 000 under $9,000 . . . . . . . . . . . . . . . . . 29,967 253,771 58,020 158,711 32,392 106,765 903,068 231,668 546,005 111,972 13,473 1.13,028 32,762 61,748 12,473 11
ll 1 8,796 139,298 418,165 86,634 10,221 97,202 25,454 55,818 11,472 1212 $9,000 under $10,000 . . . . . . . . . . . . . . . . 16,586 156,895 34,275 99,019 20,514 68,520 64
13 $10 000 under $15,000 . . . . . . . . . . . . . . . . . 29,940 352,283 63,422 240,620 51,498 135,090 1,588,190 284,368 1,102,821 237,407 12,987 150,947 32,0" 95,496 20,259 1 3
8,802 150,913 18,799 113,104 26,555 32,048 549,711 67,757 419,339 100,159 2,732 46,690 6,404 33,481 7,693 14 " .4
14 $15,000 under $20,000 . . . . . . . . . . . . . . . .. 265,034 70,256 1,252 Z7,494 3,398 20,425 5,160 15 z15 $20,000 under $25,000 . . . . . . . . . . . . . . . . . 3,726 83,380 8,135 65,008 16,642 14,912 331,932 32,320
16 $25,000 under $50,000 . . . . . . . . . . . . . . . . . 4,885 166,458 11,078 139,272 44,392 18,263 607 507,315 160,592 1,447 47,274 3,745 36,560 11,085 16
1,141 74,322 2,540 524 41 5"' .9,681 134,458 382 23,971 95617 $50,000 under $100,000 . . . . . . . . . . . . . . . . 64,170 27,620 5,405 -156,171 12'026 19,974 8,228 17
is $100,000 under $150,000 . . . . . . . . . . . . . . 174 20,430 401 17,997 9,261 724 85,741 1,618 73 681 37,862 113 12,228 298 10,722 5,274 18
128 8,468 4,536 197 33,591 419 28 602 15,569 14 2,406 34 1,937 939 1919 $150,000 under $200,000 59 9,929
20 $200,000 under $500,006 : : : :,. : : : : : : : : : . 37 10,084 76 8,868 4,970 223 62,073 473 52,224 .30,392 9 2,419 17' 1,999 1,025 20
21 $500,000 under $1,000,000 . . . . . . . . . . . . . 8 6,136 13 5,169 2,%l 33 21,658 72 18,122 11,598 - - - - - 21 C
22 $1,ODO,000 or more . . . . . . . . . . . . . . . . . . .. 3 6,492 4 6,222, 3,118 15 24,147 28 20,154 12,422 - -- - - 22 >_
t_ 4
23 Nontaxable returns, total . . . . . . . . . . . . . . . 328,818 468,437 646,514 1,090 ---------- 752 .895 1971,836 1,423,131 6,522 60,911 197,1 122,045 66 - 2 3
24 No adjusted gross income . . . . . . . . . . . . . . (2) (2) (2) - 28,613 3127,065 48,335 - (2) (2) 2) - 24 z52 89
5
25 Under $1,000 . . . . . . . . . . . . . . . . . . . . . . . . . . 136,234 67,233 16n,709 - -E306,746 139,335 307,836 28,669 12,548 25,946 - - 25
26 $1,000 under $2,000 . . . . . . . . . . . . . . . . . . . 95,301 137,532 188,552 181 - 201,685 290,052 383,153 681 10,27214,998 19,419 66 - 26 C)
27 $2,000 under $3,000 . . . . . . . . . . . . . . . . . . . 51,399 125,233 142,455 634 - 121,555 302,328 345,064 1,343 - 7,894 20,060 23,230 - - 2 7
S28 $3 ODO under $4,000 . . . . . . . . . . . . . . . . . . . 26,961 91,629 88,547 275 - 65,221 223,105 221,824 1,552 - 7 183 24,837 26,107 - - 28
29 $4, 37,910 - 21,026 92,936 82,534 1,663'000 under $5,000 . . . . . . . . . . . . . . . . . . . 8,858 38,394
- 1 0 - (2 (2) (2) - - 29
l30 $5,000 or more . . . . . . . . . . . . . . . . . . . . . . . . 3 .6 2 1 -1 362 18,0161 - 8 049 51,145 34,385 1,283 - 3,339 18,141 15,528 - - 30
1,7 477,301 95,030 1,828,441 14,223 3171 2:903,1341 1,351,708 268,781 164,434 1402 2",692 138,623 27,866 13131 Returns under $5,000 . . . . . . . . . . . . . . . .. 747,9731 0; 56
1'2'52 57
8
32 Returns $5,000 undr $10,000 . . . . . . . . . 233,259 1,583,211 503:471 834,764 168,972 806,547 5,545 :050 1 747 464 3,001,768 609,702 97,826 677,046 256,090 304,629 61,581 32
33 Returns $10,(,00 or more . . . . . . . . . . . . . .. 48,777 880,627 lC4,600 668,898 191,553 207,201 3,666,339 "l, 380 2,797,274 810,715 18,936 313,429 46,896 220,594 59,663 33
Vermont Virginia Washington
1 Grand total . . . . . . . . . . . . . . . . . . . . . . . 130,055 1521,362 219.326 253,466 54,806 1 220,881 15,476,7801 2 .109 .589 2,838,826 632,927 976,841 15,240,410 1 .706,221 2,945,452 660 953 1
2 Taxable returns, total . . . . . . . . . . . . . . . . . . 93,399 9,818 148,124 253,466 54, 806 907,300 5,014,6541 1,493,022 2,837,330 632,927 807,809 5,011,859 1,407,073 2,941,918 660,953 2
3,254 2,641 1,952 415 83 31,169 25,990 18,703 4,668 927 25,019 21,194 15,011 4,013 805 3 z
3 Under $1,000 . . . . . . . . . . . . . . . . . . . . . . . . .. - C02
12,380 18,474 8,?22 7,241 1,442 99,752 150,472 75,459 58,424 11,587 70,846 105,239 50,629 42,647 8,458 4
4 11000 under $2,ODO . . . . .. 1 888 5 ~115 $2,000 under $3,000 . . . . .. 12,267 30,332 13,393 13,519 2,701 125,837
313,490 144,652 131,756 26,216 63,933 158,271 66,677 70,757 13 ,
6 $3,000 under $4, GOD . . . . . . . . . . . . . . . . . . 11,936 41,554 16,538 19,403 3,900 124,931 437,239 188,740 192,594 38,645 83,037 292,443 111,305 142,668 28,384 6 0
1 27 $4 , 000 under $5, 000 . . . . . . . . . . . . . . . . . . . 16,611 74,250 27,677 35,956 7,249 r~~ 6,498 567,928 226,418 261,864 52,180 101,590 458,946 164,705 231,861 46,725 7
8 $5,000 und- $6,000 . . . . . . . . . . . . . . . . . . . 8,420 46,268 17,201 22,367 4,521 103,603 571,107 211,989 278,964 56,288 113,464 625,163 228,937 304,890 61 686 8
11,569 74,879 24,697 39,489 7,971 82,709 537,257 176,343 282,580 57,172 101,"8 658,715 225,902 337,637 68 :533 99 $6,000 under $7,000 . . . . . . . . . . . . . . . . . . . CD
10 $7,000 =der $8,000 . . . . . . . . . . . . . . . . . . . 6,555 48,686 14,337 26,400 5,386 49,061 366,005 102,826 212,429 43,244 76,676 572,429 169,329 319,855 64,812 10 01
11 $8 000 under $9,000 . . . . . . . . . . . . . . . . . 2 419 20,256 5,986 10 517 2,131 42,983 363,747 90,540 220,239 45,197 46,738 3917,502 110,045 231,367 47,634 11 CD
1 2 (2) (2 2) 34,357 325,407 71,899 209,093 43,307 38,878 3612 $9,000 under $10,000 . . . . . . . . . . . . . . .
. (1) 8,061 77,914 242,270 50,301 12
13 $10,000 -der $15,000 . . . . . . . . . . . . . . . . . 3,626 43,342 8,195 28,830 6,130 62,454 732,460 132,355 496,164 105,775 63,008 735,504 135,175 508,352 108,891 13
14 $15,000 -der $20,000 . . . . . . . . . . . . . . . . . 875 15,108 2,264 11,072 2,507 12,272 208,158 26,584 153,278 35,426 11,158 190,079 24,285 145,071 34,425 14
15 $20,000 -der $25,000 . . . . . . . . . . . . . . . . . 431 9,536 1,078 7,109 1,713 4,535 101,128 9,868 79, 596 20,046 4,555 101,250 10,604 81,191 20,901 15
16 $25,000 under $50,000 . . . . . . . . . . . . . . . . . 396 11,819 713 9,622 2,846 5,694 187,631 13,501 150,815 46,711 5,989 201,537 13,313 169,900 54,242 16
17 $50,000 -der $100,000 . . . . . . . . . . . . . . : : 61 3 733 148 3 098 1 231 1,182 77,152 2,605 63,899 26,551 1,190 76,962 2,711 67,669 29,048 17
18 $100,000 -der $150,000 . . . . . . . . . . . . .(2) (2i (2) (2; (2i 167 20,315 351 16,906 8,703 194 23,623 346 20,165 10,481 18
19 $150,000 under $200,000 . . . . . . . . . . . . . . . 2 367 4 311 160 7,426 98 6,050 3,376 38 6,431 83 5,656 3,043 19
20 t200 000 under $500,000 . . . . . 4 1,119 8 538 330 45 12 500 88 9,970 5,71.1 36 9,829 82 8,636 4,657 20
4 2 738 9 2,443 1,227 11 6,936 19 5,574 3,163 21
21 $500,000 under $1,000,000 . .. 1 991 1 361 261
22 $1,000,000 or an re . . . . . . . . . . . . . . . . . . .. - - - - -31 6,504 4 5,598 1 4,638 1 1,755 1 1,739 876 22
23 Nontaxable returns, total . . . . . . . . . . . . . . . 36,656 151,544 71 .202 - 313,581 1462,126 616,567 1,496 - 169,032 1228,551 299,148 3,534 ......... 23
24 No adjusted gross income . . . . . . . . . . . . . . (2) (2) (1) - 7,817 317,652 12,699 - - 8,688 316,831 16,593 - 24
25 Under $1,000 . . . . . . . . . . . . . . . . . . . . . . . . . . 15,864 7,041 15,628 - 121,045 56,537 127,705 - - 71,612 31,960 65,817 - 25
26 $1,000 under $2,000 . . . . . . . . . . . . . . . . . .. 9,707 13,129 20,431 - 92,414 135,503 184,118 680 - 38,820 57,409 70,993 430 26
27 $2 000 under $3,000 . . . . . . . . . . . . . . . . . . . 4,001 9,934 11,026 - 52,199 126,004 143,969 454 - 31,002 76,736 78,674 1,260 27
28 $3:000 under ~4,000 . . . . . . . . . . . . . . . .. 397 11,599 13,033 26,821 90 851 94 418 260 - 10,963 38,065 33,709 1,152 28
29 $4,000 under $5,000 . .. 3 10,255 45 :091 41:389 - - 4,154 18,752 15,595 571 29
30 $5,000 or more . . . . . . . . 3 .030 25.7921 12.269 102 - 3,793 22,460 17.7_67 1 30
,738FF9., 2
31 Returns under $5,000 . . . . . . . . . . . . . . . .. 92,;19::9 1213,980 136,839 76 534 15 818 11 931,453 1"258,270 ~5 5 :664 242,174 689,708 495 359 ~]6 3
0 , 415 6' 409 ~
9,030 1:3751 829,451 1 43 0
32 Returns $5,000 under $10,ODO . . . . . . . . . 32 440 21 70,045 1 4 091 23 259 315 672 2,18 565,68L6 310.96
112:642,964 1 'l
~%32
033 . . . . . . . . . .
. 16F
1 86: 33 355,272 187,062 _1. 13.953 27Returns $10,000 or more . . . . . 5,416 88,3521 12,4421 62,841 16,172 471
1
364,912 185,633 7,062 0
,-~otnotes at end of table . See text for "Description of Sample" and "Explanation of Classifications and Terms ." __JCn
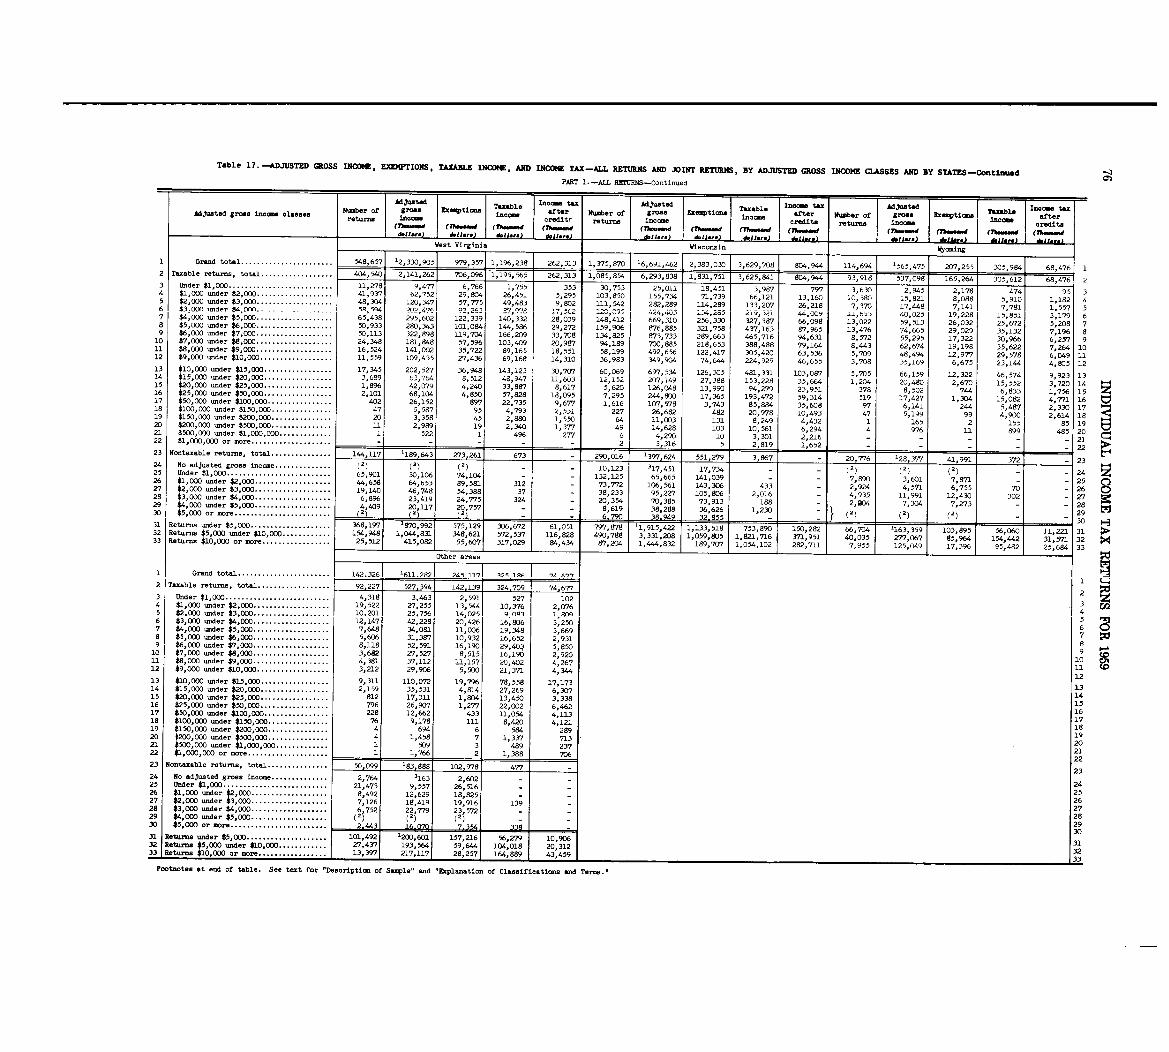
Table 17 . -ADJUSTED GROSS INCOME, EXEMPTIONS, TAXABLE INCOME, AND INCOME TAX-ALL RETURNS AND JOINT RETURNS, By ADJUSTED GROSS INCOME CLASSES AND BY STATES -ContinuedPART I .-ALL RZATRNS-C. .tinu . d
Adjusted Taxable Income tax Adjusted income tax Adjusted Ino taxNumber of gross Exemptions after Number of gross Exemptions Taxable after Number of groas Exemptions TaxableafterAdjusted gross income classes
returns income income creditr returns income income credits returns income income credits(YAe.eead (7howeand (7h-" (Th-sed (7houe-d (7howmand (Ths-sed (7h-...d (Th-.-d (Thes-d (7h..-W (Theesewdd.11ar.) d .11 ... ) d.IJ ... ~11- I 1 &11 . .. ) ~11 ... I d.11.r.) d.11 ... d11. .. ) LML- __dUAAcLL_West Virginia Wi-onsin Wyoming
1 Grand total . . . . . . . . . . . . . . . . . . . . . . . 548,657 '2,330,905 979,3571 1,196,238 262,313 1,375,870 16,691,462 2,383,030 3,629,708 804,944 114,694 1565,475 207,255 305,984 68,476 12 Taxable "turns, total . . . . . . . . . . . . . . . . . . 404,540 2,141,262 706,096 1,195,565 262,313 1,085,85.4 6,293,838 1,831,751 3,625,841 804, 93,918 537,098 165,264 305,612 68,476 23 Under $1,000 . . . . . . . . . . . . . . . . . . . . . . . . . . 11,276 9,477 6,766 1,755 353 310,753 25,011 18,451 3 987 797 3,630 2,945 2,178 474 95 34 $1,000 =der $2, GOO . . . . . . . . . . . . . . . . . . . 41,937 62,752 29,804 26,451 5,295 103,850 155,734 71,739 66:121 13,160 10,380 15,821 8,088 5,910 1,182 45 $2,000 under $3,000 . . . . . . . . . . . . . . . . . . . 48,304 120,347 57,775 49,483 9,802 111,542 282,289 114,289 133 , 207 26,218 7,370 17,448 7,141 7,781 1,557 56 $3,000 -de, $4,O(Y) . - . . _ . - . ~ ~ ---- 5A, 5C)4 202,476 92,263 87,978 7, 562 120, 09, 424,403 1~4,285 2i9,321. 44,009 11,653 40,025 19,228 15,851 3,179 67 $4,000 under $5,000 . . . . . . . . . . . . . . . . . . . 65,438 295,602 122,339 140,332 28,039 148,412 669,310 256,330 327,387 66,098 13,022 59,513 26,032 25,672 5,208 79 $5,000 under $6,000 . . . . . . . . . . . . . . . . . . . 50,933 280,343 101,084 144,586 29,272 159,906 876,885 321,758 437,163 97,965 13,476 74,665 29,029 35,132 7,196 89 $6,000 under $7,000 . . . . . . . . . . . . . . . . . . . 50,113 322,898 119,704 166,209 33,708 134,825 873,733 299,663 465,716 94,631 8,572 55,295 17,322 30,966 6,257 910 $7,000 under $8,000 . . . . . . . . . . . . . . . . . . . 24,348 181,948 57,596 103,409 20,987 94,189 700,885 218,653 388,488 79,164 8,443 62,674 19,198 35,622 7,264 1011 $8,000 under $9,000 . . . . . . . . . . . . . . . . . . . 16,524 141,002 35,722 89,165 18,551 58,199 492,656 122,417 305,420 63,536 5,709 48,494 12,977 29,578 6,049 1112 $9,000 under $10,000 . . . . . . . . . . . . . . . . . . 11,559 109,435 27,4.36 69,168 14,310 36,983 349,904 74,644 224,929 46,655 3,708 35,169 6,675 23,144 4,805 12
13 $10,000 under $15,000 . . . . . . . . . . . . . . . . . 17,345 202,527 36,948 143,123 30,707 60,069 697,534 126,305 481,331 103,087 5,705 66,159 12,322 46,574 9,923 1314 $15,000 under $20,000 . . . . . . . . . . . . . . . . . 3,689 63,764 8,512 48,947 11,603 12,152 207,149 27,388 153,228 35,664 1,204 20,480 2,670 15,552 3,720 1415 $20,000 under $25,000. . . . . . . . . . . . . . . . . 1,8% 42,079 4,240 33,887 8,617 5,620 126,048 13,990 94,279 23,951 378 8,502 744 6,833 1,756 1516 $25,000 under $50,000 . . . . . . . . . . . . . . . . . 2,101 68,104 4,850 57,828 18,095 7,295 244,SDO 17,365 193,472 59,314 519 17,427 1,304 15,082 4,771 1617 $50,000 under $100,000 . . . . . . . . . . . . . . . . 402 26,152 897 22,735 9,677 1,616 107,578 3,743 85,884 35,608 917 6,141 244 5,487 2,330 17is $100,000 under $150,000 . . . . . . . . . . . . . . . 47 5,587 95 4,793 2,531 227 26,682 482 20,978 10,493 47 5,199 99 4,900 2,614 1819 $150,000 under $200,000 . . . . . . . . . . . . . . . 20 3,358 45 2,880 1,550 64 11,003 131 8,249 4,432 1 165 2 155 95 1920 $200,000 under $500,000 . . . . . . . . . . . . . . . 11 2,989 19 2,340 1,377 49 14,628 103 10,561 6,294 4 976 11 899 485 2021 $500,000 under $1,000,000 . . . . . . . . . . . .. 1 522 1 496 277 6 4,290 10 3,301 2,216 - - - - - 2222 $1,000,000 or more . . . . . . . . . . . . . . . . . . .
.
- 2 1 3,316 5 1 2,819 1,652 - - 2223 Nontaxable -turns, total . . . . . . . . . . . . . . . 144,117 1189,643 273,261 673 290,016 1397,624 551,279 3,867 - 20,776 '28,377 41,991 372 - 2324 No adjusted gross income . . . . . . . . . . . . . . (2) (2)
(1) - - 10,123 317,451 17,734 - - (2) (2) (2)- - 2425 Under $1,000 . . . . . . . . . . . . . . . . . . . . . . . . . . 65,901 30,106 74,104 - - 132,125 65,665 141,039 - - 7 890 3 601 7 871 - - 2526 $1,000 under $2,000 . . . . . . . . . . . . . . . . . . . 44,658 64,653 gg,581 312 - 73,772 106,561 143,306 433 - 2:924 4:571 6:755 70 - 2627 $2,000 under $3,000 . . . . . . . . . . . . . . . . . . . 19,140 46,748 54,388 37 - 38,233 95,227 105,806 2,016 - 4,935 11,991 12,430 302 - 2728 $3,000 -der $4,000 . . . . . . . . . . . . . . . . . . . 6,896 23,419 24,775 324 - 20,354 70,385 73,913 188 - 2,204 7,304 7,273 - - 2829 $4,000 under $5,000 . . . . . . . . . . . . . . . . . . . 4,409 20 117 20 757 - - 8,619 38,288 36,626 1,230 - (2) 1 2930 $5,000 or more . . . . . . . . . . . . . . . . . . . . . . . . (21 - - 3
0
(2 (21
.. 6.790 38,949 32,855 - - 1) (1) (2) -
31 Returns under $5,000 . . . . . . . . . . . . . . . . . 368,197 2 29 30 6 51 1 0601 11,221 31T97, B-78 11,915,422 1, 133, R-8- 753,890 150,282 163,359 103,895 56,Returns $5,000 under $10,000 . . . . 9 1 " 1 6' 2 1 1:0 S 442 31,571 3232 . . . . . I.,. 1,Z:9.3 Z;,62 572,61717 6 12 490,788 3,331,208 1,059,805 1,821,716 371, 9 11 1 277,067 85,964 154317,02933 Returns $10,OD0 or more . . . . . . . . . . . . . . . . . 25,512 415,082 55,607 84,434 87,204 1,444,832 189,707 1,054,102 282,711 7,955 125,049 17,396 95:482 25,684 33
Other areas
1 Grand total . . . . . . . . . . . . . . . . . . . . . . . 142 .3261 1611 .2821 2451171 199 191 1 ~4 -2 Taxable returns, total . . . . . . . . . . . . . . . . . . 92,2271 527,394 142,139 324,709 74,677
23 Under $1,000 . . . . . . . . . . . . . . . . . . . . . . . . . 14"8
3:463 2,591 527 102 34 000 under $2,000 . .9:
1221 17 25, 13,544 10,376 2,076 45 .000 under $3,000 . . . ** : : : ., : : :* :,. : ., : : 10,201 25,756 14,025 9~083 1, 80c 56 $3,000 under $4,000 . . . . . . . . . . . . . . . . . . . 12,147 42,228 20,426 16 32' 67 $4,000 under $5,ODO . . . . . . . . . . . . . . . . . . . 7,648 34,081 11,006 19: "8 3:669 7
8 $5,000 under $6,000 . . . . . . . . . . . . . . . . . . . 5,606 31,387 10,932 16 :.65,2 29'1 a9 $6,000 under $7,000 . . . . . . . . . . . . . . . . . . . 8,118 52,591 16,190 29 5 : 85. 910 $7,000 under $8,000 . . . . . . . . . . . . . . . . . . . 3,682 27,527 8,515 16 190 2:920 A
11 $8 000 under $9,000 . . . . . . . . . . . . . . . . . . . 4,381 37,112 11,157 20:402 4267 1112 $9 :000 der $10,000 . . . . . . . . . . . . . . . . . . 3,212 29,906 5,500 21,371 4,344
1213 $10,000 under $15,000 . . . . . . . . . . . . . . . . . 9,311 110,072 19,796 78,558 17,1731314 $15,000 =der $20,000 . . . . . . . . . . . . . . . . . 2,159 35,531 4,814 27,269 6,3071415 $20,000 under $25,000 . . . . . . . . . . . . . . . . . 812 17,311 1,804 13,450 3,338 1516 $25,000 =der $50,000 . . . . . . . . . . . . . . . . . 796 26,907 1,277 22,002 6,4621617 $50,000 =der $100,000 . . . . . . . . . . . . . . . . 228 12,662 433 11,054 4,11317is $100,000 under $150,000 . . . . . . . . . . . . . .. 76 9,178 11.1 8,420 4,1211819 $150,000 under $200,000 . . . . . . . . . . . . . . . 4 694 6 584 289 19
20 t2OO,OOO under $500,000 . . . . . . . . . . . . . . . 4 1,458 7 1,337 7132021 $500, 000 under $1,000,000 . . . . . . . . . . . . . 1 509 3 489 2372122 $1,000,000 or
. re . . . . . . . . . . . . . . . . . . .. 1 1,766 21 1,388 706
2223 Nontaxable returns, total . . . . . . . . . . . . . . . 50,099 183,888 102,978 477
2324 No adjusted gross income . . . . . . . . . . . . . . 2,764 '163 2,602 - -
2425 Under $1,000 . . . . . . . . . . . . . . . . . . . . . . . . . . 21,473 9,557 26,516 - 2526 $1,ODO under $2,ODO . . . . . . . . . . . . . . . . . . . 8,492 12,629 18,825 - - 2627 $2,000 under $3,000 . . . . . . . . . . . . . . . . . . . 7,126 18,419 19,916 139 - 2728 $3,000 under $4,000 . . . . . . . . . . . . . . . . . . . 6 752 22 779 23,572 - -
2829 $4,000 under $5,000 . . . . . . . . . . . . . . . . . . . (2 (2) (2)- - 2930 $5,000 or mom . . . . . . . . . . . . . . . . . . . . . . . . 2,443 -
3031 Returns under $5,000 . . . . . . . . . . . . . . . . . 101,4'~2 1200:6011 157 216 56,279 10,906 3132 Returns $5,000 under $10,000 . . . . . . . . . 27,4371 193 564 59:644 104,018 20,312 3233 1 Returns $10,000 or more . . . . . . . . . . . . . . . . . 13,397 217,117 28,257 164,889 43,459 33
Footnotes at end of table . See text for "Description of Semple" and "Explanation of Classifications and Terms
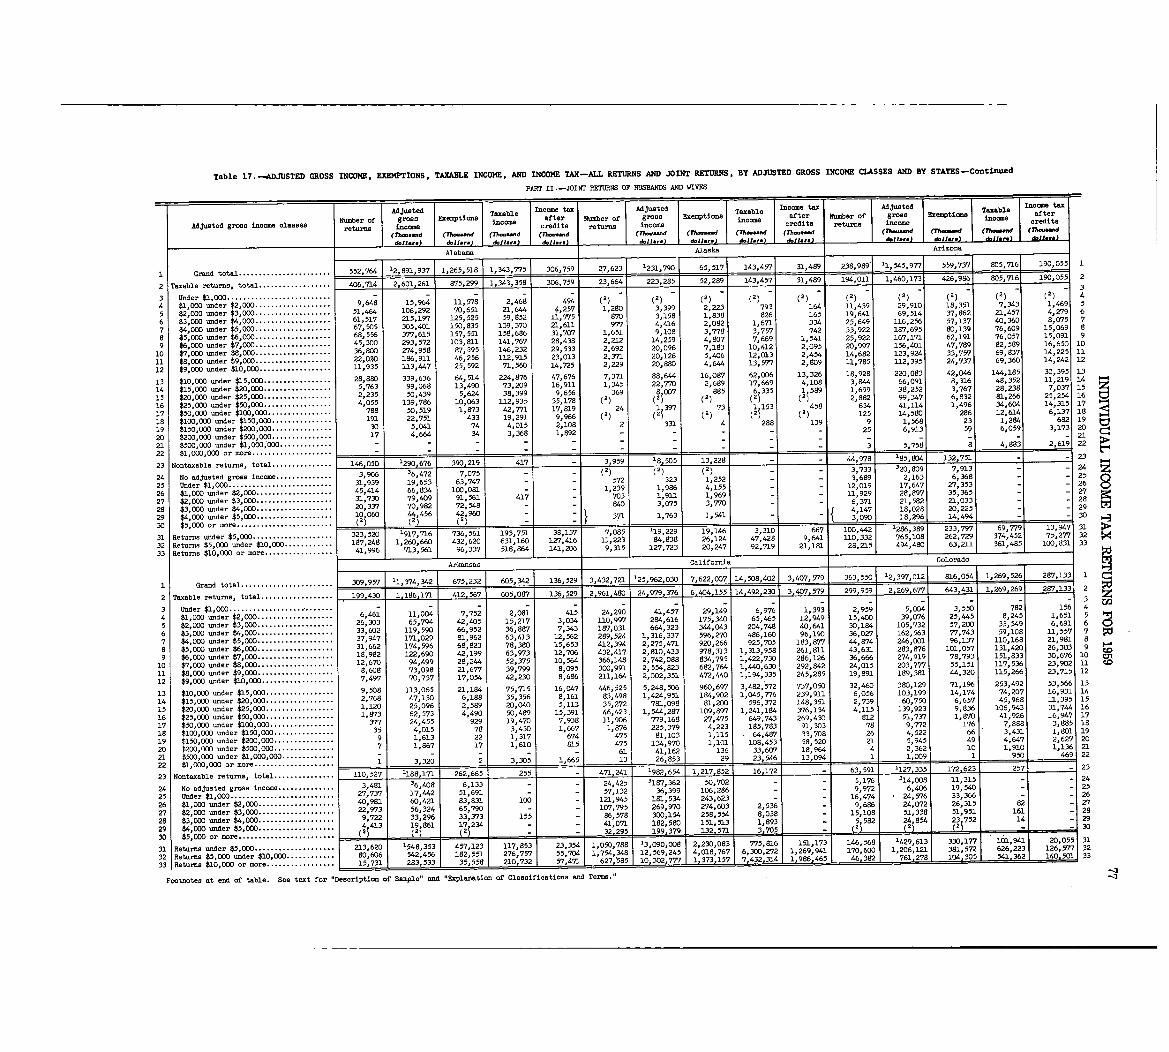
Table 17 . -ADJUSTED GROSS INCOME, EXEMPTIONS, TAXABLE INCOME, AND INCOME TAX-ALL RETURNS AND JOINT RETURNS, BY ADJUSTED GROSS INCOME CLASSES AND BY STATES -Continued
PART IT . -JOINT RETURNS OF HUSBANDS AND WIVES
Adjusted Income Adjusted Taxable Income tax Adjusted Taxable Incomegross Exemptions Taxable after Number of gross Exemptions after Number of gross Exemptions income aft rNumber of income income
Adjusted gross income classes returns income credits returns income credits returns income redits(7h- .-d (n- .. .d (7h..-d (7h--d (Th-d (Th-d (71-nd (71--d (TW--d (Th-..d (lh--d
d.11-) _db11.. . ) doJlars) doll.r .) d.11 .. . 46IL-1-- d.11-) d.Al.. . J d,11 . .. ) d,11 ...
Alabama Alaska Arizona
1 Grand total . . . . . . . . . . . . . . . . . . . . . . . 552,764 12,891,937 1,265,518 1,343,775 306,759 ~7,623 1231,790 65,517143,457 31,499 23819891 11,545,977 559,7371 805,716 190,055 1
2 Taxable returns, total . . . . . . . . . . . . . . . . . . 406,714 2,601,261 1,343,358 306,759 23,664 223,285 52,289 143,457 31,489 194,011 1,460,173 426,986 805,716 190,055 2r65
51'
3
11 ,
: -
_5,2 9
:
3 Under $1,000 . . . . . . . . . . . . . . . . . . . . . . . . .. -
(2) (2) (2) (2) (2) 4
4 1,000 under $2,ODO . . . . . . . . . . . . . . . . . . . 9,648 15,964 11,578 2,468 494 (1)(2) (2) (2) (2 )
7., 6'1125 , 52
'
5 $2,000 under $3,000 . . . . . . . 51,464 106,292 70,651 21,644 ?.,257 1,280 3,399 2,223 793 164 11,439 29,910 18,351 7,343 1,469 557
'
9
:6 $3,000 under $4,000 . . . 61,517 215,197 125,525 59,852 11,775 870 3,158 1,838 826 16519,641 69,514 37,862 21,457 4,279 6
.3 57 $4,000 under $5,000 . . . : : : : . . . . . . . . : . . . 67,505 305,401 150,835 109,370 21,611 977 4,416 2,082 1,671 334 25,649 116,256 57,137 40,360 8,075 7
8 $5 000 under $6,000 . . . . . . . . . . . . . . . . . . . 68,556 377,615 157,551 158,686 31,707 1,651 9,108 3,778 3,757742 33,922 le7,695 80,139 76,609 15,069 8
9 $6:000 under $7,000 . . . . . . . . . . . . . . . 45,300 293,572 103,811 141,767 28,438 2,212 14,259 4,807 7,669 1,541 25,922 167,171 62,191 76,057 15,091 9
10 $7 000 under $8,000 . . . . . . . . . . . . . .. 36,800 274,958 87,395 146,232 29,533 2,692 20,096 7,183 10,412 2,095 20,997 156,401 47,789 82,589 16,650 10
11 $8 :000 under $9,000 . . . . . . . . . . . . . . . . . .. 22,030 186,911 46,256 112,915 23,013 2,371 20,1265,406 12,013 2,454 14,682 123,924 33,757 69,837 14,225 11
12 $9,000 under $10,000 . . . . . . . . . . . . . . . . . . 11,935 113,447 25,592 71,560 14,725 2,229 20,890 4,644 13,577 2,809 11,785 112,395 24,737 69,360 14,242 12
13 $10,000 under $15,000 . . . . . . . . . . .. 28,880 339,636 64,514 224,876 47,676 7,371 88,644 16,087 62,006 13,326 18,928 220,083 42,046 144,185 30,395 13
14 $15,000 under $20,000 . .. 5,763 99,G68 13,490 73,209 16,911 1,345 22,770 2,689 17,669 4,108 3,844 66,091 8,316 48,352 11,219 14
15 $20,000 under $25,000 . . .'.-.**- : . . . . . 2,235 50,439 5,624 38,399 9,656 369 8 007 885 6 335 1 589 1,699 38,252 3,767 28,238 7,037 15 Z
16 $25,000 under $50,000 . . . . . . . . . . . . .. . . .
4,055 139,786 10,063 112,935 35,178 (2) 2i (2) (2i (21) 2,882 99,347 6,832 81,266 25,254 16 C1
24 1 397 73 1 153 458 634 41 114 1,496 34,6G4 14,315 1 7
17 $50,000 under $100,000 . . . . . . . . . . . . .. .. 788 50,519 1,873 42,771 17,819 (2) 2 2 125 14 580 286 12,614 6,137 1 8
is $100,000 under $150,000 . . . . . . . . . . . . . . . 191 22,751 433 19,291 9,966 i (2) ( 1) (1) H
19 $150,000 under $200,000. . . . . . . . . . . . . . . 30 5,041 74 4,015 2,108 2 331 4 288 139 9 1,568 23 1,284 682 19 t=J
20 $200,000 under $5DO,DO0. . . . . . . . . . . . . . . 17 4,664 343,368 1,892 - - - - - 25 6,913 59 6,059 3,173 20 C-4
000. . . . . . . . . . . .. - - - - - - - - - -21
21 $500,000 under$1,0001* - - 31 5,758 8 4,883 2,619 22
22 $1,000,000 or more . . . . . . . . . . . . . . . . . . .. - t_4
23 Nontaxable returns, total . . . . . . . . . . . . . . . 146,050 1290,676 390,219 417 - 3,959 18 ' 505 13,228 - - 44,978 185,8D4 132,751 - - - 23 "
24 No adjusted gross income . . . . . . . . . . . . . . 3,906 36,472 7,075 - -(2) (2) (2) - - 3,733 320,809 7,913 - - 24 z
25 Under $1,000 . . . . . . . . . . . . . . . . . . . . . .. 31,939 19,653 63,747 - 572 323 1,252 - - 3,689 2,163 6,368 - - 25
26 $1 000 under $2,000 . . . . . . . . . . . . . . . . 45,414 66,834 100,081 - - 1,239 1,986 4,155 - - 12,019 17,647 27,353 - - 26
27 $2:000 under $3,000 . . . . . . . . . . . . . . . . . . . 31,730 79,409 91,561 417 - 703 1,911 1,969 - - 11,929 28,897 35,365 - - 27
28 $3 000 under $4,000 . . . . . . . . . . . . . . . . ... 20,337 70,982 72,548 - - 840 3,075 3,770 - - 6,371 21,582 21,033 - - 28
29 $4 000 under $5,000 . . . . . . . . . . . . . . . . 10 060 44,456 42,960 14718,028 20,225 - - 29
2~ (2) (2) 371 1,763 1,541 8,296 . 14,49430 $5,000 or more . . . . . . . . . . . . . . . . . . . . . .
: I - - 30
31 Returns under $5,000 . . . . . . . . . . . . . . . 323,520 1917 716 _736,561 193,751 38,137 7,085 119:22 6 3,3101 667 100,442 1286 3891 233,797 69 13,947 311 '7791 7
187,248 1,260 660 432,620 631,160 127,416 11,225 47, 62,729 374,452 5,277 2
32 Returns $5,000 under $10,000 . . . . . . . : . . .. 38 26:11'24 428 9,641 110,332 765 108 2 3
33 Returns $10,000 or more . . . . . . . . . . . . . . . . . 41,996 713,561 96,337 518,864 . ._ 141,206 9,315 127,723 20,247 92,719 21,181 28,215 494,480 63,211 361,485 100,831. 33
Arkansas California Colorado
309,957 11,374,342 675,232 605,342 136,529 3,432,721 125,962,030 7,622,007 14,508,402 3,407,579 363,550 12,397,012 816,054 1,269,526 2 13 11 Grand total . . . . . . . . . . . . . . . . . . . . . . .
3 ' 55
02 Taxable returns, total . . . . . . . . . . . . . . . . . . 199,430 1,196,171 412,567 605,087 136,5 9 2,961,480 24,979,376 6,404,155 _14,492 .230 3,407,579 299 959 2,269,677 643,431 1 269 .269 287,133 29 9 5
9
- - - - - - - - - - - - - 3 U23 Under $1,000 . . . . . . . . . . . . . . . . . . . . . . . . .. - 9 5,004 3,550 7824 000 under 2,000 . . . . . . . . . . . . . . . . . . . 6,461 11,004 7,752 2,081 415 24,290 41,457 29,149 6,976 1,393 2,959
5 $2,000 under $3,ODO . . . . . . . . . . . . . . . . . . . 26,303 65,794 42,405 15,217 3,034 110,997 284,616 175,340 65,465 12,949 15,400 39,076 25,445 8,245 1 651 5
33,602 119,590 66,952 36,887 7,343 187,031 664,323 344,043 204,748 40,641 30,184 105,732 57,200 33,549 6 :691 6 Q
6 $3,000 under $4,000 . . . . . . . . . . . . . . . . . .. 77,743 59,108 11,557 737,947 171,029 81,962 63,413 12,562 289,524 1,316,337 596,270 486,160 96,190 r36,027 162,56 3
7 $4 ODO under $5,000 . . . . . .. 110,168 21,981 8
8 $5 000 under $6,000 . . . . . . . 31,662 174,596 68,823 78,380 15,653 412,394 2,275,471 920,266 925,705 183, irn 44,874 246,001 96,137
: 000 under $7,000 . . 18,982 1 42,199 63,973 12,706 432,417 2,810,433 978,313 1,313,958 261,811 43,631 283,876 101,057 131,420 26 303 9
9 $6 . . . 22,690 :676 10 CD1 151,833 Cn
$7 000 under $8,000 . . . . . . . 12,670 94,499 28,244 52,375 10,564 366,148 2,742,088 834,795 1,422,730 286 126 36,666 274,919 78,793 300 55,151 117,536 23,902 11 to11 $8 000 under $9, ODO . . . . . . . . . . . . 8,608 73,098 21,677 39,799 8,095 300,991 2,554,823 682,764
1,440,630 292,842 24,015 203,777
12 $9:000 under $10,000 . . . . . . . . . . . 7,497 70,737 17,054 42,2.30 8,686 211,164 2,002,351 472,440 1,194,. 335 245,285 19,891 189,381 44,320 115,266 23,715 12
13 $10,000 under $15,000 . . . . . . . . . . . . . . . .. 9,508 1.13,065 21,184 75,715 16,047 446,525 5,248,506 960,697 3,482,572 737,050 32,460 380,129 71,196 253,492 53,566 13
14 $15,000 under $20,000 . . . . . . 2,768 47,130 6,188 35,356 8,161 83,498 1,424,951 184,902 1,045,776 239,911 6,056 103,199 14,174 74,207 16,931 14
15 $20,000 under $25,000 . . . . . . . 1,120 25,096 2,589 20,040 5,113 35,272 781,098 81,200 596,372 148,351 2,739 60,750 6,657 45,968 11,395 15
16 $25,000 under $50,ODO . . . . . . . . . . . . .. .. 1,873 62,573 4,490 50,489 15,391 46,423, 1,544,287 109,897 1,241,184 376,134 4,115 139,923 9,836 106,943 31,744 1 6
. . . 938 11,906 779,168 27,475 649,743 269,430 812 51,737 1,870 41,926 16,947 17
17 $50,000 under $100,000 . . . . . . . . . . .. 377 24,455 929 19,470 7,
18 $100,000 under $150,000 . . . . . . . . . .. 35 4,015 78 3,430 1,667 1,876 225 , 379 4,223 185,783 91,303 78 9,772 176 7,888 3,885 IS. .. 1,317 674 475 81 103 1,115 64,487 33,708 26 4,522 66 3,431 1,801 19
19 $150 000 under $200,000 . .. 9 1,613 22 49 4,647 2,627 2020 t200:OOO under $500,000 . . . 7 1,867 17 1,610 815
475 134, 970 1,101 108,453 58,520 .21 5,9451,910 1,136 21
21 $500,000 under $1,000,000 . . . . . . . . . . . .. - - - - - 6141,162 136 33,607 18,964 4 2,362 10
2222 $1,000,000 .or mom . . . . . . . . . . . . . . . . . . . . 1 3,320 2 3,305 1,665 13 26,853 29 23,546 1 13,094 1 1,0091 1 950 46 9
23 Nontaxable returns, total . . . . . . . . . . . . . . . 110,527 1188,171 262,665 255 - 1 471,241 '982 .654 1,217,852 16,172 63,591 1127,335 172 623 257 ------ 7- 23
24 No adjusted gross income . . . . . . . . . . . . . . 3,481 36 , 408 6 133 - - 24,425 3187,362 50,702 - 5,176 314,008 11,315 - - 24
25 Under $1,000 . . . . . . . . . . . . . . . . . . . . . . . . . . 27,737 17,442 51:691 - - 57,132 36,399 106,286 9,972 6,40619,540 - 25
26 $1,000 under $2,000 . . . . . . . . . . . . . . . . 40,981 60,421 83,831 100 - 121,945 181,534 243,623 - 16,474 24,576 33,366 - - 26
22,973 56,324 65,790 - - 107,795 269,970 274,603 2,536 9,686 24,072 26,315 82 - 27
27 $2 , 000 under $3,000 . . .. 258,554 8,038 15,108 51,338 51,951 161 - 2828 $3,000 under $4,ODO . . . . . . . 9,722 33,296 33,373 155 - 86,578 300,154
29 $4,000 under $5,000 . . . . . . . . . . . . . . . . . . . 4,413 19 861 17,234 - - 41,071 182,580 151,513 1,893 5 582 24 854 23,752 14 - 29
30 21 (2) - 32 .295 199~379 132,571 3,7052' 2) 1) -
$5,000 or more . . . . . . . . . . . . . . . . . . . . . .. (1)
31 Returns under $5,000 . . . . . . . . . . . . . . . . . : 8 457,123 23,354 1,01:18 13 090,008 2,230,083 775,816 151,173 146,568 142~:, 3 177 161,941 20,051 3 -353 117,853 '1 32
32 Returns $5,000 under $10,000 . . . . 80,606 542,456 182,551 276,757 55,704 1, 2 :569,245 4,018,767 6,300,272 1,269,941 170,600 1,20~ 3 .1,572 626,223 126, 57~,
276 57 1 1,373,157 1 7,432 ~314 1 986 46 382 761.278 12~~54~1362 1 3333 Returns $10,000 or more . . . . . . . . . . . . : : . . . 15,73 283,533 35,558 2,10'7732 57,471 6
Footnotes at end of table . See text for "Description of Sample" and -'Explanation of Classification. and Terms ."
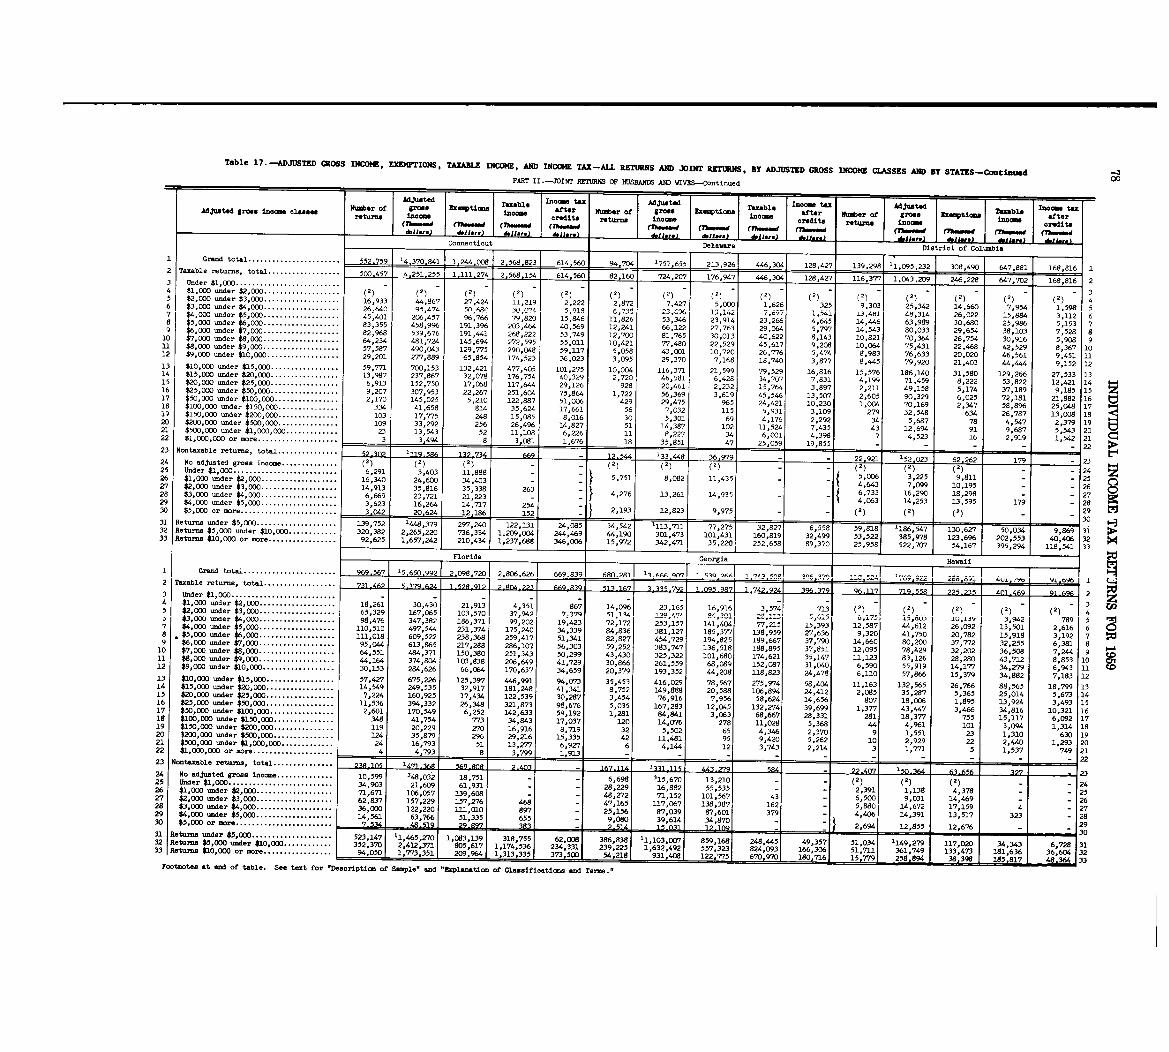
Table 17-ADJUSTED GROSS INCOME, ExEmPTIONs, TAxABLE INCOME, AxD INCOME TAx-ALL RETURNS AND joINT RETURNS, BY ADJUSTED GROSS INCOME CLASSES AND BY sTATES-Contirmsed00PART II .-JOINT RETURNS OF RUSBANW AND WIVES-Continue d
Adjusted come Adjusted Income tax justed Income taxgroan Examptions Number of gross Exemptions Taxabl TamableAdjusted gross income classes Number
of I I Tr=- In afts:sm =114 after Number of gross Examptions income aft r
returns income credits returns income credits returns income credits(Fhsse-ed (fas-sed (7h-mmed (Thavemed (Th--W (Th--d (Theseed (Thmsed (Th-sand (Theassad (Theessed (These"dd.11at .) d.11 ... I d,11-) d.11... dell.. . J d.JJ .. ) )_ __JkLAAtmL_Connecticut Delaware District of Columbia
1 Grand total . . . . . . . . . . . . . . . . . . . . . . . 552,759 2~568 823 1757,655 446,304 128,427 139,298 11,095,232 8,490 647,881 168,816 12 Taxable returns, total . . . . . . . . . . . . . . . . . . 500,457 4,251,255 1,111,274 2,568,154 614,560 82,160 724,207 176,947 446,304 128,427 116,377 1,043,209 246,228 647,702 168,816 23 Under $1,000 . . . . . . . . . . . . . . . . . . . . . . . . . .
434 $1 000 under $2,000 . . . . . . . . . . . . . . . . . : . (2) (2) (2) (2) (2) (2) (2) (2) (2) (2) (2) (2) (2) (2) (2)5 $2,000 under $3,000 . . . . . . . . . . . . . . . . . . 16,933 44,867 27,424 11,219 2,222 2,972 7,427 5,000 1,626 325 9,303 25,342 14,660 7,954 1,598 56 $3,000 under $4,000 . . . . . . . . . . . . . . . . . . . 26,640 95~474 5(),680 30,074 5,918 6,738 23,r96 13,142 7,697 1,541 1-4 .481 48,314 26,022 15,884 3,112 67 *4,000 under $5,000 . . . . . . . . . . . . . . . . . . . 45,401 206,457 96 766 820 15,846 11,826 53,346 23,914 23,266 4,645 14,446 63,999 30,680 25,986 5,153 7a $5,000 under $6,000 . . . . . . . . . . . . . . . . . . . 83,355 458,996 191 :396 20739 :464 40,569 12,241 66,122 27,763 29,064 5,797 14,543 80,033 29,654 38,103 7,528 89 $6,000 under $7,DOO . . . . . . . . . . . . . . . . . . . 82,968 539,676 191 "1 268,222 53,749 12,70C 81,765 30,013 40,622 8,143 10,821 70,364 26,754 30,916 5,908 910 $7,000 under $8,000 . . . . . . . . . . . . . . . . . . . 64,234 481,724 145,694 272,595 55,011 10,421 77,480 22,529 45,617 9,208 10,064 75,431 22,468 42,529 8,367 1011 $8, 000 under $9,000 . . . . . . . . . . . . . . . . . . . 57,587 490,043 129,775 . 290,W 59,117 5,058 43,001 10,720 26,776 5,474 8,983 76,633 20,020 46,561 9,451 1112 $9,000 under $10,000 . . . . . . . . . . . . . . . . .. 29,201 277,889 65,854 174,523 36,023 3,095 29,370 7,168 18,740 3,877 8,"5 79,920 21,403 44,444 9,152 1213 $10,000 under $15,000 . . . . . . . . . . . . . . . . . 59,771 700,153 132,421 477,405 101,275 10,004 116,371 21,599 79,529 16,816 15,576 186,140 31,590 129,266 27,533 1314 $15,0GO under $20,000 . . . . . . . . . . . . . . . . . 13,987 237,867 32,078 176,754 40,329 2,720 46,581 6,428 34,707 7,831 4,199 71,459 8,222 53,822 12 421 14:15 $20,000 under $25,000 . . . . . . . . . . . . . . . . . 6,913 152,750 17,068 117,644 29,126 928 20,461 2,232 15,764 3,897 2,211 49,158 5,174 37,189 9:185 1516 $25,000 under $50,000 . . . . . . . . . . . . . . . . . 9,207 307,953 22,267 251,604 75,864 1,722 56,369 3,619 45,546 13,507 2,605 90,329 6,025 72,181 21 882 1617 $50,000 under $100,000 . . . . . . . . . . . . . . . . 2,170 145,025 5,210 122,887 51,006 429 29,475 965 24,421 10,230 1,004 70,169 2,347 58,896 25 :048 17 b.-418 $100,000 under $150,000 . . . . . . . . . . . . . . . 334 41,658 814 35,624 17,661 56 7,032 115 5,931 3,109 279 32,548 634 26,787 13
'008is19 $150,000 under $200,000 . . . . . . . . . . . . . . . 103 17,775 248 15,085 8,016 30 5,301 69 4,176 2,292 34 5,687 78 4,547 2 379 1920 $200,000 under $500,000 . . . . . . . . . . . . . . . 109 33,292 256 26,496 14,827 51 14,387 102 11,524 7,435 43 12,694 91 9,687 5:543 20 tv21 $500,000 under $1,000,000 . . . . . . . . . . . . . 23 13,543 52 11,108 6,226 11 8,227 34 6,001 4,398 7 4,523 16 2,919 1,542 21 (_~22 $1,000,000 or mom . . . . . . . . . . . . . . . . . . . . 3 3,494 8 1,676 18 35,851 47 25,059 19,855 - - - - - 2223 Nontaxable returns, total . . . . . . . . . . . . . . . 52 302 1119J86 132,734 669 12,544 133,448 36 .(Y79 22,921 152 023 62 262 179 - 2324 No adjusted gross income . . . . . . . . . . . . . . (2) (2) (2) - (2) (2) (2) (2)
P) (2) - - 2425 Under $1,000 . . . . . . . . . . . . . . . . . . . . . . . . . . 6,291 3,40311,888 5,751 8,082 11,435 5,006 3,225 9,811 - - 2526 $1,000 under $2,000 . . . . . . . . . . . . . . . . . . . 16,340 24,600 34,403 - 4 643 7 099 10 195 - - 2627 $2,000 under $3,000 . . . . . . . . . . . . . . . . . . . 14,913 35,816 35,338 263
4,276 13,261 14,935 6:733 16:29C 18:298 - - 2728 $3,000 under $4,000 . . . . . . . . . . . . . . . . . . . 6,669 23,721 21,223 -4,063 14,253 13,595 179 - 2829 $4,000 under $5,000 . . . . . . . . . . . . . . . . . . . 3,623 16,264 14 .717 254
2,193 . 12,823 . 9,975. - (2) (2) (2 2930 $5,000 or mom . . . . . . . . . . . . . . . . . . . . . . . . 3-042 ;~n_624 12 186 15231 Returns under $5,000 . . . . . . . . . . . . . . . .. 13 :7.52 297,240 122,131 24, 5 In 32,827 558 59 1 1 '. 50,034- '116 '7 1.1:,627 9 869 3i ~P-Returns $5,000 under $10,000 . . . . . . . .. 9 144":379 244,469 44,190 1:4 40:406 3 >432 : : : 320 2 2,265 220 736,334 1 .209,004 3 .1 73 101 31 160,819 362 53 522'l 77:4 22751 499 385:978 202,55333 Returns $10,000 or mom . . . . . . . . . . . . . .
. .
. 92,625 1,657,242 210,434 1,237,688 346,006 15,972 342,471 35,2201 252,658 89,370 25,958 522,707 54,167 395,294 118,541 33
Florida Georgia Havai i1 Grand total . . . . . . . . . . . . . . . . . . . . . . . 969,5671 15~650,9921 2,098, 201 2 .806 .6 ;161 669 839 - - 1 'FA on7 I ~1. I'll 1 11.1 1:- --- ---2 Tax:dl I;,t7, total . . . . . . . . . . . . . . . . . . 73104A~ -.624 152A 91 ;~ __2,&y,2U 669 839 3.335~79;1 1,095,987 96,117 719,558 225,235 401-469 91-696 2
3000 under $2,000 . . . . . . . . . . . . . . . . . 0 21,913 4,351 867 14,0% 23,165 16,916 74 713 (2) (2)4
4 18,261 30 43 3,5 (2) (2) (2)5 000 under $3,000 . . . . . . . . . . . . . . . . . . . 65,329 167:065 103,570 37,942 7 :379 91,114I 8v'.,301 28,113 5,615 6,175 - lu,1_19 3,942 789 5$4 :000 d :r $5:000 . . . . . . . . . . . . . . . . . 'I.lG :15 $3 000 und $4 000 . . . . . . . . . . . . . . . . . 191 76 347,382 186,171 99,202 19,423 72 172 253,157 141,404 77,215 15,393 12,587 44 :612 26,092 1.3,501 2 616 67 r 497,5" 231,374 175,240 34,339 84 :836 381,127 185,377 138,959 27,636 9,320 41,750 20,782 15,918 3:192 78 $5,000 under $6,000 . . .. 111:018 609,522 238,368 259,417 51,341 82,827 454,729 194,825 189,667 37,790 14,660 80,200 37,772 32,255 6,381 89 $6,000 under $7,000 . . .. 95 044 613,865 217,288 286,107 56,303 59,252 383,747 136,518 188,895 37,851 12,095 78,429 32,202 36,508 7,2" 910 $7,000 under $8,000 . . . . . . . . . . . . . . . . . . . 64,551 494,371 150,380 251,343 50,299 43,430 325,322 101,680 174,621 35,147 11,123 83,126 28,280 43,712 8,853 1011 $8,000 under $9,000 . . . . . . . . . . . . . . . . . . . ",164 374,804 103,838 206,649 41,729 30,866 261,559 68,089 152,087 31,040 6,590 55,919 14,177 34,279 6,943 1112 $9,000 under $10,000 . . . . . . . . . . . . . . . . . . 30,153 284,626 66,064 170,637 34,659 20,379 193,352 ", 208 118,823 24,478 6,110 57,966 15,379 34,882 7,183 1213 0,000 under $15,000 . . . . . . . . . . . . . . . . . 57,427 675,226 125,397 446,991 94,073 35,453 416,029 78,567 275,974 58,404 11,163 132 565 26,766 88,565 18,799 1314 15,000 under $20,000 . . . . . . . . . . . . . . . . . 14,549 249,535 32,917 181,248 41,341 8,752 149,888 20,588 106,894 24,412 2,085 35:287 5,365 25,014 5,673 1415 000 under $25,000 . . . . . . . . . . . . . . . . . 7,224 160,925 17,434 122,539 30,287 3,454 76,916 7,956 58,624 14,656 807 18,006 1,895 13,924 3,493 1516 5,000 under $50,000 . . . . . . . . . . . . . . . . . 11,536 394,332 26,348 321,873 98,676 5,035 167,283 12,045 132,274 39,699 1,377 43,447 3,466 34,816 10,321 1617 50,000 under $100,000 . . . . . . . . . . . . . . . . 2,601 170,549 6,252 142,633 59,192 1,281 84,841 3,063 68,667 28,331 281 18,377 755 15,117 6,092 17IS $100,000 under $150,000 . . . . . . . . . . . . . . . 348 41,754 773 34,843 17,037 120 14,076 278 11,028 5 368 4,%l 101 3,094 1,314 1819 $150,000 under $200,000 . . . . . . . . . . . . . . . 119 20,229 270 16,916 8,719 32 5,502 65 4,346 2:370 9 1,551 23 1,310 630 1920 $200,000 under $500,000 . . . . . . . . . . . . . . . 124 35,879 2% 29,216 15,335 42 11.481 95 9,420 5,262 10 2,929 22 2,440 1,293 2021 $500,000 under $1,000,000 . . . . . . . . . . . . . 24 16,793 51 13,277 6,927 6 4,144 12 3,743 2,214 3 1,771 5 1,537 749 2122 $1,-,- or mom . . . . . . . . . . . . . . . . . . . . 4 4,793 8 . 3,799 1,913, - -12223 Nontaxable returns, total . . . . . . . . . . . . . . . 239 1Q5 1471,368 569 AnA ;1_4n1 167,114 1331A15 "3 .279 584 22 .4(Y7
_15""_Al A~ 127 2324 No adjusted gross income . . . . . . . . . . . . . . 10,599 348,03~ 18,751 - 6,698 315,670 13,210 - (2) (2) (2)
- - 2425 Under $1,000 . . . . . . . . . . . . . . . . . . . . . . . . . . 34,903 21,609 61,931 - 28,229 16,882 55,535 - 2,391 1,138 4,378 - 2526 $1,000 under $2,000 . . . . . . . . . . . . . . . . . . . 71,671 106,057 3.39,608 - - 48,272 71,152 101,567 43 6,500 9,031 14,469 - - 2627 $2,000 under $3,000 . . . . . . . . . . . . . . . . . . . 62,837 157,229 157,276 468 - 47,165 117,067 138,387 162 5,880 14,672 17,159 4 - 2728 $3,000 under $4,000 . . . . . . . . . . . . . . . . . .. 36,000 122,220 111,010 897 - 25,156 87,039 87,601 379 4,4066 14,391 13,517 323 - 2829 $4 000 under $5,000. . . . . . . . . . . . . . . . . . . 14,561 63,766 51,335 655 - 9,080 39,614 34,870 -94 2930 $5:000 or more . . . . . . . . . . . . . . . . . . . . . . 7 69,212 - 12-031 1 102 2,694 12,855 12,6760; .5.B . 2-51~1 2' 3031 Returns under $5pOOO . . . . . . . . . . . . . . . . . . 52 1471 11:465 2701 1,0853 :611379 3 :,75 62 C 316 :2131 03 7 159 1 241 51,034 1149 279 7 3 28 3132_, ~~2" :"39 2,
1 1 7:1 ' 1 ' 0 6 X32 Returns $5,000 under $10,000 . . . . . . . . . . 74 36 234 T31 2 1 :6 2 :4 2 5 51,73.1 361 749 :473 36, 32
370 2 412 :371 80 J,l 1 ': ' 1313 ~81:6
.~h3j 577
133 Returns $10,000 or mom . . . . . . . . . . . . . . . . '050 1,773,351 20 373,5 12
1, 779258.8% 1 33
Footnotes at end of table . See text for "Description of Sample" and "Explanation of Classifications and Terms
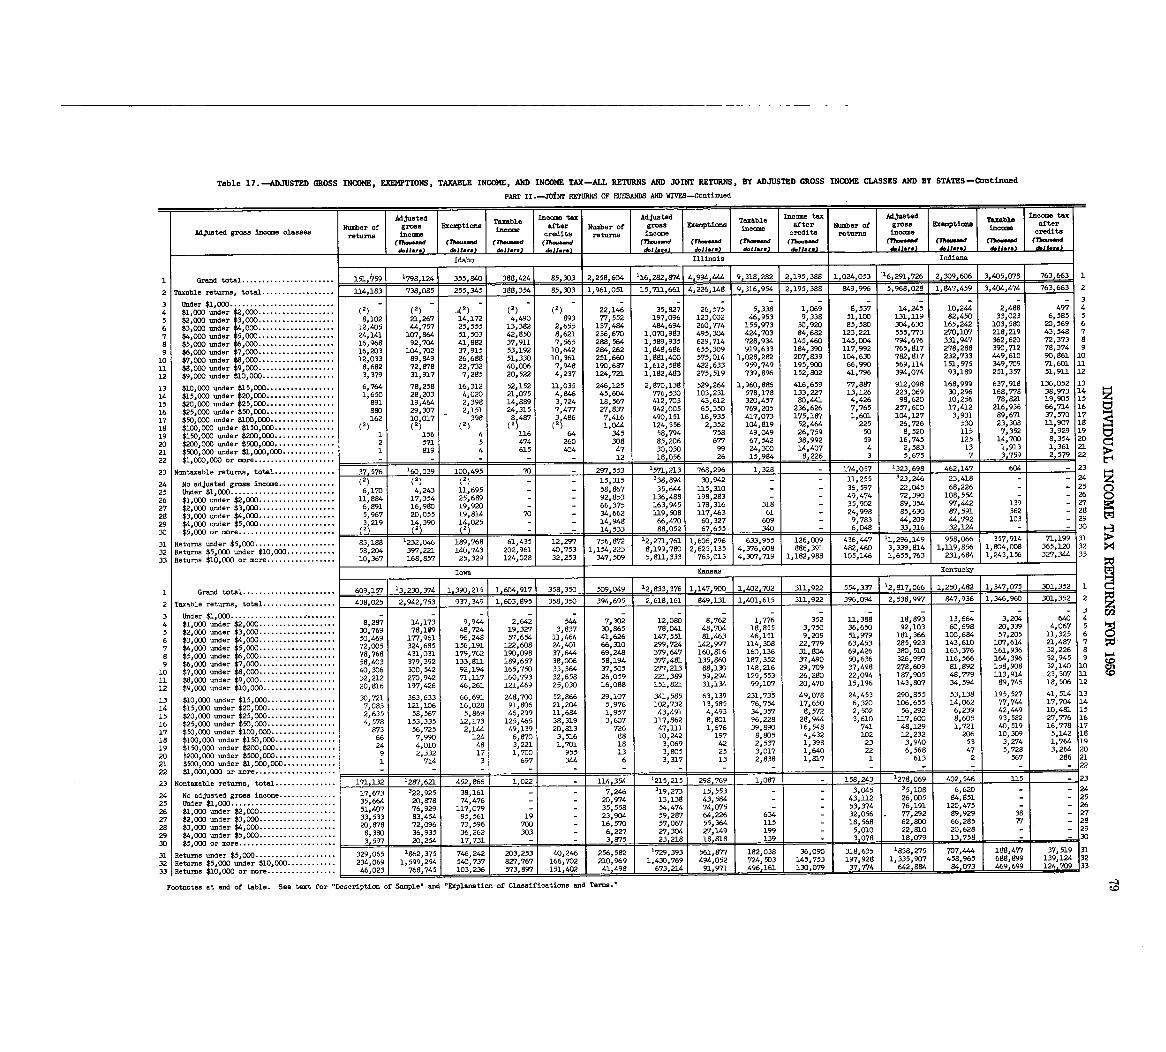
Table 17-ADJUSTED GROSS INCOME, EXEMPTIONS, TAXABLE INCOME, AND INCOME TAX-ALL RETURNS AND JOINT RETURNS, BY ADJUSTED GROSS INCOME CLASSES AND BY STATES-Continued
PART II .-J()JNr RETURNS OF HUSBANDS AND WIM-Contintied
Adjusted Taxable Inacme Adjusted Taxable Income t Adjusted Taxable Income
Number of gross Exemptions after Number of gross Exemptions after Number Of gross Exempticna afterAdjusted gross income classes returns income income credits returns income income credits returns income income credits
(7?-sand (Thousand (7h--d (Thousand (rhousand (7h-..-d (Th-mad (7haaaaaw (7h--d (Th-W (711--d
dollar.) dollar.) dollars) dollar.) d.11 . .. dollar,) doll . .L_ dollar .) doll. .. J dJl. .. ) dollar,)Idaho Illinois Indiana
1 Grand total . . . . . . . . . . . . . . . . . . . . . . . 151, ~59 1798,124 355,840 388,424 85,303 2,258,604 116.282,874 41994,444 9,318,282 2,195,388 1,024,053 *16,291,726 2,309,606 3,405,078 763 663 1
2 Taxable returns, total . . . . . . . . . . . . . . . . . . 114,183 738,085 255,34F 388,354 85,303 1,961,051 15,711,661 4,226,148 9,316,954 2,195,388 849,996 5,968,028 1,847,459 3,404,474 763,663 2
3 Under $1,000 . . . . . . . . . . . . . . . . . . . . . . . . .. - - - - - - - - - - - - - -3
4 1 000 under $2,000 . . . . . . . . . . . . . . . . . . . -41) (1) 22,146 35,927 26,575 5,338 1,069 8,537 14,245 10,2" 2,488 497 4
5 $2,000 under 3,000 . . . . . . . . . . . . . . . . . . . 8,102 21,267 14,172 4,490 893 77,552 197,096 123,002 46,953 9,338 51,100 131,119 82,450 33,023 6,585 5
6 $3,000 under $4,000 . . . 12,405 44,757 25,555 13,382 2,655 137,484 484,694 260,774 155,973 30,920 85,580 304,630 165,242 103,580 20,569 6
7 $4,000 under $5,000 . . . 24,141 107,864 51,503 42,850 8,621 236,6M 1,070,983 495,304 424,703 84,682 123,221 555,773 270,107 2,18,219 43,548 7
8 $5,000 under $6,000 . . . 16,968 92,704 41,882 37,911 7,565 288,564 1,589,935 629,714 728,934 145,460 145,004 794,676 331,947 362,620 72,373 8
9 $6,000 under $7,000 . . . 16,203 104,702 37,915 53,192 10,642 284,262 1,848,686 655,309 919,633 184,390 117,992 765,817 278,288 390,712 78,374 9
10 $7,000 under $8,000 . . . . . . . . . . . . . . . . . . . 12,033 89,849 26,688 51,330 10,361 251,660 1,881,400 575,014 1,028,282 207,839 104,630 782,817 232,733 "9,610 90,861 10
11 $8 000 under $9,000 . . . . . . . . . . . . . . . . . . . 8,682 72,878 22,732 40,006 7,948 190,687 1,612,588 422,633 959,749 195,900 66,990 569,114 151,575 349,709 71,601 11
12 $9 :000 under $10,000 . . . . . . . . . . . . . . . . . . 3,379 31,917 7,285 20,522 4,237 124,721 1,182,483 275,519 739,896 152,802 41,796 394,074 93,189 251,357 51,911 12
13 $10,000 under $15,000 . . . . . . . . . . . . . . . . . 6,764 78,258 16,312 52,152 3.1,035 246,125 2,870,138 529,264 1,960,886 416,659 77,887 912,098 168,999 637,918 136,052 1 3
14 $15,000 under $20,000 . . . . . . . . . . . . . . . . . 1,650 28,?03 4,020 21,075 4,946 45,604 776,530 103,231 578,178 133,227 13 1 126 223,069 30,296 168,778 38 973 14 1-4
15 $20,000 under $25,000 . . . . . . . . . . . . . . . . . 891 19,464 2,398 14,889 3,724 18,567 412, M3 43,612 320,457 80, "1 41426 98,620 10,256 78,821 19 :905 15 z
16 $25,000 under $50,000 . . . . . . . . . . . . . . . . 88D 29,307 2,151 24,315 7,477 27,837 942,005 65,350 769,205 236,626 7,765 257,600 17,412 216,936 66,714 1 6
17 $50,000 under $100,000 . . . . . . . . . . . . 162 10,017 398 8 487 3,496 7,416 490,151 16,935 417,073 173,187 1,601 104,127 3,931 89,671 37,570 1 7
18 $100,000 under $150,000 . . . . . . . . . . . (2) (2) (2) (2 2) 1, 0" 124,356 2,352 104,819 52,464 225 26,726 530 23,308 11,907 18 IZ3
19 $150,000 under $200,000 . . . . . . . . . . . . . . . 1 156 4 116 64 345 58,794 758 49,049 26,759 50 8,520 115 7,352 3,929 19 tj20 $200,000 under $500,000, . . . . . . . . . . . . . . 2 571 5 474 260 308 85,206 677 67,542 38,992 59 16,745 125 14,700 8,354 20 -4
21 $500,000 under $1,000,000 . . . . . . . . . . . . . 1 819 4 615 404 47 30,030 99 24,300 14,407 4 2,583 13 1,913 1,361 21
22 $1,000,000 or more . . . . . . . . . . . . . . . . . . .. - - - - 12 18,056 26 15,984 8,226 3 5,675 7 3,759 2,579 22-M- -
E762 623 Nontaxable returns, total . . . . . . . . . . . . . . . 37,576 160,039 100,495 70 ..... 297,553 1571,213 768 296 1,328 174,057 1323,698 462,147 604 _7 23
24 No adjusted gross income . . . . . . . . . . . . . .(2) (2) (2) - 15,315 338,894 30,942 - - 1-1,255 123,246 23,418 - - 24
25 Under $1,000 . . . . . . . . . . . . . . . . . . . . . . . . . . 6,IM 4,243 11,695 - 58,867 35,6" 115~,310 - 36,597 22,045 68,226 - 251 - - 49,474 72,390 108,554 - - 2626 $1,000 under $2,000 . . . . . . . . . . . . . . . . . . . 11,884 17,354 25,689 - 92,853 136,488 198,283
'
9
27 $2 000 under $3,000 . . . . . . . . . . . . . . . . . . . 6,891 16,980 19,920 - 66,375 163,945 178,316 318 - 35,902 89,354 97, "2 139 - 27
28 $3 :000 under $4,000 . . . . . . . . . . . . . . . . . . . 5,967 20,055 19,814 M 34,662 119,508 117,463 61 - 24,998 85,630 87,591 362 - 28
29 $4,000 under $5,000 . . . . . . . . . . . . . . . . . . . 31219 14 390 14,025 14,948 66,470 60,327 609 - 9,783 ", 209 44,792 103 - 29
30 $5,000 or more . . . . . . . . . . . . . . . . . . . . . . . . (2) 1 (21) (2) 1 14,533 88,052 67 655 340 1 - 6,048 33,316 1 _32 1_24 - - 30
232,046 189 768 61,435 12,297 756,872 12,271,761 1,606,296 633 955 126 009436 1
~:296,149 958 0 6 357 91499 3131 Returns under $5,000 . . . . . . . . . . . . . . . . . . 13, 8 8", 1.
140:74 376:608 886:391 412:,"1670 3 339 .41,.9
: 856.:008 165
:11. 3232 Returns $5,000 under $10,000 . . . . . . . . . 2 397 221 3 202,961 40,753 1,154,223 8,199,780 2,625,135 4
33 Returns $10,000 or more . . . . . . . . . . . . . . 10,367 168: 57 25 , 329 124,028 1 32,253 347,509 5,81.1,333 763,013 4:307,719 1,182,988 105,146 1,655,763 231,684 1 , 243,156 327,344 33
Iowa Kansas Kentuc]W
1 Grand total . . . . . . . . . . . . . . . . . . . . . . . 609,157 13,230,374 1 .390,215 1,604,917 358,350 509,049 12,833,376 1,147,900 1,402,702 311,922 554,337 12,817,066 1 .250,482 1,347,075 1
2 Taxable returns, total . . . . . . . . . . . . . . . . . . 438,025 2,942,753 937,349 1,603,895 358,350 394,695 2,618,161 849,131 1,401,615 311,922 3%,094 2,538,997 847,936 1,346,960 301,352 2z
3 Under $1,000 . . . . . . . . . . . . . . . . . . . . . . . . .. - - - - - - - - - - - - - - - 3 C02
4 $1,000 under $2,000 . . . . . . . . . . . . . . . . . .. 8,287 14,173 9,944 2,642 544 7,302 12,080 8,762 1,776 352 11,388 18,893 13,664 3,204 640 4
5 $2,000 under $3,000 . . . . . . . . . . . . . . . . . .. 30,769 78,189 48,724 19,327 3,837 30,865 78,041 48,704 18,855 3,750 36,650 92,103 60,698 20,339 4,067 5
6 $3,000 under $4,000 . . . . . . . . . . . . . . . . . . . 50,469 177,961 %,248 57,654 11,464 41,626 147,551 81,463 46,151 9,209 51,979 181,366 100,684 57,205 11 325 6
7 $4,000 under $5,000 . . . . . . . . . . . . . . . . . . . 72,005 324,685 156,191 122,608 24,401 66,310 299,724 142,997 114,308 22,779 63,453 285,923 143,610 107,614 21 :487 7
8 $5,000 under $6,000 . . . . . . . . . . . . . . . . . . . 78,768 431,031 179,762 190,098 37,644 69,248 379,647 160,816 160,136 31,804 69,426 380,510 163,376 161,936 32,226 8
9 $6,000 under $7,000 . . . . . . . . . . . . . . . . . . . 58,403 379,392 133,811 189,657 38,006 58,194 377,481 135,860 187,352 37,490 50,636 326,997 116,566 164,39632,945 9
10 $7,000 under $8,000 . . . . . . . . . . . . . . . . . . . 40,306 300,542 92,194 165,750 33,364 37,505 277,213 88,130 148,216 29,709 37,498 278,609 81,892 1DS,908 32 140 10
11 $8,000 under $9,000 . . . . . . . . . . . . . . . . . . . 32,212 2M,942 71,117 160,793 32,658 26,059 221,389 59,294 129,553 26,280 22,094 187,905 48,779 113,914 23:307 11 to
12 $9,000 under $10,000 . . . . . . . . . . . . . . . . . . 20,816 197,426 46,261 121,469 25,030 16,088 151,821 31,134 99,107 20,470 15,196 143,807 34,594 89,745 18,506 12
13 $10,000 under $15,000 . . . . . . . . . . . . . . . . . 30,721 363,633 66,691 248,700 52,866 29,107 341,585 63,139 231,73~ 49,078 24,453 290,855 53,138 195,527 41,514 13
14 $15,000 under $20,000 . . . . . . . . . . . . . . . . . 7,083 121,106 16,028 91,806 21,204 5,976 102,732 13,585 76,754 17,650 6,320 106,655 14,062 77,7" 17,704 14
15 $20,000 under $25,000 . . . . . . . . . . . . . . . . . 2,635 58,567 5,869 46,299 11,684 1,957 43,491 4,493 34,357 8,572 2,502 56,292 6,239 42,449 10,481 15
16 $25,000 under $50,000 . . . . . . . . . . . . . . . . . 4,578 153,335 12,173 125,465 38,319 3,607 117,862 8,801 96,228 28,944 3,610 117,600 8,605 93,582 27,776 16
17 $50,000 under $100,000 . . . . . . . . . . . . . . . . 873 56,725 2,1" 49,139 20,813 726 47,111 1,676 39,890 16,548 741 48,129 1,721 40,519 16,778 17
18 $100,000 under $150,000 . . . . . . . . . . . . . . . 66 7,990 124 6,870 3,516 88 10,242 197 8,805 4,432 102 12,232 206 10,309 5,142 18
19 $150,000 under $200,000 . . . . . . . . . . . . . . . 24 4,010 48 3,221 1,701 18 3,069 42 2,537 1,398 23 3,940 53 3,274 1,764 19
20 $200,000 under $500,000 . . . . . . . . . . . . . . . 9 2,332 17 1,700 955 13 3,805 25 3,017 1,640 22 6,568 47 5,728 3,264 20
21 $500,000 under $1,000,000 . . . . . . . . . . . .. 1 714 3 697 344 6 3,317 13 2,838 1,817 1 613 2 567 286 21
22 $1,000,000 or mom . . . . . . . . . . . . . . . . . . .. - - - I - - - - - -22
58 24323 Nontaxable returns, total . . . . . . . . . . . . . . . 171,132 1287,621 452,866 1,022 - 114,354 1215,215 298,769 1,087 158.243 1278,069 402,546 115 _7 23
24 No adjusted gross income . . . . . . . . . . . . . . 17,673 322,925 38,161 - - 7,246 319,273 15,553 - - 3,045 35,108 6,620 - - 24
25 Under $1,000 . . . . . . . . . . . . . . . . . . . . . . . . . . 35,664 20,878 74,476 - 20,974 13,138 43,584 - E43,112 26,005 84,851 - 25
26 $1,000 under $2,000 . . . . . . . . . . . . . . . . . . . 51,407 76,929 117,079 - - 35,558 54,474 74,075 - - 53,374 76,191 120,475 - - 26
1 _ - 2827 $2,ODO under $3,000 . . . . . . . . . . . . . . . . . . . 33,533 83,454 95,561 19 23,904 59,287 64,226 634 - 32,056 77,292 89,929 38 - 27
28 $3,0D0 under $4,000 . . . . . . . . . . . . . . . . 20,878 72,096 73,596 700 16,570 57,067 55,364 115 - 18,568 62,800 66,285 77
29 $4,000 under $5,000 . . . . . . . . . . . . . . . ... 8,380 36,935 36,262 303 6,227 27,304 27,149 199 - 5,010 22,810 20,628 - - 29
30 $5,000 or more . . . . . . . . . . . . . . . . . . . . .. .. 3,597 20,254 31 - 3 . 5 23,218 18, 8 139 - 3 078 ~18.079 30
31 Returns under $5,000 . . . . . . . 32,9,0695 1162 375 746,242 203 253 40, 46 256,5 17239),3:3 1 182 038 36 090 318,635 1838,275 M7,4" 188,477 37,519 31
2.6 1,599
82 ::2. .'q N 1
"7 9 56 'Q32 Returns $5,000 under $10,00(; : : : : : : : : : :: : : 254 540 737 7 767 166 7 2 69 4 491, 52 724:503 145:753 197,928 1,335,907 458,965 688,899 139,124 32
33 Returns $10,000 or more . . . . . . . . . . . . . . . . . 103,236 573,897 151 1 6 496,161 130,079 37,774 1 642,884 84,073 1 469,699 1 124,2"933
Footnotes at end of table . See text for "Desc~iption of Sample" and "Explanation of Classifications and Terms __3ec
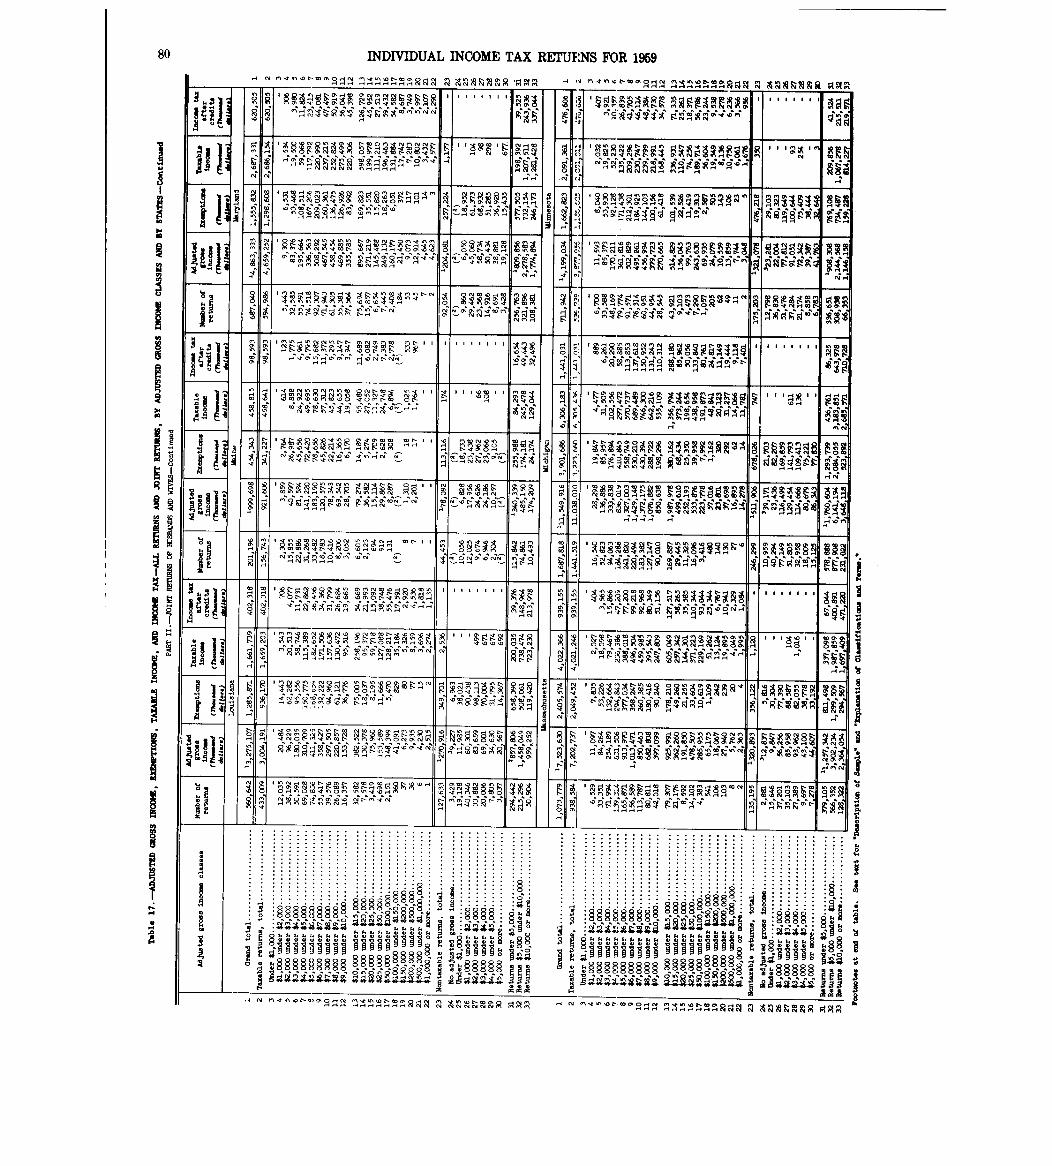
80 INDIVIDUAL INCOME TAX RETUINS FOR 1959
00 W A R ,In a' . . . . . .
. . . . . . .
10 0 0 *A tR 9 E IMR
1l; ~
, ;Q N cQ~ q
c
. . . . . . . . . ..A R H. R1 1 m R N
V, m,.o R Hli 0H
- . In In
In 0~ ZR NA 4 w w F, 'Al0 .
W-- $A ~ .ig ;s vOD
tSI
N FRI I I
~Vi .L N.
RN-W
V)-V) ~O 01` It H -4 EMU R. 9 9
p g;
U98 aHiRUJAH wm OVA k E FP c';4R A aq44
RP, R
J V, GO 14 288",H 9 R , 9 F 8,0 9 vo io E H9 *4 It, E R §411
HN H N'mm
_"W-08 "No!~ 14 N 10 N, _"t N .H U,
0 0 1'.,
iZR ll~ C17
-4-5RA-.
MN . 1"
. I . I I . . .
0 c~'19 § HA
i i 11; C; C,;,;ll~ l~! ~eiiN1 H n ~ l
RIPH Nll~ 40 .0
19mo "V N
mRg,$Al"H0,0~8 ~A@ 8 ~3 F, 9
N . 1
V, N 1pmo t
mr §§H PN" "'t 'W-MHa-M NnHHHHR' 1 ~ ZOOMc MN 1~44411~ 0 S5 w ~
AliW A'- c5~ E
4' 4MA
cz is N N 0
18~
po V,1 N w zt, INOH 0
; ~ ~ ~ ~'t MH, M
ff CN t cy iP V 0 10 lc~ cl~
AI,,orw . . I MA .,Vor-wo,N , NcVR PIPIR 11 Rml ;Q
.1 6 6 k. k. k. aq1,10, V4 4;t 3 3 39 1 1! To 0 0 t4
. . . . . . . . . . . .
6666668 . ~ 1 1 18 45? -Ezt t 11
HH i 9 .. a 3
k 88888 a
AA AAn I.4?4rmN&8 rom
PII
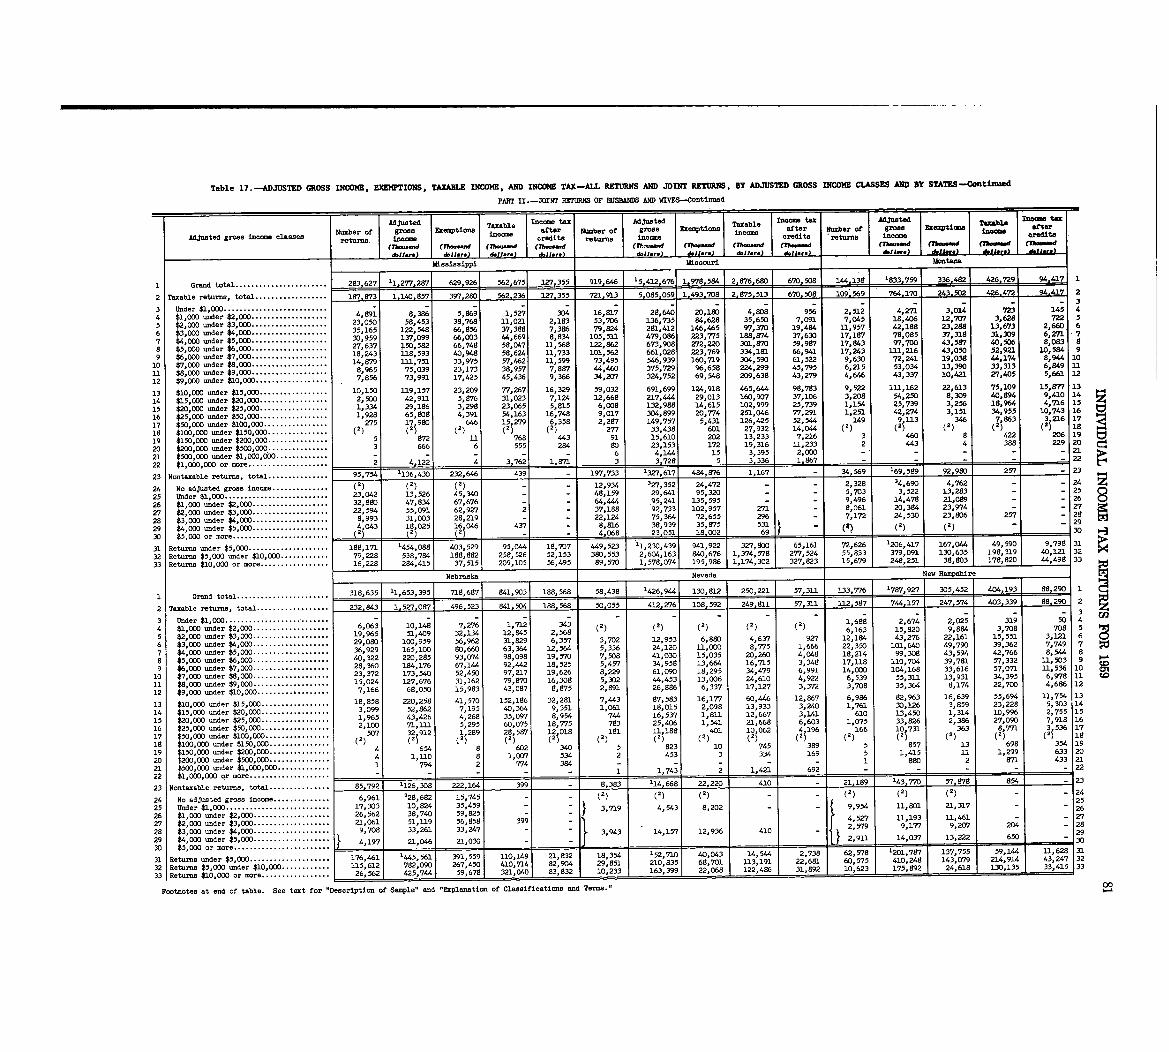
Table 17 . -ADJUSTED GROSS INCOME, EXEMPTIONS, TAXABLE INCOME, AND INCOME TAX-ALL RETURNS AND JOINT RETURN, BY ADJUSTED GROSS INCOME CLASSES AND BY STATES-Continued
PART II .-JOINT RETURNS OF HUSBANDS AND WIVES-Continued
Adjusted Taxable Income tax Adjusted Taxable income tax Adjusted IncomeNumber of gross Exemptions arts Number of gross Exemptions after Number of gross Ezemptions Taxable afte
Adjusted gross income classes income income r returns income credits , income creditsreturns. credits income returns incom
e
(Th--d (rh-w (Tho-d (71-d (n---d (7'h-.-d (Th--d (Th-...d (Thnu~d (Th-w-d (Th--dbil.r.) d.11_.) &II-) d.11 ... ) d.11 .. dllmrg)_ &JI-) I *JJ- .kMississippi Missouri Montana
.978,584I Grand total . . . . . . . . . . . . . . . . . . . . . . . 283,627 11,277,287 629,926 562,675 127,355 919,646 15 412 676 1 2,876,680 670,508 1",138 1833 .7591 336,482 426,729 1
2 Taxable returns, total . . . . . . . . . . . . . . . . . . 187,873 1,140,857 397,280 562,236 127,355 721,913 5,085,059 1,493,708 2,875,513 670.508 109.569 l7
.
243,502 426,472 94.417 2
3 Under $1,000 . . . . . . . . . . . . . . . . . . . . . . . . .. - - - - - - - - - - - - - 3
4 1 000 under $2, 000 . . . . 4 891 8,386 5,669 1,527 304 16,817 28,640 20,180 4,808 956 2,512 4,271 3,014 723 145 4
5 $2,000 under 3,000 . . .. 23:050 58,453 38,768 11,021 2,183 53,706 136,735 84,628 35,650 7,091 7,045 18,406 12,707 3,628 722 5
6 $3,000 under $4,000 . . . . . . . . . . . . . . . . . . . 35,165 122,548 66,856 37,388 7,386 79,824 281,412 146,465 97,370 19,464 11,957 42,188 23,288 13,673 2,660 6
7 $4,000 under $5,000 . . . . . . . . . . . . . . . . . . . 30,959 137,099 66,003 ", 669 8,834 105,53 .1 479,086 223,775 188,874 37,630 17,187 78,085 37,318 31,309 6,271 7
8 $5 000 under $6,000 . . . . 27 637 150 582 66 748 58 047 11,568 122,862 673,908 272,220 301,870 59,987 17,843 97,700 43,587 40,506 8,083 8
9 $6:000 under $7,000 . . . . 18,243 1-18 :593 40,1948 58:624 11, 733 101,562 661,028 223,769 334,181 66,941 17,243 111, 216 43,050 52,921 10,584 9
10 $7 000 under $8,000 . . . . . . . . . . . . . . . . . . . 14,879 111, 753. 33,975 57,462 3.1,599 73,495 546,939 160,719 304,590 61,522 9,630 72,241 19,038 ",174 8,944 10
3.1 $8:000 under $9,000 . . . . . . . . . . . . . . . . . . . 8,%5 75,039 23,173 38,957 7,887 ", 460 375,729 %,658 224,299 45,795 6,215 53,034 13,390 33,313 6,849 11
12 $9,000 under $10,000 . . . . . . . . . . . . . . . . . . 7,856 73,991 17,425 45,436 9,366 34,207 324,752 69,548 209,638 43,279 4,646 43,337 . 10,421 27,405 5,661 12
13 10,ODO under $15,000 . . . . . . . . . . . . . . . . . 10,150 119,157 23,209 77,267 16,329 59,032 691,699 124,918 465,644 98,783 9,522 111,162 22,613 75,109 15,M 13
14 5,000 under $20,000 . . . . . . . . . . . . . . . . . 2,500 42,911 5,876 31,023 7,124 12,668 217,444 29,013 160,9D7 37,106 3,208 54,250 8,309 40,8% 9,410 14
15 $20,000 under $25,000 . . . . . . . . . . . . . . . . . 1,334 29,186 3,298 23,065 5,815 6,008 132,988 14,615 102,999 25,739 1,154 25,739 3,256 18,964 4,716 15
16 $25,000 under $50,000 . . . . . . . . . . . . . . . . 1,928 65,808 4,391 54,163 16,748 9,017 304,899 20,774 251,046 77,291 1,251 42,274 3,151 34,955 10,743 16
17 $50,000 under $100,000. . . . . . . . . . . : . . . . 275 17,980 646 15 279 6 358 2,287 149,757 5,431 126,425 52,544 149 9,113 346 7 863 3,216 17(2) (2) 277 33,438 601 27,932 14,0" 18
18 $100,000 under $150,000 . . . . . . . . . . .. . . . (2) (2 2 (2) (1) (2) 21 2)
19 $150 000 under $200,000 . . . . . . . . . . . . . . . 5 872 1.1 768 "3 91 15,610 202 13,233 7,216 3 460 8 422 206 19
20 $200:000 under $500,0DO . . . . . . . . . . . . . . . 3 666 6 555 284 80 23,153 172 19,316 12,233 2 "3 4 388 229 20
21 $500,000 under $1,000,CbO . . . . . . . . . . . .. - - - - - 6 4,1" 15 3,395 2,000 - 21
22 $1,000,000 or more . . . . . . . . . . . . . . . . . . . . -1- 4,122 4 3.762 1, 8n 3 3 .728 5 3.336 1 .867 - 22
95,754 1123 Nontaxable returns, total . . . . . . . . . . . . . . . 36,430 232,646 439 - 197,733 '327,617 484,876 1,167 - 34,569 169 .589 92,980 257 2397 733l
5
9
24 No adjusted gross income . . . . . . . . . . . . . . (2) (2) (2) - - 12,934 3Z7,352 24,472 - 2,328 34,690 4,762 - 24
25 Under $1,000 . . . . . . . . . . . . . . . . . . . . . . . . . . 23,042 13,526 45,340 - 48,159 29,641 95,320 - 5,703 3,522 13,283 - 2564
'
_
26 $1 000 under $2,000 . . . . 32,880 47,834 67,676 - - 64, "4 .95,241 135,595 - - 9,496 14,478 21,089 - 2612 93
4
G6,~7, 1'827 $2 :000 under $3,000 . . . . 22,594 55,091 62,927 2 - 37,188 92,733 102,957 271 - 8,061 20,384 23,974 - 27
1'
28 $3 000 under $4,000 . . . . . . . . . . . . . . . . . .. 8,993 31,003 28,219 - - 22,124 75,364 72,655 296 - 7,172 24,530 23,806 257 28
29 $4,000 under $5,000 . . . . . . . . . . . . . . . . . . . 4,043 18 025 16 046 437 - 8,816 38,939 35,875 531 - (2) - 29
3,
.
55.
3
30 $5,000 or more . . . . . . . . . . . . . . . . . . . . . . . . (2) (21) N - - 4 068 23.051 18 .002 69 (2) 30
"g, 523'6
31 Returns under $5,000 . . . . . . . . . . . . . . . . . . . . 188,171 1454,088 403,529 95 044 18,707 "9, 523 11,230 .439 941,922 327' 65,161 72,626 1206,417 167,044 49,590 9,798 31
32 Returns $5,000 under $10,000 . . . . . . . . . . . . 79,228 538,784 188,882 258:526 52,153 380,553 2,6~ ., 163 640,676 1,374,57% 277,524 55,833 379,091 130 635 198,319 40,121. 32
33 Returns $10,000 or more . . . . . . . . . . . . . . . . . 16,228 284,415, 37,515, 209,105 56,495 89,570 1 1,5 195,986 1,174,302 327,823 15,679 248,251 38:803 178,820 ",498 33
Nebraska Ne~ada New Hampshire
1 Grand total . . . . . . . . . . . . . . . . . . . . . . . 318,635 11,653,395 718,6871 841,903 188,568 r588,438 1426,9" 130,812 250,221 57,31-1 133,776 1787,927 305,452 404,193 1
2 Taxable returns, total . . . . . . . . . . . . . . . . . . 232,843 1 .5 7,087 496 523 841,504 188,568 50 055 412,276 108,592 249,811 57,311 112,587 7",157 247 .574 403.339 ------ - z
3 Under $1,000 . . . . . . . . . . . . . . . . . . .. . . . . . .. - - - - - - - - - - - - - - - 3 U2
4 1 000 under 2,000 . . . . . . . . 6,063 10,148 7,276 1,712 343 (2) (1) (2) (2) (2) 1,688 2,674 2,025 319 50 4
5 $2,000 under $3,000 . . . . . . . . 19,965 51,409 r32,134 12,645 2,568 6 , 163 15,820 9,884 3,708 708 5 1!5
6 $3,000 under $4,000 . . . . . . . . . . . . . . . . . . . 29,080 100,959 56,962 31,829 6,357 3,702 12,953 6,880 4,637 92712,184 43,276 22,161 15,551 3,121 6
7 $4 000 under $5,000 . . . . . . . . . . . . . . . . . . . 36,929 165,100 80,660 63,364 12,564 5,336 24,120 la,000 8,775 1,666 22,350 101,640 49,790 39,362 7,749 7
8 $5:000 under $6,000 . . . . . . . . . . . . . . . . . 40,322 220,285 93,074 98,098 19,570 7,508 41,030 15,035 20,260 4,048 18,214 99,308 43,594 42,766 8,544 8
9 $6 000 under $7,000 . . . . . . . . . . . . . . . . . . 28,360 184,176 67, 1" 92,"2 18,525 5,457 34,958 13,664 16,715 3,348 17, US 110,704 39,781 57,332 11 503 9
10 23,372 173,540 52,450 97,217 19,626 18,295 34,479 6,991 14,000 104,168 33,616$7 000 under $8, 000 . . . . . . . . . . . . . . . . . .. 8,229 61,090 57,071 1
.11536 1 0
11 $8 000 under $9,ODO . . . . . . . . . . . . . . . . . . . 15,024 127,676 31,162 79, 870 16,308 5,302 44,453 13,006 24,610 4,922 6,539 55,311 13,931 34,395 6,978 11 to
12 $9:000 =der $10,000 . . . . . . . . . . . . . . . . . . 7,166 68,050 15,983 43,087 8,875 2,891 26,886 6,337 17,127 3,372 3,708 35,3648,174 22,700 4,686 1 2
13 $10,000 under $15,000 . . . . . . . . . . . . . . . . . 18,858 220,258 41,570 152,186 32,281 7, "3 87,583 16,177 60,446 12,867 6,986 82,963 16,639 55,694 11,754 13
14 $15,000 under $20,000 . . . . . . . . . . . . . . . . . 3,099 52,862 7,195 40,364 9,351 1,061 18,015 2,098 13,933 3,240 1,761 30,126 3,859 23,228 5,303 14
15 $20,000 under $25,000 . . . . . . . . . . . . . . . 1,965 43,426 4,268 35,097 8,954 744 16,537 1,811 12,667 3,1,41 610 13,450 1,314 10,996 2,755 15
16 $25,000 under $50,000 . . . . . . . . . . . . . . . 2,100 71,111 5,295 60,075 18,775 783 25,406 1,541 21,668 6,603 1,075 33,826 2,386 27,090 7,918 16
17 $50,000 under $100,000 . . . . . . . . . . . . : : : : 507 32 912 1 299 28,587 12,018 181 11,188 401 10,062 4,196 166 10,731 363 8 771 3,536 17
is $100,000 under $150,000 .(2) (2i (2; (2) (2) (2) (2) (2) (2) (2) (2) (1) (2) (2i (2) 18
19 $150 000 under $200,DW . : : : : : : : : : : . . . . 4 654 8 602 340 5 823 10 745 389 5 857 13 698 354 19
20 t200:000 under $500,000 . . . . . . . . . . . . . 4 1, no 8 1,007 534 2 453 3 334 169 5 1,415 32 1,299 633 20
21 $500,000 under $1,000,000 . . . . . . . . . .. 1 794 2 774 384 - - - - - 1 880 2 871 433 21
22 $1,000,000 or more . . . . . . . . . . . . . . . . . . .. - - 1 1 1,743 2 1,421 692 - - 22
41023 Nontaxable, returns, total . . . . . . . . . . . . . . . 85,792 1126,308 222,164 399 8.383 114,668 22,220 [:4 21,189 143 770 854 - 23
24 No adjusted gross income . . . . . . . . . . . . . 6,961 128,682 15,745 - -(2) (2) (2) - - (2) (2) (1) - - 24
25 Under $1,000 . . . . . . . . . . . . . . . . . . . . . . . . : . 17,303 10,824 35,459 - 3,719 4,543 8,202 - - 9,954 11,801 21,317 - 25
26 $1,0DO under $2,000 . . . . . . . . . . . . . . . . . . . 26,562 38,740 59,825 - - 1 26
27 $2 000 under $3,000 . . . . . . . . . . . . . . . . . . . 21,061 51,119 56,858 399 - 4,527 11,193 3.1,461 - - 27
28 $3 :000 under $4,000 . . . . . . . . . . . . . . . .. 9,70 3,261 33,247 - - 3,943 14,157 12,936 410 - 2 579 9,177 9,207 204 - 2810
29 $4,000 under $5,000 . . . . . . . . 4,197 21,046 21,030 - - 2 911 4,037 13,222 650 -
30 30$5,000 or more . . . . . . . . . . . .
. 29
31 Returns under $5,000 . . . . . . . . . . . . . . . . . . . 176,461 1445,561 391,559 110,149 21,832 18,354 152 7101 40,043 14,544 2,738 62,578 '17 137 755 7F 11, 628 31
82,904 29,851 210 : , 743,115,612 782,090 267,450 410,714 835 68 701 113,191 22
'681 60,575 '77 43,247 32
32 Returns $5,000 under $10,000 . . . . . . . . . . . :27 0
9
33 Returns $10,000 or more . . . . . . . . . . . . . . . . . 26,562 425,744, 59,678, 321,040 83,832 10,233 163,3c- 22,068 122,486 31,892 1 10,623 2 24
61,
33,415 133
Footnotes at end of table . See text for Description of Sample" and "Explanation of Classifications and Terms ." 00
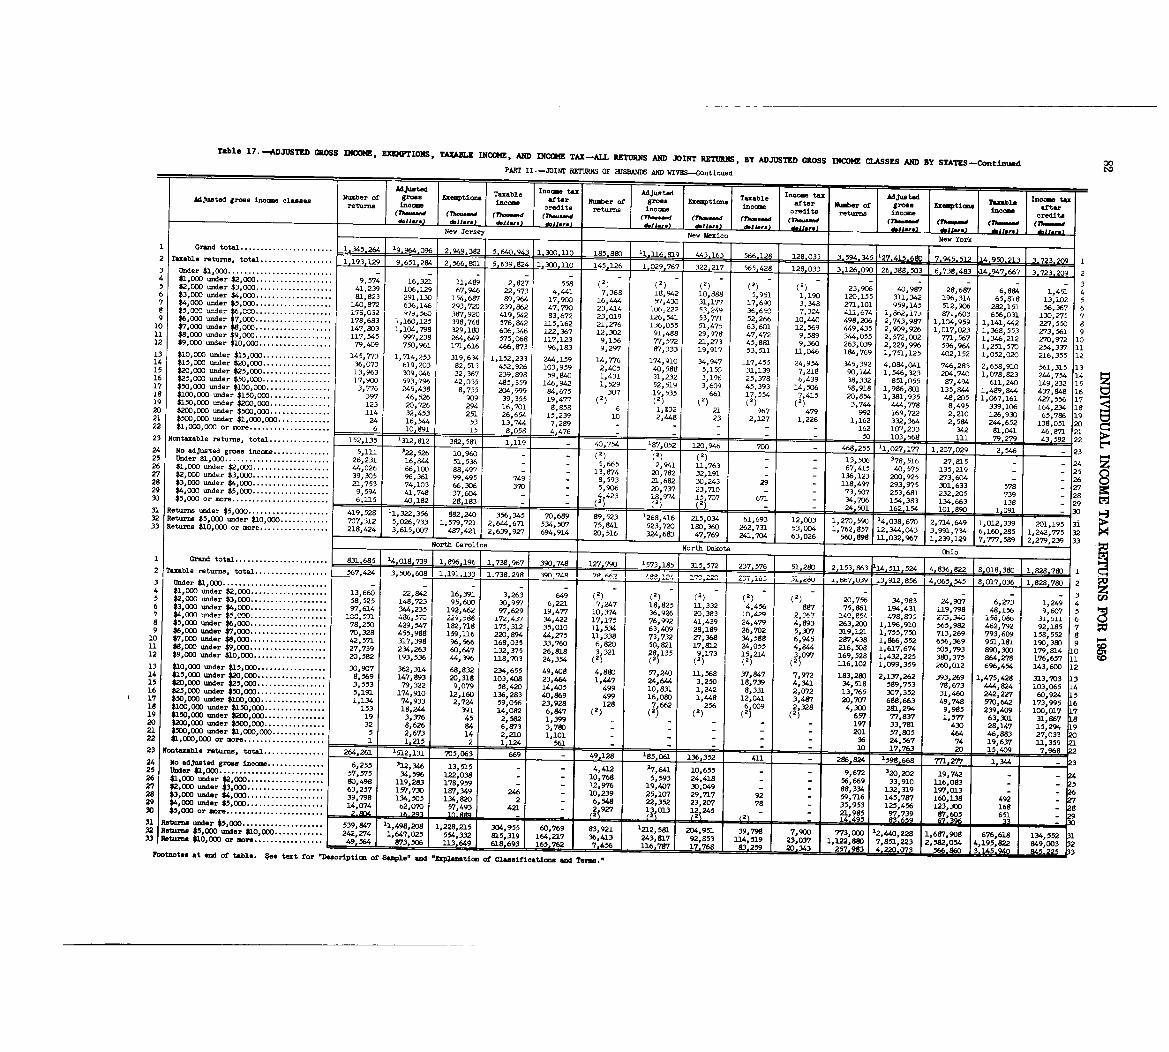
Table 17 . -ADJUSTED GROSS INCOME, EXEMPTIONS, TAXABLE INCOME, AND INCOME TAX-ALL RETURNS AIM JOINT RETURNS, BY ADJUSTED GROSS INCOME MASSES AND BY STATES-Continued 00t'DPART II .-JOIRr RETURNS OF HUSBANDS AND WIVES-Continue d
Adjusted Taxable Income tax Adjusted Taxable Income tax AdjustedTaxable Income taxurneAdjusted gross income classes Number of gross Exemptions income after Nu=zber of gross Exemptions income after Number of gross Exemptions income aft rreturns income credits
returns income credits returns income credits(7h-..W (Thmsend (n-d (Th-.-d (Th- ..,,d (rh-. .W (Th--d (rheeeaed (Theweed (Th..-d (Thew-dd.IJ-.) &IJ... d.IJ ... d.IJ.,.) d.11.. . dJJ. .. J dell .. deJ1._ )New Jersey New Vlexic. New York1 Grand total . . . . . . . . . . . . . . . . . . . . . . . 1,343,264 19,964,096 2,949,382 11 -6 819
12 Taxable returns, total . . . . . . . . . . . . . . . . . . 1,193,129 9,651,284 2,566,801 5,639,824 1, 300, 110 145,126 1,029,767 322,217 565,428 128,033 3,126,090 26,388,503 6,738,483 aA,947,667 3,723,209 23 der $1,000 . . . . . . . . . . . . . .
. - - - - - - - - - - - - - - - 34 $11,000 under ' 000 . . . . . . . . 9,574 16,321 11,489 2,827 558 (1) (1) (2)
(1) (2)23,906 40,987 28 , 687 6,884 1,451 45 000 under $3,000. . . . . . . . . . . . . . . . . . . 41,239 106,129 67,946 22,573 4,441 7,368 18,9142 10,888 5,951 1,190 120,155 311,342 196,314 65 , 819 13,102 5
6 3,000 under $4,000 . . . . . . . . . . . . . . . . . . . 81,823 291,130 154,687 89,964 17,900 16,444 57,430 31,177 17,690 3,348 271,101 959,145 512,906 282,151 56,367 67 '000 under $5,000 . . . . . . . . . . . . . . . . . . . 140,872 636,146 293,720 239,862 47,790 23,414 106 ; 222 53,249 36,650 7,324 411.,674 1,862,171 871,603 656,031 130,275 78 $5 GOO under $6, OW . . . . 178,032 979,5bO 387,920 419,542 83,672 23,019 126,541 53,771 52,266 10,440 498,206 2,743,987 1,104,959 1,141,442 227,550 89 $6 000 under $7,000 . . . . 1,78,683 1,160,125 398,768 576,842 115,162 21,276 136,055 51,475 63,601 12,569 449,435 2,909,926 1,017,023 1, W,553 273,561 910 $7,000 under $8,000 . . . . . 147,803 1,104,798 329,180 606,346 122,367 12,302 91,488 29,978 47,472 9,589 344,055 2,572,002 771,567 1,346,212 270,972 1011 $8 000 under $9,000 . . . . . . . . . . . . . . . 117,545 997,238 264,649
575,068 117,123 9,156 77,572 21,273 45,881 9,360 263,039 2,229,996 596,964 1,251,570 254,337 1112 sq :OOO under $10,000 . . . . . . . . . . . . . . . . . . 79,409 750,961 171,616 466,873 96,183 9,297 87,333 19,917 53,51111,046 184,769 1,751,125 402,152 1,052,020 216,355 1213 10,000 under $15,000 . . . . . . . . . . . . . . . . . 145,773 1,714,253 319,634 1,152,233 244,159 14,776 174,910 34,947 117,455 24,954 345,392 4,084,041 746,283 2,658,910 561,315 1314 $15,000 under $20,000 . . . . . . . . . . . . . . . . . 36,073 619,203 82,513 452,926 103,959 2,405 40,588 5,150 31,139 7,218 90, 1" 1,546,323 204,740 1,078,823 244,754 14
15 000 under $25,000 . . . . . . . . . . . . . . . . . 13,963 309,046 32,367 239,898 59,840 1,431 31,232 3,196 25,378 6,439 38,332 851,055 87,494 611,240 149,232 15 z16 5,000 under $50,ODO . . . . . . . . . . . . . . . . . 17,900 593,796 42,035 485,359 146,942 1,529 52,519 3,609 45,393 14,506 58,918 1,986,801 135,844 1,489,844 437,848 1 617 $50,ODO under $100,000 . . . . . . . . . . . . . . . . 3,776 245,438 8,755 204,9199 84,675 307 19,535 661 17 554 7 415 20,854 1,381,935 48,205 1,067,161 427,556 1 7is $100,000 under $150,000 . . . . . . . . . . . . . . . 397 46,526 909 39,355 19,477 3,7"
444,778 8,495 339,106 164,234 18 P"
(2) (2) (2) (2 2 _ti19 $150,000 under $200,000 . . . . . . . . . . . . . . . 123 20,726 294 16,701 8,858 6 1,M32 21 967 479 992 169,722 2,210 126,930 65,786 1920 $200,000 under $500,000 . . . . . . . . . . . . . . . 114 32,453 251 26,654 15,239 10 2,"8 23 2,127 1,226 1,162 332,364 2,584 2",652 138,051 2021 $500,000 under $1,000,000 . . . . . . . . . . . . . 24 16,544 53 13,744
7,289 - - - - - 162 107,233 342 81,041 46, 871 2122 $1,000,000 or mo re . . . . . . . . . . . . . . . . . . .. 6 10,891 15 ___~4476 - - 50 ill 79,279 2 22_j2,21= L23 Nontaxable retums, total . . . . . . . . . . . . . . . 152,135 '312,812 382,581 1,119 40,754 187,052 120,946 700 468,255 11,027,177 1,207,029 2,546 - 2324 No adjusted gross income . . . . . . . . . . . . .. 5,111 122,526 10,960 - (2) (2) 13,506 378,516 27,815 - - 24 z25 Under $1,000 . . . . . . . . . . . . . . . . . . . . . . . . . . 26,231 16,844 51,536 5 665 2 941 1 763 67,415 40,575 135,219 - 2526 $1,000 under $2,000 . . . . . . . . . . . . . . . . . . . 44,026 66,100 88,497 - 13 :874 20: 782 312,191 - 136,123 200,925 273,604 - - 2627 $2,000 =der $3,000 . . . . . . . . . . . . . . . . . . . 39,305 96,361 99,495 749 8 593 21,682 30,243 29 118,497 293,975 301,633 578 - 2728 $3,000 under $4,000 . . . . . . . . . . . . . . . . . . . 21,753 74,103 66,306 370 5
:906 20,737 23,710 73,507 253,681 232,205 739 - 2829 $4 000 under $5,000 . . . . . . . . . . . . . . . . . . . 9,594 41,748 37,604 - 4,423 1 15 707 671 34,706 154,383 134,663 138 - 2930 $5 :000 or more . . . . . . . . . . . . . . . . . . . . . . . . 28,183 (2) (2)'
2 .501 162.154 101 890 1.091 - 30
15
't
~'
( 231 Returns under $5,000 . . . . . . . . . . . . . . . . . . . . 419,528 11,322,356 882,240 356,345 70,689 89,523 1268,416 215,034 61,693 12,003 1,270 ' 590 114,038,670 2,714,649 1,012,339 201,195 A21 5, 523
'23 1 26832 Returns $5,000 under $10,000 . . . . . . . . . . . . 707,312 5,026,733 1,579,721 2,644,671 534,507 75,841 523,720 180,360 262,731 53 004 1,762 857 12,344,043 3,991,734 6 160,285 1,242,775 3233 Returns $10,000 or more . . . . . . . . . . . . . . . . . 218,424 3,615,007 487,421 2 .639 .927 694,914 20,516 324.683 47,769 63:026 560
: 1 1
, 1
. 1
4 241,704 898 U,032 .967 1,239,129 7 :777,589 2,279,239 33North Carolina North Dako Ollio
1 Grand total . . . . . . . . . . . . . . . . . . . . . . .. 831,68Z5'4.018,739 1, 1 .738 .967 390.748 127,790 1573.185 57:2~237 576 524 4,836,822 18 .018,380 1 .828 .78D3:11:: 51.280 12 Taxable returns, total . . . . . . . . . . . . . . . . . . L 567,424 3,506,608 1,191 .133 1 .738 .298 V-3c)0-74A I 7RA- I - 1
2------ 1, ob / U-s9 1131 9112 85566 4~065545 ~87' 36~ 1,828,7803 Under $1,000 . . . . . . . .
. - - - - - - -3$ 2 (2) (2) (2)
4 1,000 under $2,ODO . . : . . . . . . . . . . . . . . 13,660 22,842 16,391 3,263 649 (2) 20,756 34,983 24,907 6,273 1,249 42 (2) 2 7
; 9'24 7 6 , 27.
.. ... """ _:L~
_' S Ol05 $2,000 under $3,000 . . . . . . . . . . . 58,525 148,723 95,600 30 957 6,221 71247 18,825 1-1,332 4,456 887 75,861 194,431 U9,798 48,156 9,607 50 ~ g O~'6 $3,000 under $4,000 . . . . . . . . . . . 97,614 344,235 192,462 9,7:629 19,477 10,374 36,926 20,383 10,429 2,067 140,854 498,89,- 273,340 158,086 31,!'11 6
7 $4,000 under $5,000 . . . . . . . . . . . . . . . . . lo.-,591 486,570 229,588 17;e, 4-l'? 34,422 17,175 76,992 41,439 24,479 4,893 263,200 1,196 910 565,982 462,792 92,185 78 $5,000 under $6,000 . . . . . . . . . . . . . . . . . 78,250 429,547 182,718 175,312 35,010 11,534 63,409 28,199 26,702 5,307 319,121 1,755 :750 713,269 793,609 158,552 89 $6,000 under $7,000 . . . . . . . . . . . . . . . . . . . 70,328 455,988 159,116 220,894 ", 275 U, 338 73,732 27,368 34,588 6,945 287,438 1,866,552 656,369 951,181 190 380 910 $7,000 under $8,000 . . . . . . . . . . . . . . . . . . . 42,571 317,398 96,566 168,035 33,760 6,820 50,821 17,812 24,055 4,844 216,508 1,617,674 505,793 890,300 179:814 1011 $8,000 under $9,ODO . . . . . . . . . . . . . . . . . . . 27,739 234,263 60,647 132,375 26 818 3 28,135 9,173 15 214 3 097 169,528 1,432,225 380,375 864,278 176,657 11 to12 $9,000 under $10,000 . . . . . . . . . . . . . . . . . . 20,582 193,536 ", 3% 118,?03 24:354 (2') (2) (2) (2; (2i 116,102 1,099,359 260,012 696,454 143,600 1213 $10,000 under $15,000 . . . . . . . . . . . . . . . . . 30,907 362,314 68,832 234,655 49,408 4,880 57,240 U, 568 37,847 7,972 183,280 2,137,262 393,269 1,475,428 313,703 1314 $15,000 under $20,000 . . . . . . . . . . . . . . .. 8,569 147,893 20,318 103,408 23,464 l,"7 24,644 3,250 18 739 4,341 34,518 589,753 78,673 444,824 103,065 1415 $20,000 under $25,000 . . . . . . . . . . . . . . . . 3,553 79,322 9,079 58,420 14,405 499 10,831 1,242 8:331 2,072 13,765 307,352 31,460 242,227 60,924 516 $25,000 under $50,000 . . . . . . . . . . . . . . . . . 5,191 174,910 12,160 136,283 40,869 499 16,08D 1, "a 12,041 3,4V 20,707 688,663 49,748 570,642 173,995 1617 $50,000 under $100,000 . . . . . . . . . . . . . . . . 1,134 74,933 2,724 59, 23,928 128 7,662 256 6 009 2 328 4,300 281,294 9,985 239,409 100,017 1718 $100,000 under $150,000 . . . . . . . . . . . . . . . 153 18,244 391 14 2 6,847 (2) (2) (2) (2i (2 ;
657 77,837 1,577 63,301 31,867 1819 $150,000 under $200,000 . . . . . . . . . . . . . . . 19 3,376 45 2'
1,399- - - - - 197 33,781 430 28,147 15,294 19
20 000,000 under $500,000 . . . . . . . .. 32 8,626 84 6, 3 3,780 - 201 57,805 464 46,883 27,03~ 2021 $500,000 under *11000,000 . . . . . . . 5 2,673 14 2,
0 1,101 - 36 24,567 74 19,637 U, 359 2122 $1,000,000 or more . . . . . . . . . . . . . . . . . . . . 1 1 215 _ 2 1,1 561 - - - - 10 17.763 20 15.409 7 .%8 2223 Nontaxable returns, total . . . . . . . . . . . . . . . 264,261 705,063 669 49,128 185,061 136. - 286.824 1598,668 771,277 1,344 - 324 NO adjusted gross ine . . . . . . . . . . . . . . 6,255 312,346 13,515 - - 4,412 37,641 0 655 - 9,672 320,202 19,742 -
- 3
25 Under $1,000 . . . . . . . . . . . . . . . . . . . . . . . . . . 57,375 34,5% 122,038 - 10,768 5,593 :::124,2418 56,669 116,083 5J 33,91026 $3. 000 under $2,000 . . . . . . . . . . . . . . . . . . . 80,498 119,283 178,959 - - 12,976 19,40730 049
- - 88,334 132,319 197,01327 $2 :000 under $3,000 . . . . . . . . . . . . . . . . . . . 63,257 157,730 187,349 246 - 10 239 25 107 29,717 92 - 59,716 145,797 160,138 49228 $3 000 under $4,OG0 . . . . . . . . . . . . . . . . . . . 39,798 134,505 134,820 2 - 6 548 22 352 23,20,7 78 - 35,953 125,456 123,300 16829 $4,000 under $3,000 . . . . . . . . . . . . . . . . . . . 14,074 62,070 57,493 421 - 13 013
2 45
- - 21,985 97,739 87,605 65130 $5,000 or more . . . . . . . . . . . . . . . . . . . . . . . . . 2 wv~ .J9,912 - 1 . (2J 1
L2J 2 12,
5 14 .495 83.659 67 - 3QA31 Returns under $5,000 . . . . . . . . . . . . . . . . . . . . 519 :.1 60,769 83 921 1 12132: 85181 ?73 2:1 11 1 6' 134 552" :61:=32 Raturne $5,000 under $10,000 . . . . . . . . . . 2 164,217 36: 2
7 I.,195:=413 4
72Z2: L22 582 849:0049 5633 lReturas $10,000 or more . . . . . . . . . . . . . . . : :
1i 165,762 456 11 ~57 566Footnotes at end of table . See text for "Description of Sample" and "Explanation of Classifications and Terms ."
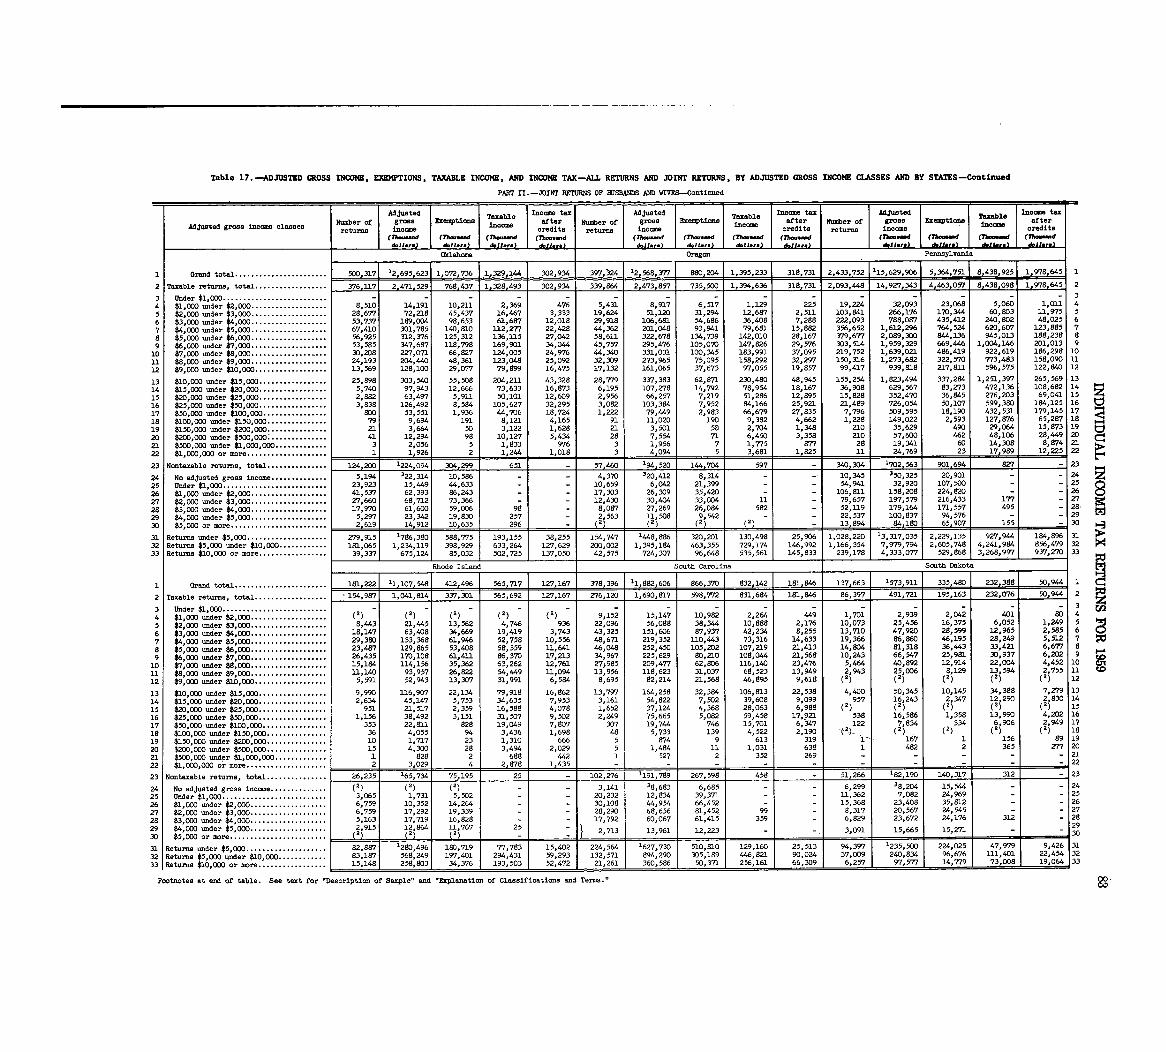
Table 17-ADJUSTED GROSS INCOME, EXEMPTIONS, TAXABLE INCOME, AND INCOME TAX-ALL RETURNS AND JOINT RETURNS, BY ADJUSTED GROSS INCOME CLASSES AND BY STATES-Continued
PART II .-JOIN!r FOrURNS OF H1JSBANDS AND WIVES-Continue d
Adjusted Taxable Income tax Adjusted Taxable Income tax Adjusted Taxable Income taxNumber of, gross Exemptions income after Number of gross Exemptions after Number of gross Exemptions after
Adjusted gross income classes returns income credits returns income income credits returns income income credit s
(7h-..w (TIM-W (7h-d (7h--d (7h--d (7h--d (Th-. ..d (rh-..W (7lw-.d (Th-d (Thwwnd (Thm-add.11-) d.11 . .. ) d.11.,.) d.11 . .. d.Ji.r.) dall,re) d.11. .. d,11-0) d.11.,.) dgli-) d,11-1
Oklahone. Oregon Pennsylvania
1 Grand total . . . . . . . . . . . . . . . . . . . . . . . 500,317 12,695p623 1,072,736 -1,329,1" 302,934 397,j24 12,568,377 880,204 1,395,233 318,731 2,433, .752 115,629,906 5,364,751 8,438,925 978,645 1
2 Taxable returns, total . . . . . . . . . . . . . . . . . . 376,117 2,471,529 768,437 1,328,493 3020934 339,964 2,473,857 735,500 1,394,636 318,731 2,093,448 14,927,343 4,463,057 8,438,098 1,978,645 2
3 Under $1,000 . . . . . . . . .. 34 $1 000 under $2, GOO . . . . . . . 8,510 14,191 10,211 2,369 476 5,431 8,917 6o517 1,129 225 190224 32,093 23,068 5,060 1,011 4
5 $2 :000 under $3,ODO . . . . . . . . . . . . . . . . . . . 28,677 72,218 45,437 16,467 3,333 19,624 51,120 31,294 12,687 2,511 103,841 266,176 170,344 60,803 11,975 56 $3,000 under $4,000 . . . . . . . . . . . . . . . . . . . 53,737 189,004 98,653 61,687 12,018 29,918 1060681 54,696 36,408 7,288 222,093 788,087 4350412 240,802 48,025 6
7 $4,000 under $5,000 . . . . . . . . . . . . . . . . . . . 67,410 30lo785 140,810 112,Z77 22,428 ", 362 201,048 93,941 79,681 15,882 356,652 1,612,296 764,524 620,607 123,885 7
8 $5,000 under $6,000 . . . . . . . . . . . . . . . . . . . 56,925 312,376 125,312 136,115 Z7,042 58,611 322,678 134,739 142,010 28,167 379,677 2,089,300 844,136 945,013 188,238 8
9 $6,000 under $7~000 . . . . . . . . . . . . . . . . . . . 53,585 347,687 118,798 169,901 34,0" 45,757 295,476 105,070 147,826 29,576 303,514 1,959,329 6690446 1,004,146 201,013 910 $7,000 under $8,000 . . . . . . . . . . . . . . . . . . . 30,208 227,071 66,827 124,005 24,976 44,340 331,031 100,345 183,991 37,095 219,752 1,639,021 486,419 922,619 186,298 1011 $8,000 under $9,000 . . . . . . . . . . . . . . . . . . . 24,193 204,440 48,361 123,048 25,092 32,309 273,965 75,095 158,292 32,2917 150,316 1,273 682 322,570 773,483 158,090 1112 $9,000 under $10,000 . . . . . . . . . . . . . . . . . . 13,569 128,100 29,077 79,899 16,475 17,132 161,065 37,673 97,055 19,857 99,417 939 :818 217,811 596,575 122,840 12
13 $10,000 under $15,000 . . . . . . . . . . . . . . . . . 25,998 303,540 55,508 204,211 43,328 28,779 337,383 62,871 230,480 48,9145 155,254 1,823,494 337o284 1,251,397 265,569 13
14 $15,000 under $20,000 . . . . . . . . . . . . . . . . . 5,740 97,943 12,666 73,633 16,873 6,195 107,278 14,792 78,954 18,167 36,908 629,567 83,273 472,136 108,682 1 4
15 $20,000 under $25,000 . . . . . . . . . . . . . . . . . 2,882 63,497 5,911 50,101 12,609 2,956 660257 7,219 51,286 12,895 15,828 352,470 36,845 276,203 69,041 15 z
16 $25,000 under $50,ODO . . . . . . . . . . . . . . . . . 3,838 126,492 8,584 105,627 32,295 3,Oa2 103,384 7,952 84,166 25,921 21,489 726,054 50,107 599,380 184,125 16 C117 $50,000 under $3.00,000 . . . . . . . . . . . . . . . . 8DO 53,551 1,936 44,706 18,724 1,222 79,449 2,983 66,679 27,835 7,796 509,595 18,190 432,531 179,145 1 7
is $100,000 under $150,000 . . . . . . . . . . . . . . . 79 9,694 191 8,121 4,165 91 11,020 190 9,382 4,662 1,228 149,022 2,593 127,876 65,287 18
19 $150,000 under $200,000 . . . . . . . . . . . . . . . 21 3,664 50 3,122 1,628 21 3,501 50 2,704 1,348 210 35o629 490 29,064 15,873 19
20 $200,000 under $500,000 : . . . . . . . . . . . . . . 41 12,294 98 10,127 5,434 28 7,554 71 6,450 3,358 210 57o6OO 462 48,106 28,"9 20
21 $500,000 under $1,000,000 . . . . . . . . . . . . . 3 2,056 5 1,833 976 3 1,956 7 1,775 877 28 19,341 60 14,308 8,874 21
22 $1,000,000 or more . . . . . . . . . . . . . . . . . . . . 1 1,926 2 1,2" 1,018 3 4,094 5 3,681 1,825 11 24,769 23 17,999 12,225 22
23 Nontaxable returns, total . . . . . . . . . . . . . . . 124,200 1224,094 304,299 651 - 57,460 194,520 144,704 597 - 34LO 304 1702,%3 901,694 SV - 23i
24 No adjusted gross income . . . . . . . . . . . . . . 5,194 322,314 10,586 - - 4,370 320,412 8,314 - 10,345 350,325 20,901 - 24
25 Under $1,000 . . . . . . . . . . . . . . . . . . . . . . . . . . 23,923 15,449 44,633 - - 10,659 6,042 21,399 - 54,941 32,920 107,500 - 25
26 $1 000 under $2,000 . . . . . . . . . . . . . . . . . . . 41,537 62,393 86,243 - - 17,303 26,309 35,420 - 106,811 158,208 224,82D - - 26
27 $2:000 under $3,000 . . . . . . . . . . . . . . . . . . . 27,660 68,712 73,366 - - 12,430 30,404 33,004 ll - 79,657 197,579 216,433 177 - 278,087 27,269 26,084 582 - 52,119 179,164 1710557 495 - 28,28 $3,000 =der $4,000 . . . . . . . . . . . . . . . . . . . 17,970 61,600 59,006 98 -
U
gi29 $4,000 under $5,000 . . . . . . . . . . . . . . . . . . . 5,297 23,342 19,830 257 - 2 563 11 508 9 542 - - 22,537 100,837 94,576 - - 29
30 $5,000 or more . . . . . . . . . . . . . . . . . . . . . . . . 2,619, 14,912, 10,635 296 - (2~ (2i (2') (2) - 13
'94
84,180 6519 155 - 30 ~_3
31 Returns under $5,000 . . . . . . . . . . . . . . . . . . . . 21 6:3110 193,155 38,255 154,747
, _ .
. 13,317,035 2 184
1 78 Z: " 1"S, 886 320,201 130,498 25,906 1,028,220
:229,135 927,9" 8% 31
32 Returns $5,000 under $10,000 . . . . . . . . . . .. 65
1,2.
U9 398 929 633,264 127,629 200,002 1,395,184 463,355 7290174 146,992 1,166,354 7,979,794 2 605,748 4,241,984 856 :479 3233 Returns $10,000 or mom . . . . . . . . . . . . . . . . . 39,337 675,124 85,032 502,725 137,050 42,575 724o3G7 96,648 535,561 145,833 239,178 4, 3,268,997 937,270 33
Rhode Island South Carolina South Dakota
1 Grand total . . . . . . . . . . . . . . . . . . . . . . . 181,222 11,107,548 412,496 5650717 127,167 378,396 11,892,606 866,370 832,142 181,846 137,663 1573,911 335.480 232 .388 50,944 1
2 Taxable returns, total . . . . . . . . . . . . . . . . . . 154,987 1,041,814 337,301 565,692 127,167 276,120 1,690,617 598,772_ 831,684 181,846 86,397 491,721 195,163 232,076 50,944 2
33 Under $1,000 . . . . . . . . . . . . . . . . . . . . . . . . .. - - - - - - - - - - - - z
4 $1,000 under $2,000 . . . . . . . . . . . . . . . . . . . (1)(2) (2) (2) (1) 9,152 15,147 10,982 2,264 449 1,701 2,939 2,042 401 80 4
5 $21 000 und r $3,000 . . . . . . . . . . . . . . . . . . . 8,443 21,445 13,562 4,746 936 22,096 56,088 38,344 10,888 2,176 10,073 25,456 16,375 6,052 1,249 5
6 $3POO0 und :r $4,000 . . . . . . . . . . . . . . . . . . . 18,147 63,408 34,669 19,419 3,743 43,325 151,606 87,937 42,234 8,255 13,710 47,920 28,599 12,965 2 585 6
7 $4,000 under $5pOOO . . . . . . . . . . . . . . . . . . . 29,380 133,368 61,946 52,758 10,556 48,671 219,352 110, "3 73,316 14,633 19,366 86,860 ",195 28,249 5 :512 7
8 $5,000 under $6,000 . . . . . . . . . . . . . . . . . . . 23,487 129,865 53,408 58,359 11,641 46,048 252,450 105,202 107,23.9 21,413 14,804 81,318 36, "3 33,421 6,677 8
9 $6,000 under $7,000 . . . . . . . . . . . . . . . . . . . 26,435 170,108 61,411 86,370 17,213 34,967 225,629 80,210 108,044 21,568 10,243 66,547 25,981 30,937 6,202 9
10 $7pOOO under $8~000 . . . . . . . . . . . . . . . . . . . 15,184 114,156 35,362 63,262 12,761 27~985 209,477 62,806 116,140 23,476 5,464 40,892 12,914 22,004 4,452 10
11 $8,000 under $9,000 . . . . . . . . . . . . . . . . . . . 11, 140 93,957 26,822 54,449 11,094 13,956 118,623 31,037 68,523 13,949 2,943 25,006 8,129 13 594 2,755 11
12 $9,000 under $10,000 . . . . . . . . . . . . . . . . . . 5,591 52,943 13,307 31,991 6,584 8,695 82,214 21,568 46, M 9,618 (2) (1) (2) (2; (2) 12
13 $10,000 under $15,000 . . . . . . . . . . . . . . . . . 9,990 116,907 22,134 79,918 16,862 13,797 164,258 32,384 106,813 22,538 4,400 50,345 10,145 34,388 7,279 13
14 $15,000 under $20,000 . . . . . . . . . . . . . . . . . 2,634 45,147 5,753 34,635 7,953 3,161 54,822 7,502 39,608 9,099 957 16 243 2 12 290 2,830 14
15 $20,000 under $25,000 . . . . . . . . . . . . . . . . . 951 21,517 2,359 16,588 4,078 1,652 37,124 4,368 28,063 6,988 (1) (2i A' (21) (2) 15
16 $25,000 under $50,000 . . . . . . . . . . . . . . . . . 1,156 38,492 3,151 31,507 9,502 2,249 75,665 5,082 59,458 17,921 538 16,586 1,358 13,990 4,202 16
17 $50,000 under $100,000 . . . . . . . . . . . . . . . . 353 22,811 828 19,049 7,807 307 19,7" 746 15,701 6,~47 122 7 834 334 6 906 2 949 17
18 $100,000 under $150,000 . . . . . . . . . . . . . . . 36 4,055 94 3,4316 1,698 48 5,733 139 4,522 2,190 - (2i (2) 2; (2; 18
19 $150,000 under $200,000 . . . . . . . . . . . . . . . 10 1,717 23 1,310 666 5 874 9 613 319 1:-- 167 1 156 89 19
20 $200,000 under $500,000 . . . . . . . . . . . . . . . 15 4,300 28 3,494 2,029 5 1,484 11 1,031 638 1 482 2 365 277 20
21 $500,000 under $1,000,000 . . . . . . . . . . . . . 1 828 2 688 442 1 527 2 352 269 - - - - - 21
22 $1,000,000 or more . . . . . . . . . . . . . . . . . . . . 2 3,029 4 2,878 1,435 - 22
23 Nontaxable returns, total . . . . . . . I . . . . . . . 26,235 165,734 75,195 25 - 102,276 1191,789 267,598 458 - 51,266 182,190 140,317 312 - 23
24 No adjusted gross income . . . . . . . . . . . . . . (1) (2) (2) - - 3,141 38,683 6,685 - - 6,299 38,204 15,544 - - 24
25 Under $1,000 . . . . . . . . . . . . . . . . . . . . . . . . . . 3,065 1,731 5,502 - 20,232 12,834 39,371 - 11,362 7,082 24,969 - 25
26 $1,000 under $2,000 . . . . . . . . . . . . . . . . . . . 6,759 10,352 14,264 - 30,108 44,954 66,452 - - 15,368 23,408 35,812 - 26
27 $2,000 under $3,000 . . . . . . . . . . . . . . . . . . . 6,759 17,292 19,339 - 28,290 68,656 81,452. 99 - 8,317 20,567 24,545 - - 27
28 $3,000 under $4,DO0 . . . . . . . . . . . . . . . . . . . 5,163 17,719 16,828 - - 17,792 60,067 61,415 359 - 6,829 23,672 24,176 312 - 28
29 $4,000 under $5,000 . . . . . . . . . . . . . . . . . 2,915 12,864 11,767 25 - 2930 $5,000 or more . . . . . . . . . . . . . . . . . . . . . . (2) 2 - 2,713 13,961 12,223 - -.1 3,091 15,665 15,271 - - 30
21 1 25:513 '.9 1 2,35,500 7,979 9:442631 Returns under $5,000 . . . . . . . . . . . . . . . . . 82,887 1280,496 18D,719 77,783 15,402 224,564 1627,730 510,810 129,160 94,397 224,025 4 31
32 Returns $5,000 under $10,ODO . . . . . . . . . 83,187 568,249 197,401 294,431 59,293 132,571 894,290 305,189 446 8 90 024 3? 9 21b 834 96,676 111,401 22 54 32
33 Returns $10,000 or mom . . . . . . . . . . . . . . . . . 15,148 258,803, 34,376 1 193,503 52,472 21,261 1 360,586 50,371 1 256:161 66,309 6 14,779 73,008 19, ~64 3 3
Footnotes at end of table . See text for "Description of Sample" and "Explanation of Classifications and Terms ." 00w
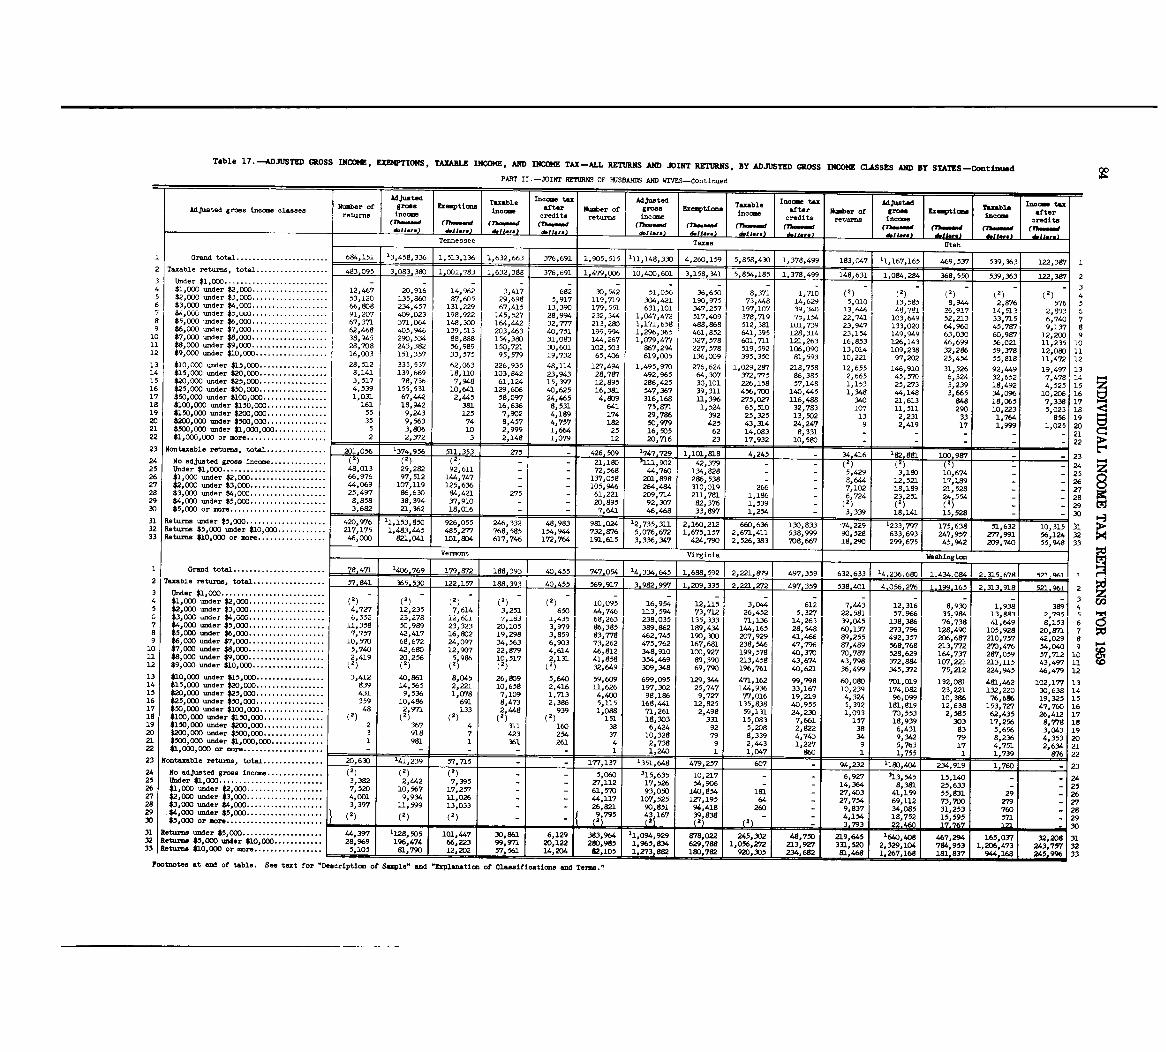
Table 17 . -ADJUSTED GROSS INCOME, EXEMPTIONS, TAXABLE INCOME, AND INCOME TAX-ALL RETURNS AND JOINT RETURNS, By ADJUSTED GROSS INCOME CLASSES AND By STATZS-ContLVA3&d
PART II .-JOINT RETURNS OF HUSBANDS AND WIVES-Contime d
Adjusted Taxable Income tax AdjustTaxable Income Adjusted Income taxNumber of gross Exemptions after Number of grose Exemptians after Number of gross Ezmmptjomm~ Taxabl eAdjusted gross income classes income income income after
returns income credits returns income credits returns (income credits(rho-d (7%--W (Th .U.-d (Th.-d (rh-.-d (7h-.-d (The-d (Th-.-d Th...-d (Th-sed (Th-sad (Tb---ddjj., .) d.11.. . d.11.1 .) d.11. .. d.11.r .) d.IJ.. . d,11 ..1 *11 ... ApIlars )Tennessee Texas Utah
1 Grand total . . . . . . . . . . . . . . . . . . . . . . . 684,151 13,458,336 1,513,136 1,632,663 376,691 1,905,515 111,148,330 4,260,159 5,858,430 1,378,499 183,047 11,167,165 469,537 539,363 122,387 12 Taxable returns, total . . . . . . . . . . . . . . . . . . 483,095 3,083,380 1,001,783 1,632,388 376,691 1,479 .006 10,400,601 3,158,341 5,854,185 1,378,4 148,631 1,084,284 368,550 539,363 122,387 23 Under $1,000 . . . . . . . . . . . . . . . . . . . . . . . . . . 34 $1,000 under $2,000 . . . . . . . . . . . . . . . . . . . 12,467 20,916 14,962 3,417 682 30,542 51,056 36,650 8,371 1,710 (2) (1) (1) (2) (2) 45 000 under $3,000 . . . . . . . . . . . . . . . . . . . 53,120 135,W 87,605 29,698 5,917 119,719 304,421 190,975 73,448 14,629 5,010 13,585 8,944 2,876 576 56 $3,000 under $4,000 . . . . . . . . . . . . . . . . . . . 66,BD8 234,457 131,229 67,415 13,390 179,551 631,101 347,257 197,107 39,340 13,A46 48,761 26,917 14,513 2,8933 f~7 $4, GOO =der $.~, ULX) . . . . . . . . . . . . . . . . . . . 91,207 409,023 198,922 145,527 28,994 232,344 1,047,472 517,409 378,719 75,154 22,741 103,649 52,213 33,715 6,740 7a $5,000 under $6,000 . . . . . . . . . . . . . . . . . . . 67,371 371,064 148,300 164,442 32,777 213,28D 1,171,658 488,868 512,381 101,739 23,947 133,020 64,960 45,787 9,137 89 $6,000 under $7,000 . . . . . . . . . . . . . . . . . . . 62,468 405,946 139,513 203,463 40,751 199,994 1,296,365 461,852 641,395 128,314 23,154 149,949 63,030 60,987 12,200 910 $7,000 ucder $8,000 . . . . . . . . . . . . . . . . . . . 38,945 290,534 88,888 154,380 31,083 144,267 1,079,477 327,578 601,711 121,263 16,853 126,143 46,699 56,021 1.1,235 1011 $8,000 under $9,000 . . . . . . . . . . . . . . . . . . . 28,708 243,382 56,989 150,721 30,601 102,503 867,294 227,578 519,592 106,090 13,014 109,238 32,286 59,378 12,080 1112 $9,000 ucder $10,000 . . . . . . . . . . . . . . . . . . 16,003 151,357 33,575 95,579 19,732 65,406 619,005 136,009 395,350 81,593 10,221 97,202 25,454 55,818 11,472 12
13 $10,000 under $15,000 . . . . . . . . . . . . . . . . . 28,512 335,537 62,063 226,935 48,114 127,494 1,495,970 276,624 1,029,287 218,758 12,655 146,910 31,526 92, "9 19,497 1314 $15,000 under $20,000 . . . . . . . . . . . . . . . . . 8,141 139,669 18,110 103,842 23,943 28,787 492,965 64,307 372,775 86,385 2,665 45,570 6,324 32,652 7,478 1415 $20,000 under $25,000 . . . . . . . . . . . . . . . . . 3,517 78,7316 7,948 61,124 15,397 12,895 286,425 30,101 226,158 57,148 1,153 25,273 3,239 18,492 4,525 1516 $25,000 under $50,000 . . . . . . . . . . . . . . . . . 4,539 155,531 10,641 129,606 40,625 16,381 547,367 39,311 456,700 140,"5 1,348 44,148 3,665 34,096 10,206 1617 $50,000 under $100,000 . . . . . . . . . . . . . . . . 1,031 67,442 2,445 58,097 24,"5 4,809 316,168 11,396 275,027 1.16,488 340 21,613 648 18,065 7,338 17is $100,000 under $150,000 . . . . . . . . . . . . . . . 161 18,942 381 16,636 8,531 641 75,871 1,524 65,510 32,783 107 11,511 290 10,223 5,023 1819 $150,000 under $200,000 . . . . . . . . . . . . . . . 55 9,243 125 7,902 4,189 174 29,786 392 25,325 13,502 13 2,231 33 1,764 856 1920 $200,~~ :der $500,000 . . . . . . . . . . . . . . . 35 9,563 74 8,457 4,757 182 50,979 425 43,314 24,247 9 2,419 17 1,999 1,025 2021$500,
der $1,000,000 . . . . . . . . . . . . . 5 3,806 10 2,999 1,664 25 16,505 62 14,083 8,331 - - - - - 2122 $1,000,000 or more . . . . . . . . . . . . . . . . . . . 2 2, Y72 3 2,148 1,079 12 20,716 23 17,932 1 10,580 - - - - 2223 Nontaxable returns, total . . . . . . . . . . . . . . . 201 056 1374 956 511,353 275 - 426 .509 1747 .729 1,101,818 4,245 - 34 416 182 881 1002987 - 2324 No adjusted gross income . . . . . . (2) 12, -. . . . . . .. k 1 (1) - 2 902 42,379 - - 2425 Under $1,000 . . . . . . . . . . . . . . . . . . . . . . . . . . 48,013 29,282 92,611 1 72:.-. 44 134,828 5,429 3,180 10,674 2526 $1,000 under $2,000 . . . . . . . . . . . . . . . . . . . 66,976 97,512 144,747 - 37 '
.201,898 286,538 - - 8,644 12,521 17,189 2627 $2,000 under $3,000 . . . . . . . . . . . . . . . . . . . 44,069 107,129 125,636 - - '05 :L 264,494 310,019 266 - 7,102 18,189 21,528 - 27
28 $3,000 under $4,000 . . . . . . . . . . . . . . . . . . . 25,497 86,630 94,421 275 - 61 221 209,714 211,781 1,186 - 6 724 23 251 24,554 - 285 829 $4,000 under $5,000 . . . . . . . . . . . . . . . . . .. 8,858 38,394 37,910 - - 92,307 82,376 1,539 - (25 (2i (1) - 2930 $5,000 or wre . . . . . . . . . . . . . . . . . . . . . . . . 3,6 21,362 18,016 - - 46, 1 33,897 1,254 - 3,339 18,141 15,528 - 3031 Returns under $5,000 . . . . . . . . . . . . . . . . . . . . 420,976 11,153,850 926,055 246,332 48,983 981,024 12 :13,5
2 2'660,636 130,833 74,229 233,797 175,638 51,632 10,31 532 Returns $5,000 under $10,000 . . . . . . . . . . . . 217,175 1,483,"5 485,277 768,585 154,9" 732,876 5 :672 1:166701 :151 2,671,411 538,999 90 528 633,693 247,957 277,991 56,124 3233 Returns $10,000 or more . . . . . . . . . . . . . . . . . "'000 821,041 101,804 617,746 172,764 191,615 3,336,347 424,790 2,526,383 708,667 18 290 299,675 45,942 209,740 55,948 33
Vermact Virginia Washington
1 Grand total . . . . . . . . . . . . . . . . . . . . . . . ~~769 179 .872 188,393 40,455 7,L7 - 'A 134,645 1,688,592 2,2121 . M A 136.680 1 .4-34 .084 1 2 .315-6791 521 - 961 12 Taxable returns, total . . . . . . . . . . . . . . . . . . 57.841 365.530 122.157 188 .393 40 .455 569,917 3.982,997 1 .209 .335 2,221,272 497,359 538,ZT4.056 .276 1,199,165 2,313,918 521,%1 23 Under $1,000 . . . . . . . . . . . . . . . . . . . . . . . . .. - - - - - - - - - - - 34 000 under $2,000 . . . . . . . . . . . . . . . . . . . (2) (2) (2) 095 16,954 12,115 3,044 612 7 44 ; 12,31~ 8,930 1,938 389 45 $28000 under $3,000 . . . . . . . . . . . . . . . . . .. 7,61 .0 22:4,727 12,235 4 3,251 ": 746 113,594 73,712 26,452 5,327 58 35,984 13,893 2'7Q5 5G $3,000 und.r $4,000 . . . . . . . . . . . . . . . . . . . 6,552 23,278 ou~ "183 1,43.~ 68,263 238,035 135,333 71,136 14,263 39, D45 138,386 76,738 41,649 8,153 67 $4,000 under $5,000 . . . . . . . . . . . . . . . . . . . 11,358 50,989 23,323 20,105 3,979 86,385 389,862 189,434 1", 165 28,548 60,137 273,7% 128,490 105,928 20,871 7a $5,000 under $6,000 . . . . . . . . . . . . . . . . . . . 7,757 42,417 16,802 19,298 3,859 83,778 462,745 190,300 207,929 41,466 89,255 492,357 206,697 210,757 42,029 89 $6,000 under $7,000 . . . . . . . . . . . . . . . . . .. 10,570 68,672 24,097 34, 56~ 6,903 73,262 475,762 167,691 238,546 47,796 87,489 568,768 213,772 270,476 54,040 910 $7,000 under $8,000 . . . . . . . . . . . . . . . . . . . 5,740 42,680 12,907 22,879 4,614 46,812 348,910 100,927 199,578 40,370 70,787 528,629 164,737 287,059 57,712 1011 $8,000 under $9,000 . . . . . . . . . . . . . . . . . 2 419 20 256 5 986 10,517 2,131 41,858 354,469 89,390 213,458 43,674 43,798 372,884 107,221 213,215 43,497 1112 $9,000 under $10,000 . . . . . . . . . . . . . . . . (2 i (2; (2') (1) (1) 32,649 309,348 69,790 196,761 40,621 36,499 345,372 75,212 224,945 46,479 12
13 $10,000 under $15,000 . . . . . . . . . . . . . . . . . 3,412 40,861 8,045 26,809 5,640 59,609 699,095 129,344 471,162 99,798 60,080 701,019 132,081 481,462 102,177 1314 $15,000 under $20,000 . . . . . . . . . . . . . . . . . 839 14,565 2,221 10,658 2,416 11,626 197,302 25,747 144,936 33,167 10,239 174,Da2 23,221 132,220 30,638 1415 *201000 und :, *25,000.. . . . . . . . . . . . . . . . . 431 9,536 1,078 7,109 1,713 4,400 98,186 9,727 77,016 19,219 4,324 %'099 10,386 76,686 19,325 1516 $25,000 und r $50,000. . . . . . . . . . . . . . .
. 359 10,486 691 8,473 2,386 5,115 168,441 12,825 135,838 40,955 5,392 181,819 12,638 153,727 47,760 1617 $50,000 under $100,000 . . . . . . . . . . . . . . . . 48 2,971 133 2 39 1,088 71,261 2,498 59,131 24,230 1,093 70,553 2,585 62,435 26,412 17is $100,000 under $150,000 . . . . . . . . . . . . . . . (2) (2)(1) (2i, (1)9 151 18,303 331 15,083 7,661 157 18,939 303 17,256 8,778 1819 $150,000 under $200,000 . . . . . . . . . . . . . . . 2 367 4 311 160 38 6,424 92 5,208 2,822 38 6,431 83 5,656 3,043 1920 1200,000 under $500,000 . . . . . . . . . . . . . . . 3 918 7 423 254 37 10,328 79 8,339 4,743 34 9,342 79 8,236 4,353 2021 $500,000 under $1,000,000 . . . . . . . . . . . . . 1 981 1 361 261 4 2,738 9 2,443 1,227 9 5,763 17 4,751 2,634 2122 $1,000,00c) or more . . . . . . . . . . . . . . . . . . .. - - - 1 1 1,240 1 1,047 860 1 1 1,755 1 1 1,739 876 22
23 Nontaxable returns, total . . . . . . . . . . . . . .. 630 141,239 57,715 177,137 13 648 479,257 607- 94,232 118D," 234,919 1,760 7 23
24 No adjusted gross income . . . . . . . . . . . . . . (2) (2) (2)5,060 315,635 10,217 - - 6,927 '13,545 15,140 - - 2425 Under $1,000 . . . . . . . . . . . . . . . . . . . . . . . . .. 3,382 2,442 7,395 27,112 17,526 54,906
- -14,364 8,381 25,633 - - 2526 $1,000 under $2,000 . . . . . . . . . . . . . . . . . . . 7,520 10,567 17,257 61,570 93,050 140,854 191 - 27,403 41,159 55,831 29 - 2627 $2,000 under $3,000 . . . . . . . . . . . . . . . . . . . 4,001 9,934 1.1,026 ",117 107,525 lZ7,195 64 - 27,754 69,112 73,700 279 - V28 $3,000 under $4,000 . . . . . . . . . . . . . . . . . . . 3,397 11,599 13,033 26,821 90,851 94,418 260 - 9,837 34,085 31,253 760 - 2829 $4,000 under $5,000 . . . . . . (2) (2) 9,795 4:3,167 39,838 - - 4,154 18,752 15,595 571. - 2930 $5,000 or more . . . . . . . . (1)
.1 2 (2) 1 - __a&L6L 121 1 3031 Returns under $5,000 . . . . . . . . . . . . . . . . . . . . 397 1128,505 101, "7 30,861] 6,129 383,964 11,094,929 878,022 245 302 1 48 750 219,645 1640,408 467,1 '115 :40737 32
-32 Returns $5,000 under $10,000 . . . . . . . . . . . . 28,969 1%,474 66,223 99,971 20,122 280,985 1,%5,834 629,788 1,056 :272 213:927 331,520 2,329,104 784,953 1
. 3-1 3233 Returns $10,000 or mom . . . . . . . . . . . . . . . . . 5,105 81,790 12 .202 57,561 14,204 02,105 1,273,882 180,782 1 920,305 234,692 1 81,"S 1 1,267,168 13
:71 -'l
Footnotes at end of table . See text for "Description of Sample" and "Explanatiom of ClaaaificatLone and Term
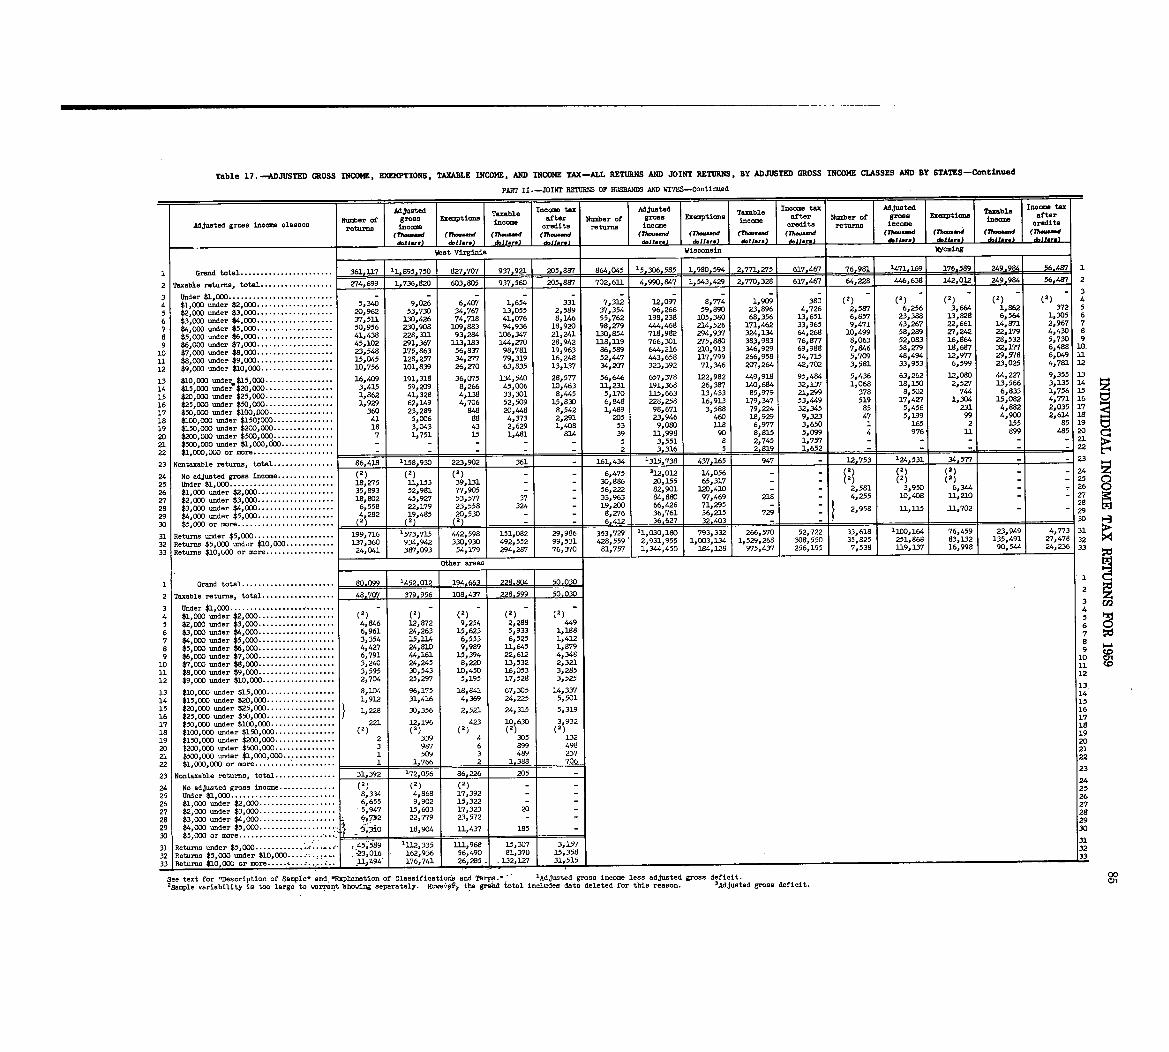
Table 17 . -ADJUSTED GROSS INCOME, EXEMPTIONS, TAXABLE INCOME, AND INCOME TAX-ALL RETURNS AND JOINT RETURNS, BY ADJUSTED GROSS INCOME CLASSES AND BY STATES-Continued
PART JI .-JOINT RETURNS OF HUSBANDS AND WIVES-Continue d
Adjusted Taxable Income Adjusted Taxable Income Adjusted Taxable Income
Adjusted grossincome classes Number of gross Exemptions income after Number of gross Exemptions income after Number of gross Exemptions income after
returns. income credits returns income credits returns income credits
(7h--d (77-W (7h--d (Yh--d (Th--d (7h--d (Th-..d (lh--.d (7hm"nd (7%--d (7h-W (T?k-d
d.11- .) d.11. .. ) d.11mr .) d.11.. . d.1i.. . d0l.r .) &liars) dw-) d.11 .. ) dollor .) *11-3
Vest Virginia Wisconsin woming
1 Grand total . . . . . . . . . . . . . . . . . . . . . . . 361,117 11,995,750 8Z7.707 937,921 205.887 864,045 15,306,585 1,980,594 2,771,Z75 617 .467 76.981 1471 .169 176,589 249,984 56,487 1
2 Taxable returns, total . . . . . . . . . . . . . . . . . . Z74,699 1,736,820 603,805 937,560 205,887 702,63.1 4,990,847 1,543,429 2,770,328 617,467 64,228 446,638 142,012 249,984 56,487 2
3 er $1,000 . . . . . . . . . . . . .. - - - - - - - - - - - - - - - 3
4 000 under 1000 . . . . . . . 5,340 9,026 6,40`7 1,654 331 7,312 12,0917 8,774 1,909 380 (2) (2) (2) (2) (2) 4
5 $2,000 under $3,000 . . . . 20,962 53,730 34,767 3-3,055 2,589 37,354 96,266 59,990 23,896 4,726 2,587 6,256 3,664 1,862 372 5
6 $3 000 under $4,000 . . . . 37,511 130,426 74,718 41,076 8,146 55,762 198,238 105,390 68,356 13,651 6,857 23,388 13,828 6,564 1,305 6
7 $4 :000 under $5,000 . . . ... . . . . . . . . . . . . . 50,956 230,908 109,883 94,936 18,920 98, Z79 444,468 214,526 171,462 33,965 9,471 43,267 22,661 L4,671 2,967 7
8 $5 000 under $6,000 . . . . 41,438 228,33.1 93,284 106,347 21,241 130,854 718,982 294,937 324,134 64,268 10,499 58,289 Z7,242 22,179 4,430 8
9 $6:000 under $7,000 . . . . 45,102 291,367 113,183 144,Z70 28,942 328,3.19 766,301 Z75,880 383,983 76,877 8,063 52,083 16,864 28,532 5,730 9
10 $7 , 000 under $8,000 . . . . . . . . 23,548 175,863 56,837 98,781 19,963 86,589 644,216 210,913 -346,929 69,988 7,846 58, Z79 18,687 32,177 6,488 10
11 $8,000 under $9,000 . . . . . . . . 3.5,045 128,257 34,Z77 79,319 16,248 52,447 443,658 3.17,799 266,958 54,715 5,709 48,494 12,977 29,578 6,049 11
12 $9,000 under $3.0,000 . . . . . . . . . . . . . . . . . . 10,756 101,839 26,Z70 63,835 13,137 34,207 323,392 71,346 207,264 42,702 3, .581 33,953 6,599 23,025 4,761 12
13 $10 000 under.$15,000 . . . . . . . . . . . . . . . . . 16,409 191,318 36,075 134,540 28,577 56,646 657,378 122,982 449,918 95,484 5,436 63,262 12,080 44,2Z7 9,355 3 .3
14 $15 :000 under $20,000 . . . . . . . . . . . . . . . . . 3,415 59,209 8,266 43,006 10,463 3-1,231 191,368 26,387 140,684 32,137 1,068 18,150 2,5Z7 13,566 3,135 14
15 $20,000 under $25,000 . . . . . . . . . . . . . . . . . 1,862 41,328 4,138 33,301 8,445 5,170 3.15,663 13,433 85,979 21,299 378 8,502 744 6,833 1,756 , z
16 $25,000 under $50,000 . . . . . . . . . . . . . . . . . 1,929 62,149 4,706 52,509 15,830 6,W 228,258 16,913 179,347 53,449 519 17,4Z7 1,304 15,082 4,771 16 tv
17 $50,000 under $100,000 . . . . . . . . . . . . . . . . 360 23,289 848 20,448 8,542 1,489 98,671 3,588 79,224 32,345 85 5,456 231 4,882 2,035 17 H
18 $100,000 under $150,000 . . . . . . . . . . . . . . . 41 5,006 88 4,373 2,291 205 23,946 460 18,929 9,323 47 5,199 99 4,900 2,614 18
19 $150,000 under $200,000 . . . . . . . . . . . . . . . 18 3,043 43 2,629 1,408 53 9,080 3.18 6,977 3,650 1 165 2 155 85 19
20 $200,000 under $500,000 . . . . . . . . . . . . . . . 7 1,751 15 1,481 814 39 11,998 90 S,W 5,099 4 976 11 899 485 20
21 $5OO,OD0 under $1,000,CbO . . . . . . . . . . . .. - - - - - 5 3,551 8 2,745 1,757 - - - - - 21;>
22 $1,000,000 or mom . . . . . . . . . . . . . . . . . . . . --=- - - - I - 2 3.316 5 2.819 1.652 - - - L - 22
23 Nontaxable returns, total . . . . . . . . . . . . . . . 86,418 1158,930 223,902 361 161,434 1315,738 437,165 947 12,753 124,531 34,577 23
24 No adjusted gross income . . . . . . . . . . . . . . (2) (2) (2) - - 6,475 312,012 14,056 - 2 24 5R
25 Under $1,000 . . . . . . . . . . . . . . . . . . . . . . . . . . 18,275 11,153 39,131 - 30,886 20,155 65,317 (:)) (2) (2) 25
26 $1,000 under $2,000 . . . . . . . . . . . . . . . . 35,893 52,981 77,905 - - 56,222 82,901 120,410 - 2,581 3,950 6,344 26
27 $2, 000 under $3,000 . . . . 18,802 45,9Z7 53,577 37 - 33,963 84,880 97,469 218 4,255 10,408 11,210 Z7
28 $3,000 under $4,000 . . . . . . . 6,558 22,179 23,558 324 - 19,2DO 66,426 71,295 - 28
29 $4,000 under $5,000 . . . . . . . . . . . . . . . . . . . (4 2 2 19,485 20,5 - - 8, Z76 36,761 36,215 729 2,958 11, 115 .11,702 29
30 $5,000 or more . . . . . . . . . . . . . . . . . . . . . . . . (2) (2) - - 6,412 36,627 1 32,403 30
S559 EReturns under $5,000 . . . . . . . . . . . . . . . . . . . 199,716 1573,715 442,598 151,082 29,986 3523 11 030 1 266 5~ 52,722 33,618 1100,1 76 45 '949 4,773 31.31 :71 793' '2
70
23
32 Returns $5,000 und,,r $10,000 . . . . . . . . . . 137,360 934,942 3-30,930 492,552 99,531 4 21,931:9585 1,13,~ 1,52 :26 "~50 35,825 251,86". .31 .92 135,491 27,478 320 0 f77 2524,041 387,093 54,179 294,287 76,370 1,3",450
S1119 4 6,195 7 538
33 Returns $lO,UO0 or more . . . . . . . . . . . . . .. 81,757 1.2 119, L 16,998 90,544 24,236 33
Other areas
1 Grand total . . . . . . . . . . . . . . . . . . . . . . . 80,099 1452,012 194.663 228.804 50,0301
2 Taxable returns, total . . . . . . . . . . . . . . . . . . 48,70`7 379,956 108,4Y7 228,599 50,030 2
3 z3 Under $1,000 . . . . . . . . . . . . . . . . . . . . . . . . U2
4 1,000 under $2,000 . . . . . (2) (2) (2) (2) (2) 4
5 2,ODO under $3,000 . . . . . 4,846 12,872 9,254 2,288 4495
6 $3,000 under $4,000 . . . . . . . . . . . . . . . . . . . 6,961 24,263 15,623 5,933 1,188 67 $4,000 under $5,000 . . . . . . . . . . . . . . 3,354 15,114 6,553 6,525 lp412 7
8 $5jOOO under $6,000 . . . : : . . . . . . . . . . . . 4,4Z7 24,810 9,989 1.1,645 1,879 8 0-1
9 $6,000 under $7,000 . .. 6 791 44,161 15,394 22,612 4,348 9 to
10 $7,000 under $8,000 . . . 31,240 24,245 8,220 13,532 2,321 10
11 $8,000 under $9,000 . . . . . . . . . . . . . . . . . . . 3,595 30,543 10,450 16,053 3,285 1112 $9,000 under $10,000 . . . . . . . . . . . . . . . . . . 2,704 25,2917 5,195 17,528 3,525 12
13 $10,000 under $15,000 . . . . . . . . . . . . . . . . . 8,104 96,175 18,841 67,305 14,337 13,
14 15,000 under $20,ODO . . . . . . . . . . . . . . . . . 1,93.2 31,416 4,369 24,225 5,501 14
15 $20,000 under $25,000 . . . . . . . . . . . . 1,228 30,356 2,521 24,315 5,31915
16 $25,000 under $50,000 . . . . . . . . . . .. 16
17 $50,000 under $100,000 . . . . . . . . . . . . . . . . 221 121 196 423 10 1 630 3,932 17
18 $100 000 under $150,000 . . (2) (2) (2) (2) (2) is
19 $150:000 under $200,000 . . : : :,.-.'.**- .. 2 339 4 305 132 19
20 t200,000 under $500,000 . . . . . . . . . . 3 987 6 899 498 20
21 $5OO,OD0 under $1,000,000 . . . . . . .. 1 509 3 489 237 21
22 $1,000,000 or more . . . . . . . . . . . . . . . . .. .. 1 1.766 2 1 .388 706 22
23 Nontaxable returns, total . . . . . . . . . . . . . . . 31,392 172,056 86,226 205 23
24 No adjusted gross income . . . . . . . . . . . . . . (2) (2) (2) - 24
25 Under $1,000 . . . . . . . . . . . . . . . . . . . . . . . . .. 8,334 4,868 17,392 25
26 $1,000 under $2,000 . . . . . . . . . . . . . . . . . .. 6,655 9,902 15,322 - 26
27 $2,000 under $3,000 . . . . . . . . . . . . . . . . . . . 5,947 15,603 17,323 20 27
28 $3,000 under $4,000 . . . . . . . . . . . . . . . . . . 6,7.52 22,T79 23,572 - 28
29 $4,000 under $5,000 . . . . . . . . . . . . . . . . 18,904 11,437 185 - 29
1 3030 $5,000 or mom . . . . . . . . . . . . . . . . . . .
31 Returns under $5,000 . . . . . . . . . . . .--- . . _45- M9 1112,335 111,968_1 15-307 3,15731
32 Returns $5,000 under $10,000 . . . . . .-23 :016 162,936 56,490 81,37015358 32
33 Returns $10,000 or mom . . . . . . . . . . . . . .. . . .14-494 176,741 26,205 132, lZ7 3 133
See text for -Description of Sample- and . -Explanation of Classifi.atimio and TLrgm .- 'Adjusted gross income less adjusted gross deficit . 00
2Sample variability is too large to warTant 'showing separately . Howevqf, the graid iotal includes data deleted for this reason . 3AdjuBted gross deficit. Cn
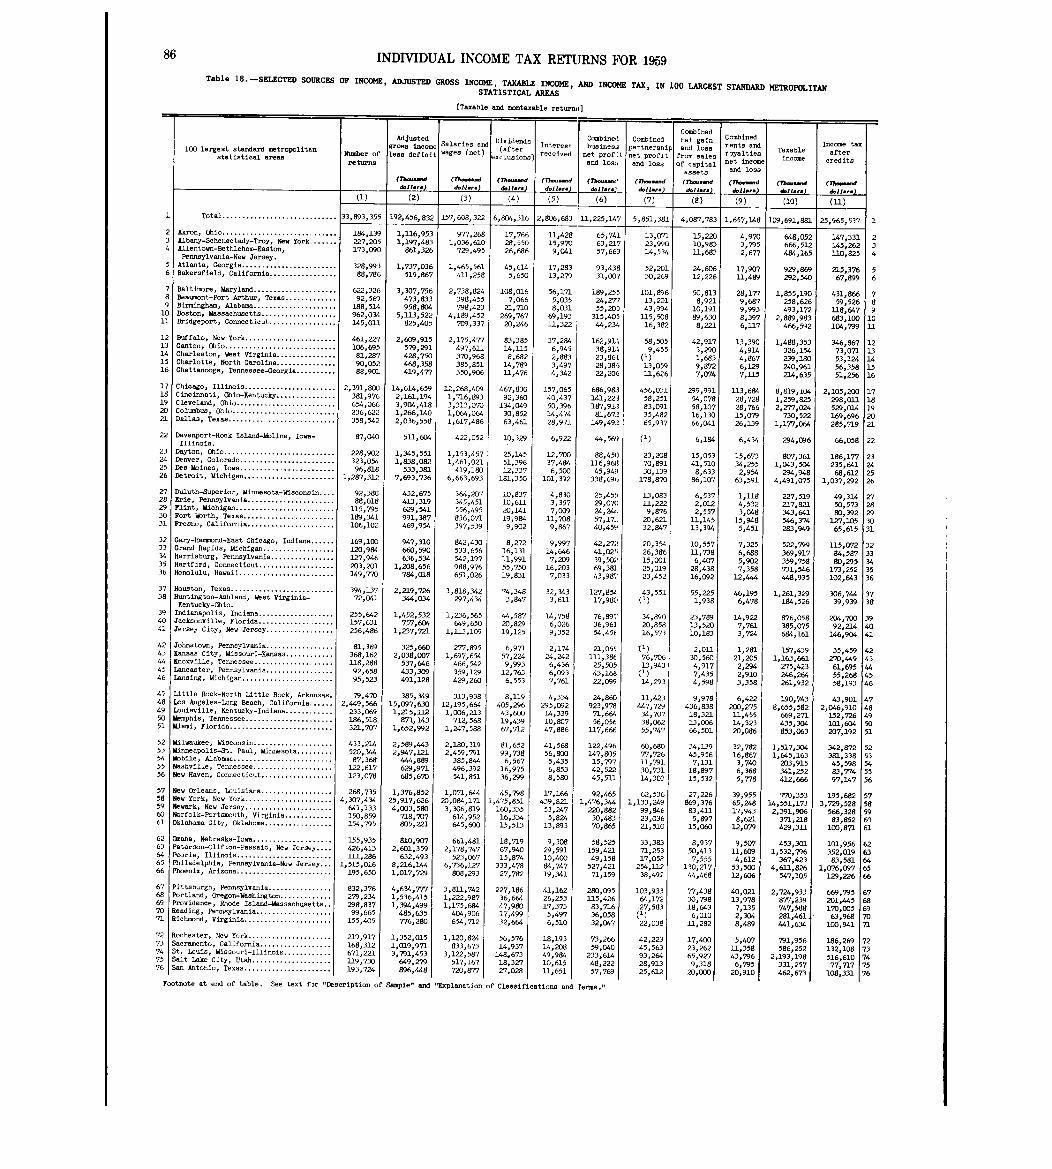
86 INDIVIDUAL INCOME TAX RETURNS FOR 1959Table 18 . -SELECTED SOURCES OF INCOME, ADJUSTED GROSS INCOME, TAXABLE INCOME, AND INCOME TAX, IN 100 LARGEST STANDARD METROPOLITAN
STATISTICAL AREAS
[Taxable and nontaxable returnit]
Combine dAdju ted
Salaries andDividends
IntConibined Comb ined net gain
Combinedre t d Inc
ta x100 largest standard metropolitan
Waab.~ I
i
0
neome
g .7Is deficit wages (net)ft er
18
eres treceived
business
net profLtpartnersh inet f t
p and los sf
n s a nroyalties Taxable a Mter
statistical areasreturns
exlos
c ionsand loan
pro iand lose
arom saleof capital net income
income credit s
assets and loss
(Th--.d (7h-...d (7h--d (Th--d (7Y.-,1 (Th- ...d (Th-d (Th-d (7h...-d (Th-dd.11. .. ) d.14... d.11-I-) d.11.r .) dDl1mrs doll.. . doll.. . d.11... dli. .. d.11-)
(2) (3) (4) (5) (6) (7) (8) (9) (10) (11 )
'I Total . . . . . . . . . . . . . . . . . . . . . . . . . . . . . 33,893,355 192,456,832 157,608,322 6,804,316 2,806,683 11,225,147 5,851,381 4,087,783 1,657,148 109,691,881 25,965,537 1
2 Akron, Ohio . . . . . . . . . . . . . . . . . . . . . . . . . . . . . 184,139 1,U6,953 977,268 17,766 11,428 65,741 13,0'a 15,220 4,970 648,052 331147 23 Albany-Schenectady-Troy, New York . . . . . . . 227,205 1,197,483 1,036,610 28,550 15,970 63,217 23,990 10,983 3,795 666,512,
145 262 34 Allentown-Bethlehem-Easton, 173,090 $61,326 729,495 26,686 9,041 57,663 14,534 1.1,683 2,677 484,165,
110 825 4Pennsylvania-New Jersey .,
5 Atlanta, Georgia . . . . . . . . . . . . . . . . . . . . . . . . 328,993 1,737,036 1,465,561 45,614 17,283 93,438 52,201 24,SG6 17,907 929,869 215 376 56 Bakersfield, California . . . . . . . . . . . . . . . . . 88,786 519,867 411,258 5,650 13,279 31,007 30,269 12,226 1.1,489 292,540,
67,899 6
7 Baltimore, Maryland . . . . . . . . . . . . . . . . . . . . . 622,326 3,307,756 2,738,824 108,016 56,171 189,255 101,896 50,813 28,177 1,855 190 431 866 78 Beawcnt-Port Arthur, Texas . . . . . . . . . . . . . 92,569 473,833 398,455 7,066 5,035 2,4,277 13,201 8,921 9,687
,258,626
,59 526 8
9 Birmingham, Alabama . . . . . . . . . . . . . . . . . . . . . 188,514 958,804 798,423 21,710 8,031 55,20D 43,994 10,191 9,993 493,172,
118 647 910 Boston, Massachusetts . . . . . . . . . . . . . . . . . . . 962,034 5,113,522 4,189,452 269,767 69,193 315,405 115,508 89,630 8,397 2,889,983,
683 100 1011 Bridgeport, Connecticut . . . . . . . . . . . . . . . . . 145,01-1 925,405 709,337 20,246 11,322 44,234 16,382 8,221 6,117 466,592,
104,799 U
12 Buffalo, New York. . . . . . . . . . . . . . . . . . . . . . . 461,227 2,609,915 2,175,477 83,385 37,284 162,914 58,505 42,917 13,390 1,488 353 346 867 1213 Canton, Ohio . . . . . . . . . . . . . . . . . . . . . . . . . . . .14 Charlest W t Vi i
106,695 579,291 497,611 14,115 6,945 38,9L. 9,455 3,290 4,914,
326,154,
73,071 1 3on, es rg nia . . . . . . . . . . . . . . . 81,287 428,750 370,968 8,682 2,883 23,861 (1 )
1,683 4,867 239,180 53,124 1415 Charlotte, North Carolina . . . . . . . . . . . . . . . 90,052 468,358 385,851 14,789 3,497 28,386 13,059 9,872 6,129 240 961 56 358 1 516 Chattanooga, Tennessee-Georgia . . . . . . . . . . 88,901 419,477 350,906 11,476 4,342 22,206 1.1,626 7,074 7,U5,
214,635,
51,256 16
17 Chicago, Illinois . . . . . . . . . . . . . . . . . . . . . . .18 Ci i
2,391,800 14,614,659 12,268,409 467p830 157,065 686,983 456,031 299,991 113,684 8,819,104 2,105,200 1 7nc nnati, Ohio-Kentucky . . . . . . . . . . . . . . . 381,976 2,161,194 1,716,893 92,360 40,437 141,223 58,251 54,078 28,728 1,259 825 298 011 1 819 Cleveland, Ohio . . . . . . . . . . . . . . . . . . . . . . . . .20 Columbus Ohi.
654,066236 622
3,904,4181
3p313,070 134,049 50,396 187,918 83,091 58,107 28,766,
2,277,024,
529,014 19, . . . . . . . . . . . . . . . . . . . . . . . . . .21 Dallas Texas
, ,266,140 1,064,064 30,852 14,474 81,672 35,482 16,130 15,079 73Op522 169,696 20, . . . . . . . . . . . . . . . . . . . . . . . . . . 358,542 2,036,558 1,617,486 63,461 28,971 149,492 65,937 66,041 26,139 1,177,064 285,719 21
22 Davenport-Rock Island-MD11ne, Iowa- 8?,040 51-1,604 422,052 10,329 6,922 44,561) (1) 6 164 4346 294 096 66 058 22Illinois ., , , ,
23 Dayton, Ohio. . . . . . . . . . . . . . . . . . . . . . . . . . . .24
228,902 lp345,551 1,153,457 25,145 12,700 88,450 23,208 15,053 15,673 807,361 186,177 23Denver, Colorado. . . . . . . . . . . . . . . . . . . . . . . .25 Des Moines I
323pO54 1,838,082 1,461,021 51,396 37,484 116,9611 70,891 41,510 34,255 1,043,504 235,641 24, owa. . . . . . . . . . . . . . . . . . . . . . . .26 Detroit, Mi .hig.. . . . . . . . . . . . . . . . . . . . . . .
96,81 81,287,312
533,3817,693,736
419,1806p663,693
12,33 7181,350
6,500101,392
45,949338o696
30,139178,870
8,63386,107
2,954
63,5912914,9148
4,491,07568p6l.2
1,037,2922526
7 Duluth-Superior, Minnesota-Wisconsin . . . . 92,388 432,675 364,207 10,837 4,830 25,455 13,083 6,537 iplis 227 519 49 314 278 Erie, Pennsylvania . . . . . . . . . . . . . . . . . . . . . . 88,016 413,319 345,451 10,611 3,357 29,070 11,222 2,012 4,532,
217,821,57350 28.9 Flint, Michig . . . . . . . . . . . . . . . . . . . . . . . . . 1-15,795 629,541 556,495 20,141 7,009 24,244 9,876 2,557 3pG48 343,641
,80 392 290 Fort Worthp Texas . . . . . . . . . . . . . . . . . . . . . . .
1 Fresno California189,34110 1
991,387 836,071 19,984 1-1,708 57,171. 20,621 U,145 15,948 546,374,
127,105 30, . . . . . . . . . . . . . . . . . . . . . . 6, 02 469,954 397,539 9,902 9,867 40,459 32,S47 13,394 5,451 283,949 65,615 31
2 Gary-hammsnd-East Chicago, Indiana . . . . . . 169,100 947,310 942,430 8,272 9,997 42,272 20,354 10,557 7,325 522 799 0721.15 3 23 Grand Rapids, Michigan . . . . . . . . . . . . . . . . . . lwo984 660,590 533,656 16,131 14,646 41,025 26,386 11,738 6,688,
369,917,
84 587 3 34 Harrisburg, Pennsylvania . . . . . . . . . . . . . . . .5
127,946 636,534 542,197 U,991 7,209 39,502 15,001 6,407 5,902 359,758,
80 295 34Hartford, Connecticut . . . . . . . . . . . . . . . . . . . 203,201 1,208,656 988,976 55,750 16,203 69,381, 25,019 28,438 7,358 731,546,
173 252 3 56 Honolulu, Hawaii . . . . . . . . . . . . . . . . . . . . . . . . 149,770 784,018 651,026 19,831 7,033 43,981,1 23,452 16,092 12,444 448,935,
102,643 3 6
7 Houston, Texas . . . . . . . . . . . . . . . . . . . . . . . . . .8 Huntin ton-Ashland W t Vi i i
394,137 2,219,726 1,818,342 74,348 32,343 127,854 43,551 55,225 46,195 1,261,329 306,744 3 7g , es rg n a- 72,041 344,0_34 297,434 3,847 3,611 17,980 1) 1,938 6 478 184 526 39 939 3 8Kentucky-Ohio ., , ,
9 Indianapolis, Indiana . . . . . . . . . . . . . . . . . . . 255,642 1,452,532 1,236,565 597 14,758 76,89T 34,890 23,789 14,92.2 876,058 204 700 390 Jacksonville, Florida . . . . . . . . . . . . . . . . . . .1 J Cit
157,631 757,604 649,650 20,829 6,026 36,962 20,858 13,520 7,761 385,075,
92,214 40ersey y, New Jersey . . . . . . . . . . . . . . . . . 256,486 1,237,721 1,113,109 19,125 9,352 54,45E 16,57-3 10,183 3,724 684,161 146,904 41
2 Johnstown, Pennsylvania . . . . . . . . . . . . . . . . . 81,369 325,660 277,895 6,971 2,174 21,055 V) 2,01.1 1,281 157,439 35 459 423 Kansas City, Missourl-Kansas . . . . . . . . . . . . 368,162 2,038,007 1,697,654 57,224 24,242 111,38E 76,706 30,560 21p205 1,163,661,"9270 43Knoxville, Tennessee . . . . . . . . . . . . . . . . . . . . 1-18,288 537,646 466,542 9,993 6,436 25,505 1.3,943 4,917 2 294 275 423
,
61 695 445 Lancaster, Pennsylvania . . . . . . . . . . . . . . . . .6 Lansing Michigan
92,65895 5 3
433,309 359,129 12,763 6,093 43,168 1) 7,435,
2,910,
246,264,
55,268 45, . . . . . . . . . . . . . . . . . . . . . . . , 2 491,128 429,260 6,553 7,761 22,099 14,293 4,598 3,358 261,932 58,193 46
7 Little Rock-North Little Rock, Arkansas . 79,470 385,349 313,938 8,119 4,334 24,860 11,423 9,978 6,422 190 743 43 901 478 Los Angeles-long Beach, California . . . . . . 2,449,566 15,097,630 12,195,664 405,296 295,092 923,978 447,729 436,838 200,275,
8,655 582,
046 91 02 489 Louisville, Kentucky-Indiana . . . . . . . . . . . . 233,069 1,215,112 1,006,213 43,600 14,339 71,664 34,707 18,321 11,455,
669 271,,726152 4 90 Memphis, Tennessee . . . . . . . . . . . . . . . . . . . . . .
1 Kiwi Florida186,518 871,143 712,568 19,439 10P807 56,056 38,062 13,006 14,323
,435,304
,
101,604 50, . . . . . . . . . . . . . . . . . . . . . . . . . . 321,707 1,652,992 1,247,588 67,712 47,886 117,666 55,747 66,501 20,086 853,063 207,192 51
2 Milwaukee, Wisconsin . . . . . . . . . . . . . . . . . . . .3 Mi li St l
433,21.4 2,589,443 2,180,319 81,652 41,568 122,496 60,680 34,139 32,782 1,517,304 342,M 52nneapo s- . Pau , Minnesota. . . . . . . . .il
520,344 2,947,121 2,459,791 99,738 56,800 147,805 77o726 45,956 16,867 1,645,163 381,338 53Mob e, Alabwa . . . . . . . . . . . . . . . . . . . . . . . . . 87,368 444,889 385,844 6,567 5,435 15,797 1-1,791 7,131 3,740 203,915 45 598 545 Nashville, Tennessee . . . . . . . . . . . . . . . . . . . . 122,617 629,971 496,392 16,975 6,853 42,522 30,731 18,897 6,368 341,252,
83,774 556 New Haven, Connecticut . . . . . . . . . . . . . . . . . . 123,078 685,670 541,851 36,299 8,580 45,511 14,303 15,532 5,778 412,666 97,147 56
7 New Orleans, Louisiana . . . . . . . . . . . . . . . . . .8
268,735 1,376,852 1,071,644 45,798 17,166 92,465 62,536 27,226 39,955 770,353 195,682 57New York, New York. . . . . . . . . . . . . . . . . . . . . .9 Newark New Je s
4p3O7,434 25,917,626 20,084,171 1,475,851 439,821 1,476,344 1,133,249 869,376 65,248 14,551,173 3,729,528 58, r ey . . . . . . . . . . . . . . . . . . . . . .Norfolk-Portsmouth, Virginia . . . . . . . . . . . .
641,13 3150,859
4,003,580718 707
3o .306,81 9614 952
160,33 516 334
53,24 75 M
220,88230 483
99,8460323
83,411 17,943 2,391,906 566p328 59
1 Oklahoma City, Oklahoma . . . . . . . . . . . . . . . . . 154,795,
805,221,
645,600,
15,513,
13,893,
70,865, 6
21,5105,99715,060
8,62112,079
371,218429,311
83,852100,871
6n61
2 Omaha, Nebraska-Iowa . . . . . . . . . . . . . . . . . . . .3 Pat s Clift
155,935 8I0p9O7 661,481 18,719 9,308 58,525 33,383 8,937 9,507 453,301 101,956 62er on- on-Passaic, New Jersey . . . . 426,413 2,601,359 2ol78,747 67,940 29,591 159,421 71,253 50,413 11,609 lo532,796 352 019 63Peoria, Illinois . . . . . . . . . . . . . . . . . . . . . . . .5 Phil d l hi
111,286 632p493 523,067 15,874 10,400 49,158 17pO58 7,555 4,612 367,423,
83,581 64a e p a, Pennsylvania-New Jersey . . . 1,515,016 8,216,144 6,736,127 333,478 84,747 527,421 254,112 130,217 53p5OO 4,611,826 1 076 097 6 56 Phoenix, Arizona . . . . . . . . . . . . . . . . . . . . . . . . 195,650 1,017,729 808,293 27,782 19,341 71,159 38,492 44,468 12,606 547,105, ,129,226 66
7 Pittsburgh, Pennsylvania . . . . . . . . . . . . . . . . 832,376 4,634,777 3,811,742 227,186 41,162 280,095 103,933 77,438 40,021 2,724 933 669 795 6 78 Portland, Oregon-Washington . . . . . . . . . . . . .idP
279,234 1,536,415 1,222,987 36,664 26,253 1.15,426 64,172 30,798 13,978,
SW,239,
201p"5 68rov ence, Rhode Island-Massachusetts . .d
298p837 1,394,499 1,175,684 47,980 17,373 83,716 27,583 18,643 7,135 747,588 170 005 69Rea ing, Pennsylvania . . . . . . . . . . . . . . . . . . . 99,665 485,635 404,906 17,499 5,497 36,058 1) 6,010 2,304 281,461,
63 968 70Richmond, Virginia . . . . . . . . . . . . . . . . . . . . . . 155,405 776,280 654,712 32,664 6,510 32,047 22,038 11,282 8,489 441,634,
100,941 71
Rochester, New York. . . . . . . . . . . . . . . . . . . . . 219p917 1,352,015 1,120,824 56,576 18,193 73,266 42,223 17,400 5,407 791 956 269186 72Sacramento, California . . . . . . . . . . . . . . . . . .St Louis Missouri-Illinois
168,312 1,019,971 833,673 14,937 14,208 59,040 45,563 23,262 11,358,
586,252,
132,108 73. , . . . . . . . . . . . .Salt Lake City, Utah . . . . . . . . . . . . . . . . . . . .
671,22 11.19 730
3,791,453649 279
3,122,587167517
148.67318 327
49,99410 615
233,61448 2
93,264 65,927 43p796 2,193,198 516p6lO 74
San Antonio, Texas . . . . . . . . . . . . . . . . . . . . . .,
193,724,
896,448,
720,877,
27,028,
1-1,651,22
57,76928,91325,612
9,31820,000
6,79520,910
331,257462,673
77,717108,33 1
2
3
575676
22
33
33
33
33
555455
555606
666466
66697071
777477
Footnote at end of table . See text for "Description of Sample" and "Explanation of Classifications and rerms .11
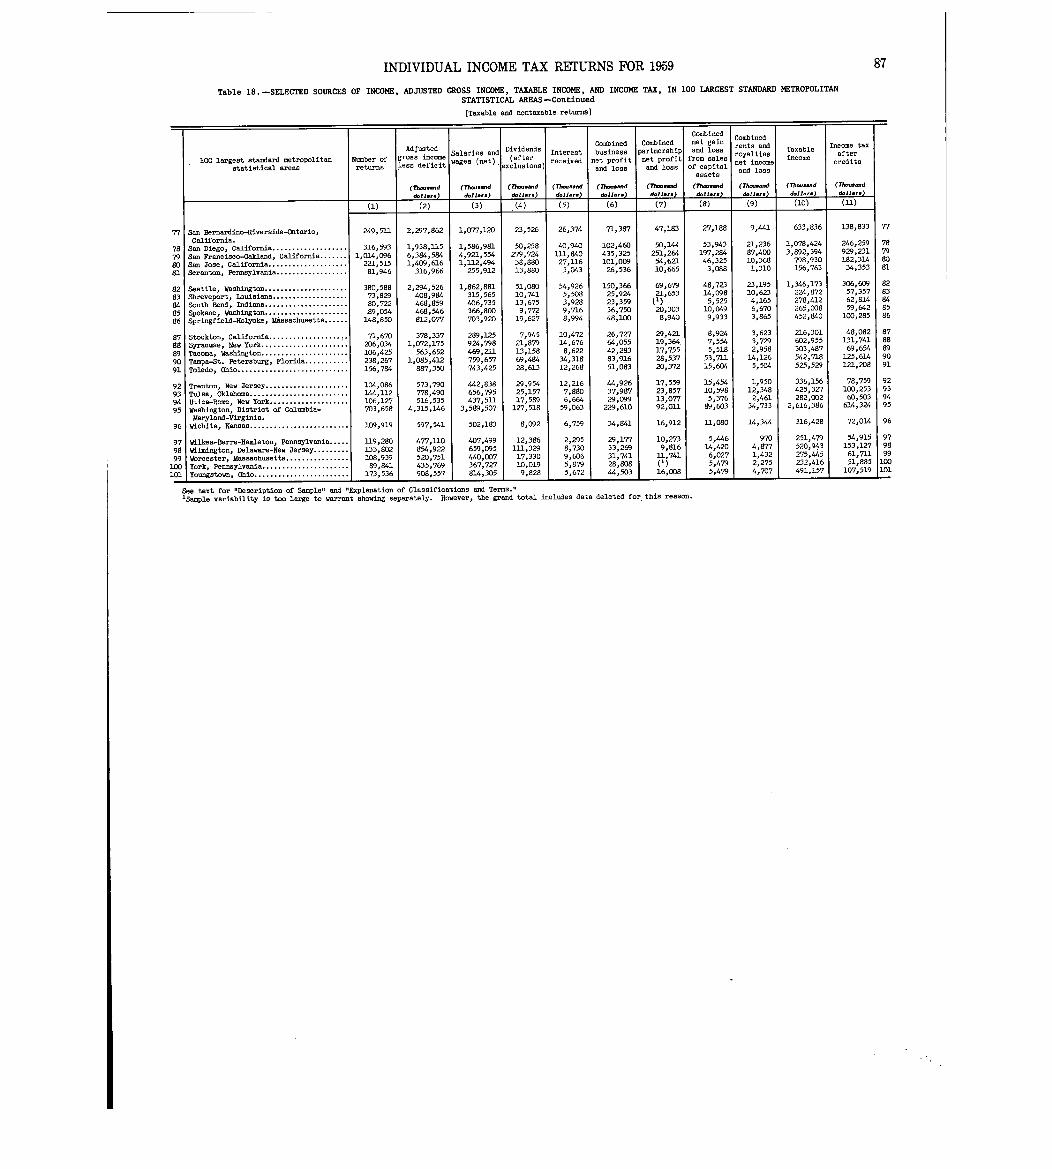
INDIVIDUAL INCOME TAX RETURNS FOR 1959
Table 18. -SELECTED SOURCES OF INCOME, ADJUSTED GROSS INCOME, TAXABLE INCOME, AND INCOME TAX, IN 100 LARGEST STANDARD METROPOLITANSTATISTICAL AREAS-Continued
(Taxable and nontaxable returns]
87
00 largest standard metropolitan
statistical areas
umber ofreturns
Adjustedgross incomeless deficit
(7h--d
Salaries and
wage, knet )
77-.-d
Dividend s
afte rexclusions )
(Th...-d
Interestreceived
Th- ...dd.11...
Combined
pro
f
bousiness
r
:_
net profi t
Landloss
(Th--d
Combinedpartnershipnet profi tand los s
(Th---dd*11...
Combine d
net gain
and
flos s
rom sale sof capita l
asset s
(Th--d
d.11. ..
Combine drents androyaltiesnet incomeand los s
(Th---.dd.11 ...
Tiaxableneome
77,- .- dd.11 .1 .)
Income taxaftercredit s
(77.u.- dd.11- )
(2) (3) .(4) (5) (6) (7) (8) (9) (10) (11 )
77 San Bernardino-Riverside-Ontario, 249,511 2,297,862 1,077,120 23,526 26,374 71,387 47,183 27,188 9,441 633,836 138,833 77
78
California .
San Diego, California . . . . . . . . . . . . . . . . . . . 316,593 1,938,115 1,586,981 50,25 87249
40,940111 840
102,460435 325
50,144
251 264
53,943197 284
21,23687 400
1,078,424
3943 892
246,259929,231
7879
79 San Francisco-Oakland, California . . . . . . .lif i
1,014,09 6221 515
6,384,5846161 409
4,921,5541 112 494
,2738 880
,27,116
,101,009
,54,621
,46,325
,10,368
,,798,930 182,314 80
8081
a . . . . . . . . . . . . . . . . . . . .San Jose, Ca ornScranton, Pennsylvania . . . . . . . . . . . . . . . . . .
,81,946
,,316,966
, ,255,912
,
13,880 3,043 26,536 10,665 3,088 1,310 156,763 34,353 81
82 Seattle, Washington . . . . . . . . . . . . . . . . . . . . . 380,588 2,294,526 1,862,881 51,080 54,926 150,366 69,679 48,7238
23,19510 623
1,346,173872224
306,609
57 357
8283
83 Shreveport, Louisiana . . . . . . . . . . . . . . . . . . . 73,829 408,984 315,565 10,741 5,508
3 928
25,92,423 359
21,65 3
(1)
14,0952 55
,4 165
,278 412
,62,814 84
8485
South Bend, Indiana . . . . . . . . . . . . . . . . . . . . .
Washington . . . . . . . . . . . . . . . . . . . . .Spokane
80,72289,054
468,859468,546
406,73 5366,800
13,6759,772
,9,716
,
36,750 20,303,
10,049
,6,670
,265,008 59,642 85
86~
Springfield-Holyoke, Massachusetts . . . . . . 148,850 812,077 703,920 19,62~ 8,994 48,100 8,940 9,933 3,865 452,840 100,285 86
87 Stockton, California. . . . . . . . . . . . . . . . . . : . 71,670 378,337 289,125 7,945 10,472 26,727 29,421 8,924554
3,62 33 729
216,301955602
48,082741131
8788
88 Syracuse, New York. . . . . . . . . . . . . . . . . . . . . . 206,03442 5106
1,072,17 5563 652
924,M
469 211
21,879
13 158
14,6768 622
64,05542 293
19,36-4 .17,755
7,5,518
,2,958
,
303,487
,69,654 89
89
90
Tacoma, Washington . . . . . . . . . . . . . . . . . . . . . .Florida. . . . . . . . . . .Tampa-St . Petersburg
,
238,267
,1,085,412
,759,657
,69p484
,34,318
,83,916 28,537 53,711 14,126 542,718 125,614 90
91~
Toledo, Ohio . . . . . . . . . . . . . . . . . . . . . . . . . . . . 156,784 887,350 743,425 28,613 12,268 51,083 20,372 15,604 5,504 525,529 121,208 91
92 Trenton, New Jersey . . . . . . . . . . . . . . . . . . . . . 104,086 573,79 04
442,83 8
656 79529,95425 157
12,21 68807
44,92 6
37 987
17,55985723
15,45410 598
1,95 012,348
336,15 6425,327
78,759100p253
929 3
9 394
Tulsa, Oklahoma . . . . . . . . . . . . . . . . . . . . . . . . .
New York . . . . . . . . . . . . . . . . . . . .Utica-Rame
144,11 2106,127
778, 9 0516,535
,437,511
,17,589
,6,664
,29,099
,13,077
,5,376 2,461 282,002 60,503 94
95,
Washington, District of Columbia- 703,658 4,315,146 3,589,507 127,518 59,063 229,610 92,02.1 99,603 34,733 2,616,386 614,324 9 5
96
Maryland-Virginia .
Wichita, Kansas . . . . . . . . . . . . . . . . . . . . . . . . . 109,919 597,541 502,183 8,092 6,759 34,841 16,912 1-1,080 14,344 316,428 72,014 9 6
97 Wilkes-Baxre-Hazleton~ Pennsylvania . . . . . 119,280 477,110 407,499 12,386 2,295 29,lT7 10,27 381 69
5,44 614 420
9704 877
251,479
943520
54,915127153
9 79 8
98 Wilmington, Delaware-New Jersey . . . . . . . . . 133,802 854,922 659,095440 007
111,32933017
8,730
9 606
33,26931 741
,74 11 1
,
6 027
,1 432
,275,445
,
61,711 9 999100
Worcester, Massachusetts . . . . . . . . . . . . . . . .Pennsylvania. . . . . . . . . . . . . . . . . . . . . .York
108,939
89,841520,751435,769
,367,727
,10,019
,5,879
,28,808
- ,
(1)
,5,479
,2,275 232,416 51,885 10C
101,
Youngstown, Ohio . . . . . . . . . . . . . . . . . . . . . . . . 1 173,536 1 908,557 1 814,305 1 9,828 1 5,6721
44,503 1 16,008 1 5,479 1 4,707 1 491,157 107,519 101
See text for -Description of Sample" and -'Explanation of Cl .ssificatios and Terms .1-
1Sample variability is too large to warrant showing separately . However, the grand total includes data deleted for, this reason .
7 t-,88- 800
RUH R k Una kkkak kkkkk
89 HH:
. . . . . . . . . . .
. . . . . . . . . . . . . . . . . . . . . . . . . . . . . . . . . . . . . . . .
tj
ciPY y -W.8r- ~-,PA5,9, p e ",P,§ J8 Pp
tog F 81 . IM9 UM
U H5,'t "M I M~~ w!! F zi t .9 1 u V. 0- ;~2 1!~g lu 1180N~w "1 0 0
i upun "I "r. ma .. . .. ME 1 F 2 9g
40 VP rlsQ,-.Qe 'Pee Jll~or .~-,~ 01~11;111~vrlr Wp ellpis"
V V Njr w o~"-Uu ~q t s,!Z 9 UU5 v -t~ !'Z ~,§?ko MH HM
16' - 1~7 - - z~' I t"Ztg Ue P r- 'W", 'p"P Pe, 'Pll, ?Vw APA~ ve-~- 'N P~ NH rJ9 J-~ 9,
HI gg H :M .~Zsk-6 9 1 M I't 9M? ~.l 9 9 91~ M F .9 R -1 19 to
e00 V 4 9 9 Z' H.' 0 x R 11 0" U N 18 1 1 r". Xg r; T4 I !"g 59 i "a H FS -4 V. Z-9,; k am m r HE U t'~ E
5ew 09 W-0 Ol 9 rM~ 6 9 R 9 E 03 E 491 Mj"§ HHH HaV4 U 6 MH ~.vglgH rM
ee ~-eep,5 Ppvr eI F 9 E 9 § R ~"Mh CH 9092 M&HE M~i 9 E r f &, H~ 4§ t N V x n 9E 9 ~!~r ~d IS; ~ s ~ 6~Iw , w
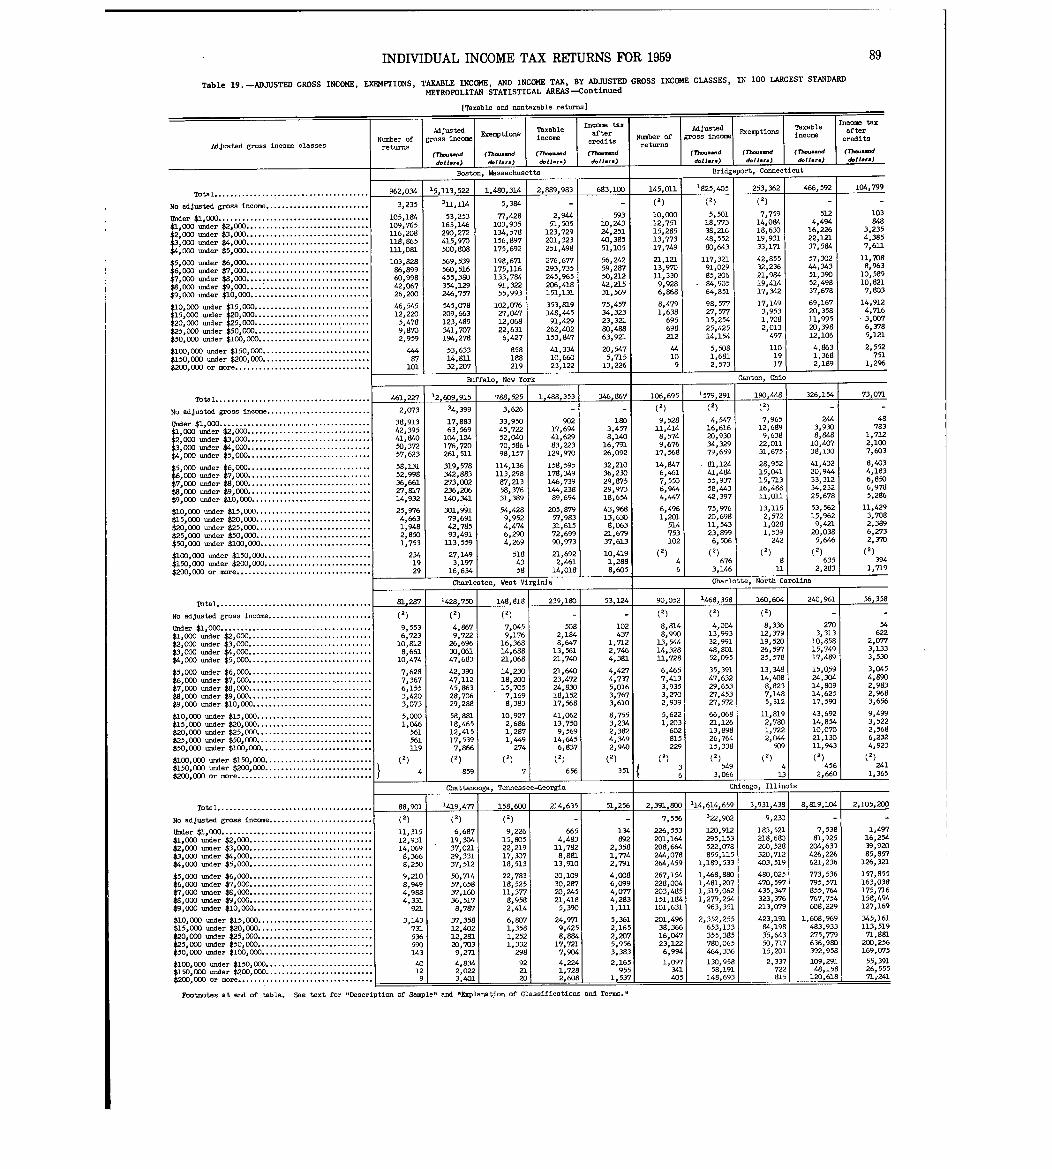
INDIVIDUAL INCOME TAX RETURNS FOR 1959
Table 19. -ADJUSTED GROSS INCOME, E)04PTIONS, TAXABLE INCOME, AND INCOME TAX, By ADJUSTED GROSS INCOME CLASSES, IN 100 LARGEST STANDARD
METROPOLITAN STATISTICAL AREAS-Continue d
(Taxable and nontaxable returns I
Number ofreturns
962,034
3,235
105,194109,765116,208118,865l3a,081
103,82886,89960,99842,06726,200
46,54512,2205,4789,8702,95 9
44487
101
461 2_27
2,073
38,91342,39541,84050,37257,623
58,13152,99836,66127,81714,932
25,9764,6631,9482,850lo75 3
2341929
81,287
(2)
9,5536,723
10,8128,661
10,474
7,6287,3676,1553,4203,073
5,0001,046
561561119
2)
4
88,901
(2)
11,31512,93114,06 98,3668,250
9,2108,9494,9884,33 1
921
3,143731536590143
40129
Adjustedgross income
(Th--dd.11.. .)
Boston, Massachusetts
15,1.13,522
311,114
53,25 3163,146290,272415,970500,808
569,539560,516455,380354,129246,757
545,078209,663123,499341,707194,27 8
53,63314,81132,207
Buffalo, Ne . York
12,609,915
34,399
17,88363,569
104,124176,720261,511
319,578342,883273,002236,206140,341
301,49179,69142,78593,491
113,559
27,1493,197
16,634
Charleston, West Virgini a
1428,750
(2)
4,8679,722
26,69630,06147,683
42,39047,11245,86328,70629,288
58,88118,46512,41517o5397,866(2)
859
1419,477
(2)
6,68719,30437,02129,33137,512
50,71457,65837,16036,51 .78,787
37,35812,40212,28120,7039,271
4,8342,0223,401
Exemptions
(Th-dbll- .)
1,480,314
5,384
77,42 8103,935134,578156,897175,692
198,671175,116133,79491,32255,993
102,07627,04712,06822,6316,427
85818821 9
788_525
3,626
33,95045,72252,04070,58698,157
114,136113,29887,21358,37631,399
54,4289,9524,4746,2904,26 9
5184358
148,818
(2)
7,0459,176
16,36814,68821,068
14,23018,20015,70 57,1698,383
10,92 72,6861,2871, "q
274
(1)7
Chattanooga, Tennessee-Georgia
158 6_00(2)
9,22615,80522,21917,30718,513
22,78318,52511,3778,9582,414
6,8071,3581,2521,332
298
922120
Taxableineome
(Th . . dd.11. ..
2,889,98 3
-
2,94451,50 5
123,729201,323251,498
276,677293,735245,%5206,418151,131
353,819148,44 591,429
262,402153,847
41,33410,66023,12 2
1,488,353
-
90217,69441,62983,223
129,970
158,595178,349146,7391", 23 889,694
205,87957,98331,61572,69990,973
21,6922,461
14,018
239,180
-
5082,1848,647
13,56121,740
21,64023,47224,83018,15217,568
41,06213,7509,569
1406456,837(2)
656
214,63 5
-
6654,483
11,78 28,881
13,910
20,10930,28720024521,41 85,390
24,9719,42580884
17,7217,904
4 2241:7282,608
Income taxafter
credits
(771--dd~11-)
683,100
-
59310,24324,25140,38551,105
56,24259,28750,21242,21531,569
75,45734,32323,32180,48863,921
20,54 75,715
13,226
346_867
-
1803,4578,140
16,79126,092
32,21036,23029,87529,97318,654
43,96813,6308,063
21,67937,613
10,4191,2888,605
53,124
-
102437
1,7122,7464,381
4,4274,7375,0163,7673,610
8,7553,2342,3824,3492,940
351
51,256
-
13489 2
2,3581,7742,791
4,0086,0994,0774,2831,111
5,3612,1652,2075,9563,383
2,165955
1,537
Number ofreturns
145,01 1
(1)
10,00012,75115,28513,77317,749
21,12113,97011,3309,9286,868
8,4791,63 8
695698.21 2
109
106,695
(2)
9,52811,4148,5749,676
17,568
14,84 76,4617,5506,9444,447
6,4961,201
514753102
(2)
46
90,052
(2)
8,8148,99 0
13,54414,3281-1,728
6,4657,4133,9353,2702,939
5,6221,203
602815229
(2)
36
2,391,8 W
7,556
226,553201o164208,664244,078264,459
267,154228,004203,485151,184101,631
201,49638,36616,04723,1226,994
1,097341405
Adjustedgross income
(TV .-dd.11 ... )
1825,40 5
(2)
5,50 118,77338,21648,55280,643
117,32191,02985,20684,90564,851
98,57727,57715,25425,42514,154
5,5081,6812,573
1579,291(2)
4,54716,61620,93034,32979,659
81,12441,48455,93758,44342,397
75, cY7620,69811,54323,8996,506
(1)676
3,146
1468,358
(2)
4,00413,99332,99148,80152,095
35,39147,63229,65327,45327,572
66,06821,12613,89826,76415,338(2)
5493,066
114,614,659
322,902
120,912295ol53522,078855,11 5
1,189,533
1,468,8801,481,2071,519,0621,279,254
963,351
2,352o255653,133355,385780,065464,336
130,95858,191
148,693
Exemptions
(77--dd.11-)
Bridgeport, Connecticut
253,362
(1)
7,75914,09418,63019,93133,171
42,85532,23621,98419,41417,342
17,1493,9531,7082,013
497
110191 7
Canton, Chi o
190,44 8
(2)
7,96512,6899,638
22,01131,675
28,95215,04115,71316,48811,011
13,11 52,5721,0281,539
242
(1)8
) l
Charlotte, North Carolin a
160,604
(1)
8,33612,37919,52026,59725,578
13,34814,40 88,8237,1485,31 2
11,8192,7801,7222,044
509(2)
41 3
Chicago, Illinois
3,931,438
9o230
183,521218,680260,528320,712403,519
480,025470,597435,347323,376213,079
423,19194,19815,64350,71715,201
2,337722815
Taxablaincome
(Th- ...dd.11 ., .)
466,592
-
5124,494
16,22622,12137,584
57,30244,34351,39052,49837,678
69,16720,35811,99520,39812,106
4,8631,3682,18 9
326,154
-
2443,9308,848
10,40738,130
41043220,94433,31234,23225,678
53,56215,9629,42120,03 85,646
(2)
6352,283
240,961
-
2703,313
10,85815,74917,489
15,0~924,30414,80914,62517,590
43,69214,85410,07021,13011,943(2)
4562,66 0
8,819,104
-
7,53881,925
204,639426,226621,236
773,536795,571855,764767,7546080229
1,608,969483,933275,779636,980392,958
109,29148,158
120,61 8
Adjusted gross income classes
Total . . . . . . . . . . . . . . . . . . . . . . . . . . . . . . . . . . . . . . .
No adjusted gross income . . . . . . . . . . . . . . . . . . . . . . . . . .
Under $1,000 . . . . . . . . . . . . . . . . . . . . . . . . . . . . . . . . . . . . . .$1 000 under $2,000 . . . . . . . . . . . . . . . . . . . . . . . . . . . . . . .
$2 :000 under $3,000 . . . . . . . . . . . . . . . . . . . . . . . . . . . . . . .
$3 000 under $4,000. . . . . . . . . . . . . . . . . . . . . . . . . . . . . . .$4 :000 under $5,000. . . . . . . . . . . . . . . . . . . . . . . . . . . . . . .
$5,000 under $6,000. . . . . . . . . . . . . . . . . . . . . . . . . . . . . . .$6,000 under $7,000. . . . . . . . . . . . . . . . . . . . . . . . . . . . . . .$7,000 under $8,000. . . . . . . . . . . . . . . . . . . . . . . . . . . . . . .$8,000 under $9,000. . . . : . . . . . . . . . . . . . . . . . . . . . . . . . .$9j0DO under $10,000. . . . . . . . . . . . . . . . . . . . . . . . . . . . . .
$10,000 under $15,000. . . . . . . . . . . . . . . . . . . . . . . . . . ...
$15,000 under $20,000. . . . . . . . . . . . . . . . . . . . . . . . . . . . .$20,000 under $25,000. . . . . . . . . . . . . . . . . . . . . . . . . . . . .$25,000 under $50,000. . . . . . . . . . . . . . . . . . . . . .. . . . . . . .$50,000 under $1.00,000. . . . . . . . . . . . . . . . . . . . . . . . . . . .
$100,000 under $150,000 . . . . . . . . . . . . . . . . . . . . . . . . . . .
$150,000 under $200,000 . . . . . . . . . . . . . .$200,000 or more . . . . . . . . . . . . . . . . . . . . .
Total . . . . . . . . . . . . . . . . . . . . . . . . . . . . . . . . . . . . . . .
No adjusted gross income . . . . . . . . . . . . . . . . . . . . . . . . . .
Under $l,000 .jj :*,**,_*******_* . . . . ***** . . . . . .$1 ODD under 000 . . . . . . . . . . . . . . . . . . . . . . . . . . . . . . .$2 :000 under $3,000. . . . . . . . . . . . . . . . . . . . . . . . . . . . . . .$30000 under $4,000. . . . . . . . . . . . . . . . . . . . . . . . . . . . . . .$4,000 under $5,000. . . . . . . . . . . . . . . . . . . . . . . . . . . . . . .
$5,000 under $6,000. . . . . . . . . . . . . . . . . . . . . . . . . . . . . . .$6,000 under $7,000. . . . . . . . . . . . . . . . . . . . . . . . . . . . . . .$7 000 under $8,000. . . . . . . . . . . . . . . . . . . . . . . . . . . . . . .$8 :000 under $9,000. . . . . . . . . . . . . . . . . . . . . . . . . . . . . . .$9,000 -der $10,000. . . . . . . . . . . . . . . . . . . . . . . . . . . . . .
$10,000 under $15,000. . . . . . . . . . . . . . . . . . . . . . . . . . . . .$15,000 under $20,000. . . . . . . . . . . . . . . . . . . . . . . . . . . . .$20,000 under $25,000. . . . . . . . . . . . . . . . . . . . . . . . . . . . .$25,000 under $50,000. . . . . . . . . . . . . . . . . . . . . . . . . . . . .$50,000 under $100,000 . . . . . . . . . . . . . . . . . . . . . . . . . . . .
$100,000 under $150,000 . . . . . . . . . . . . . . . . . . . . . . . . . . .$150,000 under $200,000. . . . . . . . . . . . . . .$200,000 or more . . . . . . . . . . . . . . . . . . . . . .
Total . . . . . . . . . . . . . . . . . . . . . . . . . . . . . . . . . . . . . . .
No adjusted gross income . . . . . . . . . . . . . . . . . . . . . . . . . .
Under $1,000 . . . . . . . . . . . . . . . . . . . . . . . . . . . . . . . . . . . . . .
$1,000 under $2,000 . . . . . . . . . . . . . . . . . . . . . . . . . . . . . . .
$2,000 under $3,000 . . . . . . . . . . . . . . . . . . . . . . . . . . . . . . .
$3,000 under $4,000 . . . . . . . . . . . . . . . . . . . . . . . . . . . . . . .
$4,000 under $5,000 . . . . . . . . . . . . . . . . . . . . . . . . . . . . . . .
$5, 000 under $6,000 . . . . . . . . . . . . . . . . . . . . . . . . . . . . . . .$6,000 under $7,000 . . . . . . . . . . . . . . . . . . . . . . . . . . . . . . .$7,000 under $8,000 . . . . . . . . . . . . . . . . . . . . . . . . . . . . . . .$8,000 under $9,000 . . . . . . . . . . . . . . . . . . . . . . . . . . . . . . .$9,000 under $10,000 . . . . . . . . . . . . . . . . . . . . . . . . . . . . . .
$10,000 under $15,000 . . . . . . . . . . . . . . . . . . . . . . . . . . . . .$15,000 under $20,000 . . . . . . . . . . . . . . . . . . . . . . . . . . . . .$20,000 under $25,000 . . . . . . . . . . . . . . . . . . . . . . . . . . . . .$25,000 under $50,000 . . . . . . . . . . . . . . . . . . . . . . . . . . . . .$50,000 under $100,000. . . . . . . . . . . . . . . . . . . . . . . . . . . .
fOO:OD0 under $150,000. . . . . . . . . . . . . . . :
150 000 under $200,000. . . . . . . . . . . . . . . . .$200,000 or more. . . . . . . . . . . . . . . . . . . . . . . . . . . . . . . . . .
Total. . . . . . . . . . . . . . . . . . . . . . . . . . . . . . . . . . . . . . .
No adjusted gross income. . . . . . . . . . . . . . . . . . . . . . . . . .
Under $1,000. . . . . . . . . . . . . . . . . . . . . . . . . . . . . . . . . . . . . .$1 000 under $2,000. . . . . . . . . . . . . . . . . . . . . . . . . . . . . . .$2:000 under $3,000. . . . . . . . . . . . . . . . . . . . . . . . . . . . . . .$3,000 =der $4,000. . . . . . . . . . . . . . . . . . . . . . . . . . . . . . .$4,000 under $5,000. . . . . . . . . . . . . . . . . . . . . . . . . . . . . . .
$5,000 under $6,000. . . . . . . . . . . . . . . . . . . . . . . . . . . . . . .$6,000 under $7,000. . . . . . . . . . . . . . . . . . . . . . . . . . . . . . .$7,000 under $8, 000. . . . . . . . . . . . . . . . . . . . . . . . . . . . . . .$8,000 under $9,000. . . . . . . . . . . . . . . . . . . . . . . . . . . . . . .$9,000 under $10,000 . . . . . . . . . . . . . . . . . . . . . . . . . . . . . .
$10,000 under $15,000 . . . . . . . . . . . . . . . . .$15,000 under $20,000 . . . . . . . . . . . . . . . . .$20,000 under $25,000 . . . . . . . . . . . . . . . . . . . . . . . . . . . . .$25,000 under $50,000. . . . . . . . . . . . . . . . . . . . . . . . . . . . .$50,000 under $100,000 . . . . . . . . . . . . . . . . . . . . . . . . . . . .
$100,000 -der $150,000 . . . . . . . . . . . . . .",000 under $200,000 . . . . . . . . . . . . . .$200,000 or more . . . . . . . . . . . . . . . . . . . . . . . . . . . . . . . . . .
Footnotes at end of table . See text for "Description of Sample" and t'Explana#on of Classifications and Terms ."
(Th-nd&11...
89
Income taxfteon
reditB
104,799
-
103848
3,2354,3857,611
11,70 88,963
10,58910,8217,803
14,9124,7163,0076,3785,121
2,552751
1,2 %
73,071
(2)
-
48783
1,7122,1007,603
8,4034,1836,8506,9785,286
11,4293,708203896,2732,370
3941,71 9
56,358
54622
2,0773,1333,530
3,0454, M2,9832,9683,656
9,4993,5222,5686,23240923
(2)
2411,36 5
2,105,200
1,49716,25439,92085,857
126,321
157,855163,038175,716158,494127,169
345,161113,51 971,891
200,256169,0`75
55,39126,55571,-241
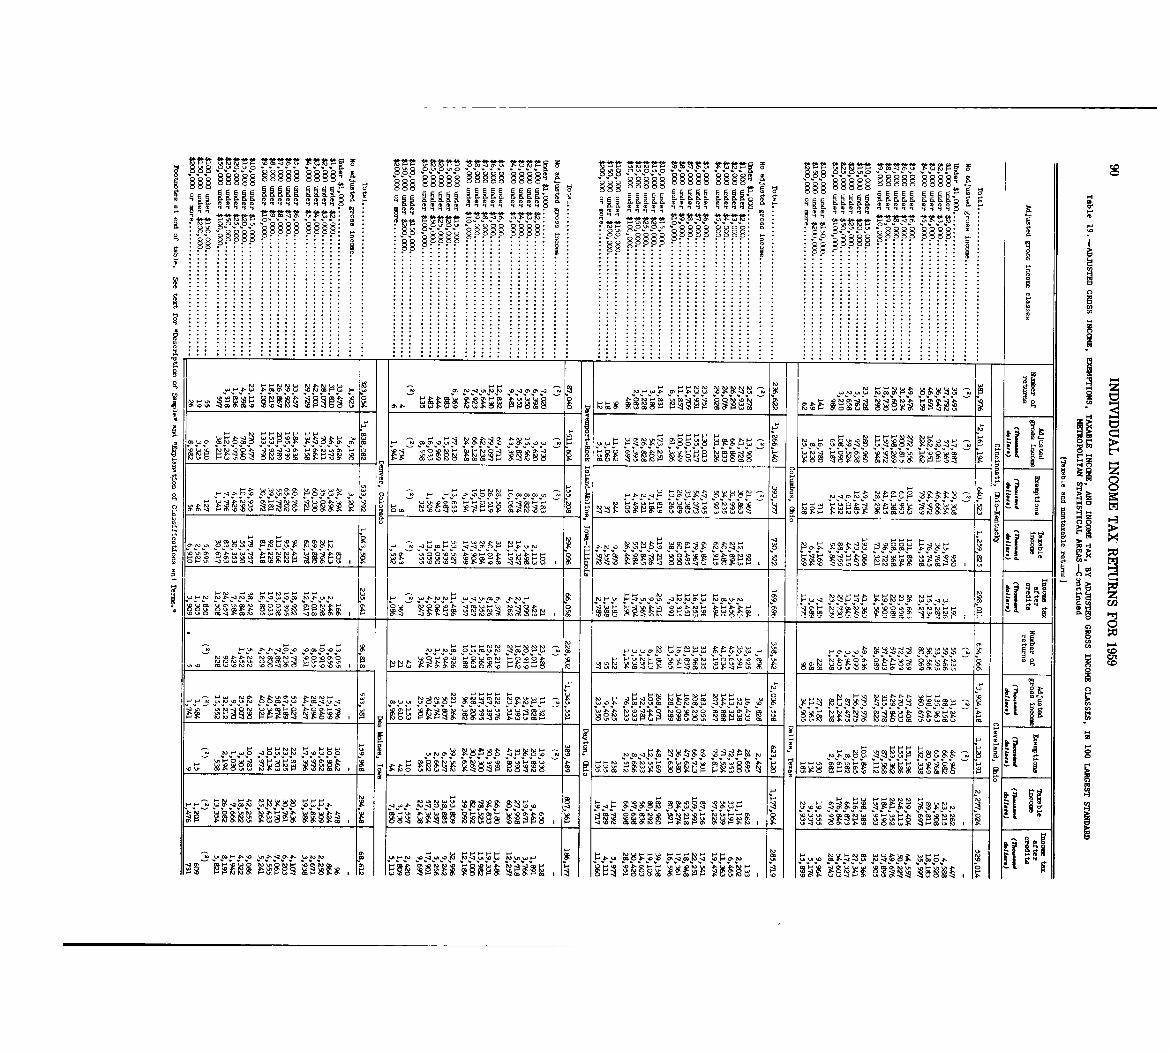
rr1m 10 -m rtnry 01 n_.t! tnn_.r18 Io - ~ ~ - - ~ ~ . - .
0 kit Zik kkkkk kk kkkkk MU-kk Me. . . . .. . -k§ kkkkk kkkkk kkkk'§. . . . . . . . . . . 04 m . § E kkkkk
r ~~rtr' M r~
1 . ? oo. . . . . . . o
18tv
. . . . . . . . . . . . . . . . . .
. . . . . . . . . . . . . . . .
N I II, wN-N I 1 1 .vp
wm 1w, Nm
m .l I "I I IP w I I :i m I I I r-M. . . . . . . . . . . . . . . . . . . .V .g. If P.l I o -I -c IN~ IcIlg MU . .Rwm I RI N o I H A
o
I ol Ir"A1. 1" "w 1. NI~I m
r * .,6t z Izo
"IN m
-IRE ~q;pp i I I
i4l,-M,
S
Zr, JIV!, p V4 t§~m gm~E . ~oo- gio I oy o~ o I ~NI l IoI gMe, f ~ o N
CAN~N Ngg~g Qo .~o
rwI" loll, 1 oIm mmu *P. r. W. R 1. -1 11 1 m m um I Im k Hog
I
o oI IN bHI Mp 2NNo -PHI- e eez`~ ev ~14 vl~,~, VPP
o na~l~ i~ I"N NS IN i 24 Of 9 1 f1i Ho P"~ 41 1 19 In ~~s !18 Z"g wl~ n. i's 10 18 t, lw~ dQ NMI m I m m M Im I ~~i 1. 1, m I—— m
PPPN NN'I N. 38 t'1 o8za 1 123 IWN I N I o I - I o g
j g~ vp ~R p ~4 gI
o
N I N I 1 8, 1 IMN I Ndw I 4Y. J y ? P,41- 1 41 WW~
-- ;-g r. V,r NZ m~318 zswIm N
Ie pl:a e e NY '.§P~9p ?'P'
lo "9 !,P ~1~ N5 ~ml i
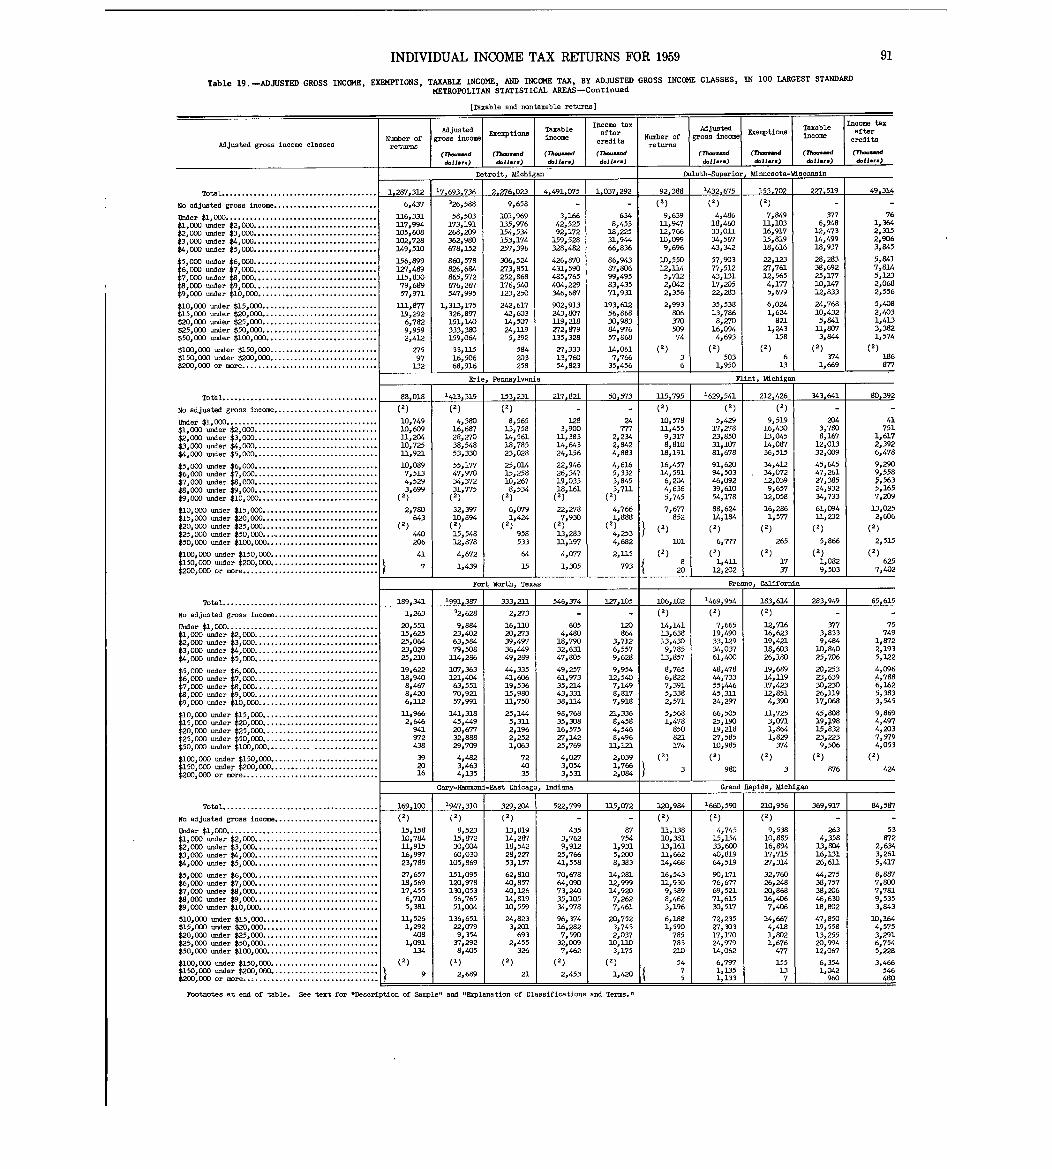
INDIVIDUAL INCOME TAX RETURNS FOR 1959
Table 19 . -ADJUSTED GROSS INCOME, EXEMPTIONS, TAXABLE INCOME, AND INCOME TAX, BY ADJUSTED GROSS INCOME CLASSES, IN 100 LARGEST STANDARD
METROPOLITAN STATISTICAL AREAS-Continued
Adjusted gross income classes
Total . . . . . . . . . . . . . . . . . . . . . . . . . . . . . . . . . . . . . . .
No adjusted gross income . . . . . . . . . . . . . . . . . . . . . . . . . .
Under $1,000 . . . . . . . . . . . . . . . . . . . . . . . . . . . . . . . . . . . . .. .$1,000 under $2,000 . . . . . . . . . . . . . . . . . . . . . . . . . . . . . . .$2,000 under $3,000 . . . . . . . . . . . . . . . . . . . . . . . . . . . . . . .$3,000 under $4,000 . . . . . . . . . . . . . . . . . . . . . . . . . . . . . . .$4,000 under $5,000 . . . . . . . . . . . . . . . . . . . . . . . . . . . . . . .
$5,000 under $6,000 . . . . . . . . . . . . . . . . . . . . . . . . . . . . . . .$6,000 under $7,000 . . . . . . . . . . . . . . . . . . . . . . . . . . . . . . .$7,000 under $8,000 . . . . . . . . . . . . . . . . . . . . . . . . . . . . . . .$8,000 under $9,000 . . . . . . . . . . . . . . . . . . . . . . . . . . . . . . .$9,000 under $10,000 . . . . . . . . . . . . . . . . . . . . . . . . . . . . . .
$10,000 under $15,ODO. . . . . . . . . . . . . . . . . . . . . . . . . . . . .$15,000 -der $20,000. . . . . . . . . . . . . . . . . . . . . . . . . . . . .$20,000 under $25,000. . . . . . . . . . . . . . . . . . . . . . . . . . . . .$25,000 under $50,000. . . . . . . . . . . . . . .$50,000 under $100,000 . . . . . . . . . . . . . .
$100,000 under $150,000. . . . . . . . . . . . . . . . . . . . . . . . . . .$150,000 under $200,000. . . . . . . . . . . . . . . . . . . . . . . . . . .$200,000 or more . . . . . . . . . . . . . . . . . . . . . . . . . . . . . . . . . .
Total . . . . . . . . . . . . . . . . . . . . . . . . . . . . . . . . . . . . . . .
No adjusted gross income . . . . . . . . . . . . . . . . . . . . . . . . . .
Under $1,000. . . . . . . . . . . . . . . . . . . . . . . . . . . . . . . . . . . . . .$1,000 under $2,000. . . . . . . . . . . . . . . . . . . . . . . . . . . . . . .$2,000 under $3,000. . . . . . . . . . . . . . . . . . . . . . . . . . . . . . .$3,OD0 under $4,000. . . . . . . . . . . . . . . . . . . . . . . . . . . . . . .$4,000 under $5,000. . . . . . . . . . . . . . . . . . . . . . . . . . . . . . .
$5,000 under $6,000. . . . . . . . . . . . . . . . . . . . . . . . . . . . . . .$6,000 under $7,000 . . . . . . . . . . . . . . . . . . . . . . . . . . . . . . .$7,000 under $8,000. . . . . . . . . . . . . . . . . . . . . . . . . . . . . . .$8,000 under $9,000. . . . . . . . . . . . . . . . . . . . . . . . . . . . . . .$9,000 under $10,000. . . . . . . . . . . . . . . . . . . . . . . . . . . . . .
$10,000 under $15,000. . . . . . . . . . . . . . . . . . . . . . . . . . . . .$15,000 under $20,000. . . . . . . . . . . . . . . . . . . . . . . . . . . . .$20,000 under $25,000. . . . . . . . . . . . . . . . . . . . . . . . . . . . .$25,000 under $50,000 . . . . . . . . . . . . . . . . . . . . . . . . . . . . .$50,000 under $100,000 . . . . . . . . . . . . . . . . . . . . . . . . . . . .
$100,000 under $150,000 . . . . . . . . . . . . .$150,000 under $200,000 . . . . . . . . . . . . .
: . . . : : : : :$200,000 or more. . . . . . . . . . . . . . . . . . . . .
Total . . . . . . . . . . . . . . . . . . . . . . . . . . . . . . . . . . . . . . .
No adjusted gross income . . . . . . . . . . . . . . . . . . . . . . . . . .
Under $1,000. . . . . . . . . . . . . . . . . . . . . . . . . . . . . . . . . . . . . .$1,000 under $2,000 . . . . . . . . . . . . . . . . . . . . . . . . . . . . . . .$2,000 under $3,000 . . . . . . . . . . . . . . . . . . . . . . . . . . . . . . .$3,000 under $4,000. . . . . . . . . . . . . . . . . . . . . . . . . . . . . . .$4,000 under $5,000 . . . . . . . . . . . . . . . . . . . . . . . . . . . . . . .
51000 under $6,000 . . . . . . . . . . . . . . . . . . . . . . . . . . . . . . .6,000 under $7,000 . . . . . . . . . . . . . . . . . . . . . .. . . . . . . . . .
$7,000 under $8,000 . . . . . . . . . . . . . . . . . . . . . . . . . . . . . . .$8,000 under $9,000 . . . . . . . . . . . . . . . . . . . . . . . . . . . . . . .$9,000 under $10,000. . . . . . . . . . . . . . . . . . . . . . . . . . . . . .
$10,000 under $15,000 . . . . . . . . . . . . . . . . . . . . . . . . . . . . .$15,000 under $20,000 . . . . . . . . . . . . . . . . . . . . . . . . . . . . .$20,000 under $25,000 . . . . . . . . . . . . . . . . . . . . . . . . . . . . .$25,000 under $50~000 . . . . . . . . . . . . . . . . . . . . . . . . . . . . .$50,000 under $100,000 . . . . . . . . . . . . . . . . . . . . . . . . . . . .
$100,000 under $150,000 . . . . . . . . . . . . . . . . . . . . . . . . . . .$150,000 under $200,000 . . . . . . . . . . . . . . . . . . . . . . . . . . .$200,000 or more . . . . . . . . . . . . . . . . . . . . . . . . . . . . . . . . . .
Total. . . . . . . . . . . . . . . . . . . . . . . . . . . . . . . . . . . . . . .
No adjusted gross income . . . . . . . . . . . . . . . . . . . . . . . . . .
Under $1,000. . . . . . . . . . . . . . . . . . . . . . . . . . . . . . . . . . . . . .$1,000 under $2,000 . . . . . . . . . . . . . . . . . . . . . . . . . . . . . . .$2,000 under $3,000 . . . . . . . . . . . . . . . . . . . . . . . . . . . . . . .$3,000 under $4,000 . . . . . . . . . . . . . . . . . . . . . . . . . . . . . . .$4,000 under $5,000 . . . . . . . . . . . . . . . . . . . . . . . . . . . . . . .
$5,000 under $6,000 . . . . . . . . . . . . . . . . . . . . . . . . . . . . . . .$6,000 under $7,000 . . . . . . . . . . . . . . . . . . . . . :$7,000 under $8,000 . . . . . . . . . . . . . . . . . . . . . . . . .$8,000 under $9,000 . . . . . . . . . . . . . . . . . . . . . . . . . . . . . . .$9,000 under $10,000. . . . . . . . . . . . . . . . . . . . . . . . . . . . . .
$10,000 under $15,000 . . . . . . . . . . . . . . . . . . . . . . . . . . . . .$15,000 under $20,000 . . . . . . . . . . . . . . . . . . . . . . . . . . . . .$20,000 under $25,000 . . . . . . . . . . . . . . . . . . . . . . . . . . . . .$25,000 under $50,000 . . . . . . . . . . . . . . . . . . . . . . . . . . . . .$50,000 under $100,000 . . . . . . . . . . . . . . . . . . . . . . . . . . . .
$100,000 under $150,000 . . . . . . . . . . . . . . . . . . . . . . . . . . .",000 under $200,000 . . . . . . . . . . . .$200,000 or more . . . . . . . . . . . . . . . . . . .
[Taxable and nontaxable returns ]
Footnotes at end of table . See text for "D~cription of Sample" and "Explanation of Classifications and Terms ."
(Th---dd.11 .. .
(2 )
(2)
91
Number ofreturns
1,287,312
6,437
326,331117,994105,608102,728149,510
156,899lZ7,489115,8_3079,68957,971
111,M19,2926,782919592,412
Z7597
1-32
88-018
)
(2)
10,74910,60931,20410,72511,921
10,0897,5134,5293,699
(2 )
2,780643
(2)
440206
41
7
189,341
1,263
20,55115,62525,06423,02925,210
19,62218,9408,4678,4206,112
11,9662,646
941972438
392016
169~100(2)
15,15810,78411,91516,99723,789
Z7,65718,56917,45 56,7105,381
11,5261,29 2
4081,091
134
(1)
9
Adjustedgross income
(Tb-.-dd.11 . . . )
Detroitp Michigan
17,693,736
326,588
58,503173,191268o209362,980678,152
860,578826,684865,572676,267547,99 5
1,313,175326,897151,140333 3801.59:064
33,11516,50668,916
Erie, Pennsylvania
1413,319(2)
4,38016,68728,Z7038,54853,330
55,17747,97034,37231,775(2 )
32,39710,894(2 )
15,54812,878
4,672
1,439
1991,387
12,628
9,89423,40263,59479,508
114,286
107,363121,40463,55170,92157,991
141,31845,44920,67732,88829,709
4,4823,4634,13 5
1947,310(2)
8,5233-5,87230,00460,030
105,869
151,095120,978130,05 356,76551,004
136,65122,(Y799,35437,2928,40 5
(1)
2,689
Exemptions
(lh-.-dd.11 . .. )
2,27§~W
9,658
101,969135,976154,534153,174257,396
306,524Z73,851252,868176,540121,250
242,61742,60314,50724 11951,392
584203258
15_3231(2)
8,56513,75814,56118,78523,028
25,01415,25810,2678,534
(2 )
6,(Y791,424
(1)95853 3
64
1 .5
Fort Worth, Texas
333,211
2,Z73
16, 11020,Z7339,49736,44949,289
44,33541,60619,53615,9803-1,750
25,1445,3112,1962,2521,06 3
72403 5
Gary-Hammond-East Chicago~ Indiana
329,20 4(2)
13,81914,28718,54228,2Z753,157
62,81040,85740,12614,81910,559
24,8233,20 1
6932,455
326
(1)
21
Tax bleaincome
(Th- .-d~611.. .
4,491,07 5
-
3,16642,52592,172
159,528328,482
426,870431,590485,765404,229346,687
902,93-3243,807119,218Z72 6791351,328
27,33313,76054,823
217,821
1283,900
11,38314,64324,156
22,94626,34719,03318,161(2 )
22,2787,930
(2 )
13,28312,197
4,(Y77
1,30 5
546,374
-
6054,48018,79032,63147,805
49,25761,97335,21443,33138, 114
98,76835,30816,575Z7,14225,769
4,OZ73,0543,53 1
522,79 9
4353,7629,91.2
25,76641,558
70,67864,09073,24035,10534,W8
96,37416,2827,59032,0097,462
(1 )
2,453
Income taxafterredit s
(Th-.-ddllaf .)
1,037,29 2
6348,45 3
18,22531,94466,836
86,94387,80699,49583,43571,931
193,61256,86830,98394,97657,868
14,061?,766
35,456
50,573
-
24777
2,2342,8424,883
4,6165,3323,8453,711
(2 )
4,7661,888
(2 )
4,2534,682
2,115
79 3
lZ7,105
-
120864
3,7126,5579,628
9,95412,5407,1498,8177,918
21,3368,4584,5468,496
1.1,121
2,0391,7662,084
115,017 2
8775 4
1,9315,2008,38 3
14,28112,99914,9207,2627,461
20,75 23,7432,037
10,11 .03,175
(2 )
1,420
Nuaiber ofreturn s
92,38 8
(2)
9,63 911, 94712,76610,0999,696
10,55012,1.145,7122,0422,356
2,99380637050974
(2)
36
115,795
(2)
10,57811,4559,3178,810
18,191
16,45714,5916,2044,6365,745
7,677
(')
852
101
820
106,102(2)
14,14113,63813,4309,78513,857
8,7656,8227,3915,3382,571
5,5681,47 8
850821174
(2)
3
120,984
(2)
3 .1,13810,38113,1613 .1,66214,468
16,5433 .1,9309,3898,4623,196
6,1881,590
785783210
5475
Adjustedgross income
(Th-.-dd.11. .. )
Duluth-Superior,_Yimesota-Wiscomin
1432,67 5(2)
4,48618,46033,011.34,56743,342
57,90377,51243,13117,20522,283
35,5383-3,786S,Z70
16,0944,693
(2)
5031,950
1629,541(2)
5,42917,Z7823,85031,10781,678
91,62094,50346,09239,61054,178
88 62414',184(2 )
6,777(2 )
1,41112,20 2
1469,954(2)
7,66519,49033,12934,03761,400
48,47844,73355i44645,31124,297
66,50525,19019,218Z7,58510,985(2)
980
1660,590
(2)
4,7451-5,15433,60040,81964,519
90,17176,67769,52171,61530,517
72,23527,30317,17024,917914,062
6,7971 1351 :133
Exemptiow
(Tb-...d&11 . .. )
3-53-702(2)
7,84911,10316,91715,81918,616
22,123Z7,76112,5654,1775,679
6,0241,624
8211,243
158(2)
613
Flint, Michigan
212,426(2)
9,51916,43013,04514,08736,515
34,41234,07212,0399,657
12,058
16,2861,577
(2)
265
(2)
1737
Fresno, California
183,614(2)
12,71616,62319,42118,60326,180
19,68914,11917,42312,8514,390
U,7253,0711,8641,829
374(2)
3
Grand Rapids, Michigan
210,956
(2)
9,53810,88516,89417,715Z7,314
32,76026,24820,86816,4067,406
14,6674,4181,8021,676
477
1551-37
TaxIncabl eome
(Th-dd.11. ..
2Z7,519
31776,948
3.2,47314,49918,937
28,28338,69225,17710,14712,833
24,76810,43 25,841
1 .1, 8(Y73,844
(2)
3741,669
343,641
-
2043,7808,167
12,01332,009
45,64547,26127,38524,93234,733
61,09411,232
(1)
5,866(2 )
1,0829,503
283,949
3773,8339,484
10,84025,706
20,25323,63930,23026,11917,068
45,80819'p81.5,83223,2239,506
(2)
876
369,917
2634,358
13,8D416,13126,611
44,Z7538,75738,20646,63018,802
47,85019,5581.3,25520,99412,067
6,3541,04 2
960
80,39
Income taxafter
credits
49.314
-
761,3642,3152,9063,845
5,8417,8145,1232,0682,556
5,4082,4031,4133,3821,574
186877
-
4175 1
1,6172,3926,478
9,2909,558~,5635,1657,209
13,0252,606
(2 )
2,515(2)
6257,402
65 .615
-
75749
1,8722,1935,122
4,0964,7886,1625,3833,545
9,8694,4974,2037,5794,053
424
84,587
-
53872
2,6343,2615,417
8,8877,8007,7819,5353,843
10,1644,5753,2916,7545,228
3,466546480
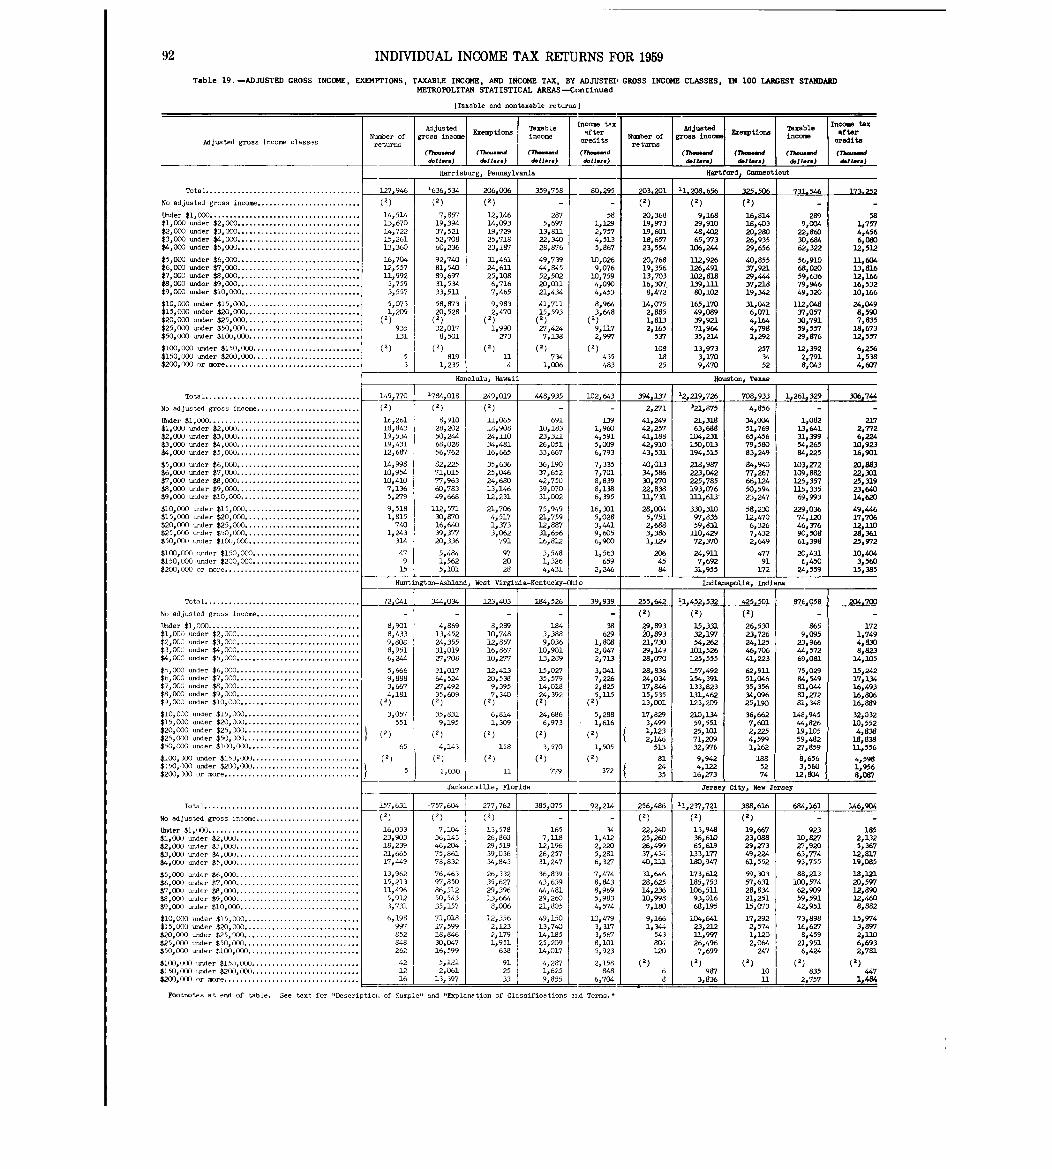
92
Table 19 . -ADJUSTED GROSS INCOME, EXEMPTIONS, TAXABLE INCOME , AND I14COME TAX, BY ADJUSTED GROSS INCOME CLASSES, IN 100 LARGEST STANDARDMETROPOLITAN STATISTICAL AREAS-Continued
Adjusted gross income classe s
Total . . . . . . . . . . . . . . . . . . . . . . . . . . . . . . . . . . . . . . .
No adjusted gross income. . . . . . . . . . . . . . . . . . . . . . . . . .
Under $1,DOO. . . . . . . . . . . . . . . . . . . . . . . . . . . . . . . . . . . . . .$1,000 -der $2,000 . . . . . . . . . . . . . . . . . . . . . . . . . . . . . . .$2,000 -der $3,000 . . . . . . . . . . . . . . . . . . . . . . . . . . . . . . .$3,000 under $4,000 . . . . . . . . . . . . . . . . . . . . . . . . . . . . . . .$4, 000 wider $5,000. . . . . . . . . . . . . . . . . . . . . . . . . . . . . . .
$5,000 under $6,000. . . . . . . . . . . . . . . . . . . . . . . . . . . . . . .$6,000 wider $7,000. . . . . . . . . . . . . . . . . . . . . . . . . . . . . . .$7,000 -der $8,000. . . . . . . . . . . . . . . . . . . . . . . . . . . . . . .$8 , 000 under $9,000. . . . . . . . . . . . . . . . . . . . . . . . . . . . . . .$9, 000 -der $10,000. . . . . . . . . . . . . . . . . . . . . . . . . . . . . .
$10,000 -der $15,000. . . . . . . . . . . . . . . . . . . . . . . . . . . . .$15,000 wider $20,000. . . . . . . . . . . . . . . . . . . . . . . . . . . . .$20pOOO -der $25,000. . . . . . . . . . . . . . . . . . . . . . . . . . . . .$25,000 -der $50,000. . . . . . . . . . . . . . . . . . . . . . . . . . . . .$50,000 -der $100,000 . . . . . . . . . . . . . . . . . . . . . . . . . . . .
$100,000 -der $150,000. . . . . . . . . . . . . . . . . . . . . . . . . . .$150,000 under $200,000. . . . . . . . . . . . . . . . . . . . . . . . . . .$200,000 or more . . . . . . . . . . . . . . . . . . . . . . . . . . . . . . . . . .
Total . . . . . . . . . . . . . . . . . . . . . . . . . . . . . . . . . . . . . . .
No adjusted grosn income . . . . . . . . . . . . . . . . . . . . . . . . . .
Under $1,000 . . . . . . . . . . . . . . . . . . . . . . . . . . . . . . . . . . . . . .$1,000 -der $2,000. . . . . . . . . . . . . . . . . . . . . . . . . . . . . . .$2,000 -der $3,000 . . . . . . . . . . . . . . . . . . . . . . . . . . . . . . .$3,000 wider $4,000 . . . . . . . . . . . . . . . . . . . . . . . . . . . . . . .$4,000 wider $5,000. . . . . . . . . . . . . . . . . . . . . . . . . . . . . . .
$5,000 under $6, 000 . . . . . . . . . . . . . . . . . . . . . . . . . . . . . . .$6,000 under $7,000 . . . . . . . . . . . . . . . . . . . . . . . . . . . . . . .$7,000 under $8,000 . . . . . . . . . . . . . . . . . . . . . . . . . . . . . . .$8,000 =der $9,,000. . . . . . . . . . . . . . . . . . . . . . . . . . . . . . .$9,OCYJ wider $10,000 . . . . . . . . . . . . . . . . . . . . . . . . . . . . . .
$10,000 under $15,000 . . . . . . . . . . . . . . . . . . . . . . . . . . . . .$15,000 under $20,000 . . . . . . . . . . . . . . . . . . . . . . . . . . . . .$20,000 -der $25,000 . . . . . . . . . . . . . . . . .$25,000 -der $50,000 . . . . . . . . . . . . . . . . .$50pOGO under $100,000 . . . . . . . . . . . . . . . . . . . . . . . . . . . .
$100,OW under $150,000 . . . . . . . . . . . . . . . . . . . . . . . . . . .$150,000 under $200,000 . . . . . . . . . . . . . . . . . . . . . . . . . . .$200,000 or more . . . . . . . . . . . . . . . . . . . . . . . . . . . . . . . . . .
Total . . . . . . . . . . . . . . . . . . . . . . . . . . . . . . . . . . . . . . .
No adjusted gross income . . . . . . . . . . . . . . . . . . . . . . . . . .
Under $1,000. . . . . . . . . . . . . . . . . . . . . . . . . . . . . . . . . . . . . .$1,000 under $2,000 . . . . . . . . . . . . . . . . . . . . . . . . . . . . . . .$2,DDO wider $3,000 . . . . . . . . . . . . . . . . . . . . . . . . . . . . . . .$3,000 -der $4,D00 . . . . . . . . . . . . . . . . . . . . . . . . . . . . . . .$4,000 .,der $5,000 . . . . . . . . . . . . . . . . . . . . . . . . . . . . . . .
$5,000 under $6,000. . . . . . . . . . . . . . . . . . . . . . . . . . . . . . .$6,000 under $7,000. . . . . . . . . . . . . . . . . . . . . . . . . . . . . . .$7,00) under $8,CX)O . . . . . . . . . . . . . . . . . . . . . . . . . . . . . . .$8,000 -der $9,000 . . . . . . . . . . . . . . . . . . . . . . . . . . . . . . .$9,000 under $10,000. . . . . . . . . . . . . . . . . . . . . . . . . . . . . .
$10,OW -der $15,000 . . . . . . . . . . . . . . . . . . . . . . . . . . . . .$15,000 -der $20,000 . . . . . . . . . . . . . . . . . . . . . . . . . . . . .$20,000 -der $25,000. . . . . . . . . . . . . . . . . . . . . . . . . . . . .$25,000 under $50,000. . . . . . . . . . . . . . . . . . . . . . . . . . . . .$50,000 under $100,000. . . . . . . . . . . . . . . . . . . . . . . . . . . .
$100,000 -der $15J,000. . . . . . . . . . . . . . . . . . . . . . . . . . .$150,OW wider $200,000. . . . . . . . . . . . . . . . . . . . . . . . . . .$200,000 or wre. . . . . . . . . . . . . . . . . . . . . . . . . . . . . . . . . .
INDIVIDUAL INCOME TAX RETURNS FOR 195 9
Number ofreturns
127,946
(1 )
14,51413,67014,72215,26113p360
16,70412p5571.1,9923,7593,557
5,0731,209
(1 )
(2)
935131
53
149,770(2 )
16,26118,84319,53419,43112,687
14p99810,95410,4107,1365,279
9,5181,815
7401,243
314
479
15
T.t~,l . . . . . . . . . . . . . . . . . . . . . . . . . . . . . . . . . . . . . . . 72,041
No adjusted gross income . . . . . . . . . . . . . . . . . . . . . . . . .. -
Tlader $1,000 . . . . . . . . . . . . . . . . . . . . . . . . . . . . . . . . . . . . . . 8,901$1,000 under $2,000 . . . . . . . . . . . . . . . . . . . . . . . . . . . . . . . 8,433$2,000 -der $3,000 . . . . . . . . . . . . . . . . . . . . . . . . . . . . . . . 9,808$3,000 under $4,000 . . . . . . . . . . . . . . . . . . . . . . . . . . . . . . . 8p951$4pOOO wider $5,000 . . . . . . . . . . . . . . . . . . . . . . . . . . . . . . . 6,244
$5,000 under $6,000 . . . . . . . . . . . . . . . . . . . . . . . . . . . . . . . 5,666$6,000 -der $7,GOO . . . . . . . . . . . . . . . . . . . . . . . . . . . . . . . qP886$7,000 under $8,000 . . . . . . . . . . . . . . . . . . . . . . . . . . . . . . . 3,667$8,000 -der $9,000 . . . . . . . . . . . . . . . . . . . . . . . . . . . . . . . 4,181$9,OOU under $10,000 . . . . . . . . . . . . . . . . . . . . . . . . . . . . . . (2)
$10,000 -der $15,000 . . . . . . . . . . . . . . . . . . . . . . . . . . . . . 3pO57$15,(YOO -der $20,000 . . . . . . . . . . . . . . . . . . . . . . . . . . . . . 551$20,000 wider $25,000 . . . . . . . . . . . . . . . . . . . . (2)$25,000 under $50,D()O . . . . . . . . . . . . . . . . . . . . . . .$50,000 under $I(Y),000 . . . . . . . . . . . . . . . . . . . . . . . . . . . . 65
$100,000 -der $150,000 . . . . . . . . . . . . . . . . . . . . . . . . . . . (2 )$150,(W -der $200,000 . . . . . . . . . . . . . . . . . . . . . . . . .
030 11 779$200,000 or more . . . . . . . . . . . . . . . . . . . . . . . . . . . . . . . . I i 1
157,63 1(2)
16pO3323,90318,23921,66517,449
13,96215,2131.1,4965,9123p731
6,19 8997852848262
421216
Adjustedgross income
(77--dd.11.,.)
Huntington-Ashland ,
344 0_34
4,86913,45224,35531,01927,708
31,01764,52427p49235,609
(2 )
35,8319pl95
(2 )
4,143(2)
[Taxable and nontaxable returns ]
Exemptions
(Th- .-dd.11 .. .)
Harrisburg, Pennisylvania
Honolulu, Hawaii
123~403
8,28910,7481.2,85716,86710,277
12,,41320,5389,3957,340
(2 )6,8141,309
(2)
15 8
Jacks-ille, Florida
Taxableincome
(Thoa-dd.11. ..
16.36, 34
(1)
7,85719,39437,52152,70860,236
92,74081,54089,69731,53433,511
58,8732Op528(2 )
32,0178P501
(2)
8191,235
20_6 006
(1)
12,14614,09319,72925p71823,187
31p46124,61125,1086,7167,465
9,9832,470
(2 )
1P990273
(2)
114
359, 58
2875,697
13,81-122,34028,876
49,73944,94552,50220,01121,434
41,71115,593(2 )
Z7,4247,138
(2)
7341,006
1784,018(2)
8,91028,20250,24468,02856,762
82,22571,01577,96360,78349,668
112,57130,87016 640391P37720,336
5,4841,5625,101
249,019
(1)
11,06518,90824,11034,48116,665
35,63625,04624,6801-3,1461.2,231
21,7064,,5171,3733,062
791
972028
448,935
-
69110,18323,31126,05133,667
36,19037,65242,75039,0`7031,002
75,94921,7591.2,881731,656l6p812
3,5481,3264,431
West Virginia-Kentucky-W o
184,526
1843,3889,036
10,9011-3,289
1-5,02735,57914,01824,392
(2 )
24,6866,97 3
(2)
3,57 0(2 )
'757,604(2)
7,10436,14346,20475p86178,832
76,46397,85086,51250,54335,157
71,01817,59918,846-30,04716,59 9
5,1212,061
1 .3,397
277,76 2(2)
13,57826,86029p51939,03634,843
26,33235p6Z729,39613,6648,006
12,3562,1.232,1791,95 1
638
912533
385,075
-
1657, US
12,19626,25731,247
36,83943,63944,48129,26021,805
49,15013,74014,18525,20914,017
4,2871,6259,855
Encome taxafterredits
(1h-d&11. ..
80,295
581,1292,7574,51.35,867
10,0269,076
10,7594,0904,453
8,9643,648
(1 )9,1172,997
(2 )
(2)
-
435483
102,643
-
1391,9604,5915,0096,793
7,3357,7018,63961,1386,395
16,3015,0283,4419,6056,900
1,56 3659,
2,246
39,939
-
38629
1,8W2,0472,713
3,0417,2262,8255,11.5
(2 )
5,2881,616
(2)
1,505
372
92,214
-
341,4122,2205,2816,3Z7
7,4748,8438,9695,9834,574
10,4793,3173,5678,1015,923
2,15 8848
6,704
Footnotes at end of table . See text for "Description of Sample" and ItExplanat~on of Classifications aTA Terms."
Number ofreturns
20.3,201
(1)
20,36819,W319,60118,65723,554
20,76819,35613,70316,307 .8,472
14,0752,8851,8132,16 5
537
1081825
394,13
2,271
41p24942,25741,18842,91043,531
40,,01334,58630,Z7022,83811,731
28,0045,7512,6883,3861,12 9
2064584
25-5 642
(1)
29,89320,89321,73029,14928,0`70
28,83624,03417,84615,5353-3,001
l7o8293,4991 ' 123
1 2,14653.3
81243 5
256,486
(1)
22,24025,26026,49937,43440,1LI
31,64628,62514,23610,9987,180
9,1661,344
5438041z)
6a
tedAdjusincomegross Exemptions
(Th--d I (7ho-..d I (Th-.-dd.11 .. ) d.11... ) d.11.,.)
11,208,65 6(2)
9, im29,91048,40265,97 3
106,244
112,9261.26,491102,818139,11180,102
165,17049,08939,92171,96435,214
3-3,97 33,1709,470
12,219,726
321,875
21,31863,688
104,231150,03 .3194p515
218,987223,042225,785193,0`76111,613
330,31097p83559,831
110,42972,370
24,913.7p69231,955
11,452,532(2)
15,33132,19754,262
101,526125,555
157,492154,391133,82.3131,462123,209
210,13439,55125,10171,,20932,976
9 9424:122
16 , Z7 3
11,237,721
(1)
1.3,94836,61065,619
133,177180,947
173,612185,753106,51.193,01668,195
104,64123,21211,99726,4967,699
(2)
9873,836
Hartford, Connecticut
325 ,(2)
16,81418,40320,28026,93529,656
40,85537,92129,44437,21819,342
31,0426,0`714,1644,7981,292
257345 2
Houiston~ Texas
708,93 3
4,856
34pOG451,76965,45679,58083,249
84,94077,26766,12450,59423,247
58p23012p4706,3267,4322,64 9
47791
172
Indianapolis, Indiana
425_501
(1)
26,53023,72624,12546,70641,223
62,93-151,04635,35634,09625,190
36p6627,6012 22.54:5991,162
1885274
Jersey City, New Jersey
388,616
(1)
19,66723,08829,27349,22461,552
59,30357,63128,83421,25115,0`73
17,2922,5741,1202,064
247(2)
1011
Taxableincome
731,546
-
2899,00422,86030,68462,322
56,91068,02059,63679,94649,320
112,04837,05730,79159,55729,876
12,3922,7916,043
lp 261-p -329-
1,0823.3p64131,39954,26584,225
103,Z72109,8821.25,357115,33569,993
229,03674,12046,37690,50861,398
20,4316p450
24,559
876,058
-
8659,095
23,96644p57269,081
75,02984,54981,04481,Z7281,34 8
148,94544p82619 10559 :482Z7,859
8o6563p560
12,804
684,161
92310,827Z7,92063,77493,755
88,213100,57462,90959,59142,951
73,89816,6Z78,459
21,9516p424
(2)835
2p757
173 .25
3%744
204-700
146,
4471,484
Income tax'afteredits
(Th-dd.11-.)
581,7574,4566pOSO
12,512
11,6043.3,81612,1M16,53210,166
24,0498,5907,835
18,67312,557
6,2561,5384,607
-
2172,7726,224
10,92316,901
20,W322,3D125,3192.3,64014,620
49,44617p70612,11028,36125,972
10,4043,560
15,385
1721,7494,8308,823
14,105
15,24217,13416,49316,80616,889
32,03210,5524,83818,83811,,556
4,5981,9568,087
-
1852,1325,367
12,81719,085
18,12120,59ql2,gqO12,4608,882
15,9743,8W2,1206,6932,781
(2)
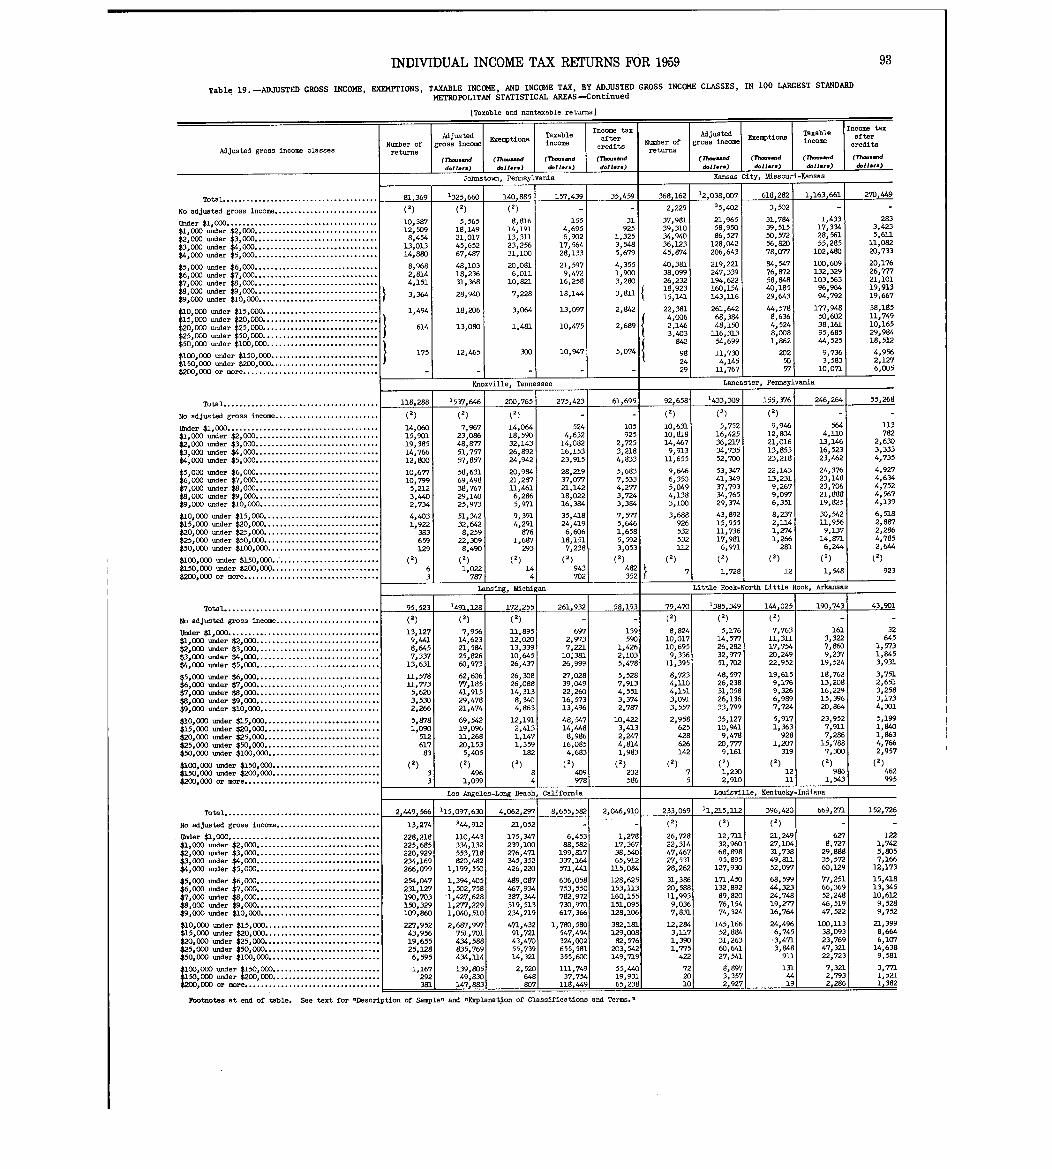
Table 19 . -ADJUSTED GROSS INCOME, EXEMPTIONS, TAXABLE INCOME, AND INCOME TAX, BY ADJUSTED GROSS INCC14E CLASSES, IN 100 LARGEST STANDARD
METROPOLITAN STATISTICAL AREAS -Continued
[Taxable and nontaxable returns I
Number ofreturns
81,369(2)
10,38712,5098,454
13,01314,880
8,9682,8144,151
3,364
1049 4
61 4
175
118,288
(2)
14,06015,90119,38514,76612o800
10,67710,79 95,2123,4402,734
4,4031,922
383659129
(2)
63
95,523(2)
13,12790"18,6457,337130631
11,57812,7735,6203o5302,266
5,8781,090
51261783
(2)
33
2,"9,566
13o274
228,218225,685220,929234,169266,099
254,047231,127190,703M,329109,860
227,95 243,95619,65525,12 86,595
1,167292381
Adjustedgross income
(77-dd.11... )
Johnstown, Pennsylvani a
1325,660(2)
5,56518,14921,01745,65267,487
48,10318,23631,368
28,.
18,20 6
13,080
12,465
1537o646(2)
7,%723,08648o87751,75757,857
58,63169,49838,76729,14025,973
51,34232 6428:259
22,3098,490(2)
1,022787
1491,128(2)
7,95614,62321,59425082660,973
62,60677,18541o91529,47821,474
69,54219,09611 26820"1535,405(2)
4961,099
115,097,630
144,912
110,"3334,132553,718820,482
1,199,550
lo394,4051,502,7581,427,6281,277,2291,040,510
2,687,9917751,701434,588835,769434,114
139,80549i830
147,883
Exemptions
(77-dd.11. . . )
140,885(2)
8,81614,19113031123,25631,100
20,0816,01110,821
7,22 8
3,064
1,481
300
Knoxville, Tennessee
200,765
(2)
14oO6418o59032ol4326,89224o942
2Oo98421,28711,4616,2865,971
9,3914,291
8761,687
293(2)
144
172,25 5(2)
11089512,02013033910064526,437
26030826008814,31 38,3404,863
12,19 12,4131 14710359
182(2)
84
4,062,297
21,052
175,347239,100276,471345,352426o220
489,0874670934387,344319,513234,219
471,43291,72143,47055,73914,321
2,520648807
Tax blincom
ea a
(77--dd.11 . . .
157,439
-
1554,6956,902
17,56428,133
21,5979,472
16,258
18,1"
13oO97
10,475
10,947
2750423
-
5244,632
14,08216,15323,915
28,21937,07721,14218,02216,384
35,41824 4196,606
18,1517,238
(2)
943702
Lansing, Michigan
261,932
(1)
-
6972o9737o221
10 ;38126,999
Z7,02839,04922,26016,57313,496
4805471404488 986
16,0854,683
409978
Los Angeles-Long Beach, California
8,655,582
6,45388o582
199,817337,164571,"l
636,058753,550782,972730,970617,366
1,780,580547,494324,002655,581355,600
111,74937,754
118'"q
Income taxafterredit .
(Th-.-ddWI-)
35,459
-
31925
1,3253,5485,679
4,3551,9003 280
381.1
2,842
2o68 9
5,074
61,695
-
10592 5
2,7253,2184,833
5,6837,5334,2773,7243,394
7o5775 6461 :6585,5923,053
(2)
482352
58,193
139590
104262,10350478
5,5287,9134o5513,3742,787
10,4223,4132,2474,8141,983
(2)
232586
2,046,910
1,27817,36738o54065,912
115,084
128,625153,113160,155151,095M,106
382,181129oOO882,576
203,542149,719
55,44019,93165,238
Number ofreturns
368,16 2
2,229
37,98139,31034,94036,12345,874
40,38138,09926 :23218 92315 , 141
22 3814 :0062,146
3,40 3842
98242 9
92,658 1
(2)
10,63110,81814,4679,913
11,655
906466,3505oO494,1383,100
3,688926532532112
(2)
7
79,470(2)
8,82410,01710,69 59,336
11,395
8,72340110401513,0913,557
2,95 8625428626142
(2)
75
233oG69
(2)
26072822,31447,46727,53128,262
31,38620,58811,9939,0367,831
12,2843,1171,3901,77 5
422
722010
Adjustedgross income
(Th-.-dd.11. .. )
Kansas City, Missouri-Kansee
12,038,00 7
15,402
21,96558,95086,527
128,042206,643
219,221247,339194,622160,154143,116
26lo64268o38448 150
116 :31354 :699
11 7304114511,76 7
1433,30 9(2)
5o75 216,42536,21734,73552,700
53,34741,34937,79334o765290374
43,89215,95511,736l7o9816o971
(1 )
1,72 8
1385,349(2)
5,17614,57726,28232o97751,702
48059726,23831,05826,13633,799
35ol2710,9419047820,7779,161
(1 )1,2302,910
Exempticn~
(77--dd.11 . .. )
618,282
3,502
31,78439,51550,57256,82078,077
84,54776,87258,84840,18529,643
44,5788,63641524So0081,862
2025057
Lancaster, Pennsylvania
155,376
(2)
9,946l2o80421,01613,85323,218
22014313,2319o2679oO976,351
8o2372,1141,2741,266
281(2)
12
Little Rock-North Little Rock, Arkansa s
1",02 5(2)
7,76311,31217,75420,24922,952
l9o6159,1769,326609897o724
5,9171,363
928lo207
319(2)
1211
Tazablincome
s
(Th-d&11. ..
1,163,661
246,264
-
5644,11013,14616,52323,462
24,37623,14823o7O621,88819,825
30,54211,9569,137
14,8716,244
(1 )
1,548
190,743
(1)
-
1613,3227,8609,237
19,524
18,76213,20816022915,39620,864
23,9527,91-17,286
15,7887,300
9861,543
Louisville, Kentucky-Indiana
11,215,11 2
(2)
12,71132,96068,89895,895
127o930
171,450132,89289,82076,15474,324
145,16652,88431026360,64127,541
8,8973,3572,9271
396,420(2)
21,24927,10431,73849,81152,097
68,599"o32324,74819,27716,764
24,4966,745-3,4713,848
91 1
131
191
1,43317,33428,56155,28 5
102,480
100,609132,329103,56 396,%494,792
177,94850060238 16195:685",525
9o7363,583
10,071
669,Z71
-
6278,72729,88835,57260o129
77,25166,36952,24846,51947,522
100,11 338,09323,76947,32122,723
7,3212,7932,286
43,90
Adjusted gross income classe s
Total . . . . . . . . . . . . . . . . . . . . . . . . . . . . . . . . . . . . . . .
No adjusted gross income. . . . . . . . . . . . . . . . . . . . . . . . . .
Under $1,000. . . . . . . . . . . . . . . . . . . . . . . . . . . . . . . . . . . . . .$1, 000 under $2,000. . . . . . . . . . . . . . . . . . . . . . . . . . . . . . .$2,000 under $3,000. . . . . . . . . . . . . . . . . . . . . . . . . . . . . . .$3 000 under $4,000. . . . . . . . . . . . . . . . . . . . . . . . . . . . . . .$4 :000 under $5,000. . . . . . . . . . . . . . . . . . . . . . . . . . . . . . .
$5,000 under $6,000. . . . . . . . . . . . . . . . . . . . . . . . . . . . . . .$6,000 under $7,000. . . . . . . . . . . . . . . . . . . . . . . . . . . . . . .$7,000 under $8,000. . . . . . . . . . . . . . . . .$8,000 under $9,000 . . . . . . . . . . . . . . . . :$9,000 under $10,000. . . . . . . . . . . . . . . . .
$10,000 under $15,000 . . . . . . . . . . . . . . . . . . . . . . . . . . . . .$15,000 under $20,000 . . . . . . . . . . . . . . .$20,000 under $25,000 . . . . . . . . . . . . . . .$250000 under $50,000 . . . . . . . . . . . . . . . . . . . . . .. . . . . . . .$500000 under $100,000 . . . . . . . . . . . . . . . . . . . . . . . . . . . .
$100,000 under $150,000 . . . . . . . . . . . . .$150,000 under $200,000 . . . . . . . . . . . .$200,000 or more . . . . . . . . . . . . . . . . . . . : . . . . . . . . . . . . . .
Total . . . . . . . . . . . . . . . . . . . . . . . . . . . . . . . . . . . . . . .
No adjusted gross income . . . . . . . . . . . . . . . . . . . . . . . . . .
Under $1,000 .$1 ODD under$2 :ODO under $30000. . . . . . . . . . . . . . . . . . . . . . . . . . . . . . .$3,000 under $4,ODO. . . . . . . . . . . . . . . . . . . . . . . . . . . . . . .$4,000 under $5,000. . . . . . . . . . . . . . . . . . . . . . . . . . . . . . .
' 000 under $6,000. . . . . . . . . . . . . . . . . . . . . . . . . . . . . . .6,000 under $7,000. . . . . . . . . . . . . . . . . . . . . . . . . . . . . . .
$7,000 under $8,000. . . . . . . . . . . . . . . . . . . . .. . . . . . . . . .$8,000 under $90000. . . . . . . . . . . . . . . . . . . . .
$9,000 under $10,000. . . . . . . . . . . . . . . . . . . . . . . . . . . . . .
$10,000 under $15,000. . . . . . . . . . . . . . . . . . . . . . . . . . . . .$15,000 under $20,000. . . . . . . . . . . . . . . .$20,000 under $25,000. . . . . . . . . . . . . . . .$25,000 under $50,000. . . . . . . . . . . . . . .$50,000 under $100,ODO. . . . . . . . . . . . . .
$100,000 under $150,000. . . . . . . . . . . . . . . . . . . . . . . . . . .$150,000 under $200,000. . . . . . . . . . . . . . . . . . . . . . . . . . .$200,000 or more. . . . . . : . . . . . . . . . . . . . . . . . . . . . . . . . . .
Total. . . . . . . . . . . . . . . . . . . . . . . . . . . . . . . . . . . . . . .
No adjusted gross income . . . . . . . . . . . . . . . . . . . . . . . . . .
Under $1,000. . . . . . . . . . . . . . . . . . . . . . . . . . . . . . . . . . . . . .$1,000 under $2,000. . . . . . . . . . . . . . . . . . . . . . . . . . . . . . .$20000 under $3,000. . . . . . . . . . . . . . . . . . . . . . . . . . . . . . .$300DO under $40000. . . . . . . . . . . . . . . . . . . . . . . . . . . . . . .$4,000 under $5,000. . . . . . . . . . . . . . . . . . . . . . . . . . . . . . .
$5,000 under $6,000. . . . . . . . . . . . . . . . . . . . . . . . . . . . . . .$60000 under $7,000. . . . . . . . . . . . . . . . . . . . . . .. . . . . . . . .$70000 under $8,000. . . . . . . . . . . . . . . . . . . . . . . . . . . . . . .$8,000 under $9,000. . . . . . . . . . . . . . . . . . . . . . . . . . . . . . .$90000 under $10,000 . . . . . . . . . . . . . . . . . . . . . . . . . . . . . .
$10,000 under $15,000. . . . . . . . . . . . . . . . . . . . . . . . . . . . .$15,000 under $20,000 . . . . . . . . . . . . . . . . . . . . . . . . . . . . .$20,000 under $25,000 . . . . . . . . . . . . . . .$25,000 under $50,ODO . . . . . . . . . . . . . . .$50,000 under $100,000 . . . . . . . . . . . . . . . . . . . . . . . . . . . .
OO,OD0 under $150,000 .Z0,000 under $200,000 . : : : : : : : : : : : : : : : : : : : :*.*****$200,000 or more . . . . . . . . . . . . . . . . . . . . . . . . . . . . . . . . . .
Total. . . . . . . . . . . . . . . . . . . . . . . . . . . . . . . . . . . . . . .
No adjusted gross income . . . . . . . . . . . . . . . . . . . . . . . . . .
Uader $1,000 . . . . . . . . . . . . . . . . . . . . . . . . . . . . . . . . . . . . . .$1,000 under $2,000 . . . . . . . . . . . . . . . . . . . . . . . . . . . . . . .$2,000 under $3,000 . . . . . . . . . . . . . . . . . . . . . . . . . . . . . . .$3,000 under $4,000 . . . . . . . . . . . . . . . . . . . . . . . . . . . . . . .$4,000 under $5,OOG . . . . . . . . . . . . . . . . . . . . . . . . . . . . . . .
$5pOOO under $6~000 . . . . . . . . . . . . . . . . . . . . . . . . . . . . . . .$6~000 under $70000 . . . . . . . . . . . . . . . . . . . . . . . . . . . . . . .$7,000 under $8,000 . . . . . . . . . . . . . . . . . . . . . . . . . . . . . . .$8,000 under $9,000 . . . . . . . . . . . . . . . . . . . . . . . . . . . . . . .$9,000 under $10,000 . . . . . . . . . . . . . . . . . . . . . . . . . . . . . .
$10,000 under $15,000. . . . . . . . . . . . . . . . . . . . . . . . . . . . .$15,000 under $20,000. . . . . . . . . . . . . . . . . . . . . . . . . . . . .$20,000 under $25,000 . . . . . . . . . . . . . . .$25,000 under $50,000 . . . . . . . . . . . . . . .$50,000 under $100,000 . . . . . . . . . . . . . . . . . . . . . . . . . . . .
$100,000 under ",000 . . . . . . . . . . . . . . . . . . . . . . . . . . .$150,000 under $200,000 . . . . . . . . . . . . . . . . . . . . . . . . . . .$200,000 or more . . . . . . . . . . . . . . . . . . . . . . . . . . . . . . . . . .
Footnotes at end of table . See text for "Description of Sample" and
INDIVIDUAL INCOME TAX RETURNS FOR 1959
t'Explana#on of Classifications and Terms ."
93
Income taxafterredits
(Th-dd.11 .. .
270, "9
2833,4235,611
11,08220,733
20,17626,77721,10119,933190667
38,18511,749l0o16529,98418,512
4,9562,1276,005
55,268
-
113782
2,6303,3334,735
409274,6344o7524,5674ol39
6,5182o8872,2864o7852o644
(1)
923
-
3264 5
1,5731,8453,931
3,7512,6513o2583,1734,301
501991,8401,8634,7662,957
(2)
462995
152,726
-
1221,7425o8057,166
12,173
15,41813,34510,6129,5289,752
21,39 98,66460107
14,63 89,581
3,772.1,5211 .382
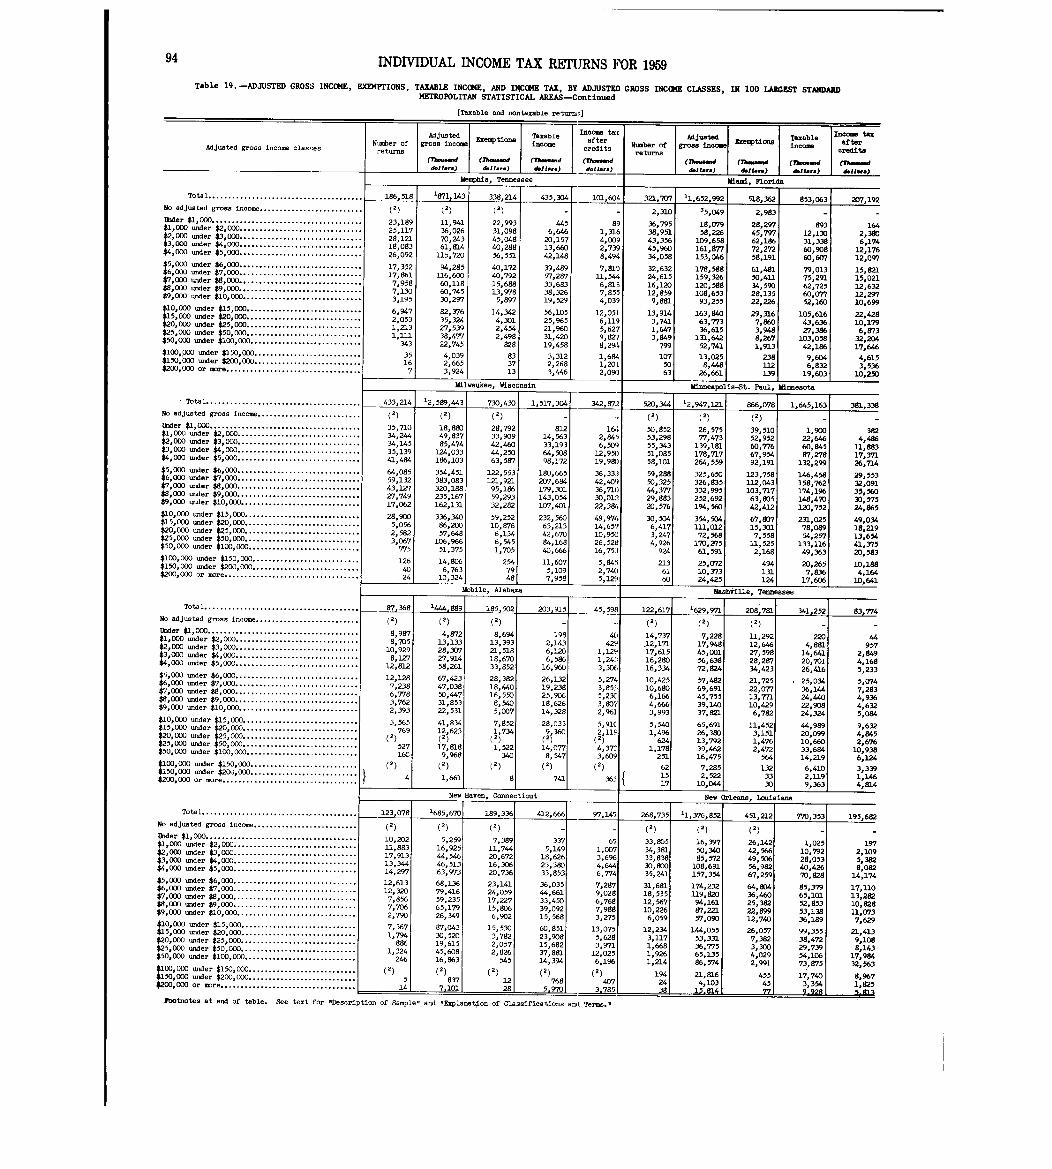
94 INDIVIDUAL INCOME TAX REVJRNS FOR 1959Table 19 . -ADJUSTED GROSS INCOME, EXEMPTIONS, TAXABLE INCOME, AND INCOME TAX, BY ADJUSTED GROSS INCOME CLASSES, IN 100 LARGEST STANDARD
METROPOLITAN STATISTICAL AREAS-Continued
[Taxable and nontaxable returmi l
Adjusted gross income classes
Total. . . . . . . . . . . . . . . . . . . . . . . . . . . . . . . . . . . . . . .
No adjusted gross income . . . . . . . . . . . . . . .
.
. . . . . . . . . .
. . . . . . . . . . . . . . . . . .. . . . . . . . . . . .
$2,000 under $3,000. . . . . . .. . . . . .
. . . . . . . . .$3,000 under $4,000 . . . . . . . . . . . . . . . . . . . . . .$4,000 under $5,000 . . . . . . . . . . . . . . . . . . . . . . . . . . . . . . .
$5,000 under $6,000 . . . . . . . . . . . . . . . . . . . . . . . . . . . . . . .$6,000 under $7,000 . . . . . . . . . . . . . . . . . . . . . . . . . . . . . . .$7,000 under $8,000 . . . . . . . . . . . . . . . . . . . . . . . . . . . . . . .$8sO00 under $9xOOO . . . . . . . . . . . . . . . . . . . . . . . . . . . . . . .$9,000 under $10,000. . . . . . . . . . . . . . . . . . . . . . . . . . . . . .
$3.0 000 under $15,000. . . . . . . . . . . . . . . . . . . . . . . . . . . . .$15:000 under $20,000. . . . . . . . . . . . . . . . . . . . . . . . . . . . .$20,000 under $25,000. . . . . . . . . . . . . . . . . . . . . . . . . . . . .$25,000 under $50,000. . . . . . . . . . . . . . . . . . . . . . . . . . . . .$50,000 under $100,000. . . . . . . . . . . . . . . . . . . . . . . . . . . .
$1001.000 under $150,000. . . . . . . . . . . . . . . . . . . . . . . . . . .$150,000 under $200,000. . . . . . . . . . . . . . . . . . . . . . . . . . .$200,000 or more . . . . . . . . . . . . . . . . . . . . . . . . . . . . . . . . . .
Total . . . . . . . . . . . . . . . . . . . . . . . . . . . . . . . . . . . . . . .
No adjusted gross income . . . . . . . . . . . . . . . . . . . . . . . . . .
Under $1,000. . . . . . . . . . . . . . . . . . . . . . . . . . . . . . . . . . . . . .$1,000 under $2,000 . . . . . . . . . . . . . . . . . . . . . . . . . . . . . . .$2,000 under $3,000 . . . . . . . . . . . . . . . . . . . . . . . . . . . . . . .$3,000 under $4,000. . . . . . . . . . . . . . . . . . . . . . . . . . . . . . .$4,000 under $5,000. . . . . . . . . . . . . . . . . . . . . . . . . . . . . . .
5,000 under $6,000. . . . . . . . . . . . . . . . . . . . . . . . . . . . . . .6 ' 000 under $7,000. . . . . . . . . . . . . . . . . . . . . . . . . . . . . . .
$7, Coo under $8,000. . . . . . . . . . . . . . . . . . . . . . . . . . . . . . .$8,000 under $9,000. . . . . . . . . . . . . . . . . . . . . . . . . . . . . . .$9,000 under $10,000. . . . . . . . . . . . . . . . . . . . . . . . . . . . . .
: 0,000 under $15,000. . . . . . . . . . . . . . . . . . . . . . . . . . . . .1115,000 under $20,000. . . . . . . . . . . . . . . . . . . . . . . . . . . . .
$20,000 under $25,000. . . . . . . . . . . . . . . . . . . . . . . . . . . . .$25 000 under $50,000 . . . . . . . . . . . . . . . . . . . . . . . . . . . . .$50 :000 under $100,000 . . . . . . . . . . . . . . . . . . . . . . . . . . . .
$100,000 under $150,000 . . . . . . . . . . . . . . . . . . . . . . . . . . .$150,000 under $200,000 . . . . . . . . . . . . . . . . . . . . . . . . . . .$200,000 or more . . . . . . . . . . . . . . . . . . . . . . . . . . . . . . . . . .
Number ofetUrcs
186,518
(2)
23,18925,11728,12118,08326,092
17,35217,86 17,9587, 1303,195
6,9472,0531,2131,3_11
343
35167
433,214
(2)
35,71034,24434,14535,13941,484
64,08559,13243,12727,74917,062
28,9005,0562,5823,06 7
775
1264024
Adjustedgross income
(rh-- .dd.J1 . .)
1871,143
(1)
11,94136,02670,24361,814
115,72 0
914,285116,60060,11860,74530,297
82,37635,32427,53938,47722,745
4,0392,6653,924
Exemptions
(7h__dd.11...)
Memphis, Tennessee
338,214
(2)
22,99331,09845,04840,28856,551
40,17240,79215,68813,97 85,897
14,3424,3012,4542,49 8
828
833713
Taxableincome
(Th-d&11...)
435,304
"56,646
20,15713,66042,148
39,48957,28733,68338,32619,529
56,10525,96521,%031,42019,45 8
3,3122,2683,446
Milwaukee, Wisconsin
12,589,443
(2)
18,88049,83785,474
124,033186,103
354,451383,083320,188235,167162,131
336,34086,20057,648
106,96651,375
14,8066,76310,324
730,430
(2)
28,79233,90942,46044,25063,587
122,553121,92195,18659,29332,282
59,25210,8766,1346,5451,705
2547948
1,517,30,4 1
81214,56333,19364,50898,172
180,665207,684179,301143,054107,401
232,56063,21342,67084,16840,666
11,60 75,1097,95 8
Mobil., Alabama
Total. . . . . . . . . . . . . . . . . . . . . . . . . . . . . . . . . . . . . . . 87,368 '444,889 185,502 203,915
No adjusted gross income. . . . . . . . . . . . . . . . . . . . . . . . . . (2) (2) (1) -Under $1,000. . . . . . . . . . . . . . . . . . . . . . . . . . . . . . . . . . . . . . 8,9V 4,872 8,694 198$1,000 under $2,000. . . . . . . . . . . . . . . . . . . . . . . . . . . . . . . 8,705 13,133 13,393 2,143$2,000 under $3,000. . . . . . . . . . . . . . . . . . . . . . . . . . . . . . . 10,929 28,307 21,518 6,120$3,000 under $4,000 . . . . . . . . . . . . . . . . . . . . . . . . . . . . . . . 8,127 27,914 18,6M 6,586$4,000 under $5,000 . . . . . . . . . . . . . . . . . . . . . . . . . . . . . . . 12,812 58,261 33,852 16,9605,000 under $6,000 . . . . . . . . . . . . . . . . . . . . . . . . . . . . . . . 12,128 67,423 28,382 26,132t6 000 under$7 000 7,238 47,038 18,440 19,238$7 :000 under $8:ooo : : : : :,* : : : : : :*.*.,*", *.* *.,.******* 6,778 50,447 16,550 25,906$8,000 under $9,000 . . . . . . . . . . . . . . . . . . . . . . . . . . . . . . . 3,762 31,853 8,540 18,626$9,000 under $10,000 . . . . . . . . . . . . . . . . . . . . . . . . . . . . . . 2,393 22,531 5,007 14,328
$10 000 under $15,000. . . . . . . . . . . . . . . . . . . . . . . . . . . . . 3,565 41,834 7,852 28,033$15:000 under $20,000. . . . . . . . . . . . . . . . . . . . . . . . . . . .. 769 12,623 1,7349 ,
$20,OD0 under $25,000. . . . . . . . . . . . . . . . . . . . . . . . . . . . . (2) (2) (2) (2)$25,000 under $50,000. . . . . . . . . . . . . . . . . . . . . . . . . . . . . 527 17 818, 1,522 14 077$50,000 under $100,000. . . . . . . . . . . . . . . . . . . . . . . . . . . . 160 9:%8 340 8:547
00,000 under $150,000. . . . . . . . . . . . . . . . . . . . . . . . . . . (2) (2) (2) (2)V50 000 under $200,000 . . . . . . . . . . . . . . . . . . . . . . 4 1,661 8 741$200 :000 or more . . . . . . . . . . . . . . . . . . . . . . .. . . . . . . : : : : :
Total . . . . . . . . . . . . . . . . . . . . . . . . . . . I . . . . . . . . . . .
No adjusted gross income . . . . . . . . . . . . . . . . . . . . . . . . . .
tkider $1,000 . . . . . . . . . . . . . . . . . . . . . . . . . . . . . . . . . . . . . .$1,0DO under $2,000 . . . . . . . . . . . . . . . . . . . . . . . . . . . . . . .$2,000 under $3,000. . . . . . . . . . . . . . . . . . . . . . . . . . . . . . .$3,000 under $4,000. . . . . . . . . . . . . . . . . . . . . . . . . . . . . . .$4,000 under $5,000. . . . . . . . . . . . . . . . . . . . . . . . . . . . . . .
$5,000 under $6,000. . . . . . . . . . . . . . . . . . . . . . . . . . . . . . .$6,000 under $7,000. . . . . . . . . . . . . . . . . . . . . . . . . . . . . . .$7,000 under $8,000. . . . . . . . . . . . . . . . . . . . . . . . . . . . . . .$8,000 under $9,000. . . . . . . . . . . . . . . . . . . . . . . . . . . . . . .$9,000 under $10,000. . . . . . . . . . . . . . . . . . . . . . . . . . . . . .
$10 000under $15,000. . . . . . . . . . . . . . . . . . . . . . . . . . . . .
$1, :000 under $20,000. . . . . . . . . . . . . . . . . . . . . . . . . . . . .$2OpOOO under $25,000 . . . . . . . . . . . . . . . . . . . . . . . . . . . . .$25,000 under $50,000 . . . . . . . . . . . . . . . . . . . . . . . . . . . . .$50,000 under $100,000 . . . . . . . . . . . . . . . . . . . . . . . . . . . .
000 under $150,000 . . . . . . . . . . . . . . . . . . . . . . . . . . .V0500',000 under $200,000 . . . . . . . . . . . . . . . . . . . . . . . . . . .$M,000 or more . . . . . . . . . . . . . . . . . . . . . . . . . . . . . . . . . .
123,07 8
(2)
10,20211,88317,91313,34414,297
12,61312,3207,8567,7062,790
7,3671,794
8861,324
246(2)
14
New Haven, Connecticut
1685,670 189,336 412,666
(2)
5,25916,92544,54646,51363,973
68,13679,41659,23565,17926,349
87,04330,52019,61545,60816,863(2)
8377-101
(2)
7,38911,7"20,67216,30620,736
23,14124,05917,22715,8066,902
15,5303,7822,0572,826
545(2)
1228
3375,149
18,62623,38033,853
36,03544,66133,45039,09215,568
60,85123,90815,68237,88114,394(2)
7685 .970
Income taxcafterredits
(Th--ddollara)
1010604
89lo3164,0092,7398,494
7,81011,5446,8157,8554,03 9
12,0516, 1.195,6279,82-78,294
1,6841,2012, 0%
342,872
1642,8456,509
12,95019,980
36,33:342,40936,71030,=22,3W.
49,97414,65710,95026,52816,7535,8452,7405,12 9
45,59 8
40429
1,1291,24-13,306
5,2743,85~~5 2303:8072,962
5,9102,119
(2 )
4 373-3 :609
(1)
36 3
97,14?
6?1,0073,6%4,6446,774
7,2879,0286,7687,9883,27 5
13,0755,6283,971
12,0256,196(2)
4073 .785
Number ofreturns
321,707
2,310
36,79538,95143,35645,96034,058
32,63224,61516,12012,M9,881
13,9143,7411,6473,84 9
799
1075063
520,344
(2)
50,85253,29855,34351,08558,101
59,28850,32544,37729,88320,576
30,5046,4173,2474,92 6
924
2136160
12_2 617
(2)
14,73712,17117,61516,28016,334
10,42510,6806 1664:6663,993
5,5401,496
6241,178
251
621517
Adjustedgross income
(7h.-ddell ...
11,652,992
35,049
18,97958,226
109,658161,Wn153,046
178,588159,326120,588108,65 393,255
163,94063,77336,61 5
131,64252,741
13,02 58'"s
26,661
&e3Ptioc8
d.11 ...
Taxableincome
(7h....dd.11. ..
Income taxafter
credits
(Th--dd.11-)
Miami, Florida
518,362 853,063 207,192
2,983
28,29745,79762,18672,27258,191
61,48150,41134,59028,13522,226
29,3167,8603,9488,2671,91 3
238112139
89312,13031,33860,90860,607
79,01375,29162,72560,07752,160
105,61643,63627,386
103,05842,186
9,6046,832
19,603
Minneapolis-St . Paul, Minnesota
12,947,121 866,078 1,645,163
(1)
26,57577,473
139,181178,717264,559
325,650326,835332,995252,692194,560
354,504111,01272,568
170,27561,591
25,07210,37324,425
(2)
39,51052,95260,77667,95492,191
123,758112,043103071763,80542,412
67,80715,3017,558
11 5252'168 ~
494~131124
Nashville, Tennesse e
1629,971
(1)
7,22817,94845,00156,63872,82A
57,48269,69145,75539,14037,821
65,69126,38013,79239,46216,475
7,2852,522
10,044
208,781
(2)
11,29212,64627,59828,28734,423
21,72522,07713,77110,4296,782
11,4523,1511,4762,472
564
1323330
New Orleans, Louisiana
1,90022,64660,84587,278
132,299
146,458158,762174,196148,4m120,732
231,02578,08954,257
133,11649,363
20:2657 836
17,606
341,25 2
2204,881
14,64120,M126,416
25,03436,1"24,44022,90824,324
"'98920,09910,66033,68414,219
6,4102, 1.199,363
268,735 11,376,852 451,2_121 770,353
(2) (2) (2) -
33,805 16,397 26,142 1,02534,381 50,340 42,566 10,79233,838 85,572 49,506 28,05330,800 108,691 56,982 40,42635,241 157,354 67,259 M,828
31,681 174,232 64,8D4 85,37918,535 119,a20 36,460 65,1011-2,567 94,161 25,382 52,85310,226 87,221 22,899 53,1386,059 57,090 12,740 36,18 9
12,234 1",055 26,057 99,3553,117 53,331 7,382 38,4721,668 36,775 3,300 29,7391,926 65,135 4,029 54,1061,214 86,574 2,991 73,87 5
194 21,816 455 17 74024 4,103 45 335438 15,8141 771 9 928
1642,3806,174
12,17612,097
15, sa15,02112,63212,29710,699
22,42810,1796,87332,20417,646
4,6153,536
10,25D
381,338
3824,486
U, 88317,37126,714
29,55332,0913P,56030,5752,4,865
49,03418,21913,65441,37520,583
10 1984:164
10,641
83,
4495 7
2,6494,1685,233
5,0747,2834,9364,6325,084
9,6324,8452,676
10,9386,124
3,3391,1464,814
195,6a2
1972,1095,3828,082
14,174
17,11013,28210,82811,0737,629
21,4139,1088,143
17,98432,563
8,%71,825
Footnotes at end of table . See text for "Description of Sample" and "Explanat~ion of Classifications so[ Terms ."
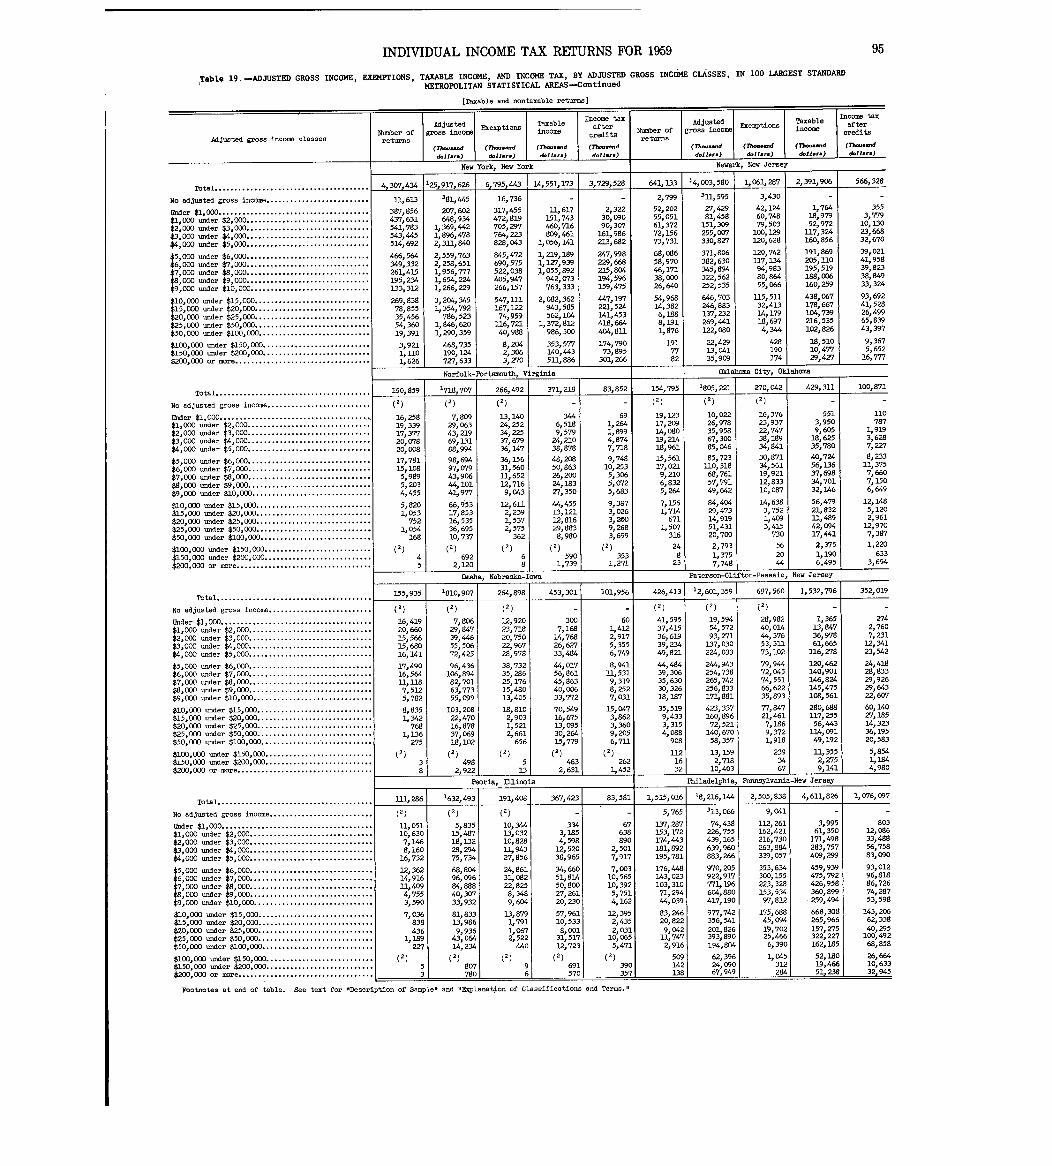
Adjusted gross income classes
Total. . . . . . . . . . . . . . . . . . . . . . . . . . . . . . . . . . . . . . .
No adjusted gross income . . . . . . . . . . . . . . . . . . . . . . . . . .
Under $1,000. . . . . . . . . . . . . . . . . . . . . . . . . . . . . . . . . . . . . .$1 000 under $2~000. . . . . . . . . . . . . . . . . . . . . . . . . . . . . . .$2 : COD under $3,000. . . . . . . . . . . . . . . . . . . . . . . . . . . . . . .$3,000 under $4,000. . . . . . . . . . . . . . . . . . . . . . . . . . . . . . .$4,000 under $5,000. . . . . . . . . . . . . . . . . . . . . . . . . . . . . . .
$5,000 under $6,000. . . . . . . . . . . . . . . . . . . . . . . . . . . . . . .$6,000 under $7,000. . . . . . . . . . . . . . . . . . . . . . . . . . . . . . .$7,000 under $8,000. . . . . . . . . . . . . . . . . . . . . . . . . . . . . . .$8,000 under $9,000. . . . . . . . . . . . . . . . . . . . . . . . . . . . . . .$9,000 under $10,000. . . . . . . . . . . . . . . . . . . . . . . . . . . . . .
$10,000 under $15,000 . . . . . . . . . . . . . . . . . . . . . . . . . . . . .$15,000 under $20,000 . . . . . . . . . . . . . . . . . . . . . . . . . . . . .$20,000 under $25,000 . . . . . . . . . . . . . . . . . . . . . . . . . . . . .$25,000 under $50,000 . . . . . . . . . . . . . . . . . . . . . . . . . . . . .$50,000 under $100,000. . . . . . . . . . . . . . . . . . . . . . . . . . . .
$100,000 -der $150,000 . . . . . . . . . . . . . . . . . . . . . . . . . . .$150,000 under $200,000 . . . . . . . . . . . . . . . . . . . . . . . . . . .$200, 000 or more . . . . . . . . . . . . . . . . . . . . . . . . . . . . . . . . . .
Total . . . . . . . . . . . . . . . . . . . . . . . . . . . . . . . . . . . . . . .
No adjusTed gross income . . . . . . . . . . . . . . . . . . . . . . . . . .
War $1,000 . . . . . . . . . . . . . . . . . . . . . . . . . . . . . . . . . . . . 11$1,000 under $2,000. . . . . . . . . . . . . . . . . . . . . . . . . . . . . . .$20000 under $3,000. . . . . . . . . . . . . . . . . . . . . . . . . . . . . . .$3 000 under $4,000. . . . . . . . . . . . . . . . . . . . . . . . . . . . . . .$4 :000 =der $5,GOO. . . . . . . . . . . . . . . . . . . . . . . . . . . . . . .
$5 000 under $6,000. . . . . . . . . . . . . . . . . . . . . . . . . . . . . . .
$6:000 =der $7,000. . . . . . . . . . . . . . . . . . . . . . . . . . . . . . .$7 000 under $8,000. . . . . . . . . . . . . . . . . . . . . . . . . . . . . . .
$8 :000 under $9,000. . . . . . . . . . . . . . . . . . . . . . . . . . . . . .
$9,000 under $10,000. . . . . . . . . . . . . . . . . . . . . . . . . . . . . .
$10,000 under $15,000. . . . . . . . . . . . . . . . . . . . . . . . . . . . .$15,000 under $20,000. . . . . . . . . . . . . . . . . . . . . . . . . . . . .$20,000 under $25,000. . . . . . . . . . . . . . . . .$25,000 -der $50,000. . . . . . . . . . . . . . . . .$50,000 under $100,000 . . . . . . . . . . . . . . . . . . . . . . . . . . . .
$100,000 -der $150,000 . . . . . . . . . . . . . . . . . . . . . . . . . . .$150,000 under $200,000 . . . . . . . . . . . . . .$200,000 or more . . . . . . . . . . . . . . . . . . . . .
Total . . . . . . . . . . . . . . . . . . . . . . . . . . . . . . . . . . . . . . .
No adjusted gross income . . . . . . . . . . . . . . . . . . . . . . . . . .
Under $1,000 . . . . . . . . . . . . . . . . . . . . . . . . . . . . . . . . . . . . . .$1,000 under $2,000 . . . . . . . . . . . . . . . . . . . . . . . . . . . . . . .$2,000 under $3,000 . . . . . . . . . . . . . . . . . . . . . . . . . . . . . . .$3,000 under $4~000 . . . . . . . . . . . . . . . . . . . . . . . . . . . . . . .$4,000 under $5,000 . . . . . . . . . . . . . . . . . . . . . . . . . . . . . . .
$5,000 -der $6,000 . . . . . . . . . . . . . . . . . . . . . . . . . . . . . . .$6,000 under $7,000 . . . . . . . . . . . . . . . . . . . . . . . . . . . . . . .$7,000 under $8,000 . . . . . . . . . . . . . . . . . . . . . . . . . . . . . . .$8,000 under $9,000 . . . . . . . . . . . . . . . . . . . . . . . . . . . . . . .$9,000 under $10,000. . . . . . . . . . . . . . . . . . . . . . . . . . . . . .
$10,000 -der $15,000. . . . . . . . . . . . . . . . . . . . . . . . . . . . .
$15 1 000 under $20,000. . . . . . . . . . . . . . . . . . . . . . . . . . . . .
$20,000 under $25,000. . . . . . . . . . . . . . . . .$25,000 under $50,000. . . . . . . . . . . . . . . . .$50,000 under $100,000. . . . . . . . . . . . . . ... . . . . . . . . . . . .
$100,000 under $150,000. . . . . . . . . . . . . . . . . . . . . . . . . . .$150,000 under $200,000. . . . . . . . . . . . . . . . . . . . . . . . . . .$200,000 or more . . . . . . . . . . . . . . . . . . . . . . . . . . . . . . . . . .
Total. . . . . . . . . . . . . . . . . . . . . . . . . . . . . . . . . . . . . . .
No adjusted gross income . . . . . . . . . . . . . . . . . . . . . . . . . .
Under $1,000 . . . . . . . . . . . . . . . . . . . . . . . . . . . . . . . . . . . . . .$1,000 under $2,000 . . . . . . . . . . . . . . . . . . . . . . . . . . . . . . .$2pOOO under $3,000 . . . . . . . . . . . . . . . . . . . . . . . . . . . . . . .$3,000 under $4,000 . . . . . . . . . . . . . . . . . . . . . . . . . . . . . . .$4,000 under $5,000 . . . . . . . . . . . . . . . . . . . . . . . . . . . . . . .
$5pOOO under $6,000 . . . . . . . . . . . . . . . . . . . . . . . . . . . . . . .$6,000 under $7,000 . . . . . . . . . . . . . . . . . . . . . . . . . . . . . . .$7,000 under $8,000 . . . . . . . . . . . . . . . . . . . . . . . . . . . . . . .$8)000 under $9~000 . . . . . . . . . . . . . . . . . . . . . . . . . . . . . . .$9,000 under $10,000 . . . . . . . . . . . . . . . . . . . . . . . . . . . . . .
$10,000 under $15,000. . . . . . . . . . . . . . . . . . . . . . . . . . . . .$15,000 under $20,000. . . . . . . . . . . . . . . .$20,000 under $25,000 . . . . . . . . . . . . . . . .$25,000 under $50,000 . . . . . . . . . . . . . . . . . . . . . . . . . . . . .$50,000 under $100,000. . . . . . . . . . . . . . . . . . . . . . . . . . . .
$100,000 under $150,000 . . . . . . . . . . . . . . . . . . . . . . . . . . .$150,000 under $200,000 . . . . . . . . . . . . . .$200,000 or more. . . . . .
INDIVIDUAL INCOME TAX RETURNS FOR 1959
Table 19 . -ADJUSTED GROSS INCOME, EXEMPTIONS, TAXABLE INCOME, AND INCOME TAX, BY ADJUSTED GROSS INCOME CLASSES, IN 100 LARGEST STANDARD
METROPOLITAN .STATISTICAL AREAS-Continue d
[Taxable and nontaxable returns ]
Number ofreturns
4,3(Y7,434
U, 613
387,856437,631541,783543,445514,692
466,564349,332261,415195,2341330312
269,83 878,85535,45654,36019,391
3,9211,1101,626
150,859
(1)
16,25819,33917,37720,07820,008
17,78115,1085,9895,2034,455
5,8201,05 3
7521,054
168
(2)
45
355,93 5
(1)
16,41920,66015,56635,68016,141
17,49016,56411, 1187,5125,782
8,8351,34 2
7681,136
275
(1)38
111, 28 6
(2)
11, 05110,6307,1468,160
16,732
12,36214,9163 .1,4094,7553,590
7,03 6838436
1,1892Z7
(1)53
Adjustedgross income
(Th--dd.11. .. )
New
'25,917,626
381,445
207,602648,934
1,369,4421,896,4782,311,840
2,559,7632,258,6511,956,7771,654,2241,266,229
3,204,3451,354,79 2
786,5231,846,6201,290,35 9
468,735190,124727,633
Norfoik-
1718,?07
(2)
7,80929,06343,21969,13188,994
98,69497,07943,90644,10141,977
66,05317,85316,53536,69510,737
(1)692
2,12 0
0--h-, Nebraska-I
1810,90`7
(2)
7,80629,84739,44655,50672,425
96,436106,89482,70163,77355,099
103,20 822,47016,8783?,06918,102
(2)
4982,922
Peoria, 111inoi
1632,493
(2)
5,83515,48718,13228,29475,734
68,80496,09684,88840,30`733,932
81,83313,9869,93 6
43,06414,234
807780
Exemptions
(Th-.-dd.11.,. )
York, New York
6,795,443
16,736
317,455472,819705,297764,223826,043
945,472690,575522,038405,947266,157
547,12.1167,12274,959
116,72140,988
8,2042,3063, Z70
Portsmuxth, Virginia
266,492
(2)
13,14024,25234,22537,67936,147
36,15631,56011, 65212,7169,043
12,61-12,2391,5372,575
362(2)
68
264,89 8
(1)
12,92023,71820~75022,96728,978
38,73235,28625,17615,48013,405
18,8102,9031,5212,66 1
65 6
(1)5
13
191,408
(1)
10,34413,03210,82811,94327,856
24,86131,08222,82 58,3489,604
13,8791,7911 067Y,522
440
(1)96
Taxableincome
(Thm.-dd.11 . . .
14,551,173
-
11, 617151,743460,716809,461
1,056,141
1,219,1891,IZ7,939;,055,892
942,073763,333
2,082,36 2943,585562,104
1,372,812986,300
3530577140,44351-1,886
371,218
(2)
-
3446,5189,579
24,21038,87848,20850,86326020024,183Z7,350
44,45513,12112,81629,8838,980
5901,73 9
owa.
453,301
-
3007,168
14,76826,62733,484
44,01756,86145,86340,00633,772
70,54916,67513,09530,26415,779
(2)
4632,631
367,423
(1)
-
3343,1854,598
12,52038,965
34,66051,81450,80027,26120,230
57,96110,53 38,001
31,51712,723
691570
Income taxcafterredit s
(77--dd.11. ..
3,729,528
-
.2,32230,09090,307
161,986233,682
247,998229,668215,804194,596159,475
447,197221,524141,453418,664404,811
174079073,895
301,266
83,852
-
691,2641,8994,8747,718
9,74810,2535,3065,0725,683
9,3873,0263,2009,2683,699
(2)
3531,271
101,956
-
601,4122,9175,3556,749
8,94111, 5319,3198,2527,031
15,0473,8623,3609,2056,71.1
(2)
2621,45 2
83,581
-
67638890
2,5017,917
7,00310,56510,3925,7514,162
12,3952,4352,03
10,06515,471
(2)
390357
Number ofreturn
s
641,13 3
2,799
52,20255,05161,37272,15673,731
68,08658,97046,17138,00026,640
54,96814,3826,1888,1911,876
1917782
154,795
(2)
19,12317,20914,08019,21418,961
15,56117,0219,2106,8325,264
7,1561,714
6711,507316
248
2 3
426,413
(2)
41,59537,41536,61939,23449,821
44,48439,30635,63030,32618,187
35,5199,4333,3154,08 8
908
1121632
1,53.5,016
5,765
3.37,2871.53,172174,443181,892195,781
176,448143,023103,31071,29444,039
83,24620,8229,04211,747
2,916
509142138
Adjustedgross income
(rh-dd.11. . .)
311,595
Z7,42981,458
151,309255,007330,8Z7
371,806382,630345,894322,562252,535
646,?03246,883137,232269,441122,080
22,42913,04135,909
1805,221
(2)
10,02226,97835,95867,30085,046
85,723110,31868,76157,79149,642
84,40429,47314,91951,43120,700
2,7931,3757,748
(2)
19,59454,57293,271
3-37,030224,033
244,943254,738265,742256,833171,881
423,337160,89672,521
140,67058,357
13,1592,718
10,403
Eeptions
(n--d(Th--d Id.11. .. ) d.11.. .
Newark, New Jerse y
14,003,580 1,061,287 2,391,906
3,430
42,12460,74879,503
100,129120,628
120,742117,13494,98380,86455,066
115,51132,41314,17918,6974,344
428190174
Oklahoma City, Okl
L270,042
(2)
16,37623,93722,74738,18934,841
30,87134,56119,92112,83310,087
14,6383,7521,4093,43.5
730
562044
Paterson-Clifton-Passaic ,
'2,601,359 1 687,5601 1,532,79 6
(2)
28,98240,01444,37653,31173,102
79,94472,04574,55166,62235,893
77,84721,4617,1869,3721,918
2393467
Tax bleincome
-
1,76418,97952,972
3.17,324160,856
19:1,869205,110195,519188,006160,259
438,067178,667104,739236,535102,82 6
18,51010,47729,427
429,311
-
5513,9509,60518,62535,780
40,72,456,13637,69834,70132,146
56,47921,83211, 48942,09417,441
2,3751,1906,49 5
1,3651.3,84736,97861,665
116, Z78
120,462140~9013.46,82,4145,475108,561
280,688117,25556,443114,09149,192
11,35 52, Z759,141
18,216,144 1 21505,8381 4,611,826
313,066 9,041 -
74,438 112,261 3,995226,755 162,421 451,350439,165 216,730 171,498639,960 263,884 283,757883,266 339,057 409,299
970,205 353,634 459,939922,917 300,155 475,792771,196 223,328 426,958604,880 153,534 360,899417,190 97,812
977,742 175,688 668,308356,541 45,094 265,966201,826 15,702 1.57,275393,890 25,466 322,227194,804 6,390 162,18 5
62,396 1,045 52,18024 090 312 19,46667949 284 L 5_1 238
Footnotes at end of table . See text for "Description of Semple-' and "Explana#on of Classifications and Terms .11
ahoma
New Jersey
Philadelphia, Pennsylvania-New Jersey
Income taxcaftereditB
(7)-. .dd.11. ..
95
566,328
-
3553,77910,13023,66832,670
39,02141,95839,82338,94933,324
93,69241,52826,49965,83943,397
9,3675,65216,7T7
100,871
-
110?87
1,9193,6287,2278,233
3 .1,3757,6607,1506,649
12,1485,1202,961
12,9707,387
1,220633
3,694
352,019
-
2742,7607,231
12,34123,542
24,41828,83329,92629,64322, 607
60,14027,18514,32336,19520,583
5,8541,1844,98 0
1,076,097
-
80312,08633,48856,75883,090
93,01296,81886,72674,28753,598
143,20662,33840,295100,49268,858
26,66410,63332.945
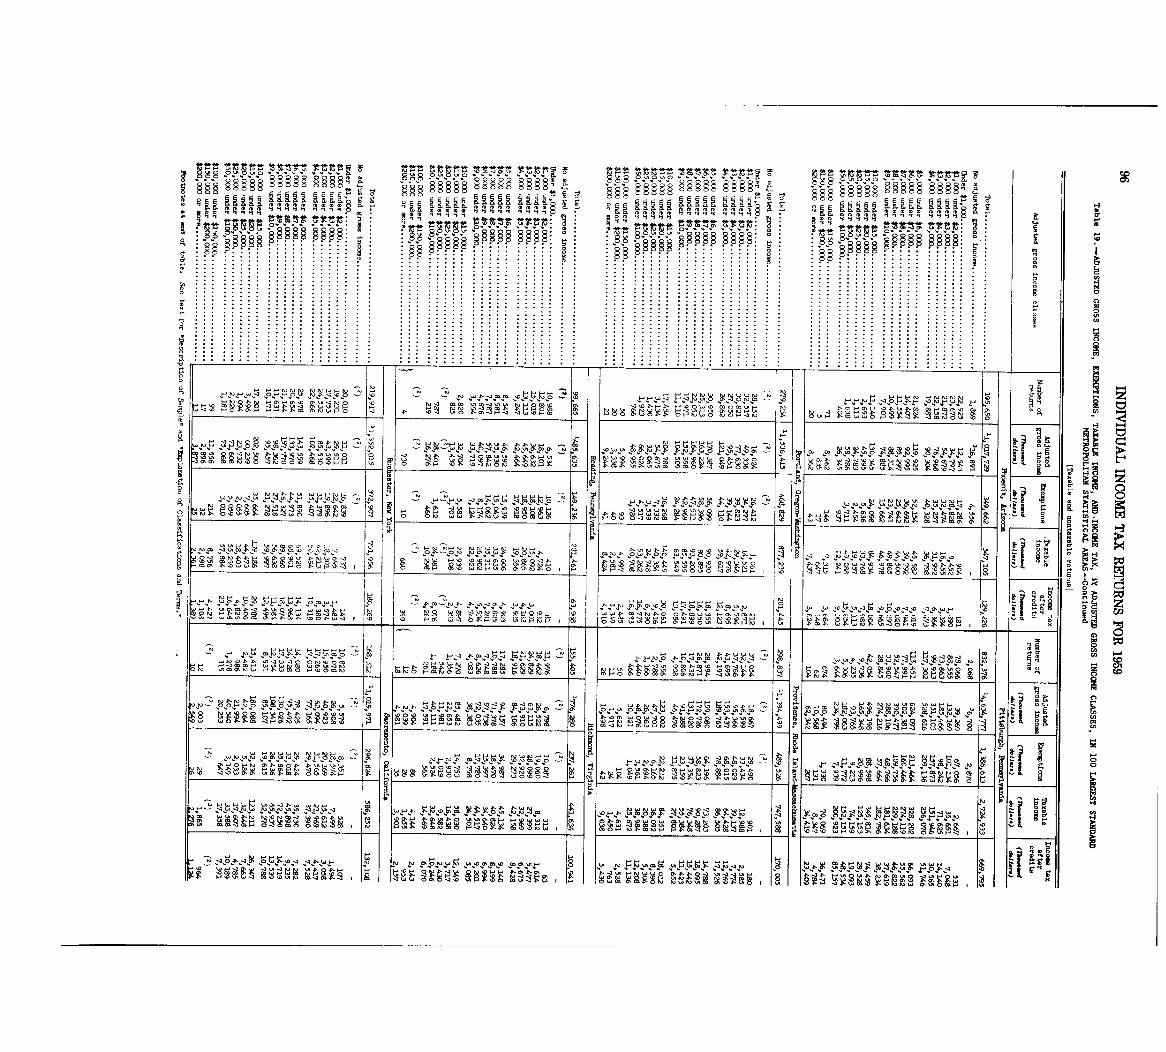
o =0§§§§l A K
r Mrtri
. . . . . . . . . . .0 0
0
. .. . . . . . . . . . . . . .
I FN.,~ NY, I z
~PPNUP v eNo, N "0
IMNo P~8~ OZY '?,Y g rw -PI P
!2 H- - F "YS.,p S-PP p Y-A~~ow '-
Ol0
N o0a 19, IN 19, ~, J~ - 1~ j,~-"WN wo "OR F0 r -u;-k - 0 ta .
89~-0 --
p -Jo "PY "P,p0' 'm wJz&14~ r .1 1 ~ Y I ~~s N ~~
", ~3 ~S.,Sowpd
q. ts.I
2H H &5
2",P~ s w .T ~p te 52 0'p 64 4'. m L
'0- dT 0,
~~ww www~ w o N ~,q
0 83 ~7- 6,,"
4,6; UNUHPKP,~'p AN'P,?e VS. vz.
a N& vqg~qVPP
w "N tog t-- ~gz? EN 20 NM C~ ~4 'H~-
XP80
HY N .,8 e, .00 ~gp.
0
vev,~.e 4, J~-
MWpy-P Y. e, V
st r- oHEN 2 f
w ug~~ San ~v F 0 r.U"s~WWO
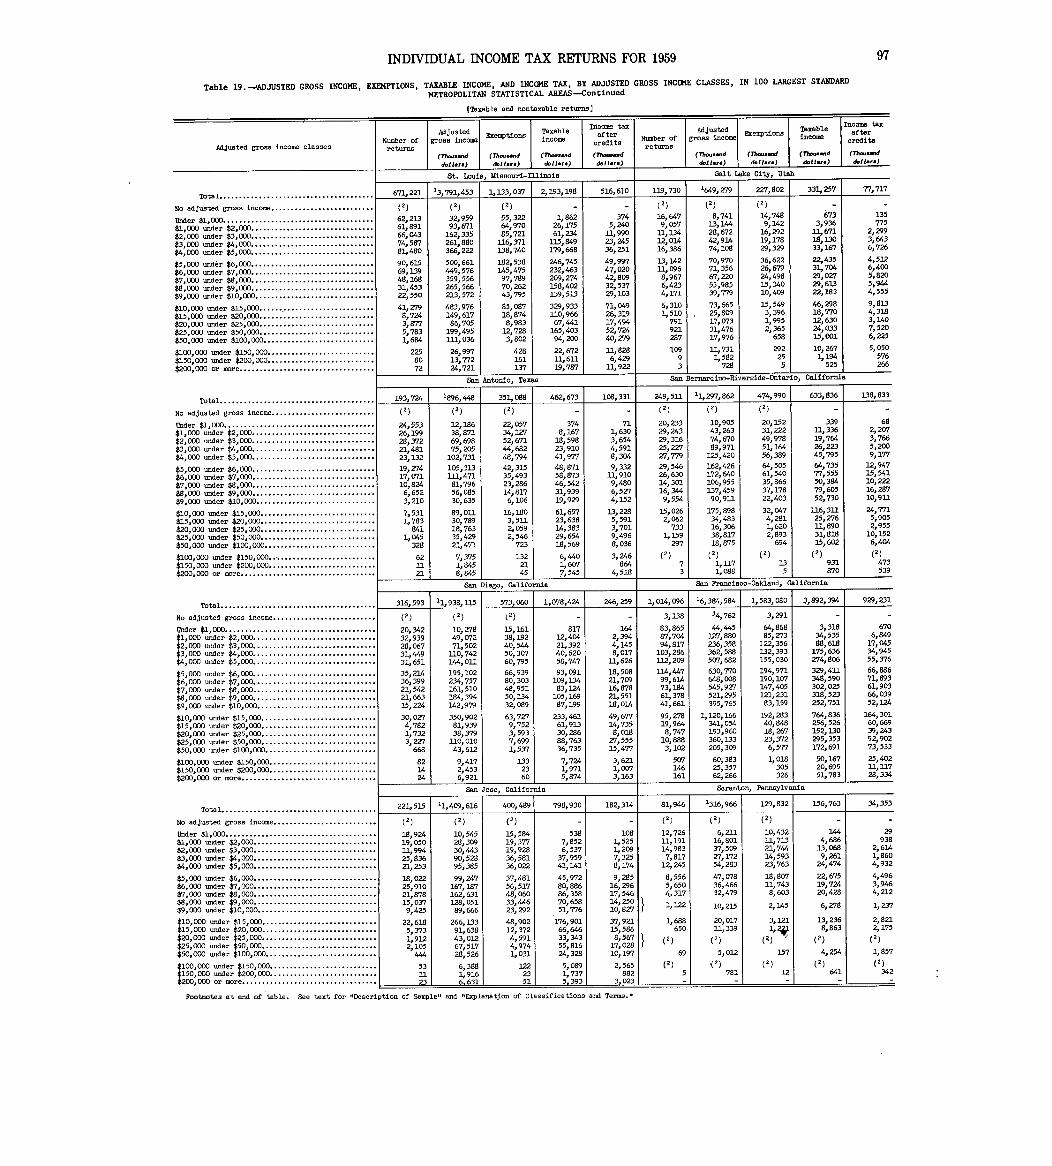
Table 19 . -ADJUSTED GROSS INCOME, EXEMPTIONS, TAXABLE INCOME, AND INCOME TAX, BY ADJUSTED GROSS INCOME CLASSES, IN 100 LARGEST STANDARD
METROPOLITAN STATISTICAL AREAS-Continued
[Taxable and nontaxable returns I
Number ofreturns
671,221
(2)62,21361,89166,04374,58781,480
90,61569,13948,16831,45322,550
41, Z798,7243,8775,7831,694
2258072
Adjustedgross income
(Thousanddollar . )
13,791,45 3
(1)
32095993,671162,335261,880366,222
500,661449,576359,556265,566213,572
483,976149,61786,705
199,495111, 036
26,99713,77224,721
Exemptions
(77--dd.11.. .)
1,133,037
(2)
55,32264,97085,721
316,371138,740
182,538145,47597,78970,26243,795
85,08718,8748,983
12,7283,802
428161137
Taxableincome
(Th-dd.11. ..
Income taxafterredits
(Tho-ddoll...
St . louis, Missouri-Illinois
2,193,198
1,86226,17561,234115,849179,668
246,745232,463209,274158,402139,513
329,933110,96667,441
165,40394,200
22,67211,61119,787
516,610
-
3745,240
11,99023,24536,2.51
49,99747,02042,80932,53729,103
71,04926,31917,49452,72440,279
1-1,M6,42911,922
San Antonio, Texas
193,724
(2)
24,55326?19928,37221,48123,132
19,Z7417,07110,8246,6523,210
7,5311?783
8411,045
328
621121
San Diego, Californi a
316,59 3
(2)
20,34232,93928,06731,44931,651
35,21436,39921,54221,66315,224
30,OZ?4,7821,7323,227
668
821424
221,515
(2)
18,92419,05011,99425,83621,253
18,02225,91021,87815,0379,425
22,6185,3731,9122,10 5444
533-123
'896,448
(2)
12,18638,87169,69875,205
102,731105,313111, 47181,79656,08530,635
89, ou30,78918,76335,42921,471
7,3751,8458,84 5
'1,938,115
(2)
10, Z7849,(77271,502
2.10,742144,011
195,102234,757161,510184,394142,979
350,90281,93938,379
3 .10,01043,612
9,4172,4536,92 1
11,409,616
(2)
10,54528,30930,44390,52895,385
99,247167,187162,631128,05189,666
266,13391,63843,01267,51728,52 6
6,3881,91 66-6311
351,08 8
(2)
22,05734,12752,67144,68248,794
42,31535,49323,28614,8176,106
16,1803,5112,0592,546
723
3322-145
573,060
(2)
15,16138,19240,54450,30760,795
66,93980,30348,95150,23432,089
63,7279,7523,5937,6991,53 7
1332360
400,499
(2)
15,58419,37719,92836,58136,022
37,48156,51748,06033,44623,292
48,90212,3724,5914,9741,03 1
1222351 1
462,673
-
3748,167
18,59823,91041,977
48,87158,87346,54231,93919,929
61,65723,63814,38329,65418,569
6,4401,607.7154 5
1,078,424
-
81712,40421,39240,62058,747
93,091109,13483,124
105,16987,199
233,46161,91330,28688,76336,73 5
7,7241,9715,874
798,930
-
5387,8526,537
37,95941,141
45,97280,88686,35870,65851,776
176,90166,64633,34355,81624,328
5,0891,73 7
-- 5,393
108,331
-
711,6303,6544,5918,304
9,332U, 9109,4806,5Z74,152
13,2285,5913,7019,4968,036
3,24 6864
4,518
246,259
-
1642,3944,1458,017
1.1,626
18,50821,70916,87821,55118,014
49,67714,73 58,018
Z7,55525,477
3,6211,0073,163
San Jose, California
182,314
-
1081,5251,2097,3258,174
9,28516,29617,54614,25010,827
37,92115,5868,567
17,02810119 7
2,565882
3,023
Number ofreturns
3 .19,730
(2)
16,6479yO57
lly 13412,01416,386
13,14221,0968,9676,4234,171
6?3101,510
791921287
10993
249,511
(2)
20,23329,24329,31625,2Z7Z7,779
29,54626,63014,30116,3449,554
15,0262,062
7331,159
297
73
1,014,09 6
3,138
83,86587,70494,817
103,286112,209
U4,44799,61473,18461,37841,661
95,27819,9648,747
10,8883,102
50`7146161
81,946
(2)
12,72611,19114,9837,817
12,245
8,5565,6504,317
1,122
1,688650
69
5-
Adjustedgross income
(77-dd.1 I...)
1649, Z79
(2)
8,74113,14428,67242,91474,108
70,97071,35667,22053,98539,779
73,66525,80917, C17331,47617,976
3.1,7311,582
728
San Bernardino-Riverside-Ontario, Californ i
11,297,86 2
(2)
10,90543,26374,67089,971
12.5,420
162,426172,640106,955137,45990'qu
175,89834,48316,30638)81718,87 5(2)
1,2.171,08 8
Salt Lake City, Utah
San Francisco-Oakland, Californi a
16,384,584
34,762
44,445lZ7,880236,358362,5885017,682
630,770648,008545,9Z7521,295395,765
1,120,166341,054193,960360,133205,309
60,38325,35762,26 6
'316,966
(2)
6,21116,80137,50927,17254,283
47,WS36,46632,479
10,215
20,0173-1,339
(2)
5,012J2)
781-
Exemptions
(Thoosanddoll. ..)
227,802
(2)
14,7489,142
16,29219,17829,329
36,62226,67924,49815,34010,409
15,5493,3961,9952,365
658
292255
474,990
(2)
20,15231,22249,97851,16456,389
64,50561,54035,86637,17822,403
32,0474,2811,6202,893
694(2)
135
1,583,08 0
3,291
64,86885, Z73
122,356132,393155,030
194,971190, 1017147,405121,23183,159
192,28340,84818,26723,3726,577
1,018305326
Scranton, Pennsylvani a
129,83 2
(1)
10,432U, 71321,74414,59323,763
18,80711,7438,603
2,14 5
3,121
0)
157
12
Taxablefcome
(77-anddollar .)
331,257
-
6733,936
11, 67118,33033,167
22,435:31,70429,02729,61322,183
46,298118,77012,63024,0333.5,001
10,2671,194
525
633,836
-
33921,33619,76426,22345?795
64,73577,55550,38479,60552,730
116,31125,2763 .1,89031,81835,602
(2)
93187 0
3,892,394
-
3,31834,535138,618
175,636Z74,806
329,411348,590302,025318,523252,751
764,836256,526152,330295,353172,691
50,16720,69551,78 3
156,763
-
1444,686
13,0689,261
Z4,474
22,67519,72420,428
6, Z78
13,2368,863
(2)
4,254(2)
641-
Adjusted gross income classe s
Total . . . . . . . . . . . . . . . . . . . . . . . . . . . . . . . . . . . . . . .
No adjusted gross income . . . . . . . . . . . . . . . . . . . . . . . . . .
Under $1,000 . . . . . . . . . . . . . . . . . . . . . . . . . . . . . . . . . . . . . .$1 000 under $2,000 . . . . . . . . . . . . . . . . . . . . . . . . . . . . . . .$2 :000 under $3,000 . . . . . . . . . . . . . . . . . . . . . . . . . . . . . .
.
.$3,000 under $4,000. . . . . . . . . . . . . . . . . . . . . . . . . . . . . . .$4,000 under $5,000. . . . . . . . . . . . . . . . . . . . . . . . . . . . . . .
$5,000 under $6,000. . . . . . . . . . . . . . . . . . . . . . . . . . . . . . .$6,000 under $7,000 . . . . . . . . . . . . . . . . . . . . . . . . . . . . . . .$7,000 under $8,000 . . . . . . . . . . . . . . . . . . . . . . . . . . . . . . .$8,000 under $9,000 . . . . . . . . . . . . . . . . . . . . . . . . . . . . . . .$9,000 under $10,000 . . . . . . . . . . . . . . . . . . . . . . . . . . . . . .
$10,000 under $15,000 . . . . . . .. . . . . . . . . . . . . . . . . . . . . . .
$15,000 under $20,000 . . . . . . . . . . . . . . . . . . . . . . . . . . . . .$20,000 under $25,000 . . . . . . . . . . . . . . . . . . . . . . . . . . . . .
$25,000 -der $50,000 . . . . . . . . . . . . . . . . . . . . . . .. . . . . . .
$50,000 under $100,000. . . . . . . . . . . . . . . . . . . . . . . . . . . .
$100,000 under $150,000. . . . . . . . . . . . . .$150,000 under $200,000. . . . . . . . . . . . . .$200,000 or more . . . . . . . . . . . . . . . . . . . . . . . . . . . . . . . . . .
Total . . . . . . . . . . . . . . . . . . . . . . . . . . . . . . . . . . . . . . .
No adjusted gross income. . . . . . . . . . . . . . . . . . . . . . . . . .
Under $1,C)00. . . . . . . . . . . . . . . . . . . . . . . . . . . . . . . . . . . . . .$1,000 under $2,000. . . . . . . . . . . . . . . . . . . . . . . . . . . . . . .$2,000 under $3,000. . . . . . . . . . . . . . . . . . . . . . . . . . . . . . .$3,000 under $4,000. . . . . . . . . . . . . . . . . . . . . . . . . . . . . . .$4,000 under $5,000. . . . . . . . . . . . . . . . . . . . . . . . . . . . . . .
$5 ' 000 under.$6,000. . . . . . . . . . . . . . . . . . . . . . . . . . . . . . .$6,000 under $7,000 . . . . . . . . . . . . . . . . . . . . . . . . . . . . . . .
$7 000 under $8,000 . . . . . . . . . . . . . . . . . . . . . . . . . . . . . . .
$8:000 under $9,000 . . . . . . . . . . . . . . . . . . . . . . . . . . . . . . .
$9,000 under $10,000. . . . . . . . . . . . . . . . . . . . . . . . . . . . . .
$10,000 under $15,000 . . . . . . . . . . . . . . . . . . . . . . . . . . . . .$15,000 under $20,000 . . . . . . . . . . . . . . . . . . . . . . . . . . . . .$20,000 under $25,000 . . . . . . . . . . . . . . . .$25,000 under $50,000 . . . . . . . . . . . . . . . .$50,000 under $100,000 . . . . . . . . . . . . . . . . . . . . . . . . . . . .
$100,000 under $150,000 . . . . . . . . . . . . . . . . . . . . . . . . . . .$150,000 under $200,000 . . . . . . . . . . . . . .$200,000 or =a . . . . . . . . . . . . . . . . . . . . .
Total . . . . . . . . . . . . . . . . . . . . . . . . . . . . . . . . . . . . . . .
No adjusted gross income . . . . . . . . . . . . . . . . . . . . . . . . . .
Under $1,000 . . . . . . . . . . . . . . . . . . . . . . . . . . . . . . . . . . . . . .$1,000 under $2,000. . . . . . . . . . . . . . . . . . . . . . . . . . . . . . .$2,000 under $3,000. . . . . . . . . . . . . . . . . . . . . . . . . . . . . . .$3,000 under $4,000. . . . . . . . . . . . . . . . . . . . . . . . . . . . . . .$4,000 under $5?000. . . . . . . . . . . . . . . . . . . . . . . . . . . . . . .
$5,000 under $6~000. . . . . . . . . . . . . . . . . . . . . . . . . . . . . . .$6,000 under $7,000. . . . . . . . . . . . . . . . .$7,000 under $8,000. . . . . . . . . . . . . . . . . .$8,000 under $9,000. . . . . . . . . . . . . . . . . . . . . . . . . . . . . . .$9,000 under $10,000. . . . . . . . . . . . . . . . . . . . . . . . . . . . . .
r
0 000 und :r $15,000. . . . . . . . . . . . . . . . . . . . . . . . . . . . .
15 :000 und r $20,0DO. . . . . . . . . . . . . . . . . . . . . . . . . . . . .$20,000 under $25,000. . . . . . . . . . . . . . .$25,000 under $50,000. . . . . . . . . . . . . . .$50,000 under $100,000. . . . . . . . . . . . . . . . . . . . . . . . . . . .
$100,000 under $150,000. . . . . . . . . . . . . . . . . . . . . . . . . . .$150,000 under $200,000. . . . . . . . . . . . .$200,000 or more. . . . . . . . . . . . . . . . . . . .
Total. . . . . . . . ... . . . . . . . . . . . . . . . . . . . . . . . . . . . . .
No adjusted gross income. . . . . . . . . . . . . . . . . . . . . . . . . .
Under $1,000. . . . . . . . . . . . . . . . . . . . . . . . . . . . . . . . . . . . . .$1,000 under $2?000 . . . . . . . . . . . . . . . . . . . . . . . . . . . . . . .$2,000 under $3,000 . . . . . . . . . . . . . . . . . . . . . . . . . . . . . . .$3,ODO under $4,000 . . . . . . . . . . . . . . . . . . . . . . . . . . . . . . .$4,000 under $5, COO . . . . . . . . . . . . . . . . . . . . . . . . . . . . . . .
$5,000 -der $6,000 . . . . . . . . . . . . . . . . . . . . . . . . . . . . . . .$6,000 under $7,000 . . . . . . . . . . . . . . . . . . . . . . . . . . . . . . .$7,000 under $8,000 . . . . . . . . . . . . . . . . . . . . . . . . . . . . . . .$8,000 under $9,000 . . . . . . . . . . . . . . . . . . . . . . . . . . . . . . .$9,000 under $10,000 . . . . . . . . . . . . . . . . . . . . . . . . . . . . . .
$10,000 under $15,000. . . . . . . . . . . . . . . . . . . . . . . . . . . . .$15,000 under $20,000 . . . . . . . . . . . . . . .$20,000 under $25,000 . . . . . . . . . . . . . . .$25,000 under $50,000 . . . . . . . . . . . . . . . . . . . . . . . . . . . . .$50,000 under $100,000 . . . . . . . . . . . . . . . . . . . . . . . . . . . .
$100,000 under $150,000 . . . . . . . . . . . . . . . . . . . . . . . . . . .$150,000 under $200,000 . . . . . . . . . . . . . . . . . . . . . . . . . . .$200,000 or more . . . . . . . . . . . . . . . . . . . . . . . . . . . . . . . . . .
Footnotes at end of table . See text for t'Description of Sample,, and
INDIVIDUAL INCOME TAX RETURNS FOR 1959
"Explanst~ion of Classifications and Te= .,-
Income taxafter
credits
(Thousanddollar.)
97
77,717
135775
2,2993,6436,726
4,5126,4005,8205,9444,555
9,8134,3183,1407,5206,225
5,050576266
3.38,833
-
682,2073,7665,2009,177
12,94715,54110,22216,28710,91.1
2,4,7715,9052,955
10,1526,404(2 )
473539
929,231
-
6706,649
17,04534,94555,376
66,88671,89361,90366,03952,124
164,30160,66939,24392,90273,533
25,40211,21728,334
34,353
2993 8
2,6141,8604,932
4,4963,9464,212
1,237
2,8212,175(2 )
1,857
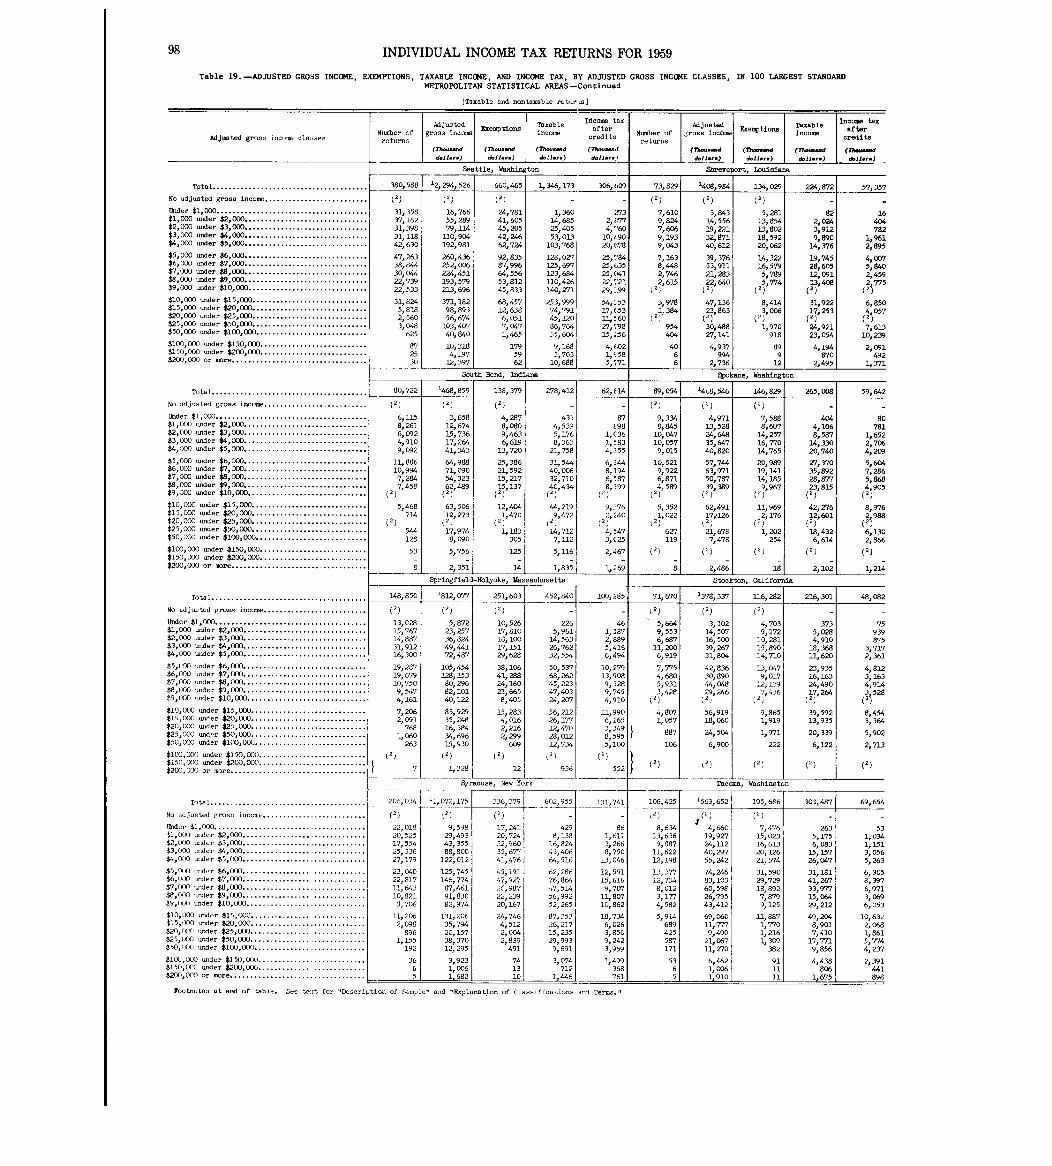
98
Table 19 . -ADJUSTED GROSS INCOME, EXEMPTIONS, TAXABLE INCOME, AND INCOME TAX, BY ADJUSTED GROSS INCOME CLASSES, IN 100 LARGEST STANDARDMETROPOLITAN STATISTICAL AREAS -Continue d
Adjusted gross incom elts ;se s
Total . . . . . . . . . . . . . . . . . . . . . . . . . . . . . . . . . . . . . . .
No adjusted gross incom . . . . . . . . . . . . . . . . . . . . . . . . . .
Under $1,000. . . . . . . . . . . . . . . . . . . . . . . . . . . . . . . . . . . . . .$1,000 under $2~000 . . . . . . . . . . . . . . . . . . . . . . . . . . . . . . .$2,000 under $3,000 . . . . . . . . . . . . . . . . . . . . . . . . . . . . . . .$3,000 under $4,000 . . . . . . . . . . . . . . . . . . . . . . . . . . . . . . .$4,000 tinder $5,000 . . . . . . . . . . . . . . . . . . . . . . . . . . . . . . .
$5,000 under $6,000 . . . . . . . . . . . . . . . . . . . . . . . . . . . . . . .$6, OW under $7,000 . . . . . . . . . . . . . . . . . . . . . . . . . . . . . . .$7,000 wider $8,000. . . . . . . . . . . . . . . . . . . . . . . . . . . . . . .$8,000 under $9,000. . . . . . . . . . . . . . . . . . . . . . . . . . . . . . .$9,000 tinder $10,000. . . . . . . . . . . . . . . . . . . . . . . . . . . . . .
$10,000 under $15,000 . . . . . . . . . . . . . . . . . . . . . . . . . . . . .$15,000 under $20,000. . . . . . . . . . . . . . . . . . . . . . . . . . . . .$20,000 under $25,000. . . . . . . . . . . . . . . . . . . . . . . . . . . . .$25,000 under $50,000. . . . . . . . . . . . . . . . . . . . . . . . . . . . .$50,000 under $100pOO0. . . . . . . . . . . . . . . . . . . . . . . . . . . .
$100,000 under $150,000 . . . . . . . . . . . . . . . . . . . . . . . . . . .$150,000 under $200,000 . . . . . . . . . . . . . . . . . . . . . . . . . . .$200,000 or tan re. . . . . . . . . . . . . . . . . . . . . . . . . . . . . . . . . .
Total . . . . . . . . . . . . . . . . . . . . . . . . . . . . . . . . . . . . . . .
No ~djwatd gross in.oine. . . . . . . . . . . . . . . . . . . . . . . . . .
Lhider $1,000 . . . . . . . . . . . . . . . . . . . . . . . . . . . . . . . . . . . . . .$1,000 under $2,000. . . . . . . . . . . . . . . . . . . . . . . . . . . . . . .$2,000 under $3,000. . . . . . . . . . . . . . . . . . . . . . . . . . . . . . .$3,000 under $4,000. . . . . . . . . . . . . . . . . . . . . . . . . . . . . . .$4,000 =der $5, 000. . . . . . . . . . . . . . . . . . . . . . . . . . . . . . .
$5,000 =der $6,000. . . . . . . . . . . . . . . . . . . . . . . . . . . . . . .$6,000 under $7,000. . . . . . . . . . . . . . . . . . . . . . . . . . . . . . .$7,000 under $8,000. . . . . . . . . . . . . . . . . . . . . . . . . . . . . . .$8,000 under $9,000 . . . . . . . . . . . . . . . .$9,000 under $10,000. . . . . . . . . . . . . . . .
$10,000 under $15,000. . . . . . . . . . . . . . . . . . . . . . . . . . . . .$15,000 under $20,000. . . . . . . . . . . . . . . . . . . . . . . . . . . . .$20,000 under $25,ODO. . . . . . . . . . . . . . . . . . . . . . . . . . . . .$25,000 under $50,000. . . . . . . . . . . . . . . . . . . . . . . . . . . . .$50, OW wider $100,000. . . . . . . . . . . . . . . . . . . . . . . . . . . .
$100,000 under $150,000. . . . . . . . . . . . . . . . . . . . . . . . . . .$150,LM under $200,000. . . . . . . . . . . . . . . . . . . . . . . . . . .$200,000 or axor. . . . . . . . . . . . . . . . . . . . . . . . . . . . . . . . . .
Total . . . . . . . . . . . . . . . . . . . . . . . . . . . . . . . . . . . . . . .
No adjusted gross incotne . . . . . . . . . . . . . . . . . . . . . . . . . .
Under $1,000 . . . . . . . . . . . . . . . . . . . . . . . . . . . . . . . . . . . . . .$1,000 under $2,000 . . . . . . . . . . . . . . . . . . . . . . . . . . . . . . .$2,000 under $3,000 . . . . . . . . . . . . . . . . . . . . . . . . . . . . . . .$3,000 under $4,000 . . . . . . . . . . . . . . . . . . . . . . . . . . . . . .$4,GOO under $5,000 . . . . . . . . . . . . . . . . . . . . . . . . . . . . . . .
$5,('0C, under $6,000 . . . . . . . . . . . . . . . . . . . . . . . . . . . _ . .$6, O(X) under $7... . . . . . . . . . . . . . . . . . . . . . . . . . . . . . .$7,000 under $8,000 . . . . . . . . . . . . . . . . . . . . . . . . . . . . . . .$8,000 under $9,000 . . . . . . . . . . . . . . . . . . . . . . . . . . . . . . .$9,000 under $10,000 . . . . . . . . . . . . . . . . . . . . . . . . . . . . . .
$10,000 order $15,000 . . . . . . . . . . . . . . . . . . . . . . . . . . . . .$1',,000 under $20,000 . . . . . . . . . . . . . . . . . . . . . . . . . . . . .$20, 000 wider $2 " 000 . . . . . . . . . . . . . . . . . . . . . . . . . . . . .$25,(M under $50,000. . . . . . . . . . . . . . . . . . . . . . . . . . . . .$50,00C under $I(X),000 . . . . . . . . . . . . . . . . . . . . . . . . . . . .
$100,000 under $150,000 . . . . . . . . . . . . . . . . . . . . . . . . . . .$150,000 under $2(X),000 . . . . . . . . . . . . . . . . . . . . . . . . . . .$200,000 or ~re. . . . . . . . . . . . . . . . . . . . . . . . . . . . . . . . . .
Total . . . . . . . . . . . . . . . . . . . . . . . . . . . . . . . . . . . . . . .
No adjusted gross inconte . . . . . . . . . . . . . . . . . . . . . . . . . .
Under $1,DW . . . . . . . . . . . . . . . . . . . . . . . . . . . . . . . . . . . . . .$1,000 under $2,000. . . . . . . . . . . . . . . . . . . . . . . . . . . . . . .$2,000 order $3,000. . . . . . . . . . . . . . . . . . . . . . . . . . . . . . .$3,0013 tsde, $4,000 . . . . . . . . . . . . . . . . . . . . . . . . . . . . .. . .$4,000 under $5, LW. . . . . . . . . . . . . . . . . . . . . . . . . . . . . . .
$5,10(W) under $6,000. ~ . . . . . . . . . . . . . . . . . . . . . . . . . . . . .$6, 006 under $7,000. . . . . . . . . . . . . . . . . . . . . . . . . . . . . . .$7, (DO under $8,000. . . . . . . . . . . . . . . . . . . . . . . . . . . . . . .$8,000 under $9, (X)O . . . . . . . . . . . . . . . . . . . . . . . . . . . . . .$9,000 under $10,000. . . . . . . . . . . . . . . . . . . . . . . . . . . . . .
$10,000 und- $1"'000. . . . . . . . . . . . . . . . . . . . . . . . . . . . .$15,000 under $20,000. . . . . . . . . . . . . . . . . . . . . . . . . . . .$20,000 under $25,000 . . . . . . . . . . . . . . . . . . . . . . . . . . . .$25,000 under $50,000 . . . . . . . . . . . . . . . . . . . . . . . . . . . .$50,1)00 under $100,000. . . . . . . . . . . . . . . . . . . . . . . . . . . .
$10G,000 under $150,0(A) . . . . . . . . . . . . . . . . . . . . . . . . . . .$150,00C under $200,OOC . . . . . . . . . . . . . . . . . . . . . . . . . .$200,DOO or wre . . . . . . . . . . . . . . . . . . . . . . . . . . . . . . . . . .
Footnotes at end of tabie . See teict for "D-cription
INDIVIDUAL INCOME TAX RETURNS FOR 1959
Nwaber ofreturns,
380,588
(2)
31,35837,16231,39831,118420630
47p26338p64430,04422,73922,533
31,8245,6182,5603,(WX
625
872530
80,72 2
6,1158,2616, 0924,9109,092
11,88610,9947,2847,4511
(2)
5,468714
(2)
5"228
53
8
148,850
(2)
13,C2815,76714,88731,91216,300
19,28719,67910,7509,5474,161
7,2062,091
7681,060
263(2 )
20~, 0
7
(2)
22,01820,52517,55425,33627,179
23,04022,81711,64310,8218,706
11,2062,098
8961,15 5
192
366
Adjustedgross incom
(Th--dd.11... )
1468,85 9
(2)
3,65 812,67415,73617,26441,343
64,98871,09054,32362,489
(2 )
63,50612,273
(2 ~
17,9748,090
5,75 6
2,35 1
(1)
5,87223,25736,82449,"172,487
105, 4.54128,15380,29682,10140,122
83,92935,24816,38434,69615,930
(2 )
1,328
'l, (Y72,175
9,59829,49343,35588, 800
122,012
125,745146,77487,46191,83082,974
131,20635,79420,15738,37012,29 5
3,9231,0061 682
[Taxable and nontaxable retur is ]
Exemption s
(77.- .-dd.11 .. .)
Seattle, Washington
'2,294,526
(2)
16,76655,28979,114U0, 904192,981
260,436252,006224,451193,579213,696
371,18298,89356,674
103,40740,840
10,3184,19-12, 3917
660,46 5
(2)
24,78141,60545,20542,24662,724
92,83587,99664,55653,81245,833
68,45712,6386,0517,0471,465
1795962
South Bend, Indiana
138,379
(1)
4,2878,0809,4636,619
13,720
25,38621,59215,217L5, 137(2 )
12,4041,470
(2)
1,183305
125-
14
1812,077 251,603
(1)
10,52617,81018,10017,15129,628
38,10641,29824,16021,6658,405
15,2834,0162,2162,299609
(2)
12
Symcuse, New York
Taxableinco-
(Th-.-dd.11.1. )
1,34.6,173 1
-
1,3601 27314 6851 2, f.'7725,'405 4, 796053,013 10'~ 0
103,768 20, 87, 8
128,027L25, 697123,684110,426140,271
253,99974,79145,12086,76435,604
9,1683,703
lOp688
M,412
-
4334,5395,1768,363
21,758
31,54440,006,32,71040' 434
(2 )
44,219
9'472
t2 ~14,7127,112
5,116
1,83 5
Springfield-Holyoke, Massachusetts
-
452,840
-
2265,961
14,56326,76232,554
50,53768,26245,22347,40324,207
56,21226,17712,47028,01212,734
(2)
936
336,3791____ 602,9551T __T
(1)
411,24'292."21 38
22,96C 16,82435,67d 4,3,40641,4761 64,516
24,746 8?,3534,512 26,2172,004 15,2352,839 29,993
491 9,691
74 3, (Y7413 71210 1,446
Incom taxafter
credits
(T).. .-dd.11., .,l
306,609
-
25,78425,63525p (4122, 72129, 199
54,-15317p E~53111,60Z?, -"9815, 256
4, 6021,9585,771
62,~14
-
87V98
1, 036~1,5834,3-55
6,2448,1946_5878,_~99(2 )
9,--762,~40
(1)4,5473,C25
2,467-
1,269
100,28 5
461,1872,8895,4166,494
10,27913,9089,3289,7454,910
11,9906,1653,3498,5955,100
(2)
55 2
131,74 1
861,6113,2668,750
13,046
4~, 111'2"16 12,551
4 16,8, 15,616
"514 9,707
~6, "2 11,8017'22,2'20,167 52,2651 10,862
18,7346,0263,8509,2423,959
11,499368761
of S-ple" and "Explanation of Cla,-ifications and Tems ."
Nuniber ofre turns
73,829
(2 )
7,61~D9,82,47,6069,1939,043
7,1638,4492,7462,615
(2 )
3,9781,384
(21
954404
406
89,054
(2)
9,3348,845
10,04710,0579,015
10,5219,9226,8714,589(2)
5,3521,022
t2l
6Z7119
(2)
11
71,670
(2 )
5,6649,5536,687
11,2006, 919
7,7754,6805,9313,428
(2 )
4, 8071, 057
887
106
106,425
(2
8~63413,6369,887
11,622U'198
13,37112,7348,0123,1714, 582
5,914689425587171
5365
Adjustedgross inconet
(77- .-dd.11 ... )
'408,984
(2)
3,84314,55619,22132,87140,612
39,37653,91121,28322,640(2 )
47,13623,863(2 )
30,48827,141
4,937994
2,736
'378,337
(2)
3,10214,5G716,50039,26731,804
42,83630,a9O44,04829,246
(2 )
56,91918,060
24,504
6,90 0
1563,652
(2 )
4,66019,92724,11240,29755,242
74,24683,10360,59826,79543,412
69,06011,7779,490
21,06711,270
6,4621,006
1 910
Exemptions
(Th-.-dd.11 . ..)
Shreveport, louisiana
134,029
(2 )
5,28113,8541-3,80218,59220,062
14,32216,5795,7895,774
(2 )
8,4143,006
(1)1,970
918899
12
Spokane, Washington
1468,546
4,97113,5282,4,64835,64740,820
57,7"63,97150,78739,389(2 )
62,491170-126
~2 ~
21,6787,478
(1)-
2,486
146,829
(2)
7,5888,607
14025716,77014,765
20,98919,14114,185
967(29'
11,9692,176
(2)
1,202254
(2)
-18
265,008
4044,1068,587
14,33020,740
Z7,37035,89228,8W23,815
(2 )
42,27612,601
(2 )
18,4326,614
(2)
-2,102
Stockton, California
216,301116028 2
(2)
4,7039,172
10,281L5, 89014,710
13,0479,03712,1397,436
(2 )
9,8651,919
1,97 1
22 2
(2 )
Tacontat, Washington
195,686
(1)
7,47615,02316,61320, 12621,574
31,59029,72918,8927,8799,125
11,8871,7701,2161,309
382
locableTaxnae
(Th-.-dd,11-)
224,87 2
822,OZ43,9129,890
14,376
19,74528,60512,09113,408
(2 )
31,92217 253(2) '
24,92123,054
4,194870
2,495
3735,0284,910
18,36811,620
23,93516,16324,49017 264
(2) '
39,59213,935
20,339
6,12 2
C
-
-
303,487
2635,1756,08315,15726,047
31,18141,26733,97715,06429,212
49,2048,9017,410
17, 7719,856
4,438806
1,675
Income taxafter
credits
(7h-.-ddbJ1. ..
57,357
-
16404782
1,9612,895
4,0075,8402,4592,775
(2 )
6,8504 057(2 1
7,61310,239
2,09 1492
1, Y7 1
59,64 2
8078 1
1,6522,7064,209
5,6047,2865,8684,90(2 )
8,9762,988(2 )
6,1302,866
(2)-
1,214
48,082
-
75939875
3,7172,361
4,8123,1634,9143 528
(2 ~
8,4543,364
5,902
2,71 3
69,654
-
531,0341,1513,0565,263
6,3058,3976,9713,0696,053
10,63 22 .o681,8615,7744,237
2,39 1441898
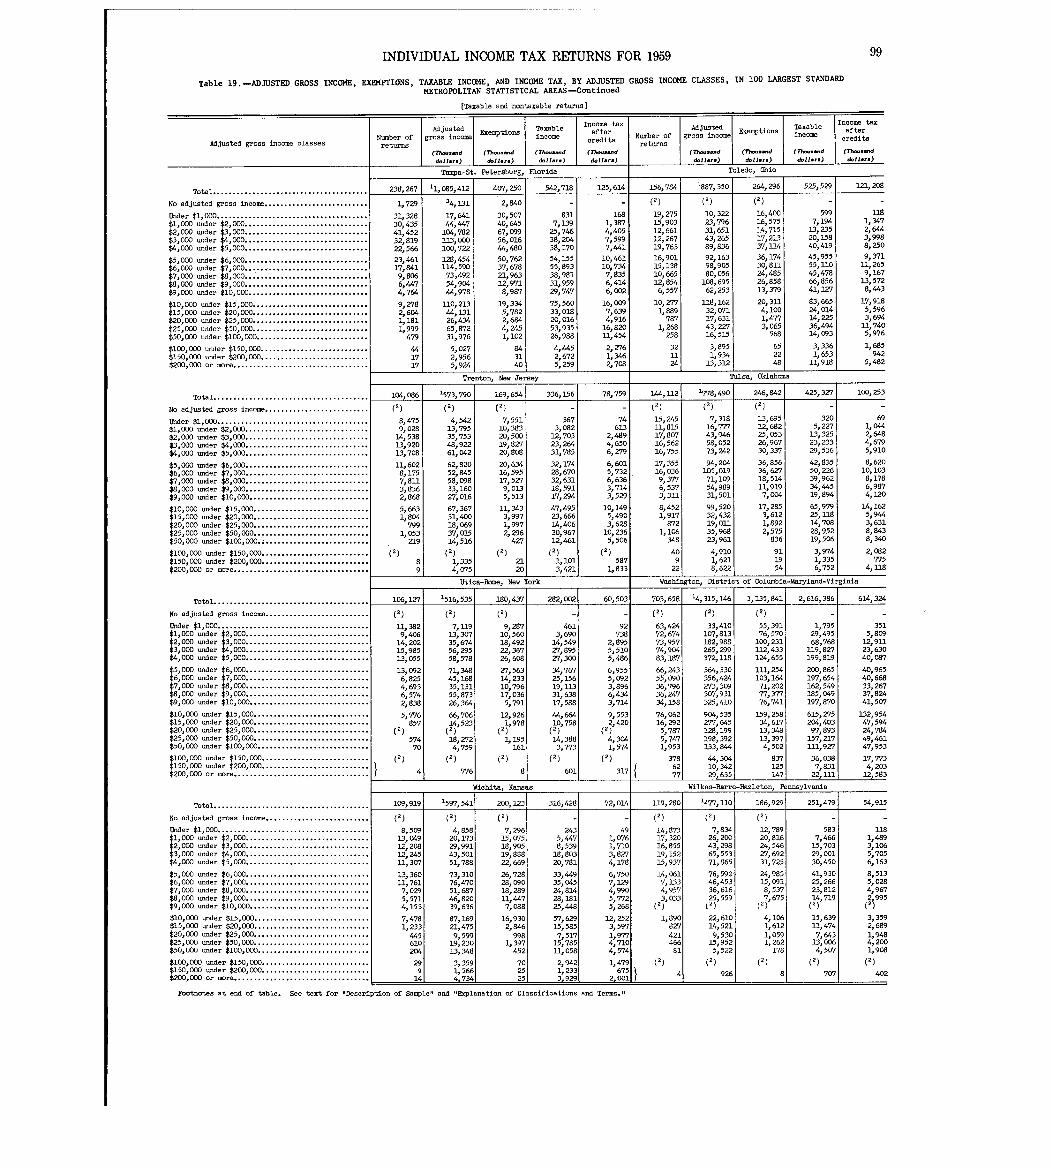
Adjusted gross income classes
Total . . . . . . . . . . . . . . . . . . . . . . . . . . . . . . . . . . . . . . .
No adjusted gross income . . . . . . . . . . . . . . . . . . . . . . . . . .
Under $1,000 . . . . . . . . . . . . . . . . . . . . . . . . . . . . . . . . . . . . . .$1,000 under $2,000 . . . . . . . . . . . . . . . . . . . . . . . . . . . . . . .$2,000 under $3,000 . . . . . . . . . . . . . . . . . . . . . . . . . . . . . . .$3,000 under $4,000 . . . . . . . . . . . . . . . . . . . . . . . . . . . . . . .$4,000 under $5,000 . . . . . . . . . . . . . . . . . . . . . . . . . . . . . . .
$5,000 under $6,000 . . . . . . . . . . . . . . . . . . . . . . . . . . . . . . .$6,000 under $7,000 . . ..- . . . . . . . . . . .$7,000 -der $8,000 . . . . . . . . . . . . . . . . .$8,000 under $9,000 . . . . . . . . . . . . . . . . . . . . . . . . . . . . . . .$9,000 -der $10,000 . . . . . . . . . . . . . . . . . . . . . . . . . . . . . .
$10,000 under $15,000 . . . . . . . . . . . . . . . . . . . . . . . . . . . . .$15,000 -der $20,000 . . . . . . . . . . . . . . . . . . . . . . . . . . . . .$20,000 under $25,000 . . . . . . . . . . . . . . . . . . . . . . . . . . . . .$25,000 under $50,000 . . . . . . . . . . . . . . . . . . . . . . . . . . . . .$50,000 under $100,000 . . . . . . . . . . . . . . . . . . . . . . . . . . . .
$100,000 under $150,000 . . . . . . . . . . . . . . . . . . . . . . . . . . .$150,000 -der $200,000. . . . . . . . . . . . . . . . . . . . . . . . . . .$200,000 or more . . . . . . . . . . . . . . . . . . . . . . . . . . . . . . . . . .
Total. . . . . . . . . . . . . . . . . . . . . . . . . . . . . . . . . . . . . . .
No adjusted gross income . . . . . . . . . . . . . . . . . . . . . . . . . .
Under $1,000 . . . . . . . . . . . . . . . . . . . . . . . . . . . . . . . . . . . . . .$1, 000 under $2,000. . . . . . . . . . . . . . . . . .$2,000 under $3,000. . . . . . . . . . . . . . . . . .$3,000 under $4,000. . . . . . . . . . . . . . . . . . . . . . . . . . . . . . .$4,000 under $5,000. . . . . . . . . . . . . . . . . . . . . . . . . . . . . . .
$5,000 under $6,000. . . . . . . . . . . . . . . . . . . . . . . . . . . . . . .$6,000 under $7,000 . . . . . . . . . . . . . . . . . . . . . . . . . . . . . . .$7,000 under $8,000. . . . . . . . . . . . . . . . . . . . . . . . . . . . . . .$8,000 -der $9,000. . . . . . . . . . . . . . . . . . . . . . . . . . . . . . .$9,000 under $10,000. . . . . . . . . . . . . . . . . . . . . . . . . . . . . .
$10,000 under $15,000. . . . . . . . . . . . . . . . . . . . . . . . . . . . .$15,000 under $20,000. . . . . . . . . . . . . . . . . . . . . . . . . . . . .$20,000 under $25,000. . . . . . . . . . . . . . . . .$25,000 under $50,000 . . . . . . . . . . . . . . . . .$50,000 under $100,000 . ; . . . . . . . . . . . . . . . . . . . . . . . . . .
$100,000 under $150,000 . . . . . . . . . . . . . . . . . . . . . . . . . . .$150,000 under $200,000 . . . . . . . . . . . . . . . . . . . . . . . . . . .$200,000 or more . . . . . . . . . . . . . . . . . . . . . . . . . . . . . . . . . .
Total . . . . . . . . . . . . . . . . . . . . . . . . . . . . . . . . . . . . . . .
No adjusted gross income . . . . . . . . . . . . . . . . . . . . . . . . . .
Under $1,000 . . . . . . . . . . . . . . . . . . . . . . . . . . . . . . . . . . . . . .$19000 under $2,000 . . . . . . . . . . . . . . . . . . . . . . . . . . . . . . .$2,000 under $3,000 . . . . . . . . . . . . . . . . . . . . . . . . . . . . . . .$3,000 under $4,000 . . . . . . . . . . . . . . . . . . . . . . . . . . . . . . .$4,000 under $5,000 . . . . . . . . . . . . . . . . . . . . . . . . . . . . . . .
$5,000 under $6,000 . . . . . . . . . . . . . . . . . . . . . . . . . . . . . . .$6,000 under $7,000 . . . . . . . . . . . . . . . . . . . . . . .. . . . . . . . .$7,000 under $8,000 . . . . . . . . . . . . . . . . . . . . . . . . . . . . . . .$8,000 under $9,000 . . . . . . . . . . . . . . . . . . . . . . . . . . . . . . .$9,000 -der $10,000 . . . . . . . . . . . . . . . . . . . . . . . . . . . . . .
$10,000 -der $15,000 . . . . . . . . . . . . . . . . . . . . . . . . . . . . .$15,000 under $20,000 . . . . . . . . . . . . . . . . . . . . . . . . . . . . .$20,000 under $25,000 . . . . . . . . . . . . . . . . . . . . . . . . . . . . .$25,000 under $50,000 . . . . . . . . . . . . . . . . . . . . . . . . . . . . .$50,000 -der $100,000 . . . . . . . . . . . . . . . . . . . . . . . . . . . .
$100,000 under $150,000 . . . . . . . . . . . . . . . . .$150,000 under $200,000 . . . . . . . . . . . . . . . . .$200,000 or more . . . . . . . . . . . . . . . . . . . . . . . . . . . . . . . . . .
Total . . . . . . . . . . . . . . . . . . . . . . . . . . . . . . . . . . . . . . .
No adjusted gross income . . . . . . . . . . . . . . . . . . . . . . . . . .
Under $1,000 . . . . . . . . . . . . . . . . . . . . . . . . . . . . . . . . . . . . . .$1,000 under $2,000 . . . . . . . . . . . . . . . . . . . . . . . . . . . . . . .$2,000 under $3,000 . . . . . . . . . . . . . . . . . . . . . . . . . . . . . . .$3,000 under $4,000 . . . . . . . . . . . . . . . . . . . . . . . . . . . . . . .$4,000 -der $5,000 . . . . . . . . . . . . . . . . . . . . . . . . . . . . . . .
$5,000 under $6,000 . . . . . . . . . . . . . . . . . . . . . . . . . . . . . . .$6,000 under $7,000 . . . . . . . . . . . . . . . . . . . . . . . . . . . . . . .$7,0()0 under $8,000 . . . . . . . . . . . . . . . . . . . . . . . . . . . . . . .$8,000 under $9,000 . . . . . . . . . . . . . . . . . . . . . . . . . . . . . . .$9,000 -der $10,000 . . . . . . . . . . . . . . . . . . . . . . . . . . . . . .
$10,000 under $15,000. . . . . . . . . . . . . . . . . . . . . . . . . . . . .$15,000 under $20,000. . . . . . . . . . . . . . . . . . . . . . . . . . . . .$20,000 -der $25,000 . . . . . . . . . . . . . . . . . . . . . . . . . . . . .$25,000 under $50,000 . . . . . . . . . . . . . . . . . . . . . . . . . . . . .$50,000 under $100,000 . . . . . . . . . . . . . . . . . . . . . . . . . . . .
$100,000 under $150,000 . . . . . . . . . . . . . . . . . . . . . . . . . . .$150,000 under $200,000 . . . . . . . . . . . . . .$200,000 or more . . . . . . . . . . . . . . . . . . . . .
INDIVIDUAL INCOME TAX RETURNS FOR 1959
Table 19 . -ADJUSTED GROSS INCOME, EXEMPTIONS, TAXABLE INCOME, AND INCOME TAX, BY ADJUSTED GROSS INCOME CLASSES, IN 100 LARGEST STANDARD
METROPOLITAN STATISTICAL AREAS-Continued
[Taxable and nontaxable returns )
Fbotnotes at end of table . See text for "Description of Sample,, and "Explanat~on of Classifications and Tems ."
(Th- ...dd.11 .. .
99
Number ofreturns
238,26 7
1,729
31,32830,43541,45232,81922,566
23,46117,8419y8O66,4474,764
9,2782,6041,1811,999479
441717
104,08 6
(1)
8,4759,028
14,53813,92013,708
11,6028,1757,8113,8362,868
5,6631,804
7991,053
219
(1)89
106,127
(2)
11,3829,406
14,20215,98513,055
13,0926,8254,6936,5742,838
5,776857
(2 )
(2)
57470
4
109,919
(1)
8,50913,04912,20812,24511,307
13,36011,7617,0295,5714,153
7,4781,23 3"5610204
299
14
Adjustedgross income
(Th-dd.11. .. )
Tampa-St . Petersburg, Florid a
'1,085,412
34,131
17,641", "7
104,782113,000100,722128y454114,59073,49254,90444,9?8
110,21344,13126,43465,87231,976
5,0272,9565,924
Trenton, New Jersey
1573,79 0(2)
4,54213,79535,75348,92261,042
62,82052,84558,09833,16027,016
67y36731,40018,06937,01514,516
(2)1,3354,07 5
Utica-Roma, New York
1516,53 5
(2)
7,1191-3,30735,67456,29558,578
71,34845,16835,13155,87326,364
66,70614,523(2 )
18,2724,759
(2)
776
1597,54 1
(2)
4,85820,17329,99143,50151,788
73,31076,47051,68746,82039,636
87,16921,4759y599
19,23013,348
3,3591,5664,734
tiExemp ons
(77--dd.11- )
407,25 0
2,840
30,50740,64567, 09956,01644,480
50,76237,67821,96312y9718,987
19,3345,7822,6844,2451,10 2
84314 0
169,654
(2)
7,55110,38320,50019,82720,808
20,63416,59517,5279,0135,533
11,3433,9971,9972,296
4Z7(2)
2120
180,437
(2)
9,28710,56018,49222,36726,608
Z7,56314,23310,79617,0365,791
12,9261,978
(2)
1,195161
(2)
8
Wichita, Kensas
200,123
(2)
7,29615, 0`7518,90519,88822,669
26,?2828,09018,28911, "77,088
16,9302,94 6998
1,39745 2
702525
Taxableincome
(Th- .-d&11 .. .
.542,718
-
8317,139
25,74638,20438,170
54,15555,89338,98131,95929,747
75,56033,01820,01653093526,988
4,4452,6725,259
336,156
-
3673,082
12,70323,26431,785
32,17428,67032,63118,59117,294
47,49523,66614y40630,96712,461(2)
1,1013,42 1
282,002
-
4613,690
14,549Z7,89527,300
34,76725,15619,11331,63817,588
44,66410 758(2) '
14,3883,773
(1)
601
316,428
2435,4478,53918,80320,781
33, "935,04524,81428,18125,448
57,62915,5857,517
15,78511,058
2y9421,2333,929
Income taxafterredit s
(T)--dd.11 ...
125,614
-
1681,3874,4057,5997,441
10,46110,?347,835604146,002
16,0097,6394,916
16,8201 .1,454
2, Z761,3462,708
78,759
-
74613
2,499406506, Z79
6,6015,7326,6363,7143,529
10,1495,4903,62810,2365,506
(1)587
1,833
60,50 3
92738
2,8955,5105,486
6,9555,0923,8966,4343,714
9,5532,420
(2 )
4,3041,574
(2)
317
72,014
491,0761,7103,8274,178
6,7507,1294,9905,7725,268
12,2523,5971,9774,7104,574
1,47 9675
2,0011
Number ofreturns
156,784
(2)
19,27515,90312,66112,26719,763
16,90115,13810,66512,8546,557
10,2771,889787
1,268258
3 21124
144,11 2
(2)
15,24511,81517,80716,56216,755
17,35516,0369,3776,5373,311
8,4521,917
8721,106
34 6
409
2 2
703,65 8
(1)
63,42472,67473,95774,90483,187
66,24355,09036,79636,24734,158
76,06216,2925,7875,7471,953
3786277
119,280
)
(2)
14,87317,32016,85519,15215,937
14,0617,1334,9573,033
(2)
1,89082742146681
(1)
4
Adjustedgross income
(n--.dd.11. ..
1887,35 0
(1)
10,32223,79631,651431,26589,836
92,16398,90580,056
108,69562,253
118,16232,07117,63143,22716,515
3,8951,934
13,31 2
1778,49 0
(2)
7,31816,77743,94658,05273,242
94,204105,01971,10954,98931,501
99,52032043219001135,96823,961
4,9101,6218,622
14,315,146
1477,110
(2)
7,83426,20043,29865,55371,865
76,59046,45336,61625,559
(2 )
22,61014,5219,530
15,9525,522
(1)
926
Exemptions
(77-...dd~ll. .. )
Toledo, Chic
264,296
(2)
16,40016,57514,71517,21337,114
36,17430,81124,48526,85813,379
20,33-14,1001,4773,065
568
652248
Tulsa, Oklahoma
246,842
(2)
13,69512,68225,05326,96730,337
36,85636,62718,51411,9197,004
17,2853,6121,8922,575
836
911954
1,135,841
(2) (2)
33,410 55,391i(Y7,813 76,570~182,988 100,231265,299 112,433372,228 124,655
364,330 111,254356,424 103,164273,309 71,202307,931 77,377325,410 76,741
904,535 159,258277,645 34,617128,199 13,348198,392 1-3,397133,844 4,502
44,304 83710,342 12.529,635, 147 ,
186,929
(1)
12,78920,81624,54627,69231,725
24,98515,0918,5377,675
(2 )
4,1061,6121,0591,262
178(2)
8
Taxableincome
(Th.-d
525,529
-
59971194
13,23520,15840,419
45,95555,11045,47866,85641,127
83,66524,01414, 22536,49414,093
3,3361,653
11,918
425,327
-
3205,227
13,32523,23329,536
42,83550,22639,96234, "519,894
65,97925,11814,70828,95219,506
3,9741,3356,752
Washington, District of Columbia-Maryland-Virgini a
2,616,386
1,79529,49568,768
119,827199,819
200,865197,654162,549185,049197,870
615,275204,40397,893157,217111,9z?
36,0387,83122,11 1
Wilkea-Barre-Hazleton, Pennsylvani a
251,47 9
5837,466
15,70329,00130,450
41,93025,26623,81214,719
(2 )
15,63911,4747,64313,0064,507
(2)
7Cr7
Income taxafter
credits
121,208
-
1181,3472,6443,9988,250
9,37111,2659,16713,5728,443
17,9185,5963,694
11,7405,976
1,685942
5,482
100,253
691,0442,6484,6795,910
8,62010,1038,1786,9874,120
14,1625,9443,6318,8438,340
2,08 2775
4,118
614,324
3515,809
12,91123,63040,087
40,96540,66833,26737,82441,50?
132,95447,59424,78449,46147,953
17,7734,20312,58 3
54,915
2181,4893,1065,?056,163
8,5135,0284,9672,995(2 )
3,3592,6891,9484,2001,908(2)
402
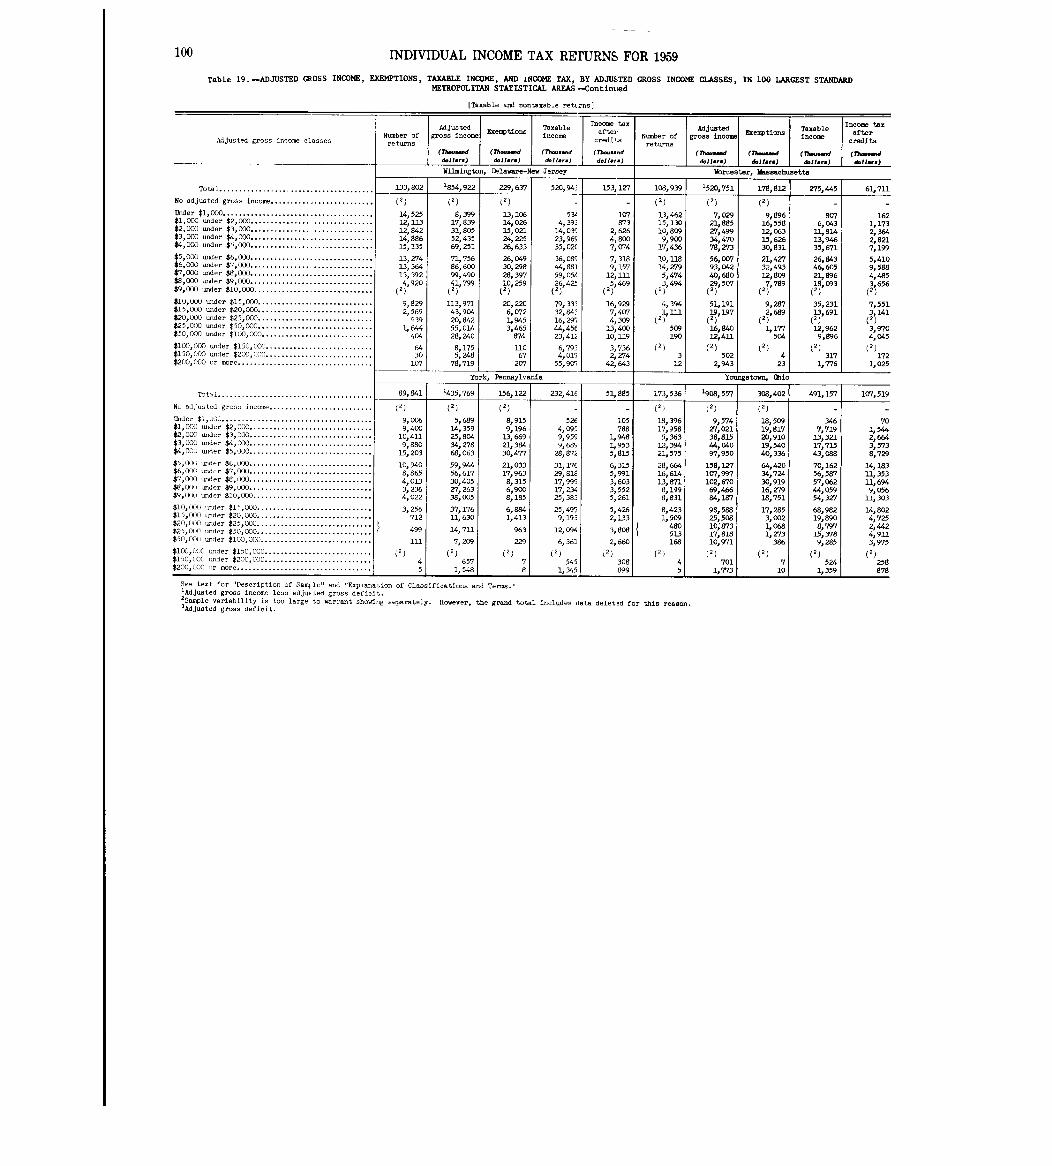
100 INDIVIDUAL INCOME TAX RErURNS FOR 195 9
Table 19 . -ADJUSTED GROSS INCOME, EXEMPTIONS, TAXABLE INCOME, AND iNCOME TAX, BY ADJUSTED GROSS INCOME CLASSES, IN 100 LARGEST STANDARDMETROPOLITAN STATISTICAL AREAS -Continued
[Taxable and nontaxable rettrns ]
Adjusted gross incom classes
Total . . . . . . . . . . . . . . . . . . . . . . . . . . . . . . . . . . . . . . .
No adjusted gross income . . . . . . . . . . . . . . . . . . . . . . . . .
Under $1,000 . . . . . . . . . . . . . . . . . . . . . . . . . . . . . . . . . . . . . .$1,WO wide, $2,000. . . . . . . . . . . . . . . . . . . . . . . . . . . . . . .$2,000 =der $3,OW. . . . . . . . . . . . . . . . . . . . . . . . . . . . . .$3,000 under $4,000. . . . . . . . . . . . . . . . . . . . . . . . . . . . . . .$4,000 =der $5,000 . . . . . . . . . . . . . . . . . . . . . . . . . . . . . . .
$5,000 wider $6,000 . . . . . . . . . . . . . . . . . . . . . . . . . . . . . . .$6,000 under $7,000 . . . . . . . . . . . . . . . . . . . . . . . . . . . . . . .$7,000 =der $8,000 . . . . . . . . . . . . . . . . . . . . . . . . . . . . . . .$8,000 under $9,000 . . . . . . . . . . . . . . . . . . . . . . . . . . . . . . .$9,000 under $10,000 . . . . . . . . . . . . . . . . . . . . . . . . . . . . . .
$10,000 under $15,000 . . . . . . . . . . . . . . . . . . . . . . . . . . . . .$15,000 under $20,000 . . . . . . . . . . . . . . . . . . . . . . . . . . . . .$20,000 under $25,OW . . . . . . . . . . . . . . . . . . . . . . . . . . . . .$25,000 order $50,000 . . . . . . . . . . . . . . . . . . . . . . . . . . . . .$50,OW under $100,000 . . . . . . . . . . . . . . . . . . . . . . . . . . . .
$100,000 wider $150,000 . . . . . . . . . . . . . . . . . . . . . . . . . . .$150,000 under $200,000 . . . . . . . . . . . . . . . . . . . . . . . . . . .$200,000 or wre . . . . . . . . . . . . . . . . . . . . . . . . . . . . . . . . . .
.
Tot.1 . . . . . . . . . . . . . . . . . . . . . . . . . . . . . . . . . . . . . . .
No adjusted gros~ inco- . . . . . . . . . . . . . . . . . . . . . . . . . .
Under $1,~OC . . . . . . . . . . . . . . . . . . . . . . . . . . . . . . . . . . . . . .$1,000 order $2,000. . . . . . . . . . . . . . . . . . . . . . . . . . . . . . .$2, 003 wider $3,000. . . . . . . . . . . . . . . . . . . . . . . . . . . . . . .$3,000 wider $4, OW. . . . . . . . . . . . . . . . . . . . . . . . . . . . . . .$4, 00C wider $5,900. . . . . . . . . . . . . . . . . . . . . . . . . . . . . . .
$5,00(, wide r $E,000 . . . . . . . . . . . . . . . . . . . . . . . . . . . . . . .$6, M ~ und- $7,000. . . . . . . . . . . . . . . . . . . . . . . . . . . . . . .$7, DOC) under $8,000 . . . . . . . . . . . . . . . . . . . . . . . . . . . . . . .$8,000 order $9 ... . . . . . . . . . . . . . . . . . . . . . . . . . . . . . .$9, OCX) wider $10,000. . . . . . . . . . . . . . . . . . . . . . . . . . . . . .
$10,00() order $11,000 . . . . . . . . . . . . . . . . . . . . . . . . . . . . .$15,DOO under $20,000 . . . . . . . . . . . . . . . . . . . . . . . . . . . . .$20,0,)0 =der $25,000 . . . . . . . . . . . . . . . . . . . . . . : : : : : : :$25,000 wider $50,000 . . . . . . . . . . . . . . . . . . . . . .$50,000 undcr $100,000 . . . . . . . . . . . . . . . . . . . . . . . . . . . .
$100,(A)C -der $150,000 . . . . . . . . . . . . . . . . . . . . . . . . . . .$150,W0 -der $2()0,000 . . . . . . . . . . . . . . . . . . . . . . . . . . .$200, CA)0 or oore . . . . . . . . . . . . . . . . . . . . . . . . . . . . . . . . . .
Number ofreturns
133,802
(2)
14,52512, 11312,84214,88615,135
13,27413,36413,3924,920
(2 )
9,8292,569939
1,644404
6430
107
89,841
(2)
9,0069,40010,4119,880
15,203
10,9408,8654,0133,2364,022
3,256712
499
ill
45
Adjustedgross income
(Th--dd.11 ... )
Exemptions
(Th-: ddoll 7
Taxableincome
(711-dd.11.. .
Wilmington, Delaware-New Jersey
'854,922
(2)
8,39917,83931,80552,43569,251
71,75686,60099,49041,799(2 )
113, 97143,90420,84255,01428,240
8,1755,248
78,719
'435,769
(2)
5,68914,35925,80434,27868,063
59,94456,61730,40527,26338,005
37,17611,630
14,711
7,209(2)
6571,548
229,637
(2)
13,10614,02615,02124,22526,633
26,04930,29828,39710,2592 )
20,2206, V721,9453,46 5
874310
67207
York, Pennisylvard a
156,122
(2)
8,9159,19613,66921,38430,477
21,03317,9638,3156,9008,185
6,8641,413
963
229
78
520,94-
5344,39-
14, 03~23,96S35,02(
36,08~44,88159,05426,4Z(2 )
79,33-32,84-16,291,44,45(23,41~
6,79,4,011
55,9M
232,41 6
52E4,0959,9599,68928,872
31,17E29,81e17,99S17,23425,38-1
25,49790193
12,094
6,362(2)
5451,345
Income taxsafterredit.
(771- ...dd.11., .)
153, IV
1(7787 3
2,6264,8007,074
7,3189,15712,1115,469
(2 )
16,9297,4074,30913,40010,119
3,7362,274
42,643
51,885
105788
1,9481,9535,815
6,3155,9913,6033,5525,261
5,4262,133
3,808
2,66012)
308899
Number ofre turn s
108,93 9
(2)
13, 46215,13010,8099,900
17,436
10, U814,2795,4743,494
(2 )
4,3941, 111
(2)
509190
(2)
312
173,536
(2 )
16,39617,9585, 363
12,39421,575
28,66416,61413,8718,1998,831
8,4231,509
4bO5.1.3168
(2)45
Adjustedoss incomegr
(TF--ddol I.. . )
Exemptions
(rh--.dd.Jl. .. )
Taxableincome
(?%...-dd.1l.r. )
Worcester, Massachusett s
1520,75 1
(2)
7,02921,885Z7,49934,47078,273
56,00793,04240,68029,507
(2 )
51,19119,197(2 )
16,84012,411
178,812
(2)
9,89616,55812,06315,62630,831
21,4Z732,49312,8097,789
(2 )
9,2872,,689
(2)
1,177504
(2 )(2)
5022,943
423
Youngstown, Chic
1908,557
(2)
9,574Z7,02138,81544, W97,950
158,127107,997102,67069,46684,187
98,58825,50810,87317,82.810,971(2)
70117773
(2)
18,50919,81720,91019,54040,336
64,42034,72430,91916, Z7918,751
17,2853,0021,0681, Z73
386
710]
275,445
8076,04311,81413,94635,671
26,84346,60521,89618,093
(2 )
35,23113,691(2 )
12,9629,896
(2)
3171,776
491,157
3467,719
13,32117,71543,088
70,16256,58757,06244,05954,327
68,98219,8908,797
15,3789,285
(1)524
1,359
Income taxosafte
edits
(rh-dd.11...
61,71 1
1621,1732,3642,8217,199
5,4109,5884,4853,656
(2 )
775513 1412 )
3,9704,045
(1)172
1,025
107,519
701,5442,6643,5738,729
14,18311,35311,6949,056
11,303
14,8024,7252, "24,9113,975
258878
See text for "Description of Sanle" and "Explariation of Classifications and Terms ."'Adjusted gross income less adjusted gross deficit .'Sample variability is too large to warrant showing separately . However, the grand total includes (late delet,2d for this reason .3Adjusted gross deficit .
HISTORICAL TABLES
INDIVIDUAL RETURNS, 1950-1959Pag e
20 . Number of returns by major characteristics,adjusted gross in-come and deficit, taxable income, and tax . . . . . . . . . . . . . . . . . . 102
21 . Returns with income tax-number, adjusted gross income, taxa-ble income, income tax, and average tax, by adjusted gross
income classes . . . . . . . . . . . . . . . . . . . . . . . . . . . . . . . . . . . . . . . . . . . . . 103
22 . Sources of income by type . . . . . . . . . . . . . . . . . . . . . . . . . . . . . . . . . . . . 105
23 . Itemized deductions on returns with adjusted gross income, by
type . . . . . . . . . . . . . . . . . . . . . . . . . . . . . . . . . . . . . . . . . . . . .. *"****" 10524 . Selected sources of income by adjusted gross income classes . . 106
25 . Number of returns, adjusted gross income, and income tax, by
States . . . . . . . . . . . . . . . . . . . . . . . . . . . . . . . . . . . . . . . . . . . . . . . . . . . . . 109
These historical data were taken from tables prepared
for Statistics of Income, Individual Income Tax Returns
for each of the years 1950 through 1959 . One must not ex-
pect exact comparability of data among all years, for the
tables span a period during which there were changes In
both the law and the return forms .
101
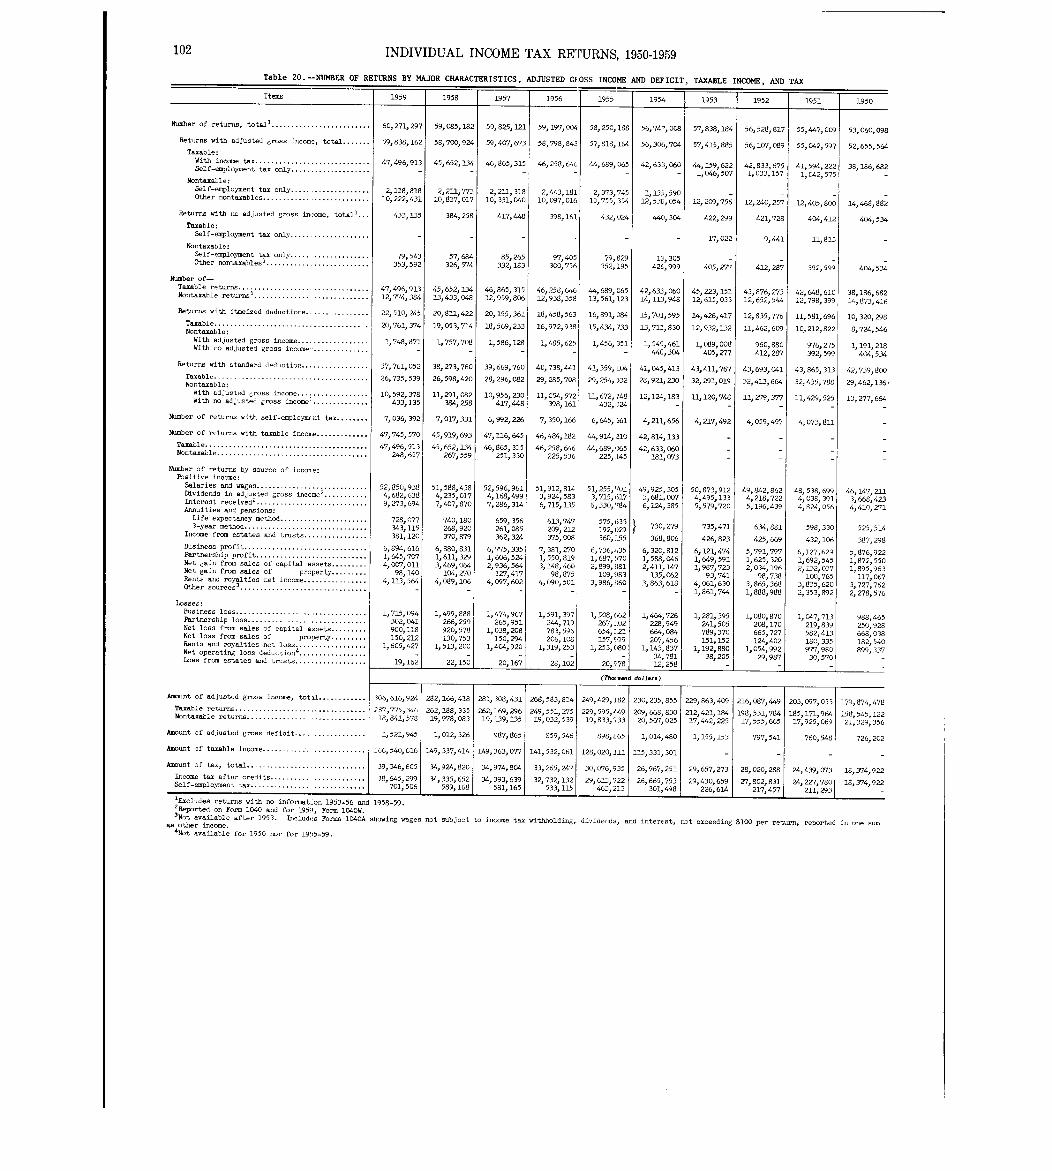
102 INDIVIDUAL INCOME TAX RE'FURNS, 1950-195 9
Table 20 . -NUMBER OF RETURNS BY MAJOR CHARACTERISTICS, ADJUSTED GFOSS INCOME AND DEFICIT, TAXABLE INCOME, AND TAX
1959
60,271,297
59,838~162
47,496,913-
2,118,81810,222,43 1
433,13 5
-
79;543353,59 2
471496j91312,774,384
22,510,245
20,761,374
1,748,871
1,715,094302,041900,118150,21 2
1,605,427
19,162-
-
37,761,052
26,735,539
10,592,37 8433,13 5
7,0-36,392
47,745,570
47,496,913248,657
52,850,9384,682,6389,273,694
728,077343,115381,120
6,8~4,6161, 645,7074,007,011
98,1404, 11.3, 564
-
306,616,924
2~7,775,34 618,841,578
1,521,945
166,540,616
39,346,805
38,645,299701,506
195 8
59,085,182
58;700,924
45,652,134-
2,211,77310,837,017
384,25 8
-
57,684326,574
451652~13413,433,048
20,811,422
19,053,714
1,757,708-
38,273,760
26,598,420
11,291,08 2384,25 8
7,017,331
45,919~693
45,652,134267,559
51,588,4384,235,0177,407,870
740, 180268,920370,879
6,880,8311,611,3293,469,064
104,2704,089,106
-
1,499,888266,259920,578130,75 3
1,513,200-
22,150
282,166,418
262,188,33519,978,083
1,012,326
149,337,414
34,924,820
34,335,65 2589,168
1957
59,825,121
59,407,673
46,865,315
2,211,31810, 331, 040
417,448
-
85,265332,18 3
46,865,31512,959,806
20,155,361
18,569,233
1,586,128-
39,669,760
28,296,082
10,956,230417,44 8
6,992,226
47,116,645
46,865,31 5251,330
52,596,9614,168,4997,286,314
659,356261,085362,324
6,775,3351,606,5242,936,564
127,4174,097,602
-
1, 474, 967265,95 1
1,038,208150,294
1,404,920-
20,167
281,308,431
262,169,29619,L39,135
987,865
149,363,077
34,974,804
34,393,63 9581,165
195 6
59,197,004
58,798,843
46,258,646-
2,443,18110,097,016
398,16 1
97,405300,75 6
46,258,64612,938,358
18,458,563
16,972,938
1,485,625-
40,738,441
29,285,708
11,054,572398,16 1
7,350,166
46,484,182
46,258,646225,536
51,912,8143,924,5836,715,135
613,747209,212375,008
7,381,2701,550,8193,148,460
98,8754, 090, 501
-
1,591,397244,719783,596206,108
1,319,253-
28,102
268,583,814
249,551,27519,032,539
859,546
141,532,061
33,265,247
32,732,13 2533, 115
Items
Umber of returns, total . . . . . . . . . . . . . . . . . . . . . . . . . .
Returns with adjusted gross income, total . . . . . . .
Tazabl :With income tax . . . . . . . . . . . . . . . . . . . . . . . . . . . . .Self-employment tax only . . . . . . . . . . . . . . . . . . . .
Nontaxable :Self-entployment tax only . . . . . . . . . . . . . . . . . . . .Other notaxables . . . . . . . . . . . . . . . . . . . . . . . . . . .
Returns with no adjusted gross inoome, total' . . .
Taxable :Self-employment tax only. . . . . . . . . . . . . . . . . . . .
Nontaxable :Self-employment tax only
. . . . . . . . - . . . . . . .Other nortaxables . . . . . . . . . . . . . . . . . . . . . . . . . . .
Umber of-Taxable returns . . . . . . . . . . . . . . . . . . . . . . . . . . . . . . . . .Nontaxable returns . . . . . . . . . . . . . . . . . . . . . . . . . . . . . .
Returns with itmeized deductions . . . . . . . . . . . . . . . .
Taxable . . . . . . . . . . . . . . . . . . . . . . . . . . . . . . . . . . . . . .Nontaxable :
With adjusted gross income . . . . . . . . . . . . . . . . . .With no adjusted gross income . . . . . . . . . . . . . .
Returns with standard dcd.cti.... . . . . . . . . . . . . . . . .
Taxable . . . . . . . . . . . . . . . . . . . . . . . . . . . . . . . . . . . . . .Noctaxable :
With adjusted gross income . . . . . . . . . . . . . . . . . .With no adjusted gross income . . . . . . . . . . . . . . .
Number of returns with self-employmEnt, tax . . . . . . . .
Number of returns with taxable incone . . . . . . . . . . . . .
Taxable . . . . . . . . . . . . . . . . . . . . . . . . . . . . . . . . . . . . . . . . .N.ntaxabl . . . . . . . . . . . . . . . . . . . . . . . . . . . . . . . . . . . . . . .
Number of returns by source of incon.s :Positive ineme :Salaries and wages . . . . . . . . . . . . . . . . . . . . . . . . . . . .Dividends in adjusted gross inccme2
-
. . . . . . . _Interest recei-d2 . . . . . . . . . . . . . . . . . . . . . . . . . . .Annuities and pensions :
Life expectancy method . . . . . . . . . . . . . . . . . . . . . .3-year method . . . . . . . . . . . . . . . . . . . . . . . . . . . . . . .
Income from estates and trusts . . . . . . . . . . . . . . . .
Business profit . . . . . . . . . . . . . . . . . . . . . . . . . . . . . . .Partnership profit . . . . . . . . . . . . . . . . . . . . . . . . . . . .Net gain f= sales of capital assets . . . . . . . . .Net gain from sales of property. . . . . . . . .Rents and royalties net income. . . . . . . . . . . . . . . .Other sourccS3 . . . . . . . . . . . . . . . . . . . . . .
Losses :Business loss . . . . . . . . . . . . . . . . . . . . . . . . . . . . . . . . .Partnership loss . . . . . . . . . . . . . . . . . . . . . . . . . . . . . .Net loss from sales of capital assets . . . . . . . . .Net loss from sales of property . . . . . . . . .Rents and royalties net loss . . . . . . . . . . . . . . . . . .Net operating loss deduction4 . . . . . . . . . . .Loss from estates and trusts . . . . . . . . . . . .
A~t of adjusted gross income, total . . . . . . . . . . . .
Taxable -tu.. . . . . . . . . . . . . . . . . . . . . . . . . . . . . . . . .Nontaxable r.t .. . . . . . . . . . . . . . . . . . . . . . . . . . . . . .
Amount of adjusted gross deficit . . . . . . . . . . . . . . . . . .
Amouct of taxable income . . . . . . . . . . . . . . . . . . . . . . . . .
Amount of tax, total . . . . . . . . . . . . . . . . . . . . . . . . . . . . . .
Income tax after credits . . . . . . . . . . . . . . . . . . . . . . .Self-employment tax . . . . . . . . . . . . . . . . . . . . . . . . . . . .
1955
58,250,188
57,818,164
44,689,06 5
2,373,74510,755,354
432,024
1, 508, 662267,102654,121157, 919
1,253,080-
20,~78
249,429,382
229,595,44919,833,-,3 3
898,865
128,020,21 1
30,076,935
29,613,72 2463,213
1954
56,747,008
56,306,7G4
42,633;060-
1,135,59012,538,054
440; 304
-
13,305426,999
42,633,06014,113,948
15,701,595
13,711,830
1,549,46144C, 304
41,045,413
28,921,230
12,124,183-
4,211,656
42,814,133
42,633,060181,073
49,925,3053,681,0076,124,385
730 27)
368,806
6,320,8121,588,0462,411,14 7
L35,0623,863,611
-
1,464,726228,949664,0&~207,456
1, 143, 83734,78112,258
1953
57,838,184
57;415,88 5
44,159,6221, 046, 507
-12,209,756
422,299
17,022
405,277
45,223,15112,615,03 3
14,426,417
12,932,13 2
1,089,008405,27 7
43,411,767
32,291,019
11,120,748-
4,217,492
-
50,873,9124,495,1335,579,720
735,471
426,823
6,121,4741,649,5911,987,72 3
93,7414,061,6301,861,744
1,281,395241,505789,370151,152
1,192,88038,205
-
1952
56,528,817
56,107,08 9
42,833,6751,033,15 7
12,240,257
421,728
9,441
-412,287
43,876,27312,652,544
12,835,776
11,462,609
960,880412,28 7
43,693,041
32,413, 664
11,279,377-
4,059,497
-
49,842,8624,218,7225,196,43 9
634,881
425,66 9
5,791,7971,625,3202,034,19 6
98,7383,865,3681,888,988
1,080,870208,170665,?27124,402
1,054,99229,987
-
195 1
55,447,009
55,042,59 7
41,594,2221,042,575
-12,405,800
404,412
11,813
392,599
42,648,61012,798,39 9
11,581,696
10,212,82 2
976,275392,599
43,865,313
32,435,788
11,429,525-
4,073,811
-
48,538,6994,038,3914,824,05 6
598,330
432,106
6,127,6291,692,5452,132,03 7
100,7653,835,6202,353,89 2
1,047,713219,839582,413180,335977,98030,570
-
-
79,829352,195
44,689,06513,561,123
16,891,084
15,434,73 3
1,456,351-
41,359,104
29,254,33 2
11, 672,748432,024
6,645,661
44,914,210
44,669,065225, 145
51,255,'1013,715,6176, 330,784
575, 633192,029360, 15 5
6,736,,,351, 687, 5702,899,88 1
109,9833,986,860
-
(Thm-d d, II-)
230,235,855
209 1 668,83 020,567,02 5
1,014,48 0
115,331,30 1
26,967,251
26,665,75 3301,498
229,863,409
212,421,18417,442,22 5
1,155,153
-
29,657,273
29,430,659226,614
216,087,449
198,531,78 417,555,66 5
797,541
-
28,020,288
27,802,831217,457
203,097,033
185,171,96417,925,06 9
760,548
-24,439,073
24,227,780211,293
195 0
53,060,098
52,655,564
38,186,682-
-14,468,882
404,534
-
404,534-
38,186,68214,873,416
10,320,298
8,724,546
1,191,218404,534
42,739,800
29,462,136-
13,277,664
46,147,2113,668,4234,410,271
525,514
387,29 8
5,876,9221,872,5501,895,96 3
117,0673,727,7622,278,576
988,465250,928668,038182,540899,337
-
1?9,874,478
158,545,12221,329,35 6
726,20 2
18,374,922
18,374,922
'Excludes returns with no information 1953-56 and 1958-59 .2,ep.,t .d on Form 1040 and for 1951) Form 1040 W,'Not available after 1953 . Includes Forms 1CL40A sh,)wing wages not subject to income tax withholding, dividends, and interest, not exceeding $100 per return, reported in one mas other income .4Not available for 1950 nor for 1955-59 .
-
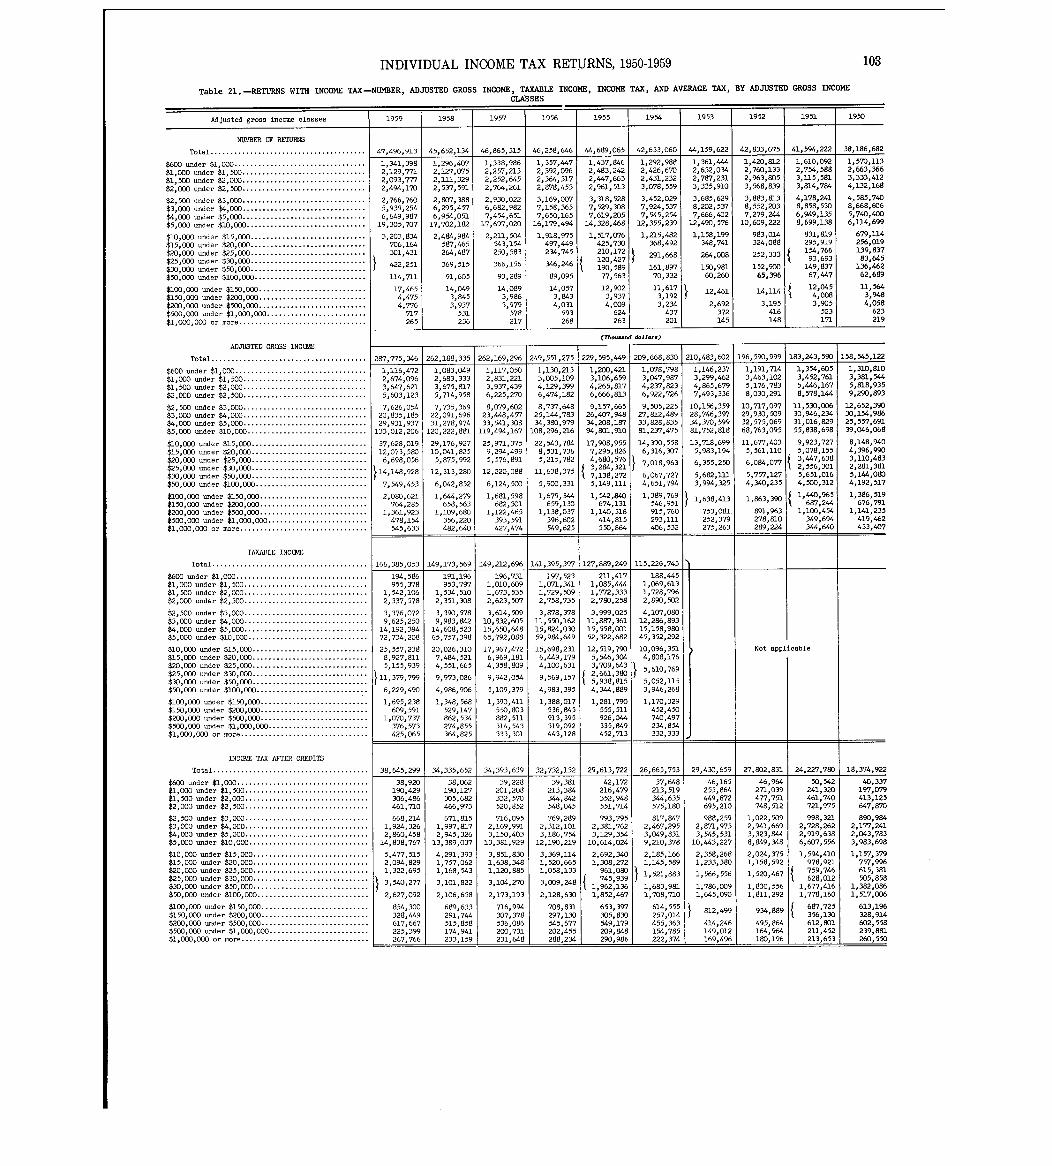
INDIVIDUAL INCOME TAX RETURNS, 1950-1959
42,833,675
Table 21 . -RETURNS WITR INCOME TAX-NUMBER, ADJUSTED GROSS INCOME, TAXABLE INCOME, INCOME TAX, AND AVERAGE TAX, BY ADJUSTED GROSS INCOME
CLASSES
Adjusted gross income classes
NUMBER OF RETURNS
Total . . . . . . . . . . . . . . . . . . . . . . . . . . . . . . . . . . . . . . .
$600 -der $1,000 . . . . . . . . . . . . . . . . . . . . . . . . . . . . . . . . .$1,000 under $1,500 . . . . . . . . . . . . . . . . . . . . . . . . . . . . . . .$1,500 under $2,000 . . . . . . . . . . . . . . . . . . . . . . . . . . . . . . .$2,000 under $2,500 . . . . . . . . . . . . . . . . . . . . . . . . . . . . . . .
$2,500 under $3,000 . . . . . . . . . . . . . . . . . . . . . . . . . . . . . . .$3,000 under $4iOOO . . . . . . . . . . . . . . . . . . . . . . . . . . . . . . .$4,000 under $5,000 . . . . . . . . . . . . . . . . . . . . . . . . . . . . . . .$5,000 -der $10,000 . . . . . . . . . . . . . . . . . . . . . . . . . . . . . .
$10,000 -der $15,000 . . . . . . . . . . . . . . . . . . . . . . . . . . . . .$15,000 =der $20,000 . . . . . . . . . . . . . . . . . . . . . . . . . . . . .$20,000 under $25,000 . . . . . . . . . . . . . . . . . . . . . : . . . . : . .$25,000 under $30,000 . . . . . . . . . . . . . . . . . . . . . . . . . . .$30,000 under $50,000 . . . . . . . . . . . . . . . . . . . .$50,000 under $100,000 . . . . . . . . . . . . . . . . . . .
$100,000 under $150,000 . . . . . . . . . . . . . . . . . . . . . . . . . . .$150,000 under $200,000 . . . . . . . . . . . . . . . . . . . . . . . . . . .$200,000 under $500,000 . . . . . . . . . . . . . . . . . . . . . . . . . . .$500,000 -der $1,000,000 . . . . . . . . . . . . . . . . . . . . . . . . .$1,000,000 or more . . . . . . . . . . . . . . . . . . . . . . . . . . . . . . . .
ADJUSTED GROSS INCOME
Total . . . . . . . . . . . . . . . . . . . . . . . . . . . . . . . . . . . . . . .
$600 under $1,000 . . . . . . . . . . . . . . . . . . . . . . . . . . . . . . . . .$1,000 under $1,500 . . . . . . . . . . . . . . . . . . . . . . . . . . . . . . .$1,500 under $2,000 . . . . . . . . . . . . . . . . . . . . . . . . . . . . . . .$2,000 under $2,500 . . . . . . . . . . . . . . . . . . . . . . . . . . . . . . .
$2,500 under $3,000 . . . . . . . . . . . . . . . . . . . . . . . . . . . . . . .$3,000 under $4,000 . . . . . . . . . . . . . . . . . . . . . . . . . . . . . . .$4,000 -der $5,000 . . . . . . . . . . . . . . . . . . . . . . . . . . . . . . .$5,000 der $10,000 . . . . . . . . . . . . . . . . . . . . . . . . . . . . . .
$10,000 under $15,000 . . . . . . . . . . . . . . . . . . . . . . . . . . . . .$15,000 -der $20,000 . . . . . . . . . . . . . . . . . . . . . . . . . . . . .$20,000 under $25,000 . . . . . . . . . . . . . . . . . . . . . . . . . . . . .$25,000 -der $30,000 . . . . . . . . . . . . . . . . . . . . . . . . . . . . .$30,000 under $50,000 . . . . . . . . . . . . . . . . . . . . . . . . . . . . .$50,000 under $100,000 . . . . . . . . . . . . . . . . . . . . . . . . . . . .
$100,000 -der $150,000 . . . . . . . . . . . . . . . . . . . . . . . . . . .$150,000 -der $200,000 . . . . . . . . . . . . . . . . . . . . . . . . . . .$200,000 -der $500,000 . . . . . . . . . . . . . . . . . . . . . . . . . . .$500,000 under $1,ODO,OOO . . . . . . . . . . . . . . . . . . . . . . . . .$1,000,000 or ore . . . . . . . . . . . . . . . . . . . . . . . . . . . . . . . .
TAXABLE INCCME
Total . . . . . . . . . . . . . . . . . . . . . . . . . . . . . . . . . . . . . . .
$600 -der $1,000 . . . . . . . . . . . . . . . . . . . . . . . . . . . . . . . . .
$1,000 under $1,500 . . . . . . . . . . . . . . . . . . . . . . . . . . . . . . .$1,500 under $2,000 . . . . . . . . . . . . . . . . . . . . . . . . . . . . . . .$2,000 -der $2,500 . . . . . . . . . . . . . . . . . . . . . . . . . . . . . . .
$2,500 -der $3,000 . . . . . . . . . . . . . . . . . . . . . . . . . . . . . . .$3,000 under $4,000 . . . . . . . . . . . . . . . . . . . . . . . . . . . . . . .$4,000 under $5,000 . . . . . . . . . . . . . . . . . . . . . . . . . . . . . . .$5,000 under $10,000 . . . . . . . . . . . . . . . . . . . . . . . . . . . . . .
$10,000 -der $15,000 . . . . . . . . . . . . . . . . . . . . . . . . . . . . .$15,000 under $20,000 . . . . . . . . . . . . . . . . . . . . . . . . . . . . .$20,000 -der $25,000 . . . . . . . . . . . . . . . . . . . . . . . . . . . . .$25,000 under $30,000 . . . . . . . . . . . . . . . . . . . . . . . . . . . . .$30,000 -der $50,000 . . . . . . . . . . . . . . . . . . . . . . . . . . . . .$50,000 -der $100,000 . . . . . . . . . . . . . . . . . . . . . . . . . . . .
$1GO,000 under $150,000 . . . . . . . . . . . . . . . . . . . . . . . . . . .$150,000 under $200,000 . . . . . . . . . . . . . . . . . . . . . . . . . . .$200,000 under $500,000 . . . . . . . . . . . . . . . . . . . . . . . . . . .$500,000 -der $1,000,000 . . . . . . . . . . . . . . . . . . . .$1,000,000 or more . . . . . . . . . . . . . . . . . . . . . . . . . . . . . . .
I4CO?& TAX AFTER CREDIT S
Total . . . . . . . . . . . . . . . . . . . . . . . . . . . . . . . . . . . . . . .
$600 under $1,000 . . . . . . . . . . . . . . . . . . . . . . . . . . . . . . . . .$1,000 under $1,500 . . . . . . . . . . . . . . . . . . . . . . . . . . . . . . .$1,500 under $2,000 . . . . . . . . . . . . . . . . . . . . . . . . . . . . . . .$2,000 -der $2,500 . . . . . . . . . . . . . . . . . . . . . . . . . . . . . . .
$2,500 -der $3,000 . . . . . . . . . . . . . . . . . . . . . . . . . . . . . . .$3,000 der $4,000 . . . . . . . . . . . . . . . . . . . . . . . . . . . . . . .$4,000 under $5,000 . . . . . . . . . . . . . . . . . . . . . . . . . . . . . . .$5,000 =der $10,000 . . . . . . . . . . . . . . . . . . . . . . . . . . . . . .
$10,000 =der $15,000 . . . . . . . . . . . . . . . . . . . . . . . . . . . . .$15,000 under $20,000 . . . . . . . . . . . . . . . . . . . . . . . . . . . . .$20,000 -der $25,000 . . . . . . . . . . . . . . . . . . . . . . . . . . . . .$25,000 under $30,000 . . . . . . . . . . . . . . . . .
. . . . . . . . .$30,000 under $50,000 . . . . . . . . . . . . . . . . .$50,000 under $100,000 . . . . . . . . . . . . . . . .
.. . .
. .. . . . . .
$100,000 under $150,000 . . . . . . . . . . . . . . . . . . . . . . . . . . .$150,000 -der $200,000 . . . . . . . . . . . . . . . . . . . . . . . . . . .$200,000 under $500,000 . . . . . . . . . . . . . . . . . . . . . . . . . . .$500,000 under $1,000,000 . . . . . . . . . . . . . . . . . . . . . . . . .$1,000,000 or more . . . . . . . . . . . . . . . . . . . . . . . . . . . . . . . .
1959 1 1958 1 1957 1 1956 1 1955 1 1954 1 1953 1 1952 1 1951
47,496,91 3
1,341,3982,129,7712,093,7772,494,170
2,766,7605,939,2546,649,98 7
19,305,707
3,203,834706,164301 431
422,251
114,71 1
17,4654,4754,776
717265
1
287,775,346
1,116,4722,674,0963,647,6215,603,123
7,626,05420,835,18529,931,937133,012,20 6
37,628,01912,073,5806,698,056
14,148,9281
7,549,453
2,080,621764,285
1,361,923478,154545,633
166,385,053
194,586955,378
1,542,1062,337,578
3,376,0729,625,250
14,192,39472,734,208
25,557,2388,927,8115,155,939
11,379,799
6,229,490
1,695,238609,591
1,070,737376 :573425 06 5
38,645,299
38,920190,429306,486461,710
668,2141,924,3262,860,458
14,838,76 7
5,477,5152,094,8291,322,695
3, -,277
2,627,09 2
854,300328,449617,667225,399267,766
45,652,134
1,296,4072,127,0752,111,3292,537,591
2,807,3886,295,4576,954,05117,702,182
2,484,984587,465264 48 7
515369 ,
91,605
14,0493,8453,937
531236
262,188,335
1,083,0492,683,3333,675,8175,714,958
7,735,36922,091,69631,278,974
120,222,881
29,176,92710,041,82 55,875,992
12,313,280
6,042,852
1,644,27 9658,563
1,109,680356,220482,640
149,173,569
191,196953,797
1,534,5102,351,308
3,390,5789,983,942
14,608,52365,757,398
20,026,3107,484,5214,551,665
9,973,086
4,986,906
1,348,56 8529,147862,534274 ' 855364,82 5
34,335,65 2
38,062190,127305,682466,973
671,81 51,997,8172,945,326
13,389,037
4,291,3931,757,0621,168,543
3,101,822
2,106,658
689,633291,7"515,858174,941233,159
46,865,31 5
1,338,9862,257,2132,252,6452,764,261
2,930,0226,682,9827,454,651
17,697,020
2,211,504543,154250,583
366,15 6
93,289
14,0893,9863,979
578217
262,169,296
1,117,0502,831,2213,937,4396,225,270
8,079,60223,448,45733,541,308119,494,167
25,971,3759,294,4995,576,891
12,220,088
6,124,500
1,681,59 8682,301
1,122,465393,591427,474
149,212,696
196,7311,010,6091,673,5352,623,507
3,614,50910,832,60515,650,64865,792,088
17,967,4726,969,1914,358,809
9,942,054
5,109,379
1,390,411550,803882,511314,543333,301
34,393,639
39,228201,208332,570520,852
716,09 52,169,9913,150,403
13,381,92 9
3,851,8301,638,3481,120,885
3,104,270
2,173,19 3
716,994307,378536,086200,731231,648
46,258,646
1,357,4472,392,0962,364,3172,878,453
3,169,0077,158,3657,650,16516,179,494
1,918,97 5497,4492-34,745
346,246
89,095
14,0573,8434,03 1
59326 8
249,551,275
1,130,2133,005,1094,129,3996,474,182
8,737,64825,1",78334,380,979
108,296,216
22,543,7848,531,7365,215,78 2
11,638,375
5,900,331
1,679,344659,130
1,138,037396,602549,62 5
141,395,397
197,5231,071,3411,729,5092,758,735
3,878,37811,550,16215,824,03059,984,649
15,698,2316,"9,1794,100,631
9,569,157
4,983,395
1,388,017536,845913,395319,092"3,12 8
32,732,13 2
39,381213,384344,842548,045
769,28 92,312,1013,186,754
12,190,21 9
3,369,1141,520,6651,058,133
3,009,248
2,128,630
708,831297,130545,677202,455288,234
44,689,06 5
1,437,6462,483,2422,447,6632,961,513
3,318,5287,529,3087,619,20 5
14,328,468
1,517,076425,730210,172120,427190 , 58977,563
12,9023,9374,009
624263
42,633,060
1,292,9882,426,6702,431,2323,078,559
3,452,0297,924,5377,545,254
12,355,239
1,215,482368,492
291 668
161,89770,332
11,6173 , 1923,234
437201
(rh-.-d dW1 ...
229,595,"9
1,200,4213,106,6594,265,8176,666,813
9,157,66 526,407,94834,208,18794,801,910
17,908,95 57,295,8264 680,5763 :284 ' 3217 , 138,2725,149,111
1,542,840674,131
1,140,318414,815550,864
1
127,889,249
211,4171,085,4441,772,3332,780,258
3,999,02 511,887,36115,558,00152,322,682
12,519,7905,546,3043,19, 132 , 661,3805 , 938,8154,344,889
1,281,790555,511926,044335,849452,71 3
29,613,722
209,668,830
1,078,7983,047,9874,237,8236,922,726
9,505,22 527,812,48933,828,83581,237,475
14,390,55 86,316,307
71018,963
6,067,7274,651,794
1,389,769546,951915,760293,111406,532
115,226,743
188,4451,069,6131,728,7962,890,502
4,107,08012,286,89315,158,98045,352,292
10,096,3514,808,176
5,610,769
5,052,1153,946,268
1,170,32 9452,450740,497234,854332,33 3
~
26,665,75 3
42,172216,479352,948551,714
793,7952,381,7623,129,354
10,614,02 4
2,692,3401,308,272
961,0801,745,939
962 , 1361,852,467
653,397305,830549,179209,848290,986
37,648213,519344,635575,180
817,8472,467,2953,049,8319,210,378
2,185,1661,145,589
1 521,883
1 :683,9811,708,710
614,555257,014455,363154,785222,374
44,159,622
1,361,4442,632,0342,787,2313,335,910
3,685,6298,202,5377,666,402
12,490,576
1,158,199348,741
264,008
150,98160,260
12,461
2,692372145
210,483,602
1,146,2373,299,4624,865,6797,493,336
10,156,35928,746,39734,370,59981,752,818
13,718,69 95,983,194
61355,250
5,682,1113,994,32 5
1,638,413
753,081 .252,379275,263
29,430,65 9
46,165255,864"9,872695,210
988,25 92,871,9753,545,531
10,443,22 7
2,358,2681,233,380
1,566,556
1,786,0091,645,09 0
1 812,499
414,246149,012169,496
1,420,8122,760,1332,963,8053,568,839
3,883,8138,552,2037,279,24410,609,222
983,014324,088
252,333
152,90065,396
14,114
3,19 5416148
196,590,999
1,191,7143,463,1025,176,7838,030,291
10,717,09729,930,50932,575,06968,763,095
11,677,4035 561,110
6 :084,077
5,757,1274,340,23 5
1,863,390
891,963278 810289,224
41,594,222
1,610,0922,754,5883,115,5813,814,764
4,178,2418,858,5306,949 , 1358,699,138
831,819295,919
154,76 693,693
149,83767,44 7
12 :0454 0083,90 5
523171
183,243,590
1,354,6053,452,7615,446,1678,578,144
11,530,00630,946,23431,016,82955,838,698
9,923,7275,078,1553,"7,6382,556,3015,651,0164,500,312
1,440,96 5687,2"
1,100,454349 694344 :640
10 3
1950
38,186,682
1,570,3232,663,3663,333,4124,132,168
4,585,7408,668,6065,740,4006,114,699
679,114256,019139 83783 645I
136,46262,689
11,5643,9484,058
62321 9
158,545,122
1,310,8103,381,5445,818,9359,290,893
12,652,39030,154,98625,557,69139,046,068
8,148,9404 396 9903 :110 :4832,281,3815,1",0804,192,517
1,386,51 9676,791
1,141,235419,462433,407
Not applicable
27,802,831
50,542241,320461,740721,975
998,3212,728,2622,919,6386,607,556
1,594,410978,921759,746628 ,01 2
1,677,4161,778,160
687:725356 130612,801211,452213,653
40,337197,079413,125647,870
890,9842,177,2412,043,7833,983,698
1,157,37 9757,996615,381505,85 8
1,382,0861,517,006
613,196328,914602,558239,881260,550
24,227,780 18,374,92 2
46,964271,039477,751748,51 2
1,022,5092,941,6693,323,8"8,849,348
2,024,3751 158,592
1 520,467
1,830,5561,811,292
934,889
495,864164,964180,196
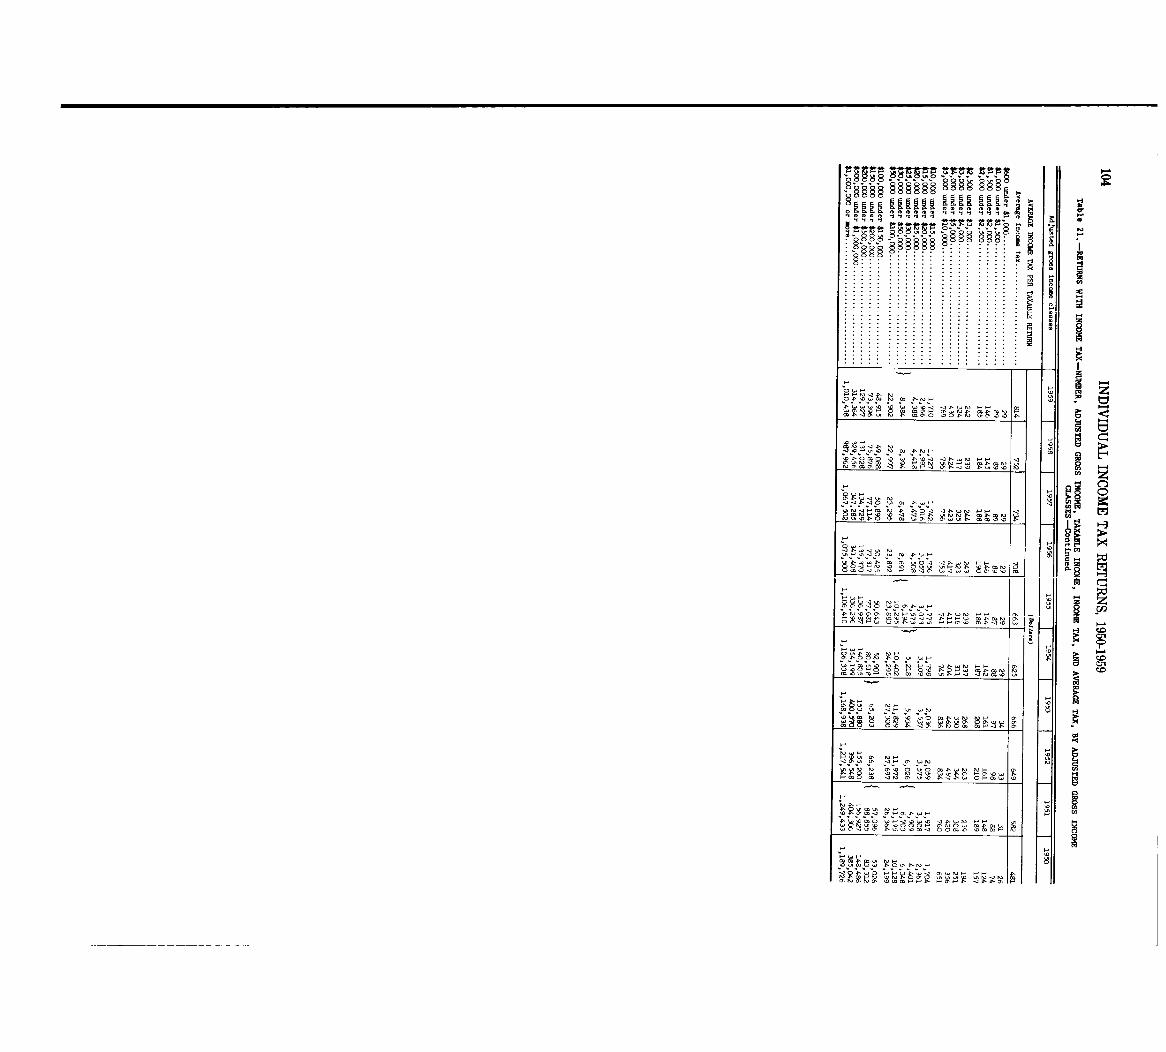
Ir TrItt MIr
un
. . . . . . . . . . . . . . . . . . . .
M z
OR
8 d 5
m !Z
m c:::
z
m- o- H
kj
o' o'
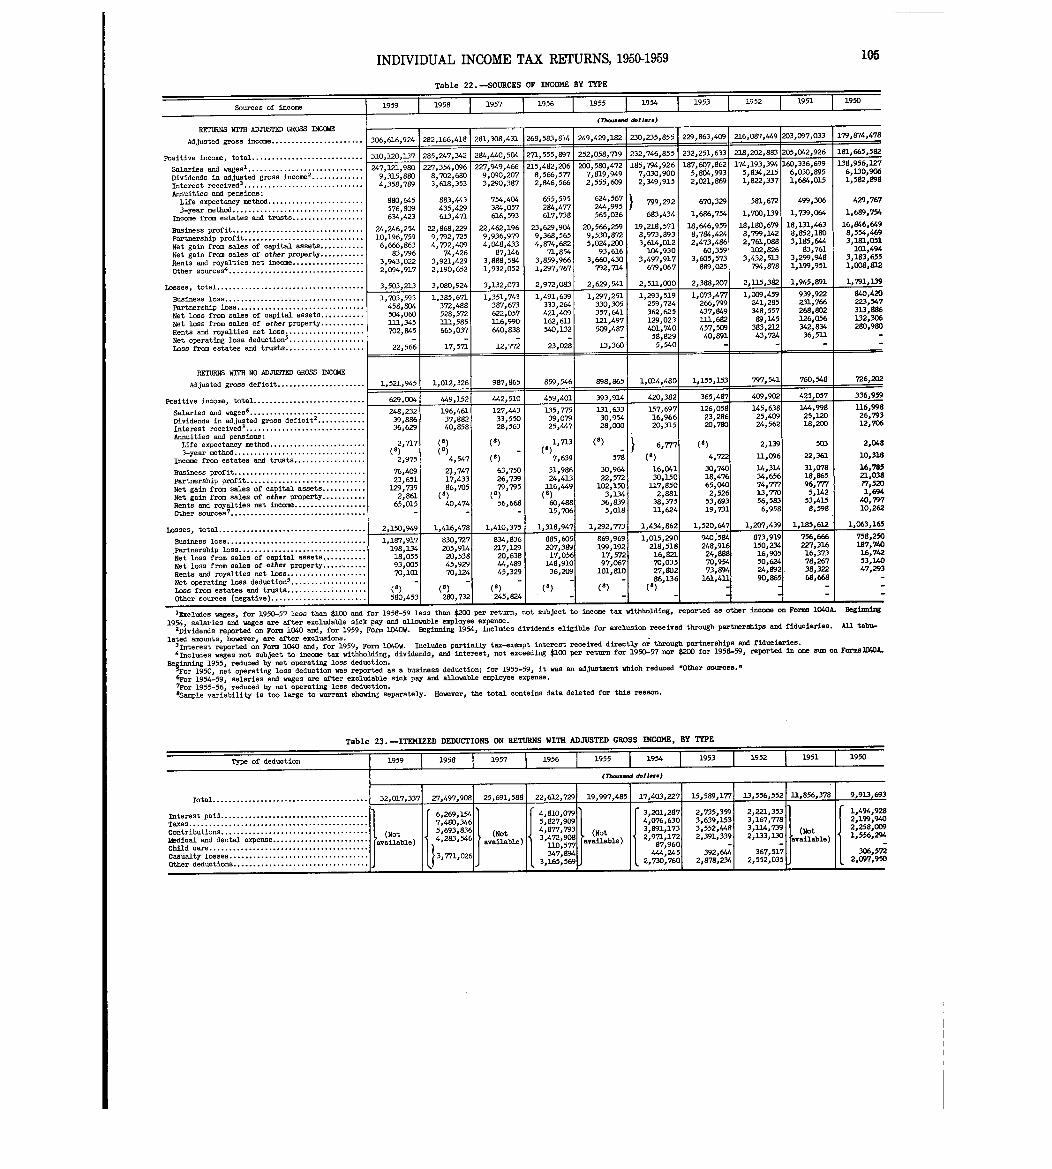
INDIVIDUAL INCOME TAX RE-TURNS, 1950-1959
Sources of income
Table 22 . -SOURCES OF INCOME BY TYP E
1959 .957 1 1956 1 1955 1 19! 1952 1 1951
(77-aod dollar.)
105
1950
RETTJRNS WITH ADJUSTED GROSS INCOM
Adjusted gross income . . . . . . . . . . . . . . . . . . . . . . . 306,616,924 282,166,418 281 1 308,431 268,583,814_ 249,429,182 230,235,855 229,863,409 216,087,449 203,097,033 179,874,478
Positive income, total . . . . . . . . . . . . . . . . . . . . . . . . . . . . 310,120,137 285,247,342 294,440,504 271,555,897 252,058,719 232,746,855 232,251,633 218,202,883 205,042,926 181,665,582
Salaries and wages' . . . . . . . . . . . . . . . . . . . . . . . . . . . . . 247,121,980 227,354,096 227,949,466 215,482,206 200,580,472 185,794,926 187,607,8629934
174,193,394
8345 215
160,336,699
89 56 030
138,956,127130 9066
Dividends in adjusted gross ineo=2. . . . . . . . . . . . . 9,315,880 8,702,680 9,090,207 8,566,577 7,819,949 7,030,900
349 9152
,5,808692 021
, ,822 3371
, ,1 684 015
, ,582 89 81
Interest received' . . . . . . . . . . . . . . . . . . . . . . . . . . . . . . 4,358,789 3,618,353 3,290,387 2,946,566 2,555,609 ,, ,, , , , , , ,
Annuities and pensions :Life expectancy method . . . . . . . . . . . . . . . . . . . . . . . . 880,645 883,443 754,404 655,595 624 567
:799,292 670,329 58.1,672 499,306 429,767
3-year method . . . . . . . . . . . . . . . . . . . . . . . .
. . . . . . . . .
td t
576,809423634
435,429471613
384,057616 593
284,477617,738
99 5244565,036 683,434 1,686p754 1,700,139 1,739,064 1,689,754
s . . . . . . . . . . . . . . . . . .rusIncome from estates an
Business profit . . . . . . . . . . . . . . . . . . . . . . . . . . . . . . . . .
,
24,246,254
,
22,868,229
,
22,462,196 23,629,9045
20,566,2599 530 872
19,218,571
8938 973
18,646,959
8 784 424
18,180,6798 799 142
18,131,463
1608 852
16,846,6498,554,40
Partnership profit . . . . . . . . . . . . . . . . . . . . . . . . . . . . . .
l tf it
10,196,759
6 666 863
9,792,7254 409792
9,936,979M 4334
9,368,5 6
4 874 682
, ,5,024,200
,,3,614,012
, ,
2,473,486
, ,2,761,088
, ,3,185o644 3,181,051
s . . . . . . . . . . .a assecapNet gain from sales oNet gain from sales of other property . . . . . . . . . . .
, ,83,796
,,74,426
,,87,146
, ,71,854 93 ' 616 104,930 60,359 102,826 83,761 101,494
Rents and royalties net income . . . . . . . . . . . . . . . . . . 3,943,022 3,921,429 3,888,584 3,859,966 3,660,430
14
~,497,91 7679 067
3,605,573889 025
3,432,51.3794 878
3,299,9481 199 951
3,183,6558121 008
other sowceS4 . . . . . . . . . . . . . . . . . . . . . . . . . . . . . . . . . . 2,094,917 2,190,652 1,932,052 1,297,767 792,7 , , , , , ,,
Losses) total . . . . . . . . . . . . . . . . . . . . . . . . . . . . . . . . . . . . . 3,503,213, 3,080,924 3,132,073 2,972,083 2~629,5411 2,511,000 2,388,207 2,11.5,382 . 1,945,891 1,791,139
Business loss . . . . . . . . . . . . . . . . . . . . . . . . . . . . . . . . . . . 1,703,593 1,385,671 1,351,743 1,491,639 1,297 251 1,293,51 959 724
1,073,477266 799
1,009,4592 41 285
939,922
766231
840,420223 547
Partnership loss . . . . . . . . . . . . . . . . . . . . . . . . . . . . . . . .t
458,804504 060
372,488572528
387,673622 057
333,264421 409
330,30 5
357,641
2 ,362,625
,
437,849
, ,348,557
,268,802
,313,886
s . . . . . . . . . . .Net loss from sales of capital ass eNet loss from sales of other property. . . . . . . . . . .
,111,345
,
111,585
,3-16,990-
,162,611 121,497 129,023 111,682 89,145 126,056 132,306
Rents and royalties net loss . . . . . . . . . . . . . . . . . . . . .
5
702,845 665,037 640,838 540,132 509,487-
401 74 0
58:829457,50940 891
383,212
43,724
342,83436,511
280,980-
. . . . . . . . . . . . . . . . . . .Net operating loss deductionLoss from estates and trusts . . . . . . . . . . . . . . . . . . . .
-
22,566
-
17,571
-
12,772
-
23,028 13,360 5,540
,- - -
RETURNS W17H NO ADJUSTED GROSS INCOME
1 JAdjusted gross deficit . . . . . . . . . . . . . . . . . . . . . . 1,521,945 1,012,326 987,865 859,546 M,865 1,014,480 1,155,I 797,5411 760,548 726,2D2
Positive income, total . . . . . . . . . . . . . . . . . . . . . . . . . . . . 629,004 "9,152 442,510 459,401 393,914 420,382 365,487 409,902 425,057 336,959
Salaries and wageS6 . . . . . . . . . . . . . . . . _ . . . . . . . . . . 248,232 196,461 127,443 135,775 131,633 157,697 126,058 145,638 144,998 3.16,99 8
Dividends in adjusted gross defiCit2 . . . . . . . . . . . . 39,886 37,882 33,550 39,079 30,9548 ODO
16,96 631 520
23,28 620 780
25,40924 562
25,12018 200
26,79312,706
Interest received3 . . . . . . . . . . . . . . . . . . . . . . . . . . . . . . 36,629 40,858
[
28,563 25,447 2 , , , , ,
Annuities and pensions :
Life expectancy method . . . . . . . . . . . . . . 2,717 1,713 6,777 (8) 2,139 503 2,048
3-ye- method . . . . . . . . . . . . . . . . . . . . . . .
Income from estates and trusts . . . . . . . . . . . . . . . . . .
( .
2,975 4,547 (1) 7,639 578 (1) 4,722 3 .1,096 22,361 10,318
Business profit . . . . . . . . . . . . . . . . . . . . . . . . . . . . . . . . . 76,409 21,747 63,750 31,98624 413
30,964
57222
16,04 115 030
30,74018 476
14,314
65 634
31,07886 518
16,78521,038
Partnership profit . . . . . . . . . . . . . . . . . . . . . . . . . . . . . .
Net gain from sales of capital assets . . . . . . . . . . .
23,65 1129 1 739
17,43 386,705
26,73979,795
,1 .16,449
,102,150
,
127,850
,65,040
,74,777
,96,777 77,520
Net gain from sales of other property. . . . . . . . . . . 21861 (8) (1)6 668
(a)60 488
3,13483 936
2,88 1
38 375
2,52669353
13,77056 583
5,14 2
53,415
1,69440,797
Rents and royalties net income . . . . . . . . . . . . . . . . . .7
65,015 40,474 5 ,-
,15 706
,0185
,62 411
,
19,73
,6,958 59 88 10,262. . . . . . . . . . . . . . . . . . . . . . . . . . . . . . . . . .Other sourceS - - , , ,
Losses, total . . . . . . . . . . . . . . . . . . . . . . . . . . . . . . . . . . . . . 2,150,949 1,416,478 1,410,375 1 1,318,947 1,292,?73 , 1,434,862 1,520,64? 1,207,439
:
1,185 612 1,063,165
Business loss . . . . . . . . . . . . . . . . . . . . . . .. *
. . . . . . . . . . 1,187,917 830,727 834,836 885,6050 389
869,969
192199
1,015,29 0218 518
940 ;584248 916
873,919
150 234
756,6663167
758,250187,740
.Partnership loss . . . . . . . . . . . . . . . . . . . . ..
. . . . . . . . . .ital assetssales of cas fN t l
198,13405518
205,914
20 538
217,12920,638
2 7,17,056
,17,572
,16,821
,24,888
,16,905
,16,373 16,742
p.
. . . . . . . . . .rome osNet loss from sales of other property . . . . . . . . . . .
,93,005
,45,929 44,489 148,910 97,067 70,035 70,954 50,624
89224
78,26732238
53,14047 293
Rents and royalties act loss . . . . . . . . . . . . . . . . . . . . 70,101 70,124 45,329 36,209 101,810 27,802
86 136
73,894161 431
,86590
. ,
66868
,-
Net operating loss deduction5 . . . . . . . . . . -
1
-
1
-
(1)
-
(1) -(8), , , ,
Loss from estates and trusts . . . . . . . . . . .
Other sources (negative) . . . . . . . . . . . . . . . . . . . . . . . .( )
1 580,453( )
, 280,732 , 245,824
'Excludes wages, for 1950-57 less than $100 and for 1958-59 less than $200 per return, not subject to income tax withholding, reported as other income on Forms 1040A. Beginci n
1954 salaries and wages axe~ after excludable sick pay and allowable employee expense .2 '
nerships and fiduciaries . All tnb~Dividends reported on Form 1.040 and, for 1959, Form 1040W. Beginning 1954s includes dividends eligible for exclusion received through part
lated amounts, however~ are after exclusions .3 - and f 1959 Form 104 Includes partially tax-exept interest received directly or through partnerships and fiduciaries .Interest reports on Form I or I
"Includes wages not subject to income tax withholding~ dividends, arid interest, not exceeding $100 per return for 1950-57 nor $200 for 1958-592 reported in one am on FormslDWA.
BegZilt 1955, reduced by act operating loss deduction.
50, net operating loss deduction was reported as a business deduction; for 1955-59, it was an adjustment which reduced -Other sources."
6For 1954-59~ salaries and wages are after excludable sick pay and allowable employee expense .
7For 1955-56, reduced by net operating loss deduction.asample variability is too large to warrant showing separately. However~ the total contains data deleted for this reason .
Table 23 . -ITEMIZED DEDUCTIONS ON RETURNS WITH ADJUSTED GROSS INCOME, BY TYPE
Type of deduction 1959 19581 19~~
1956 _195~1~914
(7housand dollars )
rotal . . . . . . . . . . . . . . . . . . . . . . . . . . . . . . . . . . . . . . .
Interest paid . . . . . . . . . . . . . . . . . . . . . . . . . . .
Taxes . . . . . . . . . . . . . . . . . . . . . . . . . . . . . . . . . . .Contributions . . . . . . . . . . . . . . . . . . . . . . . . . . . . . . . . . . . . .Medical and dental expense . . . . . . . . . . . . . . . . . . . . . . . .Child care . . . . . . . . . . . . . . . . . . . . . . . . . . . . . . . . . . . . . . . .
Casualty losses . . . . . . . . . . . . . . . . . . . . . . . . . . . . . . . . . . .Other deductions . . . . . . . . . . . . . . . . . . . . . . . . . . . . . . . . . .
32,017,337 27,497,908 25,691,588 22,612,729
6,269,1547,480,3465,693,8364,283,546
4
"10'0795'827'9-4, .1,793
3,472 1 9081101577347,894
3,165,569
19,997,485
1 1953 1 1~15~1951
15,589,17717,403,22 7
3,201,2874,076,63031891,1732,971,172
87,9604", 24 5
2,730,760
13,556p552 11,856,378
2,735,3593,639,1533,552,4482,391,33 9
392,6442,878,234
21
221 35331167 :7783,114,7392,133,130
367,5172,552,035
1950I
9,913,693
1 ,494 1 928
21199,9402,258,0091,556,294
306,5722,097,950
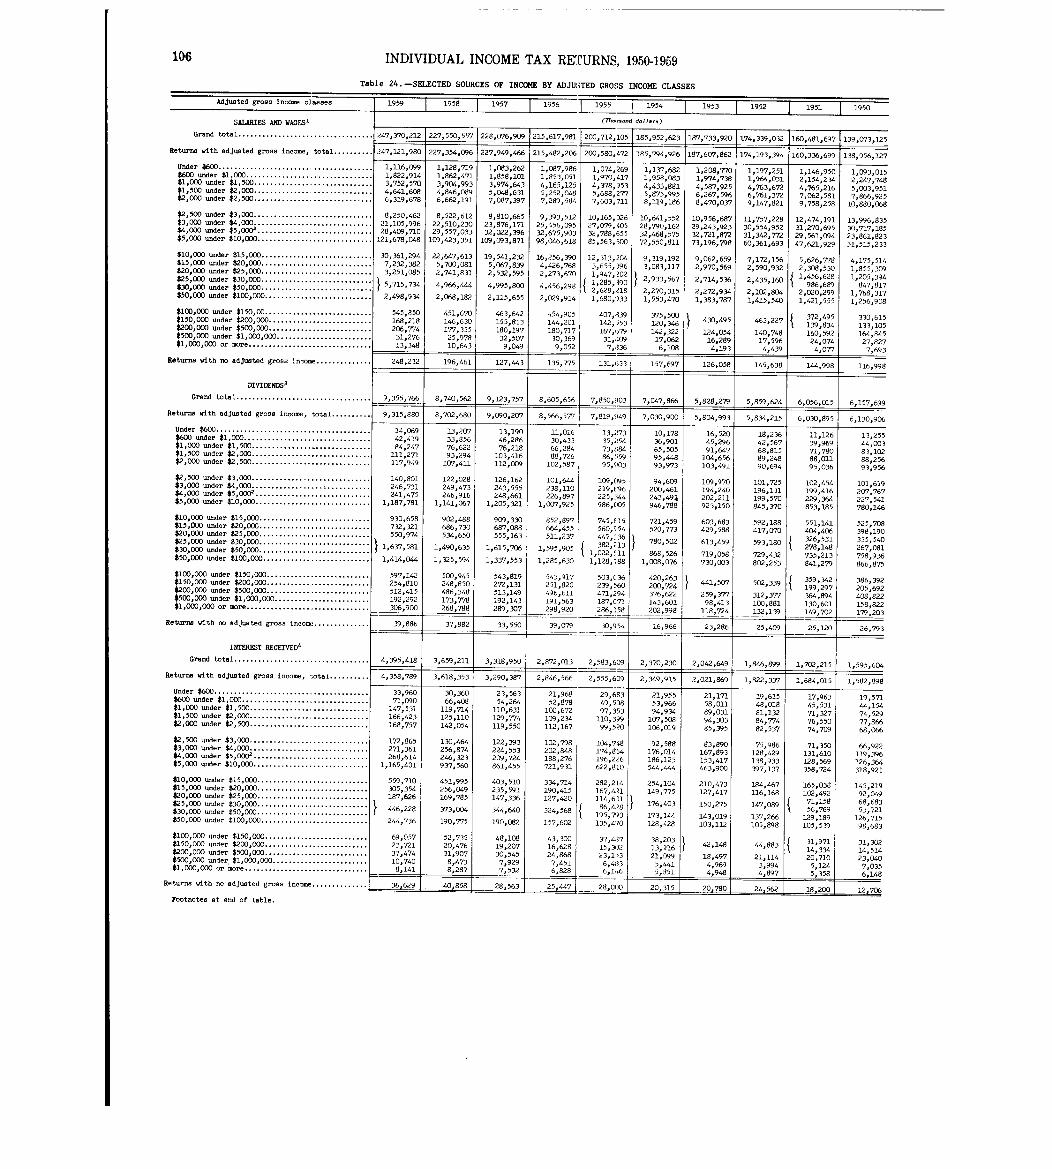
106 INDIVIDUAL INCOME TAX RETURNS, 1950-1959
Adjusted gross incom classes
Table 24 . -SELECTED SOURCES OF INCOME BY ADJUSTED GROSS INCOME CLASSES
F 1931_~ 195 0
SALARIES AND WAGES '
Grand total . . . . . . . . . . . . . . . . . . . . . . . . . . . . . . . . . .
Returns with adjusted gross incom, total . . . . . . . . . .
Under $600 . . . . . . . . . . . . . . . . . . . . . . . . . . . . . . . . . . . . . . .$600 under $1 000$1,000 under il,5(~6*. .* .'*.'. .*'. .". .'*. .". .' ." ."' .* .**.*. .'*. .' .'*.'. .**.$1,500 under $2,000 . . . . . . . . . . . . . . . . . . . . . . . . . . . . . .$2,000 under $2,500 . . . . . . . . . . . . . . . . . . . . . . . . . . . . . .
$2,500 under $3,000 . . . . . . . . . . . . . . . . . . . . . . . . . . . . . .$3,000 under $4,000 . . . . . . . . . . . . . . . . . . . . . . . . . . . . . .$4,000 under $5,0002 . . . . . . . . . . . . . . . . . . . . . . . . . . . . .$5,000 under $10,000 . . . . . . . . . . . . . . . . . . . . . . . . . . . . .
$10,000 under $15,000 . . . . . . . . . . . . . . . . . . . . . . . . . . . .$15,000 under $20,000. . . . . . . . . . . . . . . . . . . . . . . . . . . .$20,000 under $25,000. . . . . . . . . . . . . . . . . . . . . . . . . . . .$25,000 under $30,000 . . . . . . . . . . . . . . . . .$30,000 -der $50,000 . . . . . . . . . . . . . . . . .$50,000 under $100,000 . . . . . . . . . . . . . . . . . . . . . . . . . . .
$100,000 under $150,00 . . . . . . . . . . . . . . . . . . . . . . . . . . .$150,000 under $200,000 . . . . . . . . . . . . . . . . . . . . . . . . . .$200,000 under $500,000 . . . . . . . . . . . . . . . . . . . . . . . . . .$500,000 under $1,000,000 . . . . . . . . . . . . . . . . . . . . . . . .$1,000,000 or more . . . . . . . . . . . . . . . . . . . . . . . . . . . . . . .
Returns with no adjusted gross in~o.. . . . . . . . . . . . . .
DIVIDENW3
Grand total . . . . . . . . . . . . . . . . . . . . . . . . . . . . . . . . . .
Returns with adjusted gross incom, total . . . . . . . . . .
Under $600. . . . . . . . . . . . . . . . . . . . . . . . . . . . . . . . . . . . . . .$600 under $1,000. . . . . . . . . . . . . . . . . . . . . . . . . . . . . . . .$1,000 under $1,500 . . . . . . . . . . . . . . . . . . . . . . . . . . . . .$1,500 under $2,000 . . . . . . . . . . . . . . . . . . . . . . . . . . . . . .$2,000 under $2,500 . . . . . . . . . . . . . . . . . . . . . . . . . . . . . .
$2,500 under $3,000 . . . . . . . . . . . . . . . . . . . . . . . . . . . . . .$3,000 under $4,ODO . . . . . . . . . . . . . . . . . . . . . . . . . . . . .$4,000 under $5,D001 . . . . . . . . . . . . . . . . . . . . . . . . . . . . .$5,000 under $10,000 . . . . . . . . . . . . . . . . . . . . . . . . . . . . .
$10,000 under $15,000 . . . . . . . . . . . . . . . . . . . . . . . . . . . .$15,000 under $20,000 . . . . . . . . . . . . . . . . . . . . . . . . . . . .$20,000 under $25,000 . . . . . . . . . . . . . . . . . . . . . . . .$25,000 under $30pOOO . . . . . . . . . . . . . . . . . . . . . . . .$30,000 under $50,000 . . . . . . . . . . . . . . . . . . . . . . .
.$50,000 under $100~000 . . . . . . . . . . . . . . . . . . . . . . : . . . .
$100,000 -der $150,000 . . . . . . . . . . . . . . . . . . . . . . . . . .$150,000 =der $200,000 . . . . . . . . . . . . . . . . . . . . . . . . . .$200,000 under $500,000. . . . . . . . . . . . . . . . . . . . . . . . . .$5OOpOOO under $1~000~000. . . . . . . . . . . . . . . . . . . . . . . .$1,000~000 or wre . . . . . . . . . . . . . . . . . . . . . . . . . . . . . . .
Returns with no adjusted gross incom . . . . . . . . . . . . . .
INTEREST RECEIVED '
Grand total . . . . . . . . . . . . . . . . . . . . . . . . . . . . . . . . . .
Returns with adjusted gross income, total . . . . . . . . . .
Under $600 . . . . . . . . . . . . . . . . . . . . . . . . . . . . . . . . . . . . . . .$600 under $1,000 . . . . . . . . . . . . . . . . . . . . . . . . . . . . . . . .$1,000 under $1,500 . . . . . . . . . . . . . . . . . . . . . . . . . . . . . .$1,500 -der $2,000 . . . . . . . . . . . . . . . . . . . . . . . . . . . . . .$2,000 under $2,500 . . . . . . . . . . . . . . . . . . . . . . . . . . . . . .
$2,500 under $3,000 . . . . . . . . . . . . . . . . . . . . . . . . . . . . . .$3,000 under $4,000 . . . . . . . . . . . . . . . . . . . . . . . . . . . . . .$4,000 under $5,0002 . . . . . . . . . . . . . . . . _ . . . . . . . . . . .
$5,000 under $10,000 . . . . . . . . . . . . . . . . . . . . . . . . . . . . .
$10,000 under $15,000 . . . . . . . . . . . . . . . . . . . . . . . . . . . .$15,000 under $20,000 . . . . . . . . . . . . . . . . . . . . . . . . . . . .$20,000 under $25,000 . . . . . . . . . . . . . . . . . . . . . . . . . . .$25,000 Under $30,000 . . . . . . . . . . . . . . . . . . . . . . . . . . .$30,ODO =der $50,000 . . . . . . . . . . . . . . . . . . . . . . . : . : . .$50,000 =der $100,000 . . . . . . . . . . . . . . . . . . . . . . . . .
$100,000 under $150,000 . . . . . . . . . . . . . . . . . . . . . . . . . .$150,000 under $200,000 . . . . . . . . . . . . . . . . . . . . . . . . . .$200,000 under $500,000 . . . . . . . . . . . . . . . . . . . . . . . . . .$500,000 under' $1,000,000 . . . . . . . . . . . . . . . . . . . . . . . .$1,000,000 or -re . . . . . . . . . . . . . . . . . . . . . . . . . . . . . . .
Returns with no adjusted gross inconie . . . .
1959 1958 1 19W 1156 19-51 1954 1953 1952
(Th.-M d.11-)
_247,370,212 _227,550,557 228,076,909 -215,617, -981 200,712,105 185,952,623 187,733,920 174,339,032 160,481,697 139,073,12 5
,147,121,980 227,354,096 227,949,466 215,482,206
1
200,580,472 185,794,926~187,607,862~
174,193o394
-
160,336,699
_ __
138,956,12 7
1,116,099 1,128,719 1,083,262 1,087,986 1,074,269 1,137,682 1,208,770 1,197,251 1,146,950 1 093 01 51,822,914 1,862,47:1 1,858,101 1,853,051 1,970,417 1,958,083 1,974,738 1,964,031 2,154,234, ,
2 247 7483,752,570 3,904,993 3,974,643 4,165,125 4,378,)53 4,433,881 4,587,925 4,763,672 4,765,216, ,
5,003 95 14,641,608 4,846,089 5,048,631 5,252,048 5,688,277 5,973,995 6,267,596 6,761,372 7,062,581,
7o866,92 56,319y678 6,662,191 7,087,397 7o289o584 7,603,711 8,119,186 8,470,037 9,147,821 9,758,258 10,880,06 8
8,250,462 8,522,612 8,810,665 9,393,5L2 10,165,D26 10,641,5,-2 10,956,687 11,757,228 12,474,191 996 83 51 321,105,99 628,409,710
22,510,23029,557,033
23,876,17132,022,396
25,456,09532 675 903
27,079,40 532 788 655
28,790,16 232 468 575
29o243,92 372 132 872
30,554,95 24 2l
31,270,695,,
30,717,18 5
121,678,048 109,423,351 109,093,871, ,
98,046,618, ,
85,563,600, ,
72,550,811, ,
73,196,798y3 ,7723
60,361,69329,561,094
47,621,92923,861,82 331,515,23 3
30,36lo294 22,647,613 19o541,232 16,256,390 12,313,204 9,319,192 9,062,659 7,172,156 5,626,778 4 175 5147,232,382 5,700,081 5,067,839 4,426,768 3,655y396 3,083y117 2,970,569 2 , 590y932 2,308,530
, ,
1 , 855,3093,251,085 2,741,831 2,532,595 2,273,670 1 :947 :.2 20 )2,933,567 2 714 536 2 435 160
1,456,628 11205,3945,715,734 4,966,444 4,995,800 4,456o298
;1 285 390 , , ,, 986,689 847,817
2,498,934 2,068,182 2,115,655 2,029,9142,628
"218
1,680,9332,270,31 51,553,470
2,272,934
1,383,7872,102,8041,415o540
2,020,2991,421,555
1,768,3171,256,9D8
545,850168,218
451,670146,630
463,642155,813
454,90 5144,201
407,839142 ~53
375:500
120 346430,495 463,227
372 495
:
330 615
:206,774 177,335 180,197 180,717y
167,679 142, 322 124 054 140,748139 834160,592
105133164,845
31,276 25,978 32,507 30,369 31,409 17 , 062 16 :289 17,596 24,074 27 82 713,348 10,643 9,049 9,052 7,1136 6y108 4,193 4,439 4,077,
1 7,69 3
248,232 196,461 127,"3 135,775
- --------::-131,633
_=157,697 126,058
_145,638_
l-, 9~~T 116,99 8
9,355,766 8,740,562 9,123,757
- - _
8,605y656
_
7,850,903
==:~
7,047,866
=== ~
5,828,279
== :::==
5,859,624 6,056,015 6,157,699
9,315,880 8,702,680 9,090,207 8,566,577 7,819y949 7,030,900 5,804,993 5,834,215 6,030,895 6,130,906
14,069 13,207 13,190 11,016 13,273 10,178 16,520 18,236 11 126 25 51 342o419 33,856 46,286 3Oy433 35"!54 36 , 901 45,296 42,567 39 :969,
44 00 384,247 76,622 76,218 66,284 73, ~t84 65,505 91,647 68,815 71,780,
83,102111,271 93,294 103,416 88,726 86,559 95,"8 104,656 89,248 88,011 88 256117,949 107,411 112,009 102,587 95,903 93,973 103,491 90,694 95pO36,
93,956
140,801 122,028 126,162 IC1,644 109,CP95 94,609 109,970 101,725 102,454 101 619246,731 249,473 243,555 238,110 219,E96 200,461 194,240 196,131 199o416,
207,767241,47 51,187,781
246,9161,141,067
248,66 11,205,321
226,897 225y-4441 007 925 986 CO5
243,49~946 788
202,211923 150
199,570845
229,364 227,541, , , , , ,370 853,185 780y146
930,658 902,488 909,330 852,997 745,E15 721,459 603,683 592,188 551,141 525 7O8732,321 686,730 687,088 664,455 560,S54 520,773 429,588 417, (Y70 404,406y
398 19 0550 974
:
534,650 555,163 511,237 447:-36780,502 613 459 593 180 326,531
,335,540
5811,637 1,490,635 1,615,706 1,595,905 382 213, ,
278,148 267,08 1
1,414,044 1,325,594 1,337,553lo022,,'ll
1,285,630 lol28,788868,52 6
1,008,076719,058730,003
729,432
802,253735,21 3841,279
758,936
866,875
597,142254,810
500,945248,850
543,819272,131
543,917 503,C36251,820 239 560
420,26 ?7242
,441,507 502,339
359,34 219 2
386,392
512,415 486,348 513,149,
496,611 471,294,
376,622 259,377 312,3779, 9 7
364,894205,692408 822192,292 173,778 192,143 191,563 187,C71 143,601 98,413 100,861 130,601
,158 822306,900 268,788 289,307 298,920 286,158 202,998 118,724 132,139 149,702
,179,20 3
39,886 37,882 33,550 39,071) 30,954 16,966 23,286 25,409 25,120 26,793
4,395,418 3,659,211 3,318,950 2,872,013 2,583,6D9 2,370,230 2,042,649 1,846,899 1,702,215 ly595,604
4,358,789 3,618,353 3,290,387 2,846,566 2,555,609 2,349,915 1 2,021,869 1,822,337 lo684,015 1,582,89 8
33,960 30,360 23,563 21,968 29,693 21,955 21,171 19,615 17,963 19 57171,090 66,408 54y264 52,878 49,538 53,966 58yoll 48,018 45,531,
44 15 4147,531 119,714 110,631 100,672 97,353 94,934 89,031 81,132 71,327,
74 52 9166,42 3168 757
125,110142 054
129,774119 550
109,234 110,3~9112
107,508 94y3O3 84,774 76,550,
77,86 6, , , ,167 99,520 106,019 85,395 82,537 74,709 68,066
172,865271,361
130,464256,874
122,393224,553
102,798 104,74 8202o848 174 854
92,58 8176 014
83,690167 893
75,98 6128 429
71,350 66,922
268,614 246,323 209,724,
188,276 196,226,
186,12',
153,417,
138,933131,61 0128,569
119,396126 3641,165,401 937,560 861,455 721,931 622,810 544,444 463,900 397,137 358,724
,318,92 1
559,71 0305,354
451,99 5256,049
403,51 0235 591
334,714 282o2L4190 415 167 421
254,104149 775
210,47312
184,467 165,038 145,219
187 626 169,785,
147,336y ,
127,420 114,6111o 7,417 116,168 102y492
71 15892,04968 683
446 228 373,004 344,640 6 428324,568 8176,403 150,275 147,0 89
,
56,769,
53y721
244,736 190,775 190,082
9 5i
: 7) 3
157,602 135,470173,144128,428
143,019103,112
137,266105,898
129,199105,539
126,715
98,683
69,05723,721
52,73520,476
48,108
19,20743,300 37,413716,628 15 302
38:211313 916
42,148 44,88331 971
:31,302
3?,474 31,907 30,545,
24,868 23,153 21,099 18,497 21,11414 33420,710
14,51423 04010,740 8,473 7,929 ?,451 6,483 5,441 4,969 3,994 5,124
,7 0358,141 11,287 7,532 8_!~828 6,146 5,851 4,948 4,897 5 35 81,6,148
__36,629 . 40,858 28,563
25, "7
28, ~24562
Footnotes at end of table .
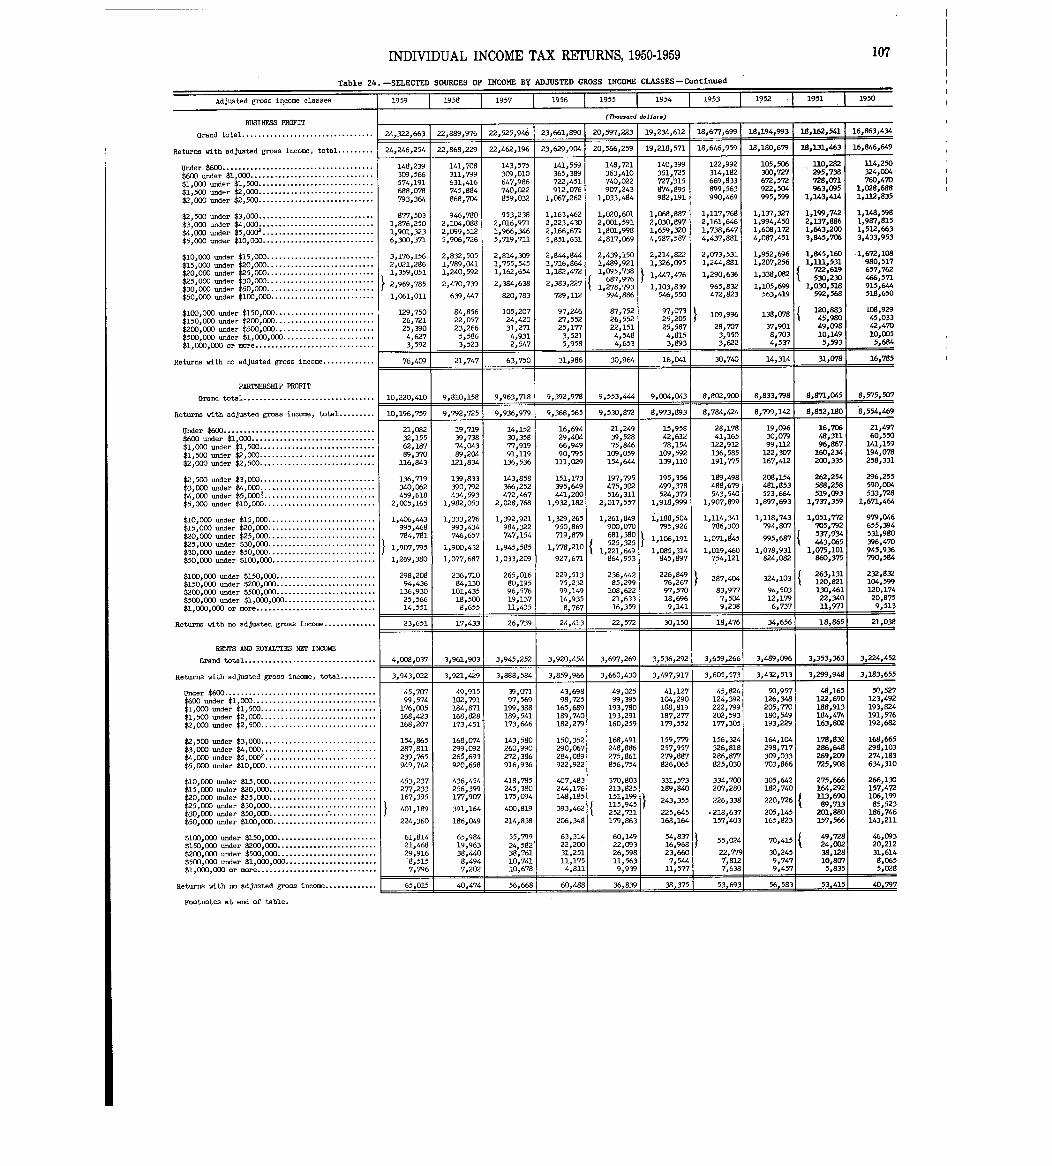
INDIVIDUAL INCOME TAX RETURNS, 1950-1959
Adjusted gross i~~ccae classes
Table 24 . -SELECTED SOURCES OF INCOME BY ADJUSTED GROSS INCOME CLASSES-Continue d
BUSINESS PROFIT
Grand total . . . . . . . . . . . . . . . . . . . . . . . . . . . . . . . . .
Returns with adjusted gross income, total . . . . . . . . .
Under $600 . . . . . . . . . . . . . . . . . . . . . . . . . . . . . . . . . . . . . .$600 under $1,000 . . . . . . . . . . . . . . . . . . .
. . . . --$1,000 under $1,500. . . . . . . . . . . . . . . . . : : .. . . . . . . . . .$1,500 under $2,000. . . . . . . . . . . . . . . . . . . . . . . . . . . . .$2,000 under $2,500. . . . . . . . . . . . . . . . . . . . . . . . . . . . .
$2 500 under $3,000 . . . . . . . . . . . . . . . . . . . . . . . . . . . . .
$3 :000 =der $4,000 . . . . . . . . . . . . . . . . . . . . . . . . . . . . .$4,000 under $5,000 . . . . . . . . . . . . . . . . . . . . . . . . . . . .
$5,000 =der $10,000 . . . . . . . . . . . . . . . . . . . . . . . . . . . .
$10 1 000 under $15,000 . . . . . . . . . . . . . . . . . . . . . . . . . . .$15,000 under $20,000 . . . . . . . . . . . . . . . . . . . . . . . . . . .$20,000 under $25,000 . . . . . . . . . . . . . . . . . . . . .
. .$25,000 under $30,000 . . . . . . . . . . . . . . . . . . . . .$30,000 under $50,000 . . . . . . . . . . . . . . . . . . . .$50,006 under $100,000 . . . . . . . . . . . . . . . . . . .
$100,000 under $150,000 . . . . . . . . . . . . . . . . . . . . . . . . .$150,000 under $200,000 . . . . . . . . . . . . .
. * :** . . . : :'$200,000 under $500,000 . . . . . . . . . . . . . : . . . . . . . .$500,000 -der $1,000,000 . . . . . . . . . . . . . . . . . . . . . . .$1,000,000 or =a . . . . . . . . . . . . . . . . . . . . . . . . . . . . . .
Returns ~ith no adjusted gross income . . . . . . . . . . . . .
PARTNERSHIP PROFIT
Grand total . . . . . . . . . . . . . . . . . . . . . . . . . . . . . . . . .
Returns with adjusted gross income, total . . . . . . . . .
Under $600 . . . . . . . . . . . . . . . . . . . . . . . . . . . . . . . . . . . . . .$600 under $1,000 . . . . . . . . . . . . . . . . . . . . . . . . . . . . . . .
$1,000 under $1,500 . . . . . . . . . . . . . . . . . . . . . . . . . . . . .$1,500 under $2,000 . . . . . . . . . . . . . . . . . . . . . . . . . . . . .$2,000 under $2,500. . . . . . . . . . . . . . . . . . . . . . . . . . . . .
$2,500 under $3,000 . . . . . . . . . . . . . . . . . . . . . . . . . . . . .
$3,000 under $4' 000i**'******'** . .
. . . . . . . . . . .. . . .$4,000 =der $5,000 . . . . . . . . . . . . . . . . . . . . . . . . . . . . .$5,000 under $10,000. . . . . . . . . . . . . . . . . . . . . . . . . . . .
$10,000 under $15,000 . . . . . . . . . . . . . . . . . . . . . . . . . . .
$15,000 under $20,000 . . . . . . . . . . . . . . . . . . . . . . . . . . .$20,000 under $25,000 . . . . . . . . . . . . . . . . . . . . . . . . . . .$25,000 under $30,000 . . . . . . . . . . . . . . . . . . . .$30 1 000 under $50,000 . . . . . .$50,000 under $100,000 . . . . . . . . . .. . .
$100,000 under $150,000 . . . . . . . . . . . . . . . . . . . . . . . . .$150,000 -der $200,000 . . . . . . . . . . . . . . . . . . . . . . . . .$200,000 under $500,000 . . . . . . . . . . . . . . . . . . . . . . . . .$500,000 under $1,000,000 . . . . . . . . . . . . . . . . . . . . . . .$1,000,000 or more . . . . . . . . . . . . . . . . . . . . . . . . . . . . . .
Returns with no adjusted gross income . . . . . . . . . . . . .
RENTS AND ROYALTIES NET INCOIE
Grand total . . . . . . . . . . . . . . . . . . . . . . . . . . . . . . . . .
Returns with adjusted gross income, total . . . . . . . . .
Under $600 . . . . . . . . . . . . . . . . . . . . . . . . . . . . . . . . . . . . . .$600 under $1,000 . . . . . . . . . . . . . . . . . . . . . . . . . . . . . . .
$1,000 under $1,500 . . . . . . . . . . . . . . . . . . . . . . . . . . . . .
$1,500 under $2,000 . . . . . . . . . . . . . . . . . . . . . . . . . . . . .
$2,000 under $2,500. . . . . . . . . . . . . . . . . . . . . . . . . . . . .
$2,500 under $3,000 . . . . . . . . . . . . . . . . . . . . . . . . . . . . .
$3,000 under $4,000. . . . . . . . . . . . . . . . . . . . . . . . . . . . .
$4,000 under $5,0002 . . . . . . . . . . . . . . . . . . . . . . . . . . . .
$5,000 under $10,000 . . . . . . . . . . . . . . . . . . . . . . . . . . . .
$10,000 under $15,000 . . . . . . . . . . . . . . . . . . . . . . . . . . .
$15,000 under $20,000 . . . . . . . . . . . . . . . . . . . . . . . . . . .
$20,000 under $25,000 . . . . . . . . . . . . . . . . . . . . . . . . . . .
$25,000 under $30,000 . . . . . . . . . . . . . . ... . . . . .
$30,000 under $50,000 . . . . . . . . . . . . . . . . . . . . .$50,000 under $100,000 . . . . . . . . . . . . . . . . . . . .
. .. . . .
$100,000 under $150,000 . . . . . . . . . . . . . . . . . . . . . . . . .
$150,000 under $200,000 . . . . . . . . . . . . . . . . . . . . . . . . .
$200,000 -der $500,000 . . . . . . . . . . . . . . . . . . . . . . . . .
$500,000 under $1,000,000 . . . . . . . . . . . . . . . . . . . . . . .
$1,000,000 or more . . . . . . . . . . . . . . . . . . . . . . . . . . . . . .
Returns with no adjusted gross income . . . . . . . . . . . . .
1959 1 1958 1 1957 1 1956 1 1955 1 1954 1 1953 1 1~52
(77,o....d dll,,,)
1951
107
1950
24,322,663 22,889,976 22s525,94~ 23,661,890 20,597,223 19,234,612 18,677,699 18,194,993 18,162,541 16,863,434
24,246,254 22,868,229 22,462,196 23,629,904 20,566,259 19,218,571 18,646,959 18,180,679 18,131,463 16p846,649
148,239 141,708 143,575 141,559 148,721 140,399 122,992 105,506 3-10,282 3-14,250
309,566 311,799 309,010 365,389 363,410 351 7251
314,182 300,727 295,738 324,004
574,191 631,416 647,986 722,451 740,022 ,,315727 669p833 672,572 728,071 760,470
688,078 745,884 740,022 912,076 907,243 874,895 899,563 922,504 963,095 1,028,688
793,364 868,704 859,032 1,067,262 1,033,484 982,191 990,469 995,599 1,143,414 1,132,835
877,503 946,780 953p238 1,163p462 1,020,601 1,068p887 1,117,768 1,137,327 1,199,742 1,148,598
1,876,250 2,104,088 2,016,971 2,223,430 2,001,591 2pO3O,897 2,161p646 1,994,450 2,137,886 1,987,815
1,901,323 2,099,512 1,966,346 2,166,671 1,801,998 1,659,320 1,738,647 1,608,172 1,643,200 1,512,663
6,300,371 5,906,726 5,719,711 5,8.51,631 4,817,069 4p587,587 4,437p881 4,087,451 3,845,706 3,433,953
3,176,156 2,832,505 2,814,301) 2,844,844 2,439,150 2,214,822 2,073,531 1,952,696 1,845,160 1,672plO8
2,021,286 1,789,041 1,755,545 1,716,864 1,489,921 1,326,095 1,244,881 1,207,256 1,111,531 980,517
359,0511 1,240,592 1,162,654 1,182,472 lpO95,738 47 61 447 1 290,636 1,338,082722 :619 657,762
:
2 969,785 2,470,739 2,384,638 2,383,2-1,278,793
,
1,103,839
,
965,832 1,105,699
530 230
1,030 518
466,571915 644
1,061,011 639,"7 820,783 729,112 594,886 546,550 472,823 563,419 592 :568 518 :650
.9,750 84,856 105,207 97,246 87,752 97,073996109 138,078
120,883 108,929
26,721 22,057 24,420 27,552 26,552 25,205,
45,980 45,03 3
25,390 23,266 31,271 25,177 22,151 25,587 28,707 37,901 49,098 42,470
4,627 5,586 4,931 3,521 4,548 4,815 3,950 8,703 10,149 10,005
3,592 3,523 2,547 1 5,958 4,653, 3,893 3,622 4,537, 5,593 5,684
76,409 21,747 63,750 31,986 30,964 16,041 30,740 14,314 31,078 16,785
10,220,410 9,810,158 9,963,718 9,392,978 9,553,444 9,004,043 8,802,900 8,833,798 8,871,045 8,575,507
10,196,759 9,792,725 9,936,979 9,368,565 9,530,872 8,973,893 8,784,424 8,799,142 8,852,180 8,554,469
21,082 19,719 14,152 16,694 21,249 15,958 28,178 19,096 16,706 21,497
32,155 39p738 30,358 29,404 39,528 42p612 41,165 30,079 48,311 60,550
62,187 74,043 77,919 66,949 75,846 78p154 122,912 99,112 96,867 141,159
89,370 89p204 91,119 90,795 109,059 109,592 136,585 122,3D7 160,234 194,078
116,843 121,834 136,536 111,029 154,644 139,110 191,775 167,412 200p335 258,331
136,719 139,833 143,858 151,173 197,795 195,356 189,498 208p154 262,254 296,255
340,062 390,792 366,252 395,649 475,302 499,378 488,679 481,853 588,258 590,004
459,618 434,593 472,467 441,200 516,311 524,379 543,540 523,664 519,093 533,728
2,005,165 1,982,053 2,028,768 1,932,182 2,017,557 1,918,999 1,907,899 1,897,693 1,737,359 1,671,464
1,406,443 1,333,276 1,392,921 1,329,265 1,261,849 1,188,504 1,114,341 1,118,743 1,051,772 979,046
995,468 993,434 984,322 950,869 900,070 795,926 786 303 794,807 705,792 655,394
784,781 746,657 747,154 719,879 611,380 19 ,1 1061,071:d45 995,687
537,934 531,980
1,907,795 1,900,432 1,945,585 1,778,210525 32 5
1,221 :649
,,
1,085,314 1,019,460 1,078,931
"3,06 51,075,101
396p470945,936
1,269,380 1,077,687 1,033,209 927,671 864,953 845,997 754,121 824,082 860,375 ~90,584
298,208 236,710 265,016 229,513 236,442 226849 287 404 324,103
263 131'
232,832
94,436 84,130 80,195 75,232 85,299 76:267, ,82 13.20 104,599
136,930 101,435 96,576 99,149 108,622 97,570 83,977 94,503 130,461 120,174
25,566 18,500 19,137 14,935 21,633 18,696 7,504 12,179 22,340 20,875
14,551 8,655 11,435 1 8,767 16,359 9~141 1 9,238 6,737 ~ 1.1,971 9,513
23,651 17,433 26,739 24,413 22p572 30,150 18,476 34,656 18,865 21,038
4,008,037 3,961,903 3,945,252 3,920,454 3,697,269 3p536,292 3,659,266 3,489,096 3,353,363 3,224,452
3,943,022 3,921,429 3,888,584 3,859,966 3,660,430 3,497,917 3,605,573 3,432,513 3,299,948 3,183,65 5
45,7017 49,915 39,071 43,698 49,025 41,127 45,824 50,957 48,165 5n,52 7
99,574 102,791 97,569 98,725 99,395 104,290 124,392 126,348 122,690 123,492
176,005 184,871 199,388 165,689 193,780 188,619 222,799 205,770 188p913 193,824
168,423 168,828 199,541 189,740 193,291 187,277 202,593 180,549 184,474 191,576
168,207 173,451 173,646 182,279 160,259 179,552 177,305 193,229 163,802 192,682
154,865 168,074 143,580 150,352 168,491 159,779 156p324 164,104 178,832 168,665
287 ' 811 299,092 260,990 290,067 248,886 257,957 326,818 298,717 286,648 298,103
239,765 265,693 272,386 284,089 275,861 279,887 286,877 309,033 269,209 274pl8 3
949,742 920,658 916,936 922,922 856,754 826,065 825,030 703,866 ?25,908 634,310
453,237 436,454 418,785 407,483 370,803 331,573 334,700 305,642 275,666 266,130
277,233 256,399 245,380 244,176 213,825 189,840 207,280 182,740 164,292 157,472
167,395 177,90`7 175,094 148,185 151,199243 355 226,338 220,726
11.3 690:
106 199
:401,189 391,164 400,819 393,462
115,94 5
t 252,711
,
225,645 -218,637 205,14589 713201,880
85 52 3186,746
224,360 186,049 214,838 206,348 179,863 168,164 157,-403 165,823 157,566 143,211
61,814 65,984 55,799'
63,314 60,149 54,837 02 455 70 41549,728 46 093
21,468 19,963 24,582 22,200 22,093 16,968, ,
24,002 20:212
29,916 38,"0 38,761 31,251 26,598 23,660 22,?79 30,245 38,128 31,614
8,515 8,494 10,741 11,175 11,563 7,544 T,812 9,747 10,80`7 8,0651 7,796 1 7,202 10,678 4,811 , 9 939 11,577 7,638 9,457 5,835 5,028
65,015 1 j0,474 ___~~6,668 60,488 1 36,139~38,315 __ 53j693 56::58:3:1_ 53,415 40 797
Footnotes at end of table .
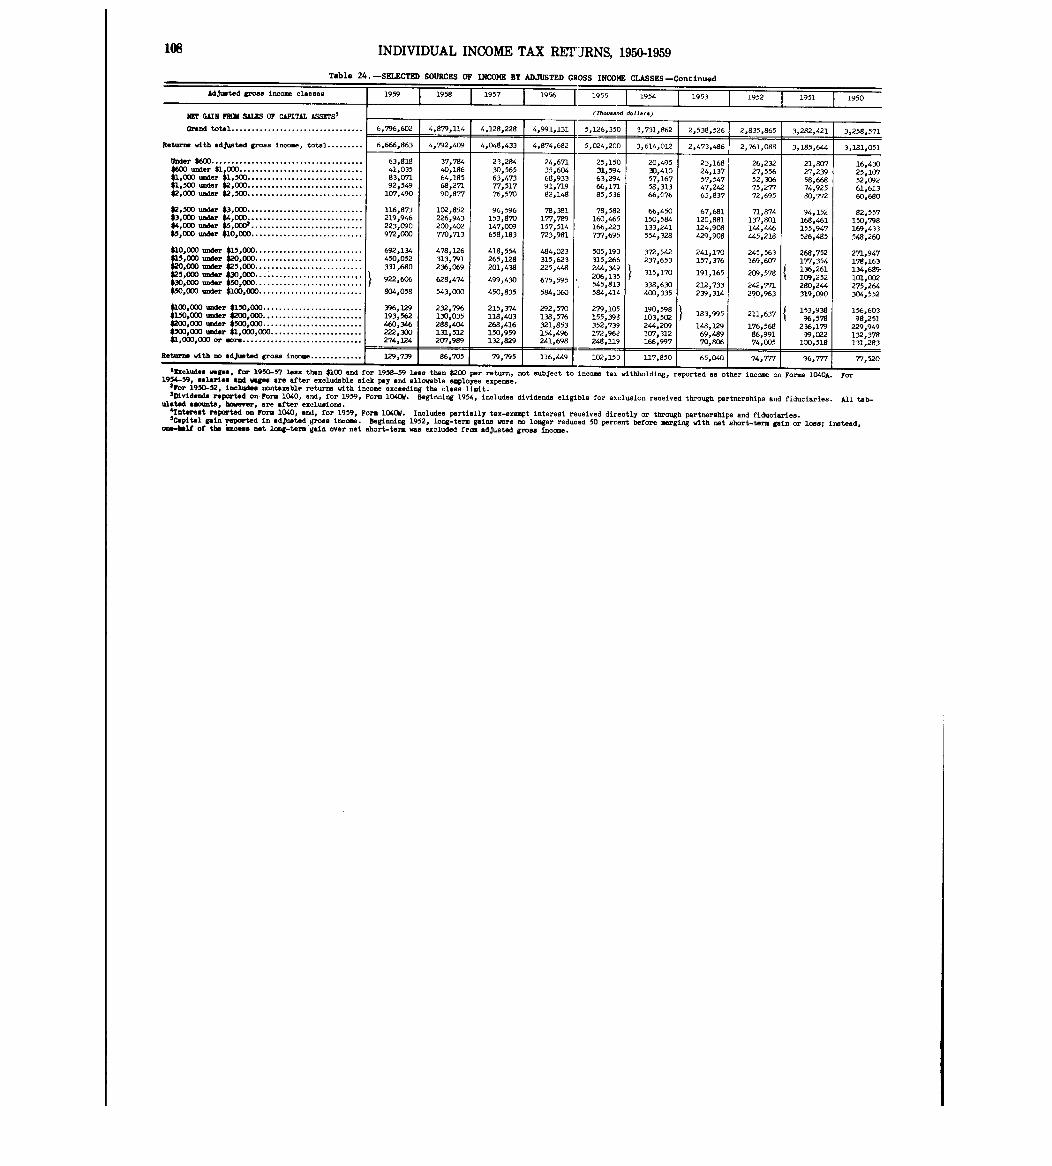
108
Adjusted gross income classes
INDIVIDUAL INWME TAX 11MURNS, 19W1959
Table 24 . -SELECTED SOURCES OF INCOME BY ADJUSTED GROSS INCOME CLASSES -Continue d
MET GAIN FKU -1- OF CAPITAL ASSETS'
Grand total . . . . . . . . . . . . . . . . . . . . . . . . . . . . . . . . .
Returns with adjusted groas inacme, total . . . . . . . . .
Omer $600 . . . . . . . . . . . . . . . . . . . . . . . . . . . . . . . . . . . . . .$1 OODr
r1g:R-r
$2,000 . . . . . . . . . . . . .$2,000 under $2,501) . . . . . . . . . . . . .
r500 under *3yOOO . . . . . . . . . . . . . . . . . . . . . . . . . . . . .
I under $4 000 . . . . . . . . . . . . . . . . . . . . . . . . . . . . .$' :0'00 under $5 :WO2 . . . . . . . . . . . . . . . . . . . . . . . . . . . .
$5,000 under $10,000 . . . . . . . . . . . . . . . . . . . . . . . . . . . .
$ 000 under $15~000 . . . . . . . . . . . . . . . . . . . . . . . . . . .
10' 000
under $20,000 . . . . . . . . . . . . . . . . . . . . . . . . . . ." 000 under $25,000 . . . . . . . . . . . . . . . . . . . . . . . . . . .0.5,000 under $30,000, . . . . . . . . . . . : : :, :
rX, 000 under $50,000-"-*--*$50,000 wsdr $100,000 . . . . . . . . . . . . . . . . . . . .
$100,000 under $1500000 . . . . . . . . . . . . . . . . . . . . . . . . .$150,00o under $200,000 . . . . . . . . . . . . . . . . . . . . . . . . .$200,000 under $50D,000 . . . . . . . . . . . . . . . . . . . . . . . . .$500,000 under $1,000~000 . . . . . . . . . . . . . . . . . o . . . . .$1,000,000 or more . . . . . . . . . . . . . . . . . . . . . . . . . . . . . .
Returns with W adjusted gross income . . . . . . . . . . . . .
1959 1 1958 1957 195 6
6,796,602
6,666,863
63,81841,03583,07192,549
I(Y7,490
116,973219,946223,090972,000
692,134450,052331,680
922,606
804,05 81
396,129193,562460,346222,300274,124
129,739
4,879,114
4,792,409
37,78440,18664,18568027190,877
102,852226,943200,402770,71 3
478,126313,791236,069
628,474
543,000
232,796130,035288,404131,512207,989
86,705
4,128,228
4,048,433
23,28430,56563,47377,51776,570
96,596153,870147,009658sl83
418,554265,128201,438
499,430
450,835
215,374118,403268,416150,959132,929
79,795
4,991,131
4,874,682
24,67135,60468,93391,71982,148
78,381177,789157,514723,981
484,023315,623225,448
675,595
584,060
292,570138,576321,853154,496241,698
116,449
1955 1954 1953 1952 1 1951 1950
(Th--d d.11 ...
5,126,350
5,024,200
25,15031,59463,29466,17185,536
78,582160,465166,223737,695
505,190315,266
244 34'206 135545,813584,41 4
279,105155,399352,73)172,%2248,11 9
102,15)
3,731,862
3,614,012
20,49530,41057,16758,31366,076
66,450150,584133,241554,328
372,542237,653
315,170
338,630400,335
190,598103,5022",209107,322166,99 7
117,850
2,538,526
2,473,486
23,16824,13757,54747,24263,837
67,681120,881124,908429,908
241,170157,376
191,165
212,733239,314
183 995
148 :12969,48970,806
65,040
2,835,86 5
2,761,088
26,23227,55652,30675,27772,695
71,874137,801144,446445,218
245,563169,607
209,578
242,771290,963
211,637
176,56886,99174,005
74,777
3,282,421
3,185,644
21,80727,23958,66874,92580,772
94,152168,461155,947526,485
268,752177,354136,261309,252290,2"319,090
153:93196 578
236 , 17999,022
100,518
96,777
Ifteluden wepax for 1950-57 less than $100 and for 1958-59 less then $200 per return, not subject to income tax withholding reported as other income on Forms 1040A .19 and Yages are after excludable sick pay and allowable employee expense .t7iqZt'5'2,"1=ludee nontemble returns with income exceeding the class limit .
3,258,57 1
3,181,05 1
16,43025,10752,09261,61360,680
82,557150,798169,433548,260
271,947178,163134,689101,002275,264304,552
156,60399,251
229,949132,378131,283
77,520
For
3DIvidenda reported on Yom 1040, andp for 1959, Form 1040W . Beginning 1954, includes dividends eligible for exclusion received through partnerships and fiduciaries . All tab-'alsted amounts, however, are after exclusions .4Interest reported on Form 1040, and, for 1959, Form 1040W. Includes partially tax-exempt interest received directly or through partnerships and fiduciaries .
SCapital pin Foported in adjusted gross income . Beginning 1952, long-term pins were no longer reduced 50 percent before merging with net short-term pin or loss; instead,one-belf of the excess not long-term gain over net short-term was excluded from adjusted gross income .
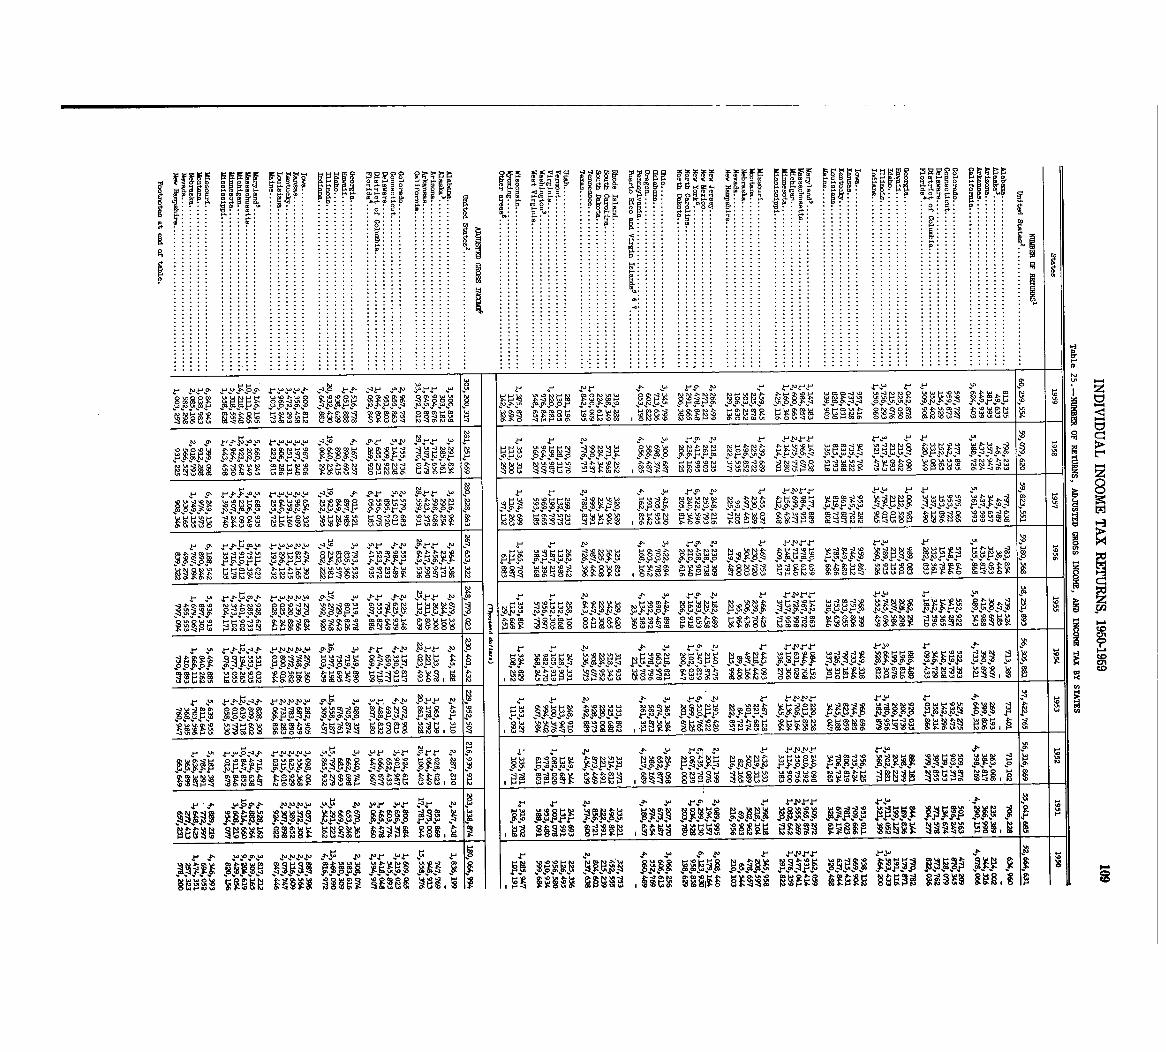
00 E I r, 5 5MR t~ r R 1. IR V RWiUR I isl0 0 P,
0 . . . . . . . . .
. . . . . . . . . . . . . . . . . . . . . . . . . . . . . . . . . . . . . . . . . . . . . . . .
61w
~~ee e 1~1 rIP lp r r1per
8 -.R~ ~z T--p- ay-&- -9T-8- vrnl kutp. ~!Bvm .- age ~~StN- - - --- --~` " ;~ " ~ "'V'" , t~9 j,- , N t z
e '1~ -- P Hy,~ A~ "4z-- Y~OPJO~;p p 'v Z~ 0, vl~~e 4 PIPIpe PZD A?e e IN v "A§ AP'?,P J8 -PY--kRt ~, K~s % 2~ Z3 ~g & g N t ~ -~ u ~3 g r, ~ & ~- e~ -N4 a 2!S~W N S~s W~ r
v s, ee-,5s,~- r&&& .~- .2r ev Per p r r e v J, ee v r ever VIP e eE~ g3 a a I t.- ~s N r. r. -. gf ~gN As- . . . -w-df ~,Huu§ Nw 1~ f I W ~3~?13 V"HF,, ~O 'M cll 'Ap. PA.I~ P.9"PyVY 9"? . W I ~Ov "
'" Tm."W a
Z~3 9 sm &W ~"O RR tH U .~ 18 H N 10 OH UHME"? w . .. ~o HM P-z
ev
A§. 'K. eJ ~'DA?A~ 1'0~0, r~ vr,~kq, J-PP, X. 5yl~" '51pu,~Y,~ A~-VP-P C4-, A~SAPS- P,-;4mg-~3~ ---~q . . .
"0W"10OW 1W 0 T H 0 ~H W ."I% mw IH W
e p eP&,Pp ~ne s-v ~ee v e ep e ever 0M 4- 0 . ~s t~ W
Hs" "'UNZwl, AP,~~ H,7. r Us,~ ?,,A~-Pp K~, ~g P&AP
~88-"w w Ro~ w ~8 N o :9 ~8 ~ 9 w R 9M '949' H8- il- H M.- MH -pMw-'39 &o No 6~ wNo ZVE w ~
r r ~-e -V 'Pee v r V e ever elP e,U MHL~Nr!~ ~E~8~6;
e ~?,PrPg K ~p IoN 'N PAK e,c%v A~- . AN ev
g Sgmm w w w a& - -F8 g- N w8 N~ ~a8 o ~8~os T!
J9 Vi p P ?Y 9 F PlY, ~g P e, J, OXtPUR &W,51p- AK4AP. J
N H. dH". w. U .o~ p ~ ~2g~ 3 "N 09RUHR a" aw fov"15w &MM ~t~ A ~UR wM I E Ims. No k UN ~Ho w8 ~H: g 6-; 2 ;w2 wt R to CD
w
e rvvv,~- F"5 ~j ~"H . ~-v ~ee v r r v 'HIP, ' IN r evIpr elP r-,HF - -
r~m-4~ "PP 9 W , P J-9 vp A~ VIr~8 Apzo . I ~ AP~ v ~PPS-.- Pp~- &1~ M41RU PPR"~&w, INH P" A5 ,Pet 3! l-,P ~-Yg U , Of's - 8U- A§ w
ww M .1 t1l fs & 8 .2 Hf, HUH r.Rw"M N o um § "Cws w8 1 1 w N U
3~ Yty p~ -." ~8 W tz--Ru~ -FaN ~-. N"mav N':F - .9 P 'P,§ P. 'P ~p'p. '? P 510 'PS~VFp ~SPVJ Z~l ve. J~p Apl ,r rJ J v
H HE UM IRM4 I a u ~1!3 RtH3 ~11 HH& E HS sg ~% i tH E 4H §!H~ I am U.12 2~ A 6.~ I " " Z-
r vvv~,~ es~ '1jr ~-v ~r v e v VP v r ever
3 p YF;P 11"Ba Jov"M PH155 .2 MHU PAR A"?M MyYJ I~AW 0-0 MOY 3§PYM IW .9
tI-: le'i 331 tw~ 9 I~s &o a 4 %w HNSHU Ml 9 ~u Z~s ~"m 16 IZO H~ ~ 3 ~"s MH HMV 1
'Pe.Pp ."?p" .9 YMP-~ P~ ll-IXI'PH~ ~.W J~ ~l t 5 Ump ;.fy
MM N k4M ov 191 HERE Hui . f I %w F a cb~ HHZ~ MEOU U091H gf-'l!"On R i F te~; f ~*U-00 99M 9 wv E
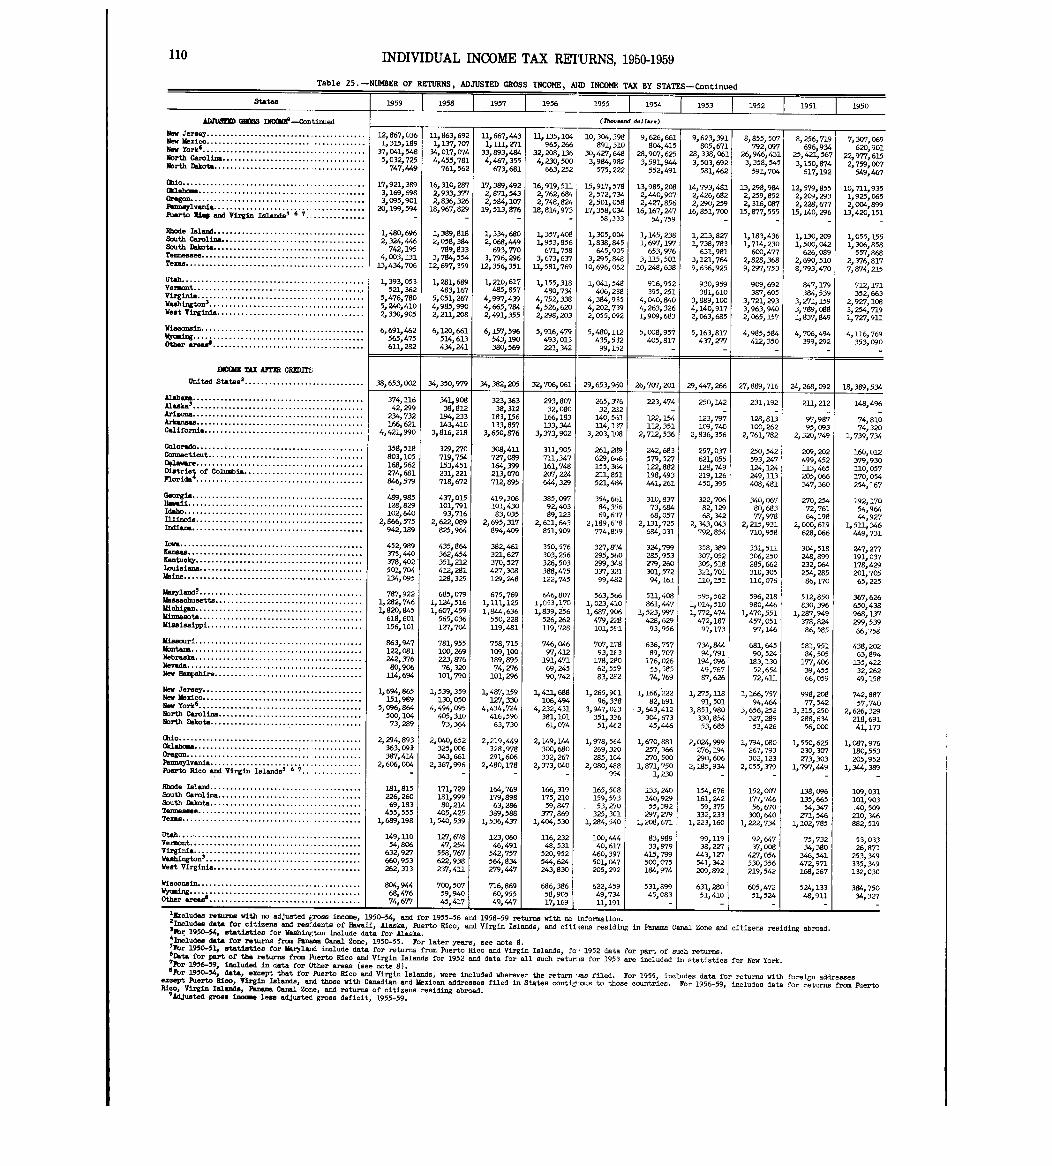
110
States
INDIVIDUAL INCOME TAX RMURNS, 1950-1959
Table 25 . -NUMBER OF RETURNS, ADJUSTED GROSS INCOME, AND INCOME TAX BY STATES -Continue d
ADWUSM I)VOW-0ontinued
New Jersey. . . . . . . . . . . . . . . . . . . . . . . . . . . . . . . . . . . . . . . .New Mexi o. . . . . . . . . . . . . . . . . . . . . . . . . . . . . . . . . . . . . . .Nov York6 . . . . . . . . . . . . . . . . . . . . . . . . . . . . . . . . . . . . . . . . .North C;arolina. . . . . . . . . . . . . . . . . . . . . . . . . . . . . . . . . . . .
North Dakota. . . . . . . . . . . . . . . . . . . . . . . . . . . . . . . . . . . . . .
1959 1958 1957 1956 1955 1954
(7~--d d~ll... )
1953 1952 1951 195 0
hio. . . . . . . . . . . . . . . . . . . . . . . . . . . . . . . . . . . . . . . . . . . . .c1dabcoa. . . . . . . . . . . . . . . . . . . . . . . . . . . . . . . . . . . . . . . . . .Oregon. . . . . . . . . . . . . . . . . . . . . . . . . . . . . . . . . . . . . . . . . . . .Pennsylvania . . . . . . . . . . . . . . . . . . . . . . . . . . . . . . . . . . . . . .puarto Xim, and Virgin 6 7 . . . . . . . . . . . . . . .
Rhode Inland . . . . . . . . . . . . . . . . . . . . . . . . . . . . . . . . . . . . . .South CW'OliUa. . . . . . . . . . . . . . . . . . . . . . . . . . . . . . . . . . . .South Dakota. . . . . . . . . . . . . . . . . . . . . . . . . . . . . . . . . . . . . .Tenn& .. . . . . . . . . . . . . . . . . . . . . . . . . . . . . . . . . . . . . . . . .Texas. . . . . . . . . . . . . . . . . . . . . . . . . . . . . . . . . . . . . . . . . . . . .
Utah . . . . . . . . . . . . . . . . . . . . . . . . . . . . . . . . . . . . . . . . . . . . . .Vermont. . . . . . . . . . . . . . . . . . . . . . . . . . . . . . . . . . . . . . . . . . .Virginia. . . . . . . . . . . . . . . . . . . . . . . . . . . . . . . . . . . . . . . . . .wamba,gto.3 . . . . . . . . . . . . . . . . . . . . . . . . . . . . . . . . . . . . . . .West Virginia. . . . . . . . . . . . . . . . . . . . . . . . . . . . . . . . . . . . .
Wisconsin. . . . . . . . . . . . . . . . . . . . . . . . . . . . . . . . . . . . . . . . .wyoKing . . . . . . . . . . . . . . . . . . . . . . . . . . . . . . . . . . . . . . . . . . .Dth.r arenas . . . . . . . . . . . . . . . . . . . . . . . . . . . . . . . . . . . . . .
12,86720361,315,18 9
37,041,5485,032,725
747,449
17,921,3893,169,6983,095,90 1
20,199,594-
1,480,6962,324,446
742,1954,003,131
13,434,706
1,393,05 3521,362
5,476,7805,240,4102,330,905
6,691,46 2565,475611, 282
11,863,69 21,137,707
34, 017, 0`744,455,78 1
761,56 2
16,33.0,2872,933,3772,836,326
18,967,829-
1,389,8182,058,384
789,8333,784,554
12,697,35 9
1,281,689483,167
5,051,2674,985,99 02, 211, 20 8
6,120,66 1514,613434,2,41
3-1,667,4431, 111, 271
33,893,4644,467,35 5
673,68 1
17,389,49 22,871,54 32, 584, 10`7
19,513,876-
1,334,6802,068,449
693,7703,796,296
12,356,351
11210,617485,857
4,997,4394,665,7842,491,35 5
6,157,5%543,19 0380,569
1111352 104965~266
32,208,13 64,230,500
663,252
16,919,5112,762,6842,748,82418,814,-973
-
1,357,4081,953,856
671,7583,673,637
11,581,769
1,155,318480,734
4,752,3384,526,62 02,298,20 3
5,916,479493,03 32.21,342
10,30423981 891,31 0
30,4Z7,6483,984,982
575,222
15,917,5782,572,7342,501,058
17,358,03458,33 3
1,305,0341,838,845
645,9053,295,W
10,696,062
1,041,548406,238
4,384,91 54,202,7392,055,0? 2
5,480,11 2435,53 299, L52
9,626,661804,415
28,907,6253,591,944
552,491
13,985,2082,440,9072,4Z7,856
16,167,24754,75 9
1,145,2381,697,197
653,9763,115,501
10,248,638
916,95 2395,251,
4,040,84 04,263,32 61,909,68 3
5,008,957405,817
-
9,623,391805,671
28,338,0613,503,692
581,462
14,793,4812,426,6822,290,259
16,851,700-
1,213,82711738,783
631,9813, 121,7649,636,925
930,959381,610
3,899,1004,140,91 72,063,685
5,163,817437,277
-
8,855,507792,097
26,946,43 13,358,54 5591,704
13,298,9842,259,85 22,316,087
15,877,555-
1,183,43 61,714,23 0
600,47 72,828,3689,297,75 3
909,69 2387,605
3,721,2933,963,9402,065,157
4,985,584412,350
-
8,256,719696,934
25,421,5673,15o,874
617,192
12,579,85 52,209,29 32,228,677
15,140,296-
1,130,2091,500,04 2
626,0892,690,5108,793,47 0
847,179384,539
3,271,1593,789,0881,837,849
4,706,494399,292
-
7,307,069620,901
22,9T7,6152,759,007
549,467
10,711,9351,925,0652,004,899
13,420,151-
1,055,15 51,306,85 8
557,8682,376,8177,874,215
712,17 1352,663
2,927,1083,254,7191,7Z7,911
4,116,769353,090
-
INOW TAX AFTER CREDIT~
United States . . . . . . . . . . . . . . . . . . . . . . . . . . . . . . . 38,653,002 34,350,979 34,382,205 32,706,061 29,653,960 26,707,201 29,447,266 27,889,716 24,268,092 18,389,534
labaMIL . . . . . . . . . . . . . . . . . . . . . . . . . . . . . . . . ..
. . . . . . . . .laska .
374,116 341,908 323,363 293,807 265, 376 223,474 250,142 231,192 211,212 148,496. . . . . . . . . . . . . . . . . . . . . . . . . . . . . . . . ..
. . . . . . . . .Lrizona
42,299 38,812 38,312 32,080 32, 2A12 - --
- -. . . . . . . . . . . . . . . . . . . . . . . . . . . . . . . . . . . . . . . . . .LrkRnBm :
234,732 194,233 183,156 166,183 140,561 122, L54 123,797 128,81.3 97,987 74,810. . . . . . . . . . . . . . . . . . . . . . . . . . . . . . . . . . . . . . . . .alifornia . . . . . . . . . . . . . . . . . . . . . . . . . . . . . . . . . . . . . . . .
166,6214,421,990
143,4103,816,218
1-33,8573,650,876
133,3443,373,902
3.14, L373,203,108
112,3512,712,536
109,7402,836,356
100,2622,761,782
95,09 32,320,749
74,3201,739,734
olorado . . . . . . . . . . . . . . . . . . . . . . . . . . . . . . . . . . . . . . . . . .onnecticut
358,518 329,270 308,411 311,905 261,289 242,683 257,037 250,542 209,202 160,012. . . . . . . . . . . . . . . . . . . . . . . . . . . . . . . . . . . . . . .#la.. . . . . . . . . . . . . . . . . . . . . . . . . . . . . . . . . . . . . . . . . .
803,105168,562
719,754153,451
727,089164,399
711,347161,748
629, 646155 3(A
579,527122 882
621,05 5128 749
593,247124 124
499,45 2113 465
379,930110 05 7istrict of Columbia. . . . . . . . . . . . . . . . . . . . . . I . . . . . . .
Flori&4274,681 231,221 213, 0`70 20`7, 224
,21-1,851
,198,493
,219,126
,249,113
,205,066
,170,054. . . . . . . . . . . . . . . . . . . . . . . . . . . . . . . . . . . . . . . . . . 646,579 718,672 712,895 644,329 521,484 441,261 450,395 408,481 347,360 254,16 7
kborgia. . . . . . . . . . . . . . . . . . . . . . . . . . . . . . . . . . . . . . . . . . .[viai i. . . . . . . . . . . . . . . . . . . . . . . . . . . . . . . . . . . . . . . . . . . .
489,985128,829
437,015101,791
419,306101,430
385,09792,403
354,66184,356
310,83773,684
322,70 682,129
340106 780 683
270,25472 761
192,17054 964daho. . . . . . . . . . . . . . . . . . . . . . . . . . . . . . . . . . . . . . . . . . . . .
llinois102,640 93,716 83,035 89,123 69, 67;7 68,057 68,342
,77,978
,64,198
,",927. . . . . . . . . . . . . . . . . . . . . . . . . . . . . . . . . . . . . . . . . .
ndiana2,866,575 2,622,089 2,695,317 2,611,643 2,189,678 2,131,725 2,343,043 2,215,931 2, 000, 619 1,51-1,346. . . . . . . . . . . . . . . . . . . . . . . . . . . . . . . . . . . . . . . . . . . 942,189 825,964 894,409 851,909 774,859 684,031 792,854 710,958 628,066 449,73 1
ow. . . . . . . . . . . . . . . . . . . . . . . . . . . . . . . . . . . . . . . . . . . . . .~=
452,989 435,864 -382,461 350,576 327,874 324,799 358,389 331,512 304,518 247,277. . . . . . . . . . . . . . . . . . . . . . . . . . . . . . . . . . . . . . . . . . . .~entucky. . . . . . . . . . . . . . . . . . . . . . . . . . . . . . . . . . . . . . . . . .
375, "0378,402
362,45 4351,212
321,627370,527
303,25 6326,503
295,56 0299,348
285,95 3Z79,260
307,052305,518
306,250285,662
248,899232 064
191,037178 429ouisiana. . . . . . . . . . . . . . . . . . . . . . . . . . . . . . . . . . . . . . . . .
M~501,704 412,281 427,308 388,475 337,321 301,572 321,701 310,305
,254,285
,201,705. . . . . . . . . . . . . . . . . . . . . . . . . . . . . . . . . . . . . . . . . . . . . L34,095 128,329 129,248 122,745 99,482 94,161 110,151 110,076 86,170 65,225
krylanO . . . . . . . . . . . . . . . . . . . . . . . . . . . . . . . . . . . . . . . . .hamaebusetta . . . . . . . . . . . . . . . . . . . . . . . . . . . . . . . . . . . . .
787,9221,282,746
685,0`791,124,516
675,7691,111,125
646,8071,053,170
563,5661,023,43.0
511,40 8861,447
595,5621,014,510
596,218980,446
512,850830 396
367,626650 438lichigan . . . . . . . . . . . . . . . . . . . . . . . . . . . . . . . . . . . . . . . . . .
I-aDta1,820,845 1,607,459 1,8",636 1,839,256 1,687,906 1,523,997 1,772,474 1,470,551
,1,287,949
,968,137. . . . . . . . . . . . . . . . . . . . . . . . . . . . . . . . . . . . . . . . .
lississippi .618,60115 0
565,036 550,228 526,262 479,228 428,629 472,187 457,051 378,824 299,539. . . . . . . . . . . . . . . . . . . . . . . . . . . . . . . . . . . . . . 6,1 1 lZ7,704 119,481 119,728 101, 591 93,956 97,173 97,146 86,585 66,758
aeouri . . . . . . . . . . . . . . . . . . . . . . . . . . . . . . . . . . . . . . . . . .ontana
863,947 781,955 758,715 746,046 707,1-,8 636,757 734,844 681,645 581,951 438,202. . . . . . . . . . . . . . . . . . . . . . . . . . . . . . . . . . . . . . . . . . .ebrasks.. . . . . . . . . . . . . . . . . . . . . . . . . . . . . . . . . . . . . . . . . .
122,081242,376
100,269223,876
109,100189,895
IY7,412191,471
93,lE 3178,280
89,707176,026
94,791194,096
90,524183,130
84,505177,406
63,894135 422evada . . . . . . . . . . . . . . . . . . . . . . . . . . . . . . . . . . . . . . . . . . . .
ev Hampshire. . . . . . . . . . . . . . . . . . . . . . . . . . . . . . . . . . . . .80,906
1.14,69476,320
101,79074, Z76
101,29669,24590,742
62,55983,282
55,58 574,769
49,76 787,626
52,65472,411
39,45 566,059
,32,26249,15 8
s" Jersey. . . . . . . . . . . . . . . . . . . . . . . . . . . . . . . . . . . . . . . .;; Mexico
1,694,865 1,539,359 1, "7, 159 1,411,688 1, 265, 901 1,166,2122 1, 275,118 1,166,757 998,208 742,887. . . . . . . . . . . . . . . . . . . . . . . . . . . . . . . . . . . . . . . .aw York6
151,989 130,050 127,330 106,494 96,328 82,691 91,501 94,464 77,542 57,740. . . . . . . . . . . . . . . . . . . . . . . . . . . . . . . . . . . . . . . . .rth Carolina
5,096,864 4,494,095 4,434,724 4,232,431 3,947,0;3 3,643,412 3,851,980 3,656,252 3,315,250 2,626,329. . . . . . . . . . . . . . . . . . . . . . . . . . . . . . . . . . . .rth Dakota . . . . . . . . . . . . . . . . . . . . . . . . . . . . . . . . . . . . . .
500,10473 289
405,31073 M4
416,59663 730
381,10161 074
351,33 651 462
304,67345 446
330,8548
327,289 288,634 218,69 1, , , , , , 53,6 5 53,426 56,000 41,173
hio. . . . . . . . . . . . . . . . . . . . . . . . . . . . . . . . . . . . . . . . . . . . . .1 .h..
2,294,893 2,040,652 2,219,449 2,149,144 1,978,564 1,670,881 2,024,999 1,794,080 1,550,625 1,087,976. . . . . . . . . . . . . . . . . . . . . . . . . . ! . . . . . . . . . . . . . . . 363,093 325,006 328,978 300,680 269,320 257,366 276,194 267,793 230,307 180,55 3regon. . . . . . . . . . . . . . I . . . . . . . . . . . . . . . . . . . . . . . . . . . . .nwylvania . . . . . . . . . . . . . . . . . . . . . . . . . . . . . . . . . . . . . .
' 6 7
387,4142, 606, 004
343,6612,367,996
291,6062,480,178
332,2672,373,040
285,IC42,080,488
Z70,5001,871,750
290,6062,185,934
302,1232,055 379
273,3031 797 "9
205,95 21 344 389erto Rico and Virgin Islands . . . . . . . . . . . . . . - - - - 994 1,230 -
,-
, ,-
, ,-
bode Island . . . . . . . . . . . . . . . . . . . . . . . . . . . . . . . . . . . . . .outh Carolina
181,82.5 171,729 164,769 166,319 165,5C8 1 .33,240 154,676 152,0(Y7 138,096 109,03 1. . . . . . . . . . . . . . . . . . . . . . . . . . . . . . . . . . .outh Dakota . . . . . . . . . . . . . . . . . . . . . . . . . . . . . . . . . . . . . .
226,26069,183
181,99 980,214
179,89 863,286
175,21 059,847
159,57353,270
140,92955,392
161,24259,375
177,74656,670
135,66554,347
101,903.40,509ermessee . . . . . . . . . . . . . . . . . . . . . . . . . . . . . . . . . . . . . . . . . 455,555 405,425 389,588 377,869 325,3C1 297,279 332,233 300,640 271,546 210,346X&A . . . . . . . . . . . . . . . . . . . . . . . . . . . . . . . . . . . . . . . . . . . . . 1,689,198 1,540,539 1,536,437 1,404,530 1,284,540 1,208,671 1,223,160 1,222,734 1,102,785 882,519
tab . . . . . . . . . . . . . . . . . . . . . . . . . . . . . . . . . . . . . . . . . . . . . .ermont
149,110 127,678 123,060 116, 232 100,444 83,989 99,119 92,647 75,732 53,033. . . . . . . . . . . . . . . . . . . . . . . . . . . . . . . . . . . . . . . . . .irginia . . .
54,806632
47,254 46,491 48,531 40,617 33,979 38,227 37,008 34,380 26,871. . . . . . . . . . . . . . . . . . . . . . . . . . . . . . . . . . . . . . .Lshington3
,927 558,767 542,757 520,952 460,397 415,799 443,127 4Z7,054 346,541 253,349. . . . . . . . . . . . . . . . . . . . . . . . . . . . . . . . . . . . . .at Virginia
660,953262
622,938 564,834 544,624 501,047 500,075 541,342 530,356 472,971 335,349. . . . . . . . . . . . . . . . . . . . . . . . . . . . . . . . . . . . . ,313 237,411 279,447 243,830 205,292 184,974 209,892 219,542 168,267 132,030
sconsin. . . . . . . . . . . . . . . . . . . . . . . . . . . . . . . . . . . . . . . . .romIng
804,944 700,507 716,869 686,386 622,459 531,899 631,280 605,472 524,133 384,750. . . . . . . . . . . . . . . . . . . . . . . . .r areass
68,476 59,940 60,955 58,905 49,734 45,083 51,410 51,524 48, 911 34,327. . . . . . . 45,417 49,447 17,169 11,191
AA
C
CCDD
III
l
I
NoNo
PePa
Te
VV
We
wi
119cludea returns vith no adjusted gross income 1950-1.4 and for 1955-56 end 1958 59 tu 'i- - ,I - re ros no rvat o~ .'Includes data for citizens and residents of Havaii, Alaska~ Puerto Rico, and Virgin Islands, and citi~ens residing in Panama Canal Zone and citizens residing abroad .3Pbr 1950-54, atAtistics for Washington include data for Alaska .41n~ludem data for returns from Pw~ Canal Zone, 1950-55 . For later years, see note 8 .57br 1950-51, Statistics for Maryland include data for returns from Puerto Rico and Virgin Islards~ fo,- 1952 data for part of such returns .6Data for part of the returns from Puerto Rico and Virgin Islands for 1952 and data for all such returis for 1953 are included in statistics for New York.,For 1956-59, included in data for Other areas (see note 8) .aPbr 1950-54, datao except that for Puerto Rico and Virgin Islands, were included where~er the return ims filed . For 1955, includes data for returns with foreign addresses
except Puerto Rim, flnin Islands, and those with Canadian and Mexican addresses filed in States contiolous to those countries . For 1956-59, includes data for returns from PuertoRico, Virgin Islands, Panama Canal Zone, and returns of citizens residing abroad .'Adjusted gross income less adjusted gross deficit, 1955-59 .
Synopsis of Laws
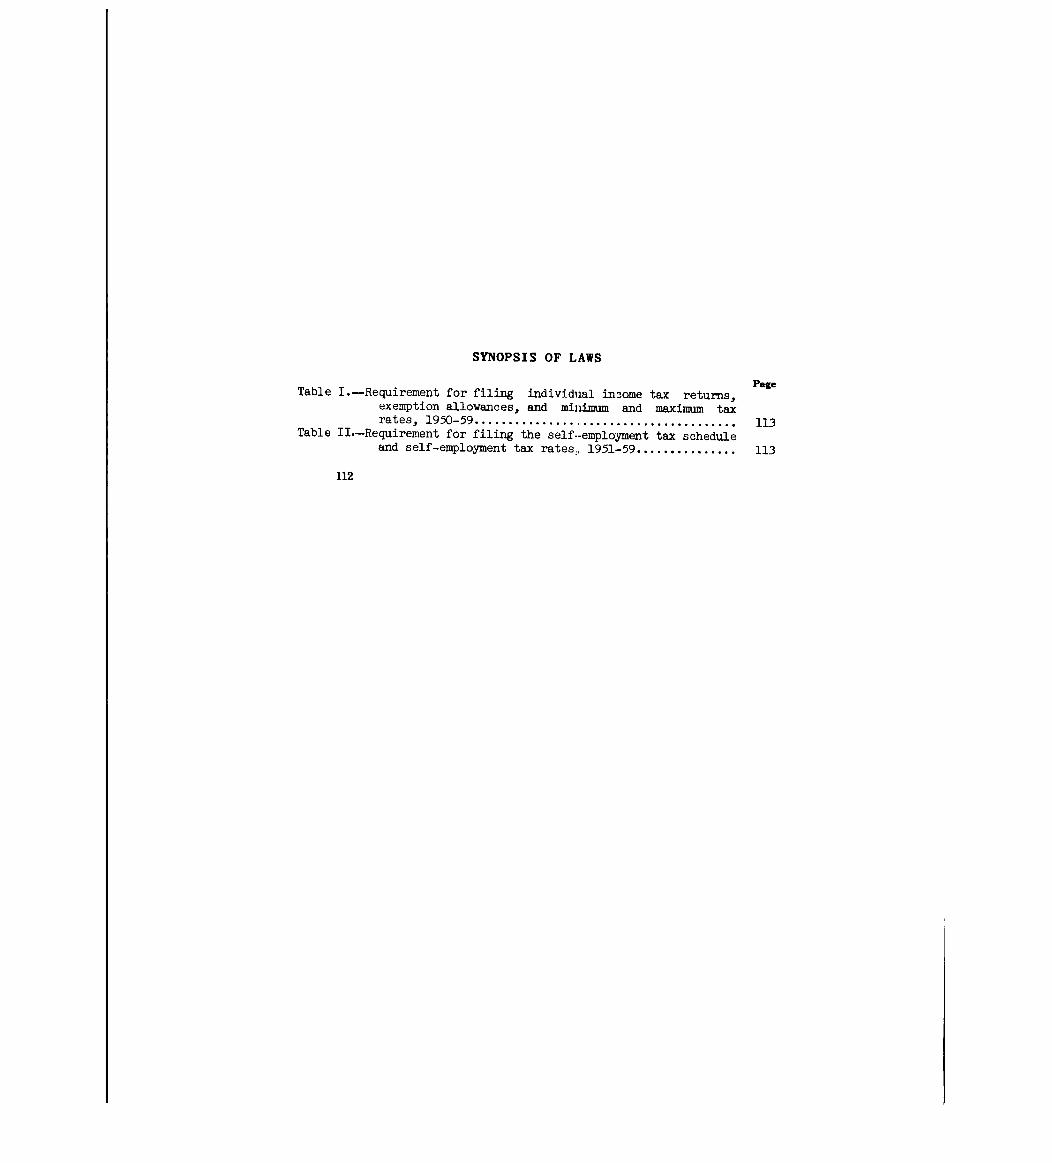
SYNOPSIS OF LAWS
Table I .-Requirement for filing individual in3ome tax returns'exemption allowances, and minimum and maximum tax
Page
rates, 1950-59 . . . . . . . . . . . . . . . . . . . . . . . . . . . . . . . . . . . . . . . 113Table II.-Requirement for filing the self--employment tax schedul e
and self-employment tax rates,, 1951-59 . . . . . . . . . . . . . . . 113
112
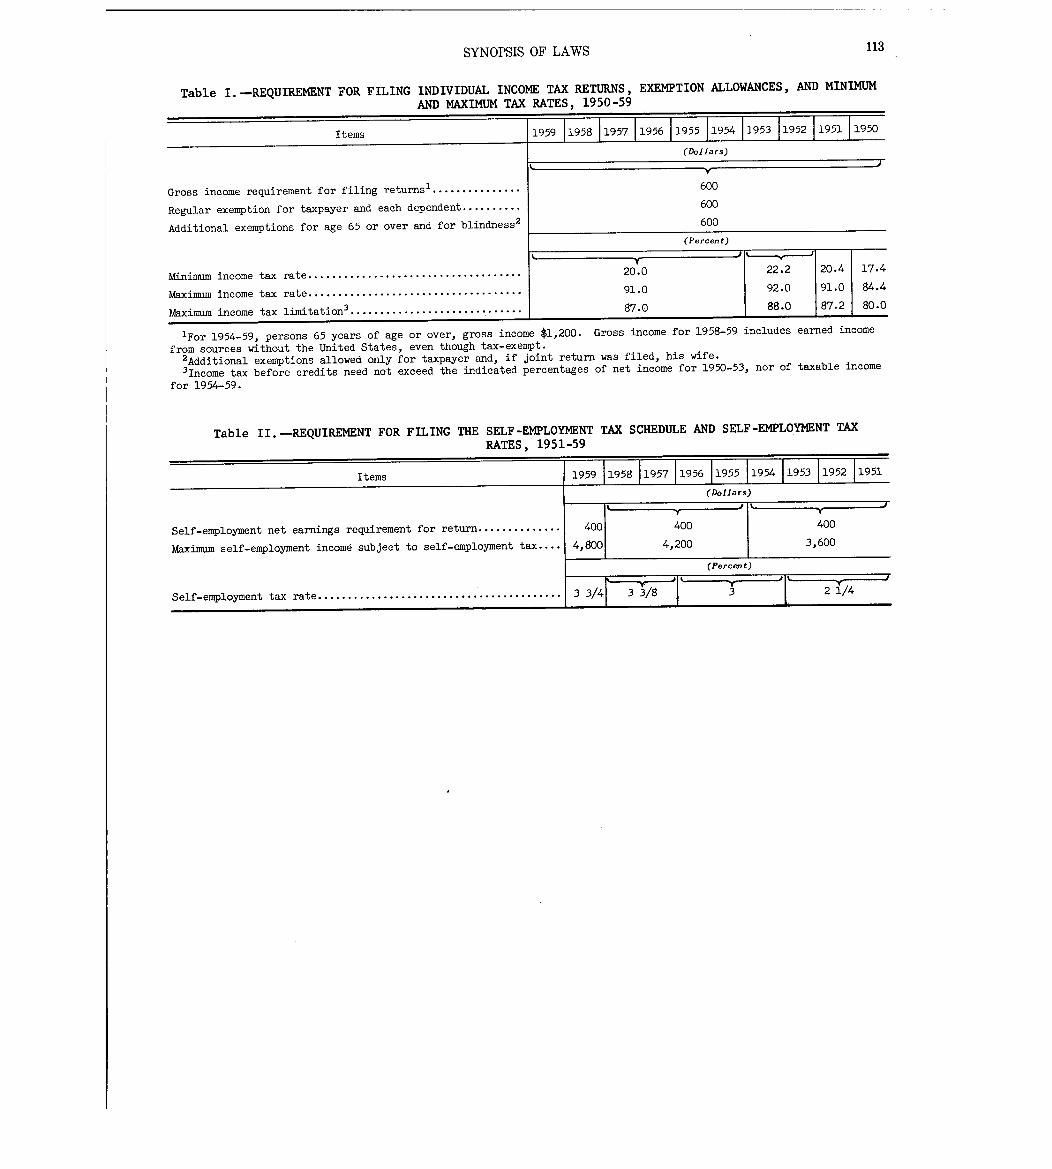
SYNOPSIS OF LAWS
195 7
Table I . -REQUIREMENT FOR FILING INDIVIDUAL INCOME TAX RETURNS, EXEMPTIONALLOWANCES, AND MINIMUM
AND MAXIMUM TAX RATES, 1950-59
Items 1959 1958 1956
(Dollars )
Gross income requirement for filing returnsi . . . . . . . . . . . . . . .
Regular exemption for taxpayer and each dependent . . . . . . . . . .
Additional exemptions for age 65 or over and for blindness 2
Minimum income tax rate . . . . . . . . . . . . . . . . . . . . . . . . . . . . . . . . . . . .
Maximum income tax rate . . . . . . . . . . . . . . . . . . . . . . . . . . . . . . . . . . . .
Maximum income tax limitation3 . . . . . . . . . . . . . . . . . . . . . . . . . . . . .
20 .0
91 .0
87 . 0
IFor 1954-59, persons 65 years of age or over, gross income $1,200 . Gross income for 1958-59 includes earned income
from sources without the United States, even though tax-exempt .2Additional exemptions allowed only for taxpayer and, if joint return was filed, his wife .3Income tax before credits need not exceed the indicated percentages of net income for 1950-53, nor of taxable income
for 1954-59 .
Table II . -REQUIREMENT FOR FILING THE SELF-EMPLOYMENT TAX SCHEDULE AND SELF-EMPLOYMENT TAX
RATES, 1951-59
Item s
Self-employment net earnings requirement for return . . . . . . . . . . . . . .
Maximum self-employment income subject to self-employment tax . . . .
Self-employment tax rate . . . . . . . . . . . . . . . . . . . . . . . . . . . . . . . . . . . . . . . . .
195 9
400
4,800
3 3/4
1958 1957
1955
600
600
600
(Percent )
1956
1954
1955
1953 195 2
1954 1953
195 1
20 .4
91 .0
87 . 2
1952
11 3
1950
17 .4
84.4
80 . 0
195 1
(Dollars)
y40 0
4,200
3 j/8
(Percent )
y3
%y
1 400
3,600
2 1/4
1959 Forms an d
Instructions
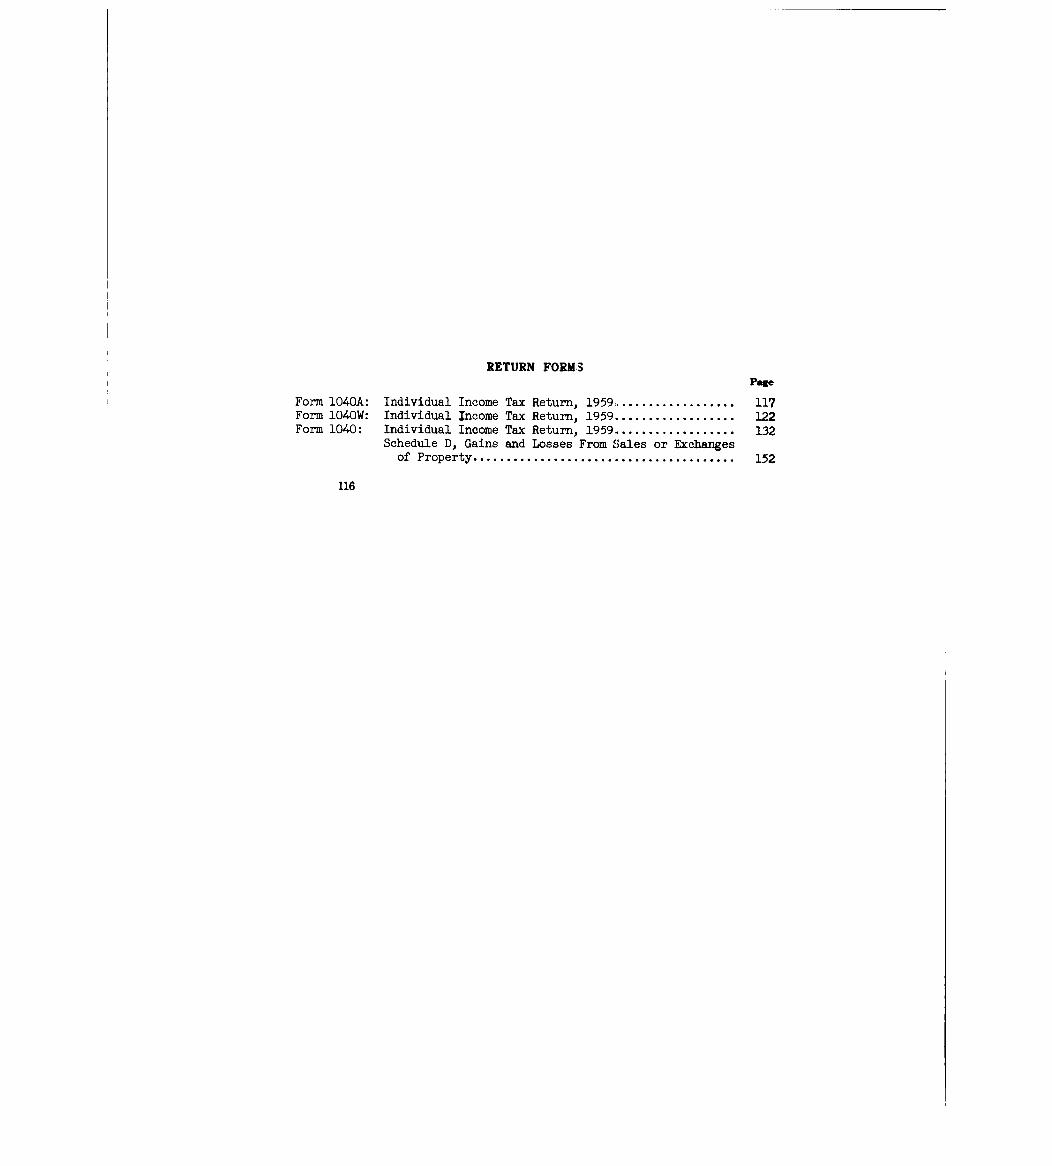
RETURN FORMSPage
Form 1040A : Individual Income Tax Return, 1959 .. . . . . . . . . . . . . . . . . . 117Form 104OW: Individual Income Tax Return, 1959. . . . . . . . . . . . . . . . . . 122Form 1040 : Individual Income Tax Return, 1959 . . . . . . . . . . . . . . . . . . 132
Schedule D, Gains and Losses From Sales or Exchange sof Property . . . . . . . . . . . . . . . . . . . . . . . . . . . . . . . . . . . . . . . 152
116
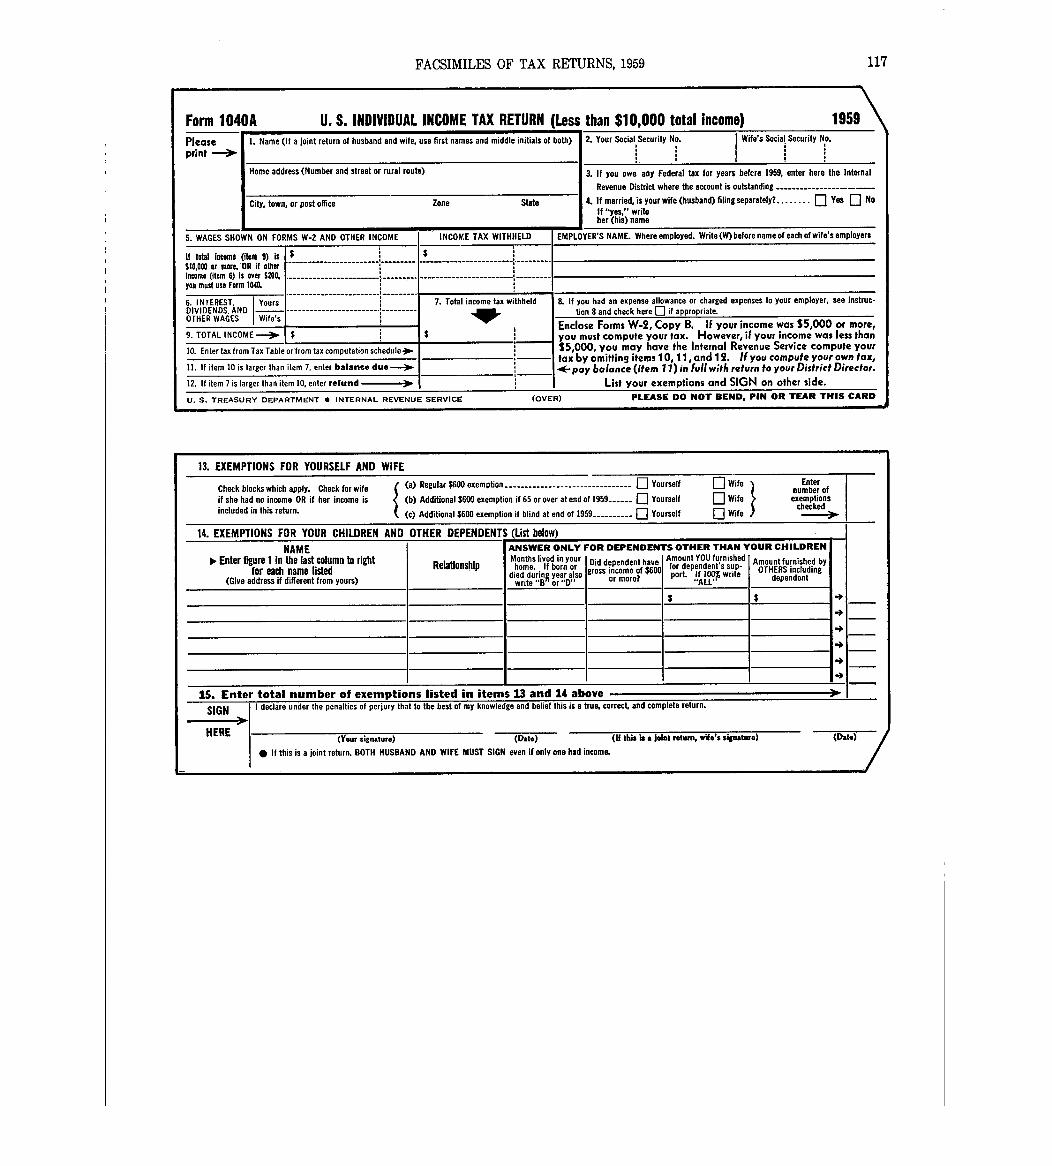
FACSIMILES OF TAX RETURNS, 1959
Form 1040A U. S . INDIVIDUAL INCOME TAX RETURN (Less than $10,000 total income) 1959Pleaseprint 0
1 . Name (if a joint return of husband and wife, use first names and middle initials of both) 2. Your Social Security No. Wife's Social Security No.
Home address (Number and street or rural route )
City, town, or post office Zone
5. WAGES SHOWN ON FORMS W-2 AND OTHER INCOME
State
11 7
3. If you owe any Federal tax for years betcre 1959, enter here the InternalRevenue District where the account is outstanding -- - ------------ - - _ _
4. If married, is your wife (husband) filing separately? . . . . . . . . E] Yes E] NoIf "yes " writeher (hi ;) nam e
INCOME TAX WITHHELD
If total income (item 9) Is $I $: --------- --------------------- ----------
$10,000 or more, OR if other * ----------------------- :income (item 6) is over $200- ------------------------ ------- -- ------------------------ ---------you must use Form 1040 .
------------------------ ------6 . INTEREST, Yours i 7 . Total income tax withheldDIVIDENDS, AND - ------------------------ ---------OTHER WAGES I Wife' s
9 . TOTAL INCOME -30-
10 . Enter tax from Tax Table or'from tax computation schedule -3~
11 . If item 10 is larger than item 7, enter balance due
12 . If item 7 is larger than item 10, enter refund 0 1
U . S . TREASURY DEPARTMENT 0 INTERNAL REVENUE SERVICE
EMPLOYER'S NAME. Where employed. Write (W) before name of each of wife's employer s
8. If you had an expense allowance or charged expenses to your employer . see instruc-
tion 8 and check here C] if appropriate.
Enclose FofmsW-2, Copy B. If your income was $5,000 or more,
youmustcompute ourtax . However, if your income was less than$5,000, you may Kave the Internal Revenue Service compute your
tax by omitting items 10, 11,and 12. If you compute your own tax,
4-pay balance (item 17) in full with return to your District Director .
List your exemptions and SIGN on other side .
(OVER) PLEASE DO NOT SEND, PIN OR TEAR THIS CARDa
13. EXEMPTIONS FOR YOURSELF AND WIF E
Check blocks which apply, Checkforwife (a) Regular $600 exemption -------------------------------- E] Yourself Wif Ent:rnumb ! of
if she had no income OR if her income is (b) Additional $600 exemption if 65 or over at end of 1959 ------ ElYourself Wif exemptlon~included in this return . i (c) Additional $600 exemption if blind at end of 1959 ---------- EJ Yourself
0
Wife checked
14 . EXEMPTIONS FOR YOUR CHILDREN AND OTHER DEPENDENTS (List below)NAME ANSWER ONLY FOR DEPENDENTS OTHERTHAN YOUR CHILDREN
lo, Enter figure I In the last column to right Months lived in your Amount YOU furnished Amount furnished byReWlionship home . If born Did dependent have for dependent's sup-for each name listed or income of $600 OTHERS includingdied during year also gross or more? port If 100~ write dependent(Give address if different from yours) write "B or"D" "ALL'
$ $
15 . Enter total number of exemptions listed in items 13 and 14 above
SIGN I declare under the penalties of perjury that to the best of my knowledge and belief this is a true, correct, and complete return .
Bar
HERE (Your signature) (Date) (H this is a joint return, wife's signature) (Date)
* If this is a joint return . BOTH HUSBAND AND WIFE MUST SIGN even if only one had income.
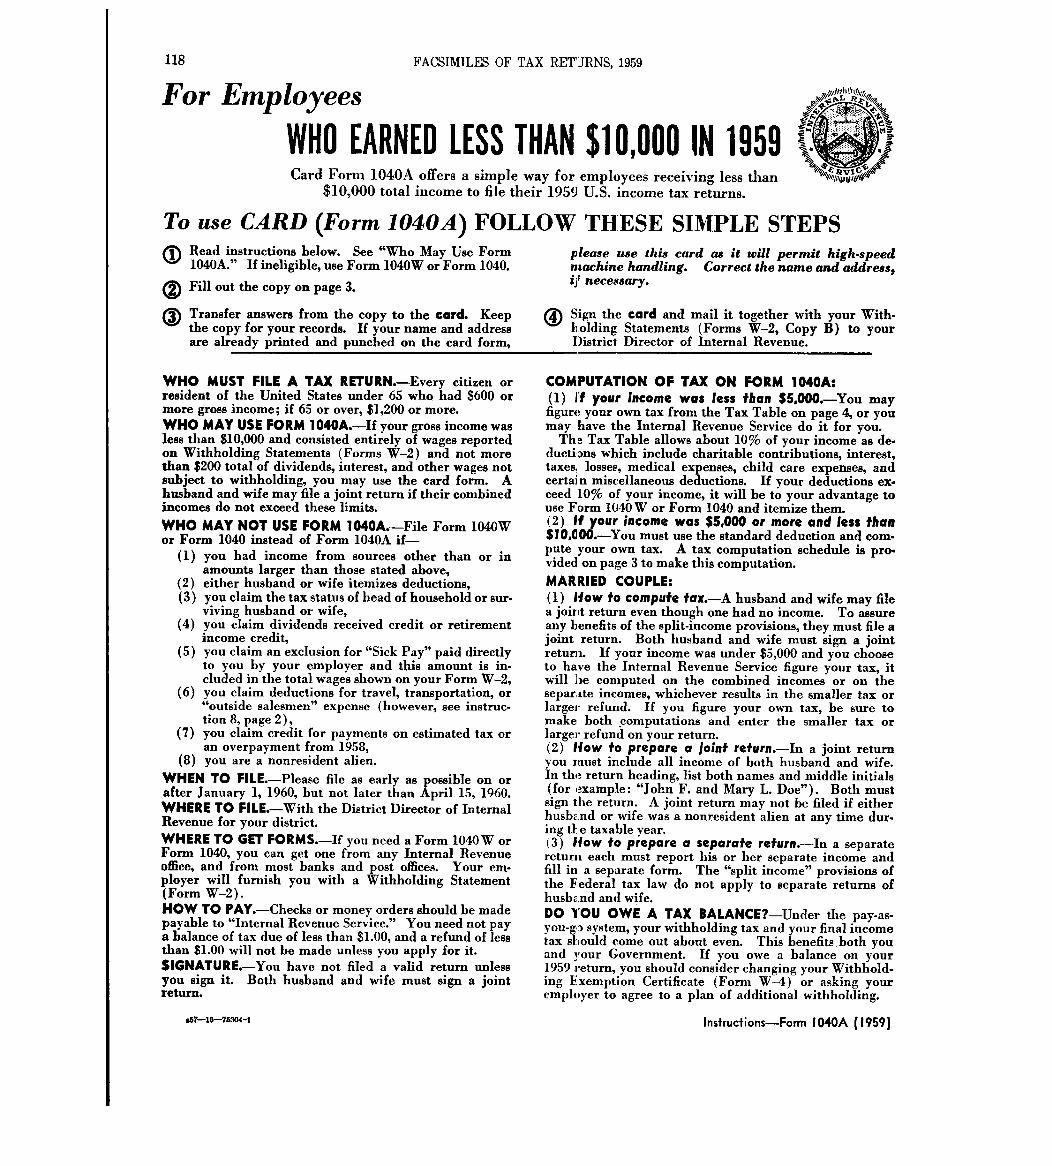
118 FACSIMILES OF TAX RETURNS, 1959
For Employees
WHO EARNED LESS THAN $1 OYOOO IN 1959Card Form 1040A offers a simple way for employees receiving less than
$10,000 total income to file their 1959 U.S. income tax returns .
To use CARD (Form 1040A) FOLLOW THESE SIMPLE STEPSRead instructions below. See "Who May Use Form1040A." If ineligible, use Form 1040W or Form 1040 .
QFill out the copy on page 3.
QTransfer answers from the copy to the card . Keepthe copy for your records . If your name and addressare already printed and punched on the card form ,
WHO MUST FILE A TAX RETURN .-Every citizen orresident of the United States under 65 who had $600 ormore gross income ; if 65 or over, $1,200 or more.WHO MAY USE FORM 1040A.-If your gross income wasless than $10,000 and consisted entirely of wages reportedon Withholding Statements (Forms W-2) and not morethan $200 total of dividends, interest, and other wages notsubject to withholding, you may use the card form. Ahusband and wife may file a joint return if their combinedincomes do not exceed these limits .WHO MAY NOT USE FORM 1040A.-File Form 104OWor Form 1040 instead of Form 1040A if-
(1) you had income from sources other than or inamolmts larger than those stated above,
(2) either husband or wife itemizes deductions ,(3) you claim the tax status of head of household or sur .
viving husband or wife,(4) you claim dividends received credit or retirement
income credit,(5) you claim an exclusion for "Sick Pay" paid directly
to you by your employer and this amount is in-cluded in the total wages shown on your Form W-2 ,
(6) you claim deductions for travel, transportation, o r
(7)
"outside salesmen" expense (however, see instruc-tion 8, page 2) ,you claim credit for payments on estimated tax oran overpayment from 1958 ,
(8) you are a nonresident alien .WHEN TO FILE.-Please file as early as possible on orafter January 1, 1960, but not later than April 15, 1960 .WHERE TO FILE-With the District Director of InternalRevenue for your district .WHERE TO GET FORMS.-If you need a Form 1040W orForm 1040, you can get one from any Internal Revenueoffice, and from most banks and post office& Your em-ployer will furnish you with a Withholding Statement(Form W-2) .HOW TO PAY .-Checks or money orders should be madepayable to "Internal Revenue Service ." You need not paya balance of tax due of less than $1.00, and a refund of lessthan $1.00 will not be made unless you apply for it .SIGNATURE,You have not filed a valid return unlessyou sign it. Both husband and wife must sign a jointreturn .
please use this card as it will permit high-speednutchine handling. Correct the name and address3,ij~ necessary.
Sign the card and mail it together with your With-holding Statements (Forms W-2, Copy B) to yourDistrict Director of Internal Revenue .
COMPUTATION OF TAX ON FORM 1040A:(1) If your income was less than $5,000,You mayfigure your own tax from the Tax Table on page 4, or youmay have the Internal Revenue Service do it for you .
The Tax Table allows about 10% of your income as de-ducti, :)ns which include charitable contributions, interest,taxes.. losses, medical expenses, child care expenses, andcertain miscellaneous deductions . If your deductions ex.ceed 107c of your income, it will be to your advantage touse F c)rm 1040 W or Form 1040 and itemize them .(2) If your income was $5,000 or more and less than$10,000.-You must use the standard deduction and com-pute your own tax . A tax computation schedule is pro .vided on page 3 to make this computation .MARRIED COUPLE:(1) How to compute tax.-A husband and wife may filea joirit return even though one had no income . To assureany benefits of the split-income provisions, they must file ajoint return. Both husband and wife must sign a jointreturn. If your income was under $5,000 and you chooseto have the Internal Revenue Service figure your tax, itwill 13e computed on the combined incomes or on theseparate incomes, whichever results in the smaller tax orlarger refund. If you figure your own tax, be sure tomake both computations and enter the smaller tax orlarger refund on your return .(2) How to prepare a joint return.-In a joint returnyou raust include all income of both husband and wife.In the return heading, list both names and middle initials~for ,-xample : "John F . and Mary L. Doe") . Both must
sign the return. A joint return may not be filed if eitherhusband or wife was a nonresident alien at any time dur-ing tLe taxable year.(3) #low to prepare a separate return.-In a separatereturn each must report his or her separate income andfill in a separate form. The "split income" provisions ofthe Federal tax law do not apply to separate returns ofhusband and wife.DO YOU OWE A TAX BALANCE?-Under the pay-as-you-g, :) system, your withholding tax and your final incometax stiould come out about even . This benefits both youand your Government . If you owe a balance on your1959 return, you should consider changing your Withhold-ing Exemption Certificate (Form W-4) or asking youremployer to agree to a plan of additional withholding .
07-16-75W4-1 Insfrudions-Form 1040A (1959)
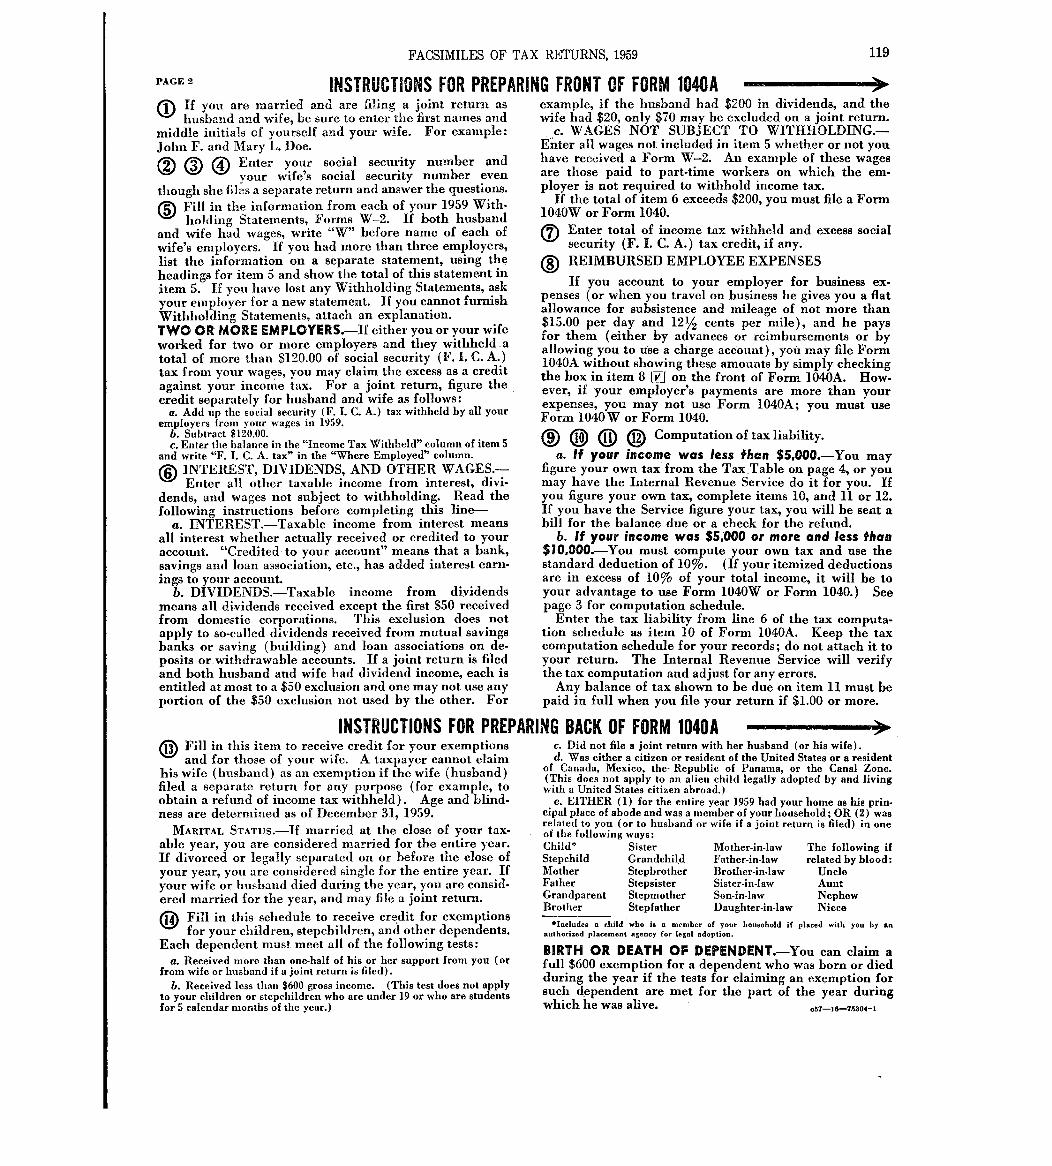
PAGE 2
FACSIMILES OF TAX RETURNS, 1959 119
INSTRUCTIONS FOR PREPARING FRONT OF FORM 1040 AT
If you are married and are Ifiling a joint retut-a ashusband and wife, be sure to enter the first names an d
middle initials of yourself and your wife . For example :John F. and Mary L . Doe.
/.-,N Enter your social security number andV0 @ your wife's social security number even
though she files a separate return and answer the questions.Fill in the information from each of your 1959 With-holdinn, Statements, Forms W-2 . If both husband
and wife had wa-es, write "W" before name of each ofwife's employers . If you had more than three employers,list the information on a separate statement, using theheadin-8 for item 5 and show the total of this statement initem 5 . I ff you have lost any Withholding Statements, askyour employer for a new statement . If you cannotfurnishWithholding Statements, attach an explanation .TWO OR MORE EMPLOYERS .-If either you or your wifeworked for two or more employers and they withheld atotal of more than $120.00 of social security (F. 1 . C. A.)tax from your wages, you may claim the excess as a creditagainst your income tax. For a joint return, figure thecredit separately for husband and wife as follows :
a. Add tip the sc~.ial security (F. 1. C. A.) tax withheld by all youremployers from your wages in 1959.
b. Subtract 81j0 .00 .c . Enter the balance in the "Income Tax Withheld" column of item 5
and write "'F. 1 . C . A. tax" in the "Where Employed" column .INTEREST, DIVIDENDS, AND OTHER WAGES.-Enter all other taxable income from interest, divi-
dends, and waffes not subject to withholding . Read thefollowing instructions before completing this line-
a. INTEREST .-Taxable income from interest meansall interest whether actually received or credited to youraccotuit. "Credited to your account" means that a bank,savings and loan association, etc ., has added interest earn-ings to your account.
b . DIVIDENDS.-Taxable income from dividendsmeans all dividends received except the first $50 receivedfrom domestic corporaiions . This exclusion does notapply to so-called dividends received from mutual savingsbanks or saving (building) and loan associations on de-posits orwithdrawable accounts . If a joint return is filedand both husband and wife had dividend income, each isentitled at most to a $50 exclusion and one may not use anyportion of the $50 exclusion not used by the other. For
example, if the husband had $200 in dividends, and thewife Ld $20, only $70 may be excluded on a joint return.
..c. WAGES NOT SUBJECT TO WITHHOLDING.-Enter all wages not included in item 5 whether or not youhave received a Form W-2 . An example of these wage s0are those paid to part-time workers on which the em-ployer is not required to withhold income tax .
If the total of item 6 exceeds $200, you must file a Form1040W or Form 1040 .
Enter total of income tax withheld and excess socialsecurity (F . 1. C. A.) tax credit, if any .
f-o'% REIMBURSED EMPLOYEE EXPENSES%_0.J
If you account to your employer for business ex .penses (or when you travel on business lie gives you a flatallowance for subsistence and mileage of not more than$15.00 per day and 121/2 cents per mile), and he paysfor them (either by advances or reimbursements or byallowing you to use a charge account), you may file Form1040A without showing these amounts by simply checkingthe box in item 8 JE on the front of Form 1040A . How.ever, if your employer's payments are more than yourexpenses, you may not use Form 1040A ; you must useForm 1040W or Form 1040.f_n~ @ Computation of tax liability .%1-7/ @ 0
a. If your income was less than $5 .000.-You mayfigure your own tax from the TaxTable on page 4, or youmay have the Internal Revenue Service do it for you . Ifyou figure your own tax, complete items 10, and 11 or 12 .If you have the Service figure your tax, you will be sent abill for the balance due or a check for the refund .
b. If your income was $5,000 or more and less than$10,000-You. must compute your own tax and use thestandard deduction of 10%. (If your itemized deductionsare in excess of 10% of your total income, it will be toyour advantage to use Forin 1040W or Form 1040 .) Seepage 3 for computation schedule .
Enter the tax liability from line 6 of the tax computa-tion schedule as item 10 of Form 1040A. Keep the taxcomputation schedule for your records ; do not attach it toyour return. The Internal Revenue Service will verifythe tax computation and adjust for any errors .
Any balance of tax shown to be due on item 11 must bepaid in full when you file your return if $1.00 or more.
INSTRUCTIONS FOR PREPARING BACK OF FORM 1040 A@
Fill in this item to receive credit for your exemptionsand for those of your wife. A taxpayer cannot clai m
his wife (husband) as art . exemption if the wife (husband)filed a separate return for any purpose (for example, toobtain a refund of income tax withheld) . Age and blind-ness are determined as of December 31, 1959 .
MARITAL STATUS.-If married at the close of your tax-able year, you are considered married for the entire year .If divorced or legally separated on or before the close ofyour year, you are considered single for the entire year. Ifyour wife or husband died during the year, you are consid-ered married for the year, and may file a joint return.
f-I'A Fill in this schedule to receive credit for exemptionskvi for your children, stepchildren, ana other dependents .Each dependent must meet all of the following tests -
a. Received more than one-half of his or her support from you (orfrom wife or husband if a joint return is filed) -
b . Received less than $600 gross income. (This test does not applyto your children or stepchildren who are under 19 or who are studentsfor 5 calendar months of the year .)
c. Did not file a joint return with her husband (or his wife) .d. Was either a citizen or resident of the United States or a resident
of Canada, Mexico, the- Republic of Panama, or the Canal Zone .(This does not apply to an alien child legally adopted by and livingwith a United States citizen abroad . )
e. EITHER (1) for the entire year 1959 had your home as his prin.cipal place of abode and was a member of your household ; OR (2) wasrelated to you (or to husband or wife if a joint return is filed) in oneof the following ways :Child* Sister Mother-in-law The following ifStepchild Grandchild Father-in-law related by blood :Mother Stepbrother Brother-in-law Uncl eFather Stepsister Sister-in-law AuntGrandparent Stepmother Son-in-law NephewBrother Stepfather Daughter-in-law Niece
*Includes a child who is a member of your household if placed with you by an
authorized placement agency for legal adoption.
BIRTH OR DEATH OF DEPENDENT.-You can claim afull $600 exemption for a dependent who was born or diedduring the year if the tests for claiming an exemption forsuch dependent are met for the part of the year duringwhich be was alive. W-M-75304-1
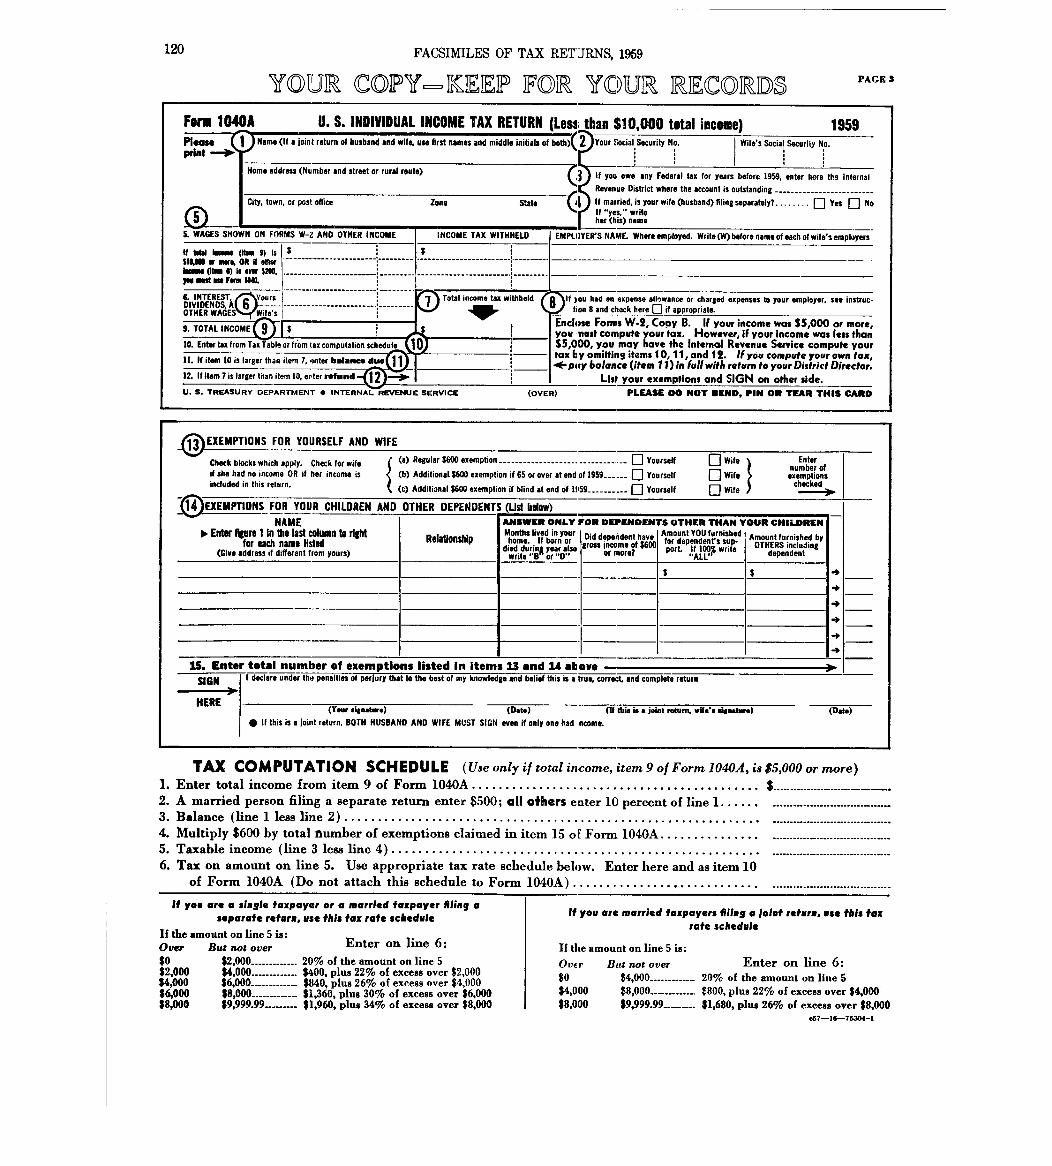
120 FACSIMILES OF TAX RET'JRNS, 1959
YOUR COPY-KEEP FOR YOUR RECORDS PAGE 3
Form 1040A U. S. INDIVIDUAL INCOME TAX RETURN (Less, than $10,000 total income) 1959Please Name (if a Joint return of husband and wife, use first names and middle initials of both)( pyou, ~--t yprint
Home address (Number and street or rural routs)
-QCity, town, or post office Zone
S. WAGES SHOWN ON FORMS W-2 AND OTHER INCOME
It bW ksme = 9) Is$IUN or mers. otherbases Ro 4) is am $2110,ps mod on Farm loft
6.'"TR'ST, our
sDIVIDEN DS, 6 ----------------- ------0THER WAGE Wife
's9
10. Enter tax from Tax-Table or fr'om tax computation schedule
11. It item 10 is larger than item 7, enter ballatme due
IL It item 7 is larger than item 10, enter rotund ---30-
INCOME TAX WITHHEL D
state
S-----------------------
D~
It you owe any Federal tax for years before 1959, enter here the Internal
Revenue District where the account is outstanding -------------------------
It married, is your wife (husband) filing separately? . . . . . . . . 1:1 Yes El Noit 1 . 1 . i ther gs, wri ahis) nam e
EMPLOYER'S NAME, Where employed . Write (W) before name of each of wife's employers
Total income tax withhold f a Aif you had an expense allowance or charged expenses to your employer see instruc-Vhon 8 and check here El if appropriate.
U . S . TREASURY DEPARTMENT 0 INTERNAL-REVENUE SERVICE
Enclose Forms W-2, Copy B . If your income was $5,000 air more,you; inust compute your tax . However, if your income was less tha n
(OVER)
4- pay balanc* (item 11) in full with return to your District Director .tax by omitting items 10, 11, and 12 . If you compute your own tax,$5,01010, you may have the Internal Revenue Service compute you r
List your exemptions and SIGN on other side.-PLEASE DO NOT BEND, PIN OR TEAR THIS CARD
3 EXEMPTIONS FOR YOURSELF AND WIFE
Check blocks which apply. Checkforwite Regular $600 exemption --------------------------------- Yourself Wi f
i :
n .Enblarin 'ofif she had no income OR it her income is Additional $600 exemption if 65 or over at end of 1959 ------ Yourself 0 W t
I
.empti ..
included in this return . (c) Additional $600 exemption if blind at end of 11,59 ---------- Yourself Wife checked
~11~4EIE:X~EMPTIONS FOR YOUR CHILDREN AND OTHER DEPENDENTS (List below)NAME ANSWER ONLY FOR DEPIENDENTS OTHER THAN YOUR CHILDRIE W
III. Ell* f1pro I In the last column b righ lfor &Kh name listed Relationship
Months lived in your Amount YOU furnishedhome. If born or Did dependent hav
M0 tor dependent's sup. Amount furnished by
(Give address if different from yours) died durinA year also gross income of $or more? port. If 100~ write
write "B or "D" "ALL'OTHERS including
dependen t
$ $
15 Enter total number of exem tions listed In Items 13 end 14 above. p
SIGN I declare under nalties of perjury that to the best of my knowledge and belief this is a trus, correct, and complete retur n)o
HERE (Yew signature) (Date) (111 this is a joint return, wife's signature) (Data )40 If this is a joint return, BOTH HUSBAND AND WIFE MUST SIGN even if only one had ncome.
TAX COMPUTATION SCHEDULE (Use only if total income, item 9 of Form 1040A, is $5,000 or more)1 . Enter total income from item 9 of Form 1040A . . . . . . . . . . . . . . . . . . . . . . . . . . . . . . . . . . . . . . . . . . . $. . . .. .. .. .. . . . . . .. .. .. .... .2 . A married person filing a separate return enter $500 ; all ofters enter 10 percent of line I . . . . . .3 . Balance (line I less line 2) . . . . . . . . . . . . . . . . . . . . . . . . . . . . . . . . . . . . . . . . . . . . . . . . . . . . . . . . . . . . . .4. Multiply $600 by total number of exemptions claimed in item 15 o f Form 1040A . . . . . . . . . . . . . . .5 . Taxable income (line 3 less line 4) . . . . . . . . . . . . . . . . . . . . . . . . . . . . . . . . . . . . . . . . . . . . . . . . . . . . . . . . . .. .. . . .. .... . .. . . .. .. .. . . .. . . .. . .6. Tax on amount on line 5. Use appropriate tax rate schedule below. Enter here and as item 10
of Form 1040A (Do not attach this schedule to Form 1040A) . . . . . . . . . . . . . . . . . . . . . . . . . . . .
If you are a single taxpayer or a married taxpayer filing aseparate return, use this tax rate schedule
If the amount on line 5 is :Over Bug not over Enter on line 6 :
so $2,000------------- 20% of the amount on line 5$2,000 $4,000 ------------- $400, plus 22% of excess over $2,000$4,000 $6,000 ------------- $840, plus 26% of excess over $4,000K000 $8,000 ------------- $1,360, plus 30% of excess over $6,000$8,000 $9,999.99 --------- $1,960, plus 34% of excess over $8,000
--------------- ---------
------------------------ ---------
----------------------
If you are married taxpayers filing a joint return. age this taxrate schedule
If t1te amount on line 5 is :
Over But not over Enter on line 6 :so $4,000------------- 20% of the amount on line 5$4,000 $8,000 ------------- $800, plus 22% of excess over $4,000$8,00 $9,999.99 -- - ----- $1,680, plus 26% of excess over $8,000
c57-16--75304-1
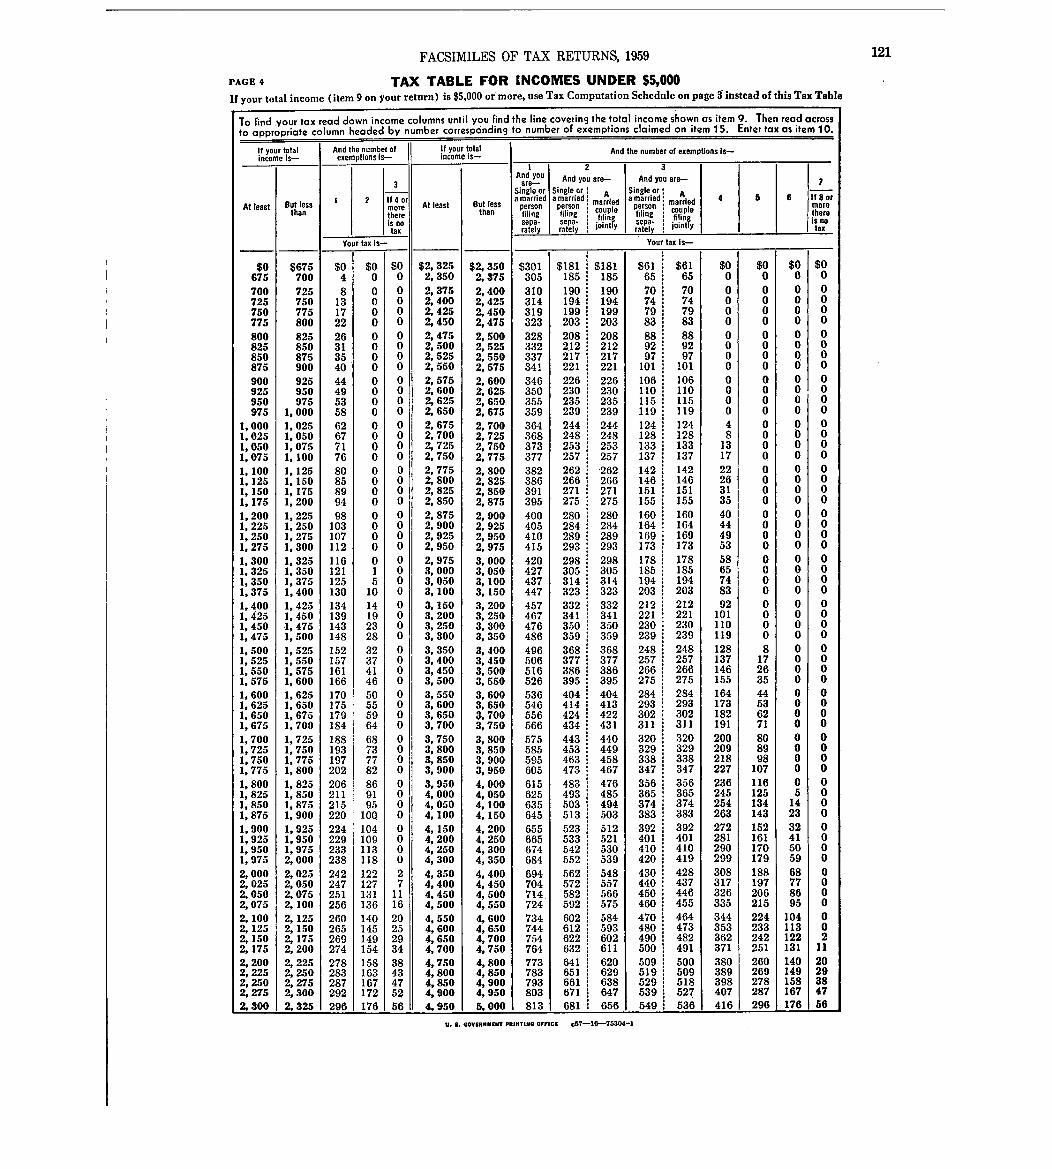
PAGE 4
FACSIMILES OF TAX RETURNS, 1959
TAX TABLE FOR INCOMES UNDER $5,000If your total income (item 9 on your return) is $5,000 or more, use Tax Computation Schedule on page 9 instead of this Tax Table
To find your tax read down income columns until you find the line covering the total income shown as item 9 . Then read acros sto appropriate column headed by number corresponcling to number of exemptions claimed on item 15 . Enter tax as item 10.
If your tota lincome is-
And the number o fexemptions is-
!f your totalincome is- And the number of exemptions is-
2 3
3And yo uare- And you are -
i lAnd you are-
lSi7
At least But less 1 2 If 4 o rmore At least But les s
Single o ramarrie d
sonI e r
S ng e or : Aamarried : d,,, : mame~,l
ng e or Aa married marriedperson t l4 5 6 If 8 or
in tothan there th 111 f,,,,g
pf i'Ing coup e
fill'' ' n
coup efiling : f-11 .infI
th..is nois no
taxsep arate,; a- i0i,, fysep
ratiysepa; . n I
i0i tax
You r tax is- Your tax Is-
$0 $675 $0 $0 $0 $2,325 $2,350 $301 $t81 $181 $61 $61 $0 $0 $0 $0675 700 4 0 0 2,350 2,375 305 185 185 65 65 0 0 0 0
700 725 8 0 0 2,375 2,400 310 190 190 70 70 0 0 0 0725 750 13 0 0 2,400 2,425 314 194 194 74 74 0 0 0 0750 775 17 0 0 2,425 2,450 319 199 199 79 79 0 0 0 0775 800 22 0 0 2,450 2,475 323 203 203 83 83 0 0 0 0
800 825 26 0 0 2,475 2,500 328 208 208 88 88 0 0 0 0825 850 31 0 0 2,500 2,525 332 2.12 212 92 92 0 0 0 0850 875 35 0 0 2,525 2,550 337 217 217 97 97 0 0 0 0875 900 40 0 0 2,550 2,575 341 221 221 101 1 10 1i 1 0 0 6 0900 925 44 0 0 2,575 2,600 346 226 226 106 106 0 0 0 0925 950 49 0 0 2,600 2,625 350 230 230 110 110 0 0 0 0950 975 53 0 0 2, 6~5 2,650 355 235 235 115 115 0 0 0 0975 1,000 58 0 0 2,650 2,675 359 239 239 119 119 0 0 0 0
1,000 1,025 62 0 0 2,675 2,700 364 244 244 124 124 4 0 0 01,025 1,050 67 0 0 2,700 2,725 368 248 248 128 128 8 0 0 01,050 1,075 71 0 0 2,725 2,750 373 253 253 133 133 13 0 0 01,075 1,100 76 0 0 2,750 2,775 377 257 257 137 137 17 0 0 0
1,100 1,125 80 0 0 2,775 2,800 382 262 -262 142 142 22 0 0 01,125 1,150 85 0 0 2,800 2,825 386 266 266 146 146 26 0 0 01,150 1,175 89 0 0 2,825 2,850 391 127 271 151 151 31 0 0 01,175 1,200 94 0 0 2,850 2,875 395 275 275 155 155 35 0 0 0
1,200 1,225 98 0 0 2,875 2,900 400 280 280 160 160 40 0 0 01,225 1,250 103 0 0 2,900 2,925 405 284 284 164 164 44 0 0 01,250 1,275 107 0 0 2,925 2,950 410 289 289 169 169 49 0 0 01,275 1,300 112 0 0 2,950 2,975 415 293 293 173 173 53 0 0 0
1,300 1,325 116 0 0 2,975 3,000 420 298 298 178 178 58 0 0 01,325 1,350 121 1 0 3,000 3,050 427 305 305 185 185 65 0 0 01,350 1,375 125 5 0 3,050 3,100 437 314 314 194 194 74 0 0 01,375 1,400 130 10 0 3,100 3,150 447 323 323 203 203 83 0 0 0
1,400 1,425 134 14 0 3,150 3,200 457 332 332 212 212 92 0 0 01,425 1,450 139 19 0 3,200 3,250 467 341 341 221 221 101 0 0 01,450 1,475 143 23 0 3,250 3,300 476 350 350 230 230 110 0 0 01,475 1,500 148 28 0 3,300 3,350 486 359 359 239 239 119 0 0 0
1,500 1,525 152 32 0 3,350 3,400 496 368 368 248 248 128 8 0 01,525 1,550 157 37 0 3,400 3,450 1506 377 377 257 257 137 17 0 01,550 1,575 161 41 0 3,450 3,500 516 386 386 266 266 146 26 0 01,575 1,600 166 46 0 3,500 3,550 526 395 395 275 275 155 35 0 0
1,600 1,625 170 50 0 3,550 3,600 536 404 404 284 284 164 44 0 01,625 1,650 175 55 0 3,600 3,650 546 414 413 293 293 173 53 0 01,650 1,675 179 59 0 3,650 3,700 556 424 422 302 302 182 62 0 01,675 1,700 184 64 0 3,700 3,750 566 434 431 311 311 191 71 0 0
1,700 1,725 188 68 0 3,750 3,800 575 443 440 320 320 200 80 0 01,725 1,750 193 73 0 3,800 3,850 585 453 449 329 1 329 209 89 0 01,750 1,775 197 77 0 3,850 3,900 595 463 458 338 338 218 98 0 01,775 1,800 202 82 0 3,900 3,950 605 473 467 347 347 227 107 0 0
1,800 1,825 206 86 0 3,950 4,000 615 483 476 356 356 236 116 0 01,825 1,850 211 91 0 4,000 4,050 625 493 485 365 365 245 125 5 01,850 1,875 215 95 0 4,050 4,100 603.5 503 494 374 374 254 134 14 01,875 1,900 220 100 0 4,100 4,150 645 513 503 383 383 263 143 23 0
1,900 1,925 224 104 0 4,150 4,200 655 523 512 392 392 272 152 32 01,925 1,950 229 109 0 4,200 4,250 665 533 521 401 401 281 161 41 01,950 1,975 233 113 0 4,250 4,300 674 542 530 410 410 290 170 50 01,975 2,000 238 118 0 4,300 4,350 684 552 539 420 419 299 179 59 0
2,000 2,025 242 122 2 4,350 4,400 694 562 548 4310 428 308 188 68 02,025 2,050 247 127 7 4,400 4,450 704 572 1 557 440 437 317 197 77 02,050 2,075 251 131 11 4,450 4,500 714, 582 566 450 446 326 206 86 02,075 2,100 256 136 16 4,500 4,550 724 592 575 460 455 335 215 95 0
2,100 2,125 260 140 20 4,550 4,600 734 602 584 470 464 344 224 104 02,125 2,150 265 145 25 4,600 4,650 744 612 593 480 473 353 233 113 02,150 2,175 269 149 29 4,650 4,700 754 622 602 490 482 362 242 122 22,175 2,200 274 154 34 4,700 4,750 764 632 611 500 491 371 251 131 1 1
2,200 2,225 278 158 38 4,750 4,800 773 641 620 509 500 380 260 140 202,225 2,250 283 163 43 4,800 4,850 783 651 629 519 509 389 269 149 292,250 2,275 287 167 47 4,850 4,900 793 661 638 529 518 398 278 158 382,275 2,300 292 172 52 4,900 4,950 803 671 647 539 527 407 287 167 47
2,300 2,325 296 176 56 4. 950 5, 000 813 1681 656 549 536 - 416 296 176 56
121
U . S. GOVIRNMENT PRINTING OrFICK c57-26-75304-1
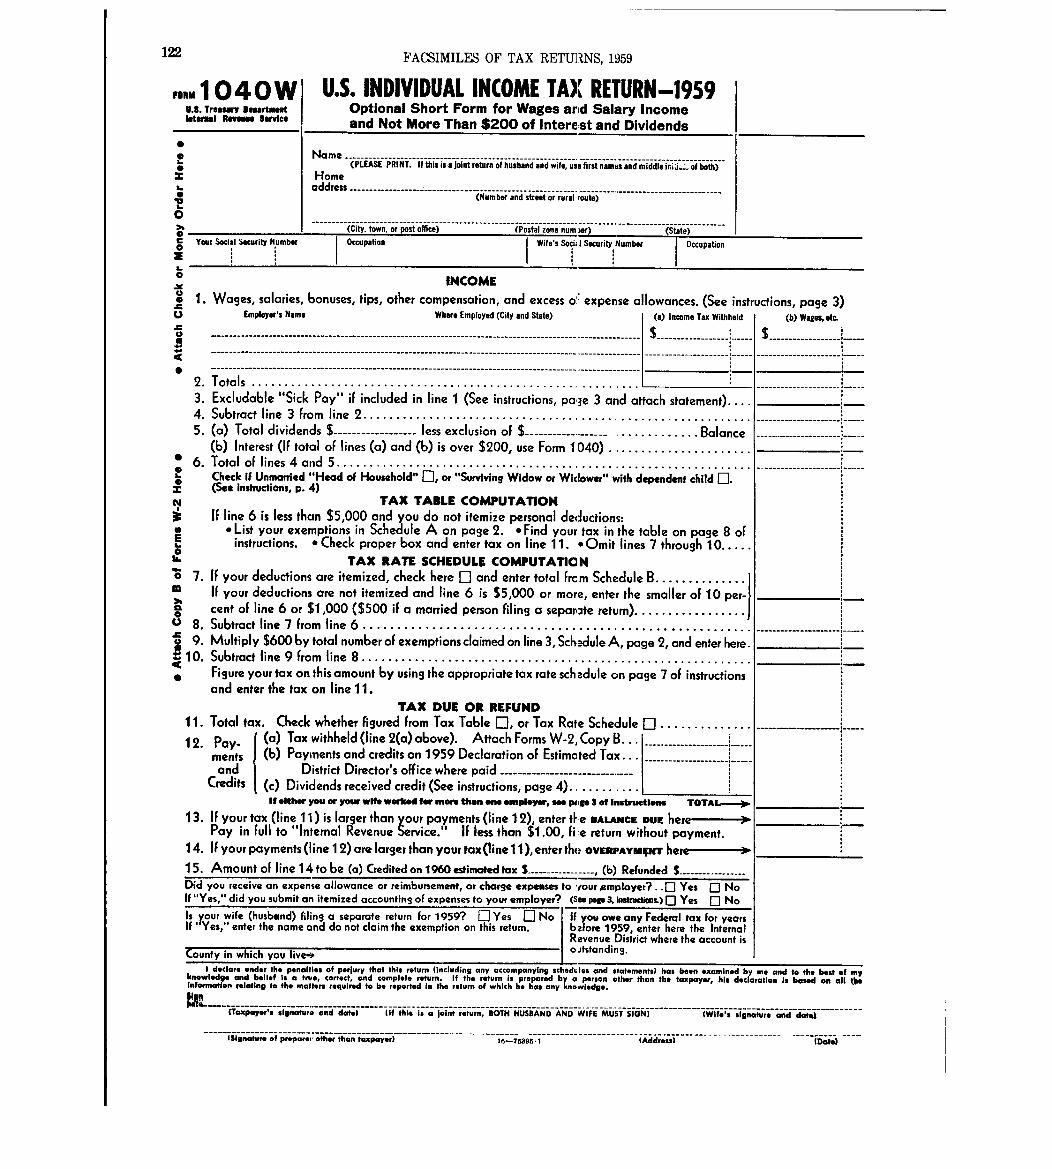
122
rojilim 1 040 WV .S . Treseen" Denrtnwdleter"I Rerroom service
0
I Your Social Security ~umber0
(PLEASE PRINT. If this is a Joint return of husband and wife, use first names and middle irij.:- of &;ilw;
U.S. INDIVIDUAL INCOME TAX RETURN-195 9Optional Short Form for Wages arid Salary Incomeand Not More Than $200 of Interest and Dividend s
Name -------------------------------------------------------------------------------------------
Homeaddress ---------------- - -----------------------------------------------------------------------------
(Number and street or rural route)
--------- ------------------- ivc~iif Z-on-e-num-, ~_ew)--------- - -----------------------(State)
I
Occupation
.W
1 . Wages, salaries, bonuses,.CU Employer's Name
M3. .CA.
FACSIMILES OF TAX RETURNS, 195 9
Wife's Soch I Security Number Occupation
INCOME
tips, other compensation, and excess ol : expense allowances . (See instructions, page 3)Where Employed (City and State)
-----------------------------------------------------------------------------------------------------------
-----------------------------------------------------------------------------------------------------------
------------------------------------------------------------------------------------------- ----------------2 . Totals . . . . . . . . . . . . . . . . . . . . . . . . . . . . . . . . . . . . . . . . . . . . . . . . . . . . . . . . . . .
(a) Income Tax Withheld
---------------------------------------
f
3 . Excludable "Sick Pay" if included in line 1 (See instructions, pa,3e 3 and attach statement) . . . .4. Subtract line 3 from line 2 . . . . . . . . . . . . . . . . . . . . . . . . . . . . . . . . . . . . . . . . . . . . . . . . . . . . . . . . . . .5 . (a) Total dividends $ ------------------ less exclusion of Balance
(6) Interest (if total of lines (a) and (6) is over $200, use Form 1 0140) . . . . . . . . . . . . . . . . . . . . .6 . Total of lines 4 and 5
Check if Unmarried "Head of Household" El, or "Surviving Widow or Widower" with dependent child El.(See Instructions, p . 4)
TAX TABLE COMPUTATIONIf line 6 is less than $5,000 and you do not itemize personal cleductions :
o List your exemptions in Schedule A on page 2 . 9 Find your tax in the table on page 8 ofinstructions . - Check proper box and enter tax on I ine 11 . - Omit I ines, 7 through 10 . . . .
TAX RATE SCHEDULE COMPUTATIO N7. If your deductions are itemized, check here El and enter total frcm Schedule B . . . . . . . . . . . . .
If your deductions are not itemized and line 6 is $5,000 or more, enter the smaller of 10 per-cent of line 6 or $1,000 ($500 if a married person Piling a separl3te return) . . . . . . . . . . . . . . . I *
8 . Subtract line 7 from line 6 . . . . . . . . . . . . . . . . . . . . . . . . . . . . . . . . . . . . . . . . . . . . . . . . . . . . . . . .0J2 9. Multiply $600 by total number of exemptions claimed online 3, Sch,--dule A, page 2, and enter here .S 10 . Subtract line 9 from line 8 . . . . . . . . . . . . . . . . . . . . . . . . . . . . . . . . . . . . . . . . . . . . . . . . . . . . . . . . . . .at
Figure your tax on this amount by using the appropriate tax rate schedule on page 7 of instructionsand enter the tax on line 11 .
TAX DUE OR REFUND11 . Total tax . Check whether Figured from Tax Table 0, or Tax Rate Schedule 0 . . . . . . . . . . . . . .12 . Pay- (a) Tax withheld (line 2(a) above) . Attach Forms W-2, Copy B . . .
ments (6) Payments and credits on 1959 Declaration of EstimctedTax . . .and District Director's office where paid ------------------------------
Credits I (c) Dividends received credit (See instructions, page 4) . . . . . . . . . . .
------------------------------------------------
Ifokbw you or yaw wlto worked for mores then one employer, a" pi is* 3 of Insilrasictlem; TOTAL_---~P-
13. IF your tax (line 11) is larger than your payments (line 12), enter tle BALANCE DU EPay in full to "Internal Revenue Service." If less than $1 .00, Re return without payment .
14. If your payments (I ine 1 2) are larger than your tax (line 11), enter tho OVERFAY11111011111INT he e 91015 . Amount of line 14 to be (a) Credited on 1960 estimated tax$ --- - ------------- (b) Refunded S -----------------Did you receive an expense allowance or reimbursement, or charge expenses to youramployer? . . [] Yes E] NoIf "Yes," did you submit an itemized accounting of expenses to your employer? (Sao P&99 3. W*UCL~OL) 0 Yes 0 NoIs , ur wife (husband) filing a eparate return for 1959? El Yes [I No If ou owe any Federal tax for yearsIf Yqes enter the name and d0snot claim the exemption on this return . b
xr, 1959,enter here the Interna l
County in which you live-*
Revenue District where the account iso itstanding .
(b) Wages6 etc-
$ ------------------
---------------------
----------------------------------- --------I
---------------------
----- - ----- - ---- - -
I declare under the penalties of perjury that this return (including any accompanying schedules and statements) has been *xamlned by me and to the best of mVkno ledge and belief is a true, coff*ct, and complete retum. If the return is prepared by a person other than the taxpayer, h
.declaration Is based on all ties,.f.i.t,
. relating to the matters required to be reported In the return of which he has any knowledge .Me
------- -B--O-T-H--H-U-5-8-A-N--D--A-N-D --- W, 44 -M- -U-5-T- -5 I-G-N-5 ------------ I-W-5f *-'-s- -s-I gn- -a-tu-r-s- -and- -d-a-t-o-1----------
_w r-e- _o-f _p_r_*_p_u_r ei- _*_t her- than- -t a--x-p-a-y-a_0----------------------- ---------------------- _(A_ d__d_ras-;-1----------------------- ---------- ----Made)
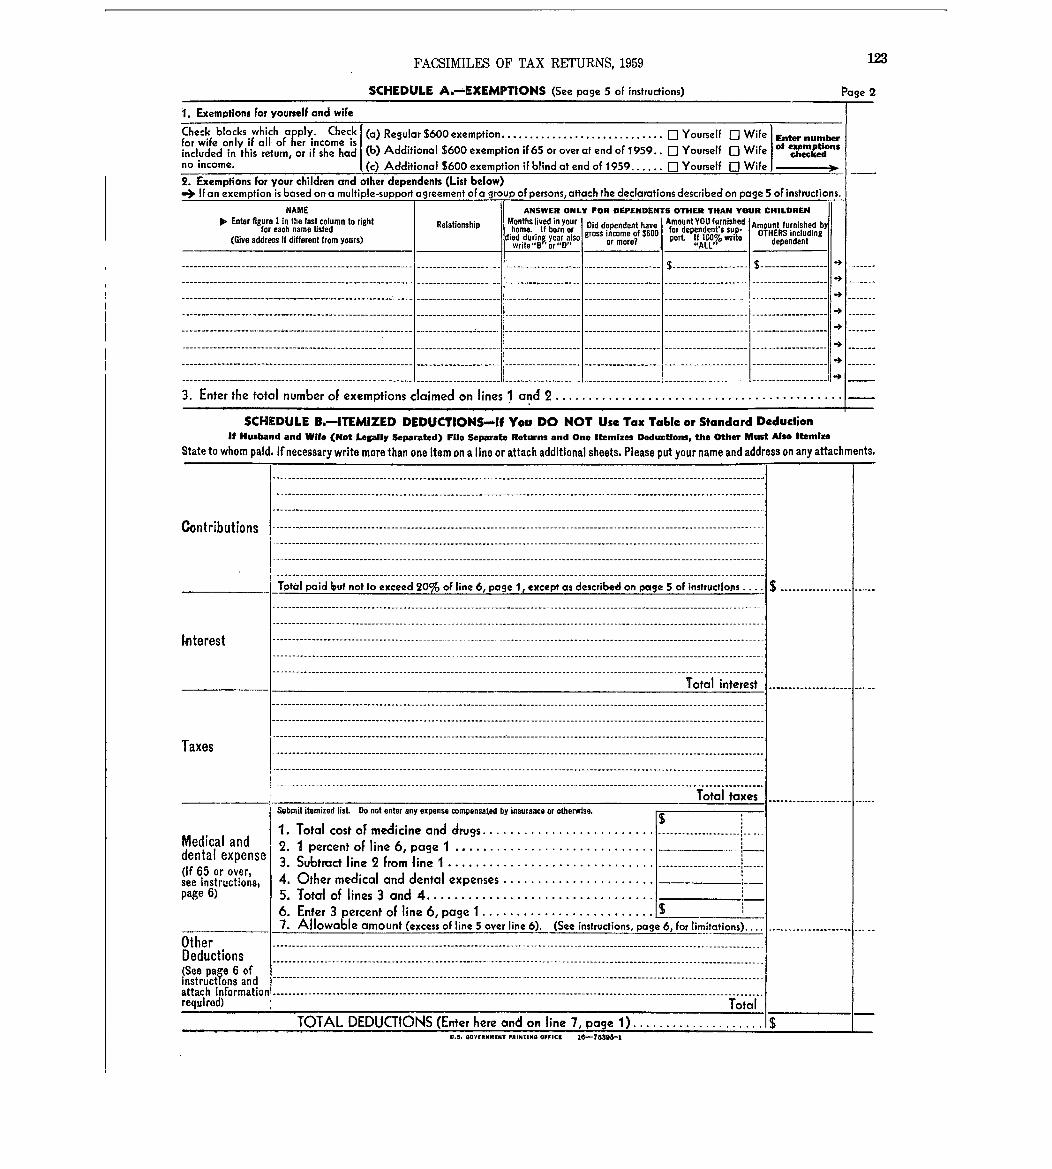
FACSIMILES OF TAX RETURNS, 1959 123
SCHEDULE A,--EXEMPTIONS (See page 5 of instructions) page 2
1 . Exemptions For yourself and wife
Check blocks which apply. Chec~kfor wife only if all of her income i sincluded in this return, or if she hadno income.
(a) Regular $600 exemption . . . . . . . . . . . . . . . . . . . . . . . . . . . . . E] Yourself [] Wife(b) Additional $600 exemption if 65 or over at end of 1959 . . [I Yourself El Wife(c) Additional $600 exemption if blind at end of 1959 . . . . . . E] Yourself E] Wife
Enter numberns
0,10.-Clo30
2 . Exemptions for your children and other dependents (List below)IFan exemption is based on a multiple-support agreement oFa group of persons,attach the declarations described on page 5 of instructions.
NAME ANSWER ONLY FOR DEPENDENTS OTHER THAN YOUR CHILDRENjo. Enter figig: I in the last column to righ t
each name liste d(Give address if different from yours)
Relationship Months lived in you rhome. If born or
died durinf, year als owrite"ll or"O"
Did dependent havegross income of $600
or more?
Amount YOU furnishedfor dependent's sup -port If 100 1 writ e
11AV
Amount furnished byOTHERS includin g
dependent
---------------------------------------------------------- --------------------- --------------------- ------------------- $ ------------------- $ ----------------- - > ------ -
---------------------------------------------------------- ------------------- - I -------- I ---------- ------------------- --------------------- ------------------- ------ -
---------------------------------------------------------- --------------------- ------------------- ------------------- -------------------- ------------------- ------ -
---------- I ------------------------- --------------------- --------------------- ------------------- ------------------- --------------------- ------------------- - > ------ -
----------------------------------------------------------- -------------- ------ ------------------- ------------------- --------------------- ------------------- ------ -
---------------------------------------------------------- ---------------------- ------------------- ------------------- --------------------- ------------------- ------ -
---------------------------------------------------------- ------------------
---- 1
------------
-------
------- I ------------ --------------------- ------------------- ------ -
---------------------------------------------------------- ------------------ ----------- -1 -------------------- --------------------- ------------------ -
3 . Enter the total number of exemptions claimed on lines I and 2 . . . . . . . . . . . . . . . . . . . . . . . . . . . . . . . . . . . . . . . . . . .
SCHEDULE B.-ITEMIZED DEDUCTIONS-if You DO NOT Use Tax Table or Standard DeductionIt Husband and Wife (Not Legally Separated) File Separate Returns and One Itemizes Deductions, the Other Must Also Itemize
Stateto whom paid . Ifnecessarywrite morethan one item on a line or attach additional sheets . Please put your name and address on any attachments .
ontributions
---------------------------------------------------------------------------------------------------------------------------- ----------------------------------------------------------------------------------------------------------------------------- ---------------------------------------------------------------------------------------------------------------------------- -
--------------------------------------------------------------------------------------------------------------------------- ---------------------------------------------------------------------------------------------------------------------------- ---------------------------------------------------------------------------------------------------------------------------- ---------------------------------------------------------------------------------------------------------------------------- -Total paid l0ut not to exceed 20% of line 6, page 1, except as described on Me 5 of instructions . - $ ------------------ ----- -
loterest
--------------------------------------------------------------------------------------------------------------------------- -
---------------------------------------------------------------------------------------------------------------------------- -
------------------------------------------------- ----------------------------------------------------------------------- ------------------------------------------------------- -------------------------------------------------------------------- ---------------------------------------------------------------------------------------------------------------------------- -
Total interest --------------------- ----- -
axes
--------------------------------------------------------------------------------------------------------------------------- ---------------------------------------------------------------------------------------------------------------------------- -
---------------------------------------------------------------------------------------------------------- ---------------------------------------------------------------------------------------------------------------------------- ---------------------------------------------------------------------------------------------------------------------------- -
Total taxes --------------------- ----- -Submit itemized list Do not enter an ex ens c m n t d b in th rwisy p e o pe sa e y surance or o e e.
$1 . Total cost of medicine and drugs .
Medical and page I . . . . . . . . . . . . . . . . . . . . . . . . . . . . .2 . 1 percent of line 6dental expens e(if 65 or over
,3 . Subtract line 2 from line I . . . . . . . . . . . . . . . . . . . . . . . . . . . . . . . . . . . . . . . . . . . . . . . . . . . . . . . . .
,s e i st 0i 4 . Other medical and dental expenses . . . . . . . . . . . . . . . . . . . . . .ons ,e n r upage 6) 5 . Total of lines 3 and 4 . . . . . . . . . . . . . . . . . . . . . . . . . . . . . . . . .
6 . Enter 3 percent of line 6, page I . . . . . . . . . . . . . . . . . . . . . . . . ..$
7 . Allowable amount (excess of line 5 over line 6) . (See instructions, pag e 6, for limitations) . _------------- --- - -
Other ------------------------------------------------------------------------------------------------------------------------ -Deduction s(See page 6 ofinstructions and ---------------------------------------------------------------------------- ---------------------------------------- -attach Information
------------------------------------------------------------------ * ------------------------------------------------- _ -, - - ' -required) Tota ITOTAL DEDUCTIONS (Enter here and on line 7, page 1) . . . . . . . ... . ... . . . . . . . . . . . $
U.S . 60VERNMENT PAINTING OFFICS 16--753WI
124 FACSIMILES OF TAX RETURNS, 1959
HOW TO PREPARE
Form I O~10 W
"sNz~-0,\. . . . . . . . . .
INDIVIDUAL INCOME TAX RETURN FOR 1959
NEW OPTIONAL FORIA 1040 WThis is a new streamlined version of the regular Form 1040 . It will be most helpful for wage andsalary earners who can't use Form 1040 A because they wish to itemize deductions, claim the "sic~-pay" exclusion or estimated tax payments, or havot $10,300 or over of income, etc . You can usethis form if :
1 . Your income consists of salary and wages regardless of amount, AND2. Not more than $200 of dividends and interest, AN D3. No other items of income .
If you dOD'tmeet these requirements, you must file Form 1040 which may be obtained from anyInternal Revenue Service office and from most banks and post offices .
INSTRUCTIONS 1040 W (195"
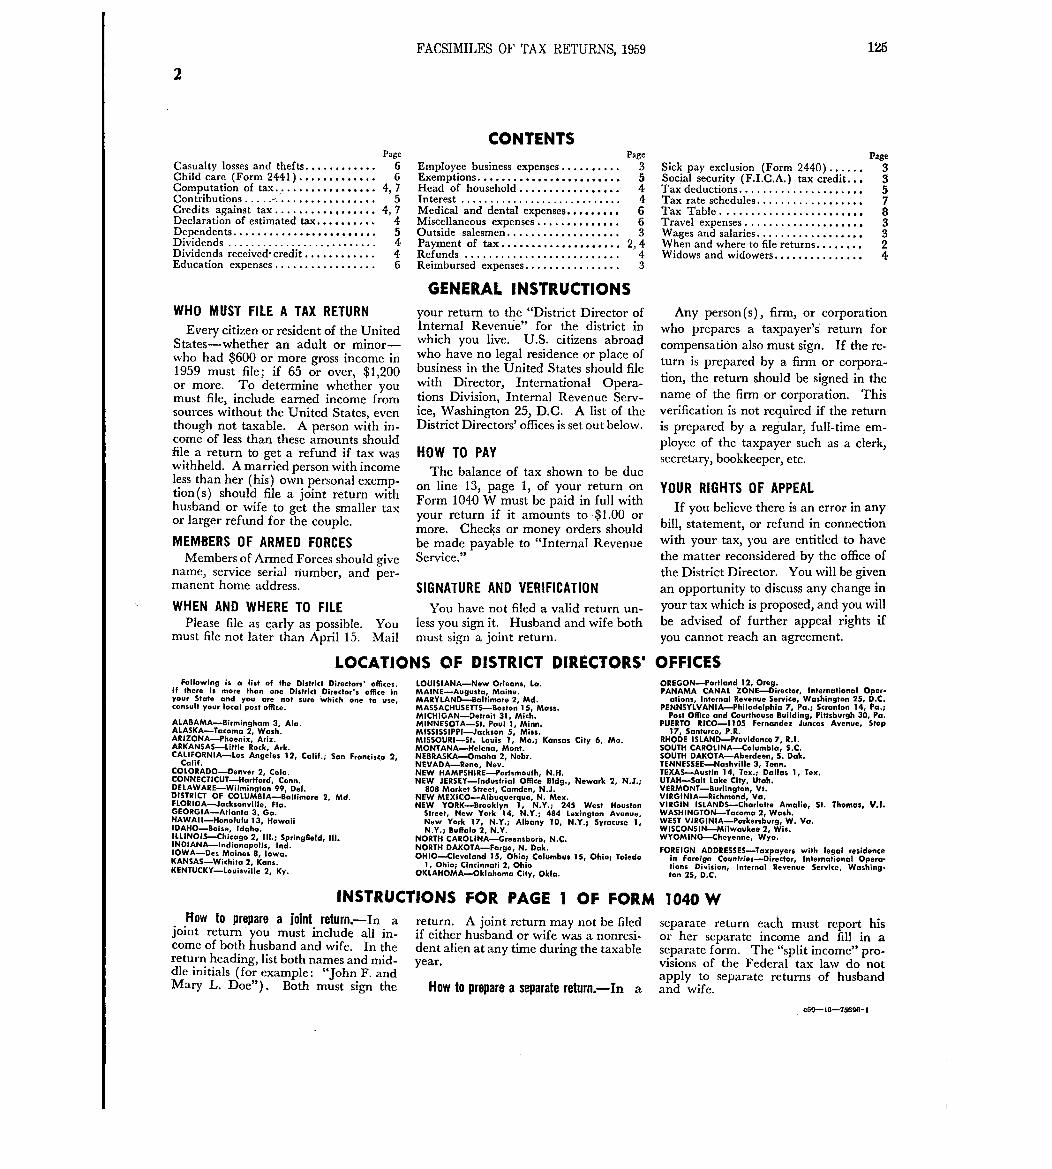
FACSIMILES OF TAX RETURNS, 195 9
2
PageCasualty losses and thefts . . . 6Child care (Form 2441) . . . . . . . . . . . . . 6Computation of tax ., .
. . . . . .. . . . . . . . 4, 7
Contributions . . . . .. . . . . . . . : . . . . . . I . 5Credits against tax . . . . . . . . . . . . . . . . . 4,7Declaration of estimated tax . . . . . . . . . . 4Dependents . . . . . . . . . . . . . . . . . . . . . . . . 5Dividends . . . . . . . . . . . . . . . . . . . . . . . . . . 4Dividends received-credit . . . . . . . . . . . . 4Education expenses . . . . . . . . . . . . . . . . . 6
WHO MUST FILE A TAX RETURNEvery citizen or i esident of the United
States-whether an adult or minor-who had $600 or more gross income in1959 must file ; if 65 or over, $1,200or more . To determine whether youmust file, include earned income fromsources without the United States, eventhough not taxable . A person with in-come of less than these amounts shouldfile a return to get a refund if tax waswithheld . A married person with incomeless than her (his) own personal exemp-tion(s) should file a joint return withhusband or wife to get the smaller taxor larger refund for the couple.
MEMBERS OF ARMED FORCESMembers of Armed Forces should give
name, service serial number, and per-manent home address .
WHEN AND WHERE TO FILEPlease file as early as possible . You
must file not later than April 15 . Mail
CONTENTSPage
Employee business expenses . . . . . . . . . . 3Exemptions . . . . . . . . . . . . . . . . . . . . . . . . 5Head of household . . . . . . . . . . . . . . . . . 4Interest . . . . 4Medical and den,~~l'e'x*p'c'n*s*e's*.'.*.' .*.' .' .* .' ., 6Miscellaneous expenses . . . . . . . . . . . . . . 6Outside salesmen . . . . . . . . . . . . . . . . . . . 3Payment of tax . . . . . . . . . . . . . . . . . . . . 2,4Refunds . . . . . . . . . . . . . . . . . . . . . . . . . . 4Reimbursed expenses . . . . . . . . . . . . . . . . 3
GENERAL INSTRUCTIONS
your return to the "District Director ofInternal Revenue" for the district inwhich you live . U.S. citizens abroadwho have no legal residence or place ofbusiness in the United States should filewith Director, International Opera-tions Division, Internal Revenue Serv-ice, Washington 25, D.C. A list of theDistrict Directors' offices is set out below .
HOW TO PA YThe balance of tax shown to be due
on line 13, page 1, of your return onForm 1040 W must be paid in full withyour return if it amounts to -$1 .00 ormore. Checks or money orders shouldbe made payable to "Internal RevenueService ."
SIGNATURE AND VERIFICATIO NYou have not filed a valid return un-
less you sign it . Husband and wife bothmust sign a joint return .
126
PageSick pay exclusion (Form 2440) . . . . . . 3Social security (F .I .C .A .) tax credit . . . 5Tax deductions . . . . . . . . . . . . . . . . . . . . . 5Tax rate schedules . . . . . . . . . . . . . . . . . . 7Tax Table . . . . . . . . . . . . . . . . . . . . . . . . 8Travel expenses . . . . . . . . . . . . . . . . . . . . 3Wages and salaries . . . . . . . . . . . . . . . . . . 3When and where to file returns . . . . . . . . 2Widows and widowers . . . . . . . . . . . . . . . 4
Any person(s), firm, or corporationwho prepares a taxpayer's- return forcompensation also must sign . If the re-turn is prepared by a firm or corpora-tion, the return should be signed in thename of the firm or corporation. Thisverification is not required if the returnis prepared by a regular, full-time em-ployee of the taxpayer such as a clerk,secretary, bookkeeper, etc .
YOUR RIGHTS OF APPEA LIf you believe there is an error in any
bill, statement, or refund in connectionwith your tax, you are entitled to havethe matter reconsidered by the office ofthe District Director . You will be givenan opportunity to discuss any change inyour tax which is proposed, and you willbe advised of further appeal rights ifyou cannot reach an agreement .
LOCATIONS OF DISTRICT DIRECTORS' OFFICESFollowing is a list of the District Directors' offices .
If there is more than one District Director's office inyour State and you are not sure which one to use,consult your local post office .
ALABAMA-Birmingham 3, Ala .ALASKA-Tacoma 2, Wash .All IZONA-Phoenix, Ariz .ARKANSAS-Liftle Rock, Ark .CALIFORNIA-Los Angeles 12, Calif . ; San Francisco 2,
Calif.COLORADO-Denver 2, Colo .CONN ECTI CUT-Hartford, Conn .DELAWARE-Wilmington 99, Del .DISTRICT OF COLUMBIA-Baltimore 2, Md .FLOR I DA-Jacksonvi lie, Fla .GEORGIA-Ationta 3, Ga .HAWAII-Honolulu 13, HawaiiIDAHO-Boise, Idaho .
ILLINOIS-Chicago 2, Ill . ; Springfield, Ill .INDIANA-Indianapolis, Ind .IOWA-Des Moines 8, Iowa .KANSAS-Wichita 2, Kans .KENTUCKY-Louisville 2, Ky .
LOUISIANA-New Orleans, La .MAINE-Augusta, Maine .MARYLAND-Baltimore 2, Md .MASSACHUSETTS-Boston 15, Mass .M :CHIGAN-Defroit 31, Mich.M NNESOTA-St . Paul 1, Minn .MISSISSIPPI-Jackson S, Miss .MISSOURI-St. Louis 1, Mo . ; Kansas City 6, Mo .MONTANA-Helena, Mont.NEBRASKA-Omaha 2, Nebr .NEVADA-Reno, Nev .NEW HAMPSHIRE--Portsmouth, N .H .NEW JERSEY-industrial Office Bldg., Newark 2, N .J. ;
808 Market Street, Camden, N .J .NEW MEXICO-Afbuquerque, N . Mex .NEW YORK-Brooklyn 1, N .Y . ; 245 West Houston
Street, New York 14, N .Y. ; 484 Lexington Avenue,New York 17, N.Y . ; Albany 10, N .Y. ; Syracuse 1,N .Y. ; Buffalo 2, N .Y .
NORTH CAROL I NA-Greensborb, N .C.NORTH DAKOTA-Fargo, N. Dak ,OHIO-Cleveland 15, Ohio; Columbus 15, Ohio ; Toledo
1, Ohio ; Cincinnati 2, OhioOKLAHOMA-Oklahorna City, Okla .
OREGON-Portland 12, Oreg .PANAMA CANAL ZONE-Director, International Oper-
ations, Internal Revenue Service, Washington 25, D.C .PENNSYLVANIA-Philadelphia 7, Pa . ; Scranton 14, Pa .;
Post Office and Courthouse Building, Pittsburgh 30, Pa .PUERTO RICO-1105 Fernandez Juncos Avenue, Stop
17, Santurce, P .R .RHODE ISLAND-Piovidence 7, R.I .SOUTH CAROL I NA-Co I umbla, S .C .SOUTH DAKOTA-Aberdeen, S . Dak.TENNESSEE-Nashville 3, Tenn .7EXAS-Austin 14, Tex . ; Dallas 1, Tex .UTAH-Salt Lake City, Utah .VERMONT-Burlington, Vt .VIRGfNIA-Richmond, Va .VIRGIN ISLANDS--Charlotte Amalie, St . Thomas, V.I.WASH INGTON-Tacoma 2, Wash .WEST VIRG IN I A-Parkersburg, W . Va .WISCONSIN-Milwaukee 2, Wis .WYOMING-Cheyenne, Wyo .
FOREIGN ADDRESS ES-Taxpayers with legal residencein Foreign Counfries-Director, International Opera-tions Division, Internal Revenue Service, Washing-ton 25, D .C .
INSTRUCTIONS FOR PAGE I OF FORM 1040 WHow to prepare a joint return .-In a
joint return you must include all in-come of both husband and wife . In thereturn heading, list both names and mid-dle initials (for example : "John F. andMary L. Doe") . Both must sign the
return . A joint return may not be filedif either husband or wife was a nonresi-dent alien at any time during the taxableyear.
How to prepare a separate return .-In a
separate return each must report hisor her separate income and fill in aseparate form. The "split income" pro-visions of the Federal tax law do notapply to separate returns of husbandand wife .
126 FACSIMILES OF TAX RETtTRNS, 1959
INSTRUCTIONS FOR PAGE I OF FORM 1040 W-Continued
Une 1, Column (a)-Income Tax Withheld-Itemize the taxes withheld in column(a) and report the total amount online 2, column (a) and on line 12 (a) .If you have lost a Withholding State-ment, ask your employer for a copy. Ifyou cannot furnish Withholding State-ments for all Federal income taxes with-held from you, attach an explanation .
Line 1, Column ffi-Wages, etc .-Enterin line 1, colurrin (b), the full amount ofyour wages, salaries, fees, commissions,tips, bonuses, and other payments foryour personal services even though taxesand other amounts have been withheldby your employer . If more space isneeded attach a se'parate statement .
Excess Social Security (F.I .C.A.) TaxCredit.-If more than $120.OC of SocialSecurity (F.I .C.A.) employee tax waswithheld during 1959 because either youor your wife received wages from morethan one employer, the excess should beclaimed as a credit against income tax .Enter any excess of Social Security(F.I .C.A.) tax withheld over $120 .00on line 1, column (a), the "Income TaxWithheld" column, and write "F .I .C.A .tax" in the "Where Employed" column.If a joint return, do not add the SocialSecurity (F.I .C.A.) tax withheld fromboth husband and wife to figure the ex-cess over $120 .00 ; compute the credit,separately .
Employe-e Business Expenses .-Thereare special rules regarding the treatmentof certain expenses incurred by an em-ployee in connection with his employ-ment, amounts charged to his em-ployer, and any advances, allowances,or reimbursements he receives for suchexpenses .
Part 1. Employee Business Expenses WhichAre Deductibl e
A. Travel, transportation, and out-side salesmen expenses :
You may deduct these expenses fromthe amounts you are required to reporton line 1, page 1, to the extent they arenot paid by your employer . See Part IIfor reporting requirements . Travel,transportation, and outside salesmenexpenses mean :
(1) Travel and transportation .-Youcan deduct the costs of bus, taxi, plane,etc ., fares or the cost of operating anautomobile in connection with yourduties as an employee. However, thecost of commuting between your resi-dence and your principal place of em-ployment is a personal expense and isnot deductible .
(2) Meals and lodging.-If you are
temporarily away on business, at leastovernight from the city, town, or othergeneral area which constitutes your prin-cipal or regular business location, youcan deduct meals and lodging in addi-tion to the travel costs.
(3) Outside salesmen.-If you arean "outside salesman," you may alsodeduct other expenses which are ordi-nary and necessary in perforning yourduties, such as business entertainment
)stationery, and postage . Art "outsidesalesman" is one who is engaged in full-time solicitation of business far his (,-in-ployer away from the emplo,7er's placeof business . It does not incluc .e a personwhose principal activities consist ofservice and delivery as, for example, amilk driver-salesman .
B. Other employee business expenses-If you itemize deductions an page 2
of your return, you may deduct (underthe heading "Other Deductions") busi-ness expenses, other than thosE describedin "A" above. Examples of such ex-penses are entertainment, p:-ofessionaland union dues, and the cost of tools,materials, etc ., which are not paid for byyour employer.
Part 11. Reporting Employee Business Ex-penses on Form 1040 W
(See Part III for supporting informa-tion to be submitted with your return .)
After answering the questions on pag eI of Form 1040 W, report the expensesand employer payments as follows :
(1) If employer's paymews equaledbusiness expenses.-No further entri isrequired on the form.
(2) If employer's payment.~ exceededbusiness expenses .-The excess amountsand the amount of any personal ex-penses paid by your employer must beincluded in income on line 1, page I ., ofForm 1040 W, and must be identifiedas "Excess Reimbursements . "
(3) If expenses exceeded employer'spayments or if the employer d~d not payfor the expenses.-The exccss of theexpenses over the employer paymentsor the unreimbursed expenscs may beclaimed as deductions as explained inPart I . Be sure to separate th :! expensesinto those relating to line 1, page I ofthe form, and those that are to be de-ducted only if you itemize deductionson page 2 of the form .
Part Ill . Additional Information To BeSubmitted With Return
A. The following information mustbe submitted with your return, exceptas explained in B and C below:
(1) The total of all aniounts re-
3
ceivcd from or charged to youremployer for business expenses,
(2) The amount of your businessexpenses broken down into suchbroad categories as transportation,meals and lodging while away fromhome overnight, entertainment ex-penses, and other business expenses,and
(3) The number of days awayfrom home on business.B. If you were required to and did
submit an expense voucher or other ac-counting to your employer which con-tained the above information, you neednot submit the information with yourreturn unless you are claiming deduc-tions for expenses that exceed employerpayments .
C. If you received per diem, in lieuof subsistence, of not more than $15 perday, or a mileage allowance of not morethan 12V2 cents per mile for travelwithin the continental limits of theUnited States, you need only submit theinformation. set forth in A, above, if youare claiming deductions for expensesthat exceed employer payments .
Line 3-Exclusion for "Sick Pay".-Thelaw allows you to exclude from incomeamounts received under a wage contin-uation plan for the period during whichyou were absent from work on accountof personal injuries or sickness. If bothyou and your employer contribute tothe plan, any benefits attributable toyour own contributions are excludablewithout limit .
The employer-provided wage contin-uation payments can be excluded at arate not to exceed $100 a week . In caseswhere these payments exceed a weeklyrate of $100, the exclusion is figured bymultiplying the amount received by 100and dividing the result by the weeklyrate of payment .
If your absence is due to sickness, theexclusion of employer-provided wagecontinuation payments does not applyto the amounts received for the first .7calendar days of each absence fromwork. However, if you were (a) hos-pitalized on account of sickness for atleast I day at any time during the ab-sence from work, or (b) injured, theexclusion applies from the first day ofabsence .
If you received sick pay and it is in-cluded in 'your gross wages as shown onForm W-2, enter the gross wages online 1, and enter on line 3 the amountof such wages to be excluded. In addi-tion, attach a statement showing yourcomputation, and indicating the periodor periods of absence, nature of sicknes s
c59-16-75396-1
4
FACSIMILES OF TAX RETURNS, 1959
INSTRUCTIONS FOR PAGE 1 OF FORM 1040 W-Continued
or injury, and whether hospitalized . Or,in lieu of a statement you may use Form2440 which 'May be obtained from anyInternal Revenue Service office .
Line 5--Dividends and InteresL--Enterall other taxable income from interestand dividends . Be sure to read the fol-lowing instructions before completingthis line-
Line 5(a)-DIVIDENDS.-Enterthe total amount of dividends received,the amount of your exclusion, and thenet amount of dividends . You are en-titled to an exclusion, of the first $50received from domestic corporations .This exclusion does not apply to so-'called dividends received from mutualsavings banks or savings (building) andloan associations on deposits or with-drawable accounts . If a joint return isfiled and both husband and wife haddividend income, each is entitled at mostto a $50 exclusion and one may not useany portion of the $50 exclusion notused by the other . For example, if thehusband had $200 in dividends, and thewife had $20, only $70 may -be excludedon a joint return .
If the total of line 5 exceeds $200, youmust file a Form 1040 .
Line 5(b)-INTEREST.-Enter allinterest whether actually received orcredited to your account . "Credited toyour account" means that a bank, sav-ings and loan association, etc ., hadadded interest earnings to your account.
SPECIAL COMPUTATIONSUnmarried Head of Household .-The law
provides a special tax rate for any indi-vidual who qualifies as a "Head ofHousehold." Only- the following per-sons may qualify : (a) one who is un-married (or legally separated) at theend of the taxable year, or (b) one whois married at the end of the year to anindividual who was a nonresident alienat any time during the taxable year .In addition, you must have furnishedover half of the cost of maintaining asyour home a household which duringthe entire year, except for temporaryabsence, was occupied as the principalplace of abode and as a member of suchhousehold by (1) any related person(see those listed under "Line 2," para-graph (e) on page 5 of these instruc-tions) for whom you are entitled to a de-duction for an exemption, unless the de-duction arises from a multiple supportagreement, (2) your unmarried child,
g ,randchild, or stepchild, even though
such child is not a dependent or (3)your married child, grandchild, or step-
child for whom you are entitled to adeduction for an exemption .
If you qualify under (a) or (b)above, you are entitled to the specialtax rate if you pay more than half thecost of maintaining a household (notnecessarily your home) which is theprincipal place of abode of your fatheror mother and who qualifies as yourdependent .
The rates for Head of Household arefound in tax rate Schedule III on page7 of these instructions.
Widows and WidowerS.-Under certainconditions a taxpayer whose husband(or wife) has died during either of hertwo preceding taxable years may com-pute her tax by including only her in-come, exemptions, and deductions, butotherwise computing the tax as if a jointreturn had been filed . . However, theexemption for the decedent may beclaimed .only for the year of death .
The conditions are that the taxpayer(a) must not have remarried, (b) mustmaintain as her home a householdwhich is the principal place of abode ofher child or stepchild for whom she isentitled to a deduction for an exemp-tion, and (c) must have been entitledto file a joint return with her husband(or wife) for the year of death .
USE OF TAX TABLE ON PAGE 8 OFTHESE INSTRUCTION S
Purpose of Table .-The table is a short-cut method of finding your income taxif your income, line 6, page 1, of yourreturn is less than $5,000 . It is pro-vided by law and saves you the troubleof itemizing deductions and computingyour tax . The table allows for an exemp-tion of $600 for each person claimed asan exemption, and charitable contribu-tions, interest, taxes, etc., approximat-ing 10 percent of your income .
LINE 12(b)-CREDIT FOR ESTIMATEDTAX PAYMENT SIf you paid any estimated tax on a
Declaration of Estimated Income Tax(Form 1040-ES) for 1959, report thetotal of such payments on line 12(b) "If on your 1958 return you had an over-payment which you chose to apply as acredit on your 1959 tax' include thecredit in this total . Also see filing re-quirements for 1960 declaration of esti-mated tax .
LINE 12(c)-DIVIDENDS RECEIVEDCREDITThe law provides a credit against tax
for dividends received from qualifyingdomestic corporations . This credit isequal to 4 percent of such dividends in
127
excess of those which you may excludefrom your gross income. The creditmay not exceed the lesser of :
(a) the total income tax reduced bythe foreign tax .credit ; or
(b) 4 percent of the taxable income .(If tax is computed, taxable income isthe amount on line 10, page 1. If theTax Table is used, it is the amount online 6, page 1, less (a) 10 percentthereof, and (b) the number of exemp-tions on line 3 of Schedule A multipliedby $600) .
LINES 13 AND 14-BALANCE OF TAX DUEOR REFUND OF OVERPAYMENTShow on line 13 any balance you
owe, or on line 14 the amount of anyoverpayment due you, after takingcredit for the amounts entered online 12
'. In the case of a refund, be sure
to use the correct post office address des-ignation on your return so that therefund check will not be returned asundeliverable by the Post Office .
In order to facilitate the processingof collections and refunds, balances dueof less than $1.00 need not be paid, andoverpayments of less than $1 .00 will berefunded only upon separate applicationto your District Director.
1960 DECLARATIONS OF ESTIMATED TAXWho Must File.-For many taxpayers
the withholding tax on wages is not suf-ficient to keep them paid up on theirincome tax. The law requires everycitizen or resident of the United Statesto file a Declaration of Estimated In-come Tax, Form 1040-ES, and to makequarterly payments in advance of filingthe annual income tax return if :
(a) his gross income can reasonablybe expected to consist of wages subjectto withholding and of not more than$100 from other sources, and to exceed-
(1) $10,000 for a head of a house-hold or a widow or widower entitled tothe special tax rates ,
(2) $5,000 for other single indi-viduals ;
(3) $5,000 for a married individualnot entitled to file a joint declaration ;
(4) $5,000 for a married individualentitled to file a joint declaration, andthe combined income of both husbandand wife can reasonably be expected toexceed $10,000 ; OR
(b) his gross income can reasonablybe expected to include more than $100from sources other than wages subject towithholding and to exceed the sum of :(1) $600 for each of his exemptions plus(2) $400 .
If you are required to file, obtain theform from any Internal Revenue Serv-
c59--16-75396-1
128 FACSIMILES OF TAX RETURNS, 1959
INSTRUCTIONS FOR PAGE 2 OF FORM 1040 W
ice office in time to file by April 15,1960 . Farmers may postpone filing their1960 declarations until Jan . 15, 1961 .
Additional Charge for Underpayment of Esti-mated Tax .-It is important that youestimate your tax carefully, becausethere is an additional charge imposed bylaw for underpayment of any install-ment of estimated tax . The additionalcharge is explained on Form 1040-ESand Form 2210 . If you had an under-payment and believe one of the excep-tions applies, attach a statement or Form2210 to your return.SCHEDULE A.-Exemptions
Line I .-List your exemptions andthose of your wife . You cannot claiman exemption for your wife if she filcs aseparate return. Age and blindness aredetermined as of December 31, 1959 .
MARITAL STATUS .-If married at theclose of your taxable year, you are con-sidered married for the entire year . Ifdivorced or legally separated on or be-fore the close of your year, you are con-sidered single for th6 entire year . Ifyour wife or husband died during theyear, you are considered married for theentire year, and may file a joint return .
Line 2.-Fill in this line to receivecredit for exemptions for your children,stepchildren, and other dependents .Each dependent must meet all of thefollowing tests :
(a) Received more than one-half of his orher support from you (or from wife or hus-band if a joint return is filed) .
(b) Received less than $600 gross income .(This test does not apply to your children orstepchildren who are under 19 or who arestudents for 5 calendar months of the year . )
(c) Did not file a joint return with herhusband (or his wife) .
(d) Was either a citizen or resident of theUnited States or a resident of Canada, Mex-ico, the Republic of Panama' or the CanalZone. (This does not apply to an alienchild legally adopted by and living with aUnited States citizen abroad . )
(e) EITHER ( I ) for the entire year 1959had your home as his principal place of abodeand was a member of your household ; OR(2) was related to you (or to husband or wifeif a joint return is filed) in one of the follow-ing ways :Child* Stepbrother Son-in-lawStepchild Stepsister Daughter-in-lawMother Stepmother The following ifFather Stepfather related by blood :Grandparent Mother-in-law Uncl eBrother Father-in-law AuntSister Brother-in-law NephewGrandchild Sister-in-law Niece
*Includes a child who is a member ofyour household if placed with you by anauthorized placement agency for legaladoption .
Definition of Support .-Support in-cludes the cost of food, shelter, clothing,medical and dental care, education, and
the like . If the item of support fur-nished is in the form of property orlodging, it will be necessary to MULsur!~,~the amount of such item of support interms of its fair market value . In de-termining the total SUPP(Tt includeamounts contributed by the dependentor others for his support and alsoamounts ordinarily excludable fromgross income. Disregard scholarships.
Definition of Student.-The law de-fines a student as an individual who,during each of 5 calendar months dur-ing the year, is (a) a full-time studentat an educational institution or (b) pur-suing a full-time course of institutionalon-farm training under the supervisionof an accredited agent of an educa-tional institution or of a State, or apolitical subdivision of a State .
Birth or Death of a Dependeni .-You canclaim a full $600 exemption for a de-pendent who was born or 6ed duringthe year if the tests for claiming anexemption for such dependcnt are metfor the part of the year during which hewas alive .
Exemptions for Individuals .1 ;upported byMore than One Taxpayer .- If several per-sons contributed toward the support ofan individual during the taKable ~7ear,but none contributed over lialf of thesupport, they may designate one of theirnumber to claim the exemption if :
(a) They as a group have providedover half of the support oF the indi-vidual ; and
(b) Each of them, had lie contrib-uted over half of the supFort, wouldhave been entitled to claim the indi-vidual as a dependent ; and
(c) The person claiming the exemp-tion for the individual contrbuted over10 percent of the support ; and
(d) Each other person in the groupwho contributed over 10 percent of' theindividual's support makes a declara-tion which must be filed wi .h your re-turn that he will not claim the individ-ual as a dependent for -the year. Form2120, Multiple Support De(laration, isavailable at any Internal Revenue Serv-ice office .
SCHEDULE B .-For Itemizing Deductions-if you do not use-Tax Table or take theStandard Deduction .CONTRIBUTIONS
If you itemize deductioni, you candeduct gifts to religious, charitable,educational, scientific, or literary or-ganizations and organizatiens for theprevention of cruelty to c1ildren andanimals, unless the organization is op-erated for personal profit, or conducts
5
propaganda or otherwise attempts toinfluence legislation . You can deductgifts to fraternal organizations if theyare to be used for charitable, religious,etc ., purposes . You can also deductgifts to veterans' organizations, or to agovernmental agency which will use thegifts for public purposes .
The law does not allow deductionsfor gifts to individuals, or to other typesof organizations, however worthy.
In general, the deduction for contri-butions may not exceed 20 percent ofline 6, page 1 . However, you may in-crease this limitation to 30 percent if theextra 10 percent consists of contribu-tions made to churches ; a convention orassociation of churches, tax-exempt edu-cational institutions, tax-exempt hos-pitals, or certain medical researchorganizations .INTEREST
If you itemize deductions, you candeduct interest you paid on your per-sonal debts, such as bank loans or homemortgages . Interest paid on behalf ofanother person is not deductible unlessyou were legally liable to pay it. In fig-uring the interest paid on a mortgageon your home, eliminate such items ascarrying charges and insurance, whichare not deductible, and taxes which maybe deductible but which should beitemized separately .
The law allows a deduction for inter-est paid for purchasing personal prop-erty (such as automobiles, radios, etc .)on the installment plan even wherethe interest charges are not separatelystated from other carrying charges . Ifit is not stated separately, this deductionis equal to 6 percent of the average un-paid monthly balance under the con-tract. Compute the average unpaidmonthly balance by adding up the un-paid balance at the beginning of eachmonth during the year and dividing by12. The unpaid balance at the begin-ning of each month is determined bytaking into account the amounts re-quired to be paid under the contractwhether or not such amounts are ac-tually paid. The interest deductionmay not exceed the portion of the totalcarrying charges attributable to thetaxable year .TAXES
If you itemize deductions, you candeduct most non-Federal taxes paid byyou. You can deduct State or localretail saler. taxes if under the laws ofyour State they are imposed directlyupon the consumor, or if they are im-posed on the retailer (or wholesaler i n
e59--16-75396-1
6
FACSIMILES OF TAX RETURNS, 195 9
INSTRUCTIONS FOR PAGE 2 OF FORM 1040 W-Continued
case of gasoline taxes) and the amountof the tax is separately stated by theretailer to the consumer . In general,you cannot deduct taxes assessed forpavements or other local improvements,including front-foot benefits, which tendto increase the value of your property.Consult your Internal Revenue Serviceoffice for circumstances under whichlocal improvemen,t taxes may be de-ducted .MEDICAL AND DENTAL EXPENSE S
If you itemize deductions, you can de-duct, within the limits described below,the amount you paid during the year(not compensated by hospital, health oraccident insurance) for medical or den-tal expenses for yourself, your wife, orany dependent who received over halfof his support from you whether or notthe dependent had gross income of $500or more. List name and amount paidto each person .
You can deduct amounts paid for theprevention, cure, correction, or treat-ment of a physical or mental defect orillness . If you pay someone to performboth nursing and domestic duties, youcan deduct only that part of the costwhich is for nursing.
You can deduct the cost of transpor-tation primarily for and essential tomedical care, but you cannot deductany other travel expense even if it bene-fits your health . Meals and lodgingwhile you are away from home receiv-ing medical treatment may not betreated as medical expenses unless theyare part of a hospital bill or are includedin the cost of care in a similar institution .
Limitations.-The deduction may notexceed $2,500 multiplied by the num-ber of exemptions other than the ex-emptions for age and blindness . Inaddition, there is a maximum limitationas follows :
(a) $5,000 if the taxpayer is singleand not a head of household or a widowor widower entitled to the special taxrates ;
(b) $5,000 if the taxpayer is marriedbut files a separate return ; or
(c) $10,000 if the taxpayer files ajoint return, or is the head of householdor a widow or widower entitled to thespecial tax rates .
Special Rules for Persons 65 or Over.-If either you or your wife were 65 orover during the year, you may disregardthe 3 percent limitation shown on line 6of the medical schedule on page 2 ofForm 1040W for you or your wife'smedical expenses but not for any de-pendent . However, the other limita-
tions are applicable. If either you oryour wife were 65 or over and in addi-tion were disabled you may also qualifyfor an additional deduction . Consultthe nearest Internal Revenue Serviceoffice for further information .OTHER DEDUCTION S
Expenses for the Care of Children and Cer-tain Other Dependents . - There is alloweda deduction not to exceed a total of$600 for expenses paid by a woman ora widower (including men who are di-vorced or legally separated under adecree and who have not remarried)for the care of one or more dependentsif such care is to enable the taxpayer tobe gainfully employed or actively toseek gainful employment . For this pur-pose, the term "'dependent" does notinclude the husband- (wife) of the tax-payer and is limited to the followingpersons for whom the taxpayer is en-titled to a deduction for an exemption :
(a) under 12 years of age ; or(b) physically or mentally incapable
of caring for themselves .Do not deduct any child-care pay- .
ments to a person for whom you claiman exemption .
In the case of a woman who is mar-ried, the deduction is allowed only (a) ifshe files a joint return with her hus-band; and (b) the deduction is reducedby the amount (if any) by which theircorribined incomes as shown on line 6,page 1, of their returns exceeds $4,500 .If the husband is incapable of self-support because he is mentally or physi-cally defective, these two limitations donot apply.
If the person who receives the pay-ment performs duties not related todependent care, only that part of thepayment which is for the dependent'scare may be deducted .
If you claim this deduction, attach adetailed statement showing the amountexpended and the person or persons towhom it was paid . If you wish, youmay obtain Form 2441 from any Inter-nal Revenue Service office for thispurpose .
Casualty Losses and Thefts .-If you item-ize deductions, you can deduct your netloss resulting from the destruction ofyour property in a fire, storm, automo-bile accident, shipwreck, or other lossescaused by natural forces. Damage toyour car by collision or accident can bededucted if due merely to faulty drivingbut cannot be deducted if due to yourwillful act or negligence . You can alsodeduct in the year of discovery lossesdue to theft, but not losses due to mis-laying or losing articles.
129
The amount of loss to be deducted ismeasured by the fair market value ofthe property just before the casualty lessits fair market value immediately afterthe casualty (but not more than the costor other adjusted basis of the property),reduced by any insurance or compensa-tion received . Explain in an attachedstatement .
Expenses for Education .- Expenses foreducation may be deducted if the edu-cation was undertaken primarily for thepurpose of :
(a) Maintaining or improving skillsrequired in your employment or othertrade or business, or
(b) Meeting the express require-ments of your employer, or the require-ments of applicable law or regulations,imposed as a condition to the retentionof your salary, status, or employment .
Expenses incurred for the purpose ofobtaining a new position, a substantialadvancement in position, or for per-sonal purposes are not deductible . Theexpenses incurred in preparing for atrade or business or a specialty are per-sonal expenses and are not deductible .
The rules for reporting deductibleeducation expenses are the same asthose shown on page 3 for the reportingof "Employee Business Expenses." Ifyou are required therein to attach astatement to your return explaining thenature of the expenses, also include adescription of the relationship of theeducation to your employment or tradeor business . If the education was re-quired by your employer, a statement tothat effect from him would be helpful .
Miscellaneous .-If you itemize deduc-tions, you can deduct several other typesof expenses under "Other Deductions ."
If you are divorced or legally sepa-rated and are making periodic paymentsof alimony or separate maintenanceunder a court decree, you can deductthe amounts specified in the decree oragreement . Periodic payments madeunder either (a) a written separationagreement entered into after August16, 1954, or (b) a 4ecree for supportentered after March 1, 1954, are alsodeductible . Such payments must beincluded in the wife's income . Youcannot deduct lump-sum settlements, orspecific maintenance payments for sup-port of minor children .
You may deduct gambling losses tothe extent of gambling winnings only ifyou itemize deductions .
If you are a tenant-stockholder in acooperative housing corporation, youcan deduct your share of its paymentsfor interest and real-estate taxes.
a59-16-75396-1
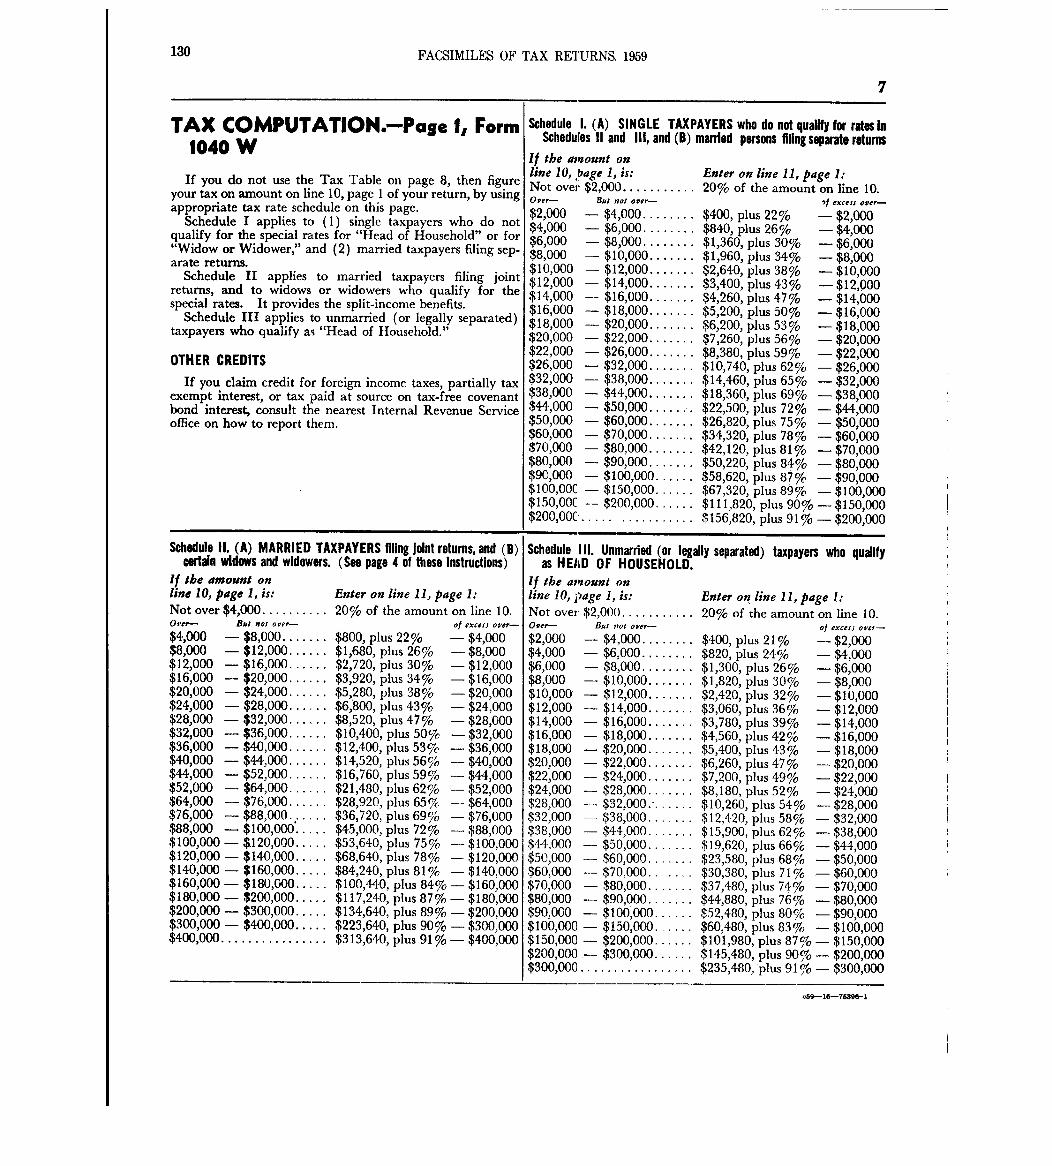
130 FACSIMILES OF TAX REI'URNS, 1959
TAX COMPUTATION .-Page 1, Form1040 W
If you do not use the Tax Table on page 8, then figureyour tax on amount on line 10, page I of your return, by usingappropriate tax rate schedule on this page.
Schedule I applies to (1) single taxpayers who do notqualify for the special rates for "Head of Household" or for"Widow or Widower," and (2) married taxpayers filing sep-arate returns.
Schedule II applies to married taxpayers filing jointreturns, and to widows or widowers who qualify for thespecial rates. It provides the split-income benefits .
Schedule III applies to unmarried (or legally separated)taxpayers who qualify as "Head of Household ."
OTHER CREDITS
If you claim credit for foreign income taxes, partially taxexempt interest, or tax paid at source on tax-free covenantbond interest, consult the nearest Internal Revenue Serviceoffice on how to report them .
Schedule 1 . (A) SINGLE TAXPAYERS who do not quality for rates InSchedules 11 and III, and (B) married persons filing separate returns
If the amount online 10,,bage 1, is: Enter on line 11, page 1:Not over $2,000 . . . . . . . . . . . 20% of the amount on line 10.Over- But not over- -)f exceis over--$2,000 - $4,000 . . . . . . . . $400, plus 22% -$2,000$4,000 -$6,000 . . . . . . . . $840, plus 261yo -$4,000$6 ' 000 -$8,000 . . . . . . . . $1,360, plus 30% -$6,000$8,000 - $10,000 . . . . . . . $1,960, plus 34% -$8,000$10,000 - $12,000 . . . . . . . $2,640, plus 38% -$10,000$12 ' 000 - $14,000 . . . . . . . $3,400, plus 43% -$12,000$14,000 -- $16,000 . . . . . . . $4,260, plus 47% -$14,600$16 ' 000 -$18,000 . . . . . . . $3,200, plus 50t7o -$16,000$18,000 - $20,000 . . . . . . . $6,200, plus 5317o -$18,000$20,000 - $22,000 . . . . . . . $7,260, plus 5617o -$20,000$22,000 - $26,000 . . . . . . . $8,380, plus 59% -$22,000$26,000 - $32,000 . . . . . . . $10,740, plus 625/o -$26,000$32,000 - $38,000 . . . . . . $14,460, plus 65% -$32,000$38,000 - $44,000 . . . . . . . $18,360, plus 6917o -$38,000$44,000 - $50,000 . . . . . . . $22,500, plus 7217o -$44,000$50,000 - $60,000 . . . . . . . $26,820, plus 75% -$30,000$60,000 - $70,000 . . . . . . . $34,320, plus 7817o -$60,000$70,000 - $80,000 . . . . . . . $42,120, plus 81% -$70,000$80,000 - $90,000 . . . . . . . $50,220, plus 841yo -$80,000$90,000 - $100,000 . $58,620, plus 87% -$90,000$100,OOC - $150,000 . . . . . . $67,320, plus 89%' -$100,000$150,OOC - $200,000 . . . . . . $111,820, plus 90% - $150,000$200,OOC . . . . . . . . . . . . . . . . $156,820, plus 91 1yo - $200,000
Schedule 11 . (A) MARRIED TAXPAYERS filing joint returns, and (B)certain widows and widowers . (See page 4 of these instructions)
If the amount online 10, page 1, is: Enter on line 11, page 1:Not over $4,000 . . . . . . . . . . 204yo of the amount on line 10 .Over-- But not over- of exceys over-
$4,000 -$8,000 . . . . . . . $800, plus 22% -$4,000$8,000 -$12,000 . . . . . . $1,680, plus 26% -$8,000$12,000 -$16,000. . . . . . $2,720, plus 301yo -$12,000$16,000 -$20,000 . . . . . . $3,920, plus 34% -$16,000$20,000 -$24,000 . . . . . . $5,280, plus 38% -$20,000$24,000 -$28,000. . . . . . $6,'800, plus 43% -$24,000$28,000 -$32,000. . . . . . $8,520, plus 471yo -$28,000$32,000 -$36,000 . . . . . . $10,400, plus 5017c -$32,000$36,000 -$40,000 . . . . . . $12,400, plus 5347c -$36,000$40,000 -$44,000 . . . . . . $14,520, plus 56% -$40,000$44,000 -$52,000. . . . . . $16,760, plus 59% -$44,000$52,000 -$64,000 . . . . . . $21,480, plus 62% --$52,000$64,000 --$76,000 . . . . . . $28,920, plus 65% -$64,000$76,000 -$88,000.
.. . . . . $36,720, plus 69% -$76,000
$88,000 -$100,000 . . . . . $45,000, plus 72% -$88,000$100,000 - ~120,000 . . . . . $53,640, plus 75% -$100,000$120,000 - $140,000 . . . . . $68,640, plus 78% -$120,000$140,000 - $160,000 . . . . . $84,240, plus 81 % -$140,000$160,000 - $180,000 . . . . . $100,440, plus 84% - $160,000$180,000 - $200,000 . . $117,240, plus 87% - $180,000$200,000 - $300,000 . . $134,640, plus 89% - $200,000$300,000 - $400,000 . . . . . $223,640, plus 90% - $300,000$400,000 . . . . . . . . . . . . . . . . $313,640, plus 91 % - $400,000
Schedule 111 . Unmarried (or legally separated) taxpayers who qualifyas HEAD OF HOUSEHOLD.
If the ansount o nline 10, page 1, is: Enter on line 11, page 1 :Not over $2,000 . . . . . . . . . . . 20% of the amount on line 10.Over- But ?tot over- of exceii over-
$2,000 - $4,000 . . . . . . . . $400, plus 21% -$2,000$4,000 - $6,000 . . . . . . . . $820, plus 24% -$4,000$6,000 - $8,000 . . . . . . . . $1,300, plus 26% -$6,000$8,000 - $10,000 . . . . . . . $1,820, plus 3017o -$8,000$10,000 - $12,000 . . . . . . . $2,420, plus 321yo -$10,000$12,000 - $14,000 . . . . . . . $3,060, plus 36% -$12,000$14,000 - $16,000 . . . . . . . $3,780, plus 391yo -$14,000$16,000 - $18,000 . . . . . . . $4,560, plus 42% -$16,000$18,000 - $20,000 . . . . . . . $5,400, plus 434yo -$18,000$20,000 - $22,000 . . . . . . . $6,260, plus 471yo -$20,000$22,000 - $24,000 . . . . . . . $7,200, plus 491yo -$22,000$24,000 - $28,000 . . . . . . . $8,180, plus 52-7o -$24,000$28,000 - $32,000 . . . . . . . . $10,260, plus 541yo -$28,000$32,000 - $38,000 . . . . . . . $12,420, plus 584yo -$32,000$38,000 - $44,000 . . . . . . . $15,900, plus 62% -$38,000$44,000 - $50,000 . . . . . . . $19,620, plus 6617o -$44,000$50)000 - $60,000 . . . . . . . $23,580, plus 681yo -$50,000$60,000 - $70,000 . . . . . . $30,380, plus 71 17o -$60,000,~70,000 - $80,000 . . . . . . . $37,480, plus 7417o -$70,000$80,000 - $90,000. . . . . . . $44,880, plus 76% -$80,000$90,000 - $106,000 . . . . . . $52,480, plus 80% -$90,000$100,000 - $150,000 . ~ . . . . $60,480, plus 83% -$100,000$150,000 - $200,000 . . . . . . $101,980, plus 87% - $150,000$200,000 - $300,000 . . . . . . $145,480, plus 90% - $200,000$300,000 . . . . . . . . . . . . . . . . . $235,480, plus 91 t7o - $300,000
c59--16-76396-1
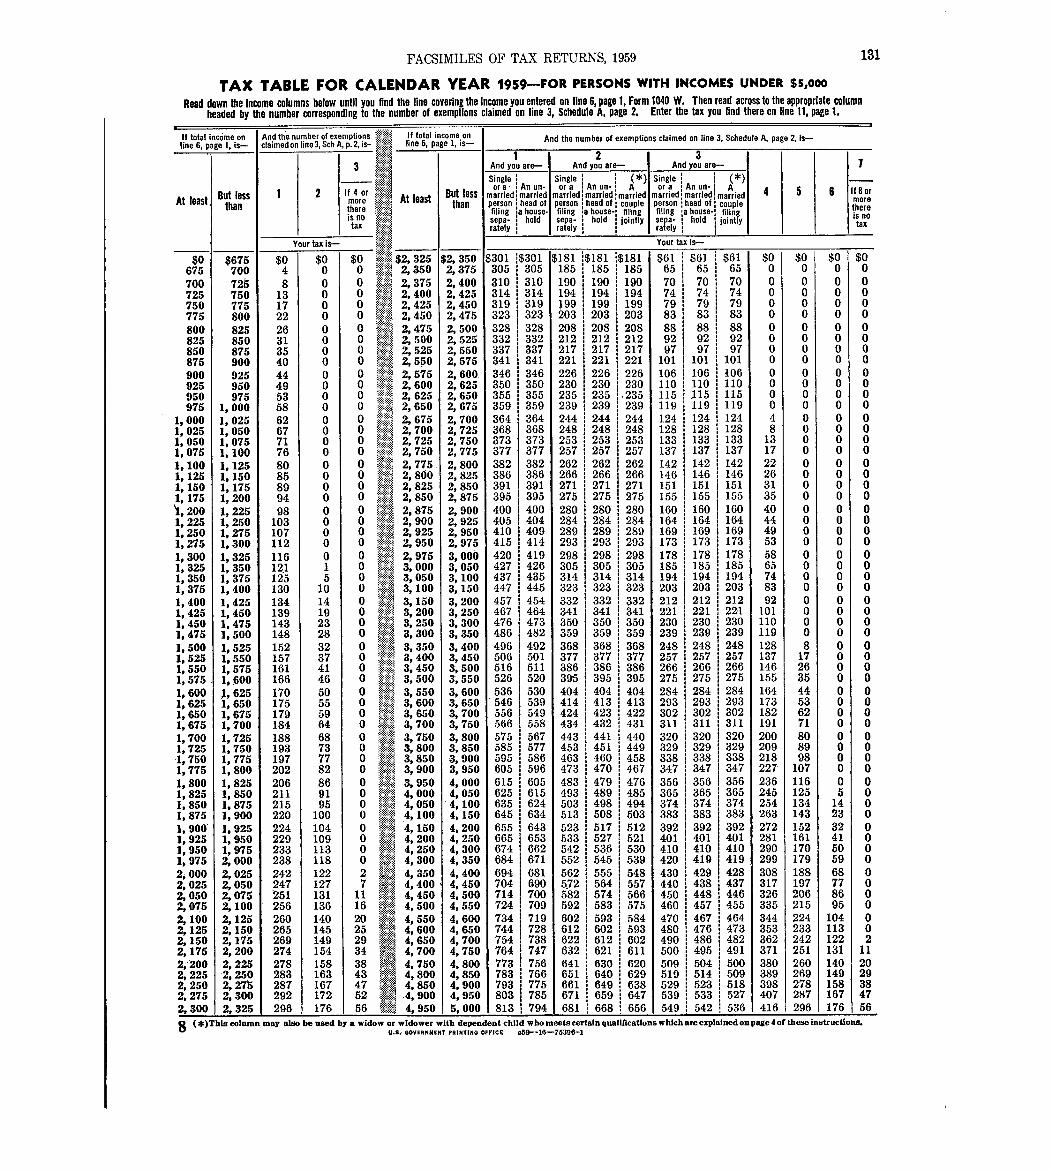
FACSIMILES OF TAX RETURNS, 1959 131
TAX TABLE FOR CALENDAR YEAR 1959-FOR PERSONS WITH INCOMES UNDER $5,000
Read down the Income columns below until you find the line covering the Income you entered on line 6, page 1, Form 1040 W. Then read across to the appropriate columnheaded by the number corresponding to the number of exemptions claimed an line 3, Schedule A, page 2. Enter the tax you rind there on line 11, page 1 .
total income o n,Un . 6, page 1, is- ~" ; : . If total i come o nAnd the number of exemptions
line 6, p go 1, is-claimedonline3, c A,p-2,is-And the number of exemptions claimed on line 3, Schedule A, page 2, Is-
1 2 33 And you are- And you are- And you are- 7
Single Single Singl e
At least out less 2 If 4 orAt leastMO r
But lessAn un -
m'a'rr'lod : marriedor a An un- A
married! married !married: :
or a An un- Amarried : married : married 4 5 6 If 8 o f
morethan r :th than pie!, s o n : head ofng
:a house-pe on head of coupl e,!,sng
J filin g:a houseperson j head of : couplefiling :a house-1 filing there
i n ois n otax
sepa hol d1; la a sepa- hold 1 ointl yIrately
sepa- I hold I jointl yrately I
stax
Y our tax Is- Your tax is-
$0 $675 $0 $0 $0 $2, 325 $2,350 $301 $301 $181 $181 :$181 $61 $61$61 $0 so $0 $0675 700 4 0 0 2 350 2,375 ovo I ouli 185 185 185 65 65 6.5 0 0 0 0700 72~ 8 0 0 2,375 2,400 310 1 310 190 i 190 190 70 70 70 0 0 0 0725 750 13 0 0 2 4000 2,425 31 3144 1 194 1 194 194 74 1 74 1 74 0 0 0 0750 775 17 0
02,425 2,450 319 319 199 199 1 199 79 1 79 79 0 0 0 0
775 800 22 0 0 20450 2,475 323 323 ~03 1 203 1 203 83 83 83 0 0 0 0800 825 26 0 0 2,475 2,500 328 328 208 1 208 : 208 88 88 88 0 0 0 0825 850 31 0 0 2P 500 2,525 332 332 212 212 1 212 92 92 92 0 0 0 0850 875 35 0 0 2,525 2 550 337 1 337 217 217 1 217 97 1 97 97 0 0 0 0875 900 40 0 0 2,550 2 : 575 341 i 341 221 221 : 221 101 101 1 101 0 0 0 0900 925 44 0 0 2 5i5 2 600 346 1 346 226 226 1 226 106 106 :. 106 0 0 0 0925 950 49 0 0 2,600 2 : 625 350 350 230 230 230 110 110 1 110
10 0 0 0
950 975 53 0 0 2,625 2,650 355 355 235 235 1,235 . 11 5115 1 115 0 0 0 0975 1,000 58 0 0 29650 2,675 359 1 359 239 239 239 119 119 119 0 0 0 0
1,000 1,025 62 0 0 2,675 2,700 364 364 244 244 244 124 124 1 124 4 0 0 01,025 1,050 67 0 0 29700 2,725 368 1 368 248 248 1 248 128 128 1. 128 8 0 0 01,050 1,075 71 0 0 2,725 29750 373 1 373 253 1 253 1 253 133 133 133 13 0 0 01,075 1,100 76 0 0 2,750 2,775 377 1 377 257 i 257 1 257 137 137 137 17 0 0 01,100 1251 80 0 0 2,775 . 2,800 382 1 382 262 1 262 .1 262 142 1 142 142 22 0 0 01,125
,1,150 85 0 0 2 8009 2,825 386 1 386 266 1. 266 1 266 146 1 146 146 26 0 0 0
1,150 19 175 89 0 0 2,825 2,850 391 1 391 271 1 271 1 27 11
151 i 151 15 1:
31 0 0 01,175 1,200 94 0 0 2,850 29875 395 1 395 275 275 . 275 155 1 15 5155 35 0 0 01,200 1,225 98 0 0 2,875 2,900 400 1 400 280 280 1 280 160 - 160 160 40 0 0 01,225 19250 103 0 0 2,900 2,925 405 1 404 284 284 1 284 164 164 1 164 44 0 0 01,250 19275 107 0 0 fi~N 2 925V 2 950 410 1 409 289 1 289 289I 9 169169 16 49 0 0 01,275 1,300 112 0
02,950 2: 975 415 414 293 1 293 293 173 1 173 173 53 0 0 0
1,300 1,325 116 0 0 2,975 3,000 420 419 298 1 298 298 178 178 1 178 58 0 0 01,325 19350 121 1 0 3 0009 3,050 427 426 305 : 305 305 185 185 1. 185 65 0 0 01,350 1,375 1~5 5
03,050 3,100 437 435 314 1 314 314 194 194 1 194 74 0 0 0
1,375 1,400 130 10 0 3,100 3,150 447 445 323 1 323 323 203 203 1. 203 83 0 0 01,400 1,425 134 14 0 3,150 3,200 457 454 332 1 332 3 .32 212 1. 212 212 92 0 0 01p 425 1,450 139 19 0 39200 3,250 467 464 341 1 341 341 221 1 221 22-1 101 0 0 01,450 1,475 143 23 0 39250 3,300 476 1 473
1350 1 350 350 230 230 230
211 01
0 0 01,475 1,500 148 28 0 3,300 3,350 482486 1 359 359 359 39239 239 19 0 0 01,500 1,525 152 32 0 3,350 39400 496 1 492 368 368 368 248 248 248 128 8 0 01,525 1,550 157 37 0 3,400 3,450 506 1. 501 377 377 377 257 257 1 257 137 17 0 01p 550 1,575 161 41 0 3 4509 3,500 516 1 611 386 386 386 266 266 1. 266 146 26 0 01,575 . 1,600 166 46
03,500 3,550 526 520 395 395 395 275 1 275 1 275 155 35 0 0
1,600 J, 625 170 50 0 39550 3,600 536 530 404 404 404 284 1 284284 1 164 44 0 01,625 1,650 175 55 0 3,600 3,650 546 539 414 413 413 293 293 29 3
3021731 2
5362
00
01,650 1,675 179 59 0 3,650 39700 556 i 549 424 423 422 302 302 8 01,675 1,700 184 64 0 ~51ililiil~': 3t 700 3,750 566 i 558 434 432 431 311 311 311 191 71 0 01,700 1p 725 188 68 0 3V 750 3,800 575 1 567 443 1 441 440 320 320 1 320 200 80 0 01,725 19750 193 73 0 3,800 3,850 58 .5 1 .577 453 451 449 329 329 11 329 209 89 0 01,750 1,775 197 77 0 39850 3,900 595 1 586 463 460 458 338 338 1. 338 218 98 0 019775 1,800 202 82 0 3 900 3,950 605 1. 596 473 470 467 347 1 347 1 347 227 107 0 01,800 1,825 206 86 0 39950 4,000 615 1 605 483 479 476 356 356 1. 356 236 116 0 01,825 1,850 211 91 0 4,000 4 050 625 1 615 493 489 485 365 1 365 1 365 245 125 5 01,850 1,875 215 95 0 4,050 4:100 635 624 503 498 494 374 374 374 2.54 134 14 01,875 1,900 220 100 0 4,100 4,150 645 634 513 508 503 383 383 383 263 143 23 01,900 1,925 224 104 0 4,150 4,200 655 643 523 517 512 392 392 392 272 152 32 01,925 19950 229 109 0 4,200 4,250 665 653 533 527 521 401 1 401 401 281 161 41 01,950 1,975 233 113 0 4 250 4,300 674 1 662 542 5,36 530 410 1 410 1 410 290 170 50 01,975 2,000 238 118 0 4' 300P 4,350 684 1. 671 552 545 539 420 419 419 299 179 59 02i 000 2,025 242 122 2 4,350 4,400 694 1 681 562 555 548 430 429 428 308 188 68 02,025 2,050 247 127 7 4 400 4,450 704 1 690 5;2 i 564 557 440 438 437 317 197 77 02,050 2,075 '251 131 11 49450 4,500 714 i 700 582 1 574 566 450 1 448 i 446 326 206 86 02,075 2,100 256 136 16 4,500 49550 724 709 592 583 575 460 457 1 455 335 215 95 029100 2,125 260 140 20 4,550 4,600 734 719 602 1. 593 584 470 467 464 344 224 104 02,125 29150 265 145 2 .5 4,600 49650 744 1 728 612 602 593 480 476 473 353 233 113 029150 2,175 269 149 29 4,650 4 700 754 1. 738 622 612 602 490 486 482 362 242 122 22,175 2,200 274 154 34 4,700 4,750 764 1. 747 632 621 611 495 491500 371 251 131 1 12,"200 2,225 278 158 38
. .....4 4,750 4,800 773 1 756 641 630 620 509 504 1 500 3110 260 140 20
2,225 29250 283 163 43 84, 00 84, 50 83 1 7661 651 640 629 519 514 509 389 269 149 292,250 2, 275 287 167 47 49850 4,900 793 1 775 (3131 1 649 638 523 518529 398 278 158 382,275 2,300 292 172 52 1,900 4,950 803 1 785 671 659 647 539 533 1 527 407 287 167 4729300 1 2,325 1 296 1 176 4995056 1 5,000 813 1 794 681 668 656 549 : 542 1 536 1 416 1 296 1 176 5 68 (*)This coluffun may also be used by a widow or widower with dependent child who meets certain qualifications which are explained on page 4 of these instructions .
U .S, GOVERNMENT PRINTING orricc 059--16-75396-1
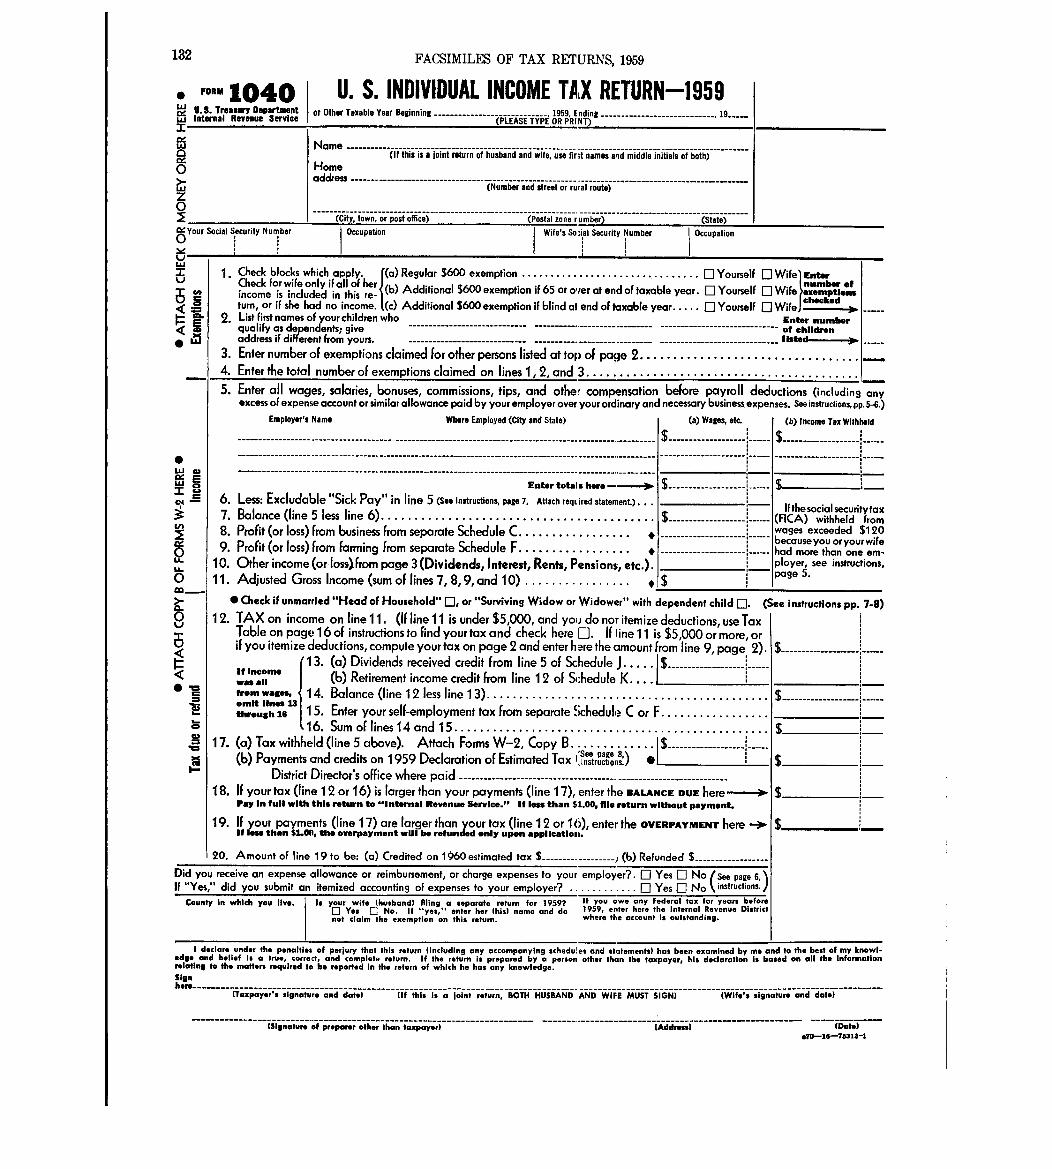
132
FORM 1040U .S . Treasury DepartmentInternal Revenue Servic e
1 .
Name ---------------------------------------------------------------------------------------------------(if this is a joint return of husband and wife, use fint names and middle initials of both )
Homeaddress ------------------------------------------------------------------------------------------- - -----
(Number and street or rural routs )
1MY= Social Security Number0
uUA
2.
FACSIMILES OF TAX RETURNS, 1959
Us S. INDIVIDUAL INCOME TAX RETURN-195 9or Other Taxable Year Beginning ----------------------------- 1959, Ending ----------------------------- 19. ....
_(PLEASETYPE OR PRINT) -
( i;;- (Postal zone rumber) (State)CitOccupation Wife's So;i,al Security Number Occupation
i
Check blocks which J(a) Regular $600 exemption . . . . . . . . . . . . . . . . . . . . . . . . . . . . . . . 0 Yourself 0 Wife Entwy i apply-h( 0 number ofCheckforwireonl rallof e r
income is included in this re- b) Additional $600 exemption if 65 or over at end of taxable year - El Yourself Wife onsturn or if she had no income. (c) Additional $600 exemption if blind of end of taxable year . . . . . [] Yourself [] Wife =--),.List Iirst names of your children who Enter numberqualify as dependents; give of childrenaddress if different from yours. ----------------------------- ----------------------------- ----------------------------- I late_ 0 - -----
3 . Enter number of exemptions claimed for other persons listed at top of page 2 . . . . . . . . . . . . . . . . . . . . . . . .4. Enter the total number of exemptions claimed on lines 1, 2, and 3 . . . . . . . . . . . . . . . . . . . . . . . . . . . . . . . .5 . Enter all wages, salaries, bonuses, commissions, tips, and othe, compensation before payroll deductions (including any
excess of expense account or similar allowance paid by your employer over your ordinary and necessary business expenses . See instructions,,pp. 5-6. )Employer's Name
1=
Where Employed (City and State )
--------------------------------------------------------------------------------------------------------
-----------------------------------------------------------------------------------------------------
---------------------------------------------------------------------------------------------------------
(a) Wages, etc. (b) Income Tax Withholdi
$ ---------------- $ ------------------- : ------
Enter totals heirs,- as 1 $ ------------------- $
6 . Less: Excludable "Sick Pay" in line 5 (see instructions, page 7. Attach required statement) . . .
7 . Balance (line 5 less line 6) . . . . . . . . . . . . . . . . . . . . . . . . . . . . . . . . . . . . . . . . .8 . Profit (or loss) from business from separate Schedule C . . . . . . . . . . . . . . . . .9 . Profit (or loss) from farming from separate Schedule F . . . . . . . . . . . . . . . . .
10. Other income (orllosWronn page 3 (Dividends, Interest, Rents, Pensions, etc .) .11 . Adiusted Gross Income (Sum of lines 7, 8, 9, and 10) . . . . . . . . . . . . . . . .
i$ ------------------- ------
---------------------
---------------------
* Check if unmarried "Head of Household" El, or "Surviving Widow or Widower" with dependent child E] . (See instructionspip . 7-8)
lFthesocial securilytax(FICA) withheld fromwages exceeded $1 20becauseyou oryourwifehad more than one em-ployer, see instructions,page 5 .
1 2. TAX on income on line 11 . (if line I I is under $5,000, and you do not itemize deductions, use TaxTable on page 16 of instructions to Find your tax and check here El. If line 11 is $5,000 or more, orif you itemize deductions, compute your tax on page 2 and enter h are the amount from line 9, page: 2) .
13. (a) Dividends received credit from line 5 of Schedule J . . . . . 1 $ ------------------- ! ------stincones iwas Oil (6) Retirement income credit from line 1 2 of Schedule K . . . . ____ ifrom wage% 1 4. Balance (line 12 less line 13) . . . . . . . . . . . . . . . . . . . . . . . . . . . . . . . . . . . . . . . . . . . .ornit lines Uthrough 16 15. Enter your self-employment tax from separate Schedule C or F . . . . . . . . . . . . . . . . .
16 . Sum of lines `14 and 15 . . . . . . . . . . . . . . . . . . . . . . . . . . . . . . . . . . . . . . . . . . . . . * . . .17. (0) Tax withheld (line 5 above). Attach Forms W-2, Copy B . . . . . . . . . . . . . 1 $ ------------------- : -------
'See nave 8 ikb) royments and credits on 1959 L)eclaration at Utimated lax lJnstructi ') 0
District Director's office where paid -------------------------------------------------------------------18. If your tax (line 12 or 16) is larger than your payments (line 17), enter the BALANCE DUE here 311
Pay In full with this return to "Internal Revenue Service ." If loss than $L .00, file return without payment.
19 . IF your payments (line 17) are larger than your tax (line 12 or 16), enter the OVERPAYMENT here --iil-It low than $LOO, the overpayment will be refunded only upon applicatiori .
20. Amount of line 19 to be: (a) Credited on 1060 estimated tax S ------------------; (b) Refunded $ ------------------Did you receive an expense allowance or reimbursement, or charge expenses to your employer? . El Yes El No Se page 6,If "Yes," did you submit an itemized accounting of expenses to your employer? . . . . . . . . . . . . 0 Yes El No ( instructiom
County in which you live . Is yErr wife (husband) filing a separate return for 1959? If you owe any Federal tax for years beforeYes E] No . If "yes," enter her (his) name and do 1959, enter here the Internal Revenue District
not claim the exemption on this return . where the account is outstanding .
$ ---------------- ---
$ -------------------
I
declare under the penalties of perjury that this return fincluding any accompanying schedule% and statements) has been examined by me and to the best of my knowl-
.d?and belief Is a true, correct, and complete return . If the return Is prepared by a person other than the taxpayer, his declaration is based on all the information
. C:Ing to the matters required to be reported In the return of which he has any knowledge .Signhere
-------- ------------------------------------------------------------------------------------------------------------------------_CTaxpayer'_,~ T~n to and date) (if this Is a joint return, BOTH HUSBAND AND WIFE MUST SIGN) (Wife's signature and date)
------------------------------------------------------------------------ ------------------------------------------ - ------------(Signature of preparer other than taxpayer) (Address) (Date)
@70-16-76313-1
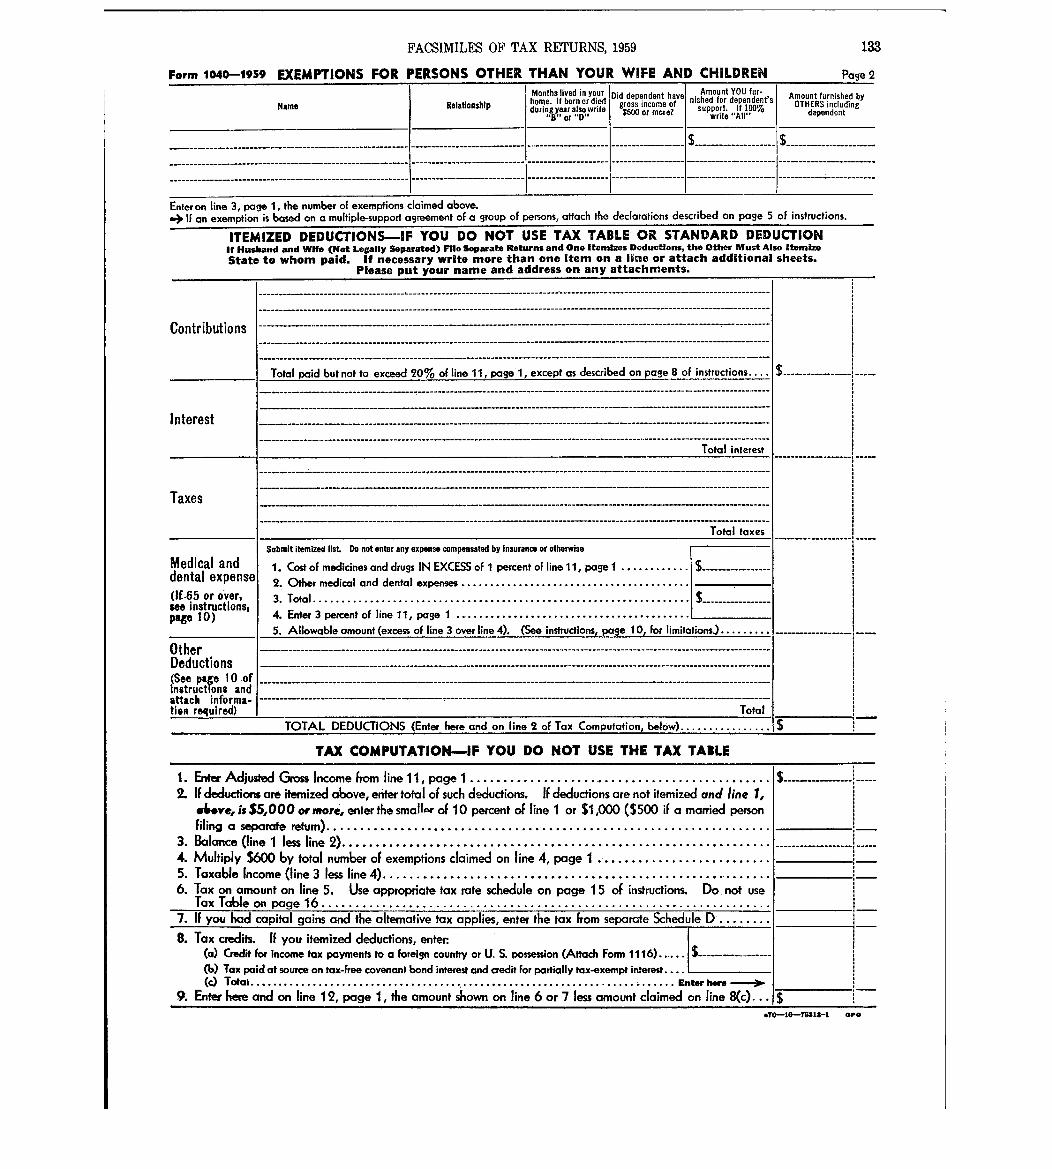
FACSIMILES OF TAX RETURNS, 1959 133
Form 1040-1959 EXEMPTIONS FOR PERSONS OTHER THAN YOUR WIFE AND CHILDREN Page 2Months lived in you r
ho e If born or died Did dependent have Amount YOU fur -nished for dependent's Amount furnished by
Name Relationship m .durinvear ~lso write
gross inc ofom emor$600 or e? support. If IDO %
" "OTHERS including
dependen t.or V' write Al l
- - - -- - --- - --------------- - - ------------------------- -
- - ------------------------------------------------------- -
----------------------------------------------------------- I
- - ---------------- ------- -
- - -- ------------ - -
- - -------------------- ----
----------- ---------
-------------I
I -------------------- I
------------------
-_ - - - -
------------------ I
$ ------------------- -
------- - -- - ---------
$ ---------------------- -
--- - ------------ - ---- -
Enteron line 3, page 1, the number of exemptions claimed above .4 If an exemption is based on a multiple-support agreement of a group of persons, attach the declarations described on page 5 of instructions .
ITEMIZED DEDUCTIONS-IF YOU DO NOT USE TAX TABLE OR STANDARD DEDUCTIONIt Husband and Willie (ket Legally Separated) File Separate Returns and One Itemizes Deductions, the Other Must Also 91temliz eState to whom paid . If necessary write more than one Item on a line or attach additional sheets .
Please put your name and address on any attachments .
Contributions
Interest
------------------------------------ I ------------------------------------ ------------------------------------------------------------------------------------------------------------------------------------------------------------------------------------------------------------------------------------------------------------------------------------------------------------------------------------------------------------------------------------------------------------------------------------ ---------- - --------------------------------------------------------------------------------------------------------- -----
Total paid but not to exceed 20% of line 11, page 1, except as described on page 8 of instructions . . . . $ --- - ---- - -----
Taxes
Medical anddental expenseOf_65 or over,see instructions,page 10 )
OtherDeductions(See page 10 ofInstructions andattach informa-tion required)
--------------------------------------------------------------------------------------------------------------------------------------------------------------------------------------------------------------------------------------
- ------- - ---- - ------ - ------------------------------------------------------- -------------------------------------------------------------------------------------------------------------------------------
Total interest
--- - - -- - ------------------------------ I --------------------------- --------------------- - ---------------------- - ---------
- - - - - - - - - -- - -- - - - - -------- - --------------------- - --------- - -- - ---------- - --------
- - - - - - - - - -----------------------------------
----------------------------------------------------------------------------------------------------------------Total taxe s
Submit itemized list . Do not enter any expense compensated by Insurance or otherwise
I . Cost of medicines and drugs IN EXCESS of I percent of line 11, page I . . . . . . . . . . . . $ ---- - --- -------
2 . Other medical and dental expenses . . . . . . . . . . . . . . . . . . . . . . . . . . . . . . . . . . . . . . . .
3 . Total . . . . . . . . . . . . . . . . . . . . . . . . . . . . . . . . . . . . . . . . . . . . . . . . . . . . . . . . . . . . . . . . . . $ ------
4. Enter 3 percent of I ine I I, page I . . . . . . . . . . . . . . . . . . . . . . . . . . . . . . . . . . . . . . . . .
5. Allowable amount (excess of line 3 over line 4) . (See instructions, page 10, for limitations .) . . . . . . . . .
--- ------------------------------------------------------------------------------------------------------------------------
-----------------------------------------------------------------------------------------------------------------------
--- - ----- ---------- - --------------- - - --------- - - -- - -- --------- - --------- - ---- - --- - ------ ------- -----------
- - - --- - --- - --------------- - --- - ---- - - - ------------ - --- - -------- - - - - - - ------------ - -- - ----- - ----------------
Total
TOTAL DEDUCTIONS (Enter here and on line 2 of Tax Computation, below) . . . . . . . . . . . . . . . .
TAX COMPUTATION-IF YOU DO NOT USE THE TAX TABL E
1 . Enter Adjusted Gross Income From line 11, page 1 . . . . . . . . . . . . . . . . . . . . . . . . . . . . . . . . . . . . . . . . . . . . .2. IF deductions are itemized above, enter total of such deductions . If deductions are not itemized and line 1 ,
w6ye, is $5,000 ornitore., enter the small- of 10 percent of line I or $1,000 ($500 if a married personFiling a separate return) . . . . . . . . . . . . . . . . . . . . . . . . . . . . . . . . . . . . . . . . . . . . . . . . . . . . . . . . .. . . . . . . . . .
3. Balance Oine 1 less line 2) . . . . . . . . . . . . . . . . . . . . . . . . . . . . . . . . . . . . . . . . . . . . . . . . . . . . . . . . . . . . . . .4. Multiply $600 by total number of exemptions claimed on line 4, page I . . . . . . . . . . . . . . . . . . . . . . . . .5. Taxable Income (line 3 less line 4) . . . . . . . . . . . . . . . . . . . . . . . . . . . . . . . . . . . . . . . . . . . . . . . . . . . . . . . .6. Tax on amount on line 5 . Use appropriate tax rate schedule on page 15 of instructions . Do, not use
Tax Table on page 16 . . . . . . . . . . . . . ..
..
. . . . . . ..
...
.. . . . . . . . . . .. . . . . . . . . . . . . . . . . . . . . . . I . . . . . . .
7. If you had capital gains and the alternative tax applies, enter the tax from separate Schedule D . . . . . . . .
S. Tax credits . If you itemized deductions, enter(a) Credit for income tax payments to a foreign country or U. S. possession (Attach Form I 116) . . . . . $ --- - - ------- -(6) Tax paid at source on tax-free covenant bond interest and credit for partially tax-exempt interest . . . .(c) Total . . . . . . . . . . . . . . . . . . . . . . . . . . . . . . . . . . . . . . . . . . . . . . . . . . . . . . . . . . . . . . . . . . . . . . . . . . . Enter here
9. Enter here and on line 12, page 1, the amount shown on line 6 or 71ess amount claimed on line 8(c) . - -
$ ---------------
------------------- 1 -----
e70--l&-75412-1 owe
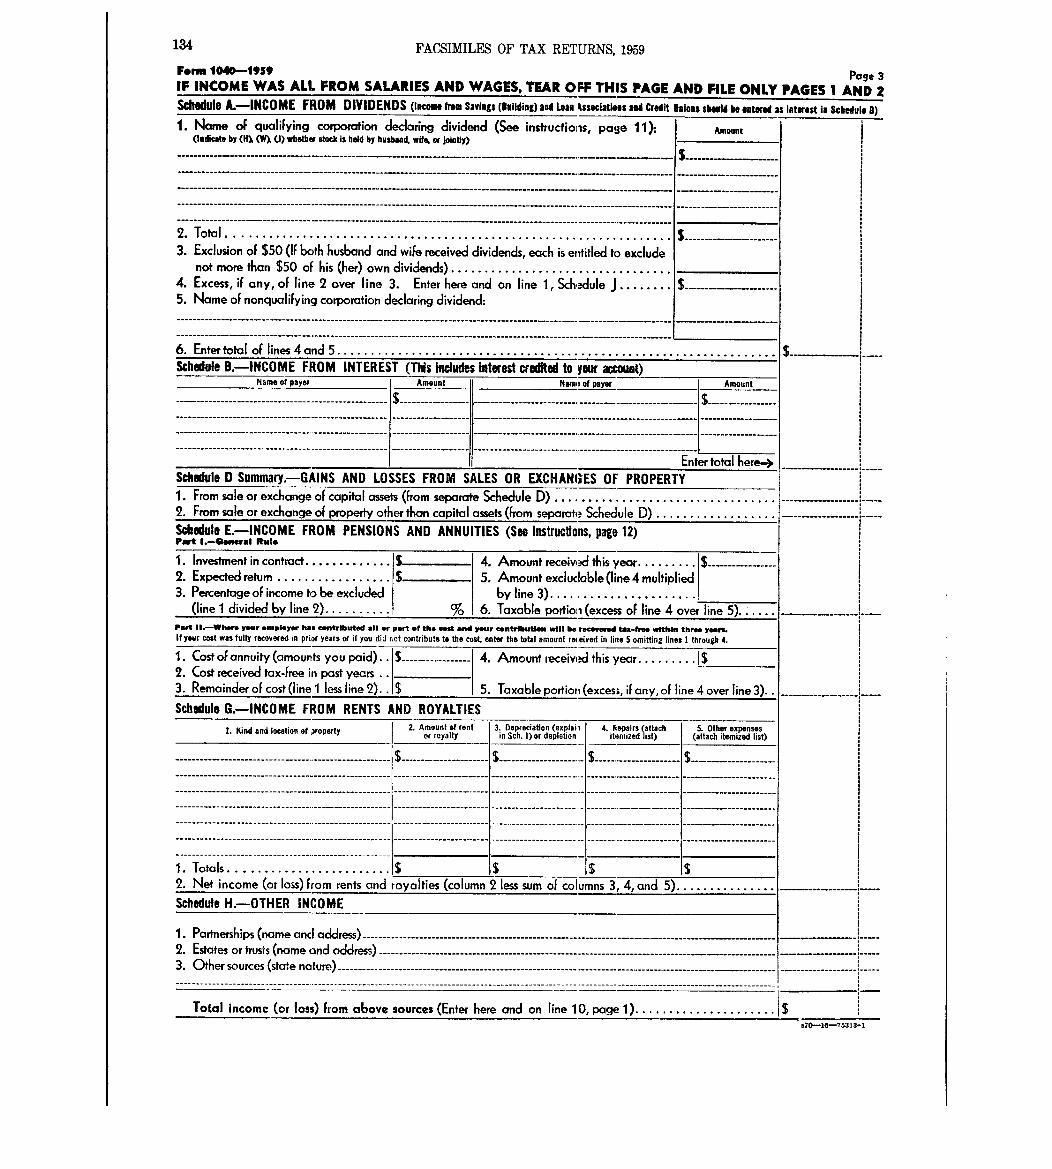
134 FACSIMILES OF TAX RETURNS, 1959
Form 11040-1959 Page 3IF INCOME WAS ALL FROM SALARIES AND WAGES . TEAR OFF THIS PAGE AND RLE ONLY PAGES 1 AND 2Schedule A.-INCOME FROM DIVIDENDS (Inceime treat Savings (Brillding) aild Loam lissecialeas and Credit Unions sheadd be entered as interest in schedule a)1 . Name of qualifying corporation declaring dividend (See inslfrucfions, page 11N
(loftits by (111 (WI 0) wbotbar stock is hold by husband, WHO, of joiatly)--- - --- - ----- - - - ------------- -------- - - -
- ------------------------- - ----------------------- - - - -- - - ---- - --- - -
- ----- - -- - ---------- - ---- - ------- - - ---------- --- - ------ - -------- - - -- - - - --
------------------------------- - ---- - -----------------------------------------------------------------------------------
---------------------------------------------------------------------------------------------------------------------
2. Toto I . . . . . . . . . . . . .
3 . Exclusion of $50 (if 6ojh husband and wife received dividends, each is entitled to excludenot more than $50 of his (her) own dividends) . . . . . . . . . . . . . . . . . . . . . . . . . . . . . . . . .
4. Excess, if any, of line 2 over line 3 . Enter here and on line 1, Sch, .-dule J . . . . . . . .5 . Name of nonqualifying corporation declaring dividend :------------------- - -- - ---------------------------------------- - -- - --- - ---------------- - --
Amoun t
S -----------------------
----------- - - ------- - - - ------------------------------------------- - -------------- - --------------------------------- 16. Enter total of lines 4 and 5 . . . . . . . . . . . . . . . . . . . . . . . . . . . . . . . . . . . . . . . . . . . . . . . . . . . . . . . . . . . . . . . . .Schedule B .-INCOME FROM INTEREST (This includes interest credited to Four ==Q
Name of payer Amount 11 Narall of payer
---------------------------------------------
------------- ------------- ---- ----- - -----------
---------------------------------------------------
-- ----------------------------------------------------------------------------------------------------------------------------- -----------------------------
Amoun t
s----- - ----------
1 11 Enter total kere-+Schedule 0 Sumniary.-GAINS AND LOSSES FROM SALES OR EXCHANGES OF PROPERTY1 . From sale or exchange of capital assets (From separate Schedule D) . . . . . . . . . . . . . . . . . . . . . . . . . . . . . . . . .2. From sale or exchange Of property other than capital assets (from separate Schedule D) . . . . . . . . . .Schedule E.-INCOME FROM PENSIONS AND ANNUITIES (See Instructions, page 12)Pwt I .-Gooperal Rati o
1 . Investment in contract . . . . . . . . . . . . . T 4. Amount received this year . . .. ' * *~4
$ -- - -- - --------2. Expected return . . . . . . . . . . . . . . . . . S- 5. Amount excluclable (line 4 multipl i3 . Percentage of income to be excluded by line 3) . . . . . . . . . . . . . . . . . . . . . .
(line 1 divided by line 2) . . . . . . . . . . . 07o 6. Taxable portion (excess of line 4 over line 5). . . . . .Pan 11-Whore "ur employer has contributed all or part of the cost and your contribull" will be recovered tox-fm within three years.If your cost was fully recovered in prior years or it you did rot contribute to the cost enter the total amount roo eived in line 5 omitting fines I through 4.
1 . Cost of annuity (amounts you paid) . . IS -----------------2 . Cost received tax-free in post years . .
13 . Remainder of cost (line I less line 2) . .1$
4. Amount received this year . . . . . . . . . I S
5 . Taxable portion (excess, if any, of line 4 over line 3) .Schedule G.-INCOME FROM RENTS AND ROYALTIE S
1. Kind and location of property
-----------------------------------------------------
-----------------------------------------------------
---------------------------------------------------
------- ----------------------------------------------
------------------------------------------------------
------------------------------------------------------
------------------------------------------------------
2. Amount of rentor royalty
$ -------------------------------------------------------------------------------------------------------------------------------------
3, Depred tion (explaiia li Sch . 1) or depletio n
$ -------------------------------------------------------------------------------------------- ---------------------------------------------- --
4. Repairs ~attachitemized ist)
$ ------------------------------------------------------------ ------------------ ------------------------------------ I ----------------
5. Other expenses(attach itemized list)
$ ------- - --- - -------
-------------------------------------------------------------------
1 . Totols . . . . . . . . . . . . . . . . . . . . . . . . IS is Is is2. Net income (or loss) From rents and royalties (column 2 less sum of columns 3, 4, and 5) . . . . . . . . . . . . . . .Schedule H .-OTHER INCOME
1 . Partnerships (name and address) ------------------------------------------------- -------------- - ----------------- - -- - - ------ - --2. Estates or trusts (name and address) --------------------------------------------------------------------------------- - - - ------------3 . Other sources (state nature) ----------------------------------------------------------------------------------------- - -- - - - ---------------------------------------------------------------------------------------------------------------------------------------------------------------
Total income (or loss) From above sources (Enter here and on line 10, page 1) . . . . . . . . . . . . . . . . . . . . .P70-16-75313-1
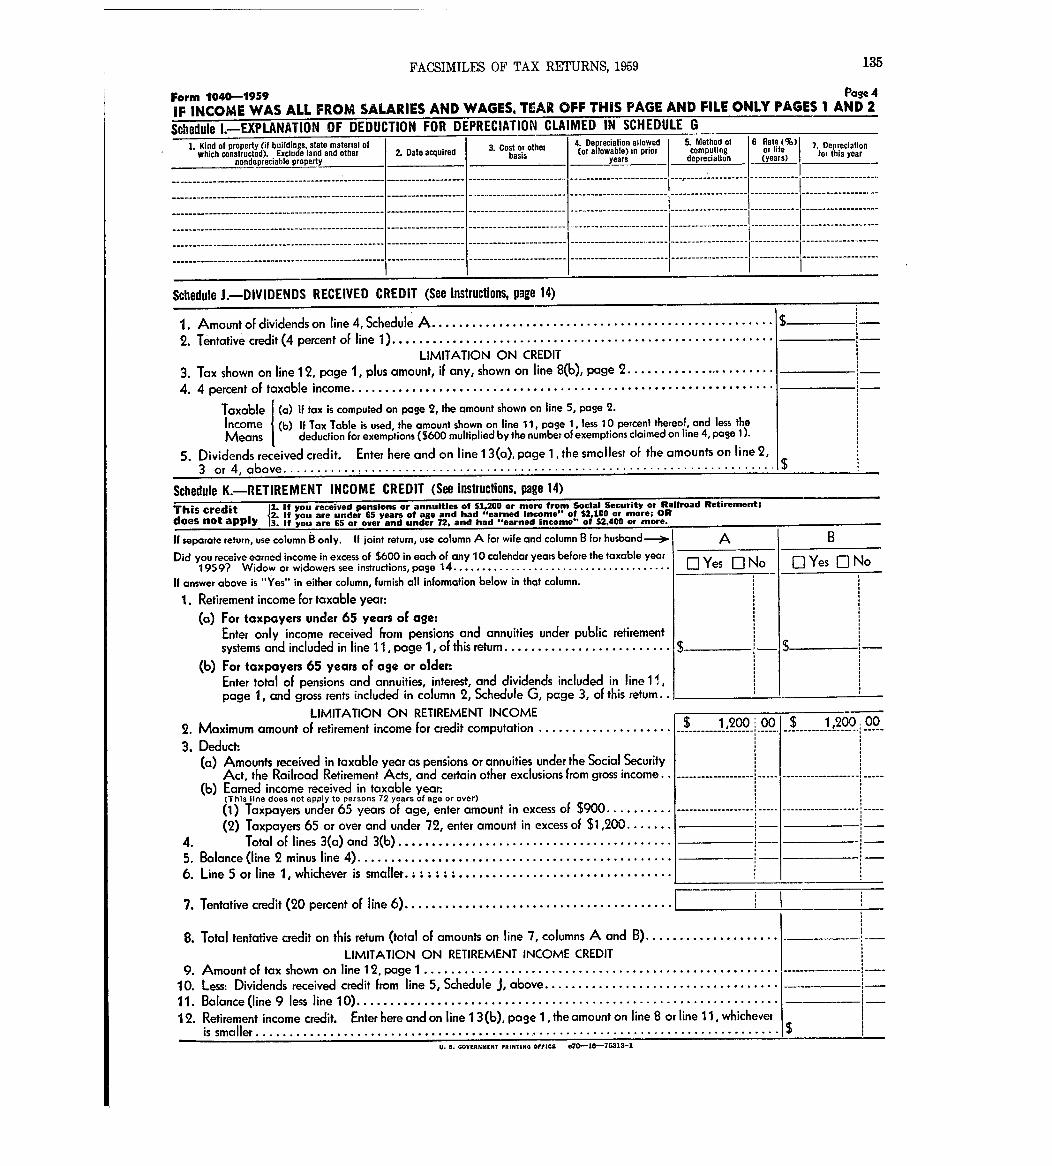
FACSIMILES OF TAX RETURNS, 1959
Form 1040-1959 Page 4IF INCOME WAS ALL FROM SALARIES AND WAGES, TEAR OFF THIS PAGE AND FILE ONLY PAGES 1 AND 2
Schedule I.-EXPLANATION OF DEDUCTION FOR DEPRECIATION CLAIMED IN SCHEDULE G
,IS, state material of1. Kind of property (if buildi nwhich constructed) . Exclu a land and other
nondepreciable property
----------- -----------------------------------------
---------------------------------------------------
-------------------------------------------------
----------------------------------------------------
---------- -----------------------------------------
----------------------------------------------------
2. Date acquired 3 . Cost of othetbasis
Schedule J .-DIVIDENDS RECEIVED CREDIT (See instructions, page 14)
af,reciation allowed4. De(01 owable) in prior
years
5. Method ofcomputing
depreci at .n
------------------
-------------------
-------------------
--------------------
-------------------
6 Rate (%)of lite(yeais )
------------------- 1 ------------
1 . Amount of dividends on line 4, Schedule A . . . . . . . . . . . . . . . . . . . . . . . . . . . . . . . . . . . . . . . . . . . . . . . . . . .2 . Tentative credit (4 percent of line 1) . . . . . . . . . . . . . . . . . . . . . . . . . . . . . . . . . . . . . . . . . . . . . . . . . . . . . . . . .
LIMITATION ON CREDIT3. Tax shown on line 12, page 1, plus amount, if any, shown on line 8(b), page 2 . . . . . . . . . . . . . . . . . . . . . . .
4. 4 percent of taxable income . . . . . . . . . . . . . . . . . . . . . . . . . . . . . . . . . . . . . . . . . . . . . . . . . . . . . . . . . . . . . . .
Taxable (a) If tax is computed on page 2, the amount shown on line 5, page 2 .Income (b) If Tax Table is used, the amount shown on line 11, page 1, less 10 percent thereof, and less theMeans deduction For exemptions ($600 multiplied by the number of exemptions claimed on line 4, page 1) .
5 . Dividends received credit . Enter here and on line 13 (a), page 1, the smol lest of the amounts on line 2,3 of 4, above . . . . . . . . . . . ! . . . . . . . . . . . . . . . . . . . . . . . . . . . . . . . . . . . . . . . . . . . . . . . . . . . . . .
.. . . . . .
Schedule K .-RETIREMENT INCOME CREDIT (See instructions . page 14 )
This credit 1. if you r calved pensions or annuities of $1,200 or more from Social Security or Railroad Retirement ;12. It you aerie under 65 years of age and had "earned Income" of S2,100 of more ; O R
woes nOL aPFINY 3. If you are 65 or over and un r 72. and had "earned Income of S2,400 or more .
If separate return, use column IEl only . If joint return, use column A for wife and column B for husband ii,
Did you receive earned income in excess of $600 in each of any 10 calehdof years before the taxable yea r1959? Widow or widowers see instructions, page 14 . . . . . . . . . . . . . . . . . . . . . . . . . . . . . . . . . . . . . .
U answer above is "Yes" in either column, Furnish all information below in that column .
1 . Retirement income for taxable year:
(a) For taxpayers under 65 years of age:
Enter only income received From pensions and annuities under public retirement
systems and included in line 11, page 1, of this return . . . . . . . . . . . . . . . . . . . . . . . . .
(b) For taxpayers 65 years of age or older:
Enter total OF pensions and annuities, interest, and dividends included in line 11,
page 1, and gross rents included in column 2, Schedule G, page 3, of this return . .
LIMITATION ON RETIREMENT INCOME
2. Maximum amount of retirement income for credit computation . . . . . . . . . . . . . . .3 . Deduct:
(a) Amounts received in taxable year as pensions or annuities under the Social SecurityAct, the Railroad Retirement Acts, and certain other exclusions from gross income . .
(b) Earned income received in taxable year :(Thls llne does not apply to persons 72 years of age or over)
0) Taxpayers under 65 years of age, enter amount in excess of $900 . . . . . . . . . .(2) Taxpayers 65 or over and under 72, enter amount in excess of $1,200 . . . . . . .
4. Total of lines 3(a) and 3(6) . . . . . . . . . . . . . . . . . . . . . . . . . . . . . . . . . . . . . . . . .5 . Balance (line 2 minus line 4) . . . . . . . . . . . . . . . . . . . . . . . . . . . . . . . . . . . . . . . . . . . . . . .6. Line 5 or line 1, whichever is smaller . . . .. . . . . . . . . . . . . . . . . . . . . . . . . . . . . . . . . . . .
A
El Yes
$ 1,200-i .00 .
S
135
7 . Depreciationtol this yea r
B
$ 1,200-00-- ------- -
7 . Tentative credit (20 percent of line 6) . . . . . . . . . . . . . . . . . . . . . . . . . . . . . . . . . . . . . . . .F
8 . Total tentative credit on this return (total of amounts on line 7, columns A and B) . . . . . . . . . . . . . . . . . . . .LIMITATION ON RETIREMENT INCOME CREDIT
9 . Amount OF tax shown on I ine 1 2, page 1 . . . . . . . . . . . . . . . . . . . . . . . . . . . . . . . . . . . . . . . . . . . . . . . . . . . . .10. Less: Dividends received credit from line 5, Schedule J, above . . . . . . . . . . . . . . . . . . . . . . . . . . . . . . . . . . .11 . Balance (line 9 less line 10) . . . . . . . . . . . . . . . . . . . . . . . . . . . . . . . . . . . . . . . . . . . . . . . . . . . . . . . . . . . . . . .12. Retirement income credit. Enter here and online 1 3(b), Page l, theamount online 8 or line 11, whicheve t
is smaller . . . . . . . . . . . . . . . . . . . . . . . . . . . . . . . . . . . . . . . . . . . . . . . . . . . . . . . . . . . . . . . . . . . . . . . . . . . . . . .U. S. G*VERNMENT PRINTING OFFIC9 o70-1.8-76313-1
136 FACSIMILES OF TAX RETURNS, 195 9
Helpful Information on
HOW TO PREPARE YOUR
Income Tax,, Return
on Form 10A~.10
for 19S9
XL 1~
~' A, ~ ~/_.
it 1111111
You can stave money for yourself and
your Government., if you-
File your return oarly-Make sure the figures are righ t
The final (late for filing your return is April 15, but tax-payers who) wait until the last minute often make costlymistakes .
You should be able to prepare your return with the assist-
ance of the information contained in this pamphlet . Theinstructions are arranged in the same order as the linesand pages of Form 1040 . If you need help from the InternalRevenue Service, you can ask questions by phone of ournearest offi, .-e or come in for other assistance .
Commissioner of Internal Revenu e
Instructions 1040 (1959)
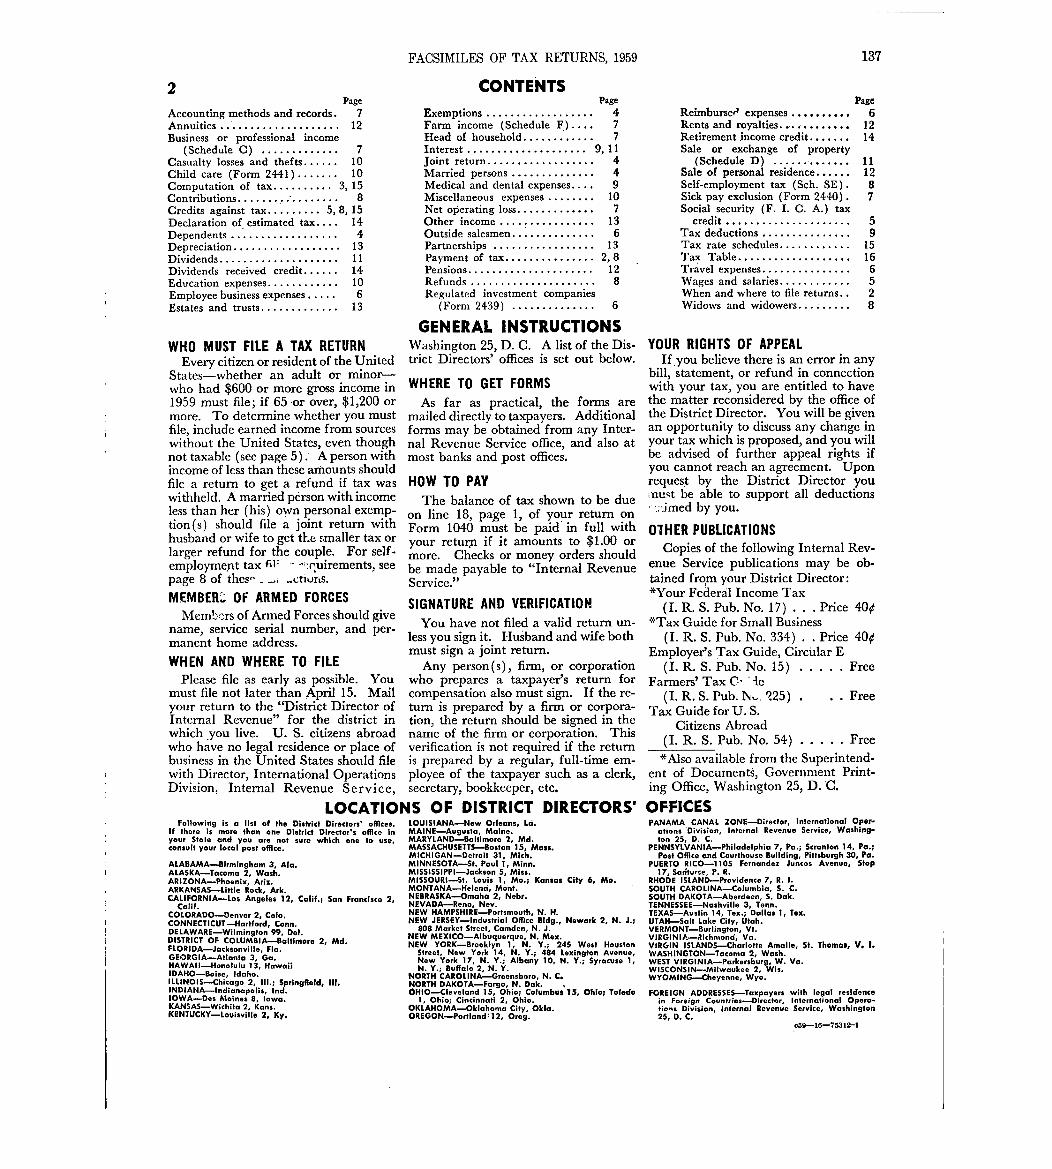
2Page
Accounting methods and records . 7Annuities . . . . . . . . . . . . . . . . . . . . . 12Business or professional incom e
(Schedule C) . . . . . . . . . . . . . 7Casualty losses and thefts . . . . . . 10Child care (Form 2441) . . . . . . . 10Computation of tax . . . . . . . . . . 3, 15Contributions . . . . . . . . .. . . . . . . . . 8Credits against tax . . . . . . . . . 5,8, 15Declaration of estimated tax . . . . 14Dependents . . . . . . . . . . . . . . . . . . 4Depreciation .
. . . . . . . . . . . . .. . . . 13
Dividends . . . . . . . . . . . . . . . . . . . . 11Dividends received credit . . . . . . 14Education expenses . . . . . . . . . . . . 10Employee business expenses . . . . . 6Estates and trusts . . . . . . . . . . . . . 1 3
WHO MUST FILE A TAX RETURNEvery citizen or resident of the Unite d
States-whether an adult or minor-who had $600 or more gross income in1959 must file ; if 65 -or over, $1,200 ormore . To determine whether you mustfile, include earned income from sourceswithout the. United States, even thoughnot taxable (see page 5) . A person withincome of less than these amounts shouldfile a return to get a refund if tax waswithheld . A married person with incomeless than her (his) own personal exemp-tion(s) should file a joint return withhusband or wife to get the smaller tax orlarger refund for the couple. For self-employment tax 41F -- -quirements, seepage 8 of thes- - _i -criuns .
MEMBER" OF ARMED FORCES
Membcrs of Armed Forces should givename, service serial number, and per-manent home address.
WHEN AND WHERE TO FIL EPlease file as early as possible . You
must file not later than April 15 . Mailyour return to the "District Director ofInternal Revenue" for the district inwhich -you live . U. S. citizens abroadwho have no legal residence or place ofbusiness in the United States should filewith Director, International OperationsDivision, Internal Revenue Service,
FACSIMILES OF TAX RETURNS, 1959
CONTENTSPage
Exemptions . . . . . . . . . . . . . . . . . . 4Farm income (Schedule F) . . . . 7
Head of household . . . . . . . . . . . . 7Interest . . . . . . . . . . . . . . . . . . . . 9,11joint return . . . . . . . . . . . . . . . . . . 4Married persons . . . . . . . . . . . . . . 4Medical and dental expenses . . . . 9Miscellaneous expenses . . . . . . . . 10Net operating loss . . . . . . . . . . . . . 7Other income . . . . .. . . . . . . . . . . . 13
Outside salesmen . . . . . . . . . . . . . . 6Partnerships . . . . . . . . . . . . . . . . . 13
Payment of tax . . . . . . . . . . . . . . . 2,8Pensions . . . . . . . . . . . . . . . . . . . . . 12Refunds . . . . . . . . . . . . . . . . . . . . . 8Regulated investment companies
(Form 2439) . . . . . . . . . . . . . 6
GENERAL INSTRUCTIONSWashington 25, D. C. A list of the Dis-
trict Directors' offices is set out below.
WHERE TO GET FORM SAs far as practical, the forms are
mailed directly to taxpayers . Additionalforms may be obtained from any Inter-nal Revenue Service office, and also atmost banks and Post offices .
HOW TO PAYThe balance of tax shown to be due
on line 18, page 1, of your return onForm 1040 must be paid in full withyour return if it amounts to $1 .00 ormore . C~ecks or money orders shouldbe made payable to "Internal RevenueService ."
SIGNATURE AND VERIFICATIONYou have not filed a valid return un-
less you sign it . Husband and wife bothmust sign a joint return .
Any person(s), firm, or corporationwho prepares a taxpayer's return forcompensation also must sign . If the re-turn is prepared by a firm or corpora-tion, the return should be signed in thename of the firm or corporation. Thisverification is not required if the returnis prepared by a regular, full-time em-ployee of the taxpayer such as a clerk,secretary, bookkeeper, etc .
137
PageReimburserl expenses . . . . . . . . . . 6Rents and royalties . . . . . . . . . . . . 12Retirement income credit . . . . . . . 14Sale or exchange of property
(Schedule D) . . . . . . . . . . . . . 11Sale of personal residence . . . . . . 12Self-employment tax (Sch . SE) . 8Sick pay exclusion (Form 2440) . 7Social security (F . 1. C. A.) tax
credit . . . . . . . . . . . . . . . . . . . . . 5Tax deductions . . . . . . . . . . . . . . . 9Tax rate schedules . . . . . . . . . . . . 15Tax Table . . . . . . . . . . . . . . . . . . . 16Travel expenses . . . . . . . . . . . . . . . 6Wages and salaries . . . . . . . . . . . . 5When and where to file returns . . 2Widows and widowers . . . . . . . . . 8
YOUR RIGHTS OF APPEA LIf,you believe there is an error in any
bill, statement, or refund in connectionwith your tax, you are entitled to havethe matter reconsidered by the office ofthe District Director . You will be givenan opportunity to discuss any change inyour tax which is proposed, and you willbe advised of further appeal rights ifyou cannot reach an agreement . Uponrequest by the District Director you
be able to support all deductions.;,.;med by you .
OTHER PUBLICATION SCopies of the following Internal Rev-
enue Service publications may be ob-tained from your District Director :*Your Fe&ral Income Tax
(I . R. S . Pub . No . 17) . . . Price 40~*Tax Guide for Small Business
(I . R. S . Pub. No. 334) . . Price 40~Employer's Tax Guide, Circular E
(I . R . S . Pub. No . 15) . . . . . FreeFarmers' Tax 0- ie
(I . R. S . Pub . N,. 125) FreeTax Guide for U. S .
Citizens Abroad(I . R. S . Pub. No. 54) . . . . . Free
*Also available from the Superintend-ent of Documents, Government Print-ing Office, Washington 25, D.C.
LOCATIONS OF DISTRICT DIRECTORS' OFFICESFollowing is a list of the District Directors' offices .
If ther is more than one District Director's office inyour State and you are not sure which one to use,consult your local post office .
ALABAMA-Birmingham 3, Ala.ALASKA-Tacoma 2, Wash .ARIZONA-Phoenix, Ariz .ARKANSAS-Little Rock, Ark.CALIFORNIA-Los Angeles 12, Calif . ; Son Francisco 2,
Calif .COLORADO-Denver 2, Colo .CONNECTICUT -Hartford, Conn.DELAWARE-Wilmington ", Del .DISTRICT OF COLUMIIIA-Baltlmore 2, Md .FLORIDA-Jacksonvi Ile, Fla .GEORGIA-Atlanta 3, Ga.HAWAII-Honolulu 13 , HawaiiIDAHO-Boise, Idaho .ILLINOIS-Chicago 2, Ill .; Springfield, 111.INDIANA-Indianapolis, Ind .IOWA-Des Moines 8, Iowa .KANSAS-Wichita 2, Kans .KENTUCKY-Louisville 2, Ky .
LOUISIANA-Now Orleans, La .MAINE-Augusta, Maine .MARYLAND-Ba Iti more 2, Md .MASSACHUSETTS-Boston 15, Mass.MICHIGAN-Detroit 31, Mich .M I NNESOTA-St . Paul 1, Minn .MISSISSIPPI-Jackson 5, Miss .MISSOURI-St . Louis 1, Mo . ; Kansas City 6, Mo .MONTANA-Helenci, Mont.NEBRASKA-Omaha 2, Nebr.NEVADA-Reno, Nev .NEW HAMPSHIRE-Portsmouth, N . H .NEW JERSEY-industrial Office Bldg ., Newark 2, N . J. ;
808 Market Street, Camden, N . J .NEW MEXICO-Albuquerque, N . Mex.NEW YORK-Brooklyn 1, N . Y . ; 245 West Houston
Street, New York 14, N . Y . ; 484 Lexington Avenue,New York 17, N . Y.; Albany 10, N . Y.; Syracuse 1,N . Y
.; Buffalo 2, N . Y .
NORTH CAROL I NA-Greensbaro, N . C .NORTH DAKOTA-Fargo, N . Dak .OHIO-Cleveland 15, Ohio ; Columbus 15, Ohio ; Toledo
1, Ohio; Cincinnati 2, Ohio .OKLAHOMA--Oklahoma City, Okla.OREGON-Portland ~ 12, Oreg .
PANAMA CANAL ZONE-Director, International Oper-ations Division, Internal Revenue Service, Washing-ton 25, D . C .
PENNSYLVANIA-Philadelphia 7, Pa .; Scranton 14, Pa . ;Post Office and Courthouse Building, Pittsburgh 30, Pa .
PUERTO RICO-1105 Fernandez Juncos Avenue, Stop17, Sariturce, P . R .
RHODE ISLAND-Providence 7, R . 1 .SOUTH CARO LI NA-Columbia, S . C.SOUTH DAKOTA-Aberdeen, S . Dak.TENN ESSE E-Nashvil le 3, Tenn.TEXAS-Austin 14, Tex . ; Dallas 1, Tex .UTAH-Salt Lake City, Utah .VERMONT-Burlington, Vt.VIRGIN I A-Richmond, Va .VIRGIN ISLANDS-Charlotte Amalie, St . Thomaeg V, 1.WASH INGTON-Tacoma 2, Wash .WEST VIRGIN IA-Parkersburg, W . Va .WISCONSIN-Milwaukee 2, Wis .WYOMING-Cheyenne, Wyo .
FOREIGN ADDRESSES-Taxpayers with legal residencein Foreign Counfries-Director, International Opera-tions Division, Internal Revenue Service, Washington25, 0. C .
c59--16-75312-1
1a8 FACSIMILES OF TAX RETURNS, 1959
3
SELECTION OF YOUR INDIVIDUAL INCOME TAX FOR MIn order to make your reporting problem as simple as possible the Internal Revenue Service has developed three
individual income tax forms . Since most taxpayers' income consisis of salary or wages, dividends, and interest, two ofthe forms have been designed to cover only the items of income and deductions which apply to this group of taxpayers .These three forms are as follows :
Form 1040AThis is the easiest form if you are eligible to use it . One of the special features is that if your income is lem than
$5,000, you can choose to have the Internal Revenue Service figure. your tax for you . You may use this form if :1 . Your gross Income was less than $10,000, AN D2. It consisted of wages reported on withholding statements (Forms W-2) and not more than $200 total of other wages, interest, and
dividends, AN D3 . You wish to take the standard deduction (about 10% of your Income) Instead of Itemizing deductions .
Form 104O WThis is a new streamlined verLaon of the regular Form 1040 . 'It will he most helpful for wage and salary earners
who can't use Form 1040A because they wish to itemize deductiorts, claim the "sickwpay" exclusion or estimated taxpayments, or have V0,000 or over of income, etc. You can use this form if :
1 . Your income consists of salary and wages regardless of amount, AND2 . Not more than $200 of dividends and interest AN D3. No other items of income .
Form 104 0This is the standard form which anyone can use . Instructions J'or this form follow .
HOW TO FILL IN FORM 1040Filling in the form involves FOUR STEPS :
STEP IClaiming You r
Exemption s
STEP 2Reporting Your
Income
STEP 3Claiming You r
Deductions
STEP 4Figuring You r
Tax
List on page I exemptions for yourself (and for your wife, if you are filing a joint return or if shehad no income) and for your children . List exemptions for dependents other than your children in theschedule at the top of page 2 .
DETAILED INSTRUCTIONS, PAGE 4 OF THIS PAMPHLET .
Enter income from salaries and wages on page 1 ; also, income ffom farming and other businessincome, the details of which will be shown in separate Schedules F and C. All other income is to bereported on page 3. If you are an employee, see pages 6 and 7 of these instructions for infor-mation relating to the treatment of sick pay and special deductions for travel expenses, reimbursedexpenses, etc .
DETAILED INSTRUCTIONS, PAGES 5, 6, AND 7 OF THIS PAMPHLET .
The law allows you to reduce your income by certain contributions to charity, expenditures forinterest, taxes, extraordinary medical and dental expenses, child care, certain losses, and miscellaneousitems, provided you itemize them on your return . Since there are restrictions on these deductions,refer to pages 8, 9, 10, and I I of this pamphlet fc r details .
The law also provides a "standard deduction" for persons who do not wish to list their deductions .The Tax Table on page 16 automatically allows e . standard deduction for persons having income of lessthan $5,000 . The standard deduction for those with income of $5,000 or more is 10 percent of theincome on line 11, page 1 of the form, but not tc) exceed $1,000 ($500 for a married person filing aseparate return) . It will be wise to compare the * total of your itemized deductions with the standarddeduction to see which method is better .
DETAILED INSTRUCTIONS, PAGES 8, 9, 10, AND 11 OF THIS PAMPHLET .
If you do not itemize deductions and if your income on line 11, page 1 of the form, is less than$5,000, you must use the Tax Table on page 16. If you itemize your deductions or if your incomeis $5,000 or more, you must use the tax comp=.tion schedule on page 2 of the form and the tax rateschedules on page 15 of this pamphlet . See page 7 if you are unmarried or legally separated, main-tain a home, and have a dependent living with you . Also see page 8 if you are a widow or widowerand have a dependent child .
DETAILED INSTRUCTIONS, .PAGE 15 OF THIS PAMPHLET
e5Q-16-75312-1
4
FACSIMILES OF TAX RETURNS, 1959
INSTRUCTIONS FOR PAGE I OF FORM 1040
MARRIED PERSONS-JOINT OR SEPARATE RETURN S
Advantages of a Joint Return .- In mostcases it is advantageous for marriedcouples to file joint returns. The lawprovides "split income" benefits in fig-uring the tax on a joint return whichoften results in a lower tax than wouldresult from separate returns.
How To Prepare a Joint Returm--In ajoint return you must include all incomeand deductions of both husband andwife . In the return heading, list bothnames including middle . initials (forexample : "John F . and Mary L . Doe") .Both must sign the return .
A husband and wife may file a jointreturn even though one of them had noincome . A joint return may not befiled if either husband or wife was a
nonresident alien at any time duringthe taxable year.
When a joint return is filed, the cou-ple assume full legal responsibility forthe entire tax, and if one fails to pay,the other must pay it.
How To Prepare a Separate Return~-In aseparate return each must report hisor her separate income and deductionsand fill in a separate form . The "splitincome" provisions of the Federal taxlaw do noi apply to separate returns ofhusband and wife . When filing sep-arate returns, the husband and wifeshould each claim the allowable deduc-tions paid with his or her own funds .(In community property States, deduc-
139
tions resulting from payments made outof funds belonging jointly to husbandand wife may be divided half and half.)If one itemizes and claims actual deduc-tions, then both must do so .
Changes in Marital StatuS.-If mar-ried at the end of your taxable year,you are considered married for the en-tire year. If divorced or legally sep-arated on or before the end of youryear, you are considered single for theentire year. If your wife or husbanddied during the year, you are consideredmarried for the entire year, and mayfile,a joint return . You may also beentitled to the benefits of a joint returnfor the two years following the death ofyour husband or wife. See page 8 .
HOW TO CLAIM YOUR EXEMPTION SYou Are Allowed a Deduction of $600 for Each Exemption for Which You Qualify as Explained Belo w
LINE I-EXEMPTIONS FOR YOU ANDWIFEFor You .-You, as the taxpayer, are al-
ways entitled to at least one exemption.If, at the end of your taxable year, youwere blind or were 65 or over, you gettwo exemptions . If you were bothblind and 65 or over, you get threeexemptions. Be sure to check theappropriate blocks.
For Your Wife.-An exemption is al-lowed for your wife (or husband) ifyou and she are filing a joint return .If ~~u file a separate return, you mayclaim her exemptions only if she had noincome and did not receive more thanhalf her support from another taxpayer .You are not entitled to an exemptionfor your wife on your return if she filesa separate return for any reason (forexample, to obtain a refund of tax with-held where her income is less than$600) . Otherwise, your wife's exemp-tions are like your own--one, if she wasneither blind nor 63 or over ; two, if shewas either blind or 65 or over ; three, ifshe was both blind and 65 or over .
In Case of Death .- If your wife or hus-band died during 1959, the number ofher or his exemptions is determined asof the date of death .
Proof of Blindness.-If totally blind,a statement of such fact must be at-tached to the return. If partially blind,attach a statement from a qualified phy-~ician or a registered optometrist that( 1) central visual acuity did not exceed20/200 in the better eye with correctinglenses, or (2) that the widest diameterof the visual field subtends an angle nogreater than 200 .
LINE 2-EXEMPTIONS FOR YOURCHILDRE NYou are entitled to one exemption for
each child (including a stepchild, alegally adopted child, and a child who isa member of your household if placedwith you by an authorized placementagency for legal adoption), if during thetaxable year, that child :
1 . Income.- Received less than $600gross income (if the child was under19 or was a student, this limitation doesnot apply), and
2 . Support .-Received more than halfof his or her support from you (or fromhusband or wife if a joint return is filed),(see definition below of support), and
3. Married Children .-Did not file ajoint return with her husband (or hiswife), and
4. Nationlity .-Was either a citizen orresident of the United Stat6s or a resi-dent of Canada, Mexico, the Republicof Panama or the Canal Zone ; or wasan alien child adopted by and livingwith a United States citizen abroad .
Defi?,tition of Support .-Support in-cludes food, shelter, clothing, medicaland dental care, education, and the like .Generally, the amount of an item ofsupport will be the amount of expenseincurred by the one furnishing suchitem. If the item of support furnishedby an individual is in the form of Prop-erty or lodging, it will be necessary tomeasure the amount of such item ofsupport in terms of its fair market value .In computing the amount of sup-port include amounts contributed bythe dependent for his own support and
also amounts ordinarily excludable fromgross in come .
In figuring whether you provide morethan half of the support of a student,you may disregard amounts receiveo byhim as scholarships.
Definition of Student.-The law de-fines a student as an individual who,during each of 5 .calendar months dur-ing the year, is (a) a full-time studentat an educational institution or (b)pursuing a full-time course of institu-tional on-farm training under the su-pervision of an accredited agent of aneducational institution or of a State, ora political subdivision of a State .
LINE 3-EXEMPTIONS FOR PERSONSOTHER THAN YOUR CHILDRE NYou are entitled to one exemption for
each other dependent who meets -all thefollowing requirements for the year :
1 . Received less than $600 gross in-come, an d
2 . Received more than half of his orher support from you (or from husbandor wife if a joint return is filed), (seedefinition of support on this page), an d
3 . Did not file a joint return with herhusband (or his wife), an d
4. Was either a citizen or residentof the United States or a resident ofCanada, Mexico, the Republic of Pan-ama or the Canal Zone, and
5 . EITHrR (1) for your entire taxableyear had your home as his. principalplace of abode and was a member ofyour household ; OR (2) was related toyou (or to husband or wife if a jointreturn is filed) in one of the followingways :
.59--16--75312-1
140
MotherFatherGrandmotherGrandfatherBrotherSiste rGrandsonGranddaughter
FACSIMILES OF TAX RETIrRNS, 1959
INSTRUCTIONS FOR PAGE I OF FORM 1040-Continued
StepbrotherStepsisterStepmotherStepfatherMother-in-lawFather-in-lawBrother-in-lawSister-in-law
Son-in-lawDaughter-in-lawThe following ifrelated by blood :
UncleAuntNephewNiece
The information concerning these de-pendents must be shown in the scheduleat the top of page 2 of Form 1040 .
Birth or Death of Dependent .-You canclaim a full $600 exemption for a de-pendent who was born or died duringthe year if the tests for claiming anexemption for such dependent are met
for the part of the year during which hewas alive .
Exemptions for Individuals Supported byMore Than One Taxpayer.- If s,2-veral per-sons contributed toward the support ofan individual during the taNable'year,but none contributed over half of thesupport, they may designate oic of theirnumber to claim the cxemptic)n if :
(a) They as a group have providedover half of the support of the indi-vidual ; and
(b) Each of them, had he contrib-uted over half of the support, would
5have been entitled to claim the indi-vidual as a dependent ; and
(c) The person claiming the exemp-tion for the individual contributed over10 percent of the support ; and
(d) Each other person in the groupwho contributed over 10 percent of theindividual's support makes a declara-tion that he will not claim the individ-ual as a dependent for the year. Thedeclarations must be filed with the re-turn of the per-son claiming the exemp-tion. Form 2120, Multiple SupportDeclaration, is available at any InternalRevenue Service office .
HOW TO REPORT YOUR INCOM EThe law says all kinds of income in cifically exempt must be included in in finding out what kinds of income
whatever form received are subject to your return, even though it may be must be reported on your income taxtax with specific exceptions . This offset by expenses and other deductions . return and what items are exempt frommeans that all income which is not spe- The following examples wi .1 help you tax .
Examples of Income Which Mulst Be Reporte dWages, salaries, bonuses, commissions,
fees, tips, and gratuities.Dividends.Interest on bank deposits, bonds, notes .Interest on U. S . Savings bonds .Profits from sales or exchanges of real
estate, securities, or other property.
ExamplesDisability retirement payments an d
other benefits paid by the VeteransAdministration on account of mili-tary service to veterans and theirfamilies .
ROUNDING OFF TO WHOLE-DOLLARAMOUNTSIf you wish, the money items on your
return and accompanying schedules re-quired by such return may be shown aswhole-dollar amounts . This means thatyou eliminate any amount less than 50cents, and increase any amount from50 cents through 99 cents to the nexthigher dollar.ATTACHMENTS TO THE RETURN
Attachments may be used in the prep-aration of your return and supplementalschedules, provided they contain all ofthe required information and that sum-marized totals of the items shown in theattachments are entered on the returnand schedules . This does not apply topage 3 of the business and farm sched-ules (Schedules C and F) which theService separates from the returns andtransmits to the Social Security Admin-istration for the recording of informa-tion in benefit accounts, or to any taxcomputation portion of a form or sched-ule .LINE 5-WAGES, SALARIES, ETC .
Enter all wages, salaries, etc ., onthe lines provided . If more space is
Industrial, civil service and other pen-sions, annuities, endowments .
Rents and royalties from property, pat-ents, copyrights .
Profits from business or profession .Your share of partnership pre fits ; estate
or trust income.of Income Which Should Hof Be
Dividends on veterans' insurance .Workmen's compensation, insurance ,
damages, etc ., for injury or sickness .Interest on State and munici :)al bonds .Life insurance proceeds upork death .
needed attach a separate statement .You must report the full amount of yourwages, salaries, fees, commissions, tips,bonuses, and other payment, for yourpersonal services even though taxes apdother amounts have been withheld byyour employer .
Payment in Merchandise, etc.-- If y o uare paid in whole or in part in mer-chandise, services, stock, or o1her thingsof value, you must determine the fairmarket value of such items and includeit in your wages .
Meals and Living Quarters.-],' mployceswho, as a matter of choice, receive mealsand lodging from their employerswhether or not it is agreed to be part oftheir salaries must include in incomethe fair market value of the imeals andlodging.
However, if, for the convenience ofyour employer, your meals are furnishedat your place of employment or you arerequired to accept lodging at your placeof employment as a condition of youremployment, the value of the meals orlodging is not to be reported in yourreturn .
Employer supplemental unemploymentbenefits .
Alimony, separate maintenance or sup-port payments received from (anddeductible by) your husband (orwife) . For details see Miscellaneous,page 10 of this pamphlet .
ReportedFederal and
benefits .State Social Security
Railroad Retirement Act benefits .Gifts, inheritances,. bequests .
Earned Income From Sources Without TheUnited States .-For the purpose of de-termining whether an income tax returnmust be filed, gross income must becomputed without regard to the exclu-sion provided for income earned fromsources without the United States . Ifyou received such income and believeit is excludable for income tax purposes,complete Form 2555 and attach it toyour Form 1040.
Income Tax Withheld .-Itemize thetaxes withheld, and report the totalamount on line 17 (a) . If you havelost a Withholding Statement, askyour employer for a copy . If you can-not furnish Withholding Statements forall taxes withheld from you, attach inexplanation .
Excess Social Security (F . 1. C. A.) TaxCredit-If more than $120 .00 of SocialSecurity (F . 1 . C. A .) employee tax waswithheld during 1959 because either youor your wife received wages from morethan one employer, the excess should beclaimed as a credit against income tax .Enter any excess of Social Security(F . 1 . C. A.) tax withheld over $120.00
c59--16-75312-1
6
FACSIMILES OF TAX RETURNS, 1959
INSTRUCTIONS FOR PAGE I OF FORM 1040-Colitinue d
on line 5, column (b), and write'T. I . C. A. tax" in the "Where Em-ployed" column. If a joint return, donot add the Social Security (F. I . C. A.)tax withheld from both husband andwife to figure the excess over $120.00 ;compute the credit separately.
Credit for Taxes Paid by Regulated Invest-ment Companies.- If you are entitled to acredit for taxes paid by a regulatedinvestment company on undistributedcapital gains, enter the credit on line5, column (b), and write "Credit fromregulated investment company" in"Where Employed" column . To sub-stantiate the credit claimed attach CopyB of Form 2439 to page I of Form 1040in the same manner as WithholdingStatements, Form W-2 .
EMPLOYEE BUSINESS EXPENSES .Certain expenses incurred by an em-
ployee in connection with his employ-ment, amounts charged to his employer,and any advances, allowances, or reim-bursements he receives for such expensesmust be taken into account in deter-mining his income tax liability . Undercertain circumstances, however, the ex-penses-and an equal amount of theemployer's payments--need not beshown on the return. The followinginstructions will assist you in makingyour computation : Part I deals with de-ductible expenses and Part II with re-porting requirements . (Note : You donot have to report in your return em-ployer paid expenses incurred for in-cidentals, such as the purchase of officesupplies for the employer or local trans-portation in connection with an errand . )
Part 1 . Employee Business Expenses WhichAre Deductibl e
The law requires that certain em-ployee business expenses be handled .differently from other expenses. Therules are as follows :
A. Travel, transportation, and out-side salesmen expenses :
You may deduct these expenses fromthe amounts you are required to reportin item 5, page 1, to the extent they arenot paid for by your employer. See PartII for reporting requirements . Travel,transportatidn, and outside salesmen ex-penses mean :
(1) Expenses for travel, includingthe cost of meals and lodging whiletemporarily away at least overnightfrom the city, town or other generalarea which constitutes your principal orregular business location are deductibleas expenses for travel while "away fromhome." For this purpose, "home"means your principal or regular businesslocation .
(2) Transportation expenses in con-nection with your duties as an employeeare deductible even though you are notaway from home as explained above.Transportation expenses include pay-ments for actual travel or, if you useyour own car, they include the businessportion of the cost of operation, inclu4-ing fuel, repairs, and depreciation . Thecost of commuting between your resi-dence and your principal place of em-ployrricht is a personal expense and isnot deductible .
(3) If you are an "outside salesman"you may deduct all of the expenseswhich are ordinary and necessary inperforming your duties . This meansthat in addition to the expenses de-scribed above you are entitled to deductother business expenses such as busines s
,,, and postage .entertainment, stationeryThe term "outside salesman" means,onewho .is engaged in full time solicitationof business for his employer away fromthe employer's place of business. Itdoes not include a person whoseprin-cipal activities consist of service anddelivery as, for example, a milk driver-salesman .
B. Other employee business expenses :If you itemize deductions on page 2
of your ret&n, you may deduct (underthe heading "Other Deductions") ordi-nary and necessary business expenses,other than those described in "A" aboveto the extent that they are not paid forby your employer. Examples of suchexpenses are entertainment, professionaland union dues, and the cost of tools,materials, etc .
Part 11 . Reporting Employee Business Ex-penses
Expenses you paid or incurred as anemployee, or expenses which youcharged to your employer, qr expensesfor which you received an advance, al-lowance, or reimbursement should behandled as follows :
A Employees who are required toand ~o account to their employers :
If you were required to and did sub-nift an expense voucher or other ac-counting to your employer in which-youlisted your business expenses by cate-gories (i . e ., transportation, meals andlodging while away from home over-night, entertainment expenses, andother business expenses), and if youranswer is "Yes" to the questions on pageI of Form 1040 relating to reimbursedexpenses, you may report as follows :
(1) If employees payments equatedbusiness expenses .-You need not re-port these items on your return eitheritemized or in total amount.
141
(2) If employer's Payments exceededbusiness expenses .-Ifyou recei~ed fromor charged to your employer (for ex-ample, through the use of credit cards)amounts in excess of your actual busi-nes~ expenses, or if your employer paid-your personal expenses for you, the ex-cess amounts and the amount of per-sonal expenses must be included inincome on line 5, page 1, of Form 1040,and must be identified as "ExcessReimbursements."
(3) If expenses exceeded employer'spayments.-If you wish to claim a de-duction for the amount of the excess ex-penses, you must, in addition to answer-ing the questions relating to businessexpenses on page I of Form 1040
,sub
mit the following information with yourreturn :
(a) The total of all amounts re-ceived from or charged to your em-ployer for business expenses, includingamounts charged directly or indirectly .through credit cards or otherwise ,
(b) The nature of your occupation,(c) The number of days away from
home on business, and(d) The amount of your expenses
which constitute ordinary and necessarybusiness expenses broken down into suchbroad categories as transportation,meals and lodging while away fromhome overnight, entertainment ex-penses, and other business' expenses .
In preparing your statement andclaiming your expenses be sure to sep-arate the expenses as explained in PartI which are deductible in computingthe amount to be entered on line 5, page1, of the return and those expenseswhich are deductible on page 2 of thereturn. Form 2106 is available in anyInternal Revenue Service office for usein listing these expenses .
If you received per diem, in lieu ofsubsistence, of not more than $15 perday, or a -mileage allowance of not morethan 12V2 cents per mile for travelwithin the continental limits of theUnited States, it will be considered,thatyou were required to account to youremployer, and you will be required toreport only the excess of the allowanceover your actual expenses .
B. Employees who do not account totheir employers or who are not reim-bursed for their expenses-
If you were not required to accountto your employer (or if you were re-quired to account and did not) or ifyour employer did not pay for your busi-ness expenses in connection . with yourduties as an employee, submit the in-formation required in subparagraph (3)above in a statement attached to you r
c59-16--75312-1
142 FACSIMILES OF TAX RETUIZNS, 1959
INSTRUCTIONS FOR PAGE 1 OF FORM 1040-Continue d
return, answer the questions on page Iof Form 1040 relating to reimbursedexpenses and complete your return asfollows :
(1) If employer's payments equaledbusiness expenses .-No further entrywith regard to the transactions need bemade on the form .
(2) If employer's payments exceededbusiness expenses .-If you receivedfrom or charged to your employer (forexample, through the use of creditcards) amounts in excess of your actualbusiness expenses, or if your employerpaid your personal expenses for you, theexcess amounts and the amount of per-sonal expenses must be included in in-come on line 5, page 1, of Form 1040,and identified as "Excess Reimburse-ments ."
(3) If your business expenses exceed-ed employer's payments or the employerdid not pay for your expenses .-Youmay claim deductions for those businessexpenses not paid by him as explainedin subparagraph (3) of Part H.
LINE 6--EXCLUSION FOR "SICK PAY"The law allows you to exclude from
income amounts received under a wagecontinuation plan for the period duringwhich you were absent from work on ac-count of personal injuries or sickness .If both you and your employer contrib-ute to the plan, any benefits attrib-utable to your own contributions areexcludable without limit, but there arecertain limitations on the exclusion ofthe benefits attributable to your employ-er's contributions . In the case of such acontributory plan, it will be necessary foryou to know to what extent any benefitsare attributable to your contributionsand to what extent they are attributableto your employer's contributions .
The employer-provided wage contin-uation payments can be excluded at arate not to, exceed $100 a week . In caseswhere these payments exceed a weeklyrate of $100, the exclusion is figured bymultiplying the amount received by 100and dividing the result by the weeklyrate of payment .
If your absence is due to sickness, theexclusion of employer-provided wagecontinuation payments does not applyto the amounts received for the first 7calendar days of each absence fromwork. However, if you were (a) hos-pitalized on account of sickness for atleast one day at any time during the ab-sence from work, or (b) injured, theexclusion applies from the first day ofabsence.
If you received sick pay and it is in-cluded in your gross wages as shown onForm W-2, enter the gross wages on
line 5, and enter on line 6 th2 amountof such wages to be excluded. In addi-tion, attach a statement showing yourcomputation, and indicating the periodor periods of absence, nature cf sicknessor injury, and whether ho~pitalizecl .Or, you may use Form 2440 which maybe obtained from any Internal RevenueService office .
Amounts received during ab :;ence dueto pregnancy are excludable as sick payonly if a statement by a physician isfurnished that it was necessax), the tax-payer reryfain at home becaus~ of sub-stantial danger of miscarriage .
LINE B-BUSINESS OR PROFESSIONGeneral.-The law taxes the profits
from a business or profession-.iot its to-tal receipts . Therefore, separate Sched-ule C (Form 1040), which contains fur-ther instructions, is provided to help youfigure your profit or loss from business .
If some of your expenses are partbusiness and part personal, you can de-duct the business portion but not thepersonal portion. For instance, a doctorwho uses his car half for business candeduct only half the operating 2xpenses .
Everyone engaged in a trade or busi-ness and making payments tc anotherperson of salaries, wages, cornmissions,interest, rent, etc ., of $600 or more inthe course of such trade or businessduring his taxable year must f ile infor-mation returns, Forms 1096 and 1099,to report such payments. If a portionof such salary or wage payments wasreported on a Withholding Statement(Form W-2), only the remainder mustbe reported on Form 1099 .
Accounting Methods and Record, ;.-Yourreturn must be on the "cash method"unless you keep books of account . "Cashmethod" means that all items cf taxableincome actually or constructively re-ceived during the year (whether in cashor in property or services) ZLnd onlythose amounts actually paid during theyear for deductible expenses are shown .Income is "constructively" receivedwhen it is credited to your account orset aside for you and may bq drawnupon by you at any time . Uncashedsalary or dividend checks, bank interestcredited to your account, matured bondcoupons, and similar items which youcan tup into cash immediLtely are"constructively received" even though
you have not actually converted theminto cash .
An "accrual method" means that youreport income when earned, e-ven if notreceived, and deduct expenses whenincurred, even if not paid within thetaxable period .
The method used in keeping yourrecords may be the cash method, or anaccrual method, so long as income isclearly reflected. However, in mostcases you must secure corisent of theCommissioner of Internal Revenue,Washington 25, D. C., before changingyour accounting method.
Net Operating Loss.-If, in 1939, yourbusiness or profession lost money insteadof making a profit, or if you had a cas-ualty loss, or a loss from the sale or otherdisposition of depreciable property (orreal property) used in your trade orbusiness, you can apply these lossesagainst your other 1959 income. Ifthese losses exceed your other income,the excess of this "net operating loss"must be carried back three years to off-set your income for 1956 first, and then1957 and 1958, and any remainingexcess may be carried forward againstyour income for the years 1960 through1964. If a carryback entitles you to arefund of prior year taxes, ask the Dis-trict Director for Form 1045 to claim aquick refund. For further information,see section 172 of the Internal RevenueCode of 1954.
If you had a loss in preceding yearswhich may be carried over to 1959, youshould apply the net operating loss de-duction as an adjustment of the amountentered on line 11, and attach a state-ment showing this computatfon .LINE 9-FARMIN G
For the assistance of farmers, a sepa-rate Schedule F (Form 1040) is providedto report farm income for income andself-employment tax purposes . Addi-tional instructions for farmers havebeen provided for use with Schedule Fwhich may be obtained from any Inter-nal Revenue Service office.SPECIAL COMPUTATION S
Unmarried Head of Household.-The lawprovides a special tax rate for any indi-vidual who qualifies as a "Head ofHousehold." Only the following per-sons may qualify : (a) one who is un-married (or legally separated) at theend of the taxable year, or (b) one whois married at the end of the year to anindividual who was a nonresident alienat any time during the taxable year.
In addition, you must have furnishedover half of the cost of maintaining asyour home a household which duringthe entire year, except for temporaryabsence, was occupied as the principalplace of abode and as a member of suchhousehold by (1) any related person(see those listed under requirement 5 atthe top of page 5 of these instructions)for whom you are entitled to a deduc-tion for an exemption, unless the de-
c59-16-75312-1
8
FACSIMILES OF TAX RETURNS, 1959
INSTRUCTIONS FOR PAGE I OF FORM 1040-Continued
duction arises from a multiple supportagreement, .(2) your unmarried child,grandchild, or stepchild, even thoughsuch child is not a dependent or (3)your married child, grandchild, or step-child for whom you are entitled to adeduction for an exemption .
If you qualify under (a) or (b)above, you are entitled to the specialtax rate if you pay more than half thecost of maintaining a household (notnecessarily your home) which is theprincipal place of abode of your fatheror mother and who qualifies as yourdependent.
The cost of maintaining a house-hold includes-such items as rent, prop-erty insurance, property taxes, mort-gage interest, repairs, utilities (gas,telephone, etc .) and cost of food. Suchexpenses do not include the cost ofclothing, education, medical treatment,vacations, life insurance, and transpor-tation . Do not include the value of per-sonal -services performed by you or bythe person qualifying you as Head ofHousehold. The above expendituresare to be considered only for determin-ing whether you are entitled to the useof the head of household tax rate. Donot claim them as deductions on yourreturn unless they are otherwise allow-able .
The .rates for Head of Household arefound in tax rate schedule III on page15 of these instructions .
Widows and WidowerS.-Under certainconditions a taxpayer whose husband(or wife) has died during either of hertwo preceding taxable years may com-pute her tax by including only her in-come, exemptions, and deductions, butotherwise computing the tax as if a jointreturn had been filed . However, theexemption for the decedent may beclaimed only for the year of death .
The conditions are that the taxpayer(a) must not have remarried, (b) mustmaintain as her home a householdwhich is the principal place of abode ofher child or stepchild for whom she isentitled to a deduction for an exemp-tion., and (c) must have been entitledto file a joint return with her husband(or wife) for the year of death .
USE OF TAX TABLE ON PAGE 16 OFTHESE INSTRUCTION S
Purpose of Table.-The table is a short-cut method of finding your income taxif your adjusted gross income, line 11page 1, of your return is less than $5,000It is provided by law and saves you thetrouble of itemizing deductions andcomputing your tax on page 2 of thereturn. The table allows for an exemp-tion of $600 for each person claimed asan exemption, and charitable contribu-tions, interest, taxes, etc ., approximat-ing 10 percent of your income.
How To Find Your TaX.-Read down-the income columns until you find theline that fits the income you reported online 11, page 1 . Then read across thatline until you come to the exemptioncolumn which is headed by a numbercorresponding to the number of exemp-tions you claimed on line 4 on page 1 .The figure you find there is your tax .
LINE 13(a)-See page 14 of these instructions.
LINE 13(b)-See page 14 of these instructions .
LINE 15-SELF-EMPLOYMENT TAXEvery self-employed individual mus t
file an annuAl return of his self-employ-ment income on Form 1040 if he has atleast $400 of net earnings from self-employment in his taxable year, eventhough he may not have sufficient in-come to require the filing of an incometax return or is already receiving socialsecurity benefits .
Generally, if you carry on a businessas a sole proprietor, or if you renderservice as an indep lerident contractor, oras a member of a partnership or similarorganization, you will have self-employ-ment income .
If your income is derived solely fromsalary or wages, or from dividends orinterest on investments, capital gains,annuities, or pensions, you will have noself-employment income and no self-employment tax to pay .
The computation of self-employmenttax is made on separate Schedule C orseparate Schedule F, which with at-tached Schedule SE should be filed
143
with your individual income tax return .The self-employment tax is a part ofthe total tax to be paid in one remit-tance with your income tax return . En-ter on line 15 the amount of your self-employment tax shown on line 34,separate Schedule C, or line 18, sepa-rate Shedule F .
Any declaration of estimated incometax required to be filed may include esti-mated tax on self-employment income .
If a citizen living abroad is'
self-employed, he should consult the perti-nent sections of 1 . R . S . Pub. 54 .
LINE 17(a)-CREDIT FOR TAX WITHHELDEnter the total amount of income tax
withhold, credit for excess F . I. C. A.tax, and credit for taxes paid by regu-lated investment companies as shown online 5, column (b) . Also see explana-tion for line 5 on pages 5 and 6 of theseinstructions relating to these credits .
LINE 17(b)-CREDIT FOR ESTIMATEDTAX PAYMENTS
If you paid any estimated tax on aDeclaration of Estimated Income Tax(Form 1040-ES) for 1959, report thetotal of such payments on line .17(b) .If on your 1958 return you had anoverpayment which you chose to applyas a credit on your 1959 tax, includethe credit in this total .
See page 14 of these instructions forfiling requirements for 1960 declarationof estimated income tax .
LINES 18 AND 19-BALANCE OF TAX DUEOR REFUND OF OVERPAYMENTShow on line 18 any balance you
owe, or on line 19 the amount of anyoverpayment due you, after takingcredit for the amounts entered on line17, In the case of a refund, be sure touse the correct post office address desig-nation on your return so that the refundcheck will not be returned as undeliver-able by the Post Office .
In order to facilitate the processingof collections and refunds, balances dueof less than $1 .00 need not be paid, andoverp. ayments of less than $1 .00 will berefunded only upon separate applicationto your District Director .
INSTRUCTIONS FOR PAGE 2 OF FORM 1040Itemized Deductions-if you do not use Tax Table or Standard Deduction .
CONTRIBUTIONSIf you itemize deductions, you can
deduct gifts to religious, charitable,educational, scientific, or literary organ-
izations, and organizations for theprevention of cruelty to children andanimals, unless the organization is 6p-erated for personal profit, or conducts
propaganda or otherwise attempts toinfluence legislation. You can deductgifts to fraternal organizations if they
a5q~16-75312-1
144 FACSIMILES OF TAX RETUItNS, 1959
INSTRUCTIONS FOR PAGE 2 OF FORM 1040-Continued
are to be used for charitable, religious,etc ., purposes. You can also deductgifts to veterans' organizations, or to agovernmental agency which will use thegifts for public purposes . A contribu-tion may be made in money or property(not services) . If in property, it isgenerally measured by the fair marketvalue of the property at the time ofcontribution .
For the contribution to be deductible,the recipient of the contribution musthave been organized or created in theUnited States or its possessions, or underour law. The law does not allow deduc-tions for gifts to individuals, or to othertypes of organizations, however worthy .
In general, the deduction for contri-butions may not exceed 20 percent ofyour adjusted gross incorne (line 11,page 1) . However, you may increasethis limitation to 30 percent if the extra10 percent consists of contributionsm1ade to churches, a convention or as-sociation of churches, tax-exempt edu-cational institutions, tax-exempt hos-pitals, or certain medical researchorganizations .
If all your contributions were to thesechurches, schools, hospitals, or medicalresearch organizations, you can deductthe contributions made but not morethan 30 percent of your adjusted grossincome. To compute the deduction forcontributions you should first figure thecontributions to these special institutionsto the extent of 10 percent of your ad-justed gross income and the amount inexcess of 10 percent should be added tothe other contributions to which the 20percent limitation applies.. Attach aschedule showing this computation .
While you can deduct gifts to thekind of organizations listed below, youcannot deduct dues or other paymentsto them, for which you receive personalbenefits . For example, you can deductgifts to a-YMCA but not dues .
Some examples of the treatment ofcontributions are :You CAN Deduct Gifts To :Churches, including assessmentsSalvation Arm),Red Cross, community chestsNonprofit schools and hospitalsVeterans' organization sBoy Scouts, Girl Scouts, and other similar
organization sNonprofit organizations primarily engaged
in conducting research or education forthe alleviation and cure of diseases suchas tuberculosis, cancer, multiple sclerosis,muscular dystrophy, cerebral palsy, polio-myelitis, diabetes, and diseases of theheart, etc .
You CANNOT Deduct Gifts To :Relatives, friends, other individualsPolitical organizations or candidatesSocial clubs
Labor unionsChambers of commercePropaganda organizations
INTERESTIf you itemizc deductions, you can
deduct interest you paid on ~our per-sonal debts, such as bank loans or homemortgages . Interest paid on businessdebts should be reported in separateSchedules C or F, or Schedule G ; page 3,of Form 1040 . Do not deduci : interestpaid on money borrowed to :)uy tax-exempt securities or single-premium lifeinsurance . Interest paid on behalf ofanother person is not deductible unlessyou were legally liable to pay it . In fig-uring the interest paid on a mortgageon your home or on an installment con-tract for goods for your personal use,eliminate such items as carrying chargesand insurance, which are not deducti-ble, and taxes which may be deductiblebut which should be itemized se-3arately .
ihe law allows a deduction for inter-est paid for purchasing personal pro].:)-crty (such as automobiles, rad :.os, etc, )on the installment plan even where theinterest charges are not separatcly stawdfrom other carrying charges . If it isnot stated separately, then the deduc-tion is equal to 6 percent of the aver-age unpaid monthly balance under thecontract . Compute the average un-paid monthly balance by adding up theunpaid balance at the begirning ofeach month during the year arid divid-ing by 12 . The unpaid balance at thebeginning of each month is determinedby taking into account the amounts re-quired to be paid under the contractwhether or not such amounts are ac-tually paid . The interest cl,~ductionmay not exceed the portion of the totalcarrying charges attributable to thetaxable year.You CAN Deduct Interest On :Your personal note to a bank or an individual• mortgage on your hom e• life insurance loan, if you pay tle interest
in cashDelinquent taxesYou CANNOT Deduct Interest O?~ :Indebtedness of another person, wh( :n you qre
not legally liable for payment of the interes tA gambling debt or other nonenfon -cable ob-
ligationA life insurance loan, if interest is added to
the loan and you report on the ~-.ash basis
TAXE SIf you itemize deductions, yo~ can
deduct most non-Federal taxes paid byyou. You can deduct State or localretail sales taxes if under the laws ofyour State they are imposed directlyupon the consumer, or if they are im-posed on the retailer (or whol2saler incase of gasoline taxes) and the amount
9
of the tax is separately stated by theretailer to the consumer . In general,you cannot deduct taxes assessed forpavements or other local improvements,including front-foot benefits, which tendto increase the value of your property .Consult your Internal Revenue Serviceoffice for circumstances under whichlocal improvement taxes may be de-ducted . If you paid foreign incometaxes, you may be entitled to a creditagainst your tax rather than a deduc-tion from income. Form 1116 shouldbe used to claim this credit .
Do not deduct on page 2 any non-~usiness Federal taxes, or any taxes paidin connection with a business or profes-sion which are deductible in Schedule Gor separate Schedule C or F .
You CAN Deduct :Personal property taxesReal estate taxe sState income taxe sState or local retail sales taxesAuto license fee sState capitation or poll taxesState gasoline taxe s
You CANNOT Deduct :Any Federal excise taxes on your personal
expenditures, such as taxes on theater ad-missions, furs, jewelry, cosmetics, trans-portation, telephone, etc .
Federal social security taxesHunting licenses, dog liconsesAuto inspection fee sWater taxesTaxes paid by you for another person
MEDICAL AND DENTAL EXPENSE SIf you itemize deductions, you can de-
duct, within the limits described below,the amount you paid during the year(not compensated by hospital, health oraccident insurance) for medical or den-tal expenses for yourself, your wife, orany dependent who received over halfof his support from you whether or notthe dependent had $600 or more grossincome. List name and amount paidto each person .
You can deduct amounts paid for theprevention, cure, correction, or treat-ment of a physidal or mental defect orillriess . If you pay someone to performboth nursing and domestic duties, youcan deduct only that part of the costwhich is for nursing .
You can deduct the cost of transpor-tation primarily for and essential tomedical care, but you cannot deductany other travel expense even if it bene-fits your health . Meals and lodgingwhile you are away from home receiv-ing medical treatment may not betreated as medical expense unless theyare part of a hospital bill or are includedin the cost of care in a similarinstitution .
c59-1 6-75312-1
10
FACSIMILES OF TAX RETURNS, 1959
INSTRUCTIONS FOR PAGE 2 OF FORM 1040-Continued
Figuring the Deduction .-You can de-duct only those medical and dental ex-penses which exceed 3 percent of youradjusted gross income . However, infiguring these expenses, the amount paidfor medicine and drugs may be takeninto account only to the extent it ex-ceeds 1 percent of your adjusted grossincome. There is a schedule providedon page 2 to make this computation .
Any expense (other than medical)claimed as a deduction for the care ofchildren and certain other dependentsshould not be included in your medicalexpense deduction .
Limitations .-The deduction may notexceed $2,500 multiplied by the num-ber of exemptions other than the exemp-tions for age and blindness . In addi-tion, there is a maximum limitation asfollows :
(a) $5,000 if the taxpayer is singleand not a head of household or a widowor widower entitled to the special tax .rates ;
(b) $5,000 if the taxpayer is marriedbut files a separate return ; o r
(c) $10,000 if the taxpayer files ajoint return, or is a head of householdor a widow or widower entitled to thespecial tax rates .Subject to the Foregoing Limitations, You
CAN Deduct as Medical Expenses Pay-ments To or For :
Physicians, dentists, nurses, and hospitalsDrugs or medicinesTransportation necessary to get medical careEyeglasses, artificial teeth, medical or surgli-
cal appliances, braces, etc .X-ray examinations or treatmentPremiums on hospital or medical insuranceYou CANNOT Deduct Payments For :Funeral expenses and cemetery plotIllegal operations or drugsTravel ordered or suggested by your doctor
for rest or chang ePremiums on life insurance
Special Rules for Persons 65 or Over.-(a) .11 not disabled.-If either you
or your wife were 65 or over duringthe taxable year, the maximum limita-tion for amounts spent is the same asset out above . However, amounts de-ductible for medical and dental ex-penses for you and your wife, if eitherwas 65 or over, are not restricted to theexcess over 3 percent of your adjustedgross income. In effect, the 3 percentrule may be disregarded. But theamounts spent by you for medicine anddrugs for yourself, your wife, and yourdependents are still limited to the excessover I percent of your adjusted grossincome, and amounts spent by you foryour dependents' medical expenses aredeductible only to the extent they exceed3 percent of your adjusted gross income .
(b) If disabled.-If either you or
your wife are disabled and 65 or over,you may qualify for an increased maxi-mum limitation . For this purpose dis-abled means that an individual is unableto engage in any substantial gainful ac-tivity by reason of any medically deter-minable physical or mental impairmentwhich can be expected to result in deathor to be of long-continued and indefiniteduration. Consult the nearest InternalRevenue Service office for further in-formation .
OTHER DEDUCTIONSExpenses for the Care of Children and Cer-
tain Other Dependents .-There is alloweda deduction not to exceed a total of$600 -for expenses paid by a woman ora widower (including men who are di-vorced or legally separated under adecree and who have not remarried)for the care of one or more dependentsif such care is to enable the taxpayer tobe gainfully employed or actively to seekgainful employment. For this purpose,the term "dependent" does not includethe husband (wife) of the taxpayer andis limited to the following persons forwhom the taxpayer is entitled to a de-duction for an exemption :
(a) under 12 years of age ; or(b) physically or mentally incapable
of caring for themselves .Do not deduct any child care pay-
ments to a person for whom you claiman exemption.
In the case of a woman who is mar-ried, the deduction is allowed only (a) ifshe files a joint return with her husband -and (b) the deduction is reduced by theamount (if any) by which their com-bined adjusted gross income exceeds$4 500. If the husband is incapable ofsel~_support because he is mentally orphysically defective, these two limita-tions do not apply .
If the person who receives the pay.ment performs duties not related to de-pendent care, only that part of the pay-ment which is for the dependent's caremay be deducted .
If you claim this deduction, attach adetailed statement showing the amountexpended and the person or persons towhom it was paid . If you wish, you mayobtain Form 2441 from any InternalRevenue Service office for this purpose .
Casualty Losses and Thefts .-I f you item.ize deductions, you can deduct your netloss resulting from the destruction ofyour property in a fire, storm, automo-bile accident, shipwreck, or other lossescaused by natural forces . Damage toyour car by collision or accident can bededucted if due merely to faulty drivingbut cannot be deducted if due to your
145
willful act or negligence . You can alsodeduct in the year of discovery lossesdue to theft, but not losses due to mis-laying or losing articles .
The amount of loss to be deducted ismeasured by the fair market value ofthe pfoperty just before the casualty lessits fair market value immediately afterthe casualty (but not more than the costor other adjusted basis of the property),reduced by any insurance or compensa-tion received . Explain in an attachedstatement .
If your 1959 casualty losses exceedyour 1959 income, the excess must betreated in the same manner as a netoperating loss described on page 7 .You CAN Deduct Losses On :Property such ~s your home, clothing, or
automobile destroyed or damaged by fireProperty, including cash, which is stolen
from yo uLoss or damage of property by flood, light-
ning, storm, explosion, or freezin gYou CANNOT Deduct Losses On :Personal injury to yourself or another personAccidental loss by you of cash or other per-
sonal propertyProperty lost in storage or in transitDamage by rust or gradual erosio nAnimals or plants damaged or destroyed by
diseas eExpenses for Education .-Expenses for
education may be deducted if the edu-cation was undertaken primarily forthe purpose of :
(a) Maintaining or improving skillsrequired in your employment or othertrade or business, o r
(b) Meeting the express require-ments of your employer, or the require-ments of applicable law or regulations,imposed as a condition to the retentionof your salary, status, or employment .
Expenses incurred for the purpose ofobtaining a new position, a substantialadvancement in position, or for per-sonal purposes are not deductible . Theexpenses incurred in preparing for atrade or business or a specialty are per-sonal expenses and are not deductible .
The rules for reporting deductibleeducation expenses are the same asthose shown on page 6 for the reportingof "Employee Business Expenses." Ifyou are required therein to attach astatement to your return explaining thenature of the expenses, also include adescription of the relationship of theeducation to your employment or tradeor business . If the education was re-quired by your employer, a statementto that effect from him would behelpful .
Miscellaneous .-If you itemize deduc.tions, you can deduct several other typesof expenses under "Other Deductions ."
c59-26-75312-1
146 FACSIMILES OF TAX RETURNS, 1959
INSTRUCTIONS FOR PAGE 2 OF FORM 1040-Continue d
If you work for wages or a salary, youcan deduct your ordinary and necessaryemployee business expenses which havenot been claimed on page 1 .You CAN Deduct Cost Of :Safety equipmen tDues to union or professional societiesEntertaining customersTools and suppliesFees to employment agencie sYou CANNOT Deduct Cost Of :Travel to and from workEntertaining friend sBribes and illegal payment s
You can deduct all ordinary and nec-essary expenses connected with the pro-
duction or collection of income, or forthe management or protection-of prop-erty held for the production o:'income.
If you are divorced or lega Ily sepa-rated and are making periodic paymentsof alimony or separate mainterance un-dtr a court decree, you can deduct theseamounts . Periodic payments madeunder eitfier (a) a written sc,~ arationagreement entered into after A agust 16,1954, or (b) a decree for support en-tered after March 1, 1954, are also de-ductible . Such payments mu;t be in-cluded in the wife's income . You can-not deduct any voluntary payments not
1 1
under a court order or a . written sepa-ration agreement, lump-sum settle-ments, or specific maintenance pay-ments for support of minor children .
You may deduct gambling losses tothe extent of gambling winnings only ifyou itemize deductions .
If you are a tenant-stockholder in acooperative 'housing corporation, youcan deduct your share of its paymentsfor interest and real-estate taxes .
Computation of Tax.-For determina-tion of tax, other than from the TaxTable, see page 15 .
INSTRUCTIONS FOR PAGE 3 OF FORM 1040SCHEDULE A-DIVIDENDS
If you own stock, the payments youreceive out of the company's earningsand profits are dividends and must bereported in your tax return . Usuallydividends are paid in cash, but if paidin merchandise or other property, theyare taxable at their fair market value .
If a distribution is not paid fromearnings and profits, it is riot taxable asa dividend, but is treated as reductionof the cost or other basis of your stock.It is not taxable until it exceeds yourcost or other basis, after which you mustgenerally include it as a gain from thesale or exchange of property, for whichspecial tax treatment is provided .
In some cases a corporation distrib-utes both a dividend and a repaymentof capital at the same time ; the checkor notice will usually show them sep-arately. In any case
.
. you must reportthe dividend portion as income.
There are special rules applicable to:tock dividends, partial liquidations,tock rights, and redemptions ; call your
Internal Revenue Service office for morecomplete information .
You may exclude from your income$50 of dividends received from quali-fying domestic corporations .
If a joint return is filed and both hus-band and wife have dividend income,each one may exclude $50 of dividendsreceived from qualifying corporations,but one may not use any portion of the$50 exclusion not used by the other.For example, if the husband had $200in dividends, and the wiAfe had $20, only$70 may be excluded on a joint return .
Use Schedule A to list your dividendsincluding dividends you receive as amember of a partnership or as a bene-ficiary of an estate or trust, and to showthe amount of the exclusion to whichyou are entitled . Dividends frommutual insurance companies which area reduction of premiums are not to be
included . So-called "dividends" fromthe following corporations are con-sidered interest and should be reportedas interest in Schedule B :
Mutual savings banks, cooperativebanks, domestic building and loan as-sociations, domestic savings 3.nd loanassociations, and Federal savings andloan associations, on defosits orwithdr-awable accounts ; and Federalcredit unions .Taxable dividends from the following
nonqualifying corporations should bereported on line 5 of ScheduleA :
(a) China Trade Act corporations .(b) so-called exempt organizations
(charitable, fraternal, etc.) am! exemptfarmers' cooperative organizations .
(c) regulated investment companiesexcept to the extent designated by thecompany to be taken into account as adividend for these purposes .
(d) corporations deriving 8C percentor more of their income from U . S . pos-sessions and 50 percent or more of theirincome from the active conduct of abusiness therein.
(e) corporations which are notdomestic corporations.
See page 14 for the credit for divi-dends received .
SCHEDULE B-INTERESTYou must include in your return any
interest you receive or which is creditedto your account (whether emered inyour pass-book or not) and can be with-drawn by you. All interest ort bonds,debentures, notes, savings accounts, orloans is taxable, except for certain gov-emmental issues. Examples of interestwhich is fully exempt from tax are (a)interest from State and municipal bondsand securities and (b) interest on any$5,000 principal value of Treasurybonds issued before March 1, 1941 .
If you own United States Savings orWar bonds (Series A to F, in(Jusive),
the gradual increase in value of eachbond (as shown in the table on its back)is considered interest, but you need notreport it in your tax return until youcash the bond or until the year of finalmaturity whichever is earlier . How-ever, if you report income on the cashmethod, you may at any time elect toreport each year the annual increase invalue, but if you do so you must reportin the first year the entire -increase todate and must continue to report theannual increase each year .
SCHEDULE D-SALE AND EXCHANGEOF PROPERT YIf you sell your house, car, furniture,
securities, real estate, or any other kindof property, you must report any profitfrom the sale on your tax return. Gen-erally, such profits are capital gains ifthe property was not held for sale tocustomers in the ordinary course of bus-iness. Separate Schedule D (Form1040) is provided to compute capitalgains and losses, and the results fromother transactions in property .
Noubusiness Bad Dobts.~-If you fail tocollect a personal loan, you can list thebad debt as a "short-term capital loss"provided the loan was made with a trueexpectation of collecting. So-calledloans to close relatives, which are reallyin the nature of gifts, must not be listedas deductible losses .
Sale of Homes, etc .-General Rule.-Thelaw requires you to report any gainsfrom the sale or exchange of your resi-dence or other nonbusiness property,but does not allow you to claim any lossfrom the sale of a home or other assetwhich was not held for the purpose ofproducing income. Your gain from thesale of this kind of property is the dif-ference between (1) the sales price and(2) your original cost plus the cost ofpermanent improvements . If deprecia-
c6g-16-75312-1
12
FACSIMILES OF TAX RETURNS, 1959
INSTRUCTIONS FOR PAGE 3 OF FORM 1040-Continue d
tion was allowed or allowable duringany period because you rented the house,or used part of it for business purposes,the original cost must be reduced by theamount of depreciation which was al-lowed or allowable .
Special Rule.-Deferring Gain When Buy'Ing New Residence .-If you sold or ex-changed your principal residence dur-ing 1959 at a gain and within one yearafter (or before) the sale you purchaseanother residence, and use it as yourprincipal residence, none of the gainis taxable if the cost'of the" new resi-dence equals or exceeds the adjustedsales price of the old residence . See,however, instructions below for infor-mation to be furnished. If instead ofpurchasing another residence, you beginconstruction of a new residence (eitherone year before or within one year afterthe sale of your old residence) anduse it as your principal residence notlater than 18 months after the sale, noneof the gain upon the sale is taxable ifyour costs attributable to constructionduring, plus the cost of land acquiredwithin, the period beginning one yearbefore the sale and ending 18 monthsafter'the sale equals or exceeds the ad-justed sales price of the old residence.If the adjusted sales price of your oldresidence exceeds the cost of your newresidence, the gain on the sale is tax-able to the extent of such excess .
The adjusted sale, price is the grossselling price less commissions, selling ex-penses, and the expenses for work per-formed on the residence in order to assistin its sale, such as redecorating expenses .Redecorating expenses must be for workperformed during the 90-day periodending on the day on which a contractto sell is entered into, and must be paidno later than 30 days after date of sale .
If, you sold or exchanged your resi-dence at a gain, report the details of thesale in separate Schedule D . If you donot intend to replace, or if the'periodfor replacement has passed, report thedetails in the year of sale. If you haveacquired your new residence and usedit as your principal residence, enter incolumn (h) only the amount of taxablegain, if any, and attach statement show-ing the purchase price, date of purchase,and date of occupancy .
If you have decided to replace, buthave not done so, or if you are unde-cided, you should enter "None" in col-umn (h) . When you do replace with-in the required period, you must advisethe District Director, giving full details .When you decide not to replace, or the,period has passed, you must file anamended return, if you previously filed a
return. Since any additional tax duewill bear interest from the due date bfthe original return until paid, it is ad-visable to file the amended return forthe year of sale as promptly as possible .Form 2119 is available at any InternalRevenue Service office for reporting thesale or exchange of your residence .
SCHEDULE E-PENSIONS AND AN14UITIESNoncontributory Annuities .-The full
amount of an annuity or a pension ofa retired employee, where the employeedid not contribute to the cost and wasnot taxable on his employer's contribu-tions, must be included in his grossincome. The total of the paymentsreceived during his taxable year shouldbe shown on line 6, part I of Schedule E .
However, if there is a death-benefitexclusion, this rule does not apply ; con-sult the Internal Revenue Service .
Other Annuities.-Amounts receivedfrom other annuities, pensions, endow-ments, or life insurance contracts for areason other than the death of theinsured, whether paid for a fixed num-ber of years or for life, may have aportion of the payment exchided fromgross income . The following types areincluded under this rule : (a) pensionswhere the employee has either con-tributed to its cost or has been taxedon his employers contributions, and (b)amounts paid for a~ reason other thanthe death of the insured under an an-nuity, endowment, or life insurancecontract .
Schedule E is provided for reportingthe taxable portion of the annuity. Ifyou are receiving payments on morethan one pension or annuity, fill out aseparate schedule for each one .
Special Rule for Certain Types of Em-ployees' AnnuitleS.-There is a special ruleprovided for amounts received as em-ployees' annuities where part of the costis contributed by the employer and theamount contributed by the employeewill be returned within 3 years from thedate of the first payment received underthe contract. If both of these condi-tions are met, then all the payments re-ceived under the contract during thefirst threeyears are to be excluded fromgross income until the employee recov-ers his ~cost (the amount contributed byhim plus the contributions made by the'employer on which the employee waspreviously taxable) ; thereafter allamounts received are fully taxable .This method of computing taxable in-come also applies to employee's bene-ficiary if employee died before receivingany annuity or pension payments .
I
147
Example : An employee receives $200a month under an annuity. While hew6rked, he contributed $4,925 towardthe cost of the annuity. His employeralso made 'Contributions toward the costof the annuity for which the employeewas not taxable . The retired employeewould be paid $7,200 during his first3 years, which amount exceeds his con-tribution of $4,925. Therefore, heexcludes from gross income all the pay-ments received from the annuity untilhe has received $4,925 . All paymentsreceived thereafter are fully taxable .
General Rule for Aiinuifles.--GeneraIly,amounts received from annuities andpensions are included in income in anamount which is figured upon your lifeexpectancy. This computation andyour life expectancy multiple can befound in the regulations covering an-nuities and pensions . Once you haveobtained the multiple it remains un-changed and it will not be necessary torecompute your taxable portion eachyear unless the payments you receivechange in amount . In making thiscomputation you can get help from theInternal Revenue Service as well asfrom some employers and insurancecompanies .
Amounts Received Under Life-InsurancePolicies by Reason of Death .- Generally, alump surn payable at the death of theinsured under a life insurance policy isexcludable from the gross income of therecipient. For more de7tailed informa-tion, call or visit your Internal RevenueService office .
SCHEDULE G-RENTS AND ROYALTIESIf you are not engaged in selling real
estate to customers, but receive rentfrom property owned or controlled byyou, or royalties from copyrights, min-eral leases, and similar rights, report thetotal amount received in Schedule G.If property other than cash was re-ceived as rent, its fair market valueshould be reported.
You are entitled to various deductionswhich are indicated in Schedule G. Inthe case of buildings you can deductdepreciation, as explained on page 13 .
You can also deduct all ordinary andnecessary expenditures on the propertysuch as taxes, interest, repairs, insurance,agent's commissions, maintenance, andsimilar items. However, you cannotdeduct capital investments or improve-ments but must add them to the basisof the property for the purpose of de-preciation. For example, a landlordcan deduct the cost of minor repairs but,not the cost of major improvements suchas a new roof or remodeling .
c5g-16-75312-1
148 FACSIMILES OF TAX RETUI',NS, 1959
INSTRUCTIONS FOR PAGE 3 OF FORM 1040-Continued
Expenses, depreciation, and depletionshould be listed in total in the columnsprovided in Sthedule G.
It You Rent Part of Your House-If you rent out only part of your prop-erty, you can deductonly that portionof your expenses which relates to therented portion . If you cannot deter-mine these expenses exactly, you mayfigure them on a proportionate basis .For example, if you rent out half ofyour home, and live in the other half,you can deduct only half of the depre-ciation, and other expenses.
Room rent and other space rentalsshould be reported as business incomein separate Schedule C if services arerendered to the occupant; otherwise,
.
report such income in Schedule G. Ifyou are engaged in the business of sbll-ing real estate, you should report rentalsreceived in separate Schedule C.
SCHEDULE H-OTHER INCOMEPartnerships.- A partnership does not
pay income tax unless it elects to betaxed on the same basis as a domesticcorporation . It does, however, file aninformation return on Form 1065 . Onlyone Form 1065 need be filed for eachpartnership . Each partner must reportin his personal tax return his share ofhis partnership's taxable income andpay tax on it .
Include in Schedule H your share ofthe ordinary income (whether actuallyreceived by you or not) or the net lossof a partnership, joint venture, or the
like, whose taxable year ends within 9twith the year covered by yotLr return .Other items of income, deductions, etc .,to be carried to the appropriate sched-ule of your individual return are shownin Schedule K of the partnership return .Your share of such income'of the fol-lowing classes should be enter .-d on theappropriate lines on Form 1043 :
Dividends.Interest on tax-free covenant bonds.Partially tax-exempt interest .Gains from the sale or exchange of
capital assets and other property .If the partnership is engaged in a
trade or business, the individULl partnermay be subject to the self-employmenttax on his share of the self-employmentincome from the partnership . In sucha case the partner's share of p2 .rtnershipself-employment net earnings (or loss)should be entered on line 28(b), page. 3,separate Schedule C. Membe:-s of farmpartnerships should use Schedule F tofigure self-employment tax .
Estates and Trusts~-If you area bene-ficiary of an estate or trust, report inyour personal tax return your taxableportion of its income (whether actuallyreceived or not) which, for tLe taxableyear, is either required to be distributedto you or has been paid or credited toyour account. Your share of such in-come of the following classes ;hould beentered on the appropriate lines onForm 1040 :
Dividends .Interest on tax-free coven .-rit bonds .
13
Partially tax-exempt interest.Gains from the sale or exchange of
capital assets and other property .All other taxable income from estates
and trusts should be included in Sched-ule H of your return . Any deprecia-tion (on estate or trust property) whichis allocable to you may be subtractedfrom estate or trust income so that onlythe net income received will be includedin your return. Information with re-spect to these items may be obtainedfrom the fiduciary.
Small Business Corporations .-If you area shareholder in a small business cor-poration which elects to have its cur-rent taxable income taxed to its stock-holders, you should report your share ofboth the distributed and undistributedcurrent taxable income as ordinary in-come in Schedule H except that por-tion which is reportable as a long-termcapital gain in Schedule D. Neithertype of income is eligible for the divi-dend received credit or the exclusion .Your share of any net operating lossshould be -treated in the same manneras if the loss were from a proprietorship .
Other Income.- If you cannot findany specific place on your return to listcertain types of income, you should re-port such income in Schedule H. Thisis the proper place to report amountsreceived as alimony, support, prizes, andrecoveries of bad debts and other itemswhich reduced your tax in a prior year .
INSTRUCTIONS FOR PAGE 4 OF FORM 1040SCHEDULE I-DEPRECIATION Straight Line Method .-To compute ,
A reasonable allowance for the ex-haustion, wear and tear, and obsolcs-cence of property used in the tradq orbusiness or of property held by the tax-payer for the production of income shallbe allowed as a depreciation deduction .The allowance does not apply to inven-tories or stock-in-trade nor to land apartfrom the improvements or physicaldevelopment added to it .
The cost (or other basis) to be recov-ered should be charged off over theexpected useful life of the property .Similar assets may be grouped togetheras one item for reporting purposes inthe depreciation schedule . For guid-ance, comprehensive tables of "averageuseful lives" of variQus kinds of build-ings, machines, and equipment in manyindustries and businesses have beenpublished in a booklet called Bulletin F,which may be purchased for 30 centsfrom the Superintendent of Documents,Government Printing Office, Washing-ton 25, D. C.
add the cost of improvements I o the cost(or other basis) of the asset and deductboth the estimated salvage value andthe total depreciation allowed or al-lowable in past years. Divide the resultby the number of years of useful life re-maining to the asset-the quotient is thedepreciation deduction .
Declining Balance Method .-L'nder thismethod a uniform rate is applied eachyear to the remaining cost or other basisof property (without adjustment forsalvage value) determined at the be-ginning of such year . For propertyacquired before January 1, 1954, orused property whenever acquired, therate of depreciation under th~~s methodmay not exceed one and one-lialf timesthe applicable straight-line ra- :e .
Special Rules for New Asset ; AcquiredAfter December 31, 1953.-The cost orother basis of an asset acqu~xed afterDecember 31, 1953, may be depreciatedunder methods proper before that date ;
or, it may be depreciated under any ofthe following methods provided (1)that the asset is tangible, (2) that it hasan estimated useful life of three years ormore, and (3) that the original use ofthe asset commenced with the taxpayerand commenced after Dec . 31, 1953 .
If an asset is constructed, reconstruct-ed, or erected by the taxpayer, so muchof the basis of the asset as is attributableto construction, reconstruction, or erec-tion after December 31, 1953, may bedepreciated under methods proper be-fore that date ; or, it may be depreciatedunder any of the following methods pro-vided that the asset meets qualifications(1) and (2) above.
(a) Declining balance method.-Thismethod may be used with a rate not inexcess of twice the applicable straight-line rate.
(b) Sum of the years-digit method.-The deduction for each year is com-puted by multiplying the cost or otherbasis of the asset (reduced by estimatedsalvage value) by the number of years
.59-16--75312-1
14
FACSIMILES OF TAX RETURNS, 195 9
INSTRUCTIONS' FOR PAGE 4 OF FORM 1040-Continue d
of useful life remaining (including theyear for which the deduction is com-puted) and dividing the product bythe sum of all the digits correspondingto the years of the estimated useful lifeof the asset . In-the case of a 5-year lifethis sum would be 15 (5 + 4 + 3 + 2 + 1) .For the first year five-fifteenths of thecost reduced by estimated salvage valuewould be allowable, for the second yearfour-fifteenths, etc .
(c) Other methods .-A taxpayer mayuse any consistent method which doesnot result in accumulated allowances atthe end of any year greater than thetotal of the accumulated allowanceswhich would have resulted from the useof the declining balance method . Thislimitation applies only during the firsttwo-thirds of the property's useful life .
Additional First Year Depreciation ForSmall Business.- Taxpayers (not includ-ing trusts) may elect to write off in theyear of acquisition 20 percent of the costof tangible personal property having anaggregate value of not more than$10,000 ($20,000 on a joint return)acquired by purchase for use in a tradeor business or to be held for the produc-tion of income. The additional depre-ciation is limited to property acquiredafter December 31, 1957, with a re-maining useful life of 6 years or moreand which is not acquired from a per-son (other 'than a brother or sister)whose relationship to the taxpayerwould result in the disallowance oflosses. In regard to the remaining costof the property, depreciation may betaken in the same manner as explainedabove beginning with the year ofacquisition. The additional first-yeardepreciation of an asset should be shownon a separate line of the depreciationschedule rather than included on theline used to show the regular deprecia-tion of the asset .
SCHEDULE J-DIVIDENDS RECEIVEDCREDITThe law provides a credit against tax
for dividends received from qualifyingdomestic corporations . This credit isequal to 4 percent of such dividends inexcess of those which you may excludefrom your gross income (see page 11 ofthis pamphlet) . The credit may notexceed the lesser of :
(a) the total income tax reduced bythe foreign tax credit ; or
(b) 4 percent of the taxable income.
SCHEDULE K-RETIREMENT INCOMECREDI TYou may qualify for this credit which
is generally 20 percent of retirement in-come if you received earned income in
excess of $600 in each of any 10 calendaryears-not necessarily c6nsecutive-be-fore the beginning of your taxable year.
The term "earned income" meanswages, salaries, or professional fees, andother amounts received as compensationfor personal services actually rendered.It does not include any amount receivedas an annuity or pension. If you wereengaged in a trade or business in whichboth personal services and capital werematerial income-producing factors, areasonable allowance as compensationfor the personal services rendered byyou, not in excess of 30% of your shareof the net profits of such trade or busi-ness, shall be considered as earnedincome.
If you are a surviving widow (wid-ower) and have not remarried, you mayuse the earned income of your deceasedhusband (wife), or you may combinesuch income with your earned income,for the purpose of determining whetheryou qualify. If a husband and wifeboth qualify and each has retirement in-come, each is entitled to the credit .
Retirement income for the purposeof the credit means-
(a) In the case of an individual whois not 65 years of age before the closeof his taxable year, only that incomereceived from pensions and annuitiesunder a public retirement system (oneestablished by the Federal Government,a State, county, city, etc.) wh ich isincluded in gross income in his return .
(b) In the case of an individual whois 65 years of age or over before theclose of his taxable year, income frompensions, annuities, interest, rents, anddividends, which are included in grossincome in his return . (Gross incomefrom rents for this purpose means grossreceipts from rents without reductionfor depreciation or any other expenses .Royalties are not considered rents forthis computation . )
The amount of the retirement incomeused for the credit computation maynot exceed $1,2100 reduced by:
(a) any amount received and exclud-ed from gross income as a pension orannuity under the Social Security Actand Railroad Retirement Acts and byother tax-exempt pensions or annuities,This reduction does not include (1) thatpart of a pension or annuity which is ex-cluded from gross income because itrepresents, in effect, a return of capitalor tax-free proceeds of a like nature, or(2) amounts excluded from gross in-come which are received as compensa-tion for injuries or sickness or underaccident or health plans ; an d
(b) in the case of any individual who
149
is not 65 before the close of the taxableyear, any amount of earned income inexcess of $900 received in the taxableyear ; and in the case of an individualwho is 65 or over but who is not 72before the close of the taxable year, anyamount of earned income in excess of$1,200 received in the taxable year(neither of the limitations in this para-graph applies to an individual who is72 or over at the close of the year) .
1960 DECLARATIONS OF ESTIMATED TAXWho Must File .-For many taxpayers
the withholding tax on wages is not suf-ficient td keep them paid up on theirincome tax. The law requires everycitizen or resident of the United Statesto file a Declaration of Estimated In-come Tax, Form 1040-E S, and to makequarterly payments in advance offiling the annual income tax return if :
(a) his gross income can reasonablybe expected to consist of wages subjectto withholding and of not more than$ 100 from other sources, and to exceed-
( 1) $ 10,000 for ahead of a householdor a widow or widower entitled to thespecial tax rates ;
(2) $5,000 for other single ind,ividuals ;
(3) $5,0.00 for a married individualnot entitled to file a joint declaration ;
(4) $5,000 for a married individualentitled to file a joint declaration, andthe combined income of both husbandand wife can reasonably be expected toexceed $10,000 ; OR
(b) his gross income can reasonablybe expected to include more than $100from sources other-than wages subject towithholding and to exceed the sum of :(1) $600 for each of his exemptions plus(2) $400.
The Internal Revenue Service willmail Form 1040-ES, as far as is prac-ticable, to each person who may need it .Others required to file should obtain theform from any Internal Revenue Serv-ice office in time to file by April 15,1960 . Farrners may postpone filingtheir 1960 declarations until January15, 1961 .
Additional Charge for Underpayment of Esti-mated Tax.-It is important that youestimate your tax carefully. It willavoid the difficulties of paying a largebalance with your final return .
Furthermore, there is an additionalcharge imposed by law for underpay-ment of any installment of estimatedtax. Details of this additional charge,and exceptions to it, are printed onForm 1040-ES and Form 2210 . If youhad an underpayment and believe oneof the exceptions applies, attach a state-ment or Form 22-10 to your return.
c59--10--75312-1
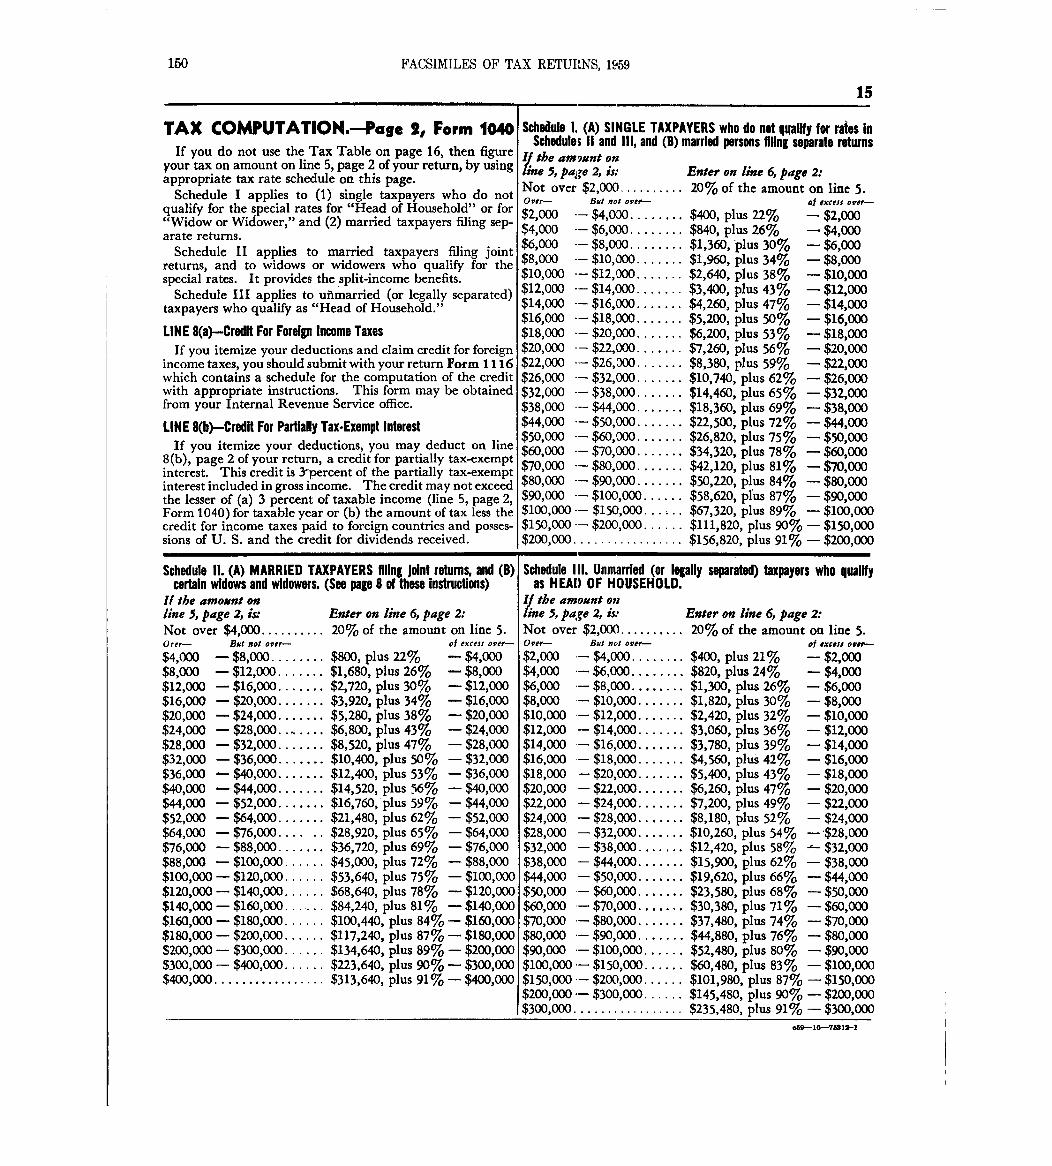
150 FACSIMILES OF TAX RETUI',NS, 1959
1 5
TAX COMPUTATION.-Page 2,r Form 100If you do not use the Tax Table on page 16, then figure
your tax on amount on line 5, page 2 of your return, by usingappropriate tax rate schedule on this page .
Schedule I applies to (1) single taxpayers who do notqualify for the special rates for "Head of Household" or for"Widow or Widower," and (2) married taxpayers filing sep-arate returns .
Schedule II applies to married taxpayers filing jointreturns, and to widows or widowers who qualify for thespecial rates . It provides the split-income benefits .
Schedule III applies to uhmarried (or legally separated)taxpayers who qualify as "Head of Household ."
LINE 8(a)-Credit For Foreign Income Taxe sIf you itemize your deductions and claim credit for foreign
income taxes, you should submit with your return Form 1116which contains a schedule for the computation of the creditwith appropriate instructions . This form may be obtainedfrom your Internal Revenue Service office .
LINE 8(b)-Credit For Partially Tax-Exempt Interes tIf you itemize your deductions, you may deduct on line
8(b), page 2 of your return, a credit for partially tax-exemptinterest. This credit is 3'percent of the partially tax-exemptinterest included in gross income . The credit may not exceedthe lesser of (a) 3 percent of taxable income (line 5, page 2,Form 1040) for taxable year or (b) the amount of tax less thecredit for income taxes paid to foreign countries and posses-sions of U. S . and the credit for dividends received .
Schedule II . (A) MARRIED TAXPAYERS filing joint returns, and (B)certain widows and widOWKL, (See page 8 of these Instructions)
If the amoxnt rline 5, page 2, is. Enter on line 6, page 2 :Not over $4,000 . . . . . . . . . . 20% of the amount on line 5 .0ver- But not over-
$4,000$8,000$12,000$16,000$20,000$24,000$28,000$32,000$36,000$40,000$44,000
-$8,000 . . . . . . . . $800, plus 22%-$12,000 . . . . . . . $1,680, plus 26%-$16,000 . . . . . . . $2,720, plus 30%-$20,000 . . . . . . . $3,920, plus 34%-$24,000 . . . . . . . $5,280, plus 38%- $28,000 . ., . . . . $6,800, plus 43%-$32,000 . . . . . . . $8,520, plus 47%-$36,000 . . . . . . . $10,400, plus 50%-$40,000 . . . . . . . $12,400, plus 53%-$44,000 . . . . . . . $14,520, plus 56%-$52,000 . . . . . . . $16,760, plus 59%
of excest over--
-$4,000-$8,000-$12,000-$16,000-$20,000-$24,000-$28,000-$32,000-$36,000-$40,000-$44,000-$52,000-$64,000-$76,000-$88,000-$100,000-$120,000-$140,000
Schedule 1 . (A) SINGLE TAXPAYERS who do not qualify for rates InSchedule ; 11 and 111, and (B) married persons filing separate returnsthe am~7unt on
line 5, pagre 2, is. Enter on line 6, page 2:Not over $2,000 . . . . . . . . . . 20% of the amount on line 5 .Over— But not ovet- of excets over-$2000 --$4,000 . . . . . . . . $400, plus 22% -$2,000$4:000 --$6,000 . . . . . . . .. $840, plus 26% -$4,000$6,000 --$8,000 . . . . . . . . $1,360,plus 30% -$6,000$8000 --$10,000 . . . . . . . $1,960, plus 34% -$8,000$1;,000 --$12,000 . . . . . . . $2,640, plus 38% -$10,000$12,000 --$14,000 . . . . . . . $3,400, plus 43% -$12,000$14,000 --$16,000 . . . . . . . $4,260
'plus 47% -$14,000
$16,000 --$18,000 . . . . . . . $5,200, plus 50% -$16,000$18,000 --$20,000 . . . . . . . $6,200, plus 53% -$18,000$20,000 --$22,000 . . . . . . . $7,260, plus 56% -$20,000$22,000 --$26,000 . . . . . . . $8,380, plus 59% -$22,000$26,000 --$32,000 . . . . . . . $10,740, plus 62% -$26,000$32,000 --$38,000 . . . . . . . $14,460, plus 65% -$32,000$38,000 --$44,000 . . . . . . . $18,360, plus 69% -$38,000$44,000 --$50,000 . . . . . . . $22,500, plus 72% -$44,000$50,000 --$60,000 . . . . . . . $26,820, plus 75% -$50,000$60,000 --$70,000 . . . . . . . $34,320, plus 78% -$60,000$7%000 --$80,000 . . . . . . . $42,120, plus 81% -$70,000$80,000 --$90,000 . . . . . . . $50,220, plus 84% -$80,000$90,000 --$100,000 . . . . . . $58,620, plus 87% -$90,000$100,000 $150,000 . . .-. . . $67,320, plus 89% -$100,000$150,000 $200,000 . . . . . . $111,820, plus 90% - $150,000$200,000 . . . . . . . . . . . . . . . . . $156,820, plus 91% - $200,000
Schedule 111. Unmarried (or legally separated) taxpayers who qualifyas HEAD OF HOUSEHOLD.
If the amomnt online 3, pa,-,,e 2, is. Enter on line 6, page 2.Not over $2,000 . . . . . . . . . . 20% of the amount on line 5.ovet- But not over-- of excesr over--$2,000 -$4,000 . . . . . . . . $400, plus 21% -$2,000$4,000 --$6,000 . . . . . . . . $820, plus 24% -$4,000$6,000 --$8,000 . . . . . . . . $1,300, plus 26% -$6,000$8,000 -$10,000 . . . . . . . $1,820, plus 30% -$8,000$10,000 --$12,000 . . . . . . . $2,420, plus 32% -$10,000$12,000 -$14,000 . . . . . . . $3,060, plus 36% -$12,000$14,000 --$16,000 . . . . . . . $3,780, plus 39% -$14,000$16,000 ~- $18,000 . . . . . . . $4,560, plus 42% -$16,000$18,000 -$20,000 . . . . . . . $5,400, plus 43% -$18,000$20,000 -$22,000 . . . . . . . $6,260, plus 47% -$20,000$22,000 -$24,000 . . . . . . . $7,200, plus 49% -$22,000$24,000 -$28,000 . . . . . . . $8,180, plus 52% -$24,000$28,000 -$32,000 . . . . . . . $10,260, plus 54% --$28,000$32,000 -$38,000 . . . . . . . $12,420, plus 58% -$32,000$38,000 -$44,000 . . . . . . . $15,900, plus 62% -$38,000$44,000 -$50,000 . . . . . . . $19,620, plus 66% -$44,000$50,000 --$60,000 . . . . . . . $23,580, plus 68% -$50,000$60,000 -$70,000 . . . . . . . $30,380, plus 71% -$60,000$70,000 --$80,000 . . . . . . . $37,480, plus 74% -$70,000$80,000 --$90,000 . . . . . . . $44,880, plus 76% -$80,000$90,000 .-$100,000 . . . . . . $52,480, plus 80% -$90,000$100,000 $150,000 . . . . . . $60,480, plus 83% -$100,000$150,000 $200,000 . . . . . . $101,980, plus 87% - $150,000$200,000 $300,000 . . . . . . $145,480, plus 90% - $200,000$300,000 . . . . . . . . . . . . . . . . . $235,480, plus 91% - $300,000
$52,000 - $64,000 . . . . . . . $21,480, plus 62%$64,000 - $76,000 . . . . . . $28,920, plus 65%$76,000 - $88,000 . . . . . . . $36,720, plus 69%$88,000 - $100,000 . . . . . . $45,000, plus 72%$100,000 - $120,000 . . . . . . $53,640, plus 75%$120,000 - $140,000 . . . . . . $68,640, plus 78%$140,000 - $160,000 . . . . . . $84,240, plus 81%$160,000 - $180,000 . . . . . . $100,440, plus 84% - $160,000$180,000 - $200,000 . . . . . . $117,240, plus 87% - $180,000$200,000 - $300,000 . . . . . . $134,640, plus 89% - $200,000$300,000 - $400,000 . . . . . . $223,640, plus 90% - $300,000$400,000 . . . . . . . . . . . . . . . . . $313,640, plus 91% - $400,000
o59--16-75312-1
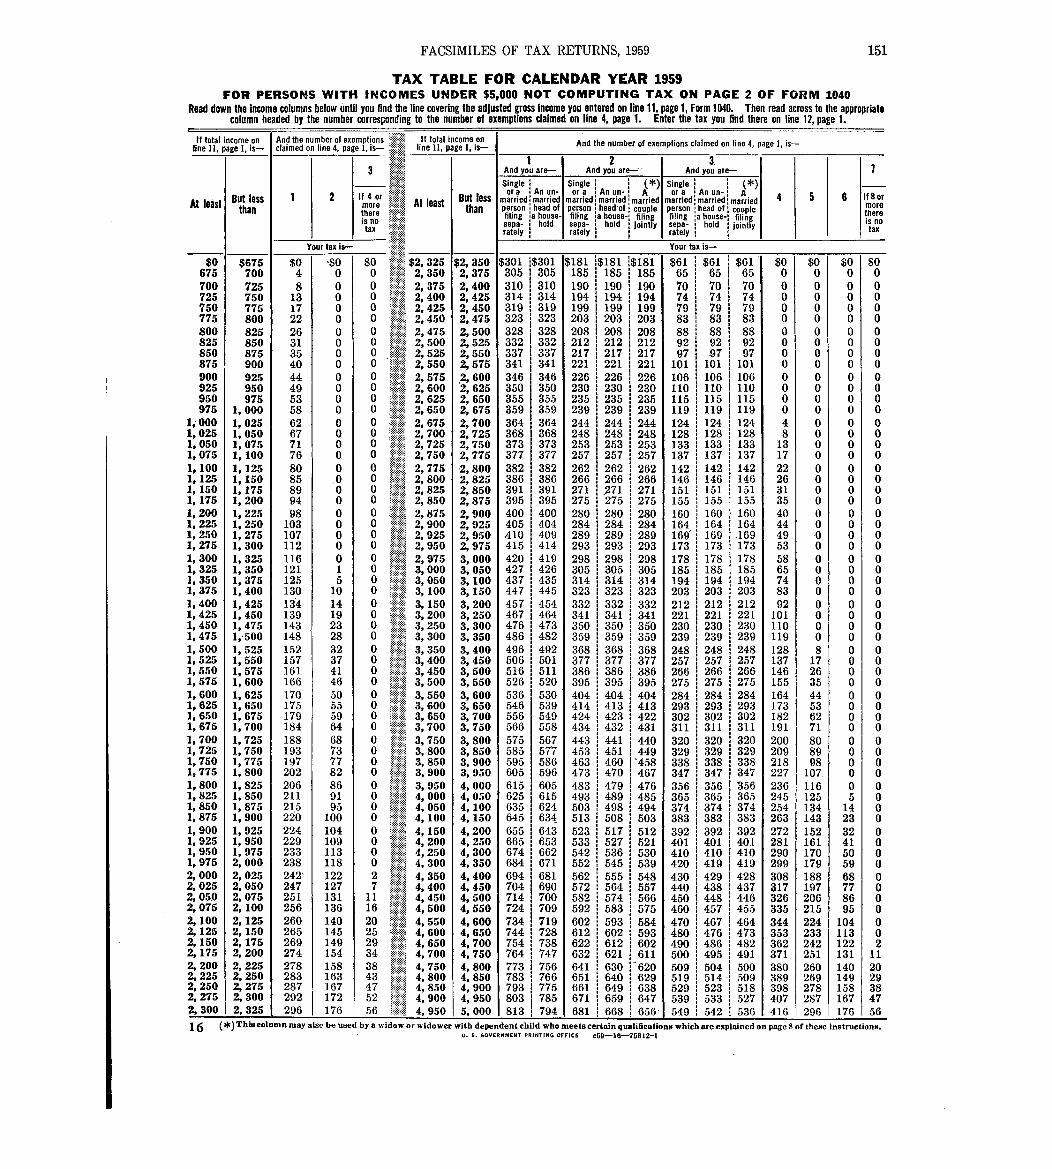
FACSIMILES OF TAX RETURNS, 1959 151
TAX TABLE FOR CALENDAR YEAR 1959FOR PERSONS WITH INCOMES UNDER $5,000 NOT COMPUTING TAX ON PAGE 2 OF FORM 1040
Read down the income columns below until you find the line covering the adjusted gross Income you entered on line 11, page 1, Form 1040. Then read across to the appropriatecolumn headed by the number corresponding to the number of exemptions claimed on line 4, page 1 . Enter the tax you find there on line 12, page 1 .
If total income o nline 11, page I, is-
And the number of exemptions If total i come o nclaimed on line 4, page 1, is- line 11, page 1, is- And the number of exemptions claimed on line 4, page 1, is-
1 2 3.3 And you are-- And you are~ And you are- 7
Single
Single M Single M
At least But less 1 2 If 4 o rmore At least But less An unor a -
marriecitmarried: An un . :or a A
married : married married: An u nor a - 1 A .
married : married'; married 4 5 6 If 8 Ormor ethan r
the eis no
than Pfe,!so n : head o fI Ing!a house -
h ld
fii~,sn gpe on : head'of coupl e:a house- : filin g1 h d 1
head ofperson couplefiling !a house-: filin
fthereis no
IIax sepa- o
ratelysepa- ol ointl yIrately 1
1 setpea- hold 1 joint lyra I y ta x
Your tax Is- Your tax is-
$0 $675 $0 10 $0 $2, 325 $2,350 $301 ;$301 $181 1$181 1$181 $61 $61 $61 $0 $0 $0 $ 0675 700 4 0 0 2 350 2,375 305 1 305 1185 185 185 65 65 65 0 0 0 0700 725 8 0 0 2,375 2,400 310 11 310 190 1. 190 i 190 70 70 70 0 0 0 0725 750 13 0 0 21400 2,425 314 314 194 1 194 1 194 74 1 74 11 74 0 0 0 0750 775 17 0
02,425 2,450 319 319 199 199 1. 199 79 1 79 1 79 0 0 0 0
775 800 22 0 0 2,450 2,475 323 323 203 1. 203 203 83 1 83 1. 83 0 0 0 0Soo 825 26 0 0 29475 2' 500 328 328 208 208 20 8
188 11 88 1 8 8
10 0 0 0
825 850 31 0 0 2,500 2t 525 332 332 212 212 212 92 1 9292 0 0 0 0850 875 35 0 0 2,525 2,550 337 337 217 217 1 217 97 97 97 0 0 0 0875 900 40 0 0 2,550 2,575 341 341 221 221 :1 221 101 101 101 0 0 0 0900 925 44 0 0 2 575
'~2 600 346 346
1226 226 1 226 106 1 106 106 0 0 0 0
925 950 49 0 0 2, 600 2: 625 350 . 350 230 230 230 110 110 110 0 0 0 0950 975 53 0 0 2,625 2,650 355 1 355 235 M 235 115 115 115 0 0 0 0975 1,000 58 0 0 2,650 2,675 359 1 359 239 239 239 119 119 1 119 0 0 0 0
lo 000 1,025 62 0 0 2,675 2,700 364 1. 364 244 244 244 124 124 1. 124 4 0 0 01,025 1,050 67 0 0 2,700 2,725 368 1 368 248 248 1 248 128 i 128 1. 128 8 0 0 01,050 1,075 71 0 0 2 7251 2 750 373 1 3731 253 253 :1 253 133 133 133 13 0 0 01,075 1,100 76 0
02,750 2:775 377 377 257 257 :1 257 137 137 137 17 0 0 0
1,100 1,125 80 0 0 2 775 -2,800 382 382 262 1 262 1 262 142 142 i 142 22 0 0 01,125 1,150 85 .0 0 2" 800 2,825 386 386 266 266 266 146 146 1 146 26 0 0 01,150 1,175 89 0 0 2,825 2,850 391 391 271 271 27 1" 151 151 151 31 0 0 01,175 1,200 94 0 0 2,850 2,875 395 395 275 275 275 155 155 155 35 0 0 01,200 1,225 98 0 0 2,875 2,900 400 1 400 280 280 1 280 160 160 160 40 0 0 01,225 1,250 103 0 0 2,900 2,925 405 1 404 284 1 284 .1 284 164 164 164 44 0 0 01,250 1p 275 107 0 0 2 9251 2,950 .410 1 409 289 289 289 169r 169 169 49 0 0 01,275 1,300 112 0
02,950 2,975 415 1 414 293 293 293 173 173 173 53 0 0 0
1,300 1,325 116 0 0 20975 3,000 i420 i 419 298 298 298 178 178 1 178 58 0 0 01,325 1,350 121 1 3,000 3,050 427 426 305 305 305 185 185 185 65 0 0 01,350 1p 375 125 5 0 3,050 3,160 437 1. 435 314 314 314 194 194 194 74 0 0 01,375 1,400 130 10 0 31100 3,150 447 1 445 329 323 323 203 1 203 203 83 0 0 01,400 1,425 134 14 0 3,150 3,200 457 454 332 332 332 212 1. 212 212 92 0 0 01,425 1,450 139 19 0 3 2000 3,250 467 464 341 341 341 221 1 221 1 22 11 101 0 0 01,450 1,475 143 23
03,250 3,300 476 1 473 350 350 360 230 230 :1 230 110 0 0 0
1,475 1,500 148 28 0 3,300 3p 350 486 482 359 359 359 239 239 239 119 0 0 01p 500 1,525 152 32 0 3 350 3 400 496 492 368 368 368 248 248 248 128 8 0 01,525 1,550 157 37 0 3,400 3: 450 506 501 377 31(7 377 257 257 1 257 137 17 0 01,550 1,575 161 41 . . . .
..3,4500 3,500 516 it 511 386 386 386 266 266 1. 266 146 26 0 0
1,575 1,600 166 46 0 3,500 3,550 526 1 520 395 395 1 395 275 275 11 275 155 35 0 01,600 1,625 170 50 0 3,550 3,600 536 530 404 404 1 404 284 284 1. 284 164 44 0 01,625 1,650 175 55 0 3,600 3,650 546 539 414 413 1 413 293 293 293 173 53 0 01,650 1,675 179 59 0 31650 3,700 556 549 424 1 423 i 422 302 302 302 182 62 0 01,675 1,700 184 64
03,700 3,750 566 558 i434 1 432 431 311 311 311 191 71 0 0
1,700 1,725 188 68 0 39750 3,800 575 567 443 1 441 440 320 320 320 200 .80 0 01,725 1,750 193 73 0 3,800 3,850 585 577 453 1 451 449 329 329 329 209 89 0 01,750 1,775 197 77 0 3,850 3,900 595 586 463 460 '458 338 338 338 218 98 0 01,775 1,800 202 82 0 3 900 3,950 605 596 473 470 467 347 347 347 227 107 . 0 01,800 1,825 206 86 0 3 9509 4,000 615 605 483 479 476 356 i 356 1 356 236 116 0 01,825 1,850 211 91
04,000 4 050 625 615 493 489 485 365 365 1 365 245 125 5 0
1,850 1,875 215 95 0 4,050 4: 100 635 624 503 498 494 374 374 1. 374 254 134 14 01,875 1,900 220 100 0 4,100 4,150 645 634 513 508 503 383 383 383 263 143 23 01,900 1,925 224 104 0 4,150 4,200 655 643 523 517 512 392 392 392 272 152 32 01,925 1,950 229 109 0 49200 4,250 665 1. 653 533 527 1 521 401 401 401 281 161 41 01,950 1,975 233 113 0 4P 250 49300 674 1 662 542 536 530 410 410 410 290 170 50 01,975 2,000 238 118
049300 4,350 684 1 67 1i 552 545 1. 539 420 419 1 419 299 179 59 0
2,000 2,025 242~ 122 2 4,350 4,400 694 681 562 555 548 430 429 1 428 308 188 68 02,025 2,050 247 127 7 4,400 49450 704 690 572 564 5 .57 440 438 437 317 197 77 02,05.0 2,075 251 131 11 4,450 49500 714 700 582 574 1. 566 450 448 446 326 206 86 02,075 2,100 256 136 16 4 5000 4,550 724 1 709 592 583 575 460 457 455 335 215 95 029100 2,125 260 140 20 4 550
P4,600 734 719 602 593 1 584 470 467 464 344 224 104 0
2,125 2,150 265 145 25 4, 600 4,650 744 1 728 612 6,02 i .593 480 476 473 353 233 113 02,150 2,175 269 149 29 4,650 4,700 754 738 622 612 602 490 486 482 362 242 122 22,175 2,200 274 154 34 4,700 4,750 764 747 632 621 611 500 495 491 371 251 131 1 12,200 2,225 278 158 38 4,750 4,800 773 756 641 630 :_620 509 504 1 500 380 260 140 2 02,225 2,250 283 163 43 4,800 4,850 783 766 651 640 629 519 514 i 509 389 269 149 2 92,250 2,275 287 167 47 4,850 4,900 793 775 661 638649 529 523 518 398 278 158 3 82,275 2,300 292 172 52 4,900 4,950 803 1. 785 671 659 647 539 533 527 407 287 167 472,300 1 2,325 1 296 176 1 56 4,950 1 5,000 1 813 794 681 668 656 549 542 536 416 296 176 5 616
(*)This column may also be used by a widow or widower with dependent child who meets certain qualifications which are explained on page 8 of these instructions .U . S . GOVERNMENT PRINTING OFFICE c59-16-75312-1
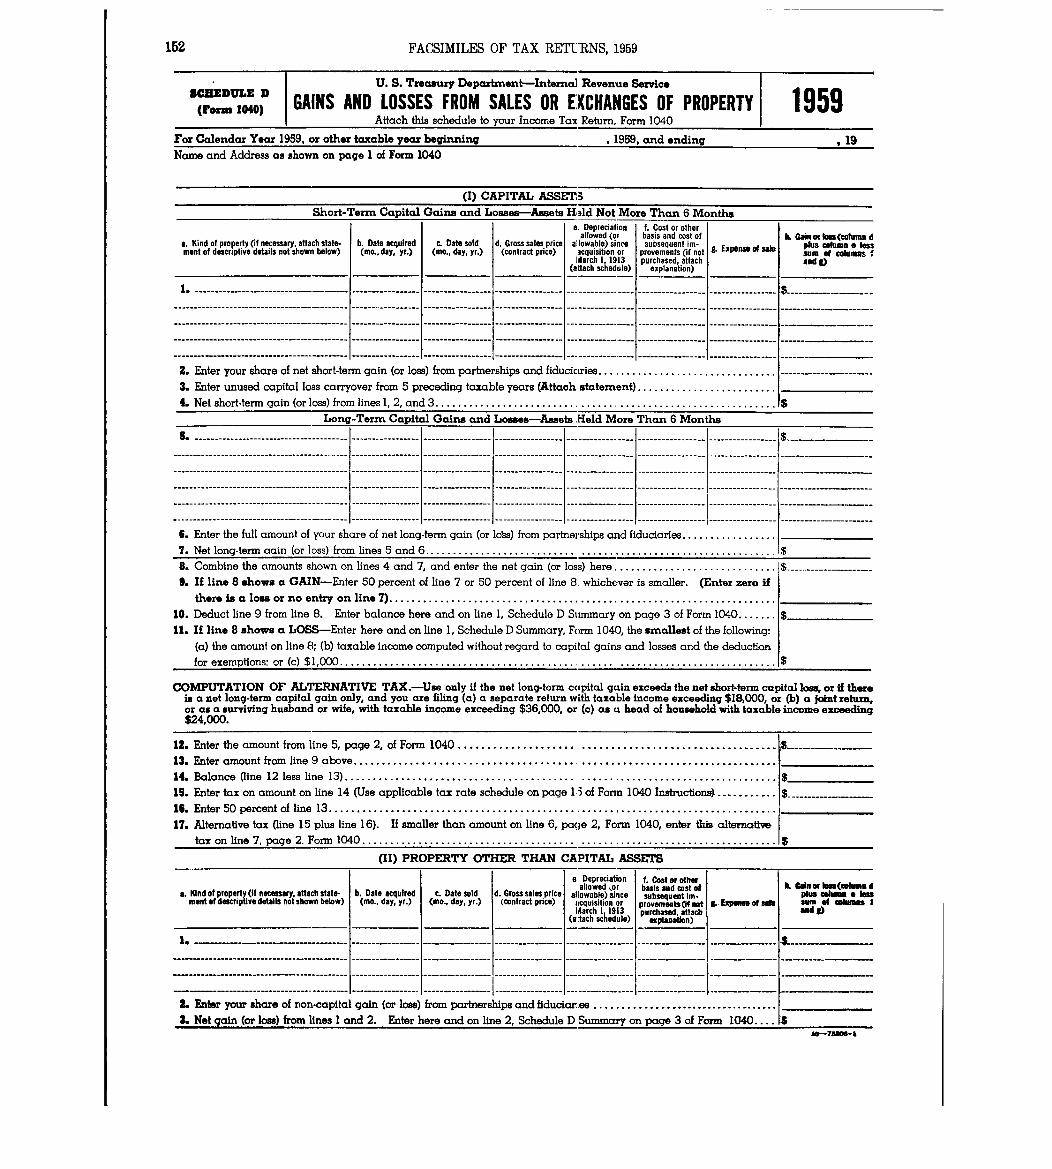
152 FACSIMILES OF TAX RETURNS, 1959
SCMDULE D(ro= 1040)
Attach this schedule to your Income Tax Return, Form 104 0For Calendar Year 1959, or other taxable year beginning 1959, and ending
Name and Address as shown on page 1 of Form 1040
(1) CAPITAL ASSET S
Short-Terrn Capital Gains and Losses-Assets H,31d Not More Than 6 Months
a. Kind of property (if necessary, attach state-ment of descriptive details not shown below)
- --------- ------ --------- - ---- - ----
--------------------------------------------
-------------------------------------------
--------------------------------------------
b. Date acquired(mo., day, yr .)
-- - -------------------------- ---
----------------
-----------------
c. Date sold(mo., day, yr .)
------ - ----------- - -------------
----------------
-----------------
.d Grosssales~priceVontract price)
----------------------------------
----------------
----------------
e . Depreciationallowed (or
allowable)since3cquisition or
(adarch 1, 1913ttach schedule)
-
------------------------- - -------
------------------
-----------------
f. Cost or otherbasis and cost ofsubsequent im-
provements (it notpurchased, attac h
explanation)
E penst of sob9,
-------------------------------------------- -- - ------------------------------- I ----------------- I ------------- I ---- I ----- - ---------- -----------------
2. Enter your share of net short-term gain (or loss) from partnerships and fiducictries . . . I . . . . . . . . . . . . . . . . . . . . . . . . . . . .
3. Enter unused capital loss carryover from 5 preceding taxable years (Attach statement) . . . . . . . . . . . . . . . . . . . . . . . . .
4. Net short-term gain (or loss) from lines 1, 2, and 3. . . . . . . . . . . . . . . . . . . . . . . . . . . . . . . . . . . . . . . . . . . . . . . . . . . . . . . . . . . . .
Long-Term Capital Gains and Losses-Assets .Helcl More Than 6 Months
5 - ---------------------------------------
--------------------------------------------
--------------------------------------------
--------------------------------------------
--------------------------------------------
-----------------
-----------------
----------------
-----------------
-----------------
------ - ---------
-----------------
------------------
-------------------------------------------- ----------------- I ----------------- I ----------------- I ----------------- ----------------- I -----------------6 . Enter the full amount of your share of net long-term gain (or lobs) from partnerships and fiduciaries . . . . . . . . . . . . . . . . .
7 . Net long-term aain (or loss) from lines 5 and 6. . . . . . . . . . . . . . . . . . . . . . . . . . . . . . . . . . . . . . . . . . . . . . . . . . . . . . . . . . . . . .
8 . Combine the amounts shown on lines 4 and 7, and enter the net gain (or loss) here . . . . . . . . . . . . . . . . . . . . . . . . . . . . .
9 . If line 8 shows a GAIN-Enter 50 percent of line 7 or 50 percent of line 8 whichever is smaller . (Enter zero if
there is a loss or no entry on line 7) . . . . . . . . . . . . . . . . . . . . . . . . . . . . . . . . . . . . . . . . . . . . . . . . . . . . . . . . . . . . . . . . . . . . .
10 . Deduct line 9 from line 8. Enter balance here and on line 1, Schedule D Summary on page 3 of Form 1040 . . . . . . .
11. If line 8 shows a LOSS-Enter here and on line 1, Schedule D Summary, Form 1040, the smallest of the following :
(o) the amount on line 8 ; (b) taxable income computed without regard to capital gains and losses and the deduction
for exemptions- or (c) $1,000 . . . . . . . . . . . . . . . . . . . . . . . . . . . . . . . . . . . . . . . . . . . . . . . . . . . . . . . . . . . . . . . . . . . . . . . . . . . . . .
1959.19
k Gain or Im(cotumn dPlots collumn 0 less;sum of Columnand S)
$
$ - ----- - --- - -------
$
COMPUTATION OF ALTERNATIVE TAX.-Use only if the net long-term CCLpital gain exceeds the net short-term capital loss, or if therein a net long-term capital gain only, and you are filing (a) a separate return w1th taxable income exceeding $IE1,000, or (b) a joint return,or as a surviving husband or wife, with taxable income exceeding $36,000, or (c) as a head of household with taxable income exceeding$24,000 .
12. Enter the amount from line 5, page 2, of Form 1040 . . . . . . . . . . . . . . . . . . . . . . . . . . . . . . . . . . . . . . . . . . . . . . . . .
13. Enter amount from line 9 above . . . . . . . . . . . . . . . . . . . . . . . . . . . . . . . . . . . . . . . . . . . . . . . . . . . . . . . . . . . . . . . . . . . . . . . .
14. Balance aine 12 less line 13) . . . . . . . . . . . . . . . . . . . . . . . . . . . . . . . . . . . . . . . . . . . . . . . . . . . . . . . . . . . . . . . . . . . . . . . . . . .
19 . Enter tax on amount on line 14 (Use applicable tax rate schedule on page 13 of Form 1040 Instructions) . . . . . . . . .. . .
16 . Enter 50 percent of line 13 . . . . . . . . . . . . . . . . . . . . . . . . . . . . . . . . . . . . . . . . . . . . . . . . . . . . . . . . . . . . . . . . . . . . . . . . . . . . . . . .
17 . Alternative tax (line 15 plus line 16) . If smaller than amount on line 6, page 2, Form 1040, enter this alternative
tax on line 7, page 2. Form 1040 . . . . . . . . . . . . . . . . . . . . . . . . . . . . . . . . . . . . . . . . . . . . . . . . . . . . . . . . . . . . . . . . . . . . . . . . .
(11) PROPERTY OTHER THAN CAPITAL ASSETS
a. Kind of property (if necessary, attach state-ment of descriptive details notshown below )
I - - - ------- - - - - - - -------------
U. S. Treasury Departmentr-Internal Revenue Servic e
GAINS AND LOSSES FROM SALES OR EXCHANGES OF PROPERT Y
b. Date acquired(mo., day, yr .)
------------------
c . Date sold(mo., day, yr.)
-- - -- - ---------
d . Gross sales price(contract price)
-----------------
a Depreciationallowed o r
allowable)since~Cqulsltiofl orfiarch 1, 191 3
(a tach schedule)
-----------------
f . Cost or oth"basis and cost atsubsequent !in-
provementa(MWpurchased, attac h
explanadon)
& ExPINMOt3lb
$_
$ -------- -
IL Galnortan(cohnandphis cahson a Is"sum of colurans Iand 2)
- - - - - ----------------------------------- I ---------- - ----- I ----- - ---------- I ----------------- I ----------- - ----
L Enter your share of non-capital gain (or loss) from partnerships and fiduciar . es . . . . . . . . . . . . . . .
. * . . . . . . . . .3. Net gain (or low) from lines I and 2. Enter here and on line 2, Schedule D Summary on page 3 of Form 1040 . . . . SU-75MG-1
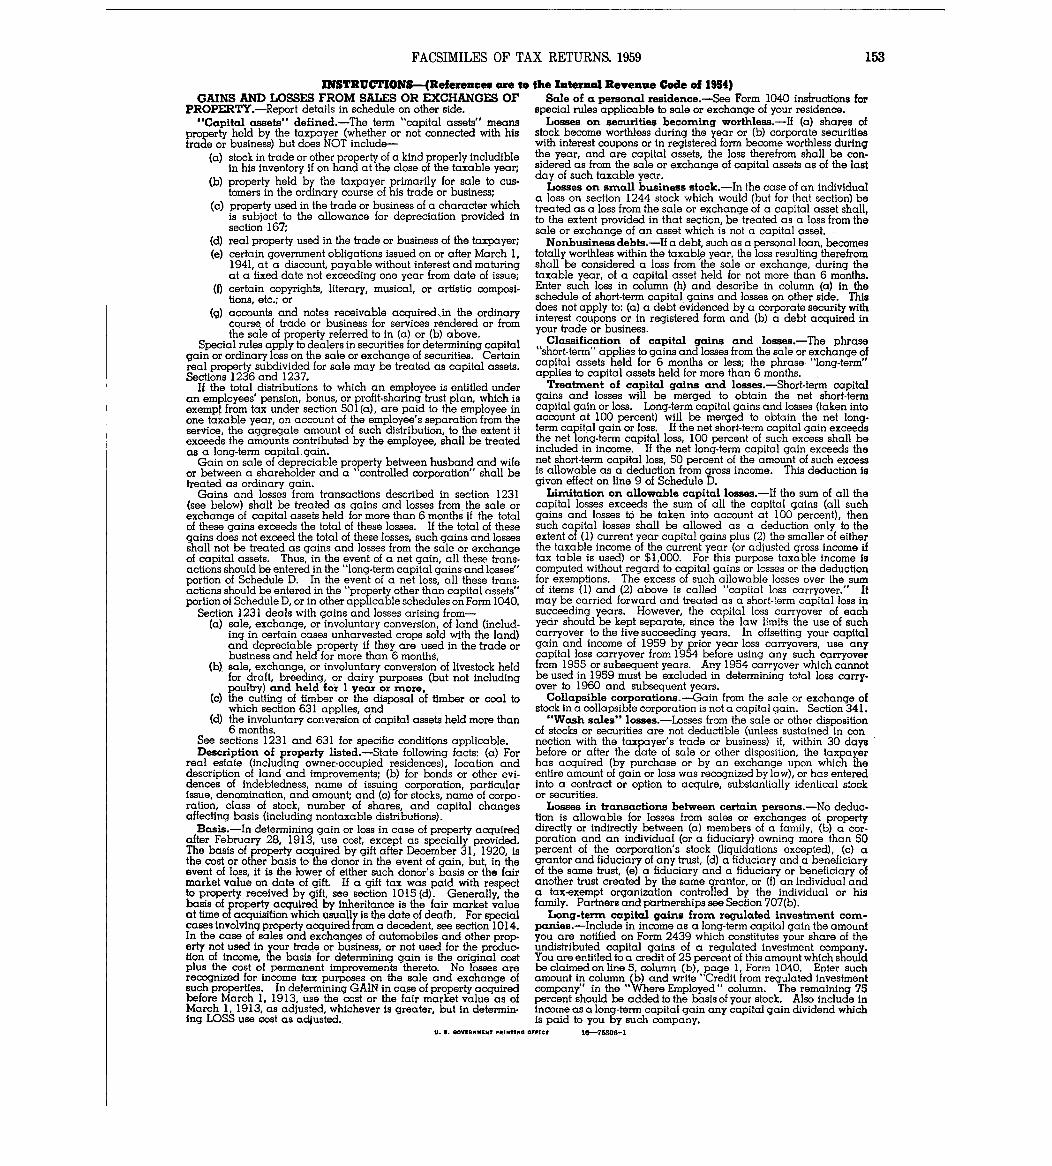
FACSIMILES OF TAX RETURNS. 1959 153
INSTRUCTIONS-(References are to the Internal Revenue Code of 1954)GAINS AND LOSSES FROM SALES OR EXCHANGES OF Sale of a personal residence .-See Form 1040 instructions for
PROPERTY.-Report details in schedule on other side. special rules applicable to sale or exchange of your residence."Capital assets" defined .-The term "capital assets" means Losses on securities becoming worthless .-If (a) shares of
property held by the taxpayer (whether or not connected with his stock become worthless during the year or (b) corporate securitiestrade or business) but does NOT include- with interest coupons or in registered form become worthless during
(a) stock in trade or other property of a kind properly includible the year, and are capital assets, the loss therefrom shall be con.in his inventory if on hand at the close of the taxable year; sidered as from the sale or exchange of capital assets as of the last
(b) property held by the taxpayer primarily for sale to cus-day of such taxable year .
tomers in the ordinary course of his trade or business, Losses on small business stock .-In the case of an individualI a loss on section 1244 stock which would (but for that section) be
(c) property used in the trade or business of a character which treated as a loss from the sale or exchange of a capital asset shall ,is subject to the allowance for depreciation provided in to the extent provided in that section, be treated as a loss from thesection 167; sale or exchange of an asset which is not a capital asset .
(d) real property used in the trade or business of the taxpayer; Nonbusiness debts.-If a debt, such as a personal loan, becomes(e) certain government obligations issued on or after March 1, totally worthless within the taxable year, the loss resulting therefrom
1941, at a discount, payable without interest and maturing shall be considered a loss from the sale or exchange, during theat a fixed date not exceeding one year from date of issue ; taxable year, of a capital asset held for not more than 6 months .
(0 certain copyrights, literary, musical, or artistic composi. Enter such loss in column (h) and describe in column (a) in thetions, etc . ; or schedule of short-term capital gains and losses on other side . This
does not apply to: (a) a debt evidenced by a corporate security with(g) accounts and notes receivable acquired,in the ordinary _+ , ; +---A f A All A-I,+ ; -A ; _f 4- A_ 1, *- f__ .4 11 1-course o a or us ess sery ces ren ere or om
the sale of ro r+- referred to in (a% -- 11-% above your trade or business .
Special rules apply to dealers in securities for determining capital " %liassiticalion or capit gcuns and losses.-Ine p asegain or ordinary loss on the sale or exchange of securities . Certain short-term" applies to gains and losses from the sale or exchange ofreal property subdivided for sale may be treated as capital assets . capital assets held for 6 months or less; the phrase "long-term"Sections 1236 and 1237. applies to capital assets held for more than 6 months. .
If the total distributions to which an employee is entitled under Treatment of capital gains and losses .-Short-term capitalan employees' pension, bonus, or profit-sharing trust plan, Which is gains and losses will be merged to obtain the net short-termexempt from tax under section 501 (a), are paid to the employee in capital gain or loss. Long-term capital gains and losses (taken intoone taxable year, on account of the employee's separation from the account at 100 percent) will be merged to obtain the net long .service, the aggregate amount of such distribution, to the extent it term capital gain or loss . If the net short-term capital gain exceedsexceeds the amounts contributed by the employee, shall be treated the net long-term capital loss, 100 percent of such excess shall beas a long-term capital - gain. included in income. If the net long-term capital gain exceeds the
Gain on sale of depreciable property between husband and wife net short-term capital loss, 50 percent of the amount of such excessor between a shareholder and a "controlled corporation" shall be is allowable as a deduction from gross income . This deduction istreated as ordinary gain. givon effect on line 9 of Schedule D.
Gains and losses from transactions described in section 1231 Limitation on allowable capital losses.-If the sum of all the(see below) shall be treated as gains and losses from
'the sale or capital losses exceeds the sum of all the capital gains (all such
exchange of capital assets held for more than 6 months if the total gains and losses to be taken into account at 100 percent), thenof these gains exceeds the total of these losses . If the total of these such capital losses shall be allowed as a deduction only to thegains does not exceed the total of these losses, such gains and losses extent of (1) current year capital gains plus (2) the smaller of eithershall not be treated as gains and losses from the sale or exchange the taxable income of the current year (or adjusted gross income ifof capital assets . Thus, in the event of a net gain, all these trans- tax table is used) or $1,000. For this purpose taxable income isactions should be entered in the "long-term capital gains and losses" computed without regard to capital gains or losses or the deductionportion of Schedule D. In the event of a net loss, all these trans. for exemptions. The excess of such allowable losses over the sumactions should be entered in the "property other than capital assets" of items (1) and (2) above is called "capital loss carryover." Itportion of Schedule D, or in other applicable schedules on Form 1040. may be carried forward and treated as a short-term capital loss i n
Section 1231 deals with gains and losses arising from- succeeding years . However, the capital loss carryover of each(a) sale, exchange, or involuntary conversion, of land (includ- year should be kept separate, since the law limits the use of such
ing in certain cases unharvested crops sold with the land) carryover to the five succeeding years . In offsetting your capitaland depreciable property if they are used in the trade or gain and income of 1959 by prior year loss carryovers, use anybusiness and held for more than 6 months, capital loss carryover frorn 1954 before using any such carryove r
(b). sale, exchange, or involuntary conversion of livestock held from 1955 or subsequent years. Any 1954 carryover which cannotfor draft, breeding, or dairy purposes (but not including be used in 1959 must be excluded in determining total loss carry,
(c) pgultry) and held for 1 year or more, over to 1960 and subsequent years .e cutting of timber or the disposal of timber or coal to Collapsible corporations .-Gain from the sale or exchange of
which section 631 applies, and stock in a collapsible corporation is not a capital gain . Section341 .(d) the involuntary conversion of capital assets held more than "Wash sales" losses .-Losses from the sale or other dispositio n
6 months. of stocks or securities are not deductible (unless sustained in conSee sections 1231 and 631 for specific conditions applicable . nection. with the taxpayer's trade or business) if, within 30 daysDescription of property listed.-State following facts : (a) For before or after the date of sale or other disposition, the taxpaye r
real estate (including owner-occupied residences), location and has acquired (by purchase or by an exchange upon which thedescription of land and improvements; (b) for bonds or other evi- entire amount of gain or loss was recognized by la w), or has entereddences of indebtedness, name of issuing corporation, particular into a contract or option to acquire, substantially identical stockissue, denomination, and amount and (c) for stocks, name of corpo . or securities .ration, class of stock, number of shares, and capital changes Losses in transactions between certain persons .-No deduc-affecting basis (including nontaxable distributions) . tion is allowable for losses from sales or exchanges of property
Basis .-In determining gain or loss in case of property acquired directly or indirectly between (a) members of a family, (b) a cor-after February 28, 1913, use cost, except as specially provided. poration and an individual (or a fiduciary) owning more than 50The basis of property acquired by gift after December 31, 1920, is percent of the corporation's stock (liquidations excepted), (c) athe cost or other basis to the donor in the event of gain, but, in the grantor and fiduciary of any trust, (d) a fiduciary and a beneficiaryevent of loss, it is the 1,ower of either such donor's basis or the fair of the same trust, (e) a fiduciary and a fiduciary or beneficiary ofmarket value on date of gift. If a gift tax was paid with respect another trust created by the same grantor, or (f) an individual andto property received by gift, see section 10 15 (d) . Generally, the a tax-exempt organization controlled by the individual or hisbasis of property acquired by inheritance is the fair market value family- Partners ; and partnerships see Section 707(b) .at time ot acquisition which usually is the date of death . For special Long-term capital gains from regulated investment com-cases inyolving property acquired from a decedent, see section 1014 . panies.-Include in income as a long-term capital gain the amountIn the case of sales and exchanges of automobiles and other prop- you are notified on Form 2439 which constitutes your share of theerty not used in your trade or business, or not used for the produc- undistributed capital gains of a regulated investment company .tion of income, the basis for determining gain is the original cost You are entitled to a credit of 25 percent of this amount which shouldplus the cost of permanent improvements thereto. No losses are be claimed on line 5, column (b), page 1, Form 1040 . Enter suchrecognized for income tax purposes on the sale and exchange of amount in column (b) and write "Credit from regulated investmentsuch properties . In determining GAIN in case of property acquired company" in the "Where Employed " column . The remaining 75before March 1, 1913,'use the cost or the fair market value as of percent should be added to the basis of your stock . Also include inMarch 1, 1913, as adjusted, whichever is greater, but in determin- income as Q long-term capital gain any capital gain dividend whiching LOSS use cost as ad4usted., is paid to you by such company.
U. S. GOVERNMENT PRINTING OFFICE 16--75306- 1
-1- - - -J. - accju r
INDEX
A
[Asterisk (*) indicates new items ]
Page Classifications of data: PageAdjusted gross income classes . . . . . . . . . . . . . . . 14Marital status of taxpayer . . . . . . . . .. . . . . . . . . . 15Number of dependents . . . . . . . . . . . . . . . . . . . . . . . . 15Pattems of income . . . . . . . . . . . . . . . . . . . . . . . . . . 14Standard metropolitan statistical areas . . . . . 15States . . . . . . . . . . . . . . . . . . . . . . . . . . . . . . . . . . . . . . 15Taxable and nontaxable status . . . . . . . . . . . . . . . 14Taxable income classes . . . . . . . . . . . . . . . . . . . . . . 14Taxpayment status and types of taxpayments . . 14, 15Type of deduction (standard or itemized) . . . . 14Types of tax (alternative tax or normal ta x
and surtax) . . . . . . . . . . . . . . . . . . . . . . . . . . . . . . . 14Community property . . . . . . . . . . . . . . . . . . . . . . . . . . . . . . 9Credit on 1960 tax . . . . . . . . . . . . . . . . . . . . . . . 21, 30, 41, 50
Accounting period . . . . . . . . . . . . . . . . . . . . . . . . . . . . . . . 11Accumulation distribution from a complex trust . . 18Additional exemptions (age and blindness) . . 8, 19, 59-64Adjusted gross deficit . . . . . . . . . . . . . . . . .. . . . . . . . . . '19Adjusted gross income . . 3 . 4, 14, 19, 24-27, 31, 35, 39,
40, 42, 44, 53-58, 67-100Alternative tax . . . . . . . . . . . . . . . . . . . . . . . 14, 20, 44-46, 66Amended returns . . . . . . . . . . . . . . . . . . . . . . . . . . . . . . . . . 11Analysis of data :
Adjusted gross income . . . . . . . . . . . . . . . . . . . . . . . 3-7Capital gains and losses . . . . . . . . . . . . . . . . . . . . 6, 7Declaration of estimated tax . . . . . . . . . . . . . . . . 4Dividends . . . . . . . . . . . . . . . . . . . . . . . . . . . . . . . . . . . 4-6Excludable sick pay . . . . . . . . . . . . . . . . . . . . . . . . . . 6Exemptions . . . . . . . . . . . . . . . . . . . . . . . . . . . . . . . . . . 8, 9Income tax after credits . . . . . . . . . . . . . . . . . . . . 3Itemized nonbusiness deductions . . . . . . . . 7, 8, 11, 12Marital status . . . . . . . . . . . . . . . . . . . . . . . . . . . . . . 8, 9Number of returns . . . . . . . . . . . . . . . . . . . . . . . . . . . 3, 11Overpayment of tax . . . . . . . . . . . . . . . . . . . . . . . . . . 4Self-employment tax . . . . . . . . . . . . . . . . . . . . . . . . . 3Sole proprietorships . . . . . . . . . . . . . . . . . . . . . . . . 8, 9Standard deduction . . . . . . . . . . . . . . . . . . . . . . . . . . 11, 12Standard metropolitan statistical areas . . . 9, 10, 11Tax withheld . . . . . . . . . . . . . . . . . . . . . . . . . . . . . . . . 4Taxable income . . . . . . . . . . . . . . . . . . . . . . . . . . . . . . 3
Average income tax . . . . . . . . . . . . . . . . . . . . . . . . . . . . . . 44Averaging process . . . . . . . . . . . . . . . . . . . . . . . . . . . . . . . 18
B
Back pay . . . . . . . . . . . . . . . . . . . . . . . . . . . . . . . . . . . . . . . . 18Business or profession . . . . . . . . . . . . . . . . . . . . . . . . . 3, 4, 14
Expenses deductible . . . . . . . . . . . . . . . . . . . . . . . . . 16, 19Net operating loss deduction . . . . . . . . . . . . . . . . 16, 18Net profit or net loss . . . . . . . . 16, 25-27, 43y 67, 86Rentals for which services were rendered . . . . 18Sole proprietorships . . . . . . . . . . . . . . . . . . . . . . . . 9
C
Calendar year returns . . . . . . . . . . . . . . . . . . . . . . . . . . . 11Capital gains and losses . . . . . . . . . . . . . . . . . . . . . . . . 6 7
Sales of assets . . . . . . . 3, 4, 16, 17, 19, 25, 26, ~8,65-67, 86
Capital loss carryover . . . . . . . . 7, 16, 17, 65, 66Excess long-term gain over short-term
loss . . . . . . . . . . . . . . . . . . . . . . . . 6, 17, 19, 45, 46Long-term . . . . . . . . . . . . . . . . . . . . . . . . . . . . 17, 65, 66Loss before limitation . . . . . . . . . . . . . . . . 7, 17, 65Short-term . . . . . . . . . . . . . . . . . . . . . . . . . . . 17, 65, 66
*Types of assets sold . .:---**-*-- 7Changes affecting comparability of data :
*Form 1040W . . . . . . . . . . . . . . . . . . . . . . . . . . . . . . . . . . 3Income tax after credits of less than $1 .00 . 14
*Life Insurance Tax Act of 1959 . . . . . . . . . . . . . . 3Pensions and annuities, noncontributor-j . . . . . 17Small Business Tax Revision Act of 1958 . . . . . 3Social Security Amendments of 1958 . . . . . . . . . . 3Technical Amendments Act of 1958 . . . . . . . . . . . . 3
*Whole dollar amounts . . . . . . . . . . . . . . . . . . . . . . . . 3
Declaration of estimated tax . . . 4, 15, 21, 30, 41, 50-52Definitions :
Exemptions . . . . . . . . . . . . . . . . . . . . . . . . . . . . . . . . . . 19Measures of individual income . . . . . . . . . . . . . . . 19, 20Sources of adjusted gross income . . . . . . . . . . . . 16-19Tax items . . . . . . . . . . . . . . . . . . . . . . . . . . . . . . . . . . . 20, 21Total itemized deductions . . . . . . . . . . . . . . . . . . . 18, 19
Dependency qualifications . . . . . . . . . . . . . . . . . . . . . . . 15, 19Dependent exemption . . . . . . . . . . . . . . . . . . . . 8, 15, 19, 59-64Dependents other than taxpayers' children . . 8, 15, 59-64Description of sample :
Coverage . . . . . . . . . . . . . . . . . . . . . . . . . . . . . . . . . . . . 13, 14Method of estimation . . . . . . . . . . . . . . . . . . . . . . . . 12Response and other nonsampling errors . . . . . . . 13Sampling variability . . . . . . . . . . . . . . . . . . . . . . . . 12, 13Selection . . . . . . . . . . . . . . . . . . . . . . . . . . . . . . . . . . . 12
Dividends :After exclusions . . . . 4, 5, 16, 18, 25-27, 40, 66, 86Domestic and foreign . . . . . . . . . . . . . . . . . . . . . . . 4, 5, 40Eligible and ineligible for exclusion . . . . . . . 4, 5, 6Eligible for tax credit . . . . . . . . . . . . . . . . . . . . . 4, 5, 6Exclusion from gross income . . . . . . . . . . . . . 4, 5, 6, 40Q&ialifying and nonqualifying domestic . . . 4, 5, 6, 16Tax credit . . . . . . . . . . . . . . . . . . . . . 4, 5, 20, 29, 41, 42
Duplication of exemption . . . . . . . . . . . . . . . . . . . . . . . . 19
E
Effective tax rate . . . . . . . . . . . . . . . . . . . . . . . . . . . . . . 44Estates and trusts . . . . . . . . . . . . . . . . . . . 18, 19, 25, 26, 29Excludable sick pay . . . . . . . . . . . . . . . . . . . . . . . . . . . . . 6, 40Exemptions . . . . . . . . . . . . 8J 29, 33, 37, 39, 40, 42, 53-64 ,
68-85, 88-100Additional (age and blindness) . . . . . . . . . 8, 19, 59-64Children . . . . . . . . . . . . . . . . . . . . . . . . . . . . 81 9 .. 15 .9 59-64Duplication of . . . . . . . . . . . . . . . . . . . . . . . . . . . . . . 19Income and dependency qualification for . . . . . 19Multiple support . . . . . . . . . . . . . . . . . . . . . . . . . . . . 19Other dependent . . . . . . . . . . . . . . . . . . . . . . . . 8, 15, 59-64Support test for . . . . . . . . . . . . . . . . . . . . . . . . . . . . 19Taxpayers . . . . . . . . . . . . . . . . . . . . . . . . . . . . . . . . . 19, 59-64
166
r
156 INDEX
F Page
FICA tax withholding . (See Social security tax . )Filing requirements . . . . . . . . . . . . . . . . . . . . . . . . . . . . . 11Foreign tax paid tax credit . . . . . . . . . . . . . . . . . . 20, 29, 42Form 1040 . . . . . . . . . . . . . . . . . . . 4-6, 112 12, 14, 18, 19, 21Form 1040A . . . . . . . . . . . . . . . . . . . . . 4, 11, 14, 16, 18-21, 3 9
*Form 104OW . . . . . . . . . . 3-6, 11, 12, 14, 18, 19, 21, 40, 41Forms and instructions, 1959 . . . . . . . . . . . . . . . . . . . . 116
G
Gross income . . . . . . . . . . . . . . . . . . . . . . . . . . . . . . . . . . . . 19Guide to :
Basic tables by subject . . . . . . . . . . . . . . . . . . . . . 23Contents . . . . . . . . . . . . . . . . . . . . . . . . . . . . . . . . . . . . VHistorical tables by subject . . . . . . . . . . . . . . . . 101
Historical data, 1950-59 :Adjusted gross deficit . . . . . . . . . . . . . . . . . . . . . . 102Adjusted gross income . . . . . . . . . . . . 102, 103, 109, 110Average income tax . . . . . . . . . . . . . . . . . . . . . . . . . . 104Business profit . . . . . . . . . . . . . . . . . . . . . . . . . . . . . 107Dividends . . . . . . . . . . . . . . . . . . . . . . . . . . . . . . . . . . . 106Income tax after credits . . . . . . . . . . . . . . 102, 103, 110Interest . . 106Itemized deductions . . . . . . . . . . . . . . . . . . . . . . . . . 105Net gain from sales of capital assets . . . . . . . 108Number of returns . . . . . . . . . . . . . . . . . . . . . 102, 103, 109Partnership profit . . . . . . . . . . . . . . . . . . . . . . . . . . 107Rents and royalties net income . . . . . . . . . . . . . . 107Salaries and wages . . . . . . . . . . . . . . . . . . . . . . . . . . 106Self-employment tax . . . . . . . . . . . . . . . . . . . . . . . . . 102States . . . . . . . . . . . . . . . . . . . . . . . . . . . . . . . . . . . . . 109, 110Sources of income by type . . . . . . . . . . . . . . . . . . . 105Taxable income . . . . . . . . . . . . . . . . . . . . . . . . . . . . . 102, 103
I
Income and dependency qualifications for exemp-
tion . . . . . . . . . . . . . . . . . . . . . . . . . . . . . . . . . . . . . . . . . . 19Income attributable to several tax years . . . . . . . . 183 19Income tax after credits . . . . . 3, 20, 21, 24, 30, 341 38 )
39, 41, 42, 44-46, 53-58, 67-100Income tax after credits of less than $1 .00 . . . . . 14Income tax before credits . . . . . . . . 20, 29, 41, 42, 45, 46Income tax rates . . . . . . . . . . . . . . . . . . . . . . . . . . . . . . . . 20Income test . . . . . . . . . . . . . . . . . . . . . . . . . . . . . . . . . . . . . 11Interest . . . . . . . . . . . . . . . . . . . . . . 16, 18, 25-27, 40, 66, 86Intermal Revenue Districts . . . . . . . . . . . . . . . . . . . . . . 15Inventions and artistic works . . . . . . . . . . . . . . . . . . . 18Itemized deduction returns . . . . . . . . 7, 8, 11, 12, 14, 42 ,
57, 58Total itemized deductions . . . . 18, 19, 25, 26, 40, 42
i
Joint returns of husbands and wives . . . . 8, 9, 31-34, 45 ,47, 53, 55, 57, 60, 77-8 5
*Life Insurance Income Tax Act of 1959 . . . . . . . . . . . 3Long-term services . . . . . . . . . . . . . . . . . . . . . . . . . . . . . . 18Lump-sum payment of insurance contracts . . . . . . . . . 18
M Page
Writal status of taxpayer . . . . . . . . . . . . . . . . . . . . . . 8, 9, 15Measure,3 of individual income :
Adjusted gross deficit . . . . . . . . . . . . . . . . . . . . . . 19
Adj'isted gross income . . . . . . . . . . . . . . . . . . . . . . . 19
Gro,3s income . . . . . . . . . . . . . . . . . . . . . . . . . . . . . . . . 19
Taxable income . . . . . . . . . . . . . . . . . . . . . . . . . . . . . . 19, 20
Taxable income for partial tax . . . . . . . . . . . . . . 20
MultipL~ support exemption . . . . . . . . . . . . . . . . . . . . . . 19
Net lonly-term gain in excess of net short-termloss . (See Capital gains and losses . )
Net 10S3 from sales of capital assets beforelimitation . (See Capital gains and losses . )
Net ope-ating loss deduction . . . . . . . . . . . . . . . . . . . . 18, 19*New data :
*Typ,,~s of assets sold (Statistics of Income-1959, Sales of Capital Assets reported onIndividual Income Tax Returns) . . . . . . . . . . . . 7
*Fonri 104OW . . . . . . 3-6, 11, 12, 14, 18, 19, 21, 40, 41Noncalendar year returns . . . . . . . . . . . . . . . . . . . . . . . . 11Normal -,ax and surtax . . . . . . . . . . . . . . 6, 14, 20, 44-46, 66Number of dependents . . . . . . . . . . . . . . . . . . . . . . . . . . . . 15Number of returns . (See specific type of returnor classification .)
0
Office of International Operations . . . . . . . . . . . . . . 15Other a~-eas . . . . . . . . . . . . . . . . . . . . . . . . . . . . . . . . . . . . . 15Other d(~pender.t exemption . . . . . . . . . . . . . . . . . . 8, 15, 59-65Other sources of adjusted gross income . . . 4, 18, 19, 25 y
26, 29, 39, 40Other tax credits . . . . . . . . . . . . . . . . . . . . . . . . 20, 21, 29, 42Overpayment of tax . . . . . . . . . . . . . . . . . . . . 43 21, 30, 39, 41
P
Partial tax . . . . . . . . . . . . . . . . . . . . . . . . . . . . . . . . . . . . . 20Partial--y tax-exempt interest tax credit . . . . . . . . 20Partnerships . . . . . . . . . . . . 3, 4, 14, 16, 25-27, 42, 67, 86Patterns of income . . . . . . . . . . . . . . . . . . . . . . . . . . . . . . 14, 43Payment~~ on 1959 declaration . . . . . . . . . . 21, 30, 41, 50-52Pensions and annuities :
Lifo expectancy method . . . . . . . . . . . . . . . 17, 25, 26, 28Non(~ontritutory . . . . . . . . . . . . . . . . . . . . . . . . . . . . . 173-year method . . . . . . . . . . . . . . . . . . . . . . . . 17, 25, 26, 28
Per cap:-ta exemption . . . . . . . . . . . . . . . . . . . . . . . . . . . . 19Preliminary Report, Statistics of Income, 1959-60, U S. Business Tax Returns . . . . . . . . . . . . . . . . 9
Publica-,ions in preparation . . . . . . . . . . . . . . . . . . back cove r
R
Refund of tax . . . . . . . . . . . . . . . . . . . . 11, 21, 30, 39, 41, 50Rents and royalties . . 14, 18, 19, 25, 26, 28, 43, 67, 86Retirement income tax credit . . . . . . . . . . . . . . . . . 20, 29, 42Returns of heads of household . . . . . . 8, 9, 46, 49, 54, 56Returns of other single persons . . . . 8, 9, 35-38, 48, 54 ,
56, 58, 64Returns of surviving spouse . . . . 8, 9, 47, 54, 56, 58, 63Returns with neither overpayments nor tax dUE~ . . . 14, 52Returns with no information . . . . . . . . . . . . . . . . . . . . . 11Returns with no taxable income . . . . . . . . . . . 29, 39, 41, 42Returns with tax due at time of filing . . . . . . . 14, 15, 51Returns with tax overpayment . . . . . . . . . . . . . . . . . 14, 15, 50
INDEX 157
S Page Tax items: Page
Salaries and wages . . . . . . . . . . . . . . . . . . . . . . . . . . . . . . 16Net . . . . . . . . . 3, 4, 14, 19, 25-27, 39, 40, 43, 67, 86Not subject to withholding . . . . . . . . . . . . . . . . . . 11, 18
Sales of capital assets . (See Capital gains andlosses .)
Sales of property other than capital assets . . . . . 17, 25,26, 28
Self-employment :Income . . . . . . . . . . . . . . . . . . . . . . . . . . . . . . . . . . . . . . 3, 11Tax . . . . . . . . . . . . . . . . . . . . . . . . . . . 3, 14, 20, 21, 30, 42Tax rate . . . . . . . . . . . . . . . . . . . . . . . . . . . . . . . . . . . . 3, 21
Separate returns of husbands and wives . . . . 8, 9, 45'
48'53, 55, 57, 61
Small Business Tax Revision Act of 1958 . . . . . . . . . 3Social Security Amendments Act of 1958 . . . . . . . . . . 3Social security tax :
*Excess . . . . . . . . . . . . . . . . . . . . . . . . . . . . . . . 2' 1, 30, 39, 41Rates . . . . . . . . . . . . . . . . . . . . . . . . . . . . . . . . . . . . . . . 3, 21
Sole proprietorships . . . . . . . . . . . . . . . . . . . . . . . . . . . . 9Community property . . . . . . . . . . . . . . . . . . . . . . . . . . 9Preliminary Report, Statistics of Income ,
1959-60, U . S . Business Tax Returns . . . . . . . 9Sources of adjusted gross income . . . . . . . . . . . 16-19, 25-27Sources of data . . . . . . . . . . . . . . . . . . . . . . . . . . . . . . . . . 11, 12
Amended returns . . . . . . . . . . . . . . . . . . . . . . . . . . . . . 11Calendar year returns . . . . . . . . . . . . . . . . . . . . . . . 11Noncalendar year returns . . . . . . . . . . . . . . . . . . . . 11Returns with no information . . . . . . . . . . . . . . . . . 11Tentative returns . . . . . . . . . . . . . . . . . . . . . . . . . . . 11Unaudited returns . . . . . . . . . . . . . . . . . . . . . . . . . . . 11
Special tax treatment . . . . . . . . . . . . . . . . . . . . . . . . . . . 18Split-income provision . . . . . . . . . . . . . . . . . . . . . . . . . . 20Standard deduction . . . . . . . . . . . . . . . 11, 12, 14, 25, 55, 56Standard metropolitan statistical areas . . . . . . . 9-11, 15 ,
86_100Map . . . . . . . . . . . . . . . . . . . . . . . . . . . . . . . . . . . . . . . . . 10
States . . . . . . . . . . . . . . . . . . . . . . . . . . . . . . . . . . . . . . . . 15, 67-76Support test for exemption . . . . . . . . . . . . . . . . . . . . . . 19Synopsis of laws . . . . . . . . . . . . . . . . . . . . . . . . . . . . . . . . 112
Tax base . (See Taxable income . )Tax credits . . . . . . . . . . . . . . . . . . 20, 21, 29, 41, 42, 45, 46
Alternative tax . . . . . . . . . . . . . . . . . . . . . . . . . . . . . 20Income tax after credits . . . . . . . . . . . . . . . . . . . . 20, 21Income tax before credits . . . . . . . . . . . . . . . . . . . 20Income tax rates . . . . . . . . . . . . . . . . . . . . . . . . . . . . 20Normal tax and surtax . . . . . . . . . . . . . . . . . . . . . . . 20Overpayment . . . . . . . . . . . . . . . . . . . . . . . . . . . . . . . . . 21Payments on 1959 declaration . . . . . . . . . . . . . . . . . 21Self-employment tax . . . . . . . . . . . . . . . . . . . . . . . . . 21Tax credits . . . . . . . . . . . . . . . . . . . . . . . . . . . . . . . . . 20, 21Tax due at time of filing . . . . . . . . . . . . . . . . . . . 21Tax withheld . . . . . . . . . . . . . . . . . . . . . . . . . . . . . . . . 21
Tax paid at source tax credit . . . . . . . . . . . . . . . . . . . 20, 21Tax rates :
Effective . . . . . . . . . . . . . . . . . . . . . . . . . . . . . . . . . . . 44Income . . . . . . . . . . . . . . . . . . . . . . . . . . . . . . . . . . . . . . 20Self-employment . . . . . . . . . . . . . . . . . . . . . . . . . . . . . 3, 21Social security . . . . . . . . . . . . . . . . . . . . . . . . . . . . . 3, 21
Tax table . . . . . . . . . . . . . . . . . . . . . . . . . . . . . . . . . . . . 11, 12, 14Tax withheld . . . . . . . . . . . . . . . . . . . 4, 21, 30, 39, 41, 50-52Taxable and nontaxable status . . . . . . . . . . . . . . . . . . . 14Taxable income . . . . . . . 3, 19, 24, 29, 33, 37, 39, 41, 42 ,
44-46, 53-58, 67-100Classes . . . . . . . . . . . . . . . . . . . . . . . . . . . . . . . . . . . 14, 45-49For partial tax . . . . . . . . . . . . . . . . . . . . . . . . . . 20, 45, 46One-half excess long-term gain . . . . . . . . . . . . . . 452 46
Taxpayers' exemption . . . . . . . . . . . . . . . . . . . . 8, 9, 15, 59-64Taxpayers' children exemptions . . . . . . . . . . . . . . . . 19, 59-64Taxpayment status and types of taxpayments . . . . . . 14, 15Technical Amendment Act of 1958 . . . . . . . . . . . . . . . . . 3Tentative returns . . . . . . . . . . . . . . . . . . . . . . . . . . . . . . . 11Throwback tax credit . . . . . . . . . . . . . . . . . . . . . . . . . . . . 20, 21Total itemized deductions . . . . . . . . 18, 19, 25, 26, 40, 42Type of deduction . . . . . . . . . . . . . . . . . . . . . . . . . . . . . . . 14
*Types of capital assets sold . . . . . . . . . . . . . . . . . . . . 7Types of tax . . . . . . . . . . . . . . . . . . . . . . . . . . . . . . . . . . . . 14
U
Unaudited returns . . . . . . . . . . . . . . . . . . . . . . . . . . . . . . .
Tax due at time of filing . . . . . . . . . . . . . . . . 21, 30, 39, 41 *Whole dollar amounts . . . . . . . . . . . . . . . . . . . . . . . . . . . . 3
* U. S . GOVERNMENT P14INTING OFFICE : 1961 0 -615OZ7
STATISTICS-OF IN. COM E
CorporationPublications in Preparation
Income Tax Returns with accounting periods ended July 1959-June 1960, Prelimi-
nary
income statement and balance sheet data, tax, and distributions to stockholders. Classifications by
major industry and size of total assets . (Fall 1961)
U. S. BusinCSS Tax Returns with accounting periods ended July 1959-June 1960, Preliminary
SOLE PROPRIETORSHIPS, PARTNERSHIPS, AND CORPORATION S
Number, receipts, profits, depreciation, total deductions, total assets, and inventory. Classifications by
industry, size of profits, and of business receipts . (December 1961)
Sales. of Capital ALssets Reported on Individual Income Tax Returns for 1959
Frequency of short- and long-term assets by type; amount of sales, gain or loss of long-term assets by
type and by income class ; corporate stock by length of time held. (Late 1961 )
Individual Income Tax Returns for 1960, Preliminary
sources of income, adjusted gross income, types of itemized deductions, exemptions, taxable income,
income tax, tax credits, self-employment tax, tax withheld, and tax payments, by size of income . Selec-
ted sources of income by States. (June 1962 )
Fiduciary, Gift, and EstatC Tax Returns filed during 1961
FIDUCIARY INCOME TAX RETURNS FOR 1960: Sources of income, deductions, exemptions, and tax .
Classifications by estate or trust income (also bank administered trust), tax status, types of tax, and
size of total income and taxable income. Selected data by States. Historical data 1951-60 .
GIFT TAX RETURNS FOR 1960- Total gifts, exclusions, deductions, specific exemption, and tax. Clas-
sifications by type of gifts, size of taxable gift and total gift, tax status, recurrent donors, and consent
status.
ESTATE TAX RETURNS : Gross estate by type of property, deductions, exemption, tax, tax credits, out-
of-state real estate, stocks and bonds of unlisted out-of-state corporations, life insurance, and annuities .
Classifications by tax status, size of gross estate and net estate before exemption, method of valuation,
and by States. Historical data 1951-61 . (December 1962 )
Recent Publication s
U. S . Business Tax Returns with accounti ng periods ended July 1958-June 1959, Sole Proprietorships,
Partnerships, and Corporations (100 pp ., 604p)
Corporation Income Tax Returns with accounting periods ended July 1958-June 1959 (274 pp ., $1 .50)
Fiduciary, Gift, and Estate Tax Returns filed during 1959 (116 pp ., 70it )
Individual Income. Tax Returns for 1958 (126 pp ., 75(p)
Farmers' Cooperative Income Tax Returns for 1953 (42 pp ., 404p)
Statistics of Income publications are for sale by the Superintendent of Documents,
U. S . Government Printing office, Washington 25, D . C .


![THE NATIONAL INTERNAL REVENUE CODE OF THE PHILIPPINES [Tax Reform Act of 1997] Republic Act No. 8424 AN ACT AMENDING THE NATIONAL INTERNAL REVENUE CODE, AS AMENDED, AND FOR OTHER PURPOSES](https://img.dokumen.tips/doc/110x75/631f25a1198185cde200f611/the-national-internal-revenue-code-of-the-philippines-tax-reform-act-of-1997-republic.jpg)


