Embed Size (px)
Citation preview
ITU-Rpy DocumentationRelease 0.3.0
Inigo del Portillo
Apr 09, 2021

First steps
1 Citation 3
2 Usage and examples 5
3 Table of Contents 7
4 Indices and tables 95
5 Other 97
Python Module Index 99
Index 101
i

ii
ITU-Rpy Documentation, Release 0.3.0
ITU-Rpy is a python implementation of the ITU-R P. Recommendations to compute atmospheric attenuation in slantand horizontal paths.
• A complete overview of the contents of this documentation can be found in the Table of Contents at the bottomof this page.
• Instructions on how to install ITU-Rpy are located at the Installation page.
• Results of running ITU-Rpy against the validation examples provided by the ITU (where available) are availableat the Validation page.
First steps 1

ITU-Rpy Documentation, Release 0.3.0
2 First steps
CHAPTER 1
Citation
If you use ITU-Rpy in one of your research projects, please cite it as:
@misc{iturpy-2017,title={ITU-Rpy: A python implementation of the ITU-R P. Recommendations to
→˓computeatmospheric attenuation in slant and horizontal paths.},
author={Inigo del Portillo},year={2017},publisher={GitHub},howpublished={\url{https://github.com/inigodelportillo/ITU-Rpy/}}
}
3

ITU-Rpy Documentation, Release 0.3.0
4 Chapter 1. Citation
CHAPTER 2
Usage and examples
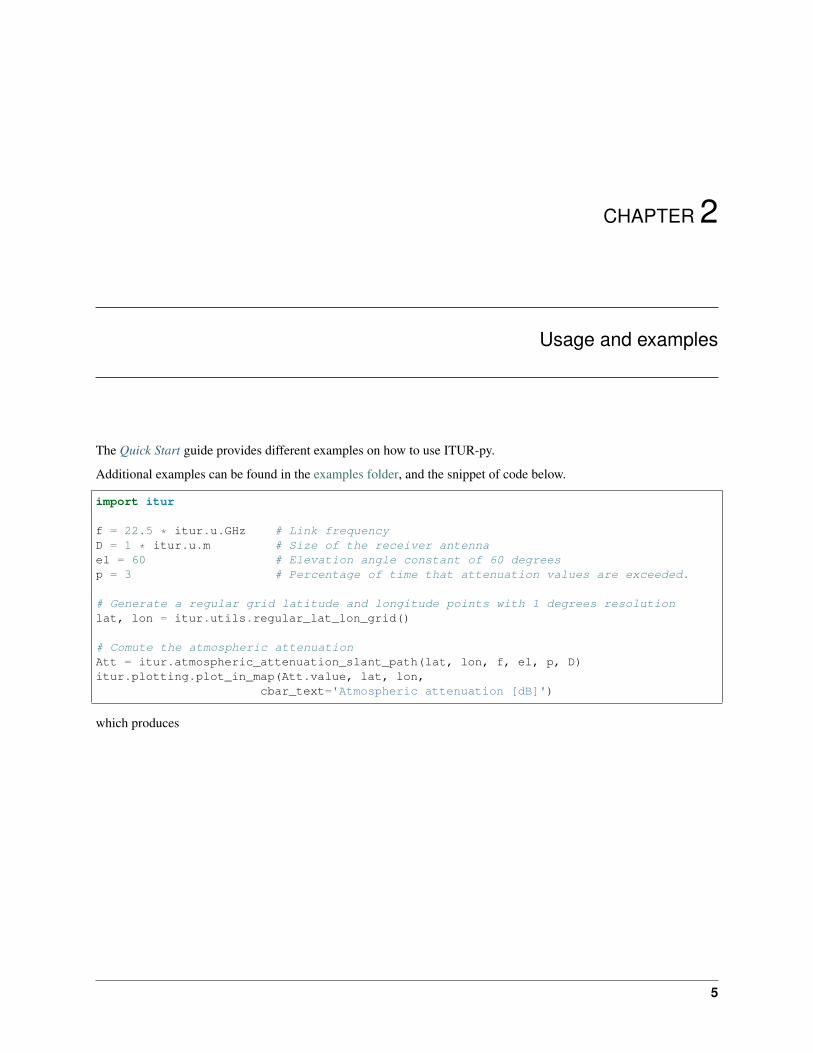
The Quick Start guide provides different examples on how to use ITUR-py.
Additional examples can be found in the examples folder, and the snippet of code below.
import itur
f = 22.5 * itur.u.GHz # Link frequencyD = 1 * itur.u.m # Size of the receiver antennael = 60 # Elevation angle constant of 60 degreesp = 3 # Percentage of time that attenuation values are exceeded.
# Generate a regular grid latitude and longitude points with 1 degrees resolutionlat, lon = itur.utils.regular_lat_lon_grid()
# Comute the atmospheric attenuationAtt = itur.atmospheric_attenuation_slant_path(lat, lon, f, el, p, D)itur.plotting.plot_in_map(Att.value, lat, lon,
cbar_text='Atmospheric attenuation [dB]')
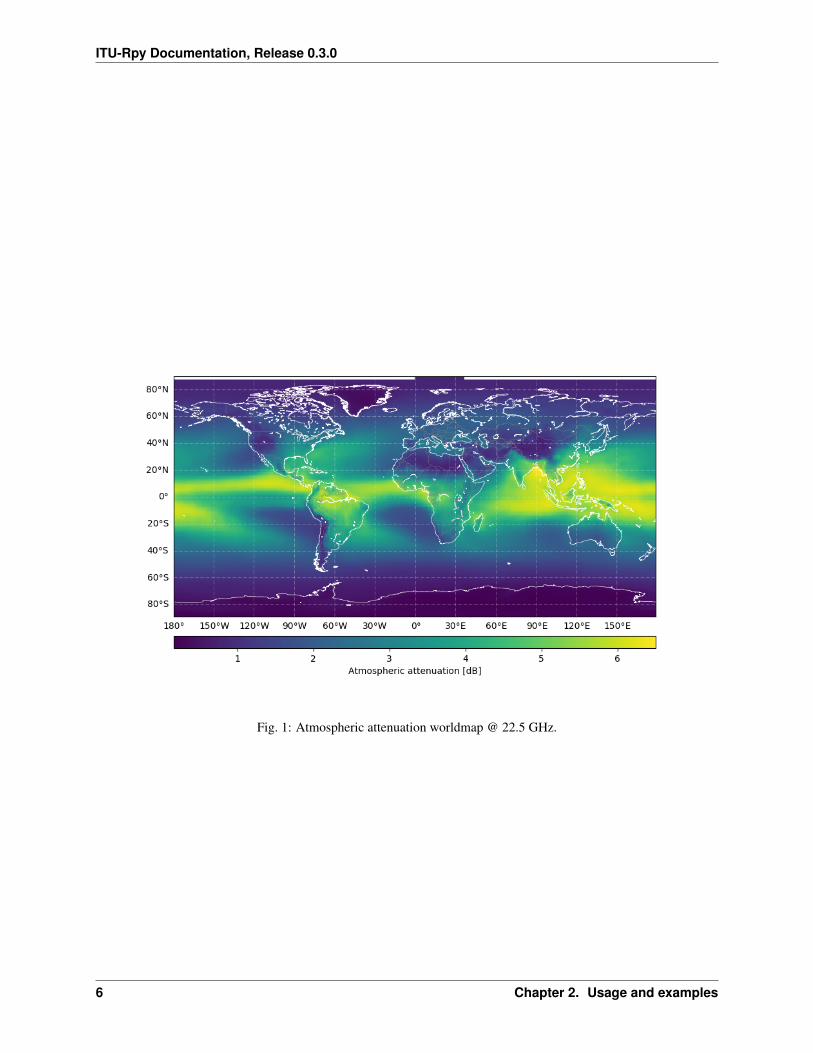
which produces
5
ITU-Rpy Documentation, Release 0.3.0
Fig. 1: Atmospheric attenuation worldmap @ 22.5 GHz.
6 Chapter 2. Usage and examples
CHAPTER 3
Table of Contents
3.1 Installation
3.1.1 Installation from pypi
To install ITU-Rpy from pypi, please use the following command on the command line:
pip install itur
3.1.2 Manual Installation
To install the development version of ITU-Rpy, please type the following commands on the command line:
git clone https://github.com/inigodelportillo/ITU-Rpycd ITU-Rpypip install -U -r requirements.txtpython setup.py install
3.1.3 Installing Cartopy
Cartopy can be used to plot results in maps. Installation of Cartopy is optional, and ITU-Rpy will still work withoutit. However, some plotting capabilities will be deactivated. A quick overview of Cartopy if provided below:
Cartopy is a Python package designed for geospatial data processing in order to produce maps and other geospatialdata analyses. Cartopy has the ability to transform points, lines, vectors, polygons and images between differentprojections, and it can be combined with Matplotlib to plot contours, images, vectors, lines or points in the transformedcoordinates.
To install Cartopy from pypi, please use the following command on the command line:
7
ITU-Rpy Documentation, Release 0.3.0
pip install cartopy
If that does not work, you can try to download it using conda:
conda -c conda-forge install cartopy
If you are using Windows, you can also install cartopy using the appropriate pre-compiled wheels file from thiswebpage. After downloading the .whl file, cartopy can be installed running:
pip install name_of_whl_file.whl
3.2 Quick Start
If you have not installed ITU-Rpy yet take a look at the installation instructions and make sure that all the requirementsare fulfilled. Examples to illustrate the usage of ITU-Rpy are provided in the examples-folder. In order to understandthe models used, check the models section .
To get started, we will walk you through a few examples that show the most illustrative case studies for
• First, we explain the basic usage of ITU-Rpy by computing the attenuation at a single location.
• Second, we explain the usage of ITU-Rpy using vectorized operations.
• Finally, we summarize other useful atmospheric functions in the library. The complete API description can beaccessed through the API section .
3.2.1 Single location attenuation
Here we will compute the link attenuation vs. at a frequency of 22.5 GHz for a link between a satellite in GEO at theorbital slot 77 W and a ground station in Boston.
In addition, we will show how to compute other parameters of interest such as 0 degree isotherm, rainfall intensityexceeded during 0.01 % of the time, total columnar content liquid water or temperature.
First, let’s define the coordinates of our ground station and compute the elevation angle of the link
import iturimport astropy.units as u
# Ground station coordinates (Boston)lat_GS = 42.3601lon_GS = -71.0942
# Satellite coordinates (GEO, 77 W)lat_sat = 0lon_sat = -77h_sat = 35786 * u.km
# Compute the elevation angle between satellite and ground stationel = itur.utils.elevation_angle(h_sat, lat_sat, lon_sat, lat_GS, lon_GS)
Next, we define the link parameters
f = 22.5 * u.GHz # Link frequencyD = 1.2 * u.m # Antenna diameters
8 Chapter 3. Table of Contents
ITU-Rpy Documentation, Release 0.3.0
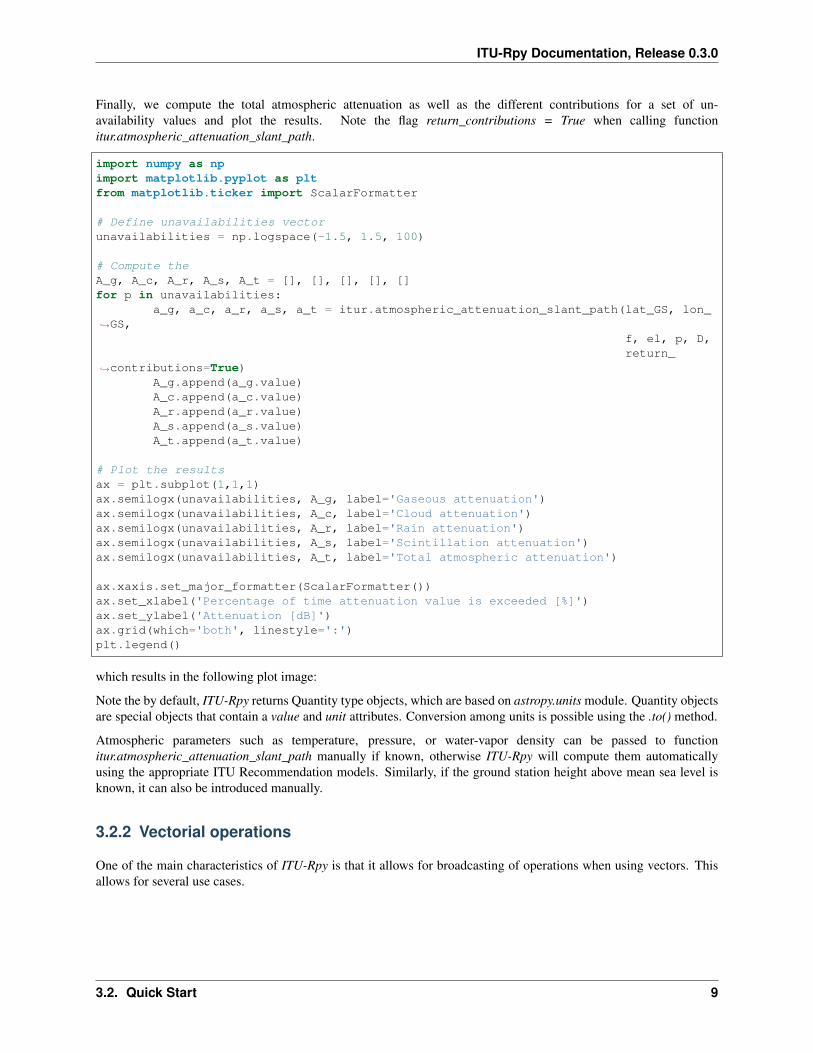
Finally, we compute the total atmospheric attenuation as well as the different contributions for a set of un-availability values and plot the results. Note the flag return_contributions = True when calling functionitur.atmospheric_attenuation_slant_path.
import numpy as npimport matplotlib.pyplot as pltfrom matplotlib.ticker import ScalarFormatter
# Define unavailabilities vectorunavailabilities = np.logspace(-1.5, 1.5, 100)
# Compute theA_g, A_c, A_r, A_s, A_t = [], [], [], [], []for p in unavailabilities:
a_g, a_c, a_r, a_s, a_t = itur.atmospheric_attenuation_slant_path(lat_GS, lon_→˓GS,
f, el, p, D,return_
→˓contributions=True)A_g.append(a_g.value)A_c.append(a_c.value)A_r.append(a_r.value)A_s.append(a_s.value)A_t.append(a_t.value)
# Plot the resultsax = plt.subplot(1,1,1)ax.semilogx(unavailabilities, A_g, label='Gaseous attenuation')ax.semilogx(unavailabilities, A_c, label='Cloud attenuation')ax.semilogx(unavailabilities, A_r, label='Rain attenuation')ax.semilogx(unavailabilities, A_s, label='Scintillation attenuation')ax.semilogx(unavailabilities, A_t, label='Total atmospheric attenuation')
ax.xaxis.set_major_formatter(ScalarFormatter())ax.set_xlabel('Percentage of time attenuation value is exceeded [%]')ax.set_ylabel('Attenuation [dB]')ax.grid(which='both', linestyle=':')plt.legend()
which results in the following plot image:
Note the by default, ITU-Rpy returns Quantity type objects, which are based on astropy.units module. Quantity objectsare special objects that contain a value and unit attributes. Conversion among units is possible using the .to() method.
Atmospheric parameters such as temperature, pressure, or water-vapor density can be passed to functionitur.atmospheric_attenuation_slant_path manually if known, otherwise ITU-Rpy will compute them automaticallyusing the appropriate ITU Recommendation models. Similarly, if the ground station height above mean sea level isknown, it can also be introduced manually.
3.2.2 Vectorial operations
One of the main characteristics of ITU-Rpy is that it allows for broadcasting of operations when using vectors. Thisallows for several use cases.
3.2. Quick Start 9
ITU-Rpy Documentation, Release 0.3.0
Fig. 1: Atmospheric attenuation at Boston for a link to GEO - 77 W.
Multiple cities
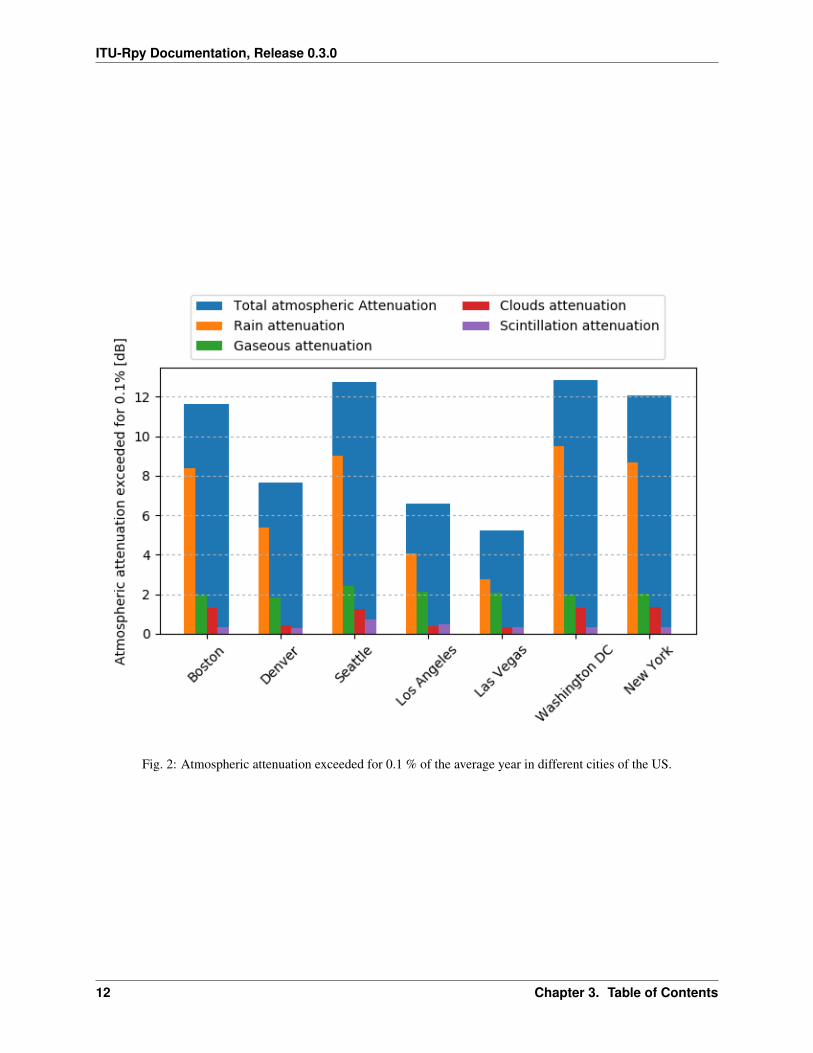
First, we might be interested in computing the atmospheric attenuation values exceeded for 0.1 % of the time for abunch of locations. This can be done as:
import iturcities = {'Boston': (42.36, -71.06),
'New York': (40.71, -74.01),'Los Angeles': (34.05, -118.24),'Denver': (39.74, -104.99),'Las Vegas': (36.20, -115.14),'Seattle': (47.61, -122.33),'Washington DC': (38.91, -77.04)}
lat = [coords[0] for coords in cities.values()]lon = [coords[1] for coords in cities.values()]
# Satellite coordinates (GEO, 4 E)lat_sat = 0lon_sat = -77h_sat = 35786 * itur.u.km
# Compute the elevation angle between satellite and ground stationsel = itur.utils.elevation_angle(h_sat, lat_sat, lon_sat, lat, lon)
# Set the link parametersf = 22.5 * itur.u.GHz # Link frequencyD = 1.2 * itur.u.m # Antenna diametersp = 0.1 # Unavailability (Values exceeded 0.1% of time)
(continues on next page)
10 Chapter 3. Table of Contents
ITU-Rpy Documentation, Release 0.3.0
(continued from previous page)
# Compute the atmospheric attenuationAg, Ac, Ar, As, Att = itur.atmospheric_attenuation_slant_path(
lat, lon, f, el, p, D, return_contributions=True)
and we can plot the results
# Plot the resultscity_idx = np.arange(len(cities))width = 0.15
fig, ax = plt.subplots(1, 1)ax.bar(city_idx, Att.value, 0.6, label='Total atmospheric Attenuation')
ax.bar(city_idx - 1.5 * width, Ar.value, width, label='Rain attenuation')ax.bar(city_idx - 0.5 * width, Ag.value, width, label='Gaseous attenuation')ax.bar(city_idx + 0.5 * width, Ac.value, width, label='Clouds attenuation')ax.bar(city_idx + 1.5 * width, As.value, width,
label='Scintillation attenuation')
# Set the labelsticks = ax.set_xticklabels([''] + list(cities.keys()))for t in ticks:
t.set_rotation(45)ax.set_ylabel('Atmospheric attenuation exceeded for 0.1% [dB]')
# Format imageax.yaxis.grid(which='both', linestyle=':')ax.legend(loc='upper center', bbox_to_anchor=(0.5, 1.3), ncol=2)plt.tight_layout(rect=(0, 0, 1, 0.85))
Attenuation over regions of the Earth
A second use case for vectorization is computation of the atmospheric attenuation (and other parameters) over largegeographical regions. Let’s say that we want to compute the attenuation over Africa of a new Ka-band satellite locatedin GEO at slot 4 E.
import iturimport astropy.units as u
# Generate regular grid of latitude and longitudes with 1 degree resolutionlat, lon = itur.utils.regular_lat_lon_grid(lat_max=60,
lat_min=-60,lon_max=65,lon_min=-35)
# Satellite coordinates (GEO, 4 E)lat_sat = 0lon_sat = 4h_sat = 35786 * u.km
# Compute the elevation angle between satellite and ground stationel = itur.utils.elevation_angle(h_sat, lat_sat, lon_sat, lat, lon)
f = 22.5 * u.GHz # Link frequency
(continues on next page)
3.2. Quick Start 11
ITU-Rpy Documentation, Release 0.3.0
Fig. 2: Atmospheric attenuation exceeded for 0.1 % of the average year in different cities of the US.
12 Chapter 3. Table of Contents
ITU-Rpy Documentation, Release 0.3.0
(continued from previous page)
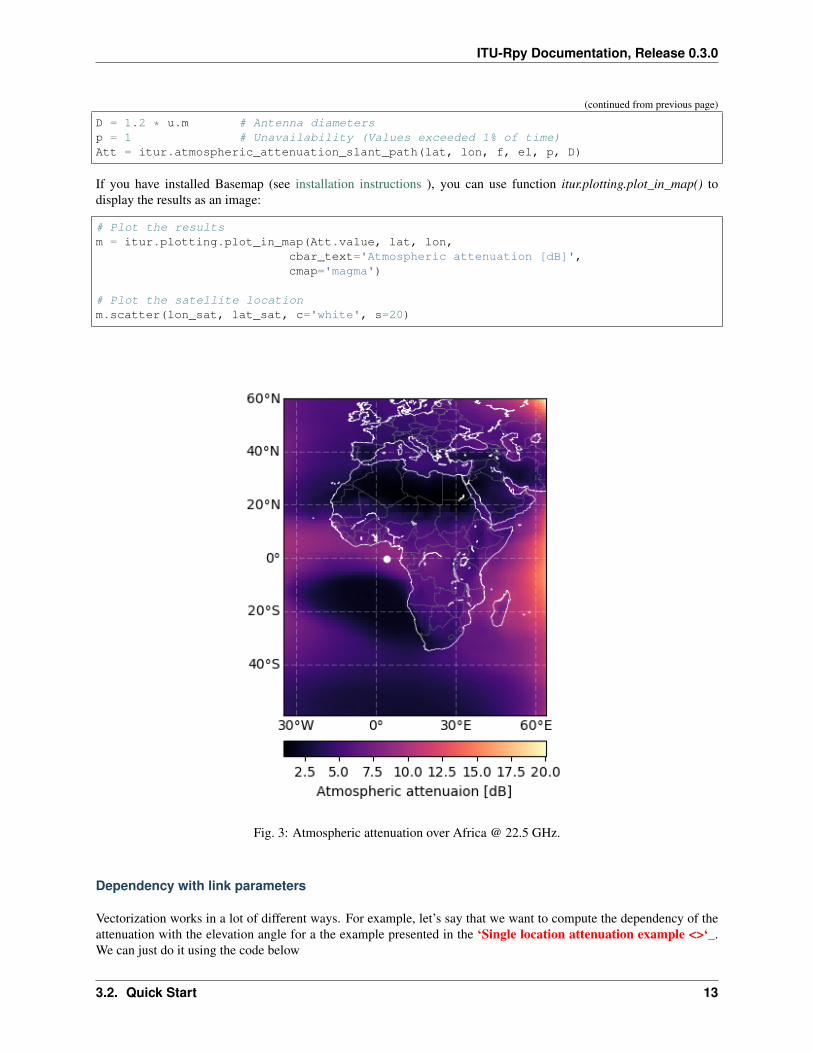
D = 1.2 * u.m # Antenna diametersp = 1 # Unavailability (Values exceeded 1% of time)Att = itur.atmospheric_attenuation_slant_path(lat, lon, f, el, p, D)
If you have installed Basemap (see installation instructions ), you can use function itur.plotting.plot_in_map() todisplay the results as an image:
# Plot the resultsm = itur.plotting.plot_in_map(Att.value, lat, lon,
cbar_text='Atmospheric attenuation [dB]',cmap='magma')
# Plot the satellite locationm.scatter(lon_sat, lat_sat, c='white', s=20)
Fig. 3: Atmospheric attenuation over Africa @ 22.5 GHz.
Dependency with link parameters
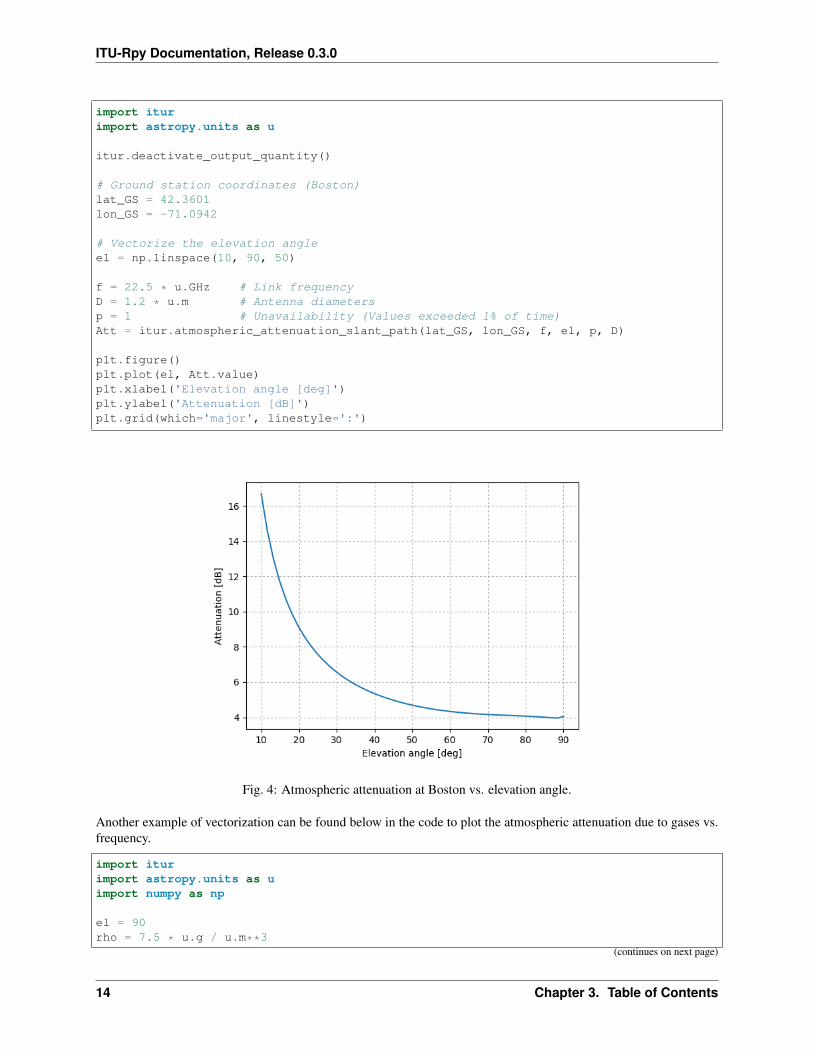
Vectorization works in a lot of different ways. For example, let’s say that we want to compute the dependency of theattenuation with the elevation angle for a the example presented in the ‘Single location attenuation example <>‘_.We can just do it using the code below
3.2. Quick Start 13
ITU-Rpy Documentation, Release 0.3.0
import iturimport astropy.units as u
itur.deactivate_output_quantity()
# Ground station coordinates (Boston)lat_GS = 42.3601lon_GS = -71.0942
# Vectorize the elevation angleel = np.linspace(10, 90, 50)
f = 22.5 * u.GHz # Link frequencyD = 1.2 * u.m # Antenna diametersp = 1 # Unavailability (Values exceeded 1% of time)Att = itur.atmospheric_attenuation_slant_path(lat_GS, lon_GS, f, el, p, D)
plt.figure()plt.plot(el, Att.value)plt.xlabel('Elevation angle [deg]')plt.ylabel('Attenuation [dB]')plt.grid(which='major', linestyle=':')
Fig. 4: Atmospheric attenuation at Boston vs. elevation angle.
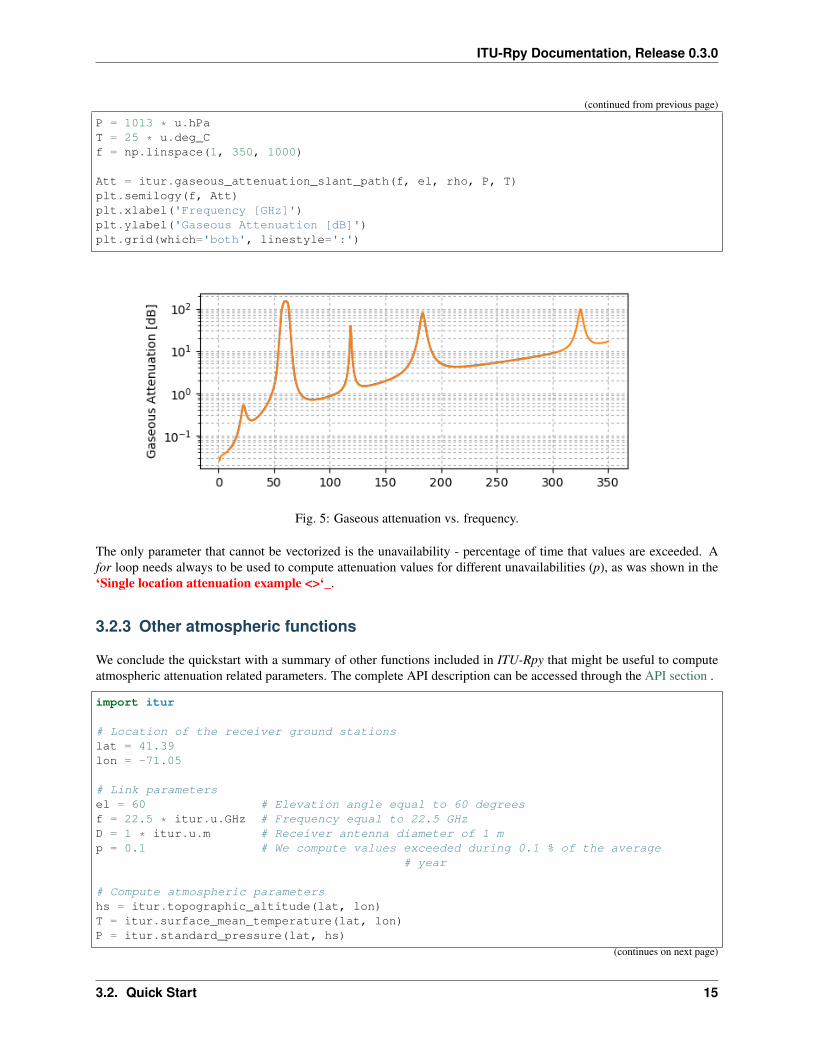
Another example of vectorization can be found below in the code to plot the atmospheric attenuation due to gases vs.frequency.
import iturimport astropy.units as uimport numpy as np
el = 90rho = 7.5 * u.g / u.m**3
(continues on next page)
14 Chapter 3. Table of Contents
ITU-Rpy Documentation, Release 0.3.0
(continued from previous page)
P = 1013 * u.hPaT = 25 * u.deg_Cf = np.linspace(1, 350, 1000)
Att = itur.gaseous_attenuation_slant_path(f, el, rho, P, T)plt.semilogy(f, Att)plt.xlabel('Frequency [GHz]')plt.ylabel('Gaseous Attenuation [dB]')plt.grid(which='both', linestyle=':')
Fig. 5: Gaseous attenuation vs. frequency.
The only parameter that cannot be vectorized is the unavailability - percentage of time that values are exceeded. Afor loop needs always to be used to compute attenuation values for different unavailabilities (p), as was shown in the‘Single location attenuation example <>‘_.
3.2.3 Other atmospheric functions
We conclude the quickstart with a summary of other functions included in ITU-Rpy that might be useful to computeatmospheric attenuation related parameters. The complete API description can be accessed through the API section .
import itur
# Location of the receiver ground stationslat = 41.39lon = -71.05
# Link parametersel = 60 # Elevation angle equal to 60 degreesf = 22.5 * itur.u.GHz # Frequency equal to 22.5 GHzD = 1 * itur.u.m # Receiver antenna diameter of 1 mp = 0.1 # We compute values exceeded during 0.1 % of the average
# year
# Compute atmospheric parametershs = itur.topographic_altitude(lat, lon)T = itur.surface_mean_temperature(lat, lon)P = itur.standard_pressure(lat, hs)
(continues on next page)
3.2. Quick Start 15
ITU-Rpy Documentation, Release 0.3.0
(continued from previous page)
rho_p = itur.surface_water_vapour_density(lat, lon, p, hs)rho_sa = itur.models.itu835.water_vapour_density(lat, hs)T_sa = itur.models.itu835.temperature(lat, hs)V = itur.models.itu836.total_water_vapour_content(lat, lon, p, hs)
# Compute rain and cloud-related parametersR_prob = itur.models.itu618.rain_attenuation_probability(lat, lon, el, hs)R_pct_prob = itur.models.itu837.rain_percentage_probability(lat, lon)R001 = itur.models.itu837.rainfall_rate(lat, lon, p)h_0 = itur.models.itu839.isoterm_0(lat, lon)h_rain = itur.models.itu839.rain_height(lat, lon)L_red = itur.models.itu840.columnar_content_reduced_liquid(lat, lon, p)A_w = itur.models.itu676.zenit_water_vapour_attenuation(lat, lon, p, f, alt=hs)
# Compute attenuation valuesA_g = itur.gaseous_attenuation_slant_path(f, el, rho_p, P, T)A_r = itur.rain_attenuation(lat, lon, f, el, hs=hs, p=p)A_c = itur.cloud_attenuation(lat, lon, el, f, p)A_s = itur.scintillation_attenuation(lat, lon, f, el, p, D)A_t = itur.atmospheric_attenuation_slant_path(lat, lon, f, el, p, D)
Running the code above produces the following results. The ITU Recommendation where the variable or the procedureto compute it is referred appears in square brackets.
The ITU recommendations predict the following values for the point locatedat coordinates (41.39, -71.05)
- Height above the sea level [ITU-R P.1511] 22.9 m- Surface mean temperature [ITU-R P.1510] 9.4 deg_C- Surface pressure [ITU-R P.835] 1005.4 hPa- Standard surface temperature [ITU-R P.835] 13.6 deg_C- Standard water vapour density [ITU-R P.835] 8.9 g / m3- Water vapor density (p=0.1%) [ITU-R P.836] 20.3 g / m3- Total water vapour content (p=0.1%) [ITU-R P.836] 54.6 kg / m2- Rain attenuation probability [ITU-R P.618] 9.6 %- Rain percentage probability [ITU-R P.837] 7.8 %- Rainfall rate exceeded for p=0.1% [ITU-R P.837] 12.9 mm / h- 0 degree C isotherm height [ITU-R P.839] 3.2 km- Rain height [ITU-R P.839] 3.5 km- Columnar content of reduced liquid (p=0.1%) [ITU-R P.840] 3.0 kg / m2- Zenit water vapour attenuation (p=0.1%) [ITU-R P.676] 1.5 dB
Attenuation values exceeded for p=0.1% of the average year for a link with el=60 deg,→˓f=22.5 GHz,D=1.0 m and receiver ground station located at coordinates (41.39, -71.05)
- Rain attenuation [ITU-R P.618] 8.2 dB- Gaseous attenuation [ITU-R P.676] 1.5 dB- Clouds attenuation [ITU-R P.840] 1.6 dB- Scintillation attenuation [ITU-R P.618] 0.3 dB- Total atmospheric attenuation [ITU-R P.618] 10.8 dB
3.3 API Documentation
ITU-Rpy
16 Chapter 3. Table of Contents
ITU-Rpy Documentation, Release 0.3.0
3.3.1 Contents
itur package
Package contents
ITU-RPy is a python implementation of the ITU-P R Recommendations.
ITU-Rpy can be used to compute atmospheric attenuation for Earth-to-space and horizontal paths, for frequencies inthe GHz range.
The propagation loss on an Earth-space path and a horizontal-path, relative to the free-space loss, is the sum of differentcontributions, namely:
• attenuation by atmospheric gases;
• attenuation by rain, other precipitation and clouds;
• scintillation and multipath effects;
• attenuation by sand and dust storms.
Each of these contributions has its own characteristics as a function of frequency, geographic location and elevationangle. ITU-Rpy allows for fast, vectorial computation of the different contributions to the atmospheric attenuation.
itur.utils package
itur.utils is a utilities library for ITU-Rpy.
This utility library for ITU-Rpy contains methods to: * Load data and build an interpolator object. * Prepare the inputand output arrays, and handle unit transformations. * Compute distances and elevation angles between two points onEarth and
or space.
itur.utils.load_data_interpolator(path_lat, path_lon, path_data, interp_fcn, flip_ud=True)Load a lat-lon tabulated dataset and build an interpolator.
Parameters
• path_lat (string) – Path for the file containing the latitude values
• path_lon (string) – Path for the file containing the longitude values
• path_data (string) – Path for the file containing the data values
• interp_fcn (string) – The interpolation function to be used
• flip_ud (boolean) – Whether to flip the latitude and data arrays along the first axis.This is an artifact of the format that the ITU uses to encode its data, which is inconsistentacross recommendations (in some recommendations, latitude are sorted in ascending order,in others they are sorted in descending order).
Returns interp – An interpolator that given a latitude-longitude pair, returns the data value
Return type interp_fcn
itur.utils.load_data(path, is_text=False, **kwargs)Load data files from ./itur/data/.
Loads data from a comma-separated values file. The contents of the file can be numeric or text-based.
Parameters
3.3. API Documentation 17
ITU-Rpy Documentation, Release 0.3.0
• path (string) – Path of the data to load
• is_text (bool) – Indicates whether the data is text (True) or numerical (False). Defaultvalue is False.
Returns data – Numpy-array with the data. Numerical data is returned as a float
Return type numpy.ndarray
itur.utils.get_input_type(inpt)Return the type of the input.
If the input is an object of type Quantity, it returns the type of the associated value
Parameters inpt (object) – The input object.
Returns type – The type of the input.
Return type type
itur.utils.prepare_input_array(input_array)Format an array to be a 2-D numpy-array.
If the contents of input_array are 0-D or 1-D, it converts is to an array with at least two dimensions.
Parameters input_array (numpy.ndarray, sequence, or number) – The inputvalue. It can be a scalar, 1-D array, or 2-D array.
Returns output_array – An 2-D numpy array with the input values
Return type numpy.ndarray
itur.utils.prepare_output_array(output_array, type_input=None)Format the output to have the same shape and type as the input.
This function is a generic wrapper to format the output of a function to have the same type as the input. ITU-Rpy makes extensive use of numpy arrays, but uses this function to return outputs having the same type that wasprovided in the input of the function.
itur.utils.prepare_quantity(value, units=None, name_val=None)Convert the input to the required units.
The function verifies that the input has the right units and converts it to the desired units. For example, if a valueis introduced in km but posterior frequencies require this value to be in meters, this function would be calledwith units=u.m
Parameters
• value (astropy.units.Quantity, number, sequence, or np.ndarry)– The input value
• units (astropy.units) – Desired units of the output
• name_val (string) – Name of the variable (for debugging purposes)
Returns q – An numpy array with the values converted to the desired units.
Return type numpy.ndarray
itur.utils.compute_distance_earth_to_earth(lat_p, lon_p, lat_grid, lon_grid,method=None)
Compute the distance between a point and a matrix of (lat, lons).
If the number of elements in lat_grid is smaller than 100,000, uses the WGS84 method, otherwise, uses theHaversine formula.
Parameters
18 Chapter 3. Table of Contents
ITU-Rpy Documentation, Release 0.3.0
• lat_p (number) – Latitude projection of the point P (degrees)
• lon_p (number) – Longitude projection of the point P (degrees)
• lat_grid (number, sequence of np.ndarray) – Grid of latitude points towhich compute the distance (degrees)
• lon_grid (number, sequence of np.ndarray) – Grid of longitude points towhich compute the distance (degrees)
Returns d – Distance between the point P and each point in (lat_grid, lon_grid) (km)
Return type numpy.ndarray
itur.utils.compute_distance_earth_to_earth_wgs84(lat_p, lon_p, lat_grid, lon_grid)Compute the distance between points using the WGS84 inverse method.
Compute the distance between a point (P) in (lat_p, lon_p) and a matrix of latitude and longitudes (lat_grid,lon_grid) using the WGS84 inverse method.
Parameters
• lat_p (number) – Latitude projection of the point P (degrees)
• lon_p (number) – Longitude projection of the point P (degrees)
• lat_grid (number, sequence of np.ndarray) – Grid of latitude points towhich compute the distance (degrees)
• lon_grid (number, sequence of np.ndarray) – Grid of longitude points towhich compute the distance (degrees)
Returns d – Distance between the point P and each point in (lat_grid, lon_grid) (km)
Return type numpy.ndarray
itur.utils.compute_distance_earth_to_earth_haversine(lat_p, lon_p, lat_grid,lon_grid)
Compute the distance between points using the Haversine formula.
Compute the distance between a point (P) in (lat_s, lon_s) and a matrix of latitude and longitudes (lat_grid,lon_grid) using the Haversine formula.
Parameters
• lat_p (number) – Latitude projection of the point P (degrees)
• lon_p (number) – Longitude projection of the point P (degrees)
• lat_grid (number, sequence of np.ndarray) – Grid of latitude points towhich compute the distance (degrees)
• lon_grid (number, sequence of np.ndarray) – Grid of longitude points towhich compute the distance (degrees)
Returns d – Distance between the point P and each point in (lat_grid, lon_grid) (km)
Return type numpy.ndarray
References
This is based on the Haversine formula
3.3. API Documentation 19
ITU-Rpy Documentation, Release 0.3.0
itur.utils.regular_lat_lon_grid(resolution_lat=1, resolution_lon=1, lon_start_0=False,lat_min=-90, lat_max=90, lon_min=-180, lon_max=180)
Build regular latitude and longitude matrices.
Builds a latitude and longitude coordinate matrix with resolution resolution_lat, resolution_lon.
Parameters
• resolution_lat (number) – Resolution for the latitude axis (deg)
• resolution_lon (number) – Resolution for the longitude axis (deg)
• lon_start_0 (boolean) – Indicates whether the longitude is indexed using a 0 - 360scale (True) or using -180 - 180 scale (False). Default value is False
Returns
• lat (numpy.ndarray) – Grid of coordinates of the latitude point
• lon (numpy.ndarray) – Grid of coordinates of the longitude point
itur.utils.elevation_angle(h, lat_s, lon_s, lat_grid, lon_grid)Compute the elevation angle between a satellite and a point on Earth.
Compute the elevation angle between a satellite located in an orbit at height h and located above coordinates(lat_s, lon_s) and a matrix of latitude and longitudes (lat_grid, lon_grid).
Parameters
• h (float) – Orbital altitude of the satellite (km)
• lat_s (float) – Latitude of the projection of the satellite (degrees)
• lon_s (float) – Longitude of the projection of the satellite (degrees)
• lat_grid (number, sequence of np.ndarray) – Grid of latitude points towhich compute the elevation angle (degrees)
• lon_grid (number, sequence of np.ndarray) – Grid of longitude points towhich compute the elevation angle (degrees)
Returns elevation – Elevation angle between the satellite and each point in (lat_grid, lon_grid)(degrees)
Return type numpy.ndarray
References
[1] http://www.propagation.gatech.edu/ECE6390/notes/ASD5.pdf - Slides 3, 4
itur.plotting package
itur.plotting provides convenient function to plot maps in ITU-Rpy.
This submodule uses matplotlib and cartopy as the default library to plot maps. Alternatively, the user can usebasemap (if installed).
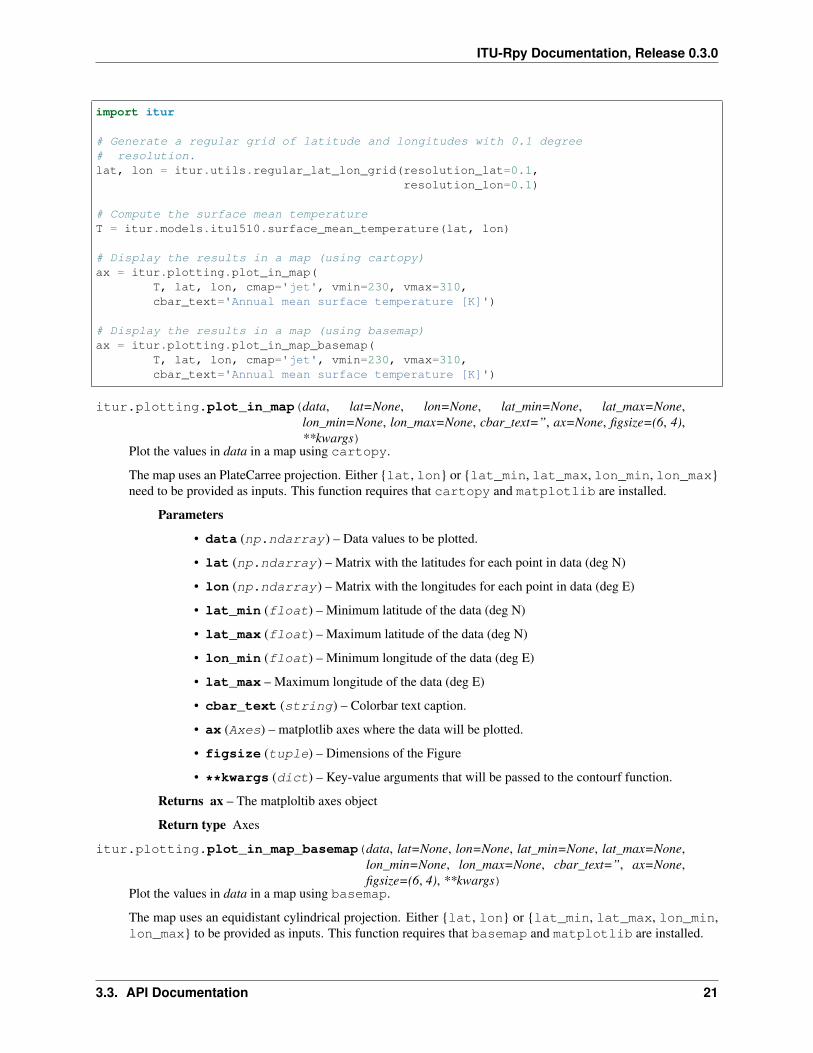
The example below shows the use of plot_in_map to display the mean surface temperature on the Earth.
20 Chapter 3. Table of Contents
ITU-Rpy Documentation, Release 0.3.0
import itur
# Generate a regular grid of latitude and longitudes with 0.1 degree# resolution.lat, lon = itur.utils.regular_lat_lon_grid(resolution_lat=0.1,
resolution_lon=0.1)
# Compute the surface mean temperatureT = itur.models.itu1510.surface_mean_temperature(lat, lon)
# Display the results in a map (using cartopy)ax = itur.plotting.plot_in_map(
T, lat, lon, cmap='jet', vmin=230, vmax=310,cbar_text='Annual mean surface temperature [K]')
# Display the results in a map (using basemap)ax = itur.plotting.plot_in_map_basemap(
T, lat, lon, cmap='jet', vmin=230, vmax=310,cbar_text='Annual mean surface temperature [K]')
itur.plotting.plot_in_map(data, lat=None, lon=None, lat_min=None, lat_max=None,lon_min=None, lon_max=None, cbar_text=”, ax=None, figsize=(6, 4),**kwargs)
Plot the values in data in a map using cartopy.
The map uses an PlateCarree projection. Either {lat, lon} or {lat_min, lat_max, lon_min, lon_max}need to be provided as inputs. This function requires that cartopy and matplotlib are installed.
Parameters
• data (np.ndarray) – Data values to be plotted.
• lat (np.ndarray) – Matrix with the latitudes for each point in data (deg N)
• lon (np.ndarray) – Matrix with the longitudes for each point in data (deg E)
• lat_min (float) – Minimum latitude of the data (deg N)
• lat_max (float) – Maximum latitude of the data (deg N)
• lon_min (float) – Minimum longitude of the data (deg E)
• lat_max – Maximum longitude of the data (deg E)
• cbar_text (string) – Colorbar text caption.
• ax (Axes) – matplotlib axes where the data will be plotted.
• figsize (tuple) – Dimensions of the Figure
• **kwargs (dict) – Key-value arguments that will be passed to the contourf function.
Returns ax – The matploltib axes object
Return type Axes
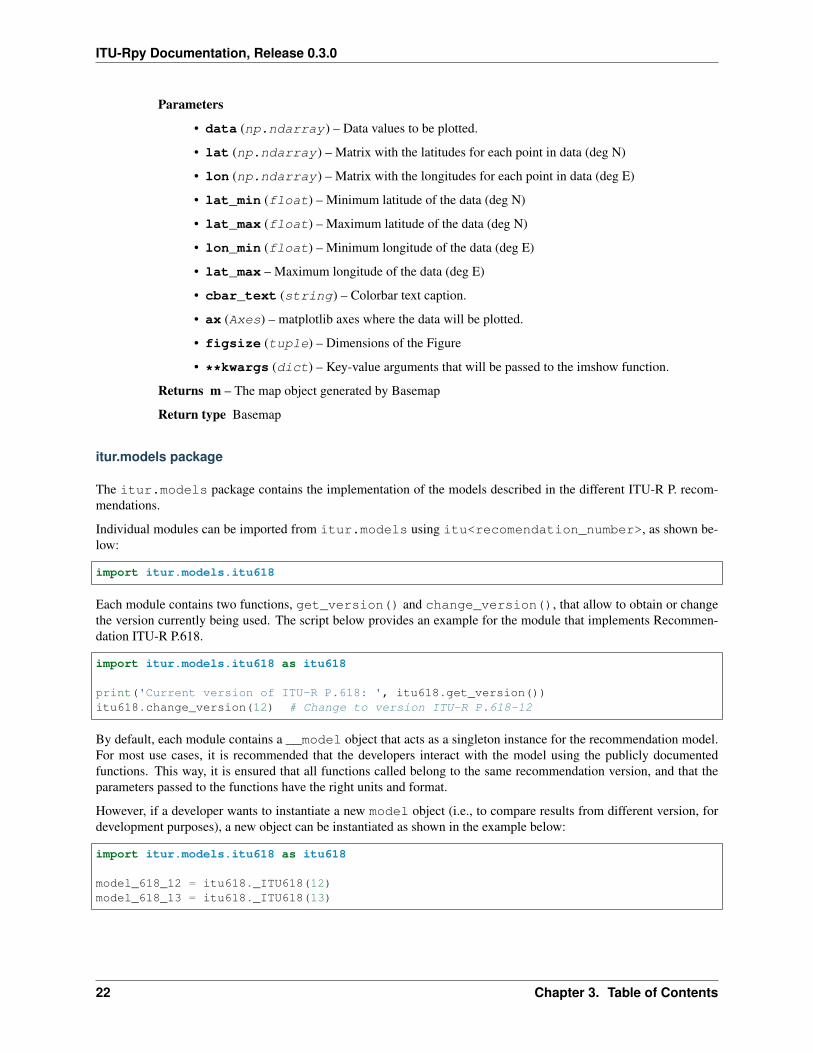
itur.plotting.plot_in_map_basemap(data, lat=None, lon=None, lat_min=None, lat_max=None,lon_min=None, lon_max=None, cbar_text=”, ax=None,figsize=(6, 4), **kwargs)
Plot the values in data in a map using basemap.
The map uses an equidistant cylindrical projection. Either {lat, lon} or {lat_min, lat_max, lon_min,lon_max} to be provided as inputs. This function requires that basemap and matplotlib are installed.
3.3. API Documentation 21
ITU-Rpy Documentation, Release 0.3.0
Parameters
• data (np.ndarray) – Data values to be plotted.
• lat (np.ndarray) – Matrix with the latitudes for each point in data (deg N)
• lon (np.ndarray) – Matrix with the longitudes for each point in data (deg E)
• lat_min (float) – Minimum latitude of the data (deg N)
• lat_max (float) – Maximum latitude of the data (deg N)
• lon_min (float) – Minimum longitude of the data (deg E)
• lat_max – Maximum longitude of the data (deg E)
• cbar_text (string) – Colorbar text caption.
• ax (Axes) – matplotlib axes where the data will be plotted.
• figsize (tuple) – Dimensions of the Figure
• **kwargs (dict) – Key-value arguments that will be passed to the imshow function.
Returns m – The map object generated by Basemap
Return type Basemap
itur.models package
The itur.models package contains the implementation of the models described in the different ITU-R P. recom-mendations.
Individual modules can be imported from itur.models using itu<recomendation_number>, as shown be-low:
import itur.models.itu618
Each module contains two functions, get_version() and change_version(), that allow to obtain or changethe version currently being used. The script below provides an example for the module that implements Recommen-dation ITU-R P.618.
import itur.models.itu618 as itu618
print('Current version of ITU-R P.618: ', itu618.get_version())itu618.change_version(12) # Change to version ITU-R P.618-12
By default, each module contains a __model object that acts as a singleton instance for the recommendation model.For most use cases, it is recommended that the developers interact with the model using the publicly documentedfunctions. This way, it is ensured that all functions called belong to the same recommendation version, and that theparameters passed to the functions have the right units and format.
However, if a developer wants to instantiate a new model object (i.e., to compare results from different version, fordevelopment purposes), a new object can be instantiated as shown in the example below:
import itur.models.itu618 as itu618
model_618_12 = itu618._ITU618(12)model_618_13 = itu618._ITU618(13)
22 Chapter 3. Table of Contents
ITU-Rpy Documentation, Release 0.3.0
Package contents
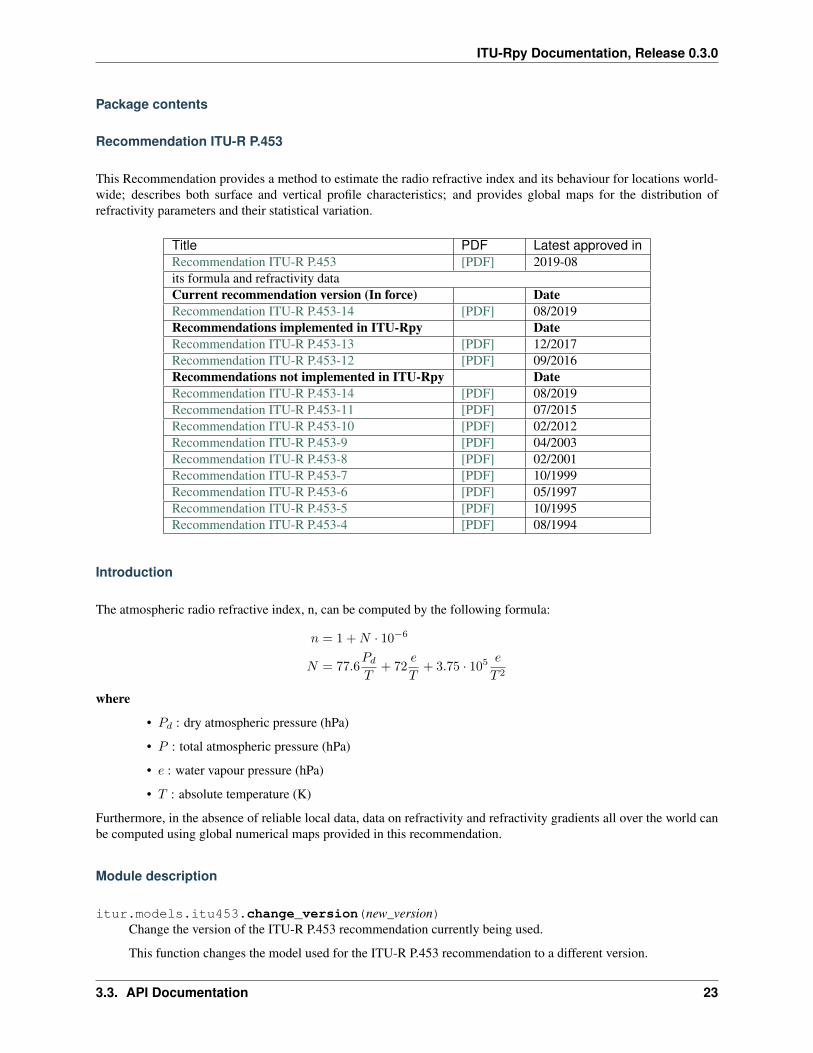
Recommendation ITU-R P.453
This Recommendation provides a method to estimate the radio refractive index and its behaviour for locations world-wide; describes both surface and vertical profile characteristics; and provides global maps for the distribution ofrefractivity parameters and their statistical variation.
Title PDF Latest approved inRecommendation ITU-R P.453 [PDF] 2019-08its formula and refractivity dataCurrent recommendation version (In force) DateRecommendation ITU-R P.453-14 [PDF] 08/2019Recommendations implemented in ITU-Rpy DateRecommendation ITU-R P.453-13 [PDF] 12/2017Recommendation ITU-R P.453-12 [PDF] 09/2016Recommendations not implemented in ITU-Rpy DateRecommendation ITU-R P.453-14 [PDF] 08/2019Recommendation ITU-R P.453-11 [PDF] 07/2015Recommendation ITU-R P.453-10 [PDF] 02/2012Recommendation ITU-R P.453-9 [PDF] 04/2003Recommendation ITU-R P.453-8 [PDF] 02/2001Recommendation ITU-R P.453-7 [PDF] 10/1999Recommendation ITU-R P.453-6 [PDF] 05/1997Recommendation ITU-R P.453-5 [PDF] 10/1995Recommendation ITU-R P.453-4 [PDF] 08/1994
Introduction
The atmospheric radio refractive index, n, can be computed by the following formula:
𝑛 = 1 +𝑁 · 10−6
𝑁 = 77.6𝑃𝑑
𝑇+ 72
𝑒
𝑇+ 3.75 · 105 𝑒
𝑇 2
where
• 𝑃𝑑 : dry atmospheric pressure (hPa)
• 𝑃 : total atmospheric pressure (hPa)
• 𝑒 : water vapour pressure (hPa)
• 𝑇 : absolute temperature (K)
Furthermore, in the absence of reliable local data, data on refractivity and refractivity gradients all over the world canbe computed using global numerical maps provided in this recommendation.
Module description
itur.models.itu453.change_version(new_version)Change the version of the ITU-R P.453 recommendation currently being used.
This function changes the model used for the ITU-R P.453 recommendation to a different version.
3.3. API Documentation 23
ITU-Rpy Documentation, Release 0.3.0
Parameters new_version (int) – Number of the version to use. Valid values are:
• 13: Activates recommendation ITU-R P.453-13 (12/17)
• 12: Activates recommendation ITU-R P.453-12 (07/15)
itur.models.itu453.get_version()Obtain the version of the ITU-R P.453 recommendation currently being used.
Returns version – The version of the ITU-R P.453 recommendation being used.
Return type int
itur.models.itu453.wet_term_radio_refractivity(e, T)Determine the wet term of the radio refractivity.
Parameters
• e (number or Quantity) – Water vapour pressure (hPa)
• T (number or Quantity) – Absolute temperature (K)
Returns N_wet – Wet term of the radio refractivity (-)
Return type Quantity
References
[1] The radio refractive index: its formula and refractivity data https://www.itu.int/rec/R-REC-P.453/en
itur.models.itu453.dry_term_radio_refractivity(Pd, T)Determine the dry term of the radio refractivity.
Parameters
• Pd (number or Quantity) – Dry atmospheric pressure (hPa)
• T (number or Quantity) – Absolute temperature (K)
Returns N_dry – Dry term of the radio refractivity (-)
Return type Quantity
References
[1] The radio refractive index: its formula and refractivity data https://www.itu.int/rec/R-REC-P.453/en
itur.models.itu453.radio_refractive_index(P, e, T)Compute the radio refractive index.
Parameters
• P (number or Quantity) – Total atmospheric pressure (hPa)
• e (number or Quantity) – Water vapour pressure (hPa)
• T (number or Quantity) – Absolute temperature (K)
Returns n – Radio refractive index (-)
Return type Quantity
24 Chapter 3. Table of Contents
ITU-Rpy Documentation, Release 0.3.0
References
[1] The radio refractive index: its formula and refractivity data https://www.itu.int/rec/R-REC-P.453/en
itur.models.itu453.water_vapour_pressure(T, P, H, type_hydrometeor=’water’)Determine the water vapour pressure.
Parameters
• T (number or Quantity) – Absolute temperature (C)
• P (number or Quantity) – Total atmospheric pressure (hPa)
• H (number or Quantity) – Relative humidity (%)
• type_hydrometeor (string) – Type of hydrometeor. Valid strings are ‘water’ and‘ice’
Returns e – Water vapour pressure (hPa)
Return type Quantity
References
[1] The radio refractive index: its formula and refractivity data https://www.itu.int/rec/R-REC-P.453/en
itur.models.itu453.saturation_vapour_pressure(T, P, type_hydrometeor=’water’)Determine the saturation water vapour pressure.
Parameters
• T (number or Quantity) – Absolute temperature (C)
• P (number or Quantity) – Total atmospheric pressure (hPa)
• type_hydrometeor (string) – Type of hydrometeor. Valid strings are ‘water’ and‘ice’
Returns e_s – Saturation water vapour pressure (hPa)
Return type Quantity
References
[1] The radio refractive index: its formula and refractivity data https://www.itu.int/rec/R-REC-P.453/en
itur.models.itu453.map_wet_term_radio_refractivity(lat, lon, p=50)Determine the wet term of the radio refractivity.
Parameters
• lat (number, sequence, or numpy.ndarray) – Latitudes of the receiver points
• lon (number, sequence, or numpy.ndarray) – Longitudes of the receiverpoints
Returns N_wet – Wet term of the radio refractivity (-)
Return type Quantity
3.3. API Documentation 25
ITU-Rpy Documentation, Release 0.3.0
References
[1] The radio refractive index: its formula and refractivity data https://www.itu.int/rec/R-REC-P.453/en
itur.models.itu453.DN65(lat, lon, p)
Determine the statistics of the vertical gradient of radio refractivity in the lower 65 m from the surface ofthe Earth.
Parameters
• lat (number, sequence, or numpy.ndarray) – Latitudes of the receiver points
• lon (number, sequence, or numpy.ndarray) – Longitudes of the receiverpoints
• p (number) – Percentage of time exceeded for p% of the average year
Returns DN65_p – Vertical gradient of radio refractivity in the lowest 65 m from the surface of theEarth exceeded for p% of the average year
Return type Quantity
References
[1] The radio refractive index: its formula and refractivity data https://www.itu.int/rec/R-REC-P.453/en
itur.models.itu453.DN1(lat, lon, p)
Determine the statistics of the vertical gradient of radio refractivity over 1 km layer from the surface.
Parameters
• lat (number, sequence, or numpy.ndarray) – Latitudes of the receiver points
• lon (number, sequence, or numpy.ndarray) – Longitudes of the receiverpoints
• p (number) – Percentage of time exceeded for p% of the average year
Returns DN1_p – Vertical gradient of radio refractivity over a 1 km layer from the surface exceededfor p% of the average year
Return type Quantity
References
[1] The radio refractive index: its formula and refractivity data https://www.itu.int/rec/R-REC-P.453/en
Recommendation ITU-R P.530
This Recommendation provides prediction methods for the propagation effects that should be taken into account in thedesign of digital fixed line-of-sight links, both in clear-air and rainfall conditions. It also provides link design guidancein clear step-by-step procedures including the use of mitigation techniques to minimize propagation impairments. Thefinal outage predicted is the base for other Recommendations addressing error performance and availability.
26 Chapter 3. Table of Contents
ITU-Rpy Documentation, Release 0.3.0
Title PDF Latest approved inRecommendation ITU-R P.530 [PDF] 2017-12Propagation data and prediction methods required for the design of terrestrial line-of-sight systemsCurrent recommendation version (In force) DateRecommendation ITU-R P.530-17 [PDF] 12/2017Recommendations implemented in ITU-Rpy DateRecommendation ITU-R P.530-17 [PDF] 12/2017Recommendation ITU-R P.530-16 [PDF] 07/2015Recommendations not implemented in ITU-Rpy
Date
Recommendation ITU-R P.530-15 [PDF] 09/2013Recommendation ITU-R P.530-14 [PDF] 02/2012Recommendation ITU-R P.530-13 [PDF] 10/2009Recommendation ITU-R P.530-12 [PDF] 02/2007Recommendation ITU-R P.530-11 [PDF] 03/2005Recommendation ITU-R P.530-10 [PDF] 11/2001Recommendation ITU-R P.530-9 [PDF] 02/2001Recommendation ITU-R P.530-8 [PDF] 10/1999Recommendation ITU-R P.530-7 [PDF] 08/1997Recommendation ITU-R P.530-6 [PDF] 10/1995Recommendation ITU-R P.530-5 [PDF] 08/1994
Introduction
The propagation loss on a terrestrial line-of-sight path relative to the free-space loss (see Recommendation ITU-RP.525) is the sum of different contributions as follows:
• attenuation due to atmospheric gases;
• diffraction fading due to obstruction or partial obstruction of the path;
• fading due to multipath, beam spreading and scintillation;
• attenuation due to variation of the angle-of-arrival/launch;
• attenuation due to precipitation;
• attenuation due to sand and dust storms.
Each of these contributions has its own characteristics as a function of frequency, path length and geographic location.These are described in the paragraphs that follow.
Module description
itur.models.itu530.change_version(new_version)Change the version of the ITU-R P.530 recommendation currently being used.
This function changes the model used for the ITU-R P.530 recommendation to a different version.
Parameters new_version (int) – Number of the version to use. Valid values are:
• 16: Activates recommendation ITU-R P.530-16 (07/15) (Current version)
itur.models.itu530.get_version()Obtain the version of the ITU-R P.530 recommendation currently being used.
3.3. API Documentation 27
ITU-Rpy Documentation, Release 0.3.0
Returns version – The version of the ITU-R P.530 recommendation being used.
Return type int
itur.models.itu530.fresnel_ellipse_radius(d1, d2, f)Compute the radius of the first Fresnel ellipsoid.
Parameters
• d1 (number, sequence, or numpy.ndarray) – Distances from the first terminalto the path obstruction. [km]
• d2 (number, sequence, or numpy.ndarray) – Distances from the second ter-minal to the path obstruction. [km]
• f (number) – Frequency of the link [GHz]
Returns F1 – Radius of the first Fresnel ellipsoid [m]
Return type Quantity
References
[1] Propagation data and prediction methods required for the design of terrestrial line-of-sight systems: https://www.itu.int/rec/R-REC-P.530/en
itur.models.itu530.diffraction_loss(d1, d2, h, f)Estimate the diffraction loss over average terrain.
Diffraction loss over average terrain. This value is valid for losses greater than 15 dB.
Parameters
• d1 (number, sequence, or numpy.ndarray) – Distances from the first terminalto the path obstruction. [km]
• d2 (number, sequence, or numpy.ndarray) – Distances from the second ter-minal to the path obstruction. [km]
• h (number, sequence, or numpy.ndarray) – Height difference between mostsignificant path blockage and the path trajectory. h is negative if the top of the obstructionof interest is above the virtual line-of-sight. [m]
• f (number) – Frequency of the link [GHz]
Returns A_d – Diffraction loss over average terrain [dB]
Return type Quantity
References
[1] Propagation data and prediction methods required for the design of terrestrial line-of-sight systems: https://www.itu.int/rec/R-REC-P.530/en
itur.models.itu530.multipath_loss_for_A(lat, lon, h_e, h_r, d, f, A)Estimate the single-frequency (or narrow-band) fading distribution.
Method for predicting the single-frequency (or narrow-band) fading distribution at large fade depths in theaverage worst month in any part of the world. Given a fade depth value ‘A’, determines the amount of time itwill be exceeded during a year
This method does not make use of the path profile and can be used for initial planning, licensing, or designpurposes.
28 Chapter 3. Table of Contents
ITU-Rpy Documentation, Release 0.3.0
This method is only valid for small percentages of time.
Multi-path fading and enhancement only need to be calculated for path lengths longer than 5 km, and can be setto zero for shorter paths.
Parameters
• lat (number, sequence, or numpy.ndarray) – Latitudes of the receiver points
• lon (number, sequence, or numpy.ndarray) – Longitudes of the receiverpoints
• h_e (number) – Emitter antenna height (above the sea level) [m]
• h_r (number) – Receiver antenna height (above the sea level) [m]
• d (number, sequence, or numpy.ndarray) – Distances between antennas [km]
• f (number) – Frequency of the link [GHz]
• A (number) – Fade depth [dB]
Returns p_w – percentage of time that fade depth A is exceeded in the average worst month [%]
Return type Quantity
References
[1] Propagation data and prediction methods required for the design of terrestrial line-of-sight systems: https://www.itu.int/rec/R-REC-P.530/en
itur.models.itu530.multipath_loss(lat, lon, h_e, h_r, d, f, A)Estimate the percentage of time that any fade depth is exceeded.
Method for predicting the percentage of time that any fade depth is exceeded. This method combines the deepfading distribution given in the multipath_loss_for_A’ and an empirical interpolation procedure for shallowfading down to 0 dB.
This method does not make use of the path profile and can be used for initial planning, licensing, or designpurposes.
Multi-path fading and enhancement only need to be calculated for path lengths longer than 5 km, and can be setto zero for shorter paths.
Parameters
• lat (number, sequence, or numpy.ndarray) – Latitudes of the receiver points
• lon (number, sequence, or numpy.ndarray) – Longitudes of the receiverpoints
• h_e (number) – Emitter antenna height (above the sea level) [m]
• h_r (number) – Receiver antenna height (above the sea level) [m]
• d (number, sequence, or numpy.ndarray) – Distances between antennas [km]
• f (number) – Frequency of the link [GHz]
• A (number) – Fade depth [dB]
Returns p_w – percentage of time that fade depth A is exceeded in the average worst month [%]
Return type Quantity
3.3. API Documentation 29
ITU-Rpy Documentation, Release 0.3.0
References
[1] Propagation data and prediction methods required for the design of terrestrial line-of-sight systems: https://www.itu.int/rec/R-REC-P.530/en
itur.models.itu530.rain_attenuation(lat, lon, d, f, el, p, tau=45, R001=None)Estimate long-term statistics of rain attenuation.
Attenuation can also occur as a result of absorption and scattering by such hydro-meteors as rain, snow, hail andfog. Although rain attenuation can be ignored at frequencies below about 5 GHz, it must be included in designcalculations at higher frequencies, where its importance increases rapidly.
Parameters
• lat (number, sequence, or numpy.ndarray) – Latitudes of the receiver points
• lon (number, sequence, or numpy.ndarray) – Longitudes of the receiverpoints
• d (number, sequence, or numpy.ndarray) – Path length [km]
• f (number) – Frequency of the link [GHz]
• el (sequence, or number) – Elevation angle (degrees)
• p (number) – Percentage of the time the rain attenuation value is exceeded.
• R001 (number, optional) – Point rainfall rate for the location for 0.01% of an averageyear (mm/h). If not provided, an estimate is obtained from Recommendation Recommenda-tion ITU-R P.837. Some useful values:
– 0.25 mm/h : Drizzle
– 2.5 mm/h : Light rain
– 12.5 mm/h : Medium rain
– 25.0 mm/h : Heavy rain
– 50.0 mm/h : Downpour
– 100 mm/h : Tropical
– 150 mm/h : Monsoon
• tau (number, optional) – Polarization tilt angle relative to the horizontal (degrees)(tau = 45 deg for circular polarization). Default value is 45
Returns A_r – Attenuation exceeded during p percent of the time [dB]
Return type Quantity
References
[1] Propagation data and prediction methods required for the design of terrestrial line-of-sight systems: https://www.itu.int/rec/R-REC-P.530/en
itur.models.itu530.inverse_rain_attenuation(lat, lon, d, f, el, Ap, tau=45, R001=None)Estimate the percentage of time a given attenuation is exceeded.
Estimate the percentage of time a given attenuation is exceeded due to rain events.
Parameters
• lat (number, sequence, or numpy.ndarray) – Latitudes of the receiver points
30 Chapter 3. Table of Contents
ITU-Rpy Documentation, Release 0.3.0
• lon (number, sequence, or numpy.ndarray) – Longitudes of the receiverpoints
• d (number, sequence, or numpy.ndarray) – Path length [km]
• f (number) – Frequency of the link [GHz]
• el (sequence, or number) – Elevation angle (degrees)
• Ap (number) – Fade depth
• R001 (number, optional) – Point rainfall rate for the location for 0.01% of an averageyear (mm/h). If not provided, an estimate is obtained from Recommendation Recommenda-tion ITU-R P.837. Some useful values:
– 0.25 mm/h : Drizzle
– 2.5 mm/h : Light rain
– 12.5 mm/h : Medium rain
– 25.0 mm/h : Heavy rain
– 50.0 mm/h : Downpour
– 100 mm/h : Tropical
– 150 mm/h : Monsoon
• tau (number, optional) – Polarization tilt angle relative to the horizontal (degrees)(tau = 45 deg for circular polarization). Default value is 45
Returns p – Percentage of time that the attenuation A is exceeded.
Return type Quantity
References
[1] Propagation data and prediction methods required for the design of terrestrial line-of-sight systems: https://www.itu.int/rec/R-REC-P.530/en
itur.models.itu530.rain_event_count(lat, lon, d, f, el, A, tau=45, R001=None)Estimate the number of fade events exceeding attenuation ‘A’.
Estimate the number of fade events exceeding attenuation ‘A’ for 10 seconds or longer.
Parameters
• lat (number, sequence, or numpy.ndarray) – Latitudes of the receiver points
• lon (number, sequence, or numpy.ndarray) – Longitudes of the receiverpoints
• d (number, sequence, or numpy.ndarray) – Path length [km]
• f (number) – Frequency of the link [GHz]
• el (sequence, or number) – Elevation angle (degrees)
• A (number) – Fade depth
• R001 (number, optional) – Point rainfall rate for the location for 0.01% of an averageyear (mm/h). If not provided, an estimate is obtained from Recommendation Recommenda-tion ITU-R P.837. Some useful values:
– 0.25 mm/h : Drizzle
3.3. API Documentation 31
ITU-Rpy Documentation, Release 0.3.0
– 2.5 mm/h : Light rain
– 12.5 mm/h : Medium rain
– 25.0 mm/h : Heavy rain
– 50.0 mm/h : Downpour
– 100 mm/h : Tropical
– 150 mm/h : Monsoon
• tau (number, optional) – Polarization tilt angle relative to the horizontal (degrees)(tau = 45 deg for circular polarization). Default value is 45
Returns p – Percentage of time that the attenuation A is exceeded.
Return type Quantity
References
[1] Propagation data and prediction methods required for the design of terrestrial line-of-sight systems: https://www.itu.int/rec/R-REC-P.530/en
itur.models.itu530.XPD_outage_clear_air(lat, lon, h_e, h_r, d, f, XPD_g, C0_I, XPIF=0)Estimate the probability of outage due to cross-polar discrimination.
Estimate the probability of outage due to cross-polar discrimination reduction due to clear-air effects, assumingthat a target C0_I is required.
Parameters
• lat (number, sequence, or numpy.ndarray) – Latitudes of the receiver points
• lon (number, sequence, or numpy.ndarray) – Longitudes of the receiverpoints
• h_e (number) – Emitter antenna height (above the sea level) [m]
• h_r (number) – Receiver antenna height (above the sea level) [m]
• d (number, sequence, or numpy.ndarray) – Distances between antennas [km]
• f (number) – Frequency of the link [GHz]
• XPD_g (number) – Manufacturer’s guaranteed minimum XPD at boresight for both thetransmitting and receiving antennas [dB]
• C0_I (number) – Carrier-to-interference ratio for a reference BER [dB]
• XPIF (number, optional) – Laboratory-measured cross-polarization improvementfactor that gives the difference in cross-polar isolation (XPI) at sufficiently large carrier-to-noise ratio (typically 35 dB) and at a specific BER for systems with and without crosspolar interference canceler (XPIC). A typical value of XPIF is about 20 dB. Default value 0dB (no XPIC) [dB]
Returns p_XP – Probability of outage due to clear-air cross-polarization
Return type Quantity
32 Chapter 3. Table of Contents
ITU-Rpy Documentation, Release 0.3.0
References
[1] Propagation data and prediction methods required for the design of terrestrial line-of-sight systems: https://www.itu.int/rec/R-REC-P.530/en
itur.models.itu530.XPD_outage_precipitation(lat, lon, d, f, el, C0_I, tau=45, U0=15,XPIF=0)
Estimate the probability of outage due to cross-polar discrimination.
Estimate the probability of outage due to cross-polar discrimination reduction due to clear-air effects, assumingthat a target C0_I is required.
Parameters
• lat (number, sequence, or numpy.ndarray) – Latitudes of the receiver points
• lon (number, sequence, or numpy.ndarray) – Longitudes of the receiverpoints
• d (number, sequence, or numpy.ndarray) – Distances between antennas [km]
• f (number) – Frequency of the link [GHz]
• el (sequence, or number) – Elevation angle (degrees)
• C0_I (number) – Carrier-to-interference ratio for a reference BER [dB]
• tau (number, optional) – Polarization tilt angle relative to the horizontal (degrees)(tau = 45 deg for circular polarization). Default value is 45
• U0 (number, optional) – Coefficient for the cumulative distribution of the co-polarattenuation (CPA) for rain. Default 15 dB.
• XPIF (number, optional) – Laboratory-measured cross-polarization improvementfactor that gives the difference in cross-polar isolation (XPI) at sufficiently large carrier-to-noise ratio (typically 35 dB) and at a specific BER for systems with and without crosspolar interference canceler (XPIC). A typical value of XPIF is about 20 dB. Default value 0dB (no XPIC) [dB]
Returns p_XP – Probability of outage due to clear-air cross-polarization
Return type Quantity
References
[1] Propagation data and prediction methods required for the design of terrestrial line-of-sight systems: https://www.itu.int/rec/R-REC-P.530/en
Recommendation ITU-R P.618
This Recommendation provides methods to predict the various propagation parameters needed in planning Earth-spacesystems operating in either the Earth-to-space or space-to-Earth direction.
3.3. API Documentation 33
ITU-Rpy Documentation, Release 0.3.0
Title PDF Latest approved inRecommendation ITU-R P.618 [PDF] 2017-12Propagation data and prediction methods required for the design of Earth-space telecommunication systemsCurrent recommendation version (Inforce)
Date
Recommendation ITU-R P.618-13 [PDF] 12/2017Recommendations implemented in ITU-Rpy
Date
Recommendation ITU-R P.618-13 [PDF] 12/2017Recommendation ITU-R P.618-12 [PDF] 07/2015Recommendations not implemented inITU-Rpy
Date
Recommendation ITU-R P.618-11 [PDF] 09/2013Recommendation ITU-R P.618-10 [PDF] 10/2009Recommendation ITU-R P.618-9 [PDF] 08/2007Recommendation ITU-R P.618-8 [PDF] 04/2003Recommendation ITU-R P.618-7 [PDF] 02/2001Recommendation ITU-R P.618-6 [PDF] 10/1999Recommendation ITU-R P.618-5 [PDF] 05/1997Recommendation ITU-R P.618-4 [PDF] 10/1995Recommendation ITU-R P.618-3 [PDF] 08/1994
Introduction
The propagation loss on an Earth-space path, relative to the free-space loss, is the sum of different contributions asfollows:
• attenuation by atmospheric gases;
• attenuation by rain, other precipitation and clouds;
• focusing and defocusing;
• decrease in antenna gain due to wave-front incoherence;
• scintillation and multipath effects;
• attenuation by sand and dust storms.
Each of these contributions has its own characteristics as a function of frequency, geographic location and elevationangle. As a rule, at elevation angles above 10 degrees, only gaseous attenuation, rain and cloud attenuation andpossibly scintillation will be significant, depending on propagation conditions.
Module description
itur.models.itu618.change_version(new_version)Change the version of the ITU-R P.618 recommendation currently being used.
This function changes the model used for the ITU-R P.618 recommendation to a different version.
Parameters new_version (int) – Number of the version to use. Valid values are:
• 13: Activates recommendation ITU-R P.618-13 (12/17) (Current version)
• 12: Activates recommendation ITU-R P.618-12 (07/15) (Superseded)
34 Chapter 3. Table of Contents
ITU-Rpy Documentation, Release 0.3.0
itur.models.itu618.get_version()The version of the current model for the ITU-R P.618 recommendation.
Obtain the version of the ITU-R P.618 recommendation currently being used.
Returns version – The version of the ITU-R P.618 recommendation being used.
Return type int
itur.models.itu618.rain_attenuation(lat, lon, f, el, hs=None, p=0.01, R001=None, tau=45,Ls=None)
Calculation of long-term rain attenuation statistics from point rainfall rate. The following procedure providesestimates of the long-term statistics of the slant-path rain attenuation at a given location for frequencies up to 55GHz.
Parameters
• lat (number, sequence, or numpy.ndarray) – Latitudes of the receiver points
• lon (number, sequence, or numpy.ndarray) – Longitudes of the receiverpoints
• f (number) – Frequency (GHz)
• el (sequence, or number) – Elevation angle (degrees)
• hs (number, sequence, or numpy.ndarray, optional) – Heigh abovemean sea level of the earth station (km). If local data for the earth station height abovemean sea level is not available, an estimate is obtained from the maps of topographic alti-tude given in Recommendation ITU-R P.1511.
• p (number, optional) – Percentage of the time the rain attenuation value is exceeded.
• R001 (number, optional) – Point rainfall rate for the location for 0.01% of an averageyear (mm/h). If not provided, an estimate is obtained from Recommendation Recommenda-tion ITU-R P.837. Some useful values:
– 0.25 mm/h : Drizzle
– 2.5 mm/h : Light rain
– 12.5 mm/h : Medium rain
– 25.0 mm/h : Heavy rain
– 50.0 mm/h : Downpour
– 100 mm/h : Tropical
– 150 mm/h : Monsoon
• tau (number, optional) – Polarization tilt angle relative to the horizontal (degrees)(tau = 45 deg for circular polarization). Default value is 45
• Ls (number, optional) – Slant path length (km). If not provided, it will be computedusing the rain height and the elevation angle. The ITU model does not require this parameteras an input.
Returns attenuation – Attenuation due to rain (dB)
Return type Quantity
3.3. API Documentation 35
ITU-Rpy Documentation, Release 0.3.0
References
[1] Propagation data and prediction methods required for the design of Earth-space telecommunication systems:https://www.itu.int/dms_pubrec/itu-r/rec/p/R-REC-P.618-12-201507-I!!PDF-E.pdf
itur.models.itu618.rain_attenuation_probability(lat, lon, el, hs=None, Ls=None,P0=None)
The following procedure computes the probability of non-zero rain attenuation on a given slant path Pr(Ar > 0).
Parameters
• lat (number, sequence, or numpy.ndarray) – Latitudes of the receiver points
• lon (number, sequence, or numpy.ndarray) – Longitudes of the receiverpoints
• el (sequence, or number) – Elevation angle (degrees)
• hs (number, sequence, or numpy.ndarray, optional) – Heigh abovemean sea level of the earth station (km). If local data for the earth station height abovemean sea level is not available, an estimate is obtained from the maps of topographic alti-tude given in Recommendation ITU-R P.1511.
• Ls (number, sequence, or numpy.ndarray, optional) – Slant path lengthfrom the earth station to the rain height (km). If data about the rain height is not available,this value is estimated automatically using Recommendation ITU-R P.838
• P0 (number, sequence, or numpy.ndarray, optional) – Probability ofrain at the earth station, (0 P0 1)
Returns p – Probability of rain attenuation on the slant path (%)
Return type Quantity
References
[1] Propagation data and prediction methods required for the design of Earth-space telecommunication systems:https://www.itu.int/dms_pubrec/itu-r/rec/p/R-REC-P.618-12-201507-I!!PDF-E.pdf
itur.models.itu618.site_diversity_rain_outage_probability(lat1, lon1, a1, el1, lat2,lon2, a2, el2, f, tau=45,hs1=None, hs2=None)
Calculate the link outage probability in a diversity based scenario (two ground stations) due to rain attenuation.This method is valid for frequencies below 20 GHz, as at higher frequencies other impairments might affectaffect site diversity performance.
This method predicts Pr(A1 > a1, A2 > a2), the joint probability (%) that the attenuation on the path to the firstsite is greater than a1 and the attenuation on the path to the second site is greater than a2.
Parameters
• lat1 (number or Quantity) – Latitude of the first ground station (deg)
• lon1 (number or Quantity) – Longitude of the first ground station (deg)
• a1 (number or Quantity) – Maximum admissible attenuation of the first ground sta-tion (dB)
• el1 (number or Quantity) – Elevation angle to the first ground station (deg)
• lat2 (number or Quantity) – Latitude of the second ground station (deg)
• lon2 (number or Quantity) – Longitude of the second ground station (deg)
36 Chapter 3. Table of Contents
ITU-Rpy Documentation, Release 0.3.0
• a2 (number or Quantity) – Maximum admissible attenuation of the second groundstation (dB)
• el2 (number or Quantity) – Elevation angle to the second ground station (deg)
• f (number or Quantity) – Frequency (GHz)
• tau (number, optional) – Polarization tilt angle relative to the horizontal (degrees)(tau = 45 deg for circular polarization). Default value is 45
• hs1 (number or Quantity, optional) – Altitude over the sea level of the firstground station (km). If not provided, uses Recommendation ITU-R P.1511 to compute thetoporgraphic altitude
• hs2 (number or Quantity, optional) – Altitude over the sea level of the firstground station (km). If not provided, uses Recommendation ITU-R P.1511 to compute thetoporgraphic altitude
Returns probability – Joint probability (%) that the attenuation on the path to the first site is greaterthan a1 and the attenuation on the path to the second site is greater than a2
Return type Quantity
References
[1] Propagation data and prediction methods required for the design of Earth-space telecommunication systems:https://www.itu.int/dms_pubrec/itu-r/rec/p/R-REC-P.618-12-201507-I!!PDF-E.pdf
itur.models.itu618.scintillation_attenuation(lat, lon, f, el, p, D, eta=0.5, T=None,H=None, P=None, hL=1000)
Calculation of monthly and long-term statistics of amplitude scintillations at elevation angles greater than 5°and frequencies up to 20 GHz.
Parameters
• lat (number, sequence, or numpy.ndarray) – Latitudes of the receiver points
• lon (number, sequence, or numpy.ndarray) – Longitudes of the receiverpoints
• f (number or Quantity) – Frequency (GHz)
• el (sequence, or number) – Elevation angle (degrees)
• p (number) – Percentage of the time the scintillation attenuation value is exceeded.
• D (number) – Physical diameter of the earth-station antenna (m)
• eta (number, optional) – Antenna efficiency. Default value 0.5 (conservative esti-mate)
• T (number, sequence, or numpy.ndarray, optional) – Average surfaceambient temperature (°C) at the site. If None, uses the ITU-R P.453 to estimate the wetterm of the radio refractivity.
• H (number, sequence, or numpy.ndarray, optional) – Average surfacerelative humidity (%) at the site. If None, uses the ITU-R P.453 to estimate the wet term ofthe radio refractivity.
• P (number, sequence, or numpy.ndarray, optional) – Average surfacepressure (hPa) at the site. If None, uses the ITU-R P.453 to estimate the wet term of theradio refractivity.
3.3. API Documentation 37
ITU-Rpy Documentation, Release 0.3.0
• hL (number, optional) – Height of the turbulent layer (m). Default value 1000 m
Returns attenuation – Attenuation due to scintillation (dB)
Return type Quantity
References
[1] Propagation data and prediction methods required for the design of Earth-space telecommunication systems:https://www.itu.int/dms_pubrec/itu-r/rec/p/R-REC-P.618-12-201507-I!!PDF-E.pdf
itur.models.itu618.scintillation_attenuation_sigma(lat, lon, f, el, p, D, eta=0.5,T=None, H=None, P=None,hL=1000)
Calculation of the standard deviation of the amplitude of the scintillations attenuation at elevation angles greaterthan 5° and frequencies up to 20 GHz.
Parameters
• lat (number, sequence, or numpy.ndarray) – Latitudes of the receiver points
• lon (number, sequence, or numpy.ndarray) – Longitudes of the receiverpoints
• f (number or Quantity) – Frequency (GHz)
• el (sequence, or number) – Elevation angle (degrees)
• p (number) – Percentage of the time the scintillation attenuation value is exceeded.
• D (number) – Physical diameter of the earth-station antenna (m)
• eta (number, optional) – Antenna efficiency. Default value 0.5 (conservative esti-mate)
• T (number, sequence, or numpy.ndarray, optional) – Average surfaceambient temperature (°C) at the site. If None, uses the ITU-R P.453 to estimate the wetterm of the radio refractivity.
• H (number, sequence, or numpy.ndarray, optional) – Average surfacerelative humidity (%) at the site. If None, uses the ITU-R P.453 to estimate the wet term ofthe radio refractivity.
• P (number, sequence, or numpy.ndarray, optional) – Average surfacepressure (hPa) at the site. If None, uses the ITU-R P.453 to estimate the wet term of theradio refractivity.
• hL (number, optional) – Height of the turbulent layer (m). Default value 1000 m
Returns attenuation – Attenuation due to scintillation (dB)
Return type Quantity
References
[1] Propagation data and prediction methods required for the design of Earth-space telecommunication systems:https://www.itu.int/dms_pubrec/itu-r/rec/p/R-REC-P.618-12-201507-I!!PDF-E.pdf
itur.models.itu618.rain_cross_polarization_discrimination(Ap, f, el, p, tau=45)Calculation of the cross-polarization discrimination (XPD) statistics from rain attenuation statistics. The fol-lowing procedure provides estimates of the long-term statistics of the cross-polarization discrimination (XPD)statistics for frequencies up to 55 GHz and elevation angles lower than 60 deg.
38 Chapter 3. Table of Contents
ITU-Rpy Documentation, Release 0.3.0
Parameters
• Ap (number, sequence, or numpy.ndarray) – Rain attenuation (dB) exceededfor the required percentage of time, p, for the path in question, commonly called co-polarattenuation (CPA)
• f (number) – Frequency
• el (number, sequence, or numpy.ndarray) – Elevation angle (degrees)
• p (number) – Percentage of the time the XPD is exceeded.
• tau (number, optional) – Polarization tilt angle relative to the horizontal (degrees)(tau = 45 deg for circular polarization). Default value is 45
Returns attenuation – Cross-polarization discrimination (dB)
Return type Quantity
References
[1] Propagation data and prediction methods required for the design of Earth-space telecommunication systems:https://www.itu.int/dms_pubrec/itu-r/rec/p/R-REC-P.618-12-201507-I!!PDF-E.pdf
itur.models.itu618.fit_rain_attenuation_to_lognormal(lat, lon, f, el, hs, P_k, tau)Compute the log-normal fit of rain attenuation vs. probability of occurrence.
Parameters
• lat (number, sequence, or numpy.ndarray) – Latitudes of the receiver points
• lon (number, sequence, or numpy.ndarray) – Longitudes of the receiverpoints
• f (number or Quantity) – Frequency (GHz)
• el (sequence, or number) – Elevation angle (degrees)
• hs (number, sequence, or numpy.ndarray, optional) – Heigh abovemean sea level of the earth station (km). If local data for the earth station height abovemean sea level is not available, an estimate is obtained from the maps of topographic alti-tude given in Recommendation ITU-R P.1511.
• P_k (number) – Rain probability
• tau (number, optional) – Polarization tilt angle relative to the horizontal (degrees)(tau = 45 deg for circular polarization). Default value is 45
Returns
• sigma_lna – Standar deviation of the lognormal distribution
• m_lna – Mean of the lognormal distribution
References
[1] Propagation data and prediction methods required for the design of Earth-space telecommunication systems:https://www.itu.int/dms_pubrec/itu-r/rec/p/R-REC-P.618-12-201507-I!!PDF-E.pdf
3.3. API Documentation 39
ITU-Rpy Documentation, Release 0.3.0
Recommendation ITU-R P.676
This Recommendation provides methods to estimate the attenuation of atmospheric gases on terrestrial and slant paths
Title PDF Latest approved inRecommendation ITU-R P.676 [PDF] 2019-08Attenuation by atmospheric gases and related effectsCurrent recommendation version (In force) DateRecommendation ITU-R P.676-12 [PDF] 08/2019Recommendations implemented in ITU-Rpy DateRecommendation ITU-R P.676-12 [PDF] 08/2019Recommendation ITU-R P.676-11 [PDF] 09/2016Recommendation ITU-R P.676-10 [PDF] 09/2013Recommendation ITU-R P.676-9 [PDF] 02/2012Recommendations not implemented in ITU-Rpy DateRecommendation ITU-R P.676-8 [PDF] 10/2009Recommendation ITU-R P.676-7 [PDF] 02/2007Recommendation ITU-R P.676-6 [PDF] 03/2005Recommendation ITU-R P.676-5 [PDF] 02/2001Recommendation ITU-R P.676-4 [PDF] 10/1999Recommendation ITU-R P.676-3 [PDF] 08/1997Recommendation ITU-R P.676-2 [PDF] 10/1995Recommendation ITU-R P.676-1 [PDF] 03/1992
Introduction
This Recommendation provides the following three methods of predicting the specific and path gaseous attenuationdue to oxygen and water vapour:
• Calculation of specific and path gaseous attenuation using the line-by-line summation assuming the atmosphericpressure, temperature, and water vapour density vs. height;
• An approximate estimate of specific and path gaseous attenuation assuming the water vapour density at thesurface of the Earth;
• An approximate estimate of path attenuation assuming the integrated water vapour content along the path.
These prediction methods can use local meteorological data, or reference atmospheres or meteorological maps corre-sponding to a desired probability of exceedance that are provided in other ITU-R P-series Recommendations. In theabsence of local data, a combination of: a) the reference atmospheric profiles given in Recommendation ITU-R P.835may be used, b) the mean annual global reference atmosphere given in Recommendation ITU-R P.835, c) the map ofmean annual surface temperature in Recommendation ITU-R P.1510 and d) the maps of surface water vapour densityvs. exceedance probability given in Recommendation ITU-R P.836 may be used in lieu of the standard ground-levelsurface water vapour density of 7.5 g/m3.
The method to compute an estimate of gaseous attenuation computed by a summation of individual absorption linesthat is valid for the frequency range 1-1 000 GHz, and the method to compute a simplified approximate method toestimate gaseous attenuation that is applicable in the frequency range 1-350 GHz.
Module description
itur.models.itu676.change_version(new_version)Change the version of the ITU-R P.676 recommendation currently being used.
40 Chapter 3. Table of Contents
ITU-Rpy Documentation, Release 0.3.0
This function changes the model used for the ITU-R P.676 recommendation to a different version.
Parameters new_version (int) – Number of the version to use. Valid values are:
• 12: Activates recommendation ITU-R P.676-12 (08/19) (Current version)
• 11: Activates recommendation ITU-R P.676-11 (09/16) (Superseded)
• 10: Activates recommendation ITU-R P.676-10 (09/13) (Superseded)
• 9: Activates recommendation ITU-R P.676-9 (02/12) (Superseded)
itur.models.itu676.get_version()Obtain the version of the ITU-R P.676 recommendation currently being used.
Returns version – The version of the ITU-R P.530 recommendation being used.
Return type int
itur.models.itu676.gaseous_attenuation_terrestrial_path(r, f, el, rho, P, T, mode)Estimate the attenuation of atmospheric gases on terrestrial paths. This function operates in two modes, ‘approx’,and ‘exact’:
• ‘approx’: a simplified approximate method to estimate gaseous attenuation that is applicable in the fre-quency range 1-350 GHz.
• ‘exact’: an estimate of gaseous attenuation computed by summation of individual absorption lines that isvalid for the frequency range 1-1,000 GHz
Parameters
• r (number or Quantity) – Path length (km)
• f (number or Quantity) – Frequency (GHz)
• el (sequence, number or Quantity) – Elevation angle (degrees)
• rho (number or Quantity) – Water vapor density (g/m**3)
• P (number or Quantity) – Atmospheric pressure (hPa)
• T (number or Quantity) – Absolute temperature (K)
• mode (string, optional) – Mode for the calculation. Valid values are ‘approx’, ‘ex-act’. If ‘approx’ Uses the method in Annex 2 of the recommendation (if any), else uses themethod described in Section 1. Default, ‘approx’
Returns attenuation – Terrestrial path attenuation (dB)
Return type Quantity
References
[1] Attenuation by atmospheric gases: https://www.itu.int/rec/R-REC-P.676/en
itur.models.itu676.gaseous_attenuation_slant_path(f, el, rho, P, T, V_t=None, h=None,mode=’approx’)
Estimate the attenuation of atmospheric gases on slant paths. This function operates in two modes, ‘approx’,and ‘exact’:
• ‘approx’: a simplified approximate method to estimate gaseous attenuation that is applicable in the fre-quency range 1-350 GHz.
• ‘exact’: an estimate of gaseous attenuation computed by summation of individual absorption lines that isvalid for the frequency range 1-1,000 GHz
3.3. API Documentation 41
ITU-Rpy Documentation, Release 0.3.0
Parameters
• f (number or Quantity) – Frequency (GHz)
• el (sequence, number or Quantity) – Elevation angle (degrees)
• rho (number or Quantity) – Water vapor density (g/m3)
• P (number or Quantity) – Atmospheric pressure (hPa)
• T (number or Quantity) – Absolute temperature (K)
• V_t (number or Quantity (kg/m2)) – Integrated water vapour content from: a)local radiosonde or radiometric data or b) at the required percentage of time (kg/m2) ob-tained from the digital maps in Recommendation ITU-R P.836 (kg/m2). If None, use gen-eral method to compute the wet-component of the gaseous attenuation. If provided, ‘h’ mustbe also provided. Default is None.
• h (number, sequence, or numpy.ndarray) – Altitude of the receivers. If None,use the topographical altitude as described in recommendation ITU-R P.1511. If provided,‘V_t’ needs to be also provided. Default is None.
• mode (string, optional) – Mode for the calculation. Valid values are ‘approx’, ‘ex-act’. If ‘approx’ Uses the method in Annex 2 of the recommendation (if any), else uses themethod described in Section 1. Default, ‘approx’
Returns attenuation – Slant path attenuation (dB)
Return type Quantity
References
[1] Attenuation by atmospheric gases: https://www.itu.int/rec/R-REC-P.676/en
itur.models.itu676.gaseous_attenuation_inclined_path(f, el, rho, P, T, h1, h2,mode=’approx’)
Estimate the attenuation of atmospheric gases on inclined paths between two ground stations at heights h1 andh2. This function operates in two modes, ‘approx’, and ‘exact’:
• ‘approx’: a simplified approximate method to estimate gaseous attenuation that is applicable in the fre-quency range 1-350 GHz.
• ‘exact’: an estimate of gaseous attenuation computed by summation of individual absorption lines that isvalid for the frequency range 1-1,000 GHz
Parameters
• f (number or Quantity) – Frequency (GHz)
• el (sequence, number or Quantity) – Elevation angle (degrees)
• rho (number or Quantity) – Water vapor density (g/m3)
• P (number or Quantity) – Atmospheric pressure (hPa)
• T (number or Quantity) – Absolute temperature (K)
• h1 (number or Quantity) – Height of ground station 1 (km)
• h2 (number or Quantity) – Height of ground station 2 (km)
• mode (string, optional) – Mode for the calculation. Valid values are ‘approx’, ‘ex-act’. If ‘approx’ Uses the method in Annex 2 of the recommendation (if any), else uses themethod described in Section 1. Default, ‘approx’
42 Chapter 3. Table of Contents
ITU-Rpy Documentation, Release 0.3.0
Returns attenuation – Inclined path attenuation (dB)
Return type Quantity
References
[1] Attenuation by atmospheric gases: https://www.itu.int/rec/R-REC-P.676/en
itur.models.itu676.slant_inclined_path_equivalent_height(f, p, rho=7.5, T=298.15)Computes the equivalent height to be used for oxygen and water vapour gaseous attenuation computations.
Parameters
• f (number or Quantity) – Frequency (GHz)
• p (number) – Percentage of the time the gaseous attenuation value is exceeded.
• rho (number or Quantity) – Water vapor density (g/m3)
• P (number or Quantity) – Atmospheric pressure (hPa)
• T (number or Quantity) – Absolute temperature (K)
Returns ho, hw – Equivalent height for oxygen and water vapour (m)
Return type Quantity
References
[1] Attenuation by atmospheric gases: https://www.itu.int/rec/R-REC-P.676/en
itur.models.itu676.zenit_water_vapour_attenuation(lat, lon, p, f, V_t=None, h=None)An alternative method may be used to compute the slant path attenuation by water vapour, in cases where theintegrated water vapour content along the path, V_t, is known.
Parameters
• lat (number, sequence, or numpy.ndarray) – Latitudes of the receiver points
• lon (number, sequence, or numpy.ndarray) – Longitudes of the receiverpoints
• p (number) – Percentage of the time the zenit water vapour attenuation value is exceeded.
• f (number or Quantity) – Frequency (GHz)
• V_t (number or Quantity, optional) – Integrated water vapour content alongthe path (kg/m2 or mm). If not provided this value is estimated using RecommendationITU-R P.836. Default value None
• h (number, sequence, or numpy.ndarray) – Altitude of the receivers. If None,use the topographical altitude as described in recommendation ITU-R P.1511
Returns A_w – Water vapour attenuation along the slant path (dB)
Return type Quantity
References
[1] Attenuation by atmospheric gases: https://www.itu.int/rec/R-REC-P.676/en
3.3. API Documentation 43
ITU-Rpy Documentation, Release 0.3.0
itur.models.itu676.gammaw_approx(f, P, rho, T)Method to estimate the specific attenuation due to water vapour using the approximate method descibed inAnnex 2.
Parameters
• f (number or Quantity) – Frequency (GHz)
• P (number or Quantity) – Atmospheric pressure (hPa)
• rho (number or Quantity) – Water vapor density (g/m3)
• T (number or Quantity) – Absolute temperature (K)
Returns gamma_w – Water vapour specific attenuation (dB/km)
Return type Quantity
References
[1] Attenuation by atmospheric gases: https://www.itu.int/rec/R-REC-P.676/en
itur.models.itu676.gamma0_approx(f, P, rho, T)Method to estimate the specific attenuation due to dry atmosphere using the approximate method descibed inAnnex 2.
Parameters
• f (number or Quantity) – Frequency (GHz)
• P (number or Quantity) – Atmospheric pressure (hPa)
• rho (number or Quantity) – Water vapor density (g/m3)
• T (number or Quantity) – Absolute temperature (K)
Returns gamma_w – Dry atmosphere specific attenuation (dB/km)
Return type Quantity
References
[1] Attenuation by atmospheric gases: https://www.itu.int/rec/R-REC-P.676/en
itur.models.itu676.gammaw_exact(f, P, rho, T)Method to estimate the specific attenuation due to water vapour using the line-by-line method described inAnnex 1 of the recommendation.
Parameters
• f (number or Quantity) – Frequency (GHz)
• P (number or Quantity) – Atmospheric pressure (hPa)
• rho (number or Quantity) – Water vapor density (g/m3)
• T (number or Quantity) – Absolute temperature (K)
Returns gamma_w – Water vapour specific attenuation (dB/km)
Return type Quantity
44 Chapter 3. Table of Contents
ITU-Rpy Documentation, Release 0.3.0
References
[1] Attenuation by atmospheric gases: https://www.itu.int/rec/R-REC-P.676/en
itur.models.itu676.gamma0_exact(f, P, rho, T)Method to estimate the specific attenuation due to dry atmosphere using the line-by-line method described inAnnex 1 of the recommendation.
Parameters
• f (number or Quantity) – Frequency (GHz)
• P (number or Quantity) – Atmospheric pressure (hPa)
• rho (number or Quantity) – Water vapor density (g/m3)
• T (number or Quantity) – Absolute temperature (K)
Returns gamma_w – Dry atmosphere specific attenuation (dB/km)
Return type Quantity
References
[1] Attenuation by atmospheric gases: https://www.itu.int/rec/R-REC-P.676/en
itur.models.itu676.gamma_exact(f, P, rho, T)Method to estimate the specific attenuation using the line-by-line method described in Annex 1 of the recom-mendation.
Parameters
• f (number or Quantity) – Frequency (GHz)
• P (number or Quantity) – Atmospheric pressure (hPa)
• rho (number or Quantity) – Water vapor density (g/m3)
• T (number or Quantity) – Absolute temperature (K)
Returns gamma – Specific attenuation (dB/km)
Return type Quantity
References
[1] Attenuation by atmospheric gases: https://www.itu.int/rec/R-REC-P.676/en
Recommendation ITU-R P.835
This Recommendation provides expressions and data for reference standard atmospheres required for the calculationof gaseous attenuation on Earth-space paths.
3.3. API Documentation 45
ITU-Rpy Documentation, Release 0.3.0
Title PDF Latest approved inRecommendation ITU-R P.835 [PDF] 2017-12Reference Standard AtmospheresCurrent recommendation version (In force) DateRecommendation ITU-R P.835-6 [PDF] 12/2017Recommendations implemented in ITU-Rpy DateRecommendation ITU-R P.835-6 [PDF] 12/2017Recommendation ITU-R P.835-5 [PDF] 02/2012Recommendations not implemented in ITU-Rpy DateRecommendation ITU-R P.835-4 [PDF] 03/2005Recommendation ITU-R P.835-3 [PDF] 10/1999Recommendation ITU-R P.835-2 [PDF] 08/1997Recommendation ITU-R P.835-1 [PDF] 08/1994
Introduction
This recommendation provides the equations to determine the temperature, pressure and water-vapour pressure as afunction of altitude, as described in the U.S. Standard Atmosphere 1976. These values should be used for calculatinggaseous attenuation when more reliable local data are not available.
Module description
itur.models.itu835.change_version(new_version)Change the version of the ITU-R P.835 recommendation currently being used.
This function changes the model used for the ITU-R P.835 recommendation to a different version.
Parameters new_version (int) – Number of the version to use. Valid values are:
• 6: Activates recommendation ITU-R P.835-6 (12/17) (Current version)
• 5: Activates recommendation ITU-R P.835-5 (02/12) (Superseded)
itur.models.itu835.get_version()The version of the model currently in use for the ITU-R P.835 recommendation.
Obtain the version of the ITU-R P.835 recommendation currently being used.
Returns version – The version of the ITU-R P.835 recommendation being used.
Return type int
itur.models.itu835.temperature(lat, h, season=’summer’)Determine the temperature at a given latitude and height.
Method to determine the temperature as a function of altitude and latitude, for calculating gaseous attenuationalong an Earth-space path. This method is recommended when more reliable local data are not available.
Parameters
• lat (number, sequence, or numpy.ndarray) – Latitudes of the receiver points
• h (number or Quantity) – Height (km)
• season (string) – Season of the year (available values, ‘summer’, and ‘winter’). Default‘summer’
Returns T – Temperature (K)
46 Chapter 3. Table of Contents
ITU-Rpy Documentation, Release 0.3.0
Return type Quantity
References
[1] Reference Standard Atmospheres https://www.itu.int/rec/R-REC-P.835/en
itur.models.itu835.pressure(lat, h, season=’summer’)Determine the atmospheric pressure at a given latitude and height.
Method to determine the pressure as a function of altitude and latitude, for calculating gaseous attenuation alongan Earth-space path. This method is recommended when more reliable local data are not available.
Parameters
• lat (number, sequence, or numpy.ndarray) – Latitudes of the receiver points
• h (number or Quantity) – Height (km)
• season (string) – Season of the year (available values, ‘summer’, and ‘winter’). Default‘summer’
Returns P – Pressure (hPa)
Return type Quantity
References
[1] Reference Standard Atmospheres https://www.itu.int/rec/R-REC-P.835/en
itur.models.itu835.water_vapour_density(lat, h, season=’summer’)Determine the water vapour density at a given latitude and height.
Method to determine the water-vapour density as a function of altitude and latitude, for calculating gaseousattenuation along an Earth-space path. This method is recommended when more reliable local data are notavailable.
Parameters
• lat (number, sequence, or numpy.ndarray) – Latitudes of the receiver points
• h (number or Quantity) – Height (km)
• season (string) – Season of the year (available values, ‘summer’, and ‘winter’). Default‘summer’
Returns rho – Water vapour density (g/m^3)
Return type Quantity
References
[1] Reference Standard Atmospheres https://www.itu.int/rec/R-REC-P.835/en
itur.models.itu835.standard_temperature(h, T_0=288.15)Determine the standard temperature at a given height.
Method to compute the temperature of an standard atmosphere at a given height. The reference standard atmo-sphere is based on the United States Standard Atmosphere, 1976, in which the atmosphere is divided into sevensuccessive layers showing linear variation with temperature.
Parameters
3.3. API Documentation 47
ITU-Rpy Documentation, Release 0.3.0
• h (number or Quantity) – Height (km)
• T_0 (number or Quantity) – Surface temperature (K)
Returns T – Temperature (K)
Return type Quantity
References
[1] Reference Standard Atmospheres https://www.itu.int/rec/R-REC-P.835/en
itur.models.itu835.standard_pressure(h, T_0=288.15, P_0=1013.25)Determine the standard pressure at a given height.
Method to compute the total atmopsheric pressure of an standard atmosphere at a given height.
The reference standard atmosphere is based on the United States Standard Atmosphere, 1976, in which theatmosphere is divided into seven successive layers showing linear variation with temperature.
Parameters
• h (number or Quantity) – Height (km)
• T_0 (number or Quantity) – Surface temperature (K)
• P_0 (number or Quantity) – Surface pressure (hPa)
Returns P – Pressure (hPa)
Return type Quantity
References
[1] Reference Standard Atmospheres https://www.itu.int/rec/R-REC-P.835/en
itur.models.itu835.standard_water_vapour_density(h, h_0=2, rho_0=7.5)Determine the standard water vapour density at a given height.
The reference standard atmosphere is based on the United States Standard Atmosphere, 1976, in which theatmosphere is divided into seven successive layers showing linear variation with temperature.
Parameters
• h (number or Quantity) – Height (km)
• h_0 (number or Quantity) – Scale height (km)
• rho_0 (number or Quantity) – Surface water vapour density (g/m^3)
Returns rho – Water vapour density (g/m^3)
Return type Quantity
References
[1] Reference Standard Atmospheres https://www.itu.int/rec/R-REC-P.835/en
itur.models.itu835.standard_water_vapour_pressure(h, h_0=2, rho_0=7.5)Determine the standard water vapour pressure at a given height.
The reference standard atmosphere is based on the United States Standard Atmosphere, 1976, in which theatmosphere is divided into seven successive layers showing linear variation with temperature.
48 Chapter 3. Table of Contents
ITU-Rpy Documentation, Release 0.3.0
Parameters
• h (number or Quantity) – Height (km)
• h_0 (number or Quantity) – Scale height (km)
• rho_0 (number or Quantity) – Surface water vapour density (g/m^3)
Returns e – Water vapour pressure (hPa)
Return type Quantity
References
[1] Reference Standard Atmospheres https://www.itu.int/rec/R-REC-P.835/en
Recommendation ITU-R P.836
This Recommendation provides methods to predict the surface water vapour density and total columnar water vapourcontent on Earth-space paths.
Title PDF Latest approved inRecommendation ITU-R P.836 [PDF] 2017-12surface density and total columnar contentCurrent recommendation version (In force) DateRecommendation ITU-R P.836-6 [PDF] 12/2017Recommendations implemented in ITU-Rpy DateRecommendation ITU-R P.836-6 [PDF] 12/2017Recommendation ITU-R P.836-5 [PDF] 09/2013Recommendation ITU-R P.836-4 [PDF] 10/2009Recommendations not implemented in ITU-Rpy DateRecommendation ITU-R P.836-3 [PDF] 11/2001Recommendation ITU-R P.836-2 [PDF] 02/2001Recommendation ITU-R P.836-1 [PDF] 08/1997Recommendation ITU-R P.836-0 [PDF] 03/1992
Introduction
Atmospheric water vapour and oxygen cause absorption at millimetre wavelengths especially in the proximity ofabsorption lines (see Recommendation ITU-R P.676). The concentration of atmospheric oxygen is relatively constant;however, the concentration of water vapour varies both geographically and with time.
For some applications, the total water vapour content along a path can be used for the calculation of excess path lengthand for the attenuation due to atmospheric water vapour, where the attenuation due to atmospheric water vapour isassumed to be proportional to the total water vapour content through its specific mass absorption coefficient.
This Recommendation provides method used for global calculations of propagation effects that require an estimate ofsurface water vapour density or total columnar content of water vapour and its seasonal variation, when more accuratelocal data are not available.
3.3. API Documentation 49
ITU-Rpy Documentation, Release 0.3.0
Module description
itur.models.itu836.change_version(new_version)Change the version of the ITU-R P.836 recommendation currently being used.
This function changes the model used for the ITU-R P.836 recommendation to a different version.
Parameters new_version (int) – Number of the version to use. Valid values are:
• 6: Activates recommendation ITU-R P.836-6 (12/17) (Current version)
• 5: Activates recommendation ITU-R P.836-5 (09/13) (Superseded)
• 4: Activates recommendation ITU-R P.836-4 (10/09) (Superseded)
itur.models.itu836.get_version()Obtain the version of the ITU-R P.836 recommendation currently being used.
Returns version – Version currently being used.
Return type int
itur.models.itu836.surface_water_vapour_density(lat, lon, p, alt=None)Compute the surface water vapour density along a path.
This method computes the surface water vapour density along a path at a desired location on the surface of theEarth.
Parameters
• lat (number, sequence, or numpy.ndarray) – Latitudes of the receiver points
• lon (number, sequence, or numpy.ndarray) – Longitudes of the receiverpoints
• p (number) – Percentage of time exceeded for p% of the average year
• alt (number, sequence, or numpy.ndarray) – Altitude of the receivers. IfNone, use the topographical altitude as described in recommendation ITU-R P.1511
Returns rho – Surface water vapour density (g/m3)
Return type Quantity
References
[1] Water vapour: surface density and total columnar content https://www.itu.int/rec/R-REC-P.836/en
itur.models.itu836.total_water_vapour_content(lat, lon, p, alt=None)Compute the total water vapour content along a path.
This method computes the total water vapour content along a path at a desired location on the surface of theEarth.
Parameters
• lat (number, sequence, or numpy.ndarray) – Latitudes of the receiver points
• lon (number, sequence, or numpy.ndarray) – Longitudes of the receiverpoints
• p (number) – Percentage of time exceeded for p% of the average year
• alt (number, sequence, or numpy.ndarray) – Altitude of the receivers. IfNone, use the topographical altitude as described in recommendation ITU-R P.1511
50 Chapter 3. Table of Contents
ITU-Rpy Documentation, Release 0.3.0
Returns V – Total water vapour content (kg/m2)
Return type Quantity
References
[1] Water vapour: surface density and total columnar content https://www.itu.int/rec/R-REC-P.836/en
Recommendation ITU-R P.837
This Recommendation provides a method to compute the characteristics of precipitation for propagation modelling
Title PDF Latest approved inRecommendation ITU-R P.837 [PDF] 2017-06Characteristics of precipitation for propagation modellingCurrent recommendation version (In force) DateRecommendation ITU-R P.837-7 [PDF] 06/2017Recommendations implemented in ITU-Rpy DateRecommendation ITU-R P.837-7 [PDF] 06/2017Recommendation ITU-R P.837-6 [PDF] 02/2012Recommendations not implemented in ITU-Rpy DateRecommendation ITU-R P.837-5 [PDF] 08/2007Recommendation ITU-R P.837-4 [PDF] 04/2003Recommendation ITU-R P.837-3 [PDF] 02/2001Recommendation ITU-R P.837-2 [PDF] 10/1999Recommendation ITU-R P.837-1 [PDF] 08/1994
Introduction
Rainfall rate statistics with a 1-min integration time are required for the prediction of rain attenuation in terrestrial andsatellite links. Data of long-term measurements of rainfall rate may be available from local sources, but only withhigher integration times. This Recommendation provides maps of meteorological parameters that have been obtainedusing the European Centre for Medium-Range Weather Forecast (ECMWF) ERA-40 re-analysis database, which arerecommended for the prediction of rainfall rate statistics with a 1-min integration time, when local measurements aremissing.
Module description
itur.models.itu837.change_version(new_version)Change the version of the ITU-R P.837 recommendation currently being used.
This function changes the model used for the ITU-R P.837 recommendation to a different version.
Parameters new_version (int) – Number of the version to use. Valid values are:
• 7: Activates recommendation ITU-R P.837-7 (12/17) (Current version)
• 6: Activates recommendation ITU-R P.837-6 (02/12) (Superseded)
itur.models.itu837.get_version()Obtain the version of the ITU-R P.837 recommendation currently being used.
Returns version – Version currently being used.
3.3. API Documentation 51
ITU-Rpy Documentation, Release 0.3.0
Return type int
itur.models.itu837.rainfall_probability(lat, lon)Compute the percentage probability of rain in an average year, P0, at a given location.
Parameters
• lat (number, sequence, or numpy.ndarray) – Latitudes of the receiver points
• lon (number, sequence, or numpy.ndarray) – Longitudes of the receiverpoints
Returns P0 – Percentage probability of rain in an average year (%)
Return type numpy.ndarray
References
[1] Characteristics of precipitation for propagation modelling https://www.itu.int/rec/R-REC-P.837/en
itur.models.itu837.rainfall_rate(lat, lon, p)Compute the rainfall rate exceeded for p% of the average year at a given location.
Parameters
• lat (number, sequence, or numpy.ndarray) – Latitudes of the receiver points
• lon (number, sequence, or numpy.ndarray) – Longitudes of the receiverpoints
• p (number) – Percentage of time exceeded for p% of the average year
Returns R001 – Rainfall rate exceeded for p% of the average year
Return type numpy.ndarray
References
[1] Characteristics of precipitation for propagation modelling https://www.itu.int/rec/R-REC-P.837/en
itur.models.itu837.unavailability_from_rainfall_rate(lat, lon, R)Compute the percentage of time of the average year that a given rainfall rate (R) is exceeded at a given location
This method calls successively to rainfall_rate (sing bisection) with different values of p.
Note: This method cannot operate in a vectorized manner.
Parameters
• lat (number) – Latitude of the receiver point
• lon (number) – Longitude of the receiver point
• R (number, sequence, or numpy.ndarray) – Rainfall rate (mm/h)
Returns p – Rainfall rate exceeded for p% of the average year
Return type numpy.ndarray
References
[1] Characteristics of precipitation for propagation modelling https://www.itu.int/rec/R-REC-P.837/en
52 Chapter 3. Table of Contents
ITU-Rpy Documentation, Release 0.3.0
Recommendation ITU-R P.838
This Recommendation provides a method to compute the specific attenuation for rain for use in prediction methods.
Title PDF Latest approved inRecommendation ITU-R P.838 [PDF] 2005-03Specific attenuation model for rain for use in prediction methodsCurrent recommendation version (In force) DateRecommendation ITU-R P.838-3 [PDF] 03/2005Recommendations implemented in ITU-Rpy DateRecommendation ITU-R P.838-3 [PDF] 03/2005Recommendation ITU-R P.838-2 [PDF] 04/2003Recommendation ITU-R P.838-1 [PDF] 10/1999Recommendation ITU-R P.838-0 [PDF] 03/1992
Introduction
The specific attenuation 𝛾𝑅 (dB/km) is obtained from the rain rate 𝑅 : 𝑚𝑎𝑡ℎ : (mm/h) using the power-law relation-ship:
𝛾𝑅 = 𝑘𝑅𝛼
Values for the coefficients 𝑘 and 𝛼 are determined as functions of frequency, f (GHz), and this recommendationprovides value valid in the range from 1 to 1 000 GHz. The models from Recommendation ITU-R P.838 have beendeveloped from curve-fitting to power-law coefficients derived from scattering calculations:
Module description
itur.models.itu838.change_version(new_version)Change the version of the ITU-R P.838 recommendation currently being used.
This function changes the model used for the ITU-R P.838 recommendation to a different version.
Parameters new_version (int) – Number of the version to use. Valid values are:
• 3: Activates recommendation ITU-R P.838-3 (03/05) (Current version)
• 2: Activates recommendation ITU-R P.838-2 (04/03) (Superseded)
• 1: Activates recommendation ITU-R P.838-1 (10/99) (Superseded)
• 0: Activates recommendation ITU-R P.838-0 (03/92) (Superseded)
itur.models.itu838.get_version()Obtain the version of the ITU-R P.838 recommendation currently being used.
Returns version – Version currently being used.
Return type int
itur.models.itu838.rain_specific_attenuation_coefficients(f, el, tau)Compute the values for the coefficients k and 𝛼.
A method to compute the values for the coefficients k and 𝛼 to compute the rain specific attenuation 𝛾𝑅 (dB/km)(dB/km)
Parameters
3.3. API Documentation 53
ITU-Rpy Documentation, Release 0.3.0
• f (number or Quantity) – Frequency (GHz)
• el (number, sequence, or numpy.ndarray) – Elevation angle of the receiverpoints
• tau (number, sequence, or numpy.ndarray) – Polarization tilt angle relativeto the horizontal (degrees). Tau = 45 deg for circular polarization)
Returns
• k (number) – Coefficient k (non-dimensional)
• 𝛼 (number) – Coefficient 𝛼 (non-dimensional)
References
[1] Rain height model for prediction methods: https://www.itu.int/rec/R-REC-P.838/en
itur.models.itu838.rain_specific_attenuation(R, f, el, tau)Compute the specific attenuation 𝛾_R (dB/km) given the rainfall rate.
A method to compute the specific attenuation 𝛾_R (dB/km) from rain. The value is obtained from the rainfallrate R (mm/h) using a power law relationship.
𝛾𝑅 = 𝑘𝑅𝛼
Parameters
• R (number, sequence, numpy.ndarray or Quantity) – Rain rate (mm/h)
• f (number or Quantity) – Frequency (GHz)
• el (number, sequence, or numpy.ndarray) – Elevation angle of the receiverpoints
• tau (number, sequence, or numpy.ndarray) – Polarization tilt angle relativeto the horizontal (degrees). Tau = 45 deg for circular polarization)
Returns 𝛾_R – Specific attenuation from rain (dB/km)
Return type numpy.ndarray
References
[1] Rain height model for prediction methods: https://www.itu.int/rec/R-REC-P.838/en
Recommendation ITU-R P.839
This Recommendation provides a method to predict the rain height for propagation prediction.
54 Chapter 3. Table of Contents
ITU-Rpy Documentation, Release 0.3.0
Title PDF Latest approved inRecommendation ITU-R P.839 [PDF] 2013-09Rain height model for prediction methodsCurrent recommendation version (In force) DateRecommendation ITU-R P.839-4 [PDF] 09/2013Recommendations implemented in ITU-Rpy DateRecommendation ITU-R P.839-4 [PDF] 09/2013Recommendation ITU-R P.839-3 [PDF] 02/2001Recommendation ITU-R P.839-2 [PDF] 10/1999Recommendations not implemented in ITU-Rpy DateRecommendation ITU-R P.839-1 [PDF] 08/1997Recommendation ITU-R P.839-0 [PDF] 03/1992
Introduction
The mean annual rain height above mean sea level, hR, may be obtained from the 0° C isotherm as:
ℎ𝑅 = ℎ0 + 0.36 km
for areas of the world where no specific information is available, the mean annual 0° C isotherm height above meansea level, h0, is an integral part of this Recommendation. The data is provided from 0° to 360° in longitude and from+90° to –90° in latitude. For a location different from the grid-points, the mean annual 0° C isotherm height abovemean sea level at the desired location can be derived by performing a bilinear interpolation on the values at the fourclosest gridpoints.
Module description
itur.models.itu839.change_version(new_version)Change the version of the ITU-R P.839 recommendation currently being used.
This function changes the model used for the ITU-R P.839 recommendation to a different version.
Parameters new_version (int) – Number of the version to use. Valid values are:
• 4: Activates recommendation ITU-R P.839-4 (09/2013) (Current version)
• 3: Activates recommendation ITU-R P.839-3 (02/01) (Superseded)
• 2: Activates recommendation ITU-R P.839-2 (10/99) (Superseded)
itur.models.itu839.get_version()Obtain the version of the ITU-R P.839 recommendation currently being used.
Returns version – Version currently being used.
Return type int
itur.models.itu839.isoterm_0(lat, lon)Estimate the zero degree Celsius isoterm height for propagation prediction.
Parameters
• lat (number, sequence, or numpy.ndarray) – Latitudes of the receiver points
• lon (number, sequence, or numpy.ndarray) – Longitudes of the receiverpoints
3.3. API Documentation 55
ITU-Rpy Documentation, Release 0.3.0
Returns h0 – Zero degree Celsius isoterm height (km)
Return type numpy.ndarray
References
[1] Rain height model for prediction methods: https://www.itu.int/rec/R-REC-P.839/en
itur.models.itu839.rain_height(lat, lon)Estimate the annual mean rain height for propagation prediction.
The mean annual rain height above mean sea level, ℎ𝑅, may be obtained from the 0° C isotherm as:
ℎ𝑅 = ℎ0 + 0.36 km
Parameters
• lat (number, sequence, or numpy.ndarray) – Latitudes of the receiver points
• lon (number, sequence, or numpy.ndarray) – Longitudes of the receiverpoints
Returns hR – Annual mean rain height (km)
Return type numpy.ndarray
References
[1] Rain height model for prediction methods: https://www.itu.int/rec/R-REC-P.839/en
Recommendation ITU-R P.840
This Recommendation provides methods to predict the attenuation due to clouds and fog on Earth-space paths.
Title PDF Latest approved inRecommendation ITU-R P.840 [PDF] 2019-08Attenuation due to clouds and fogCurrent recommendation version (In force) DateRecommendation ITU-R P.840-8 [PDF] 08/2019Recommendations implemented in ITU-Rpy DateRecommendation ITU-R P.840-8 [PDF] 08/2019Recommendation ITU-R P.840-7 [PDF] 12/2017Recommendation ITU-R P.840-6 [PDF] 09/2013Recommendation ITU-R P.840-5 [PDF] 02/2012Recommendation ITU-R P.840-4 [PDF] 10/2009Recommendations not implemented in ITU-Rpy DateRecommendation ITU-R P.840-3 [PDF] 10/1999Recommendation ITU-R P.840-2 [PDF] 08/1997Recommendation ITU-R P.840-1 [PDF] 08/1994
56 Chapter 3. Table of Contents
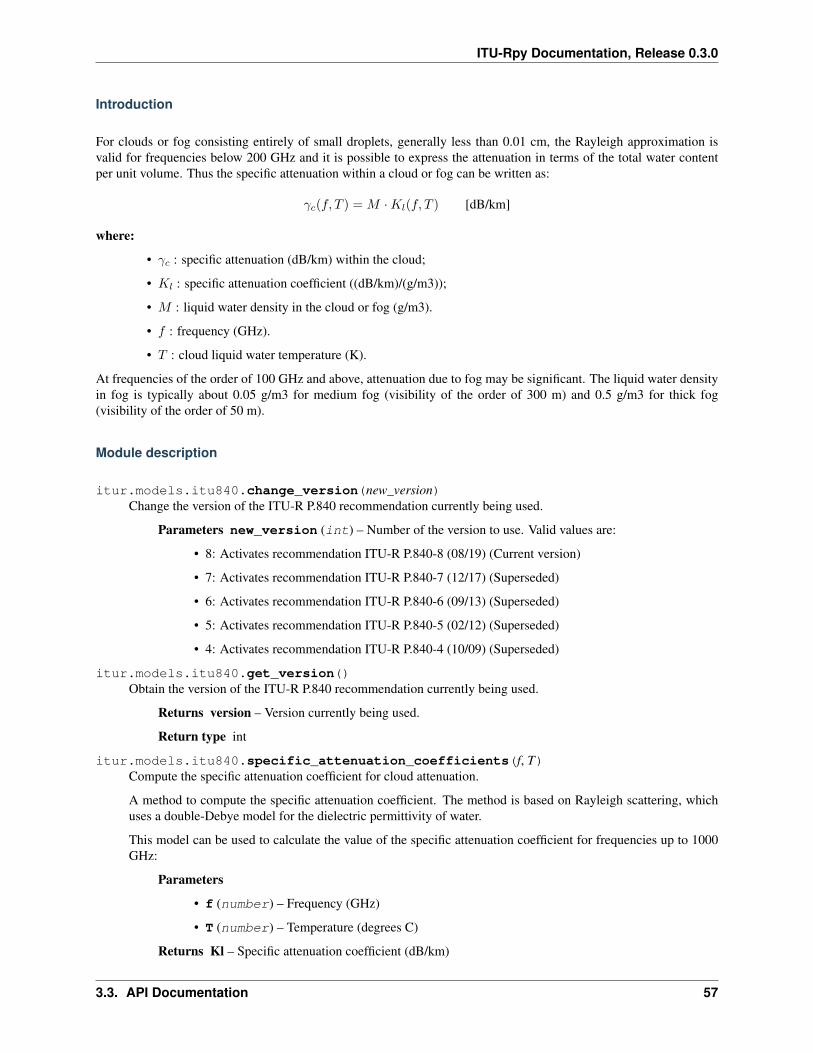
ITU-Rpy Documentation, Release 0.3.0
Introduction
For clouds or fog consisting entirely of small droplets, generally less than 0.01 cm, the Rayleigh approximation isvalid for frequencies below 200 GHz and it is possible to express the attenuation in terms of the total water contentper unit volume. Thus the specific attenuation within a cloud or fog can be written as:
𝛾𝑐(𝑓, 𝑇 ) = 𝑀 ·𝐾𝑙(𝑓, 𝑇 ) [dB/km]
where:
• 𝛾𝑐 : specific attenuation (dB/km) within the cloud;
• 𝐾𝑙 : specific attenuation coefficient ((dB/km)/(g/m3));
• 𝑀 : liquid water density in the cloud or fog (g/m3).
• 𝑓 : frequency (GHz).
• 𝑇 : cloud liquid water temperature (K).
At frequencies of the order of 100 GHz and above, attenuation due to fog may be significant. The liquid water densityin fog is typically about 0.05 g/m3 for medium fog (visibility of the order of 300 m) and 0.5 g/m3 for thick fog(visibility of the order of 50 m).
Module description
itur.models.itu840.change_version(new_version)Change the version of the ITU-R P.840 recommendation currently being used.
Parameters new_version (int) – Number of the version to use. Valid values are:
• 8: Activates recommendation ITU-R P.840-8 (08/19) (Current version)
• 7: Activates recommendation ITU-R P.840-7 (12/17) (Superseded)
• 6: Activates recommendation ITU-R P.840-6 (09/13) (Superseded)
• 5: Activates recommendation ITU-R P.840-5 (02/12) (Superseded)
• 4: Activates recommendation ITU-R P.840-4 (10/09) (Superseded)
itur.models.itu840.get_version()Obtain the version of the ITU-R P.840 recommendation currently being used.
Returns version – Version currently being used.
Return type int
itur.models.itu840.specific_attenuation_coefficients(f, T)Compute the specific attenuation coefficient for cloud attenuation.
A method to compute the specific attenuation coefficient. The method is based on Rayleigh scattering, whichuses a double-Debye model for the dielectric permittivity of water.
This model can be used to calculate the value of the specific attenuation coefficient for frequencies up to 1000GHz:
Parameters
• f (number) – Frequency (GHz)
• T (number) – Temperature (degrees C)
Returns Kl – Specific attenuation coefficient (dB/km)
3.3. API Documentation 57
ITU-Rpy Documentation, Release 0.3.0
Return type numpy.ndarray
References
[1] Attenuation due to clouds and fog: https://www.itu.int/rec/R-REC-P.840/en
itur.models.itu840.columnar_content_reduced_liquid(lat, lon, p)Compute the total columnar contents of reduced cloud liquid water.
A method to compute the total columnar content of reduced cloud liquid water, Lred (kg/m2), exceeded for p%of the average year
Parameters
• lat (number, sequence, or numpy.ndarray) – Latitudes of the receiver points
• lon (number, sequence, or numpy.ndarray) – Longitudes of the receiverpoints
• p (number) – Percentage of time exceeded for p% of the average year
Returns Lred – Total columnar content of reduced cloud liquid water, Lred (kg/m2), exceeded forp% of the average year
Return type numpy.ndarray
References
[1] Attenuation due to clouds and fog: https://www.itu.int/rec/R-REC-P.840/en
itur.models.itu840.cloud_attenuation(lat, lon, el, f, p, Lred=None)Compute the cloud attenuation in a slant path.
A method to estimate the attenuation due to clouds along slant paths for a given probability. If local measureddata of the total columnar content of cloud liquid water reduced to a temperature of 273.15 K, Lred, is availablefrom other sources, (e.g., from ground radiometric measurements, Earth observation products, or meteorologicalnumerical products), the value should be used directly.
The value of the cloud attenuation is computed as:
𝐴 =𝐿𝑟𝑒𝑑(lat, lon, 𝑝, 𝑇 ) ·𝐾𝑙(𝑓, 𝑇 )
sin(el)
where:
• 𝐿𝑟𝑒𝑑 : total columnar content of liquid water reduced to a temperature of 273.15 K (kg/m2);
• 𝐾𝑙 : specific attenuation coefficient ((dB/km)/(g/m3));
• 𝑒𝑙 : path elevation angle (deg).
• 𝑓 : frequency (GHz).
• 𝑝 : Percentage of time exceeded for p% of the average year (%).
• 𝑇 : temperature (K). Equal to 273.15 K.
Parameters
• lat (number, sequence, or numpy.ndarray) – Latitudes of the receiver points
• lon (number, sequence, or numpy.ndarray) – Longitudes of the receiverpoints
58 Chapter 3. Table of Contents
ITU-Rpy Documentation, Release 0.3.0
• el (number, sequence, or numpy.ndarray) – Elevation angle of the receiverpoints (deg)
• f (number) – Frequency (GHz)
• p (number) – Percentage of time exceeded for p% of the average year
• Lred (number) – Total columnar contents of reduced cloud liquid water. (kg/m2)
Returns A – Cloud attenuation, A (dB), exceeded for p% of the average year
Return type numpy.ndarray
References
[1] Attenuation due to clouds and fog: https://www.itu.int/rec/R-REC-P.840/en
itur.models.itu840.lognormal_approximation_coefficient(lat, lon)Total columnar contents of cloud liquid water distribution coefficients.
The annual statistics of the total columnar content of reduced cloud liquid water content can be approximatedby a log-normal distribution. This function computes the coefficients for the mean, 𝑚, standard deviation, 𝜎,and probability of non-zero reduced total columnar content of cloud liquid water, 𝑃𝑐𝑙𝑤, for such the log-normaldistribution.
Parameters
• lat (number, sequence, or numpy.ndarray) – Latitudes of the receiver points
• lon (number, sequence, or numpy.ndarray) – Longitudes of the receiverpoints
Returns
• m (numpy.ndarray) – Mean of the lognormal distribution
• 𝜎 (numpy.ndarray) – Standard deviation of the lognormal distribution
• Pclw (numpy.ndarray) – Probability of cloud liquid water of the lognormal distribution
References
[1] Attenuation due to clouds and fog: https://www.itu.int/rec/R-REC-P.840/en
Recommendation ITU-R P.1144
This Recommendation provides a guide to the Recommendations of Radiocommunication Study Group 3 which con-tain propagation prediction methods. It advises users on the most appropriate methods for particular applications aswell as the limits, required input information, and output for each of these methods.
Title PDF Approved inRecommendation ITU-R P.1144 [PDF] 2019-08Guide to the application of the propagation methods of Radiocommunication Study Group 3Latest Recommendation DateRecommendation ITU-R P.1144-10 [PDF] 08/2019
3.3. API Documentation 59
ITU-Rpy Documentation, Release 0.3.0
Introduction
Recommendation ITU-R P.1144 provides . In particular, the recommendation describes how to perform bi-linear andbi-cubic interpolation over the geophysical maps included in other recommendations.
Module description
Interpolation methods for the geophysical properties used to compute propagation effects. These methods are basedon those in Recommendation ITU-R P.1144-7.
References
[1] Guide to the application of the propagation methods of Radiocommunication Study Group 3: https://www.itu.int/rec/R-REC-P.1144/en
itur.models.itu1144.is_regular_grid(lats_o, lons_o)Determinere whether the grids in lats_o and lons_o are both regular grids or not.
A grid is regular if the difference (column-wise or row-wise) between consecutive values is constant across thegrid.
Parameters
• lats_o (numpy.ndarray) – Grid of latitude coordinates
• lons_o (numpy.ndarray) – Grid of longitude coordinates
Returns is_regular
Return type boolean
itur.models.itu1144.nearest_2D_interpolator(lats_o, lons_o, values)Produces a 2D interpolator function using the nearest value interpolation method. If the grids are regular grids,uses the scipy.interpolate.RegularGridInterpolator, otherwise, scipy.intepolate.griddata
Values can be interpolated from the returned function as follows:
f = nearest_2D_interpolator(lat_origin, lon_origin, values_origin)interp_values = f(lat_interp, lon_interp)
Parameters
• lats_o (numpy.ndarray) – Latitude coordinates of the values usde by the interpolator
• lons_o (numpy.ndarray) – Longitude coordinates of the values usde by the interpola-tor
• values (numpy.ndarray) – Values usde by the interpolator
Returns interpolator – Nearest neighbour interpolator function
Return type function
itur.models.itu1144.bilinear_2D_interpolator(lats_o, lons_o, values)Produces a 2D interpolator function using the bilinear interpolation method. If the grids are regular grids, usesthe scipy.interpolate.RegularGridInterpolator, otherwise, scipy.intepolate.griddata
Values can be interpolated from the returned function as follows:
60 Chapter 3. Table of Contents
ITU-Rpy Documentation, Release 0.3.0
f = nearest_2D_interpolator(lat_origin, lon_origin, values_origin)interp_values = f(lat_interp, lon_interp)
Parameters
• lats_o (numpy.ndarray) – Latitude coordinates of the values usde by the interpolator
• lons_o (numpy.ndarray) – Longitude coordinates of the values usde by the interpola-tor
• values (numpy.ndarray) – Values usde by the interpolator
Returns interpolator – Bilinear interpolator function
Return type function
itur.models.itu1144.bicubic_2D_interpolator(lats_o, lons_o, values)Produces a 2D interpolator function using the bicubic interpolation method. Uses the scipy.intepolate.griddatamethod.
Values can be interpolated from the returned function as follows:
f = nearest_2D_interpolator(lat_origin, lon_origin, values_origin)interp_values = f(lat_interp, lon_interp)
Parameters
• lats_o (numpy.ndarray) – Latitude coordinates of the values usde by the interpolator
• lons_o (numpy.ndarray) – Longitude coordinates of the values usde by the interpola-tor
• values (numpy.ndarray) – Values usde by the interpolator
Returns interpolator – Bicubic interpolator function
Return type function
Recommendation ITU-R P.1510
This Recommendation contains monthly and annual maps of mean surface temperature that are recommended for theprediction of statistics of different propagation effects such as rainfall rate, rain attenuation and gaseous attenuationdue to water vapour and oxygen.
Title PDF Latest approved inRecommendation ITU-R P.1510 [PDF] 2017-06Mean surface temperatureCurrent recommendation version (In force) DateRecommendation ITU-R P.1510-1 [PDF] 06/2017Recommendations implemented in ITU-Rpy DateRecommendation ITU-R P.1510-1 [PDF] 06/2017Recommendation ITU-R P.1510-0 [PDF] 02/2001
3.3. API Documentation 61
ITU-Rpy Documentation, Release 0.3.0
Introduction
Recommendation ITU-R P.1510 contains monthly and annual maps of mean surface temperature that are recom-mended for the prediction of statistics of different propagation effects such as rainfall rate, rain attenuation and gaseousattenuation due to water vapour and oxygen.
The monthly and annual mean surface temperature data (K) at 2 m above the surface of the Earth is an integral partof this Recommendation, and is provided as a grid. The latitude grid is from 90° N to +90° N in 0.75° steps, and thelongitude grid is from 180° E to +180° E in 0.75° steps.
The monthly mean surface temperature maps have been derived from 36 years (1979-2014) of European Centre ofMedium-range Weather Forecast (ECMWF) ERA Interim data, and the annual mean surface temperature map is theaverage of the monthly mean surface temperature maps weighted by the relative number of days in each calendarmonth.
Module description
itur.models.itu1510.change_version(new_version)Change the version of the ITU-R P.1510 recommendation currently being used.
This function changes the model used for the ITU-R P.1510 recommendation to a different version.
Parameters new_version (int) – Number of the version to use. Valid values are:
• 1: Activates recommendation ITU-R P.1510-1 (06/17) (Current version)
• 0: Activates recommendation ITU-R P.1510-0 (02/01) (Current version)
itur.models.itu1510.get_version()Obtain the version of the ITU-R P.1510 recommendation currently being used.
Returns version – Version currently being used.
Return type int
itur.models.itu1510.surface_mean_temperature(lat, lon)Annual mean surface temperature (K) at 2 m above the surface of the Earth.
A method to estimate the annual mean surface temperature (K) at 2 m above the surface of the Earth
Parameters
• lat (number, sequence, or numpy.ndarray) – Latitudes of the receiver points
• lon (number, sequence, or numpy.ndarray) – Longitudes of the receiverpoints
Returns annual_temperature – Annual mean surface temperature (K). Same dimensions as lat andlon.
Return type numpy.ndarray
References
[1] Annual mean surface temperature: https://www.itu.int/rec/R-REC-P.1510/en
itur.models.itu1510.surface_month_mean_temperature(lat, lon, m)Monthly mean surface temperature (K) at 2 m above the surface of the Earth.
A method to estimate the monthly mean surface temperature (K) at 2 m above the surface of the Earth
62 Chapter 3. Table of Contents
ITU-Rpy Documentation, Release 0.3.0
Parameters
• lat (number, sequence, or numpy.ndarray) – Latitudes of the receiver points
• lon (number, sequence, or numpy.ndarray) – Longitudes of the receiverpoints
• m (integer) – Index of the month (1=Jan, 2=Feb, 3=Mar, 4=Apr, . . . )
Returns monthly_temperature – Monthly mean surface temperature (K). Same dimensions as latand lon.
Return type numpy.ndarray
References
[1] Annual mean surface temperature: https://www.itu.int/rec/R-REC-P.1510/en
Recommendation ITU-R P.1511
This Recommendation provides global topographical data, information on geographic coordinates, and height data forthe prediction of propagation effects for Earth-space paths in ITU-R recommendations.
Title PDF Latest approved inRecommendation ITU-R P.1511 [PDF] 2019-08Topography for Earth-to-space propagation modellingCurrent recommendation version (In force) DateRecommendation ITU-R P.1511-2 [PDF] 08/2019Recommendations implemented in ITU-Rpy DateRecommendation ITU-R P.1511-2 [PDF] 08/2019Recommendation ITU-R P.1511-1 [PDF] 07/2015Recommendation ITU-R P.1511-0 [PDF] 02/2001
Introduction
This model shall be used to obtain the height above mean sea level when no local data are available or when no datawith a better spatial resolution is available.
The values of topographic height of the surface of the Earth above mean sea level (km) are an integral part of thisRecommendation. The data is provided on a 1/12° grid in both latitude and longitude. For a location different fromthe grid points, the height above mean sea level at the desired location can be obtained by performing a bi-cubicinterpolation on the values at the sixteen closest grid points
Module description
itur.models.itu1511.change_version(new_version)Change the version of the ITU-R P.1511 recommendation currently being used.
Parameters new_version (int) – Number of the version to use. Valid values are:
• 1: Activates recommendation ITU-R P.1511-1 (07/15) (Current version)
• 0: Activates recommendation ITU-R P.1511-0 (02/01) (Superseded)
3.3. API Documentation 63
ITU-Rpy Documentation, Release 0.3.0
itur.models.itu1511.get_version()Obtain the version of the ITU-R P.1511 recommendation currently being used.
Returns version – Version currently being used.
Return type int
itur.models.itu1511.topographic_altitude(lat, lon)Topographical height (km) above mean sea level of the surface of the Earth.
Parameters
• lat (number, sequence, or numpy.ndarray) – Latitudes of the receiver points
• lon (number, sequence, or numpy.ndarray) – Longitudes of the receiverpoints
Returns altitude – Topographic altitude (km)
Return type numpy.ndarray
References
[1] Topography for Earth-to-space propagation modelling: https://www.itu.int/rec/R-REC-P.1511/en
Recommendation ITU-R P.1623
This Recommendation provides prediction methods of fade dynamics on Earth-space paths.
Title PDF Latest approved inRecommendation ITU-R P.1623 [PDF] 2005-03Prediction method of fade dynamics on Earth-space pathsCurrent recommendation version (In force) DateRecommendation ITU-R P.1623-1 [PDF] 03/2005Recommendations implemented in ITU-Rpy DateRecommendation ITU-R P.1623-1 [PDF] 03/2005Recommendation ITU-R P.1623-0 [PDF] 04/2003
Introduction
In the design of a variety of telecommunication systems, the dynamic characteristics of fading due to atmosphericpropagation are of concern to optimize system capacity and meet quality and reliability criteria. Examples are fixednetworks that include a space segment and systems that apply fade mitigation or resource sharing techniques.
Several temporal scales can be defined, and it is useful to have information on fade slope, fade duration and interfadeduration statistics for a given attenuation level. Fade duration is defined as the time interval between two crossingsabove the same attenuation threshold whereas interfade duration is defined as the time interval between two crossingsbelow the same attenuation threshold. Fade slope is defined as the rate of change of attenuation with time.
Of particular interest in the context of availability criteria is the distinction between fades of shorter and longer durationthan 10 s. Knowledge of the distribution of fade duration as a function of fade depth is also a prerequisite for theapplication of risk concepts in the provision of telecommunication services.
In addition, information about the expected fade slope is essential to assess the required minimum tracking rate of afade mitigation system.
64 Chapter 3. Table of Contents
ITU-Rpy Documentation, Release 0.3.0
Module description
itur.models.itu1623.Qfunc(z)Tail distribution function of the standard normal distribution.
Q(z) is the probability that a normal (Gaussian) random variable will a value larger than z standard deviations
The Q-function can be expressed in terms of the error function as
𝑄(𝑧) =1
2
(︂1− 𝑒𝑟𝑓
(︂𝑧√2
)︂)︂Parameters z (float) – Value to evaluate Q at.
Returns q – Value of the Q function evaluated at z.
Return type float
itur.models.itu1623.change_version(new_version)Change the version of the ITU-R P.1623 recommendation currently being used.
This function changes the model used for the ITU-R P.1623 recommendation to a different version.
Parameters new_version (int) – Number of the version to use. Valid values are:
• 1: Activates recommendation ITU-R P.1623-1 (03/2005) (Current version)
• 0: Activates recommendation ITU-R P.1623-0 (04/2003) (Superseded)
itur.models.itu1623.get_version()Obtain the version of the ITU-R P.1623 recommendation currently being used.
Returns version – Version currently being used.
Return type int
itur.models.itu1623.fade_duration_probability(D, A, el, f)Compute the probability of occurrence of fades of duration longer than D.
Compute the probability of occurrence of fades of duration d longer than D (s), given that the attenuation a isgreater than A (dB).
This probability can be estimated from the ratio of the number of fades of duration longer than D to the totalnumber of fades observed, given that the threshold A is exceeded.
Parameters
• D (number, sequence, or numpy.ndarray) – Event durations, array, (s)
• A (number) – Attenuation threshold, scalar, (dB)
• el (number) – Elevation angle towards the satellite, deg (5 - 60)
• f (number) – Frequency, GHz (between 10 and 50 GHz)
Returns p – Probability of occurence of fade events of duration d longer than D given a>A, P(d >D|a > A)
Return type number, sequence, or numpy.ndarray
References
[1] Prediction method of fade dynamics on Earth-space paths: https://www.itu.int/rec/R-REC-P.1623/en
3.3. API Documentation 65
ITU-Rpy Documentation, Release 0.3.0
itur.models.itu1623.fade_duration_cummulative_probability(D, A, el, f)Compute the cumulative probability of exceedance of fades of duration longer than D.
Compute the cummulative exceedance probability F(d > D|a > A), the total fraction (between 0 and 1) of fadetime due to fades of duration d longer than D (s), given that the attenuation a is greater than A (dB).
Parameters
• D (number, sequence, or numpy.ndarray) – Event durations, array, (s)
• A (number) – Attenuation threshold, scalar, (dB)
• el (number) – Elevation angle towards the satellite, deg (5 - 60)
• f (number) – Frequency, GHz (between 10 and 50 GHz)
Returns F – Cumulative probability of exceedance, total fraction of fade time due to fades of d > D
Return type number, sequence, or numpy.ndarray
References
[1] Prediction method of fade dynamics on Earth-space paths: https://www.itu.int/rec/R-REC-P.1623/en
itur.models.itu1623.fade_duration_number_fades(D, A, el, f, T_tot)Compute the number of fades of duration longer than D.
For a given reference period, the number of fades of duration longer D is estimated by multiplying the probabilityof occurrence P(d > D|a > A) by the total number of fades exceeding the threshold, Ntot(A).
Parameters
• D (number, sequence, or numpy.ndarray) – Event durations, array, (s)
• A (number) – Attenuation threshold, scalar, (dB)
• el (number) – Elevation angle towards the satellite, deg (5 - 60)
• f (number) – Frequency, GHz (between 10 and 50 GHz)
• T_tot (number) – Total fade time from cumulative distribution (P(A)/100)*Referencetime period. T_tot should be obtained from local data. If this long-term statistic is notavailable, an estimate can be calculated from Recommendation ITU-R P.618. In this casethe procedure consists in calculating the CDF of total attenuation, deriving the percentageof time the considered attenuation threshold A is exceeded and then the associated totalexceedance time T_tot for the reference period considered.
For a reference period of a year, T_tot = ((100-availability_in_pctg)/100)*365.25*24*3600[s]
Returns N – threshold A
Return type Total number of fades of duration d longer than D, for a given
References
[1] Prediction method of fade dynamics on Earth-space paths: https://www.itu.int/rec/R-REC-P.1623/en
itur.models.itu1623.fade_duration_total_exceedance_time(D, A, el, f, T_tot)Compute the total exceedance time of fades of duration longer than D.
The total exceedance time due to fade events of duration longer than D is obtained by multiplying the fractionof time F(d > D|a > A) by the total time that the threshold is exceeded, Ttot(A).
66 Chapter 3. Table of Contents
ITU-Rpy Documentation, Release 0.3.0
Parameters
• D (number, sequence, or numpy.ndarray) – Event durations, array, (s)
• A (number) – Attenuation threshold, scalar, (dB)
• el (number) – Elevation angle towards the satellite, deg (5 - 60)
• f (number) – Frequency, GHz (between 10 and 50 GHz)
• T_tot (number) – Total fade time from cumulative distribution (P(A)/100)*Referencetime period. T_tot should be obtained from local data. If this long-term statistic is notavailable, an estimate can be calculated from Recommendation ITU-R P.618. In this casethe procedure consists in calculating the CDF of total attenuation, deriving the percentageof time the considered attenuation threshold A is exceeded and then the associated totalexceedance time T_tot for the reference period considered.
For a reference period of a year, T_tot = ((100-availability_in_pctg)/100)*365.25*24*3600[s]
Returns T
Return type Total fading time due to fades of d > D for A threshold.
References
[1] Prediction method of fade dynamics on Earth-space paths: https://www.itu.int/rec/R-REC-P.1623/en
itur.models.itu1623.fade_duration(D, A, el, f, T_tot)Compute the probability of occurrence of fades of duration longer than D.
Compute the probability of occurrence of fades of duration d longer than D (s), given that the attenuation a isgreater than A (dB) and F(d > D|a > A), the cumulative exceedance probability, or, equivalently, the total fraction(between 0 and 1) of fade time due to fades of duration d longer than D (s), given that the attenuation a is greaterthan A (dB).
The function also returns other parameters associated to the fade duration prediction method. See ITU-R P.1623Annex 1 Section 2.2
Parameters
• D (number, sequence, or numpy.ndarray) – Event durations, array, (s)
• A (number) – Attenuation threshold, scalar, (dB)
• el (number) – Elevation angle towards the satellite, deg (5 - 60)
• f (number) – Frequency, GHz (between 10 and 50 GHz)
• T_tot (number) – Total fade time from cumulative distribution (P(A)/100)*Referencetime period. T_tot should be obtained from local data. If this long-term statistic is notavailable, an estimate can be calculated from Recommendation ITU-R P.618. In this casethe procedure consists in calculating the CDF of total attenuation, deriving the percentageof time the considered attenuation threshold A is exceeded and then the associated totalexceedance time T_tot for the reference period considered.
For a reference period of a year, T_tot = ((100-availability_in_pctg)/100)*365.25*24*3600[s]
Returns
• p (probability of occurence of fade events of ) – duration d longer than D given a>A, P(d >D|a > A)
3.3. API Documentation 67
ITU-Rpy Documentation, Release 0.3.0
• F (cumulative probability of exceedance, total) – fraction of fade time due to fades of d > D
• N (total number of fades of duration d longer than D, for a given) – threshold A
• T (total fading time due to fades of d > D for A threshold)
References
[1] Prediction method of fade dynamics on Earth-space paths: https://www.itu.int/rec/R-REC-P.1623/en
itur.models.itu1623.fade_slope(z, A, f_B, delta_t)Compute the probability of exceeding a valueo f fade slope.
Fade slope is defined as the rate of change of attenuation with time information about the expected fade slope isessential to assess the required minimum tracking rate of a fade mitigation system. The model is valid for thefollowing ranges of parameters:
• frequencies from 10 to 30 GHz
• elevation angles from 10° to 50°.
See ITU-R P.1623 Annex 1 Section 3.2
Parameters
• z (number, sequence, or numpy.ndarray) – array of fade slope values (dB/s)
• A (number) – attenuation threshold, scalar, dB (range 0 - 20 dB)
• f_B (number) – 3 dB cut-off frequency of the low pass filter (Hz, range 0.001 - 1) usedto remove tropospheric scintillation and rapid variations of rain attenuation from the signal.Experimental results show that a 3 dB cut-off frequency of 0.02 Hz allows scintillation andrapid variations of rain attenuation to be filtered out adequately.
• delta_t (number) – Time interval length over which fade slope is calculated (s), 2-200s
Returns
• p (conditional probability (probability density function)) – that the fade slope is equal to thefade slope for a given attenuation value, A
• P (conditional probability (complementary cumulative) – distribution function)that the fadeslope is exceeded for a given attenuation value, A
• P2 (conditional probability that the absolute value of ) – the fade slope is exceeded for agiven attenuation value, A
• sigma_z (standard deviation of the conditional fade slope)
• Remark
• ——
• The output is an array of 4 elements.
Example
import itur.models.itu1623 as itu1623
z = np.linspace(-2,2,100)A = 10
(continues on next page)
68 Chapter 3. Table of Contents
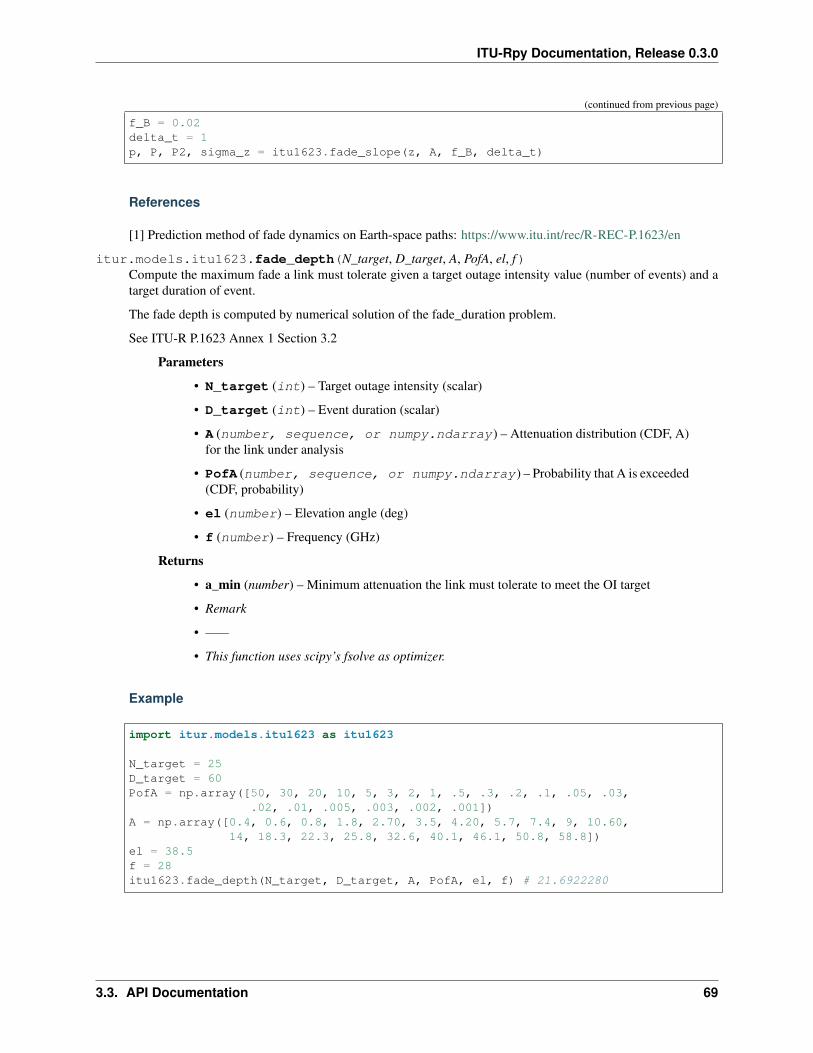
ITU-Rpy Documentation, Release 0.3.0
(continued from previous page)
f_B = 0.02delta_t = 1p, P, P2, sigma_z = itu1623.fade_slope(z, A, f_B, delta_t)
References
[1] Prediction method of fade dynamics on Earth-space paths: https://www.itu.int/rec/R-REC-P.1623/en
itur.models.itu1623.fade_depth(N_target, D_target, A, PofA, el, f)Compute the maximum fade a link must tolerate given a target outage intensity value (number of events) and atarget duration of event.
The fade depth is computed by numerical solution of the fade_duration problem.
See ITU-R P.1623 Annex 1 Section 3.2
Parameters
• N_target (int) – Target outage intensity (scalar)
• D_target (int) – Event duration (scalar)
• A (number, sequence, or numpy.ndarray) – Attenuation distribution (CDF, A)for the link under analysis
• PofA (number, sequence, or numpy.ndarray) – Probability that A is exceeded(CDF, probability)
• el (number) – Elevation angle (deg)
• f (number) – Frequency (GHz)
Returns
• a_min (number) – Minimum attenuation the link must tolerate to meet the OI target
• Remark
• ——
• This function uses scipy’s fsolve as optimizer.
Example
import itur.models.itu1623 as itu1623
N_target = 25D_target = 60PofA = np.array([50, 30, 20, 10, 5, 3, 2, 1, .5, .3, .2, .1, .05, .03,
.02, .01, .005, .003, .002, .001])A = np.array([0.4, 0.6, 0.8, 1.8, 2.70, 3.5, 4.20, 5.7, 7.4, 9, 10.60,
14, 18.3, 22.3, 25.8, 32.6, 40.1, 46.1, 50.8, 58.8])el = 38.5f = 28itu1623.fade_depth(N_target, D_target, A, PofA, el, f) # 21.6922280
3.3. API Documentation 69
ITU-Rpy Documentation, Release 0.3.0
References
[1] Prediction method of fade dynamics on Earth-space paths: https://www.itu.int/rec/R-REC-P.1623/en
Recommendation ITU-R P.1853
This Recommendation provides methods to synthesize rain attenuation and scintillation for terrestrial and Earth-spacepaths and total attenuation and tropospheric scintillation for Earth-space paths.
Title PDF Latest approved inRecommendation ITU-R P.1853 [PDF] 2019-08Time series synthesis of tropospheric impairmentsCurrent recommendation version (In force) DateRecommendation ITU-R P.1853-2 [PDF] 08/2019Recommendations implemented in ITU-Rpy DateRecommendation ITU-R P.1853-1 [PDF] 02/2012Recommendation ITU-R P.1853-0 [PDF] 10/2009Recommendations not implemented in ITU-Rpy DateRecommendation ITU-R P.1853-2 [PDF] 08/2019
Introduction
The planning and design of terrestrial and Earth-space radiocommunication systems requires the ability to synthesizethe time dynamics of the propagation channel. For example, this information may be required to design various fademitigation techniques such as, inter alia, adaptive coding and modulation, and transmit power control.
The methodology presented in this Recommendation provides a technique to synthesize rain attenuation and scintilla-tion time series for terrestrial and Earth-space paths and total attenuation and tropospheric scintillation for Earth-spacepaths that approximate the rain attenuation statistics at a particular location.
Module description
itur.models.itu1853.change_version(new_version)Change the version of the ITU-R P.1853 recommendation currently being used.
Parameters new_version (int) – Number of the version to use. Valid values are:
• 1: Activates recommendation ITU-R P.1853-1 (02/12) (Current version)
• 0: Activates recommendation ITU-R P.1853-0 (10/09) (Superseded)
itur.models.itu1853.get_version()Obtain the version of the ITU-R P.1853 recommendation currently being used.
Returns version – Version currently being used.
Return type int
itur.models.itu1853.set_seed(seed)Set the seed used to generate random numbers.
Parameters seed (int) – Seed used to generate random numbers
70 Chapter 3. Table of Contents
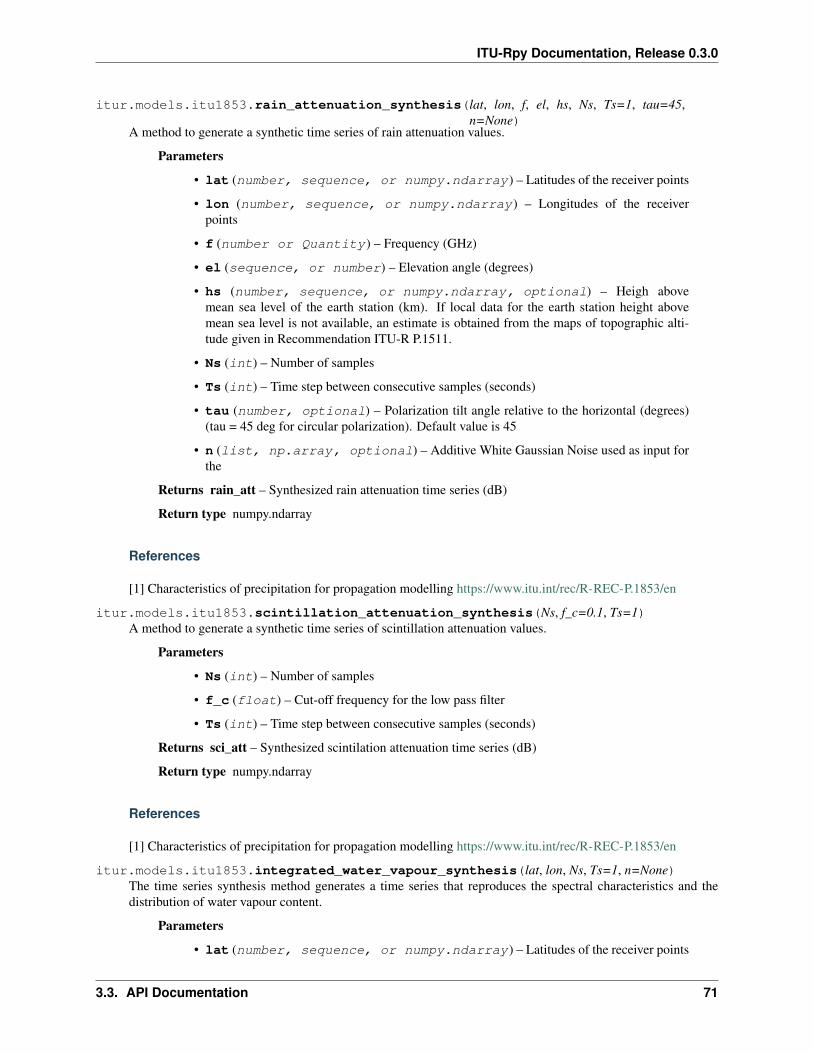
ITU-Rpy Documentation, Release 0.3.0
itur.models.itu1853.rain_attenuation_synthesis(lat, lon, f, el, hs, Ns, Ts=1, tau=45,n=None)
A method to generate a synthetic time series of rain attenuation values.
Parameters
• lat (number, sequence, or numpy.ndarray) – Latitudes of the receiver points
• lon (number, sequence, or numpy.ndarray) – Longitudes of the receiverpoints
• f (number or Quantity) – Frequency (GHz)
• el (sequence, or number) – Elevation angle (degrees)
• hs (number, sequence, or numpy.ndarray, optional) – Heigh abovemean sea level of the earth station (km). If local data for the earth station height abovemean sea level is not available, an estimate is obtained from the maps of topographic alti-tude given in Recommendation ITU-R P.1511.
• Ns (int) – Number of samples
• Ts (int) – Time step between consecutive samples (seconds)
• tau (number, optional) – Polarization tilt angle relative to the horizontal (degrees)(tau = 45 deg for circular polarization). Default value is 45
• n (list, np.array, optional) – Additive White Gaussian Noise used as input forthe
Returns rain_att – Synthesized rain attenuation time series (dB)
Return type numpy.ndarray
References
[1] Characteristics of precipitation for propagation modelling https://www.itu.int/rec/R-REC-P.1853/en
itur.models.itu1853.scintillation_attenuation_synthesis(Ns, f_c=0.1, Ts=1)A method to generate a synthetic time series of scintillation attenuation values.
Parameters
• Ns (int) – Number of samples
• f_c (float) – Cut-off frequency for the low pass filter
• Ts (int) – Time step between consecutive samples (seconds)
Returns sci_att – Synthesized scintilation attenuation time series (dB)
Return type numpy.ndarray
References
[1] Characteristics of precipitation for propagation modelling https://www.itu.int/rec/R-REC-P.1853/en
itur.models.itu1853.integrated_water_vapour_synthesis(lat, lon, Ns, Ts=1, n=None)The time series synthesis method generates a time series that reproduces the spectral characteristics and thedistribution of water vapour content.
Parameters
• lat (number, sequence, or numpy.ndarray) – Latitudes of the receiver points
3.3. API Documentation 71
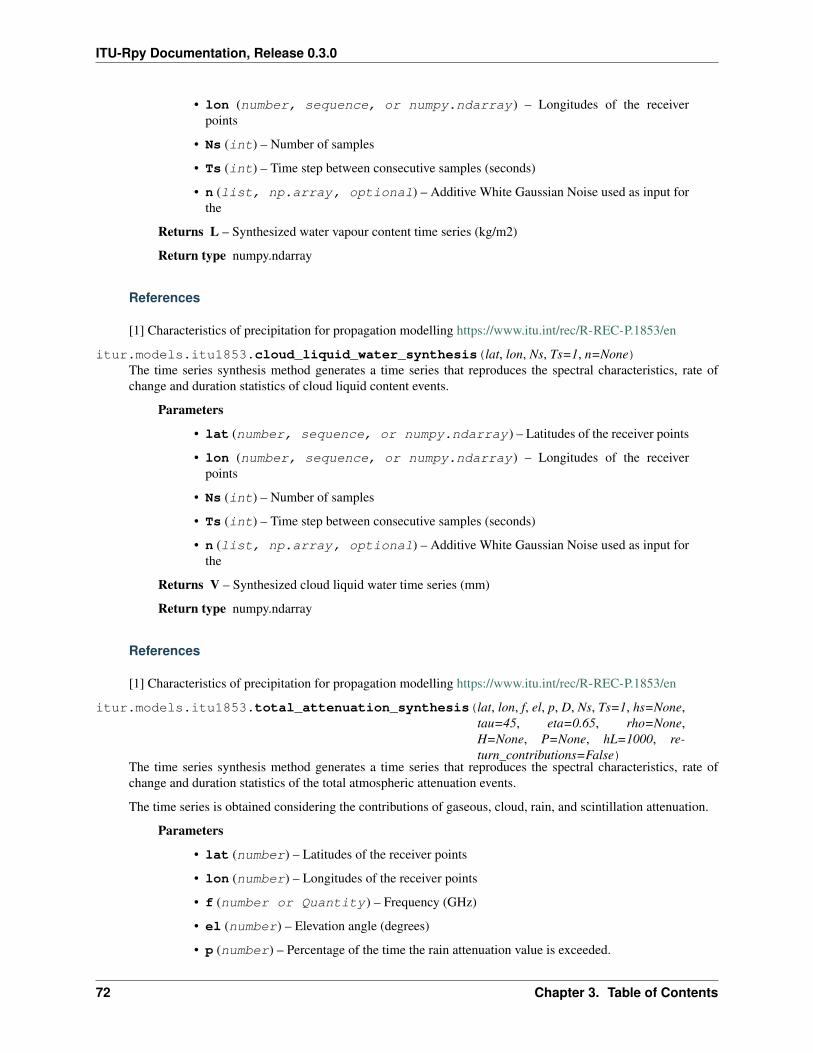
ITU-Rpy Documentation, Release 0.3.0
• lon (number, sequence, or numpy.ndarray) – Longitudes of the receiverpoints
• Ns (int) – Number of samples
• Ts (int) – Time step between consecutive samples (seconds)
• n (list, np.array, optional) – Additive White Gaussian Noise used as input forthe
Returns L – Synthesized water vapour content time series (kg/m2)
Return type numpy.ndarray
References
[1] Characteristics of precipitation for propagation modelling https://www.itu.int/rec/R-REC-P.1853/en
itur.models.itu1853.cloud_liquid_water_synthesis(lat, lon, Ns, Ts=1, n=None)The time series synthesis method generates a time series that reproduces the spectral characteristics, rate ofchange and duration statistics of cloud liquid content events.
Parameters
• lat (number, sequence, or numpy.ndarray) – Latitudes of the receiver points
• lon (number, sequence, or numpy.ndarray) – Longitudes of the receiverpoints
• Ns (int) – Number of samples
• Ts (int) – Time step between consecutive samples (seconds)
• n (list, np.array, optional) – Additive White Gaussian Noise used as input forthe
Returns V – Synthesized cloud liquid water time series (mm)
Return type numpy.ndarray
References
[1] Characteristics of precipitation for propagation modelling https://www.itu.int/rec/R-REC-P.1853/en
itur.models.itu1853.total_attenuation_synthesis(lat, lon, f, el, p, D, Ns, Ts=1, hs=None,tau=45, eta=0.65, rho=None,H=None, P=None, hL=1000, re-turn_contributions=False)
The time series synthesis method generates a time series that reproduces the spectral characteristics, rate ofchange and duration statistics of the total atmospheric attenuation events.
The time series is obtained considering the contributions of gaseous, cloud, rain, and scintillation attenuation.
Parameters
• lat (number) – Latitudes of the receiver points
• lon (number) – Longitudes of the receiver points
• f (number or Quantity) – Frequency (GHz)
• el (number) – Elevation angle (degrees)
• p (number) – Percentage of the time the rain attenuation value is exceeded.
72 Chapter 3. Table of Contents
ITU-Rpy Documentation, Release 0.3.0
• D (number or Quantity) – Physical diameter of the earth-station antenna (m)
• Ns (int) – Number of samples
• Ts (int) – Time step between consecutive samples (seconds)
• tau (number, optional) – Polarization tilt angle relative to the horizontal (degrees)(tau = 45 deg for circular polarization). Default value is 45
• hs (number, sequence, or numpy.ndarray, optional) – Heigh abovemean sea level of the earth station (km). If local data for the earth station height abovemean sea level is not available, an estimate is obtained from the maps of topographic alti-tude given in Recommendation ITU-R P.1511.
• eta (number, optional) – Antenna efficiency. Default value 0.5 (conservative esti-mate)
• rho (number or Quantity, optional) – Water vapor density (g/m3). If not pro-vided, an estimate is obtained from Recommendation Recommendation ITU-R P.836.
• H (number, sequence, or numpy.ndarray, optional) – Average surfacerelative humidity (%) at the site. If None, uses the ITU-R P.453 to estimate the wet term ofthe radio refractivity.
• P (number, sequence, or numpy.ndarray, optional) – Average surfacepressure (hPa) at the site. If None, uses the ITU-R P.453 to estimate the wet term of theradio refractivity.
• hL (number, optional) – Height of the turbulent layer (m). Default value 1000 m
• return_contributions (bool, optional) – Determines whether individual con-tributions from gases, rain, clouds and scintillation are returned in addition ot the total at-tenuation (True), or just the total atmospheric attenuation (False). Default is False
Returns
• A (Quantity) – Synthesized total atmospheric attenuation time series (dB)
• Ag, Ac, Ar, As, A (tuple) – Synthesized Gaseous, Cloud, Rain, Scintillation contributionsto total attenuation time series, and synthesized total attenuation time seires (dB).
References
[1] Characteristics of precipitation for propagation modelling https://www.itu.int/rec/R-REC-P.1853/en
It is also advisable that developers use the index, module index, and search page below for quick access to specificfunctions:
• genindex
• modindex
• search
3.4 Validation
ITU-Rpy has been validated using the ITU Validation examples (rev 5.1) , which provides test cases for parts ofRecommendations ITU-R P.453-14, P.618-13, P.676-12, P.836-6, P.837-7, P.838-3, P.839-4, P.840-8, P.1511-2, P.1623-1.
3.4. Validation 73
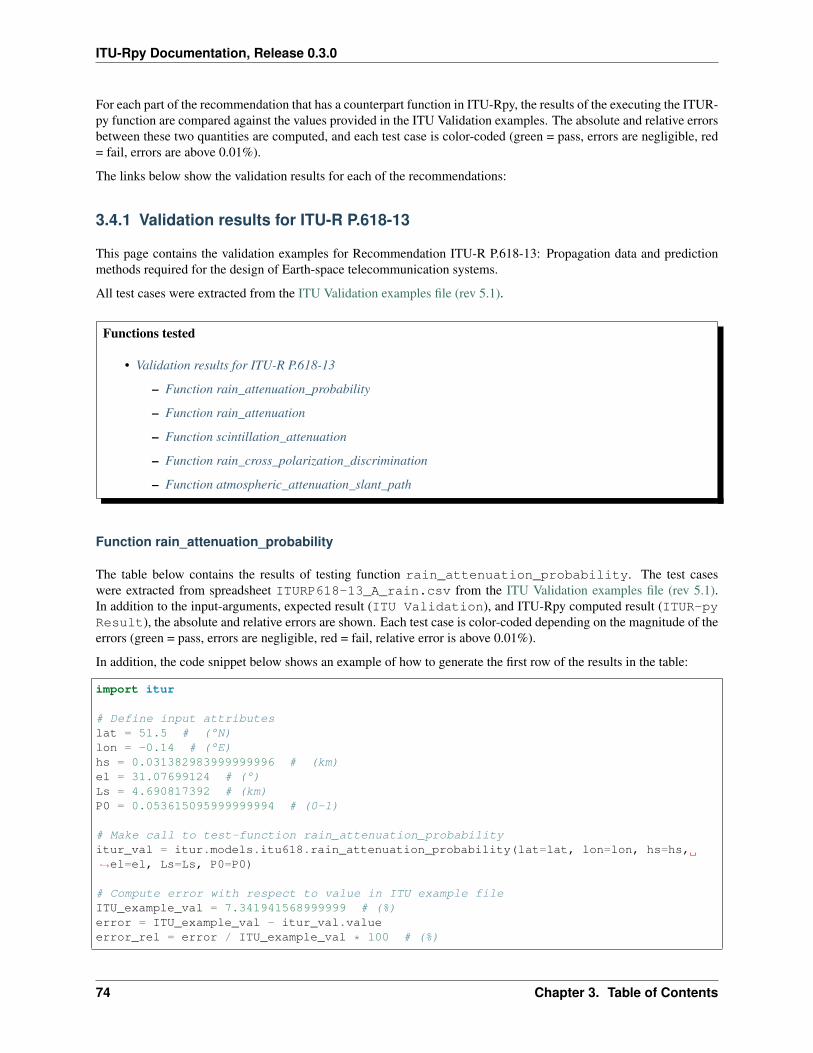
ITU-Rpy Documentation, Release 0.3.0
For each part of the recommendation that has a counterpart function in ITU-Rpy, the results of the executing the ITUR-py function are compared against the values provided in the ITU Validation examples. The absolute and relative errorsbetween these two quantities are computed, and each test case is color-coded (green = pass, errors are negligible, red= fail, errors are above 0.01%).
The links below show the validation results for each of the recommendations:
3.4.1 Validation results for ITU-R P.618-13
This page contains the validation examples for Recommendation ITU-R P.618-13: Propagation data and predictionmethods required for the design of Earth-space telecommunication systems.
All test cases were extracted from the ITU Validation examples file (rev 5.1).
Functions tested
• Validation results for ITU-R P.618-13
– Function rain_attenuation_probability
– Function rain_attenuation
– Function scintillation_attenuation
– Function rain_cross_polarization_discrimination
– Function atmospheric_attenuation_slant_path
Function rain_attenuation_probability
The table below contains the results of testing function rain_attenuation_probability. The test caseswere extracted from spreadsheet ITURP618-13_A_rain.csv from the ITU Validation examples file (rev 5.1).In addition to the input-arguments, expected result (ITU Validation), and ITU-Rpy computed result (ITUR-pyResult), the absolute and relative errors are shown. Each test case is color-coded depending on the magnitude of theerrors (green = pass, errors are negligible, red = fail, relative error is above 0.01%).
In addition, the code snippet below shows an example of how to generate the first row of the results in the table:
import itur
# Define input attributeslat = 51.5 # (°N)lon = -0.14 # (°E)hs = 0.031382983999999996 # (km)el = 31.07699124 # (°)Ls = 4.690817392 # (km)P0 = 0.053615095999999994 # (0-1)
# Make call to test-function rain_attenuation_probabilityitur_val = itur.models.itu618.rain_attenuation_probability(lat=lat, lon=lon, hs=hs,→˓el=el, Ls=Ls, P0=P0)
# Compute error with respect to value in ITU example fileITU_example_val = 7.341941568999999 # (%)error = ITU_example_val - itur_val.valueerror_rel = error / ITU_example_val * 100 # (%)
74 Chapter 3. Table of Contents
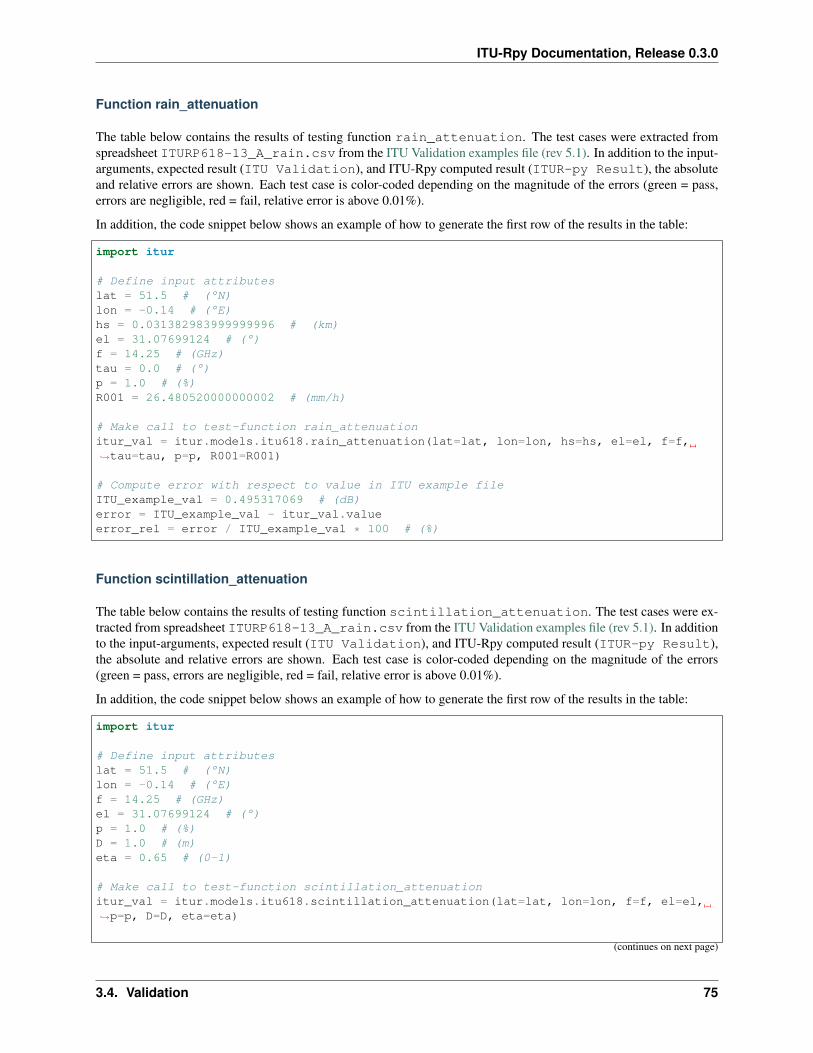
ITU-Rpy Documentation, Release 0.3.0
Function rain_attenuation
The table below contains the results of testing function rain_attenuation. The test cases were extracted fromspreadsheet ITURP618-13_A_rain.csv from the ITU Validation examples file (rev 5.1). In addition to the input-arguments, expected result (ITU Validation), and ITU-Rpy computed result (ITUR-py Result), the absoluteand relative errors are shown. Each test case is color-coded depending on the magnitude of the errors (green = pass,errors are negligible, red = fail, relative error is above 0.01%).
In addition, the code snippet below shows an example of how to generate the first row of the results in the table:
import itur
# Define input attributeslat = 51.5 # (°N)lon = -0.14 # (°E)hs = 0.031382983999999996 # (km)el = 31.07699124 # (°)f = 14.25 # (GHz)tau = 0.0 # (°)p = 1.0 # (%)R001 = 26.480520000000002 # (mm/h)
# Make call to test-function rain_attenuationitur_val = itur.models.itu618.rain_attenuation(lat=lat, lon=lon, hs=hs, el=el, f=f,→˓tau=tau, p=p, R001=R001)
# Compute error with respect to value in ITU example fileITU_example_val = 0.495317069 # (dB)error = ITU_example_val - itur_val.valueerror_rel = error / ITU_example_val * 100 # (%)
Function scintillation_attenuation
The table below contains the results of testing function scintillation_attenuation. The test cases were ex-tracted from spreadsheet ITURP618-13_A_rain.csv from the ITU Validation examples file (rev 5.1). In additionto the input-arguments, expected result (ITU Validation), and ITU-Rpy computed result (ITUR-py Result),the absolute and relative errors are shown. Each test case is color-coded depending on the magnitude of the errors(green = pass, errors are negligible, red = fail, relative error is above 0.01%).
In addition, the code snippet below shows an example of how to generate the first row of the results in the table:
import itur
# Define input attributeslat = 51.5 # (°N)lon = -0.14 # (°E)f = 14.25 # (GHz)el = 31.07699124 # (°)p = 1.0 # (%)D = 1.0 # (m)eta = 0.65 # (0-1)
# Make call to test-function scintillation_attenuationitur_val = itur.models.itu618.scintillation_attenuation(lat=lat, lon=lon, f=f, el=el,→˓p=p, D=D, eta=eta)
(continues on next page)
3.4. Validation 75
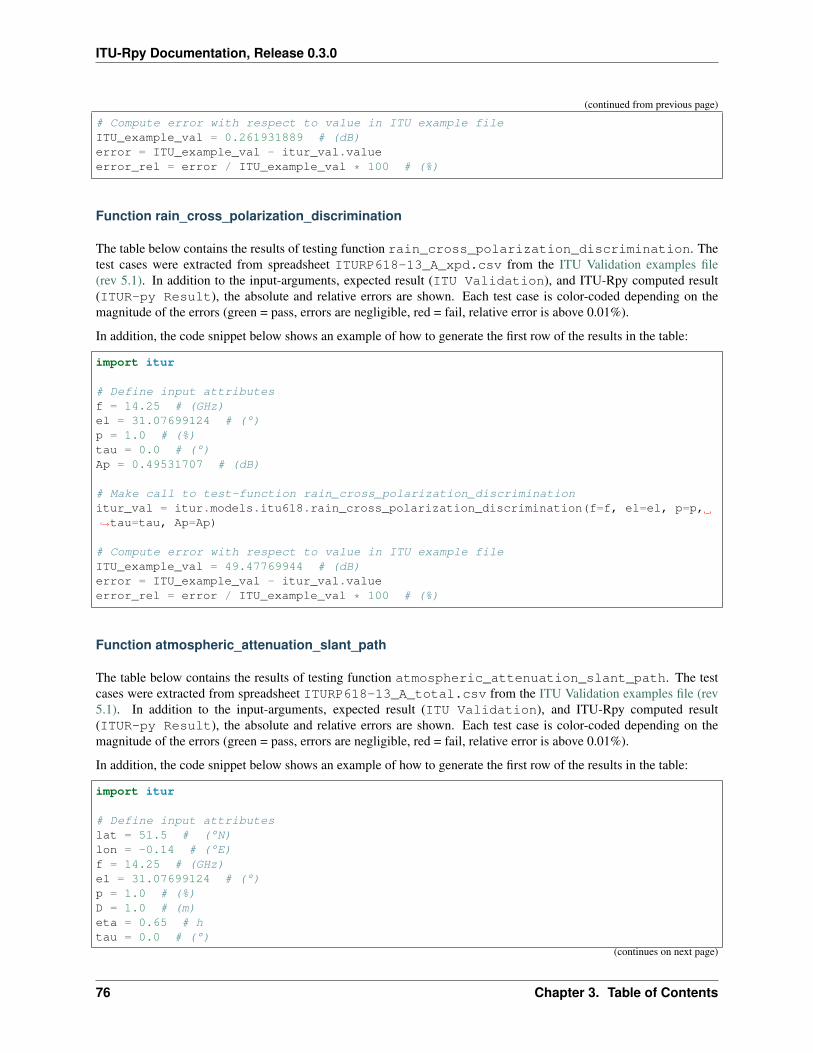
ITU-Rpy Documentation, Release 0.3.0
(continued from previous page)
# Compute error with respect to value in ITU example fileITU_example_val = 0.261931889 # (dB)error = ITU_example_val - itur_val.valueerror_rel = error / ITU_example_val * 100 # (%)
Function rain_cross_polarization_discrimination
The table below contains the results of testing function rain_cross_polarization_discrimination. Thetest cases were extracted from spreadsheet ITURP618-13_A_xpd.csv from the ITU Validation examples file(rev 5.1). In addition to the input-arguments, expected result (ITU Validation), and ITU-Rpy computed result(ITUR-py Result), the absolute and relative errors are shown. Each test case is color-coded depending on themagnitude of the errors (green = pass, errors are negligible, red = fail, relative error is above 0.01%).
In addition, the code snippet below shows an example of how to generate the first row of the results in the table:
import itur
# Define input attributesf = 14.25 # (GHz)el = 31.07699124 # (°)p = 1.0 # (%)tau = 0.0 # (°)Ap = 0.49531707 # (dB)
# Make call to test-function rain_cross_polarization_discriminationitur_val = itur.models.itu618.rain_cross_polarization_discrimination(f=f, el=el, p=p,→˓tau=tau, Ap=Ap)
# Compute error with respect to value in ITU example fileITU_example_val = 49.47769944 # (dB)error = ITU_example_val - itur_val.valueerror_rel = error / ITU_example_val * 100 # (%)
Function atmospheric_attenuation_slant_path
The table below contains the results of testing function atmospheric_attenuation_slant_path. The testcases were extracted from spreadsheet ITURP618-13_A_total.csv from the ITU Validation examples file (rev5.1). In addition to the input-arguments, expected result (ITU Validation), and ITU-Rpy computed result(ITUR-py Result), the absolute and relative errors are shown. Each test case is color-coded depending on themagnitude of the errors (green = pass, errors are negligible, red = fail, relative error is above 0.01%).
In addition, the code snippet below shows an example of how to generate the first row of the results in the table:
import itur
# Define input attributeslat = 51.5 # (°N)lon = -0.14 # (°E)f = 14.25 # (GHz)el = 31.07699124 # (°)p = 1.0 # (%)D = 1.0 # (m)eta = 0.65 # htau = 0.0 # (°)
(continues on next page)
76 Chapter 3. Table of Contents
ITU-Rpy Documentation, Release 0.3.0
(continued from previous page)
hs = 0.031382983999999996 # (km)
# Make call to test-function atmospheric_attenuation_slant_pathitur_val = itur.atmospheric_attenuation_slant_path(lat=lat, lon=lon, f=f, el=el, p=p,→˓D=D, eta=eta, tau=tau, hs=hs)
# Compute error with respect to value in ITU example fileITU_example_val = 1.212790721 # (dB)error = ITU_example_val - itur_val.valueerror_rel = error / ITU_example_val * 100 # (%)
3.4.2 Validation results for ITU-R P.676-12
This page contains the validation examples for Recommendation ITU-R P.676-12: Attenuation by atmospheric gasesand related effects.
All test cases were extracted from the ITU Validation examples file (rev 5.1).
Functions tested
• Validation results for ITU-R P.676-12
– Function zenit_water_vapour_attenuation
– Function gamma0_exact
– Function gaseous_attenuation_slant_path
– Function gammaw_exact
– Function gamma_exact
Function zenit_water_vapour_attenuation
The table below contains the results of testing function zenit_water_vapour_attenuation. The test caseswere extracted from spreadsheet ITURP676-12_zenith_attenuation.csv from the ITU Validation exam-ples file (rev 5.1). In addition to the input-arguments, expected result (ITU Validation), and ITU-Rpy computedresult (ITUR-py Result), the absolute and relative errors are shown. Each test case is color-coded depending onthe magnitude of the errors (green = pass, errors are negligible, red = fail, relative error is above 0.01%).
In addition, the code snippet below shows an example of how to generate the first row of the results in the table:
import itur
# Define input attributeslat = 0.0 # (°N)lon = 0.0 # (°E)p = 0.0 # (hPa)f = 14.25 # (GHz)h = 0.031382983999999996 # (km)V_t = 33.72946527 # (kg/m2)
# Make call to test-function zenit_water_vapour_attenuationitur_val = itur.models.itu676.zenit_water_vapour_attenuation(lat=lat, lon=lon, p=p,→˓f=f, h=h, V_t=V_t) (continues on next page)
3.4. Validation 77
ITU-Rpy Documentation, Release 0.3.0
(continued from previous page)
# Compute error with respect to value in ITU example fileITU_example_val = 0.070935174 # (dB/km)error = ITU_example_val - itur_val.valueerror_rel = error / ITU_example_val * 100 # (%)
Function gamma0_exact
The table below contains the results of testing function gamma0_exact. The test cases were extracted fromspreadsheet ITURP676-12_gamma.csv from the ITU Validation examples file (rev 5.1). In addition to the input-arguments, expected result (ITU Validation), and ITU-Rpy computed result (ITUR-py Result), the absoluteand relative errors are shown. Each test case is color-coded depending on the magnitude of the errors (green = pass,errors are negligible, red = fail, relative error is above 0.01%).
In addition, the code snippet below shows an example of how to generate the first row of the results in the table:
import itur
# Define input attributesf = 12.0 # (GHz)P = 1013.25 # (hPA)rho = 7.5 # (g/cm3)T = 288.15 # (K)
# Make call to test-function gamma0_exactitur_val = itur.models.itu676.gamma0_exact(f=f, P=P, rho=rho, T=T)
# Compute error with respect to value in ITU example fileITU_example_val = 0.008698264 # (dB/km)error = ITU_example_val - itur_val.valueerror_rel = error / ITU_example_val * 100 # (%)
Function gaseous_attenuation_slant_path
The table below contains the results of testing function gaseous_attenuation_slant_path. The test caseswere extracted from spreadsheet ITURP676-12_A_gas.csv from the ITU Validation examples file (rev 5.1). Inaddition to the input-arguments, expected result (ITU Validation), and ITU-Rpy computed result (ITUR-pyResult), the absolute and relative errors are shown. Each test case is color-coded depending on the magnitude of theerrors (green = pass, errors are negligible, red = fail, relative error is above 0.01%).
In addition, the code snippet below shows an example of how to generate the first row of the results in the table:
import itur
# Define input attributesf = 14.25 # (GHz)el = 31.07699124 # (°)rho = 13.79653679 # (g/m3)P = 1009.485612 # (hPA)T = 283.6108756 # (C)h = 0.031382983999999996 # (km)V_t = 33.72946527 # (kg/m2)
# Make call to test-function gaseous_attenuation_slant_path(continues on next page)
78 Chapter 3. Table of Contents
ITU-Rpy Documentation, Release 0.3.0
(continued from previous page)
itur_val = itur.models.itu676.gaseous_attenuation_slant_path(f=f, el=el, rho=rho, P=P,→˓ T=T, h=h, V_t=V_t)
# Compute error with respect to value in ITU example fileITU_example_val = 0.226874038 # (dB)error = ITU_example_val - itur_val.valueerror_rel = error / ITU_example_val * 100 # (%)
Function gammaw_exact
The table below contains the results of testing function gammaw_exact. The test cases were extracted fromspreadsheet ITURP676-12_gamma.csv from the ITU Validation examples file (rev 5.1). In addition to the input-arguments, expected result (ITU Validation), and ITU-Rpy computed result (ITUR-py Result), the absoluteand relative errors are shown. Each test case is color-coded depending on the magnitude of the errors (green = pass,errors are negligible, red = fail, relative error is above 0.01%).
In addition, the code snippet below shows an example of how to generate the first row of the results in the table:
import itur
# Define input attributesf = 12.0 # (GHz)P = 1013.25 # (hPA)rho = 7.5 # (g/cm3)T = 288.15 # (K)
# Make call to test-function gammaw_exactitur_val = itur.models.itu676.gammaw_exact(f=f, P=P, rho=rho, T=T)
# Compute error with respect to value in ITU example fileITU_example_val = 0.009535388 # (dB/km)error = ITU_example_val - itur_val.valueerror_rel = error / ITU_example_val * 100 # (%)
Function gamma_exact
The table below contains the results of testing function gamma_exact. The test cases were extracted from spread-sheet ITURP676-12_gamma.csv from the ITU Validation examples file (rev 5.1). In addition to the input-arguments, expected result (ITU Validation), and ITU-Rpy computed result (ITUR-py Result), the absoluteand relative errors are shown. Each test case is color-coded depending on the magnitude of the errors (green = pass,errors are negligible, red = fail, relative error is above 0.01%).
In addition, the code snippet below shows an example of how to generate the first row of the results in the table:
import itur
# Define input attributesf = 12.0 # (GHz)P = 1013.25 # (hPA)rho = 7.5 # (g/cm3)T = 288.15 # (K)
# Make call to test-function gamma_exactitur_val = itur.models.itu676.gamma_exact(f=f, P=P, rho=rho, T=T)
(continues on next page)
3.4. Validation 79
ITU-Rpy Documentation, Release 0.3.0
(continued from previous page)
# Compute error with respect to value in ITU example fileITU_example_val = 0.018233652 # (dB/km)error = ITU_example_val - itur_val.valueerror_rel = error / ITU_example_val * 100 # (%)
3.4.3 Validation results for ITU-R P.836-6
This page contains the validation examples for Recommendation ITU-R P.836-6: Water vapour: surface density andtotal columnar content.
All test cases were extracted from the ITU Validation examples file (rev 5.1).
Functions tested
• Validation results for ITU-R P.836-6
– Function surface_water_vapour_density
– Function total_water_vapour_content
Function surface_water_vapour_density
The table below contains the results of testing function surface_water_vapour_density. The test cases wereextracted from spreadsheet ITURP836-6_surface_water_vapour_density_annual.csv from the ITUValidation examples file (rev 5.1). In addition to the input-arguments, expected result (ITU Validation), andITU-Rpy computed result (ITUR-py Result), the absolute and relative errors are shown. Each test case is color-coded depending on the magnitude of the errors (green = pass, errors are negligible, red = fail, relative error is above0.01%).
In addition, the code snippet below shows an example of how to generate the first row of the results in the table:
import itur
# Define input attributeslat = 3.133 # (°N)lon = 101.7 # (°E)alt = 0.05125146 # (km)p = 0.1 # (%)
# Make call to test-function surface_water_vapour_densityitur_val = itur.models.itu836.surface_water_vapour_density(lat=lat, lon=lon, alt=alt,→˓p=p)
# Compute error with respect to value in ITU example fileITU_example_val = 24.32302408 # (g/m3)error = ITU_example_val - itur_val.valueerror_rel = error / ITU_example_val * 100 # (%)
80 Chapter 3. Table of Contents
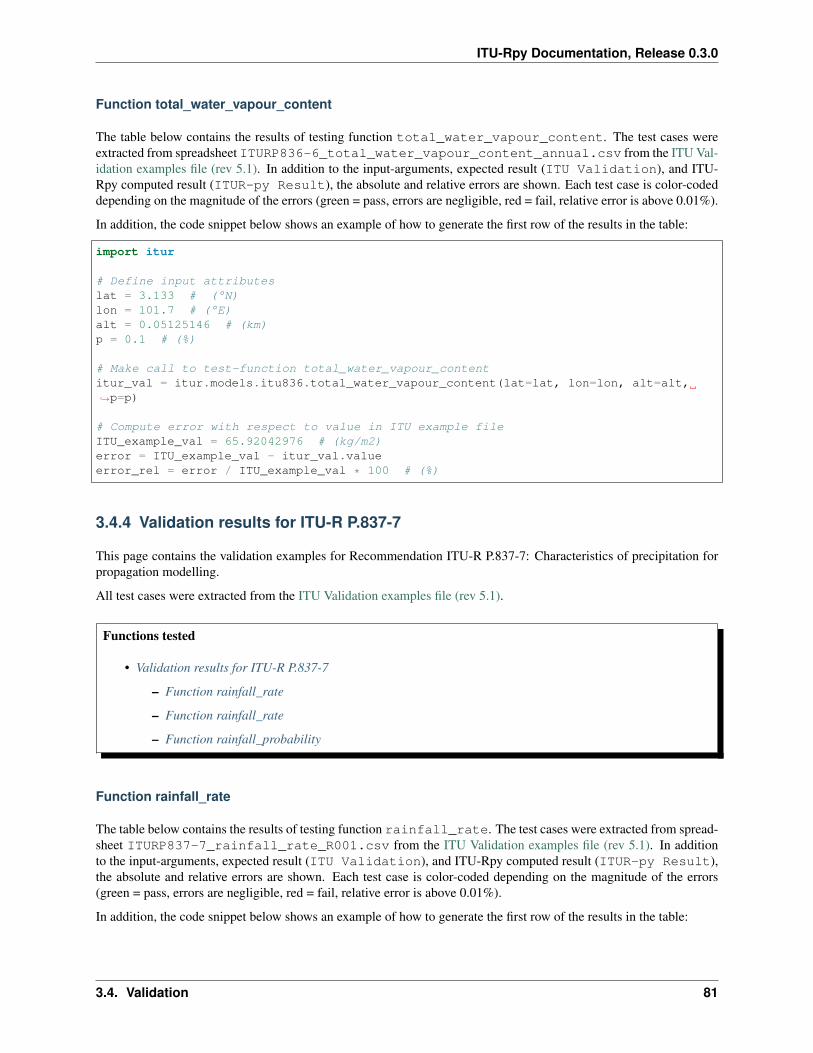
ITU-Rpy Documentation, Release 0.3.0
Function total_water_vapour_content
The table below contains the results of testing function total_water_vapour_content. The test cases wereextracted from spreadsheet ITURP836-6_total_water_vapour_content_annual.csv from the ITU Val-idation examples file (rev 5.1). In addition to the input-arguments, expected result (ITU Validation), and ITU-Rpy computed result (ITUR-py Result), the absolute and relative errors are shown. Each test case is color-codeddepending on the magnitude of the errors (green = pass, errors are negligible, red = fail, relative error is above 0.01%).
In addition, the code snippet below shows an example of how to generate the first row of the results in the table:
import itur
# Define input attributeslat = 3.133 # (°N)lon = 101.7 # (°E)alt = 0.05125146 # (km)p = 0.1 # (%)
# Make call to test-function total_water_vapour_contentitur_val = itur.models.itu836.total_water_vapour_content(lat=lat, lon=lon, alt=alt,→˓p=p)
# Compute error with respect to value in ITU example fileITU_example_val = 65.92042976 # (kg/m2)error = ITU_example_val - itur_val.valueerror_rel = error / ITU_example_val * 100 # (%)
3.4.4 Validation results for ITU-R P.837-7
This page contains the validation examples for Recommendation ITU-R P.837-7: Characteristics of precipitation forpropagation modelling.
All test cases were extracted from the ITU Validation examples file (rev 5.1).
Functions tested
• Validation results for ITU-R P.837-7
– Function rainfall_rate
– Function rainfall_rate
– Function rainfall_probability
Function rainfall_rate
The table below contains the results of testing function rainfall_rate. The test cases were extracted from spread-sheet ITURP837-7_rainfall_rate_R001.csv from the ITU Validation examples file (rev 5.1). In additionto the input-arguments, expected result (ITU Validation), and ITU-Rpy computed result (ITUR-py Result),the absolute and relative errors are shown. Each test case is color-coded depending on the magnitude of the errors(green = pass, errors are negligible, red = fail, relative error is above 0.01%).
In addition, the code snippet below shows an example of how to generate the first row of the results in the table:
3.4. Validation 81
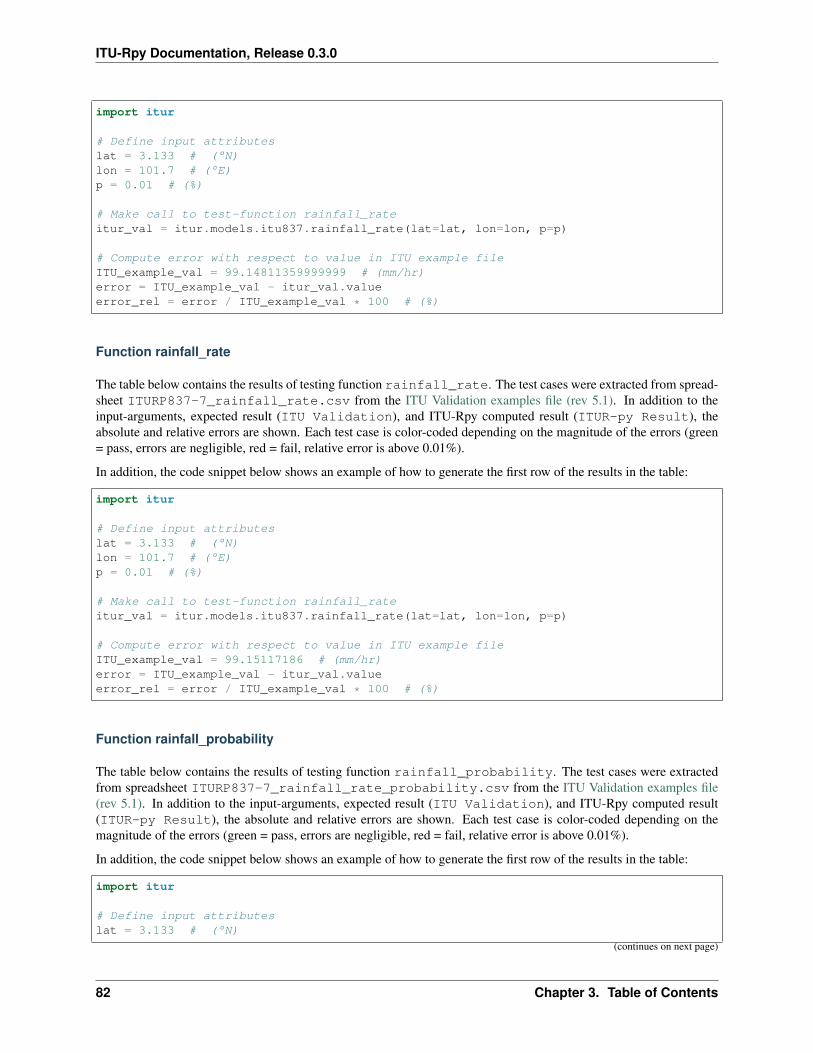
ITU-Rpy Documentation, Release 0.3.0
import itur
# Define input attributeslat = 3.133 # (°N)lon = 101.7 # (°E)p = 0.01 # (%)
# Make call to test-function rainfall_rateitur_val = itur.models.itu837.rainfall_rate(lat=lat, lon=lon, p=p)
# Compute error with respect to value in ITU example fileITU_example_val = 99.14811359999999 # (mm/hr)error = ITU_example_val - itur_val.valueerror_rel = error / ITU_example_val * 100 # (%)
Function rainfall_rate
The table below contains the results of testing function rainfall_rate. The test cases were extracted from spread-sheet ITURP837-7_rainfall_rate.csv from the ITU Validation examples file (rev 5.1). In addition to theinput-arguments, expected result (ITU Validation), and ITU-Rpy computed result (ITUR-py Result), theabsolute and relative errors are shown. Each test case is color-coded depending on the magnitude of the errors (green= pass, errors are negligible, red = fail, relative error is above 0.01%).
In addition, the code snippet below shows an example of how to generate the first row of the results in the table:
import itur
# Define input attributeslat = 3.133 # (°N)lon = 101.7 # (°E)p = 0.01 # (%)
# Make call to test-function rainfall_rateitur_val = itur.models.itu837.rainfall_rate(lat=lat, lon=lon, p=p)
# Compute error with respect to value in ITU example fileITU_example_val = 99.15117186 # (mm/hr)error = ITU_example_val - itur_val.valueerror_rel = error / ITU_example_val * 100 # (%)
Function rainfall_probability
The table below contains the results of testing function rainfall_probability. The test cases were extractedfrom spreadsheet ITURP837-7_rainfall_rate_probability.csv from the ITU Validation examples file(rev 5.1). In addition to the input-arguments, expected result (ITU Validation), and ITU-Rpy computed result(ITUR-py Result), the absolute and relative errors are shown. Each test case is color-coded depending on themagnitude of the errors (green = pass, errors are negligible, red = fail, relative error is above 0.01%).
In addition, the code snippet below shows an example of how to generate the first row of the results in the table:
import itur
# Define input attributeslat = 3.133 # (°N)
(continues on next page)
82 Chapter 3. Table of Contents
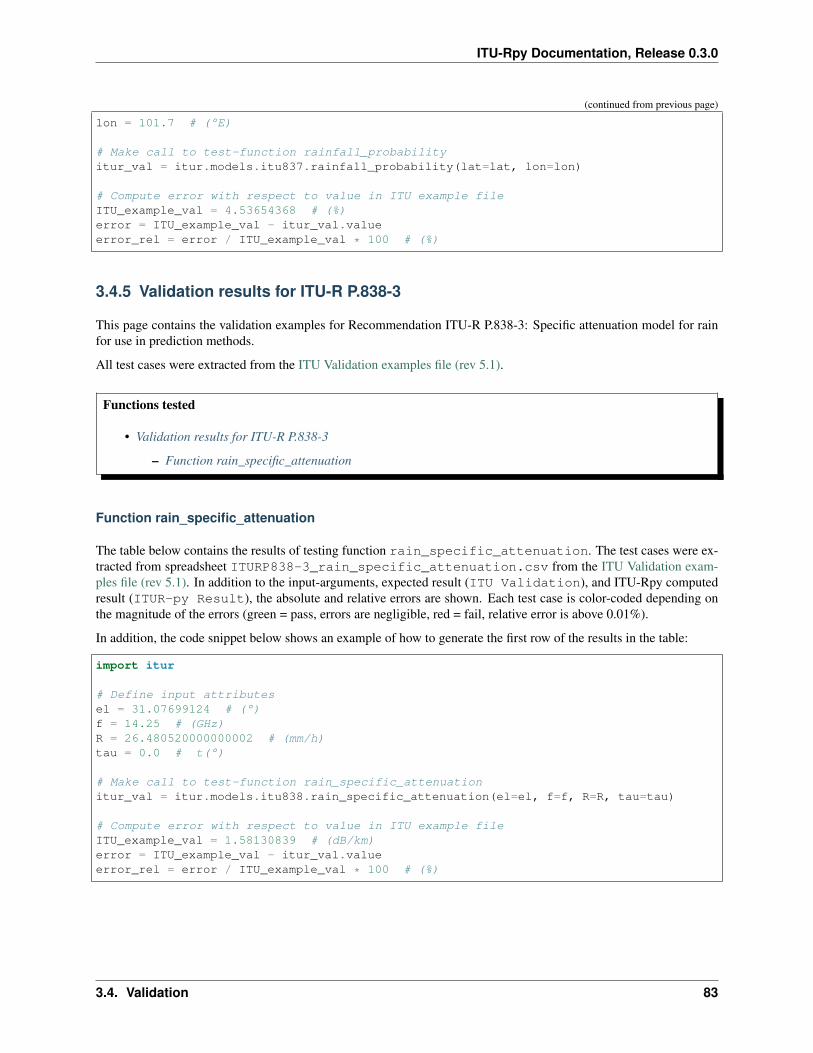
ITU-Rpy Documentation, Release 0.3.0
(continued from previous page)
lon = 101.7 # (°E)
# Make call to test-function rainfall_probabilityitur_val = itur.models.itu837.rainfall_probability(lat=lat, lon=lon)
# Compute error with respect to value in ITU example fileITU_example_val = 4.53654368 # (%)error = ITU_example_val - itur_val.valueerror_rel = error / ITU_example_val * 100 # (%)
3.4.5 Validation results for ITU-R P.838-3
This page contains the validation examples for Recommendation ITU-R P.838-3: Specific attenuation model for rainfor use in prediction methods.
All test cases were extracted from the ITU Validation examples file (rev 5.1).
Functions tested
• Validation results for ITU-R P.838-3
– Function rain_specific_attenuation
Function rain_specific_attenuation
The table below contains the results of testing function rain_specific_attenuation. The test cases were ex-tracted from spreadsheet ITURP838-3_rain_specific_attenuation.csv from the ITU Validation exam-ples file (rev 5.1). In addition to the input-arguments, expected result (ITU Validation), and ITU-Rpy computedresult (ITUR-py Result), the absolute and relative errors are shown. Each test case is color-coded depending onthe magnitude of the errors (green = pass, errors are negligible, red = fail, relative error is above 0.01%).
In addition, the code snippet below shows an example of how to generate the first row of the results in the table:
import itur
# Define input attributesel = 31.07699124 # (°)f = 14.25 # (GHz)R = 26.480520000000002 # (mm/h)tau = 0.0 # t(°)
# Make call to test-function rain_specific_attenuationitur_val = itur.models.itu838.rain_specific_attenuation(el=el, f=f, R=R, tau=tau)
# Compute error with respect to value in ITU example fileITU_example_val = 1.58130839 # (dB/km)error = ITU_example_val - itur_val.valueerror_rel = error / ITU_example_val * 100 # (%)
3.4. Validation 83
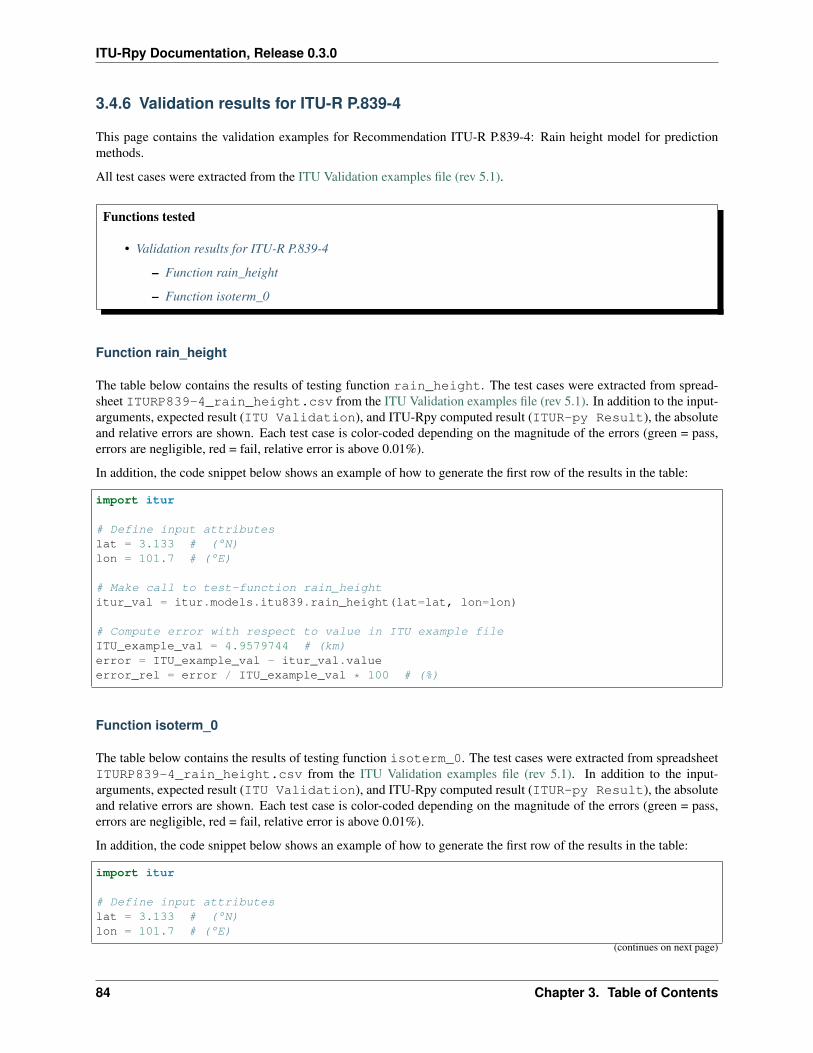
ITU-Rpy Documentation, Release 0.3.0
3.4.6 Validation results for ITU-R P.839-4
This page contains the validation examples for Recommendation ITU-R P.839-4: Rain height model for predictionmethods.
All test cases were extracted from the ITU Validation examples file (rev 5.1).
Functions tested
• Validation results for ITU-R P.839-4
– Function rain_height
– Function isoterm_0
Function rain_height
The table below contains the results of testing function rain_height. The test cases were extracted from spread-sheet ITURP839-4_rain_height.csv from the ITU Validation examples file (rev 5.1). In addition to the input-arguments, expected result (ITU Validation), and ITU-Rpy computed result (ITUR-py Result), the absoluteand relative errors are shown. Each test case is color-coded depending on the magnitude of the errors (green = pass,errors are negligible, red = fail, relative error is above 0.01%).
In addition, the code snippet below shows an example of how to generate the first row of the results in the table:
import itur
# Define input attributeslat = 3.133 # (°N)lon = 101.7 # (°E)
# Make call to test-function rain_heightitur_val = itur.models.itu839.rain_height(lat=lat, lon=lon)
# Compute error with respect to value in ITU example fileITU_example_val = 4.9579744 # (km)error = ITU_example_val - itur_val.valueerror_rel = error / ITU_example_val * 100 # (%)
Function isoterm_0
The table below contains the results of testing function isoterm_0. The test cases were extracted from spreadsheetITURP839-4_rain_height.csv from the ITU Validation examples file (rev 5.1). In addition to the input-arguments, expected result (ITU Validation), and ITU-Rpy computed result (ITUR-py Result), the absoluteand relative errors are shown. Each test case is color-coded depending on the magnitude of the errors (green = pass,errors are negligible, red = fail, relative error is above 0.01%).
In addition, the code snippet below shows an example of how to generate the first row of the results in the table:
import itur
# Define input attributeslat = 3.133 # (°N)lon = 101.7 # (°E)
(continues on next page)
84 Chapter 3. Table of Contents
ITU-Rpy Documentation, Release 0.3.0
(continued from previous page)
# Make call to test-function isoterm_0itur_val = itur.models.itu839.isoterm_0(lat=lat, lon=lon)
# Compute error with respect to value in ITU example fileITU_example_val = 4.5979744 # (km)error = ITU_example_val - itur_val.valueerror_rel = error / ITU_example_val * 100 # (%)
3.4.7 Validation results for ITU-R P.840-8
This page contains the validation examples for Recommendation ITU-R P.840-8: Attenuation due to clouds and fog.
All test cases were extracted from the ITU Validation examples file (rev 5.1).
Functions tested
• Validation results for ITU-R P.840-8
– Function cloud_attenuation
– Function columnar_content_reduced_liquid
Function cloud_attenuation
The table below contains the results of testing function cloud_attenuation. The test cases were extractedfrom spreadsheet ITURP840-8_cloud_attenuation.csv from the ITU Validation examples file (rev 5.1).In addition to the input-arguments, expected result (ITU Validation), and ITU-Rpy computed result (ITUR-pyResult), the absolute and relative errors are shown. Each test case is color-coded depending on the magnitude of theerrors (green = pass, errors are negligible, red = fail, relative error is above 0.01%).
In addition, the code snippet below shows an example of how to generate the first row of the results in the table:
import itur
# Define input attributeslat = 51.5 # (°N)lon = -0.14 # (°E)f = 14.25 # (GHz)el = 31.07699124 # (°)p = 1.0 # (%)
# Make call to test-function cloud_attenuationitur_val = itur.models.itu840.cloud_attenuation(lat=lat, lon=lon, f=f, el=el, p=p)
# Compute error with respect to value in ITU example fileITU_example_val = 0.45516982 # (dB)error = ITU_example_val - itur_val.valueerror_rel = error / ITU_example_val * 100 # (%)
3.4. Validation 85
ITU-Rpy Documentation, Release 0.3.0
Function columnar_content_reduced_liquid
The table below contains the results of testing function columnar_content_reduced_liquid. The test caseswere extracted from spreadsheet ITURP840-8_columnar_content_reduced_liquid.csv from the ITUValidation examples file (rev 5.1). In addition to the input-arguments, expected result (ITU Validation), andITU-Rpy computed result (ITUR-py Result), the absolute and relative errors are shown. Each test case is color-coded depending on the magnitude of the errors (green = pass, errors are negligible, red = fail, relative error is above0.01%).
In addition, the code snippet below shows an example of how to generate the first row of the results in the table:
import itur
# Define input attributeslat = 3.133 # (°N)lon = 101.7 # (°E)p = 0.1 # (%)
# Make call to test-function columnar_content_reduced_liquiditur_val = itur.models.itu840.columnar_content_reduced_liquid(lat=lat, lon=lon, p=p)
# Compute error with respect to value in ITU example fileITU_example_val = 3.805251208 # (kg/m2)error = ITU_example_val - itur_val.valueerror_rel = error / ITU_example_val * 100 # (%)
3.4.8 Validation results for ITU-R P.1510-1
This page contains the validation examples for Recommendation ITU-R P.1510-1: Mean surface temperature.
All test cases were extracted from the ITU Validation examples file (rev 5.1).
Functions tested
• Validation results for ITU-R P.1510-1
– Function surface_mean_temperature
Function surface_mean_temperature
The table below contains the results of testing function surface_mean_temperature. The test cases wereextracted from spreadsheet ITURP1510-1_temperature.csv from the ITU Validation examples file (rev 5.1).In addition to the input-arguments, expected result (ITU Validation), and ITU-Rpy computed result (ITUR-pyResult), the absolute and relative errors are shown. Each test case is color-coded depending on the magnitude of theerrors (green = pass, errors are negligible, red = fail, relative error is above 0.01%).
In addition, the code snippet below shows an example of how to generate the first row of the results in the table:
import itur
# Define input attributeslat = 51.5 # (°N)lon = -0.14 # (°E)
(continues on next page)
86 Chapter 3. Table of Contents
ITU-Rpy Documentation, Release 0.3.0
(continued from previous page)
# Make call to test-function surface_mean_temperatureitur_val = itur.models.itu1510.surface_mean_temperature(lat=lat, lon=lon)
# Compute error with respect to value in ITU example fileITU_example_val = 283.6108756 # (K)error = ITU_example_val - itur_val.valueerror_rel = error / ITU_example_val * 100 # (%)
3.4.9 Validation results for ITU-R P.1511-1
This page contains the validation examples for Recommendation ITU-R P.1511-1: Topography for Earth-to-spacepropagation modelling.
All test cases were extracted from the ITU Validation examples file (rev 5.1).
Functions tested
• Validation results for ITU-R P.1511-1
– Function topographic_altitude
Function topographic_altitude
The table below contains the results of testing function topographic_altitude. The test cases were extractedfrom spreadsheet ITURP1511-1_topographic_altitude.csv from the ITU Validation examples file (rev5.1). In addition to the input-arguments, expected result (ITU Validation), and ITU-Rpy computed result(ITUR-py Result), the absolute and relative errors are shown. Each test case is color-coded depending on themagnitude of the errors (green = pass, errors are negligible, red = fail, relative error is above 0.01%).
In addition, the code snippet below shows an example of how to generate the first row of the results in the table:
import itur
# Define input attributeslat = 3.133 # (°N)lon = 101.7 # (°E)
# Make call to test-function topographic_altitudeitur_val = itur.models.itu1511.topographic_altitude(lat=lat, lon=lon)
# Compute error with respect to value in ITU example fileITU_example_val = 0.23610446 # (km)error = ITU_example_val - itur_val.valueerror_rel = error / ITU_example_val * 100 # (%)
3.4.10 Validation results for ITU-R P.1511-2
This page contains the validation examples for Recommendation ITU-R P.1511-2: Topography for Earth-to-spacepropagation modelling.
All test cases were extracted from the ITU Validation examples file (rev 5.1).
3.4. Validation 87
ITU-Rpy Documentation, Release 0.3.0
Functions tested
• Validation results for ITU-R P.1511-2
– Function topographic_altitude
Function topographic_altitude
The table below contains the results of testing function topographic_altitude. The test cases were extractedfrom spreadsheet ITURP1511-2_topographic_altitude.csv from the ITU Validation examples file (rev5.1). In addition to the input-arguments, expected result (ITU Validation), and ITU-Rpy computed result(ITUR-py Result), the absolute and relative errors are shown. Each test case is color-coded depending on themagnitude of the errors (green = pass, errors are negligible, red = fail, relative error is above 0.01%).
In addition, the code snippet below shows an example of how to generate the first row of the results in the table:
import itur
# Define input attributeslat = 3.133 # (°N)lon = 101.7 # (°E)
# Make call to test-function topographic_altitudeitur_val = itur.models.itu1511.topographic_altitude(lat=lat, lon=lon)
# Compute error with respect to value in ITU example fileITU_example_val = 0.05125146 # (km)error = ITU_example_val - itur_val.valueerror_rel = error / ITU_example_val * 100 # (%)
3.4.11 Validation results ITU-R P.1623-1
This page contains the validation examples for Recommendation ITU-R P.1623-1: Prediction method of fade dynamicson Earth-space paths.
All test cases were extracted from the ITU Validation examples file (rev 5.1).
Functions tested
• Validation results ITU-R P.1623-1
– Function fade_duration_number_fades
– Function fade_duration_total_exceedance_time
– Function fade_duration_probability
– Function fade_duration_cummulative_probability
Function fade_duration_number_fades
The table below contains the results of testing function fade_duration_number_fades. The test cases wereextracted from spreadsheet ITURP1623-1_number_of_fades.csv from the ITU Validation examples file (rev
88 Chapter 3. Table of Contents
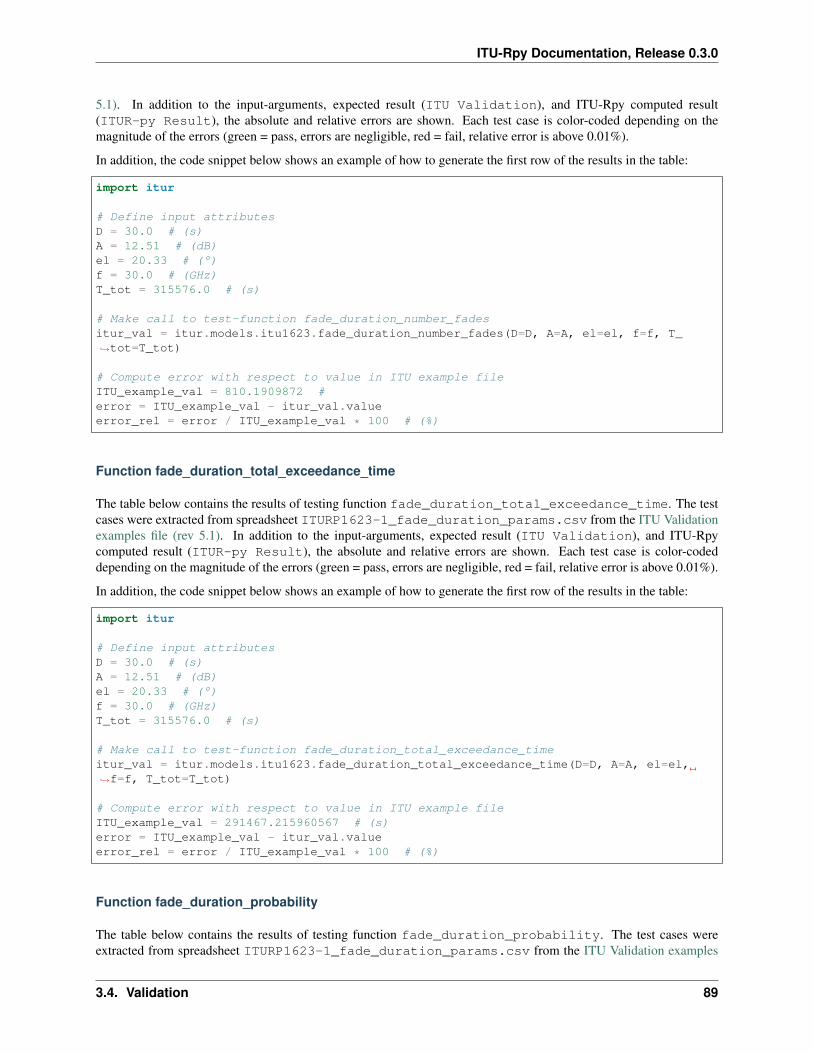
ITU-Rpy Documentation, Release 0.3.0
5.1). In addition to the input-arguments, expected result (ITU Validation), and ITU-Rpy computed result(ITUR-py Result), the absolute and relative errors are shown. Each test case is color-coded depending on themagnitude of the errors (green = pass, errors are negligible, red = fail, relative error is above 0.01%).
In addition, the code snippet below shows an example of how to generate the first row of the results in the table:
import itur
# Define input attributesD = 30.0 # (s)A = 12.51 # (dB)el = 20.33 # (°)f = 30.0 # (GHz)T_tot = 315576.0 # (s)
# Make call to test-function fade_duration_number_fadesitur_val = itur.models.itu1623.fade_duration_number_fades(D=D, A=A, el=el, f=f, T_→˓tot=T_tot)
# Compute error with respect to value in ITU example fileITU_example_val = 810.1909872 #error = ITU_example_val - itur_val.valueerror_rel = error / ITU_example_val * 100 # (%)
Function fade_duration_total_exceedance_time
The table below contains the results of testing function fade_duration_total_exceedance_time. The testcases were extracted from spreadsheet ITURP1623-1_fade_duration_params.csv from the ITU Validationexamples file (rev 5.1). In addition to the input-arguments, expected result (ITU Validation), and ITU-Rpycomputed result (ITUR-py Result), the absolute and relative errors are shown. Each test case is color-codeddepending on the magnitude of the errors (green = pass, errors are negligible, red = fail, relative error is above 0.01%).
In addition, the code snippet below shows an example of how to generate the first row of the results in the table:
import itur
# Define input attributesD = 30.0 # (s)A = 12.51 # (dB)el = 20.33 # (°)f = 30.0 # (GHz)T_tot = 315576.0 # (s)
# Make call to test-function fade_duration_total_exceedance_timeitur_val = itur.models.itu1623.fade_duration_total_exceedance_time(D=D, A=A, el=el,→˓f=f, T_tot=T_tot)
# Compute error with respect to value in ITU example fileITU_example_val = 291467.215960567 # (s)error = ITU_example_val - itur_val.valueerror_rel = error / ITU_example_val * 100 # (%)
Function fade_duration_probability
The table below contains the results of testing function fade_duration_probability. The test cases wereextracted from spreadsheet ITURP1623-1_fade_duration_params.csv from the ITU Validation examples
3.4. Validation 89
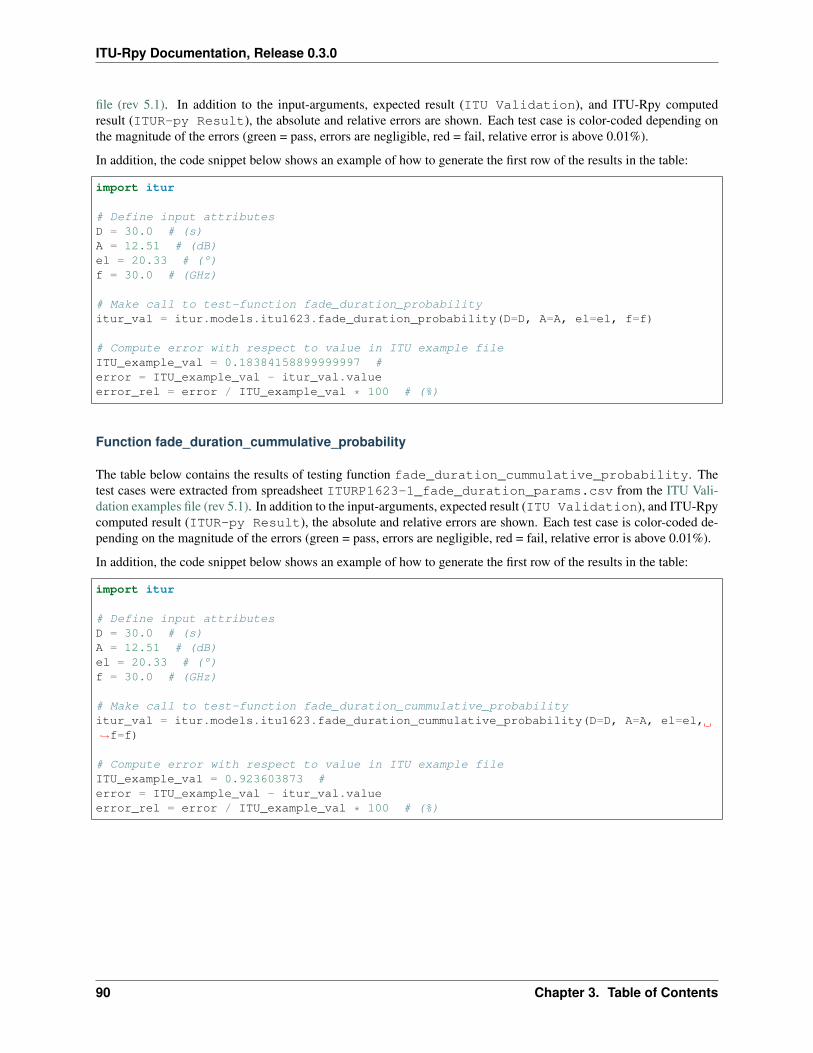
ITU-Rpy Documentation, Release 0.3.0
file (rev 5.1). In addition to the input-arguments, expected result (ITU Validation), and ITU-Rpy computedresult (ITUR-py Result), the absolute and relative errors are shown. Each test case is color-coded depending onthe magnitude of the errors (green = pass, errors are negligible, red = fail, relative error is above 0.01%).
In addition, the code snippet below shows an example of how to generate the first row of the results in the table:
import itur
# Define input attributesD = 30.0 # (s)A = 12.51 # (dB)el = 20.33 # (°)f = 30.0 # (GHz)
# Make call to test-function fade_duration_probabilityitur_val = itur.models.itu1623.fade_duration_probability(D=D, A=A, el=el, f=f)
# Compute error with respect to value in ITU example fileITU_example_val = 0.18384158899999997 #error = ITU_example_val - itur_val.valueerror_rel = error / ITU_example_val * 100 # (%)
Function fade_duration_cummulative_probability
The table below contains the results of testing function fade_duration_cummulative_probability. Thetest cases were extracted from spreadsheet ITURP1623-1_fade_duration_params.csv from the ITU Vali-dation examples file (rev 5.1). In addition to the input-arguments, expected result (ITU Validation), and ITU-Rpycomputed result (ITUR-py Result), the absolute and relative errors are shown. Each test case is color-coded de-pending on the magnitude of the errors (green = pass, errors are negligible, red = fail, relative error is above 0.01%).
In addition, the code snippet below shows an example of how to generate the first row of the results in the table:
import itur
# Define input attributesD = 30.0 # (s)A = 12.51 # (dB)el = 20.33 # (°)f = 30.0 # (GHz)
# Make call to test-function fade_duration_cummulative_probabilityitur_val = itur.models.itu1623.fade_duration_cummulative_probability(D=D, A=A, el=el,→˓f=f)
# Compute error with respect to value in ITU example fileITU_example_val = 0.923603873 #error = ITU_example_val - itur_val.valueerror_rel = error / ITU_example_val * 100 # (%)
90 Chapter 3. Table of Contents
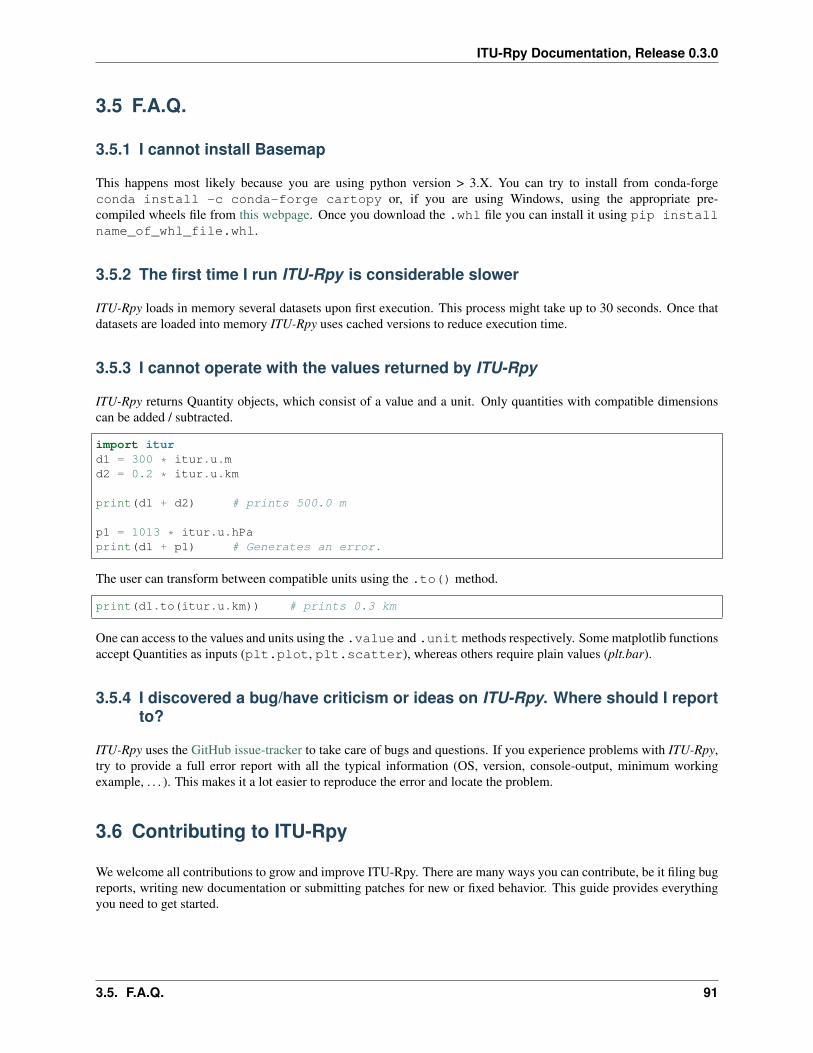
ITU-Rpy Documentation, Release 0.3.0
3.5 F.A.Q.
3.5.1 I cannot install Basemap
This happens most likely because you are using python version > 3.X. You can try to install from conda-forgeconda install -c conda-forge cartopy or, if you are using Windows, using the appropriate pre-compiled wheels file from this webpage. Once you download the .whl file you can install it using pip installname_of_whl_file.whl.
3.5.2 The first time I run ITU-Rpy is considerable slower
ITU-Rpy loads in memory several datasets upon first execution. This process might take up to 30 seconds. Once thatdatasets are loaded into memory ITU-Rpy uses cached versions to reduce execution time.
3.5.3 I cannot operate with the values returned by ITU-Rpy
ITU-Rpy returns Quantity objects, which consist of a value and a unit. Only quantities with compatible dimensionscan be added / subtracted.
import iturd1 = 300 * itur.u.md2 = 0.2 * itur.u.km
print(d1 + d2) # prints 500.0 m
p1 = 1013 * itur.u.hPaprint(d1 + p1) # Generates an error.
The user can transform between compatible units using the .to() method.
print(d1.to(itur.u.km)) # prints 0.3 km
One can access to the values and units using the .value and .unitmethods respectively. Some matplotlib functionsaccept Quantities as inputs (plt.plot, plt.scatter), whereas others require plain values (plt.bar).
3.5.4 I discovered a bug/have criticism or ideas on ITU-Rpy. Where should I reportto?
ITU-Rpy uses the GitHub issue-tracker to take care of bugs and questions. If you experience problems with ITU-Rpy,try to provide a full error report with all the typical information (OS, version, console-output, minimum workingexample, . . . ). This makes it a lot easier to reproduce the error and locate the problem.
3.6 Contributing to ITU-Rpy
We welcome all contributions to grow and improve ITU-Rpy. There are many ways you can contribute, be it filing bugreports, writing new documentation or submitting patches for new or fixed behavior. This guide provides everythingyou need to get started.
3.5. F.A.Q. 91
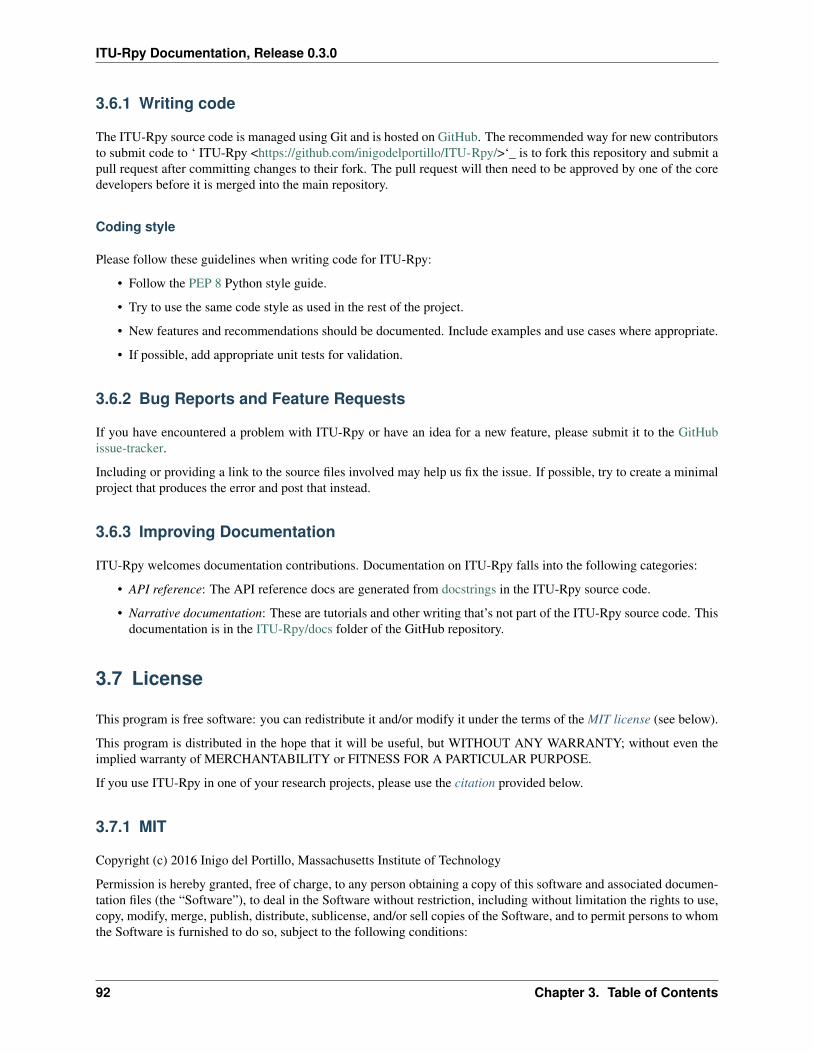
ITU-Rpy Documentation, Release 0.3.0
3.6.1 Writing code
The ITU-Rpy source code is managed using Git and is hosted on GitHub. The recommended way for new contributorsto submit code to ‘ ITU-Rpy <https://github.com/inigodelportillo/ITU-Rpy/>‘_ is to fork this repository and submit apull request after committing changes to their fork. The pull request will then need to be approved by one of the coredevelopers before it is merged into the main repository.
Coding style
Please follow these guidelines when writing code for ITU-Rpy:
• Follow the PEP 8 Python style guide.
• Try to use the same code style as used in the rest of the project.
• New features and recommendations should be documented. Include examples and use cases where appropriate.
• If possible, add appropriate unit tests for validation.
3.6.2 Bug Reports and Feature Requests
If you have encountered a problem with ITU-Rpy or have an idea for a new feature, please submit it to the GitHubissue-tracker.
Including or providing a link to the source files involved may help us fix the issue. If possible, try to create a minimalproject that produces the error and post that instead.
3.6.3 Improving Documentation
ITU-Rpy welcomes documentation contributions. Documentation on ITU-Rpy falls into the following categories:
• API reference: The API reference docs are generated from docstrings in the ITU-Rpy source code.
• Narrative documentation: These are tutorials and other writing that’s not part of the ITU-Rpy source code. Thisdocumentation is in the ITU-Rpy/docs folder of the GitHub repository.
3.7 License
This program is free software: you can redistribute it and/or modify it under the terms of the MIT license (see below).
This program is distributed in the hope that it will be useful, but WITHOUT ANY WARRANTY; without even theimplied warranty of MERCHANTABILITY or FITNESS FOR A PARTICULAR PURPOSE.
If you use ITU-Rpy in one of your research projects, please use the citation provided below.
3.7.1 MIT
Copyright (c) 2016 Inigo del Portillo, Massachusetts Institute of Technology
Permission is hereby granted, free of charge, to any person obtaining a copy of this software and associated documen-tation files (the “Software”), to deal in the Software without restriction, including without limitation the rights to use,copy, modify, merge, publish, distribute, sublicense, and/or sell copies of the Software, and to permit persons to whomthe Software is furnished to do so, subject to the following conditions:
92 Chapter 3. Table of Contents
ITU-Rpy Documentation, Release 0.3.0
The above copyright notice and this permission notice shall be included in all copies or substantial portions of theSoftware.
THE SOFTWARE IS PROVIDED “AS IS”, WITHOUT WARRANTY OF ANY KIND, EXPRESS OR IMPLIED,INCLUDING BUT NOT LIMITED TO THE WARRANTIES OF MERCHANTABILITY, FITNESS FOR A PAR-TICULAR PURPOSE AND NONINFRINGEMENT. IN NO EVENT SHALL THE AUTHORS OR COPYRIGHTHOLDERS BE LIABLE FOR ANY CLAIM, DAMAGES OR OTHER LIABILITY, WHETHER IN AN ACTIONOF CONTRACT, TORT OR OTHERWISE, ARISING FROM, OUT OF OR IN CONNECTION WITH THE SOFT-WARE OR THE USE OR OTHER DEALINGS IN THE SOFTWARE.
3.7.2 Citation
If you use ITU-Rpy in one of your research projects, please cite it as:
@misc{iturpy-2017,title={ITU-Rpy: A python implementation of the ITU-R P. Recommendations to
→˓computeatmospheric attenuation in slant and horizontal paths.},
author={Inigo del Portillo},year={2017},publisher={GitHub},howpublished={\url{https://github.com/inigodelportillo/ITU-Rpy/}}
}
3.8 Contact
ITU-Rpy is developed and maintained by Inigo del Portillo ([email protected]).
ITU-Rpy uses the GitHub issue-tracker to take care of bugs and questions. If you experience problems with ITU-Rpy,try to provide a full error report with all the typical information (OS, version, console-output, minimum workingexample, . . . ). This makes it a lot easier to reproduce the error and locate the problem.
3.8.1 Citation
If you use ITU-Rpy in one of your research projects, please cite it as:
@misc{iturpy-2017,title={ITU-Rpy: A python implementation of the ITU-R P. Recommendations to
→˓computeatmospheric attenuation in slant and horizontal paths.},
author={Inigo del Portillo},year={2017},publisher={GitHub},howpublished={\url{https://github.com/inigodelportillo/ITU-Rpy/}}
}
3.8. Contact 93
ITU-Rpy Documentation, Release 0.3.0
94 Chapter 3. Table of Contents

CHAPTER 4
Indices and tables
• genindex
• modindex
• search
95

ITU-Rpy Documentation, Release 0.3.0
96 Chapter 4. Indices and tables
CHAPTER 5
Other
ITU-Rpy is mainly written in Python 3 and continuously tested with Python 3.5-3.9.
ITU-Rpy has the following dependencies: numpy, scipy, pyproj, and astropy. Installing cartopy and matplotlib isrecommended to display results in a map.
97
ITU-Rpy Documentation, Release 0.3.0
98 Chapter 5. Other
Python Module Index
iitur, 17itur.models, 23itur.models.itu1144, 60itur.models.itu1510, 62itur.models.itu1511, 63itur.models.itu1623, 65itur.models.itu1853, 70itur.models.itu453, 23itur.models.itu530, 27itur.models.itu618, 34itur.models.itu676, 40itur.models.itu835, 46itur.models.itu836, 50itur.models.itu837, 51itur.models.itu838, 53itur.models.itu839, 55itur.models.itu840, 57itur.plotting, 20itur.utils, 17
99
ITU-Rpy Documentation, Release 0.3.0
100 Python Module Index
Index
Bbicubic_2D_interpolator() (in module
itur.models.itu1144), 61bilinear_2D_interpolator() (in module
itur.models.itu1144), 60
Cchange_version() (in module itur.models.itu1510),
62change_version() (in module itur.models.itu1511),
63change_version() (in module itur.models.itu1623),
65change_version() (in module itur.models.itu1853),
70change_version() (in module itur.models.itu453),
23change_version() (in module itur.models.itu530),
27change_version() (in module itur.models.itu618),
34change_version() (in module itur.models.itu676),
40change_version() (in module itur.models.itu835),
46change_version() (in module itur.models.itu836),
50change_version() (in module itur.models.itu837),
51change_version() (in module itur.models.itu838),
53change_version() (in module itur.models.itu839),
55change_version() (in module itur.models.itu840),
57cloud_attenuation() (in module
itur.models.itu840), 58cloud_liquid_water_synthesis() (in module
itur.models.itu1853), 72
columnar_content_reduced_liquid() (inmodule itur.models.itu840), 58
compute_distance_earth_to_earth() (inmodule itur.utils), 18
compute_distance_earth_to_earth_haversine()(in module itur.utils), 19
compute_distance_earth_to_earth_wgs84()(in module itur.utils), 19
Ddiffraction_loss() (in module
itur.models.itu530), 28DN1() (in module itur.models.itu453), 26DN65() (in module itur.models.itu453), 26dry_term_radio_refractivity() (in module
itur.models.itu453), 24
Eelevation_angle() (in module itur.utils), 20
Ffade_depth() (in module itur.models.itu1623), 69fade_duration() (in module itur.models.itu1623),
67fade_duration_cummulative_probability()
(in module itur.models.itu1623), 65fade_duration_number_fades() (in module
itur.models.itu1623), 66fade_duration_probability() (in module
itur.models.itu1623), 65fade_duration_total_exceedance_time()
(in module itur.models.itu1623), 66fade_slope() (in module itur.models.itu1623), 68fit_rain_attenuation_to_lognormal() (in
module itur.models.itu618), 39fresnel_ellipse_radius() (in module
itur.models.itu530), 28
Ggamma0_approx() (in module itur.models.itu676), 44
101
ITU-Rpy Documentation, Release 0.3.0
gamma0_exact() (in module itur.models.itu676), 45gamma_exact() (in module itur.models.itu676), 45gammaw_approx() (in module itur.models.itu676), 43gammaw_exact() (in module itur.models.itu676), 44gaseous_attenuation_inclined_path() (in
module itur.models.itu676), 42gaseous_attenuation_slant_path() (in mod-
ule itur.models.itu676), 41gaseous_attenuation_terrestrial_path()
(in module itur.models.itu676), 41get_input_type() (in module itur.utils), 18get_version() (in module itur.models.itu1510), 62get_version() (in module itur.models.itu1511), 63get_version() (in module itur.models.itu1623), 65get_version() (in module itur.models.itu1853), 70get_version() (in module itur.models.itu453), 24get_version() (in module itur.models.itu530), 27get_version() (in module itur.models.itu618), 34get_version() (in module itur.models.itu676), 41get_version() (in module itur.models.itu835), 46get_version() (in module itur.models.itu836), 50get_version() (in module itur.models.itu837), 51get_version() (in module itur.models.itu838), 53get_version() (in module itur.models.itu839), 55get_version() (in module itur.models.itu840), 57
Iintegrated_water_vapour_synthesis() (in
module itur.models.itu1853), 71inverse_rain_attenuation() (in module
itur.models.itu530), 30is_regular_grid() (in module
itur.models.itu1144), 60isoterm_0() (in module itur.models.itu839), 55itur (module), 17itur.models (module), 23itur.models.itu1144 (module), 60itur.models.itu1510 (module), 62itur.models.itu1511 (module), 63itur.models.itu1623 (module), 65itur.models.itu1853 (module), 70itur.models.itu453 (module), 23itur.models.itu530 (module), 27itur.models.itu618 (module), 34itur.models.itu676 (module), 40itur.models.itu835 (module), 46itur.models.itu836 (module), 50itur.models.itu837 (module), 51itur.models.itu838 (module), 53itur.models.itu839 (module), 55itur.models.itu840 (module), 57itur.plotting (module), 20itur.utils (module), 17
Lload_data() (in module itur.utils), 17load_data_interpolator() (in module itur.utils),
17lognormal_approximation_coefficient()
(in module itur.models.itu840), 59
Mmap_wet_term_radio_refractivity() (in
module itur.models.itu453), 25multipath_loss() (in module itur.models.itu530),
29multipath_loss_for_A() (in module
itur.models.itu530), 28
Nnearest_2D_interpolator() (in module
itur.models.itu1144), 60
Pplot_in_map() (in module itur.plotting), 21plot_in_map_basemap() (in module itur.plotting),
21prepare_input_array() (in module itur.utils), 18prepare_output_array() (in module itur.utils), 18prepare_quantity() (in module itur.utils), 18pressure() (in module itur.models.itu835), 47
QQfunc() (in module itur.models.itu1623), 65
Rradio_refractive_index() (in module
itur.models.itu453), 24rain_attenuation() (in module
itur.models.itu530), 30rain_attenuation() (in module
itur.models.itu618), 35rain_attenuation_probability() (in module
itur.models.itu618), 36rain_attenuation_synthesis() (in module
itur.models.itu1853), 70rain_cross_polarization_discrimination()
(in module itur.models.itu618), 38rain_event_count() (in module
itur.models.itu530), 31rain_height() (in module itur.models.itu839), 56rain_specific_attenuation() (in module
itur.models.itu838), 54rain_specific_attenuation_coefficients()
(in module itur.models.itu838), 53rainfall_probability() (in module
itur.models.itu837), 52
102 Index
ITU-Rpy Documentation, Release 0.3.0
rainfall_rate() (in module itur.models.itu837), 52regular_lat_lon_grid() (in module itur.utils), 19
Ssaturation_vapour_pressure() (in module
itur.models.itu453), 25scintillation_attenuation() (in module
itur.models.itu618), 37scintillation_attenuation_sigma() (in
module itur.models.itu618), 38scintillation_attenuation_synthesis()
(in module itur.models.itu1853), 71set_seed() (in module itur.models.itu1853), 70site_diversity_rain_outage_probability()
(in module itur.models.itu618), 36slant_inclined_path_equivalent_height()
(in module itur.models.itu676), 43specific_attenuation_coefficients() (in
module itur.models.itu840), 57standard_pressure() (in module
itur.models.itu835), 48standard_temperature() (in module
itur.models.itu835), 47standard_water_vapour_density() (in mod-
ule itur.models.itu835), 48standard_water_vapour_pressure() (in mod-
ule itur.models.itu835), 48surface_mean_temperature() (in module
itur.models.itu1510), 62surface_month_mean_temperature() (in mod-
ule itur.models.itu1510), 62surface_water_vapour_density() (in module
itur.models.itu836), 50
Ttemperature() (in module itur.models.itu835), 46topographic_altitude() (in module
itur.models.itu1511), 64total_attenuation_synthesis() (in module
itur.models.itu1853), 72total_water_vapour_content() (in module
itur.models.itu836), 50
Uunavailability_from_rainfall_rate() (in
module itur.models.itu837), 52
Wwater_vapour_density() (in module
itur.models.itu835), 47water_vapour_pressure() (in module
itur.models.itu453), 25wet_term_radio_refractivity() (in module
itur.models.itu453), 24
XXPD_outage_clear_air() (in module
itur.models.itu530), 32XPD_outage_precipitation() (in module
itur.models.itu530), 33
Zzenit_water_vapour_attenuation() (in mod-
ule itur.models.itu676), 43
Index 103


