Embed Size (px)
Citation preview
Isle of Wight Council
Retail Study
May 2018
Volume 2 – Appendices
creative minds safe hands www.wyg.com
creative minds safe hands www.wyg.com
WYG, 90 Victoria Street, Bristol, BS1 6DP Tel: +44 (0)117 9254393 Email: [email protected] www.wyg.com
Retail Study www.wyg.com
Appendices
Appendix A NEMS Household Survey Results and Zone Plan
Appendix B Stakeholder Engagement Summary
Appendix C Experian Mosaic Brochure
Appendix D Health Check Proformas
Appendix E Statistical Retail Tables – Population and Expenditure
Appendix F Statistical Retail Tables – Convenience Goods Capacity
Appendix G Statistical Retail Tables – Comparison Goods Capacity
Appendix H Recommended Shopping Frontage and Boundary Plans
Retail Study www.wyg.com
Appendix A NEMS Household Survey Results and Zone Plan
This market research and the design of material used to obtain this survey information have been originated by and belong to NEMS market research, and may not be used or reproduced in whole or part without the company's written consent, or that of the Client.
NEMS market research 22 Manor Way Belasis Hall Technology Park Billingham TS23 4HN Tel 01642 37 33 55 www.nemsmr.co.uk
Isle of Wight Household Survey for WYG January 2018 Job Ref: 090118
NEMS market research 2 Isle of Wight Household Survey, January 2018
Table of Contents Introduction: Research Background & Objectives 3 Research Methodology 3 Sampling 3 Weightings 5 Statistical Accuracy 7 Data Tables 8 Appendices: Data Tabulations - By Zone – Filtered Nulls (Weighted) 10-72 By Centre Mentioned at Q19 (Weighted) 74-89 Sample Questionnaire Map
NEMS market research 3 Isle of Wight Household Survey, January 2018
Introduction
1.1 Research Background & Objectives To conduct a survey amongst residents in the Isle of Wight area to assess shopping habits for main food and grocery, top-up food and non-food shopping.
1.2 Research Methodology A total of 1,000 telephone interviews were conducted between Friday 19th January 2018 and Friday 2nd February 2018. Interviews were conducted using NEMS in-house CATI (Computer Assisted Telephone Interviewing) Unit. Respondents were contacted during the day and in the evening. All respondents were the main shopper in the household, determined using a preliminary filter question.
1.3 Sampling
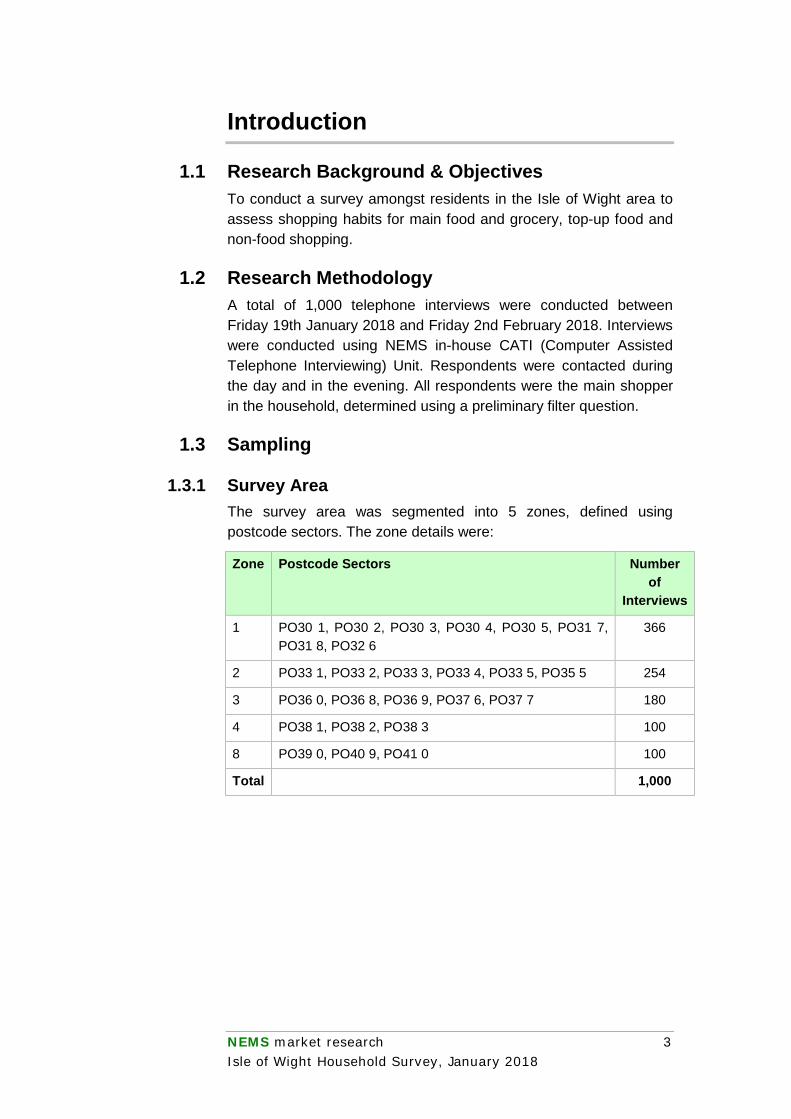
1.3.1 Survey Area The survey area was segmented into 5 zones, defined using postcode sectors. The zone details were:
Zone Postcode Sectors Number of
Interviews
1 PO30 1, PO30 2, PO30 3, PO30 4, PO30 5, PO31 7, PO31 8, PO32 6
366
2 PO33 1, PO33 2, PO33 3, PO33 4, PO33 5, PO35 5 254
3 PO36 0, PO36 8, PO36 9, PO37 6, PO37 7 180
4 PO38 1, PO38 2, PO38 3 100
8 PO39 0, PO40 9, PO41 0 100
Total 1,000
NEMS market research 4 Isle of Wight Household Survey, January 2018
1.3.2 Telephone Numbers All available telephone numbers are used to obtain the sample of interviews. This includes published telephone numbers (land-lines and some mobile numbers) but is supplemented with ex-directory numbers as the demographic profile of this sub-set is different to the demographics of the published numbers sample. Ex-directory numbers are randomly generated using the published numbers as a ‘seed’. Business numbers are de-duped and excluded. We don’t screen against the TPS (Telephone Preference Service) database, again because the demographic profile of TPS registered numbers is slightly different to the rest of the population. In addition, there is no legal requirement to screen against TPS registered numbers; market research is not classified as unsolicited sales and marketing.
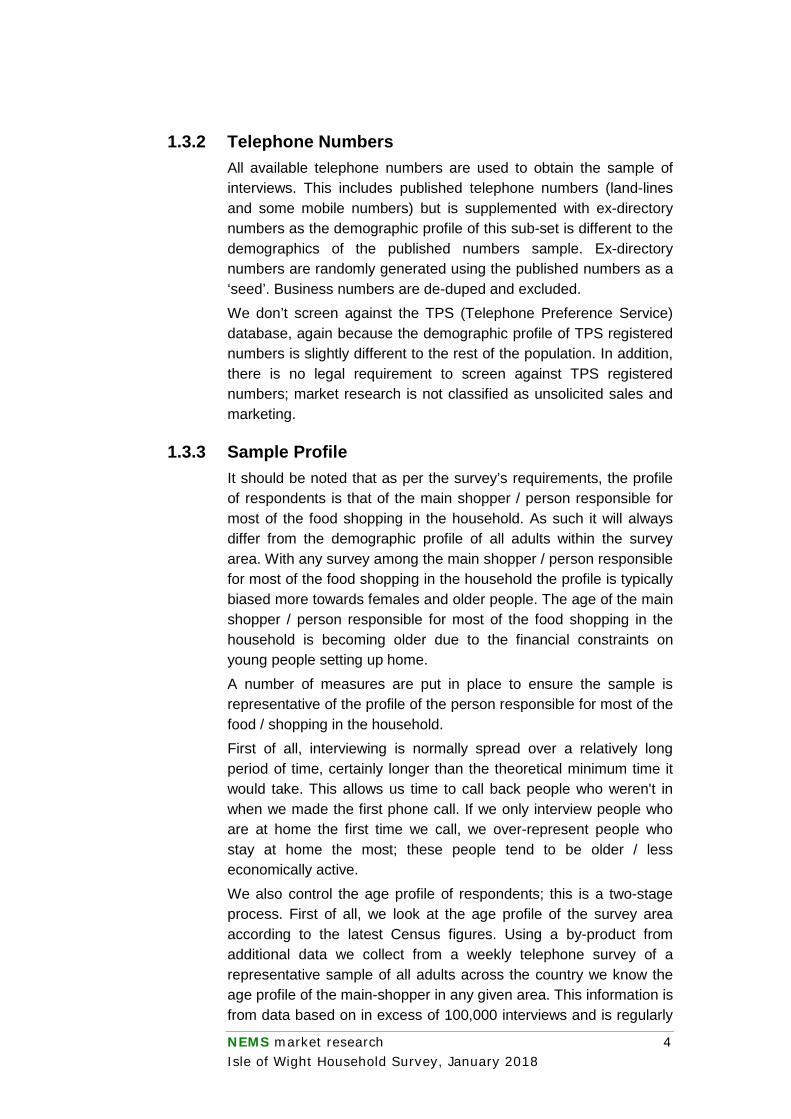
1.3.3 Sample Profile It should be noted that as per the survey’s requirements, the profile of respondents is that of the main shopper / person responsible for most of the food shopping in the household. As such it will always differ from the demographic profile of all adults within the survey area. With any survey among the main shopper / person responsible for most of the food shopping in the household the profile is typically biased more towards females and older people. The age of the main shopper / person responsible for most of the food shopping in the household is becoming older due to the financial constraints on young people setting up home. A number of measures are put in place to ensure the sample is representative of the profile of the person responsible for most of the food / shopping in the household. First of all, interviewing is normally spread over a relatively long period of time, certainly longer than the theoretical minimum time it would take. This allows us time to call back people who weren't in when we made the first phone call. If we only interview people who are at home the first time we call, we over-represent people who stay at home the most; these people tend to be older / less economically active. We also control the age profile of respondents; this is a two-stage process. First of all, we look at the age profile of the survey area according to the latest Census figures. Using a by-product from additional data we collect from a weekly telephone survey of a representative sample of all adults across the country we know the age profile of the main-shopper in any given area. This information is from data based on in excess of 100,000 interviews and is regularly
NEMS market research 5 Isle of Wight Household Survey, January 2018
updated and is therefore probably the most accurate and up to date information of its kind. Stratified random sampling helps ensure that the sample is as representative as possible. While the system dials the next random selected number for interviewers, all calls are made by interviewers; no automated call handling systems are used.
1.3.4 Time of Interviewing Approximately two-thirds of all calls are made outside normal working hours.
1.3.5 Monitoring of Calls At least 5% of telephone interviews are randomly and remotely monitored by Team Leaders to ensure the interviewing is conducted to the requisite standard. Both the dialogue and on-screen entries are monitored and evaluated. Interviewers are offered re-training should these standards not be met.
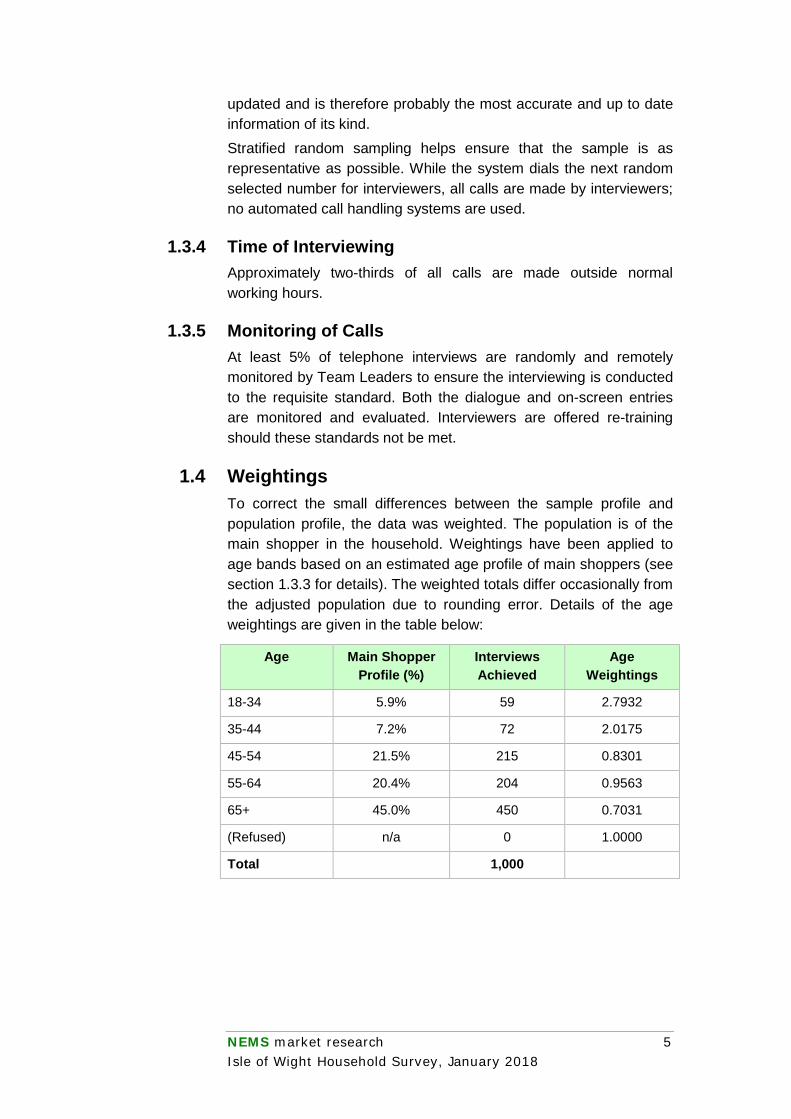
1.4 Weightings To correct the small differences between the sample profile and population profile, the data was weighted. The population is of the main shopper in the household. Weightings have been applied to age bands based on an estimated age profile of main shoppers (see section 1.3.3 for details). The weighted totals differ occasionally from the adjusted population due to rounding error. Details of the age weightings are given in the table below:
Age Main Shopper Profile (%)
Interviews Achieved
Age Weightings
18-34 5.9% 59 2.7932
35-44 7.2% 72 2.0175
45-54 21.5% 215 0.8301
55-64 20.4% 204 0.9563
65+ 45.0% 450 0.7031
(Refused) n/a 0 1.0000
Total 1,000
NEMS market research 6 Isle of Wight Household Survey, January 2018
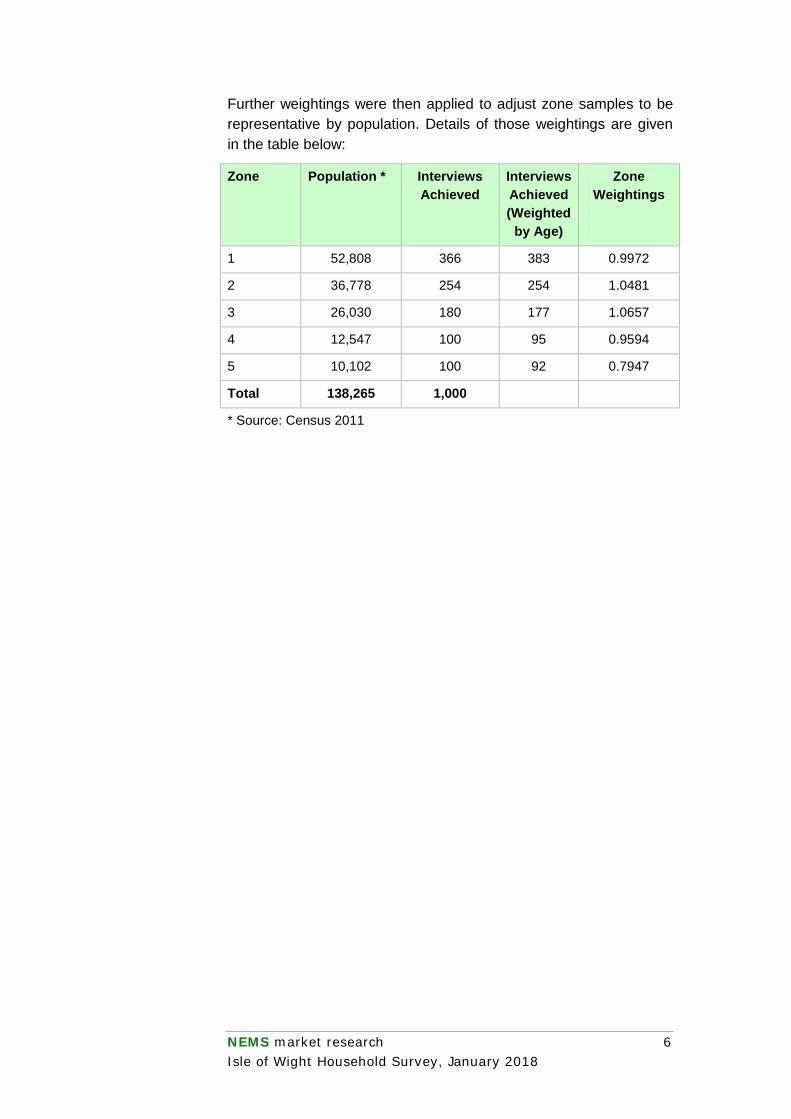
Further weightings were then applied to adjust zone samples to be representative by population. Details of those weightings are given in the table below:
Zone Population * Interviews Achieved
Interviews Achieved (Weighted
by Age)
Zone Weightings
1 52,808 366 383 0.9972
2 36,778 254 254 1.0481
3 26,030 180 177 1.0657
4 12,547 100 95 0.9594
5 10,102 100 92 0.7947
Total 138,265 1,000
* Source: Census 2011
NEMS market research 7 Isle of Wight Household Survey, January 2018
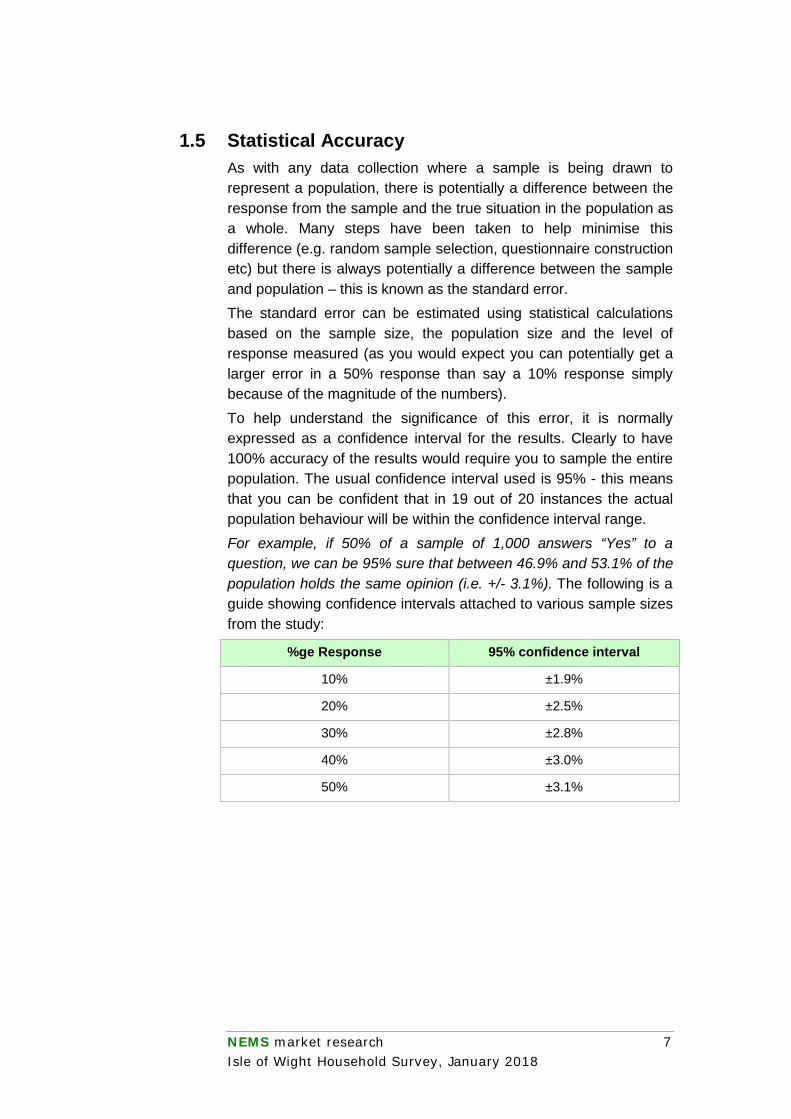
1.5 Statistical Accuracy As with any data collection where a sample is being drawn to represent a population, there is potentially a difference between the response from the sample and the true situation in the population as a whole. Many steps have been taken to help minimise this difference (e.g. random sample selection, questionnaire construction etc) but there is always potentially a difference between the sample and population – this is known as the standard error. The standard error can be estimated using statistical calculations based on the sample size, the population size and the level of response measured (as you would expect you can potentially get a larger error in a 50% response than say a 10% response simply because of the magnitude of the numbers). To help understand the significance of this error, it is normally expressed as a confidence interval for the results. Clearly to have 100% accuracy of the results would require you to sample the entire population. The usual confidence interval used is 95% - this means that you can be confident that in 19 out of 20 instances the actual population behaviour will be within the confidence interval range. For example, if 50% of a sample of 1,000 answers “Yes” to a question, we can be 95% sure that between 46.9% and 53.1% of the population holds the same opinion (i.e. +/- 3.1%). The following is a guide showing confidence intervals attached to various sample sizes from the study:
%ge Response 95% confidence interval
10% ±1.9%
20% ±2.5%
30% ±2.8%
40% ±3.0%
50% ±3.1%
NEMS market research 8 Isle of Wight Household Survey, January 2018
1.6 Data Tables Tables are presented in question order with the question number analysed shown at the top of the table. Those questions where the respondent is prompted with a list of possible answers are indicated in the question text with a suffix of [PR]. The sample size for each question and corresponding column criteria is shown at the base of each table. A description of the criteria determining to whom the question applies is shown in italics directly below the question text; if there is no such text evident then the question base is the full study sample. If the tabulated data is weighted (indicated in the header of the tabulations), in addition to the sample base, the weighted base is also shown at the bottom of each table. Unless indicated otherwise in the footer of the tabulations, all percentages are calculated down the column. Arithmetic rounding to whole numbers may mean that columns of percentages do not sum to exactly 100%. Zero per cent denotes a percentage of less than 0.05%. Percentages are calculated on the number of respondents and not the number of responses. This means that where more than one answer can be given to a question the sum of percentages may exceed 100%. All such multi-response questions are indicated in the tabulated by a suffix of [MR] on the question text. Where appropriate to the question, means are shown at the bottom of response tables. These are calculated in one of two ways: if the data is captured to a coded response a weighted mean is calculated and the code weightings are shown as a prefix above the question text; if actual specific values were captured from respondents these individual numbers are used to calculate the mean.
Appendix 1: Data Tabulations By Zone – Filtered Nulls (Weighted)
By Zone Filtered (Nulls) Isle of Wight Household Survey Page 10 Weighted: for WYG January 2018
Total Zone 1 Zone 2 Zone 3 Zone 4 Zone 5
Column %ges. 090118 NEMS market research
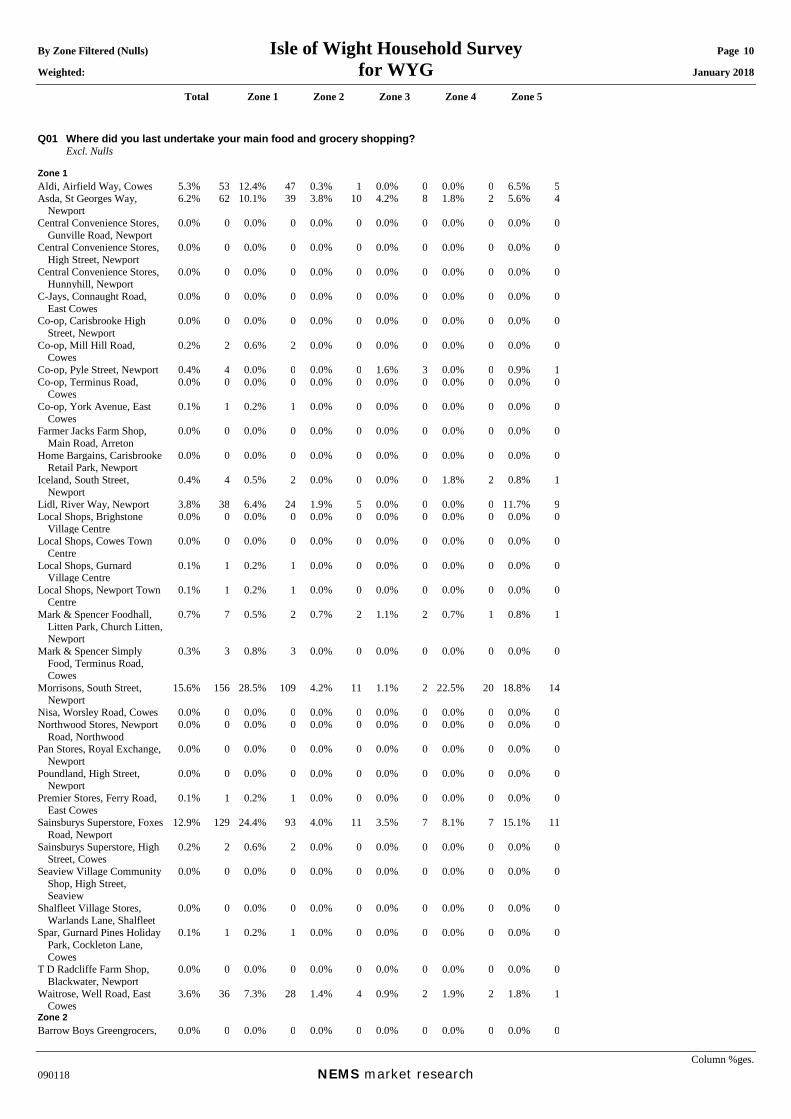
Q01 Where did you last undertake your main food and grocery shopping? Excl. Nulls Zone 1 Aldi, Airfield Way, Cowes 5.3% 53 12.4% 47 0.3% 1 0.0% 0 0.0% 0 6.5% 5Asda, St Georges Way,
Newport 6.2% 62 10.1% 39 3.8% 10 4.2% 8 1.8% 2 5.6% 4
Central Convenience Stores, Gunville Road, Newport
0.0% 0 0.0% 0 0.0% 0 0.0% 0 0.0% 0 0.0% 0
Central Convenience Stores, High Street, Newport
0.0% 0 0.0% 0 0.0% 0 0.0% 0 0.0% 0 0.0% 0
Central Convenience Stores, Hunnyhill, Newport
0.0% 0 0.0% 0 0.0% 0 0.0% 0 0.0% 0 0.0% 0
C-Jays, Connaught Road, East Cowes
0.0% 0 0.0% 0 0.0% 0 0.0% 0 0.0% 0 0.0% 0
Co-op, Carisbrooke High Street, Newport
0.0% 0 0.0% 0 0.0% 0 0.0% 0 0.0% 0 0.0% 0
Co-op, Mill Hill Road, Cowes
0.2% 2 0.6% 2 0.0% 0 0.0% 0 0.0% 0 0.0% 0
Co-op, Pyle Street, Newport 0.4% 4 0.0% 0 0.0% 0 1.6% 3 0.0% 0 0.9% 1Co-op, Terminus Road,
Cowes 0.0% 0 0.0% 0 0.0% 0 0.0% 0 0.0% 0 0.0% 0
Co-op, York Avenue, East Cowes
0.1% 1 0.2% 1 0.0% 0 0.0% 0 0.0% 0 0.0% 0
Farmer Jacks Farm Shop, Main Road, Arreton
0.0% 0 0.0% 0 0.0% 0 0.0% 0 0.0% 0 0.0% 0
Home Bargains, Carisbrooke Retail Park, Newport
0.0% 0 0.0% 0 0.0% 0 0.0% 0 0.0% 0 0.0% 0
Iceland, South Street, Newport
0.4% 4 0.5% 2 0.0% 0 0.0% 0 1.8% 2 0.8% 1
Lidl, River Way, Newport 3.8% 38 6.4% 24 1.9% 5 0.0% 0 0.0% 0 11.7% 9Local Shops, Brighstone
Village Centre 0.0% 0 0.0% 0 0.0% 0 0.0% 0 0.0% 0 0.0% 0
Local Shops, Cowes Town Centre
0.0% 0 0.0% 0 0.0% 0 0.0% 0 0.0% 0 0.0% 0
Local Shops, Gurnard Village Centre
0.1% 1 0.2% 1 0.0% 0 0.0% 0 0.0% 0 0.0% 0
Local Shops, Newport Town Centre
0.1% 1 0.2% 1 0.0% 0 0.0% 0 0.0% 0 0.0% 0
Mark & Spencer Foodhall, Litten Park, Church Litten, Newport
0.7% 7 0.5% 2 0.7% 2 1.1% 2 0.7% 1 0.8% 1
Mark & Spencer Simply Food, Terminus Road, Cowes
0.3% 3 0.8% 3 0.0% 0 0.0% 0 0.0% 0 0.0% 0
Morrisons, South Street, Newport
15.6% 156 28.5% 109 4.2% 11 1.1% 2 22.5% 20 18.8% 14
Nisa, Worsley Road, Cowes 0.0% 0 0.0% 0 0.0% 0 0.0% 0 0.0% 0 0.0% 0Northwood Stores, Newport
Road, Northwood 0.0% 0 0.0% 0 0.0% 0 0.0% 0 0.0% 0 0.0% 0
Pan Stores, Royal Exchange, Newport
0.0% 0 0.0% 0 0.0% 0 0.0% 0 0.0% 0 0.0% 0
Poundland, High Street, Newport
0.0% 0 0.0% 0 0.0% 0 0.0% 0 0.0% 0 0.0% 0
Premier Stores, Ferry Road, East Cowes
0.1% 1 0.2% 1 0.0% 0 0.0% 0 0.0% 0 0.0% 0
Sainsburys Superstore, Foxes Road, Newport
12.9% 129 24.4% 93 4.0% 11 3.5% 7 8.1% 7 15.1% 11
Sainsburys Superstore, High Street, Cowes
0.2% 2 0.6% 2 0.0% 0 0.0% 0 0.0% 0 0.0% 0
Seaview Village Community Shop, High Street, Seaview
0.0% 0 0.0% 0 0.0% 0 0.0% 0 0.0% 0 0.0% 0
Shalfleet Village Stores, Warlands Lane, Shalfleet
0.0% 0 0.0% 0 0.0% 0 0.0% 0 0.0% 0 0.0% 0
Spar, Gurnard Pines Holiday Park, Cockleton Lane, Cowes
0.1% 1 0.2% 1 0.0% 0 0.0% 0 0.0% 0 0.0% 0
T D Radcliffe Farm Shop, Blackwater, Newport
0.0% 0 0.0% 0 0.0% 0 0.0% 0 0.0% 0 0.0% 0
Waitrose, Well Road, East Cowes
3.6% 36 7.3% 28 1.4% 4 0.9% 2 1.9% 2 1.8% 1
Zone 2 Barrow Boys Greengrocers, 0.0% 0 0.0% 0 0.0% 0 0.0% 0 0.0% 0 0.0% 0
By Zone Filtered (Nulls) Isle of Wight Household Survey Page 11 Weighted: for WYG January 2018
Total Zone 1 Zone 2 Zone 3 Zone 4 Zone 5
Column %ges. 090118 NEMS market research
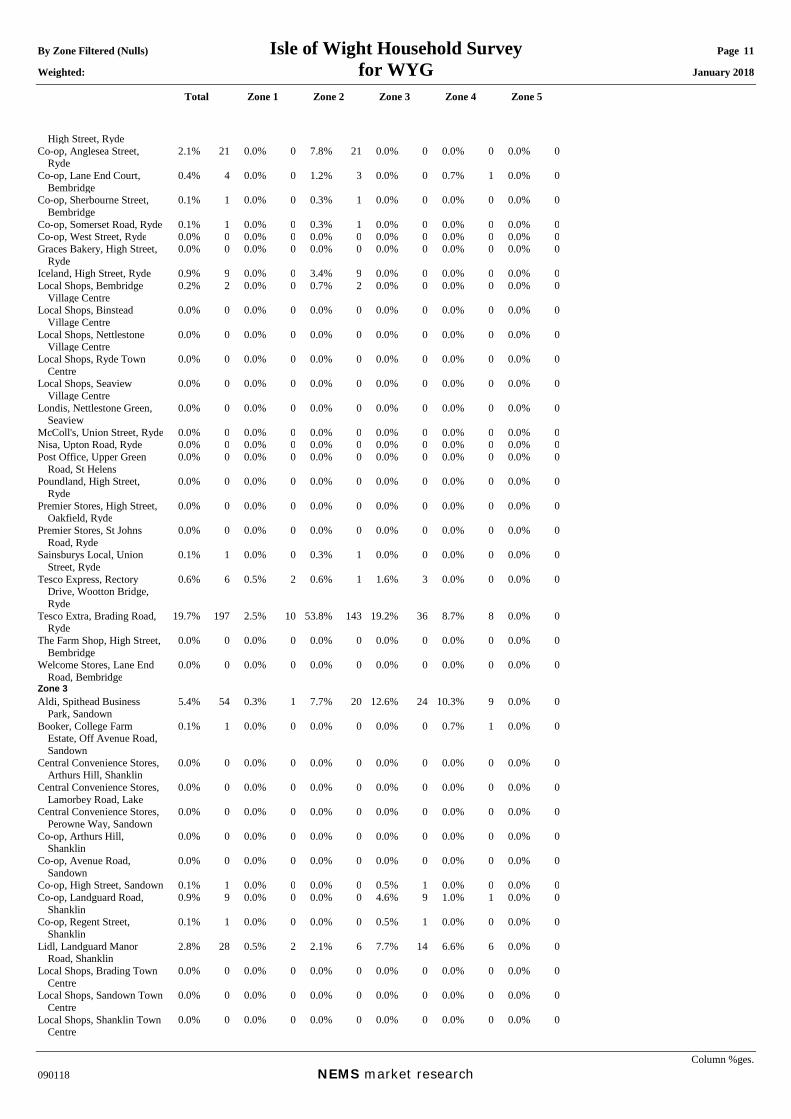
High Street, Ryde Co-op, Anglesea Street,
Ryde 2.1% 21 0.0% 0 7.8% 21 0.0% 0 0.0% 0 0.0% 0
Co-op, Lane End Court, Bembridge
0.4% 4 0.0% 0 1.2% 3 0.0% 0 0.7% 1 0.0% 0
Co-op, Sherbourne Street, Bembridge
0.1% 1 0.0% 0 0.3% 1 0.0% 0 0.0% 0 0.0% 0
Co-op, Somerset Road, Ryde 0.1% 1 0.0% 0 0.3% 1 0.0% 0 0.0% 0 0.0% 0Co-op, West Street, Ryde 0.0% 0 0.0% 0 0.0% 0 0.0% 0 0.0% 0 0.0% 0Graces Bakery, High Street,
Ryde 0.0% 0 0.0% 0 0.0% 0 0.0% 0 0.0% 0 0.0% 0
Iceland, High Street, Ryde 0.9% 9 0.0% 0 3.4% 9 0.0% 0 0.0% 0 0.0% 0Local Shops, Bembridge
Village Centre 0.2% 2 0.0% 0 0.7% 2 0.0% 0 0.0% 0 0.0% 0
Local Shops, Binstead Village Centre
0.0% 0 0.0% 0 0.0% 0 0.0% 0 0.0% 0 0.0% 0
Local Shops, Nettlestone Village Centre
0.0% 0 0.0% 0 0.0% 0 0.0% 0 0.0% 0 0.0% 0
Local Shops, Ryde Town Centre
0.0% 0 0.0% 0 0.0% 0 0.0% 0 0.0% 0 0.0% 0
Local Shops, Seaview Village Centre
0.0% 0 0.0% 0 0.0% 0 0.0% 0 0.0% 0 0.0% 0
Londis, Nettlestone Green, Seaview
0.0% 0 0.0% 0 0.0% 0 0.0% 0 0.0% 0 0.0% 0
McColl's, Union Street, Ryde 0.0% 0 0.0% 0 0.0% 0 0.0% 0 0.0% 0 0.0% 0Nisa, Upton Road, Ryde 0.0% 0 0.0% 0 0.0% 0 0.0% 0 0.0% 0 0.0% 0Post Office, Upper Green
Road, St Helens 0.0% 0 0.0% 0 0.0% 0 0.0% 0 0.0% 0 0.0% 0
Poundland, High Street, Ryde
0.0% 0 0.0% 0 0.0% 0 0.0% 0 0.0% 0 0.0% 0
Premier Stores, High Street, Oakfield, Ryde
0.0% 0 0.0% 0 0.0% 0 0.0% 0 0.0% 0 0.0% 0
Premier Stores, St Johns Road, Ryde
0.0% 0 0.0% 0 0.0% 0 0.0% 0 0.0% 0 0.0% 0
Sainsburys Local, Union Street, Ryde
0.1% 1 0.0% 0 0.3% 1 0.0% 0 0.0% 0 0.0% 0
Tesco Express, Rectory Drive, Wootton Bridge, Ryde
0.6% 6 0.5% 2 0.6% 1 1.6% 3 0.0% 0 0.0% 0
Tesco Extra, Brading Road, Ryde
19.7% 197 2.5% 10 53.8% 143 19.2% 36 8.7% 8 0.0% 0
The Farm Shop, High Street, Bembridge
0.0% 0 0.0% 0 0.0% 0 0.0% 0 0.0% 0 0.0% 0
Welcome Stores, Lane End Road, Bembridge
0.0% 0 0.0% 0 0.0% 0 0.0% 0 0.0% 0 0.0% 0
Zone 3 Aldi, Spithead Business
Park, Sandown 5.4% 54 0.3% 1 7.7% 20 12.6% 24 10.3% 9 0.0% 0
Booker, College Farm Estate, Off Avenue Road, Sandown
0.1% 1 0.0% 0 0.0% 0 0.0% 0 0.7% 1 0.0% 0
Central Convenience Stores, Arthurs Hill, Shanklin
0.0% 0 0.0% 0 0.0% 0 0.0% 0 0.0% 0 0.0% 0
Central Convenience Stores, Lamorbey Road, Lake
0.0% 0 0.0% 0 0.0% 0 0.0% 0 0.0% 0 0.0% 0
Central Convenience Stores, Perowne Way, Sandown
0.0% 0 0.0% 0 0.0% 0 0.0% 0 0.0% 0 0.0% 0
Co-op, Arthurs Hill, Shanklin
0.0% 0 0.0% 0 0.0% 0 0.0% 0 0.0% 0 0.0% 0
Co-op, Avenue Road, Sandown
0.0% 0 0.0% 0 0.0% 0 0.0% 0 0.0% 0 0.0% 0
Co-op, High Street, Sandown 0.1% 1 0.0% 0 0.0% 0 0.5% 1 0.0% 0 0.0% 0Co-op, Landguard Road,
Shanklin 0.9% 9 0.0% 0 0.0% 0 4.6% 9 1.0% 1 0.0% 0
Co-op, Regent Street, Shanklin
0.1% 1 0.0% 0 0.0% 0 0.5% 1 0.0% 0 0.0% 0
Lidl, Landguard Manor Road, Shanklin
2.8% 28 0.5% 2 2.1% 6 7.7% 14 6.6% 6 0.0% 0
Local Shops, Brading Town Centre
0.0% 0 0.0% 0 0.0% 0 0.0% 0 0.0% 0 0.0% 0
Local Shops, Sandown Town Centre
0.0% 0 0.0% 0 0.0% 0 0.0% 0 0.0% 0 0.0% 0
Local Shops, Shanklin Town Centre
0.0% 0 0.0% 0 0.0% 0 0.0% 0 0.0% 0 0.0% 0
By Zone Filtered (Nulls) Isle of Wight Household Survey Page 12 Weighted: for WYG January 2018
Total Zone 1 Zone 2 Zone 3 Zone 4 Zone 5
Column %ges. 090118 NEMS market research
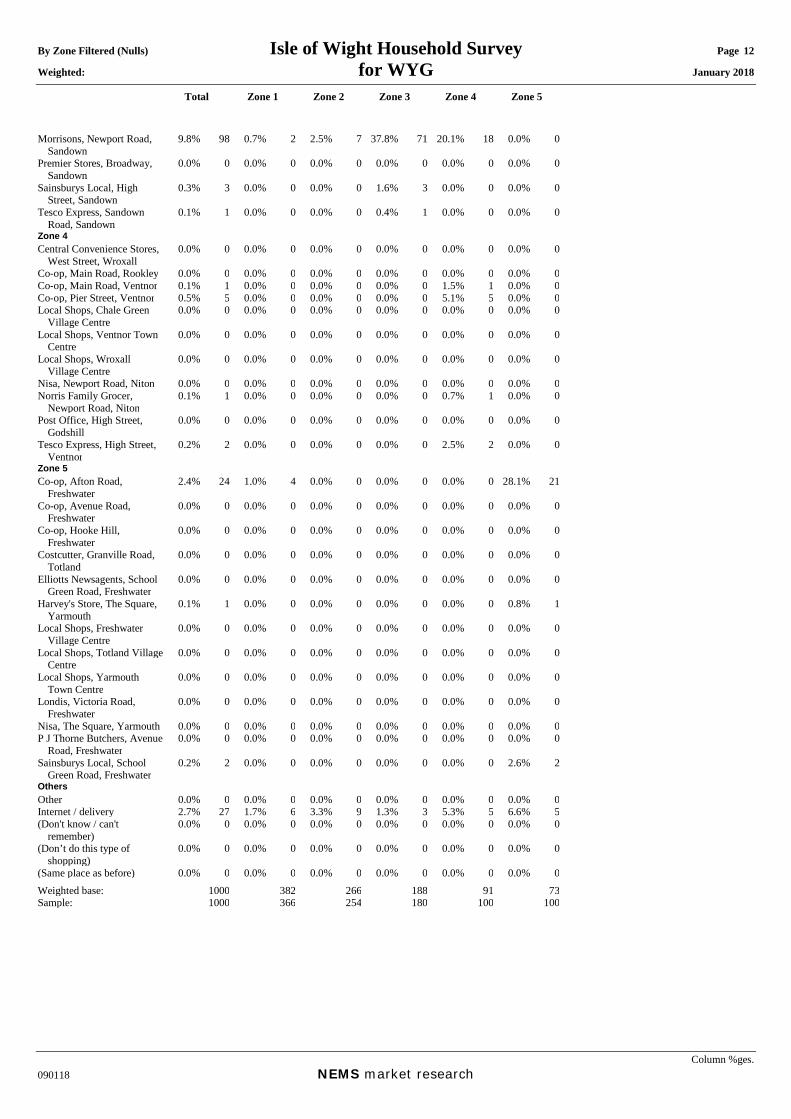
Morrisons, Newport Road, Sandown
9.8% 98 0.7% 2 2.5% 7 37.8% 71 20.1% 18 0.0% 0
Premier Stores, Broadway, Sandown
0.0% 0 0.0% 0 0.0% 0 0.0% 0 0.0% 0 0.0% 0
Sainsburys Local, High Street, Sandown
0.3% 3 0.0% 0 0.0% 0 1.6% 3 0.0% 0 0.0% 0
Tesco Express, Sandown Road, Sandown
0.1% 1 0.0% 0 0.0% 0 0.4% 1 0.0% 0 0.0% 0
Zone 4 Central Convenience Stores,
West Street, Wroxall 0.0% 0 0.0% 0 0.0% 0 0.0% 0 0.0% 0 0.0% 0
Co-op, Main Road, Rookley 0.0% 0 0.0% 0 0.0% 0 0.0% 0 0.0% 0 0.0% 0Co-op, Main Road, Ventnor 0.1% 1 0.0% 0 0.0% 0 0.0% 0 1.5% 1 0.0% 0Co-op, Pier Street, Ventnor 0.5% 5 0.0% 0 0.0% 0 0.0% 0 5.1% 5 0.0% 0Local Shops, Chale Green
Village Centre 0.0% 0 0.0% 0 0.0% 0 0.0% 0 0.0% 0 0.0% 0
Local Shops, Ventnor Town Centre
0.0% 0 0.0% 0 0.0% 0 0.0% 0 0.0% 0 0.0% 0
Local Shops, Wroxall Village Centre
0.0% 0 0.0% 0 0.0% 0 0.0% 0 0.0% 0 0.0% 0
Nisa, Newport Road, Niton 0.0% 0 0.0% 0 0.0% 0 0.0% 0 0.0% 0 0.0% 0Norris Family Grocer,
Newport Road, Niton 0.1% 1 0.0% 0 0.0% 0 0.0% 0 0.7% 1 0.0% 0
Post Office, High Street, Godshill
0.0% 0 0.0% 0 0.0% 0 0.0% 0 0.0% 0 0.0% 0
Tesco Express, High Street, Ventnor
0.2% 2 0.0% 0 0.0% 0 0.0% 0 2.5% 2 0.0% 0
Zone 5 Co-op, Afton Road,
Freshwater 2.4% 24 1.0% 4 0.0% 0 0.0% 0 0.0% 0 28.1% 21
Co-op, Avenue Road, Freshwater
0.0% 0 0.0% 0 0.0% 0 0.0% 0 0.0% 0 0.0% 0
Co-op, Hooke Hill, Freshwater
0.0% 0 0.0% 0 0.0% 0 0.0% 0 0.0% 0 0.0% 0
Costcutter, Granville Road, Totland
0.0% 0 0.0% 0 0.0% 0 0.0% 0 0.0% 0 0.0% 0
Elliotts Newsagents, School Green Road, Freshwater
0.0% 0 0.0% 0 0.0% 0 0.0% 0 0.0% 0 0.0% 0
Harvey's Store, The Square, Yarmouth
0.1% 1 0.0% 0 0.0% 0 0.0% 0 0.0% 0 0.8% 1
Local Shops, Freshwater Village Centre
0.0% 0 0.0% 0 0.0% 0 0.0% 0 0.0% 0 0.0% 0
Local Shops, Totland Village Centre
0.0% 0 0.0% 0 0.0% 0 0.0% 0 0.0% 0 0.0% 0
Local Shops, Yarmouth Town Centre
0.0% 0 0.0% 0 0.0% 0 0.0% 0 0.0% 0 0.0% 0
Londis, Victoria Road, Freshwater
0.0% 0 0.0% 0 0.0% 0 0.0% 0 0.0% 0 0.0% 0
Nisa, The Square, Yarmouth 0.0% 0 0.0% 0 0.0% 0 0.0% 0 0.0% 0 0.0% 0P J Thorne Butchers, Avenue
Road, Freshwater 0.0% 0 0.0% 0 0.0% 0 0.0% 0 0.0% 0 0.0% 0
Sainsburys Local, School Green Road, Freshwater
0.2% 2 0.0% 0 0.0% 0 0.0% 0 0.0% 0 2.6% 2
Others Other 0.0% 0 0.0% 0 0.0% 0 0.0% 0 0.0% 0 0.0% 0Internet / delivery 2.7% 27 1.7% 6 3.3% 9 1.3% 3 5.3% 5 6.6% 5(Don't know / can't
remember) 0.0% 0 0.0% 0 0.0% 0 0.0% 0 0.0% 0 0.0% 0
(Don’t do this type of shopping)
0.0% 0 0.0% 0 0.0% 0 0.0% 0 0.0% 0 0.0% 0
(Same place as before) 0.0% 0 0.0% 0 0.0% 0 0.0% 0 0.0% 0 0.0% 0Weighted base: 1000 382 266 188 91 73Sample: 1000 366 254 180 100 100
By Zone Filtered (Nulls) Isle of Wight Household Survey Page 13 Weighted: for WYG January 2018
Total Zone 1 Zone 2 Zone 3 Zone 4 Zone 5
Column %ges. 090118 NEMS market research
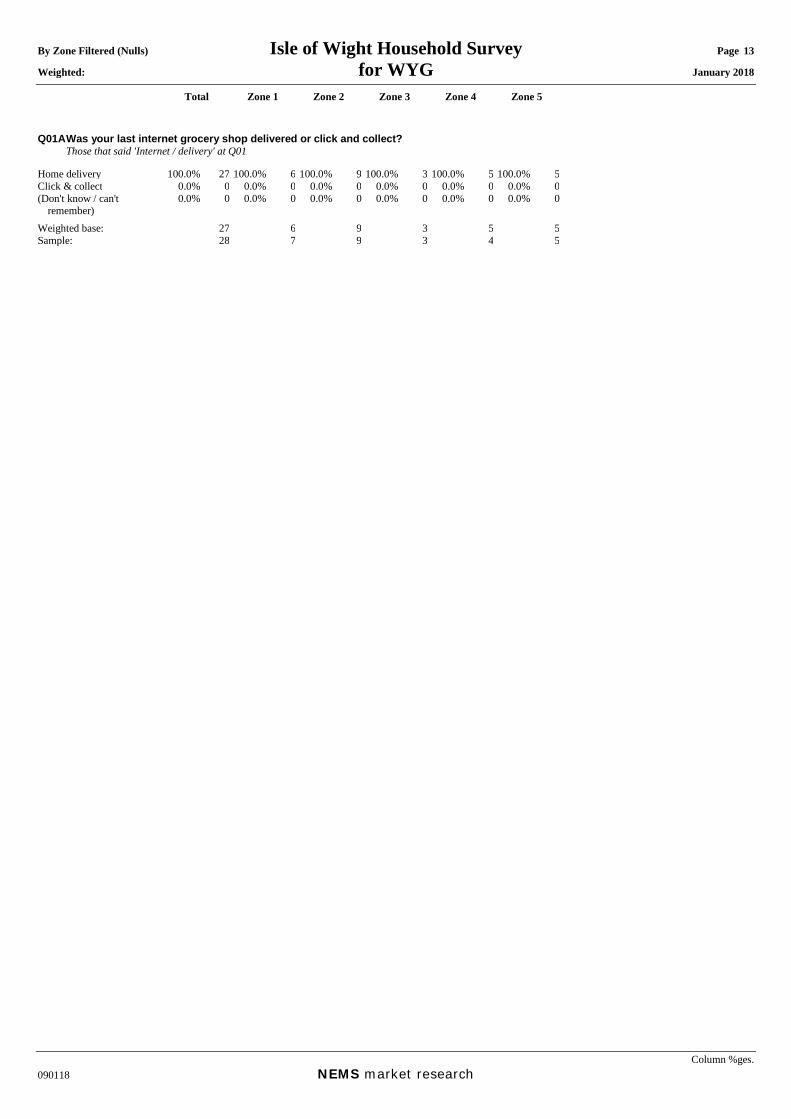
Q01A Was your last internet grocery shop delivered or click and collect? Those that said 'Internet / delivery' at Q01 Home delivery 100.0% 27 100.0% 6 100.0% 9 100.0% 3 100.0% 5 100.0% 5Click & collect 0.0% 0 0.0% 0 0.0% 0 0.0% 0 0.0% 0 0.0% 0(Don't know / can't
remember) 0.0% 0 0.0% 0 0.0% 0 0.0% 0 0.0% 0 0.0% 0
Weighted base: 27 6 9 3 5 5Sample: 28 7 9 3 4 5
By Zone Filtered (Nulls) Isle of Wight Household Survey Page 14 Weighted: for WYG January 2018
Total Zone 1 Zone 2 Zone 3 Zone 4 Zone 5
Column %ges. 090118 NEMS market research
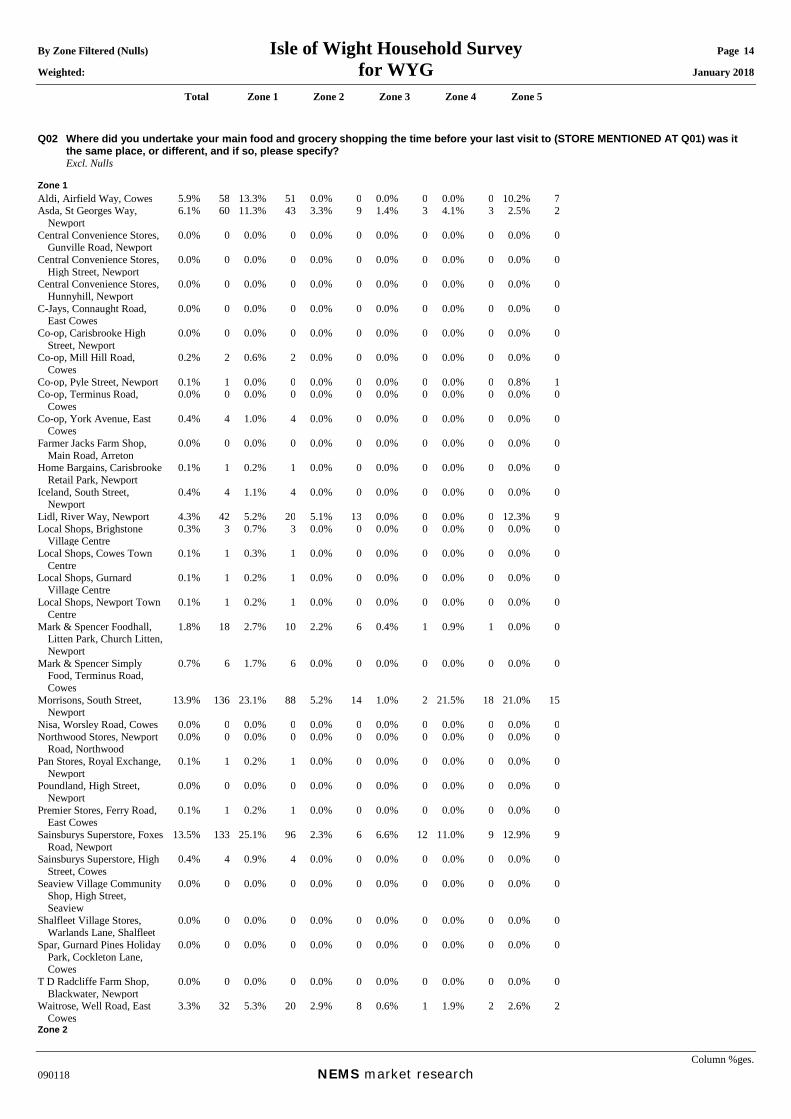
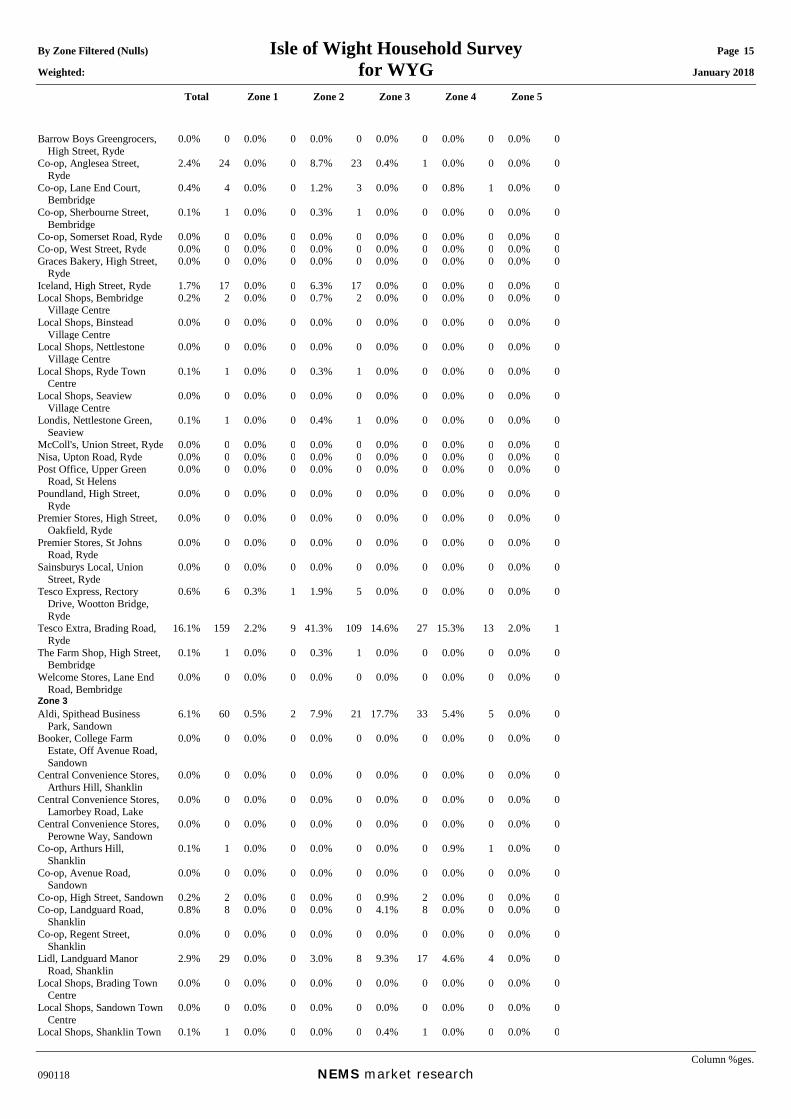
Q02 Where did you undertake your main food and grocery shopping the time before your last visit to (STORE MENTIONED AT Q01) was it the same place, or different, and if so, please specify?
Excl. Nulls Zone 1 Aldi, Airfield Way, Cowes 5.9% 58 13.3% 51 0.0% 0 0.0% 0 0.0% 0 10.2% 7Asda, St Georges Way,
Newport 6.1% 60 11.3% 43 3.3% 9 1.4% 3 4.1% 3 2.5% 2
Central Convenience Stores, Gunville Road, Newport
0.0% 0 0.0% 0 0.0% 0 0.0% 0 0.0% 0 0.0% 0
Central Convenience Stores, High Street, Newport
0.0% 0 0.0% 0 0.0% 0 0.0% 0 0.0% 0 0.0% 0
Central Convenience Stores, Hunnyhill, Newport
0.0% 0 0.0% 0 0.0% 0 0.0% 0 0.0% 0 0.0% 0
C-Jays, Connaught Road, East Cowes
0.0% 0 0.0% 0 0.0% 0 0.0% 0 0.0% 0 0.0% 0
Co-op, Carisbrooke High Street, Newport
0.0% 0 0.0% 0 0.0% 0 0.0% 0 0.0% 0 0.0% 0
Co-op, Mill Hill Road, Cowes
0.2% 2 0.6% 2 0.0% 0 0.0% 0 0.0% 0 0.0% 0
Co-op, Pyle Street, Newport 0.1% 1 0.0% 0 0.0% 0 0.0% 0 0.0% 0 0.8% 1Co-op, Terminus Road,
Cowes 0.0% 0 0.0% 0 0.0% 0 0.0% 0 0.0% 0 0.0% 0
Co-op, York Avenue, East Cowes
0.4% 4 1.0% 4 0.0% 0 0.0% 0 0.0% 0 0.0% 0
Farmer Jacks Farm Shop, Main Road, Arreton
0.0% 0 0.0% 0 0.0% 0 0.0% 0 0.0% 0 0.0% 0
Home Bargains, Carisbrooke Retail Park, Newport
0.1% 1 0.2% 1 0.0% 0 0.0% 0 0.0% 0 0.0% 0
Iceland, South Street, Newport
0.4% 4 1.1% 4 0.0% 0 0.0% 0 0.0% 0 0.0% 0
Lidl, River Way, Newport 4.3% 42 5.2% 20 5.1% 13 0.0% 0 0.0% 0 12.3% 9Local Shops, Brighstone
Village Centre 0.3% 3 0.7% 3 0.0% 0 0.0% 0 0.0% 0 0.0% 0
Local Shops, Cowes Town Centre
0.1% 1 0.3% 1 0.0% 0 0.0% 0 0.0% 0 0.0% 0
Local Shops, Gurnard Village Centre
0.1% 1 0.2% 1 0.0% 0 0.0% 0 0.0% 0 0.0% 0
Local Shops, Newport Town Centre
0.1% 1 0.2% 1 0.0% 0 0.0% 0 0.0% 0 0.0% 0
Mark & Spencer Foodhall, Litten Park, Church Litten, Newport
1.8% 18 2.7% 10 2.2% 6 0.4% 1 0.9% 1 0.0% 0
Mark & Spencer Simply Food, Terminus Road, Cowes
0.7% 6 1.7% 6 0.0% 0 0.0% 0 0.0% 0 0.0% 0
Morrisons, South Street, Newport
13.9% 136 23.1% 88 5.2% 14 1.0% 2 21.5% 18 21.0% 15
Nisa, Worsley Road, Cowes 0.0% 0 0.0% 0 0.0% 0 0.0% 0 0.0% 0 0.0% 0Northwood Stores, Newport
Road, Northwood 0.0% 0 0.0% 0 0.0% 0 0.0% 0 0.0% 0 0.0% 0
Pan Stores, Royal Exchange, Newport
0.1% 1 0.2% 1 0.0% 0 0.0% 0 0.0% 0 0.0% 0
Poundland, High Street, Newport
0.0% 0 0.0% 0 0.0% 0 0.0% 0 0.0% 0 0.0% 0
Premier Stores, Ferry Road, East Cowes
0.1% 1 0.2% 1 0.0% 0 0.0% 0 0.0% 0 0.0% 0
Sainsburys Superstore, Foxes Road, Newport
13.5% 133 25.1% 96 2.3% 6 6.6% 12 11.0% 9 12.9% 9
Sainsburys Superstore, High Street, Cowes
0.4% 4 0.9% 4 0.0% 0 0.0% 0 0.0% 0 0.0% 0
Seaview Village Community Shop, High Street, Seaview
0.0% 0 0.0% 0 0.0% 0 0.0% 0 0.0% 0 0.0% 0
Shalfleet Village Stores, Warlands Lane, Shalfleet
0.0% 0 0.0% 0 0.0% 0 0.0% 0 0.0% 0 0.0% 0
Spar, Gurnard Pines Holiday Park, Cockleton Lane, Cowes
0.0% 0 0.0% 0 0.0% 0 0.0% 0 0.0% 0 0.0% 0
T D Radcliffe Farm Shop, Blackwater, Newport
0.0% 0 0.0% 0 0.0% 0 0.0% 0 0.0% 0 0.0% 0
Waitrose, Well Road, East Cowes
3.3% 32 5.3% 20 2.9% 8 0.6% 1 1.9% 2 2.6% 2
Zone 2
By Zone Filtered (Nulls) Isle of Wight Household Survey Page 15 Weighted: for WYG January 2018
Total Zone 1 Zone 2 Zone 3 Zone 4 Zone 5
Column %ges. 090118 NEMS market research
Barrow Boys Greengrocers, High Street, Ryde
0.0% 0 0.0% 0 0.0% 0 0.0% 0 0.0% 0 0.0% 0
Co-op, Anglesea Street, Ryde
2.4% 24 0.0% 0 8.7% 23 0.4% 1 0.0% 0 0.0% 0
Co-op, Lane End Court, Bembridge
0.4% 4 0.0% 0 1.2% 3 0.0% 0 0.8% 1 0.0% 0
Co-op, Sherbourne Street, Bembridge
0.1% 1 0.0% 0 0.3% 1 0.0% 0 0.0% 0 0.0% 0
Co-op, Somerset Road, Ryde 0.0% 0 0.0% 0 0.0% 0 0.0% 0 0.0% 0 0.0% 0Co-op, West Street, Ryde 0.0% 0 0.0% 0 0.0% 0 0.0% 0 0.0% 0 0.0% 0Graces Bakery, High Street,
Ryde 0.0% 0 0.0% 0 0.0% 0 0.0% 0 0.0% 0 0.0% 0
Iceland, High Street, Ryde 1.7% 17 0.0% 0 6.3% 17 0.0% 0 0.0% 0 0.0% 0Local Shops, Bembridge
Village Centre 0.2% 2 0.0% 0 0.7% 2 0.0% 0 0.0% 0 0.0% 0
Local Shops, Binstead Village Centre
0.0% 0 0.0% 0 0.0% 0 0.0% 0 0.0% 0 0.0% 0
Local Shops, Nettlestone Village Centre
0.0% 0 0.0% 0 0.0% 0 0.0% 0 0.0% 0 0.0% 0
Local Shops, Ryde Town Centre
0.1% 1 0.0% 0 0.3% 1 0.0% 0 0.0% 0 0.0% 0
Local Shops, Seaview Village Centre
0.0% 0 0.0% 0 0.0% 0 0.0% 0 0.0% 0 0.0% 0
Londis, Nettlestone Green, Seaview
0.1% 1 0.0% 0 0.4% 1 0.0% 0 0.0% 0 0.0% 0
McColl's, Union Street, Ryde 0.0% 0 0.0% 0 0.0% 0 0.0% 0 0.0% 0 0.0% 0Nisa, Upton Road, Ryde 0.0% 0 0.0% 0 0.0% 0 0.0% 0 0.0% 0 0.0% 0Post Office, Upper Green
Road, St Helens 0.0% 0 0.0% 0 0.0% 0 0.0% 0 0.0% 0 0.0% 0
Poundland, High Street, Ryde
0.0% 0 0.0% 0 0.0% 0 0.0% 0 0.0% 0 0.0% 0
Premier Stores, High Street, Oakfield, Ryde
0.0% 0 0.0% 0 0.0% 0 0.0% 0 0.0% 0 0.0% 0
Premier Stores, St Johns Road, Ryde
0.0% 0 0.0% 0 0.0% 0 0.0% 0 0.0% 0 0.0% 0
Sainsburys Local, Union Street, Ryde
0.0% 0 0.0% 0 0.0% 0 0.0% 0 0.0% 0 0.0% 0
Tesco Express, Rectory Drive, Wootton Bridge, Ryde
0.6% 6 0.3% 1 1.9% 5 0.0% 0 0.0% 0 0.0% 0
Tesco Extra, Brading Road, Ryde
16.1% 159 2.2% 9 41.3% 109 14.6% 27 15.3% 13 2.0% 1
The Farm Shop, High Street, Bembridge
0.1% 1 0.0% 0 0.3% 1 0.0% 0 0.0% 0 0.0% 0
Welcome Stores, Lane End Road, Bembridge
0.0% 0 0.0% 0 0.0% 0 0.0% 0 0.0% 0 0.0% 0
Zone 3 Aldi, Spithead Business
Park, Sandown 6.1% 60 0.5% 2 7.9% 21 17.7% 33 5.4% 5 0.0% 0
Booker, College Farm Estate, Off Avenue Road, Sandown
0.0% 0 0.0% 0 0.0% 0 0.0% 0 0.0% 0 0.0% 0
Central Convenience Stores, Arthurs Hill, Shanklin
0.0% 0 0.0% 0 0.0% 0 0.0% 0 0.0% 0 0.0% 0
Central Convenience Stores, Lamorbey Road, Lake
0.0% 0 0.0% 0 0.0% 0 0.0% 0 0.0% 0 0.0% 0
Central Convenience Stores, Perowne Way, Sandown
0.0% 0 0.0% 0 0.0% 0 0.0% 0 0.0% 0 0.0% 0
Co-op, Arthurs Hill, Shanklin
0.1% 1 0.0% 0 0.0% 0 0.0% 0 0.9% 1 0.0% 0
Co-op, Avenue Road, Sandown
0.0% 0 0.0% 0 0.0% 0 0.0% 0 0.0% 0 0.0% 0
Co-op, High Street, Sandown 0.2% 2 0.0% 0 0.0% 0 0.9% 2 0.0% 0 0.0% 0Co-op, Landguard Road,
Shanklin 0.8% 8 0.0% 0 0.0% 0 4.1% 8 0.0% 0 0.0% 0
Co-op, Regent Street, Shanklin
0.0% 0 0.0% 0 0.0% 0 0.0% 0 0.0% 0 0.0% 0
Lidl, Landguard Manor Road, Shanklin
2.9% 29 0.0% 0 3.0% 8 9.3% 17 4.6% 4 0.0% 0
Local Shops, Brading Town Centre
0.0% 0 0.0% 0 0.0% 0 0.0% 0 0.0% 0 0.0% 0
Local Shops, Sandown Town Centre
0.0% 0 0.0% 0 0.0% 0 0.0% 0 0.0% 0 0.0% 0
Local Shops, Shanklin Town 0.1% 1 0.0% 0 0.0% 0 0.4% 1 0.0% 0 0.0% 0
By Zone Filtered (Nulls) Isle of Wight Household Survey Page 16 Weighted: for WYG January 2018
Total Zone 1 Zone 2 Zone 3 Zone 4 Zone 5
Column %ges. 090118 NEMS market research
Centre Morrisons, Newport Road,
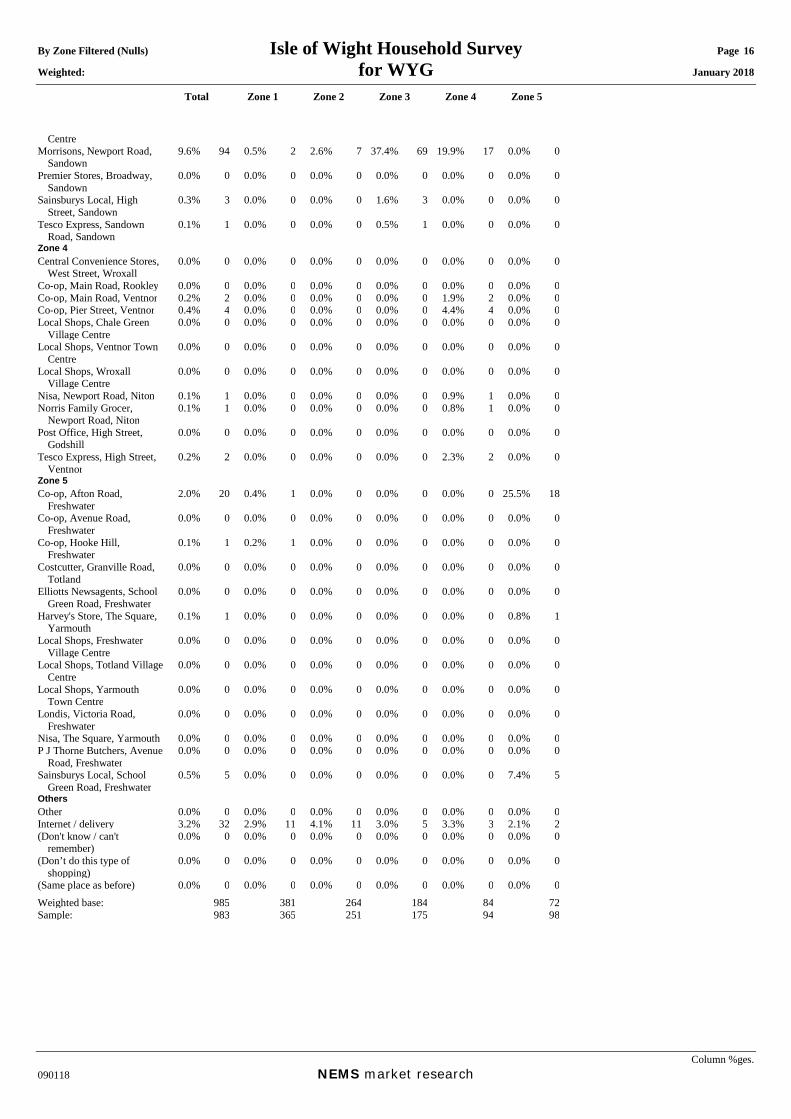
Sandown 9.6% 94 0.5% 2 2.6% 7 37.4% 69 19.9% 17 0.0% 0
Premier Stores, Broadway, Sandown
0.0% 0 0.0% 0 0.0% 0 0.0% 0 0.0% 0 0.0% 0
Sainsburys Local, High Street, Sandown
0.3% 3 0.0% 0 0.0% 0 1.6% 3 0.0% 0 0.0% 0
Tesco Express, Sandown Road, Sandown
0.1% 1 0.0% 0 0.0% 0 0.5% 1 0.0% 0 0.0% 0
Zone 4 Central Convenience Stores,
West Street, Wroxall 0.0% 0 0.0% 0 0.0% 0 0.0% 0 0.0% 0 0.0% 0
Co-op, Main Road, Rookley 0.0% 0 0.0% 0 0.0% 0 0.0% 0 0.0% 0 0.0% 0Co-op, Main Road, Ventnor 0.2% 2 0.0% 0 0.0% 0 0.0% 0 1.9% 2 0.0% 0Co-op, Pier Street, Ventnor 0.4% 4 0.0% 0 0.0% 0 0.0% 0 4.4% 4 0.0% 0Local Shops, Chale Green
Village Centre 0.0% 0 0.0% 0 0.0% 0 0.0% 0 0.0% 0 0.0% 0
Local Shops, Ventnor Town Centre
0.0% 0 0.0% 0 0.0% 0 0.0% 0 0.0% 0 0.0% 0
Local Shops, Wroxall Village Centre
0.0% 0 0.0% 0 0.0% 0 0.0% 0 0.0% 0 0.0% 0
Nisa, Newport Road, Niton 0.1% 1 0.0% 0 0.0% 0 0.0% 0 0.9% 1 0.0% 0Norris Family Grocer,
Newport Road, Niton 0.1% 1 0.0% 0 0.0% 0 0.0% 0 0.8% 1 0.0% 0
Post Office, High Street, Godshill
0.0% 0 0.0% 0 0.0% 0 0.0% 0 0.0% 0 0.0% 0
Tesco Express, High Street, Ventnor
0.2% 2 0.0% 0 0.0% 0 0.0% 0 2.3% 2 0.0% 0
Zone 5 Co-op, Afton Road,
Freshwater 2.0% 20 0.4% 1 0.0% 0 0.0% 0 0.0% 0 25.5% 18
Co-op, Avenue Road, Freshwater
0.0% 0 0.0% 0 0.0% 0 0.0% 0 0.0% 0 0.0% 0
Co-op, Hooke Hill, Freshwater
0.1% 1 0.2% 1 0.0% 0 0.0% 0 0.0% 0 0.0% 0
Costcutter, Granville Road, Totland
0.0% 0 0.0% 0 0.0% 0 0.0% 0 0.0% 0 0.0% 0
Elliotts Newsagents, School Green Road, Freshwater
0.0% 0 0.0% 0 0.0% 0 0.0% 0 0.0% 0 0.0% 0
Harvey's Store, The Square, Yarmouth
0.1% 1 0.0% 0 0.0% 0 0.0% 0 0.0% 0 0.8% 1
Local Shops, Freshwater Village Centre
0.0% 0 0.0% 0 0.0% 0 0.0% 0 0.0% 0 0.0% 0
Local Shops, Totland Village Centre
0.0% 0 0.0% 0 0.0% 0 0.0% 0 0.0% 0 0.0% 0
Local Shops, Yarmouth Town Centre
0.0% 0 0.0% 0 0.0% 0 0.0% 0 0.0% 0 0.0% 0
Londis, Victoria Road, Freshwater
0.0% 0 0.0% 0 0.0% 0 0.0% 0 0.0% 0 0.0% 0
Nisa, The Square, Yarmouth 0.0% 0 0.0% 0 0.0% 0 0.0% 0 0.0% 0 0.0% 0P J Thorne Butchers, Avenue
Road, Freshwater 0.0% 0 0.0% 0 0.0% 0 0.0% 0 0.0% 0 0.0% 0
Sainsburys Local, School Green Road, Freshwater
0.5% 5 0.0% 0 0.0% 0 0.0% 0 0.0% 0 7.4% 5
Others Other 0.0% 0 0.0% 0 0.0% 0 0.0% 0 0.0% 0 0.0% 0Internet / delivery 3.2% 32 2.9% 11 4.1% 11 3.0% 5 3.3% 3 2.1% 2(Don't know / can't
remember) 0.0% 0 0.0% 0 0.0% 0 0.0% 0 0.0% 0 0.0% 0
(Don’t do this type of shopping)
0.0% 0 0.0% 0 0.0% 0 0.0% 0 0.0% 0 0.0% 0
(Same place as before) 0.0% 0 0.0% 0 0.0% 0 0.0% 0 0.0% 0 0.0% 0Weighted base: 985 381 264 184 84 72Sample: 983 365 251 175 94 98
By Zone Filtered (Nulls) Isle of Wight Household Survey Page 17 Weighted: for WYG January 2018
Total Zone 1 Zone 2 Zone 3 Zone 4 Zone 5
Column %ges. 090118 NEMS market research
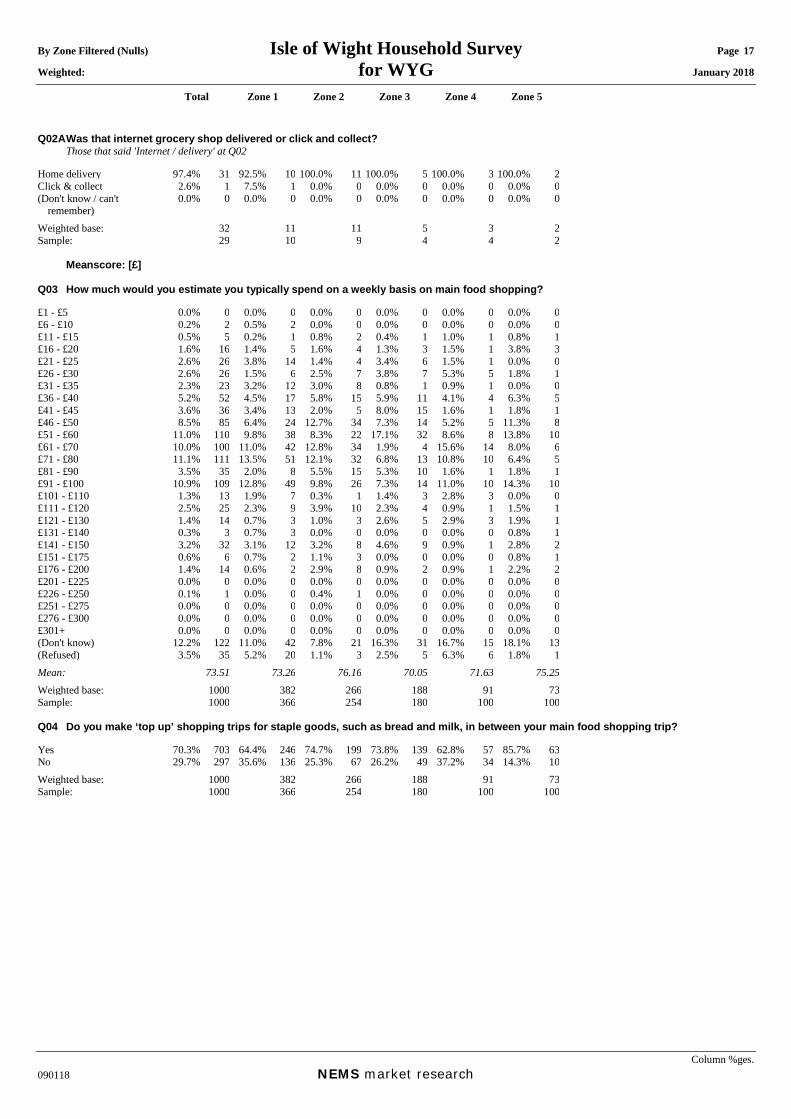
Q02A Was that internet grocery shop delivered or click and collect? Those that said 'Internet / delivery' at Q02 Home delivery 97.4% 31 92.5% 10 100.0% 11 100.0% 5 100.0% 3 100.0% 2Click & collect 2.6% 1 7.5% 1 0.0% 0 0.0% 0 0.0% 0 0.0% 0(Don't know / can't
remember) 0.0% 0 0.0% 0 0.0% 0 0.0% 0 0.0% 0 0.0% 0
Weighted base: 32 11 11 5 3 2Sample: 29 10 9 4 4 2 Meanscore: [£] Q03 How much would you estimate you typically spend on a weekly basis on main food shopping? £1 - £5 0.0% 0 0.0% 0 0.0% 0 0.0% 0 0.0% 0 0.0% 0£6 - £10 0.2% 2 0.5% 2 0.0% 0 0.0% 0 0.0% 0 0.0% 0£11 - £15 0.5% 5 0.2% 1 0.8% 2 0.4% 1 1.0% 1 0.8% 1£16 - £20 1.6% 16 1.4% 5 1.6% 4 1.3% 3 1.5% 1 3.8% 3£21 - £25 2.6% 26 3.8% 14 1.4% 4 3.4% 6 1.5% 1 0.0% 0£26 - £30 2.6% 26 1.5% 6 2.5% 7 3.8% 7 5.3% 5 1.8% 1£31 - £35 2.3% 23 3.2% 12 3.0% 8 0.8% 1 0.9% 1 0.0% 0£36 - £40 5.2% 52 4.5% 17 5.8% 15 5.9% 11 4.1% 4 6.3% 5£41 - £45 3.6% 36 3.4% 13 2.0% 5 8.0% 15 1.6% 1 1.8% 1£46 - £50 8.5% 85 6.4% 24 12.7% 34 7.3% 14 5.2% 5 11.3% 8£51 - £60 11.0% 110 9.8% 38 8.3% 22 17.1% 32 8.6% 8 13.8% 10£61 - £70 10.0% 100 11.0% 42 12.8% 34 1.9% 4 15.6% 14 8.0% 6£71 - £80 11.1% 111 13.5% 51 12.1% 32 6.8% 13 10.8% 10 6.4% 5£81 - £90 3.5% 35 2.0% 8 5.5% 15 5.3% 10 1.6% 1 1.8% 1£91 - £100 10.9% 109 12.8% 49 9.8% 26 7.3% 14 11.0% 10 14.3% 10£101 - £110 1.3% 13 1.9% 7 0.3% 1 1.4% 3 2.8% 3 0.0% 0£111 - £120 2.5% 25 2.3% 9 3.9% 10 2.3% 4 0.9% 1 1.5% 1£121 - £130 1.4% 14 0.7% 3 1.0% 3 2.6% 5 2.9% 3 1.9% 1£131 - £140 0.3% 3 0.7% 3 0.0% 0 0.0% 0 0.0% 0 0.8% 1£141 - £150 3.2% 32 3.1% 12 3.2% 8 4.6% 9 0.9% 1 2.8% 2£151 - £175 0.6% 6 0.7% 2 1.1% 3 0.0% 0 0.0% 0 0.8% 1£176 - £200 1.4% 14 0.6% 2 2.9% 8 0.9% 2 0.9% 1 2.2% 2£201 - £225 0.0% 0 0.0% 0 0.0% 0 0.0% 0 0.0% 0 0.0% 0£226 - £250 0.1% 1 0.0% 0 0.4% 1 0.0% 0 0.0% 0 0.0% 0£251 - £275 0.0% 0 0.0% 0 0.0% 0 0.0% 0 0.0% 0 0.0% 0£276 - £300 0.0% 0 0.0% 0 0.0% 0 0.0% 0 0.0% 0 0.0% 0£301+ 0.0% 0 0.0% 0 0.0% 0 0.0% 0 0.0% 0 0.0% 0(Don't know) 12.2% 122 11.0% 42 7.8% 21 16.3% 31 16.7% 15 18.1% 13(Refused) 3.5% 35 5.2% 20 1.1% 3 2.5% 5 6.3% 6 1.8% 1Mean: 73.51 73.26 76.16 70.05 71.63 75.25Weighted base: 1000 382 266 188 91 73Sample: 1000 366 254 180 100 100 Q04 Do you make ‘top up’ shopping trips for staple goods, such as bread and milk, in between your main food shopping trip? Yes 70.3% 703 64.4% 246 74.7% 199 73.8% 139 62.8% 57 85.7% 63No 29.7% 297 35.6% 136 25.3% 67 26.2% 49 37.2% 34 14.3% 10Weighted base: 1000 382 266 188 91 73Sample: 1000 366 254 180 100 100
By Zone Filtered (Nulls) Isle of Wight Household Survey Page 18 Weighted: for WYG January 2018
Total Zone 1 Zone 2 Zone 3 Zone 4 Zone 5
Column %ges. 090118 NEMS market research
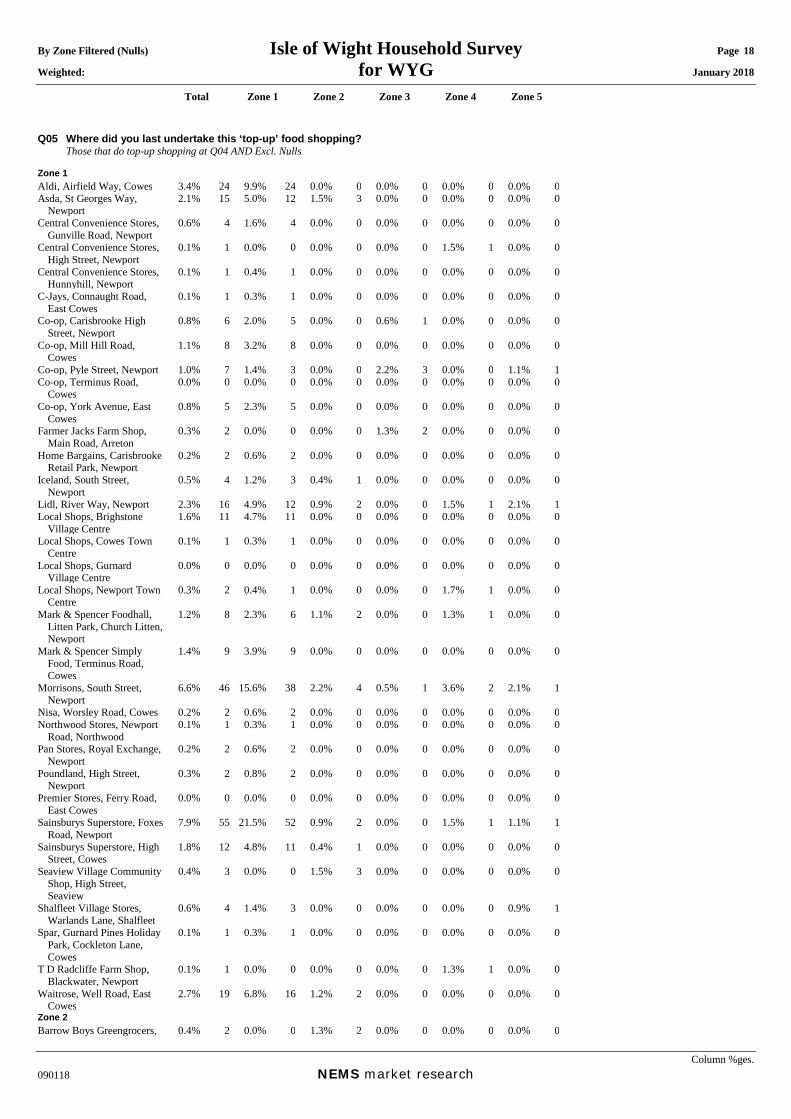
Q05 Where did you last undertake this ‘top-up’ food shopping? Those that do top-up shopping at Q04 AND Excl. Nulls Zone 1 Aldi, Airfield Way, Cowes 3.4% 24 9.9% 24 0.0% 0 0.0% 0 0.0% 0 0.0% 0Asda, St Georges Way,
Newport 2.1% 15 5.0% 12 1.5% 3 0.0% 0 0.0% 0 0.0% 0
Central Convenience Stores, Gunville Road, Newport
0.6% 4 1.6% 4 0.0% 0 0.0% 0 0.0% 0 0.0% 0
Central Convenience Stores, High Street, Newport
0.1% 1 0.0% 0 0.0% 0 0.0% 0 1.5% 1 0.0% 0
Central Convenience Stores, Hunnyhill, Newport
0.1% 1 0.4% 1 0.0% 0 0.0% 0 0.0% 0 0.0% 0
C-Jays, Connaught Road, East Cowes
0.1% 1 0.3% 1 0.0% 0 0.0% 0 0.0% 0 0.0% 0
Co-op, Carisbrooke High Street, Newport
0.8% 6 2.0% 5 0.0% 0 0.6% 1 0.0% 0 0.0% 0
Co-op, Mill Hill Road, Cowes
1.1% 8 3.2% 8 0.0% 0 0.0% 0 0.0% 0 0.0% 0
Co-op, Pyle Street, Newport 1.0% 7 1.4% 3 0.0% 0 2.2% 3 0.0% 0 1.1% 1Co-op, Terminus Road,
Cowes 0.0% 0 0.0% 0 0.0% 0 0.0% 0 0.0% 0 0.0% 0
Co-op, York Avenue, East Cowes
0.8% 5 2.3% 5 0.0% 0 0.0% 0 0.0% 0 0.0% 0
Farmer Jacks Farm Shop, Main Road, Arreton
0.3% 2 0.0% 0 0.0% 0 1.3% 2 0.0% 0 0.0% 0
Home Bargains, Carisbrooke Retail Park, Newport
0.2% 2 0.6% 2 0.0% 0 0.0% 0 0.0% 0 0.0% 0
Iceland, South Street, Newport
0.5% 4 1.2% 3 0.4% 1 0.0% 0 0.0% 0 0.0% 0
Lidl, River Way, Newport 2.3% 16 4.9% 12 0.9% 2 0.0% 0 1.5% 1 2.1% 1Local Shops, Brighstone
Village Centre 1.6% 11 4.7% 11 0.0% 0 0.0% 0 0.0% 0 0.0% 0
Local Shops, Cowes Town Centre
0.1% 1 0.3% 1 0.0% 0 0.0% 0 0.0% 0 0.0% 0
Local Shops, Gurnard Village Centre
0.0% 0 0.0% 0 0.0% 0 0.0% 0 0.0% 0 0.0% 0
Local Shops, Newport Town Centre
0.3% 2 0.4% 1 0.0% 0 0.0% 0 1.7% 1 0.0% 0
Mark & Spencer Foodhall, Litten Park, Church Litten, Newport
1.2% 8 2.3% 6 1.1% 2 0.0% 0 1.3% 1 0.0% 0
Mark & Spencer Simply Food, Terminus Road, Cowes
1.4% 9 3.9% 9 0.0% 0 0.0% 0 0.0% 0 0.0% 0
Morrisons, South Street, Newport
6.6% 46 15.6% 38 2.2% 4 0.5% 1 3.6% 2 2.1% 1
Nisa, Worsley Road, Cowes 0.2% 2 0.6% 2 0.0% 0 0.0% 0 0.0% 0 0.0% 0Northwood Stores, Newport
Road, Northwood 0.1% 1 0.3% 1 0.0% 0 0.0% 0 0.0% 0 0.0% 0
Pan Stores, Royal Exchange, Newport
0.2% 2 0.6% 2 0.0% 0 0.0% 0 0.0% 0 0.0% 0
Poundland, High Street, Newport
0.3% 2 0.8% 2 0.0% 0 0.0% 0 0.0% 0 0.0% 0
Premier Stores, Ferry Road, East Cowes
0.0% 0 0.0% 0 0.0% 0 0.0% 0 0.0% 0 0.0% 0
Sainsburys Superstore, Foxes Road, Newport
7.9% 55 21.5% 52 0.9% 2 0.0% 0 1.5% 1 1.1% 1
Sainsburys Superstore, High Street, Cowes
1.8% 12 4.8% 11 0.4% 1 0.0% 0 0.0% 0 0.0% 0
Seaview Village Community Shop, High Street, Seaview
0.4% 3 0.0% 0 1.5% 3 0.0% 0 0.0% 0 0.0% 0
Shalfleet Village Stores, Warlands Lane, Shalfleet
0.6% 4 1.4% 3 0.0% 0 0.0% 0 0.0% 0 0.9% 1
Spar, Gurnard Pines Holiday Park, Cockleton Lane, Cowes
0.1% 1 0.3% 1 0.0% 0 0.0% 0 0.0% 0 0.0% 0
T D Radcliffe Farm Shop, Blackwater, Newport
0.1% 1 0.0% 0 0.0% 0 0.0% 0 1.3% 1 0.0% 0
Waitrose, Well Road, East Cowes
2.7% 19 6.8% 16 1.2% 2 0.0% 0 0.0% 0 0.0% 0
Zone 2 Barrow Boys Greengrocers, 0.4% 2 0.0% 0 1.3% 2 0.0% 0 0.0% 0 0.0% 0
By Zone Filtered (Nulls) Isle of Wight Household Survey Page 19 Weighted: for WYG January 2018
Total Zone 1 Zone 2 Zone 3 Zone 4 Zone 5
Column %ges. 090118 NEMS market research
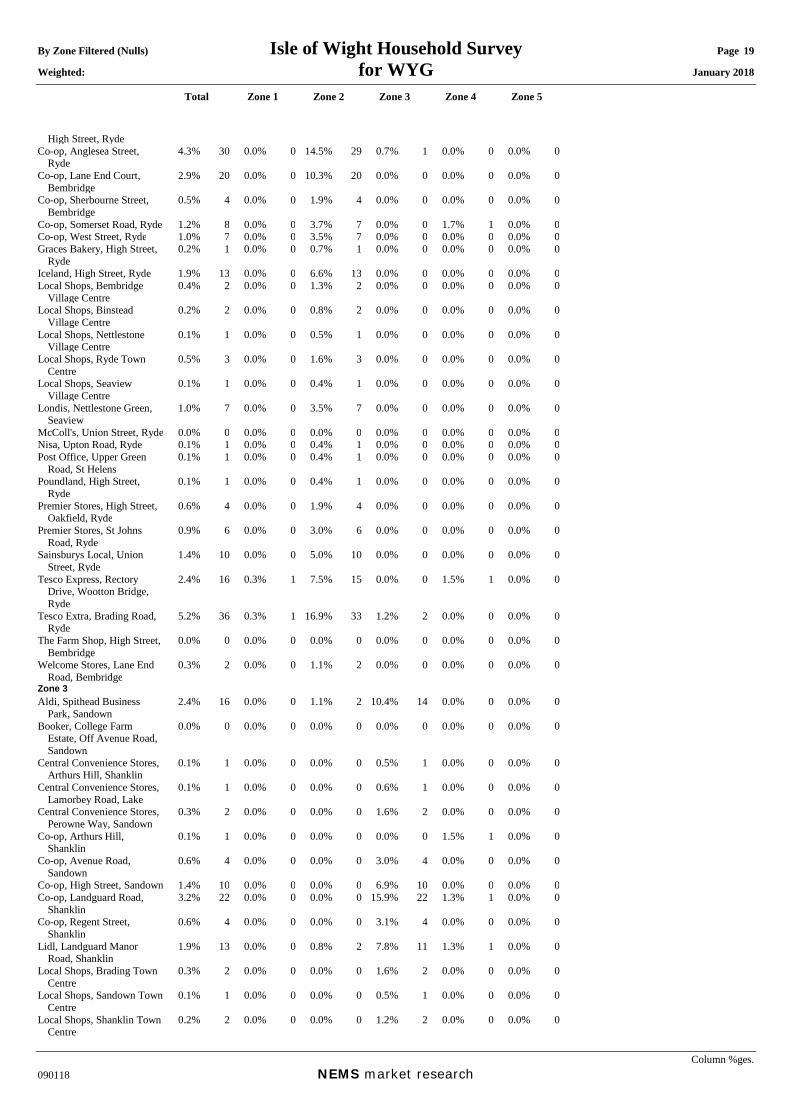
High Street, Ryde Co-op, Anglesea Street,
Ryde 4.3% 30 0.0% 0 14.5% 29 0.7% 1 0.0% 0 0.0% 0
Co-op, Lane End Court, Bembridge
2.9% 20 0.0% 0 10.3% 20 0.0% 0 0.0% 0 0.0% 0
Co-op, Sherbourne Street, Bembridge
0.5% 4 0.0% 0 1.9% 4 0.0% 0 0.0% 0 0.0% 0
Co-op, Somerset Road, Ryde 1.2% 8 0.0% 0 3.7% 7 0.0% 0 1.7% 1 0.0% 0Co-op, West Street, Ryde 1.0% 7 0.0% 0 3.5% 7 0.0% 0 0.0% 0 0.0% 0Graces Bakery, High Street,
Ryde 0.2% 1 0.0% 0 0.7% 1 0.0% 0 0.0% 0 0.0% 0
Iceland, High Street, Ryde 1.9% 13 0.0% 0 6.6% 13 0.0% 0 0.0% 0 0.0% 0Local Shops, Bembridge
Village Centre 0.4% 2 0.0% 0 1.3% 2 0.0% 0 0.0% 0 0.0% 0
Local Shops, Binstead Village Centre
0.2% 2 0.0% 0 0.8% 2 0.0% 0 0.0% 0 0.0% 0
Local Shops, Nettlestone Village Centre
0.1% 1 0.0% 0 0.5% 1 0.0% 0 0.0% 0 0.0% 0
Local Shops, Ryde Town Centre
0.5% 3 0.0% 0 1.6% 3 0.0% 0 0.0% 0 0.0% 0
Local Shops, Seaview Village Centre
0.1% 1 0.0% 0 0.4% 1 0.0% 0 0.0% 0 0.0% 0
Londis, Nettlestone Green, Seaview
1.0% 7 0.0% 0 3.5% 7 0.0% 0 0.0% 0 0.0% 0
McColl's, Union Street, Ryde 0.0% 0 0.0% 0 0.0% 0 0.0% 0 0.0% 0 0.0% 0Nisa, Upton Road, Ryde 0.1% 1 0.0% 0 0.4% 1 0.0% 0 0.0% 0 0.0% 0Post Office, Upper Green
Road, St Helens 0.1% 1 0.0% 0 0.4% 1 0.0% 0 0.0% 0 0.0% 0
Poundland, High Street, Ryde
0.1% 1 0.0% 0 0.4% 1 0.0% 0 0.0% 0 0.0% 0
Premier Stores, High Street, Oakfield, Ryde
0.6% 4 0.0% 0 1.9% 4 0.0% 0 0.0% 0 0.0% 0
Premier Stores, St Johns Road, Ryde
0.9% 6 0.0% 0 3.0% 6 0.0% 0 0.0% 0 0.0% 0
Sainsburys Local, Union Street, Ryde
1.4% 10 0.0% 0 5.0% 10 0.0% 0 0.0% 0 0.0% 0
Tesco Express, Rectory Drive, Wootton Bridge, Ryde
2.4% 16 0.3% 1 7.5% 15 0.0% 0 1.5% 1 0.0% 0
Tesco Extra, Brading Road, Ryde
5.2% 36 0.3% 1 16.9% 33 1.2% 2 0.0% 0 0.0% 0
The Farm Shop, High Street, Bembridge
0.0% 0 0.0% 0 0.0% 0 0.0% 0 0.0% 0 0.0% 0
Welcome Stores, Lane End Road, Bembridge
0.3% 2 0.0% 0 1.1% 2 0.0% 0 0.0% 0 0.0% 0
Zone 3 Aldi, Spithead Business
Park, Sandown 2.4% 16 0.0% 0 1.1% 2 10.4% 14 0.0% 0 0.0% 0
Booker, College Farm Estate, Off Avenue Road, Sandown
0.0% 0 0.0% 0 0.0% 0 0.0% 0 0.0% 0 0.0% 0
Central Convenience Stores, Arthurs Hill, Shanklin
0.1% 1 0.0% 0 0.0% 0 0.5% 1 0.0% 0 0.0% 0
Central Convenience Stores, Lamorbey Road, Lake
0.1% 1 0.0% 0 0.0% 0 0.6% 1 0.0% 0 0.0% 0
Central Convenience Stores, Perowne Way, Sandown
0.3% 2 0.0% 0 0.0% 0 1.6% 2 0.0% 0 0.0% 0
Co-op, Arthurs Hill, Shanklin
0.1% 1 0.0% 0 0.0% 0 0.0% 0 1.5% 1 0.0% 0
Co-op, Avenue Road, Sandown
0.6% 4 0.0% 0 0.0% 0 3.0% 4 0.0% 0 0.0% 0
Co-op, High Street, Sandown 1.4% 10 0.0% 0 0.0% 0 6.9% 10 0.0% 0 0.0% 0Co-op, Landguard Road,
Shanklin 3.2% 22 0.0% 0 0.0% 0 15.9% 22 1.3% 1 0.0% 0
Co-op, Regent Street, Shanklin
0.6% 4 0.0% 0 0.0% 0 3.1% 4 0.0% 0 0.0% 0
Lidl, Landguard Manor Road, Shanklin
1.9% 13 0.0% 0 0.8% 2 7.8% 11 1.3% 1 0.0% 0
Local Shops, Brading Town Centre
0.3% 2 0.0% 0 0.0% 0 1.6% 2 0.0% 0 0.0% 0
Local Shops, Sandown Town Centre
0.1% 1 0.0% 0 0.0% 0 0.5% 1 0.0% 0 0.0% 0
Local Shops, Shanklin Town Centre
0.2% 2 0.0% 0 0.0% 0 1.2% 2 0.0% 0 0.0% 0
By Zone Filtered (Nulls) Isle of Wight Household Survey Page 20 Weighted: for WYG January 2018
Total Zone 1 Zone 2 Zone 3 Zone 4 Zone 5
Column %ges. 090118 NEMS market research
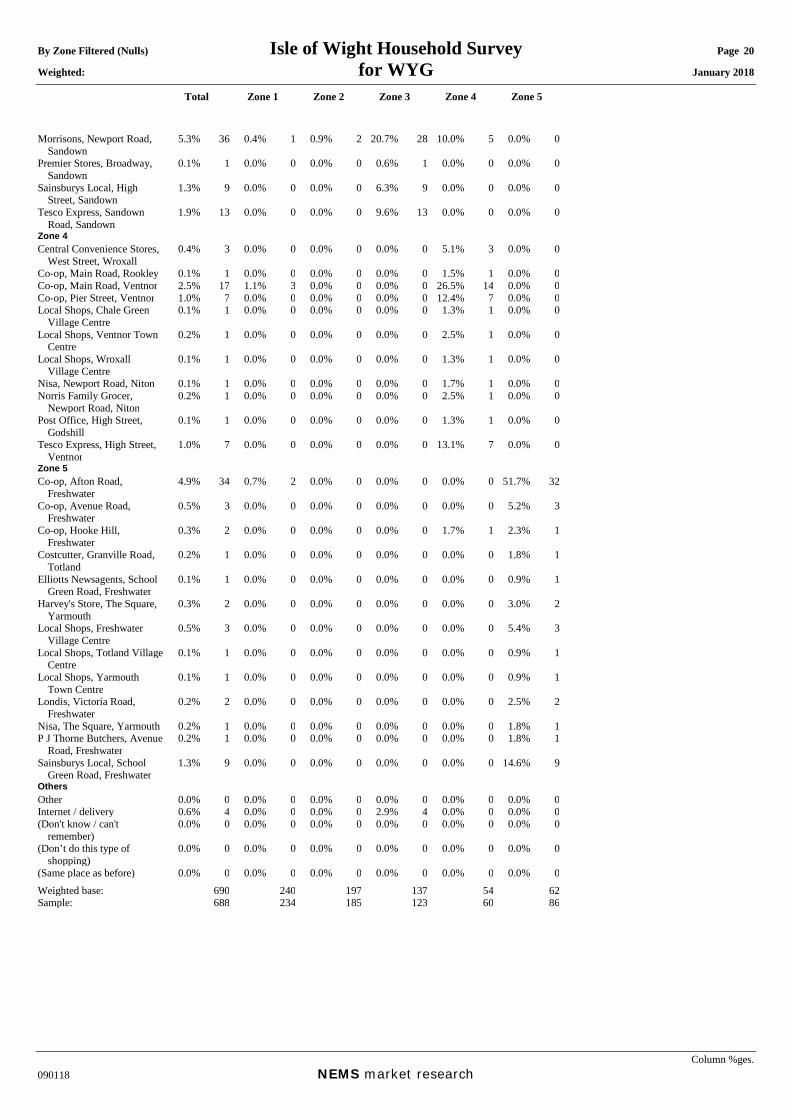
Morrisons, Newport Road, Sandown
5.3% 36 0.4% 1 0.9% 2 20.7% 28 10.0% 5 0.0% 0
Premier Stores, Broadway, Sandown
0.1% 1 0.0% 0 0.0% 0 0.6% 1 0.0% 0 0.0% 0
Sainsburys Local, High Street, Sandown
1.3% 9 0.0% 0 0.0% 0 6.3% 9 0.0% 0 0.0% 0
Tesco Express, Sandown Road, Sandown
1.9% 13 0.0% 0 0.0% 0 9.6% 13 0.0% 0 0.0% 0
Zone 4 Central Convenience Stores,
West Street, Wroxall 0.4% 3 0.0% 0 0.0% 0 0.0% 0 5.1% 3 0.0% 0
Co-op, Main Road, Rookley 0.1% 1 0.0% 0 0.0% 0 0.0% 0 1.5% 1 0.0% 0Co-op, Main Road, Ventnor 2.5% 17 1.1% 3 0.0% 0 0.0% 0 26.5% 14 0.0% 0Co-op, Pier Street, Ventnor 1.0% 7 0.0% 0 0.0% 0 0.0% 0 12.4% 7 0.0% 0Local Shops, Chale Green
Village Centre 0.1% 1 0.0% 0 0.0% 0 0.0% 0 1.3% 1 0.0% 0
Local Shops, Ventnor Town Centre
0.2% 1 0.0% 0 0.0% 0 0.0% 0 2.5% 1 0.0% 0
Local Shops, Wroxall Village Centre
0.1% 1 0.0% 0 0.0% 0 0.0% 0 1.3% 1 0.0% 0
Nisa, Newport Road, Niton 0.1% 1 0.0% 0 0.0% 0 0.0% 0 1.7% 1 0.0% 0Norris Family Grocer,
Newport Road, Niton 0.2% 1 0.0% 0 0.0% 0 0.0% 0 2.5% 1 0.0% 0
Post Office, High Street, Godshill
0.1% 1 0.0% 0 0.0% 0 0.0% 0 1.3% 1 0.0% 0
Tesco Express, High Street, Ventnor
1.0% 7 0.0% 0 0.0% 0 0.0% 0 13.1% 7 0.0% 0
Zone 5 Co-op, Afton Road,
Freshwater 4.9% 34 0.7% 2 0.0% 0 0.0% 0 0.0% 0 51.7% 32
Co-op, Avenue Road, Freshwater
0.5% 3 0.0% 0 0.0% 0 0.0% 0 0.0% 0 5.2% 3
Co-op, Hooke Hill, Freshwater
0.3% 2 0.0% 0 0.0% 0 0.0% 0 1.7% 1 2.3% 1
Costcutter, Granville Road, Totland
0.2% 1 0.0% 0 0.0% 0 0.0% 0 0.0% 0 1.8% 1
Elliotts Newsagents, School Green Road, Freshwater
0.1% 1 0.0% 0 0.0% 0 0.0% 0 0.0% 0 0.9% 1
Harvey's Store, The Square, Yarmouth
0.3% 2 0.0% 0 0.0% 0 0.0% 0 0.0% 0 3.0% 2
Local Shops, Freshwater Village Centre
0.5% 3 0.0% 0 0.0% 0 0.0% 0 0.0% 0 5.4% 3
Local Shops, Totland Village Centre
0.1% 1 0.0% 0 0.0% 0 0.0% 0 0.0% 0 0.9% 1
Local Shops, Yarmouth Town Centre
0.1% 1 0.0% 0 0.0% 0 0.0% 0 0.0% 0 0.9% 1
Londis, Victoria Road, Freshwater
0.2% 2 0.0% 0 0.0% 0 0.0% 0 0.0% 0 2.5% 2
Nisa, The Square, Yarmouth 0.2% 1 0.0% 0 0.0% 0 0.0% 0 0.0% 0 1.8% 1P J Thorne Butchers, Avenue
Road, Freshwater 0.2% 1 0.0% 0 0.0% 0 0.0% 0 0.0% 0 1.8% 1
Sainsburys Local, School Green Road, Freshwater
1.3% 9 0.0% 0 0.0% 0 0.0% 0 0.0% 0 14.6% 9
Others Other 0.0% 0 0.0% 0 0.0% 0 0.0% 0 0.0% 0 0.0% 0Internet / delivery 0.6% 4 0.0% 0 0.0% 0 2.9% 4 0.0% 0 0.0% 0(Don't know / can't
remember) 0.0% 0 0.0% 0 0.0% 0 0.0% 0 0.0% 0 0.0% 0
(Don’t do this type of shopping)
0.0% 0 0.0% 0 0.0% 0 0.0% 0 0.0% 0 0.0% 0
(Same place as before) 0.0% 0 0.0% 0 0.0% 0 0.0% 0 0.0% 0 0.0% 0Weighted base: 690 240 197 137 54 62Sample: 688 234 185 123 60 86
By Zone Filtered (Nulls) Isle of Wight Household Survey Page 21 Weighted: for WYG January 2018
Total Zone 1 Zone 2 Zone 3 Zone 4 Zone 5
Column %ges. 090118 NEMS market research
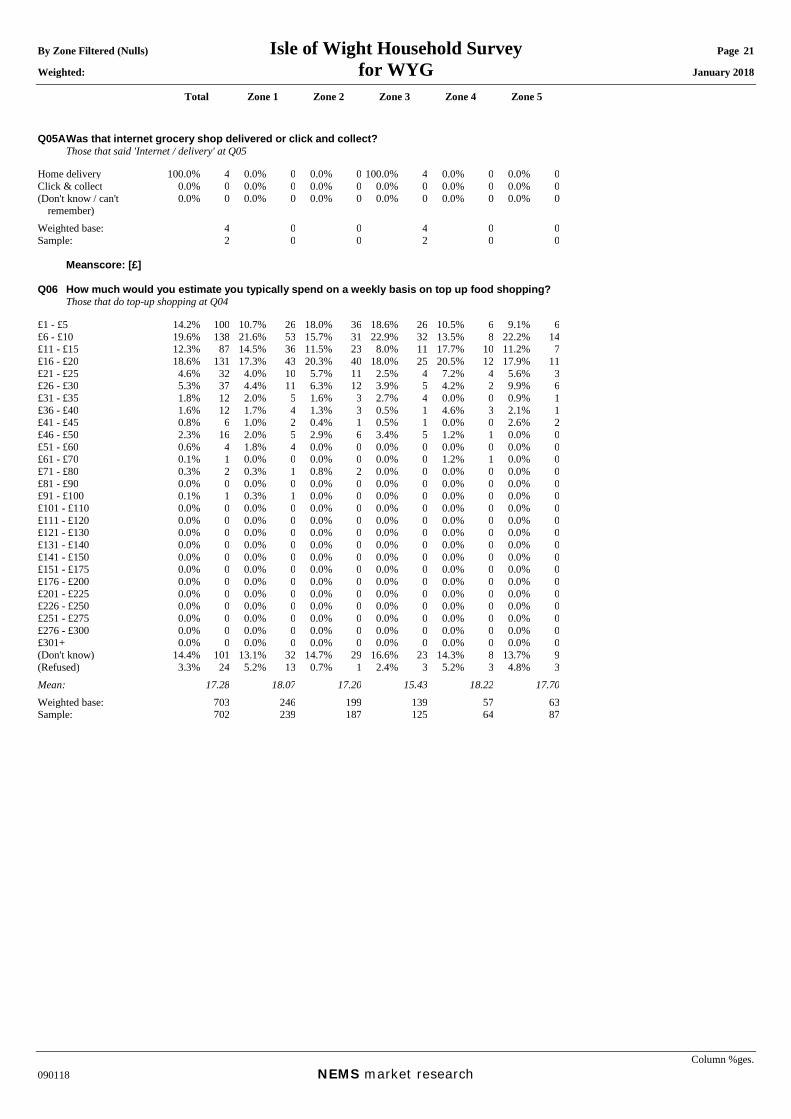
Q05A Was that internet grocery shop delivered or click and collect? Those that said 'Internet / delivery' at Q05 Home delivery 100.0% 4 0.0% 0 0.0% 0 100.0% 4 0.0% 0 0.0% 0Click & collect 0.0% 0 0.0% 0 0.0% 0 0.0% 0 0.0% 0 0.0% 0(Don't know / can't
remember) 0.0% 0 0.0% 0 0.0% 0 0.0% 0 0.0% 0 0.0% 0
Weighted base: 4 0 0 4 0 0Sample: 2 0 0 2 0 0 Meanscore: [£] Q06 How much would you estimate you typically spend on a weekly basis on top up food shopping? Those that do top-up shopping at Q04 £1 - £5 14.2% 100 10.7% 26 18.0% 36 18.6% 26 10.5% 6 9.1% 6£6 - £10 19.6% 138 21.6% 53 15.7% 31 22.9% 32 13.5% 8 22.2% 14£11 - £15 12.3% 87 14.5% 36 11.5% 23 8.0% 11 17.7% 10 11.2% 7£16 - £20 18.6% 131 17.3% 43 20.3% 40 18.0% 25 20.5% 12 17.9% 11£21 - £25 4.6% 32 4.0% 10 5.7% 11 2.5% 4 7.2% 4 5.6% 3£26 - £30 5.3% 37 4.4% 11 6.3% 12 3.9% 5 4.2% 2 9.9% 6£31 - £35 1.8% 12 2.0% 5 1.6% 3 2.7% 4 0.0% 0 0.9% 1£36 - £40 1.6% 12 1.7% 4 1.3% 3 0.5% 1 4.6% 3 2.1% 1£41 - £45 0.8% 6 1.0% 2 0.4% 1 0.5% 1 0.0% 0 2.6% 2£46 - £50 2.3% 16 2.0% 5 2.9% 6 3.4% 5 1.2% 1 0.0% 0£51 - £60 0.6% 4 1.8% 4 0.0% 0 0.0% 0 0.0% 0 0.0% 0£61 - £70 0.1% 1 0.0% 0 0.0% 0 0.0% 0 1.2% 1 0.0% 0£71 - £80 0.3% 2 0.3% 1 0.8% 2 0.0% 0 0.0% 0 0.0% 0£81 - £90 0.0% 0 0.0% 0 0.0% 0 0.0% 0 0.0% 0 0.0% 0£91 - £100 0.1% 1 0.3% 1 0.0% 0 0.0% 0 0.0% 0 0.0% 0£101 - £110 0.0% 0 0.0% 0 0.0% 0 0.0% 0 0.0% 0 0.0% 0£111 - £120 0.0% 0 0.0% 0 0.0% 0 0.0% 0 0.0% 0 0.0% 0£121 - £130 0.0% 0 0.0% 0 0.0% 0 0.0% 0 0.0% 0 0.0% 0£131 - £140 0.0% 0 0.0% 0 0.0% 0 0.0% 0 0.0% 0 0.0% 0£141 - £150 0.0% 0 0.0% 0 0.0% 0 0.0% 0 0.0% 0 0.0% 0£151 - £175 0.0% 0 0.0% 0 0.0% 0 0.0% 0 0.0% 0 0.0% 0£176 - £200 0.0% 0 0.0% 0 0.0% 0 0.0% 0 0.0% 0 0.0% 0£201 - £225 0.0% 0 0.0% 0 0.0% 0 0.0% 0 0.0% 0 0.0% 0£226 - £250 0.0% 0 0.0% 0 0.0% 0 0.0% 0 0.0% 0 0.0% 0£251 - £275 0.0% 0 0.0% 0 0.0% 0 0.0% 0 0.0% 0 0.0% 0£276 - £300 0.0% 0 0.0% 0 0.0% 0 0.0% 0 0.0% 0 0.0% 0£301+ 0.0% 0 0.0% 0 0.0% 0 0.0% 0 0.0% 0 0.0% 0(Don't know) 14.4% 101 13.1% 32 14.7% 29 16.6% 23 14.3% 8 13.7% 9(Refused) 3.3% 24 5.2% 13 0.7% 1 2.4% 3 5.2% 3 4.8% 3Mean: 17.28 18.07 17.20 15.43 18.22 17.70Weighted base: 703 246 199 139 57 63Sample: 702 239 187 125 64 87

By Zone Filtered (Nulls) Isle of Wight Household Survey Page 22 Weighted: for WYG January 2018
Total Zone 1 Zone 2 Zone 3 Zone 4 Zone 5
Column %ges. 090118 NEMS market research
Q07 Where did you last buy clothing or footwear goods? Excl. Nulls Zone 1 Aldi, Airfield Way, Cowes 0.1% 1 0.2% 1 0.0% 0 0.0% 0 0.0% 0 0.0% 0Asda, St Georges Way,
Newport 1.1% 11 2.2% 8 0.0% 0 0.6% 1 1.9% 2 0.0% 0
B&Q, Dodnor Lane, Newport
0.1% 1 0.0% 0 0.0% 0 0.6% 1 0.0% 0 0.0% 0
Capitol Furniture Galleries, Bernard Way, Newport
0.0% 0 0.0% 0 0.0% 0 0.0% 0 0.0% 0 0.0% 0
Carisbrooke Retail Park (formerly Gunville Trading Estate),Taylor Road, Newport (Argos, Mothercare, Home Bargains, Dreams and Carpetright)
0.6% 6 0.0% 0 1.2% 3 0.0% 0 3.1% 3 0.0% 0
Carisbrooke Village Centre 0.0% 0 0.0% 0 0.0% 0 0.0% 0 0.0% 0 0.0% 0Coppins Bridge Retail Park,
Furlongs, Newport (Cineworld, Fever Bar, Pizza Hut, KFC, Maplin and Office Outlet)
0.1% 1 0.3% 1 0.0% 0 0.0% 0 0.0% 0 0.0% 0
Cowes Town Centre 1.0% 9 1.9% 7 1.0% 2 0.0% 0 0.0% 0 0.0% 0Dodner Industrial Estate,
Newport 0.0% 0 0.0% 0 0.0% 0 0.0% 0 0.0% 0 0.0% 0
East Cowes Town Centre 0.1% 1 0.2% 1 0.0% 0 0.0% 0 0.0% 0 0.0% 0Forest View Garden Centre,
Forest Road, Newport 0.0% 0 0.0% 0 0.0% 0 0.0% 0 0.0% 0 0.0% 0
Isle of Wight Motorcycles, Daish Way, Newport
0.1% 1 0.0% 0 0.0% 0 0.0% 0 1.1% 1 0.0% 0
Lidl, River Way, Newport 0.1% 1 0.0% 0 0.0% 0 0.0% 0 0.0% 0 0.8% 1Long Lane Carpets &
Flooring, Long Lane, Newport
0.0% 0 0.0% 0 0.0% 0 0.0% 0 0.0% 0 0.0% 0
Marks & Spencer, Church Litten, Newport
7.9% 72 5.8% 20 9.6% 24 8.3% 14 11.6% 10 6.4% 4
Matalan, Furrlongs, Newport 2.5% 23 2.8% 10 0.7% 2 5.0% 9 0.9% 1 3.1% 2Mole Country Stores,
Blackwater, Newport 0.1% 1 0.0% 0 0.4% 1 0.0% 0 0.0% 0 0.0% 0
Morrisons, South Street, Newport
0.0% 0 0.0% 0 0.0% 0 0.0% 0 0.0% 0 0.0% 0
Newport Town Centre 43.0% 396 48.2% 170 33.2% 81 41.0% 71 42.2% 36 57.3% 39Northwood Village Centre 0.0% 0 0.0% 0 0.0% 0 0.0% 0 0.0% 0 0.0% 0Oakfield District Centre,
Ryde 0.0% 0 0.0% 0 0.0% 0 0.0% 0 0.0% 0 0.0% 0
Riverway Industrial Estate, Riverway, Newport (Magnet Trade, Topps Tiles)
0.0% 0 0.0% 0 0.0% 0 0.0% 0 0.0% 0 0.0% 0
Sainsburys Superstore, Foxes Road, Newport
2.0% 19 2.8% 10 0.7% 2 1.4% 2 1.6% 1 4.7% 3
Sainsburys Superstore, High Street, Cowes
0.1% 1 0.2% 1 0.0% 0 0.0% 0 0.0% 0 0.0% 0
The Range, Place Road, Cowes
0.0% 0 0.0% 0 0.0% 0 0.0% 0 0.0% 0 0.0% 0
Towngate Retail Park, Newport (Halfords, Mattressman and Pavers)
0.0% 0 0.0% 0 0.0% 0 0.0% 0 0.0% 0 0.0% 0
Wakes Retail Park, Medina Way, Newport (Pets at Home, Currys, PC World and Dunelm)
0.0% 0 0.0% 0 0.0% 0 0.0% 0 0.0% 0 0.0% 0
Zone 2 Bembridge Village Centre 0.0% 0 0.0% 0 0.0% 0 0.0% 0 0.0% 0 0.0% 0Busy Bee Garden Centre,
Brading Road, Ryde 0.0% 0 0.0% 0 0.0% 0 0.0% 0 0.0% 0 0.0% 0
Medina Garden Centre, Staplers Road, Wootton Bridge, Ryde
0.0% 0 0.0% 0 0.0% 0 0.0% 0 0.0% 0 0.0% 0
Ryde Town Centre 4.6% 42 0.8% 3 14.1% 34 2.9% 5 0.0% 0 0.0% 0Seaview Village Centre 0.0% 0 0.0% 0 0.0% 0 0.0% 0 0.0% 0 0.0% 0Spinnaker Chandlery, 0.1% 1 0.0% 0 0.4% 1 0.0% 0 0.0% 0 0.0% 0

By Zone Filtered (Nulls) Isle of Wight Household Survey Page 23 Weighted: for WYG January 2018
Total Zone 1 Zone 2 Zone 3 Zone 4 Zone 5
Column %ges. 090118 NEMS market research
Embankment Road, Bembridge
Tesco Extra, Brading Road, Ryde
0.9% 8 0.7% 3 0.6% 1 1.8% 3 1.1% 1 0.0% 0
Westridge Golf Centre, Brading Road, Ryde
0.0% 0 0.0% 0 0.0% 0 0.0% 0 0.0% 0 0.0% 0
Wooton Bridge Village Centre
0.0% 0 0.0% 0 0.0% 0 0.0% 0 0.0% 0 0.0% 0
Aldi, Spithead Bus Park, Sandown
0.0% 0 0.0% 0 0.0% 0 0.0% 0 0.0% 0 0.0% 0
Zone 3 Brading Town Centre 0.0% 0 0.0% 0 0.0% 0 0.0% 0 0.0% 0 0.0% 0Honnor & Jeffrey Dalverton
Garden Centre, Newport Road, Sandown
0.1% 1 0.0% 0 0.0% 0 0.4% 1 0.0% 0 0.0% 0
Jubilee Garden Centre, Newport Road, Branstone, Sandown
0.1% 1 0.0% 0 0.0% 0 0.4% 1 0.0% 0 0.0% 0
Lake Industrial Estate, Lake Industrial Way, Sandown
0.0% 0 0.0% 0 0.0% 0 0.0% 0 0.0% 0 0.0% 0
Lake Village Centre 0.0% 0 0.0% 0 0.0% 0 0.0% 0 0.0% 0 0.0% 0Languard Holiday Park,
Shanklin 0.0% 0 0.0% 0 0.0% 0 0.0% 0 0.0% 0 0.0% 0
Lidl, Landguard Manor Road, Shanklin
0.1% 1 0.0% 0 0.0% 0 0.0% 0 0.9% 1 0.0% 0
Morrisons, Newport Road, Sandown
0.0% 0 0.0% 0 0.0% 0 0.0% 0 0.0% 0 0.0% 0
Oasis, Carpenters Road, Brading
0.0% 0 0.0% 0 0.0% 0 0.0% 0 0.0% 0 0.0% 0
Sandown Town Centre 0.7% 6 0.0% 0 0.0% 0 3.7% 6 0.0% 0 0.0% 0Shanklin Town Centre 1.0% 9 0.0% 0 0.0% 0 3.7% 6 3.3% 3 0.0% 0Spithead Business Centre,
Newport Road, Sandown 0.0% 0 0.0% 0 0.0% 0 0.0% 0 0.0% 0 0.0% 0
Thomson Plant and Garden Centre, Watery Lane, Newchurch
0.0% 0 0.0% 0 0.0% 0 0.0% 0 0.0% 0 0.0% 0
Zone 4 Godshill Village Centre 0.0% 0 0.0% 0 0.0% 0 0.0% 0 0.0% 0 0.0% 0Niton Village Centre 0.0% 0 0.0% 0 0.0% 0 0.0% 0 0.0% 0 0.0% 0Other - Zone 4 0.0% 0 0.0% 0 0.0% 0 0.0% 0 0.0% 0 0.0% 0Ventnor Town Centre 0.5% 4 0.0% 0 0.0% 0 1.2% 2 2.7% 2 0.0% 0Zone 5 Freshwater Town Centre 0.2% 2 0.0% 0 0.0% 0 0.0% 0 0.0% 0 2.8% 2Honnor & Jeffrey Afton
Garden Centre, Afton Road, Freshwater
0.0% 0 0.0% 0 0.0% 0 0.0% 0 0.0% 0 0.0% 0
Totland Village Centre 0.0% 0 0.0% 0 0.0% 0 0.0% 0 0.0% 0 0.0% 0Yarmouth Town Centre 0.0% 0 0.0% 0 0.0% 0 0.0% 0 0.0% 0 0.0% 0Outside Survey Area Abroad 0.9% 8 1.8% 6 0.4% 1 0.4% 1 0.0% 0 0.0% 0Bournemouth Town Centre 0.1% 1 0.2% 1 0.0% 0 0.0% 0 0.0% 0 0.0% 0Bradbeers Retail Park,
Wellington Way, Hedge End
0.0% 0 0.0% 0 0.0% 0 0.0% 0 0.0% 0 0.0% 0
Brighton City Centre 0.3% 2 0.0% 0 0.0% 0 0.0% 0 0.9% 1 2.4% 2Central London 0.8% 7 0.7% 2 0.8% 2 1.1% 2 0.8% 1 0.0% 0Gunwharf Quays,
Portsmouth 0.5% 5 0.2% 1 0.8% 2 0.6% 1 0.9% 1 0.0% 0
Hedge End Retail Park, Charles Watts Way, Southampton
0.0% 0 0.0% 0 0.0% 0 0.0% 0 0.0% 0 0.0% 0
Ikea, West Quay Road, Southampton
0.0% 0 0.0% 0 0.0% 0 0.0% 0 0.0% 0 0.0% 0
Lymington Town Centre 0.1% 1 0.0% 0 0.3% 1 0.0% 0 0.0% 0 0.0% 0Mountbatten Retail Park,
Western Esplanade, Southampton
0.0% 0 0.0% 0 0.0% 0 0.0% 0 0.0% 0 0.0% 0
Newchurch Village Centre 0.0% 0 0.0% 0 0.0% 0 0.0% 0 0.0% 0 0.0% 0Ocean Retail Park, Burrfields
Road, Portsmouth 0.0% 0 0.0% 0 0.0% 0 0.0% 0 0.0% 0 0.0% 0
Other - Outside Survey Area 1.3% 12 1.7% 6 1.2% 3 1.2% 2 0.0% 0 1.7% 1Portsmouth City Centre 1.9% 㔂̂ז 1.5% 5 4.4% 11 0.0% 0 0.9% 1 0.8% 1Sofasofa, Viaduct Works,
Newport 0.0% 0 0.0% 0 0.0% 0 0.0% 0 0.0% 0 0.0% 0
By Zone Filtered (Nulls) Isle of Wight Household Survey Page 24 Weighted: for WYG January 2018
Total Zone 1 Zone 2 Zone 3 Zone 4 Zone 5
Column %ges. 090118 NEMS market research
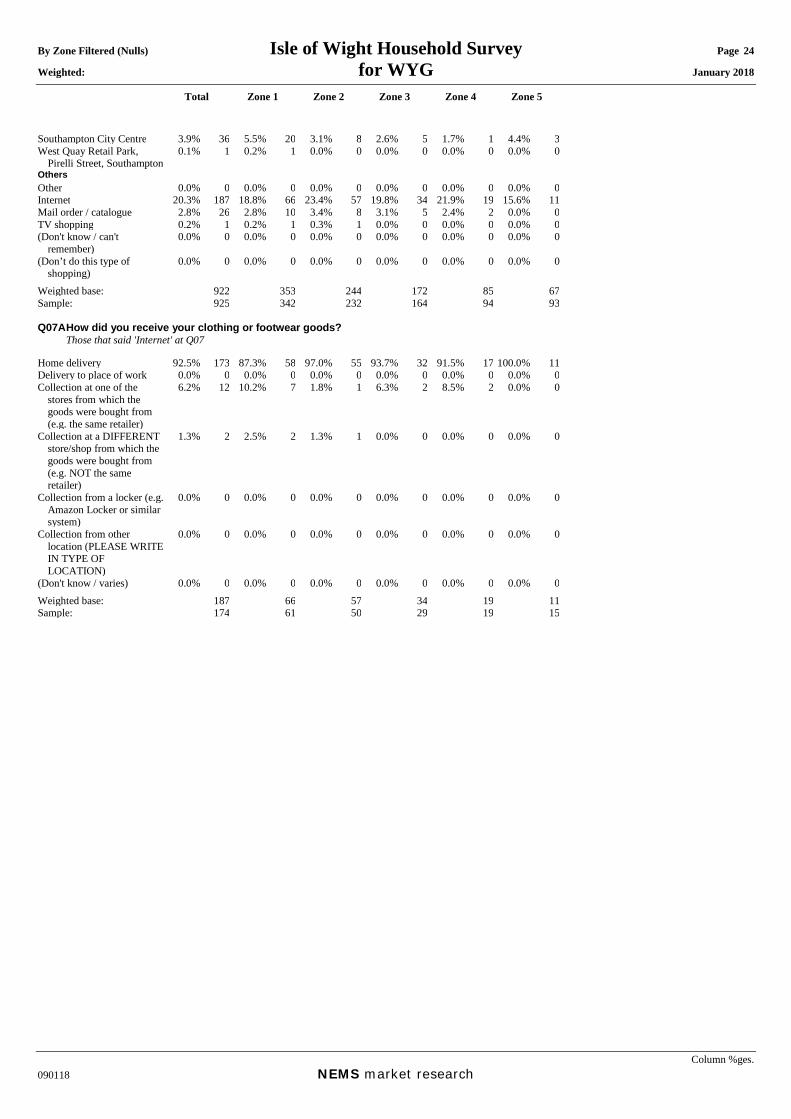
Southampton City Centre 3.9% 36 5.5% 20 3.1% 8 2.6% 5 1.7% 1 4.4% 3West Quay Retail Park,
Pirelli Street, Southampton 0.1% 1 0.2% 1 0.0% 0 0.0% 0 0.0% 0 0.0% 0
Others Other 0.0% 0 0.0% 0 0.0% 0 0.0% 0 0.0% 0 0.0% 0Internet 20.3% 187 18.8% 66 23.4% 57 19.8% 34 21.9% 19 15.6% 11Mail order / catalogue 2.8% 26 2.8% 10 3.4% 8 3.1% 5 2.4% 2 0.0% 0TV shopping 0.2% 1 0.2% 1 0.3% 1 0.0% 0 0.0% 0 0.0% 0(Don't know / can't
remember) 0.0% 0 0.0% 0 0.0% 0 0.0% 0 0.0% 0 0.0% 0
(Don’t do this type of shopping)
0.0% 0 0.0% 0 0.0% 0 0.0% 0 0.0% 0 0.0% 0
Weighted base: 922 353 244 172 85 67Sample: 925 342 232 164 94 93 Q07A How did you receive your clothing or footwear goods? Those that said 'Internet' at Q07 Home delivery 92.5% 173 87.3% 58 97.0% 55 93.7% 32 91.5% 17 100.0% 11Delivery to place of work 0.0% 0 0.0% 0 0.0% 0 0.0% 0 0.0% 0 0.0% 0Collection at one of the
stores from which the goods were bought from (e.g. the same retailer)
6.2% 12 10.2% 7 1.8% 1 6.3% 2 8.5% 2 0.0% 0
Collection at a DIFFERENT store/shop from which the goods were bought from (e.g. NOT the same retailer)
1.3% 2 2.5% 2 1.3% 1 0.0% 0 0.0% 0 0.0% 0
Collection from a locker (e.g. Amazon Locker or similar system)
0.0% 0 0.0% 0 0.0% 0 0.0% 0 0.0% 0 0.0% 0
Collection from other location (PLEASE WRITE IN TYPE OF LOCATION)
0.0% 0 0.0% 0 0.0% 0 0.0% 0 0.0% 0 0.0% 0
(Don't know / varies) 0.0% 0 0.0% 0 0.0% 0 0.0% 0 0.0% 0 0.0% 0Weighted base: 187 66 57 34 19 11Sample: 174 61 50 29 19 15

By Zone Filtered (Nulls) Isle of Wight Household Survey Page 25 Weighted: for WYG January 2018
Total Zone 1 Zone 2 Zone 3 Zone 4 Zone 5
Column %ges. 090118 NEMS market research
Q08 Where did you last buy books, CDs or DVDs? Excl. Nulls Zone 1 Aldi, Airfield Way, Cowes 0.0% 0 0.0% 0 0.0% 0 0.0% 0 0.0% 0 0.0% 0Asda, St Georges Way,
Newport 0.3% 2 0.2% 1 0.0% 0 1.2% 2 0.0% 0 0.0% 0
B&Q, Dodnor Lane, Newport
0.0% 0 0.0% 0 0.0% 0 0.0% 0 0.0% 0 0.0% 0
Capitol Furniture Galleries, Bernard Way, Newport
0.0% 0 0.0% 0 0.0% 0 0.0% 0 0.0% 0 0.0% 0
Carisbrooke Retail Park (formerly Gunville Trading Estate),Taylor Road, Newport (Argos, Mothercare, Home Bargains, Dreams and Carpetright)
0.0% 0 0.0% 0 0.0% 0 0.0% 0 0.0% 0 0.0% 0
Carisbrooke Village Centre 0.0% 0 0.0% 0 0.0% 0 0.0% 0 0.0% 0 0.0% 0Coppins Bridge Retail Park,
Furlongs, Newport (Cineworld, Fever Bar, Pizza Hut, KFC, Maplin and Office Outlet)
0.1% 1 0.0% 0 0.0% 0 0.0% 0 0.0% 0 1.1% 1
Cowes Town Centre 0.4% 3 0.3% 1 0.0% 0 0.0% 0 0.0% 0 4.2% 2Dodner Industrial Estate,
Newport 0.0% 0 0.0% 0 0.0% 0 0.0% 0 0.0% 0 0.0% 0
East Cowes Town Centre 0.4% 3 0.2% 1 0.0% 0 1.5% 2 0.0% 0 0.0% 0Forest View Garden Centre,
Forest Road, Newport 0.0% 0 0.0% 0 0.0% 0 0.0% 0 0.0% 0 0.0% 0
Isle of Wight Motorcycles, Daish Way, Newport
0.0% 0 0.0% 0 0.0% 0 0.0% 0 0.0% 0 0.0% 0
Lidl, River Way, Newport 0.1% 1 0.0% 0 0.0% 0 0.0% 0 0.0% 0 1.1% 1Long Lane Carpets &
Flooring, Long Lane, Newport
0.0% 0 0.0% 0 0.0% 0 0.0% 0 0.0% 0 0.0% 0
Marks & Spencer, Church Litten, Newport
0.0% 0 0.0% 0 0.0% 0 0.0% 0 0.0% 0 0.0% 0
Matalan, Furrlongs, Newport 0.0% 0 0.0% 0 0.0% 0 0.0% 0 0.0% 0 0.0% 0Mole Country Stores,
Blackwater, Newport 0.0% 0 0.0% 0 0.0% 0 0.0% 0 0.0% 0 0.0% 0
Morrisons, South Street, Newport
1.3% 10 1.6% 4 0.8% 2 2.6% 4 0.0% 0 0.0% 0
Newport Town Centre 24.6% 180 33.4% 95 16.0% 31 17.4% 25 29.0% 17 23.5% 12Northwood Village Centre 0.0% 0 0.0% 0 0.0% 0 0.0% 0 0.0% 0 0.0% 0Oakfield District Centre,
Ryde 0.0% 0 0.0% 0 0.0% 0 0.0% 0 0.0% 0 0.0% 0
Riverway Industrial Estate, Riverway, Newport (Magnet Trade, Topps Tiles)
0.0% 0 0.0% 0 0.0% 0 0.0% 0 0.0% 0 0.0% 0
Sainsburys Superstore, Foxes Road, Newport
1.9% 14 4.2% 12 0.4% 1 0.5% 1 0.0% 0 1.1% 1
Sainsburys Superstore, High Street, Cowes
0.0% 0 0.0% 0 0.0% 0 0.0% 0 0.0% 0 0.0% 0
The Range, Place Road, Cowes
0.0% 0 0.0% 0 0.0% 0 0.0% 0 0.0% 0 0.0% 0
Towngate Retail Park, Newport (Halfords, Mattressman and Pavers)
0.0% 0 0.0% 0 0.0% 0 0.0% 0 0.0% 0 0.0% 0
Wakes Retail Park, Medina Way, Newport (Pets at Home, Currys, PC World and Dunelm)
0.0% 0 0.0% 0 0.0% 0 0.0% 0 0.0% 0 0.0% 0
Zone 2 Bembridge Village Centre 0.1% 1 0.0% 0 0.4% 1 0.0% 0 0.0% 0 0.0% 0Busy Bee Garden Centre,
Brading Road, Ryde 0.1% 1 0.0% 0 0.0% 0 0.0% 0 1.1% 1 0.0% 0
Medina Garden Centre, Staplers Road, Wootton Bridge, Ryde
0.0% 0 0.0% 0 0.0% 0 0.0% 0 0.0% 0 0.0% 0
Ryde Town Centre 4.9% 36 0.9% 3 14.7% 29 3.4% 5 0.0% 0 0.0% 0Seaview Village Centre 0.0% 0 0.0% 0 0.0% 0 0.0% 0 0.0% 0 0.0% 0Spinnaker Chandlery, 0.0% 0 0.0% 0 0.0% 0 0.0% 0 0.0% 0 0.0% 0

By Zone Filtered (Nulls) Isle of Wight Household Survey Page 26 Weighted: for WYG January 2018
Total Zone 1 Zone 2 Zone 3 Zone 4 Zone 5
Column %ges. 090118 NEMS market research
Embankment Road, Bembridge
Tesco Extra, Brading Road, Ryde
5.0% 37 0.0% 0 10.1% 20 10.6% 15 2.6% 2 0.0% 0
Westridge Golf Centre, Brading Road, Ryde
0.0% 0 0.0% 0 0.0% 0 0.0% 0 0.0% 0 0.0% 0
Wooton Bridge Village Centre
0.0% 0 0.0% 0 0.0% 0 0.0% 0 0.0% 0 0.0% 0
Aldi, Spithead Bus Park, Sandown
0.0% 0 0.0% 0 0.0% 0 0.0% 0 0.0% 0 0.0% 0
Zone 3 Brading Town Centre 0.0% 0 0.0% 0 0.0% 0 0.0% 0 0.0% 0 0.0% 0Honnor & Jeffrey Dalverton
Garden Centre, Newport Road, Sandown
0.0% 0 0.0% 0 0.0% 0 0.0% 0 0.0% 0 0.0% 0
Jubilee Garden Centre, Newport Road, Branstone, Sandown
0.0% 0 0.0% 0 0.0% 0 0.0% 0 0.0% 0 0.0% 0
Lake Industrial Estate, Lake Industrial Way, Sandown
0.0% 0 0.0% 0 0.0% 0 0.0% 0 0.0% 0 0.0% 0
Lake Village Centre 0.0% 0 0.0% 0 0.0% 0 0.0% 0 0.0% 0 0.0% 0Languard Holiday Park,
Shanklin 0.1% 1 0.0% 0 0.0% 0 0.5% 1 0.0% 0 0.0% 0
Lidl, Landguard Manor Road, Shanklin
0.0% 0 0.0% 0 0.0% 0 0.0% 0 0.0% 0 0.0% 0
Morrisons, Newport Road, Sandown
1.5% 11 0.0% 0 0.4% 1 6.1% 9 2.8% 2 0.0% 0
Oasis, Carpenters Road, Brading
0.0% 0 0.0% 0 0.0% 0 0.0% 0 0.0% 0 0.0% 0
Sandown Town Centre 0.4% 3 0.0% 0 0.0% 0 2.1% 3 0.0% 0 0.0% 0Shanklin Town Centre 1.2% 9 0.3% 1 0.0% 0 4.2% 6 3.8% 2 0.0% 0Spithead Business Centre,
Newport Road, Sandown 0.0% 0 0.0% 0 0.0% 0 0.0% 0 0.0% 0 0.0% 0
Thomson Plant and Garden Centre, Watery Lane, Newchurch
0.0% 0 0.0% 0 0.0% 0 0.0% 0 0.0% 0 0.0% 0
Zone 4 Godshill Village Centre 0.0% 0 0.0% 0 0.0% 0 0.0% 0 0.0% 0 0.0% 0Niton Village Centre 0.0% 0 0.0% 0 0.0% 0 0.0% 0 0.0% 0 0.0% 0Other - Zone 4 0.0% 0 0.0% 0 0.0% 0 0.0% 0 0.0% 0 0.0% 0Ventnor Town Centre 0.2% 2 0.0% 0 0.0% 0 0.0% 0 2.8% 2 0.0% 0Zone 5 Freshwater Town Centre 0.5% 3 0.0% 0 0.0% 0 0.0% 0 0.0% 0 6.5% 3Honnor & Jeffrey Afton
Garden Centre, Afton Road, Freshwater
0.0% 0 0.0% 0 0.0% 0 0.0% 0 0.0% 0 0.0% 0
Totland Village Centre 0.0% 0 0.0% 0 0.0% 0 0.0% 0 0.0% 0 0.0% 0Yarmouth Town Centre 0.1% 1 0.0% 0 0.0% 0 0.0% 0 0.0% 0 1.1% 1Outside Survey Area Abroad 0.3% 2 0.2% 1 0.5% 1 0.5% 1 0.0% 0 0.0% 0Bournemouth Town Centre 0.1% 1 0.0% 0 0.4% 1 0.0% 0 0.0% 0 0.0% 0Bradbeers Retail Park,
Wellington Way, Hedge End
0.0% 0 0.0% 0 0.0% 0 0.0% 0 0.0% 0 0.0% 0
Brighton City Centre 0.0% 0 0.0% 0 0.0% 0 0.0% 0 0.0% 0 0.0% 0Central London 0.1% 1 0.2% 1 0.0% 0 0.0% 0 0.0% 0 0.0% 0Gunwharf Quays,
Portsmouth 0.3% 2 0.7% 2 0.0% 0 0.0% 0 0.0% 0 0.0% 0
Hedge End Retail Park, Charles Watts Way, Southampton
0.0% 0 0.0% 0 0.0% 0 0.0% 0 0.0% 0 0.0% 0
Ikea, West Quay Road, Southampton
0.0% 0 0.0% 0 0.0% 0 0.0% 0 0.0% 0 0.0% 0
Lymington Town Centre 0.1% 1 0.3% 1 0.0% 0 0.0% 0 0.0% 0 0.0% 0Mountbatten Retail Park,
Western Esplanade, Southampton
0.0% 0 0.0% 0 0.0% 0 0.0% 0 0.0% 0 0.0% 0
Newchurch Village Centre 0.0% 0 0.0% 0 0.0% 0 0.0% 0 0.0% 0 0.0% 0Ocean Retail Park, Burrfields
Road, Portsmouth 0.0% 0 0.0% 0 0.0% 0 0.0% 0 0.0% 0 0.0% 0
Other - Outside Survey Area 0.5% 4 1.4% 4 0.0% 0 0.0% 0 0.0% 0 0.0% 0Portsmouth City Centre 0.1% 1 0.0% 0 0.0% 0 0.5% 1 0.0% 0 0.0% 0Sofasofa, Viaduct Works,
Newport 0.0% 0 0.0% 0 0.0% 0 0.0% 0 0.0% 0 0.0% 0
By Zone Filtered (Nulls) Isle of Wight Household Survey Page 27 Weighted: for WYG January 2018
Total Zone 1 Zone 2 Zone 3 Zone 4 Zone 5
Column %ges. 090118 NEMS market research
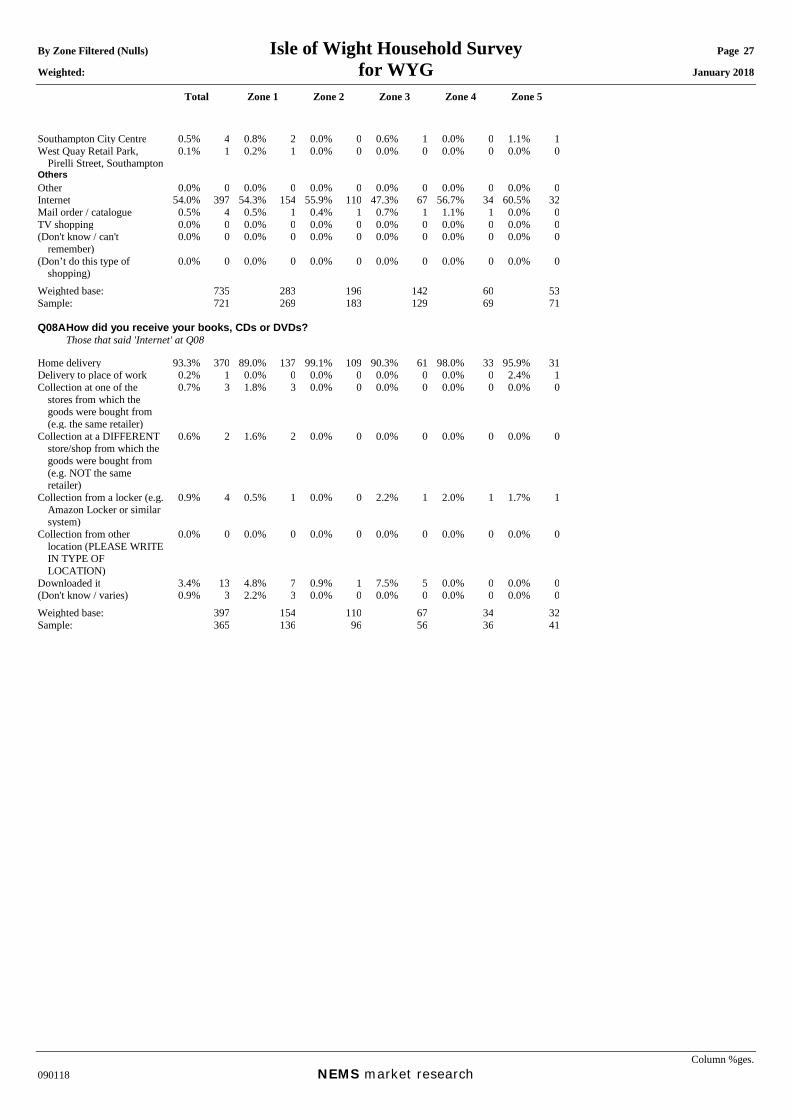
Southampton City Centre 0.5% 4 0.8% 2 0.0% 0 0.6% 1 0.0% 0 1.1% 1West Quay Retail Park,
Pirelli Street, Southampton 0.1% 1 0.2% 1 0.0% 0 0.0% 0 0.0% 0 0.0% 0
Others Other 0.0% 0 0.0% 0 0.0% 0 0.0% 0 0.0% 0 0.0% 0Internet 54.0% 397 54.3% 154 55.9% 110 47.3% 67 56.7% 34 60.5% 32Mail order / catalogue 0.5% 4 0.5% 1 0.4% 1 0.7% 1 1.1% 1 0.0% 0TV shopping 0.0% 0 0.0% 0 0.0% 0 0.0% 0 0.0% 0 0.0% 0(Don't know / can't
remember) 0.0% 0 0.0% 0 0.0% 0 0.0% 0 0.0% 0 0.0% 0
(Don’t do this type of shopping)
0.0% 0 0.0% 0 0.0% 0 0.0% 0 0.0% 0 0.0% 0
Weighted base: 735 283 196 142 60 53Sample: 721 269 183 129 69 71 Q08A How did you receive your books, CDs or DVDs? Those that said 'Internet' at Q08 Home delivery 93.3% 370 89.0% 137 99.1% 109 90.3% 61 98.0% 33 95.9% 31Delivery to place of work 0.2% 1 0.0% 0 0.0% 0 0.0% 0 0.0% 0 2.4% 1Collection at one of the
stores from which the goods were bought from (e.g. the same retailer)
0.7% 3 1.8% 3 0.0% 0 0.0% 0 0.0% 0 0.0% 0
Collection at a DIFFERENT store/shop from which the goods were bought from (e.g. NOT the same retailer)
0.6% 2 1.6% 2 0.0% 0 0.0% 0 0.0% 0 0.0% 0
Collection from a locker (e.g. Amazon Locker or similar system)
0.9% 4 0.5% 1 0.0% 0 2.2% 1 2.0% 1 1.7% 1
Collection from other location (PLEASE WRITE IN TYPE OF LOCATION)
0.0% 0 0.0% 0 0.0% 0 0.0% 0 0.0% 0 0.0% 0
Downloaded it 3.4% 13 4.8% 7 0.9% 1 7.5% 5 0.0% 0 0.0% 0(Don't know / varies) 0.9% 3 2.2% 3 0.0% 0 0.0% 0 0.0% 0 0.0% 0Weighted base: 397 154 110 67 34 32Sample: 365 136 96 56 36 41

By Zone Filtered (Nulls) Isle of Wight Household Survey Page 28 Weighted: for WYG January 2018
Total Zone 1 Zone 2 Zone 3 Zone 4 Zone 5
Column %ges. 090118 NEMS market research
Q09 Where did you last buy furnishings and household textile goods? Excl. Nulls Zone 1 Aldi, Airfield Way, Cowes 0.5% 4 1.2% 4 0.0% 0 0.0% 0 0.0% 0 0.0% 0Asda, St Georges Way,
Newport 0.9% 7 2.4% 7 0.0% 0 0.0% 0 0.0% 0 0.0% 0
B&Q, Dodnor Lane, Newport
1.8% 14 2.1% 6 1.2% 2 2.2% 3 0.0% 0 3.1% 2
Capitol Furniture Galleries, Bernard Way, Newport
0.0% 0 0.0% 0 0.0% 0 0.0% 0 0.0% 0 0.0% 0
Carisbrooke Retail Park (formerly Gunville Trading Estate),Taylor Road, Newport (Argos, Mothercare, Home Bargains, Dreams and Carpetright)
3.1% 24 2.8% 8 1.9% 4 3.6% 5 8.9% 6 1.0% 1
Carisbrooke Village Centre 0.0% 0 0.0% 0 0.0% 0 0.0% 0 0.0% 0 0.0% 0Coppins Bridge Retail Park,
Furlongs, Newport (Cineworld, Fever Bar, Pizza Hut, KFC, Maplin and Office Outlet)
0.2% 2 0.0% 0 0.4% 1 0.0% 0 1.4% 1 0.0% 0
Cowes Town Centre 4.2% 32 6.9% 21 2.2% 4 1.9% 3 2.7% 2 5.3% 3Dodner Industrial Estate,
Newport 0.0% 0 0.0% 0 0.0% 0 0.0% 0 0.0% 0 0.0% 0
East Cowes Town Centre 0.0% 0 0.0% 0 0.0% 0 0.0% 0 0.0% 0 0.0% 0Forest View Garden Centre,
Forest Road, Newport 0.0% 0 0.0% 0 0.0% 0 0.0% 0 0.0% 0 0.0% 0
Isle of Wight Motorcycles, Daish Way, Newport
0.0% 0 0.0% 0 0.0% 0 0.0% 0 0.0% 0 0.0% 0
Lidl, River Way, Newport 0.0% 0 0.0% 0 0.0% 0 0.0% 0 0.0% 0 0.0% 0Long Lane Carpets &
Flooring, Long Lane, Newport
0.0% 0 0.0% 0 0.0% 0 0.0% 0 0.0% 0 0.0% 0
Marks & Spencer, Church Litten, Newport
2.3% 18 1.4% 4 2.7% 6 2.7% 4 2.3% 1 4.7% 3
Matalan, Furrlongs, Newport 0.3% 2 0.3% 1 0.0% 0 0.0% 0 2.1% 1 0.0% 0Mole Country Stores,
Blackwater, Newport 0.0% 0 0.0% 0 0.0% 0 0.0% 0 0.0% 0 0.0% 0
Morrisons, South Street, Newport
1.5% 12 2.0% 6 0.4% 1 0.6% 1 4.2% 3 3.0% 2
Newport Town Centre 25.5% 197 34.3% 102 19.6% 40 19.0% 29 27.8% 18 14.4% 8Northwood Village Centre 0.3% 2 0.7% 2 0.0% 0 0.0% 0 0.0% 0 0.0% 0Oakfield District Centre,
Ryde 0.0% 0 0.0% 0 0.0% 0 0.0% 0 0.0% 0 0.0% 0
Riverway Industrial Estate, Riverway, Newport (Magnet Trade, Topps Tiles)
1.3% 10 0.7% 2 2.0% 4 2.2% 3 0.0% 0 1.4% 1
Sainsburys Superstore, Foxes Road, Newport
1.3% 10 2.9% 9 0.0% 0 0.7% 1 0.0% 0 1.0% 1
Sainsburys Superstore, High Street, Cowes
0.0% 0 0.0% 0 0.0% 0 0.0% 0 0.0% 0 0.0% 0
The Range, Place Road, Cowes
0.7% 6 0.2% 1 1.9% 4 0.7% 1 0.0% 0 0.0% 0
Towngate Retail Park, Newport (Halfords, Mattressman and Pavers)
0.0% 0 0.0% 0 0.0% 0 0.0% 0 0.0% 0 0.0% 0
Wakes Retail Park, Medina Way, Newport (Pets at Home, Currys, PC World and Dunelm)
19.3% 149 16.7% 50 19.9% 41 21.4% 33 16.7% 11 28.3% 15
Zone 2 Bembridge Village Centre 0.0% 0 0.0% 0 0.0% 0 0.0% 0 0.0% 0 0.0% 0Busy Bee Garden Centre,
Brading Road, Ryde 0.3% 2 0.0% 0 0.5% 1 0.5% 1 0.0% 0 1.2% 1
Medina Garden Centre, Staplers Road, Wootton Bridge, Ryde
0.0% 0 0.0% 0 0.0% 0 0.0% 0 0.0% 0 0.0% 0
Ryde Town Centre 3.6% 28 1.9% 6 8.6% 18 2.7% 4 1.1% 1 0.0% 0Seaview Village Centre 0.0% 0 0.0% 0 0.0% 0 0.0% 0 0.0% 0 0.0% 0Spinnaker Chandlery, 0.0% 0 0.0% 0 0.0% 0 0.0% 0 0.0% 0 0.0% 0
By Zone Filtered (Nulls) Isle of Wight Household Survey Page 29 Weighted: for WYG January 2018
Total Zone 1 Zone 2 Zone 3 Zone 4 Zone 5
Column %ges. 090118 NEMS market research
Embankment Road, Bembridge
Tesco Extra, Brading Road, Ryde
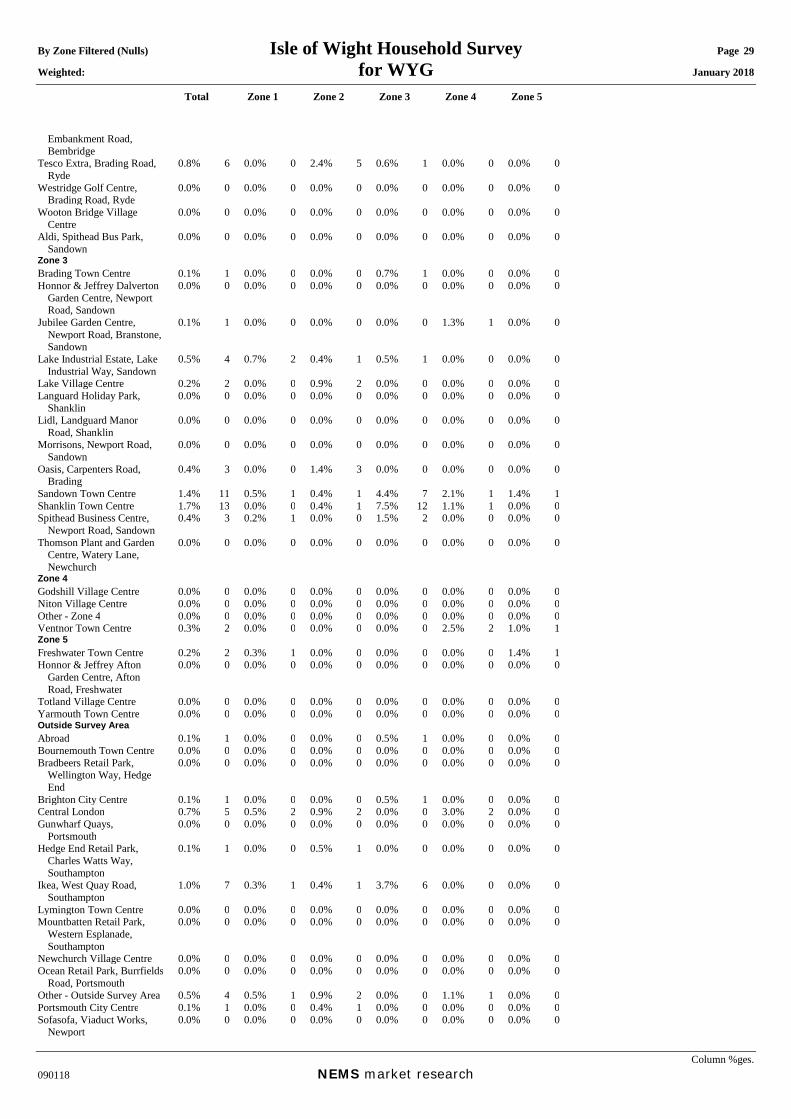
0.8% 6 0.0% 0 2.4% 5 0.6% 1 0.0% 0 0.0% 0
Westridge Golf Centre, Brading Road, Ryde
0.0% 0 0.0% 0 0.0% 0 0.0% 0 0.0% 0 0.0% 0
Wooton Bridge Village Centre
0.0% 0 0.0% 0 0.0% 0 0.0% 0 0.0% 0 0.0% 0
Aldi, Spithead Bus Park, Sandown
0.0% 0 0.0% 0 0.0% 0 0.0% 0 0.0% 0 0.0% 0
Zone 3 Brading Town Centre 0.1% 1 0.0% 0 0.0% 0 0.7% 1 0.0% 0 0.0% 0Honnor & Jeffrey Dalverton
Garden Centre, Newport Road, Sandown
0.0% 0 0.0% 0 0.0% 0 0.0% 0 0.0% 0 0.0% 0
Jubilee Garden Centre, Newport Road, Branstone, Sandown
0.1% 1 0.0% 0 0.0% 0 0.0% 0 1.3% 1 0.0% 0
Lake Industrial Estate, Lake Industrial Way, Sandown
0.5% 4 0.7% 2 0.4% 1 0.5% 1 0.0% 0 0.0% 0
Lake Village Centre 0.2% 2 0.0% 0 0.9% 2 0.0% 0 0.0% 0 0.0% 0Languard Holiday Park,
Shanklin 0.0% 0 0.0% 0 0.0% 0 0.0% 0 0.0% 0 0.0% 0
Lidl, Landguard Manor Road, Shanklin
0.0% 0 0.0% 0 0.0% 0 0.0% 0 0.0% 0 0.0% 0
Morrisons, Newport Road, Sandown
0.0% 0 0.0% 0 0.0% 0 0.0% 0 0.0% 0 0.0% 0
Oasis, Carpenters Road, Brading
0.4% 3 0.0% 0 1.4% 3 0.0% 0 0.0% 0 0.0% 0
Sandown Town Centre 1.4% 11 0.5% 1 0.4% 1 4.4% 7 2.1% 1 1.4% 1Shanklin Town Centre 1.7% 13 0.0% 0 0.4% 1 7.5% 12 1.1% 1 0.0% 0Spithead Business Centre,
Newport Road, Sandown 0.4% 3 0.2% 1 0.0% 0 1.5% 2 0.0% 0 0.0% 0
Thomson Plant and Garden Centre, Watery Lane, Newchurch
0.0% 0 0.0% 0 0.0% 0 0.0% 0 0.0% 0 0.0% 0
Zone 4 Godshill Village Centre 0.0% 0 0.0% 0 0.0% 0 0.0% 0 0.0% 0 0.0% 0Niton Village Centre 0.0% 0 0.0% 0 0.0% 0 0.0% 0 0.0% 0 0.0% 0Other - Zone 4 0.0% 0 0.0% 0 0.0% 0 0.0% 0 0.0% 0 0.0% 0Ventnor Town Centre 0.3% 2 0.0% 0 0.0% 0 0.0% 0 2.5% 2 1.0% 1Zone 5 Freshwater Town Centre 0.2% 2 0.3% 1 0.0% 0 0.0% 0 0.0% 0 1.4% 1Honnor & Jeffrey Afton
Garden Centre, Afton Road, Freshwater
0.0% 0 0.0% 0 0.0% 0 0.0% 0 0.0% 0 0.0% 0
Totland Village Centre 0.0% 0 0.0% 0 0.0% 0 0.0% 0 0.0% 0 0.0% 0Yarmouth Town Centre 0.0% 0 0.0% 0 0.0% 0 0.0% 0 0.0% 0 0.0% 0Outside Survey Area Abroad 0.1% 1 0.0% 0 0.0% 0 0.5% 1 0.0% 0 0.0% 0Bournemouth Town Centre 0.0% 0 0.0% 0 0.0% 0 0.0% 0 0.0% 0 0.0% 0Bradbeers Retail Park,
Wellington Way, Hedge End
0.0% 0 0.0% 0 0.0% 0 0.0% 0 0.0% 0 0.0% 0
Brighton City Centre 0.1% 1 0.0% 0 0.0% 0 0.5% 1 0.0% 0 0.0% 0Central London 0.7% 5 0.5% 2 0.9% 2 0.0% 0 3.0% 2 0.0% 0Gunwharf Quays,
Portsmouth 0.0% 0 0.0% 0 0.0% 0 0.0% 0 0.0% 0 0.0% 0
Hedge End Retail Park, Charles Watts Way, Southampton
0.1% 1 0.0% 0 0.5% 1 0.0% 0 0.0% 0 0.0% 0
Ikea, West Quay Road, Southampton
1.0% 7 0.3% 1 0.4% 1 3.7% 6 0.0% 0 0.0% 0
Lymington Town Centre 0.0% 0 0.0% 0 0.0% 0 0.0% 0 0.0% 0 0.0% 0Mountbatten Retail Park,
Western Esplanade, Southampton
0.0% 0 0.0% 0 0.0% 0 0.0% 0 0.0% 0 0.0% 0
Newchurch Village Centre 0.0% 0 0.0% 0 0.0% 0 0.0% 0 0.0% 0 0.0% 0Ocean Retail Park, Burrfields
Road, Portsmouth 0.0% 0 0.0% 0 0.0% 0 0.0% 0 0.0% 0 0.0% 0
Other - Outside Survey Area 0.5% 4 0.5% 1 0.9% 2 0.0% 0 1.1% 1 0.0% 0Portsmouth City Centre 0.1% 1 0.0% 0 0.4% 1 0.0% 0 0.0% 0 0.0% 0Sofasofa, Viaduct Works,
Newport 0.0% 0 0.0% 0 0.0% 0 0.0% 0 0.0% 0 0.0% 0

By Zone Filtered (Nulls) Isle of Wight Household Survey Page 30 Weighted: for WYG January 2018
Total Zone 1 Zone 2 Zone 3 Zone 4 Zone 5
Column %ges. 090118 NEMS market research
Southampton City Centre 5.4% 42 6.9% 20 3.1% 6 4.8% 7 2.3% 1 11.5% 6West Quay Retail Park,
Pirelli Street, Southampton 0.2% 2 0.0% 0 0.8% 2 0.0% 0 0.0% 0 0.0% 0
Others Other 0.0% 0 0.0% 0 0.0% 0 0.0% 0 0.0% 0 0.0% 0Internet 16.3% 126 11.4% 34 25.4% 52 12.3% 19 18.3% 12 18.1% 10Mail order / catalogue 2.1% 16 1.7% 5 0.7% 1 4.8% 7 1.1% 1 3.1% 2TV shopping 0.1% 1 0.3% 1 0.0% 0 0.0% 0 0.0% 0 0.0% 0(Don't know / can't
remember) 0.0% 0 0.0% 0 0.0% 0 0.0% 0 0.0% 0 0.0% 0
(Don’t do this type of shopping)
0.0% 0 0.0% 0 0.0% 0 0.0% 0 0.0% 0 0.0% 0
Weighted base: 773 297 204 153 64 54Sample: 763 279 191 147 73 73 Q09A How did you receive your furnishings and household textile goods? Those that said 'Internet' at Q09 Home delivery 89.9% 113 77.6% 26 95.0% 49 100.0% 19 84.2% 10 93.2% 9Delivery to place of work 0.0% 0 0.0% 0 0.0% 0 0.0% 0 0.0% 0 0.0% 0Collection at one of the
stores from which the goods were bought from (e.g. the same retailer)
6.7% 9 22.4% 8 0.0% 0 0.0% 0 7.9% 1 0.0% 0
Collection at a DIFFERENT store/shop from which the goods were bought from (e.g. NOT the same retailer)
1.4% 2 0.0% 0 3.3% 2 0.0% 0 0.0% 0 0.0% 0
Collection from a locker (e.g. Amazon Locker or similar system)
0.0% 0 0.0% 0 0.0% 0 0.0% 0 0.0% 0 0.0% 0
Collection from other location (PLEASE WRITE IN TYPE OF LOCATION)
0.0% 0 0.0% 0 0.0% 0 0.0% 0 0.0% 0 0.0% 0
(Don't know / varies) 1.9% 2 0.0% 0 1.7% 1 0.0% 0 7.9% 1 6.8% 1Weighted base: 126 34 52 19 12 10Sample: 121 31 45 18 13 14
By Zone Filtered (Nulls) Isle of Wight Household Survey Page 31 Weighted: for WYG January 2018
Total Zone 1 Zone 2 Zone 3 Zone 4 Zone 5
Column %ges. 090118 NEMS market research
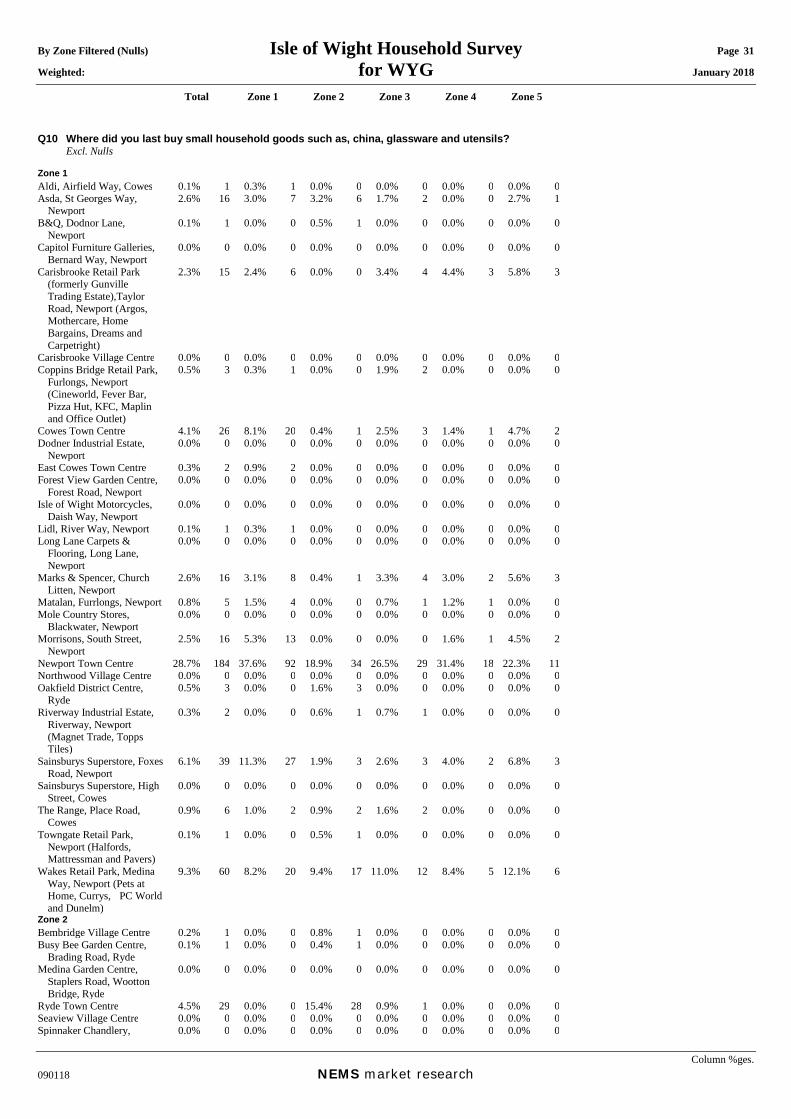
Q10 Where did you last buy small household goods such as, china, glassware and utensils? Excl. Nulls Zone 1 Aldi, Airfield Way, Cowes 0.1% 1 0.3% 1 0.0% 0 0.0% 0 0.0% 0 0.0% 0Asda, St Georges Way,
Newport 2.6% 16 3.0% 7 3.2% 6 1.7% 2 0.0% 0 2.7% 1
B&Q, Dodnor Lane, Newport
0.1% 1 0.0% 0 0.5% 1 0.0% 0 0.0% 0 0.0% 0
Capitol Furniture Galleries, Bernard Way, Newport
0.0% 0 0.0% 0 0.0% 0 0.0% 0 0.0% 0 0.0% 0
Carisbrooke Retail Park (formerly Gunville Trading Estate),Taylor Road, Newport (Argos, Mothercare, Home Bargains, Dreams and Carpetright)
2.3% 15 2.4% 6 0.0% 0 3.4% 4 4.4% 3 5.8% 3
Carisbrooke Village Centre 0.0% 0 0.0% 0 0.0% 0 0.0% 0 0.0% 0 0.0% 0Coppins Bridge Retail Park,
Furlongs, Newport (Cineworld, Fever Bar, Pizza Hut, KFC, Maplin and Office Outlet)
0.5% 3 0.3% 1 0.0% 0 1.9% 2 0.0% 0 0.0% 0
Cowes Town Centre 4.1% 26 8.1% 20 0.4% 1 2.5% 3 1.4% 1 4.7% 2Dodner Industrial Estate,
Newport 0.0% 0 0.0% 0 0.0% 0 0.0% 0 0.0% 0 0.0% 0
East Cowes Town Centre 0.3% 2 0.9% 2 0.0% 0 0.0% 0 0.0% 0 0.0% 0Forest View Garden Centre,
Forest Road, Newport 0.0% 0 0.0% 0 0.0% 0 0.0% 0 0.0% 0 0.0% 0
Isle of Wight Motorcycles, Daish Way, Newport
0.0% 0 0.0% 0 0.0% 0 0.0% 0 0.0% 0 0.0% 0
Lidl, River Way, Newport 0.1% 1 0.3% 1 0.0% 0 0.0% 0 0.0% 0 0.0% 0Long Lane Carpets &
Flooring, Long Lane, Newport
0.0% 0 0.0% 0 0.0% 0 0.0% 0 0.0% 0 0.0% 0
Marks & Spencer, Church Litten, Newport
2.6% 16 3.1% 8 0.4% 1 3.3% 4 3.0% 2 5.6% 3
Matalan, Furrlongs, Newport 0.8% 5 1.5% 4 0.0% 0 0.7% 1 1.2% 1 0.0% 0Mole Country Stores,
Blackwater, Newport 0.0% 0 0.0% 0 0.0% 0 0.0% 0 0.0% 0 0.0% 0
Morrisons, South Street, Newport
2.5% 16 5.3% 13 0.0% 0 0.0% 0 1.6% 1 4.5% 2
Newport Town Centre 28.7% 184 37.6% 92 18.9% 34 26.5% 29 31.4% 18 22.3% 11Northwood Village Centre 0.0% 0 0.0% 0 0.0% 0 0.0% 0 0.0% 0 0.0% 0Oakfield District Centre,
Ryde 0.5% 3 0.0% 0 1.6% 3 0.0% 0 0.0% 0 0.0% 0
Riverway Industrial Estate, Riverway, Newport (Magnet Trade, Topps Tiles)
0.3% 2 0.0% 0 0.6% 1 0.7% 1 0.0% 0 0.0% 0
Sainsburys Superstore, Foxes Road, Newport
6.1% 39 11.3% 27 1.9% 3 2.6% 3 4.0% 2 6.8% 3
Sainsburys Superstore, High Street, Cowes
0.0% 0 0.0% 0 0.0% 0 0.0% 0 0.0% 0 0.0% 0
The Range, Place Road, Cowes
0.9% 6 1.0% 2 0.9% 2 1.6% 2 0.0% 0 0.0% 0
Towngate Retail Park, Newport (Halfords, Mattressman and Pavers)
0.1% 1 0.0% 0 0.5% 1 0.0% 0 0.0% 0 0.0% 0
Wakes Retail Park, Medina Way, Newport (Pets at Home, Currys, PC World and Dunelm)
9.3% 60 8.2% 20 9.4% 17 11.0% 12 8.4% 5 12.1% 6
Zone 2 Bembridge Village Centre 0.2% 1 0.0% 0 0.8% 1 0.0% 0 0.0% 0 0.0% 0Busy Bee Garden Centre,
Brading Road, Ryde 0.1% 1 0.0% 0 0.4% 1 0.0% 0 0.0% 0 0.0% 0
Medina Garden Centre, Staplers Road, Wootton Bridge, Ryde
0.0% 0 0.0% 0 0.0% 0 0.0% 0 0.0% 0 0.0% 0
Ryde Town Centre 4.5% 29 0.0% 0 15.4% 28 0.9% 1 0.0% 0 0.0% 0Seaview Village Centre 0.0% 0 0.0% 0 0.0% 0 0.0% 0 0.0% 0 0.0% 0Spinnaker Chandlery, 0.0% 0 0.0% 0 0.0% 0 0.0% 0 0.0% 0 0.0% 0

By Zone Filtered (Nulls) Isle of Wight Household Survey Page 32 Weighted: for WYG January 2018
Total Zone 1 Zone 2 Zone 3 Zone 4 Zone 5
Column %ges. 090118 NEMS market research
Embankment Road, Bembridge
Tesco Extra, Brading Road, Ryde
9.4% 60 1.1% 3 23.9% 43 10.7% 12 2.6% 1 1.4% 1
Westridge Golf Centre, Brading Road, Ryde
0.0% 0 0.0% 0 0.0% 0 0.0% 0 0.0% 0 0.0% 0
Wooton Bridge Village Centre
0.0% 0 0.0% 0 0.0% 0 0.0% 0 0.0% 0 0.0% 0
Aldi, Spithead Bus Park, Sandown
0.1% 1 0.0% 0 0.0% 0 0.0% 0 1.6% 1 0.0% 0
Zone 3 Brading Town Centre 0.0% 0 0.0% 0 0.0% 0 0.0% 0 0.0% 0 0.0% 0Honnor & Jeffrey Dalverton
Garden Centre, Newport Road, Sandown
0.0% 0 0.0% 0 0.0% 0 0.0% 0 0.0% 0 0.0% 0
Jubilee Garden Centre, Newport Road, Branstone, Sandown
0.0% 0 0.0% 0 0.0% 0 0.0% 0 0.0% 0 0.0% 0
Lake Industrial Estate, Lake Industrial Way, Sandown
0.0% 0 0.0% 0 0.0% 0 0.0% 0 0.0% 0 0.0% 0
Lake Village Centre 0.0% 0 0.0% 0 0.0% 0 0.0% 0 0.0% 0 0.0% 0Languard Holiday Park,
Shanklin 0.0% 0 0.0% 0 0.0% 0 0.0% 0 0.0% 0 0.0% 0
Lidl, Landguard Manor Road, Shanklin
0.3% 2 0.0% 0 0.0% 0 1.7% 2 0.0% 0 0.0% 0
Morrisons, Newport Road, Sandown
0.7% 4 0.0% 0 0.4% 1 2.1% 2 2.4% 1 0.0% 0
Oasis, Carpenters Road, Brading
0.0% 0 0.0% 0 0.0% 0 0.0% 0 0.0% 0 0.0% 0
Sandown Town Centre 0.0% 0 0.0% 0 0.0% 0 0.0% 0 0.0% 0 0.0% 0Shanklin Town Centre 3.3% 21 0.0% 0 0.0% 0 16.4% 18 4.6% 3 0.0% 0Spithead Business Centre,
Newport Road, Sandown 0.0% 0 0.0% 0 0.0% 0 0.0% 0 0.0% 0 0.0% 0
Thomson Plant and Garden Centre, Watery Lane, Newchurch
0.0% 0 0.0% 0 0.0% 0 0.0% 0 0.0% 0 0.0% 0
Zone 4 Godshill Village Centre 0.0% 0 0.0% 0 0.0% 0 0.0% 0 0.0% 0 0.0% 0Niton Village Centre 0.0% 0 0.0% 0 0.0% 0 0.0% 0 0.0% 0 0.0% 0Other - Zone 4 0.0% 0 0.0% 0 0.0% 0 0.0% 0 0.0% 0 0.0% 0Ventnor Town Centre 1.5% 10 0.0% 0 0.0% 0 0.0% 0 17.2% 10 0.0% 0Zone 5 Freshwater Town Centre 2.0% 13 0.8% 2 0.0% 0 0.0% 0 0.0% 0 22.2% 11Honnor & Jeffrey Afton
Garden Centre, Afton Road, Freshwater
0.0% 0 0.0% 0 0.0% 0 0.0% 0 0.0% 0 0.0% 0
Totland Village Centre 0.0% 0 0.0% 0 0.0% 0 0.0% 0 0.0% 0 0.0% 0Yarmouth Town Centre 0.0% 0 0.0% 0 0.0% 0 0.0% 0 0.0% 0 0.0% 0Outside Survey Area Abroad 0.3% 2 0.4% 1 0.0% 0 0.7% 1 0.0% 0 0.0% 0Bournemouth Town Centre 0.0% 0 0.0% 0 0.0% 0 0.0% 0 0.0% 0 0.0% 0Bradbeers Retail Park,
Wellington Way, Hedge End
0.0% 0 0.0% 0 0.0% 0 0.0% 0 0.0% 0 0.0% 0
Brighton City Centre 0.0% 0 0.0% 0 0.0% 0 0.0% 0 0.0% 0 0.0% 0Central London 0.4% 3 0.6% 2 0.6% 1 0.0% 0 0.0% 0 0.0% 0Gunwharf Quays,
Portsmouth 0.1% 1 0.0% 0 0.0% 0 0.0% 0 1.2% 1 0.0% 0
Hedge End Retail Park, Charles Watts Way, Southampton
0.0% 0 0.0% 0 0.0% 0 0.0% 0 0.0% 0 0.0% 0
Ikea, West Quay Road, Southampton
1.5% 9 0.0% 0 3.1% 6 1.6% 2 3.4% 2 0.0% 0
Lymington Town Centre 0.0% 0 0.0% 0 0.0% 0 0.0% 0 0.0% 0 0.0% 0Mountbatten Retail Park,
Western Esplanade, Southampton
0.0% 0 0.0% 0 0.0% 0 0.0% 0 0.0% 0 0.0% 0
Newchurch Village Centre 0.0% 0 0.0% 0 0.0% 0 0.0% 0 0.0% 0 0.0% 0Ocean Retail Park, Burrfields
Road, Portsmouth 0.0% 0 0.0% 0 0.0% 0 0.0% 0 0.0% 0 0.0% 0
Other - Outside Survey Area 0.6% 4 0.3% 1 0.4% 1 2.3% 3 0.0% 0 0.0% 0Portsmouth City Centre 0.1% 1 0.0% 0 0.0% 0 0.7% 1 0.0% 0 0.0% 0Sofasofa, Viaduct Works,
Newport 0.0% 0 0.0% 0 0.0% 0 0.0% 0 0.0% 0 0.0% 0
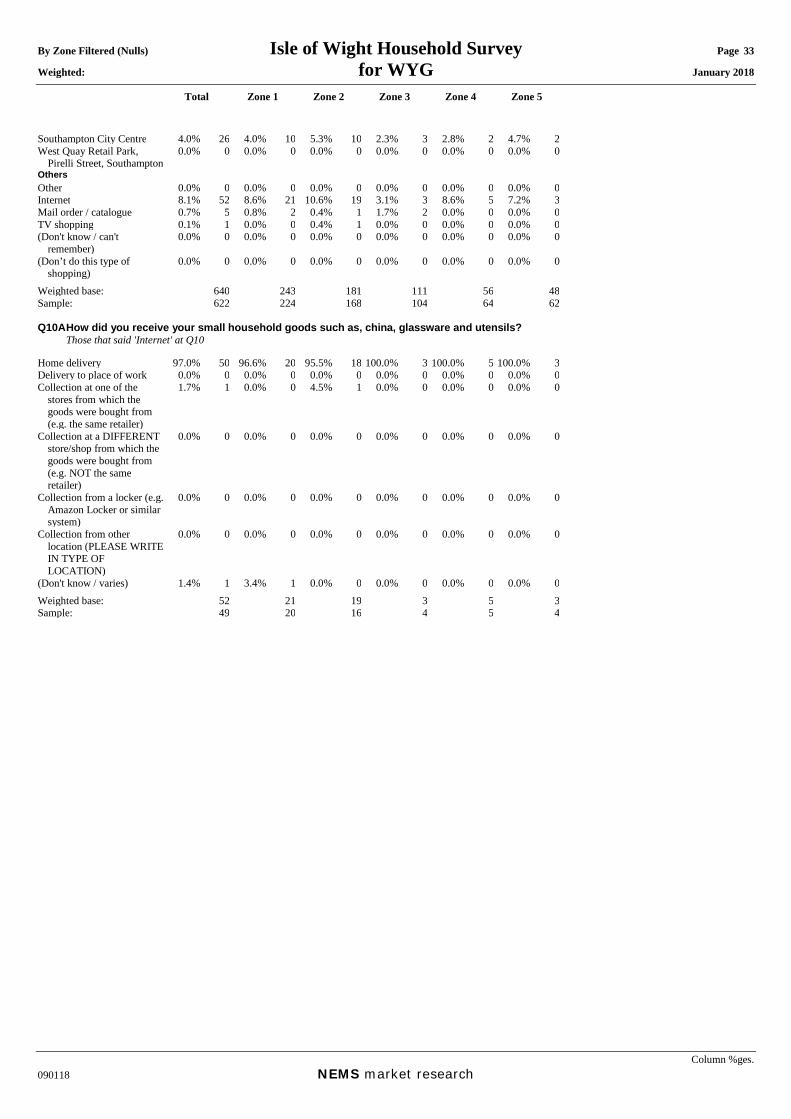
By Zone Filtered (Nulls) Isle of Wight Household Survey Page 33 Weighted: for WYG January 2018
Total Zone 1 Zone 2 Zone 3 Zone 4 Zone 5
Column %ges. 090118 NEMS market research
Southampton City Centre 4.0% 26 4.0% 10 5.3% 10 2.3% 3 2.8% 2 4.7% 2West Quay Retail Park,
Pirelli Street, Southampton 0.0% 0 0.0% 0 0.0% 0 0.0% 0 0.0% 0 0.0% 0
Others Other 0.0% 0 0.0% 0 0.0% 0 0.0% 0 0.0% 0 0.0% 0Internet 8.1% 52 8.6% 21 10.6% 19 3.1% 3 8.6% 5 7.2% 3Mail order / catalogue 0.7% 5 0.8% 2 0.4% 1 1.7% 2 0.0% 0 0.0% 0TV shopping 0.1% 1 0.0% 0 0.4% 1 0.0% 0 0.0% 0 0.0% 0(Don't know / can't
remember) 0.0% 0 0.0% 0 0.0% 0 0.0% 0 0.0% 0 0.0% 0
(Don’t do this type of shopping)
0.0% 0 0.0% 0 0.0% 0 0.0% 0 0.0% 0 0.0% 0
Weighted base: 640 243 181 111 56 48Sample: 622 224 168 104 64 62 Q10A How did you receive your small household goods such as, china, glassware and utensils? Those that said 'Internet' at Q10 Home delivery 97.0% 50 96.6% 20 95.5% 18 100.0% 3 100.0% 5 100.0% 3Delivery to place of work 0.0% 0 0.0% 0 0.0% 0 0.0% 0 0.0% 0 0.0% 0Collection at one of the
stores from which the goods were bought from (e.g. the same retailer)
1.7% 1 0.0% 0 4.5% 1 0.0% 0 0.0% 0 0.0% 0
Collection at a DIFFERENT store/shop from which the goods were bought from (e.g. NOT the same retailer)
0.0% 0 0.0% 0 0.0% 0 0.0% 0 0.0% 0 0.0% 0
Collection from a locker (e.g. Amazon Locker or similar system)
0.0% 0 0.0% 0 0.0% 0 0.0% 0 0.0% 0 0.0% 0
Collection from other location (PLEASE WRITE IN TYPE OF LOCATION)
0.0% 0 0.0% 0 0.0% 0 0.0% 0 0.0% 0 0.0% 0
(Don't know / varies) 1.4% 1 3.4% 1 0.0% 0 0.0% 0 0.0% 0 0.0% 0Weighted base: 52 21 19 3 5 3Sample: 49 20 16 4 5 4

By Zone Filtered (Nulls) Isle of Wight Household Survey Page 34 Weighted: for WYG January 2018
Total Zone 1 Zone 2 Zone 3 Zone 4 Zone 5
Column %ges. 090118 NEMS market research
Q11 Where did you last buy items such as clocks, jewellery, watches? Excl. Nulls Zone 1 Aldi, Airfield Way, Cowes 0.0% 0 0.0% 0 0.0% 0 0.0% 0 0.0% 0 0.0% 0Asda, St Georges Way,
Newport 0.0% 0 0.0% 0 0.0% 0 0.0% 0 0.0% 0 0.0% 0
B&Q, Dodnor Lane, Newport
0.0% 0 0.0% 0 0.0% 0 0.0% 0 0.0% 0 0.0% 0
Capitol Furniture Galleries, Bernard Way, Newport
0.0% 0 0.0% 0 0.0% 0 0.0% 0 0.0% 0 0.0% 0
Carisbrooke Retail Park (formerly Gunville Trading Estate),Taylor Road, Newport (Argos, Mothercare, Home Bargains, Dreams and Carpetright)
3.9% 21 4.9% 10 2.1% 3 4.3% 5 4.4% 2 4.2% 2
Carisbrooke Village Centre 0.0% 0 0.0% 0 0.0% 0 0.0% 0 0.0% 0 0.0% 0Coppins Bridge Retail Park,
Furlongs, Newport (Cineworld, Fever Bar, Pizza Hut, KFC, Maplin and Office Outlet)
0.0% 0 0.0% 0 0.0% 0 0.0% 0 0.0% 0 0.0% 0
Cowes Town Centre 4.9% 26 11.3% 23 0.0% 0 0.8% 1 5.0% 2 0.0% 0Dodner Industrial Estate,
Newport 0.0% 0 0.0% 0 0.0% 0 0.0% 0 0.0% 0 0.0% 0
East Cowes Town Centre 0.1% 1 0.3% 1 0.0% 0 0.0% 0 0.0% 0 0.0% 0Forest View Garden Centre,
Forest Road, Newport 0.0% 0 0.0% 0 0.0% 0 0.0% 0 0.0% 0 0.0% 0
Isle of Wight Motorcycles, Daish Way, Newport
0.0% 0 0.0% 0 0.0% 0 0.0% 0 0.0% 0 0.0% 0
Lidl, River Way, Newport 0.0% 0 0.0% 0 0.0% 0 0.0% 0 0.0% 0 0.0% 0Long Lane Carpets &
Flooring, Long Lane, Newport
0.0% 0 0.0% 0 0.0% 0 0.0% 0 0.0% 0 0.0% 0
Marks & Spencer, Church Litten, Newport
0.5% 3 0.0% 0 1.1% 1 0.0% 0 1.8% 1 1.5% 1
Matalan, Furrlongs, Newport 0.0% 0 0.0% 0 0.0% 0 0.0% 0 0.0% 0 0.0% 0Mole Country Stores,
Blackwater, Newport 0.0% 0 0.0% 0 0.0% 0 0.0% 0 0.0% 0 0.0% 0
Morrisons, South Street, Newport
0.0% 0 0.0% 0 0.0% 0 0.0% 0 0.0% 0 0.0% 0
Newport Town Centre 37.7% 198 40.1% 81 33.5% 46 34.5% 38 39.8% 15 47.9% 17Northwood Village Centre 0.0% 0 0.0% 0 0.0% 0 0.0% 0 0.0% 0 0.0% 0Oakfield District Centre,
Ryde 0.0% 0 0.0% 0 0.0% 0 0.0% 0 0.0% 0 0.0% 0
Riverway Industrial Estate, Riverway, Newport (Magnet Trade, Topps Tiles)
0.0% 0 0.0% 0 0.0% 0 0.0% 0 0.0% 0 0.0% 0
Sainsburys Superstore, Foxes Road, Newport
0.4% 2 0.8% 2 0.0% 0 0.0% 0 0.0% 0 1.5% 1
Sainsburys Superstore, High Street, Cowes
0.0% 0 0.0% 0 0.0% 0 0.0% 0 0.0% 0 0.0% 0
The Range, Place Road, Cowes
0.4% 2 0.4% 1 0.0% 0 0.9% 1 0.0% 0 0.0% 0
Towngate Retail Park, Newport (Halfords, Mattressman and Pavers)
0.0% 0 0.0% 0 0.0% 0 0.0% 0 0.0% 0 0.0% 0
Wakes Retail Park, Medina Way, Newport (Pets at Home, Currys, PC World and Dunelm)
0.8% 4 1.0% 2 0.7% 1 0.7% 1 1.8% 1 0.0% 0
Zone 2 Bembridge Village Centre 0.6% 3 0.0% 0 2.1% 3 0.0% 0 0.0% 0 0.0% 0Busy Bee Garden Centre,
Brading Road, Ryde 0.1% 1 0.0% 0 0.0% 0 0.7% 1 0.0% 0 0.0% 0
Medina Garden Centre, Staplers Road, Wootton Bridge, Ryde
0.0% 0 0.0% 0 0.0% 0 0.0% 0 0.0% 0 0.0% 0
Ryde Town Centre 6.4% 34 0.5% 1 21.4% 30 2.2% 2 0.0% 0 1.8% 1Seaview Village Centre 0.0% 0 0.0% 0 0.0% 0 0.0% 0 0.0% 0 0.0% 0Spinnaker Chandlery, 0.0% 0 0.0% 0 0.0% 0 0.0% 0 0.0% 0 0.0% 0

By Zone Filtered (Nulls) Isle of Wight Household Survey Page 35 Weighted: for WYG January 2018
Total Zone 1 Zone 2 Zone 3 Zone 4 Zone 5
Column %ges. 090118 NEMS market research
Embankment Road, Bembridge
Tesco Extra, Brading Road, Ryde
0.8% 4 0.0% 0 1.8% 2 1.4% 1 0.0% 0 0.0% 0
Westridge Golf Centre, Brading Road, Ryde
0.0% 0 0.0% 0 0.0% 0 0.0% 0 0.0% 0 0.0% 0
Wooton Bridge Village Centre
0.0% 0 0.0% 0 0.0% 0 0.0% 0 0.0% 0 0.0% 0
Aldi, Spithead Bus Park, Sandown
0.0% 0 0.0% 0 0.0% 0 0.0% 0 0.0% 0 0.0% 0
Zone 3 Brading Town Centre 0.1% 1 0.0% 0 0.5% 1 0.0% 0 0.0% 0 0.0% 0Honnor & Jeffrey Dalverton
Garden Centre, Newport Road, Sandown
0.0% 0 0.0% 0 0.0% 0 0.0% 0 0.0% 0 0.0% 0
Jubilee Garden Centre, Newport Road, Branstone, Sandown
0.0% 0 0.0% 0 0.0% 0 0.0% 0 0.0% 0 0.0% 0
Lake Industrial Estate, Lake Industrial Way, Sandown
0.0% 0 0.0% 0 0.0% 0 0.0% 0 0.0% 0 0.0% 0
Lake Village Centre 0.0% 0 0.0% 0 0.0% 0 0.0% 0 0.0% 0 0.0% 0Languard Holiday Park,
Shanklin 0.0% 0 0.0% 0 0.0% 0 0.0% 0 0.0% 0 0.0% 0
Lidl, Landguard Manor Road, Shanklin
0.0% 0 0.0% 0 0.0% 0 0.0% 0 0.0% 0 0.0% 0
Morrisons, Newport Road, Sandown
0.0% 0 0.0% 0 0.0% 0 0.0% 0 0.0% 0 0.0% 0
Oasis, Carpenters Road, Brading
0.0% 0 0.0% 0 0.0% 0 0.0% 0 0.0% 0 0.0% 0
Sandown Town Centre 1.8% 9 0.0% 0 1.1% 1 6.5% 7 1.8% 1 0.0% 0Shanklin Town Centre 4.7% 25 0.0% 0 0.5% 1 17.6% 19 12.2% 5 0.0% 0Spithead Business Centre,
Newport Road, Sandown 0.0% 0 0.0% 0 0.0% 0 0.0% 0 0.0% 0 0.0% 0
Thomson Plant and Garden Centre, Watery Lane, Newchurch
0.0% 0 0.0% 0 0.0% 0 0.0% 0 0.0% 0 0.0% 0
Zone 4 Godshill Village Centre 0.3% 1 0.3% 1 0.5% 1 0.0% 0 0.0% 0 0.0% 0Niton Village Centre 0.0% 0 0.0% 0 0.0% 0 0.0% 0 0.0% 0 0.0% 0Other - Zone 4 0.0% 0 0.0% 0 0.0% 0 0.0% 0 0.0% 0 0.0% 0Ventnor Town Centre 1.3% 7 0.0% 0 0.0% 0 0.7% 1 15.7% 6 0.0% 0Zone 5 Freshwater Town Centre 1.4% 7 0.9% 2 0.0% 0 0.0% 0 0.0% 0 15.8% 6Honnor & Jeffrey Afton
Garden Centre, Afton Road, Freshwater
0.0% 0 0.0% 0 0.0% 0 0.0% 0 0.0% 0 0.0% 0
Totland Village Centre 0.0% 0 0.0% 0 0.0% 0 0.0% 0 0.0% 0 0.0% 0Yarmouth Town Centre 0.1% 1 0.3% 1 0.0% 0 0.0% 0 0.0% 0 0.0% 0Outside Survey Area Abroad 3.0% 16 4.5% 9 1.4% 2 3.0% 3 3.5% 1 0.0% 0Bournemouth Town Centre 0.0% 0 0.0% 0 0.0% 0 0.0% 0 0.0% 0 0.0% 0Bradbeers Retail Park,
Wellington Way, Hedge End
0.0% 0 0.0% 0 0.0% 0 0.0% 0 0.0% 0 0.0% 0
Brighton City Centre 0.2% 1 0.5% 1 0.0% 0 0.0% 0 0.0% 0 0.0% 0Central London 0.7% 3 0.8% 2 0.6% 1 0.9% 1 0.0% 0 0.0% 0Gunwharf Quays,
Portsmouth 1.0% 5 1.0% 2 2.2% 3 0.0% 0 0.0% 0 0.0% 0
Hedge End Retail Park, Charles Watts Way, Southampton
0.0% 0 0.0% 0 0.0% 0 0.0% 0 0.0% 0 0.0% 0
Ikea, West Quay Road, Southampton
0.1% 1 0.0% 0 0.5% 1 0.0% 0 0.0% 0 0.0% 0
Lymington Town Centre 0.0% 0 0.0% 0 0.0% 0 0.0% 0 0.0% 0 0.0% 0Mountbatten Retail Park,
Western Esplanade, Southampton
0.0% 0 0.0% 0 0.0% 0 0.0% 0 0.0% 0 0.0% 0
Newchurch Village Centre 0.0% 0 0.0% 0 0.0% 0 0.0% 0 0.0% 0 0.0% 0Ocean Retail Park, Burrfields
Road, Portsmouth 0.0% 0 0.0% 0 0.0% 0 0.0% 0 0.0% 0 0.0% 0
Other - Outside Survey Area 1.7% 9 3.1% 6 1.2% 2 0.9% 1 0.0% 0 0.0% 0Portsmouth City Centre 0.2% 1 0.4% 1 0.0% 0 0.0% 0 0.0% 0 0.0% 0Sofasofa, Viaduct Works,
Newport 0.0% 0 0.0% 0 0.0% 0 0.0% 0 0.0% 0 0.0% 0

By Zone Filtered (Nulls) Isle of Wight Household Survey Page 36 Weighted: for WYG January 2018
Total Zone 1 Zone 2 Zone 3 Zone 4 Zone 5
Column %ges. 090118 NEMS market research
Southampton City Centre 3.0% 16 3.6% 7 4.2% 6 1.5% 2 0.0% 0 3.4% 1West Quay Retail Park,
Pirelli Street, Southampton 0.0% 0 0.0% 0 0.0% 0 0.0% 0 0.0% 0 0.0% 0
Others Other 0.0% 0 0.0% 0 0.0% 0 0.0% 0 0.0% 0 0.0% 0Internet 22.4% 118 22.7% 46 23.6% 33 23.5% 26 12.4% 5 23.9% 9Mail order / catalogue 1.1% 6 2.2% 4 0.5% 1 0.0% 0 1.8% 1 0.0% 0TV shopping 0.3% 2 0.4% 1 0.5% 1 0.0% 0 0.0% 0 0.0% 0(Don't know / can't
remember) 0.0% 0 0.0% 0 0.0% 0 0.0% 0 0.0% 0 0.0% 0
(Don’t do this type of shopping)
0.0% 0 0.0% 0 0.0% 0 0.0% 0 0.0% 0 0.0% 0
Weighted base: 525 202 138 110 39 36Sample: 526 204 129 103 43 47 Q11A How did you receive your items such as clocks, jewellery, watches? Those that said 'Internet' at Q11 Home delivery 99.3% 117 98.2% 45 100.0% 33 100.0% 26 100.0% 5 100.0% 9Delivery to place of work 0.0% 0 0.0% 0 0.0% 0 0.0% 0 0.0% 0 0.0% 0Collection at one of the
stores from which the goods were bought from (e.g. the same retailer)
0.0% 0 0.0% 0 0.0% 0 0.0% 0 0.0% 0 0.0% 0
Collection at a DIFFERENT store/shop from which the goods were bought from (e.g. NOT the same retailer)
0.7% 1 1.8% 1 0.0% 0 0.0% 0 0.0% 0 0.0% 0
Collection from a locker (e.g. Amazon Locker or similar system)
0.0% 0 0.0% 0 0.0% 0 0.0% 0 0.0% 0 0.0% 0
Collection from other location (PLEASE WRITE IN TYPE OF LOCATION)
0.0% 0 0.0% 0 0.0% 0 0.0% 0 0.0% 0 0.0% 0
(Don't know / varies) 0.0% 0 0.0% 0 0.0% 0 0.0% 0 0.0% 0 0.0% 0Weighted base: 118 46 33 26 5 9Sample: 112 44 29 21 6 12

By Zone Filtered (Nulls) Isle of Wight Household Survey Page 37 Weighted: for WYG January 2018
Total Zone 1 Zone 2 Zone 3 Zone 4 Zone 5
Column %ges. 090118 NEMS market research
Q12 Where did you last buy toys, games, bicycles and other recreational/sports goods? Excl. Nulls Zone 1 Aldi, Airfield Way, Cowes 0.3% 2 0.9% 2 0.0% 0 0.0% 0 0.0% 0 0.0% 0Asda, St Georges Way,
Newport 0.2% 1 0.3% 1 0.0% 0 0.0% 0 1.4% 1 0.0% 0
B&Q, Dodnor Lane, Newport
0.0% 0 0.0% 0 0.0% 0 0.0% 0 0.0% 0 0.0% 0
Capitol Furniture Galleries, Bernard Way, Newport
0.0% 0 0.0% 0 0.0% 0 0.0% 0 0.0% 0 0.0% 0
Carisbrooke Retail Park (formerly Gunville Trading Estate),Taylor Road, Newport (Argos, Mothercare, Home Bargains, Dreams and Carpetright)
4.4% 26 4.6% 10 1.0% 2 5.6% 6 11.5% 5 5.5% 2
Carisbrooke Village Centre 0.0% 0 0.0% 0 0.0% 0 0.0% 0 0.0% 0 0.0% 0Coppins Bridge Retail Park,
Furlongs, Newport (Cineworld, Fever Bar, Pizza Hut, KFC, Maplin and Office Outlet)
0.1% 1 0.0% 0 0.5% 1 0.0% 0 0.0% 0 0.0% 0
Cowes Town Centre 1.6% 9 1.9% 4 1.3% 2 0.0% 0 0.0% 0 6.8% 3Dodner Industrial Estate,
Newport 0.0% 0 0.0% 0 0.0% 0 0.0% 0 0.0% 0 0.0% 0
East Cowes Town Centre 0.1% 1 0.0% 0 0.0% 0 0.0% 0 0.0% 0 1.7% 1Forest View Garden Centre,
Forest Road, Newport 0.0% 0 0.0% 0 0.0% 0 0.0% 0 0.0% 0 0.0% 0
Isle of Wight Motorcycles, Daish Way, Newport
0.0% 0 0.0% 0 0.0% 0 0.0% 0 0.0% 0 0.0% 0
Lidl, River Way, Newport 0.0% 0 0.0% 0 0.0% 0 0.0% 0 0.0% 0 0.0% 0Long Lane Carpets &
Flooring, Long Lane, Newport
0.0% 0 0.0% 0 0.0% 0 0.0% 0 0.0% 0 0.0% 0
Marks & Spencer, Church Litten, Newport
0.3% 2 0.0% 0 0.0% 0 0.7% 1 1.4% 1 1.3% 1
Matalan, Furrlongs, Newport 0.0% 0 0.0% 0 0.0% 0 0.0% 0 0.0% 0 0.0% 0Mole Country Stores,
Blackwater, Newport 0.0% 0 0.0% 0 0.0% 0 0.0% 0 0.0% 0 0.0% 0
Morrisons, South Street, Newport
0.2% 1 0.0% 0 0.0% 0 0.8% 1 0.0% 0 0.0% 0
Newport Town Centre 35.2% 205 43.7% 97 26.4% 43 34.2% 37 33.2% 16 28.9% 13Northwood Village Centre 0.1% 1 0.0% 0 0.5% 1 0.0% 0 0.0% 0 0.0% 0Oakfield District Centre,
Ryde 0.0% 0 0.0% 0 0.0% 0 0.0% 0 0.0% 0 0.0% 0
Riverway Industrial Estate, Riverway, Newport (Magnet Trade, Topps Tiles)
0.0% 0 0.0% 0 0.0% 0 0.0% 0 0.0% 0 0.0% 0
Sainsburys Superstore, Foxes Road, Newport
0.8% 5 0.9% 2 0.0% 0 0.7% 1 1.9% 1 1.7% 1
Sainsburys Superstore, High Street, Cowes
0.0% 0 0.0% 0 0.0% 0 0.0% 0 0.0% 0 0.0% 0
The Range, Place Road, Cowes
0.5% 3 0.7% 2 0.6% 1 0.0% 0 0.0% 0 0.0% 0
Towngate Retail Park, Newport (Halfords, Mattressman and Pavers)
1.9% 11 2.2% 5 2.4% 4 0.9% 1 1.4% 1 1.7% 1
Wakes Retail Park, Medina Way, Newport (Pets at Home, Currys, PC World and Dunelm)
0.7% 4 0.4% 1 0.0% 0 0.9% 1 1.7% 1 3.0% 1
Zone 2 Bembridge Village Centre 0.0% 0 0.0% 0 0.0% 0 0.0% 0 0.0% 0 0.0% 0Busy Bee Garden Centre,
Brading Road, Ryde 0.1% 1 0.3% 1 0.0% 0 0.0% 0 0.0% 0 0.0% 0
Medina Garden Centre, Staplers Road, Wootton Bridge, Ryde
0.0% 0 0.0% 0 0.0% 0 0.0% 0 0.0% 0 0.0% 0
Ryde Town Centre 4.5% 26 0.7% 2 13.6% 22 1.8% 2 1.7% 1 0.0% 0Seaview Village Centre 0.0% 0 0.0% 0 0.0% 0 0.0% 0 0.0% 0 0.0% 0Spinnaker Chandlery, 0.0% 0 0.0% 0 0.0% 0 0.0% 0 0.0% 0 0.0% 0

By Zone Filtered (Nulls) Isle of Wight Household Survey Page 38 Weighted: for WYG January 2018
Total Zone 1 Zone 2 Zone 3 Zone 4 Zone 5
Column %ges. 090118 NEMS market research
Embankment Road, Bembridge
Tesco Extra, Brading Road, Ryde
3.8% 22 0.8% 2 10.3% 17 2.7% 3 0.0% 0 1.3% 1
Westridge Golf Centre, Brading Road, Ryde
0.3% 1 0.0% 0 0.5% 1 0.7% 1 0.0% 0 0.0% 0
Wooton Bridge Village Centre
0.0% 0 0.0% 0 0.0% 0 0.0% 0 0.0% 0 0.0% 0
Aldi, Spithead Bus Park, Sandown
0.0% 0 0.0% 0 0.0% 0 0.0% 0 0.0% 0 0.0% 0
Zone 3 Brading Town Centre 0.0% 0 0.0% 0 0.0% 0 0.0% 0 0.0% 0 0.0% 0Honnor & Jeffrey Dalverton
Garden Centre, Newport Road, Sandown
0.0% 0 0.0% 0 0.0% 0 0.0% 0 0.0% 0 0.0% 0
Jubilee Garden Centre, Newport Road, Branstone, Sandown
0.0% 0 0.0% 0 0.0% 0 0.0% 0 0.0% 0 0.0% 0
Lake Industrial Estate, Lake Industrial Way, Sandown
0.1% 1 0.3% 1 0.0% 0 0.0% 0 0.0% 0 0.0% 0
Lake Village Centre 0.0% 0 0.0% 0 0.0% 0 0.0% 0 0.0% 0 0.0% 0Languard Holiday Park,
Shanklin 0.0% 0 0.0% 0 0.0% 0 0.0% 0 0.0% 0 0.0% 0
Lidl, Landguard Manor Road, Shanklin
0.2% 1 0.0% 0 0.0% 0 0.9% 1 0.0% 0 0.0% 0
Morrisons, Newport Road, Sandown
0.0% 0 0.0% 0 0.0% 0 0.0% 0 0.0% 0 0.0% 0
Oasis, Carpenters Road, Brading
0.0% 0 0.0% 0 0.0% 0 0.0% 0 0.0% 0 0.0% 0
Sandown Town Centre 0.3% 1 0.0% 0 0.0% 0 1.4% 1 0.0% 0 0.0% 0Shanklin Town Centre 5.0% 29 0.0% 0 2.3% 4 18.1% 20 12.0% 6 0.0% 0Spithead Business Centre,
Newport Road, Sandown 0.0% 0 0.0% 0 0.0% 0 0.0% 0 0.0% 0 0.0% 0
Thomson Plant and Garden Centre, Watery Lane, Newchurch
0.0% 0 0.0% 0 0.0% 0 0.0% 0 0.0% 0 0.0% 0
Zone 4 Godshill Village Centre 0.0% 0 0.0% 0 0.0% 0 0.0% 0 0.0% 0 0.0% 0Niton Village Centre 0.0% 0 0.0% 0 0.0% 0 0.0% 0 0.0% 0 0.0% 0Other - Zone 4 0.0% 0 0.0% 0 0.0% 0 0.0% 0 0.0% 0 0.0% 0Ventnor Town Centre 0.6% 4 0.3% 1 0.0% 0 0.0% 0 6.0% 3 0.0% 0Zone 5 Freshwater Town Centre 0.4% 2 0.0% 0 0.0% 0 0.0% 0 0.0% 0 5.5% 2Honnor & Jeffrey Afton
Garden Centre, Afton Road, Freshwater
0.1% 1 0.0% 0 0.0% 0 0.0% 0 0.0% 0 1.7% 1
Totland Village Centre 0.1% 1 0.0% 0 0.0% 0 0.0% 0 0.0% 0 1.3% 1Yarmouth Town Centre 0.1% 1 0.0% 0 0.0% 0 0.0% 0 0.0% 0 1.3% 1Outside Survey Area Abroad 0.1% 1 0.0% 0 0.0% 0 0.7% 1 0.0% 0 0.0% 0Bournemouth Town Centre 0.0% 0 0.0% 0 0.0% 0 0.0% 0 0.0% 0 0.0% 0Bradbeers Retail Park,
Wellington Way, Hedge End
0.0% 0 0.0% 0 0.0% 0 0.0% 0 0.0% 0 0.0% 0
Brighton City Centre 0.0% 0 0.0% 0 0.0% 0 0.0% 0 0.0% 0 0.0% 0Central London 0.0% 0 0.0% 0 0.0% 0 0.0% 0 0.0% 0 0.0% 0Gunwharf Quays,
Portsmouth 0.3% 2 0.0% 0 1.2% 2 0.0% 0 0.0% 0 0.0% 0
Hedge End Retail Park, Charles Watts Way, Southampton
0.0% 0 0.0% 0 0.0% 0 0.0% 0 0.0% 0 0.0% 0
Ikea, West Quay Road, Southampton
0.0% 0 0.0% 0 0.0% 0 0.0% 0 0.0% 0 0.0% 0
Lymington Town Centre 0.1% 1 0.0% 0 0.5% 1 0.0% 0 0.0% 0 0.0% 0Mountbatten Retail Park,
Western Esplanade, Southampton
0.3% 1 0.0% 0 0.5% 1 0.7% 1 0.0% 0 0.0% 0
Newchurch Village Centre 0.1% 1 0.3% 1 0.0% 0 0.0% 0 0.0% 0 0.0% 0Ocean Retail Park, Burrfields
Road, Portsmouth 0.0% 0 0.0% 0 0.0% 0 0.0% 0 0.0% 0 0.0% 0
Other - Outside Survey Area 0.4% 2 0.3% 1 0.0% 0 0.7% 1 1.4% 1 0.0% 0Portsmouth City Centre 0.1% 1 0.0% 0 0.5% 1 0.0% 0 0.0% 0 0.0% 0Sofasofa, Viaduct Works,
Newport 0.0% 0 0.0% 0 0.0% 0 0.0% 0 0.0% 0 0.0% 0
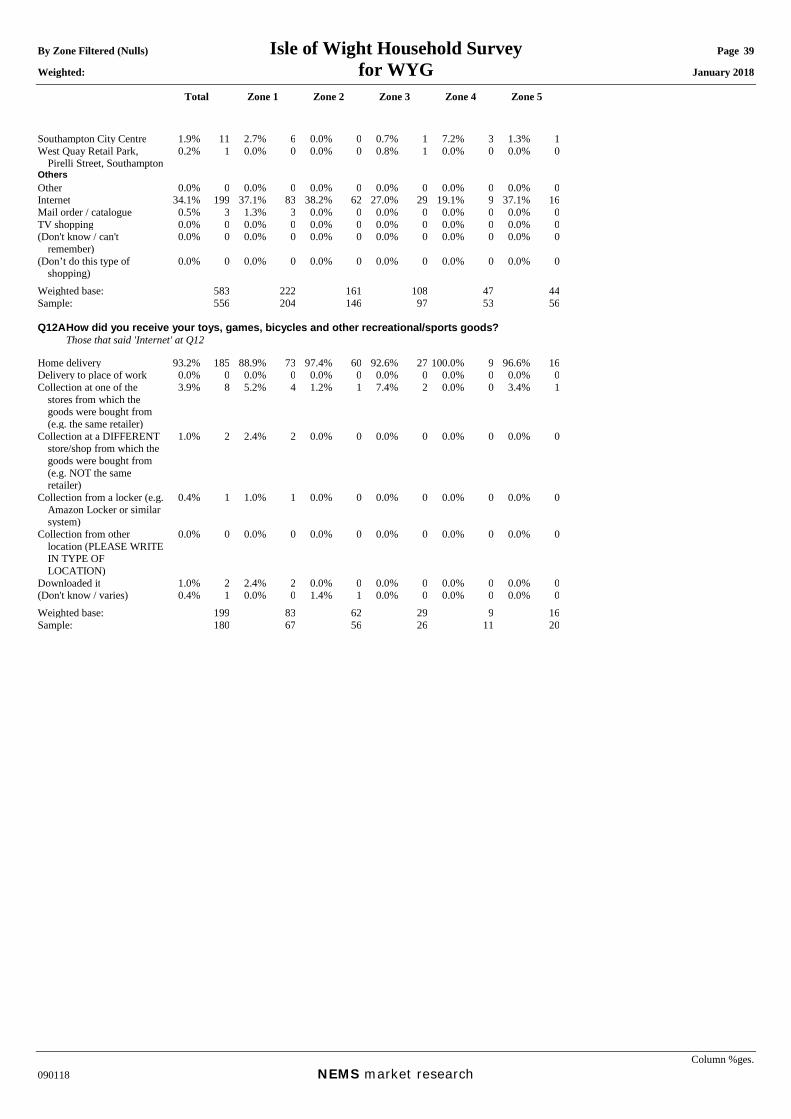
By Zone Filtered (Nulls) Isle of Wight Household Survey Page 39 Weighted: for WYG January 2018
Total Zone 1 Zone 2 Zone 3 Zone 4 Zone 5
Column %ges. 090118 NEMS market research
Southampton City Centre 1.9% 11 2.7% 6 0.0% 0 0.7% 1 7.2% 3 1.3% 1West Quay Retail Park,
Pirelli Street, Southampton 0.2% 1 0.0% 0 0.0% 0 0.8% 1 0.0% 0 0.0% 0
Others Other 0.0% 0 0.0% 0 0.0% 0 0.0% 0 0.0% 0 0.0% 0Internet 34.1% 199 37.1% 83 38.2% 62 27.0% 29 19.1% 9 37.1% 16Mail order / catalogue 0.5% 3 1.3% 3 0.0% 0 0.0% 0 0.0% 0 0.0% 0TV shopping 0.0% 0 0.0% 0 0.0% 0 0.0% 0 0.0% 0 0.0% 0(Don't know / can't
remember) 0.0% 0 0.0% 0 0.0% 0 0.0% 0 0.0% 0 0.0% 0
(Don’t do this type of shopping)
0.0% 0 0.0% 0 0.0% 0 0.0% 0 0.0% 0 0.0% 0
Weighted base: 583 222 161 108 47 44Sample: 556 204 146 97 53 56 Q12A How did you receive your toys, games, bicycles and other recreational/sports goods? Those that said 'Internet' at Q12 Home delivery 93.2% 185 88.9% 73 97.4% 60 92.6% 27 100.0% 9 96.6% 16Delivery to place of work 0.0% 0 0.0% 0 0.0% 0 0.0% 0 0.0% 0 0.0% 0Collection at one of the
stores from which the goods were bought from (e.g. the same retailer)
3.9% 8 5.2% 4 1.2% 1 7.4% 2 0.0% 0 3.4% 1
Collection at a DIFFERENT store/shop from which the goods were bought from (e.g. NOT the same retailer)
1.0% 2 2.4% 2 0.0% 0 0.0% 0 0.0% 0 0.0% 0
Collection from a locker (e.g. Amazon Locker or similar system)
0.4% 1 1.0% 1 0.0% 0 0.0% 0 0.0% 0 0.0% 0
Collection from other location (PLEASE WRITE IN TYPE OF LOCATION)
0.0% 0 0.0% 0 0.0% 0 0.0% 0 0.0% 0 0.0% 0
Downloaded it 1.0% 2 2.4% 2 0.0% 0 0.0% 0 0.0% 0 0.0% 0(Don't know / varies) 0.4% 1 0.0% 0 1.4% 1 0.0% 0 0.0% 0 0.0% 0Weighted base: 199 83 62 29 9 16Sample: 180 67 56 26 11 20
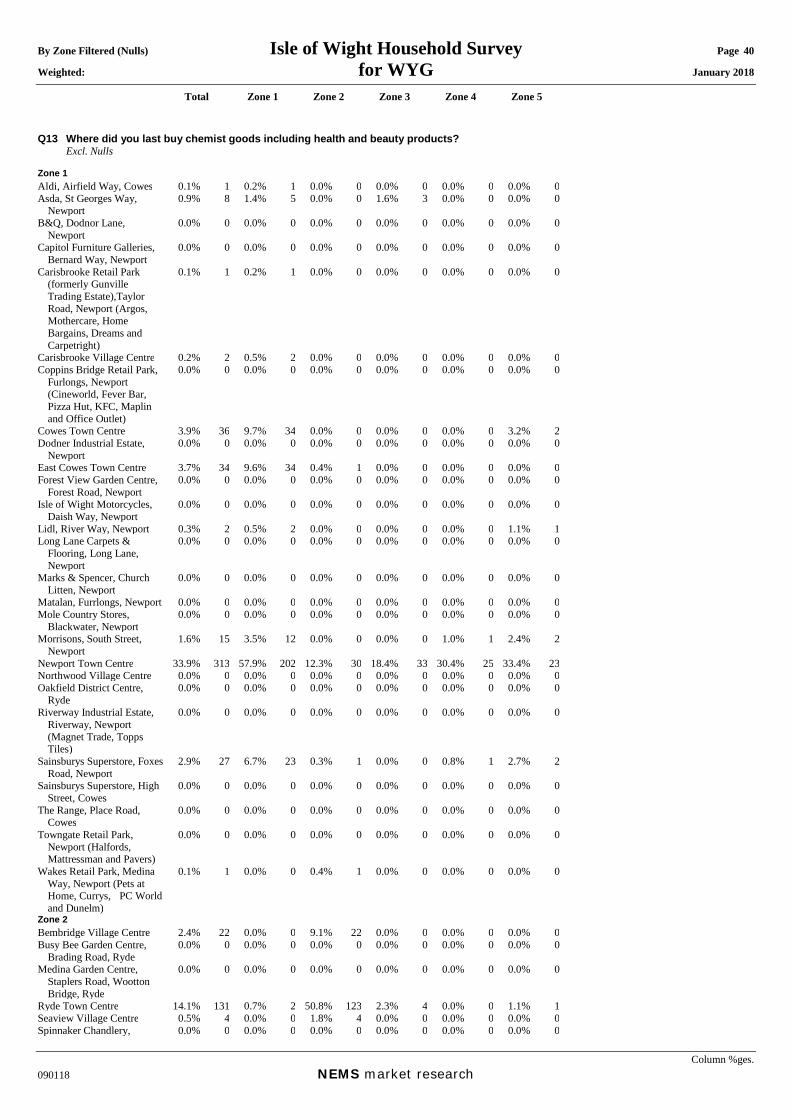
By Zone Filtered (Nulls) Isle of Wight Household Survey Page 40 Weighted: for WYG January 2018
Total Zone 1 Zone 2 Zone 3 Zone 4 Zone 5
Column %ges. 090118 NEMS market research
Q13 Where did you last buy chemist goods including health and beauty products? Excl. Nulls Zone 1 Aldi, Airfield Way, Cowes 0.1% 1 0.2% 1 0.0% 0 0.0% 0 0.0% 0 0.0% 0Asda, St Georges Way,
Newport 0.9% 8 1.4% 5 0.0% 0 1.6% 3 0.0% 0 0.0% 0
B&Q, Dodnor Lane, Newport
0.0% 0 0.0% 0 0.0% 0 0.0% 0 0.0% 0 0.0% 0
Capitol Furniture Galleries, Bernard Way, Newport
0.0% 0 0.0% 0 0.0% 0 0.0% 0 0.0% 0 0.0% 0
Carisbrooke Retail Park (formerly Gunville Trading Estate),Taylor Road, Newport (Argos, Mothercare, Home Bargains, Dreams and Carpetright)
0.1% 1 0.2% 1 0.0% 0 0.0% 0 0.0% 0 0.0% 0
Carisbrooke Village Centre 0.2% 2 0.5% 2 0.0% 0 0.0% 0 0.0% 0 0.0% 0Coppins Bridge Retail Park,
Furlongs, Newport (Cineworld, Fever Bar, Pizza Hut, KFC, Maplin and Office Outlet)
0.0% 0 0.0% 0 0.0% 0 0.0% 0 0.0% 0 0.0% 0
Cowes Town Centre 3.9% 36 9.7% 34 0.0% 0 0.0% 0 0.0% 0 3.2% 2Dodner Industrial Estate,
Newport 0.0% 0 0.0% 0 0.0% 0 0.0% 0 0.0% 0 0.0% 0
East Cowes Town Centre 3.7% 34 9.6% 34 0.4% 1 0.0% 0 0.0% 0 0.0% 0Forest View Garden Centre,
Forest Road, Newport 0.0% 0 0.0% 0 0.0% 0 0.0% 0 0.0% 0 0.0% 0
Isle of Wight Motorcycles, Daish Way, Newport
0.0% 0 0.0% 0 0.0% 0 0.0% 0 0.0% 0 0.0% 0
Lidl, River Way, Newport 0.3% 2 0.5% 2 0.0% 0 0.0% 0 0.0% 0 1.1% 1Long Lane Carpets &
Flooring, Long Lane, Newport
0.0% 0 0.0% 0 0.0% 0 0.0% 0 0.0% 0 0.0% 0
Marks & Spencer, Church Litten, Newport
0.0% 0 0.0% 0 0.0% 0 0.0% 0 0.0% 0 0.0% 0
Matalan, Furrlongs, Newport 0.0% 0 0.0% 0 0.0% 0 0.0% 0 0.0% 0 0.0% 0Mole Country Stores,
Blackwater, Newport 0.0% 0 0.0% 0 0.0% 0 0.0% 0 0.0% 0 0.0% 0
Morrisons, South Street, Newport
1.6% 15 3.5% 12 0.0% 0 0.0% 0 1.0% 1 2.4% 2
Newport Town Centre 33.9% 313 57.9% 202 12.3% 30 18.4% 33 30.4% 25 33.4% 23Northwood Village Centre 0.0% 0 0.0% 0 0.0% 0 0.0% 0 0.0% 0 0.0% 0Oakfield District Centre,
Ryde 0.0% 0 0.0% 0 0.0% 0 0.0% 0 0.0% 0 0.0% 0
Riverway Industrial Estate, Riverway, Newport (Magnet Trade, Topps Tiles)
0.0% 0 0.0% 0 0.0% 0 0.0% 0 0.0% 0 0.0% 0
Sainsburys Superstore, Foxes Road, Newport
2.9% 27 6.7% 23 0.3% 1 0.0% 0 0.8% 1 2.7% 2
Sainsburys Superstore, High Street, Cowes
0.0% 0 0.0% 0 0.0% 0 0.0% 0 0.0% 0 0.0% 0
The Range, Place Road, Cowes
0.0% 0 0.0% 0 0.0% 0 0.0% 0 0.0% 0 0.0% 0
Towngate Retail Park, Newport (Halfords, Mattressman and Pavers)
0.0% 0 0.0% 0 0.0% 0 0.0% 0 0.0% 0 0.0% 0
Wakes Retail Park, Medina Way, Newport (Pets at Home, Currys, PC World and Dunelm)
0.1% 1 0.0% 0 0.4% 1 0.0% 0 0.0% 0 0.0% 0
Zone 2 Bembridge Village Centre 2.4% 22 0.0% 0 9.1% 22 0.0% 0 0.0% 0 0.0% 0Busy Bee Garden Centre,
Brading Road, Ryde 0.0% 0 0.0% 0 0.0% 0 0.0% 0 0.0% 0 0.0% 0
Medina Garden Centre, Staplers Road, Wootton Bridge, Ryde
0.0% 0 0.0% 0 0.0% 0 0.0% 0 0.0% 0 0.0% 0
Ryde Town Centre 14.1% 131 0.7% 2 50.8% 123 2.3% 4 0.0% 0 1.1% 1Seaview Village Centre 0.5% 4 0.0% 0 1.8% 4 0.0% 0 0.0% 0 0.0% 0Spinnaker Chandlery, 0.0% 0 0.0% 0 0.0% 0 0.0% 0 0.0% 0 0.0% 0

By Zone Filtered (Nulls) Isle of Wight Household Survey Page 41 Weighted: for WYG January 2018
Total Zone 1 Zone 2 Zone 3 Zone 4 Zone 5
Column %ges. 090118 NEMS market research
Embankment Road, Bembridge
Tesco Extra, Brading Road, Ryde
5.4% 49 0.6% 2 16.7% 41 3.8% 7 0.0% 0 0.0% 0
Westridge Golf Centre, Brading Road, Ryde
0.0% 0 0.0% 0 0.0% 0 0.0% 0 0.0% 0 0.0% 0
Wooton Bridge Village Centre
0.6% 5 0.2% 1 1.8% 4 0.0% 0 0.0% 0 0.0% 0
Aldi, Spithead Bus Park, Sandown
0.8% 7 0.3% 1 1.2% 3 1.8% 3 0.0% 0 0.0% 0
Zone 3 Brading Town Centre 0.0% 0 0.0% 0 0.0% 0 0.0% 0 0.0% 0 0.0% 0Honnor & Jeffrey Dalverton
Garden Centre, Newport Road, Sandown
0.0% 0 0.0% 0 0.0% 0 0.0% 0 0.0% 0 0.0% 0
Jubilee Garden Centre, Newport Road, Branstone, Sandown
0.0% 0 0.0% 0 0.0% 0 0.0% 0 0.0% 0 0.0% 0
Lake Industrial Estate, Lake Industrial Way, Sandown
0.0% 0 0.0% 0 0.0% 0 0.0% 0 0.0% 0 0.0% 0
Lake Village Centre 0.4% 4 0.0% 0 0.0% 0 2.2% 4 0.0% 0 0.0% 0Languard Holiday Park,
Shanklin 0.0% 0 0.0% 0 0.0% 0 0.0% 0 0.0% 0 0.0% 0
Lidl, Landguard Manor Road, Shanklin
0.1% 1 0.0% 0 0.0% 0 0.6% 1 0.0% 0 0.0% 0
Morrisons, Newport Road, Sandown
1.5% 13 0.3% 1 0.0% 0 5.1% 9 4.0% 3 0.0% 0
Oasis, Carpenters Road, Brading
0.0% 0 0.0% 0 0.0% 0 0.0% 0 0.0% 0 0.0% 0
Sandown Town Centre 4.9% 45 0.0% 0 0.0% 0 25.2% 45 0.0% 0 0.0% 0Shanklin Town Centre 7.7% 71 0.2% 1 1.1% 3 34.5% 62 7.0% 6 0.0% 0Spithead Business Centre,
Newport Road, Sandown 0.0% 0 0.0% 0 0.0% 0 0.0% 0 0.0% 0 0.0% 0
Thomson Plant and Garden Centre, Watery Lane, Newchurch
0.0% 0 0.0% 0 0.0% 0 0.0% 0 0.0% 0 0.0% 0
Zone 4 Godshill Village Centre 0.0% 0 0.0% 0 0.0% 0 0.0% 0 0.0% 0 0.0% 0Niton Village Centre 0.2% 2 0.0% 0 0.0% 0 0.0% 0 2.7% 2 0.0% 0Other - Zone 4 0.0% 0 0.0% 0 0.0% 0 0.0% 0 0.0% 0 0.0% 0Ventnor Town Centre 4.4% 40 0.3% 1 0.0% 0 0.0% 0 47.3% 40 0.0% 0Zone 5 Freshwater Town Centre 3.3% 31 1.0% 3 0.0% 0 0.0% 0 0.0% 0 38.8% 27Honnor & Jeffrey Afton
Garden Centre, Afton Road, Freshwater
0.0% 0 0.0% 0 0.0% 0 0.0% 0 0.0% 0 0.0% 0
Totland Village Centre 0.0% 0 0.0% 0 0.0% 0 0.0% 0 0.0% 0 0.0% 0Yarmouth Town Centre 1.8% 17 2.2% 8 0.0% 0 0.0% 0 0.0% 0 13.3% 9Outside Survey Area Abroad 0.0% 0 0.0% 0 0.0% 0 0.0% 0 0.0% 0 0.0% 0Bournemouth Town Centre 0.0% 0 0.0% 0 0.0% 0 0.0% 0 0.0% 0 0.0% 0Bradbeers Retail Park,
Wellington Way, Hedge End
0.0% 0 0.0% 0 0.0% 0 0.0% 0 0.0% 0 0.0% 0
Brighton City Centre 0.0% 0 0.0% 0 0.0% 0 0.0% 0 0.0% 0 0.0% 0Central London 0.1% 1 0.0% 0 0.0% 0 0.4% 1 0.0% 0 0.0% 0Gunwharf Quays,
Portsmouth 0.0% 0 0.0% 0 0.0% 0 0.0% 0 0.0% 0 0.0% 0
Hedge End Retail Park, Charles Watts Way, Southampton
0.0% 0 0.0% 0 0.0% 0 0.0% 0 0.0% 0 0.0% 0
Ikea, West Quay Road, Southampton
0.0% 0 0.0% 0 0.0% 0 0.0% 0 0.0% 0 0.0% 0
Lymington Town Centre 0.0% 0 0.0% 0 0.0% 0 0.0% 0 0.0% 0 0.0% 0Mountbatten Retail Park,
Western Esplanade, Southampton
0.0% 0 0.0% 0 0.0% 0 0.0% 0 0.0% 0 0.0% 0
Newchurch Village Centre 0.0% 0 0.0% 0 0.0% 0 0.0% 0 0.0% 0 0.0% 0Ocean Retail Park, Burrfields
Road, Portsmouth 0.0% 0 0.0% 0 0.0% 0 0.0% 0 0.0% 0 0.0% 0
Other - Outside Survey Area 0.3% 3 0.2% 1 0.9% 2 0.0% 0 0.0% 0 0.0% 0Portsmouth City Centre 0.1% 1 0.0% 0 0.0% 0 0.5% 1 0.0% 0 0.0% 0Sofasofa, Viaduct Works,
Newport 0.0% 0 0.0% 0 0.0% 0 0.0% 0 0.0% 0 0.0% 0
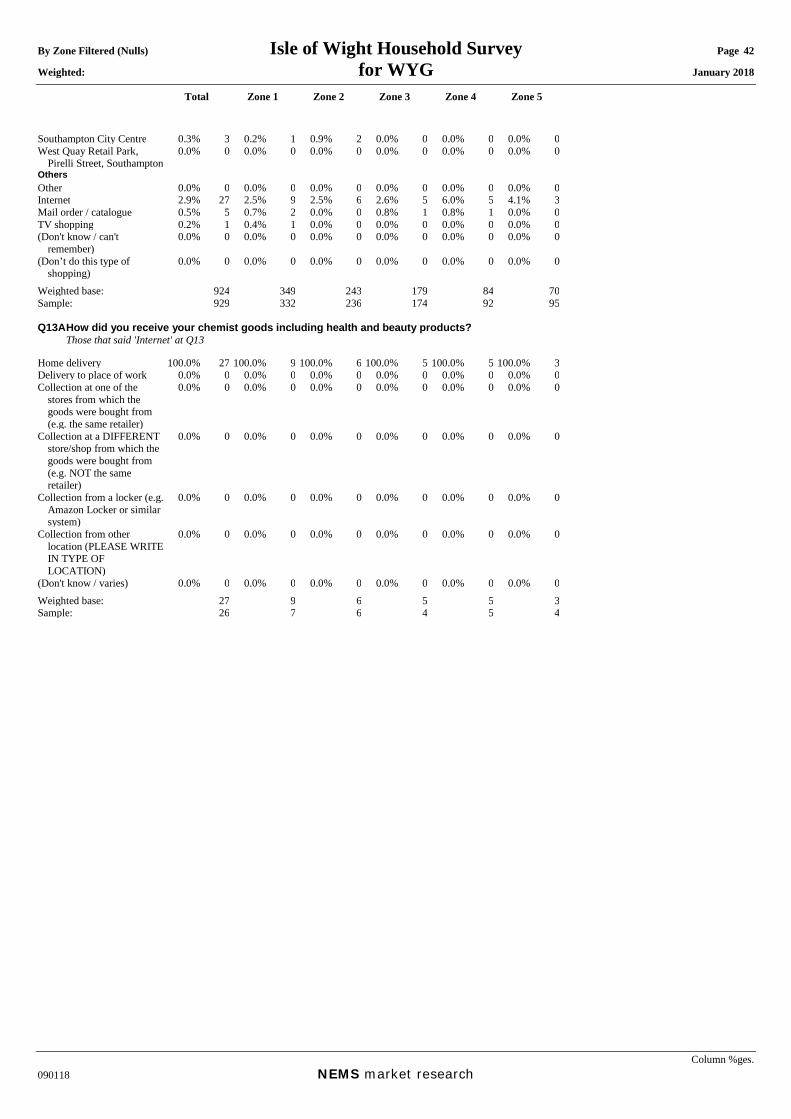
By Zone Filtered (Nulls) Isle of Wight Household Survey Page 42 Weighted: for WYG January 2018
Total Zone 1 Zone 2 Zone 3 Zone 4 Zone 5
Column %ges. 090118 NEMS market research
Southampton City Centre 0.3% 3 0.2% 1 0.9% 2 0.0% 0 0.0% 0 0.0% 0West Quay Retail Park,
Pirelli Street, Southampton 0.0% 0 0.0% 0 0.0% 0 0.0% 0 0.0% 0 0.0% 0
Others Other 0.0% 0 0.0% 0 0.0% 0 0.0% 0 0.0% 0 0.0% 0Internet 2.9% 27 2.5% 9 2.5% 6 2.6% 5 6.0% 5 4.1% 3Mail order / catalogue 0.5% 5 0.7% 2 0.0% 0 0.8% 1 0.8% 1 0.0% 0TV shopping 0.2% 1 0.4% 1 0.0% 0 0.0% 0 0.0% 0 0.0% 0(Don't know / can't
remember) 0.0% 0 0.0% 0 0.0% 0 0.0% 0 0.0% 0 0.0% 0
(Don’t do this type of shopping)
0.0% 0 0.0% 0 0.0% 0 0.0% 0 0.0% 0 0.0% 0
Weighted base: 924 349 243 179 84 70Sample: 929 332 236 174 92 95 Q13A How did you receive your chemist goods including health and beauty products? Those that said 'Internet' at Q13 Home delivery 100.0% 27 100.0% 9 100.0% 6 100.0% 5 100.0% 5 100.0% 3Delivery to place of work 0.0% 0 0.0% 0 0.0% 0 0.0% 0 0.0% 0 0.0% 0Collection at one of the
stores from which the goods were bought from (e.g. the same retailer)
0.0% 0 0.0% 0 0.0% 0 0.0% 0 0.0% 0 0.0% 0
Collection at a DIFFERENT store/shop from which the goods were bought from (e.g. NOT the same retailer)
0.0% 0 0.0% 0 0.0% 0 0.0% 0 0.0% 0 0.0% 0
Collection from a locker (e.g. Amazon Locker or similar system)
0.0% 0 0.0% 0 0.0% 0 0.0% 0 0.0% 0 0.0% 0
Collection from other location (PLEASE WRITE IN TYPE OF LOCATION)
0.0% 0 0.0% 0 0.0% 0 0.0% 0 0.0% 0 0.0% 0
(Don't know / varies) 0.0% 0 0.0% 0 0.0% 0 0.0% 0 0.0% 0 0.0% 0Weighted base: 27 9 6 5 5 3Sample: 26 7 6 4 5 4
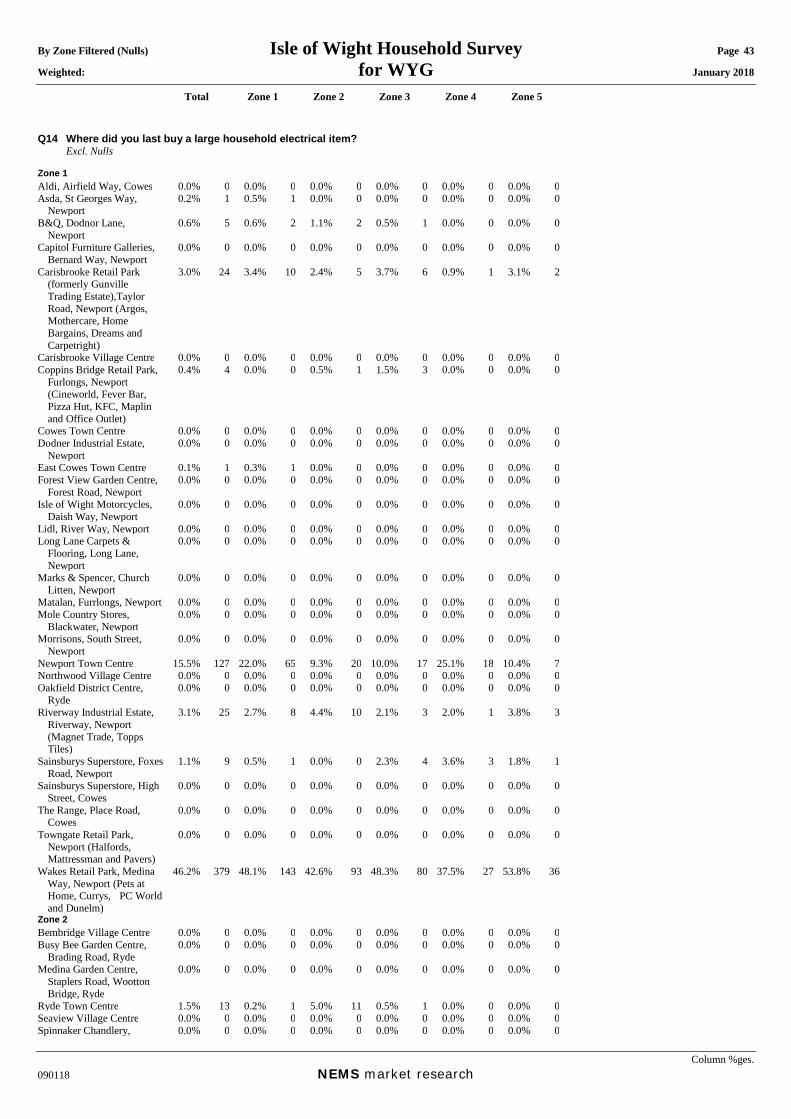
By Zone Filtered (Nulls) Isle of Wight Household Survey Page 43 Weighted: for WYG January 2018
Total Zone 1 Zone 2 Zone 3 Zone 4 Zone 5
Column %ges. 090118 NEMS market research
Q14 Where did you last buy a large household electrical item? Excl. Nulls Zone 1 Aldi, Airfield Way, Cowes 0.0% 0 0.0% 0 0.0% 0 0.0% 0 0.0% 0 0.0% 0Asda, St Georges Way,
Newport 0.2% 1 0.5% 1 0.0% 0 0.0% 0 0.0% 0 0.0% 0
B&Q, Dodnor Lane, Newport
0.6% 5 0.6% 2 1.1% 2 0.5% 1 0.0% 0 0.0% 0
Capitol Furniture Galleries, Bernard Way, Newport
0.0% 0 0.0% 0 0.0% 0 0.0% 0 0.0% 0 0.0% 0
Carisbrooke Retail Park (formerly Gunville Trading Estate),Taylor Road, Newport (Argos, Mothercare, Home Bargains, Dreams and Carpetright)
3.0% 24 3.4% 10 2.4% 5 3.7% 6 0.9% 1 3.1% 2
Carisbrooke Village Centre 0.0% 0 0.0% 0 0.0% 0 0.0% 0 0.0% 0 0.0% 0Coppins Bridge Retail Park,
Furlongs, Newport (Cineworld, Fever Bar, Pizza Hut, KFC, Maplin and Office Outlet)
0.4% 4 0.0% 0 0.5% 1 1.5% 3 0.0% 0 0.0% 0
Cowes Town Centre 0.0% 0 0.0% 0 0.0% 0 0.0% 0 0.0% 0 0.0% 0Dodner Industrial Estate,
Newport 0.0% 0 0.0% 0 0.0% 0 0.0% 0 0.0% 0 0.0% 0
East Cowes Town Centre 0.1% 1 0.3% 1 0.0% 0 0.0% 0 0.0% 0 0.0% 0Forest View Garden Centre,
Forest Road, Newport 0.0% 0 0.0% 0 0.0% 0 0.0% 0 0.0% 0 0.0% 0
Isle of Wight Motorcycles, Daish Way, Newport
0.0% 0 0.0% 0 0.0% 0 0.0% 0 0.0% 0 0.0% 0
Lidl, River Way, Newport 0.0% 0 0.0% 0 0.0% 0 0.0% 0 0.0% 0 0.0% 0Long Lane Carpets &
Flooring, Long Lane, Newport
0.0% 0 0.0% 0 0.0% 0 0.0% 0 0.0% 0 0.0% 0
Marks & Spencer, Church Litten, Newport
0.0% 0 0.0% 0 0.0% 0 0.0% 0 0.0% 0 0.0% 0
Matalan, Furrlongs, Newport 0.0% 0 0.0% 0 0.0% 0 0.0% 0 0.0% 0 0.0% 0Mole Country Stores,
Blackwater, Newport 0.0% 0 0.0% 0 0.0% 0 0.0% 0 0.0% 0 0.0% 0
Morrisons, South Street, Newport
0.0% 0 0.0% 0 0.0% 0 0.0% 0 0.0% 0 0.0% 0
Newport Town Centre 15.5% 127 22.0% 65 9.3% 20 10.0% 17 25.1% 18 10.4% 7Northwood Village Centre 0.0% 0 0.0% 0 0.0% 0 0.0% 0 0.0% 0 0.0% 0Oakfield District Centre,
Ryde 0.0% 0 0.0% 0 0.0% 0 0.0% 0 0.0% 0 0.0% 0
Riverway Industrial Estate, Riverway, Newport (Magnet Trade, Topps Tiles)
3.1% 25 2.7% 8 4.4% 10 2.1% 3 2.0% 1 3.8% 3
Sainsburys Superstore, Foxes Road, Newport
1.1% 9 0.5% 1 0.0% 0 2.3% 4 3.6% 3 1.8% 1
Sainsburys Superstore, High Street, Cowes
0.0% 0 0.0% 0 0.0% 0 0.0% 0 0.0% 0 0.0% 0
The Range, Place Road, Cowes
0.0% 0 0.0% 0 0.0% 0 0.0% 0 0.0% 0 0.0% 0
Towngate Retail Park, Newport (Halfords, Mattressman and Pavers)
0.0% 0 0.0% 0 0.0% 0 0.0% 0 0.0% 0 0.0% 0
Wakes Retail Park, Medina Way, Newport (Pets at Home, Currys, PC World and Dunelm)
46.2% 379 48.1% 143 42.6% 93 48.3% 80 37.5% 27 53.8% 36
Zone 2 Bembridge Village Centre 0.0% 0 0.0% 0 0.0% 0 0.0% 0 0.0% 0 0.0% 0Busy Bee Garden Centre,
Brading Road, Ryde 0.0% 0 0.0% 0 0.0% 0 0.0% 0 0.0% 0 0.0% 0
Medina Garden Centre, Staplers Road, Wootton Bridge, Ryde
0.0% 0 0.0% 0 0.0% 0 0.0% 0 0.0% 0 0.0% 0
Ryde Town Centre 1.5% 13 0.2% 1 5.0% 11 0.5% 1 0.0% 0 0.0% 0Seaview Village Centre 0.0% 0 0.0% 0 0.0% 0 0.0% 0 0.0% 0 0.0% 0Spinnaker Chandlery, 0.0% 0 0.0% 0 0.0% 0 0.0% 0 0.0% 0 0.0% 0

By Zone Filtered (Nulls) Isle of Wight Household Survey Page 44 Weighted: for WYG January 2018
Total Zone 1 Zone 2 Zone 3 Zone 4 Zone 5
Column %ges. 090118 NEMS market research
Embankment Road, Bembridge
Tesco Extra, Brading Road, Ryde
3.5% 28 0.0% 0 8.3% 18 4.1% 7 4.4% 3 0.0% 0
Westridge Golf Centre, Brading Road, Ryde
0.0% 0 0.0% 0 0.0% 0 0.0% 0 0.0% 0 0.0% 0
Wooton Bridge Village Centre
0.0% 0 0.0% 0 0.0% 0 0.0% 0 0.0% 0 0.0% 0
Aldi, Spithead Bus Park, Sandown
0.0% 0 0.0% 0 0.0% 0 0.0% 0 0.0% 0 0.0% 0
Zone 3 Brading Town Centre 0.0% 0 0.0% 0 0.0% 0 0.0% 0 0.0% 0 0.0% 0Honnor & Jeffrey Dalverton
Garden Centre, Newport Road, Sandown
0.0% 0 0.0% 0 0.0% 0 0.0% 0 0.0% 0 0.0% 0
Jubilee Garden Centre, Newport Road, Branstone, Sandown
0.0% 0 0.0% 0 0.0% 0 0.0% 0 0.0% 0 0.0% 0
Lake Industrial Estate, Lake Industrial Way, Sandown
0.0% 0 0.0% 0 0.0% 0 0.0% 0 0.0% 0 0.0% 0
Lake Village Centre 0.0% 0 0.0% 0 0.0% 0 0.0% 0 0.0% 0 0.0% 0Languard Holiday Park,
Shanklin 0.0% 0 0.0% 0 0.0% 0 0.0% 0 0.0% 0 0.0% 0
Lidl, Landguard Manor Road, Shanklin
0.0% 0 0.0% 0 0.0% 0 0.0% 0 0.0% 0 0.0% 0
Morrisons, Newport Road, Sandown
0.0% 0 0.0% 0 0.0% 0 0.0% 0 0.0% 0 0.0% 0
Oasis, Carpenters Road, Brading
0.0% 0 0.0% 0 0.0% 0 0.0% 0 0.0% 0 0.0% 0
Sandown Town Centre 0.1% 1 0.0% 0 0.0% 0 0.5% 1 0.0% 0 0.0% 0Shanklin Town Centre 0.6% 5 0.0% 0 0.0% 0 1.4% 2 2.7% 2 0.8% 1Spithead Business Centre,
Newport Road, Sandown 0.0% 0 0.0% 0 0.0% 0 0.0% 0 0.0% 0 0.0% 0
Thomson Plant and Garden Centre, Watery Lane, Newchurch
0.0% 0 0.0% 0 0.0% 0 0.0% 0 0.0% 0 0.0% 0
Zone 4 Godshill Village Centre 0.0% 0 0.0% 0 0.0% 0 0.0% 0 0.0% 0 0.0% 0Niton Village Centre 0.0% 0 0.0% 0 0.0% 0 0.0% 0 0.0% 0 0.0% 0Other - Zone 4 0.0% 0 0.0% 0 0.0% 0 0.0% 0 0.0% 0 0.0% 0Ventnor Town Centre 0.1% 1 0.0% 0 0.0% 0 0.0% 0 0.9% 1 0.0% 0Zone 5 Freshwater Town Centre 0.2% 2 0.0% 0 0.0% 0 0.0% 0 0.0% 0 2.5% 2Honnor & Jeffrey Afton
Garden Centre, Afton Road, Freshwater
0.0% 0 0.0% 0 0.0% 0 0.0% 0 0.0% 0 0.0% 0
Totland Village Centre 0.0% 0 0.0% 0 0.0% 0 0.0% 0 0.0% 0 0.0% 0Yarmouth Town Centre 0.0% 0 0.0% 0 0.0% 0 0.0% 0 0.0% 0 0.0% 0Outside Survey Area Abroad 0.0% 0 0.0% 0 0.0% 0 0.0% 0 0.0% 0 0.0% 0Bournemouth Town Centre 0.0% 0 0.0% 0 0.0% 0 0.0% 0 0.0% 0 0.0% 0Bradbeers Retail Park,
Wellington Way, Hedge End
0.0% 0 0.0% 0 0.0% 0 0.0% 0 0.0% 0 0.0% 0
Brighton City Centre 0.0% 0 0.0% 0 0.0% 0 0.0% 0 0.0% 0 0.0% 0Central London 0.2% 2 0.2% 1 0.4% 1 0.0% 0 0.0% 0 0.0% 0Gunwharf Quays,
Portsmouth 0.0% 0 0.0% 0 0.0% 0 0.0% 0 0.0% 0 0.0% 0
Hedge End Retail Park, Charles Watts Way, Southampton
0.0% 0 0.0% 0 0.0% 0 0.0% 0 0.0% 0 0.0% 0
Ikea, West Quay Road, Southampton
0.0% 0 0.0% 0 0.0% 0 0.0% 0 0.0% 0 0.0% 0
Lymington Town Centre 0.0% 0 0.0% 0 0.0% 0 0.0% 0 0.0% 0 0.0% 0Mountbatten Retail Park,
Western Esplanade, Southampton
0.0% 0 0.0% 0 0.0% 0 0.0% 0 0.0% 0 0.0% 0
Newchurch Village Centre 0.0% 0 0.0% 0 0.0% 0 0.0% 0 0.0% 0 0.0% 0Ocean Retail Park, Burrfields
Road, Portsmouth 0.1% 1 0.0% 0 0.3% 1 0.0% 0 0.0% 0 0.0% 0
Other - Outside Survey Area 0.2% 1 0.2% 1 0.0% 0 0.5% 1 0.0% 0 0.0% 0Portsmouth City Centre 0.0% 0 0.0% 0 0.0% 0 0.0% 0 0.0% 0 0.0% 0Sofasofa, Viaduct Works,
Newport 0.0% 0 0.0% 0 0.0% 0 0.0% 0 0.0% 0 0.0% 0
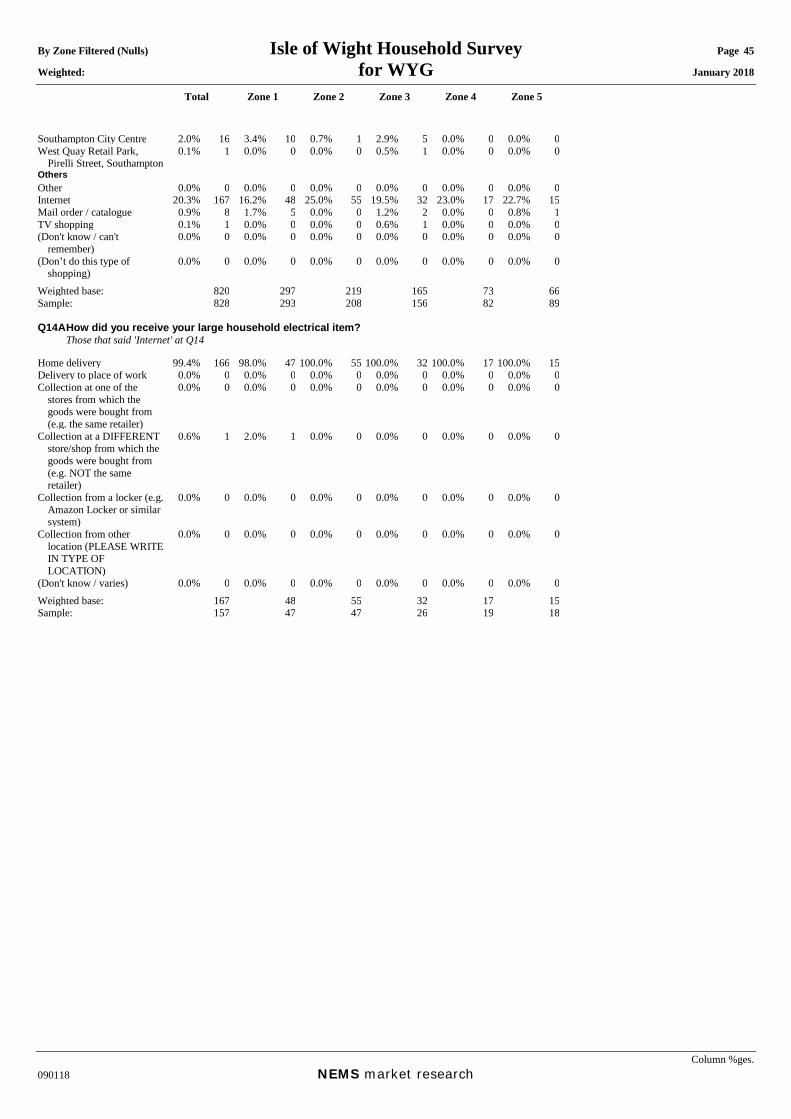
By Zone Filtered (Nulls) Isle of Wight Household Survey Page 45 Weighted: for WYG January 2018
Total Zone 1 Zone 2 Zone 3 Zone 4 Zone 5
Column %ges. 090118 NEMS market research
Southampton City Centre 2.0% 16 3.4% 10 0.7% 1 2.9% 5 0.0% 0 0.0% 0West Quay Retail Park,
Pirelli Street, Southampton 0.1% 1 0.0% 0 0.0% 0 0.5% 1 0.0% 0 0.0% 0
Others Other 0.0% 0 0.0% 0 0.0% 0 0.0% 0 0.0% 0 0.0% 0Internet 20.3% 167 16.2% 48 25.0% 55 19.5% 32 23.0% 17 22.7% 15Mail order / catalogue 0.9% 8 1.7% 5 0.0% 0 1.2% 2 0.0% 0 0.8% 1TV shopping 0.1% 1 0.0% 0 0.0% 0 0.6% 1 0.0% 0 0.0% 0(Don't know / can't
remember) 0.0% 0 0.0% 0 0.0% 0 0.0% 0 0.0% 0 0.0% 0
(Don’t do this type of shopping)
0.0% 0 0.0% 0 0.0% 0 0.0% 0 0.0% 0 0.0% 0
Weighted base: 820 297 219 165 73 66Sample: 828 293 208 156 82 89 Q14A How did you receive your large household electrical item? Those that said 'Internet' at Q14 Home delivery 99.4% 166 98.0% 47 100.0% 55 100.0% 32 100.0% 17 100.0% 15Delivery to place of work 0.0% 0 0.0% 0 0.0% 0 0.0% 0 0.0% 0 0.0% 0Collection at one of the
stores from which the goods were bought from (e.g. the same retailer)
0.0% 0 0.0% 0 0.0% 0 0.0% 0 0.0% 0 0.0% 0
Collection at a DIFFERENT store/shop from which the goods were bought from (e.g. NOT the same retailer)
0.6% 1 2.0% 1 0.0% 0 0.0% 0 0.0% 0 0.0% 0
Collection from a locker (e.g. Amazon Locker or similar system)
0.0% 0 0.0% 0 0.0% 0 0.0% 0 0.0% 0 0.0% 0
Collection from other location (PLEASE WRITE IN TYPE OF LOCATION)
0.0% 0 0.0% 0 0.0% 0 0.0% 0 0.0% 0 0.0% 0
(Don't know / varies) 0.0% 0 0.0% 0 0.0% 0 0.0% 0 0.0% 0 0.0% 0Weighted base: 167 48 55 32 17 15Sample: 157 47 47 26 19 18

By Zone Filtered (Nulls) Isle of Wight Household Survey Page 46 Weighted: for WYG January 2018
Total Zone 1 Zone 2 Zone 3 Zone 4 Zone 5
Column %ges. 090118 NEMS market research
Q15 Where did you last buy small electrical goods (cameras, tablets, blenders)? Excl. Nulls Zone 1 Aldi, Airfield Way, Cowes 0.1% 1 0.0% 0 0.0% 0 0.0% 0 0.0% 0 1.2% 1Asda, St Georges Way,
Newport 1.1% 8 2.1% 6 0.4% 1 0.6% 1 0.9% 1 0.0% 0
B&Q, Dodnor Lane, Newport
0.2% 1 0.0% 0 0.4% 1 0.0% 0 0.0% 0 0.9% 1
Capitol Furniture Galleries, Bernard Way, Newport
0.0% 0 0.0% 0 0.0% 0 0.0% 0 0.0% 0 0.0% 0
Carisbrooke Retail Park (formerly Gunville Trading Estate),Taylor Road, Newport (Argos, Mothercare, Home Bargains, Dreams and Carpetright)
5.8% 45 9.3% 26 2.2% 4 6.4% 10 2.8% 2 4.1% 3
Carisbrooke Village Centre 0.0% 0 0.0% 0 0.0% 0 0.0% 0 0.0% 0 0.0% 0Coppins Bridge Retail Park,
Furlongs, Newport (Cineworld, Fever Bar, Pizza Hut, KFC, Maplin and Office Outlet)
0.0% 0 0.0% 0 0.0% 0 0.0% 0 0.0% 0 0.0% 0
Cowes Town Centre 0.9% 7 2.3% 7 0.4% 1 0.0% 0 0.0% 0 0.0% 0Dodner Industrial Estate,
Newport 0.0% 0 0.0% 0 0.0% 0 0.0% 0 0.0% 0 0.0% 0
East Cowes Town Centre 0.0% 0 0.0% 0 0.0% 0 0.0% 0 0.0% 0 0.0% 0Forest View Garden Centre,
Forest Road, Newport 0.0% 0 0.0% 0 0.0% 0 0.0% 0 0.0% 0 0.0% 0
Isle of Wight Motorcycles, Daish Way, Newport
0.0% 0 0.0% 0 0.0% 0 0.0% 0 0.0% 0 0.0% 0
Lidl, River Way, Newport 0.4% 3 0.2% 1 0.4% 1 0.5% 1 0.0% 0 2.0% 1Long Lane Carpets &
Flooring, Long Lane, Newport
0.0% 0 0.0% 0 0.0% 0 0.0% 0 0.0% 0 0.0% 0
Marks & Spencer, Church Litten, Newport
0.0% 0 0.0% 0 0.0% 0 0.0% 0 0.0% 0 0.0% 0
Matalan, Furrlongs, Newport 0.0% 0 0.0% 0 0.0% 0 0.0% 0 0.0% 0 0.0% 0Mole Country Stores,
Blackwater, Newport 0.0% 0 0.0% 0 0.0% 0 0.0% 0 0.0% 0 0.0% 0
Morrisons, South Street, Newport
0.8% 6 0.8% 2 0.4% 1 0.6% 1 0.0% 0 3.5% 2
Newport Town Centre 17.8% 139 26.0% 74 10.1% 21 12.6% 20 22.5% 16 13.1% 8Northwood Village Centre 0.0% 0 0.0% 0 0.0% 0 0.0% 0 0.0% 0 0.0% 0Oakfield District Centre,
Ryde 0.0% 0 0.0% 0 0.0% 0 0.0% 0 0.0% 0 0.0% 0
Riverway Industrial Estate, Riverway, Newport (Magnet Trade, Topps Tiles)
0.5% 4 0.0% 0 1.0% 2 0.6% 1 0.9% 1 0.0% 0
Sainsburys Superstore, Foxes Road, Newport
3.3% 26 6.4% 18 0.4% 1 2.4% 4 1.9% 1 2.7% 2
Sainsburys Superstore, High Street, Cowes
0.0% 0 0.0% 0 0.0% 0 0.0% 0 0.0% 0 0.0% 0
The Range, Place Road, Cowes
0.1% 1 0.3% 1 0.0% 0 0.0% 0 0.0% 0 0.0% 0
Towngate Retail Park, Newport (Halfords, Mattressman and Pavers)
0.0% 0 0.0% 0 0.0% 0 0.0% 0 0.0% 0 0.0% 0
Wakes Retail Park, Medina Way, Newport (Pets at Home, Currys, PC World and Dunelm)
30.0% 234 28.2% 80 29.8% 61 32.0% 51 30.8% 22 32.5% 20
Zone 2 Bembridge Village Centre 0.0% 0 0.0% 0 0.0% 0 0.0% 0 0.0% 0 0.0% 0Busy Bee Garden Centre,
Brading Road, Ryde 0.0% 0 0.0% 0 0.0% 0 0.0% 0 0.0% 0 0.0% 0
Medina Garden Centre, Staplers Road, Wootton Bridge, Ryde
0.0% 0 0.0% 0 0.0% 0 0.0% 0 0.0% 0 0.0% 0
Ryde Town Centre 2.8% 22 0.0% 0 8.7% 18 1.5% 2 1.9% 1 0.0% 0Seaview Village Centre 0.0% 0 0.0% 0 0.0% 0 0.0% 0 0.0% 0 0.0% 0Spinnaker Chandlery, 0.0% 0 0.0% 0 0.0% 0 0.0% 0 0.0% 0 0.0% 0

By Zone Filtered (Nulls) Isle of Wight Household Survey Page 47 Weighted: for WYG January 2018
Total Zone 1 Zone 2 Zone 3 Zone 4 Zone 5
Column %ges. 090118 NEMS market research
Embankment Road, Bembridge
Tesco Extra, Brading Road, Ryde
6.9% 54 0.7% 2 18.3% 37 6.0% 9 7.2% 5 0.0% 0
Westridge Golf Centre, Brading Road, Ryde
0.0% 0 0.0% 0 0.0% 0 0.0% 0 0.0% 0 0.0% 0
Wooton Bridge Village Centre
0.0% 0 0.0% 0 0.0% 0 0.0% 0 0.0% 0 0.0% 0
Aldi, Spithead Bus Park, Sandown
0.4% 3 0.0% 0 0.0% 0 1.9% 3 0.0% 0 0.0% 0
Zone 3 Brading Town Centre 0.0% 0 0.0% 0 0.0% 0 0.0% 0 0.0% 0 0.0% 0Honnor & Jeffrey Dalverton
Garden Centre, Newport Road, Sandown
0.0% 0 0.0% 0 0.0% 0 0.0% 0 0.0% 0 0.0% 0
Jubilee Garden Centre, Newport Road, Branstone, Sandown
0.0% 0 0.0% 0 0.0% 0 0.0% 0 0.0% 0 0.0% 0
Lake Industrial Estate, Lake Industrial Way, Sandown
0.0% 0 0.0% 0 0.0% 0 0.0% 0 0.0% 0 0.0% 0
Lake Village Centre 0.0% 0 0.0% 0 0.0% 0 0.0% 0 0.0% 0 0.0% 0Languard Holiday Park,
Shanklin 0.0% 0 0.0% 0 0.0% 0 0.0% 0 0.0% 0 0.0% 0
Lidl, Landguard Manor Road, Shanklin
0.1% 1 0.0% 0 0.0% 0 0.5% 1 0.0% 0 0.0% 0
Morrisons, Newport Road, Sandown
0.0% 0 0.0% 0 0.0% 0 0.0% 0 0.0% 0 0.0% 0
Oasis, Carpenters Road, Brading
0.0% 0 0.0% 0 0.0% 0 0.0% 0 0.0% 0 0.0% 0
Sandown Town Centre 0.1% 1 0.0% 0 0.0% 0 0.5% 1 0.0% 0 0.0% 0Shanklin Town Centre 1.9% 14 0.0% 0 0.0% 0 8.7% 14 1.1% 1 0.0% 0Spithead Business Centre,
Newport Road, Sandown 0.0% 0 0.0% 0 0.0% 0 0.0% 0 0.0% 0 0.0% 0
Thomson Plant and Garden Centre, Watery Lane, Newchurch
0.0% 0 0.0% 0 0.0% 0 0.0% 0 0.0% 0 0.0% 0
Zone 4 Godshill Village Centre 0.0% 0 0.0% 0 0.0% 0 0.0% 0 0.0% 0 0.0% 0Niton Village Centre 0.0% 0 0.0% 0 0.0% 0 0.0% 0 0.0% 0 0.0% 0Other - Zone 4 0.0% 0 0.0% 0 0.0% 0 0.0% 0 0.0% 0 0.0% 0Ventnor Town Centre 0.5% 4 0.0% 0 0.0% 0 0.0% 0 5.2% 4 0.0% 0Zone 5 Freshwater Town Centre 1.1% 8 0.0% 0 0.0% 0 0.0% 0 0.0% 0 13.5% 8Honnor & Jeffrey Afton
Garden Centre, Afton Road, Freshwater
0.0% 0 0.0% 0 0.0% 0 0.0% 0 0.0% 0 0.0% 0
Totland Village Centre 0.0% 0 0.0% 0 0.0% 0 0.0% 0 0.0% 0 0.0% 0Yarmouth Town Centre 0.0% 0 0.0% 0 0.0% 0 0.0% 0 0.0% 0 0.0% 0Outside Survey Area Abroad 0.1% 1 0.0% 0 0.0% 0 0.6% 1 0.0% 0 0.0% 0Bournemouth Town Centre 0.0% 0 0.0% 0 0.0% 0 0.0% 0 0.0% 0 0.0% 0Bradbeers Retail Park,
Wellington Way, Hedge End
0.0% 0 0.0% 0 0.0% 0 0.0% 0 0.0% 0 0.0% 0
Brighton City Centre 0.0% 0 0.0% 0 0.0% 0 0.0% 0 0.0% 0 0.0% 0Central London 0.3% 2 0.2% 1 0.5% 1 0.5% 1 0.0% 0 0.0% 0Gunwharf Quays,
Portsmouth 0.0% 0 0.0% 0 0.0% 0 0.0% 0 0.0% 0 0.0% 0
Hedge End Retail Park, Charles Watts Way, Southampton
0.0% 0 0.0% 0 0.0% 0 0.0% 0 0.0% 0 0.0% 0
Ikea, West Quay Road, Southampton
0.0% 0 0.0% 0 0.0% 0 0.0% 0 0.0% 0 0.0% 0
Lymington Town Centre 0.0% 0 0.0% 0 0.0% 0 0.0% 0 0.0% 0 0.0% 0Mountbatten Retail Park,
Western Esplanade, Southampton
0.0% 0 0.0% 0 0.0% 0 0.0% 0 0.0% 0 0.0% 0
Newchurch Village Centre 0.0% 0 0.0% 0 0.0% 0 0.0% 0 0.0% 0 0.0% 0Ocean Retail Park, Burrfields
Road, Portsmouth 0.0% 0 0.0% 0 0.0% 0 0.0% 0 0.0% 0 0.0% 0
Other - Outside Survey Area 0.3% 2 0.3% 1 0.4% 1 0.5% 1 0.0% 0 0.0% 0Portsmouth City Centre 0.0% 0 0.0% 0 0.0% 0 0.0% 0 0.0% 0 0.0% 0Sofasofa, Viaduct Works,
Newport 0.0% 0 0.0% 0 0.0% 0 0.0% 0 0.0% 0 0.0% 0
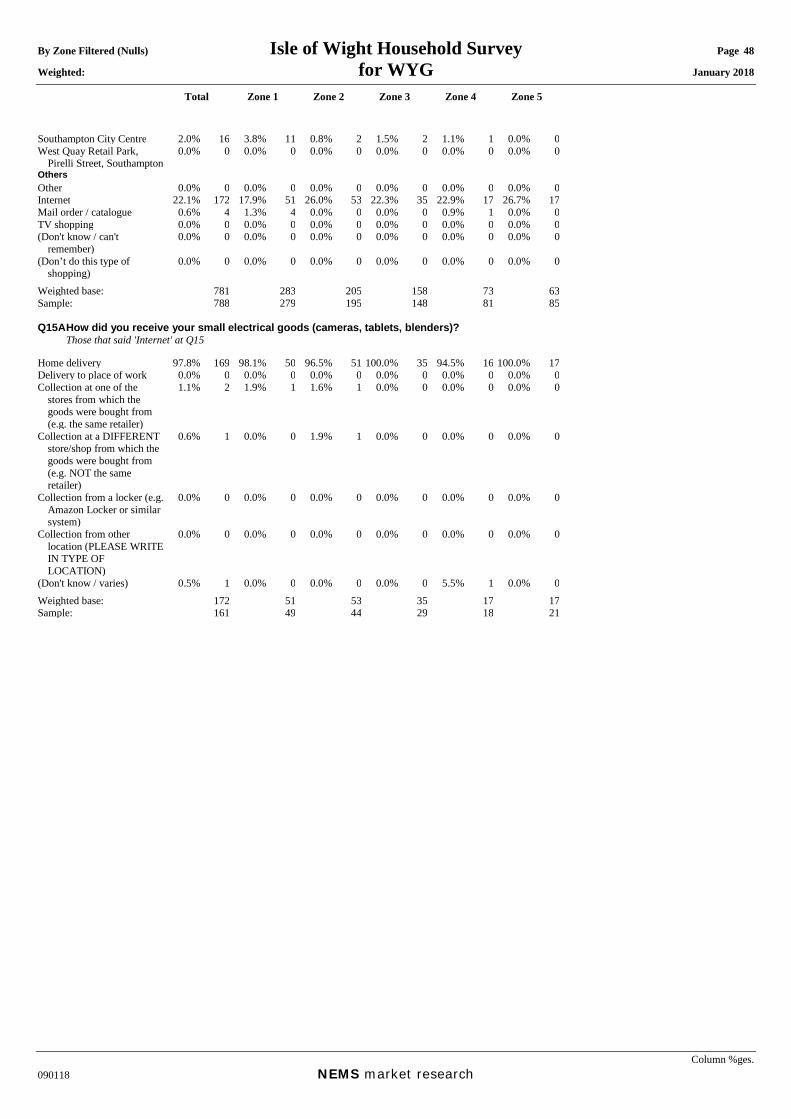
By Zone Filtered (Nulls) Isle of Wight Household Survey Page 48 Weighted: for WYG January 2018
Total Zone 1 Zone 2 Zone 3 Zone 4 Zone 5
Column %ges. 090118 NEMS market research
Southampton City Centre 2.0% 16 3.8% 11 0.8% 2 1.5% 2 1.1% 1 0.0% 0West Quay Retail Park,
Pirelli Street, Southampton 0.0% 0 0.0% 0 0.0% 0 0.0% 0 0.0% 0 0.0% 0
Others Other 0.0% 0 0.0% 0 0.0% 0 0.0% 0 0.0% 0 0.0% 0Internet 22.1% 172 17.9% 51 26.0% 53 22.3% 35 22.9% 17 26.7% 17Mail order / catalogue 0.6% 4 1.3% 4 0.0% 0 0.0% 0 0.9% 1 0.0% 0TV shopping 0.0% 0 0.0% 0 0.0% 0 0.0% 0 0.0% 0 0.0% 0(Don't know / can't
remember) 0.0% 0 0.0% 0 0.0% 0 0.0% 0 0.0% 0 0.0% 0
(Don’t do this type of shopping)
0.0% 0 0.0% 0 0.0% 0 0.0% 0 0.0% 0 0.0% 0
Weighted base: 781 283 205 158 73 63Sample: 788 279 195 148 81 85 Q15A How did you receive your small electrical goods (cameras, tablets, blenders)? Those that said 'Internet' at Q15 Home delivery 97.8% 169 98.1% 50 96.5% 51 100.0% 35 94.5% 16 100.0% 17Delivery to place of work 0.0% 0 0.0% 0 0.0% 0 0.0% 0 0.0% 0 0.0% 0Collection at one of the
stores from which the goods were bought from (e.g. the same retailer)
1.1% 2 1.9% 1 1.6% 1 0.0% 0 0.0% 0 0.0% 0
Collection at a DIFFERENT store/shop from which the goods were bought from (e.g. NOT the same retailer)
0.6% 1 0.0% 0 1.9% 1 0.0% 0 0.0% 0 0.0% 0
Collection from a locker (e.g. Amazon Locker or similar system)
0.0% 0 0.0% 0 0.0% 0 0.0% 0 0.0% 0 0.0% 0
Collection from other location (PLEASE WRITE IN TYPE OF LOCATION)
0.0% 0 0.0% 0 0.0% 0 0.0% 0 0.0% 0 0.0% 0
(Don't know / varies) 0.5% 1 0.0% 0 0.0% 0 0.0% 0 5.5% 1 0.0% 0Weighted base: 172 51 53 35 17 17Sample: 161 49 44 29 18 21
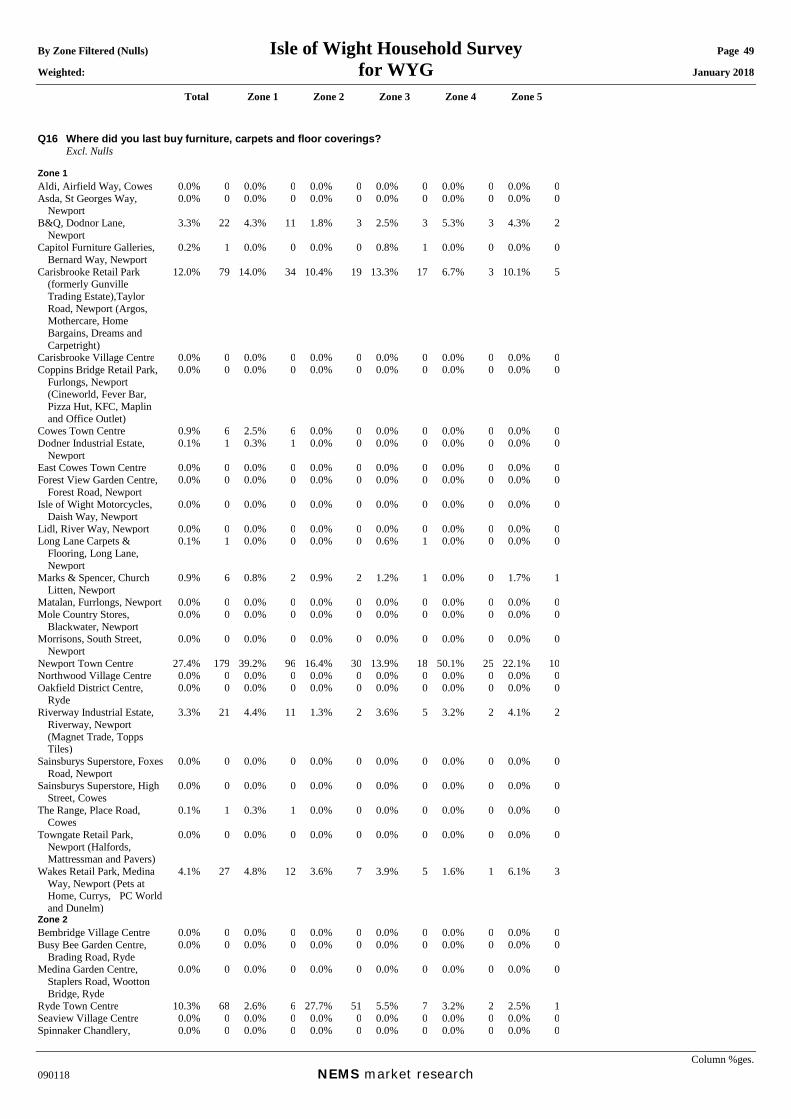
By Zone Filtered (Nulls) Isle of Wight Household Survey Page 49 Weighted: for WYG January 2018
Total Zone 1 Zone 2 Zone 3 Zone 4 Zone 5
Column %ges. 090118 NEMS market research
Q16 Where did you last buy furniture, carpets and floor coverings? Excl. Nulls Zone 1 Aldi, Airfield Way, Cowes 0.0% 0 0.0% 0 0.0% 0 0.0% 0 0.0% 0 0.0% 0Asda, St Georges Way,
Newport 0.0% 0 0.0% 0 0.0% 0 0.0% 0 0.0% 0 0.0% 0
B&Q, Dodnor Lane, Newport
3.3% 22 4.3% 11 1.8% 3 2.5% 3 5.3% 3 4.3% 2
Capitol Furniture Galleries, Bernard Way, Newport
0.2% 1 0.0% 0 0.0% 0 0.8% 1 0.0% 0 0.0% 0
Carisbrooke Retail Park (formerly Gunville Trading Estate),Taylor Road, Newport (Argos, Mothercare, Home Bargains, Dreams and Carpetright)
12.0% 79 14.0% 34 10.4% 19 13.3% 17 6.7% 3 10.1% 5
Carisbrooke Village Centre 0.0% 0 0.0% 0 0.0% 0 0.0% 0 0.0% 0 0.0% 0Coppins Bridge Retail Park,
Furlongs, Newport (Cineworld, Fever Bar, Pizza Hut, KFC, Maplin and Office Outlet)
0.0% 0 0.0% 0 0.0% 0 0.0% 0 0.0% 0 0.0% 0
Cowes Town Centre 0.9% 6 2.5% 6 0.0% 0 0.0% 0 0.0% 0 0.0% 0Dodner Industrial Estate,
Newport 0.1% 1 0.3% 1 0.0% 0 0.0% 0 0.0% 0 0.0% 0
East Cowes Town Centre 0.0% 0 0.0% 0 0.0% 0 0.0% 0 0.0% 0 0.0% 0Forest View Garden Centre,
Forest Road, Newport 0.0% 0 0.0% 0 0.0% 0 0.0% 0 0.0% 0 0.0% 0
Isle of Wight Motorcycles, Daish Way, Newport
0.0% 0 0.0% 0 0.0% 0 0.0% 0 0.0% 0 0.0% 0
Lidl, River Way, Newport 0.0% 0 0.0% 0 0.0% 0 0.0% 0 0.0% 0 0.0% 0Long Lane Carpets &
Flooring, Long Lane, Newport
0.1% 1 0.0% 0 0.0% 0 0.6% 1 0.0% 0 0.0% 0
Marks & Spencer, Church Litten, Newport
0.9% 6 0.8% 2 0.9% 2 1.2% 1 0.0% 0 1.7% 1
Matalan, Furrlongs, Newport 0.0% 0 0.0% 0 0.0% 0 0.0% 0 0.0% 0 0.0% 0Mole Country Stores,
Blackwater, Newport 0.0% 0 0.0% 0 0.0% 0 0.0% 0 0.0% 0 0.0% 0
Morrisons, South Street, Newport
0.0% 0 0.0% 0 0.0% 0 0.0% 0 0.0% 0 0.0% 0
Newport Town Centre 27.4% 179 39.2% 96 16.4% 30 13.9% 18 50.1% 25 22.1% 10Northwood Village Centre 0.0% 0 0.0% 0 0.0% 0 0.0% 0 0.0% 0 0.0% 0Oakfield District Centre,
Ryde 0.0% 0 0.0% 0 0.0% 0 0.0% 0 0.0% 0 0.0% 0
Riverway Industrial Estate, Riverway, Newport (Magnet Trade, Topps Tiles)
3.3% 21 4.4% 11 1.3% 2 3.6% 5 3.2% 2 4.1% 2
Sainsburys Superstore, Foxes Road, Newport
0.0% 0 0.0% 0 0.0% 0 0.0% 0 0.0% 0 0.0% 0
Sainsburys Superstore, High Street, Cowes
0.0% 0 0.0% 0 0.0% 0 0.0% 0 0.0% 0 0.0% 0
The Range, Place Road, Cowes
0.1% 1 0.3% 1 0.0% 0 0.0% 0 0.0% 0 0.0% 0
Towngate Retail Park, Newport (Halfords, Mattressman and Pavers)
0.0% 0 0.0% 0 0.0% 0 0.0% 0 0.0% 0 0.0% 0
Wakes Retail Park, Medina Way, Newport (Pets at Home, Currys, PC World and Dunelm)
4.1% 27 4.8% 12 3.6% 7 3.9% 5 1.6% 1 6.1% 3
Zone 2 Bembridge Village Centre 0.0% 0 0.0% 0 0.0% 0 0.0% 0 0.0% 0 0.0% 0Busy Bee Garden Centre,
Brading Road, Ryde 0.0% 0 0.0% 0 0.0% 0 0.0% 0 0.0% 0 0.0% 0
Medina Garden Centre, Staplers Road, Wootton Bridge, Ryde
0.0% 0 0.0% 0 0.0% 0 0.0% 0 0.0% 0 0.0% 0
Ryde Town Centre 10.3% 68 2.6% 6 27.7% 51 5.5% 7 3.2% 2 2.5% 1Seaview Village Centre 0.0% 0 0.0% 0 0.0% 0 0.0% 0 0.0% 0 0.0% 0Spinnaker Chandlery, 0.0% 0 0.0% 0 0.0% 0 0.0% 0 0.0% 0 0.0% 0

By Zone Filtered (Nulls) Isle of Wight Household Survey Page 50 Weighted: for WYG January 2018
Total Zone 1 Zone 2 Zone 3 Zone 4 Zone 5
Column %ges. 090118 NEMS market research
Embankment Road, Bembridge
Tesco Extra, Brading Road, Ryde
0.0% 0 0.0% 0 0.0% 0 0.0% 0 0.0% 0 0.0% 0
Westridge Golf Centre, Brading Road, Ryde
0.0% 0 0.0% 0 0.0% 0 0.0% 0 0.0% 0 0.0% 0
Wooton Bridge Village Centre
0.0% 0 0.0% 0 0.0% 0 0.0% 0 0.0% 0 0.0% 0
Aldi, Spithead Bus Park, Sandown
0.1% 1 0.4% 1 0.0% 0 0.0% 0 0.0% 0 0.0% 0
Zone 3 Brading Town Centre 0.2% 1 0.0% 0 0.0% 0 0.8% 1 0.0% 0 0.0% 0Honnor & Jeffrey Dalverton
Garden Centre, Newport Road, Sandown
0.0% 0 0.0% 0 0.0% 0 0.0% 0 0.0% 0 0.0% 0
Jubilee Garden Centre, Newport Road, Branstone, Sandown
0.0% 0 0.0% 0 0.0% 0 0.0% 0 0.0% 0 0.0% 0
Lake Industrial Estate, Lake Industrial Way, Sandown
1.8% 12 1.2% 3 1.3% 2 4.8% 6 0.0% 0 0.0% 0
Lake Village Centre 1.1% 7 0.7% 2 1.7% 3 1.9% 3 0.0% 0 0.0% 0Languard Holiday Park,
Shanklin 0.0% 0 0.0% 0 0.0% 0 0.0% 0 0.0% 0 0.0% 0
Lidl, Landguard Manor Road, Shanklin
0.0% 0 0.0% 0 0.0% 0 0.0% 0 0.0% 0 0.0% 0
Morrisons, Newport Road, Sandown
0.0% 0 0.0% 0 0.0% 0 0.0% 0 0.0% 0 0.0% 0
Oasis, Carpenters Road, Brading
0.9% 6 0.0% 0 1.6% 3 0.6% 1 3.9% 2 0.0% 0
Sandown Town Centre 3.5% 23 0.3% 1 3.3% 6 10.1% 13 5.7% 3 0.0% 0Shanklin Town Centre 3.8% 25 0.0% 0 1.7% 3 14.0% 18 6.7% 3 0.0% 0Spithead Business Centre,
Newport Road, Sandown 0.9% 6 0.3% 1 1.7% 3 1.7% 2 0.0% 0 0.0% 0
Thomson Plant and Garden Centre, Watery Lane, Newchurch
0.0% 0 0.0% 0 0.0% 0 0.0% 0 0.0% 0 0.0% 0
Zone 4 Godshill Village Centre 0.0% 0 0.0% 0 0.0% 0 0.0% 0 0.0% 0 0.0% 0Niton Village Centre 0.0% 0 0.0% 0 0.0% 0 0.0% 0 0.0% 0 0.0% 0Other - Zone 4 0.0% 0 0.0% 0 0.0% 0 0.0% 0 0.0% 0 0.0% 0Ventnor Town Centre 0.1% 1 0.3% 1 0.0% 0 0.0% 0 0.0% 0 0.0% 0Zone 5 Freshwater Town Centre 2.7% 18 1.4% 3 0.0% 0 0.0% 0 0.0% 0 30.9% 14Honnor & Jeffrey Afton
Garden Centre, Afton Road, Freshwater
0.4% 3 1.1% 3 0.0% 0 0.0% 0 0.0% 0 0.0% 0
Totland Village Centre 0.0% 0 0.0% 0 0.0% 0 0.0% 0 0.0% 0 0.0% 0Yarmouth Town Centre 0.0% 0 0.0% 0 0.0% 0 0.0% 0 0.0% 0 0.0% 0Outside Survey Area Abroad 0.2% 2 0.4% 1 0.0% 0 0.0% 0 1.4% 1 0.0% 0Bournemouth Town Centre 0.0% 0 0.0% 0 0.0% 0 0.0% 0 0.0% 0 0.0% 0Bradbeers Retail Park,
Wellington Way, Hedge End
0.2% 1 0.0% 0 0.0% 0 0.8% 1 0.0% 0 0.0% 0
Brighton City Centre 0.1% 1 0.0% 0 0.0% 0 0.6% 1 0.0% 0 0.0% 0Central London 1.0% 6 0.6% 1 2.7% 5 0.0% 0 0.0% 0 0.0% 0Gunwharf Quays,
Portsmouth 0.0% 0 0.0% 0 0.0% 0 0.0% 0 0.0% 0 0.0% 0
Hedge End Retail Park, Charles Watts Way, Southampton
0.1% 1 0.0% 0 0.0% 0 0.0% 0 0.0% 0 1.2% 1
Ikea, West Quay Road, Southampton
1.5% 10 1.9% 5 1.6% 3 1.5% 2 0.0% 0 0.0% 0
Lymington Town Centre 0.0% 0 0.0% 0 0.0% 0 0.0% 0 0.0% 0 0.0% 0Mountbatten Retail Park,
Western Esplanade, Southampton
0.0% 0 0.0% 0 0.0% 0 0.0% 0 0.0% 0 0.0% 0
Newchurch Village Centre 0.0% 0 0.0% 0 0.0% 0 0.0% 0 0.0% 0 0.0% 0Ocean Retail Park, Burrfields
Road, Portsmouth 0.3% 2 0.4% 1 0.0% 0 0.7% 1 0.0% 0 0.0% 0
Other - Outside Survey Area 0.8% 5 0.3% 1 1.3% 2 0.0% 0 2.7% 1 1.4% 1Portsmouth City Centre 0.1% 1 0.4% 1 0.0% 0 0.0% 0 0.0% 0 0.0% 0Sofasofa, Viaduct Works,
Newport 0.1% 1 0.3% 1 0.0% 0 0.0% 0 0.0% 0 0.0% 0
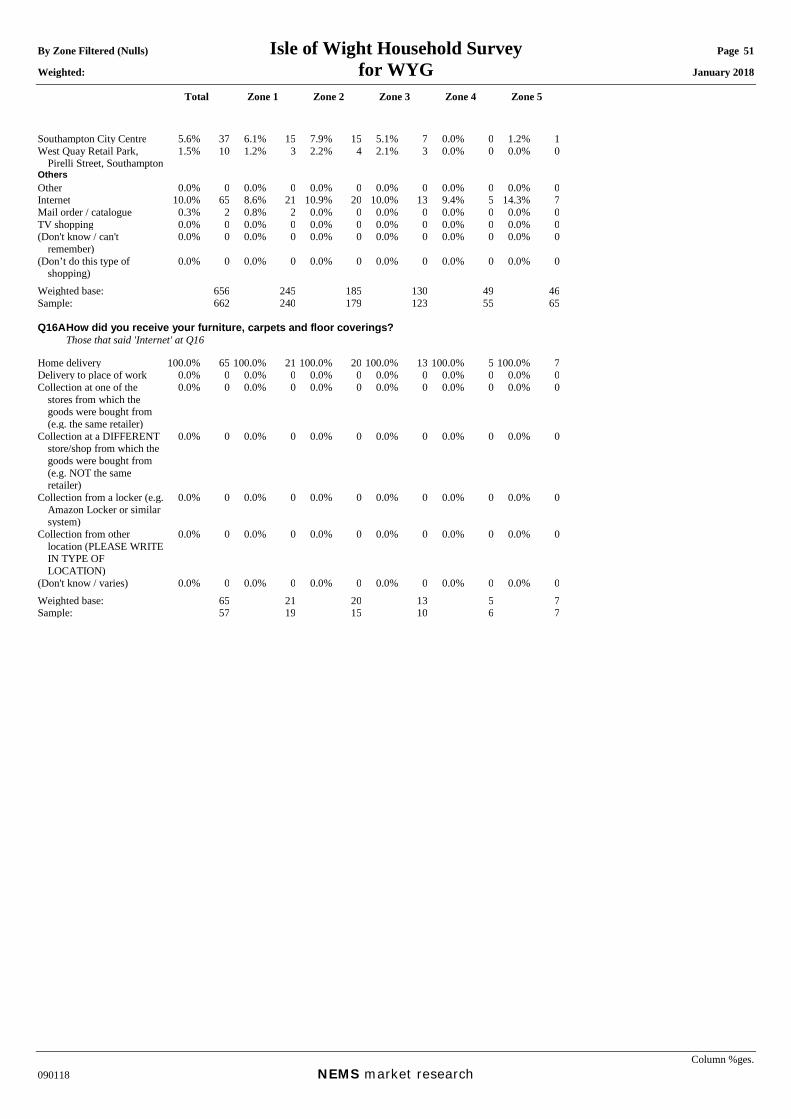
By Zone Filtered (Nulls) Isle of Wight Household Survey Page 51 Weighted: for WYG January 2018
Total Zone 1 Zone 2 Zone 3 Zone 4 Zone 5
Column %ges. 090118 NEMS market research
Southampton City Centre 5.6% 37 6.1% 15 7.9% 15 5.1% 7 0.0% 0 1.2% 1West Quay Retail Park,
Pirelli Street, Southampton 1.5% 10 1.2% 3 2.2% 4 2.1% 3 0.0% 0 0.0% 0
Others Other 0.0% 0 0.0% 0 0.0% 0 0.0% 0 0.0% 0 0.0% 0Internet 10.0% 65 8.6% 21 10.9% 20 10.0% 13 9.4% 5 14.3% 7Mail order / catalogue 0.3% 2 0.8% 2 0.0% 0 0.0% 0 0.0% 0 0.0% 0TV shopping 0.0% 0 0.0% 0 0.0% 0 0.0% 0 0.0% 0 0.0% 0(Don't know / can't
remember) 0.0% 0 0.0% 0 0.0% 0 0.0% 0 0.0% 0 0.0% 0
(Don’t do this type of shopping)
0.0% 0 0.0% 0 0.0% 0 0.0% 0 0.0% 0 0.0% 0
Weighted base: 656 245 185 130 49 46Sample: 662 240 179 123 55 65 Q16A How did you receive your furniture, carpets and floor coverings? Those that said 'Internet' at Q16 Home delivery 100.0% 65 100.0% 21 100.0% 20 100.0% 13 100.0% 5 100.0% 7Delivery to place of work 0.0% 0 0.0% 0 0.0% 0 0.0% 0 0.0% 0 0.0% 0Collection at one of the
stores from which the goods were bought from (e.g. the same retailer)
0.0% 0 0.0% 0 0.0% 0 0.0% 0 0.0% 0 0.0% 0
Collection at a DIFFERENT store/shop from which the goods were bought from (e.g. NOT the same retailer)
0.0% 0 0.0% 0 0.0% 0 0.0% 0 0.0% 0 0.0% 0
Collection from a locker (e.g. Amazon Locker or similar system)
0.0% 0 0.0% 0 0.0% 0 0.0% 0 0.0% 0 0.0% 0
Collection from other location (PLEASE WRITE IN TYPE OF LOCATION)
0.0% 0 0.0% 0 0.0% 0 0.0% 0 0.0% 0 0.0% 0
(Don't know / varies) 0.0% 0 0.0% 0 0.0% 0 0.0% 0 0.0% 0 0.0% 0Weighted base: 65 21 20 13 5 7Sample: 57 19 15 10 6 7

By Zone Filtered (Nulls) Isle of Wight Household Survey Page 52 Weighted: for WYG January 2018
Total Zone 1 Zone 2 Zone 3 Zone 4 Zone 5
Column %ges. 090118 NEMS market research
Q17 Where did you last buy DIY (including gardening) goods? Excl. Nulls Zone 1 Aldi, Airfield Way, Cowes 0.0% 0 0.0% 0 0.0% 0 0.0% 0 0.0% 0 0.0% 0Asda, St Georges Way,
Newport 0.1% 1 0.0% 0 0.4% 1 0.0% 0 0.0% 0 0.0% 0
B&Q, Dodnor Lane, Newport
65.4% 527 66.3% 204 63.2% 132 63.0% 96 64.2% 46 74.8% 48
Capitol Furniture Galleries, Bernard Way, Newport
0.0% 0 0.0% 0 0.0% 0 0.0% 0 0.0% 0 0.0% 0
Carisbrooke Retail Park (formerly Gunville Trading Estate),Taylor Road, Newport (Argos, Mothercare, Home Bargains, Dreams and Carpetright)
0.2% 2 0.0% 0 0.4% 1 0.0% 0 1.1% 1 0.0% 0
Carisbrooke Village Centre 0.0% 0 0.0% 0 0.0% 0 0.0% 0 0.0% 0 0.0% 0Coppins Bridge Retail Park,
Furlongs, Newport (Cineworld, Fever Bar, Pizza Hut, KFC, Maplin and Office Outlet)
0.0% 0 0.0% 0 0.0% 0 0.0% 0 0.0% 0 0.0% 0
Cowes Town Centre 1.9% 15 4.9% 15 0.0% 0 0.0% 0 0.0% 0 0.0% 0Dodner Industrial Estate,
Newport 0.2% 2 0.5% 2 0.0% 0 0.0% 0 0.0% 0 0.0% 0
East Cowes Town Centre 0.1% 1 0.2% 1 0.0% 0 0.0% 0 0.0% 0 0.0% 0Forest View Garden Centre,
Forest Road, Newport 0.5% 4 0.9% 3 0.4% 1 0.0% 0 0.0% 0 0.0% 0
Isle of Wight Motorcycles, Daish Way, Newport
0.0% 0 0.0% 0 0.0% 0 0.0% 0 0.0% 0 0.0% 0
Lidl, River Way, Newport 0.1% 1 0.2% 1 0.0% 0 0.0% 0 0.0% 0 0.0% 0Long Lane Carpets &
Flooring, Long Lane, Newport
0.0% 0 0.0% 0 0.0% 0 0.0% 0 0.0% 0 0.0% 0
Marks & Spencer, Church Litten, Newport
0.0% 0 0.0% 0 0.0% 0 0.0% 0 0.0% 0 0.0% 0
Matalan, Furrlongs, Newport 0.0% 0 0.0% 0 0.0% 0 0.0% 0 0.0% 0 0.0% 0Mole Country Stores,
Blackwater, Newport 0.1% 1 0.0% 0 0.0% 0 0.0% 0 0.9% 1 0.0% 0
Morrisons, South Street, Newport
0.0% 0 0.0% 0 0.0% 0 0.0% 0 0.0% 0 0.0% 0
Newport Town Centre 11.1% 89 17.0% 52 6.7% 14 7.1% 11 13.6% 10 3.6% 2Northwood Village Centre 0.0% 0 0.0% 0 0.0% 0 0.0% 0 0.0% 0 0.0% 0Oakfield District Centre,
Ryde 0.0% 0 0.0% 0 0.0% 0 0.0% 0 0.0% 0 0.0% 0
Riverway Industrial Estate, Riverway, Newport (Magnet Trade, Topps Tiles)
2.4% 20 2.3% 7 4.8% 10 1.2% 2 0.0% 0 1.2% 1
Sainsburys Superstore, Foxes Road, Newport
0.0% 0 0.0% 0 0.0% 0 0.0% 0 0.0% 0 0.0% 0
Sainsburys Superstore, High Street, Cowes
0.0% 0 0.0% 0 0.0% 0 0.0% 0 0.0% 0 0.0% 0
The Range, Place Road, Cowes
0.7% 5 0.3% 1 1.4% 3 0.0% 0 0.0% 0 2.5% 2
Towngate Retail Park, Newport (Halfords, Mattressman and Pavers)
0.0% 0 0.0% 0 0.0% 0 0.0% 0 0.0% 0 0.0% 0
Wakes Retail Park, Medina Way, Newport (Pets at Home, Currys, PC World and Dunelm)
0.7% 6 1.6% 5 0.0% 0 0.5% 1 0.0% 0 0.0% 0
Zone 2 Bembridge Village Centre 0.3% 3 0.0% 0 1.3% 3 0.0% 0 0.0% 0 0.0% 0Busy Bee Garden Centre,
Brading Road, Ryde 1.4% 11 0.0% 0 4.4% 9 0.5% 1 1.1% 1 0.9% 1
Medina Garden Centre, Staplers Road, Wootton Bridge, Ryde
0.1% 1 0.0% 0 0.0% 0 0.7% 1 0.0% 0 0.0% 0
Ryde Town Centre 3.4% 27 0.8% 2 11.0% 23 1.2% 2 0.0% 0 0.0% 0Seaview Village Centre 0.0% 0 0.0% 0 0.0% 0 0.0% 0 0.0% 0 0.0% 0Spinnaker Chandlery, 0.0% 0 0.0% 0 0.0% 0 0.0% 0 0.0% 0 0.0% 0

By Zone Filtered (Nulls) Isle of Wight Household Survey Page 53 Weighted: for WYG January 2018
Total Zone 1 Zone 2 Zone 3 Zone 4 Zone 5
Column %ges. 090118 NEMS market research
Embankment Road, Bembridge
Tesco Extra, Brading Road, Ryde
0.0% 0 0.0% 0 0.0% 0 0.0% 0 0.0% 0 0.0% 0
Westridge Golf Centre, Brading Road, Ryde
0.0% 0 0.0% 0 0.0% 0 0.0% 0 0.0% 0 0.0% 0
Wooton Bridge Village Centre
0.0% 0 0.0% 0 0.0% 0 0.0% 0 0.0% 0 0.0% 0
Aldi, Spithead Bus Park, Sandown
0.4% 4 0.0% 0 0.0% 0 1.9% 3 0.9% 1 0.0% 0
Zone 3 Brading Town Centre 0.0% 0 0.0% 0 0.0% 0 0.0% 0 0.0% 0 0.0% 0Honnor & Jeffrey Dalverton
Garden Centre, Newport Road, Sandown
0.4% 3 0.0% 0 0.4% 1 1.5% 2 0.0% 0 0.0% 0
Jubilee Garden Centre, Newport Road, Branstone, Sandown
0.6% 4 0.9% 3 0.0% 0 1.2% 2 0.0% 0 0.0% 0
Lake Industrial Estate, Lake Industrial Way, Sandown
0.1% 1 0.0% 0 0.0% 0 0.0% 0 0.9% 1 0.0% 0
Lake Village Centre 0.2% 1 0.2% 1 0.0% 0 0.5% 1 0.0% 0 0.0% 0Languard Holiday Park,
Shanklin 0.0% 0 0.0% 0 0.0% 0 0.0% 0 0.0% 0 0.0% 0
Lidl, Landguard Manor Road, Shanklin
0.1% 1 0.0% 0 0.0% 0 0.7% 1 0.0% 0 0.0% 0
Morrisons, Newport Road, Sandown
0.1% 1 0.0% 0 0.0% 0 0.5% 1 0.0% 0 0.0% 0
Oasis, Carpenters Road, Brading
0.0% 0 0.0% 0 0.0% 0 0.0% 0 0.0% 0 0.0% 0
Sandown Town Centre 1.2% 9 0.3% 1 0.4% 1 4.7% 7 0.9% 1 0.0% 0Shanklin Town Centre 2.5% 20 0.0% 0 0.4% 1 11.5% 18 2.7% 2 0.0% 0Spithead Business Centre,
Newport Road, Sandown 0.0% 0 0.0% 0 0.0% 0 0.0% 0 0.0% 0 0.0% 0
Thomson Plant and Garden Centre, Watery Lane, Newchurch
0.6% 5 0.6% 2 0.8% 2 0.7% 1 0.0% 0 0.0% 0
Zone 4 Godshill Village Centre 0.0% 0 0.0% 0 0.0% 0 0.0% 0 0.0% 0 0.0% 0Niton Village Centre 0.0% 0 0.0% 0 0.0% 0 0.0% 0 0.0% 0 0.0% 0Other - Zone 4 0.1% 1 0.0% 0 0.0% 0 0.0% 0 1.1% 1 0.0% 0Ventnor Town Centre 0.9% 7 0.0% 0 0.0% 0 0.0% 0 10.1% 7 0.0% 0Zone 5 Freshwater Town Centre 1.1% 9 0.2% 1 0.0% 0 0.0% 0 0.0% 0 13.3% 9Honnor & Jeffrey Afton
Garden Centre, Afton Road, Freshwater
0.3% 3 0.3% 1 0.0% 0 0.0% 0 0.0% 0 2.6% 2
Totland Village Centre 0.0% 0 0.0% 0 0.0% 0 0.0% 0 0.0% 0 0.0% 0Yarmouth Town Centre 0.0% 0 0.0% 0 0.0% 0 0.0% 0 0.0% 0 0.0% 0Outside Survey Area Abroad 0.0% 0 0.0% 0 0.0% 0 0.0% 0 0.0% 0 0.0% 0Bournemouth Town Centre 0.1% 1 0.2% 1 0.0% 0 0.0% 0 0.0% 0 0.0% 0Bradbeers Retail Park,
Wellington Way, Hedge End
0.0% 0 0.0% 0 0.0% 0 0.0% 0 0.0% 0 0.0% 0
Brighton City Centre 0.0% 0 0.0% 0 0.0% 0 0.0% 0 0.0% 0 0.0% 0Central London 0.0% 0 0.0% 0 0.0% 0 0.0% 0 0.0% 0 0.0% 0Gunwharf Quays,
Portsmouth 0.0% 0 0.0% 0 0.0% 0 0.0% 0 0.0% 0 0.0% 0
Hedge End Retail Park, Charles Watts Way, Southampton
0.0% 0 0.0% 0 0.0% 0 0.0% 0 0.0% 0 0.0% 0
Ikea, West Quay Road, Southampton
0.0% 0 0.0% 0 0.0% 0 0.0% 0 0.0% 0 0.0% 0
Lymington Town Centre 0.0% 0 0.0% 0 0.0% 0 0.0% 0 0.0% 0 0.0% 0Mountbatten Retail Park,
Western Esplanade, Southampton
0.0% 0 0.0% 0 0.0% 0 0.0% 0 0.0% 0 0.0% 0
Newchurch Village Centre 0.0% 0 0.0% 0 0.0% 0 0.0% 0 0.0% 0 0.0% 0Ocean Retail Park, Burrfields
Road, Portsmouth 0.0% 0 0.0% 0 0.0% 0 0.0% 0 0.0% 0 0.0% 0
Other - Outside Survey Area 0.1% 1 0.0% 0 0.0% 0 0.0% 0 0.9% 1 0.0% 0Portsmouth City Centre 0.0% 0 0.0% 0 0.0% 0 0.0% 0 0.0% 0 0.0% 0Sofasofa, Viaduct Works,
Newport 0.0% 0 0.0% 0 0.0% 0 0.0% 0 0.0% 0 0.0% 0
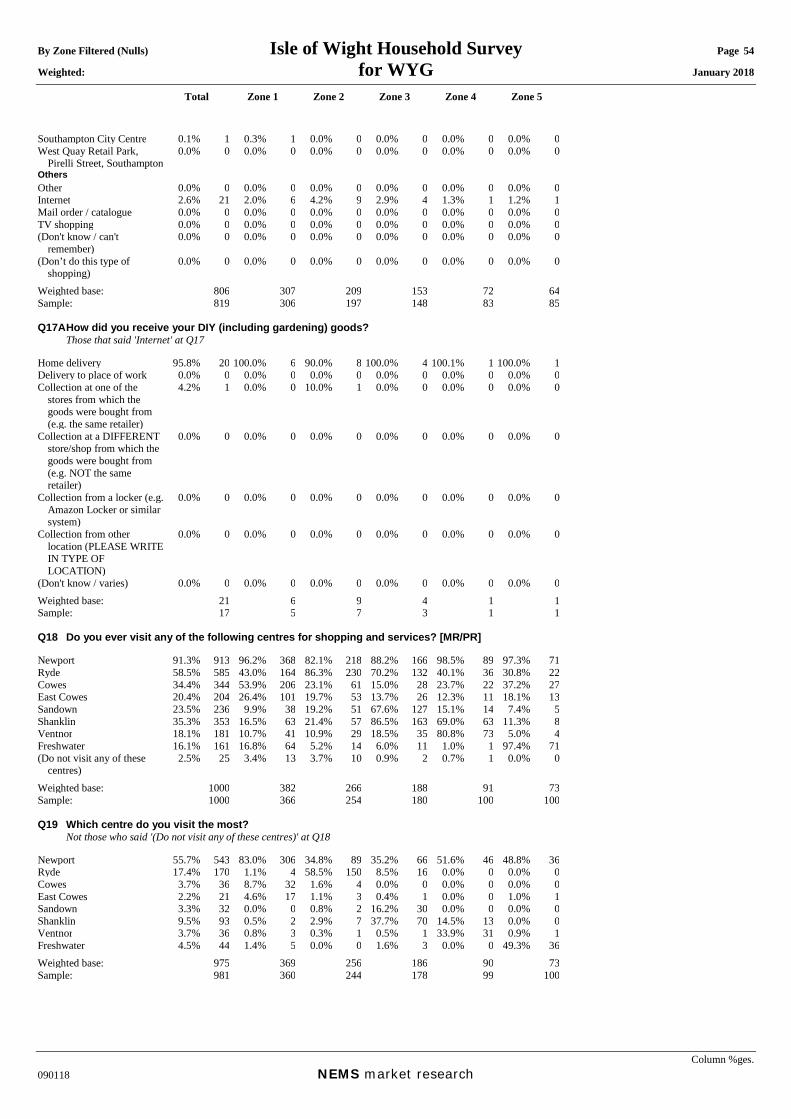
By Zone Filtered (Nulls) Isle of Wight Household Survey Page 54 Weighted: for WYG January 2018
Total Zone 1 Zone 2 Zone 3 Zone 4 Zone 5
Column %ges. 090118 NEMS market research
Southampton City Centre 0.1% 1 0.3% 1 0.0% 0 0.0% 0 0.0% 0 0.0% 0West Quay Retail Park,
Pirelli Street, Southampton 0.0% 0 0.0% 0 0.0% 0 0.0% 0 0.0% 0 0.0% 0
Others Other 0.0% 0 0.0% 0 0.0% 0 0.0% 0 0.0% 0 0.0% 0Internet 2.6% 21 2.0% 6 4.2% 9 2.9% 4 1.3% 1 1.2% 1Mail order / catalogue 0.0% 0 0.0% 0 0.0% 0 0.0% 0 0.0% 0 0.0% 0TV shopping 0.0% 0 0.0% 0 0.0% 0 0.0% 0 0.0% 0 0.0% 0(Don't know / can't
remember) 0.0% 0 0.0% 0 0.0% 0 0.0% 0 0.0% 0 0.0% 0
(Don’t do this type of shopping)
0.0% 0 0.0% 0 0.0% 0 0.0% 0 0.0% 0 0.0% 0
Weighted base: 806 307 209 153 72 64Sample: 819 306 197 148 83 85 Q17A How did you receive your DIY (including gardening) goods? Those that said 'Internet' at Q17 Home delivery 95.8% 20 100.0% 6 90.0% 8 100.0% 4 100.1% 1 100.0% 1Delivery to place of work 0.0% 0 0.0% 0 0.0% 0 0.0% 0 0.0% 0 0.0% 0Collection at one of the
stores from which the goods were bought from (e.g. the same retailer)
4.2% 1 0.0% 0 10.0% 1 0.0% 0 0.0% 0 0.0% 0
Collection at a DIFFERENT store/shop from which the goods were bought from (e.g. NOT the same retailer)
0.0% 0 0.0% 0 0.0% 0 0.0% 0 0.0% 0 0.0% 0
Collection from a locker (e.g. Amazon Locker or similar system)
0.0% 0 0.0% 0 0.0% 0 0.0% 0 0.0% 0 0.0% 0
Collection from other location (PLEASE WRITE IN TYPE OF LOCATION)
0.0% 0 0.0% 0 0.0% 0 0.0% 0 0.0% 0 0.0% 0
(Don't know / varies) 0.0% 0 0.0% 0 0.0% 0 0.0% 0 0.0% 0 0.0% 0Weighted base: 21 6 9 4 1 1Sample: 17 5 7 3 1 1 Q18 Do you ever visit any of the following centres for shopping and services? [MR/PR] Newport 91.3% 913 96.2% 368 82.1% 218 88.2% 166 98.5% 89 97.3% 71Ryde 58.5% 585 43.0% 164 86.3% 230 70.2% 132 40.1% 36 30.8% 22Cowes 34.4% 344 53.9% 206 23.1% 61 15.0% 28 23.7% 22 37.2% 27East Cowes 20.4% 204 26.4% 101 19.7% 53 13.7% 26 12.3% 11 18.1% 13Sandown 23.5% 236 9.9% 38 19.2% 51 67.6% 127 15.1% 14 7.4% 5Shanklin 35.3% 353 16.5% 63 21.4% 57 86.5% 163 69.0% 63 11.3% 8Ventnor 18.1% 181 10.7% 41 10.9% 29 18.5% 35 80.8% 73 5.0% 4Freshwater 16.1% 161 16.8% 64 5.2% 14 6.0% 11 1.0% 1 97.4% 71(Do not visit any of these
centres) 2.5% 25 3.4% 13 3.7% 10 0.9% 2 0.7% 1 0.0% 0
Weighted base: 1000 382 266 188 91 73Sample: 1000 366 254 180 100 100 Q19 Which centre do you visit the most? Not those who said '(Do not visit any of these centres)' at Q18 Newport 55.7% 543 83.0% 306 34.8% 89 35.2% 66 51.6% 46 48.8% 36Ryde 17.4% 170 1.1% 4 58.5% 150 8.5% 16 0.0% 0 0.0% 0Cowes 3.7% 36 8.7% 32 1.6% 4 0.0% 0 0.0% 0 0.0% 0East Cowes 2.2% 21 4.6% 17 1.1% 3 0.4% 1 0.0% 0 1.0% 1Sandown 3.3% 32 0.0% 0 0.8% 2 16.2% 30 0.0% 0 0.0% 0Shanklin 9.5% 93 0.5% 2 2.9% 7 37.7% 70 14.5% 13 0.0% 0Ventnor 3.7% 36 0.8% 3 0.3% 1 0.5% 1 33.9% 31 0.9% 1Freshwater 4.5% 44 1.4% 5 0.0% 0 1.6% 3 0.0% 0 49.3% 36Weighted base: 975 369 256 186 90 73Sample: 981 360 244 178 99 100
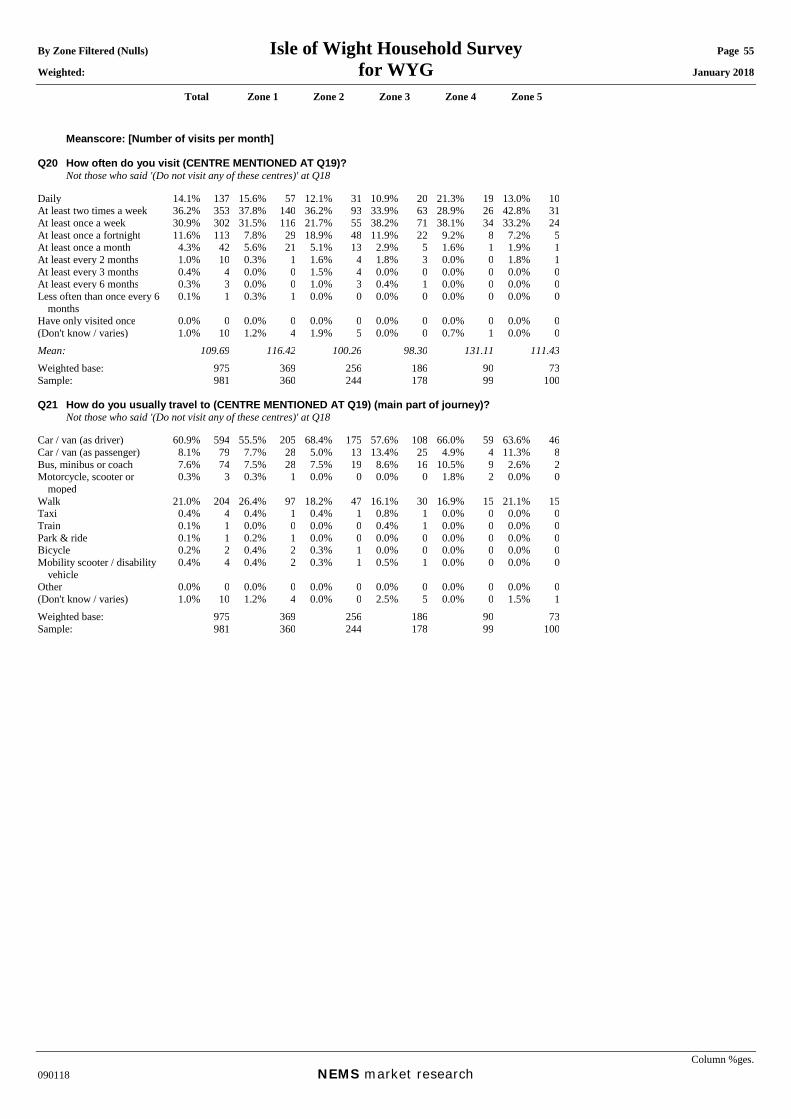
By Zone Filtered (Nulls) Isle of Wight Household Survey Page 55 Weighted: for WYG January 2018
Total Zone 1 Zone 2 Zone 3 Zone 4 Zone 5
Column %ges. 090118 NEMS market research
Meanscore: [Number of visits per month] Q20 How often do you visit (CENTRE MENTIONED AT Q19)? Not those who said '(Do not visit any of these centres)' at Q18 Daily 14.1% 137 15.6% 57 12.1% 31 10.9% 20 21.3% 19 13.0% 10At least two times a week 36.2% 353 37.8% 140 36.2% 93 33.9% 63 28.9% 26 42.8% 31At least once a week 30.9% 302 31.5% 116 21.7% 55 38.2% 71 38.1% 34 33.2% 24At least once a fortnight 11.6% 113 7.8% 29 18.9% 48 11.9% 22 9.2% 8 7.2% 5At least once a month 4.3% 42 5.6% 21 5.1% 13 2.9% 5 1.6% 1 1.9% 1At least every 2 months 1.0% 10 0.3% 1 1.6% 4 1.8% 3 0.0% 0 1.8% 1At least every 3 months 0.4% 4 0.0% 0 1.5% 4 0.0% 0 0.0% 0 0.0% 0At least every 6 months 0.3% 3 0.0% 0 1.0% 3 0.4% 1 0.0% 0 0.0% 0Less often than once every 6
months 0.1% 1 0.3% 1 0.0% 0 0.0% 0 0.0% 0 0.0% 0
Have only visited once 0.0% 0 0.0% 0 0.0% 0 0.0% 0 0.0% 0 0.0% 0(Don't know / varies) 1.0% 10 1.2% 4 1.9% 5 0.0% 0 0.7% 1 0.0% 0Mean: 109.69 116.42 100.26 98.30 131.11 111.43Weighted base: 975 369 256 186 90 73Sample: 981 360 244 178 99 100 Q21 How do you usually travel to (CENTRE MENTIONED AT Q19) (main part of journey)? Not those who said '(Do not visit any of these centres)' at Q18 Car / van (as driver) 60.9% 594 55.5% 205 68.4% 175 57.6% 108 66.0% 59 63.6% 46Car / van (as passenger) 8.1% 79 7.7% 28 5.0% 13 13.4% 25 4.9% 4 11.3% 8Bus, minibus or coach 7.6% 74 7.5% 28 7.5% 19 8.6% 16 10.5% 9 2.6% 2Motorcycle, scooter or
moped 0.3% 3 0.3% 1 0.0% 0 0.0% 0 1.8% 2 0.0% 0
Walk 21.0% 204 26.4% 97 18.2% 47 16.1% 30 16.9% 15 21.1% 15Taxi 0.4% 4 0.4% 1 0.4% 1 0.8% 1 0.0% 0 0.0% 0Train 0.1% 1 0.0% 0 0.0% 0 0.4% 1 0.0% 0 0.0% 0Park & ride 0.1% 1 0.2% 1 0.0% 0 0.0% 0 0.0% 0 0.0% 0Bicycle 0.2% 2 0.4% 2 0.3% 1 0.0% 0 0.0% 0 0.0% 0Mobility scooter / disability
vehicle 0.4% 4 0.4% 2 0.3% 1 0.5% 1 0.0% 0 0.0% 0
Other 0.0% 0 0.0% 0 0.0% 0 0.0% 0 0.0% 0 0.0% 0(Don't know / varies) 1.0% 10 1.2% 4 0.0% 0 2.5% 5 0.0% 0 1.5% 1Weighted base: 975 369 256 186 90 73Sample: 981 360 244 178 99 100
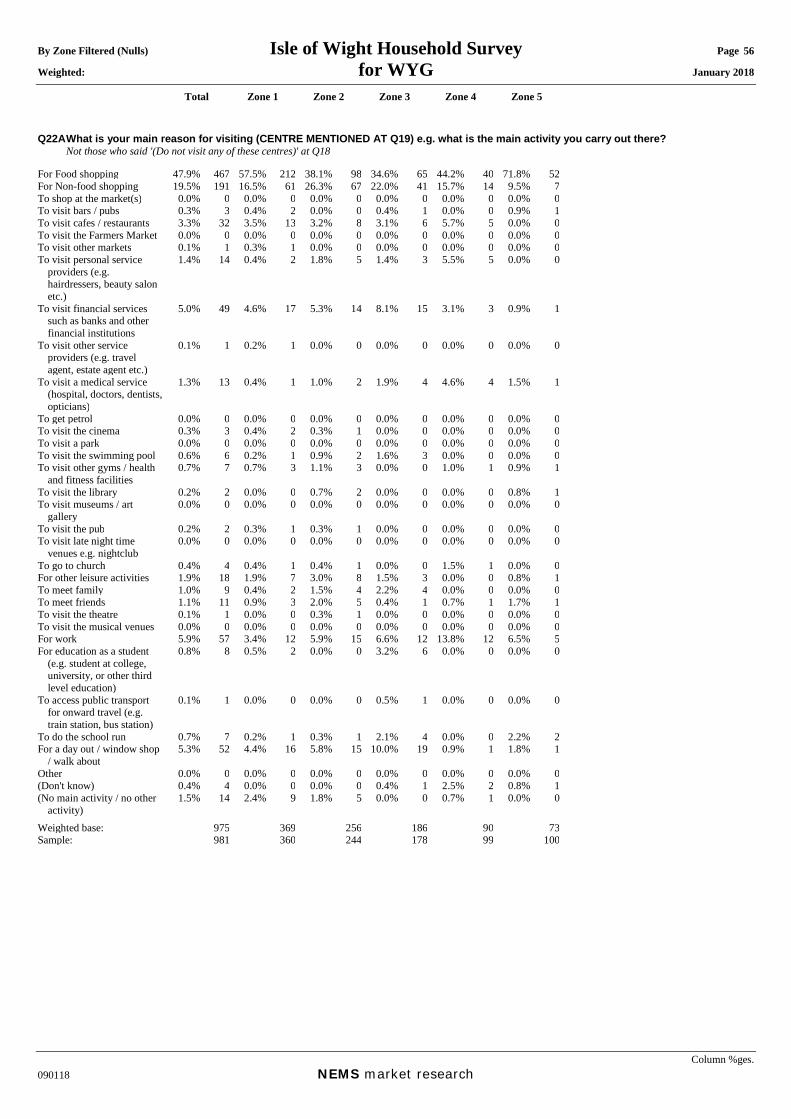
By Zone Filtered (Nulls) Isle of Wight Household Survey Page 56 Weighted: for WYG January 2018
Total Zone 1 Zone 2 Zone 3 Zone 4 Zone 5
Column %ges. 090118 NEMS market research
Q22A What is your main reason for visiting (CENTRE MENTIONED AT Q19) e.g. what is the main activity you carry out there? Not those who said '(Do not visit any of these centres)' at Q18 For Food shopping 47.9% 467 57.5% 212 38.1% 98 34.6% 65 44.2% 40 71.8% 52For Non-food shopping 19.5% 191 16.5% 61 26.3% 67 22.0% 41 15.7% 14 9.5% 7To shop at the market(s) 0.0% 0 0.0% 0 0.0% 0 0.0% 0 0.0% 0 0.0% 0To visit bars / pubs 0.3% 3 0.4% 2 0.0% 0 0.4% 1 0.0% 0 0.9% 1To visit cafes / restaurants 3.3% 32 3.5% 13 3.2% 8 3.1% 6 5.7% 5 0.0% 0To visit the Farmers Market 0.0% 0 0.0% 0 0.0% 0 0.0% 0 0.0% 0 0.0% 0To visit other markets 0.1% 1 0.3% 1 0.0% 0 0.0% 0 0.0% 0 0.0% 0To visit personal service
providers (e.g. hairdressers, beauty salon etc.)
1.4% 14 0.4% 2 1.8% 5 1.4% 3 5.5% 5 0.0% 0
To visit financial services such as banks and other financial institutions
5.0% 49 4.6% 17 5.3% 14 8.1% 15 3.1% 3 0.9% 1
To visit other service providers (e.g. travel agent, estate agent etc.)
0.1% 1 0.2% 1 0.0% 0 0.0% 0 0.0% 0 0.0% 0
To visit a medical service (hospital, doctors, dentists, opticians)
1.3% 13 0.4% 1 1.0% 2 1.9% 4 4.6% 4 1.5% 1
To get petrol 0.0% 0 0.0% 0 0.0% 0 0.0% 0 0.0% 0 0.0% 0To visit the cinema 0.3% 3 0.4% 2 0.3% 1 0.0% 0 0.0% 0 0.0% 0To visit a park 0.0% 0 0.0% 0 0.0% 0 0.0% 0 0.0% 0 0.0% 0To visit the swimming pool 0.6% 6 0.2% 1 0.9% 2 1.6% 3 0.0% 0 0.0% 0To visit other gyms / health
and fitness facilities 0.7% 7 0.7% 3 1.1% 3 0.0% 0 1.0% 1 0.9% 1
To visit the library 0.2% 2 0.0% 0 0.7% 2 0.0% 0 0.0% 0 0.8% 1To visit museums / art
gallery 0.0% 0 0.0% 0 0.0% 0 0.0% 0 0.0% 0 0.0% 0
To visit the pub 0.2% 2 0.3% 1 0.3% 1 0.0% 0 0.0% 0 0.0% 0To visit late night time
venues e.g. nightclub 0.0% 0 0.0% 0 0.0% 0 0.0% 0 0.0% 0 0.0% 0
To go to church 0.4% 4 0.4% 1 0.4% 1 0.0% 0 1.5% 1 0.0% 0For other leisure activities 1.9% 18 1.9% 7 3.0% 8 1.5% 3 0.0% 0 0.8% 1To meet family 1.0% 9 0.4% 2 1.5% 4 2.2% 4 0.0% 0 0.0% 0To meet friends 1.1% 11 0.9% 3 2.0% 5 0.4% 1 0.7% 1 1.7% 1To visit the theatre 0.1% 1 0.0% 0 0.3% 1 0.0% 0 0.0% 0 0.0% 0To visit the musical venues 0.0% 0 0.0% 0 0.0% 0 0.0% 0 0.0% 0 0.0% 0For work 5.9% 57 3.4% 12 5.9% 15 6.6% 12 13.8% 12 6.5% 5For education as a student
(e.g. student at college, university, or other third level education)
0.8% 8 0.5% 2 0.0% 0 3.2% 6 0.0% 0 0.0% 0
To access public transport for onward travel (e.g. train station, bus station)
0.1% 1 0.0% 0 0.0% 0 0.5% 1 0.0% 0 0.0% 0
To do the school run 0.7% 7 0.2% 1 0.3% 1 2.1% 4 0.0% 0 2.2% 2For a day out / window shop
/ walk about 5.3% 52 4.4% 16 5.8% 15 10.0% 19 0.9% 1 1.8% 1
Other 0.0% 0 0.0% 0 0.0% 0 0.0% 0 0.0% 0 0.0% 0(Don't know) 0.4% 4 0.0% 0 0.0% 0 0.4% 1 2.5% 2 0.8% 1(No main activity / no other
activity) 1.5% 14 2.4% 9 1.8% 5 0.0% 0 0.7% 1 0.0% 0
Weighted base: 975 369 256 186 90 73Sample: 981 360 244 178 99 100
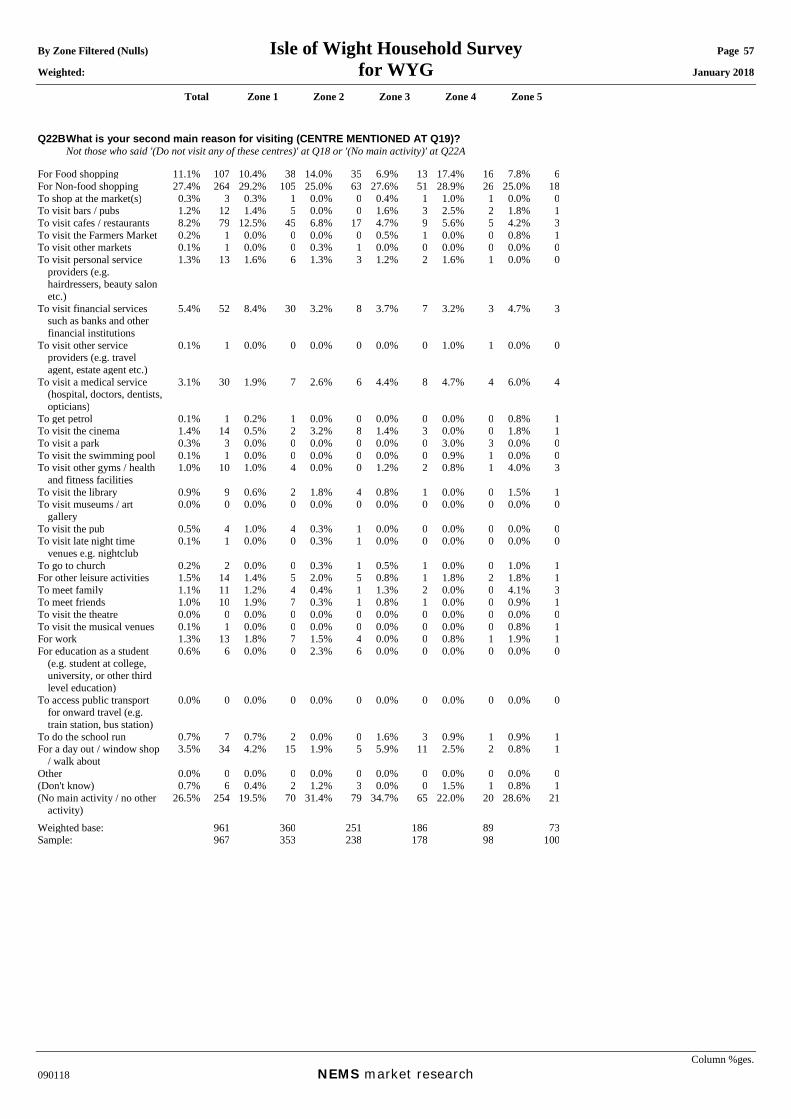
By Zone Filtered (Nulls) Isle of Wight Household Survey Page 57 Weighted: for WYG January 2018
Total Zone 1 Zone 2 Zone 3 Zone 4 Zone 5
Column %ges. 090118 NEMS market research
Q22B What is your second main reason for visiting (CENTRE MENTIONED AT Q19)? Not those who said '(Do not visit any of these centres)' at Q18 or '(No main activity)' at Q22A For Food shopping 11.1% 107 10.4% 38 14.0% 35 6.9% 13 17.4% 16 7.8% 6For Non-food shopping 27.4% 264 29.2% 105 25.0% 63 27.6% 51 28.9% 26 25.0% 18To shop at the market(s) 0.3% 3 0.3% 1 0.0% 0 0.4% 1 1.0% 1 0.0% 0To visit bars / pubs 1.2% 12 1.4% 5 0.0% 0 1.6% 3 2.5% 2 1.8% 1To visit cafes / restaurants 8.2% 79 12.5% 45 6.8% 17 4.7% 9 5.6% 5 4.2% 3To visit the Farmers Market 0.2% 1 0.0% 0 0.0% 0 0.5% 1 0.0% 0 0.8% 1To visit other markets 0.1% 1 0.0% 0 0.3% 1 0.0% 0 0.0% 0 0.0% 0To visit personal service
providers (e.g. hairdressers, beauty salon etc.)
1.3% 13 1.6% 6 1.3% 3 1.2% 2 1.6% 1 0.0% 0
To visit financial services such as banks and other financial institutions
5.4% 52 8.4% 30 3.2% 8 3.7% 7 3.2% 3 4.7% 3
To visit other service providers (e.g. travel agent, estate agent etc.)
0.1% 1 0.0% 0 0.0% 0 0.0% 0 1.0% 1 0.0% 0
To visit a medical service (hospital, doctors, dentists, opticians)
3.1% 30 1.9% 7 2.6% 6 4.4% 8 4.7% 4 6.0% 4
To get petrol 0.1% 1 0.2% 1 0.0% 0 0.0% 0 0.0% 0 0.8% 1To visit the cinema 1.4% 14 0.5% 2 3.2% 8 1.4% 3 0.0% 0 1.8% 1To visit a park 0.3% 3 0.0% 0 0.0% 0 0.0% 0 3.0% 3 0.0% 0To visit the swimming pool 0.1% 1 0.0% 0 0.0% 0 0.0% 0 0.9% 1 0.0% 0To visit other gyms / health
and fitness facilities 1.0% 10 1.0% 4 0.0% 0 1.2% 2 0.8% 1 4.0% 3
To visit the library 0.9% 9 0.6% 2 1.8% 4 0.8% 1 0.0% 0 1.5% 1To visit museums / art
gallery 0.0% 0 0.0% 0 0.0% 0 0.0% 0 0.0% 0 0.0% 0
To visit the pub 0.5% 4 1.0% 4 0.3% 1 0.0% 0 0.0% 0 0.0% 0To visit late night time
venues e.g. nightclub 0.1% 1 0.0% 0 0.3% 1 0.0% 0 0.0% 0 0.0% 0
To go to church 0.2% 2 0.0% 0 0.3% 1 0.5% 1 0.0% 0 1.0% 1For other leisure activities 1.5% 14 1.4% 5 2.0% 5 0.8% 1 1.8% 2 1.8% 1To meet family 1.1% 11 1.2% 4 0.4% 1 1.3% 2 0.0% 0 4.1% 3To meet friends 1.0% 10 1.9% 7 0.3% 1 0.8% 1 0.0% 0 0.9% 1To visit the theatre 0.0% 0 0.0% 0 0.0% 0 0.0% 0 0.0% 0 0.0% 0To visit the musical venues 0.1% 1 0.0% 0 0.0% 0 0.0% 0 0.0% 0 0.8% 1For work 1.3% 13 1.8% 7 1.5% 4 0.0% 0 0.8% 1 1.9% 1For education as a student
(e.g. student at college, university, or other third level education)
0.6% 6 0.0% 0 2.3% 6 0.0% 0 0.0% 0 0.0% 0
To access public transport for onward travel (e.g. train station, bus station)
0.0% 0 0.0% 0 0.0% 0 0.0% 0 0.0% 0 0.0% 0
To do the school run 0.7% 7 0.7% 2 0.0% 0 1.6% 3 0.9% 1 0.9% 1For a day out / window shop
/ walk about 3.5% 34 4.2% 15 1.9% 5 5.9% 11 2.5% 2 0.8% 1
Other 0.0% 0 0.0% 0 0.0% 0 0.0% 0 0.0% 0 0.0% 0(Don't know) 0.7% 6 0.4% 2 1.2% 3 0.0% 0 1.5% 1 0.8% 1(No main activity / no other
activity) 26.5% 254 19.5% 70 31.4% 79 34.7% 65 22.0% 20 28.6% 21
Weighted base: 961 360 251 186 89 73Sample: 967 353 238 178 98 100
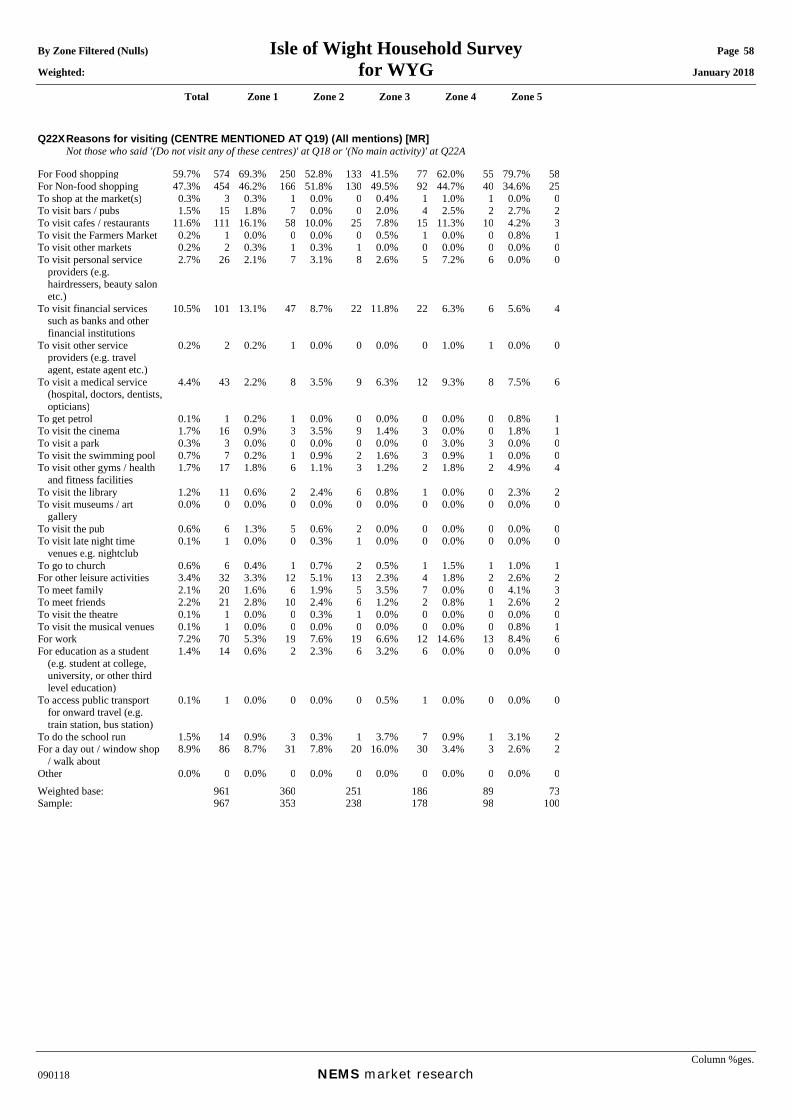
By Zone Filtered (Nulls) Isle of Wight Household Survey Page 58 Weighted: for WYG January 2018
Total Zone 1 Zone 2 Zone 3 Zone 4 Zone 5
Column %ges. 090118 NEMS market research
Q22X Reasons for visiting (CENTRE MENTIONED AT Q19) (All mentions) [MR] Not those who said '(Do not visit any of these centres)' at Q18 or '(No main activity)' at Q22A For Food shopping 59.7% 574 69.3% 250 52.8% 133 41.5% 77 62.0% 55 79.7% 58For Non-food shopping 47.3% 454 46.2% 166 51.8% 130 49.5% 92 44.7% 40 34.6% 25To shop at the market(s) 0.3% 3 0.3% 1 0.0% 0 0.4% 1 1.0% 1 0.0% 0To visit bars / pubs 1.5% 15 1.8% 7 0.0% 0 2.0% 4 2.5% 2 2.7% 2To visit cafes / restaurants 11.6% 111 16.1% 58 10.0% 25 7.8% 15 11.3% 10 4.2% 3To visit the Farmers Market 0.2% 1 0.0% 0 0.0% 0 0.5% 1 0.0% 0 0.8% 1To visit other markets 0.2% 2 0.3% 1 0.3% 1 0.0% 0 0.0% 0 0.0% 0To visit personal service
providers (e.g. hairdressers, beauty salon etc.)
2.7% 26 2.1% 7 3.1% 8 2.6% 5 7.2% 6 0.0% 0
To visit financial services such as banks and other financial institutions
10.5% 101 13.1% 47 8.7% 22 11.8% 22 6.3% 6 5.6% 4
To visit other service providers (e.g. travel agent, estate agent etc.)
0.2% 2 0.2% 1 0.0% 0 0.0% 0 1.0% 1 0.0% 0
To visit a medical service (hospital, doctors, dentists, opticians)
4.4% 43 2.2% 8 3.5% 9 6.3% 12 9.3% 8 7.5% 6
To get petrol 0.1% 1 0.2% 1 0.0% 0 0.0% 0 0.0% 0 0.8% 1To visit the cinema 1.7% 16 0.9% 3 3.5% 9 1.4% 3 0.0% 0 1.8% 1To visit a park 0.3% 3 0.0% 0 0.0% 0 0.0% 0 3.0% 3 0.0% 0To visit the swimming pool 0.7% 7 0.2% 1 0.9% 2 1.6% 3 0.9% 1 0.0% 0To visit other gyms / health
and fitness facilities 1.7% 17 1.8% 6 1.1% 3 1.2% 2 1.8% 2 4.9% 4
To visit the library 1.2% 11 0.6% 2 2.4% 6 0.8% 1 0.0% 0 2.3% 2To visit museums / art
gallery 0.0% 0 0.0% 0 0.0% 0 0.0% 0 0.0% 0 0.0% 0
To visit the pub 0.6% 6 1.3% 5 0.6% 2 0.0% 0 0.0% 0 0.0% 0To visit late night time
venues e.g. nightclub 0.1% 1 0.0% 0 0.3% 1 0.0% 0 0.0% 0 0.0% 0
To go to church 0.6% 6 0.4% 1 0.7% 2 0.5% 1 1.5% 1 1.0% 1For other leisure activities 3.4% 32 3.3% 12 5.1% 13 2.3% 4 1.8% 2 2.6% 2To meet family 2.1% 20 1.6% 6 1.9% 5 3.5% 7 0.0% 0 4.1% 3To meet friends 2.2% 21 2.8% 10 2.4% 6 1.2% 2 0.8% 1 2.6% 2To visit the theatre 0.1% 1 0.0% 0 0.3% 1 0.0% 0 0.0% 0 0.0% 0To visit the musical venues 0.1% 1 0.0% 0 0.0% 0 0.0% 0 0.0% 0 0.8% 1For work 7.2% 70 5.3% 19 7.6% 19 6.6% 12 14.6% 13 8.4% 6For education as a student
(e.g. student at college, university, or other third level education)
1.4% 14 0.6% 2 2.3% 6 3.2% 6 0.0% 0 0.0% 0
To access public transport for onward travel (e.g. train station, bus station)
0.1% 1 0.0% 0 0.0% 0 0.5% 1 0.0% 0 0.0% 0
To do the school run 1.5% 14 0.9% 3 0.3% 1 3.7% 7 0.9% 1 3.1% 2For a day out / window shop
/ walk about 8.9% 86 8.7% 31 7.8% 20 16.0% 30 3.4% 3 2.6% 2
Other 0.0% 0 0.0% 0 0.0% 0 0.0% 0 0.0% 0 0.0% 0Weighted base: 961 360 251 186 89 73Sample: 967 353 238 178 98 100

By Zone Filtered (Nulls) Isle of Wight Household Survey Page 59 Weighted: for WYG January 2018
Total Zone 1 Zone 2 Zone 3 Zone 4 Zone 5
Column %ges. 090118 NEMS market research
Q23A Why do you prefer to visit (CENTRE MENTIONED AT Q19)? 1st mention Not those who said '(Do not visit any of these centres)' at Q18 Attractive environment / nice
place 2.6% 26 2.9% 11 2.7% 7 1.6% 3 5.3% 5 0.0% 0
Clean streets / well maintained
0.0% 0 0.0% 0 0.0% 0 0.0% 0 0.0% 0 0.0% 0
Close to friends / relatives 1.4% 14 0.7% 3 0.9% 2 2.9% 5 3.2% 3 0.9% 1Close to home 52.4% 510 60.9% 225 51.5% 132 43.5% 81 38.8% 35 51.9% 38Close to seafront, marina or
estuary waterfront 0.5% 5 0.4% 1 1.0% 2 0.5% 1 0.0% 0 0.0% 0
Close to work / en route to work
1.4% 13 0.9% 3 2.4% 6 1.0% 2 0.0% 0 2.7% 2
Easy to get to by bus 1.0% 9 0.9% 3 1.4% 4 0.9% 2 0.0% 0 1.0% 1Easy to get to by car 1.0% 10 0.7% 2 0.4% 1 2.2% 4 0.0% 0 2.6% 2Easy to get to by train 0.1% 1 0.0% 0 0.0% 0 0.4% 1 0.0% 0 0.0% 0Familiar / know where
everything is 1.4% 14 2.4% 9 1.2% 3 0.0% 0 0.9% 1 1.0% 1
Good cafés 0.1% 1 0.0% 0 0.0% 0 0.5% 1 0.0% 0 0.0% 0Good disabled access 0.0% 0 0.0% 0 0.0% 0 0.0% 0 0.0% 0 0.0% 0Good for a day out 0.2% 2 0.3% 1 0.0% 0 0.4% 1 0.0% 0 0.0% 0Good layout / shops close
together 0.8% 8 0.9% 3 0.0% 0 1.6% 3 0.7% 1 1.8% 1
Good market 0.1% 1 0.3% 1 0.0% 0 0.0% 0 0.0% 0 0.0% 0Good pubs / bars 0.1% 1 0.2% 1 0.0% 0 0.0% 0 0.0% 0 0.0% 0Good range of health and
fitness facilities (e.g. gyms, leisure centres)
0.2% 2 0.0% 0 0.0% 0 0.4% 1 1.5% 1 0.0% 0
Good range of hotels 0.0% 0 0.0% 0 0.0% 0 0.0% 0 0.0% 0 0.0% 0Good restaurants 0.2% 2 0.3% 1 0.0% 0 0.5% 1 0.0% 0 0.0% 0Has undercover shopping 0.0% 0 0.0% 0 0.0% 0 0.0% 0 0.0% 0 0.0% 0Nice atmosphere / friendly
people 0.0% 0 0.0% 0 0.0% 0 0.0% 0 0.0% 0 0.0% 0
Parking - it's cheap 0.1% 1 0.0% 0 0.0% 0 0.0% 0 0.0% 0 0.8% 1Parking - it's easy to find a
space 0.7% 7 1.2% 4 0.7% 2 0.0% 0 0.9% 1 0.0% 0
Parking - it's free 0.7% 7 0.7% 3 1.7% 4 0.0% 0 0.0% 0 0.0% 0Parking - it's in a good
location 0.2% 2 0.3% 1 0.0% 0 0.5% 1 0.0% 0 0.0% 0
Pedestrianised areas 0.0% 0 0.0% 0 0.0% 0 0.0% 0 0.0% 0 0.0% 0Quiet / not busy 0.2% 2 0.5% 2 0.0% 0 0.0% 0 0.0% 0 0.0% 0Services - good for financial
services (e.g. banks / building societies)
1.7% 16 0.4% 1 1.4% 4 2.5% 5 4.6% 4 3.0% 2
Services - good for other services (e.g. library, hairdresser, vets etc.)
0.4% 4 0.0% 0 0.6% 2 0.4% 1 1.5% 1 0.0% 0
Shops - good opening hours / open on Sundays
0.4% 4 0.0% 0 1.2% 3 0.0% 0 0.7% 1 0.0% 0
Shops - good range of affordable shops
1.3% 13 0.8% 3 0.9% 2 2.1% 4 3.6% 3 0.8% 1
Shops - good range of bakers / butchers / greengrocers
0.2% 2 0.0% 0 0.3% 1 0.5% 1 0.0% 0 0.0% 0
Shops - good range of clothes shops
1.8% 18 0.7% 3 3.1% 8 2.4% 5 2.5% 2 0.0% 0
Shops - good range of 'high street' retailers
2.0% 20 1.5% 6 1.0% 3 4.5% 8 2.0% 2 1.5% 1
Shops - good range of independent shops
1.4% 14 0.9% 3 1.8% 5 1.9% 4 1.0% 1 1.8% 1
Shops - good range of non-food shops generally
6.0% 58 4.2% 16 8.2% 21 6.6% 12 6.3% 6 5.5% 4
Shops - good range of quality shops
2.4% 23 1.2% 4 2.8% 7 3.7% 7 5.0% 5 0.0% 0
Shops - good range of supermarkets
1.8% 18 1.5% 6 1.5% 4 0.4% 1 1.5% 1 8.5% 6
Traditional / quaint 0.4% 3 0.2% 1 0.0% 0 0.9% 2 0.0% 0 1.5% 1You can get everything you
need there 3.5% 34 2.7% 10 1.5% 4 6.9% 13 7.1% 6 0.8% 1
Other 0.0% 0 0.0% 0 0.0% 0 0.0% 0 0.0% 0 0.0% 0Good cinema 0.0% 0 0.0% 0 0.0% 0 0.0% 0 0.0% 0 0.0% 0Good for leisure activities 0.1% 1 0.0% 0 0.0% 0 0.4% 1 0.0% 0 0.8% 1Good location / in the middle
of the island 0.1% 1 0.0% 0 0.0% 0 0.0% 0 0.0% 0 0.9% 1
Like the Co-op store 0.3% 3 0.8% 3 0.0% 0 0.0% 0 0.0% 0 0.0% 0

By Zone Filtered (Nulls) Isle of Wight Household Survey Page 60 Weighted: for WYG January 2018
Total Zone 1 Zone 2 Zone 3 Zone 4 Zone 5
Column %ges. 090118 NEMS market research
Like the Lidl store 0.1% 1 0.0% 0 0.0% 0 0.5% 1 0.0% 0 0.0% 0Like the Marks & Spencer
store 0.3% 3 0.0% 0 0.6% 1 0.9% 2 0.0% 0 0.0% 0
Like the Next store 0.1% 1 0.0% 0 0.0% 0 0.4% 1 0.0% 0 0.0% 0Like the W Hurst & Son
store 0.0% 0 0.0% 0 0.0% 0 0.0% 0 0.0% 0 0.0% 0
Like the Waitrose store 0.3% 3 0.0% 0 0.8% 2 0.0% 0 0.0% 0 1.0% 1Like to support local shops 0.0% 0 0.0% 0 0.0% 0 0.0% 0 0.0% 0 0.0% 0On the school run 0.1% 1 0.0% 0 0.3% 1 0.0% 0 0.0% 0 0.0% 0Petrol's cheap there 0.1% 1 0.0% 0 0.0% 0 0.0% 0 0.0% 0 0.8% 1(Don't know) 0.4% 3 0.0% 0 0.3% 1 0.4% 1 2.0% 2 0.0% 0(No reason / no other reason) 9.9% 96 10.8% 40 9.6% 25 7.6% 14 10.7% 10 10.5% 8Weighted base: 975 369 256 186 90 73Sample: 981 360 244 178 99 100

By Zone Filtered (Nulls) Isle of Wight Household Survey Page 61 Weighted: for WYG January 2018
Total Zone 1 Zone 2 Zone 3 Zone 4 Zone 5
Column %ges. 090118 NEMS market research
Q23B Why do you prefer to visit (CENTRE MENTIONED AT Q19)? 2nd mention Not those who said '(Do not visit any of these centres)' at Q18 or '(No reason)' at Q23A Attractive environment / nice
place 1.8% 16 2.8% 9 0.3% 1 1.6% 3 0.8% 1 3.7% 2
Clean streets / well maintained
0.0% 0 0.0% 0 0.0% 0 0.0% 0 0.0% 0 0.0% 0
Close to friends / relatives 0.7% 6 0.0% 0 1.0% 2 1.7% 3 1.0% 1 0.0% 0Close to home 4.0% 35 4.2% 14 3.6% 8 0.4% 1 11.8% 9 4.2% 3Close to seafront, marina or
estuary waterfront 0.9% 8 0.3% 1 1.1% 3 1.5% 3 0.8% 1 1.2% 1
Close to work / en route to work
0.6% 5 0.8% 2 0.3% 1 1.1% 2 0.0% 0 0.0% 0
Easy to get to by bus 0.1% 1 0.0% 0 0.0% 0 0.0% 0 0.8% 1 0.0% 0Easy to get to by car 0.7% 7 0.5% 2 1.1% 3 1.3% 2 0.0% 0 0.0% 0Easy to get to by train 0.0% 0 0.0% 0 0.0% 0 0.0% 0 0.0% 0 0.0% 0Familiar / know where
everything is 0.7% 6 1.4% 5 0.4% 1 0.0% 0 0.8% 1 0.0% 0
Good cafés 0.4% 3 1.0% 3 0.0% 0 0.0% 0 0.0% 0 0.0% 0Good disabled access 0.0% 0 0.0% 0 0.0% 0 0.0% 0 0.0% 0 0.0% 0Good for a day out 0.0% 0 0.0% 0 0.0% 0 0.0% 0 0.0% 0 0.0% 0Good layout / shops close
together 0.9% 8 1.3% 4 0.9% 2 0.4% 1 0.0% 0 0.9% 1
Good market 0.2% 1 0.4% 1 0.0% 0 0.0% 0 0.0% 0 0.0% 0Good pubs / bars 0.8% 7 1.7% 6 0.4% 1 0.6% 1 0.0% 0 0.0% 0Good range of health and
fitness facilities (e.g. gyms, leisure centres)
0.7% 6 0.8% 3 1.3% 3 0.4% 1 0.0% 0 0.0% 0
Good range of hotels 0.0% 0 0.0% 0 0.0% 0 0.0% 0 0.0% 0 0.0% 0Good restaurants 0.3% 3 0.2% 1 0.6% 1 0.4% 1 0.0% 0 0.0% 0Has undercover shopping 0.0% 0 0.0% 0 0.0% 0 0.0% 0 0.0% 0 0.0% 0Nice atmosphere / friendly
people 0.1% 1 0.0% 0 0.0% 0 0.0% 0 0.8% 1 0.0% 0
Parking - it's cheap 0.2% 2 0.0% 0 0.4% 1 0.4% 1 0.0% 0 0.0% 0Parking - it's easy to find a
space 1.0% 9 0.6% 2 1.0% 2 1.9% 3 1.8% 1 0.0% 0
Parking - it's free 0.4% 4 0.3% 1 0.7% 2 0.6% 1 0.0% 0 0.0% 0Parking - it's in a good
location 0.4% 3 0.6% 2 0.0% 0 0.0% 0 1.1% 1 0.9% 1
Pedestrianised areas 0.0% 0 0.0% 0 0.0% 0 0.0% 0 0.0% 0 0.0% 0Quiet / not busy 0.3% 2 0.0% 0 0.7% 2 0.0% 0 0.8% 1 0.0% 0Services - good for financial
services (e.g. banks / building societies)
1.5% 13 2.2% 7 0.0% 0 2.6% 5 0.8% 1 1.0% 1
Services - good for other services (e.g. library, hairdresser, vets etc.)
0.7% 6 0.8% 3 0.3% 1 0.9% 1 1.7% 1 0.0% 0
Shops - good opening hours / open on Sundays
0.0% 0 0.0% 0 0.0% 0 0.0% 0 0.0% 0 0.0% 0
Shops - good range of affordable shops
1.5% 13 1.3% 4 1.0% 2 2.6% 4 0.0% 0 3.6% 2
Shops - good range of bakers / butchers / greengrocers
0.6% 5 0.0% 0 0.3% 1 1.7% 3 1.8% 1 0.0% 0
Shops - good range of clothes shops
0.7% 6 1.0% 3 0.4% 1 0.0% 0 2.1% 2 0.0% 0
Shops - good range of 'high street' retailers
1.4% 13 1.9% 6 0.0% 0 1.5% 3 1.0% 1 4.3% 3
Shops - good range of independent shops
1.4% 12 1.1% 4 2.5% 6 0.4% 1 0.8% 1 1.7% 1
Shops - good range of non-food shops generally
4.7% 41 6.0% 20 4.9% 11 3.1% 5 3.7% 3 3.2% 2
Shops - good range of quality shops
2.0% 18 2.2% 7 1.0% 2 1.0% 2 6.6% 5 1.7% 1
Shops - good range of supermarkets
2.0% 18 1.5% 5 1.4% 3 2.2% 4 1.8% 1 6.3% 4
Traditional / quaint 0.6% 5 1.0% 3 0.0% 0 0.0% 0 0.0% 0 2.9% 2You can get everything you
need there 3.4% 30 2.9% 10 1.5% 4 8.1% 14 3.5% 3 0.0% 0
Other 0.0% 0 0.0% 0 0.0% 0 0.0% 0 0.0% 0 0.0% 0Good cinema 0.3% 2 0.2% 1 0.0% 0 0.5% 1 1.0% 1 0.0% 0Good for leisure activities 0.1% 1 0.2% 1 0.0% 0 0.0% 0 0.0% 0 0.0% 0Good location / in the middle
of the island 0.0% 0 0.0% 0 0.0% 0 0.0% 0 0.0% 0 0.0% 0
Like the Co-op store 0.0% 0 0.0% 0 0.0% 0 0.0% 0 0.0% 0 0.0% 0
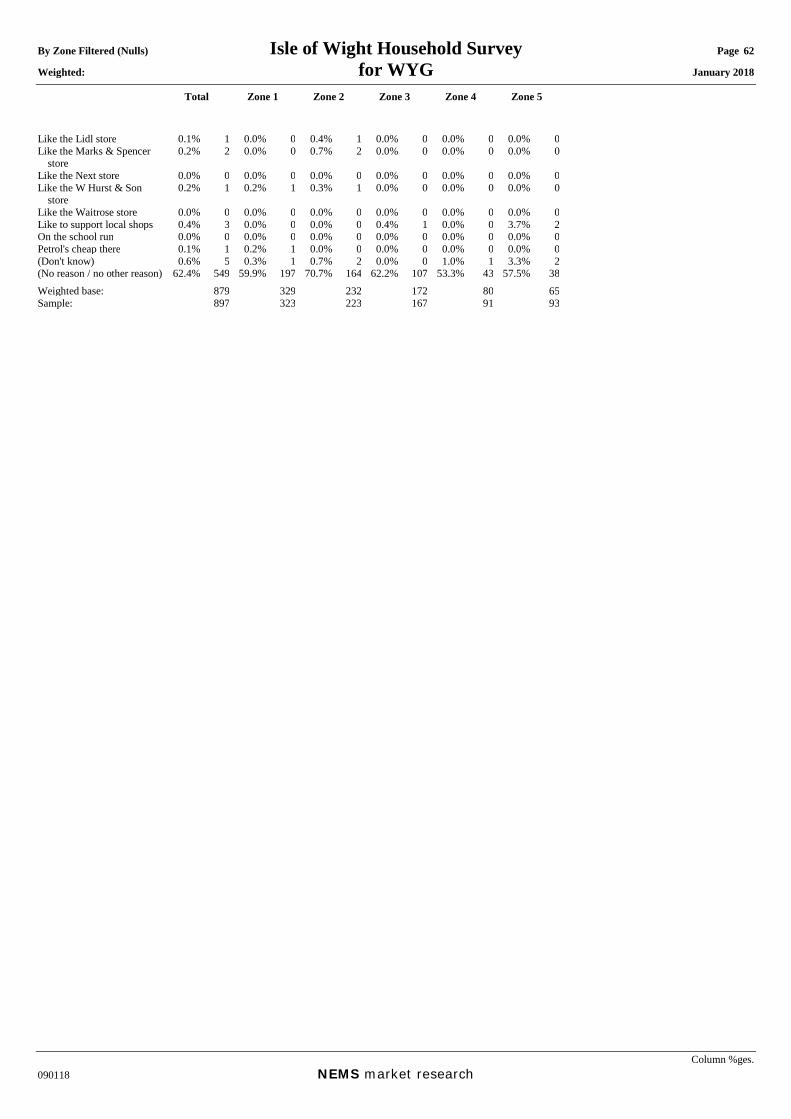
By Zone Filtered (Nulls) Isle of Wight Household Survey Page 62 Weighted: for WYG January 2018
Total Zone 1 Zone 2 Zone 3 Zone 4 Zone 5
Column %ges. 090118 NEMS market research
Like the Lidl store 0.1% 1 0.0% 0 0.4% 1 0.0% 0 0.0% 0 0.0% 0Like the Marks & Spencer
store 0.2% 2 0.0% 0 0.7% 2 0.0% 0 0.0% 0 0.0% 0
Like the Next store 0.0% 0 0.0% 0 0.0% 0 0.0% 0 0.0% 0 0.0% 0Like the W Hurst & Son
store 0.2% 1 0.2% 1 0.3% 1 0.0% 0 0.0% 0 0.0% 0
Like the Waitrose store 0.0% 0 0.0% 0 0.0% 0 0.0% 0 0.0% 0 0.0% 0Like to support local shops 0.4% 3 0.0% 0 0.0% 0 0.4% 1 0.0% 0 3.7% 2On the school run 0.0% 0 0.0% 0 0.0% 0 0.0% 0 0.0% 0 0.0% 0Petrol's cheap there 0.1% 1 0.2% 1 0.0% 0 0.0% 0 0.0% 0 0.0% 0(Don't know) 0.6% 5 0.3% 1 0.7% 2 0.0% 0 1.0% 1 3.3% 2(No reason / no other reason) 62.4% 549 59.9% 197 70.7% 164 62.2% 107 53.3% 43 57.5% 38Weighted base: 879 329 232 172 80 65Sample: 897 323 223 167 91 93
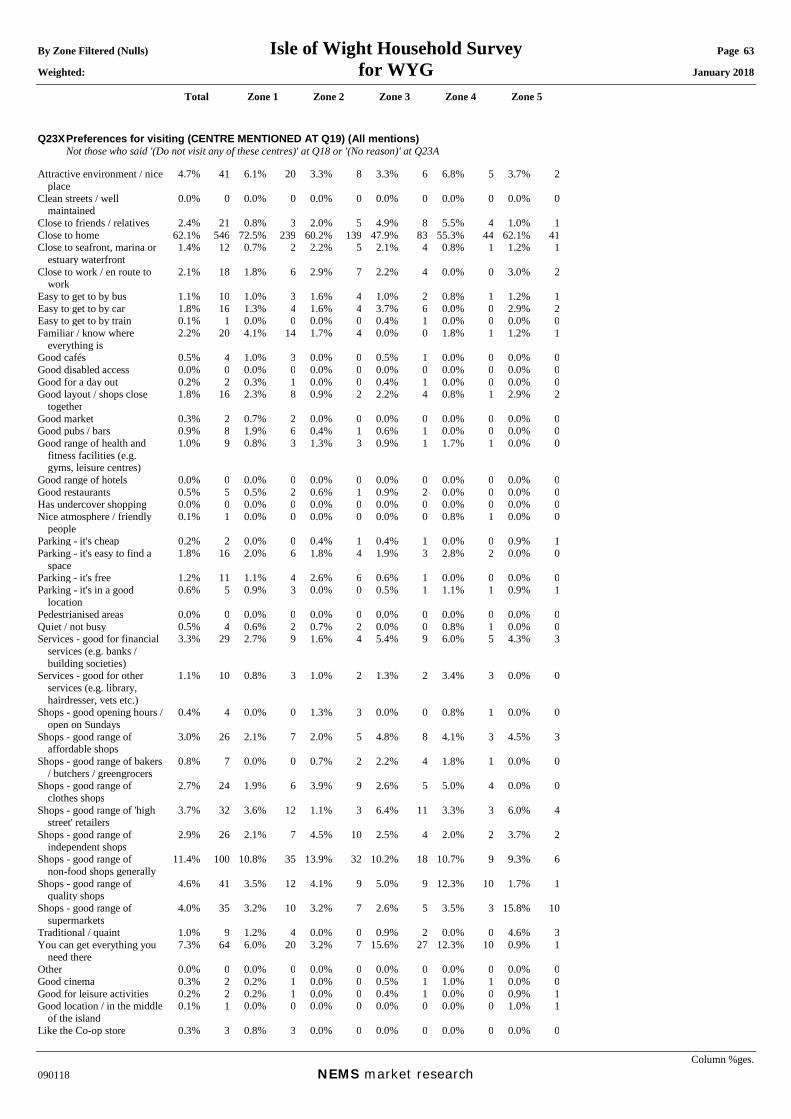
By Zone Filtered (Nulls) Isle of Wight Household Survey Page 63 Weighted: for WYG January 2018
Total Zone 1 Zone 2 Zone 3 Zone 4 Zone 5
Column %ges. 090118 NEMS market research
Q23X Preferences for visiting (CENTRE MENTIONED AT Q19) (All mentions) Not those who said '(Do not visit any of these centres)' at Q18 or '(No reason)' at Q23A Attractive environment / nice
place 4.7% 41 6.1% 20 3.3% 8 3.3% 6 6.8% 5 3.7% 2
Clean streets / well maintained
0.0% 0 0.0% 0 0.0% 0 0.0% 0 0.0% 0 0.0% 0
Close to friends / relatives 2.4% 21 0.8% 3 2.0% 5 4.9% 8 5.5% 4 1.0% 1Close to home 62.1% 546 72.5% 239 60.2% 139 47.9% 83 55.3% 44 62.1% 41Close to seafront, marina or
estuary waterfront 1.4% 12 0.7% 2 2.2% 5 2.1% 4 0.8% 1 1.2% 1
Close to work / en route to work
2.1% 18 1.8% 6 2.9% 7 2.2% 4 0.0% 0 3.0% 2
Easy to get to by bus 1.1% 10 1.0% 3 1.6% 4 1.0% 2 0.8% 1 1.2% 1Easy to get to by car 1.8% 16 1.3% 4 1.6% 4 3.7% 6 0.0% 0 2.9% 2Easy to get to by train 0.1% 1 0.0% 0 0.0% 0 0.4% 1 0.0% 0 0.0% 0Familiar / know where
everything is 2.2% 20 4.1% 14 1.7% 4 0.0% 0 1.8% 1 1.2% 1
Good cafés 0.5% 4 1.0% 3 0.0% 0 0.5% 1 0.0% 0 0.0% 0Good disabled access 0.0% 0 0.0% 0 0.0% 0 0.0% 0 0.0% 0 0.0% 0Good for a day out 0.2% 2 0.3% 1 0.0% 0 0.4% 1 0.0% 0 0.0% 0Good layout / shops close
together 1.8% 16 2.3% 8 0.9% 2 2.2% 4 0.8% 1 2.9% 2
Good market 0.3% 2 0.7% 2 0.0% 0 0.0% 0 0.0% 0 0.0% 0Good pubs / bars 0.9% 8 1.9% 6 0.4% 1 0.6% 1 0.0% 0 0.0% 0Good range of health and
fitness facilities (e.g. gyms, leisure centres)
1.0% 9 0.8% 3 1.3% 3 0.9% 1 1.7% 1 0.0% 0
Good range of hotels 0.0% 0 0.0% 0 0.0% 0 0.0% 0 0.0% 0 0.0% 0Good restaurants 0.5% 5 0.5% 2 0.6% 1 0.9% 2 0.0% 0 0.0% 0Has undercover shopping 0.0% 0 0.0% 0 0.0% 0 0.0% 0 0.0% 0 0.0% 0Nice atmosphere / friendly
people 0.1% 1 0.0% 0 0.0% 0 0.0% 0 0.8% 1 0.0% 0
Parking - it's cheap 0.2% 2 0.0% 0 0.4% 1 0.4% 1 0.0% 0 0.9% 1Parking - it's easy to find a
space 1.8% 16 2.0% 6 1.8% 4 1.9% 3 2.8% 2 0.0% 0
Parking - it's free 1.2% 11 1.1% 4 2.6% 6 0.6% 1 0.0% 0 0.0% 0Parking - it's in a good
location 0.6% 5 0.9% 3 0.0% 0 0.5% 1 1.1% 1 0.9% 1
Pedestrianised areas 0.0% 0 0.0% 0 0.0% 0 0.0% 0 0.0% 0 0.0% 0Quiet / not busy 0.5% 4 0.6% 2 0.7% 2 0.0% 0 0.8% 1 0.0% 0Services - good for financial
services (e.g. banks / building societies)
3.3% 29 2.7% 9 1.6% 4 5.4% 9 6.0% 5 4.3% 3
Services - good for other services (e.g. library, hairdresser, vets etc.)
1.1% 10 0.8% 3 1.0% 2 1.3% 2 3.4% 3 0.0% 0
Shops - good opening hours / open on Sundays
0.4% 4 0.0% 0 1.3% 3 0.0% 0 0.8% 1 0.0% 0
Shops - good range of affordable shops
3.0% 26 2.1% 7 2.0% 5 4.8% 8 4.1% 3 4.5% 3
Shops - good range of bakers / butchers / greengrocers
0.8% 7 0.0% 0 0.7% 2 2.2% 4 1.8% 1 0.0% 0
Shops - good range of clothes shops
2.7% 24 1.9% 6 3.9% 9 2.6% 5 5.0% 4 0.0% 0
Shops - good range of 'high street' retailers
3.7% 32 3.6% 12 1.1% 3 6.4% 11 3.3% 3 6.0% 4
Shops - good range of independent shops
2.9% 26 2.1% 7 4.5% 10 2.5% 4 2.0% 2 3.7% 2
Shops - good range of non-food shops generally
11.4% 100 10.8% 35 13.9% 32 10.2% 18 10.7% 9 9.3% 6
Shops - good range of quality shops
4.6% 41 3.5% 12 4.1% 9 5.0% 9 12.3% 10 1.7% 1
Shops - good range of supermarkets
4.0% 35 3.2% 10 3.2% 7 2.6% 5 3.5% 3 15.8% 10
Traditional / quaint 1.0% 9 1.2% 4 0.0% 0 0.9% 2 0.0% 0 4.6% 3You can get everything you
need there 7.3% 64 6.0% 20 3.2% 7 15.6% 27 12.3% 10 0.9% 1
Other 0.0% 0 0.0% 0 0.0% 0 0.0% 0 0.0% 0 0.0% 0Good cinema 0.3% 2 0.2% 1 0.0% 0 0.5% 1 1.0% 1 0.0% 0Good for leisure activities 0.2% 2 0.2% 1 0.0% 0 0.4% 1 0.0% 0 0.9% 1Good location / in the middle
of the island 0.1% 1 0.0% 0 0.0% 0 0.0% 0 0.0% 0 1.0% 1
Like the Co-op store 0.3% 3 0.8% 3 0.0% 0 0.0% 0 0.0% 0 0.0% 0
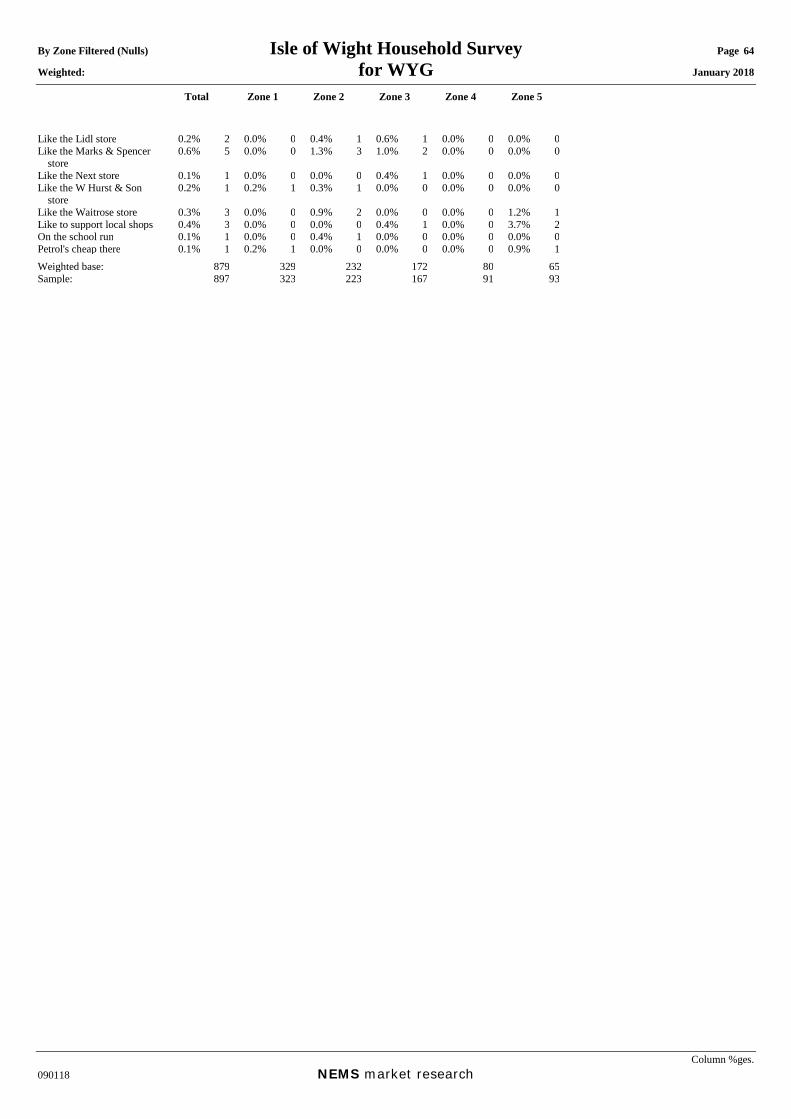
By Zone Filtered (Nulls) Isle of Wight Household Survey Page 64 Weighted: for WYG January 2018
Total Zone 1 Zone 2 Zone 3 Zone 4 Zone 5
Column %ges. 090118 NEMS market research
Like the Lidl store 0.2% 2 0.0% 0 0.4% 1 0.6% 1 0.0% 0 0.0% 0Like the Marks & Spencer
store 0.6% 5 0.0% 0 1.3% 3 1.0% 2 0.0% 0 0.0% 0
Like the Next store 0.1% 1 0.0% 0 0.0% 0 0.4% 1 0.0% 0 0.0% 0Like the W Hurst & Son
store 0.2% 1 0.2% 1 0.3% 1 0.0% 0 0.0% 0 0.0% 0
Like the Waitrose store 0.3% 3 0.0% 0 0.9% 2 0.0% 0 0.0% 0 1.2% 1Like to support local shops 0.4% 3 0.0% 0 0.0% 0 0.4% 1 0.0% 0 3.7% 2On the school run 0.1% 1 0.0% 0 0.4% 1 0.0% 0 0.0% 0 0.0% 0Petrol's cheap there 0.1% 1 0.2% 1 0.0% 0 0.0% 0 0.0% 0 0.9% 1Weighted base: 879 329 232 172 80 65Sample: 897 323 223 167 91 93
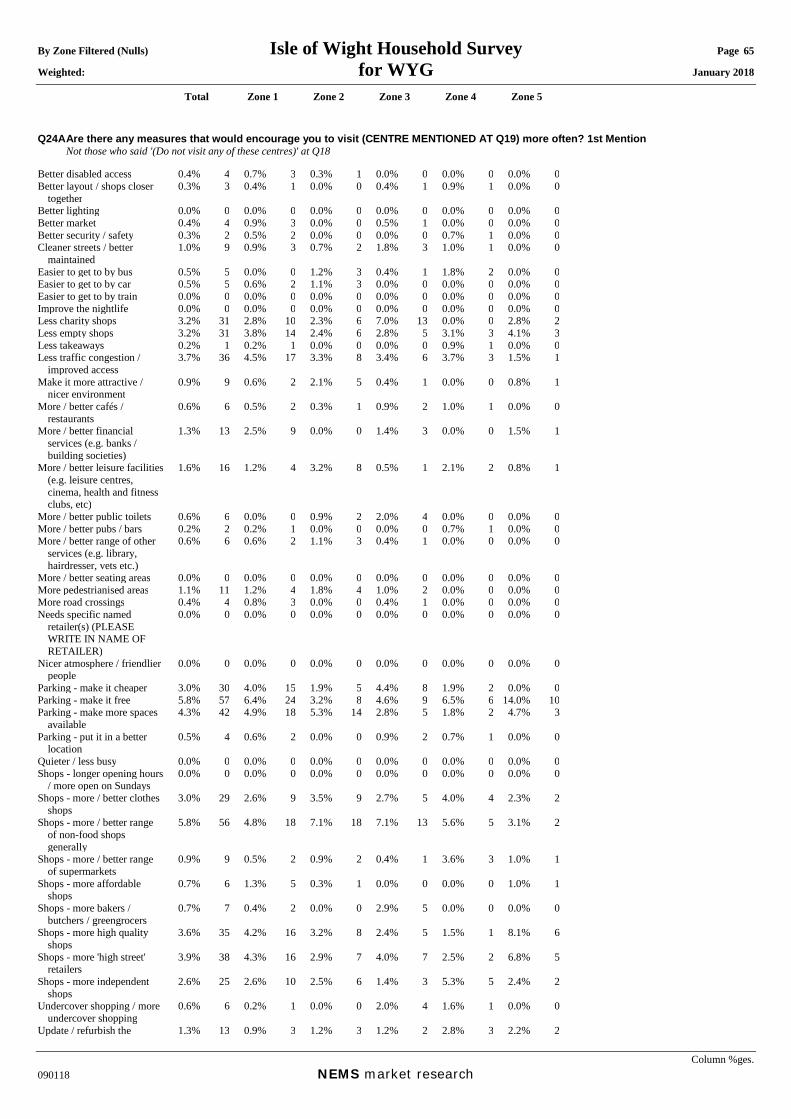
By Zone Filtered (Nulls) Isle of Wight Household Survey Page 65 Weighted: for WYG January 2018
Total Zone 1 Zone 2 Zone 3 Zone 4 Zone 5
Column %ges. 090118 NEMS market research
Q24A Are there any measures that would encourage you to visit (CENTRE MENTIONED AT Q19) more often? 1st Mention Not those who said '(Do not visit any of these centres)' at Q18 Better disabled access 0.4% 4 0.7% 3 0.3% 1 0.0% 0 0.0% 0 0.0% 0Better layout / shops closer
together 0.3% 3 0.4% 1 0.0% 0 0.4% 1 0.9% 1 0.0% 0
Better lighting 0.0% 0 0.0% 0 0.0% 0 0.0% 0 0.0% 0 0.0% 0Better market 0.4% 4 0.9% 3 0.0% 0 0.5% 1 0.0% 0 0.0% 0Better security / safety 0.3% 2 0.5% 2 0.0% 0 0.0% 0 0.7% 1 0.0% 0Cleaner streets / better
maintained 1.0% 9 0.9% 3 0.7% 2 1.8% 3 1.0% 1 0.0% 0
Easier to get to by bus 0.5% 5 0.0% 0 1.2% 3 0.4% 1 1.8% 2 0.0% 0Easier to get to by car 0.5% 5 0.6% 2 1.1% 3 0.0% 0 0.0% 0 0.0% 0Easier to get to by train 0.0% 0 0.0% 0 0.0% 0 0.0% 0 0.0% 0 0.0% 0Improve the nightlife 0.0% 0 0.0% 0 0.0% 0 0.0% 0 0.0% 0 0.0% 0Less charity shops 3.2% 31 2.8% 10 2.3% 6 7.0% 13 0.0% 0 2.8% 2Less empty shops 3.2% 31 3.8% 14 2.4% 6 2.8% 5 3.1% 3 4.1% 3Less takeaways 0.2% 1 0.2% 1 0.0% 0 0.0% 0 0.9% 1 0.0% 0Less traffic congestion /
improved access 3.7% 36 4.5% 17 3.3% 8 3.4% 6 3.7% 3 1.5% 1
Make it more attractive / nicer environment
0.9% 9 0.6% 2 2.1% 5 0.4% 1 0.0% 0 0.8% 1
More / better cafés / restaurants
0.6% 6 0.5% 2 0.3% 1 0.9% 2 1.0% 1 0.0% 0
More / better financial services (e.g. banks / building societies)
1.3% 13 2.5% 9 0.0% 0 1.4% 3 0.0% 0 1.5% 1
More / better leisure facilities (e.g. leisure centres, cinema, health and fitness clubs, etc)
1.6% 16 1.2% 4 3.2% 8 0.5% 1 2.1% 2 0.8% 1
More / better public toilets 0.6% 6 0.0% 0 0.9% 2 2.0% 4 0.0% 0 0.0% 0More / better pubs / bars 0.2% 2 0.2% 1 0.0% 0 0.0% 0 0.7% 1 0.0% 0More / better range of other
services (e.g. library, hairdresser, vets etc.)
0.6% 6 0.6% 2 1.1% 3 0.4% 1 0.0% 0 0.0% 0
More / better seating areas 0.0% 0 0.0% 0 0.0% 0 0.0% 0 0.0% 0 0.0% 0More pedestrianised areas 1.1% 11 1.2% 4 1.8% 4 1.0% 2 0.0% 0 0.0% 0More road crossings 0.4% 4 0.8% 3 0.0% 0 0.4% 1 0.0% 0 0.0% 0Needs specific named
retailer(s) (PLEASE WRITE IN NAME OF RETAILER)
0.0% 0 0.0% 0 0.0% 0 0.0% 0 0.0% 0 0.0% 0
Nicer atmosphere / friendlier people
0.0% 0 0.0% 0 0.0% 0 0.0% 0 0.0% 0 0.0% 0
Parking - make it cheaper 3.0% 30 4.0% 15 1.9% 5 4.4% 8 1.9% 2 0.0% 0Parking - make it free 5.8% 57 6.4% 24 3.2% 8 4.6% 9 6.5% 6 14.0% 10Parking - make more spaces
available 4.3% 42 4.9% 18 5.3% 14 2.8% 5 1.8% 2 4.7% 3
Parking - put it in a better location
0.5% 4 0.6% 2 0.0% 0 0.9% 2 0.7% 1 0.0% 0
Quieter / less busy 0.0% 0 0.0% 0 0.0% 0 0.0% 0 0.0% 0 0.0% 0Shops - longer opening hours
/ more open on Sundays 0.0% 0 0.0% 0 0.0% 0 0.0% 0 0.0% 0 0.0% 0
Shops - more / better clothes shops
3.0% 29 2.6% 9 3.5% 9 2.7% 5 4.0% 4 2.3% 2
Shops - more / better range of non-food shops generally
5.8% 56 4.8% 18 7.1% 18 7.1% 13 5.6% 5 3.1% 2
Shops - more / better range of supermarkets
0.9% 9 0.5% 2 0.9% 2 0.4% 1 3.6% 3 1.0% 1
Shops - more affordable shops
0.7% 6 1.3% 5 0.3% 1 0.0% 0 0.0% 0 1.0% 1
Shops - more bakers / butchers / greengrocers
0.7% 7 0.4% 2 0.0% 0 2.9% 5 0.0% 0 0.0% 0
Shops - more high quality shops
3.6% 35 4.2% 16 3.2% 8 2.4% 5 1.5% 1 8.1% 6
Shops - more 'high street' retailers
3.9% 38 4.3% 16 2.9% 7 4.0% 7 2.5% 2 6.8% 5
Shops - more independent shops
2.6% 25 2.6% 10 2.5% 6 1.4% 3 5.3% 5 2.4% 2
Undercover shopping / more undercover shopping
0.6% 6 0.2% 1 0.0% 0 2.0% 4 1.6% 1 0.0% 0
Update / refurbish the 1.3% 13 0.9% 3 1.2% 3 1.2% 2 2.8% 3 2.2% 2

By Zone Filtered (Nulls) Isle of Wight Household Survey Page 66 Weighted: for WYG January 2018
Total Zone 1 Zone 2 Zone 3 Zone 4 Zone 5
Column %ges. 090118 NEMS market research
shopping area Other 0.0% 0 0.0% 0 0.0% 0 0.0% 0 0.0% 0 0.0% 0A billboard with the map of
the town on 0.0% 0 0.0% 0 0.0% 0 0.0% 0 0.0% 0 0.0% 0
A bridge to the mainland 0.1% 1 0.0% 0 0.3% 1 0.0% 0 0.0% 0 0.0% 0A music store 0.0% 0 0.0% 0 0.0% 0 0.0% 0 0.0% 0 0.0% 0A petrol station 0.0% 0 0.0% 0 0.0% 0 0.0% 0 0.0% 0 0.0% 0Keep the library open 0.1% 1 0.0% 0 0.0% 0 0.0% 0 0.0% 0 0.8% 1Less betting shops 0.1% 1 0.2% 1 0.0% 0 0.0% 0 0.0% 0 0.0% 0Less cafes 0.4% 3 0.9% 3 0.0% 0 0.0% 0 0.0% 0 0.0% 0Less developments 0.2% 2 0.4% 2 0.0% 0 0.0% 0 0.0% 0 0.0% 0Less hairdressers 0.0% 0 0.0% 0 0.0% 0 0.0% 0 0.0% 0 0.0% 0Less jewellers 0.0% 0 0.0% 0 0.0% 0 0.0% 0 0.0% 0 0.0% 0Less pot holes / better road
surfaces 0.7% 6 1.3% 5 0.0% 0 0.9% 2 0.0% 0 0.0% 0
Less supermarkets 0.5% 5 0.9% 3 0.0% 0 0.0% 0 1.5% 1 0.0% 0Lower bus fares 0.6% 6 0.0% 0 2.2% 6 0.0% 0 0.0% 0 0.0% 0Lower business rates 0.2% 2 0.3% 1 0.0% 0 0.0% 0 0.0% 0 1.0% 1Lower prices at the leisure
centre 0.0% 0 0.0% 0 0.0% 0 0.0% 0 0.0% 0 0.0% 0
More antique shops 0.1% 1 0.0% 0 0.3% 1 0.0% 0 0.0% 0 0.0% 0More cycle routes 0.1% 1 0.0% 0 0.3% 1 0.0% 0 0.0% 0 0.0% 0More dropped curbs 0.0% 0 0.0% 0 0.0% 0 0.0% 0 0.0% 0 0.0% 0More events in town 0.0% 0 0.0% 0 0.0% 0 0.0% 0 0.0% 0 0.0% 0More off licenses 0.0% 0 0.0% 0 0.0% 0 0.0% 0 0.0% 0 0.0% 0Needs specific named
retailer: Aldi store 0.0% 0 0.0% 0 0.0% 0 0.0% 0 0.0% 0 0.0% 0
Needs specific named retailer: Burger King restaurant
0.2% 2 0.5% 2 0.0% 0 0.0% 0 0.0% 0 0.0% 0
Needs specific named retailer: Debenhams store
0.3% 3 0.0% 0 0.8% 2 0.5% 1 0.0% 0 0.0% 0
Needs specific named retailer: Dominos restaurant
0.1% 1 0.0% 0 0.0% 0 0.5% 1 0.0% 0 0.0% 0
Needs specific named retailer: Dorothy Perkins store
0.3% 3 0.8% 3 0.0% 0 0.0% 0 0.0% 0 0.0% 0
Needs specific named retailer: HMV store
0.2% 2 0.3% 1 0.3% 1 0.0% 0 0.0% 0 0.0% 0
Needs specific named retailer: Home Bargains store
0.1% 1 0.0% 0 0.3% 1 0.0% 0 0.0% 0 0.0% 0
Needs specific named retailer: JD Sports store
0.0% 0 0.0% 0 0.0% 0 0.0% 0 0.0% 0 0.0% 0
Needs specific named retailer: John Lewis store
0.3% 3 0.2% 1 0.7% 2 0.4% 1 0.0% 0 0.0% 0
Needs specific named retailer: Lakeland store
0.1% 1 0.0% 0 0.0% 0 0.0% 0 0.0% 0 1.0% 1
Needs specific named retailer: Morrisons store
0.1% 1 0.2% 1 0.0% 0 0.0% 0 0.0% 0 0.8% 1
Needs specific named retailer: Primark store
2.3% 22 3.4% 12 2.1% 5 0.4% 1 2.1% 2 2.2% 2
Needs specific named retailer: Starbucks cafe
0.2% 2 0.0% 0 0.8% 2 0.0% 0 0.0% 0 0.0% 0
Needs specific named retailer: Waitrose store
0.0% 0 0.0% 0 0.0% 0 0.0% 0 0.0% 0 0.0% 0
Needs specific named retailer: Zara store
0.1% 1 0.0% 0 0.3% 1 0.0% 0 0.0% 0 0.0% 0
New clock in the square 0.1% 1 0.2% 1 0.0% 0 0.0% 0 0.0% 0 0.0% 0Parking - longer stay parking 0.1% 1 0.0% 0 0.4% 1 0.0% 0 0.0% 0 0.0% 0Refurbish the ice rink 0.0% 0 0.0% 0 0.0% 0 0.0% 0 0.0% 0 0.0% 0(Don't know) 2.4% 23 1.5% 6 3.0% 8 3.5% 7 2.1% 2 1.7% 1(Nothing / nothing else) 32.8% 320 28.1% 104 35.4% 91 34.0% 63 40.2% 36 35.4% 26Weighted base: 975 369 256 186 90 73Sample: 981 360 244 178 99 100
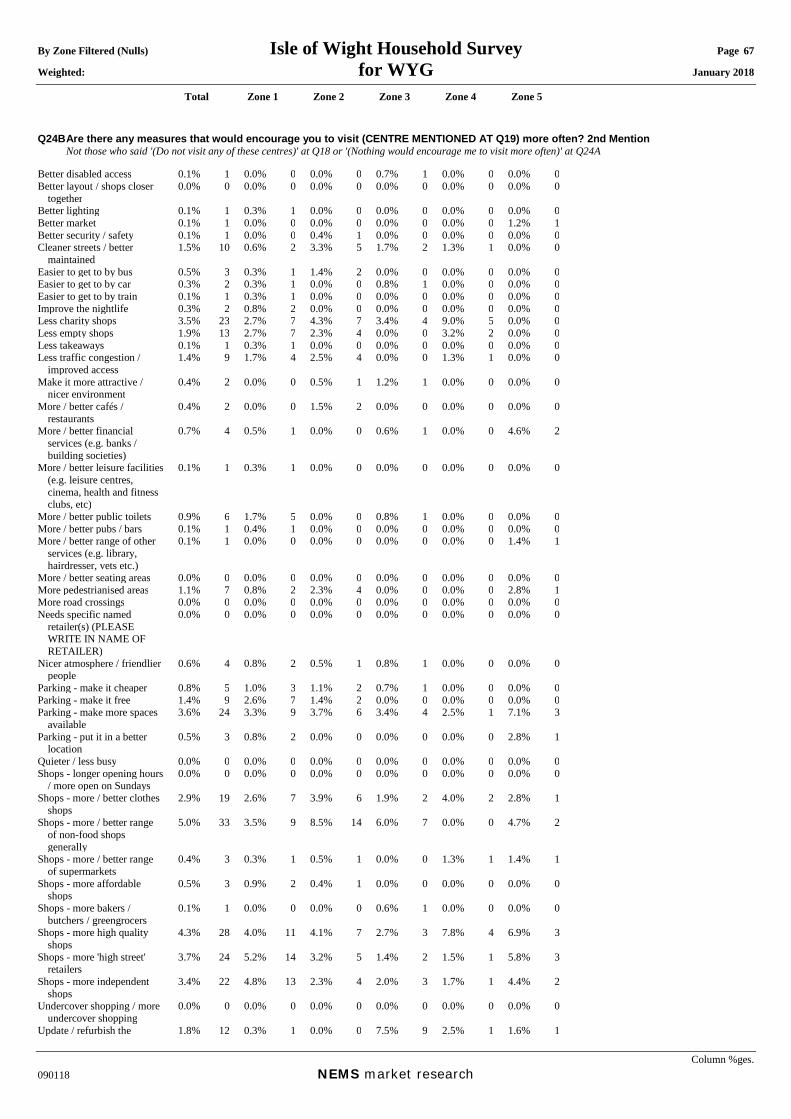
By Zone Filtered (Nulls) Isle of Wight Household Survey Page 67 Weighted: for WYG January 2018
Total Zone 1 Zone 2 Zone 3 Zone 4 Zone 5
Column %ges. 090118 NEMS market research
Q24B Are there any measures that would encourage you to visit (CENTRE MENTIONED AT Q19) more often? 2nd Mention Not those who said '(Do not visit any of these centres)' at Q18 or '(Nothing would encourage me to visit more often)' at Q24A Better disabled access 0.1% 1 0.0% 0 0.0% 0 0.7% 1 0.0% 0 0.0% 0Better layout / shops closer
together 0.0% 0 0.0% 0 0.0% 0 0.0% 0 0.0% 0 0.0% 0
Better lighting 0.1% 1 0.3% 1 0.0% 0 0.0% 0 0.0% 0 0.0% 0Better market 0.1% 1 0.0% 0 0.0% 0 0.0% 0 0.0% 0 1.2% 1Better security / safety 0.1% 1 0.0% 0 0.4% 1 0.0% 0 0.0% 0 0.0% 0Cleaner streets / better
maintained 1.5% 10 0.6% 2 3.3% 5 1.7% 2 1.3% 1 0.0% 0
Easier to get to by bus 0.5% 3 0.3% 1 1.4% 2 0.0% 0 0.0% 0 0.0% 0Easier to get to by car 0.3% 2 0.3% 1 0.0% 0 0.8% 1 0.0% 0 0.0% 0Easier to get to by train 0.1% 1 0.3% 1 0.0% 0 0.0% 0 0.0% 0 0.0% 0Improve the nightlife 0.3% 2 0.8% 2 0.0% 0 0.0% 0 0.0% 0 0.0% 0Less charity shops 3.5% 23 2.7% 7 4.3% 7 3.4% 4 9.0% 5 0.0% 0Less empty shops 1.9% 13 2.7% 7 2.3% 4 0.0% 0 3.2% 2 0.0% 0Less takeaways 0.1% 1 0.3% 1 0.0% 0 0.0% 0 0.0% 0 0.0% 0Less traffic congestion /
improved access 1.4% 9 1.7% 4 2.5% 4 0.0% 0 1.3% 1 0.0% 0
Make it more attractive / nicer environment
0.4% 2 0.0% 0 0.5% 1 1.2% 1 0.0% 0 0.0% 0
More / better cafés / restaurants
0.4% 2 0.0% 0 1.5% 2 0.0% 0 0.0% 0 0.0% 0
More / better financial services (e.g. banks / building societies)
0.7% 4 0.5% 1 0.0% 0 0.6% 1 0.0% 0 4.6% 2
More / better leisure facilities (e.g. leisure centres, cinema, health and fitness clubs, etc)
0.1% 1 0.3% 1 0.0% 0 0.0% 0 0.0% 0 0.0% 0
More / better public toilets 0.9% 6 1.7% 5 0.0% 0 0.8% 1 0.0% 0 0.0% 0More / better pubs / bars 0.1% 1 0.4% 1 0.0% 0 0.0% 0 0.0% 0 0.0% 0More / better range of other
services (e.g. library, hairdresser, vets etc.)
0.1% 1 0.0% 0 0.0% 0 0.0% 0 0.0% 0 1.4% 1
More / better seating areas 0.0% 0 0.0% 0 0.0% 0 0.0% 0 0.0% 0 0.0% 0More pedestrianised areas 1.1% 7 0.8% 2 2.3% 4 0.0% 0 0.0% 0 2.8% 1More road crossings 0.0% 0 0.0% 0 0.0% 0 0.0% 0 0.0% 0 0.0% 0Needs specific named
retailer(s) (PLEASE WRITE IN NAME OF RETAILER)
0.0% 0 0.0% 0 0.0% 0 0.0% 0 0.0% 0 0.0% 0
Nicer atmosphere / friendlier people
0.6% 4 0.8% 2 0.5% 1 0.8% 1 0.0% 0 0.0% 0
Parking - make it cheaper 0.8% 5 1.0% 3 1.1% 2 0.7% 1 0.0% 0 0.0% 0Parking - make it free 1.4% 9 2.6% 7 1.4% 2 0.0% 0 0.0% 0 0.0% 0Parking - make more spaces
available 3.6% 24 3.3% 9 3.7% 6 3.4% 4 2.5% 1 7.1% 3
Parking - put it in a better location
0.5% 3 0.8% 2 0.0% 0 0.0% 0 0.0% 0 2.8% 1
Quieter / less busy 0.0% 0 0.0% 0 0.0% 0 0.0% 0 0.0% 0 0.0% 0Shops - longer opening hours
/ more open on Sundays 0.0% 0 0.0% 0 0.0% 0 0.0% 0 0.0% 0 0.0% 0
Shops - more / better clothes shops
2.9% 19 2.6% 7 3.9% 6 1.9% 2 4.0% 2 2.8% 1
Shops - more / better range of non-food shops generally
5.0% 33 3.5% 9 8.5% 14 6.0% 7 0.0% 0 4.7% 2
Shops - more / better range of supermarkets
0.4% 3 0.3% 1 0.5% 1 0.0% 0 1.3% 1 1.4% 1
Shops - more affordable shops
0.5% 3 0.9% 2 0.4% 1 0.0% 0 0.0% 0 0.0% 0
Shops - more bakers / butchers / greengrocers
0.1% 1 0.0% 0 0.0% 0 0.6% 1 0.0% 0 0.0% 0
Shops - more high quality shops
4.3% 28 4.0% 11 4.1% 7 2.7% 3 7.8% 4 6.9% 3
Shops - more 'high street' retailers
3.7% 24 5.2% 14 3.2% 5 1.4% 2 1.5% 1 5.8% 3
Shops - more independent shops
3.4% 22 4.8% 13 2.3% 4 2.0% 3 1.7% 1 4.4% 2
Undercover shopping / more undercover shopping
0.0% 0 0.0% 0 0.0% 0 0.0% 0 0.0% 0 0.0% 0
Update / refurbish the 1.8% 12 0.3% 1 0.0% 0 7.5% 9 2.5% 1 1.6% 1
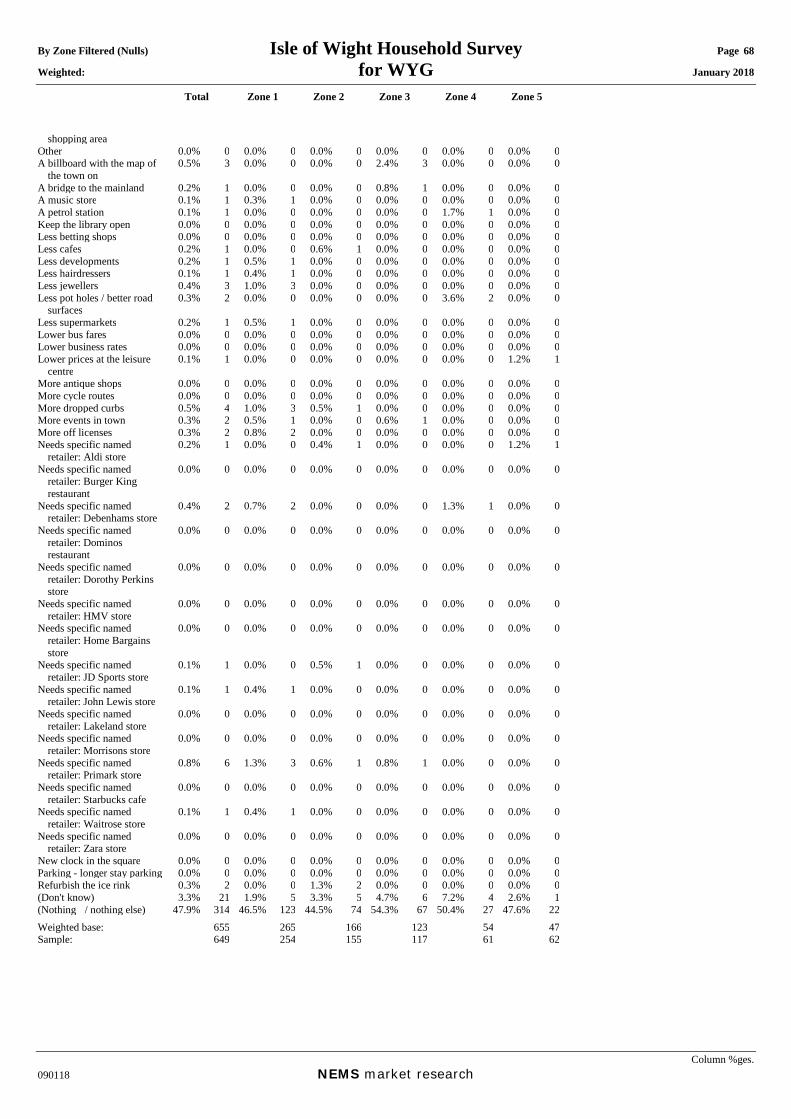
By Zone Filtered (Nulls) Isle of Wight Household Survey Page 68 Weighted: for WYG January 2018
Total Zone 1 Zone 2 Zone 3 Zone 4 Zone 5
Column %ges. 090118 NEMS market research
shopping area Other 0.0% 0 0.0% 0 0.0% 0 0.0% 0 0.0% 0 0.0% 0A billboard with the map of
the town on 0.5% 3 0.0% 0 0.0% 0 2.4% 3 0.0% 0 0.0% 0
A bridge to the mainland 0.2% 1 0.0% 0 0.0% 0 0.8% 1 0.0% 0 0.0% 0A music store 0.1% 1 0.3% 1 0.0% 0 0.0% 0 0.0% 0 0.0% 0A petrol station 0.1% 1 0.0% 0 0.0% 0 0.0% 0 1.7% 1 0.0% 0Keep the library open 0.0% 0 0.0% 0 0.0% 0 0.0% 0 0.0% 0 0.0% 0Less betting shops 0.0% 0 0.0% 0 0.0% 0 0.0% 0 0.0% 0 0.0% 0Less cafes 0.2% 1 0.0% 0 0.6% 1 0.0% 0 0.0% 0 0.0% 0Less developments 0.2% 1 0.5% 1 0.0% 0 0.0% 0 0.0% 0 0.0% 0Less hairdressers 0.1% 1 0.4% 1 0.0% 0 0.0% 0 0.0% 0 0.0% 0Less jewellers 0.4% 3 1.0% 3 0.0% 0 0.0% 0 0.0% 0 0.0% 0Less pot holes / better road
surfaces 0.3% 2 0.0% 0 0.0% 0 0.0% 0 3.6% 2 0.0% 0
Less supermarkets 0.2% 1 0.5% 1 0.0% 0 0.0% 0 0.0% 0 0.0% 0Lower bus fares 0.0% 0 0.0% 0 0.0% 0 0.0% 0 0.0% 0 0.0% 0Lower business rates 0.0% 0 0.0% 0 0.0% 0 0.0% 0 0.0% 0 0.0% 0Lower prices at the leisure
centre 0.1% 1 0.0% 0 0.0% 0 0.0% 0 0.0% 0 1.2% 1
More antique shops 0.0% 0 0.0% 0 0.0% 0 0.0% 0 0.0% 0 0.0% 0More cycle routes 0.0% 0 0.0% 0 0.0% 0 0.0% 0 0.0% 0 0.0% 0More dropped curbs 0.5% 4 1.0% 3 0.5% 1 0.0% 0 0.0% 0 0.0% 0More events in town 0.3% 2 0.5% 1 0.0% 0 0.6% 1 0.0% 0 0.0% 0More off licenses 0.3% 2 0.8% 2 0.0% 0 0.0% 0 0.0% 0 0.0% 0Needs specific named
retailer: Aldi store 0.2% 1 0.0% 0 0.4% 1 0.0% 0 0.0% 0 1.2% 1
Needs specific named retailer: Burger King restaurant
0.0% 0 0.0% 0 0.0% 0 0.0% 0 0.0% 0 0.0% 0
Needs specific named retailer: Debenhams store
0.4% 2 0.7% 2 0.0% 0 0.0% 0 1.3% 1 0.0% 0
Needs specific named retailer: Dominos restaurant
0.0% 0 0.0% 0 0.0% 0 0.0% 0 0.0% 0 0.0% 0
Needs specific named retailer: Dorothy Perkins store
0.0% 0 0.0% 0 0.0% 0 0.0% 0 0.0% 0 0.0% 0
Needs specific named retailer: HMV store
0.0% 0 0.0% 0 0.0% 0 0.0% 0 0.0% 0 0.0% 0
Needs specific named retailer: Home Bargains store
0.0% 0 0.0% 0 0.0% 0 0.0% 0 0.0% 0 0.0% 0
Needs specific named retailer: JD Sports store
0.1% 1 0.0% 0 0.5% 1 0.0% 0 0.0% 0 0.0% 0
Needs specific named retailer: John Lewis store
0.1% 1 0.4% 1 0.0% 0 0.0% 0 0.0% 0 0.0% 0
Needs specific named retailer: Lakeland store
0.0% 0 0.0% 0 0.0% 0 0.0% 0 0.0% 0 0.0% 0
Needs specific named retailer: Morrisons store
0.0% 0 0.0% 0 0.0% 0 0.0% 0 0.0% 0 0.0% 0
Needs specific named retailer: Primark store
0.8% 6 1.3% 3 0.6% 1 0.8% 1 0.0% 0 0.0% 0
Needs specific named retailer: Starbucks cafe
0.0% 0 0.0% 0 0.0% 0 0.0% 0 0.0% 0 0.0% 0
Needs specific named retailer: Waitrose store
0.1% 1 0.4% 1 0.0% 0 0.0% 0 0.0% 0 0.0% 0
Needs specific named retailer: Zara store
0.0% 0 0.0% 0 0.0% 0 0.0% 0 0.0% 0 0.0% 0
New clock in the square 0.0% 0 0.0% 0 0.0% 0 0.0% 0 0.0% 0 0.0% 0Parking - longer stay parking 0.0% 0 0.0% 0 0.0% 0 0.0% 0 0.0% 0 0.0% 0Refurbish the ice rink 0.3% 2 0.0% 0 1.3% 2 0.0% 0 0.0% 0 0.0% 0(Don't know) 3.3% 21 1.9% 5 3.3% 5 4.7% 6 7.2% 4 2.6% 1(Nothing / nothing else) 47.9% 314 46.5% 123 44.5% 74 54.3% 67 50.4% 27 47.6% 22Weighted base: 655 265 166 123 54 47Sample: 649 254 155 117 61 62

By Zone Filtered (Nulls) Isle of Wight Household Survey Page 69 Weighted: for WYG January 2018
Total Zone 1 Zone 2 Zone 3 Zone 4 Zone 5
Column %ges. 090118 NEMS market research
Q24X Measures encouraging more visits to (CENTRE MENTIONED AT Q19) (All mentions) Not those who said '(Do not visit any of these centres)' at Q18 or '(Nothing would encourage me to visit more often)' at Q24A Better disabled access 1.0% 6 1.4% 4 1.1% 2 0.7% 1 0.0% 0 0.0% 0Better layout / shops closer
together 0.5% 3 0.5% 1 0.0% 0 0.6% 1 1.5% 1 0.0% 0
Better lighting 0.4% 3 0.5% 1 0.4% 1 0.0% 0 0.0% 0 1.4% 1Better market 1.3% 9 2.5% 7 0.0% 0 1.3% 2 0.0% 0 1.2% 1Better security / safety 0.5% 3 0.7% 2 0.4% 1 0.0% 0 1.3% 1 0.0% 0Cleaner streets / better
maintained 2.9% 19 1.9% 5 4.4% 7 4.3% 5 3.0% 2 0.0% 0
Easier to get to by bus 1.3% 8 0.3% 1 3.2% 5 0.6% 1 3.0% 2 0.0% 0Easier to get to by car 1.1% 7 1.2% 3 1.7% 3 0.8% 1 0.0% 0 1.2% 1Easier to get to by train 0.1% 1 0.3% 1 0.0% 0 0.0% 0 0.0% 0 0.0% 0Improve the nightlife 0.7% 5 1.5% 4 0.5% 1 0.0% 0 0.0% 0 0.0% 0Less charity shops 8.3% 55 6.6% 17 7.9% 13 14.0% 17 9.0% 5 4.4% 2Less empty shops 6.7% 44 8.0% 21 5.9% 10 4.3% 5 8.4% 5 6.3% 3Less takeaways 0.3% 2 0.5% 1 0.0% 0 0.0% 0 1.5% 1 0.0% 0Less traffic congestion /
improved access 6.9% 45 7.9% 21 7.6% 13 5.1% 6 7.4% 4 2.4% 1
Make it more attractive / nicer environment
1.8% 11 0.9% 2 3.8% 6 1.8% 2 0.0% 0 1.2% 1
More / better cafés / restaurants
1.2% 8 0.8% 2 2.0% 3 1.4% 2 1.7% 1 0.0% 0
More / better financial services (e.g. banks / building societies)
2.5% 16 3.7% 10 0.0% 0 2.7% 3 0.0% 0 6.9% 3
More / better leisure facilities (e.g. leisure centres, cinema, health and fitness clubs, etc)
2.5% 17 1.9% 5 4.9% 8 0.7% 1 3.6% 2 1.2% 1
More / better public toilets 1.8% 12 1.7% 5 1.4% 2 3.9% 5 0.0% 0 0.0% 0More / better pubs / bars 0.6% 4 1.2% 3 0.0% 0 0.0% 0 1.3% 1 0.0% 0More / better range of other
services (e.g. library, hairdresser, vets etc.)
1.0% 7 0.8% 2 1.8% 3 0.6% 1 0.0% 0 1.4% 1
More / better seating areas 0.0% 0 0.0% 0 0.0% 0 0.0% 0 0.0% 0 0.0% 0More pedestrianised areas 2.8% 18 2.5% 7 5.0% 8 1.5% 2 0.0% 0 2.8% 1More road crossings 0.6% 4 1.1% 3 0.0% 0 0.6% 1 0.0% 0 0.0% 0Needs specific named
retailer(s) (PLEASE WRITE IN NAME OF RETAILER)
0.0% 0 0.0% 0 0.0% 0 0.0% 0 0.0% 0 0.0% 0
Nicer atmosphere / friendlier people
0.6% 4 0.8% 2 0.5% 1 0.8% 1 0.0% 0 0.0% 0
Parking - make it cheaper 5.3% 35 6.6% 17 4.0% 7 7.3% 9 3.2% 2 0.0% 0Parking - make it free 10.1% 66 11.6% 31 6.3% 10 7.0% 9 10.9% 6 21.6% 10Parking - make more spaces
available 10.1% 66 10.2% 27 12.0% 20 7.6% 9 5.5% 3 14.3% 7
Parking - put it in a better location
1.2% 8 1.6% 4 0.0% 0 1.3% 2 1.3% 1 2.8% 1
Quieter / less busy 0.0% 0 0.0% 0 0.0% 0 0.0% 0 0.0% 0 0.0% 0Shops - longer opening hours
/ more open on Sundays 0.0% 0 0.0% 0 0.0% 0 0.0% 0 0.0% 0 0.0% 0
Shops - more / better clothes shops
7.0% 46 6.2% 16 8.9% 15 5.4% 7 10.7% 6 5.2% 2
Shops - more / better range of non-food shops generally
13.6% 89 10.2% 27 19.5% 32 16.7% 21 9.4% 5 9.5% 4
Shops - more / better range of supermarkets
1.8% 12 1.0% 3 1.9% 3 0.6% 1 7.4% 4 3.0% 1
Shops - more affordable shops
1.5% 10 2.8% 7 0.9% 1 0.0% 0 0.0% 0 1.6% 1
Shops - more bakers / butchers / greengrocers
1.2% 8 0.6% 2 0.0% 0 5.0% 6 0.0% 0 0.0% 0
Shops - more high quality shops
9.7% 64 9.9% 26 9.0% 15 6.4% 8 10.3% 6 19.4% 9
Shops - more 'high street' retailers
9.0% 59 10.1% 27 7.7% 13 6.8% 8 5.7% 3 16.3% 8
Shops - more independent shops
7.3% 48 8.7% 23 6.2% 10 4.1% 5 10.5% 6 8.2% 4
Undercover shopping / more undercover shopping
0.9% 6 0.3% 1 0.0% 0 3.0% 4 2.7% 1 0.0% 0
Update / refurbish the 3.8% 25 1.5% 4 1.9% 3 9.3% 11 7.2% 4 5.0% 2
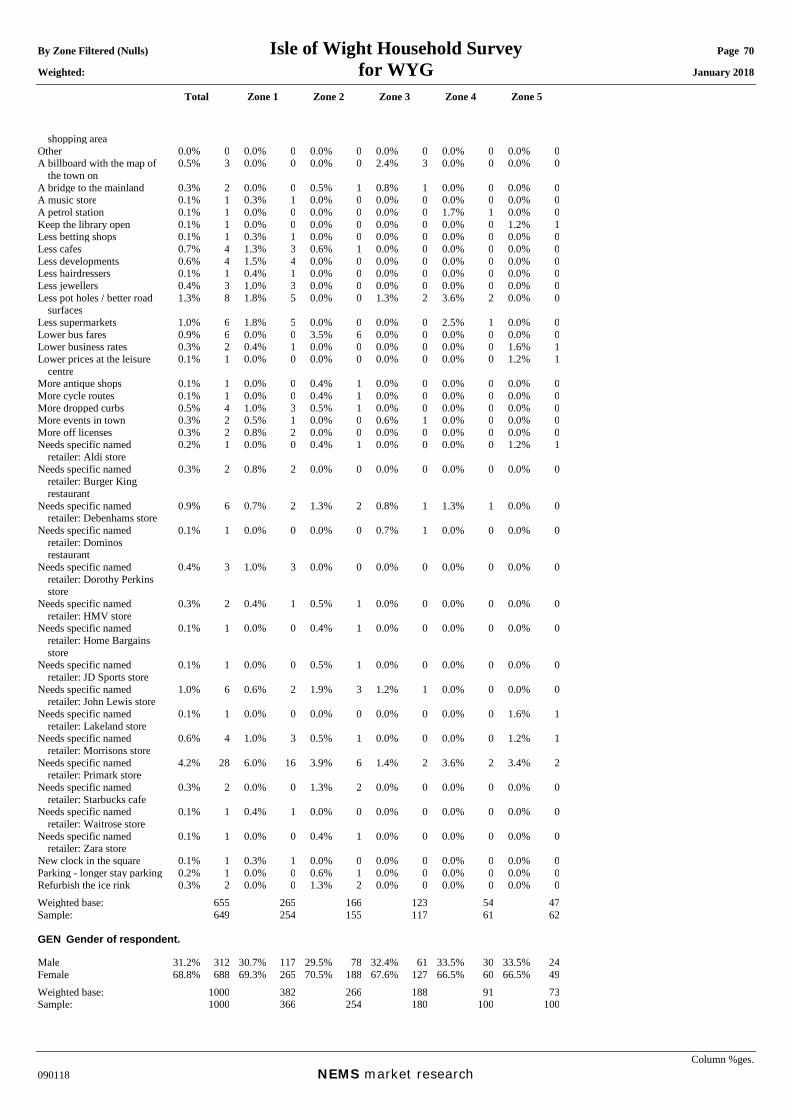
By Zone Filtered (Nulls) Isle of Wight Household Survey Page 70 Weighted: for WYG January 2018
Total Zone 1 Zone 2 Zone 3 Zone 4 Zone 5
Column %ges. 090118 NEMS market research
shopping area Other 0.0% 0 0.0% 0 0.0% 0 0.0% 0 0.0% 0 0.0% 0A billboard with the map of
the town on 0.5% 3 0.0% 0 0.0% 0 2.4% 3 0.0% 0 0.0% 0
A bridge to the mainland 0.3% 2 0.0% 0 0.5% 1 0.8% 1 0.0% 0 0.0% 0A music store 0.1% 1 0.3% 1 0.0% 0 0.0% 0 0.0% 0 0.0% 0A petrol station 0.1% 1 0.0% 0 0.0% 0 0.0% 0 1.7% 1 0.0% 0Keep the library open 0.1% 1 0.0% 0 0.0% 0 0.0% 0 0.0% 0 1.2% 1Less betting shops 0.1% 1 0.3% 1 0.0% 0 0.0% 0 0.0% 0 0.0% 0Less cafes 0.7% 4 1.3% 3 0.6% 1 0.0% 0 0.0% 0 0.0% 0Less developments 0.6% 4 1.5% 4 0.0% 0 0.0% 0 0.0% 0 0.0% 0Less hairdressers 0.1% 1 0.4% 1 0.0% 0 0.0% 0 0.0% 0 0.0% 0Less jewellers 0.4% 3 1.0% 3 0.0% 0 0.0% 0 0.0% 0 0.0% 0Less pot holes / better road
surfaces 1.3% 8 1.8% 5 0.0% 0 1.3% 2 3.6% 2 0.0% 0
Less supermarkets 1.0% 6 1.8% 5 0.0% 0 0.0% 0 2.5% 1 0.0% 0Lower bus fares 0.9% 6 0.0% 0 3.5% 6 0.0% 0 0.0% 0 0.0% 0Lower business rates 0.3% 2 0.4% 1 0.0% 0 0.0% 0 0.0% 0 1.6% 1Lower prices at the leisure
centre 0.1% 1 0.0% 0 0.0% 0 0.0% 0 0.0% 0 1.2% 1
More antique shops 0.1% 1 0.0% 0 0.4% 1 0.0% 0 0.0% 0 0.0% 0More cycle routes 0.1% 1 0.0% 0 0.4% 1 0.0% 0 0.0% 0 0.0% 0More dropped curbs 0.5% 4 1.0% 3 0.5% 1 0.0% 0 0.0% 0 0.0% 0More events in town 0.3% 2 0.5% 1 0.0% 0 0.6% 1 0.0% 0 0.0% 0More off licenses 0.3% 2 0.8% 2 0.0% 0 0.0% 0 0.0% 0 0.0% 0Needs specific named
retailer: Aldi store 0.2% 1 0.0% 0 0.4% 1 0.0% 0 0.0% 0 1.2% 1
Needs specific named retailer: Burger King restaurant
0.3% 2 0.8% 2 0.0% 0 0.0% 0 0.0% 0 0.0% 0
Needs specific named retailer: Debenhams store
0.9% 6 0.7% 2 1.3% 2 0.8% 1 1.3% 1 0.0% 0
Needs specific named retailer: Dominos restaurant
0.1% 1 0.0% 0 0.0% 0 0.7% 1 0.0% 0 0.0% 0
Needs specific named retailer: Dorothy Perkins store
0.4% 3 1.0% 3 0.0% 0 0.0% 0 0.0% 0 0.0% 0
Needs specific named retailer: HMV store
0.3% 2 0.4% 1 0.5% 1 0.0% 0 0.0% 0 0.0% 0
Needs specific named retailer: Home Bargains store
0.1% 1 0.0% 0 0.4% 1 0.0% 0 0.0% 0 0.0% 0
Needs specific named retailer: JD Sports store
0.1% 1 0.0% 0 0.5% 1 0.0% 0 0.0% 0 0.0% 0
Needs specific named retailer: John Lewis store
1.0% 6 0.6% 2 1.9% 3 1.2% 1 0.0% 0 0.0% 0
Needs specific named retailer: Lakeland store
0.1% 1 0.0% 0 0.0% 0 0.0% 0 0.0% 0 1.6% 1
Needs specific named retailer: Morrisons store
0.6% 4 1.0% 3 0.5% 1 0.0% 0 0.0% 0 1.2% 1
Needs specific named retailer: Primark store
4.2% 28 6.0% 16 3.9% 6 1.4% 2 3.6% 2 3.4% 2
Needs specific named retailer: Starbucks cafe
0.3% 2 0.0% 0 1.3% 2 0.0% 0 0.0% 0 0.0% 0
Needs specific named retailer: Waitrose store
0.1% 1 0.4% 1 0.0% 0 0.0% 0 0.0% 0 0.0% 0
Needs specific named retailer: Zara store
0.1% 1 0.0% 0 0.4% 1 0.0% 0 0.0% 0 0.0% 0
New clock in the square 0.1% 1 0.3% 1 0.0% 0 0.0% 0 0.0% 0 0.0% 0Parking - longer stay parking 0.2% 1 0.0% 0 0.6% 1 0.0% 0 0.0% 0 0.0% 0Refurbish the ice rink 0.3% 2 0.0% 0 1.3% 2 0.0% 0 0.0% 0 0.0% 0Weighted base: 655 265 166 123 54 47Sample: 649 254 155 117 61 62 GEN Gender of respondent. Male 31.2% 312 30.7% 117 29.5% 78 32.4% 61 33.5% 30 33.5% 24Female 68.8% 688 69.3% 265 70.5% 188 67.6% 127 66.5% 60 66.5% 49Weighted base: 1000 382 266 188 91 73Sample: 1000 366 254 180 100 100
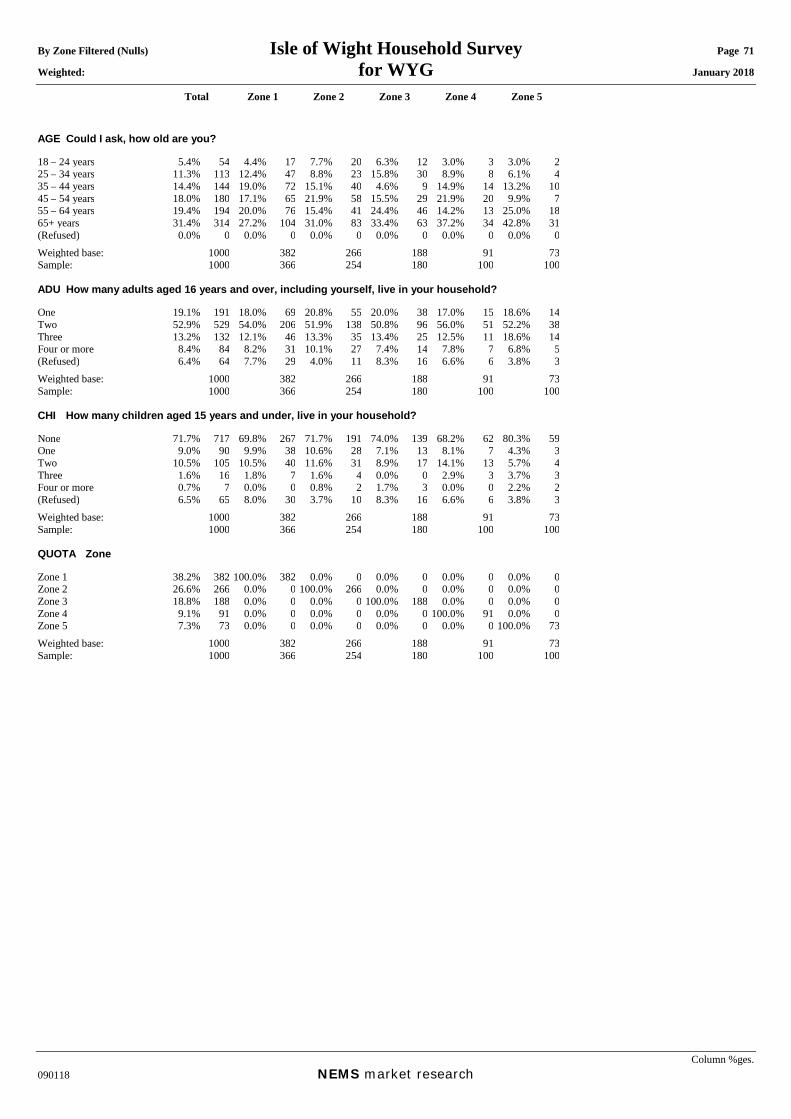
By Zone Filtered (Nulls) Isle of Wight Household Survey Page 71 Weighted: for WYG January 2018
Total Zone 1 Zone 2 Zone 3 Zone 4 Zone 5
Column %ges. 090118 NEMS market research
AGE Could I ask, how old are you? 18 – 24 years 5.4% 54 4.4% 17 7.7% 20 6.3% 12 3.0% 3 3.0% 225 – 34 years 11.3% 113 12.4% 47 8.8% 23 15.8% 30 8.9% 8 6.1% 435 – 44 years 14.4% 144 19.0% 72 15.1% 40 4.6% 9 14.9% 14 13.2% 1045 – 54 years 18.0% 180 17.1% 65 21.9% 58 15.5% 29 21.9% 20 9.9% 755 – 64 years 19.4% 194 20.0% 76 15.4% 41 24.4% 46 14.2% 13 25.0% 1865+ years 31.4% 314 27.2% 104 31.0% 83 33.4% 63 37.2% 34 42.8% 31(Refused) 0.0% 0 0.0% 0 0.0% 0 0.0% 0 0.0% 0 0.0% 0Weighted base: 1000 382 266 188 91 73Sample: 1000 366 254 180 100 100 ADU How many adults aged 16 years and over, including yourself, live in your household? One 19.1% 191 18.0% 69 20.8% 55 20.0% 38 17.0% 15 18.6% 14Two 52.9% 529 54.0% 206 51.9% 138 50.8% 96 56.0% 51 52.2% 38Three 13.2% 132 12.1% 46 13.3% 35 13.4% 25 12.5% 11 18.6% 14Four or more 8.4% 84 8.2% 31 10.1% 27 7.4% 14 7.8% 7 6.8% 5(Refused) 6.4% 64 7.7% 29 4.0% 11 8.3% 16 6.6% 6 3.8% 3Weighted base: 1000 382 266 188 91 73Sample: 1000 366 254 180 100 100 CHI How many children aged 15 years and under, live in your household? None 71.7% 717 69.8% 267 71.7% 191 74.0% 139 68.2% 62 80.3% 59One 9.0% 90 9.9% 38 10.6% 28 7.1% 13 8.1% 7 4.3% 3Two 10.5% 105 10.5% 40 11.6% 31 8.9% 17 14.1% 13 5.7% 4Three 1.6% 16 1.8% 7 1.6% 4 0.0% 0 2.9% 3 3.7% 3Four or more 0.7% 7 0.0% 0 0.8% 2 1.7% 3 0.0% 0 2.2% 2(Refused) 6.5% 65 8.0% 30 3.7% 10 8.3% 16 6.6% 6 3.8% 3Weighted base: 1000 382 266 188 91 73Sample: 1000 366 254 180 100 100 QUOTA Zone Zone 1 38.2% 382 100.0% 382 0.0% 0 0.0% 0 0.0% 0 0.0% 0Zone 2 26.6% 266 0.0% 0 100.0% 266 0.0% 0 0.0% 0 0.0% 0Zone 3 18.8% 188 0.0% 0 0.0% 0 100.0% 188 0.0% 0 0.0% 0Zone 4 9.1% 91 0.0% 0 0.0% 0 0.0% 0 100.0% 91 0.0% 0Zone 5 7.3% 73 0.0% 0 0.0% 0 0.0% 0 0.0% 0 100.0% 73Weighted base: 1000 382 266 188 91 73Sample: 1000 366 254 180 100 100
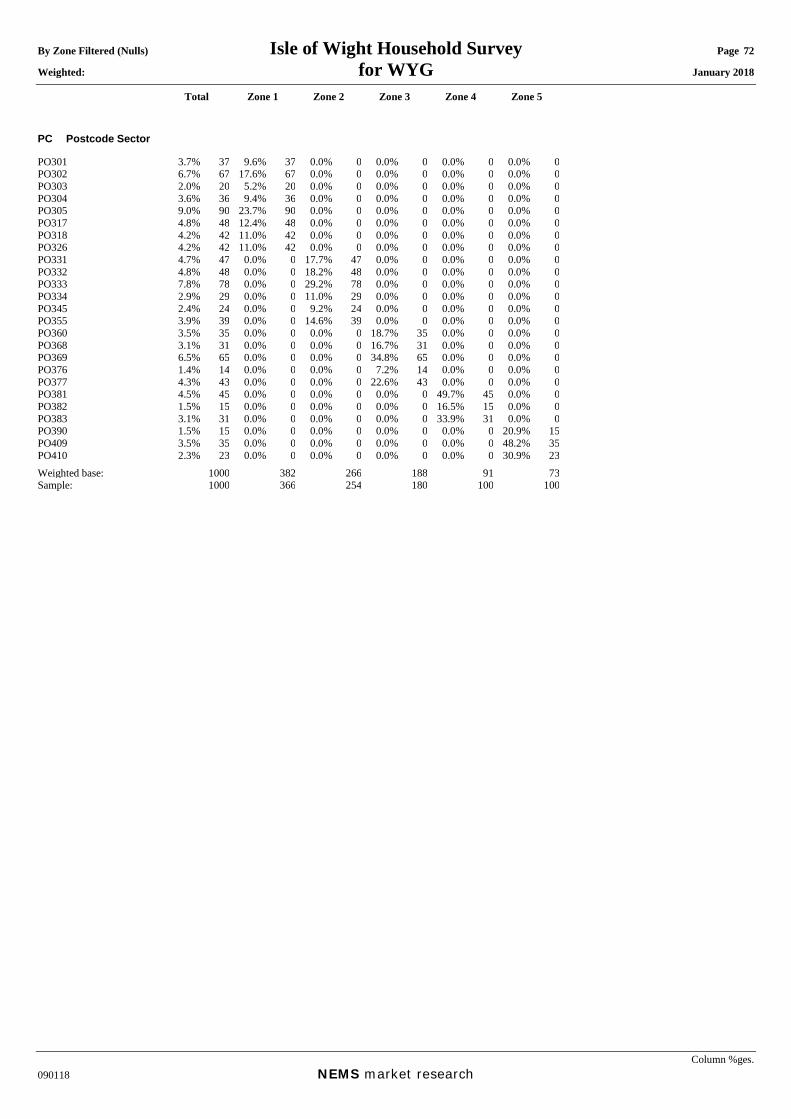
By Zone Filtered (Nulls) Isle of Wight Household Survey Page 72 Weighted: for WYG January 2018
Total Zone 1 Zone 2 Zone 3 Zone 4 Zone 5
Column %ges. 090118 NEMS market research
PC Postcode Sector PO301 3.7% 37 9.6% 37 0.0% 0 0.0% 0 0.0% 0 0.0% 0PO302 6.7% 67 17.6% 67 0.0% 0 0.0% 0 0.0% 0 0.0% 0PO303 2.0% 20 5.2% 20 0.0% 0 0.0% 0 0.0% 0 0.0% 0PO304 3.6% 36 9.4% 36 0.0% 0 0.0% 0 0.0% 0 0.0% 0PO305 9.0% 90 23.7% 90 0.0% 0 0.0% 0 0.0% 0 0.0% 0PO317 4.8% 48 12.4% 48 0.0% 0 0.0% 0 0.0% 0 0.0% 0PO318 4.2% 42 11.0% 42 0.0% 0 0.0% 0 0.0% 0 0.0% 0PO326 4.2% 42 11.0% 42 0.0% 0 0.0% 0 0.0% 0 0.0% 0PO331 4.7% 47 0.0% 0 17.7% 47 0.0% 0 0.0% 0 0.0% 0PO332 4.8% 48 0.0% 0 18.2% 48 0.0% 0 0.0% 0 0.0% 0PO333 7.8% 78 0.0% 0 29.2% 78 0.0% 0 0.0% 0 0.0% 0PO334 2.9% 29 0.0% 0 11.0% 29 0.0% 0 0.0% 0 0.0% 0PO345 2.4% 24 0.0% 0 9.2% 24 0.0% 0 0.0% 0 0.0% 0PO355 3.9% 39 0.0% 0 14.6% 39 0.0% 0 0.0% 0 0.0% 0PO360 3.5% 35 0.0% 0 0.0% 0 18.7% 35 0.0% 0 0.0% 0PO368 3.1% 31 0.0% 0 0.0% 0 16.7% 31 0.0% 0 0.0% 0PO369 6.5% 65 0.0% 0 0.0% 0 34.8% 65 0.0% 0 0.0% 0PO376 1.4% 14 0.0% 0 0.0% 0 7.2% 14 0.0% 0 0.0% 0PO377 4.3% 43 0.0% 0 0.0% 0 22.6% 43 0.0% 0 0.0% 0PO381 4.5% 45 0.0% 0 0.0% 0 0.0% 0 49.7% 45 0.0% 0PO382 1.5% 15 0.0% 0 0.0% 0 0.0% 0 16.5% 15 0.0% 0PO383 3.1% 31 0.0% 0 0.0% 0 0.0% 0 33.9% 31 0.0% 0PO390 1.5% 15 0.0% 0 0.0% 0 0.0% 0 0.0% 0 20.9% 15PO409 3.5% 35 0.0% 0 0.0% 0 0.0% 0 0.0% 0 48.2% 35PO410 2.3% 23 0.0% 0 0.0% 0 0.0% 0 0.0% 0 30.9% 23Weighted base: 1000 382 266 188 91 73Sample: 1000 366 254 180 100 100
Appendix 2: Data Tabulations By Centre Mentioned at Q19 (Weighted)
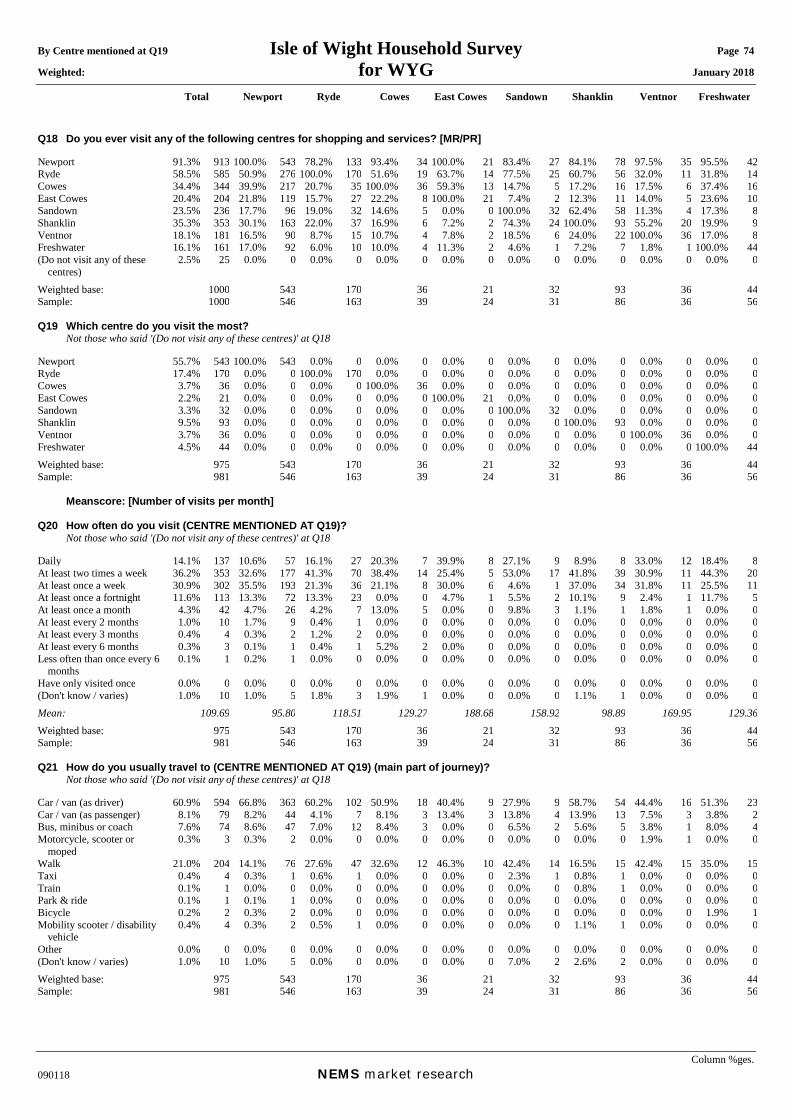
By Centre mentioned at Q19 Isle of Wight Household Survey Page 74 Weighted: for WYG January 2018
Total Newport Ryde Cowes East Cowes Sandown Shanklin Ventnor Freshwater
Column %ges. 090118 NEMS market research
Q18 Do you ever visit any of the following centres for shopping and services? [MR/PR] Newport 91.3% 913 100.0% 543 78.2% 133 93.4% 34 100.0% 21 83.4% 27 84.1% 78 97.5% 35 95.5% 42Ryde 58.5% 585 50.9% 276 100.0% 170 51.6% 19 63.7% 14 77.5% 25 60.7% 56 32.0% 11 31.8% 14Cowes 34.4% 344 39.9% 217 20.7% 35 100.0% 36 59.3% 13 14.7% 5 17.2% 16 17.5% 6 37.4% 16East Cowes 20.4% 204 21.8% 119 15.7% 27 22.2% 8 100.0% 21 7.4% 2 12.3% 11 14.0% 5 23.6% 10Sandown 23.5% 236 17.7% 96 19.0% 32 14.6% 5 0.0% 0 100.0% 32 62.4% 58 11.3% 4 17.3% 8Shanklin 35.3% 353 30.1% 163 22.0% 37 16.9% 6 7.2% 2 74.3% 24 100.0% 93 55.2% 20 19.9% 9Ventnor 18.1% 181 16.5% 90 8.7% 15 10.7% 4 7.8% 2 18.5% 6 24.0% 22 100.0% 36 17.0% 8Freshwater 16.1% 161 17.0% 92 6.0% 10 10.0% 4 11.3% 2 4.6% 1 7.2% 7 1.8% 1 100.0% 44(Do not visit any of these
centres) 2.5% 25 0.0% 0 0.0% 0 0.0% 0 0.0% 0 0.0% 0 0.0% 0 0.0% 0 0.0% 0
Weighted base: 1000 543 170 36 21 32 93 36 44Sample: 1000 546 163 39 24 31 86 36 56 Q19 Which centre do you visit the most? Not those who said '(Do not visit any of these centres)' at Q18 Newport 55.7% 543 100.0% 543 0.0% 0 0.0% 0 0.0% 0 0.0% 0 0.0% 0 0.0% 0 0.0% 0Ryde 17.4% 170 0.0% 0 100.0% 170 0.0% 0 0.0% 0 0.0% 0 0.0% 0 0.0% 0 0.0% 0Cowes 3.7% 36 0.0% 0 0.0% 0 100.0% 36 0.0% 0 0.0% 0 0.0% 0 0.0% 0 0.0% 0East Cowes 2.2% 21 0.0% 0 0.0% 0 0.0% 0 100.0% 21 0.0% 0 0.0% 0 0.0% 0 0.0% 0Sandown 3.3% 32 0.0% 0 0.0% 0 0.0% 0 0.0% 0 100.0% 32 0.0% 0 0.0% 0 0.0% 0Shanklin 9.5% 93 0.0% 0 0.0% 0 0.0% 0 0.0% 0 0.0% 0 100.0% 93 0.0% 0 0.0% 0Ventnor 3.7% 36 0.0% 0 0.0% 0 0.0% 0 0.0% 0 0.0% 0 0.0% 0 100.0% 36 0.0% 0Freshwater 4.5% 44 0.0% 0 0.0% 0 0.0% 0 0.0% 0 0.0% 0 0.0% 0 0.0% 0 100.0% 44Weighted base: 975 543 170 36 21 32 93 36 44Sample: 981 546 163 39 24 31 86 36 56 Meanscore: [Number of visits per month] Q20 How often do you visit (CENTRE MENTIONED AT Q19)? Not those who said '(Do not visit any of these centres)' at Q18 Daily 14.1% 137 10.6% 57 16.1% 27 20.3% 7 39.9% 8 27.1% 9 8.9% 8 33.0% 12 18.4% 8At least two times a week 36.2% 353 32.6% 177 41.3% 70 38.4% 14 25.4% 5 53.0% 17 41.8% 39 30.9% 11 44.3% 20At least once a week 30.9% 302 35.5% 193 21.3% 36 21.1% 8 30.0% 6 4.6% 1 37.0% 34 31.8% 11 25.5% 11At least once a fortnight 11.6% 113 13.3% 72 13.3% 23 0.0% 0 4.7% 1 5.5% 2 10.1% 9 2.4% 1 11.7% 5At least once a month 4.3% 42 4.7% 26 4.2% 7 13.0% 5 0.0% 0 9.8% 3 1.1% 1 1.8% 1 0.0% 0At least every 2 months 1.0% 10 1.7% 9 0.4% 1 0.0% 0 0.0% 0 0.0% 0 0.0% 0 0.0% 0 0.0% 0At least every 3 months 0.4% 4 0.3% 2 1.2% 2 0.0% 0 0.0% 0 0.0% 0 0.0% 0 0.0% 0 0.0% 0At least every 6 months 0.3% 3 0.1% 1 0.4% 1 5.2% 2 0.0% 0 0.0% 0 0.0% 0 0.0% 0 0.0% 0Less often than once every 6
months 0.1% 1 0.2% 1 0.0% 0 0.0% 0 0.0% 0 0.0% 0 0.0% 0 0.0% 0 0.0% 0
Have only visited once 0.0% 0 0.0% 0 0.0% 0 0.0% 0 0.0% 0 0.0% 0 0.0% 0 0.0% 0 0.0% 0(Don't know / varies) 1.0% 10 1.0% 5 1.8% 3 1.9% 1 0.0% 0 0.0% 0 1.1% 1 0.0% 0 0.0% 0Mean: 109.69 95.80 118.51 129.27 188.68 158.92 98.89 169.95 129.36Weighted base: 975 543 170 36 21 32 93 36 44Sample: 981 546 163 39 24 31 86 36 56 Q21 How do you usually travel to (CENTRE MENTIONED AT Q19) (main part of journey)? Not those who said '(Do not visit any of these centres)' at Q18 Car / van (as driver) 60.9% 594 66.8% 363 60.2% 102 50.9% 18 40.4% 9 27.9% 9 58.7% 54 44.4% 16 51.3% 23Car / van (as passenger) 8.1% 79 8.2% 44 4.1% 7 8.1% 3 13.4% 3 13.8% 4 13.9% 13 7.5% 3 3.8% 2Bus, minibus or coach 7.6% 74 8.6% 47 7.0% 12 8.4% 3 0.0% 0 6.5% 2 5.6% 5 3.8% 1 8.0% 4Motorcycle, scooter or
moped 0.3% 3 0.3% 2 0.0% 0 0.0% 0 0.0% 0 0.0% 0 0.0% 0 1.9% 1 0.0% 0
Walk 21.0% 204 14.1% 76 27.6% 47 32.6% 12 46.3% 10 42.4% 14 16.5% 15 42.4% 15 35.0% 15Taxi 0.4% 4 0.3% 1 0.6% 1 0.0% 0 0.0% 0 2.3% 1 0.8% 1 0.0% 0 0.0% 0Train 0.1% 1 0.0% 0 0.0% 0 0.0% 0 0.0% 0 0.0% 0 0.8% 1 0.0% 0 0.0% 0Park & ride 0.1% 1 0.1% 1 0.0% 0 0.0% 0 0.0% 0 0.0% 0 0.0% 0 0.0% 0 0.0% 0Bicycle 0.2% 2 0.3% 2 0.0% 0 0.0% 0 0.0% 0 0.0% 0 0.0% 0 0.0% 0 1.9% 1Mobility scooter / disability
vehicle 0.4% 4 0.3% 2 0.5% 1 0.0% 0 0.0% 0 0.0% 0 1.1% 1 0.0% 0 0.0% 0
Other 0.0% 0 0.0% 0 0.0% 0 0.0% 0 0.0% 0 0.0% 0 0.0% 0 0.0% 0 0.0% 0(Don't know / varies) 1.0% 10 1.0% 5 0.0% 0 0.0% 0 0.0% 0 7.0% 2 2.6% 2 0.0% 0 0.0% 0Weighted base: 975 543 170 36 21 32 93 36 44Sample: 981 546 163 39 24 31 86 36 56
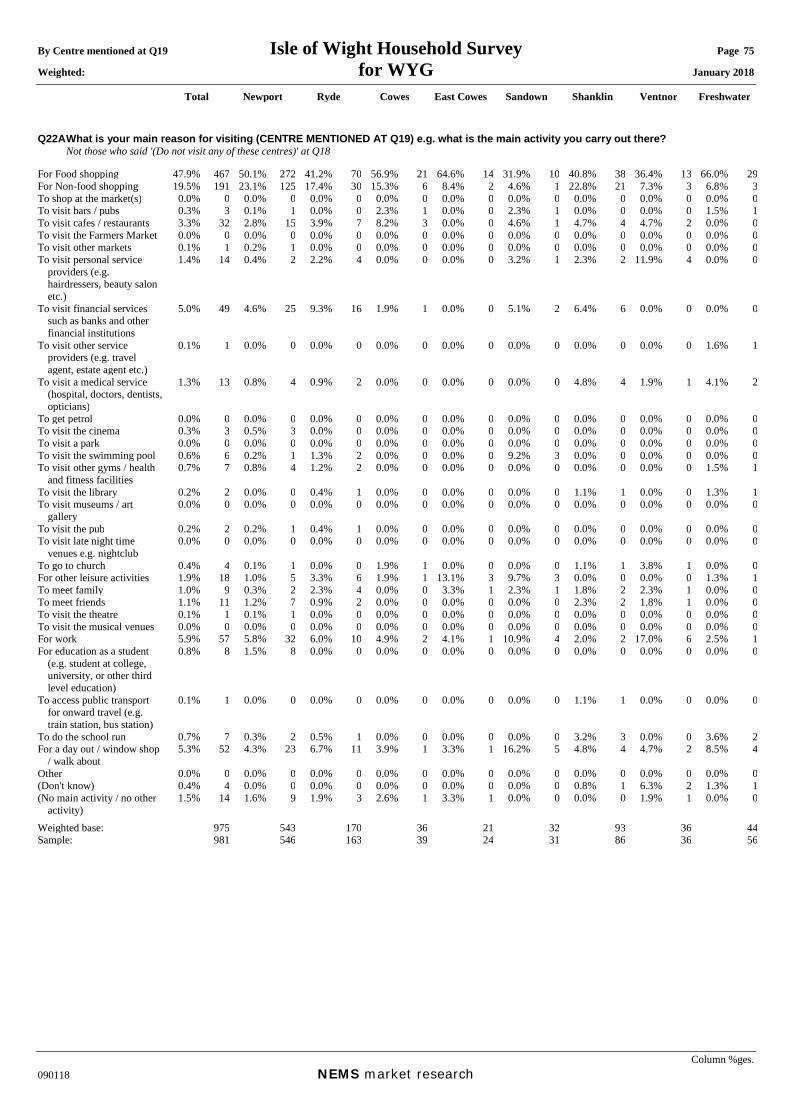
By Centre mentioned at Q19 Isle of Wight Household Survey Page 75 Weighted: for WYG January 2018
Total Newport Ryde Cowes East Cowes Sandown Shanklin Ventnor Freshwater
Column %ges. 090118 NEMS market research
Q22A What is your main reason for visiting (CENTRE MENTIONED AT Q19) e.g. what is the main activity you carry out there? Not those who said '(Do not visit any of these centres)' at Q18 For Food shopping 47.9% 467 50.1% 272 41.2% 70 56.9% 21 64.6% 14 31.9% 10 40.8% 38 36.4% 13 66.0% 29For Non-food shopping 19.5% 191 23.1% 125 17.4% 30 15.3% 6 8.4% 2 4.6% 1 22.8% 21 7.3% 3 6.8% 3To shop at the market(s) 0.0% 0 0.0% 0 0.0% 0 0.0% 0 0.0% 0 0.0% 0 0.0% 0 0.0% 0 0.0% 0To visit bars / pubs 0.3% 3 0.1% 1 0.0% 0 2.3% 1 0.0% 0 2.3% 1 0.0% 0 0.0% 0 1.5% 1To visit cafes / restaurants 3.3% 32 2.8% 15 3.9% 7 8.2% 3 0.0% 0 4.6% 1 4.7% 4 4.7% 2 0.0% 0To visit the Farmers Market 0.0% 0 0.0% 0 0.0% 0 0.0% 0 0.0% 0 0.0% 0 0.0% 0 0.0% 0 0.0% 0To visit other markets 0.1% 1 0.2% 1 0.0% 0 0.0% 0 0.0% 0 0.0% 0 0.0% 0 0.0% 0 0.0% 0To visit personal service
providers (e.g. hairdressers, beauty salon etc.)
1.4% 14 0.4% 2 2.2% 4 0.0% 0 0.0% 0 3.2% 1 2.3% 2 11.9% 4 0.0% 0
To visit financial services such as banks and other financial institutions
5.0% 49 4.6% 25 9.3% 16 1.9% 1 0.0% 0 5.1% 2 6.4% 6 0.0% 0 0.0% 0
To visit other service providers (e.g. travel agent, estate agent etc.)
0.1% 1 0.0% 0 0.0% 0 0.0% 0 0.0% 0 0.0% 0 0.0% 0 0.0% 0 1.6% 1
To visit a medical service (hospital, doctors, dentists, opticians)
1.3% 13 0.8% 4 0.9% 2 0.0% 0 0.0% 0 0.0% 0 4.8% 4 1.9% 1 4.1% 2
To get petrol 0.0% 0 0.0% 0 0.0% 0 0.0% 0 0.0% 0 0.0% 0 0.0% 0 0.0% 0 0.0% 0To visit the cinema 0.3% 3 0.5% 3 0.0% 0 0.0% 0 0.0% 0 0.0% 0 0.0% 0 0.0% 0 0.0% 0To visit a park 0.0% 0 0.0% 0 0.0% 0 0.0% 0 0.0% 0 0.0% 0 0.0% 0 0.0% 0 0.0% 0To visit the swimming pool 0.6% 6 0.2% 1 1.3% 2 0.0% 0 0.0% 0 9.2% 3 0.0% 0 0.0% 0 0.0% 0To visit other gyms / health
and fitness facilities 0.7% 7 0.8% 4 1.2% 2 0.0% 0 0.0% 0 0.0% 0 0.0% 0 0.0% 0 1.5% 1
To visit the library 0.2% 2 0.0% 0 0.4% 1 0.0% 0 0.0% 0 0.0% 0 1.1% 1 0.0% 0 1.3% 1To visit museums / art
gallery 0.0% 0 0.0% 0 0.0% 0 0.0% 0 0.0% 0 0.0% 0 0.0% 0 0.0% 0 0.0% 0
To visit the pub 0.2% 2 0.2% 1 0.4% 1 0.0% 0 0.0% 0 0.0% 0 0.0% 0 0.0% 0 0.0% 0To visit late night time
venues e.g. nightclub 0.0% 0 0.0% 0 0.0% 0 0.0% 0 0.0% 0 0.0% 0 0.0% 0 0.0% 0 0.0% 0
To go to church 0.4% 4 0.1% 1 0.0% 0 1.9% 1 0.0% 0 0.0% 0 1.1% 1 3.8% 1 0.0% 0For other leisure activities 1.9% 18 1.0% 5 3.3% 6 1.9% 1 13.1% 3 9.7% 3 0.0% 0 0.0% 0 1.3% 1To meet family 1.0% 9 0.3% 2 2.3% 4 0.0% 0 3.3% 1 2.3% 1 1.8% 2 2.3% 1 0.0% 0To meet friends 1.1% 11 1.2% 7 0.9% 2 0.0% 0 0.0% 0 0.0% 0 2.3% 2 1.8% 1 0.0% 0To visit the theatre 0.1% 1 0.1% 1 0.0% 0 0.0% 0 0.0% 0 0.0% 0 0.0% 0 0.0% 0 0.0% 0To visit the musical venues 0.0% 0 0.0% 0 0.0% 0 0.0% 0 0.0% 0 0.0% 0 0.0% 0 0.0% 0 0.0% 0For work 5.9% 57 5.8% 32 6.0% 10 4.9% 2 4.1% 1 10.9% 4 2.0% 2 17.0% 6 2.5% 1For education as a student
(e.g. student at college, university, or other third level education)
0.8% 8 1.5% 8 0.0% 0 0.0% 0 0.0% 0 0.0% 0 0.0% 0 0.0% 0 0.0% 0
To access public transport for onward travel (e.g. train station, bus station)
0.1% 1 0.0% 0 0.0% 0 0.0% 0 0.0% 0 0.0% 0 1.1% 1 0.0% 0 0.0% 0
To do the school run 0.7% 7 0.3% 2 0.5% 1 0.0% 0 0.0% 0 0.0% 0 3.2% 3 0.0% 0 3.6% 2For a day out / window shop
/ walk about 5.3% 52 4.3% 23 6.7% 11 3.9% 1 3.3% 1 16.2% 5 4.8% 4 4.7% 2 8.5% 4
Other 0.0% 0 0.0% 0 0.0% 0 0.0% 0 0.0% 0 0.0% 0 0.0% 0 0.0% 0 0.0% 0(Don't know) 0.4% 4 0.0% 0 0.0% 0 0.0% 0 0.0% 0 0.0% 0 0.8% 1 6.3% 2 1.3% 1(No main activity / no other
activity) 1.5% 14 1.6% 9 1.9% 3 2.6% 1 3.3% 1 0.0% 0 0.0% 0 1.9% 1 0.0% 0
Weighted base: 975 543 170 36 21 32 93 36 44Sample: 981 546 163 39 24 31 86 36 56
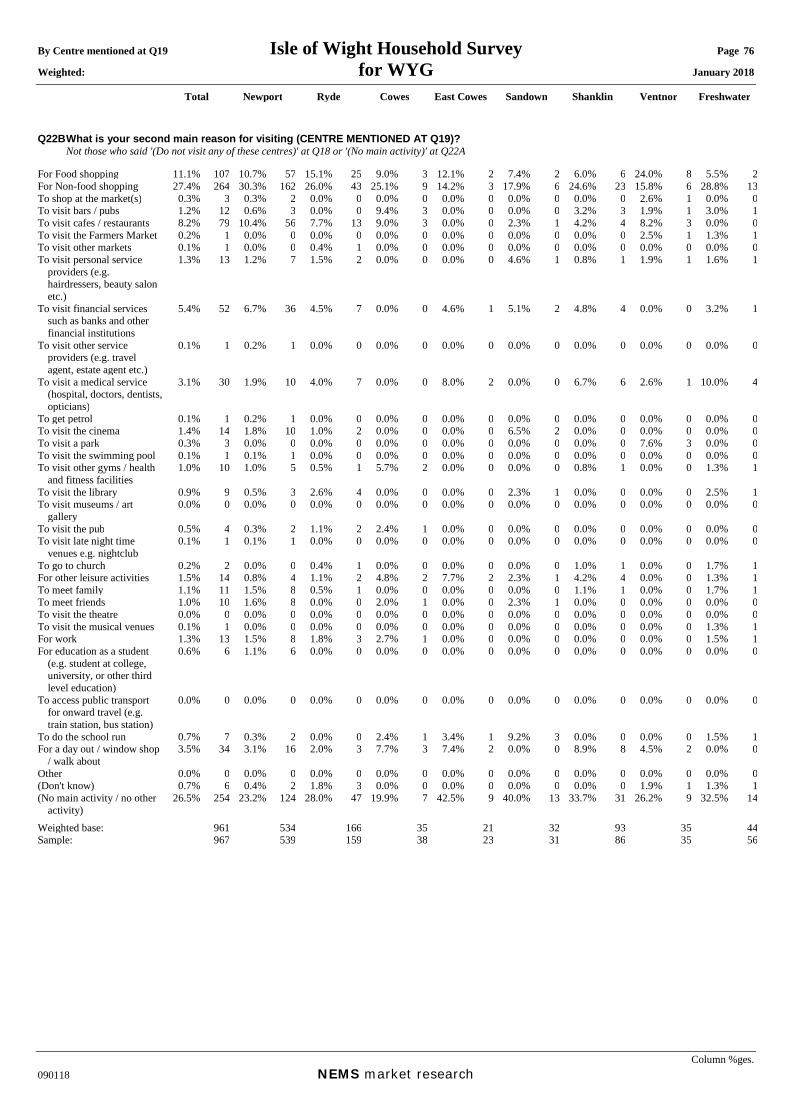
By Centre mentioned at Q19 Isle of Wight Household Survey Page 76 Weighted: for WYG January 2018
Total Newport Ryde Cowes East Cowes Sandown Shanklin Ventnor Freshwater
Column %ges. 090118 NEMS market research
Q22B What is your second main reason for visiting (CENTRE MENTIONED AT Q19)? Not those who said '(Do not visit any of these centres)' at Q18 or '(No main activity)' at Q22A For Food shopping 11.1% 107 10.7% 57 15.1% 25 9.0% 3 12.1% 2 7.4% 2 6.0% 6 24.0% 8 5.5% 2For Non-food shopping 27.4% 264 30.3% 162 26.0% 43 25.1% 9 14.2% 3 17.9% 6 24.6% 23 15.8% 6 28.8% 13To shop at the market(s) 0.3% 3 0.3% 2 0.0% 0 0.0% 0 0.0% 0 0.0% 0 0.0% 0 2.6% 1 0.0% 0To visit bars / pubs 1.2% 12 0.6% 3 0.0% 0 9.4% 3 0.0% 0 0.0% 0 3.2% 3 1.9% 1 3.0% 1To visit cafes / restaurants 8.2% 79 10.4% 56 7.7% 13 9.0% 3 0.0% 0 2.3% 1 4.2% 4 8.2% 3 0.0% 0To visit the Farmers Market 0.2% 1 0.0% 0 0.0% 0 0.0% 0 0.0% 0 0.0% 0 0.0% 0 2.5% 1 1.3% 1To visit other markets 0.1% 1 0.0% 0 0.4% 1 0.0% 0 0.0% 0 0.0% 0 0.0% 0 0.0% 0 0.0% 0To visit personal service
providers (e.g. hairdressers, beauty salon etc.)
1.3% 13 1.2% 7 1.5% 2 0.0% 0 0.0% 0 4.6% 1 0.8% 1 1.9% 1 1.6% 1
To visit financial services such as banks and other financial institutions
5.4% 52 6.7% 36 4.5% 7 0.0% 0 4.6% 1 5.1% 2 4.8% 4 0.0% 0 3.2% 1
To visit other service providers (e.g. travel agent, estate agent etc.)
0.1% 1 0.2% 1 0.0% 0 0.0% 0 0.0% 0 0.0% 0 0.0% 0 0.0% 0 0.0% 0
To visit a medical service (hospital, doctors, dentists, opticians)
3.1% 30 1.9% 10 4.0% 7 0.0% 0 8.0% 2 0.0% 0 6.7% 6 2.6% 1 10.0% 4
To get petrol 0.1% 1 0.2% 1 0.0% 0 0.0% 0 0.0% 0 0.0% 0 0.0% 0 0.0% 0 0.0% 0To visit the cinema 1.4% 14 1.8% 10 1.0% 2 0.0% 0 0.0% 0 6.5% 2 0.0% 0 0.0% 0 0.0% 0To visit a park 0.3% 3 0.0% 0 0.0% 0 0.0% 0 0.0% 0 0.0% 0 0.0% 0 7.6% 3 0.0% 0To visit the swimming pool 0.1% 1 0.1% 1 0.0% 0 0.0% 0 0.0% 0 0.0% 0 0.0% 0 0.0% 0 0.0% 0To visit other gyms / health
and fitness facilities 1.0% 10 1.0% 5 0.5% 1 5.7% 2 0.0% 0 0.0% 0 0.8% 1 0.0% 0 1.3% 1
To visit the library 0.9% 9 0.5% 3 2.6% 4 0.0% 0 0.0% 0 2.3% 1 0.0% 0 0.0% 0 2.5% 1To visit museums / art
gallery 0.0% 0 0.0% 0 0.0% 0 0.0% 0 0.0% 0 0.0% 0 0.0% 0 0.0% 0 0.0% 0
To visit the pub 0.5% 4 0.3% 2 1.1% 2 2.4% 1 0.0% 0 0.0% 0 0.0% 0 0.0% 0 0.0% 0To visit late night time
venues e.g. nightclub 0.1% 1 0.1% 1 0.0% 0 0.0% 0 0.0% 0 0.0% 0 0.0% 0 0.0% 0 0.0% 0
To go to church 0.2% 2 0.0% 0 0.4% 1 0.0% 0 0.0% 0 0.0% 0 1.0% 1 0.0% 0 1.7% 1For other leisure activities 1.5% 14 0.8% 4 1.1% 2 4.8% 2 7.7% 2 2.3% 1 4.2% 4 0.0% 0 1.3% 1To meet family 1.1% 11 1.5% 8 0.5% 1 0.0% 0 0.0% 0 0.0% 0 1.1% 1 0.0% 0 1.7% 1To meet friends 1.0% 10 1.6% 8 0.0% 0 2.0% 1 0.0% 0 2.3% 1 0.0% 0 0.0% 0 0.0% 0To visit the theatre 0.0% 0 0.0% 0 0.0% 0 0.0% 0 0.0% 0 0.0% 0 0.0% 0 0.0% 0 0.0% 0To visit the musical venues 0.1% 1 0.0% 0 0.0% 0 0.0% 0 0.0% 0 0.0% 0 0.0% 0 0.0% 0 1.3% 1For work 1.3% 13 1.5% 8 1.8% 3 2.7% 1 0.0% 0 0.0% 0 0.0% 0 0.0% 0 1.5% 1For education as a student
(e.g. student at college, university, or other third level education)
0.6% 6 1.1% 6 0.0% 0 0.0% 0 0.0% 0 0.0% 0 0.0% 0 0.0% 0 0.0% 0
To access public transport for onward travel (e.g. train station, bus station)
0.0% 0 0.0% 0 0.0% 0 0.0% 0 0.0% 0 0.0% 0 0.0% 0 0.0% 0 0.0% 0
To do the school run 0.7% 7 0.3% 2 0.0% 0 2.4% 1 3.4% 1 9.2% 3 0.0% 0 0.0% 0 1.5% 1For a day out / window shop
/ walk about 3.5% 34 3.1% 16 2.0% 3 7.7% 3 7.4% 2 0.0% 0 8.9% 8 4.5% 2 0.0% 0
Other 0.0% 0 0.0% 0 0.0% 0 0.0% 0 0.0% 0 0.0% 0 0.0% 0 0.0% 0 0.0% 0(Don't know) 0.7% 6 0.4% 2 1.8% 3 0.0% 0 0.0% 0 0.0% 0 0.0% 0 1.9% 1 1.3% 1(No main activity / no other
activity) 26.5% 254 23.2% 124 28.0% 47 19.9% 7 42.5% 9 40.0% 13 33.7% 31 26.2% 9 32.5% 14
Weighted base: 961 534 166 35 21 32 93 35 44Sample: 967 539 159 38 23 31 86 35 56
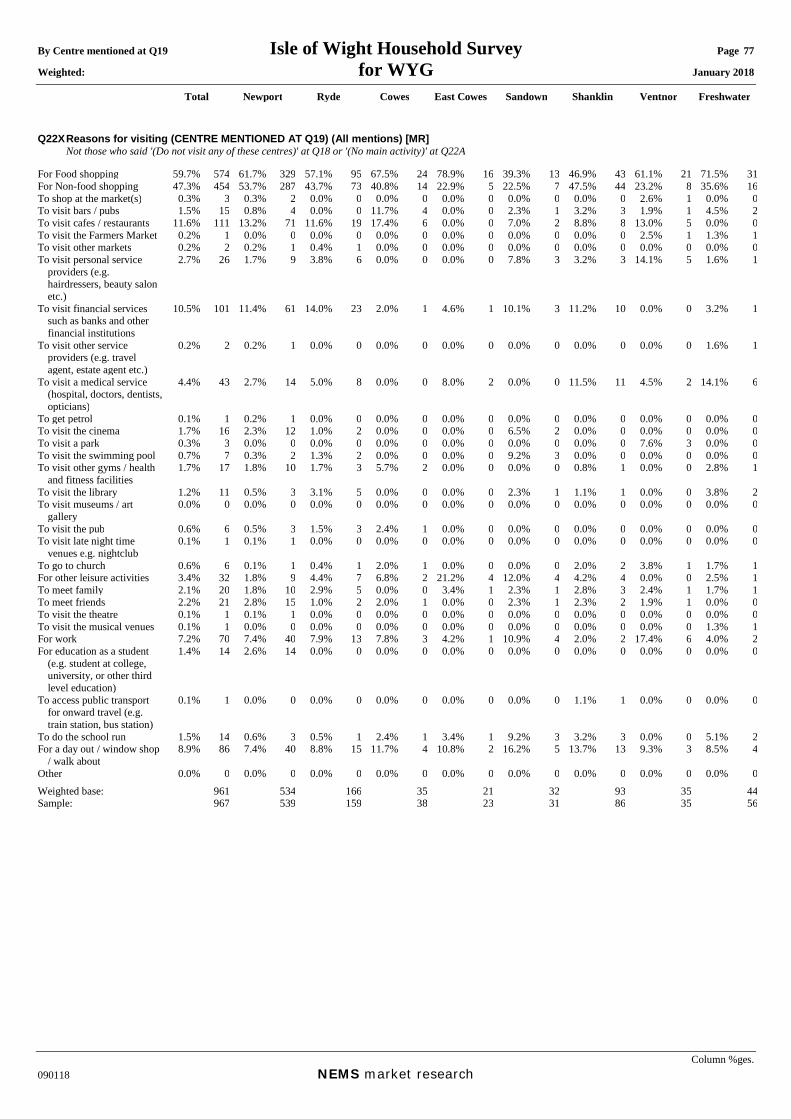
By Centre mentioned at Q19 Isle of Wight Household Survey Page 77 Weighted: for WYG January 2018
Total Newport Ryde Cowes East Cowes Sandown Shanklin Ventnor Freshwater
Column %ges. 090118 NEMS market research
Q22X Reasons for visiting (CENTRE MENTIONED AT Q19) (All mentions) [MR] Not those who said '(Do not visit any of these centres)' at Q18 or '(No main activity)' at Q22A For Food shopping 59.7% 574 61.7% 329 57.1% 95 67.5% 24 78.9% 16 39.3% 13 46.9% 43 61.1% 21 71.5% 31For Non-food shopping 47.3% 454 53.7% 287 43.7% 73 40.8% 14 22.9% 5 22.5% 7 47.5% 44 23.2% 8 35.6% 16To shop at the market(s) 0.3% 3 0.3% 2 0.0% 0 0.0% 0 0.0% 0 0.0% 0 0.0% 0 2.6% 1 0.0% 0To visit bars / pubs 1.5% 15 0.8% 4 0.0% 0 11.7% 4 0.0% 0 2.3% 1 3.2% 3 1.9% 1 4.5% 2To visit cafes / restaurants 11.6% 111 13.2% 71 11.6% 19 17.4% 6 0.0% 0 7.0% 2 8.8% 8 13.0% 5 0.0% 0To visit the Farmers Market 0.2% 1 0.0% 0 0.0% 0 0.0% 0 0.0% 0 0.0% 0 0.0% 0 2.5% 1 1.3% 1To visit other markets 0.2% 2 0.2% 1 0.4% 1 0.0% 0 0.0% 0 0.0% 0 0.0% 0 0.0% 0 0.0% 0To visit personal service
providers (e.g. hairdressers, beauty salon etc.)
2.7% 26 1.7% 9 3.8% 6 0.0% 0 0.0% 0 7.8% 3 3.2% 3 14.1% 5 1.6% 1
To visit financial services such as banks and other financial institutions
10.5% 101 11.4% 61 14.0% 23 2.0% 1 4.6% 1 10.1% 3 11.2% 10 0.0% 0 3.2% 1
To visit other service providers (e.g. travel agent, estate agent etc.)
0.2% 2 0.2% 1 0.0% 0 0.0% 0 0.0% 0 0.0% 0 0.0% 0 0.0% 0 1.6% 1
To visit a medical service (hospital, doctors, dentists, opticians)
4.4% 43 2.7% 14 5.0% 8 0.0% 0 8.0% 2 0.0% 0 11.5% 11 4.5% 2 14.1% 6
To get petrol 0.1% 1 0.2% 1 0.0% 0 0.0% 0 0.0% 0 0.0% 0 0.0% 0 0.0% 0 0.0% 0To visit the cinema 1.7% 16 2.3% 12 1.0% 2 0.0% 0 0.0% 0 6.5% 2 0.0% 0 0.0% 0 0.0% 0To visit a park 0.3% 3 0.0% 0 0.0% 0 0.0% 0 0.0% 0 0.0% 0 0.0% 0 7.6% 3 0.0% 0To visit the swimming pool 0.7% 7 0.3% 2 1.3% 2 0.0% 0 0.0% 0 9.2% 3 0.0% 0 0.0% 0 0.0% 0To visit other gyms / health
and fitness facilities 1.7% 17 1.8% 10 1.7% 3 5.7% 2 0.0% 0 0.0% 0 0.8% 1 0.0% 0 2.8% 1
To visit the library 1.2% 11 0.5% 3 3.1% 5 0.0% 0 0.0% 0 2.3% 1 1.1% 1 0.0% 0 3.8% 2To visit museums / art
gallery 0.0% 0 0.0% 0 0.0% 0 0.0% 0 0.0% 0 0.0% 0 0.0% 0 0.0% 0 0.0% 0
To visit the pub 0.6% 6 0.5% 3 1.5% 3 2.4% 1 0.0% 0 0.0% 0 0.0% 0 0.0% 0 0.0% 0To visit late night time
venues e.g. nightclub 0.1% 1 0.1% 1 0.0% 0 0.0% 0 0.0% 0 0.0% 0 0.0% 0 0.0% 0 0.0% 0
To go to church 0.6% 6 0.1% 1 0.4% 1 2.0% 1 0.0% 0 0.0% 0 2.0% 2 3.8% 1 1.7% 1For other leisure activities 3.4% 32 1.8% 9 4.4% 7 6.8% 2 21.2% 4 12.0% 4 4.2% 4 0.0% 0 2.5% 1To meet family 2.1% 20 1.8% 10 2.9% 5 0.0% 0 3.4% 1 2.3% 1 2.8% 3 2.4% 1 1.7% 1To meet friends 2.2% 21 2.8% 15 1.0% 2 2.0% 1 0.0% 0 2.3% 1 2.3% 2 1.9% 1 0.0% 0To visit the theatre 0.1% 1 0.1% 1 0.0% 0 0.0% 0 0.0% 0 0.0% 0 0.0% 0 0.0% 0 0.0% 0To visit the musical venues 0.1% 1 0.0% 0 0.0% 0 0.0% 0 0.0% 0 0.0% 0 0.0% 0 0.0% 0 1.3% 1For work 7.2% 70 7.4% 40 7.9% 13 7.8% 3 4.2% 1 10.9% 4 2.0% 2 17.4% 6 4.0% 2For education as a student
(e.g. student at college, university, or other third level education)
1.4% 14 2.6% 14 0.0% 0 0.0% 0 0.0% 0 0.0% 0 0.0% 0 0.0% 0 0.0% 0
To access public transport for onward travel (e.g. train station, bus station)
0.1% 1 0.0% 0 0.0% 0 0.0% 0 0.0% 0 0.0% 0 1.1% 1 0.0% 0 0.0% 0
To do the school run 1.5% 14 0.6% 3 0.5% 1 2.4% 1 3.4% 1 9.2% 3 3.2% 3 0.0% 0 5.1% 2For a day out / window shop
/ walk about 8.9% 86 7.4% 40 8.8% 15 11.7% 4 10.8% 2 16.2% 5 13.7% 13 9.3% 3 8.5% 4
Other 0.0% 0 0.0% 0 0.0% 0 0.0% 0 0.0% 0 0.0% 0 0.0% 0 0.0% 0 0.0% 0Weighted base: 961 534 166 35 21 32 93 35 44Sample: 967 539 159 38 23 31 86 35 56
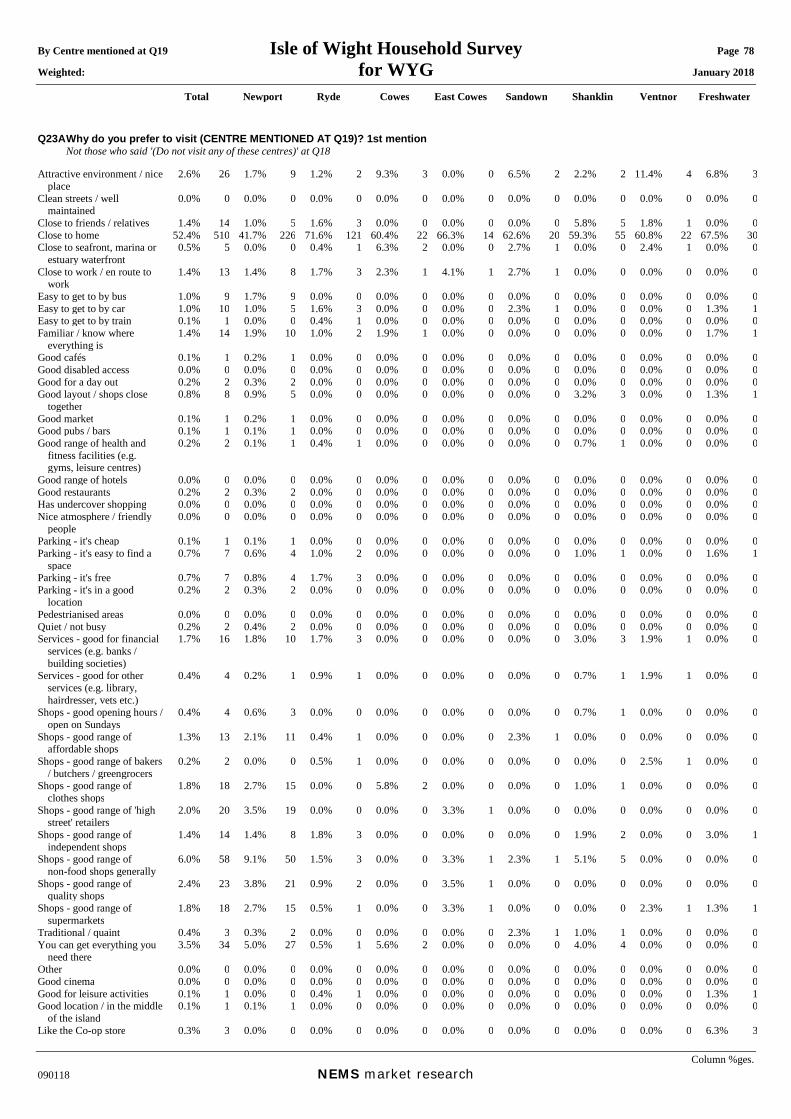
By Centre mentioned at Q19 Isle of Wight Household Survey Page 78 Weighted: for WYG January 2018
Total Newport Ryde Cowes East Cowes Sandown Shanklin Ventnor Freshwater
Column %ges. 090118 NEMS market research
Q23A Why do you prefer to visit (CENTRE MENTIONED AT Q19)? 1st mention Not those who said '(Do not visit any of these centres)' at Q18 Attractive environment / nice
place 2.6% 26 1.7% 9 1.2% 2 9.3% 3 0.0% 0 6.5% 2 2.2% 2 11.4% 4 6.8% 3
Clean streets / well maintained
0.0% 0 0.0% 0 0.0% 0 0.0% 0 0.0% 0 0.0% 0 0.0% 0 0.0% 0 0.0% 0
Close to friends / relatives 1.4% 14 1.0% 5 1.6% 3 0.0% 0 0.0% 0 0.0% 0 5.8% 5 1.8% 1 0.0% 0Close to home 52.4% 510 41.7% 226 71.6% 121 60.4% 22 66.3% 14 62.6% 20 59.3% 55 60.8% 22 67.5% 30Close to seafront, marina or
estuary waterfront 0.5% 5 0.0% 0 0.4% 1 6.3% 2 0.0% 0 2.7% 1 0.0% 0 2.4% 1 0.0% 0
Close to work / en route to work
1.4% 13 1.4% 8 1.7% 3 2.3% 1 4.1% 1 2.7% 1 0.0% 0 0.0% 0 0.0% 0
Easy to get to by bus 1.0% 9 1.7% 9 0.0% 0 0.0% 0 0.0% 0 0.0% 0 0.0% 0 0.0% 0 0.0% 0Easy to get to by car 1.0% 10 1.0% 5 1.6% 3 0.0% 0 0.0% 0 2.3% 1 0.0% 0 0.0% 0 1.3% 1Easy to get to by train 0.1% 1 0.0% 0 0.4% 1 0.0% 0 0.0% 0 0.0% 0 0.0% 0 0.0% 0 0.0% 0Familiar / know where
everything is 1.4% 14 1.9% 10 1.0% 2 1.9% 1 0.0% 0 0.0% 0 0.0% 0 0.0% 0 1.7% 1
Good cafés 0.1% 1 0.2% 1 0.0% 0 0.0% 0 0.0% 0 0.0% 0 0.0% 0 0.0% 0 0.0% 0Good disabled access 0.0% 0 0.0% 0 0.0% 0 0.0% 0 0.0% 0 0.0% 0 0.0% 0 0.0% 0 0.0% 0Good for a day out 0.2% 2 0.3% 2 0.0% 0 0.0% 0 0.0% 0 0.0% 0 0.0% 0 0.0% 0 0.0% 0Good layout / shops close
together 0.8% 8 0.9% 5 0.0% 0 0.0% 0 0.0% 0 0.0% 0 3.2% 3 0.0% 0 1.3% 1
Good market 0.1% 1 0.2% 1 0.0% 0 0.0% 0 0.0% 0 0.0% 0 0.0% 0 0.0% 0 0.0% 0Good pubs / bars 0.1% 1 0.1% 1 0.0% 0 0.0% 0 0.0% 0 0.0% 0 0.0% 0 0.0% 0 0.0% 0Good range of health and
fitness facilities (e.g. gyms, leisure centres)
0.2% 2 0.1% 1 0.4% 1 0.0% 0 0.0% 0 0.0% 0 0.7% 1 0.0% 0 0.0% 0
Good range of hotels 0.0% 0 0.0% 0 0.0% 0 0.0% 0 0.0% 0 0.0% 0 0.0% 0 0.0% 0 0.0% 0Good restaurants 0.2% 2 0.3% 2 0.0% 0 0.0% 0 0.0% 0 0.0% 0 0.0% 0 0.0% 0 0.0% 0Has undercover shopping 0.0% 0 0.0% 0 0.0% 0 0.0% 0 0.0% 0 0.0% 0 0.0% 0 0.0% 0 0.0% 0Nice atmosphere / friendly
people 0.0% 0 0.0% 0 0.0% 0 0.0% 0 0.0% 0 0.0% 0 0.0% 0 0.0% 0 0.0% 0
Parking - it's cheap 0.1% 1 0.1% 1 0.0% 0 0.0% 0 0.0% 0 0.0% 0 0.0% 0 0.0% 0 0.0% 0Parking - it's easy to find a
space 0.7% 7 0.6% 4 1.0% 2 0.0% 0 0.0% 0 0.0% 0 1.0% 1 0.0% 0 1.6% 1
Parking - it's free 0.7% 7 0.8% 4 1.7% 3 0.0% 0 0.0% 0 0.0% 0 0.0% 0 0.0% 0 0.0% 0Parking - it's in a good
location 0.2% 2 0.3% 2 0.0% 0 0.0% 0 0.0% 0 0.0% 0 0.0% 0 0.0% 0 0.0% 0
Pedestrianised areas 0.0% 0 0.0% 0 0.0% 0 0.0% 0 0.0% 0 0.0% 0 0.0% 0 0.0% 0 0.0% 0Quiet / not busy 0.2% 2 0.4% 2 0.0% 0 0.0% 0 0.0% 0 0.0% 0 0.0% 0 0.0% 0 0.0% 0Services - good for financial
services (e.g. banks / building societies)
1.7% 16 1.8% 10 1.7% 3 0.0% 0 0.0% 0 0.0% 0 3.0% 3 1.9% 1 0.0% 0
Services - good for other services (e.g. library, hairdresser, vets etc.)
0.4% 4 0.2% 1 0.9% 1 0.0% 0 0.0% 0 0.0% 0 0.7% 1 1.9% 1 0.0% 0
Shops - good opening hours / open on Sundays
0.4% 4 0.6% 3 0.0% 0 0.0% 0 0.0% 0 0.0% 0 0.7% 1 0.0% 0 0.0% 0
Shops - good range of affordable shops
1.3% 13 2.1% 11 0.4% 1 0.0% 0 0.0% 0 2.3% 1 0.0% 0 0.0% 0 0.0% 0
Shops - good range of bakers / butchers / greengrocers
0.2% 2 0.0% 0 0.5% 1 0.0% 0 0.0% 0 0.0% 0 0.0% 0 2.5% 1 0.0% 0
Shops - good range of clothes shops
1.8% 18 2.7% 15 0.0% 0 5.8% 2 0.0% 0 0.0% 0 1.0% 1 0.0% 0 0.0% 0
Shops - good range of 'high street' retailers
2.0% 20 3.5% 19 0.0% 0 0.0% 0 3.3% 1 0.0% 0 0.0% 0 0.0% 0 0.0% 0
Shops - good range of independent shops
1.4% 14 1.4% 8 1.8% 3 0.0% 0 0.0% 0 0.0% 0 1.9% 2 0.0% 0 3.0% 1
Shops - good range of non-food shops generally
6.0% 58 9.1% 50 1.5% 3 0.0% 0 3.3% 1 2.3% 1 5.1% 5 0.0% 0 0.0% 0
Shops - good range of quality shops
2.4% 23 3.8% 21 0.9% 2 0.0% 0 3.5% 1 0.0% 0 0.0% 0 0.0% 0 0.0% 0
Shops - good range of supermarkets
1.8% 18 2.7% 15 0.5% 1 0.0% 0 3.3% 1 0.0% 0 0.0% 0 2.3% 1 1.3% 1
Traditional / quaint 0.4% 3 0.3% 2 0.0% 0 0.0% 0 0.0% 0 2.3% 1 1.0% 1 0.0% 0 0.0% 0You can get everything you
need there 3.5% 34 5.0% 27 0.5% 1 5.6% 2 0.0% 0 0.0% 0 4.0% 4 0.0% 0 0.0% 0
Other 0.0% 0 0.0% 0 0.0% 0 0.0% 0 0.0% 0 0.0% 0 0.0% 0 0.0% 0 0.0% 0Good cinema 0.0% 0 0.0% 0 0.0% 0 0.0% 0 0.0% 0 0.0% 0 0.0% 0 0.0% 0 0.0% 0Good for leisure activities 0.1% 1 0.0% 0 0.4% 1 0.0% 0 0.0% 0 0.0% 0 0.0% 0 0.0% 0 1.3% 1Good location / in the middle
of the island 0.1% 1 0.1% 1 0.0% 0 0.0% 0 0.0% 0 0.0% 0 0.0% 0 0.0% 0 0.0% 0
Like the Co-op store 0.3% 3 0.0% 0 0.0% 0 0.0% 0 0.0% 0 0.0% 0 0.0% 0 0.0% 0 6.3% 3

By Centre mentioned at Q19 Isle of Wight Household Survey Page 79 Weighted: for WYG January 2018
Total Newport Ryde Cowes East Cowes Sandown Shanklin Ventnor Freshwater
Column %ges. 090118 NEMS market research
Like the Lidl store 0.1% 1 0.0% 0 0.0% 0 0.0% 0 0.0% 0 0.0% 0 1.1% 1 0.0% 0 0.0% 0Like the Marks & Spencer
store 0.3% 3 0.6% 3 0.0% 0 0.0% 0 0.0% 0 0.0% 0 0.0% 0 0.0% 0 0.0% 0
Like the Next store 0.1% 1 0.1% 1 0.0% 0 0.0% 0 0.0% 0 0.0% 0 0.0% 0 0.0% 0 0.0% 0Like the W Hurst & Son
store 0.0% 0 0.0% 0 0.0% 0 0.0% 0 0.0% 0 0.0% 0 0.0% 0 0.0% 0 0.0% 0
Like the Waitrose store 0.3% 3 0.0% 0 0.0% 0 0.0% 0 13.0% 3 0.0% 0 0.0% 0 0.0% 0 0.0% 0Like to support local shops 0.0% 0 0.0% 0 0.0% 0 0.0% 0 0.0% 0 0.0% 0 0.0% 0 0.0% 0 0.0% 0On the school run 0.1% 1 0.0% 0 0.5% 1 0.0% 0 0.0% 0 0.0% 0 0.0% 0 0.0% 0 0.0% 0Petrol's cheap there 0.1% 1 0.1% 1 0.0% 0 0.0% 0 0.0% 0 0.0% 0 0.0% 0 0.0% 0 0.0% 0(Don't know) 0.4% 3 0.6% 3 0.0% 0 0.0% 0 0.0% 0 0.0% 0 0.0% 0 0.0% 0 0.0% 0(No reason / no other reason) 9.9% 96 10.5% 57 7.4% 13 8.4% 3 3.3% 1 16.2% 5 9.3% 9 15.0% 5 8.0% 4Weighted base: 975 543 170 36 21 32 93 36 44Sample: 981 546 163 39 24 31 86 36 56
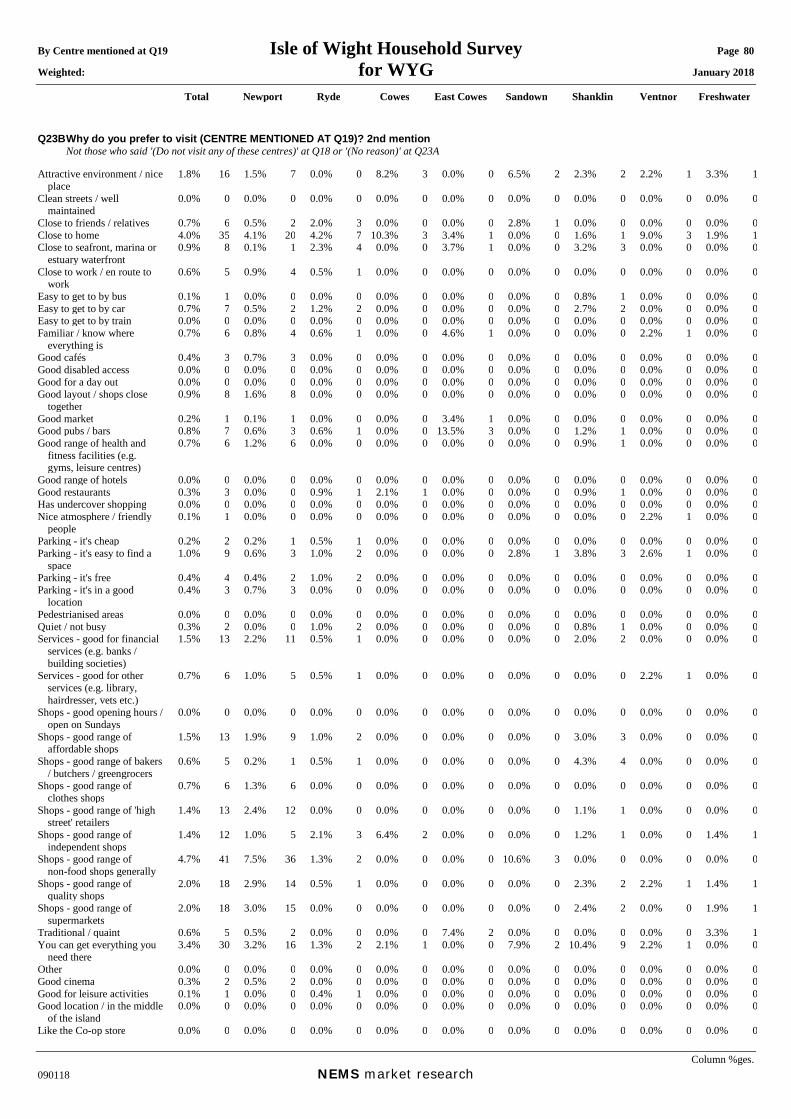
By Centre mentioned at Q19 Isle of Wight Household Survey Page 80 Weighted: for WYG January 2018
Total Newport Ryde Cowes East Cowes Sandown Shanklin Ventnor Freshwater
Column %ges. 090118 NEMS market research
Q23B Why do you prefer to visit (CENTRE MENTIONED AT Q19)? 2nd mention Not those who said '(Do not visit any of these centres)' at Q18 or '(No reason)' at Q23A Attractive environment / nice
place 1.8% 16 1.5% 7 0.0% 0 8.2% 3 0.0% 0 6.5% 2 2.3% 2 2.2% 1 3.3% 1
Clean streets / well maintained
0.0% 0 0.0% 0 0.0% 0 0.0% 0 0.0% 0 0.0% 0 0.0% 0 0.0% 0 0.0% 0
Close to friends / relatives 0.7% 6 0.5% 2 2.0% 3 0.0% 0 0.0% 0 2.8% 1 0.0% 0 0.0% 0 0.0% 0Close to home 4.0% 35 4.1% 20 4.2% 7 10.3% 3 3.4% 1 0.0% 0 1.6% 1 9.0% 3 1.9% 1Close to seafront, marina or
estuary waterfront 0.9% 8 0.1% 1 2.3% 4 0.0% 0 3.7% 1 0.0% 0 3.2% 3 0.0% 0 0.0% 0
Close to work / en route to work
0.6% 5 0.9% 4 0.5% 1 0.0% 0 0.0% 0 0.0% 0 0.0% 0 0.0% 0 0.0% 0
Easy to get to by bus 0.1% 1 0.0% 0 0.0% 0 0.0% 0 0.0% 0 0.0% 0 0.8% 1 0.0% 0 0.0% 0Easy to get to by car 0.7% 7 0.5% 2 1.2% 2 0.0% 0 0.0% 0 0.0% 0 2.7% 2 0.0% 0 0.0% 0Easy to get to by train 0.0% 0 0.0% 0 0.0% 0 0.0% 0 0.0% 0 0.0% 0 0.0% 0 0.0% 0 0.0% 0Familiar / know where
everything is 0.7% 6 0.8% 4 0.6% 1 0.0% 0 4.6% 1 0.0% 0 0.0% 0 2.2% 1 0.0% 0
Good cafés 0.4% 3 0.7% 3 0.0% 0 0.0% 0 0.0% 0 0.0% 0 0.0% 0 0.0% 0 0.0% 0Good disabled access 0.0% 0 0.0% 0 0.0% 0 0.0% 0 0.0% 0 0.0% 0 0.0% 0 0.0% 0 0.0% 0Good for a day out 0.0% 0 0.0% 0 0.0% 0 0.0% 0 0.0% 0 0.0% 0 0.0% 0 0.0% 0 0.0% 0Good layout / shops close
together 0.9% 8 1.6% 8 0.0% 0 0.0% 0 0.0% 0 0.0% 0 0.0% 0 0.0% 0 0.0% 0
Good market 0.2% 1 0.1% 1 0.0% 0 0.0% 0 3.4% 1 0.0% 0 0.0% 0 0.0% 0 0.0% 0Good pubs / bars 0.8% 7 0.6% 3 0.6% 1 0.0% 0 13.5% 3 0.0% 0 1.2% 1 0.0% 0 0.0% 0Good range of health and
fitness facilities (e.g. gyms, leisure centres)
0.7% 6 1.2% 6 0.0% 0 0.0% 0 0.0% 0 0.0% 0 0.9% 1 0.0% 0 0.0% 0
Good range of hotels 0.0% 0 0.0% 0 0.0% 0 0.0% 0 0.0% 0 0.0% 0 0.0% 0 0.0% 0 0.0% 0Good restaurants 0.3% 3 0.0% 0 0.9% 1 2.1% 1 0.0% 0 0.0% 0 0.9% 1 0.0% 0 0.0% 0Has undercover shopping 0.0% 0 0.0% 0 0.0% 0 0.0% 0 0.0% 0 0.0% 0 0.0% 0 0.0% 0 0.0% 0Nice atmosphere / friendly
people 0.1% 1 0.0% 0 0.0% 0 0.0% 0 0.0% 0 0.0% 0 0.0% 0 2.2% 1 0.0% 0
Parking - it's cheap 0.2% 2 0.2% 1 0.5% 1 0.0% 0 0.0% 0 0.0% 0 0.0% 0 0.0% 0 0.0% 0Parking - it's easy to find a
space 1.0% 9 0.6% 3 1.0% 2 0.0% 0 0.0% 0 2.8% 1 3.8% 3 2.6% 1 0.0% 0
Parking - it's free 0.4% 4 0.4% 2 1.0% 2 0.0% 0 0.0% 0 0.0% 0 0.0% 0 0.0% 0 0.0% 0Parking - it's in a good
location 0.4% 3 0.7% 3 0.0% 0 0.0% 0 0.0% 0 0.0% 0 0.0% 0 0.0% 0 0.0% 0
Pedestrianised areas 0.0% 0 0.0% 0 0.0% 0 0.0% 0 0.0% 0 0.0% 0 0.0% 0 0.0% 0 0.0% 0Quiet / not busy 0.3% 2 0.0% 0 1.0% 2 0.0% 0 0.0% 0 0.0% 0 0.8% 1 0.0% 0 0.0% 0Services - good for financial
services (e.g. banks / building societies)
1.5% 13 2.2% 11 0.5% 1 0.0% 0 0.0% 0 0.0% 0 2.0% 2 0.0% 0 0.0% 0
Services - good for other services (e.g. library, hairdresser, vets etc.)
0.7% 6 1.0% 5 0.5% 1 0.0% 0 0.0% 0 0.0% 0 0.0% 0 2.2% 1 0.0% 0
Shops - good opening hours / open on Sundays
0.0% 0 0.0% 0 0.0% 0 0.0% 0 0.0% 0 0.0% 0 0.0% 0 0.0% 0 0.0% 0
Shops - good range of affordable shops
1.5% 13 1.9% 9 1.0% 2 0.0% 0 0.0% 0 0.0% 0 3.0% 3 0.0% 0 0.0% 0
Shops - good range of bakers / butchers / greengrocers
0.6% 5 0.2% 1 0.5% 1 0.0% 0 0.0% 0 0.0% 0 4.3% 4 0.0% 0 0.0% 0
Shops - good range of clothes shops
0.7% 6 1.3% 6 0.0% 0 0.0% 0 0.0% 0 0.0% 0 0.0% 0 0.0% 0 0.0% 0
Shops - good range of 'high street' retailers
1.4% 13 2.4% 12 0.0% 0 0.0% 0 0.0% 0 0.0% 0 1.1% 1 0.0% 0 0.0% 0
Shops - good range of independent shops
1.4% 12 1.0% 5 2.1% 3 6.4% 2 0.0% 0 0.0% 0 1.2% 1 0.0% 0 1.4% 1
Shops - good range of non-food shops generally
4.7% 41 7.5% 36 1.3% 2 0.0% 0 0.0% 0 10.6% 3 0.0% 0 0.0% 0 0.0% 0
Shops - good range of quality shops
2.0% 18 2.9% 14 0.5% 1 0.0% 0 0.0% 0 0.0% 0 2.3% 2 2.2% 1 1.4% 1
Shops - good range of supermarkets
2.0% 18 3.0% 15 0.0% 0 0.0% 0 0.0% 0 0.0% 0 2.4% 2 0.0% 0 1.9% 1
Traditional / quaint 0.6% 5 0.5% 2 0.0% 0 0.0% 0 7.4% 2 0.0% 0 0.0% 0 0.0% 0 3.3% 1You can get everything you
need there 3.4% 30 3.2% 16 1.3% 2 2.1% 1 0.0% 0 7.9% 2 10.4% 9 2.2% 1 0.0% 0
Other 0.0% 0 0.0% 0 0.0% 0 0.0% 0 0.0% 0 0.0% 0 0.0% 0 0.0% 0 0.0% 0Good cinema 0.3% 2 0.5% 2 0.0% 0 0.0% 0 0.0% 0 0.0% 0 0.0% 0 0.0% 0 0.0% 0Good for leisure activities 0.1% 1 0.0% 0 0.4% 1 0.0% 0 0.0% 0 0.0% 0 0.0% 0 0.0% 0 0.0% 0Good location / in the middle
of the island 0.0% 0 0.0% 0 0.0% 0 0.0% 0 0.0% 0 0.0% 0 0.0% 0 0.0% 0 0.0% 0
Like the Co-op store 0.0% 0 0.0% 0 0.0% 0 0.0% 0 0.0% 0 0.0% 0 0.0% 0 0.0% 0 0.0% 0
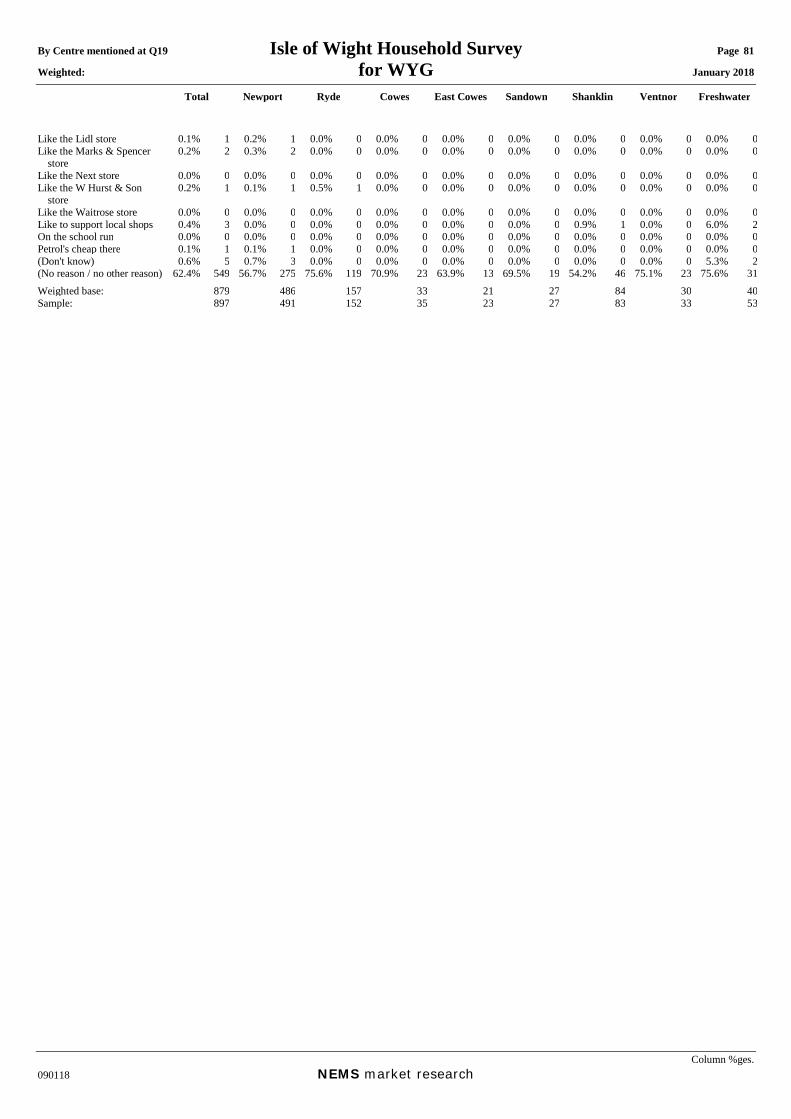
By Centre mentioned at Q19 Isle of Wight Household Survey Page 81 Weighted: for WYG January 2018
Total Newport Ryde Cowes East Cowes Sandown Shanklin Ventnor Freshwater
Column %ges. 090118 NEMS market research
Like the Lidl store 0.1% 1 0.2% 1 0.0% 0 0.0% 0 0.0% 0 0.0% 0 0.0% 0 0.0% 0 0.0% 0Like the Marks & Spencer
store 0.2% 2 0.3% 2 0.0% 0 0.0% 0 0.0% 0 0.0% 0 0.0% 0 0.0% 0 0.0% 0
Like the Next store 0.0% 0 0.0% 0 0.0% 0 0.0% 0 0.0% 0 0.0% 0 0.0% 0 0.0% 0 0.0% 0Like the W Hurst & Son
store 0.2% 1 0.1% 1 0.5% 1 0.0% 0 0.0% 0 0.0% 0 0.0% 0 0.0% 0 0.0% 0
Like the Waitrose store 0.0% 0 0.0% 0 0.0% 0 0.0% 0 0.0% 0 0.0% 0 0.0% 0 0.0% 0 0.0% 0Like to support local shops 0.4% 3 0.0% 0 0.0% 0 0.0% 0 0.0% 0 0.0% 0 0.9% 1 0.0% 0 6.0% 2On the school run 0.0% 0 0.0% 0 0.0% 0 0.0% 0 0.0% 0 0.0% 0 0.0% 0 0.0% 0 0.0% 0Petrol's cheap there 0.1% 1 0.1% 1 0.0% 0 0.0% 0 0.0% 0 0.0% 0 0.0% 0 0.0% 0 0.0% 0(Don't know) 0.6% 5 0.7% 3 0.0% 0 0.0% 0 0.0% 0 0.0% 0 0.0% 0 0.0% 0 5.3% 2(No reason / no other reason) 62.4% 549 56.7% 275 75.6% 119 70.9% 23 63.9% 13 69.5% 19 54.2% 46 75.1% 23 75.6% 31Weighted base: 879 486 157 33 21 27 84 30 40Sample: 897 491 152 35 23 27 83 33 53
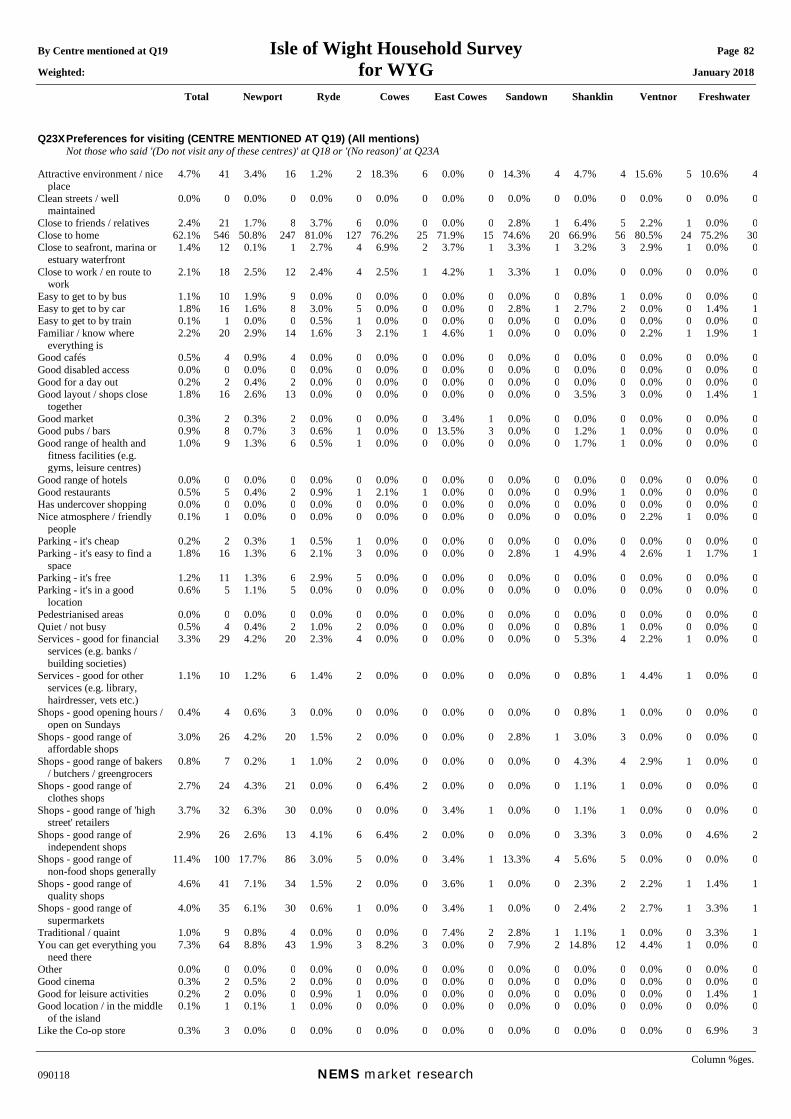
By Centre mentioned at Q19 Isle of Wight Household Survey Page 82 Weighted: for WYG January 2018
Total Newport Ryde Cowes East Cowes Sandown Shanklin Ventnor Freshwater
Column %ges. 090118 NEMS market research
Q23X Preferences for visiting (CENTRE MENTIONED AT Q19) (All mentions) Not those who said '(Do not visit any of these centres)' at Q18 or '(No reason)' at Q23A Attractive environment / nice
place 4.7% 41 3.4% 16 1.2% 2 18.3% 6 0.0% 0 14.3% 4 4.7% 4 15.6% 5 10.6% 4
Clean streets / well maintained
0.0% 0 0.0% 0 0.0% 0 0.0% 0 0.0% 0 0.0% 0 0.0% 0 0.0% 0 0.0% 0
Close to friends / relatives 2.4% 21 1.7% 8 3.7% 6 0.0% 0 0.0% 0 2.8% 1 6.4% 5 2.2% 1 0.0% 0Close to home 62.1% 546 50.8% 247 81.0% 127 76.2% 25 71.9% 15 74.6% 20 66.9% 56 80.5% 24 75.2% 30Close to seafront, marina or
estuary waterfront 1.4% 12 0.1% 1 2.7% 4 6.9% 2 3.7% 1 3.3% 1 3.2% 3 2.9% 1 0.0% 0
Close to work / en route to work
2.1% 18 2.5% 12 2.4% 4 2.5% 1 4.2% 1 3.3% 1 0.0% 0 0.0% 0 0.0% 0
Easy to get to by bus 1.1% 10 1.9% 9 0.0% 0 0.0% 0 0.0% 0 0.0% 0 0.8% 1 0.0% 0 0.0% 0Easy to get to by car 1.8% 16 1.6% 8 3.0% 5 0.0% 0 0.0% 0 2.8% 1 2.7% 2 0.0% 0 1.4% 1Easy to get to by train 0.1% 1 0.0% 0 0.5% 1 0.0% 0 0.0% 0 0.0% 0 0.0% 0 0.0% 0 0.0% 0Familiar / know where
everything is 2.2% 20 2.9% 14 1.6% 3 2.1% 1 4.6% 1 0.0% 0 0.0% 0 2.2% 1 1.9% 1
Good cafés 0.5% 4 0.9% 4 0.0% 0 0.0% 0 0.0% 0 0.0% 0 0.0% 0 0.0% 0 0.0% 0Good disabled access 0.0% 0 0.0% 0 0.0% 0 0.0% 0 0.0% 0 0.0% 0 0.0% 0 0.0% 0 0.0% 0Good for a day out 0.2% 2 0.4% 2 0.0% 0 0.0% 0 0.0% 0 0.0% 0 0.0% 0 0.0% 0 0.0% 0Good layout / shops close
together 1.8% 16 2.6% 13 0.0% 0 0.0% 0 0.0% 0 0.0% 0 3.5% 3 0.0% 0 1.4% 1
Good market 0.3% 2 0.3% 2 0.0% 0 0.0% 0 3.4% 1 0.0% 0 0.0% 0 0.0% 0 0.0% 0Good pubs / bars 0.9% 8 0.7% 3 0.6% 1 0.0% 0 13.5% 3 0.0% 0 1.2% 1 0.0% 0 0.0% 0Good range of health and
fitness facilities (e.g. gyms, leisure centres)
1.0% 9 1.3% 6 0.5% 1 0.0% 0 0.0% 0 0.0% 0 1.7% 1 0.0% 0 0.0% 0
Good range of hotels 0.0% 0 0.0% 0 0.0% 0 0.0% 0 0.0% 0 0.0% 0 0.0% 0 0.0% 0 0.0% 0Good restaurants 0.5% 5 0.4% 2 0.9% 1 2.1% 1 0.0% 0 0.0% 0 0.9% 1 0.0% 0 0.0% 0Has undercover shopping 0.0% 0 0.0% 0 0.0% 0 0.0% 0 0.0% 0 0.0% 0 0.0% 0 0.0% 0 0.0% 0Nice atmosphere / friendly
people 0.1% 1 0.0% 0 0.0% 0 0.0% 0 0.0% 0 0.0% 0 0.0% 0 2.2% 1 0.0% 0
Parking - it's cheap 0.2% 2 0.3% 1 0.5% 1 0.0% 0 0.0% 0 0.0% 0 0.0% 0 0.0% 0 0.0% 0Parking - it's easy to find a
space 1.8% 16 1.3% 6 2.1% 3 0.0% 0 0.0% 0 2.8% 1 4.9% 4 2.6% 1 1.7% 1
Parking - it's free 1.2% 11 1.3% 6 2.9% 5 0.0% 0 0.0% 0 0.0% 0 0.0% 0 0.0% 0 0.0% 0Parking - it's in a good
location 0.6% 5 1.1% 5 0.0% 0 0.0% 0 0.0% 0 0.0% 0 0.0% 0 0.0% 0 0.0% 0
Pedestrianised areas 0.0% 0 0.0% 0 0.0% 0 0.0% 0 0.0% 0 0.0% 0 0.0% 0 0.0% 0 0.0% 0Quiet / not busy 0.5% 4 0.4% 2 1.0% 2 0.0% 0 0.0% 0 0.0% 0 0.8% 1 0.0% 0 0.0% 0Services - good for financial
services (e.g. banks / building societies)
3.3% 29 4.2% 20 2.3% 4 0.0% 0 0.0% 0 0.0% 0 5.3% 4 2.2% 1 0.0% 0
Services - good for other services (e.g. library, hairdresser, vets etc.)
1.1% 10 1.2% 6 1.4% 2 0.0% 0 0.0% 0 0.0% 0 0.8% 1 4.4% 1 0.0% 0
Shops - good opening hours / open on Sundays
0.4% 4 0.6% 3 0.0% 0 0.0% 0 0.0% 0 0.0% 0 0.8% 1 0.0% 0 0.0% 0
Shops - good range of affordable shops
3.0% 26 4.2% 20 1.5% 2 0.0% 0 0.0% 0 2.8% 1 3.0% 3 0.0% 0 0.0% 0
Shops - good range of bakers / butchers / greengrocers
0.8% 7 0.2% 1 1.0% 2 0.0% 0 0.0% 0 0.0% 0 4.3% 4 2.9% 1 0.0% 0
Shops - good range of clothes shops
2.7% 24 4.3% 21 0.0% 0 6.4% 2 0.0% 0 0.0% 0 1.1% 1 0.0% 0 0.0% 0
Shops - good range of 'high street' retailers
3.7% 32 6.3% 30 0.0% 0 0.0% 0 3.4% 1 0.0% 0 1.1% 1 0.0% 0 0.0% 0
Shops - good range of independent shops
2.9% 26 2.6% 13 4.1% 6 6.4% 2 0.0% 0 0.0% 0 3.3% 3 0.0% 0 4.6% 2
Shops - good range of non-food shops generally
11.4% 100 17.7% 86 3.0% 5 0.0% 0 3.4% 1 13.3% 4 5.6% 5 0.0% 0 0.0% 0
Shops - good range of quality shops
4.6% 41 7.1% 34 1.5% 2 0.0% 0 3.6% 1 0.0% 0 2.3% 2 2.2% 1 1.4% 1
Shops - good range of supermarkets
4.0% 35 6.1% 30 0.6% 1 0.0% 0 3.4% 1 0.0% 0 2.4% 2 2.7% 1 3.3% 1
Traditional / quaint 1.0% 9 0.8% 4 0.0% 0 0.0% 0 7.4% 2 2.8% 1 1.1% 1 0.0% 0 3.3% 1You can get everything you
need there 7.3% 64 8.8% 43 1.9% 3 8.2% 3 0.0% 0 7.9% 2 14.8% 12 4.4% 1 0.0% 0
Other 0.0% 0 0.0% 0 0.0% 0 0.0% 0 0.0% 0 0.0% 0 0.0% 0 0.0% 0 0.0% 0Good cinema 0.3% 2 0.5% 2 0.0% 0 0.0% 0 0.0% 0 0.0% 0 0.0% 0 0.0% 0 0.0% 0Good for leisure activities 0.2% 2 0.0% 0 0.9% 1 0.0% 0 0.0% 0 0.0% 0 0.0% 0 0.0% 0 1.4% 1Good location / in the middle
of the island 0.1% 1 0.1% 1 0.0% 0 0.0% 0 0.0% 0 0.0% 0 0.0% 0 0.0% 0 0.0% 0
Like the Co-op store 0.3% 3 0.0% 0 0.0% 0 0.0% 0 0.0% 0 0.0% 0 0.0% 0 0.0% 0 6.9% 3
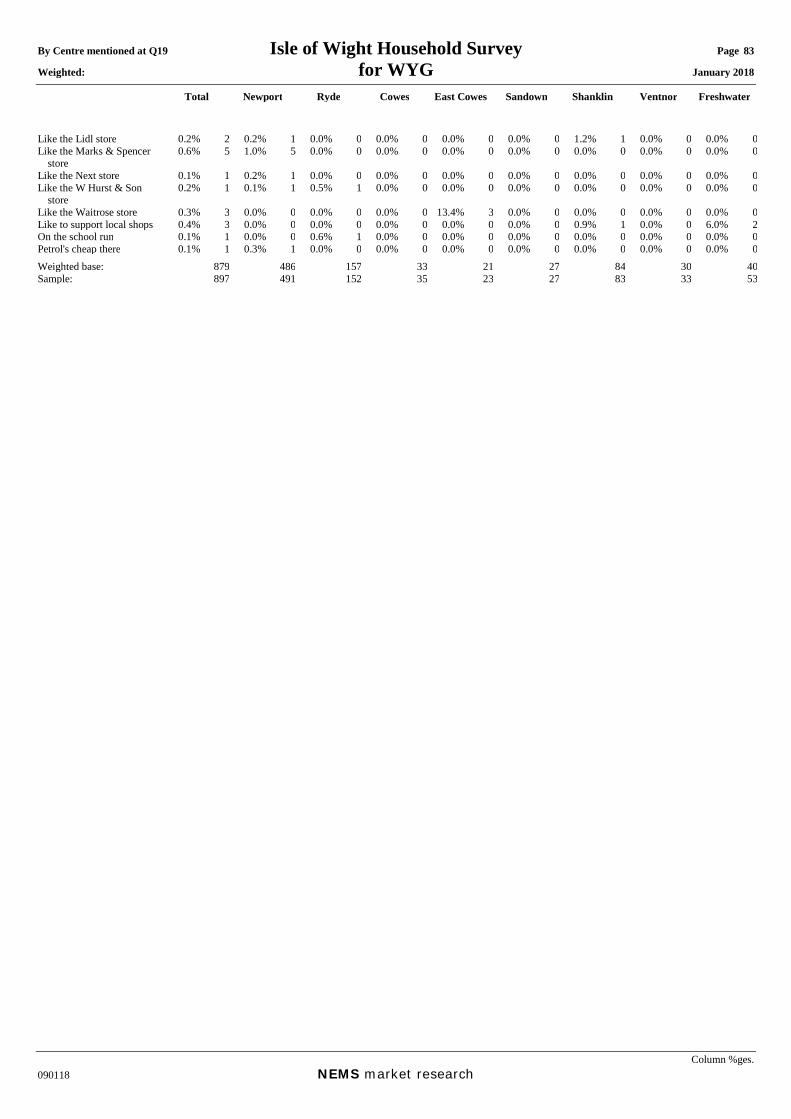
By Centre mentioned at Q19 Isle of Wight Household Survey Page 83 Weighted: for WYG January 2018
Total Newport Ryde Cowes East Cowes Sandown Shanklin Ventnor Freshwater
Column %ges. 090118 NEMS market research
Like the Lidl store 0.2% 2 0.2% 1 0.0% 0 0.0% 0 0.0% 0 0.0% 0 1.2% 1 0.0% 0 0.0% 0Like the Marks & Spencer
store 0.6% 5 1.0% 5 0.0% 0 0.0% 0 0.0% 0 0.0% 0 0.0% 0 0.0% 0 0.0% 0
Like the Next store 0.1% 1 0.2% 1 0.0% 0 0.0% 0 0.0% 0 0.0% 0 0.0% 0 0.0% 0 0.0% 0Like the W Hurst & Son
store 0.2% 1 0.1% 1 0.5% 1 0.0% 0 0.0% 0 0.0% 0 0.0% 0 0.0% 0 0.0% 0
Like the Waitrose store 0.3% 3 0.0% 0 0.0% 0 0.0% 0 13.4% 3 0.0% 0 0.0% 0 0.0% 0 0.0% 0Like to support local shops 0.4% 3 0.0% 0 0.0% 0 0.0% 0 0.0% 0 0.0% 0 0.9% 1 0.0% 0 6.0% 2On the school run 0.1% 1 0.0% 0 0.6% 1 0.0% 0 0.0% 0 0.0% 0 0.0% 0 0.0% 0 0.0% 0Petrol's cheap there 0.1% 1 0.3% 1 0.0% 0 0.0% 0 0.0% 0 0.0% 0 0.0% 0 0.0% 0 0.0% 0Weighted base: 879 486 157 33 21 27 84 30 40Sample: 897 491 152 35 23 27 83 33 53
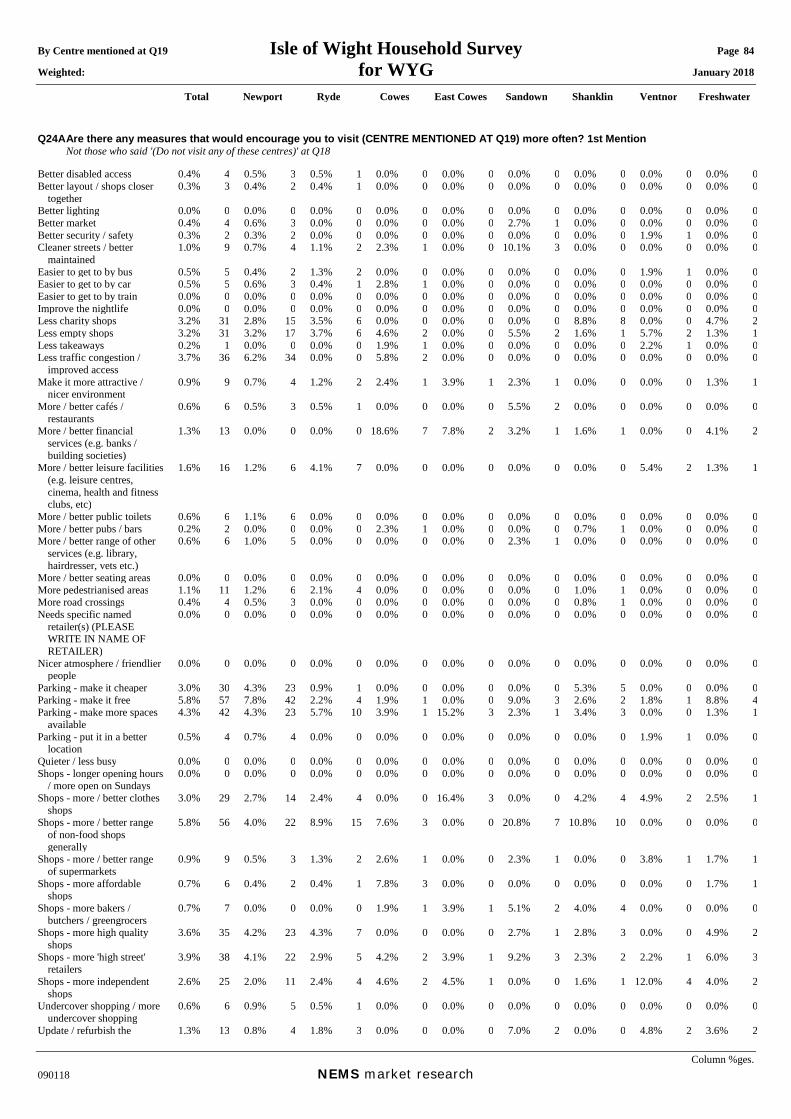
By Centre mentioned at Q19 Isle of Wight Household Survey Page 84 Weighted: for WYG January 2018
Total Newport Ryde Cowes East Cowes Sandown Shanklin Ventnor Freshwater
Column %ges. 090118 NEMS market research
Q24A Are there any measures that would encourage you to visit (CENTRE MENTIONED AT Q19) more often? 1st Mention Not those who said '(Do not visit any of these centres)' at Q18 Better disabled access 0.4% 4 0.5% 3 0.5% 1 0.0% 0 0.0% 0 0.0% 0 0.0% 0 0.0% 0 0.0% 0Better layout / shops closer
together 0.3% 3 0.4% 2 0.4% 1 0.0% 0 0.0% 0 0.0% 0 0.0% 0 0.0% 0 0.0% 0
Better lighting 0.0% 0 0.0% 0 0.0% 0 0.0% 0 0.0% 0 0.0% 0 0.0% 0 0.0% 0 0.0% 0Better market 0.4% 4 0.6% 3 0.0% 0 0.0% 0 0.0% 0 2.7% 1 0.0% 0 0.0% 0 0.0% 0Better security / safety 0.3% 2 0.3% 2 0.0% 0 0.0% 0 0.0% 0 0.0% 0 0.0% 0 1.9% 1 0.0% 0Cleaner streets / better
maintained 1.0% 9 0.7% 4 1.1% 2 2.3% 1 0.0% 0 10.1% 3 0.0% 0 0.0% 0 0.0% 0
Easier to get to by bus 0.5% 5 0.4% 2 1.3% 2 0.0% 0 0.0% 0 0.0% 0 0.0% 0 1.9% 1 0.0% 0Easier to get to by car 0.5% 5 0.6% 3 0.4% 1 2.8% 1 0.0% 0 0.0% 0 0.0% 0 0.0% 0 0.0% 0Easier to get to by train 0.0% 0 0.0% 0 0.0% 0 0.0% 0 0.0% 0 0.0% 0 0.0% 0 0.0% 0 0.0% 0Improve the nightlife 0.0% 0 0.0% 0 0.0% 0 0.0% 0 0.0% 0 0.0% 0 0.0% 0 0.0% 0 0.0% 0Less charity shops 3.2% 31 2.8% 15 3.5% 6 0.0% 0 0.0% 0 0.0% 0 8.8% 8 0.0% 0 4.7% 2Less empty shops 3.2% 31 3.2% 17 3.7% 6 4.6% 2 0.0% 0 5.5% 2 1.6% 1 5.7% 2 1.3% 1Less takeaways 0.2% 1 0.0% 0 0.0% 0 1.9% 1 0.0% 0 0.0% 0 0.0% 0 2.2% 1 0.0% 0Less traffic congestion /
improved access 3.7% 36 6.2% 34 0.0% 0 5.8% 2 0.0% 0 0.0% 0 0.0% 0 0.0% 0 0.0% 0
Make it more attractive / nicer environment
0.9% 9 0.7% 4 1.2% 2 2.4% 1 3.9% 1 2.3% 1 0.0% 0 0.0% 0 1.3% 1
More / better cafés / restaurants
0.6% 6 0.5% 3 0.5% 1 0.0% 0 0.0% 0 5.5% 2 0.0% 0 0.0% 0 0.0% 0
More / better financial services (e.g. banks / building societies)
1.3% 13 0.0% 0 0.0% 0 18.6% 7 7.8% 2 3.2% 1 1.6% 1 0.0% 0 4.1% 2
More / better leisure facilities (e.g. leisure centres, cinema, health and fitness clubs, etc)
1.6% 16 1.2% 6 4.1% 7 0.0% 0 0.0% 0 0.0% 0 0.0% 0 5.4% 2 1.3% 1
More / better public toilets 0.6% 6 1.1% 6 0.0% 0 0.0% 0 0.0% 0 0.0% 0 0.0% 0 0.0% 0 0.0% 0More / better pubs / bars 0.2% 2 0.0% 0 0.0% 0 2.3% 1 0.0% 0 0.0% 0 0.7% 1 0.0% 0 0.0% 0More / better range of other
services (e.g. library, hairdresser, vets etc.)
0.6% 6 1.0% 5 0.0% 0 0.0% 0 0.0% 0 2.3% 1 0.0% 0 0.0% 0 0.0% 0
More / better seating areas 0.0% 0 0.0% 0 0.0% 0 0.0% 0 0.0% 0 0.0% 0 0.0% 0 0.0% 0 0.0% 0More pedestrianised areas 1.1% 11 1.2% 6 2.1% 4 0.0% 0 0.0% 0 0.0% 0 1.0% 1 0.0% 0 0.0% 0More road crossings 0.4% 4 0.5% 3 0.0% 0 0.0% 0 0.0% 0 0.0% 0 0.8% 1 0.0% 0 0.0% 0Needs specific named
retailer(s) (PLEASE WRITE IN NAME OF RETAILER)
0.0% 0 0.0% 0 0.0% 0 0.0% 0 0.0% 0 0.0% 0 0.0% 0 0.0% 0 0.0% 0
Nicer atmosphere / friendlier people
0.0% 0 0.0% 0 0.0% 0 0.0% 0 0.0% 0 0.0% 0 0.0% 0 0.0% 0 0.0% 0
Parking - make it cheaper 3.0% 30 4.3% 23 0.9% 1 0.0% 0 0.0% 0 0.0% 0 5.3% 5 0.0% 0 0.0% 0Parking - make it free 5.8% 57 7.8% 42 2.2% 4 1.9% 1 0.0% 0 9.0% 3 2.6% 2 1.8% 1 8.8% 4Parking - make more spaces
available 4.3% 42 4.3% 23 5.7% 10 3.9% 1 15.2% 3 2.3% 1 3.4% 3 0.0% 0 1.3% 1
Parking - put it in a better location
0.5% 4 0.7% 4 0.0% 0 0.0% 0 0.0% 0 0.0% 0 0.0% 0 1.9% 1 0.0% 0
Quieter / less busy 0.0% 0 0.0% 0 0.0% 0 0.0% 0 0.0% 0 0.0% 0 0.0% 0 0.0% 0 0.0% 0Shops - longer opening hours
/ more open on Sundays 0.0% 0 0.0% 0 0.0% 0 0.0% 0 0.0% 0 0.0% 0 0.0% 0 0.0% 0 0.0% 0
Shops - more / better clothes shops
3.0% 29 2.7% 14 2.4% 4 0.0% 0 16.4% 3 0.0% 0 4.2% 4 4.9% 2 2.5% 1
Shops - more / better range of non-food shops generally
5.8% 56 4.0% 22 8.9% 15 7.6% 3 0.0% 0 20.8% 7 10.8% 10 0.0% 0 0.0% 0
Shops - more / better range of supermarkets
0.9% 9 0.5% 3 1.3% 2 2.6% 1 0.0% 0 2.3% 1 0.0% 0 3.8% 1 1.7% 1
Shops - more affordable shops
0.7% 6 0.4% 2 0.4% 1 7.8% 3 0.0% 0 0.0% 0 0.0% 0 0.0% 0 1.7% 1
Shops - more bakers / butchers / greengrocers
0.7% 7 0.0% 0 0.0% 0 1.9% 1 3.9% 1 5.1% 2 4.0% 4 0.0% 0 0.0% 0
Shops - more high quality shops
3.6% 35 4.2% 23 4.3% 7 0.0% 0 0.0% 0 2.7% 1 2.8% 3 0.0% 0 4.9% 2
Shops - more 'high street' retailers
3.9% 38 4.1% 22 2.9% 5 4.2% 2 3.9% 1 9.2% 3 2.3% 2 2.2% 1 6.0% 3
Shops - more independent shops
2.6% 25 2.0% 11 2.4% 4 4.6% 2 4.5% 1 0.0% 0 1.6% 1 12.0% 4 4.0% 2
Undercover shopping / more undercover shopping
0.6% 6 0.9% 5 0.5% 1 0.0% 0 0.0% 0 0.0% 0 0.0% 0 0.0% 0 0.0% 0
Update / refurbish the 1.3% 13 0.8% 4 1.8% 3 0.0% 0 0.0% 0 7.0% 2 0.0% 0 4.8% 2 3.6% 2
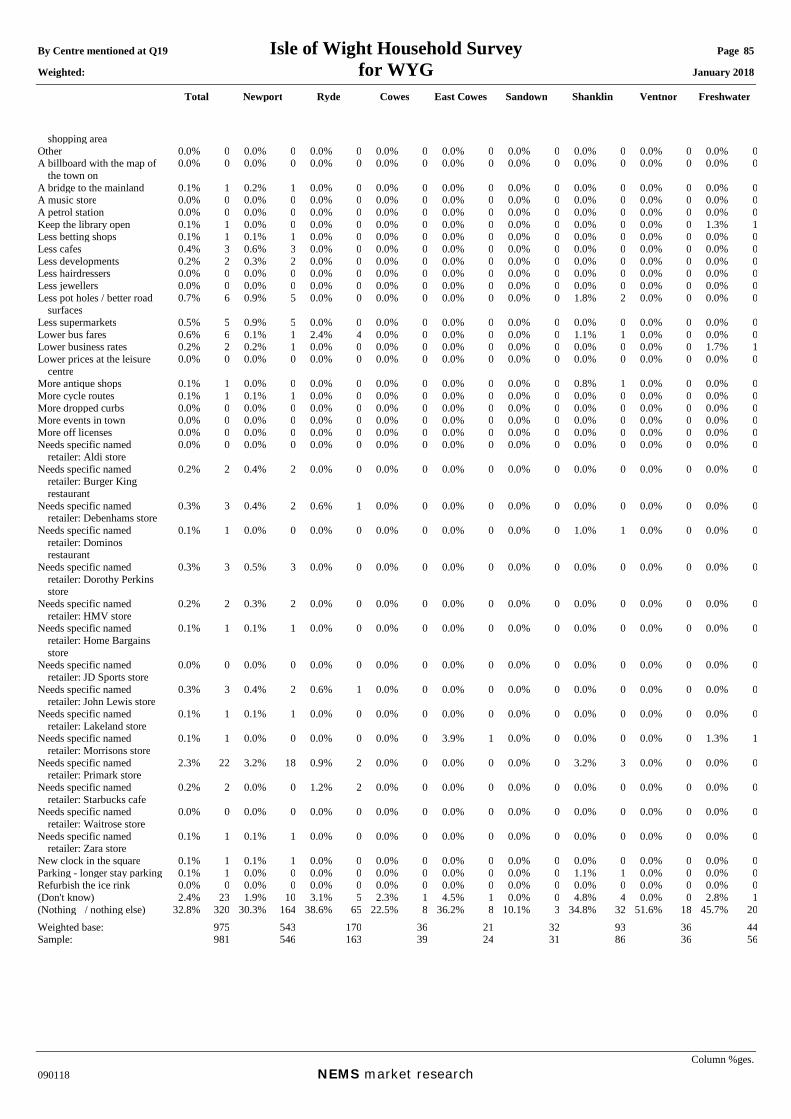
By Centre mentioned at Q19 Isle of Wight Household Survey Page 85 Weighted: for WYG January 2018
Total Newport Ryde Cowes East Cowes Sandown Shanklin Ventnor Freshwater
Column %ges. 090118 NEMS market research
shopping area Other 0.0% 0 0.0% 0 0.0% 0 0.0% 0 0.0% 0 0.0% 0 0.0% 0 0.0% 0 0.0% 0A billboard with the map of
the town on 0.0% 0 0.0% 0 0.0% 0 0.0% 0 0.0% 0 0.0% 0 0.0% 0 0.0% 0 0.0% 0
A bridge to the mainland 0.1% 1 0.2% 1 0.0% 0 0.0% 0 0.0% 0 0.0% 0 0.0% 0 0.0% 0 0.0% 0A music store 0.0% 0 0.0% 0 0.0% 0 0.0% 0 0.0% 0 0.0% 0 0.0% 0 0.0% 0 0.0% 0A petrol station 0.0% 0 0.0% 0 0.0% 0 0.0% 0 0.0% 0 0.0% 0 0.0% 0 0.0% 0 0.0% 0Keep the library open 0.1% 1 0.0% 0 0.0% 0 0.0% 0 0.0% 0 0.0% 0 0.0% 0 0.0% 0 1.3% 1Less betting shops 0.1% 1 0.1% 1 0.0% 0 0.0% 0 0.0% 0 0.0% 0 0.0% 0 0.0% 0 0.0% 0Less cafes 0.4% 3 0.6% 3 0.0% 0 0.0% 0 0.0% 0 0.0% 0 0.0% 0 0.0% 0 0.0% 0Less developments 0.2% 2 0.3% 2 0.0% 0 0.0% 0 0.0% 0 0.0% 0 0.0% 0 0.0% 0 0.0% 0Less hairdressers 0.0% 0 0.0% 0 0.0% 0 0.0% 0 0.0% 0 0.0% 0 0.0% 0 0.0% 0 0.0% 0Less jewellers 0.0% 0 0.0% 0 0.0% 0 0.0% 0 0.0% 0 0.0% 0 0.0% 0 0.0% 0 0.0% 0Less pot holes / better road
surfaces 0.7% 6 0.9% 5 0.0% 0 0.0% 0 0.0% 0 0.0% 0 1.8% 2 0.0% 0 0.0% 0
Less supermarkets 0.5% 5 0.9% 5 0.0% 0 0.0% 0 0.0% 0 0.0% 0 0.0% 0 0.0% 0 0.0% 0Lower bus fares 0.6% 6 0.1% 1 2.4% 4 0.0% 0 0.0% 0 0.0% 0 1.1% 1 0.0% 0 0.0% 0Lower business rates 0.2% 2 0.2% 1 0.0% 0 0.0% 0 0.0% 0 0.0% 0 0.0% 0 0.0% 0 1.7% 1Lower prices at the leisure
centre 0.0% 0 0.0% 0 0.0% 0 0.0% 0 0.0% 0 0.0% 0 0.0% 0 0.0% 0 0.0% 0
More antique shops 0.1% 1 0.0% 0 0.0% 0 0.0% 0 0.0% 0 0.0% 0 0.8% 1 0.0% 0 0.0% 0More cycle routes 0.1% 1 0.1% 1 0.0% 0 0.0% 0 0.0% 0 0.0% 0 0.0% 0 0.0% 0 0.0% 0More dropped curbs 0.0% 0 0.0% 0 0.0% 0 0.0% 0 0.0% 0 0.0% 0 0.0% 0 0.0% 0 0.0% 0More events in town 0.0% 0 0.0% 0 0.0% 0 0.0% 0 0.0% 0 0.0% 0 0.0% 0 0.0% 0 0.0% 0More off licenses 0.0% 0 0.0% 0 0.0% 0 0.0% 0 0.0% 0 0.0% 0 0.0% 0 0.0% 0 0.0% 0Needs specific named
retailer: Aldi store 0.0% 0 0.0% 0 0.0% 0 0.0% 0 0.0% 0 0.0% 0 0.0% 0 0.0% 0 0.0% 0
Needs specific named retailer: Burger King restaurant
0.2% 2 0.4% 2 0.0% 0 0.0% 0 0.0% 0 0.0% 0 0.0% 0 0.0% 0 0.0% 0
Needs specific named retailer: Debenhams store
0.3% 3 0.4% 2 0.6% 1 0.0% 0 0.0% 0 0.0% 0 0.0% 0 0.0% 0 0.0% 0
Needs specific named retailer: Dominos restaurant
0.1% 1 0.0% 0 0.0% 0 0.0% 0 0.0% 0 0.0% 0 1.0% 1 0.0% 0 0.0% 0
Needs specific named retailer: Dorothy Perkins store
0.3% 3 0.5% 3 0.0% 0 0.0% 0 0.0% 0 0.0% 0 0.0% 0 0.0% 0 0.0% 0
Needs specific named retailer: HMV store
0.2% 2 0.3% 2 0.0% 0 0.0% 0 0.0% 0 0.0% 0 0.0% 0 0.0% 0 0.0% 0
Needs specific named retailer: Home Bargains store
0.1% 1 0.1% 1 0.0% 0 0.0% 0 0.0% 0 0.0% 0 0.0% 0 0.0% 0 0.0% 0
Needs specific named retailer: JD Sports store
0.0% 0 0.0% 0 0.0% 0 0.0% 0 0.0% 0 0.0% 0 0.0% 0 0.0% 0 0.0% 0
Needs specific named retailer: John Lewis store
0.3% 3 0.4% 2 0.6% 1 0.0% 0 0.0% 0 0.0% 0 0.0% 0 0.0% 0 0.0% 0
Needs specific named retailer: Lakeland store
0.1% 1 0.1% 1 0.0% 0 0.0% 0 0.0% 0 0.0% 0 0.0% 0 0.0% 0 0.0% 0
Needs specific named retailer: Morrisons store
0.1% 1 0.0% 0 0.0% 0 0.0% 0 3.9% 1 0.0% 0 0.0% 0 0.0% 0 1.3% 1
Needs specific named retailer: Primark store
2.3% 22 3.2% 18 0.9% 2 0.0% 0 0.0% 0 0.0% 0 3.2% 3 0.0% 0 0.0% 0
Needs specific named retailer: Starbucks cafe
0.2% 2 0.0% 0 1.2% 2 0.0% 0 0.0% 0 0.0% 0 0.0% 0 0.0% 0 0.0% 0
Needs specific named retailer: Waitrose store
0.0% 0 0.0% 0 0.0% 0 0.0% 0 0.0% 0 0.0% 0 0.0% 0 0.0% 0 0.0% 0
Needs specific named retailer: Zara store
0.1% 1 0.1% 1 0.0% 0 0.0% 0 0.0% 0 0.0% 0 0.0% 0 0.0% 0 0.0% 0
New clock in the square 0.1% 1 0.1% 1 0.0% 0 0.0% 0 0.0% 0 0.0% 0 0.0% 0 0.0% 0 0.0% 0Parking - longer stay parking 0.1% 1 0.0% 0 0.0% 0 0.0% 0 0.0% 0 0.0% 0 1.1% 1 0.0% 0 0.0% 0Refurbish the ice rink 0.0% 0 0.0% 0 0.0% 0 0.0% 0 0.0% 0 0.0% 0 0.0% 0 0.0% 0 0.0% 0(Don't know) 2.4% 23 1.9% 10 3.1% 5 2.3% 1 4.5% 1 0.0% 0 4.8% 4 0.0% 0 2.8% 1(Nothing / nothing else) 32.8% 320 30.3% 164 38.6% 65 22.5% 8 36.2% 8 10.1% 3 34.8% 32 51.6% 18 45.7% 20Weighted base: 975 543 170 36 21 32 93 36 44Sample: 981 546 163 39 24 31 86 36 56
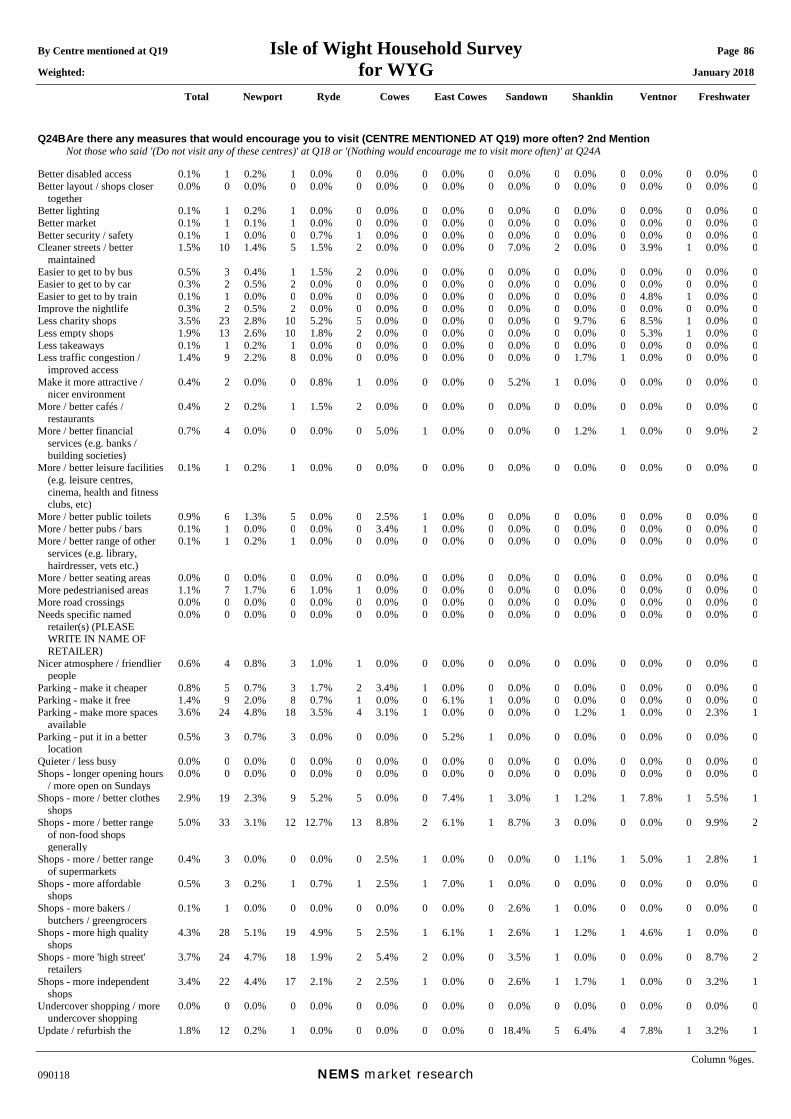
By Centre mentioned at Q19 Isle of Wight Household Survey Page 86 Weighted: for WYG January 2018
Total Newport Ryde Cowes East Cowes Sandown Shanklin Ventnor Freshwater
Column %ges. 090118 NEMS market research
Q24B Are there any measures that would encourage you to visit (CENTRE MENTIONED AT Q19) more often? 2nd Mention Not those who said '(Do not visit any of these centres)' at Q18 or '(Nothing would encourage me to visit more often)' at Q24A Better disabled access 0.1% 1 0.2% 1 0.0% 0 0.0% 0 0.0% 0 0.0% 0 0.0% 0 0.0% 0 0.0% 0Better layout / shops closer
together 0.0% 0 0.0% 0 0.0% 0 0.0% 0 0.0% 0 0.0% 0 0.0% 0 0.0% 0 0.0% 0
Better lighting 0.1% 1 0.2% 1 0.0% 0 0.0% 0 0.0% 0 0.0% 0 0.0% 0 0.0% 0 0.0% 0Better market 0.1% 1 0.1% 1 0.0% 0 0.0% 0 0.0% 0 0.0% 0 0.0% 0 0.0% 0 0.0% 0Better security / safety 0.1% 1 0.0% 0 0.7% 1 0.0% 0 0.0% 0 0.0% 0 0.0% 0 0.0% 0 0.0% 0Cleaner streets / better
maintained 1.5% 10 1.4% 5 1.5% 2 0.0% 0 0.0% 0 7.0% 2 0.0% 0 3.9% 1 0.0% 0
Easier to get to by bus 0.5% 3 0.4% 1 1.5% 2 0.0% 0 0.0% 0 0.0% 0 0.0% 0 0.0% 0 0.0% 0Easier to get to by car 0.3% 2 0.5% 2 0.0% 0 0.0% 0 0.0% 0 0.0% 0 0.0% 0 0.0% 0 0.0% 0Easier to get to by train 0.1% 1 0.0% 0 0.0% 0 0.0% 0 0.0% 0 0.0% 0 0.0% 0 4.8% 1 0.0% 0Improve the nightlife 0.3% 2 0.5% 2 0.0% 0 0.0% 0 0.0% 0 0.0% 0 0.0% 0 0.0% 0 0.0% 0Less charity shops 3.5% 23 2.8% 10 5.2% 5 0.0% 0 0.0% 0 0.0% 0 9.7% 6 8.5% 1 0.0% 0Less empty shops 1.9% 13 2.6% 10 1.8% 2 0.0% 0 0.0% 0 0.0% 0 0.0% 0 5.3% 1 0.0% 0Less takeaways 0.1% 1 0.2% 1 0.0% 0 0.0% 0 0.0% 0 0.0% 0 0.0% 0 0.0% 0 0.0% 0Less traffic congestion /
improved access 1.4% 9 2.2% 8 0.0% 0 0.0% 0 0.0% 0 0.0% 0 1.7% 1 0.0% 0 0.0% 0
Make it more attractive / nicer environment
0.4% 2 0.0% 0 0.8% 1 0.0% 0 0.0% 0 5.2% 1 0.0% 0 0.0% 0 0.0% 0
More / better cafés / restaurants
0.4% 2 0.2% 1 1.5% 2 0.0% 0 0.0% 0 0.0% 0 0.0% 0 0.0% 0 0.0% 0
More / better financial services (e.g. banks / building societies)
0.7% 4 0.0% 0 0.0% 0 5.0% 1 0.0% 0 0.0% 0 1.2% 1 0.0% 0 9.0% 2
More / better leisure facilities (e.g. leisure centres, cinema, health and fitness clubs, etc)
0.1% 1 0.2% 1 0.0% 0 0.0% 0 0.0% 0 0.0% 0 0.0% 0 0.0% 0 0.0% 0
More / better public toilets 0.9% 6 1.3% 5 0.0% 0 2.5% 1 0.0% 0 0.0% 0 0.0% 0 0.0% 0 0.0% 0More / better pubs / bars 0.1% 1 0.0% 0 0.0% 0 3.4% 1 0.0% 0 0.0% 0 0.0% 0 0.0% 0 0.0% 0More / better range of other
services (e.g. library, hairdresser, vets etc.)
0.1% 1 0.2% 1 0.0% 0 0.0% 0 0.0% 0 0.0% 0 0.0% 0 0.0% 0 0.0% 0
More / better seating areas 0.0% 0 0.0% 0 0.0% 0 0.0% 0 0.0% 0 0.0% 0 0.0% 0 0.0% 0 0.0% 0More pedestrianised areas 1.1% 7 1.7% 6 1.0% 1 0.0% 0 0.0% 0 0.0% 0 0.0% 0 0.0% 0 0.0% 0More road crossings 0.0% 0 0.0% 0 0.0% 0 0.0% 0 0.0% 0 0.0% 0 0.0% 0 0.0% 0 0.0% 0Needs specific named
retailer(s) (PLEASE WRITE IN NAME OF RETAILER)
0.0% 0 0.0% 0 0.0% 0 0.0% 0 0.0% 0 0.0% 0 0.0% 0 0.0% 0 0.0% 0
Nicer atmosphere / friendlier people
0.6% 4 0.8% 3 1.0% 1 0.0% 0 0.0% 0 0.0% 0 0.0% 0 0.0% 0 0.0% 0
Parking - make it cheaper 0.8% 5 0.7% 3 1.7% 2 3.4% 1 0.0% 0 0.0% 0 0.0% 0 0.0% 0 0.0% 0Parking - make it free 1.4% 9 2.0% 8 0.7% 1 0.0% 0 6.1% 1 0.0% 0 0.0% 0 0.0% 0 0.0% 0Parking - make more spaces
available 3.6% 24 4.8% 18 3.5% 4 3.1% 1 0.0% 0 0.0% 0 1.2% 1 0.0% 0 2.3% 1
Parking - put it in a better location
0.5% 3 0.7% 3 0.0% 0 0.0% 0 5.2% 1 0.0% 0 0.0% 0 0.0% 0 0.0% 0
Quieter / less busy 0.0% 0 0.0% 0 0.0% 0 0.0% 0 0.0% 0 0.0% 0 0.0% 0 0.0% 0 0.0% 0Shops - longer opening hours
/ more open on Sundays 0.0% 0 0.0% 0 0.0% 0 0.0% 0 0.0% 0 0.0% 0 0.0% 0 0.0% 0 0.0% 0
Shops - more / better clothes shops
2.9% 19 2.3% 9 5.2% 5 0.0% 0 7.4% 1 3.0% 1 1.2% 1 7.8% 1 5.5% 1
Shops - more / better range of non-food shops generally
5.0% 33 3.1% 12 12.7% 13 8.8% 2 6.1% 1 8.7% 3 0.0% 0 0.0% 0 9.9% 2
Shops - more / better range of supermarkets
0.4% 3 0.0% 0 0.0% 0 2.5% 1 0.0% 0 0.0% 0 1.1% 1 5.0% 1 2.8% 1
Shops - more affordable shops
0.5% 3 0.2% 1 0.7% 1 2.5% 1 7.0% 1 0.0% 0 0.0% 0 0.0% 0 0.0% 0
Shops - more bakers / butchers / greengrocers
0.1% 1 0.0% 0 0.0% 0 0.0% 0 0.0% 0 2.6% 1 0.0% 0 0.0% 0 0.0% 0
Shops - more high quality shops
4.3% 28 5.1% 19 4.9% 5 2.5% 1 6.1% 1 2.6% 1 1.2% 1 4.6% 1 0.0% 0
Shops - more 'high street' retailers
3.7% 24 4.7% 18 1.9% 2 5.4% 2 0.0% 0 3.5% 1 0.0% 0 0.0% 0 8.7% 2
Shops - more independent shops
3.4% 22 4.4% 17 2.1% 2 2.5% 1 0.0% 0 2.6% 1 1.7% 1 0.0% 0 3.2% 1
Undercover shopping / more undercover shopping
0.0% 0 0.0% 0 0.0% 0 0.0% 0 0.0% 0 0.0% 0 0.0% 0 0.0% 0 0.0% 0
Update / refurbish the 1.8% 12 0.2% 1 0.0% 0 0.0% 0 0.0% 0 18.4% 5 6.4% 4 7.8% 1 3.2% 1
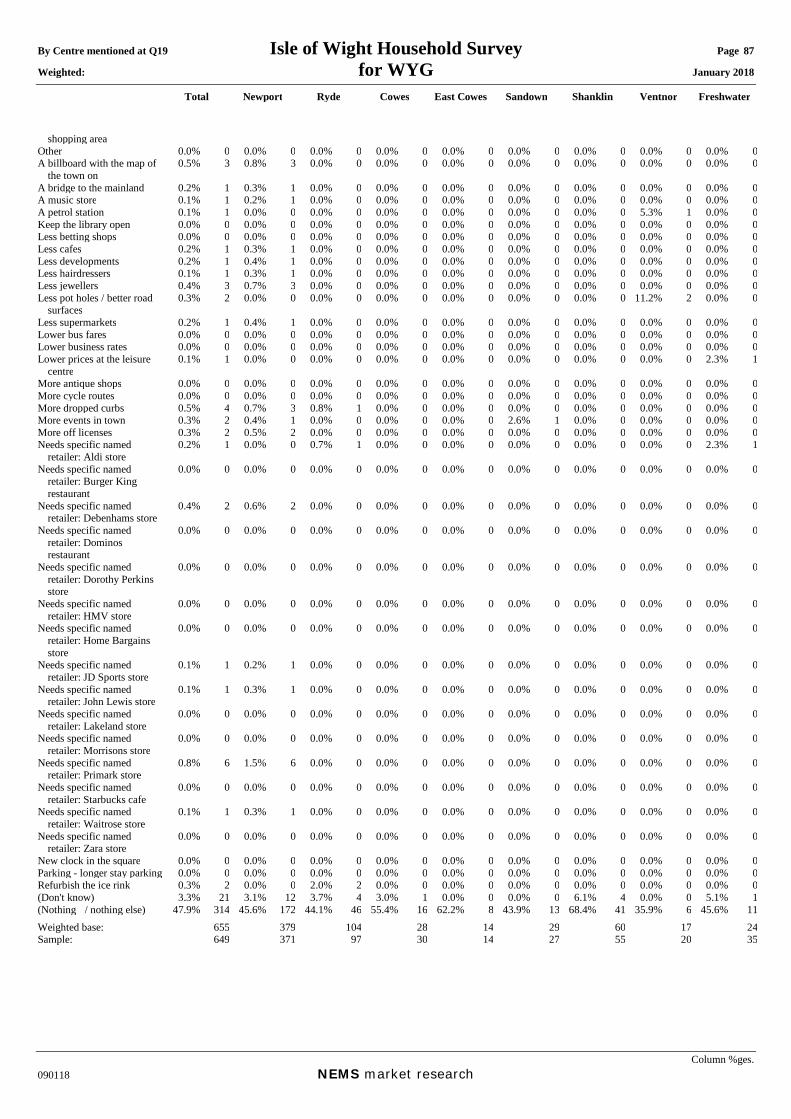
By Centre mentioned at Q19 Isle of Wight Household Survey Page 87 Weighted: for WYG January 2018
Total Newport Ryde Cowes East Cowes Sandown Shanklin Ventnor Freshwater
Column %ges. 090118 NEMS market research
shopping area Other 0.0% 0 0.0% 0 0.0% 0 0.0% 0 0.0% 0 0.0% 0 0.0% 0 0.0% 0 0.0% 0A billboard with the map of
the town on 0.5% 3 0.8% 3 0.0% 0 0.0% 0 0.0% 0 0.0% 0 0.0% 0 0.0% 0 0.0% 0
A bridge to the mainland 0.2% 1 0.3% 1 0.0% 0 0.0% 0 0.0% 0 0.0% 0 0.0% 0 0.0% 0 0.0% 0A music store 0.1% 1 0.2% 1 0.0% 0 0.0% 0 0.0% 0 0.0% 0 0.0% 0 0.0% 0 0.0% 0A petrol station 0.1% 1 0.0% 0 0.0% 0 0.0% 0 0.0% 0 0.0% 0 0.0% 0 5.3% 1 0.0% 0Keep the library open 0.0% 0 0.0% 0 0.0% 0 0.0% 0 0.0% 0 0.0% 0 0.0% 0 0.0% 0 0.0% 0Less betting shops 0.0% 0 0.0% 0 0.0% 0 0.0% 0 0.0% 0 0.0% 0 0.0% 0 0.0% 0 0.0% 0Less cafes 0.2% 1 0.3% 1 0.0% 0 0.0% 0 0.0% 0 0.0% 0 0.0% 0 0.0% 0 0.0% 0Less developments 0.2% 1 0.4% 1 0.0% 0 0.0% 0 0.0% 0 0.0% 0 0.0% 0 0.0% 0 0.0% 0Less hairdressers 0.1% 1 0.3% 1 0.0% 0 0.0% 0 0.0% 0 0.0% 0 0.0% 0 0.0% 0 0.0% 0Less jewellers 0.4% 3 0.7% 3 0.0% 0 0.0% 0 0.0% 0 0.0% 0 0.0% 0 0.0% 0 0.0% 0Less pot holes / better road
surfaces 0.3% 2 0.0% 0 0.0% 0 0.0% 0 0.0% 0 0.0% 0 0.0% 0 11.2% 2 0.0% 0
Less supermarkets 0.2% 1 0.4% 1 0.0% 0 0.0% 0 0.0% 0 0.0% 0 0.0% 0 0.0% 0 0.0% 0Lower bus fares 0.0% 0 0.0% 0 0.0% 0 0.0% 0 0.0% 0 0.0% 0 0.0% 0 0.0% 0 0.0% 0Lower business rates 0.0% 0 0.0% 0 0.0% 0 0.0% 0 0.0% 0 0.0% 0 0.0% 0 0.0% 0 0.0% 0Lower prices at the leisure
centre 0.1% 1 0.0% 0 0.0% 0 0.0% 0 0.0% 0 0.0% 0 0.0% 0 0.0% 0 2.3% 1
More antique shops 0.0% 0 0.0% 0 0.0% 0 0.0% 0 0.0% 0 0.0% 0 0.0% 0 0.0% 0 0.0% 0More cycle routes 0.0% 0 0.0% 0 0.0% 0 0.0% 0 0.0% 0 0.0% 0 0.0% 0 0.0% 0 0.0% 0More dropped curbs 0.5% 4 0.7% 3 0.8% 1 0.0% 0 0.0% 0 0.0% 0 0.0% 0 0.0% 0 0.0% 0More events in town 0.3% 2 0.4% 1 0.0% 0 0.0% 0 0.0% 0 2.6% 1 0.0% 0 0.0% 0 0.0% 0More off licenses 0.3% 2 0.5% 2 0.0% 0 0.0% 0 0.0% 0 0.0% 0 0.0% 0 0.0% 0 0.0% 0Needs specific named
retailer: Aldi store 0.2% 1 0.0% 0 0.7% 1 0.0% 0 0.0% 0 0.0% 0 0.0% 0 0.0% 0 2.3% 1
Needs specific named retailer: Burger King restaurant
0.0% 0 0.0% 0 0.0% 0 0.0% 0 0.0% 0 0.0% 0 0.0% 0 0.0% 0 0.0% 0
Needs specific named retailer: Debenhams store
0.4% 2 0.6% 2 0.0% 0 0.0% 0 0.0% 0 0.0% 0 0.0% 0 0.0% 0 0.0% 0
Needs specific named retailer: Dominos restaurant
0.0% 0 0.0% 0 0.0% 0 0.0% 0 0.0% 0 0.0% 0 0.0% 0 0.0% 0 0.0% 0
Needs specific named retailer: Dorothy Perkins store
0.0% 0 0.0% 0 0.0% 0 0.0% 0 0.0% 0 0.0% 0 0.0% 0 0.0% 0 0.0% 0
Needs specific named retailer: HMV store
0.0% 0 0.0% 0 0.0% 0 0.0% 0 0.0% 0 0.0% 0 0.0% 0 0.0% 0 0.0% 0
Needs specific named retailer: Home Bargains store
0.0% 0 0.0% 0 0.0% 0 0.0% 0 0.0% 0 0.0% 0 0.0% 0 0.0% 0 0.0% 0
Needs specific named retailer: JD Sports store
0.1% 1 0.2% 1 0.0% 0 0.0% 0 0.0% 0 0.0% 0 0.0% 0 0.0% 0 0.0% 0
Needs specific named retailer: John Lewis store
0.1% 1 0.3% 1 0.0% 0 0.0% 0 0.0% 0 0.0% 0 0.0% 0 0.0% 0 0.0% 0
Needs specific named retailer: Lakeland store
0.0% 0 0.0% 0 0.0% 0 0.0% 0 0.0% 0 0.0% 0 0.0% 0 0.0% 0 0.0% 0
Needs specific named retailer: Morrisons store
0.0% 0 0.0% 0 0.0% 0 0.0% 0 0.0% 0 0.0% 0 0.0% 0 0.0% 0 0.0% 0
Needs specific named retailer: Primark store
0.8% 6 1.5% 6 0.0% 0 0.0% 0 0.0% 0 0.0% 0 0.0% 0 0.0% 0 0.0% 0
Needs specific named retailer: Starbucks cafe
0.0% 0 0.0% 0 0.0% 0 0.0% 0 0.0% 0 0.0% 0 0.0% 0 0.0% 0 0.0% 0
Needs specific named retailer: Waitrose store
0.1% 1 0.3% 1 0.0% 0 0.0% 0 0.0% 0 0.0% 0 0.0% 0 0.0% 0 0.0% 0
Needs specific named retailer: Zara store
0.0% 0 0.0% 0 0.0% 0 0.0% 0 0.0% 0 0.0% 0 0.0% 0 0.0% 0 0.0% 0
New clock in the square 0.0% 0 0.0% 0 0.0% 0 0.0% 0 0.0% 0 0.0% 0 0.0% 0 0.0% 0 0.0% 0Parking - longer stay parking 0.0% 0 0.0% 0 0.0% 0 0.0% 0 0.0% 0 0.0% 0 0.0% 0 0.0% 0 0.0% 0Refurbish the ice rink 0.3% 2 0.0% 0 2.0% 2 0.0% 0 0.0% 0 0.0% 0 0.0% 0 0.0% 0 0.0% 0(Don't know) 3.3% 21 3.1% 12 3.7% 4 3.0% 1 0.0% 0 0.0% 0 6.1% 4 0.0% 0 5.1% 1(Nothing / nothing else) 47.9% 314 45.6% 172 44.1% 46 55.4% 16 62.2% 8 43.9% 13 68.4% 41 35.9% 6 45.6% 11Weighted base: 655 379 104 28 14 29 60 17 24Sample: 649 371 97 30 14 27 55 20 35
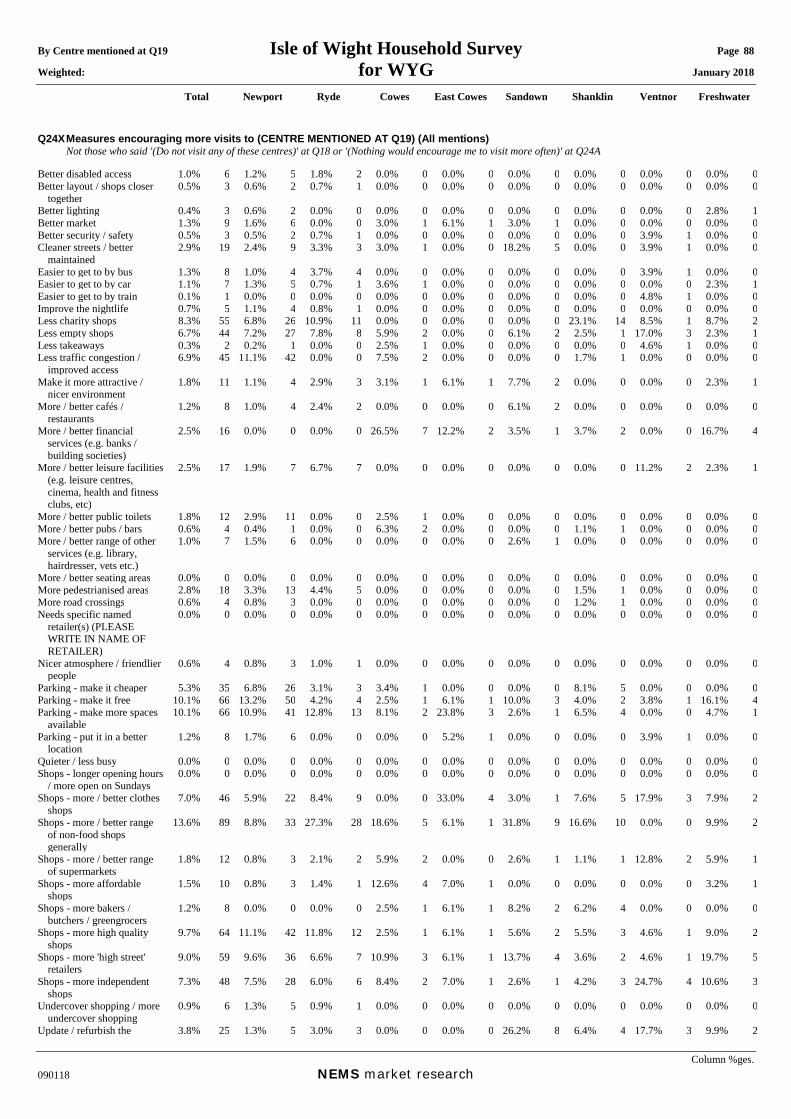
By Centre mentioned at Q19 Isle of Wight Household Survey Page 88 Weighted: for WYG January 2018
Total Newport Ryde Cowes East Cowes Sandown Shanklin Ventnor Freshwater
Column %ges. 090118 NEMS market research
Q24X Measures encouraging more visits to (CENTRE MENTIONED AT Q19) (All mentions) Not those who said '(Do not visit any of these centres)' at Q18 or '(Nothing would encourage me to visit more often)' at Q24A Better disabled access 1.0% 6 1.2% 5 1.8% 2 0.0% 0 0.0% 0 0.0% 0 0.0% 0 0.0% 0 0.0% 0Better layout / shops closer
together 0.5% 3 0.6% 2 0.7% 1 0.0% 0 0.0% 0 0.0% 0 0.0% 0 0.0% 0 0.0% 0
Better lighting 0.4% 3 0.6% 2 0.0% 0 0.0% 0 0.0% 0 0.0% 0 0.0% 0 0.0% 0 2.8% 1Better market 1.3% 9 1.6% 6 0.0% 0 3.0% 1 6.1% 1 3.0% 1 0.0% 0 0.0% 0 0.0% 0Better security / safety 0.5% 3 0.5% 2 0.7% 1 0.0% 0 0.0% 0 0.0% 0 0.0% 0 3.9% 1 0.0% 0Cleaner streets / better
maintained 2.9% 19 2.4% 9 3.3% 3 3.0% 1 0.0% 0 18.2% 5 0.0% 0 3.9% 1 0.0% 0
Easier to get to by bus 1.3% 8 1.0% 4 3.7% 4 0.0% 0 0.0% 0 0.0% 0 0.0% 0 3.9% 1 0.0% 0Easier to get to by car 1.1% 7 1.3% 5 0.7% 1 3.6% 1 0.0% 0 0.0% 0 0.0% 0 0.0% 0 2.3% 1Easier to get to by train 0.1% 1 0.0% 0 0.0% 0 0.0% 0 0.0% 0 0.0% 0 0.0% 0 4.8% 1 0.0% 0Improve the nightlife 0.7% 5 1.1% 4 0.8% 1 0.0% 0 0.0% 0 0.0% 0 0.0% 0 0.0% 0 0.0% 0Less charity shops 8.3% 55 6.8% 26 10.9% 11 0.0% 0 0.0% 0 0.0% 0 23.1% 14 8.5% 1 8.7% 2Less empty shops 6.7% 44 7.2% 27 7.8% 8 5.9% 2 0.0% 0 6.1% 2 2.5% 1 17.0% 3 2.3% 1Less takeaways 0.3% 2 0.2% 1 0.0% 0 2.5% 1 0.0% 0 0.0% 0 0.0% 0 4.6% 1 0.0% 0Less traffic congestion /
improved access 6.9% 45 11.1% 42 0.0% 0 7.5% 2 0.0% 0 0.0% 0 1.7% 1 0.0% 0 0.0% 0
Make it more attractive / nicer environment
1.8% 11 1.1% 4 2.9% 3 3.1% 1 6.1% 1 7.7% 2 0.0% 0 0.0% 0 2.3% 1
More / better cafés / restaurants
1.2% 8 1.0% 4 2.4% 2 0.0% 0 0.0% 0 6.1% 2 0.0% 0 0.0% 0 0.0% 0
More / better financial services (e.g. banks / building societies)
2.5% 16 0.0% 0 0.0% 0 26.5% 7 12.2% 2 3.5% 1 3.7% 2 0.0% 0 16.7% 4
More / better leisure facilities (e.g. leisure centres, cinema, health and fitness clubs, etc)
2.5% 17 1.9% 7 6.7% 7 0.0% 0 0.0% 0 0.0% 0 0.0% 0 11.2% 2 2.3% 1
More / better public toilets 1.8% 12 2.9% 11 0.0% 0 2.5% 1 0.0% 0 0.0% 0 0.0% 0 0.0% 0 0.0% 0More / better pubs / bars 0.6% 4 0.4% 1 0.0% 0 6.3% 2 0.0% 0 0.0% 0 1.1% 1 0.0% 0 0.0% 0More / better range of other
services (e.g. library, hairdresser, vets etc.)
1.0% 7 1.5% 6 0.0% 0 0.0% 0 0.0% 0 2.6% 1 0.0% 0 0.0% 0 0.0% 0
More / better seating areas 0.0% 0 0.0% 0 0.0% 0 0.0% 0 0.0% 0 0.0% 0 0.0% 0 0.0% 0 0.0% 0More pedestrianised areas 2.8% 18 3.3% 13 4.4% 5 0.0% 0 0.0% 0 0.0% 0 1.5% 1 0.0% 0 0.0% 0More road crossings 0.6% 4 0.8% 3 0.0% 0 0.0% 0 0.0% 0 0.0% 0 1.2% 1 0.0% 0 0.0% 0Needs specific named
retailer(s) (PLEASE WRITE IN NAME OF RETAILER)
0.0% 0 0.0% 0 0.0% 0 0.0% 0 0.0% 0 0.0% 0 0.0% 0 0.0% 0 0.0% 0
Nicer atmosphere / friendlier people
0.6% 4 0.8% 3 1.0% 1 0.0% 0 0.0% 0 0.0% 0 0.0% 0 0.0% 0 0.0% 0
Parking - make it cheaper 5.3% 35 6.8% 26 3.1% 3 3.4% 1 0.0% 0 0.0% 0 8.1% 5 0.0% 0 0.0% 0Parking - make it free 10.1% 66 13.2% 50 4.2% 4 2.5% 1 6.1% 1 10.0% 3 4.0% 2 3.8% 1 16.1% 4Parking - make more spaces
available 10.1% 66 10.9% 41 12.8% 13 8.1% 2 23.8% 3 2.6% 1 6.5% 4 0.0% 0 4.7% 1
Parking - put it in a better location
1.2% 8 1.7% 6 0.0% 0 0.0% 0 5.2% 1 0.0% 0 0.0% 0 3.9% 1 0.0% 0
Quieter / less busy 0.0% 0 0.0% 0 0.0% 0 0.0% 0 0.0% 0 0.0% 0 0.0% 0 0.0% 0 0.0% 0Shops - longer opening hours
/ more open on Sundays 0.0% 0 0.0% 0 0.0% 0 0.0% 0 0.0% 0 0.0% 0 0.0% 0 0.0% 0 0.0% 0
Shops - more / better clothes shops
7.0% 46 5.9% 22 8.4% 9 0.0% 0 33.0% 4 3.0% 1 7.6% 5 17.9% 3 7.9% 2
Shops - more / better range of non-food shops generally
13.6% 89 8.8% 33 27.3% 28 18.6% 5 6.1% 1 31.8% 9 16.6% 10 0.0% 0 9.9% 2
Shops - more / better range of supermarkets
1.8% 12 0.8% 3 2.1% 2 5.9% 2 0.0% 0 2.6% 1 1.1% 1 12.8% 2 5.9% 1
Shops - more affordable shops
1.5% 10 0.8% 3 1.4% 1 12.6% 4 7.0% 1 0.0% 0 0.0% 0 0.0% 0 3.2% 1
Shops - more bakers / butchers / greengrocers
1.2% 8 0.0% 0 0.0% 0 2.5% 1 6.1% 1 8.2% 2 6.2% 4 0.0% 0 0.0% 0
Shops - more high quality shops
9.7% 64 11.1% 42 11.8% 12 2.5% 1 6.1% 1 5.6% 2 5.5% 3 4.6% 1 9.0% 2
Shops - more 'high street' retailers
9.0% 59 9.6% 36 6.6% 7 10.9% 3 6.1% 1 13.7% 4 3.6% 2 4.6% 1 19.7% 5
Shops - more independent shops
7.3% 48 7.5% 28 6.0% 6 8.4% 2 7.0% 1 2.6% 1 4.2% 3 24.7% 4 10.6% 3
Undercover shopping / more undercover shopping
0.9% 6 1.3% 5 0.9% 1 0.0% 0 0.0% 0 0.0% 0 0.0% 0 0.0% 0 0.0% 0
Update / refurbish the 3.8% 25 1.3% 5 3.0% 3 0.0% 0 0.0% 0 26.2% 8 6.4% 4 17.7% 3 9.9% 2
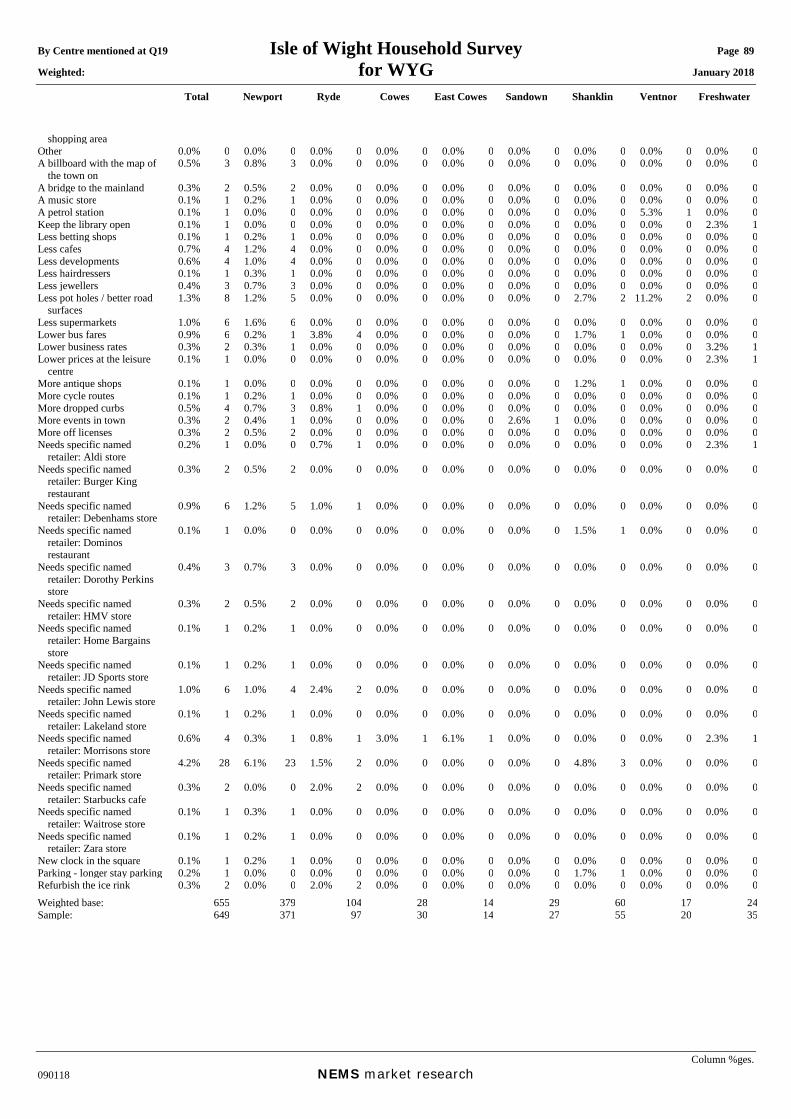
By Centre mentioned at Q19 Isle of Wight Household Survey Page 89 Weighted: for WYG January 2018
Total Newport Ryde Cowes East Cowes Sandown Shanklin Ventnor Freshwater
Column %ges. 090118 NEMS market research
shopping area Other 0.0% 0 0.0% 0 0.0% 0 0.0% 0 0.0% 0 0.0% 0 0.0% 0 0.0% 0 0.0% 0A billboard with the map of
the town on 0.5% 3 0.8% 3 0.0% 0 0.0% 0 0.0% 0 0.0% 0 0.0% 0 0.0% 0 0.0% 0
A bridge to the mainland 0.3% 2 0.5% 2 0.0% 0 0.0% 0 0.0% 0 0.0% 0 0.0% 0 0.0% 0 0.0% 0A music store 0.1% 1 0.2% 1 0.0% 0 0.0% 0 0.0% 0 0.0% 0 0.0% 0 0.0% 0 0.0% 0A petrol station 0.1% 1 0.0% 0 0.0% 0 0.0% 0 0.0% 0 0.0% 0 0.0% 0 5.3% 1 0.0% 0Keep the library open 0.1% 1 0.0% 0 0.0% 0 0.0% 0 0.0% 0 0.0% 0 0.0% 0 0.0% 0 2.3% 1Less betting shops 0.1% 1 0.2% 1 0.0% 0 0.0% 0 0.0% 0 0.0% 0 0.0% 0 0.0% 0 0.0% 0Less cafes 0.7% 4 1.2% 4 0.0% 0 0.0% 0 0.0% 0 0.0% 0 0.0% 0 0.0% 0 0.0% 0Less developments 0.6% 4 1.0% 4 0.0% 0 0.0% 0 0.0% 0 0.0% 0 0.0% 0 0.0% 0 0.0% 0Less hairdressers 0.1% 1 0.3% 1 0.0% 0 0.0% 0 0.0% 0 0.0% 0 0.0% 0 0.0% 0 0.0% 0Less jewellers 0.4% 3 0.7% 3 0.0% 0 0.0% 0 0.0% 0 0.0% 0 0.0% 0 0.0% 0 0.0% 0Less pot holes / better road
surfaces 1.3% 8 1.2% 5 0.0% 0 0.0% 0 0.0% 0 0.0% 0 2.7% 2 11.2% 2 0.0% 0
Less supermarkets 1.0% 6 1.6% 6 0.0% 0 0.0% 0 0.0% 0 0.0% 0 0.0% 0 0.0% 0 0.0% 0Lower bus fares 0.9% 6 0.2% 1 3.8% 4 0.0% 0 0.0% 0 0.0% 0 1.7% 1 0.0% 0 0.0% 0Lower business rates 0.3% 2 0.3% 1 0.0% 0 0.0% 0 0.0% 0 0.0% 0 0.0% 0 0.0% 0 3.2% 1Lower prices at the leisure
centre 0.1% 1 0.0% 0 0.0% 0 0.0% 0 0.0% 0 0.0% 0 0.0% 0 0.0% 0 2.3% 1
More antique shops 0.1% 1 0.0% 0 0.0% 0 0.0% 0 0.0% 0 0.0% 0 1.2% 1 0.0% 0 0.0% 0More cycle routes 0.1% 1 0.2% 1 0.0% 0 0.0% 0 0.0% 0 0.0% 0 0.0% 0 0.0% 0 0.0% 0More dropped curbs 0.5% 4 0.7% 3 0.8% 1 0.0% 0 0.0% 0 0.0% 0 0.0% 0 0.0% 0 0.0% 0More events in town 0.3% 2 0.4% 1 0.0% 0 0.0% 0 0.0% 0 2.6% 1 0.0% 0 0.0% 0 0.0% 0More off licenses 0.3% 2 0.5% 2 0.0% 0 0.0% 0 0.0% 0 0.0% 0 0.0% 0 0.0% 0 0.0% 0Needs specific named
retailer: Aldi store 0.2% 1 0.0% 0 0.7% 1 0.0% 0 0.0% 0 0.0% 0 0.0% 0 0.0% 0 2.3% 1
Needs specific named retailer: Burger King restaurant
0.3% 2 0.5% 2 0.0% 0 0.0% 0 0.0% 0 0.0% 0 0.0% 0 0.0% 0 0.0% 0
Needs specific named retailer: Debenhams store
0.9% 6 1.2% 5 1.0% 1 0.0% 0 0.0% 0 0.0% 0 0.0% 0 0.0% 0 0.0% 0
Needs specific named retailer: Dominos restaurant
0.1% 1 0.0% 0 0.0% 0 0.0% 0 0.0% 0 0.0% 0 1.5% 1 0.0% 0 0.0% 0
Needs specific named retailer: Dorothy Perkins store
0.4% 3 0.7% 3 0.0% 0 0.0% 0 0.0% 0 0.0% 0 0.0% 0 0.0% 0 0.0% 0
Needs specific named retailer: HMV store
0.3% 2 0.5% 2 0.0% 0 0.0% 0 0.0% 0 0.0% 0 0.0% 0 0.0% 0 0.0% 0
Needs specific named retailer: Home Bargains store
0.1% 1 0.2% 1 0.0% 0 0.0% 0 0.0% 0 0.0% 0 0.0% 0 0.0% 0 0.0% 0
Needs specific named retailer: JD Sports store
0.1% 1 0.2% 1 0.0% 0 0.0% 0 0.0% 0 0.0% 0 0.0% 0 0.0% 0 0.0% 0
Needs specific named retailer: John Lewis store
1.0% 6 1.0% 4 2.4% 2 0.0% 0 0.0% 0 0.0% 0 0.0% 0 0.0% 0 0.0% 0
Needs specific named retailer: Lakeland store
0.1% 1 0.2% 1 0.0% 0 0.0% 0 0.0% 0 0.0% 0 0.0% 0 0.0% 0 0.0% 0
Needs specific named retailer: Morrisons store
0.6% 4 0.3% 1 0.8% 1 3.0% 1 6.1% 1 0.0% 0 0.0% 0 0.0% 0 2.3% 1
Needs specific named retailer: Primark store
4.2% 28 6.1% 23 1.5% 2 0.0% 0 0.0% 0 0.0% 0 4.8% 3 0.0% 0 0.0% 0
Needs specific named retailer: Starbucks cafe
0.3% 2 0.0% 0 2.0% 2 0.0% 0 0.0% 0 0.0% 0 0.0% 0 0.0% 0 0.0% 0
Needs specific named retailer: Waitrose store
0.1% 1 0.3% 1 0.0% 0 0.0% 0 0.0% 0 0.0% 0 0.0% 0 0.0% 0 0.0% 0
Needs specific named retailer: Zara store
0.1% 1 0.2% 1 0.0% 0 0.0% 0 0.0% 0 0.0% 0 0.0% 0 0.0% 0 0.0% 0
New clock in the square 0.1% 1 0.2% 1 0.0% 0 0.0% 0 0.0% 0 0.0% 0 0.0% 0 0.0% 0 0.0% 0Parking - longer stay parking 0.2% 1 0.0% 0 0.0% 0 0.0% 0 0.0% 0 0.0% 0 1.7% 1 0.0% 0 0.0% 0Refurbish the ice rink 0.3% 2 0.0% 0 2.0% 2 0.0% 0 0.0% 0 0.0% 0 0.0% 0 0.0% 0 0.0% 0Weighted base: 655 379 104 28 14 29 60 17 24Sample: 649 371 97 30 14 27 55 20 35
Appendix 3: Sample Questionnaire
Job No: 090118Isle of Wight Retail Study
Good morning / afternoon / evening, I am…………… from NEMS Market Research, Independent Market Research Company, and we are conducting a short survey in the Isle of Wight about shopping? Do you have time to answer some questions please? It will take about 7 minutes
QA Are you the person responsible for the main food shopping in your household?
YesNo
IF ‘YES’ – CONTINUE INTERVIEW. IF ‘NO’ – ASK, COULD I SPEAK TO THE PERSON WHO IS RESPONSIBLE FOR MOST OF THE FOOD SHOPPING, IF NOT AVAILABLE THANK AND CLOSE INTERVIEW
Q01 Where did you last undertake your main food and grocery shopping?DO NOT READ OUT. ONE ANSWER ONLY.
#ConvenienceConvenience List
(Don't know / can't remember)CLOSE - DON'T COUNT
(Don’t do this type of shopping)CLOSE - DON'T COUNT
Those who said "Internet / delivery" at Q01Q01A Was your last internet grocery shop delivered or click and collect?
DO NOT READ OUT. ONE ANSWER ONLY.
1 Home delivery2 Click & collect3 (Don't know / can't remember)
Q02 Where did you undertake your main food and grocery shopping the time before your last visit to (STORE MENTIONED AT Q01) was it the same place, or different, and if so, please specify?DO NOT READ OUT. ONE ANSWER ONLY.
#ConvenienceConvenience List
Those who said "Internet / delivery" at Q01Q02A Was that internet grocery shop delivered or click and collect?
DO NOT READ OUT. ONE ANSWER ONLY.
1 Home delivery2 Click & collect3 (Don't know / can't remember)
Q03 How much would you estimate you typically spend on a weekly basis on main food shopping?DO NOT PROMPT. ONE ANSWER ONLY.
X To the nearest £: (PLEASE WRITE IN)Y (Don't know / varies)Z (Refused)
Q04 Do you make ‘top up’ shopping trips for staple goods, such as bread and milk, in between your main food shopping trip?
DO NOT READ OUT. ONE ANSWER ONLY.
1 Yes GO TO Q052 No GO TO Q07
Q05 Where did you last undertake this ‘top-up’ food shopping?DO NOT READ OUT. ONE ANSWER ONLY.
#ConvenienceConvenience List
Q06 How much would you estimate you typically spend on a weekly basis on top up food shopping?DO NOT PROMPT. ONE ANSWER ONLY.
X To the nearest £: (PLEASE WRITE IN)Y (Don't know / varies)Z (Refused)
Q07 Where did you last buy clothing or footwear goods?DO NOT PROMPT. ONE ANSWER ONLY. IF IN STORE IN A SUPERMARKET WRITE IN NAME OF SUPERMARKET AND TOWN.
#ComparisonComparison List
Those who said "Internet" at Q07Q07A How did you receive your clothing or footwear goods?
DO NOT PROMPT. ONE ANSWER ONLY. NOTE IF RESPONDENT SAYS THEY COLLECTED IT - PLEASE PROBE FOR WHICH METHOD OF COLLECTION THEY USED AND CHOOSE ACCORDINGLY.
1 Home delivery2 Delivery to place of work3 Collection at one of the stores from which the goods were bought from (e.g. the same retailer)4 Collection at a DIFFERENT store/shop from which the goods were bought from (e.g. NOT the same retailer)5 Collection from a locker (e.g. Amazon Locker or similar system)6 Collection from other location (PLEASE WRITE IN TYPE OF LOCATION)7 (Don't know / varies)
Q08 Where did you last buy books, CDs or DVDs?DO NOT PROMPT. ONE ANSWER ONLY. IF IN STORE IN A SUPERMARKET WRITE IN NAME OF SUPERMARKET AND TOWN.
#ComparisonComparison List
Those who said "Internet" at Q08Q08A How did you receive your books, CDs or DVDs?
DO NOT PROMPT. ONE ANSWER ONLY. NOTE IF RESPONDENT SAYS THEY COLLECTED IT - PLEASE PROBE FOR WHICH METHOD OF COLLECTION THEY USED AND CHOOSE ACCORDINGLY.
1 Home delivery2 Delivery to place of work3 Collection at one of the stores from which the goods were bought from (e.g. the same retailer)4 Collection at a DIFFERENT store/shop from which the goods were bought from (e.g. NOT the same retailer)5 Collection from a locker (e.g. Amazon Locker or similar system)6 Collection from other location (PLEASE WRITE IN TYPE OF LOCATION)7 (Don't know / varies)
Q09 Where did you last buy furnishings and household textile goods?DO NOT PROMPT. ONE ANSWER ONLY. IF IN STORE IN A SUPERMARKET WRITE IN NAME OF SUPERMARKET AND TOWN.
#ComparisonComparison List
Those who said "Internet" at Q09Q09A How did you receive your furnishings and household textile goods?
DO NOT PROMPT. ONE ANSWER ONLY. NOTE IF RESPONDENT SAYS THEY COLLECTED IT - PLEASE PROBE FOR WHICH METHOD OF COLLECTION THEY USED AND CHOOSE ACCORDINGLY.
1 Home delivery2 Delivery to place of work3 Collection at one of the stores from which the goods were bought from (e.g. the same retailer)4 Collection at a DIFFERENT store/shop from which the goods were bought from (e.g. NOT the same retailer)5 Collection from a locker (e.g. Amazon Locker or similar system)6 Collection from other location (PLEASE WRITE IN TYPE OF LOCATION)7 (Don't know / varies)
Q10 Where did you last buy small household goods such as, china, glassware and utensils?DO NOT PROMPT. ONE ANSWER ONLY. IF IN STORE IN A SUPERMARKET WRITE IN NAME OF SUPERMARKET AND TOWN.
#ComparisonComparison List
Those who said "Internet" at Q10Q10A How did you receive your small household goods such as, china, glassware and utensils?
DO NOT PROMPT. ONE ANSWER ONLY. NOTE IF RESPONDENT SAYS THEY COLLECTED IT - PLEASE PROBE FOR WHICH METHOD OF COLLECTION THEY USED AND CHOOSE ACCORDINGLY.
1 Home delivery2 Delivery to place of work3 Collection at one of the stores from which the goods were bought from (e.g. the same retailer)4 Collection at a DIFFERENT store/shop from which the goods were bought from (e.g. NOT the same retailer)5 Collection from a locker (e.g. Amazon Locker or similar system)6 Collection from other location (PLEASE WRITE IN TYPE OF LOCATION)7 (Don't know / varies)
Q11 Where did you last buy items such as clocks, jewellery, watches?DO NOT PROMPT. ONE ANSWER ONLY. IF IN STORE IN A SUPERMARKET WRITE IN NAME OF SUPERMARKET AND TOWN.
#ComparisonComparison List
Those who said "Internet" at Q11Q11A How did you receive your items such as clocks, jewellery, watches?
DO NOT PROMPT. ONE ANSWER ONLY. NOTE IF RESPONDENT SAYS THEY COLLECTED IT - PLEASE PROBE FOR WHICH METHOD OF COLLECTION THEY USED AND CHOOSE ACCORDINGLY.
1 Home delivery2 Delivery to place of work3 Collection at one of the stores from which the goods were bought from (e.g. the same retailer)4 Collection at a DIFFERENT store/shop from which the goods were bought from (e.g. NOT the same retailer)5 Collection from a locker (e.g. Amazon Locker or similar system)6 Collection from other location (PLEASE WRITE IN TYPE OF LOCATION)7 (Don't know / varies)
Q12 Where did you last buy toys, games, bicycles and other recreational/sports goods? DO NOT PROMPT. ONE ANSWER ONLY. IF IN STORE IN A SUPERMARKET WRITE IN NAME OF SUPERMARKET AND TOWN.
#ComparisonComparison List
Those who said "Internet" at Q12Q12A How did you receive your toys, games, bicycles and other recreational/sports goods?
DO NOT PROMPT. ONE ANSWER ONLY. NOTE IF RESPONDENT SAYS THEY COLLECTED IT - PLEASE PROBE FOR WHICH METHOD OF COLLECTION THEY USED AND CHOOSE ACCORDINGLY.
1 Home delivery2 Delivery to place of work3 Collection at one of the stores from which the goods were bought from (e.g. the same retailer)4 Collection at a DIFFERENT store/shop from which the goods were bought from (e.g. NOT the same retailer)5 Collection from a locker (e.g. Amazon Locker or similar system)6 Collection from other location (PLEASE WRITE IN TYPE OF LOCATION)7 (Don't know / varies)
Q13 Where did you last buy chemist goods including health and beauty products?DO NOT PROMPT. ONE ANSWER ONLY. IF IN STORE IN A SUPERMARKET WRITE IN NAME OF SUPERMARKET AND TOWN.
#ComparisonComparison List
Those who said "Internet" at Q13Q13A How did you receive your chemist goods including health and beauty products?
DO NOT PROMPT. ONE ANSWER ONLY. NOTE IF RESPONDENT SAYS THEY COLLECTED IT - PLEASE PROBE FOR WHICH METHOD OF COLLECTION THEY USED AND CHOOSE ACCORDINGLY.
1 Home delivery2 Delivery to place of work3 Collection at one of the stores from which the goods were bought from (e.g. the same retailer)4 Collection at a DIFFERENT store/shop from which the goods were bought from (e.g. NOT the same retailer)5 Collection from a locker (e.g. Amazon Locker or similar system)6 Collection from other location (PLEASE WRITE IN TYPE OF LOCATION)7 (Don't know / varies)
Q14 Where did you last buy a large household electrical item?DO NOT PROMPT. ONE ANSWER ONLY. IF IN STORE IN A SUPERMARKET WRITE IN NAME OF SUPERMARKET AND TOWN.
#ComparisonComparison List
Those who said "Internet" at Q14Q14A How did you receive your large household electrical item?
DO NOT PROMPT. ONE ANSWER ONLY. NOTE IF RESPONDENT SAYS THEY COLLECTED IT - PLEASE PROBE FOR WHICH METHOD OF COLLECTION THEY USED AND CHOOSE ACCORDINGLY.
1 Home delivery2 Delivery to place of work3 Collection at one of the stores from which the goods were bought from (e.g. the same retailer)4 Collection at a DIFFERENT store/shop from which the goods were bought from (e.g. NOT the same retailer)5 Collection from a locker (e.g. Amazon Locker or similar system)6 Collection from other location (PLEASE WRITE IN TYPE OF LOCATION)7 (Don't know / varies)
Q15 Where did you last buy small electrical goods (cameras, tablets, blenders)?DO NOT PROMPT. ONE ANSWER ONLY. IF IN STORE IN A SUPERMARKET WRITE IN NAME OF SUPERMARKET AND TOWN.
#ComparisonComparison List
Those who said "Internet" at Q15Q15A How did you receive your small electrical goods (cameras, tablets, blenders)?
DO NOT PROMPT. ONE ANSWER ONLY. NOTE IF RESPONDENT SAYS THEY COLLECTED IT - PLEASE PROBE FOR WHICH METHOD OF COLLECTION THEY USED AND CHOOSE ACCORDINGLY.
1 Home delivery2 Delivery to place of work3 Collection at one of the stores from which the goods were bought from (e.g. the same retailer)4 Collection at a DIFFERENT store/shop from which the goods were bought from (e.g. NOT the same retailer)5 Collection from a locker (e.g. Amazon Locker or similar system)6 Collection from other location (PLEASE WRITE IN TYPE OF LOCATION)7 (Don't know / varies)
Q16 Where did you last buy furniture, carpets and floor coverings?DO NOT PROMPT. ONE ANSWER ONLY. IF IN STORE IN A SUPERMARKET WRITE IN NAME OF SUPERMARKET AND TOWN.
#ComparisonComparison List
Those who said "Internet" at Q16Q16A How did you receive your furniture, carpets and floor coverings?
DO NOT PROMPT. ONE ANSWER ONLY. NOTE IF RESPONDENT SAYS THEY COLLECTED IT - PLEASE PROBE FOR WHICH METHOD OF COLLECTION THEY USED AND CHOOSE ACCORDINGLY.
1 Home delivery2 Delivery to place of work3 Collection at one of the stores from which the goods were bought from (e.g. the same retailer)4 Collection at a DIFFERENT store/shop from which the goods were bought from (e.g. NOT the same retailer)5 Collection from a locker (e.g. Amazon Locker or similar system)6 Collection from other location (PLEASE WRITE IN TYPE OF LOCATION)7 (Don't know / varies)
Q17 Where did you last buy DIY (including gardening) goods?DO NOT PROMPT. ONE ANSWER ONLY. IF IN STORE IN A SUPERMARKET WRITE IN NAME OF SUPERMARKET AND TOWN.
#ComparisonComparison List
Those who said "Internet" at Q17Q17A How did you receive your DIY (including gardening) goods?
DO NOT PROMPT. ONE ANSWER ONLY. NOTE IF RESPONDENT SAYS THEY COLLECTED IT - PLEASE PROBE FOR WHICH METHOD OF COLLECTION THEY USED AND CHOOSE ACCORDINGLY.
1 Home delivery2 Delivery to place of work3 Collection at one of the stores from which the goods were bought from (e.g. the same retailer)4 Collection at a DIFFERENT store/shop from which the goods were bought from (e.g. NOT the same retailer)5 Collection from a locker (e.g. Amazon Locker or similar system)6 Collection from other location (PLEASE WRITE IN TYPE OF LOCATION)7 (Don't know / varies)
Q18 Do you ever visit any of the following centres for shopping and services?READ OUT. CAN BE MULTICODED.
1 Newport2 Ryde3 Cowes4 East Cowes5 Sandown6 Shanklin7 Ventnor8 Freshwater9 (Do not visit any of these centres)
Q19 Which centre do you visit the most?DO NOT READ OUT. ONE ANSWER ONLY. IF THEY SAY THERE ISN'T ONE CENTRE WHICH THEY VISIT THE MOST - ASK FOR THE ONE THEY VISITED LAST
1 Newport2 Ryde3 Cowes4 East Cowes5 Sandown6 Shanklin7 Ventnor8 Freshwater
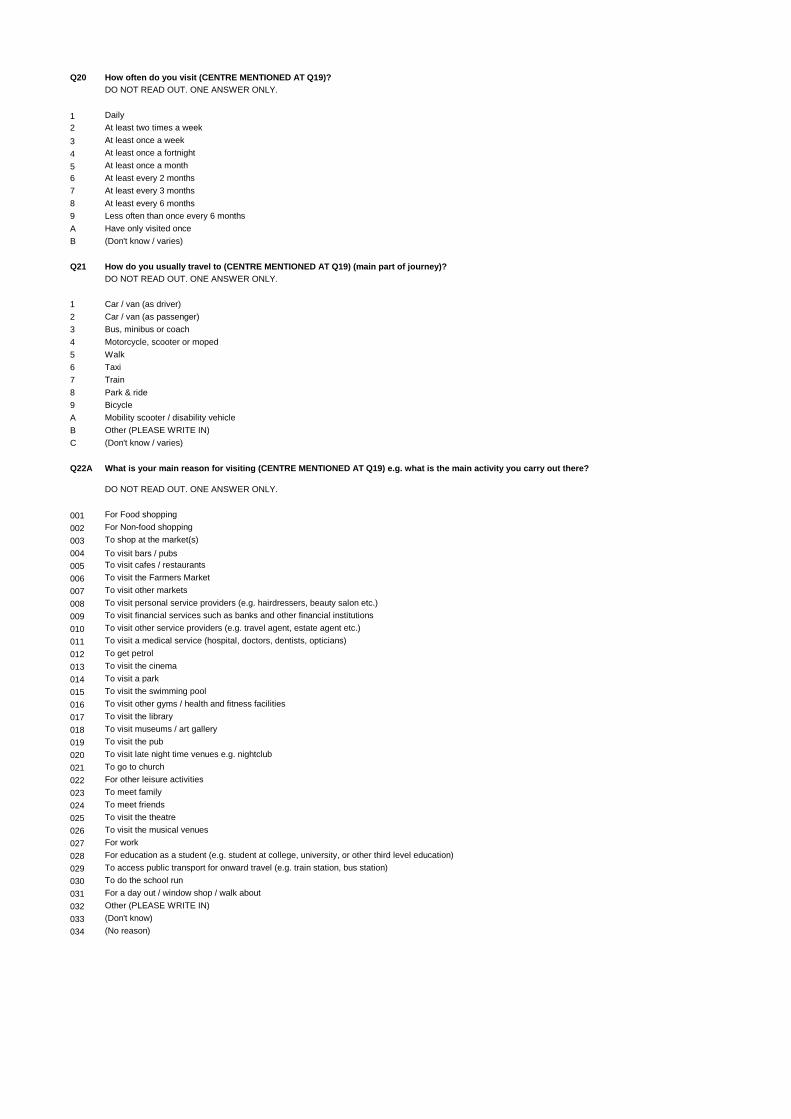
Q20 How often do you visit (CENTRE MENTIONED AT Q19)?DO NOT READ OUT. ONE ANSWER ONLY.
1 Daily2 At least two times a week3 At least once a week4 At least once a fortnight5 At least once a month6 At least every 2 months7 At least every 3 months8 At least every 6 months9 Less often than once every 6 monthsA Have only visited onceB (Don't know / varies)
Q21 How do you usually travel to (CENTRE MENTIONED AT Q19) (main part of journey)?DO NOT READ OUT. ONE ANSWER ONLY.
1 Car / van (as driver)2 Car / van (as passenger)3 Bus, minibus or coach 4 Motorcycle, scooter or moped5 Walk6 Taxi7 Train8 Park & ride 9 BicycleA Mobility scooter / disability vehicleB Other (PLEASE WRITE IN)C (Don't know / varies)
Q22A What is your main reason for visiting (CENTRE MENTIONED AT Q19) e.g. what is the main activity you carry out there?
DO NOT READ OUT. ONE ANSWER ONLY.
001 For Food shopping002 For Non-food shopping 003 To shop at the market(s)004 To visit bars / pubs005 To visit cafes / restaurants 006 To visit the Farmers Market 007 To visit other markets008 To visit personal service providers (e.g. hairdressers, beauty salon etc.) 009 To visit financial services such as banks and other financial institutions010 To visit other service providers (e.g. travel agent, estate agent etc.) 011 To visit a medical service (hospital, doctors, dentists, opticians)012 To get petrol013 To visit the cinema014 To visit a park015 To visit the swimming pool016 To visit other gyms / health and fitness facilities 017 To visit the library018 To visit museums / art gallery 019 To visit the pub020 To visit late night time venues e.g. nightclub 021 To go to church022 For other leisure activities 023 To meet family024 To meet friends 025 To visit the theatre026 To visit the musical venues 027 For work028 For education as a student (e.g. student at college, university, or other third level education)029 To access public transport for onward travel (e.g. train station, bus station) 030 To do the school run031 For a day out / window shop / walk about 032 Other (PLEASE WRITE IN)033 (Don't know)034 (No reason)
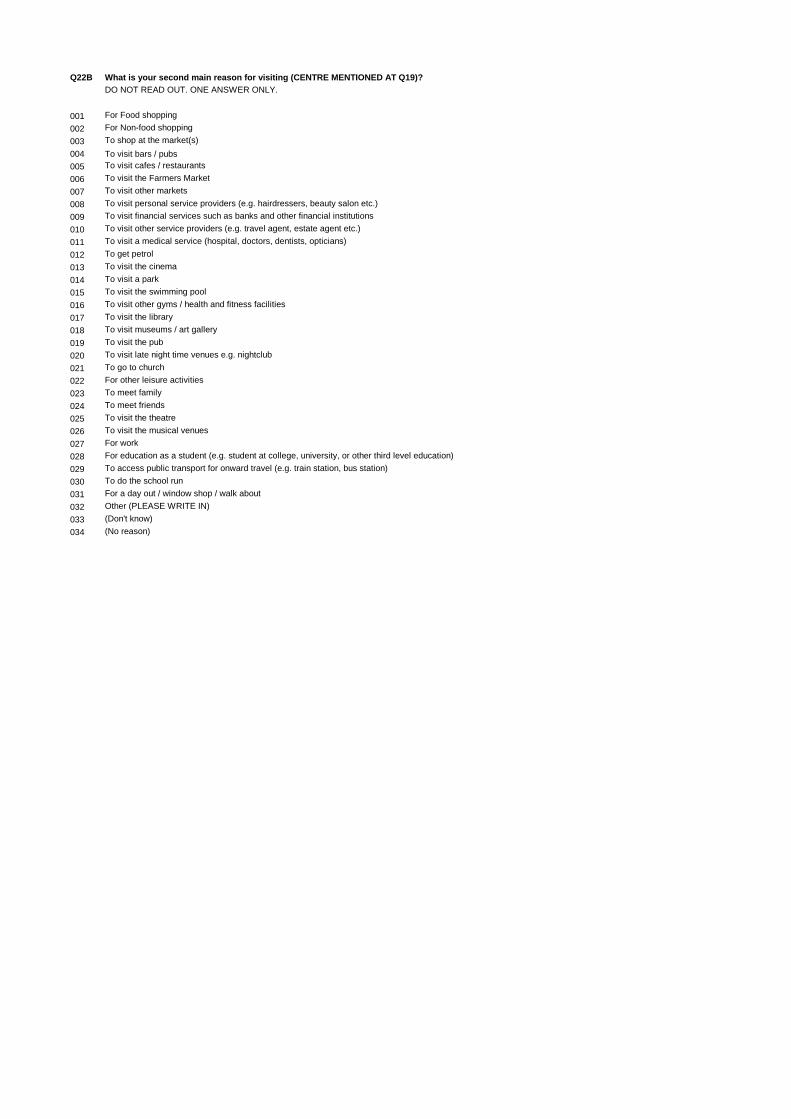
Q22B What is your second main reason for visiting (CENTRE MENTIONED AT Q19)?DO NOT READ OUT. ONE ANSWER ONLY.
001 For Food shopping002 For Non-food shopping 003 To shop at the market(s)004 To visit bars / pubs005 To visit cafes / restaurants 006 To visit the Farmers Market 007 To visit other markets008 To visit personal service providers (e.g. hairdressers, beauty salon etc.) 009 To visit financial services such as banks and other financial institutions010 To visit other service providers (e.g. travel agent, estate agent etc.) 011 To visit a medical service (hospital, doctors, dentists, opticians)012 To get petrol013 To visit the cinema014 To visit a park015 To visit the swimming pool016 To visit other gyms / health and fitness facilities 017 To visit the library018 To visit museums / art gallery 019 To visit the pub020 To visit late night time venues e.g. nightclub 021 To go to church022 For other leisure activities 023 To meet family024 To meet friends 025 To visit the theatre026 To visit the musical venues 027 For work028 For education as a student (e.g. student at college, university, or other third level education)029 To access public transport for onward travel (e.g. train station, bus station) 030 To do the school run031 For a day out / window shop / walk about 032 Other (PLEASE WRITE IN)033 (Don't know)034 (No reason)
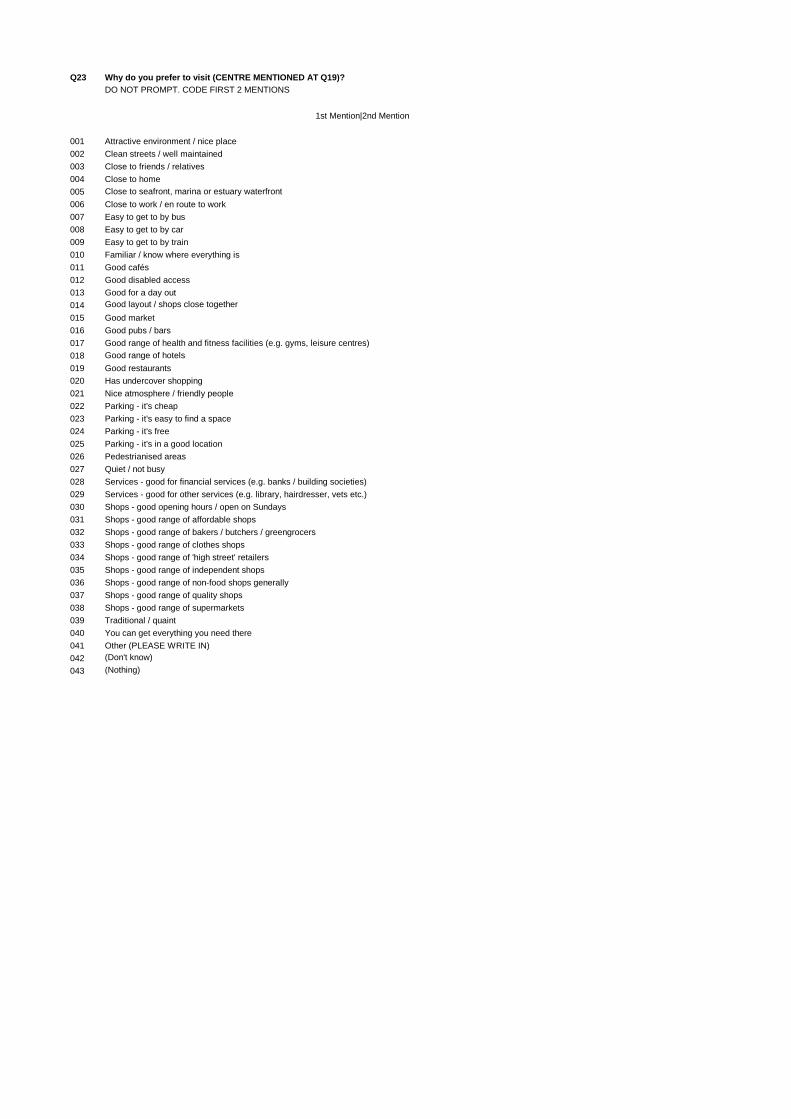
Q23 Why do you prefer to visit (CENTRE MENTIONED AT Q19)?DO NOT PROMPT. CODE FIRST 2 MENTIONS
1st Mention|2nd Mention
001 Attractive environment / nice place002 Clean streets / well maintained003 Close to friends / relatives004 Close to home005 Close to seafront, marina or estuary waterfront 006 Close to work / en route to work007 Easy to get to by bus008 Easy to get to by car009 Easy to get to by train010 Familiar / know where everything is011 Good cafés012 Good disabled access013 Good for a day out014 Good layout / shops close together015 Good market016 Good pubs / bars017 Good range of health and fitness facilities (e.g. gyms, leisure centres)018 Good range of hotels019 Good restaurants020 Has undercover shopping021 Nice atmosphere / friendly people022 Parking - it's cheap023 Parking - it's easy to find a space024 Parking - it's free025 Parking - it's in a good location026 Pedestrianised areas027 Quiet / not busy028 Services - good for financial services (e.g. banks / building societies)029 Services - good for other services (e.g. library, hairdresser, vets etc.)030 Shops - good opening hours / open on Sundays031 Shops - good range of affordable shops032 Shops - good range of bakers / butchers / greengrocers033 Shops - good range of clothes shops034 Shops - good range of 'high street' retailers035 Shops - good range of independent shops036 Shops - good range of non-food shops generally037 Shops - good range of quality shops038 Shops - good range of supermarkets039 Traditional / quaint040 You can get everything you need there041 Other (PLEASE WRITE IN)042 (Don't know)043 (Nothing)
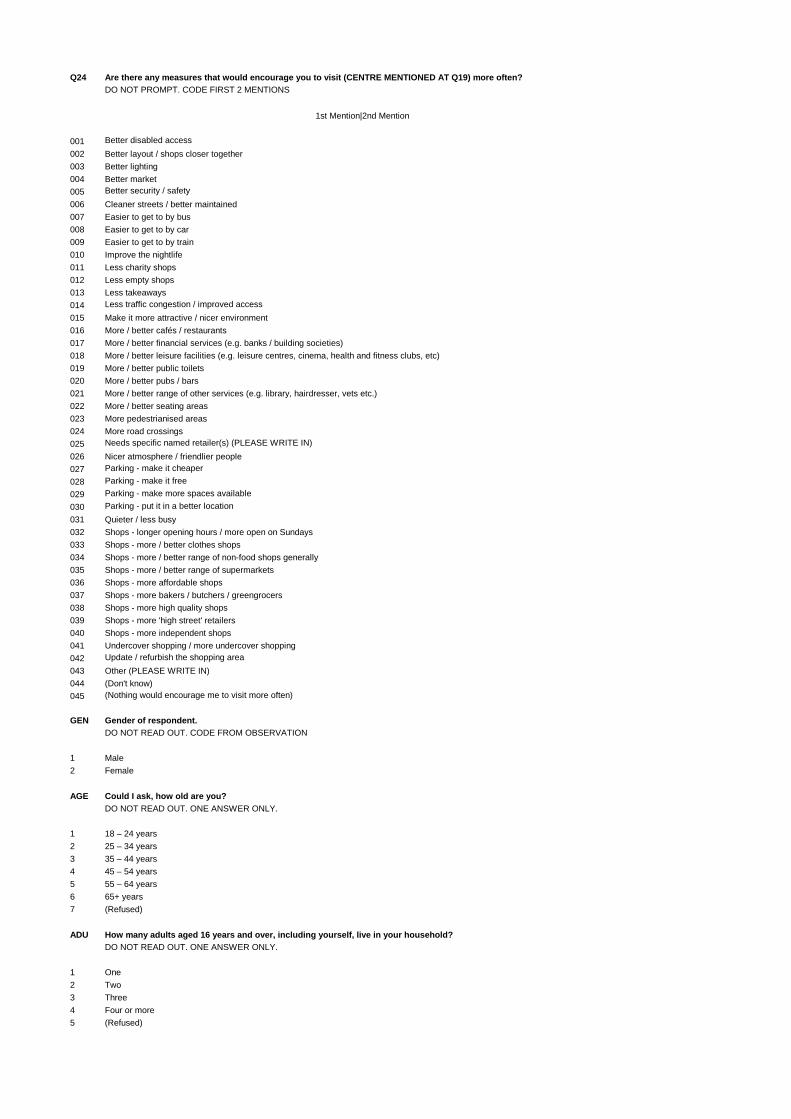
Q24 Are there any measures that would encourage you to visit (CENTRE MENTIONED AT Q19) more often?DO NOT PROMPT. CODE FIRST 2 MENTIONS
1st Mention|2nd Mention
001 Better disabled access002 Better layout / shops closer together003 Better lighting004 Better market005 Better security / safety006 Cleaner streets / better maintained007 Easier to get to by bus008 Easier to get to by car009 Easier to get to by train010 Improve the nightlife011 Less charity shops012 Less empty shops013 Less takeaways014 Less traffic congestion / improved access015 Make it more attractive / nicer environment016 More / better cafés / restaurants017 More / better financial services (e.g. banks / building societies)018 More / better leisure facilities (e.g. leisure centres, cinema, health and fitness clubs, etc)019 More / better public toilets020 More / better pubs / bars021 More / better range of other services (e.g. library, hairdresser, vets etc.)022 More / better seating areas023 More pedestrianised areas024 More road crossings025 Needs specific named retailer(s) (PLEASE WRITE IN)026 Nicer atmosphere / friendlier people027 Parking - make it cheaper028 Parking - make it free029 Parking - make more spaces available030 Parking - put it in a better location031 Quieter / less busy032 Shops - longer opening hours / more open on Sundays033 Shops - more / better clothes shops034 Shops - more / better range of non-food shops generally035 Shops - more / better range of supermarkets036 Shops - more affordable shops037 Shops - more bakers / butchers / greengrocers038 Shops - more high quality shops039 Shops - more 'high street' retailers040 Shops - more independent shops041 Undercover shopping / more undercover shopping042 Update / refurbish the shopping area043 Other (PLEASE WRITE IN)044 (Don't know)045 (Nothing would encourage me to visit more often)
GEN Gender of respondent.DO NOT READ OUT. CODE FROM OBSERVATION
1 Male2 Female
AGE Could I ask, how old are you?DO NOT READ OUT. ONE ANSWER ONLY.
1 18 – 24 years2 25 – 34 years3 35 – 44 years4 45 – 54 years5 55 – 64 years6 65+ years7 (Refused)
ADU How many adults aged 16 years and over, including yourself, live in your household?DO NOT READ OUT. ONE ANSWER ONLY.
1 One2 Two3 Three4 Four or more5 (Refused)

CHI How many children aged 15 years and under, live in your household?DO NOT READ OUT. ONE ANSWER ONLY.
1 None2 One3 Two4 Three5 Four or more6 (Refused)
OCC What is the occupation of the chief income earner in your household?IF RETIRED PLEASE ASK FOR PREVIOUS OCCUPATION.
1 Occupation / job description (PLEASE WRITE IN)2 Retired state pension - ONLY3 (Refused)
Thank and close
Appendix 4: Map
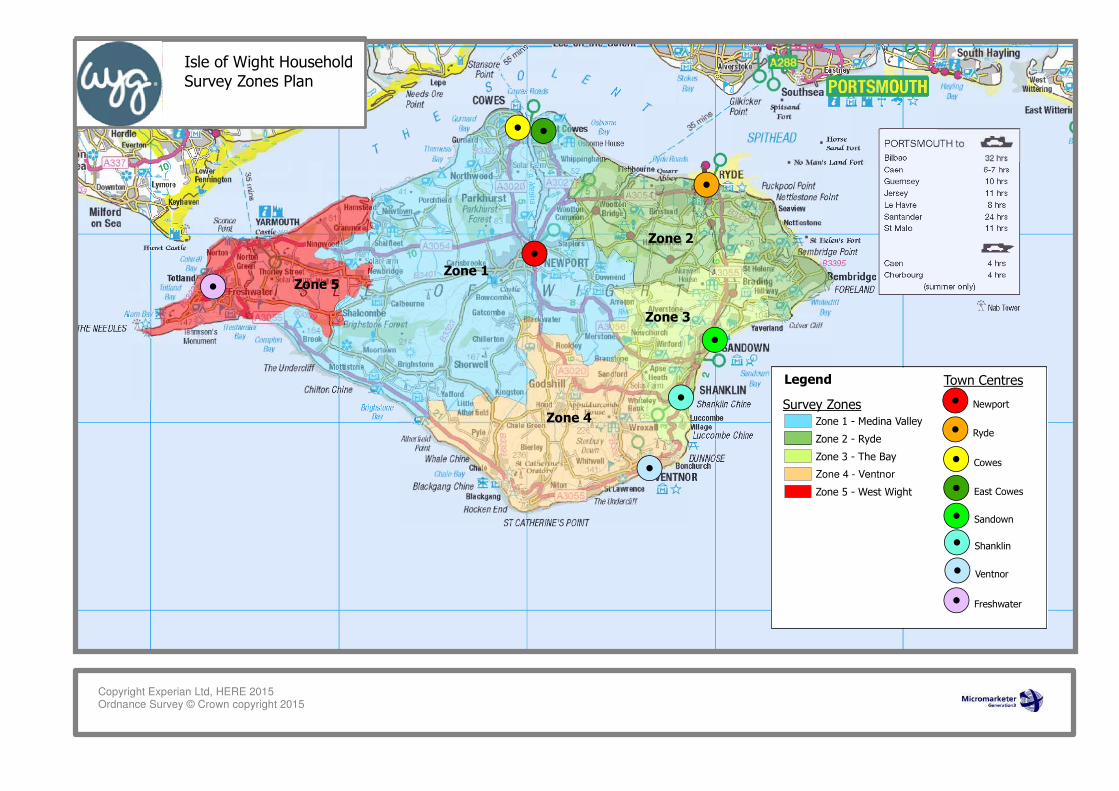
!.
!.
!.!.
!.
!.
!.
!.
Copyright Experian Ltd, HERE 2015Ordnance Survey © Crown copyright 2015
Isle of Wight Household
Survey Zones Plan
Zone 1
Zone 2
Zone 3
Zone 4
Zone 5
Legend
Zone 1 - Medina Valley
Zone 2 - Ryde
Zone 3 - The Bay
Zone 4 - Ventnor
Zone 5 - West Wight
!. Sandown
!. Shanklin
!. Ventnor
!. Freshwater
Survey Zones
Town Centres
!. Newport
!. Ryde
!. Cowes
!. East Cowes
Retail Study www.wyg.com
Appendix B Stakeholder Engagement Summary
Isle of Wight Council
Retail Study 2018
Stakeholder Engagement Statement
_________________________________________________________________________
Page 1
Introduction
This Stakeholder Engagement Statement sets out the engagement undertaken with key stakeholders
to inform the preparation of the Isle of Wight Retail Study. In order to inform the qualitative retail
needs assessment, we engaged with key stakeholders as agreed with the Isle of Wight Council. The
key stakeholders identified by the Council comprised the following:
• Newport Business Association
• Cowes Business Association
• Ryde Business Association
• Sandown Business Association
• East Cowes Business Association
Communication with Stakeholders
Contact details for the above stakeholders were provided by the Isle of Wight Council. Each
association was then contacted via email, informing them of the retail study and asking for their
feedback. The initial email was sent to all identified stakeholders on the 23 February 2018. The email
invited comments concerning the town centres and specifically on the following:
• any views on how the town centres are performing;
• specific strengths/weaknesses of the centres;
• suggestions for improvements to the town centres.
Feedback was requested via email or arrangement of a telephone discussion. The email originally
requested all feedback to be received by 9 March 2018.
Further reminder emails were issued to all business associations on 12th March 2018 and again to
Newport, Sandown and Ryde business associations on 21st March 2018, requesting any feedback to
inform the retail study. Again, feedback was invited via email or telephone discussion.
East Cowes Business Association confirmed that the information and stakeholder engagement request
had been circulated to all members of the business association. Ryde Business Association confirmed
that the retail study would be discussed at the meeting on 7th March and all feedback would be
issued thereafter. Cowes Business Association provided a collation of all feedback received from local
businesses via email on 20 March 2018.
Isle of Wight Council
Retail Study 2018
Stakeholder Engagement Statement
_________________________________________________________________________
Page 2
No feedback was received from Newport or Sandown business associations.
Feedback Received
Feedback was received on the following town centres:
• Ryde Town Centre – summary of the discussion held at the Ryde Business Association
meeting and collated into a report, appended to this report;
• Cowes Town Centre – collated feedback received from members of the Cowes Business
Association; and
• East Cowes Town Centre – feedback received from individual town centre businesses.
A summary of the feedback received is set out below.
Ryde Town Centre
Views/performance of the centre:
• Over the last 10-15 years the retail area of the town centre has decreased and very few
retailers remain in the Upper High Street (past traffic lights), which was once a considerable
shopping area. Many retail premises along this street are now in residential use. However,
there are a few key retailers and services within the area which contribute to the centre.
• The outer areas of the main town centre (Upper High Street before traffic lights and Cross
Street) have attracted smaller independent businesses over the last 2-4 years due to the
lower rents and business rate relief.
• Some vacant larger units, for instance those on Union Street, have remained empty over the
last few years. This is partly due to the area having higher rental costs and business rates.
• Service led businesses within the centre have reported to be doing well, although other
retailers have reported a slight down turn in the last 18-24 months.
• The centre benefits from a range of independent shops creating an attractive shopping
experience.
• Free on street car parking for up to an hour is provided on both Union Street and Upper High
Street, which enables people to park directly outside shops and encourages trips to the town
centre.
• However, car parking charges across the island have recently increased, particularly for short
stay car parks located closer to the town centre.
Isle of Wight Council
Retail Study 2018
Stakeholder Engagement Statement
_________________________________________________________________________
Page 3
• The town centre contains historic features and buildings including the Victoria Arcade, which
create interest and help to differentiate the centre from others. However, the natural layout
of the town and historic shops can cause issues regarding accessibility for wheelchair and
pushchair users. In addition, Union Street is a fairly steep hill making it more challenging for
some users.
• Many of the transport links are also situated at the north of the centre (bottom of the town)
so shops at the higher end of the town attract lower natural footfall levels.
• The town centre is within walking distance of both the beach and open park space, which
allows visitors to utilise both the town centre shops and services whilst also visiting the
beach/park.
• The transport links to the town centre are good, with bus and train services to other parts of
the island and the Hover Travel and Wight Link passenger services to the mainland.
Ideas/suggestions for improvements:
• The signage within the town could benefit from improvement, at present there is a lack of
signage directing people to car parking, toilet facilities and also advising of facilities such as
the park and ride at St John’s train station.
• The Business Association is currently seeking to improve the lack of signage by producing a
downloadable map. However, hard copies and signage/way finder signs are required within
the centre to direct people around the town.
• Links between the town centre and St John’s train station could be improved could help to
encourage people to walk from the top of the town and down towards Union
Street/Esplanade areas.
• The formation of the retail space within the town centre is broken up with independents
located towards the periphery at the top and lower ends of the centre, whilst the middle
section of the High Street contains national multiples. A better mix throughout the town could
help to increase footfall and in particular a key shop/retailer of significance at the top end of
the town would help to attract footfall in this area.
• There are a number of unused buildings within the centre (e.g. Ryde Theatre on Lind Street)
which could be put into active use. The buildings could be used in a multi-purpose way such
as providing meeting spaces, start-up business space, offices etc. as there is a general lack of
facilities such as these on the Island. In Ryde office space is generally located out of the
town centre and by bringing offices into the centre, it would help to contribute to the
everyday local economy.
Isle of Wight Council
Retail Study 2018
Stakeholder Engagement Statement
_________________________________________________________________________
Page 4
• There are few useable outdoor spaces within the town centre which restricts the
opportunities for markets and outdoor areas for people to sit.
• The introduction of modern and attractive usable street furniture would benefit the town
centre and would help to encourage people to walk through and stay longer within the
centre, rather than just stopping off for specific shops.
• The centre would benefit from additional opportunities for start-up businesses through ‘pop-
up’ shops etc.
• Although it is noted that a number of people would like a greater number of national multiple
retailers present on the island, it is important to ensure that the value and contribution of the
current independent shops is taken as a high priority.
Cowes Town Centre
Views of the centre:
• The town centre benefits from a bespoke High Street with many interesting shops.
• There is a good variety of shops and is not just a tourist town.
• The town centre occupies a prominent position next to the sea.
• People enjoy shopping locally, yet the loss of banks and a Post Office has resulted in more
people travelling to Newport and undertaking their shopping there.
• There is a lack of parking within the town centre.
• The town centre is very spread out and the first impression when getting off the Red Jet is
not positive.
Ideas/suggestions for improvements:
• The parking facilities could be improved, for example, parking could be free for the first hour
and then pay if you wish to stay longer, similar to the multi-storey in Newport. This could
help to encourage people to pop into the town to use the butchers/coffee shops etc.
• The use of non-car motor travel should be encouraged to try and reduce the number of
vehicles entering the town centre and requiring car parking.
• More events should be held in the town centre such as raft races, street food and vintage
festivals, fun days with street performers and farmers’ markets, to encourage greater visitor
numbers and also create activity within the town centre.
Isle of Wight Council
Retail Study 2018
Stakeholder Engagement Statement
_________________________________________________________________________
Page 5
• The High Street could benefit from a general clean-up and improvement of the environmental
quality of the Parade in particular, to achieve more of a ‘village green’ feel to encourage
family friendly picnics and similar activities.
• During the Christmas season, consideration should be given to providing Christmas
trees/planters with seasonal plants to improve and create a more festive environment within
the town centre.
• Cowes Town Centre should be promoted to all tour companies as a destination to encourage
higher visitor numbers.
East Cowes
Views of the centre:
• The Town Centre is deteriorating as local people do not visit due to the congestion from Red
Funnel and there is nothing to attract people to the town.
• The area outside the Waitrose store is good for hosting events, yet it detracts people from
the main town centre and consideration should be given to include other local businesses in
any events and encourage people through the centre.
• The lack of car parking (both short and long term) deters people from visiting/stopping long
within the centre.
Ideas/suggestions for improvements:
• The environment needs improvement and links between the seafront and town centre should
be enhanced and better promoted.
• New signage and way finders should be provided to direct visitors to the local shops and car
parking.
• The bus stop is currently located outside of the Waitrose store and in proximity to Red
Funnel. However, this seems to deter visitors from using the centre and encourages them to
get straight on the ferry rather than exploring the centre. A map of East Cowes Town Centre
could be provided at the bus stop to direct/encourage visitors to visit the town centre.
• The town centre and wider area is in need of regeneration. However, it is important that new
houses are lived in throughout the year to support the town centre and are not just holiday
homes occupied a few months of the year.
Isle of Wight Council
Retail Study 2018
Stakeholder Engagement Statement
_________________________________________________________________________
Page 6
• The Council could consider purchasing some land to provide sufficient car parking within the
town centre. At present, tourists do not know where they can park whilst waiting for the ferry
and this discourages them from using the town centre.
• The town centre would benefit from a greater number of restaurants and good pubs serving
food. Many tourists currently go to Cowes via the floating bridge for restaurants, and due to
the charge of the bridge, they now consider staying in Cowes for future trips, resulting in less
visitors staying in East Cowes Town Centre.
• The town centre would also benefit from the opening of a gym and swimming pool to provide
leisure facilities for residents/visitors of the town.
• The opening of a cinema within the town centre would help to attract more people to the
centre.
All towns
Some comments received also related to all of the towns and are summarised below:
• The provision of more free car parking was raised as a potential improvement for all town
centres. Suggestions included providing 2 hours’ free car parking in each centre to allow
people to use the local shops etc. and have lunch. This would help to attract people into the
town centres rather than using the out of centre foodstores where they do not have to pay
for parking.
• The current traffic calming measures used in some of the town centres are considered
unnecessary as they block up the town centres creating congestion. In addition, they are
considered not to be eco-friendly and waste fuel.
Summary
In summary, the feedback received from key stakeholders identified parking as an issue which deters
people from visiting/staying long within each of the town centres. Improvements to the
environmental quality in each of the centres was also raised as a suggestion/measure to encourage a
greater number of visits to the centres.
RYDE
MARCH 2018
Chair ZT
Isle of Wight Retail Study Feedback
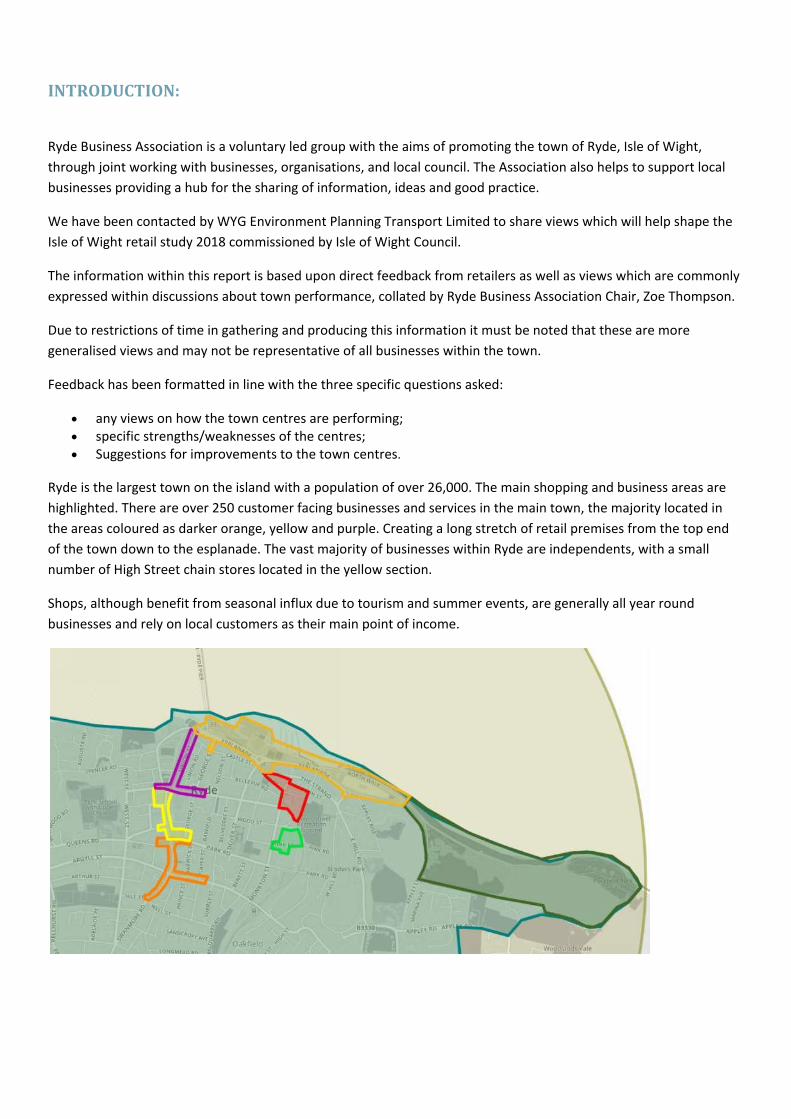
INTRODUCTION:
Ryde Business Association is a voluntary led group with the aims of promoting the town of Ryde, Isle of Wight, through joint working with businesses, organisations, and local council. The Association also helps to support local businesses providing a hub for the sharing of information, ideas and good practice.
We have been contacted by WYG Environment Planning Transport Limited to share views which will help shape the Isle of Wight retail study 2018 commissioned by Isle of Wight Council.
The information within this report is based upon direct feedback from retailers as well as views which are commonly expressed within discussions about town performance, collated by Ryde Business Association Chair, Zoe Thompson.
Due to restrictions of time in gathering and producing this information it must be noted that these are more generalised views and may not be representative of all businesses within the town.
Feedback has been formatted in line with the three specific questions asked:
• any views on how the town centres are performing; • specific strengths/weaknesses of the centres; • Suggestions for improvements to the town centres.
Ryde is the largest town on the island with a population of over 26,000. The main shopping and business areas are highlighted. There are over 250 customer facing businesses and services in the main town, the majority located in the areas coloured as darker orange, yellow and purple. Creating a long stretch of retail premises from the top end of the town down to the esplanade. The vast majority of businesses within Ryde are independents, with a small number of High Street chain stores located in the yellow section.
Shops, although benefit from seasonal influx due to tourism and summer events, are generally all year round businesses and rely on local customers as their main point of income.
Ryde – Town Performance.
Overall retailers report a very fluctuating time in regards to performance.
In the last 10-15 years the retail area of the town has decreased, with very few retailers remaining in the upper high street (past traffic lights) which was once a considerable shopping area. Previous retail premises along this street have been granted change of use to become accommodation. It should be noted however that there are a few key retailers in this area including a large haberdashery, butchers, Polish Deli, Hairdressers etc. We are therefore mindful to ensure that this part of the town continues to be included when considering any future development.
In more recent years (2-4years) there appears a pattern of shops opening and being more sustainable in the outer areas of the main town (Upper high Street (before traffic lights), Cross St etc). These areas benefit from lower rental and business rate relief and so are attractive options to smaller independent businesses.
Retailers in the main areas of the town – Union Street, report that the last couple of years have been the first in many, where larger shop premises have remained empty, this is likely to be reflective of the hardship faced in general high street trading as seen in many UK towns. This area has higher rental costs and considerable business rates making it more challenging for retailers to remain sustainable.
More recently Ryde appears to have built up its retail sector once again. There are currently only 5 vacant shop premises in the main shopping district, which is very positive in comparison to most of the larger towns on the island. As is a pattern across all UK towns, service led businesses are doing well, hairdressers, coffee shops etc. For other retailers, they report a slight down turn in the last 18-24 months, however there appears little pattern to the fluctuations in trading based on wider economic issues, with businesses more likely to report being effected by things like poor weather.
Overall Ryde would see itself as in a good position in comparison to some other towns on the island, however there are issues (outlined in the next section) which can have significant negative impact to trade and could change the performance of the town very quickly.
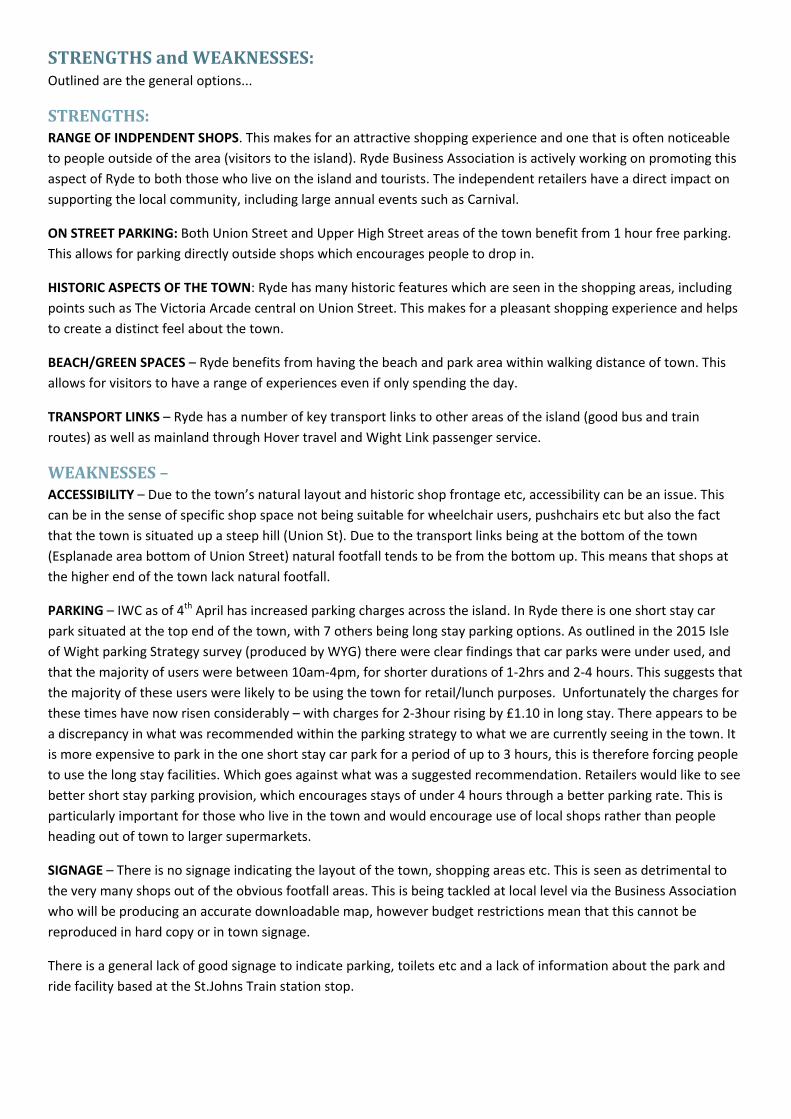
STRENGTHS and WEAKNESSES: Outlined are the general options...
STRENGTHS: RANGE OF INDPENDENT SHOPS. This makes for an attractive shopping experience and one that is often noticeable to people outside of the area (visitors to the island). Ryde Business Association is actively working on promoting this aspect of Ryde to both those who live on the island and tourists. The independent retailers have a direct impact on supporting the local community, including large annual events such as Carnival.
ON STREET PARKING: Both Union Street and Upper High Street areas of the town benefit from 1 hour free parking. This allows for parking directly outside shops which encourages people to drop in.
HISTORIC ASPECTS OF THE TOWN: Ryde has many historic features which are seen in the shopping areas, including points such as The Victoria Arcade central on Union Street. This makes for a pleasant shopping experience and helps to create a distinct feel about the town.
BEACH/GREEN SPACES – Ryde benefits from having the beach and park area within walking distance of town. This allows for visitors to have a range of experiences even if only spending the day.
TRANSPORT LINKS – Ryde has a number of key transport links to other areas of the island (good bus and train routes) as well as mainland through Hover travel and Wight Link passenger service.
WEAKNESSES – ACCESSIBILITY – Due to the town’s natural layout and historic shop frontage etc, accessibility can be an issue. This can be in the sense of specific shop space not being suitable for wheelchair users, pushchairs etc but also the fact that the town is situated up a steep hill (Union St). Due to the transport links being at the bottom of the town (Esplanade area bottom of Union Street) natural footfall tends to be from the bottom up. This means that shops at the higher end of the town lack natural footfall.
PARKING – IWC as of 4th April has increased parking charges across the island. In Ryde there is one short stay car park situated at the top end of the town, with 7 others being long stay parking options. As outlined in the 2015 Isle of Wight parking Strategy survey (produced by WYG) there were clear findings that car parks were under used, and that the majority of users were between 10am-4pm, for shorter durations of 1-2hrs and 2-4 hours. This suggests that the majority of these users were likely to be using the town for retail/lunch purposes. Unfortunately the charges for these times have now risen considerably – with charges for 2-3hour rising by £1.10 in long stay. There appears to be a discrepancy in what was recommended within the parking strategy to what we are currently seeing in the town. It is more expensive to park in the one short stay car park for a period of up to 3 hours, this is therefore forcing people to use the long stay facilities. Which goes against what was a suggested recommendation. Retailers would like to see better short stay parking provision, which encourages stays of under 4 hours through a better parking rate. This is particularly important for those who live in the town and would encourage use of local shops rather than people heading out of town to larger supermarkets.
SIGNAGE – There is no signage indicating the layout of the town, shopping areas etc. This is seen as detrimental to the very many shops out of the obvious footfall areas. This is being tackled at local level via the Business Association who will be producing an accurate downloadable map, however budget restrictions mean that this cannot be reproduced in hard copy or in town signage.
There is a general lack of good signage to indicate parking, toilets etc and a lack of information about the park and ride facility based at the St.Johns Train station stop.
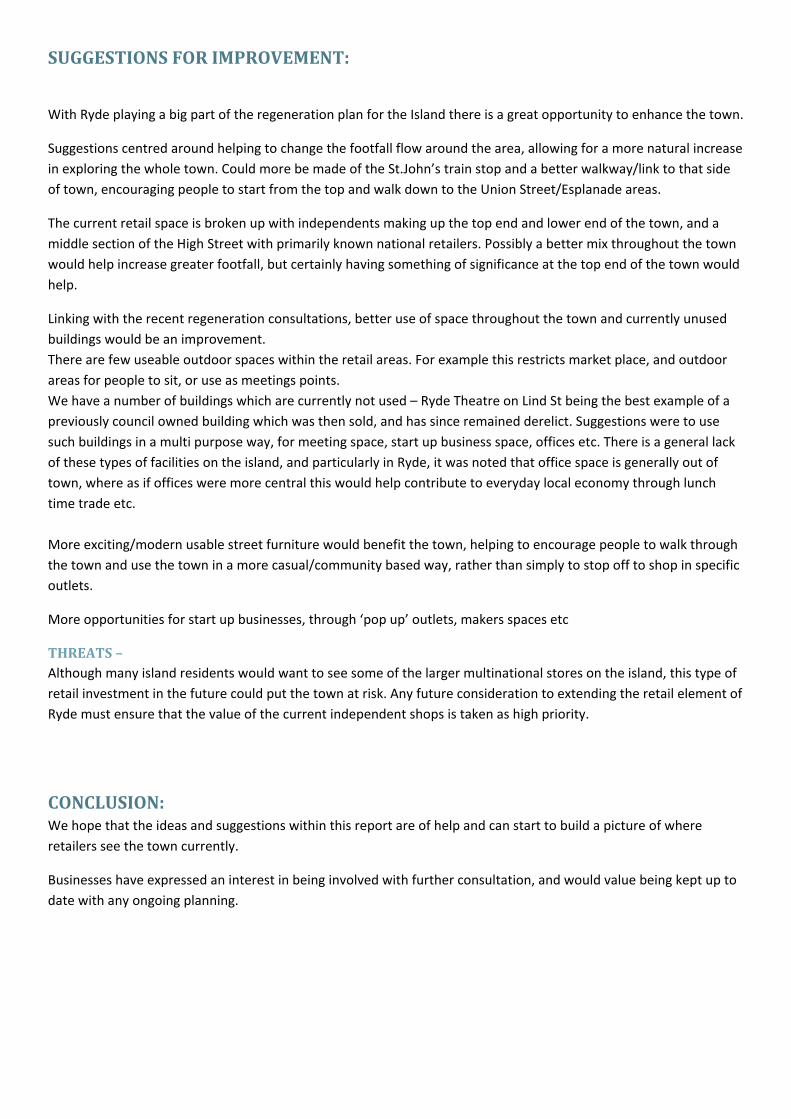
SUGGESTIONS FOR IMPROVEMENT:
With Ryde playing a big part of the regeneration plan for the Island there is a great opportunity to enhance the town.
Suggestions centred around helping to change the footfall flow around the area, allowing for a more natural increase in exploring the whole town. Could more be made of the St.John’s train stop and a better walkway/link to that side of town, encouraging people to start from the top and walk down to the Union Street/Esplanade areas.
The current retail space is broken up with independents making up the top end and lower end of the town, and a middle section of the High Street with primarily known national retailers. Possibly a better mix throughout the town would help increase greater footfall, but certainly having something of significance at the top end of the town would help.
Linking with the recent regeneration consultations, better use of space throughout the town and currently unused buildings would be an improvement. There are few useable outdoor spaces within the retail areas. For example this restricts market place, and outdoor areas for people to sit, or use as meetings points. We have a number of buildings which are currently not used – Ryde Theatre on Lind St being the best example of a previously council owned building which was then sold, and has since remained derelict. Suggestions were to use such buildings in a multi purpose way, for meeting space, start up business space, offices etc. There is a general lack of these types of facilities on the island, and particularly in Ryde, it was noted that office space is generally out of town, where as if offices were more central this would help contribute to everyday local economy through lunch time trade etc. More exciting/modern usable street furniture would benefit the town, helping to encourage people to walk through the town and use the town in a more casual/community based way, rather than simply to stop off to shop in specific outlets.
More opportunities for start up businesses, through ‘pop up’ outlets, makers spaces etc
THREATS – Although many island residents would want to see some of the larger multinational stores on the island, this type of retail investment in the future could put the town at risk. Any future consideration to extending the retail element of Ryde must ensure that the value of the current independent shops is taken as high priority.
CONCLUSION: We hope that the ideas and suggestions within this report are of help and can start to build a picture of where retailers see the town currently.
Businesses have expressed an interest in being involved with further consultation, and would value being kept up to date with any ongoing planning.

Retail Study www.wyg.com
Appendix C Experian Mosaic Brochure
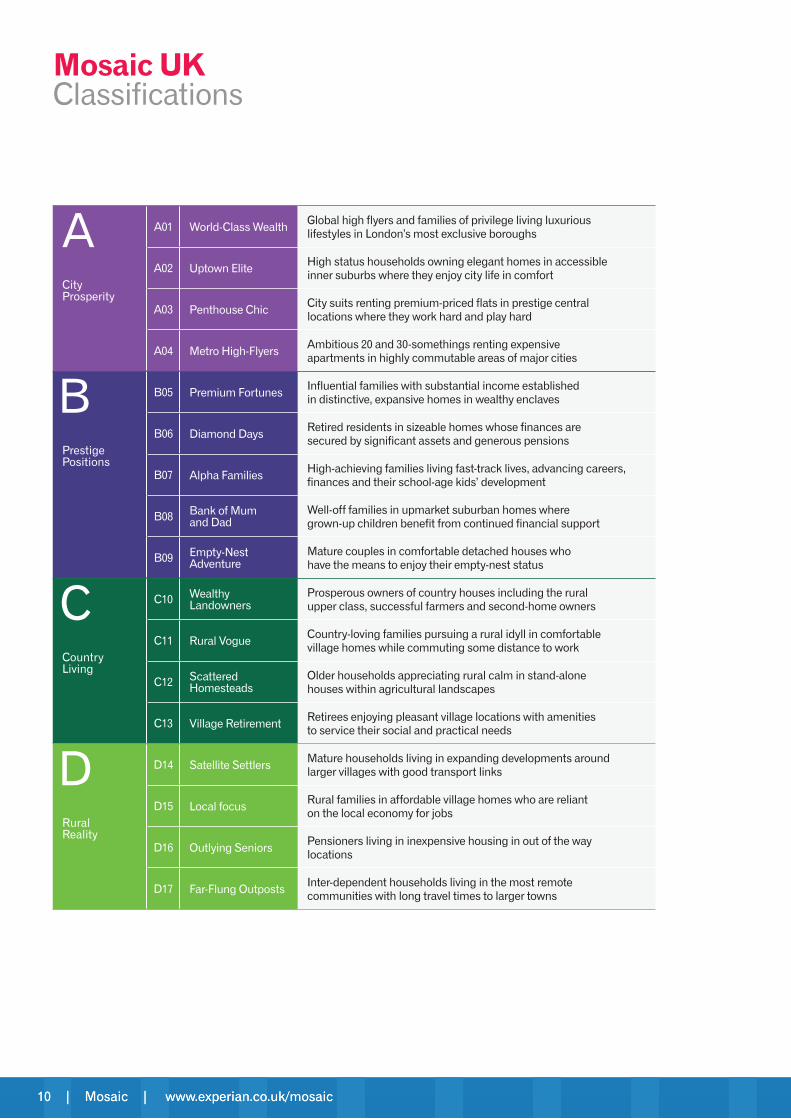
10 | Mosaic | www.experian.co.uk/mosaic
Mosaic UK Classifications
10 | Mosaic | www.experian.co.uk/mosaic
A City
A01 World-Class WealthGlobal high flyers and families of privilege living luxurious lifestyles in London’s most exclusive boroughs
A02 Uptown Elite
inner suburbs where they enjoy city life in comfort
A03City suits renting premium-priced flats in prestige central locations where they work hard and play hard
A04Ambitious 20 and 30-somethings renting expensive apartments in highly commutable areas of major cities
B
B05Influential families with substantial income established in distinctive, expansive homes in wealthy enclaves
B06 Diamond DaysRetired residents in sizeable homes whose finances are secured by significant assets and generous pensions
B07 Alpha Familiesfinances and their school-age kids’ development
B08Bank of Mum and Dad
Well-off families in upmarket suburban homes where grown-up children benefit from continued financial support
B09 Empty-Nest Adventure
Mature couples in comfortable detached houses who have the means to enjoy their empty-nest status
C Country Living
C10 Wealthy Landowners
upper class, successful farmers and second-home owners
C11 Rural VogueCountry-loving families pursuing a rural idyll in comfortable village homes while commuting some distance to work
C12 Scattered Older households appreciating rural calm in stand-alone houses within agricultural landscapes
C13 Village RetirementRetirees enjoying pleasant village locations with amenities to service their social and practical needs
D Rural Reality
D14 Satellite SettlersMature households living in expanding developments around larger villages with good transport links
D15 Local focusRural families in affordable village homes who are reliant on the local economy for jobs
D16 Outlying Seniorslocations
D17 Far-Flung OutpostsInter-dependent households living in the most remote communities with long travel times to larger towns
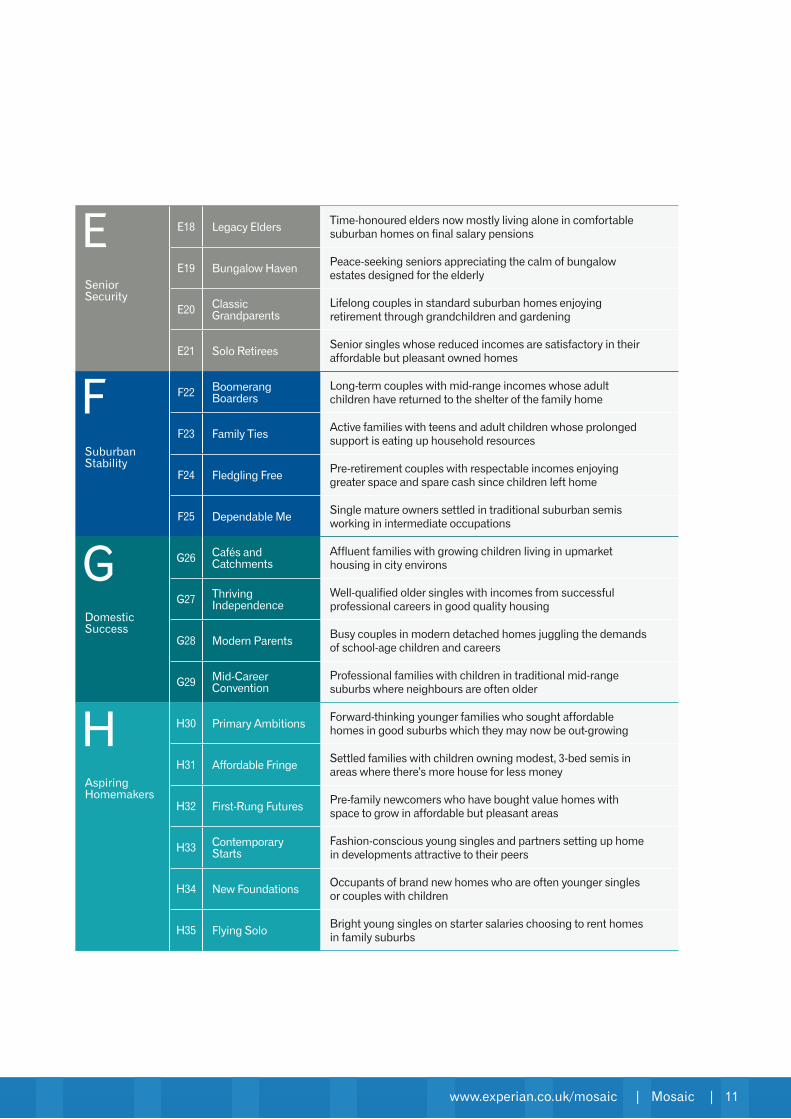
www.experian.co.uk/mosaic | Mosaic | 11
E Senior Security
E18 Legacy EldersTime-honoured elders now mostly living alone in comfortable suburban homes on final salary pensions
E19estates designed for the elderly
E20 Classic Grandparents
Lifelong couples in standard suburban homes enjoying retirement through grandchildren and gardening
E21 Solo RetireesSenior singles whose reduced incomes are satisfactory in their affordable but pleasant owned homes
F Suburban Stability
F22 Boomerang Boarders
Long-term couples with mid-range incomes whose adult children have returned to the shelter of the family home
F23 Family TiesActive families with teens and adult children whose prolonged support is eating up household resources
F24 Fledgling Freegreater space and spare cash since children left home
F25 Dependable MeSingle mature owners settled in traditional suburban semis working in intermediate occupations
G Domestic Success
G26 Cafés and Catchments
Affluent families with growing children living in upmarket housing in city environs
G27 Thriving Independence
Well-qualified older singles with incomes from successful professional careers in good quality housing
G28Busy couples in modern detached homes juggling the demands of school-age children and careers
G29 Mid-Career Convention suburbs where neighbours are often older
Aspiring
Forward-thinking younger families who sought affordable homes in good suburbs which they may now be out-growing
Affordable FringeSettled families with children owning modest, 3-bed semis in areas where there’s more house for less money
First-Rung Futuresspace to grow in affordable but pleasant areas
Contemporary Starts
Fashion-conscious young singles and partners setting up home in developments attractive to their peers
New FoundationsOccupants of brand new homes who are often younger singles or couples with children
Flying SoloBright young singles on starter salaries choosing to rent homes in family suburbs
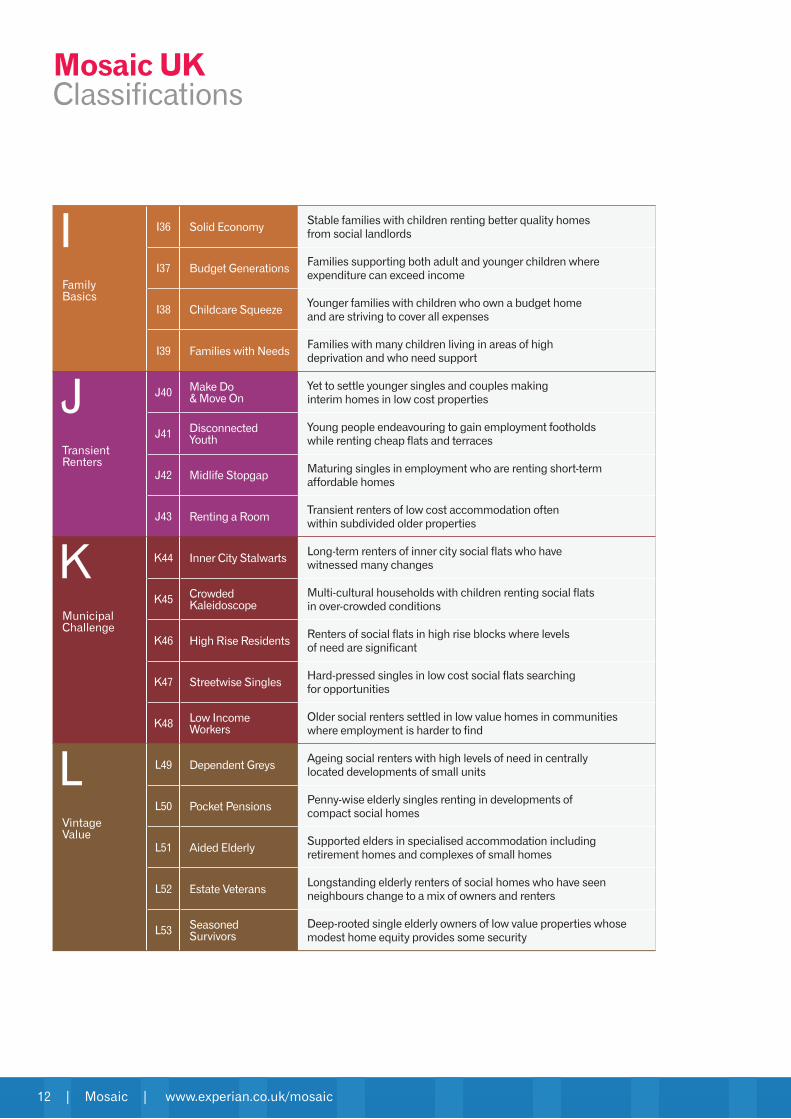
12 | Mosaic | www.experian.co.uk/mosaic
I Family Basics
I36 Solid EconomyStable families with children renting better quality homes from social landlords
I37 Budget GenerationsFamilies supporting both adult and younger children where expenditure can exceed income
I38 Childcare SqueezeYounger families with children who own a budget home and are striving to cover all expenses
I39 Families with NeedsFamilies with many children living in areas of high deprivation and who need support
J Transient Renters
J40 Make Do & Move On
Yet to settle younger singles and couples making interim homes in low cost properties
J41 Disconnected Youth
Young people endeavouring to gain employment footholds while renting cheap flats and terraces
J42 Midlife StopgapMaturing singles in employment who are renting short-term affordable homes
J43 Renting a RoomTransient renters of low cost accommodation often within subdivided older properties
Municipal Challenge
Inner City StalwartsLong-term renters of inner city social flats who have witnessed many changes
Crowded Multi-cultural households with children renting social flats in over-crowded conditions
Renters of social flats in high rise blocks where levels of need are significant
Streetwise Singles
for opportunities
Low Income Workers
Older social renters settled in low value homes in communities where employment is harder to find
L Vintage Value
L49 Dependent GreysAgeing social renters with high levels of need in centrally located developments of small units
L50
compact social homes
L51 Aided ElderlySupported elders in specialised accommodation including retirement homes and complexes of small homes
L52 Estate VeteransLongstanding elderly renters of social homes who have seen neighbours change to a mix of owners and renters
L53 Seasoned Survivors
Deep-rooted single elderly owners of low value properties whose modest home equity provides some security
Mosaic UK Classifications
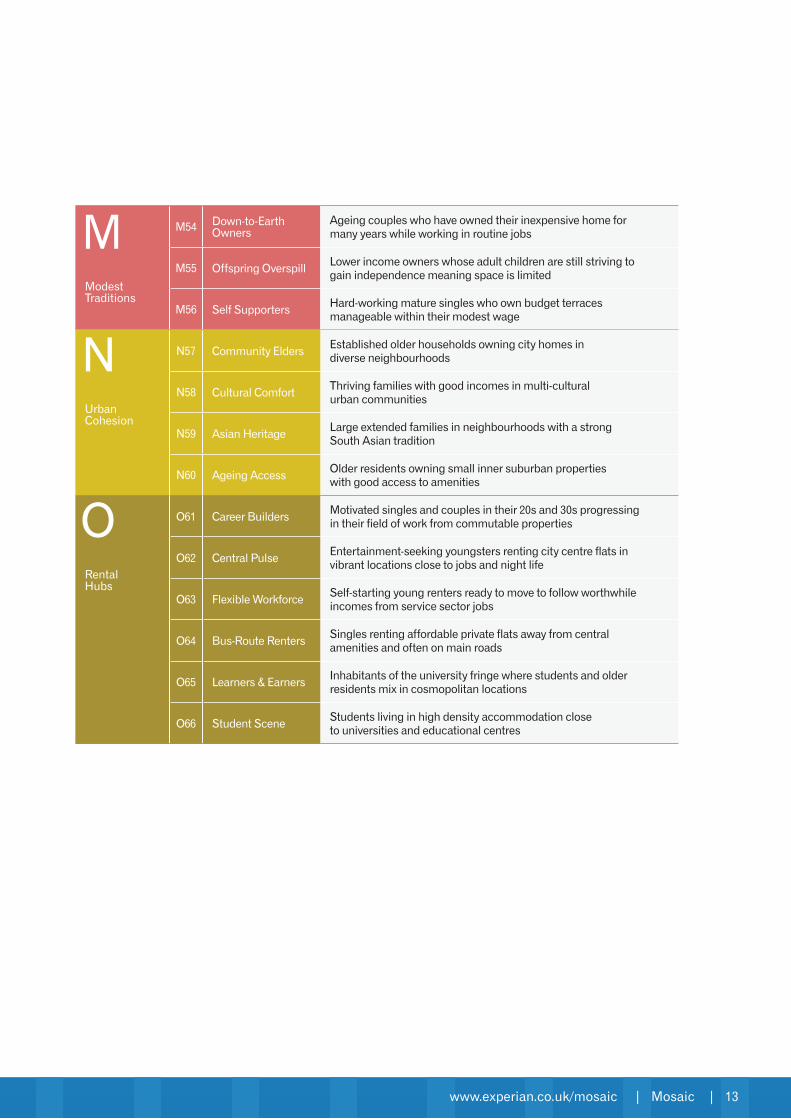
www.experian.co.uk/mosaic | Mosaic | 13
M Modest Traditions
M54 Down-to-Earth Owners
Ageing couples who have owned their inexpensive home for many years while working in routine jobs
M55 Offspring OverspillLower income owners whose adult children are still striving to gain independence meaning space is limited
M56 Self Supportersmanageable within their modest wage
N Urban Cohesion
N57 Community EldersEstablished older households owning city homes in diverse neighbourhoods
N58 Cultural ComfortThriving families with good incomes in multi-cultural urban communities
N59Large extended families in neighbourhoods with a strong South Asian tradition
N60 Ageing AccessOlder residents owning small inner suburban properties with good access to amenities
O Rental
O61 Career BuildersMotivated singles and couples in their 20s and 30s progressing in their field of work from commutable properties
O62Entertainment-seeking youngsters renting city centre flats in vibrant locations close to jobs and night life
O63 Flexible WorkforceSelf-starting young renters ready to move to follow worthwhile incomes from service sector jobs
O64 Bus-Route RentersSingles renting affordable private flats away from central amenities and often on main roads
O65 Learners & EarnersInhabitants of the university fringe where students and older residents mix in cosmopolitan locations
O66 Student SceneStudents living in high density accommodation close to universities and educational centres

Retail Study www.wyg.com
Appendix D Health Check Proformas
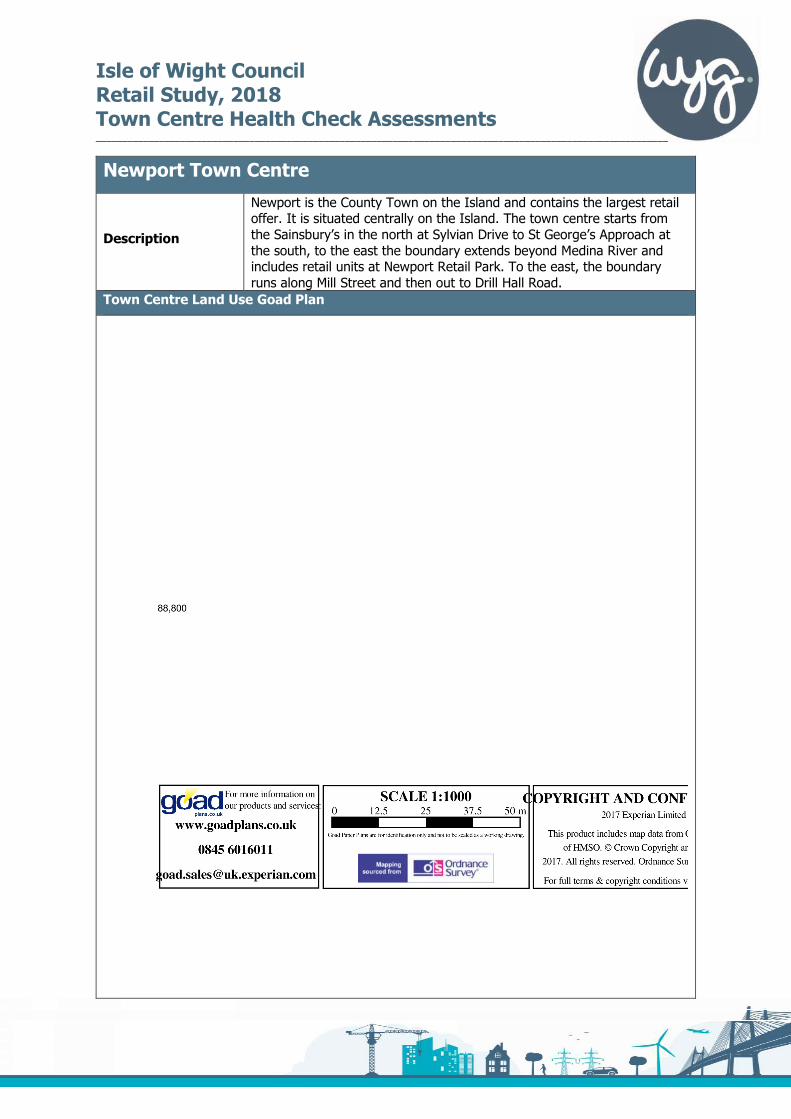
Isle of Wight Council Retail Study, 2018 Town Centre Health Check Assessments
____________________________________________________________________________________________________________
Newport Town Centre
Description
Newport is the County Town on the Island and contains the largest retail offer. It is situated centrally on the Island. The town centre starts from
the Sainsbury’s in the north at Sylvian Drive to St George’s Approach at
the south, to the east the boundary extends beyond Medina River and includes retail units at Newport Retail Park. To the east, the boundary
runs along Mill Street and then out to Drill Hall Road.
Town Centre Land Use Goad Plan
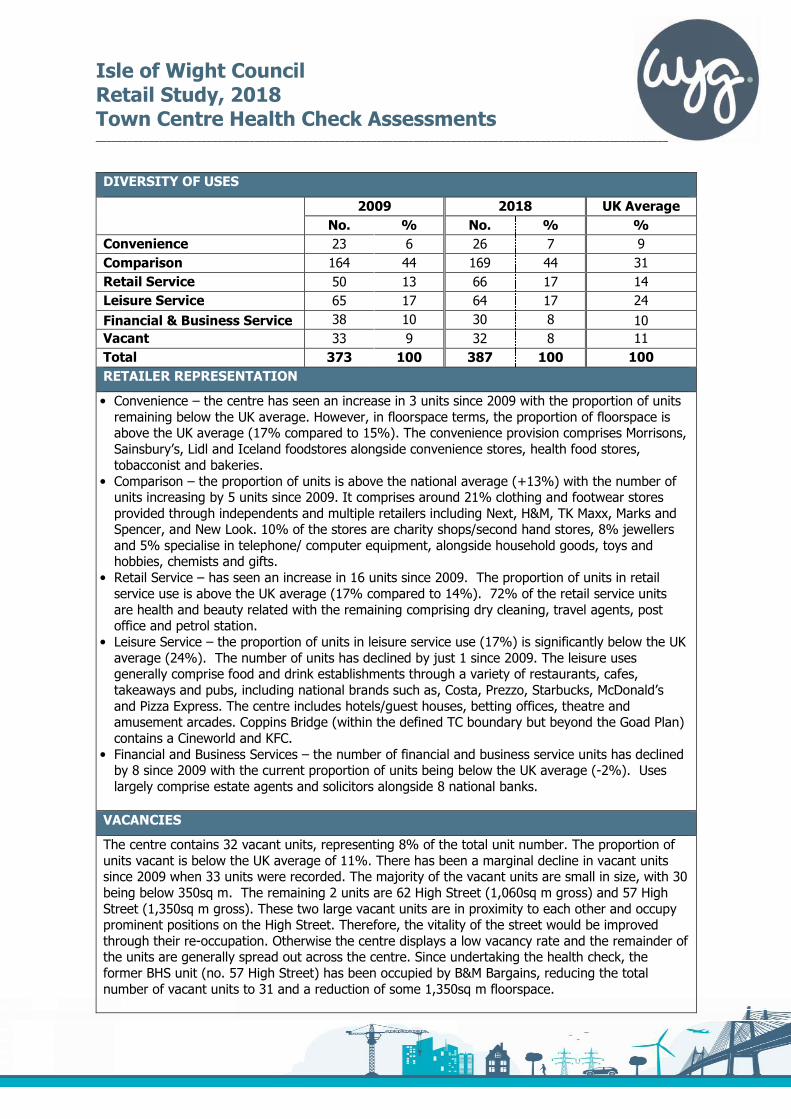
Isle of Wight Council Retail Study, 2018 Town Centre Health Check Assessments
____________________________________________________________________________________________________________
DIVERSITY OF USES
2009 2018 UK Average
No. % No. % %
Convenience 23 6 26 7 9
Comparison 164 44 169 44 31
Retail Service 50 13 66 17 14
Leisure Service 65 17 64 17 24
Financial & Business Service 38 10 30 8 10
Vacant 33 9 32 8 11
Total 373 100 387 100 100
RETAILER REPRESENTATION
• Convenience – the centre has seen an increase in 3 units since 2009 with the proportion of units remaining below the UK average. However, in floorspace terms, the proportion of floorspace is above the UK average (17% compared to 15%). The convenience provision comprises Morrisons,
Sainsbury’s, Lidl and Iceland foodstores alongside convenience stores, health food stores,
tobacconist and bakeries.
• Comparison – the proportion of units is above the national average (+13%) with the number of units increasing by 5 units since 2009. It comprises around 21% clothing and footwear stores
provided through independents and multiple retailers including Next, H&M, TK Maxx, Marks and Spencer, and New Look. 10% of the stores are charity shops/second hand stores, 8% jewellers
and 5% specialise in telephone/ computer equipment, alongside household goods, toys and hobbies, chemists and gifts.
• Retail Service – has seen an increase in 16 units since 2009. The proportion of units in retail service use is above the UK average (17% compared to 14%). 72% of the retail service units
are health and beauty related with the remaining comprising dry cleaning, travel agents, post office and petrol station.
• Leisure Service – the proportion of units in leisure service use (17%) is significantly below the UK
average (24%). The number of units has declined by just 1 since 2009. The leisure uses generally comprise food and drink establishments through a variety of restaurants, cafes,
takeaways and pubs, including national brands such as, Costa, Prezzo, Starbucks, McDonald’s
and Pizza Express. The centre includes hotels/guest houses, betting offices, theatre and amusement arcades. Coppins Bridge (within the defined TC boundary but beyond the Goad Plan)
contains a Cineworld and KFC.
• Financial and Business Services – the number of financial and business service units has declined by 8 since 2009 with the current proportion of units being below the UK average (-2%). Uses
largely comprise estate agents and solicitors alongside 8 national banks.
VACANCIES
The centre contains 32 vacant units, representing 8% of the total unit number. The proportion of
units vacant is below the UK average of 11%. There has been a marginal decline in vacant units since 2009 when 33 units were recorded. The majority of the vacant units are small in size, with 30
being below 350sq m. The remaining 2 units are 62 High Street (1,060sq m gross) and 57 High
Street (1,350sq m gross). These two large vacant units are in proximity to each other and occupy prominent positions on the High Street. Therefore, the vitality of the street would be improved
through their re-occupation. Otherwise the centre displays a low vacancy rate and the remainder of the units are generally spread out across the centre. Since undertaking the health check, the
former BHS unit (no. 57 High Street) has been occupied by B&M Bargains, reducing the total
number of vacant units to 31 and a reduction of some 1,350sq m floorspace.
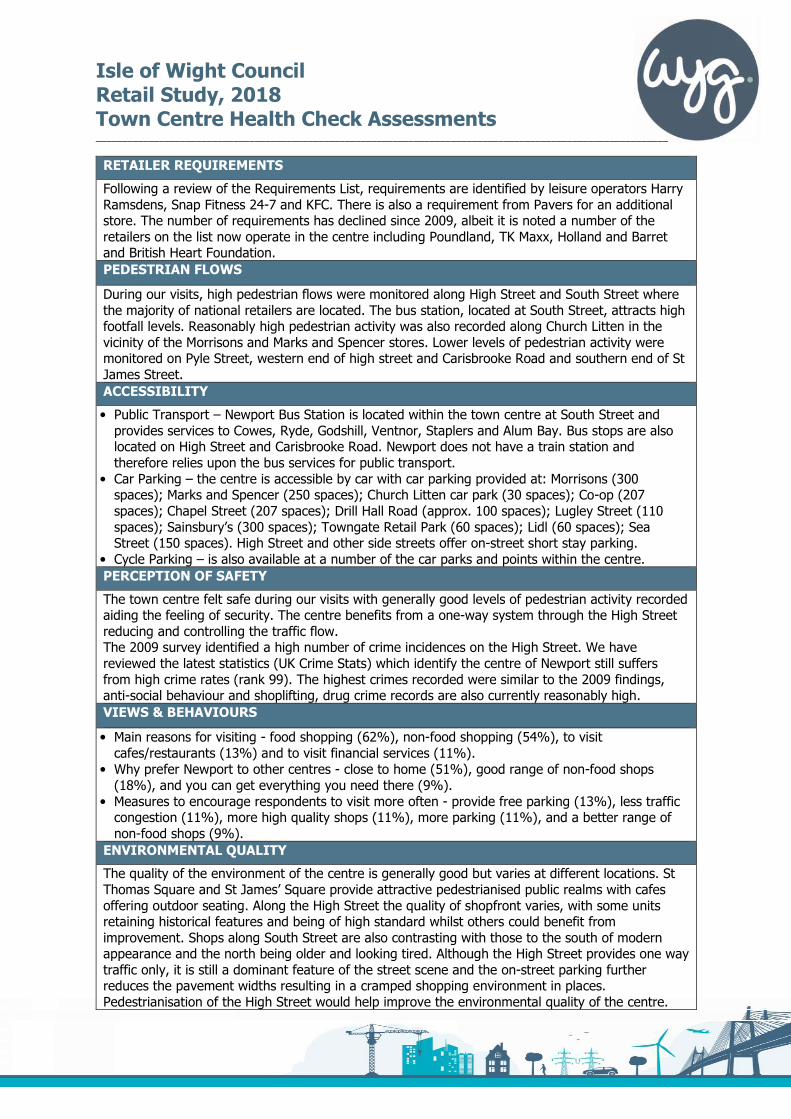
Isle of Wight Council Retail Study, 2018 Town Centre Health Check Assessments
____________________________________________________________________________________________________________
RETAILER REQUIREMENTS
Following a review of the Requirements List, requirements are identified by leisure operators Harry
Ramsdens, Snap Fitness 24-7 and KFC. There is also a requirement from Pavers for an additional store. The number of requirements has declined since 2009, albeit it is noted a number of the
retailers on the list now operate in the centre including Poundland, TK Maxx, Holland and Barret and British Heart Foundation.
PEDESTRIAN FLOWS
During our visits, high pedestrian flows were monitored along High Street and South Street where
the majority of national retailers are located. The bus station, located at South Street, attracts high footfall levels. Reasonably high pedestrian activity was also recorded along Church Litten in the
vicinity of the Morrisons and Marks and Spencer stores. Lower levels of pedestrian activity were monitored on Pyle Street, western end of high street and Carisbrooke Road and southern end of St
James Street.
ACCESSIBILITY
• Public Transport – Newport Bus Station is located within the town centre at South Street and provides services to Cowes, Ryde, Godshill, Ventnor, Staplers and Alum Bay. Bus stops are also located on High Street and Carisbrooke Road. Newport does not have a train station and
therefore relies upon the bus services for public transport.
• Car Parking – the centre is accessible by car with car parking provided at: Morrisons (300 spaces); Marks and Spencer (250 spaces); Church Litten car park (30 spaces); Co-op (207
spaces); Chapel Street (207 spaces); Drill Hall Road (approx. 100 spaces); Lugley Street (110
spaces); Sainsbury’s (300 spaces); Towngate Retail Park (60 spaces); Lidl (60 spaces); Sea Street (150 spaces). High Street and other side streets offer on-street short stay parking.
• Cycle Parking – is also available at a number of the car parks and points within the centre.
PERCEPTION OF SAFETY
The town centre felt safe during our visits with generally good levels of pedestrian activity recorded aiding the feeling of security. The centre benefits from a one-way system through the High Street
reducing and controlling the traffic flow. The 2009 survey identified a high number of crime incidences on the High Street. We have
reviewed the latest statistics (UK Crime Stats) which identify the centre of Newport still suffers
from high crime rates (rank 99). The highest crimes recorded were similar to the 2009 findings, anti-social behaviour and shoplifting, drug crime records are also currently reasonably high.
VIEWS & BEHAVIOURS
• Main reasons for visiting - food shopping (62%), non-food shopping (54%), to visit
cafes/restaurants (13%) and to visit financial services (11%).
• Why prefer Newport to other centres - close to home (51%), good range of non-food shops
(18%), and you can get everything you need there (9%).
• Measures to encourage respondents to visit more often - provide free parking (13%), less traffic congestion (11%), more high quality shops (11%), more parking (11%), and a better range of
non-food shops (9%).
ENVIRONMENTAL QUALITY
The quality of the environment of the centre is generally good but varies at different locations. St
Thomas Square and St James’ Square provide attractive pedestrianised public realms with cafes
offering outdoor seating. Along the High Street the quality of shopfront varies, with some units retaining historical features and being of high standard whilst others could benefit from
improvement. Shops along South Street are also contrasting with those to the south of modern appearance and the north being older and looking tired. Although the High Street provides one way
traffic only, it is still a dominant feature of the street scene and the on-street parking further reduces the pavement widths resulting in a cramped shopping environment in places.
Pedestrianisation of the High Street would help improve the environmental quality of the centre.
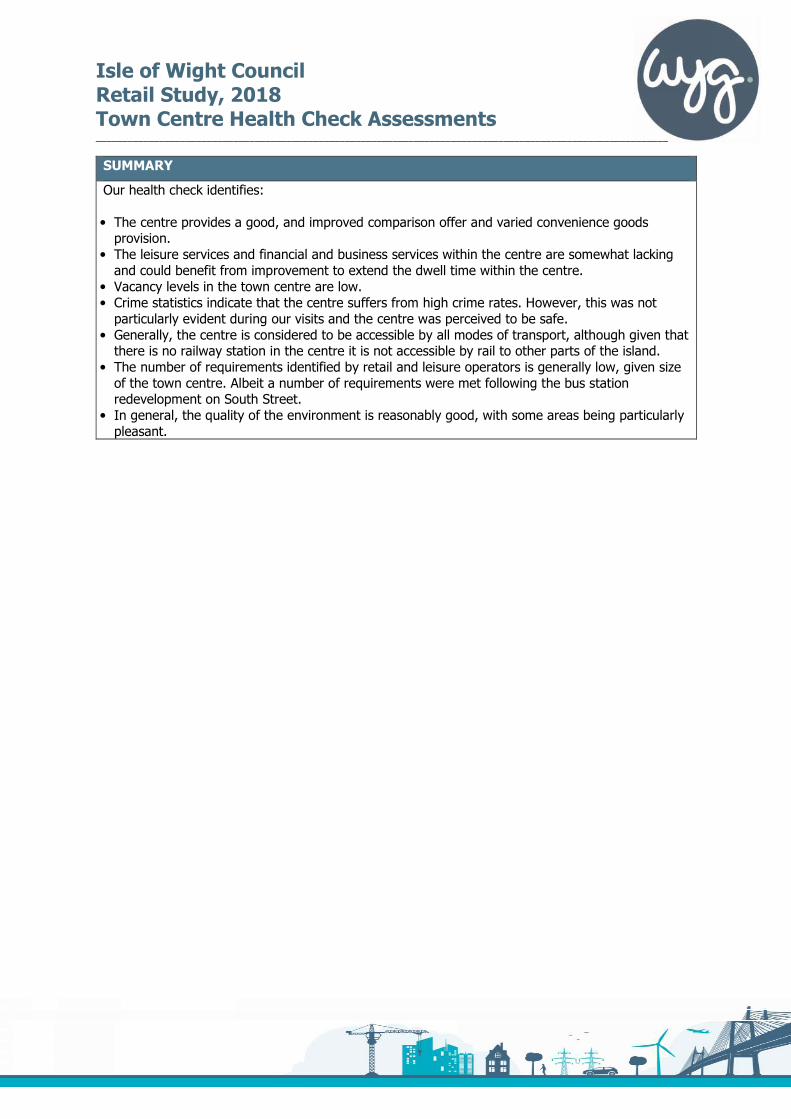
Isle of Wight Council Retail Study, 2018 Town Centre Health Check Assessments
____________________________________________________________________________________________________________
SUMMARY
Our health check identifies:
• The centre provides a good, and improved comparison offer and varied convenience goods provision.
• The leisure services and financial and business services within the centre are somewhat lacking and could benefit from improvement to extend the dwell time within the centre.
• Vacancy levels in the town centre are low. • Crime statistics indicate that the centre suffers from high crime rates. However, this was not particularly evident during our visits and the centre was perceived to be safe.
• Generally, the centre is considered to be accessible by all modes of transport, although given that there is no railway station in the centre it is not accessible by rail to other parts of the island.
• The number of requirements identified by retail and leisure operators is generally low, given size of the town centre. Albeit a number of requirements were met following the bus station redevelopment on South Street.
• In general, the quality of the environment is reasonably good, with some areas being particularly pleasant.
Isle of Wight Council Retail Study, 2018 Town Centre Health Check Assessments
______________________________________________________________________________________________________________
Cowes Town Centre
Description
Cowes Town Centre is located in the northern part of the Island to the west of the River Medina. Retail and service provision within the Town Centre is primarily focused on High Street alongside Bath Road and Birmingham Road. The centre, contains 159 retail, commercial leisure, and financial service units.
Town Centre Land Use Goad Plan
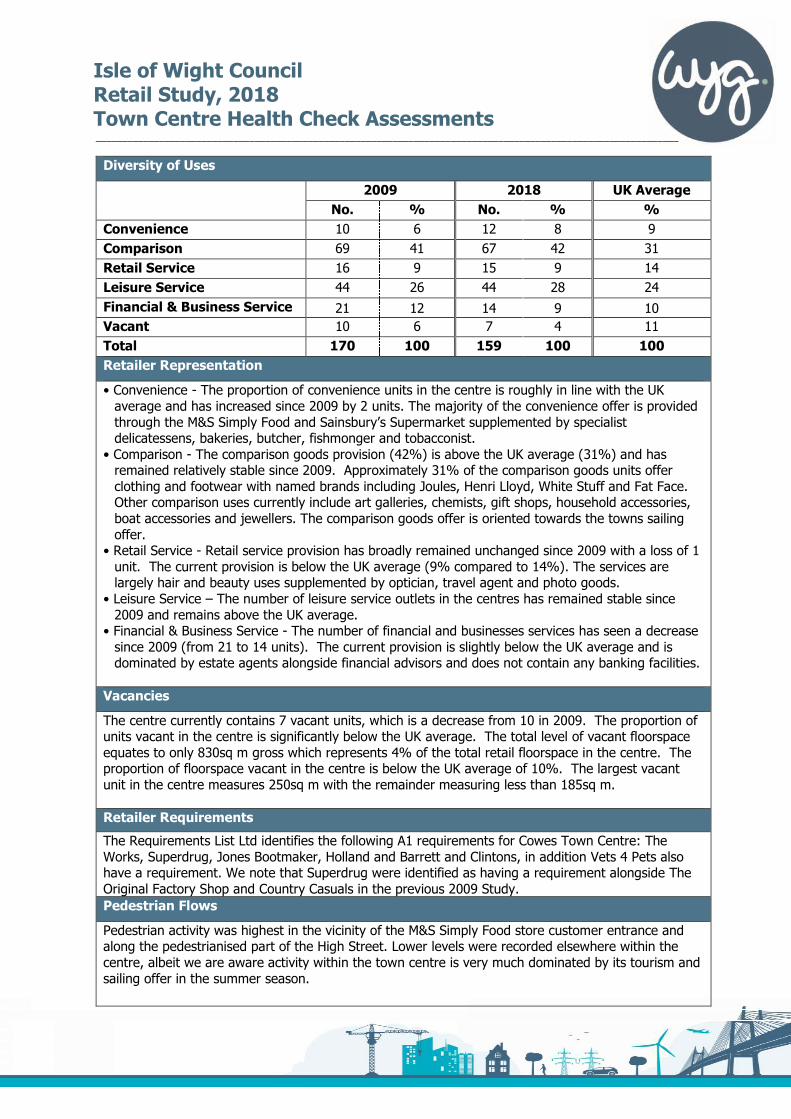
Isle of Wight Council Retail Study, 2018 Town Centre Health Check Assessments
______________________________________________________________________________________________________________
Diversity of Uses
2009 2018 UK Average
No. % No. % %
Convenience 10 6 12 8 9
Comparison 69 41 67 42 31
Retail Service 16 9 15 9 14
Leisure Service 44 26 44 28 24
Financial & Business Service 21 12 14 9 10
Vacant 10 6 7 4 11
Total 170 100 159 100 100
Retailer Representation
• Convenience - The proportion of convenience units in the centre is roughly in line with the UK average and has increased since 2009 by 2 units. The majority of the convenience offer is provided through the M&S Simply Food and Sainsbury’s Supermarket supplemented by specialist delicatessens, bakeries, butcher, fishmonger and tobacconist.
• Comparison - The comparison goods provision (42%) is above the UK average (31%) and has remained relatively stable since 2009. Approximately 31% of the comparison goods units offer clothing and footwear with named brands including Joules, Henri Lloyd, White Stuff and Fat Face. Other comparison uses currently include art galleries, chemists, gift shops, household accessories, boat accessories and jewellers. The comparison goods offer is oriented towards the towns sailing offer.
• Retail Service - Retail service provision has broadly remained unchanged since 2009 with a loss of 1 unit. The current provision is below the UK average (9% compared to 14%). The services are largely hair and beauty uses supplemented by optician, travel agent and photo goods.
• Leisure Service – The number of leisure service outlets in the centres has remained stable since 2009 and remains above the UK average.
• Financial & Business Service - The number of financial and businesses services has seen a decrease since 2009 (from 21 to 14 units). The current provision is slightly below the UK average and is dominated by estate agents alongside financial advisors and does not contain any banking facilities.
Vacancies
The centre currently contains 7 vacant units, which is a decrease from 10 in 2009. The proportion of units vacant in the centre is significantly below the UK average. The total level of vacant floorspace equates to only 830sq m gross which represents 4% of the total retail floorspace in the centre. The proportion of floorspace vacant in the centre is below the UK average of 10%. The largest vacant unit in the centre measures 250sq m with the remainder measuring less than 185sq m. Retailer Requirements
The Requirements List Ltd identifies the following A1 requirements for Cowes Town Centre: The Works, Superdrug, Jones Bootmaker, Holland and Barrett and Clintons, in addition Vets 4 Pets also have a requirement. We note that Superdrug were identified as having a requirement alongside The Original Factory Shop and Country Casuals in the previous 2009 Study. Pedestrian Flows
Pedestrian activity was highest in the vicinity of the M&S Simply Food store customer entrance and along the pedestrianised part of the High Street. Lower levels were recorded elsewhere within the centre, albeit we are aware activity within the town centre is very much dominated by its tourism and sailing offer in the summer season.
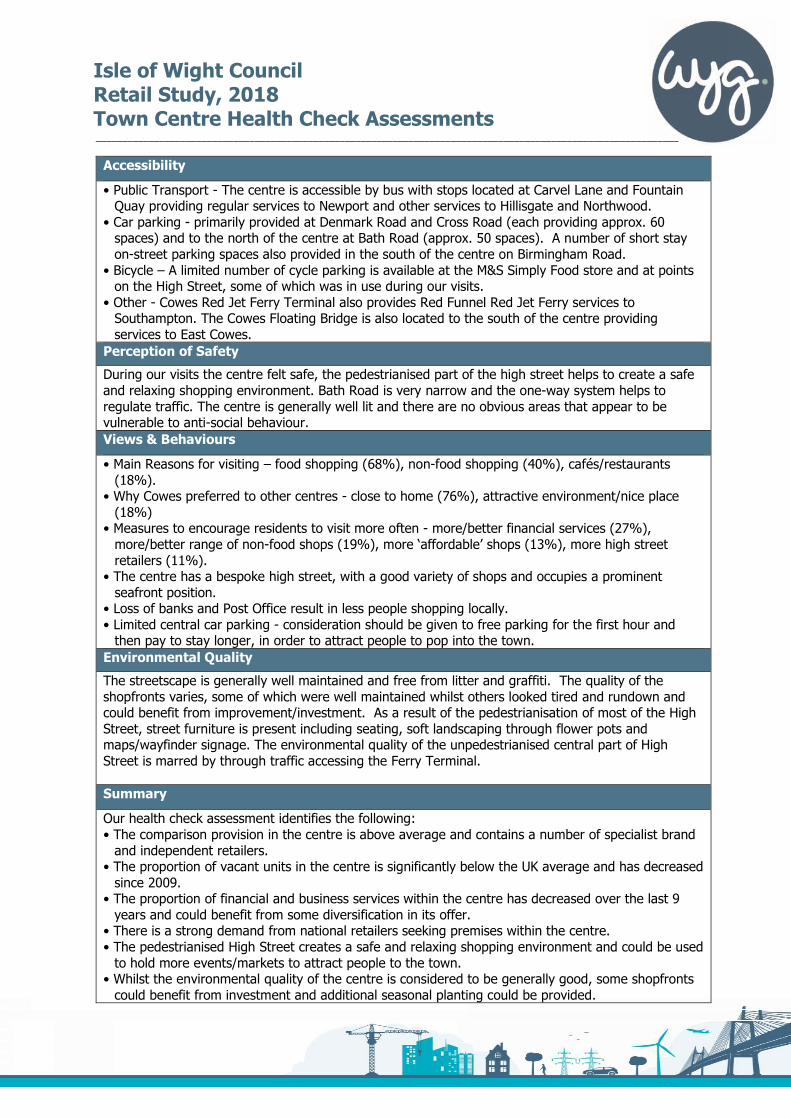
Isle of Wight Council Retail Study, 2018 Town Centre Health Check Assessments
______________________________________________________________________________________________________________
Accessibility
• Public Transport - The centre is accessible by bus with stops located at Carvel Lane and Fountain Quay providing regular services to Newport and other services to Hillisgate and Northwood.
• Car parking - primarily provided at Denmark Road and Cross Road (each providing approx. 60 spaces) and to the north of the centre at Bath Road (approx. 50 spaces). A number of short stay on-street parking spaces also provided in the south of the centre on Birmingham Road.
• Bicycle – A limited number of cycle parking is available at the M&S Simply Food store and at points on the High Street, some of which was in use during our visits.
• Other - Cowes Red Jet Ferry Terminal also provides Red Funnel Red Jet Ferry services to Southampton. The Cowes Floating Bridge is also located to the south of the centre providing services to East Cowes.
Perception of Safety
During our visits the centre felt safe, the pedestrianised part of the high street helps to create a safe and relaxing shopping environment. Bath Road is very narrow and the one-way system helps to regulate traffic. The centre is generally well lit and there are no obvious areas that appear to be vulnerable to anti-social behaviour. Views & Behaviours
• Main Reasons for visiting – food shopping (68%), non-food shopping (40%), cafés/restaurants (18%).
• Why Cowes preferred to other centres - close to home (76%), attractive environment/nice place (18%)
• Measures to encourage residents to visit more often - more/better financial services (27%), more/better range of non-food shops (19%), more ‘affordable’ shops (13%), more high street retailers (11%).
• The centre has a bespoke high street, with a good variety of shops and occupies a prominent seafront position.
• Loss of banks and Post Office result in less people shopping locally. • Limited central car parking - consideration should be given to free parking for the first hour and then pay to stay longer, in order to attract people to pop into the town.
Environmental Quality
The streetscape is generally well maintained and free from litter and graffiti. The quality of the shopfronts varies, some of which were well maintained whilst others looked tired and rundown and could benefit from improvement/investment. As a result of the pedestrianisation of most of the High Street, street furniture is present including seating, soft landscaping through flower pots and maps/wayfinder signage. The environmental quality of the unpedestrianised central part of High Street is marred by through traffic accessing the Ferry Terminal. Summary
Our health check assessment identifies the following: • The comparison provision in the centre is above average and contains a number of specialist brand and independent retailers.
• The proportion of vacant units in the centre is significantly below the UK average and has decreased since 2009.
• The proportion of financial and business services within the centre has decreased over the last 9 years and could benefit from some diversification in its offer.
• There is a strong demand from national retailers seeking premises within the centre. • The pedestrianised High Street creates a safe and relaxing shopping environment and could be used to hold more events/markets to attract people to the town.
• Whilst the environmental quality of the centre is considered to be generally good, some shopfronts could benefit from investment and additional seasonal planting could be provided.
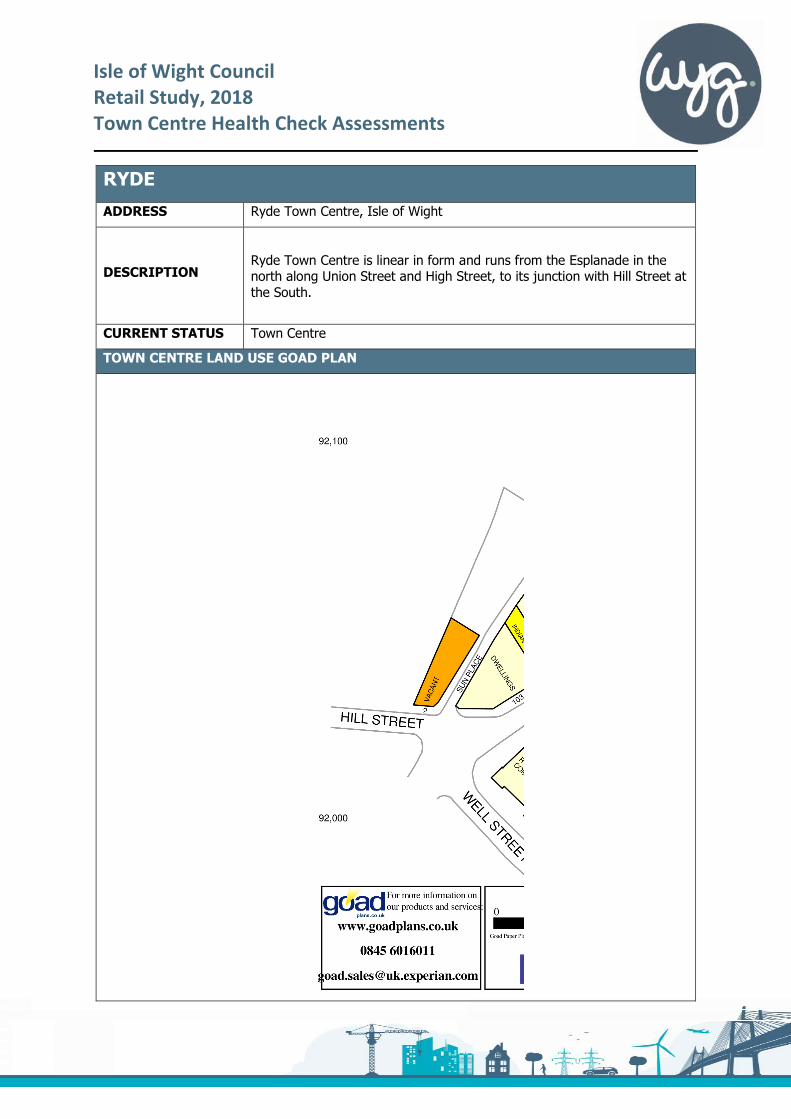
Isle of Wight Council
Retail Study, 2018
Town Centre Health Check Assessments
RYDE
ADDRESS Ryde Town Centre, Isle of Wight
DESCRIPTION Ryde Town Centre is linear in form and runs from the Esplanade in the north along Union Street and High Street, to its junction with Hill Street at
the South.
CURRENT STATUS Town Centre
TOWN CENTRE LAND USE GOAD PLAN
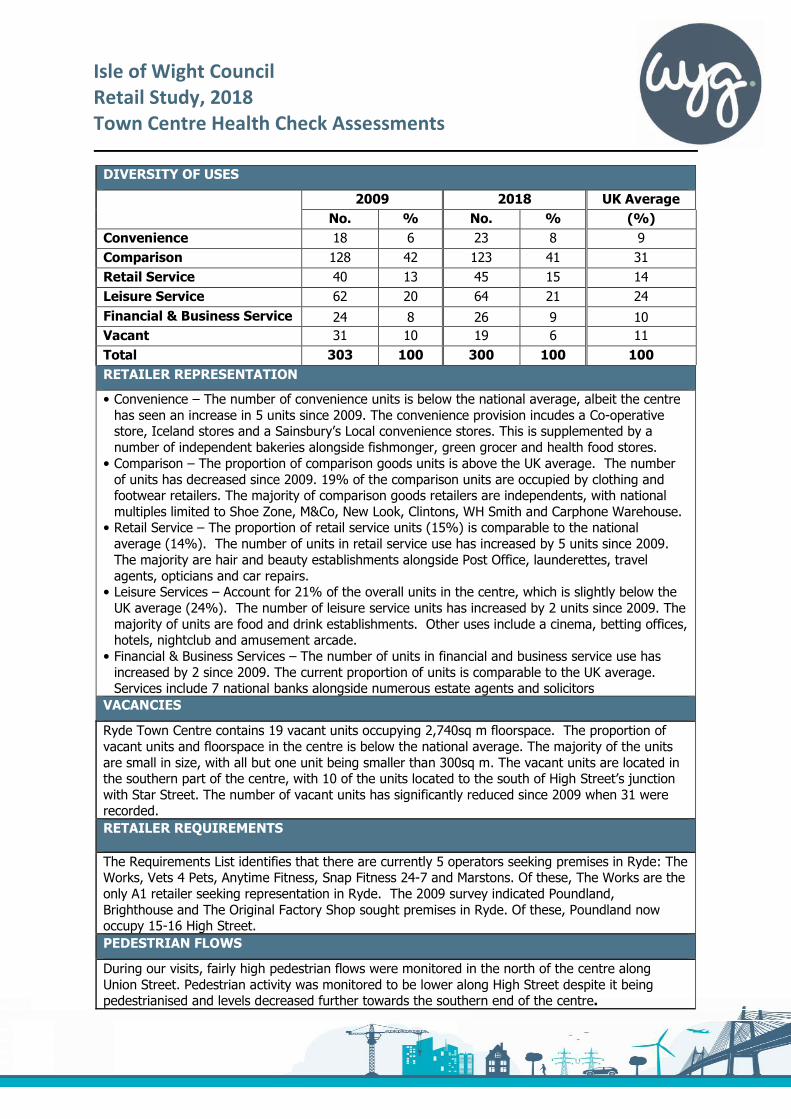
Isle of Wight Council
Retail Study, 2018
Town Centre Health Check Assessments
DIVERSITY OF USES
2009 2018 UK Average
No. % No. % (%)
Convenience 18 6 23 8 9
Comparison 128 42 123 41 31
Retail Service 40 13 45 15 14
Leisure Service 62 20 64 21 24
Financial & Business Service 24 8 26 9 10
Vacant 31 10 19 6 11
Total 303 100 300 100 100
RETAILER REPRESENTATION
• Convenience – The number of convenience units is below the national average, albeit the centre
has seen an increase in 5 units since 2009. The convenience provision incudes a Co-operative store, Iceland stores and a Sainsbury’s Local convenience stores. This is supplemented by a
number of independent bakeries alongside fishmonger, green grocer and health food stores.
• Comparison – The proportion of comparison goods units is above the UK average. The number
of units has decreased since 2009. 19% of the comparison units are occupied by clothing and footwear retailers. The majority of comparison goods retailers are independents, with national
multiples limited to Shoe Zone, M&Co, New Look, Clintons, WH Smith and Carphone Warehouse. • Retail Service – The proportion of retail service units (15%) is comparable to the national
average (14%). The number of units in retail service use has increased by 5 units since 2009.
The majority are hair and beauty establishments alongside Post Office, launderettes, travel
agents, opticians and car repairs. • Leisure Services – Account for 21% of the overall units in the centre, which is slightly below the
UK average (24%). The number of leisure service units has increased by 2 units since 2009. The
majority of units are food and drink establishments. Other uses include a cinema, betting offices, hotels, nightclub and amusement arcade.
• Financial & Business Services – The number of units in financial and business service use has
increased by 2 since 2009. The current proportion of units is comparable to the UK average. Services include 7 national banks alongside numerous estate agents and solicitors
VACANCIES
Ryde Town Centre contains 19 vacant units occupying 2,740sq m floorspace. The proportion of
vacant units and floorspace in the centre is below the national average. The majority of the units
are small in size, with all but one unit being smaller than 300sq m. The vacant units are located in the southern part of the centre, with 10 of the units located to the south of High Street’s junction
with Star Street. The number of vacant units has significantly reduced since 2009 when 31 were recorded.
RETAILER REQUIREMENTS
The Requirements List identifies that there are currently 5 operators seeking premises in Ryde: The Works, Vets 4 Pets, Anytime Fitness, Snap Fitness 24-7 and Marstons. Of these, The Works are the
only A1 retailer seeking representation in Ryde. The 2009 survey indicated Poundland,
Brighthouse and The Original Factory Shop sought premises in Ryde. Of these, Poundland now occupy 15-16 High Street.
PEDESTRIAN FLOWS
During our visits, fairly high pedestrian flows were monitored in the north of the centre along
Union Street. Pedestrian activity was monitored to be lower along High Street despite it being pedestrianised and levels decreased further towards the southern end of the centre.
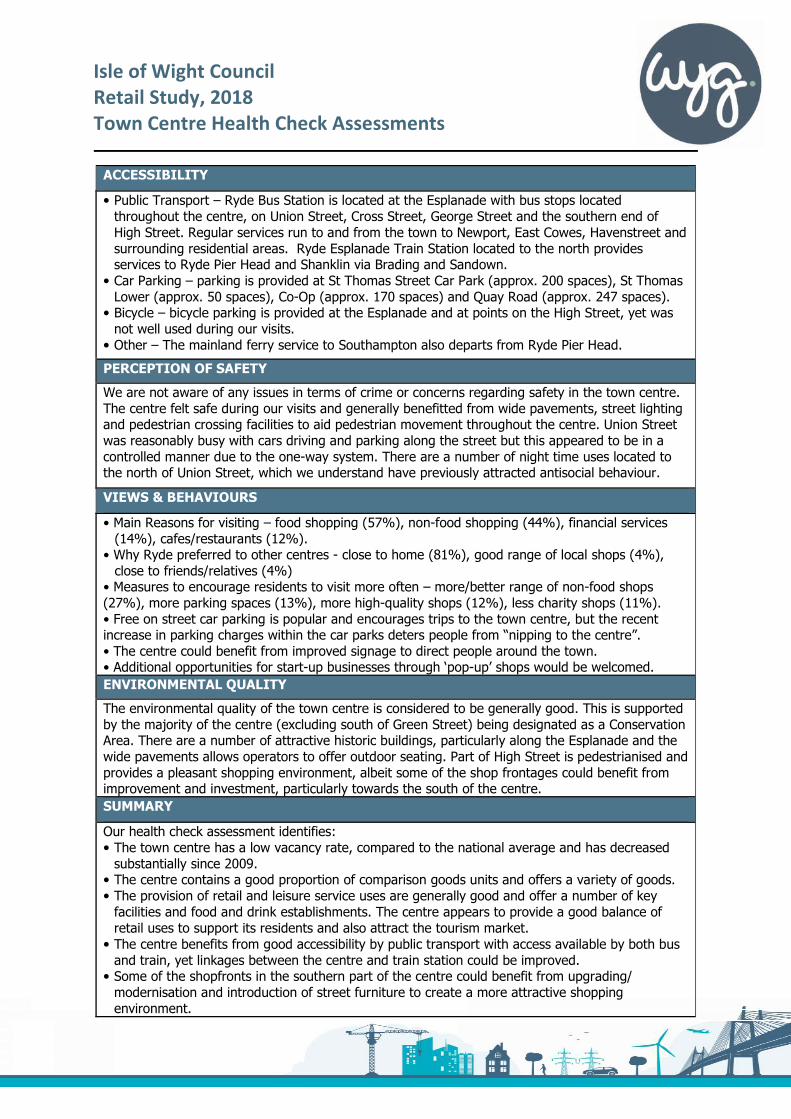
Isle of Wight Council
Retail Study, 2018
Town Centre Health Check Assessments
ACCESSIBILITY
• Public Transport – Ryde Bus Station is located at the Esplanade with bus stops located
throughout the centre, on Union Street, Cross Street, George Street and the southern end of
High Street. Regular services run to and from the town to Newport, East Cowes, Havenstreet and
surrounding residential areas. Ryde Esplanade Train Station located to the north provides services to Ryde Pier Head and Shanklin via Brading and Sandown.
• Car Parking – parking is provided at St Thomas Street Car Park (approx. 200 spaces), St Thomas
Lower (approx. 50 spaces), Co-Op (approx. 170 spaces) and Quay Road (approx. 247 spaces). • Bicycle – bicycle parking is provided at the Esplanade and at points on the High Street, yet was
not well used during our visits.
• Other – The mainland ferry service to Southampton also departs from Ryde Pier Head.
PERCEPTION OF SAFETY
We are not aware of any issues in terms of crime or concerns regarding safety in the town centre.
The centre felt safe during our visits and generally benefitted from wide pavements, street lighting and pedestrian crossing facilities to aid pedestrian movement throughout the centre. Union Street
was reasonably busy with cars driving and parking along the street but this appeared to be in a
controlled manner due to the one-way system. There are a number of night time uses located to the north of Union Street, which we understand have previously attracted antisocial behaviour.
VIEWS & BEHAVIOURS
• Main Reasons for visiting – food shopping (57%), non-food shopping (44%), financial services
(14%), cafes/restaurants (12%). • Why Ryde preferred to other centres - close to home (81%), good range of local shops (4%),
close to friends/relatives (4%) • Measures to encourage residents to visit more often – more/better range of non-food shops
(27%), more parking spaces (13%), more high-quality shops (12%), less charity shops (11%).
• Free on street car parking is popular and encourages trips to the town centre, but the recent increase in parking charges within the car parks deters people from “nipping to the centre”.
• The centre could benefit from improved signage to direct people around the town. • Additional opportunities for start-up businesses through ‘pop-up’ shops would be welcomed.
ENVIRONMENTAL QUALITY
The environmental quality of the town centre is considered to be generally good. This is supported
by the majority of the centre (excluding south of Green Street) being designated as a Conservation Area. There are a number of attractive historic buildings, particularly along the Esplanade and the
wide pavements allows operators to offer outdoor seating. Part of High Street is pedestrianised and
provides a pleasant shopping environment, albeit some of the shop frontages could benefit from improvement and investment, particularly towards the south of the centre.
SUMMARY
Our health check assessment identifies:
• The town centre has a low vacancy rate, compared to the national average and has decreased
substantially since 2009. • The centre contains a good proportion of comparison goods units and offers a variety of goods.
• The provision of retail and leisure service uses are generally good and offer a number of key
facilities and food and drink establishments. The centre appears to provide a good balance of
retail uses to support its residents and also attract the tourism market.
• The centre benefits from good accessibility by public transport with access available by both bus
and train, yet linkages between the centre and train station could be improved. • Some of the shopfronts in the southern part of the centre could benefit from upgrading/
modernisation and introduction of street furniture to create a more attractive shopping
environment.
Isle of Wight Council Retail Study, 2018 Town Centre Health Check Assessments
____________________________________________________________________________________________________________
Sandown Town Centre
Description
Sandown is one of the three ‘Bay Towns’ located in the south-eastern part of the island. The Town Centre is linear in form. The town centre primarily extends along the High Street which runs parallel with the sea front/Esplanade. The town centre also includes retail facilities on Melville Street and the top of Pier Street. The retail offer, particularly comparison and service uses, are predominantly oriented towards the tourism market.
Town Centre Land Use Goad Plan
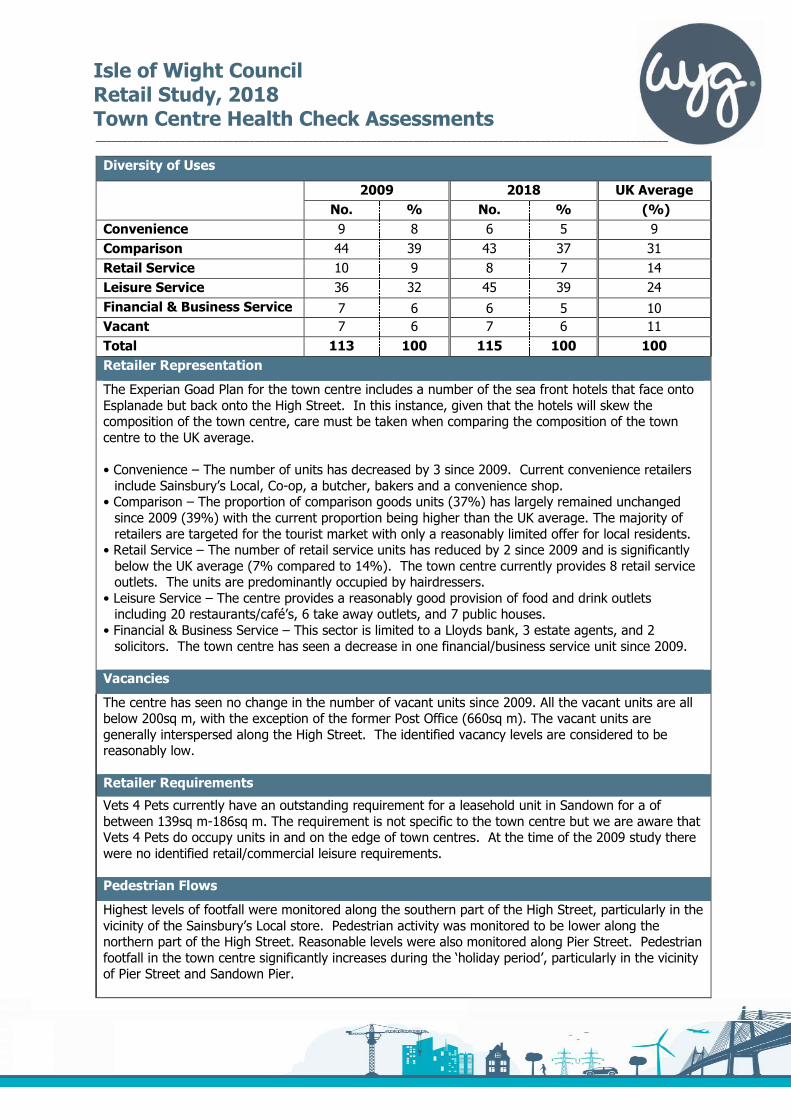
Isle of Wight Council Retail Study, 2018 Town Centre Health Check Assessments
____________________________________________________________________________________________________________
Diversity of Uses
2009 2018 UK Average
No. % No. % (%)
Convenience 9 8 6 5 9
Comparison 44 39 43 37 31
Retail Service 10 9 8 7 14
Leisure Service 36 32 45 39 24
Financial & Business Service 7 6 6 5 10
Vacant 7 6 7 6 11
Total 113 100 115 100 100
Retailer Representation
The Experian Goad Plan for the town centre includes a number of the sea front hotels that face onto Esplanade but back onto the High Street. In this instance, given that the hotels will skew the composition of the town centre, care must be taken when comparing the composition of the town centre to the UK average. • Convenience – The number of units has decreased by 3 since 2009. Current convenience retailers include Sainsbury’s Local, Co-op, a butcher, bakers and a convenience shop.
• Comparison – The proportion of comparison goods units (37%) has largely remained unchanged since 2009 (39%) with the current proportion being higher than the UK average. The majority of retailers are targeted for the tourist market with only a reasonably limited offer for local residents.
• Retail Service – The number of retail service units has reduced by 2 since 2009 and is significantly below the UK average (7% compared to 14%). The town centre currently provides 8 retail service outlets. The units are predominantly occupied by hairdressers.
• Leisure Service – The centre provides a reasonably good provision of food and drink outlets including 20 restaurants/café’s, 6 take away outlets, and 7 public houses.
• Financial & Business Service – This sector is limited to a Lloyds bank, 3 estate agents, and 2 solicitors. The town centre has seen a decrease in one financial/business service unit since 2009.
Vacancies
The centre has seen no change in the number of vacant units since 2009. All the vacant units are all below 200sq m, with the exception of the former Post Office (660sq m). The vacant units are generally interspersed along the High Street. The identified vacancy levels are considered to be reasonably low.
Retailer Requirements
Vets 4 Pets currently have an outstanding requirement for a leasehold unit in Sandown for a of between 139sq m-186sq m. The requirement is not specific to the town centre but we are aware that Vets 4 Pets do occupy units in and on the edge of town centres. At the time of the 2009 study there were no identified retail/commercial leisure requirements. Pedestrian Flows
Highest levels of footfall were monitored along the southern part of the High Street, particularly in the vicinity of the Sainsbury’s Local store. Pedestrian activity was monitored to be lower along the northern part of the High Street. Reasonable levels were also monitored along Pier Street. Pedestrian footfall in the town centre significantly increases during the ‘holiday period’, particularly in the vicinity of Pier Street and Sandown Pier.
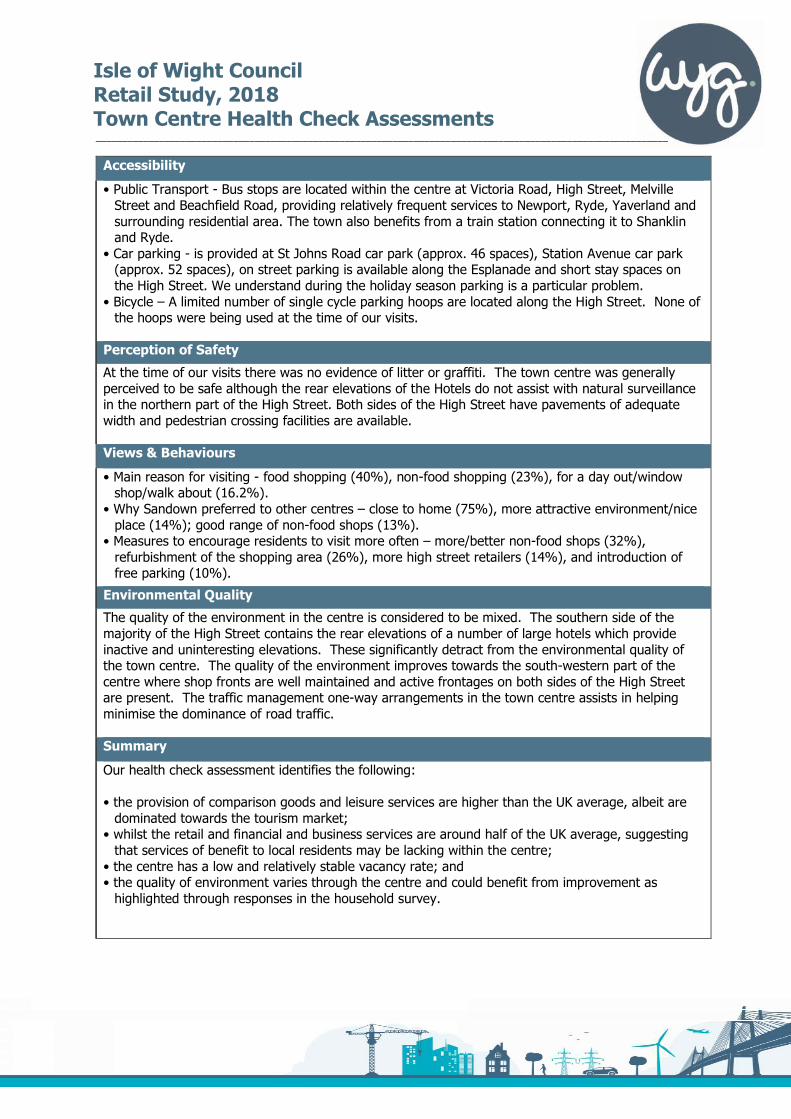
Isle of Wight Council Retail Study, 2018 Town Centre Health Check Assessments
____________________________________________________________________________________________________________
Accessibility
• Public Transport - Bus stops are located within the centre at Victoria Road, High Street, Melville Street and Beachfield Road, providing relatively frequent services to Newport, Ryde, Yaverland and surrounding residential area. The town also benefits from a train station connecting it to Shanklin and Ryde.
• Car parking - is provided at St Johns Road car park (approx. 46 spaces), Station Avenue car park (approx. 52 spaces), on street parking is available along the Esplanade and short stay spaces on the High Street. We understand during the holiday season parking is a particular problem.
• Bicycle – A limited number of single cycle parking hoops are located along the High Street. None of the hoops were being used at the time of our visits.
Perception of Safety
At the time of our visits there was no evidence of litter or graffiti. The town centre was generally perceived to be safe although the rear elevations of the Hotels do not assist with natural surveillance in the northern part of the High Street. Both sides of the High Street have pavements of adequate width and pedestrian crossing facilities are available.
Views & Behaviours
• Main reason for visiting - food shopping (40%), non-food shopping (23%), for a day out/window shop/walk about (16.2%).
• Why Sandown preferred to other centres – close to home (75%), more attractive environment/nice place (14%); good range of non-food shops (13%).
• Measures to encourage residents to visit more often – more/better non-food shops (32%), refurbishment of the shopping area (26%), more high street retailers (14%), and introduction of free parking (10%).
Environmental Quality
The quality of the environment in the centre is considered to be mixed. The southern side of the majority of the High Street contains the rear elevations of a number of large hotels which provide inactive and uninteresting elevations. These significantly detract from the environmental quality of the town centre. The quality of the environment improves towards the south-western part of the centre where shop fronts are well maintained and active frontages on both sides of the High Street are present. The traffic management one-way arrangements in the town centre assists in helping minimise the dominance of road traffic. Summary
Our health check assessment identifies the following: • the provision of comparison goods and leisure services are higher than the UK average, albeit are dominated towards the tourism market;
• whilst the retail and financial and business services are around half of the UK average, suggesting that services of benefit to local residents may be lacking within the centre;
• the centre has a low and relatively stable vacancy rate; and • the quality of environment varies through the centre and could benefit from improvement as highlighted through responses in the household survey.
Isle of Wight Council
Retail Study, 2018
Town Centre Health Check Assessments
SHANKLIN
DESCRIPTION
Shanklin Town Centre is located to the east of the Island
along the Bay between Sandown and Ventnor. The town centre provides 179 commercial units and is generally linear in
form running from the station in the north along Regent Street and High Street to Church Road in the south.
TOWN CENTRE LAND USE GOAD PLAN
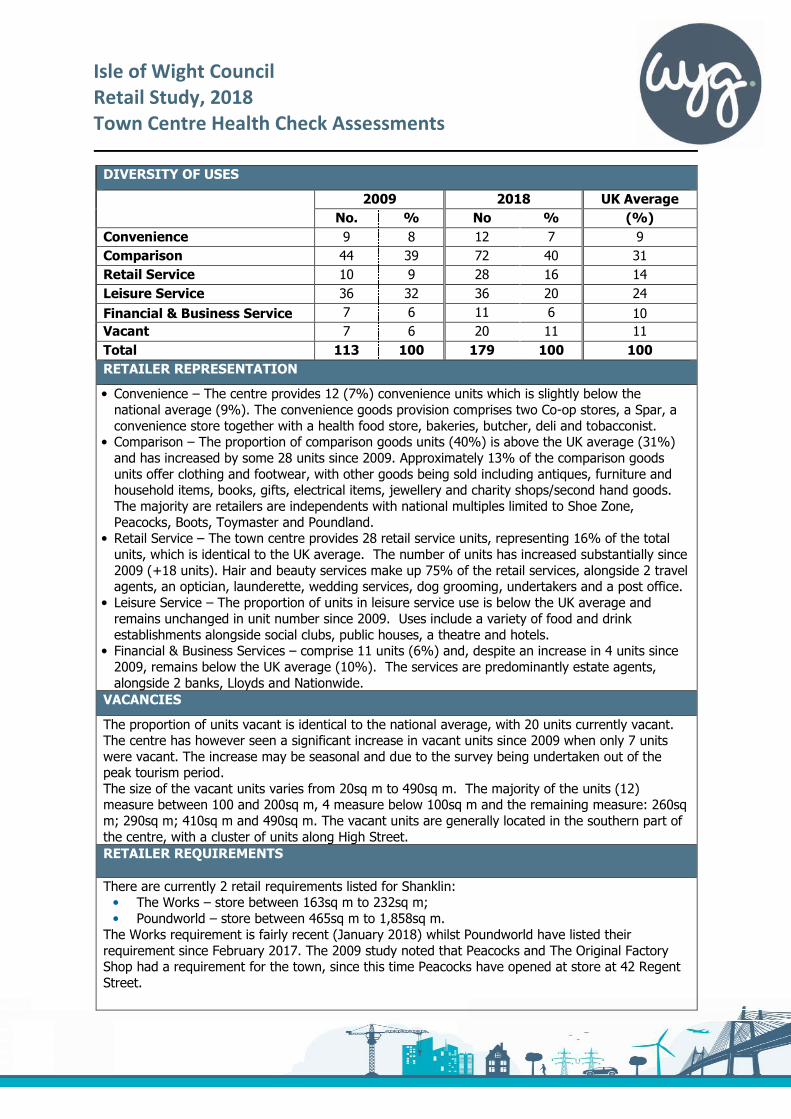
Isle of Wight Council
Retail Study, 2018
Town Centre Health Check Assessments
DIVERSITY OF USES
2009 2018 UK Average
No. % No % (%)
Convenience 9 8 12 7 9
Comparison 44 39 72 40 31
Retail Service 10 9 28 16 14
Leisure Service 36 32 36 20 24
Financial & Business Service 7 6 11 6 10
Vacant 7 6 20 11 11
Total 113 100 179 100 100
RETAILER REPRESENTATION
• Convenience – The centre provides 12 (7%) convenience units which is slightly below the national average (9%). The convenience goods provision comprises two Co-op stores, a Spar, a
convenience store together with a health food store, bakeries, butcher, deli and tobacconist. • Comparison – The proportion of comparison goods units (40%) is above the UK average (31%) and has increased by some 28 units since 2009. Approximately 13% of the comparison goods
units offer clothing and footwear, with other goods being sold including antiques, furniture and household items, books, gifts, electrical items, jewellery and charity shops/second hand goods.
The majority are retailers are independents with national multiples limited to Shoe Zone,
Peacocks, Boots, Toymaster and Poundland. • Retail Service – The town centre provides 28 retail service units, representing 16% of the total units, which is identical to the UK average. The number of units has increased substantially since
2009 (+18 units). Hair and beauty services make up 75% of the retail services, alongside 2 travel agents, an optician, launderette, wedding services, dog grooming, undertakers and a post office.
• Leisure Service – The proportion of units in leisure service use is below the UK average and remains unchanged in unit number since 2009. Uses include a variety of food and drink
establishments alongside social clubs, public houses, a theatre and hotels. • Financial & Business Services – comprise 11 units (6%) and, despite an increase in 4 units since 2009, remains below the UK average (10%). The services are predominantly estate agents,
alongside 2 banks, Lloyds and Nationwide.
VACANCIES
The proportion of units vacant is identical to the national average, with 20 units currently vacant. The centre has however seen a significant increase in vacant units since 2009 when only 7 units
were vacant. The increase may be seasonal and due to the survey being undertaken out of the peak tourism period.
The size of the vacant units varies from 20sq m to 490sq m. The majority of the units (12) measure between 100 and 200sq m, 4 measure below 100sq m and the remaining measure: 260sq
m; 290sq m; 410sq m and 490sq m. The vacant units are generally located in the southern part of
the centre, with a cluster of units along High Street.
RETAILER REQUIREMENTS
There are currently 2 retail requirements listed for Shanklin: • The Works – store between 163sq m to 232sq m;
• Poundworld – store between 465sq m to 1,858sq m.
The Works requirement is fairly recent (January 2018) whilst Poundworld have listed their
requirement since February 2017. The 2009 study noted that Peacocks and The Original Factory Shop had a requirement for the town, since this time Peacocks have opened at store at 42 Regent
Street.
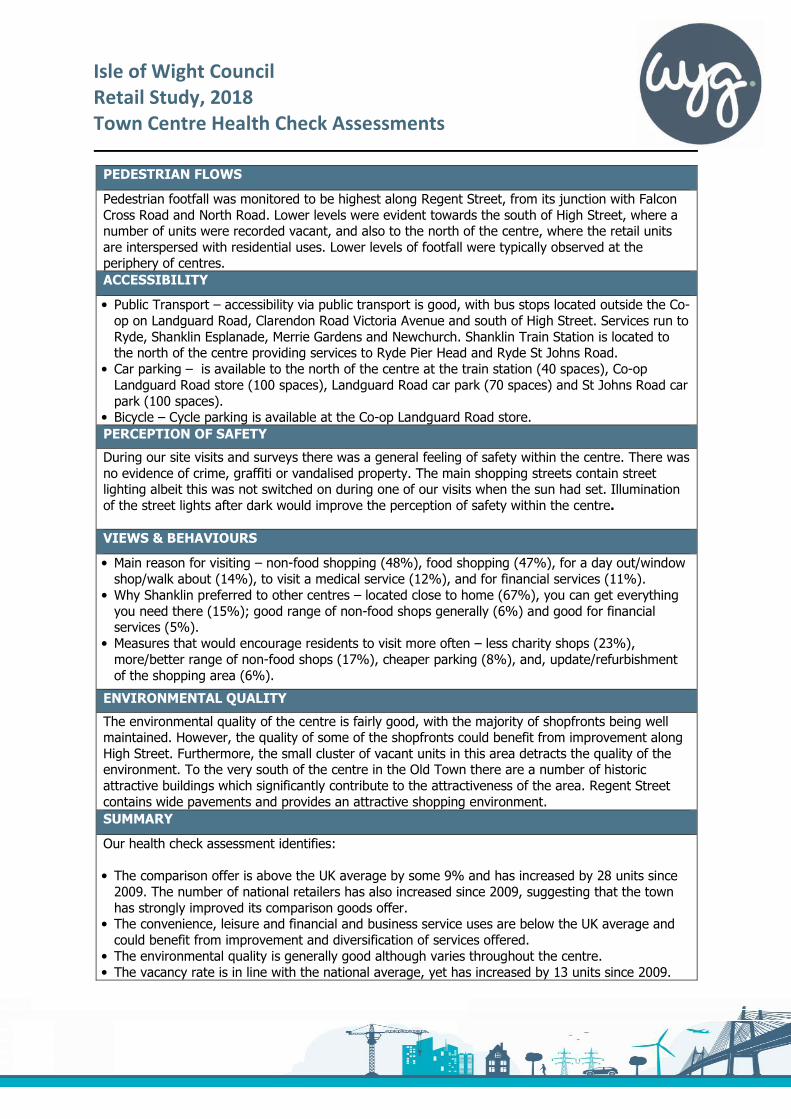
Isle of Wight Council
Retail Study, 2018
Town Centre Health Check Assessments
PEDESTRIAN FLOWS
Pedestrian footfall was monitored to be highest along Regent Street, from its junction with Falcon
Cross Road and North Road. Lower levels were evident towards the south of High Street, where a number of units were recorded vacant, and also to the north of the centre, where the retail units
are interspersed with residential uses. Lower levels of footfall were typically observed at the periphery of centres.
ACCESSIBILITY
• Public Transport – accessibility via public transport is good, with bus stops located outside the Co-op on Landguard Road, Clarendon Road Victoria Avenue and south of High Street. Services run to
Ryde, Shanklin Esplanade, Merrie Gardens and Newchurch. Shanklin Train Station is located to the north of the centre providing services to Ryde Pier Head and Ryde St Johns Road.
• Car parking – is available to the north of the centre at the train station (40 spaces), Co-op Landguard Road store (100 spaces), Landguard Road car park (70 spaces) and St Johns Road car
park (100 spaces). • Bicycle – Cycle parking is available at the Co-op Landguard Road store.
PERCEPTION OF SAFETY
During our site visits and surveys there was a general feeling of safety within the centre. There was
no evidence of crime, graffiti or vandalised property. The main shopping streets contain street lighting albeit this was not switched on during one of our visits when the sun had set. Illumination
of the street lights after dark would improve the perception of safety within the centre.
VIEWS & BEHAVIOURS
• Main reason for visiting – non-food shopping (48%), food shopping (47%), for a day out/window shop/walk about (14%), to visit a medical service (12%), and for financial services (11%).
• Why Shanklin preferred to other centres – located close to home (67%), you can get everything you need there (15%); good range of non-food shops generally (6%) and good for financial services (5%).
• Measures that would encourage residents to visit more often – less charity shops (23%), more/better range of non-food shops (17%), cheaper parking (8%), and, update/refurbishment
of the shopping area (6%).
ENVIRONMENTAL QUALITY
The environmental quality of the centre is fairly good, with the majority of shopfronts being well maintained. However, the quality of some of the shopfronts could benefit from improvement along
High Street. Furthermore, the small cluster of vacant units in this area detracts the quality of the environment. To the very south of the centre in the Old Town there are a number of historic
attractive buildings which significantly contribute to the attractiveness of the area. Regent Street
contains wide pavements and provides an attractive shopping environment.
SUMMARY
Our health check assessment identifies:
• The comparison offer is above the UK average by some 9% and has increased by 28 units since 2009. The number of national retailers has also increased since 2009, suggesting that the town
has strongly improved its comparison goods offer. • The convenience, leisure and financial and business service uses are below the UK average and could benefit from improvement and diversification of services offered.
• The environmental quality is generally good although varies throughout the centre. • The vacancy rate is in line with the national average, yet has increased by 13 units since 2009.
Isle of Wight Council Retail Study, 2018 Town Centre Health Check Assessments
____________________________________________________________________________________________________________
Ventnor Town Centre
Description
Ventnor is located on the south coast of the island. Providing some 92 commercial units, the town centre runs from the edge of Central car park
along High Street, the southern side of Church Street, and along Pier Street just past its junction with Albert Street.
Town Centre Land Use Goad Plan
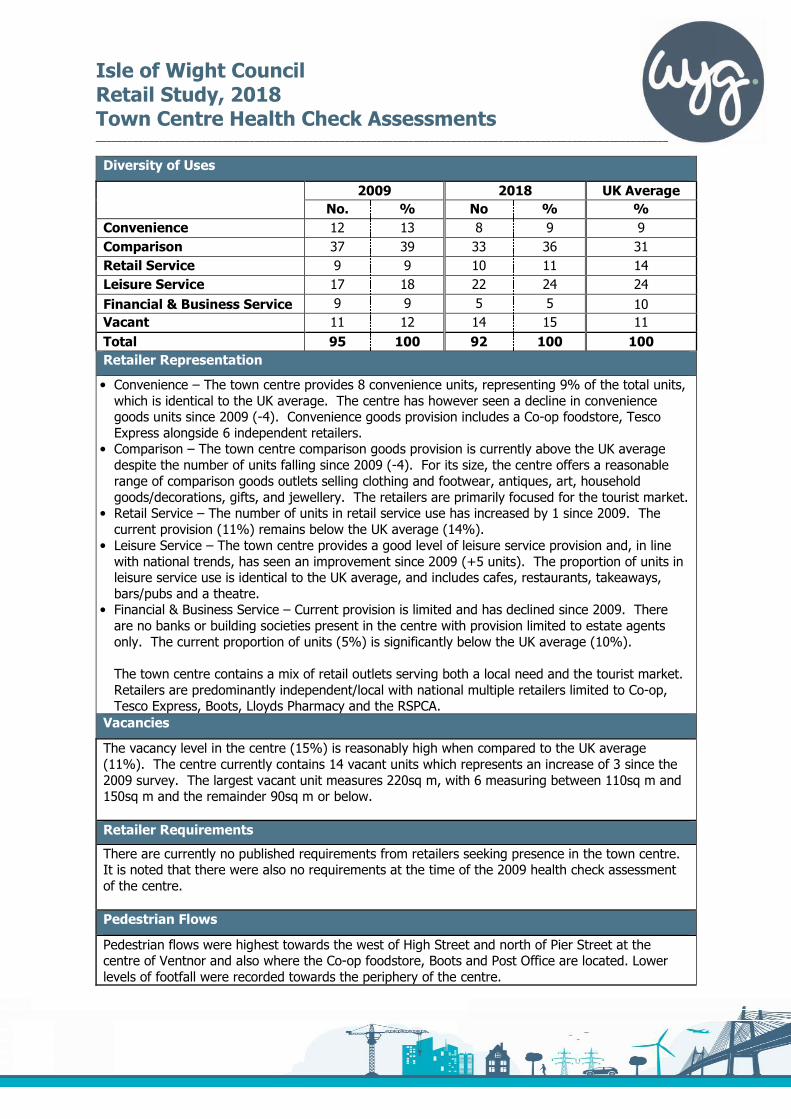
Isle of Wight Council Retail Study, 2018 Town Centre Health Check Assessments
____________________________________________________________________________________________________________
Diversity of Uses
2009 2018 UK Average
No. % No % %
Convenience 12 13 8 9 9
Comparison 37 39 33 36 31
Retail Service 9 9 10 11 14
Leisure Service 17 18 22 24 24
Financial & Business Service 9 9 5 5 10
Vacant 11 12 14 15 11
Total 95 100 92 100 100
Retailer Representation
• Convenience – The town centre provides 8 convenience units, representing 9% of the total units,
which is identical to the UK average. The centre has however seen a decline in convenience goods units since 2009 (-4). Convenience goods provision includes a Co-op foodstore, Tesco
Express alongside 6 independent retailers. • Comparison – The town centre comparison goods provision is currently above the UK average despite the number of units falling since 2009 (-4). For its size, the centre offers a reasonable
range of comparison goods outlets selling clothing and footwear, antiques, art, household
goods/decorations, gifts, and jewellery. The retailers are primarily focused for the tourist market. • Retail Service – The number of units in retail service use has increased by 1 since 2009. The current provision (11%) remains below the UK average (14%).
• Leisure Service – The town centre provides a good level of leisure service provision and, in line with national trends, has seen an improvement since 2009 (+5 units). The proportion of units in leisure service use is identical to the UK average, and includes cafes, restaurants, takeaways,
bars/pubs and a theatre. • Financial & Business Service – Current provision is limited and has declined since 2009. There are no banks or building societies present in the centre with provision limited to estate agents
only. The current proportion of units (5%) is significantly below the UK average (10%).
The town centre contains a mix of retail outlets serving both a local need and the tourist market.
Retailers are predominantly independent/local with national multiple retailers limited to Co-op, Tesco Express, Boots, Lloyds Pharmacy and the RSPCA.
Vacancies
The vacancy level in the centre (15%) is reasonably high when compared to the UK average
(11%). The centre currently contains 14 vacant units which represents an increase of 3 since the
2009 survey. The largest vacant unit measures 220sq m, with 6 measuring between 110sq m and 150sq m and the remainder 90sq m or below.
Retailer Requirements
There are currently no published requirements from retailers seeking presence in the town centre. It is noted that there were also no requirements at the time of the 2009 health check assessment
of the centre.
Pedestrian Flows
Pedestrian flows were highest towards the west of High Street and north of Pier Street at the centre of Ventnor and also where the Co-op foodstore, Boots and Post Office are located. Lower
levels of footfall were recorded towards the periphery of the centre.
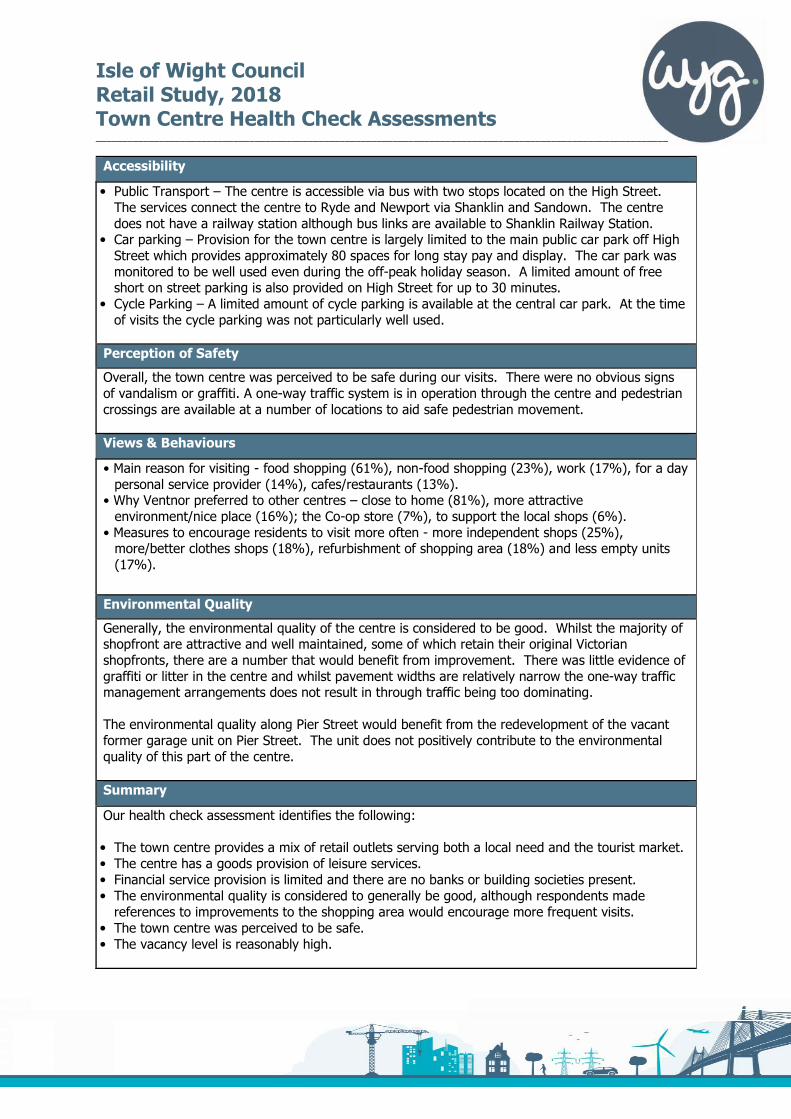
Isle of Wight Council Retail Study, 2018 Town Centre Health Check Assessments
____________________________________________________________________________________________________________
Accessibility
• Public Transport – The centre is accessible via bus with two stops located on the High Street. The services connect the centre to Ryde and Newport via Shanklin and Sandown. The centre
does not have a railway station although bus links are available to Shanklin Railway Station. • Car parking – Provision for the town centre is largely limited to the main public car park off High Street which provides approximately 80 spaces for long stay pay and display. The car park was
monitored to be well used even during the off-peak holiday season. A limited amount of free short on street parking is also provided on High Street for up to 30 minutes.
• Cycle Parking – A limited amount of cycle parking is available at the central car park. At the time of visits the cycle parking was not particularly well used.
Perception of Safety
Overall, the town centre was perceived to be safe during our visits. There were no obvious signs
of vandalism or graffiti. A one-way traffic system is in operation through the centre and pedestrian
crossings are available at a number of locations to aid safe pedestrian movement.
Views & Behaviours
• Main reason for visiting - food shopping (61%), non-food shopping (23%), work (17%), for a day
personal service provider (14%), cafes/restaurants (13%). • Why Ventnor preferred to other centres – close to home (81%), more attractive
environment/nice place (16%); the Co-op store (7%), to support the local shops (6%).
• Measures to encourage residents to visit more often - more independent shops (25%), more/better clothes shops (18%), refurbishment of shopping area (18%) and less empty units
(17%).
Environmental Quality
Generally, the environmental quality of the centre is considered to be good. Whilst the majority of shopfront are attractive and well maintained, some of which retain their original Victorian
shopfronts, there are a number that would benefit from improvement. There was little evidence of
graffiti or litter in the centre and whilst pavement widths are relatively narrow the one-way traffic management arrangements does not result in through traffic being too dominating.
The environmental quality along Pier Street would benefit from the redevelopment of the vacant
former garage unit on Pier Street. The unit does not positively contribute to the environmental
quality of this part of the centre.
Summary
Our health check assessment identifies the following:
• The town centre provides a mix of retail outlets serving both a local need and the tourist market. • The centre has a goods provision of leisure services. • Financial service provision is limited and there are no banks or building societies present. • The environmental quality is considered to generally be good, although respondents made references to improvements to the shopping area would encourage more frequent visits.
• The town centre was perceived to be safe. • The vacancy level is reasonably high.
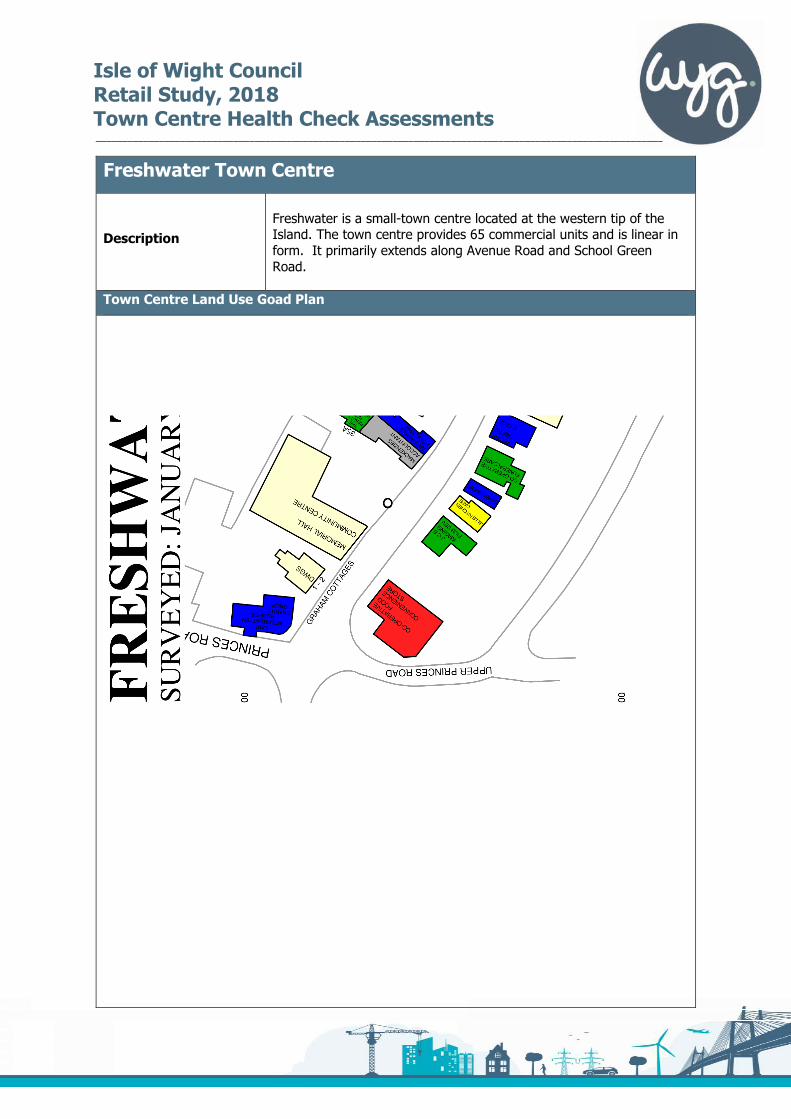
Isle of Wight Council Retail Study, 2018 Town Centre Health Check Assessments
___________________________________________________________________________________________________________
Freshwater Town Centre
Description
Freshwater is a small-town centre located at the western tip of the Island. The town centre provides 65 commercial units and is linear in form. It primarily extends along Avenue Road and School Green Road.
Town Centre Land Use Goad Plan
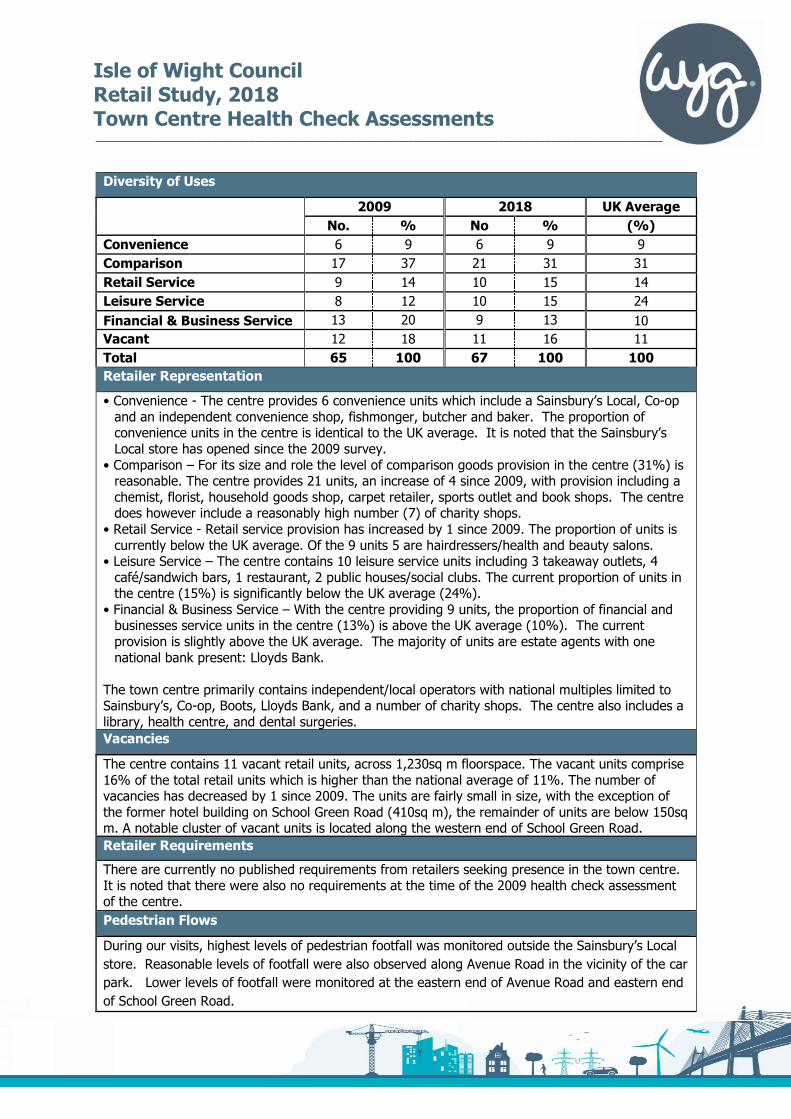
Isle of Wight Council Retail Study, 2018 Town Centre Health Check Assessments
___________________________________________________________________________________________________________
Diversity of Uses
2009 2018 UK Average
No. % No % (%)
Convenience 6 9 6 9 9
Comparison 17 37 21 31 31
Retail Service 9 14 10 15 14
Leisure Service 8 12 10 15 24
Financial & Business Service 13 20 9 13 10
Vacant 12 18 11 16 11
Total 65 100 67 100 100
Retailer Representation
• Convenience - The centre provides 6 convenience units which include a Sainsbury’s Local, Co-op and an independent convenience shop, fishmonger, butcher and baker. The proportion of convenience units in the centre is identical to the UK average. It is noted that the Sainsbury’s Local store has opened since the 2009 survey.
• Comparison – For its size and role the level of comparison goods provision in the centre (31%) is reasonable. The centre provides 21 units, an increase of 4 since 2009, with provision including a chemist, florist, household goods shop, carpet retailer, sports outlet and book shops. The centre does however include a reasonably high number (7) of charity shops.
• Retail Service - Retail service provision has increased by 1 since 2009. The proportion of units is currently below the UK average. Of the 9 units 5 are hairdressers/health and beauty salons.
• Leisure Service – The centre contains 10 leisure service units including 3 takeaway outlets, 4 café/sandwich bars, 1 restaurant, 2 public houses/social clubs. The current proportion of units in the centre (15%) is significantly below the UK average (24%).
• Financial & Business Service – With the centre providing 9 units, the proportion of financial and businesses service units in the centre (13%) is above the UK average (10%). The current provision is slightly above the UK average. The majority of units are estate agents with one national bank present: Lloyds Bank.
The town centre primarily contains independent/local operators with national multiples limited to Sainsbury’s, Co-op, Boots, Lloyds Bank, and a number of charity shops. The centre also includes a library, health centre, and dental surgeries. Vacancies
The centre contains 11 vacant retail units, across 1,230sq m floorspace. The vacant units comprise 16% of the total retail units which is higher than the national average of 11%. The number of vacancies has decreased by 1 since 2009. The units are fairly small in size, with the exception of the former hotel building on School Green Road (410sq m), the remainder of units are below 150sq m. A notable cluster of vacant units is located along the western end of School Green Road.
Retailer Requirements
There are currently no published requirements from retailers seeking presence in the town centre. It is noted that there were also no requirements at the time of the 2009 health check assessment of the centre.
Pedestrian Flows
During our visits, highest levels of pedestrian footfall was monitored outside the Sainsbury’s Local
store. Reasonable levels of footfall were also observed along Avenue Road in the vicinity of the car
park. Lower levels of footfall were monitored at the eastern end of Avenue Road and eastern end
of School Green Road.
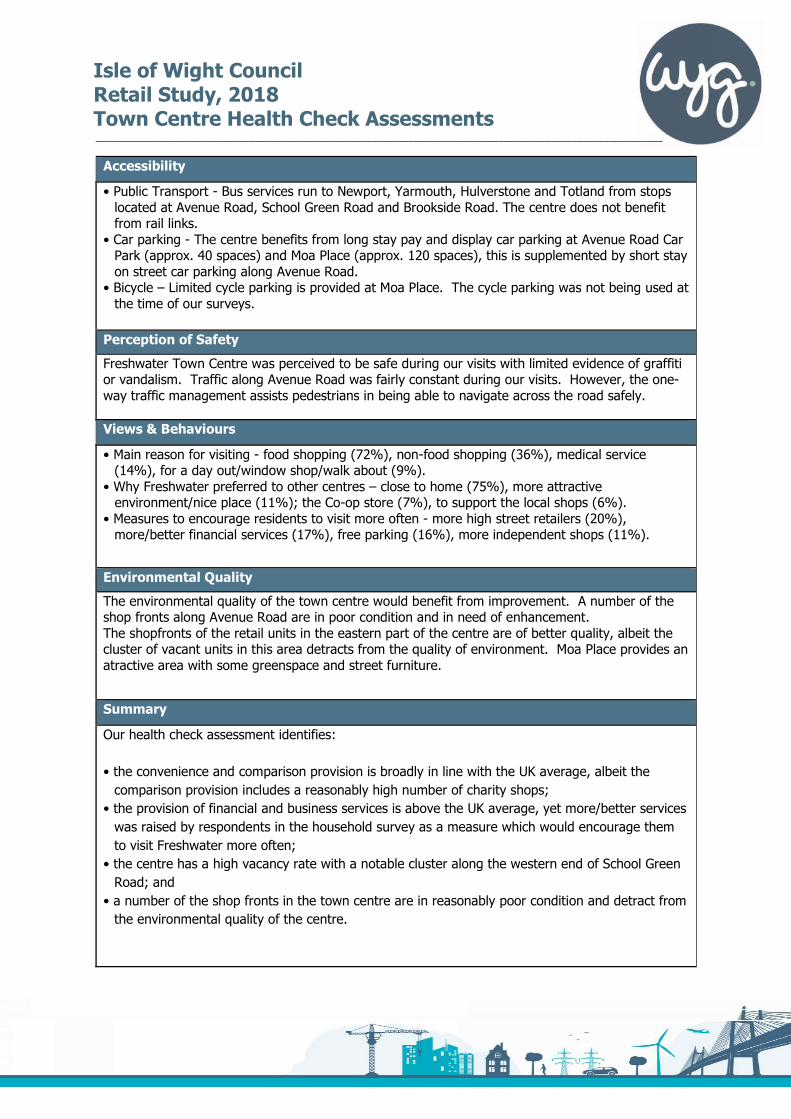
Isle of Wight Council Retail Study, 2018 Town Centre Health Check Assessments
___________________________________________________________________________________________________________
Accessibility
• Public Transport - Bus services run to Newport, Yarmouth, Hulverstone and Totland from stops located at Avenue Road, School Green Road and Brookside Road. The centre does not benefit from rail links.
• Car parking - The centre benefits from long stay pay and display car parking at Avenue Road Car Park (approx. 40 spaces) and Moa Place (approx. 120 spaces), this is supplemented by short stay on street car parking along Avenue Road.
• Bicycle – Limited cycle parking is provided at Moa Place. The cycle parking was not being used at the time of our surveys.
Perception of Safety
Freshwater Town Centre was perceived to be safe during our visits with limited evidence of graffiti or vandalism. Traffic along Avenue Road was fairly constant during our visits. However, the one-way traffic management assists pedestrians in being able to navigate across the road safely.
Views & Behaviours
• Main reason for visiting - food shopping (72%), non-food shopping (36%), medical service (14%), for a day out/window shop/walk about (9%).
• Why Freshwater preferred to other centres – close to home (75%), more attractive environment/nice place (11%); the Co-op store (7%), to support the local shops (6%).
• Measures to encourage residents to visit more often - more high street retailers (20%), more/better financial services (17%), free parking (16%), more independent shops (11%).
Environmental Quality
The environmental quality of the town centre would benefit from improvement. A number of the shop fronts along Avenue Road are in poor condition and in need of enhancement. The shopfronts of the retail units in the eastern part of the centre are of better quality, albeit the cluster of vacant units in this area detracts from the quality of environment. Moa Place provides an atractive area with some greenspace and street furniture.
Summary
Our health check assessment identifies:
• the convenience and comparison provision is broadly in line with the UK average, albeit the
comparison provision includes a reasonably high number of charity shops;
• the provision of financial and business services is above the UK average, yet more/better services
was raised by respondents in the household survey as a measure which would encourage them
to visit Freshwater more often;
• the centre has a high vacancy rate with a notable cluster along the western end of School Green
Road; and
• a number of the shop fronts in the town centre are in reasonably poor condition and detract from
the environmental quality of the centre.
Isle of Wight Council Retail Study, 2018 Town Centre Health Check Assessments
______________________________________________________________________________________________________________
East Cowes Town Centre
Description
East Cowes Town Centre is located in the northern part of the Island to
the east of the River Medina. Retail and service provision within the Town Centre is primarily focused on York Avenue, Castle Street and
Clarence Road. The centre, containing 51 retail, commercial leisure, and
financial service units, also includes a Waitrose store accessed on foot from Well Road.
Town Centre Land Use Goad Plan
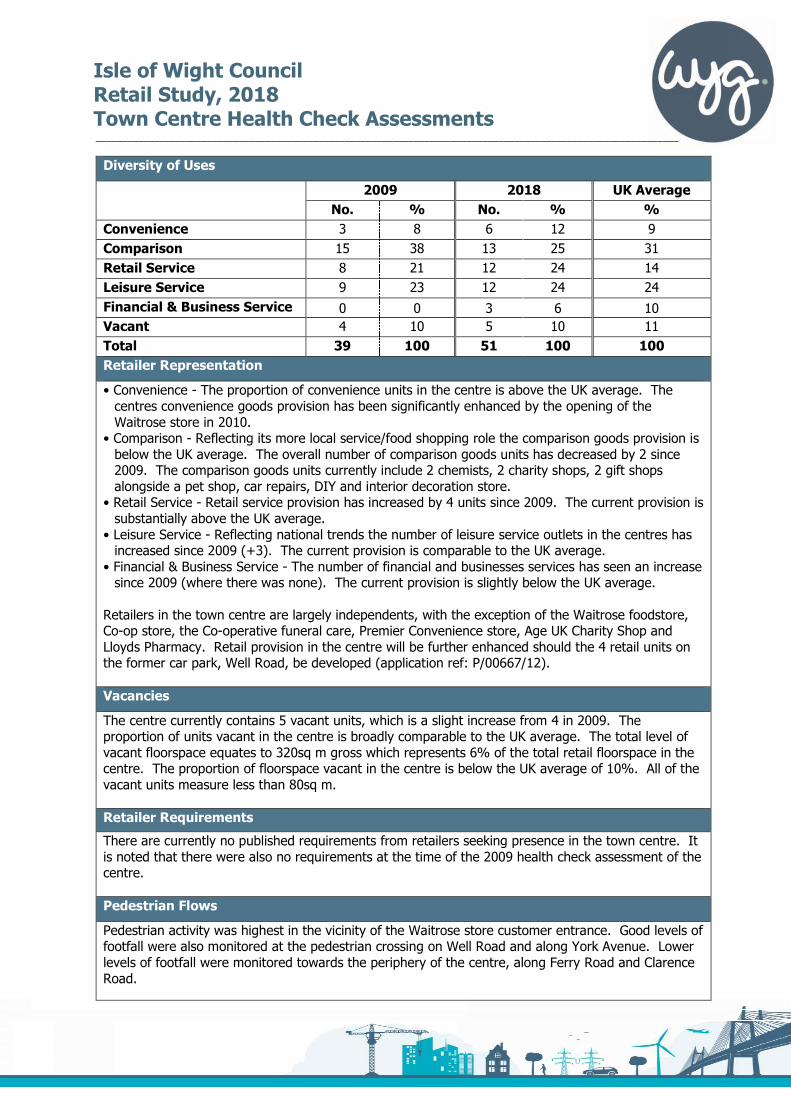
Isle of Wight Council Retail Study, 2018 Town Centre Health Check Assessments
______________________________________________________________________________________________________________
Diversity of Uses
2009 2018 UK Average
No. % No. % %
Convenience 3 8 6 12 9
Comparison 15 38 13 25 31
Retail Service 8 21 12 24 14
Leisure Service 9 23 12 24 24
Financial & Business Service 0 0 3 6 10
Vacant 4 10 5 10 11
Total 39 100 51 100 100
Retailer Representation
• Convenience - The proportion of convenience units in the centre is above the UK average. The
centres convenience goods provision has been significantly enhanced by the opening of the
Waitrose store in 2010. • Comparison - Reflecting its more local service/food shopping role the comparison goods provision is
below the UK average. The overall number of comparison goods units has decreased by 2 since 2009. The comparison goods units currently include 2 chemists, 2 charity shops, 2 gift shops
alongside a pet shop, car repairs, DIY and interior decoration store. • Retail Service - Retail service provision has increased by 4 units since 2009. The current provision is
substantially above the UK average.
• Leisure Service - Reflecting national trends the number of leisure service outlets in the centres has increased since 2009 (+3). The current provision is comparable to the UK average.
• Financial & Business Service - The number of financial and businesses services has seen an increase since 2009 (where there was none). The current provision is slightly below the UK average.
Retailers in the town centre are largely independents, with the exception of the Waitrose foodstore, Co-op store, the Co-operative funeral care, Premier Convenience store, Age UK Charity Shop and
Lloyds Pharmacy. Retail provision in the centre will be further enhanced should the 4 retail units on the former car park, Well Road, be developed (application ref: P/00667/12).
Vacancies
The centre currently contains 5 vacant units, which is a slight increase from 4 in 2009. The proportion of units vacant in the centre is broadly comparable to the UK average. The total level of
vacant floorspace equates to 320sq m gross which represents 6% of the total retail floorspace in the centre. The proportion of floorspace vacant in the centre is below the UK average of 10%. All of the
vacant units measure less than 80sq m.
Retailer Requirements
There are currently no published requirements from retailers seeking presence in the town centre. It
is noted that there were also no requirements at the time of the 2009 health check assessment of the centre.
Pedestrian Flows
Pedestrian activity was highest in the vicinity of the Waitrose store customer entrance. Good levels of footfall were also monitored at the pedestrian crossing on Well Road and along York Avenue. Lower
levels of footfall were monitored towards the periphery of the centre, along Ferry Road and Clarence
Road.
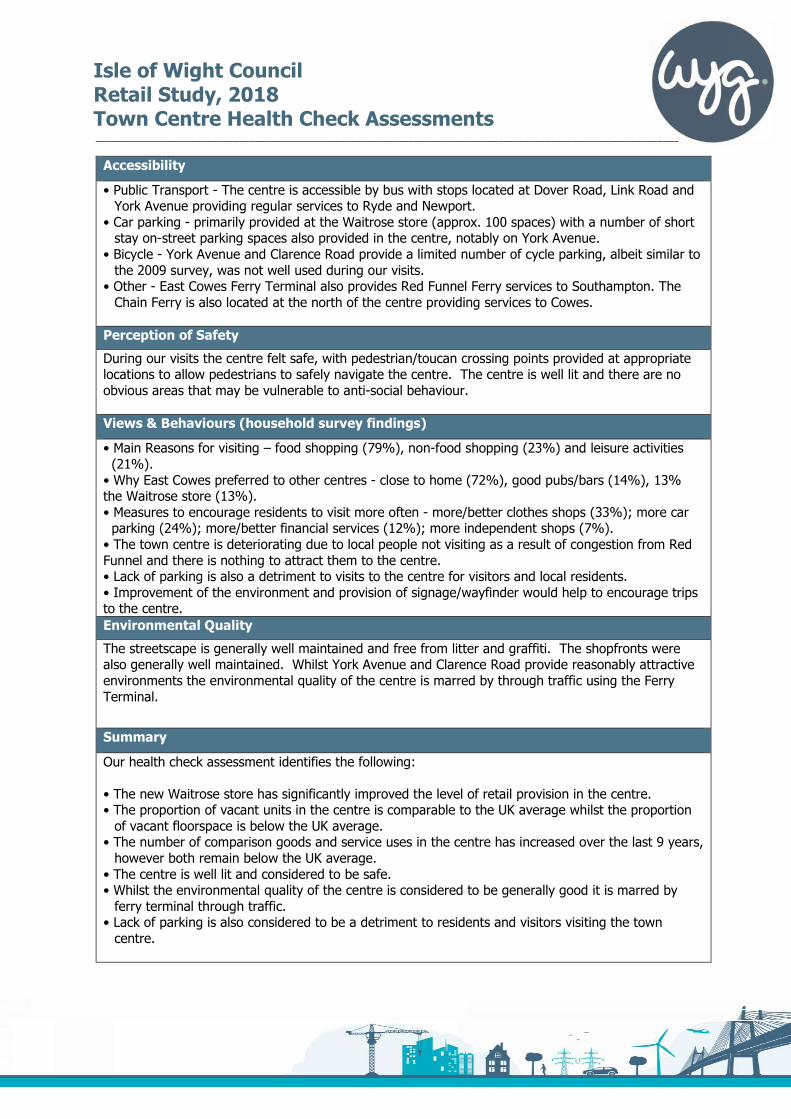
Isle of Wight Council Retail Study, 2018 Town Centre Health Check Assessments
______________________________________________________________________________________________________________
Accessibility
• Public Transport - The centre is accessible by bus with stops located at Dover Road, Link Road and York Avenue providing regular services to Ryde and Newport.
• Car parking - primarily provided at the Waitrose store (approx. 100 spaces) with a number of short stay on-street parking spaces also provided in the centre, notably on York Avenue.
• Bicycle - York Avenue and Clarence Road provide a limited number of cycle parking, albeit similar to
the 2009 survey, was not well used during our visits. • Other - East Cowes Ferry Terminal also provides Red Funnel Ferry services to Southampton. The
Chain Ferry is also located at the north of the centre providing services to Cowes.
Perception of Safety
During our visits the centre felt safe, with pedestrian/toucan crossing points provided at appropriate locations to allow pedestrians to safely navigate the centre. The centre is well lit and there are no
obvious areas that may be vulnerable to anti-social behaviour.
Views & Behaviours (household survey findings)
• Main Reasons for visiting – food shopping (79%), non-food shopping (23%) and leisure activities
(21%).
• Why East Cowes preferred to other centres - close to home (72%), good pubs/bars (14%), 13% the Waitrose store (13%).
• Measures to encourage residents to visit more often - more/better clothes shops (33%); more car parking (24%); more/better financial services (12%); more independent shops (7%).
• The town centre is deteriorating due to local people not visiting as a result of congestion from Red
Funnel and there is nothing to attract them to the centre. • Lack of parking is also a detriment to visits to the centre for visitors and local residents.
• Improvement of the environment and provision of signage/wayfinder would help to encourage trips to the centre.
Environmental Quality
The streetscape is generally well maintained and free from litter and graffiti. The shopfronts were also generally well maintained. Whilst York Avenue and Clarence Road provide reasonably attractive
environments the environmental quality of the centre is marred by through traffic using the Ferry
Terminal.
Summary
Our health check assessment identifies the following:
• The new Waitrose store has significantly improved the level of retail provision in the centre. • The proportion of vacant units in the centre is comparable to the UK average whilst the proportion
of vacant floorspace is below the UK average. • The number of comparison goods and service uses in the centre has increased over the last 9 years,
however both remain below the UK average.
• The centre is well lit and considered to be safe. • Whilst the environmental quality of the centre is considered to be generally good it is marred by
ferry terminal through traffic. • Lack of parking is also considered to be a detriment to residents and visitors visiting the town
centre.

Retail Study www.wyg.com
Appendix E Statistical Retail Tables -
Population and Expenditure
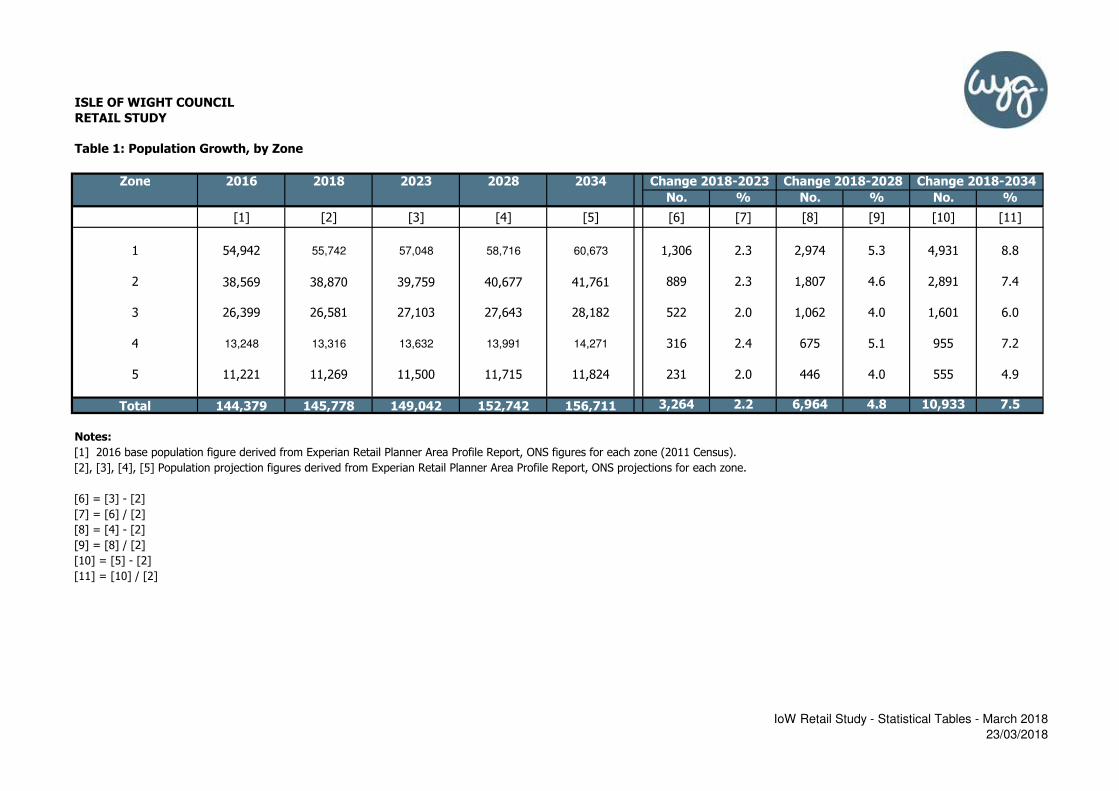
ISLE OF WIGHT COUNCIL
RETAIL STUDY
Table 1: Population Growth, by Zone
Zone 2016 2018 2023 2028 2034
No. % No. % No. %
[1] [2] [3] [4] [5] [6] [7] [8] [9] [10] [11]
1 54,942 55,742 57,048 58,716 60,673 1,306 2.3 2,974 5.3 4,931 8.8
2 38,569 38,870 39,759 40,677 41,761 889 2.3 1,807 4.6 2,891 7.4
3 26,399 26,581 27,103 27,643 28,182 522 2.0 1,062 4.0 1,601 6.0
4 13,248 13,316 13,632 13,991 14,271 316 2.4 675 5.1 955 7.2
5 11,221 11,269 11,500 11,715 11,824 231 2.0 446 4.0 555 4.9
Total 144,379 145,778 149,042 152,742 156,711 3,264 2.2 6,964 4.8 10,933 7.5
Notes:
[1] 2016 base population figure derived from Experian Retail Planner Area Profile Report, ONS figures for each zone (2011 Census).
[2], [3], [4], [5] Population projection figures derived from Experian Retail Planner Area Profile Report, ONS projections for each zone.
[6] = [3] - [2]
[7] = [6] / [2]
[8] = [4] - [2]
[9] = [8] / [2]
[10] = [5] - [2]
[11] = [10] / [2]
Change 2018-2028 Change 2018-2034Change 2018-2023
IoW Retail Study - Statistical Tables - March 2018
23/03/2018
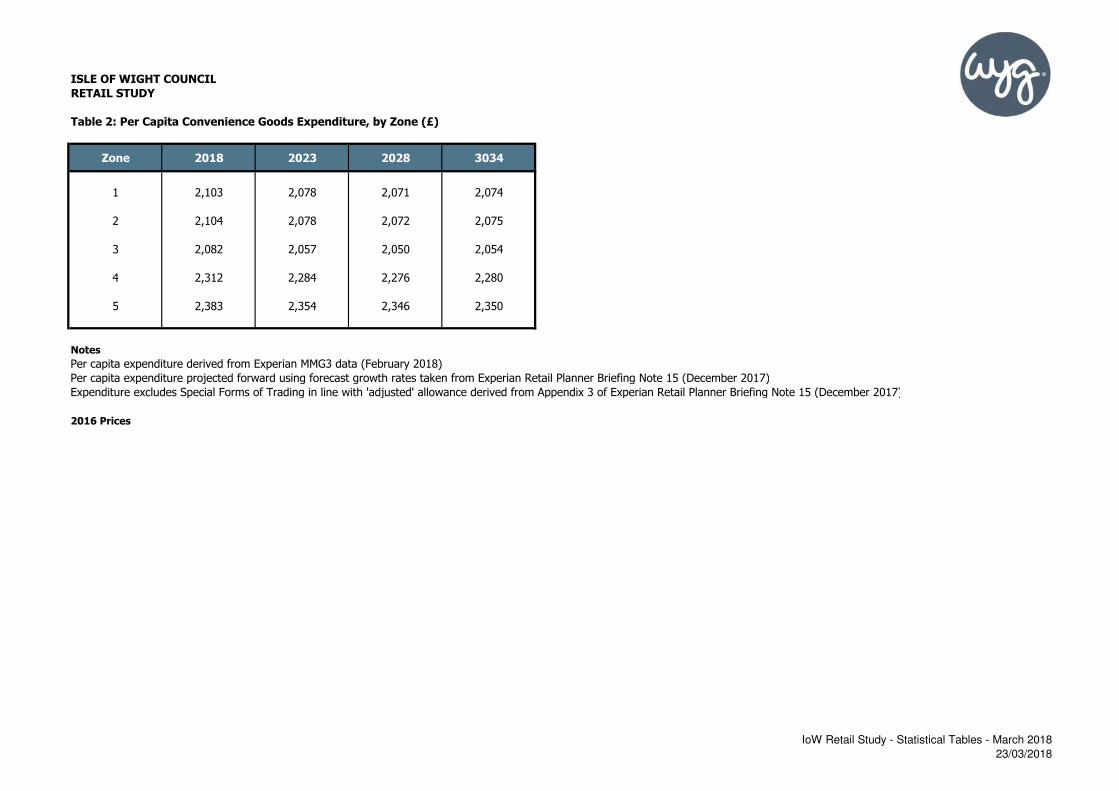
ISLE OF WIGHT COUNCIL
RETAIL STUDY
Table 2: Per Capita Convenience Goods Expenditure, by Zone (£)
Zone 2018 2023 2028 3034
1 2,103 2,078 2,071 2,074
2 2,104 2,078 2,072 2,075
3 2,082 2,057 2,050 2,054
4 2,312 2,284 2,276 2,280
5 2,383 2,354 2,346 2,350
Notes
Per capita expenditure derived from Experian MMG3 data (February 2018)
Per capita expenditure projected forward using forecast growth rates taken from Experian Retail Planner Briefing Note 15 (December 2017)
Expenditure excludes Special Forms of Trading in line with 'adjusted' allowance derived from Appendix 3 of Experian Retail Planner Briefing Note 15 (December 2017)
2016 Prices
IoW Retail Study - Statistical Tables - March 2018
23/03/2018
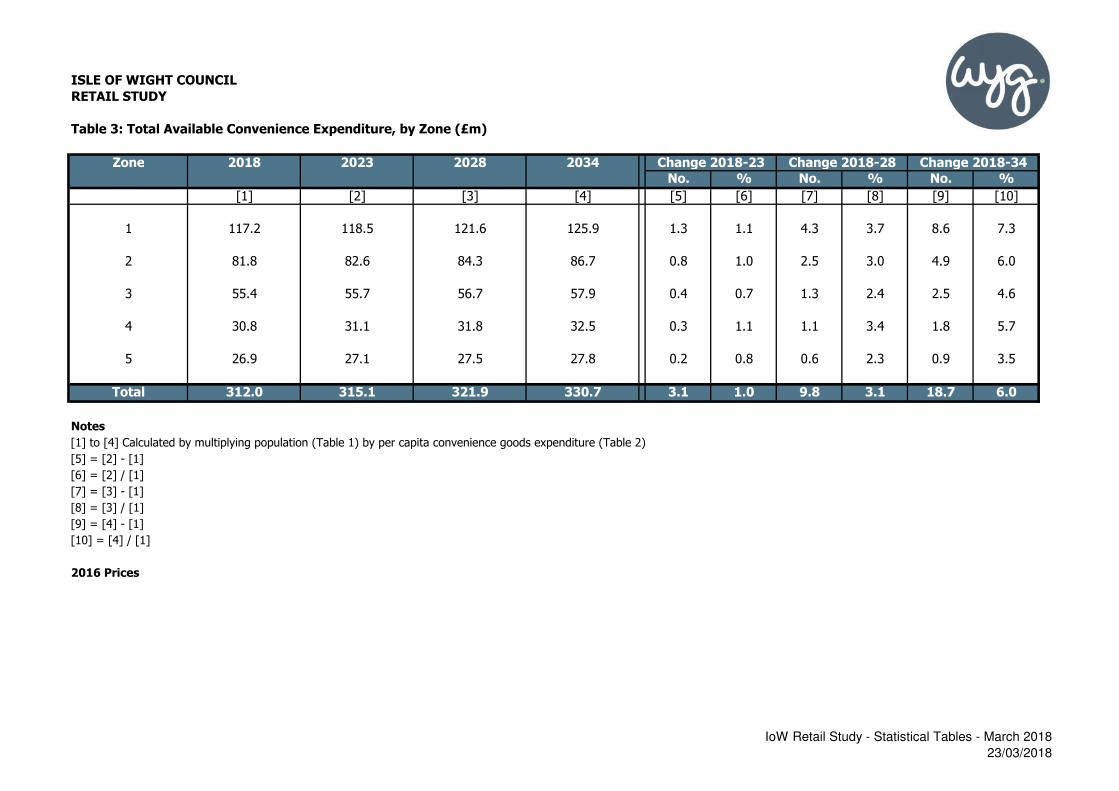
ISLE OF WIGHT COUNCIL
RETAIL STUDY
Table 3: Total Available Convenience Expenditure, by Zone (£m)
Zone 2018 2023 2028 2034
No. % No. % No. %
[1] [2] [3] [4] [5] [6] [7] [8] [9] [10]
1 117.2 118.5 121.6 125.9 1.3 1.1 4.3 3.7 8.6 7.3
2 81.8 82.6 84.3 86.7 0.8 1.0 2.5 3.0 4.9 6.0
3 55.4 55.7 56.7 57.9 0.4 0.7 1.3 2.4 2.5 4.6
4 30.8 31.1 31.8 32.5 0.3 1.1 1.1 3.4 1.8 5.7
5 26.9 27.1 27.5 27.8 0.2 0.8 0.6 2.3 0.9 3.5
Total 312.0 315.1 321.9 330.7 3.1 1.0 9.8 3.1 18.7 6.0
Notes
[1] to [4] Calculated by multiplying population (Table 1) by per capita convenience goods expenditure (Table 2)
[5] = [2] - [1]
[6] = [2] / [1]
[7] = [3] - [1]
[8] = [3] / [1]
[9] = [4] - [1]
[10] = [4] / [1]
2016 Prices
Change 2018-23 Change 2018-28 Change 2018-34
IoW Retail Study - Statistical Tables - March 2018
23/03/2018
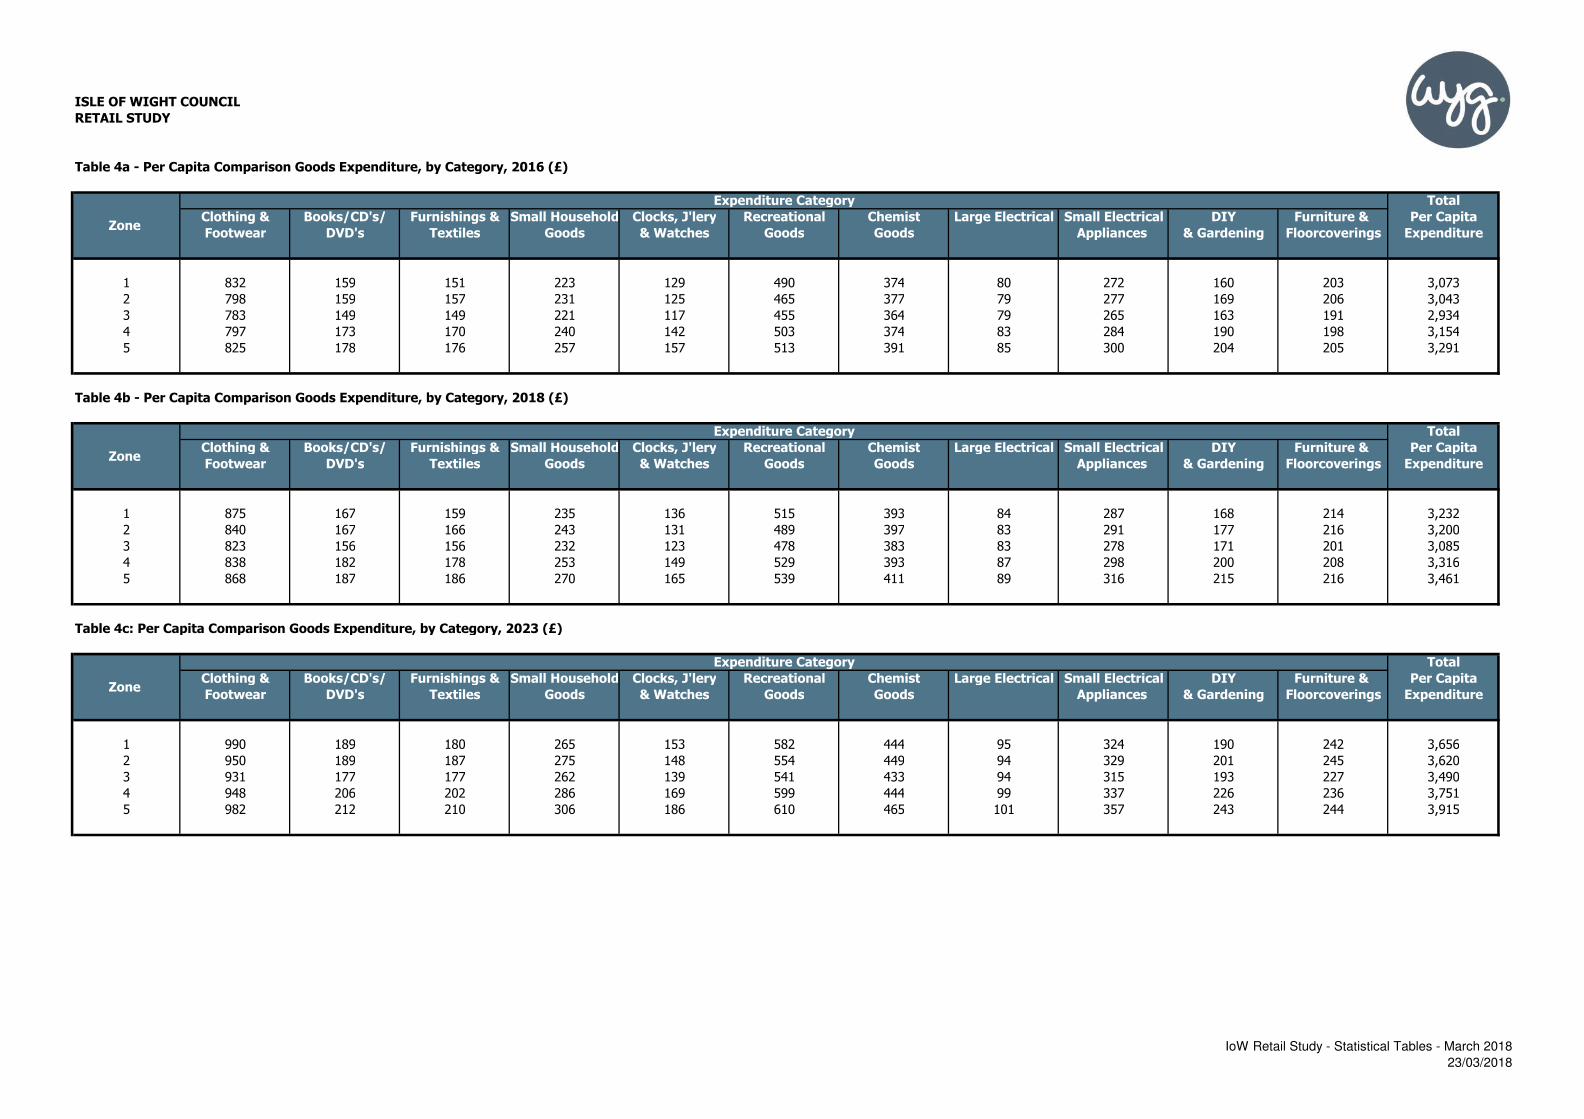
ISLE OF WIGHT COUNCIL
RETAIL STUDY
Table 4a - Per Capita Comparison Goods Expenditure, by Category, 2016 (£)
Total
Clothing & Books/CD's/ Furnishings & Small Household Clocks, J'lery Recreational Chemist Large Electrical Small Electrical DIY Furniture & Per Capita
Footwear DVD's Textiles Goods & Watches Goods Goods Appliances & Gardening Floorcoverings Expenditure
1 832 159 151 223 129 490 374 80 272 160 203 3,073
2 798 159 157 231 125 465 377 79 277 169 206 3,043
3 783 149 149 221 117 455 364 79 265 163 191 2,934
4 797 173 170 240 142 503 374 83 284 190 198 3,154
5 825 178 176 257 157 513 391 85 300 204 205 3,291
Table 4b - Per Capita Comparison Goods Expenditure, by Category, 2018 (£)
Total
Clothing & Books/CD's/ Furnishings & Small Household Clocks, J'lery Recreational Chemist Large Electrical Small Electrical DIY Furniture & Per Capita
Footwear DVD's Textiles Goods & Watches Goods Goods Appliances & Gardening Floorcoverings Expenditure
1 875 167 159 235 136 515 393 84 287 168 214 3,232
2 840 167 166 243 131 489 397 83 291 177 216 3,200
3 823 156 156 232 123 478 383 83 278 171 201 3,085
4 838 182 178 253 149 529 393 87 298 200 208 3,316
5 868 187 186 270 165 539 411 89 316 215 216 3,461
Table 4c: Per Capita Comparison Goods Expenditure, by Category, 2023 (£)
Total
Clothing & Books/CD's/ Furnishings & Small Household Clocks, J'lery Recreational Chemist Large Electrical Small Electrical DIY Furniture & Per Capita
Footwear DVD's Textiles Goods & Watches Goods Goods Appliances & Gardening Floorcoverings Expenditure
1 990 189 180 265 153 582 444 95 324 190 242 3,656
2 950 189 187 275 148 554 449 94 329 201 245 3,620
3 931 177 177 262 139 541 433 94 315 193 227 3,490
4 948 206 202 286 169 599 444 99 337 226 236 3,751
5 982 212 210 306 186 610 465 101 357 243 244 3,915
Zone
Zone
Expenditure Category
Expenditure Category
Zone
Expenditure Category
IoW Retail Study - Statistical Tables - March 2018
23/03/2018
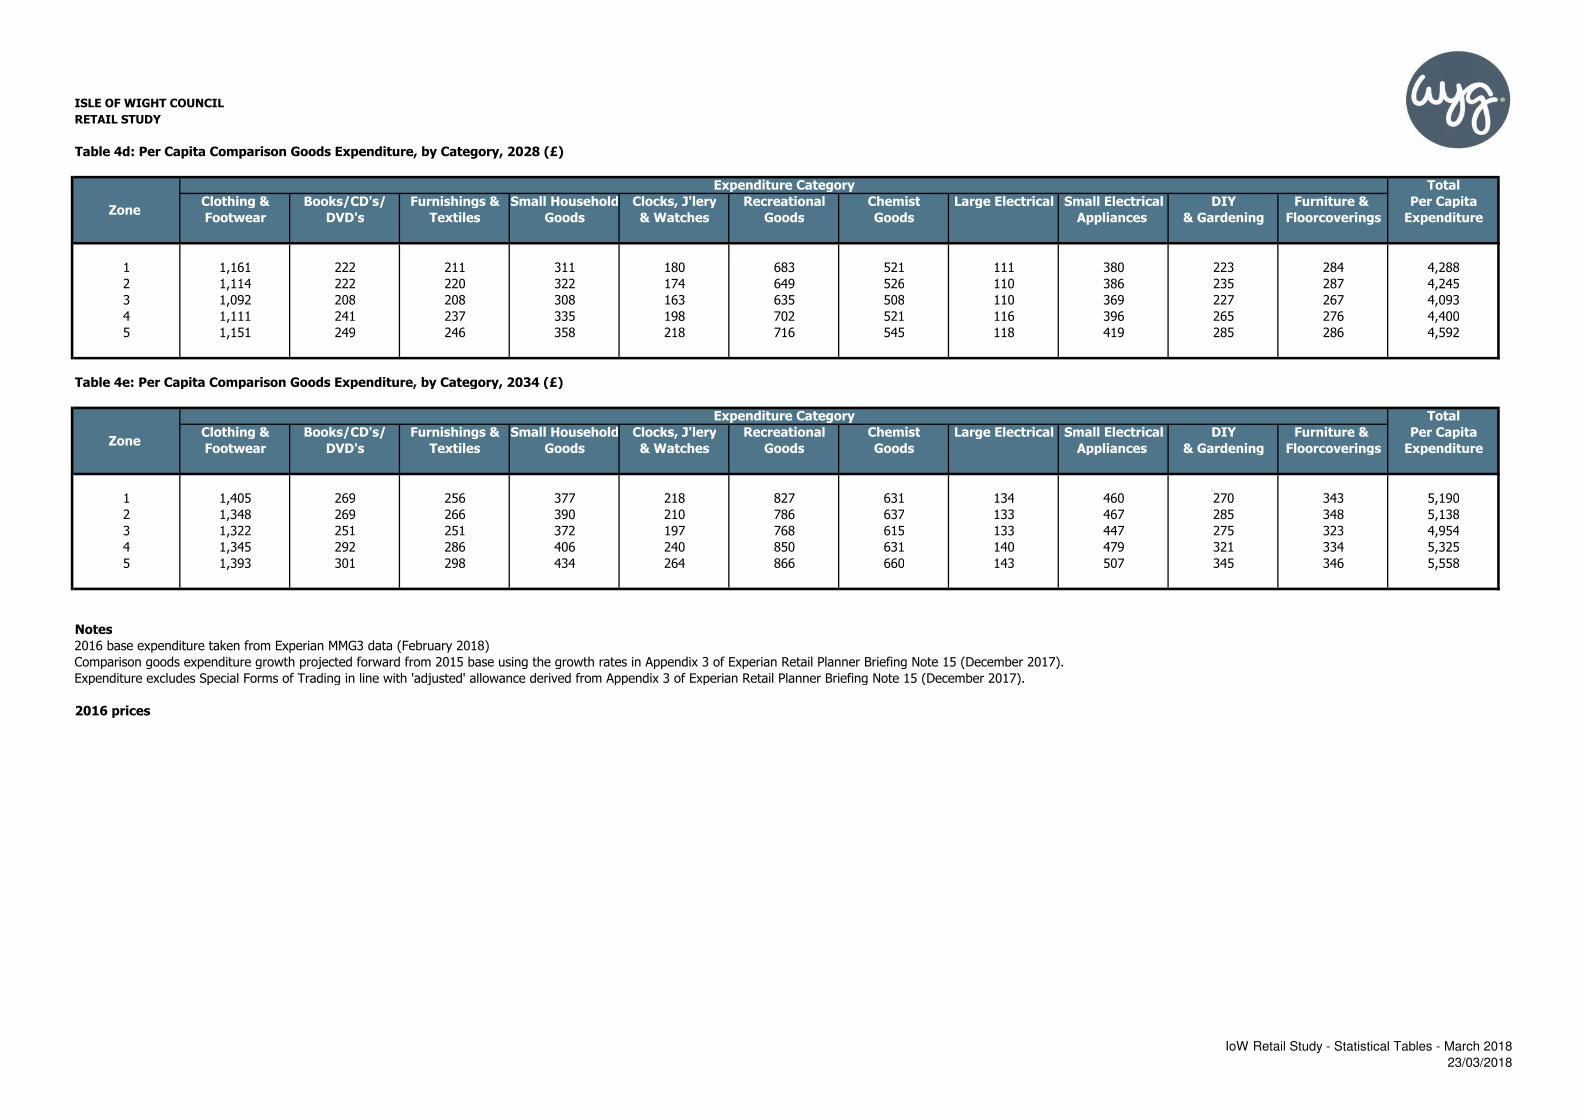
ISLE OF WIGHT COUNCIL
RETAIL STUDY
Table 4d: Per Capita Comparison Goods Expenditure, by Category, 2028 (£)
Total
Clothing & Books/CD's/ Furnishings & Small Household Clocks, J'lery Recreational Chemist Large Electrical Small Electrical DIY Furniture & Per Capita
Footwear DVD's Textiles Goods & Watches Goods Goods Appliances & Gardening Floorcoverings Expenditure
1 1,161 222 211 311 180 683 521 111 380 223 284 4,288
2 1,114 222 220 322 174 649 526 110 386 235 287 4,245
3 1,092 208 208 308 163 635 508 110 369 227 267 4,093
4 1,111 241 237 335 198 702 521 116 396 265 276 4,400
5 1,151 249 246 358 218 716 545 118 419 285 286 4,592
Table 4e: Per Capita Comparison Goods Expenditure, by Category, 2034 (£)
Total
Clothing & Books/CD's/ Furnishings & Small Household Clocks, J'lery Recreational Chemist Large Electrical Small Electrical DIY Furniture & Per Capita
Footwear DVD's Textiles Goods & Watches Goods Goods Appliances & Gardening Floorcoverings Expenditure
1 1,405 269 256 377 218 827 631 134 460 270 343 5,190
2 1,348 269 266 390 210 786 637 133 467 285 348 5,138
3 1,322 251 251 372 197 768 615 133 447 275 323 4,954
4 1,345 292 286 406 240 850 631 140 479 321 334 5,325
5 1,393 301 298 434 264 866 660 143 507 345 346 5,558
Notes
2016 base expenditure taken from Experian MMG3 data (February 2018)
Comparison goods expenditure growth projected forward from 2015 base using the growth rates in Appendix 3 of Experian Retail Planner Briefing Note 15 (December 2017).
Expenditure excludes Special Forms of Trading in line with 'adjusted' allowance derived from Appendix 3 of Experian Retail Planner Briefing Note 15 (December 2017).
2016 prices
Zone
Expenditure Category
Zone
Expenditure Category
IoW Retail Study - Statistical Tables - March 2018
23/03/2018

ISLE OF WIGHT COUNCIL
RETAIL STUDY
Table 5a: Total Comparison Goods Expenditure, by Category, 2018 (£m)
Clothing & Books/CD's/ Furnishings & Small Household Clocks, J'lery Recreational Chemist Large Electrical Small Electrical DIY Furniture &
Footwear DVD's Textiles Goods & Watches Goods Goods Appliances & Gardening Floorcoverings
1 48.8 9.3 8.9 13.1 7.6 28.7 21.9 4.7 16.0 9.4 11.9
2 32.6 6.5 6.4 9.4 5.1 19.0 15.4 3.2 11.3 6.9 8.4
3 21.9 4.2 4.2 6.2 3.3 12.7 10.2 2.2 7.4 4.5 5.3
4 11.2 2.4 2.4 3.4 2.0 7.0 5.2 1.2 4.0 2.7 2.8
5 9.8 2.1 2.1 3.0 1.9 6.1 4.6 1.0 3.6 2.4 2.4
Total 124.2 24.5 23.9 35.1 19.8 73.6 57.4 12.2 42.2 25.9 30.9
Table 5b: Total Comparison Goods Expenditure, by Category, 2023 (£m)
Clothing & Books/CD's/ Furnishings & Small Household Clocks, J'lery Recreational Chemist Large Electrical Small Electrical DIY Furniture &
Footwear DVD's Textiles Goods & Watches Goods Goods Appliances & Gardening Floorcoverings
1 56.5 10.8 10.3 15.1 8.7 33.2 25.4 5.4 18.5 10.9 13.8
2 37.8 7.5 7.4 10.9 5.9 22.0 17.8 3.7 13.1 8.0 9.7
3 25.2 4.8 4.8 7.1 3.8 14.7 11.7 2.5 8.5 5.2 6.2
4 12.9 2.8 2.7 3.9 2.3 8.2 6.1 1.3 4.6 3.1 3.2
5 11.3 2.4 2.4 3.5 2.1 7.0 5.3 1.2 4.1 2.8 2.8
Total 143.7 28.4 27.7 40.6 22.8 85.1 66.3 14.2 48.8 30.0 35.7
Expenditure Category
Expenditure Category
Zone
Zone
IoW Retail Study - Statistical Tables - March 2018
23/03/2018
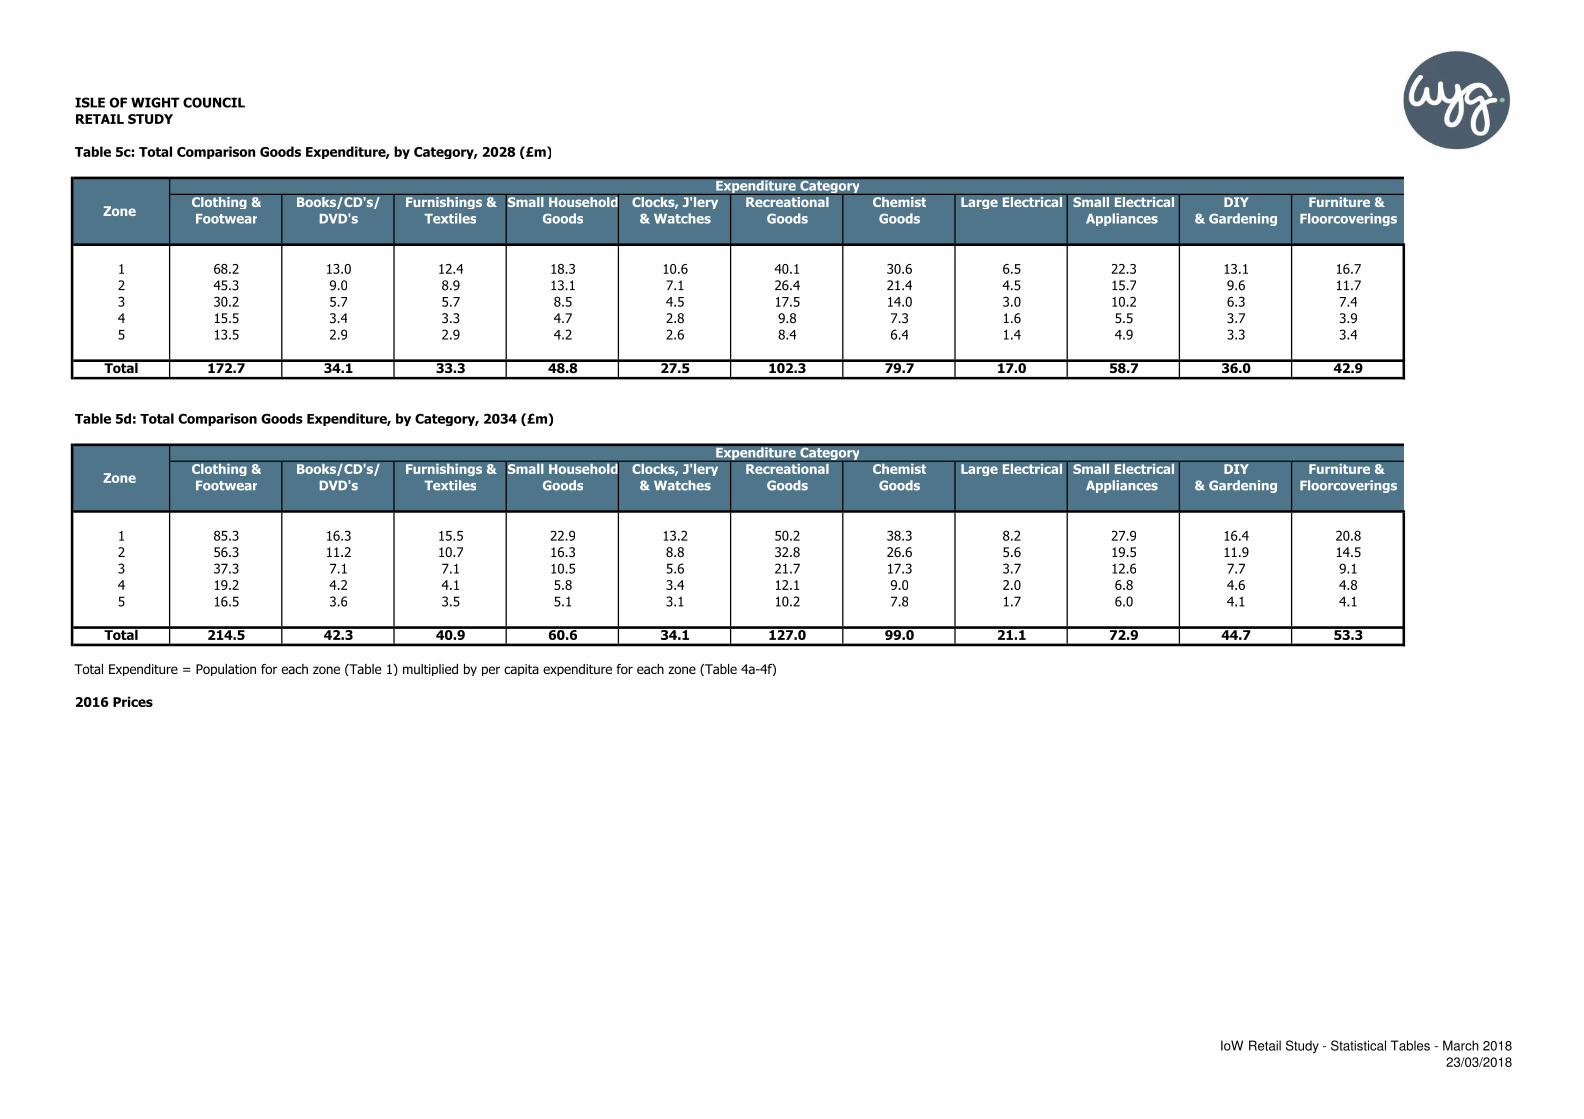
ISLE OF WIGHT COUNCIL
RETAIL STUDY
Table 5c: Total Comparison Goods Expenditure, by Category, 2028 (£m)
Clothing & Books/CD's/ Furnishings & Small Household Clocks, J'lery Recreational Chemist Large Electrical Small Electrical DIY Furniture &
Footwear DVD's Textiles Goods & Watches Goods Goods Appliances & Gardening Floorcoverings
1 68.2 13.0 12.4 18.3 10.6 40.1 30.6 6.5 22.3 13.1 16.7
2 45.3 9.0 8.9 13.1 7.1 26.4 21.4 4.5 15.7 9.6 11.7
3 30.2 5.7 5.7 8.5 4.5 17.5 14.0 3.0 10.2 6.3 7.4
4 15.5 3.4 3.3 4.7 2.8 9.8 7.3 1.6 5.5 3.7 3.9
5 13.5 2.9 2.9 4.2 2.6 8.4 6.4 1.4 4.9 3.3 3.4
Total 172.7 34.1 33.3 48.8 27.5 102.3 79.7 17.0 58.7 36.0 42.9
Table 5d: Total Comparison Goods Expenditure, by Category, 2034 (£m)
Clothing & Books/CD's/ Furnishings & Small Household Clocks, J'lery Recreational Chemist Large Electrical Small Electrical DIY Furniture &
Footwear DVD's Textiles Goods & Watches Goods Goods Appliances & Gardening Floorcoverings
1 85.3 16.3 15.5 22.9 13.2 50.2 38.3 8.2 27.9 16.4 20.8
2 56.3 11.2 10.7 16.3 8.8 32.8 26.6 5.6 19.5 11.9 14.5
3 37.3 7.1 7.1 10.5 5.6 21.7 17.3 3.7 12.6 7.7 9.1
4 19.2 4.2 4.1 5.8 3.4 12.1 9.0 2.0 6.8 4.6 4.8
5 16.5 3.6 3.5 5.1 3.1 10.2 7.8 1.7 6.0 4.1 4.1
Total 214.5 42.3 40.9 60.6 34.1 127.0 99.0 21.1 72.9 44.7 53.3
Total Expenditure = Population for each zone (Table 1) multiplied by per capita expenditure for each zone (Table 4a-4f)
2016 Prices
Expenditure Category
Expenditure Category
Zone
Zone
IoW Retail Study - Statistical Tables - March 2018
23/03/2018
Retail Study www.wyg.com
Appendix F Statistical Retail Tables -
Convenience Goods Capacity
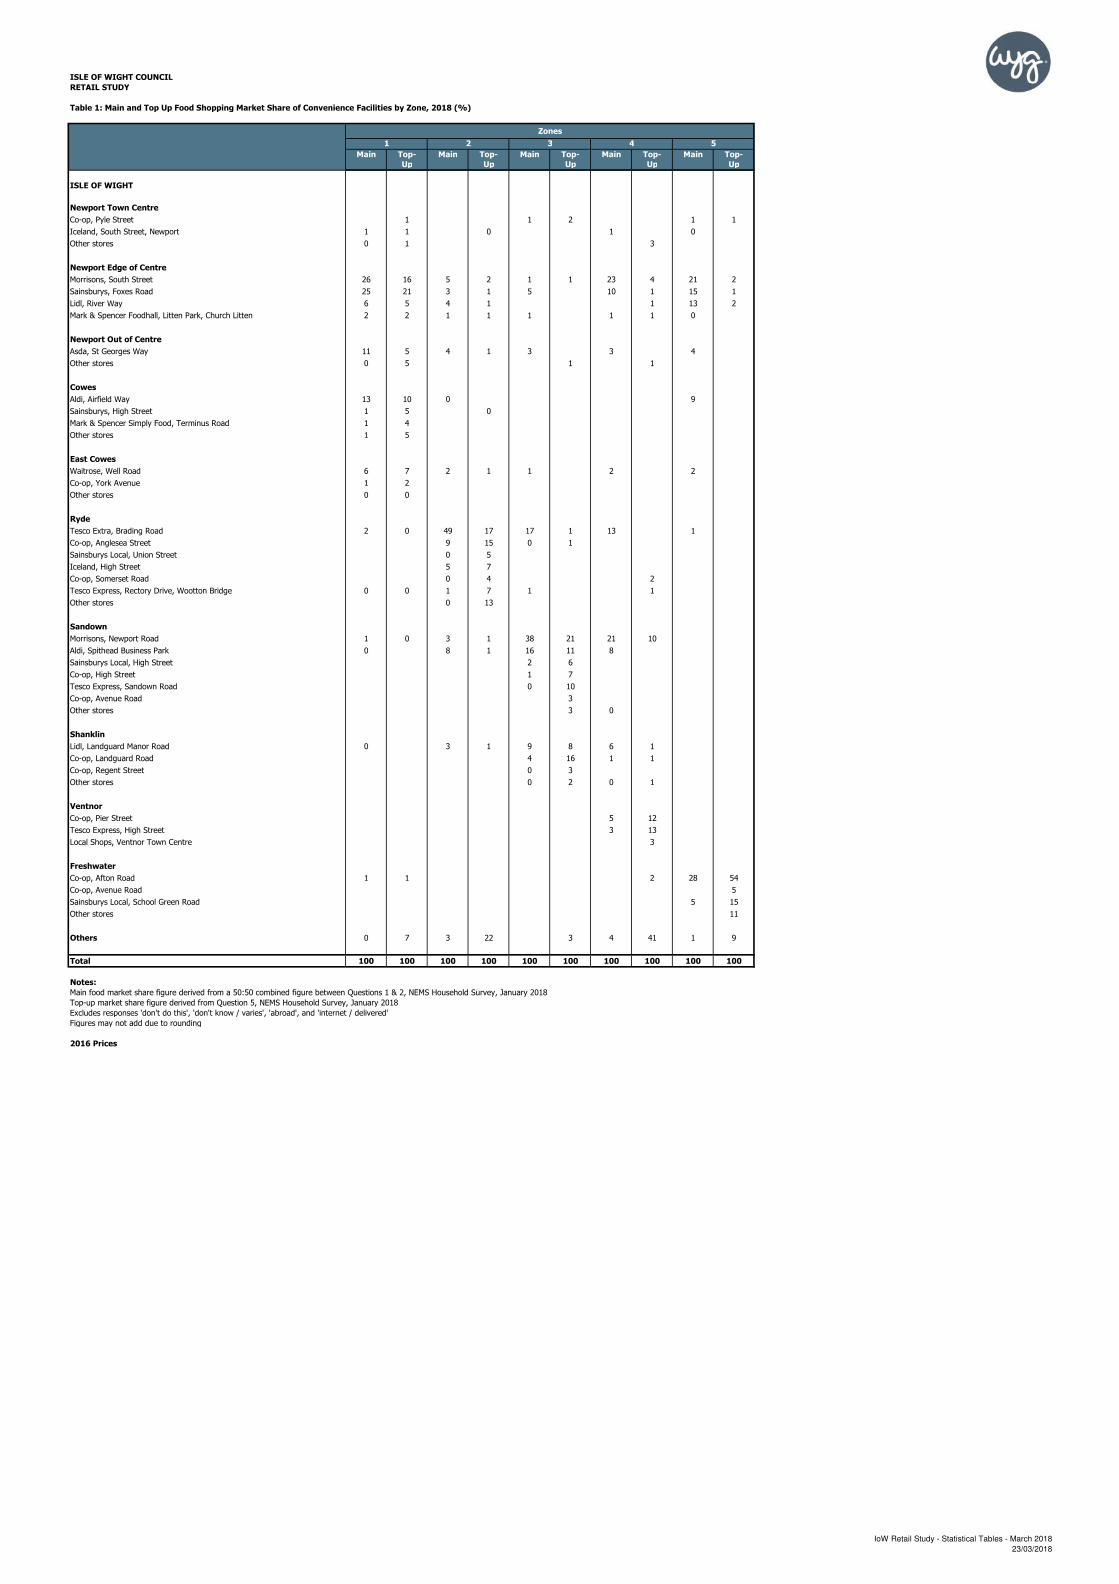
ISLE OF WIGHT COUNCIL
RETAIL STUDY
Table 1: Main and Top Up Food Shopping Market Share of Convenience Facilities by Zone, 2018 (%)
Main Top- Main Top- Main Top- Main Top- Main Top-
Up Up Up Up Up
ISLE OF WIGHT
Newport Town Centre
Co-op, Pyle Street 1 1 2 1 1
Iceland, South Street, Newport 1 1 0 1 0
Other stores 0 1 3
Newport Edge of Centre
Morrisons, South Street 26 16 5 2 1 1 23 4 21 2
Sainsburys, Foxes Road 25 21 3 1 5 10 1 15 1
Lidl, River Way 6 5 4 1 1 13 2
Mark & Spencer Foodhall, Litten Park, Church Litten 2 2 1 1 1 1 1 0
Newport Out of Centre
Asda, St Georges Way 11 5 4 1 3 3 4
Other stores 0 5 1 1
Cowes
Aldi, Airfield Way 13 10 0 9
Sainsburys, High Street 1 5 0
Mark & Spencer Simply Food, Terminus Road 1 4
Other stores 1 5
East Cowes
Waitrose, Well Road 6 7 2 1 1 2 2
Co-op, York Avenue 1 2
Other stores 0 0
Ryde
Tesco Extra, Brading Road 2 0 49 17 17 1 13 1
Co-op, Anglesea Street 9 15 0 1
Sainsburys Local, Union Street 0 5
Iceland, High Street 5 7
Co-op, Somerset Road 0 4 2
Tesco Express, Rectory Drive, Wootton Bridge 0 0 1 7 1 1
Other stores 0 13
Sandown
Morrisons, Newport Road 1 0 3 1 38 21 21 10
Aldi, Spithead Business Park 0 8 1 16 11 8
Sainsburys Local, High Street 2 6
Co-op, High Street 1 7
Tesco Express, Sandown Road 0 10
Co-op, Avenue Road 3
Other stores 3 0
Shanklin
Lidl, Landguard Manor Road 0 3 1 9 8 6 1
Co-op, Landguard Road 4 16 1 1
Co-op, Regent Street 0 3
Other stores 0 2 0 1
Ventnor
Co-op, Pier Street 5 12
Tesco Express, High Street 3 13
Local Shops, Ventnor Town Centre 3
Freshwater
Co-op, Afton Road 1 1 2 28 54
Co-op, Avenue Road 5
Sainsburys Local, School Green Road 5 15
Other stores 11
Others 0 7 3 22 3 4 41 1 9
Total 100 100 100 100 100 100 100 100 100 100
Notes:
Main food market share figure derived from a 50:50 combined figure between Questions 1 & 2, NEMS Household Survey, January 2018
Top-up market share figure derived from Question 5, NEMS Household Survey, January 2018
Excludes responses 'don't do this', 'don't know / varies', 'abroad', and 'internet / delivered'
Figures may not add due to rounding
2016 Prices
2 3 4 5
Zones
1
IoW Retail Study - Statistical Tables - March 2018
23/03/2018

ISLE OF WIGHT COUNCIL
RETAIL STUDY
Table 2: Main and Top Up Food Shopping Turnover of Convenience Facilities, 2018 (£m)
Main Top- Main Top- Main Top- Main Top- Main Top-
Up Up Up Up Up
ISLE OF WIGHT
Newport Town Centre
Co-op, Pyle Street 0.5 0.3 0.4 0.2 0.1
Iceland, South Street, Newport 0.7 0.4 0.1 0.2 0.1
Other stores 0.2 0.4 0.3
Newport Edge of Centre
Morrisons, South Street 21.7 5.5 2.8 0.5 0.4 0.1 5.0 0.3 3.9 0.2
Sainsburys, Foxes Road 20.8 7.6 1.9 0.2 2.0 2.1 0.1 2.8 0.1
Lidl, River Way 4.8 1.7 2.1 0.2 0.1 2.4 0.2
Mark & Spencer Foodhall, Litten Park, Church Litten 1.3 0.8 0.9 0.3 0.3 0.2 0.1 0.1
Newport Out of Centre
Asda, St Georges Way 9.0 1.7 2.1 0.4 1.1 0.7 0.8
Other stores 0.2 1.9 0.1 0.1
Cowes
Aldi, Airfield Way 10.8 3.5 0.1 1.6
Sainsburys, High Street 0.6 1.7 0.1
Mark & Spencer Simply Food, Terminus Road 1.0 1.4
Other stores 0.8 1.7
East Cowes
Waitrose, Well Road 5.3 2.4 1.3 0.3 0.3 0.4 0.4
Co-op, York Avenue 0.5 0.8
Other stores 0.2 0.1
Ryde
Tesco Extra, Brading Road 2.0 0.1 28.3 4.1 6.7 0.2 2.7 0.2
Co-op, Anglesea Street 4.9 3.6 0.1 0.1
Sainsburys Local, Union Street 0.1 1.2
Iceland, High Street 2.9 1.6
Co-op, Somerset Road 0.1 0.9 0.2
Tesco Express, Rectory Drive, Wootton Bridge 0.3 0.1 0.7 1.8 0.3 0.1
Other stores 0.1 3.2
Sandown
Morrisons, Newport Road 0.5 0.1 1.5 0.2 14.9 3.5 4.5 0.9
Aldi, Spithead Business Park 0.3 4.6 0.3 6.0 1.8 1.8
Sainsburys Local, High Street 0.6 1.1
Co-op, High Street 0.3 1.2
Tesco Express, Sandown Road 0.2 1.6
Co-op, Avenue Road 0.5
Other stores 0.5 0.1
Shanklin
Lidl, Landguard Manor Road 0.2 1.5 0.2 3.4 1.3 1.3 0.1
Co-op, Landguard Road 1.7 2.7 0.1 0.1
Co-op, Regent Street 0.1 0.5
Other stores 0.1 0.4
Ventnor
Co-op, Pier Street 1.1 1.1
Tesco Express, High Street 0.5 1.2
Local Shops, Ventnor Town Centre 0.2
Freshwater
Co-op, Afton Road 0.7 0.3 0.2 5.3 4.4
Co-op, Avenue Road 0.4
Sainsburys Local, School Green Road 1.0 1.2
Other stores 0.8
Others 0.3 2.5 1.4 5.3 0.5 0.8 3.8 0.2 0.8
Total 82.1 35.2 57.3 24.5 38.7 16.6 21.6 9.2 18.8 8.1
Notes:
Total convenience goods expenditure per zone taken from Table 3
Split in Main/Top-up expenditure derived from Questions 3 and 6, NEMS Household Survey, January 2018
Excludes responses 'don't do this', 'don't know / varies', 'abroad', and 'internet / delivered'
Figures may not add due to rounding
2016 Prices
Zones
321 54
IoW Retail Study - Statistical Tables - March 2018
23/03/2018
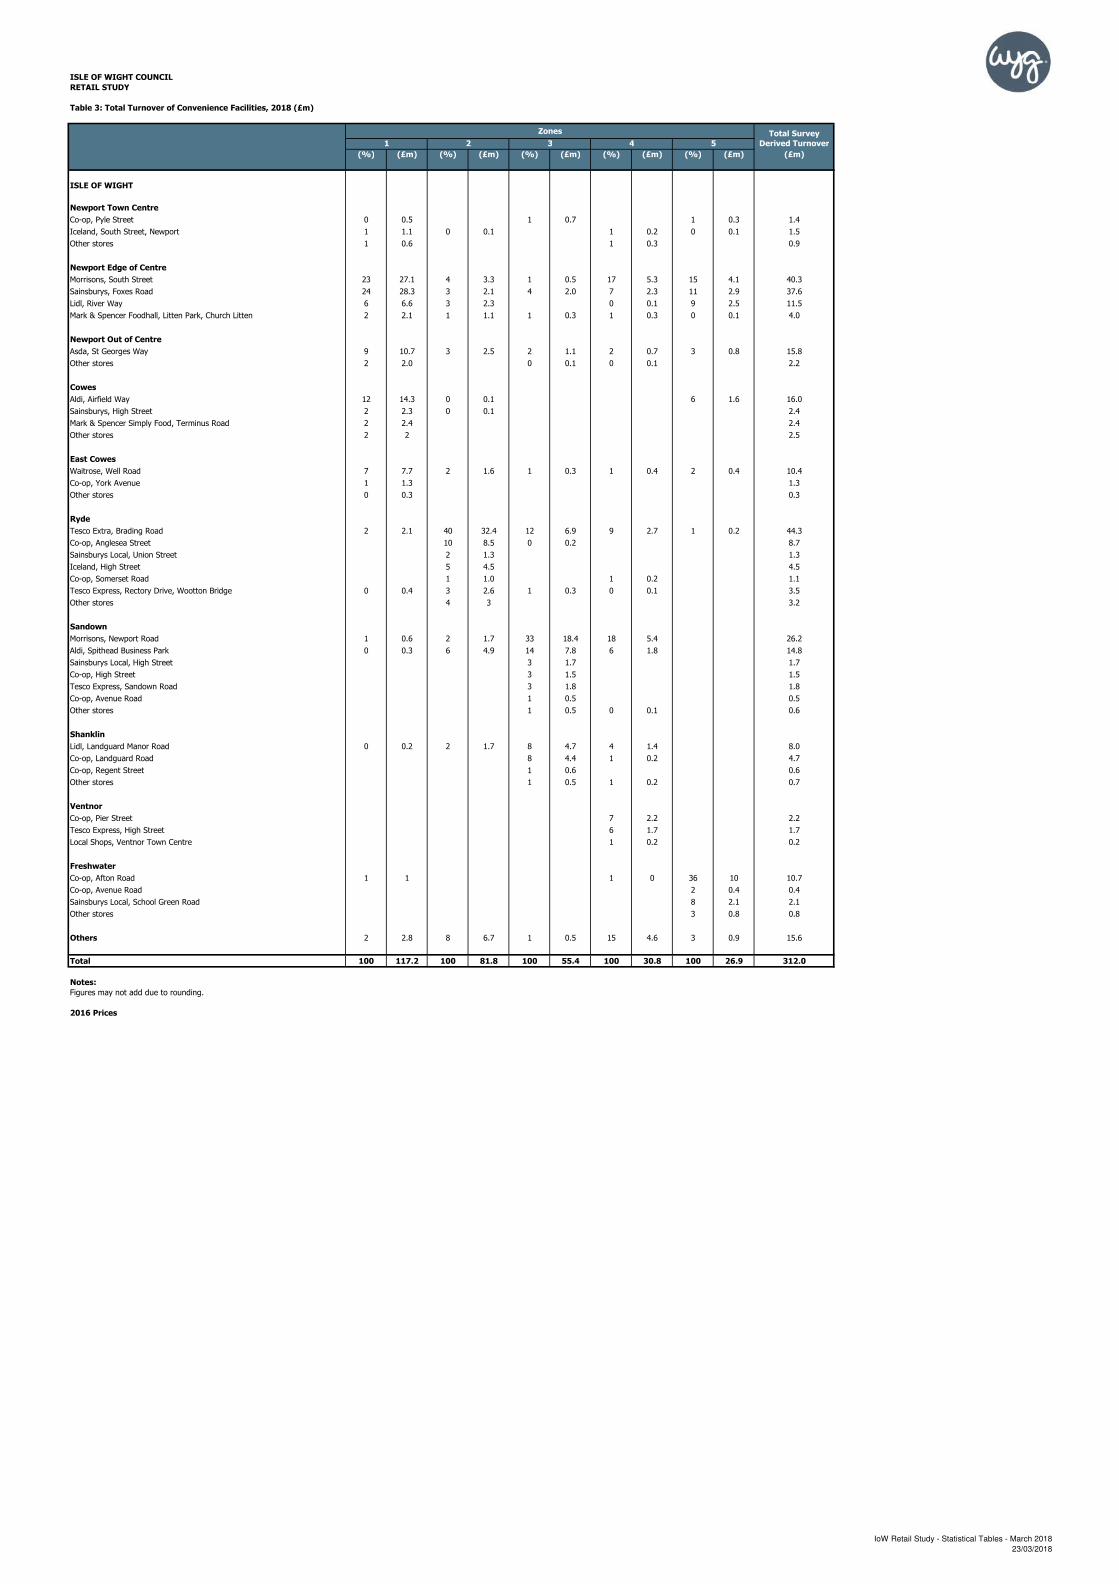
ISLE OF WIGHT COUNCIL
RETAIL STUDY
Table 3: Total Turnover of Convenience Facilities, 2018 (£m)
Total Survey
Derived Turnover
(%) (£m) (%) (£m) (%) (£m) (%) (£m) (%) (£m) (£m)
ISLE OF WIGHT
Newport Town Centre
Co-op, Pyle Street 0 0.5 1 0.7 1 0.3 1.4
Iceland, South Street, Newport 1 1.1 0 0.1 1 0.2 0 0.1 1.5
Other stores 1 0.6 1 0.3 0.9
Newport Edge of Centre
Morrisons, South Street 23 27.1 4 3.3 1 0.5 17 5.3 15 4.1 40.3
Sainsburys, Foxes Road 24 28.3 3 2.1 4 2.0 7 2.3 11 2.9 37.6
Lidl, River Way 6 6.6 3 2.3 0 0.1 9 2.5 11.5
Mark & Spencer Foodhall, Litten Park, Church Litten 2 2.1 1 1.1 1 0.3 1 0.3 0 0.1 4.0
Newport Out of Centre
Asda, St Georges Way 9 10.7 3 2.5 2 1.1 2 0.7 3 0.8 15.8
Other stores 2 2.0 0 0.1 0 0.1 2.2
Cowes
Aldi, Airfield Way 12 14.3 0 0.1 6 1.6 16.0
Sainsburys, High Street 2 2.3 0 0.1 2.4
Mark & Spencer Simply Food, Terminus Road 2 2.4 2.4
Other stores 2 2 2.5
East Cowes
Waitrose, Well Road 7 7.7 2 1.6 1 0.3 1 0.4 2 0.4 10.4
Co-op, York Avenue 1 1.3 1.3
Other stores 0 0.3 0.3
Ryde
Tesco Extra, Brading Road 2 2.1 40 32.4 12 6.9 9 2.7 1 0.2 44.3
Co-op, Anglesea Street 10 8.5 0 0.2 8.7
Sainsburys Local, Union Street 2 1.3 1.3
Iceland, High Street 5 4.5 4.5
Co-op, Somerset Road 1 1.0 1 0.2 1.1
Tesco Express, Rectory Drive, Wootton Bridge 0 0.4 3 2.6 1 0.3 0 0.1 3.5
Other stores 4 3 3.2
Sandown
Morrisons, Newport Road 1 0.6 2 1.7 33 18.4 18 5.4 26.2
Aldi, Spithead Business Park 0 0.3 6 4.9 14 7.8 6 1.8 14.8
Sainsburys Local, High Street 3 1.7 1.7
Co-op, High Street 3 1.5 1.5
Tesco Express, Sandown Road 3 1.8 1.8
Co-op, Avenue Road 1 0.5 0.5
Other stores 1 0.5 0 0.1 0.6
Shanklin
Lidl, Landguard Manor Road 0 0.2 2 1.7 8 4.7 4 1.4 8.0
Co-op, Landguard Road 8 4.4 1 0.2 4.7
Co-op, Regent Street 1 0.6 0.6
Other stores 1 0.5 1 0.2 0.7
Ventnor
Co-op, Pier Street 7 2.2 2.2
Tesco Express, High Street 6 1.7 1.7
Local Shops, Ventnor Town Centre 1 0.2 0.2
Freshwater
Co-op, Afton Road 1 1 1 0 36 10 10.7
Co-op, Avenue Road 2 0.4 0.4
Sainsburys Local, School Green Road 8 2.1 2.1
Other stores 3 0.8 0.8
Others 2 2.8 8 6.7 1 0.5 15 4.6 3 0.9 15.6
Total 100 117.2 100 81.8 100 55.4 100 30.8 100 26.9 312.0
Notes:
Figures may not add due to rounding.
2016 Prices
Zones
3 4 51 2
IoW Retail Study - Statistical Tables - March 2018
23/03/2018
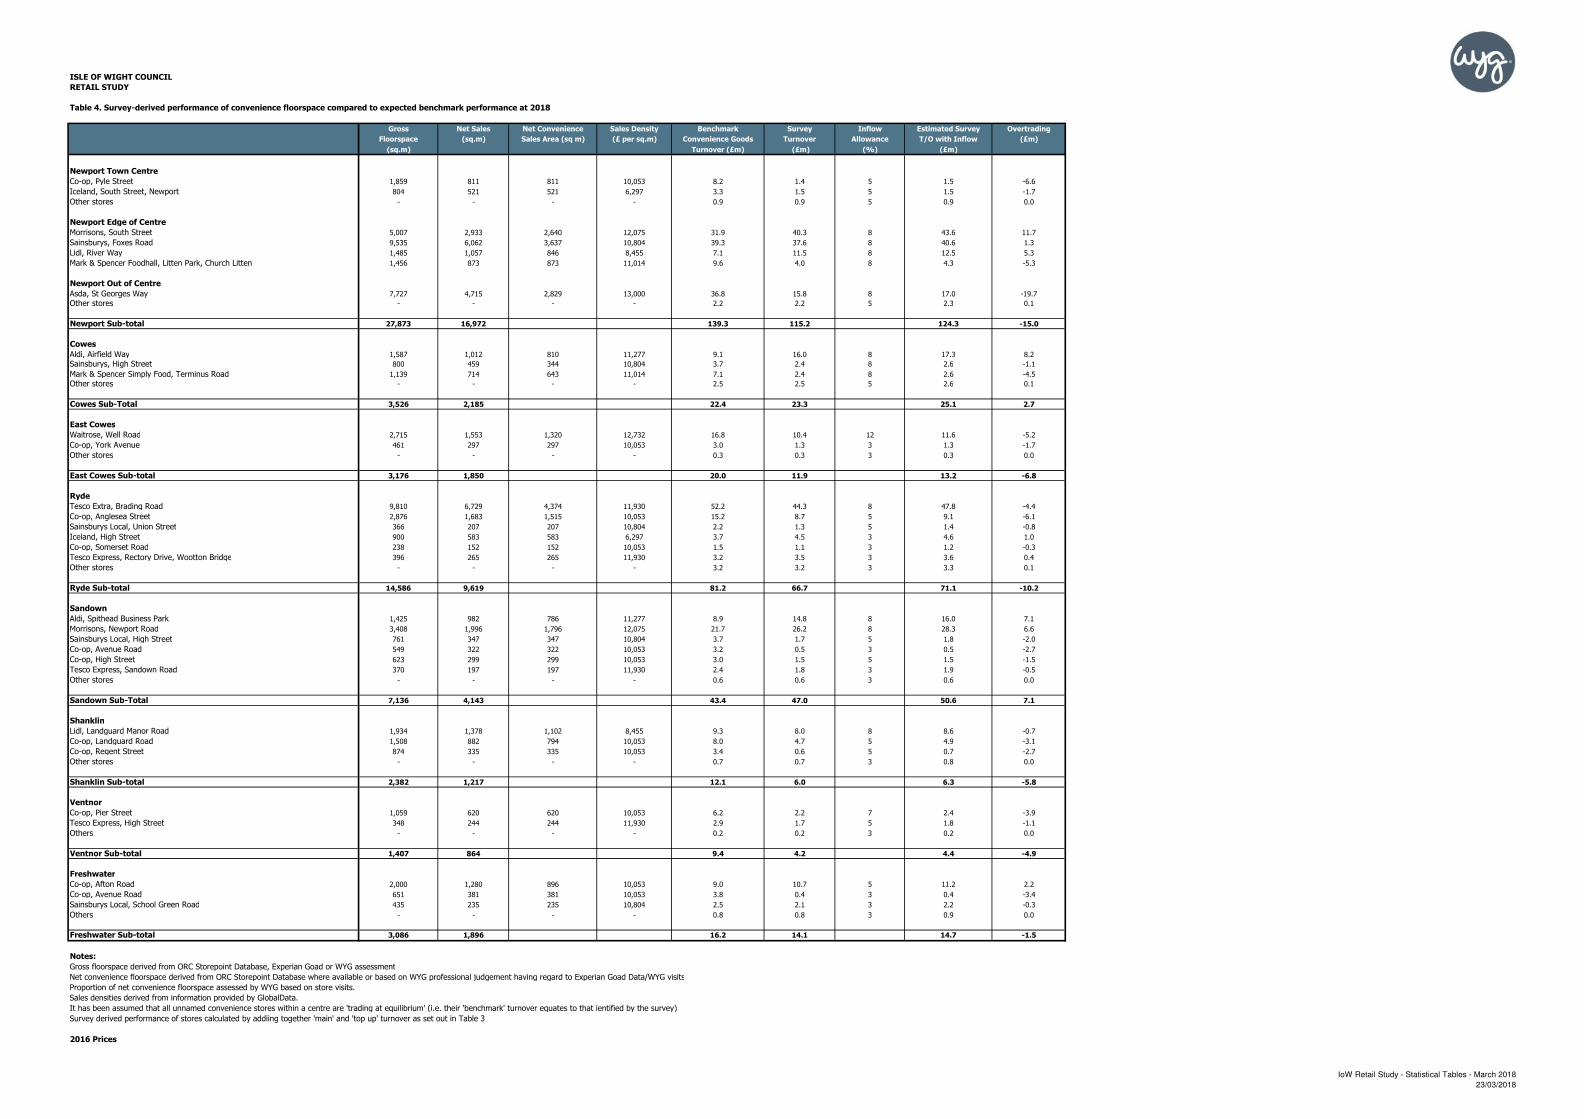
ISLE OF WIGHT COUNCIL
RETAIL STUDY
Table 4. Survey-derived performance of convenience floorspace compared to expected benchmark performance at 2018
Gross Net Sales Net Convenience Sales Density Benchmark Survey Inflow Estimated Survey Overtrading
Floorspace (sq.m) Sales Area (sq m) (£ per sq.m) Convenience Goods Turnover Allowance T/O with Inflow (£m)
(sq.m) Turnover (£m) (£m) (%) (£m)
Newport Town Centre
Co-op, Pyle Street 1,859 811 811 10,053 8.2 1.4 5 1.5 -6.6
Iceland, South Street, Newport 804 521 521 6,297 3.3 1.5 5 1.5 -1.7
Other stores - - - - 0.9 0.9 5 0.9 0.0
Newport Edge of Centre
Morrisons, South Street 5,007 2,933 2,640 12,075 31.9 40.3 8 43.6 11.7
Sainsburys, Foxes Road 9,535 6,062 3,637 10,804 39.3 37.6 8 40.6 1.3
Lidl, River Way 1,485 1,057 846 8,455 7.1 11.5 8 12.5 5.3
Mark & Spencer Foodhall, Litten Park, Church Litten 1,456 873 873 11,014 9.6 4.0 8 4.3 -5.3
Newport Out of Centre
Asda, St Georges Way 7,727 4,715 2,829 13,000 36.8 15.8 8 17.0 -19.7
Other stores - - - - 2.2 2.2 5 2.3 0.1
Newport Sub-total 27,873 16,972 139.3 115.2 124.3 -15.0
Cowes
Aldi, Airfield Way 1,587 1,012 810 11,277 9.1 16.0 8 17.3 8.2
Sainsburys, High Street 800 459 344 10,804 3.7 2.4 8 2.6 -1.1
Mark & Spencer Simply Food, Terminus Road 1,139 714 643 11,014 7.1 2.4 8 2.6 -4.5
Other stores - - - - 2.5 2.5 5 2.6 0.1
Cowes Sub-Total 3,526 2,185 22.4 23.3 25.1 2.7
East Cowes
Waitrose, Well Road 2,715 1,553 1,320 12,732 16.8 10.4 12 11.6 -5.2
Co-op, York Avenue 461 297 297 10,053 3.0 1.3 3 1.3 -1.7
Other stores - - - - 0.3 0.3 3 0.3 0.0
East Cowes Sub-total 3,176 1,850 20.0 11.9 13.2 -6.8
Ryde
Tesco Extra, Brading Road 9,810 6,729 4,374 11,930 52.2 44.3 8 47.8 -4.4
Co-op, Anglesea Street 2,876 1,683 1,515 10,053 15.2 8.7 5 9.1 -6.1
Sainsburys Local, Union Street 366 207 207 10,804 2.2 1.3 5 1.4 -0.8
Iceland, High Street 900 583 583 6,297 3.7 4.5 3 4.6 1.0
Co-op, Somerset Road 238 152 152 10,053 1.5 1.1 3 1.2 -0.3
Tesco Express, Rectory Drive, Wootton Bridge 396 265 265 11,930 3.2 3.5 3 3.6 0.4
Other stores - - - - 3.2 3.2 3 3.3 0.1
Ryde Sub-total 14,586 9,619 81.2 66.7 71.1 -10.2
Sandown
Aldi, Spithead Business Park 1,425 982 786 11,277 8.9 14.8 8 16.0 7.1
Morrisons, Newport Road 3,408 1,996 1,796 12,075 21.7 26.2 8 28.3 6.6
Sainsburys Local, High Street 761 347 347 10,804 3.7 1.7 5 1.8 -2.0
Co-op, Avenue Road 549 322 322 10,053 3.2 0.5 3 0.5 -2.7
Co-op, High Street 623 299 299 10,053 3.0 1.5 5 1.5 -1.5
Tesco Express, Sandown Road 370 197 197 11,930 2.4 1.8 3 1.9 -0.5
Other stores - - - - 0.6 0.6 3 0.6 0.0
Sandown Sub-Total 7,136 4,143 43.4 47.0 50.6 7.1
Shanklin
Lidl, Landguard Manor Road 1,934 1,378 1,102 8,455 9.3 8.0 8 8.6 -0.7
Co-op, Landguard Road 1,508 882 794 10,053 8.0 4.7 5 4.9 -3.1
Co-op, Regent Street 874 335 335 10,053 3.4 0.6 5 0.7 -2.7
Other stores - - - - 0.7 0.7 3 0.8 0.0
Shanklin Sub-total 2,382 1,217 12.1 6.0 6.3 -5.8
Ventnor
Co-op, Pier Street 1,059 620 620 10,053 6.2 2.2 7 2.4 -3.9
Tesco Express, High Street 348 244 244 11,930 2.9 1.7 5 1.8 -1.1
Others - - - - 0.2 0.2 3 0.2 0.0
Ventnor Sub-total 1,407 864 9.4 4.2 4.4 -4.9
Freshwater
Co-op, Afton Road 2,000 1,280 896 10,053 9.0 10.7 5 11.2 2.2
Co-op, Avenue Road 651 381 381 10,053 3.8 0.4 3 0.4 -3.4
Sainsburys Local, School Green Road 435 235 235 10,804 2.5 2.1 3 2.2 -0.3
Others - - - - 0.8 0.8 3 0.9 0.0
Freshwater Sub-total 3,086 1,896 16.2 14.1 14.7 -1.5
Notes:
Gross floorspace derived from ORC Storepoint Database, Experian Goad or WYG assessment #REF! #REF! #REF! #REF!
Net convenience floorspace derived from ORC Storepoint Database where available or based on WYG professional judgement having regard to Experian Goad Data/WYG visits
Sales densities derived from information provided by GlobalData.
It has been assumed that all unnamed convenience stores within a centre are 'trading at equilibrium' (i.e. their 'benchmark' turnover equates to that ientified by the survey)
Survey derived performance of stores calculated by addiing together 'main' and 'top up' turnover as set out in Table 3
2016 Prices
Proportion of net convenience floorspace assessed by WYG based on store visits.
IoW Retail Study - Statistical Tables - March 2018
23/03/2018

ISLE OF WIGHT COUNCIL
RETAIL STUDY
TABLE 5: ESTIMATED (BASELINE) CAPACITY FOR NEW CONVENIENCE GOODS PROVISION WITHIN NEWPORT
Table 5a: Estimated ‘Capacity’ for Convenience Goods Facilities in Newport
YearBenchmark Turnover
£m1 Newport Turnover £m
2 Newport Inflow £mSurplus Expenditure
£m
2018 139.3 115.2 9.0 -15.0 =
2023 138.8 116.4 9.1 -13.3
2028 139.3 118.9 9.3 -11.1
2034 140.1 122.1 9.6 -8.4
Notes:
1. Allows for increased turnover efficiency as set out in Table 4a Experian Retail Planner 15 (December 2017)
2. Assumes constant market share claimed by Newport facilities
2016 prices
Table 5b: Quantitative Need for Additional Convenience Goods Floorspace in Newport
Year Surplus
£m Min1
Max2
2018 -15.0 0 0
2023 -13.3 0 0
2028 -11.1 0 0
2034 -8.4 0 0
Notes:
1. Average sales density assumed to be £11,952 per sq.m based on the average sales density of the leading four supermarkets - derived by GlobalData
2. Average sales density assumed to be £9,866 per sq.m is based on the average of discount operators (Aldi & Lidl) - derived from GlobalData
Allows for increased turnover efficiency as set out in Table 4a Experian Retail Planner 15 (December 2017)
2016 prices
Floorspace Requirement
IoW Retail Study - Statistical Tables - March 2018
23/03/2018

ISLE OF WIGHT COUNCIL
RETAIL STUDY
TABLE 6: ESTIMATED (BASELINE) CAPACITY FOR NEW CONVENIENCE GOODS PROVISION WITHIN COWES
Table 6a: Estimated ‘Capacity’ for Convenience Goods Facilities in Cowes
YearBenchmark Turnover
£m1 Cowes Turnover £m
2 Cowes Inflow £mSurplus Expenditure
£m
2018 22.4 23.3 1.8 2.7 =
2023 22.4 23.5 1.8 3.0
2028 22.4 24.0 1.8 3.5
2034 22.6 24.7 1.9 4.0
Notes:
1. Allows for increased turnover efficiency as set out in Table 4a Experian Retail Planner 15 (December 2017).
2. Assumes constant market share claimed by Cowes facilities
2016 prices
Table 6b: Quantitative Need for Additional Convenience Goods Floorspace in Cowes
Year Surplus
£m Min1
Max2
2018 2.7 200 300
2023 3.0 300 300
2028 3.5 300 400
2034 4.0 300 400
Notes:
1. Average sales density assumed to be £11,952 per sq.m based on the average sales density of the leading four supermarkets - derived by GlobalData
2. Average sales density assumed to be £9,866 per sq.m is based on the average of discount operators (Aldi & Lidl) - derived from GlobalData
Allows for increased turnover efficiency as set out in Table 4a Experian Retail Planner 15 (December 2017).
2016 prices
Floorspace Requirement
IoW Retail Study - Statistical Tables - March 2018
23/03/2018
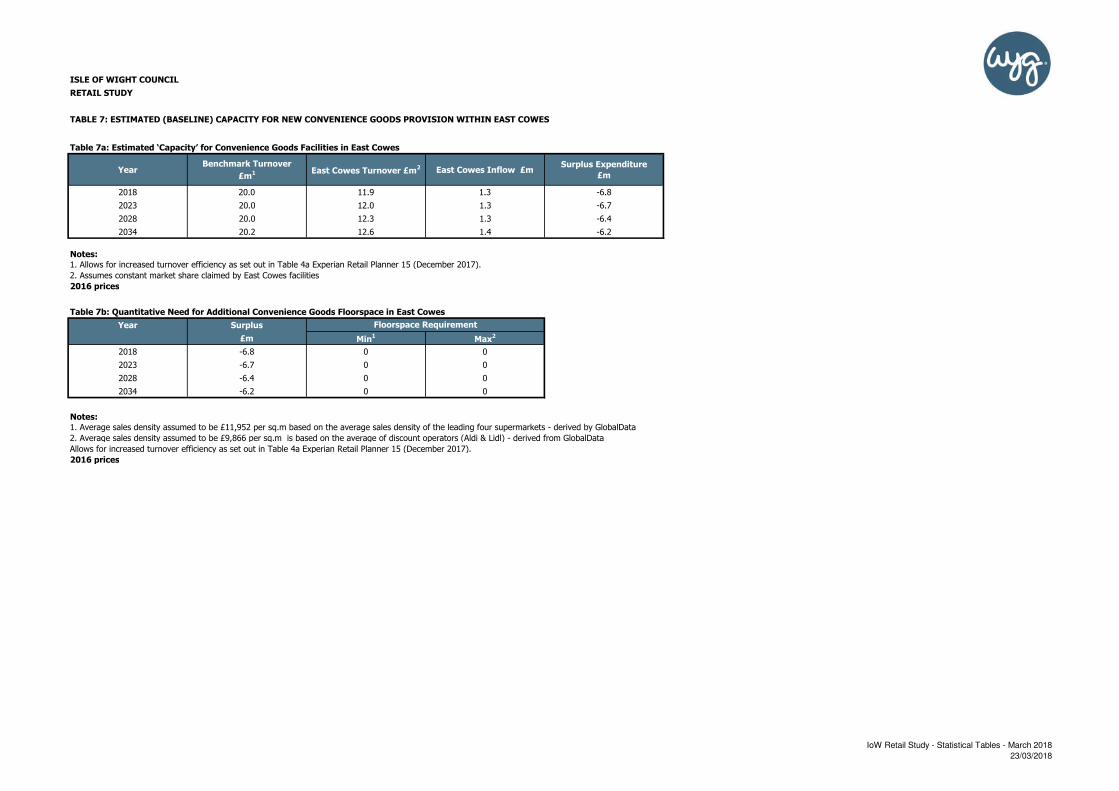
ISLE OF WIGHT COUNCIL
RETAIL STUDY
TABLE 7: ESTIMATED (BASELINE) CAPACITY FOR NEW CONVENIENCE GOODS PROVISION WITHIN EAST COWES
Table 7a: Estimated ‘Capacity’ for Convenience Goods Facilities in East Cowes
YearBenchmark Turnover
£m1 East Cowes Turnover £m
2 East Cowes Inflow £mSurplus Expenditure
£m
2018 20.0 11.9 1.3 -6.8 =
2023 20.0 12.0 1.3 -6.7
2028 20.0 12.3 1.3 -6.4
2034 20.2 12.6 1.4 -6.2
Notes:
1. Allows for increased turnover efficiency as set out in Table 4a Experian Retail Planner 15 (December 2017).
2. Assumes constant market share claimed by East Cowes facilities
2016 prices
Table 7b: Quantitative Need for Additional Convenience Goods Floorspace in East Cowes
Year Surplus
£m Min1
Max2
2018 -6.8 0 0
2023 -6.7 0 0
2028 -6.4 0 0
2034 -6.2 0 0
Notes:
1. Average sales density assumed to be £11,952 per sq.m based on the average sales density of the leading four supermarkets - derived by GlobalData
2. Average sales density assumed to be £9,866 per sq.m is based on the average of discount operators (Aldi & Lidl) - derived from GlobalData
Allows for increased turnover efficiency as set out in Table 4a Experian Retail Planner 15 (December 2017).
2016 prices
Floorspace Requirement
IoW Retail Study - Statistical Tables - March 2018
23/03/2018

ISLE OF WIGHT COUNCIL
RETAIL STUDY
TABLE 8: ESTIMATED (BASELINE) CAPACITY FOR NEW CONVENIENCE GOODS PROVISION WITHIN RYDE
Table 8a: Estimated ‘Capacity’ for Convenience Goods Facilities in Ryde
YearBenchmark Turnover
£m1 Ryde Turnover £m
2 Ryde Inflow £mSurplus Expenditure
£m
2018 81.2 66.7 4.4 -10.2 =
2023 81.0 67.3 4.5 -9.2
2028 81.2 68.8 4.6 -7.9
2034 81.7 70.7 4.7 -6.4
Notes:
1. Allows for increased turnover efficiency as set out in Table 4a Experian Retail Planner 15 (December 2017).
2. Assumes constant market share claimed by Ryde facilities
2016 prices
Table 8b: Quantitative Need for Additional Convenience Goods Floorspace in Ryde
Year Surplus
£m Min1
Max2
2018 -10.2 0 0
2023 -9.2 0 0
2028 -7.9 0 0
2034 -6.4 0 0
Notes:
1. Average sales density assumed to be £11,952 per sq.m based on the average sales density of the leading four supermarkets - derived by GlobalData
2. Average sales density assumed to be £9,866 per sq.m is based on the average of discount operators (Aldi & Lidl) - derived from GlobalData
Allows for increased turnover efficiency as set out in Table 4a Experian Retail Planner 15 (December 2017).
2016 prices
Floorspace Requirement
IoW Retail Study - Statistical Tables - March 2018
23/03/2018

ISLE OF WIGHT COUNCIL
RETAIL STUDY
TABLE 9: ESTIMATED (BASELINE) CAPACITY FOR NEW CONVENIENCE GOODS PROVISION WITHIN SANDOWN
Table 9a: Estimated ‘Capacity’ for Convenience Goods Facilities in Sandown
YearBenchmark Turnover
£m1 Sandown Turnover £m
2 Sandown Inflow £mSurplus Expenditure
£m
2018 43.4 47.0 3.5 7.1 =
2023 43.3 47.5 3.6 7.7
2028 43.4 48.5 3.6 8.7
2034 43.7 49.9 3.7 9.9
Notes:
1. Allows for increased turnover efficiency as set out in Table 4a Experian Retail Planner 15 (December 2017).
2. Assumes constant market share claimed by Sandown facilities
2016 prices
Table 9b: Quantitative Need for Additional Convenience Goods Floorspace in Sandown
Year Surplus
£m Min1
Max2
2018 7.1 600 700
2023 7.7 600 800
2028 8.7 700 900
2034 9.9 800 1,000
Notes:
1. Average sales density assumed to be £12,072 per sq.m based on the average sales density of the leading four supermarkets - derived by GlobalData.
2. Average sales density assumed to be £9,764 per sq.m is based on the average of discount operators (Aldi & Lidl) - derived from GlobalData.
Allows for increased turnover efficiency as set out in Table 4a Experian Retail Planner 15 (December 2017).
2016 prices
Floorspace Requirement
IoW Retail Study - Statistical Tables - March 2018
23/03/2018

ISLE OF WIGHT COUNCIL
RETAIL STUDY
TABLE 10: ESTIMATED (BASELINE) CAPACITY FOR NEW CONVENIENCE GOODS PROVISION WITHIN SHANKLIN
Table 10a: Estimated ‘Capacity’ for Convenience Goods Facilities in Shanklin
YearBenchmark Turnover
£m1 Shanklin Turnover £m
2 Shanklin Inflow £mSurplus Expenditure
£m
2018 12.1 6.0 0.3 -5.8 =
2023 12.0 6.1 0.3 -5.7
2028 12.1 6.2 0.3 -5.6
2034 12.2 6.4 0.3 -5.5
Notes:
1. Allows for increased turnover efficiency as set out in Table 4a Experian Retail Planner 15 (December 2017).
2. Assumes constant market share claimed by Shanklin facilities
2016 prices
Table 10b: Quantitative Need for Additional Convenience Goods Floorspace in Shanklin
Year Surplus
£m Min1
Max2
2018 -5.8 0 0
2023 -5.7 0 0
2028 -5.6 0 0
2034 -5.5 0 0
Notes:
1. Average sales density assumed to be £11,952 per sq.m based on the average sales density of the leading four supermarkets - derived by GlobalData
2. Average sales density assumed to be £9,866 per sq.m is based on the average of discount operators (Aldi & Lidl) - derived from GlobalData
Allows for increased turnover efficiency as set out in Table 4a Experian Retail Planner 15 (December 2017).
2016 prices
Floorspace Requirement
IoW Retail Study - Statistical Tables - March 2018
23/03/2018

ISLE OF WIGHT COUNCIL
RETAIL STUDY
TABLE 11: ESTIMATED (BASELINE) CAPACITY FOR NEW CONVENIENCE GOODS PROVISION WITHIN VENTNOR
Table 11a: Estimated ‘Capacity’ for Convenience Goods Facilities in Ventnor
YearBenchmark Turnover
£m1 Ventnor Turnover £m
2 Ventnor Inflow £mSurplus Expenditure
£m
2018 9.4 4.2 0.2 -4.9 =
2023 9.3 4.2 0.3 -4.9
2028 9.4 4.3 0.3 -4.8
2034 9.4 4.4 0.3 -4.7
Notes:
1. Allows for increased turnover efficiency as set out in Table 4a Experian Retail Planner 15 (December 2017).
2. Assumes constant market share claimed by Ventnor facilities
2016 prices
Table 11b: Quantitative Need for Additional Convenience Goods Floorspace in Ventnor
Year Surplus
£m Min1
Max2
2018 -4.9 0 0
2023 -4.9 0 0
2028 -4.8 0 0
2034 -4.7 0 0
Notes:
1. Average sales density assumed to be £11,952 per sq.m based on the average sales density of the leading four supermarkets - derived by GlobalData
2. Average sales density assumed to be £9,866 per sq.m is based on the average of discount operators (Aldi & Lidl) - derived from GlobalData
Allows for increased turnover efficiency as set out in Table 4a Experian Retail Planner 15 (December 2017).
2016 prices
Floorspace Requirement
IoW Retail Study - Statistical Tables - March 2018
23/03/2018

ISLE OF WIGHT COUNCIL
RETAIL STUDY
TABLE 12: ESTIMATED (BASELINE) CAPACITY FOR NEW CONVENIENCE GOODS PROVISION WITHIN FRESHWATER
Table 12a: Estimated ‘Capacity’ for Convenience Goods Facilities in Freshwater
YearBenchmark Turnover
£m1 Freshwater Turnover £m
2 Freshwater Inflow £mSurplus Expenditure
£m
2018 22.4 14.1 0.6 -7.7 =
2023 22.4 14.2 0.6 -7.5
2028 22.4 14.5 0.7 -7.2
2034 22.6 15.0 0.7 -6.9
Notes:
1. Allows for increased turnover efficiency as set out in Table 4a Experian Retail Planner 15 (December 2017).
2. Assumes constant market share claimed by Freshwater facilities
2016 prices
Table 12b: Quantitative Need for Additional Convenience Goods Floorspace in Freshwater
Year Surplus
£m Min1
Max2
2018 -7.7 0 0
2023 -7.5 0 0
2028 -7.2 0 0
2034 -6.9 0 0
Notes:
1. Average sales density assumed to be £11,952 per sq.m based on the average sales density of the leading four supermarkets - derived by GlobalData
2. Average sales density assumed to be £9,866 per sq.m is based on the average of discount operators (Aldi & Lidl) - derived from GlobalData
Allows for increased turnover efficiency as set out in Table 4a Experian Retail Planner 15 (December 2017).
2016 prices
Floorspace Requirement
IoW Retail Study - Statistical Tables - March 2018
23/03/2018
Retail Study www.wyg.com
Appendix G Statistical Retail Tables -
Comparison Goods Capacity
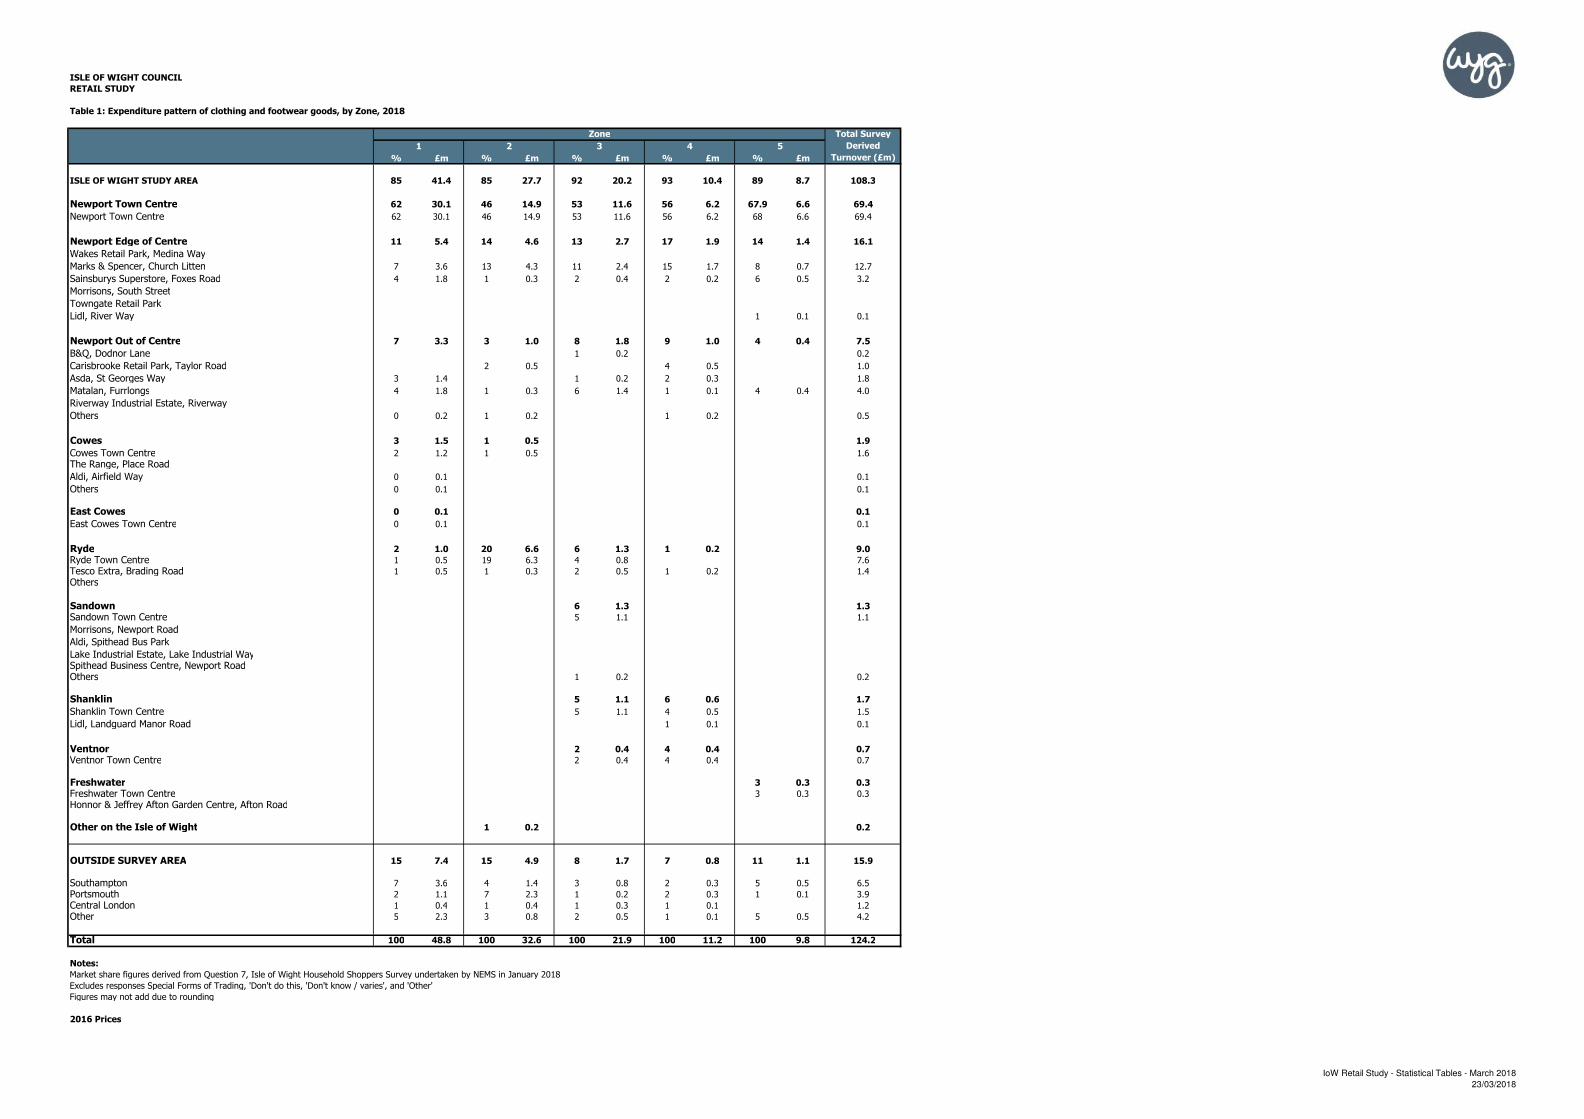
ISLE OF WIGHT COUNCIL
RETAIL STUDY
Table 1: Expenditure pattern of clothing and footwear goods, by Zone, 2018
Total Survey
Derived
% £m % £m % £m % £m % £m Turnover (£m)
ISLE OF WIGHT STUDY AREA 85 41.4 85 27.7 92 20.2 93 10.4 89 8.7 108.3
Newport Town Centre 62 30.1 46 14.9 53 11.6 56 6.2 67.9 6.6 69.4
Newport Town Centre 62 30.1 46 14.9 53 11.6 56 6.2 68 6.6 69.4
Newport Edge of Centre 11 5.4 14 4.6 13 2.7 17 1.9 14 1.4 16.1
Wakes Retail Park, Medina Way
Marks & Spencer, Church Litten 7 3.6 13 4.3 11 2.4 15 1.7 8 0.7 12.7
Sainsburys Superstore, Foxes Road 4 1.8 1 0.3 2 0.4 2 0.2 6 0.5 3.2
Morrisons, South Street
Towngate Retail Park
Lidl, River Way 1 0.1 0.1
Newport Out of Centre 7 3.3 3 1.0 8 1.8 9 1.0 4 0.4 7.5
B&Q, Dodnor Lane 1 0.2 0.2
Carisbrooke Retail Park, Taylor Road 2 0.5 4 0.5 1.0
Asda, St Georges Way 3 1.4 1 0.2 2 0.3 1.8
Matalan, Furrlongs 4 1.8 1 0.3 6 1.4 1 0.1 4 0.4 4.0
Riverway Industrial Estate, Riverway
Others 0 0.2 1 0.2 1 0.2 0.5
Cowes 3 1.5 1 0.5 1.9
Cowes Town Centre 2 1.2 1 0.5 1.6
The Range, Place Road
Aldi, Airfield Way 0 0.1 0.1
Others 0 0.1 0.1
East Cowes 0 0.1 0.1
East Cowes Town Centre 0 0.1 0.1
Ryde 2 1.0 20 6.6 6 1.3 1 0.2 9.0
Ryde Town Centre 1 0.5 19 6.3 4 0.8 7.6
Tesco Extra, Brading Road 1 0.5 1 0.3 2 0.5 1 0.2 1.4
Others
Sandown 6 1.3 1.3
Sandown Town Centre 5 1.1 1.1
Morrisons, Newport Road
Aldi, Spithead Bus Park
Lake Industrial Estate, Lake Industrial WaySpithead Business Centre, Newport RoadOthers 1 0.2 0.2
Shanklin 5 1.1 6 0.6 1.7
Shanklin Town Centre 5 1.1 4 0.5 1.5
Lidl, Landguard Manor Road 1 0.1 0.1
Ventnor 2 0.4 4 0.4 0.7
Ventnor Town Centre 2 0.4 4 0.4 0.7
Freshwater 3 0.3 0.3
Freshwater Town Centre 3 0.3 0.3
Honnor & Jeffrey Afton Garden Centre, Afton Road
Other on the Isle of Wight 1 0.2 0.2
OUTSIDE SURVEY AREA 15 7.4 15 4.9 8 1.7 7 0.8 11 1.1 15.9
Southampton 7 3.6 4 1.4 3 0.8 2 0.3 5 0.5 6.5
Portsmouth 2 1.1 7 2.3 1 0.2 2 0.3 1 0.1 3.9
Central London 1 0.4 1 0.4 1 0.3 1 0.1 1.2
Other 5 2.3 3 0.8 2 0.5 1 0.1 5 0.5 4.2
Total 100 48.8 100 32.6 100 21.9 100 11.2 100 9.8 124.2
Notes:
Market share figures derived from Question 7, Isle of Wight Household Shoppers Survey undertaken by NEMS in January 2018
Excludes responses Special Forms of Trading, 'Don't do this, 'Don't know / varies', and 'Other'
Figures may not add due to rounding
2016 Prices
1 5432
Zone
IoW Retail Study - Statistical Tables - March 2018
23/03/2018
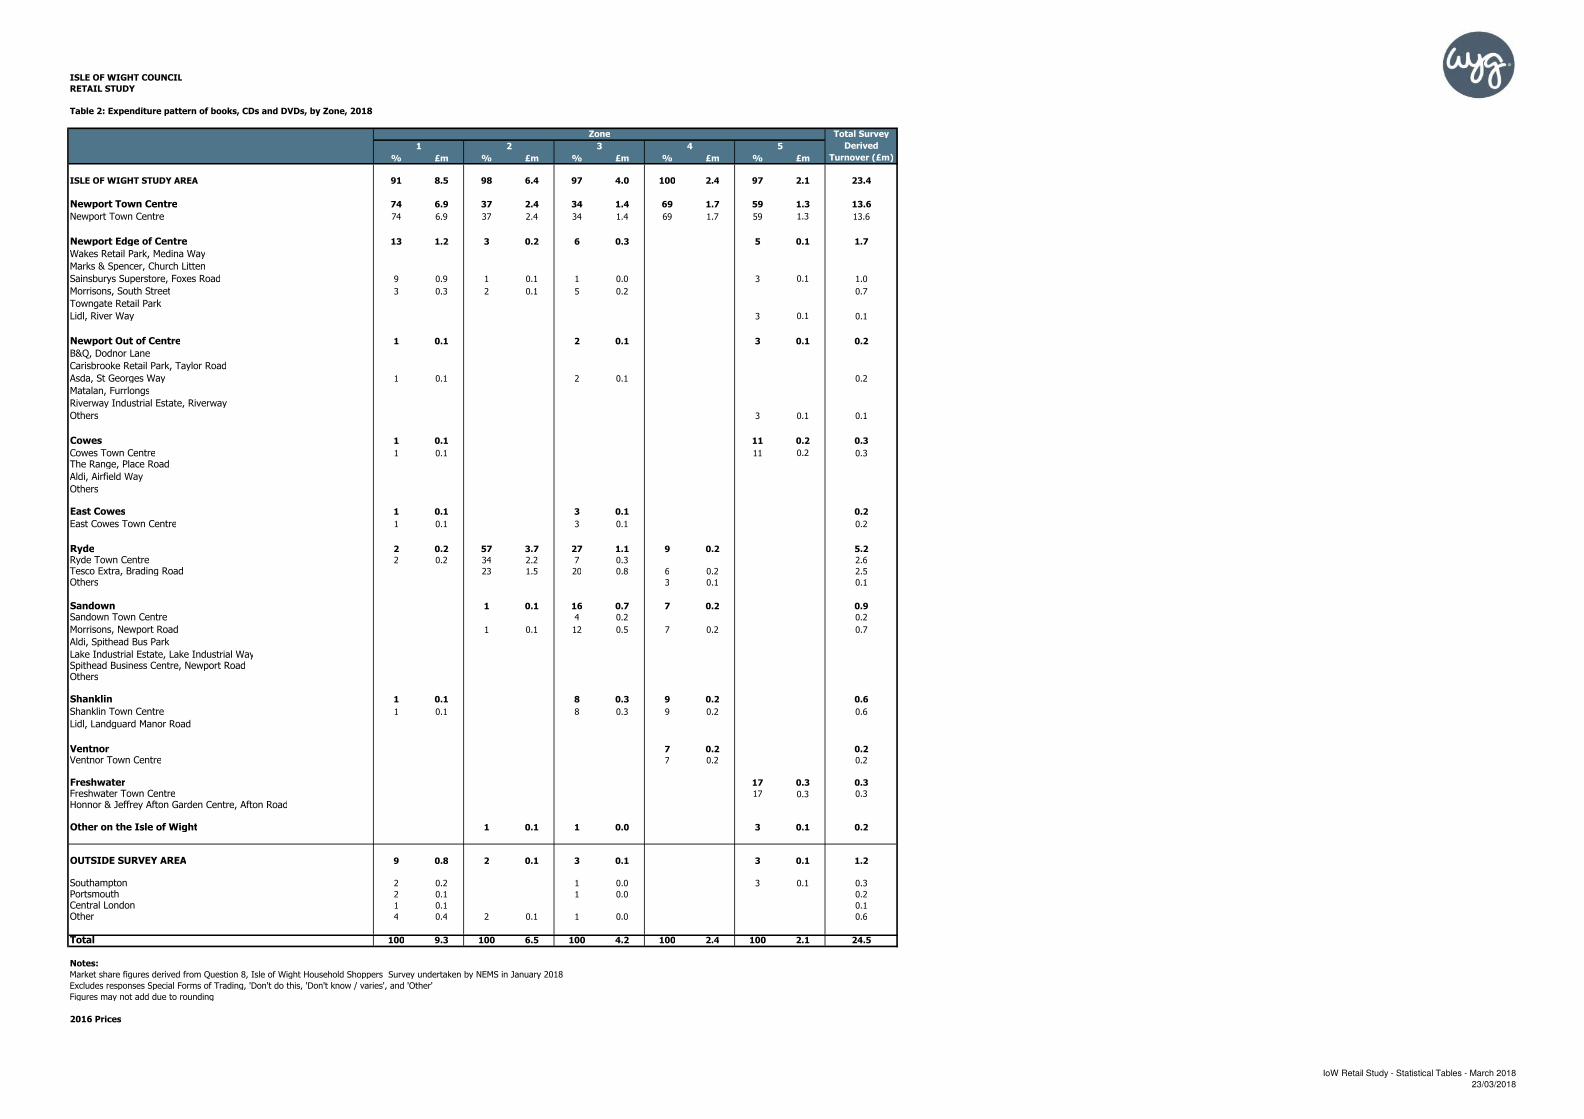
ISLE OF WIGHT COUNCIL
RETAIL STUDY
Table 2: Expenditure pattern of books, CDs and DVDs, by Zone, 2018
Total Survey
Derived
% £m % £m % £m % £m % £m Turnover (£m)
ISLE OF WIGHT STUDY AREA 91 8.5 98 6.4 97 4.0 100 2.4 97 2.1 23.4
Newport Town Centre 74 6.9 37 2.4 34 1.4 69 1.7 59 1.3 13.6
Newport Town Centre 74 6.9 37 2.4 34 1.4 69 1.7 59 1.3 13.6
Newport Edge of Centre 13 1.2 3 0.2 6 0.3 5 0.1 1.7
Wakes Retail Park, Medina Way
Marks & Spencer, Church Litten
Sainsburys Superstore, Foxes Road 9 0.9 1 0.1 1 0.0 3 0.1 1.0
Morrisons, South Street 3 0.3 2 0.1 5 0.2 0.7
Towngate Retail Park
Lidl, River Way 3 0.1 0.1
Newport Out of Centre 1 0.1 2 0.1 3 0.1 0.2
B&Q, Dodnor Lane
Carisbrooke Retail Park, Taylor Road
Asda, St Georges Way 1 0.1 2 0.1 0.2
Matalan, Furrlongs
Riverway Industrial Estate, Riverway
Others 3 0.1 0.1
Cowes 1 0.1 11 0.2 0.3
Cowes Town Centre 1 0.1 11 0.2 0.3
The Range, Place Road
Aldi, Airfield Way
Others
East Cowes 1 0.1 3 0.1 0.2
East Cowes Town Centre 1 0.1 3 0.1 0.2
Ryde 2 0.2 57 3.7 27 1.1 9 0.2 5.2
Ryde Town Centre 2 0.2 34 2.2 7 0.3 2.6
Tesco Extra, Brading Road 23 1.5 20 0.8 6 0.2 2.5
Others 3 0.1 0.1
Sandown 1 0.1 16 0.7 7 0.2 0.9
Sandown Town Centre 4 0.2 0.2
Morrisons, Newport Road 1 0.1 12 0.5 7 0.2 0.7
Aldi, Spithead Bus Park
Lake Industrial Estate, Lake Industrial WaySpithead Business Centre, Newport RoadOthers
Shanklin 1 0.1 8 0.3 9 0.2 0.6
Shanklin Town Centre 1 0.1 8 0.3 9 0.2 0.6
Lidl, Landguard Manor Road
Ventnor 7 0.2 0.2
Ventnor Town Centre 7 0.2 0.2
Freshwater 17 0.3 0.3
Freshwater Town Centre 17 0.3 0.3
Honnor & Jeffrey Afton Garden Centre, Afton Road
Other on the Isle of Wight 1 0.1 1 0.0 3 0.1 0.2
OUTSIDE SURVEY AREA 9 0.8 2 0.1 3 0.1 3 0.1 1.2
Southampton 2 0.2 1 0.0 3 0.1 0.3
Portsmouth 2 0.1 1 0.0 0.2
Central London 1 0.1 0.1
Other 4 0.4 2 0.1 1 0.0 0.6
Total 100 9.3 100 6.5 100 4.2 100 2.4 100 2.1 24.5
Notes:
Market share figures derived from Question 8, Isle of Wight Household Shoppers Survey undertaken by NEMS in January 2018
Excludes responses Special Forms of Trading, 'Don't do this, 'Don't know / varies', and 'Other'
Figures may not add due to rounding
2016 Prices
Zone
1 2 3 4 5
IoW Retail Study - Statistical Tables - March 2018
23/03/2018

ISLE OF WIGHT COUNCIL
RETAIL STUDY
Table 3: Expenditure pattern of furnishings and household textile goods, by Zone, 2018
Total Survey
Derived
% £m % £m % £m % £m % £m Turnover (£m)
ISLE OF WIGHT STUDY AREA 91 8.0 91 5.8 89 3.7 92 2.2 85 1.8 21.5
Newport Town Centre 40 3.5 26.5 1.7 23 1.0 35 0.8 18 0.4 7.4
Newport Town Centre 40 3.5 27 1.7 23 1.0 35 0.8 18 0.4 7.4
Newport Edge of Centre 27 2.4 31 2.0 31 1.3 29 0.7 47 1.0 7.3
Wakes Retail Park, Medina Way 19 1.7 27 1.7 26 1.1 21 0.5 36 0.8 5.8
Marks & Spencer, Church Litten 2 0.1 4 0.2 3 0.1 3 0.1 6 0.1 0.7
Sainsburys Superstore, Foxes Road 3 0.3 1 0.0 1 0.0 0.4
Morrisons, South Street 2 0.2 0 0.0 1 0.0 5 0.1 4 0.1 0.5
Towngate Retail Park
Lidl, River Way
Newport Out of Centre 10 0.9 7 0.5 10 0.4 15 0.4 7 0.1 2.2
B&Q, Dodnor Lane 2 0.2 2 0.1 3 0.1 4 0.1 0.5
Carisbrooke Retail Park, Taylor Road 3 0.3 3 0.2 4 0.2 11 0.3 1 0.0 0.9
Asda, St Georges Way 3 0.3 0.3
Matalan, Furrlongs 0 0.0 3 0.1 0.1
Riverway Industrial Estate, Riverway 1 0.1 3 0.2 3 0.1 2 0.0 0.4
Others 1 0.0 2 0.0 0.1
Cowes 10 0.9 5 0.3 3 0.1 3 0.1 7 0.1 1.6
Cowes Town Centre 8 0.7 3 0.2 2 0.1 3 0.1 7 0.1 1.2
The Range, Place Road 0 0.0 3 0.2 1 0.0 0.2
Aldi, Airfield Way 1 0.1 0.1
Others 1 0.1 0.1
East Cowes
East Cowes Town Centre
Ryde 2 0.2 16 1.0 5 0.2 1 0.0 2 0.0 1.4
Ryde Town Centre 2 0.2 12 0.7 3 0.1 1 0.0 1.1
Tesco Extra, Brading Road 3 0.2 1 0.0 0.2
Others 1 0.0 1 0.0 2 0.0 0.1
Sandown 2 0.1 1 0.1 8 0.3 4 0.1 2 0.0 0.7
Sandown Town Centre 1 0.0 0 0.0 5 0.2 3 0.1 2 0.0 0.4
Morrisons, Newport Road
Aldi, Spithead Bus Park
Lake Industrial Estate, Lake Industrial Way 1 0.1 0 0.0 1 0.0 0.1
Spithead Business Centre, Newport Road 0 0.0 2 0.1 0.1
Others 2 0.0 0.0
Shanklin 0 0.0 9 0.4 1 0.0 0.4
Shanklin Town Centre 0 0.0 9 0.4 1 0.0 0.4
Lidl, Landguard Manor Road
Ventnor 3 0.1 1 0.0 0.1
Ventnor Town Centre 3 0.1 1 0.0 0.1
Freshwater 0 0.0 2 0.0 0.1
Freshwater Town Centre 0 0.0 2 0.0 0.1
Honnor & Jeffrey Afton Garden Centre, Afton Road
Other on the Isle of Wight 3 0.2 1 0.0 0.2
OUTSIDE SURVEY AREA 9 0.8 9 0.6 11 0.5 8 0.2 15 0.3 2.4
Southampton 8 0.7 7 0.4 10 0.4 3 0.1 15 0.3 2.0
Portsmouth 0 0.0 0.0
Central London 1 0.1 1 0.1 4 0.1 0.2
Other 1 0.0 1 0.1 1 0.0 1 0.0 0.2
Total 100 8.9 100 6.4 100 4.2 100 2.4 100 2.1 23.9
Notes:
Market share figures derived from Question 9, Isle of Wight Household Shoppers Survey undertaken by NEMS in January 2018
Excludes responses Special Forms of Trading, 'Don't do this, 'Don't know / varies', and 'Other'
Figures may not add due to rounding
2016 Prices
Zone
1 2 3 4 5
IoW Retail Study - Statistical Tables - March 2018
23/03/2018

ISLE OF WIGHT COUNCIL
RETAIL STUDY
Table 4: Expenditure pattern of small household goods such as glassware and utensils, by Zone, 2018
Total Survey
Derived
% £m % £m % £m % £m % £m Turnover (£m)
ISLE OF WIGHT STUDY AREA 94 12.3 89 8.4 92 5.7 92 3.1 95 2.9 32.4
Newport Town Centre 41 5.4 21.3 2.0 28 1.7 34 1.2 24 0.7 11.0
Newport Town Centre 41 5.4 21 2.0 28 1.7 34 1.2 24 0.7 11.0
Newport Edge of Centre 31 4.1 14 1.3 18 1.1 19 0.6 31 1.0 8.0
Wakes Retail Park, Medina Way 9 1.2 11 1.0 12 0.7 9 0.3 13 0.4 3.6
Marks & Spencer, Church Litten 3 0.4 0 0.0 3 0.2 3 0.1 6 0.2 1.0
Sainsburys Superstore, Foxes Road 12 1.6 2 0.2 3 0.2 4 0.1 7 0.2 2.4
Morrisons, South Street 6 0.8 2 0.1 5 0.1 1.0
Towngate Retail Park 1 0.1 0.1
Lidl, River Way 0 0.0 0.0
Newport Out of Centre 8 1.0 5 0.5 9 0.5 6 0.2 9 0.3 2.5
B&Q, Dodnor Lane 1 0.1 0.1
Carisbrooke Retail Park, Taylor Road 3 0.3 4 0.2 5 0.2 6 0.2 0.9
Asda, St Georges Way 3 0.4 4 0.3 2 0.1 3 0.1 1.0
Matalan, Furrlongs 2 0.2 1 0.0 1 0.0 0.3
Riverway Industrial Estate, Riverway 1 0.1 1 0.0 0.1
Others 0 0.0 2 0.1 0.2
Cowes 10 1.4 1 0.1 4 0.3 2 0.1 5 0.2 2.0
Cowes Town Centre 9 1.2 0 0.0 3 0.2 2 0.1 5 0.2 1.6
The Range, Place Road 1 0.1 1 0.1 2 0.1 0.3
Aldi, Airfield Way 0 0.0 0.0
Others
East Cowes 1 0.1 0.1
East Cowes Town Centre 1 0.1 0.1
Ryde 1 0.2 47 4.4 12 0.8 3 0.1 1 0.0 5.5
Ryde Town Centre 17 1.6 1 0.1 1.7
Tesco Extra, Brading Road 1 0.2 27 2.5 11 0.7 3 0.1 1 0.0 3.5
Others 2 0.2 0.2
Sandown 0 0.0 2 0.1 4 0.1 0.3
Sandown Town Centre
Morrisons, Newport Road 0 0.0 2 0.1 3 0.1 0.3
Aldi, Spithead Bus Park 2 0.1 0.1
Lake Industrial Estate, Lake Industrial WaySpithead Business Centre, Newport RoadOthers
Shanklin 19 1.2 5 0.2 1.3
Shanklin Town Centre 17 1.1 5 0.2 1.2
Lidl, Landguard Manor Road 2 0.1 0.1
Ventnor 19 0.6 0.6
Ventnor Town Centre 19 0.6 0.6
Freshwater 1 0.1 24 0.7 0.8
Freshwater Town Centre 1 0.1 24 0.7 0.8
Honnor & Jeffrey Afton Garden Centre, Afton Road
Other on the Isle of Wight 1 0.1 0.1
OUTSIDE SURVEY AREA 6 0.8 11 1.0 8 0.5 8 0.3 5 0.2 2.7
Southampton 4 0.6 10 0.9 4 0.2 7 0.2 5 0.2 2.1
Portsmouth 1 0.0 1 0.0 0.1
Central London 1 0.1 1 0.1 0.1
Other 1 0.1 0 0.0 3 0.2 0.3
Total 100 13.1 100 9.4 100 6.2 100 3.4 100 3.0 35.1
Notes:
Market share figures derived from Question 10, Isle of Wight Household Shoppers Survey undertaken by NEMS in January 2018
Excludes responses Special Forms of Trading, 'Don't do this, 'Don't know / varies', and 'Other'
Figures may not add due to rounding
2016 Prices
Zone
1 2 3 4 5
IoW Retail Study - Statistical Tables - March 2018
23/03/2018
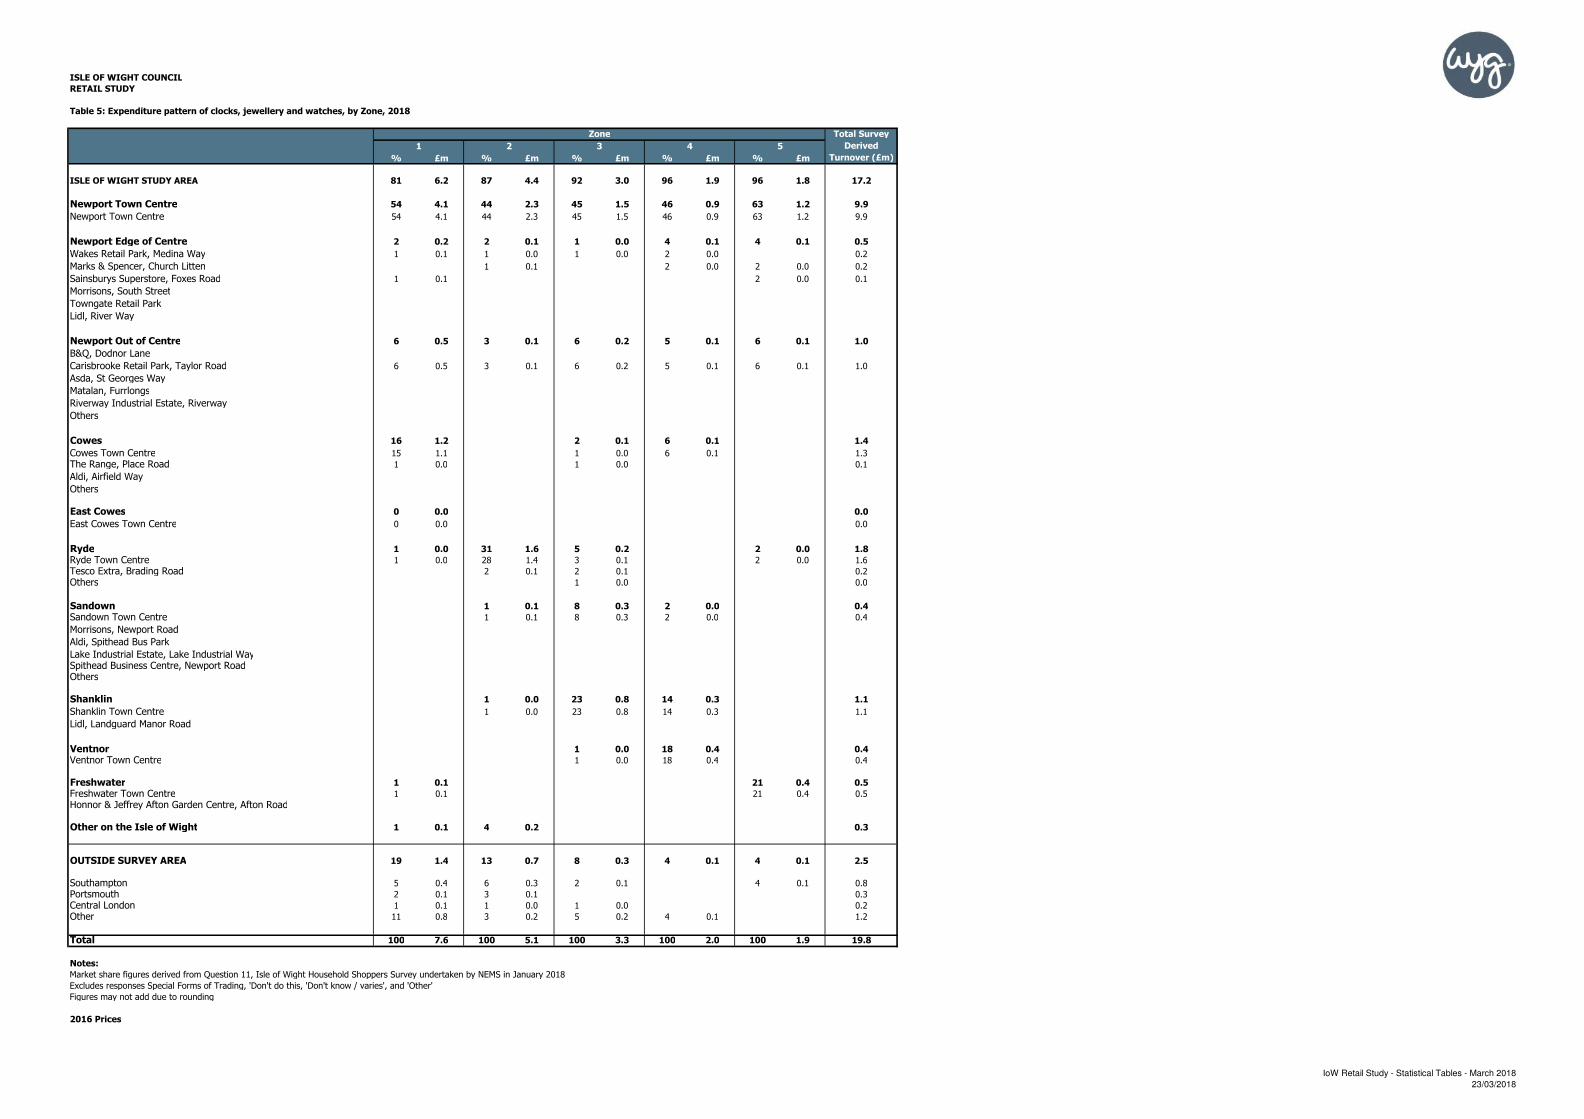
ISLE OF WIGHT COUNCIL
RETAIL STUDY
Table 5: Expenditure pattern of clocks, jewellery and watches, by Zone, 2018
Total Survey
Derived
% £m % £m % £m % £m % £m Turnover (£m)
ISLE OF WIGHT STUDY AREA 81 6.2 87 4.4 92 3.0 96 1.9 96 1.8 17.2
Newport Town Centre 54 4.1 44 2.3 45 1.5 46 0.9 63 1.2 9.9
Newport Town Centre 54 4.1 44 2.3 45 1.5 46 0.9 63 1.2 9.9
Newport Edge of Centre 2 0.2 2 0.1 1 0.0 4 0.1 4 0.1 0.5
Wakes Retail Park, Medina Way 1 0.1 1 0.0 1 0.0 2 0.0 0.2
Marks & Spencer, Church Litten 1 0.1 2 0.0 2 0.0 0.2
Sainsburys Superstore, Foxes Road 1 0.1 2 0.0 0.1
Morrisons, South Street
Towngate Retail Park
Lidl, River Way
Newport Out of Centre 6 0.5 3 0.1 6 0.2 5 0.1 6 0.1 1.0
B&Q, Dodnor Lane
Carisbrooke Retail Park, Taylor Road 6 0.5 3 0.1 6 0.2 5 0.1 6 0.1 1.0
Asda, St Georges Way
Matalan, Furrlongs
Riverway Industrial Estate, Riverway
Others
Cowes 16 1.2 2 0.1 6 0.1 1.4
Cowes Town Centre 15 1.1 1 0.0 6 0.1 1.3
The Range, Place Road 1 0.0 1 0.0 0.1
Aldi, Airfield Way
Others
East Cowes 0 0.0 0.0
East Cowes Town Centre 0 0.0 0.0
Ryde 1 0.0 31 1.6 5 0.2 2 0.0 1.8
Ryde Town Centre 1 0.0 28 1.4 3 0.1 2 0.0 1.6
Tesco Extra, Brading Road 2 0.1 2 0.1 0.2
Others 1 0.0 0.0
Sandown 1 0.1 8 0.3 2 0.0 0.4
Sandown Town Centre 1 0.1 8 0.3 2 0.0 0.4
Morrisons, Newport Road
Aldi, Spithead Bus Park
Lake Industrial Estate, Lake Industrial WaySpithead Business Centre, Newport RoadOthers
Shanklin 1 0.0 23 0.8 14 0.3 1.1
Shanklin Town Centre 1 0.0 23 0.8 14 0.3 1.1
Lidl, Landguard Manor Road
Ventnor 1 0.0 18 0.4 0.4
Ventnor Town Centre 1 0.0 18 0.4 0.4
Freshwater 1 0.1 21 0.4 0.5
Freshwater Town Centre 1 0.1 21 0.4 0.5
Honnor & Jeffrey Afton Garden Centre, Afton Road
Other on the Isle of Wight 1 0.1 4 0.2 0.3
OUTSIDE SURVEY AREA 19 1.4 13 0.7 8 0.3 4 0.1 4 0.1 2.5
Southampton 5 0.4 6 0.3 2 0.1 4 0.1 0.8
Portsmouth 2 0.1 3 0.1 0.3
Central London 1 0.1 1 0.0 1 0.0 0.2
Other 11 0.8 3 0.2 5 0.2 4 0.1 1.2
Total 100 7.6 100 5.1 100 3.3 100 2.0 100 1.9 19.8
Notes:
Market share figures derived from Question 11, Isle of Wight Household Shoppers Survey undertaken by NEMS in January 2018
Excludes responses Special Forms of Trading, 'Don't do this, 'Don't know / varies', and 'Other'
Figures may not add due to rounding
2016 Prices
3
Zone
1 2 54
IoW Retail Study - Statistical Tables - March 2018
23/03/2018
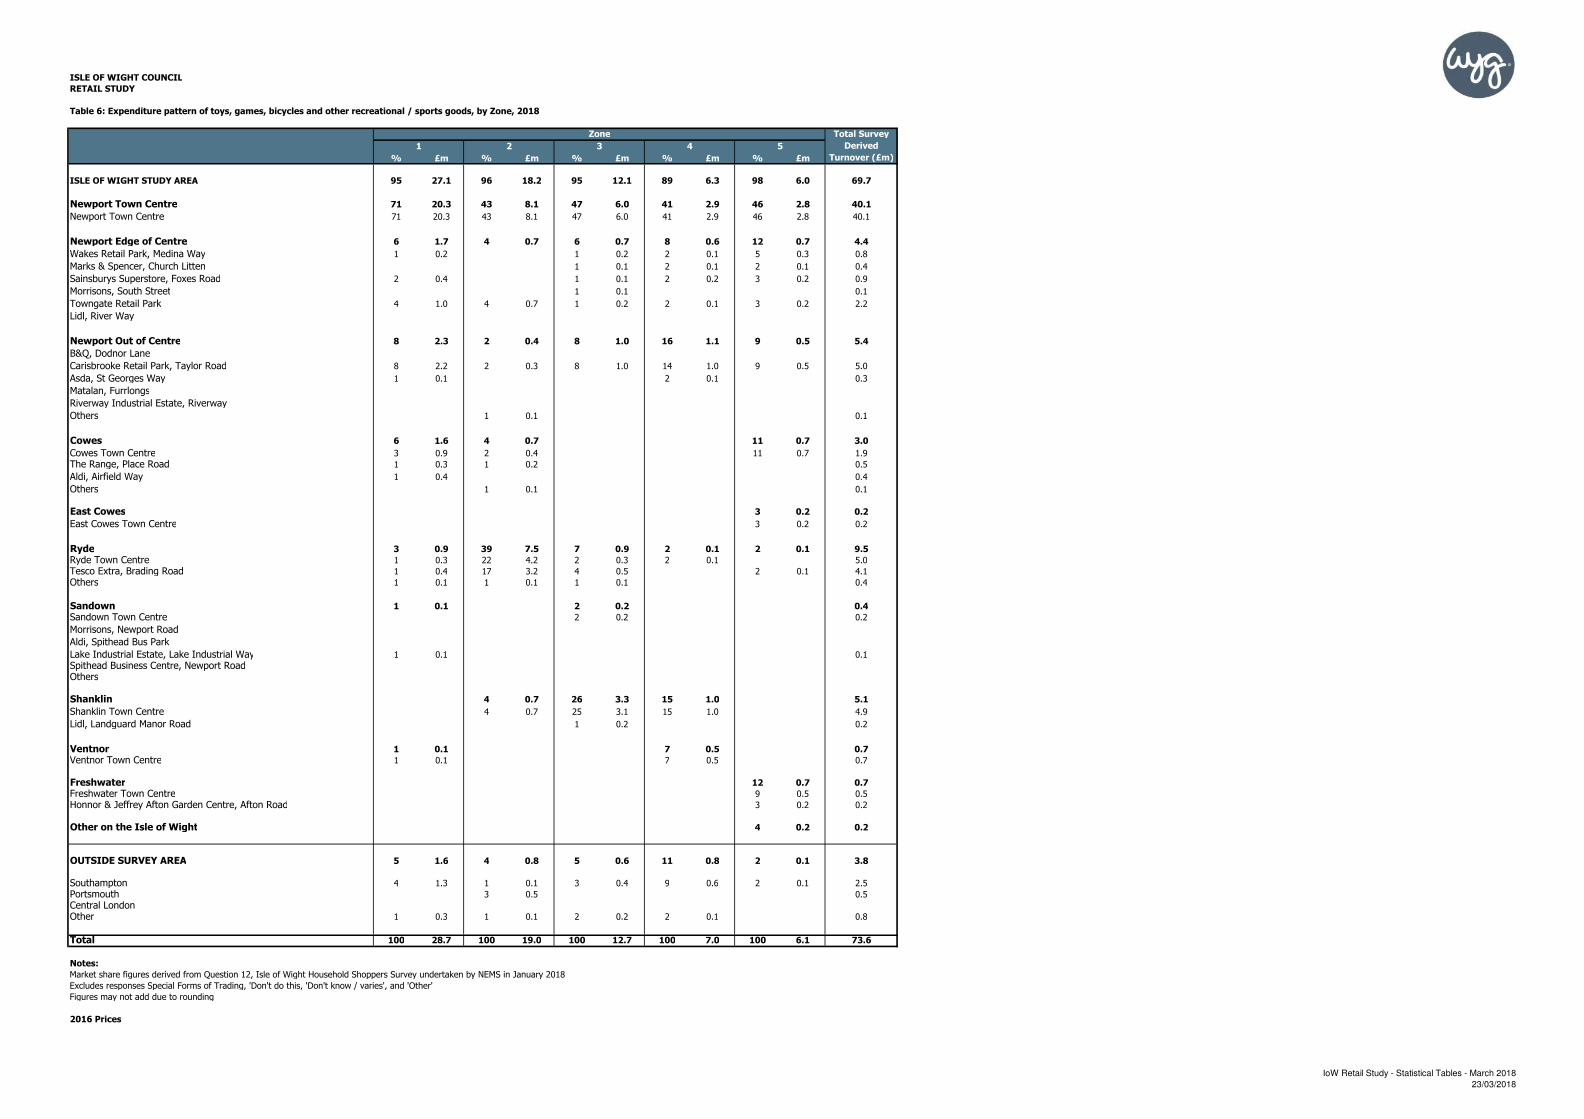
ISLE OF WIGHT COUNCIL
RETAIL STUDY
Table 6: Expenditure pattern of toys, games, bicycles and other recreational / sports goods, by Zone, 2018
Total Survey
Derived
% £m % £m % £m % £m % £m Turnover (£m)
ISLE OF WIGHT STUDY AREA 95 27.1 96 18.2 95 12.1 89 6.3 98 6.0 69.7
Newport Town Centre 71 20.3 43 8.1 47 6.0 41 2.9 46 2.8 40.1
Newport Town Centre 71 20.3 43 8.1 47 6.0 41 2.9 46 2.8 40.1
Newport Edge of Centre 6 1.7 4 0.7 6 0.7 8 0.6 12 0.7 4.4
Wakes Retail Park, Medina Way 1 0.2 1 0.2 2 0.1 5 0.3 0.8
Marks & Spencer, Church Litten 1 0.1 2 0.1 2 0.1 0.4
Sainsburys Superstore, Foxes Road 2 0.4 1 0.1 2 0.2 3 0.2 0.9
Morrisons, South Street 1 0.1 0.1
Towngate Retail Park 4 1.0 4 0.7 1 0.2 2 0.1 3 0.2 2.2
Lidl, River Way
Newport Out of Centre 8 2.3 2 0.4 8 1.0 16 1.1 9 0.5 5.4
B&Q, Dodnor Lane
Carisbrooke Retail Park, Taylor Road 8 2.2 2 0.3 8 1.0 14 1.0 9 0.5 5.0
Asda, St Georges Way 1 0.1 2 0.1 0.3
Matalan, Furrlongs
Riverway Industrial Estate, Riverway
Others 1 0.1 0.1
Cowes 6 1.6 4 0.7 11 0.7 3.0
Cowes Town Centre 3 0.9 2 0.4 11 0.7 1.9
The Range, Place Road 1 0.3 1 0.2 0.5
Aldi, Airfield Way 1 0.4 0.4
Others 1 0.1 0.1
East Cowes 3 0.2 0.2
East Cowes Town Centre 3 0.2 0.2
Ryde 3 0.9 39 7.5 7 0.9 2 0.1 2 0.1 9.5
Ryde Town Centre 1 0.3 22 4.2 2 0.3 2 0.1 5.0
Tesco Extra, Brading Road 1 0.4 17 3.2 4 0.5 2 0.1 4.1
Others 1 0.1 1 0.1 1 0.1 0.4
Sandown 1 0.1 2 0.2 0.4
Sandown Town Centre 2 0.2 0.2
Morrisons, Newport Road
Aldi, Spithead Bus Park
Lake Industrial Estate, Lake Industrial Way 1 0.1 0.1
Spithead Business Centre, Newport RoadOthers
Shanklin 4 0.7 26 3.3 15 1.0 5.1
Shanklin Town Centre 4 0.7 25 3.1 15 1.0 4.9
Lidl, Landguard Manor Road 1 0.2 0.2
Ventnor 1 0.1 7 0.5 0.7
Ventnor Town Centre 1 0.1 7 0.5 0.7
Freshwater 12 0.7 0.7
Freshwater Town Centre 9 0.5 0.5
Honnor & Jeffrey Afton Garden Centre, Afton Road 3 0.2 0.2
Other on the Isle of Wight 4 0.2 0.2
OUTSIDE SURVEY AREA 5 1.6 4 0.8 5 0.6 11 0.8 2 0.1 3.8
Southampton 4 1.3 1 0.1 3 0.4 9 0.6 2 0.1 2.5
Portsmouth 3 0.5 0.5
Central LondonOther 1 0.3 1 0.1 2 0.2 2 0.1 0.8
Total 100 28.7 100 19.0 100 12.7 100 7.0 100 6.1 73.6
Notes:
Market share figures derived from Question 12, Isle of Wight Household Shoppers Survey undertaken by NEMS in January 2018
Excludes responses Special Forms of Trading, 'Don't do this, 'Don't know / varies', and 'Other'
Figures may not add due to rounding
2016 Prices
Zone
1 2 3 4 5
IoW Retail Study - Statistical Tables - March 2018
23/03/2018
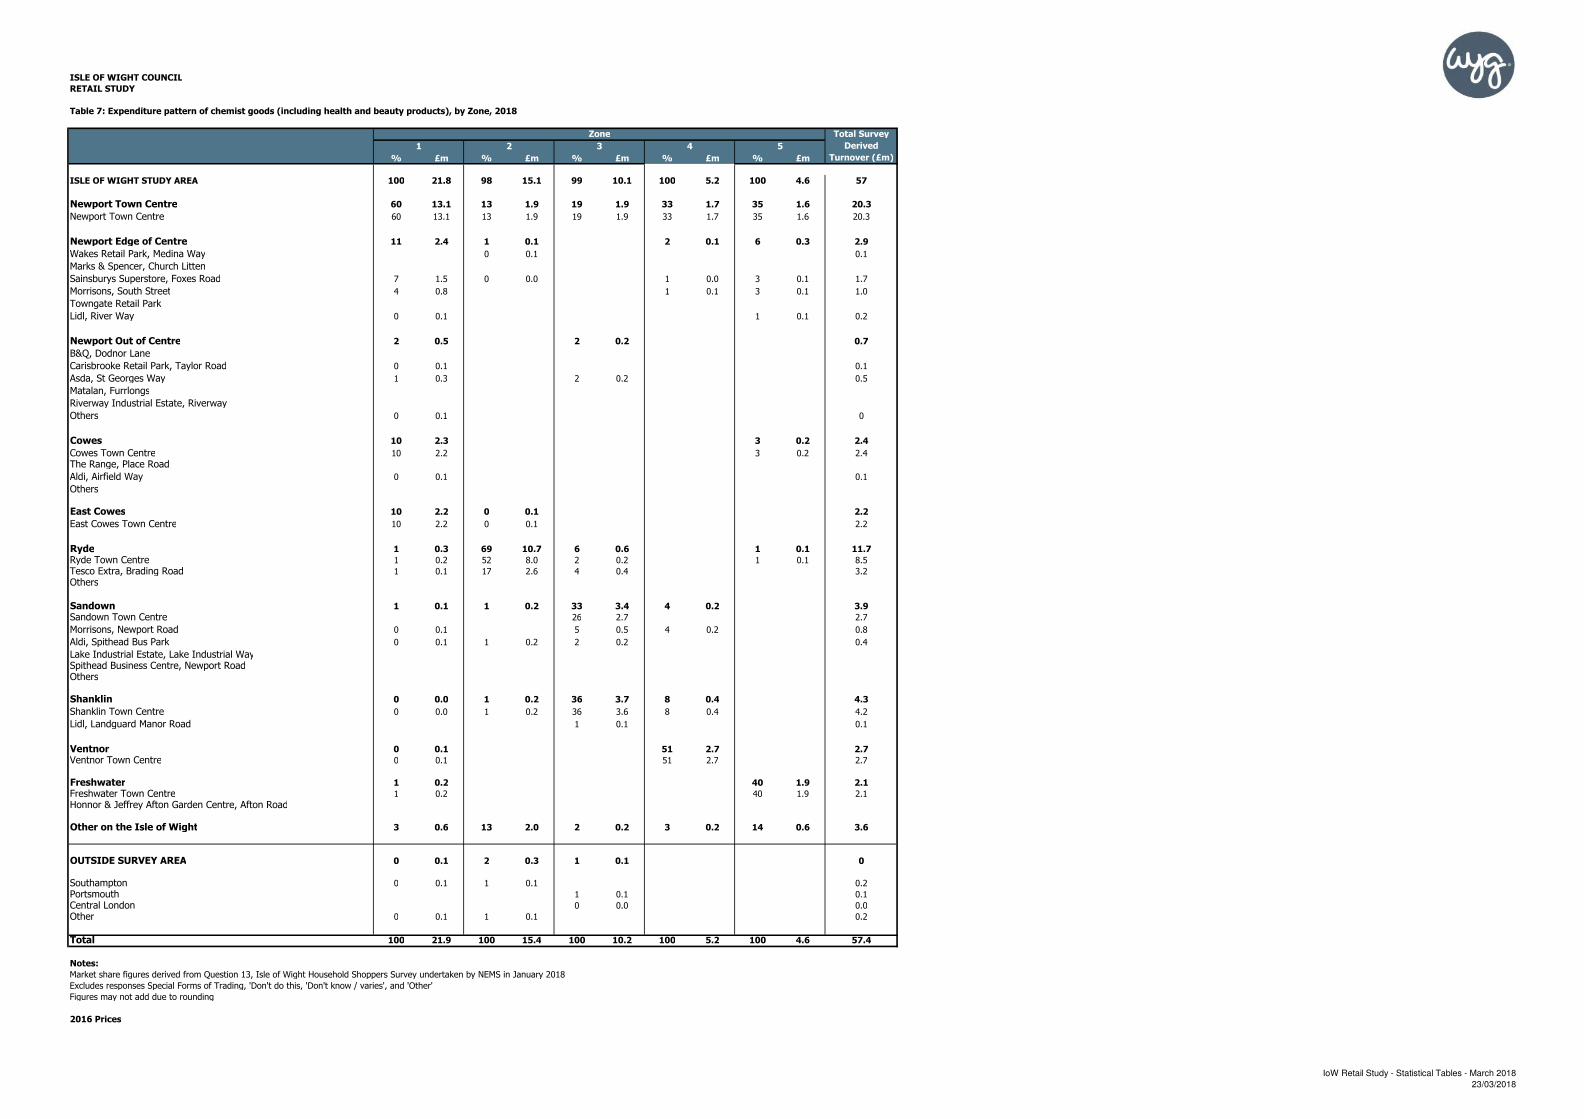
ISLE OF WIGHT COUNCIL
RETAIL STUDY
Table 7: Expenditure pattern of chemist goods (including health and beauty products), by Zone, 2018
Total Survey
Derived
% £m % £m % £m % £m % £m Turnover (£m)
ISLE OF WIGHT STUDY AREA 100 21.8 98 15.1 99 10.1 100 5.2 100 4.6 57
Newport Town Centre 60 13.1 13 1.9 19 1.9 33 1.7 35 1.6 20.3
Newport Town Centre 60 13.1 13 1.9 19 1.9 33 1.7 35 1.6 20.3
Newport Edge of Centre 11 2.4 1 0.1 2 0.1 6 0.3 2.9
Wakes Retail Park, Medina Way 0 0.1 0.1
Marks & Spencer, Church Litten
Sainsburys Superstore, Foxes Road 7 1.5 0 0.0 1 0.0 3 0.1 1.7
Morrisons, South Street 4 0.8 1 0.1 3 0.1 1.0
Towngate Retail Park
Lidl, River Way 0 0.1 1 0.1 0.2
Newport Out of Centre 2 0.5 2 0.2 0.7
B&Q, Dodnor Lane
Carisbrooke Retail Park, Taylor Road 0 0.1 0.1
Asda, St Georges Way 1 0.3 2 0.2 0.5
Matalan, Furrlongs
Riverway Industrial Estate, Riverway
Others 0 0.1 0
Cowes 10 2.3 3 0.2 2.4
Cowes Town Centre 10 2.2 3 0.2 2.4
The Range, Place Road
Aldi, Airfield Way 0 0.1 0.1
Others
East Cowes 10 2.2 0 0.1 2.2
East Cowes Town Centre 10 2.2 0 0.1 2.2
Ryde 1 0.3 69 10.7 6 0.6 1 0.1 11.7
Ryde Town Centre 1 0.2 52 8.0 2 0.2 1 0.1 8.5
Tesco Extra, Brading Road 1 0.1 17 2.6 4 0.4 3.2
Others
Sandown 1 0.1 1 0.2 33 3.4 4 0.2 3.9
Sandown Town Centre 26 2.7 2.7
Morrisons, Newport Road 0 0.1 5 0.5 4 0.2 0.8
Aldi, Spithead Bus Park 0 0.1 1 0.2 2 0.2 0.4
Lake Industrial Estate, Lake Industrial WaySpithead Business Centre, Newport RoadOthers
Shanklin 0 0.0 1 0.2 36 3.7 8 0.4 4.3
Shanklin Town Centre 0 0.0 1 0.2 36 3.6 8 0.4 4.2
Lidl, Landguard Manor Road 1 0.1 0.1
Ventnor 0 0.1 51 2.7 2.7
Ventnor Town Centre 0 0.1 51 2.7 2.7
Freshwater 1 0.2 40 1.9 2.1
Freshwater Town Centre 1 0.2 40 1.9 2.1
Honnor & Jeffrey Afton Garden Centre, Afton Road
Other on the Isle of Wight 3 0.6 13 2.0 2 0.2 3 0.2 14 0.6 3.6
OUTSIDE SURVEY AREA 0 0.1 2 0.3 1 0.1 0
Southampton 0 0.1 1 0.1 0.2
Portsmouth 1 0.1 0.1
Central London 0 0.0 0.0
Other 0 0.1 1 0.1 0.2
Total 100 21.9 100 15.4 100 10.2 100 5.2 100 4.6 57.4
Notes:
Market share figures derived from Question 13, Isle of Wight Household Shoppers Survey undertaken by NEMS in January 2018
Excludes responses Special Forms of Trading, 'Don't do this, 'Don't know / varies', and 'Other'
Figures may not add due to rounding
2016 Prices
Zone
1 2 3 4 5
IoW Retail Study - Statistical Tables - March 2018
23/03/2018
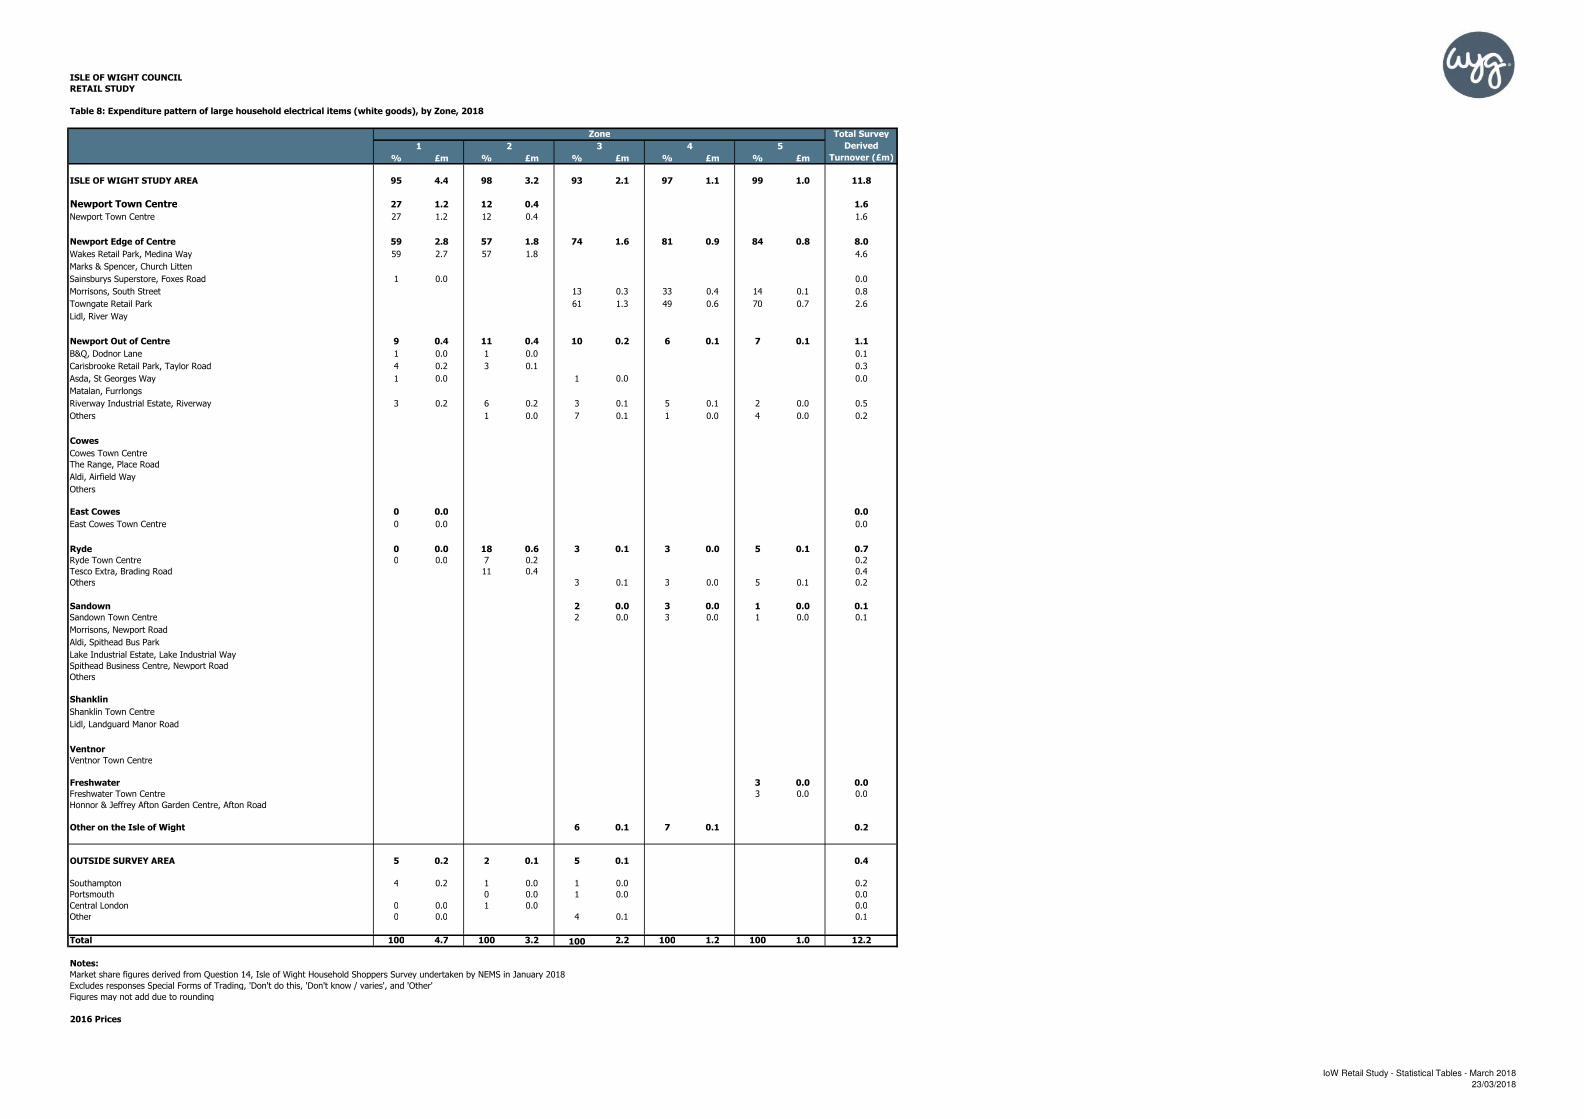
ISLE OF WIGHT COUNCIL
RETAIL STUDY
Table 8: Expenditure pattern of large household electrical items (white goods), by Zone, 2018
Total Survey
Derived
% £m % £m % £m % £m % £m Turnover (£m)
ISLE OF WIGHT STUDY AREA 95 4.4 98 3.2 93 2.1 97 1.1 99 1.0 11.8
Newport Town Centre 27 1.2 12 0.4 1.6
Newport Town Centre 27 1.2 12 0.4 1.6
Newport Edge of Centre 59 2.8 57 1.8 74 1.6 81 0.9 84 0.8 8.0
Wakes Retail Park, Medina Way 59 2.7 57 1.8 4.6
Marks & Spencer, Church Litten
Sainsburys Superstore, Foxes Road 1 0.0 0.0
Morrisons, South Street 13 0.3 33 0.4 14 0.1 0.8
Towngate Retail Park 61 1.3 49 0.6 70 0.7 2.6
Lidl, River Way
Newport Out of Centre 9 0.4 11 0.4 10 0.2 6 0.1 7 0.1 1.1
B&Q, Dodnor Lane 1 0.0 1 0.0 0.1
Carisbrooke Retail Park, Taylor Road 4 0.2 3 0.1 0.3
Asda, St Georges Way 1 0.0 1 0.0 0.0
Matalan, Furrlongs
Riverway Industrial Estate, Riverway 3 0.2 6 0.2 3 0.1 5 0.1 2 0.0 0.5
Others 1 0.0 7 0.1 1 0.0 4 0.0 0.2
Cowes
Cowes Town Centre
The Range, Place Road
Aldi, Airfield Way
Others
East Cowes 0 0.0 0.0
East Cowes Town Centre 0 0.0 0.0
Ryde 0 0.0 18 0.6 3 0.1 3 0.0 5 0.1 0.7
Ryde Town Centre 0 0.0 7 0.2 0.2
Tesco Extra, Brading Road 11 0.4 0.4
Others 3 0.1 3 0.0 5 0.1 0.2
Sandown 2 0.0 3 0.0 1 0.0 0.1
Sandown Town Centre 2 0.0 3 0.0 1 0.0 0.1
Morrisons, Newport Road
Aldi, Spithead Bus Park
Lake Industrial Estate, Lake Industrial Way
Spithead Business Centre, Newport Road
Others
Shanklin
Shanklin Town Centre
Lidl, Landguard Manor Road
Ventnor
Ventnor Town Centre
Freshwater 3 0.0 0.0
Freshwater Town Centre 3 0.0 0.0
Honnor & Jeffrey Afton Garden Centre, Afton Road
Other on the Isle of Wight 6 0.1 7 0.1 0.2
OUTSIDE SURVEY AREA 5 0.2 2 0.1 5 0.1 0.4
Southampton 4 0.2 1 0.0 1 0.0 0.2
Portsmouth 0 0.0 1 0.0 0.0
Central London 0 0.0 1 0.0 0.0
Other 0 0.0 4 0.1 0.1
Total 100 4.7 100 3.2 100 2.2 100 1.2 100 1.0 12.2
Notes:
Market share figures derived from Question 14, Isle of Wight Household Shoppers Survey undertaken by NEMS in January 2018
Excludes responses Special Forms of Trading, 'Don't do this, 'Don't know / varies', and 'Other'
Figures may not add due to rounding
2016 Prices
Zone
1 2 3 4 5
IoW Retail Study - Statistical Tables - March 2018
23/03/2018

ISLE OF WIGHT COUNCIL
RETAIL STUDY
Table 9: Expenditure pattern of small electrical goods (cameras, tablets, hairdryers, blenders), by Zone, 2018
Total Survey
Derived
% £m % £m % £m % £m % £m Turnover (£m)
ISLE OF WIGHT STUDY AREA 95 15.1 98 11.1 96 7.1 99 3.9 100 3.6 40.8
Newport Town Centre 32 5.1 14 1.5 16 1.2 30 1.2 18 0.6 9.7
Newport Town Centre 32 5.1 14 1.5 16 1.2 30 1.2 18 0.6 9.7
Newport Edge of Centre 44 7.1 42 4.7 46 3.4 43 1.7 55 2.0 18.8
Wakes Retail Park, Medina Way 35 5.6 40 4.6 41 3.1 40 1.6 44 1.6 16.4
Marks & Spencer, Church Litten
Sainsburys Superstore, Foxes Road 8 1.3 0 0.1 3 0.2 2 0.1 4 0.1 1.8
Morrisons, South Street 1 0.2 1 0.1 1 0.1 5 0.2 0.5
Towngate Retail Park
Lidl, River Way 0 0.0 0 0.1 1 0.0 3 0.1 0.2
Newport Out of Centre 14 2.3 5 0.6 10 0.7 6 0.2 7 0.2 4.1
B&Q, Dodnor Lane 0 0.1 1 0.0 0.1
Carisbrooke Retail Park, Taylor Road 11 1.8 3 0.3 8 0.6 4 0.1 6 0.2 3.1
Asda, St Georges Way 3 0.4 0 0.1 1 0.1 1 0.0 0.6
Matalan, Furrlongs
Riverway Industrial Estate, Riverway 1 0.2 1 0.1 1 0.0 0.3
Others
Cowes 3 0.5 0 0.1 2 0.1 0.6
Cowes Town Centre 3 0.5 0 0.1 0.5
The Range, Place Road 0 0.1 0.1
Aldi, Airfield Way 2 0.1 0.1
Others
East Cowes
East Cowes Town Centre
Ryde 1 0.1 36 4.1 10 0.7 12 0.5 5.4
Ryde Town Centre 12 1.3 2 0.1 2 0.1 1.6
Tesco Extra, Brading Road 1 0.1 25 2.8 8 0.6 9 0.4 3.9
Others
Sandown 3 0.2 0.2
Sandown Town Centre 1 0.0 0.0
Morrisons, Newport Road
Aldi, Spithead Bus Park 2 0.2 0.2
Lake Industrial Estate, Lake Industrial Way
Spithead Business Centre, Newport Road
Others
Shanklin 12 0.9 1 0.1 0.9
Shanklin Town Centre 11 0.8 1 0.1 0.9
Lidl, Landguard Manor Road 1 0.0 0.0
Ventnor 7 0.3 0.3
Ventnor Town Centre 7 0.3 0.3
Freshwater 18 0.7 0.7
Freshwater Town Centre 18 0.7 0.7
Honnor & Jeffrey Afton Garden Centre, Afton Road
Other on the Isle of Wight
OUTSIDE SURVEY AREA 5 0.9 2 0.2 4 0.3 1 0.1 1.5
Southampton 5 0.8 1 0.1 2 0.1 1 0.1 1.1
Portsmouth
Central London 0 0.0 1 0.1 1 0.0 0.2
Other 0 0.1 0 0.1 1 0.1 0.2
Total 100 16.0 100 11.3 100 7.4 100 4.0 100 3.6 42.2
Notes:
Market share figures derived from Question 15, Isle of Wight Household Shoppers Survey undertaken by NEMS in January 2018
Excludes responses Special Forms of Trading, 'Don't do this, 'Don't know / varies', and 'Other'
Figures may not add due to rounding
2016 Prices
Zone
1 2 3 4 5
IoW Retail Study - Statistical Tables - March 2018
23/03/2018

ISLE OF WIGHT COUNCIL
RETAIL STUDY
Table 10: Expenditure pattern of furniture, carpets and floor coverings, by Zone, 2018
Total Survey
Derived
% £m % £m % £m % £m % £m Turnover (£m)
ISLE OF WIGHT STUDY AREA 87 10.4 82 6.9 88 4.7 95 2.6 95 2.3 27.0
Newport Town Centre 43 5.2 18 1.6 15 0.8 55 1.5 26 0.6 9.7
Newport Town Centre 43 5.2 18 1.6 15 0.8 55 1.5 26 0.6 9.7
Newport Edge of Centre 6 0.7 5 0.4 6 0.3 2 0.0 9 0.2 1.7
Wakes Retail Park, Medina Way 5 0.6 4 0.3 4 0.2 2 0.0 7 0.2 1.4
Marks & Spencer, Church Litten 1 0.1 1 0.1 1 0.1 2 0.0 0.3
Sainsburys Superstore, Foxes Road
Morrisons, South Street
Towngate Retail Park
Lidl, River Way
Newport Out of Centre 25 3.0 15 1.3 23 1.2 17 0.5 22 0.5 6.5
B&Q, Dodnor Lane 5 0.6 2 0.2 3 0.1 6 0.2 5 0.1 1.2
Carisbrooke Retail Park, Taylor Road 15 1.8 12 1.0 15 0.8 7 0.2 12 0.3 4.1
Asda, St Georges Way
Matalan, Furrlongs
Riverway Industrial Estate, Riverway 5 0.6 1 0.1 4 0.2 4 0.1 5 0.1 1.1
Others 0 0.0 2 0.1 0.1
Cowes 3 0.4 0.4
Cowes Town Centre 3 0.3 0.3
The Range, Place Road 0 0.0 0.0
Aldi, Airfield Way
Others
East Cowes
East Cowes Town Centre
Ryde 3 0.3 31 2.6 6 0.3 4 0.1 3 0.1 3.5
Ryde Town Centre 3 0.3 31 2.6 6 0.3 4 0.1 3 0.1 3.5
Tesco Extra, Brading RoadOthers
Sandown 2 0.3 7 0.6 18 1.0 6 0.2 2.1
Sandown Town Centre 0 0.0 4 0.3 11 0.6 6 0.2 1.1
Morrisons, Newport Road
Aldi, Spithead Bus Park 0 0.1 0.1
Lake Industrial Estate, Lake Industrial Way 1 0.2 1 0.1 5 0.3 0.6
Spithead Business Centre, Newport Road 0 0.0 2 0.2 2 0.1 0.3
Others
Shanklin 2 0.2 16 0.8 7 0.2 1.2
Shanklin Town Centre 2 0.2 16 0.8 7 0.2 1.2
Lidl, Landguard Manor Road
Ventnor 0 0.0 0.0
Ventnor Town Centre 0 0.0 0.0
Freshwater 3 0.3 36 0.9 1.2
Freshwater Town Centre 2 0.2 36 0.9 1.1
Honnor & Jeffrey Afton Garden Centre, Afton Road 1 0.1 0.1
Other on the Isle of Wight 1 0.1 4 0.3 4 0.2 4 0.1 0.7
OUTSIDE SURVEY AREA 13 1.5 18 1.5 12 0.6 5 0.1 5 0.1 3.9
Southampton 10 1.2 13 1.1 10 0.5 3 0.1 2.9
Portsmouth 1 0.1 1 0.0 0.1
Central London 1 0.1 3 0.3 0.3
Other 1 0.1 1 0.1 2 0.1 5 0.1 2 0.0 0.5
Total 100 11.9 100 8.4 100 5.3 100 2.8 100 2.4 30.9
Notes:
Market share figures derived from Question 16, Isle of Wight Household Shoppers Survey undertaken by NEMS in January 2018
Excludes responses Special Forms of Trading, 'Don't do this, 'Don't know / varies', and 'Other'
Figures may not add due to rounding
2016 Prices
Zone
1 2 3 4 5
IoW Retail Study - Statistical Tables - March 2018
23/03/2018
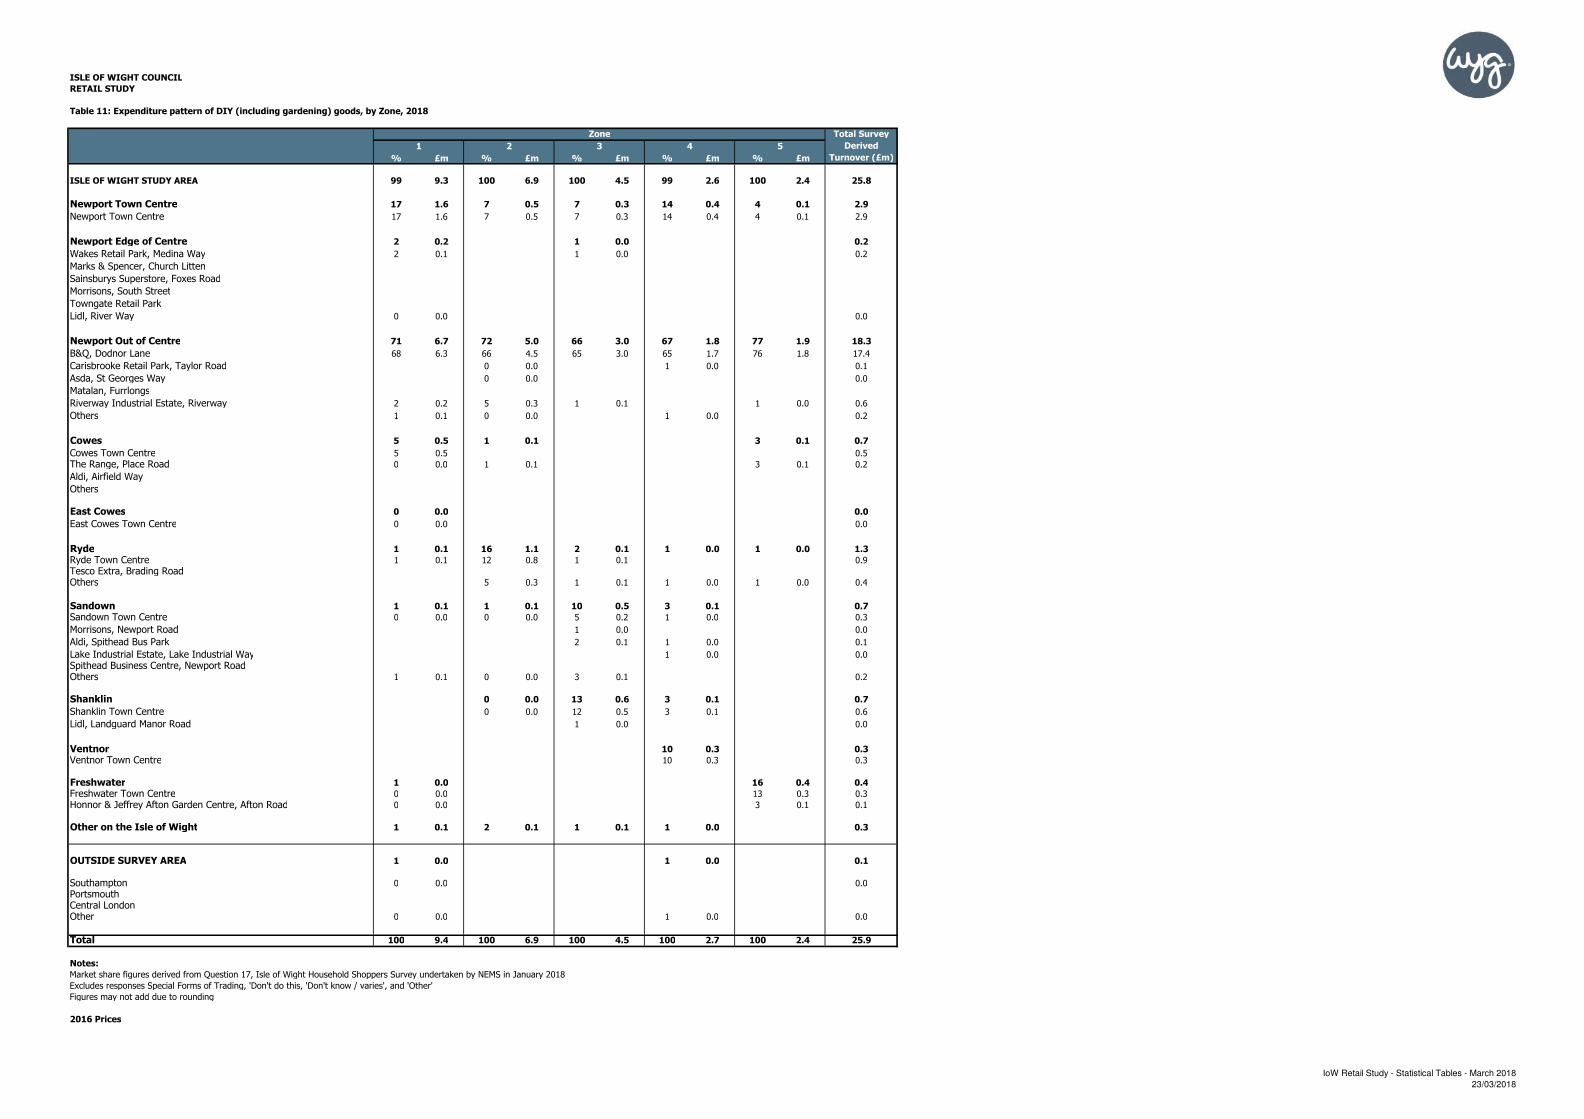
ISLE OF WIGHT COUNCIL
RETAIL STUDY
Table 11: Expenditure pattern of DIY (including gardening) goods, by Zone, 2018
Total Survey
Derived
% £m % £m % £m % £m % £m Turnover (£m)
ISLE OF WIGHT STUDY AREA 99 9.3 100 6.9 100 4.5 99 2.6 100 2.4 25.8
Newport Town Centre 17 1.6 7 0.5 7 0.3 14 0.4 4 0.1 2.9
Newport Town Centre 17 1.6 7 0.5 7 0.3 14 0.4 4 0.1 2.9
Newport Edge of Centre 2 0.2 1 0.0 0.2
Wakes Retail Park, Medina Way 2 0.1 1 0.0 0.2
Marks & Spencer, Church Litten
Sainsburys Superstore, Foxes Road
Morrisons, South Street
Towngate Retail Park
Lidl, River Way 0 0.0 0.0
Newport Out of Centre 71 6.7 72 5.0 66 3.0 67 1.8 77 1.9 18.3
B&Q, Dodnor Lane 68 6.3 66 4.5 65 3.0 65 1.7 76 1.8 17.4
Carisbrooke Retail Park, Taylor Road 0 0.0 1 0.0 0.1
Asda, St Georges Way 0 0.0 0.0
Matalan, Furrlongs
Riverway Industrial Estate, Riverway 2 0.2 5 0.3 1 0.1 1 0.0 0.6
Others 1 0.1 0 0.0 1 0.0 0.2
Cowes 5 0.5 1 0.1 3 0.1 0.7
Cowes Town Centre 5 0.5 0.5
The Range, Place Road 0 0.0 1 0.1 3 0.1 0.2
Aldi, Airfield Way
Others
East Cowes 0 0.0 0.0
East Cowes Town Centre 0 0.0 0.0
Ryde 1 0.1 16 1.1 2 0.1 1 0.0 1 0.0 1.3
Ryde Town Centre 1 0.1 12 0.8 1 0.1 0.9
Tesco Extra, Brading RoadOthers 5 0.3 1 0.1 1 0.0 1 0.0 0.4
Sandown 1 0.1 1 0.1 10 0.5 3 0.1 0.7
Sandown Town Centre 0 0.0 0 0.0 5 0.2 1 0.0 0.3
Morrisons, Newport Road 1 0.0 0.0
Aldi, Spithead Bus Park 2 0.1 1 0.0 0.1
Lake Industrial Estate, Lake Industrial Way 1 0.0 0.0
Spithead Business Centre, Newport RoadOthers 1 0.1 0 0.0 3 0.1 0.2
Shanklin 0 0.0 13 0.6 3 0.1 0.7
Shanklin Town Centre 0 0.0 12 0.5 3 0.1 0.6
Lidl, Landguard Manor Road 1 0.0 0.0
Ventnor 10 0.3 0.3
Ventnor Town Centre 10 0.3 0.3
Freshwater 1 0.0 16 0.4 0.4
Freshwater Town Centre 0 0.0 13 0.3 0.3
Honnor & Jeffrey Afton Garden Centre, Afton Road 0 0.0 3 0.1 0.1
Other on the Isle of Wight 1 0.1 2 0.1 1 0.1 1 0.0 0.3
OUTSIDE SURVEY AREA 1 0.0 1 0.0 0.1
Southampton 0 0.0 0.0
PortsmouthCentral LondonOther 0 0.0 1 0.0 0.0
Total 100 9.4 100 6.9 100 4.5 100 2.7 100 2.4 25.9
Notes:
Market share figures derived from Question 17, Isle of Wight Household Shoppers Survey undertaken by NEMS in January 2018
Excludes responses Special Forms of Trading, 'Don't do this, 'Don't know / varies', and 'Other'
Figures may not add due to rounding
2016 Prices
Zone
1 2 3 4 5
IoW Retail Study - Statistical Tables - March 2018
23/03/2018
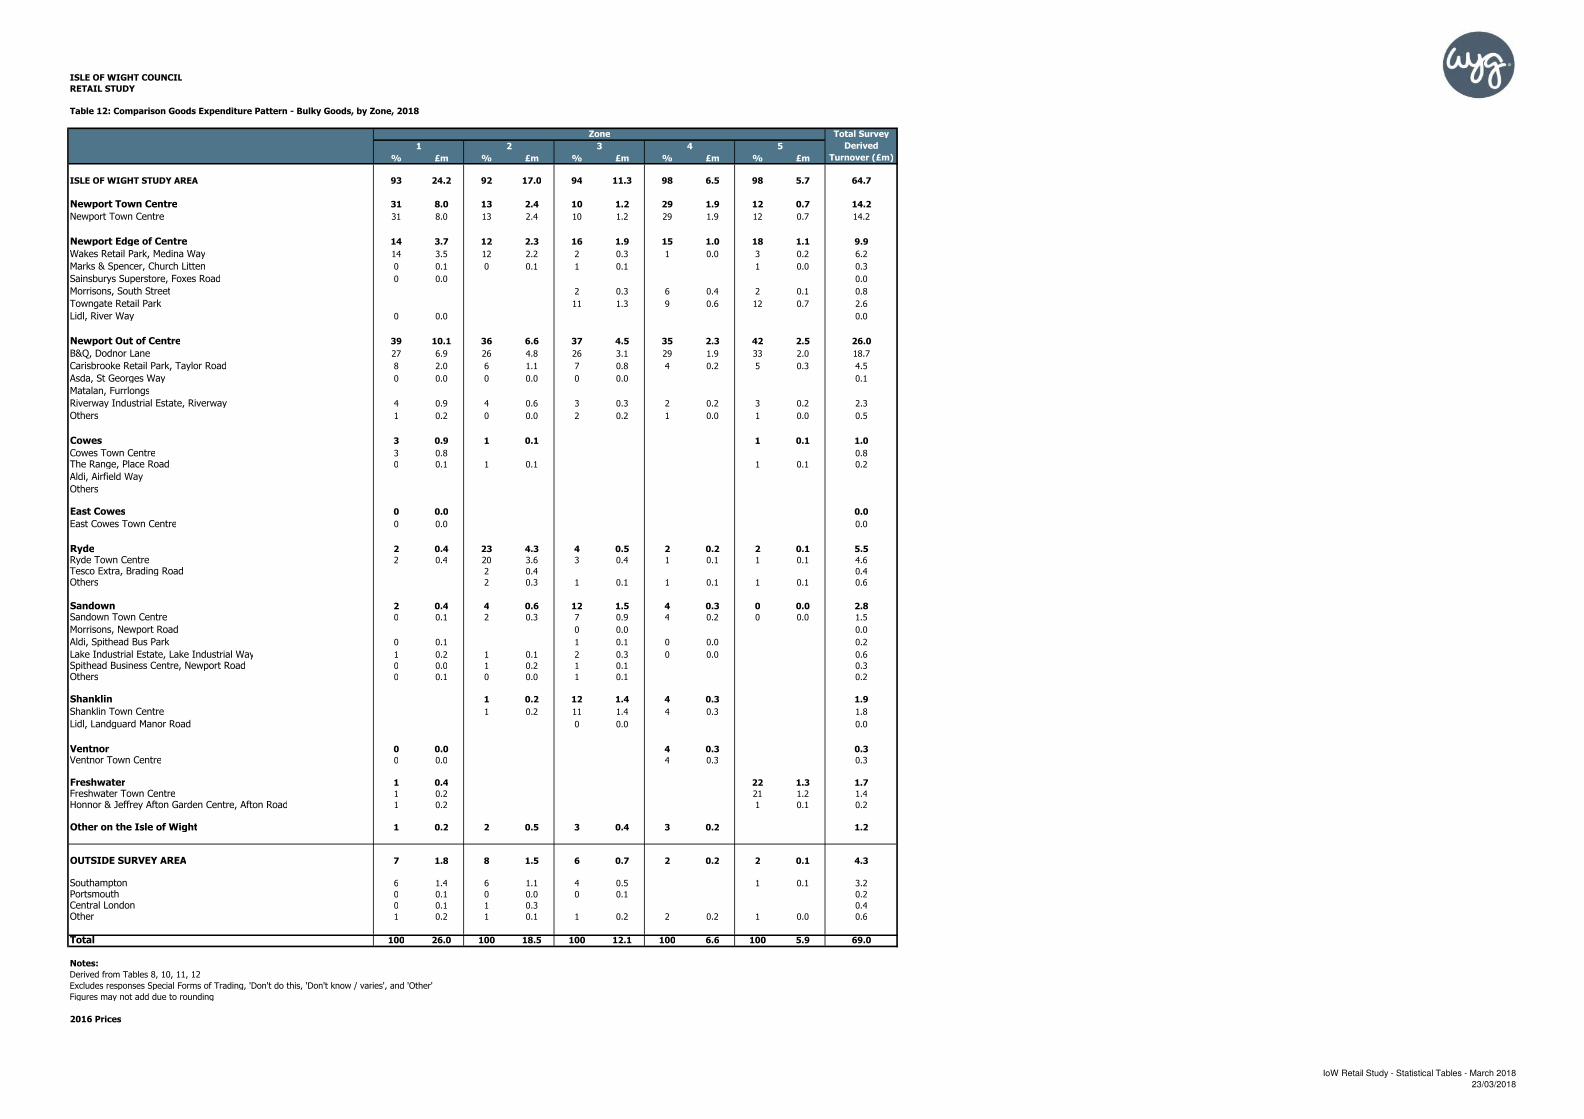
ISLE OF WIGHT COUNCIL
RETAIL STUDY
Table 12: Comparison Goods Expenditure Pattern - Bulky Goods, by Zone, 2018
Total Survey
Derived
% £m % £m % £m % £m % £m Turnover (£m)
ISLE OF WIGHT STUDY AREA 93 24.2 92 17.0 94 11.3 98 6.5 98 5.7 64.7
Newport Town Centre 31 8.0 13 2.4 10 1.2 29 1.9 12 0.7 14.2
Newport Town Centre 31 8.0 13 2.4 10 1.2 29 1.9 12 0.7 14.2
Newport Edge of Centre 14 3.7 12 2.3 16 1.9 15 1.0 18 1.1 9.9
Wakes Retail Park, Medina Way 14 3.5 12 2.2 2 0.3 1 0.0 3 0.2 6.2
Marks & Spencer, Church Litten 0 0.1 0 0.1 1 0.1 1 0.0 0.3
Sainsburys Superstore, Foxes Road 0 0.0 0.0
Morrisons, South Street 2 0.3 6 0.4 2 0.1 0.8
Towngate Retail Park 11 1.3 9 0.6 12 0.7 2.6
Lidl, River Way 0 0.0 0.0
Newport Out of Centre 39 10.1 36 6.6 37 4.5 35 2.3 42 2.5 26.0
B&Q, Dodnor Lane 27 6.9 26 4.8 26 3.1 29 1.9 33 2.0 18.7
Carisbrooke Retail Park, Taylor Road 8 2.0 6 1.1 7 0.8 4 0.2 5 0.3 4.5
Asda, St Georges Way 0 0.0 0 0.0 0 0.0 0.1
Matalan, Furrlongs
Riverway Industrial Estate, Riverway 4 0.9 4 0.6 3 0.3 2 0.2 3 0.2 2.3
Others 1 0.2 0 0.0 2 0.2 1 0.0 1 0.0 0.5
Cowes 3 0.9 1 0.1 1 0.1 1.0
Cowes Town Centre 3 0.8 0.8
The Range, Place Road 0 0.1 1 0.1 1 0.1 0.2
Aldi, Airfield Way
Others
East Cowes 0 0.0 0.0
East Cowes Town Centre 0 0.0 0.0
Ryde 2 0.4 23 4.3 4 0.5 2 0.2 2 0.1 5.5
Ryde Town Centre 2 0.4 20 3.6 3 0.4 1 0.1 1 0.1 4.6
Tesco Extra, Brading Road 2 0.4 0.4
Others 2 0.3 1 0.1 1 0.1 1 0.1 0.6
Sandown 2 0.4 4 0.6 12 1.5 4 0.3 0 0.0 2.8
Sandown Town Centre 0 0.1 2 0.3 7 0.9 4 0.2 0 0.0 1.5
Morrisons, Newport Road 0 0.0 0.0
Aldi, Spithead Bus Park 0 0.1 1 0.1 0 0.0 0.2
Lake Industrial Estate, Lake Industrial Way 1 0.2 1 0.1 2 0.3 0 0.0 0.6
Spithead Business Centre, Newport Road 0 0.0 1 0.2 1 0.1 0.3
Others 0 0.1 0 0.0 1 0.1 0.2
Shanklin 1 0.2 12 1.4 4 0.3 1.9
Shanklin Town Centre 1 0.2 11 1.4 4 0.3 1.8
Lidl, Landguard Manor Road 0 0.0 0.0
Ventnor 0 0.0 4 0.3 0.3
Ventnor Town Centre 0 0.0 4 0.3 0.3
Freshwater 1 0.4 22 1.3 1.7
Freshwater Town Centre 1 0.2 21 1.2 1.4
Honnor & Jeffrey Afton Garden Centre, Afton Road 1 0.2 1 0.1 0.2
Other on the Isle of Wight 1 0.2 2 0.5 3 0.4 3 0.2 1.2
OUTSIDE SURVEY AREA 7 1.8 8 1.5 6 0.7 2 0.2 2 0.1 4.3
Southampton 6 1.4 6 1.1 4 0.5 1 0.1 3.2
Portsmouth 0 0.1 0 0.0 0 0.1 0.2
Central London 0 0.1 1 0.3 0.4
Other 1 0.2 1 0.1 1 0.2 2 0.2 1 0.0 0.6
Total 100 26.0 100 18.5 100 12.1 100 6.6 100 5.9 69.0
Notes:
Derived from Tables 8, 10, 11, 12
Excludes responses Special Forms of Trading, 'Don't do this, 'Don't know / varies', and 'Other'
Figures may not add due to rounding
2016 Prices
Zone
1 2 3 4 5
IoW Retail Study - Statistical Tables - March 2018
23/03/2018
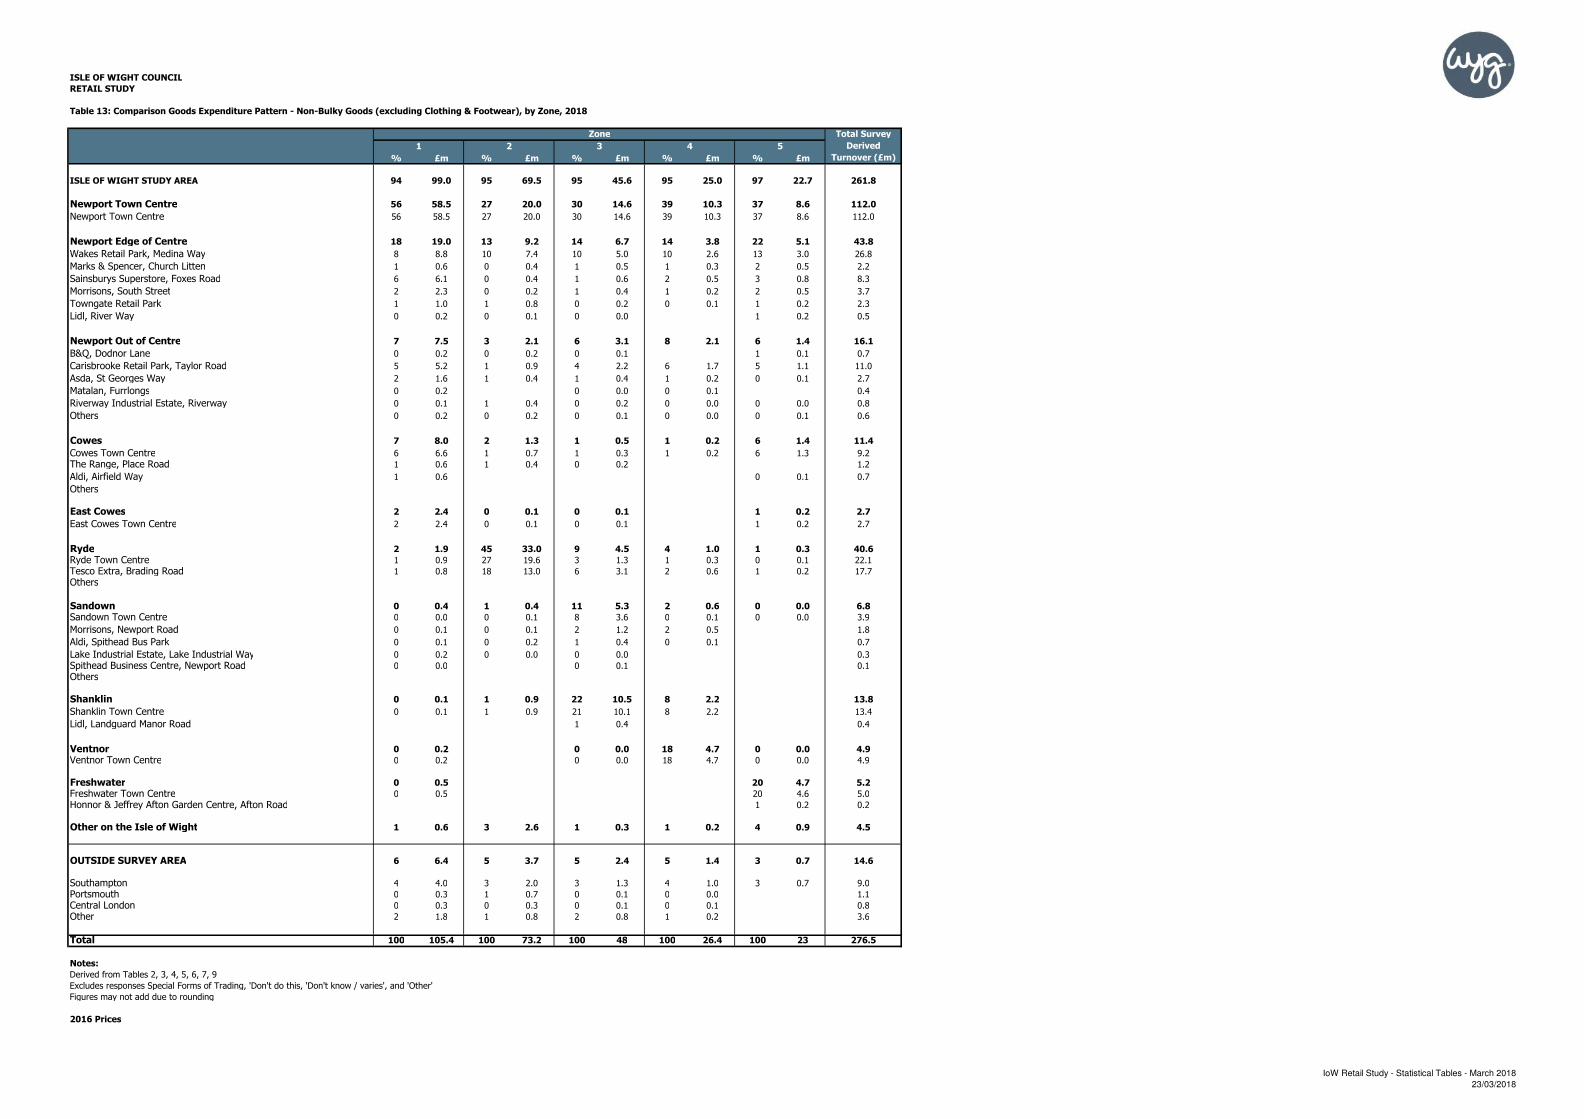
ISLE OF WIGHT COUNCIL
RETAIL STUDY
Table 13: Comparison Goods Expenditure Pattern - Non-Bulky Goods (excluding Clothing & Footwear), by Zone, 2018
Total Survey
Derived
% £m % £m % £m % £m % £m Turnover (£m)
ISLE OF WIGHT STUDY AREA 94 99.0 95 69.5 95 45.6 95 25.0 97 22.7 261.8
94
Newport Town Centre 56 58.5 27 20.0 30 14.6 39 10.3 37 8.6 112.0
Newport Town Centre 56 58.5 27 20.0 30 14.6 39 10.3 37 8.6 112.0
Newport Edge of Centre 18 19.0 13 9.2 14 6.7 14 3.8 22 5.1 43.8
Wakes Retail Park, Medina Way 8 8.8 10 7.4 10 5.0 10 2.6 13 3.0 26.8
Marks & Spencer, Church Litten 1 0.6 0 0.4 1 0.5 1 0.3 2 0.5 2.2
Sainsburys Superstore, Foxes Road 6 6.1 0 0.4 1 0.6 2 0.5 3 0.8 8.3
Morrisons, South Street 2 2.3 0 0.2 1 0.4 1 0.2 2 0.5 3.7
Towngate Retail Park 1 1.0 1 0.8 0 0.2 0 0.1 1 0.2 2.3
Lidl, River Way 0 0.2 0 0.1 0 0.0 1 0.2 0.5
Newport Out of Centre 7 7.5 3 2.1 6 3.1 8 2.1 6 1.4 16.1
B&Q, Dodnor Lane 0 0.2 0 0.2 0 0.1 1 0.1 0.7
Carisbrooke Retail Park, Taylor Road 5 5.2 1 0.9 4 2.2 6 1.7 5 1.1 11.0
Asda, St Georges Way 2 1.6 1 0.4 1 0.4 1 0.2 0 0.1 2.7
Matalan, Furrlongs 0 0.2 0 0.0 0 0.1 0.4
Riverway Industrial Estate, Riverway 0 0.1 1 0.4 0 0.2 0 0.0 0 0.0 0.8
Others 0 0.2 0 0.2 0 0.1 0 0.0 0 0.1 0.6
Cowes 7 8.0 2 1.3 1 0.5 1 0.2 6 1.4 11.4
Cowes Town Centre 6 6.6 1 0.7 1 0.3 1 0.2 6 1.3 9.2
The Range, Place Road 1 0.6 1 0.4 0 0.2 1.2
Aldi, Airfield Way 1 0.6 0 0.1 0.7
Others
East Cowes 2 2.4 0 0.1 0 0.1 1 0.2 2.7
East Cowes Town Centre 2 2.4 0 0.1 0 0.1 1 0.2 2.7
Ryde 2 1.9 45 33.0 9 4.5 4 1.0 1 0.3 40.6
Ryde Town Centre 1 0.9 27 19.6 3 1.3 1 0.3 0 0.1 22.1
Tesco Extra, Brading Road 1 0.8 18 13.0 6 3.1 2 0.6 1 0.2 17.7
Others
Sandown 0 0.4 1 0.4 11 5.3 2 0.6 0 0.0 6.8
Sandown Town Centre 0 0.0 0 0.1 8 3.6 0 0.1 0 0.0 3.9
Morrisons, Newport Road 0 0.1 0 0.1 2 1.2 2 0.5 1.8
Aldi, Spithead Bus Park 0 0.1 0 0.2 1 0.4 0 0.1 0.7
Lake Industrial Estate, Lake Industrial Way 0 0.2 0 0.0 0 0.0 0.3
Spithead Business Centre, Newport Road 0 0.0 0 0.1 0.1
Others
Shanklin 0 0.1 1 0.9 22 10.5 8 2.2 13.8
Shanklin Town Centre 0 0.1 1 0.9 21 10.1 8 2.2 13.4
Lidl, Landguard Manor Road 1 0.4 0.4
Ventnor 0 0.2 0 0.0 18 4.7 0 0.0 4.9
Ventnor Town Centre 0 0.2 0 0.0 18 4.7 0 0.0 4.9
Freshwater 0 0.5 20 4.7 5.2
Freshwater Town Centre 0 0.5 20 4.6 5.0
Honnor & Jeffrey Afton Garden Centre, Afton Road 1 0.2 0.2
Other on the Isle of Wight 1 0.6 3 2.6 1 0.3 1 0.2 4 0.9 4.5
OUTSIDE SURVEY AREA 6 6.4 5 3.7 5 2.4 5 1.4 3 0.7 14.6
Southampton 4 4.0 3 2.0 3 1.3 4 1.0 3 0.7 9.0
Portsmouth 0 0.3 1 0.7 0 0.1 0 0.0 1.1
Central London 0 0.3 0 0.3 0 0.1 0 0.1 0.8
Other 2 1.8 1 0.8 2 0.8 1 0.2 3.6
Total 100 105.4 100 73.2 100 48 100 26.4 100 23 276.5
Notes:
Derived from Tables 2, 3, 4, 5, 6, 7, 9
Excludes responses Special Forms of Trading, 'Don't do this, 'Don't know / varies', and 'Other'
Figures may not add due to rounding
2016 Prices
Zone
1 2 3 54
IoW Retail Study - Statistical Tables - March 2018
23/03/2018
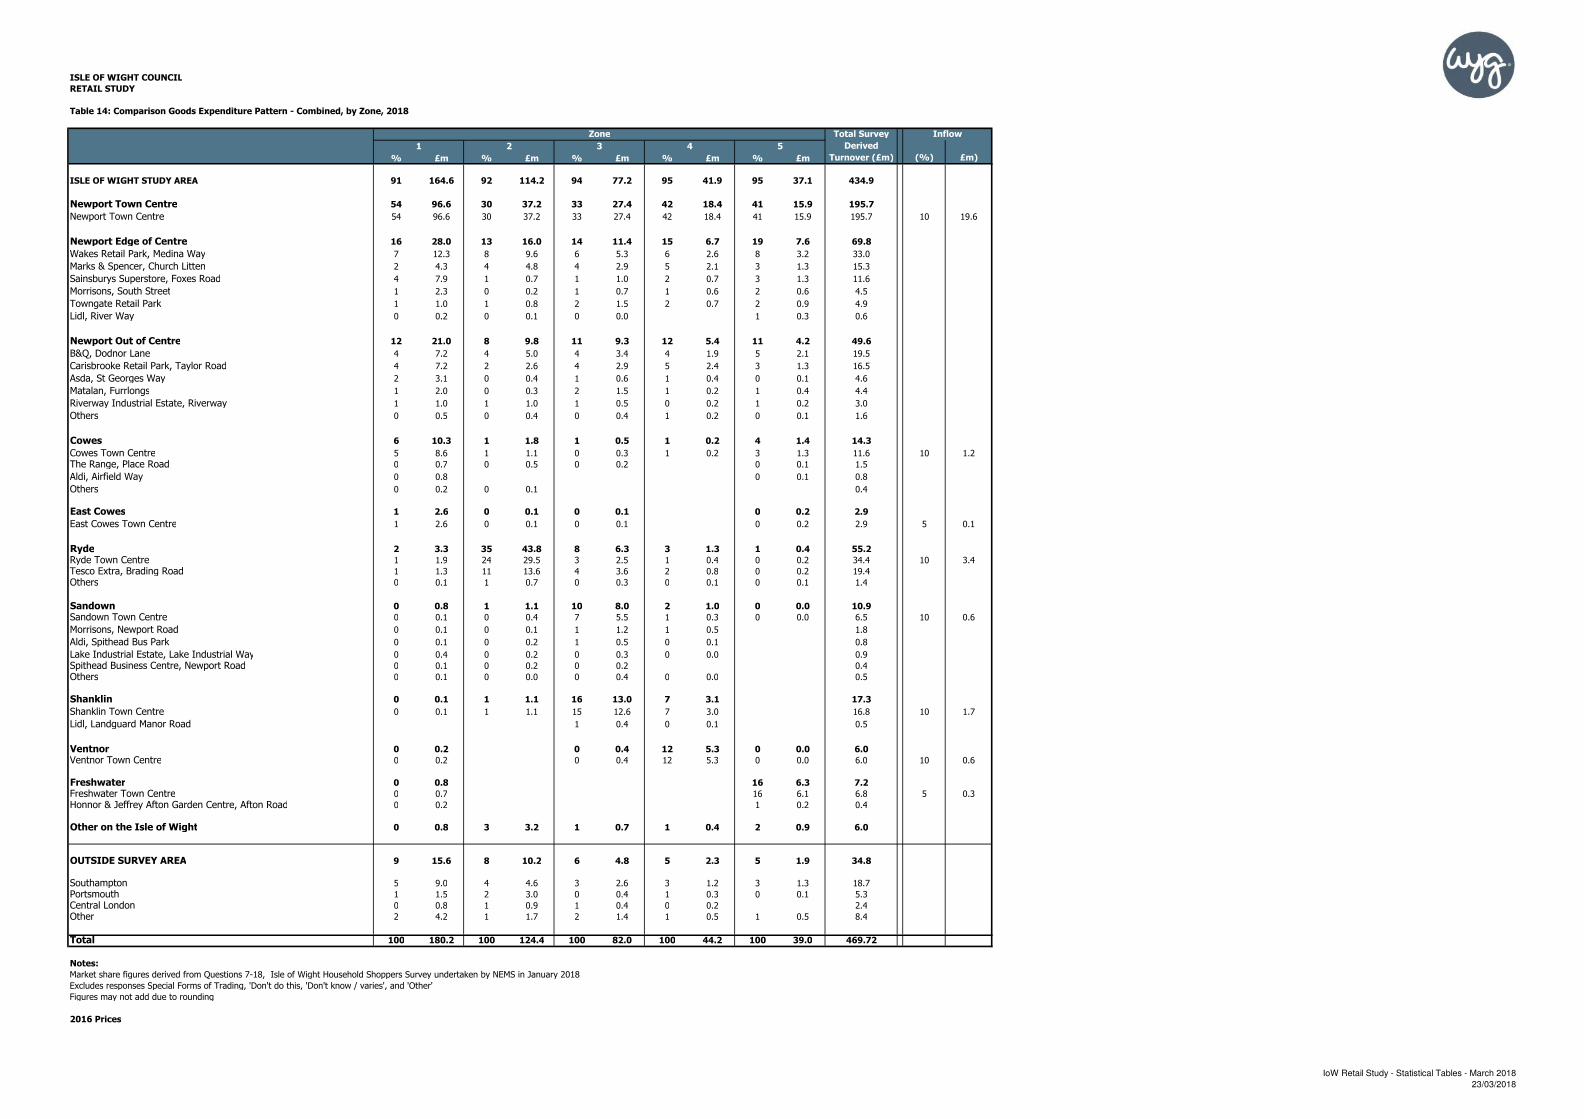
ISLE OF WIGHT COUNCIL
RETAIL STUDY
Table 14: Comparison Goods Expenditure Pattern - Combined, by Zone, 2018
Total Survey
Derived
% £m % £m % £m % £m % £m Turnover (£m) (%) £m)
ISLE OF WIGHT STUDY AREA 91 164.6 92 114.2 94 77.2 95 41.9 95 37.1 434.9
91 95
Newport Town Centre 54 96.6 30 37.2 33 27.4 42 18.4 41 15.9 195.7
Newport Town Centre 54 96.6 30 37.2 33 27.4 42 18.4 41 15.9 195.7 10 19.6
Newport Edge of Centre 16 28.0 13 16.0 14 11.4 15 6.7 19 7.6 69.8
Wakes Retail Park, Medina Way 7 12.3 8 9.6 6 5.3 6 2.6 8 3.2 33.0
Marks & Spencer, Church Litten 2 4.3 4 4.8 4 2.9 5 2.1 3 1.3 15.3
Sainsburys Superstore, Foxes Road 4 7.9 1 0.7 1 1.0 2 0.7 3 1.3 11.6
Morrisons, South Street 1 2.3 0 0.2 1 0.7 1 0.6 2 0.6 4.5
Towngate Retail Park 1 1.0 1 0.8 2 1.5 2 0.7 2 0.9 4.9
Lidl, River Way 0 0.2 0 0.1 0 0.0 1 0.3 0.6
Newport Out of Centre 12 21.0 8 9.8 11 9.3 12 5.4 11 4.2 49.6
B&Q, Dodnor Lane 4 7.2 4 5.0 4 3.4 4 1.9 5 2.1 19.5
Carisbrooke Retail Park, Taylor Road 4 7.2 2 2.6 4 2.9 5 2.4 3 1.3 16.5
Asda, St Georges Way 2 3.1 0 0.4 1 0.6 1 0.4 0 0.1 4.6
Matalan, Furrlongs 1 2.0 0 0.3 2 1.5 1 0.2 1 0.4 4.4
Riverway Industrial Estate, Riverway 1 1.0 1 1.0 1 0.5 0 0.2 1 0.2 3.0
Others 0 0.5 0 0.4 0 0.4 1 0.2 0 0.1 1.6
Cowes 6 10.3 1 1.8 1 0.5 1 0.2 4 1.4 14.3
Cowes Town Centre 5 8.6 1 1.1 0 0.3 1 0.2 3 1.3 11.6 10 1.2
The Range, Place Road 0 0.7 0 0.5 0 0.2 0 0.1 1.5
Aldi, Airfield Way 0 0.8 0 0.1 0.8
Others 0 0.2 0 0.1 0.4
East Cowes 1 2.6 0 0.1 0 0.1 0 0.2 2.9
East Cowes Town Centre 1 2.6 0 0.1 0 0.1 0 0.2 2.9 5 0.1
Ryde 2 3.3 35 43.8 8 6.3 3 1.3 1 0.4 55.2
Ryde Town Centre 1 1.9 24 29.5 3 2.5 1 0.4 0 0.2 34.4 10 3.4
Tesco Extra, Brading Road 1 1.3 11 13.6 4 3.6 2 0.8 0 0.2 19.4
Others 0 0.1 1 0.7 0 0.3 0 0.1 0 0.1 1.4
Sandown 0 0.8 1 1.1 10 8.0 2 1.0 0 0.0 10.9
Sandown Town Centre 0 0.1 0 0.4 7 5.5 1 0.3 0 0.0 6.5 10 0.6
Morrisons, Newport Road 0 0.1 0 0.1 1 1.2 1 0.5 1.8
Aldi, Spithead Bus Park 0 0.1 0 0.2 1 0.5 0 0.1 0.8
Lake Industrial Estate, Lake Industrial Way 0 0.4 0 0.2 0 0.3 0 0.0 0.9
Spithead Business Centre, Newport Road 0 0.1 0 0.2 0 0.2 0.4
Others 0 0.1 0 0.0 0 0.4 0 0.0 0.5
Shanklin 0 0.1 1 1.1 16 13.0 7 3.1 17.3
Shanklin Town Centre 0 0.1 1 1.1 15 12.6 7 3.0 16.8 10 1.7
Lidl, Landguard Manor Road 1 0.4 0 0.1 0.5
Ventnor 0 0.2 0 0.4 12 5.3 0 0.0 6.0
Ventnor Town Centre 0 0.2 0 0.4 12 5.3 0 0.0 6.0 10 0.6
Freshwater 0 0.8 16 6.3 7.2
Freshwater Town Centre 0 0.7 16 6.1 6.8 5 0.3
Honnor & Jeffrey Afton Garden Centre, Afton Road 0 0.2 1 0.2 0.4
Other on the Isle of Wight 0 0.8 3 3.2 1 0.7 1 0.4 2 0.9 6.0
OUTSIDE SURVEY AREA 9 15.6 8 10.2 6 4.8 5 2.3 5 1.9 34.8
Southampton 5 9.0 4 4.6 3 2.6 3 1.2 3 1.3 18.7
Portsmouth 1 1.5 2 3.0 0 0.4 1 0.3 0 0.1 5.3
Central London 0 0.8 1 0.9 1 0.4 0 0.2 2.4
Other 2 4.2 1 1.7 2 1.4 1 0.5 1 0.5 8.4
Total 100 180.2 100 124.4 100 82.0 100 44.2 100 39.0 469.72
Notes:
Market share figures derived from Questions 7-18, Isle of Wight Household Shoppers Survey undertaken by NEMS in January 2018
Excludes responses Special Forms of Trading, 'Don't do this, 'Don't know / varies', and 'Other'
Figures may not add due to rounding
2016 Prices
InflowZone
1 2 3 4 5
IoW Retail Study - Statistical Tables - March 2018
23/03/2018
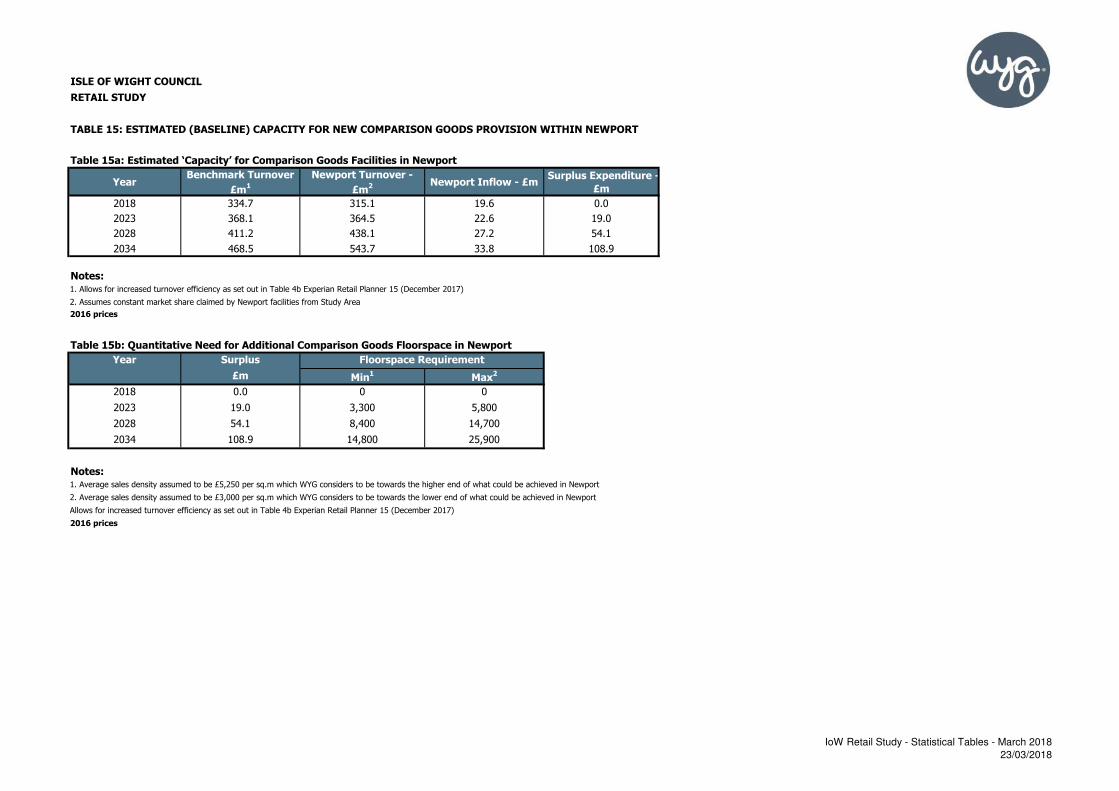
ISLE OF WIGHT COUNCIL
RETAIL STUDY
TABLE 15: ESTIMATED (BASELINE) CAPACITY FOR NEW COMPARISON GOODS PROVISION WITHIN NEWPORT
Table 15a: Estimated ‘Capacity’ for Comparison Goods Facilities in Newport
YearBenchmark Turnover
£m1
Newport Turnover -
£m2 Newport Inflow - £m
Surplus Expenditure -
£m
2018 334.7 315.1 19.6 0.0 6.21%
2023 368.1 364.5 22.6 19.0 6.21%
2028 411.2 438.1 27.2 54.1 6.21%
2034 468.5 543.7 33.8 108.9 6.21%
Notes:
1. Allows for increased turnover efficiency as set out in Table 4b Experian Retail Planner 15 (December 2017)
2. Assumes constant market share claimed by Newport facilities from Study Area
2016 prices
Table 15b: Quantitative Need for Additional Comparison Goods Floorspace in Newport
Year Surplus
£m Min1
Max2
2018 0.0 0 0
2023 19.0 3,300 5,800
2028 54.1 8,400 14,700
2034 108.9 14,800 25,900
Notes: 1. Average sales density assumed to be £5,250 per sq.m which WYG considers to be towards the higher end of what could be achieved in Newport
2. Average sales density assumed to be £3,000 per sq.m which WYG considers to be towards the lower end of what could be achieved in Newport
Allows for increased turnover efficiency as set out in Table 4b Experian Retail Planner 15 (December 2017)
2016 prices
Floorspace Requirement
IoW Retail Study - Statistical Tables - March 2018
23/03/2018
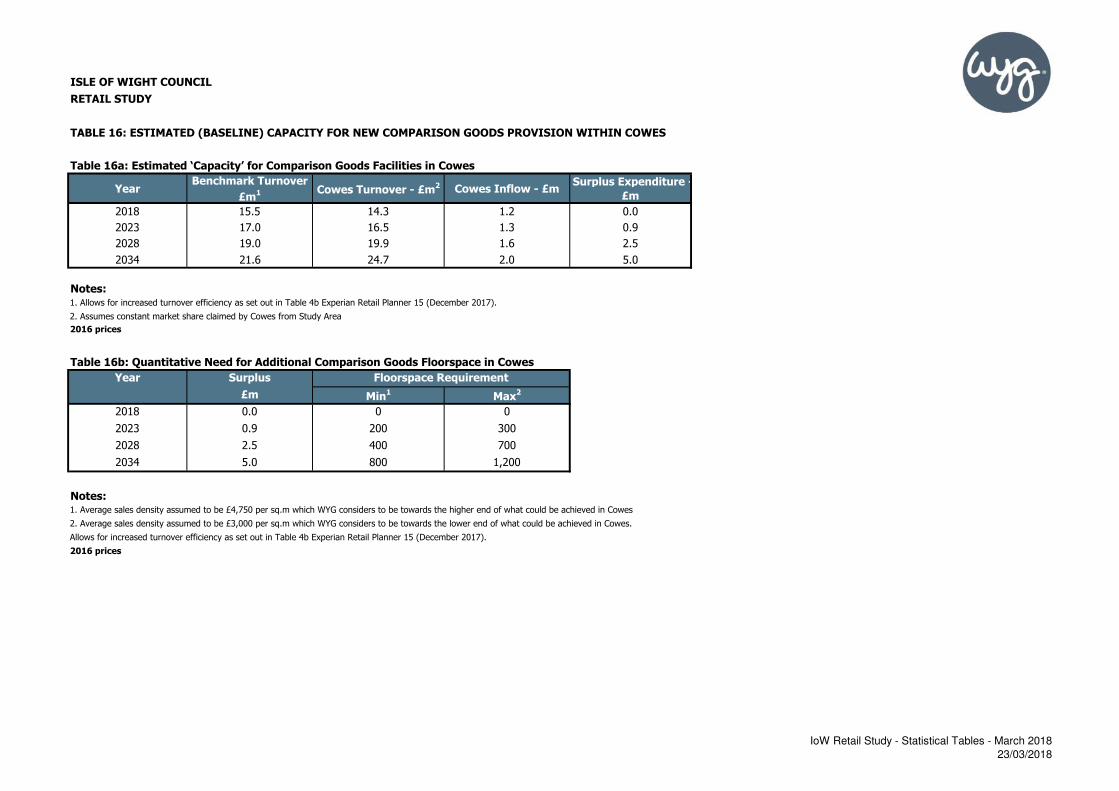
ISLE OF WIGHT COUNCIL
RETAIL STUDY
TABLE 16: ESTIMATED (BASELINE) CAPACITY FOR NEW COMPARISON GOODS PROVISION WITHIN COWES
Table 16a: Estimated ‘Capacity’ for Comparison Goods Facilities in Cowes
YearBenchmark Turnover
£m1 Cowes Turnover - £m
2 Cowes Inflow - £mSurplus Expenditure -
£m
2018 15.5 14.3 1.2 0.0
2023 17.0 16.5 1.3 0.9
2028 19.0 19.9 1.6 2.5
2034 21.6 24.7 2.0 5.0
Notes:1. Allows for increased turnover efficiency as set out in Table 4b Experian Retail Planner 15 (December 2017).
2. Assumes constant market share claimed by Cowes from Study Area
2016 prices
Table 16b: Quantitative Need for Additional Comparison Goods Floorspace in Cowes
Year Surplus
£m Min1
Max2
2018 0.0 0 0
2023 0.9 200 300
2028 2.5 400 700
2034 5.0 800 1,200
Notes: 1. Average sales density assumed to be £4,750 per sq.m which WYG considers to be towards the higher end of what could be achieved in Cowes
2. Average sales density assumed to be £3,000 per sq.m which WYG considers to be towards the lower end of what could be achieved in Cowes.
Allows for increased turnover efficiency as set out in Table 4b Experian Retail Planner 15 (December 2017).
2016 prices
Floorspace Requirement
IoW Retail Study - Statistical Tables - March 2018
23/03/2018

ISLE OF WIGHT COUNCIL
RETAIL STUDY
TABLE 17: ESTIMATED (BASELINE) CAPACITY FOR NEW COMPARISON GOODS PROVISION WITHIN EAST COWES
Table 17a: Estimated ‘Capacity’ for Comparison Goods Facilities in East Cowes
YearBenchmark Turnover
£m1
East Cowes Turnover -
£m2
East Cowes Inflow -
£m
Surplus Expenditure -
£m
2018 3.1 2.9 0.1 0.0
2023 3.4 3.4 0.2 0.2
2028 3.8 4.1 0.2 0.5
2034 4.3 5.0 0.3 1.0
Notes:1. Allows for increased turnover efficiency as set out in Table 4b Experian Retail Planner 15 (December 2017).
2. Assumes constant market share claimed by East Cowes from Study Area
2016 prices
Table 17b: Quantitative Need for Additional Comparison Goods Floorspace in East Cowes
Year Surplus
£m Min1
Max2
2018 0.0 0 0
2023 0.2 0 100
2028 0.5 100 100
2034 1.0 200 200
Notes: 1. Average sales density assumed to be £4,750 per sq.m which WYG considers to be towards the higher end of what could be achieved in East Cowes
2. Average sales density assumed to be £3,000 per sq.m which WYG considers to be towards the lower end of what could be achieved in East Cowes.
Allows for increased turnover efficiency as set out in Table 4b Experian Retail Planner 15 (December 2017).
2016 prices
Floorspace Requirement
IoW Retail Study - Statistical Tables - March 2018
23/03/2018

ISLE OF WIGHT COUNCIL
RETAIL STUDY
TABLE 18: ESTIMATED (BASELINE) CAPACITY FOR NEW COMPARISON GOODS PROVISION WITHIN RYDE
Table 18a: Estimated ‘Capacity’ for Comparison Goods Facilities in Ryde
YearBenchmark Turnover
£m1 Ryde Turnover - £m
2 Ryde Inflow - £mSurplus Expenditure -
£m
2018 58.6 55.2 3.4 0.0
2023 64.4 63.8 4.0 3.3
2028 72.0 76.7 4.8 9.5
2034 82.0 95.2 5.9 19.1
Notes:1. Allows for increased turnover efficiency as set out in Table 4b Experian Retail Planner 15 (December 2017).
2. Assumes constant market share claimed by Ryde from Study Area
2016 prices
Table 18b: Quantitative Need for Additional Comparison Goods Floorspace in Ryde
Year Surplus
£m Min1
Max2
2018 0.0 0 0
2023 3.3 600 1,000
2028 9.5 1,600 2,600
2034 19.1 2,900 4,500
Notes: 1. Average sales density assumed to be £4,750 per sq.m which WYG considers to be towards the higher end of what could be achieved in Ryde
2. Average sales density assumed to be £3,000 per sq.m which WYG considers to be towards the lower end of what could be achieved in Ryde.
Allows for increased turnover efficiency as set out in Table 4b Experian Retail Planner 15 (December 2017).
2016 prices
Floorspace Requirement
IoW Retail Study - Statistical Tables - March 2018
23/03/2018

ISLE OF WIGHT COUNCIL
RETAIL STUDY
TABLE 19: ESTIMATED (BASELINE) CAPACITY FOR NEW COMPARISON GOODS PROVISION WITHIN SANDOWN
Table 19a: Estimated ‘Capacity’ for Comparison Goods Facilities in Sandown
YearBenchmark Turnover
£m1
Sandown Turnover -
£m2 Sandown Inflow - £m
Surplus Expenditure -
£m
2018 11.6 10.9 0.6 0.0
2023 12.7 12.7 0.7 0.7
2028 14.2 15.2 0.9 1.9
2034 16.2 18.9 1.1 3.8
Notes:1. Allows for increased turnover efficiency as set out in Table 4b Experian Retail Planner 15 (December 2017).
2. Assumes constant market share claimed by Sandown from Study Area
2016 prices
Table 19b: Quantitative Need for Additional Comparison Goods Floorspace in Sandown
Year Surplus
£m Min1
Max2
2018 0.0 0 0
2023 0.7 100 200
2028 1.9 300 500
2034 3.8 600 900
Notes: 1. Average sales density assumed to be £4,750 per sq.m which WYG considers to be towards the higher end of what could be achieved in Sandown
2. Average sales density assumed to be £3,000 per sq.m which WYG considers to be towards the lower end of what could be achieved in Sandown.
Allows for increased turnover efficiency as set out in Table 4b Experian Retail Planner 15 (December 2017).
2016 prices
Floorspace Requirement
IoW Retail Study - Statistical Tables - March 2018
23/03/2018

ISLE OF WIGHT COUNCIL
RETAIL STUDY
TABLE 20: ESTIMATED (BASELINE) CAPACITY FOR NEW COMPARISON GOODS PROVISION WITHIN SHANKLIN
Table 20a: Estimated ‘Capacity’ for Comparison Goods Facilities in Shanklin
YearBenchmark Turnover
£m1
Shanklin Turnover -
£m2 Shanklin Inflow - £m
Surplus Expenditure -
£m
2018 19.0 17.3 1.7 0.0
2023 20.9 20.0 1.9 1.1
2028 23.3 24.1 2.3 3.1
2034 26.6 29.9 2.9 6.2
Notes:1. Allows for increased turnover efficiency as set out in Table 4b Experian Retail Planner 15 (December 2017).
2. Assumes constant market share claimed by Shanklin from Study Area
2016 prices
Table 20b: Quantitative Need for Additional Comparison Goods Floorspace in Shanklin
Year Surplus
£m Min1
Max2
2018 0.0 0 0
2023 1.1 200 300
2028 3.1 500 800
2034 6.2 900 1,500
Notes: 1. Average sales density assumed to be £4,750 per sq.m which WYG considers to be towards the higher end of what could be achieved in Shanklin
2. Average sales density assumed to be £3,000 per sq.m which WYG considers to be towards the lower end of what could be achieved in Shanklin.
Allows for increased turnover efficiency as set out in Table 4b Experian Retail Planner 15 (December 2017).
2016 prices
Floorspace Requirement
IoW Retail Study - Statistical Tables - March 2018
23/03/2018

ISLE OF WIGHT COUNCIL
RETAIL STUDY
TABLE 21: ESTIMATED (BASELINE) CAPACITY FOR NEW COMPARISON GOODS PROVISION WITHIN VENTNOR
Table 21a: Estimated ‘Capacity’ for Comparison Goods Facilities in Ventnor
YearBenchmark Turnover
£m1
Ventnor Turnover -
£m2 Ventnor Inflow - £m
Surplus Expenditure -
£m
2018 6.6 6.0 0.6 0.0
2023 7.3 6.9 0.7 0.4
2028 8.1 8.3 0.8 1.1
2034 9.2 10.3 1.0 2.1
Notes:1. Allows for increased turnover efficiency as set out in Table 4b Experian Retail Planner 15 (December 2017).
2. Assumes constant market share claimed by Ventnor from Study Area
2016 prices
Table 21b: Quantitative Need for Additional Comparison Goods Floorspace in Ventnor
Year Surplus
£m Min1
Max2
2018 0.0 0 0
2023 0.4 100 100
2028 1.1 200 300
2034 2.1 300 500
Notes: 1. Average sales density assumed to be £4,750 per sq.m which WYG considers to be towards the higher end of what could be achieved in Ventnor.
2. Average sales density assumed to be £3,000 per sq.m which WYG considers to be towards the lower end of what could be achieved in Ventnor.
Allows for increased turnover efficiency as set out in Table 4b Experian Retail Planner 15 (December 2017).
2016 prices
Floorspace Requirement
IoW Retail Study - Statistical Tables - March 2018
23/03/2018

ISLE OF WIGHT COUNCIL
RETAIL STUDY
TABLE 22: ESTIMATED (BASELINE) CAPACITY FOR NEW COMPARISON GOODS PROVISION WITHIN FRESHWATER
Table 22a: Estimated ‘Capacity’ for Comparison Goods Facilities in Freshwater
YearBenchmark Turnover
£m1
Freshwater Turnover -
£m2
Freshwater Inflow -
£m
Surplus Expenditure -
£m
2018 7.5 7.2 0.3 0.0
2023 8.2 8.3 0.4 0.4
2028 9.2 10.0 0.5 1.2
2034 10.5 12.3 0.6 2.4
Notes:1. Allows for increased turnover efficiency as set out in Table 4b Experian Retail Planner 15 (December 2017).
2. Assumes constant market share claimed by Freshwater from Study Area
2016 prices
Table 22b: Quantitative Need for Additional Comparison Goods Floorspace in Freshwater
Year Surplus
£m Min1
Max2
2018 0.0 0 0
2023 0.4 100 100
2028 1.2 200 300
2034 2.4 400 600
Notes: 1. Average sales density assumed to be £4,750 per sq.m which WYG considers to be towards the higher end of what could be achieved in Freshwater.
2. Average sales density assumed to be £3,000 per sq.m which WYG considers to be towards the lower end of what could be achieved in Freshwater.
Allows for increased turnover efficiency as set out in Table 4b Experian Retail Planner 15 (December 2017).
2016 prices
Floorspace Requirement
IoW Retail Study - Statistical Tables - March 2018
23/03/2018
Retail Study www.wyg.com
Appendix H Recommended Shopping Frontage
and Boundary Plans
FOXES
RO
AD
ST
JAM
ES
STR
EE
T
CE
NT
RA
LM
AR
KE
T
SOUTH STREET
ST
JA
ME
SS
QU
AR
E
GR
AY
SW
ALK
ST
JA
ME
SS
TR
EE
T
HIGH STREET
CROCKERSTREET
TH
ES
TA
BL
ES
TO
WN
LA
NE
QUAY
STREET
ORCHARD STREET
MIL
LS
TR
EE
T
CH
AIN
LA
NE
ST THOMAS SQUARE
CO
CK
RA
MS
YA
RD
SOUTH STREET
LUGLEY STREET
PYLE STREET
CH
UR
CH
LIT
TE
N
ST CROSS COURT
DRILL
HALL
RO
AD
ST
JA
ME
SS
TR
EE
T
CROCKER STREET
ST
JA
ME
SS
TR
EE
T
HO
LY
RO
OD
ST
RE
ET
CA
ST
LE
HO
LD
LA
NE
PYLE STREET
MIL
LSTR
EET
ST
JA
ME
SS
TR
EE
T
CH
ALM
ER
SW
AY
LITTEN PARK
PO
ST
OFF
ICE
LA
NE
WATC
HBELL
LAN
E
CARIS
BRO
OKE
RO
AD
HIGH STREET
HIG
HS
TR
EET
NE
WS
TR
EE
T
HIGH STREET
CHAPEL STREET
SEA STREET
SCARROTS LANE
HO
LY
RO
OD
ST
RE
ET
OR
CH
AR
DS
TR
EE
T
LUGLEY STREET
VICARAGE WALK
RIV
ER
WA
Y
SYLVAN DRIVE
HUNNYCROSS WAY
TRAFALGAR ROAD
449,400 449,500 449,600 449,700 449,800 449,900 450,000 450,100 450,200 450,300
88,700
88,800
88,900
89,000
89,100
89,200
89,300
89,400
89,500
89,600NEWPORT (ISLE OF WIGHT)
Goad Paper Plans are for identification only and not to be scaled as a working drawing.
0 12.5 25 37.5 50 m
SCALE 1:1000
www.goadplans.co.uk
0845 6016011
COPYRIGHT AND CONFIDENTIALITY NOTICE
For full terms & copyright conditions visit www.goadplans.co.uk/copyright
This product includes map data from Ordnance Survey by the permission
of HMSO. © Crown Copyright and database right of the Crown
For more information on
our products and services:2017 Experian Limited All Rights Reserved
2017. All rights reserved. Ordnance Survey Licence number PU100017316.
HIG
HSTR
EET
TOWN QUAY
MARKET
HIL
L
CRO
SSSTR
EET
THECUT
SUN HILL
SH
OO
TE
RS
HIL
L
HIG
HS
TR
EE
T
BA
TH
RO
AD
TERMINUS ROAD
HIG
HS
TR
EE
T
WATCH
HOUSELANE
MIDDLETON TERRACE
BIRM
ING
HAM
RO
AD
BARS HILL
1-6
AD
MIR
ALS
WH
AR
F
CA
RV
EL
LA
NE
ST
MA
RY
SR
OA
D
FOUNTAIN QUAY
BECKFORD ROAD
DENMARK ROAD
THE ARCADE
YO
RK
ST
RE
ET
MIL
LHIL
LROAD
449,400 449,500 449,600 449,700 449,800 449,900 450,000
95,700
95,800
95,900
96,000
96,100
96,200
96,300
96,400
96,500
Goad Paper Plans are for identification only and not to be scaled as a working drawing.
0 12.5 25 37.5 50 m
SCALE 1:1000
www.goadplans.co.uk
0845 6016011
COPYRIGHT AND CONFIDENTIALITY NOTIC
For full terms & copyright conditions visit www.goadplans.co.uk/copyright
This product includes map data from Ordnance Survey by the permission
of HMSO. © Crown Copyright and database right of the Crown
For more information on
our products and services:
COWES
2017 Experian Limited All Rights Reserved
2017. All rights reserved. Ordnance Survey Licence number PU100017316.
HILL STREET
BEDWORTH PLACE
GREEN STREET
LIND STREET
WELL
STR
EET
STAR STREET
JOHN STREET
ST
TH
OM
AS
SQ
UARE
ESPLANADE
CROWN STREET
CH
UR
CH
LA
NE
NEWPORT STREET
CROSS STREET
ST
TH
OM
AS
ST
RE
ET
SU
NP
LA
CE
ST JOHNS ROAD
ALBERT PLACE
MANOR GARDENS
ANGLESEA STREET
MELVILLE STREET
BANKPLACE
YELFS ROAD
WHEELWRIGHTS
GARFIELD ROAD
BANK GARDENS
UN
ION
RO
AD
GE
OR
GE
ST
RE
ET
GE
OR
GE
ST
RE
ET
LIN
DH
ILL
HIG
HS
TR
EE
T
CASTLE
STR
EET
ST
PE
TE
RS
ME
WS
CH
UR
CH
LA
NE
UN
ION
STR
EE
T
VICTORIA ARCADE
459,000 459,100 459,200 459,300 459,400 459,500
91,900
92,000
92,100
92,200
92,300
92,400
92,500
92,600
92,700
92,800
92,900
93,000
Goad Paper Plans are for identification only and not to be scaled as a working drawing.
0 12.5 25 37.5 50 m
SCALE 1:1000
www.goadplans.co.uk
0845 6016011
COPYRIGHT AND CONFIDENTIALITY NOTIC
For full terms & copyright conditions visit www.goadplans.co.uk/copyright
This product includes map data from Ordnance Survey by the permission
of HMSO. © Crown Copyright and database right of the Crown
For more information on
our products and services:2017 Experian Limited All Rights Reserved
2017. All rights reserved. Ordnance Survey Licence number PU100017316.
RYDE
PIE
RS
TR
EE
T
ESPLA
NADE
HIGH
STREET
AV
EN
UE
RO
AD
GU
AD
ELO
UP
ER
OA
D
ALBIO
NR
OAD
HIGH
STREET
YO
RK
RO
AD
ESPLANADE
ESPLANAD
E
CULVERPARADE
MELVILLE STREET
ST
JO
HN
SR
OA
D
BEACHFIELD
ROAD
VICTORIA ROAD
ALB
ER
TR
OA
D
ES
PLA
NA
DE
RO
AD
WIL
KE
SR
OA
D
STATION AVENUE
FIT
ZR
OY
ST
RE
ET
ESPLA
NADE
459,600 459,700 459,800 459,900 460,000 460,100 460,200 460,300
83,800
83,900
84,000
84,100
84,200
84,300
84,400
84,500
Goad Paper Plans are for identification only and not to be scaled as a working drawing.
0 12.5 25 37.5 50 m
SCALE 1:1000
www.goadplans.co.uk
0845 6016011
COPYRIGHT AND CONFIDENTIALITY NOTICE
For full terms & copyright conditions visit www.goadplans.co.uk/copyright
This product includes map data from Ordnance Survey by the permission
of HMSO. © Crown Copyright and database right of the Crown
For more information on
our products and services:
SANDOWN
2017 Experian Limited All Rights Reserved
2017. All rights reserved. Ordnance Survey Licence number PU100017316.
CLARENDON ROAD
CARTER AVENUE
CARTER ROAD
FALCON CROSS ROAD
MARINE CROSS ROAD
RE
GE
NT
STR
EE
T
SAINT PAULS AVENUE
NO
RTH
RO
AD
YAR
BO
RO
UG
HAR
CAD
E
HIG
HS
TR
EE
T
CR
OS
SS
TR
EE
T
VICTORIA AVENUE
PALMERSTO
NRO
AD
PR
OS
PE
CT
RO
AD
ATHERLEY ROAD
ST PAULS CRESCENT
EASTCLIFF ROAD
LA
ND
GU
AR
DR
OA
D
ORCHARDLEIGH ROAD
STEEPHILL ROAD
ST
JO
HN
SR
OA
D
RE
GE
NT
ST
RE
ET
COLLINGWOOD ROAD
POMONAROAD
458,000 458,100 458,200 458,300
81,000
81,100
81,200
81,300
81,400
81,500
81,600
81,700
81,800
81,900
82,000
Goad Paper Plans are for identification only and not to be scaled as a working drawing.
0 12.5 25 37.5 50 m
SCALE 1:1000
www.goadplans.co.uk
0845 6016011
COPYRIGHT AND CONFIDENTIALITY NOTIC
For full terms & copyright conditions visit www.goadplans.co.uk/copyright
This product includes map data from Ordnance Survey by the permission
of HMSO. © Crown Copyright and database right of the Crown
For more information on
our products and services:
SHANKLIN
2017 Experian Limited All Rights Reserved
2017. All rights reserved. Ordnance Survey Licence number PU100017316.
HAMBROUGH ROAD
ALBERT STREET
PO
UN
DLA
NE
SP
RIN
GH
ILL
HIGH STREET
CHUR
CH
STREET
DUDLEY ROAD
MA
RK
ET
ST
RE
ET
PIE
RSTR
EET
456,200 456,300 456,400 456,500 456,600
77,400
77,500
77,600
77,700
VENTNOR
Goad Paper Plans are for identification only and not to be scaled as a working drawing.
0 12.5 25 37.5 50 m
SCALE 1:1000
www.goadplans.co.uk
0845 6016011
COPYRIGHT AND CONFIDENTIALITY NOTICE
This product includes map data from Ordnance Survey by the permission
of HMSO. © Crown Copyright and database right of the Crown
For more information on
our products and services:2017 Experian Limited All Rights Reserved
2017. All rights reserved. Ordnance Survey Licence number PU100017316.
AVENUE ROAD
AV
EN
UE
RO
AD
UP
PE
RP
RIN
CE
SR
OA
D
DA
LL
SQ
UA
RE
SCHOOL GREEN ROAD
SCHOOL GREEN ROAD
TENNYSON ROAD
HIG
HS
TR
EE
T
WE
EK
ES
CO
UR
T
MO
AP
LA
CE
QU
EE
NS
RO
AD
PR
INC
ES
RO
AD
BROO
KSIDE
ROAD
433,300 433,400 433,500 433,600 433,700 433,800 433,900
87,000
87,100
87,200
87,300
FRESHWATER
Goad Paper Plans are for identification only and not to be scaled as a working drawing.
0 12.5 25 37.5 50 m
SCALE 1:1000
www.goadplans.co.uk
0845 6016011
COPYRIGHT AND CONFIDENTIALITY NOTICE
For full terms & copyright conditions visit www.goadplans.co.uk/copyright
SURVEYED: JANUARY 2018
This product includes map data from Ordnance Survey by the permission
of HMSO. © Crown Copyright and database right of the Crown
For more information on
our products and services:2017 Experian Limited All Rights Reserved
2017. All rights reserved. Ordnance Survey Licence number PU100017316.
SCHOOL HILL ROAD
CASTLE
STR
EET M
ARSHROAD
SE
YM
OU
RC
OU
RT
CH
UR
CH
PATH
WELL
ROAD
FERRY ROAD
WELL
ROAD
CA
ST
LE
ST
RE
ET
OS
BO
RN
ER
OA
D
BRID
GE
ROAD
DOVER ROAD
YOR
KAVEN
UE
LINKROAD
CLA
RE
NC
ER
OA
D
YORK
AVENUE
450,100 450,200 450,300 450,400 450,500
95,500
95,600
95,700
95,800
EAST COWES
Goad Paper Plans are for identification only and not to be scaled as a working drawing.
0 12.5 25 37.5 50 m
SCALE 1:1000
www.goadplans.co.uk
0845 6016011
COPYRIGHT AND CONFIDENTIALITY NOTICE
For full terms & copyright conditions visit www.goadplans.co.uk/copyright
UPDATED: JANUARY 2018
This product includes map data from Ordnance Survey by the permission
of HMSO. © Crown Copyright and database right of the Crown
For more information on
our products and services:2016 Experian Limited All Rights Reserved
2016. All rights reserved. Ordnance Survey Licence number PU100017316.


