Embed Size (px)
Citation preview
MEASURING, MANAGING AND IMPROVING BUSINESS PERFORMANCE
Peter Luff, President
Andy Hart, EMEA Mall & UK Retail Business Development Manager
IPSOS RETAIL PERFORMANCE
© Ipsos Retail Performance | Retail | Internal Client Use Only | Version 1
SUMMARY1. INTRODUCTIONS
Who IRP are and our history
2. HOW WE HAVE BEEN HELPING OUR CLIENTS FOR 30+ YEARS
Solution Overview
3. AUTOMATIC COUNTING
Why count customers?
4. SOCIAL DISTANCING OCCUPANCY SOLUTION
5. THANK YOU AND QUESTIONS
2 ‒
© Ipsos Retail Performance | Retail | Internal Client Use Only | Version 1 3 ‒
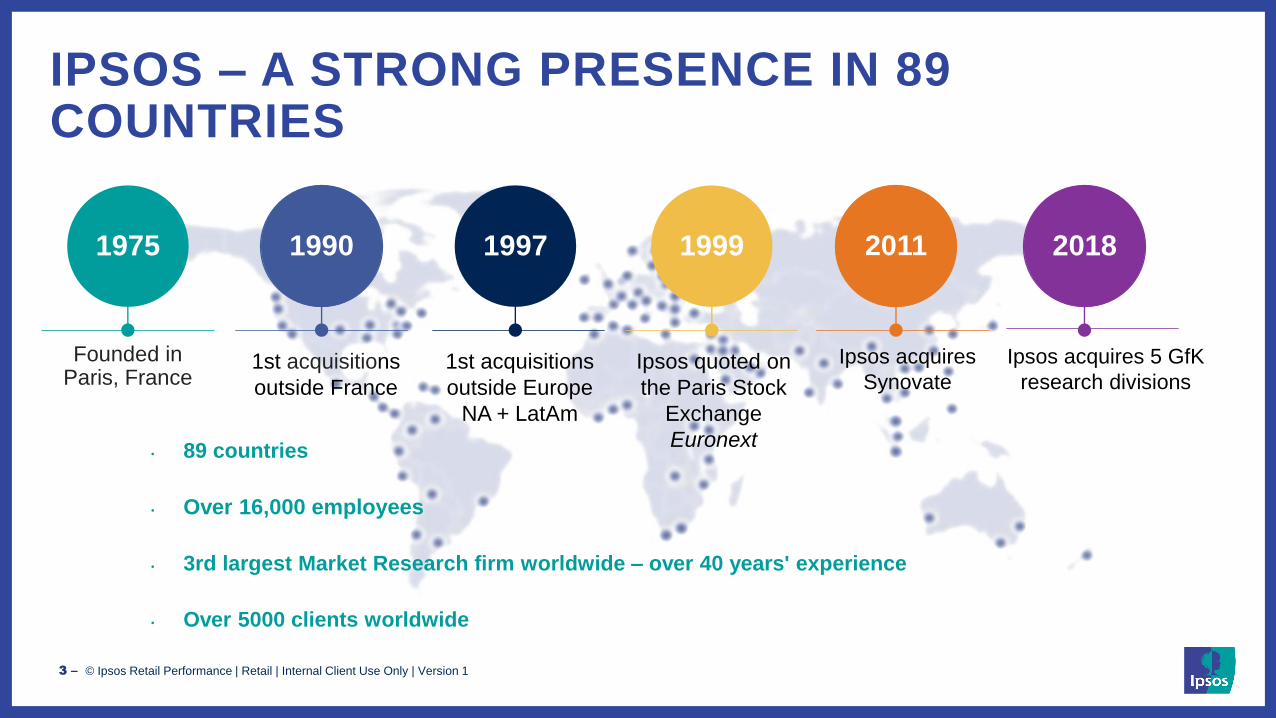
IPSOS – A STRONG PRESENCE IN 89 COUNTRIES
1975 1990 1997 20111999
1st acquisitions
outside France
Ipsos acquires
Synovate1st acquisitions
outside Europe
NA + LatAm
Ipsos quoted on
the Paris Stock
Exchange
Euronext
Founded in Paris, France
• 89 countries
• Over 16,000 employees
• 3rd largest Market Research firm worldwide – over 40 years' experience
• Over 5000 clients worldwide
2018
Ipsos acquires 5 GfK
research divisions
© Ipsos Retail Performance | Retail | Internal Client Use Only | Version 1 4 ‒
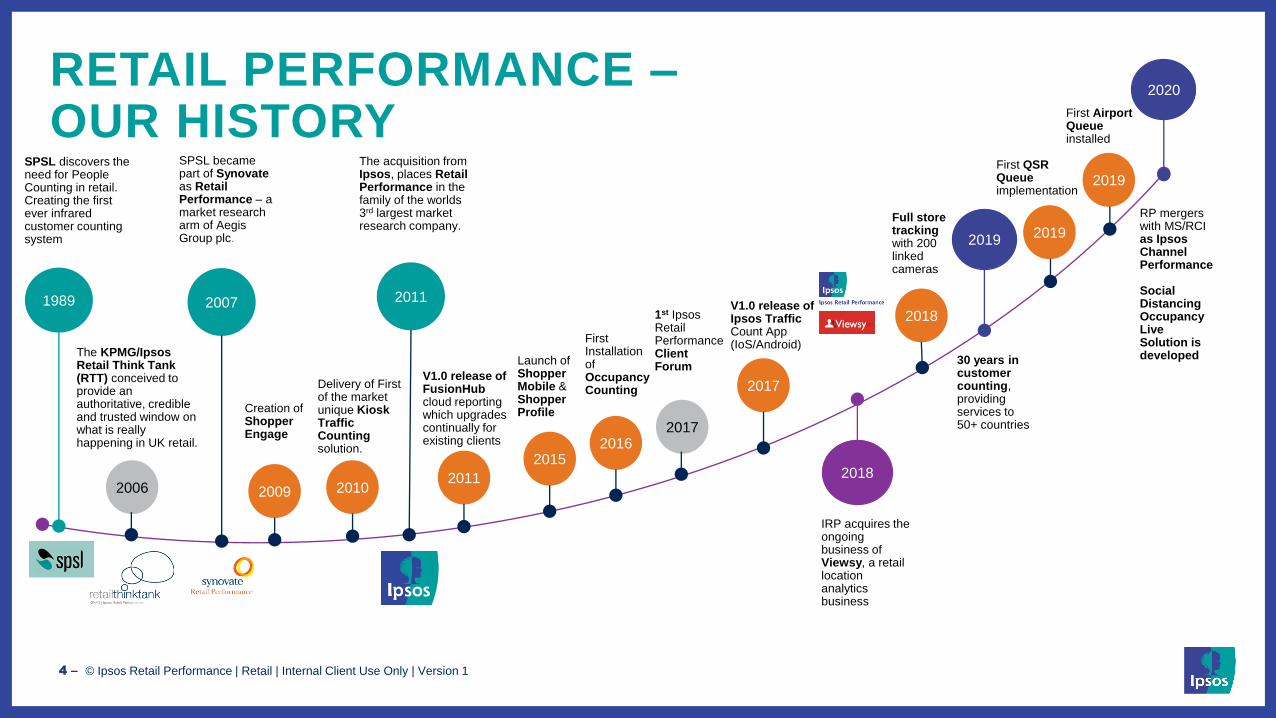
RETAIL PERFORMANCE –OUR HISTORY
2018
Full store tracking with 200 linked cameras
SPSL became part of Synovateas Retail Performance – a market research arm of Aegis Group plc.
2007
2006
The KPMG/Ipsos Retail Think Tank (RTT) conceived to provide an authoritative, credible and trusted window on what is really happening in UK retail.
1989
SPSL discovers the need for People Counting in retail. Creating the first ever infrared customer counting system
2018
IRP acquires the ongoing business of Viewsy, a retail location analytics business
2019
30 years in customer counting, providing services to 50+ countries
2011
The acquisition from Ipsos, places Retail Performance in the family of the worlds 3rd largest market research company.
2010
Delivery of First of the market unique Kiosk Traffic Counting solution.
2011
V1.0 release of FusionHubcloud reporting which upgrades continually for existing clients
2015
Launch of Shopper Mobile &Shopper Profile
2016
First Installation of Occupancy Counting
2019
First QSR Queue implementation
2017
V1.0 release of Ipsos Traffic Count App (IoS/Android)
2009
Creation of Shopper Engage
2020
RP mergers with MS/RCI as Ipsos Channel Performance
Social Distancing Occupancy Live Solution is developed
2019
First Airport Queue installed
2017
1st Ipsos Retail Performance Client Forum
© Ipsos Retail Performance | Retail | Internal Client Use Only | Version 1 5 ‒
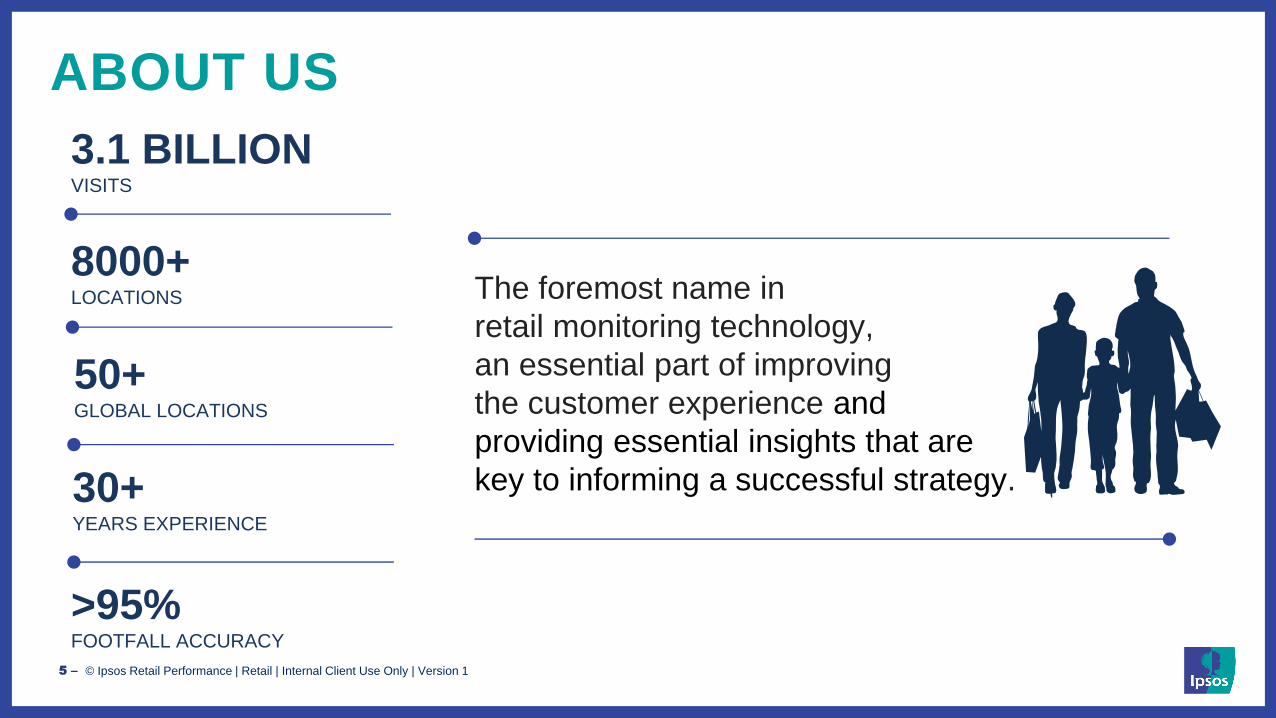
ABOUT US
The foremost name in
retail monitoring technology,
an essential part of improving
the customer experience and
providing essential insights that are
key to informing a successful strategy.
3.1 BILLIONVISITS
8000+LOCATIONS
50+GLOBAL LOCATIONS
30+YEARS EXPERIENCE
>95%FOOTFALL ACCURACY
© Ipsos Retail Performance | Retail | Internal Client Use Only | Version 1 6 ‒
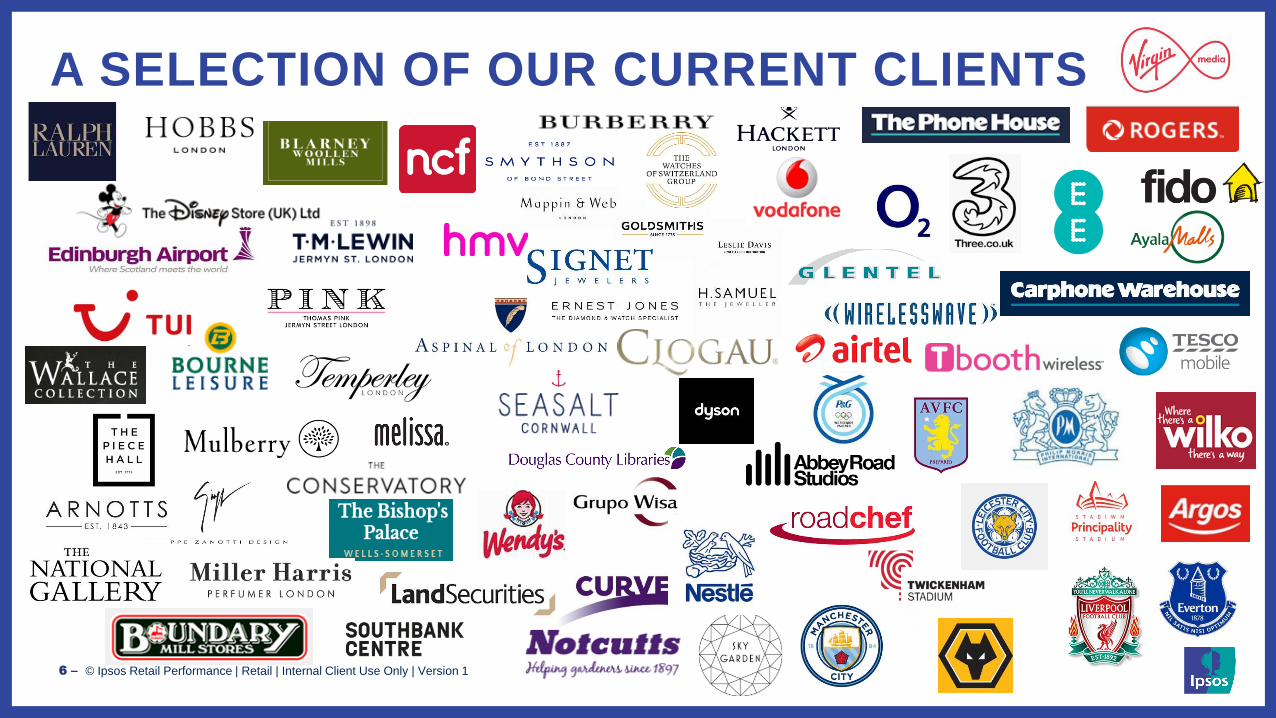
A SELECTION OF OUR CURRENT CLIENTS
© Ipsos Retail Performance | Retail | Internal Client Use Only | Version 1
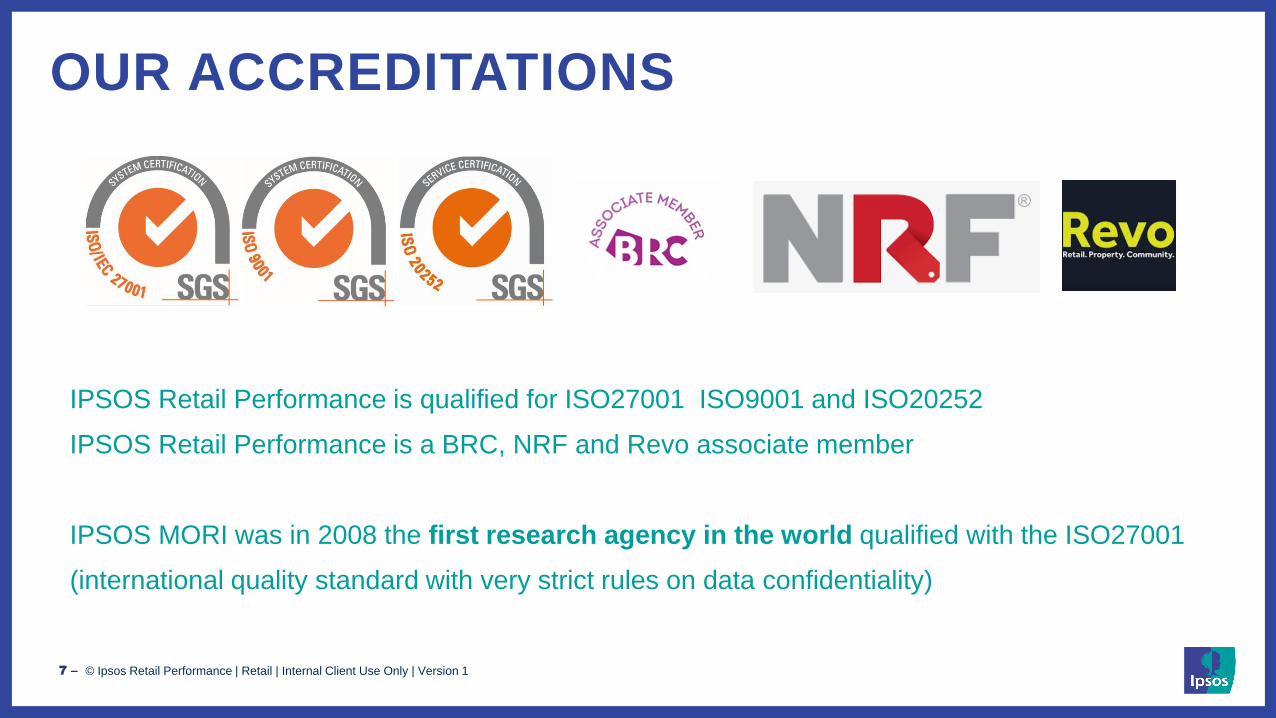
OUR ACCREDITATIONS
IPSOS Retail Performance is qualified for ISO27001 ISO9001 and ISO20252
IPSOS Retail Performance is a BRC, NRF and Revo associate member
IPSOS MORI was in 2008 the first research agency in the world qualified with the ISO27001
(international quality standard with very strict rules on data confidentiality)
7 ‒

© Ipsos Retail Performance | Retail | Internal Client Use Only | Version 1
HOW DO WE HELP OUR CLEINTS MEASURE, MANAGE AND IMPROVE?
8 ‒
© Ipsos Retail Performance | Retail | Internal Client Use Only | Version 1 9 ‒
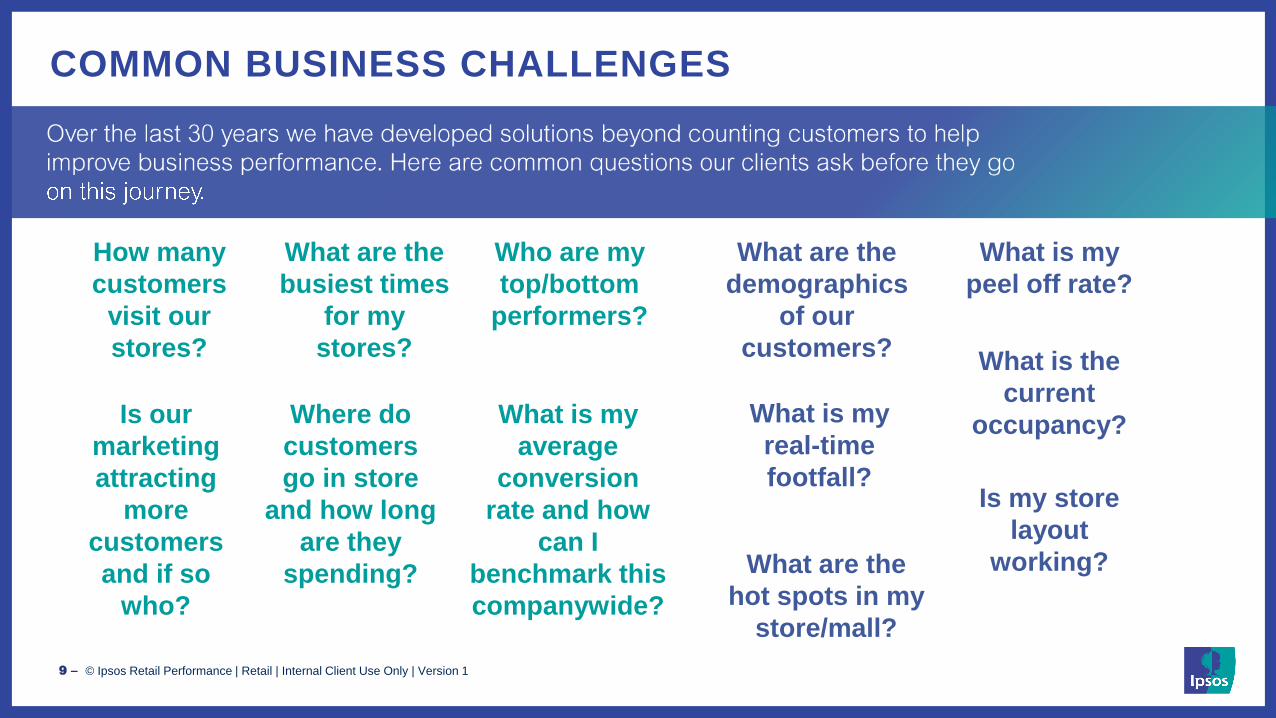
COMMON BUSINESS CHALLENGES
How many
customers
visit our
stores?
What are the
busiest times
for my
stores?
Who are my
top/bottom
performers?
Is our
marketing
attracting
more
customers
and if so
who?
Where do
customers
go in store
and how long
are they
spending?
What is my
average
conversion
rate and how
can I
benchmark this
companywide?
What are the
demographics
of our
customers?
What is my
peel off rate?
What is the
current
occupancy?What is my
real-time
footfall?Is my store
layout
working?What are the
hot spots in my
store/mall?
© Ipsos | Doc Name10 ‒
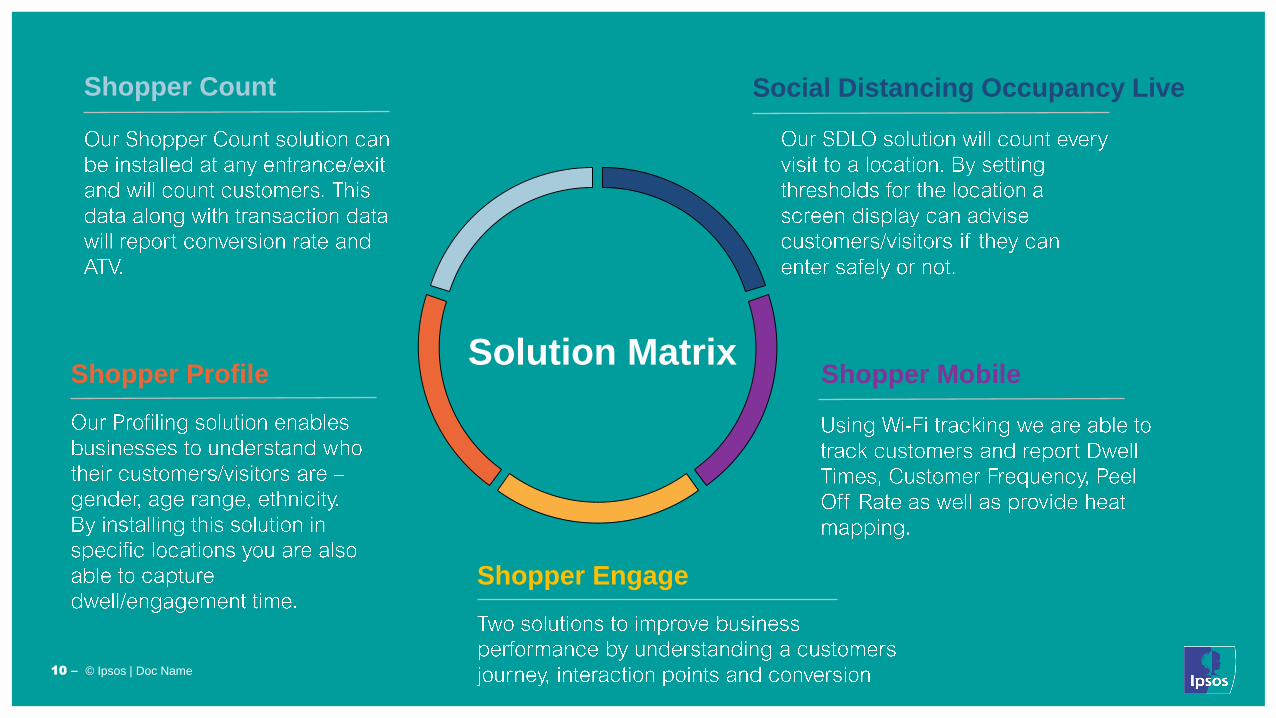
Shopper Profile Shopper Mobile
Social Distancing Occupancy LiveShopper Count
Shopper Engage
Solution Matrix
© Ipsos Retail Performance | Retail | Internal Client Use Only | Version 1
SHOPPER COUNT
11 ‒
© Ipsos Retail Performance | Retail | Internal Client Use Only | Version 1
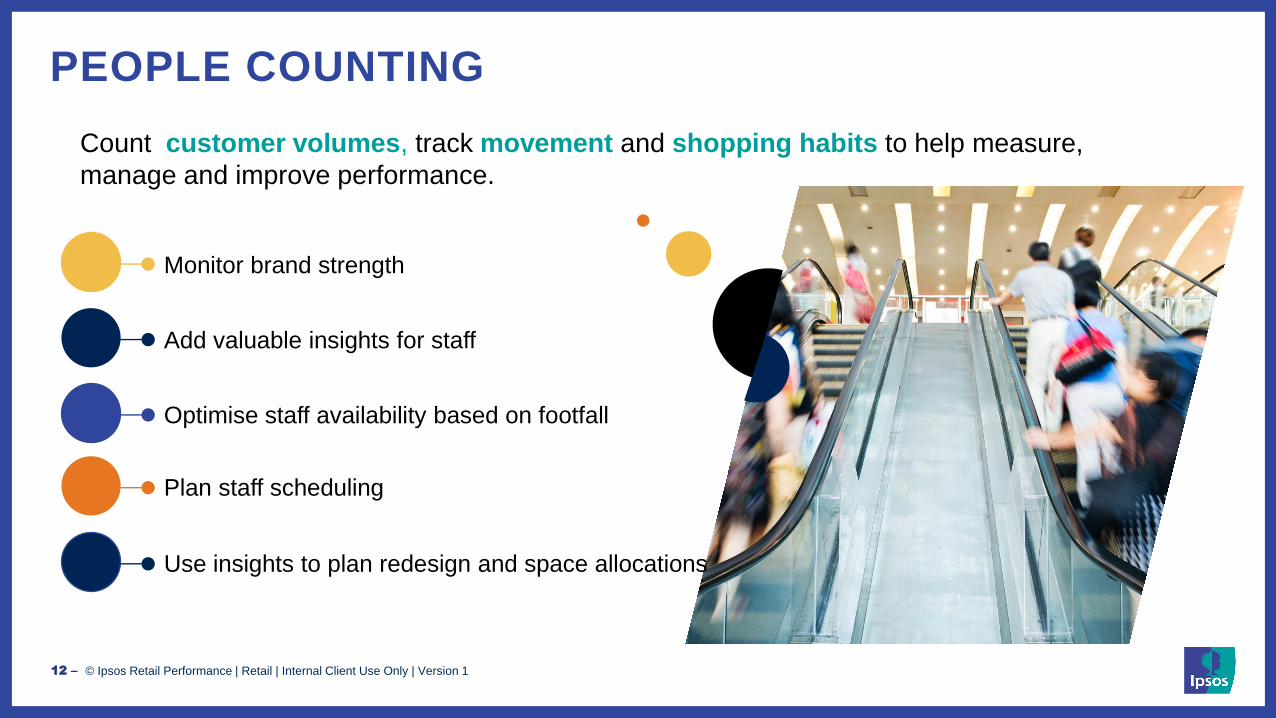
PEOPLE COUNTING
Count customer volumes, track movement and shopping habits to help measure,
manage and improve performance.
Monitor brand strength
Add valuable insights for staff
Optimise staff availability based on footfall
Plan staff scheduling
Use insights to plan redesign and space allocations
12 ‒
© Ipsos Retail Performance | Retail | Internal Client Use Only | Version 1
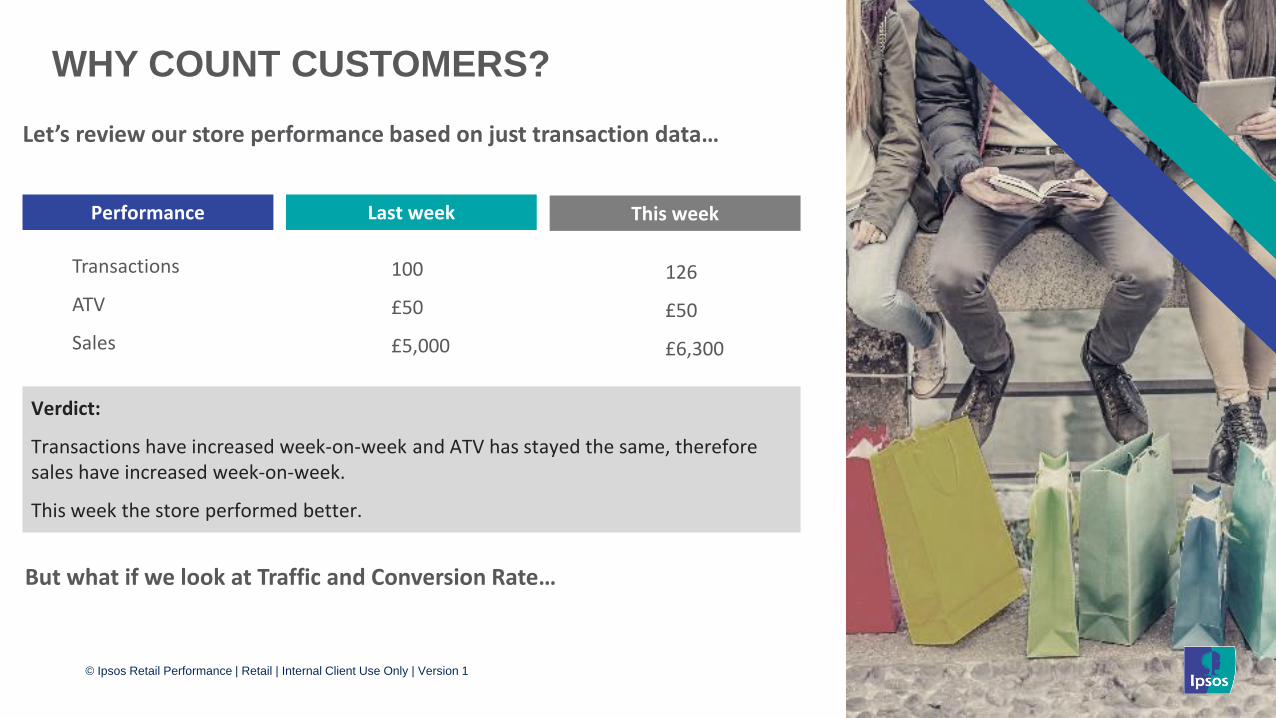
Let’s review our store performance based on just transaction data…
Transactions
ATV
Sales
100
£50
£5,000
126
£50
£6,300
But what if we look at Traffic and Conversion Rate…
Performance Last week This week
Verdict:
Transactions have increased week-on-week and ATV has stayed the same, therefore sales have increased week-on-week.
This week the store performed better.
WHY COUNT CUSTOMERS?
© Ipsos Retail Performance | Retail | Internal Client Use Only | Version 1
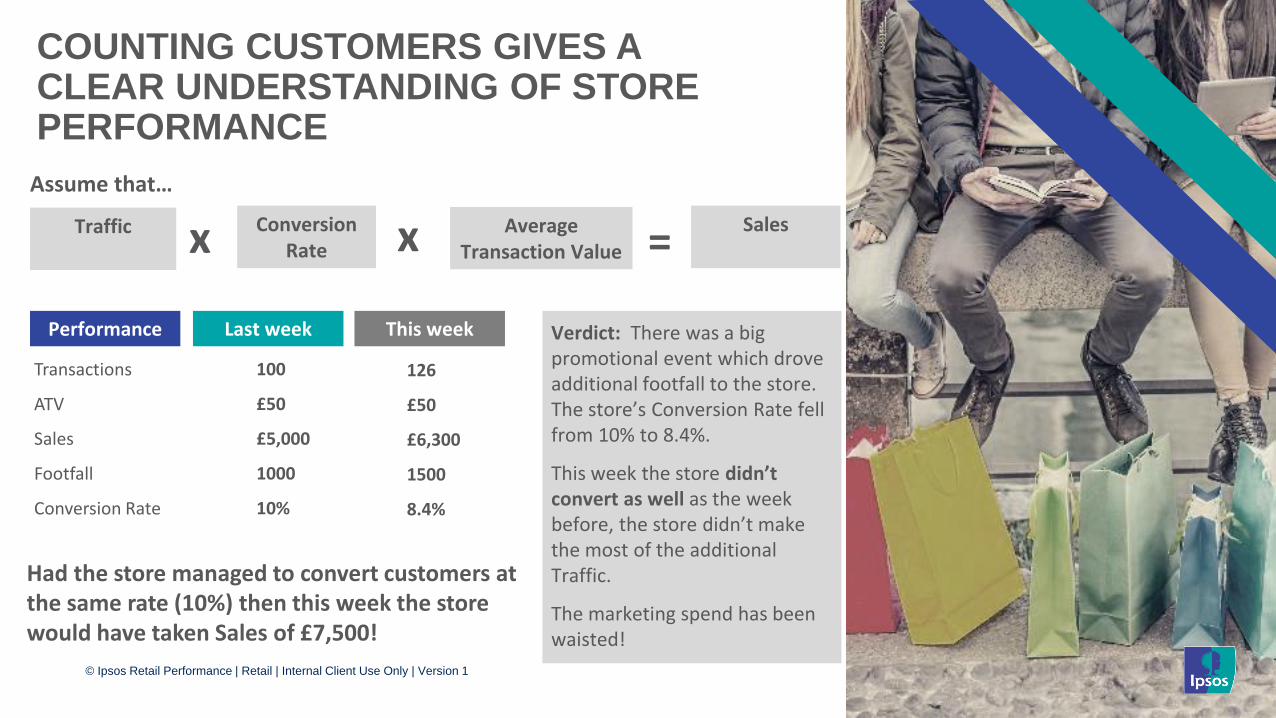
Performance
Transactions
ATV
Sales
Footfall
Conversion Rate
100
£50
£5,000
1000
10%
126
£50
£6,300
1500
8.4%
Verdict: There was a big promotional event which drove additional footfall to the store. The store’s Conversion Rate fell from 10% to 8.4%.
This week the store didn’t convert as well as the week before, the store didn’t make the most of the additional Traffic.
The marketing spend has been waisted!
Had the store managed to convert customers at the same rate (10%) then this week the store would have taken Sales of £7,500!
Assume that…
Last week This week
Traffic Conversion Rate
Average Transaction Value
Salesx x =
COUNTING CUSTOMERS GIVES A CLEAR UNDERSTANDING OF STORE PERFORMANCE
© Ipsos Retail Performance | Retail | Internal Client Use Only | Version 1
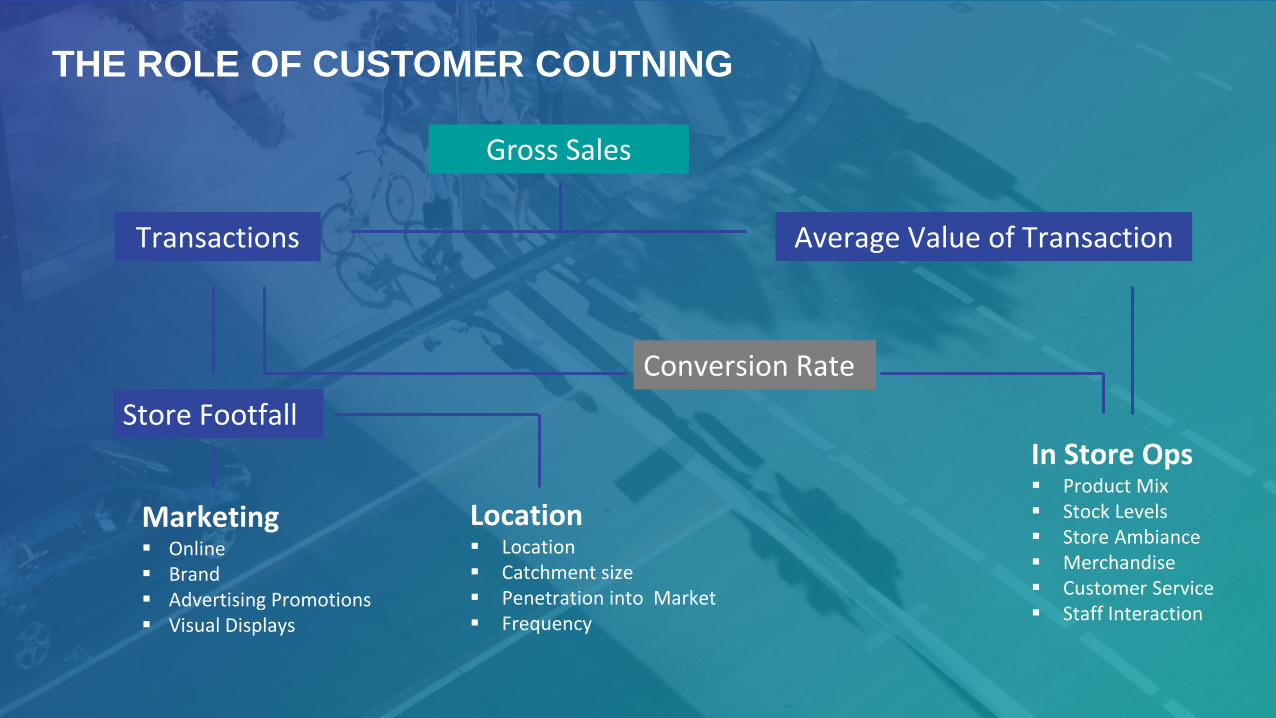
Gross Sales
Transactions Average Value of Transaction
In Store Ops ▪ Product Mix ▪ Stock Levels▪ Store Ambiance▪ Merchandise▪ Customer Service▪ Staff Interaction
Conversion Rate
Store Footfall
Marketing▪ Online▪ Brand ▪ Advertising Promotions▪ Visual Displays
Location▪ Location▪ Catchment size▪ Penetration into Market▪ Frequency
THE ROLE OF CUSTOMER COUTNING
© Ipsos Retail Performance | Retail | Internal Client Use Only | Version 1
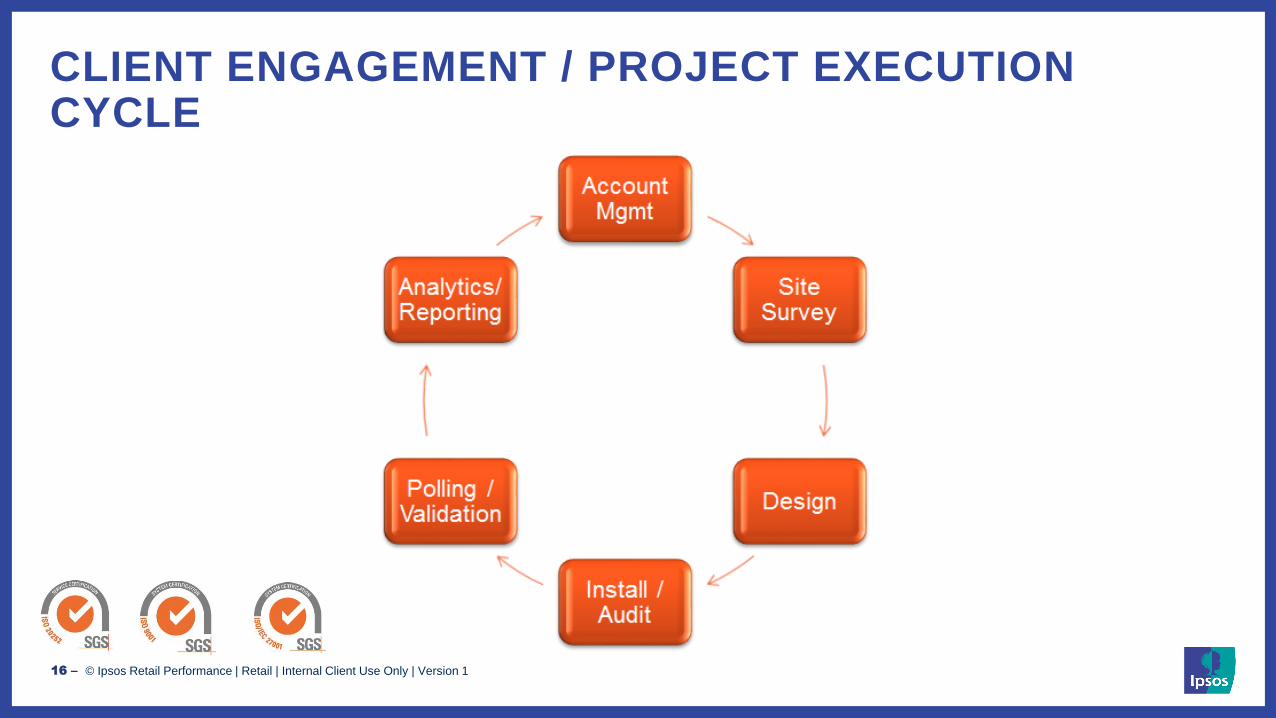
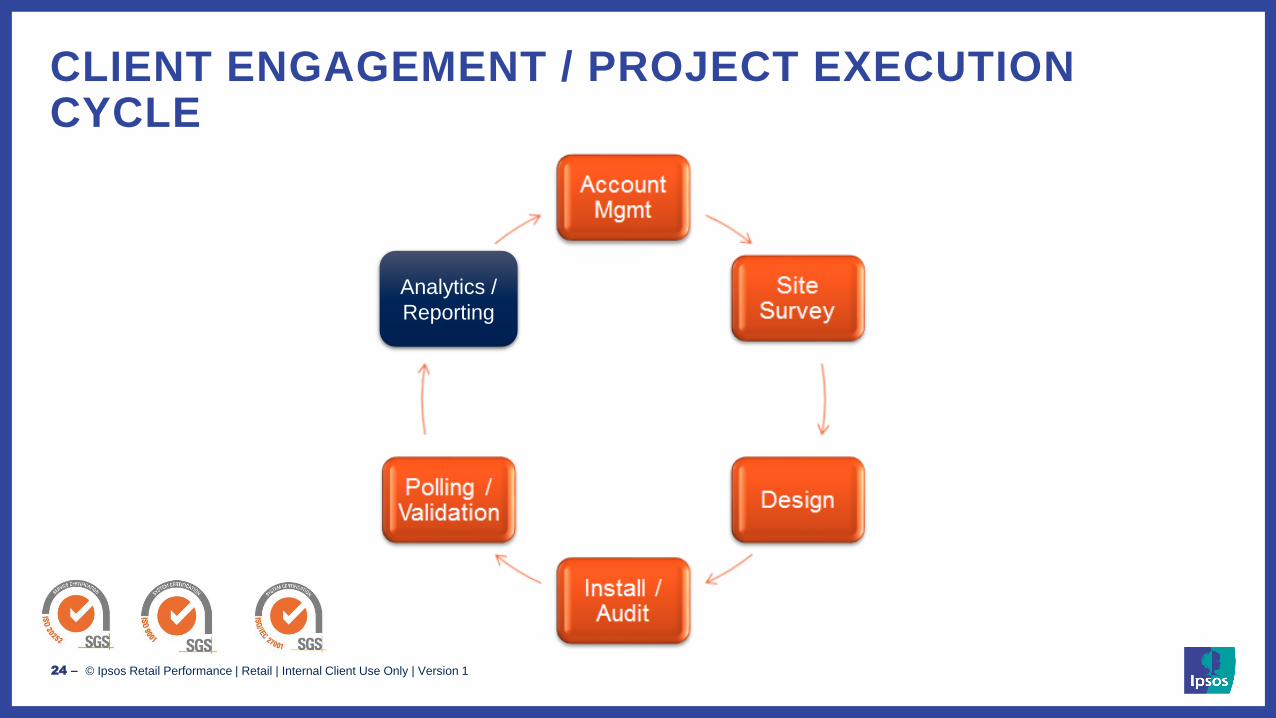
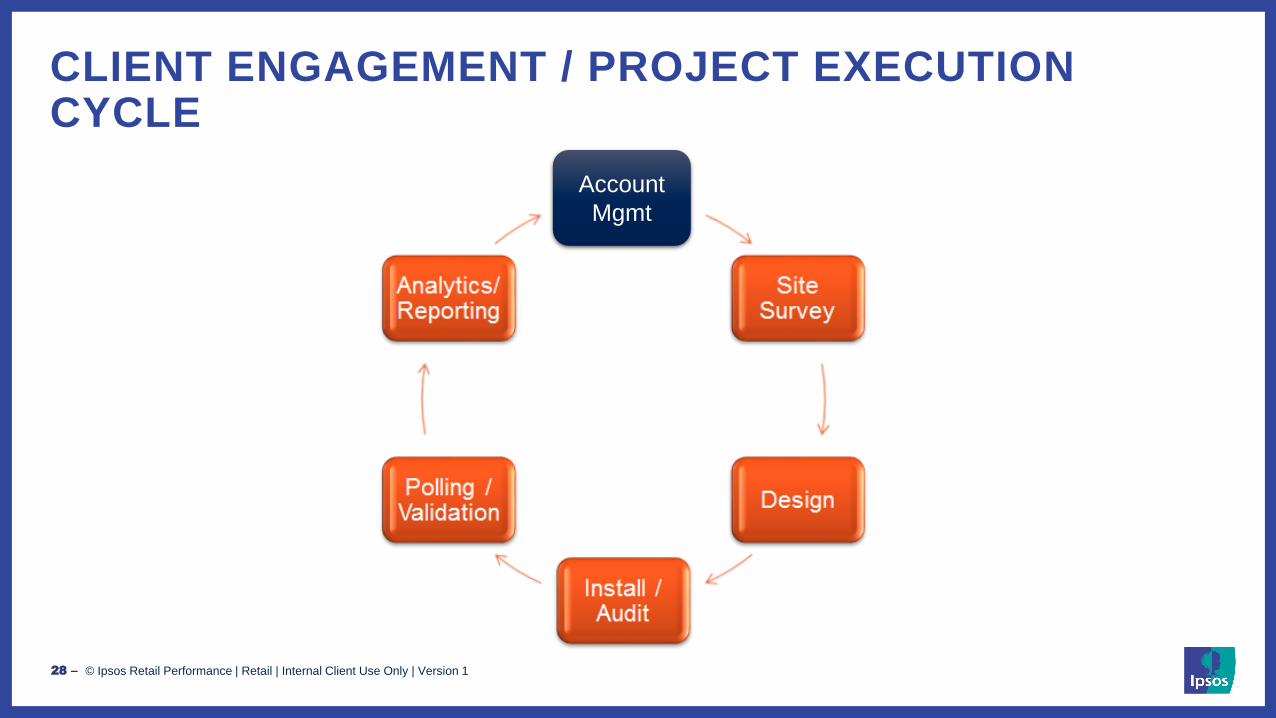
CLIENT ENGAGEMENT / PROJECT EXECUTION CYCLE
16 ‒
© Ipsos Retail Performance | Retail | Internal Client Use Only | Version 1
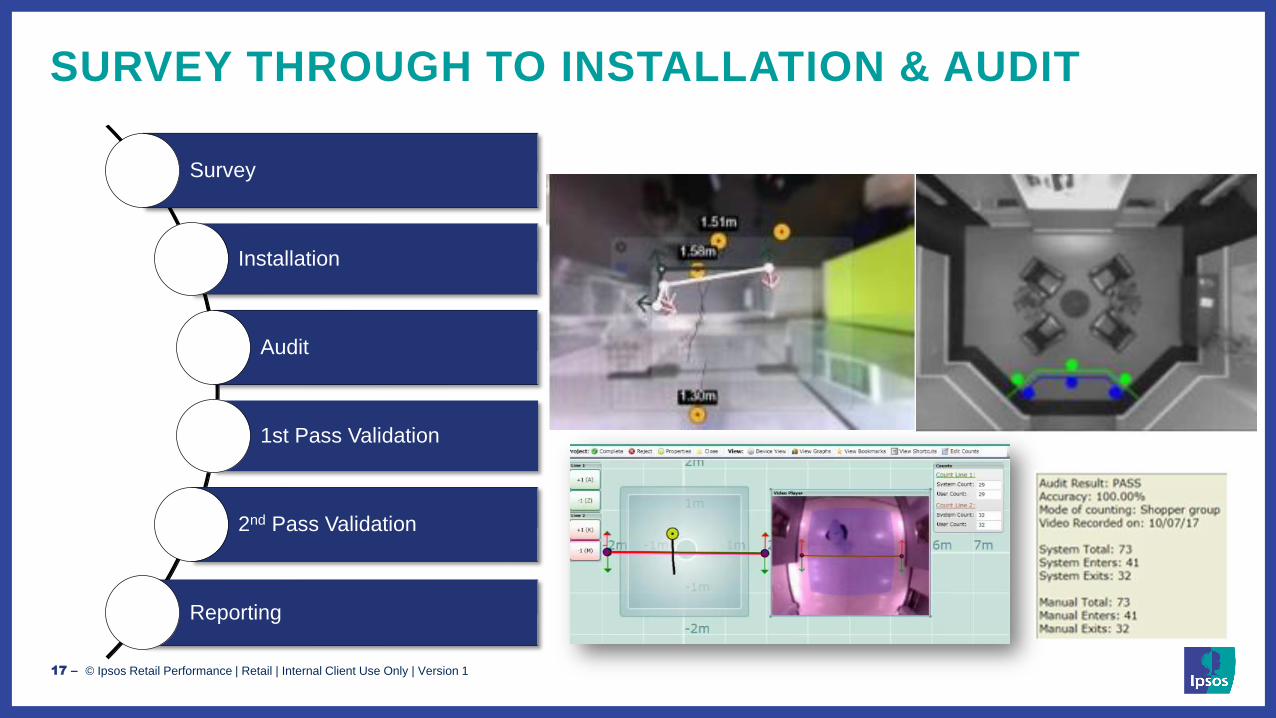
SURVEY THROUGH TO INSTALLATION & AUDIT
Survey
Installation
Audit
1st Pass Validation
2nd Pass Validation
Reporting
17 ‒
© Ipsos Retail Performance | Retail | Internal Client Use Only | Version 1
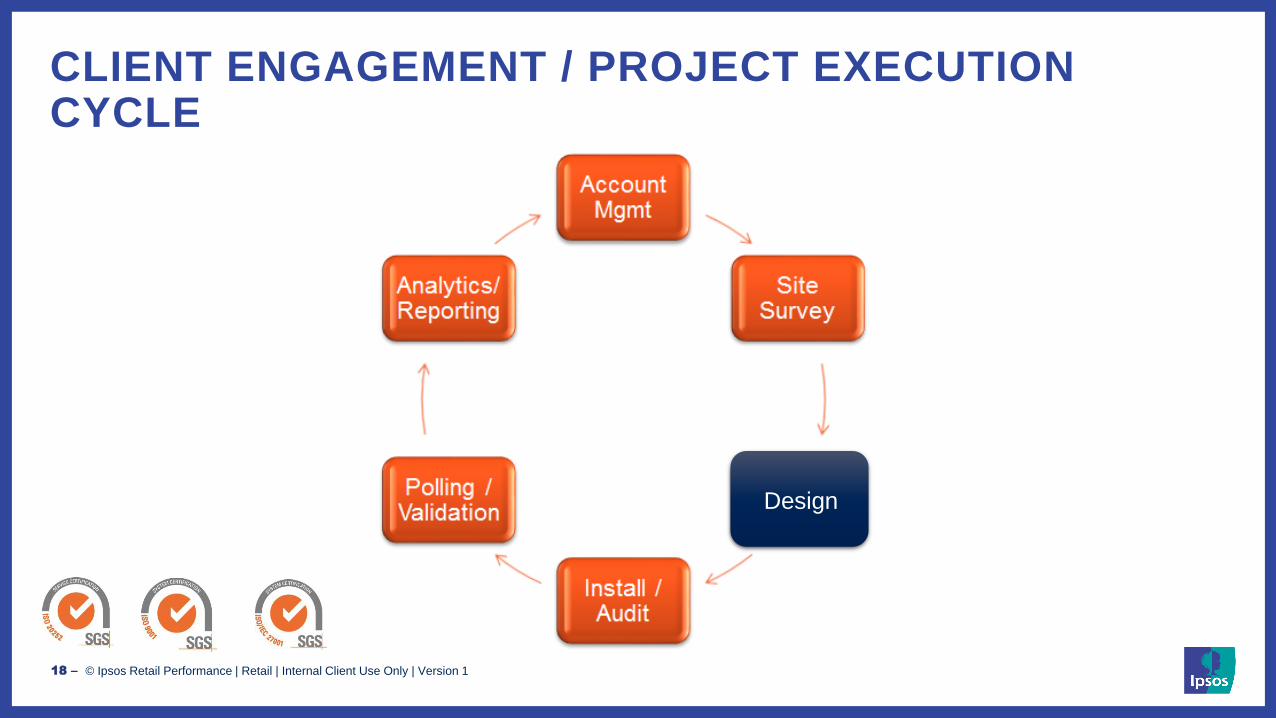
CLIENT ENGAGEMENT / PROJECT EXECUTION CYCLE
Design
18 ‒
© Ipsos Retail Performance | Retail | Internal Client Use Only | Version 1
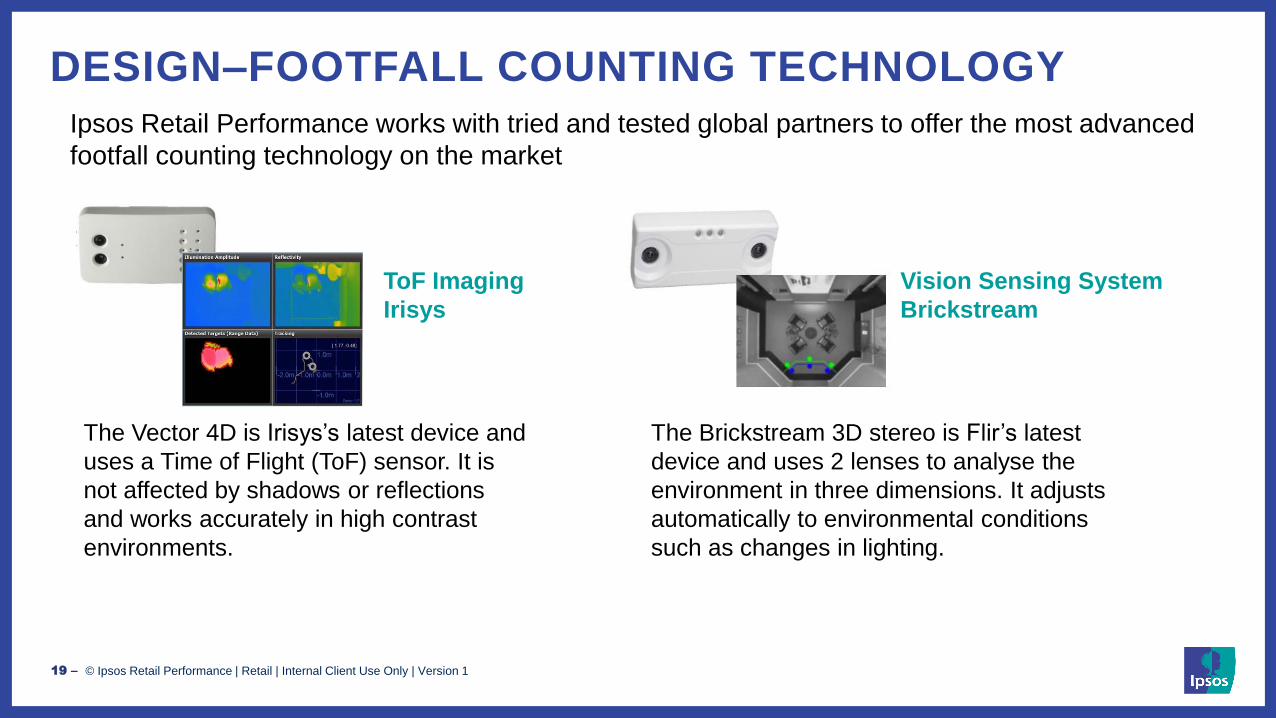
DESIGN–FOOTFALL COUNTING TECHNOLOGY
ToF Imaging
Irisys
Vision Sensing System
Brickstream
Ipsos Retail Performance works with tried and tested global partners to offer the most advanced
footfall counting technology on the market
The Vector 4D is Irisys’s latest device and
uses a Time of Flight (ToF) sensor. It is
not affected by shadows or reflections
and works accurately in high contrast
environments.
The Brickstream 3D stereo is Flir’s latest
device and uses 2 lenses to analyse the
environment in three dimensions. It adjusts
automatically to environmental conditions
such as changes in lighting.
19 ‒
© Ipsos Retail Performance | Retail | Internal Client Use Only | Version 1
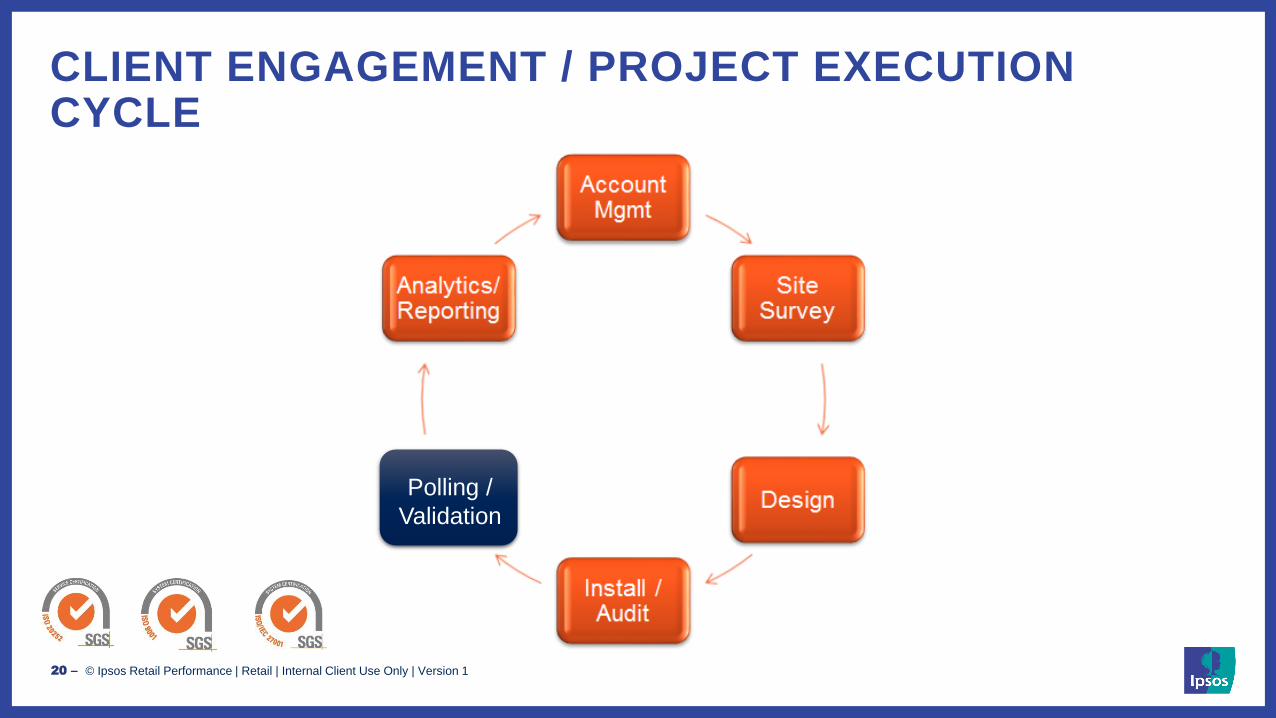
CLIENT ENGAGEMENT / PROJECT EXECUTION CYCLE
Polling /
Validation
20 ‒
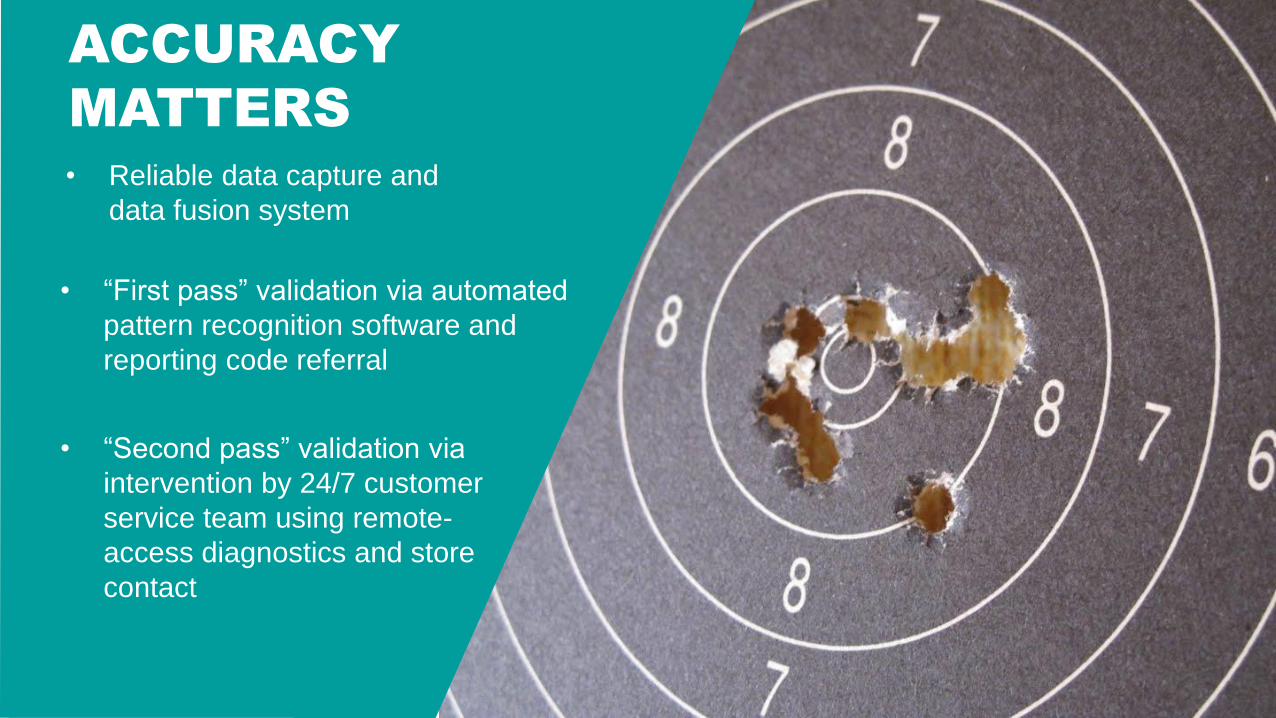
ACCURACY
MATTERS• Reliable data capture and
data fusion system
• “First pass” validation via automated
pattern recognition software and
reporting code referral
• “Second pass” validation via
intervention by 24/7 customer
service team using remote-
access diagnostics and store
contact
© Ipsos Retail Performance | Retail | Internal Client Use Only | Version 1 22 ‒
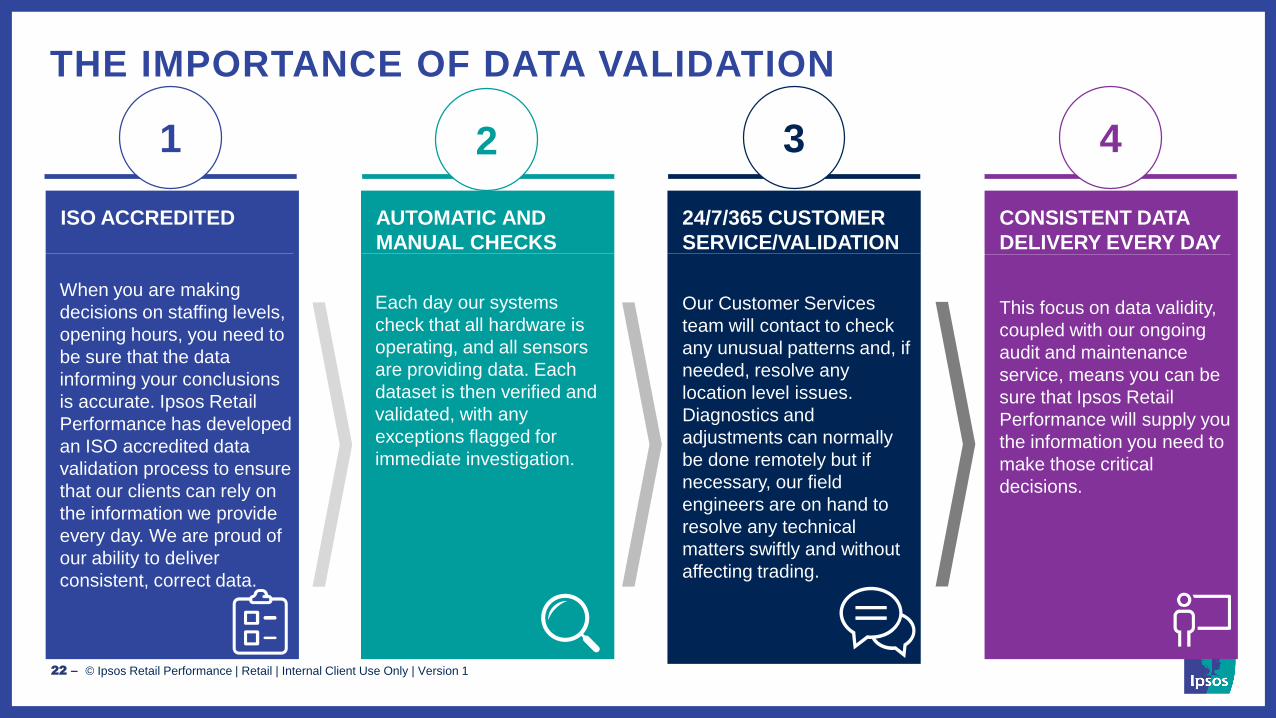
THE IMPORTANCE OF DATA VALIDATION
ISO ACCREDITED
When you are making
decisions on staffing levels,
opening hours, you need to
be sure that the data
informing your conclusions
is accurate. Ipsos Retail
Performance has developed
an ISO accredited data
validation process to ensure
that our clients can rely on
the information we provide
every day. We are proud of
our ability to deliver
consistent, correct data.
AUTOMATIC AND
MANUAL CHECKS
Each day our systems
check that all hardware is
operating, and all sensors
are providing data. Each
dataset is then verified and
validated, with any
exceptions flagged for
immediate investigation.
24/7/365 CUSTOMER
SERVICE/VALIDATION
Our Customer Services
team will contact to check
any unusual patterns and, if
needed, resolve any
location level issues.
Diagnostics and
adjustments can normally
be done remotely but if
necessary, our field
engineers are on hand to
resolve any technical
matters swiftly and without
affecting trading.
CONSISTENT DATA
DELIVERY EVERY DAY
This focus on data validity,
coupled with our ongoing
audit and maintenance
service, means you can be
sure that Ipsos Retail
Performance will supply you
the information you need to
make those critical
decisions.
1 2 3 4
© Ipsos Retail Performance | Retail | Internal Client Use Only | Version 1
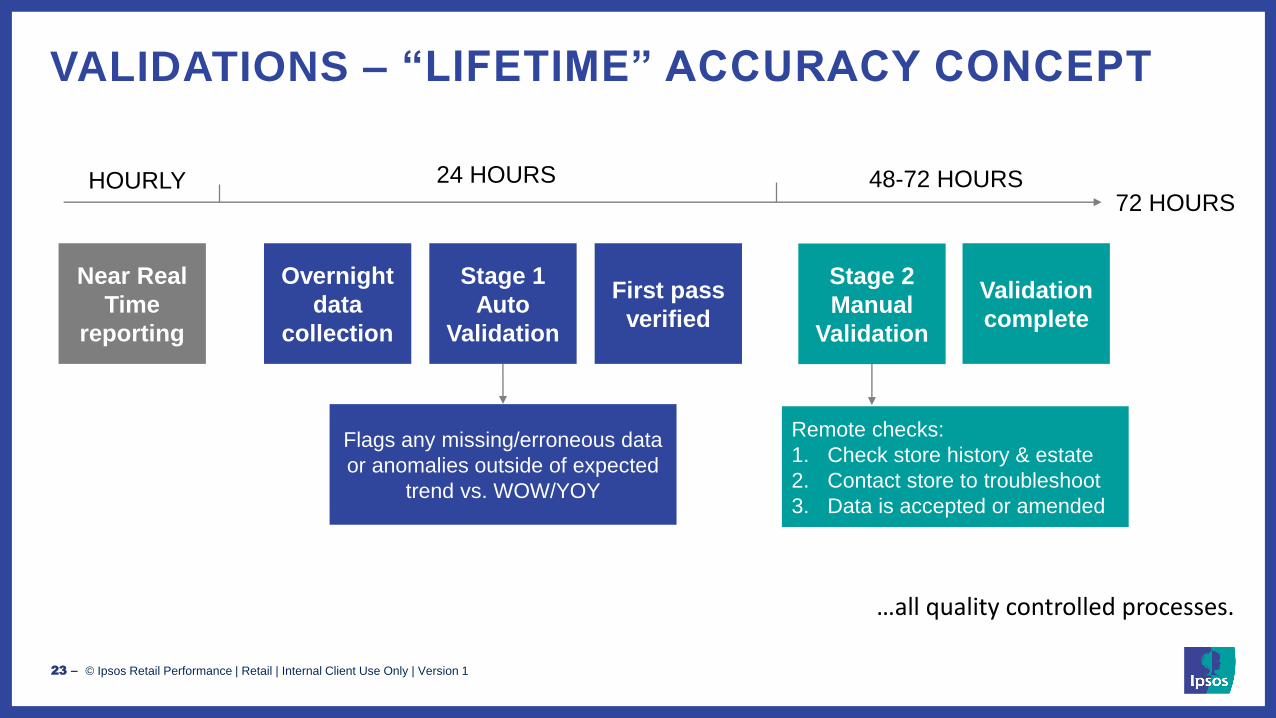
VALIDATIONS – “LIFETIME” ACCURACY CONCEPT
…all quality controlled processes.
23 ‒
Stage 1
Auto
Validation
First pass
verified
Stage 2
Manual
Validation
Validation
complete
HOURLY 24 HOURS
72 HOURS48-72 HOURS
Overnight
data
collection
Near Real
Time
reporting
Remote checks:
1. Check store history & estate
2. Contact store to troubleshoot
3. Data is accepted or amended
Flags any missing/erroneous data
or anomalies outside of expected
trend vs. WOW/YOY
© Ipsos Retail Performance | Retail | Internal Client Use Only | Version 1
CLIENT ENGAGEMENT / PROJECT EXECUTION CYCLE
Analytics /
Reporting
24 ‒
© Ipsos Retail Performance | Retail | Internal Client Use Only | Version 1
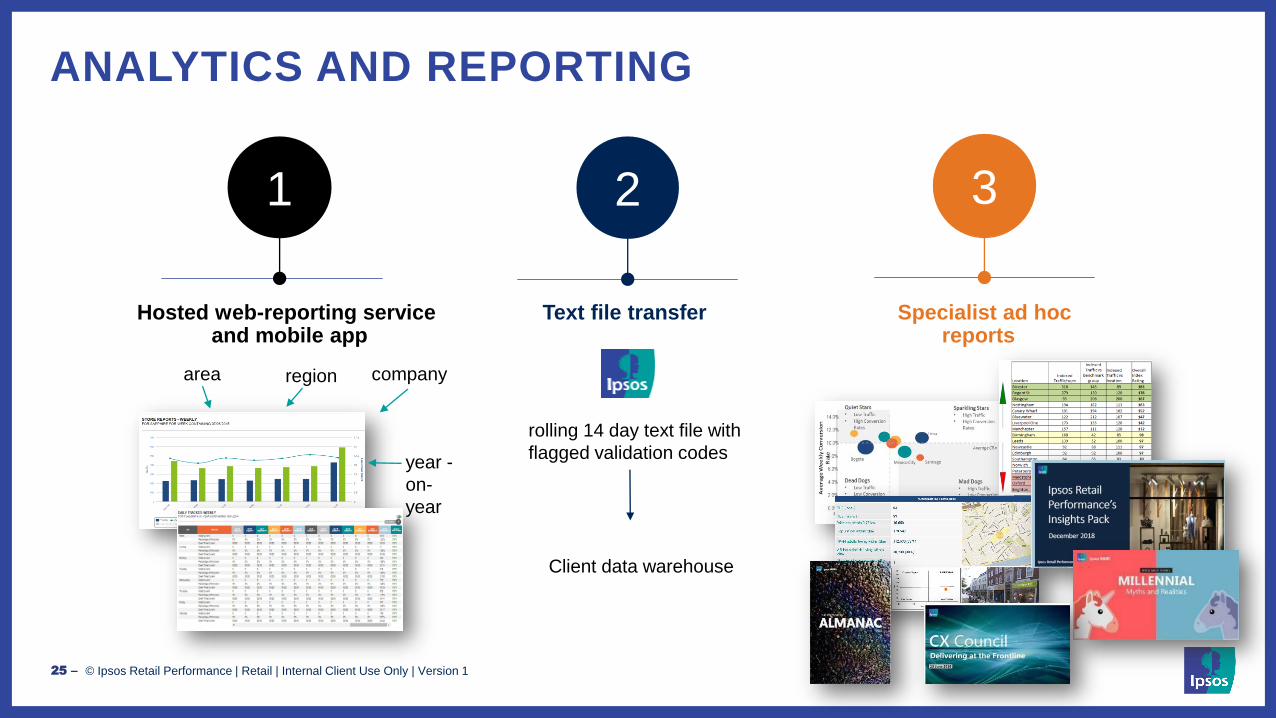
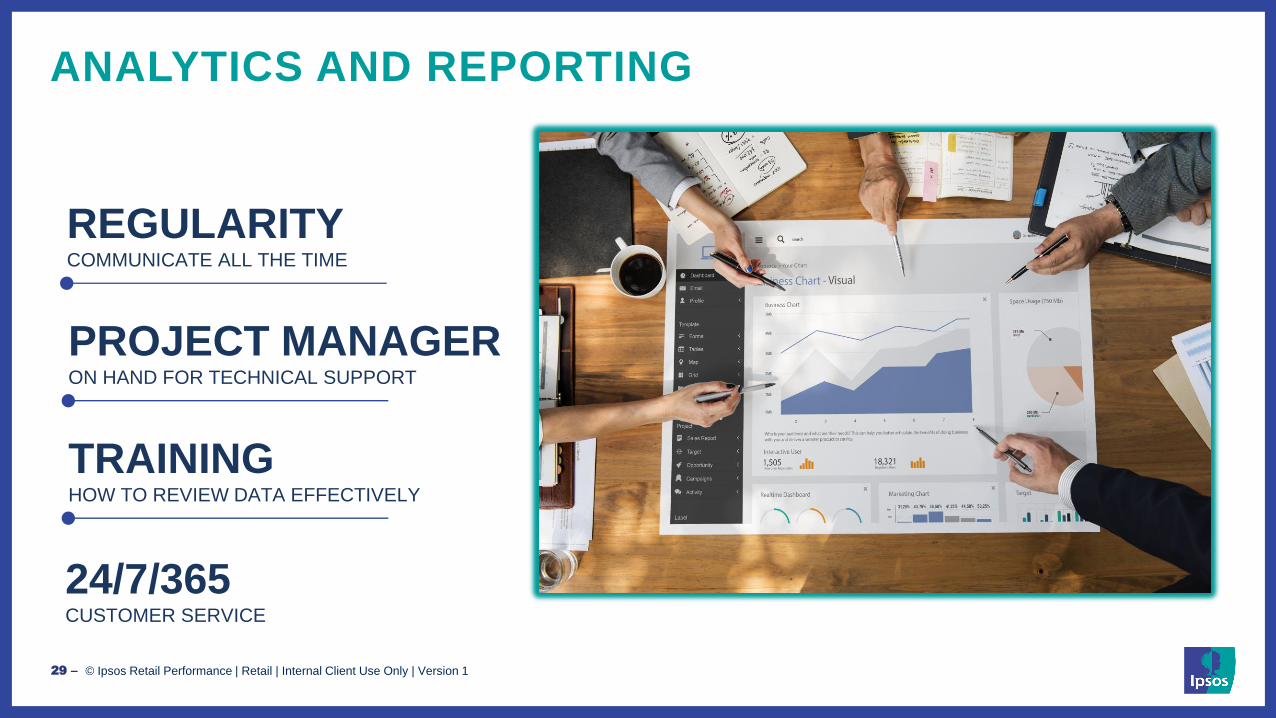
ANALYTICS AND REPORTING
Hosted web-reporting serviceand mobile app
Text file transfer Specialist ad hoc reports
1 2 3
area region company
year -
on-
year
rolling 14 day text file with
flagged validation codes
Client data warehouse
25 ‒
© Ipsos Retail Performance | Retail | Internal Client Use Only | Version 1
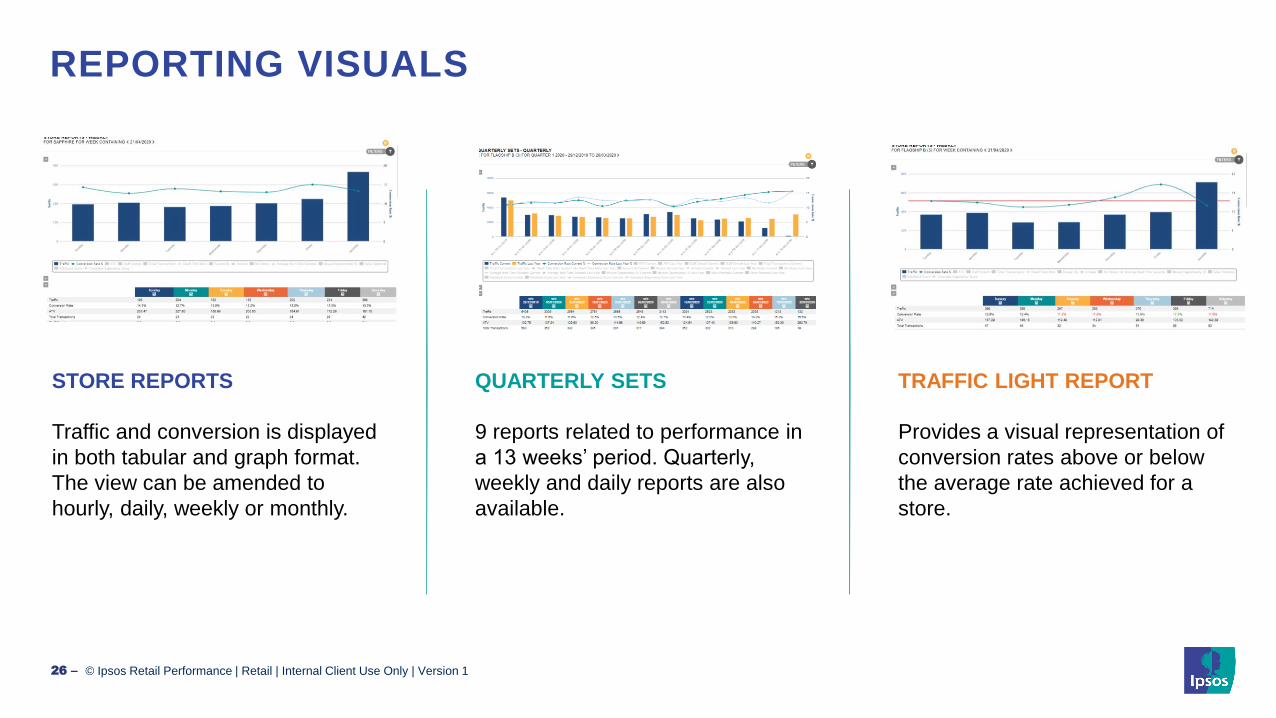
STORE REPORTS QUARTERLY SETS TRAFFIC LIGHT REPORT
Traffic and conversion is displayed
in both tabular and graph format.
The view can be amended to
hourly, daily, weekly or monthly.
9 reports related to performance in
a 13 weeks’ period. Quarterly,
weekly and daily reports are also
available.
Provides a visual representation of
conversion rates above or below
the average rate achieved for a
store.
26 ‒
REPORTING VISUALS
27 ‒
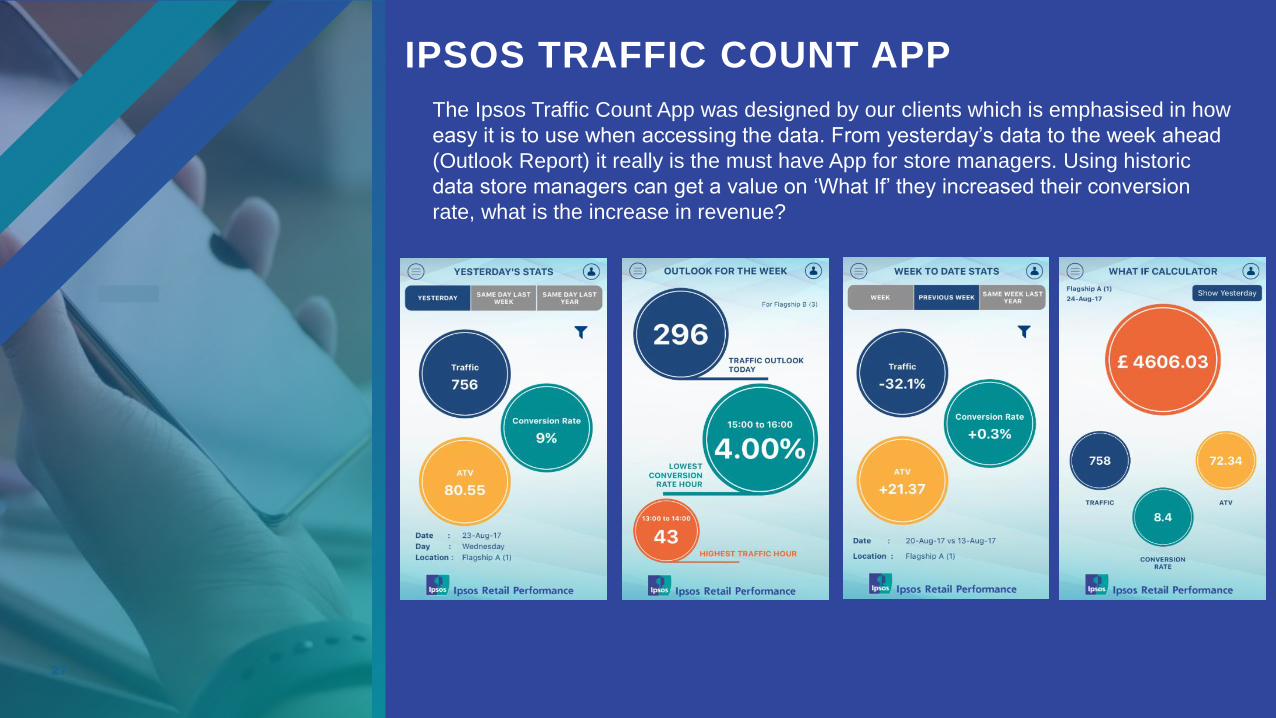
IPSOS TRAFFIC COUNT APP
The Ipsos Traffic Count App was designed by our clients which is emphasised in how
easy it is to use when accessing the data. From yesterday’s data to the week ahead
(Outlook Report) it really is the must have App for store managers. Using historic
data store managers can get a value on ‘What If’ they increased their conversion
rate, what is the increase in revenue?
© Ipsos Retail Performance | Retail | Internal Client Use Only | Version 1
CLIENT ENGAGEMENT / PROJECT EXECUTION CYCLE
Account
Mgmt
28 ‒
© Ipsos Retail Performance | Retail | Internal Client Use Only | Version 1
ANALYTICS AND REPORTING
REGULARITYCOMMUNICATE ALL THE TIME
PROJECT MANAGERON HAND FOR TECHNICAL SUPPORT
TRAINING HOW TO REVIEW DATA EFFECTIVELY
24/7/365CUSTOMER SERVICE
29 ‒
© Ipsos Retail Performance | Retail | Internal Client Use Only | Version 1
“knowing our predicted hourly footfall levels, transformed
our workforce scheduling, we are now able to match sales
teams to customers to really optimise conversion”.
David Botfield, Retail Operations Director
EE
30 ‒

© Ipsos Retail Performance | Retail | Internal Client Use Only | Version 1 31 ‒
© Ipsos Retail Performance | Retail | Internal Client Use Only | Version 1
SOCIAL DISTANCING LIVE OCCUPANCY
32 ‒
© Ipsos Retail Performance | Retail | Internal Client Use Only | Version 1
33
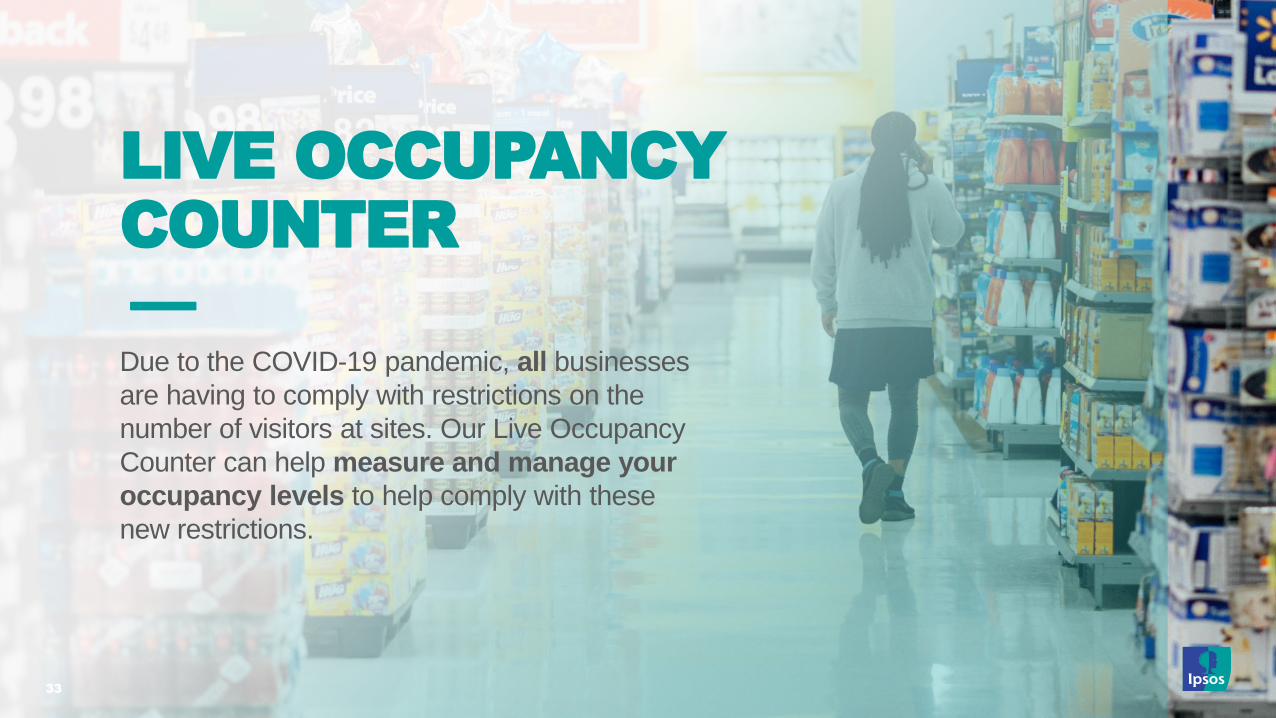
Due to the COVID-19 pandemic, all businesses
are having to comply with restrictions on the
number of visitors at sites. Our Live Occupancy
Counter can help measure and manage your
occupancy levels to help comply with these
new restrictions.
LIVE OCCUPANCY COUNTER
—
© Ipsos Retail Performance | Retail | Internal Client Use Only | Version 1 34 ‒
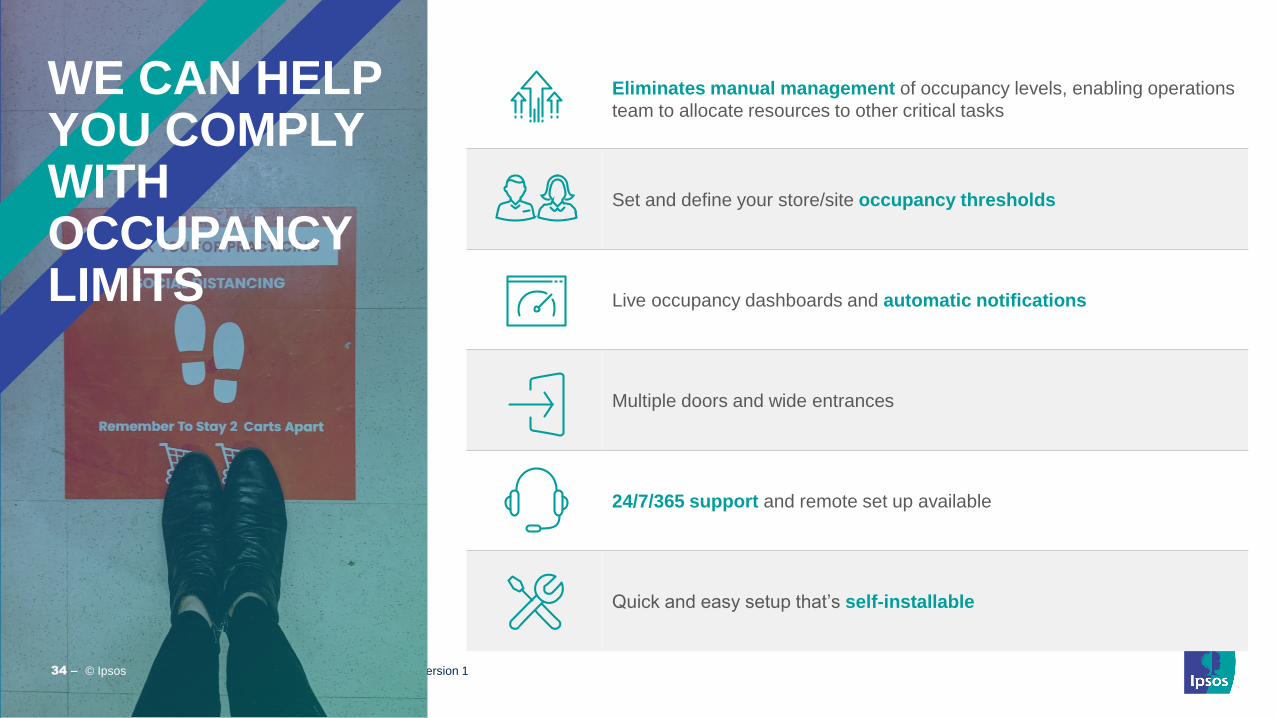
WE CAN HELP YOU COMPLY WITH OCCUPANCY LIMITS
34 ‒ © Ipsos
Eliminates manual management of occupancy levels, enabling operations
team to allocate resources to other critical tasks
Set and define your store/site occupancy thresholds
Live occupancy dashboards and automatic notifications
Multiple doors and wide entrances
24/7/365 support and remote set up available
Quick and easy setup that’s self-installable
© Ipsos Retail Performance | Retail | Internal Client Use Only | Version 1 35 ‒
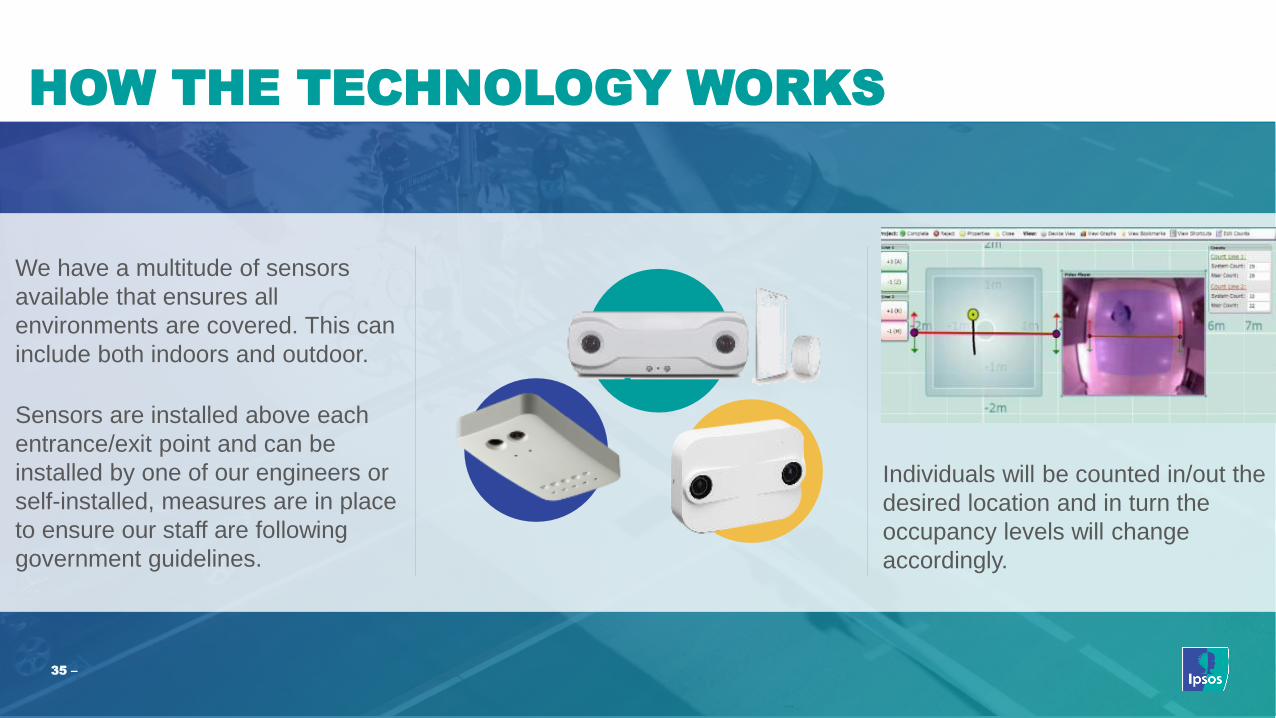
HOW THE TECHNOLOGY WORKS
We have a multitude of sensors
available that ensures all
environments are covered. This can
include both indoors and outdoor.
Sensors are installed above each
entrance/exit point and can be
installed by one of our engineers or
self-installed, measures are in place
to ensure our staff are following
government guidelines.
Individuals will be counted in/out the
desired location and in turn the
occupancy levels will change
accordingly.
© Ipsos Retail Performance | Retail | Internal Client Use Only | Version 1
We understand that a Social Distancing solution will need to be
installed in a wide range of locations; whether that be for a retail
store, an office building, toilet facilities, staff rooms or warehouses.
Which is why we have developed 3 options for you.
The options range from having a front of house display for a single
entrance with no network connectivity (option 1), multiple entrances
that require network access (option 2) through to full reporting, front
of house display and audit process (option 3)
To make things easier we have detailed each option in detail
before…
36
What are my options?
© Ipsos Retail Performance | Retail | Internal Client Use Only | Version 1 37 ‒
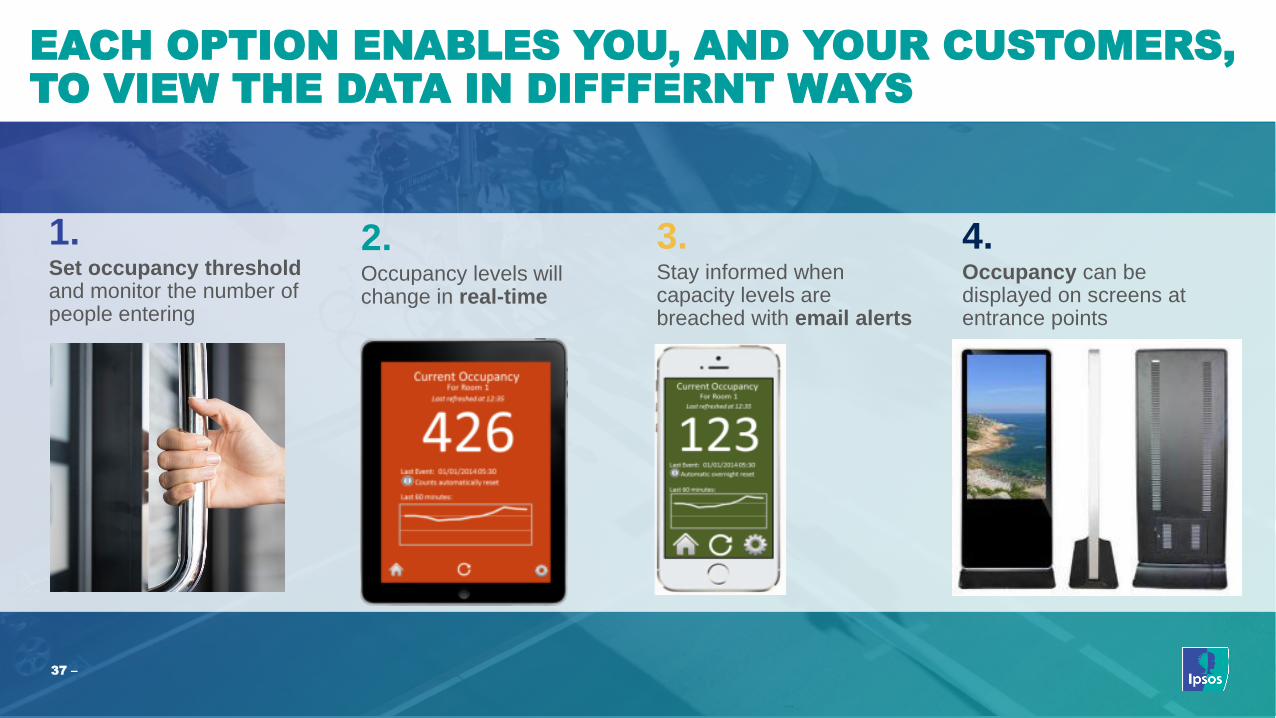
EACH OPTION ENABLES YOU, AND YOUR CUSTOMERS, TO VIEW THE DATA IN DIFFFERNT WAYS
1.Set occupancy threshold and monitor the number of people entering
2.Occupancy levels will change in real-time
3.Stay informed when capacity levels are breached with email alerts
4.Occupancy can be displayed on screens at entrance points
© Ipsos Retail Performance | Retail | Internal Client Use Only | Version 1 38 ‒
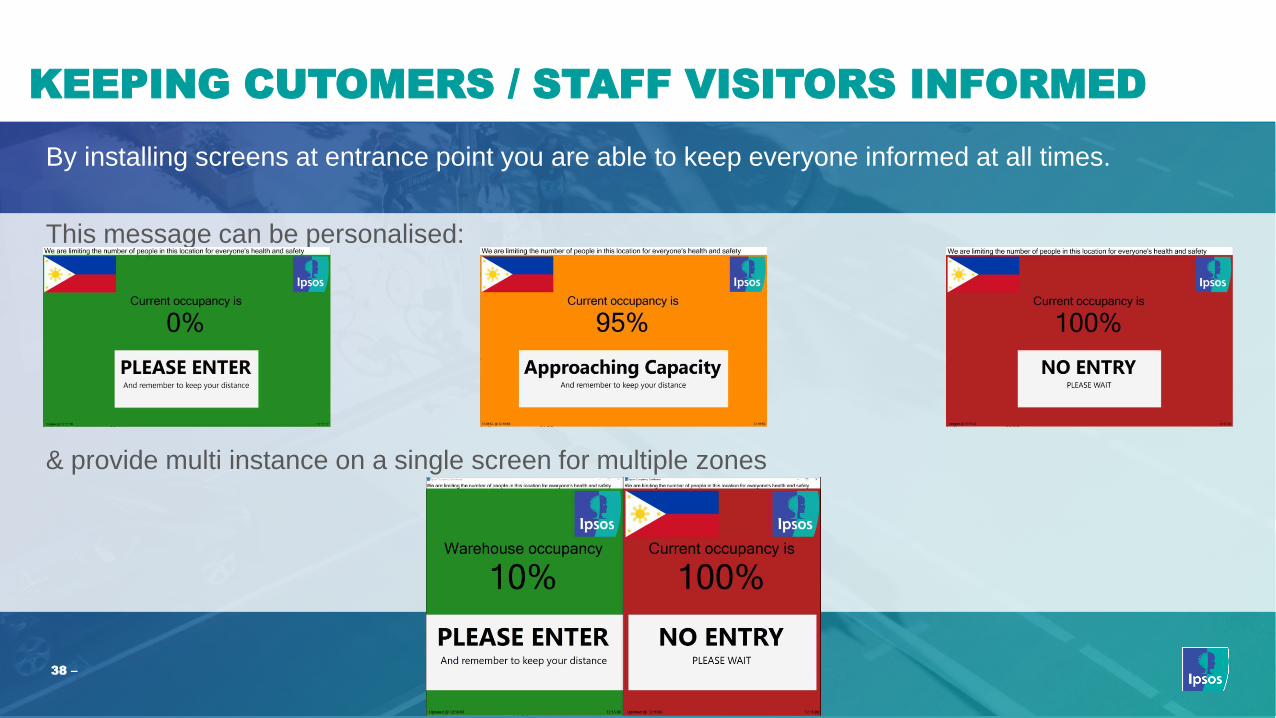
KEEPING CUTOMERS / STAFF VISITORS INFORMED
By installing screens at entrance point you are able to keep everyone informed at all times.
This message can be personalised:
& provide multi instance on a single screen for multiple zones
© Ipsos Retail Performance | Retail | Internal Client Use Only | Version 1
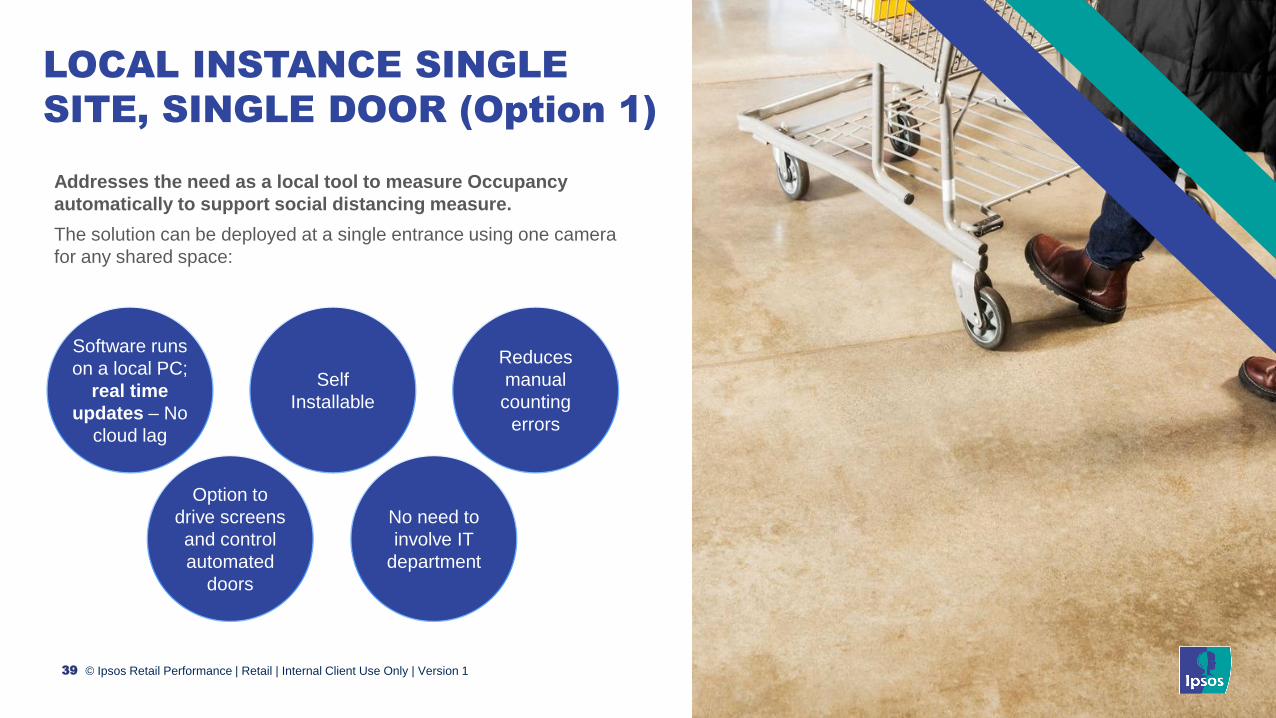
Addresses the need as a local tool to measure Occupancy
automatically to support social distancing measure.
The solution can be deployed at a single entrance using one camera
for any shared space:
39
Software runs
on a local PC;
real time
updates – No
cloud lag
Self
Installable
Reduces
manual
counting
errors
Option to
drive screens
and control
automated
doors
No need to
involve IT
department
LOCAL INSTANCE SINGLE
SITE, SINGLE DOOR (Option 1)
© Ipsos Retail Performance | Retail | Internal Client Use Only | Version 1
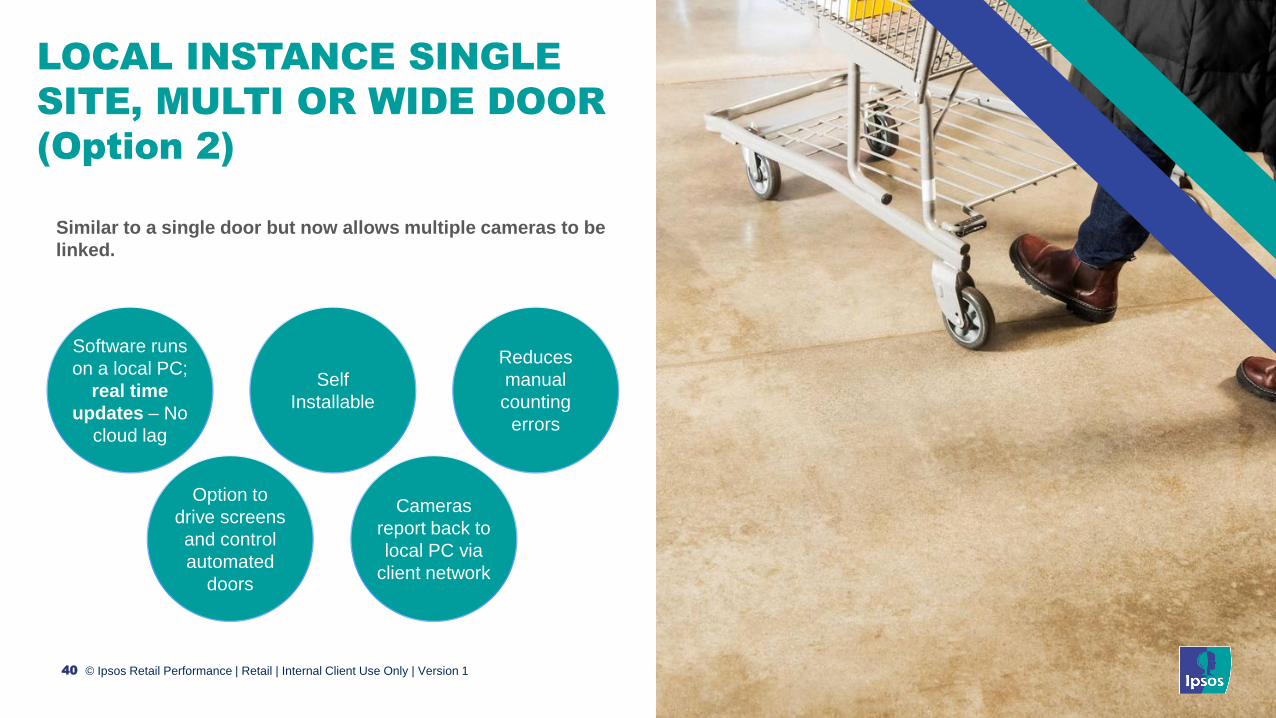
Similar to a single door but now allows multiple cameras to be
linked.
40
Software runs
on a local PC;
real time
updates – No
cloud lag
Self
Installable
Reduces
manual
counting
errors
Option to
drive screens
and control
automated
doors
Cameras
report back to
local PC via
client network
LOCAL INSTANCE SINGLE
SITE, MULTI OR WIDE DOOR
(Option 2)
© Ipsos Retail Performance | Retail | Internal Client Use Only | Version 1
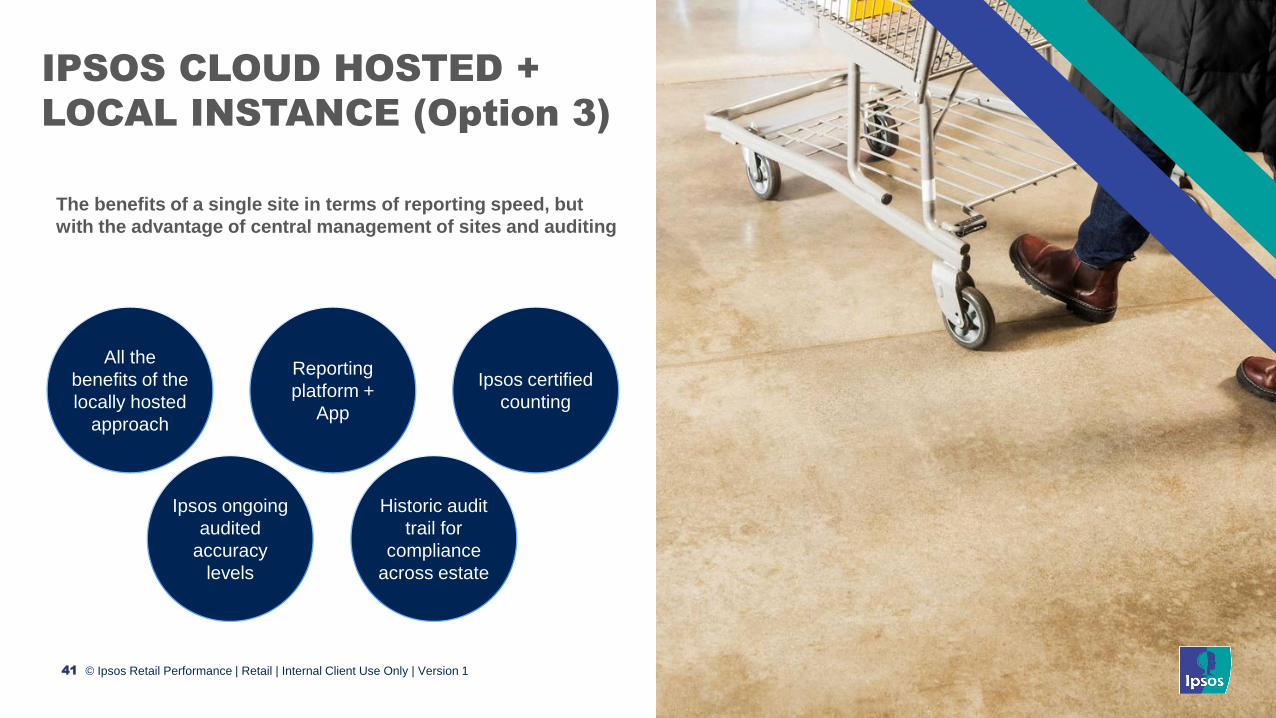
The benefits of a single site in terms of reporting speed, but
with the advantage of central management of sites and auditing
41
All the
benefits of the
locally hosted
approach
Reporting
platform +
App
Ipsos certified
counting
Ipsos ongoing
audited
accuracy
levels
Historic audit
trail for
compliance
across estate
IPSOS CLOUD HOSTED +
LOCAL INSTANCE (Option 3)
© 2020 Ipsos. All rights reserved. Contains Ipsos' Confidential
and Proprietary information and may not be disclosed or
reproduced without the prior written consent of Ipsos.
CHANNEL PERFORMANCE:
Research solutions for improving performance across
all customer touchpoints to ensure success during and
long after the COVID-19 crisis
© Ipsos Retail Performance | Retail | Internal Client Use Only | Version 1
43
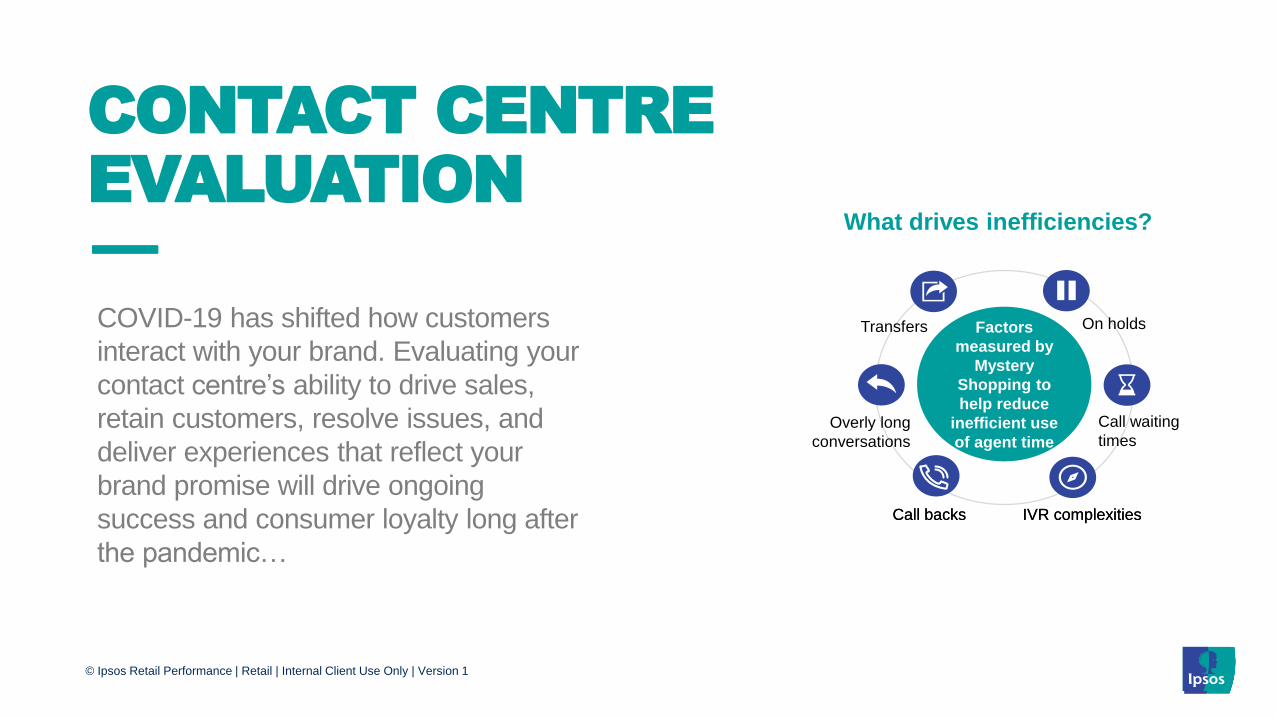
CONTACT CENTRE EVALUATION—COVID-19 has shifted how customers
interact with your brand. Evaluating your
contact centre’s ability to drive sales,
retain customers, resolve issues, and
deliver experiences that reflect your
brand promise will drive ongoing
success and consumer loyalty long after
the pandemic…
Call backs IVR complexitiesCall backs
Overly long
conversations
Transfers On holds
Call waiting
times
IVR complexities
Factors
measured by
Mystery
Shopping to
help reduce
inefficient use
of agent time
What drives inefficiencies?
© Ipsos Retail Performance | Retail | Internal Client Use Only | Version 1
44
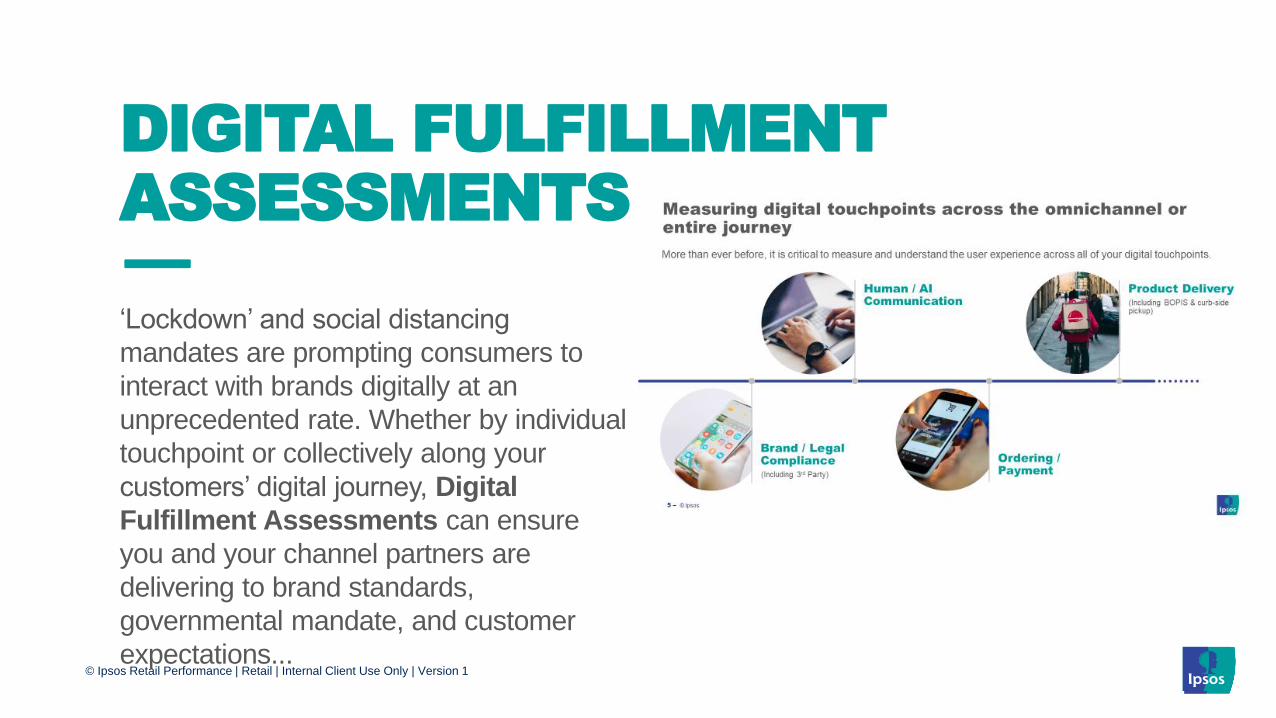
DIGITAL FULFILLMENT ASSESSMENTS—‘Lockdown’ and social distancing
mandates are prompting consumers to
interact with brands digitally at an
unprecedented rate. Whether by individual
touchpoint or collectively along your
customers’ digital journey, Digital
Fulfillment Assessments can ensure
you and your channel partners are
delivering to brand standards,
governmental mandate, and customer
expectations...
© Ipsos Retail Performance | Retail | Internal Client Use Only | Version 1
45
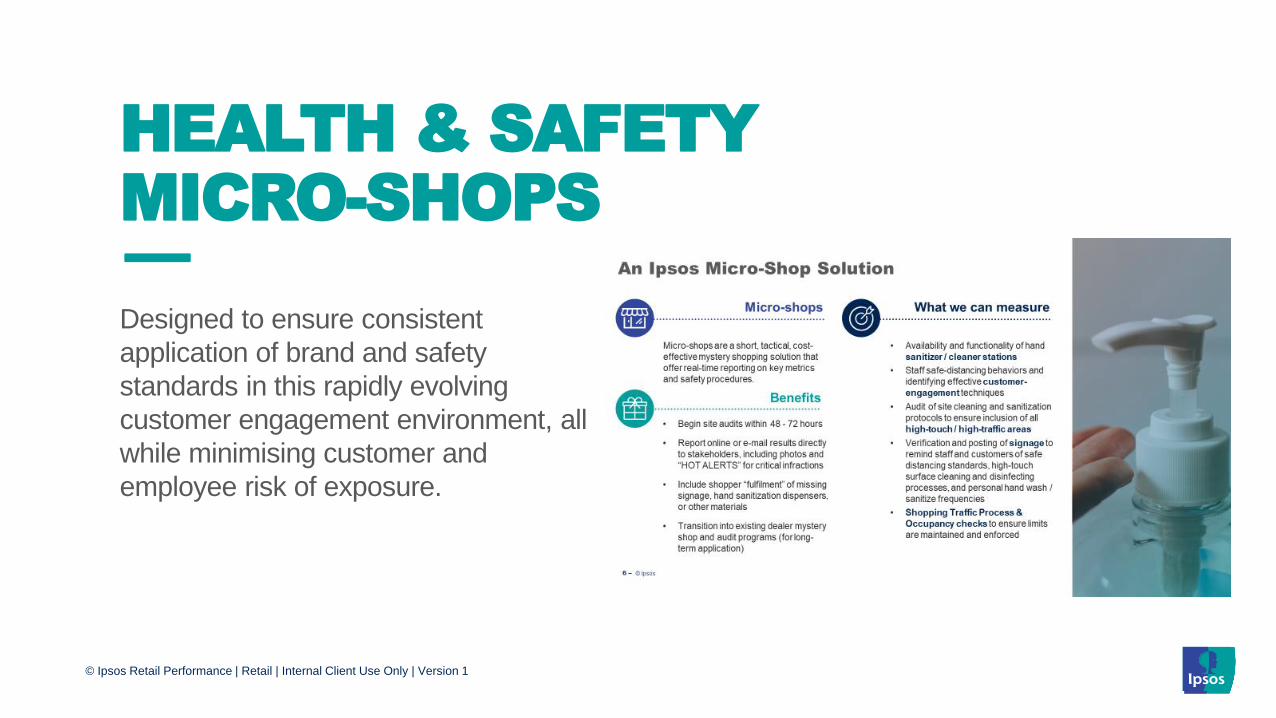
Designed to ensure consistent
application of brand and safety
standards in this rapidly evolving
customer engagement environment, all
while minimising customer and
employee risk of exposure.
HEALTH & SAFETY MICRO-SHOPS—
© Ipsos Retail Performance | Retail | Internal Client Use Only | Version 1
46
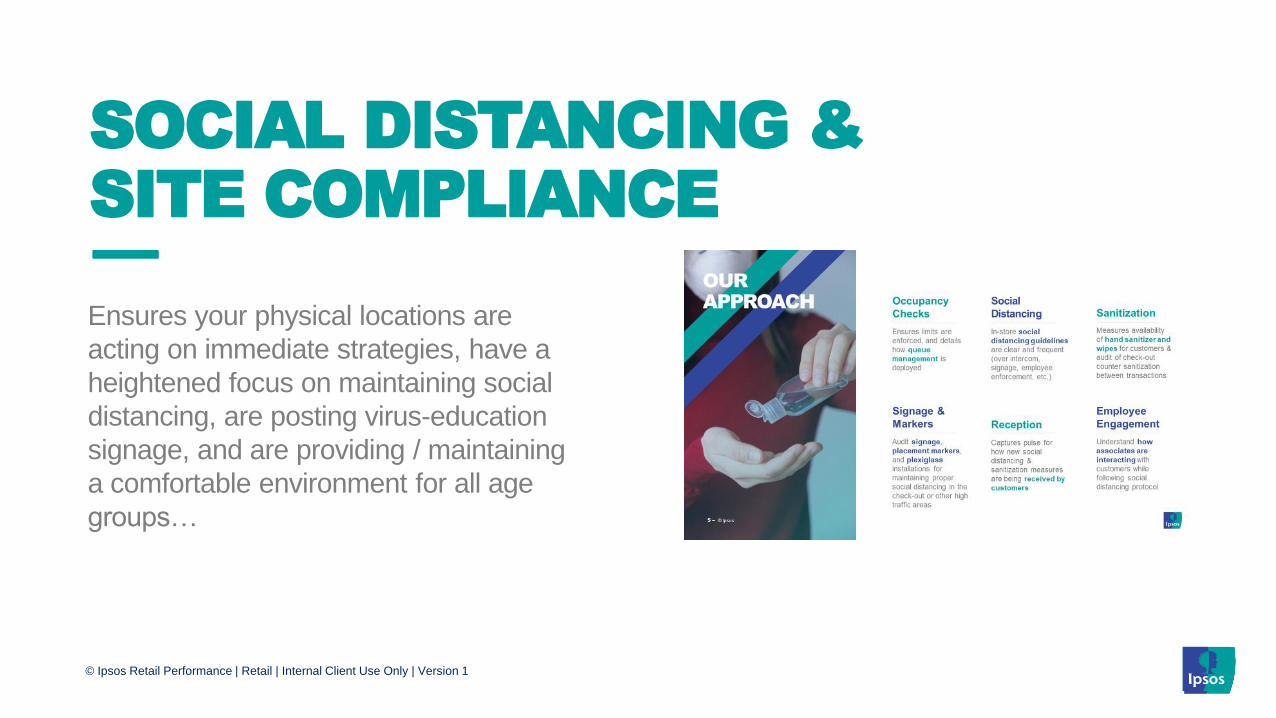
Ensures your physical locations are
acting on immediate strategies, have a
heightened focus on maintaining social
distancing, are posting virus-education
signage, and are providing / maintaining
a comfortable environment for all age
groups…
SOCIAL DISTANCING & SITE COMPLIANCE—
© Ipsos Retail Performance | Retail | Internal Client Use Only | Version 1
47
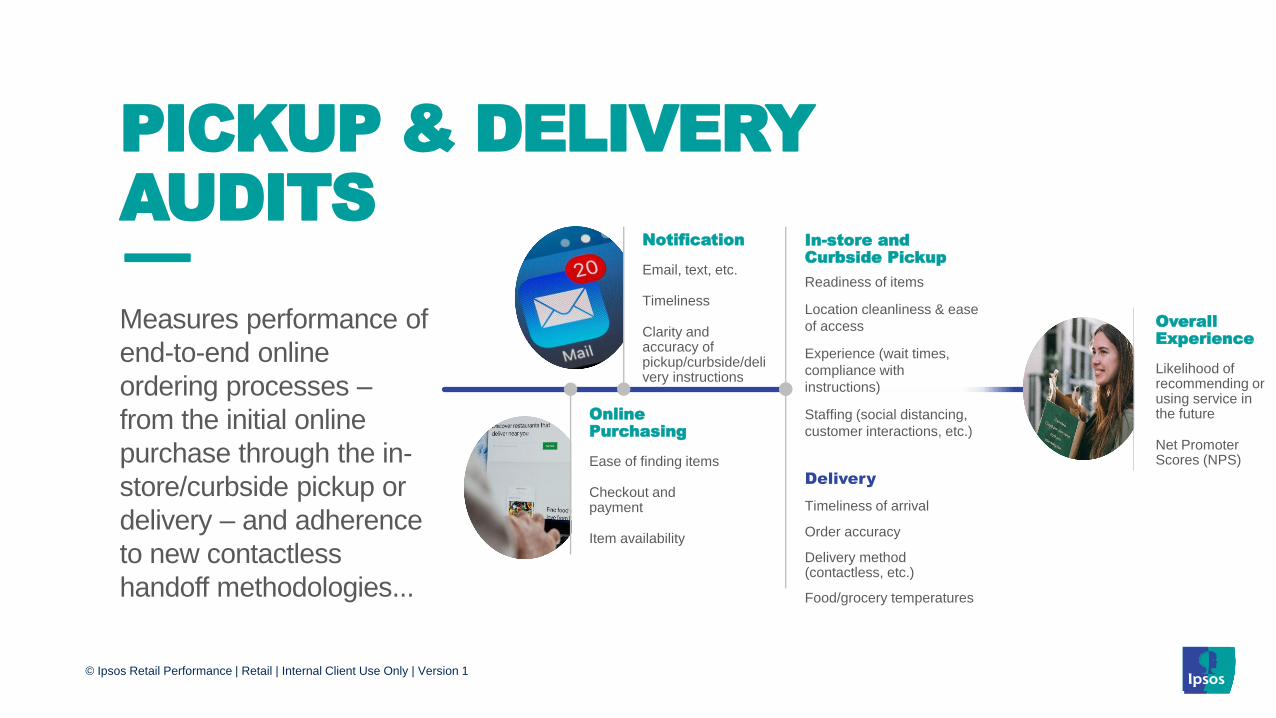
Measures performance of
end-to-end online
ordering processes –
from the initial online
purchase through the in-
store/curbside pickup or
delivery – and adherence
to new contactless
handoff methodologies...
PICKUP & DELIVERY AUDITS— Notification
Email, text, etc.
Timeliness
Clarity and accuracy of pickup/curbside/delivery instructions
Online Purchasing
Ease of finding items
Checkout and payment
Item availability
In-store and Curbside Pickup
Readiness of items
Location cleanliness & ease
of access
Experience (wait times,
compliance with
instructions)
Staffing (social distancing,
customer interactions, etc.)
Delivery
Timeliness of arrival
Order accuracy
Delivery method (contactless, etc.)
Food/grocery temperatures
Overall Experience
Likelihood of recommending or using service in the future
Net Promoter Scores (NPS)

THANK YOU & QUESTIONS

© Ipsos Retail Performance | Retail | Internal Client Use Only | Version 1 50 ‒
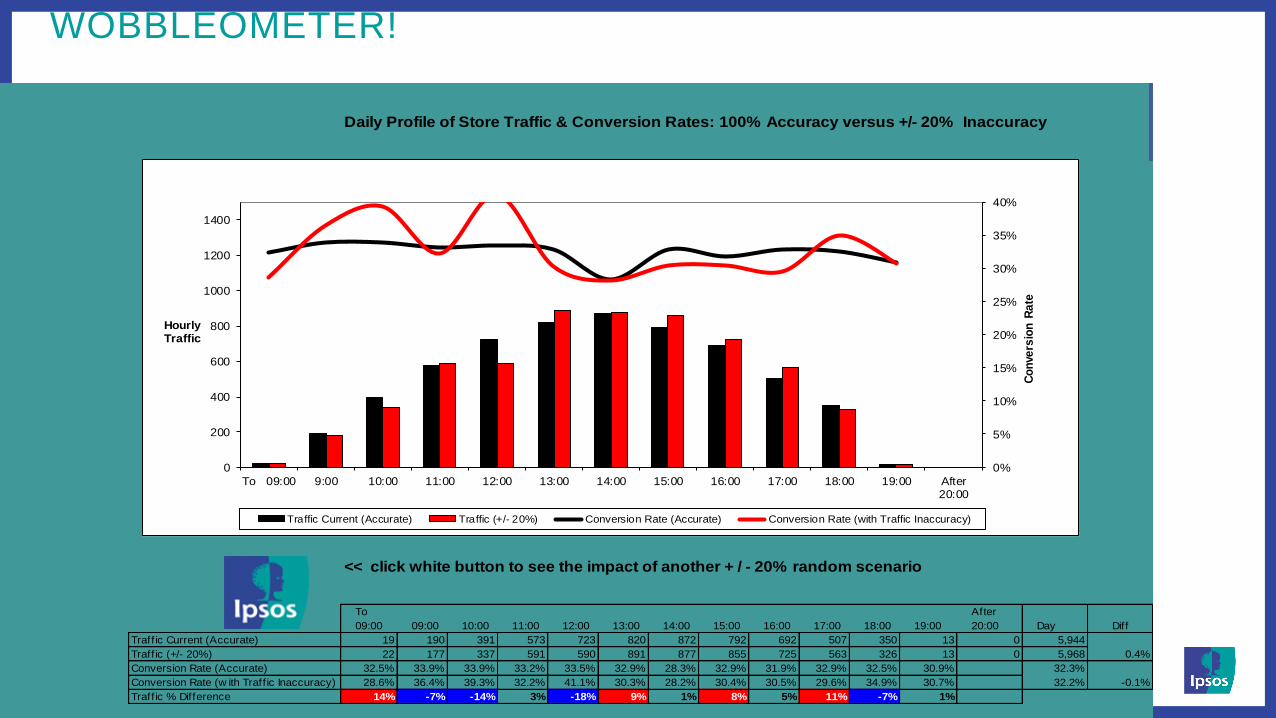
WOBBLEOMETER!
Daily Profile of Store Traffic & Conversion Rates: 100% Accuracy versus +/- 20% Inaccuracy
<< click white button to see the impact of another + / - 20% random scenario
To
09:00 09:00 10:00 11:00 12:00 13:00 14:00 15:00 16:00 17:00 18:00 19:00
After
20:00 Day Diff
Traff ic Current (Accurate) 19 190 391 573 723 820 872 792 692 507 350 13 0 5,944
Traff ic (+/- 20%) 22 177 337 591 590 891 877 855 725 563 326 13 0 5,968 0.4%
Conversion Rate (Accurate) 32.5% 33.9% 33.9% 33.2% 33.5% 32.9% 28.3% 32.9% 31.9% 32.9% 32.5% 30.9% 32.3%
Conversion Rate (w ith Traff ic Inaccuracy) 28.6% 36.4% 39.3% 32.2% 41.1% 30.3% 28.2% 30.4% 30.5% 29.6% 34.9% 30.7% 32.2% -0.1%
Traffic % Difference 14% -7% -14% 3% -18% 9% 1% 8% 5% 11% -7% 1%
0%
5%
10%
15%
20%
25%
30%
35%
40%
0
200
400
600
800
1000
1200
1400
To 09:00 9:00 10:00 11:00 12:00 13:00 14:00 15:00 16:00 17:00 18:00 19:00 After20:00
Co
nve
rsio
n R
ate
HourlyTraffic
Traffic Current (Accurate) Traffic (+/- 20%) Conversion Rate (Accurate) Conversion Rate (with Traffic Inaccuracy)
© Ipsos Retail Performance | Retail | Internal Client Use Only | Version 1
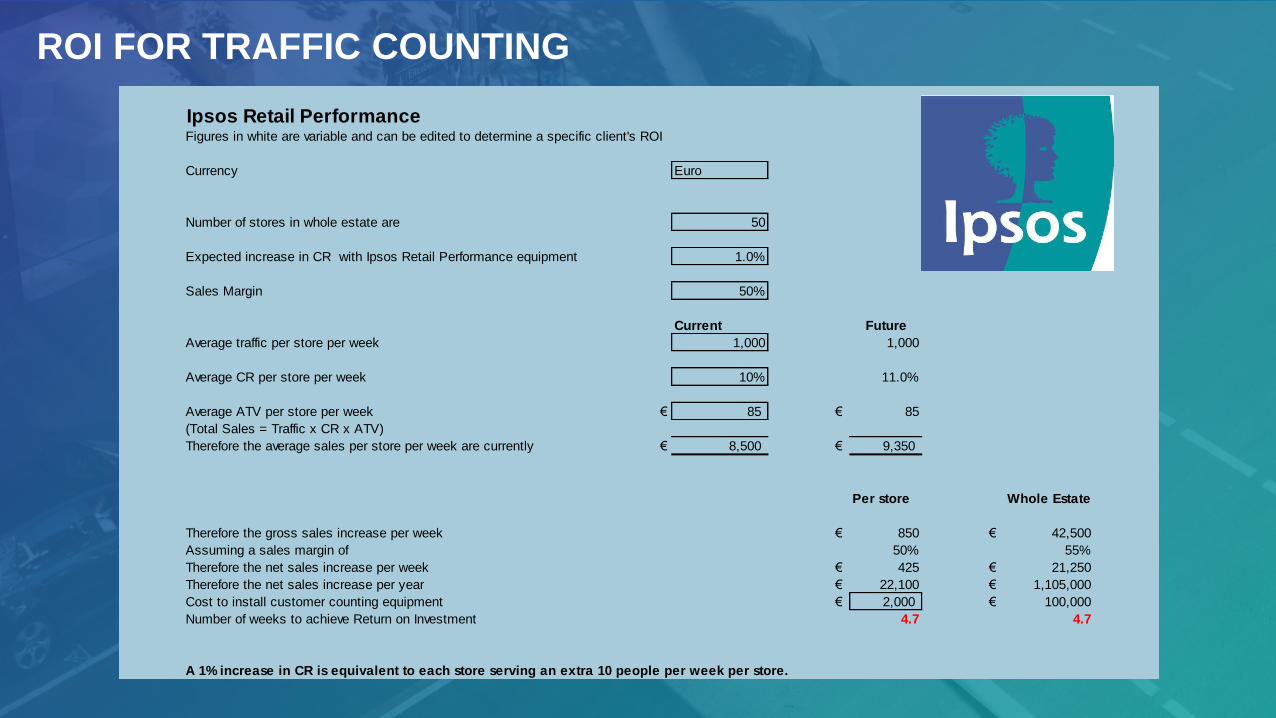
Euro
Pounds SterlingIpsos Retail Performance Dollar Figures in white are variable and can be edited to determine a specific client's ROI
Currency Euro
Number of stores in whole estate are 50
Expected increase in CR with Ipsos Retail Performance equipment 1.0%
Sales Margin 50%
Current Future
Average traffic per store per week 1,000 1,000
Average CR per store per week 10% 11.0%
Average ATV per store per week € 85 € 85
(Total Sales = Traffic x CR x ATV)
Therefore the average sales per store per week are currently € 8,500 € 9,350
Per store Whole Estate
Therefore the gross sales increase per week € 850 € 42,500
Assuming a sales margin of 50% 55%
Therefore the net sales increase per week € 425 € 21,250
Therefore the net sales increase per year € 22,100 € 1,105,000
Cost to install customer counting equipment € 2,000 € 100,000
Number of weeks to achieve Return on Investment 4.7 4.7
A 1% increase in CR is equivalent to each store serving an extra 10 people per week per store.
ROI FOR TRAFFIC COUNTING