Embed Size (px)
Citation preview
Is biofuel policy harming biodiversity in Europe?
J E A N N E T T E E G G E R S *, K A T J A T R O L T Z S C H *, A L E S S A N D R A FA L C U C C I w , L U I G I
M A I O R A N O w , P E T E R H . V E R B U R G z, E R I K F R A M S T A D § , G E R A L D L O U E T T E } ,
D I R K M A E S } k, S Z A B O L C S N A G Y **, W I M O Z I N G A w w and B E N D E L B A E R E zz*European Forest Institute, Torikatu 34, 80100 Joensuu, Finland, wDepartment of Animal and Human Biology, Sapienza University
of Rome, Viale, dell’Universita 32, I-00185 Rome, Italy, zLand Dynamics Group, Wageningen University, PO Box 47, 6700 AA
Wageningen, The Netherlands, §Norwegian Institute for Nature Research, Gaustadalleen 21, N-0349 Oslo, Norway, }Research
Institute for Nature and Forest, Kliniekstraat 25, B-1070 Brussels, Belgium, kButterfly Conservation Europe, PO Box 506, NL-6700
AM Wageningen, The Netherlands, **Wetlands International, PO Box 471, NL-6700 AL Wageningen, The Netherlands,
wwWageningen UR, Alterra, Centre for Ecosystem Studies, PO Box 47, NL-6700 AA, Wageningen, The Netherlands,
zzECNC – European Centre for Nature Conservation, PO Box 90154, 5000 LG Tilburg, The Netherlands
Abstract
We assessed the potential impacts of land-use changes resulting from a change in the
current biofuel policy on biodiversity in Europe. We evaluated the possible impact of
both arable and woody biofuel crops on changes in distribution of 313 species pertaining
to different taxonomic groups. Using species-specific information on habitat suitability
as well as land use simulations for three different biofuel policy options, we downscaled
available species distribution data from the original resolution of 50 to 1 km. The
downscaled maps were then applied to analyse potential changes in habitat size and
species composition at different spatial levels. Our results indicate that more species
might suffer from habitat losses rather than benefit from a doubled biofuel target, while
abolishing the biofuel target would mainly have positive effects. However, the possible
impacts vary spatially and depend on the biofuel crop choice, with woody crops being
less detrimental than arable crops. Our results give an indication for policy and decision
makers of what might happen to biodiversity under a changed biofuel policy in the
European Union. The presented approach is considered to be innovative as to date no
comparable policy impact assessment has been applied to such a large set of key species
at the European scale.
Keywords: biodiversity, biofuel crop type, biofuel policy, downscaling, Europe, habitat suitability,
impact assessment, land-use change
Received 3 December 2008 and accepted 12 December 2008
Introduction
It is widely accepted that anthropogenic emissions of
carbon dioxide (CO2), together with other greenhouse
gases, are leading to global climate change (Solomon
et al., 2007). The necessity of reducing emissions of CO2
and other greenhouse gases has evolved into the estab-
lishment of climate-change strategies in the industria-
lized countries to comply with their quantitative
commitments under the Kyoto Protocol (Simeonova,
2005). In this context, renewable energies are seen as
one of the key options to mitigate CO2 emissions (EEA,
2006; Faaij, 2006; Fargione et al., 2008).
Transport is responsible for circa 25% of the energy-
related greenhouse gas emissions worldwide, and the
increasing trend of emissions in this sector is foreseen to
continue (Kahn Ribeiro et al., 2007). Compatible with
many conventional engines and blendable with current
fossil fuels, biofuels have potential to contribute to
emission reductions in the transport sector (Farrell
et al., 2006; Koh & Ghazoul, 2008; Tan et al., 2008).
Following Quadrelli & Peterson (2007), oilseed-derived
biodiesel leads to greenhouse gas reductions, on a
well-to-wheel basis, of 40–60% when compared with
conventional petroleum diesel. However, biofuels
are under heavy discussion in terms of economicCorrespondence: Jeannette Eggers, tel. 1 358 10 773 4318, fax
1 358 10 773 4377, e-mail: [email protected]
GCB Bioenergy (2009) 1, 18–34, doi: 10.1111/j.1757-1707.2009.01002.x
r 2009 The Authors18 Journal compilation r 2009 Blackwell Publishing Ltd
cost-benefits and their environmental and social im-
pacts. Currently, very high production costs form a
barrier to a higher share of biofuels in the transport
fuel mix, and energy input/output ratios are often
marginal (Sims et al., 2006; Quadrelli & Peterson,
2007). Moreover, the production of biofuels is criticized
for competing with global food production, intensifying
agricultural land use, increasing demands for irrigation,
harming biodiversity and soil conditions, and for the
potential contribution to green house gas emissions
arising from land conversion, fertilizers and machinery
(Koh, 2007; Biemans et al., 2008; Eickhout et al., 2008;
Marshall, 2008; Rowe et al., 2008; Russi, 2008). Never-
theless, considering the increasing oil prices and the
expected technological development in their production
process, biofuels can potentially play an important role
for the transport sector in the long-term planning
(Ahman & Nilsson, 2008; Mathiesen et al., 2008).
The production of biofuels and problems related to it
received increasing attention in the European Union
(EU) policy and will probably continue to do so. The EU
promotes the production of biofuels through the appli-
cation of the ‘biofuels directive’ (2003/30/EC Directive
on the promotion of the use of biofuels and other
renewable fuels for transport) which sets a target of
5.75% share of biofuels in the transport sector by 2010
for all the EU member states. In 2008 the European
Commission presented a proposal for a new directive
aiming at establishing an overall binding target for
biofuels in transport (10% minimum target) to be
achieved by each member state by 2020 (Commission
of the European Communities, 2008).
The cultivation of biofuel crops has a significant
impact on land-use. Out of the total area of arable land
in the 25 European Union (EU25) countries in 2005 (97
million ha), about 1.8 million ha were used for produ-
cing raw materials for biofuels (Commission of the
European Communities, 2005). An increasing demand
for biofuels could lead to the expansion of cultivated
areas. Possible consequences are increasing environ-
mental pressures, further habitat loss and biodiversity
decline, especially if forest, grassland, peatland and
wetlands are converted into monoculture plantations
for the production of biofuels. However, in situations
where energy crop plantations replace other monocul-
tures the direct impacts on biodiversity are not likely to
be significant (CBD, 2008).
Currently, biofuel crops are mainly grown as normal
arable crops rich in sugar, starch or vegetable oil, such
as cereals, maize or rape seed (EEA, 2007; Koh &
Ghazoul, 2008). An alternative to these first-generation
biofuel crops are second-generation biofuel crops, pro-
duced from nonfood, ligno-cellulosic materials such as
wood, energy grass or any other cellulosic biomass.
They are still under development, but are expected to
play a vital role in the biofuel sector in the future when
second generation production technologies will become
operational (Tan et al., 2008). Ligno-cellulosic crops are
already cultivated on a small scale, but currently used
only for generating heat and electricity (Wright, 2006;
EEA, 2007; Harvey, 2007; Rowe et al., 2008). Such
perennial crop types are considered to have higher rates
of energy savings and greenhouse gas reductions as
well as better carbon sequestration possibilities com-
pared with annual energy crops (Karp & Shield, 2008;
Schmer et al., 2008). From a biodiversity perspective the
production of second-generation biofuel crops has sev-
eral environmental advantages over the cultivation of
arable crops: longer rotation periods, lower fertilizer
and pesticide input, and better soil protection (EEA,
2007). Although the effects of perennial crops on land-
scape structure can be substantial due to their growing
size of 2 to 5 m, they may have a positive function on
landscape diversity and can create valuable habitat and
shelter for certain mammals and bird species when
grown as strips and not over large areas (EEA, 2007).
Potential implications for hydrology and biodiversity
result from their generally high water use due to deep
rooting (Karp & Shield, 2008) and the risk of introduced
crops becoming invasive (Raghu et al., 2006).
Through its impact on land use, the production of
biomass for biofuel also has a significant effect on the
EU’s target of halting the loss of biodiversity by 2010.
There is an increasing need for cost-effective tools to
assess the impact of EU policy measures on biodiversity
(Delbaere, 2006). This paper presents an innovative
method to assess biodiversity impacts resulting from
changing land use due to the production of biofuel
crops in Europe, distinguishing between arable (first-
generation) and woody (second-generation) crop types.
In particular we focus on two questions: (1) what might
happen if we doubled the current EU biofuel target, and
(2) what might happen if we abolished the current
biofuel target. While biodiversity as such includes all
forms of life, our impact assessment is restricted to a set
of 313 species pertaining to four taxonomical groups.
Materials and methods
Input data
Species-specific information. Species-specific information
was obtained from a database created within the
BioScore project funded through the EC Sixth
Framework Programme for Research and Technical
Development. As it is practically impossible to work
with the whole set of animal and plant species
occurring in Europe, many of which are currently still
I S B I O F U E L P O L I C Y H A R M I N G E U R O P E A N B I O D I V E R S I T Y ? 19
r 2009 The AuthorsJournal compilation r 2009 Blackwell Publishing Ltd, GCB Bioenergy, 1, 18–34
unknown (Mace, 2004), the number of species
considered in the BioScore database is reduced to a
subset of species, following selection criteria described
in (Louette et al., unpublished data). The database
provides information on environmental requirements
(e.g. land cover and elevation ranges), and sensitivity to
various pressures (e.g. fragmentation, pollution, climate
change) for 2163 species, belonging to eight taxonomical
groups (mammals, reptiles, amphibians, birds, vascular
plants, freshwater fish, aquatic macrobenthos, and
butterflies). In this study, we considered mammals,
reptiles, amphibians, and birds, and in particular
those species for which detailed and reliable European
distribution data at a resolution of 50 km were available
(313 species, see Table 1). These species-specific
distribution maps (presence/absence) are based on a
number of data sources (Hagemeijer & Blair, 1997;
Mitchell-Jones et al., 1999; Gasc et al., 2004; Linnell
et al., 2007; Temple & Terry, 2007) which
characteristics have been summarized in Delbaere &
Nieto Serradilla (2004). A list of the species considered
in this study is available in the online supporting
information Table S1.
To address the potential impacts of land use changes
resulting from biofuel crop production, we applied
information on the suitability of different land cover
classes as potential habitat for each species, and the
elevation ranges (minimum and maximum elevation)
in which each species occurs, from the BioScore
database. Elevation ranges were not available for
birds. The database distinguishes four different
levels of habitat suitability (‘suitability levels’) which
vary depending on land cover and biogeographical
region (BGR): unsuitable, low, medium and high
suitability (Maiorano et al., 2007). The land cover
classes considered follow the CORINE land cover
classification (level 3, EEA, 2000). For each species, the
IUCN Red List (IUCN, 2008) provided information on
the conservation status. Data on elevation covering the
entire study area was obtained from the GTOPO30
digital elevation model for Europe at 1 km resolution
(USGS, 2006). The study area was divided into 11 BGR
as defined by the European Environment Agency (EEA,
2005b) at a scale of � 1 : 10 000 000.
Land use scenario. The effects of the implementation of
the biofuels directive on land use were evaluated by
the EUruralis 2.0 project (Rienks, 2008; Verburg et al.,
2008; WUR, MNP, 2008) based on a land use scenario
for the 27 EU countries for the period 2000 to 2030 at
1 km resolution. This ‘Global Economy’ scenario
assumes a continuing globalization with open borders,
limited trade barriers, rapid economic growth, strong
economic development and low levels of government
intervention resembling the scenario conditions of the
Special Report on Emissions Scenarios of the
International Panel on Climate Change (SRES IPCC)
A1 scenario (Nakicenovic & Swart, 2000; Westhoek
et al., 2006). Within this scenario three policy options
are explored related to the biofuels directive:
� Policy option (e1) of no or low ambition on biofuels:
0% blending obligation on share of biofuels in
transport sector in 2010 and kept constant after-
wards.
� Policy option (e2) of medium ambition on biofuels:
5.75% blending obligation on share of biofuels in
transport sector in 2010 and kept constant after-
wards.
� Policy option (e3) of high ambition on biofuels:
11.5% blending obligation on share of biofuels in
transport sector in 2010 and kept constant after-
wards.
In all three-policy options (e1, e2, e3), the biofuel ambi-
tions are assumed to be solely met by first generation
biofuel crops. Furthermore, in its current implementa-
tion, increased biofuel ambitions in other world regions
are disregarded (Banse et al., 2008). The amount of
biofuels produced within the EU27 to meet the biofuel
targets depends on global trade policies that determine
the share of biofuels domestically produced and im-
ported in combination with changing food and feed
supply and demand. The land use projections are out-
put of a combination of different models, including a
global general equilibrium model (van Meijl et al., 2006;
Banse et al., 2008), an integrated assessment model that
accounts for environmental and land-based impacts
(Eickhout et al., 2007), and the Dyna-CLUE model
applied to spatially allocate the different land uses
(Verburg et al., 2006; Hellmann & Verburg, 2008). Be-
Table 1 Number of species in Europe, number of species
retained in the BioScore database, and number of species
considered in this study, for the analysed species groups
Taxonomical
group
Total number
of species
occurring
in Europe
Retained
number in
BioScore
database
Number of
species
considered
in this
study
Birds 526 518 204
Mammals 295 61 60
Reptiles 217 29 29
Amphibians 88 20 20
Total 1126 628 313
20 J . E G G E R S et al.
r 2009 The AuthorsJournal compilation r 2009 Blackwell Publishing Ltd, GCB Bioenergy, 1, 18–34
sides biofuel crops the land use simulation includes 17
categories of land use which are based on an aggrega-
tion of the CORINE legend (EEA, 2000). Within the
arable land category the most likely locations for biofuel
crop production are simulated by accounting for trans-
port costs to likely locations of processing industry, land
suitability and rotation systems (Hellmann & Verburg,
2008). Scenario conditions include the scale of the
processing industry, transportation constraints, the use
of set-aside land and restricted areas (such as the
NATURA2000 designated areas). Although limited to
the EU27 area, the policy options imply impacts on
other world regions too, due to the assumption of a
global trade in the food, feed and bioenergy sector.
However, with our study we focus only on the biodi-
versity impacts within the EU. For global impacts we
refer to the analysis in WUR, MNP (2008) and Banse
et al. (2008).
The policy option of medium ambition (e2) can be
considered as a reference scenario, as it reflects the
currently implemented target of the EU biofuels direc-
tive. The e1 policy option indicates the abolishment of
the biofuel target, while the e3 policy option reflects a
doubling of the current target. The area devoted to the
cultivation of biofuel crops increases from 0.5% of total
land area in the year 2000 to 1.2%, 2.7% and 3.9% of total
land area in the year 2030 for the policy options e1, e2
and e3, respectively. The land use projections in all three
policy options are attributed to different factors, such as
demographic and economic development as well as
agricultural and several other policies including biofuel
targets (Westhoek et al., 2006). However, the biofuel
policy options differ from each other only in the biofuel
target, whereas all other policies are kept constant. Thus
any difference among e1, e2 and e3 is linked to biofuel
policy. Therefore, comparing the policy options allows
us to quantify the relative impact of biofuel policy on
land use, and thus to link the subsequent land use
changes to impacts on biodiversity. Besides the land
use projections for the three policy options, also a base
map for the year 2000 following the same land use
classification scheme was used in this study.
Method
Our approach is based on two main steps. In a first step,
we applied a downscaling of the original species dis-
tribution data from 50 to 1 km resolution, by linking the
land use projections (e1, e2, e3) and the year 2000 land
use map with the species-specific information on dis-
tribution and habitat suitability. The downscaling was
performed in connection with two different biofuel crop
types (first- and second-generation crops). In a second
step, the downscaled distribution data for the different
biofuel policy and crop options were compared with
each other to assess biodiversity impacts of changes in
the biofuel crop production.
Downscaling of the species distribution maps. The species-
and region-specific habitat suitability levels and
elevation ranges were used to downscale and refine
the available species distribution data (presence/
absence) from the original resolution of 50 km to a
resolution of 1 km for the biofuel policy options (year
2030) and the base year 2000. This means that for every
species and each possible combination of land use type,
elevation and BGR, the related habitat suitability level
was queried from the BioScore database. The habitat
suitability levels were then linked with the maps on
land use type (year 2000, e1, e2, e3), elevation and BGR
in order to identify areas where a species potentially
occurs within its distribution area. The resulting
downscaled distribution maps present habitat
suitability levels within the area of species presence.
The land use classes for the policy options are
simulated based on a generalization of the CORINE
land cover classes used in the BioScore database. A
conversion had to be applied to link these two
classification schemes and derive information on
habitat suitability for the biofuel policy options. To
establish such a conversion, the base map for the year
2000 was combined with the CORINE 2000 map. The
dominant CORINE class(es) were identified for each
class of the base map in each BGR. If several CORINE
classes were codominant in one land use class of the
base map, multiple CORINE classes were linked to that
land use class. In such case the maximum suitability
level for these CORINE classes from the BioScore
database was assigned to the respective land use class
in the land use maps of the biofuel policy options. This
was the case for (semi-)natural vegetation (in five
regions), forest (in four regions), pastures (in three
regions), permanent crops (in two regions), and
sparsely vegetated areas (in one region). For example,
in the alpine region, the three CORINE classes
‘broadleaved forest’, ‘coniferous forest’ and ‘mixed
forest’ are codominant within the area covered by the
class ‘forest’ of the year 2000 base map. In the alpine
region, coniferous forest provides highly suitable
habitat for red squirrels (Sciurus vulgaris L.) and the
species has only a medium suitability in broadleaved
and mixed forests. Choosing the maximum suitability
level as explained above, we therefore assigned high
habitat suitability to the class ‘forest’ in the downscaled
maps for red squirrel in the alpine region.
In the European biofuel policy options, only first
generation biofuel crops are considered. In order to
analyse the impact of cultivating different crop types
I S B I O F U E L P O L I C Y H A R M I N G E U R O P E A N B I O D I V E R S I T Y ? 21
r 2009 The AuthorsJournal compilation r 2009 Blackwell Publishing Ltd, GCB Bioenergy, 1, 18–34
on biodiversity, we assumed in a comparative analysis
that woody crops would be cultivated instead of arable
biofuel crops at the same sites. Thus, we needed to
consider two crop options when downscaling the
distribution maps: (a) first generation biofuel crops
(arable crops such as maize, wheat or potatoes),
cultivated at all sites marked as ‘biofuel crops’ in the
policy options; and (b) second generation woody
biofuel crops (short-rotation woody crops such as
willow and poplar), cultivated at all sites marked as
‘biofuel crops’ in the policy options. In order to
differentiate between the species-specific habitat
suitabilities of different crop types, the land use class
‘biofuel crops’ was linked with the habitat suitability
level of the CORINE class ‘arable land’ to analyse
impacts of first-generation arable biofuel crops
(hereafter referred to as option ‘arable’), and with
habitat suitability of the CORINE class ‘fruit trees and
berry plantations’ used as a proxy for woody crop
plantations to study impacts of second-generation
woody biofuel crops (hereafter referred to as option
‘woody’). For birds, in addition to the suitability levels
per CORINE land cover class as given in the BioScore
database, explicit habitat suitability levels for woody
crops were available. Therefore we linked these levels to
the woody crop option in our analysis for birds.
Comparison of the biofuel policy and crop options. The
comparison of the biofuel policy options considers the
impacts of (1) doubling the current biofuel target (e3 vs.
e2), and (2) abolishing the current biofuel target (e1 vs.
e2). Both comparisons were assessed for the arable crop
option. In order to compare the impacts of arable and
woody crops, we also analysed the differences between
the woody and the arable crop option for the e2
scenario. Additionally, we studied the land use
changes between the base year 2000 and the e2 policy
option for 2030 to put our results into perspective of the
overall land use changes (‘overall development’)
projected for this period in the EUruralis Global
Economy scenario.
Following the approach adopted by Maiorano et al.
(2007), the habitat suitability levels of the downscaled
distribution maps were grouped into two classes:
potential species presence (medium and high suitable
habitat) and potential species absence (unsuitable and
low suitable habitat or species not present). The
resulting binary maps were used to calculate for each
species group, and for all species combined, the total
number of species potentially occurring in each
1 km� 1 km grid cell. Based on these totals,
differences between the biofuel policy options were
calculated at European level.
Changes in the size of suitable habitat
At the level of BGR we analysed which species might
gain or lose habitat if the biofuel target was doubled or
abolished, and if woody crops would be cultivated
instead of arable crops, relative to the reference policy
option e2. In addition we evaluated the habitat size
changes occurring between the base year 2000 and 2030
for the e2 policy option. To concentrate on major
changes in potential habitat size, we considered only
those changes exceeding an increase or decrease of 1%
of the potential habitat of the species in a BGR. In all
other cases the potential habitat was considered as
stable. The resulting figures were used to derive the
percentage of species occurring in a BGR which might
increase, decrease or keep their potential habitat size
under the different assumptions. These analyses were
also carried out with attention to the conservation status
of the species. To derive the number of threatened
species impacted, the IUCN Red List categories ‘near
threatened’, ‘vulnerable’, ‘endangered’ and ‘critically
endangered’ were aggregated. Applying this aggrega-
tion, 74 Red-listed species which are threatened in
(parts of) the EU were covered in this study.
Changes in species composition and total species number
Moreover, we analysed the potential change in species
composition between the different biofuel policy op-
tions, the two biofuel crop types, and between the base
year 2000 and year 2030. It was calculated as the ratio
between the number of species potentially gaining or
losing their entire habitat in each 1 km� 1 km cell when
comparing the policy options, and the total species
number (based on the e2 option) of that cell. When
studying the potential change in species composition
for the period 2000–2030, the total species numbers in
the base year 2000 were used as reference values, while
we applied the species numbers of the e2 arable option
for the comparison between arable and woody crop
choice. We consider it a species loss when one or more
species potentially lose their entire habitat in a 1 km�1 km grid cell, while species gain occurs when one or
more species potentially gain habitat in a 1 km� 1 km
grid cell where they were not present before.
For visualization purposes we aggregated the out-
comes of this analysis at the level of 50 km� 50 km cells.
In particular, to each 50 km� 50 km cell we assigned the
percentage of area potentially gained or lost within this
cell by 450% of the species, having the policy option e2
as reference. For the comparison between 2000 and 2030
the base year 2000 served as reference. From this
analysis, we excluded cells with less than six species
(corresponding to o1% of the study area), as they were
22 J . E G G E R S et al.
r 2009 The AuthorsJournal compilation r 2009 Blackwell Publishing Ltd, GCB Bioenergy, 1, 18–34
considered as unrepresentative. The relative changes in
species composition were calculated for all taxonomical
groups combined.
In addition, we analysed the area with a potential
change in total species number for each species group,
based on the difference in the total number of species
potentially occurring for each 1 km� 1 km grid cell
between the policy options, between the two crop types,
and for the period 2000–2030.
All analyses were based on the EU27 area following
the spatial coverage of the land use simulations.
Results
Changes in the size of suitable habitat between the biofuelpolicy and crop options
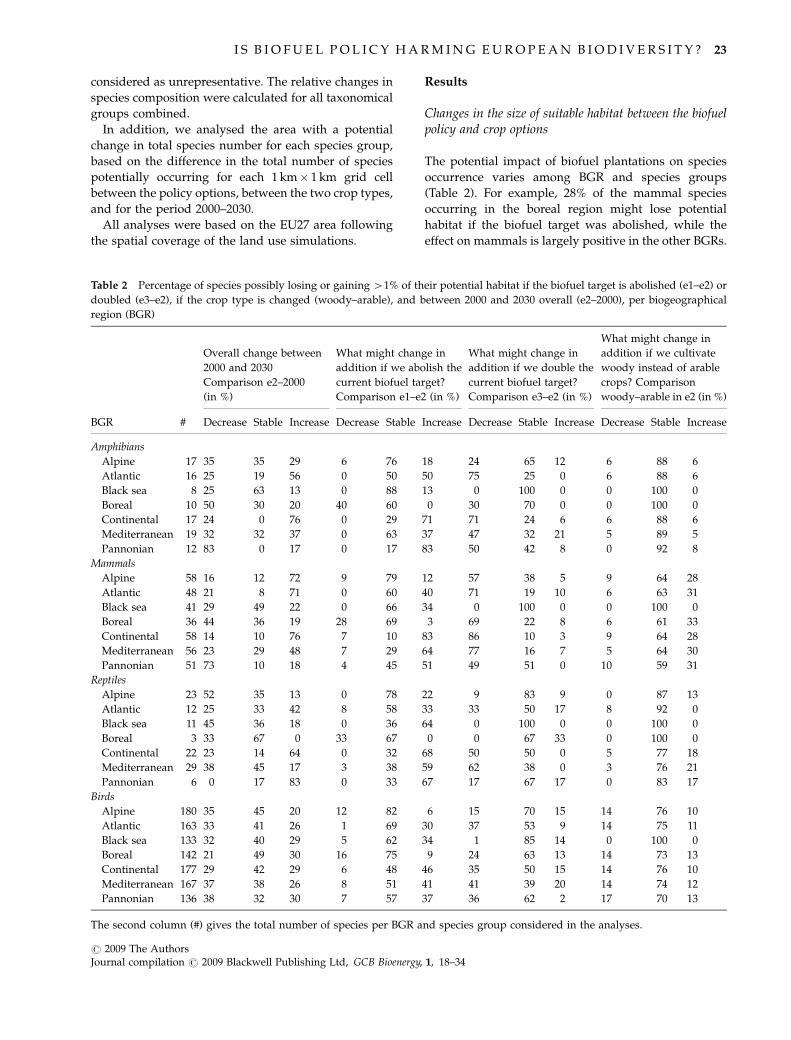
The potential impact of biofuel plantations on species
occurrence varies among BGR and species groups
(Table 2). For example, 28% of the mammal species
occurring in the boreal region might lose potential
habitat if the biofuel target was abolished, while the
effect on mammals is largely positive in the other BGRs.
Table 2 Percentage of species possibly losing or gaining 41% of their potential habitat if the biofuel target is abolished (e1–e2) or
doubled (e3–e2), if the crop type is changed (woody–arable), and between 2000 and 2030 overall (e2–2000), per biogeographical
region (BGR)
Overall change between
2000 and 2030
Comparison e2–2000
(in %)
What might change in
addition if we abolish the
current biofuel target?
Comparison e1–e2 (in %)
What might change in
addition if we double the
current biofuel target?
Comparison e3–e2 (in %)
What might change in
addition if we cultivate
woody instead of arable
crops? Comparison
woody–arable in e2 (in %)
BGR # Decrease Stable Increase Decrease Stable Increase Decrease Stable Increase Decrease Stable Increase
Amphibians
Alpine 17 35 35 29 6 76 18 24 65 12 6 88 6
Atlantic 16 25 19 56 0 50 50 75 25 0 6 88 6
Black sea 8 25 63 13 0 88 13 0 100 0 0 100 0
Boreal 10 50 30 20 40 60 0 30 70 0 0 100 0
Continental 17 24 0 76 0 29 71 71 24 6 6 88 6
Mediterranean 19 32 32 37 0 63 37 47 32 21 5 89 5
Pannonian 12 83 0 17 0 17 83 50 42 8 0 92 8
Mammals
Alpine 58 16 12 72 9 79 12 57 38 5 9 64 28
Atlantic 48 21 8 71 0 60 40 71 19 10 6 63 31
Black sea 41 29 49 22 0 66 34 0 100 0 0 100 0
Boreal 36 44 36 19 28 69 3 69 22 8 6 61 33
Continental 58 14 10 76 7 10 83 86 10 3 9 64 28
Mediterranean 56 23 29 48 7 29 64 77 16 7 5 64 30
Pannonian 51 73 10 18 4 45 51 49 51 0 10 59 31
Reptiles
Alpine 23 52 35 13 0 78 22 9 83 9 0 87 13
Atlantic 12 25 33 42 8 58 33 33 50 17 8 92 0
Black sea 11 45 36 18 0 36 64 0 100 0 0 100 0
Boreal 3 33 67 0 33 67 0 0 67 33 0 100 0
Continental 22 23 14 64 0 32 68 50 50 0 5 77 18
Mediterranean 29 38 45 17 3 38 59 62 38 0 3 76 21
Pannonian 6 0 17 83 0 33 67 17 67 17 0 83 17
Birds
Alpine 180 35 45 20 12 82 6 15 70 15 14 76 10
Atlantic 163 33 41 26 1 69 30 37 53 9 14 75 11
Black sea 133 32 40 29 5 62 34 1 85 14 0 100 0
Boreal 142 21 49 30 16 75 9 24 63 13 14 73 13
Continental 177 29 42 29 6 48 46 35 50 15 14 76 10
Mediterranean 167 37 38 26 8 51 41 41 39 20 14 74 12
Pannonian 136 38 32 30 7 57 37 36 62 2 17 70 13
The second column (#) gives the total number of species per BGR and species group considered in the analyses.
I S B I O F U E L P O L I C Y H A R M I N G E U R O P E A N B I O D I V E R S I T Y ? 23
r 2009 The AuthorsJournal compilation r 2009 Blackwell Publishing Ltd, GCB Bioenergy, 1, 18–34
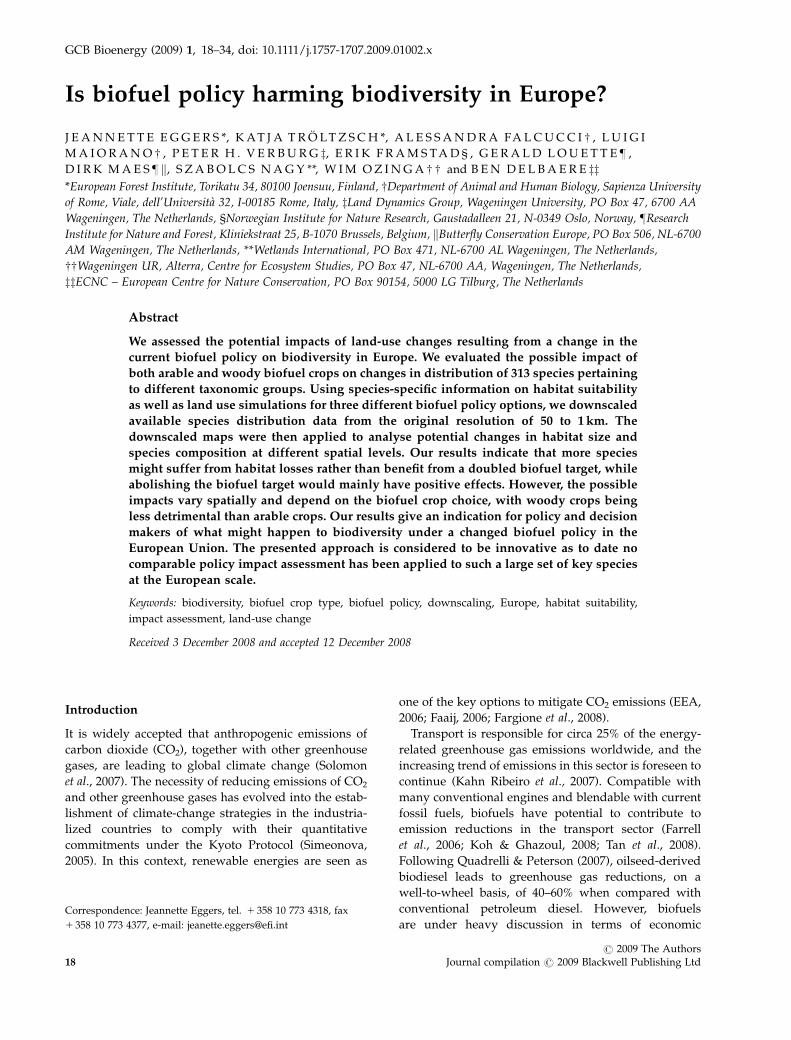
Besides the regional differences, these numbers also
indicate that for most of the regions and species groups,
the amount of species that might lose habitat when
doubling the current biofuel target far outweighs the
amount of species that might gain habitat. The poten-
tially negative impacts of a doubled target are largest
for mammals, especially in the continental region. This
is particularly of concern for species like Elk (Alces
alces), East European hedgehog (Erinaceus roumanicus),
Dormouse (Dryomys nitedula) and Etruscan shrew (Sun-
cus etruscus), which also show a potentially decreasing
trend for the overall development between 2000 and
2030. Thus, doubling the target might increase the
already existing pressure on those species. More species
would win rather than lose potential habitat if the
current biofuel target was abolished. Only in the Boreal
zone the situation is different, as here potential habitat
loss is higher than habitat gain for all species groups if
abolishing the current target. The impact of cultivating
woody instead of arable biofuel crops is positive for
mammals and reptiles – more species might win rather
than lose potential habitat. For birds, the effect would
be slightly negative, while the crop option choice has
only a small impact on amphibians.
When comparing the changes in potential habitat size
arising from different biofuel policies to the changes
resulting from the overall development between 2000
and 2030 (Table 2), we can notice that the impacts of
biofuel policies are strong. In many cases the number of
species affected by habitat size changes related to a
change in biofuel target exceeds the number of species
concerned by the changes between 2000 and 2030 under
the current target. This is especially valid for amphi-
bians, reptiles and mammals where a doubling of the
biofuel target would mean in many regions an addi-
tional potential habitat loss for much more species than
those already affected by the overall changes happening
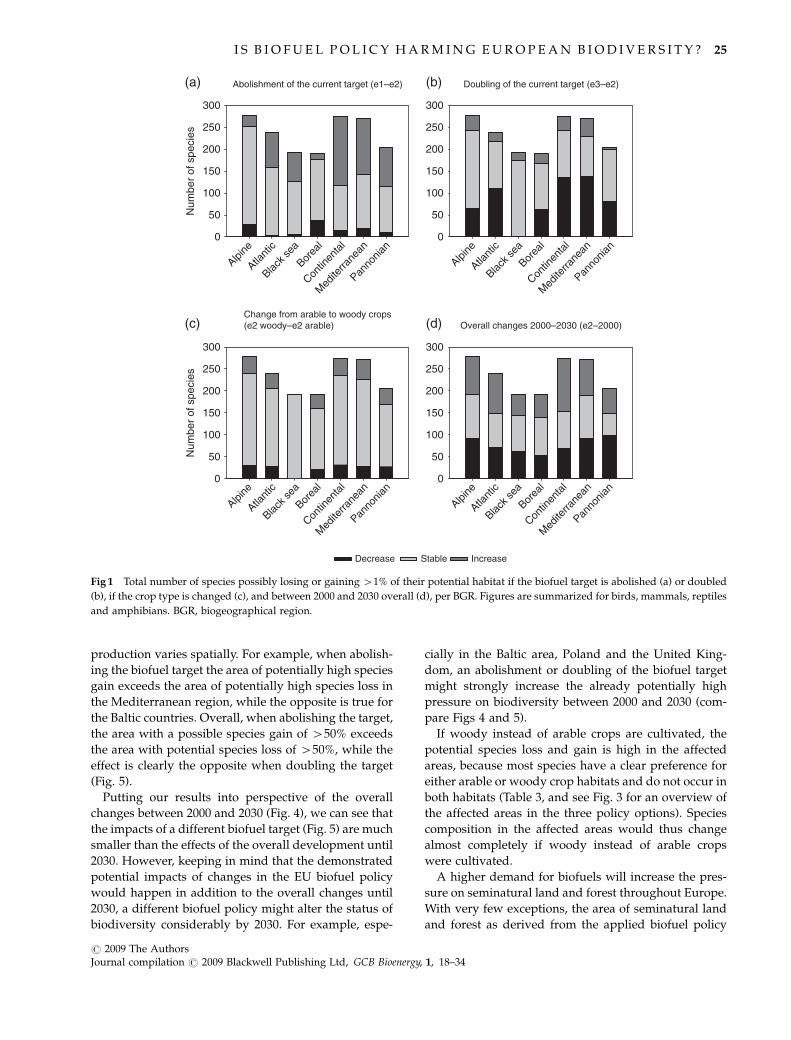
within 30 years. Looking at the species group totals
(Fig. 1), we can identify the Mediterranean, Continental
and Atlantic zone as most affected by a doubling of the
biofuel target (Fig. 1b) when comparing to the overall
changes between 2000 and 2030 (Fig. 1d). An abolish-
ment of the target (Fig. 1a) would have a potentially
stronger positive effect for most of the species than the
expected positive development between 2000 and 2030
in most of the regions. Changes in the choice of the
biofuel crop type (Fig. 1c) have a smaller impact on
habitat size changes compared with the overall devel-
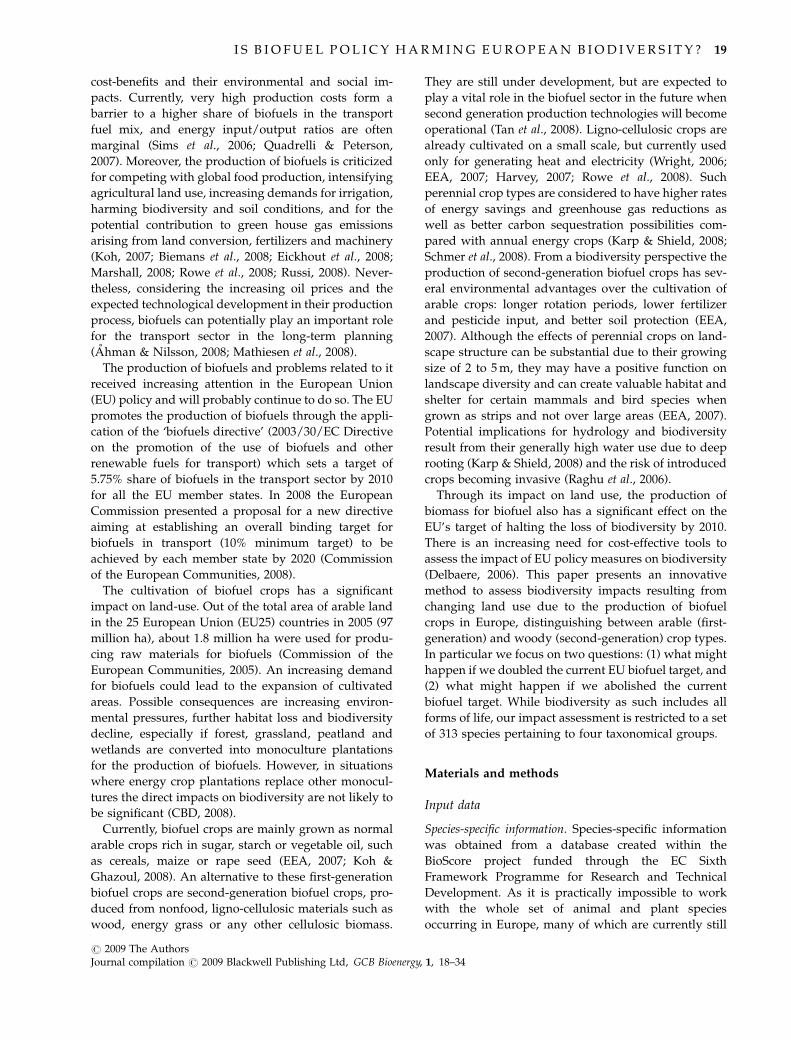
opment until 2030. The trends in potential habitat size
changes are similar when only Red List species are
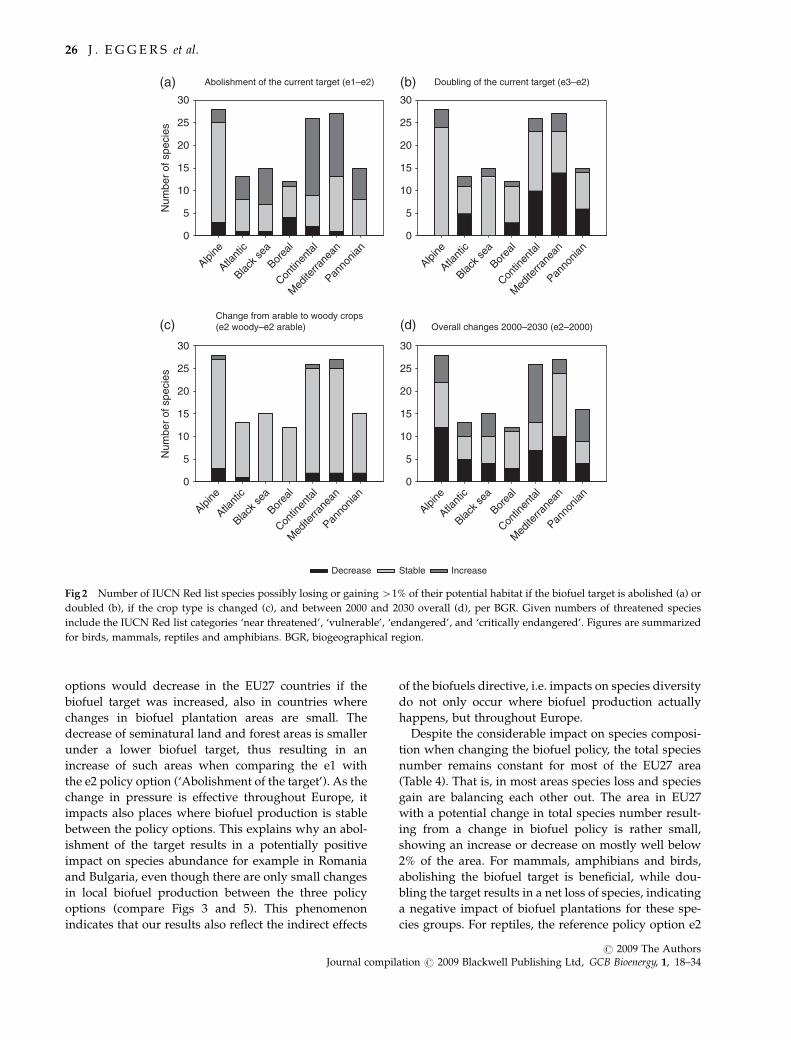
considered (Fig. 2). However, some differences exist.
For example, there is no negative impact of doubling
the biofuel target on the considered Red List species in
the Alpine region (Fig. 2b). Also the impact of the crop
choice is less pronounced for Red List species compared
with all species (Fig. 2c).
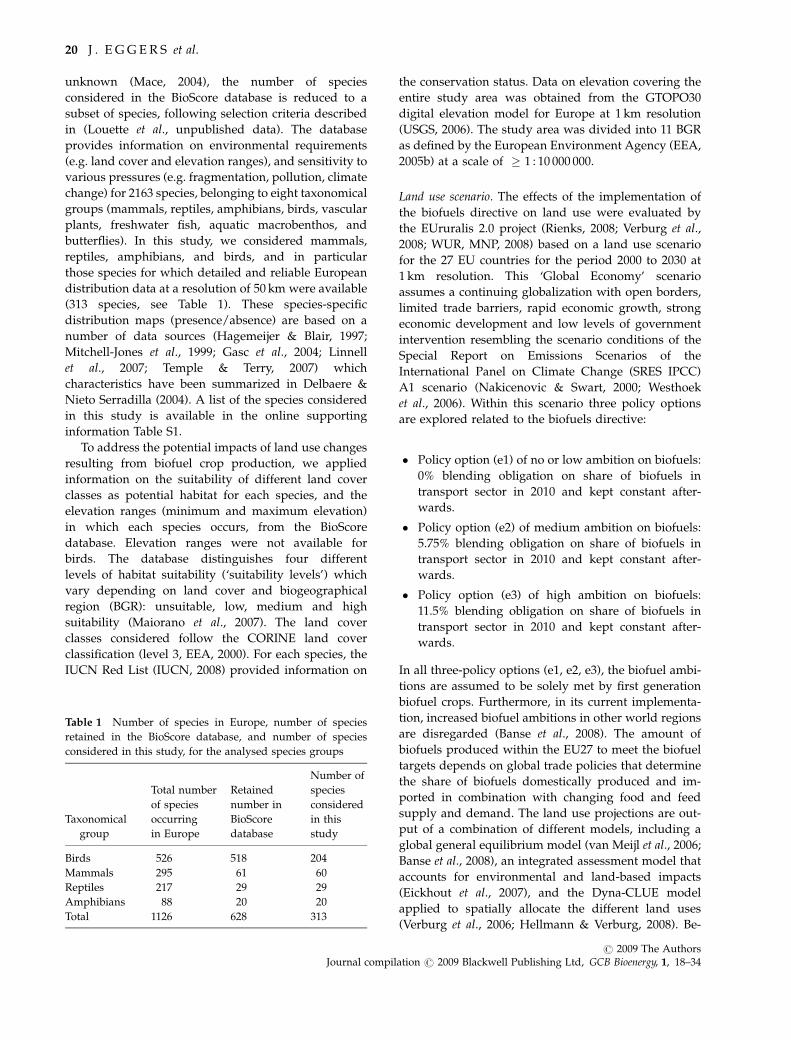
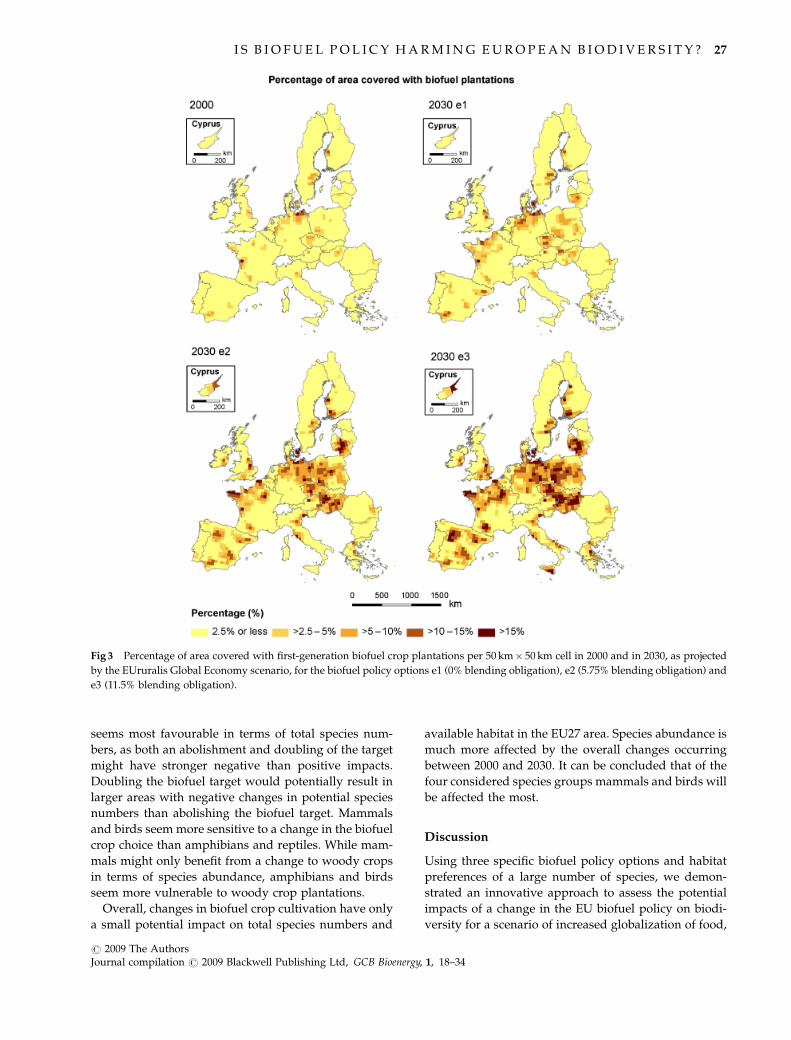
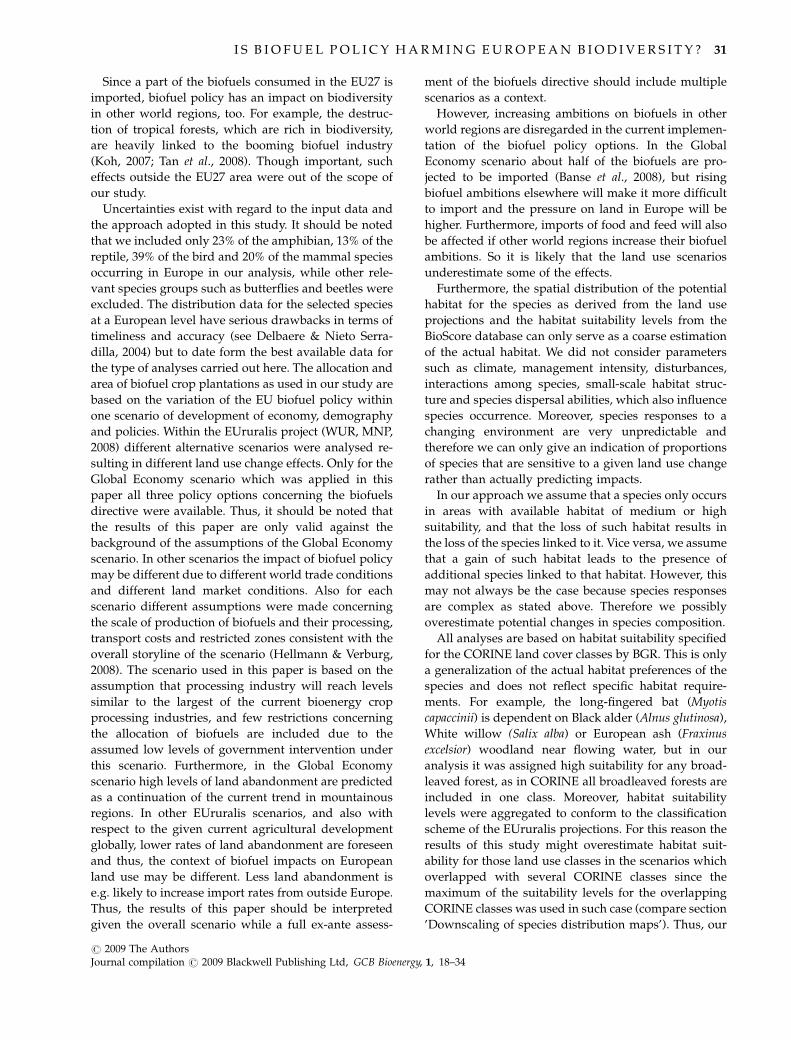
Changes in species composition and total species number
For comparison with the changes in species composi-
tion, Fig. 3 shows the percentage of area covered by
first-generation biofuel crop plantations in the three
biofuel policy options, also aggregated on 50 km�50 km level. The projected biofuel crop coverage varies
notably among the countries as well as among the
policy options. The proportion of arable land devoted
to biofuel crops increases substantially in most coun-
tries when the biofuel target is increased. For the
comparative analyses on woody biofuel crops, the same
locations of biofuel plantations were assumed for the
crop production (compare section ’Downscaling of spe-
cies distribution maps’).
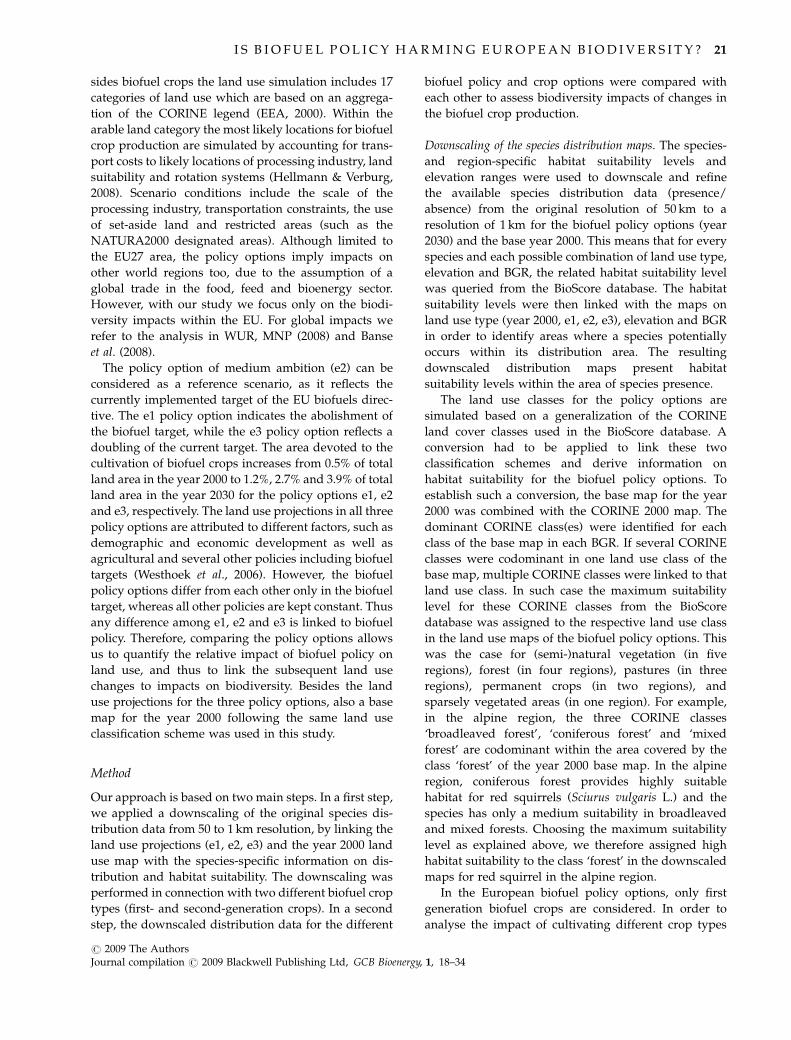
The changes in species composition potentially occur-
ring until 2030 and the additional impacts caused by a
change in the biofuel target are shown in Figs 4 and 5,
however focusing only on the strongest effects (poten-
tial species gain or loss 450%). The figures identify
hotspots in Europe where 450% of the local species
might lose their entire habitat (potential species loss of
450%) and hotspots where the amount of species
gaining new habitat at sites they were not present
before amounts to 450% of the local species (potential
species gain 450%), if the current biofuel target was
changed, and for the overall development between 2000
and 2030. Attention should be paid to the different
classification scales when comparing the figures.
The following example shall help interpreting the
figures on changes in species composition: A grid cell
in the species gain maps which corresponds e.g. to class
‘3–5%’ indicates that on 3–5% of its area a potential
species gain of 450% occurs. Species gain of 450%
means that the number of species potentially gaining
new habitat in that grid cell exceeds 50% of the species
present in the cell under the current biofuel target (e2
policy option). In other words, if 15 species are present
in a certain grid cell under the e1 option while they are
not present in the same grid cell under the e2 option, we
observe a gain of 15 species for that cell when abolish-
ing the biofuel target (comparison e1–e2, ‘Abolishment
of the target’). Relating these 15 species to the total
number of species present in that grid cell under the e2
option, e.g. 25 species, would result in that case in a
potential species gain of 450% (15/25). Areas with
potential species gain or loss of o50% are not consid-
ered in the maps.
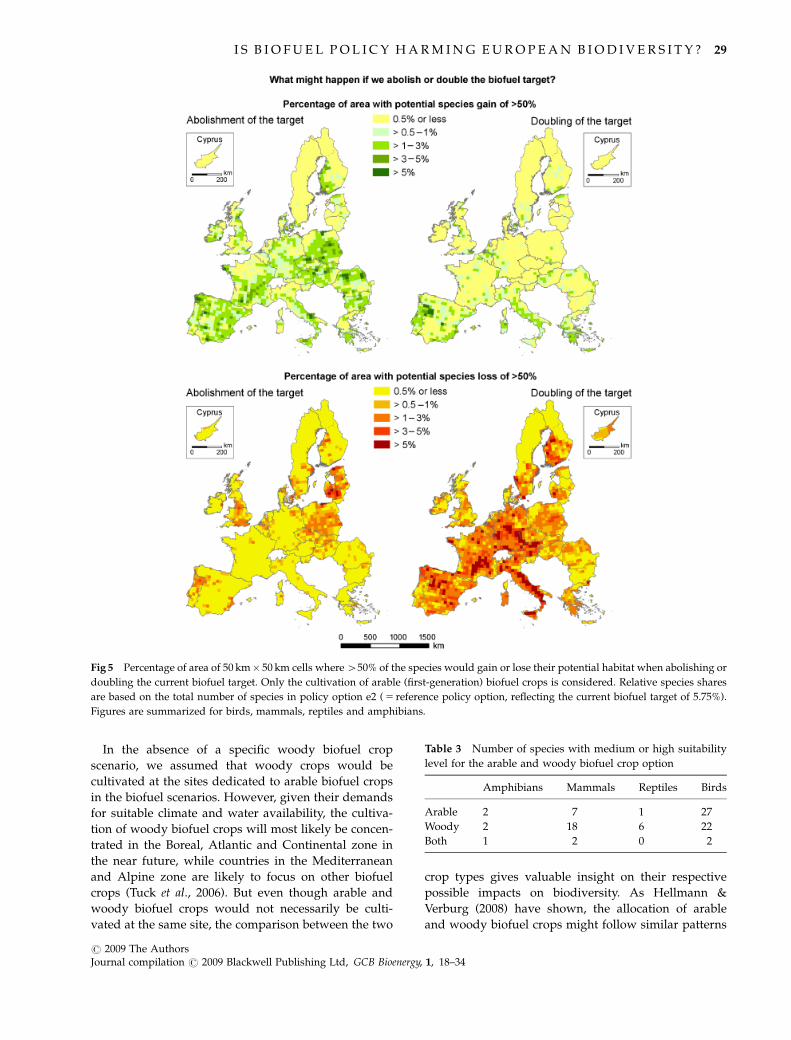
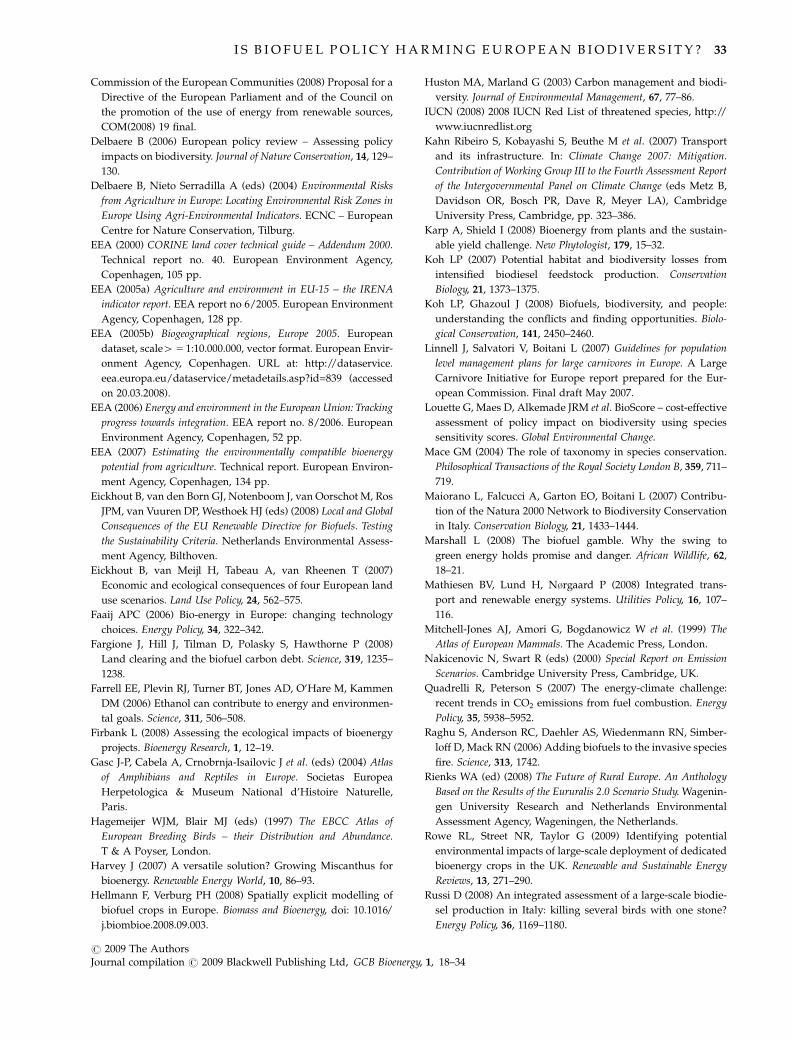
From the maps we can notice that the areas of
potential species gain and loss do not necessarily
overlap, indicating that the impact of biofuel crop
24 J . E G G E R S et al.
r 2009 The AuthorsJournal compilation r 2009 Blackwell Publishing Ltd, GCB Bioenergy, 1, 18–34
production varies spatially. For example, when abolish-
ing the biofuel target the area of potentially high species
gain exceeds the area of potentially high species loss in
the Mediterranean region, while the opposite is true for
the Baltic countries. Overall, when abolishing the target,
the area with a possible species gain of 450% exceeds
the area with potential species loss of 450%, while the
effect is clearly the opposite when doubling the target
(Fig. 5).
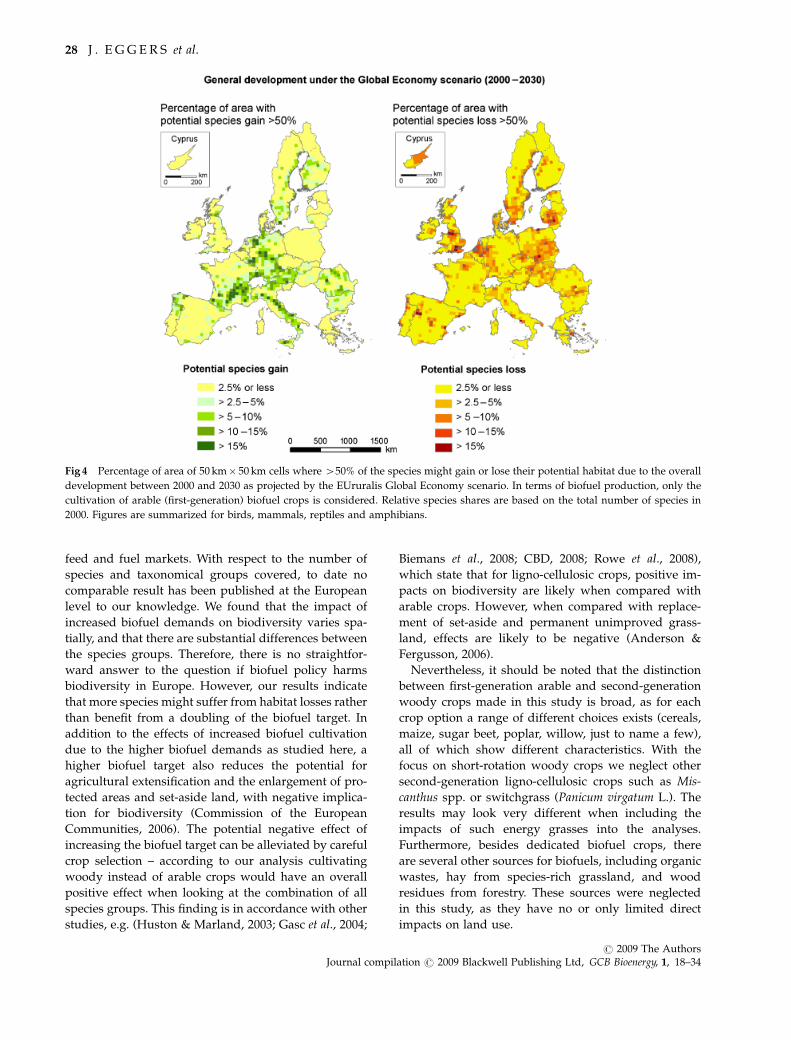
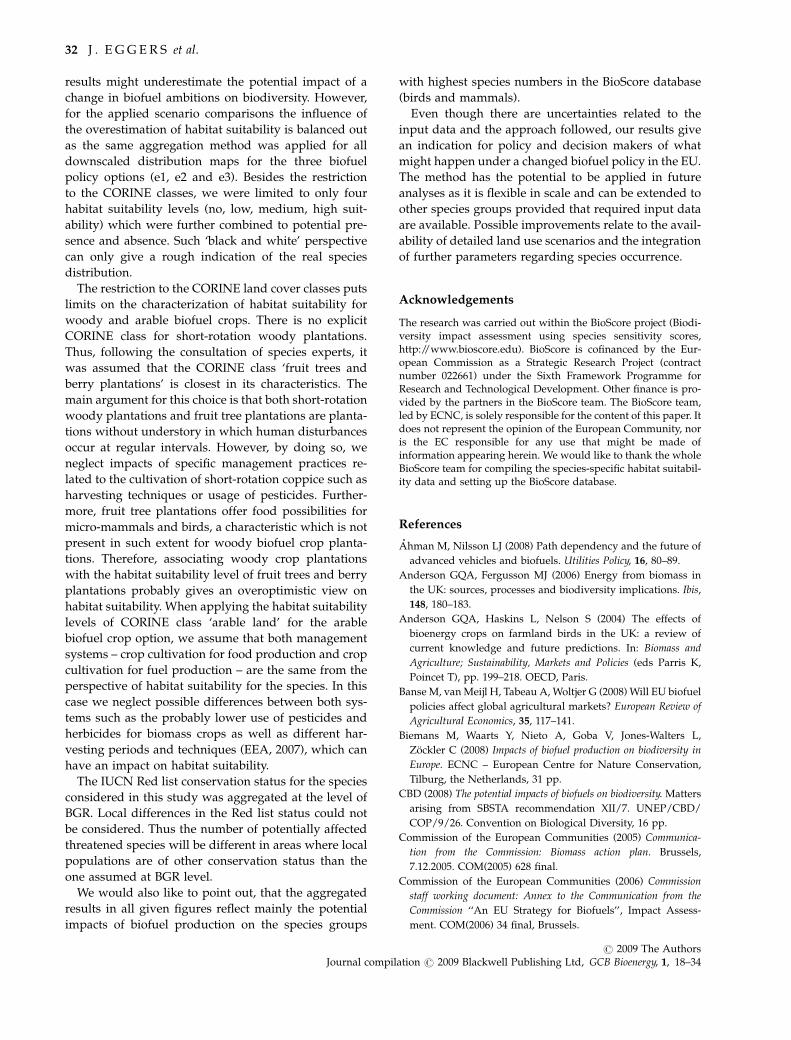
Putting our results into perspective of the overall
changes between 2000 and 2030 (Fig. 4), we can see that
the impacts of a different biofuel target (Fig. 5) are much
smaller than the effects of the overall development until
2030. However, keeping in mind that the demonstrated
potential impacts of changes in the EU biofuel policy
would happen in addition to the overall changes until
2030, a different biofuel policy might alter the status of
biodiversity considerably by 2030. For example, espe-
cially in the Baltic area, Poland and the United King-
dom, an abolishment or doubling of the biofuel target
might strongly increase the already potentially high
pressure on biodiversity between 2000 and 2030 (com-
pare Figs 4 and 5).
If woody instead of arable crops are cultivated, the
potential species loss and gain is high in the affected
areas, because most species have a clear preference for
either arable or woody crop habitats and do not occur in
both habitats (Table 3, and see Fig. 3 for an overview of
the affected areas in the three policy options). Species
composition in the affected areas would thus change
almost completely if woody instead of arable crops
were cultivated.
A higher demand for biofuels will increase the pres-
sure on seminatural land and forest throughout Europe.
With very few exceptions, the area of seminatural land
and forest as derived from the applied biofuel policy
Doubling of the current target (e3–e2)
Alpine
Atlant
ic
Black s
ea
Borea
l
Contin
enta
l
Med
iterra
nean
Panno
nian
0
50
100
150
200
250
300
Overall changes 2000–2030 (e2–2000)
Alpine
Atlant
ic
Black s
ea
Borea
l
Contin
enta
l
Med
iterra
nean
Panno
nian
0
50
100
150
200
250
300
Decrease
Change from arable to woody crops(e2 woody–e2 arable)
Alpine
Atlant
ic
Black s
ea
Borea
l
Contin
enta
l
Med
iterra
nean
Panno
nian
Num
ber
of s
peci
es
0
50
100
150
200
250
300
Stable
Abolishment of the current target (e1–e2)
Alpine
Atlant
ic
Black s
ea
Borea
l
Contin
enta
l
Med
iterra
nean
Panno
nian
Num
ber
of s
peci
es
0
50
100
150
200
250
300
(a)
(c) (d)
(b)
Increase
Fig 1 Total number of species possibly losing or gaining 41% of their potential habitat if the biofuel target is abolished (a) or doubled
(b), if the crop type is changed (c), and between 2000 and 2030 overall (d), per BGR. Figures are summarized for birds, mammals, reptiles
and amphibians. BGR, biogeographical region.
I S B I O F U E L P O L I C Y H A R M I N G E U R O P E A N B I O D I V E R S I T Y ? 25
r 2009 The AuthorsJournal compilation r 2009 Blackwell Publishing Ltd, GCB Bioenergy, 1, 18–34
options would decrease in the EU27 countries if the
biofuel target was increased, also in countries where
changes in biofuel plantation areas are small. The
decrease of seminatural land and forest areas is smaller
under a lower biofuel target, thus resulting in an
increase of such areas when comparing the e1 with
the e2 policy option (‘Abolishment of the target’). As the
change in pressure is effective throughout Europe, it
impacts also places where biofuel production is stable
between the policy options. This explains why an abol-
ishment of the target results in a potentially positive
impact on species abundance for example in Romania
and Bulgaria, even though there are only small changes
in local biofuel production between the three policy
options (compare Figs 3 and 5). This phenomenon
indicates that our results also reflect the indirect effects
of the biofuels directive, i.e. impacts on species diversity
do not only occur where biofuel production actually
happens, but throughout Europe.
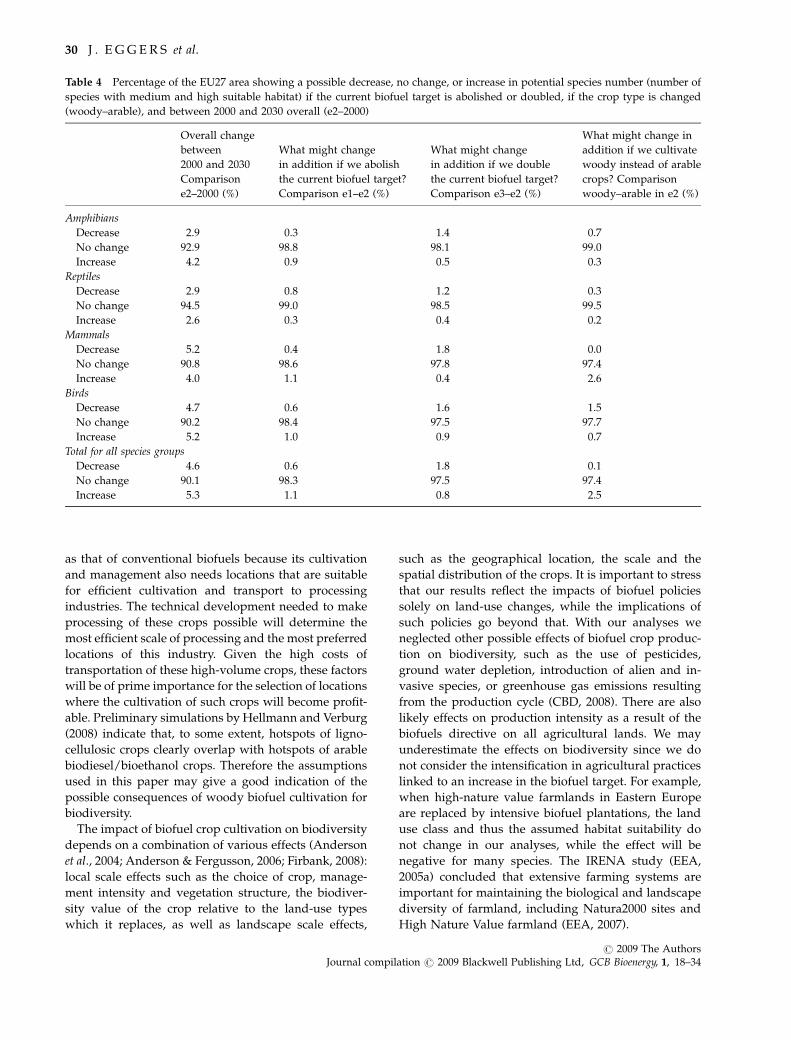
Despite the considerable impact on species composi-
tion when changing the biofuel policy, the total species
number remains constant for most of the EU27 area
(Table 4). That is, in most areas species loss and species
gain are balancing each other out. The area in EU27
with a potential change in total species number result-
ing from a change in biofuel policy is rather small,
showing an increase or decrease on mostly well below
2% of the area. For mammals, amphibians and birds,
abolishing the biofuel target is beneficial, while dou-
bling the target results in a net loss of species, indicating
a negative impact of biofuel plantations for these spe-
cies groups. For reptiles, the reference policy option e2
Doubling of the current target (e3–e2)
Alpine
Atlant
ic
Black s
ea
Borea
l
Contin
enta
l
Med
iterra
nean
Panno
nian
0
5
10
15
20
25
30
Overall changes 2000–2030 (e2–2000)
Alpine
Atlant
ic
Black s
ea
Borea
l
Contin
enta
l
Med
iterra
nean
Panno
nian
0
5
10
15
20
25
30
Decrease
Change from arable to woody crops(e2 woody–e2 arable)
Alpine
Atlant
ic
Black s
ea
Borea
l
Contin
enta
l
Med
iterra
nean
Panno
nian
Num
ber
of s
peci
es
0
5
10
15
20
25
30
Stable
Abolishment of the current target (e1–e2)(a) (b)
(d)(c)
Alpine
Atlant
ic
Black s
ea
Borea
l
Contin
enta
l
Med
iterra
nean
Panno
nian
Num
ber
of s
peci
es
0
5
10
15
20
25
30
Increase
Fig 2 Number of IUCN Red list species possibly losing or gaining 41% of their potential habitat if the biofuel target is abolished (a) or
doubled (b), if the crop type is changed (c), and between 2000 and 2030 overall (d), per BGR. Given numbers of threatened species
include the IUCN Red list categories ‘near threatened’, ‘vulnerable’, ‘endangered’, and ‘critically endangered’. Figures are summarized
for birds, mammals, reptiles and amphibians. BGR, biogeographical region.
26 J . E G G E R S et al.
r 2009 The AuthorsJournal compilation r 2009 Blackwell Publishing Ltd, GCB Bioenergy, 1, 18–34
seems most favourable in terms of total species num-
bers, as both an abolishment and doubling of the target
might have stronger negative than positive impacts.
Doubling the biofuel target would potentially result in
larger areas with negative changes in potential species
numbers than abolishing the biofuel target. Mammals
and birds seem more sensitive to a change in the biofuel
crop choice than amphibians and reptiles. While mam-
mals might only benefit from a change to woody crops
in terms of species abundance, amphibians and birds
seem more vulnerable to woody crop plantations.
Overall, changes in biofuel crop cultivation have only
a small potential impact on total species numbers and
available habitat in the EU27 area. Species abundance is
much more affected by the overall changes occurring
between 2000 and 2030. It can be concluded that of the
four considered species groups mammals and birds will
be affected the most.
Discussion
Using three specific biofuel policy options and habitat
preferences of a large number of species, we demon-
strated an innovative approach to assess the potential
impacts of a change in the EU biofuel policy on biodi-
versity for a scenario of increased globalization of food,
Fig 3 Percentage of area covered with first-generation biofuel crop plantations per 50 km� 50 km cell in 2000 and in 2030, as projected
by the EUruralis Global Economy scenario, for the biofuel policy options e1 (0% blending obligation), e2 (5.75% blending obligation) and
e3 (11.5% blending obligation).
I S B I O F U E L P O L I C Y H A R M I N G E U R O P E A N B I O D I V E R S I T Y ? 27
r 2009 The AuthorsJournal compilation r 2009 Blackwell Publishing Ltd, GCB Bioenergy, 1, 18–34
feed and fuel markets. With respect to the number of
species and taxonomical groups covered, to date no
comparable result has been published at the European
level to our knowledge. We found that the impact of
increased biofuel demands on biodiversity varies spa-
tially, and that there are substantial differences between
the species groups. Therefore, there is no straightfor-
ward answer to the question if biofuel policy harms
biodiversity in Europe. However, our results indicate
that more species might suffer from habitat losses rather
than benefit from a doubling of the biofuel target. In
addition to the effects of increased biofuel cultivation
due to the higher biofuel demands as studied here, a
higher biofuel target also reduces the potential for
agricultural extensification and the enlargement of pro-
tected areas and set-aside land, with negative implica-
tion for biodiversity (Commission of the European
Communities, 2006). The potential negative effect of
increasing the biofuel target can be alleviated by careful
crop selection – according to our analysis cultivating
woody instead of arable crops would have an overall
positive effect when looking at the combination of all
species groups. This finding is in accordance with other
studies, e.g. (Huston & Marland, 2003; Gasc et al., 2004;
Biemans et al., 2008; CBD, 2008; Rowe et al., 2008),
which state that for ligno-cellulosic crops, positive im-
pacts on biodiversity are likely when compared with
arable crops. However, when compared with replace-
ment of set-aside and permanent unimproved grass-
land, effects are likely to be negative (Anderson &
Fergusson, 2006).
Nevertheless, it should be noted that the distinction
between first-generation arable and second-generation
woody crops made in this study is broad, as for each
crop option a range of different choices exists (cereals,
maize, sugar beet, poplar, willow, just to name a few),
all of which show different characteristics. With the
focus on short-rotation woody crops we neglect other
second-generation ligno-cellulosic crops such as Mis-
canthus spp. or switchgrass (Panicum virgatum L.). The
results may look very different when including the
impacts of such energy grasses into the analyses.
Furthermore, besides dedicated biofuel crops, there
are several other sources for biofuels, including organic
wastes, hay from species-rich grassland, and wood
residues from forestry. These sources were neglected
in this study, as they have no or only limited direct
impacts on land use.
Fig 4 Percentage of area of 50 km� 50 km cells where 450% of the species might gain or lose their potential habitat due to the overall
development between 2000 and 2030 as projected by the EUruralis Global Economy scenario. In terms of biofuel production, only the
cultivation of arable (first-generation) biofuel crops is considered. Relative species shares are based on the total number of species in
2000. Figures are summarized for birds, mammals, reptiles and amphibians.
28 J . E G G E R S et al.
r 2009 The AuthorsJournal compilation r 2009 Blackwell Publishing Ltd, GCB Bioenergy, 1, 18–34
In the absence of a specific woody biofuel crop
scenario, we assumed that woody crops would be
cultivated at the sites dedicated to arable biofuel crops
in the biofuel scenarios. However, given their demands
for suitable climate and water availability, the cultiva-
tion of woody biofuel crops will most likely be concen-
trated in the Boreal, Atlantic and Continental zone in
the near future, while countries in the Mediterranean
and Alpine zone are likely to focus on other biofuel
crops (Tuck et al., 2006). But even though arable and
woody biofuel crops would not necessarily be culti-
vated at the same site, the comparison between the two
crop types gives valuable insight on their respective
possible impacts on biodiversity. As Hellmann &
Verburg (2008) have shown, the allocation of arable
and woody biofuel crops might follow similar patterns
Fig 5 Percentage of area of 50 km� 50 km cells where 450% of the species would gain or lose their potential habitat when abolishing or
doubling the current biofuel target. Only the cultivation of arable (first-generation) biofuel crops is considered. Relative species shares
are based on the total number of species in policy option e2 ( 5 reference policy option, reflecting the current biofuel target of 5.75%).
Figures are summarized for birds, mammals, reptiles and amphibians.
Table 3 Number of species with medium or high suitability
level for the arable and woody biofuel crop option
Amphibians Mammals Reptiles Birds
Arable 2 7 1 27
Woody 2 18 6 22
Both 1 2 0 2
I S B I O F U E L P O L I C Y H A R M I N G E U R O P E A N B I O D I V E R S I T Y ? 29
r 2009 The AuthorsJournal compilation r 2009 Blackwell Publishing Ltd, GCB Bioenergy, 1, 18–34
as that of conventional biofuels because its cultivation
and management also needs locations that are suitable
for efficient cultivation and transport to processing
industries. The technical development needed to make
processing of these crops possible will determine the
most efficient scale of processing and the most preferred
locations of this industry. Given the high costs of
transportation of these high-volume crops, these factors
will be of prime importance for the selection of locations
where the cultivation of such crops will become profit-
able. Preliminary simulations by Hellmann and Verburg
(2008) indicate that, to some extent, hotspots of ligno-
cellulosic crops clearly overlap with hotspots of arable
biodiesel/bioethanol crops. Therefore the assumptions
used in this paper may give a good indication of the
possible consequences of woody biofuel cultivation for
biodiversity.
The impact of biofuel crop cultivation on biodiversity
depends on a combination of various effects (Anderson
et al., 2004; Anderson & Fergusson, 2006; Firbank, 2008):
local scale effects such as the choice of crop, manage-
ment intensity and vegetation structure, the biodiver-
sity value of the crop relative to the land-use types
which it replaces, as well as landscape scale effects,
such as the geographical location, the scale and the
spatial distribution of the crops. It is important to stress
that our results reflect the impacts of biofuel policies
solely on land-use changes, while the implications of
such policies go beyond that. With our analyses we
neglected other possible effects of biofuel crop produc-
tion on biodiversity, such as the use of pesticides,
ground water depletion, introduction of alien and in-
vasive species, or greenhouse gas emissions resulting
from the production cycle (CBD, 2008). There are also
likely effects on production intensity as a result of the
biofuels directive on all agricultural lands. We may
underestimate the effects on biodiversity since we do
not consider the intensification in agricultural practices
linked to an increase in the biofuel target. For example,
when high-nature value farmlands in Eastern Europe
are replaced by intensive biofuel plantations, the land
use class and thus the assumed habitat suitability do
not change in our analyses, while the effect will be
negative for many species. The IRENA study (EEA,
2005a) concluded that extensive farming systems are
important for maintaining the biological and landscape
diversity of farmland, including Natura2000 sites and
High Nature Value farmland (EEA, 2007).
Table 4 Percentage of the EU27 area showing a possible decrease, no change, or increase in potential species number (number of
species with medium and high suitable habitat) if the current biofuel target is abolished or doubled, if the crop type is changed
(woody–arable), and between 2000 and 2030 overall (e2–2000)
Overall change
between
2000 and 2030
Comparison
e2–2000 (%)
What might change
in addition if we abolish
the current biofuel target?
Comparison e1–e2 (%)
What might change
in addition if we double
the current biofuel target?
Comparison e3–e2 (%)
What might change in
addition if we cultivate
woody instead of arable
crops? Comparison
woody–arable in e2 (%)
Amphibians
Decrease 2.9 0.3 1.4 0.7
No change 92.9 98.8 98.1 99.0
Increase 4.2 0.9 0.5 0.3
Reptiles
Decrease 2.9 0.8 1.2 0.3
No change 94.5 99.0 98.5 99.5
Increase 2.6 0.3 0.4 0.2
Mammals
Decrease 5.2 0.4 1.8 0.0
No change 90.8 98.6 97.8 97.4
Increase 4.0 1.1 0.4 2.6
Birds
Decrease 4.7 0.6 1.6 1.5
No change 90.2 98.4 97.5 97.7
Increase 5.2 1.0 0.9 0.7
Total for all species groups
Decrease 4.6 0.6 1.8 0.1
No change 90.1 98.3 97.5 97.4
Increase 5.3 1.1 0.8 2.5
30 J . E G G E R S et al.
r 2009 The AuthorsJournal compilation r 2009 Blackwell Publishing Ltd, GCB Bioenergy, 1, 18–34
Since a part of the biofuels consumed in the EU27 is
imported, biofuel policy has an impact on biodiversity
in other world regions, too. For example, the destruc-
tion of tropical forests, which are rich in biodiversity,
are heavily linked to the booming biofuel industry
(Koh, 2007; Tan et al., 2008). Though important, such
effects outside the EU27 area were out of the scope of
our study.
Uncertainties exist with regard to the input data and
the approach adopted in this study. It should be noted
that we included only 23% of the amphibian, 13% of the
reptile, 39% of the bird and 20% of the mammal species
occurring in Europe in our analysis, while other rele-
vant species groups such as butterflies and beetles were
excluded. The distribution data for the selected species
at a European level have serious drawbacks in terms of
timeliness and accuracy (see Delbaere & Nieto Serra-
dilla, 2004) but to date form the best available data for
the type of analyses carried out here. The allocation and
area of biofuel crop plantations as used in our study are
based on the variation of the EU biofuel policy within
one scenario of development of economy, demography
and policies. Within the EUruralis project (WUR, MNP,
2008) different alternative scenarios were analysed re-
sulting in different land use change effects. Only for the
Global Economy scenario which was applied in this
paper all three policy options concerning the biofuels
directive were available. Thus, it should be noted that
the results of this paper are only valid against the
background of the assumptions of the Global Economy
scenario. In other scenarios the impact of biofuel policy
may be different due to different world trade conditions
and different land market conditions. Also for each
scenario different assumptions were made concerning
the scale of production of biofuels and their processing,
transport costs and restricted zones consistent with the
overall storyline of the scenario (Hellmann & Verburg,
2008). The scenario used in this paper is based on the
assumption that processing industry will reach levels
similar to the largest of the current bioenergy crop
processing industries, and few restrictions concerning
the allocation of biofuels are included due to the
assumed low levels of government intervention under
this scenario. Furthermore, in the Global Economy
scenario high levels of land abandonment are predicted
as a continuation of the current trend in mountainous
regions. In other EUruralis scenarios, and also with
respect to the given current agricultural development
globally, lower rates of land abandonment are foreseen
and thus, the context of biofuel impacts on European
land use may be different. Less land abandonment is
e.g. likely to increase import rates from outside Europe.
Thus, the results of this paper should be interpreted
given the overall scenario while a full ex-ante assess-
ment of the biofuels directive should include multiple
scenarios as a context.
However, increasing ambitions on biofuels in other
world regions are disregarded in the current implemen-
tation of the biofuel policy options. In the Global
Economy scenario about half of the biofuels are pro-
jected to be imported (Banse et al., 2008), but rising
biofuel ambitions elsewhere will make it more difficult
to import and the pressure on land in Europe will be
higher. Furthermore, imports of food and feed will also
be affected if other world regions increase their biofuel
ambitions. So it is likely that the land use scenarios
underestimate some of the effects.
Furthermore, the spatial distribution of the potential
habitat for the species as derived from the land use
projections and the habitat suitability levels from the
BioScore database can only serve as a coarse estimation
of the actual habitat. We did not consider parameters
such as climate, management intensity, disturbances,
interactions among species, small-scale habitat struc-
ture and species dispersal abilities, which also influence
species occurrence. Moreover, species responses to a
changing environment are very unpredictable and
therefore we can only give an indication of proportions
of species that are sensitive to a given land use change
rather than actually predicting impacts.
In our approach we assume that a species only occurs
in areas with available habitat of medium or high
suitability, and that the loss of such habitat results in
the loss of the species linked to it. Vice versa, we assume
that a gain of such habitat leads to the presence of
additional species linked to that habitat. However, this
may not always be the case because species responses
are complex as stated above. Therefore we possibly
overestimate potential changes in species composition.
All analyses are based on habitat suitability specified
for the CORINE land cover classes by BGR. This is only
a generalization of the actual habitat preferences of the
species and does not reflect specific habitat require-
ments. For example, the long-fingered bat (Myotis
capaccinii) is dependent on Black alder (Alnus glutinosa),
White willow (Salix alba) or European ash (Fraxinus
excelsior) woodland near flowing water, but in our
analysis it was assigned high suitability for any broad-
leaved forest, as in CORINE all broadleaved forests are
included in one class. Moreover, habitat suitability
levels were aggregated to conform to the classification
scheme of the EUruralis projections. For this reason the
results of this study might overestimate habitat suit-
ability for those land use classes in the scenarios which
overlapped with several CORINE classes since the
maximum of the suitability levels for the overlapping
CORINE classes was used in such case (compare section
’Downscaling of species distribution maps’). Thus, our
I S B I O F U E L P O L I C Y H A R M I N G E U R O P E A N B I O D I V E R S I T Y ? 31
r 2009 The AuthorsJournal compilation r 2009 Blackwell Publishing Ltd, GCB Bioenergy, 1, 18–34
results might underestimate the potential impact of a
change in biofuel ambitions on biodiversity. However,
for the applied scenario comparisons the influence of
the overestimation of habitat suitability is balanced out
as the same aggregation method was applied for all
downscaled distribution maps for the three biofuel
policy options (e1, e2 and e3). Besides the restriction
to the CORINE classes, we were limited to only four
habitat suitability levels (no, low, medium, high suit-
ability) which were further combined to potential pre-
sence and absence. Such ‘black and white’ perspective
can only give a rough indication of the real species
distribution.
The restriction to the CORINE land cover classes puts
limits on the characterization of habitat suitability for
woody and arable biofuel crops. There is no explicit
CORINE class for short-rotation woody plantations.
Thus, following the consultation of species experts, it
was assumed that the CORINE class ‘fruit trees and
berry plantations’ is closest in its characteristics. The
main argument for this choice is that both short-rotation
woody plantations and fruit tree plantations are planta-
tions without understory in which human disturbances
occur at regular intervals. However, by doing so, we
neglect impacts of specific management practices re-
lated to the cultivation of short-rotation coppice such as
harvesting techniques or usage of pesticides. Further-
more, fruit tree plantations offer food possibilities for
micro-mammals and birds, a characteristic which is not
present in such extent for woody biofuel crop planta-
tions. Therefore, associating woody crop plantations
with the habitat suitability level of fruit trees and berry
plantations probably gives an overoptimistic view on
habitat suitability. When applying the habitat suitability
levels of CORINE class ‘arable land’ for the arable
biofuel crop option, we assume that both management
systems – crop cultivation for food production and crop
cultivation for fuel production – are the same from the
perspective of habitat suitability for the species. In this
case we neglect possible differences between both sys-
tems such as the probably lower use of pesticides and
herbicides for biomass crops as well as different har-
vesting periods and techniques (EEA, 2007), which can
have an impact on habitat suitability.
The IUCN Red list conservation status for the species
considered in this study was aggregated at the level of
BGR. Local differences in the Red list status could not
be considered. Thus the number of potentially affected
threatened species will be different in areas where local
populations are of other conservation status than the
one assumed at BGR level.
We would also like to point out, that the aggregated
results in all given figures reflect mainly the potential
impacts of biofuel production on the species groups
with highest species numbers in the BioScore database
(birds and mammals).
Even though there are uncertainties related to the
input data and the approach followed, our results give
an indication for policy and decision makers of what
might happen under a changed biofuel policy in the EU.
The method has the potential to be applied in future
analyses as it is flexible in scale and can be extended to
other species groups provided that required input data
are available. Possible improvements relate to the avail-
ability of detailed land use scenarios and the integration
of further parameters regarding species occurrence.
Acknowledgements
The research was carried out within the BioScore project (Biodi-versity impact assessment using species sensitivity scores,http://www.bioscore.edu). BioScore is cofinanced by the Eur-opean Commission as a Strategic Research Project (contractnumber 022661) under the Sixth Framework Programme forResearch and Technological Development. Other finance is pro-vided by the partners in the BioScore team. The BioScore team,led by ECNC, is solely responsible for the content of this paper. Itdoes not represent the opinion of the European Community, noris the EC responsible for any use that might be made ofinformation appearing herein. We would like to thank the wholeBioScore team for compiling the species-specific habitat suitabil-ity data and setting up the BioScore database.
References
Ahman M, Nilsson LJ (2008) Path dependency and the future of
advanced vehicles and biofuels. Utilities Policy, 16, 80–89.
Anderson GQA, Fergusson MJ (2006) Energy from biomass in
the UK: sources, processes and biodiversity implications. Ibis,
148, 180–183.
Anderson GQA, Haskins L, Nelson S (2004) The effects of
bioenergy crops on farmland birds in the UK: a review of
current knowledge and future predictions. In: Biomass and
Agriculture; Sustainability, Markets and Policies (eds Parris K,
Poincet T), pp. 199–218. OECD, Paris.
Banse M, van Meijl H, Tabeau A, Woltjer G (2008) Will EU biofuel
policies affect global agricultural markets? European Review of
Agricultural Economics, 35, 117–141.
Biemans M, Waarts Y, Nieto A, Goba V, Jones-Walters L,
Zockler C (2008) Impacts of biofuel production on biodiversity in
Europe. ECNC – European Centre for Nature Conservation,
Tilburg, the Netherlands, 31 pp.
CBD (2008) The potential impacts of biofuels on biodiversity. Matters
arising from SBSTA recommendation XII/7. UNEP/CBD/
COP/9/26. Convention on Biological Diversity, 16 pp.
Commission of the European Communities (2005) Communica-
tion from the Commission: Biomass action plan. Brussels,
7.12.2005. COM(2005) 628 final.
Commission of the European Communities (2006) Commission
staff working document: Annex to the Communication from the
Commission ‘‘An EU Strategy for Biofuels’’, Impact Assess-
ment. COM(2006) 34 final, Brussels.
32 J . E G G E R S et al.
r 2009 The AuthorsJournal compilation r 2009 Blackwell Publishing Ltd, GCB Bioenergy, 1, 18–34
Commission of the European Communities (2008) Proposal for a
Directive of the European Parliament and of the Council on
the promotion of the use of energy from renewable sources,
COM(2008) 19 final.
Delbaere B (2006) European policy review – Assessing policy
impacts on biodiversity. Journal of Nature Conservation, 14, 129–
130.
Delbaere B, Nieto Serradilla A (eds) (2004) Environmental Risks
from Agriculture in Europe: Locating Environmental Risk Zones in
Europe Using Agri-Environmental Indicators. ECNC – European
Centre for Nature Conservation, Tilburg.
EEA (2000) CORINE land cover technical guide – Addendum 2000.
Technical report no. 40. European Environment Agency,
Copenhagen, 105 pp.
EEA (2005a) Agriculture and environment in EU-15 – the IRENA
indicator report. EEA report no 6/2005. European Environment
Agency, Copenhagen, 128 pp.
EEA (2005b) Biogeographical regions, Europe 2005. European
dataset, scale45 1:10.000.000, vector format. European Envir-
onment Agency, Copenhagen. URL at: http://dataservice.
eea.europa.eu/dataservice/metadetails.asp?id=839 (accessed
on 20.03.2008).
EEA (2006) Energy and environment in the European Union: Tracking
progress towards integration. EEA report no. 8/2006. European
Environment Agency, Copenhagen, 52 pp.
EEA (2007) Estimating the environmentally compatible bioenergy
potential from agriculture. Technical report. European Environ-
ment Agency, Copenhagen, 134 pp.
Eickhout B, van den Born GJ, Notenboom J, van Oorschot M, Ros
JPM, van Vuuren DP, Westhoek HJ (eds) (2008) Local and Global
Consequences of the EU Renewable Directive for Biofuels. Testing
the Sustainability Criteria. Netherlands Environmental Assess-
ment Agency, Bilthoven.
Eickhout B, van Meijl H, Tabeau A, van Rheenen T (2007)
Economic and ecological consequences of four European land
use scenarios. Land Use Policy, 24, 562–575.
Faaij APC (2006) Bio-energy in Europe: changing technology
choices. Energy Policy, 34, 322–342.
Fargione J, Hill J, Tilman D, Polasky S, Hawthorne P (2008)
Land clearing and the biofuel carbon debt. Science, 319, 1235–
1238.
Farrell EE, Plevin RJ, Turner BT, Jones AD, O’Hare M, Kammen
DM (2006) Ethanol can contribute to energy and environmen-
tal goals. Science, 311, 506–508.
Firbank L (2008) Assessing the ecological impacts of bioenergy
projects. Bioenergy Research, 1, 12–19.
Gasc J-P, Cabela A, Crnobrnja-Isailovic J et al. (eds) (2004) Atlas
of Amphibians and Reptiles in Europe. Societas Europea
Herpetologica & Museum National d’Histoire Naturelle,
Paris.
Hagemeijer WJM, Blair MJ (eds) (1997) The EBCC Atlas of
European Breeding Birds – their Distribution and Abundance.
T & A Poyser, London.
Harvey J (2007) A versatile solution? Growing Miscanthus for
bioenergy. Renewable Energy World, 10, 86–93.
Hellmann F, Verburg PH (2008) Spatially explicit modelling of
biofuel crops in Europe. Biomass and Bioenergy, doi: 10.1016/
j.biombioe.2008.09.003.
Huston MA, Marland G (2003) Carbon management and biodi-
versity. Journal of Environmental Management, 67, 77–86.
IUCN (2008) 2008 IUCN Red List of threatened species, http://
www.iucnredlist.org
Kahn Ribeiro S, Kobayashi S, Beuthe M et al. (2007) Transport
and its infrastructure. In: Climate Change 2007: Mitigation.
Contribution of Working Group III to the Fourth Assessment Report
of the Intergovernmental Panel on Climate Change (eds Metz B,
Davidson OR, Bosch PR, Dave R, Meyer LA), Cambridge
University Press, Cambridge, pp. 323–386.
Karp A, Shield I (2008) Bioenergy from plants and the sustain-
able yield challenge. New Phytologist, 179, 15–32.
Koh LP (2007) Potential habitat and biodiversity losses from
intensified biodiesel feedstock production. Conservation
Biology, 21, 1373–1375.
Koh LP, Ghazoul J (2008) Biofuels, biodiversity, and people:
understanding the conflicts and finding opportunities. Biolo-
gical Conservation, 141, 2450–2460.
Linnell J, Salvatori V, Boitani L (2007) Guidelines for population
level management plans for large carnivores in Europe. A Large
Carnivore Initiative for Europe report prepared for the Eur-
opean Commission. Final draft May 2007.
Louette G, Maes D, Alkemade JRM et al. BioScore – cost-effective
assessment of policy impact on biodiversity using species
sensitivity scores. Global Environmental Change.
Mace GM (2004) The role of taxonomy in species conservation.
Philosophical Transactions of the Royal Society London B, 359, 711–
719.
Maiorano L, Falcucci A, Garton EO, Boitani L (2007) Contribu-
tion of the Natura 2000 Network to Biodiversity Conservation
in Italy. Conservation Biology, 21, 1433–1444.
Marshall L (2008) The biofuel gamble. Why the swing to
green energy holds promise and danger. African Wildlife, 62,
18–21.
Mathiesen BV, Lund H, N�rgaard P (2008) Integrated trans-
port and renewable energy systems. Utilities Policy, 16, 107–
116.
Mitchell-Jones AJ, Amori G, Bogdanowicz W et al. (1999) The
Atlas of European Mammals. The Academic Press, London.
Nakicenovic N, Swart R (eds) (2000) Special Report on Emission
Scenarios. Cambridge University Press, Cambridge, UK.
Quadrelli R, Peterson S (2007) The energy-climate challenge:
recent trends in CO2 emissions from fuel combustion. Energy
Policy, 35, 5938–5952.
Raghu S, Anderson RC, Daehler AS, Wiedenmann RN, Simber-
loff D, Mack RN (2006) Adding biofuels to the invasive species
fire. Science, 313, 1742.
Rienks WA (ed) (2008) The Future of Rural Europe. An Anthology
Based on the Results of the Eururalis 2.0 Scenario Study. Wagenin-
gen University Research and Netherlands Environmental
Assessment Agency, Wageningen, the Netherlands.
Rowe RL, Street NR, Taylor G (2009) Identifying potential
environmental impacts of large-scale deployment of dedicated
bioenergy crops in the UK. Renewable and Sustainable Energy
Reviews, 13, 271–290.
Russi D (2008) An integrated assessment of a large-scale biodie-
sel production in Italy: killing several birds with one stone?
Energy Policy, 36, 1169–1180.
I S B I O F U E L P O L I C Y H A R M I N G E U R O P E A N B I O D I V E R S I T Y ? 33
r 2009 The AuthorsJournal compilation r 2009 Blackwell Publishing Ltd, GCB Bioenergy, 1, 18–34
Schmer MR, Vogel KP, Mitchell RB, Perrin RK (2008) Net energy
of cellulosic ethanol from switchgrass. Proceedings of the
National Academy of Sciences USA, 105, 464–469.
Simeonova K (2005) Integrated climate-change strategies of
industrialized countries. Energy, 30, 2537–2557.
Sims REH, Hastings A, Schlamadinger B, Taylor G, Smith P
(2006) Energy crops: current status and future prospects.
Global Change Biology, 12, 2054–2076.
Solomon S, Qin D, Manning M et al. (2007) Technical Summary. In:
Climate Change 2007: The Physical Science Basis. Contribution of
Working Group I to the Fourth Assessment Report of the Inter-
governmental Panel on Climate Change (eds Solomon S, Qin D,
Manning M, Chen Z, Marquis M, Averyt KB, Tignor M, Miller
HL), Cambridge University Press, Cambridge, pp. 19–92.
Tan KT, Lee KT, Mohamed AR (2008) Role of energy policy in
renewable energy accomplishment: the case of second-genera-
tion bioethanol. Energy Policy, 36, 3360–3365.
Temple HJ, Terry AC (2007) The Status and Distribution of Eur-
opean Mammals. Office for Official Publications of the Eur-
opean Communities, Luxembourg .
Tuck G, Glendining MJ, Smith P, House JI, Wattenbach M (2006)
The potential distribution of bioenergy crops in Europe under
present and future climate. Biomass and Bioenergy, 30, 183–197.
USGS (2006) GTOPO30 Hydro 1k dataset – hydrologically
correct digital elevation model for Europe, 1 km resolution. URL
at: http://edc.usgs.gov/products/elevation/gtopo30/hydro/
eu_dem.html (accessed on 20.03.2008).
van Meijl H, van Rheenen T, Tabeau A, Eickhout B (2006) The
impact of different policy environments on agricultural land use
in Europe. Agriculture, Ecosystems & Environment, 114, 21–38.
Verburg PH, Bakker M, Overmars KP, Staritsky I (2008) Land-
scape level simulation of land use change. In: Sustainability
Impact Assessment of Land Use Changes (eds Helming K, Perez-
Soba M, Tabbush P), Springer, Berlin, pp. 211–227.
Verburg PH, Schulp CJE, Witte N, Veldkamp A (2006) Down-
scaling of land use change scenarios to assess the dynamics of
European landscapes. Agriculture, Ecosystems and Environment,
114, 39–56.
Westhoek HJ, van den Berg M, Bakkes JA (2006) Scenario
development to explore the future of Europe’s rural areas.
Agriculture, Ecosystems and Environment, 114, 7–20.
Wright L (2006) Worldwide commercial development of bioe-
nergy with a focus on energy crop-based projects. Biomass and
Bioenergy, 30, 706–714.
WUR, MNP (2008) Eururalis 2.0 DVD. Available via internet:
http://www.eururalis.eu/app/register.html
Supporting Information
Additional Supporting Information may be found in the
online version of this article:
Table S1. List of species considered in our study.
Please note: Wiley-Blackwell are not responsible for the
content or functionality of any supporting materials sup-
plied by the authors. Any queries (other than missing
material) should be directed to the corresponding author
for the article.
34 J . E G G E R S et al.
r 2009 The AuthorsJournal compilation r 2009 Blackwell Publishing Ltd, GCB Bioenergy, 1, 18–34


