Embed Size (px)
Citation preview
ANALYSIS OF BIOFUEL SUPPORT POLICIES
Tobias Wiesenthal1*, Burkhard Schade1*, Panayotis Christidis1*, Guillaume Leduc1*, Luc Pelkmans2, Leen Govaerts2 1 European Commission, JRC-IPTS, Edificio Expo; C/ Inca Garcilaso, s/n; E-41092 Sevilla, Spain, tel: + 34 95 44 88 306;
fax: + 34 954488279; [email protected] 2 VITO, Mol, Belgium
* The views expressed are purely those of the authors and may not in any circumstances be regarded as stating an official position of the European Commission.
ABSTRACT: To achieve the recently adopted target of a 10% minimum share of biofuels in transport fuels a 10fold growth of the biofuel market is needed between 2005 and 2020. With an increasing number of feedstock and technologies becoming available, the larger market also allows for a differentiation among different biofuel types. A scenario-based analysis was used to evaluate the effectiveness and efficiency of biofuel support policies, taking into account the impacts of biofuel production on the energy and agricultural markets in order to reflect the reaction of the various sectors of the economy to changes in the level of biofuel production. In addition, the suitability of complementary measures in steering the market was assessed. Keywords: bio-energy policy, market implementation, economic aspects
1 INTRODUCTION Biofuels are a promising option to help reduce the oil dependency of the transport sector and simultaneously decrease its greenhouse gas emissions. Moreover, the cultivation of feedstock for biofuels creates an alternative outlet for farms produce. Biofuel consumption in Europe is thus promoted both by individual Member States and at EU-level. The EU biofuels directive [1] sets an indicative target of a 5.75% share of biofuels in total gasoline and diesel demand to be met by 2010, which was taken over by most Member States in their national objectives [2].
The European Council recently adopted a minimum binding target for the share of biofuels of 10% of all transport fuels by 2020 [3]. This was proposed by the European Commission in the context of the overall proposed target for a 20% share of renewable energies in total energy consumption [4]. It complements the Biomass Action Plan [5] and the EU strategy on biofuels [6] proposed in 2005 and 2006, respectively. However, the progress in introducing biofuels remains low on an EU average. Biofuels consumption merely reached 1% of all transport fuels consumed by the end of 2005, half of the indicative target of 2% set by the EU. This shortcoming is due to the fact that biofuels production and consumption are concentrated on a limited number of Member States, with other Member States only slowly building up a domestic support policy. In 2005, more than 80% of overall EU biodiesel was produced in only three Member States – Germany, France and Italy. Likewise, Spain, Sweden, Germany and France contributed to 80% of EU's bioethanol production [7]. Assessing the measures and market conditions related to the successful introduction of biofuels in a selected number of Member States can thus deliver important insights into how to further accelerate the deployment of alternative motor fuels in the EU. This is the focus of the PREMIA project, a specific support action funded under the sixth RTD framework programme [8]. In this paper, the preliminary results of the analysis of a variety of biofuel support measures and technologies will be
presented, combining scenarios evaluating different future policy options with the historic assessment of biofuel policies that were carried out as part of the PREMIA project. Bearing in mind that the 10% biofuel target implies a 10fold increase in consumption levels between 2005 and 2020, a future biofuel policy will need to be efficient and effective at the same time. On the other hand, larger markets and increasing numbers of biofuel production pathways with different characteristics in terms of greenhouse gas emissions, production costs and potentials allow for a differentiation of the market. Member States may decide to favour a certain biofuel strategy (e.g. with regard to imports, production pathways) in order to better serve the objectives underlying their biofuel support policy, i.e. increasing supply security, reducing GHG emissions and supporting the agricultural sector. It is thus of interest to analyse complementary policies and measures for their suitability to provide such steering. The results of this analysis are presented in chapter five of this paper. Chapter 2 introduces the PREMIA biofuel model, followed by an overview of the scenarios produced. As the choice of some hypothesis and input parameters largely determines the scenario outcome, they are explained in detail in chapter four, complemented by the assessment of the response of the model to changes in key parameters. After the assessment of policies and measures, conclusions are provided. 2 MODELLING APPROACH The PREMIA biofuel model is based on a recursive year by year simulation of biofuel demand and supply until 2030. For each set of exogenously given parameters an equilibrium point is found at which the costs of biofuels equal those of the fossil alternative they substitute, taking into account the feedback loops of the agricultural market and restrictions in the annual growth rates of capacity. The model delivers detailed outcomes for the types of biofuels considered – biodiesel or ethanol, first or second generation – with regard to production capacity and
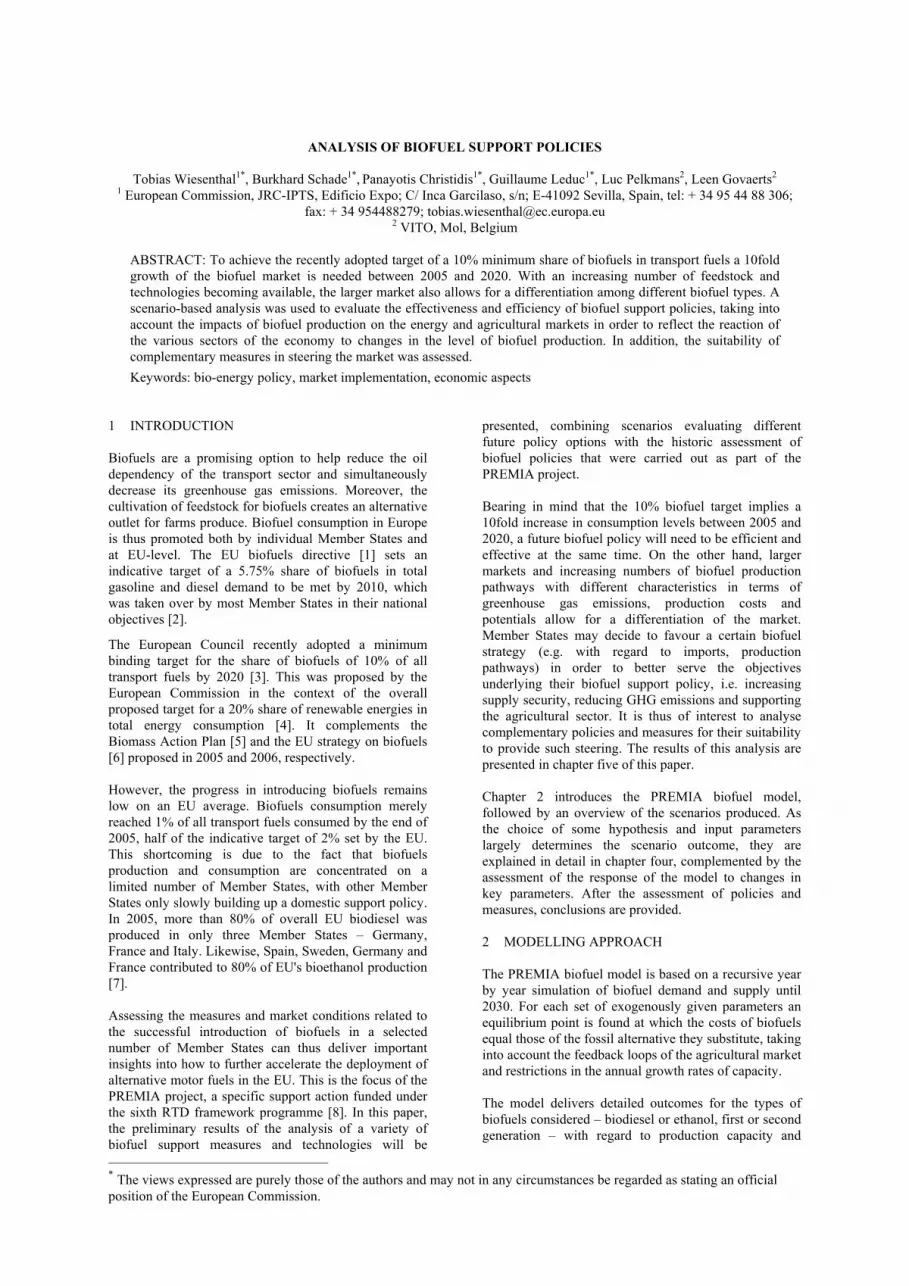
produced volumes, costs and well-to-wheel emissions of greenhouse gases. Historical values for biofuel production, consumption and production capacities are incorporated up to 2005. The model focuses on the main production pathways of biofuels, namely biodiesel based on rapeseed and sunflower and ethanol based on cereals and sugar beet, as well as advanced 2nd generation pathways from lignocellulosic feedstock (i.e. ethanol and synthetic diesel BtL). Their technical coefficients, costs and greenhouse gas emissions are based on the analysis carried out by JRC/EUCAR/CONCAWE [9], with additional information from the TRIAS project and the PREMIA regional stakeholder workshops, held in Seville, Athens, Paris, Tallin and Cologne in late 2006/early 2007. Figure 1 summarises the way the different factors interact. Impacts are traced in the various sectors. The chart is restricted to the EU domestic biofuel market Regarding imports, biofuel prices are given as exogenous variables as well as their maximum penetration levels. Other main exogenous parameters include: • Selection of biofuel production pathways; • Production costs and maturity factors (learning of
new production technologies); • Well-to-wheel emissions of greenhouse gases; • Development of oil prices and subsequently the
fossil fuel prices; • Elasticities of the raw material prices; • Transport fuel demand.
Demand
Fossil fuel prices
Fuel demandTransport demandEnergy markets
(e.g. oil prices)
Biofuel prices
Convfuel price
Feedstock demand
Feedstock prices
Suitability (high/low blends)
Agricultural production
Production
Productioncapacity
Productioncosts
Emissions of greenhouse gases
Biofuels Module
Demand
Fossil fuel prices
Fuel demandTransport demandEnergy markets
(e.g. oil prices)
Biofuel prices
Convfuel price
Feedstock demand
Feedstock prices
Suitability (high/low blends)
Agricultural production
Production
Productioncapacity
Productioncosts
Emissions of greenhouse gases
Biofuels Module
Figure 1: Interaction of factors affecting supply and demand of biofuels [10] The model determines the penetration of biofuels as a function of final price of biofuels relative to the pump price of fossil fuels. These are affected by the prices of oil and raw materials as well as the production costs that each alternative pathway entails (depending on capital costs, feedstock prices, load factors etc.).
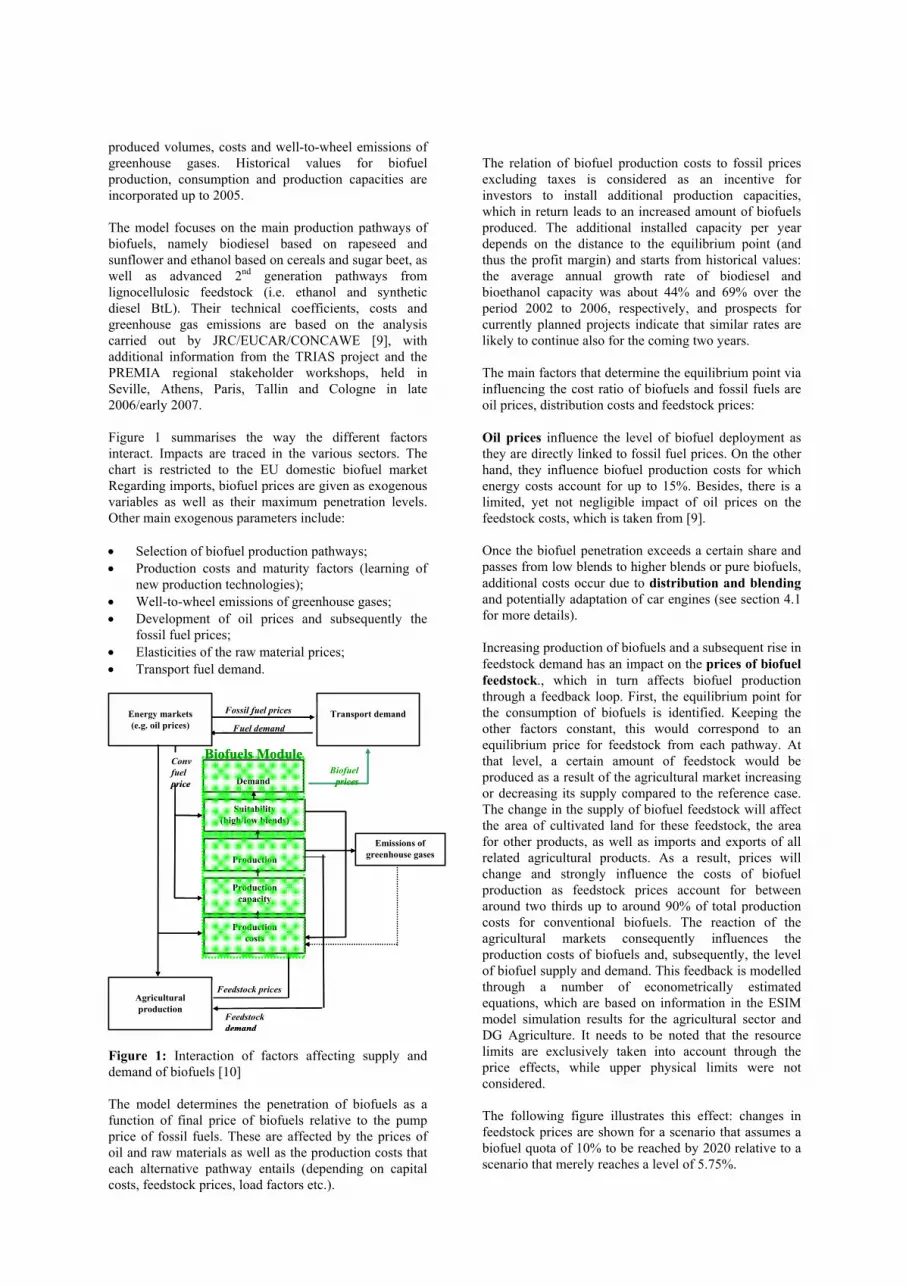
The relation of biofuel production costs to fossil prices excluding taxes is considered as an incentive for investors to install additional production capacities, which in return leads to an increased amount of biofuels produced. The additional installed capacity per year depends on the distance to the equilibrium point (and thus the profit margin) and starts from historical values: the average annual growth rate of biodiesel and bioethanol capacity was about 44% and 69% over the period 2002 to 2006, respectively, and prospects for currently planned projects indicate that similar rates are likely to continue also for the coming two years. The main factors that determine the equilibrium point via influencing the cost ratio of biofuels and fossil fuels are oil prices, distribution costs and feedstock prices: Oil prices influence the level of biofuel deployment as they are directly linked to fossil fuel prices. On the other hand, they influence biofuel production costs for which energy costs account for up to 15%. Besides, there is a limited, yet not negligible impact of oil prices on the feedstock costs, which is taken from [9]. Once the biofuel penetration exceeds a certain share and passes from low blends to higher blends or pure biofuels, additional costs occur due to distribution and blending and potentially adaptation of car engines (see section 4.1 for more details). Increasing production of biofuels and a subsequent rise in feedstock demand has an impact on the prices of biofuel feedstock., which in turn affects biofuel production through a feedback loop. First, the equilibrium point for the consumption of biofuels is identified. Keeping the other factors constant, this would correspond to an equilibrium price for feedstock from each pathway. At that level, a certain amount of feedstock would be produced as a result of the agricultural market increasing or decreasing its supply compared to the reference case. The change in the supply of biofuel feedstock will affect the area of cultivated land for these feedstock, the area for other products, as well as imports and exports of all related agricultural products. As a result, prices will change and strongly influence the costs of biofuel production as feedstock prices account for between around two thirds up to around 90% of total production costs for conventional biofuels. The reaction of the agricultural markets consequently influences the production costs of biofuels and, subsequently, the level of biofuel supply and demand. This feedback is modelled through a number of econometrically estimated equations, which are based on information in the ESIM model simulation results for the agricultural sector and DG Agriculture. It needs to be noted that the resource limits are exclusively taken into account through the price effects, while upper physical limits were not considered. The following figure illustrates this effect: changes in feedstock prices are shown for a scenario that assumes a biofuel quota of 10% to be reached by 2020 relative to a scenario that merely reaches a level of 5.75%.
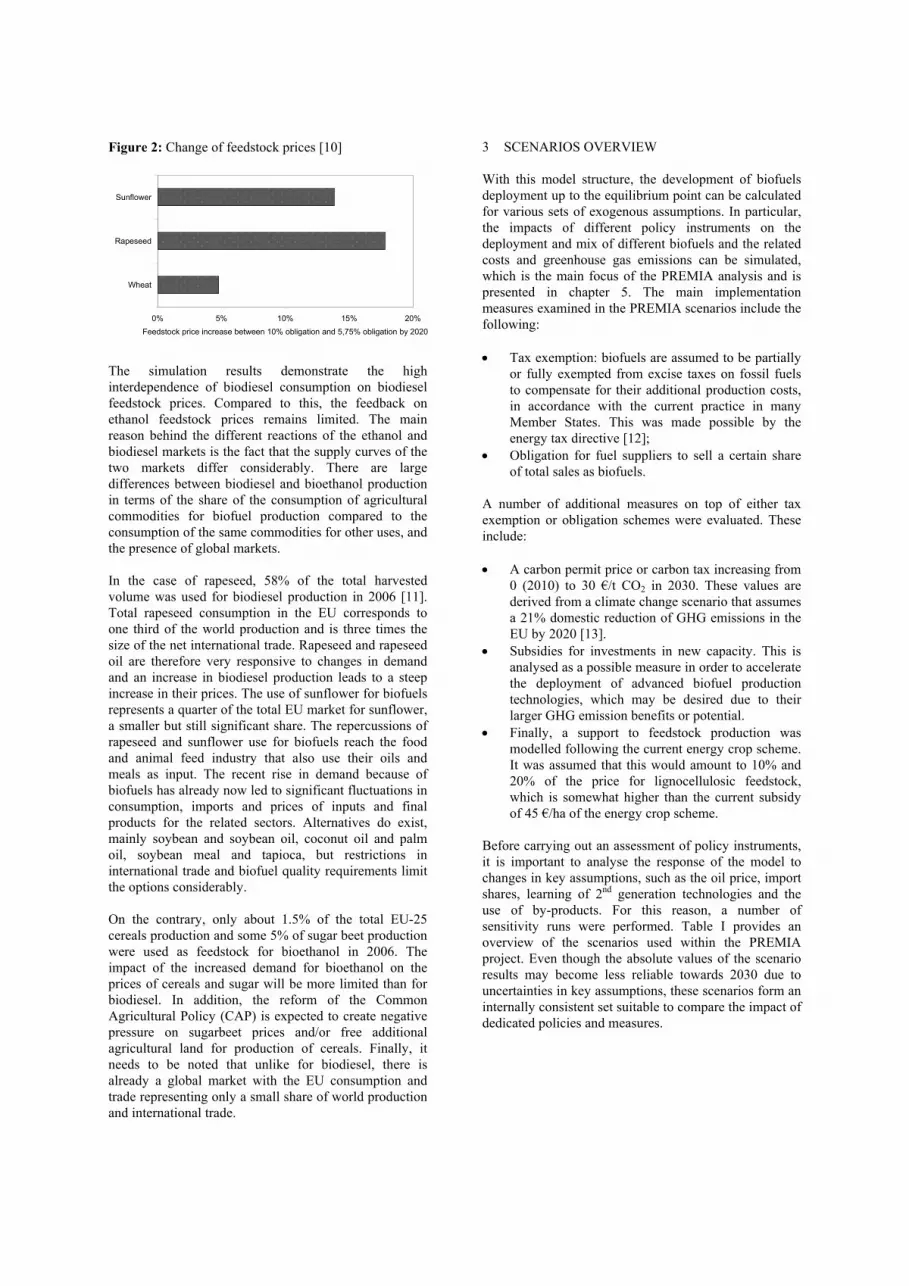
Figure 2: Change of feedstock prices [10]
0% 5% 10% 15% 20%
Wheat
Rapeseed
Sunflower
Feedstock price increase between 10% obligation and 5,75% obligation by 2020
The simulation results demonstrate the high interdependence of biodiesel consumption on biodiesel feedstock prices. Compared to this, the feedback on ethanol feedstock prices remains limited. The main reason behind the different reactions of the ethanol and biodiesel markets is the fact that the supply curves of the two markets differ considerably. There are large differences between biodiesel and bioethanol production in terms of the share of the consumption of agricultural commodities for biofuel production compared to the consumption of the same commodities for other uses, and the presence of global markets. In the case of rapeseed, 58% of the total harvested volume was used for biodiesel production in 2006 [11]. Total rapeseed consumption in the EU corresponds to one third of the world production and is three times the size of the net international trade. Rapeseed and rapeseed oil are therefore very responsive to changes in demand and an increase in biodiesel production leads to a steep increase in their prices. The use of sunflower for biofuels represents a quarter of the total EU market for sunflower, a smaller but still significant share. The repercussions of rapeseed and sunflower use for biofuels reach the food and animal feed industry that also use their oils and meals as input. The recent rise in demand because of biofuels has already now led to significant fluctuations in consumption, imports and prices of inputs and final products for the related sectors. Alternatives do exist, mainly soybean and soybean oil, coconut oil and palm oil, soybean meal and tapioca, but restrictions in international trade and biofuel quality requirements limit the options considerably. On the contrary, only about 1.5% of the total EU-25 cereals production and some 5% of sugar beet production were used as feedstock for bioethanol in 2006. The impact of the increased demand for bioethanol on the prices of cereals and sugar will be more limited than for biodiesel. In addition, the reform of the Common Agricultural Policy (CAP) is expected to create negative pressure on sugarbeet prices and/or free additional agricultural land for production of cereals. Finally, it needs to be noted that unlike for biodiesel, there is already a global market with the EU consumption and trade representing only a small share of world production and international trade.
3 SCENARIOS OVERVIEW With this model structure, the development of biofuels deployment up to the equilibrium point can be calculated for various sets of exogenous assumptions. In particular, the impacts of different policy instruments on the deployment and mix of different biofuels and the related costs and greenhouse gas emissions can be simulated, which is the main focus of the PREMIA analysis and is presented in chapter 5. The main implementation measures examined in the PREMIA scenarios include the following: • Tax exemption: biofuels are assumed to be partially
or fully exempted from excise taxes on fossil fuels to compensate for their additional production costs, in accordance with the current practice in many Member States. This was made possible by the energy tax directive [12];
• Obligation for fuel suppliers to sell a certain share of total sales as biofuels.
A number of additional measures on top of either tax exemption or obligation schemes were evaluated. These include: • A carbon permit price or carbon tax increasing from
0 (2010) to 30 €/t CO2 in 2030. These values are derived from a climate change scenario that assumes a 21% domestic reduction of GHG emissions in the EU by 2020 [13].
• Subsidies for investments in new capacity. This is analysed as a possible measure in order to accelerate the deployment of advanced biofuel production technologies, which may be desired due to their larger GHG emission benefits or potential.
• Finally, a support to feedstock production was modelled following the current energy crop scheme. It was assumed that this would amount to 10% and 20% of the price for lignocellulosic feedstock, which is somewhat higher than the current subsidy of 45 €/ha of the energy crop scheme.
Before carrying out an assessment of policy instruments, it is important to analyse the response of the model to changes in key assumptions, such as the oil price, import shares, learning of 2nd generation technologies and the use of by-products. For this reason, a number of sensitivity runs were performed. Table I provides an overview of the scenarios used within the PREMIA project. Even though the absolute values of the scenario results may become less reliable towards 2030 due to uncertainties in key assumptions, these scenarios form an internally consistent set suitable to compare the impact of dedicated policies and measures.
Table I: Overview of scenarios [10]
Ass
essm
ent f
ocus
Oil
pric
e (U
S$/b
bl)
Impo
rt sh
are
(%)
Mat
urity
of 2
nd
gene
ratio
n
By-
prod
uct u
se
Tax
exe
mpt
ion
Obl
igat
ion
Car
bon
pric
e
Cap
ital g
rant
(%
) Fe
edst
ock
supp
ort
(%)
Reference 65 30 REF Dyn no 2 no no no
65 30 REF Dyn no yes no no no
65 30 10 yr late Dyn no yes no no no
Learning rates 65 30
10 yr faster Dyn no yes no no no
65 30 REF Dyn yes no no no no
65 30 REF Animal yes no no no no
By-product use 65 30 REF
Energy yes no no no no
65 30 REF Dyn no no no no no
80 30 REF Dyn no no no no no
100 30 REF Dyn no no no no no
Oil price effect 120 30 REF Dyn no no no no no
65 30 REF Dyn no yes no no no
65 0 REF Dyn no yes no no no Imports 65 50 REF Dyn no yes no no no
65 30 REF Dyn yes no no no no
80 30 REF Dyn yes no no no no
100 30 REF Dyn yes no no no no
120 30 REF Dyn yes no no no no
Tax exemption 65 30 REF Dyn 0 no no no no CO2 price 65 30 REF Dyn yes no 1 no no
65 30 REF Dyn no 3 no no no
65 30 REF Dyn no 4 no no no Obligation 65 30 REF Dyn no 5 no no no
65 30 REF Dyn yes 4 no 10 no
65 30 REF Dyn no 4 no 20 no Capital grant 65 30 REF Dyn no 4 no 50 no
65 30 REF Dyn yes no no no 10
65 30 REF Dyn yes no no no 20 Feedstock 65 30 REF Dyn yes no no no 50
REF: reference, see text Dyn: dynamic depending on volumes, see text 0: Tax reduction so as to reach a 10% share by 2020 1: 30 €/t CO2 by 2030 2: 2.3% after 2007 3: 5.75% after 2012 4: 10% by 2020 5: equal shares for bioethanol and –diesel
4 HYPOTHESIS AND SENSITIVITY ANALYSIS In the following, a number of key input parameters of the PREMIA scenarios will be presented. They are based on available literature, sometimes updated or modified to take into account feedback from regional stakeholder workshops. The sensitivity of the model results to these parameters will be illustrated for technology learning, the use of by-products, oil prices and the maximum allowed share of imports. 4.1 Biofuel technology selection and distribution costs The analysis in PREMIA takes into account the main options for biodiesel, bioethanol and 2nd generation biofuel production technologies based on lignocellulosic feedstock. Other biofuels such as biogas are not considered, mainly because the use of biogas necessitates a completely new infrastructure that will most probably not be primarily pushed by biofuel policies but rather by policies aiming at increasing the share of gas-fuelled vehicles, which is beyond the scope of this assessment. Conventional biodiesel (also: fatty-acid methyl ester, FAME) is based on transesterification of vegetable oils or animal fats, which are derived mainly from rapeseed and sunflower in the EU. Oil seeds are crushed to produce vegetable oil and oil cake, a by-product used for animal feed. Alternatively, other oil types can be used for biodiesel production, such as used frying oil (which has proven successful in Austria). The oil is combined with alcohol (methanol or ethanol) and transformed into biodiesel, with glycerine as a by-product. During the production process, bioethanol can be used to replace methanol. Biodiesel can either be distributed by road tanker or shipped to refineries or depots to be blended with diesel fuel or sold in its pure form at fuel stations. Biodiesel replaces fossil diesel and can be blended in different shares. Current legislation limits the maximum blend of biodiesel in fossil diesel to 5% in volume terms, equalling 4.6% in energy, mainly because of concerns over the stability of biodiesel. Within the model it was assumed that a revision of the European Standard EN 590 will take place, which would allow a maximum blending 10% in terms of volume for biodiesel (9.2% in energy terms). For a deployment beyond such level additional distribution and storage costs were assumed. Such a revision seems likely: the Commission has recently asked the European Committee for Standardization CEN to reconsider the current limit. Conventional bioethanol can be produced from biological feedstock that contains sugar or starch that can be converted into sugar. The biomass options considered here include sugarbeet and wheat (cereals) as well as sugar cane for imported bioethanol, which are treated in the traditional fermentation process. Bioethanol can be used in different ways to replace fossil based gasoline: as low blends in the car fleet or high blends in dedicated flexi-fuel vehicles, or as ETBE. ETBE is an additive to enhance the octane rating of petrol as a replacement of the fossil MTBE (replacing lead and benzene in unleaded petrol) and currently presents the most frequent use of ethanol in Europe with
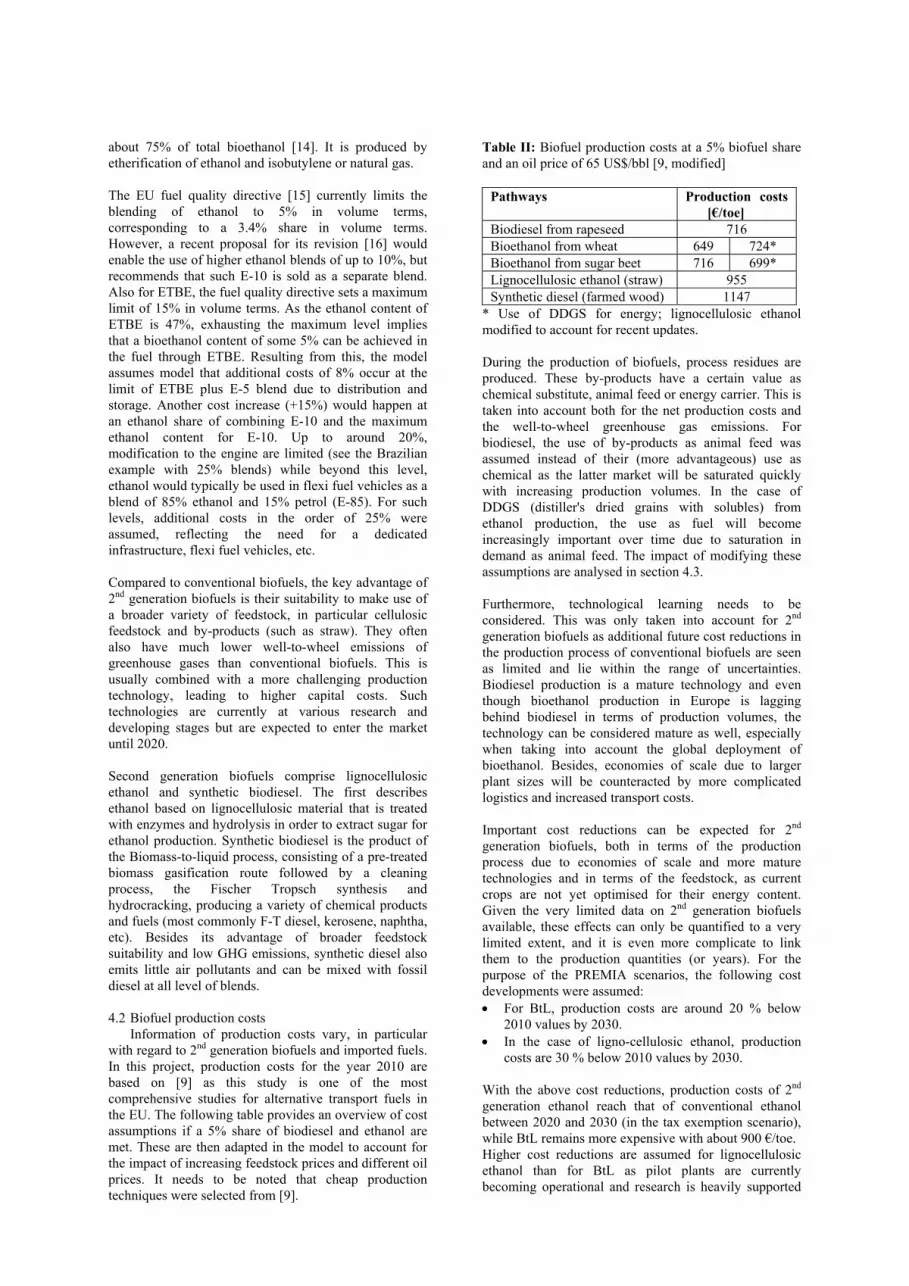
about 75% of total bioethanol [14]. It is produced by etherification of ethanol and isobutylene or natural gas. The EU fuel quality directive [15] currently limits the blending of ethanol to 5% in volume terms, corresponding to a 3.4% share in volume terms. However, a recent proposal for its revision [16] would enable the use of higher ethanol blends of up to 10%, but recommends that such E-10 is sold as a separate blend. Also for ETBE, the fuel quality directive sets a maximum limit of 15% in volume terms. As the ethanol content of ETBE is 47%, exhausting the maximum level implies that a bioethanol content of some 5% can be achieved in the fuel through ETBE. Resulting from this, the model assumes model that additional costs of 8% occur at the limit of ETBE plus E-5 blend due to distribution and storage. Another cost increase (+15%) would happen at an ethanol share of combining E-10 and the maximum ethanol content for E-10. Up to around 20%, modification to the engine are limited (see the Brazilian example with 25% blends) while beyond this level, ethanol would typically be used in flexi fuel vehicles as a blend of 85% ethanol and 15% petrol (E-85). For such levels, additional costs in the order of 25% were assumed, reflecting the need for a dedicated infrastructure, flexi fuel vehicles, etc. Compared to conventional biofuels, the key advantage of 2nd generation biofuels is their suitability to make use of a broader variety of feedstock, in particular cellulosic feedstock and by-products (such as straw). They often also have much lower well-to-wheel emissions of greenhouse gases than conventional biofuels. This is usually combined with a more challenging production technology, leading to higher capital costs. Such technologies are currently at various research and developing stages but are expected to enter the market until 2020. Second generation biofuels comprise lignocellulosic ethanol and synthetic biodiesel. The first describes ethanol based on lignocellulosic material that is treated with enzymes and hydrolysis in order to extract sugar for ethanol production. Synthetic biodiesel is the product of the Biomass-to-liquid process, consisting of a pre-treated biomass gasification route followed by a cleaning process, the Fischer Tropsch synthesis and hydrocracking, producing a variety of chemical products and fuels (most commonly F-T diesel, kerosene, naphtha, etc). Besides its advantage of broader feedstock suitability and low GHG emissions, synthetic diesel also emits little air pollutants and can be mixed with fossil diesel at all level of blends. 4.2 Biofuel production costs Information of production costs vary, in particular with regard to 2nd generation biofuels and imported fuels. In this project, production costs for the year 2010 are based on [9] as this study is one of the most comprehensive studies for alternative transport fuels in the EU. The following table provides an overview of cost assumptions if a 5% share of biodiesel and ethanol are met. These are then adapted in the model to account for the impact of increasing feedstock prices and different oil prices. It needs to be noted that cheap production techniques were selected from [9].
Table II: Biofuel production costs at a 5% biofuel share and an oil price of 65 US$/bbl [9, modified]
Pathways Production costs [€/toe]
Biodiesel from rapeseed 716 Bioethanol from wheat 649 724* Bioethanol from sugar beet 716 699* Lignocellulosic ethanol (straw) 955 Synthetic diesel (farmed wood) 1147
* Use of DDGS for energy; lignocellulosic ethanol modified to account for recent updates. During the production of biofuels, process residues are produced. These by-products have a certain value as chemical substitute, animal feed or energy carrier. This is taken into account both for the net production costs and the well-to-wheel greenhouse gas emissions. For biodiesel, the use of by-products as animal feed was assumed instead of their (more advantageous) use as chemical as the latter market will be saturated quickly with increasing production volumes. In the case of DDGS (distiller's dried grains with solubles) from ethanol production, the use as fuel will become increasingly important over time due to saturation in demand as animal feed. The impact of modifying these assumptions are analysed in section 4.3. Furthermore, technological learning needs to be considered. This was only taken into account for 2nd generation biofuels as additional future cost reductions in the production process of conventional biofuels are seen as limited and lie within the range of uncertainties. Biodiesel production is a mature technology and even though bioethanol production in Europe is lagging behind biodiesel in terms of production volumes, the technology can be considered mature as well, especially when taking into account the global deployment of bioethanol. Besides, economies of scale due to larger plant sizes will be counteracted by more complicated logistics and increased transport costs. Important cost reductions can be expected for 2nd
generation biofuels, both in terms of the production process due to economies of scale and more mature technologies and in terms of the feedstock, as current crops are not yet optimised for their energy content. Given the very limited data on 2nd generation biofuels available, these effects can only be quantified to a very limited extent, and it is even more complicate to link them to the production quantities (or years). For the purpose of the PREMIA scenarios, the following cost developments were assumed: • For BtL, production costs are around 20 % below
2010 values by 2030. • In the case of ligno-cellulosic ethanol, production
costs are 30 % below 2010 values by 2030. With the above cost reductions, production costs of 2nd generation ethanol reach that of conventional ethanol between 2020 and 2030 (in the tax exemption scenario), while BtL remains more expensive with about 900 €/toe. Higher cost reductions are assumed for lignocellulosic ethanol than for BtL as pilot plants are currently becoming operational and research is heavily supported

also by the USA. Furthermore, the extension from 1st to 2nd generation ethanol production bears fewer risks and is smoother than that from 1st to 2nd generation biodiesel, as major parts of the plant remain the same in the case of wheat-based ethanol. This is supported by other studies [e.g. 17] that assume steeper cost reductions for lignocellulosic ethanol than for BtL. In order to estimate the effect of different cost reductions on the deployment of second generation biofuels, two sensitivity runs were carried out for the reference scenario that assumes a 10% obligation by 2020 at an oil price of 65 US$/bbl. In the case of low maturity, the above cost reductions are achieved with a ten year delay. The high maturity scenario assumes that the values are reached one decade early. The effects are shown in the following chart. While in the case of low learning 2nd generation biofuels would basically not enter the market, their share can reach above two percent by 2020 if a steeper learning curve is assumed. This indicates that these assumptions are crucial for estimating the time of entry into the market and deployment of advanced biofuels. Figure 3: Share of advanced biofuels in total fuel demand for different maturities by 2020 in a 10% obligation case [10]
Low learning
Reference learning
High learning
0,0% 0,5% 1,0% 1,5% 2,0% 2,5%Share in total fuel demand
4.3 Greenhouse gas emissions Consistent with the cost data, also greenhouse gas emissions are taken from [9] and presented in table III; they comprise emissions during the complete pathway from well to wheel. Usually, there is a broad range in well-to-wheel emission levels, depending largely on the way that by-products are accounted for and the origin of the fossil energy needed for the conversion. Table III: Well-to-wheel greenhouse gas emissions of different biofuels in 2010 [9]
Pathway
WTW GHG emissions in t CO2-equivalent/ toe
Ethanol from wheat 2.00 1.65* Ethanol sugar beet 2.47 1.29* Ligno-cellulosic ethanol 0.42 Sugar cane (Brazil) 0.49 Biodiesel 1.73 Synthetic biodiesel (BtL) 0.35 Gasoline 3.65 Diesel 3.69
* Use of DDGS for energy
It is assumed that in the case of glycerine from biodiesel production by-products will be used for animal feed rather than as chemical substitute. DDGS from ethanol production will primarily be used as animal feed (80% of total volume) until production levels reach around 5000 toe. With increasing production volumes, the energetic use of DDGS increases up to a share of 80% of all by-products at production levels of 15000 toe. This leads to changes in both GHG credits and costs but may be more realistic vis-à-vis a saturation of by-product markets. While the scenarios assume a shift from the use of DDGS as animal feed to energetic use following rising production volumes, two sensitivity runs were carried out, with one of them illustrating a complete use of DDGS for animal feed, and the other a purely energetic use. The results clearly demonstrate the important impact of the assumed well-to-wheel emissions on the deployment, GHG emissions and costs of biofuels. Table IV: Impact of by-product use on deployment, costs and GHG emissions for domestic ethanol [10]
2010 2020
energetic use
animal feed
energetic use
animal feed
Bioethanol share of fuel demand 1.1% 1.3% 7.5% 10.8%Production costs (€/toe) 716 671 818 787 Avoided GHG emissions ethanol (Mio t) 9.1 9.1 74 89 Costs per avoided emission (€/t CO2-eq) 86 83 127 135
It needs to be noted that the emission coefficients shown in table III are valid for the year 2010 and that the values for 2020 and 2030 might vary. Furthermore, emissions from imported ethanol may change over time. They describe current management practices in Brazil but could be significantly higher if e.g. deforestation is done to enlarge the cultivation area, or if imports come from other regions etc. Also GHG emission levels for fossil petrol and diesel may increase substantially if produced from CtL (Coal to liquid) or oil sands etc. These considerations could nevertheless not be quantified within this study. 4.4 Oil price Apart from dedicated biofuel support policies and measures, the evolution of the oil price has the largest impact on the deployment of biofuels. This effect was assessed by calculating a reference scenario without any biofuel policy for four different oil prices, ranging from 65 US$/bbl to 120 US$/bbl. The results indicate that biofuels can achieve a share of up to 6% by 2020 at an assumed oil price of 120 US$/bbl without any kind of support policy. At an oil price of 65 US$/bbl, their share remains limited. The maximum import level for these scenarios was set at 30% of total biofuel consumption volumes.
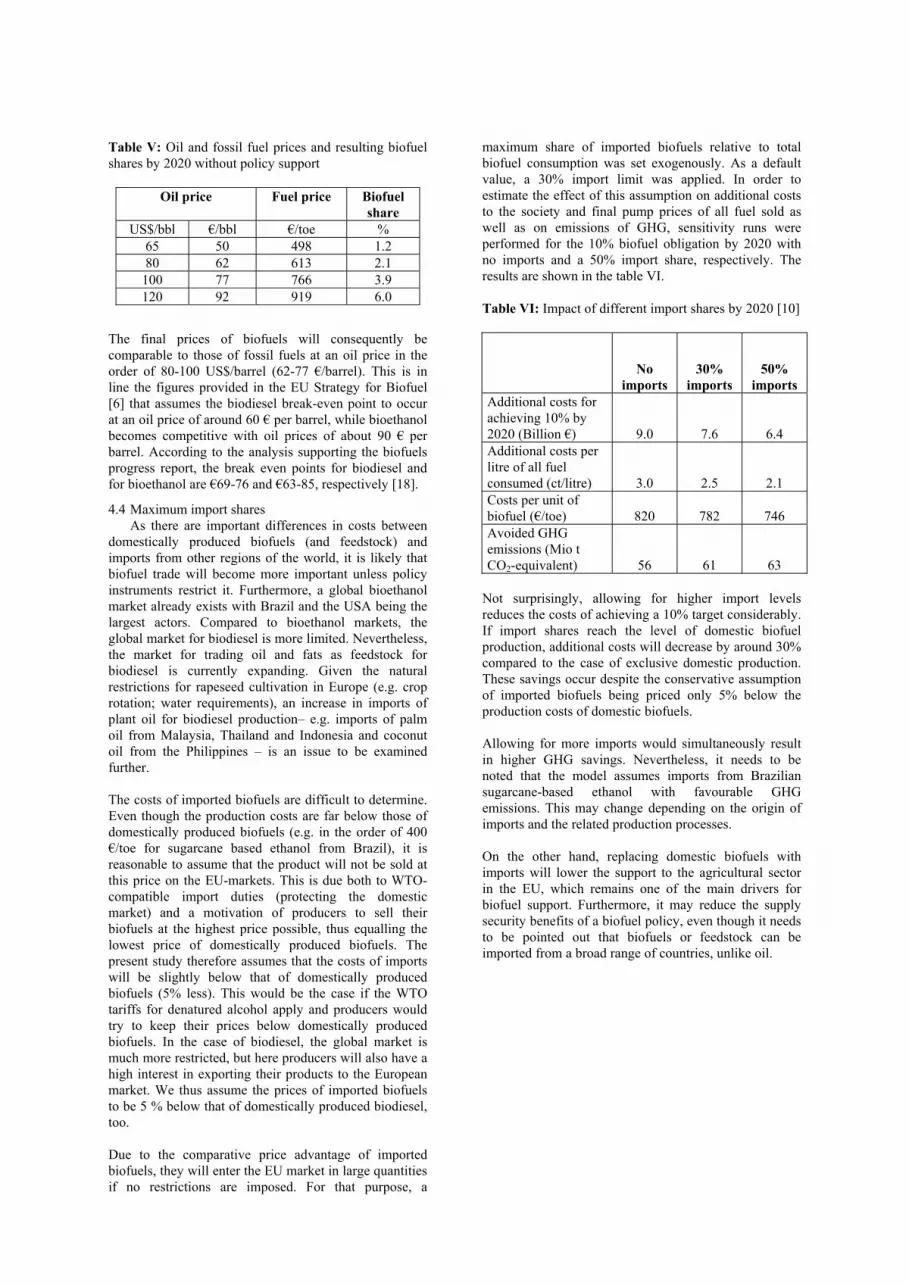
Table V: Oil and fossil fuel prices and resulting biofuel shares by 2020 without policy support
Oil price Fuel price Biofuel share
US$/bbl €/bbl €/toe % 65 50 498 1.2 80 62 613 2.1
100 77 766 3.9 120 92 919 6.0
The final prices of biofuels will consequently be comparable to those of fossil fuels at an oil price in the order of 80-100 US$/barrel (62-77 €/barrel). This is in line the figures provided in the EU Strategy for Biofuel [6] that assumes the biodiesel break-even point to occur at an oil price of around 60 € per barrel, while bioethanol becomes competitive with oil prices of about 90 € per barrel. According to the analysis supporting the biofuels progress report, the break even points for biodiesel and for bioethanol are €69-76 and €63-85, respectively [18].
4.4 Maximum import shares As there are important differences in costs between domestically produced biofuels (and feedstock) and imports from other regions of the world, it is likely that biofuel trade will become more important unless policy instruments restrict it. Furthermore, a global bioethanol market already exists with Brazil and the USA being the largest actors. Compared to bioethanol markets, the global market for biodiesel is more limited. Nevertheless, the market for trading oil and fats as feedstock for biodiesel is currently expanding. Given the natural restrictions for rapeseed cultivation in Europe (e.g. crop rotation; water requirements), an increase in imports of plant oil for biodiesel production– e.g. imports of palm oil from Malaysia, Thailand and Indonesia and coconut oil from the Philippines – is an issue to be examined further. The costs of imported biofuels are difficult to determine. Even though the production costs are far below those of domestically produced biofuels (e.g. in the order of 400 €/toe for sugarcane based ethanol from Brazil), it is reasonable to assume that the product will not be sold at this price on the EU-markets. This is due both to WTO-compatible import duties (protecting the domestic market) and a motivation of producers to sell their biofuels at the highest price possible, thus equalling the lowest price of domestically produced biofuels. The present study therefore assumes that the costs of imports will be slightly below that of domestically produced biofuels (5% less). This would be the case if the WTO tariffs for denatured alcohol apply and producers would try to keep their prices below domestically produced biofuels. In the case of biodiesel, the global market is much more restricted, but here producers will also have a high interest in exporting their products to the European market. We thus assume the prices of imported biofuels to be 5 % below that of domestically produced biodiesel, too. Due to the comparative price advantage of imported biofuels, they will enter the EU market in large quantities if no restrictions are imposed. For that purpose, a
maximum share of imported biofuels relative to total biofuel consumption was set exogenously. As a default value, a 30% import limit was applied. In order to estimate the effect of this assumption on additional costs to the society and final pump prices of all fuel sold as well as on emissions of GHG, sensitivity runs were performed for the 10% biofuel obligation by 2020 with no imports and a 50% import share, respectively. The results are shown in the table VI. Table VI: Impact of different import shares by 2020 [10]
No
imports 30%
imports 50%
imports Additional costs for achieving 10% by 2020 (Billion €) 9.0 7.6 6.4 Additional costs per litre of all fuel consumed (ct/litre) 3.0 2.5 2.1 Costs per unit of biofuel (€/toe) 820 782 746 Avoided GHG emissions (Mio t CO2-equivalent) 56 61 63
Not surprisingly, allowing for higher import levels reduces the costs of achieving a 10% target considerably. If import shares reach the level of domestic biofuel production, additional costs will decrease by around 30% compared to the case of exclusive domestic production. These savings occur despite the conservative assumption of imported biofuels being priced only 5% below the production costs of domestic biofuels. Allowing for more imports would simultaneously result in higher GHG savings. Nevertheless, it needs to be noted that the model assumes imports from Brazilian sugarcane-based ethanol with favourable GHG emissions. This may change depending on the origin of imports and the related production processes. On the other hand, replacing domestic biofuels with imports will lower the support to the agricultural sector in the EU, which remains one of the main drivers for biofuel support. Furthermore, it may reduce the supply security benefits of a biofuel policy, even though it needs to be pointed out that biofuels or feedstock can be imported from a broad range of countries, unlike oil.
5 ASSESSMENT OF BIOFUEL SUPPORT POLICIES AND MEASURES In the following, the results of the PREMIA scenarios will be combined with the assessment of biofuel policies in a number of Member States. This approach allows a scenario-based outlook on the importance and limitations of different policies and measures in a growing biofuel market that can be complemented with the assessment of historic facts. For the historic assessment, the conclusions are drawn from the analysis done within the PREMIA project, which focused on the following Member States: Germany, France, Austria, Sweden, Czech Republic, Spain, Poland and the UK. More detailed information can be found in [19]. As the production costs of biofuels will remain above fossil fuel prices (except for oil prices above some 80-100 US$/bbl), supporting mechanisms will be necessary for promoting biofuels. Demand side mechanisms have been efficient for initiating a biofuel market in the past as they compensate the additional production costs of biofuels. As a result, the consumer will pay a similar price for biofuels and fossil fuels. The most important instruments of this category are partial or total tax exemptions and obligations. Supply side instruments (e.g. capital grants or feedstock subsidies) have had limited success in pushing biofuels so far. Nevertheless, they may be suitable for providing support dedicated to a specific production pathway or feedstock and will thus be analysed in section 5.2. 5.1 Demand side instruments 5.1.1 Tax reduction on final biofuel price A reduced tax rate or even a complete tax exemption of biofuels has proved to be a successful and effective instrument for pushing biofuels into the market. Following the energy taxation directive, the reduction level is limited to the fuel tax (i.e. not extended to VAT exemption), and no overcompensation is allowed.
The success of this instrument is strongly linked to the tax level, which needs to be high enough to compensate for the additional production costs of biofuels compared to the fossil alternatives. In Germany, tax levels increased after 1999 due to the introduction of the ecotax, which led to a tax exemption of 47 ct/litre biodiesel, one of the highest values in the EU. Consequently, Germany managed to reach a biodiesel share of 6 % in total diesel demand by 2005. The Swedish success in introducing bioethanol was similarly influenced by the high share of taxes on fossil gasoline. All Member States that achieved a high level of biofuels by 2005 had a full tax break in place and high fossil fuel tax levels. However, the reverse case does not seem true (e.g. limited uptake of ethanol in Germany despite high tax breaks), which indicates that a tax exemption is not a sufficient condition to reach a high share of biofuels [19]. For the PREMIA scenarios simulating a full exemption of biofuels from the mineral oil tax, relatively high tax levels were assumed. The weighted average of mineral oil tax levels in the EU-15 in 2005 was adopted, which
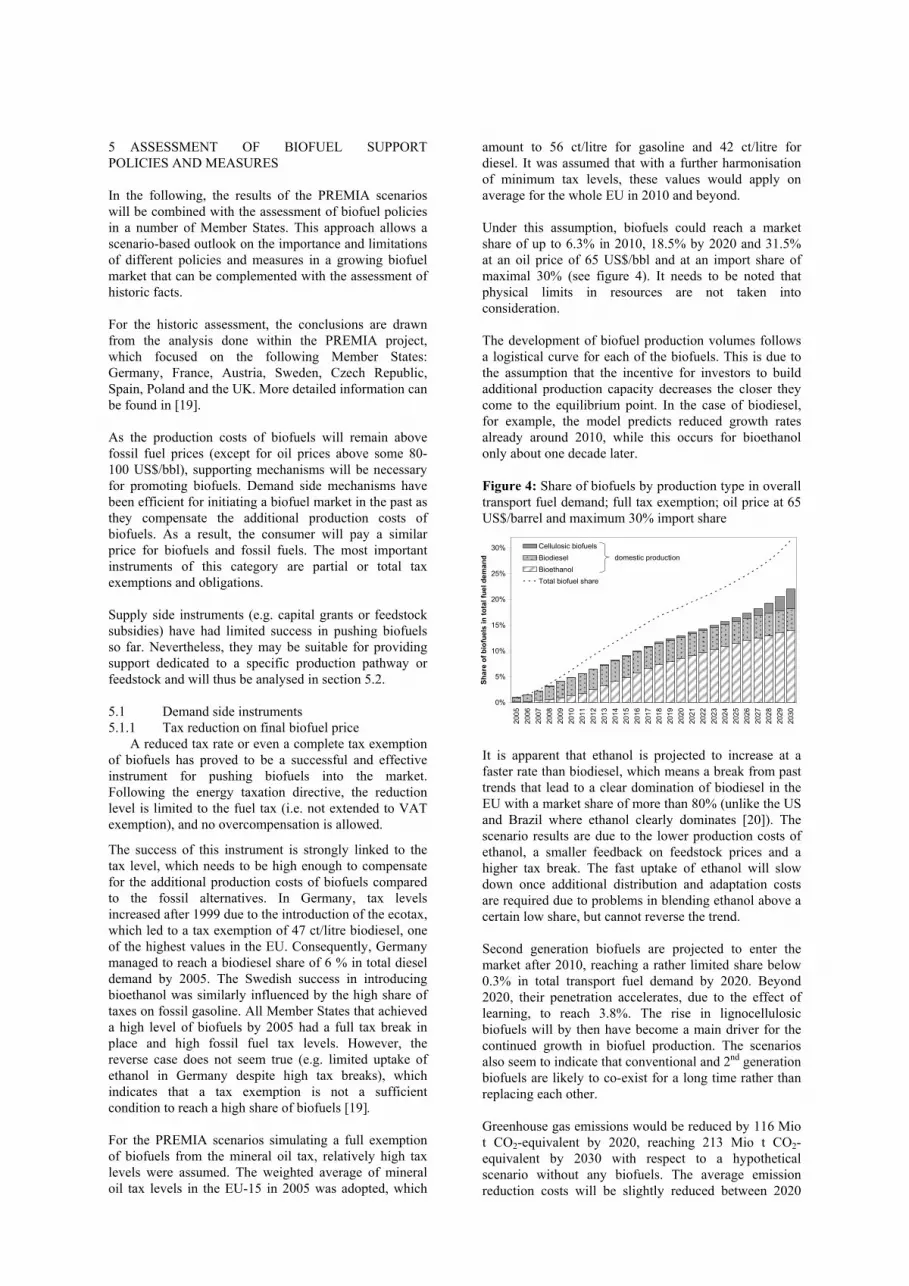
amount to 56 ct/litre for gasoline and 42 ct/litre for diesel. It was assumed that with a further harmonisation of minimum tax levels, these values would apply on average for the whole EU in 2010 and beyond. Under this assumption, biofuels could reach a market share of up to 6.3% in 2010, 18.5% by 2020 and 31.5% at an oil price of 65 US$/bbl and at an import share of maximal 30% (see figure 4). It needs to be noted that physical limits in resources are not taken into consideration. The development of biofuel production volumes follows a logistical curve for each of the biofuels. This is due to the assumption that the incentive for investors to build additional production capacity decreases the closer they come to the equilibrium point. In the case of biodiesel, for example, the model predicts reduced growth rates already around 2010, while this occurs for bioethanol only about one decade later. Figure 4: Share of biofuels by production type in overall transport fuel demand; full tax exemption; oil price at 65 US$/barrel and maximum 30% import share
0%
5%
10%
15%
20%
25%
30%
2005
2006
2007
2008
2009
2010
2011
2012
2013
2014
2015
2016
2017
2018
2019
2020
2021
2022
2023
2024
2025
2026
2027
2028
2029
2030
Shar
e of
bio
fuel
s in
tota
l fue
l dem
and
Cellulosic biofuelsBiodieselBioethanolTotal biofuel share
domestic production
It is apparent that ethanol is projected to increase at a faster rate than biodiesel, which means a break from past trends that lead to a clear domination of biodiesel in the EU with a market share of more than 80% (unlike the US and Brazil where ethanol clearly dominates [20]). The scenario results are due to the lower production costs of ethanol, a smaller feedback on feedstock prices and a higher tax break. The fast uptake of ethanol will slow down once additional distribution and adaptation costs are required due to problems in blending ethanol above a certain low share, but cannot reverse the trend. Second generation biofuels are projected to enter the market after 2010, reaching a rather limited share below 0.3% in total transport fuel demand by 2020. Beyond 2020, their penetration accelerates, due to the effect of learning, to reach 3.8%. The rise in lignocellulosic biofuels will by then have become a main driver for the continued growth in biofuel production. The scenarios also seem to indicate that conventional and 2nd generation biofuels are likely to co-exist for a long time rather than replacing each other. Greenhouse gas emissions would be reduced by 116 Mio t CO2-equivalent by 2020, reaching 213 Mio t CO2-equivalent by 2030 with respect to a hypothetical scenario without any biofuels. The average emission reduction costs will be slightly reduced between 2020
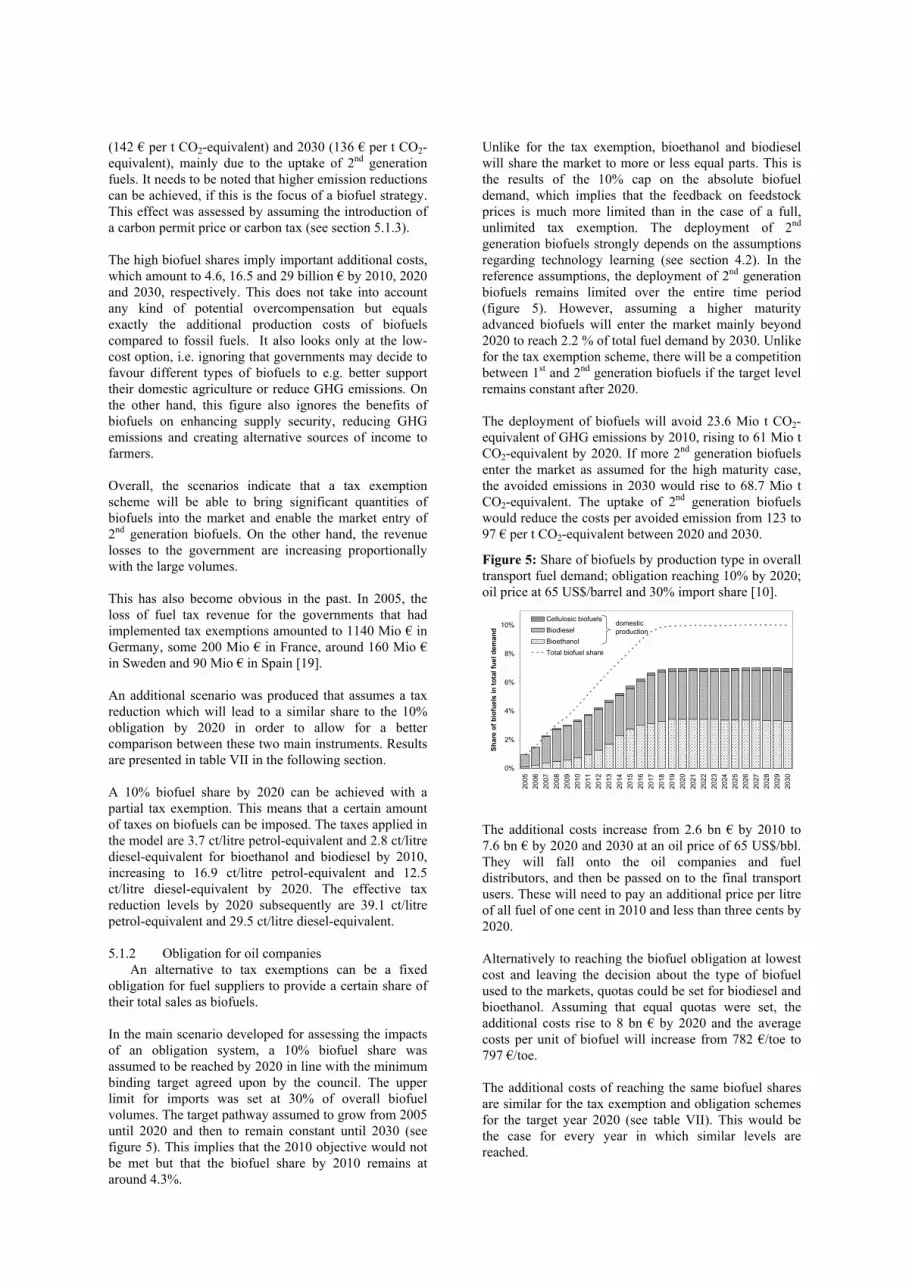
(142 € per t CO2-equivalent) and 2030 (136 € per t CO2-equivalent), mainly due to the uptake of 2nd generation fuels. It needs to be noted that higher emission reductions can be achieved, if this is the focus of a biofuel strategy. This effect was assessed by assuming the introduction of a carbon permit price or carbon tax (see section 5.1.3). The high biofuel shares imply important additional costs, which amount to 4.6, 16.5 and 29 billion € by 2010, 2020 and 2030, respectively. This does not take into account any kind of potential overcompensation but equals exactly the additional production costs of biofuels compared to fossil fuels. It also looks only at the low-cost option, i.e. ignoring that governments may decide to favour different types of biofuels to e.g. better support their domestic agriculture or reduce GHG emissions. On the other hand, this figure also ignores the benefits of biofuels on enhancing supply security, reducing GHG emissions and creating alternative sources of income to farmers. Overall, the scenarios indicate that a tax exemption scheme will be able to bring significant quantities of biofuels into the market and enable the market entry of 2nd generation biofuels. On the other hand, the revenue losses to the government are increasing proportionally with the large volumes. This has also become obvious in the past. In 2005, the loss of fuel tax revenue for the governments that had implemented tax exemptions amounted to 1140 Mio € in Germany, some 200 Mio € in France, around 160 Mio € in Sweden and 90 Mio € in Spain [19]. An additional scenario was produced that assumes a tax reduction which will lead to a similar share to the 10% obligation by 2020 in order to allow for a better comparison between these two main instruments. Results are presented in table VII in the following section. A 10% biofuel share by 2020 can be achieved with a partial tax exemption. This means that a certain amount of taxes on biofuels can be imposed. The taxes applied in the model are 3.7 ct/litre petrol-equivalent and 2.8 ct/litre diesel-equivalent for bioethanol and biodiesel by 2010, increasing to 16.9 ct/litre petrol-equivalent and 12.5 ct/litre diesel-equivalent by 2020. The effective tax reduction levels by 2020 subsequently are 39.1 ct/litre petrol-equivalent and 29.5 ct/litre diesel-equivalent. 5.1.2 Obligation for oil companies An alternative to tax exemptions can be a fixed obligation for fuel suppliers to provide a certain share of their total sales as biofuels. In the main scenario developed for assessing the impacts of an obligation system, a 10% biofuel share was assumed to be reached by 2020 in line with the minimum binding target agreed upon by the council. The upper limit for imports was set at 30% of overall biofuel volumes. The target pathway assumed to grow from 2005 until 2020 and then to remain constant until 2030 (see figure 5). This implies that the 2010 objective would not be met but that the biofuel share by 2010 remains at around 4.3%.
Unlike for the tax exemption, bioethanol and biodiesel will share the market to more or less equal parts. This is the results of the 10% cap on the absolute biofuel demand, which implies that the feedback on feedstock prices is much more limited than in the case of a full, unlimited tax exemption. The deployment of 2nd generation biofuels strongly depends on the assumptions regarding technology learning (see section 4.2). In the reference assumptions, the deployment of 2nd generation biofuels remains limited over the entire time period (figure 5). However, assuming a higher maturity advanced biofuels will enter the market mainly beyond 2020 to reach 2.2 % of total fuel demand by 2030. Unlike for the tax exemption scheme, there will be a competition between 1st and 2nd generation biofuels if the target level remains constant after 2020. The deployment of biofuels will avoid 23.6 Mio t CO2-equivalent of GHG emissions by 2010, rising to 61 Mio t CO2-equivalent by 2020. If more 2nd generation biofuels enter the market as assumed for the high maturity case, the avoided emissions in 2030 would rise to 68.7 Mio t CO2-equivalent. The uptake of 2nd generation biofuels would reduce the costs per avoided emission from 123 to 97 € per t CO2-equivalent between 2020 and 2030.
Figure 5: Share of biofuels by production type in overall transport fuel demand; obligation reaching 10% by 2020; oil price at 65 US$/barrel and 30% import share [10].
0%
2%
4%
6%
8%
10%
2005
2006
2007
2008
2009
2010
2011
2012
2013
2014
2015
2016
2017
2018
2019
2020
2021
2022
2023
2024
2025
2026
2027
2028
2029
2030
Shar
e of
bio
fuel
s in
tota
l fue
l dem
and
Cellulosic biofuelsBiodieselBioethanolTotal biofuel share
domestic production
The additional costs increase from 2.6 bn € by 2010 to 7.6 bn € by 2020 and 2030 at an oil price of 65 US$/bbl. They will fall onto the oil companies and fuel distributors, and then be passed on to the final transport users. These will need to pay an additional price per litre of all fuel of one cent in 2010 and less than three cents by 2020. Alternatively to reaching the biofuel obligation at lowest cost and leaving the decision about the type of biofuel used to the markets, quotas could be set for biodiesel and bioethanol. Assuming that equal quotas were set, the additional costs rise to 8 bn € by 2020 and the average costs per unit of biofuel will increase from 782 €/toe to 797 €/toe. The additional costs of reaching the same biofuel shares are similar for the tax exemption and obligation schemes for the target year 2020 (see table VII). This would be the case for every year in which similar levels are reached.
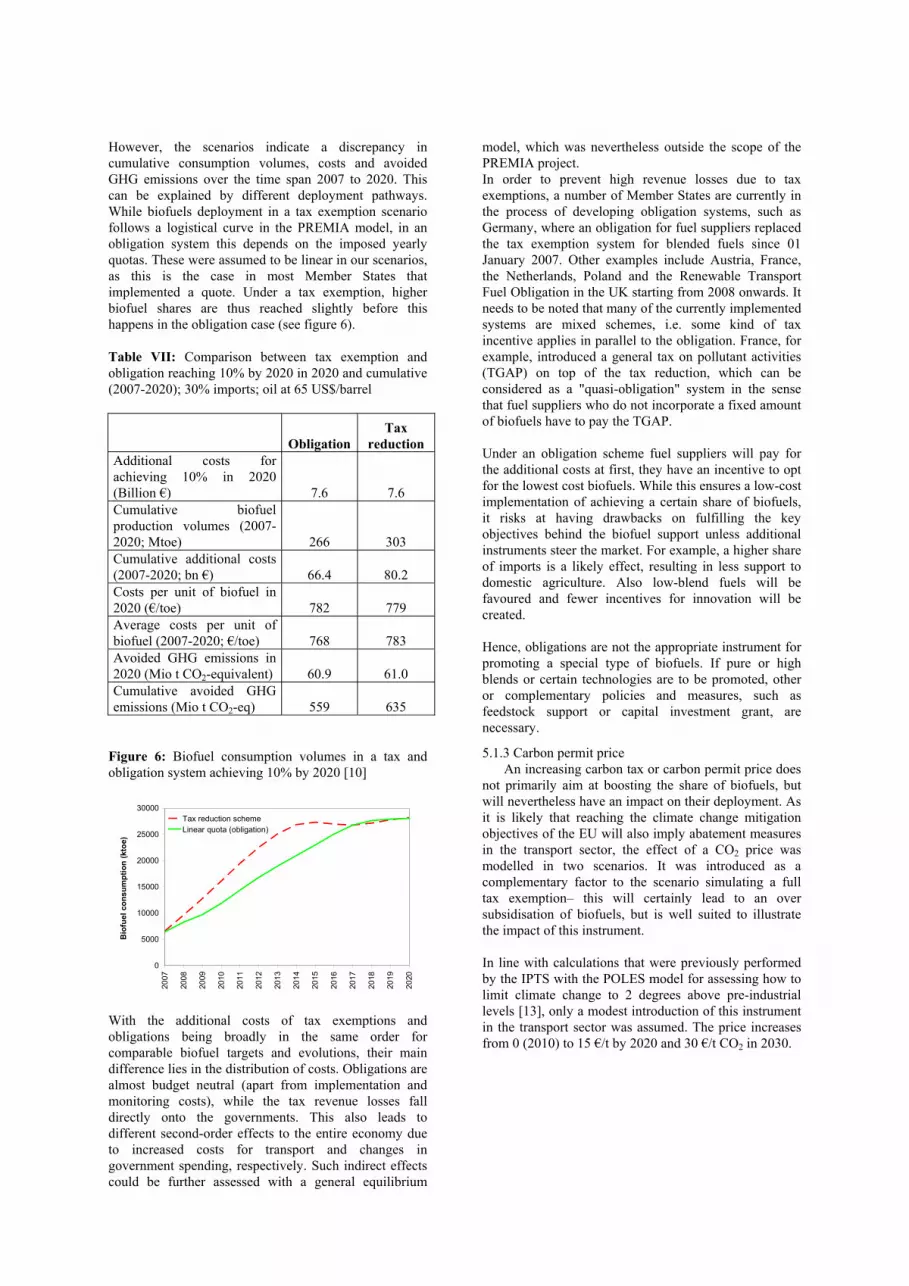
However, the scenarios indicate a discrepancy in cumulative consumption volumes, costs and avoided GHG emissions over the time span 2007 to 2020. This can be explained by different deployment pathways. While biofuels deployment in a tax exemption scenario follows a logistical curve in the PREMIA model, in an obligation system this depends on the imposed yearly quotas. These were assumed to be linear in our scenarios, as this is the case in most Member States that implemented a quote. Under a tax exemption, higher biofuel shares are thus reached slightly before this happens in the obligation case (see figure 6). Table VII: Comparison between tax exemption and obligation reaching 10% by 2020 in 2020 and cumulative (2007-2020); 30% imports; oil at 65 US$/barrel
Obligation Tax
reduction Additional costs for achieving 10% in 2020 (Billion €) 7.6 7.6 Cumulative biofuel production volumes (2007-2020; Mtoe) 266 303 Cumulative additional costs (2007-2020; bn €) 66.4 80.2 Costs per unit of biofuel in 2020 (€/toe) 782 779 Average costs per unit of biofuel (2007-2020; €/toe) 768 783 Avoided GHG emissions in 2020 (Mio t CO2-equivalent) 60.9 61.0 Cumulative avoided GHG emissions (Mio t CO2-eq) 559 635
Figure 6: Biofuel consumption volumes in a tax and obligation system achieving 10% by 2020 [10]
0
5000
10000
15000
20000
25000
30000
2007
2008
2009
2010
2011
2012
2013
2014
2015
2016
2017
2018
2019
2020
Bio
fuel
con
sum
ptio
n (k
toe)
Tax reduction schemeLinear quota (obligation)
With the additional costs of tax exemptions and obligations being broadly in the same order for comparable biofuel targets and evolutions, their main difference lies in the distribution of costs. Obligations are almost budget neutral (apart from implementation and monitoring costs), while the tax revenue losses fall directly onto the governments. This also leads to different second-order effects to the entire economy due to increased costs for transport and changes in government spending, respectively. Such indirect effects could be further assessed with a general equilibrium
model, which was nevertheless outside the scope of the PREMIA project. In order to prevent high revenue losses due to tax exemptions, a number of Member States are currently in the process of developing obligation systems, such as Germany, where an obligation for fuel suppliers replaced the tax exemption system for blended fuels since 01 January 2007. Other examples include Austria, France, the Netherlands, Poland and the Renewable Transport Fuel Obligation in the UK starting from 2008 onwards. It needs to be noted that many of the currently implemented systems are mixed schemes, i.e. some kind of tax incentive applies in parallel to the obligation. France, for example, introduced a general tax on pollutant activities (TGAP) on top of the tax reduction, which can be considered as a "quasi-obligation" system in the sense that fuel suppliers who do not incorporate a fixed amount of biofuels have to pay the TGAP. Under an obligation scheme fuel suppliers will pay for the additional costs at first, they have an incentive to opt for the lowest cost biofuels. While this ensures a low-cost implementation of achieving a certain share of biofuels, it risks at having drawbacks on fulfilling the key objectives behind the biofuel support unless additional instruments steer the market. For example, a higher share of imports is a likely effect, resulting in less support to domestic agriculture. Also low-blend fuels will be favoured and fewer incentives for innovation will be created. Hence, obligations are not the appropriate instrument for promoting a special type of biofuels. If pure or high blends or certain technologies are to be promoted, other or complementary policies and measures, such as feedstock support or capital investment grant, are necessary.
5.1.3 Carbon permit price An increasing carbon tax or carbon permit price does not primarily aim at boosting the share of biofuels, but will nevertheless have an impact on their deployment. As it is likely that reaching the climate change mitigation objectives of the EU will also imply abatement measures in the transport sector, the effect of a CO2 price was modelled in two scenarios. It was introduced as a complementary factor to the scenario simulating a full tax exemption– this will certainly lead to an over subsidisation of biofuels, but is well suited to illustrate the impact of this instrument. In line with calculations that were previously performed by the IPTS with the POLES model for assessing how to limit climate change to 2 degrees above pre-industrial levels [13], only a modest introduction of this instrument in the transport sector was assumed. The price increases from 0 (2010) to 15 €/t by 2020 and 30 €/t CO2 in 2030.
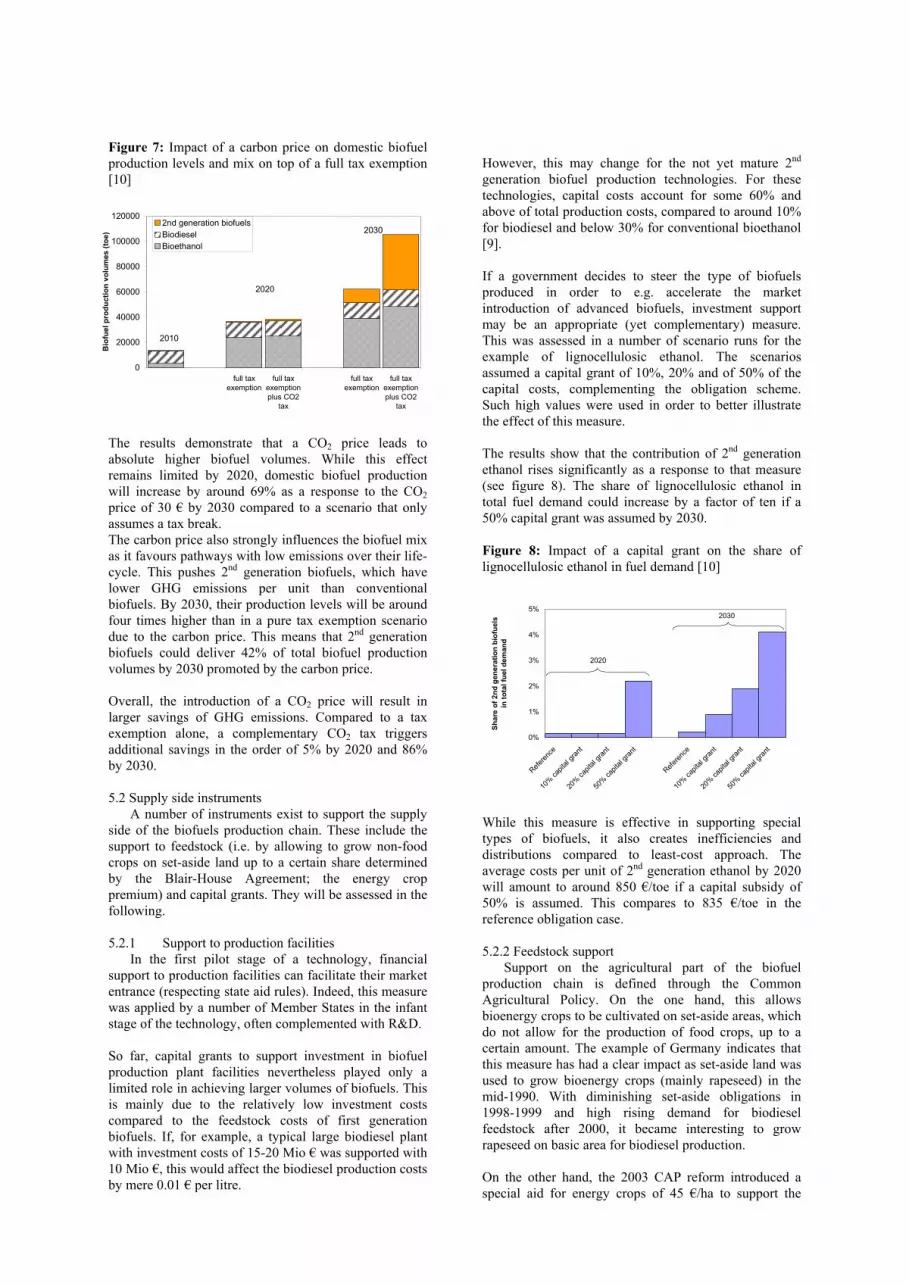
Figure 7: Impact of a carbon price on domestic biofuel production levels and mix on top of a full tax exemption [10]
0
20000
40000
60000
80000
100000
120000
full taxexemption
full taxexemptionplus CO2
tax
full taxexemption
full taxexemptionplus CO2
tax
Bio
fuel
pro
duct
ion
volu
mes
(toe
)
2nd generation biofuelsBiodieselBioethanol
2010
2020
2030
The results demonstrate that a CO2 price leads to absolute higher biofuel volumes. While this effect remains limited by 2020, domestic biofuel production will increase by around 69% as a response to the CO2 price of 30 € by 2030 compared to a scenario that only assumes a tax break. The carbon price also strongly influences the biofuel mix as it favours pathways with low emissions over their life-cycle. This pushes 2nd generation biofuels, which have lower GHG emissions per unit than conventional biofuels. By 2030, their production levels will be around four times higher than in a pure tax exemption scenario due to the carbon price. This means that 2nd generation biofuels could deliver 42% of total biofuel production volumes by 2030 promoted by the carbon price. Overall, the introduction of a CO2 price will result in larger savings of GHG emissions. Compared to a tax exemption alone, a complementary CO2 tax triggers additional savings in the order of 5% by 2020 and 86% by 2030. 5.2 Supply side instruments A number of instruments exist to support the supply side of the biofuels production chain. These include the support to feedstock (i.e. by allowing to grow non-food crops on set-aside land up to a certain share determined by the Blair-House Agreement; the energy crop premium) and capital grants. They will be assessed in the following. 5.2.1 Support to production facilities In the first pilot stage of a technology, financial support to production facilities can facilitate their market entrance (respecting state aid rules). Indeed, this measure was applied by a number of Member States in the infant stage of the technology, often complemented with R&D. So far, capital grants to support investment in biofuel production plant facilities nevertheless played only a limited role in achieving larger volumes of biofuels. This is mainly due to the relatively low investment costs compared to the feedstock costs of first generation biofuels. If, for example, a typical large biodiesel plant with investment costs of 15-20 Mio € was supported with 10 Mio €, this would affect the biodiesel production costs by mere 0.01 € per litre.
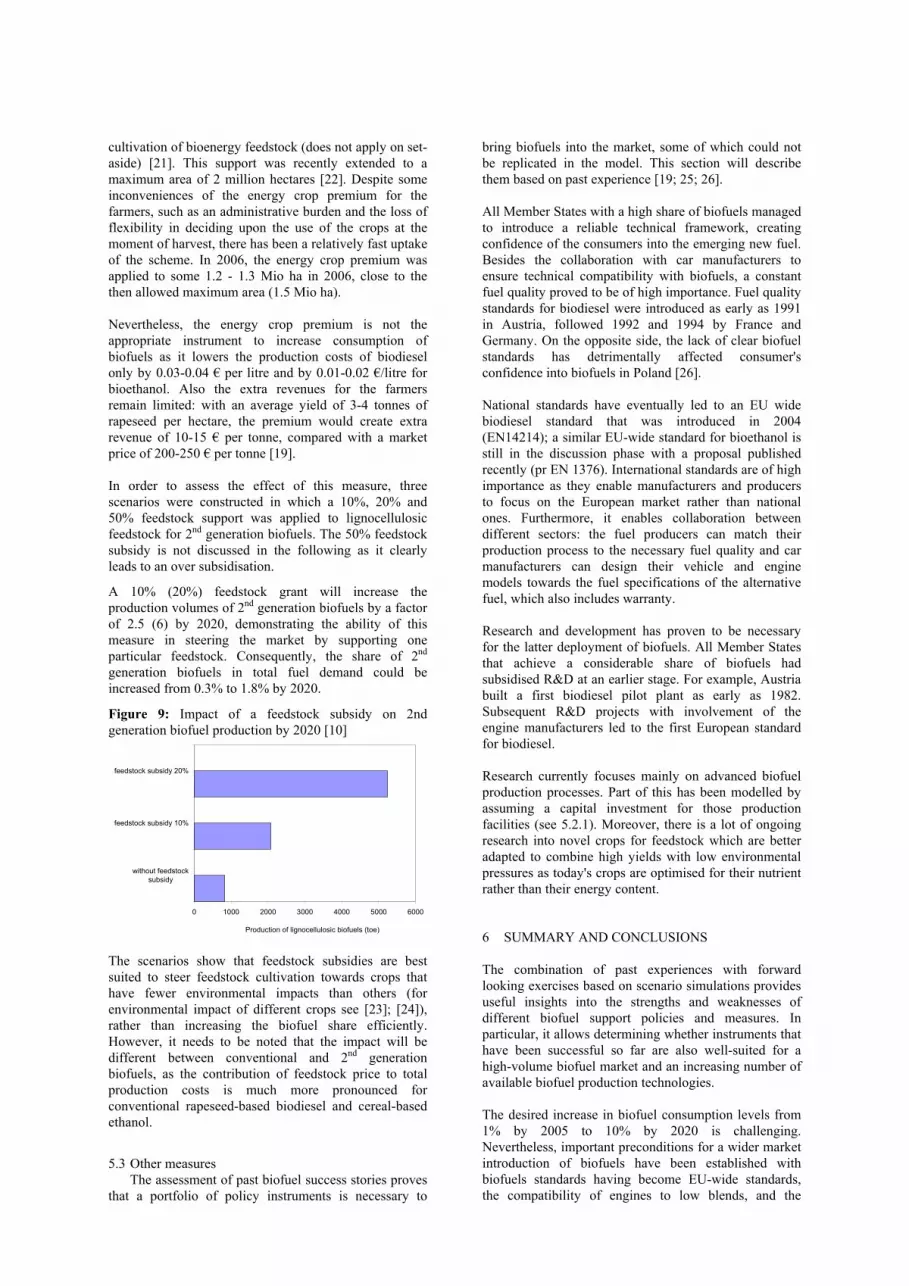
However, this may change for the not yet mature 2nd generation biofuel production technologies. For these technologies, capital costs account for some 60% and above of total production costs, compared to around 10% for biodiesel and below 30% for conventional bioethanol [9]. If a government decides to steer the type of biofuels produced in order to e.g. accelerate the market introduction of advanced biofuels, investment support may be an appropriate (yet complementary) measure. This was assessed in a number of scenario runs for the example of lignocellulosic ethanol. The scenarios assumed a capital grant of 10%, 20% and of 50% of the capital costs, complementing the obligation scheme. Such high values were used in order to better illustrate the effect of this measure. The results show that the contribution of 2nd generation ethanol rises significantly as a response to that measure (see figure 8). The share of lignocellulosic ethanol in total fuel demand could increase by a factor of ten if a 50% capital grant was assumed by 2030. Figure 8: Impact of a capital grant on the share of lignocellulosic ethanol in fuel demand [10]
0%
1%
2%
3%
4%
5%
Referen
ce
10% ca
pital
grant
20% ca
pital
grant
50% ca
pital
grant
Referen
ce
10% ca
pital
grant
20% ca
pital
grant
50% ca
pital
grant
Shar
e of
2nd
gen
erat
ion
biof
uels
in to
tal f
uel d
eman
d
2020
2030
While this measure is effective in supporting special types of biofuels, it also creates inefficiencies and distributions compared to least-cost approach. The average costs per unit of 2nd generation ethanol by 2020 will amount to around 850 €/toe if a capital subsidy of 50% is assumed. This compares to 835 €/toe in the reference obligation case. 5.2.2 Feedstock support Support on the agricultural part of the biofuel production chain is defined through the Common Agricultural Policy. On the one hand, this allows bioenergy crops to be cultivated on set-aside areas, which do not allow for the production of food crops, up to a certain amount. The example of Germany indicates that this measure has had a clear impact as set-aside land was used to grow bioenergy crops (mainly rapeseed) in the mid-1990. With diminishing set-aside obligations in 1998-1999 and high rising demand for biodiesel feedstock after 2000, it became interesting to grow rapeseed on basic area for biodiesel production. On the other hand, the 2003 CAP reform introduced a special aid for energy crops of 45 €/ha to support the
cultivation of bioenergy feedstock (does not apply on set-aside) [21]. This support was recently extended to a maximum area of 2 million hectares [22]. Despite some inconveniences of the energy crop premium for the farmers, such as an administrative burden and the loss of flexibility in deciding upon the use of the crops at the moment of harvest, there has been a relatively fast uptake of the scheme. In 2006, the energy crop premium was applied to some 1.2 - 1.3 Mio ha in 2006, close to the then allowed maximum area (1.5 Mio ha). Nevertheless, the energy crop premium is not the appropriate instrument to increase consumption of biofuels as it lowers the production costs of biodiesel only by 0.03-0.04 € per litre and by 0.01-0.02 €/litre for bioethanol. Also the extra revenues for the farmers remain limited: with an average yield of 3-4 tonnes of rapeseed per hectare, the premium would create extra revenue of 10-15 € per tonne, compared with a market price of 200-250 € per tonne [19]. In order to assess the effect of this measure, three scenarios were constructed in which a 10%, 20% and 50% feedstock support was applied to lignocellulosic feedstock for 2nd generation biofuels. The 50% feedstock subsidy is not discussed in the following as it clearly leads to an over subsidisation.
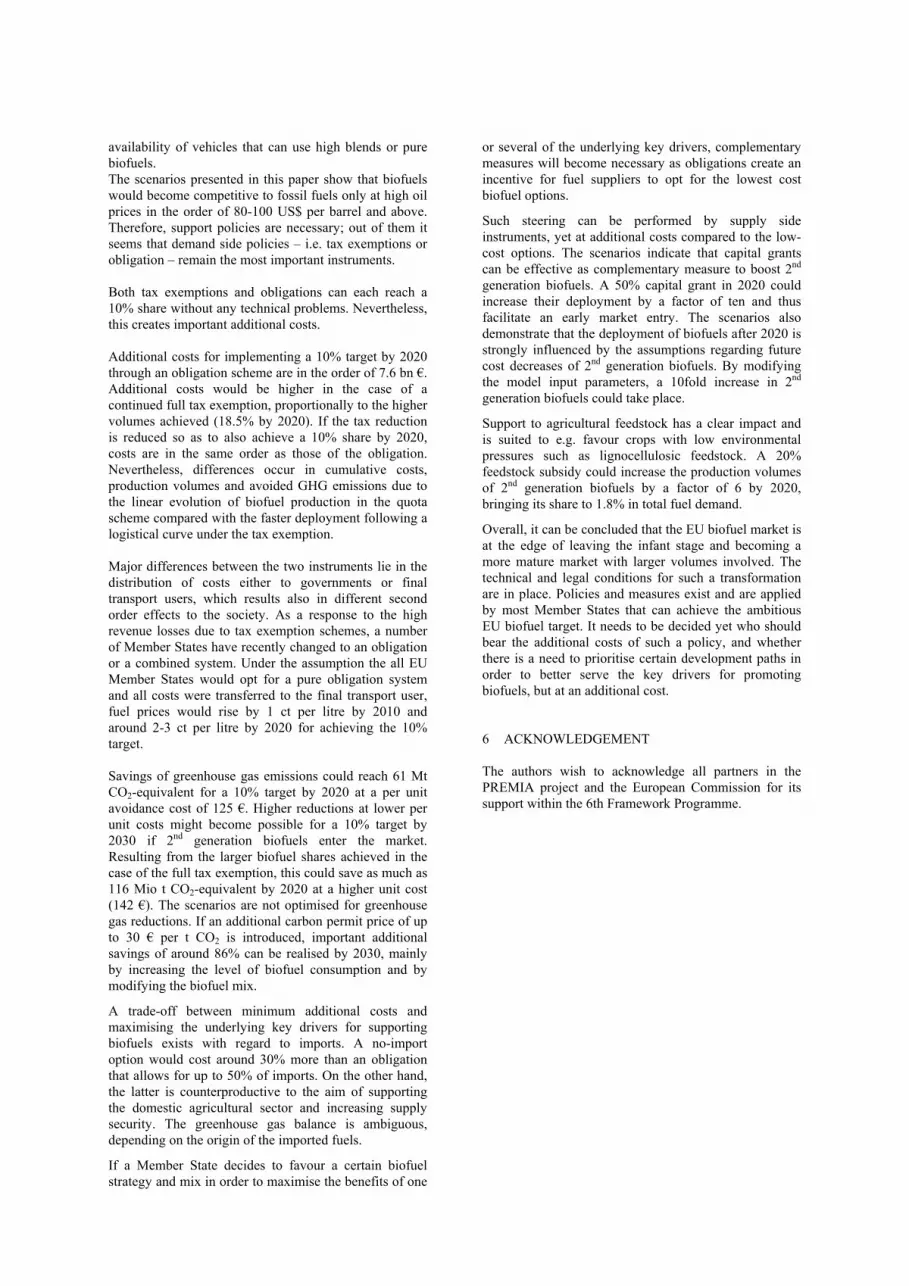
A 10% (20%) feedstock grant will increase the production volumes of 2nd generation biofuels by a factor of 2.5 (6) by 2020, demonstrating the ability of this measure in steering the market by supporting one particular feedstock. Consequently, the share of 2nd generation biofuels in total fuel demand could be increased from 0.3% to 1.8% by 2020.
Figure 9: Impact of a feedstock subsidy on 2nd generation biofuel production by 2020 [10]
0 1000 2000 3000 4000 5000 6000
without feedstocksubsidy
feedstock subsidy 10%
feedstock subsidy 20%
Production of lignocellulosic biofuels (toe)
The scenarios show that feedstock subsidies are best suited to steer feedstock cultivation towards crops that have fewer environmental impacts than others (for environmental impact of different crops see [23]; [24]), rather than increasing the biofuel share efficiently. However, it needs to be noted that the impact will be different between conventional and 2nd generation biofuels, as the contribution of feedstock price to total production costs is much more pronounced for conventional rapeseed-based biodiesel and cereal-based ethanol.
5.3 Other measures The assessment of past biofuel success stories proves that a portfolio of policy instruments is necessary to
bring biofuels into the market, some of which could not be replicated in the model. This section will describe them based on past experience [19; 25; 26]. All Member States with a high share of biofuels managed to introduce a reliable technical framework, creating confidence of the consumers into the emerging new fuel. Besides the collaboration with car manufacturers to ensure technical compatibility with biofuels, a constant fuel quality proved to be of high importance. Fuel quality standards for biodiesel were introduced as early as 1991 in Austria, followed 1992 and 1994 by France and Germany. On the opposite side, the lack of clear biofuel standards has detrimentally affected consumer's confidence into biofuels in Poland [26]. National standards have eventually led to an EU wide biodiesel standard that was introduced in 2004 (EN14214); a similar EU-wide standard for bioethanol is still in the discussion phase with a proposal published recently (pr EN 1376). International standards are of high importance as they enable manufacturers and producers to focus on the European market rather than national ones. Furthermore, it enables collaboration between different sectors: the fuel producers can match their production process to the necessary fuel quality and car manufacturers can design their vehicle and engine models towards the fuel specifications of the alternative fuel, which also includes warranty. Research and development has proven to be necessary for the latter deployment of biofuels. All Member States that achieve a considerable share of biofuels had subsidised R&D at an earlier stage. For example, Austria built a first biodiesel pilot plant as early as 1982. Subsequent R&D projects with involvement of the engine manufacturers led to the first European standard for biodiesel. Research currently focuses mainly on advanced biofuel production processes. Part of this has been modelled by assuming a capital investment for those production facilities (see 5.2.1). Moreover, there is a lot of ongoing research into novel crops for feedstock which are better adapted to combine high yields with low environmental pressures as today's crops are optimised for their nutrient rather than their energy content. 6 SUMMARY AND CONCLUSIONS The combination of past experiences with forward looking exercises based on scenario simulations provides useful insights into the strengths and weaknesses of different biofuel support policies and measures. In particular, it allows determining whether instruments that have been successful so far are also well-suited for a high-volume biofuel market and an increasing number of available biofuel production technologies. The desired increase in biofuel consumption levels from 1% by 2005 to 10% by 2020 is challenging. Nevertheless, important preconditions for a wider market introduction of biofuels have been established with biofuels standards having become EU-wide standards, the compatibility of engines to low blends, and the
availability of vehicles that can use high blends or pure biofuels. The scenarios presented in this paper show that biofuels would become competitive to fossil fuels only at high oil prices in the order of 80-100 US$ per barrel and above. Therefore, support policies are necessary; out of them it seems that demand side policies – i.e. tax exemptions or obligation – remain the most important instruments. Both tax exemptions and obligations can each reach a 10% share without any technical problems. Nevertheless, this creates important additional costs. Additional costs for implementing a 10% target by 2020 through an obligation scheme are in the order of 7.6 bn €. Additional costs would be higher in the case of a continued full tax exemption, proportionally to the higher volumes achieved (18.5% by 2020). If the tax reduction is reduced so as to also achieve a 10% share by 2020, costs are in the same order as those of the obligation. Nevertheless, differences occur in cumulative costs, production volumes and avoided GHG emissions due to the linear evolution of biofuel production in the quota scheme compared with the faster deployment following a logistical curve under the tax exemption. Major differences between the two instruments lie in the distribution of costs either to governments or final transport users, which results also in different second order effects to the society. As a response to the high revenue losses due to tax exemption schemes, a number of Member States have recently changed to an obligation or a combined system. Under the assumption the all EU Member States would opt for a pure obligation system and all costs were transferred to the final transport user, fuel prices would rise by 1 ct per litre by 2010 and around 2-3 ct per litre by 2020 for achieving the 10% target. Savings of greenhouse gas emissions could reach 61 Mt CO2-equivalent for a 10% target by 2020 at a per unit avoidance cost of 125 €. Higher reductions at lower per unit costs might become possible for a 10% target by 2030 if 2nd generation biofuels enter the market. Resulting from the larger biofuel shares achieved in the case of the full tax exemption, this could save as much as 116 Mio t CO2-equivalent by 2020 at a higher unit cost (142 €). The scenarios are not optimised for greenhouse gas reductions. If an additional carbon permit price of up to 30 € per t CO2 is introduced, important additional savings of around 86% can be realised by 2030, mainly by increasing the level of biofuel consumption and by modifying the biofuel mix.
A trade-off between minimum additional costs and maximising the underlying key drivers for supporting biofuels exists with regard to imports. A no-import option would cost around 30% more than an obligation that allows for up to 50% of imports. On the other hand, the latter is counterproductive to the aim of supporting the domestic agricultural sector and increasing supply security. The greenhouse gas balance is ambiguous, depending on the origin of the imported fuels.
If a Member State decides to favour a certain biofuel strategy and mix in order to maximise the benefits of one
or several of the underlying key drivers, complementary measures will become necessary as obligations create an incentive for fuel suppliers to opt for the lowest cost biofuel options.
Such steering can be performed by supply side instruments, yet at additional costs compared to the low-cost options. The scenarios indicate that capital grants can be effective as complementary measure to boost 2nd generation biofuels. A 50% capital grant in 2020 could increase their deployment by a factor of ten and thus facilitate an early market entry. The scenarios also demonstrate that the deployment of biofuels after 2020 is strongly influenced by the assumptions regarding future cost decreases of 2nd generation biofuels. By modifying the model input parameters, a 10fold increase in 2nd generation biofuels could take place.
Support to agricultural feedstock has a clear impact and is suited to e.g. favour crops with low environmental pressures such as lignocellulosic feedstock. A 20% feedstock subsidy could increase the production volumes of 2nd generation biofuels by a factor of 6 by 2020, bringing its share to 1.8% in total fuel demand.
Overall, it can be concluded that the EU biofuel market is at the edge of leaving the infant stage and becoming a more mature market with larger volumes involved. The technical and legal conditions for such a transformation are in place. Policies and measures exist and are applied by most Member States that can achieve the ambitious EU biofuel target. It needs to be decided yet who should bear the additional costs of such a policy, and whether there is a need to prioritise certain development paths in order to better serve the key drivers for promoting biofuels, but at an additional cost. 6 ACKNOWLEDGEMENT The authors wish to acknowledge all partners in the PREMIA project and the European Commission for its support within the 6th Framework Programme.
7 REFERENCES [1] Directive 2003/30/EC of 8 May 2003 on the
promotion of the use of biofuels or other renewable fuels for transport.
[2] Member States’ Reports in the frame of Directive 2003/30/EC, 2004, 2005 and 2006 reports.
[3] Presidency Conclusions. Council of the European Union. Brussels European Council. 8/9 March 2007
[4] European Commission: Commission staff working document - Renewable Energy Road Map - Summary of the impact assessment. COM(2006) 848 final.
[5] European Commission: Communication from the Commission on the Biomass Action Plan. COM(2005) 628 final
[6] European Commission: Communication from the Commission - An EU Strategy for Biofuels. COM(2006) 34 final
[7] EurObserv'ER, Biofuels Barometer – 3.9 million tons produced in 2005, May 2006.
[8] Website of the PREMIA project: www.premia-eu.org
[9] JRC, EUCAR, CONCAWE, Well-to-Wheels analysis of future automotive fuels and powertrains in the European context, WELL-to-WHEELS report, Version 2b, May 2006.
[10] T. Wiesenthal; P. Christidis, B. Schade, L. Pelkmans: Biofuel Scenario for the EU. PREMIA WP6 report, forthcoming.
[11] European Commission: Annexes to the report from the Commission to the Council on the review of the energy crops scheme. SEC(2006) 1167.
[12] Directive 2003/96/EC of 27 October 2003 restructuring the Community framework for the taxation of energy products and electricity.
[13] European Commission: Limiting Global Climate Change to 2 degrees Celsius. The way ahead for 2020 and beyond. COM (2007)2.
[14] European Commission: Impact Assessment of a Proposal for a Directive of the European Parliament and of the Council modifying Directive 98/70/EC relating to the quality of petrol and diesel fuels. SEC (2007)55.
[15] Directive 98/70/EC of the European Parliament and of the Council of 13 October 1998 relating to the quality of petrol and diesel fuels and amending Directive 93/12/EEC (amended with 2003/17/EC)
[16] European Commission: Proposal for a directive amending Directive 98/70/EC as regards the specification of petrol, diesel and gas-oil and the introduction of a mechanism to monitor and reduce greenhouse gas emissions from the use of road transport fuels and amending Council Directive 1999/32/EC, as regards the specification of fuel used by inland waterway vessels and repealing Directive 93/12/EEC. COM(2007) 18 final.
[17] Hamelinck, C.N., Faaij, A.P.C., Outlook for advanced biofuels, Energy Policy, Vol.34, pp.3268-3283, 2006.
[18] European Commission: Accompanying document to the Communication on the Biofuels Progress Report (COM(2006) 845 final): Review of economic and environmental data for the biofuels progress report. SEC(2006) 1721/2
[19] L. Pelkmans, E. Portouli, A. Papageorgiou, P. Georgopoulos (2006): Impact assessment of measures towards the introduction of biofuels in the European Union, PREMIA WP4 report, September 2006.
[20] F.O Licht, World biodiesel production to cross 4 million tonne mark in 2006, World Ethanol & Biofuels Report, edition April 26, 2006.
[21] COUNCIL REGULATION (EC) No 1782/2003 establishing common rules for direct support schemes under the common agricultural policy and establishing certain support schemes for farmers.
[22] European Commission staff working document - Annexes to the report from the Commission to the Council on the review of the energy crops scheme. COM(2006) 500 final.
[23] European Environment Agency (2006): How much bioenergy can Europe produce without harming the environment? EEA Report 7/2006.
[24] "Sustainable Bioenergy cropping systems for the Mediterranean", Expert consultation, 9-10 Feb. 2006, Madrid, Spain.
[25] T. Wiesenthal; G. Leduc; L. Pelkmans; P. Christidis, P. Georgopoulos: Assessment of biofuel policies – lessons learnt and future policy options. Policy Synthesis of the Premia project. PREMIA WP7 report, forthcoming
[26] van Thuijl, E., Deurwaarder, E.P., European biofuel policies in retrospect, ECN, May, 2006.


