Embed Size (px)
Citation preview
UNIVERSITA’ DEGLI STUDI DI BERGAMO DIPARTIMENTO DI INGEGNERIA GESTIONALE
QUADERNI DEL DIPARTIMENTO†
Department of Economics and Technology Management
Working Paper
n. 02 – 2010
IPO pricing: growth rates implied in offer prices
by
Giordano Cogliati, Stefano Paleari, Silvio Vismara
† Il Dipartimento ottempera agli obblighi previsti dall’art. 1 del D.L.L. 31.8.1945, n. 660 e successive modificazioni.

COMITATO DI REDAZIONE§ Lucio Cassia, Gianmaria Martini, Stefano Paleari, Andrea Salanti § L’accesso alla Collana dei Quaderni del Dipartimento di Ingegneria Gestionale è approvato dal Comitato di Redazione. I Working Papers della Collana costituiscono un servizio atto a fornire la tempestiva divulgazione dei risultati dell’attività di ricerca, siano essi in forma provvisoria o definitiva.

1
IPO pricing: growth rates implied in offer prices
Giordano Cogliati, Stefano Paleari, Silvio Vismara*
University of Bergamo Department of Economics and Technology Management
Abstract
This paper studies the valuation of companies going public and defines a methodology to infer the growth expectations implicit in their IPO prices. The proposed reverse-engineered DCF model is operable by individual investors, as it does not require access to private information or sell-side analysts’ forecasts Applying the procedure to a sample of IPOs in three European countries (France, Italy, and Germany), we estimate the cash flow growth implied by offer prices and examine the bias of implied growth in comparison to the realized. We find that the estimated growth in cash flow is much higher than its actual realization, with the median IPO firm overvalued at the offering by 74%. Estimation errors increase with IPO firms’ leverage and underpricing, while decrease with age, size, and book-to-market ratios. Further tests find that post-IPO returns are lower for issues whose implied growth is more upward biased.
Keywords: Initial Public Offerings, DCF model, valuation, growth rates.
JEL classification: G00, G30.
* Corresponding author: [email protected] Tel.: +39 035 2052352; fax: +39 035 74231126. University of Bergamo, Department of Economics and Technology Management, viale Marconi 5, 24044 Dalmine (BG), Italy. We thank Peter Roosenboom and the participants at the IPO Day at the Italian Stock Exchange (in particular the discussant Jay Ritter), at the EFMA IPO Symposium at the University of Oxford (in particular the discussant Ranko Jelic), at the European FMA Conference in Prague (in particular the discussant Wolfgang Aussnegg) and at seminars at the University of Bergamo and at the University of Turin for their comments and suggestions. We acknowledge the financial support given by the Italian Ministry of Education, University and Research (FIRB project RBNE03ZLFW).
2
1. Introduction
When going public, firms are faced with a difficult decision: how to determine the offer
price for their shares. This is an especially challenging task, but of great interest for investors as the
rewards for correctly identifying the best IPO firms ex ante are substantial. Despite considerable
research efforts, however, IPO valuations are still largely mysterious. In particular, most of the
literature (e.g. Chemmanur, He, and Hu, 2009; Chemmanur and Hu, 2007) inherently posit that
private information contributes substantially to institutions’ ability to value and avoid the worst-
performing firms. These papers suggest that individuals suffer worse returns because they are not
on an equal playing field with institutions. Recently, however, Barber and Odean (2008) and Field
and Lowry (2009) pointed out that the fundamental difference between institutional and individual
investors relies in the use of readily available public information. Institutions are indeed more likely
to invest in firms that tend to perform better, and they earn higher returns as a result. Individuals
have access to the same information, but they appear to either disregard or misinterpret its relevance
for firm value. Field and Lowry (2009) conclude that “much of the advantage institutions possess
simply reflects institutions doing their homework, and individuals would benefit greatly by doing
theirs”.
Based on this latter stream of literature, we propose a methodology to infer the growth
expectations implicit in the IPO prices, based on readily available public information. Specifically,
we rely on data from IPO prospectuses, which is likely the most cost-efficient means of obtaining
information about the companies going public (Friedlan, 1994). Utilizing detailed data about IPO
valuations, we study the growth expectations implied in IPO offer prices. By investigating this
information, researchers and investors can understand how underwriters justify the offer price for
the firms they take public. Rather than starting our analysis with analysts’ forecasts to arrive at a
target stock valuation, we start instead with what we do know with certainty: the IPO price. By
working backwards, or reverse-engineering, we work out the amount of cash that the company will
have to produce in the years following the IPO to ‘justify’ that price.
Our empirical analysis is based on the population of non-financial companies that went
public during the period 1995-2001 on the stock markets of the three largest economies in
Continental Europe, namely France (Euronext Paris), Germany (Deutsche Börse), and Italy (Borsa
Italiana). We find that the Discounted Cash Flow (DCF) is the model of direct valuation that is most
widely used to price IPOs. Specifically, we investigate a sample of 184 IPOs priced using a DCF
model to address a basic research question: at what rates were the IPO firms expected to grow by
their underwriters?
3
To answer this question, we reverse-engineer the underwriters’ DCF models to get back the
implied growth rates of free cash flow over the next five years. We propose an estimation procedure
which uses public information to estimate the cash flow growth rates implied by IPO prices, with an
approach similar to that of estimating the internal rate of return on a bond using market values and
coupon payments. The proposed method of reverse engineering the DCF model is easy to
understand and operable by individual investors, not requiring access to private information or sell-
side analysts’ forecasts. The pressure on analysts to produce favourable (overoptimistic) reports on
IPO firms is indeed well documented and has attracted considerable regulatory attention (e.g.
Derrien, 2007).
The empirical findings corroborate the evidence of IPO overvaluation (e.g., Purnanandam
and Swaminathan, 2004) and optimism in growth forecasts (e.g., Dechow et al., 2000). We find
indeed that the market attaches a high growth expectation to IPO firms: the cash flow of an
“average” IPO firm is expected to grow by about one-third each year. Unfortunately, ex-post
realisations do not meet such ambitious ex-ante targets; we find that median post-IPO growth rates
are only slightly positive (1.8%) over the five years following an IPO. Such discrepancy between
ex-ante expectations and ex-post realizations is also found to condition the post-issue market
performance of firms.
The remainder of the paper is organised as follows. Section 2 reviews the literature and
introduce the DCF valuation methodology. Our reverse-engineered model is presented in Section 3,
and our sample is described in Section 4. Section 5 compares ex-ante estimates to ex-post
realisations. Section 6 and 7 study the determinants of estimation errors and their relationship to
long-run market returns. Our conclusions are summarised in Section 8.
2. The valuation of IPOs
There exist two approaches to firm valuation. In direct valuation, the firm’s value is
estimated from its fundamentals; in relative valuation, it is estimated from the prices of comparable
firms. In both approaches, the valuation faces specific difficulties related to the IPO timing
decision. For example, firms may schedule their IPO in order to take advantage of “windows of
opportunity”. These are periods of market buoyancy during which other companies in the same
industry tend to be overvalued (Loughran and Ritter, 1995). Thus, investors risk over-paying for
stock in firms priced using relative valuation methodologies. Besides, firms may decide to go public
when they are able to display positive growth opportunities, and thus induce optimistic valuations.
To do this, firms may time their IPO for when transitory earnings are high, since investors have
4
difficulty distinguishing between transitory and permanent earnings (this is the signal-jamming
explanation given by Stein, 1989). Finally, managers may window-dress accounting numbers to
make their firms look better (Teoh et al., 1998). Again, investors risk over-valuation of such firms.
Since the seminal paper on valuing IPOs by Kim and Ritter (1999), a few recent papers have
investigated the valuation of IPOs (e.g. Berkman et al., 2000; Purnanandam and Swaminathan,
2004; Jagannathan and Gao, 2005). However, all these studies use ex-post value estimates produced
by researchers to test the accuracy of valuations and typically find that IPO firms are overvalued at
offer prices relative to their comparables. We are aware of only three other papers investigating the
accuracy of the valuation models actually used by investment banks: Cassia et al. (2004) in Italy,
Roosenboom (2007) in France, and Deloof et al. (2009) in Belgium1. All three studies take
advantage of the extensive disclosure required of companies going public in Continental Europe
and confirm that the DCF model is widely adopted when valuing firms going public2. Our
descriptive statistics (see Table 2) corroborate the prominence of the DCF model among European
IPO underwriters.
In the DCF model3, the Enterprise Value at time t (EVt) is estimated as the present value of
expected future Free Cash Flows to the Firm (Et[FFCFt+i]), conditional on information available at
time t and discounted at a rate that reflects the relative degree of risk (see Table 1 for notation).
Subtracting the Debt Outstanding at time t (Dt) then yields an estimate for the equity value (Et).
Unless there are specific plans or reasons for terminating the business in the near term, the
assumption of ongoing concern requires one to estimate the value of future cash flows over an
1 Cassia et al. (2004) examined the methods used by underwriters to value 83 IPOs in Italy during the period 1999-2002 and find that relative valuation is the approach more frequently adopted by underwriters (87% of the IPOs), closely followed by DCF (80%). Roosenboom (2007) studied 228 French IPOs from the period 1990-1999, finding that while underwriters often use two or more valuation methods, they base their pricing on a single method. In particular, the DCF model is more frequently used when aggregate stock market returns are high or volatile. Finally, Deloof et al. (2009) studied 49 IPOs from the 1993-2001 period on the Brussels Stock Exchange and found that DCF is by far the most popular valuation method, being used to price all IPOs in the sample. 2 The challenge of using accounting numbers for valuation has long attracted financial accounting researchers and professional financial analysts. The value of a business is indeed based on its future prospects, so valuation models involving forecasts understandably have considerable currency. Among all the direct valuation models proposed in the literature, DCF and Residual Income Model (RIM) are the two most important alternatives. Although Residual Income Model (RIM) gained much attention in the scientific literature, there is no evidence of its use by the underwriters of European IPOs The RIM introduces an explicit charge for equity, and subtracts it from the net income to define the Residual Income. The present value of the Residual Income is added to the book value of equity to arrive at an equity valuation. Various extensions (Ohlson and Jeuttner-Nauroth, 2005; Ohlson and Gao, 2006) reconcile RIM with standard models that rest on taking the present value of free cash flows (Ohlson, 2009). 3 The DCF model can be implemented from two different perspectives: that of shareholders (the equity side, or equity DCF) or that of the firm (the assets side, or enterprise DCF). The latter is more widespread, and refers to Free Cash Flows to the Firm (FFCF). This quantity is defined as the residual cash flow remaining after deducting operating costs and taxes, but not interest owed on debts. FFCF is discounted at a rate reflecting the firm’s degree of business risk. Since a firm can be seen as a set of assets, some financed with equity and others financed with debt, the total cost of its capital is often calculated as a weighted average of the costs of the two types of funding (Weighted Average Cost of Capital, WACC). The usual assumptions are that the firm’s financial structure can be considered constant, and that the cost of its capital does not change in the future. In this case, it follows that the WACC is constant in time. A detailed description of DCF valuation techniques can be found in text books such as Penman (2007) and Damodaran (2006).
5
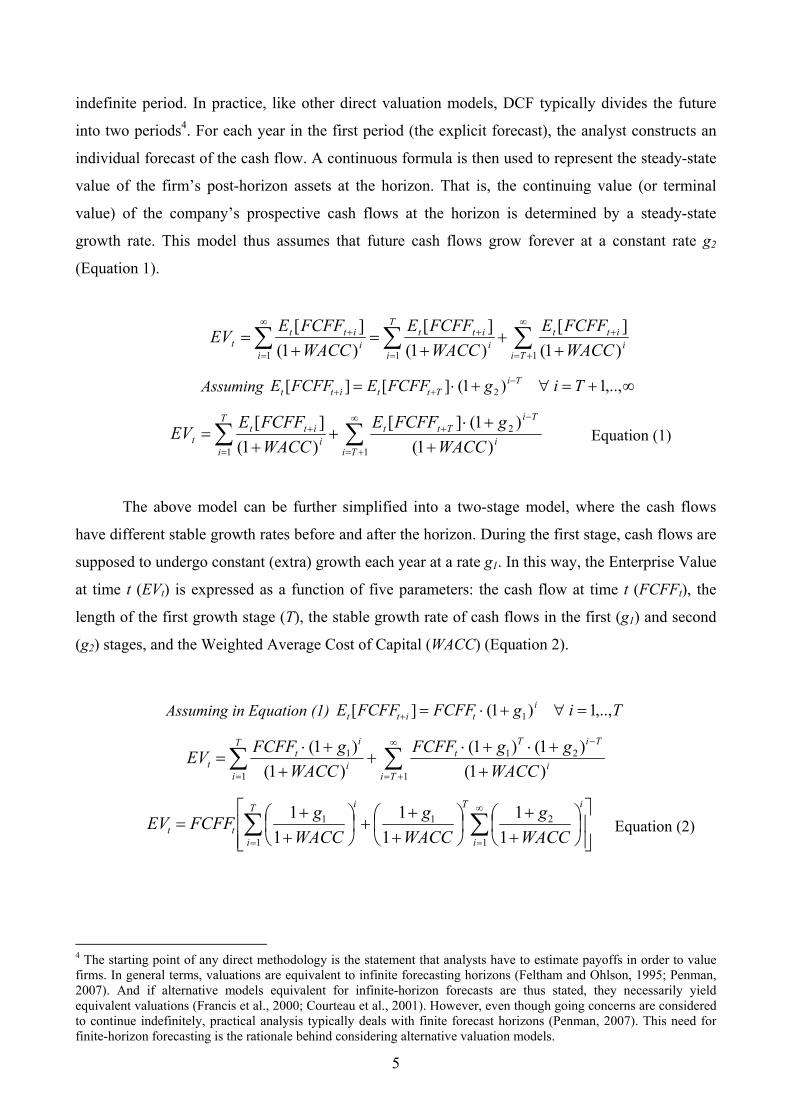
indefinite period. In practice, like other direct valuation models, DCF typically divides the future
into two periods4. For each year in the first period (the explicit forecast), the analyst constructs an
individual forecast of the cash flow. A continuous formula is then used to represent the steady-state
value of the firm’s post-horizon assets at the horizon. That is, the continuing value (or terminal
value) of the company’s prospective cash flows at the horizon is determined by a steady-state
growth rate. This model thus assumes that future cash flows grow forever at a constant rate g2
(Equation 1).
∑∑∑∞
+=
+
=
+∞
=
+
++
+=
+=
111 )1(][
)1(][
)1(][
Tii
ittT
ii
itt
ii
ittt WACC
FCFFEWACCFCFFE
WACCFCFFEEV
Assuming ∞+=∀+⋅= −++ ,..,1)1(][][ 2 TigFCFFEFCFFE Ti
Tttitt
∑∑∞
+=
−+
=
+
++⋅
++
=1
2
1 )1()1(][
)1(][
Tii
TiTtt
T
ii
ittt WACC
gFCFFEWACCFCFFEEV Equation (1)
The above model can be further simplified into a two-stage model, where the cash flows
have different stable growth rates before and after the horizon. During the first stage, cash flows are
supposed to undergo constant (extra) growth each year at a rate g1. In this way, the Enterprise Value
at time t (EVt) is expressed as a function of five parameters: the cash flow at time t (FCFFt), the
length of the first growth stage (T), the stable growth rate of cash flows in the first (g1) and second
(g2) stages, and the Weighted Average Cost of Capital (WACC) (Equation 2).
Assuming in Equation (1) TigFCFFFCFFE ititt ,..,1)1(][ 1 =∀+⋅=+
∑∑∞
+=
−
= ++⋅+⋅
++
+⋅=
1
21
1
1
)1()1()1(
)1()1(
Tii
TiTt
T
ii
it
t WACCggFCFF
WACCgFCFFEV
⎥⎥⎦
⎤
⎢⎢⎣
⎡⎟⎠⎞
⎜⎝⎛++
⎟⎠⎞
⎜⎝⎛++
+⎟⎠⎞
⎜⎝⎛++
= ∑∑∞
== 1
21
1
1
11
11
11
i
iTT
i
i
tt WACCg
WACCg
WACCgFCFFEV Equation (2)
4 The starting point of any direct methodology is the statement that analysts have to estimate payoffs in order to value firms. In general terms, valuations are equivalent to infinite forecasting horizons (Feltham and Ohlson, 1995; Penman, 2007). And if alternative models equivalent for infinite-horizon forecasts are thus stated, they necessarily yield equivalent valuations (Francis et al., 2000; Courteau et al., 2001). However, even though going concerns are considered to continue indefinitely, practical analysis typically deals with finite forecast horizons (Penman, 2007). This need for finite-horizon forecasting is the rationale behind considering alternative valuation models.

6
Table 1. Notation and definition of the variables
Notation Definition
Panel A: Notation used in the reverse-engineered DCF model EVt Enterprise Value at time t Et Equity value at time t Dt Value of outstanding Debt at time t
FCFFt Free Cash Flows to the Firm at time t Et[FFCFt+i] Expected Free Cash Flows to the Firm (estimated at time t for time t+i)
WACC Weighted Average Cost of Capital g1 Growth rate during the first stage (“extra growth”) of the DCF model g2 Growth rate during the second stage (“stable growth”) of the DCF model T Duration of the first stage of the DCF model (years)
FCFFIPO Free Cash Flows to the Firm prior to the IPO, as reported in the prospectus
EVIPO Enterprise Value at IPO: IPOIPOIPOIPO CIDEEV −+=
EIPO Equity value at IPO price: )( newpreIPOIPO NSHNSHpE +⋅=
DIPO Value of outstanding Debt before the IPO, as reported in the prospectus
CIIPO Cash Inflow at the IPO due to the subscription of newly issued shares: newIPOIPO NSHpCI ⋅=
NSHpre Number of shares existing prior to the IPO NSHnew Number of newly issued shares (primary offer)
pIPO Offer price: ( ) preIPOIPOIPO NSHDEVp −=
vIPO Fair price: ( ) preIPOFCFFactual
IPOIPO NSHDEVv −=
EEi,j Estimation Error for firm j in year i
( ) ][/][ ,,,, jiIPOjijiIPOji FCFFEFCFFFCFFEEE −=
O.V.I. Over-Valuation Index (O.V.I.): ( ) IPOIPOIPO pvp /−
Panel B: Definition of the variables used in the empirical analysis Short-Term Implied Growth
Rate (g1) The short-term extra-growth rate (g1) implicit in IPO prices, derived through the reverse-DCF model (Equation 7)
Estimation Error (EE)
Estimation Errors, defined as the difference between estimated and actual cash flows, scaled by estimated cash flows:
ijIPO
jii
jIPO
jiIPO
jijiIPOji gFCFF
FCFFgFCFFFCFFE
FCFFFCFFEEE
)1()1(
][][
1,
,1,
,
,,, +⋅
−+⋅=
−=
AGE Natural log of one plus the firm’s age, measured as calendar year of the IPO minus the calendar year of founding.
SIZE Natural log of pre-IPO sales (€m) LEVERAGE Book value of debt divided by the book value of equity at the IPO.
P/E Price-to-earnings ratio at the IPO
Book to Market (B2M)
The ratio between the book and market values of equity. Book value is the pre-IPO book value of equity plus the capital inflow at the IPO (primary offer); market value is the number of shares outstanding after the IPO times the offer price.
D_VC Venture Capital dummy, equal to 1 if one or more venture capitalists are pre-IPO shareholders.
SECTOR ER Extra return in the firm’s sector over the 6 months prior to listing (the extra return of the European Datastream sector index divided by the European Datastream index).
MOMENTUM Market momentum, measured as Datastream Country Market index return over the 6 months prior to the listing, for each firm in the sample.
D_BUBBLE Internet Bubble, equal to 1 if the company went public during the period 1999-2001, 0 otherwise. DILUTION The ratio between the number of newly issued shares and the number of pre-IPO shares.
PARTICIPATION The ratio between the number of existing shares sold by existing shareholders and the number of pre-IPO shares.
UNDERPRICING Stock return on the first day of trading.
7
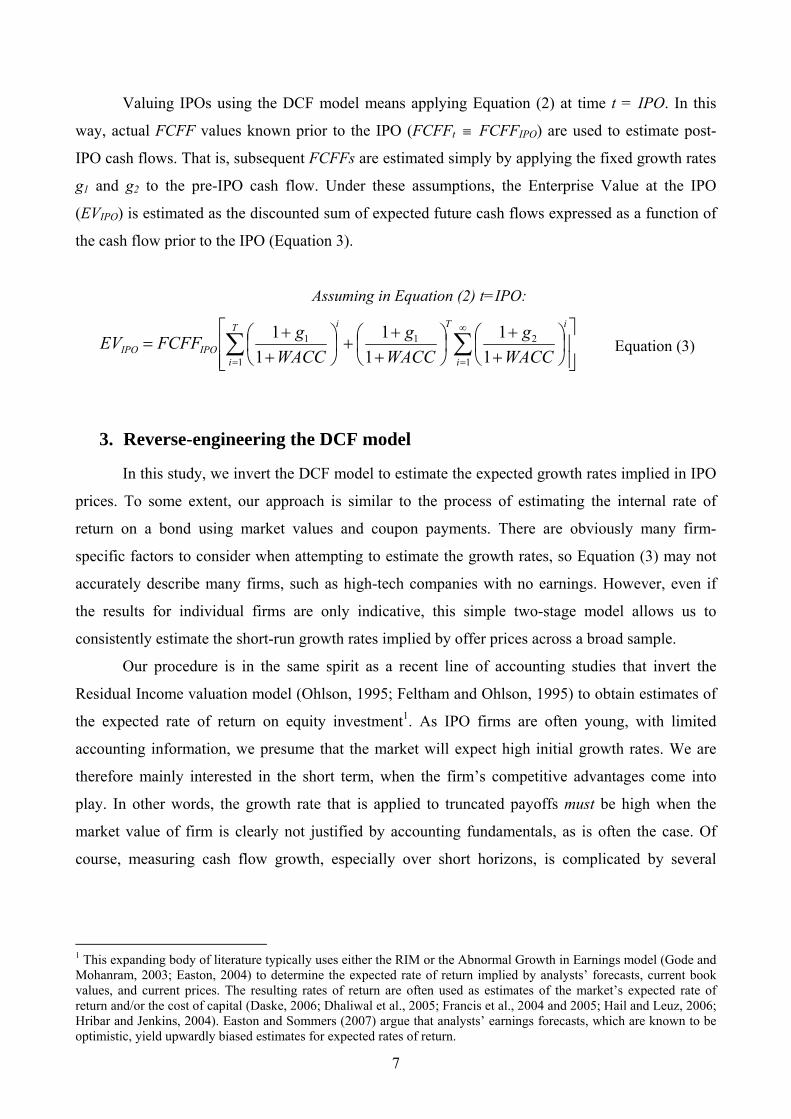
Valuing IPOs using the DCF model means applying Equation (2) at time t = IPO. In this
way, actual FCFF values known prior to the IPO (FCFFt ≡ FCFFIPO) are used to estimate post-
IPO cash flows. That is, subsequent FCFFs are estimated simply by applying the fixed growth rates
g1 and g2 to the pre-IPO cash flow. Under these assumptions, the Enterprise Value at the IPO
(EVIPO) is estimated as the discounted sum of expected future cash flows expressed as a function of
the cash flow prior to the IPO (Equation 3).
Assuming in Equation (2) t=IPO:
⎥⎥⎦
⎤
⎢⎢⎣
⎡⎟⎠⎞
⎜⎝⎛++
⎟⎠⎞
⎜⎝⎛++
+⎟⎠⎞
⎜⎝⎛++
= ∑∑∞
== 1
21
1
1
11
11
11
i
iTT
i
i
IPOIPO WACCg
WACCg
WACCgFCFFEV Equation (3)
3. Reverse-engineering the DCF model
In this study, we invert the DCF model to estimate the expected growth rates implied in IPO
prices. To some extent, our approach is similar to the process of estimating the internal rate of
return on a bond using market values and coupon payments. There are obviously many firm-
specific factors to consider when attempting to estimate the growth rates, so Equation (3) may not
accurately describe many firms, such as high-tech companies with no earnings. However, even if
the results for individual firms are only indicative, this simple two-stage model allows us to
consistently estimate the short-run growth rates implied by offer prices across a broad sample.
Our procedure is in the same spirit as a recent line of accounting studies that invert the
Residual Income valuation model (Ohlson, 1995; Feltham and Ohlson, 1995) to obtain estimates of
the expected rate of return on equity investment1. As IPO firms are often young, with limited
accounting information, we presume that the market will expect high initial growth rates. We are
therefore mainly interested in the short term, when the firm’s competitive advantages come into
play. In other words, the growth rate that is applied to truncated payoffs must be high when the
market value of firm is clearly not justified by accounting fundamentals, as is often the case. Of
course, measuring cash flow growth, especially over short horizons, is complicated by several
1 This expanding body of literature typically uses either the RIM or the Abnormal Growth in Earnings model (Gode and Mohanram, 2003; Easton, 2004) to determine the expected rate of return implied by analysts’ forecasts, current book values, and current prices. The resulting rates of return are often used as estimates of the market’s expected rate of return and/or the cost of capital (Daske, 2006; Dhaliwal et al., 2005; Francis et al., 2004 and 2005; Hail and Leuz, 2006; Hribar and Jenkins, 2004). Easton and Sommers (2007) argue that analysts’ earnings forecasts, which are known to be optimistic, yield upwardly biased estimates for expected rates of return.
8
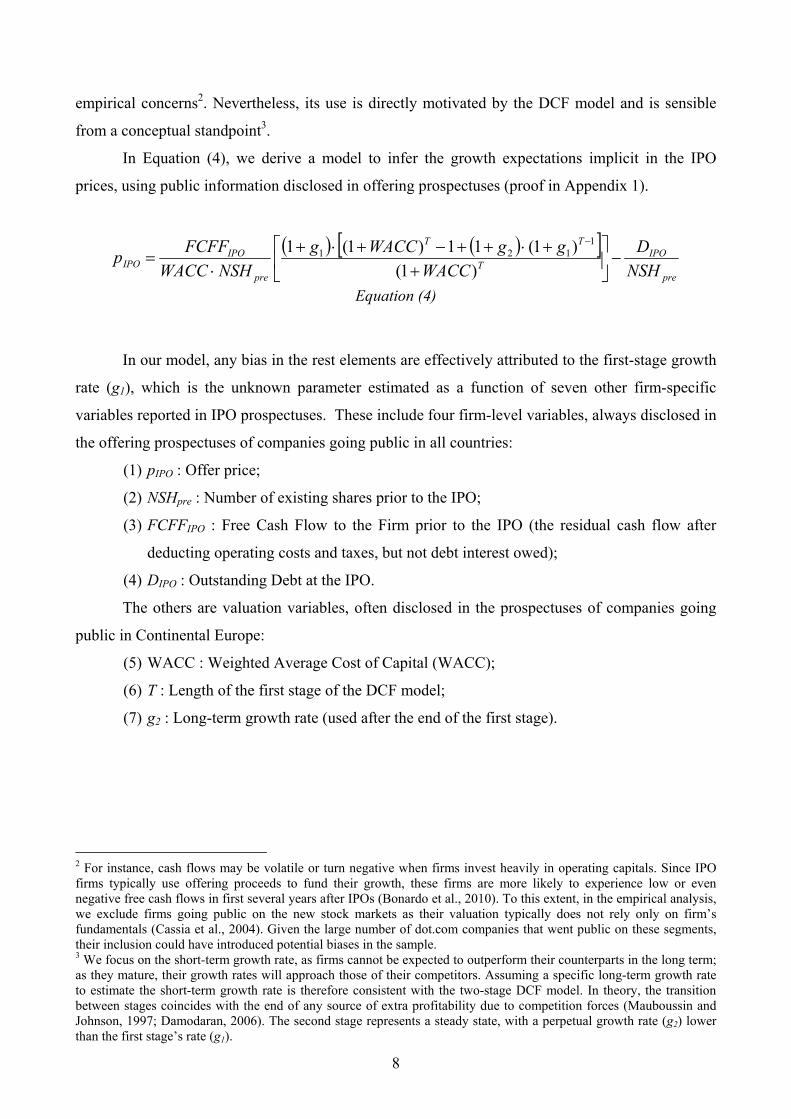
empirical concerns2. Nevertheless, its use is directly motivated by the DCF model and is sensible
from a conceptual standpoint3.
In Equation (4), we derive a model to infer the growth expectations implicit in the IPO
prices, using public information disclosed in offering prospectuses (proof in Appendix 1).
( ) ( )[ ]pre
IPOT
TT
pre
IPOIPO NSH
DWACC
ggWACCgNSHWACC
FCFFp −⎥⎦
⎤⎢⎣
⎡+
+⋅++−+⋅+⋅
=−
)1()1(11)1(1 1
121
Equation (4)
In our model, any bias in the rest elements are effectively attributed to the first-stage growth
rate (g1), which is the unknown parameter estimated as a function of seven other firm-specific
variables reported in IPO prospectuses. These include four firm-level variables, always disclosed in
the offering prospectuses of companies going public in all countries:
(1) pIPO : Offer price;
(2) NSHpre : Number of existing shares prior to the IPO;
(3) FCFFIPO : Free Cash Flow to the Firm prior to the IPO (the residual cash flow after
deducting operating costs and taxes, but not debt interest owed);
(4) DIPO : Outstanding Debt at the IPO.
The others are valuation variables, often disclosed in the prospectuses of companies going
public in Continental Europe:
(5) WACC : Weighted Average Cost of Capital (WACC);
(6) T : Length of the first stage of the DCF model;
(7) g2 : Long-term growth rate (used after the end of the first stage).
2 For instance, cash flows may be volatile or turn negative when firms invest heavily in operating capitals. Since IPO firms typically use offering proceeds to fund their growth, these firms are more likely to experience low or even negative free cash flows in first several years after IPOs (Bonardo et al., 2010). To this extent, in the empirical analysis, we exclude firms going public on the new stock markets as their valuation typically does not rely only on firm’s fundamentals (Cassia et al., 2004). Given the large number of dot.com companies that went public on these segments, their inclusion could have introduced potential biases in the sample. 3 We focus on the short-term growth rate, as firms cannot be expected to outperform their counterparts in the long term; as they mature, their growth rates will approach those of their competitors. Assuming a specific long-term growth rate to estimate the short-term growth rate is therefore consistent with the two-stage DCF model. In theory, the transition between stages coincides with the end of any source of extra profitability due to competition forces (Mauboussin and Johnson, 1997; Damodaran, 2006). The second stage represents a steady state, with a perpetual growth rate (g2) lower than the first stage’s rate (g1).
9
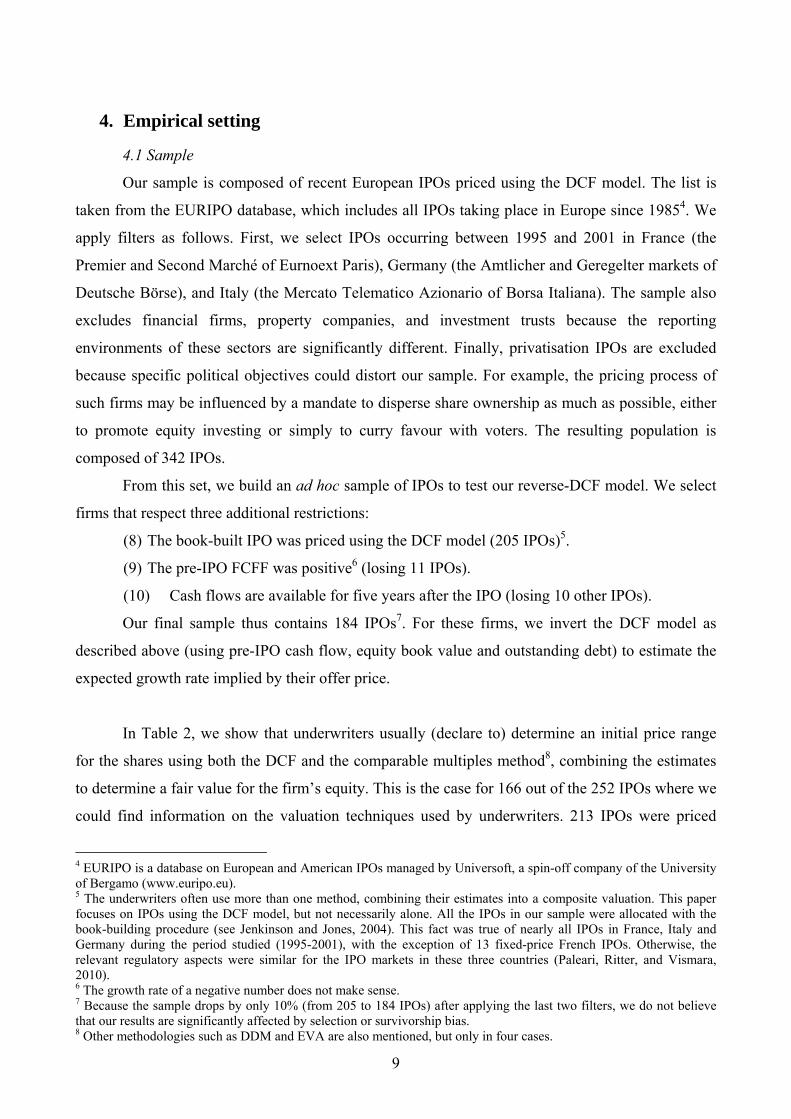
4. Empirical setting
4.1 Sample
Our sample is composed of recent European IPOs priced using the DCF model. The list is
taken from the EURIPO database, which includes all IPOs taking place in Europe since 19854. We
apply filters as follows. First, we select IPOs occurring between 1995 and 2001 in France (the
Premier and Second Marché of Eurnoext Paris), Germany (the Amtlicher and Geregelter markets of
Deutsche Börse), and Italy (the Mercato Telematico Azionario of Borsa Italiana). The sample also
excludes financial firms, property companies, and investment trusts because the reporting
environments of these sectors are significantly different. Finally, privatisation IPOs are excluded
because specific political objectives could distort our sample. For example, the pricing process of
such firms may be influenced by a mandate to disperse share ownership as much as possible, either
to promote equity investing or simply to curry favour with voters. The resulting population is
composed of 342 IPOs.
From this set, we build an ad hoc sample of IPOs to test our reverse-DCF model. We select
firms that respect three additional restrictions:
(8) The book-built IPO was priced using the DCF model (205 IPOs)5.
(9) The pre-IPO FCFF was positive6 (losing 11 IPOs).
(10) Cash flows are available for five years after the IPO (losing 10 other IPOs).
Our final sample thus contains 184 IPOs7. For these firms, we invert the DCF model as
described above (using pre-IPO cash flow, equity book value and outstanding debt) to estimate the
expected growth rate implied by their offer price.
In Table 2, we show that underwriters usually (declare to) determine an initial price range
for the shares using both the DCF and the comparable multiples method8, combining the estimates
to determine a fair value for the firm’s equity. This is the case for 166 out of the 252 IPOs where we
could find information on the valuation techniques used by underwriters. 213 IPOs were priced
4 EURIPO is a database on European and American IPOs managed by Universoft, a spin-off company of the University of Bergamo (www.euripo.eu). 5 The underwriters often use more than one method, combining their estimates into a composite valuation. This paper focuses on IPOs using the DCF model, but not necessarily alone. All the IPOs in our sample were allocated with the book-building procedure (see Jenkinson and Jones, 2004). This fact was true of nearly all IPOs in France, Italy and Germany during the period studied (1995-2001), with the exception of 13 fixed-price French IPOs. Otherwise, the relevant regulatory aspects were similar for the IPO markets in these three countries (Paleari, Ritter, and Vismara, 2010). 6 The growth rate of a negative number does not make sense. 7 Because the sample drops by only 10% (from 205 to 184 IPOs) after applying the last two filters, we do not believe that our results are significantly affected by selection or survivorship bias. 8 Other methodologies such as DDM and EVA are also mentioned, but only in four cases.
10
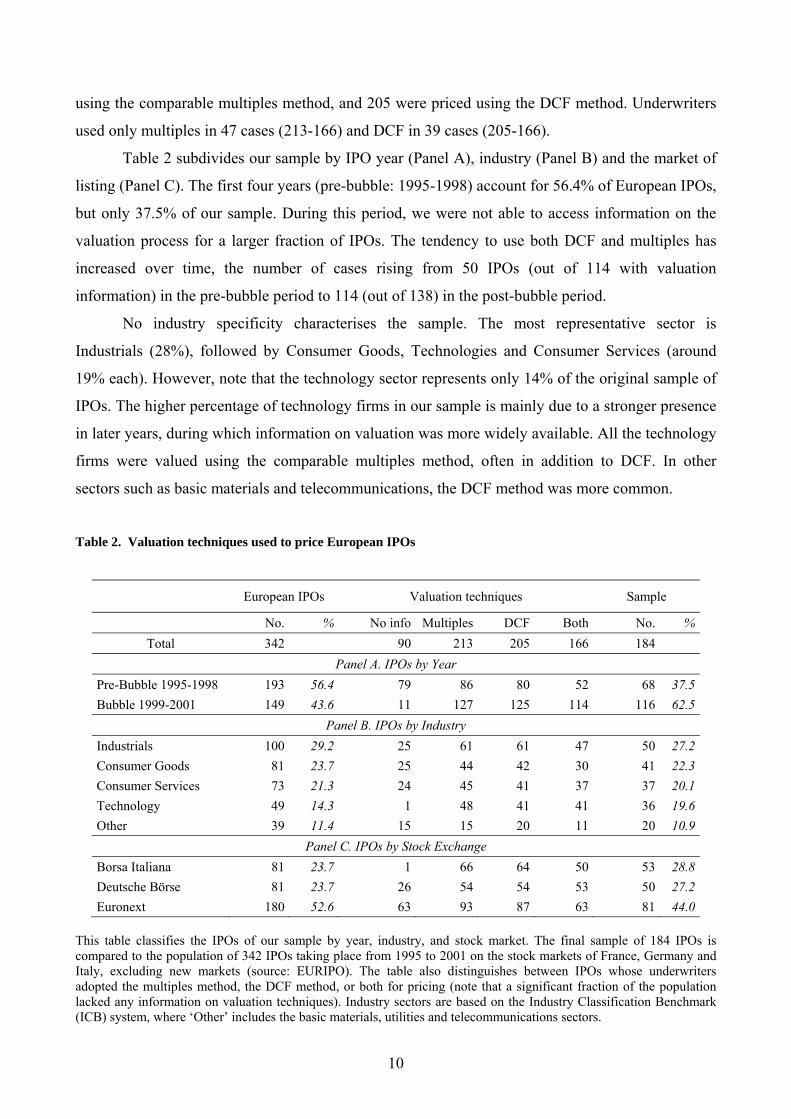
using the comparable multiples method, and 205 were priced using the DCF method. Underwriters
used only multiples in 47 cases (213-166) and DCF in 39 cases (205-166).
Table 2 subdivides our sample by IPO year (Panel A), industry (Panel B) and the market of
listing (Panel C). The first four years (pre-bubble: 1995-1998) account for 56.4% of European IPOs,
but only 37.5% of our sample. During this period, we were not able to access information on the
valuation process for a larger fraction of IPOs. The tendency to use both DCF and multiples has
increased over time, the number of cases rising from 50 IPOs (out of 114 with valuation
information) in the pre-bubble period to 114 (out of 138) in the post-bubble period.
No industry specificity characterises the sample. The most representative sector is
Industrials (28%), followed by Consumer Goods, Technologies and Consumer Services (around
19% each). However, note that the technology sector represents only 14% of the original sample of
IPOs. The higher percentage of technology firms in our sample is mainly due to a stronger presence
in later years, during which information on valuation was more widely available. All the technology
firms were valued using the comparable multiples method, often in addition to DCF. In other
sectors such as basic materials and telecommunications, the DCF method was more common.
Table 2. Valuation techniques used to price European IPOs
European IPOs Valuation techniques Sample
No. % No info Multiples DCF Both No. %Total 342 90 213 205 166 184
Panel A. IPOs by Year Pre-Bubble 1995-1998 193 56.4 79 86 80 52 68 37.5Bubble 1999-2001 149 43.6 11 127 125 114 116 62.5
Panel B. IPOs by Industry Industrials 100 29.2 25 61 61 47 50 27.2Consumer Goods 81 23.7 25 44 42 30 41 22.3Consumer Services 73 21.3 24 45 41 37 37 20.1Technology 49 14.3 1 48 41 41 36 19.6Other 39 11.4 15 15 20 11 20 10.9
Panel C. IPOs by Stock Exchange Borsa Italiana 81 23.7 1 66 64 50 53 28.8Deutsche Börse 81 23.7 26 54 54 53 50 27.2Euronext 180 52.6 63 93 87 63 81 44.0
This table classifies the IPOs of our sample by year, industry, and stock market. The final sample of 184 IPOs is compared to the population of 342 IPOs taking place from 1995 to 2001 on the stock markets of France, Germany and Italy, excluding new markets (source: EURIPO). The table also distinguishes between IPOs whose underwriters adopted the multiples method, the DCF method, or both for pricing (note that a significant fraction of the population lacked any information on valuation techniques). Industry sectors are based on the Industry Classification Benchmark (ICB) system, where ‘Other’ includes the basic materials, utilities and telecommunications sectors.
11
4.2 Valuation information
In our model (Equation 4), the unknown parameter (g1) is estimated as a function of seven
other firm-specific variables reported in IPO prospectuses. Of these, the firm-specific variables (i.e.
offer price, number of shares, cash flows and debt outstanding) were hand-collected for each IPO
from the offerings prospectuses, whereas the valuation-specific variables (i.e. WACC, T and g2)
were fully disclosed only in 68 cases9. We rely therefore on a subsample of 68 IPOs with full
disclosure of valuation information (labeled, full disclosure subsample).
In order to extend the usability of our reverse-engineered DCF model, we propose a
methodology to estimate the valuation information eventually not disclosed in IPO prospectuses.
The aim is to provide a formal instrument that can be used to infer the valuation assumptions made
by the underwriters, even if not readily available. Such methodology is applied to the remaining
subsample of 116 IPOs with some missing information on the DCF estimates (labeled, estimation
subsample). Specifically, only in this subsample, when specific information on a single valuation
variable was not available, we filled it in using the following assumptions:
(1) WACC (firm-specific)10. The Weighted Average Cost of Capital (WACC) is computed as
DIPOIPOIPOEIPOIPOIPO KEDDKEDEWACC ⋅++⋅+= )]/([)]/([ . Data on the firm’s pre-
IPO debt (DIPO) and Equity (EIPO) market values are taken from the EURIPO database.
The cost of equity capital (KE) is calculated using the Capital Asset Pricing Model
(CAPM) as follows: )(MRPrK EfE ⋅+= β , where rf is the risk-free rate, βE is the firm’s
unlevered beta11, and MRP is the Market Risk Premium. Consistent with the literature
(Claus and Thomas, 2001), we adopt the Ibbotson International Cost of Capital Reports
to obtain estimates for year- and country-specific risk-free rates and MRPs. The
promised return on debt is computed as follows: )1()( CfD trK −⋅Δ+= . The spread Δ is
defined for each firm according to its S&P risk class, based on the ratio between
operating profit and interest expenses, using the conversion tables published by 9 Other four prospectuses reported the length of the first stage but not the WACC. 10 To infer expected growth from valuation models requires one to estimate a key model element - the discount rate, among others. Due to the challenge in estimating the cost of capital, it is difficult to assess how much the bias in implied growth should be attributed to underwriters’ expectational errors rather than noise in estimated discount rates. This is an important distinction between this method and the one of implying the cost of equity. However, the latter usually rely on private information or forecasts that we aim to exclude from our model. This is intended to be unbiased by sell-side analysts forecasts and to be usable by individual investors. On the contrary, prior studies focussed on the implied cost of equity have obtained expected growth either by using analysts’ forecasts (e.g., Gebhardt et al. 2001) or by assuming linear fading in profitability (e.g., Claus and Thomas 2001). Other studies estimate the cost of equity and long-term growth jointly at the sample or portfolio level (e.g., Easton 2004; Easton and Sommers 2007), but in this way the implied growth obtained is not firm specific. 11 Betas are estimated for the first 250 days of trading after the IPO (excluding the first 21 trading days after the IPO, in order to avoid a potential bias from the price stabilisation period of underwriters). These estimates use post-IPO information. We also estimated the betas using ex-ante information (i.e., average industry betas for the months prior to the IPO), but the results do not vary appreciably.
12
Damodaran (2006). The corporate tax rate tC is the statutory corporate income tax rate
for resident companies, as reported in the “Corporate Tax Rate Survey” by KPMG, and
refers to the country of a company’s headquarters12.
(2) T (constant). The first period of the DCF model (before the steady state) is typically a-
five year forecast. T is assumed equal to 5 years for all firms13.
(3) g2 (constant). The long-term growth rate is assumed to equal 2.5% for all firms. This
value approximates the historical growth of real gross domestic product in Europe14.
Table 3 reports the descriptive statistics the full sample of 184 IPOs, and for two
subsamples: the one with full disclosure on valuation information (full disclosure subsample of 68
IPOs) and the one with DCF parameter estimated under the above reported assumptions (estimation
subsample of 116 IPOs). We also applied the assumptions to the whole sample of IPOs, including
those with full disclosure. We can therefore compare two separate statistics for the sample of 184
IPOs. One is made of 68 IPOs with full disclosure and 116 IPOs with estimation; the other is built
by estimation, neglecting the valuation information available for 68 IPOs. The descriptive statistics
of these samples are, obviously, the same with regards to non valuation-specific variables (they are
made indeed by the same IPO firms). However, also estimated valuation-specific variables (i.e.
WACC, T and g2) do not differ significantly among subsamples. Finally, we introduce a control
sample of IPOs for which we do not have access to information on the valuation techniques used by
underwriters due to lack of disclosure. This control sample is made of 109 firms gone public in the
12 The estimates do not vary significantly if we use alternative tax rates obtained from the “Worldwide Corporate Tax Guide”, published yearly by Ernst & Young. 13 The DCF method was always applied by underwriters in a two-stage model, with the exception of three cases in which a three-stage is used where the first period of explicit forecast is followed by a second phase where only the main economic-financial features are explicitly forecasted. This represents an attempt to overcome the trade-off between the need to extend the stage of explicit forecast long enough, and on the other hand, the need to limit the explicit forecast period to a reasonable length so that a reliable estimate is obtained. Three-stage DCF typically improve the identification of the steady-state for the beginning of the last period of implicit forecasts (Cassia and Vismara, 2009). In our model this variable is set constant to 5 years to make implied growth rates estimates comparable amongst the sample. 14 The correct value of a firm’s stock can be computed by capitalizing nominal cash flows at a nominal rate, or real cash flows at a real rate. Assuming a constant discount rate, inflation rate, and real growth rate during the second stage of the DCF (infinite horizon), these two methods are equivalent. During periods of inflation, the nominal cost of equity is higher by virtue of higher inflation. However, the nominal growth rate will also be higher – thus, inflation’s effect on the real value of the stock will be neutral. As pointed out by Ritter and Warr (2002), misevaluation will occur if investors use a nominal discount rate but fail to incorporate a higher nominal growth rate into their valuations. In our model, the WACC is a nominal amount so conceptually we are discounting the future more when inflation is higher than expected. Since inflation is not changing much during our sample period, however, our results are not significantly affected by this fact. As mentioned in footnote 3, IPO firms cannot be expected to outperform in the long term; as they mature, their growth rates will approach those of their competitors. It is therefore not possible a priori to assume higher steady-state perpetual growth rates (g2) for a particular company or industry (Mauboussin and Johnson, 1997; Damodaran, 2006). The long-term assumption of a general model must necessarily be the same for all the firms.
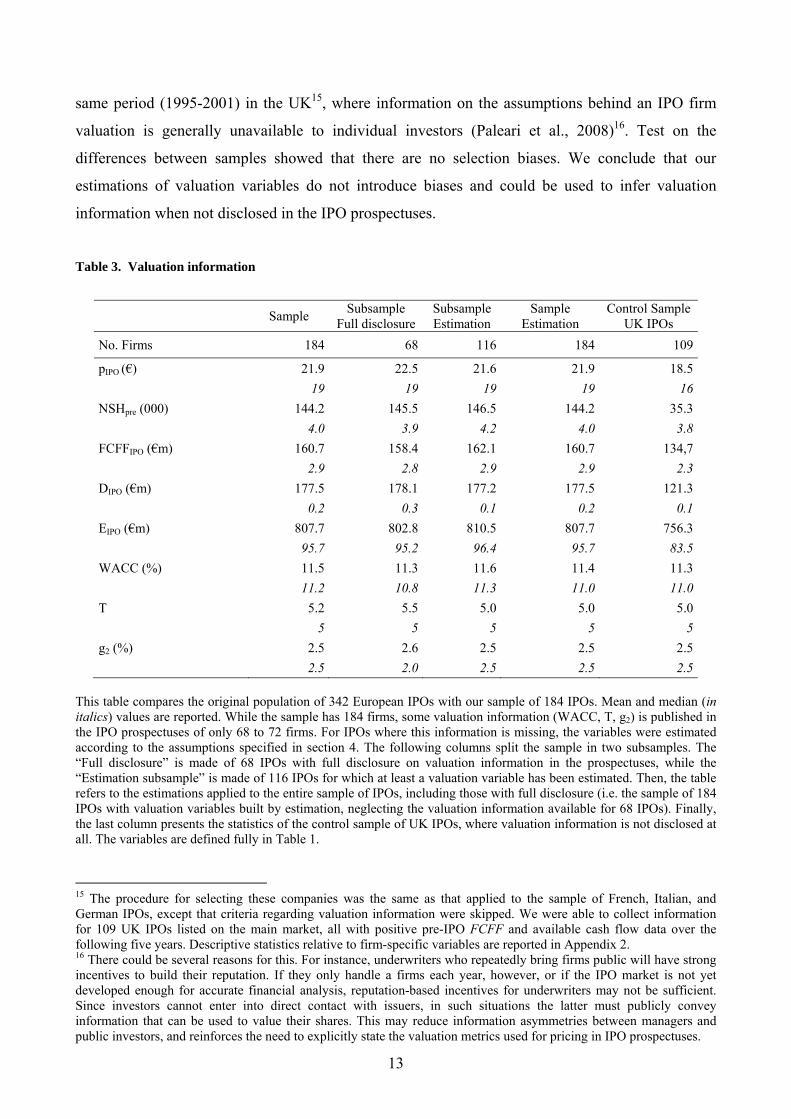
13
same period (1995-2001) in the UK15, where information on the assumptions behind an IPO firm
valuation is generally unavailable to individual investors (Paleari et al., 2008)16. Test on the
differences between samples showed that there are no selection biases. We conclude that our
estimations of valuation variables do not introduce biases and could be used to infer valuation
information when not disclosed in the IPO prospectuses.
Table 3. Valuation information
Sample Subsample
Full disclosure Subsample Estimation
Sample Estimation
Control Sample UK IPOs
No. Firms 184 68 116 184 109
pIPO (€) 21.9 22.5 21.6 21.9 18.5 19 19 19 19 16NSHpre (000) 144.2 145.5 146.5 144.2 35.3 4.0 3.9 4.2 4.0 3.8FCFFIPO (€m) 160.7 158.4 162.1 160.7 134,7 2.9 2.8 2.9 2.9 2.3DIPO (€m) 177.5 178.1 177.2 177.5 121.3 0.2 0.3 0.1 0.2 0.1EIPO (€m) 807.7 802.8 810.5 807.7 756.3 95.7 95.2 96.4 95.7 83.5WACC (%) 11.5 11.3 11.6 11.4 11.3 11.2 10.8 11.3 11.0 11.0T 5.2 5.5 5.0 5.0 5.0 5 5 5 5 5g2 (%) 2.5 2.6 2.5 2.5 2.5 2.5 2.0 2.5 2.5 2.5
This table compares the original population of 342 European IPOs with our sample of 184 IPOs. Mean and median (in italics) values are reported. While the sample has 184 firms, some valuation information (WACC, T, g2) is published in the IPO prospectuses of only 68 to 72 firms. For IPOs where this information is missing, the variables were estimated according to the assumptions specified in section 4. The following columns split the sample in two subsamples. The “Full disclosure” is made of 68 IPOs with full disclosure on valuation information in the prospectuses, while the “Estimation subsample” is made of 116 IPOs for which at least a valuation variable has been estimated. Then, the table refers to the estimations applied to the entire sample of IPOs, including those with full disclosure (i.e. the sample of 184 IPOs with valuation variables built by estimation, neglecting the valuation information available for 68 IPOs). Finally, the last column presents the statistics of the control sample of UK IPOs, where valuation information is not disclosed at all. The variables are defined fully in Table 1.
15 The procedure for selecting these companies was the same as that applied to the sample of French, Italian, and German IPOs, except that criteria regarding valuation information were skipped. We were able to collect information for 109 UK IPOs listed on the main market, all with positive pre-IPO FCFF and available cash flow data over the following five years. Descriptive statistics relative to firm-specific variables are reported in Appendix 2. 16 There could be several reasons for this. For instance, underwriters who repeatedly bring firms public will have strong incentives to build their reputation. If they only handle a firms each year, however, or if the IPO market is not yet developed enough for accurate financial analysis, reputation-based incentives for underwriters may not be sufficient. Since investors cannot enter into direct contact with issuers, in such situations the latter must publicly convey information that can be used to value their shares. This may reduce information asymmetries between managers and public investors, and reinforces the need to explicitly state the valuation metrics used for pricing in IPO prospectuses.
14
5. Implied growth rates and estimation errors.
We shall now determine at what rates the IPO firms were expected to grow by their
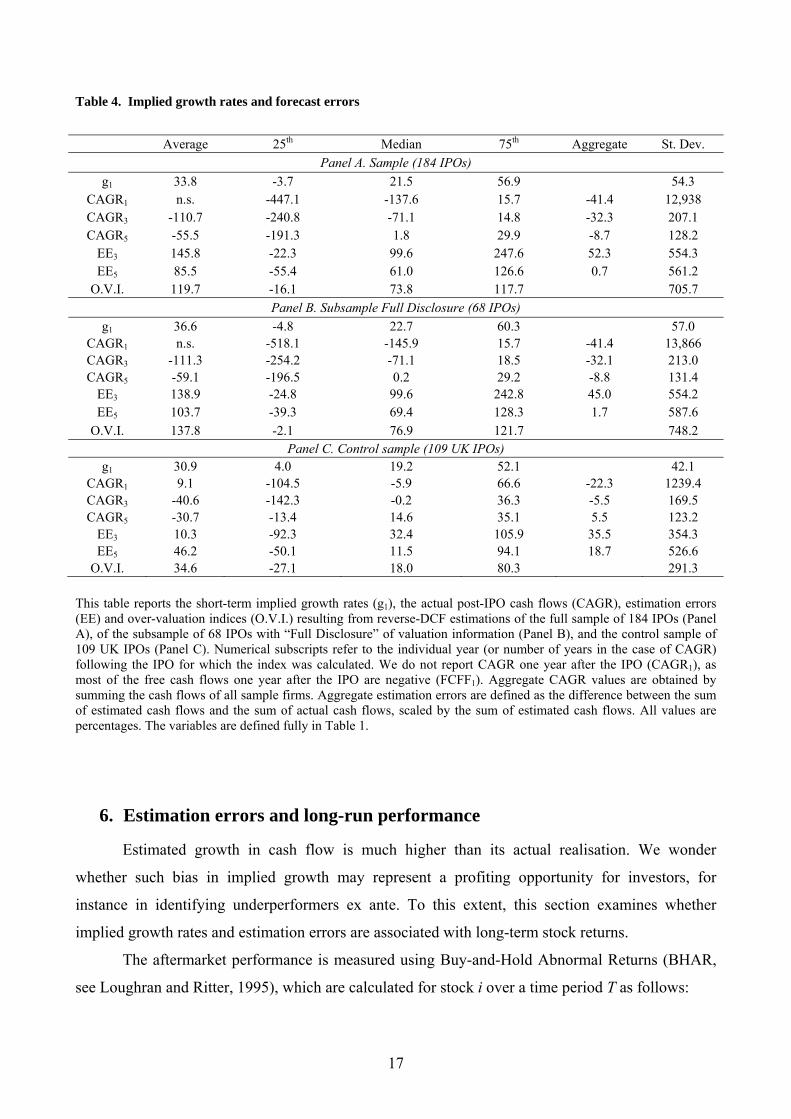
underwriters. To do so, we estimate the reverse-DCF model expressed in Equation (4). Results are
reported in Table 4, while appendixes 3, 4, and 5 describes several robustness checks we have made
on the model17.
We find that the “average” IPO firm is expected to grow on average by 33.8% annually
during its first five years as a public company (21.5 in median). However, in light of the
underwriters’ optimistic tendencies, such growth rates implied by IPO prices are likely to be higher
than their realisations18. Our results confirm this hypothesis. In fact, the median Compound Annual
Growth Rate (CAGR) of FCFF is negative in the first years after the IPO. In the first year (CAGR1),
the median is below −100%, meaning that most of the companies in our sample showed a negative
cash flow in the first year after going public, although all had positive FCFF values prior to the IPO
(this was one of our selection criteria). This may be taken as evidence of either intense investment
activity after listing or market timing motivations to go public (i.e., the signal-jamming and
window-dressing hypotheses19). Cash flows recover as time passes, however, the median CAGR
over five years (CAGR5) is positive at 1.8%. However, even at this time actual growth rates are
17 Given the skewness of distributions of firm-specific variables, throughout the paper we provide descriptive statistics in terms of averages, medians, and percentiles. We also estimate each variable at an “aggregate” level (i.e., a sum of the variable over all firms in the sample). Appendix 3 provides for the full sample of 184 IPOs a breakdown of the implied growth rates, actual CAGR values, estimation errors, and overvaluation indices by year of listing, industry, stock exchange, and size. Appendix 4 shows that estimations using the first-day prices yield higher results due to underpricing, whereas estimations based on preliminary offer prices yield lower results due to the partial adjustment phenomenon (the offer price is typically higher than the preliminary offer price). Appendix 5 reports the results of a sensitivity analysis performed with different assumptions for valuation variables. Similar results were obtained. 18 Of course, it is also possible that the differences between real IPO prices and fair values are incentive-based (i.e., deliberate) and therefore unrelated to overconfidence. The difficulty of valuing IPOs is indeed keenly felt by investment banks, who are subject to reputation incentives. If the firm is undervalued, its existing shareholders do not appreciate “leaving money on the table”. If the firm is overvalued, investors will be displeased and exercise caution in subscribing to future IPOs underwritten by the same banks. Underwriters who repeatedly bring firms public will have strong incentives to build their reputation. If they only handle a firms each year, however, or if the IPO market is not yet developed enough for accurate financial analysis, reputation-based incentives for underwriters may not be sufficient. Since investors cannot enter into direct contact with issuers, in such situations the latter must publicly convey information that can be used to value their shares. This may reduce information asymmetries between managers and public investors, and reinforces the need to explicitly state the valuation metrics used for pricing in IPO prospectuses. Such speculation lies beyond the scope of this paper, whose aim is to estimate how much growth expectations exceed the rates driven by fundamentals. 19 Firm valuation faces specific difficulties related to the IPO timing decision. For example, firms may schedule their IPO in order to take advantage of “windows of opportunity”. These are periods of market buoyancy during which other companies in the same industry tend to be overvalued (Loughran and Ritter, 1995). Thus, investors risk over-paying for stock in firms priced using relative valuation methodologies. Besides, firms may decide to go public when they are able to display positive growth opportunities, and thus induce optimistic valuations (Paleari and Vismara, 2007). To do this, firms may time their IPO for when transitory earnings are high, since investors have difficulty distinguishing between transitory and permanent earnings (this is the signal-jamming explanation given by Stein, 1989). Finally, managers may window-dress accounting numbers to make their firms look better (Teoh et al., 1998). Again, investors risk over-valuation of such firms (Bonardo et al., 2007).
15
much lower than expected (the corresponding median values implied by offer prices is 21.5%) and
for only 66 firms actual flows were higher than expected.
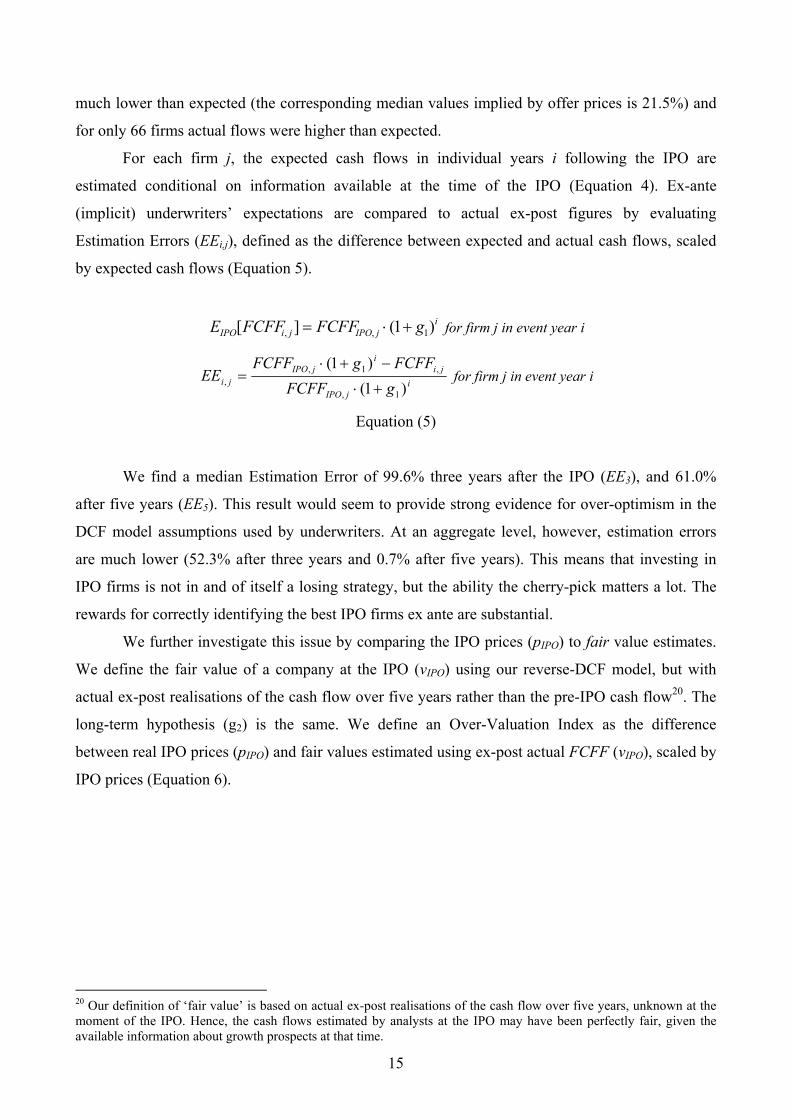
For each firm j, the expected cash flows in individual years i following the IPO are
estimated conditional on information available at the time of the IPO (Equation 4). Ex-ante
(implicit) underwriters’ expectations are compared to actual ex-post figures by evaluating
Estimation Errors (EEi,j), defined as the difference between expected and actual cash flows, scaled
by expected cash flows (Equation 5).
i
jIPOjiIPO gFCFFFCFFE )1(][ 1,, +⋅= for firm j in event year i
ijIPO
jii
jIPOji gFCFF
FCFFgFCFFEE
)1()1(
1,
,1,, +⋅
−+⋅= for firm j in event year i
Equation (5)
We find a median Estimation Error of 99.6% three years after the IPO (EE3), and 61.0%
after five years (EE5). This result would seem to provide strong evidence for over-optimism in the
DCF model assumptions used by underwriters. At an aggregate level, however, estimation errors
are much lower (52.3% after three years and 0.7% after five years). This means that investing in
IPO firms is not in and of itself a losing strategy, but the ability the cherry-pick matters a lot. The
rewards for correctly identifying the best IPO firms ex ante are substantial.
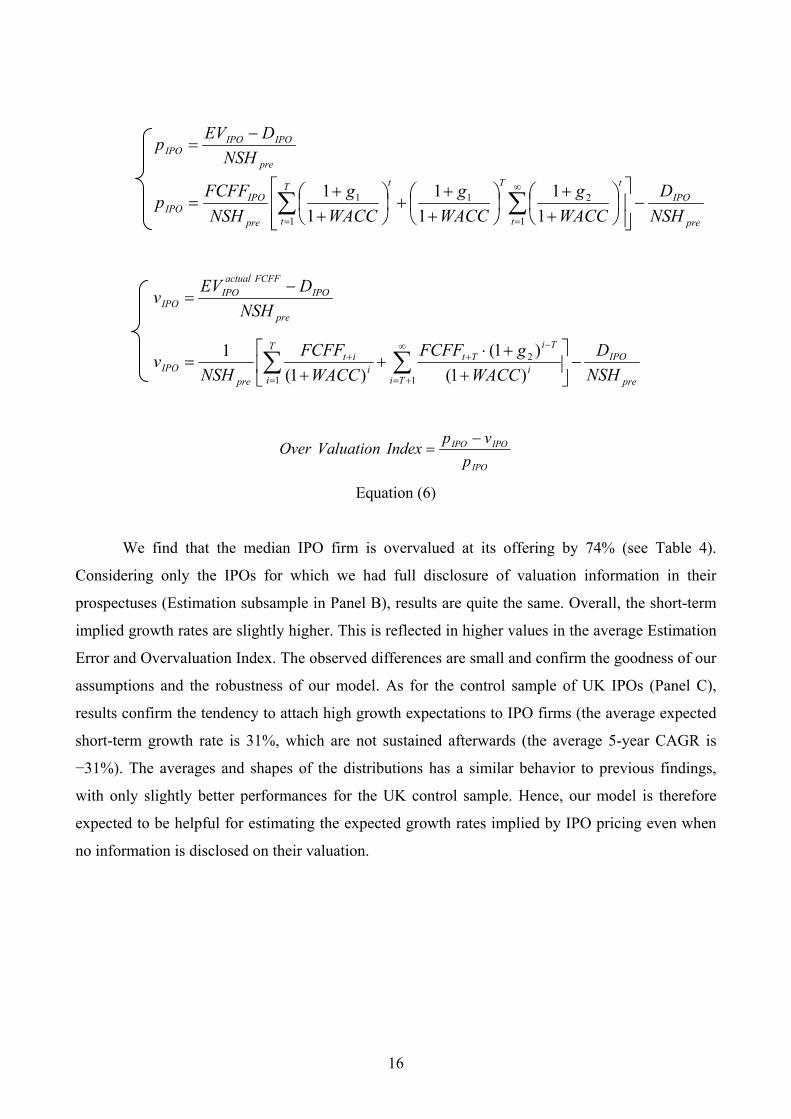
We further investigate this issue by comparing the IPO prices (pIPO) to fair value estimates.
We define the fair value of a company at the IPO (vIPO) using our reverse-DCF model, but with
actual ex-post realisations of the cash flow over five years rather than the pre-IPO cash flow20. The
long-term hypothesis (g2) is the same. We define an Over-Valuation Index as the difference
between real IPO prices (pIPO) and fair values estimated using ex-post actual FCFF (vIPO), scaled by
IPO prices (Equation 6).
20 Our definition of ‘fair value’ is based on actual ex-post realisations of the cash flow over five years, unknown at the moment of the IPO. Hence, the cash flows estimated by analysts at the IPO may have been perfectly fair, given the available information about growth prospects at that time.
16
pre
IPOIPOIPO NSH
DEVp −=
pre
IPO
t
tTT
t
t
pre
IPOIPO NSH
DWACC
gWACC
gWACC
gNSH
FCFFp −⎥⎥⎦
⎤
⎢⎢⎣
⎡⎟⎠⎞
⎜⎝⎛++
⎟⎠⎞
⎜⎝⎛++
+⎟⎠⎞
⎜⎝⎛++
= ∑∑∞
== 1
21
1
1
11
11
11
pre
IPOFCFFactual
IPOIPO NSH
DEVv −=
pre
IPO
Tii
TiTt
T
ii
it
preIPO NSH
DWACC
gFCFFWACC
FCFFNSH
v −⎥⎦
⎤⎢⎣
⎡+
+⋅+
+= ∑∑
∞
+=
−+
=
+
1
2
1 )1()1(
)1(1
IPO
IPOIPO
pvp
IndexValuationOver−
=
Equation (6)
We find that the median IPO firm is overvalued at its offering by 74% (see Table 4).
Considering only the IPOs for which we had full disclosure of valuation information in their
prospectuses (Estimation subsample in Panel B), results are quite the same. Overall, the short-term
implied growth rates are slightly higher. This is reflected in higher values in the average Estimation
Error and Overvaluation Index. The observed differences are small and confirm the goodness of our
assumptions and the robustness of our model. As for the control sample of UK IPOs (Panel C),
results confirm the tendency to attach high growth expectations to IPO firms (the average expected
short-term growth rate is 31%, which are not sustained afterwards (the average 5-year CAGR is
−31%). The averages and shapes of the distributions has a similar behavior to previous findings,
with only slightly better performances for the UK control sample. Hence, our model is therefore
expected to be helpful for estimating the expected growth rates implied by IPO pricing even when
no information is disclosed on their valuation.
17
Table 4. Implied growth rates and forecast errors
Average 25th Median 75th Aggregate St. Dev.
Panel A. Sample (184 IPOs) g1 33.8 -3.7 21.5 56.9 54.3
CAGR1 n.s. -447.1 -137.6 15.7 -41.4 12,938 CAGR3 -110.7 -240.8 -71.1 14.8 -32.3 207.1 CAGR5 -55.5 -191.3 1.8 29.9 -8.7 128.2
EE3 145.8 -22.3 99.6 247.6 52.3 554.3 EE5 85.5 -55.4 61.0 126.6 0.7 561.2
O.V.I. 119.7 -16.1 73.8 117.7 705.7 Panel B. Subsample Full Disclosure (68 IPOs)
g1 36.6 -4.8 22.7 60.3 57.0 CAGR1 n.s. -518.1 -145.9 15.7 -41.4 13,866 CAGR3 -111.3 -254.2 -71.1 18.5 -32.1 213.0 CAGR5 -59.1 -196.5 0.2 29.2 -8.8 131.4
EE3 138.9 -24.8 99.6 242.8 45.0 554.2 EE5 103.7 -39.3 69.4 128.3 1.7 587.6
O.V.I. 137.8 -2.1 76.9 121.7 748.2 Panel C. Control sample (109 UK IPOs)
g1 30.9 4.0 19.2 52.1 42.1 CAGR1 9.1 -104.5 -5.9 66.6 -22.3 1239.4 CAGR3 -40.6 -142.3 -0.2 36.3 -5.5 169.5 CAGR5 -30.7 -13.4 14.6 35.1 5.5 123.2
EE3 10.3 -92.3 32.4 105.9 35.5 354.3 EE5 46.2 -50.1 11.5 94.1 18.7 526.6
O.V.I. 34.6 -27.1 18.0 80.3 291.3 This table reports the short-term implied growth rates (g1), the actual post-IPO cash flows (CAGR), estimation errors (EE) and over-valuation indices (O.V.I.) resulting from reverse-DCF estimations of the full sample of 184 IPOs (Panel A), of the subsample of 68 IPOs with “Full Disclosure” of valuation information (Panel B), and the control sample of 109 UK IPOs (Panel C). Numerical subscripts refer to the individual year (or number of years in the case of CAGR) following the IPO for which the index was calculated. We do not report CAGR one year after the IPO (CAGR1), as most of the free cash flows one year after the IPO are negative (FCFF1). Aggregate CAGR values are obtained by summing the cash flows of all sample firms. Aggregate estimation errors are defined as the difference between the sum of estimated cash flows and the sum of actual cash flows, scaled by the sum of estimated cash flows. All values are percentages. The variables are defined fully in Table 1.
6. Estimation errors and long-run performance
Estimated growth in cash flow is much higher than its actual realisation. We wonder
whether such bias in implied growth may represent a profiting opportunity for investors, for
instance in identifying underperformers ex ante. To this extent, this section examines whether
implied growth rates and estimation errors are associated with long-term stock returns.
The aftermarket performance is measured using Buy-and-Hold Abnormal Returns (BHAR,
see Loughran and Ritter, 1995), which are calculated for stock i over a time period T as follows:
18
1)1(1
,, −⎥⎦
⎤⎢⎣
⎡+= ∏
=
T
ttiTi RBHR
∑ ∏∏= ==
⎥⎦
⎤⎢⎣
⎡⎟⎟⎠
⎞⎜⎜⎝
⎛+−⎟⎟
⎠
⎞⎜⎜⎝
⎛+=
N
i
T
ttM
T
tti RR
NBHAR
1 1,
1, )1()1(1
where Ri,t is the return of stock i at time t and N is the number of stocks in the portfolio.
For each company, the corresponding DJ EURO STOXX industry index is used as a benchmark to
compute industry-adjusted normal returns21. We find that our sample under-performs the
benchmark index by about 25% over three years and 14% over five years. Prior literature has found
that long-run, post-IPO performance is predictable based on a variety of firm- and offer-specific
characteristic. We purposely choose measures of firm and offer quality that should be readily
available to any investor. Specifically, we control for firm age and size, as less information tends to
be available about smaller and younger firms, suggesting that underwriters will have more difficulty
valuing such issues (Field and Lowry, 2009). Prior research has also considered a wide variety of
characteristics that can affect the post-IPO performance, such as leverage (Eckbo and Norli, 2005),
price multiples (Purnanandam and Swaminathan, 2004), underpricing (Krigman et al., 1999), the
presence of venture capitalists (Brav and Gompers, 1997), or the dilution of the original
shareholders’ stake at the time of the IPO (Leland and Pyle, 1977). We also control for ‘external’
factors, such as extra return in the firm’s sector, market momentum (Carhart, 1997), and internet
bubble.
Our paper, however, is centred on the usability of growth estimated and forecast errors. Cash flow
estimates are a major factor in valuing new issues, so errors in this variable are expected to be an
important determinant of aftermarket stock performance. IPOs whose actual ex-post cash flows
exceed expectations are likely to experience higher abnormal returns in the years after issue, while
those whose FCFFs are less than expected are likely to suffer lower BHARs. We therefore
hypothesise that EE will be negatively correlated with BHAR if investors use the cash flow
expectations implicit in IPO valuations. If the underwriter’s estimate turns out to be erroneous,
stock prices should react accordingly.
Table 5 presents the results of the regression analysis on the determinants of long-run performance,
while notation and correlation analysis are reported in Table 1 and Appendix 6, respectively22. We
21 We exclude the first 21 trading days after the IPO date to avoid a potential bias from the price stabilisation period of underwriters. We also repeated the analysis employing local Datastream market indexes. The empirical findings reported here are robust with respect to the index employed. 22 The cross-sectional determinants of BHAR and, in the following section, of estimation errors (EE) are investigated using robust OLS regressions. When identifying the explanatory variables, we focus on variables that prior studies have shown to have some predictive power and checked for the absence of mutual correlations. Tables 5 and 6 report the
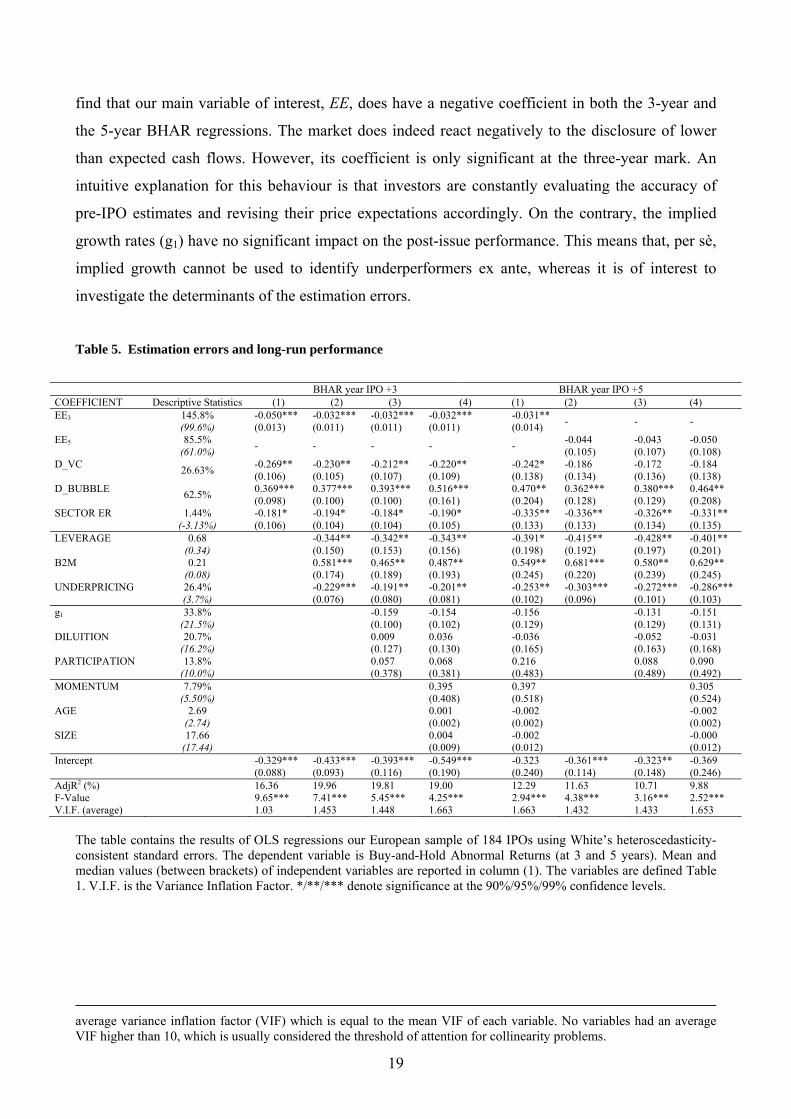
19
find that our main variable of interest, EE, does have a negative coefficient in both the 3-year and
the 5-year BHAR regressions. The market does indeed react negatively to the disclosure of lower
than expected cash flows. However, its coefficient is only significant at the three-year mark. An
intuitive explanation for this behaviour is that investors are constantly evaluating the accuracy of
pre-IPO estimates and revising their price expectations accordingly. On the contrary, the implied
growth rates (g1) have no significant impact on the post-issue performance. This means that, per sè,
implied growth cannot be used to identify underperformers ex ante, whereas it is of interest to
investigate the determinants of the estimation errors.
Table 5. Estimation errors and long-run performance
BHAR year IPO +3 BHAR year IPO +5
COEFFICIENT Descriptive Statistics (1) (2) (3) (4) (1) (2) (3) (4) EE3 145.8% -0.050*** -0.032*** -0.032*** -0.032*** -0.031** - - - (99.6%) (0.013) (0.011) (0.011) (0.011) (0.014) EE5 85.5% - - - - - -0.044 -0.043 -0.050 (61.0%) (0.105) (0.107) (0.108) D_VC 26.63% -0.269** -0.230** -0.212** -0.220** -0.242* -0.186 -0.172 -0.184 (0.106) (0.105) (0.107) (0.109) (0.138) (0.134) (0.136) (0.138) D_BUBBLE 62.5% 0.369*** 0.377*** 0.393*** 0.516*** 0.470** 0.362*** 0.380*** 0.464** (0.098) (0.100) (0.100) (0.161) (0.204) (0.128) (0.129) (0.208) SECTOR ER 1.44% -0.181* -0.194* -0.184* -0.190* -0.335** -0.336** -0.326** -0.331** (-3.13%) (0.106) (0.104) (0.104) (0.105) (0.133) (0.133) (0.134) (0.135) LEVERAGE 0.68 -0.344** -0.342** -0.343** -0.391* -0.415** -0.428** -0.401** (0.34) (0.150) (0.153) (0.156) (0.198) (0.192) (0.197) (0.201) B2M 0.21 0.581*** 0.465** 0.487** 0.549** 0.681*** 0.580** 0.629** (0.08) (0.174) (0.189) (0.193) (0.245) (0.220) (0.239) (0.245) UNDERPRICING 26.4% -0.229*** -0.191** -0.201** -0.253** -0.303*** -0.272*** -0.286*** (3.7%) (0.076) (0.080) (0.081) (0.102) (0.096) (0.101) (0.103) g1 33.8% -0.159 -0.154 -0.156 -0.131 -0.151 (21.5%) (0.100) (0.102) (0.129) (0.129) (0.131) DILUITION 20.7% 0.009 0.036 -0.036 -0.052 -0.031 (16.2%) (0.127) (0.130) (0.165) (0.163) (0.168) PARTICIPATION 13.8% 0.057 0.068 0.216 0.088 0.090 (10.0%) (0.378) (0.381) (0.483) (0.489) (0.492) MOMENTUM 7.79% 0.395 0.397 0.305 (5.50%) (0.408) (0.518) (0.524) AGE 2.69 0.001 -0.002 -0.002 (2.74) (0.002) (0.002) (0.002) SIZE 17.66 0.004 -0.002 -0.000 (17.44) (0.009) (0.012) (0.012) Intercept -0.329*** -0.433*** -0.393*** -0.549*** -0.323 -0.361*** -0.323** -0.369 (0.088) (0.093) (0.116) (0.190) (0.240) (0.114) (0.148) (0.246) AdjR2 (%) 16.36 19.96 19.81 19.00 12.29 11.63 10.71 9.88 F-Value 9.65*** 7.41*** 5.45*** 4.25*** 2.94*** 4.38*** 3.16*** 2.52*** V.I.F. (average) 1.03 1.453 1.448 1.663 1.663 1.432 1.433 1.653
The table contains the results of OLS regressions our European sample of 184 IPOs using White’s heteroscedasticity-consistent standard errors. The dependent variable is Buy-and-Hold Abnormal Returns (at 3 and 5 years). Mean and median values (between brackets) of independent variables are reported in column (1). The variables are defined Table 1. V.I.F. is the Variance Inflation Factor. */**/*** denote significance at the 90%/95%/99% confidence levels.
average variance inflation factor (VIF) which is equal to the mean VIF of each variable. No variables had an average VIF higher than 10, which is usually considered the threshold of attention for collinearity problems.
20
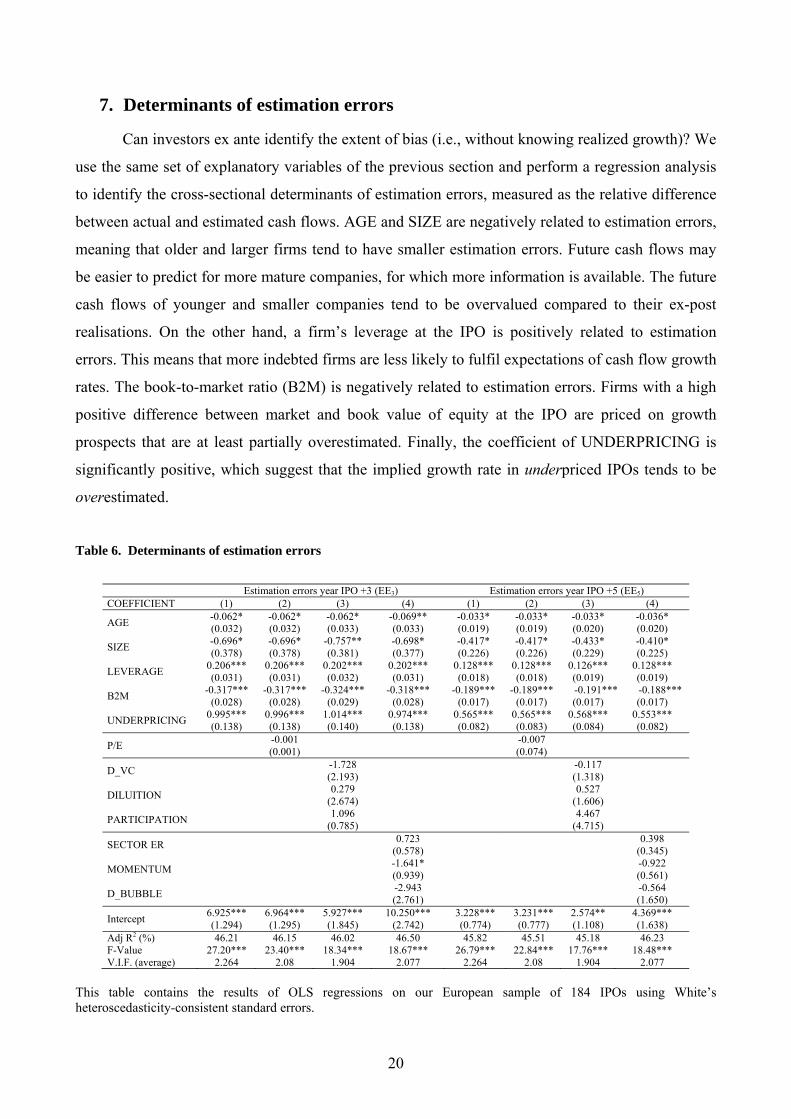
7. Determinants of estimation errors
Can investors ex ante identify the extent of bias (i.e., without knowing realized growth)? We
use the same set of explanatory variables of the previous section and perform a regression analysis
to identify the cross-sectional determinants of estimation errors, measured as the relative difference
between actual and estimated cash flows. AGE and SIZE are negatively related to estimation errors,
meaning that older and larger firms tend to have smaller estimation errors. Future cash flows may
be easier to predict for more mature companies, for which more information is available. The future
cash flows of younger and smaller companies tend to be overvalued compared to their ex-post
realisations. On the other hand, a firm’s leverage at the IPO is positively related to estimation
errors. This means that more indebted firms are less likely to fulfil expectations of cash flow growth
rates. The book-to-market ratio (B2M) is negatively related to estimation errors. Firms with a high
positive difference between market and book value of equity at the IPO are priced on growth
prospects that are at least partially overestimated. Finally, the coefficient of UNDERPRICING is
significantly positive, which suggest that the implied growth rate in underpriced IPOs tends to be
overestimated.
Table 6. Determinants of estimation errors
Estimation errors year IPO +3 (EE3) Estimation errors year IPO +5 (EE5) COEFFICIENT (1) (2) (3) (4) (1) (2) (3) (4)
AGE -0.062* -0.062* -0.062* -0.069** -0.033* -0.033* -0.033* -0.036* (0.032) (0.032) (0.033) (0.033) (0.019) (0.019) (0.020) (0.020)
SIZE -0.696* -0.696* -0.757** -0.698* -0.417* -0.417* -0.433* -0.410* (0.378) (0.378) (0.381) (0.377) (0.226) (0.226) (0.229) (0.225)
LEVERAGE 0.206*** 0.206*** 0.202*** 0.202*** 0.128*** 0.128*** 0.126*** 0.128*** (0.031) (0.031) (0.032) (0.031) (0.018) (0.018) (0.019) (0.019)
B2M -0.317*** -0.317*** -0.324*** -0.318*** -0.189*** -0.189*** -0.191*** -0.188*** (0.028) (0.028) (0.029) (0.028) (0.017) (0.017) (0.017) (0.017)
UNDERPRICING 0.995*** 0.996*** 1.014*** 0.974*** 0.565*** 0.565*** 0.568*** 0.553*** (0.138) (0.138) (0.140) (0.138) (0.082) (0.083) (0.084) (0.082)
P/E -0.001 -0.007 (0.001) (0.074)
D_VC -1.728 -0.117 (2.193) (1.318)
DILUITION 0.279 0.527 (2.674) (1.606)
PARTICIPATION 1.096 4.467 (0.785) (4.715)
SECTOR ER 0.723 0.398 (0.578) (0.345)
MOMENTUM -1.641* -0.922 (0.939) (0.561)
D_BUBBLE -2.943 -0.564 (2.761) (1.650)
Intercept 6.925*** 6.964*** 5.927*** 10.250*** 3.228*** 3.231*** 2.574** 4.369*** (1.294) (1.295) (1.845) (2.742) (0.774) (0.777) (1.108) (1.638)
Adj R2 (%) 46.21 46.15 46.02 46.50 45.82 45.51 45.18 46.23 F-Value 27.20*** 23.40*** 18.34*** 18.67*** 26.79*** 22.84*** 17.76*** 18.48*** V.I.F. (average) 2.264 2.08 1.904 2.077 2.264 2.08 1.904 2.077
This table contains the results of OLS regressions on our European sample of 184 IPOs using White’s heteroscedasticity-consistent standard errors.
21
8. Conclusions
IPOs can be valued using a variety of methods, but a DCF calculation is usually involved.
According to official IPO prospectuses, the vast majority of firms going public in continental
Europe are priced using (also) the DCF method. In this paper, we study these IPOs and reverse-
engineer the model to infer the growth rates implied by offer prices.
As pointed out by Loughran and Ritter (1995), the extraordinary growth rates of some recent
IPOs can justify such excessive valuation levels as long as most investors believe they have
identified the next Microsoft. However, investors seem to be systematically overoptimistic in their
assessments. As a consequence, nearly all IPOs are valued too highly. The expected growth rates
implicit in IPOs prices are so high that it would be difficult for most IPO firms to meet them. We
propose a methodology to infer the growth expectations implicit in the IPO prices. The peculiarity
of our approach is that it uses only readily available public information, not requiring access to
private information or sell-side analysts’ forecasts.
Applying the procedure to a sample of IPOs in three European countries (France, Italy, and
Germany), we estimate the cash flow growth implied by offer prices and examine the bias of
implied growth in comparison to the realized. We find that IPO firms are typically priced on the
basis of high growth expectations. The cash flow of the “average” IPO firm is expected to grow by
a factor of about one-third annually over five years. These ex-ante implied growth rates are not
sustained by ex-post realisations: the actual CAGR of cash flows are much lower than expected. We
also compare IPO prices with “fair value” estimates obtained by using actual ex-post cash flows in
our reverse-DCF model, and find that the median IPO firm is overvalued at the offering by 74%.
Estimation errors (i.e., the difference between implied and realized growth) increase with
IPO firms’ leverage, pre-IPO earnings, and underpricing, while decrease with age, size, and book-
to-market ratios. Further tests find that post-IPO returns are lower for issues whose implied growth
is more upward biased. Investors could therefore profiting from ex ante identifying biases.
We expect this research to be of interest to both financial academics and practitioners. From
an academic perspective, this paper contributes to the literature on IPO pricing by proposing a
reverse-engineered DCF model to estimate the expected growth rates implied by offered prices. By
investigating this information, researchers can understand how underwriters arrive at valuations for
the firms they take public. From the perspective of investors, this study improves our understanding
of the helpfulness and limitations of underwriters’ estimates, and more generally, of the
determinants of IPO valuations. Part of the appeal of the study is indeed its immediate applicability
to investment decision on the base of publicly available information.

22
References
Baginski, S. and J. Wahlen, 2003, “Residual Income Risk, Intrinsic Values and Share Prices”, Accounting Review, 78, 327-351.
Barber, B. and T., Odean, 2008, “All that glitters: the effect of attention on the buying behaviour of individual and institutional investors”, Review of Financial Studies, 21, 785-818.
Berkman, H., M.E. Bradbury and J. Ferguson, 2000, “The Accuracy of Price-Earnings and Discounted Cash Flow Methods of IPO Equity Valuation”, Journal of International Financial Management and Accounting, 11, 71-83.
Bonardo, D., Paleari, S., Vismara, S., 2007. The non-linear relationship between managerial ownership and firm performance. Corporate Ownership and Control, 4 (4), pag. 18-29.
Bonardo D., Paleari S., Vismara S., 2010. The M&A dynamics of European Science Based Entrepreneurial Firms. Journal of Technology Transfer, 35 (1), pag. 141 - 180.
Bonardo D., Paleari S., Vismara, S., 2010. When academia comes to market: Does university affiliation reduce the uncertainty of IPOs?. International Journal of Entrepreneurship and Innovation, forthcoming.
Bonardo, D., Paleari, S., Vismara, S., 2010. Valuing university-based firms: the effects of academic affiliation on IPO performance. Entrepreneurship Theory and Practice, forthcoming.
Brav, A. and P.A. Gompers, 1997, “Myth or Reality? The Long-Run Underperformance of Initial Public Offerings: Evidence from Venture and Nonventure Capital-Backed Companies, Journal of Finance, 52, 1791-1821.
Carhart, M.M., 1997, “On Persistence in Mutual Fund Performance”, Journal of Finance, 52, 57-82. Cassia, L., S. Paleari and S. Vismara, 2004, “The Valuation of Firms Listed on the Nuovo Mercato:
The Peer Comparables Approach”, Advances in Financial Economics, 10, 113-129. Cassia, L. and S. Vismara, 2009, “Valuation accuracy and infinity horizon forecast: Empirical
evidence from Europe”, Journal of International Financial Management and Accounting, 20 (2), forthcoming.
Chemmanur, T. and G. Hu, 2007, “Institutional Trading, Allocation Sales, and Private Information in Ipos”, Western Finance Association 2007 Meetings Paper.
Chemmanur, T., S. He and G. Hu, 2009, “The role of institutional investors in seasoned equity offerings”, Journal of Financial Economics, 94, 384-411.
Claus, J. and J. Thomas. 2001, “Equity risk premium as low as three percent? Evidence from analysts’ earnings forecasts for domestic and international stocks”, Journal of Finance, 56, 1629-1666.
Courteau, L., J. Kao J., G. Richardson G., 2001, “Equity valuation employing the ideal versus ad hoc terminal value expressions”, Contemporary Accounting Research, 18, 625–61.
Damodaran, A., 2006, “Damodaran on Valuation”, John Wiley and Sons, New York Daske, H., 2006, “Economic benefits of adopting IFRS or US-GAAP – Have the expected costs of
equity capital really decreased?”, Journal of Business, Finance, and Accounting, 33, 329-373.
Dechow, P.M., A. Hutton, and R.G. Sloan, 2000, “The relation between analysts’ forecasts of long-term earnings growth and stock price performance following equity offerings”. Contemporary Accounting Research 17 (1), 1–32.
Dechow, P.M. and R.G. Sloan, 1997, “Returns to contrarian investment: Tests of the naïve expectations hypotheses”, Journal of Financial Economics, 43, 3-28.
Deloof M., W., De Maeseneire and K. Inghelbrecht, 2009, “How do investment banks value IPOs?”, Journal of Business Finance and Accounting, forthcoming.
Derrien, F., 2007, “Currying Favor to Win IPO Mandates”, Working paper, AFA Conference (Chicago).
Dhaliwal, D., L. Krull, O. Li and W. Moser, 2005, “Dividend taxes and implied cost of capital”, Journal of Accounting Research, 43, 675-715.

23
Easton, P., 2004. “PE rations, PEG rations, and estimating the implied expected rate of return on equity capital”, Accounting Review, 79, 73-95.
Easton, P., 2006, “Use of forecasts of earnings to estimate and compare cost of capital across regimes”, Journal of Business, Finance, and Accounting, 33, 374-394.
Easton, P., G. Taylor, P. Shroff and T. Sougiannis, 2002, “Using forecasts of earnings to simultaneously estimate growth and the rate of return on equity investments, Journal of Accounting Research, 40, 657-676.
Easton, P. and G. Sommers, 2007, “Effect of analysts’ optimism on estimates of the expected rate of return implied by earnings forecasts”, Journal of Accounting Research, 45 (5), 983-1015.
Eckbo, B., and Ø. Norli, 2005, “Liquidity risk, leverage and long-run IPO returns”, Journal of Corporate Finance, 11, 1-35.
Fama, E. and K. French, 1993, “Common Risk Factors in the Returns on Stocks and Bonds”, Journal of Financial Economics, 53, 427-465.
Feltham, G.A. and J. A. Ohlson, 1995, “Valuation and clean surplus accounting for operating and financial activities”, Contemporary Accounting Research, 11, 689-731.
Field, L.C. and Lowry, M., 2009, “Institutional versus Individual Investment in IPOs: The Importance of Firm Fundamentals”, Journal of Financial and Quantitative Analysis, 44, 489-516.
Francis, J., P. Olsson, D. Oswald, 2000, “Comparing the Accuracy and Explainability of Dividend, Free Cash Flow, and Abnormal Earnings Equity Value Estimates”, Journal of Accounting Research, 38, 1, 45-70.
Francis, J., R. LaFond, P. Olsson, K. Schipper, 2004, “Costs of equity and earnings attributes”, Accounting Review, 79, 967-1011.
Francis, J., I. Khurana and R. Periera, 2005, “Disclosure incentives and effects on cost of capital around the world”, Accounting Review, 80, 1125-1163.
Friedlan, J., 1994, “Accounting choices by issuers of initial public offerings”, Contemporary Accounting Research, 11, 1-32.
Gebhardt, W.R., C.M.C. Lee and B. Swaminathan, 2001, “Toward an implied cost of capital”, Journal of Accounting Research, 39, 135-176.
Gode, D. and P. Mohanram, 2003, “Inferring the cost of capital using the Ohlson-Juettner model”, Review of Accounting Studies, 8, 399-431.
Hail, L. and C. Leuz, 2006, “International differences in the cost of equity capital: Do legal institutions and securities regulation matter?”, Journal of Accounting Research, 44, 437-483.
Hanley, K., 1993, “The Underpricing of Initial Public Offerings and the Partial Adjustment Phenomenon,” Journal of Financial Economics, 34, 231-250.
Hege, U., F. Palomino and A. Schwienbacher, 2006, “Venture Capital Performance: The Disparity between Europe and the United States”, Working Paper, HEC Paris.
Hribar, P. and N. Jenkins, 2004, “The effect of accounting restatements on earnings revisions and the estimated cost of capital”, Review of Accounting Studies, 9, 337-356.
Jagannathan, R. and Y.R. Gao, 2005, “Are IPOs underpriced? A closer examination”, Working paper, EFMA Conference (Milan).
Jenkinson, T. and H. Jones, 2004, “Bids and Allocation in European IPO Bookbuilding”, Journal of Finance, 59 (5), 2309-2338.
Jenkinson, T., A. Morrison and W. Wilhelm, 2006, “Why are European IPOs so Rarely Prices Outside the Indicative Price Range?”, Journal of Financial Economics, 80, 185-209.
Kerins, F., K. Kutsuna and R. Smith, 2007, “Why Are IPOs Underpriced? Evidence from Japan’s Hybrid Auction-Method Offerings”, Journal of Financial Economics, 85, 637-666.
Kim, M., and Ritter, J. R., 1999, “Valuing IPOs”, Journal of Financial Economics, 53, 409–437. Kraus, T. and H.P. Burghof, 2003, “Post-IPO Performance and the Exit of Venture Capitalists”,
Working Paper, Universität München.

24
Krigman, L., W. Shaw and K. Womack, 1999, “The Persistence of IPO Mispricing and the Predictive Power of Flipping”, The Journal of Finance, 54(3), 1015-1044.
Leland H. and D. Pyle, 1977, “Informational Asymmetries, Financial Structure, and Financial Intermediation”, The Journal of Finance, 32(2), 371-387.
Loughran, T. and J.R. Ritter, 1995, “The new issue puzzle”, Journal of Finance, 50, 23-51. Loughran, T. and J.R. Ritter, 2002, “Why Don’t Issuers Get Upset About Leaving Money on the
Table in IPOs?” Review of Financial Studies, 15, 413-443. Mauboussin, M. and P. Johnson, 1997, “Competitive Advantage Period: The Neglected Value
Driver”, Financial Management, 26, 67-74. Megginson, W.L. and K.A. Weiss, 1991, “Venture Capitalist Certification in Initial Public
Offerings, Journal of Finance, 46, 879-903. Ohlson, J.A., 1995, “Earnings, Book Values, and Dividends in Equity Valuations”, Contemporary
Accounting Research, 11, 661–687. Ohlson, J.A., 2009, “Accounting Data and Value: The Basic Results”, Contemporary Accounting
Review, 26, 231-259. Ohlson, J.A. and Z. Gao, 2006, “Earnings, earnings growth, and value”. Boston: Now Publishers. Ohlson, J.A., and B. Juettner-Nauroth, 2005, “Expected EPS and EPS growth as determinants of
value”, Review of Accounting Studies, 10, 349–65. Paleari, S., Pellizzoni, E., Vismara, S. 2008. The going public decision: Evidence from the IPOs in
Italy and in the UK. International Journal of Applied Decision Sciences, 1, 131-152. Paleari, S., Ritter, J.R., Vismara, S., 2010. Explaining the Simultaneous Consolidation and.
Fragmentation of Europe's Stock Markets. Working paper, University of Florida. Paleari S., Vismara S., 2007, Over-optimism when pricing IPOs, Managerial Finance, 33 (6), pag.
352-367. Penman, S.H., 2007, Financial Statement Analysis and Security Valuation (3rd ed.), McGraw-Hill,
New York. Purnanandam, A. and B. Swaminathan, 2004, “Are IPOs Really Underpricied?” Review of
Financial Studies, 17, 811-848. Rindermann, G., 2004, “The Performance of Venture-Backed IPOs on Europe's New Stock
Markets: Evidence from France, Germany and the UK”, Advances in Financial Economics, 10, 231-294.
Ritter, J.R. and R.S. Warr, 2002, “The Decline of Inflation and the Bull Market of 1982-1999”, Journal of Financial and Quantitative Analysis, 37, 29-61.
Roosenboom, P.G.J., 2007 “How do underwriters value IPOs? An empirical analysis of the French IPO market”, Contemporary Accounting Research, 24 (4), 1217-1243.
Stein, J., 1989, “Efficient capital markets, inefficient firms: a model of myopic corporate behaviour”, Quarterly Journal of Economics, 104, 655–669.
Teoh, S.H., I. Welch and T.J. Wong, 1998, “Earnings management and the long-run market performance of initial public offerings”, Journal of Finance, 53, 1935-1974.
Thomas, J.K., 2007 “Discussion of How do underwriters value IPOs? An empirical analysis of the French IPO market”, Contemporary Accounting Research, 24 (4), 1245-1254.
25
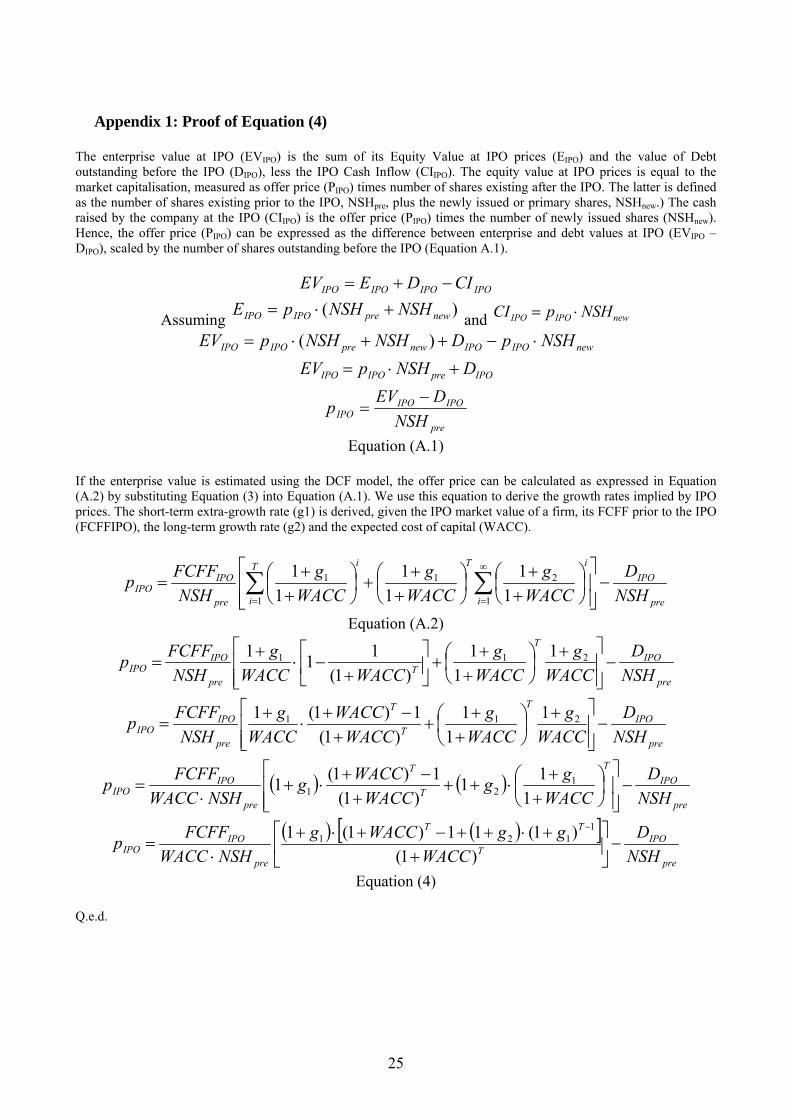
Appendix 1: Proof of Equation (4)
The enterprise value at IPO (EVIPO) is the sum of its Equity Value at IPO prices (EIPO) and the value of Debt outstanding before the IPO (DIPO), less the IPO Cash Inflow (CIIPO). The equity value at IPO prices is equal to the market capitalisation, measured as offer price (PIPO) times number of shares existing after the IPO. The latter is defined as the number of shares existing prior to the IPO, NSHpre, plus the newly issued or primary shares, NSHnew.) The cash raised by the company at the IPO (CIIPO) is the offer price (PIPO) times the number of newly issued shares (NSHnew). Hence, the offer price (PIPO) can be expressed as the difference between enterprise and debt values at IPO (EVIPO – DIPO), scaled by the number of shares outstanding before the IPO (Equation A.1).
IPOIPOIPOIPO CIDEEV −+=
Assuming )( newpreIPOIPO NSHNSHpE +⋅= and newIPOIPO NSHpCI ⋅= newIPOIPOnewpreIPOIPO NSHpDNSHNSHpEV ⋅−++⋅= )(
IPOpreIPOIPO DNSHpEV +⋅=
pre
IPOIPOIPO NSH
DEVp −=
Equation (A.1)
If the enterprise value is estimated using the DCF model, the offer price can be calculated as expressed in Equation (A.2) by substituting Equation (3) into Equation (A.1). We use this equation to derive the growth rates implied by IPO prices. The short-term extra-growth rate (g1) is derived, given the IPO market value of a firm, its FCFF prior to the IPO (FCFFIPO), the long-term growth rate (g2) and the expected cost of capital (WACC).
pre
IPO
i
iTT
i
i
pre
IPOIPO NSH
DWACC
gWACC
gWACC
gNSH
FCFFp −⎥⎥⎦
⎤
⎢⎢⎣
⎡⎟⎠⎞
⎜⎝⎛++
⎟⎠⎞
⎜⎝⎛++
+⎟⎠⎞
⎜⎝⎛++
= ∑∑∞
== 1
21
1
1
11
11
11
Equation (A.2)
pre
IPOT
Tpre
IPOIPO NSH
DWACC
gWACC
gWACCWACC
gNSH
FCFFp −⎥⎥⎦
⎤
⎢⎢⎣
⎡ +⎟⎠⎞
⎜⎝⎛++
+⎥⎦
⎤⎢⎣
⎡+
−⋅+
= 211 11
1)1(
111
pre
IPOT
T
T
pre
IPOIPO NSH
DWACC
gWACC
gWACC
WACCWACC
gNSH
FCFFp −⎥⎥⎦
⎤
⎢⎢⎣
⎡ +⎟⎠⎞
⎜⎝⎛++
++
−+⋅
+= 211 1
11
)1(1)1(1
( ) ( )pre
IPOT
T
T
pre
IPOIPO NSH
DWACC
ggWACC
WACCgNSHWACC
FCFFp −⎥⎥⎦
⎤
⎢⎢⎣
⎡⎟⎠⎞
⎜⎝⎛++
⋅+++
−+⋅+
⋅=
111
)1(1)1(1 1
21
( ) ( )[ ]
pre
IPOT
TT
pre
IPOIPO NSH
DWACC
ggWACCgNSHWACC
FCFFp −⎥⎦
⎤⎢⎣
⎡+
+⋅++−+⋅+⋅
=−
)1()1(11)1(1 1
121
Equation (4)
Q.e.d.
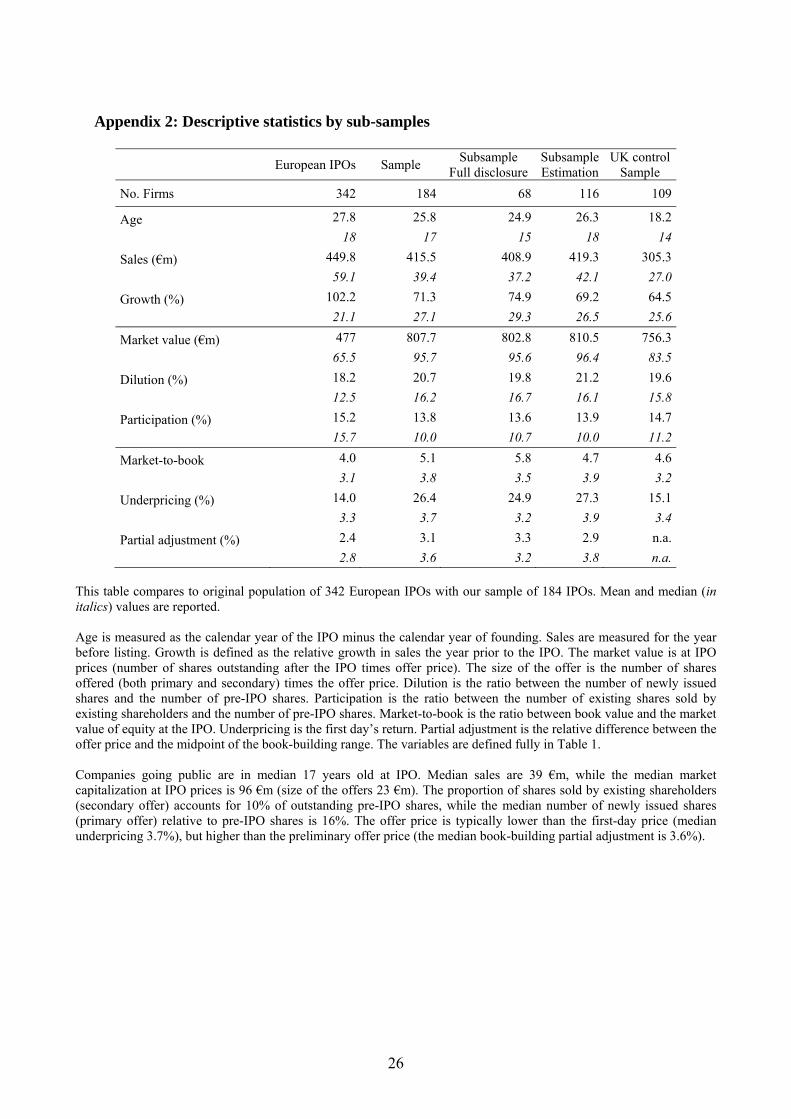
26
Appendix 2: Descriptive statistics by sub-samples
European IPOs Sample Subsample
Full disclosure Subsample Estimation
UK control Sample
No. Firms 342 184 68 116 109
Age 27.8 25.8 24.9 26.3 18.2
18 17 15 18 14
Sales (€m) 449.8 415.5 408.9 419.3 305.3
59.1 39.4 37.2 42.1 27.0
Growth (%) 102.2 71.3 74.9 69.2 64.5
21.1 27.1 29.3 26.5 25.6
Market value (€m) 477 807.7 802.8 810.5 756.3
65.5 95.7 95.6 96.4 83.5
Dilution (%) 18.2 20.7 19.8 21.2 19.6
12.5 16.2 16.7 16.1 15.8
Participation (%) 15.2 13.8 13.6 13.9 14.7
15.7 10.0 10.7 10.0 11.2
Market-to-book 4.0 5.1 5.8 4.7 4.6
3.1 3.8 3.5 3.9 3.2
Underpricing (%) 14.0 26.4 24.9 27.3 15.1
3.3 3.7 3.2 3.9 3.4
Partial adjustment (%) 2.4 3.1 3.3 2.9 n.a.
2.8 3.6 3.2 3.8 n.a. This table compares to original population of 342 European IPOs with our sample of 184 IPOs. Mean and median (in italics) values are reported. Age is measured as the calendar year of the IPO minus the calendar year of founding. Sales are measured for the year before listing. Growth is defined as the relative growth in sales the year prior to the IPO. The market value is at IPO prices (number of shares outstanding after the IPO times offer price). The size of the offer is the number of shares offered (both primary and secondary) times the offer price. Dilution is the ratio between the number of newly issued shares and the number of pre-IPO shares. Participation is the ratio between the number of existing shares sold by existing shareholders and the number of pre-IPO shares. Market-to-book is the ratio between book value and the market value of equity at the IPO. Underpricing is the first day’s return. Partial adjustment is the relative difference between the offer price and the midpoint of the book-building range. The variables are defined fully in Table 1. Companies going public are in median 17 years old at IPO. Median sales are 39 €m, while the median market capitalization at IPO prices is 96 €m (size of the offers 23 €m). The proportion of shares sold by existing shareholders (secondary offer) accounts for 10% of outstanding pre-IPO shares, while the median number of newly issued shares (primary offer) relative to pre-IPO shares is 16%. The offer price is typically lower than the first-day price (median underpricing 3.7%), but higher than the preliminary offer price (the median book-building partial adjustment is 3.6%).
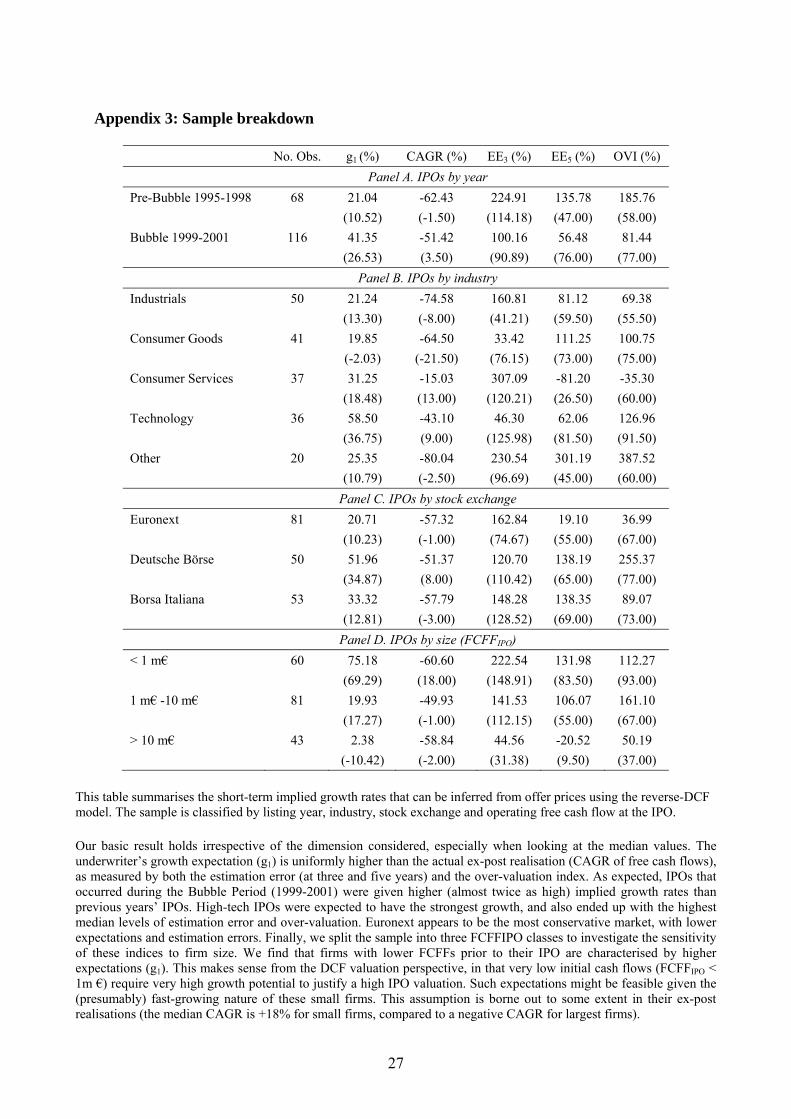
27
Appendix 3: Sample breakdown
No. Obs. g1 (%) CAGR (%) EE3 (%) EE5 (%) OVI (%)
Panel A. IPOs by year Pre-Bubble 1995-1998 68 21.04 -62.43 224.91 135.78 185.76 (10.52) (-1.50) (114.18) (47.00) (58.00) Bubble 1999-2001 116 41.35 -51.42 100.16 56.48 81.44 (26.53) (3.50) (90.89) (76.00) (77.00)
Panel B. IPOs by industry Industrials 50 21.24 -74.58 160.81 81.12 69.38 (13.30) (-8.00) (41.21) (59.50) (55.50) Consumer Goods 41 19.85 -64.50 33.42 111.25 100.75 (-2.03) (-21.50) (76.15) (73.00) (75.00) Consumer Services 37 31.25 -15.03 307.09 -81.20 -35.30 (18.48) (13.00) (120.21) (26.50) (60.00) Technology 36 58.50 -43.10 46.30 62.06 126.96 (36.75) (9.00) (125.98) (81.50) (91.50) Other 20 25.35 -80.04 230.54 301.19 387.52 (10.79) (-2.50) (96.69) (45.00) (60.00)
Panel C. IPOs by stock exchange Euronext 81 20.71 -57.32 162.84 19.10 36.99 (10.23) (-1.00) (74.67) (55.00) (67.00) Deutsche Börse 50 51.96 -51.37 120.70 138.19 255.37 (34.87) (8.00) (110.42) (65.00) (77.00) Borsa Italiana 53 33.32 -57.79 148.28 138.35 89.07 (12.81) (-3.00) (128.52) (69.00) (73.00)
Panel D. IPOs by size (FCFFIPO) < 1 m€ 60 75.18 -60.60 222.54 131.98 112.27 (69.29) (18.00) (148.91) (83.50) (93.00) 1 m€ -10 m€ 81 19.93 -49.93 141.53 106.07 161.10 (17.27) (-1.00) (112.15) (55.00) (67.00) > 10 m€ 43 2.38 -58.84 44.56 -20.52 50.19 (-10.42) (-2.00) (31.38) (9.50) (37.00)
This table summarises the short-term implied growth rates that can be inferred from offer prices using the reverse-DCF model. The sample is classified by listing year, industry, stock exchange and operating free cash flow at the IPO. Our basic result holds irrespective of the dimension considered, especially when looking at the median values. The underwriter’s growth expectation (g1) is uniformly higher than the actual ex-post realisation (CAGR of free cash flows), as measured by both the estimation error (at three and five years) and the over-valuation index. As expected, IPOs that occurred during the Bubble Period (1999-2001) were given higher (almost twice as high) implied growth rates than previous years’ IPOs. High-tech IPOs were expected to have the strongest growth, and also ended up with the highest median levels of estimation error and over-valuation. Euronext appears to be the most conservative market, with lower expectations and estimation errors. Finally, we split the sample into three FCFFIPO classes to investigate the sensitivity of these indices to firm size. We find that firms with lower FCFFs prior to their IPO are characterised by higher expectations (g1). This makes sense from the DCF valuation perspective, in that very low initial cash flows (FCFFIPO < 1m €) require very high growth potential to justify a high IPO valuation. Such expectations might be feasible given the (presumably) fast-growing nature of these small firms. This assumption is borne out to some extent in their ex-post realisations (the median CAGR is +18% for small firms, compared to a negative CAGR for largest firms).
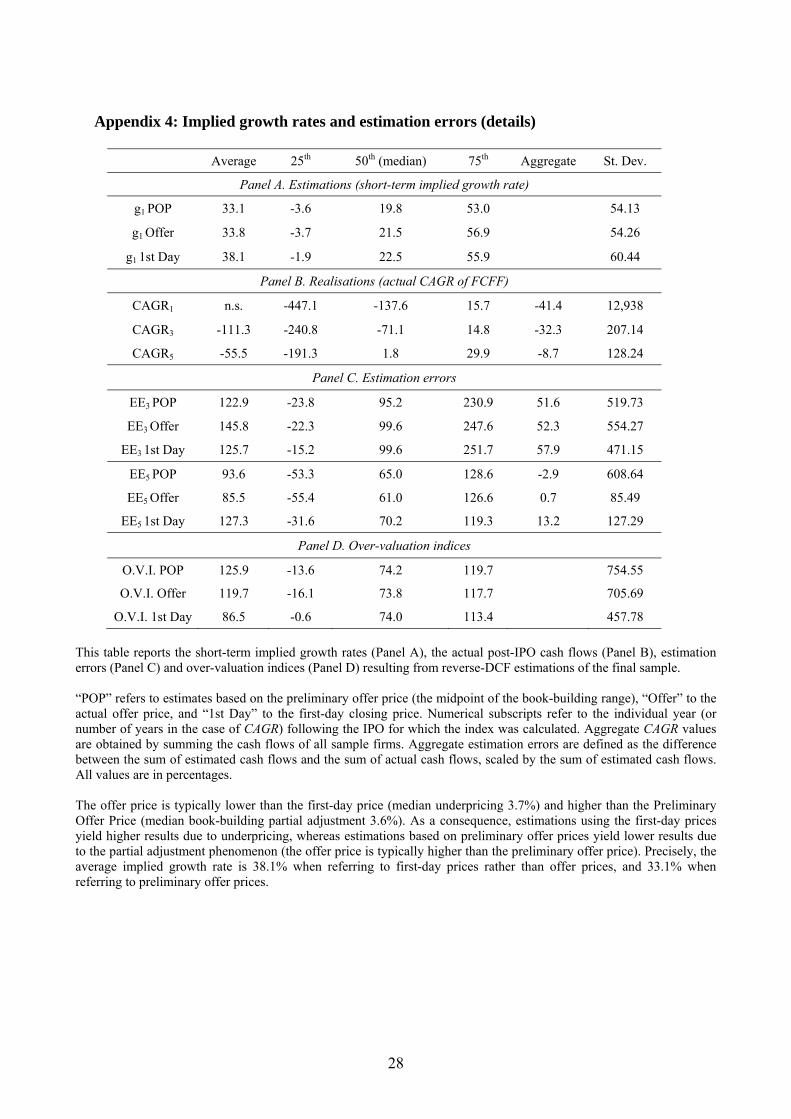
28
Appendix 4: Implied growth rates and estimation errors (details)
Average 25th 50th (median) 75th Aggregate St. Dev.
Panel A. Estimations (short-term implied growth rate)
g1 POP 33.1 -3.6 19.8 53.0 54.13
g1 Offer 33.8 -3.7 21.5 56.9 54.26
g1 1st Day 38.1 -1.9 22.5 55.9 60.44
Panel B. Realisations (actual CAGR of FCFF)
CAGR1 n.s. -447.1 -137.6 15.7 -41.4 12,938
CAGR3 -111.3 -240.8 -71.1 14.8 -32.3 207.14
CAGR5 -55.5 -191.3 1.8 29.9 -8.7 128.24
Panel C. Estimation errors
EE3 POP 122.9 -23.8 95.2 230.9 51.6 519.73
EE3 Offer 145.8 -22.3 99.6 247.6 52.3 554.27
EE3 1st Day 125.7 -15.2 99.6 251.7 57.9 471.15
EE5 POP 93.6 -53.3 65.0 128.6 -2.9 608.64
EE5 Offer 85.5 -55.4 61.0 126.6 0.7 85.49
EE5 1st Day 127.3 -31.6 70.2 119.3 13.2 127.29
Panel D. Over-valuation indices
O.V.I. POP 125.9 -13.6 74.2 119.7 754.55
O.V.I. Offer 119.7 -16.1 73.8 117.7 705.69
O.V.I. 1st Day 86.5 -0.6 74.0 113.4 457.78 This table reports the short-term implied growth rates (Panel A), the actual post-IPO cash flows (Panel B), estimation errors (Panel C) and over-valuation indices (Panel D) resulting from reverse-DCF estimations of the final sample. “POP” refers to estimates based on the preliminary offer price (the midpoint of the book-building range), “Offer” to the actual offer price, and “1st Day” to the first-day closing price. Numerical subscripts refer to the individual year (or number of years in the case of CAGR) following the IPO for which the index was calculated. Aggregate CAGR values are obtained by summing the cash flows of all sample firms. Aggregate estimation errors are defined as the difference between the sum of estimated cash flows and the sum of actual cash flows, scaled by the sum of estimated cash flows. All values are in percentages. The offer price is typically lower than the first-day price (median underpricing 3.7%) and higher than the Preliminary Offer Price (median book-building partial adjustment 3.6%). As a consequence, estimations using the first-day prices yield higher results due to underpricing, whereas estimations based on preliminary offer prices yield lower results due to the partial adjustment phenomenon (the offer price is typically higher than the preliminary offer price). Precisely, the average implied growth rate is 38.1% when referring to first-day prices rather than offer prices, and 33.1% when referring to preliminary offer prices.
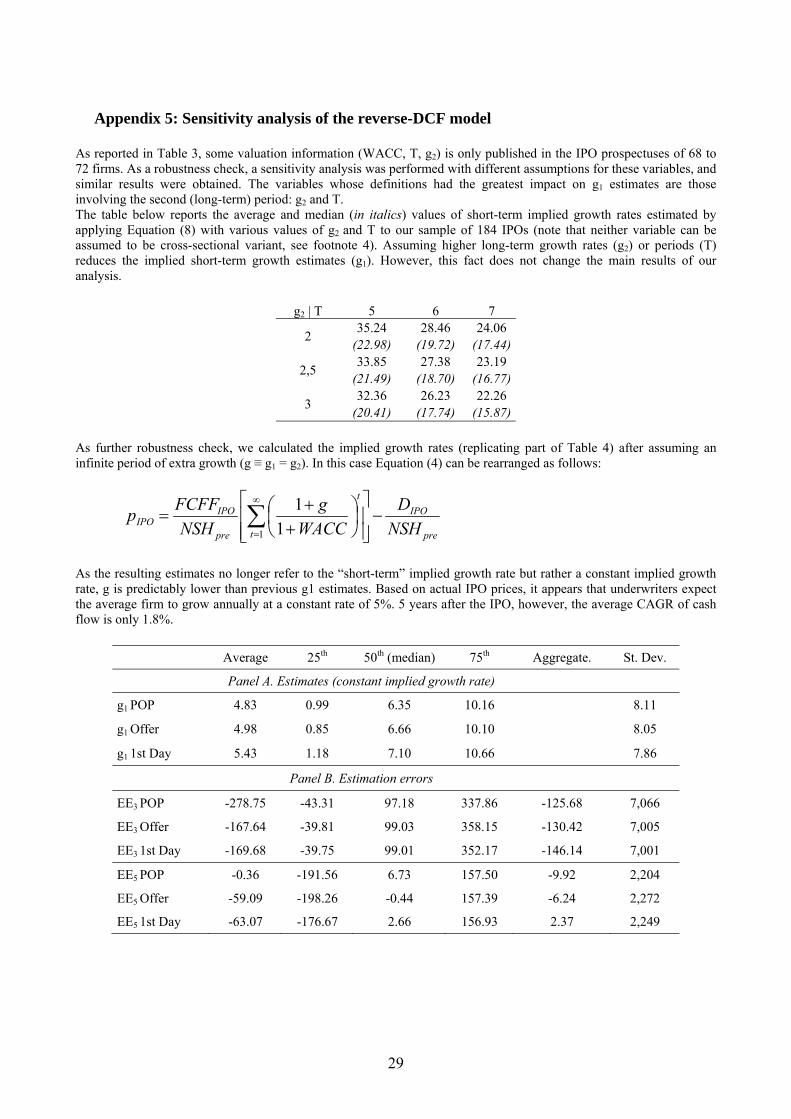
29
Appendix 5: Sensitivity analysis of the reverse-DCF model
As reported in Table 3, some valuation information (WACC, T, g2) is only published in the IPO prospectuses of 68 to 72 firms. As a robustness check, a sensitivity analysis was performed with different assumptions for these variables, and similar results were obtained. The variables whose definitions had the greatest impact on g1 estimates are those involving the second (long-term) period: g2 and T. The table below reports the average and median (in italics) values of short-term implied growth rates estimated by applying Equation (8) with various values of g2 and T to our sample of 184 IPOs (note that neither variable can be assumed to be cross-sectional variant, see footnote 4). Assuming higher long-term growth rates (g2) or periods (T) reduces the implied short-term growth estimates (g1). However, this fact does not change the main results of our analysis.
g2 | T 5 6 7
2 35.24 28.46 24.06 (22.98) (19.72) (17.44)
2,5 33.85 27.38 23.19 (21.49) (18.70) (16.77)
3 32.36 26.23 22.26 (20.41) (17.74) (15.87)
As further robustness check, we calculated the implied growth rates (replicating part of Table 4) after assuming an infinite period of extra growth (g ≡ g1 = g2). In this case Equation (4) can be rearranged as follows:
pre
IPO
t
t
pre
IPOIPO NSH
DWACC
gNSH
FCFFp −⎥⎥⎦
⎤
⎢⎢⎣
⎡⎟⎠⎞
⎜⎝⎛++
= ∑∞
=1 11
As the resulting estimates no longer refer to the “short-term” implied growth rate but rather a constant implied growth rate, g is predictably lower than previous g1 estimates. Based on actual IPO prices, it appears that underwriters expect the average firm to grow annually at a constant rate of 5%. 5 years after the IPO, however, the average CAGR of cash flow is only 1.8%.
Average 25th 50th (median) 75th Aggregate. St. Dev.
Panel A. Estimates (constant implied growth rate)
g1 POP 4.83 0.99 6.35 10.16 8.11
g1 Offer 4.98 0.85 6.66 10.10 8.05
g1 1st Day 5.43 1.18 7.10 10.66 7.86
Panel B. Estimation errors
EE3 POP -278.75 -43.31 97.18 337.86 -125.68 7,066
EE3 Offer -167.64 -39.81 99.03 358.15 -130.42 7,005
EE3 1st Day -169.68 -39.75 99.01 352.17 -146.14 7,001
EE5 POP -0.36 -191.56 6.73 157.50 -9.92 2,204
EE5 Offer -59.09 -198.26 -0.44 157.39 -6.24 2,272
EE5 1st Day -63.07 -176.67 2.66 156.93 2.37 2,249
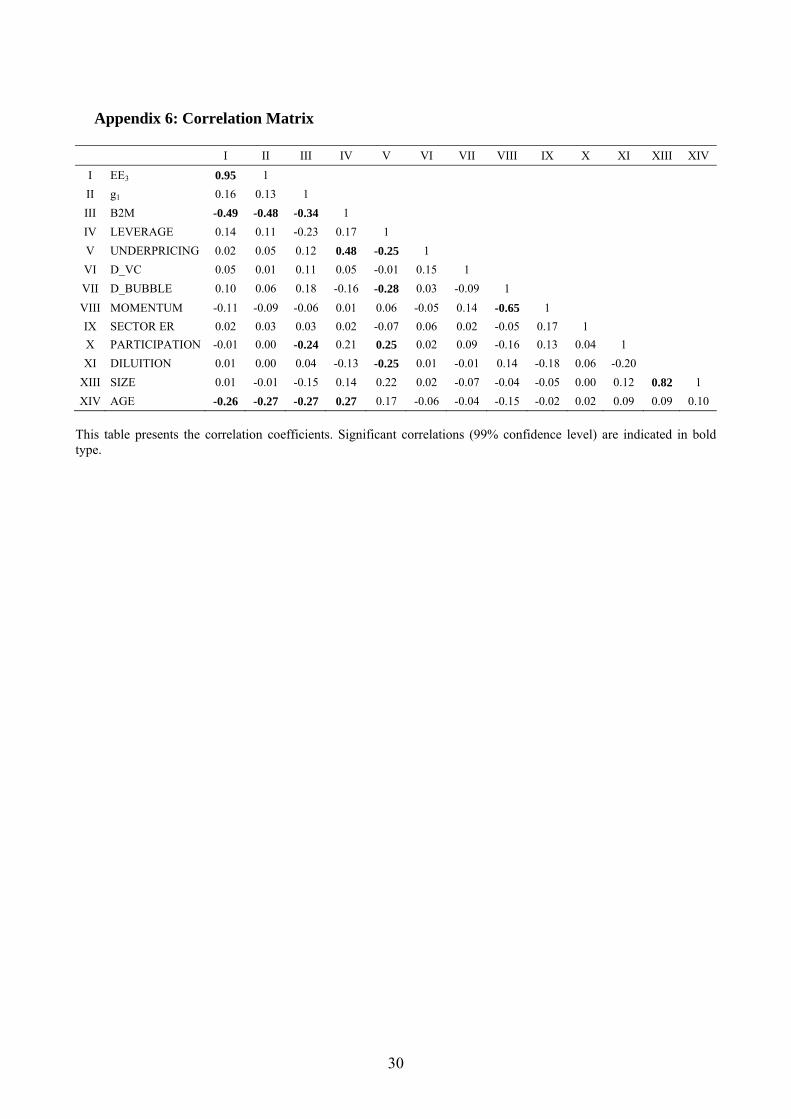
30
Appendix 6: Correlation Matrix
I II III IV V VI VII VIII IX X XI XIII XIV I EE3 0.95 1 II g1 0.16 0.13 1 III B2M -0.49 -0.48 -0.34 1 IV LEVERAGE 0.14 0.11 -0.23 0.17 1 V UNDERPRICING 0.02 0.05 0.12 0.48 -0.25 1 VI D_VC 0.05 0.01 0.11 0.05 -0.01 0.15 1 VII D_BUBBLE 0.10 0.06 0.18 -0.16 -0.28 0.03 -0.09 1 VIII MOMENTUM -0.11 -0.09 -0.06 0.01 0.06 -0.05 0.14 -0.65 1 IX SECTOR ER 0.02 0.03 0.03 0.02 -0.07 0.06 0.02 -0.05 0.17 1 X PARTICIPATION -0.01 0.00 -0.24 0.21 0.25 0.02 0.09 -0.16 0.13 0.04 1 XI DILUITION 0.01 0.00 0.04 -0.13 -0.25 0.01 -0.01 0.14 -0.18 0.06 -0.20
XIII SIZE 0.01 -0.01 -0.15 0.14 0.22 0.02 -0.07 -0.04 -0.05 0.00 0.12 0.82 1 XIV AGE -0.26 -0.27 -0.27 0.27 0.17 -0.06 -0.04 -0.15 -0.02 0.02 0.09 0.09 0.10
This table presents the correlation coefficients. Significant correlations (99% confidence level) are indicated in bold type.


