Embed Size (px)
Citation preview
A
adatwttwr©
K
1
obapmmucia
1t
i
0d
Wear 262 (2007) 505–513
Investigation of disc/pad interface temperatures in friction braking
H.S. Qi ∗, A.J. DaySchool of Engineering, Design and Technology, University of Bradford, West Yorkshire BD7 1DP, UK
Received 5 May 2005; received in revised form 18 August 2006; accepted 31 August 2006Available online 25 October 2006
bstract
Maintaining appropriate levels of friction interface temperature is important for the overall operating effectiveness of modern friction brakes,nd implicitly the safety of the vehicle. Measurement and prediction of the distribution and magnitude of brake friction interface temperatures areifficult. A thermocouple method with an exposed hot junction configuration was used for interface temperature measurement, and the magnitudend distribution of the friction interface temperature were investigated in this study. Using a designed experiment approach, the factors affectinghe interface temperature, including the number of braking applications, sliding speed, braking load and type of friction material were studied. Itas found that the number of braking applications had the strongest effect on the friction interface temperature. The real contact area between
he disc and pad, i.e. pad regions where the bulk of the kinetic energy is dissipated via friction, had a significant effect on the braking interface
emperature. For understanding the effect of real contact area on local interface temperatures and friction coefficient, finite element analysis (FEA)as conducted, and it was found that the maximum temperature at the friction interface does not increase linearly with decreasing contact areaatio. This finding is potentially significant in optimising the design and formulation of friction materials for stable friction and wear performance.2006 Elsevier B.V. All rights reserved.
ment;
dtecmmpefafnmdMc
eywords: Friction; Interface; Contact; Temperature; Measurement; Finite Ele
. Introduction
Friction brakes are required to transform large amountsf kinetic energy into heat energy at the contact surfacesetween a brake rotor and stator. The temperature distributiont the friction interface generated in the process is a com-lex phenomenon, which directly affects the braking perfor-ance and has been investigated by many researchers overany years [1–5]. The aim of the work presented here is to
nderstand disc/pad interface temperature and friction in vehi-le braking by means of an exposed thermocouple technique fornterface temperature measurements and FE thermal modelingpproach.
.1. The technique of exposed thermocouple interface
emperature measurementIt would be desirable to measure interface temperatures dur-ng actual friction braking tests so that the precise operating con-
∗ Corresponding author. Tel.: +44 1274235451; fax: +44 1274234525.E-mail address: [email protected] (H.S. Qi).
mteeb[i
043-1648/$ – see front matter © 2006 Elsevier B.V. All rights reserved.oi:10.1016/j.wear.2006.08.027
Thermal; Brake
itions were known for design purposes. However, measuringhe interface temperature of a friction pair is a difficult task. Sev-ral methods have been reported [5–8], and these methods can beategorized into non-contact measurement, which includes theethods such as optical and infrared measurement, and contacteasurement, which includes the methods such as thermocou-
le and temperature sensitive material coating (or paint). Thexposed thermocouple technique for measuring grinding inter-ace temperature was developed by Qi [9] and was reported asn effective method for measuring interface temperature of ariction pair. The difference of the exposed thermocouple tech-ique in comparison with conventional embedded thermocoupleethod is that the hot junction of the thermocouple is located
irectly at the friction interface. The validation work by Xu andalkin [10] shows that the exposed thermocouple technique
an measure temperature as accurate as other common acceptedethods, and confirms that directly contact of the hot junction
ip of thermocouple to the interface of a friction pair has littleffect on the quality of the temperature signal produced. The
xposed thermocouple technique was adopted in measuring therake disc/pad interface temperature in authors’ previous work11]. In this study, the technique of the exposed thermocouplenterface temperature measurement is used in the investigation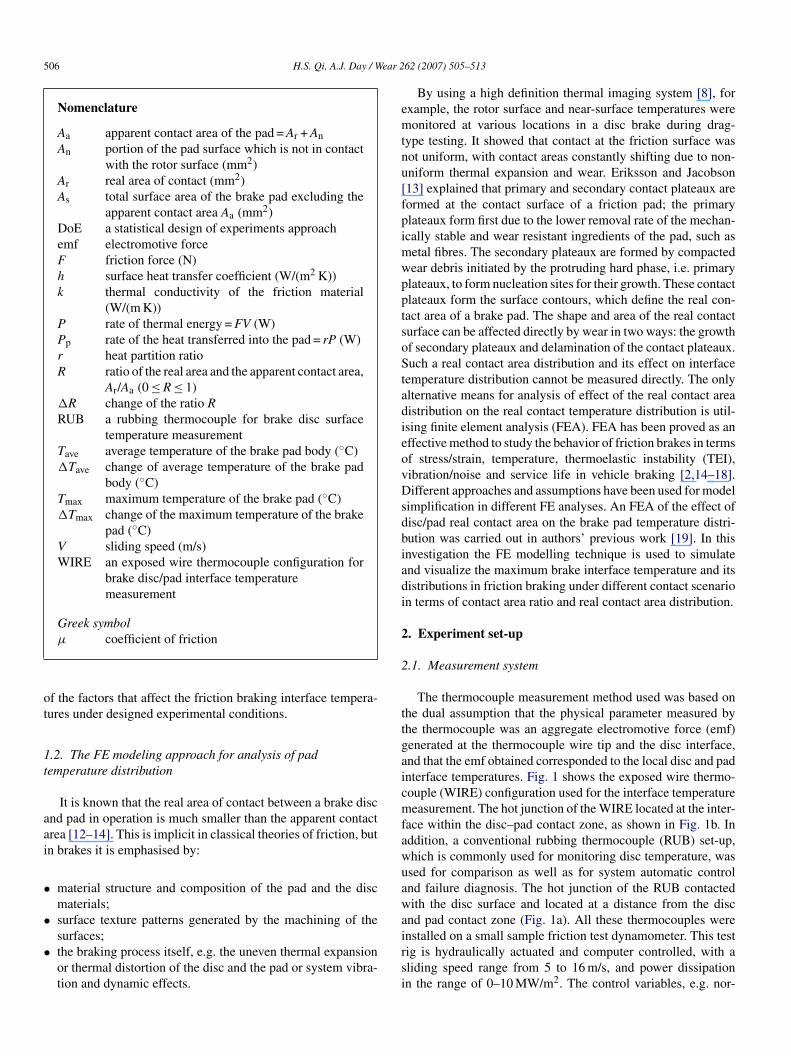
506 H.S. Qi, A.J. Day / Wear 2
Nomenclature
Aa apparent contact area of the pad = Ar + AnAn portion of the pad surface which is not in contact
with the rotor surface (mm2)Ar real area of contact (mm2)As total surface area of the brake pad excluding the
apparent contact area Aa (mm2)DoE a statistical design of experiments approachemf electromotive forceF friction force (N)h surface heat transfer coefficient (W/(m2 K))k thermal conductivity of the friction material
(W/(m K))P rate of thermal energy = FV (W)Pp rate of the heat transferred into the pad = rP (W)r heat partition ratioR ratio of the real area and the apparent contact area,
Ar/Aa (0 ≤ R ≤ 1)�R change of the ratio RRUB a rubbing thermocouple for brake disc surface
temperature measurementTave average temperature of the brake pad body (◦C)�Tave change of average temperature of the brake pad
body (◦C)Tmax maximum temperature of the brake pad (◦C)�Tmax change of the maximum temperature of the brake
pad (◦C)V sliding speed (m/s)WIRE an exposed wire thermocouple configuration for
brake disc/pad interface temperaturemeasurement
Greek symbol
ot
1t
aai
•
•
•
emtnu[fpimwpptsoStadieovDsdbiadi
2
2
ttgaicmfawuaw
μ coefficient of friction
f the factors that affect the friction braking interface tempera-ures under designed experimental conditions.
.2. The FE modeling approach for analysis of pademperature distribution
It is known that the real area of contact between a brake discnd pad in operation is much smaller than the apparent contactrea [12–14]. This is implicit in classical theories of friction, butn brakes it is emphasised by:
material structure and composition of the pad and the discmaterials;
surface texture patterns generated by the machining of thesurfaces;the braking process itself, e.g. the uneven thermal expansionor thermal distortion of the disc and the pad or system vibra-tion and dynamic effects.airsi
62 (2007) 505–513
By using a high definition thermal imaging system [8], forxample, the rotor surface and near-surface temperatures wereonitored at various locations in a disc brake during drag-
ype testing. It showed that contact at the friction surface wasot uniform, with contact areas constantly shifting due to non-niform thermal expansion and wear. Eriksson and Jacobson13] explained that primary and secondary contact plateaux areormed at the contact surface of a friction pad; the primarylateaux form first due to the lower removal rate of the mechan-cally stable and wear resistant ingredients of the pad, such as
etal fibres. The secondary plateaux are formed by compactedear debris initiated by the protruding hard phase, i.e. primarylateaux, to form nucleation sites for their growth. These contactlateaux form the surface contours, which define the real con-act area of a brake pad. The shape and area of the real contacturface can be affected directly by wear in two ways: the growthf secondary plateaux and delamination of the contact plateaux.uch a real contact area distribution and its effect on interface
emperature distribution cannot be measured directly. The onlylternative means for analysis of effect of the real contact areaistribution on the real contact temperature distribution is util-sing finite element analysis (FEA). FEA has been proved as anffective method to study the behavior of friction brakes in termsf stress/strain, temperature, thermoelastic instability (TEI),ibration/noise and service life in vehicle braking [2,14–18].ifferent approaches and assumptions have been used for model
implification in different FE analyses. An FEA of the effect ofisc/pad real contact area on the brake pad temperature distri-ution was carried out in authors’ previous work [19]. In thisnvestigation the FE modelling technique is used to simulatend visualize the maximum brake interface temperature and itsistributions in friction braking under different contact scenarion terms of contact area ratio and real contact area distribution.
. Experiment set-up
.1. Measurement system
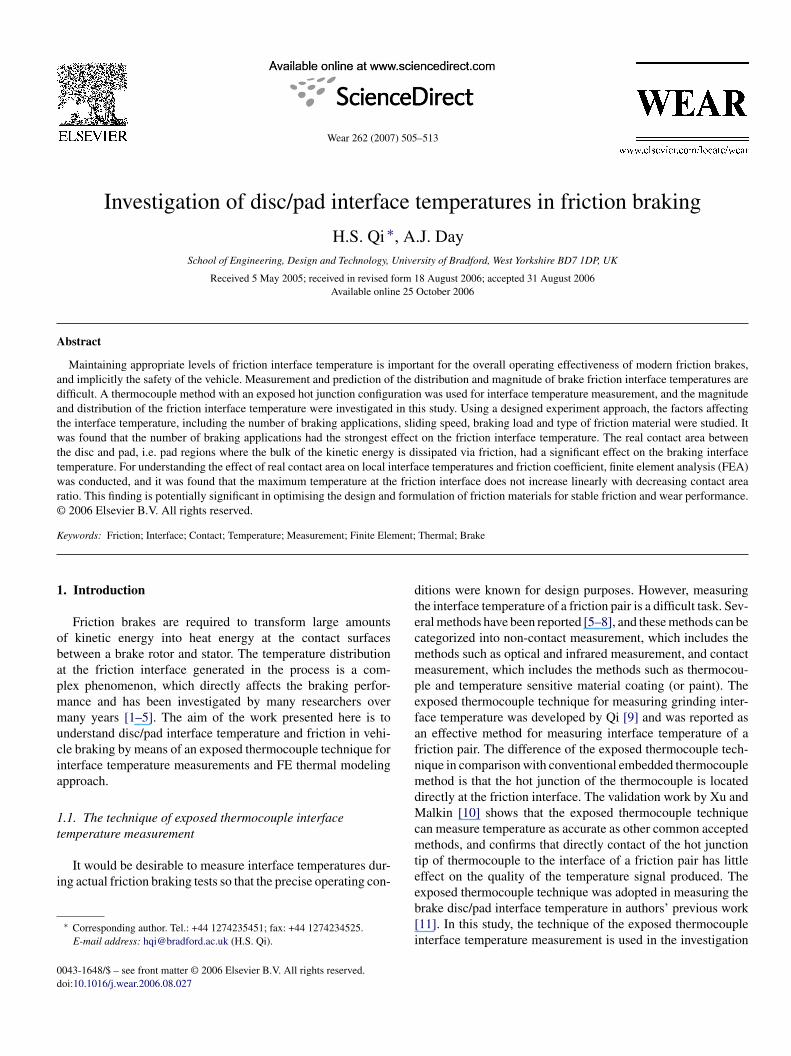
The thermocouple measurement method used was based onhe dual assumption that the physical parameter measured byhe thermocouple was an aggregate electromotive force (emf)enerated at the thermocouple wire tip and the disc interface,nd that the emf obtained corresponded to the local disc and padnterface temperatures. Fig. 1 shows the exposed wire thermo-ouple (WIRE) configuration used for the interface temperatureeasurement. The hot junction of the WIRE located at the inter-
ace within the disc–pad contact zone, as shown in Fig. 1b. Inddition, a conventional rubbing thermocouple (RUB) set-up,hich is commonly used for monitoring disc temperature, wassed for comparison as well as for system automatic controlnd failure diagnosis. The hot junction of the RUB contactedith the disc surface and located at a distance from the disc
nd pad contact zone (Fig. 1a). All these thermocouples were
nstalled on a small sample friction test dynamometer. This testig is hydraulically actuated and computer controlled, with aliding speed range from 5 to 16 m/s, and power dissipationn the range of 0–10 MW/m2. The control variables, e.g. nor-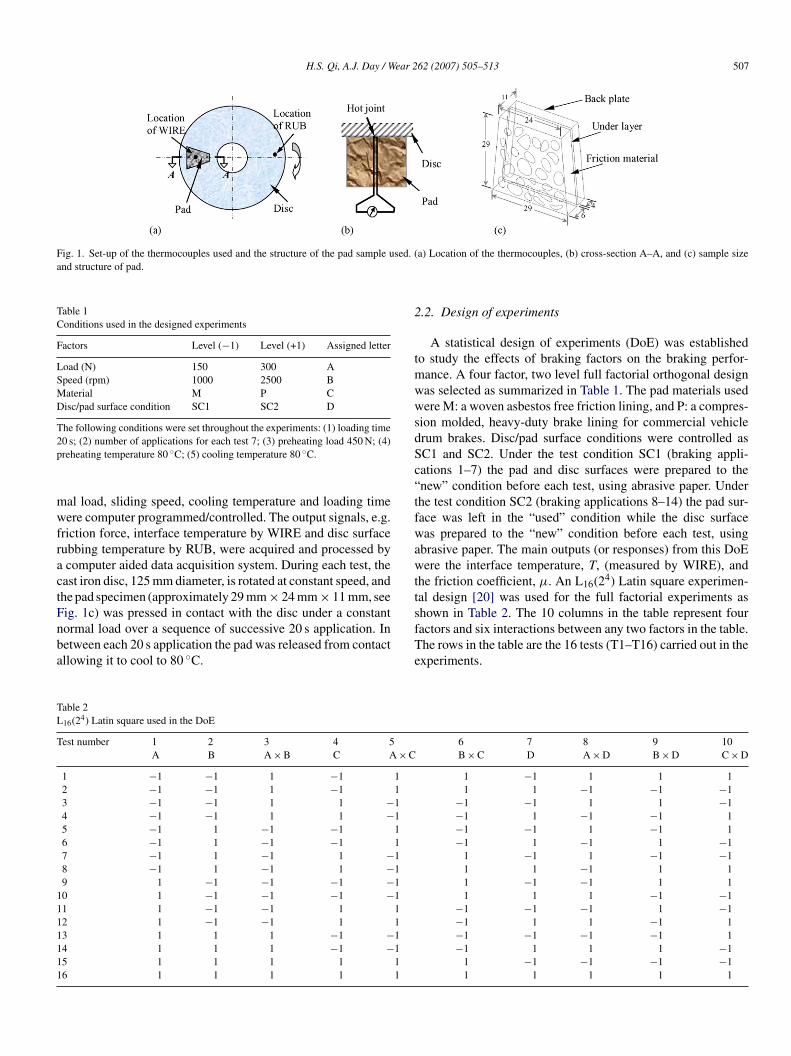
H.S. Qi, A.J. Day / Wear 262 (2007) 505–513 507
Fig. 1. Set-up of the thermocouples used and the structure of the pad sample used. (and structure of pad.
Table 1Conditions used in the designed experiments
Factors Level (−1) Level (+1) Assigned letter
Load (N) 150 300 ASpeed (rpm) 1000 2500 BMaterial M P CDisc/pad surface condition SC1 SC2 D
The following conditions were set throughout the experiments: (1) loading time2p
mwfractFnba
2
tmwwsdSc“tfwawttshown in Table 2. The 10 columns in the table represent four
TL
T
1111111
0 s; (2) number of applications for each test 7; (3) preheating load 450 N; (4)reheating temperature 80 ◦C; (5) cooling temperature 80 ◦C.
al load, sliding speed, cooling temperature and loading timeere computer programmed/controlled. The output signals, e.g.
riction force, interface temperature by WIRE and disc surfaceubbing temperature by RUB, were acquired and processed bycomputer aided data acquisition system. During each test, theast iron disc, 125 mm diameter, is rotated at constant speed, andhe pad specimen (approximately 29 mm × 24 mm × 11 mm, seeig. 1c) was pressed in contact with the disc under a constant
ormal load over a sequence of successive 20 s application. Inetween each 20 s application the pad was released from contactllowing it to cool to 80 ◦C.fTe
able 2
16(24) Latin square used in the DoE
est number 1 2 3 4 5A B A × B C A × C
1 −1 −1 1 −1 12 −1 −1 1 −1 13 −1 −1 1 1 −14 −1 −1 1 1 −15 −1 1 −1 −1 16 −1 1 −1 −1 17 −1 1 −1 1 −18 −1 1 −1 1 −19 1 −1 −1 −1 −10 1 −1 −1 −1 −11 1 −1 −1 1 12 1 −1 −1 1 13 1 1 1 −1 −14 1 1 1 −1 −15 1 1 1 1 16 1 1 1 1 1
a) Location of the thermocouples, (b) cross-section A–A, and (c) sample size
.2. Design of experiments
A statistical design of experiments (DoE) was establishedo study the effects of braking factors on the braking perfor-
ance. A four factor, two level full factorial orthogonal designas selected as summarized in Table 1. The pad materials usedere M: a woven asbestos free friction lining, and P: a compres-
ion molded, heavy-duty brake lining for commercial vehiclerum brakes. Disc/pad surface conditions were controlled asC1 and SC2. Under the test condition SC1 (braking appli-ations 1–7) the pad and disc surfaces were prepared to thenew” condition before each test, using abrasive paper. Underhe test condition SC2 (braking applications 8–14) the pad sur-ace was left in the “used” condition while the disc surfaceas prepared to the “new” condition before each test, using
brasive paper. The main outputs (or responses) from this DoEere the interface temperature, T, (measured by WIRE), and
he friction coefficient, μ. An L16(24) Latin square experimen-al design [20] was used for the full factorial experiments as
actors and six interactions between any two factors in the table.he rows in the table are the 16 tests (T1–T16) carried out in thexperiments.
6 7 8 9 10B × C D A × D B × D C × D
1 −1 1 1 11 1 −1 −1 −1
−1 −1 1 1 −1−1 1 −1 −1 1−1 −1 1 −1 1−1 1 −1 1 −1
1 −1 1 −1 −11 1 −1 1 11 −1 −1 1 11 1 1 −1 −1
−1 −1 −1 1 −1−1 1 1 −1 1−1 −1 −1 −1 1−1 1 1 1 −1
1 −1 −1 −1 −11 1 1 1 1
508 H.S. Qi, A.J. Day / Wear 262 (2007) 505–513
Table 3Pad friction material properties used in the FE models [15]
Elastic modulus (GPa) 1.25Poisson’s ratio 0.3Thermal conductivity (W/(m K)) 2.06HD
3
iutrtteapFTalttAwaI
wlsdtsbwTl
Table 5The transient boundary
Surfaces Heating phase Cooling phase
Heat flux h (W/(m2 ◦C)) Heat flux h (W/(m2 ◦C))
Ar Pp/Ar 0 0 10An 0 0 0 10As 0 10 0 10
IttTf
4
4
orimas shown in Fig. 2, during individual braking applications the
TC
M
M
RAHC
eat capacity (J/(kg K)) 749ensity (kg/m) 14.3
. Set-up for finite element (FE) modelling
In the FE modeling, the pad’s surface temperature variationsn friction braking was studied with special interest in the nonniform contact at the brake friction interface and the real con-act area ratio, R = Ar/Aa. A constant thermal energy partitionatio, r, was introduced under the assumption that r only affectshe absolute pad temperature but has no significant effect on theemperature variation; such assumption helps to make the mod-lling manageable. The loading input conditions were the sames those used in the experimental investigation. The materialroperty of the friction pad detailed in Table 3 was used in theE modeling. Fig. 1c shows the 3D model of the friction pad.he model had three layers: friction material (6 mm thick withn apparent rubbing surface area of Aa = 768.5 mm2), an under-ayer (1 mm thick) and a backplate (4 mm thick). To representhe different thermal behavior, the front face of the pad was par-itioned into the real contact area, Ar, and the non-contact area,n, as shown in Fig. 1c. A free meshing technique was usedith four-node tetrahedronal solid elements. The FE modelling
nd simulation was carried out using the commercially available-DEAS CAE system [21].
The ratio of the real area and the apparent contact area, R,as set up as a control factor in the FE modelling. Five models,
abeled PSC1–PSC5, were set-up for simulating five contactcenarios. Table 4 details the contact area ratio and the real areaistribution used, from which the effective heat flux acting onhe real contact interface, Pb/Ar, was obtained. The friction heatource at the disc/pad interface was treated as a thermal loadoundary for the pad. Two sequential heating and cooling phases
ere set up as the thermal load boundary condition as shown inable 5. In the heating phase (20 s duration) a constant normaload was assumed to act on the pad with a constant sliding speed.
tts
able 4onditions and assumptions used in the FE models
odel number PSC1 PSC2
odels
= Ar/Aa 1 0.487
r (×10−4 m2) 7.685 3.74eat flux, Pb/Ar (W/m2) 101,496 208,556onstants Friction coefficient μ = 0.4, friction speed V = 6.5 m
heat transfer coefficient h = 10 W/(m2 ◦C), partitio
Fig. 2. Typical temperature–time signals from the experiments.
n the cooling phase, the pad front surface was removed fromhe disc surface for 40 s, during which time surface heat transferook place on all the pad surfaces including the pad front surface.he surface heat transfer from the pad front surface occurred via
orced convection or free convection.
. Results
.1. Temperature signals assessment
Fig. 2 shows a general overview of the temperature signalsbtained during the friction braking tests using the scale testig. This shows that the signals responded to the brake load-ng phase and the cooling phase correctly. The reliability of the
easuring system was assessed by analyzing the RUB signals;
emperature indicated by RUB increased from start tempera-ure of 80 ◦C. After each application, the temperature returnedteadily to 80 ◦C and then increased again as the next application
PSC3 PSC4 PSC5
0.386 0.554 0.5362.967 4.257 4.116262,892 183,219 189,523
/s, normal load = 300 N,n ratio r = 0.1
H.S. Qi, A.J. Day / Wear 262 (2007) 505–513 509
eratu
stsitdTtWrd
4
ettIotgcdrte(pfnalFt
4
ctF
fbcmimtflt8fRpTcwb
4
uwere simulated by FEA. Figs. 5 and 6 are the typical temperatureplots. Fig. 5 shows the graph of maximum temperature, Tmax,versus time obtained from the simulation of the FE model PSC5.It shows that the maximum temperature increased rapidly dur-
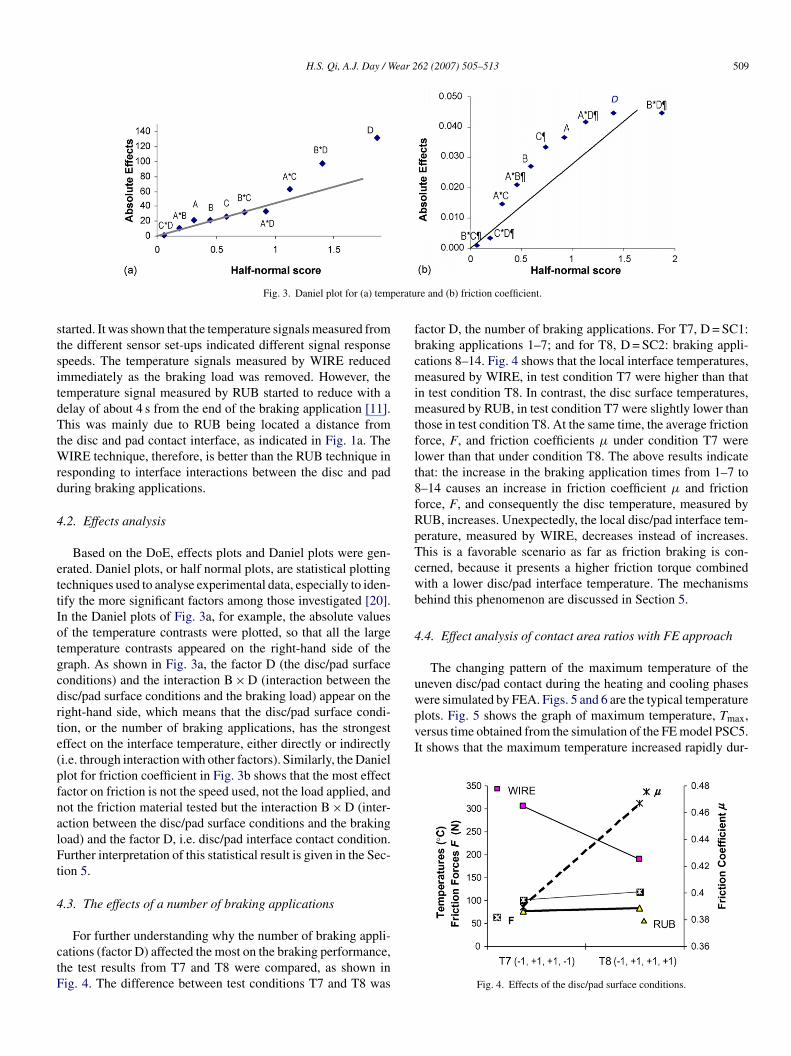
Fig. 3. Daniel plot for (a) temp
tarted. It was shown that the temperature signals measured fromhe different sensor set-ups indicated different signal responsepeeds. The temperature signals measured by WIRE reducedmmediately as the braking load was removed. However, theemperature signal measured by RUB started to reduce with aelay of about 4 s from the end of the braking application [11].his was mainly due to RUB being located a distance from
he disc and pad contact interface, as indicated in Fig. 1a. TheIRE technique, therefore, is better than the RUB technique in
esponding to interface interactions between the disc and paduring braking applications.
.2. Effects analysis
Based on the DoE, effects plots and Daniel plots were gen-rated. Daniel plots, or half normal plots, are statistical plottingechniques used to analyse experimental data, especially to iden-ify the more significant factors among those investigated [20].n the Daniel plots of Fig. 3a, for example, the absolute valuesf the temperature contrasts were plotted, so that all the largeemperature contrasts appeared on the right-hand side of theraph. As shown in Fig. 3a, the factor D (the disc/pad surfaceonditions) and the interaction B × D (interaction between theisc/pad surface conditions and the braking load) appear on theight-hand side, which means that the disc/pad surface condi-ion, or the number of braking applications, has the strongestffect on the interface temperature, either directly or indirectlyi.e. through interaction with other factors). Similarly, the Daniellot for friction coefficient in Fig. 3b shows that the most effectactor on friction is not the speed used, not the load applied, andot the friction material tested but the interaction B × D (inter-ction between the disc/pad surface conditions and the brakingoad) and the factor D, i.e. disc/pad interface contact condition.urther interpretation of this statistical result is given in the Sec-
ion 5.
.3. The effects of a number of braking applications
For further understanding why the number of braking appli-ations (factor D) affected the most on the braking performance,he test results from T7 and T8 were compared, as shown inig. 4. The difference between test conditions T7 and T8 was
re and (b) friction coefficient.
actor D, the number of braking applications. For T7, D = SC1:raking applications 1–7; and for T8, D = SC2: braking appli-ations 8–14. Fig. 4 shows that the local interface temperatures,easured by WIRE, in test condition T7 were higher than that
n test condition T8. In contrast, the disc surface temperatures,easured by RUB, in test condition T7 were slightly lower than
hose in test condition T8. At the same time, the average frictionorce, F, and friction coefficients μ under condition T7 wereower than that under condition T8. The above results indicatehat: the increase in the braking application times from 1–7 to–14 causes an increase in friction coefficient μ and frictionorce, F, and consequently the disc temperature, measured byUB, increases. Unexpectedly, the local disc/pad interface tem-erature, measured by WIRE, decreases instead of increases.his is a favorable scenario as far as friction braking is con-erned, because it presents a higher friction torque combinedith a lower disc/pad interface temperature. The mechanismsehind this phenomenon are discussed in Section 5.
.4. Effect analysis of contact area ratios with FE approach
The changing pattern of the maximum temperature of theneven disc/pad contact during the heating and cooling phases
Fig. 4. Effects of the disc/pad surface conditions.
510 H.S. Qi, A.J. Day / Wear 262 (2007) 505–513
F
itsoFthsicrap3
F
op
atrdtrt
Fn
TA
�
�
�
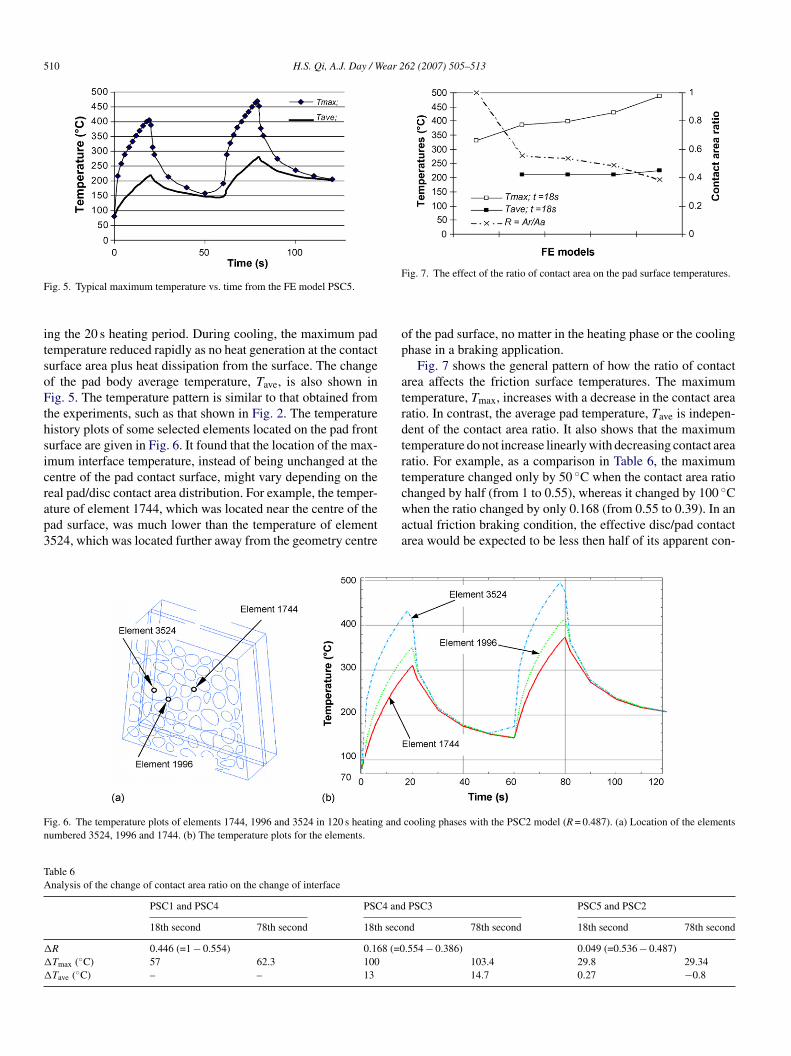
ig. 5. Typical maximum temperature vs. time from the FE model PSC5.
ng the 20 s heating period. During cooling, the maximum pademperature reduced rapidly as no heat generation at the contacturface area plus heat dissipation from the surface. The changef the pad body average temperature, Tave, is also shown inig. 5. The temperature pattern is similar to that obtained from
he experiments, such as that shown in Fig. 2. The temperatureistory plots of some selected elements located on the pad fronturface are given in Fig. 6. It found that the location of the max-mum interface temperature, instead of being unchanged at theentre of the pad contact surface, might vary depending on the
eal pad/disc contact area distribution. For example, the temper-ture of element 1744, which was located near the centre of thead surface, was much lower than the temperature of element524, which was located further away from the geometry centrecwaa
ig. 6. The temperature plots of elements 1744, 1996 and 3524 in 120 s heating andumbered 3524, 1996 and 1744. (b) The temperature plots for the elements.
able 6nalysis of the change of contact area ratio on the change of interface
PSC1 and PSC4 PSC4 and
18th second 78th second 18th seco
R 0.446 (=1 − 0.554) 0.168 (=0Tmax (◦C) 57 62.3 100Tave (◦C) – – 13
ig. 7. The effect of the ratio of contact area on the pad surface temperatures.
f the pad surface, no matter in the heating phase or the coolinghase in a braking application.
Fig. 7 shows the general pattern of how the ratio of contactrea affects the friction surface temperatures. The maximumemperature, Tmax, increases with a decrease in the contact areaatio. In contrast, the average pad temperature, Tave is indepen-ent of the contact area ratio. It also shows that the maximumemperature do not increase linearly with decreasing contact areaatio. For example, as a comparison in Table 6, the maximumemperature changed only by 50 ◦C when the contact area ratiohanged by half (from 1 to 0.55), whereas it changed by 100 ◦C
hen the ratio changed by only 0.168 (from 0.55 to 0.39). In anctual friction braking condition, the effective disc/pad contactrea would be expected to be less then half of its apparent con-
cooling phases with the PSC2 model (R = 0.487). (a) Location of the elements
PSC3 PSC5 and PSC2
nd 78th second 18th second 78th second
.554 − 0.386) 0.049 (=0.536 − 0.487)103.4 29.8 29.3414.7 0.27 −0.8
ear 262 (2007) 505–513 511
tsdm
5
5
5
bagebdnpaTsitcmmilrphpTetnFabbp
5
asc[ctoatsbc
F
cutmbi(tiP3mfaph
owdatipeibfcd
eaam
H.S. Qi, A.J. Day / W
act area [12,13]. It can be expected therefore, from the aboveimulation results, that the change of the effective contact areauring braking will have a significant effect on the local padaximum temperature variation.
. Discussions
.1. The effects of the disc/pad interface variation
.1.1. The local interface temperatureWhen two new pad and disc surfaces come into contact under
raking load, the pad friction surface is only in partial contactt bulk/macro scale, as the two surfaces are not bedded in (i.e.eometric conformity is not achieved) [14]. Wear subsequentlynables bedding-in to be completed. Furthermore, as the num-er of braking applications increases, the local real contact areaistribution will change at macro/micro scale as well. In theew condition, the pad surface is in an open condition, i.e. onlyrimary contact plateaux are in contact with the disc and therere pores or voids existing between the primary contact plateaux.his is another reason why the initial real contact area Ar is muchmaller than the apparent contact area Aa. As the number of brak-ng applications increases, however, the wear debris will fill inhe “open” area between the primary contact plateaux, as a so-alled ‘secondary contact plateaux’ formation [13]. This processay be belonging to the ‘burnishing’. The ‘geometric confor-ity’ and ‘secondary contact plateaux’ formation are a physical
ncrease in the real contact area Ar. If assuming that total normaload and friction coefficient are constant, then the increase in theeal contact area Ar means a decrease in the average local normalressure and friction/shear stress (F/Ar). As a result, the localeat flux and local temperature at the interface, which is pro-ortional to the friction/shear stress (Tmax ∝ F/Ar) will decrease.he bulk average temperature, which is the function of the appar-nt contact area (Tave ∝ F/Aa), however, will not be affected byhe change of the real contact area. This may explain the phe-omena found in the experiments (in Fig. 4) and obtained in theEA (in Fig. 7) regarding to the local disc/pad interface temper-ture (or Tmax) and the disc surface temperature (or Tave). It cane concluded that the change of the effective contact area duringraking has a significant effect on the pad local maximum tem-eratures and has little effect on the pad average temperatures.
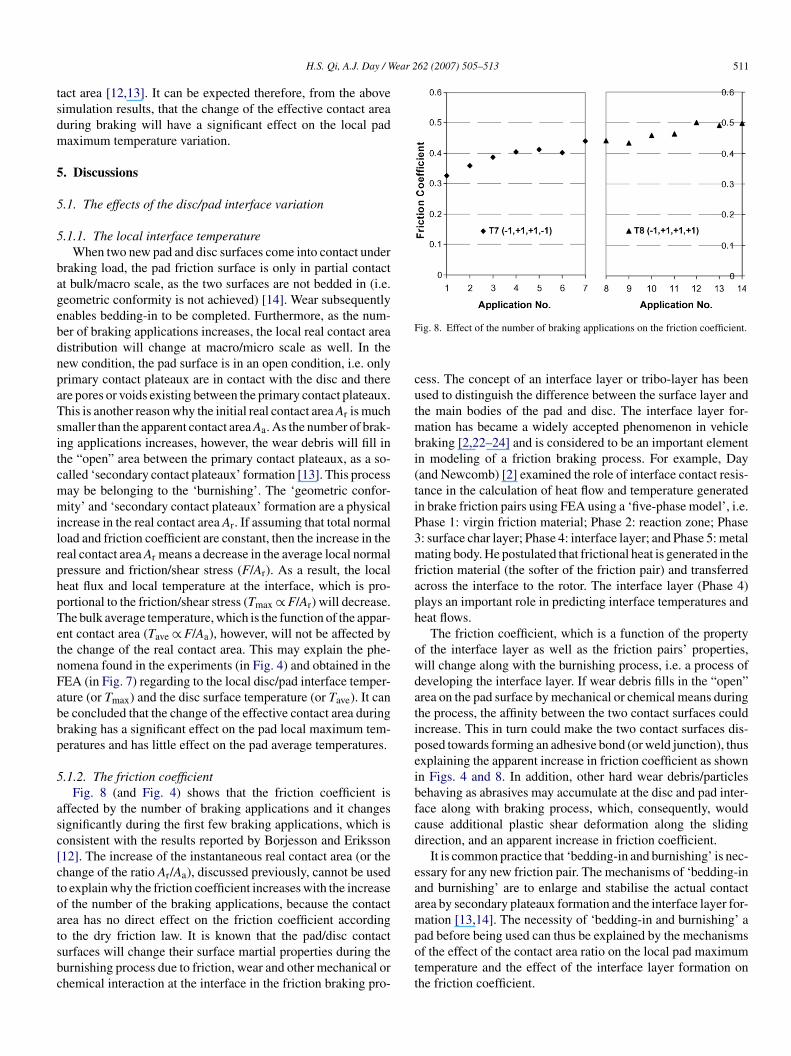
.1.2. The friction coefficientFig. 8 (and Fig. 4) shows that the friction coefficient is
ffected by the number of braking applications and it changesignificantly during the first few braking applications, which isonsistent with the results reported by Borjesson and Eriksson12]. The increase of the instantaneous real contact area (or thehange of the ratio Ar/Aa), discussed previously, cannot be usedo explain why the friction coefficient increases with the increasef the number of the braking applications, because the contactrea has no direct effect on the friction coefficient according
o the dry friction law. It is known that the pad/disc contacturfaces will change their surface martial properties during theurnishing process due to friction, wear and other mechanical orhemical interaction at the interface in the friction braking pro-pott
ig. 8. Effect of the number of braking applications on the friction coefficient.
ess. The concept of an interface layer or tribo-layer has beensed to distinguish the difference between the surface layer andhe main bodies of the pad and disc. The interface layer for-
ation has became a widely accepted phenomenon in vehicleraking [2,22–24] and is considered to be an important elementn modeling of a friction braking process. For example, Dayand Newcomb) [2] examined the role of interface contact resis-ance in the calculation of heat flow and temperature generatedn brake friction pairs using FEA using a ‘five-phase model’, i.e.hase 1: virgin friction material; Phase 2: reaction zone; Phase: surface char layer; Phase 4: interface layer; and Phase 5: metalating body. He postulated that frictional heat is generated in the
riction material (the softer of the friction pair) and transferredcross the interface to the rotor. The interface layer (Phase 4)lays an important role in predicting interface temperatures andeat flows.
The friction coefficient, which is a function of the propertyf the interface layer as well as the friction pairs’ properties,ill change along with the burnishing process, i.e. a process ofeveloping the interface layer. If wear debris fills in the “open”rea on the pad surface by mechanical or chemical means duringhe process, the affinity between the two contact surfaces couldncrease. This in turn could make the two contact surfaces dis-osed towards forming an adhesive bond (or weld junction), thusxplaining the apparent increase in friction coefficient as shownn Figs. 4 and 8. In addition, other hard wear debris/particlesehaving as abrasives may accumulate at the disc and pad inter-ace along with braking process, which, consequently, wouldause additional plastic shear deformation along the slidingirection, and an apparent increase in friction coefficient.
It is common practice that ‘bedding-in and burnishing’ is nec-ssary for any new friction pair. The mechanisms of ‘bedding-innd burnishing’ are to enlarge and stabilise the actual contactrea by secondary plateaux formation and the interface layer for-ation [13,14]. The necessity of ‘bedding-in and burnishing’ a
ad before being used can thus be explained by the mechanisms
f the effect of the contact area ratio on the local pad maximumemperature and the effect of the interface layer formation onhe friction coefficient.
5 ear 2
5
5m
botdmtusic
5
cFtmhvsswcIvba
6
(
(
(
(
(
(
A
cLiK
R
[
[
[
[
[
[
[
12 H.S. Qi, A.J. Day / W
.2. Issues on future work
.2.1. Further development in interface signaleasurementsThe DoE experiments explored the phenomenon that the
edding-in and burnishing in braking process will provide aptimised braking condition, i.e. a combination of high frictionorque and a low maximum interface temperature. This con-ition could only be detected by using interface temperatureeasurement techniques, e.g. using WIRE in this work. Conven-
ional measurement techniques, e.g. RUB, which are commonlysed in industrial research/development, are unable to detectuch friction interface phenomena. Further development andmprovement of the exposed thermocouple technique is beingarried out by authors.
.2.2. Further development of the FE approachIt is for the first time to simulate an uneven brake disc/pad
ontact scenario using FEA. The information obtained fromEA, such as the interface temperature under an uneven con-
act changing with the real area of contact in a non-linearanner, allows interface contact condition to be predicted to
elp in understanding how the friction interface temperaturearies in friction braking processes. The FE models, where theize of real contact surface is fixed for each model, provide atep towards much sophisticated simulations. One such stepould be to make the size of real contact surface as a pro-
ess variable, changing with time during the FE simulation.t is expected that the dynamic nature of the interface contactariation and the consequent thermal behavior during frictionraking will be further understood by this advanced FE modelingpproach.
. Conclusions
1) The experimental results confirm that the brake frictioninterface temperature can be measured by an exposed ther-mocouple technique, and that the temperature characteris-tics identified from these measurements cannot be identifiedby other temperature measurement techniques.
2) A statistical Design of Experiments approach has indicatedthat the number of braking applications has the strongesteffect on the interface temperatures in comparison withother factors, i.e. friction loads, sliding speeds and frictionmaterial composition.
3) Finite element simulations have predicted a correlationbetween the contact area ratio and the interface maximumtemperature. It has been shown for the first time that the max-imum temperature at the friction interface does not increaselinearly with decreasing contact area ratio, but in contrast,the contact area ratio has little effect on the average pad bulktemperature.
4) The findings from the experiments and FE simulations pro-
vide an insight into how the real contact area affects the fric-tion interface temperature in friction braking. These findingshave been used to interpret the well-known ‘Bedding-in’ and‘Burnishing’ processes in friction braking.[
62 (2007) 505–513
5) For a better understanding of friction braking and partic-ularly friction interface effects, a direct friction interfacetemperature measurement technique, such as the exposedthermocouple technique used described here, should beused.
6) The FEA approach used in this study for simulating thethermo-mechanical nature of the brake friction interface canprovide insight into the tribological nature of brake frictionprocess.
cknowledgements
The authors would like to acknowledge the assistance ofolleagues in the Automotive Modelling & Control Researchaboratory at the University of Bradford School of Engineer-
ng, Design & Technology, in particular Mr. K. Noor, Mr. K. H.uan, Dr. G. Rosala and Mr. C. Mistry, for their contributions.
eferences
[1] J.J. Santini, F.E. Kennedy, Experimental investigation of surface tempera-tures and wear in disk brakes, Lubr. Eng. 31 (8) (1975), 402–404, 413–417.
[2] A.J. Day, T.P. Newcomb, Dissipation of frictional energy from the interfaceof an annular disc brake, Proc. Inst. Mech. Eng. D: Transp. Eng. 198 (11)(1984) 201–209.
[3] A.A. Evtushenko, E.G. Ivanik, S. Konechny, Determination of the effectiveheating depth of the disc brake pad, Trenie i Iznosv 19 (3) (1998) 318–322.
[4] K.H. Wollenweber, R. Leiter, Function-monitoring brake system: tem-perature monitoring brake system, in: Proceedings of the Institution ofMechanical Engineers, International Conference on Braking of Road Vehi-cles, IMechE, vol. C444/049/93, 1993, pp. 23–48.
[5] J. Bijwe, Nidhi, N. Majumdar, B.K. Satapathy, Influence of modified phe-nolic resins on the fade and recovery behavior of friction materials, Wear259 (2005) 1068–1078.
[6] O.S.C. Dinc, M. Ettles, S.J. Calabrese, H.A. Scarton, The measurement ofsurface temperature in dry or lubricated sliding’, Trans. ASME, J. Tribol.115 (1993) 78–82.
[7] H.H.H. Shu, E.W. Gaylord, W.F. Hughes, The relationship between therubbing interface temperature distribution and dynamic thermocouple tem-perature, ASME J. Basic Eng. 86 (1964) 417–422.
[8] Anon, Material development using infra-red thermography, Metallurgia 62(12) (1995) 409–410.
[9] H.S. Qi, A contact length model for grinding wheel–workpiece contact,Ph.D. Thesis, Liverpool John Moores University, UK, 1995.
10] X. Xu, S. Malkin, Comparison of methods to measure grinding tempera-tures, J. Manuf. Sci. Eng. 123 (2) (2001) 191–195.
11] H.S. Qi, K. Noor, A.J. Day, Interface temperature in friction braking,in: Proceedings of the International Conference ‘Braking 2002—from thedriver to the road’, Leeds, UK, 10–12 July, 2002.
12] M. Borjesson, P. Eriksson, The role of friction films in automotive brakessubjected to low contact forces, in: Proceedings of the Braking of RoadVehicles, IMechE, vol. C444/026, 1993, pp. 259–268.
13] M. Eriksson, S. Jacobson, Tribological surfaces of organic brake pads,Tribol. Int. 33 (2000) 817–827.
14] A.J. Day, B.R. Shilton, Braking of Road Vehicles 2004, University of Brad-ford, 2004, ISBN 1 85143 2175.
15] M.M. Abd-Rabou, M.G. El-Sherbiny, Thermo elastic study on brake padsusing FEA, J. Eng. Appl. Sci. 45 (5) (1998) 709–719.
16] P. Dufrenoy, D. Weichert, Prediction of railway disc brake temperatures
taking the bearing surface variation into account, Proc. Inst. Mech. Eng. F:Rail Rapid Transit 209 (1995) 67–76.17] A.J. Day, A.B. Ahsi, Heat flow and temperatures in friction material duringbraking, in: Proceedings of the 17th Leeds-Lyon Symposium on Tribology,Leeds, UK, September, 1990, pp. 183–191.

ear 2
[
[
[
[[
H.S. Qi, A.J. Day / W
18] A. Floquet, M.C. Dubourg, Non-axisymmetric effects for three-dimen-sional analysis of a brake, Trans. ASME, J. Tribol. 116 (1994) 401–408.
19] H.S. Qi, A.J. Day, K.H. Kuan, G. Rosala, A contribution towards under-
standing brake interface temperatures, in: Proceedings of the InternationalConference ‘Braking 2004—Vehicle Braking & Chassis Control’, Leeds,UK, 7–9 July, 2004.20] D.M. Grove, T.P. Davis, Engineering Quality and Experimental Design,Longman Group UK Ltd., 1992.
[
[
62 (2007) 505–513 513
21] http://www.eds.com/products/plm/ideas/ds/.22] S.K. Rhee, M.G. Jacko, P.H.S. Tsang, The role of friction film in friction,
wear and noise of automotive brakes, Wear 146 (1991) 89–97.
23] J. Sugishita, S. Fujiyoshi, The effect of cast iron graphites on friction andwear performance. I. Graphite film formation on grey cast iron surfaces,Wear 66 (1981) 209–221.
24] T. Liu, S.K. Rhee, K.L. Lawson, A study of wear rates and transfer filmsof friction materials, Wear 60 (1980) 1–12.


![Wpmen]^ - Flying Disc Museum](https://img.dokumen.tips/doc/110x75/633c817562e54755e7023f2c/wpmen-flying-disc-museum.jpg)


