Embed Size (px)
Citation preview
Journal of Pharmaceutical and Biomedical Analysis 41 (2006) 165–175
Investigation of degradation products in a topical gel containingerythromycin and benzoyl peroxide by liquid
chromatography–mass spectrometry
Erik Haghedooren, Kiran Kumar Raju Bhupathi Raju.V.S., Pieter Dehouck, Cindy Govaerts,Ann Van Schepdael, Jos Hoogmartens, Erwin Adams ∗
Laboratorium voor Farmaceutische Chemie en Analyse van Geneesmiddelen, Faculteit Farmaceutische Wetenschappen,Katholieke Universiteit Leuven, O&N 2, Herestraat 49, Postbus 923, B-3000 Leuven, Belgium
Received 18 August 2005; received in revised form 4 November 2005; accepted 10 November 2005Available online 27 December 2005
Abstract
Benzamycin®, combining benzoyl peroxide and erythromycin, is a topical gel used in the treatment of acne vulgaris. Because of the reactivity ofbTdao©
K
1
ctcotarivapitt
0d
enzoyl peroxide, preparations containing both erythromycin and benzoyl peroxide might be unstable and degradation products could be formed.o investigate and identify these latter products, a gradient-based liquid chromatographic method using volatile mobile phase constituents waseveloped. Mass spectrometry data were acquired on solutions containing erythromycin and benzoyl peroxide and on freshly prepared, 2-month-oldnd 18-month-old samples of Benzamycin®. With the reference spectra as interpretative templates, it was concluded that erythromycin undergoesxidation, followed by benzoylation.
2005 Elsevier B.V. All rights reserved.
eywords: Benzoyl peroxide; Erythromycin; Degradation products; LC–MS
. Introduction
Common acne, medically known as acne vulgaris, is a skinondition characterized by pimples, occurring commonly ineenagers and to a lesser extent in young adults. It is the mostommon dermatological disorder [1]. Treatment drugs can beral or topical, and are given as a single drug or as a combina-ion. The combination of the antibiotic erythromycin (Fig. 1)nd benzoyl peroxide in a topical gel (Benzamycin®) waseported to have an additive effect compared with the admin-stration of either agent as monotherapy. This combination pre-ents the emergence of resistant strains of Propionibacteriumcnes [2]. On the other hand, a stability problem may occur inreparations containing both erythromycin and benzoyl perox-de, because of the reactivity of the latter. It was shown thatretinoin in tretinoin gel microsphere undergoes degradation inhe presence of erythromycin-benzoyl peroxide topical gel. The
∗ Corresponding author. Tel.: +32 16 323444; fax: +32 16 323448.E-mail address: [email protected] (E. Adams).
interaction between erythromycin and benzoylperoxide was notstudied [3].
The official non-volatile method for the analysis of ery-thromycin, prescribed by the European Pharmacopoeia [4] andthe United States Pharmacopeia [5], is based on work by Pae-sen et al. [6,7]. Govaerts et al. developed a gradient liquidchromatographic (LC) method on XTerraTM RP18, compati-ble with mass spectrometry (MS) [8]. Later, Chepkwony etal. developed an isocratic non-volatile method on XTerraTM
RP18, which was able to separate more unidentified peaks fromthe known related substances [9]. Based on the latter method,Chitneni et al. developed a volatile mobile phase and identi-fied eight additional impurities of erythromycin by MS [10].For the analysis of benzoyl peroxide, the United States Phar-macopeia prescribes an LC method [11]. For the analysis ofboth active substances, only one method has been publishedwhere benzoyl peroxide was assayed by LC, while erythromycinwas determined using a microbiological assay [12]. Dehoucket al. developed a non-volatile method showing a good separa-tion and quantitative determination of erythromycin and benzoylperoxide [13].
731-7085/$ – see front matter © 2005 Elsevier B.V. All rights reserved.oi:10.1016/j.jpba.2005.11.019
166 E. Haghedooren et al. / Journal of Pharmaceutical and Biomedical Analysis 41 (2006) 165–175
In this study, experiments on solutions containing ery-thromycin and benzoyl peroxide were carried out before investi-gating the gels, since reaction products are formed more quicklyin solutions than in gels. This would help to identify the reac-tion products formed in gels. The Benzamycin® samples werestored in a refrigerator, as prescribed, to guarantee the stabil-ity during two months. The aim of this study was to investigatethe erythromycin derivatives that are formed by the reaction oferythromycin with benzoyl peroxide by LC–MS. A volatile LCmethod had to be developed.
2. Experimental
2.1. Chemicals
Acetonitrile, HPLC gradient grade and ascorbic acid werepurchased from Acros Organics (Geel, Belgium), dipotas-sium hydrogen phosphate and phosphoric acid were fromMerck (Darmstadt, Germany), 2-propanol Chromasolv® andammonium hydrogen carbonate from Riedel-de Haen (Seelze,Germany) and glacial acetic acid p.a. from VWR (Leuven, Bel-
F
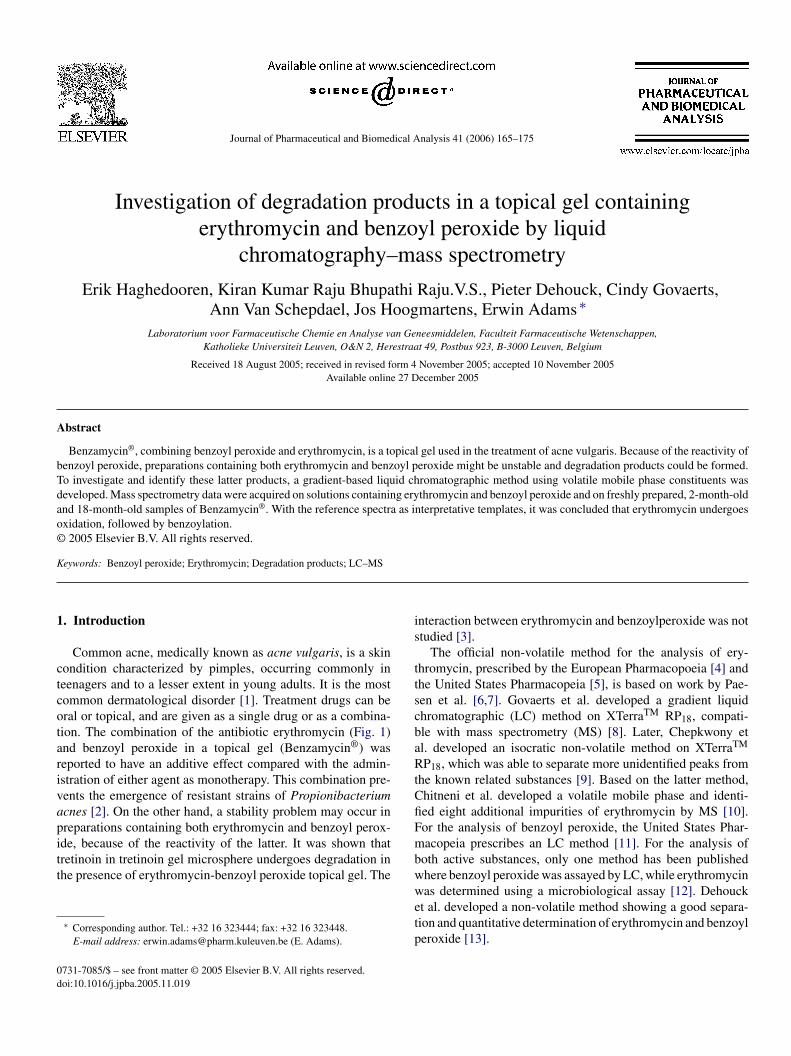
ig. 1. Chemical structure of erythromycin A, its related substances and proposed stru ctures for the related substances formed by the reaction with benzoyl peroxide.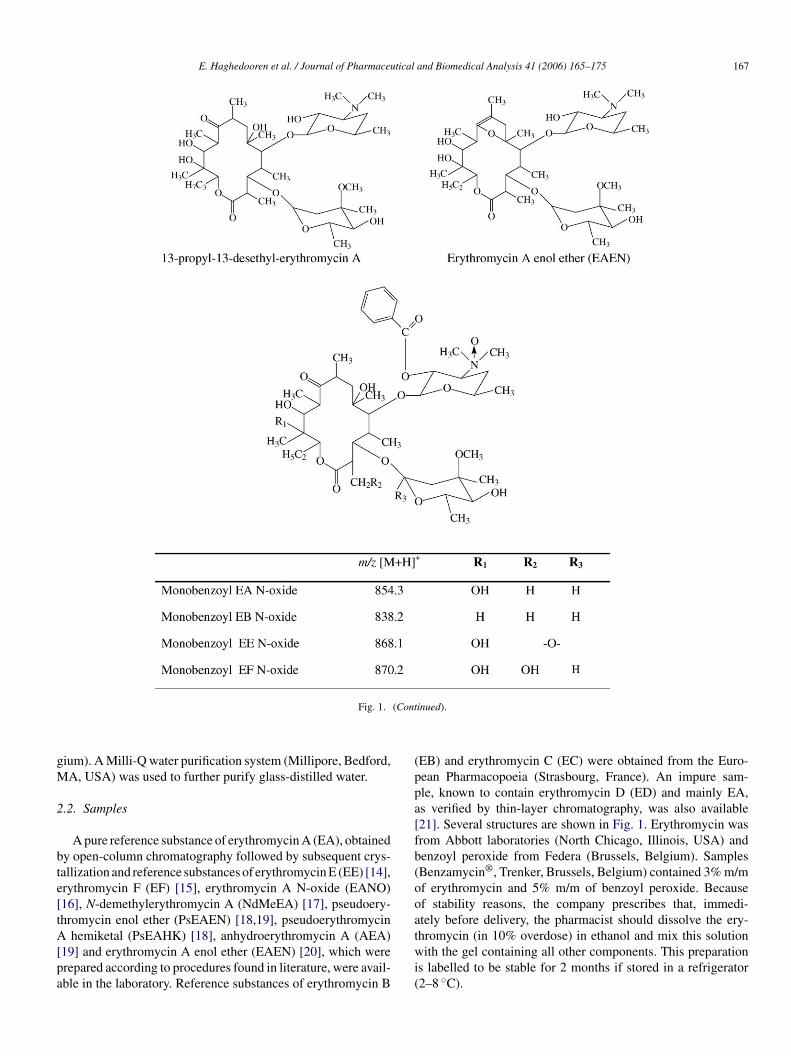
E. Haghedooren et al. / Journal of Pharmaceutical and Biomedical Analysis 41 (2006) 165–175 167
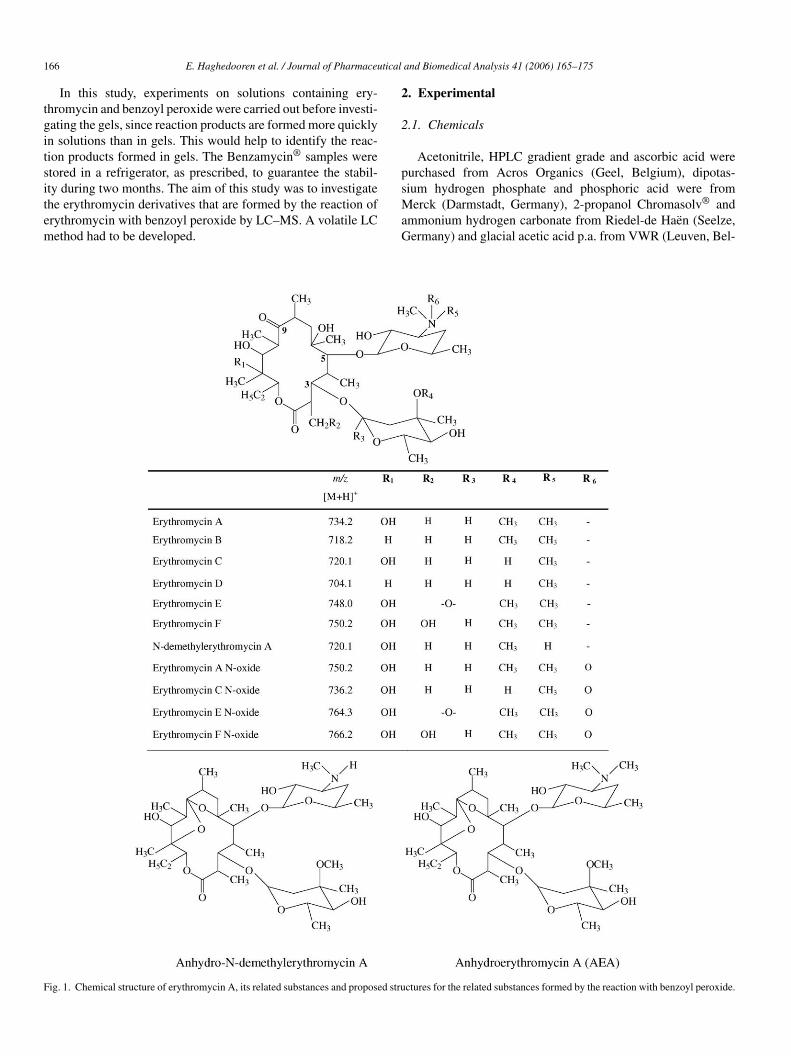
Fig. 1. (Continued).
gium). A Milli-Q water purification system (Millipore, Bedford,MA, USA) was used to further purify glass-distilled water.
2.2. Samples
A pure reference substance of erythromycin A (EA), obtainedby open-column chromatography followed by subsequent crys-tallization and reference substances of erythromycin E (EE) [14],erythromycin F (EF) [15], erythromycin A N-oxide (EANO)[16], N-demethylerythromycin A (NdMeEA) [17], pseudoery-thromycin enol ether (PsEAEN) [18,19], pseudoerythromycinA hemiketal (PsEAHK) [18], anhydroerythromycin A (AEA)[19] and erythromycin A enol ether (EAEN) [20], which wereprepared according to procedures found in literature, were avail-able in the laboratory. Reference substances of erythromycin B
(EB) and erythromycin C (EC) were obtained from the Euro-pean Pharmacopoeia (Strasbourg, France). An impure sam-ple, known to contain erythromycin D (ED) and mainly EA,as verified by thin-layer chromatography, was also available[21]. Several structures are shown in Fig. 1. Erythromycin wasfrom Abbott laboratories (North Chicago, Illinois, USA) andbenzoyl peroxide from Federa (Brussels, Belgium). Samples(Benzamycin®, Trenker, Brussels, Belgium) contained 3% m/mof erythromycin and 5% m/m of benzoyl peroxide. Becauseof stability reasons, the company prescribes that, immedi-ately before delivery, the pharmacist should dissolve the ery-thromycin (in 10% overdose) in ethanol and mix this solutionwith the gel containing all other components. This preparationis labelled to be stable for 2 months if stored in a refrigerator(2–8 ◦C).
168 E. Haghedooren et al. / Journal of Pharmaceutical and Biomedical Analysis 41 (2006) 165–175
2.3. Sample preparation
2.3.1. Solution of erythromycin and benzoyl peroxideA solution containing 3 mg/mL of erythromycin and
1 mg/mL of benzoyl peroxide was prepared in ammonium bicar-bonate buffer (pH 7.0; 0.2 M)–acetonitrile (50:50, v/v). 0.2 Macetic acid was used to adjust the pH of the buffer before bring-ing to volume. The chosen concentrations of active substancescorrespond to an equimolar mixture, and this implies that theconcentration of benzoyl peroxide is lower than that in the gel.For identification purposes, 0.2 mg/mL of EA, EB, EC, EE,EF, NdMeEA, EANO, AEA, benzoic acid and 0.005 mg/mLof PsEAEN or EAEN were dissolved in the above-describedsolution.
2.3.2. Extraction of erythromycin and related compoundsfrom the Benzamycin® gel
For the extraction of erythromycin, ammonium bicarbon-ate buffer (pH 7.0; 0.2 M)–acetonitrile (75:25, v/v) was used.1.000 g of gel was diluted with this mixture, brought to 25.0 mLand stirred for 30 min. The solution was filtered through a 0.2 �mmembrane filter and 100 �L of the filtrate was analyzed by LC.A higher concentration of acetonitrile was not used, since thiswould extract more benzoyl peroxide.
2
qe1twFhsw
itive ion mode. Data were recorded and processed with Xcalibursoftware (Thermo Finnigan). As a stationary phase, an XTerraTM
RP18 5 �m column (250 mm × 2.1 mm i.d.) was used. The col-umn was kept at 55 ◦C in a water bath with a heating immersioncirculator (Julabo, Seelbach, Germany).
The EA reference substance was used to tune the instrument.This tune file was used during the subsequent investigation oferythromycin fractions. Nitrogen supplied by a Nitroprime TMMembrane unit, type SNIFF (AGA, Lidingo, Sweden) was usedas auxiliary and sheath gas. Helium was used as collision gas inthe ion trap. For MS/MS investigation, the protonated EA wasisolated in the ion trap and collisionally activated with differentcollision energy levels (CEL) to find the optimal CEL (28%),which generated the highest intensity of product ions needed forfurther collision-induced dissociation (CID) experiments. CIDspectral data or LC/MS3 spectra were obtained for the productions relevant to the identification of the unknowns.
3. Results and discussion
3.1. Development of a volatile LC method compatible withMS
A problem in combining LC and MS is the incompati-bility of non-volatile mobile phase additives and MS detec-t ®
wcmXtntppbb
F imm5 ammo1 ion vo
.4. LC instrumentation and chromatographic conditions
The LC apparatus consisted of a Spectra SYSTEM P1000XRuaternary pump, a Spectra SERIES AS100 autosamplerquipped with a 20 �L loop, a variable wavelength Spectra00 UV–vis detector set at 215 nm, all from Thermo Separa-ion Products (Fremont, CA, USA) and connected to a computerith ChromPerfect 4.4.0 software (Justice Laboratory Software,ife, UK). Mobile phases were degassed before use by spargingelium. The LC system was coupled to a LCQ ion trap masspectrometer (Thermo Finnigan, San Jose, CA, USA) equippedith an electrospray ionisation (ESI) source operated in the pos-
ig. 2. Typical chromatogram of an erythromycin-benzoyl peroxide solution�m (250 mm × 4.6 mm i.d.) at 55◦ C. Mobile phase: 2-propanol–acetonitrile–mL/min, sample: erythromycin (3 mg/mL)-benzoyl peroxide (1 mg/mL), inject
ion. Until now, LC of Benzamycin has been performedith mobile phases containing non-volatile additives and using
olumn dimensions of 250 mm × 4.6 mm i.d. [13]. Here, aobile phase with a volatile buffer was developed using anTerraTM RP18 5 �m column (250 mm × 4.6 mm i.d.). Among
he tested volatile buffers, ammonium acetate and ammo-ium bicarbonate, the latter gave a better separation, althoughhe overall selectivity was less good in comparison with thehosphate buffer used in references [10,13]. The final mobilehase consisted of 2-propanol–acetonitrile–ammonium bicar-onate buffer 0.2 M (adjusted to pH 7.0 using 0.2 M acetic acidefore bringing to volume)–water (18.75:6.25:5:70, v/v/v/v).
ediately after preparation of the mixture. Stationary phase: XTerraTM RP18
nium bicarbonate (pH 7.0; 0.2 M)–water (18.75:6.25:5:70, v/v/v/v), Flow rate:lume: 100 �L, detection: UV at 215 nm. See Fig. 1 for compound abbreviations.
E. Haghedooren et al. / Journal of Pharmaceutical and Biomedical Analysis 41 (2006) 165–175 169
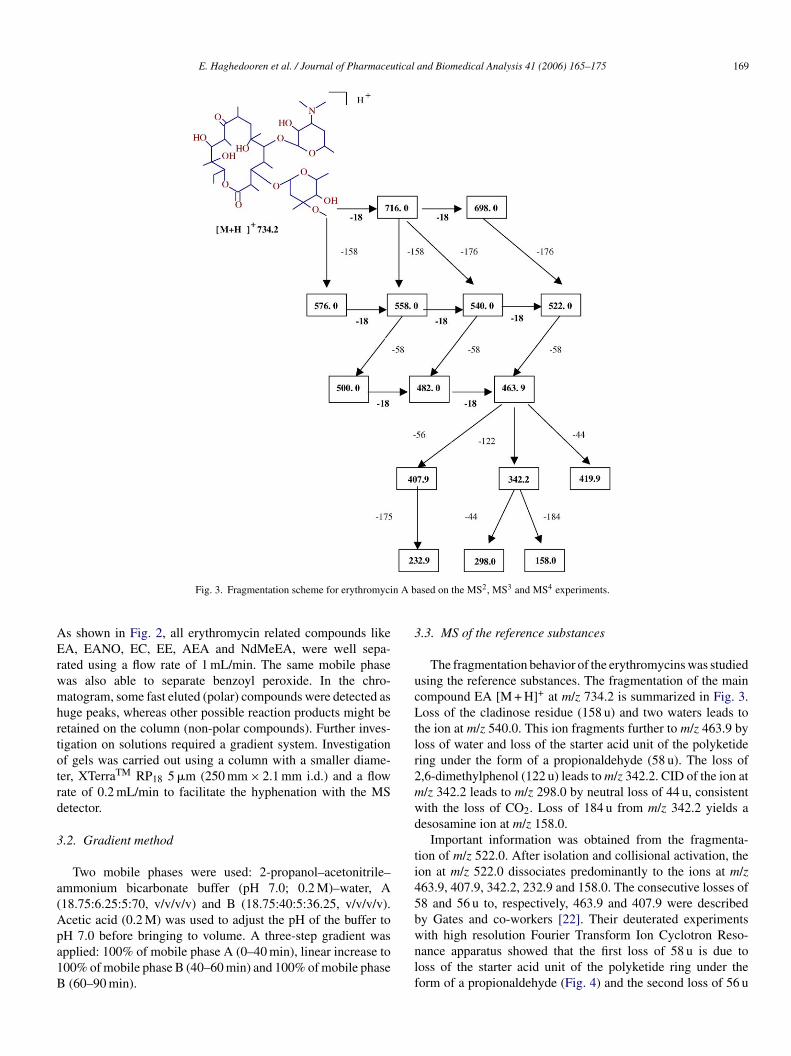
Fig. 3. Fragmentation scheme for erythromycin A based on the MS2, MS3 and MS4 experiments.
As shown in Fig. 2, all erythromycin related compounds likeEA, EANO, EC, EE, AEA and NdMeEA, were well sepa-rated using a flow rate of 1 mL/min. The same mobile phasewas also able to separate benzoyl peroxide. In the chro-matogram, some fast eluted (polar) compounds were detected ashuge peaks, whereas other possible reaction products might beretained on the column (non-polar compounds). Further inves-tigation on solutions required a gradient system. Investigationof gels was carried out using a column with a smaller diame-ter, XTerraTM RP18 5 �m (250 mm × 2.1 mm i.d.) and a flowrate of 0.2 mL/min to facilitate the hyphenation with the MSdetector.
3.2. Gradient method
Two mobile phases were used: 2-propanol–acetonitrile–ammonium bicarbonate buffer (pH 7.0; 0.2 M)–water, A(18.75:6.25:5:70, v/v/v/v) and B (18.75:40:5:36.25, v/v/v/v).Acetic acid (0.2 M) was used to adjust the pH of the buffer topH 7.0 before bringing to volume. A three-step gradient wasapplied: 100% of mobile phase A (0–40 min), linear increase to100% of mobile phase B (40–60 min) and 100% of mobile phaseB (60–90 min).
3.3. MS of the reference substances
The fragmentation behavior of the erythromycins was studiedusing the reference substances. The fragmentation of the maincompound EA [M + H]+ at m/z 734.2 is summarized in Fig. 3.Loss of the cladinose residue (158 u) and two waters leads tothe ion at m/z 540.0. This ion fragments further to m/z 463.9 byloss of water and loss of the starter acid unit of the polyketidering under the form of a propionaldehyde (58 u). The loss of2,6-dimethylphenol (122 u) leads to m/z 342.2. CID of the ion atm/z 342.2 leads to m/z 298.0 by neutral loss of 44 u, consistentwith the loss of CO2. Loss of 184 u from m/z 342.2 yields adesosamine ion at m/z 158.0.
Important information was obtained from the fragmenta-tion of m/z 522.0. After isolation and collisional activation, theion at m/z 522.0 dissociates predominantly to the ions at m/z463.9, 407.9, 342.2, 232.9 and 158.0. The consecutive losses of58 and 56 u to, respectively, 463.9 and 407.9 were describedby Gates and co-workers [22]. Their deuterated experimentswith high resolution Fourier Transform Ion Cyclotron Reso-nance apparatus showed that the first loss of 58 u is due toloss of the starter acid unit of the polyketide ring under theform of a propionaldehyde (Fig. 4) and the second loss of 56 u
170 E. Haghedooren et al. / Journal of Pharmaceutical and Biomedical Analysis 41 (2006) 165–175
Fig. 4. According to described biosynthetic routes, the aglycone of erythromycinis formed by incorporation of seven propionate units, one of which is used asthe starter acid. The starter acid of EA is boxed with a full line. The neighboringoxygen containing unit is boxed with a dotted line.
involves the neighboring oxygen-containing unit of the ring.All abundant product ions observed in the second-generationproduct ion scan were further investigated in different MS4
experiments.
Mass spectra of EB, EC, ED, EE, EF, NdMeEA, EANO,PsEAEN, PsEAHK, AEA and EAEN were similarly recorded.The mass spectrometric data were incorporated in a library withas main objective the confirmation of their presence in a com-mercial sample and the use as interpretative templates for thestructure elucidation of unknowns [10].
3.4. MS of the solutions containing erythromycin andbenzoyl peroxide
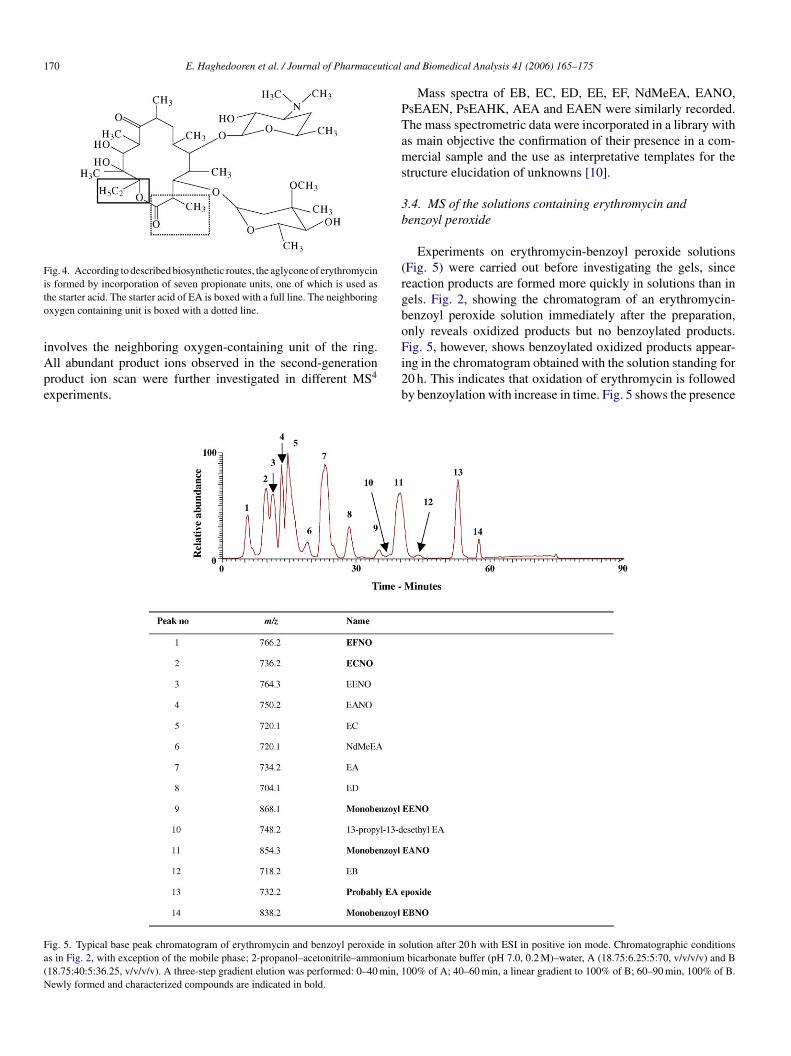
Experiments on erythromycin-benzoyl peroxide solutions(Fig. 5) were carried out before investigating the gels, sincereaction products are formed more quickly in solutions than ingels. Fig. 2, showing the chromatogram of an erythromycin-benzoyl peroxide solution immediately after the preparation,only reveals oxidized products but no benzoylated products.Fig. 5, however, shows benzoylated oxidized products appear-ing in the chromatogram obtained with the solution standing for20 h. This indicates that oxidation of erythromycin is followedby benzoylation with increase in time. Fig. 5 shows the presence
Fa(N
ig. 5. Typical base peak chromatogram of erythromycin and benzoyl peroxide in ss in Fig. 2, with exception of the mobile phase; 2-propanol–acetonitrile–ammonium18.75:40:5:36.25, v/v/v/v). A three-step gradient elution was performed: 0–40 min, 1ewly formed and characterized compounds are indicated in bold.
olution after 20 h with ESI in positive ion mode. Chromatographic conditionsbicarbonate buffer (pH 7.0, 0.2 M)–water, A (18.75:6.25:5:70, v/v/v/v) and B00% of A; 40–60 min, a linear gradient to 100% of B; 60–90 min, 100% of B.
E. Haghedooren et al. / Journal of Pharmaceutical and Biomedical Analysis 41 (2006) 165–175 171
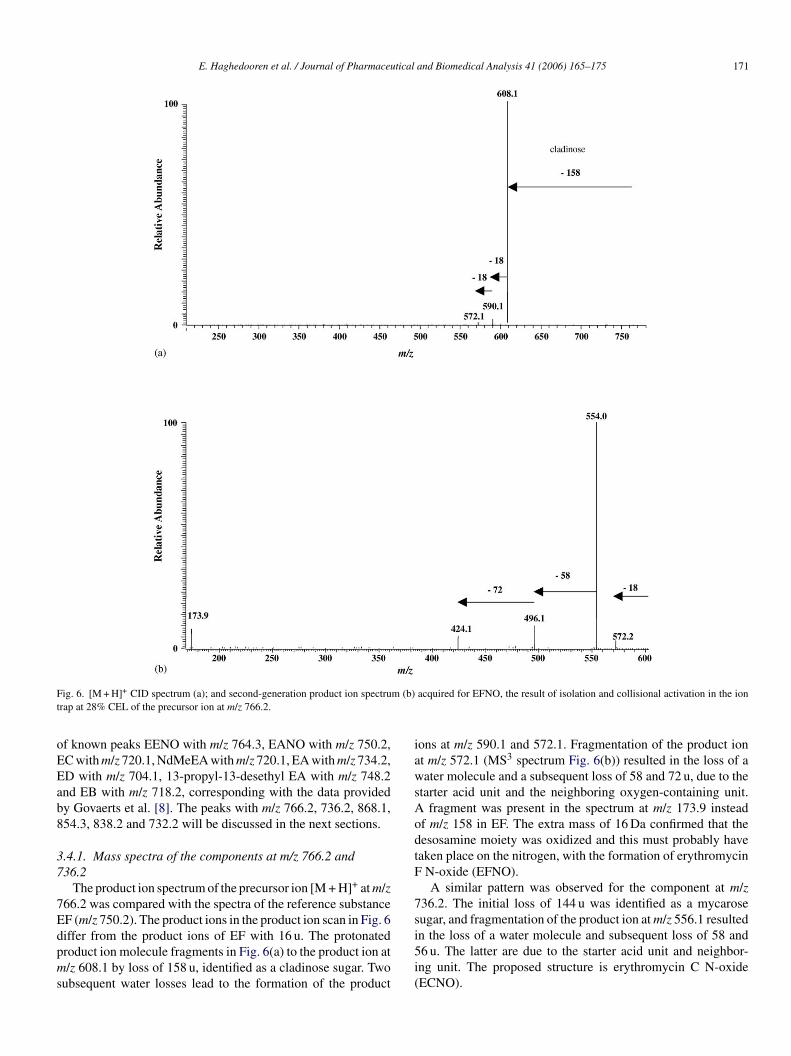
Fig. 6. [M + H]+ CID spectrum (a); and second-generation product ion spectrum (b) acquired for EFNO, the result of isolation and collisional activation in the iontrap at 28% CEL of the precursor ion at m/z 766.2.
of known peaks EENO with m/z 764.3, EANO with m/z 750.2,EC with m/z 720.1, NdMeEA with m/z 720.1, EA with m/z 734.2,ED with m/z 704.1, 13-propyl-13-desethyl EA with m/z 748.2and EB with m/z 718.2, corresponding with the data providedby Govaerts et al. [8]. The peaks with m/z 766.2, 736.2, 868.1,854.3, 838.2 and 732.2 will be discussed in the next sections.
3.4.1. Mass spectra of the components at m/z 766.2 and736.2
The product ion spectrum of the precursor ion [M + H]+ at m/z766.2 was compared with the spectra of the reference substanceEF (m/z 750.2). The product ions in the product ion scan in Fig. 6differ from the product ions of EF with 16 u. The protonatedproduct ion molecule fragments in Fig. 6(a) to the product ion atm/z 608.1 by loss of 158 u, identified as a cladinose sugar. Twosubsequent water losses lead to the formation of the product
ions at m/z 590.1 and 572.1. Fragmentation of the product ionat m/z 572.1 (MS3 spectrum Fig. 6(b)) resulted in the loss of awater molecule and a subsequent loss of 58 and 72 u, due to thestarter acid unit and the neighboring oxygen-containing unit.A fragment was present in the spectrum at m/z 173.9 insteadof m/z 158 in EF. The extra mass of 16 Da confirmed that thedesosamine moiety was oxidized and this must probably havetaken place on the nitrogen, with the formation of erythromycinF N-oxide (EFNO).
A similar pattern was observed for the component at m/z736.2. The initial loss of 144 u was identified as a mycarosesugar, and fragmentation of the product ion at m/z 556.1 resultedin the loss of a water molecule and subsequent loss of 58 and56 u. The latter are due to the starter acid unit and neighbor-ing unit. The proposed structure is erythromycin C N-oxide(ECNO).
172 E. Haghedooren et al. / Journal of Pharmaceutical and Biomedical Analysis 41 (2006) 165–175
Fig. 7. [M + H]+ CID spectrum acquired for monobenzoyl EENO, the result of isolation and collisional activation in the ion trap at 28% CEL of the precursor ion atm/z 868.1.
3.4.2. Mass spectra of the components at m/z 868.1, 854.3and 838.2
The product ion spectrum of the precursor ion [M + H]+ atm/z 868.1 was compared with the spectrum of the referencesubstance EE with m/z 748. There is a difference of 120 Dabetween the two ions. The protonated molecule fragments tothe product ion at m/z 694.1 by loss of 174 u, identified as acladinose sugar with the oxygen of the glycosidic bond (Fig. 7).Two subsequent water losses lead to the formation of productions at m/z 676.1 and 658.4. Further loss of 58 u of the starter acidunit yields an m/z of 600.0 and further loss of 72 u yields an m/zof 528.0. Instead of the desosamine sugar (m/z 158) an ion withm/z 277.9 was present. The extra mass of 120 Da, is probablydue to oxidation of the nitrogen and benzoylation of the hydroxylgroup. The proposed structure is monobenzoyl erythromycin EN-oxide (monobenzoyl EENO).
Similar patterns were obtained for the component at m/z 854.3and m/z 838.2, except for the first loss of 158 u, correspondingto a cladinose sugar. Both compounds differ 120 u from theirrespective reference compounds EA and EB. They have a similarloss of 58 u (starter acid unit) and at m/z 278.0 a benzoylatedand oxidized desosamine sugar is detected. So, the proposedstructures are, respectively, monobenzoyl erythromycin A N-oxide (monobenzoyl EANO) and monobenzoyl erythromycinB N-oxide (monobenzoyl EBNO).
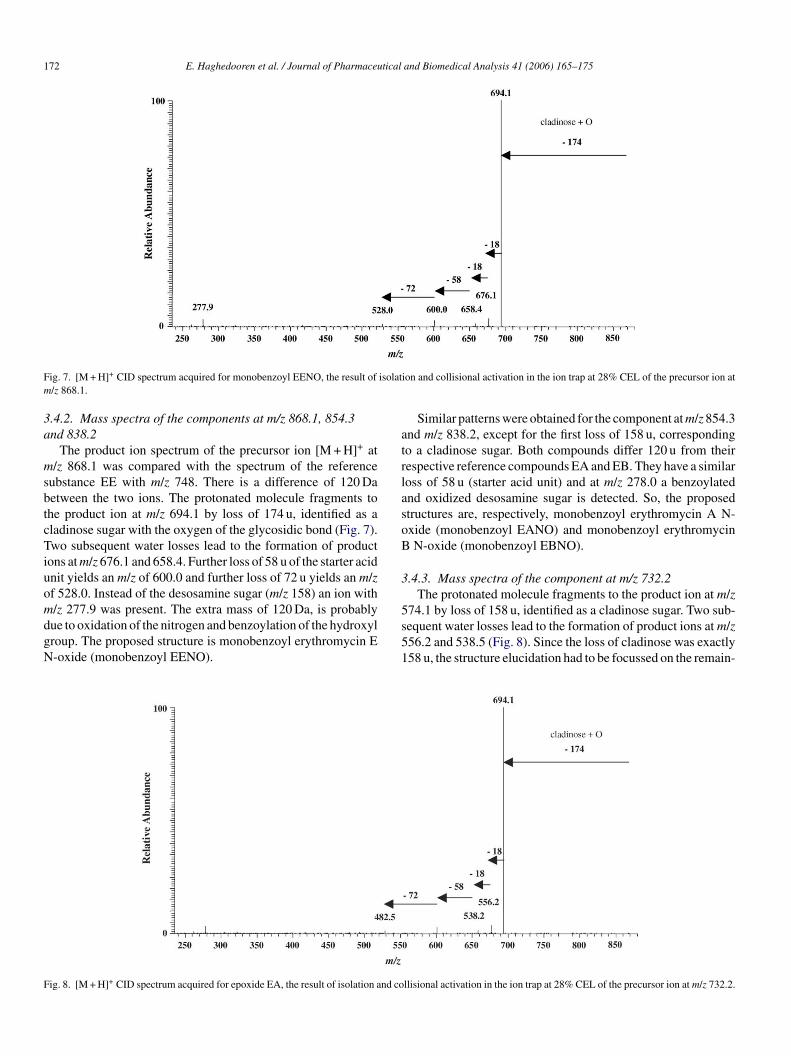
3.4.3. Mass spectra of the component at m/z 732.2The protonated molecule fragments to the product ion at m/z
574.1 by loss of 158 u, identified as a cladinose sugar. Two sub-sequent water losses lead to the formation of product ions at m/z556.2 and 538.5 (Fig. 8). Since the loss of cladinose was exactly158 u, the structure elucidation had to be focussed on the remain-
F nd co
ig. 8. [M + H]+ CID spectrum acquired for epoxide EA, the result of isolation a llisional activation in the ion trap at 28% CEL of the precursor ion at m/z 732.2.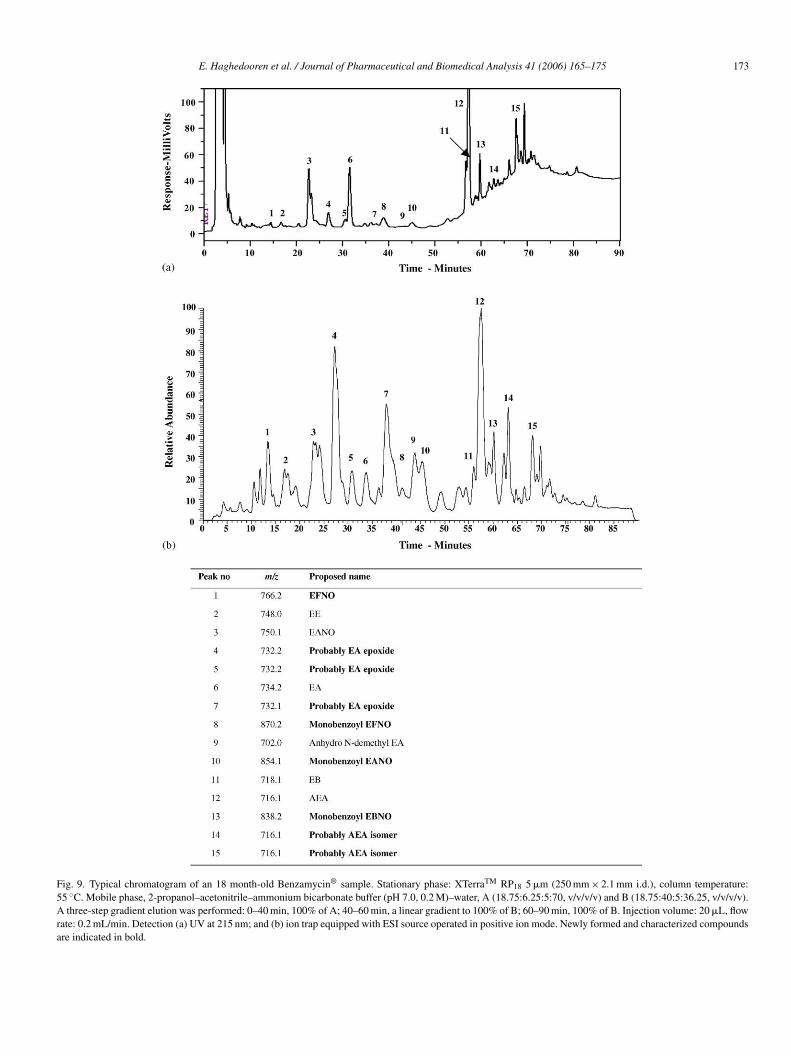
E. Haghedooren et al. / Journal of Pharmaceutical and Biomedical Analysis 41 (2006) 165–175 173
Fig. 9. Typical chromatogram of an 18 month-old Benzamycin® sample. Stationary phase: XTerraTM RP18 5 �m (250 mm × 2.1 mm i.d.), column temperature:55 ◦C. Mobile phase, 2-propanol–acetonitrile–ammonium bicarbonate buffer (pH 7.0, 0.2 M)–water, A (18.75:6.25:5:70, v/v/v/v) and B (18.75:40:5:36.25, v/v/v/v).A three-step gradient elution was performed: 0–40 min, 100% of A; 40–60 min, a linear gradient to 100% of B; 60–90 min, 100% of B. Injection volume: 20 �L, flowrate: 0.2 mL/min. Detection (a) UV at 215 nm; and (b) ion trap equipped with ESI source operated in positive ion mode. Newly formed and characterized compoundsare indicated in bold.
174 E. Haghedooren et al. / Journal of Pharmaceutical and Biomedical Analysis 41 (2006) 165–175
ing part of the compound. The mass of 732.2 has only 2 unitsdifference with EA (m/z of 734.2), hence a radical epoxide for-mation was considered to be formed from the hydroxyl on C6,C11 or on C2′ in the desosamine moiety. The radical forma-tion would be induced by benzoyl peroxide. The three differentpotential sites of epoxide formation could explain the appear-ance of three peaks of m/z 732.2 in Fig. 9. The proposed structureis an EA epoxide, involving C6, C11 or C2′ hydroxyl.
3.5. MS of Benzamycin® samples
Full mass spectral acquisition over the mass range m/z155–2000 was performed to gain information about all com-ponents in the commercial Benzamycin® samples.
Commercial Benzamycin® samples, freshly prepared, 2-month old and 18-month old were analyzed for the structure elu-cidation of unknown impurities. Freshly prepared and 2-month-old Benzamycin® samples did not show related substances otherthan those present in the erythromycin used for the prepa-ration. Analysis of the 18-month-old samples revealed some
related substances, which were also present in the erythromycin-benzoyl peroxide solution and also some additional related sub-stances. Fig. 9(a) (LC–UV) and Fig. 9(b) (LC–MS) show chro-matograms of 18-month-old commercial Benzamycin® sam-ples.
Mass spectrometric analysis of Benzamycin® samplesresulted in the m/z values indicated in Fig. 9. The spectra ofseveral peaks matched with the spectra of the reference sub-stances and of impurities found in the erythromycin-benzoylperoxide solution. The peaks at m/z 702.0 and 716.1 were alreadydescribed by Chitneni et al. [10]. One unidentified peak, hav-ing an m/z of 870.0 was only observed in the 18-month-oldBenzamycin® sample.
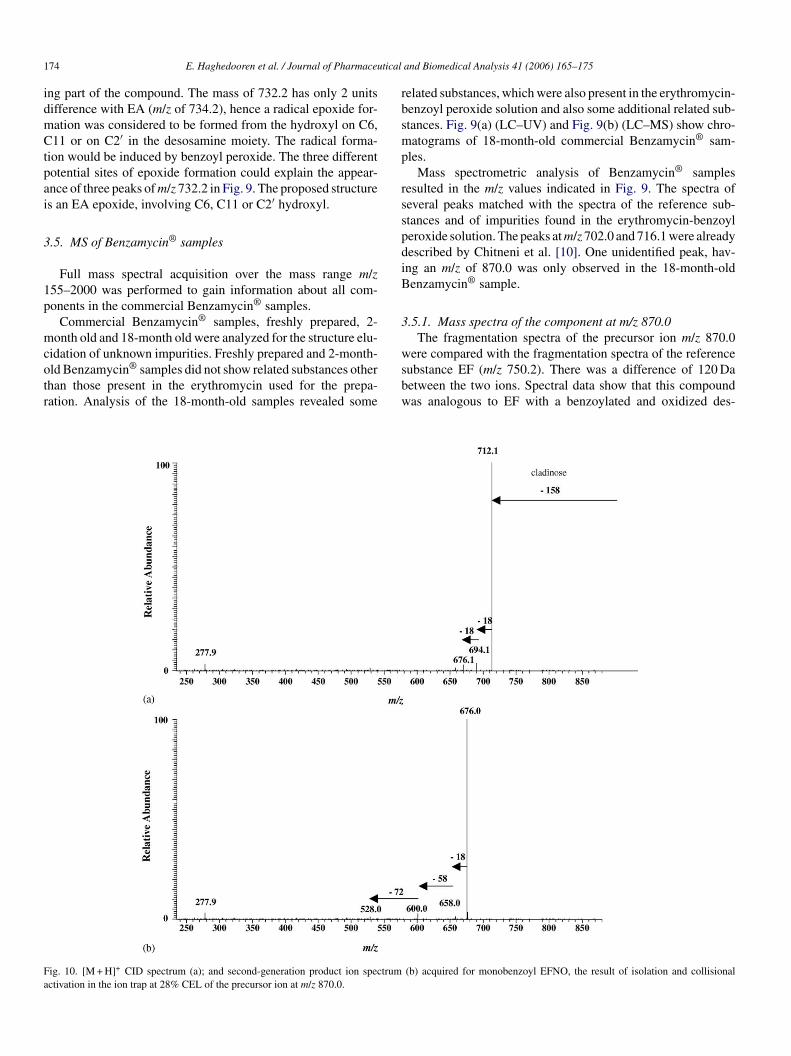
3.5.1. Mass spectra of the component at m/z 870.0The fragmentation spectra of the precursor ion m/z 870.0
were compared with the fragmentation spectra of the referencesubstance EF (m/z 750.2). There was a difference of 120 Dabetween the two ions. Spectral data show that this compoundwas analogous to EF with a benzoylated and oxidized des-
Fa
ig. 10. [M + H]+ CID spectrum (a); and second-generation product ion spectrumctivation in the ion trap at 28% CEL of the precursor ion at m/z 870.0.
(b) acquired for monobenzoyl EFNO, the result of isolation and collisional
E. Haghedooren et al. / Journal of Pharmaceutical and Biomedical Analysis 41 (2006) 165–175 175
osamine. Similar to EFNO, this compound looses first a 158 ucladinose sugar and two subsequent water molecules of 18 u(Fig. 10). With MS3, a loss of 58 u of the starter acid unit andfurther loss of 72 u due to the neighboring oxygen-containingunit was observed. In accordance with the compounds with m/z868.1 (monobenzoyl EENO), 854.3 (monobenzoyl EANO) and838.2 (monobenzoyl EBNO), an m/z at 277.9 of the benzoylatedand oxidized desosamine sugar was found. The proposed struc-ture is monobenzoyl erythromycin F N-oxide (monobenzoylEFNO).
3.5.2. Mass spectra of the component at m/z 702.0Based on the MS/MS and MS3 spectrum, Chitneni et al.
postulated that the compound at m/z 702.0 could be anhy-dro N-demethylerythromycin A or N-demethyl erythromycinA enolether, but taking the relative retention time in account,the peak was assumed to be anhydro N-demethylerythromycin[10].
3.5.3. Mass spectra of the components with m/z 716.1Fig. 8 shows peak 12 with an m/z of 716.1, identified as
AEA using a reference compound. Apart from this peak, twoadditional peaks are observed with the same m/z, and thesame fragmentation pattern but a different retention time. Forboth, the proposed structure is an isomer of AEA. Such iso-mer structures were also reported previously for anhydro N-d
4
MpsswmE
mryomE
tf
Acknowledgements
E. Haghedooren enjoys a grant of the Institute for the Promo-tion of Innovation through Science and Technology in Flanders(IWT-Vlaanderen).
E. Adams is a postdoctoral fellow of the Fund for ScientificResearch-Flanders (Belgium).
The authors thank the company Trenker (Brussels, Belgium)for the donation of Benzamycin® samples.
This work was supported by the Flemish Fund for ScientificResearch (Research Project G.0355.98).
References
[1] G.E. Pierard, Rev. Med. Liege 52 (1997) 120–122.[2] J.J. Leyden, J. Am. Acad. Dermatol. 49 (2003) 200–210.[3] J. Nyirady, C. Lucas, M. Yusuf, P. Mignone, S. Wisniewski, Cutis 70
(2002) 295–298.[4] European Pharmacopoeia, fifth ed., Council of Europe, Strasbourg, 2005,
p. 1518–1520.[5] United States Pharmacopeia, 28th ed., United States Pharmacopeial Con-
vention, Rockville, MD, 2005, pp. 757–758.[6] J. Paesen, E. Roets, J. Hoogmartens, Chromatographia 32 (1991)
162–166.[7] J. Paesen, D.H. Calam, J.H.McB. Miller, G. Raiola, A. Rozanski, B.
Silver, J. Hoogmartens, J. Liq. Chromatogr. 16 (1993) 1529–1544.[8] C. Govaerts, H.K. Chepkwony, A. Van Schepdael, E. Roets, J. Hoog-
martens, Rapid Commun. Mass Spectrom. 14 (2000) 878–884.
[
[
[[
[
[[
[[
[
[
[
[
emethylerythromycin A [10].
. Conclusion
After the development of a gradient-based volatile method forS, the fragmentation behavior of the unknown erythromycin
eaks was studied in comparison with that of the referenceubstances. The analysis of erythromycin-benzoyl peroxideolutions revealed formation of new erythromycin derivatives,hich were identified as EFNO, ECNO, monobenzoyl EENO,onobenzoyl EANO, probably EA epoxide and monobenzoylBNO.
It was observed that freshly prepared Benzamycin® and 2-onth-old (expiry date) samples showed no additional peaks
elated to the oxidation or benzoylation of erythromycin. Anal-sis of 18-month-old Benzamycin® samples revealed formationf EANO, EFNO, probably EA epoxide, probably AEA isomer,onobenzoyl EANO, monobenzoyl EBNO and monobenzoylFNO.
From the results it can be concluded that the preparations con-aining erythromycin and benzoyl peroxide undergo oxidationollowed by benzoylation.
[9] H.K. Chepkwony, P. Dehouck, E. Roets, J. Hoogmartens, Chro-matographia 53 (2001) 159–165.
10] S.K. Chitneni, C. Govaerts, E. Adams, A. Van Schepdael, J. Hoog-martens, J. Chromatogr. A 1056 (2004) 111–120.
11] United States Pharmacopeia, 28th ed., United States Pharmacopeial Con-vention, Rockville, MD, 2005, pp. 236–237.
12] B. Vermeulen, J.P. Remon, H. Nelis, Int. J. Pharm. 178 (1999) 137–141.13] P. Dehouck, E. Van Looy, E. Haghedooren, K. Deckers, Y. Vander Hey-
den, E. Adams, E. Roets, J. Hoogmartens, J. Chromatogr. B 794 (2003)293–302.
14] J.R. Martin, R.S. Egan, A.W. Goldstein, P. Collum, Tetrahedron 31(1975) 1985–1989.
15] P.J. Atkins, T.O. Herbert, N.B. Jones, Int. J. Pharm. 30 (1986) 199–207.16] E.H. Flynn, E.H. Sigal, P.F. Wi/ley, K. Gerzon, J. Am. Chem. Soc. 76
(1954) 3121–3131.17] L.A. Freiberg, US Pat. 1972. 3, p. 725, 385, CA 1996.18] H.A. Kirst, J.A. Wind, J.W. Paschal, J. Org. Chem. 52 (1987)
4359–4362.19] C. Vinckier, R. Hauchecorne, T. Cachet, G. Van den Mooter, J. Hoog-
martens, Int. J. Pharm. 55 (1989) 67–76.20] P. Kurath, P.H. Jones, R.S. Egan, T.J. Perun, Experientia 27 (1971)
362–363.21] I.O. Kibwage, E. Roets, J. Hoogmartens, J. Chromatogr. 256 (1983)
164–171.22] P.J. Gates, G.C. Kearney, R. Jones, P.F. Leadley, J. Staunton, Rapid
Commun. Mass Spectrom. 13 (1999) 242–246.


