Embed Size (px)
Citation preview
Journal of Geo-Engineering Sciences 1 (2013) 1–12DOI 10.3233/JGS-13005IOS Press
1
Investigation of bearing capacity factor ofT-bar penetrometer at shallow depths inclayey soils
Marcio S.S. Almeida∗, Jose Renato M.S. Oliveira, Khader I. Rammah and Pablo C. TrejoGraduate School of Engineering, COPPE, Federal University of Rio de Janeiro, Brazil
Abstract. The T-bar penetrometer is normally used in both in-situ and on the centrifuge to establish profiles of the undrainedshear strength of fine-grain soils. However, adequate measurement of the undrained shear strength at shallow depths requiresunderstanding the failure mechanism at these depths.
For onshore and offshore structures such as pipelines, the assessment of soil parameters, in particular the undrained shearstrength at shallow depth can be very critical to achieve both efficient and economic design. However, this requires the evaluationof the value of T-bar bearing factor (Nb ) corresponding to both shallow and very shallow depths.
This paper describes a series of geotechnical centrifuge tests undertaken using three different sizes of the T-bar penetrometeron two types of clayery soil.
The results of the undrained strength obtained from each T-bar were compared with the results obtained from the biggerT-bars. The curves that describes the variation of the T-bar factor (Nb ) versus the penetration depth were established from thecomparison of all results obtained from the three different sizes of the T-bar. The results of (Nb ) obtained in this study werecompared with results obtained from both numerical and analytic solutions proposed in the literature.
Generally, the experimental data obtained in this study presented Nb values higher than those predicted by others authorsfor all H/D ratios. However, the comparison indicates that the Nb values obtained in this study showed relatively reasonableagreement with those values obtained from the literature by adopting a non-homogenous strength profile.
Keywords: T-bar penetrometer, physical modelling, geotechnical centrifuge, clay, shallow depths
1. Introduction
The use of penetrometer probes in fine-grained soils to measure undrained shear strength at shallow depthsrequires the comprehension of how the failure mechanisms behave in intermediate situations in which the probecannot yet be considered deeply buried [1].
That is the case of the T-bar penetrometer which has been widely used in situ, mainly offshore [2, 3], and also inphysical modelling for the measurement of very soft clay strength profiles [4, 5]. The equation that associates forcereadings with the undrained shear strength is only valid for deep penetration failure mechanisms.
However, for onshore and offshore structures such as pipelines, the study of very shallow soil parameters is vitalfor an efficient and economic design. Most lifelines are inserted less than two diameters in the seabed soil; thereforecost-effective ways to evaluate the strength profile are much appreciated.
∗Corresponding author: Marcio S.S. Almeida, Graduate School of Engineering, COPPE, Federal University of Rio de Janeiro, Caixa Postal68506, CEP 21945-970, Brazil. Tel.: +55 21 25627200; E-mail: [email protected].
ISSN 2213-2880/13/$27.50 © 2013 – IOS Press and the authors. All rights reserved
2 M.S.S. Almeida et al. / Investigation of bearing capacity factor of T-bar penetrometer
This paper describes a series of geotechnical centrifuge T-bar penetrometer tests undertaken with three differentsizes on the same soil sample. The smaller probes’ undrained strength results are compared with those of the largerones, leading to a T-bar bearing factor (Nb ) curve that indicates the appropriate values for very shallow depths.These data are also compared with numerical analysis and analytic equations proposed in the literature.
2. T-bar Penetrometer
The T-bar penetrometer was originally developed for use in centrifuge testing [4, 6], aimed at providing a con-tinuous profile of the undrained strength of clay beds. It comprises a cylindrical bar that is attached perpendicularlyto the penetrometer shaft and has a projected area of 5 to 10 times the shaft area. The principle of this penetrometeris to force the soil to flow around the probe, minimising the relative magnitude of the volume expansion of thesoil due to the insertion of the shaft. In this way, the correction of the measured penetration resistance due to theoverburden stress is minimised [7].
A number of other flow type penetrometers have been proposed [2] but the T-bar is the most widely used,particularly in centrifuge physical modelling in relation to fine-grained soils [8].
Stewart and Randolph [6] proposed the following equation to obtain Su from T-bar measurements based on [9]:
Su = FV
NbDL(1)
where FV is the vertical force measured during penetration; D is the pipe diameter; L is the bar length; and Nb isthe T-bar bearing factor.
Alternatively, Equation (1) can be written as:
Su = qm/Nb (2)
where qm is the measured resistance during penetration.Chung and Randolph [1] and Randolph [10] suggested a correction on the measured values qm. This correction
is largely dependent on the ratio between the areas of shaft (push rods) and T-bar, which is typically 0.1 to 0.2, butalso depends on the total vertical stress, which is quite low in the present study. Therefore this correction is far lesssignificant than that on the piezocone [1] and is not considered in the present paper.
The T-bar bearing factor Nb depends on the surface roughness of the bar, varying between 9.1 (fully smooth) and11.9 (fully rough). An average value of 10.5 is recommended for general use in deep penetration conditions [10],although [11] suggested an average value of 12 based on high quality samples from ten onshore and offshore sitesaround the world. Low et al. [12] concluded that although theoretical solutions generally predict the trends of thefield data, further studies are required to improve the theoretical solutions.
However, the T-bar factor changes at shallow embedment due to the change in bearing capacity mechanism.Barboza-Cruz and Randolph [13] investigated the penetration of a cylindrical object into soft clay, starting froma very small embedment using a large deformation finite element approach with remeshing and interpolationtechniques. The results show an evolution of the bearing capacity factor for a penetration depth H/D > 0.5%. Fourequations are presented, considering fully smooth and fully rough interfaces and homogeneous (Su = 9 kPa) andnon-homogeneous (Su = 5 + 1.5 H/D) soil profiles. Oliveira et al. [14] proposed the following polynomial adjustment(Equation 3), based on a series of numerical analysis, which is only valid for the interval 0 ≤ (H/D) ≤ 6, where H isthe burial depth of the bar measured from the soil surface to the lower generatrix. The soft clay soil was simulatedusing the Tresca model, and an interface factor � = 0.5 was chosen to simulate an average surface roughness. Ahomogeneous undrained strength profile was assumed with Su = 1 kPa.
Nb = 0.0053
(H
D
)6
− 0.1102
(H
D
)5
+ 0.9079
(H
D
)4
− 3.7002
(H
D
)3
+ 7.2509
(H
D
)2
− 3.9168
(H
D
)+ 5.3519 (3)
M.S.S. Almeida et al. / Investigation of bearing capacity factor of T-bar penetrometer 3
The results indicate a mean initial value around 5.24 for H/D = 0, which is close to the expected Terzaghi bearingcapacity factor of 5.14 for a flat plate foundation, and a mean final value around 10.5 for H/D = 6 which is the sameproposed by [10] for a fully-buried condition.
White et al. [15] describes the interpretation of T-bar penetrometer tests at shallow depths in soft soils consideringtwo mechanisms: soil buoyancy and the reduced bearing factor associated to shallow failure mechanism. The resultsshow that the transition depth between shallow to deep failure behaviour vary between 2 and 8 bar diameters, forsofter and stiffer soils respectively.
3. Test concept
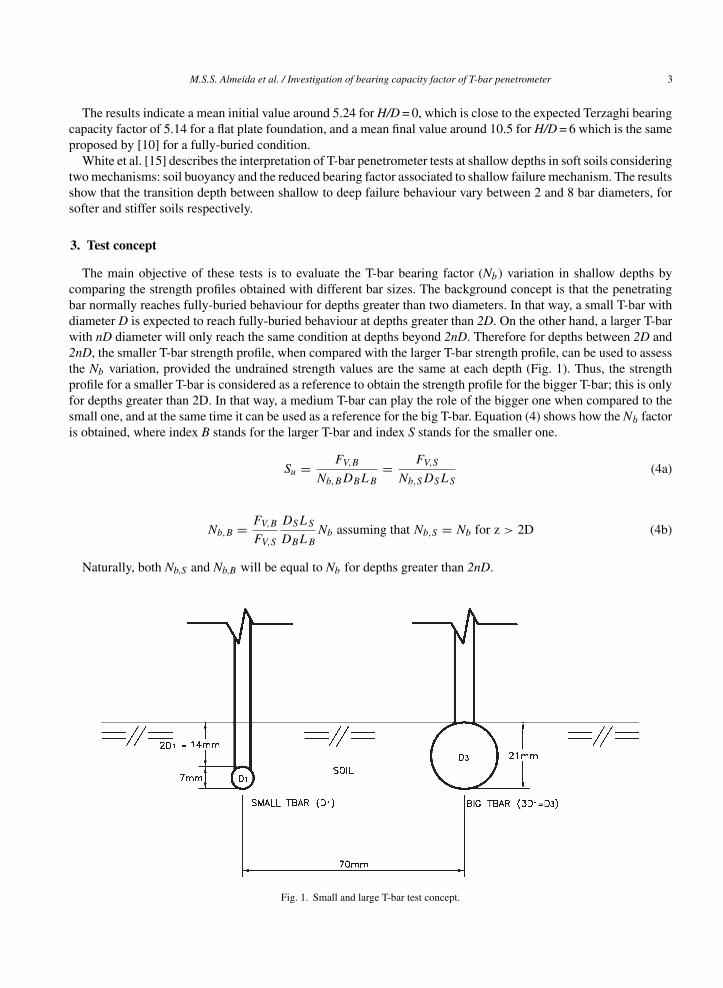
The main objective of these tests is to evaluate the T-bar bearing factor (Nb ) variation in shallow depths bycomparing the strength profiles obtained with different bar sizes. The background concept is that the penetratingbar normally reaches fully-buried behaviour for depths greater than two diameters. In that way, a small T-bar withdiameter D is expected to reach fully-buried behaviour at depths greater than 2D. On the other hand, a larger T-barwith nD diameter will only reach the same condition at depths beyond 2nD. Therefore for depths between 2D and2nD, the smaller T-bar strength profile, when compared with the larger T-bar strength profile, can be used to assessthe Nb variation, provided the undrained strength values are the same at each depth (Fig. 1). Thus, the strengthprofile for a smaller T-bar is considered as a reference to obtain the strength profile for the bigger T-bar; this is onlyfor depths greater than 2D. In that way, a medium T-bar can play the role of the bigger one when compared to thesmall one, and at the same time it can be used as a reference for the big T-bar. Equation (4) shows how the Nb factoris obtained, where index B stands for the larger T-bar and index S stands for the smaller one.
Su = FV,B
Nb,BDBLB
= FV,S
Nb,SDSLS
(4a)
Nb,B = FV,B
FV,S
DSLS
DBLB
Nb assuming that Nb,S = Nb for z > 2D (4b)
Naturally, both Nb,S and Nb,B will be equal to Nb for depths greater than 2nD.
Fig. 1. Small and large T-bar test concept.
4 M.S.S. Almeida et al. / Investigation of bearing capacity factor of T-bar penetrometer
Table 1Geotechnical properties of the kaolin-sand artificial clay mixture
Property Value
Liquid limit, wL 44%Plastic limit, wP 22%Soil particle density, Gs 2.61Effective unit weight, γ ′ 4.7 kN/m3
Coefficient of consolidation (mean value), cv 5.3 m2/yr
Table 2Geotechnical properties of the Roncador natural marine clay
Property Value
Liquid limit, wL 82%Plastic Index, IP 59%Soil particle density, Gs 2.66Effective unit weight, γ ′ 6.4 kN/m3
Coefficient of consolidation (mean value), cv 0.9 m2/yr
4. Soil properties
The tests were carried out in two different soils: artificial clay made of a 75% kaolin and 25% sand mixture, anda natural marine clay from the Roncador offshore site near Rio de Janeiro [16].
The artificial clay proportion was defined based on the results of a series of shear strength and consolidationtests. The percentage that led to geotechnical parameters as close as possible to those of typical Brazilian colluviumdeposits was selected. Table 1 shows the main geotechnical properties of this material.
The natural marine clay soil samples were taken from deepwater oil production sites offshore Rio de Janeiro Stateusing a Kullenberg sampler. The material was stored in PVC tubes that were internally sealed with paraffin. Thesoil can be described as greyish silty clay with some sand, and is classified as high plasticity clay (CH) accordingto the Unified Soil Classification System. Table 2 shows the main geotechnical properties of this material.
5. Test set-up
The tests were carried out at the Alberto Luiz Coimbra Institute – Graduate School and Research in Engineering(COPPE) 1.0 m diameter 90 g-ton load capacity mini-drum geotechnical centrifuge [17]. It includes 16 data acqui-sition channels and a 2 step motor drive and servo-controlled actuators: a linear one and a one which turntable onwhich the first one is mounted. The centrifuge is capable of 90◦ movement, changing the rotation axis from thevertical to the horizontal position, allowing more complex sample preparation. COPPE’s centrifuge has been mainlyused in studies related to pipelines [14], penetration tests [5, 8, 16] and mudmats [18]. For the present applicationa strongbox of dimension 502 mm in length, 210 mm wide and 140 mm high was used.
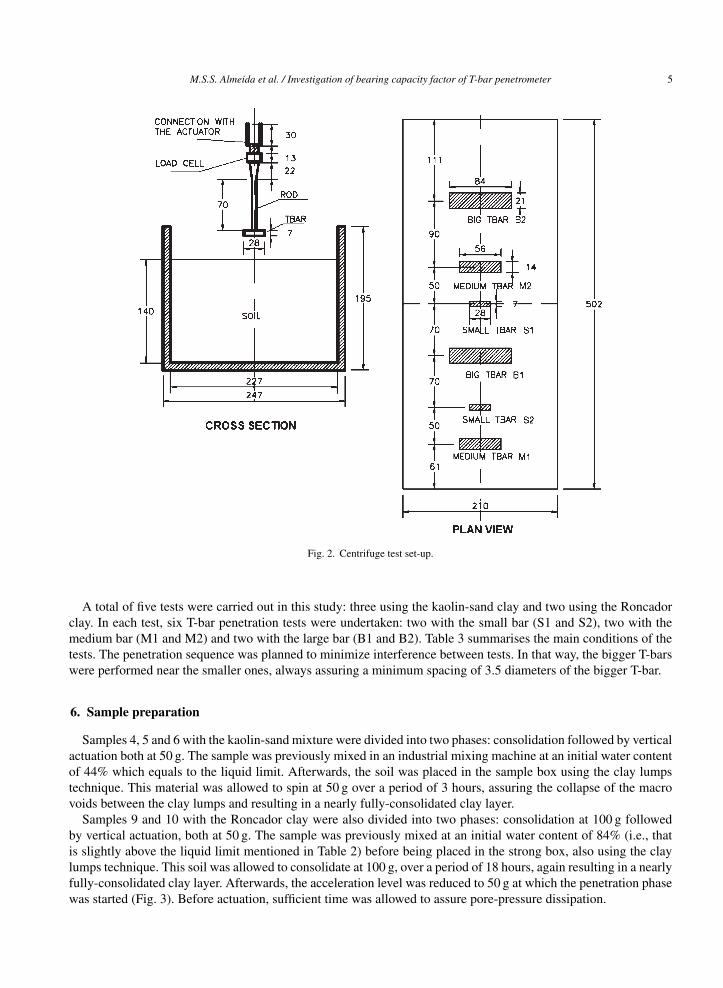
Three miniature T-bars were developed, comprising different bar diameters of 7 mm, 14 mm and 21 mm thatcorrespond to bar lengths of 28 mm, 56 mm and 84 mm, respectively. In such way, the medium one is twice the sizeof the smaller one, and the larger one is three times the size of the smaller one. The vertical force was measuredusing miniature tension and compression load cells, which are compensated for bending moments and thermalvariations, attached to the rigid shafts that hold the bars (Fig. 2). Although the location of the load cell incorporatesome contribution of the shaft friction forces during the penetration, this input was considered negligible, once thefocus of the paper is the behaviour at shallow depths.
The penetration rate was adjusted according to the bar dimensions in order to keep a constant normalisedvelocity, which is defined as the product of the penetration velocity by the bar diameter divided by the coefficient ofconsolidation [19]. Therefore the small T-bar was driven at 0.3 mm/s, the medium one at 0.2 mm/s, and the largerone at 0.1 mm/s.
M.S.S. Almeida et al. / Investigation of bearing capacity factor of T-bar penetrometer 5
Fig. 2. Centrifuge test set-up.
A total of five tests were carried out in this study: three using the kaolin-sand clay and two using the Roncadorclay. In each test, six T-bar penetration tests were undertaken: two with the small bar (S1 and S2), two with themedium bar (M1 and M2) and two with the large bar (B1 and B2). Table 3 summarises the main conditions of thetests. The penetration sequence was planned to minimize interference between tests. In that way, the bigger T-barswere performed near the smaller ones, always assuring a minimum spacing of 3.5 diameters of the bigger T-bar.
6. Sample preparation
Samples 4, 5 and 6 with the kaolin-sand mixture were divided into two phases: consolidation followed by verticalactuation both at 50 g. The sample was previously mixed in an industrial mixing machine at an initial water contentof 44% which equals to the liquid limit. Afterwards, the soil was placed in the sample box using the clay lumpstechnique. This material was allowed to spin at 50 g over a period of 3 hours, assuring the collapse of the macrovoids between the clay lumps and resulting in a nearly fully-consolidated clay layer.
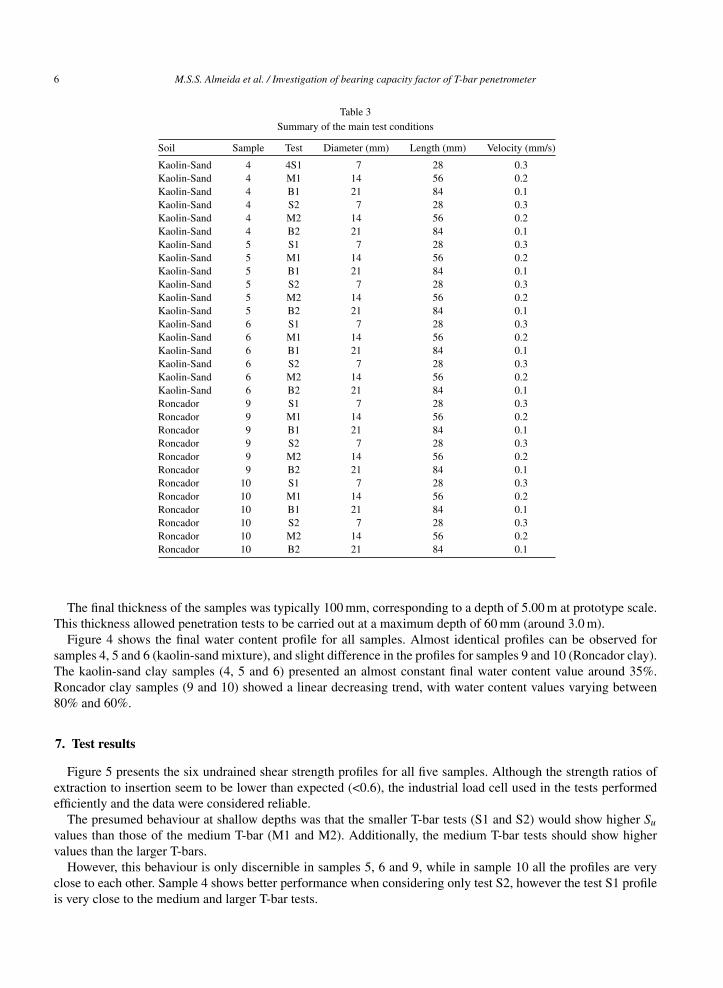
Samples 9 and 10 with the Roncador clay were also divided into two phases: consolidation at 100 g followedby vertical actuation, both at 50 g. The sample was previously mixed at an initial water content of 84% (i.e., thatis slightly above the liquid limit mentioned in Table 2) before being placed in the strong box, also using the claylumps technique. This soil was allowed to consolidate at 100 g, over a period of 18 hours, again resulting in a nearlyfully-consolidated clay layer. Afterwards, the acceleration level was reduced to 50 g at which the penetration phasewas started (Fig. 3). Before actuation, sufficient time was allowed to assure pore-pressure dissipation.
6 M.S.S. Almeida et al. / Investigation of bearing capacity factor of T-bar penetrometer
Table 3Summary of the main test conditions
Soil Sample Test Diameter (mm) Length (mm) Velocity (mm/s)
Kaolin-Sand 4 4S1 7 28 0.3Kaolin-Sand 4 M1 14 56 0.2Kaolin-Sand 4 B1 21 84 0.1Kaolin-Sand 4 S2 7 28 0.3Kaolin-Sand 4 M2 14 56 0.2Kaolin-Sand 4 B2 21 84 0.1Kaolin-Sand 5 S1 7 28 0.3Kaolin-Sand 5 M1 14 56 0.2Kaolin-Sand 5 B1 21 84 0.1Kaolin-Sand 5 S2 7 28 0.3Kaolin-Sand 5 M2 14 56 0.2Kaolin-Sand 5 B2 21 84 0.1Kaolin-Sand 6 S1 7 28 0.3Kaolin-Sand 6 M1 14 56 0.2Kaolin-Sand 6 B1 21 84 0.1Kaolin-Sand 6 S2 7 28 0.3Kaolin-Sand 6 M2 14 56 0.2Kaolin-Sand 6 B2 21 84 0.1Roncador 9 S1 7 28 0.3Roncador 9 M1 14 56 0.2Roncador 9 B1 21 84 0.1Roncador 9 S2 7 28 0.3Roncador 9 M2 14 56 0.2Roncador 9 B2 21 84 0.1Roncador 10 S1 7 28 0.3Roncador 10 M1 14 56 0.2Roncador 10 B1 21 84 0.1Roncador 10 S2 7 28 0.3Roncador 10 M2 14 56 0.2Roncador 10 B2 21 84 0.1
The final thickness of the samples was typically 100 mm, corresponding to a depth of 5.00 m at prototype scale.This thickness allowed penetration tests to be carried out at a maximum depth of 60 mm (around 3.0 m).
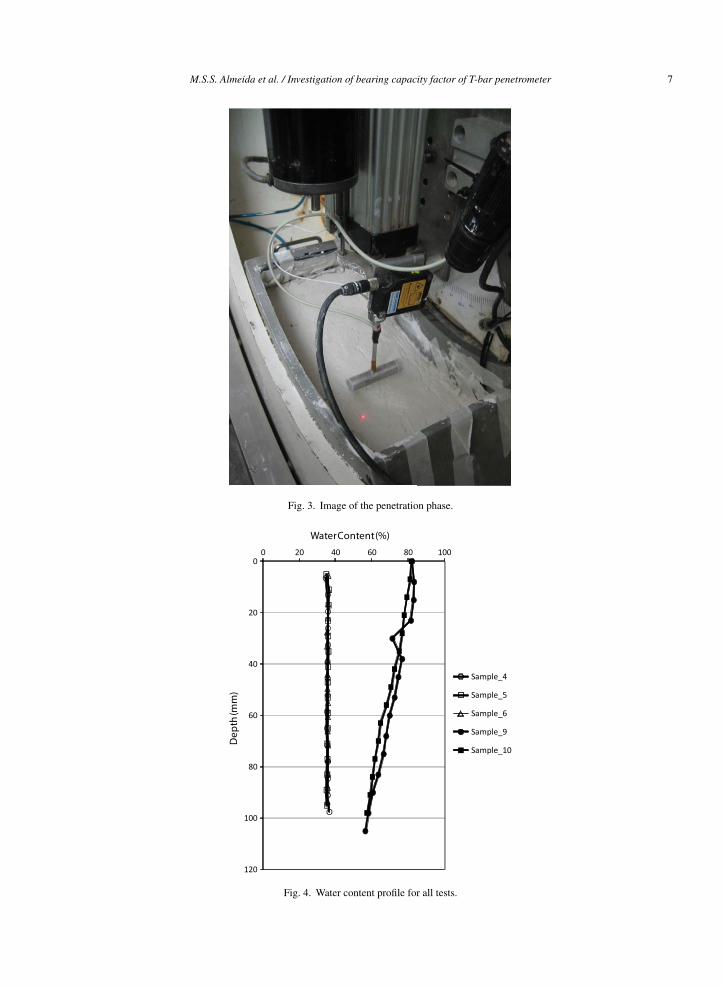
Figure 4 shows the final water content profile for all samples. Almost identical profiles can be observed forsamples 4, 5 and 6 (kaolin-sand mixture), and slight difference in the profiles for samples 9 and 10 (Roncador clay).The kaolin-sand clay samples (4, 5 and 6) presented an almost constant final water content value around 35%.Roncador clay samples (9 and 10) showed a linear decreasing trend, with water content values varying between80% and 60%.
7. Test results
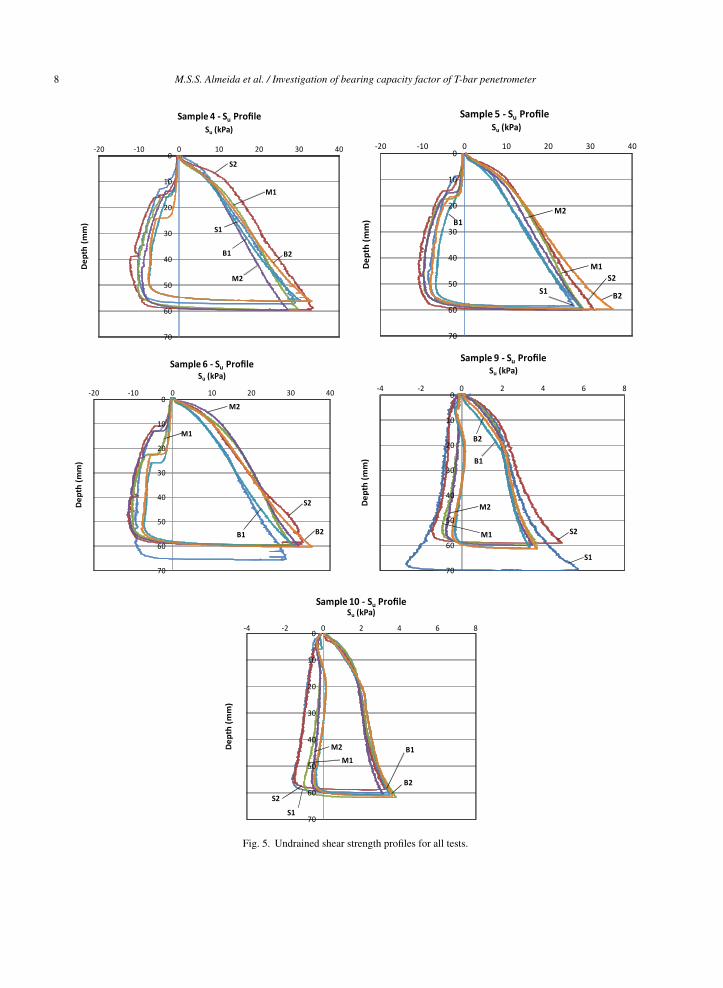
Figure 5 presents the six undrained shear strength profiles for all five samples. Although the strength ratios ofextraction to insertion seem to be lower than expected (<0.6), the industrial load cell used in the tests performedefficiently and the data were considered reliable.
The presumed behaviour at shallow depths was that the smaller T-bar tests (S1 and S2) would show higher Su
values than those of the medium T-bar (M1 and M2). Additionally, the medium T-bar tests should show highervalues than the larger T-bars.
However, this behaviour is only discernible in samples 5, 6 and 9, while in sample 10 all the profiles are veryclose to each other. Sample 4 shows better performance when considering only test S2, however the test S1 profileis very close to the medium and larger T-bar tests.
M.S.S. Almeida et al. / Investigation of bearing capacity factor of T-bar penetrometer 7
Fig. 3. Image of the penetration phase.
Fig. 4. Water content profile for all tests.
8 M.S.S. Almeida et al. / Investigation of bearing capacity factor of T-bar penetrometer
0
10
20
30
40
50
60
70
-20 -10 0 10 20 30 40
Dep
th (
mm
)
Su (kPa)Sample 5 - Su Profile
S1
S2M1
M2B1
B2
0
10
20
30
40
50
60
70
-4 -2 0 2 4 6 8
Dep
th (
mm
)Su (kPa)
Sample 9 - Su Profile
S1
S2M1
M2
B1
B2
0
10
20
30
40
50
60
70
-20 -10 0 10 20 30 40
Dep
th (
mm
)
Su (kPa)Sample 4 - Su Profile
S1
S2
M2
M1
B1 B2
0
10
20
30
40
50
60
70
-20 -10 0 10 20 30 40
Dep
th (
mm
)
Su (kPa)Sample 6 - Su Profile
B1
M1
M2
S2
B2
0
10
20
30
40
50
60
70
-4 -2 0 2 4 6 8
Dep
th (
mm
)
Su (kPa)Sample 10 - Su Profile
S1
B1M1
M2
S2
B2
Fig. 5. Undrained shear strength profiles for all tests.
M.S.S. Almeida et al. / Investigation of bearing capacity factor of T-bar penetrometer 9
Table 4Tests used to obtain the T-bar bearing factors
Soil Sample Smaller T-bar test Larger T-bar test
Kaolin-Sand 4 S1 B1Kaolin-Sand 4 S2 B2Kaolin-Sand 4 M1 B1Kaolin-Sand 5 S1 B1Kaolin-Sand 5 S2 B1Kaolin-Sand 5 S2 B2Kaolin-Sand 5 S2 M1Kaolin-Sand 5 M1 B1Kaolin-Sand 6 S2 B1Kaolin-Sand 6 M1 B1Kaolin-Sand 6 M2 B2Roncador 9 S1 B1Roncador 9 S2 B1Roncador 9 S2 M1Roncador 9 S1 M2Roncador 9 M1 B1Roncador 9 M2 B2Roncador 10 S1 B2Roncador 10 S2 B1Roncador 10 S1 M2Roncador 10 S2 M1Roncador 10 M1 B1
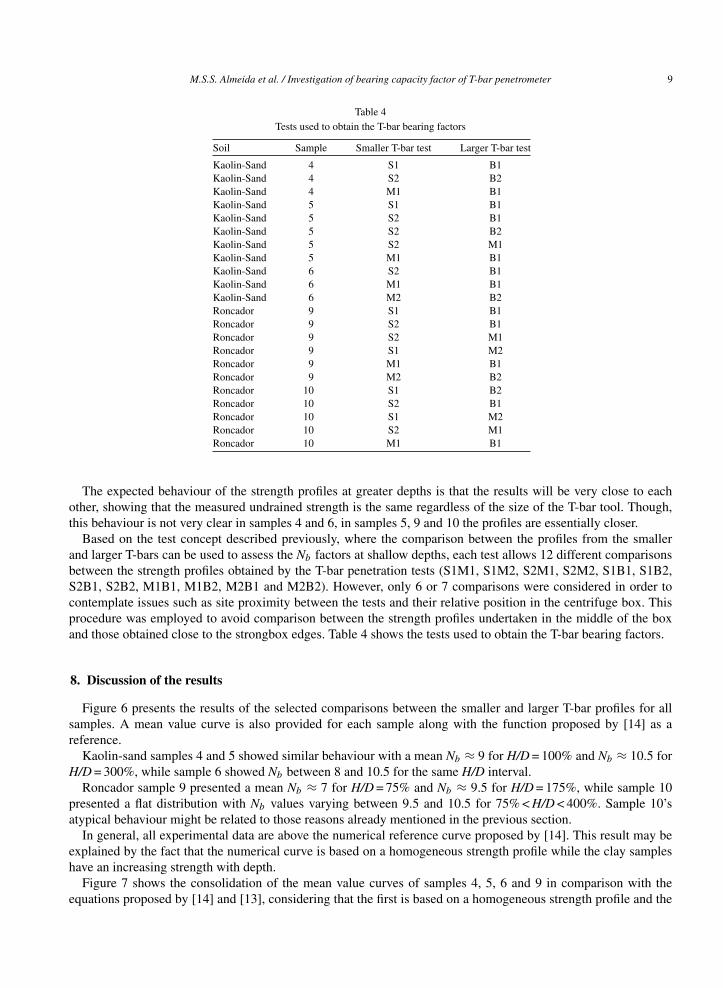
The expected behaviour of the strength profiles at greater depths is that the results will be very close to eachother, showing that the measured undrained strength is the same regardless of the size of the T-bar tool. Though,this behaviour is not very clear in samples 4 and 6, in samples 5, 9 and 10 the profiles are essentially closer.
Based on the test concept described previously, where the comparison between the profiles from the smallerand larger T-bars can be used to assess the Nb factors at shallow depths, each test allows 12 different comparisonsbetween the strength profiles obtained by the T-bar penetration tests (S1M1, S1M2, S2M1, S2M2, S1B1, S1B2,S2B1, S2B2, M1B1, M1B2, M2B1 and M2B2). However, only 6 or 7 comparisons were considered in order tocontemplate issues such as site proximity between the tests and their relative position in the centrifuge box. Thisprocedure was employed to avoid comparison between the strength profiles undertaken in the middle of the boxand those obtained close to the strongbox edges. Table 4 shows the tests used to obtain the T-bar bearing factors.
8. Discussion of the results
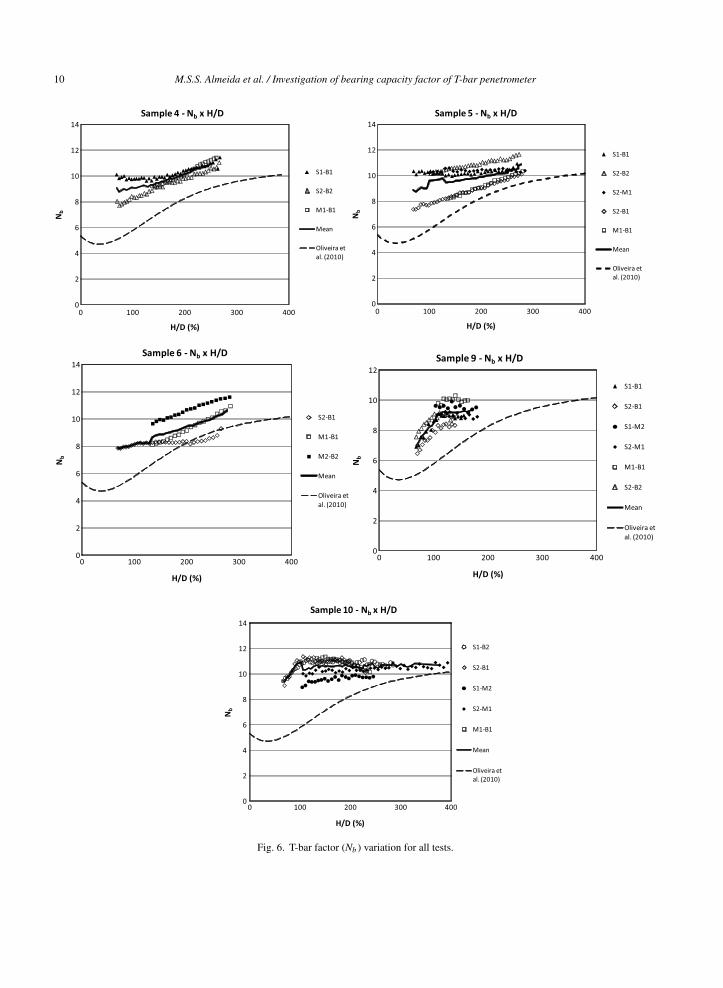
Figure 6 presents the results of the selected comparisons between the smaller and larger T-bar profiles for allsamples. A mean value curve is also provided for each sample along with the function proposed by [14] as areference.
Kaolin-sand samples 4 and 5 showed similar behaviour with a mean Nb ≈ 9 for H/D = 100% and Nb ≈ 10.5 forH/D = 300%, while sample 6 showed Nb between 8 and 10.5 for the same H/D interval.
Roncador sample 9 presented a mean Nb ≈ 7 for H/D = 75% and Nb ≈ 9.5 for H/D = 175%, while sample 10presented a flat distribution with Nb values varying between 9.5 and 10.5 for 75% < H/D < 400%. Sample 10’satypical behaviour might be related to those reasons already mentioned in the previous section.
In general, all experimental data are above the numerical reference curve proposed by [14]. This result may beexplained by the fact that the numerical curve is based on a homogeneous strength profile while the clay sampleshave an increasing strength with depth.
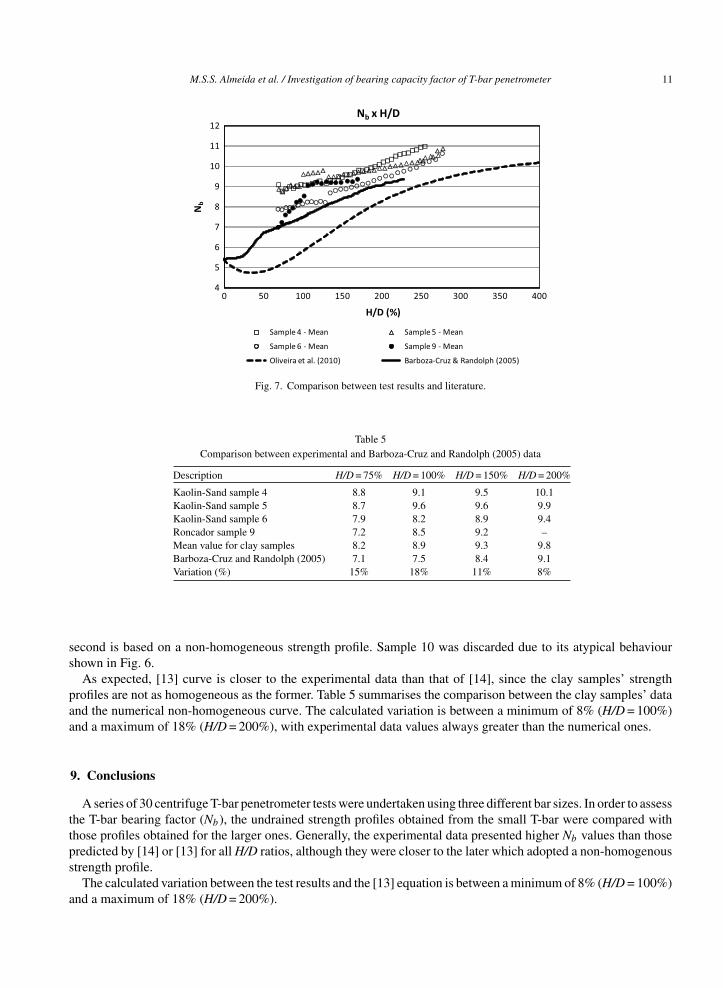
Figure 7 shows the consolidation of the mean value curves of samples 4, 5, 6 and 9 in comparison with theequations proposed by [14] and [13], considering that the first is based on a homogeneous strength profile and the
10 M.S.S. Almeida et al. / Investigation of bearing capacity factor of T-bar penetrometer
Fig. 6. T-bar factor (Nb ) variation for all tests.
M.S.S. Almeida et al. / Investigation of bearing capacity factor of T-bar penetrometer 11
Fig. 7. Comparison between test results and literature.
Table 5Comparison between experimental and Barboza-Cruz and Randolph (2005) data
Description H/D = 75% H/D = 100% H/D = 150% H/D = 200%
Kaolin-Sand sample 4 8.8 9.1 9.5 10.1Kaolin-Sand sample 5 8.7 9.6 9.6 9.9Kaolin-Sand sample 6 7.9 8.2 8.9 9.4Roncador sample 9 7.2 8.5 9.2 –Mean value for clay samples 8.2 8.9 9.3 9.8Barboza-Cruz and Randolph (2005) 7.1 7.5 8.4 9.1Variation (%) 15% 18% 11% 8%
second is based on a non-homogeneous strength profile. Sample 10 was discarded due to its atypical behaviourshown in Fig. 6.
As expected, [13] curve is closer to the experimental data than that of [14], since the clay samples’ strengthprofiles are not as homogeneous as the former. Table 5 summarises the comparison between the clay samples’ dataand the numerical non-homogeneous curve. The calculated variation is between a minimum of 8% (H/D = 100%)and a maximum of 18% (H/D = 200%), with experimental data values always greater than the numerical ones.
9. Conclusions
A series of 30 centrifuge T-bar penetrometer tests were undertaken using three different bar sizes. In order to assessthe T-bar bearing factor (Nb ), the undrained strength profiles obtained from the small T-bar were compared withthose profiles obtained for the larger ones. Generally, the experimental data presented higher Nb values than thosepredicted by [14] or [13] for all H/D ratios, although they were closer to the later which adopted a non-homogenousstrength profile.
The calculated variation between the test results and the [13] equation is between a minimum of 8% (H/D = 100%)and a maximum of 18% (H/D = 200%).
12 M.S.S. Almeida et al. / Investigation of bearing capacity factor of T-bar penetrometer
Acknowledgments
The authors are indebted to CENPES/PETROBRAS and the CAPES Funding Agency for their financial supportand interest in this project, and would also like to thank Julio Pequeno for his help with the centrifuge tests andJuliana Lukiantchuki for reviewing the paper.
References
[1] Chung SF, Randolph MF. Penetration resistance in soft clay for different shaped penetrometers. Proc 2nd Int Conf on Site Characterisation,Porto, 2004;pp. 671-677.
[2] Randolph MF. Offshore Geotechnics –the challenges of Deepwater Soft Sediments. In: Geotechinical Engineering State of the Art andPractice. GeoCongress 2012. ASCE Geotechinical Special Publication No. 226.
[3] Lunne T, Andersen K, Low HE, Sjursen M, Li X, Randolph MF. Guidelines for offshore in situ testing and interpretation in deep watersoft soils. Canadian Geotech J 2011;48(6):543-556.
[4] Stewart DP, Randolph MF. T-bar penetration testing in soft clay. J of Geotech Eng Div, ASCE 1994;120(12):2230-2235.[5] Oliveira JRMS, Almeida MSS. Pore-pressure generation in cyclic T-bar tests on clayey soil. In: International Journal of Physical Modelling
in Geotechnics 2010;10:19-24.[6] Stewart DP, Randolph MF. A new site investigation tool for the centrifuge, Proc Int Conf on Centrifuge Modeling –Centrifuge ’91, Boulder,
Colorado, 1991; 531-538.[7] Watson PG, Newson TA, Randolph MF. Strength profiling in soft offshore soils, Proc 1st Int Conf on Site Characterisation - ISC ’98,
Atlanta, 1998;21389-1394.[8] Almeida MSS, Oliveira JRMS, Motta HPG, Almeida MCF, Borges RG. CPT and T-bar Penetrometers for Site Investigation in Centrifuge
Tests. Soils and Rocks, Sao Paulo 2011;34(1):79-88.[9] Randolph MF, Houlsby GT. The limiting pressure on a circular pile loaded laterally in cohesive soil, Geotechnique 1984;34(4):613-623.
[10] Randolph MF. Characterization of soft sediments for offshore applications. Proc Geotechnical and Geophysical Site Characterization,Millpress, Rotterdam, 2004; pp. 209-232.
[11] Low HE, Lunne T, Anderesen KH, Sjursen MA, Li X, Randolph MF. Estimation of intact and remoulded undrained shear strengthfrompenetration tests in soft clays. Geotechnique 2010;60(11):843-859.
[12] Low HE, Randolph MF, Lunne T, Anderesen KH, Sjursen MA. Effects of soil characteristics on relative values of piezocone, T-bar andball penetration resistances. Geotechnique 2011;61(8):651-664.
[13] Barboza-Cruz ER, Randolph MF. Bearing capacity and large penetration of a cylindrical object at shallow embedment. Proc Frontiers inoffshore geotechnics, Australia: Perth, 2005. pp. 615-621.
[14] Oliveira JRMS, Almeida MSS, Almeida MCF, Borges RG. Physical Modeling of Lateral Clay-Pipe Interaction. Journal of Geotechnicaland Geoenvironmental Engineering 2010;136:950-956.
[15] White DJ, Gaudin C, Boylan N, Zhou, H. Interpretation of T-bar penetrometer tests at shallow embedment and in very soft soils. CanadianGeotechnical Journal 2010;47(2):218-229.
[16] Oliveira JRMS, Almeida MSS, Motta HPG, Almeida MCF. Influence of penetration rate on penetrometer resistance. Journal of Geotechnicaland Geoenvironmental Engineering 2011;137:695-703.
[17] Neto JLS, Oliveira JRMS, Almeida MSS, Almeida MCF, Fagundes DF. Retrofits to COPPE mini-drum geotechnical centrifuge. Proc 7thInt Conf on Physical Modelling in Geotechnics, Zurich, 2010;1:211-216.
[18] Fagundes DF, Rammah KI, Almeida MSS, Pequeno J, Oliveira JRMS, Borges RG. Strength Behaviour Analysis of an offshore BrazilianMarine Clay. Proc 31st Int Conf on Ocean, Offshore and Artic Engineering, 2012.
[19] Chung SF, Randolph MF, Schneider JA. Effect of penetration rate on penetrometer resistance in clay. Journal of Geotechnical andGeoenvironmental Engineering, ASCE, 2006;132(9):1188-1196.


