Embed Size (px)
Citation preview
Investigating Entrepreneurial Intensity
and Capability among South African
Exporting Firms
MPHO RAYMOND SEFALAFALA
Student Number: 9613093A
A research report submitted to the Faculty of Commerce, Law and Management,
University of the Witwatersrand, in partial fulfilment of the requirements for the
degree of Master of Management with specialisation in Entrepreneurship and New
Venture Creation.
University of the Witwatersrand, Johannesburg, March 2012
ii
ABSTRACT
Given the increasing interest in international entrepreneurship and an increasing
reliance of emerging economies on exporting to reach global markets, an investigation
into internationalising firms in emerging economies is vital. Not only do these firms
face pressures arising from the liability of smallness, foreignness, and resource
limitations, but they also need compensating advantages in order to viably compete on
the international stage.
This study contributes to the international entrepreneurship literature by analysing the
relationship between entrepreneurial intensity and capability, taken as independent
variables, and their effect on international performance, taken as a multi-item
dependent variable. The study uses a sample of 117 South African exporting firms of
any size, industry, and/or age. Furthermore foreign environmental conditions within
which these firms operate are measured in terms of their impact/moderation on the
relationship between the independent variables and international performance. The
study examines entrepreneurial intensity, which is a measure of the level of
entrepreneurship in a firm that looks at both the degree and frequency of events with
respect to innovativeness, proactiveness and risk-taking. The study also examines
three entrepreneurial capabilities – namely social capital, human capital, and
technology - that can enhance a firm’s international performance. Performance
consists of two dimensions – namely economic performance and export intensity.
Export intensity is a proxy of international intensity, measured as a ratio of foreign
sales as a percentage of total sales.
In this study, the dimensions of social capital that are measured are social interaction,
relationship quality and network ties. Social capital is analysed in relationships among
firms and their foreign actors/contacts. Social capital is also analysed as a
multidimensional asset inside the business relationships comprising of both strong and
weak ties, and implemented by the firms with their international partners or contacts.
Social interaction and relationship quality corresponds to inter-organisational strong
ties whereas network ties correspond to weak ties.
iii
Human capital consists of three dimensions – namely foreign institutional knowledge,
foreign business knowledge, and internationalisation knowledge – based on the
conception of foreign market knowledge.
The two aspects of technology that are measured are technology distinctiveness and
technology acquisition.
The study also offers insights into key firm-level factors that influence international
performance under foreign environmental conditions characterised by hostility and
dynamism.
Hypotheses were put forward to be tested in order to facilitate the study. To test the
hypothesised bivariate relationship between entrepreneurial intensity and
performance, correlation analysis was performed to examine the relationship between
the predictors and the performance variables. Similarly, the tests were performed to
examine the hypothesised bivariate relationship between entrepreneurial capabilities
and performance variables. To test the impact of the environmental moderators on
the efficacy of entrepreneurial intensity (EI) and entrepreneurial capability (EC),
multiple regression analysis was performed.
Overall the results show that EI and EC had a significant effect on both performance
measures, with EC predicting stronger than EI.
The results showed that different aspects of EI were associated with performance
depending on the performance outcomes desired. Frequency of entrepreneurship was
related to economic performance whereas entrepreneurial orientation (EO) was
related to export intensity. Furthermore EI had a weakening impact under moderating
conditions of increasing hostility on both performance measures. Dynamism did not
moderate the relationship between EI and performance.
EC had a positive impact under all moderating conditions on both performance
measures.
Social capital played an important role in hostile foreign environments whereas human
capital was more important in dynamic foreign environments. In hostile foreign
iv
business environments, strongly embedded relationships did not provide benefits for
advancing business whereas weak ties did. In dynamic foreign environments,
internationalisation knowledge (prior internationalisation experience) was associated
with both performance variables whereas foreign institutional knowledge (FIK) and
foreign business knowledge (FBK) were not found to be important.
The overall comparison revealed that in the foreign market environment,
entrepreneurial capabilities were more important predictors of performance than
entrepreneurial intensity. This suggests that entrepreneurial firms must possess
compensating advantages in order to compete viably in unfamiliar markets abroad if
they are not strong on innovation, proactiveness, and taking risks. Knowledge-based
factors encourage initiative and flexibility among managers to gain influence over vital
resources. However the challenge remains for the firms in emerging economies to
adopt technology and act entrepreneurially.
The results suggest that exporting firms in emerging market countries should pursue
an entrepreneurial posture in order to achieve higher export intensity and engage in
frequent product, process, and service enhancement activities if the objective is to
achieve economic performance.
Furthermore, the study found that entrepreneurial capability among South African
exporting firms is positively related to performance. The study found that in order to
improve their export intensity, human capital and social capital are among the most
essential capabilities for organisational perfomance, whereas technology was not.
The purpose of this research was to perform an empirical investigation on three main
constructs - namely: entrepreneurial intensity, entrepreneurial capabilities, and the
environmental dimensions - among South African exporting firms and the relationship
of these factors with international performance.
This study integrates the role of entrepreneurial intensity and capability in
international entrepreneurship and their effects on performance of exporting firms
within an emerging market context.

v
In line with theoretical studies in international entrepreneurship, this study reinforces
the strategic role of entrepreneurial capabilities such as social capital and human
capital in enhancing international performance. The role of EO and technology
acquisition is also acknowledged.

vi
DECLARATION
I, Mpho Raymond Sefalafala, declare that this research report is my own work except
as indicated in the references and acknowledgements. It is submitted in partial
fulfilment of the requirements for the degree of Master of Management in the
University of the Witwatersrand, Johannesburg. It has not been submitted before for
any degree or examination in this or any other university.
MPHO RAYMOND SEFALAFALA
Signed at ……………………………………………………
On the …………………………….. day of ………………………… 2012

vii
DEDICATION
“An apple never falls far from the tree,” English proverb.
This research report is dedicated to my dear parents, Mr Rector Matome Sefalafala
and Mrs Rachel Moremadi Sefalafala, without whose vision and greatness I would not
have followed this path.

viii
ACKNOWLEDGEMENTS
“It is said that an artist must pause occasionally from the task of painting a great
masterpiece and take a sometimes difficult step back from the canvas in order to view
the work in progress from a more objective, less involved perspective. It is, after all,
only by stepping back that the artist is better able to identify any flaws to correct or
strokes of brilliance from which renewed inspiration may be drawn to complete the
magnum opus. Indeed, it may be ironically prudent to pull back in order to move
forward more wisely and more purposefully than before, whether it be in art or other
fields of endeavour. It is thus where one finds oneself after a year of frantic and furious
search: taking pause, breath and stock of what has been in order to better plot out
what is to be, ” Wolfgang Welsch.
While this work has been an iterative and reflective process of self-pursuit and
realisation, I wish to acknowledge those who provided assistance and support through
and through to its completion.
I would like to express my sincere gratitude to:
Dr Jose Barreira, my supervisor, for his time, guidance, and mentoring throughout the
process of conducting this research;
Mrs Merle Werbeloff for her unparalleled guidance and tireless effort in assistance
with the statistical analysis;
The export councils who distributed my questionnaires to their members;
All friends who assisted in any way, and family for their moral support and
encouragement;
The firms that took the time and effort to complete the survey questionnaires;
Finally, and most importantly, my wife and children for their endless love and support
that carried me through the course.
ix
TABLE OF CONTENTS
ABSTRACT ..................................................................................... II
DECLARATION ............................................................................. VI
DEDICATION ............................................................................... VII
LIST OF TABLES .........................................................................XIII
LIST OF FIGURES .................................................................... XVIII
CHAPTER 1: INTRODUCTION ....................................................... 1
1.1 PURPOSE OF THE STUDY ............................................................................ 1
1.2 CONTEXT OF THE STUDY ............................................................................. 3 1.2.1 SOUTH AFRICAN EXPORTS ...................................................................................... 6
1.3 PROBLEM STATEMENT ................................................................................ 7 1.3.1 MAIN PROBLEM ...................................................................................................... 7 1.3.2 SUB-PROBLEMS ..................................................................................................... 7
1.4 SIGNIFICANCE OF THE STUDY ...................................................................... 7
1.5 DELIMITATIONS OF THE STUDY................................................................... 11
1.6 DEFINITION OF TERMS .............................................................................. 11
1.7 ASSUMPTIONS ......................................................................................... 14
CHAPTER 2: LITERATURE REVIEW ........................................... 15
2.1. INTRODUCTION ........................................................................................ 15
2.2. DEFINITION OF TOPIC OR BACKGROUND DISCUSSION ................................... 15 2.2.1. INTERNATIONALISATION ........................................................................................ 15 2.2.2. MEASUREMENT OF INTERNATIONAL PERFORMANCE ................................................ 21
2.3. ENTREPRENEURIAL INTENSITY ................................................................... 25 2.3.1 THE DIMENSIONS OF ENTREPRENEURSHIP ............................................................. 25 2.3.2 THE CONCEPT OF ENTREPRENEURIAL INTENSITY .................................................... 30 2.3.3 ENTREPRENEURIAL INTENSITY AND PERFORMANCE ................................................ 32 2.3.4 ENTREPRENEURIAL INTENSITY AND INTERNATIONALISATION .................................... 34 2.3.5 SUMMARY OF LITERATURE ON ENTREPRENEURIAL INTENSITY AND FORMULATION OF
HYPOTHESIS 1 37
2.4. ENTREPRENEURIAL CAPABILITIES .............................................................. 39 2.4.1 INTRODUCTION ..................................................................................................... 39 2.4.2 SOCIAL CAPITAL ................................................................................................... 41 2.4.2.1 SOCIAL CAPITAL THEORY OF ENTREPRENEURSHIP .................................................. 41 2.4.2.2 SOCIAL CAPITAL AND INTERNATIONALISATION ......................................................... 47 2.4.3 HUMAN CAPITAL ................................................................................................... 54 2.4.3.1 HUMAN CAPITAL THEORY OF ENTREPRENEURSHIP .................................................. 54 2.4.3.2 HUMAN CAPITAL AND INTERNATIONALISATION ......................................................... 59
x
2.4.4 TECHNOLOGY ...................................................................................................... 65 2.4.5 SUMMARY OF LITERATURE ON ENTREPRENEURIAL CAPABILITIES AND FORMULATION OF
HYPOTHESIS 2 71
2.5. THE ENVIRONMENT .................................................................................. 73 2.5.1 ENVIRONMENTAL HOSTILITY .................................................................................. 74 2.5.2 ENVIRONMENTAL DYNAMISM ................................................................................. 75 2.5.3 SUMMARY OF LITERATURE REVIEW ON THE ENVIRONMENTAL FACTORS AND
FORMULATION OF HYPOTHESIS 3 AND 4 ........................................................................................... 76
2.6. CONCLUSION OF LITERATURE REVIEW ....................................................... 77 2.6.1 HYPOTHESIS 1: .................................................................................................... 78 2.6.2 HYPOTHESIS 2: .................................................................................................... 78 2.6.3 HYPOTHESIS 3: .................................................................................................... 78 2.6.4 HYPOTHESIS 4: .................................................................................................... 78 2.6.5 THE THEORETICAL FRAMEWORK ............................................................................ 79
CHAPTER 3: RESEARCH METHODOLOGY ............................... 81
3.1 RESEARCH METHODOLOGY /PARADIGM ...................................................... 81
3.2 RESEARCH DESIGN .................................................................................. 84
3.3 POPULATION AND SAMPLE......................................................................... 85 3.3.1 POPULATION ........................................................................................................ 85 3.3.2 SAMPLE AND SAMPLING METHOD ........................................................................... 85
3.4 THE RESEARCH INSTRUMENT .................................................................... 88
3.5 PROCEDURE FOR DATA COLLECTION .......................................................... 92
3.6 DATA ANALYSIS AND INTERPRETATION ....................................................... 92 3.6.1 REGRESSION ANALYSIS ........................................................................................ 92 3.6.2 MODERATOR EFFECTS .......................................................................................... 94 3.6.3 REGRESSION ASSUMPTIONS ................................................................................. 95 3.6.4 DESCRIPTIVE STATISTICS ...................................................................................... 96 3.6.5 EXPLORATORY DATA ANALYSIS ............................................................................. 96
3.7 VALIDITY AND RELIABILITY ......................................................................... 97 3.7.1 EXTERNAL VALIDITY .............................................................................................. 98 3.7.2 INTERNAL VALIDITY ............................................................................................... 98 3.7.3 RELIABILITY ......................................................................................................... 99
3.8 LIMITATIONS OF THE STUDY ..................................................................... 101
CHAPTER 4: PRESENTATION OF RESULTS ........................... 103
4.1 INTRODUCTION ...................................................................................... 103
4.2 SAMPLE CHARACTERISTICS ..................................................................... 103 4.2.1 DEMOGRAPHIC PROFILE OF RESPONDENTS .......................................................... 103 4.2.2 DEMOGRAPHIC PROFILE OF FIRMS ....................................................................... 104 4.2.2.1 FIRM SIZE .......................................................................................................... 104 4.2.2.2 FIRM AGE ........................................................................................................... 104 4.2.2.3 FIRM INDUSTRY .................................................................................................. 105 4.2.2.4 SPEED OF INTERNATIONALISATION ...................................................................... 106 4.2.2.5 SCOPE OF INTERNATIONALISATION ...................................................................... 107 4.2.2.6 EXPORT INTENSITY ............................................................................................. 107
4.3 MEASUREMENT OF VARIABLES OF THE MODEL .......................................... 109 4.3.1 RELIABILITY ....................................................................................................... 110 4.3.1.1 INDEPENDENT VARIABLES ................................................................................... 111 4.3.1.1.1 ENTREPRENEURIAL INTENSITY (EI) ................................................................ 111
xi
4.3.1.1.2 ENTREPRENEURIAL CAPABILITIES (EC) .......................................................... 112 4.3.1.2 MODERATING VARIABLES .................................................................................... 113 4.3.1.2.1 HOSTILITY .................................................................................................... 113 4.3.1.2.2 DYNAMISM ................................................................................................... 113 4.3.1.3 DEPENDENT VARIABLES ...................................................................................... 113 4.3.1.3.1 ECONOMIC PERFORMANCE ............................................................................ 114 4.3.2 VALIDITY ............................................................................................................ 114 4.3.2.1 INDEPENDENT VARIABLES ................................................................................... 115 4.3.2.1.1 ENTREPRENEURIAL INTENSITY (EI) ................................................................ 115 4.3.2.1.2 ENTREPRENEURIAL CAPABILITIES (EC) .......................................................... 118 4.3.2.2 HYPOTHESISED MODERATING VARIABLES ............................................................ 120 4.3.2.2.1 HOSTILITY .................................................................................................... 122 4.3.2.2.2 DYNAMISM ................................................................................................... 124 4.3.2.3 DEPENDENT VARIABLES ...................................................................................... 124 4.3.2.3.1 ECONOMIC PERFORMANCE ............................................................................ 125 4.3.2.3.2 EVALUATION OF THE RETENTION OF ADDITIONAL MEASURES OF THE DEPENDENT
VARIABLE 126 4.3.3 DESCRIPTIVE STATISTICS .................................................................................... 131 4.3.3.1 DESCRIPTIVE STATISTICS .................................................................................... 131 4.3.3.2 GRAPHICAL FREQUENCY DISTRIBUTIONS .............................................................. 132 4.3.5 CONTROL VARIABLES .......................................................................................... 132 4.3.6 CONCLUSIONS ON THE MEASUREMENTS ADEQUACY OF THE VARIABLES ................. 133
4.4 TESTS OF THE MODEL ............................................................................. 134 4.4.1 HYPOTHESES RESTATED BASED ON CONCLUSIONS ON THE MEASUREMENTS ADEQUACY
OF THE VARIABLES ....................................................................................................................... 137 4.4.2 SYSTEMATIC PRESENTATION OF THE MODEL: BASE MODEL AND MODERATED MODEL
138
4.5 CHECK FOR REGRESSION ASSUMPTIONS .................................................. 172
4.6 CONCLUSIONS ....................................................................................... 172
4.7 SUMMARY OF THE RESULTS .................................................................... 173
CHAPTER 5: DISCUSSION OF THE RESULTS ......................... 176
5.1 SAMPLE CHARACTERISTICS ..................................................................... 176 5.2.1 DEMOGRAPHIC PROFILE OF RESPONDENTS .......................................................... 176 5.2.2 DEMOGRAPHIC PROFILE OF FIRMS ....................................................................... 177 5.2.2.1 FIRM SIZE .......................................................................................................... 177 5.2.2.2 FIRM INDUSTRY .................................................................................................. 177 5.2.2.3 FIRM AGE ........................................................................................................... 178 5.2.2.4 SPEED OF INTERNATIONALISATION ...................................................................... 178 5.2.2.5 SCOPE OF INTERNATIONALISATION ...................................................................... 178 5.2.2.6 EXPORT INTENSITY ............................................................................................. 179
5.2 DISCUSSION PERTAINING TO ENTREPRENEURIAL INTENSITY: HYPOTHESIS 1 AND
HYPOTHESIS 3 ....................................................................................... 180
5.4 DISCUSSION PERTAINING TO PERTAINING TO ENTREPRENEURIAL CAPABILITIES: HYPOTHESIS 2 AND HYPOTHESIS 4 .......................................................... 189
5.5 CONCLUSION ......................................................................................... 202
CHAPTER 6: CONCLUSIONS AND RECOMMENDATIONS ...... 209
6.1 INTRODUCTION ...................................................................................... 209
6.2 CONCLUSIONS OF THE STUDY ................................................................. 209
xii
6.3 RECOMMENDATIONS .............................................................................. 216
6.4 SUGGESTIONS FOR FURTHER RESEARCH ................................................. 217
REFERENCES ............................................................................ 218
APPENDIX A ............................................................................... 229
ETHICS LETTER ................................................................................................ 230
ACTUAL RESEARCH INSTRUMENT ....................................................................... 231
APPENDIX B ............................................................................... 232
CONSISTENCY MATRIX ....................................................................................... 233
APPENDIX C ............................................................................... 236
TABLES AND FIGURES ........................................................................................ 237
xiii
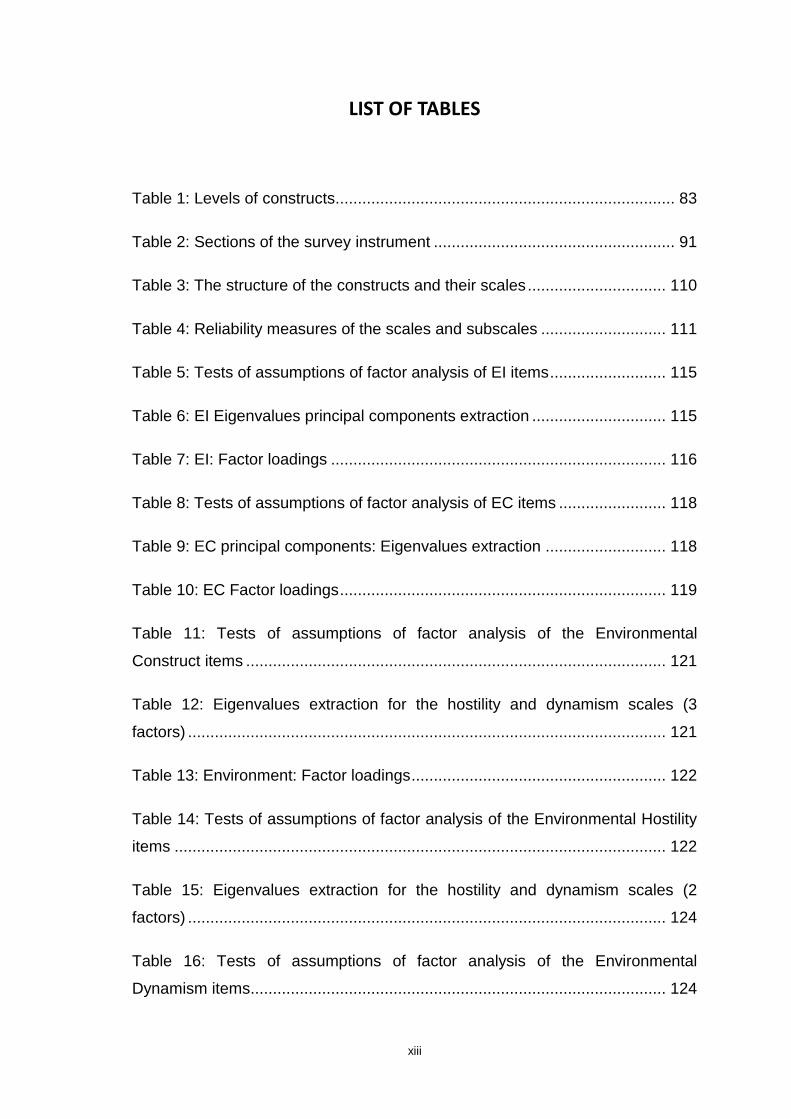
LIST OF TABLES
Table 1: Levels of constructs............................................................................ 83
Table 2: Sections of the survey instrument ...................................................... 91
Table 3: The structure of the constructs and their scales ............................... 110
Table 4: Reliability measures of the scales and subscales ............................ 111
Table 5: Tests of assumptions of factor analysis of EI items .......................... 115
Table 6: EI Eigenvalues principal components extraction .............................. 115
Table 7: EI: Factor loadings ........................................................................... 116
Table 8: Tests of assumptions of factor analysis of EC items ........................ 118
Table 9: EC principal components: Eigenvalues extraction ........................... 118
Table 10: EC Factor loadings ......................................................................... 119
Table 11: Tests of assumptions of factor analysis of the Environmental
Construct items .............................................................................................. 121
Table 12: Eigenvalues extraction for the hostility and dynamism scales (3
factors) ........................................................................................................... 121
Table 13: Environment: Factor loadings ......................................................... 122
Table 14: Tests of assumptions of factor analysis of the Environmental Hostility
items .............................................................................................................. 122
Table 15: Eigenvalues extraction for the hostility and dynamism scales (2
factors) ........................................................................................................... 124
Table 16: Tests of assumptions of factor analysis of the Environmental
Dynamism items ............................................................................................. 124
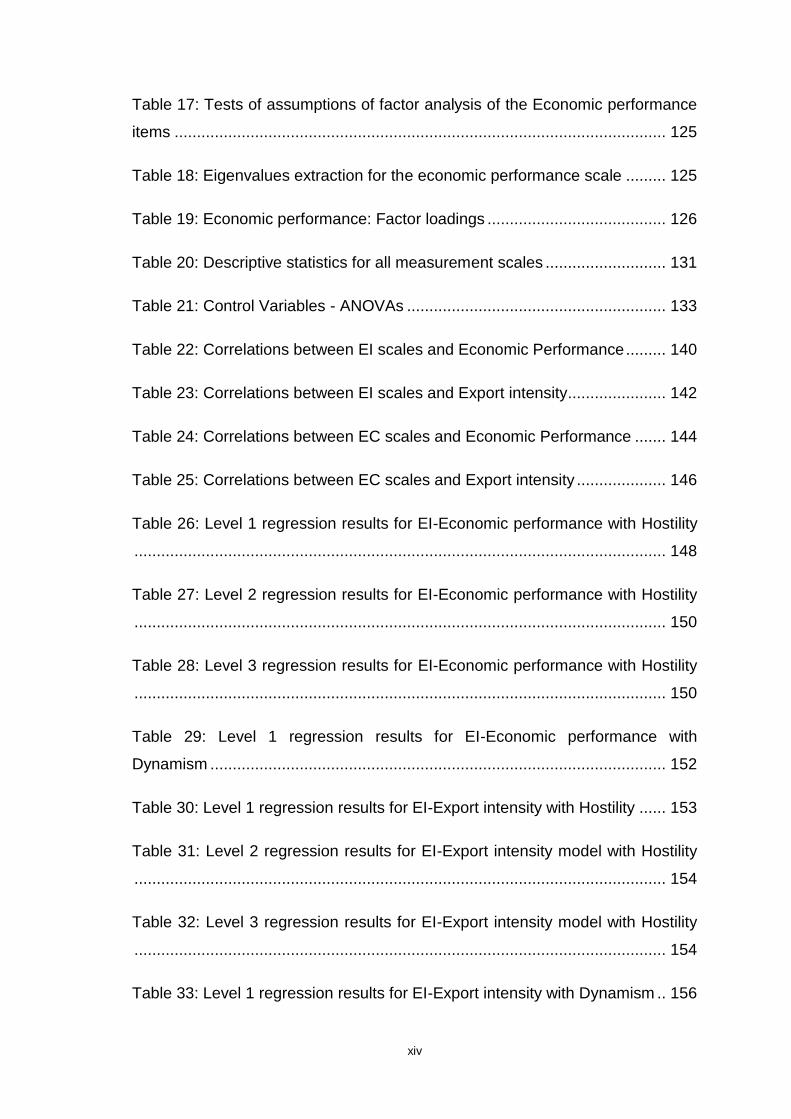
xiv
Table 17: Tests of assumptions of factor analysis of the Economic performance
items .............................................................................................................. 125
Table 18: Eigenvalues extraction for the economic performance scale ......... 125
Table 19: Economic performance: Factor loadings ........................................ 126
Table 20: Descriptive statistics for all measurement scales ........................... 131
Table 21: Control Variables - ANOVAs .......................................................... 133
Table 22: Correlations between EI scales and Economic Performance ......... 140
Table 23: Correlations between EI scales and Export intensity...................... 142
Table 24: Correlations between EC scales and Economic Performance ....... 144
Table 25: Correlations between EC scales and Export intensity .................... 146
Table 26: Level 1 regression results for EI-Economic performance with Hostility
....................................................................................................................... 148
Table 27: Level 2 regression results for EI-Economic performance with Hostility
....................................................................................................................... 150
Table 28: Level 3 regression results for EI-Economic performance with Hostility
....................................................................................................................... 150
Table 29: Level 1 regression results for EI-Economic performance with
Dynamism ...................................................................................................... 152
Table 30: Level 1 regression results for EI-Export intensity with Hostility ...... 153
Table 31: Level 2 regression results for EI-Export intensity model with Hostility
....................................................................................................................... 154
Table 32: Level 3 regression results for EI-Export intensity model with Hostility
....................................................................................................................... 154
Table 33: Level 1 regression results for EI-Export intensity with Dynamism .. 156
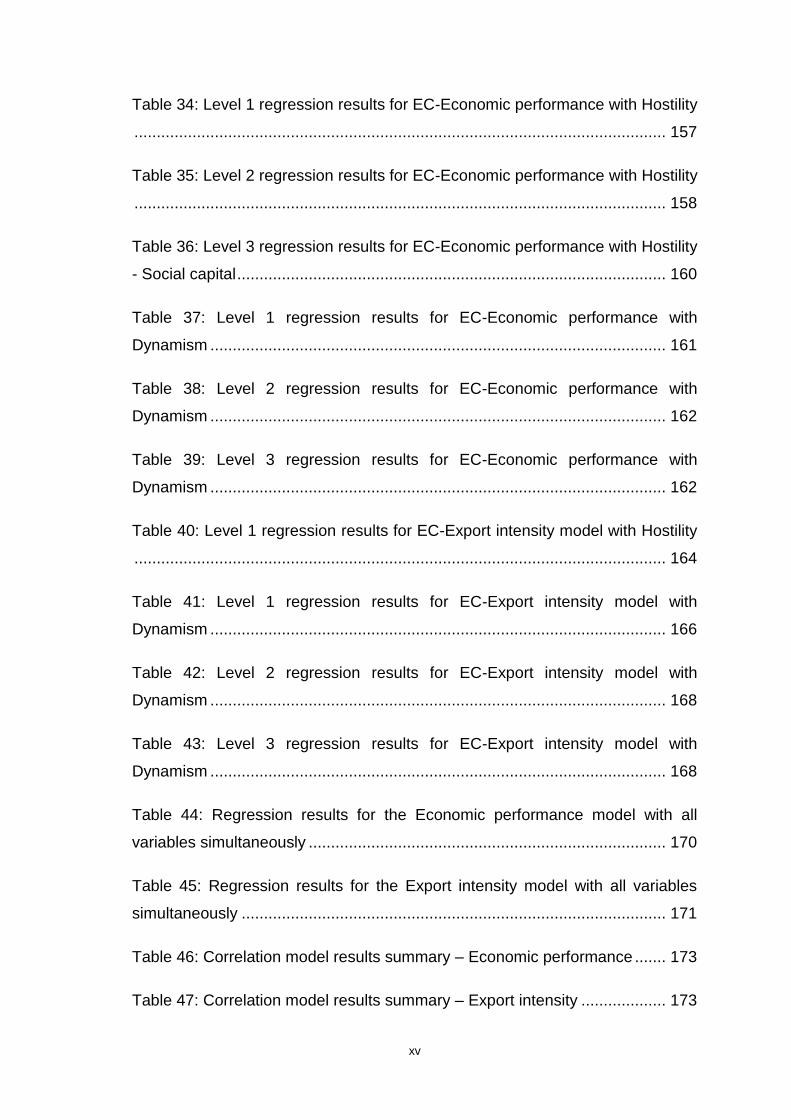
xv
Table 34: Level 1 regression results for EC-Economic performance with Hostility
....................................................................................................................... 157
Table 35: Level 2 regression results for EC-Economic performance with Hostility
....................................................................................................................... 158
Table 36: Level 3 regression results for EC-Economic performance with Hostility
- Social capital ................................................................................................ 160
Table 37: Level 1 regression results for EC-Economic performance with
Dynamism ...................................................................................................... 161
Table 38: Level 2 regression results for EC-Economic performance with
Dynamism ...................................................................................................... 162
Table 39: Level 3 regression results for EC-Economic performance with
Dynamism ...................................................................................................... 162
Table 40: Level 1 regression results for EC-Export intensity model with Hostility
....................................................................................................................... 164
Table 41: Level 1 regression results for EC-Export intensity model with
Dynamism ...................................................................................................... 166
Table 42: Level 2 regression results for EC-Export intensity model with
Dynamism ...................................................................................................... 168
Table 43: Level 3 regression results for EC-Export intensity model with
Dynamism ...................................................................................................... 168
Table 44: Regression results for the Economic performance model with all
variables simultaneously ................................................................................ 170
Table 45: Regression results for the Export intensity model with all variables
simultaneously ............................................................................................... 171
Table 46: Correlation model results summary – Economic performance ....... 173
Table 47: Correlation model results summary – Export intensity ................... 173
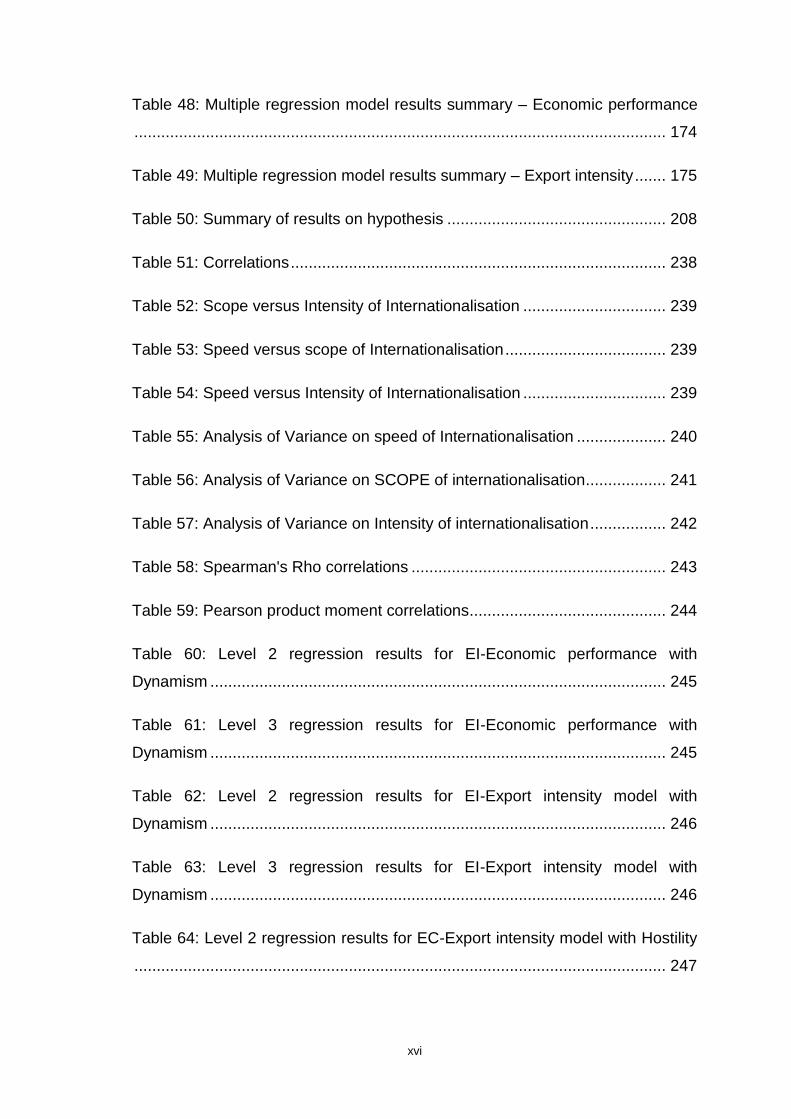
xvi
Table 48: Multiple regression model results summary – Economic performance
....................................................................................................................... 174
Table 49: Multiple regression model results summary – Export intensity ....... 175
Table 50: Summary of results on hypothesis ................................................. 208
Table 51: Correlations .................................................................................... 238
Table 52: Scope versus Intensity of Internationalisation ................................ 239
Table 53: Speed versus scope of Internationalisation .................................... 239
Table 54: Speed versus Intensity of Internationalisation ................................ 239
Table 55: Analysis of Variance on speed of Internationalisation .................... 240
Table 56: Analysis of Variance on SCOPE of internationalisation.................. 241
Table 57: Analysis of Variance on Intensity of internationalisation ................. 242
Table 58: Spearman's Rho correlations ......................................................... 243
Table 59: Pearson product moment correlations............................................ 244
Table 60: Level 2 regression results for EI-Economic performance with
Dynamism ...................................................................................................... 245
Table 61: Level 3 regression results for EI-Economic performance with
Dynamism ...................................................................................................... 245
Table 62: Level 2 regression results for EI-Export intensity model with
Dynamism ...................................................................................................... 246
Table 63: Level 3 regression results for EI-Export intensity model with
Dynamism ...................................................................................................... 246
Table 64: Level 2 regression results for EC-Export intensity model with Hostility
....................................................................................................................... 247

xvii
Table 65: Level 3 regression results for EC-Export intensity model with Hostility
....................................................................................................................... 247
xviii
LIST OF FIGURES
Figure 1: The contextual model of the study ...................................................... 6
Figure 2: High-level conceptual model of constructs ........................................ 11
Figure 3: An illustration of entrepreneurial intensity ......................................... 32
Figure 4: The entrepreneurial grid. Source: Morris et al. (1994)....................... 32
Figure 5: The theoretical framework model of the study .................................. 80
Figure 6: Respondent characteristics: Position in the firm ............................. 103
Figure 7: Respondent characteristics: Highest qualification level................... 104
Figure 8: Company characteristics: Size as measured by number of employees
....................................................................................................................... 104
Figure 9: Company characteristics: Age as measured by when firm was
founded .......................................................................................................... 105
Figure 10: Company characteristics: Industry type ........................................ 105
Figure 11: Company characteristics: Technological intensity of industry ....... 106
Figure 12: Company characteristics: Speed of entry to international markets 106
Figure 13: Company characteristics: Number of countries exporting to ......... 107
Figure 14: Company characteristics: export sales as a percentage of total sales
(export intensity) ............................................................................................. 108
Figure 15: Mean scores across groups ordered on export speed .................. 129
Figure 16: Mean scores across groups ordered on export scope .................. 130
Figure 17: Mean scores across groups ordered on export intensity ............... 130
Figure 18: Restatement of the conceptual model ........................................... 136
xix
Figure 19: Scatterplots of the significant relations among EI variables and
Economic performance .................................................................................. 141
Figure 20: Scatterplots of the significant relations among EI variates and Export
intensity .......................................................................................................... 143
Figure 21: Scatterplots of the significant relations among EC variables and
Economic performance .................................................................................. 145
Figure 22: Scatterplots of the significant relations among EC variables and
Export intensity ............................................................................................... 147
Figure 23: A representation of the moderating effect of Hostility on the relation
between EI and Economic Performance ........................................................ 149
Figure 24: A representation of the moderating effect of Hostility on the relation
between EI and Export intensity ..................................................................... 155
Figure 25: A representation of the moderating effect of Hostility on the relation
between Social capital and Economic Performance ...................................... 159
Figure 26: A representation of the moderating effect of Dynamism on the
relation between Internationalisation knowledge and Economic performance 163
Figure 27: A representation of the moderating effect of Hostility on the relation
between EC and Export intensity ................................................................... 165
Figure 28: A representation of the moderating effect of Dynamism on the
relation between EC and Export intensity ...................................................... 167
Figure 29: A representation of the moderating effect of Dynamism on the
relation between foreign institutional knowledge and Export intensity ............ 169
Figure 30: Frequency distribution for EI ......................................................... 248
Figure 31: Frequency distribution for EC ........................................................ 248
Figure 32: Frequency distribution for Hostility ................................................ 249
xx
Figure 33: Frequency distribution for Dynamism ............................................ 249
Figure 34: Frequency distribution for Economic performance ........................ 250
Figure 35: Frequency distribution for Export intensity .................................... 250
Figure 36: Frequency distribution for level 2 variables ................................... 251
Figure 37: Frequency distribution for level 3 variables ................................... 252
Figure 38: Frequency distribution for interaction terms .................................. 253
Figure 39: Frequency distribution for transformed level 3 variables ............... 254
Figure 40: Histogram of residuals of social interaction with economic
performance - Hypothesis 4a (i) ..................................................................... 255
Figure 41: Observed versus Residual values of social interaction with economic
performance - Hypothesis 4a (i) ..................................................................... 255
Figure 42: Histogram of residuals of internationalisation knowledge with
economic performance - Hypothesis 4a (i) ..................................................... 256
Figure 43: Observed versus Residual values of internationalisation knowledge
with economic performance - Hypothesis 4a (i) ............................................. 256
Figure 44: Histogram of residuals of proactiveness with export intensity -
Hypothesis 3b (i) ............................................................................................ 257
Figure 45: Observed versus Residual values of proactiveness with export
intensity - Hypothesis 3b (i) ............................................................................ 257
1
CHAPTER 1: INTRODUCTION
1.1 Purpose of the study
Studies have confirmed that entrepreneurship and the ability to enterprise enables
firms to perform better than competitors. In recent times, characterised by
globalisation of the world economy, firms are advised to consider internationalisation
of their operations in order to remain competitive (Zahra and Bogner, 2000; Oviatt and
McDougall, 2005). Internationalisation as an activity opens new markets and therefore
is essentially entrepreneurial in nature. The increase in globalisation of trade and
internationalisation of businesses compels firms to consider what firm characteristics
and capabilities contribute to international success.
The purpose of this research was to perform an empirical investigation on three main
constructs – namely: entrepreneurial intensity, entrepreneurial capabilities, and the
environment - among South African exporting firms and the relationship of these
factors with international performance. A literature review was conducted to provide a
theoretical review of the extant theory that relates to the problem under study and
context of the research project. Through scientific empirical methods, the
characteristics and relationships between the constructs are tested to derive
conclusions.
In this study, entrepreneurial intensity (EI) is conceptualised as a measure of the level
of entrepreneurship within a firm and comprises of both degree and frequency of
entrepreneurship activities. The degree of entrepreneurship, also known as
entrepreneurial oriantation (EO), is a multi-dimensional construct comprising of three
sub-dimensions, namely: innovativeness, proactiveness, and risk-taking, whereas
frequency of entrepreneurship refers to the number of such events.
Based on literature reviews, entrepreneurial capabilities (EC) are viewed as a broader
range of abilities or competencies needed to initiate appropriate action in specific
2
organisational situations. This study focuses on the following entrepreneurial
capabilities: social capital, human capital, and technology.
The study purports that the extent to which each of these dimensions (of
entrepreneurial intensity and capabilities) is useful for predicting the international
success of the firm may be contingent on the characteristics of the foreign business
environment within which the firm operates. Consistent with prior research, the
present study looks at the moderating effect of the environment on the IE-
performance and EC-performance relationship and relies on two environmental
dimensions, namely dynamism and hostility.
3
1.2 Context of the study
Globalisation of the world economy has encouraged companies to leverage their
resources and skills by expanding into existing or new foreign markets (Zahra and
Garvis, 2000). Globalisation refers to the process of worldwide venture activities.
Internationalisation is an important route through which new and small ventures can
realise their growth potential (Pangarkar, 2008) and this is particularly vital for the
continued growth and development of new and small ventures in emerging economies
(Manolova, Manev and Gyoshev, 2010). To this end, the development of export
activity is viewed as an attractive mode of venturing into foreign market opportunities
(Haahti, Madupu, Yavas and Babakus, 2005) and is indeed an entrepreneurial act,
consisting of identifying and exploiting new business opportunities in a new
environment (Ripollés-Meliá, Menguzzato-Boulard and Sánchez-Peinado, 2007).
International entrepreneurship refers to the process of discovering and creatively
exploiting opportunities that exist outside a firm’s national borders in order to obtain
competitive advantage (Zahra, Cloninger, Yu and Choi, 2004). The internationalisation
of activities is becoming the growth method most commonly used by small and
medium-sized enterprises. In particular, the export of products represents the
predominant mode of international expansion with these type of firms versus
mechanisms such as investments abroad or international alliances (Acedo and Casillas,
2007). In general, exporting symbolises one of the main forms of internationalisation.
The rapid globalisation of world markets has encouraged companies of all sizes and
national origins to expand internationally (Zahra, Hayton, Marcel and O'Neill, 2001).
Much of the empirical work in export and international entrepreneurship is based
primarily on firms in advanced economies (Singh, 2009). Limited research has been
conducted in the context of developing countries, including South Africa (Scheepers,
Hough and Bloom, 2007). While the majority of research has employed samples drawn
from the United States, Canada, Israel, Sweden, etc., the importance of international
entrepreneurship has been recognised and there is a growing interest on the
importance of exporting among emerging economies (Haahti et al., 2005; Singh, 2009;
Javalgi and Todd, 2010) such as India and China.
4
Emerging markets are characterised by relatively small firms serving small domestic
markets. Singh (2009) suggests that small and medium-sized enterprises (SMEs) avoid
undertaking risky activities like exporting as they have severe resource constraints
such as financial, technological and human, to divulge in exporting activity. Faced with
rising competition in their domestic markets and attracted to opportunities in foreign
markets, SMEs are increasingly looking towards internationalisation as a means of
creating and sustaining competitive advantage (Zahra, Ucbasaran and Newey, 2009).
Firms in many emerging economies are increasingly relying on exports for venturing
into foreign markets.
Following this view, export is an effective way towards internationalisation, but it
requires organisational capabilities. Success in global entrepreneurship requires
resourcefulness and entrepreneurial risk-taking. Based on Oviatt and McDougall
(1994), Jones and Coviello (2005) emphasise that internationalisation is firm-level
behaviour and that certain conditions within the firm and environmental factors are
necessary and sufficient to explain internationalisation. Entrepreneurial behaviour and
unique entrepreneurial capabilities enable internationalising firms to make a leap into
the international arena (Zhou, 2007).
Entrepreneurial behaviour is defined as the sum of a company’s efforts aimed at
innovation, proactiveness, and risk-taking. These efforts offer an important means of
revitalizing and renewing companies and improving performance (Zahra and Garvis,
2000). In order to benefit from their international expansion, companies need to foster
entrepreneurship throughout their operations (Zahra et al., 2001). An organisation’s
performance from the perspective of entrepreneurship at a point in time can be
shown by its entrepreneurial intensity score (Ireland, Kuratko and Morris, 2006). In this
study we use the concept of entrepreneurial intensity to empirically assess the level of
entrepreneurship among internationalising firms and its relationship to performance in
their attempt to exploit opportunities in foreign markets.
Entrepreneurial capabilities are viewed as a broader range of abilities needed to
initiate appropriate action in specific organisational situations and reflect the capacity
to initiate and sustain an entrepreneurial dynamism throughout the organisation
5
(Obrecht, 2004). The core competencies represent collective learning in the
organisation. Possession of a wide range of distinct competencies is a catalyst for
entrepreneurial intensity. Obrecht (2004) declared that human capital and social
capital are among the most essential capabilities for organisational perfomance. In
addition, Zahra et al. (2000) suggested that the firm’s technological capability is critical
to successful internationalisation. Similarly, other researchers in the literature of
international entrepreneurship have asserted that knowledge-based, social-based, and
technological capabilities are important for successful international expansion (Autio,
Sapienza and Almeida, 2000; Deeds, 2001; Zhou, 2007). This paper contends that firms
should hold a portfolio of entrepreneurial capabilities in their attempt to promote
entrepreneurship in the international arena characterised by competitiveness and
uncertainty. Based on literature, three entrepreneurial capabilities were identified and
investigated: Social capital, human capital, and technology.
Zahra and Bogner (2000) states that foreign opportunities, however, are tempered by
the constraints imposed by the competitive forces that exist in international
environments, such as aggressive government intervention, technological changes,
and fierce local rivalries all contributing to hostile international environment. The
benefits derived by SMEs from internationalisation may depend on the characteristics
of the international business environment (Pangarkar, 2008). Lumpkin and Dess (1996)
premised that firm behaviour and firm characteristics may vary, contingent on
influences external to the firm. This study therefore examines the moderation effect of
the environment in the relationship between entrepreneurial intensity and firm
performance, as well as entrepreneurial capabilities and firm performance. The two
aspects of the environment under study are: environmental hostility and dynamism.
The model in Figure 1 shows the context of this study.
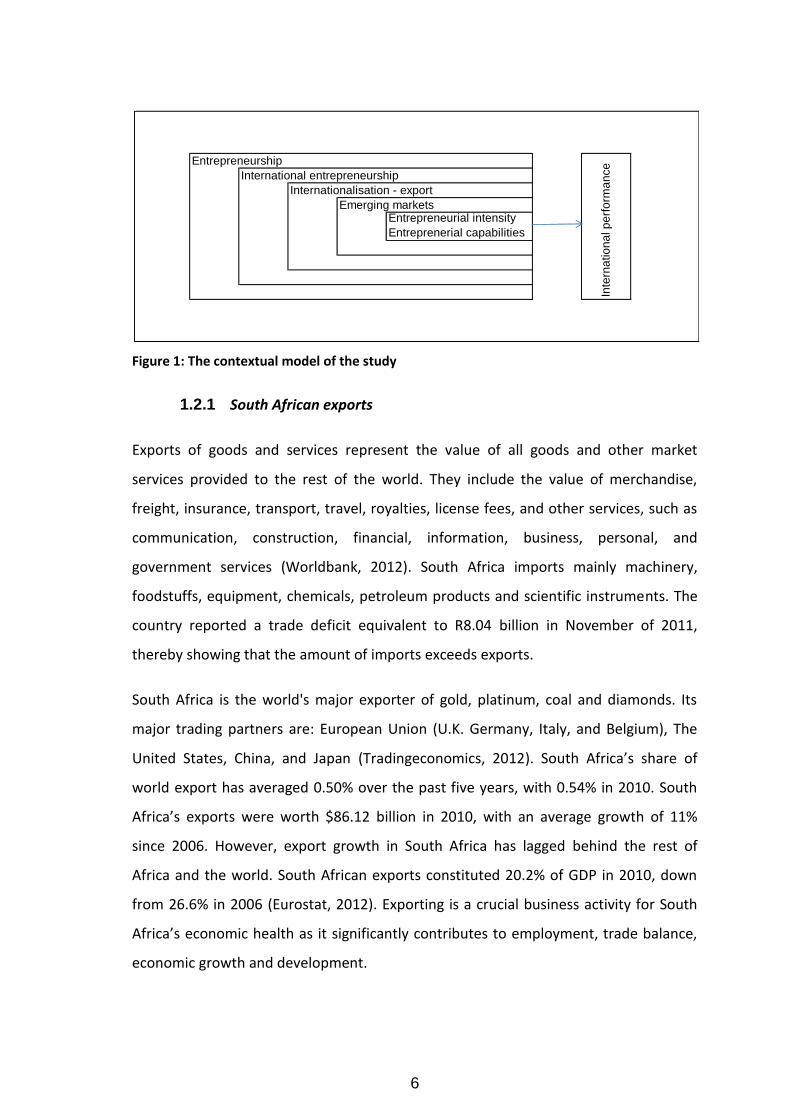
6
Figure 1: The contextual model of the study
1.2.1 South African exports
Exports of goods and services represent the value of all goods and other market
services provided to the rest of the world. They include the value of merchandise,
freight, insurance, transport, travel, royalties, license fees, and other services, such as
communication, construction, financial, information, business, personal, and
government services (Worldbank, 2012). South Africa imports mainly machinery,
foodstuffs, equipment, chemicals, petroleum products and scientific instruments. The
country reported a trade deficit equivalent to R8.04 billion in November of 2011,
thereby showing that the amount of imports exceeds exports.
South Africa is the world's major exporter of gold, platinum, coal and diamonds. Its
major trading partners are: European Union (U.K. Germany, Italy, and Belgium), The
United States, China, and Japan (Tradingeconomics, 2012). South Africa’s share of
world export has averaged 0.50% over the past five years, with 0.54% in 2010. South
Africa’s exports were worth $86.12 billion in 2010, with an average growth of 11%
since 2006. However, export growth in South Africa has lagged behind the rest of
Africa and the world. South African exports constituted 20.2% of GDP in 2010, down
from 26.6% in 2006 (Eurostat, 2012). Exporting is a crucial business activity for South
Africa’s economic health as it significantly contributes to employment, trade balance,
economic growth and development.
Entrepreneurship
International entrepreneurship
Internationalisation - export
Emerging marketsEntrepreneurial intensity
Entreprenerial capabilities
Inte
rna
tio
na
l p
erf
orm
an
ce
7
1.3 Problem statement
1.3.1 Main problem
The main problem of this study is to examine the effect of entrepreneurial intensity and
capabilities on international performance among South African exporting firms. The
moderating effect of environmental characteristics on the relationships is also examined. The
two aspects of the environment under study are environmental hostility and dynamism.
1.3.2 Sub-problems
The first sub-problem is to examine the relationship between entrepreneurial intensity
and international performance as well as the moderating effect of environmental
hostility and dynamism on the relationship.
The second sub-problem is to examine the relationship between entrepreneurial
capabilities and international performance as well as the moderating effect of
environmental hostility and dynamism on the relationship.
1.4 Significance of the study
Entrepreneurship scholars have empirically linked entrepreneurial behaviour to high
performance among firms (Zahra and Garvis, 2000; Lumpkin and Dess, 2001; Wiklund
and Shepherd, 2005). While the popular view held among scholars is that the level of
entrepreneurship in a firm can be measured in terms of degree of entrepreneurship or
entrepreneurial orientation, several other authors (Morris and Sexton, 1996; Kuratko,
Hornsby and Goldsby, 2007; Scheepers et al., 2007) have since followed Morris and
Sexton’s extended conceptualisation, which not only looks at the degree of
entrepreneurship but also the frequency of entrepreneurship, and hence the concept
of entrepreneurial intensity.
However, none of the studies on entrepreneurial intensity has been conducted within
an international entrepreneurship context. It is acknowledged that while variations
exist in how the entrepreneurship constructs has been studied (and particularly the
entrepreneurial orientation construct), most of these studies were conducted within
8
the field of corporate entrepreneurship (Zahra and Garvis, 2000; Scheepers et al.,
2007; Urban, 2010) and in developed economies (Scheepers et al., 2007; Singh, 2009).
Of those studies conducted within developing countries, the focus was on
entrepreneurial orientation rather than intensity (Ibeh, 2003; Javalgi and Todd, 2010;
Urban, 2010).This research will build on our understanding of entrepreneurial intensity
in organisations, which is still in its infancy (Morris, Kuratko and Covin, 2008).
Furthermore, theoretical studies in international entrepreneurship have acknowledged
the role of entrepreneurial capabilities such as social capital, human capital, and
technology in international entrepreneurship, and examined the relationship between
these constructs and international performance.
Tentative evidence shows that social capital positively contributes to international
performance (Hoang and Antoncic, 2003; Presutti, Boari and Fratocchi, 2007;
Pangarkar, 2008). On the other hand, the extant literature shows that firms can
leverage human capital to positively influence their international success (Samiee and
Walters, 1999; Yli-Renko, Autio and Sapienza, 2001; McDougall, Oviatt and Sharader,
2003; Ibrahim, 2004; Oviatt and McDougall, 2005; Zhou, 2007; Casillas, Moreno,
Acedo, Gallego and Ramos, 2009; Javalgi and Todd, 2010). Obrecht (2004) concluded
that human capital and social capital are among the most essential capabilities for firm
perfomance. Zahra and Bogner (2000) suggested that the firm’s technological
capability is critical to successful internationalisation. Similarly, other researchers in
the literature of international entrepreneurship have asserted that knowledge-based,
social-based, and technological-based capabilities are important for successful
international expansion (Autio et al., 2000; Deeds, 2001; Zhou, 2007; Brennan and
Garvey, 2009). While studies in international entrepreneurship have acknowledged the
role of entrepreneurial capabilities, none of the studies have studied these concepts
together in a single integrative study.
Following the call to explore the moderating effect of factors external to the firm on
the relationship between entrepreneurship and performance, a number of studies
emerged (Wiklund and Shepherd, 2005; Li, Huang and Tsai, 2009). Urban (2010)
observed significant correlations between entrepreneurial orientation (EO) and
9
environmental hostility and dynamism among Johannesburg-based firms. Ibeh (2003)
found an association between EO and export performance among small Nigerian firms
operating in hostile environments. Ibeh (2003) suggested that this orientation is
associated with certain decision-maker characteristics such as international
orientation, contacts and previous business experience, as well as firm-level
competencies; although no evidence to this effect was provided. Zahra and Garvis
(2000) investigated the moderating effect of environmental hostility on the
relationship between international corporate entrepreneurship and financial
performance. Despite the increasing number of studies focusing on the contingent
relationship between entrepreneurial behaviour and firm performance, none of the
studies focused on the entrepreneurial intensity construct. Furthermore none of the
contingency-based studies (contingent on the environment) focused on
entrepreneurial capabilities. This shows the incompleteness of studies in this field.
Theory development and testing are central to the advancement of entrepreneurship
as a scholarly field (Zahra, 2007). In response to the widespread calls for greater rigour
and relevance in future studies (Ibeh, 2003; Oviatt and McDougall, 2005; Zahra, 2007;
Seno-Alday, 2010), this study integrates concepts from entrepreneurship, strategy, and
international entrepreneurship. This thereby depicts the complex nature of the field.
Specifically, this study fills the knowledge gap in that it looks at international
entrepreneurship through the prism of such dimensions as entrepreneurial
orientation, frequency of entrepreneurship, social capital, human capital and
technology within an emerging market. The attention paid to the moderating effects of
the environment on performance in this investigation enriches its relevance
particularly in an emerging market context. Furthermore, this study looks at
performance as a multi-item construct versus a single construct in most studies.
In emerging economies such as South Africa where growth is often the primary goal of
organisations, entrepreneurship is expected to be the fuel of economic development.
In the midst of globalisation, countries such as South Africa need to improve their
international competitiveness which underpins the survival and growth of firms in the
international markets.
10
Lack of pertinent entrepreneurial competencies such as human and social capital and
technology expertise have been touted as one of the reasons associated with
entrepreneurial failure. The global entrepreneurship monitor reports that South
Africa’s total entrepreneurial activity (TEA) ranks lower than its peers in the low to
middle income countries and is dominated by ‘necessity entrepreneurs’ with low
expectations of growth and job creation (GEM, 2009). The South African government
has been injecting risk capital in institutional assistance and promotional programs in
an attempt to promote export growth. However the exports-to-GDP ratio has declined
from 2006 to 2010.
Since a firm’s entrepreneurial posture and capabilities may be critical to the long-term
survival of a firm, they have an impact on job creation and social development. There
is tentative evidence in support of the constructs on international performance that
policy makers in business, government and educational institutions could put more
emphasis on programs that foster the development of these constructs among
executive leadership of firms so as to avert the flow of risk capital towards low quality
entrepreneurship. It is therefore of paramount importance to facilitate the empirical
study of these constructs.
Given the dynamic nature of global trade, and increasing reliance of emerging
economies on exporting to reach global markets, it is vital to conduct an investigation
of internationalising firms in emerging economies, taking into account their unique
characteristics and the external environment in theoretical development. Ultimately,
this study aims to elicit more interest in these concepts so as to promote further
research in the South African context.
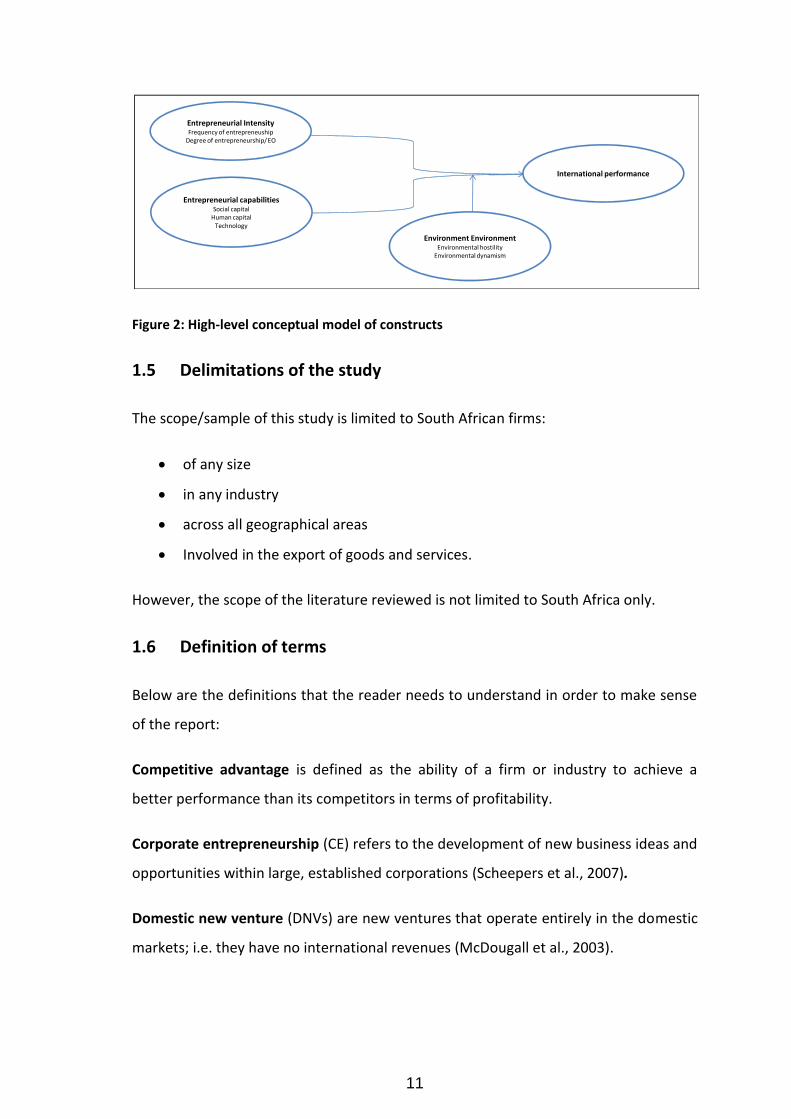
Figure 2 provides an overview of the conceptual model showing the high-level
constructs guiding the study. The main constructs in the model are entrepreneurial
intensity, entrepreneurial capabilities, the environment, and international
performance relationship as covered by the literature.
11
Figure 2: High-level conceptual model of constructs
1.5 Delimitations of the study
The scope/sample of this study is limited to South African firms:
of any size
in any industry
across all geographical areas
Involved in the export of goods and services.
However, the scope of the literature reviewed is not limited to South Africa only.
1.6 Definition of terms
Below are the definitions that the reader needs to understand in order to make sense
of the report:
Competitive advantage is defined as the ability of a firm or industry to achieve a
better performance than its competitors in terms of profitability.
Corporate entrepreneurship (CE) refers to the development of new business ideas and
opportunities within large, established corporations (Scheepers et al., 2007).
Domestic new venture (DNVs) are new ventures that operate entirely in the domestic
markets; i.e. they have no international revenues (McDougall et al., 2003).
Entrepreneurial IntensityFrequency of entrepreneuship
Degree of entrepreneurship/ EO
Entrepreneurial capabilitiesSocial capital
Human capitalTechnology
Environment EnvironmentEnvironmental hostility
Environmental dynamism
International performance
12
Entrepreneurial behaviour is defined as the sum of a company’s efforts aimed at
innovation, proactiveness, and risk-taking.
Entrepreneurial capabilities (EC) are viewed as a broader range of abilities or
competencies needed to initiate appropriate action in specific organisational
situations.
Entrepreneurial intensity (EI) is a measure of the level of entrepreneurship within a
firm and comprises of both degree and frequency of entrepreneurship activities.
Entrepreneurial firm can be described in terms of aggressive strategic postures,
innovativeness, and risk-taking (Covin and Slevin, 1990).
*Entrepreneurial firm can also be described in terms of its inclination to take on
business-related risks, to favour change and innovation, and to assume an aggressive
competitive posture vis-à-vis its competitors (Leiblein and Reuer, 2004).
*Entrepreneurial firm – another definition of an entrepreneurial firm is a start-up firm
which is usually characterised by resource constraints such as lack of tangible assets.
* Either of the definitions is applicable depending on the context used.
Entrepreneurship within organisations is a fundamental posture, instrumentally
important to strategic innovation, particularly under shifting external environmental
conditions (Urban, 2010).
International entrepreneurship means the process of discovering and creatively
exploiting opportunities that exist outside a firm’s national borders in order to obtain
competitive advantage (Zahra et al., 2004).
International entrepreneurship is the discovery, enactment, evaluation and
exploitation of opportunities across national borders to create future goods and
services (Oviatt and McDougall, 2005).
Internationalisation (of a firm) is its involvement in cross-border business activity to
derive revenues.
13
International firm is a firm that operates across its national borders. The research
consider firms to be internationalised when their foreign sales represent more
than10% of total sales (Zhou, 2007) or number of countries where the firm operates is
greater than five.
International new ventures (INVs) or Born-global firms are businesses that, from
inception, seek to derive significant competitive advantage from the use of resources
and the sale of outputs in multiple countries (McDougall et al., 2003).
Resource based theories – resource based theories hypothesise that the firm’s
strategic decisions (e.g. Internationalisation) rests on the availability of resources such
finance and infrastructure or lack of them.
Top Management Teams (TMTs) refers to the upper management within an
organisation, which sets and directs corporate policy and strategic formulation within
an organisation.
Traditional theories of internationalisation that depicted internationalisation as an
incremental process and occurring at a later stage of the firm’s growth process
(Ibrahim, 2004). These theories were also referred as the sequential or process or
stages or Uppsala theories of internationalisation.
14
1.7 Assumptions
This section states any assumptions that could influence the outcome of the research.
The following assumptions were made in this study:
All the companies that responded are registered South African companies and are
actively involved in exports. The survey was targeted at South African firms, and
the questions asked in the questionnaire are only applicable to exporting firms
The convenient sample used in the study represents the population of South
African exporting firms across all industries in all geographical areas and therefore
the results can be generalised
The respondents have enough knowledge of export practices within their firms,
and that their responses are truthful and representative of views of their firms
Each of the respondents uniquely represents a firm and there is only one
respondent per firm. In cases where the respondents were from the same holding
company, they were in different business units with their own management and
export practices, and therefore can be treated as different companies.
15
CHAPTER 2: LITERATURE REVIEW
According to Cooper (1984), a literature review provides a theoretical review of the
extant theory that relates to the problem under study (Creswell, 2008).It provides a
meaningful context of the research project and locates it within the universe of
research that already exists. In a quantitative study a literature review can be used
deductively as a basis for advancing research questions or hypothesis (Creswell, 2008).
2.1. Introduction
This section presents a literature study developed to provide a theoretical lens and
perspective on the constructs discussed in the main problem and sub-problems of this
study. The literature review begins by defining internationalisation and measures of
international performance. Then the main constructs are rigorously discussed as a
basis for the development of hypothesis. Finally follows the conclusion of the literature
review, culminating in the summarization of hypotheses. The section concludes with
the presentation of a theoretical framework for the study.
2.2. Definition of topic or background discussion
2.2.1. Internationalisation
International entrepreneurship is an increasingly a popular academic concern which is
strongly influenced by the conceptual integration of the disciplines of international
business, entrepreneurship and strategic management. The process of inquiry into the
internationalisation of business includes grappling with existential questions about the
phenomenon: what is it, why does it exist, and what makes it tick (Seno-Alday, 2010)?.
International entrepreneurship is positioned at the nexus of internationalisation and
entrepreneurship where entrepreneurial behaviour involves cross-border business
activity. According to Zahra and George (2002), international entrepreneurship means
the process of discovering and creatively exploiting opportunities that exist outside a
firm’s national borders in order to obtain competitive advantage (Zahra et al., 2004).
Oviatt and McDougall (2005) defined international entrepreneurship as the discovery,
16
enactment, evaluation and exploitation of opportunities across national borders to
create future goods and services. According to Oviatt et al. (2005) international
entrepreneurship entails a combination of innovative, proactive, and risk-seeking
behaviour that crosses national borders and is intended to create value in
organisations.
From these definitional perspectives it is clear that international entrepreneurship has
a common heritage with entrepreneurship, with international entrepreneurship
focusing on new foreign markets. This exposure to new cultures and languages, and
different ways of doing business amounts to increased risk-taking (Welch, 2004). The
process of preparing for entry may include foreign market visits, foreign market
research, and government export services, and experimentation with the market to
gain experiential knowledge. A number of external environmental factors such as
technological, cultural, geographical, demographic, as well as the government can
provide motive to go international. According to resource based theories
entrepreneurial firms venture into foreign markets in search of critical resources;
entrepreneurial firms with more resources have more likelihood to engage in
international activities (Ibrahim, 2004).
The Schumpeterian definition of entrepreneurship emphasised breaking new ground,
in such areas as entering new markets, introducing new products, applying new
production methods, and developing new supply sources. The internationalisation of
activities is becoming the growth method most commonly used by small and medium-
sized enterprises. Exporting symbolises one of the main forms of firm
internationalisation as opposed to other mechanisms such as investments abroad or
international alliances. Exporting as an activity opens new markets and is essentially
entrepreneurial in nature.
Historically, multinational enterprises (MNEs) are developed from large, mature,
domestic firms and the study of the international entrepreneurship focused on large,
mature corporations (Welch, 2004). This distinction was preserved by government-
imposed barriers, segregated and protected domestic markets (Dana and Wright,
2004).This implied that international economic activity was controlled and constrained
17
within the boundaries of the ‘nation-state’. The dominant international model
employed by the MNEs was that of market expansion through creation of autonomous
subsidiaries in foreign nations, which distributed products from the ‘parent nation’
(Oviatt et al., 2005). Regulatory and environmental barriers, and resource constraints
shielded SMEs from competing directly with MNEs in the same market (Dana and
Wright, 2004).
Today, advances in communication technology, manufacturing technology and
transportation as well as trade liberalisation have allowed small and large companies
alike to compete in international markets. Geographical locations are no longer
significant barriers to internationalisation. The traditional theories of MNE
internationalisation, which emphasised organisational scale as an important
competitive advantage in the international arena, are no longer adequate to explain
the internationalisation of smaller firms.
The traditional theories of internationalisation depicted internationalisation as an
incremental process and occur at a later stage of the firm’s growth process (Ibrahim,
2004). These theories were referred to as the sequential or process or stages or
Uppsala theories of internationalisation. At the early stage of firm’s growth process,
the firm’s horizon is limited to domestic market; as it grows it expands and invests in
foreign markets to exploit windows of opportunity (Ibrahim, 2004). The knowledge
gained at one stage can profoundly influence future internationalisation as firms
experiment, take risk, and learn. International venturing can broaden a firms
knowledge base through learning about new markets, customers, cultures,
technologies, and innovation systems, which can enhance a firm’s performance (Zahra
and Garvis, 2000). The major assumption is that internationalisation is a time-based
process as a result of domestic-based growth and gradual accumulation of knowledge
as the management team gains experience and knowledge of foreign markets.
International business research through the years seems to have acknowledged that
other forms of international business exist outside the monolithic multinational
enterprise (Seno-Alday, 2010). The recent phenomenal growth of early
internationalising firms cannot be explained by the process theory. These firms initiate
18
international activities during the venture creation process or in the early stage of
venture growth with resources constrained by their young age and smallness. They
internationalise rapidly despite resource constraints across the value chain and other
administrative challenges that accompany international expansion. The emergence of
international new ventures (INVs) presents a unique challenge to stages theory (Autio
et al., 2000; McDougall et al., 2003; Ibrahim, 2004; Oviatt and McDougall, 2005). Other
researchers have used terms such as global start-ups or born-globals. INVs are
businesses that, from inception, seek to derive significant competitive advantage from
the use of resources and the sale of outputs in multiple countries (McDougall et al.,
2003).
Diverse criterion for defining firm age is observable among researchers. Coviello and
Jones (2004) and McDougall et al. (2003) suggest that six years appears to be the cut-
off used to define international new ventures while other researchers have examined
firms as old as ten (Li et al., 2009) or twelve years.
Smaller entrepreneurial firms have ingenuous techniques to overcome their initial
conditions of lack of resources in order to exploit the international market. They can
focus on a set of capabilities, competencies, knowledge, and skills needed by the world
markets. Internal factors such as superior or unmatched technology may provide a firm
with an absolute advantage. According to Autio (2005) research on INVs has mostly
emphasised explanation of how early and rapid internationalisation is possible. Oviatt
and McDougall (2005) describe a framework of four basic elements for sustainable
existence of international new ventures: organisational formation through
internalisation of some transactions, strong reliance on alternative governance
structures to access resources, establishment of foreign location advantages, and
control over unique resources. The framework incorporates ideas from
entrepreneurship scholars about how ventures gain influence over vital resources
without owning them to develop a competitive advantage.
In their study comparing what distinguishes INVs from domestic new ventures (DNVs),
McDougall et al. (2003) found them to be significantly different on the basis of their
entrepreneurial team experience, strategy, and industry structure. More specifically,
19
entrepreneurial teams of INVs exhibited higher levels of international and industry
experience, employed more aggressive strategies, operated in more channels, and
competed on the basis of differentiation, placing more emphasis on innovation. They
were also more likely to operate in industries characterised by a higher degree of
global integration. The emphasis on the dimension of entrepreneurial teams rather
than the individual entrepreneur implies entrepreneurship works well in teams,
drawing on the diversity, and complementarities of knowledge, skills, and networks.
The top management team can access and mobilise resources through their cross-
border knowledge networks, or their international social capital. Such factors as lack of
human capital, social capital, innovation and technological capabilities have been
stated as obstacles hampering international development among SMEs (Camisón and
Villar-López, 2010).
McDougall et al. (2003) describes globally integrated industries as those in which many
firms within the industry coordinates their activities and competitive strategies across
a variety of countries through the use of knowledge and technology. However, the
hypothesis of global integration remains to be verified empirically, owing to lack of
archival data on firm internationalisation in different industry sectors (Autio, 2005).
Conventional wisdom suggests that superior technological advantages and innovation
can give the firm a competitive advantage over local competitors in the foreign
market. Technological intensiveness is found to be consistently related to the
propensity to export according to various studies (Serra, Pointon and Abdou, 2011). In
attempt to shed some light on international growth in entrepreneurial firms using
international growth of high-technology firms, Autio et al. (2000) focused on
knowledge intensity and imitability of its core technologies. Imitability is defined as the
ease with which a firm's technology can be learned or replicated by outsiders. It is
expected that when a firm's key resources are imitable, the firm cannot realise its full
rent-generating potential. Contrary to expectation, Autio et al. (2000) found that
although greater knowledge intensity was associated with faster international growth,
firms with more imitable technologies grew faster. A possible reason to the question of
imitability is found in Oviatt and McDougall (2005)’s assertion that new ventures
confronted with such circumstances must internationalise from inception or else be at
20
a disadvantage to other organisations that may attempt to uncover the secret or to
produce alternative knowledge. Knowledge, being at least to some degree a public
good, may not remain unique for long, and its easy dissemination threatens a firm's
rent-earning opportunity.
McDougall (2005) states that although imitation may be prevented by means such as
patents, copyrights, or trade secrets, to keep it proprietary, patents and copyrights are
ignored in some countries. Furthermore, the release of patented knowledge into a
market may advance competitors' production of alternative or even improved
technology. In a dynamic environment, copyrights and other means of intellectual
property protection appear to speed up the diffusion of knowledge to rivals and
therefore may not enhance venture performance (Zahra and Bogner, 2000).
McDougall et al. (2003) suggested that early internationalisation may be not only an
opportunity but also a necessity to ensure chances for growth, because opportunity
windows are short in dynamic sectors. Industries with rapid changes in technology and
shorter product life cycles may naturally lead firms to internationalisation.
Fan and Phan (2007) reported result of a comparative study highlighting the
similarities between international new ventures and traditional, staged
internationalising firms. This study found little difference in product uniqueness,
technological sophistication, and degree of customization or pricing advantages
between these two groups. These similarities between the supposedly distinct breeds
of firms raised the question why some firms delayed their internationalisation when
they could easily have gone international at birth (Fan and Phan, 2007)?. Fan and Phan
(2007) found that apart from specific technological advantage, the decision for a new
venture to internationalise at inception is influenced by the size of its home market
and by its production capacity. Other studies have pointed to the management
commitment to exporting as an indicator (Javalgi and Todd, 2010; Serra et al., 2011) ;
in line with entrepreneurial studies affirming intention as a strong predictor of planned
behaviour.
21
Resource based theories espouse that the availability of resources, or lack of them,
can attribute to a firm’s decision to go international. The resource based theory
advanced two views as motives for internationalisation: firstly, that entrepreneurs
venture into foreign markets in search of critical resources and secondly that the more
resources an entrepreneurial firm has the more likely it will engage in international
activities (Ibrahim et al., 2004).
Other models such as the network approach emphasised the development of strategic
alliances to spread costs and reduce risk and uncertainty in the international market
(Ibrahim, 2004). Firms engage in a range of international networks and
internationalisation processes, including internationalisation of markets, research
collaboration, labour recruitment, and knowledge transfer. One way that international
trade can help in the process of economic growth is by transferring the benefits of
technology across borders (Mastromarco and Ghosh, 2009).
It becomes clear from the literature that internationalisation process calls for a
different set of capabilities that not all firms may possess (Seno-Alday, 2010).
Furthermore, traditional theoretical approaches do not adequately explain certain
aspects related to the international orientation of SMEs of recent (McDougall et al.,
2003; Oviatt and McDougall, 2005). Hence research must tackle questions about what
such a basket of unique capabilities and international advantages should entail.
2.2.2. Measurement of international performance
The literature has suggested an empirical link between entrepreneurial behaviour, the
role of entrepreneurial capabilities, and international performance among firms.
Performance is the single more important dimension of business venture’s overall
operations without which the firm will not survive, whether that is described as
sustainable, satisfactory, or profitable, etc. The questions to be asked are: What is a
suitable measurement of international performance of a firm? And what are the
criteria used in arriving at that choice of the suitability of a measurement?
Researchers have stated that the entrepreneurial success construct has two distinct
dimensions, namely economic success and the entrepreneur's satisfaction (Urban,
22
Vuuren and Barreira, 2008). Knight (2001) measured international performance in
terms of traditional measures of the money-making activities of the firm, including
market share, sales growth, and return on investment (Knight, 2001). SiImilarly
Camisón and Villar-López (2010) measured this construct interms of economic
performance, comprising these observable items: return on assets, sales growth, and
increase in market share.
These traditional accounting measures are necessary but not sufficient to capture
overall firm international performance. It has been suggested that non-financial
measures may offer more comprehensive evaluation (Li et al., 2009). Wiklund and
Shepherd (2005) argued that growth as a measure of performance may be more
accurate and accessible than accounting measures of financial performance.
Ripollés-Meliá et al. (2007) argued for the importance of analyzing internationalisation
from the entrepreneurship perspective in order to advance in the study of firm
internationalisation. They proposed widening the scope of theoretical approaches and
measured internationalisation in terms of international intensity comprising of the
following dimensions – namely: degree of internationalisation, scope of
internationalisation, and speed of internationalisation.
In terms of the measure of degree of internationalisation, a firm is considered to be
internationalized when their foreign sales represents at-least 25% of total sales
(Ripollés-Meliá et al., 2007; Javalgi and Todd, 2010). Others have used 20% (foreign
sales) as the benchmark point (Zhou, 2007). Other researchers in export studies have
referred to this measure as export intensity.
International sales as a percentage of total sales is the most commonly used measure
to capture the effectiveness of international performance (Yli-Renko et al., 2001;
Javalgi and Todd, 2010). This indicator is said to adequately reflect international
intensity since the greater the intensity of the firm’s international presence, the
greater and more irreversible its commitment to its assets for internationalisation
(Camisón and Villar-López, 2010). It is also a viable proxy for the degree of
23
internationalisation (Zhou, 2007). This measure has also been referred to as export
intensity, and this is the term adopted in this study.
Rapid growth has been examined in numerous studies of new ventures and has been
found to be an important indicator of performance (McDougall et al., 2003). Foreign
sales growth had been used as an indicator for international performance (Autio et al.,
2000; Zhou, 2007). Foreign sales growth indicates how well (or poorly) a firm
internationalizes once the process has started (Zhou, 2007). Lumpkin and Dess (1996)
however, stated that firms operating in growing industries may perform better
regardless of their behaviour.
Scope of internationalisation is measured as the number of countries where firms are
operating (Ripollés-Meliá et al., 2007). This variable serves as a proxy of a firm’s global
geographic diversity. The greater the global scope of a firm’s operations, the greater its
opportunities to innovate, take risks, learn new skills, and explore new systems. Some
of the firm’s international operations can benefit from transferring and transforming
the experiences gained from some of the ventures, which can further increase
entrepreneurship activities (Zahra, 2000). Having a wider international market scope
exposes SMEs to a rich network of information that encourages and enhances future
product innovation (Zahra et al., 2009). International diversification can also generate
the capital necessary to support large-scale projects, spread the risk and provide
additional market. Global geographic diversity determines the firm’s overall
performance (Zahra, 2000).
Internationalisation speed is measured as the number of years elapsed between firm
foundation and initial entry into foreign markets (Ripollés-Meliá et al., 2007).The
shorter the time to achieve the export benchmark (significant exporter), the faster in
its speed internationalisation.
Some studies have used international experience measured as the number of years
that firms have been operating abroad (Camisón and Villar-López, 2010). This study
does not look at this measure under performance as it has been captured as a human
capital variable.
24
Employee growth has been used to (together with other growth variables) to measure
growth (Urban et al., 2008; Li et al., 2009). Growth is an important aspect in
entrepreneurship; more so is employee growth as job creation is seen as the
legitimacy of entrepreneurship in South Africa.
Following this literature discussion, it can be concluded that international performance
should be measured as a multi-item measure in terms of economic performance as
well as internationalisation intensity. The measurement of international performance
adopted in this study is a multi-dimensional composite, comprising of traditional
measures of economic performance as well as the additional measures of international
intensity proposed by internationalisation theory. Economic performance is
operationalised as an index of six commonly used performance measures pertaining to
financial performance and growth thereby incorporating different dimensions of
performance (Wiklund and Shepherd, 2005). Due to the difficulty in acquiring
information from private companies, it was decided to limit the questions to
perceptual measures rather than annual reports. International intensity is measured
by degree of internationalisation (export intensity), scope of internationalisation, and
speed of internationalisation. These measures are summarised as follows:
Economic performance
Financial performance
o export profitability
o overall profitability
o export market share
Growth
o employee growth
o foreign sales growth
o exports market share growth
International intensity
o degree of internationalisation (export intensity)
o scope of internationalisation
25
o speed of internationalisation
2.3. Entrepreneurial intensity
This section of the report relates to the first sub-problem.
2.3.1 The dimensions of entrepreneurship
Entrepreneurship can be defined as the process of creating value by bringing together
a unique combination of resources to exploit an opportunity (Morris et al., 2008). The
entrepreneurship phenomenon exists virtually in every organisational context, be it
small, or a home-based independent establishment, to a large multinational
corporation. For both start-up ventures and existing firms, entrepreneurship carried on
in the pursuit of business opportunities spurs business expansion, technological
progress, and wealth creation (Lumpkin and Dess, 1996). Undelying entrepreneurial
attitudes and behaviours are three key dimensions: innovativeness, risk-taking, and
proactiveness (Covin and Slevin, 1990; Wiklund and Shepherd, 2005). To the extent
that an undertaking demonstrates some amount of innovativeness, risk-taking, and
proactiveness, it can be considered an entrepreneurial event, and the person behind it
the entrepreneur (Morris and Sexton, 1996). Prior research has defined an
entrepreneurial firm as one that engages in product market innovation, undertakes
somewhat risky ventures, and is first to come up with proactive innovations, beating
competitors to the punch (Wiklund and Shepherd, 2005).
A fundermantal question in entrepreneurship research concerns what it means to
describe a particular event as “entrepreneurial” and to establish its underlyning
nature. Researchers have made considerable progress in identyfiying the core
dimensions that underlie the entrepreneurship construct (Covin and Slevin, 1990;
Lumpkin and Dess, 1996; Certo, Moss and Short, 2009). There is unsurmountable
concensus in the extant literature that the key dimensions that underlie the
entrepreneurship construct are: innovativeness, proactiveness, and risk-taking.
Lumpkin and Dess (1996) argue that five dimensions, instead of three, should be used
to measure entrepreneurship, namely autonomy, competitive aggressiveness,
proactiveness, innovativeness and risk-taking. In line with Scheepers et al. (2007) and
26
other stated researchers, this study views autonomy as an internal condition that
influences the organisational climate. Furthermore, competitive aggressiveness forms
part of the proactiveness dimension and does not represent a separate dimension. The
three dimensions of what characterises an entrepreneurial organisation are discussed
next.
Innovativeness
The innovativeness dimension of entrepreneurship reflects a tendency of a firm to
engage in and support new ideas, novelty, experimentation, and creative processes,
thereby departing from established practices and technologies, and leading to new
products, services, or technological processes (Lumpkin and Dess, 1996). The
foundation for this concept can be traced back to the writings of entrepreneurship
scholar Joseph Schumpeter who postulated that the entry of innovative new
combinations into a marketplace enabled societal progress through economic
development. Innovative entry disrupts existing market conditions and stimulates new
demand, thereby enacting Schumpeter’s process of ‘‘creative destruction’’, (Certo et
al., 2009). Venkataraman (2004) advocated that several neccessary factors that must
accompany risk capital for the Schumpetarian entrepreneurship to flourish – these are
access to novel ideas, role models, informal forums, region-specific opportunities,
safety nets (against entrepreneurial failure), access to large markets and executive
leadership.
Innovations may be incremental or radical, meaning that they may either build off of
existing skills to create incremental improvements, or rather require brand new skills
to develop new ideas and in the process destroy existing skills and competencies
(Certo et al., 2009). Urban et al. (2011) states that enterprises can use technological
innovation, defined as the generation of new products and processes or significant
technological improvements in current products and processes, to achieve objectives
such as maximising profits, gaining market share, creating niche markets or adding
value for stakeholders. An examination of revolutionary technological breakthrough
innovations since the onset of industrial revolutions revealed that independent
inventors and small newly founded ventures contributed more proportions of
27
fundamentally new innovations than contributions of large firms (Urban, Barreira,
Carmichael, Dagada, Duneas, Marcelle et al., 2011). Large firms tend to follow
incremental rather than revolutionary ideas.
An innovation orientation may be an effective response by SMEs to overcome the
liabilities associated with smallness especially in situations of resource scarcity, market
entry and when facing more established and resourceful incumbents (Urban et al.,
2011). Much of the pressure to innovate is due to external forces, including the
emergence of new and improved technologies, the globalisation of markets, and the
fragmentation of markets, governemt deregulation, and dramatic social change.
Innovativeness is aimed at developing new products, services, and processes, and
firms that are successful in their innovation efforts are said to profit more than their
competitors (Certo et al., 2009). The services sector, given their intangible nature and
the ease with which service concepts can be replicated, lend themselves to continuous
(incremental) innovation and improvement (Morris et al., 2008). Process innovations
include innovative production techniques, distribution approaches, selling methods,
purchasing programs, and administrative systems (Morris et al., 2008). Highly
innovative companies tend to have a systematic and well defined innovation strategy
comprising cross functional teams (Morris et al., 2008).
Procativeness
Proactiveness reflects an action orientation and refers to a firm's response to
promising market opportunities (Lumpkin and Dess, 1996). Although innovativeness
relates to a firm’s orientation toward creating innovative responses, proactiveness is
related to anticipating and acting on future wants and needs in the market, which
would enable a firm to gain first-mover advantage ahead of the competition (Lumpkin
and Dess, 1996). The proactiveness dimension reflects top management orientation to
pursuing enhanced competitiveness, and includes initiative, competitive
aggressiveness and boldness. Competitive aggressiveness involves the propensity to
directly and intensely challenge its competitors (Ibid). A characteristic of a proactive
enterprise therefore involves aggressive and unconventional tactics towards rival
enterprises in the same market segment (Scheepers, Hough and Bloom, 2008).
28
Proactive organisations shape their environments by actively seeking and exploiting
opportunities. A proactive firm seizes new opportunities and takes pre-emptive action
in response to perceived opportunity (Lumpkin and Dess 1996). In essence, proactive
firms introduce new products, technologies, administrative techniques to shape their
environment and not react to it (Patel and D’Souza, 2009). These are pioneering firms
that take first mover advantage to earn higher economic profits through such
advantages as technological leadership (Lee et al., 2001; Lumpkin and Dess, 2001;
Wiklund and Shepherd, 2005). These first mover firms can set the rules of competition
by setting product and technological standards, controlling distribution channels, and
strengthen their market position. While cautious firms may wait on the sidelines for
others to pave the way, aggressive entrants move first.
Proactiveness is concerned with implementation, with taking responsibility and doing
whatever is necessary to bring an entrepreneurial concept to fruition. Whereas
innovativeness may be an internal response from a firm, seeking opportunities to
innovate is a complementary activity. These actions enable firms to acquire market
share and outperform competitors (Lumpkin and Dess, 2001).
Risk-taking
Typical elements of risk-taking such as heavy borrowing, committing a large portion of
one’s assets to a course of action, or action in the face of uncertainty are associated
with the risk-return tradeoff. Hornsby et al. (2002) confirmed five distinct internal
organisational factors necessary to support entrepreneurship within organisations:
rewards/recognition; management support; resources, including time availability;
organisational structure; and acceptance of risk (Hornsby, Kuratko and Zahra, 2002).
Risk-taking refers to a firm’s tendency to engage in high-risk projects and managerial
preferences for bold versus cautious actions in order to achieve firm objectives. Risk-
taking involves the willingness to commit significant resources to opportunities with a
reasonable chance of costly failure as well as success. Risk-taking orientation indicates
a willingness to engage resources in strategies or projects where the outcome may be
29
highly uncertain (Wiklund and Shepherd, 2005). Risk can be managed by engaging in
experiments, testing the markets, acquring knowledge, and the use of networks.
Interestingly, studies have shown that entrepreneurs perceive a business situation to
be less risky than non-entrepreneurs. They cognitively categorize business situations
more positively. Certo et al. (2009) states that prior research sugests that
entrepreneurs themselves do not perceive their actions as risky and dispel the
common defining perception of entrepreneurs as chronic risk takers. Entrepreneurship
does not entail reckless decision making, but reasonable awareness of the risks
involved and these risks can be calculated and managed. When risk and uncertainty
are thus differentiated, individuals and firms acting entrepreneurially may be more
specifically thought of as effective uncertainty reducers, rather than reckless risk
takers (Certo et al., 2009).
Discussions on risk generally focus on what happens when the entreprenuer pursues a
concept and it does not work out. It is should however be noted that there are two
sides to the risk equation with the other side reflecting lack of innoivation. Risk is high
when companies engage in breakthrough innovations that create new markets and
industry redefinition (Morris et al., 2008). In the same breath, companies that do not
innovate are faced with higher risk of market and technology shifts that are capitalised
on by competitors. Kurtoko et al. refers to this as “missing the boat” or the risk in not
pursuing a course of action when that would have proven profitable. Although
innovativeness can help firms make novel combinations and proactiveness can help
identify novel opportunities, risk-taking is also necessary to support both
innovativeness and proactiveness (Patel and D’Souza, 2009).
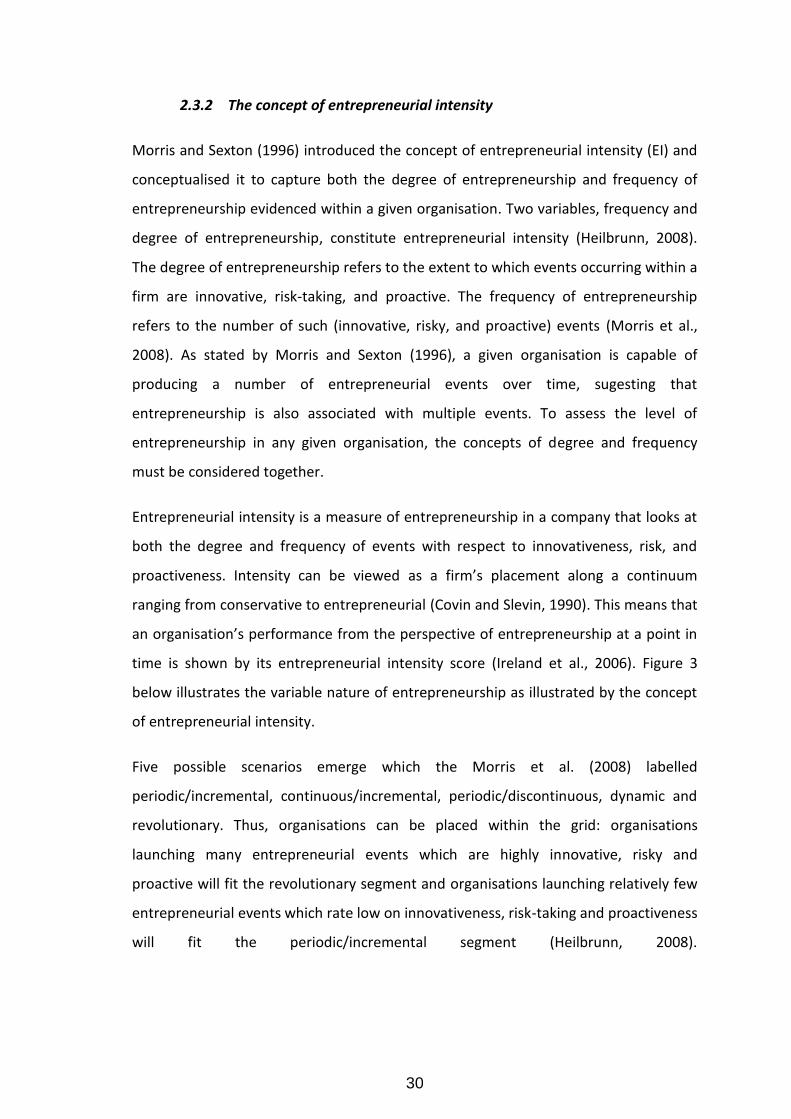
30
2.3.2 The concept of entrepreneurial intensity
Morris and Sexton (1996) introduced the concept of entrepreneurial intensity (EI) and
conceptualised it to capture both the degree of entrepreneurship and frequency of
entrepreneurship evidenced within a given organisation. Two variables, frequency and
degree of entrepreneurship, constitute entrepreneurial intensity (Heilbrunn, 2008).
The degree of entrepreneurship refers to the extent to which events occurring within a
firm are innovative, risk-taking, and proactive. The frequency of entrepreneurship
refers to the number of such (innovative, risky, and proactive) events (Morris et al.,
2008). As stated by Morris and Sexton (1996), a given organisation is capable of
producing a number of entrepreneurial events over time, sugesting that
entrepreneurship is also associated with multiple events. To assess the level of
entrepreneurship in any given organisation, the concepts of degree and frequency
must be considered together.
Entrepreneurial intensity is a measure of entrepreneurship in a company that looks at
both the degree and frequency of events with respect to innovativeness, risk, and
proactiveness. Intensity can be viewed as a firm’s placement along a continuum
ranging from conservative to entrepreneurial (Covin and Slevin, 1990). This means that
an organisation’s performance from the perspective of entrepreneurship at a point in
time is shown by its entrepreneurial intensity score (Ireland et al., 2006). Figure 3
below illustrates the variable nature of entrepreneurship as illustrated by the concept
of entrepreneurial intensity.
Five possible scenarios emerge which the Morris et al. (2008) labelled
periodic/incremental, continuous/incremental, periodic/discontinuous, dynamic and
revolutionary. Thus, organisations can be placed within the grid: organisations
launching many entrepreneurial events which are highly innovative, risky and
proactive will fit the revolutionary segment and organisations launching relatively few
entrepreneurial events which rate low on innovativeness, risk-taking and proactiveness
will fit the periodic/incremental segment (Heilbrunn, 2008).
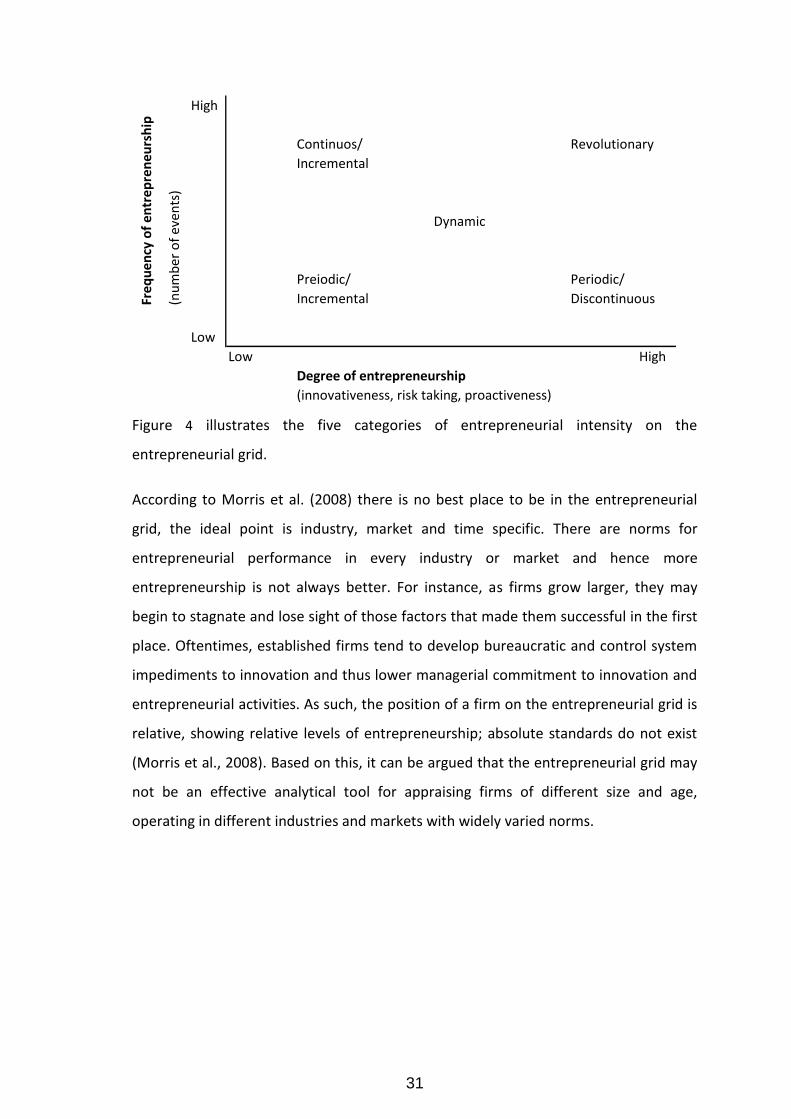
31
Figure 4 illustrates the five categories of entrepreneurial intensity on the
entrepreneurial grid.
According to Morris et al. (2008) there is no best place to be in the entrepreneurial
grid, the ideal point is industry, market and time specific. There are norms for
entrepreneurial performance in every industry or market and hence more
entrepreneurship is not always better. For instance, as firms grow larger, they may
begin to stagnate and lose sight of those factors that made them successful in the first
place. Oftentimes, established firms tend to develop bureaucratic and control system
impediments to innovation and thus lower managerial commitment to innovation and
entrepreneurial activities. As such, the position of a firm on the entrepreneurial grid is
relative, showing relative levels of entrepreneurship; absolute standards do not exist
(Morris et al., 2008). Based on this, it can be argued that the entrepreneurial grid may
not be an effective analytical tool for appraising firms of different size and age,
operating in different industries and markets with widely varied norms.
High
Continuos/ Revolutionary
Incremental
Dynamic
Preiodic/ Periodic/
Incremental Discontinuous
Low
Low High
Degree of entrepreneurship
(innovativeness, risk taking, proactiveness)
(nu
mb
er o
f e
ven
ts)
Fre
qu
en
cy o
f e
ntr
ep
ren
eu
rsh
ip
High
Continuous/ Revolusionary
Incremental
Dynamic
Periodic/ Periodic/
Incremental Discontinuous
Low
Low High
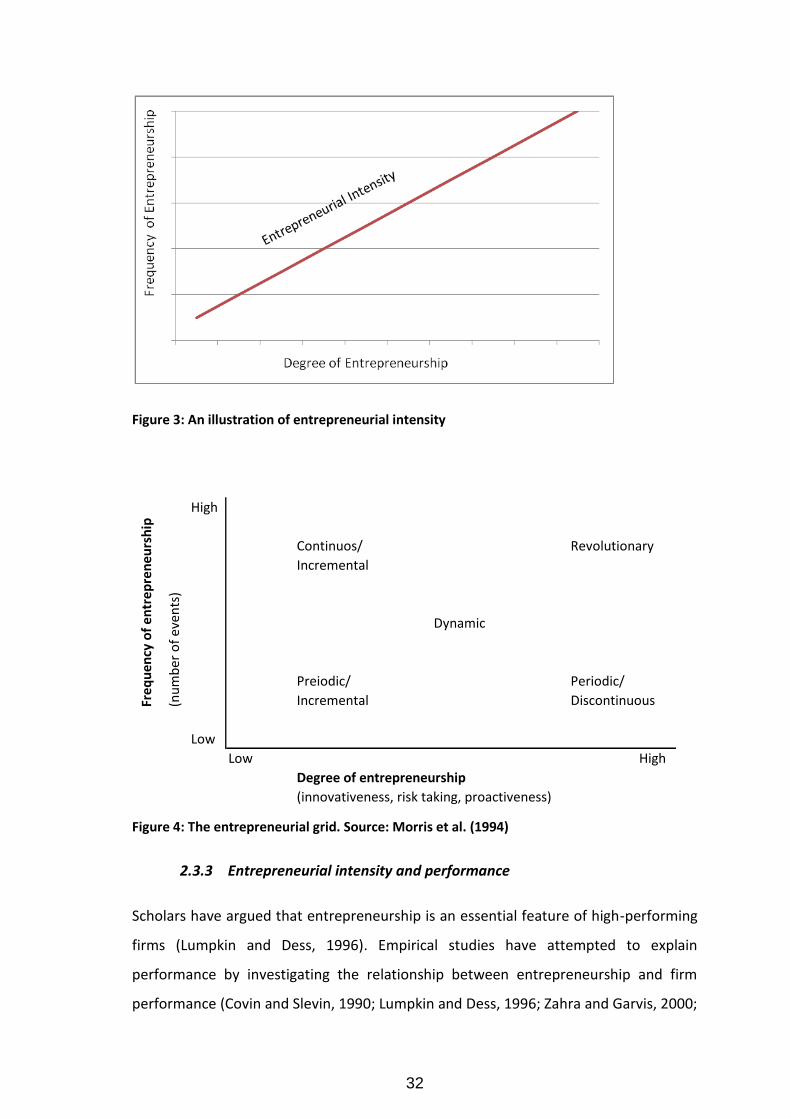
32
Figure 3: An illustration of entrepreneurial intensity
Figure 4: The entrepreneurial grid. Source: Morris et al. (1994)
2.3.3 Entrepreneurial intensity and performance
Scholars have argued that entrepreneurship is an essential feature of high-performing
firms (Lumpkin and Dess, 1996). Empirical studies have attempted to explain
performance by investigating the relationship between entrepreneurship and firm
performance (Covin and Slevin, 1990; Lumpkin and Dess, 1996; Zahra and Garvis, 2000;
High
Continuos/ Revolutionary
Incremental
Dynamic
Preiodic/ Periodic/
Incremental Discontinuous
Low
Low High
Degree of entrepreneurship
(innovativeness, risk taking, proactiveness)
(nu
mb
er o
f e
ven
ts)
Fre
qu
en
cy o
f e
ntr
ep
ren
eu
rsh
ip
High
Continuous/ Revolusionary
Incremental
Dynamic
Periodic/ Periodic/
Incremental Discontinuous
Low
Low High
33
Lumpkin and Dess, 2001; Zahra et al., 2001; Wiklund and Shepherd, 2005; Zhou, 2007;
Li et al., 2009; Patel and D’Souza, 2009; Frank, Kessler and Fink, 2010; Javalgi and Todd,
2010). These studies found that entrepreneurial behaviour enables firms to perform
better than competitors and enhance firm performance (Zahra and Garvis, 2000;
Lumpkin and Dess, 2001; Wiklund and Shepherd, 2005).
The popular view held among scholars is that the variable nature of entrepreneurship
can be measured in terms of entrepreneurial orientation (EO). Entrepreneurial
orientation refers to a firm's strategic orientation, acquiring specific entrepreneurial
aspects of decision-making styles, practices, and methods (Lumpkin and Dess, 1996;
2001). Entrepreneurial orientation reflects how a firm operates rather than what it
does (Lumpkin and Dess, 1996) and can be an important measure of how a firm is
organised to discover and exploit market opportunities (Zahra and Garvis, 2000;
Wiklund and Shepherd, 2005).
Entrepreneurial orientation consists of three sub-dimensions: innovativeness, risk-
taking and proactiveness. Researchers have used other terms such as strategic
posture, degree of entrepreneurship, and entrepreneurship level to talk about what is
in essence an equivalent concept (Covin and Slevin, 1990; Kuratko et al., 2007;
Scheepers et al., 2007; Zhou, 2007). However, Morris and Sexton (1996) regard
entrepreneurial orientation as a one-dimensional view of the entrepreneurship
phenomenon, and added another dimension, namely frequency of entrepreneurship,
and called this phenomenon entrepreneurial intensity (EI) (Scheepers et al., 2007). The
argument is that in addition to how much the extend of innovativeness, risk-taking and
proactive entrepreneurial events are, the question of how many such events take
place is just as important. Several other authors (Kuratko et al., 2007; Scheepers et al.,
2007; Morris et al., 2008) have since followed Morris and Sexton’s distinct
conceptualisation of the two constructs, i.e. entrepreneurial orientation and
entrepreneurial intensity. There seem to be consensus that EI is a two-dimensional
construct consisting of both degree and frequency of entrepreneurship.
Researchers have demonstrated statistically significant relationships between EI and a
number of company performance indicators (Morris and Sexton, 1996; Kuratko et al.,
34
2007; Scheepers et al., 2007). The relationship is stronger when more weight is placed
on degree versus the frequency of entrepreneurship demonstrated by a firm (Morris
and Sexton, 1996). It may be that frequency has more of a short-term impact whereas
degree is better able to impact long-term outcomes (Morris et al., 2008), however
there is no evidence of this hypothesis. As indicated by Morris et al. (2008), our
understanding of entrepreneurial intensity is still in its infancy.
It is not clear whether high levels of entrepreneurship intensity are sustainable (Morris
et al., 2008). Covin and Slevin (1990) found that companies alternate between dynamic
periods of the most strategic postures and periods where innovations are more
incremental and lower intensity depending on the industry life cycle. The research
suggested that performance is influenced by the fit between strategic posture,
organisation structure, and industry life cycle stage (Covin and Slevin, 1990). In
addition, Scheepers et al. (2007) indicated that the level of entrepreneurship will vary
in intensity, depending on changes in the organisation culture.
2.3.4 Entrepreneurial intensity and internationalisation
In the international context, barely any study conducted on the concept of
entrepreneurial intensity (EI) exists, with the existing studies conducted within
corporate entrepreneurship and more especially on the EO construct. Thus, the
existing literature will form the foundation from which an integrative
conceptualisation can be developed for international entrepreneurship.
International entrepreneurship is “...a combination of innovative, proactive and risk-
seeking behaviour that crosses national borders and is intended to create value in
organisations” (Jones and Coviello, 2005). Research in international entrepreneurship
appear to mirror empirical developments in entrepreneurship research and its
emergence reflects complementary theoretical interests (Jones and Coviello, 2005).
Particular interest has been paid to examining entrepreneurship (at firm level) as a
process of behaviour manifesting in entrepreneurial events, and exhibiting
entrepreneurial orientations (Zahra and Garvis, 2000; Zhou, 2007; Li et al., 2009; Patel
and D’Souza, 2009; Javalgi and Todd, 2010).
35
Entrepreneurial orientation (EO) is defined as the firm’s predisposition to engage in
entrepreneurial processes, practices, and decision making, characterised by its
organisational culture for innovativeness, risk-taking, and proactiveness (Lumpkin and
Dess, 1996). In the context of internationalisation, the term international
entrepreneurial orientation is adopted by extending the conceptual domain to the
firm-level processes and activities across national borders (Knight, 2001; Zhou, 2007).
This study expands EO construct and suggest that such behavioural patterns are
associated with multiple events, to operationalise the concept of entrepreneurial
intensity.
Empirical studies among internationalised firms confirmed that entrepreneurial
orientation is positively related to firm performance (Zhou, 2007; Li et al., 2009; Patel
and D’Souza, 2009; Javalgi and Todd, 2010). Accordingly, international entrepreneurial
orientation is essential for firms to discover entrepreneurial opportunities in foreign
markets. Firms with more aptitude for innovativeness, risk-taking, proactiveness, will
gain greater competitive advantage and accomplish higher firm performance.
Researchers suggested that in order to better understand the EO-performance
relationship both the direct and indirect effects of the entrepreneurial orientation on
firm performance should be studied (Wiklund and Shepherd; 2005; Li et al., 2009). The
relationship between entrepreneurial behaviour and firm performance may be a
contingent one rather than direct (Lyon, Lumpkin and Dess, 2000). In their
investigation among small businesses, Wiklund and Shepherd (2005) found that the
analysing only the direct effects provided an incomplete picture of the relationship
between EO and performance.
As argued by Lumpkin and Dess (1996), few studies investigating the independent
effect of entrepreneurial orientation on firm performance regard the factors that may
mediate the strength of the entrepreneurial orientation - firm performance
relationship (Wiklund and Shepherd, 2005). In a study among Chinese firms, Zhou
(2007) found that international entrepreneurial proclivity had significant effects on the
speed of born-global development and performance of early internationalisation
through the pathway of foreign market knowledge. In other words, international
36
entrepreneurial proclivity drives acquisition of foreign market knowledge which leads
to early and rapid internationalisation. Similarly, Li et al. (2009) found that
entrepreneurial orientation indirectly influences firm performance by influencing
knowledge creation process. Autio et al. (2000) found that earlier initiation of
internationalisation and greater knowledge intensity induces greater entrepreneurial
behaviour and confers a growth advantage. The development of entrepreneurial
orientation requires organisational members to engage in intensive knowledge
activities (Li et al., 2009).
Interestingly, Zhou (2007) found that the three dimensions of entrepreneurial
proclivity did not seem to play an equally important role in facilitating the knowledge
effect on born-global internationalisation. The proactiveness dimension appears to be
more pronounced, followed by the innovative dimension. But, the risk-taking
dimension is less salient. On the contrary, Patel and D’Souza (2009) found that
proactivity and risk-taking played a role in enhancing export performance of SMEs.
However, their study did not find support for innovation as a factor that enhances
export performance.
Covin and Slevin (1989) positioned EO as a multi-faceted construct with its three
dimensions working in combination, rather than any one dimension individually, to
enable the entrepreneurial behaviour of a firm. Morris and Sexton (1996) argued that
EO dimensions may be combined in unique ways that vary from one firm to the next
(Morris and Sexton, 1996). According to Lumpkin and Dess (1996) these dimensions
are based on firm characteristics that may vary independently of each other,
contingent on influences that are both internal and external to a firm. The researcher’s
view is that whether individually or in combination, these dimensions play an
important role in enabling firms to act in an entrepreneurial manner, an underlying
theme accepted by both camps (Certo et al., 2009).
Despite broad agreement on the theorized effects of EO, extensive debate has
continued regarding its conceptualisation and measurement (Lyon et al., 2000).
Hansen et al. (2011) noted from several studies, that researchers have deleted items
or have collapsed the scale into two factors based on exploratory factor analysis. In
37
others, researchers have focused on only one dimension of the construct to the
exclusion of the others. The view in this study is that firms can be labelled
entrepreneurial only if they are simultaneously innovative, proactive, and risk-taking.
Wiklund and Shepherd (2005) found that the dynamism of the environment is
important moderator of the EO-business performance relationship. A high EO enables
businesses that face performance constraints in terms of a stable environment to
achieve superior performance. This confirmed the proposition made by Lumpkin and
Dess (1996) in their conceptual model which suggested that factors internal and
external to the firm may moderate the relationship between EO and performance.
The linkage between EI and performance appears to be stronger for firms that operate
in increasingly turbulent environments. Zahra and Garvis (2000) found that firms that
aggressively pursued entrepreneurship behaviour in international environments with
higher levels of hostility experienced higher returns (Zahra and Garvis, 2000).
Entrepreneurial intensity is likely to influence the interaction between the firms
external environment (Morris et al., 2008).
2.3.5 Summary of literature on entrepreneurial intensity and formulation of
hypothesis 1
The concept of entrepreneurial intensity is conceptualised to capture both the degree
entrepreneurship and frequency of entrepreneurship within a given organisation. The
degree of entrepreneurship refers to the extent to which events occurring within a
firm are innovative, risk-taking, and proactive (Morris and Sexton, 1996). The degree of
entrepreneurship within a firm is also known as entrepreneurial orientation. The
frequency of entrepreneurship refers to the number of such (innovative, risky, and
proactive) events (Morris et al., 2008). As stated by (Morris and Sexton, 1996), a given
organisation is capable of producing a number of entrepreneurial events over time,
sugesting that entrepreneurship is also associated with multiple events.
Scholars have argued that entrepreneurship is an essential feature of high-performing
firms (Lumpkin and Dess, 1996) and several studies have attempted to explain
performance by investigating the relationship between entrepreneurship and firm
38
performance (Covin and Slevin, 1990; Lumpkin and Dess, 1996; Zahra and Garvis, 2000;
Lumpkin and Dess, 2001; Zahra et al., 2001; Wiklund and Shepherd, 2005; Zhou, 2007;
Li et al., 2009; Patel and D’Souza, 2009; Frank et al., 2010; Javalgi and Todd, 2010).
Although most research on the entrepreneurship construct focused on the
entrepreneurial orientation and conducted within the realm of corporate
entrepreneurship, no research on the expanded construct of entrepreneurial intensity
has been conducted within the context of international entrepreneurship. Given that
research in international entrepreneurship tends to mirror empirical developments in
entrepreneurship research and its emergence reflects complementary theoretical
interests (Jones and Coviello, 2005), it would seem complementary to explore the
relationship between entrepreneurship and performance among international firms.
These theoretical underpinnings lead to the following hypothesis:
Hypothesis 1: Entrepreneurial intensity is positively related to international
performance.
39
2.4. Entrepreneurial capabilities
This section of the report relates to the second sub-problem.
2.4.1 Introduction
The concept of entrepreneurial capabilities takes its roots from the resource based
view of the firm, which proposes that venture performance is largely determined by its
unique resource and capabilities (Deeds, 2001). Resources are primarily tangible
assets, including physical and financial assets. Following theoretical literature
reviewed, capabilities can be classified into social capital, human capital, and
technology (Autio et al., 2000; Deeds, 2001; Obrecht, 2004; Zhou, 2007; Camisón and
Villar-López, 2010). Capabilities are a stock of intangible assets or knowledge-based
factors associated with individuals who posses them or with the firm as an
organisation (Deeds, 2001).
Obrecht (2004) declared that human capital and social capital are among the most
essential capabilities for organisational perfomance. Zahra et al. (2000) added that the
firm’s technological capability is critical to successful internationalisation. Bojica and
Fuentes (2011) maintained that market and technological knowledge represent a
necessary condition for identification and exploitation of opportunities and therefore
play an important role in sustaining entrepreneurial activities. Similarly, other
researchers in the literature of international entrepreneurship have asserted that
knowledge-based, social-based, and technological capabilities are important for
successful international expansion (Autio et al., 2000; Deeds, 2001; Zhou, 2007;
Brennan and Garvey, 2009). Entrepreneurial capabilities are viewed as a broader range
of abilities needed to initiate appropriate action in specific organisational situations
and reflect the capacity to initiate and sustain an entrepreneurial dynamism
throughout the organisation (Obrecht, 2004).
Leiblein and Reuer (2004) marked the need for theoretical literature to investigate the
specific capabilities that lead to successful internationalisation. Entrepreneurial firms
are commonly portrayed in international entrepreneurship literature as lacking in
possession tangible assets and capital (Leiblein and Reuer, 2004; Li et al., 2009).
40
Nonetheless, Camisón and Villar-López ( 2010) found that financial assets did not
appear to be determinants of international intensity. Entrepreneurship literature puts
more emphasis on resourcefulness and gaining influence over vital resources rather
than owning them. Therefore this study does not look at the dimension of financial
assets. This suggests that entrepreneurial firms must possess compensating
advantages in order to compete viably in unfamiliar markets abroad.
Intangible assets are a determining factor of economic performance (Camisón and
Villar-López, 2010). Entrepreneurial capability is therefore conceptualised as a multi-
dimensional construct comprising of three intangible firm assets, namely social capital,
human capital, and technology. In this section the three entrepreneurial capabilities
that have been identified as distinct competencies purported to be catalytic to
entrepreneurial success in the international arena are discussed.
41
2.4.2 Social capital
2.4.2.1 Social capital theory of entrepreneurship
The assumption that all economic activity is embedded in social relations has been
acknowledged and the significance of the social aspects of the entrepreneurial process
has been increasingly recognised (Anderson and Miller, 2003; Ulhøi, 2005; Jack, 2010).
The formation and development of a firm is related to the entrepreneur’s social world,
and to all of the subjective configurations associated with this social world (Anderson
and Miller, 2003; Ulhøi, 2005; Jack, 2010). In other words, entrepreneurship can be
described as a social undertaking and as a consequence is carried out and understood
within the context of social systems (Jack, 2010). The view therefore is that
entrepreneurship is not an individual act, operating in isolation from social process;
and that entrepreneurial activities are results of social interactions and mechanisms.
Social capital is defined as the norms and social relations embedded in the social
structures of society that enable people to coordinate action and to achieve desired
goals (Molina-Morales and Martínez-Fernández, 2010). Similarly social capital can be
defined as resources embedded in a social structure of relationships which are
accessed and/or mobilised in purposive actions (Burt, 2000). Social capital is often
explained in terms of social exchange. According to Burt (Burt, 1992; Burt, 1997) social
capital is broadly defined as an asset that is embedded in social relations and
networks.
Anderson and Jack (2002) concluded that social capital comprises both the network
and the assets that may be mobilised through that network. Simply put, the nature of
social capital both structures and facilitates the operation of networks and their actors
(Westerlund and Svahn, 2008).
The network perspective is increasingly being embraced as a mechanism for
considering the creation and development of new ventures. Firms make active efforts
to build them (Jones and Coviello, 2005). Social capital provides networks that
facilitate the discovery of opportunities, as well as the identification, collection and
allocation of scarce resources (Davidsson and Honig, 2003) stated in Urban and Shaw
42
(2010). Arguing from a networking perspective, Walter, Auer and Ritter (2006) states
that it is the capability of networking that is essential and not only the existence of a
network. Network theory examines how network structure, and the position of
individuals in that structure, impacts one's ability to bring about change or produce
performance advantages (Burt, 1992).
Networking extends the reach and abilities of the individual to capture resources that
are held by others and so improve entrepreneurial effectiveness and themselves
(networks) become the mode of being entrepreneurial. For example social capital can
contribute to overcome information asymmetries and pave the way to entrepreneurial
finance (Bauernschuster, Falck and Heblich, 2010). Networks are a socially constructed
‘‘strategic alliance’’ for operations as well as instituting change, developing growth and
thus creating the future Anderson, Dodd and Jack (2010). Using a database of
biotechnology firms, research has shown that high technology new firms extensively
used strategic alliances (upstream, horizontal, and downstream) to gain access to
knowledge, resources and capabilities (Haeussler, Patzelt and Zahra, 2010). Knowledge
networks are viewed as the repositories of broad and complex sets of expertise,
experience and accumulated knowledge from which both inside and outside members
can draw (Etemad and Lee, 2003).
Researchers have acknowledged that social capital created within networks and
through social interaction is related to the growth of new and small business ventures
(Anderson, Dodd and Jack, 2010). Anderson et al. (2010) argued for the social nature of
entrepreneurial growth and the importance of networking in growth.
Anderson and Miller (2003) construed entrepreneurship as a social activity and argued,
based on empirical findings from literature, that entrepreneurship can be understood
in terms of entrepreneurial social groups and social embeddedness as represented in
the relationship between the entrepreneur and context. Urban and Shaw (2010)
explained that sources of social capital lie in the social structure within which the actor
is located.
43
The social capital value of a network is a function of both form and content (Burt,
1997) and governance. Social capital is a multifaceted concept distinguished in terms
of its relational, cognitive dimensions and structural. These three dimensions of social
capital reflect how and with whom people and organisations are connected and
interact (Hoang and Antoncic, 2003; Parra-Requena, Molina-Morales and GarcÍA-
Villaverde, 2010).
The cognitive dimension of social capital manifests the perspectives, narratives,
values, language, and goals that the individual members share with each other
(Lindstrand, Melén and Nordman, 2011). Other researchers defined the cognitive
dimension as the degree to which people and organisations share goals and culture
(Parra-Requena et al., 2010). The cognitive dimension refers to resources that provide
shared representations, interpretations and systems of meaning among the parties
(Westerlund and Svahn, 2008).
The relational dimension reflects the quality of relationships and the key elements of
the relational dimension are perceived sense trust and proximity, and social
interaction between the individuals (Westerlund and Svahn, 2008; Lindstrand et al.,
2011). The relational view of the firm suggests that relationship-building capabilities
are valuable assets that can lead to better performance. SME’s ability to build informal
cooperative relationships with other organisations is a critical strategic capability
(Haahti et al., 2005). Social capital in a relationship enables the firm to tap into the
knowledge resources of its exchange partner. Through close social interaction, firms
are able to increase the depth, breadth, and efficiency of mutual knowledge exchange.
According to Westerlund and Svahn (2008), the relational dimension results in and
reflects the impact of the structural and cognitive dimensions.
The structural dimension of social capital highlights the network configuration and
what knowledge is available through the structure (Lindstrand et al., 2011). The
structural dimension denotes loose and non-embedded ties amongst business actors
operating in detached contexts with infrequent or irregular business contacts but
resulting in access to a broader set of new useful contacts and links to the marketplace
(Pirolo and Presutti, 2010).
44
Network ties may vary in intensity, strength and length affecting how resources and
information flow. Researchers recognise that network ties can be categorized into
“strong” or “weak”. The cognitive and relational dimension of social capital are
considered as inter-organisational strong ties whereas the structural dimension of
social capital is referred to as the inter-organisational weak (Coviello, 2006; Presutti et
al., 2007; Bhagavatula, Elfring, van Tilburg and van de Bunt, 2010). Strong ties play a
crucial role in transmitting sensitive information in social networks whereas weak ties
can disperse extremely valuable information (Ding, Steil, Dixon, Parrish and Brown,
2011). In a study on creation of innovation within firms, Rost (2011) showed that
strong and weak ties are not alternatives but complementary. In particular, weak
network architectures have no value without strong ties, whereas strong ties have
some value without weak network architectures but are leveraged by this type of
structure (Rost, 2011).
The relational–cognitive configuration (strong ties) refers to the extent that the
business relationship between a firm and its partners is marked by the presence of
goodwill trust, expectations of reciprocity, and cognitive identification (Pirolo and
Presutti, 2010). Strong ties promote the development of trust and cognitive
identification and joint problem solving, which reduce the risk of opportunism
between network players through a continuous reinforcement of their business
relationship (Uzzi, 1997). Leung, Zhang, Wong and Foo (2006) found network effects,
particularly strong ties, can be useful to entrepreneurial firms in the acquisition of
human resources (recruitment) with common values and goals.
According to the theory of structural embeddedness, network structure and a firm’s
network position are considered to be both opportunities and constraints.
Strong ties can reduce the flow of new information between interrelated partners
because redundant ties to the same network partners mean that there are few or no
links to outside partners who can potentially contribute innovative ideas (Burt, 1992).
Over-embeddedness amongst networked organisations may become a social liability
resulting in dependency problems or vulnerability as a result of unexpected loss of a
45
core network player (Burt, 1992; Uzzi, 1997). In this context, networking may result in
a time consuming and costly effort.
A weak tie-based network relation means that the persons in question may not
personally know each other (but may know of each other) and is thus a basis for non-
redundant information (Ulhøi, 2005).
Network theory also recognises the brokerage role of intermediary members in
facilitating transactions or knowledge flows between members unknown to each
other. The broker transfers expectations of trust and commitment from pre-existing
relationships to newly formed ones (Uzzi, 1997). This point was illustrated the
infamous structural hole theory (Burt, 1992), which asserts that relationships
characterised by the absence of cohesive social networks are able to obtain and
monitor information more effectively. A structural hole is a disconnection or extremely
weak relationship between two contacts (Batjargal, 2007).
Coviello (2006) mentioned that the conduct and performance of firms can be
understood by examining the network of relationships in which they are embedded. It
has been suggested that entrepreneurs build and use networks that vary according to
the phase of entrepreneurship (Jack, 2010). Pirolo and Presutti (2010) found that
strong and weak ties influence performance in different ways depending on whether
the performance target is economic or innovation, and the stage in the life-cycle of the
firm. Pirolo and Presutti (2010) recommended that start-up firms should progress from
strong ties of social capital toward weak ties to meet the increased quantity and scope
of their resource needs during the innovation process as required during the start-up’s
life cycle. Hite and Hesterly (2001), cited in Coviello (2006) proposed that the
entrepreneurial network will shift from being identity-based (path dependent) to more
calculative (intentionally managed) over time. Hite and Hesterly argued that the
network will begin with a base of strong socially embedded ties, and will evolve and
become less cohesive over time (Coviello, 2006). As the firm moves into the growth
stage, the network changes to encompass a balance of embedded and arm's length
economic ties that are more intentionally managed to explore growth (Coviello, 2006).
46
Drawing from the discussion presented, it is evident that there is a link between social
capital and entrepreneurial performance (Davidsson and Honig, 2003; Coviello, 2006;
Anderson et al., 2010; Bauernschuster et al., 2010). Social capital comprises both the
network and the resources that may be mobilised through that network. Social
resources and entrepreneurial networks provide information, create opportunities and
enable resources to be accessed (Jack, 2010). Social capital is a multi-fasceted and
dynamic concept (Pirolo and Presutti, 2010). Entrepreneurial networks can take
different form with different features (Hoang and Antoncic, 2003; Coviello, 2006;
Presutti et al., 2007; Bhagavatula et al., 2010; Parra-Requena et al., 2010) and evolve
and develop over time (Coviello, 2006; Jack, 2010). Social capital theory explains the
ability of actors to extract benefits from their social structures, networks and
memberships and can be used to supplement the effects of education, experience and
financial capital (Venter, Urban and Rwigema, 2008). The next section focuses on the
link between social capital and internationalisation.
47
2.4.2.2 Social capital and internationalisation
Leiblein and Reuer (2004) premised that entrepreneurial firms face severe resource
constraints arising from factors such as the possession of few tangible assets and large
capital requirements and that these firms are faced with the challenges of overcoming
foreign market entry barriers. In the international context, these resource constraints
extend beyond financial constraints to include administrative resource constraints
arising from a lack of familiarity with local market conditions and customs in host
countries (Leiblein and Reuer, 2004).
Davidsson and Honig (2003) found that social capital, consisting of both strong and
weak ties, was a robust predictor for advancing through the start-up process. The
researchers also found membership to a business network to be a strong predictor of
outcomes like making a first sales or showing a profit and rapid growth.
Anderson et al. (2010) argued for the social nature of entrepreneurial growth and the
importance of networking in growth. Internationalisation is an important route
through which new and small ventures can realise their growth potential (Pangarkar,
2008).
Research in international business and competitive strategy has contended that firms
are at a natural disadvantage when expanding into foreign markets and contend that
building foreign sales is one of the key rationales for collaborating with other firms
(Leiblein and Reuer, 2004).
Jones, Coviello and Tang (2005) consolidated different views from international
entrepreneurship research and pointed that entrepreneurial internationalisation
behaviour is a complex social phenomenon encompassing borderless resources and
networks. To succeed internationally firms must acquire information about foreign
markets from external parties (Presutti et al., 2007). Information about foreign
markets is acquired through a firm’s social network (Agndal, Chetty and Wilson, 2008).
Noting other studies Leiblein and Reuer (2004) stated that born globals firms have
been able to internationalise rapidly despite resource constraints across the value
48
chain and other administrative challenges that accompany international expansion.
Coviello (2006) found that entrepreneurial growth is indeed co-created through
strategic networking practices. Internationalisation is the most effective form of
entrepreneurial growth (Acedo and Casillas, 2007).
A number of entrepreneurship studies have supported the arguments of scholars
regarding the importance of networks for entrepreneurial success (Hoang and
Antoncic, 2003). Business networks are considered the long-term business
relationships that a firm has with the actors in a business network i.e. its customers,
distributors, suppliers, competitors and government (Urban, Van Vuuren and Barreira,
2008).
In their study regarding the growth of international new ventures, Presutti et al. (2007)
verified that social capital is a critical source of knowledge acquisition abroad. Social
capital can play a role substitutive for more formal institutions in small business
environments characterised by lack of market-oriented institutions such as specialized
venture capital firms providing entrepreneurial finance (Bauernschuster et al., 2010).
An entrepreneurial firm can also use alliances to develop its foreign sales base. The
empirical evidence from a study among firms in a high technology industry revealed
that the formation of collaborative linkages is associated with greater foreign sales
(Leiblein and Reuer, 2004). These researchers identified at least two mechanisms
through which alliances may enhance organisational growth in general and the
development of foreign sales in particular. Firstly, alliances enable firms to acquire
complementary assets and local knowledge thereby enabling entrepreneurial firms
with proactive competitive strategies to enter into a market before rivalry dissipates
rents. Secondly, alliances can be viewed as transitional learning investments that open
doors to future expansion opportunities.
To better understand how social capital affects international performance, several
studies have drawn from the knowledge-based view of the firm. Social capital is a key
regulator of learning, and therefore, of knowledge-based competitive advantage (Yli-
Renko et al., 2001; 2002; Haahti et al., 2005, Presutti et al., 2007; Zhou, 2007). A study
49
of internationally oriented SMEs from mainland China, found that social networks
mediate the link between internationalisation and performance through information
benefits such as knowledge of foreign market opportunities, advice and experiential
learning, and referral trust and solidarity (Manolova et al., 2010). SMEs employing
cooperative strategies to enrich their knowledge base about export markets can
consequently improve their performance (Haahti et al., 2005).
In a study among Swedish biotech SMEs Lindstrand et al. (2011) found that all
dimensions of social capital affect the acquisition of foreign market knowledge and
financial resources. A study among UK high-technology ventures found that the social
interaction and network ties dimensions of social capital are indeed associated with
greater knowledge acquisition, but that the relationship quality dimension is negatively
associated with knowledge acquisition (Yli-Renko et al., 2001). This indicates that there
are mixed findings regarding the relevance of social capital dimensions to acquisition
of foreign market knowledge.
Coviello (2006) stated from prior research that the benefits of social capital for new
ventures included better access to resources and international opportunities, and a
means by which to overcome the liabilities of newness and foreignness. Yli-Renko et al.
(2002) showed that external social capital (in the form of management contacts,
involved customers and involved suppliers) positively impacts upon foreign market
knowledge and, in turn, the international growth of new ventures.
A firm’s distinctive knowledge on internationalisation is obtained from diverse sources
through individual level, organisational, and inter-organisational relationships (Yli-
Renko, Autio and Tontti, 2002; Casillas, Acedo and Barbero, 2010) and derived from
the participation in social and institutional networks (Casillas et al., 2010). A review of
the work of Lin and Chaney (2007) in their study of the internationalisation process of
Taiwanese SMEs noted that entrepreneurial firms are able to exploit advantages from
being part of a network, such as low transaction costs, assured orders, and access to
external resources and knowledge (Manolova et al., 2010).
50
Casillas et al. (2010) found that collective knowledge, i.e. knowledge derived from
participation in social and institutional network, has a more intense influence than the
individual knowledge in motivating favourable attitude to initiate a process of
internationalisation through exports. Yli-Renko et al. (2001) maintains that competitive
advantage derives not solely from firm-level resources but also from difficult-to-
imitate capabilities embedded in dyadic and network relationships. Collective
knowledge seems to be more important in an international context, where the
individual search for information is more difficult. Knowledge-based competition has
magnified the importance of learning alliances as a fast and effective way to develop
such capabilities.
Oviatt and McDougall (2005) presented a framework that incorporates recently
developed ideas from entrepreneurship scholars about how ventures gain influence
over vital resources without owning them, and from strategic management scholars
about how competitive advantage is developed and sustained. In their framework they
describe strong reliance on alternative governance structures to access resources as a
necessary element for the existence of international new ventures.
It is evident from the extant literature that there is widespread agreement regarding
the importance of networks in successful ventures (Davidsson and Honig, 2003; Urban
et al., 2008) and specifically international ventures (Yli-Renko et al., 2002; Hoang and
Antoncic, 2003; Leiblein and Reuer, 2004; Haahti et al., 2005; Presutti et al., 2007).
However, having a good network in itself is no guarantee for success Bhagavatula et al.
(2010).
Arguing from a capability-based view of the firm, Walter et al. (2006) stated that it is
the ability to network that is essential and not only the existence of a network,
highlighting that firms perform better as their network capability increases.
Westerlund and Svahn (2008) indicated that the relevant dimensions of value in
relationships should be distinguished, cultivated and managed carefully. Some
relationships are arguably more important or valuable than others and firms with
limited resources need to build fewer relationships with greater outcomes
(Westerlund and Svahn, 2008).
51
Social capital use can contribute to a rapid internationalisation; however, this may
impede a firm’s understanding of a foreign market. In their study of growth of Italian
international new ventures, Presutti et al. (2007) showed that strong ties (both
relational and cognitive dimensions) were negatively linked to knowledge acquisition.
This could be explained by the surmise that very close customer relationships may
result in over-embeddedness (Uzzi, 1997). Yli-Renko et al. (2001) posited that there
may be a presence of information redundancy within strong business ties. In other
words, very close relationships may insulate small firms from other external sources of
knowledge and information.
Recent network research in international entrepreneurship has become more
sophisticated in that it deconstructs network dynamics and the relationships between
networks and resources.
Based on the findings of their study among biotech SMEs, Lindstrand et al. (2011)
argued that social capital should not be perceived as a static concept. The usefulness
of an individual’s social capital often changes during the SMEs’ internationalisation. In
the early phase of internationalisation, SMEs primarily draw on the social capital
residing in direct relationships to enable foreign market entries (FMEs). Later on, the
role of indirect relationships social capital becomes more prominent, indicating that
social capital changes with the firm stage of internationalisation (Agndal et al., 2008).
Coviello (2006) noted the network dynamics of early stage entrepreneurial firms and
argued, that the network begins with a base of strong socially embedded ties, and will
evolve and become less cohesive over time. Agndal et al. (2008) suggested that in the
later stages of internationalisation, firms may have exhausted the readily recognisable
opportunities available through their well-known partners. According to Agndal et al.
(2008), in the later stages of internationalisation, indirect relationships may provide
unexpected opportunities as managers obtain new information from previously
unconnected networks.
Research has pointed to the need for entrepreneurs to consider carefully the balance
between the risks and benefits of particular types of alliances as well as alternative
mechanisms for organizing the firm’s international expansion (Leiblein and Reuer,
52
2004). Lechner et al. (2006) and Bhagavatula et al. (2010) indicated that it is important
to know the conditions under which different network elements lead to specific
benefits and to have the right mix of strong and weak ties. This mix is contingent on a
number of aspects, such as the industrial, technological and environmental conditions.
Cross-country research shows that networks are crucial in leveraging external
resources such as venture capital or angel funding, and that entrepreneurs perceive
opportunities based on the cohesion of their networks (Jones, Coviello and Tang,
2005). However, Danis, De Clercq and Petricevic (2010) provided empirical proof that
social networks are more important for new business activity in emerging than in
developed economies due to high regulatory and normative institutional burdens in
emerging markets. This may be explained by Singh (2009)’s posit that emerging market
firms may not target overseas customers though the advertising campaigns due to
their limited resources.
As stated in Batjargal (2007), Batjargal found in prior research among entrepreneurs
that an effective way of managing hostile environments in transition economies is
doing business through personal networks of relationships because network ties
provide resources and information, and help to find clients, suppliers, and investors,
who are socially bound. Research exploring the internationalisation of entrepreneurial
ventures in Bulgaria found that domestic personal networks have a positive effect on
internationalisation (Manolova et al., 2010). Manolova et al. (2010) remarked that
entrepreneurial firms in transition economies use network embeddedness to decrease
transaction and information-acquisition costs and develop resources and capabilities
needed for internationalisation. Cohesive networks are conducive to firm survival
because of high trust, cooperative norms and informal sanctions for deviant
behaviours (Batjargal, 2007).
Extant literature has identified the numerous constraints faced by SMEs in expanding
internationally. The relevance of social capital in the SME internationalisation context
is mainly a consequence of the resource limitations arising from the liability of
smallness and newness in the foreign markets (Leiblein and Reuer, 2004; Coviello,
2006). In order to remain competitive and to take advantage of new market
53
opportunities, entrepreneurial firms need to gain influence over vital resources
without owning them (Oviatt and McDougall, 2005). From an entrepreneurial
perspective, social capital is a key driver in providing access to these resources (Yli-
Renko et al., 2002; Coviello, 2006; Manolova et al., 2010; Casillas et al., 2010).
This review has argued and evidenced on the connection between social capital or
social networks and international entrepreneurial performance. There seem to be
tentative evidence that social capital positively contributes to international
performance (Pangarkar, 2008). Manolova et al. (2010) explored the role of personal
and inter-firm networks for new-venture internationalisation. Yli-Renko et al. (2001)
examined the effects of social capital in key customer relationships on knowledge
acquisition and knowledge exploitation, although their study was not located in the
domain international entrepreneurship. Yli-Renko et al. (2002) developed a model of
the international growth of technology-based new firms by drawing on the social
capital theory and the knowledge-based view of the firm. This paper focuses on the
following dimensions of social capital: Social interaction, relationship quality and
network ties (Yli-Renko, 2001).
Based on Yli-Renko (2001), our empirical study will look at social capital as a
multidimensional asset inside the business relationships comprising of both strong and
weak ties, and implemented by the firms with their international partners or contacts.
Social capital is analyzed in relationships among firms and their foreign actors/contacts
rather than domestic. It follows that the two views used in the deconstruction of social
capital, i.e. the strong ties/weak ties as well as the relational/cognitive/ structural
dimensions, are applicable to our conceptualisation of social capital in this study: the
social interaction and relationship quality constructs are analogous to the relational
dimension whereas the network ties construct represents the structural dimension.
Using the alternative categorization, the social interaction and relationship quality
represents inter-organisational strong ties whereas network ties represent inter-
organisational weak ties. The above discussion illustrates that relationships, of one
form or another, are at the core of competiveness.
54
2.4.3 Human capital
2.4.3.1 Human capital theory of entrepreneurship
Entrepreneurship can be defined as an activity and process involving the discovery,
creation, and exploitation of opportunities in order to create value by introducing new
goods, services, processes and organisations (Blanco, 2007). The fundamental activity
of entrepreneurship is new venture creation, and new venture creation is a process.
Based on a meta-analytical review of literature integrating results from three decades
of human capital research in entrepreneurship, Unger, Rauch, Frese and Rosenbusch
(2009) state that human capital attributes including education, experience, knowledge,
and skills are critical resources for success in entrepreneurial firms. Opportunity
recognition is at the beginning of this entrepreneurship process (Urban, 2009a).
According to Dimov and Shepard (2005) and Unger et al. (2009) human capital is an
important variable that increases entrepreneurs’ capabilities of recognition and
exploitation of business opportunities.
Entrepreneurs are those people who sense, create, and respond to change regarding a
possible opportunity for profit (Blanco, 2007). It is a person’s specific knowledge that is
apparently the most important contributing factor in making a discovery and exploiting
wealth-generating ideas, Urban (2010) citing prior research. Urban (2009a) states that
the ability to identify opportunities is related to human capital variables such as
education, work experience, prior start-up experience, and prior knowledge, and prior
knowledge of customer problems. There is a positive relationship between human
capital and success (Unger, Rauch, Frese and Rosenbusch, 2009; Urban, 2009b). Based
on these perspectives, the study posits human capital as an important antecedent to
entrepreneurial alertness, opportunity recognition, and entrepreneurial success and
therefore lies at the core of the entrepreneurial process.
Different approaches have been adopted by scholars about the nature of an
opportunity, and there exist different streams on the definition for what constitutes an
entrepreneurial opportunity or whether opportunities are ‘identified’, ‘recognised’, or
‘created’ (Ardichvili, Cardozo and Ray, 2003; Urban, 2009a; Tang, Kacmar and Busenitz,
55
2010). Urban (2009a) defines an entrepreneurial opportunity as a feasible, profit-
seeking, potential venture that provides an innovative new product or service to the
market, improves on an existing product/service, or imitates a profitable
product/service in a less than saturated market. Urban (2009a) states that
‘recognition’ carries with it a presumed ontological perspective that opportunities
‘exist out there’ and it is the entrepreneur’s role to recognise them. In other words,
‘recognition’ suggests that opportunities are objective phenomena that exist whether
or not anyone discovers them. ‘Creation’ limits opportunities to only those that the
entrepreneur creates (Urban, 2009a). While elements of opportunities may be
‘recognised’, opportunities are made, not found. It is built in the mind of the
entrepreneur (Blanco, 2007). ‘Identification’ seems a more inclusive term that
encompasses both potential opportunities already existing in the environment and
opportunities that are created by the entrepreneur (Urban, 2009a). Entrepreneurs
create opportunities to create and deliver value for stakeholders in prospective
(Ardichvili et al., 2003). Vaghely and Julien (2010) integrated the opportunity
recognition or discovery viewpoint and the opportunity construction or enactment
streams of thought into a pragmatic frame that suggests that entrepreneurial
opportunities can be recognised and constructed at the same time in a variety of
combinations and recognised or constructed individually.
Opportunity recognition process begins when alert entrepreneur notice factors in their
domain of expertise that result in the recognition and evaluation of potential business
opportunities (Ardichvili et al., 2003). Blanco states that the process of opportunity
recognition starts with sensing of a need or a possibility for change and action, and the
realisation of an idea (Therin, 2007). Other researcher have called this state
entrepreneurial awareness, defined as a propensity to notice and be sensitive to
information about objects, incidents, and patterns of behaviour in the environment,
with special sensitivity to maker and user problems, unmet needs and interests, and
novel combinations of resources (Ardichvili et al., 2003). Alertness is an individual's
ability to identify opportunities which are overlooked by others. Tang, Kacmar and
Busenitz (2010) defined alertness as consisting of three distinct elements: scanning
56
and searching for information, connecting previously-disparate information, and
making evaluations on the existence of profitable business opportunities.
Alertness is likely to be heightened when there is a coincidence of several factors:
certain personality traits (creativity and optimism); relevant prior knowledge and
experience; and social networks (Ardichvili et al., 2003). Tang et al. (2010) found that
entrepreneurs' prior knowledge is significantly related to alertness and that alertness is
positively associated with firms' innovation. Prior knowledge refers to an individual's
distinctive information about a particular subject matter and provides him or her with
the capacity to identify certain opportunities. The type of knowledge involved affects
knowledge acquisition and exploitation (Yli-Renko and Autio, 2001).
Opportunity recognition may be the result of systematic search of answers to a specific
question and/or careful strategic planning. Opportunity recognition consists of either
perceiving a possibility to create new businesses, or significantly improving the
position of an existing business, resulting in new profit potential (Urban, 2009).
However these views have been challenged by the existence of ‘accidentally’
discovered ventures, which happens when people discover the value of the
information they perceive.
Researchers have argued that the creation of successful businesses follows successful
‘opportunity development’, which involves the entrepreneur’s creative work, rather
than ‘opportunity recognition’ (Urban, 2009). This opportunity development process
includes recognition of an opportunity, its evaluation, and development. The need or
resource ‘recognised’ or ‘perceived’ cannot become viable without this ‘development’
(Urban, 2009). Opportunities are evaluated at each stage of their development and the
evaluation may be informal or even unarticulated (Ardichvili et al., 2003; Tang, 2010).
The term ‘‘evaluation’’ typically communicates a judgment, which determines whether
a developing opportunity will receive the resources to mature to its next stage. It does
not entail the actual launching and capitalising on the opportunity, only whether an
opportunity exists. Entrepreneurs may informally pursue investigations of presumed
market needs or resources, judge the content of the new information, filter
unessential information until concluding either that these warrant no further
57
consideration based on market needs and value creation capability (Ardichvili et al.,
2003; Tang, 2010).
In general, people discover opportunities that others do not identify for two reasons;
first, they have better access to information about the existence of the opportunity.
Second, they are better able than others to recognise opportunities given the same
amount of information about it (Urban 2010). The ability to identify opportunities is a
cognitive task that allows some individuals, though not others, to identify
opportunities (Shane, Locke and Collins, 2003). The broad notion of human capital
includes both innate characteristics and those that can be acquired. Their discussion
focuses on prior knowledge necessary to perform entrepreneurial tasks.
Human capital theory maintains that knowledge provides individuals with increase in
their cognitive abilities, leading to more productive and efficient potential activity
(Urban, 2008). Knowledge can be defined as high-value form of information combined
with experience, context, interpretation, and reflection which can readily be applied to
decision making and action (Vaghely and Julien, 2010). Prior research identified three
major dimensions of prior knowledge that are important to the process of opportunity
identification. The first is prior knowledge of markets, which enables people to
understand demand conditions, therefore facilitating opportunity discovery. Second is
prior knowledge of how to serve markets, which helps identify opportunities because
people know the rules and operations in the markets. Finally, prior knowledge of
customer problems or needs stimulates opportunity identification because such
knowledge would help trigger a new product or service to solve customer problems or
to satisfy unmet needs (Ardichvili et al., 2003; Tang et al., 2010).
Differences in human capital are related to the selection and application of different
opportunity identification processes. People tend to notice information that is related
to what they already know (Ardichvili et al., 2003). Prior knowledge plays a critical role
in intellectual performance and affects the ability to identify entrepreneurial
opportunities. Entrepreneurs with prior knowledge of a given domain are alert to
opportunities in that business environment. Information and knowledge are vital in
order to match (technology-based) solutions to opportunities, reduce uncertainties
58
improve feasibility, and predict consequences (Blanco, 2007 in Therin, 2007). Linking
patterns of information from various sources forms the basis of innovation and new
business opportunities (Vaghely and Julien, 2010). Having experience and knowledge
within an industry facilitates entrepreneurs recognising market gaps and assessing the
market potential of new ventures.
Knowledge is particularly important for technology-based firms: generating and
exploiting knowledge in high-technology sectors demands that knowledge be
continually replenished. Yli-Renko and Autio (2001) argue that technology-based firms
can leverage inter-organisational relationships to acquire external knowledge and
exploit it for competitive advantage. Entrepreneurial competency consists of a
combination of skills, knowledge and resources that distinguish an entrepreneur from
competitors (Urban, 2009b). Techno-entrepreneurs often have technical skills
(Contractora and Kundub, 2004) but usually lack the business management and
marketing skills necessary for commercial success. They will not succeed if they
implement business practices in an arbitrary and uncoordinated manner, expending
scarce resources on unproductive initiatives. Knowledge-based competition has
magnified the importance of learning alliances as a fast and effective way to develop
such capabilities. To achieve a competitive advantage, firms need better quality,
improved efficiency, innovation, and customer experience. This requires a constant
search for new tools and management opportunities that would provide these
competencies (Li-Renko and Autio, 2001; Abdelkader, 2004). Introducing technology
into the scope of entrepreneurship brings in more novelty, new eventualities, as well
as constraints and contexts (Blanco, 2007).
Unger et al. (2009) looked at specific conceptualisations of human capital attributes
and found that different conceptualisations of human capital differently relate to
business success. Their study distinguishes human capital along with two distinct
conceptualisations of human capital attributes: human capital investments versus
outcomes of human capital investments and task-related human capital versus human
capital not related to a task. Human capital investments include experiences such as
education and work experience that may or may not lead to knowledge and skills. The
outcomes of human capital investments are acquired knowledge and skills. The human
59
capital–success relationship was higher for knowledge and skills which are outcomes of
human capital investments compared to education and experience which are direct
human capital investments, indicating that knowledge and skills are more important
than education and experience for entrepreneurial success.
Task-relatedness addresses whether or not human capital investments and outcomes
are related to a specific task, such as running a business venture. Human capital leads
to higher performance only if it is applied and successfully transferred to the specific
tasks that need to be performed by the entrepreneur (Unger et al., 2009). Task-
specific and industry-specific human capital, as measured by prior experience, are
stronger predictors of performance than are measures of general human capital i.e.
qualifications (Patzelt, 2010; Zarutskie, 2010).
Research has shown that human capital positively affects entrepreneurial performance
(Dimov and Shepherd, 2005; Patel and D’Souza, 2009; Unger et al., 2009; Urban,
2009a; Zarutskie, 2010). Human capital comprises education, work experience,
entrepreneurial experience, and prior knowledge (Unger et al., 2009; Urban, 2009a;
Bhagavatula et al., 2010) and these are important stimulus of entrepreneurial
alertness, opportunity recognition and exploitation (Ardichvili et al., 2003; Blanco,
2007; Tang et al., 2010; Vaghely and Julien, 2010). Human capital is a high-level
construct which has been distinguished into human capital investments and human
capital outcomes (Unger, 2009). Specific forms of human capital such as industry-
specific and/or task-related have been shown to be superior predictors of
entrepreneurial performance (Yli-Renko et al., 2001; Unger et al., 2009; Patzelt, 2010;
Zarutskie, 2010). The next section focuses on the relationship between human capital
in firm internationalisation.
2.4.3.2 Human capital and internationalisation
The cross border practice of entrepreneurship has been labelled international
entrepreneurship and can be understood from Shane and Venkataraman’s opportunity
discovery, evaluation and exploitation entrepreneurship perspective. International
experience can lead to opportunity identification, market knowledge, and network
60
building, all of which are determinants of internationalisation (McDougall et al., 2003).
Zhou (2007) argued that innovative and proactive pursuit of entrepreneurial
opportunities across national borders among entrepreneurial international firms led to
acquisition of requisite foreign market knowledge. Based on literature, Casillas et al.
(2009) stated that in the international entrepreneurship context, knowledge allows a
clearer understanding of the process of identifying and exploiting opportunities
abroad.
Knowledge about foreign markets and entrepreneurial knowledge is critical to the
firm’s success in the international market. Ibrahim (2004) stated that acquisition of
knowledge allows firms to enhance their learning capabilities, thereby reducing
uncertainty and risk and improve their competitive position (Autio et al., 2000). Samiee
and Walters (1999) observed a significant relationship between firms participating in
structured export knowledge acquisition (through formal, structured export education
programs) and export performance. Contractora and Kundub (2004) found that
attributes such as technical education and foreign experience among Indian and
Taiwanese techno-entrepreneurs were linked to successful export performance.
Educational profile and professional experience appear to be most influential in the
international entrepreneurship phenomenon. The background professional experience
together with the networks of individuals or within the management team play a role
in the establishment of the international new ventures (Oviatt and McDougall, 2005).
Education level and international experience positively affect international
performance (McDougall et al., 2003; Camisón and Villar-López, 2010; Javalgi and
Todd, 2010). Internationalisation can promote learning and the accumulation of the
knowledge, skills and capabilities that SMEs need to create and sustain competitive
advantage. Learning and knowledge accumulation can also improve product
innovations (Zahra et al., 2009). Accordingly, human capital is a significant predictor of
international performance (Javalgi and Todd, 2010).
According to the historic work of Johanson and Vahlne (1977; 1990), market
knowledge, along with commitment, is central to the Uppsala model of firm
internationalisation (Weerawardena, Mort, Liesch and Knight, 2007; Zhou, 2007;
61
Casillas et al., 2009). The basic assumption is that internationalisation is the
consequence of a series of incremental decisions and the knowledge acquired on a
market basis through experience and supports the company’s behaviour. Knowlege
gained at various stages can profoundly influence future international expansion, as
firms experiment, take risks,and learn (Zahra and Garvis, 2000). Recent international
entrepreneurship literature that explains the born-global or early internationalisation
suggests foreign market knowledge as a key factor in understanding and explains the
rapid internationalisation of the firms (Knight and Cavusgil, 2004).
These arguments show that knowledge is considered an essential resource in a
company’s internationalisation process, both from the sequential point of view and
from the perspective of international entrepreneurship (Zhou, 2007; Brennan and
Garvey, 2009; Casillas et al., 2009). Although the two approaches assert that
knowledge-based capabilities are important for successful international expansion, the
incremental internationalisation and the born-global internationalisation differ on
what constitutes the sources of the knowledge.
Entrepreneurship scholars have argued from the organisational learning context that
three types of knowledge are critical to the firm’s success in the international market:
knowledge about the technology, foreign market knowledge and entrepreneurship
knowledge (Ibrahim, 2004). Zhou (2007) argued that for early internationalising firms,
foreign market knowledge can be acquired early on in the life of the firm and tends to
emanate from the innovative and proactive pursuit of entrepreneurial opportunities
across national borders, rather than from incremental accumulation of experience in
foreign markets as argued by the traditional view. However, Weerawardena et al.
(2007) found that a gap still remained in that both the experiential learning
perspective of accelerated internationalisation of born global firms as well as the
incremental internationalisation (Uppsala model ) failed to capture the learning that is
undertaken by these firms and their founders prior to the firm’s legal establishment or
at the pre-internationalisation stage.
Weerawardena et al. (2007) surmised that learning and knowledge acquisition should
be positioned as an antecedent at the pre-internationalisation stage in the
62
internationalisation process. Casillas et al. (2009) ‘s integrative model of the role of
knowledge in the internationalisation process seems to have paved the way to bridge
the gap espoused by researchers regarding the knowledge context. Casillas et al.
(2009) distingushes several phases of knowledge that constitutes the main factors
behind a company’s international behaviour: prior knowledge; acquisition of new
knowledge; integration of both sets of knowledge; action and feedback knowledge
(Casillas et al., 2009). Casillas et al. (2010) incorporated the unlearning context into a
learning model of the internationalisation process and argued that the unlearning
context plays an important mediating role between existing knowledge of the
internationalisation process and the active search of new knowledge. Companies
initiating an internationalisation process should rid themselves of certain routines
developed in their domestic markets before starting the learning process required for
their expansion abroad (Casillas et al., 2009).
Accordingly, internationalisation is itself a learning process in which the company,
starting from the different degrees of previous knowledge at its disposal, generates
new knowledge based on its behaviour abroad (Casillas et al., 2009) and unlearns its
old modus operandi.
In a comparative study of international new ventures (INVs) and domestic new
ventures (DNVs), the entrepreneurial team of INVs exhibited higher levels of previous
international and industry experience (McDougall et al., 2003). McDougall et al. (2003)
contended that founders of INVs saw opportunities to earn higher return as a result of
previous international experience. Prior international exposure of entrepreneurs can
act as a trigger for the founding of an international venture. However, Autio (2005)
maintained that due to its context-specific nature, knowledge created in one context is
not easily transferred to other contexts. Camisón and Villar-López (2010) contended
that international experience is determined by whether the firm has prior experience
in regions similar to the new markets it is entering.
However the prior knowledge and experience view does not exhaust the human
capital debate of firm internationalisation. In a case study among small Scottish firms
Fletcher and Harris (2011) found that these firms may be characterised by lack of
63
relevant experience or useful networks, and relied on rarely used sources like
recruitment, government advisors and consultants to acquire indirect experience.
Similarly, Haahti et al. (2005) found that SMEs employing cooperative strategies to
enrich their knowledge base about export markets consequently improve their
performance. Thus firms can rapidly access critical exporting knowledge by recruiting
knowledgeable, experienced export staff and by positioning itself within alliances and
networks. Autio (2005) asserts that international managerial experience had become
more widely available, enabling firms to quickly acquire such knowledge through
recruitment.
Taking from the Uppsala school of thought, Casillas (2009) explicated that companies
will initiate their internationalisation in those countries that are physically or
psychologically closer to their own in order to minimize the degree of uncertainty and
apparent risk. Based on the work of Johanson and Vahlne (1977) this concept is known
as ‘psychic distance’ and has been defined as factors preventing the flow of
information from and to the market including such factors as language, culture,
political systems, level of education, level of industrial development (Brennan and
Garvey, 2009). The basic assumption is that lack of knowledge about foreign markets is
an obstacle to the development of international venture. However this view is less
widely accepted today with the advent of technology development, and more
specifically the effects of online internationalisation where knowledge is the subject of
the exchange (Yamin and Sinkovics, 2006). These properties of e-commerce have been
described as the ‘death of distance’.
The extant literature shows that firms can leverage human capital to positively
influence their international success (Samiee and Walters, 1999; Yli-Renko et al., 2001;
McDougall et al., 2003; Ibrahim, 2004; Oviatt and McDougall, 2005; Zhou, 2007;
Casillas et al., 2009;Javalgi and Todd, 2010). The apparent tension between the
sequential process of internationalisation and the international entrepreneurship view
with regards to knowledge can be resolved by understanding the souce of foreign
knowledge (Zhou, 2007). Knowledge gained from international experience can be
turned into an endowment of internationally exploitable intangible assets and into a
64
differentiation competitive strategy to achieve superior international performance
(Camisón and Villar-López 2010; Patzelt, 2010).
Knowledge of markets is an important source of entrepreneurial opportunities. The
notion of internationalisation knowledge adopted in this research is based on the
international market knowledge conception (Hadley and Wilson, 2003; Zhou, 2007;
Casillas et al., 2009) consiting of three dimensions: foreign institutional knowledge,
foreign business knowledge, and internationalisation knowledge. The focus is on these
dimensions because they encompass both the accumulated skills and knowledge
learnt though experience, education and training, and performed tasks, thereby
covering the human capital investments and outcomes conceptuslised by Unger et al.
(2009). These dimensions capture task-specific aspects of human capital that have
been found to be stronger predictors of performance than are measures of general
human capital i.e. qualifications (Patzelt, 2010; Zarutskie, 2010). Gimmon and Levie
(2010) found support for the importance of competence-based human capital
(business management and technological expertise) over academic qualifications on
the survival of high-technology ventures. Bojica and Fuentes (2011) explained that this
type of knowledge exercised in the performance of tasks is rare, heterogeneous and
difficult to articulate and imitate due to its tacit nature, and is essential for the
identification and exploitation of entrepreneurial opportunities.
65
2.4.4 Technology
Technological innovation is of fundamental importance as a driver for global growth
and economic development (Erensal, Öncan and Demircan, 2006; Urban et al., 2011).
Due to the rapid and dynamic shifts in markets, the unlimited proliferation of new
technologies, and the resultant shrinking product life cycles, companies have to
consistently to develop new products if they are to gain or maintain a competitive
edge (Erensal et al., 2006). In such a turbulent environment, firms are focusing more
attention on innovation and increasing investment in technology as a source of that
innovation (Lee, Yoon, Lee and Park, 2009).
“According to Schumpeter (1976, p. 132), the function of entrepreneurs is to reform or
revolutionalize the pattern of production by exploiting an invention or, more generally,
an untried technological possibility for producing a new commodity or producing an
old one in a new way, by opening up a new source of supply of materials or a new
outlet for products, by reorganizing an industry and so on...” (Venkataraman, 2004).
Schumpeterian capitalism is characterised by rapid change, strives for disruption
rather than stability, and centres on the entrepreneur to create the change.
Entrepreneurship plays an important role in the development and commercialization
of new technologies. A firm’s technology is defined as as ‘the company’s technological
skills and knowledge as well as the products, services, and processes based on these
skills and knowledge (Yli-Renko et al., 2001). Technological change, and hence
innovation, is the specific tool by which entrepreneurs enact opportunities.
Technological innovation is defined as the generation of new products and processes
or significant technological improvements in the current products and processes.
Product technology is the technology purchased by the customer and used to meet his
needs. Product technology includes the technology used in product development and,
the technology used for the service and distribution of the product (Furu, 2000;
Erensal et al., 2006). Process technology is the technology utilized to manufacture the
product at the lowest cost. Moreover, process technology also includes the technology
used in quality control, inventory control and production planning (Furu, 2000; Erensal
66
et al., 2006). Product innovation enables firms to maintain their position in the market
or their relationship with important customers, while process innovation would aim to
improve their competitiveness by reducing production costs and increasing the
flexibility of their productive apparatus (Raymond and St-Pierre, 2010).
Deeds (2001) provided evidence that high technology ventures create entrepreneurial
wealth by investing resources in the development of technological capabilities. Based
on the work of Kim (1980) on the development of Korea, Filippetti and Peyrache (2011)
define the concept of technological capabilities as “the ability to make effective use of
technological knowledge in efforts to assimilate, use, adapt, and change existing
technology”. Technological capability measures the extent to which the organisation is
proficient in the use of advanced technologies and systems. At the firm-level,
technological capabilities are defined as the knowledge, competences, and skills that
the firm needs to acquire, adapt, improve in order to create technology (Filippetti and
Peyrache, 2011). Raymond and St-Pierre (2010) argued that the firm’s strategic
capabilities can be leveraged for the purposes of innovation.
Knight (2001) defines technology acquisition as the efforts by management to acquire
technologies that will augment the firm’s ability to compete in international markets,
via the creation of superior products and/or processes. Improved technology is widely
regarded as a critical, fundamental lever for allowing firms to innovate and respond to
changing conditions in their external. Technology acquisition that allows the firm to
compete more effectively, increase operational efficiency, or launch products that
better satisfy customer needs can have a favourable effect on market share and
overall performance (Knight, 2001).
Based on the above, technology capability in this study is viewed from two paradigms
or perspectives: the first paradigms views technology as a firm’s skill or competence
necessary to bring about innovative processes; and the second paradigms looks
technology as a resource acquired and available to the firm from which innovative
products or processes can be produced. Accordingly, this study refers to two
dimensions of technology: technology distinctiveness and technology acquisition.
67
Technology capability within a firm is an important determinant of innovation and
performance (Raymond and St-Pierre, 2010). According to Raymond and St-Pierre
(2010) technological capability forms part of a firm’s strategic capabilities and should
be coherent with the firm’s strategy, business model, and technological choice in order
to improve performance. Additionally, in order to be successful, a venture’s technology
strategy should be customized to match the conditions of its external environment
(Zahra and Garvis, 2000). Technology is a strategic asset and therefore, the
organisation’s ability to manage and exploit technology can be considered as a core
competency (Erensal et al., 2006).
According to Knight (2001), international entrepreneurial orientation tends to promote
the development of a strategic competencies such as technology acquisition (Knight,
2001). It has been argued that entrepreneurial orientation should be instrumental into
the development and enactment of organisational routines. Contrary to Knight (2001)
‘s results, Urban (2010) found no significant correlations between EO and technology
orientation among Johannesburg-based firms. This perhaps emphasises the challenge
for firms in emerging economies to adopt technology and act entrepreneurially.
Urban et al. (2011) states from research that a firm’s use of technology and innovation
to achieve its objectives such as maximising profits, gaining market share, creating
niche markets or adding value to shareholders can be used as a basis of evaluating firm
performance. Using a sample of a sample of North American semiconductor firms,
Leiblein and Reuer (2004) provided evidence that the influence of technological
capabilities and international alliances differs across entrepreneurial and established
firms. The researchers argued that these differences are due to the dissimilar
strategies and resource characteristics of entrepreneurial versus established firms
(Leiblein and Reuer, 2004).The findings of a study conducted by Raymond and St-Pierre
(2010) among manufacturing SMEs indicated that entrepreneurial SMEs that possesed
technological capabilities and were leaders in R&D and product innovation.
An examination of major technological breakthroughs revealed that an overwhelming
proportion was contributed by independent inventors and small newly founded firms
rather than major firms (Urban et al., 2011). SMEs capability to invest in R&D and to
68
assimilate advanced technologies plays a significant role in their innovativeness
(Raymond and St-Pierre, 2010).
In a study involving new high-technology firms participating in an Israeli technology
incubator program, Gimmon and Levie (2010) found that although the founder’s
management expertise attracted external investment, general technological expertise
did not. Erensal et al. (2006) found that product and process technologies alone will
not provide competitive advantages; it is the concept of management of technology
that provides a balanced and integrative approach to deal with complex investment
decisions on technology. The concept of the management of technology emerges to be
more important than both the product technology and the process technology.
Other researchers proposed that innovation and firms’ capacity to innovate can be
associated with the capacity to combine and exchange knowledge resources (Molina-
Morales and Martínez-Fernández, 2010). Empirical evidence from a study of high-
technology firms indicates that technological capabilities and the formation of
international collaborative linkages are jointly associated with entrepreneurial firms’
abilities to build a foreign sales base (Leiblein and Reuer, 2004; Raymond and St-Pierre,
2010). In their study focusing on internal technological capabilities among high-
technology new firms (HTNFs), Haeussler et al. (2010) found that the degree of
specialization of these capabilities significantly influences the contribution of strategic
alliances to their new product development.
Knight (2001) found that although R&D may be costly and can decrease the short term
profitability of foreign ventures, R&D is critical to the pursuit of foreign business to the
extent it allows firms to address the specific needs of foreign customers. Companies
may need to invest in R&D to upgrade and accelerate their innovative capabilities.
Raymond and St-Pierre (2010) stated that the firm’s success rests in its ability to create
distinctive capabilities such as research and development (R&D), networking and
technology. Through cooperation with outside experts for the supply of peripheral
resources, firms may derive the benefits such as cost reduction, improved quality and
flexibility. Inter-firm capabilities that span organisational boundaries may achieves the
dual role by compensating the for lack of internal resources through (1) generation of
69
new knowledge and (2) assimilation of external knowledge and technology. The
acquired technology and knowledge may be used to achieve a competitive advantage
(Oviatt and McDougall, 2005; Raymond and St-Pierre, 2010).
Haeussler et al. (2010) showed in study among young high-technology firms that
alliance success depends on a firm's alliance experience. Firms with considerable
alliance experience in the domain stand to gain more benefits from entering into
additional alliances (up to a certain point) than firms with a limited experience. The
relationship between the number of strategic alliances and the rate of new product
development is said to be inverted U-shaped (Urban et al., 2011). This means that the
rate of new product development increases as the number of strategic alliances
increases, and then after a certain number of alliances are attained, rate of new
product development begins to decrease.
Oviatt and McDougall (2005) contend that inter-firm alliances rely on alternative
governance structures and posit that international entrepreneurial firms strongly rely
on such arrangements to access resources and power. In the international markets,
these collaborations are aimed at reducing uncertainty related to the liability of
foreignness and benefiting from economies of scale or diversification (Autio et al.,
2000). Such relationships often rely on the principle of a social contract, dependent on
the control of behaviour through trust and moral obligation, and reputation. However
due to the potential for opportunism (Haeussler et al., 2010), the risks of dissipating
competitive advantages, expropriation and imitation, losing opportunities for learning,
and becoming a 'hollow corporation' are significant (Oviatt and McDougall, 2005).
Haeussler et al. (2010) emphasized the importance of internal technological
capabilities in determining potential benefits and risks when joining strategic alliances.
The literature reveals that technological capabilities have always been unevenly
distributed across countries reflecting the differences in capabilities among countries.
In particular, a few countries from the developed world have accounted for the lion’s
share of technological capabilities and responsible for the major production of
technology and innovation (Filippetti and Peyrache, 2011). Lee (2011) empirically
found that the firms with higher technological intensity had higher export performance
70
and this explained differences in economic growth across countries (Lee, 2011).
Filippetti and Peyrache (2011) confirmed that a process of development and diffusion
of technological infrastructure is taking place particularly in the ‘catching-up
countries’, leading to the reduction of the digital divide, reflecting increasing
investment in education and research among these countries.
Mastromarco and Ghosh (2009) state that human capital plays a role in economic
growth by helping in the adoption of technology from abroad and in creating the
appropriate domestic technology. Technology diffusion through external R&D depends
on the level of accumulated human capital (Mastromarco and Ghosh, 2009). In the
context of emerging markets this raises the debate whether these economies are able
to absorb the knowledge and technologies transferred externally, including across the
borders, to build up their own innovation capability (Li, 2011).
The process of technology adoption and diffusion does not occur in a spontaneous way
(Erensal et al., 2006). Due to the tacit and context-specific nature of technological
knowledge, it is not easy for recipient firms to acquire innovation capacity through the
mere license or purchase of external technology (Li, 2011). In a study among Chinese
high-technology state-owned enterprises Li (2011) looked at the impact of three types
of investments for acquiring technological knowledge - In-house R&D; Importing
foreign technology; and purchasing domestic technology - on the innovation
capabilities of firms. The results showed that domestic technology purchases have a
favourable direct impact on innovation, suggesting that firms have less difficulty in
absorbing domestic technological knowledge than utilizing foreign technology and that
absorptive capacity is contingent upon the source or nature of the external knowledge
(Li, 2011). This argument confirms the notion that knowledge spillovers are
geographically localized (Mastromarco and Ghosh, 2009).
Scholars of innovation recognise that knowledge flow displays geographic clustering,
and therefore innovations developed in remote regions diffuse less widely and/or
rapidly (Waguespack and Birnir, 2005; Mastromarco and Ghosh, 2009). On the other
hand, scholars have also established that discoveries or inventions combining
otherwise disconnected knowledge clusters tend to be more novel, and therefore will
71
ultimately diffuse more widely and/or rapidly (Waguespack and Birnir, 2005;
Mastromarco and Ghosh, 2009).
In an analysis of the citations received by US patents office (patents are a common
measure of the technical and economic importance of technology), Waguespack and
Birnir (2005) found that cross-state collaborations do indeed result in higher rates of
citation relative to new inventions where all inventors are located in the same region.
This argument is consolidated by the social network theory which advocates that social
distance or weak social ties (as proxied by geographic distance) are the most valuable
network positions and result in truly novel ideas and therefore will diffuse more widely
and/or rapidly (Burt, 2000; Mastromarco and Ghosh, 2009).
Evaluating regional transformation through technological entrepreneurship,
Venkataraman (2004) analysed how in a modern economy, universities and research
and development laboratories are the incubators of novel technical ideas; the
emergence of high-tech wealth creating regions such Silicon Valley in California,
Research Triangle in North Carolina, and Cambridge in the United Kingdom is
testimony to the regional promotion of an enterprising spirit (Urban, 2010; Urban et
al., 2011). Regional innovative capability is a crucial factor in building regional
competitive advantage under the present techno-economic paradigm (Urban et al.,
2011).
Entrepreneurship plays an important role in the development and commercialization
of new technologies. Technology capability within a firm is an important determinant
of innovation and performance. Technology competence and technology acquisition
will augment the firm’s ability to compete in international markets.
2.4.5 Summary of literature on entrepreneurial capabilities and formulation
of hypothesis 2
Obrecht (2004) declared that human capital and social capital are among the most
essential capabilities for organisational perfomance. Zahra et al. (2000) suggested that
the firm’s technological capability is critical to successful internationalisation. Bojica
and Fuentes (2011) maintained that market and technological knowledge represent a
72
necessary condition for identification and exploitation of opportunities and therefore
play an important role in sustaining entrepreneurial activities. Similarly, other
researchers in the literature of international entrepreneurship have asserted that
knowledge-based, social-based, and technological capabilities are important for
successful international expansion (Autio et al., 2000; Deeds, 2001; Zhou, 2007;
Brennan and Garvey, 2009). Entrepreneurial capabilities are viewed as a broader range
of abilities needed to initiate appropriate action in specific organisational situations
and reflect the capacity to initiate and sustain an entrepreneurial dynamism
throughout the organisation (Obrecht, 2004).
Leiblein and Reuer (2004) marked the need for theoretical literature to investigate the
specific capabilities that lead to successful internationalisation. Based on theoretical
literature, the study focuses at a family of entrepreneurial capabilities, which can be
classified into social capital, human capital, and technology (Autio et al., 2000; Deeds,
2001; Obrecht, 2004; Zhou, 2007; Camisón and Villar-López, 2010).
Pangarkar (2008) stated, based on the work of prior researchers, that entrepreneurial
firms possesing stronger capabilities will enjoy greater competitive advantage over
existing or potential competitors in the foreign markets and hence the better their
performance.
These theoretical underpinnings lead to the following hypothesis:
Hypothesis 2: Entrepreneurial capabilities are positively related to international
performance.
73
2.5. The environment
This section of the report relates to both the first and second sub-problems.
Jones and Coviello (2005) emphasise that certain conditions within the firm and
environmental factors are necessary to explain internationalisation. Foreign
opportunities are tempered by the constraints imposed by the competitive forces that
exist in international environments, such as aggressive government intervention,
technological changes, and fierce local rivalries all contributing to hostile international
environment. Turbulent business environments characterised by rapid and dynamic
shifts in markets, the unlimited proliferation of new technologies, and the resultant
shrinking product life cycles, force companies to consistently be innovative in order to
gain or maintain a competitive edge (Erensal et al., 2006).
Bhagavatula et al. (2010) pointed that different elements of social capital lead to
specific benefits depending on a number of aspects, such as the industrial,
technological and environmental conditions. Batjargal explored ways of managing
hostile environments in transition economies and found that entrepreneurs effectively
did this by doing business through personal networks of relationships. Network ties
provided resources and information, and help to find clients, suppliers, and investors,
who are socially bound (Batjargal, 2007).
Research found that technological capabilities can improve performance within certain
environments; however the same choices may lower performance in other
environments. In other words, the external environment, can moderate the
relationship between a firm’s technological choices and its performance (Zahra and
Garvis, 2000).
Similarly, Lumpkin and Dess (1996) premised that EO dimensions may vary
independently contingent on influences external to the firm. Firms with
entrepreneurial orientation can discover and exploit new market and respond to
challenges to in the competitive and uncertain environment (Lumpkin and Dess, 1996).
74
The benefits derived by SMEs from internationalisation may depend on the
characteristics of the international business environment (Pangarkar, 2008). As
previously stated firm behaviour and characteristics may vary, contingent on
influences external to the firm. Firms (managers) can consciously make strategic
choices which optimize the characteristics of a given environment.
This study therefore examines the moderator effect of the environment in the
relationship between entrepreneurial intensity, entrepreneurial capabilities and
international performance. The two sub-dimensions of the environment under study
are: environmental hostility and dynamism. These are briefly discussed below:
2.5.1 Environmental hostility
Environmental hostility refers to unfavourable environmental changes, which create
threats to a company’s mission. Hostility arises from several sources like radical
industry change; new legislative requirements placed on an industry, or intensified
competition (Zahra and Garvis, 2000; Lumpkin and Dess, 2001; Scheepers et al., 2007).
Zahra and Garvis (2000) found that perceived characteristics of the international
environment, in particular when market turbulence is high, firm entrepreneurship can
positively affect firm performance. Zahra found that firms that aggressively pursued
entrepreneurship behaviour in international environments with higher levels of
hostility experienced higher returns (Zahra and Garvis, 2000).
Hostile environments create threats, which may force a company to respond in
innovative ways to minimise threats and create opportunities. Those ventures that
align their strategic choices with their external environments are better positioned to
achieve superior performance. For instance, in hostile environments pioneering firms
managed to grow despite operating in price-based competitive environments while
charging high prices by limiting product line breath to a small number of product
offerings that provided a “tight fit” with market needs (Covin, Slevin and Heeley, 2000;
Zahra and Bogner, 2000). In such environments, entrepreneurial firms, more especially
firms in high-tech industries, apply their relative agility and flexibility to innovate and
take risks (Ibeh, 2003).
75
On the contrary, firms adopt a conservative strategic posture to achieve better
performance in benign environments (i.e. low hostility) (Covin and Slevin, 1989),
suggesting a strategic fit between an entrepreneurial strategic posture and the level of
hostility in the environment. Benign environments are generally thought to provide a
safe setting for business climate due to their relatively stable industry settings,
abundant exploitable opportunities, and sparse competition. Pangarkar (2008) states
that environments characterised by factors such as high market demand and/or
growth potential, low investment risk, favourable attitude of the host government
towards foreign firms and high political and economic stability, provide firms ample
opportunities to grow and also to achieve scale economies.
2.5.2 Environmental dynamism
While a number of studies have been done on environmental hostility, very few exist
on environmental dynamism. Environmental dynamism can be defined as the
perceived instability of an enterprise’s market, due to unpredictable and persistent
changes in its external environment. These changes result from the entry or exit of
competitors, changes in customers’ needs, and shifts in technological conditions
(Lumpkin and Dess, 2001; Scheepers et al., 2007; Urban, 2010). Dynamism reflects the
rate and continuity of change within an industry (Zahra and Bogner, 2000).
Wiklund and Shepherd (2005) and Urban (2010) found that the dynamism of the
environment is important moderator of the EO and business performance. Dynamic
environments create opportunities for companies to act more entrepreneurially
(Scheepers et al., 2007). For instance, Zahra and Bogner (2000) found that new product
radicality, which means developing and introducing new products ahead of
competitors, enhances performance in dynamic environments. Research and
development (R&D), however, was not associated with strong short-term
performance. (Zahra and Bogner, 2000) - It may take some time for a company to
realise the benefits of investing in R&D.
Zahra and Bogner (2000) suggested that dynamism should encourage firms to
copyright or patent their innovations to safeguard them against abuses by rivals. The
76
researchers found that in a dynamic environment, copyrights and other means of
intellectual property protection did not enhance performance. They argued that the
release of such information into the market rather facilitates the diffusion of the
knowledge to rivals.
2.5.3 Summary of literature review on the environmental factors and
formulation of hypothesis 3 and 4
The environment can either have a negative or a positive impact on firm performance.
Environmental factors are necessary to explain internationalisation. Foreign
opportunities are tempered by the constraints imposed by the competitive forces that
exist in international environments. The external environment can moderate the
relationship between a firm behaviour and its performance. Similarly external
environment can moderate the relationship between a firm’s internal capabilities and
its performance.
Hostile environments create threats, which may force a company to respond in
innovative ways to minimise threats and create opportunities. On the contrary, benign
environments provide a safe business climate and firms adopt a conservative strategic
posture to achieve better results. Wiklund and Shepherd (2005) found that the
dynamism of the environment moderates the relationship between entrepreneurial
behaviour and business performance. Under conditions of environmental dynamism
firms act entrepreneurially to create opportunities (Scheepers et al., 2007).
These arguments inform the formulation of the following hypotheses:
Hypothesis 3: The relationship between entrepreneurial intensity and international
performance is moderated by the environmental characteristics.
Hypothesis 4: The relationship between entrepreneurial capabilities and
international performance is moderated by the environmental characteristics.
77
2.6. Conclusion of Literature Review
The literature reviewed the concept of entrepreneurial intensity which is
conceptualised to capture both the degree entrepreneurship and frequency of
entrepreneurship within a given organisation. The degree of entrepreneurship, also
known as entrepreneurial orientation (EO) refers to the extent to which events
occurring within a firm are innovative, risk-taking, and proactive (Morris and Sexton,
1996).The frequency of entrepreneurship refers to the number of such (innovative,
risky, and proactive) events (Morris et al., 2008). Several studies in entrepreneurship
have attempted to explain performance by investigating the relationship between
entrepreneurship and firm performance. Given that research in international
entrepreneurship tends to mirror empirical developments in entrepreneurship
research, it is suggested that the relationship should be investigated among
international firms.
The literature further reviewed specific entrepreneurial capabilities that lead to
successful internationalisation. These are classified into social capital, human capital,
and technology (Autio et al., 2000; Deeds, 2001; Obrecht, 2004; Zhou, 2007; Camisón
and Villar-López, 2010). Based on the literature, it can be concluded that
entrepreneurial firms possesing stronger capabilities will enjoy greater competitive
advantage over existing or potential competitors in the foreign markets and hence the
better their performance.
The literature review pointed that certain conditions within the environment explain
internationalisation. In particular, the external environment can moderate the
relationship between a firm’s technological choices and its performance. The
environmental factors reviewed in this chapter are environmental hostility and
dynamism.
The following hypotheses were formulated by drawing on the emerging body of
knowledge. Given the multi-level dimensionality of the constructs, instead of
numerous hypotheses, the study formulates high-level hypotheses termed here as 1st
order Hypotheses which allow for general explanations using the main constructs. In
78
Chapter 4 the hypothesis are restated including the lower level sub-hypotheses that
make up the hypotheses stated below.
1st order Hypotheses
2.6.1 Hypothesis 1:
Entrepreneurial intensity is positively related to international performance
2.6.2 Hypothesis 2:
Entrepreneurial capabilities are positively related to international performance
2.6.3 Hypothesis 3:
The relationship between entrepreneurial intensity and international performance is
moderated by the environmental characteristics
2.6.4 Hypothesis 4:
The relationship between entrepreneurial capabilities and international performance is
moderated by the environmental characteristics
79
2.6.5 The theoretical framework
Figure 5 shows the theoretical framework model of the study. The model comprises
four sets of constructs and is briefly explained as follows:
(1) The entrepreneurial intensity construct, comprising of two main dimensions degree
and frequency of entrepreneurship. The degree of entrepreneurship dimension/
entrepreneurial orientation (EO) comprises of three sub-dimensions innovativeness,
proactiveness, and risk-taking;
(2) The entrepreneurial capabilities construct, comprising of three dimensions, social
capital, human capital, and technology. Social capital consists of social interaction,
relationship quality, and network ties. Human capital comprises of foreign institutional
knowledge (FIK), foreign business knowledge (FBK), and internationalisation
knowledge. The technology dimension comprises of technology distinctiveness and
technology acquisition.
(3) The outcome variable, namely international performance comprises of 9 measures,
which are grouped into two categories: economic performance and international
intensity. Economic performance comprises of export profitability, overall profitability,
export market share, employee growth, foreign sales growth, and exports market
share growth. International intensity comprises of degree of internationalisation
(export intensity), scope of internationalisation, and speed of internationalisation;
(4) The environmental variables posited to moderate the relationship between
entrepreneurial intensity-performance and entrepreneurial capabilities-performance.
The composites of the environment are two variables, namely environmental hostility
and environmental dynamism.
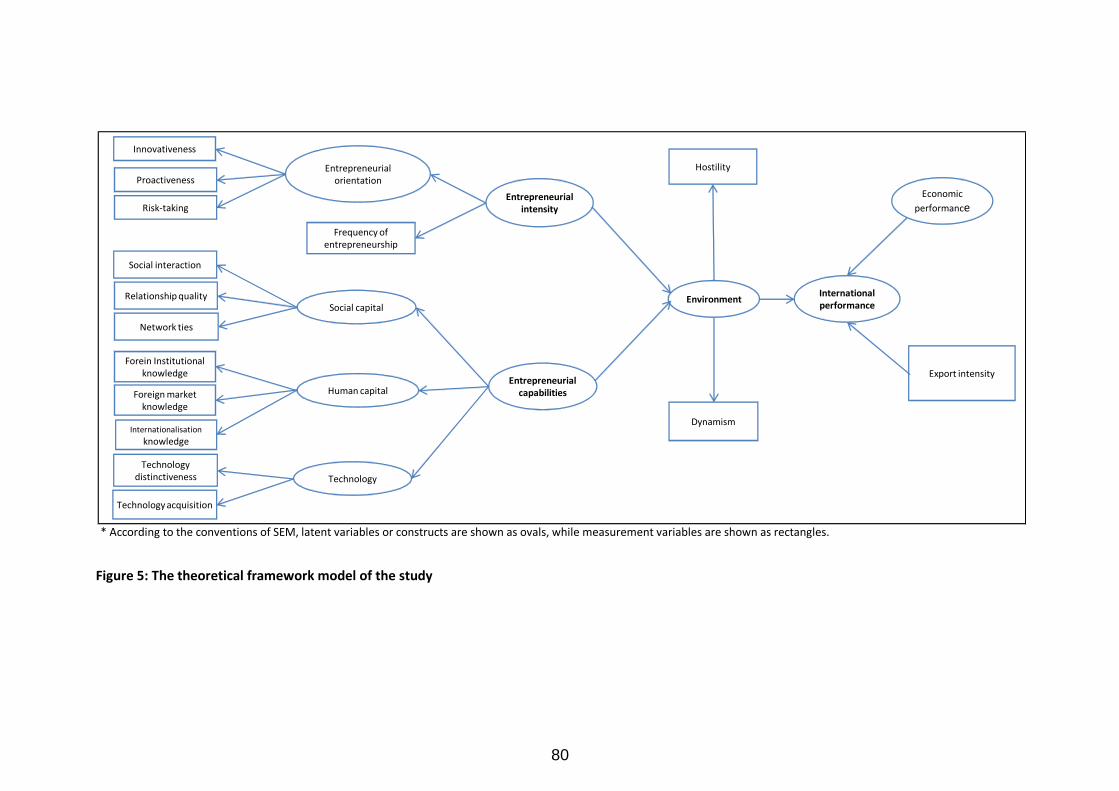
80
Figure 5: The theoretical framework model of the study
* According to the conventions of SEM, latent variables or constructs are shown as ovals, while measurement variables are shown as rectangles.
Entrepreneurial intensity
Entrepreneurial capabilities
Frequency of entrepreneurship
International performance
Economic
performance
Export intensity
Entrepreneurial orientation
Innovativeness
Proactiveness
Risk-taking
Hostility
Dynamism
EnvironmentSocial capital
Network ties
Social interaction
Relationship quality
Human capital
Forein Institutional knowledge
Internationalisation
knowledge
Foreign market knowledge
Technology
Technology acquisition
Technology distinctiveness
81
CHAPTER 3: RESEARCH METHODOLOGY
Methodology refers to the philosophical rationale and/or justification for the approach
to research and the use of specific data collection, sampling and analysis tools. This
section describes the methodology that was followed to test the hypotheses that were
put forward to address the sub-problems presented in the previous chapters.
3.1 Research methodology /paradigm
The study was quantitative in nature. Quantitative research methods are those in
which the observed data exist in a numerical form. Quantitative research (also known
as empirical research) is a means for testing objective theories by examining the
relationship among variables (Creswell, 2008). The scientific approach involves
formulating a problem, developing a hypothesis, testing it and drawing conclusions.
The research approach used in this study is deductive. A deductive approach describes
the situation whereby the researcher, on the basis of what is known in a particular
domain and the theoretical considerations in relation to that field, deduces a
hypothesis (or hypotheses) that is/are subjected to empirical scrutiny (Kock, 2007).
The deductive approach progresses in the following steps (Kock, 2007):
1. Hypotheses are deduced from literature review
2. The hypotheses are operationalised to enable the variables to be measured
quantitatively
3. Data is collected
4. The operational hypotheses are subjected to empirical scrutiny
5. The outcome of the inquiry is examined with the application of statistical
techniques
6. The theory is verified or modified if necessary
As stated already, quantitative or empirical research is concerned with establishing the
relationship between variables. This research study is based on the proposition that
82
relationships do exist between the constructs/or variables: entrepreneurial intensity
(EI), entrepreneurial capabilities (EC), the environment characteristics, and
international performance. The central research problem of this study was to examine
the relationship between entrepreneurial intensity, entrepreneurial capabilities, and
international performance among South African exporting firms and the moderating
effect of the environmental characteristics on these relationships.
Research traditions dictate that hypotheses must be stated precisely to facilitate
statistical testing. The arising hypotheses have been summarised in Section 2.6.1 to
Section 2.6.4. For completion, the hypotheses are re-stated here:
H1: Entrepreneurial intensity is positively related to international performance
H2: Entrepreneurial capability is positively related to international performance
H3: The relationship between entrepreneurial intensity and international
performance is moderated by environmental hostility and dynamism
H4: The relationship between entrepreneurial capability and international
performance is moderated by environmental hostility and dynamism
The hypotheses have been framed as research hypotheses rather than as statistical
null and alternative hypotheses. As such, the research seeks to obtain support for
them. Later in Chapter 4 the research uses correlations and regression analysis to test
statistical null hypotheses and seeks to reject them so as to provide support for the
research hypotheses.
The constructs in the hypothesis statements have 3 levels that differ in their levels of
abstraction (first order, second order and third level). The 3 levels of measurement for
the constructs are achieved by taking summative measures across subscales. For
example, EI is a level 1 construct and it is measured by considering jointly the subscales
for EO and frequency of entrepreneurship, which are both level 2. EO is measured by
jointly considering all the items measuring the level 3 dimensions – innovativeness,
proactiveness, and risk-taking. Frequency of entrepreneurship is measured by taking
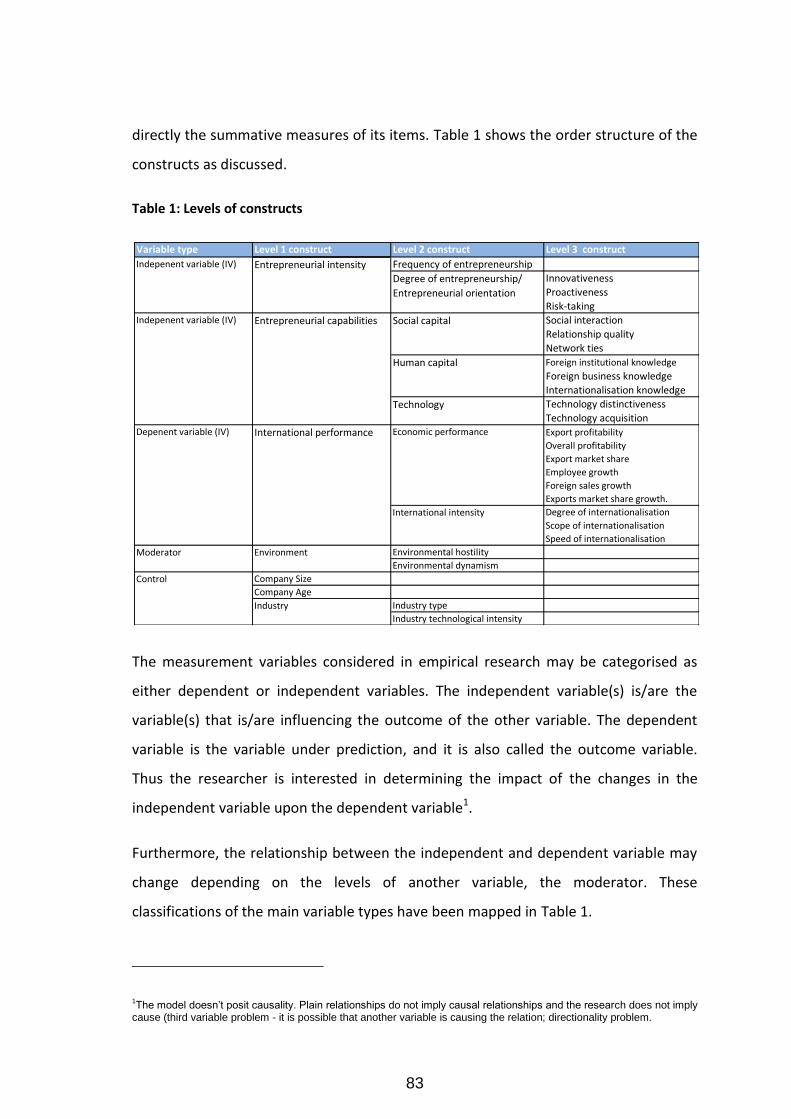
83
directly the summative measures of its items. Table 1 shows the order structure of the
constructs as discussed.
Table 1: Levels of constructs
The measurement variables considered in empirical research may be categorised as
either dependent or independent variables. The independent variable(s) is/are the
variable(s) that is/are influencing the outcome of the other variable. The dependent
variable is the variable under prediction, and it is also called the outcome variable.
Thus the researcher is interested in determining the impact of the changes in the
independent variable upon the dependent variable1.
Furthermore, the relationship between the independent and dependent variable may
change depending on the levels of another variable, the moderator. These
classifications of the main variable types have been mapped in Table 1.
1The model doesn’t posit causality. Plain relationships do not imply causal relationships and the research does not imply
cause (third variable problem - it is possible that another variable is causing the relation; directionality problem.
Variable type Level 1 construct Level 2 construct Level 3 construct
Frequency of entrepreneurship
Innovativeness
Proactiveness
Risk-taking
Social interaction
Relationship quality
Network ties
Foreign institutional knowledge
Foreign business knowledge
Internationalisation knowledge
Technology distinctiveness
Technology acquisition
Export profitability
Overall profitability
Export market share
Employee growth
Foreign sales growth
Exports market share growth.
Degree of internationalisation
Scope of internationalisation
Speed of internationalisation
Environmental hostility
Environmental dynamism
Company Size
Company Age
Industry type
Industry technological intensity
Degree of entrepreneurship/
Entrepreneurial orientation
International performance Economic performance
International intensity
Environment
Human capital
Technology
Social capital
Indepenent variable (IV)
Indepenent variable (IV)
Depenent variable (IV)
Moderator
Industry
Control
Entrepreneurial intensity
Entrepreneurial capabilities
84
It is important to note that the construct of environmental has been coined by the
researcher and constructed to reflect the constructs of hostility and dynamism. These
two constructs are considered separately as second-order level constructs as there is
no theoretical basis for combining them into the higher order construct
“Environment”. In Chapter two, the said relationships between our constructs for the
study have been depicted in the model in Figure 5 section 2.6.5.
3.2 Research Design
The research strategy used was an online web-based survey. Survey methods gather
primary data through the direct questioning of the respondent. Online surveys are very
effective for collecting data from large samples because they are automated, cheaper
and faster, and can reach geographically dispersed target population (Wegner, 2007).
Online surveys still enjoy perceived anonymity, although there are growing concerns
about privacy.
The primary drawback experienced in this research is that there is a lack of
comprehensive sampling frames, i.e. e-mail listings may be outdated or may not be
exclusive to specific user groups. Secondly, the recipients tend to distrust unsolicited
emails and may simply not respond or even threaten.
In order to maximise participation in the self-administered survey, effort was made to
ensure that survey was easy to read. Furthermore, an official ethics letter from Wits
Business School (See APPENDIX A, Ethics letter) was attached to assure anonymity,
confidentiality and good ethical treatment of the participants.
85
3.3 Population and sample
3.3.1 Population
The research population comprised of South African firms of any size that are involved
in export of goods, products, or services to any cross-border destination in the world
and in any industry. The Department of Trade and Industry (DTI) as well as Statistics
South Africa (Stats SA) could not provide information on the population of SA
exporting firms, and further attempts with other sources did not yield any results.
Therefore population size of SA exporting firms is unknown.
3.3.2 Sample and sampling method
The units of analysis in the sampling frame are exporting firms in South Africa (SA). The
survey questionnaires were targeted at senior or executive management who are
knowledgeable about export practices and performance within their firms. This firm
level approach is consistent with entrepreneurship studies among firms whereby the
individual entrepreneur is regarded as a firm; whereby at the firm level, mangers’ self-
perception of a firm’s strategic orientation and different aspects of the firm represents
firm behaviour (Urban and Oosthuizen, 2009). The research uses a sample of South
African firms and focuses on firm-level behavioural practices among the responding
firms and relates these to self reported (perceptual) measures.
The Department of Trade and Industry does not have an explicit database of South
African exporting firms. To the researcher’s knowledge there is no single database in
South Africa listing exporters. The sample frame was therefore constructed as a
convenience sample using a number of sources which follows:
Members of export councils listed on the DTI website. Each export council was
requested to circulate the link to the questionnaire to their member firms via
email. Some of the councils refused to pass the survey link to their member firms;
in these cases, the researcher attempted to contact the firms through contacts
obtained from the companies’ websites.
86
A database obtained from the Department of Agriculture, Forestry and Fisheries
A database purchased from an online database re-seller. The database listed firms
in spread across a variety of industries
The firms on the databases were cross matched to ensure there were no duplicates.
Our final list of responses included only firms that met the criteria for our sample
frame. Although the export councils listed may be a wide variety, the researcher does
not claim them to be representative of various industry sectors; furthermore, it is
acknowledged that membership to specific councils might have been induced by
specific interests (e.g. firms seeking promotion opportunities) and therefore there
might exist the potential of common method bias. Common method bias refers to
variance that is attributed to the measurement method rather than the constructs of
interest.
In all it is estimated that up to 1500 emails were sent out. The researcher anticipated
that at least 150 questionnaire responses, representing a 10% anticipated response
rate. A minimum sample size of questionnaires n = 150 was targeted for the purposes
of quantitative analysis. For those potential respondents whose email addresses were
from the acquired databases, weekly reminders were sent. For those that relied on the
export councils, emails were sent out periodically to the councils to remind their
members to participate, however it could not be verified whether this was done; thus
non-response bias is likely to exist.
Inevitably, majority of the emails did not reach their intended recipients; this may be
due to wrong email addresses; strict firewall policies among the firms sampled; and
email address changes due to labour mobility.
The researcher therefore makes provision that sample may not be representative of
the population of exporting firms in South Africa and this should be borne in mind
when interpreting the results.
Of the +- 1500 emailed links to the survey questionnaires, 181 responses were
received over a period of 12 weeks and 33 of them were incomplete. The remaining
87
148 complete questionnaires were available for the quantitative analysis, representing
a useable response rate of 10%. This is a reasonable response rate, given that a
number of emails did not reach the recipients presumably due staff mobility, error in
capturing email addresses, and/or strict email policy among the companies surveyed.
Preliminary analyses were conducted to provide information about the characteristics
of sample firms.
Preliminary profile analysis of the data revealed that firms with export intensity
(export sales as a percentage of total sales) of less than 10% and exporting to fewer
than 5 countries had significant differences in economic performance compared to the
rest of the firms. This implied a difference in firm commitment to exporting. These
firms could not be considered as trading internationally to any material extent.
Therefore, firms with export intensity of less than 10% and exported to less than 5
countries were excluded from the sample. Given the context of the internationalising
firms from a less developed country (South Africa), in line with Zhou (2007), the
researcher adjusted the percentage of foreign sales defined for firms for the advanced
countries (10 or 20%). The less restrictive cut-off of 10% which is in line with previous
studies (Zhou, 2007) was adopted. Hence, in this study, a firm is considered
internationalized when their foreign sales represents at-least 10% of total sales or
exports to more than five countries.
The sample size of the refined final sample presented for further analysis was 117.
88
3.4 The research instrument
Consistent with the chosen research design, a structured questionnaire was used to
conduct the survey. The questionnaire Appendix B (Actual research instrument) was
constructed in order to assess top level management perspectives about their firm’s
practices in relation to the constructs. The preamble to the questionnaire made clear
to the respondents the purpose of the survey and assured confidentiality and
obedience to research ethics.
The survey instrument was built based on literature pertaining to the constructs. The
scale comprised of multi-item sub-scales for the constructs as well as a demographic
section. The instrument consisted of seven sections, A to G, as illustrated in Table 2.
Section A pertains to the demography questions. The items related to the control
variables as well as internationalisation performance items were grouped into this
section. The included questions were found to relate to the demographic questions
and it was logical to group them together.
Section B had two sub-scales for the entrepreneurial intensity construct, which are
frequency of entrepreneurship and entrepreneurial orientation (EO). Section C, D, and
E corresponds to the component scales for the entrepreneurial capabilities construct,
which are Human capital, Social capital, and Technology, respectively. Entrepreneurial
intensity is a level 1 construct. Entrepreneurial orientation (EO) and frequency of
entrepreneurship dimensions are level 2 constructs and together they make up the
entrepreneurial intensity construct. EO has three dimensions – innovativeness,
proactiveness, and risk-taking.
Section F had two component sub-scales for the environment construct, which are
environmental hostility and environmental dynamism. The environment is a level 1
construct, comprising of two level 2 dimensions – environmental hostility (questions
53 – 58) and environmental dynamism (questions 59 to 63).
89
Section G comprised the remainder of the international performance items which
were not been included in Section A, namely the economic performance subscale.
Performance is a level 1 construct, comprising of two level 2 dimensions – economic
performance and international intensity. Economic performance is divided into two
level 3 measures - financial performance (questions 64, 65, 68, and 69) and growth
(questions 66, and 67). Economic performance was a perceptive measure of company
performance for the past three years – the supposition was that performance over
three years is broad enough time-space to account for seasonal and cyclical variations
in business practices and performance.
Following the frequently used approach to assess international performance in the
literature, a perceptual measure of a self-report was used. In the questionnaire,
respondents were asked to rate their satisfaction with the three measuring items
(export profitability, overall profitability, and market share) over the past three years.
The measure was obtained for each item on a seven-point scale, ranging from 1 = very
dissatisfied, to 7 = very satisfied (Zhou, 2007). The composite variable, financial
performance was measured as the average of the three observable indicators
(Pangarkar, 2008; Camisón and Villar-López, 2010).
Similarly, the respondents were asked to rate their satisfaction with the three
measuring items on growth (employee growth, foreign sales growth, and exports
market share growth) over the past three years. The measure was obtained for each
item on a seven-point scale, ranging from 1 = very dissatisfied, to 7 = very satisfied
(Zhou, 2007). The composite variable, growth was measured as the average of the
three indicators that are observable (Pangarkar, 2008; Camisón and Villar-López,
2010).
International intensity comprises of three level 3 measures of internationalisation -
namely speed (question 7), scope (question 8), and export intensity (question 9).
The questions in section B to G were measured on a one directional 7-point Likert-type
scale, with 1 being the least impression and 7 the most (e.g. 1 = strongly disagree - 7 =
90
strongly agree; or 1 = very inactive - 7 very active; or 1 = much worse – 7 = much
better). Using similar scale anchors or values (“extremely” vs. “somewhat,” “always”
vs. “never,” and “strongly agree” vs. “strongly disagree”) makes it easier for the
respondents to complete the questionnaire (Podsakoff, MacKenzie, Lee and Podsakoff,
2003).The advantage of a 7-point scale is that it allows more variability among
respondents. Question 49 and 50 were a duplicate, and hence item 50 was deleted in
the analysis phase.
As already indicated, the main constructs - entrepreneurial intensity, entrepreneurial
capabilities, environment, and performance - are high-level constructs with their own
sub-scales. The sub-scales used in constructing the instrument have been adapted
from existing items used and validated in prior studies as illustrated in Table 2.
Level 1 is the highest level of measurement – for this level all the items measuring the
level 2 dimensions were considered jointly. Similarly the level 2 construct is the second
level of measurement in terms of conceptual complexity for this level all the items
measuring the level 3 dimensions were considered jointly. This breakdown is
illustrated in Table 2 below. For example, EI is a level 1 construct and it is measured by
considering jointly the items for EO and frequency of entrepreneurship. EO is
measured by jointly considering all the items measuring the level 3 dimensions –
innovativeness, proactiveness, and risk-taking.
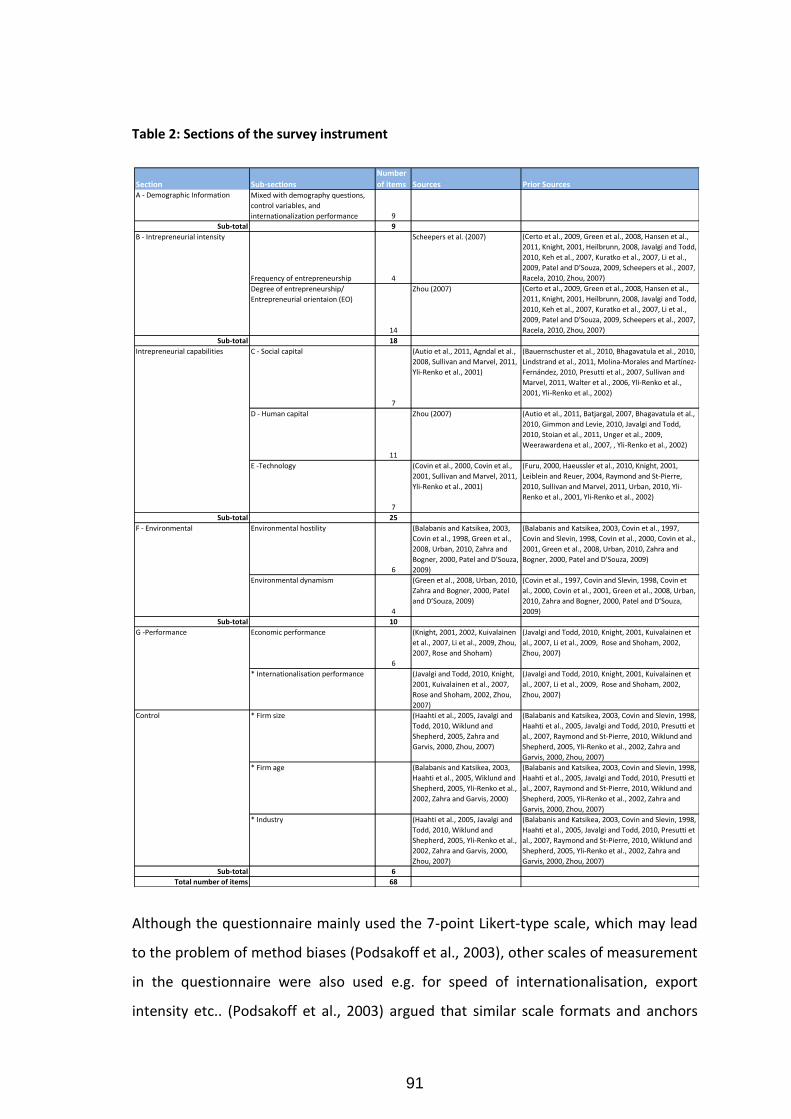
91
Table 2: Sections of the survey instrument
Although the questionnaire mainly used the 7-point Likert-type scale, which may lead
to the problem of method biases (Podsakoff et al., 2003), other scales of measurement
in the questionnaire were also used e.g. for speed of internationalisation, export
intensity etc.. (Podsakoff et al., 2003) argued that similar scale formats and anchors
Section Sub-sections
Number
of items Sources Prior SourcesA - Demographic Information
Sub-total 9
B - Intrepreneurial intensity
Frequency of entrepreneurship 4
Scheepers et al. (2007) (Certo et al., 2009, Green et al., 2008, Hansen et al.,
2011, Knight, 2001, Heilbrunn, 2008, Javalgi and Todd,
2010, Keh et al., 2007, Kuratko et al., 2007, Li et al.,
2009, Patel and D’Souza, 2009, Scheepers et al., 2007,
Racela, 2010, Zhou, 2007)
Degree of entrepreneurship/
Entrepreneurial orientaion (EO)
14
Zhou (2007) (Certo et al., 2009, Green et al., 2008, Hansen et al.,
2011, Knight, 2001, Heilbrunn, 2008, Javalgi and Todd,
2010, Keh et al., 2007, Kuratko et al., 2007, Li et al.,
2009, Patel and D’Souza, 2009, Scheepers et al., 2007,
Racela, 2010, Zhou, 2007)
Sub-total 18
Intrepreneurial capabilities C - Social capital
7
(Autio et al., 2011, Agndal et al.,
2008, Sullivan and Marvel, 2011,
Yli-Renko et al., 2001)
(Bauernschuster et al., 2010, Bhagavatula et al., 2010,
Lindstrand et al., 2011, Molina-Morales and Martínez-
Fernández, 2010, Presutti et al., 2007, Sullivan and
Marvel, 2011, Walter et al., 2006, Yli-Renko et al.,
2001, Yli-Renko et al., 2002)
D - Human capital
11
Zhou (2007) (Autio et al., 2011, Batjargal, 2007, Bhagavatula et al.,
2010, Gimmon and Levie, 2010, Javalgi and Todd,
2010, Stoian et al., 2011, Unger et al., 2009,
Weerawardena et al., 2007, , Yli-Renko et al., 2002)
E -Technology
7
(Covin et al., 2000, Covin et al.,
2001, Sullivan and Marvel, 2011,
Yli-Renko et al., 2001)
(Furu, 2000, Haeussler et al., 2010, Knight, 2001,
Leiblein and Reuer, 2004, Raymond and St-Pierre,
2010, Sullivan and Marvel, 2011, Urban, 2010, Yli-
Renko et al., 2001, Yli-Renko et al., 2002)
Sub-total 25
Environmental hostility
6
(Balabanis and Katsikea, 2003,
Covin et al., 1998, Green et al.,
2008, Urban, 2010, Zahra and
Bogner, 2000, Patel and D’Souza,
2009)
(Balabanis and Katsikea, 2003, Covin et al., 1997,
Covin and Slevin, 1998, Covin et al., 2000, Covin et al.,
2001, Green et al., 2008, Urban, 2010, Zahra and
Bogner, 2000, Patel and D’Souza, 2009)
Environmental dynamism
4
(Green et al., 2008, Urban, 2010,
Zahra and Bogner, 2000, Patel
and D’Souza, 2009)
(Covin et al., 1997, Covin and Slevin, 1998, Covin et
al., 2000, Covin et al., 2001, Green et al., 2008, Urban,
2010, Zahra and Bogner, 2000, Patel and D’Souza,
2009)
Sub-total 10
Economic performance
6
(Knight, 2001, 2002, Kuivalainen
et al., 2007, Li et al., 2009, Zhou,
2007, Rose and Shoham)
(Javalgi and Todd, 2010, Knight, 2001, Kuivalainen et
al., 2007, Li et al., 2009, Rose and Shoham, 2002,
Zhou, 2007)
* Internationalisation performance (Javalgi and Todd, 2010, Knight,
2001, Kuivalainen et al., 2007,
Rose and Shoham, 2002, Zhou,
2007)
(Javalgi and Todd, 2010, Knight, 2001, Kuivalainen et
al., 2007, Li et al., 2009, Rose and Shoham, 2002,
Zhou, 2007)
* Firm size (Haahti et al., 2005, Javalgi and
Todd, 2010, Wiklund and
Shepherd, 2005, Zahra and
Garvis, 2000, Zhou, 2007)
(Balabanis and Katsikea, 2003, Covin and Slevin, 1998,
Haahti et al., 2005, Javalgi and Todd, 2010, Presutti et
al., 2007, Raymond and St-Pierre, 2010, Wiklund and
Shepherd, 2005, Yli-Renko et al., 2002, Zahra and
Garvis, 2000, Zhou, 2007)
* Firm age (Balabanis and Katsikea, 2003,
Haahti et al., 2005, Wiklund and
Shepherd, 2005, Yli-Renko et al.,
2002, Zahra and Garvis, 2000)
(Balabanis and Katsikea, 2003, Covin and Slevin, 1998,
Haahti et al., 2005, Javalgi and Todd, 2010, Presutti et
al., 2007, Raymond and St-Pierre, 2010, Wiklund and
Shepherd, 2005, Yli-Renko et al., 2002, Zahra and
Garvis, 2000, Zhou, 2007)
* Industry (Haahti et al., 2005, Javalgi and
Todd, 2010, Wiklund and
Shepherd, 2005, Yli-Renko et al.,
2002, Zahra and Garvis, 2000,
Zhou, 2007)
(Balabanis and Katsikea, 2003, Covin and Slevin, 1998,
Haahti et al., 2005, Javalgi and Todd, 2010, Presutti et
al., 2007, Raymond and St-Pierre, 2010, Wiklund and
Shepherd, 2005, Yli-Renko et al., 2002, Zahra and
Garvis, 2000, Zhou, 2007)
Sub-total 6
Total number of items 68
G -Performance
Control
F - Environmental
Mixed with demography questions,
control variables, and
internationalization performance 9
92
may increase the possibility that some of the covariation observed among the
constructs examined may be the result of the consistency in the scale properties rather
than the content of the items.
3.5 Procedure for data collection
The hypotheses that have been deduced drive the process of gathering data through
the selected methods (Kock, 2007). Creswell (2008) describes a survey research as one
strategy for enquiry associatedwith quantitative research. This study uses an online
survey as a method of collecting data from respondents in the sample frame. Data was
collected by means of a self-administered online survey over a period of 12 weeks. The
questionnaire link was sent via email to the targeted respondents. The responses were
collected through a collector which had been setup on www.surveymonkey.com.
3.6 Data analysis and interpretation
The analytical approach adopted in this study comprised of four main steps is
discussed in this sub-section. Statistical significance for the purposes of this research
project were assessed at the p-value=0.05 level (i.e. 95% confidence level). The
probability (p-value) of 0.05 or smaller indicates that there is a 5% chance that the
relationship between two variables occurred by chance alone and the relationship is
thus may be considered to be statistically significant.
3.6.1 Regression analysis
This research problem has hypothesised the influence of entrepreneurship variables
on the performance of internationalising firms. In order to test the hypothesised
relationships, the researcher constructed statistical models in the form of linear
regression. Multiple regression analysis is a multivariate statistical technique used to
analyse the relationship between a single dependent variable and several independent
variables (Hair, Black, Babin and Anderson, 2010). The researcher used hierarchical
regression analysis to assess the contribution of moderator variables added in
sequence to the other predictors present in the model.
93
Research problems largely resolved through the application of regression analysis fall
into either of the following classes: prediction or explanation. Prediction involves the
extent to which the independent variables can predict the dependent variable;
Explanation examines the regression coefficients (magnitude, sign and statistical
significance) for each independent variable and attempts to develop a theoretical
reason for the effects of the independent variables (Hair et al., 2010). Our research
problem is illustrative of a confirmatory study seeking to test the hypotheses
statistically.
The essence of regression analysis is to build a model, comprising of weighted
independent variables, the moderator and the dependent variable, with the aim:
To represent the hypothesised relationships
To select the model that best predicts the dependent variable
Multiple linear regression models that represent the hypothesised relationships were
constructed using the Statistica software package StatSoft, Inc. (2011), STATISTICA
(data analysis software system), version 10. www.statsoft.com. The interpretation of
the regression model examines the role played by each independent variable in the
prediction of the dependent measure (Hair et al., 2010). This study examines, through
hierarchical multiple regressions:
1. the individual contribution of the variables to the model;
2. the simultaneous assessment between all the variables and the dependent
variable; and
3. The moderation effect of the interaction variables to the above relationships.
I.e. the change in the slope of the above stated relationships along all values of
the moderator variable
In all cases, regression analyses started by analysing measures of the constructs at the
highest level (first order), and then proceeded to regressing the second level
performance measures on the second level predictor measures, followed in turn by
the third level analyses. For instance, entrepreneurial capabilities comprises three
94
level2 dimensions, namely human capital, social capital and, technology. Each of the
level2 dimensions themselves comprises of level 3 variables which are also analysed.
The researcher used this exhaustive method of hypothesis testing to take account of
the possibility that combinations of subscales used as single predictors may mask the
relations between the individual subscales and the performance measures.
3.6.2 Moderator effects
Moderation refers to the examination of the statistical interaction between two
independent variables in predicting a dependent variable. Moderator effects occur
when a moderator variable changes the strength of the relationship between one or
more independent variables and the dependent variable(Baron and Kenny, 1986). In
order to assess the significance of the moderator, the following steps are followed
(Hair et al., 2010):
1. Estimate the original (unmoderated) equation
2. Estimate the moderated relationship (original equation plus the moderator
variable)
3. Assess the change in R-squared. If the change is statistically significant, then the
moderator effect is significant
It is commonly suggested in research that all independent variables that constituted an
interaction should be mean-centered term in order to mitigate the potential threat of
multi-collinearity. However, Hess (2007) analytically proved that the multi-collinearity
problem in the moderated regression remains unchanged by mean-centering. Mean-
centering neither changes the computational precision of parameters, the sampling
accuracy of main effects, simple effects, interaction effects, nor the R2 (Hess, 2007).
Therefore the independent variables that constitute the interaction term in performing
step 2 above were not centred, as this does not solve the potential problem of multi-
collinearity.
The discussion on moderation concludes with the presentation and analysis of slopes.
95
3.6.3 Regression assumptions
The underlying statistical assumptions of normality, linearity, multicollinearity,
independence of error terms, and equality of variances (homoscedasticity) must be
met before the estimation of the multivariate model.
Linearity refers to the implicit assumption in correlation analysis that the collection of
data can be described by a straight line passing through the data array (Cooper and
Schindler, 2008). The relationships are examined to identify any possible departure
from linearity that may affect the estimation of the strength of the relationship by
examining the scatter plots of the variables as well as the residuals of the regressions.
In the present research, bivariate scatterplots were used to examine the linear
relations between the predictor variables and performance variables.
The scores for each variable in the analysis should be normally distributed to result in
valid statistical tests of F-stats and t statistics. Multivariate normality refers to the
shape of the distribution of the individual variables benchmarked against the normal
distribution. The researcher assessed normality by looking at the shape of the
frequency distributions with superimposed normal probability plots, as well as
considering the descriptive statistics of the skewness and kurtosis indices.
Independence of error terms is essential in order to meet the condition of
independence of the independent variable. The residual plots are used to identify such
occurrences by observing whether the residuals exhibit any pattern (i.e. correlated
errors).
Homoscedasticity refers to the assumption that dependent variable(s) exhibit equal
level of variance across the range of independent variables (Hair et al., 2010). This
requirement is essential because it is undesirable to have the dependence relationship
concentrated on a limited range of independent values. If the dispersion is unequal
across values of independent variables, the relationship is said to be heteroscedastic
(Hair et al., 2010).
96
The above described statistical assumptions were performed and remedial steps
carried out where necessary to avert flawed analysis. The details are discussed in
section 4.4 of Chapter four.
3.6.4 Descriptive statistics
Descriptive statistics of the composite variables will be presented to numerically
profile the sample data. For continuous variables, means, standard deviations and
variance in the variables were presented and analysed. Frequency distributions were
used to describe the categorical demographic characteristics of the respondents.
Skewness and Kurtosis indices will be presented.
3.6.5 Exploratory data analysis
Exploratory data analysis (EDA) is about investigating patterns in the collected data in
order to guide data analysis or suggest revisions to the initial data analysis plan
(Cooper and Schindler, 2008). A range of diagnostic techniques are conducted to
facilitate discovery of any observations with particular influences on the results or any
possible multivariate relationships among the data. In our exploratory data analysis we
evaluate:
1. the presence of outliers in the data
2. international intensity as a measure of performance
3. the control variables (firm age, size and industry)
Outliers are observations with a unique combination of characteristics identifiable as
distinctly different from the other observations (Hair et al., 2010). The presence of
outliers may affect empirical analysis. The researcher examined the data for potential
outliers and decisions on their deletion or retention are discussed in Chapter four.
Section 2.2.2 of the literature review posed the question: What is a suitable
measurement of international performance of a firm? While there has been
widespread use of economic performance measures, Ripollés-Meliá et al. (2007)
proposed measuring internationalisation in terms of international intensity comprising
97
of degree; scope; and speed of internationalisation. These measures are examined in
the analyses to assess their validity as measures of international performance. Chi
square test was used to detect the strength of the relations between the three sets of
bivariate relations and the categorical variables.
Control variables are variables introduced to help interpret the relationship between
variables (Cooper and Schindler, 2008). Prior empirical research has highlighted the
theoretical importance of firm age, size, and industry in their relationship to
performance (Yli-Renko et al., 2001; Coviello and Jones, 2004; Javalgi and Todd, 2010).
These variables affect the venture’s ability to obtain and deploy resources (Zahra and
Bogner, 2000). Firm age influences entrepreneurial intensity (Scheepers et al., 2007;
Heilbrunn, 2008). For instance, the older the companies the less entrepreneurial they
become (Scheepers et al., 2007). Large firms are seen to possess resource slack and
capabilities to overcoming foreign market barriers and will have a performance edge
over their smaller counter parts.Industry type was included because of the inter
industry differences in entrepreneurial activities (Morris et al., 2008), and the
technology intensity has an effect on the propensity to export (Serra et al., 2011).
Therefore the study tests for the statistical significance of these factors to evaluate
whether the research model should include these factors as control variables to
provide added validity to the results.
3.7 Validity and reliability
Measurement error is guaranteed to distort the observed relationships and makes
multivariate techniques less powerful, therefore it is imperative for the researcher to
improve reliability and validity (Hair et al., 2010).
In order to enhance the reliability of data – this is to eliminate inconsistencies and
ambiguity in the wording of the instructions and the items the survey was pre-tested
with the help of an expert who reviewed the survey. Secondly, in order to measure the
constructs, tried and tested scales obtained from prior studies are used, which have
been validated. Thirdly, the researcher used multi-item measures in our scales since
98
they provide considerable advantages over single-item measures (Pirolo and Presutti,
2010). These steps were taken as pre-cautionary measures to obtain validity and
reliability.
The validity and reliability of scales were evaluated at both level 2 and 3 of the
constructs. The next three sub-sections discuss the technical ways in which the
measuring tool was tested for validity and reliability.
3.7.1 External validity
The external validity of research findings is the data’s ability to be generalised across
persons, settings, and times (Cooper and Schindler, 2008). The researcher attempted
to achieve external validity by sampling respondents from variety of industries
operating throughout South Africa. As a requirement for statistical inferences, the
researcher also tried to get a high number of respondents (n> 100). However, the
ability to make generalisations across the population of SA exporting firms remains
limited by the use of convenience sampling methodology.
3.7.2 Internal validity
Construct validity is the extent to which the items in a construct measure what the
researcher actually wishes to measure. In general, the measurement scales used were
taken from prior studies. Internal validity of the research requires that the constructs
measured are valid. In an attempt to enhance construct validity, it is ensured that the
operational definitions of the constructs were theoretically grounded.
Construct validity of scales/subscales comprising the research instrument was
evaluated using factor analysis with the objective to establish whether the items
converged as expected based upon findings of prior researchers. The degree to which
the scores on the scale load on a single factor is referred to as convergent validity. The
degree to which scores on a scale do not correlate with scores from scales designed to
measure different constructs is discriminant validity (Cooper and Schindler, 2008).
Before proceeding with the exploratory factor analysis, the researcher tested the
99
underlying assumptions that sufficient correlations existed among the variables of the
analysis using the Kaiser-Meyer-Olkin Measure of Sampling Adequacy (KMO) and
Bartlett's Test of Sphericity.
Factor analysis using principal component extraction and varimax rotation was used as
the factor model as this method is well specified for identifying latent constructs or
dimensions. The decision on the number of factors was determined based on the
following considerations (Hair et al., 2010):
The selection of factors with eigenvalues greater than 1.0
A predetermined number of factors based on prior research
Enough factors to meet a specified percentage (60%) of variance explained
Combination of the above three criteria were used for validity checks of the
data derived factor solution. As recommended for sample sizes greater than
100, factor loadings were assessed as follows (Hair et al., 2010): +-.40 are
minimally acceptable; +-0.5 or greater is practically significant; and > 1.7 are
indicative of a well defined structure.
The anticipated factor structure would also serve as a check that the scores obtained
did not comprise mainly common method variance defined by Podsakoff (2003) as
variance attributable to the measurement method rather than to the underlying
constructs. The presence of common method variance would be expected to obscure
the expected factor structure, resulting in a single factor emerging from the
exploratory factor analysis (Podsakoff et al., 2003).
3.7.3 Reliability
Reliability is concerned with estimates of the degree to which a measurement is free
from random error. A measure is said to be reliable to the degree that it produces
consistent results (Cooper and Schindler, 2008). Internal consistency reliability
indicates the consistency with which the respondents responded to the questions on
the scale. It indicates the degree to which the items in the instrument are
100
homogeneous and reflect the same underlying construct (Cooper and Schindler, 2008).
Reliability of an instrument is a necessary (but not sufficient) condition for validity.
The scales were measured for internal consistency by subjecting the constituent items
to a reliability test using Cronbach’s alpha (α), item-to-total correlation, and inter-item
correlation (Hair et al., 2010). Cronbach’s alpha (α), the reliability coefficient, measures
the consistency of the entire scale. Inter-item correlation is the correlation among
items. As suggested (Hair et al., 2010):
Generally, If Cronbach’s α > 0.7 then internal consistency reliability is good
although the lower limit of 0.6 is acceptable in exploratory research; if
Cronbach’s α < 0.6 then internal consistency reliability is poor
Inter-item correlation must exceed 0.30
101
3.8 Limitations of the study
This study has some inherent limitations:
The cross-sectional design prevents us from studying causal relationships among
our variables. It may take considerable time for the effects of entrepreneurship to
materialize (Lumpkin and Dess, 1996). Venkataraman suggested that longitudinal
designs are needed in configurational studies (Wiklund and Shepherd, 2005),
however this was not possible due to the limited timelines for this study. A
longitudinal investigation (measuring entrepreneurial intensity and capabilities at
one point, and then performance at some point later) would provide further
insights into the dynamic nature entrepreneurial intensity and capabilities and
their effect on international performance. Future research might use longitudinal
design to draw causal inferences of our model
The single-country focus might suggest a certain amount of ethnocentrism in the
findings (Coviello and Jones, 2004)
The study is based on self-report data incurring the possibility of common method
bias. However, respondents were provided with anonymity and we perceive that
sensitive data was not requested. Future studies might use objective measures for
firm performance to strengthen the research design
Only one member of top management per firm was surveyed. It may be possible
that another study examining all members of the top management team may yield
different outcomes
The respondents included management at various levels within their firms
(Founders, CEOs, executives, export managers, etc). This is a heterogeneous group
and different views may exist at different levels on management
Not all export councils agreed to distribute the questionnaire to their members,
and therefore the sample may be biased towards those sectors that received the
questionnaires from their council rather than directly from the researcher

102
Nonparticipation bias – the lower response rate (+-10%) may have affected the
final sample in unknown ways, as the lower the response rate, the greater the
sample bias
Most of the literature reviewed was from developed countries, with a few
exceptions from India and China.
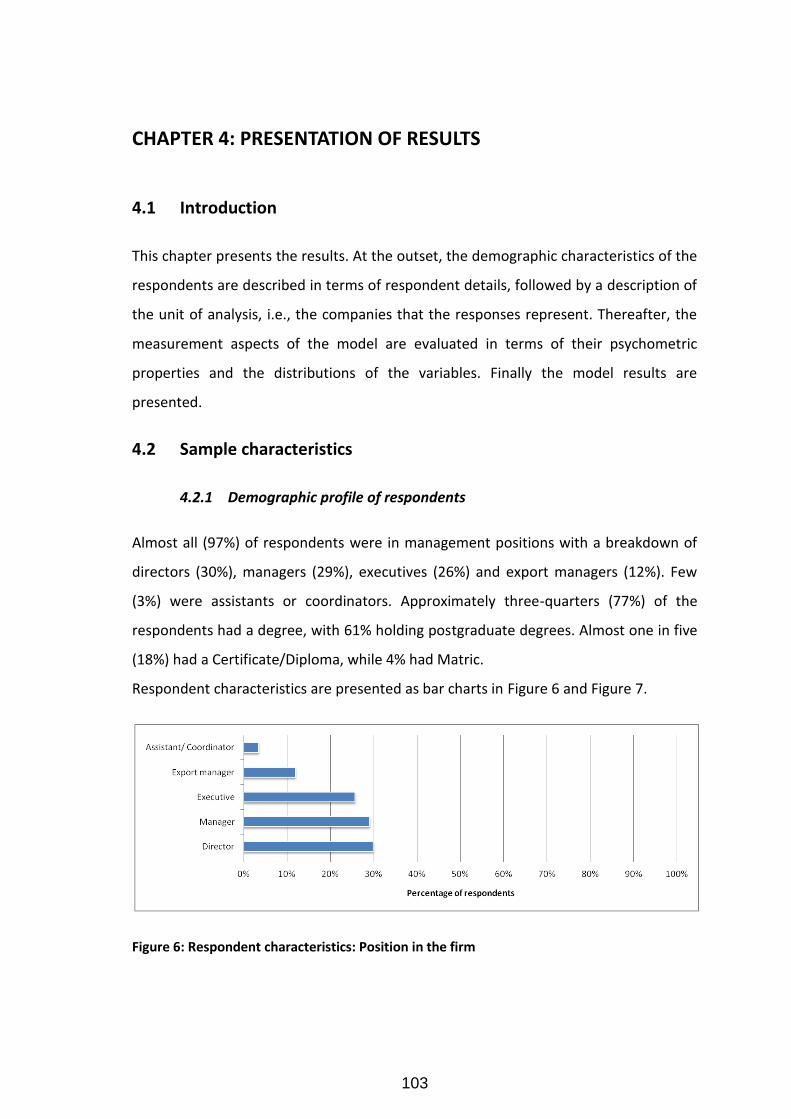
103
CHAPTER 4: PRESENTATION OF RESULTS
4.1 Introduction
This chapter presents the results. At the outset, the demographic characteristics of the
respondents are described in terms of respondent details, followed by a description of
the unit of analysis, i.e., the companies that the responses represent. Thereafter, the
measurement aspects of the model are evaluated in terms of their psychometric
properties and the distributions of the variables. Finally the model results are
presented.
4.2 Sample characteristics
4.2.1 Demographic profile of respondents
Almost all (97%) of respondents were in management positions with a breakdown of
directors (30%), managers (29%), executives (26%) and export managers (12%). Few
(3%) were assistants or coordinators. Approximately three-quarters (77%) of the
respondents had a degree, with 61% holding postgraduate degrees. Almost one in five
(18%) had a Certificate/Diploma, while 4% had Matric.
Respondent characteristics are presented as bar charts in Figure 6 and Figure 7.
Figure 6: Respondent characteristics: Position in the firm
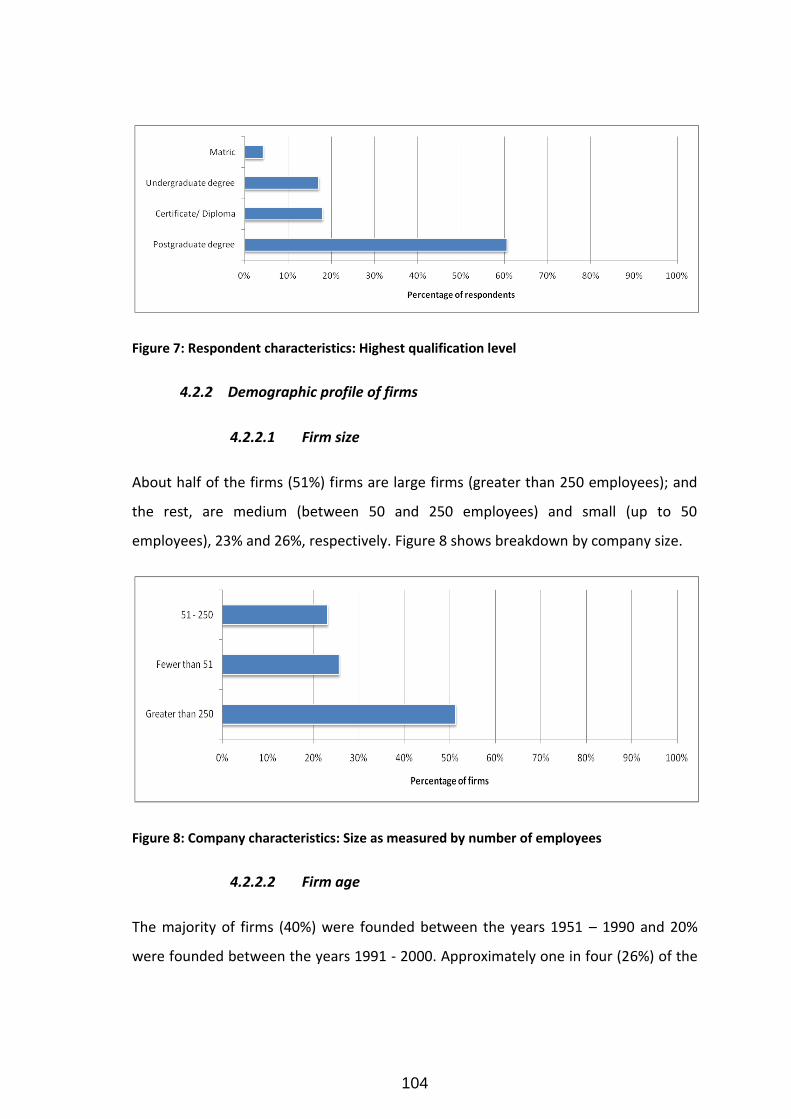
104
Figure 7: Respondent characteristics: Highest qualification level
4.2.2 Demographic profile of firms
4.2.2.1 Firm size
About half of the firms (51%) firms are large firms (greater than 250 employees); and
the rest, are medium (between 50 and 250 employees) and small (up to 50
employees), 23% and 26%, respectively. Figure 8 shows breakdown by company size.
Figure 8: Company characteristics: Size as measured by number of employees
4.2.2.2 Firm age
The majority of firms (40%) were founded between the years 1951 – 1990 and 20%
were founded between the years 1991 - 2000. Approximately one in four (26%) of the
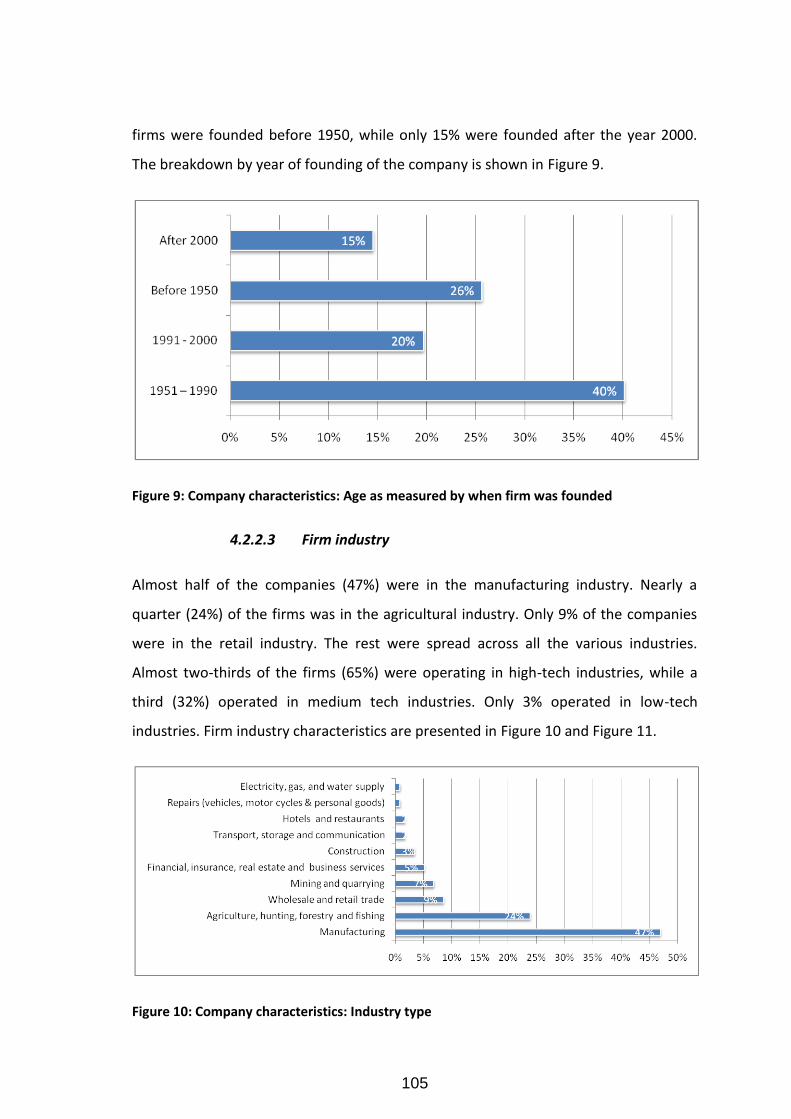
105
firms were founded before 1950, while only 15% were founded after the year 2000.
The breakdown by year of founding of the company is shown in Figure 9.
Figure 9: Company characteristics: Age as measured by when firm was founded
4.2.2.3 Firm industry
Almost half of the companies (47%) were in the manufacturing industry. Nearly a
quarter (24%) of the firms was in the agricultural industry. Only 9% of the companies
were in the retail industry. The rest were spread across all the various industries.
Almost two-thirds of the firms (65%) were operating in high-tech industries, while a
third (32%) operated in medium tech industries. Only 3% operated in low-tech
industries. Firm industry characteristics are presented in Figure 10 and Figure 11.
Figure 10: Company characteristics: Industry type
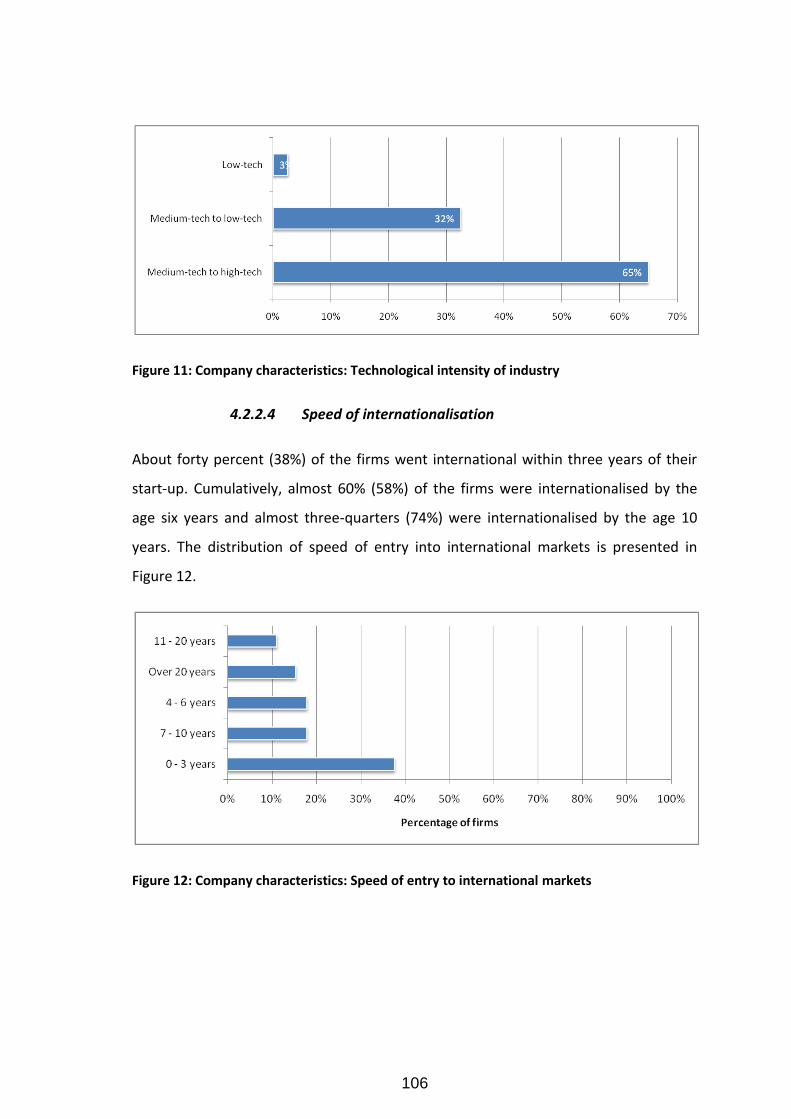
106
Figure 11: Company characteristics: Technological intensity of industry
4.2.2.4 Speed of internationalisation
About forty percent (38%) of the firms went international within three years of their
start-up. Cumulatively, almost 60% (58%) of the firms were internationalised by the
age six years and almost three-quarters (74%) were internationalised by the age 10
years. The distribution of speed of entry into international markets is presented in
Figure 12.
Figure 12: Company characteristics: Speed of entry to international markets
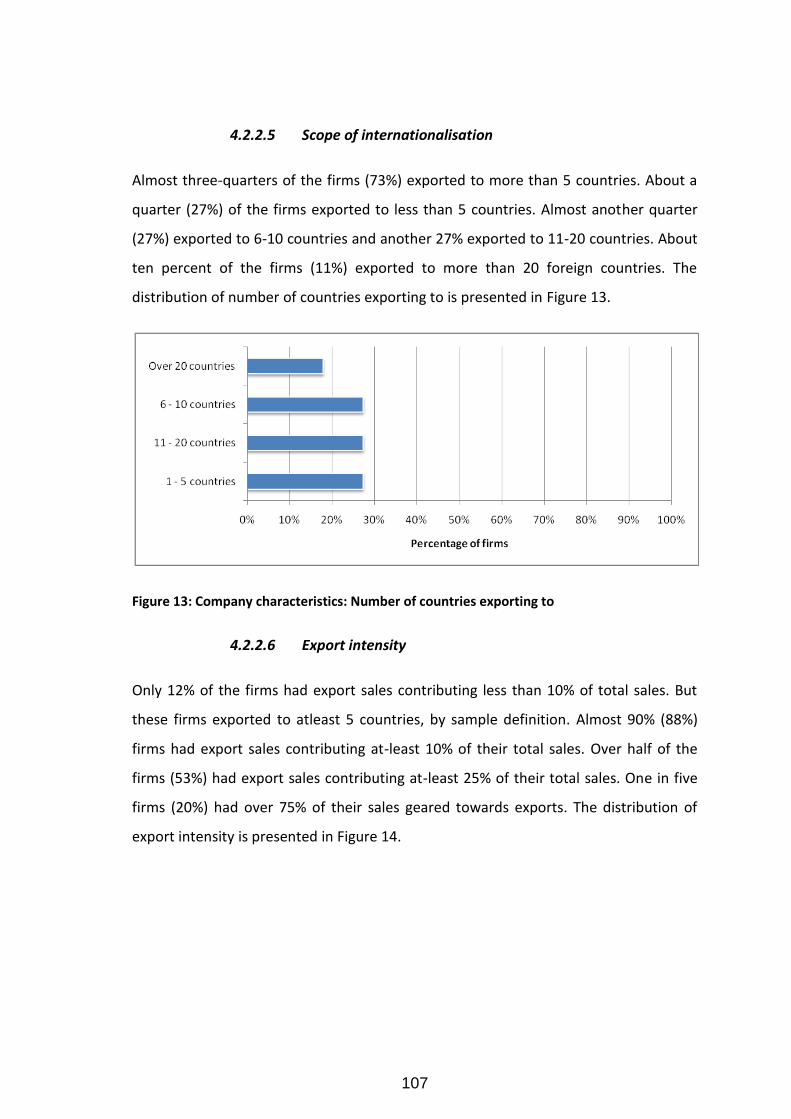
107
4.2.2.5 Scope of internationalisation
Almost three-quarters of the firms (73%) exported to more than 5 countries. About a
quarter (27%) of the firms exported to less than 5 countries. Almost another quarter
(27%) exported to 6-10 countries and another 27% exported to 11-20 countries. About
ten percent of the firms (11%) exported to more than 20 foreign countries. The
distribution of number of countries exporting to is presented in Figure 13.
Figure 13: Company characteristics: Number of countries exporting to
4.2.2.6 Export intensity
Only 12% of the firms had export sales contributing less than 10% of total sales. But
these firms exported to atleast 5 countries, by sample definition. Almost 90% (88%)
firms had export sales contributing at-least 10% of their total sales. Over half of the
firms (53%) had export sales contributing at-least 25% of their total sales. One in five
firms (20%) had over 75% of their sales geared towards exports. The distribution of
export intensity is presented in Figure 14.
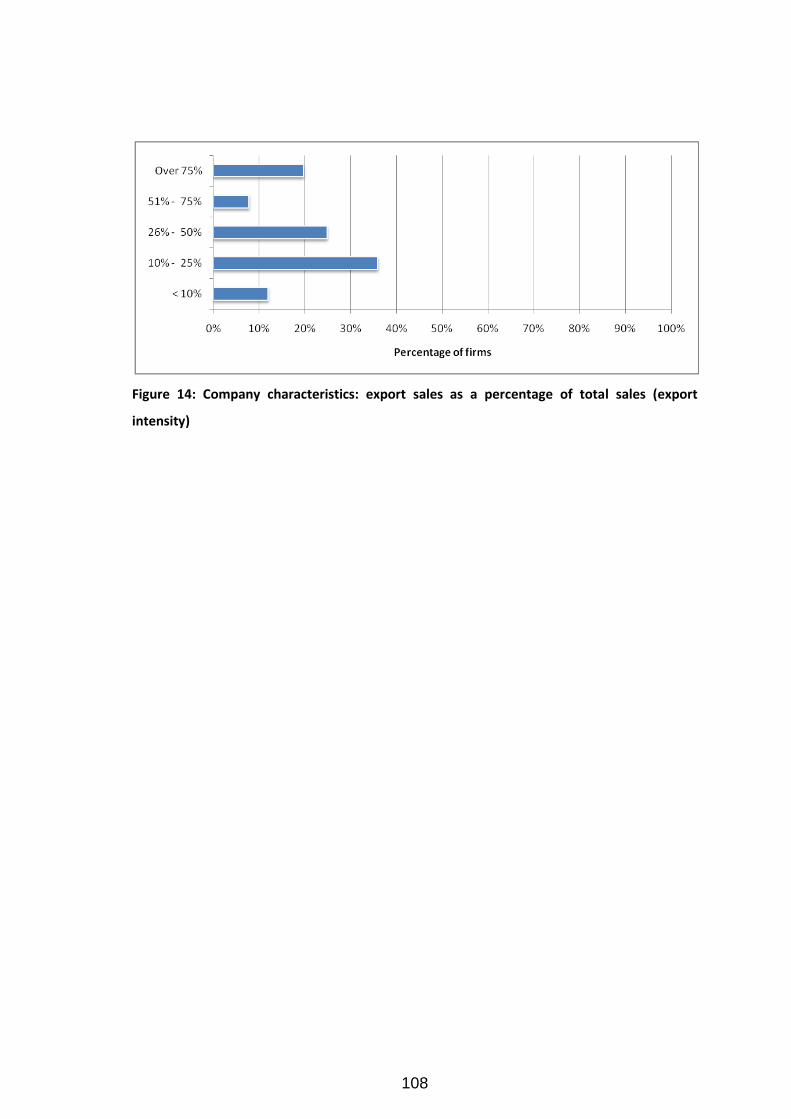
108
Figure 14: Company characteristics: export sales as a percentage of total sales (export
intensity)
109
4.3 Measurement of variables of the model
This section examines the psychometric properties of the scales of the independent
variables, hypothesised moderators and dependent variables in terms of reliability and
validity. This is essential before any examination of the structure of the hypothesized
model can be performed.
In view of the large number of constructs and thus measurement scales used in the
research, the structure of the constructs and their scales is re-presented in Table 3.
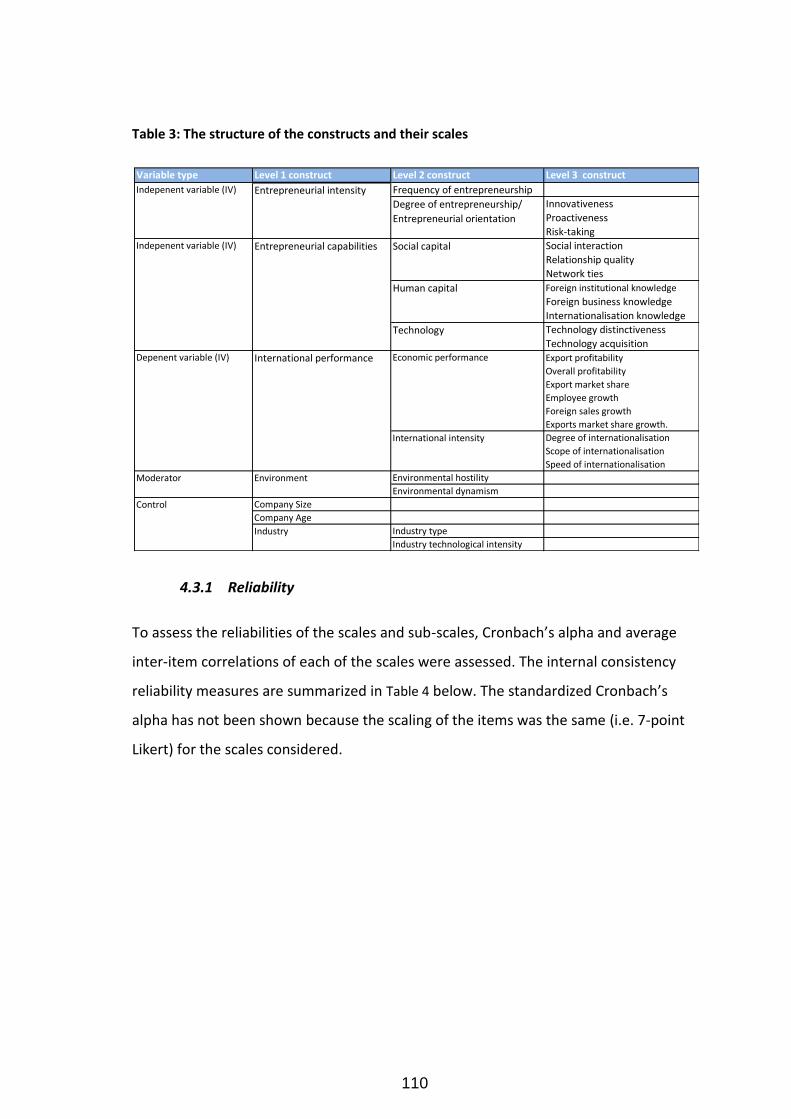
110
Table 3: The structure of the constructs and their scales
4.3.1 Reliability
To assess the reliabilities of the scales and sub-scales, Cronbach’s alpha and average
inter-item correlations of each of the scales were assessed. The internal consistency
reliability measures are summarized in Table 4 below. The standardized Cronbach’s
alpha has not been shown because the scaling of the items was the same (i.e. 7-point
Likert) for the scales considered.
Variable type Level 1 construct Level 2 construct Level 3 construct
Frequency of entrepreneurship
Innovativeness
Proactiveness
Risk-taking
Social interaction
Relationship quality
Network ties
Foreign institutional knowledge
Foreign business knowledge
Internationalisation knowledge
Technology distinctiveness
Technology acquisition
Export profitability
Overall profitability
Export market share
Employee growth
Foreign sales growth
Exports market share growth.
Degree of internationalisation
Scope of internationalisation
Speed of internationalisation
Environmental hostility
Environmental dynamism
Company Size
Company Age
Industry type
Industry technological intensity
Degree of entrepreneurship/
Entrepreneurial orientation
International performance Economic performance
International intensity
Environment
Human capital
Technology
Social capital
Indepenent variable (IV)
Indepenent variable (IV)
Depenent variable (IV)
Moderator
Industry
Control
Entrepreneurial intensity
Entrepreneurial capabilities
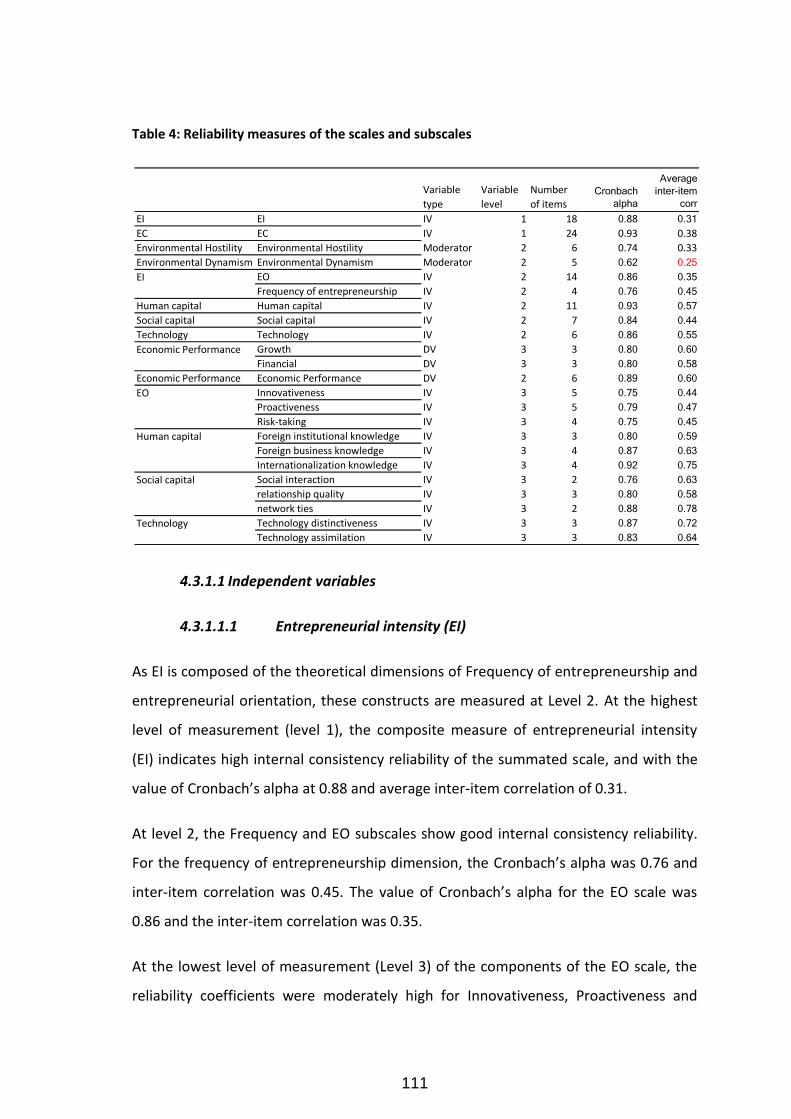
111
Table 4: Reliability measures of the scales and subscales
4.3.1.1 Independent variables
4.3.1.1.1 Entrepreneurial intensity (EI)
As EI is composed of the theoretical dimensions of Frequency of entrepreneurship and
entrepreneurial orientation, these constructs are measured at Level 2. At the highest
level of measurement (level 1), the composite measure of entrepreneurial intensity
(EI) indicates high internal consistency reliability of the summated scale, and with the
value of Cronbach’s alpha at 0.88 and average inter-item correlation of 0.31.
At level 2, the Frequency and EO subscales show good internal consistency reliability.
For the frequency of entrepreneurship dimension, the Cronbach’s alpha was 0.76 and
inter-item correlation was 0.45. The value of Cronbach’s alpha for the EO scale was
0.86 and the inter-item correlation was 0.35.
At the lowest level of measurement (Level 3) of the components of the EO scale, the
reliability coefficients were moderately high for Innovativeness, Proactiveness and
Variable
type
Variable
level
Number
of itemsCronbach
alpha
Average
inter-item
corr
EI EI IV 1 18 0.88 0.31
EC EC IV 1 24 0.93 0.38
Environmental Hostility Environmental Hostility Moderator 2 6 0.74 0.33
Environmental Dynamism Environmental Dynamism Moderator 2 5 0.62 0.25
EO IV 2 14 0.86 0.35
Frequency of entrepreneurship IV 2 4 0.76 0.45
Human capital Human capital IV 2 11 0.93 0.57
Social capital Social capital IV 2 7 0.84 0.44
Technology Technology IV 2 6 0.86 0.55
Growth DV 3 3 0.80 0.60
Financial DV 3 3 0.80 0.58
Economic Performance Economic Performance DV 2 6 0.89 0.60
Innovativeness IV 3 5 0.75 0.44
Proactiveness IV 3 5 0.79 0.47
Risk-taking IV 3 4 0.75 0.45
Foreign institutional knowledge IV 3 3 0.80 0.59
Foreign business knowledge IV 3 4 0.87 0.63
Internationalization knowledge IV 3 4 0.92 0.75
Social interaction IV 3 2 0.76 0.63
relationship quality IV 3 3 0.80 0.58
network ties IV 3 2 0.88 0.78
Technology distinctiveness IV 3 3 0.87 0.72
Technology assimilation IV 3 3 0.83 0.64
EO
EI
Human capital
Social capital
Technology
Economic Performance
112
Risk-taking with values of 0.75, 0.79, and 0.75 for Cronbach’s Alpha respectively, and
values of 0.44, 0.47, and 0.45 for inter-item correlation respectively.
The above results confirm that the individual items of both the subscales (frequency
and EO) and the items of the EI scale are measuring consistently, with the minimum
value of Cronbach’s alpha at 0.76 and the inter-item correlations exceeding the
minimum guideline score for adequate internal consistency reliability of 0.3.
4.3.1.1.2 Entrepreneurial capabilities (EC)
The level 1 construct, entrepreneurial capacity, is a composite construct made up by
combining theoretically distinct dimensions, namely human capital, social capital and
technology. Our scale reliability analysis for entrepreneurial capability scale at level 1,
shows a calculated Cronbach’s alpha of 0.93 and inter-item correlation of 0.38.
At level 2, the values of Cronbach’s alpha for the level 2 subscales of human capital,
social capital, and technology were high at 0.93, 0.84, and 0.86 respectively, with
respective values for inter-item correlations of 0.57, 0.44, and 0.55.
At level 3, the human capital variables - namely foreign institutional knowledge,
foreign business knowledge, and internationalisation knowledge measured 0.80, 0.87,
and 0.92 on Cronbach’s alpha respectively, and 0.59, 0.63, and 0.75 on inter-item
correlation respectively.
At level 3, the social capital variables - namely social interaction, relationship quality,
and network ties measured 0.76, 0.80, and 0.88 on Cronbach’s alpha respectively, and
0.63, 0.58, and 0.78 on inter-item correlation respectively.
At level 3, the technology variables - namely technology distinctiveness and technology
acquisition measured 0.87, and 0.83 on Cronbach’s alpha respectively, and 0.72 and
0.64 on inter-item correlation respectively.
Accordingly, the above analyses show acceptable to good levels of internal consistency
reliability of the subscales of the EC construct with all Cronbach’s alphas (except
113
relationship quality, 0.58) exceeding 0.8 and the minimum inter-item correlations of
0.44 at subscale level exceeding the minimum accepted score of 0.3 for inter-item
correlation. The Cronbach’s alpha for social interaction is 0.76 which still exceeds the
acceptable minimum of 0.7.
4.3.1.2 Moderating variables
The hypothesised environment construct is a level 1 composite abstract comprising
two separate distinct dimension, namely environmental hostility and environmental
dynamism. Hostility and dynamism are thus assessed separately at level 2.
4.3.1.2.1 Hostility
At level 2, the value of Cronbach’s alpha for the environmental hostility scale was 0.74,
and 0.33 on inter-item correlation. The calculated Cronbach’s alpha of 0.74 is higher
than the acceptable value of 0.7. The calculated inter-item correlation of 0.33
marginally exceeds the minimum recommended 0.3. This scale thus meets the
conditions of satisfactory reliability.
4.3.1.2.2 Dynamism
At level 2, the environmental dynamism scale scored 0.62 on Cronbach’s alpha, and
0.31 on inter-item correlation. The calculated Cronbach’s alpha of 0.62 is lower than
the acceptable minimum score of 0.7 but higher than the more lenient acceptable
value of 0.6. The calculated the inter-item correlation value of 0.25 is below the
minimum recommended 0.3. Thus the internal consistency reliability of the dynamism
scale is considered weak.
4.3.1.3 Dependent variables
Export intensity, Scope of internationalisation and Speed of internationalisation are all
measures of International Intensity, but as they were all single-item measures, they
could not be assessed for internal consistency reliability.
114
4.3.1.3.1 Economic performance
Economic performance, a level 2 measure, is a subset of the international performance
construct (level 1). Economic performance consists of level 3 measures, financial
performance and growth.
At level 2, the subscale economic performance measured 0.89 on Cronbach’s alpha,
and 0.60 on inter-item correlation.
At level 3, the economic performance variables - namely financial performance and
growth each measured 0.80 on Cronbach’s alpha, and 0.58, and 0.60 on inter-item
correlations respectively.
This scale as well as its subscales meets the conditions of high internal consistency
reliability.
4.3.2 Validity
This study uses exploratory factor analysis (EFA) for confirmatory purposes to confirm
the perceived structure of the individual theoretically derived scales. The primary aim
of factor analysis is to determine the underlying structure among the variables with
the aim to explain the patterns of interrelationships (correlations) among the
variables. Sets of variables that are highly interrelated are known as factors.
For the purposes of this study, in cases where variables designed to reflect the same
construct loaded on different factors from those defined in the theory, the researcher
noted these results but continued to work with the combinations of items derived
from theory. The research was not designed to attempt to create new scales but rather
to confirm the reliabilities of the existing theoretical scales. Thus the discussion is
limited to the number of factors that provide the highest level of interpretability in line
with theoretical constructs. The aim of the research was to search for or define the
fundamental constructs or dimensions assumed to underlie the variables, and the
purpose of the research was to retain the nature and character of the original variables
with minimal addition of new information.
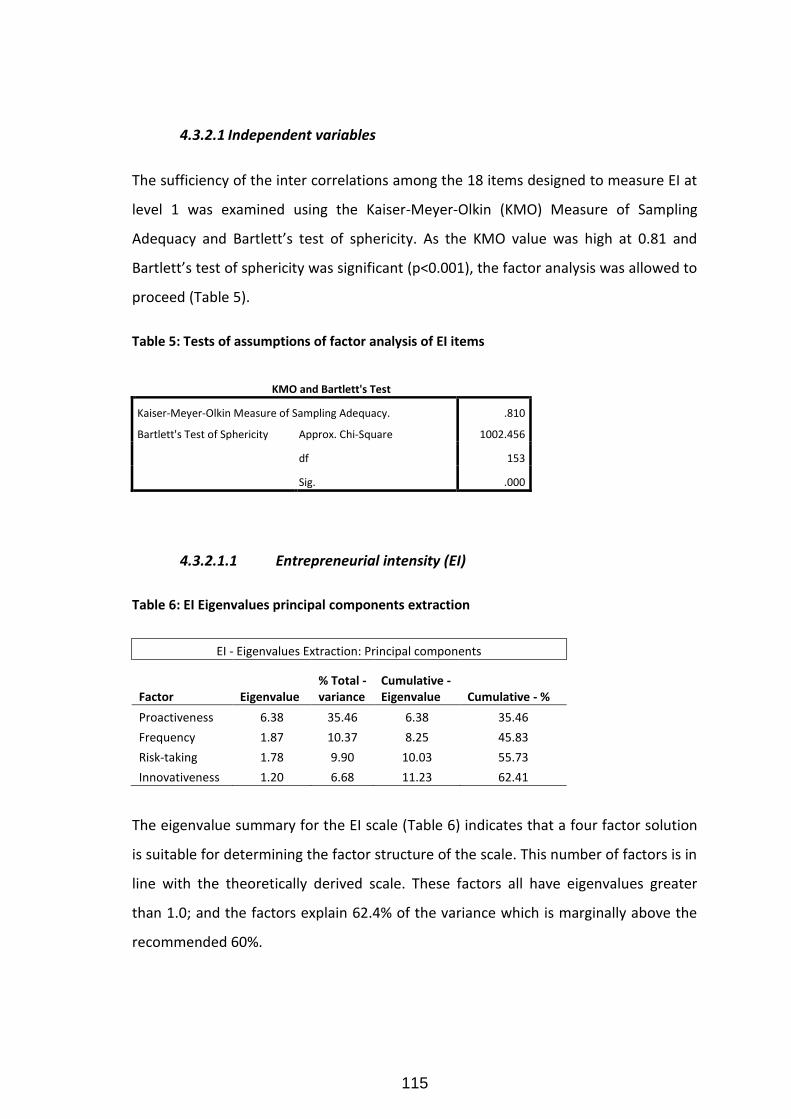
115
4.3.2.1 Independent variables
The sufficiency of the inter correlations among the 18 items designed to measure EI at
level 1 was examined using the Kaiser-Meyer-Olkin (KMO) Measure of Sampling
Adequacy and Bartlett’s test of sphericity. As the KMO value was high at 0.81 and
Bartlett’s test of sphericity was significant (p<0.001), the factor analysis was allowed to
proceed (Table 5).
Table 5: Tests of assumptions of factor analysis of EI items
KMO and Bartlett's Test
Kaiser-Meyer-Olkin Measure of Sampling Adequacy. .810
Bartlett's Test of Sphericity Approx. Chi-Square 1002.456
df 153
Sig. .000
4.3.2.1.1 Entrepreneurial intensity (EI)
Table 6: EI Eigenvalues principal components extraction
EI - Eigenvalues Extraction: Principal components
Factor Eigenvalue % Total - variance
Cumulative - Eigenvalue Cumulative - %
Proactiveness 6.38 35.46 6.38 35.46
Frequency 1.87 10.37 8.25 45.83
Risk-taking 1.78 9.90 10.03 55.73
Innovativeness 1.20 6.68 11.23 62.41
The eigenvalue summary for the EI scale (Table 6) indicates that a four factor solution
is suitable for determining the factor structure of the scale. This number of factors is in
line with the theoretically derived scale. These factors all have eigenvalues greater
than 1.0; and the factors explain 62.4% of the variance which is marginally above the
recommended 60%.
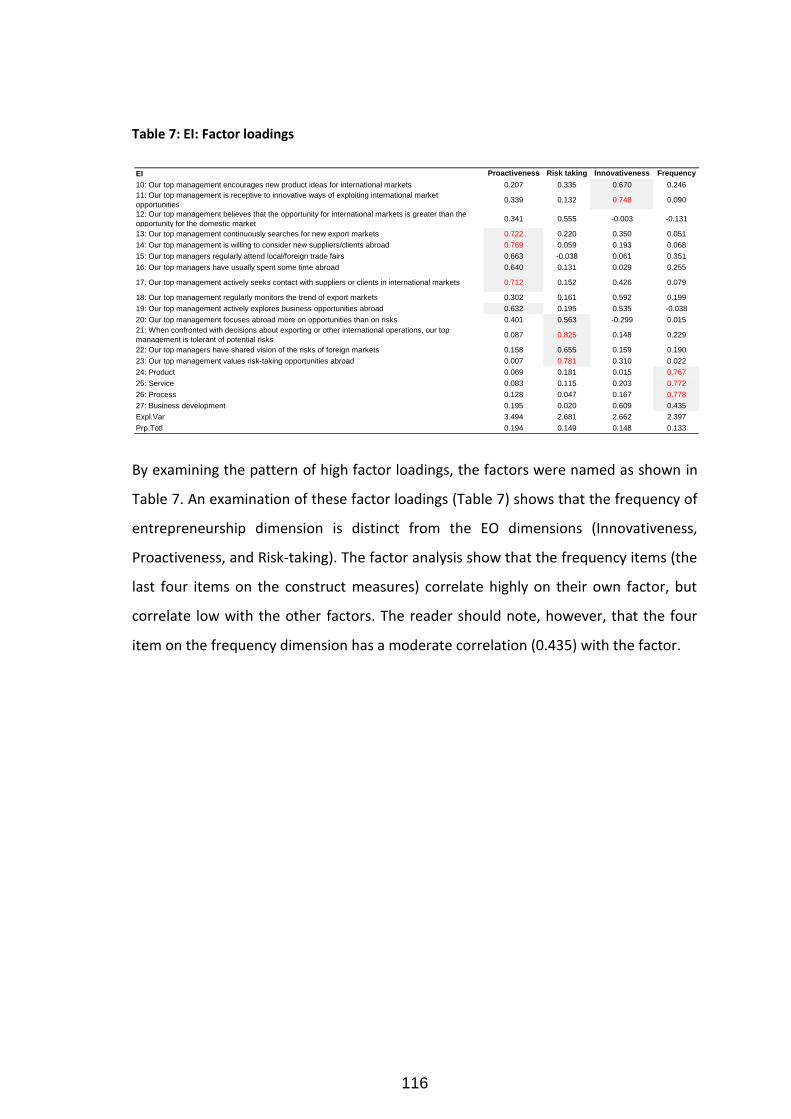
116
Table 7: EI: Factor loadings
By examining the pattern of high factor loadings, the factors were named as shown in
Table 7. An examination of these factor loadings (Table 7) shows that the frequency of
entrepreneurship dimension is distinct from the EO dimensions (Innovativeness,
Proactiveness, and Risk-taking). The factor analysis show that the frequency items (the
last four items on the construct measures) correlate highly on their own factor, but
correlate low with the other factors. The reader should note, however, that the four
item on the frequency dimension has a moderate correlation (0.435) with the factor.
EI Proactiveness Risk taking Innovativeness Frequency
10: Our top management encourages new product ideas for international markets 0.207 0.335 0.670 0.246
11: Our top management is receptive to innovative ways of exploiting international market
opportunities0.339 0.132 0.748 0.090
12: Our top management believes that the opportunity for international markets is greater than the
opportunity for the domestic market0.341 0.555 -0.003 -0.131
13: Our top management continuously searches for new export markets 0.722 0.220 0.350 0.051
14: Our top management is willing to consider new suppliers/clients abroad 0.769 0.059 0.193 0.068
15: Our top managers regularly attend local/foreign trade fairs 0.663 -0.038 0.061 0.351
16: Our top managers have usually spent some time abroad 0.640 0.131 0.029 0.255
17: Our top management actively seeks contact with suppliers or clients in international markets 0.712 0.152 0.426 0.079
18: Our top management regularly monitors the trend of export markets 0.302 0.161 0.592 0.199
19: Our top management actively explores business opportunities abroad 0.632 0.195 0.535 -0.038
20: Our top management focuses abroad more on opportunities than on risks 0.401 0.563 -0.299 0.015
21: When confronted with decisions about exporting or other international operations, our top
management is tolerant of potential risks0.087 0.825 0.148 0.229
22: Our top managers have shared vision of the risks of foreign markets 0.158 0.655 0.159 0.190
23: Our top management values risk-taking opportunities abroad 0.007 0.781 0.310 0.022
24: Product 0.069 0.181 0.015 0.767
25: Service 0.083 0.115 0.203 0.772
26: Process 0.128 0.047 0.167 0.778
27: Business development 0.195 0.020 0.609 0.435
Expl.Var 3.494 2.681 2.662 2.397
Prp.Totl 0.194 0.149 0.148 0.133
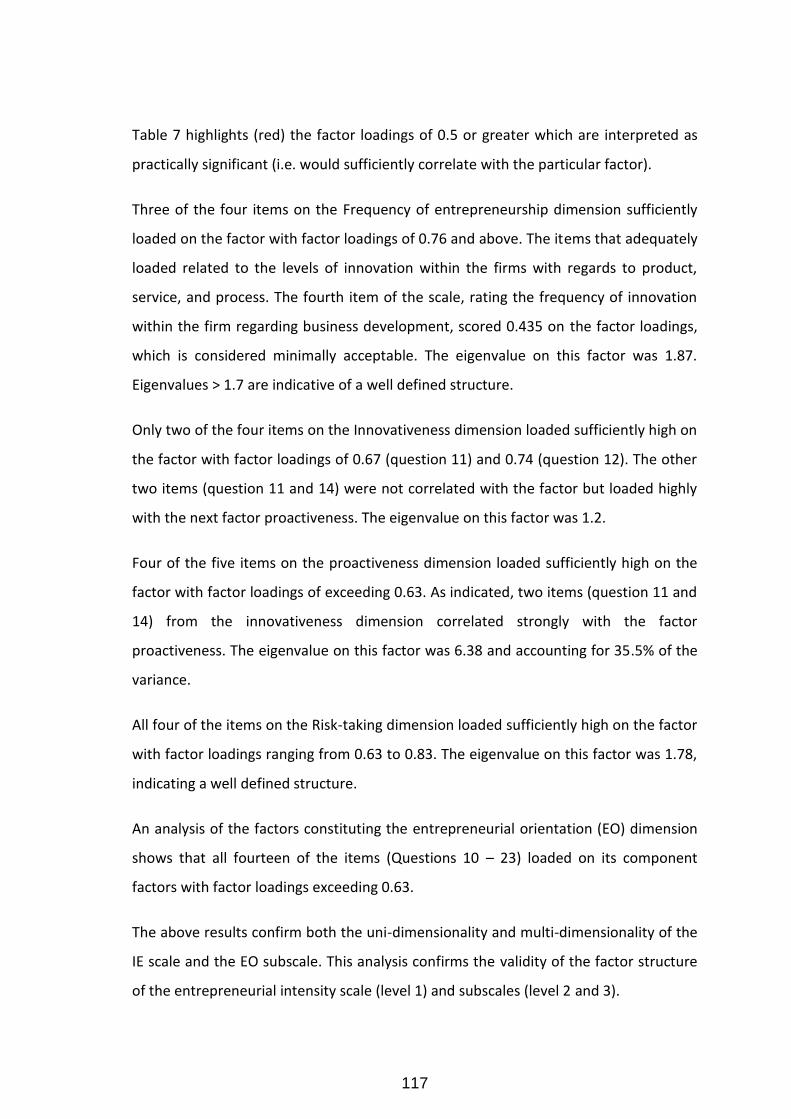
117
Table 7 highlights (red) the factor loadings of 0.5 or greater which are interpreted as
practically significant (i.e. would sufficiently correlate with the particular factor).
Three of the four items on the Frequency of entrepreneurship dimension sufficiently
loaded on the factor with factor loadings of 0.76 and above. The items that adequately
loaded related to the levels of innovation within the firms with regards to product,
service, and process. The fourth item of the scale, rating the frequency of innovation
within the firm regarding business development, scored 0.435 on the factor loadings,
which is considered minimally acceptable. The eigenvalue on this factor was 1.87.
Eigenvalues > 1.7 are indicative of a well defined structure.
Only two of the four items on the Innovativeness dimension loaded sufficiently high on
the factor with factor loadings of 0.67 (question 11) and 0.74 (question 12). The other
two items (question 11 and 14) were not correlated with the factor but loaded highly
with the next factor proactiveness. The eigenvalue on this factor was 1.2.
Four of the five items on the proactiveness dimension loaded sufficiently high on the
factor with factor loadings of exceeding 0.63. As indicated, two items (question 11 and
14) from the innovativeness dimension correlated strongly with the factor
proactiveness. The eigenvalue on this factor was 6.38 and accounting for 35.5% of the
variance.
All four of the items on the Risk-taking dimension loaded sufficiently high on the factor
with factor loadings ranging from 0.63 to 0.83. The eigenvalue on this factor was 1.78,
indicating a well defined structure.
An analysis of the factors constituting the entrepreneurial orientation (EO) dimension
shows that all fourteen of the items (Questions 10 – 23) loaded on its component
factors with factor loadings exceeding 0.63.
The above results confirm both the uni-dimensionality and multi-dimensionality of the
IE scale and the EO subscale. This analysis confirms the validity of the factor structure
of the entrepreneurial intensity scale (level 1) and subscales (level 2 and 3).
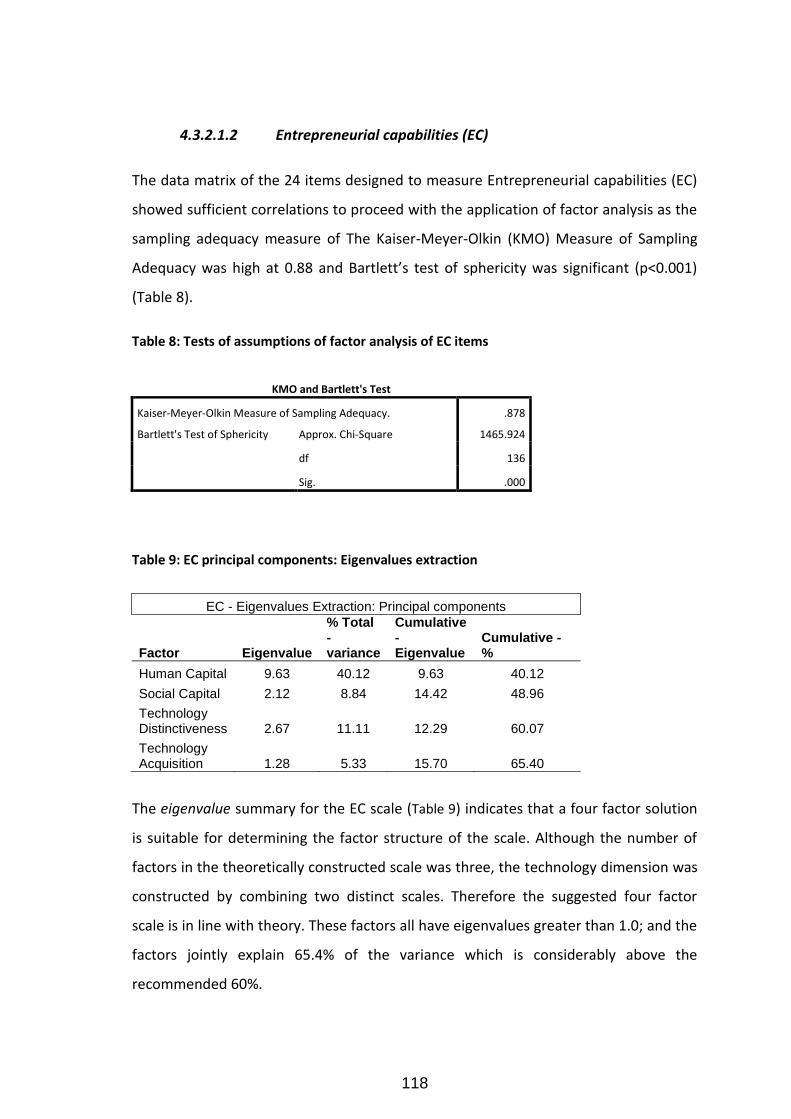
118
4.3.2.1.2 Entrepreneurial capabilities (EC)
The data matrix of the 24 items designed to measure Entrepreneurial capabilities (EC)
showed sufficient correlations to proceed with the application of factor analysis as the
sampling adequacy measure of The Kaiser-Meyer-Olkin (KMO) Measure of Sampling
Adequacy was high at 0.88 and Bartlett’s test of sphericity was significant (p<0.001)
(Table 8).
Table 8: Tests of assumptions of factor analysis of EC items
KMO and Bartlett's Test
Kaiser-Meyer-Olkin Measure of Sampling Adequacy. .878
Bartlett's Test of Sphericity Approx. Chi-Square 1465.924
df 136
Sig. .000
Table 9: EC principal components: Eigenvalues extraction
EC - Eigenvalues Extraction: Principal components
Factor Eigenvalue
% Total - variance
Cumulative - Eigenvalue
Cumulative - %
Human Capital 9.63 40.12 9.63 40.12
Social Capital 2.12 8.84 14.42 48.96
Technology Distinctiveness 2.67 11.11 12.29 60.07
Technology Acquisition 1.28 5.33 15.70 65.40
The eigenvalue summary for the EC scale (Table 9) indicates that a four factor solution
is suitable for determining the factor structure of the scale. Although the number of
factors in the theoretically constructed scale was three, the technology dimension was
constructed by combining two distinct scales. Therefore the suggested four factor
scale is in line with theory. These factors all have eigenvalues greater than 1.0; and the
factors jointly explain 65.4% of the variance which is considerably above the
recommended 60%.
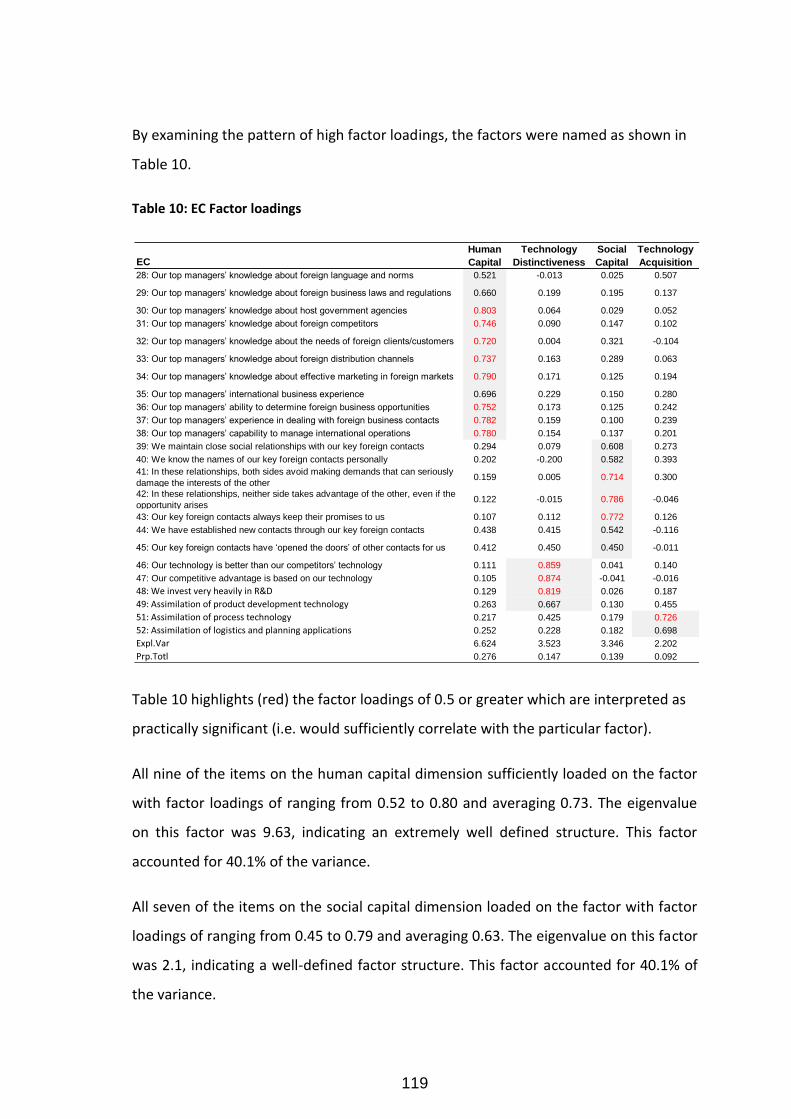
119
By examining the pattern of high factor loadings, the factors were named as shown in
Table 10.
Table 10: EC Factor loadings
Table 10 highlights (red) the factor loadings of 0.5 or greater which are interpreted as
practically significant (i.e. would sufficiently correlate with the particular factor).
All nine of the items on the human capital dimension sufficiently loaded on the factor
with factor loadings of ranging from 0.52 to 0.80 and averaging 0.73. The eigenvalue
on this factor was 9.63, indicating an extremely well defined structure. This factor
accounted for 40.1% of the variance.
All seven of the items on the social capital dimension loaded on the factor with factor
loadings of ranging from 0.45 to 0.79 and averaging 0.63. The eigenvalue on this factor
was 2.1, indicating a well-defined factor structure. This factor accounted for 40.1% of
the variance.
EC
Human
Capital
Technology
Distinctiveness
Social
Capital
Technology
Acquisition
28: Our top managers’ knowledge about foreign language and norms 0.521 -0.013 0.025 0.507
29: Our top managers’ knowledge about foreign business laws and regulations 0.660 0.199 0.195 0.137
30: Our top managers’ knowledge about host government agencies 0.803 0.064 0.029 0.052
31: Our top managers’ knowledge about foreign competitors 0.746 0.090 0.147 0.102
32: Our top managers’ knowledge about the needs of foreign clients/customers 0.720 0.004 0.321 -0.104
33: Our top managers’ knowledge about foreign distribution channels 0.737 0.163 0.289 0.063
34: Our top managers’ knowledge about effective marketing in foreign markets 0.790 0.171 0.125 0.194
35: Our top managers’ international business experience 0.696 0.229 0.150 0.280
36: Our top managers’ ability to determine foreign business opportunities 0.752 0.173 0.125 0.242
37: Our top managers’ experience in dealing with foreign business contacts 0.782 0.159 0.100 0.239
38: Our top managers’ capability to manage international operations 0.780 0.154 0.137 0.201
39: We maintain close social relationships with our key foreign contacts 0.294 0.079 0.608 0.273
40: We know the names of our key foreign contacts personally 0.202 -0.200 0.582 0.393
41: In these relationships, both sides avoid making demands that can seriously
damage the interests of the other0.159 0.005 0.714 0.300
42: In these relationships, neither side takes advantage of the other, even if the
opportunity arises0.122 -0.015 0.786 -0.046
43: Our key foreign contacts always keep their promises to us 0.107 0.112 0.772 0.126
44: We have established new contacts through our key foreign contacts 0.438 0.415 0.542 -0.116
45: Our key foreign contacts have ‘opened the doors’ of other contacts for us 0.412 0.450 0.450 -0.011
46: Our technology is better than our competitors’ technology 0.111 0.859 0.041 0.140
47: Our competitive advantage is based on our technology 0.105 0.874 -0.041 -0.016
48: We invest very heavily in R&D 0.129 0.819 0.026 0.187
49: Assimilation of product development technology 0.263 0.667 0.130 0.455
51: Assimilation of process technology 0.217 0.425 0.179 0.726
52: Assimilation of logistics and planning applications 0.252 0.228 0.182 0.698
Expl.Var 6.624 3.523 3.346 2.202
Prp.Totl 0.276 0.147 0.139 0.092
120
The technology dimension clearly shows composition of two separate dimensions –
technology distinctiveness and technology acquisition.
All three items on the technology distinctiveness dimension sufficiently loaded on the
factor with factor loadings exceeding 0.81 (questions 46 - 48). A fourth item (question
49), belonging to the next dimension, Technology acquisition, loaded higher with this
factor (0.67) than with its own factor (0.45). The eigenvalue on this factor was 2.7.
Although all three items on the technology acquisition dimension loaded sufficiently
high on the factor, only two of the items loaded highly with the factor, with factor
loadings of almost exceeding 0.70. As previously explained the question 49 (49:
Assimilation of product development technology) overlapped between the technology
distinction and technology acquisition factors. For ease of interpretation the item
(question 49) is left assigned to the acquisition dimension, thereby retaining the
character of the original variables. The eigenvalue on this factor was 1.2.
An analysis of the factors (Level 3) constituting the technology dimension shows that
all six of the items (Questions 46 – 52; Question 50 was deleted as per chapter 3)
loaded on its component items with factor loadings exceeding 0.67.
This analysis confirms the validity of the factor structure of the entrepreneurial
capability scale (level 1) and subscales (level 2). However caution needs to be exercised
with regard to the technology dimension at Level 3.
4.3.2.2 Hypothesised Moderating variables
As already stated, the scales for hostility and dynamism were assessed separately at
level 2 rather than at the level 1 for this construct (i.e. environment).
The data matrix of the 11 items designed to measure the environmental construct
showed barely sufficient correlations to proceed with the application of factor analysis
as the sampling adequacy measure of The Kaiser-Meyer-Olkin (KMO) Measure of
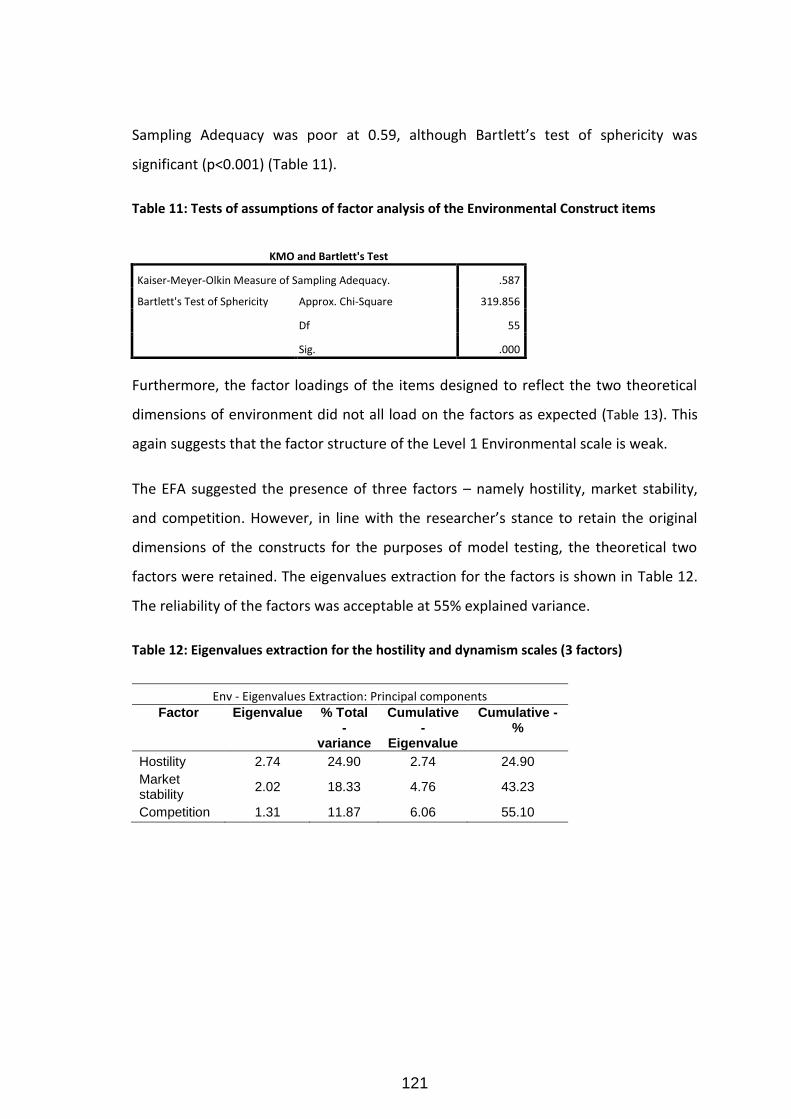
121
Sampling Adequacy was poor at 0.59, although Bartlett’s test of sphericity was
significant (p<0.001) (Table 11).
Table 11: Tests of assumptions of factor analysis of the Environmental Construct items
KMO and Bartlett's Test
Kaiser-Meyer-Olkin Measure of Sampling Adequacy. .587
Bartlett's Test of Sphericity Approx. Chi-Square 319.856
Df 55
Sig. .000
Furthermore, the factor loadings of the items designed to reflect the two theoretical
dimensions of environment did not all load on the factors as expected (Table 13). This
again suggests that the factor structure of the Level 1 Environmental scale is weak.
The EFA suggested the presence of three factors – namely hostility, market stability,
and competition. However, in line with the researcher’s stance to retain the original
dimensions of the constructs for the purposes of model testing, the theoretical two
factors were retained. The eigenvalues extraction for the factors is shown in Table 12.
The reliability of the factors was acceptable at 55% explained variance.
Table 12: Eigenvalues extraction for the hostility and dynamism scales (3 factors)
Env - Eigenvalues Extraction: Principal components Factor Eigenvalue % Total
- variance
Cumulative -
Eigenvalue
Cumulative - %
Hostility 2.74 24.90 2.74 24.90
Market stability
2.02 18.33 4.76 43.23
Competition 1.31 11.87 6.06 55.10
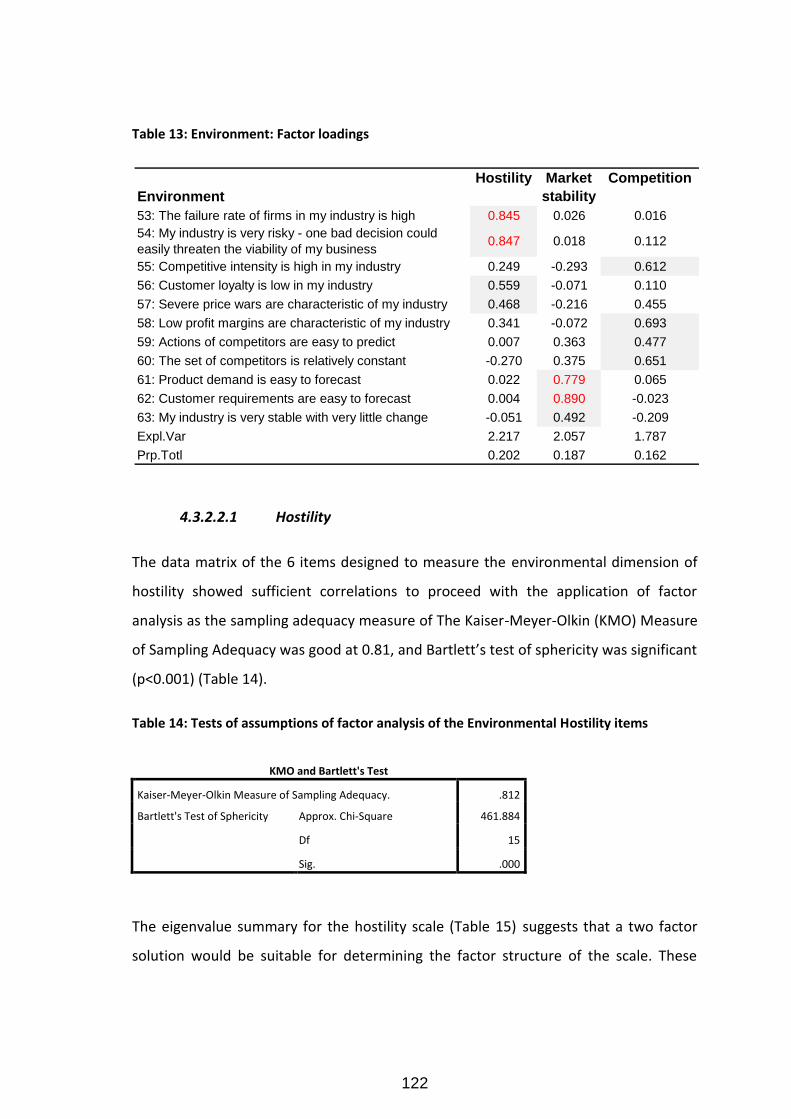
122
Table 13: Environment: Factor loadings
4.3.2.2.1 Hostility
The data matrix of the 6 items designed to measure the environmental dimension of
hostility showed sufficient correlations to proceed with the application of factor
analysis as the sampling adequacy measure of The Kaiser-Meyer-Olkin (KMO) Measure
of Sampling Adequacy was good at 0.81, and Bartlett’s test of sphericity was significant
(p<0.001) (Table 14).
Table 14: Tests of assumptions of factor analysis of the Environmental Hostility items
KMO and Bartlett's Test
Kaiser-Meyer-Olkin Measure of Sampling Adequacy. .812
Bartlett's Test of Sphericity Approx. Chi-Square 461.884
Df 15
Sig. .000
The eigenvalue summary for the hostility scale (Table 15) suggests that a two factor
solution would be suitable for determining the factor structure of the scale. These
Environment
Hostility Market
stability
Competition
53: The failure rate of firms in my industry is high 0.845 0.026 0.016
54: My industry is very risky - one bad decision could
easily threaten the viability of my business0.847 0.018 0.112
55: Competitive intensity is high in my industry 0.249 -0.293 0.612
56: Customer loyalty is low in my industry 0.559 -0.071 0.110
57: Severe price wars are characteristic of my industry 0.468 -0.216 0.455
58: Low profit margins are characteristic of my industry 0.341 -0.072 0.693
59: Actions of competitors are easy to predict 0.007 0.363 0.477
60: The set of competitors is relatively constant -0.270 0.375 0.651
61: Product demand is easy to forecast 0.022 0.779 0.065
62: Customer requirements are easy to forecast 0.004 0.890 -0.023
63: My industry is very stable with very little change -0.051 0.492 -0.209
Expl.Var 2.217 2.057 1.787
Prp.Totl 0.202 0.187 0.162

123
factors both have eigenvalues greater than 1.0; and the factors cumulatively explain
62.1% of the variance which is above the recommended 60%.
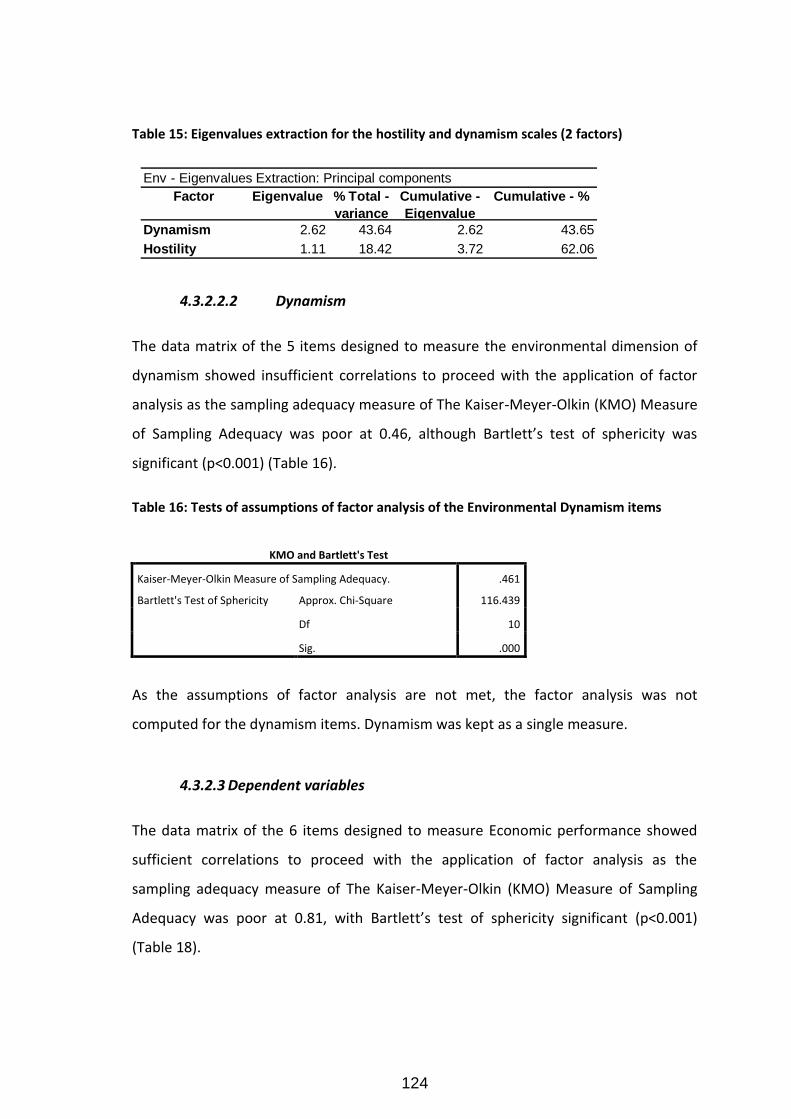
124
Table 15: Eigenvalues extraction for the hostility and dynamism scales (2 factors)
4.3.2.2.2 Dynamism
The data matrix of the 5 items designed to measure the environmental dimension of
dynamism showed insufficient correlations to proceed with the application of factor
analysis as the sampling adequacy measure of The Kaiser-Meyer-Olkin (KMO) Measure
of Sampling Adequacy was poor at 0.46, although Bartlett’s test of sphericity was
significant (p<0.001) (Table 16).
Table 16: Tests of assumptions of factor analysis of the Environmental Dynamism items
KMO and Bartlett's Test
Kaiser-Meyer-Olkin Measure of Sampling Adequacy. .461
Bartlett's Test of Sphericity Approx. Chi-Square 116.439
Df 10
Sig. .000
As the assumptions of factor analysis are not met, the factor analysis was not
computed for the dynamism items. Dynamism was kept as a single measure.
4.3.2.3 Dependent variables
The data matrix of the 6 items designed to measure Economic performance showed
sufficient correlations to proceed with the application of factor analysis as the
sampling adequacy measure of The Kaiser-Meyer-Olkin (KMO) Measure of Sampling
Adequacy was poor at 0.81, with Bartlett’s test of sphericity significant (p<0.001)
(Table 18).
Factor Eigenvalue % Total -
variance
Cumulative -
Eigenvalue
Cumulative - %
Dynamism 2.62 43.64 2.62 43.65
Hostility 1.11 18.42 3.72 62.06
Env - Eigenvalues Extraction: Principal components
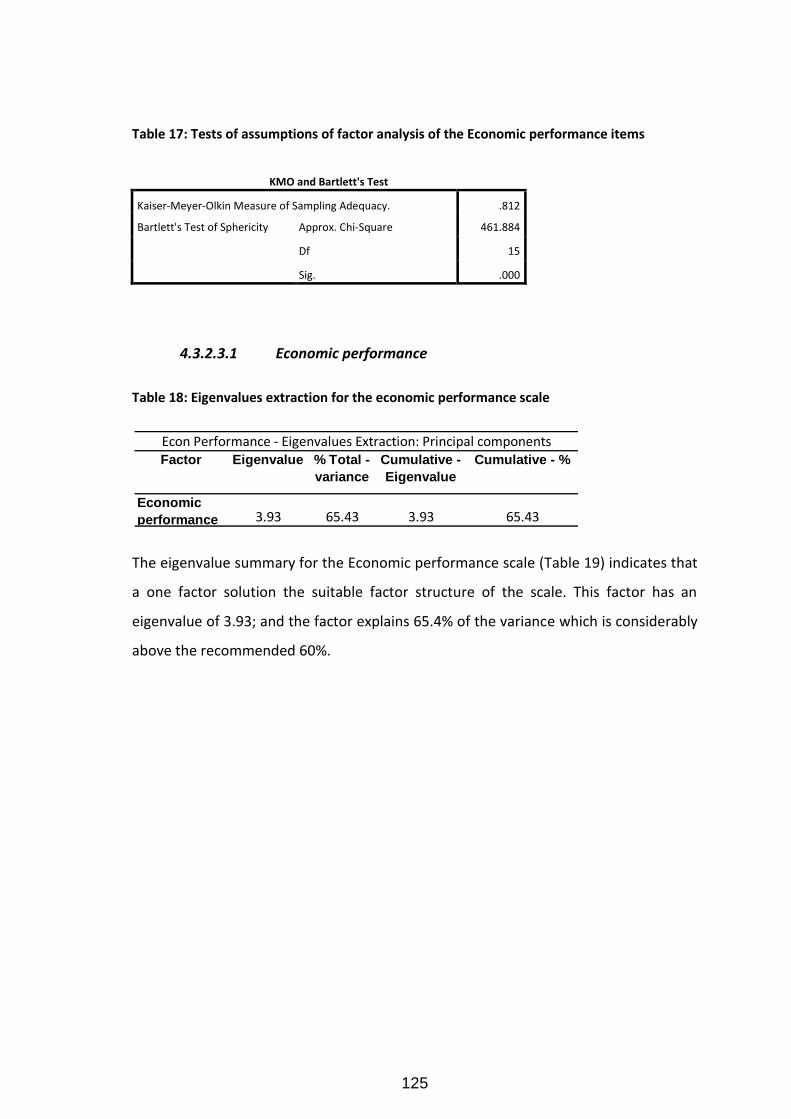
125
Table 17: Tests of assumptions of factor analysis of the Economic performance items
KMO and Bartlett's Test
Kaiser-Meyer-Olkin Measure of Sampling Adequacy. .812
Bartlett's Test of Sphericity Approx. Chi-Square 461.884
Df 15
Sig. .000
4.3.2.3.1 Economic performance
Table 18: Eigenvalues extraction for the economic performance scale
The eigenvalue summary for the Economic performance scale (Table 19) indicates that
a one factor solution the suitable factor structure of the scale. This factor has an
eigenvalue of 3.93; and the factor explains 65.4% of the variance which is considerably
above the recommended 60%.
Factor Eigenvalue % Total -
variance
Cumulative -
Eigenvalue
Cumulative - %
Economic
performance 3.93 65.43 3.93 65.43
Econ Performance - Eigenvalues Extraction: Principal components
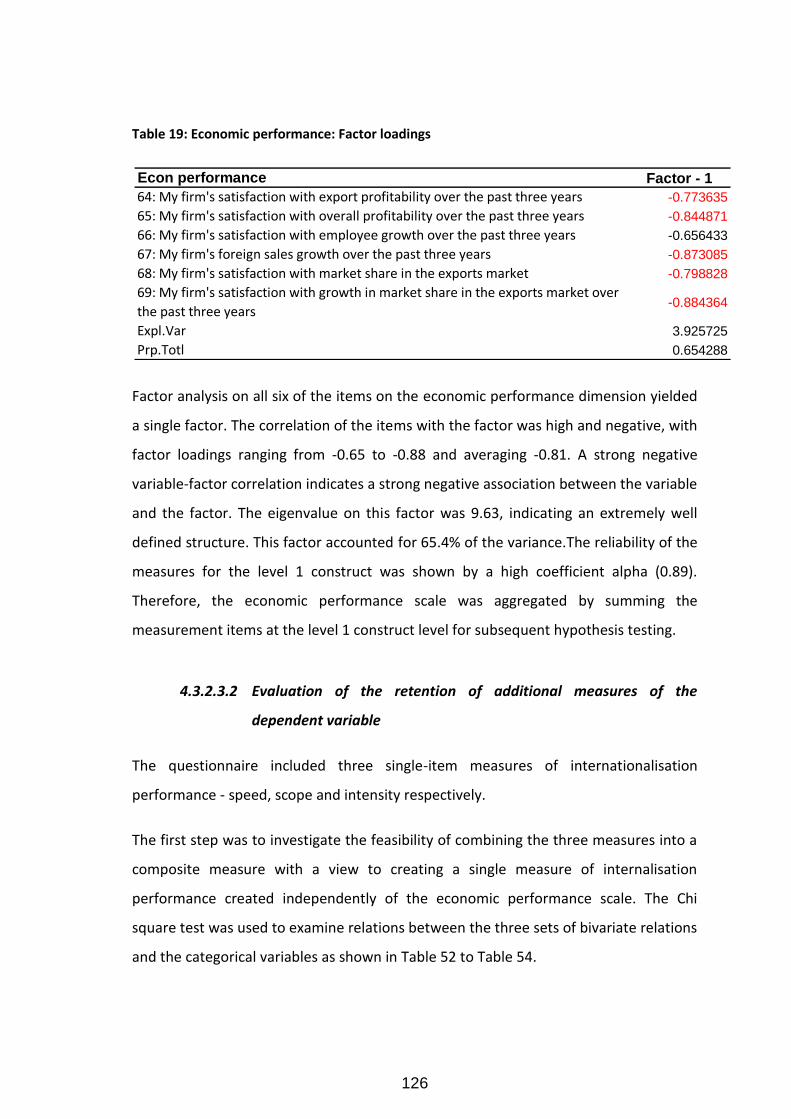
126
Table 19: Economic performance: Factor loadings
Factor analysis on all six of the items on the economic performance dimension yielded
a single factor. The correlation of the items with the factor was high and negative, with
factor loadings ranging from -0.65 to -0.88 and averaging -0.81. A strong negative
variable-factor correlation indicates a strong negative association between the variable
and the factor. The eigenvalue on this factor was 9.63, indicating an extremely well
defined structure. This factor accounted for 65.4% of the variance.The reliability of the
measures for the level 1 construct was shown by a high coefficient alpha (0.89).
Therefore, the economic performance scale was aggregated by summing the
measurement items at the level 1 construct level for subsequent hypothesis testing.
4.3.2.3.2 Evaluation of the retention of additional measures of the
dependent variable
The questionnaire included three single-item measures of internationalisation
performance - speed, scope and intensity respectively.
The first step was to investigate the feasibility of combining the three measures into a
composite measure with a view to creating a single measure of internalisation
performance created independently of the economic performance scale. The Chi
square test was used to examine relations between the three sets of bivariate relations
and the categorical variables as shown in Table 52 to Table 54.
Econ performance Factor - 1
64: My firm's satisfaction with export profitability over the past three years -0.773635
65: My firm's satisfaction with overall profitability over the past three years -0.844871
66: My firm's satisfaction with employee growth over the past three years -0.656433
67: My firm's foreign sales growth over the past three years -0.873085
68: My firm's satisfaction with market share in the exports market -0.798828
69: My firm's satisfaction with growth in market share in the exports market over
the past three years-0.884364
Expl.Var 3.925725
Prp.Totl 0.654288
127
Relation between speed, scope and intensity of internationalisation
No significant relations were found between the three measures of
internationalisation: between Scope and Export intensity χ2(2) = 4.233, p>0.05;
between Speed and Scope χ2(8) = 9.978, p>0.05; and between Speed and intensity
χ2(4) = 8.527, p>0.05.
As these three measures were found to be uncorrelated, there was no clear evidence
of an internally consistent single composite measure of the dependent variable,
Internationalisation performance, which could be derived from these three measures.
Consequently, the researcher undertook to assess the merits of using each measure
separately in additional tests of the model. As each of the three variables were
measured on an ordinal categorical scale, three sets 1-way Analyses of Variance were
computed using these measures as independent variables. The Level 1-3 measures of
EI and EC, and in line with the moderation hypotheses, the interactions of hostility and
the EI and EC measures at Levels 1-3, and the interaction of dynamism and the EI and
EC measures at Levels 1-3, served as single dependent variable measures in these
ANOVAs.
Effects of speed, scope and intensity of internationalisation on scale variables
The researcher then looked for significant effects of each of these three
internationalisation measures on the 1st, 2nd and 3rd level measures of International EI
and EC, and in line with the moderation hypotheses, on the interactions of hostility or
dynamism and the EI measures at Levels 1-3, and between hostility or dynamism and
the EC measures at Levels 1-3. For example, a significant effect of export intensity on
EC would imply a difference in EC depending on the Export intensity levels, while a
significant interaction of EC and Hostility would imply a difference in export intensity
depending on the combination of EC and Hostility levels. Such significant effects would
then suggest that Export intensity be retained as a measure of the dependent variable,
Internationalisation performance. On the other hand, nonsignificant effects of export
intensity on the Level 1-3 measures of EI and EC and on their interaction effects with
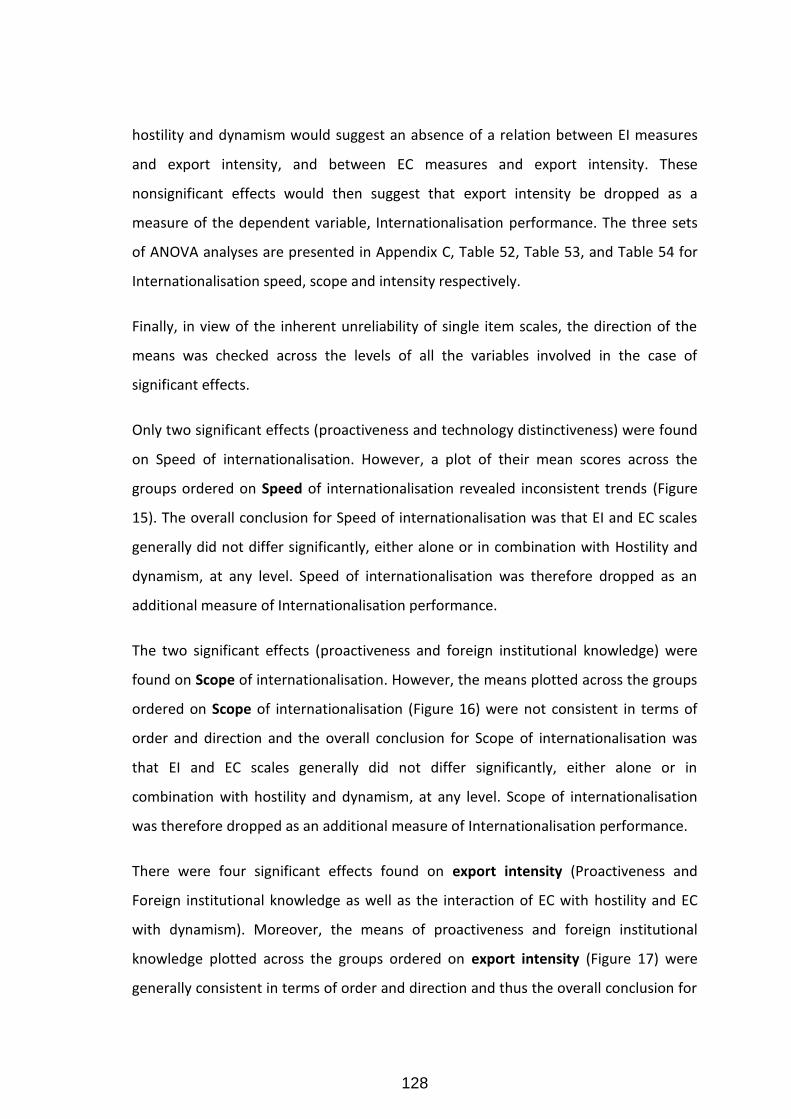
128
hostility and dynamism would suggest an absence of a relation between EI measures
and export intensity, and between EC measures and export intensity. These
nonsignificant effects would then suggest that export intensity be dropped as a
measure of the dependent variable, Internationalisation performance. The three sets
of ANOVA analyses are presented in Appendix C, Table 52, Table 53, and Table 54 for
Internationalisation speed, scope and intensity respectively.
Finally, in view of the inherent unreliability of single item scales, the direction of the
means was checked across the levels of all the variables involved in the case of
significant effects.
Only two significant effects (proactiveness and technology distinctiveness) were found
on Speed of internationalisation. However, a plot of their mean scores across the
groups ordered on Speed of internationalisation revealed inconsistent trends (Figure
15). The overall conclusion for Speed of internationalisation was that EI and EC scales
generally did not differ significantly, either alone or in combination with Hostility and
dynamism, at any level. Speed of internationalisation was therefore dropped as an
additional measure of Internationalisation performance.
The two significant effects (proactiveness and foreign institutional knowledge) were
found on Scope of internationalisation. However, the means plotted across the groups
ordered on Scope of internationalisation (Figure 16) were not consistent in terms of
order and direction and the overall conclusion for Scope of internationalisation was
that EI and EC scales generally did not differ significantly, either alone or in
combination with hostility and dynamism, at any level. Scope of internationalisation
was therefore dropped as an additional measure of Internationalisation performance.
There were four significant effects found on export intensity (Proactiveness and
Foreign institutional knowledge as well as the interaction of EC with hostility and EC
with dynamism). Moreover, the means of proactiveness and foreign institutional
knowledge plotted across the groups ordered on export intensity (Figure 17) were
generally consistent in terms of order and direction and thus the overall conclusion for
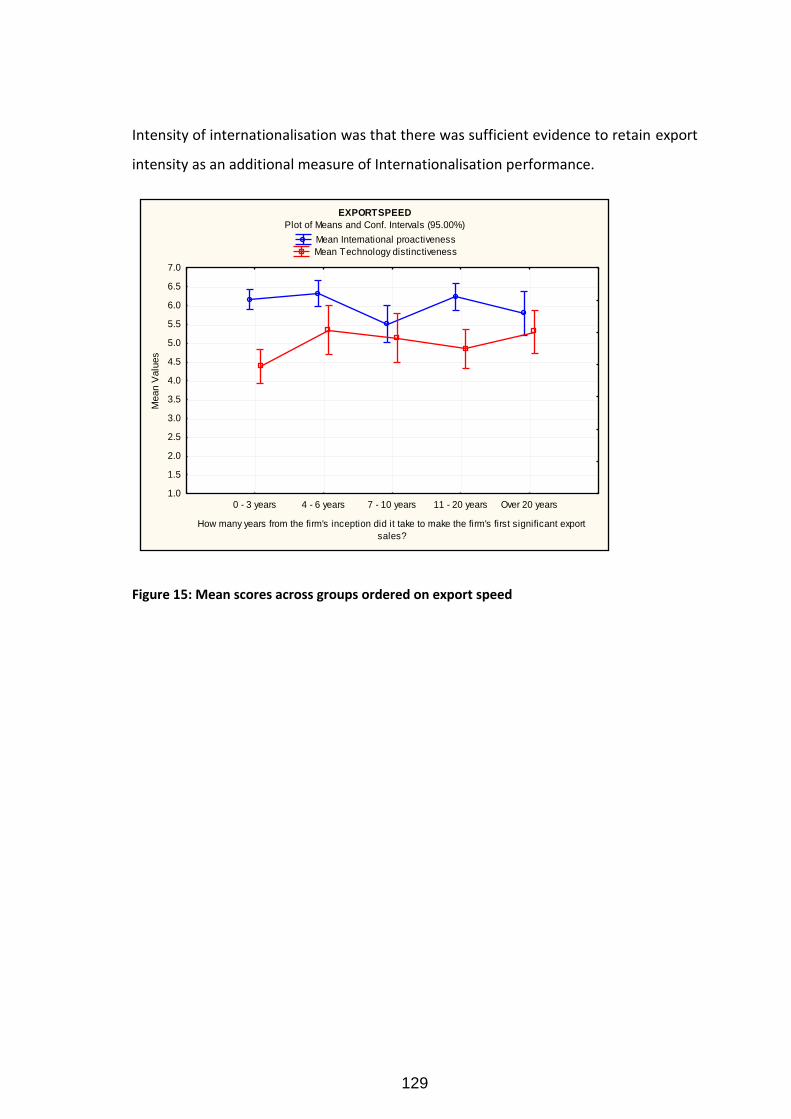
129
Intensity of internationalisation was that there was sufficient evidence to retain export
intensity as an additional measure of Internationalisation performance.
Figure 15: Mean scores across groups ordered on export speed
EXPORT SPEED
Plot of Means and Conf. Intervals (95.00%)
Mean International proactiveness
Mean Technology distinctiveness
0 - 3 years 4 - 6 years 7 - 10 years 11 - 20 years Over 20 years
How many years from the firm's inception did it take to make the firm's first significant export
sales?
1.0
1.5
2.0
2.5
3.0
3.5
4.0
4.5
5.0
5.5
6.0
6.5
7.0
Mean V
alu
es
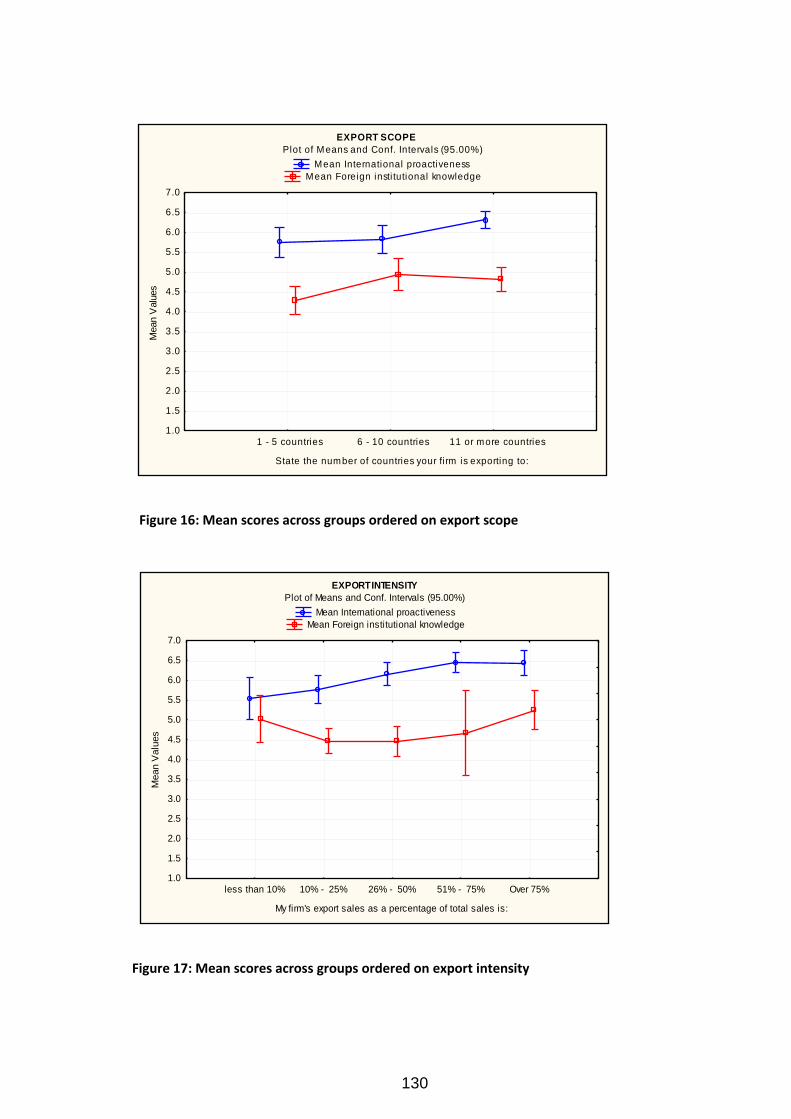
130
Figure 16: Mean scores across groups ordered on export scope
Figure 17: Mean scores across groups ordered on export intensity
EXPORT SCOPE
Plot of Means and Conf. Intervals (95.00%)
Mean International proactiveness
Mean Foreign insti tutional knowledge
1 - 5 countries 6 - 10 countries 11 or more countries
State the number of countries your fi rm is exporting to:
1.0
1.5
2.0
2.5
3.0
3.5
4.0
4.5
5.0
5.5
6.0
6.5
7.0
Mean V
alu
es
EXPORT INTENSITY
Plot of Means and Conf. Intervals (95.00%)
Mean International proactiveness
Mean Foreign institutional knowledge
less than 10% 10% - 25% 26% - 50% 51% - 75% Over 75%
My firm's export sales as a percentage of total sales is:
1.0
1.5
2.0
2.5
3.0
3.5
4.0
4.5
5.0
5.5
6.0
6.5
7.0
Mean V
alu
es
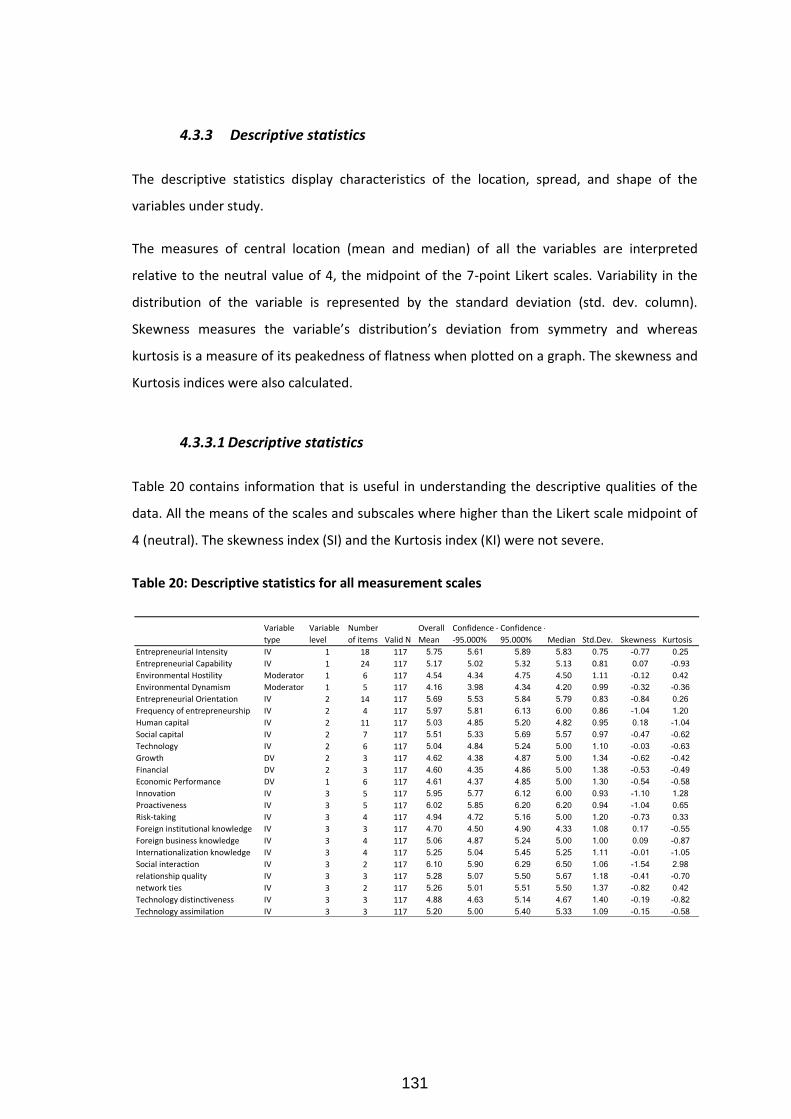
131
4.3.3 Descriptive statistics
The descriptive statistics display characteristics of the location, spread, and shape of the
variables under study.
The measures of central location (mean and median) of all the variables are interpreted
relative to the neutral value of 4, the midpoint of the 7-point Likert scales. Variability in the
distribution of the variable is represented by the standard deviation (std. dev. column).
Skewness measures the variable’s distribution’s deviation from symmetry and whereas
kurtosis is a measure of its peakedness of flatness when plotted on a graph. The skewness and
Kurtosis indices were also calculated.
4.3.3.1 Descriptive statistics
Table 20 contains information that is useful in understanding the descriptive qualities of the
data. All the means of the scales and subscales where higher than the Likert scale midpoint of
4 (neutral). The skewness index (SI) and the Kurtosis index (KI) were not severe.
Table 20: Descriptive statistics for all measurement scales
Variable
type
Variable
level
Number
of items Valid N
Overall
Mean
Confidence -
-95.000%
Confidence -
95.000% Median Std.Dev. Skewness Kurtosis
Entrepreneurial Intensity IV 1 18 117 5.75 5.61 5.89 5.83 0.75 -0.77 0.25
Entrepreneurial Capability IV 1 24 117 5.17 5.02 5.32 5.13 0.81 0.07 -0.93
Environmental Hostility Moderator 1 6 117 4.54 4.34 4.75 4.50 1.11 -0.12 0.42
Environmental Dynamism Moderator 1 5 117 4.16 3.98 4.34 4.20 0.99 -0.32 -0.36
Entrepreneurial Orientation IV 2 14 117 5.69 5.53 5.84 5.79 0.83 -0.84 0.26
Frequency of entrepreneurship IV 2 4 117 5.97 5.81 6.13 6.00 0.86 -1.04 1.20
Human capital IV 2 11 117 5.03 4.85 5.20 4.82 0.95 0.18 -1.04
Social capital IV 2 7 117 5.51 5.33 5.69 5.57 0.97 -0.47 -0.62
Technology IV 2 6 117 5.04 4.84 5.24 5.00 1.10 -0.03 -0.63
Growth DV 2 3 117 4.62 4.38 4.87 5.00 1.34 -0.62 -0.42
Financial DV 2 3 117 4.60 4.35 4.86 5.00 1.38 -0.53 -0.49
Economic Performance DV 1 6 117 4.61 4.37 4.85 5.00 1.30 -0.54 -0.58
Innovation IV 3 5 117 5.95 5.77 6.12 6.00 0.93 -1.10 1.28
Proactiveness IV 3 5 117 6.02 5.85 6.20 6.20 0.94 -1.04 0.65
Risk-taking IV 3 4 117 4.94 4.72 5.16 5.00 1.20 -0.73 0.33
Foreign institutional knowledge IV 3 3 117 4.70 4.50 4.90 4.33 1.08 0.17 -0.55
Foreign business knowledge IV 3 4 117 5.06 4.87 5.24 5.00 1.00 0.09 -0.87
Internationalization knowledge IV 3 4 117 5.25 5.04 5.45 5.25 1.11 -0.01 -1.05
Social interaction IV 3 2 117 6.10 5.90 6.29 6.50 1.06 -1.54 2.98
relationship quality IV 3 3 117 5.28 5.07 5.50 5.67 1.18 -0.41 -0.70
network ties IV 3 2 117 5.26 5.01 5.51 5.50 1.37 -0.82 0.42
Technology distinctiveness IV 3 3 117 4.88 4.63 5.14 4.67 1.40 -0.19 -0.82
Technology assimilation IV 3 3 117 5.20 5.00 5.40 5.33 1.09 -0.15 -0.58
132
4.3.3.2 Graphical frequency distributions
An analysis of the level 3 distributions shows that a few variable distributions namely
Innovativeness, Proactiveness, Social Interaction, Relationship Quality, and Network
Ties - were negatively skewed, with skew indices more negative than -1, although not
extremely skewed based on the criterion of -3 for an extreme skew index. A range of
variable transformation techniques were explored to test whether the transformed
variables might result in normal distributions, but the skewness indices and shapes of
the distributions were not substantially improved, the researcher preferred to use the
untransformed variables consistent with the approach of maintaining the original scale
measures as far as possible. Thus the original untransformed Level 3 measurement
variables were considered in subsequent model testing.
An analysis of the level 1 distributions shows that the variables were fairly normally
distributed about the means. The frequency distributions for the Level 1-3 measures
may be found in Appendix C, Figure 30 to Figure 39.
4.3.5 Control variables
Tests were performed for the statistical significance of the effect of firm age, size, and
industry as possible factors to control when examining the relationship between the
predictor variables and performance.
Firm Size was operationalised as number of employees, whereas firm Age was
operationalised as age of firm since founding year, and firm Industry operationalised as
industry type and level of industry technological intensity. As shown in Table 21, there
was no significant difference in performance (p>0.05) for any of these possible control
variables. Therefore firm Size, Age, and Industry are not correlated with Economic
performance and were therefore not entered as control variables when testing the
researcher’s model.
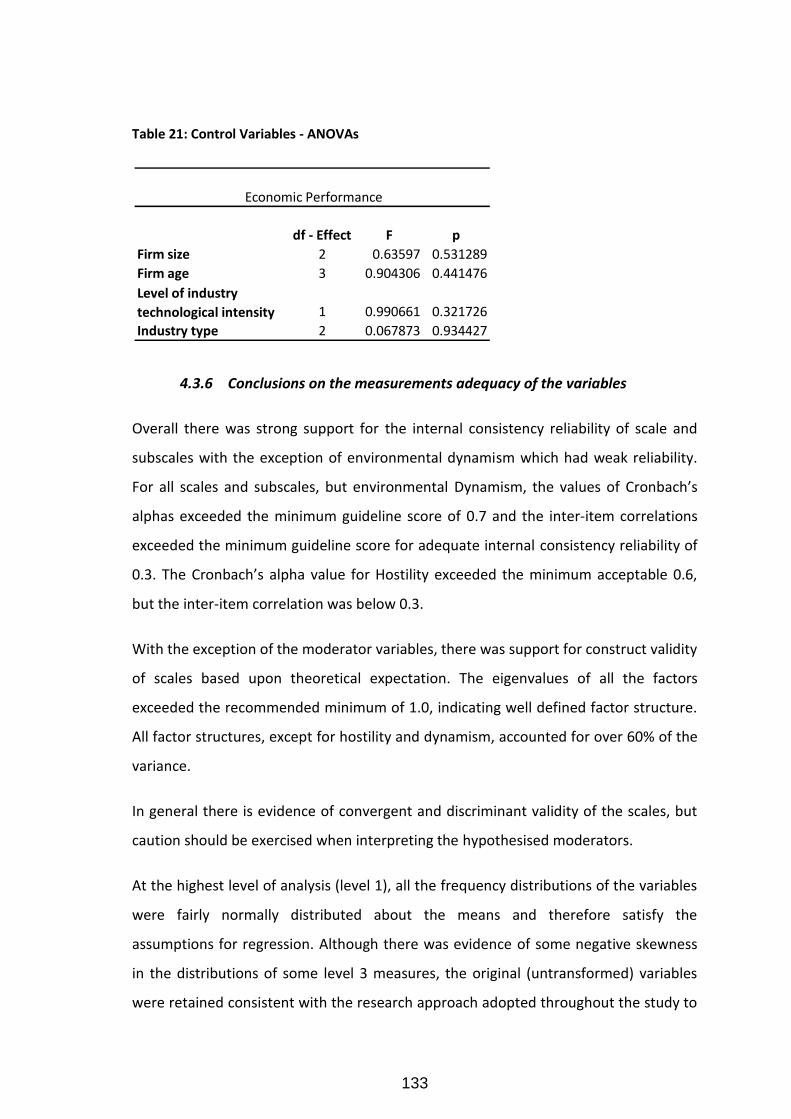
133
Table 21: Control Variables - ANOVAs
4.3.6 Conclusions on the measurements adequacy of the variables
Overall there was strong support for the internal consistency reliability of scale and
subscales with the exception of environmental dynamism which had weak reliability.
For all scales and subscales, but environmental Dynamism, the values of Cronbach’s
alphas exceeded the minimum guideline score of 0.7 and the inter-item correlations
exceeded the minimum guideline score for adequate internal consistency reliability of
0.3. The Cronbach’s alpha value for Hostility exceeded the minimum acceptable 0.6,
but the inter-item correlation was below 0.3.
With the exception of the moderator variables, there was support for construct validity
of scales based upon theoretical expectation. The eigenvalues of all the factors
exceeded the recommended minimum of 1.0, indicating well defined factor structure.
All factor structures, except for hostility and dynamism, accounted for over 60% of the
variance.
In general there is evidence of convergent and discriminant validity of the scales, but
caution should be exercised when interpreting the hypothesised moderators.
At the highest level of analysis (level 1), all the frequency distributions of the variables
were fairly normally distributed about the means and therefore satisfy the
assumptions for regression. Although there was evidence of some negative skewness
in the distributions of some level 3 measures, the original (untransformed) variables
were retained consistent with the research approach adopted throughout the study to
df - Effect F p
Firm size 2 0.63597 0.531289
Firm age 3 0.904306 0.441476
Level of industry
technological intensity 1 0.990661 0.321726
Industry type 2 0.067873 0.934427
Economic Performance
134
use theoretical measures as far as possible. Examination of residual regression plots
was thus necessary to check whether the assumptions of the regression were satisfied
despite a degree of non-normality in the score distributions.
The final performance measures for the model are economic performance and export
intensity and there are no control variables. Economic performance is a single factor.
4.4 Tests of the model
The previous sections have largely confirmed the measurement adequacy of the
scales; and provided satisfactory evidence of theirconstruct validity. The next step was
to test hypotheses, with the primary aim to analyze the predictive power of the
independent variables as represented in the model.
The outcome variables, Economic performance and Export intensity, were measured
on different scales. Economic performance was measured on an equal interval scale
whereas Export intensity was originally measured on an ordinal scale. While
parametric statistics assume that the variables are measured on at least an interval
scale, the parametric approach of hierarchical linear regression analysis was adopted
as explained in footnote2.
2Export Intensity was originally measured on an ordinal scale. As it is one of the outcome or dependent variables of the study, the
researcher needed to check whether its prediction could proceed via parametric or nonparametric statistics. While parametric
statistics assume that the variables are measured on at least an interval scale, nonparametric statistics assume only an ordinal
scale of measurement.
Ideally, if the Export Intensity scale could be considered to be equal interval, the same hierarchical linear regression analysis
method could be applied as for the prediction of Economic Performance, the other outcome variable.
The nonparametric Spearman's Rho correlations between all predictor variables and Export Intensity were compared to the
corresponding parametric Pearson product moment correlations to see whether they were different. This comparative analysis
used the Fisher Z transformation of the correlations (Cohen, 1992).
135
In order to accommodate the tests of the two dependent variables, the initial model
was tested in two separate steps:
The first model, having economic performance as the dependent variable
The second model, having export intensity as the dependent variable
The conceptual model is restated in Figure 18. The only difference in this model to the
original conceptual model (Figure 1) is that in this model:
Economic performance is a 1 factor composite
Export intensity is the second outcome variable – Scope and Speed have been
removed
As the Spearman's Rho correlation and Pearson product moment correlations were not significantly different for any predictor
variable with Export Intensity, the parametric approach of hierarchical linear regression analysis was adopted. The Spearman's Rho
correlation and Pearson product moment correlations are presented in Table 58 and Table 59 in Appendix C.
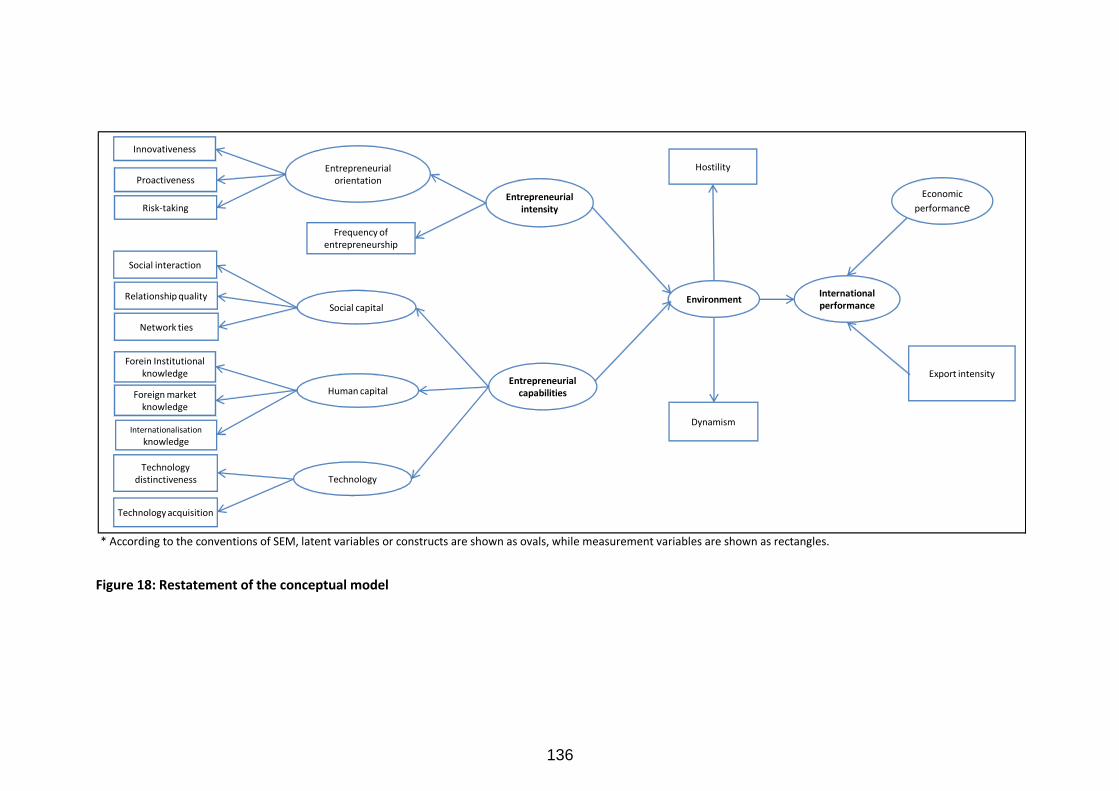
136
Figure 18: Restatement of the conceptual model
* According to the conventions of SEM, latent variables or constructs are shown as ovals, while measurement variables are shown as rectangles.
Entrepreneurial intensity
Entrepreneurial capabilities
Frequency of entrepreneurship
International performance
Economic
performance
Export intensity
Entrepreneurial orientation
Innovativeness
Proactiveness
Risk-taking
Hostility
Dynamism
EnvironmentSocial capital
Network ties
Social interaction
Relationship quality
Human capital
Forein Institutional knowledge
Internationalisation
knowledge
Foreign market knowledge
Technology
Technology acquisition
Technology distinctiveness
137
4.4.1 Hypotheses restated based on conclusions on the measurements
adequacy of the variables
The hypotheses are restated to incorporate:
the split of the performance variables – economic performance and export
intensity
The explicit statement of the hypothesis involving the environmental
characteristics (moderators) into separate hypothesis for Hostility and dynamism
In order to link the newly stated hypotheses to the original hypothesis, the original
hypotheses are stated, and then followed by the new hypotheses.
Original Hypothesis 1: Entrepreneurial intensity is positively related to international
performance.
New Hypothesis 1:
H1a: Entrepreneurial intensity is positively related to economic performance
H1b: Entrepreneurial intensity is positively related to export intensity
Original Hypothesis 2: Entrepreneurial capabilities are positively related to
international performance
New Hypothesis 2:
H2a: Entrepreneurial capabilities are positively related to economic performance
H2b: Entrepreneurial capabilities are positively related to export intensity
Original Hypothesis 3: The relationship between entrepreneurial intensity and
international performance is moderated by the environmental characteristics
New Hypothesis 3:
138
H3a (i): The relationship between entrepreneurial intensity and economic performance
is moderated by environmental hostility
H3a (ii): The relationship between entrepreneurial intensity and economic
performance is moderated by environmental dynamism
H3b (i): The relationship between entrepreneurial intensity and export intensity is
moderated by environmental hostility
H3b (ii): The relationship between entrepreneurial intensity and export intensity is
moderated by environmental dynamism
Original Hypothesis 4: The relationship between entrepreneurial capabilities and
international performance is moderated by the environmental characteristics
New Hypothesis 4:
H4a (i): The relationship between entrepreneurial capabilities and economic
performance is moderated by environmental hostility
H4a (ii): The relationship between entrepreneurial capabilities and economic
performance is moderated by environmental dynamism
H4b (i): The relationship between entrepreneurial capabilities and export intensity is
moderated by environmental hostility
H4b (ii): The relationship between entrepreneurial capabilities and export intensity is
moderated by environmental dynamism
4.4.2 Systematic presentation of the model: Base model and moderated
model
The model is assessed systematically at level 1, level 2, and level 3 of the
measurements variables. For each of the levels of measurement, the base model as
well as the moderated model is assessed. The model with economic performance as a
139
performance variable is assessed separately from the model with export intensity as a
performance variable. Hypotheses 1 and 2 are based on bivariate relationships
between the independent and dependent variables; therefore the test of the
hypotheses is based on the correlations between the variables as well as the
scatterplots. Hypotheses 3 and 4 are based on multivariate relationships between the
independent and dependent variables; therefore the test of the hypotheses is on the
basis of multiple regression analysis.
The results are presented as follows: Firstly, the constructs are tested individually for
their predictive power to the model for each hypothesis; then, in the case of multiple
regression analysis, all the predictors are included in the model simultaneously to
check whether the regression weights are similar in the presence of other variables.
Using this method, the researcher attempted to control for specification error by
including only relevant variables in the model and excluding irrelevant variables. The
results are presented by sub-hypotheses, and then on the basis of the results
conclusions are drawn for the overarching (original) hypotheses. Lastly, the summary
regression results are presented.
Hypothesis 1: Entrepreneurial intensity is positively related to international
performance
H1a: Entrepreneurial intensity is positively related to economic performance
The first hypothesis posits a bivariate relation; therefore the test of the hypothesis is
on the basis of the correlations as well as the scatterplots. Correlation between any
pair of variables provides insights into how the variables’ values covary or move up or
down together. There is a significant correlation (r=0.27, p<0.01) between
entrepreneurial intensity (EI) and economic performance (Table 22). This means that
the higher the EI of a firm the more likely it would be to have higher economic
performance. The level 1 model explains approximately 7.2% of the variance in
Economic performance. Although this relationship is considered weak, the result
supports H1a.
140
Table 22: Correlations between EI scales and Economic Performance
Level of scale EI Scale
Pearson Correlations with Economic Performance
1 EI .27 p<0.01
2 EO .22 p<0.05
2 Frequency of entrepreneurship .32 p<0.001
3 Innovation .11 p>0.05
3 Proactiveness .16 p>0.05
3 Risk-taking .27 p<0.01
Further analysis into the components of EI shows that Frequency of entrepreneurship
(r=0.32, p<0.001) and EO (r=0.22, p<0.05) are both significant correlates of Economic
performance. Further analysis into the components of EO shows that Innovativeness
and Proactiveness are not significant correlates of economic performance, whereas
Risk-taking (r=0.27, p<0.01) is a significant correlate.
The scatterplots of these significant relations among EI variables and Economic
performance are presented in Figure 19.
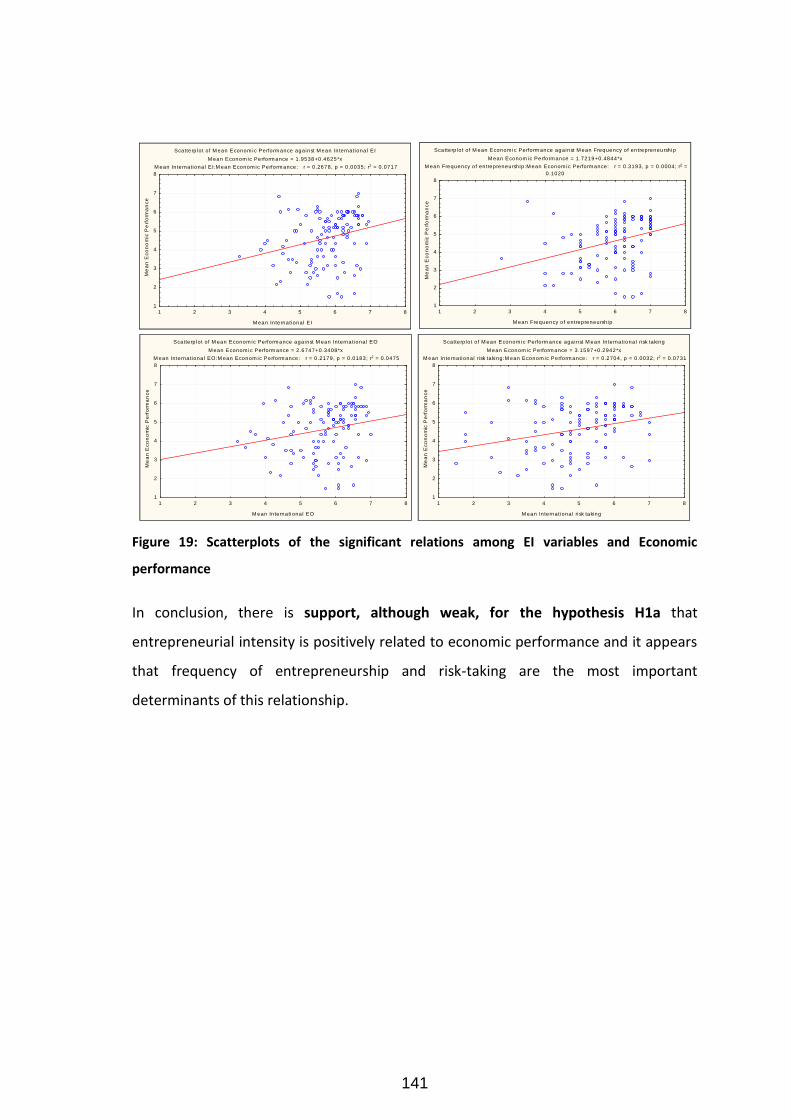
141
Figure 19: Scatterplots of the significant relations among EI variables and Economic
performance
In conclusion, there is support, although weak, for the hypothesis H1a that
entrepreneurial intensity is positively related to economic performance and it appears
that frequency of entrepreneurship and risk-taking are the most important
determinants of this relationship.
Scatterplot of M ean Econom ic Perform ance against M ean International EI
M ean Econom ic Perform ance = 1.9538+0.4625*x
M ean International EI:M ean Econom ic Perform ance: r = 0.2678, p = 0.0035; r2 = 0.0717
1 2 3 4 5 6 7 8
M ean International EI
1
2
3
4
5
6
7
8
Me
an
Eco
no
mic
Pe
rfo
rma
nce
Scatterplot of M ean Econom ic Perform ance against M ean Frequency of entrepreneurship
M ean Econom ic Perform ance = 1.7219+0.4844*x
M ean Frequency of entrepreneurship:M ean Econom ic Perform ance: r = 0.3193, p = 0.0004; r2 =
0.1020
1 2 3 4 5 6 7 8
M ean Frequency of entrepreneurship
1
2
3
4
5
6
7
8
Me
an
Eco
no
mic
Pe
rfo
rma
nce
Scatterplot of M ean Econom ic Perform ance against M ean International EO
M ean Econom ic Perform ance = 2.6747+0.3408*x
M ean International EO:M ean Econom ic Perform ance: r = 0.2179, p = 0.0183; r2 = 0.0475
1 2 3 4 5 6 7 8
M ean International EO
1
2
3
4
5
6
7
8
Me
an
Eco
no
mic
Pe
rfo
rma
nce
Scatterplot of M ean Econom ic Perform ance against M ean International risk taking
M ean Econom ic Perform ance = 3.1597+0.2942*x
M ean International risk taking:M ean Econom ic Perform ance: r = 0.2704, p = 0.0032; r2 = 0.0731
1 2 3 4 5 6 7 8
M ean International risk taking
1
2
3
4
5
6
7
8
Me
an
Eco
no
mic
Pe
rfo
rma
nce
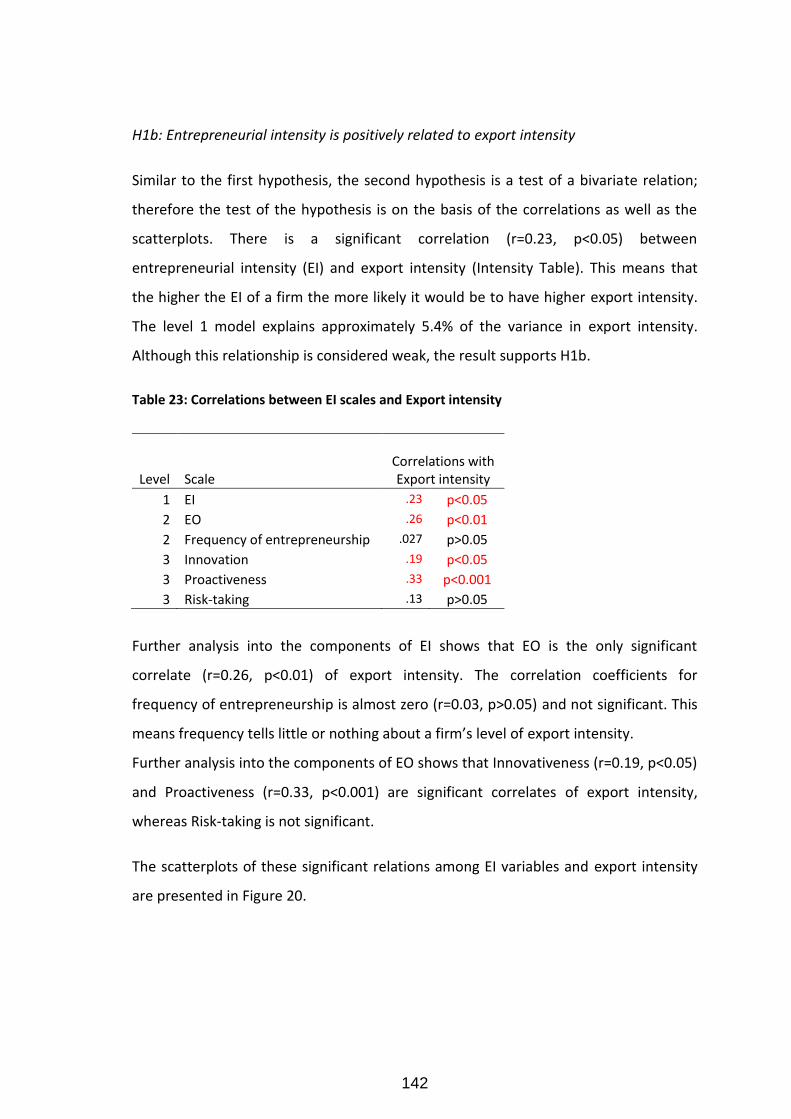
142
H1b: Entrepreneurial intensity is positively related to export intensity
Similar to the first hypothesis, the second hypothesis is a test of a bivariate relation;
therefore the test of the hypothesis is on the basis of the correlations as well as the
scatterplots. There is a significant correlation (r=0.23, p<0.05) between
entrepreneurial intensity (EI) and export intensity (Intensity Table). This means that
the higher the EI of a firm the more likely it would be to have higher export intensity.
The level 1 model explains approximately 5.4% of the variance in export intensity.
Although this relationship is considered weak, the result supports H1b.
Table 23: Correlations between EI scales and Export intensity
Level Scale Correlations with Export intensity
1 EI .23 p<0.05
2 EO .26 p<0.01
2 Frequency of entrepreneurship .027 p>0.05
3 Innovation .19 p<0.05
3 Proactiveness .33 p<0.001
3 Risk-taking .13 p>0.05
Further analysis into the components of EI shows that EO is the only significant
correlate (r=0.26, p<0.01) of export intensity. The correlation coefficients for
frequency of entrepreneurship is almost zero (r=0.03, p>0.05) and not significant. This
means frequency tells little or nothing about a firm’s level of export intensity.
Further analysis into the components of EO shows that Innovativeness (r=0.19, p<0.05)
and Proactiveness (r=0.33, p<0.001) are significant correlates of export intensity,
whereas Risk-taking is not significant.
The scatterplots of these significant relations among EI variables and export intensity
are presented in Figure 20.
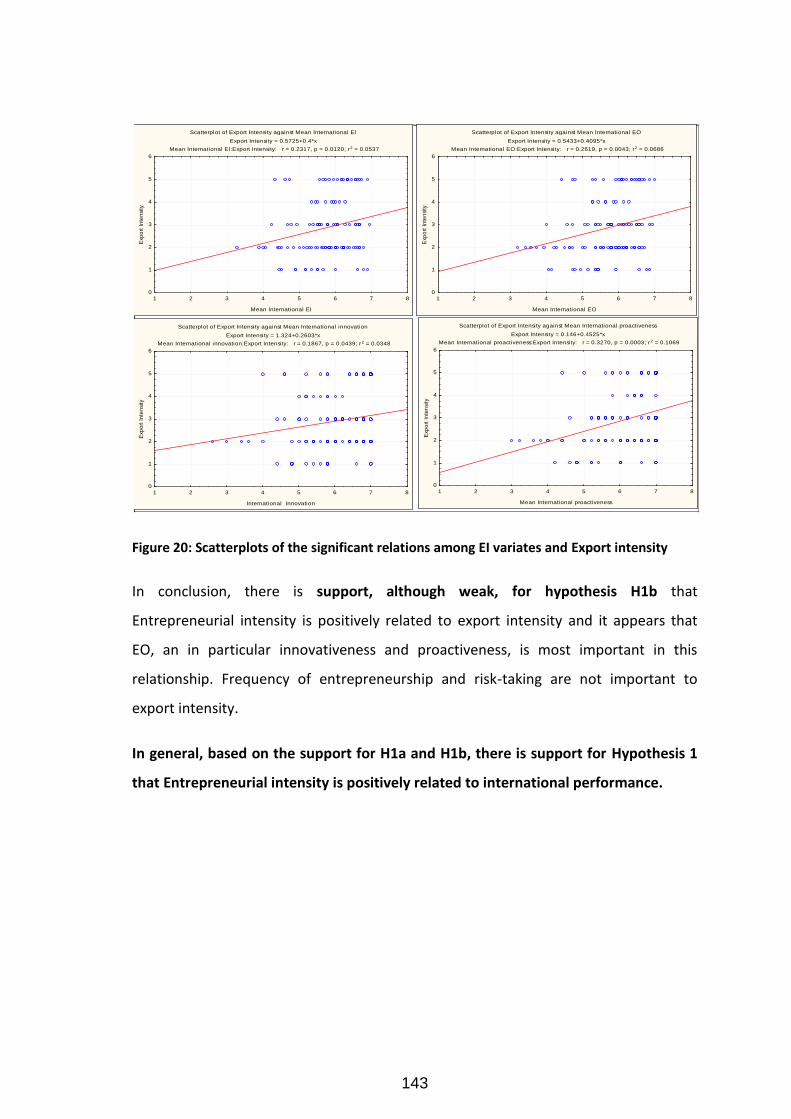
143
Figure 20: Scatterplots of the significant relations among EI variates and Export intensity
In conclusion, there is support, although weak, for hypothesis H1b that
Entrepreneurial intensity is positively related to export intensity and it appears that
EO, an in particular innovativeness and proactiveness, is most important in this
relationship. Frequency of entrepreneurship and risk-taking are not important to
export intensity.
In general, based on the support for H1a and H1b, there is support for Hypothesis 1
that Entrepreneurial intensity is positively related to international performance.
Scatterplot of Export Intensity against Mean International EI
Export Intensity = 0.5725+0.4*x
Mean International EI:Export Intensity: r = 0.2317, p = 0.0120; r2 = 0.0537
1 2 3 4 5 6 7 8
Mean International EI
0
1
2
3
4
5
6
Exp
ort
In
ten
sity
Scatterplot of Export Intensity against Mean International EO
Export Intensity = 0.5433+0.4095*x
Mean International EO:Export Intensity: r = 0.2619, p = 0.0043; r2 = 0.0686
1 2 3 4 5 6 7 8
Mean International EO
0
1
2
3
4
5
6
Exp
ort
In
ten
sity
Scatterplot of Export Intensity against Mean International innovation
Export Intensity = 1.324+0.2603*x
Mean International innovation:Export Intensity: r = 0.1867, p = 0.0439; r2 = 0.0348
1 2 3 4 5 6 7 8
International Innovation
0
1
2
3
4
5
6
Exp
ort
In
ten
sity
Scatterplot of Export Intensity against Mean International proactiveness
Export Intensity = 0.146+0.4525*x
Mean International proactiveness:Export Intensity: r = 0.3270, p = 0.0003; r2 = 0.1069
1 2 3 4 5 6 7 8
Mean International proactiveness
0
1
2
3
4
5
6
Exp
ort
In
ten
sity
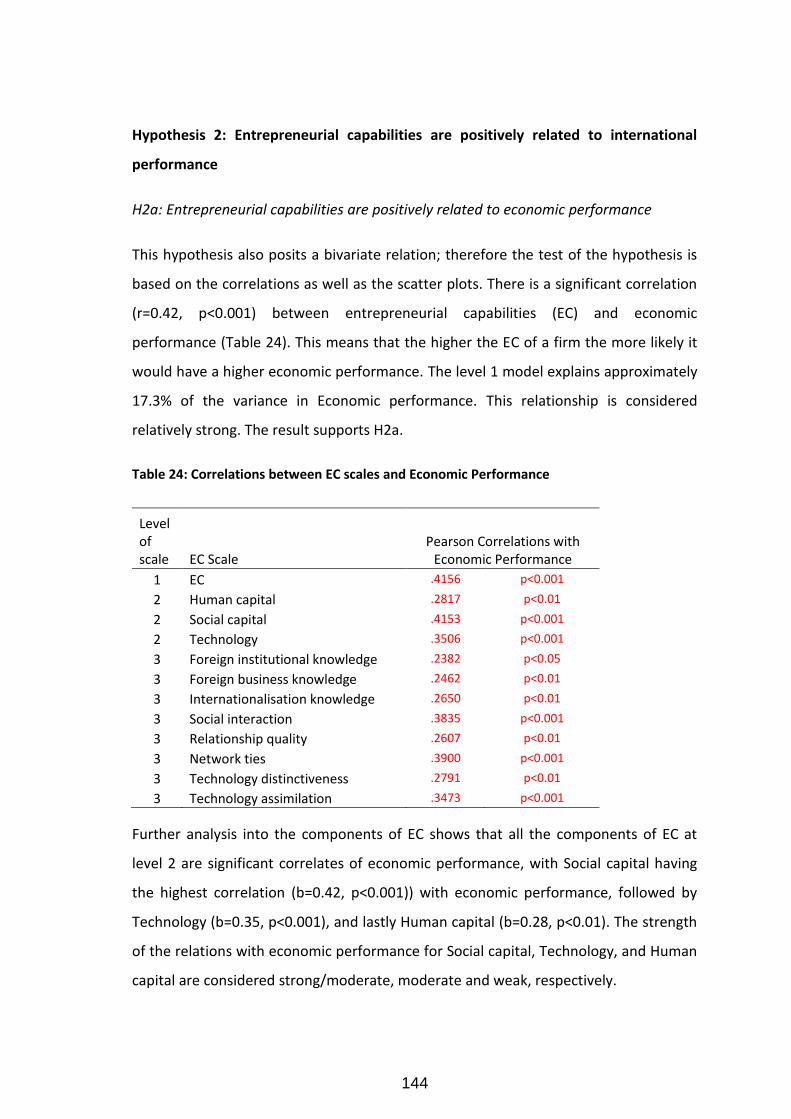
144
Hypothesis 2: Entrepreneurial capabilities are positively related to international
performance
H2a: Entrepreneurial capabilities are positively related to economic performance
This hypothesis also posits a bivariate relation; therefore the test of the hypothesis is
based on the correlations as well as the scatter plots. There is a significant correlation
(r=0.42, p<0.001) between entrepreneurial capabilities (EC) and economic
performance (Table 24). This means that the higher the EC of a firm the more likely it
would have a higher economic performance. The level 1 model explains approximately
17.3% of the variance in Economic performance. This relationship is considered
relatively strong. The result supports H2a.
Table 24: Correlations between EC scales and Economic Performance
Level of scale EC Scale
Pearson Correlations with Economic Performance
1 EC .4156 p<0.001
2 Human capital .2817 p<0.01
2 Social capital .4153 p<0.001
2 Technology .3506 p<0.001
3 Foreign institutional knowledge .2382 p<0.05
3 Foreign business knowledge .2462 p<0.01
3 Internationalisation knowledge .2650 p<0.01
3 Social interaction .3835 p<0.001
3 Relationship quality .2607 p<0.01
3 Network ties .3900 p<0.001
3 Technology distinctiveness .2791 p<0.01
3 Technology assimilation .3473 p<0.001
Further analysis into the components of EC shows that all the components of EC at
level 2 are significant correlates of economic performance, with Social capital having
the highest correlation (b=0.42, p<0.001)) with economic performance, followed by
Technology (b=0.35, p<0.001), and lastly Human capital (b=0.28, p<0.01). The strength
of the relations with economic performance for Social capital, Technology, and Human
capital are considered strong/moderate, moderate and weak, respectively.
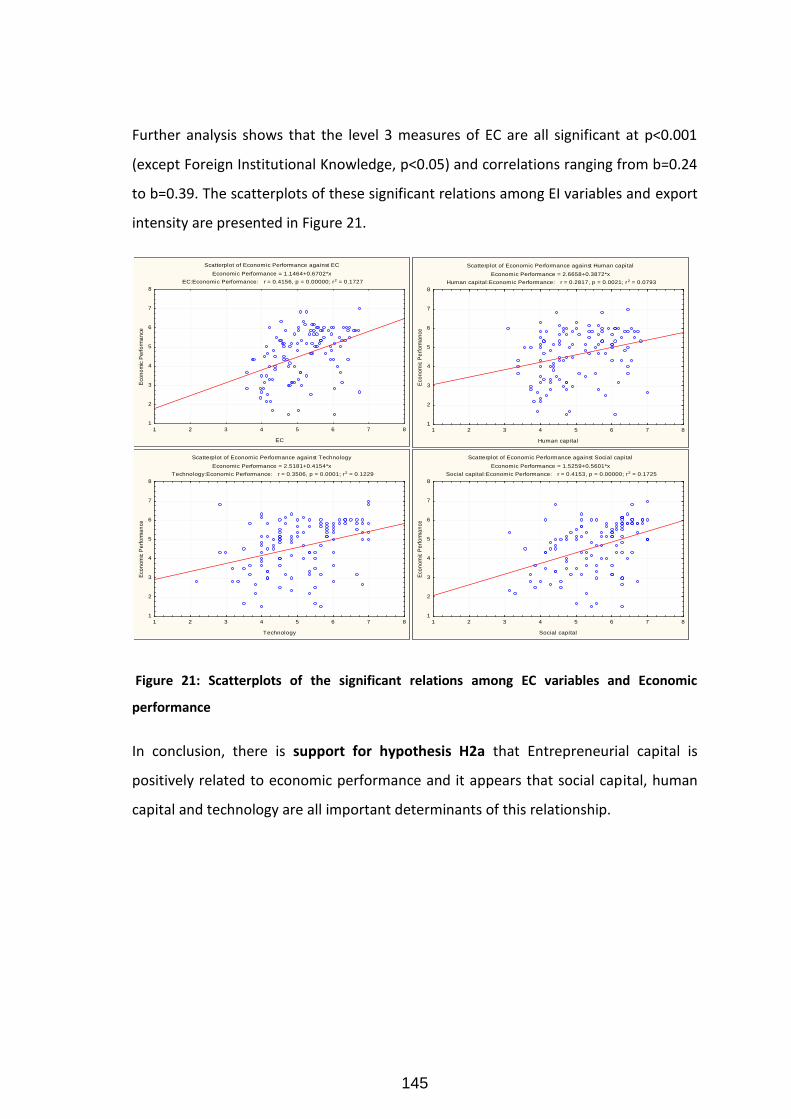
145
Further analysis shows that the level 3 measures of EC are all significant at p<0.001
(except Foreign Institutional Knowledge, p<0.05) and correlations ranging from b=0.24
to b=0.39. The scatterplots of these significant relations among EI variables and export
intensity are presented in Figure 21.
Figure 21: Scatterplots of the significant relations among EC variables and Economic
performance
In conclusion, there is support for hypothesis H2a that Entrepreneurial capital is
positively related to economic performance and it appears that social capital, human
capital and technology are all important determinants of this relationship.
Scatterplot of Economic Performance against EC
Economic Performance = 1.1464+0.6702*x
EC:Economic Performance: r = 0.4156, p = 0.00000; r2 = 0.1727
1 2 3 4 5 6 7 8
EC
1
2
3
4
5
6
7
8
Eco
no
mic
Pe
rfo
rma
nce
Scatterplot of Economic Performance against Human capital
Economic Performance = 2.6658+0.3872*x
Human capital:Economic Performance: r = 0.2817, p = 0.0021; r2 = 0.0793
1 2 3 4 5 6 7 8
Human capital
1
2
3
4
5
6
7
8
Eco
no
mic
Pe
rfo
rma
nce
Scatterplot of Economic Performance against Technology
Economic Performance = 2.5181+0.4154*x
Technology:Economic Performance: r = 0.3506, p = 0.0001; r2 = 0.1229
1 2 3 4 5 6 7 8
Technology
1
2
3
4
5
6
7
8
Eco
no
mic
Pe
rfo
rma
nce
Scatterplot of Economic Performance against Social capital
Economic Performance = 1.5259+0.5601*x
Social capital:Economic Performance: r = 0.4153, p = 0.00000; r2 = 0.1725
1 2 3 4 5 6 7 8
Social capital
1
2
3
4
5
6
7
8
Eco
no
mic
Pe
rfo
rma
nce
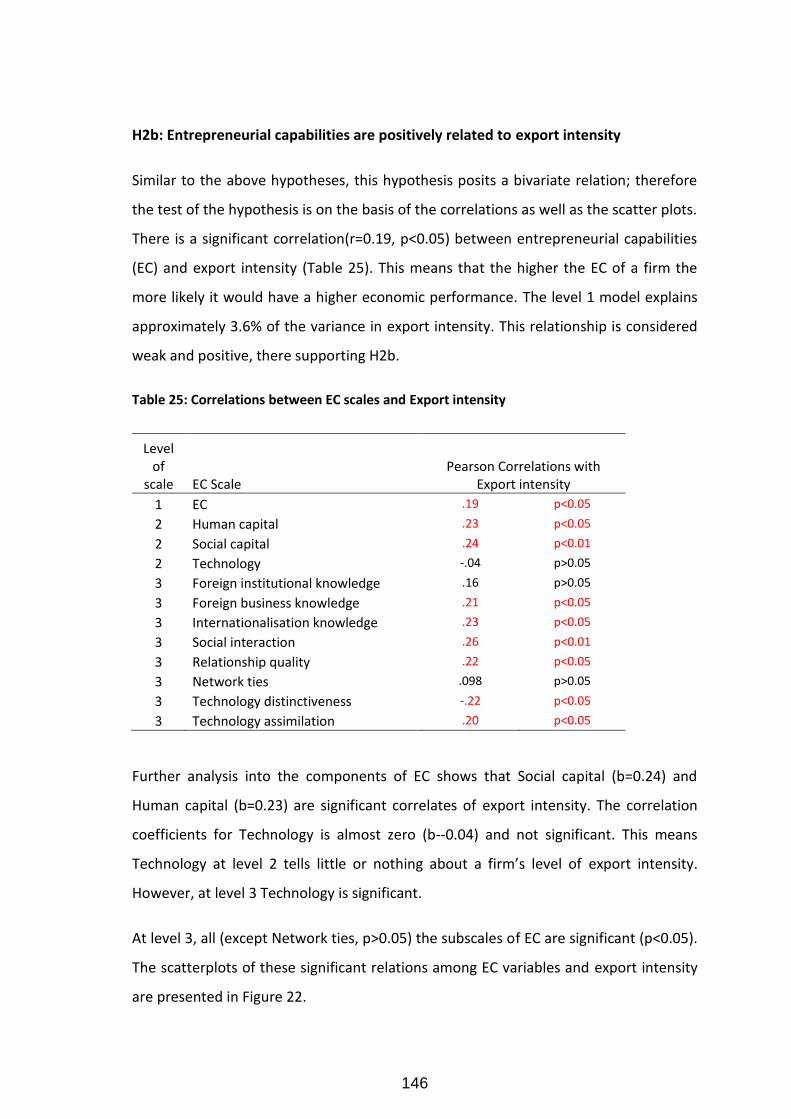
146
H2b: Entrepreneurial capabilities are positively related to export intensity
Similar to the above hypotheses, this hypothesis posits a bivariate relation; therefore
the test of the hypothesis is on the basis of the correlations as well as the scatter plots.
There is a significant correlation(r=0.19, p<0.05) between entrepreneurial capabilities
(EC) and export intensity (Table 25). This means that the higher the EC of a firm the
more likely it would have a higher economic performance. The level 1 model explains
approximately 3.6% of the variance in export intensity. This relationship is considered
weak and positive, there supporting H2b.
Table 25: Correlations between EC scales and Export intensity
Level of
scale EC Scale Pearson Correlations with
Export intensity
1 EC .19 p<0.05
2 Human capital .23 p<0.05
2 Social capital .24 p<0.01
2 Technology -.04 p>0.05
3 Foreign institutional knowledge .16 p>0.05
3 Foreign business knowledge .21 p<0.05
3 Internationalisation knowledge .23 p<0.05
3 Social interaction .26 p<0.01
3 Relationship quality .22 p<0.05
3 Network ties .098 p>0.05
3 Technology distinctiveness -.22 p<0.05
3 Technology assimilation .20 p<0.05
Further analysis into the components of EC shows that Social capital (b=0.24) and
Human capital (b=0.23) are significant correlates of export intensity. The correlation
coefficients for Technology is almost zero (b--0.04) and not significant. This means
Technology at level 2 tells little or nothing about a firm’s level of export intensity.
However, at level 3 Technology is significant.
At level 3, all (except Network ties, p>0.05) the subscales of EC are significant (p<0.05).
The scatterplots of these significant relations among EC variables and export intensity
are presented in Figure 22.
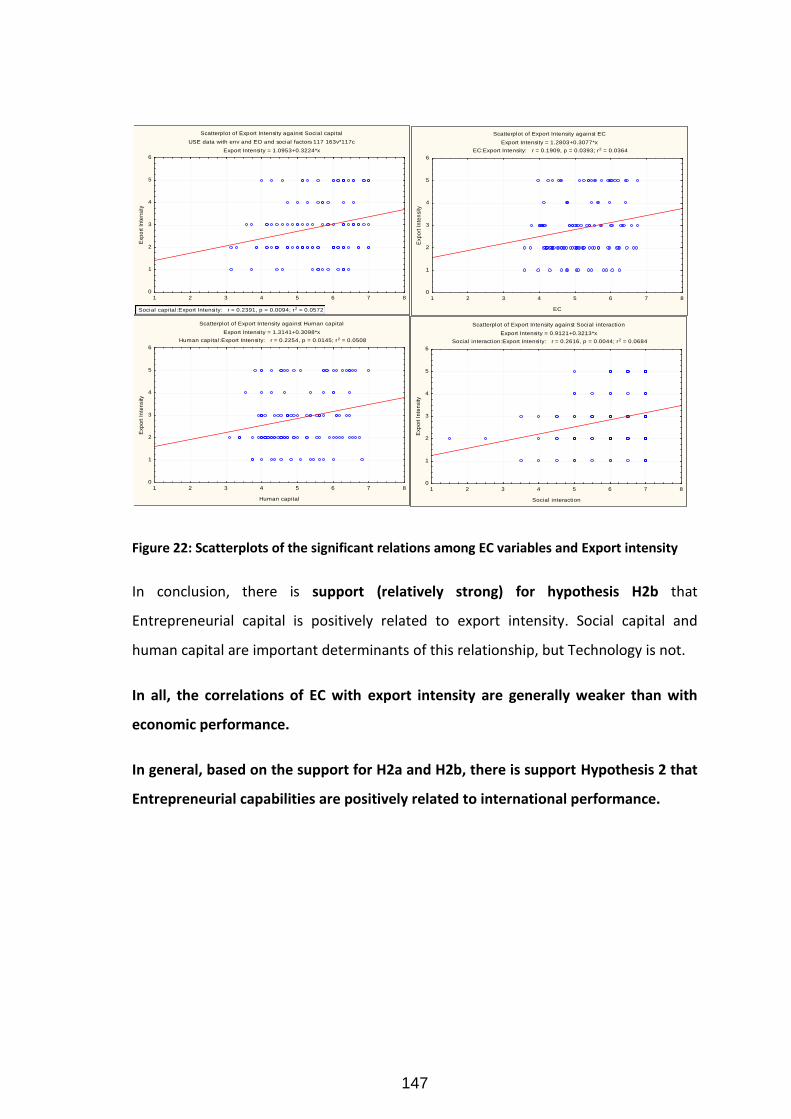
147
Figure 22: Scatterplots of the significant relations among EC variables and Export intensity
In conclusion, there is support (relatively strong) for hypothesis H2b that
Entrepreneurial capital is positively related to export intensity. Social capital and
human capital are important determinants of this relationship, but Technology is not.
In all, the correlations of EC with export intensity are generally weaker than with
economic performance.
In general, based on the support for H2a and H2b, there is support Hypothesis 2 that
Entrepreneurial capabilities are positively related to international performance.
Scatterplot of Export Intensity against Human capital
Export Intensity = 1.3141+0.3098*x
Human capital:Export Intensity: r = 0.2254, p = 0.0145; r2 = 0.0508
1 2 3 4 5 6 7 8
Human capital
0
1
2
3
4
5
6
Exp
ort
In
ten
sity
Scatterplot of Export Intensity against EC
Export Intensity = 1.2803+0.3077*x
EC:Export Intensity: r = 0.1909, p = 0.0393; r2 = 0.0364
1 2 3 4 5 6 7 8
EC
0
1
2
3
4
5
6
Exp
ort
In
ten
sity
Scatterplot of Export Intensity against Social capital
USE data with env and EO and social factors 117 163v*117c
Export Intensity = 1.0953+0.3224*x
1 2 3 4 5 6 7 8
Social capital
0
1
2
3
4
5
6
Exp
ort
In
ten
sity
Social capital:Export Intensity: r = 0.2391, p = 0.0094; r2 = 0.0572
Scatterplot of Export Intensity against Social interaction
Export Intensity = 0.9121+0.3213*x
Social interaction:Export Intensity: r = 0.2616, p = 0.0044; r2 = 0.0684
1 2 3 4 5 6 7 8
Social interaction
0
1
2
3
4
5
6
Exp
ort
In
ten
sity
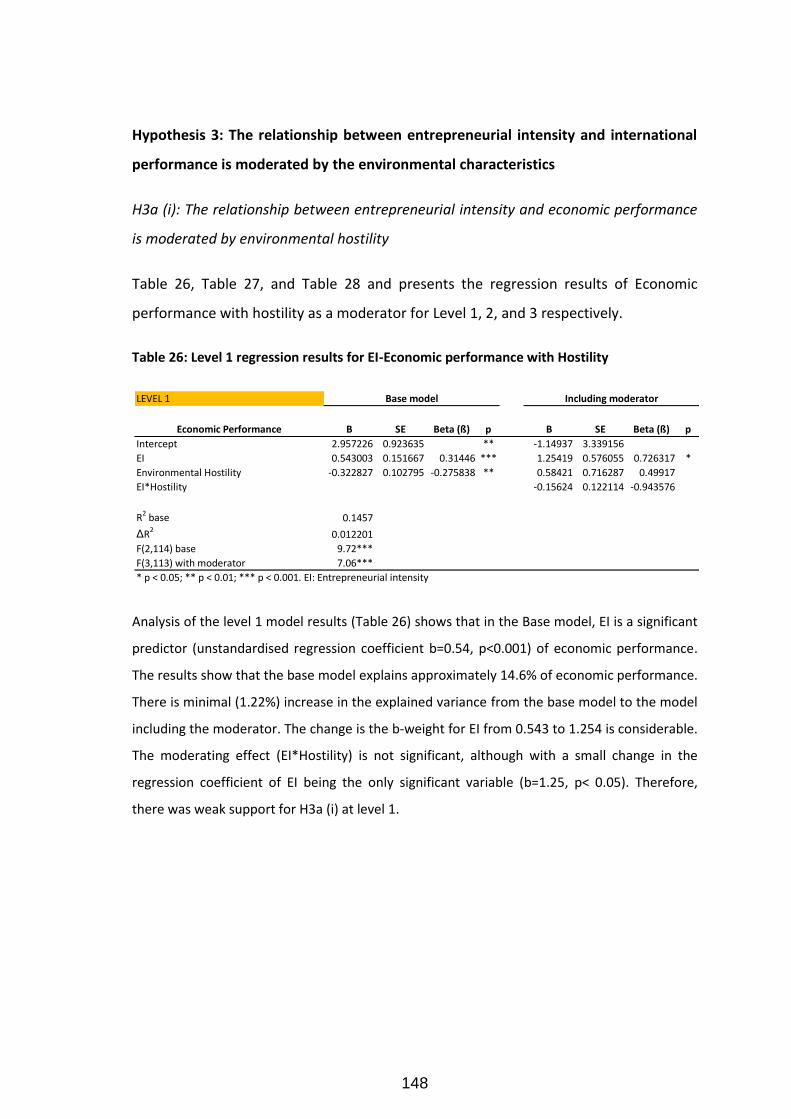
148
Hypothesis 3: The relationship between entrepreneurial intensity and international
performance is moderated by the environmental characteristics
H3a (i): The relationship between entrepreneurial intensity and economic performance
is moderated by environmental hostility
Table 26, Table 27, and Table 28 and presents the regression results of Economic
performance with hostility as a moderator for Level 1, 2, and 3 respectively.
Table 26: Level 1 regression results for EI-Economic performance with Hostility
Analysis of the level 1 model results (Table 26) shows that in the Base model, EI is a significant
predictor (unstandardised regression coefficient b=0.54, p<0.001) of economic performance.
The results show that the base model explains approximately 14.6% of economic performance.
There is minimal (1.22%) increase in the explained variance from the base model to the model
including the moderator. The change is the b-weight for EI from 0.543 to 1.254 is considerable.
The moderating effect (EI*Hostility) is not significant, although with a small change in the
regression coefficient of EI being the only significant variable (b=1.25, p< 0.05). Therefore,
there was weak support for H3a (i) at level 1.
LEVEL 1
Economic Performance B SE Beta (ß) p B SE Beta (ß) p
Intercept 2.957226 0.923635 ** -1.14937 3.339156
EI 0.543003 0.151667 0.31446 *** 1.25419 0.576055 0.726317 *
Environmental Hostility -0.322827 0.102795 -0.275838 ** 0.58421 0.716287 0.49917
EI*Hostility -0.15624 0.122114 -0.943576
R2 base 0.1457
ΔR2
0.012201
F(2,114) base 9.72***
F(3,113) with moderator 7.06***
* p < 0.05; ** p < 0.01; *** p < 0.001. EI: Entrepreneurial intensity
Base model Including moderator
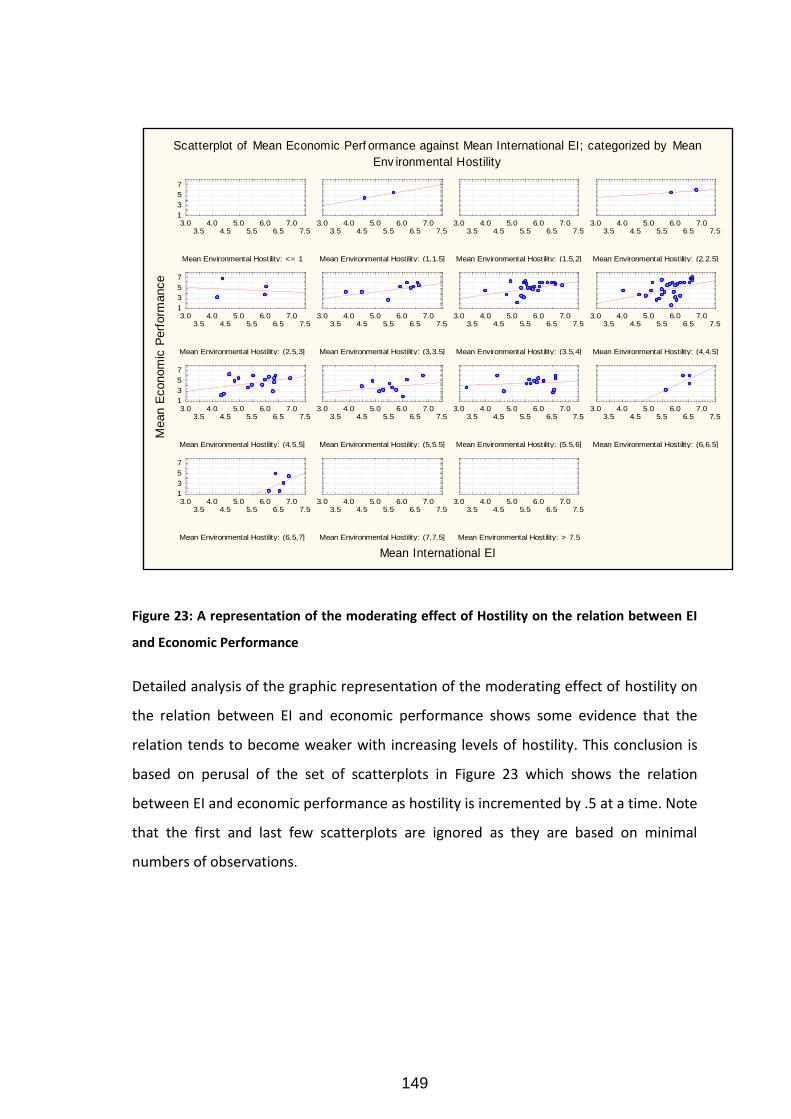
149
Figure 23: A representation of the moderating effect of Hostility on the relation between EI
and Economic Performance
Detailed analysis of the graphic representation of the moderating effect of hostility on
the relation between EI and economic performance shows some evidence that the
relation tends to become weaker with increasing levels of hostility. This conclusion is
based on perusal of the set of scatterplots in Figure 23 which shows the relation
between EI and economic performance as hostility is incremented by .5 at a time. Note
that the first and last few scatterplots are ignored as they are based on minimal
numbers of observations.
Scatterplot of Mean Economic Perf ormance against Mean International EI; categorized by Mean
Env ironmental Hostility
Mean International EI
Mean E
conom
ic P
erf
orm
ance
Mean Environmental Hostility: <= 1
3.03.5
4.04.5
5.05.5
6.06.5
7.07.5
1
3
5
7
Mean Environmental Hostility: (1,1.5]
3.03.5
4.04.5
5.05.5
6.06.5
7.07.5
Mean Environmental Hostility: (1.5,2]
3.03.5
4.04.5
5.05.5
6.06.5
7.07.5
Mean Environmental Hostility: (2,2.5]
3.03.5
4.04.5
5.05.5
6.06.5
7.07.5
Mean Environmental Hostility: (2.5,3]
3.03.5
4.04.5
5.05.5
6.06.5
7.07.5
1
3
5
7
Mean Environmental Hostility: (3,3.5]
3.03.5
4.04.5
5.05.5
6.06.5
7.07.5
Mean Environmental Hostility: (3.5,4]
3.03.5
4.04.5
5.05.5
6.06.5
7.07.5
Mean Environmental Hostility: (4,4.5]
3.03.5
4.04.5
5.05.5
6.06.5
7.07.5
Mean Environmental Hostility: (4.5,5]
3.03.5
4.04.5
5.05.5
6.06.5
7.07.5
1
3
5
7
Mean Environmental Hostility: (5,5.5]
3.03.5
4.04.5
5.05.5
6.06.5
7.07.5
Mean Environmental Hostility: (5.5,6]
3.03.5
4.04.5
5.05.5
6.06.5
7.07.5
Mean Environmental Hostility: (6,6.5]
3.03.5
4.04.5
5.05.5
6.06.5
7.07.5
Mean Environmental Hostility: (6.5,7]
3.03.5
4.04.5
5.05.5
6.06.5
7.07.5
1
3
5
7
Mean Environmental Hostility: (7,7.5]
3.03.5
4.04.5
5.05.5
6.06.5
7.07.5
Mean Environmental Hostility: > 7.5
3.03.5
4.04.5
5.05.5
6.06.5
7.07.5
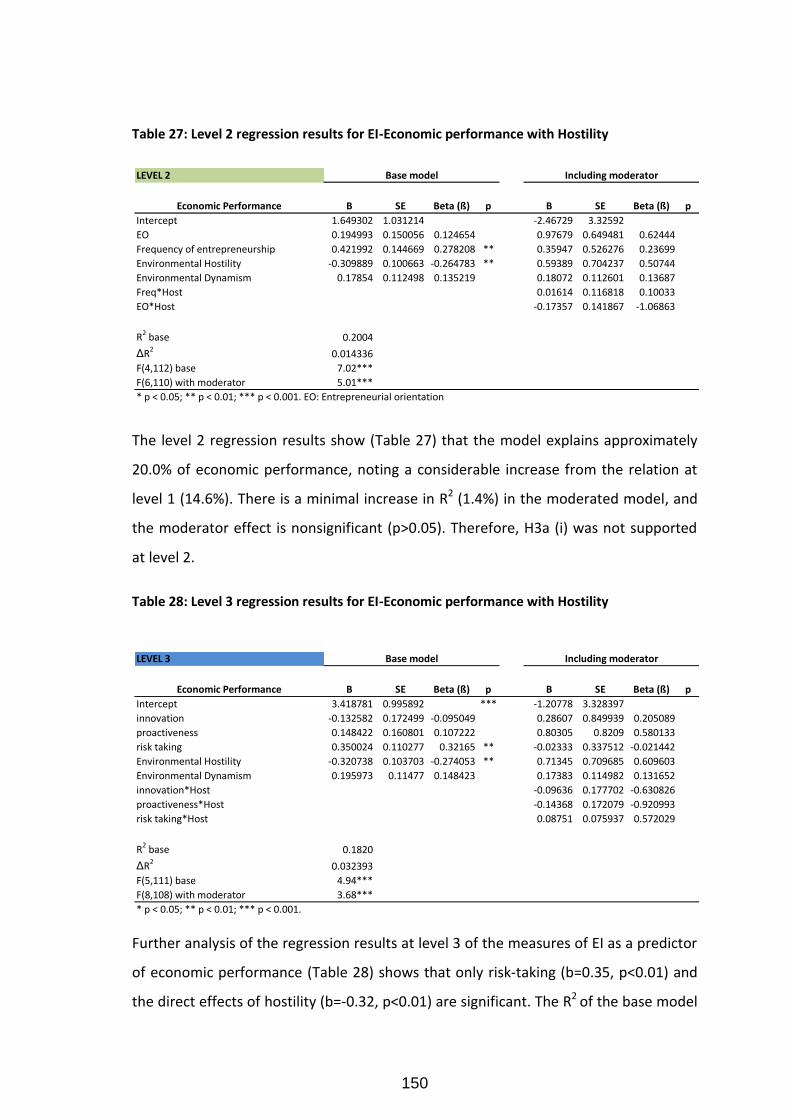
150
Table 27: Level 2 regression results for EI-Economic performance with Hostility
The level 2 regression results show (Table 27) that the model explains approximately
20.0% of economic performance, noting a considerable increase from the relation at
level 1 (14.6%). There is a minimal increase in R2 (1.4%) in the moderated model, and
the moderator effect is nonsignificant (p>0.05). Therefore, H3a (i) was not supported
at level 2.
Table 28: Level 3 regression results for EI-Economic performance with Hostility
Further analysis of the regression results at level 3 of the measures of EI as a predictor
of economic performance (Table 28) shows that only risk-taking (b=0.35, p<0.01) and
the direct effects of hostility (b=-0.32, p<0.01) are significant. The R2 of the base model
LEVEL 2
Economic Performance B SE Beta (ß) p B SE Beta (ß) p
Intercept 1.649302 1.031214 -2.46729 3.32592
EO 0.194993 0.150056 0.124654 0.97679 0.649481 0.62444
Frequency of entrepreneurship 0.421992 0.144669 0.278208 ** 0.35947 0.526276 0.23699
Environmental Hostility -0.309889 0.100663 -0.264783 ** 0.59389 0.704237 0.50744
Environmental Dynamism 0.17854 0.112498 0.135219 0.18072 0.112601 0.13687
Freq*Host 0.01614 0.116818 0.10033
EO*Host -0.17357 0.141867 -1.06863
R2 base 0.2004
ΔR2
0.014336
F(4,112) base 7.02***
F(6,110) with moderator 5.01***
* p < 0.05; ** p < 0.01; *** p < 0.001. EO: Entrepreneurial orientation
Base model Including moderator
LEVEL 3
Economic Performance B SE Beta (ß) p B SE Beta (ß) p
Intercept 3.418781 0.995892 *** -1.20778 3.328397
innovation -0.132582 0.172499 -0.095049 0.28607 0.849939 0.205089
proactiveness 0.148422 0.160801 0.107222 0.80305 0.8209 0.580133
risk taking 0.350024 0.110277 0.32165 ** -0.02333 0.337512 -0.021442
Environmental Hostility -0.320738 0.103703 -0.274053 ** 0.71345 0.709685 0.609603
Environmental Dynamism 0.195973 0.11477 0.148423 0.17383 0.114982 0.131652
innovation*Host -0.09636 0.177702 -0.630826
proactiveness*Host -0.14368 0.172079 -0.920993
risk taking*Host 0.08751 0.075937 0.572029
R2 base 0.1820
ΔR2
0.032393
F(5,111) base 4.94***
F(8,108) with moderator 3.68***
* p < 0.05; ** p < 0.01; *** p < 0.001.
Base model Including moderator
151
is 18% and increased by 3.3% when the model included the moderator, hostility.
However, the moderation model is nonsignificant (p>0.05). Therefore, H3a (i) was not
supported at level 3.
Based on the analysis the level 1,2, and 3 regression results for the EI construct, it can
be concluded that there is partial/weak support for the hypothesis H3a (i) that the
relationship between entrepreneurial intensity and economic performance is
moderated by environmental hostility.
Note: From this point on in the analysis of regressions results, only the level 1 results
are presented by default. The level 2 and 3 results will only be presented where
there is a significant effect. The tables for the nonsignificant level 2 and 3 results are
presented in the Appendix C for perusal.
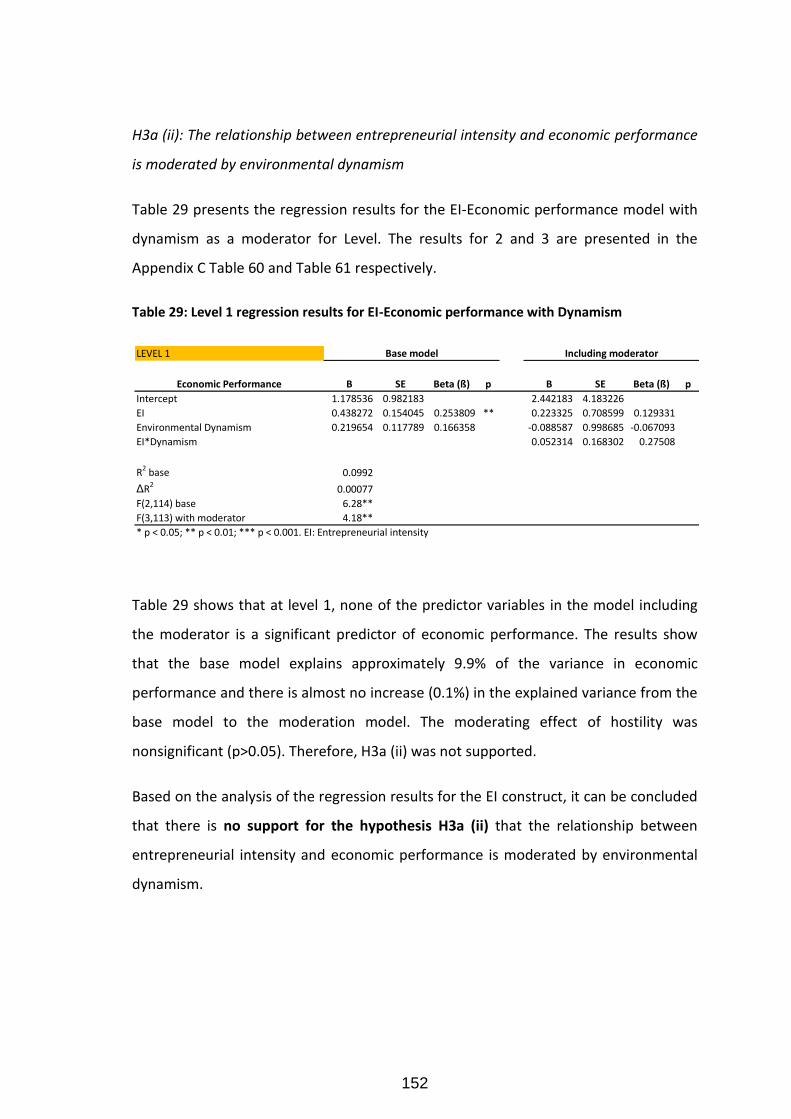
152
H3a (ii): The relationship between entrepreneurial intensity and economic performance
is moderated by environmental dynamism
Table 29 presents the regression results for the EI-Economic performance model with
dynamism as a moderator for Level. The results for 2 and 3 are presented in the
Appendix C Table 60 and Table 61 respectively.
Table 29: Level 1 regression results for EI-Economic performance with Dynamism
Table 29 shows that at level 1, none of the predictor variables in the model including
the moderator is a significant predictor of economic performance. The results show
that the base model explains approximately 9.9% of the variance in economic
performance and there is almost no increase (0.1%) in the explained variance from the
base model to the moderation model. The moderating effect of hostility was
nonsignificant (p>0.05). Therefore, H3a (ii) was not supported.
Based on the analysis of the regression results for the EI construct, it can be concluded
that there is no support for the hypothesis H3a (ii) that the relationship between
entrepreneurial intensity and economic performance is moderated by environmental
dynamism.
LEVEL 1
Economic Performance B SE Beta (ß) p B SE Beta (ß) p
Intercept 1.178536 0.982183 2.442183 4.183226
EI 0.438272 0.154045 0.253809 ** 0.223325 0.708599 0.129331
Environmental Dynamism 0.219654 0.117789 0.166358 -0.088587 0.998685 -0.067093
EI*Dynamism 0.052314 0.168302 0.27508
R2 base 0.0992
ΔR2
0.00077
F(2,114) base 6.28**
F(3,113) with moderator 4.18**
* p < 0.05; ** p < 0.01; *** p < 0.001. EI: Entrepreneurial intensity
Base model Including moderator
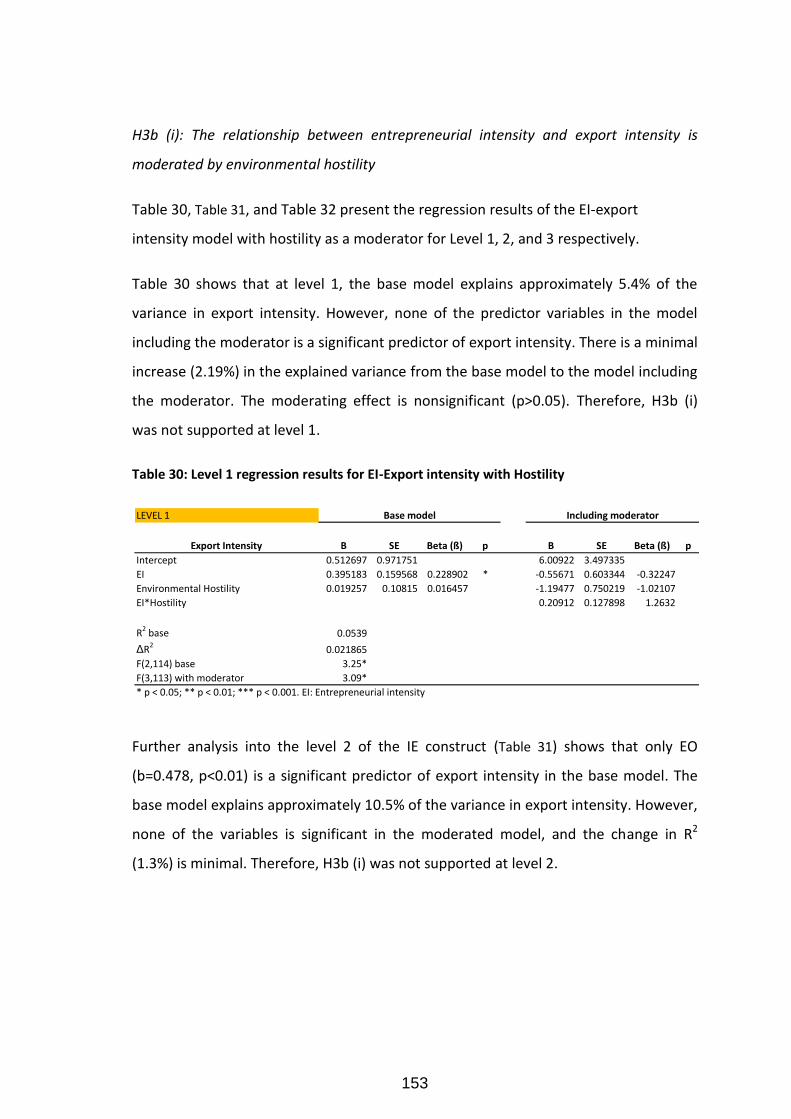
153
H3b (i): The relationship between entrepreneurial intensity and export intensity is
moderated by environmental hostility
Table 30, Table 31, and Table 32 present the regression results of the EI-export
intensity model with hostility as a moderator for Level 1, 2, and 3 respectively.
Table 30 shows that at level 1, the base model explains approximately 5.4% of the
variance in export intensity. However, none of the predictor variables in the model
including the moderator is a significant predictor of export intensity. There is a minimal
increase (2.19%) in the explained variance from the base model to the model including
the moderator. The moderating effect is nonsignificant (p>0.05). Therefore, H3b (i)
was not supported at level 1.
Table 30: Level 1 regression results for EI-Export intensity with Hostility
Further analysis into the level 2 of the IE construct (Table 31) shows that only EO
(b=0.478, p<0.01) is a significant predictor of export intensity in the base model. The
base model explains approximately 10.5% of the variance in export intensity. However,
none of the variables is significant in the moderated model, and the change in R2
(1.3%) is minimal. Therefore, H3b (i) was not supported at level 2.
LEVEL 1
Export Intensity B SE Beta (ß) p B SE Beta (ß) p
Intercept 0.512697 0.971751 6.00922 3.497335
EI 0.395183 0.159568 0.228902 * -0.55671 0.603344 -0.32247
Environmental Hostility 0.019257 0.10815 0.016457 -1.19477 0.750219 -1.02107
EI*Hostility 0.20912 0.127898 1.2632
R2 base 0.0539
ΔR2
0.021865
F(2,114) base 3.25*
F(3,113) with moderator 3.09*
* p < 0.05; ** p < 0.01; *** p < 0.001. EI: Entrepreneurial intensity
Base model Including moderator
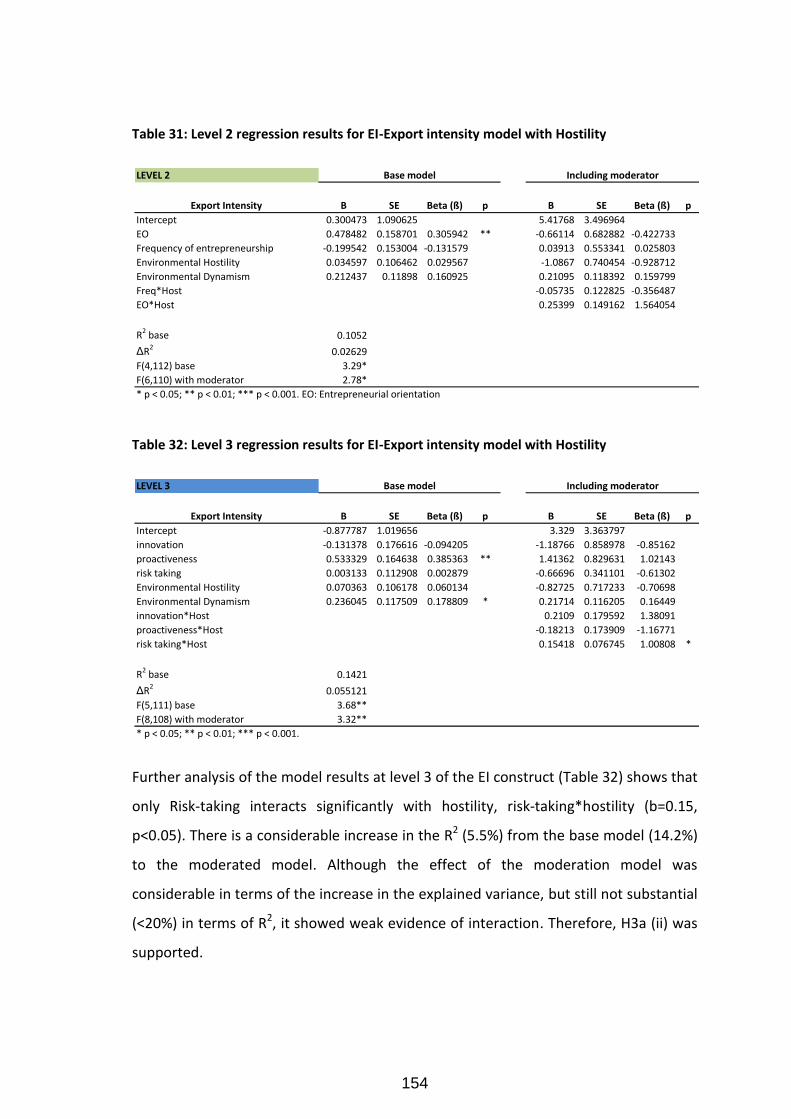
154
Table 31: Level 2 regression results for EI-Export intensity model with Hostility
Table 32: Level 3 regression results for EI-Export intensity model with Hostility
Further analysis of the model results at level 3 of the EI construct (Table 32) shows that
only Risk-taking interacts significantly with hostility, risk-taking*hostility (b=0.15,
p<0.05). There is a considerable increase in the R2 (5.5%) from the base model (14.2%)
to the moderated model. Although the effect of the moderation model was
considerable in terms of the increase in the explained variance, but still not substantial
(<20%) in terms of R2, it showed weak evidence of interaction. Therefore, H3a (ii) was
supported.
LEVEL 2
Export Intensity B SE Beta (ß) p B SE Beta (ß) p
Intercept 0.300473 1.090625 5.41768 3.496964
EO 0.478482 0.158701 0.305942 ** -0.66114 0.682882 -0.422733
Frequency of entrepreneurship -0.199542 0.153004 -0.131579 0.03913 0.553341 0.025803
Environmental Hostility 0.034597 0.106462 0.029567 -1.0867 0.740454 -0.928712
Environmental Dynamism 0.212437 0.11898 0.160925 0.21095 0.118392 0.159799
Freq*Host -0.05735 0.122825 -0.356487
EO*Host 0.25399 0.149162 1.564054
R2 base 0.1052
ΔR20.02629
F(4,112) base 3.29*
F(6,110) with moderator 2.78*
* p < 0.05; ** p < 0.01; *** p < 0.001. EO: Entrepreneurial orientation
Base model Including moderator
LEVEL 3
Export Intensity B SE Beta (ß) p B SE Beta (ß) p
Intercept -0.877787 1.019656 3.329 3.363797
innovation -0.131378 0.176616 -0.094205 -1.18766 0.858978 -0.85162
proactiveness 0.533329 0.164638 0.385363 ** 1.41362 0.829631 1.02143
risk taking 0.003133 0.112908 0.002879 -0.66696 0.341101 -0.61302
Environmental Hostility 0.070363 0.106178 0.060134 -0.82725 0.717233 -0.70698
Environmental Dynamism 0.236045 0.117509 0.178809 * 0.21714 0.116205 0.16449
innovation*Host 0.2109 0.179592 1.38091
proactiveness*Host -0.18213 0.173909 -1.16771
risk taking*Host 0.15418 0.076745 1.00808 *
R2 base 0.1421
ΔR20.055121
F(5,111) base 3.68**
F(8,108) with moderator 3.32**
* p < 0.05; ** p < 0.01; *** p < 0.001.
Base model Including moderator
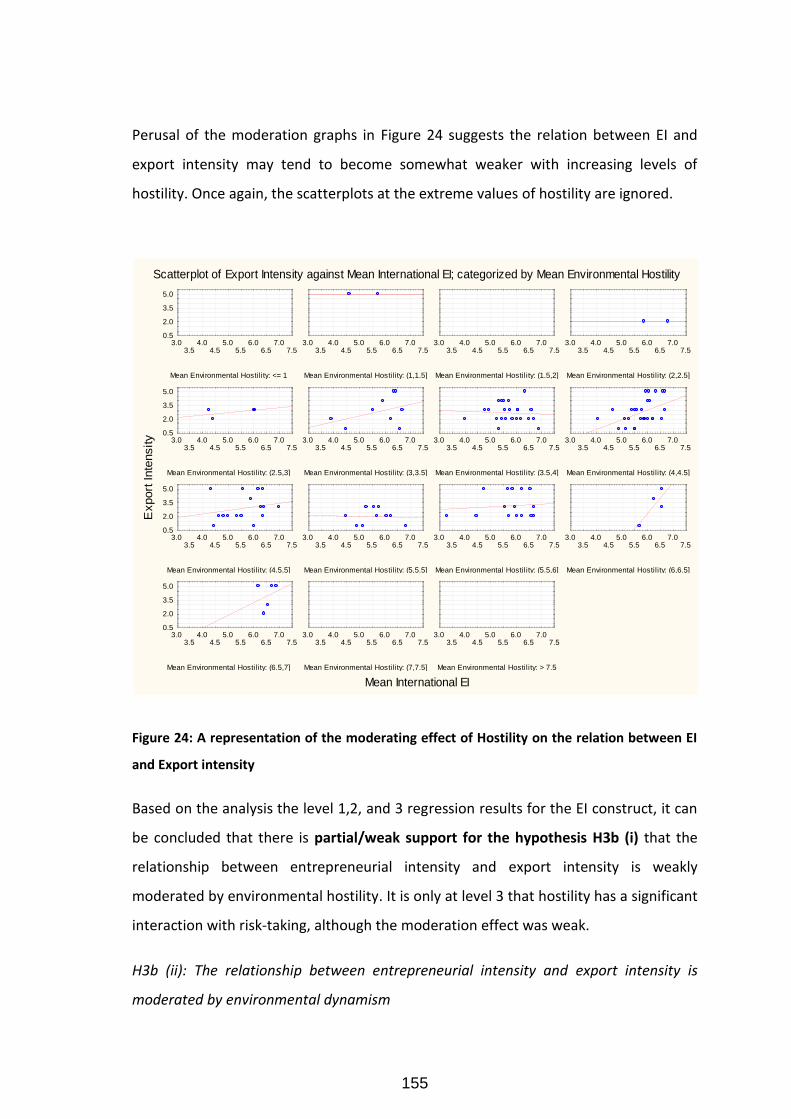
155
Perusal of the moderation graphs in Figure 24 suggests the relation between EI and
export intensity may tend to become somewhat weaker with increasing levels of
hostility. Once again, the scatterplots at the extreme values of hostility are ignored.
Figure 24: A representation of the moderating effect of Hostility on the relation between EI
and Export intensity
Based on the analysis the level 1,2, and 3 regression results for the EI construct, it can
be concluded that there is partial/weak support for the hypothesis H3b (i) that the
relationship between entrepreneurial intensity and export intensity is weakly
moderated by environmental hostility. It is only at level 3 that hostility has a significant
interaction with risk-taking, although the moderation effect was weak.
H3b (ii): The relationship between entrepreneurial intensity and export intensity is
moderated by environmental dynamism
Scatterplot of Export Intensity against Mean International EI; categorized by Mean Environmental Hostility
Mean International EI
Export
Inte
nsity
Mean Environmental Hostility: <= 1
3.03.5
4.04.5
5.05.5
6.06.5
7.07.5
0.5
2.0
3.5
5.0
Mean Environmental Hostility: (1,1.5]
3.03.5
4.04.5
5.05.5
6.06.5
7.07.5
Mean Environmental Hostility: (1.5,2]
3.03.5
4.04.5
5.05.5
6.06.5
7.07.5
Mean Environmental Hostility: (2,2.5]
3.03.5
4.04.5
5.05.5
6.06.5
7.07.5
Mean Environmental Hostility: (2.5,3]
3.03.5
4.04.5
5.05.5
6.06.5
7.07.5
0.5
2.0
3.5
5.0
Mean Environmental Hostility: (3,3.5]
3.03.5
4.04.5
5.05.5
6.06.5
7.07.5
Mean Environmental Hostility: (3.5,4]
3.03.5
4.04.5
5.05.5
6.06.5
7.07.5
Mean Environmental Hostility: (4,4.5]
3.03.5
4.04.5
5.05.5
6.06.5
7.07.5
Mean Environmental Hostility: (4.5,5]
3.03.5
4.04.5
5.05.5
6.06.5
7.07.5
0.5
2.0
3.5
5.0
Mean Environmental Hostility: (5,5.5]
3.03.5
4.04.5
5.05.5
6.06.5
7.07.5
Mean Environmental Hostility: (5.5,6]
3.03.5
4.04.5
5.05.5
6.06.5
7.07.5
Mean Environmental Hostility: (6,6.5]
3.03.5
4.04.5
5.05.5
6.06.5
7.07.5
Mean Environmental Hostility: (6.5,7]
3.03.5
4.04.5
5.05.5
6.06.5
7.07.5
0.5
2.0
3.5
5.0
Mean Environmental Hostility: (7,7.5]
3.03.5
4.04.5
5.05.5
6.06.5
7.07.5
Mean Environmental Hostility: > 7.5
3.03.5
4.04.5
5.05.5
6.06.5
7.07.5
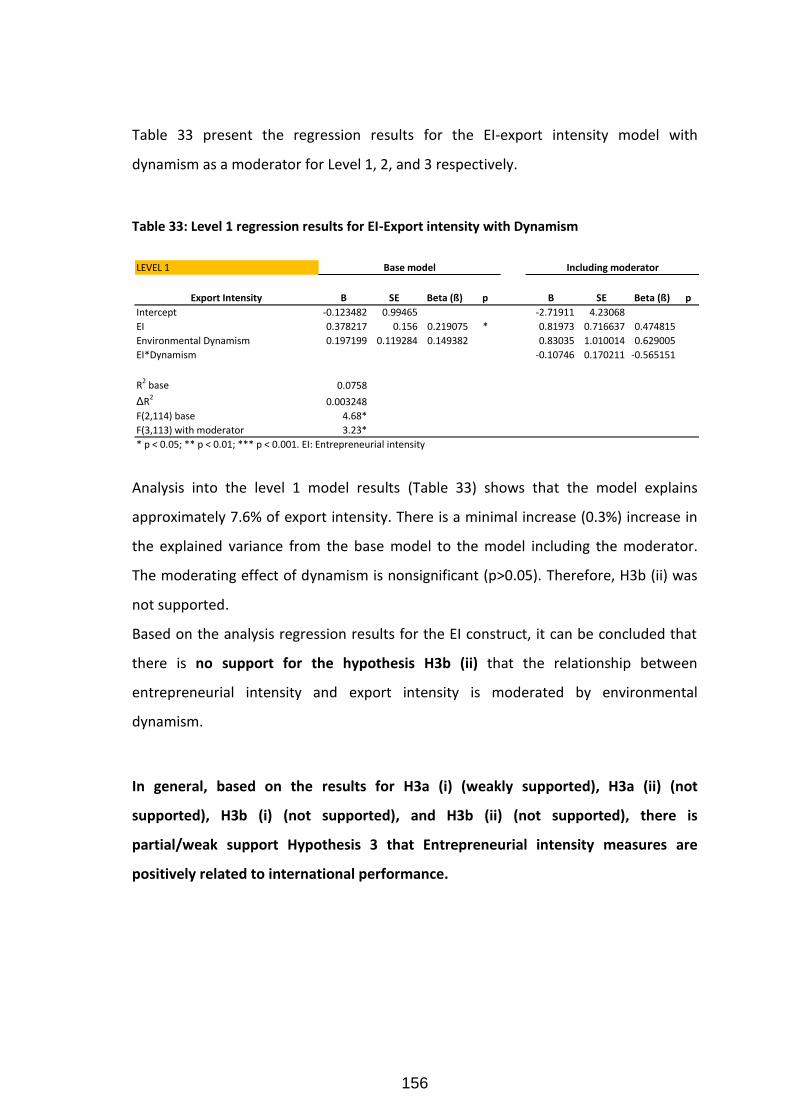
156
Table 33 present the regression results for the EI-export intensity model with
dynamism as a moderator for Level 1, 2, and 3 respectively.
Table 33: Level 1 regression results for EI-Export intensity with Dynamism
Analysis into the level 1 model results (Table 33) shows that the model explains
approximately 7.6% of export intensity. There is a minimal increase (0.3%) increase in
the explained variance from the base model to the model including the moderator.
The moderating effect of dynamism is nonsignificant (p>0.05). Therefore, H3b (ii) was
not supported.
Based on the analysis regression results for the EI construct, it can be concluded that
there is no support for the hypothesis H3b (ii) that the relationship between
entrepreneurial intensity and export intensity is moderated by environmental
dynamism.
In general, based on the results for H3a (i) (weakly supported), H3a (ii) (not
supported), H3b (i) (not supported), and H3b (ii) (not supported), there is
partial/weak support Hypothesis 3 that Entrepreneurial intensity measures are
positively related to international performance.
LEVEL 1
Export Intensity B SE Beta (ß) p B SE Beta (ß) p
Intercept -0.123482 0.99465 -2.71911 4.23068
EI 0.378217 0.156 0.219075 * 0.81973 0.716637 0.474815
Environmental Dynamism 0.197199 0.119284 0.149382 0.83035 1.010014 0.629005
EI*Dynamism -0.10746 0.170211 -0.565151
R2 base 0.0758
ΔR2
0.003248
F(2,114) base 4.68*
F(3,113) with moderator 3.23*
* p < 0.05; ** p < 0.01; *** p < 0.001. EI: Entrepreneurial intensity
Base model Including moderator
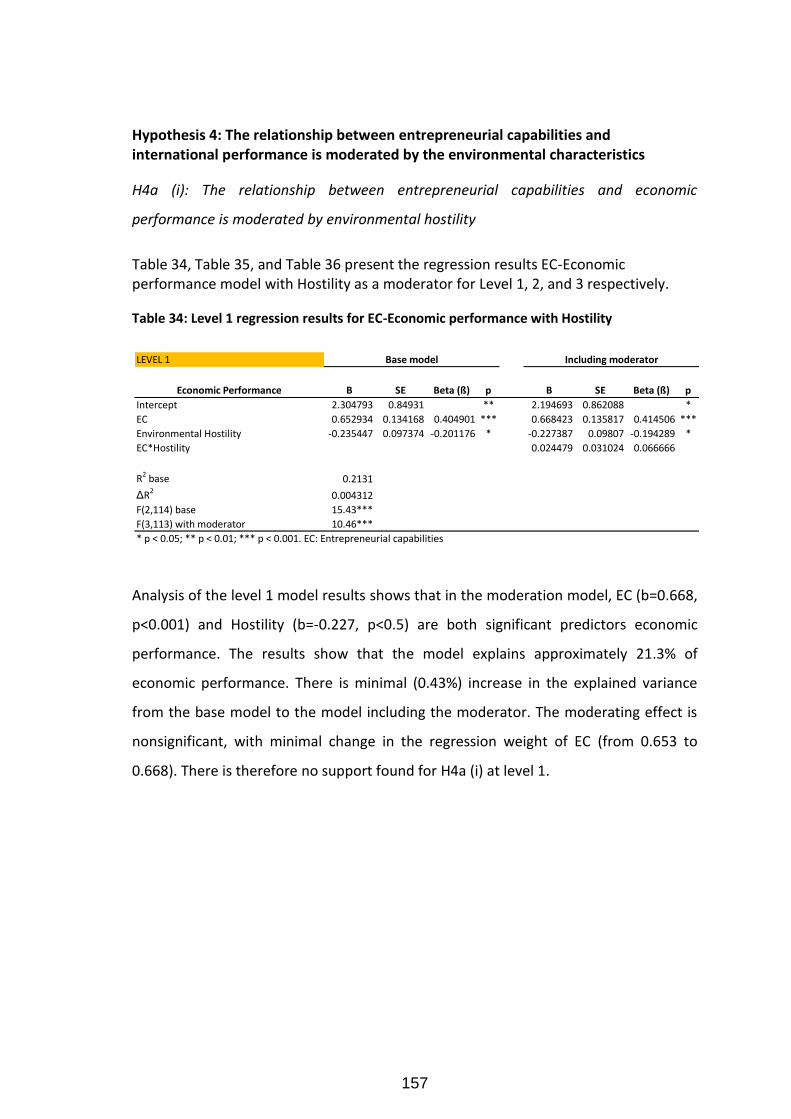
157
Hypothesis 4: The relationship between entrepreneurial capabilities and international performance is moderated by the environmental characteristics
H4a (i): The relationship between entrepreneurial capabilities and economic
performance is moderated by environmental hostility
Table 34, Table 35, and Table 36 present the regression results EC-Economic performance model with Hostility as a moderator for Level 1, 2, and 3 respectively.
Table 34: Level 1 regression results for EC-Economic performance with Hostility
Analysis of the level 1 model results shows that in the moderation model, EC (b=0.668,
p<0.001) and Hostility (b=-0.227, p<0.5) are both significant predictors economic
performance. The results show that the model explains approximately 21.3% of
economic performance. There is minimal (0.43%) increase in the explained variance
from the base model to the model including the moderator. The moderating effect is
nonsignificant, with minimal change in the regression weight of EC (from 0.653 to
0.668). There is therefore no support found for H4a (i) at level 1.
LEVEL 1
Economic Performance B SE Beta (ß) p B SE Beta (ß) p
Intercept 2.304793 0.84931 ** 2.194693 0.862088 *
EC 0.652934 0.134168 0.404901 *** 0.668423 0.135817 0.414506 ***
Environmental Hostility -0.235447 0.097374 -0.201176 * -0.227387 0.09807 -0.194289 *
EC*Hostility 0.024479 0.031024 0.066666
R2 base 0.2131
ΔR2
0.004312
F(2,114) base 15.43***
F(3,113) with moderator 10.46***
* p < 0.05; ** p < 0.01; *** p < 0.001. EC: Entrepreneurial capabilities
Base model Including moderator
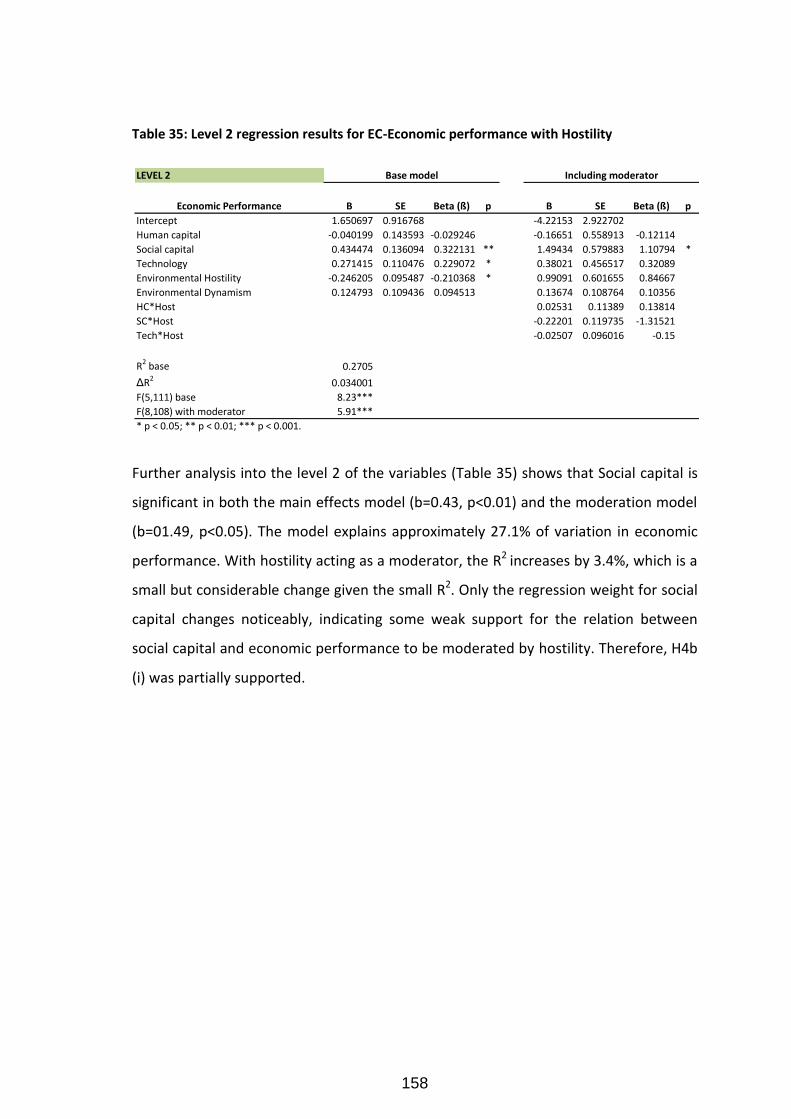
158
Table 35: Level 2 regression results for EC-Economic performance with Hostility
Further analysis into the level 2 of the variables (Table 35) shows that Social capital is
significant in both the main effects model (b=0.43, p<0.01) and the moderation model
(b=01.49, p<0.05). The model explains approximately 27.1% of variation in economic
performance. With hostility acting as a moderator, the R2 increases by 3.4%, which is a
small but considerable change given the small R2. Only the regression weight for social
capital changes noticeably, indicating some weak support for the relation between
social capital and economic performance to be moderated by hostility. Therefore, H4b
(i) was partially supported.
LEVEL 2
Economic Performance B SE Beta (ß) p B SE Beta (ß) p
Intercept 1.650697 0.916768 -4.22153 2.922702
Human capital -0.040199 0.143593 -0.029246 -0.16651 0.558913 -0.12114
Social capital 0.434474 0.136094 0.322131 ** 1.49434 0.579883 1.10794 *
Technology 0.271415 0.110476 0.229072 * 0.38021 0.456517 0.32089
Environmental Hostility -0.246205 0.095487 -0.210368 * 0.99091 0.601655 0.84667
Environmental Dynamism 0.124793 0.109436 0.094513 0.13674 0.108764 0.10356
HC*Host 0.02531 0.11389 0.13814
SC*Host -0.22201 0.119735 -1.31521
Tech*Host -0.02507 0.096016 -0.15
R2 base 0.2705
ΔR20.034001
F(5,111) base 8.23***
F(8,108) with moderator 5.91***
* p < 0.05; ** p < 0.01; *** p < 0.001.
Base model Including moderator
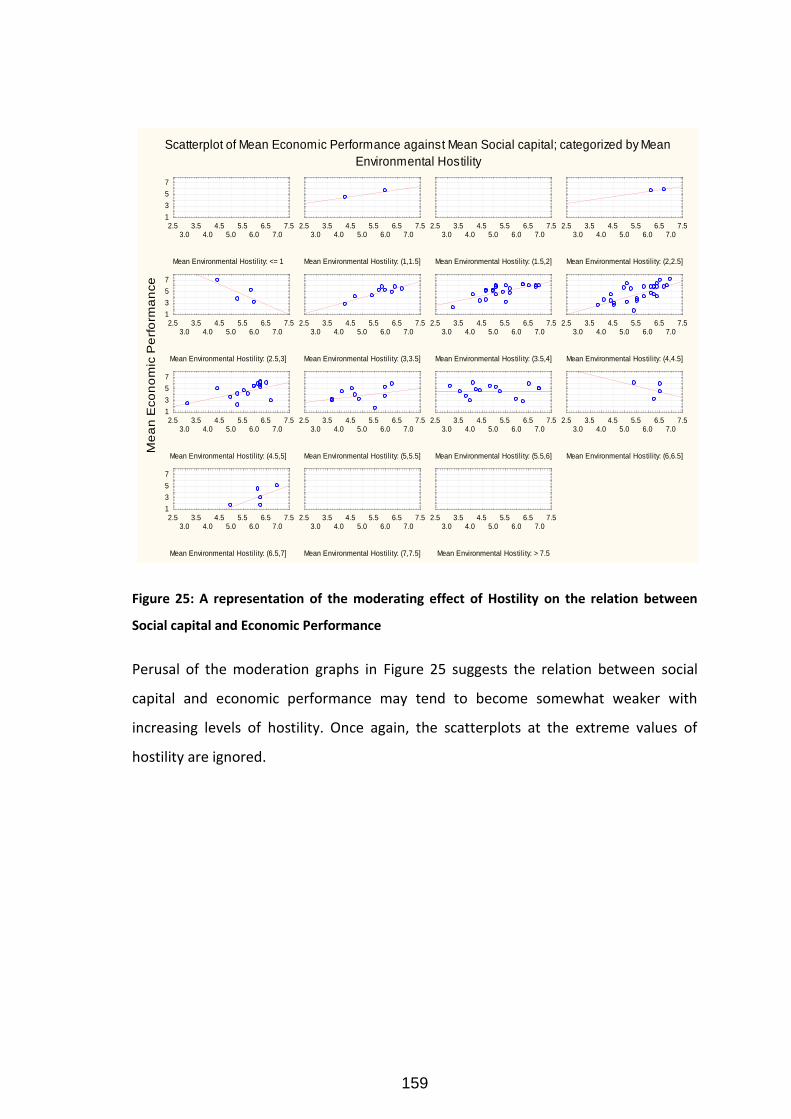
159
Figure 25: A representation of the moderating effect of Hostility on the relation between
Social capital and Economic Performance
Perusal of the moderation graphs in Figure 25 suggests the relation between social
capital and economic performance may tend to become somewhat weaker with
increasing levels of hostility. Once again, the scatterplots at the extreme values of
hostility are ignored.
Scatterplot of Mean Economic Performance against Mean Social capital; categorized by Mean
Environmental Hostility
Mean Social capital
Me
an
Eco
no
mic
Pe
rfo
rma
nce
Mean Environmental Hostility: <= 1
2.53.0
3.54.0
4.55.0
5.56.0
6.57.0
7.51
3
5
7
Mean Environmental Hostility: (1,1.5]
2.53.0
3.54.0
4.55.0
5.56.0
6.57.0
7.5
Mean Environmental Hostility: (1.5,2]
2.53.0
3.54.0
4.55.0
5.56.0
6.57.0
7.5
Mean Environmental Hostility: (2,2.5]
2.53.0
3.54.0
4.55.0
5.56.0
6.57.0
7.5
Mean Environmental Hostility: (2.5,3]
2.53.0
3.54.0
4.55.0
5.56.0
6.57.0
7.51
3
5
7
Mean Environmental Hostility: (3,3.5]
2.53.0
3.54.0
4.55.0
5.56.0
6.57.0
7.5
Mean Environmental Hostility: (3.5,4]
2.53.0
3.54.0
4.55.0
5.56.0
6.57.0
7.5
Mean Environmental Hostility: (4,4.5]
2.53.0
3.54.0
4.55.0
5.56.0
6.57.0
7.5
Mean Environmental Hostility: (4.5,5]
2.53.0
3.54.0
4.55.0
5.56.0
6.57.0
7.51
3
5
7
Mean Environmental Hostility: (5,5.5]
2.53.0
3.54.0
4.55.0
5.56.0
6.57.0
7.5
Mean Environmental Hostility: (5.5,6]
2.53.0
3.54.0
4.55.0
5.56.0
6.57.0
7.5
Mean Environmental Hostility: (6,6.5]
2.53.0
3.54.0
4.55.0
5.56.0
6.57.0
7.5
Mean Environmental Hostility: (6.5,7]
2.53.0
3.54.0
4.55.0
5.56.0
6.57.0
7.51
3
5
7
Mean Environmental Hostility: (7,7.5]
2.53.0
3.54.0
4.55.0
5.56.0
6.57.0
7.5
Mean Environmental Hostility: > 7.5
2.53.0
3.54.0
4.55.0
5.56.0
6.57.0
7.5
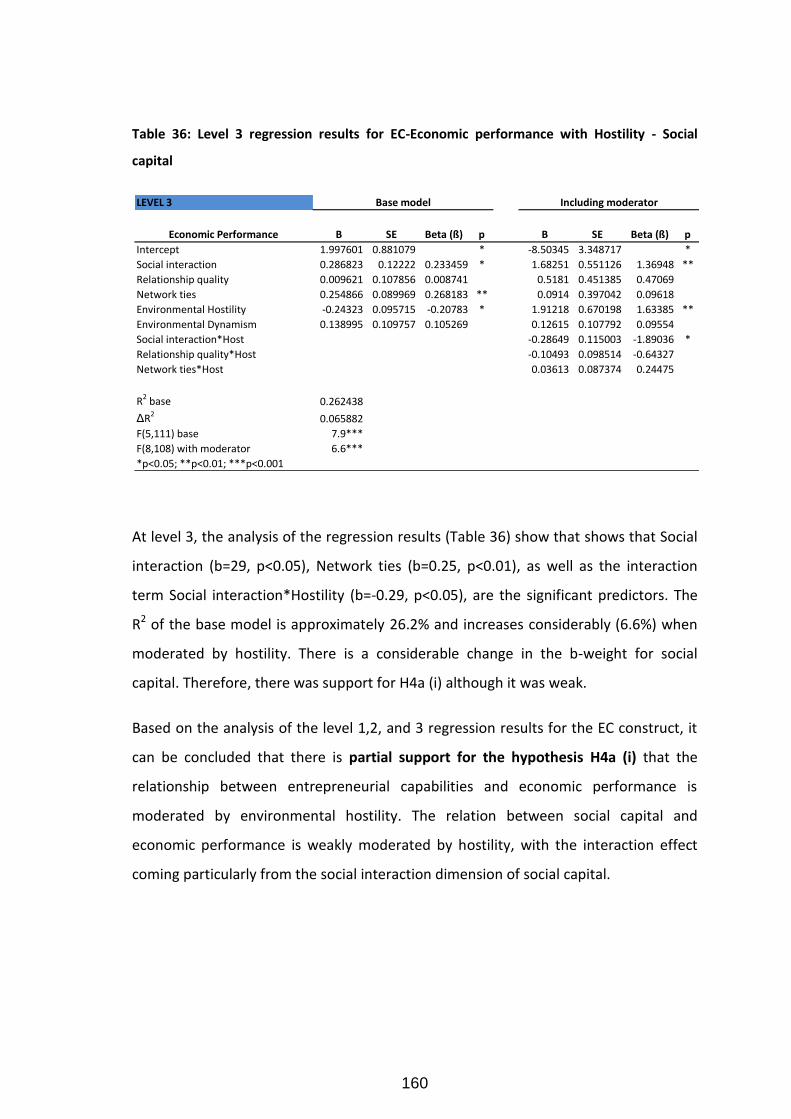
160
Table 36: Level 3 regression results for EC-Economic performance with Hostility - Social
capital
At level 3, the analysis of the regression results (Table 36) show that shows that Social
interaction (b=29, p<0.05), Network ties (b=0.25, p<0.01), as well as the interaction
term Social interaction*Hostility (b=-0.29, p<0.05), are the significant predictors. The
R2 of the base model is approximately 26.2% and increases considerably (6.6%) when
moderated by hostility. There is a considerable change in the b-weight for social
capital. Therefore, there was support for H4a (i) although it was weak.
Based on the analysis of the level 1,2, and 3 regression results for the EC construct, it
can be concluded that there is partial support for the hypothesis H4a (i) that the
relationship between entrepreneurial capabilities and economic performance is
moderated by environmental hostility. The relation between social capital and
economic performance is weakly moderated by hostility, with the interaction effect
coming particularly from the social interaction dimension of social capital.
LEVEL 3
Economic Performance B SE Beta (ß) p B SE Beta (ß) p
Intercept 1.997601 0.881079 * -8.50345 3.348717 *
Social interaction 0.286823 0.12222 0.233459 * 1.68251 0.551126 1.36948 **
Relationship quality 0.009621 0.107856 0.008741 0.5181 0.451385 0.47069
Network ties 0.254866 0.089969 0.268183 ** 0.0914 0.397042 0.09618
Environmental Hostility -0.24323 0.095715 -0.20783 * 1.91218 0.670198 1.63385 **
Environmental Dynamism 0.138995 0.109757 0.105269 0.12615 0.107792 0.09554
Social interaction*Host -0.28649 0.115003 -1.89036 *
Relationship quality*Host -0.10493 0.098514 -0.64327
Network ties*Host 0.03613 0.087374 0.24475
R2 base 0.262438
ΔR20.065882
F(5,111) base 7.9***
F(8,108) with moderator 6.6***
*p<0.05; **p<0.01; ***p<0.001
Base model Including moderator
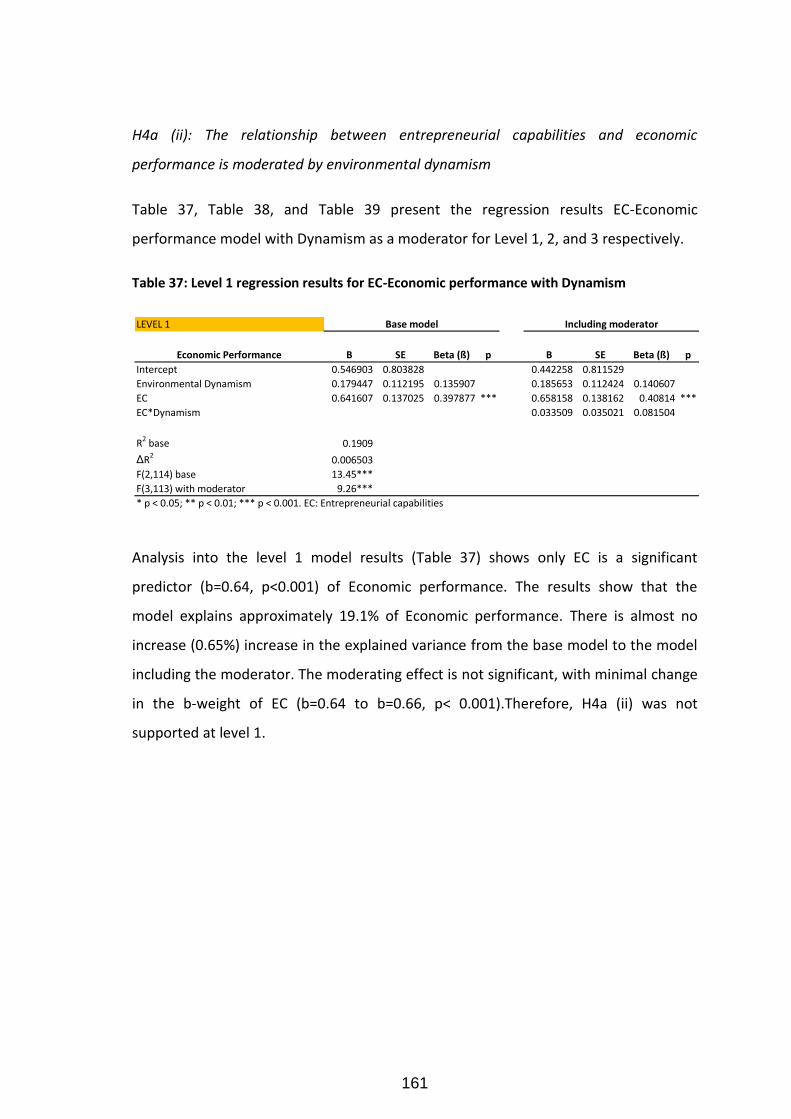
161
H4a (ii): The relationship between entrepreneurial capabilities and economic
performance is moderated by environmental dynamism
Table 37, Table 38, and Table 39 present the regression results EC-Economic
performance model with Dynamism as a moderator for Level 1, 2, and 3 respectively.
Table 37: Level 1 regression results for EC-Economic performance with Dynamism
Analysis into the level 1 model results (Table 37) shows only EC is a significant
predictor (b=0.64, p<0.001) of Economic performance. The results show that the
model explains approximately 19.1% of Economic performance. There is almost no
increase (0.65%) increase in the explained variance from the base model to the model
including the moderator. The moderating effect is not significant, with minimal change
in the b-weight of EC (b=0.64 to b=0.66, p< 0.001).Therefore, H4a (ii) was not
supported at level 1.
LEVEL 1
Economic Performance B SE Beta (ß) p B SE Beta (ß) p
Intercept 0.546903 0.803828 0.442258 0.811529
Environmental Dynamism 0.179447 0.112195 0.135907 0.185653 0.112424 0.140607
EC 0.641607 0.137025 0.397877 *** 0.658158 0.138162 0.40814 ***
EC*Dynamism 0.033509 0.035021 0.081504
R2 base 0.1909
ΔR2
0.006503
F(2,114) base 13.45***
F(3,113) with moderator 9.26***
* p < 0.05; ** p < 0.01; *** p < 0.001. EC: Entrepreneurial capabilities
Base model Including moderator
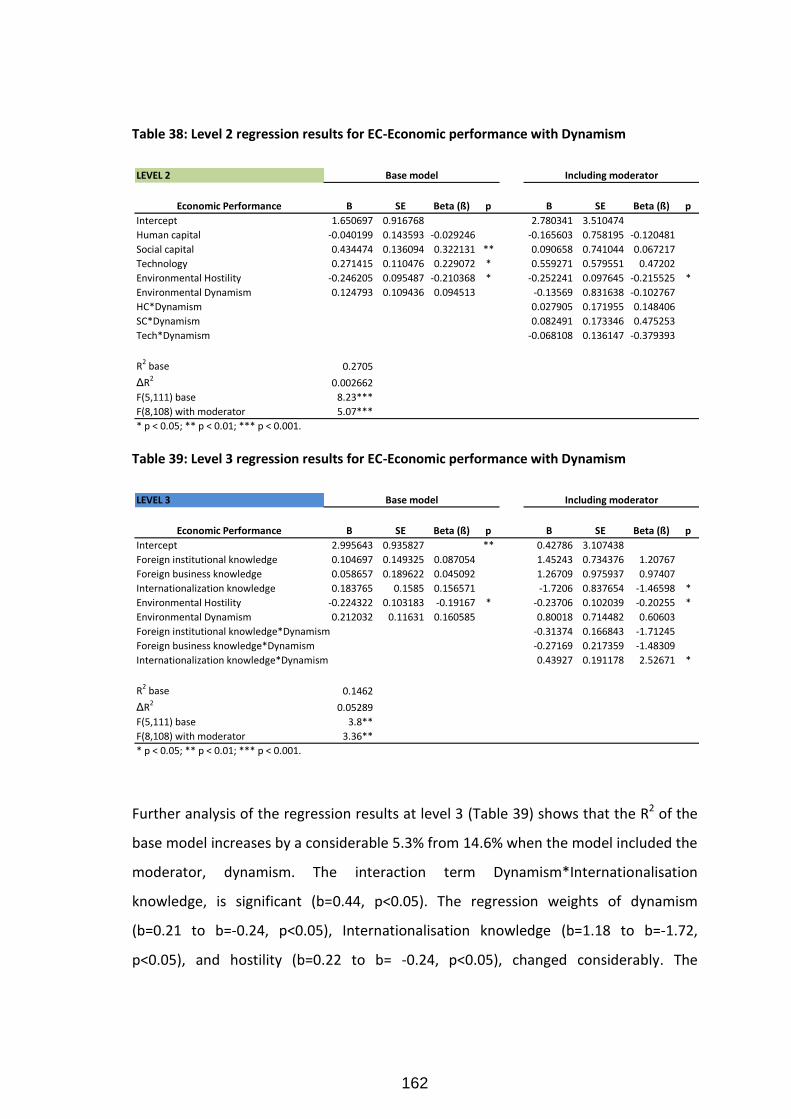
162
Table 38: Level 2 regression results for EC-Economic performance with Dynamism
Table 39: Level 3 regression results for EC-Economic performance with Dynamism
Further analysis of the regression results at level 3 (Table 39) shows that the R2 of the
base model increases by a considerable 5.3% from 14.6% when the model included the
moderator, dynamism. The interaction term Dynamism*Internationalisation
knowledge, is significant (b=0.44, p<0.05). The regression weights of dynamism
(b=0.21 to b=-0.24, p<0.05), Internationalisation knowledge (b=1.18 to b=-1.72,
p<0.05), and hostility (b=0.22 to b= -0.24, p<0.05), changed considerably. The
LEVEL 2
Economic Performance B SE Beta (ß) p B SE Beta (ß) p
Intercept 1.650697 0.916768 2.780341 3.510474
Human capital -0.040199 0.143593 -0.029246 -0.165603 0.758195 -0.120481
Social capital 0.434474 0.136094 0.322131 ** 0.090658 0.741044 0.067217
Technology 0.271415 0.110476 0.229072 * 0.559271 0.579551 0.47202
Environmental Hostility -0.246205 0.095487 -0.210368 * -0.252241 0.097645 -0.215525 *
Environmental Dynamism 0.124793 0.109436 0.094513 -0.13569 0.831638 -0.102767
HC*Dynamism 0.027905 0.171955 0.148406
SC*Dynamism 0.082491 0.173346 0.475253
Tech*Dynamism -0.068108 0.136147 -0.379393
R2 base 0.2705
ΔR20.002662
F(5,111) base 8.23***
F(8,108) with moderator 5.07***
* p < 0.05; ** p < 0.01; *** p < 0.001.
Base model Including moderator
LEVEL 3
Economic Performance B SE Beta (ß) p B SE Beta (ß) p
Intercept 2.995643 0.935827 ** 0.42786 3.107438
Foreign institutional knowledge 0.104697 0.149325 0.087054 1.45243 0.734376 1.20767
Foreign business knowledge 0.058657 0.189622 0.045092 1.26709 0.975937 0.97407
Internationalization knowledge 0.183765 0.1585 0.156571 -1.7206 0.837654 -1.46598 *
Environmental Hostility -0.224322 0.103183 -0.19167 * -0.23706 0.102039 -0.20255 *
Environmental Dynamism 0.212032 0.11631 0.160585 0.80018 0.714482 0.60603
Foreign institutional knowledge*Dynamism -0.31374 0.166843 -1.71245
Foreign business knowledge*Dynamism -0.27169 0.217359 -1.48309
Internationalization knowledge*Dynamism 0.43927 0.191178 2.52671 *
R2 base 0.1462
ΔR20.05289
F(5,111) base 3.8**
F(8,108) with moderator 3.36**
* p < 0.05; ** p < 0.01; *** p < 0.001.
Base model Including moderator
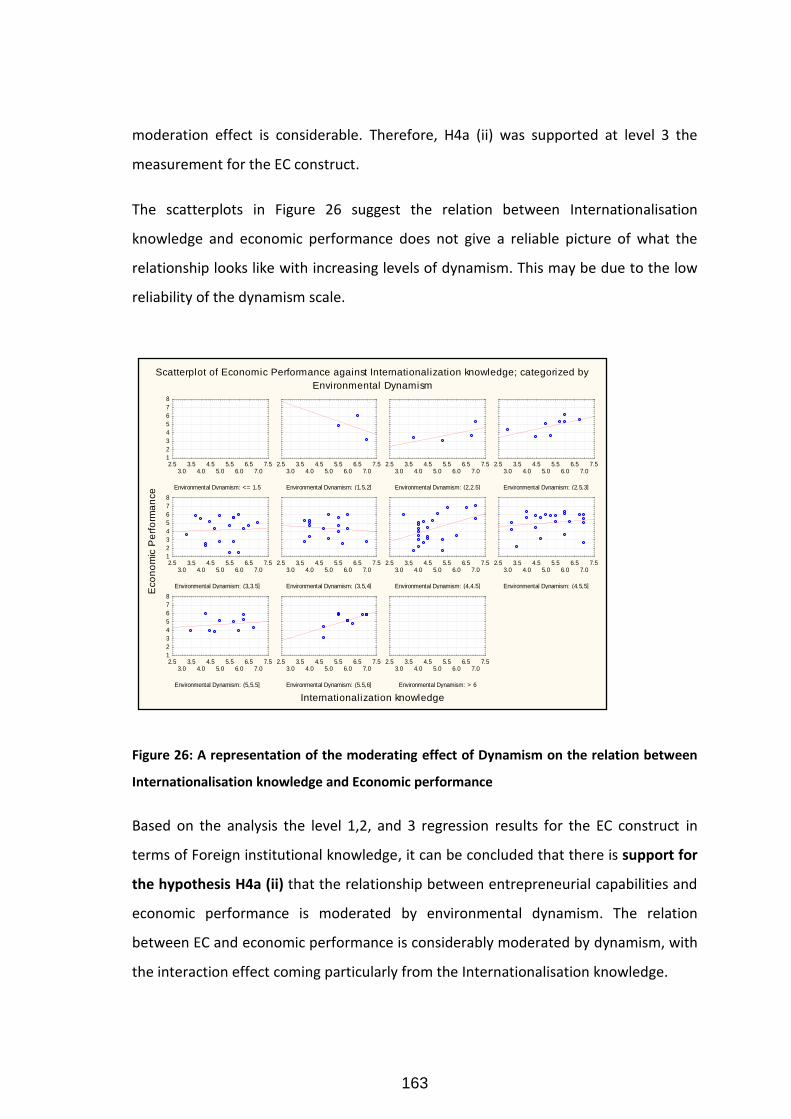
163
moderation effect is considerable. Therefore, H4a (ii) was supported at level 3 the
measurement for the EC construct.
The scatterplots in Figure 26 suggest the relation between Internationalisation
knowledge and economic performance does not give a reliable picture of what the
relationship looks like with increasing levels of dynamism. This may be due to the low
reliability of the dynamism scale.
Figure 26: A representation of the moderating effect of Dynamism on the relation between
Internationalisation knowledge and Economic performance
Based on the analysis the level 1,2, and 3 regression results for the EC construct in
terms of Foreign institutional knowledge, it can be concluded that there is support for
the hypothesis H4a (ii) that the relationship between entrepreneurial capabilities and
economic performance is moderated by environmental dynamism. The relation
between EC and economic performance is considerably moderated by dynamism, with
the interaction effect coming particularly from the Internationalisation knowledge.
Scatterplot of Economic Performance against Internationalization knowledge; categorized by
Environmental Dynamism
Internationalization knowledge
Eco
no
mic
Pe
rfo
rma
nce Environmental Dynamism: <= 1.5
2.53.0
3.54.0
4.55.0
5.56.0
6.57.0
7.51
2
3
4
5
6
7
8
Environmental Dynamism: (1.5,2]
2.53.0
3.54.0
4.55.0
5.56.0
6.57.0
7.5
Environmental Dynamism: (2,2.5]
2.53.0
3.54.0
4.55.0
5.56.0
6.57.0
7.5
Environmental Dynamism: (2.5,3]
2.53.0
3.54.0
4.55.0
5.56.0
6.57.0
7.5
Environmental Dynamism: (3,3.5]
2.53.0
3.54.0
4.55.0
5.56.0
6.57.0
7.51
2
3
4
5
6
7
8
Environmental Dynamism: (3.5,4]
2.53.0
3.54.0
4.55.0
5.56.0
6.57.0
7.5
Environmental Dynamism: (4,4.5]
2.53.0
3.54.0
4.55.0
5.56.0
6.57.0
7.5
Environmental Dynamism: (4.5,5]
2.53.0
3.54.0
4.55.0
5.56.0
6.57.0
7.5
Environmental Dynamism: (5,5.5]
2.53.0
3.54.0
4.55.0
5.56.0
6.57.0
7.51
2
3
4
5
6
7
8
Environmental Dynamism: (5.5,6]
2.53.0
3.54.0
4.55.0
5.56.0
6.57.0
7.5
Environmental Dynamism: > 6
2.53.0
3.54.0
4.55.0
5.56.0
6.57.0
7.5
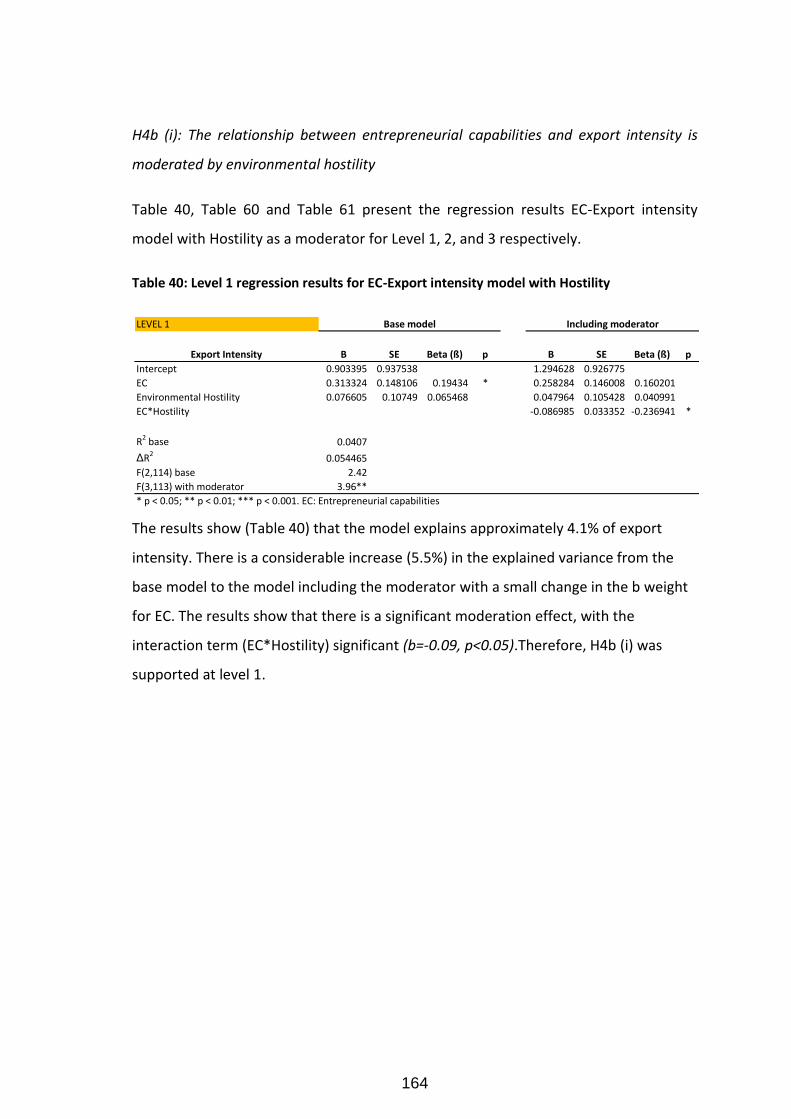
164
H4b (i): The relationship between entrepreneurial capabilities and export intensity is
moderated by environmental hostility
Table 40, Table 60 and Table 61 present the regression results EC-Export intensity
model with Hostility as a moderator for Level 1, 2, and 3 respectively.
Table 40: Level 1 regression results for EC-Export intensity model with Hostility
The results show (Table 40) that the model explains approximately 4.1% of export
intensity. There is a considerable increase (5.5%) in the explained variance from the
base model to the model including the moderator with a small change in the b weight
for EC. The results show that there is a significant moderation effect, with the
interaction term (EC*Hostility) significant (b=-0.09, p<0.05).Therefore, H4b (i) was
supported at level 1.
LEVEL 1
Export Intensity B SE Beta (ß) p B SE Beta (ß) p
Intercept 0.903395 0.937538 1.294628 0.926775
EC 0.313324 0.148106 0.19434 * 0.258284 0.146008 0.160201
Environmental Hostility 0.076605 0.10749 0.065468 0.047964 0.105428 0.040991
EC*Hostility -0.086985 0.033352 -0.236941 *
R2 base 0.0407
ΔR2
0.054465
F(2,114) base 2.42
F(3,113) with moderator 3.96**
* p < 0.05; ** p < 0.01; *** p < 0.001. EC: Entrepreneurial capabilities
Base model Including moderator
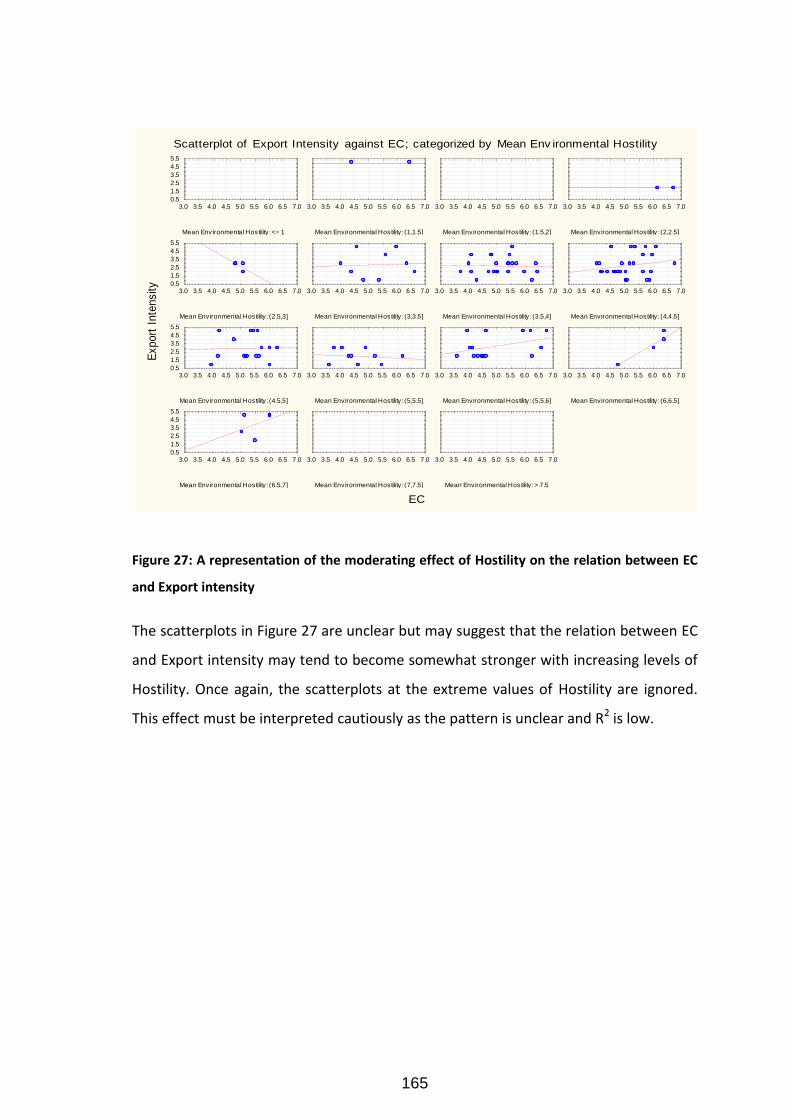
165
Figure 27: A representation of the moderating effect of Hostility on the relation between EC
and Export intensity
The scatterplots in Figure 27 are unclear but may suggest that the relation between EC
and Export intensity may tend to become somewhat stronger with increasing levels of
Hostility. Once again, the scatterplots at the extreme values of Hostility are ignored.
This effect must be interpreted cautiously as the pattern is unclear and R2 is low.
Scatterplot of Export Intensity against EC; categorized by Mean Env ironmental Hostility
EC
Export
Inte
nsity
Mean Environmental Hostility : <= 1
3.0 3.5 4.0 4.5 5.0 5.5 6.0 6.5 7.00.5
1.5
2.5
3.5
4.5
5.5
Mean Environmental Hostility : (1,1.5]
3.0 3.5 4.0 4.5 5.0 5.5 6.0 6.5 7.0
Mean Environmental Hostility : (1.5,2]
3.0 3.5 4.0 4.5 5.0 5.5 6.0 6.5 7.0
Mean Environmental Hostility : (2,2.5]
3.0 3.5 4.0 4.5 5.0 5.5 6.0 6.5 7.0
Mean Environmental Hostility : (2.5,3]
3.0 3.5 4.0 4.5 5.0 5.5 6.0 6.5 7.00.5
1.5
2.5
3.5
4.5
5.5
Mean Environmental Hostility : (3,3.5]
3.0 3.5 4.0 4.5 5.0 5.5 6.0 6.5 7.0
Mean Environmental Hostility : (3.5,4]
3.0 3.5 4.0 4.5 5.0 5.5 6.0 6.5 7.0
Mean Environmental Hostility : (4,4.5]
3.0 3.5 4.0 4.5 5.0 5.5 6.0 6.5 7.0
Mean Environmental Hostility : (4.5,5]
3.0 3.5 4.0 4.5 5.0 5.5 6.0 6.5 7.00.5
1.5
2.5
3.5
4.5
5.5
Mean Environmental Hostility : (5,5.5]
3.0 3.5 4.0 4.5 5.0 5.5 6.0 6.5 7.0
Mean Environmental Hostility : (5.5,6]
3.0 3.5 4.0 4.5 5.0 5.5 6.0 6.5 7.0
Mean Environmental Hostility : (6,6.5]
3.0 3.5 4.0 4.5 5.0 5.5 6.0 6.5 7.0
Mean Environmental Hostility : (6.5,7]
3.0 3.5 4.0 4.5 5.0 5.5 6.0 6.5 7.00.5
1.5
2.5
3.5
4.5
5.5
Mean Environmental Hostility : (7,7.5]
3.0 3.5 4.0 4.5 5.0 5.5 6.0 6.5 7.0
Mean Environmental Hostility : > 7.5
3.0 3.5 4.0 4.5 5.0 5.5 6.0 6.5 7.0
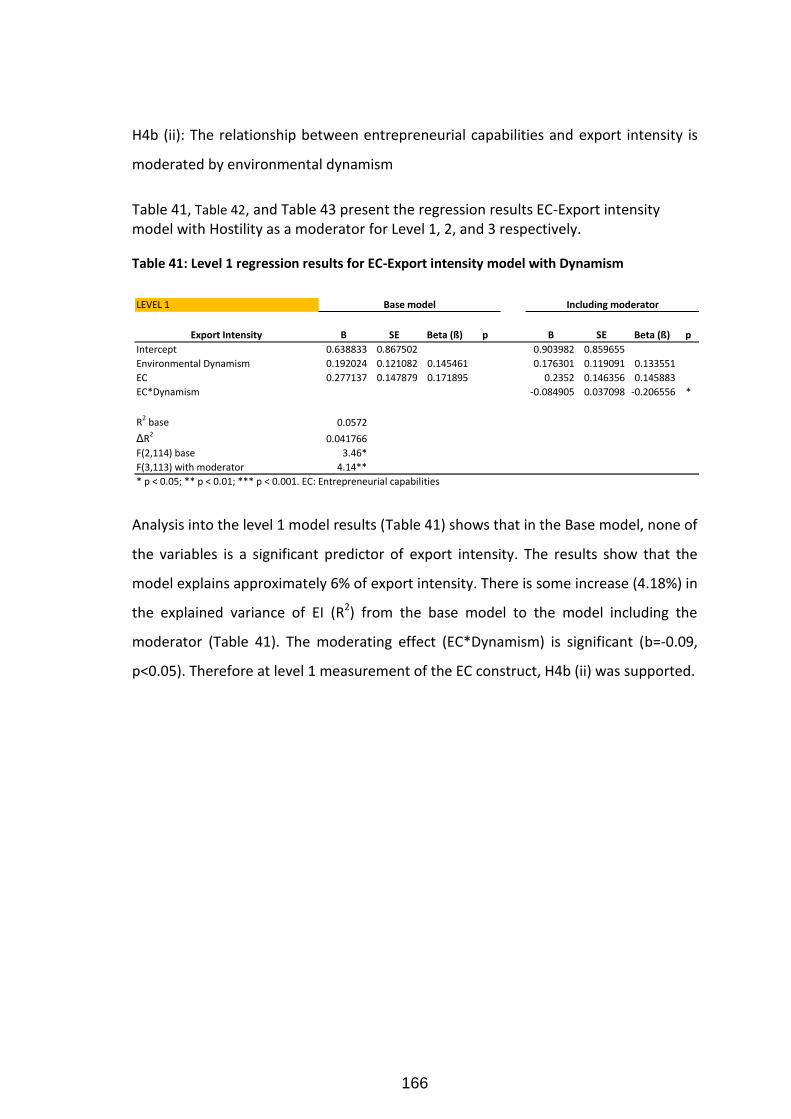
166
H4b (ii): The relationship between entrepreneurial capabilities and export intensity is
moderated by environmental dynamism
Table 41, Table 42, and Table 43 present the regression results EC-Export intensity model with Hostility as a moderator for Level 1, 2, and 3 respectively.
Table 41: Level 1 regression results for EC-Export intensity model with Dynamism
Analysis into the level 1 model results (Table 41) shows that in the Base model, none of
the variables is a significant predictor of export intensity. The results show that the
model explains approximately 6% of export intensity. There is some increase (4.18%) in
the explained variance of EI (R2) from the base model to the model including the
moderator (Table 41). The moderating effect (EC*Dynamism) is significant (b=-0.09,
p<0.05). Therefore at level 1 measurement of the EC construct, H4b (ii) was supported.
LEVEL 1
Export Intensity B SE Beta (ß) p B SE Beta (ß) p
Intercept 0.638833 0.867502 0.903982 0.859655
Environmental Dynamism 0.192024 0.121082 0.145461 0.176301 0.119091 0.133551
EC 0.277137 0.147879 0.171895 0.2352 0.146356 0.145883
EC*Dynamism -0.084905 0.037098 -0.206556 *
R2 base 0.0572
ΔR2
0.041766
F(2,114) base 3.46*
F(3,113) with moderator 4.14**
* p < 0.05; ** p < 0.01; *** p < 0.001. EC: Entrepreneurial capabilities
Base model Including moderator
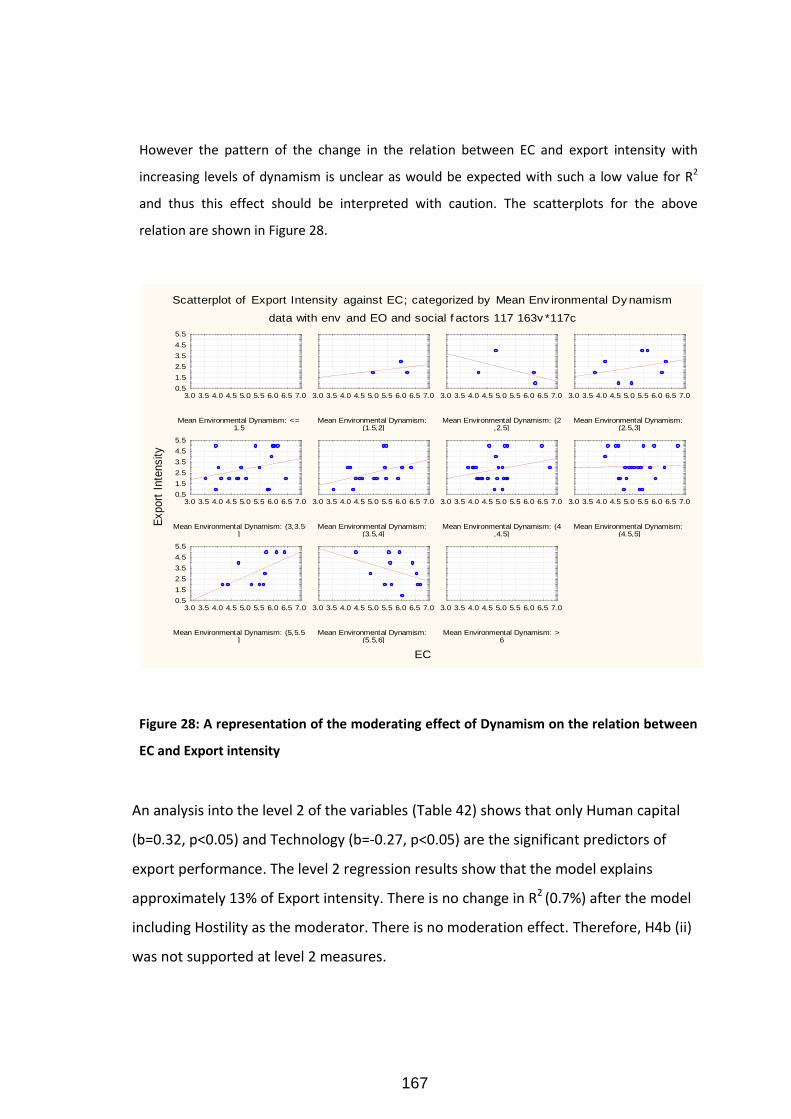
167
However the pattern of the change in the relation between EC and export intensity with
increasing levels of dynamism is unclear as would be expected with such a low value for R2
and thus this effect should be interpreted with caution. The scatterplots for the above
relation are shown in Figure 28.
Figure 28: A representation of the moderating effect of Dynamism on the relation between
EC and Export intensity
An analysis into the level 2 of the variables (Table 42) shows that only Human capital
(b=0.32, p<0.05) and Technology (b=-0.27, p<0.05) are the significant predictors of
export performance. The level 2 regression results show that the model explains
approximately 13% of Export intensity. There is no change in R2 (0.7%) after the model
including Hostility as the moderator. There is no moderation effect. Therefore, H4b (ii)
was not supported at level 2 measures.
Scatterplot of Export Intensity against EC; categorized by Mean Env ironmental Dy namism
data with env and EO and social f actors 117 163v *117c
EC
Export
Inte
nsity
Mean Environmental Dynamism: <=1.5
3.0 3.5 4.0 4.5 5.0 5.5 6.0 6.5 7.00.5
1.5
2.5
3.5
4.5
5.5
Mean Environmental Dynamism: (1.5,2]
3.0 3.5 4.0 4.5 5.0 5.5 6.0 6.5 7.0
Mean Environmental Dynamism: (2,2.5]
3.0 3.5 4.0 4.5 5.0 5.5 6.0 6.5 7.0
Mean Environmental Dynamism: (2.5,3]
3.0 3.5 4.0 4.5 5.0 5.5 6.0 6.5 7.0
Mean Environmental Dynamism: (3,3.5]
3.0 3.5 4.0 4.5 5.0 5.5 6.0 6.5 7.00.5
1.5
2.5
3.5
4.5
5.5
Mean Environmental Dynamism: (3.5,4]
3.0 3.5 4.0 4.5 5.0 5.5 6.0 6.5 7.0
Mean Environmental Dynamism: (4,4.5]
3.0 3.5 4.0 4.5 5.0 5.5 6.0 6.5 7.0
Mean Environmental Dynamism: (4.5,5]
3.0 3.5 4.0 4.5 5.0 5.5 6.0 6.5 7.0
Mean Environmental Dynamism: (5,5.5]
3.0 3.5 4.0 4.5 5.0 5.5 6.0 6.5 7.00.5
1.5
2.5
3.5
4.5
5.5
Mean Environmental Dynamism: (5.5,6]
3.0 3.5 4.0 4.5 5.0 5.5 6.0 6.5 7.0
Mean Environmental Dynamism: >6
3.0 3.5 4.0 4.5 5.0 5.5 6.0 6.5 7.0
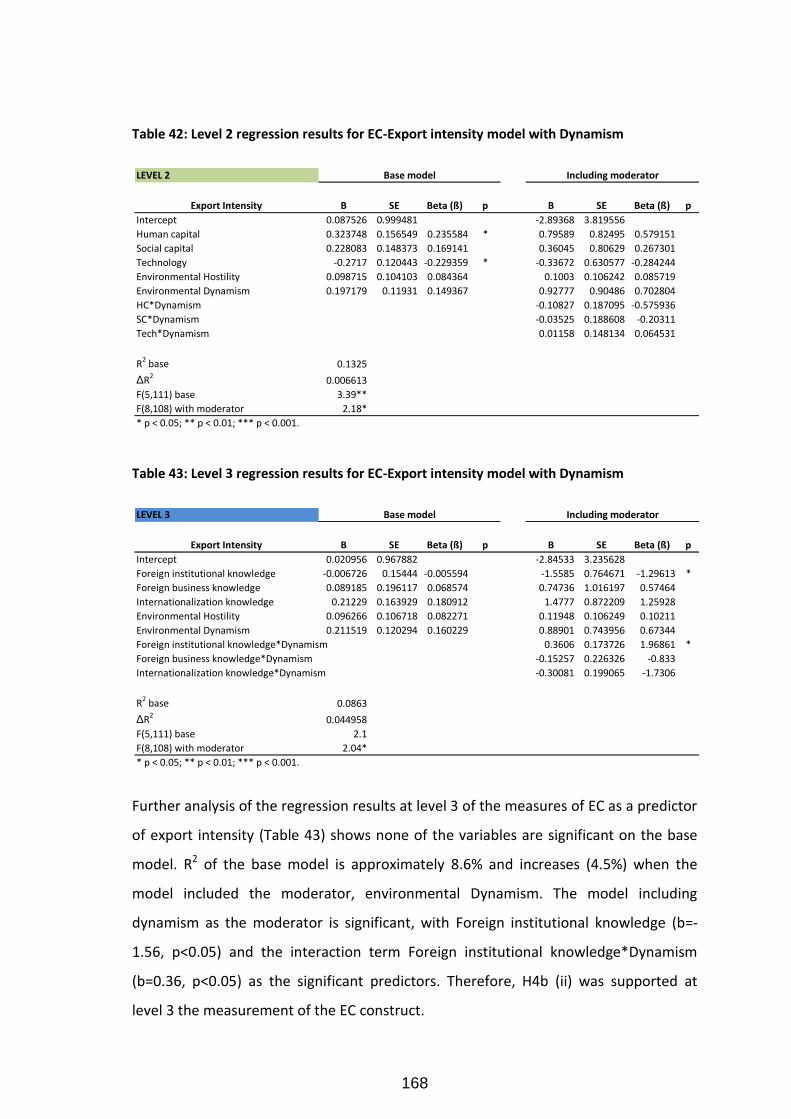
168
Table 42: Level 2 regression results for EC-Export intensity model with Dynamism
Table 43: Level 3 regression results for EC-Export intensity model with Dynamism
Further analysis of the regression results at level 3 of the measures of EC as a predictor
of export intensity (Table 43) shows none of the variables are significant on the base
model. R2 of the base model is approximately 8.6% and increases (4.5%) when the
model included the moderator, environmental Dynamism. The model including
dynamism as the moderator is significant, with Foreign institutional knowledge (b=-
1.56, p<0.05) and the interaction term Foreign institutional knowledge*Dynamism
(b=0.36, p<0.05) as the significant predictors. Therefore, H4b (ii) was supported at
level 3 the measurement of the EC construct.
LEVEL 2
Export Intensity B SE Beta (ß) p B SE Beta (ß) p
Intercept 0.087526 0.999481 -2.89368 3.819556
Human capital 0.323748 0.156549 0.235584 * 0.79589 0.82495 0.579151
Social capital 0.228083 0.148373 0.169141 0.36045 0.80629 0.267301
Technology -0.2717 0.120443 -0.229359 * -0.33672 0.630577 -0.284244
Environmental Hostility 0.098715 0.104103 0.084364 0.1003 0.106242 0.085719
Environmental Dynamism 0.197179 0.11931 0.149367 0.92777 0.90486 0.702804
HC*Dynamism -0.10827 0.187095 -0.575936
SC*Dynamism -0.03525 0.188608 -0.20311
Tech*Dynamism 0.01158 0.148134 0.064531
R2 base 0.1325
ΔR2
0.006613
F(5,111) base 3.39**
F(8,108) with moderator 2.18*
* p < 0.05; ** p < 0.01; *** p < 0.001.
Base model Including moderator
LEVEL 3
Export Intensity B SE Beta (ß) p B SE Beta (ß) p
Intercept 0.020956 0.967882 -2.84533 3.235628
Foreign institutional knowledge -0.006726 0.15444 -0.005594 -1.5585 0.764671 -1.29613 *
Foreign business knowledge 0.089185 0.196117 0.068574 0.74736 1.016197 0.57464
Internationalization knowledge 0.21229 0.163929 0.180912 1.4777 0.872209 1.25928
Environmental Hostility 0.096266 0.106718 0.082271 0.11948 0.106249 0.10211
Environmental Dynamism 0.211519 0.120294 0.160229 0.88901 0.743956 0.67344
Foreign institutional knowledge*Dynamism 0.3606 0.173726 1.96861 *
Foreign business knowledge*Dynamism -0.15257 0.226326 -0.833
Internationalization knowledge*Dynamism -0.30081 0.199065 -1.7306
R2 base 0.0863
ΔR20.044958
F(5,111) base 2.1
F(8,108) with moderator 2.04*
* p < 0.05; ** p < 0.01; *** p < 0.001.
Base model Including moderator
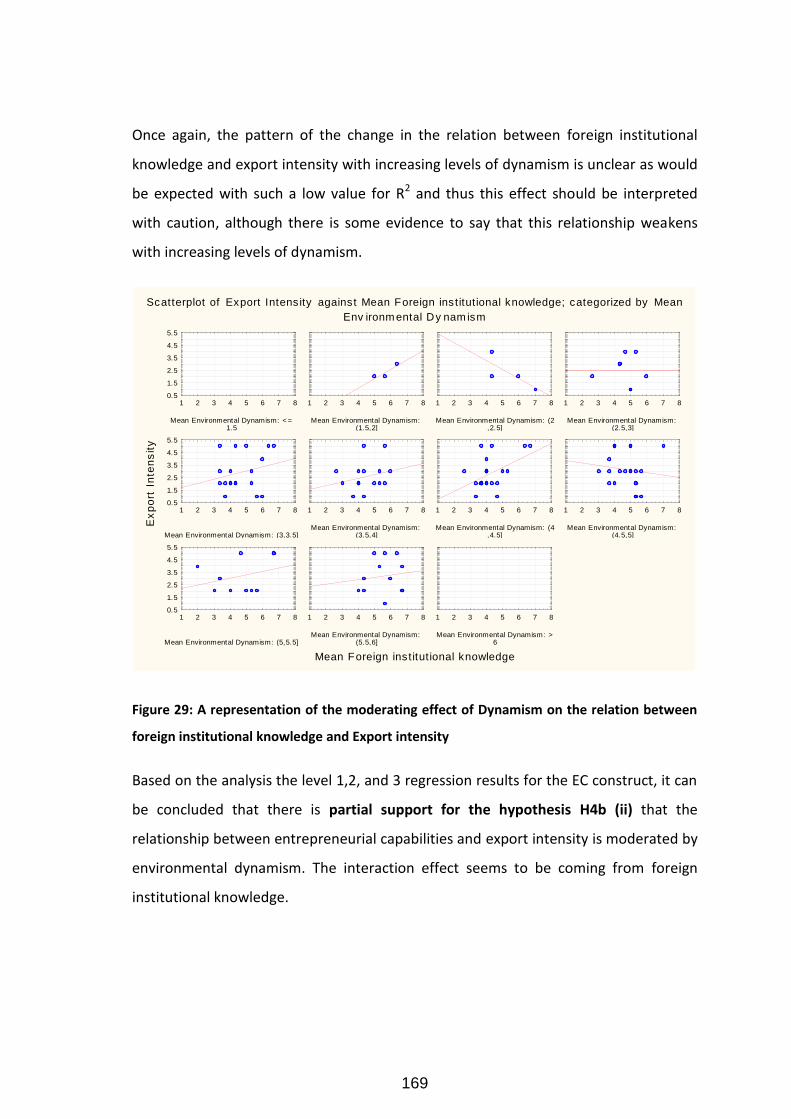
169
Once again, the pattern of the change in the relation between foreign institutional
knowledge and export intensity with increasing levels of dynamism is unclear as would
be expected with such a low value for R2 and thus this effect should be interpreted
with caution, although there is some evidence to say that this relationship weakens
with increasing levels of dynamism.
Figure 29: A representation of the moderating effect of Dynamism on the relation between
foreign institutional knowledge and Export intensity
Based on the analysis the level 1,2, and 3 regression results for the EC construct, it can
be concluded that there is partial support for the hypothesis H4b (ii) that the
relationship between entrepreneurial capabilities and export intensity is moderated by
environmental dynamism. The interaction effect seems to be coming from foreign
institutional knowledge.
Scatterplot of Export Intensity against Mean Foreign institut ional knowledge; categorized by Mean
Env ironm ental Dy nam ism
Mean Foreign institut ional knowledge
Ex
po
rt I
nte
ns
ity
Mean Environmental Dynamism: < =1.5
1 2 3 4 5 6 7 80.5
1.5
2.5
3.5
4.5
5.5
Mean Environmental Dynamism: (1.5,2]
1 2 3 4 5 6 7 8
Mean Environmental Dynamism: (2,2.5]
1 2 3 4 5 6 7 8
Mean Environmental Dynamism: (2.5,3]
1 2 3 4 5 6 7 8
Mean Environmental Dynamism: (3,3.5]
1 2 3 4 5 6 7 80.5
1.5
2.5
3.5
4.5
5.5
Mean Environmental Dynamism: (3.5,4]
1 2 3 4 5 6 7 8
Mean Environmental Dynamism: (4,4.5]
1 2 3 4 5 6 7 8
Mean Environmental Dynamism: (4.5,5]
1 2 3 4 5 6 7 8
Mean Environmental Dynamism: (5,5.5]
1 2 3 4 5 6 7 80.5
1.5
2.5
3.5
4.5
5.5
Mean Environmental Dynamism: (5.5,6]
1 2 3 4 5 6 7 8
Mean Environmental Dynamism: >6
1 2 3 4 5 6 7 8
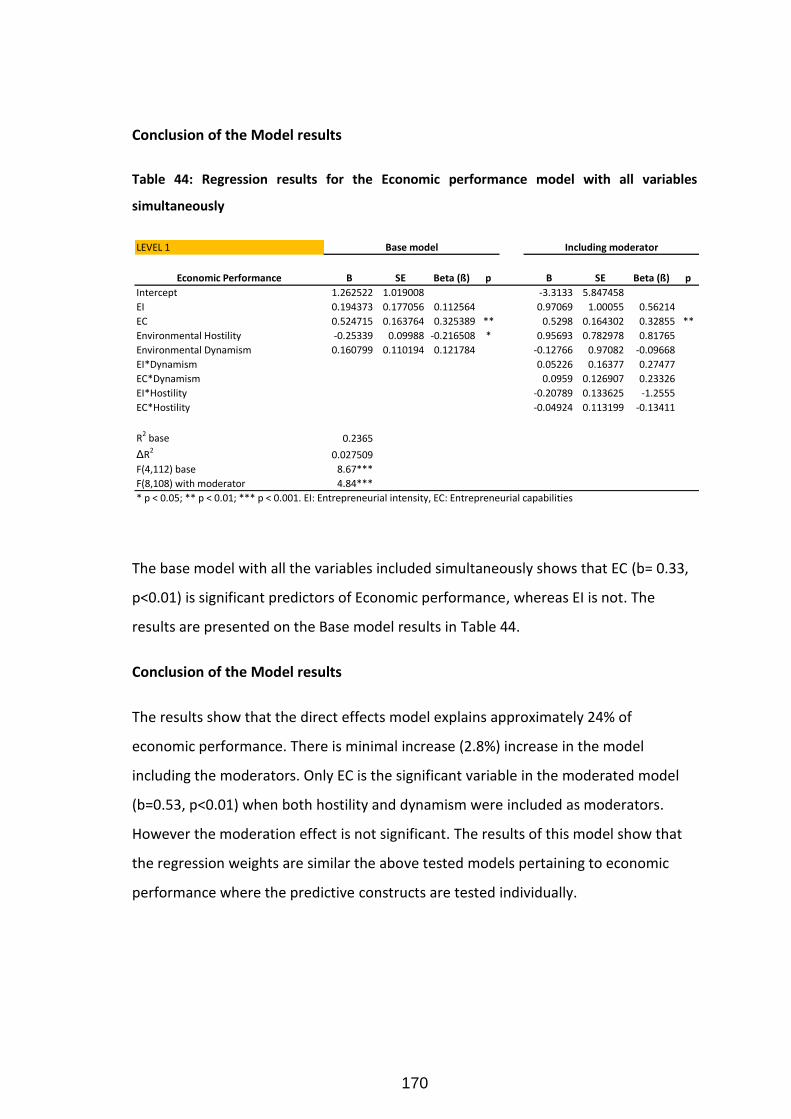
170
Conclusion of the Model results
Table 44: Regression results for the Economic performance model with all variables
simultaneously
The base model with all the variables included simultaneously shows that EC (b= 0.33,
p<0.01) is significant predictors of Economic performance, whereas EI is not. The
results are presented on the Base model results in Table 44.
Conclusion of the Model results
The results show that the direct effects model explains approximately 24% of
economic performance. There is minimal increase (2.8%) increase in the model
including the moderators. Only EC is the significant variable in the moderated model
(b=0.53, p<0.01) when both hostility and dynamism were included as moderators.
However the moderation effect is not significant. The results of this model show that
the regression weights are similar the above tested models pertaining to economic
performance where the predictive constructs are tested individually.
LEVEL 1
Economic Performance B SE Beta (ß) p B SE Beta (ß) p
Intercept 1.262522 1.019008 -3.3133 5.847458
EI 0.194373 0.177056 0.112564 0.97069 1.00055 0.56214
EC 0.524715 0.163764 0.325389 ** 0.5298 0.164302 0.32855 **
Environmental Hostility -0.25339 0.09988 -0.216508 * 0.95693 0.782978 0.81765
Environmental Dynamism 0.160799 0.110194 0.121784 -0.12766 0.97082 -0.09668
EI*Dynamism 0.05226 0.16377 0.27477
EC*Dynamism 0.0959 0.126907 0.23326
EI*Hostility -0.20789 0.133625 -1.2555
EC*Hostility -0.04924 0.113199 -0.13411
R2 base 0.2365
ΔR20.027509
F(4,112) base 8.67***
F(8,108) with moderator 4.84***
Base model Including moderator
* p < 0.05; ** p < 0.01; *** p < 0.001. EI: Entrepreneurial intensity, EC: Entrepreneurial capabilities
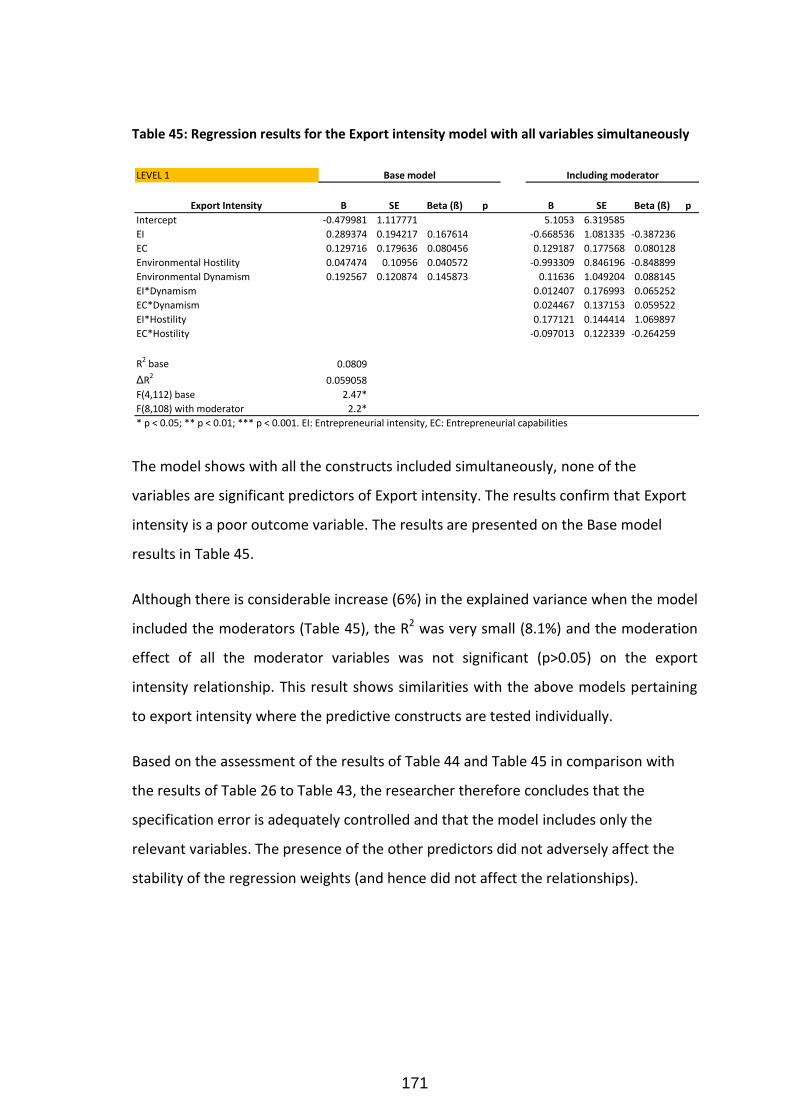
171
Table 45: Regression results for the Export intensity model with all variables simultaneously
The model shows with all the constructs included simultaneously, none of the
variables are significant predictors of Export intensity. The results confirm that Export
intensity is a poor outcome variable. The results are presented on the Base model
results in Table 45.
Although there is considerable increase (6%) in the explained variance when the model
included the moderators (Table 45), the R2 was very small (8.1%) and the moderation
effect of all the moderator variables was not significant (p>0.05) on the export
intensity relationship. This result shows similarities with the above models pertaining
to export intensity where the predictive constructs are tested individually.
Based on the assessment of the results of Table 44 and Table 45 in comparison with
the results of Table 26 to Table 43, the researcher therefore concludes that the
specification error is adequately controlled and that the model includes only the
relevant variables. The presence of the other predictors did not adversely affect the
stability of the regression weights (and hence did not affect the relationships).
LEVEL 1
Export Intensity B SE Beta (ß) p B SE Beta (ß) p
Intercept -0.479981 1.117771 5.1053 6.319585
EI 0.289374 0.194217 0.167614 -0.668536 1.081335 -0.387236
EC 0.129716 0.179636 0.080456 0.129187 0.177568 0.080128
Environmental Hostility 0.047474 0.10956 0.040572 -0.993309 0.846196 -0.848899
Environmental Dynamism 0.192567 0.120874 0.145873 0.11636 1.049204 0.088145
EI*Dynamism 0.012407 0.176993 0.065252
EC*Dynamism 0.024467 0.137153 0.059522
EI*Hostility 0.177121 0.144414 1.069897
EC*Hostility -0.097013 0.122339 -0.264259
R2 base 0.0809
ΔR2
0.059058
F(4,112) base 2.47*
F(8,108) with moderator 2.2*
Base model Including moderator
* p < 0.05; ** p < 0.01; *** p < 0.001. EI: Entrepreneurial intensity, EC: Entrepreneurial capabilities
172
4.5 Check for regression assumptions
At the highest level of analysis (level 1), all the frequency distributions of the variables
were fairly normally distributed about the means and therefore satisfy the
assumptions for regression.
Examination of residual regression plots shows that the residuals are fairly normal,
with homogeneous variance across values of the predictors. Thus the assumptions of
the regression were satisfied despite. Only the residual plots where the interaction
effect is significant (p<0.05) and substantial change in the b-weight are presented in
Appendix C Figure 40 to Figure 45.
4.6 Conclusions
The correlation model results summary for are presented for the outcome variable
economic performance (Table 46 and Table 48) and for the other outcome variable
Export intensity (Table 47 and Table 49). The model results correspond to hypothesis 1
and hypothesis 2 respectively. The multiple regression model results summary for are
presented for the outcome variable economic performance (Table 48) and for export
intensity (Table 49).
The independent variables i.e. main constructs significantly predict the outcome
variables. Based on the results, economic performance seems to be a better outcome
variable than export intensity, having more variance explained per model. There is
some level evidence to support all the main hypotheses (at level 1) overall. However,
for export intensity even though there is some evidence of moderation, the R2 are too
small. Hostility does appear to be a significant moderator even though there is some
weak evidence that it could be affecting the relationships. It appears that dynamism
did affect the relationships at level 3.
Social capital is an important predictor of economic performance. In particular, Social
interaction and network ties were predicting significantly. The relationship between
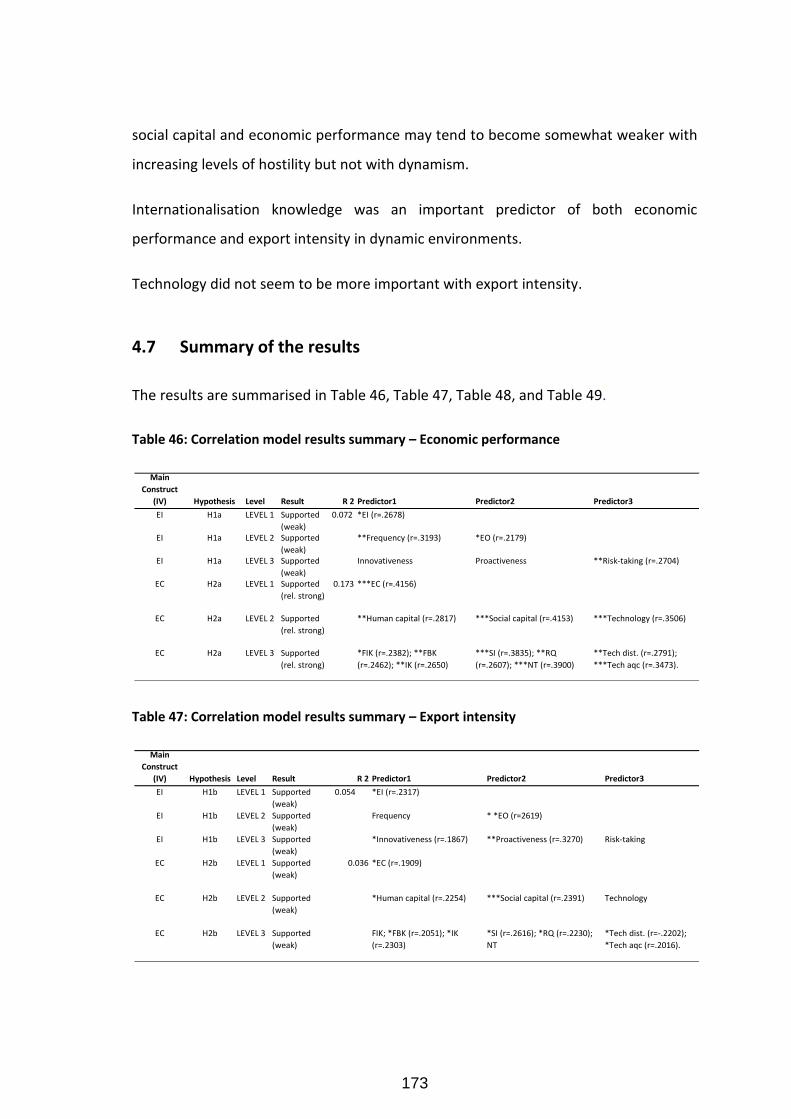
173
social capital and economic performance may tend to become somewhat weaker with
increasing levels of hostility but not with dynamism.
Internationalisation knowledge was an important predictor of both economic
performance and export intensity in dynamic environments.
Technology did not seem to be more important with export intensity.
4.7 Summary of the results
The results are summarised in Table 46, Table 47, Table 48, and Table 49.
Table 46: Correlation model results summary – Economic performance
Table 47: Correlation model results summary – Export intensity
Main
Construct
(IV) Hypothesis Level Result R 2 Predictor1 Predictor2 Predictor3
EI H1a LEVEL 1 Supported
(weak)
0.072 *EI (r=.2678)
EI H1a LEVEL 2 Supported
(weak)
**Frequency (r=.3193) *EO (r=.2179)
EI H1a LEVEL 3 Supported
(weak)
Innovativeness Proactiveness **Risk-taking (r=.2704)
EC H2a LEVEL 1 Supported
(rel. strong)
0.173 ***EC (r=.4156)
EC H2a LEVEL 2 Supported
(rel. strong)
**Human capital (r=.2817) ***Social capital (r=.4153) ***Technology (r=.3506)
EC H2a LEVEL 3 Supported
(rel. strong)
*FIK (r=.2382); **FBK
(r=.2462); **IK (r=.2650)
***SI (r=.3835); **RQ
(r=.2607); ***NT (r=.3900)
**Tech dist. (r=.2791);
***Tech aqc (r=.3473).
Main
Construct
(IV) Hypothesis Level Result R 2 Predictor1 Predictor2 Predictor3
EI H1b LEVEL 1 Supported
(weak)
0.054 *EI (r=.2317)
EI H1b LEVEL 2 Supported
(weak)
Frequency * *EO (r=2619)
EI H1b LEVEL 3 Supported
(weak)
*Innovativeness (r=.1867) **Proactiveness (r=.3270) Risk-taking
EC H2b LEVEL 1 Supported
(weak)
0.036 *EC (r=.1909)
EC H2b LEVEL 2 Supported
(weak)
*Human capital (r=.2254) ***Social capital (r=.2391) Technology
EC H2b LEVEL 3 Supported
(weak)
FIK; *FBK (r=.2051); *IK
(r=.2303)
*SI (r=.2616); *RQ (r=.2230);
NT
*Tech dist. (r=-.2202);
*Tech aqc (r=.2016).
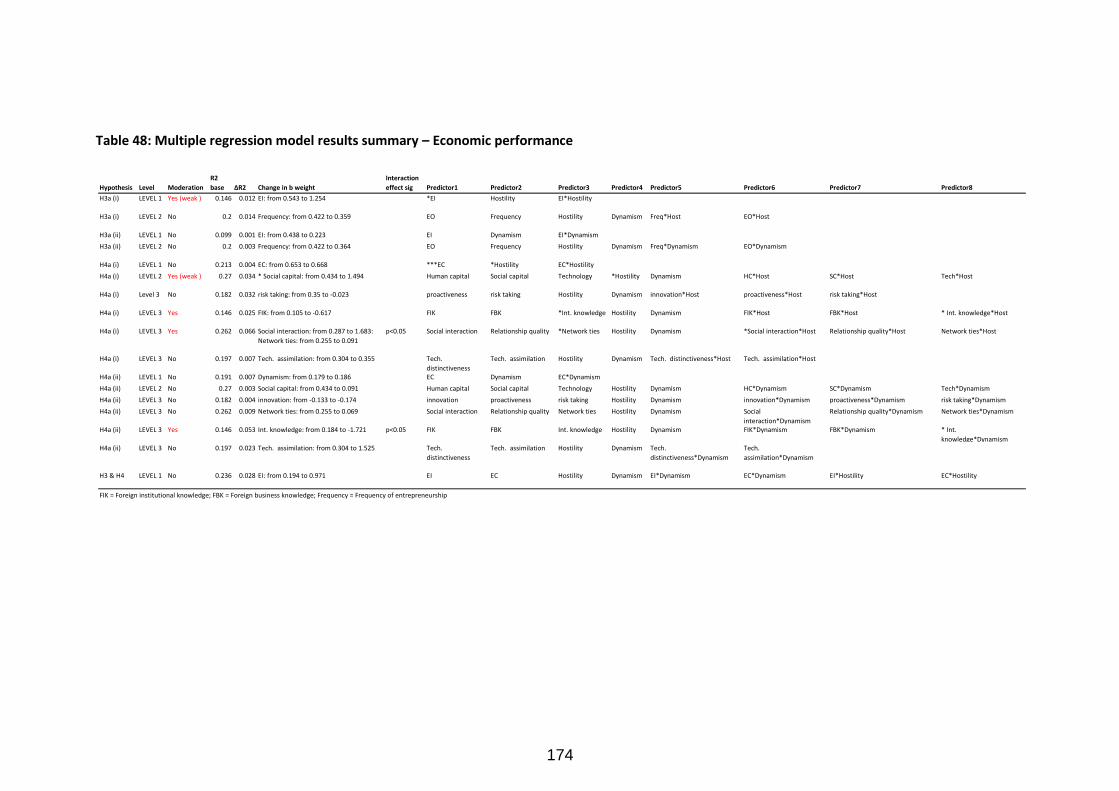
174
Table 48: Multiple regression model results summary – Economic performance
Hypothesis Level Moderation
R2
base ΔR2 Change in b weight
Interaction
effect sig Predictor1 Predictor2 Predictor3 Predictor4 Predictor5 Predictor6 Predictor7 Predictor8
H3a (i) LEVEL 1 Yes (weak ) 0.146 0.012 EI: from 0.543 to 1.254 *EI Hostility EI*Hostility
H3a (i) LEVEL 2 No 0.2 0.014 Frequency: from 0.422 to 0.359 EO Frequency Hostility Dynamism Freq*Host EO*Host
H3a (ii) LEVEL 1 No 0.099 0.001 EI: from 0.438 to 0.223 EI Dynamism EI*Dynamism
H3a (ii) LEVEL 2 No 0.2 0.003 Frequency: from 0.422 to 0.364 EO Frequency Hostility Dynamism Freq*Dynamism EO*Dynamism
H4a (i) LEVEL 1 No 0.213 0.004 EC: from 0.653 to 0.668 ***EC *Hostility EC*Hostility
H4a (i) LEVEL 2 Yes (weak ) 0.27 0.034 * Social capital: from 0.434 to 1.494 Human capital Social capital Technology *Hostility Dynamism HC*Host SC*Host Tech*Host
H4a (i) Level 3 No 0.182 0.032 risk taking: from 0.35 to -0.023 proactiveness risk taking Hostility Dynamism innovation*Host proactiveness*Host risk taking*Host
H4a (i) LEVEL 3 Yes 0.146 0.025 FIK: from 0.105 to -0.617 FIK FBK *Int. knowledge Hostility Dynamism FIK*Host FBK*Host * Int. knowledge*Host
H4a (i) LEVEL 3 Yes 0.262 0.066 Social interaction: from 0.287 to 1.683:
Network ties: from 0.255 to 0.091
p<0.05 Social interaction Relationship quality *Network ties Hostility Dynamism *Social interaction*Host Relationship quality*Host Network ties*Host
H4a (i) LEVEL 3 No 0.197 0.007 Tech. assimilation: from 0.304 to 0.355 Tech.
distinctiveness
Tech. assimilation Hostility Dynamism Tech. distinctiveness*Host Tech. assimilation*Host
H4a (ii) LEVEL 1 No 0.191 0.007 Dynamism: from 0.179 to 0.186 EC Dynamism EC*Dynamism
H4a (ii) LEVEL 2 No 0.27 0.003 Social capital: from 0.434 to 0.091 Human capital Social capital Technology Hostility Dynamism HC*Dynamism SC*Dynamism Tech*Dynamism
H4a (ii) LEVEL 3 No 0.182 0.004 innovation: from -0.133 to -0.174 innovation proactiveness risk taking Hostility Dynamism innovation*Dynamism proactiveness*Dynamism risk taking*Dynamism
H4a (ii) LEVEL 3 No 0.262 0.009 Network ties: from 0.255 to 0.069 Social interaction Relationship quality Network ties Hostility Dynamism Social
interaction*Dynamism
Relationship quality*Dynamism Network ties*Dynamism
H4a (ii) LEVEL 3 Yes 0.146 0.053 Int. knowledge: from 0.184 to -1.721 p<0.05 FIK FBK Int. knowledge Hostility Dynamism FIK*Dynamism FBK*Dynamism * Int.
knowledge*DynamismH4a (ii) LEVEL 3 No 0.197 0.023 Tech. assimilation: from 0.304 to 1.525 Tech.
distinctiveness
Tech. assimilation Hostility Dynamism Tech.
distinctiveness*Dynamism
Tech.
assimilation*Dynamism
H3 & H4 LEVEL 1 No 0.236 0.028 EI: from 0.194 to 0.971 EI EC Hostility Dynamism EI*Dynamism EC*Dynamism EI*Hostility EC*Hostility
FIK = Foreign institutional knowledge; FBK = Foreign business knowledge; Frequency = Frequency of entrepreneurship
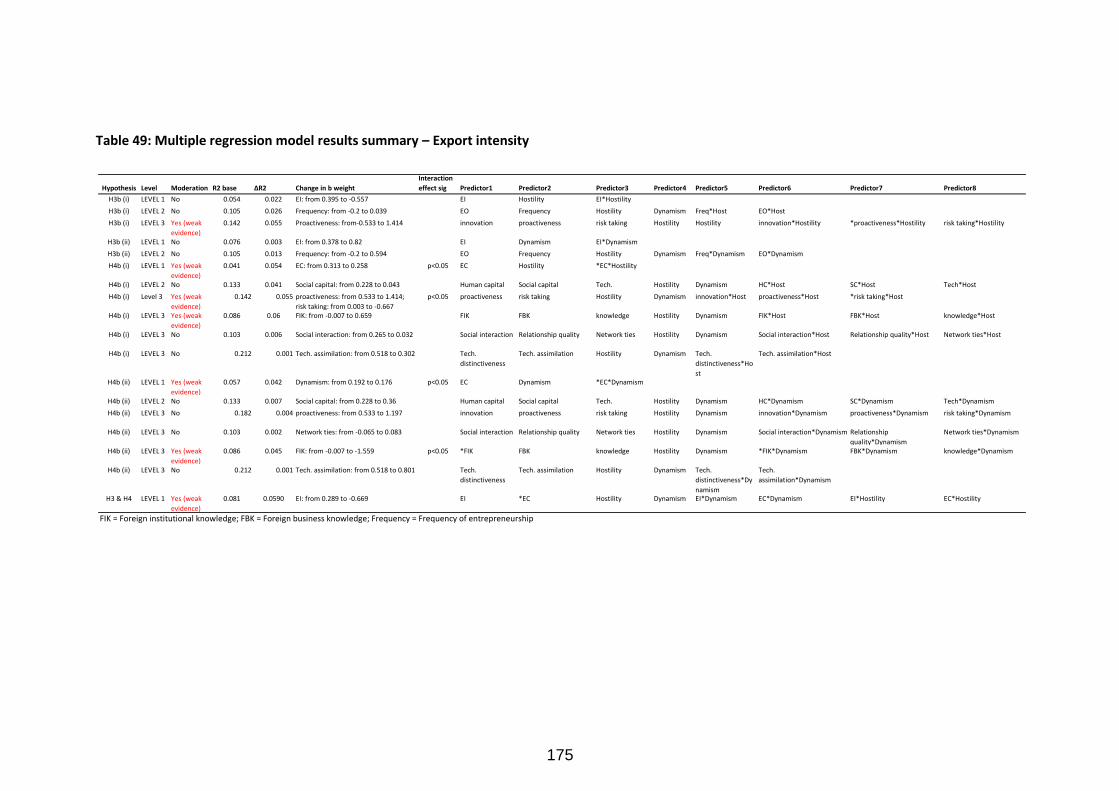
175
Table 49: Multiple regression model results summary – Export intensity
Hypothesis Level Moderation R2 base ΔR2 Change in b weight
Interaction
effect sig Predictor1 Predictor2 Predictor3 Predictor4 Predictor5 Predictor6 Predictor7 Predictor8
H3b (i) LEVEL 1 No 0.054 0.022 EI: from 0.395 to -0.557 EI Hostility EI*Hostility
H3b (i) LEVEL 2 No 0.105 0.026 Frequency: from -0.2 to 0.039 EO Frequency Hostility Dynamism Freq*Host EO*Host
H3b (i) LEVEL 3 Yes (weak
evidence)
0.142 0.055 Proactiveness: from-0.533 to 1.414 innovation proactiveness risk taking Hostility Hostility innovation*Hostility *proactiveness*Hostility risk taking*Hostility
H3b (ii) LEVEL 1 No 0.076 0.003 EI: from 0.378 to 0.82 EI Dynamism EI*Dynamism
H3b (ii) LEVEL 2 No 0.105 0.013 Frequency: from -0.2 to 0.594 EO Frequency Hostility Dynamism Freq*Dynamism EO*Dynamism
H4b (i) LEVEL 1 Yes (weak
evidence)
0.041 0.054 EC: from 0.313 to 0.258 p<0.05 EC Hostility *EC*Hostility
H4b (i) LEVEL 2 No 0.133 0.041 Social capital: from 0.228 to 0.043 Human capital Social capital Tech. Hostility Dynamism HC*Host SC*Host Tech*Host
H4b (i) Level 3 Yes (weak
evidence)
0.142 0.055 proactiveness: from 0.533 to 1.414;
risk taking: from 0.003 to -0.667
p<0.05 proactiveness risk taking Hostility Dynamism innovation*Host proactiveness*Host *risk taking*Host
H4b (i) LEVEL 3 Yes (weak
evidence)
0.086 0.06 FIK: from -0.007 to 0.659 FIK FBK knowledge Hostility Dynamism FIK*Host FBK*Host knowledge*Host
H4b (i) LEVEL 3 No 0.103 0.006 Social interaction: from 0.265 to 0.032 Social interaction Relationship quality Network ties Hostility Dynamism Social interaction*Host Relationship quality*Host Network ties*Host
H4b (i) LEVEL 3 No 0.212 0.001 Tech. assimilation: from 0.518 to 0.302 Tech.
distinctiveness
Tech. assimilation Hostility Dynamism Tech.
distinctiveness*Ho
st
Tech. assimilation*Host
H4b (ii) LEVEL 1 Yes (weak
evidence)
0.057 0.042 Dynamism: from 0.192 to 0.176 p<0.05 EC Dynamism *EC*Dynamism
H4b (ii) LEVEL 2 No 0.133 0.007 Social capital: from 0.228 to 0.36 Human capital Social capital Tech. Hostility Dynamism HC*Dynamism SC*Dynamism Tech*Dynamism
H4b (ii) LEVEL 3 No 0.182 0.004 proactiveness: from 0.533 to 1.197 innovation proactiveness risk taking Hostility Dynamism innovation*Dynamism proactiveness*Dynamism risk taking*Dynamism
H4b (ii) LEVEL 3 No 0.103 0.002 Network ties: from -0.065 to 0.083 Social interaction Relationship quality Network ties Hostility Dynamism Social interaction*Dynamism Relationship
quality*Dynamism
Network ties*Dynamism
H4b (ii) LEVEL 3 Yes (weak
evidence)
0.086 0.045 FIK: from -0.007 to -1.559 p<0.05 *FIK FBK knowledge Hostility Dynamism *FIK*Dynamism FBK*Dynamism knowledge*Dynamism
H4b (ii) LEVEL 3 No 0.212 0.001 Tech. assimilation: from 0.518 to 0.801 Tech.
distinctiveness
Tech. assimilation Hostility Dynamism Tech.
distinctiveness*Dy
namism
Tech.
assimilation*Dynamism
H3 & H4 LEVEL 1 Yes (weak
evidence)
0.081 0.0590 EI: from 0.289 to -0.669 EI *EC Hostility Dynamism EI*Dynamism EC*Dynamism EI*Hostility EC*Hostility
FIK = Foreign institutional knowledge; FBK = Foreign business knowledge; Frequency = Frequency of entrepreneurship
176
CHAPTER 5: DISCUSSION OF THE RESULTS
This chapter discusses and explains the results with reference to the literature review.
Section 5.1 discusses the sample characteristics in terms of the demographic profiles of
the respondents and the firms that they represent. Then section 5.2 and 5.3 discusses
empirical results of the model. Since the aim is to estimate the relationships between
constructs as stated in the first and second sub-problems in Chapter 1, the results of
the model are discussed by construct. Section 5.2 discusses the results pertaining to
entrepreneurial intensity. Section 5.3 discusses the results pertaining to
entrepreneurial capabilities. Section 5.4 summarises the discussion.
5.1 Sample characteristics
A deeper understanding of the demographic profile of the respondents and the firms
can provide more insights in the interpretation of the results. This section discusses
the findings relating to the demographics of the sample.
5.2.1 Demographic profile of respondents
Despite the lack of well defined sapling frame of SA exporting firms and the potential
difficulty in obtaining survey responses in the target management level, the results
revealed that almost all (97%) of respondents were in management positions.
Furthermore, three-quarters (77%) of the respondents had a degree, with 61% holding
postgraduate degrees. This is in line with the expectations of the researcher that the
respondents should have enough knowledge of export practices and performance
within their firms. It is expected that this sample of respondents are conversant with
the strategic orientation and different aspects of the firms they represents.
177
5.2.2 Demographic profile of firms
5.2.2.1 Firm size
Almost a quarter of the respondent firms were small size firms (up to 50 employees),
and another quarter were medium size firms (between 50 and 250 employees). In line
with the resource based theories these SMEs may have ventured into foreign markets
in search of critical resources (Ibrahim et al., 2004). Smaller entrepreneurial firms may
have ingenuous techniques to overcome their initial conditions of lack of resources in
order to exploit the international market. They can focus on a set of capabilities,
competencies, knowledge, and skills needed by the world markets.
The literature purported that size may be particularly important for firms in emerging
economies, and alluded that most of the firms in emerging economies are small (Singh,
2009). However, the sample revealed that about half of the firms (51%) firms were
large firms (greater than 250 employees). This breakdown shows that today’s advances
in communication technology, manufacturing technology and transportation as well as
trade liberalization have allowed small and large companies alike to compete in
international markets.
5.2.2.2 Firm industry
In line with the characteristics of samples observed in international entrepreneurship
research (Coviello and Jones, 2004; Javalgi and Todd, 2010), majority of the companies
were high-technology firms (65%) and operating in the manufacturing industry (47%).
A substantial number (24%) of the firms was in the agricultural industry, and this was
not expected.
The high concentration of the firms in high technology sectors (two thirds) may be
indicative to the fact that the windows of opportunity in these dynamic sectors are
short. Industries with rapid changes in technology and shorter product life cycles may
naturally lead firms to internationalisation. Technological intensiveness was found to
be consistently related to the propensity to export according to various studies (Serra
et al., 2011).
178
5.2.2.3 Firm age
A cumulative 66% of the firms that responded were founded before 1990. Although
not within the scope of this study, it may turn out that given the older firm age among
the firms, and their early foreign market entry, these firms have been internationalised
for a long time and as such have a broad knowledge base acquired through learning
about new markets, customers, cultures, technologies, and innovation systems, which
can enhance a firm’s performance (Zahra and Garvis, 2000). The organisational
knowledge gained at one stage can profoundly influence performance as firms
experiment, take risk, learn and gains experience and knowledge of foreign markets.
5.2.2.4 Speed of internationalisation
The traditional theories of internationalisation (process theory) advocate that at the
early stage of firm’s growth process, the firm’s horizon is limited to domestic market
(Ibrahim, 2004). Contrary to this view, the sample revealed that almost 60% of the
firms were internationalised by the age of six years. These firms initiate international
activities in the early stage of venture growth with resources constrained by their
young age. The early internationalisation among these firms cannot be explained by
the process theory.
Coviello and Jones (2004) and McDougall et al. (2003) defined firms that achieved
significant export sales within six years of founding as international new ventures
(NIVs) or born-global firms. Despite resource constraints across the value chain and
other administrative challenges that may accompany international expansion, these
firms were able to internationalise rapidly.
5.2.2.5 Scope of internationalisation
This variable serves as a proxy of a firm’s global geographic diversity. Three quarters of
the firms exported to more than 5 countries. Although this measure was found not to
have a significant correlation with economic performance, it may be linked to
entrepreneurial orientation. Having a wider international market scope exposes SMEs
179
to a rich network of information that encourages and enhances future product
innovation (Zahra et al., 2009). The greater the global scope of a firm’s operations, the
greater its opportunities to innovate, take risks, learn new skills, and explore new
systems. Global geographic diversity may determine the firm’s overall performance
(Zahra, 2000).
5.2.2.6 Export intensity
This indicator is said to adequately reflect international intensity since the greater the
intensity of the firm’s international presence, the greater and more irreversible its
commitment to its assets for internationalisation (Camisón and Villar-López, 2010). A
fifth of the firms (20%) had over 75% of their sales geared towards exports. Over half
of the firms (53%) had export sales contributing at-least 25% of their total sales. In line
with the norms defined among advanced countries, a firm is considered to be
internationalized when their foreign sales represents at-least 25% of total sales
(Ripollés-Meliá et al., 2007; Javalgi and Todd, 2010).
Prior research found that this objective measure, namely export intensity, is positively
related with the subjective measure of export performance, namely economic
performance (Stoian, Rialp and Rialp, 2011).
180
5.2 Discussion pertaining to entrepreneurial intensity: Hypothesis 1
and Hypothesis 3
Hypotheses 1 and 3 relates to the entrepreneurial intensity (EI) construct. The original
hypotheses are stated below together with their sub-hypotheses derived in the
previous chapter. The findings are discussed by hypothesis and explanations are
offered in relation to the literature.
Hypothesis 1: Entrepreneurial intensity is positively related to international performance.
H1a: Entrepreneurial intensity is positively related to economic performance
H1b: Entrepreneurial intensity is positively related to export intensity
H1a: Entrepreneurial intensity is positively related to economic performance
(Supported)
The findings reveal significant correlation between entrepreneurial intensity and
economic performance. The study finds that frequency of entrepreneurship activities
and risk-taking play an important role in enhancing economic performance. However,
it did not find support for innovativeness and proactiveness as factors that enhance
economic performance.
The result means that despite not engaging in breakthrough innovations that create
new markets and industry redefinition (Morris et al., 2008), exporting firms engage in
frequent product, process, and service enhancement activities. Although they may not
be at the forefront in pursuing enhanced competitiveness in response to promising
foreign market opportunities and actively seeking new opportunities abroad (Lumpkin
and Dess, 1996), exporting firms adopt strategies that are more tolerant of potential
risks of foreign markets. A risk-taking orientation indicates a willingness to engage
resources in strategies or projects where the outcome may be highly uncertain
181
(Wiklund and Shepherd, 2003). Risk-taking firms in the international arena perceive
business situations to be less risky and focus more on opportunities. This may be
because these firms take reasonable awareness of the risks involved in foreign markets
and employ strategies to calculate and manage the uncertainties (Wiklund and
Shepherd, 2005; Certo et al., 2009).
In line with prior research (Zhou, 2007; Patel and D’Souza, 2009), the study found that
not all the three dimensions of entrepreneurial orientation seemed to play a role in
enhancing economic performance.
H1b: Entrepreneurial intensity is positively related to export intensity (Supported)
Similar to H1a, the study finds that entrepreneurial intensity is significantly correlated
to export intensity. However frequency of entrepreneurship activities did not play a
role in export intensity. Innovativeness and proactiveness played a role in enhancing
export intensity, but there was no support for risk-taking as a factor.
The results show that the other dimensions of EO could compensate for the limited
role of risk-taking in advancing export intensity. The firms perceive greater
opportunities in the international markets and are open to innovative ways of
exploiting opportunities by encouraging new product ideas for the international
markets to boost foreign sales. These firms are action orientation toward creating
innovative responses to markets needs by proactively anticipating and acting on future
client needs in the market, which enables them to gain first-mover advantage ahead of
the competition (Lumpkin and Dess, 1996). The top management team pursues a
competitive orientation by spending time abroad and attending foreign trade fares in
search of new export markets. Whereas innovativeness may be an internal response
from a firm, seeking opportunities (proactiveness) to innovate is a complementary
activity.
182
Conclusion regarding Hypothesis 1: Entrepreneurial intensity is positively related to
international performance (Supported).
It was expected that the entrepreneurial intensity and international performance
among exporting firms will be significantly associated with each other. The empirical
study revealed that frequency of entrepreneurial activities is related to economic
performance, whereas EO is related to export intensity.
The results showed that in order to achieve financial success and growth, exporting
firms have to take risks by frequently engaging in product, process, and service
enhancement activities to take advantage of foreign market opportunities (H1a).
On the other hand in order to achieve higher foreign sales as a percentage of total
sales, firms have to adopt an entrepreneurial orientation by proactively innovating
new products for the international markets to boost foreign sales. The development of
entrepreneurial orientation requires organisational members to engage in proactive
activities such as spending time abroad and attending foreign trade fares in search of
new opportunities (H1b). Innovativeness and proactiveness could compensate for the
limited role of risk-taking in advancing export intensity.
In extending the findings of empirical studies among internationalised firms that
entrepreneurial orientation is positively related to firm performance (Zhou, 2007; Li et
al., 2009; Patel and D’Souza, 2009; Javalgi and Todd, 2010), this study confirms that
entrepreneurial intensity is positively related to international performance (H1).
183
Hypothesis 3: The relationship between entrepreneurial intensity and international
performance is moderated by the environmental characteristics
H3a (i): The relationship between entrepreneurial intensity and economic performance is
moderated by environmental hostility
H3a (ii): The relationship between entrepreneurial intensity and economic performance is
moderated by environmental dynamism
H3b (i): The relationship between entrepreneurial intensity and export intensity is
moderated by environmental hostility
H3b (ii): The relationship between entrepreneurial intensity and export intensity is
moderated by environmental dynamism
H3a (i): The relationship between entrepreneurial intensity and economic
performance is moderated by environmental hostility (weakly supported)
The results showed weak evidence that environmental hostility moderates the
relationship between intense entrepreneurial activity and economic performance. The
findings reveal that in an environment characterised by hostility, entrepreneurial
intensity is weakly associated with economic performance. As the level of hostility
increases, the relation between EI and economic performance tends to become
weaker.
The result implies that in a hostile international environment, it becomes less
important to pursue aggressive entrepreneurship behaviour in order to achieve growth
in market share and greater financial performance. Foreign opportunities are
tempered by the constraints imposed by the competitive forces that exist in
international environments, such as aggressive government intervention, unfavourable
supply conditions, and fierce local rivalries all contributing to hostile international
environment. Although the literature suggests that firms will need to adopt EO to
184
remain competitive (Zahra and Garvis, 2000; Urban, 2010), a possible explanation for
the observed moderation effect is that these firms perceive high levels of industry risk
and adopt a conservative strategic posture by avoiding commitment of resources
aimed at innovation, proactiveness, and risk-taking in the foreign markets. A
conservative strategic posture refers to when the top management adopts a style that
is decidedly risk-averse, non-innovative, and reactive (Covin and Slevin, 1990). This
could mean that the firms opt to simply refine and adapt existing products, services,
and technology to better suit current needs rather than develop of new products,
services, and technology (Patel and D’Souza, 2009).
H3a (ii): The relationship between entrepreneurial intensity and economic
performance is moderated by environmental dynamism (not supported)
The results did not find support for the hypothesis H3a (ii) that the relationship
between entrepreneurial intensity and economic performance is moderated by
environmental dynamism. This result is contrary to prior research findings. Wiklund
and Shepherd (2005) and Urban (2010) found that the dynamism of the environment is
important moderator of the EO and business performance. According to (Scheepers et
al., 2007) dynamic environments create opportunities for companies to act more
entrepreneurially.
A possible reason for the lack of support for this hypothesis may be that certain
innovative activities such as R&D do not yield short-term results in performance (Zahra
and Bogner, 2000) and therefore it may take some time for a company to realise the
benefits of investments in innovation. Another possible reason for the lack of support
for this hypothesis may be associated with the low reliability of dynamism scale.
H3b (i): The relationship between entrepreneurial intensity and export intensity is
moderated by environmental hostility (weakly supported)
The results showed weak evidence that environmental hostility moderates the
relationship between intense entrepreneurial activity and export intensity. The
findings reveal that in an environment characterised by hostility, entrepreneurial
185
intensity is weakly associated with export intensity. As the level of hostility increases,
the relation between EI and export intensity tends to become weaker.
The result implies that in international environments with higher levels of hostility,
more efforts aimed at pursuing aggressive entrepreneurial behaviour do not result in
more export sales. Foreign opportunities are tempered by the constraints imposed by
the competitive forces that exist in international environments, such as aggressive
government intervention, unfavourable supply conditions, and too many competitors
all contributing to hostile international environment.
The literature however suggested that firms need to adopt EO to remain competitive
in hostile market environments (Zahra and Garvis, 2000; Urban, 2010). This study
found that as the level of environmental hostility increased, the relationship between
EI and export intensity weakened. A possible reason for this may be that in
international environments with higher levels of hostility, exporting firms simply back
track their efforts in those markets and focus on alternative markets, including
domestic. International diversification can also generate the resources necessary to
support projects, spread the risk and provide additional market. Global geographic
diversity determines the firm’s overall performance (Zahra and Garvis, 2000).
H3b (ii): The relationship between entrepreneurial intensity and export intensity is
moderated by environmental dynamism (not supported)
Similar to H3a (ii), the results did not find support for the hypothesis H3b (ii) that the
relationship between entrepreneurial intensity and export intensity is moderated by
environmental dynamism. This finding is contrary to the extant literature which
suggests that in markets characterised by rapid and dynamic shifts, the unlimited
proliferation of new technologies, and the resultant shrinking product life cycles, firms
resort to radical product innovation to enhance performance (Zahra and Bogner, 2000)
Environmental dynamism can be defined as the perceived instability of an enterprise’s
market, due to unpredictable and persistent changes in its external environment.
These changes result from the entry or exit of competitors, changes in customers’
186
needs, and shifts in technological conditions (Lumpkin and Dess, 2001; Scheepers et
al., 2007; Urban, 2010). Dynamism reflects the rate and continuity of change within an
industry (Zahra and Bogner, 2000).
The high concentration of the firms in high technology sectors (two thirds) in this study
may imply that the firms by default are focusing more attention on innovation (Lee et
al., 2009; Serra et al., 2011) regardless of whether the environment is dynamic or not.
Industries with rapid changes in technology and shorter product life cycles may
naturally lead firms to consistently to develop new products in order to gain or
maintain a competitive edge (Erensal et al., 2006).
Another possible reason for the lack of support for this hypothesis may be associated
with the low reliability of dynamism scale.
187
Conclusion regarding Hypothesis 3: The relationship between entrepreneurial
intensity and international performance is moderated by the environmental
characteristics (partially supported).
The empirical study showed weak evidence that environmental hostility moderates the
relationship between intense entrepreneurial activity (EI) and the two performance
measures - economic performance and export intensity (Hypotheses H3a (i) and H3b
(i)). However, the study did not find evidence that environmental dynamism
moderates the relationship between EI and performance - Hypotheses H3a (ii) and H3b
(ii).
The findings reveal that in an environment characterised by hostility, entrepreneurial
intensity is weakly associated with both economic performance and export intensity.
As the level of hostility increases, the relation between EI and performance tends to
becomes weaker.
The result implies that it becomes less important for firms to pursue aggressive
entrepreneurship behaviour in the international environments with higher levels of
hostility in order to grow market share and achieve greater financial performance. In
hostile international environments exporting firms may simply back track their efforts
in those markets and focus on alternative markets, including domestic. International
diversification is a strategy that enables firms to generate the resources necessary to
support projects, spread the risk and provide additional market. Global geographic
diversity determines the firm’s overall performance (Zahra and Garvis, 2000). In
response to the perceived high levels of industry risk firms adopt a conservative
strategic posture by avoiding commitment of resources and adopt a style that is
decidedly risk-averse, non-innovative, and reactive (Covin and Slevin, 1990).
On the contrary, the findings revealed that environmental dynamism did not moderate
the relationship between entrepreneurial intensity and performance (both economic
performance and export intensity).
188
Environmental dynamism refers to the perceived instability of an enterprise’s market,
due to unpredictable and persistent changes in its external environment. These
changes result from the entry or exit of competitors, changes in customers’ needs, and
shifts in technological conditions (Lumpkin and Dess, 2001; Scheepers et al., 2007;
Urban, 2010). The research found that among the exporting firms, the level of
environmental dynamism did not affect the relationship between EI and performance.
The study suggests that it may take some time for firms to realise the benefits of
investments in innovative activities when the firms respond to shifts in technological
conditions. The study observed that given high concentration of the firms in high
technology sectors, these firms naturally lends themselves to radical innovation
strategies regardless of whether the environment is dynamic or not. Furthermore the
study suggests investments in innovative activities in response to dynamic changes in
the environment may take time to pay off.
In conclusion, the study found that international firms rely on entrepreneurial
strategies and actions to achieve performance in hostile foreign market environments.
However, the study did not find support for the moderating effect of dynamism on the
EI-performance relationship. The study therefore found partial support for hypothesis
3.
189
5.4 Discussion pertaining to pertaining to entrepreneurial capabilities:
Hypothesis 2 and Hypothesis 4
Hypotheses 2 and 4 relates to the entrepreneurial capabilities (EC) construct. Similar
to Section 5.2, the original hypotheses are stated below together with their sub-
hypotheses derived in the previous chapter. The findings are discussed by hypothesis
and explanations are offered in relation to the literature
Hypothesis 2: Entrepreneurial capabilities are positively related to international
performance.
H2a: Entrepreneurial capabilities are positively related to economic performance
H2b: Entrepreneurial capabilities are positively related to export intensity
H2a: Entrepreneurial capabilities are positively related to economic performance
(Supported)
The findings reveal significant correlation between entrepreneurial capabilities and
economic performance. The study finds that social capital, human capital, and
technology play an important role in enhancing economic performance. Social capital
is the most important determinant of economic performance, followed by technology
and then human capital, with all the variables of these dimensions playing a significant
role.
Entrepreneurial capabilities are viewed as a broader range of abilities needed to
initiate appropriate action in specific organisational situations and reflect the capacity
to initiate and sustain an entrepreneurial dynamism throughout the organisation
(Obrecht, 2004). In line with existing literature international entrepreneurship, the
study found that human capital, social capital, and technological capabilities are
important for economic performance (Autio et al., 2000; Deeds, 2001; Zhou, 2007;
Brennan and Garvey, 2009).
190
H2b: Entrepreneurial capabilities are positively related to export intensity
(Supported)
Similar to H2a, the study finds that entrepreneurial capabilities are significantly
correlated to export intensity. The findings revealed that social capital and, human
capital played a role in enhancing export intensity, however technology did not play a
role in enhancing export intensity. In line with previous research, this study confirms
that human capital and social capital are among the most essential capabilities for
organisational perfomance (Obrecht, 2004).
Further analysis of the findings revealed that all the variables of these dimensions,
including technology, played a significant role. However, technology distinctiveness
was negatively correlated to export intensity, whereas technology acquisition did
enhance export intensity. Technology distinctiveness and technology acquisition are
the two variables that combine to form the technology dimension.
Technology acquisition has been defined as the efforts by management to acquire
technologies that will augment the firm’s ability to compete in international markets,
via the creation of superior products and/or processes (Knight, 2001). The results imply
that the firms use the technology acquired to compete more effectively, increase
operational efficiency, or launch products that better satisfy customer needs and
therefore increase their foreign sales. Improved technology is widely regarded as a
critical, fundamental lever for allowing firms to innovate and respond to changing
conditions in their external environment. The acquired technology may be used to
achieve a competitive advantage (Oviatt and McDougall, 2005; Raymond and St-Pierre,
2010).
On the other hand, technology distinctiveness negatively affected firm’s foreign sales
in international markets as a percentage of overall sales. A possible reason might be
that the firms do not necessarily compete in the foreign market on the basis of having
unique or superior technology and/or R&D than competitors; they may simply be
improving on an existing product/service, or imitates other technologies; or they may
191
be focusing on other competitive strategies such as pricing, relationships and/or
service offering. This perhaps emphasises the challenge for firms in emerging
economies to adopt technology and act entrepreneurially.
Conclusion regarding Hypothesis 2: Entrepreneurial capabilities are positively related to international performance (Supported).
It was expected that the entrepreneurial capabilities and international performance
among exporting firms will be significantly associated with each other. The empirical
study revealed human capital, social capital and technology were positively related to
economic performance, whereas only human capital and social capital were related to
export intensity. With regards to technology, the results showed that acquired
technologies did augment the firms’ ability to compete in international markets;
however the firms did not perceive themselves to be competing on the basis of
superior technology to improve export intensity.
The results showed that in order to achieve financial success in international expansion
knowledge-based, social-based and technological capabilities are important (Autio et
al., 2000; Deeds, 2001; Zhou, 2007; Brennan and Garvey, 2009).
Further analysis of the findings revealed that all the variables of the entrepreneurial
capabilities construct, played a significant role international performance, possession
of distinct technologies compared to competitors was negatively correlated to export
intensity. Investment in distinct technology might be expensive.
This suggests that the firms did not necessarily compete in the foreign market on the
basis of having unique or superior technology and/or R&D than competitors; but
rather simply improve existing products/services, or imitate other technologies. This
perhaps emphasises the challenge for firms in emerging economies to adopt
technology and act entrepreneurially in order to boost their export sales.
192
Hypothesis 4: The relationship between entrepreneurial capabilities and international
performance is moderated by the environmental characteristics
H4a (i): The relationship between entrepreneurial capabilities and economic performance is
moderated by environmental hostility
H4a (ii): The relationship between entrepreneurial capabilities and economic performance is
moderated by environmental dynamism
H4b (i): The relationship between entrepreneurial capabilities and export intensity is
moderated by environmental hostility
H4b (ii): The relationship between entrepreneurial capabilities and export intensity is
moderated by environmental dynamism
H4a (i): The relationship between entrepreneurial capabilities and economic
performance is moderated by environmental hostility (weakly supported)
The results showed evidence that environmental hostility moderates the relationship
between EC and economic performance. There was a significant correlation between
EC and environment hostility. The findings reveal that in an environment characterised
by hostility, entrepreneurial capabilities are associated with economic performance,
with social capital being the only important attribute of EC.
As the level of hostility increases, the relation between social capital and economic
performance tends to become weaker. A closer look at the relationship shows that
social interaction and network ties are the important attributes of social capital in this
relationship. Further investigation into the moderation effect revealed that it is the
interaction of social interaction (strong ties) that weakens the relationship; Network
ties (weak ties) remained a positive contributor to economic performance.
Under foreign environments characterised by hostility, human capital and technology
did not play a role in enhancing economic performance. The findings imply that social
193
capital provides compensating advantages (for technology and human capital) in order
to compete viably in unfamiliar hostile markets abroad. Social capital theory explains
the ability of actors to extract benefits from their social structures and can be used to
supplement the effects of education, experience and financial capital (Venter et al.,
2008). The relevance of social capital in this context might be mainly a consequence of
the resource limitations arising from the liability of smallness and newness in the
foreign markets (Leiblein and Reuer, 2004; Coviello, 2006). In order to remain
competitive and to take advantage of new market opportunities, entrepreneurial firms
need to gain influence over vital resources without owning them (Oviatt and
McDougall, 2005). From an entrepreneurial perspective, social capital is a key driver in
providing access to these resources (Yli-Renko et al., 2002; Coviello, 2006; Casillas et
al., 2010; Manolova et al., 2010). Social capital can play a role substitutive for more
formal institutions in small business environments characterised by lack of market-
oriented institutions such as specialized venture capital firms providing
entrepreneurial finance (Bauernschuster et al., 2010).
Another possible reason for the importance of social capital is that social relations with
foreign contacts may provide information about foreign markets necessary to succeed
internationally (Presutti et al., 2007; Agndal et al., 2008). In line with existing research,
this study confirms that, in hostile foreign markets, external social capital positively
impacts the international growth and economic performance of firms.
The study particularly finds that in a hostile international environment, social
interaction and network ties played an important role in enhancing economic
performance. However, there was no support for relationship quality as a factor that
enhanced economic performance. The relational quality dimension reflects perceived
sense of trust and fairness. Social interaction in this study relates close contacts with
key foreign contacts (customers, suppliers, marketing and distribution partners, and
government agencies); whereas network ties relates to the establishment of networks
through key foreign contacts, which can ’open doors’ to other contacts. Accordingly,
the social interaction represents strong ties with key foreign contacts whereas the
194
network ties represent weak ties. Consistent with (Rost, 2011), strong and weak ties
are not alternatives but complementary.
Arguments in support of the importance of social interaction and network ties relate to
overcoming information asymmetries such as finding clients, suppliers, and investors.
Networks facilitate the discovery of international opportunities, allocation of scarce
resources, and serve as a brokerage to other unknown networks. In these
relationships, trust was not considered important in promoting economic
performance. Networking extends the reach and abilities of the individual to capture
resources that are held by others and so improve entrepreneurial effectiveness.
As already stated, as the level of hostility increases, the relation between social capital
and economic performance tends to become weaker. While Network ties (weak ties)
remain a positive contributor to economic performance under hostile environments,
social interaction (strong ties) attributes to a weak relationship. The result implies that
it becomes less important to maintain strong socially embedded ties when the foreign
business environment is characterised by unfavourable supply conditions, lack the
abundance of resources, high political and economic instability and/or intensified
competition. A plausible explanation is that ties to the same network partners (strong
ties) could mean that there are few or no links to outside partners who can potentially
contribute innovative ideas (Burt, 1992). In this context, networking may result in a
time consuming and costly effort. For instance, the unexpected loss of a core network
player (e.g. an important political player or a big client) may result in dependency
problems or vulnerability. Furthermore, very close ties may isolate firms from other
external sources of knowledge and information (Yli-Renko et al., 2001). Over-
embeddedness has been indicated to be a social liability (Burt, 1992; Uzzi, 1997) and a
source of redundant information.
On the other hand it still remains important to maintain weak ties (network ties) at
arm's length and manage them more intentionally to explore growth (Coviello, 2006).
A weak tie-based network relation means that the persons in question may not
personally know each other (but may know of each other) and is thus a basis for non-
195
redundant information (Ulhoi, 2005). This result agrees with the finding among US
firms that the use of trade shows and export promotion services complements the
firm’s internal resources in achieving success in international markets (Wilkinson and
Brouthers, 2006)
H4a (ii): The relationship between entrepreneurial capabilities and economic
performance is moderated by environmental dynamism
The results showed evidence that environmental dynamism moderates the
relationship between EC and economic performance. There was a significant
correlation between EC and environmental dynamism. The findings reveal that in an
environment characterised by unpredictable and persistent changes in its external
such as the entry or exit of competitors, changes in customers’ needs, and shifts in
technological conditions, entrepreneurial capabilities are associated with economic
performance. Internationalisation knowledge, which was itemised by prior
international business experience, the ability to determine foreign business
opportunities, experience in dealing with foreign customers and managing foreign
operations, seems to contribute towards enhancing economic performance.
International experience can lead to opportunity identification, market knowledge,
and network building, all of which are determinants of internationalisation (McDougall
et al., 2003). However, the results do not adequately show what the nature of the
relationship seems to be, i.e. whether the strength of the relationship increases or
decreases with increasing levels of dynamism. This is perhaps attributable to the low
reliability of the dynamism scale.
Foreign institutional knowledge (FIK) and foreign business knowledge (FBK) were not
found to be important aspects of human capital in this moderation relationship.
Accordingly, knowledge of foreign languages, norms, business laws and regulations
which are elements of FIK as well as knowledge of foreign customers, competitors,
government agencies which are elements of FBK did not play a role in the moderation
relationship between EC and performance in dynamic foreign market environments.
The research maintains that these aspects of knowledge as described (FIK and FBK) are
196
context-specific in nature and will not necessarily change with the change dynamism in
the international environment.
However, prior internationalisation experience with the various aspects of the foreign
market (internationalisation knowledge) did affect the relationship. This study
contends that prior experience in similar markets (similar to the current markets
served) resulted in successful economic performance (Camisón and Villar-López, 2010).
H4b (i): The relationship between entrepreneurial capabilities and export intensity is
moderated by environmental hostility (weakly supported)
The results showed weak evidence that environmental hostility moderates the
relationship between EC and export intensity. There was a significant correlation
between EC and environmental hostility. The findings reveal that in an international
environment characterised by hostility, entrepreneurial capabilities are weakly
associated with export intensity, however none of the dimensions of EC was an
important factor as a single unit.
However, the results do not adequately show what the nature of the relationship
seems to be i.e. whether the strength of the relationship increases or decreases with
increasing levels of hostility. This result is not particularly useful given the low variation
in export intensity explained by EC (4%).
H4b (ii): The relationship between entrepreneurial capabilities and export intensity is
moderated by the environmental dynamism (weakly supported)
The results showed weak evidence that environmental dynamism moderates the
relationship between EC and export intensity. There was a significant correlation
between EC and environmental dynamism. The findings reveal that in an international
environment characterised by unpredictable and persistent changes in its external
such as the entry or exit of competitors, changes in customers’ needs, and shifts in
technological conditions, entrepreneurial capabilities are associated with export
intensity. Although weakly supported, the results seem to suggest that the strength of
the relationship increases with increasing levels of dynamism. Internationalisation
197
knowledge seems to be the important factor contributing towards enhancing export
intensity in dynamic environments. International experience can lead to opportunity
identification, market knowledge, and network building in markets characterised by
rapid and dynamic shifts, all of which are determinants of internationalisation
(McDougall et al., 2003).
This result is not particularly useful given the low variation in export intensity
explained by EC (6%). Nonetheless, due to the low reliability of the dynamism scale the
results should be interpreted cautiously.
198
Conclusion regarding Hypothesis 4: The relationship between entrepreneurial
capabilities and international performance is moderated by the environmental
characteristics (supported).
The empirical study showed evidence that environmental hostility moderates the
relationship between entrepreneurial capabilities and the two performance measures -
economic performance and export intensity (Hypotheses H4a (i) and H4b (i)).
Furthermore, the study revealed weak evidence that environmental dynamism
moderates the relationship between entrepreneurial capabilities and performance -
Hypotheses H4a (i) and H4b (ii). Although the moderation effect of both environmental
variables (hostility and dynamism) was weakly supported for export intensity, the
effect of dynamism was found to be relatively stronger for economic performance.
This means that the relationship between entrepreneurial capabilities and economic
performance was more strongly moderated by environmental dynamism than it was
for all the other hypothesised moderation relationships for the EC construct.
The results revealed that in foreign environment characterised by hostility, social
capital is the most important attribute of entrepreneurial capabilities associated with
economic performance. The relationship was such that as the level of hostility
increased, the relation between social capital and economic performance tends to
become weaker. A closer look at the relationship showed that social interaction and
network ties are the important attributes of social capital in this relationship. Further
investigation into the moderation effect revealed that it is the interaction of social
interaction (strong ties) that weakens the relationship; whereas network ties (weak
ties) remained a positive contributor to economic performance. Human capital and
technology did not play a role in enhancing economic performance. The findings
implied that social capital provides compensating advantages (for technology and
human capital) in order to compete viably in unfamiliar hostile markets abroad.
The significance of social capital is that social relations with foreign contacts may
provide information about foreign markets necessary to succeed internationally
(Presutti et al., 2007; Agndal et al., 2008). In line with existing research, this study
199
confirms that, in hostile foreign markets, external social capital positively impacts the
international growth and economic performance of firms.
Of the social capital attributes, social interaction and network ties were found to play
an important role in enhancing economic performance. However, relationship quality
did not in enhance economic performance. The view is that social interaction and
network ties are critical to overcoming information asymmetries such as finding
clients, suppliers, and investors. Networks facilitate the discovery of international
opportunities, allocation of scarce resources, and serve as a brokerage to other
unknown networks. Networking extends the reach and abilities of the individual to
capture resources that are held by others and so improve entrepreneurial
effectiveness. In these relationships, trust was not considered important in promoting
economic performance, and hence relationship quality did not play a role.
As already stated, as the level of hostility increases, the relation between social capital
and economic performance tends to become weaker. While Network ties (weak ties)
remain a positive contributor to economic performance under hostile environments,
social interaction (strong ties) attributes to a weak relationship.
The weakening of the relationship between economic performance and social
interaction when the level of hostility increased implied that maintaining strong
socially embedded ties became less important is such environments. This meant that
when the foreign business environment is characterised by unfavourable supply
conditions, lack the abundance of resources, high political and economic instability
and/or intensified competition, strong embeddedness became a social liability and did
not provide benefits for advancing business. It would seem that strong ties resulted in
dependency problems, vulnerability, and were a source of redundant information.
However maintaining weak ties under hostile foreign environments remained an
important source of nonredundant information which can be linked to growth.
The results revealed that in foreign environment characterised by dynamism,
internationalisation knowledge (conceptualised as prior internationalisation
200
experience) was the most important attribute of entrepreneurial capabilities
associated with economic performance and export performance. The nature of the
relationship with economic performance as the level of dynamism increased could not
be established, however with export intensity the results seemed to suggest that the
strength of the relationships increased with increasing levels of dynamism. The
research acknowledges the low reliability of the dynamism scale and the low explained
variation in economic performance (4%) and export intensity (6%), and hence caution
in interpreting this result.
As mentioned, it can be noted that relationship with export intensity the level of
dynamism showed some evidence to say that relationship between EC (as signified by
internationalisation knowledge) and export intensity weakens with increasing levels of
dynamism. The researcher suggests that as firms increase the ratio of foreign sales as a
percentage of total sales, the exposure to new cultures and languages, and different
ways of doing business may amount to increased risk-taking (Welch, 2004) and hence
weakens the relationship.
Internationalisation knowledge, which was itemised by prior international business
experience, the ability to determine foreign business opportunities, experience in
dealing with foreign customers and managing foreign operations, seems to contribute
towards enhancing economic performance. The researcher finds that this construct
should be renamed prior internationalisation experience. Prior international
experience can lead to further opportunity identification, market knowledge, and
network building, all of which are determinants of internationalisation (McDougall et
al., 2003).
Foreign institutional knowledge (FIK) and foreign business knowledge (FBK) were not
found to be important aspects of human capital in these moderation relationships
within dynamic environments.
FIK was itemised by knowledge of foreign languages, norms, business laws and
regulations whereas FBK was itemised by knowledge of foreign customers,
201
competitors, government agencies. The view is that these aspects of knowledge are
context-specific in nature and will not necessarily change with the change dynamism in
the international environment, and therefore they did not moderate the relationships.
As already discussed, prior internationalisation experience was the most important
attribute of human capital critical in the moderation effect of dynamism on the
relationship between EC and economic performance as well as EC and export intensity.
This study contends that this prior experience is transferable when the prior
environments are similar to the current markets served.
202
5.5 Conclusion
This chapter discussed in great detail the results for the hypothesis that were
formulated and tested in order to estimate the relationships between constructs as
stated in the first and second sub-problems in Chapter 1. In order to allow a logical
flow of the discussion, the results were discussed following the constructs which
formed the independent variables. Section 5.2 discusses the results pertaining to
entrepreneurial intensity. Firstly the results pertaining entrepreneurial intensity (H1
and H3); Followed by results pertaining entrepreneurial capabilities (H2 and H4). For
each hypothesis, the results for the sub-hypothesis are discussed. At the summit of this
section, a presentation of table summary of the outcome of the hypothesis testing is
shown. The summary findings are as follows:
Summary discussion regarding Hypothesis 1: Entrepreneurial intensity is positively
related to international performance (Supported).
The empirical study revealed that frequency of entrepreneurial activities is related
to economic performance, whereas EO is related to export intensity
In order to achieve higher export intensity, firms have to adopt an entrepreneurial
orientation by proactively innovating new products for the international markets to
boost foreign sales
The study extends the body of literature among internationalised firms based on
EO-performance relationship (Zhou, 2007; Li et al., 2009; Patel and D’Souza, 2009;
Javalgi and Todd, 2010) by advancing that entrepreneurial intensity is positively
related to international performance.
Summary discussion regarding Hypothesis 3: The relationship between
entrepreneurial intensity and international performance is moderated by the
environmental characteristics (partially supported).
The empirical study showed weak evidence that environmental hostility moderates
the relationship between entrepreneurial intensity and the two performance
203
measures - economic performance and export intensity (Hypotheses H3a (i) and
H3b (i))
However, the study did not find evidence that environmental dynamism moderates
the relationship between entrepreneurial intensity and performance - Hypotheses
H3a (i) and H3b (ii)
International environments characterised by hostility, entrepreneurial intensity is
weakly associated with both economic performance and export intensity
As the level of hostility increases, the relation between entrepreneurial intensity
and performance tends to becomes weaker. This implies that in these
environments, it becomes less important to pursue aggressive entrepreneurship in
order to grow business and achieve greater financial performance. In hostile
international environments exporting firms may simply back slash focus their
efforts in those markets and focus on alternative markets, including domestic
On the contrary, the findings revealed that in an environment dynamism did not
moderate the relationship between entrepreneurial intensity and performance
(both economic performance and export intensity)
The research found that among the exporting firms the level of environmental
dynamism did not affect the relationship between EI and performance. The study
observed that given high concentration of the firms in high technology sectors,
these firms naturally lends themselves to radical innovation strategies regardless of
whether the environment is dynamic or not. Furthermore the study suggests
investments in innovative activities in response to dynamic changes in the
environment may take time to pay off.
In conclusion pertaining to the hypothesis on entrepreneurial intensity and
performance
International firms rely on entrepreneurial strategies and actions to achieve
performance in hostile foreign market environments. However, the study did not
find support for the moderating effect of dynamism on the EI-performance
relationship.
204
Summary discussion regarding Hypothesis 2: Entrepreneurial capabilities are
positively related to international performance (Supported)
The empirical study revealed human capital, social capital and technology were
positively related to economic performance, whereas only human capital and
social capital were related to export intensity
With regards to technology, the results showed that acquired technologies did
augment the firms’ ability to compete in international markets, however the firm’s
did not perceive themselves to be competing on the basis of superior technology
to improve export intensity
The results showed that in order to achieve financial success in international
expansion knowledge-based, social-based, and technological capabilities are
important (Autio et al., 2000; Deeds, 2001; Zhou, 2007; Brennan and Garvey, 2009)
Further analysis of the findings revealed that all the variables of the
entrepreneurial capabilities construct, played a significant role international
performance, possession of distinct technologies compared to competitors was
negatively correlated to export intensity
This suggests that the firms did not necessarily compete in the foreign market on
the basis of having unique or superior technology and/or R&D than competitors;
but rather simply improve existing products/services, or imitate other
technologies. This perhaps emphasises the challenge for firms in emerging
economies to adopt technology and act entrepreneurially in order to boost their
export sales.
205
Summary discussion regarding Hypothesis 4: The relationship between
entrepreneurial capabilities and international performance is moderated by the
environmental characteristics (supported)
Environmental hostility moderates the relationship between entrepreneurial
capabilities and the two performance measures - economic performance and
export intensity (Hypotheses H4a (i) and H4b (i))
The study revealed weak evidence that environmental dynamism moderates the
relationship between entrepreneurial capabilities and performance - Hypotheses
H4a (i) and H4b (ii)
This means that the relationship between entrepreneurial capabilities and
economic performance was more strongly moderated by environmental dynamism
than it was for all the other hypothesised moderation relationships for the EC
construct
In foreign environment characterised by hostility, social capital is the most
important attribute of entrepreneurial capabilities associated with economic
performance. As the level of hostility increased, the relation between social capital
and economic performance tends to become weaker
Social interaction and network ties are the important attributes of social capital in
this relationship. The moderation effect revealed that it is the interaction of social
interaction (strong ties) that weakens the relationship; whereas network ties (weak
ties) remained a positive contributor to economic performance
Human capital and technology did not play a role in enhancing economic
performance. The findings implied that social capital provides compensating
advantages (for technology and human capital) in order to compete viably in
unfamiliar hostile markets abroad
Social relations with foreign contacts may provide information about foreign
markets necessary to succeed internationally (Presutti et al., 2007; Agndal et al.,
2008)
206
In line with existing research, this study confirms that, in hostile foreign markets,
external social capital positively impacts the international growth and economic
performance of firms
Social interaction and network ties were found to play an important role in
enhancing economic performance, however, relationship quality did not
The view is that social interaction and network ties are critical to overcoming
information asymmetries such as finding clients, suppliers, and investors. Trust was
not considered important in promoting economic performance, and hence
relationship quality did not play a role
This meant that when the foreign business environment is hostile, strong
embeddedness became a social liability and did not provide benefits for advancing
business
It would seem that strong ties resulted in dependency problems, vulnerability, and
were a source of redundant information. However maintaining weak ties under
hostile foreign environments remained an important source of nonredundant
information which can be linked to growth
In foreign environment characterised by dynamism, internationalisation knowledge
(conceptualised as prior internationalisation experience) was the most important
attribute of entrepreneurial capabilities associated with economic performance
and export performance
The research acknowledges the low reliability of the dynamism scale and the low
explained variation in economic performance (4%) and export intensity (6%), and
hence caution in interpreting this result
The researcher suggests that as firms increase the ratio of foreign sales as a
percentage of total sales, the exposure to new cultures and languages, and
different ways of doing business may amount to increased risk-taking (Welch,
2004) and hence weakens the relationship
Internationalisation knowledge has been conceptualised as prior
internationalisation experience
207
Foreign institutional knowledge (FIK) and foreign business knowledge (FBK) were
not found to be important aspects of human capital in these moderation
relationships within dynamic environments
The view is that aspects of FIK and FBK are context-specific in nature and will not
necessarily change with the change dynamism in the international environment,
and therefore they did not moderate the relationships
Prior internationalisation experience was the most important attribute of human
capital critical in the moderation effect of dynamism on the relationship between
EC and economic performance as well as EC and export intensity. This study
contends that this prior experience is transferable when the prior environments
are similar to the current markets served.
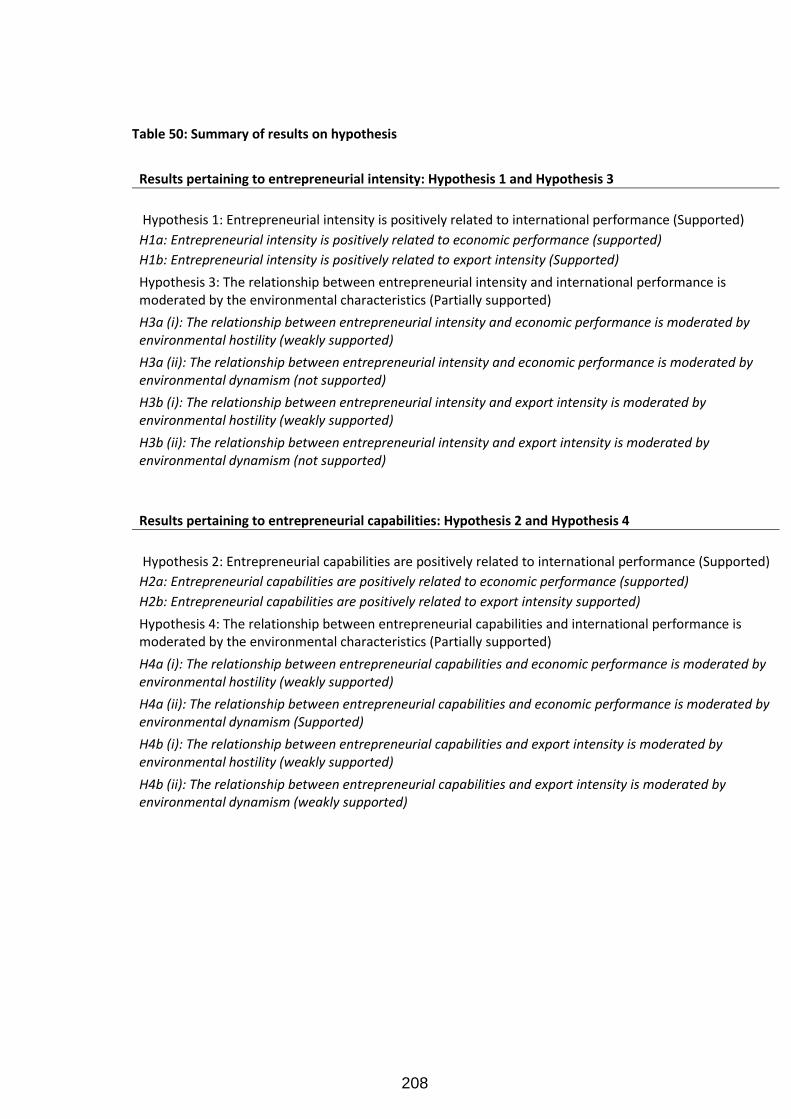
208
Table 50: Summary of results on hypothesis
Results pertaining to entrepreneurial intensity: Hypothesis 1 and Hypothesis 3
Hypothesis 1: Entrepreneurial intensity is positively related to international performance (Supported)
H1a: Entrepreneurial intensity is positively related to economic performance (supported)
H1b: Entrepreneurial intensity is positively related to export intensity (Supported)
Hypothesis 3: The relationship between entrepreneurial intensity and international performance is moderated by the environmental characteristics (Partially supported)
H3a (i): The relationship between entrepreneurial intensity and economic performance is moderated by environmental hostility (weakly supported)
H3a (ii): The relationship between entrepreneurial intensity and economic performance is moderated by environmental dynamism (not supported)
H3b (i): The relationship between entrepreneurial intensity and export intensity is moderated by environmental hostility (weakly supported)
H3b (ii): The relationship between entrepreneurial intensity and export intensity is moderated by environmental dynamism (not supported)
Results pertaining to entrepreneurial capabilities: Hypothesis 2 and Hypothesis 4
Hypothesis 2: Entrepreneurial capabilities are positively related to international performance (Supported)
H2a: Entrepreneurial capabilities are positively related to economic performance (supported)
H2b: Entrepreneurial capabilities are positively related to export intensity supported)
Hypothesis 4: The relationship between entrepreneurial capabilities and international performance is moderated by the environmental characteristics (Partially supported)
H4a (i): The relationship between entrepreneurial capabilities and economic performance is moderated by environmental hostility (weakly supported)
H4a (ii): The relationship between entrepreneurial capabilities and economic performance is moderated by environmental dynamism (Supported)
H4b (i): The relationship between entrepreneurial capabilities and export intensity is moderated by environmental hostility (weakly supported)
H4b (ii): The relationship between entrepreneurial capabilities and export intensity is moderated by environmental dynamism (weakly supported)
209
CHAPTER 6: CONCLUSIONS AND RECOMMENDATIONS
6.1 Introduction
The first objective of this chapter is to summarise the findings of this study based on
the evidence presented in the previous chapter and draw conclusions based on the
findings. The second objective is to provide recommendations to each of the
stakeholders (entrepreneurs, companies, researchers, and policy makers). The last
section attempts to elicit further research by proposing a few research areas that may
be undertaken in the field. The next section discusses the conclusions of the study; the
last two sections provide recommendations to stakeholders and suggestions for future
research respectively.
6.2 Conclusions of the study
Globalisation of the world economy has encouraged companies to leverage their
resources and skills by expanding into existing or new foreign markets (Zahra and
Garvis, 2000). The process of discovering and creatively exploiting opportunities that
exist outside a firm’s national borders in order to obtain competitive advantage has
been labelled international entrepreneurship. Exporting is viewed as an attractive
mode of venturing into foreign market opportunities (Haahti et al., 2005) and is indeed
an entrepreneurial activity since it consist of identifying and exploiting new business
opportunities in a new environment (Ripollés-Meliá et al., 2007). Export of products
represents the predominant mode of international expansion (Acedo and Casillas,
2007) and is tipped vital for the growth and development of firms in emerging
economies (Manolova et al., 2010).
Due to rapid globalisation of world markets, companies of all sizes have been
encouraged to expand internationally. Emerging markets are characterised by
relatively small, domestic firms with severe resource constraints in terms of financial,
technological and personnel resources.
210
Majority of the empirical work in export and international entrepreneurship is based
primarily on firms based in advanced economies (Singh, 2009). Limited research has
been conducted in the context of developing countries, including South Africa
(Scheepers et al., 2007). Faced with rising competition in their domestic markets, these
firms should look into foreign markets as a means to achieve growth and creating a
sustainable performance. As already pointed, export is an effective way towards
internationalisation, but it requires organisational capabilities. In order to compete
effectively on the international stage these firms need to exhibit high level of
entrepreneurial behaviour and unique entrepreneurial capabilities (Zhou, 2007).
Entrepreneurial behaviour among firms and possession of a broader range of abilities
needed to initiate appropriate action in specific organisational situations are
necessary.
This study contributes to the international entrepreneurship literature by analysing the
relationship between entrepreneurial intensity and capability, taken as independent
variables, and their effect on international performance, taken as a multi-item
dependent variable. The study utilises a sample of South African exporting firms of any
size, industry, and/or age. Furthermore foreign environmental conditions within which
these firms operate are measured in terms of their impact on the relationship between
the independent variables and international performance.
With reference to the context of the study, the findings of this study are important for
the following reasons:
The findings may have implications to South African firms as well as other
developing countries
Entrepreneurial intensity has not been studied within the context of international
entrepreneurship and therefore is still in infancy stage
Entrepreneurial intensity and capabilities have not been studied together in an
integrative study
The study advances literature in terms of managing internationalised firms under
hostile and/or dynamic environments
211
International performance is measured as a multi-item measure consisting of
economic performance and export intensity
South African businesses face challenges of international competitiveness, trade
deficit, as well as job creation.
In line with prior research on entrepreneurial orientation (Zhou, 2007; Li et al., 2009;
Patel and D’Souza, 2009; Javalgi and Todd, 2010), the results of the study showed that
entrepreneurial intensity is positively related to international performance. South
African exporting firms should enforce different aspect of entrepreneurial intensity
depending on the intended performance target they want to reach.
If their objective is to achieve growth and financial performance, exporting firms
should engage in frequent product, process, and service enhancement activities. On
the other hand, if their objective is to achieve higher export intensity, the firms have to
adopt an entrepreneurial orientation by proactively innovating new products for the
international markets to boost foreign sales. The development of entrepreneurial
orientation would require organisational members to engage in proactive activities
such as spending time abroad and attending foreign trade fares in search of new
opportunities. However, they should be cautious to avoid taking risks in these
environments to avoid losses that could affect their foreign sales revenue.
The study found that entrepreneurial capability among South African exporting firms is
positively related to performance. Entrepreneurial capabilities enable management
initiate appropriate action in specific organisational situations and reflect the capacity
to initiate and sustain an entrepreneurial dynamism throughout the organisation
(Obrecht, 2004). In line with existing literature in international entrepreneurship, the
study confirms that knowledge-based, social-based, and technological capabilities are
important for successful international expansion (Autio et al., 2000; Deeds, 2001;
Zhou, 2007; Brennan and Garvey, 2009). The study however, found that in order to
improve their export intensity, human capital and social capital are among the most
essential capabilities for organisational perfomance (Obrecht, 2004) but technology
was not.
212
The firms did not perceive that competing on the basis of distinct technologies
compared to competitors was essential to improve export intensity. This is possibly
due to the time lag that it takes to derive benefits from investments in technology
intensive activities such as R&D. It is suggested the firms may simply be improving on
an existing product/service, or imitate other technologies; or they may be focusing on
other competitive strategies such as pricing, relationships and/or service offering.
However, in line with the findings, acquisition of internal technologies necessary for
operational efficiency, or launching products that better satisfy customer needs, and
logistic applications is essential to improving export intensity.
The overall comparison revealed that in the foreign market environment,
entrepreneurial capabilities were more important predictors of performance than
entrepreneurial intensity. This suggests that entrepreneurial firms must possess
compensating advantages in order to compete viably in unfamiliar markets abroad if
they are not strong on innovation, proactiveness, and taking risks. Knowledge-based
factors enable management the initiative and flexibility to gain influence over vital
resources. In line with other research, venture performance is largely determined by
its unique resource and capabilities (Deeds, 2001).
Firm behaviour may differ contingent on influences external to the firm. Zahra (2000)
states that foreign opportunities, however, are tempered by the constraints imposed
by the competitive forces that exist in international environments, such as aggressive
government intervention, technological changes, and fierce local rivalries all
contributing to hostile international environment.
The study found that international firms rely on different strategies and actions to
achieve superior performance in hostile foreign market environments. The result
showed that the pursuit of aggressive entrepreneurship behaviour in the international
environments with higher levels of hostility is not essential in order to improve export
intensity or achieve greater economic performance. In response to the perceived high
levels of industry risk, firms adopt a conservative strategic posture by avoiding
commitment of resources and adopt a style that is decidedly risk-averse, non-
213
innovative, and reactive (Covin and Slevin, 1990). Under these conditions exporting
firms may simply back track their efforts in those markets and focus on alternative
markets. Adoption of an international diversification is a strategy that enables firms to
generate the resources necessary to support projects, spread the risk and provide
additional market. In line with existing research, global geographic diversity
determines the firm’s overall performance (Zahra and Garvis, 2000).
The research found that among the SA exporting firms, the level of environmental
dynamism in the foreign markets did not moderate the relationship between
entrepreneurial intensity and performance. This may be because it may take some
time for firms to realise the benefits of investments in innovative activities when the
firms respond to shifts in technological conditions. It suggested that given the high
concentration of the firms in high technology sectors within our sample, these firms
naturally lends themselves to radical innovation strategies regardless of whether the
environment is dynamic or not.
The research found that the relationship between entrepreneurial capabilities and
international performance is moderated by both environmental hostility and
dynamism, with stronger effects manifested for economic performance than for export
intensity. In foreign environment characterised by hostility, social capital is the most
important attribute of entrepreneurial capabilities associated with economic
performance.
The finding revealed that as the level of hostility increased, the relation between social
capital and economic performance tends to become weaker. Social interaction and
network ties are the important attributes of social capital in this relationship, with
social interaction (strong ties) contributing to the fading relationship; whereas network
ties (weak ties) remained a positive contributor to economic performance.
Social relations with foreign contacts may provide information about foreign markets
necessary to succeed internationally (Presutti et al., 2007; Agndal et al., 2008). Human
capital and technology did not play a role in enhancing economic performance under
214
hostile foreign environments. The findings implied that social capital provides
compensating advantages (for technology and human capital) in order to compete
viably in unfamiliar hostile markets abroad. In line with existing research, this study
confirms that, in hostile foreign markets, external social capital positively impacts the
international growth and economic performance of firms.
In line with Burt (2000) the study found that the structural configuration of
relationships is more important than the quality of the relationship when the
environment is characterised by political and/or economic instability and/or intensified
competition. Social interaction and network ties were found to play an important role
in enhancing economic performance in hostile foreign environments, however
relationship quality did not. The view is that social interaction and network ties are
critical to overcoming information asymmetries such as finding clients, suppliers, and
investors. Trust was not considered important in promoting economic performance,
and hence relationship quality did not play a role. This meant that when the foreign
business environment is hostile, strong embeddedness became a social liability and did
not provide benefits for advancing business. Firms can overcome the limitations of
inadequate information about foreign markets by using their network ties in the
targeted markets instead of social ties.
It would seem that strong ties result in dependency problems, vulnerability, and were
a source of redundant information. However maintaining weak ties under hostile
foreign environments remained an important source of useful information which can
be linked to growth. Companies operating in hostile foreign environments are advised
not to waste too much time and effort in maintaining close/personal social relations
with their key foreign contacts. They should direct their focus on building sparse
professional networks with structural holes in order to gain access to vital knowledge
and other resources.
In foreign environment characterised by dynamism, internationalisation knowledge
(conceptualised as prior internationalisation experience) was the most important
215
attribute of entrepreneurial capabilities associated with economic performance and
export intensity.
The research acknowledges the low reliability of the dynamism scale and the low
explained variation in economic performance (4%) and export intensity (6%), and
hence caution in interpreting this result is advised.
In this study internationalisation knowledge has been conceptualised as prior
internationalisation experience. Foreign institutional knowledge (FIK) and foreign
business knowledge (FBK) were not found to be important aspects of human capital in
these moderation relationships within dynamic environments. This implies that in
dynamic foreign markets knowledge of foreign languages and norms, laws and
regulations, host government agencies, and market conditions did not boost
performance.
The research suggests that as firms increase the ratio of foreign sales as a percentage
of total sales, the exposure to new cultures and languages, and different ways of doing
business may amount to increased risk-taking (Welch, 2004) and hence weakens the
relationship between FIK and FBK with export intensity. Aspects of FIK and FBK are
context-specific in nature and will not necessarily change with the change in dynamism
in the international environment, and therefore these factors did not moderate the
relationships.
Prior internationalisation experience is the most important attribute of human capital
critical in the moderation effect of dynamism on the relationship between
entrepreneurial capabilities and economic performance as well as entrepreneurial
capabilities and export intensity. This implies that when the foreign business
environment is characterised by dynamic changes such as changes in customers’
needs, and shifts in technological conditions, prior internationalisation experience
among top management can lead to further opportunity identification, market
knowledge, and network building, all of which are determinants of internationalisation
(McDougall et al., 2003). This study contends that this prior experience is transferable
216
when the prior environments are similar to the current markets served and therefore
it should not be taken for granted that experience in dissimilar foreign markets is
sufficient (Autio, 2005; Camisón and Villar-López, 2010).
In conclusion, using an integrative approach that inter-relates entrepreneurial intensity
among firms and their capabilities, the research attempted to investigate the
antecedents of export intensity and economic performance within a foreign market
environmental context.
Although some of the results were weak in terms of a large amount of unexplained
variation in the outcome variables, they are acceptable for theoretical and practical
purposes.
6.3 Recommendations
Emerging market exporting firms should be encouraged to adopt international
entrepreneurial intensity as the appropriate strategic orientation
Top management teams of emerging market exporting companies should seek to
improve their overall entrepreneurial capabilities in order to overcome obstacles
hampering international performance
South Africa needs to improve its international competitiveness by channelling risk
capital towards internationalised firms with pertinent entrepreneurial
competencies such as human and social capital and technology acquisition
South African exporting firms should know the conditions under which different
mixes of weak network ties and strong ties lead to specific benefits in their foreign
markets
Policy makers in business, government and educational institutions should put
more emphasis on programs that foster the development of entrepreneurial
capabilities among executives of exporting firms.
217
6.4 Suggestions for further research
This research has important implications regarding the antecedent of performance
among exporting firms within an emerging market context. In order to elicit further
research efforts in the field, the following suggestions for future research are made:
Although the current study demonstrated statistically significant relationships
between independent variables and the performance indicators, the results were
not strong (low r-squared). Morris and Sexton (1996) found stronger relationships
when more weight is placed on degree versus the frequency of entrepreneurship
demonstrated by a firm (Morris and Sexton, 1996). Given the infancy of our
understanding of entrepreneurial intensity, future research could advance our
understanding and benefit from assigning more weight to EO than to frequency
Research could investigate whether possession of financial asset impacts
international performance among firms
Research could investigate whether the decision for new ventures to
internationalise (at inception) is influenced by the size of its home market or by its
production capacity as indicated by Fan and Phan (2007), or by management
commitment to exporting as indicated by other researches such as Javalgi and
Todd (2010) and Serra et al. (2011) or by the firm’s possession of resources
(Ibrahim et al., 2004)
Examine opportunity recognition and exploitation among South African firms in
international markets
Investigate the practice of firms to engage in a range of internationalisation
processes such as international networks, research collaboration, labour
recruitment, and knowledge transfer
Research could look into whether involvement in international trade does lead to
economic growth or knowledge transfer among the firms and hence across borders
as claimed by Mastromarco and Ghosh (2009)
Investigate whether there are region specific opportunities that (can) enable South
African exporting firms to flourish.
218
REFERENCES
Acedo, F. J. and Casillas, J. C. (2007) Age at entry in international markets of Spanish SMEs. Entrepreneurial and institutional determinants., International Journal of Entrepreneurial Behaviour & Research, 13(3), pp. 130-150.
Adler, P. S. and Kwon, S.-W. (2000) 'Social Capital: The Good, the Bad, and the Ugly', In Eric, L. L. (ed.), Knowledge and Social Capital, Butterworth-Heinemann, Boston, pp. 89-115.
Agndal, H., Chetty, S. and Wilson, H. (2008) Social capital dynamics and foreign market entry, International Business Review, 17(6), pp. 663-675.
Anderson, A. R., Dodd, S. D. and Jack, S. (2010) Network practices and entrepreneurial growth, Scandinavian Journal of Management, 26(2), pp. 121-133.
Anderson, A. R. and Miller, C. J. (2003) "Class matters": human and social capital in the entrepreneurial process, Journal of Socio-Economics, 32(1), pp. 17-36.
Ardichvili, A., Cardozo, R. and Ray, S. (2003) A theory of entrepreneurial opportunity identification and development, Journal of Business Venturing, 18(1), pp. 105-123.
Autio, E. (2005) Creative Tension: The Significance of Ben Oviatt's and Patricia McDougall's Article 'Toward a Theory of International New Ventures', Journal of International Business Studies, 36(1), pp. 9-19.
Autio, E., Sapienza, H. J. and Almeida, J. G. (2000) Effects of age at entry, knowledge intensity, and imitability on international growth, Academy of Management Journal, 43(5), pp. 909-924.
Baron, R. M. and Kenny, D. A. (1986) The moderator-mediator variable distinction in social psychological research: Conceptual, strategic, and statistical considerations., Journal of Personality and Social Psychology, 51(6), pp. 1173-1182.
Batjargal, B. (2007) Internet entrepreneurship: Social capital, human capital, and performance of Internet ventures in China, Research Policy, 36(5), pp. 605-618.
Bauernschuster, S., Falck, O. and Heblich, S. (2010) Social capital access and entrepreneurship, Journal of Economic Behavior & Organization, 76(3), pp. 821-833.
Bhagavatula, S., Elfring, T., van Tilburg, A. and van de Bunt, G. G. (2010) How social and human capital influence opportunity recognition and resource
219
mobilization in India's handloom industry, Journal of Business Venturing, 25(3), pp. 245-260.
Blanco, S. (2007) How techno-entrepreneurs build a potentially exciting future, Handbook of Research on Techno-Entrepreneurship, 1, pp. 3-25.
Bojica, A. M. and Fuentes, M. d. M. F. (2011) Knowledge acquisition and corporate entrepreneurship: Insights from Spanish SMEs in the ICT sector, Journal of World Business, p. 12.
Brennan, L. and Garvey, D. (2009) The role of knowledge in internationalization, Research in International Business and Finance, 23(2), pp. 120-133.
Burt, R. (1992) Structural Holes: The Social Structure of Competition, Harvard University Press, Cambridge, Massachusetts, USA.
Burt, R. S. (1997) A note on social capital and network content, Social Networks, 19(4), pp. 355-373.
Burt, R. S. (2000) The network structure of social capital, Research in Organizational Behavior, 22, pp. 345-423.
Camisón, C. and Villar-López, A. (2010) Effect of SMEs' International Experience on Foreign Intensity and Economic Performance: The Mediating Role of Internationally Exploitable Assets and Competitive Strategy, Journal of Small Business Management, 48(2), pp. 116 - 151.
Casillas, J. C., Acedo, F. J. and Barbero, J. L. (2010) Learning, unlearning and internationalisation: Evidence from the pre-export phase, International Journal of Information Management, 30(2), pp. 162-173.
Casillas, J. C., Moreno, A. M., Acedo, F. J., Gallego, M. A. and Ramos, E. (2009) An integrative model of the role of knowledge in the internationalization process, Journal of World Business, 44(3), pp. 311-322.
Certo, S. T., Moss, T. W. and Short, J. C. (2009) Entrepreneurial orientation: An applied perspective, Business Horizons, 52(4), pp. 319-324.
Contractora, F. J. and Kundub, S. (2004) The role of export-driven entrepreneurship in economic development: A comparison of software exports from India, China, and Taiwan, Technological Forecasting & Social Change, 71, pp. 799–822.
Cooper, D. R. and Schindler, P. S. (eds.) (2008) Business Research Methods: International edition, 10 ed., McGraw-Hill.
Coviello, N. E. (2006) The Network Dynamics of International New Ventures, Journal of International Business Studies, 37(5), pp. 713-731.
220
Coviello, N. E. and Jones, M. V. (2004) Methodological issues in international entrepreneurship research, Journal of Business Venturing, 19(4), pp. 485-508.
Covin, J. G. and Slevin, D. P. (1990) NEW VENTURE STRATEGIC POSTURE, STRUCTURE, AND PERFORMANCE: AN INDUSTRY LIFE CYCLE ANALYSIS, Journal of Business Venturing, 5, pp. 123 - 135.
Covin, J. G., Slevin, D. P. and Heeley, M. B. (2000) PIONEERS AND FOLLOWERS: COMPETITIVE TACTICS, ENVIRONMENT, AND FIRM GROWTH, Journal of Business Venturing, 15, pp. 175–210.
Creswell, J. W. (ed.) (2008) RESEARCH DESIGN: Qaulitative, Quantitative, and Mixed Methods Approaches, 3 ed.
Dana, L.-P. and Wright, R. W. (2004) Emerging paradigms of international entreprenurship, Handbook of Research on International Entrepreneurship, pp. 3 - 15.
Danis, W. M., De Clercq, D. and Petricevic, O. (2010) Are social networks more important for new business activity in emerging than developed economies? An empirical extension, International Business Review, In Press, Corrected Proof.
Davidsson, P. and Honig, B. (2003) The role of social and human capital among nascent entrepreneurs, Journal of Business Venturing, 18(3), pp. 301-331.
Deeds, D. L. (2001) The role of R&D intensity, technical development and absorptive capacity in creating entrepreneurial wealth in high technology start-ups, Journal of Engineering and Technology Management, 18(1), pp. 29-47.
Dimov, D. P. and Shepherd, D. A. (2005) Human capital theory and venture capital firms: exploring "home runs" and "strike outs", Journal of Business Venturing, 20(1), pp. 1-21.
Ding, L., Steil, D., Dixon, B., Parrish, A. and Brown, D. (2011) A relation context oriented approach to identify strong ties in social networks, Knowledge-Based Systems, In Press, Uncorrected Proof.
Erensal, Y. C., Öncan, T. and Demircan, M. L. (2006) Determining key capabilities in technology management using fuzzy analytic hierarchy process: A case study of Turkey, Information Sciences, 176(18), pp. 2755-2770.
Etemad, H. and Lee, Y. (2003) The Knowledge Network of International Entrepreneurship: Theory and Evidence, Small Business Economics, 20(1), pp. 5-23.
221
Eurostat (2012) South Africa Main Econmic Indicators,
Fan, T. and Phan, P. (2007) International new ventures: revisiting the influences behind the 'born-global firm', Journal of International Business Studies, 38, pp. 1113 - 1131.
Filippetti, A. and Peyrache, A. (2011) The Patterns of Technological Capabilities of Countries: A Dual Approach using Composite Indicators and Data Envelopment Analysis, World Development, In Press, Corrected Proof.
Fletcher, M. and Harris, S. (2011) Knowledge acquisition for the internationalization of the smaller firm: Content and sources, International Business Review, In Press, Corrected Proof.
Frank, H., Kessler, A. and Fink, M. (2010) Entrepreneurial Orientation and Business Performance – A Replication Study, SBR, 62, pp. 175-198.
Furu, P. (2000) Integration of Technological Competence in the MNC: The Role of the Subsidiary Environment, MIR: Management International Review, 40(1), pp. 7-27.
GEM (2009) The Global Entrepreneurship Monitor.
Gimmon, E. and Levie, J. (2010) Founder's human capital, external investment, and the survival of new high-technology ventures, Research Policy, 39(9), pp. 1214-1226.
Haahti, A., Madupu, V., Yavas, U. and Babakus, E. (2005) Cooperative strategy, knowledge intensity and export performance of small and medium sized enterprises, Journal of World Business, 40(2), pp. 124-138.
Hadley, R. D. and Wilson, H. I. M. (2003) The network model of internationalisation and experiential knowledge, International Business Review, 12(6), pp. 697-717.
Haeussler, C., Patzelt, H. and Zahra, S. A. (2010) Strategic alliances and product development in high technology new firms: The moderating effect of technological capabilities, Journal of Business Venturing, In Press, Corrected Proof.
Hair, J. F., Black, W. C., Babin, B. J. and Anderson, R. E. (eds.) (2010) Multivariate Data Analysis: A global perspective Seventh Edition ed., PEARSON.
Hansen, J. D., Deitz, G. D., Tokman, M., Marino, L. D. and Weaver, K. M. (2011) Cross-national invariance of the entrepreneurial orientation scale, Journal of Business Venturing, 26(1), pp. 61-78.
222
Heilbrunn, S. (2008) Factors influencing entrepreneurial intensity in communities, Journal of Enterprising Communities, 2(1), p. 37.
Hess, J. D. (2007) Mean-Centering Does Not Alleviate Collinearity Problems in Moderated Multiple Regression Models, Marketing Science, 26(3), pp. 438-445.
Hoang, H. and Antoncic, B. (2003) Network-based research in entrepreneurship: A critical review, Journal of Business Venturing, 18(2), pp. 165-187.
Hornsby, J. S., Kuratko, D. F. and Zahra, S. A. (2002) Middle managers' perception of the internal environment for corporate entrepreneurship: assessing a measurement scale, Journal of Business Venturing, 17(3), pp. 253-273.
Ibeh, K. I. N. (2003) Toward a Contingency Framework of Export Entrepreneurship: Conceptualisations and Empirical Evidence, Small Business Economics, 20, pp. 49-68.
Ibrahim, B. A. (2004) Internationalization: Motive and Process, Handbook of Research on International Entrepreneurship, pp. 129 -136.
Ireland, R. D., Kuratko, D. F. and Morris, M. H. (2006) A Health Audit for Corporate Entrepreneurship: Innovation at all levels - Part 1, Journal of Business Strategy, 27(1), pp. 10-17.
Jack, S. L. (2010) Approaches to studying networks: Implications and outcomes, Journal of Business Venturing, 25(1), pp. 120-137.
Javalgi, R. G. and Todd, P. R. (2010) Entrepreneurial orientation, management commitment, and human capital: The internationalization of SMEs in India, Journal of Business Research, In Press, Corrected Proof.
Jones, M. V., Coviello, N. and Tang, Y. K. (2011) International Entrepreneurship research (1989-2009): A domain ontology and thematic analysis, Journal of Business Venturing, In Press, Corrected Proof.
Jones, M. V. and Coviello, N. E. (2005) Internationalisation: Conceptualising an Entrepreneurial Process of Behaviour in Time, Journal of International Business Studies, 36(3), pp. 284-303.
Knight, G. A. (2001) Entrepreneurship and strategy in the international SME, Journal of International Management, 7(3), pp. 155-171.
Kock, C. (2007) Is Practical Reasoning Presumptive?, Informal Logic, 27(1), pp. 91-108.
Kuratko, D. F., Hornsby, J. S. and Goldsby, M. G. (2007) The Relationship of Stakeholder Salience, Organizational Posture, and Entrepreneurial
223
Intensity to Corporate Entrepreneurship, Journal of Leadership & Organizational Studies, 13(4), p. 56.
Lee, J. (2011) Export specialization and economic growth around the world, Economic Systems, 35(1), pp. 45-63.
Lee, S., Yoon, B., Lee, C. and Park, J. (2009) Business planning based on technological capabilities: Patent analysis for technology-driven roadmapping, Technological Forecasting and Social Change, 76(6), pp. 769-786.
Leiblein, M. J. and Reuer, J. J. (2004) Building a foreign sales base: the roles of capabilities and alliances for entrepreneurial firms, Journal of Business Venturing, 19(2), pp. 285-307.
Leung, A., Zhang, J., Wong, P. K. and Foo, M. D. (2006) The use of networks in human resource acquisition for entrepreneurial firms: Multiple "fit" considerations, Journal of Business Venturing, 21(5), pp. 664-686.
Li, X. (2011) Sources of External Technology, Absorptive Capacity, and Innovation Capability in Chinese State-Owned High-Tech Enterprises, World Development, In Press, Corrected Proof.
Li, Y.-H., Huang, J.-W. and Tsai, M.-T. (2009) Entrepreneurial orientation and firm performance: The role of knowledge creation process, Industrial Marketing Management, 38(4), pp. 440-449.
Lindstrand, A., Melén, S. and Nordman, E. R. (2011) Turning social capital into business: A study of the internationalization of biotech SMEs, International Business Review, 20(2), pp. 194-212.
Lumpkin, G. T. and Dess, G. G. (1996) Clarifying the entrepreneurial orientation construct and linking it to performance, The academy of Management Review, 21(1), pp. 135-172.
Lumpkin, G. T. and Dess, G. G. (2001) Linking two dimensions of entrepreneurial orientation to firm performance: The moderating role of environment and industry life cycle, Journal of Business Venturing, 16(5), pp. 429-451.
Lyon, D. W., Lumpkin, G. T. and Dess, G. G. (2000) Enhancing entrepreneurial orientation research: operationalizing and measuring a key strategic decision making process, Journal of Management, 26(5), pp. 1055-1085.
Manolova, T. S., Manev, I. M. and Gyoshev, B. S. (2010) In good company: The role of personal and inter-firm networks for new-venture internationalization in a transition economy, Journal of World Business, 45(3), pp. 257-265.
224
Mastromarco, C. and Ghosh, S. (2009) Foreign Capital, Human Capital, and Efficiency: A Stochastic Frontier Analysis for Developing Countries, World Development, 37(2), pp. 489-502.
McDougall, P. P., Oviatt, B. M. and Sharader, R. C. (2003) A comparison of international and domestic new ventures, Journal of International Entrepreneurship, 1(52 - 89).
Molina-Morales, F. X. and Martínez-Fernández, M. T. (2010) Social Networks: Effects of Social Capital on Firm Innovation, Journal of Small Business Management, 48(2), pp. 258-279.
Morris, M., Kuratko, D. and Covin, J. (eds.) (2008) Corporate entrepreneurship & innovation, 2 ed., South Western: Cengage Learning.
Morris, M. H. and Sexton, D. L. (1996) The concept of entrepreneurial intensity: Implications for company performance, Journal of Business Research, 36(1), pp. 5-13.
Obrecht, J.-J. (2004) Entrepreneurial capabilities: a resource-based sytematic approach to international entrepreneurship, Handbook of Research on International Entrepreneurship, pp. 248 - 264.
Oviatt, B. M. and McDougall, P. P. (2005) Toward a Theory of International New Ventures, Journal of International Business Studies, 36(1), pp. 29-41.
Pangarkar, N. (2008) Internationalization and performance of small- and medium-sized enterprises, Journal of World Business, 43(4), pp. 475-485.
Parra-Requena, G., Molina-Morales, F. X. and GarcÍA-Villaverde, P. M. (2010) The Mediating Effect of Cognitive Social Capital on Knowledge Acquisition in Clustered Firms, Growth and Change, 41(1), pp. 59-84.
Patel, P. C. and D’Souza, R. R. (2009) Leveraging Entrepreneurial Orientation to Enhance SME Export Performance.from University of Louisville, Louisville, Kentucky.
Patzelt, H. (2010) CEO human capital, top management teams, and the acquisition of venture capital in new technology ventures: An empirical analysis, Journal of Engineering and Technology Management, 27(3-4), pp. 131-147.
Pirolo, L. and Presutti, M. (2010) The Impact of Social Capital on the Start-ups’ Performance Growth, Journal of Small Business Management, 48(2), pp. 197 - 227.
Podsakoff, P. M., MacKenzie, S. B., Lee, J.-Y. and Podsakoff, N. P. (2003) Common Method Biases in Behavioral Research: A Critical Review of
225
the Literature and Recommended Remedies, Journal of Applied Psychology, 88(8), pp. 879–903.
Presutti, M., Boari, C. and Fratocchi, L. (2007) Knowledge acquisition and the foreign development of high-tech start-ups: A social capital approach, International Business Review, 16(1), pp. 23-46.
Raymond, L. and St-Pierre, J. (2010) Strategic capabilities for product innovation in SMEs. A gestalts perspective, Entrepreneurship and innovation, 11(3), pp. 209-220.
Ripollés-Meliá, M., Menguzzato-Boulard, M. and Sánchez-Peinado, L. (2007) Entrepreneurial orientation and international commitment, Journal of International Entrepreneurship, 5(3-4), pp. 65-83.
Rost, K. (2011) The strength of strong ties in the creation of innovation, Research Policy, 40(4), pp. 588-604.
Samiee, S. and Walters, P. G. P. (1999) Determinants of structured export knowledge acquisition, International Business Review, 8(4), pp. 373-397.
Scheepers, M., Hough, J. and Bloom, J. (2007) Entrepreneurial intensity:A comparative analysis of established companies in South Africa, SAJEMS, 10(2), pp. 238-255.
Scheepers, M. J., Hough, J. and Bloom, J. Z. (2008) Nurturing the corporate entrepreneurship capability, South African Business Review, 12(3), pp. 50-75.
Seno-Alday, S. (2010) International business thought: A 50-year footprint, Journal of International Management, 16, pp. 16 - 31.
Serra, F., Pointon, J. and Abdou, H. (2011) Factors influencing the propensity to export: A study of UK and Portuguese textile firms, International Business Review, In Press, Corrected Proof.
Shane, S., Locke, E. A. and Collins, C. J. (2003) Entrepreneurial motivation, Human Resource Management Review, 13, pp. 257-279.
Singh, D. A. (2009) Export performance of emerging market firms, International Business Review, 18(4), pp. 321-330.
Stoian, M.-C., Rialp, A. and Rialp, J. (2011) Export performance under the microscope: A glance through Spanish lenses, International Business Review, 20(2), pp. 117-135.
Tang, J., Kacmar, K. M. and Busenitz, L. (2010) Entrepreneurial alertness in the pursuit of new opportunities, Journal of Business Venturing, In Press, Corrected Proof.
226
Therin, F. (ed.) (2007) Handbook of Research on Techno-Entrepreneurship, Edward Elgar.
Tradingeconomics (2012) South Africa Balance of Trade,
Ulhøi, J. P. (2005) The social dimensions of entrepreneurship, Technovation, 25, pp. 939–946.
Unger, J. M., Rauch, A., Frese, M. and Rosenbusch, N. (2009) Human capital and entrepreneurial success: A meta-analytical review, Journal of Business Venturing, In Press, Corrected Proof.
Urban, B. (2009a) Opportunity recognition: delineating the process and motivators for serial entrepreneurs, SAJEMS, 12(4), pp. 513-532.
Urban, B. (2010) Technology and entrepreneurial orientation at the organisational level in the Johannesburg area, SA Journal of Human Resource Management Science, 8, pp. 212-220.
Urban, B. (ed.) (2009b) Frontiers in entrepreneurship, Vol. 1, South Africa: Heinemann.
Urban, B., Barreira, J., Carmichael, T., Dagada, R., Duneas, N., Marcelle, G. and Smith, P. (eds.) (2011) Technopreneurship: Strategy, Innovation, and Entrepreneurship, Vol. 3, Pearson.
Urban, B. and Oosthuizen, J. (2009) AN EMPIRICAL ANALYSIS OF CORPORATE ENTREPRENEURSHIP IN THE SOUTH AFRICAN MINING INDUSTRY, Journal of Contemporary Management, 6, pp. 170 - 192.
Urban, B. and Shaw, G. (2010) Social capital for business start-up: perceptions of community support and motives, Journal of Contemporary Management, 7, pp. 492 - 510.
Urban, B., Vuuren, J. V. and Barreira, J. (2008) High-growth entrepreneurs: the relevance of business knowledge and work experience on venture success, Journal of Contemporary, 5, pp. 58 - 71.
Uzzi, B. (1997) Social Structure and Competition in Interfirm Networks: The Paradox of Embeddedness, Administrative Science Quarterly, 42(1), pp. 35-67.
Vaghely, I. P. and Julien, P.-A. (2010) Are opportunities recognized or constructed?: An information perspective on entrepreneurial opportunity identification, Journal of Business Venturing, 25(1), pp. 73-86.
Venkataraman, S. (2004) Regional transformation through technological entreprenurship, Journal of Business Venturing, 19, pp. 153-167.
227
Venter, R., Urban, B. and Rwigema, H. (eds.) (2008) entreprenuership: theory and practice, Vol. 2, Oxford university press Southern Africa (Pty) Ltd.
Waguespack, D. M. and Birnir, J. K. (2005) Foreignness and the diffusion of ideas, Journal of Engineering and Technology Management, 22(1-2), pp. 31-50.
Walter, A., Auer, M. and Ritter, T. (2006) The impact of network capabilities and entrepreneurial orientation on university spin-off performance, Journal of Business Venturing, 21(4), pp. 541-567.
Weerawardena, J., Mort, G. S., Liesch, P. W. and Knight, G. (2007) Conceptualizing accelerated internationalization in the born global firm: A dynamic capabilities perspective, Journal of World Business, 42(3), pp. 294-306.
Wegner, T. (ed.) (2007) APPLIED BUSINESS STATISTICS -Methods and Excel-based Applications, 2 ed., Juta.
Welch, L. S. (2004) International entrepreneurship and internationalization common threads, Handbook of Research on International Entrepreneurship, pp. 129 -136.
Westerlund, M. and Svahn, S. (2008) A relationship value perspective of social capital in networks of software SMEs, Industrial Marketing Management, 37(5), pp. 492-501.
Wiklund, J. and Shepherd, D. (2005) Entrepreneurial orientation and small business performance: a configurational approach, Journal of Business Venturing, 20(1), pp. 71-91.
Wilkinson, T. and Brouthers, L. E. (2006) Trade promotion and SME export performance, International Business Review, 15(3), pp. 233-252.
Worldbank (2012) Export of goods and services (% of GDP),
Yamin, M. and Sinkovics, R. R. (2006) Online internationalisation, psychic distance reduction and the virtuality trap, International Business Review, 15, pp. 339 - 360.
Yli-Renko, H., Autio, E. and Sapienza, H. J. (2001) Social capital, knowledge acquisition, and knowledge exploitation in young technology-based firms, Strategic Management Journal, 22(6-7), pp. 587-613.
Yli-Renko, H., Autio, E. and Tontti, V. (2002) Social capital, knowledge, and the international growth of technology-based new firms, International Business Review, 11(3), pp. 279-304.
228
Zahra, S., Hayton, J., Marcel, J. and O'Neill, H. (2001) Fostering entrepreneurship during international expansion:: Managing key challenges, European Management Journal, 19(4), pp. 359-369.
Zahra, S. A. (2007) Contextualizing theory building in entrepreneurship research, Journal of Business Venturing, 22(3), pp. 443-452.
Zahra, S. A. and Bogner, W. C. (2000) Technology strategy and software new ventures' performance: Exploring the moderating effect of the competitive environment, Journal of Business Venturing, 15(2), pp. 135-173.
Zahra, S. A., Cloninger, P., Yu, J. F. and Choi, Y. (2004) Internationalization: Motive and Process, Handbook of Research on International Entrepreneurship, pp. 129 -136.
Zahra, S. A. and Garvis, D. M. (2000) International corporate entrepreneurship and firm performance: The moderating effect of international environmental hostility, Journal of Business Venturing, 15(5-6), pp. 469-492.
Zahra, S. A., Ucbasaran, D. and Newey, L. R. (2009) Social knowledge and SMEs' innovative gains from internationalization, European Management Review, 6(2), pp. 81-93.
Zarutskie, R. (2010) The role of top management team human capital in venture capital markets: Evidence from first-time funds, Journal of Business Venturing, 25(1), pp. 155-172.
Zhou, L. (2007) The effects of entrepreneurial proclivity and foreign market knowledge on early internationalization, Journal of World Business, 42, pp. 281–293.

229
APPENDIX A

230
Ethics letter

231
Actual research instrument

232
APPENDIX B

233
Consistency matrix
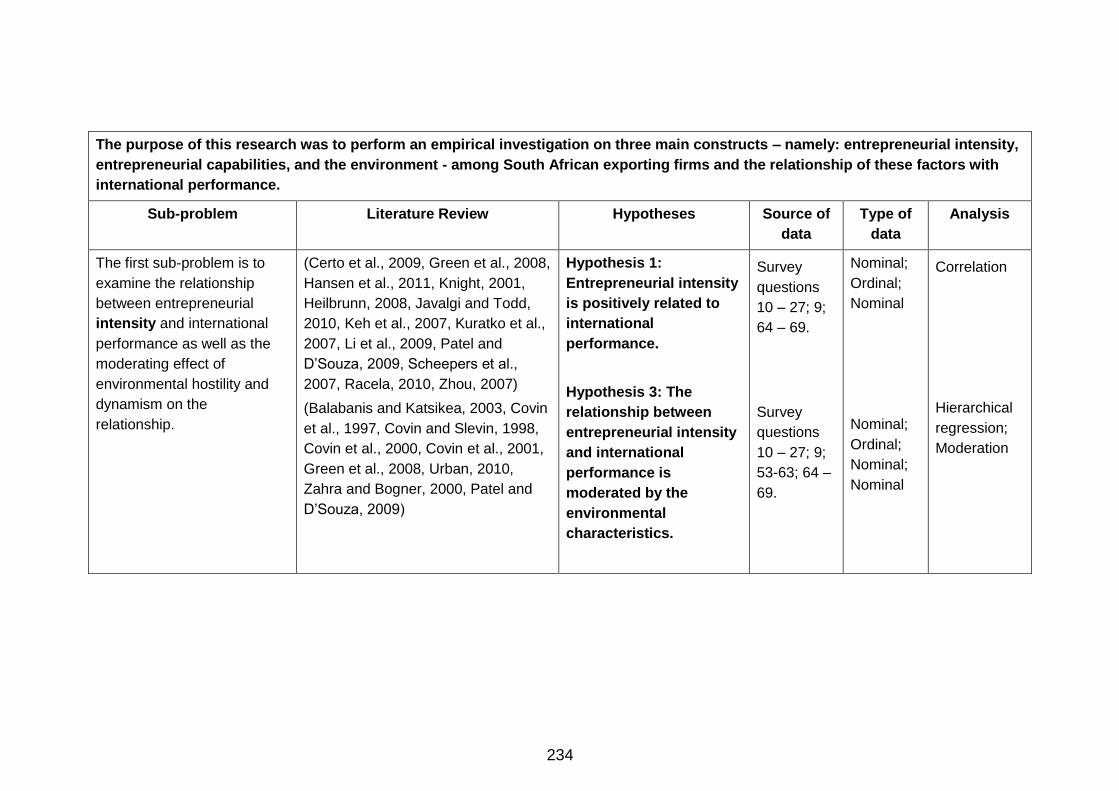
234
The purpose of this research was to perform an empirical investigation on three main constructs – namely: entrepreneurial intensity,
entrepreneurial capabilities, and the environment - among South African exporting firms and the relationship of these factors with
international performance.
Sub-problem Literature Review Hypotheses Source of
data
Type of
data
Analysis
The first sub-problem is to
examine the relationship
between entrepreneurial
intensity and international
performance as well as the
moderating effect of
environmental hostility and
dynamism on the
relationship.
(Certo et al., 2009, Green et al., 2008,
Hansen et al., 2011, Knight, 2001,
Heilbrunn, 2008, Javalgi and Todd,
2010, Keh et al., 2007, Kuratko et al.,
2007, Li et al., 2009, Patel and
D’Souza, 2009, Scheepers et al.,
2007, Racela, 2010, Zhou, 2007)
(Balabanis and Katsikea, 2003, Covin
et al., 1997, Covin and Slevin, 1998,
Covin et al., 2000, Covin et al., 2001,
Green et al., 2008, Urban, 2010,
Zahra and Bogner, 2000, Patel and
D’Souza, 2009)
Hypothesis 1:
Entrepreneurial intensity
is positively related to
international
performance.
Hypothesis 3: The
relationship between
entrepreneurial intensity
and international
performance is
moderated by the
environmental
characteristics.
Survey
questions
10 – 27; 9;
64 – 69.
Survey
questions
10 – 27; 9;
53-63; 64 –
69.
Nominal;
Ordinal;
Nominal
Nominal;
Ordinal;
Nominal;
Nominal
Correlation
Hierarchical
regression;
Moderation
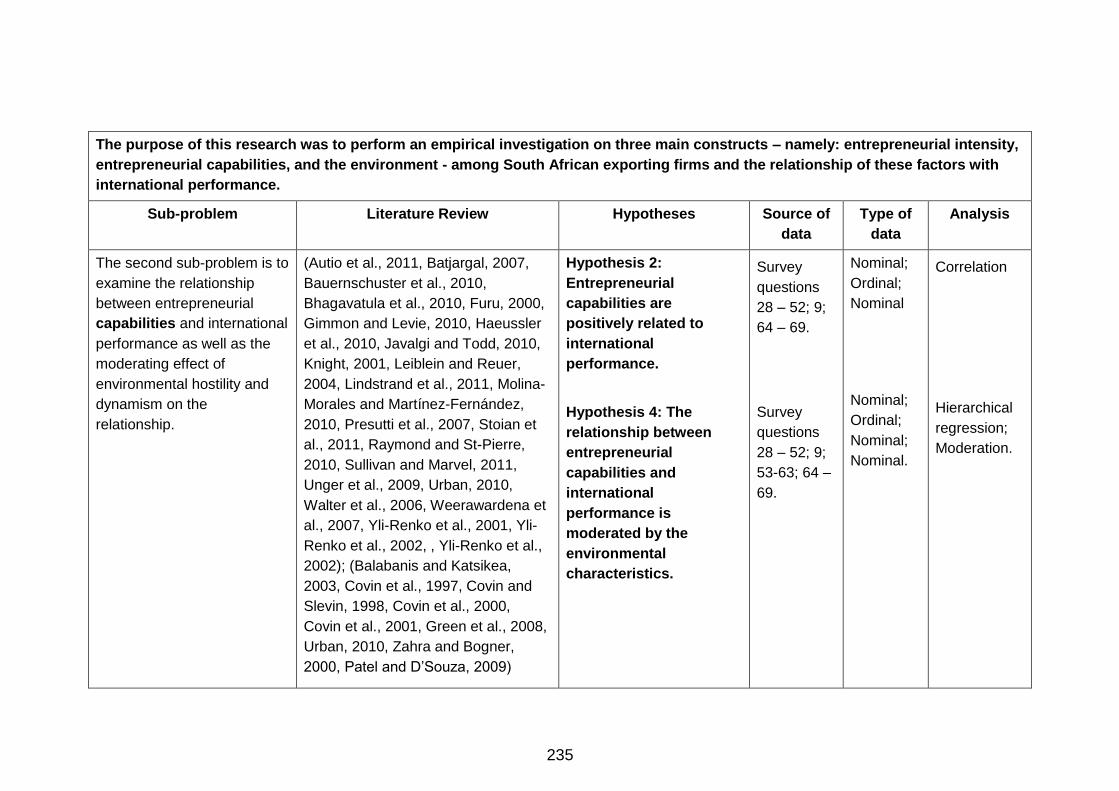
235
The purpose of this research was to perform an empirical investigation on three main constructs – namely: entrepreneurial intensity,
entrepreneurial capabilities, and the environment - among South African exporting firms and the relationship of these factors with
international performance.
Sub-problem Literature Review Hypotheses Source of
data
Type of
data
Analysis
The second sub-problem is to
examine the relationship
between entrepreneurial
capabilities and international
performance as well as the
moderating effect of
environmental hostility and
dynamism on the
relationship.
(Autio et al., 2011, Batjargal, 2007,
Bauernschuster et al., 2010,
Bhagavatula et al., 2010, Furu, 2000,
Gimmon and Levie, 2010, Haeussler
et al., 2010, Javalgi and Todd, 2010,
Knight, 2001, Leiblein and Reuer,
2004, Lindstrand et al., 2011, Molina-
Morales and Martínez-Fernández,
2010, Presutti et al., 2007, Stoian et
al., 2011, Raymond and St-Pierre,
2010, Sullivan and Marvel, 2011,
Unger et al., 2009, Urban, 2010,
Walter et al., 2006, Weerawardena et
al., 2007, Yli-Renko et al., 2001, Yli-
Renko et al., 2002, , Yli-Renko et al.,
2002); (Balabanis and Katsikea,
2003, Covin et al., 1997, Covin and
Slevin, 1998, Covin et al., 2000,
Covin et al., 2001, Green et al., 2008,
Urban, 2010, Zahra and Bogner,
2000, Patel and D’Souza, 2009)
Hypothesis 2:
Entrepreneurial
capabilities are
positively related to
international
performance.
Hypothesis 4: The
relationship between
entrepreneurial
capabilities and
international
performance is
moderated by the
environmental
characteristics.
Survey
questions
28 – 52; 9;
64 – 69.
Survey
questions
28 – 52; 9;
53-63; 64 –
69.
Nominal;
Ordinal;
Nominal
Nominal;
Ordinal;
Nominal;
Nominal.
Correlation
Hierarchical
regression;
Moderation.

236
APPENDIX C

237
Tables and figures
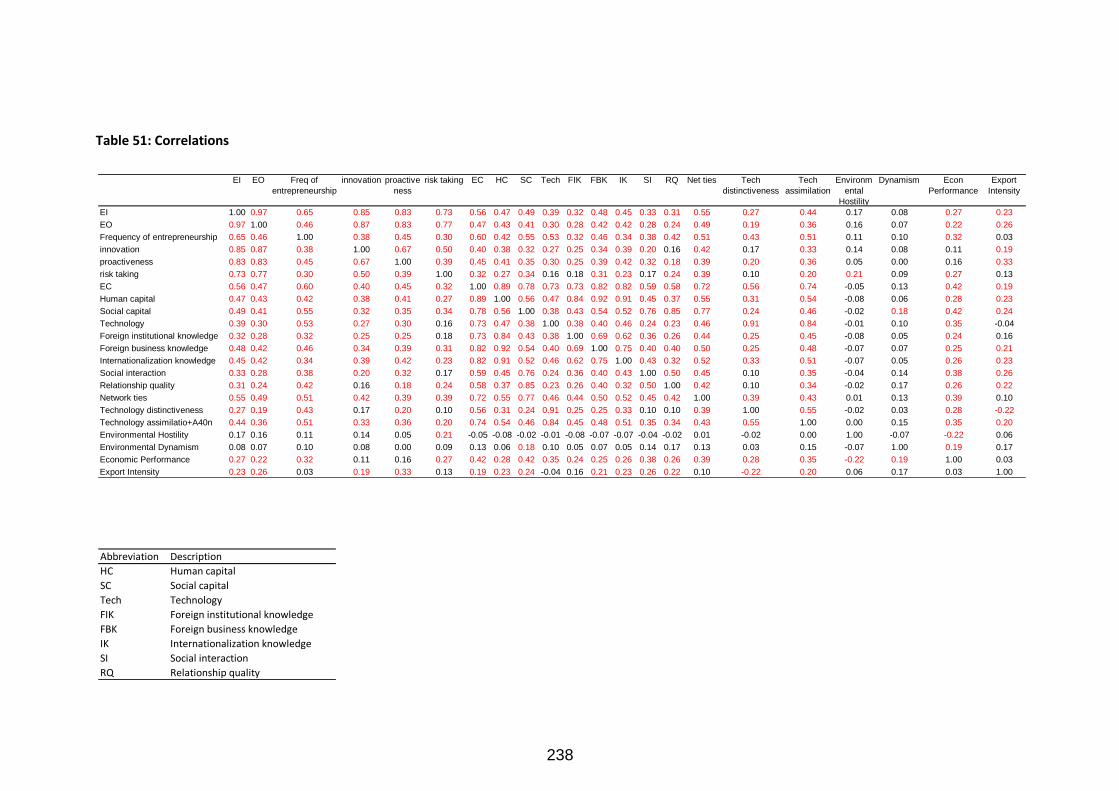
238
Table 51: Correlations
EI EO Freq of
entrepreneurship
innovation proactive
ness
risk taking EC HC SC Tech FIK FBK IK SI RQ Net ties Tech
distinctiveness
Tech
assimilation
Environm
ental
Hostility
Dynamism Econ
Performance
Export
Intensity
EI 1.00 0.97 0.65 0.85 0.83 0.73 0.56 0.47 0.49 0.39 0.32 0.48 0.45 0.33 0.31 0.55 0.27 0.44 0.17 0.08 0.27 0.23
EO 0.97 1.00 0.46 0.87 0.83 0.77 0.47 0.43 0.41 0.30 0.28 0.42 0.42 0.28 0.24 0.49 0.19 0.36 0.16 0.07 0.22 0.26
Frequency of entrepreneurship 0.65 0.46 1.00 0.38 0.45 0.30 0.60 0.42 0.55 0.53 0.32 0.46 0.34 0.38 0.42 0.51 0.43 0.51 0.11 0.10 0.32 0.03
innovation 0.85 0.87 0.38 1.00 0.67 0.50 0.40 0.38 0.32 0.27 0.25 0.34 0.39 0.20 0.16 0.42 0.17 0.33 0.14 0.08 0.11 0.19
proactiveness 0.83 0.83 0.45 0.67 1.00 0.39 0.45 0.41 0.35 0.30 0.25 0.39 0.42 0.32 0.18 0.39 0.20 0.36 0.05 0.00 0.16 0.33
risk taking 0.73 0.77 0.30 0.50 0.39 1.00 0.32 0.27 0.34 0.16 0.18 0.31 0.23 0.17 0.24 0.39 0.10 0.20 0.21 0.09 0.27 0.13
EC 0.56 0.47 0.60 0.40 0.45 0.32 1.00 0.89 0.78 0.73 0.73 0.82 0.82 0.59 0.58 0.72 0.56 0.74 -0.05 0.13 0.42 0.19
Human capital 0.47 0.43 0.42 0.38 0.41 0.27 0.89 1.00 0.56 0.47 0.84 0.92 0.91 0.45 0.37 0.55 0.31 0.54 -0.08 0.06 0.28 0.23
Social capital 0.49 0.41 0.55 0.32 0.35 0.34 0.78 0.56 1.00 0.38 0.43 0.54 0.52 0.76 0.85 0.77 0.24 0.46 -0.02 0.18 0.42 0.24
Technology 0.39 0.30 0.53 0.27 0.30 0.16 0.73 0.47 0.38 1.00 0.38 0.40 0.46 0.24 0.23 0.46 0.91 0.84 -0.01 0.10 0.35 -0.04
Foreign institutional knowledge 0.32 0.28 0.32 0.25 0.25 0.18 0.73 0.84 0.43 0.38 1.00 0.69 0.62 0.36 0.26 0.44 0.25 0.45 -0.08 0.05 0.24 0.16
Foreign business knowledge 0.48 0.42 0.46 0.34 0.39 0.31 0.82 0.92 0.54 0.40 0.69 1.00 0.75 0.40 0.40 0.50 0.25 0.48 -0.07 0.07 0.25 0.21
Internationalization knowledge 0.45 0.42 0.34 0.39 0.42 0.23 0.82 0.91 0.52 0.46 0.62 0.75 1.00 0.43 0.32 0.52 0.33 0.51 -0.07 0.05 0.26 0.23
Social interaction 0.33 0.28 0.38 0.20 0.32 0.17 0.59 0.45 0.76 0.24 0.36 0.40 0.43 1.00 0.50 0.45 0.10 0.35 -0.04 0.14 0.38 0.26
Relationship quality 0.31 0.24 0.42 0.16 0.18 0.24 0.58 0.37 0.85 0.23 0.26 0.40 0.32 0.50 1.00 0.42 0.10 0.34 -0.02 0.17 0.26 0.22
Network ties 0.55 0.49 0.51 0.42 0.39 0.39 0.72 0.55 0.77 0.46 0.44 0.50 0.52 0.45 0.42 1.00 0.39 0.43 0.01 0.13 0.39 0.10
Technology distinctiveness 0.27 0.19 0.43 0.17 0.20 0.10 0.56 0.31 0.24 0.91 0.25 0.25 0.33 0.10 0.10 0.39 1.00 0.55 -0.02 0.03 0.28 -0.22
Technology assimilatio+A40n 0.44 0.36 0.51 0.33 0.36 0.20 0.74 0.54 0.46 0.84 0.45 0.48 0.51 0.35 0.34 0.43 0.55 1.00 0.00 0.15 0.35 0.20
Environmental Hostility 0.17 0.16 0.11 0.14 0.05 0.21 -0.05 -0.08 -0.02 -0.01 -0.08 -0.07 -0.07 -0.04 -0.02 0.01 -0.02 0.00 1.00 -0.07 -0.22 0.06
Environmental Dynamism 0.08 0.07 0.10 0.08 0.00 0.09 0.13 0.06 0.18 0.10 0.05 0.07 0.05 0.14 0.17 0.13 0.03 0.15 -0.07 1.00 0.19 0.17
Economic Performance 0.27 0.22 0.32 0.11 0.16 0.27 0.42 0.28 0.42 0.35 0.24 0.25 0.26 0.38 0.26 0.39 0.28 0.35 -0.22 0.19 1.00 0.03
Export Intensity 0.23 0.26 0.03 0.19 0.33 0.13 0.19 0.23 0.24 -0.04 0.16 0.21 0.23 0.26 0.22 0.10 -0.22 0.20 0.06 0.17 0.03 1.00
Abbreviation Description
HC Human capital
SC Social capital
Tech Technology
FIK Foreign institutional knowledge
FBK Foreign business knowledge
IK Internationalization knowledge
SI Social interaction
RQ Relationship quality
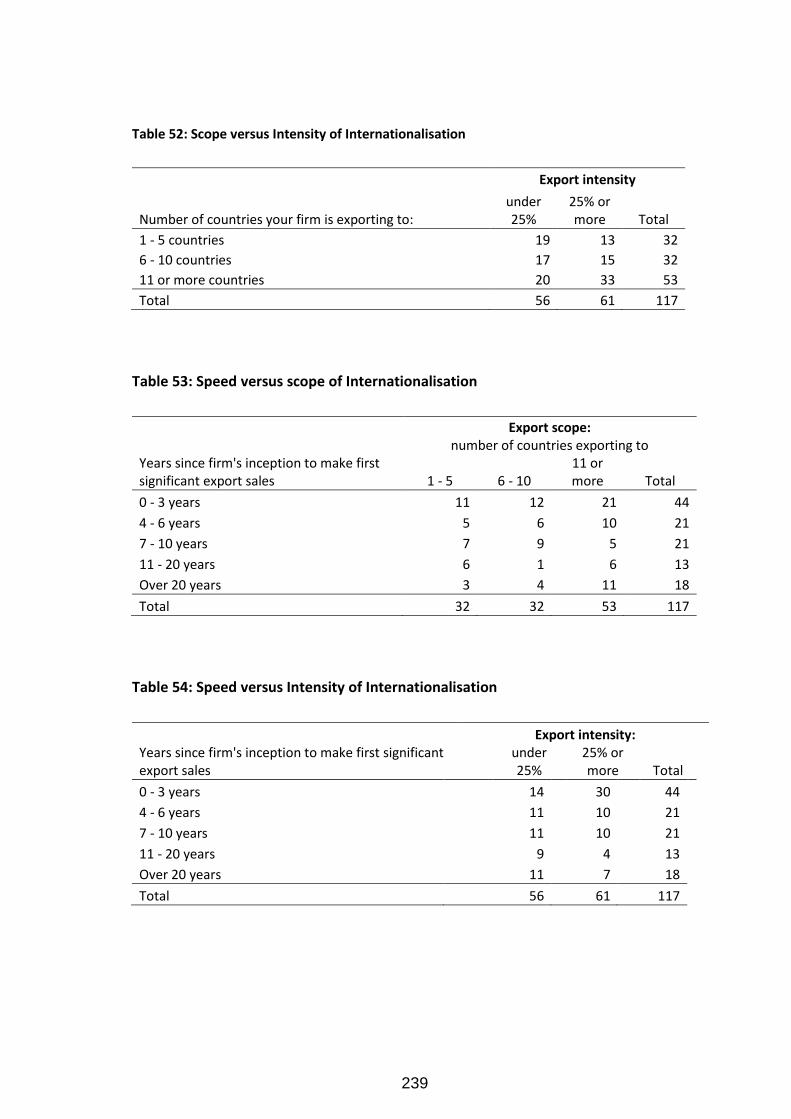
239
Table 52: Scope versus Intensity of Internationalisation
Export intensity
Number of countries your firm is exporting to: under 25%
25% or more Total
1 - 5 countries 19 13 32
6 - 10 countries 17 15 32
11 or more countries 20 33 53
Total 56 61 117
Table 53: Speed versus scope of Internationalisation
Export scope: number of countries exporting to
Years since firm's inception to make first significant export sales 1 - 5 6 - 10
11 or more Total
0 - 3 years 11 12 21 44
4 - 6 years 5 6 10 21
7 - 10 years 7 9 5 21
11 - 20 years 6 1 6 13
Over 20 years 3 4 11 18
Total 32 32 53 117
Table 54: Speed versus Intensity of Internationalisation
Export intensity:
Years since firm's inception to make first significant export sales
under 25%
25% or more Total
0 - 3 years 14 30 44
4 - 6 years 11 10 21
7 - 10 years 11 10 21
11 - 20 years 9 4 13
Over 20 years 11 7 18
Total 56 61 117
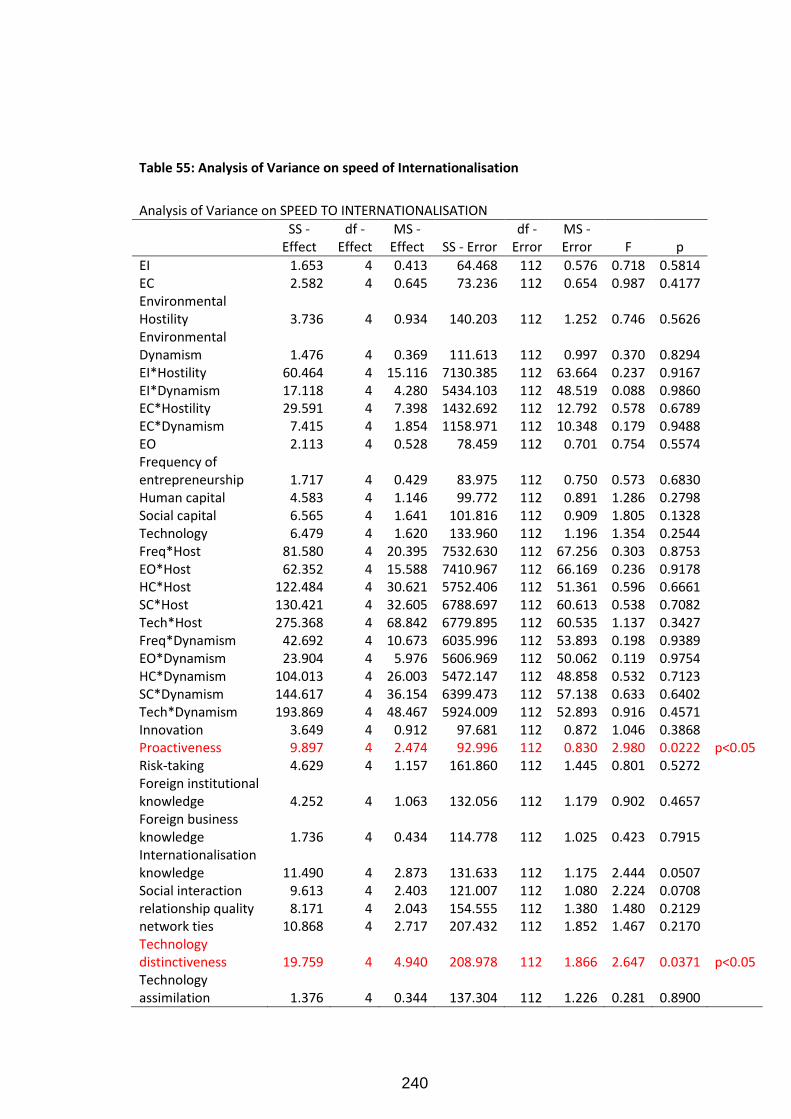
240
Table 55: Analysis of Variance on speed of Internationalisation
Analysis of Variance on SPEED TO INTERNATIONALISATION
SS - Effect
df - Effect
MS - Effect SS - Error
df - Error
MS - Error F p
EI 1.653 4 0.413 64.468 112 0.576 0.718 0.5814 EC 2.582 4 0.645 73.236 112 0.654 0.987 0.4177 Environmental
Hostility 3.736 4 0.934 140.203 112 1.252 0.746 0.5626 Environmental
Dynamism 1.476 4 0.369 111.613 112 0.997 0.370 0.8294 EI*Hostility 60.464 4 15.116 7130.385 112 63.664 0.237 0.9167 EI*Dynamism 17.118 4 4.280 5434.103 112 48.519 0.088 0.9860 EC*Hostility 29.591 4 7.398 1432.692 112 12.792 0.578 0.6789 EC*Dynamism 7.415 4 1.854 1158.971 112 10.348 0.179 0.9488 EO 2.113 4 0.528 78.459 112 0.701 0.754 0.5574 Frequency of
entrepreneurship 1.717 4 0.429 83.975 112 0.750 0.573 0.6830 Human capital 4.583 4 1.146 99.772 112 0.891 1.286 0.2798 Social capital 6.565 4 1.641 101.816 112 0.909 1.805 0.1328 Technology 6.479 4 1.620 133.960 112 1.196 1.354 0.2544 Freq*Host 81.580 4 20.395 7532.630 112 67.256 0.303 0.8753 EO*Host 62.352 4 15.588 7410.967 112 66.169 0.236 0.9178 HC*Host 122.484 4 30.621 5752.406 112 51.361 0.596 0.6661 SC*Host 130.421 4 32.605 6788.697 112 60.613 0.538 0.7082 Tech*Host 275.368 4 68.842 6779.895 112 60.535 1.137 0.3427 Freq*Dynamism 42.692 4 10.673 6035.996 112 53.893 0.198 0.9389 EO*Dynamism 23.904 4 5.976 5606.969 112 50.062 0.119 0.9754 HC*Dynamism 104.013 4 26.003 5472.147 112 48.858 0.532 0.7123 SC*Dynamism 144.617 4 36.154 6399.473 112 57.138 0.633 0.6402 Tech*Dynamism 193.869 4 48.467 5924.009 112 52.893 0.916 0.4571 Innovation 3.649 4 0.912 97.681 112 0.872 1.046 0.3868 Proactiveness 9.897 4 2.474 92.996 112 0.830 2.980 0.0222 p<0.05
Risk-taking 4.629 4 1.157 161.860 112 1.445 0.801 0.5272 Foreign institutional
knowledge 4.252 4 1.063 132.056 112 1.179 0.902 0.4657 Foreign business
knowledge 1.736 4 0.434 114.778 112 1.025 0.423 0.7915 Internationalisation
knowledge 11.490 4 2.873 131.633 112 1.175 2.444 0.0507 Social interaction 9.613 4 2.403 121.007 112 1.080 2.224 0.0708 relationship quality 8.171 4 2.043 154.555 112 1.380 1.480 0.2129 network ties 10.868 4 2.717 207.432 112 1.852 1.467 0.2170 Technology
distinctiveness 19.759 4 4.940 208.978 112 1.866 2.647 0.0371 p<0.05 Technology assimilation 1.376 4 0.344 137.304 112 1.226 0.281 0.8900
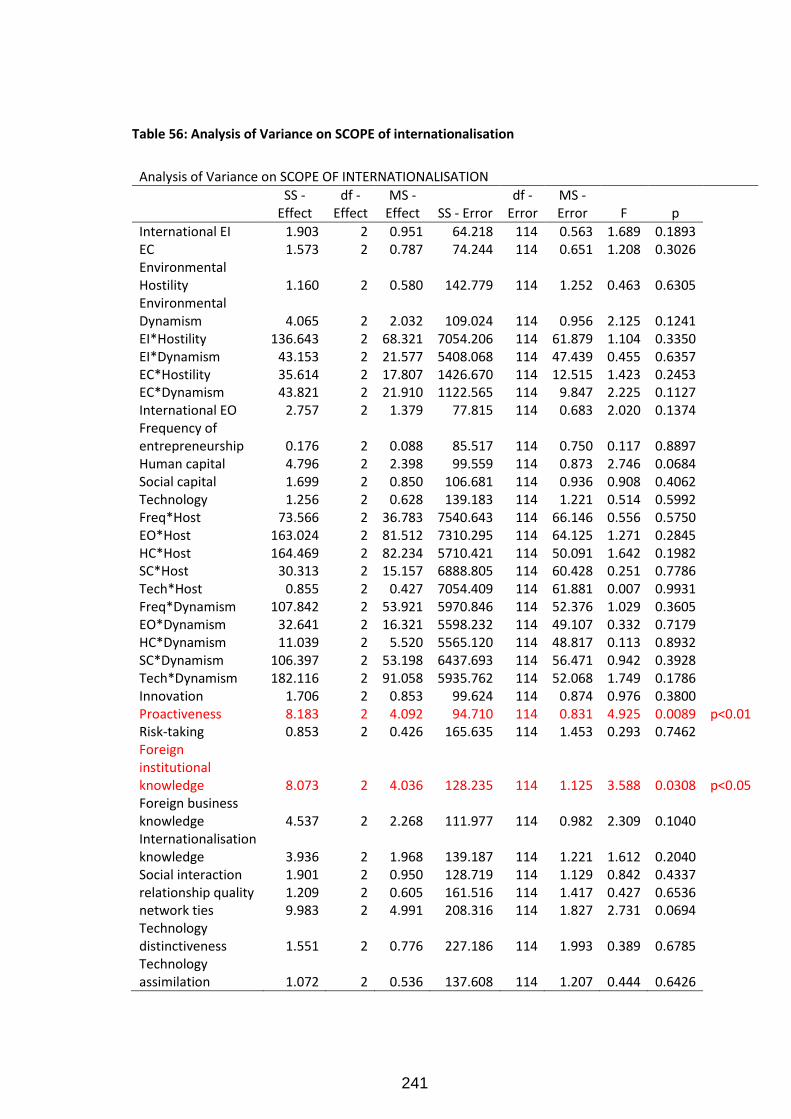
241
Table 56: Analysis of Variance on SCOPE of internationalisation
Analysis of Variance on SCOPE OF INTERNATIONALISATION
SS - Effect
df - Effect
MS - Effect SS - Error
df - Error
MS - Error F p
International EI 1.903 2 0.951 64.218 114 0.563 1.689 0.1893 EC 1.573 2 0.787 74.244 114 0.651 1.208 0.3026 Environmental
Hostility 1.160 2 0.580 142.779 114 1.252 0.463 0.6305 Environmental
Dynamism 4.065 2 2.032 109.024 114 0.956 2.125 0.1241 EI*Hostility 136.643 2 68.321 7054.206 114 61.879 1.104 0.3350 EI*Dynamism 43.153 2 21.577 5408.068 114 47.439 0.455 0.6357 EC*Hostility 35.614 2 17.807 1426.670 114 12.515 1.423 0.2453 EC*Dynamism 43.821 2 21.910 1122.565 114 9.847 2.225 0.1127 International EO 2.757 2 1.379 77.815 114 0.683 2.020 0.1374 Frequency of
entrepreneurship 0.176 2 0.088 85.517 114 0.750 0.117 0.8897 Human capital 4.796 2 2.398 99.559 114 0.873 2.746 0.0684 Social capital 1.699 2 0.850 106.681 114 0.936 0.908 0.4062 Technology 1.256 2 0.628 139.183 114 1.221 0.514 0.5992 Freq*Host 73.566 2 36.783 7540.643 114 66.146 0.556 0.5750 EO*Host 163.024 2 81.512 7310.295 114 64.125 1.271 0.2845 HC*Host 164.469 2 82.234 5710.421 114 50.091 1.642 0.1982 SC*Host 30.313 2 15.157 6888.805 114 60.428 0.251 0.7786 Tech*Host 0.855 2 0.427 7054.409 114 61.881 0.007 0.9931 Freq*Dynamism 107.842 2 53.921 5970.846 114 52.376 1.029 0.3605 EO*Dynamism 32.641 2 16.321 5598.232 114 49.107 0.332 0.7179 HC*Dynamism 11.039 2 5.520 5565.120 114 48.817 0.113 0.8932 SC*Dynamism 106.397 2 53.198 6437.693 114 56.471 0.942 0.3928 Tech*Dynamism 182.116 2 91.058 5935.762 114 52.068 1.749 0.1786 Innovation 1.706 2 0.853 99.624 114 0.874 0.976 0.3800 Proactiveness 8.183 2 4.092 94.710 114 0.831 4.925 0.0089 p<0.01
Risk-taking 0.853 2 0.426 165.635 114 1.453 0.293 0.7462 Foreign
institutional knowledge 8.073 2 4.036 128.235 114 1.125 3.588 0.0308 p<0.05 Foreign business knowledge 4.537 2 2.268 111.977 114 0.982 2.309 0.1040
Internationalisation knowledge 3.936 2 1.968 139.187 114 1.221 1.612 0.2040
Social interaction 1.901 2 0.950 128.719 114 1.129 0.842 0.4337 relationship quality 1.209 2 0.605 161.516 114 1.417 0.427 0.6536 network ties 9.983 2 4.991 208.316 114 1.827 2.731 0.0694 Technology
distinctiveness 1.551 2 0.776 227.186 114 1.993 0.389 0.6785 Technology
assimilation 1.072 2 0.536 137.608 114 1.207 0.444 0.6426
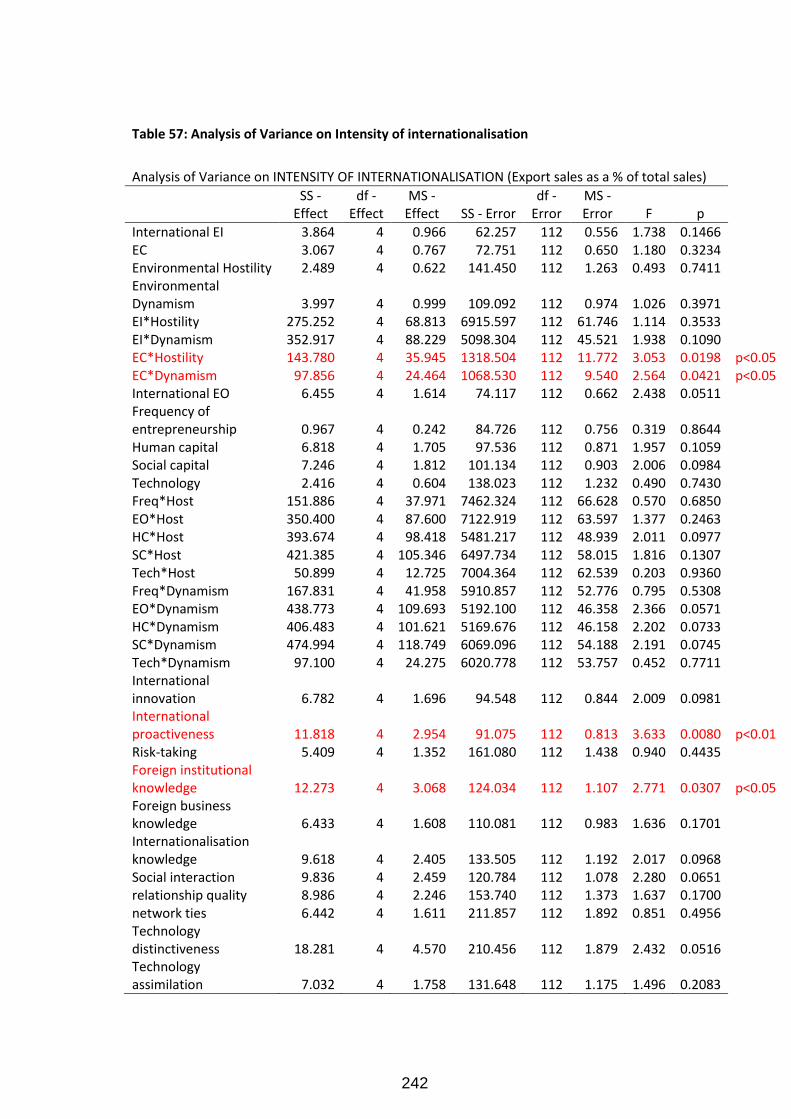
242
Table 57: Analysis of Variance on Intensity of internationalisation
Analysis of Variance on INTENSITY OF INTERNATIONALISATION (Export sales as a % of total sales)
SS - Effect
df - Effect
MS - Effect SS - Error
df - Error
MS - Error F p
International EI 3.864 4 0.966 62.257 112 0.556 1.738 0.1466 EC 3.067 4 0.767 72.751 112 0.650 1.180 0.3234 Environmental Hostility 2.489 4 0.622 141.450 112 1.263 0.493 0.7411 Environmental
Dynamism 3.997 4 0.999 109.092 112 0.974 1.026 0.3971 EI*Hostility 275.252 4 68.813 6915.597 112 61.746 1.114 0.3533 EI*Dynamism 352.917 4 88.229 5098.304 112 45.521 1.938 0.1090 EC*Hostility 143.780 4 35.945 1318.504 112 11.772 3.053 0.0198 p<0.05
EC*Dynamism 97.856 4 24.464 1068.530 112 9.540 2.564 0.0421 p<0.05 International EO 6.455 4 1.614 74.117 112 0.662 2.438 0.0511
Frequency of entrepreneurship 0.967 4 0.242 84.726 112 0.756 0.319 0.8644
Human capital 6.818 4 1.705 97.536 112 0.871 1.957 0.1059 Social capital 7.246 4 1.812 101.134 112 0.903 2.006 0.0984 Technology 2.416 4 0.604 138.023 112 1.232 0.490 0.7430 Freq*Host 151.886 4 37.971 7462.324 112 66.628 0.570 0.6850 EO*Host 350.400 4 87.600 7122.919 112 63.597 1.377 0.2463 HC*Host 393.674 4 98.418 5481.217 112 48.939 2.011 0.0977 SC*Host 421.385 4 105.346 6497.734 112 58.015 1.816 0.1307 Tech*Host 50.899 4 12.725 7004.364 112 62.539 0.203 0.9360 Freq*Dynamism 167.831 4 41.958 5910.857 112 52.776 0.795 0.5308 EO*Dynamism 438.773 4 109.693 5192.100 112 46.358 2.366 0.0571 HC*Dynamism 406.483 4 101.621 5169.676 112 46.158 2.202 0.0733 SC*Dynamism 474.994 4 118.749 6069.096 112 54.188 2.191 0.0745 Tech*Dynamism 97.100 4 24.275 6020.778 112 53.757 0.452 0.7711 International
innovation 6.782 4 1.696 94.548 112 0.844 2.009 0.0981 International
proactiveness 11.818 4 2.954 91.075 112 0.813 3.633 0.0080 p<0.01 Risk-taking 5.409 4 1.352 161.080 112 1.438 0.940 0.4435
Foreign institutional knowledge 12.273 4 3.068 124.034 112 1.107 2.771 0.0307 p<0.05 Foreign business knowledge 6.433 4 1.608 110.081 112 0.983 1.636 0.1701
Internationalisation knowledge 9.618 4 2.405 133.505 112 1.192 2.017 0.0968
Social interaction 9.836 4 2.459 120.784 112 1.078 2.280 0.0651 relationship quality 8.986 4 2.246 153.740 112 1.373 1.637 0.1700 network ties 6.442 4 1.611 211.857 112 1.892 0.851 0.4956 Technology
distinctiveness 18.281 4 4.570 210.456 112 1.879 2.432 0.0516 Technology
assimilation 7.032 4 1.758 131.648 112 1.175 1.496 0.2083

243
Table 58: Spearman's Rho correlations
Spearman correlations
Growth Financial Economic Performance
Export Intensity
Foreign institutional knowledge 0.23 0.24 0.24 0.12
Foreign business knowledge 0.27 0.24 0.26 0.17
Internationalization knowledge 0.25 0.30 0.28 0.25
Human capital 0.29 0.30 0.31 0.21
Social interaction 0.43 0.41 0.43 0.24
relationship quality 0.29 0.29 0.31 0.21
network ties 0.37 0.41 0.40 0.13
Social capital 0.42 0.44 0.45 0.23
Technology distinctiveness 0.30 0.30 0.31 -0.18
Technology assimilation 0.33 0.36 0.34 0.19
Technology 0.37 0.37 0.38 -0.03
International innovation 0.13 0.15 0.13 0.19
International proactiveness 0.18 0.22 0.20 0.32
International risk taking 0.31 0.29 0.30 0.15
International EO 0.25 0.27 0.25 0.25
Frequency of entrepreneurship 0.36 0.37 0.38 0.00
International EI 0.31 0.32 0.31 0.23
Environmental Hostility -0.14 -0.26 -0.21 0.05
Environmental Dynamism 0.26 0.13 0.20 0.17
EC 0.42 0.43 0.44 0.18
EI*Hostility 0.05 -0.07 -0.02 0.16
EI*Dynamism 0.34 0.22 0.28 0.26
EC*Hostility -0.01 0.00 0.00 -0.23
EC*Dynamism -0.05 -0.02 -0.04 -0.22
Freq*Host 0.10 -0.01 0.05 0.05
EO*Host 0.03 -0.08 -0.04 0.19
HC*Host 0.10 -0.02 0.04 0.14
SC*Host 0.19 0.08 0.14 0.18
Tech*Host 0.14 0.04 0.09 0.01
Freq*Dynamism 0.37 0.25 0.33 0.13
EO*Dynamism 0.32 0.20 0.26 0.28
HC*Dynamism 0.36 0.25 0.32 0.28
SC*Dynamism 0.40 0.30 0.37 0.24
Tech*Dynamism 0.40 0.29 0.35 0.09
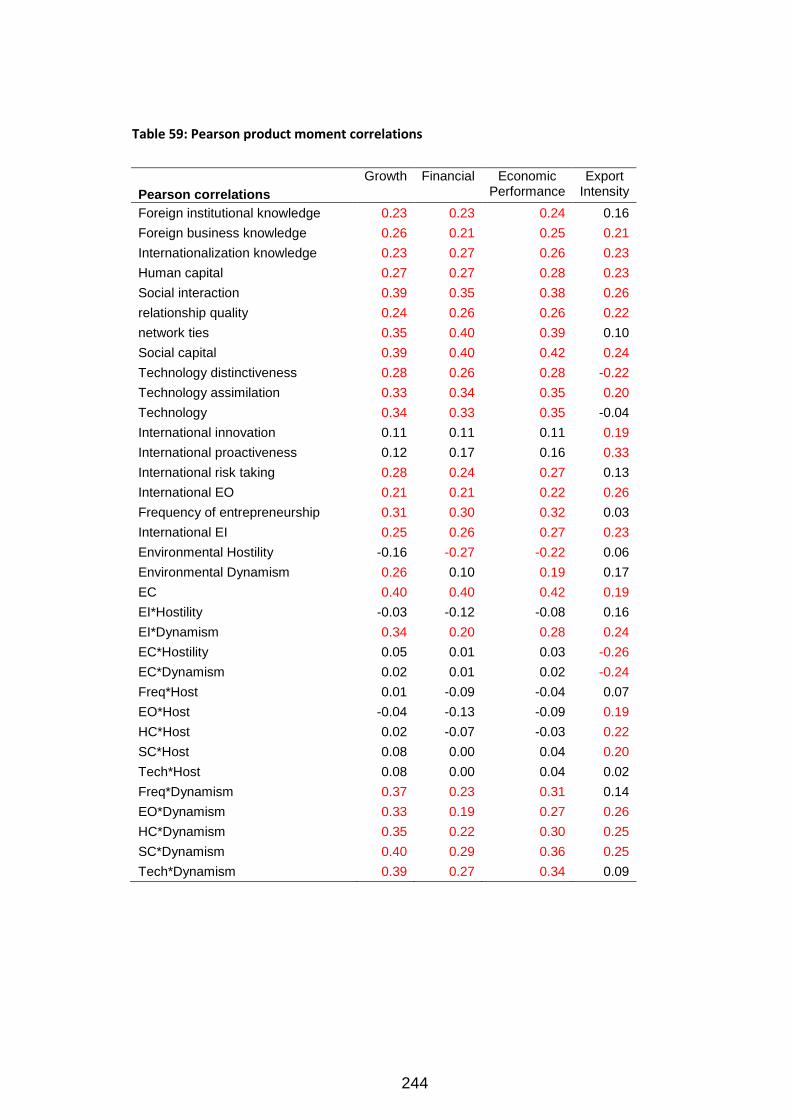
244
Table 59: Pearson product moment correlations
Pearson correlations
Growth Financial Economic Performance
Export Intensity
Foreign institutional knowledge 0.23 0.23 0.24 0.16
Foreign business knowledge 0.26 0.21 0.25 0.21
Internationalization knowledge 0.23 0.27 0.26 0.23
Human capital 0.27 0.27 0.28 0.23
Social interaction 0.39 0.35 0.38 0.26
relationship quality 0.24 0.26 0.26 0.22
network ties 0.35 0.40 0.39 0.10
Social capital 0.39 0.40 0.42 0.24
Technology distinctiveness 0.28 0.26 0.28 -0.22
Technology assimilation 0.33 0.34 0.35 0.20
Technology 0.34 0.33 0.35 -0.04
International innovation 0.11 0.11 0.11 0.19
International proactiveness 0.12 0.17 0.16 0.33
International risk taking 0.28 0.24 0.27 0.13
International EO 0.21 0.21 0.22 0.26
Frequency of entrepreneurship 0.31 0.30 0.32 0.03
International EI 0.25 0.26 0.27 0.23
Environmental Hostility -0.16 -0.27 -0.22 0.06
Environmental Dynamism 0.26 0.10 0.19 0.17
EC 0.40 0.40 0.42 0.19
EI*Hostility -0.03 -0.12 -0.08 0.16
EI*Dynamism 0.34 0.20 0.28 0.24
EC*Hostility 0.05 0.01 0.03 -0.26
EC*Dynamism 0.02 0.01 0.02 -0.24
Freq*Host 0.01 -0.09 -0.04 0.07
EO*Host -0.04 -0.13 -0.09 0.19
HC*Host 0.02 -0.07 -0.03 0.22
SC*Host 0.08 0.00 0.04 0.20
Tech*Host 0.08 0.00 0.04 0.02
Freq*Dynamism 0.37 0.23 0.31 0.14
EO*Dynamism 0.33 0.19 0.27 0.26
HC*Dynamism 0.35 0.22 0.30 0.25
SC*Dynamism 0.40 0.29 0.36 0.25
Tech*Dynamism 0.39 0.27 0.34 0.09
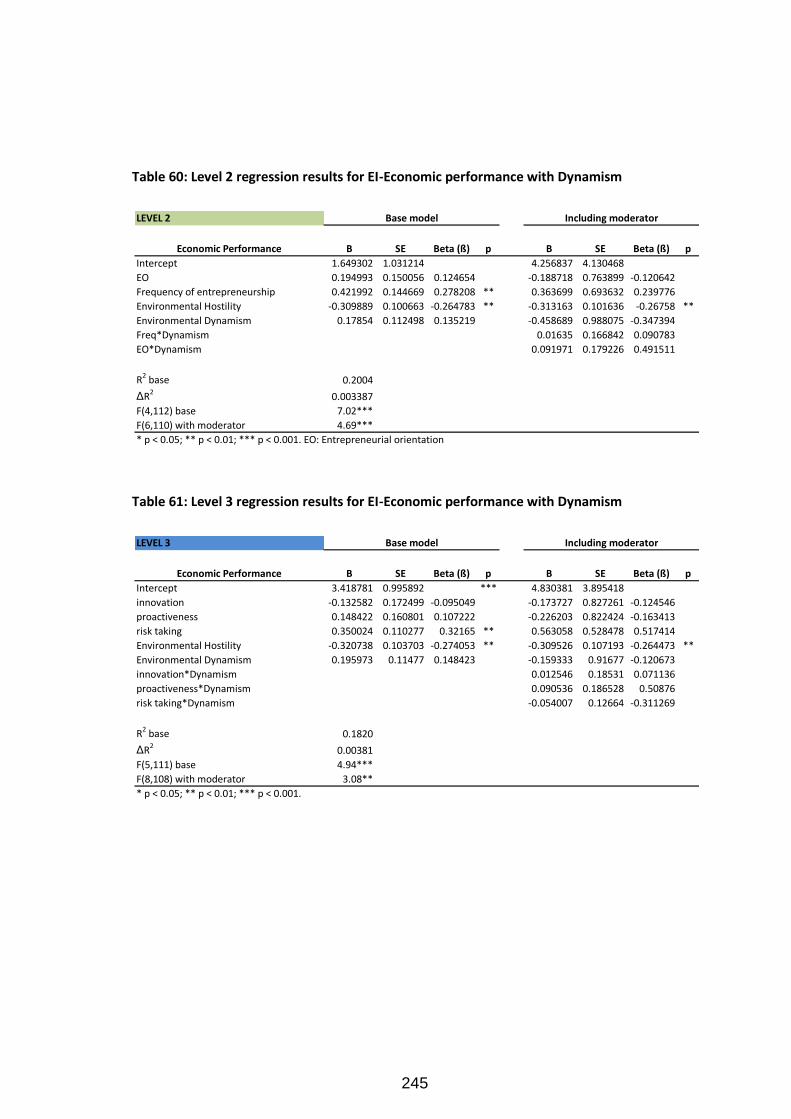
245
Table 60: Level 2 regression results for EI-Economic performance with Dynamism
Table 61: Level 3 regression results for EI-Economic performance with Dynamism
LEVEL 2
Economic Performance B SE Beta (ß) p B SE Beta (ß) p
Intercept 1.649302 1.031214 4.256837 4.130468
EO 0.194993 0.150056 0.124654 -0.188718 0.763899 -0.120642
Frequency of entrepreneurship 0.421992 0.144669 0.278208 ** 0.363699 0.693632 0.239776
Environmental Hostility -0.309889 0.100663 -0.264783 ** -0.313163 0.101636 -0.26758 **
Environmental Dynamism 0.17854 0.112498 0.135219 -0.458689 0.988075 -0.347394
Freq*Dynamism 0.01635 0.166842 0.090783
EO*Dynamism 0.091971 0.179226 0.491511
R2 base 0.2004
ΔR2
0.003387
F(4,112) base 7.02***
F(6,110) with moderator 4.69***
* p < 0.05; ** p < 0.01; *** p < 0.001. EO: Entrepreneurial orientation
Base model Including moderator
LEVEL 3
Economic Performance B SE Beta (ß) p B SE Beta (ß) p
Intercept 3.418781 0.995892 *** 4.830381 3.895418
innovation -0.132582 0.172499 -0.095049 -0.173727 0.827261 -0.124546
proactiveness 0.148422 0.160801 0.107222 -0.226203 0.822424 -0.163413
risk taking 0.350024 0.110277 0.32165 ** 0.563058 0.528478 0.517414
Environmental Hostility -0.320738 0.103703 -0.274053 ** -0.309526 0.107193 -0.264473 **
Environmental Dynamism 0.195973 0.11477 0.148423 -0.159333 0.91677 -0.120673
innovation*Dynamism 0.012546 0.18531 0.071136
proactiveness*Dynamism 0.090536 0.186528 0.50876
risk taking*Dynamism -0.054007 0.12664 -0.311269
R2 base 0.1820
ΔR20.00381
F(5,111) base 4.94***
F(8,108) with moderator 3.08**
* p < 0.05; ** p < 0.01; *** p < 0.001.
Base model Including moderator
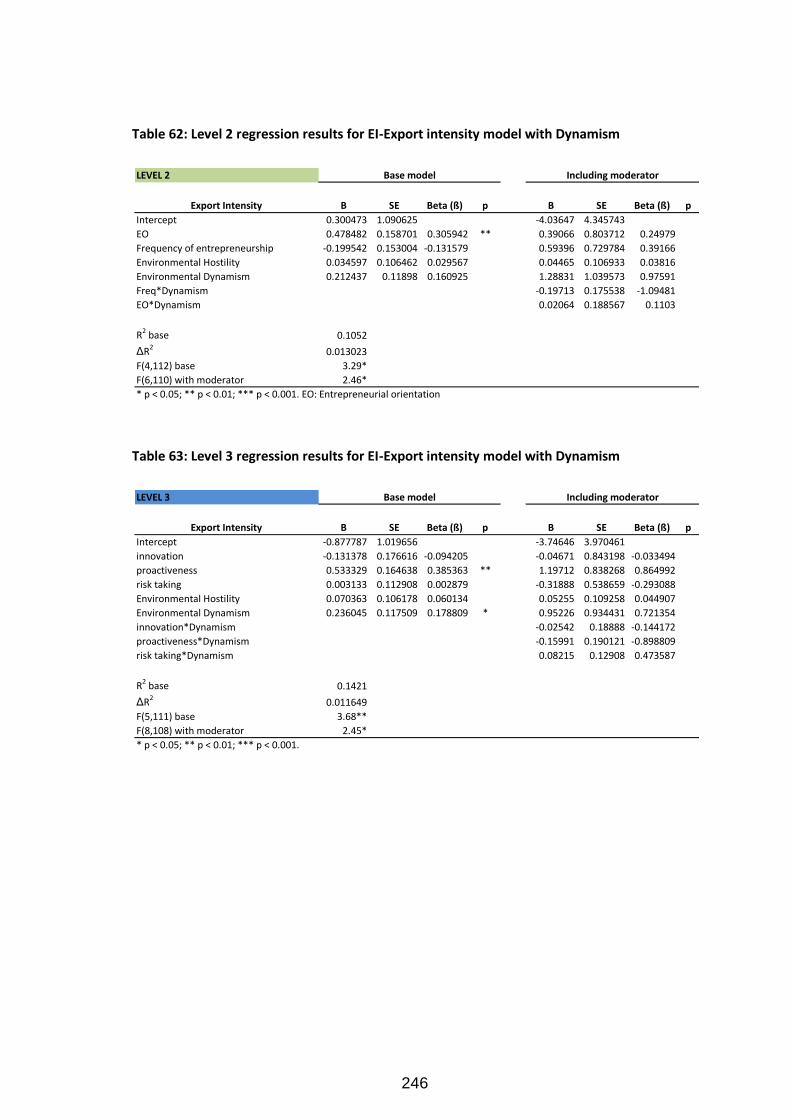
246
Table 62: Level 2 regression results for EI-Export intensity model with Dynamism
Table 63: Level 3 regression results for EI-Export intensity model with Dynamism
LEVEL 2
Export Intensity B SE Beta (ß) p B SE Beta (ß) p
Intercept 0.300473 1.090625 -4.03647 4.345743
EO 0.478482 0.158701 0.305942 ** 0.39066 0.803712 0.24979
Frequency of entrepreneurship -0.199542 0.153004 -0.131579 0.59396 0.729784 0.39166
Environmental Hostility 0.034597 0.106462 0.029567 0.04465 0.106933 0.03816
Environmental Dynamism 0.212437 0.11898 0.160925 1.28831 1.039573 0.97591
Freq*Dynamism -0.19713 0.175538 -1.09481
EO*Dynamism 0.02064 0.188567 0.1103
R2 base 0.1052
ΔR20.013023
F(4,112) base 3.29*
F(6,110) with moderator 2.46*
* p < 0.05; ** p < 0.01; *** p < 0.001. EO: Entrepreneurial orientation
Base model Including moderator
LEVEL 3
Export Intensity B SE Beta (ß) p B SE Beta (ß) p
Intercept -0.877787 1.019656 -3.74646 3.970461
innovation -0.131378 0.176616 -0.094205 -0.04671 0.843198 -0.033494
proactiveness 0.533329 0.164638 0.385363 ** 1.19712 0.838268 0.864992
risk taking 0.003133 0.112908 0.002879 -0.31888 0.538659 -0.293088
Environmental Hostility 0.070363 0.106178 0.060134 0.05255 0.109258 0.044907
Environmental Dynamism 0.236045 0.117509 0.178809 * 0.95226 0.934431 0.721354
innovation*Dynamism -0.02542 0.18888 -0.144172
proactiveness*Dynamism -0.15991 0.190121 -0.898809
risk taking*Dynamism 0.08215 0.12908 0.473587
R2 base 0.1421
ΔR2
0.011649
F(5,111) base 3.68**
F(8,108) with moderator 2.45*
* p < 0.05; ** p < 0.01; *** p < 0.001.
Base model Including moderator
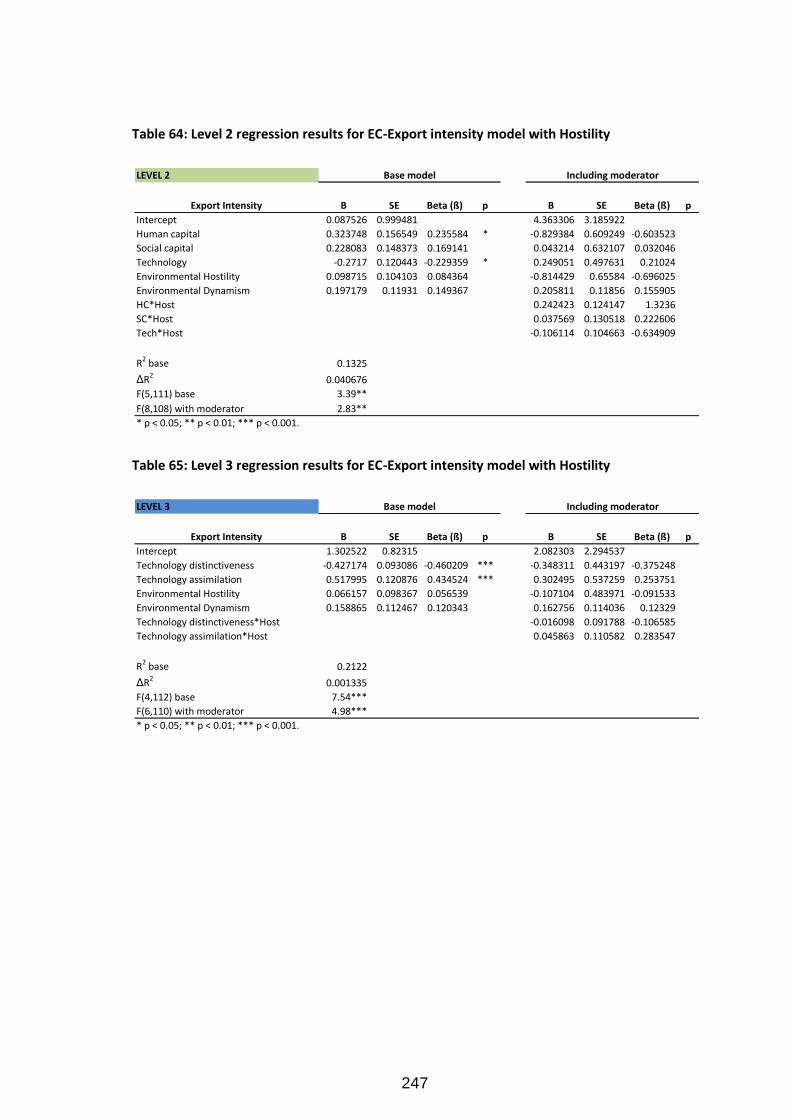
247
Table 64: Level 2 regression results for EC-Export intensity model with Hostility
Table 65: Level 3 regression results for EC-Export intensity model with Hostility
LEVEL 2
Export Intensity B SE Beta (ß) p B SE Beta (ß) p
Intercept 0.087526 0.999481 4.363306 3.185922
Human capital 0.323748 0.156549 0.235584 * -0.829384 0.609249 -0.603523
Social capital 0.228083 0.148373 0.169141 0.043214 0.632107 0.032046
Technology -0.2717 0.120443 -0.229359 * 0.249051 0.497631 0.21024
Environmental Hostility 0.098715 0.104103 0.084364 -0.814429 0.65584 -0.696025
Environmental Dynamism 0.197179 0.11931 0.149367 0.205811 0.11856 0.155905
HC*Host 0.242423 0.124147 1.3236
SC*Host 0.037569 0.130518 0.222606
Tech*Host -0.106114 0.104663 -0.634909
R2 base 0.1325
ΔR20.040676
F(5,111) base 3.39**
F(8,108) with moderator 2.83**
* p < 0.05; ** p < 0.01; *** p < 0.001.
Base model Including moderator
LEVEL 3
Export Intensity B SE Beta (ß) p B SE Beta (ß) p
Intercept 1.302522 0.82315 2.082303 2.294537
Technology distinctiveness -0.427174 0.093086 -0.460209 *** -0.348311 0.443197 -0.375248
Technology assimilation 0.517995 0.120876 0.434524 *** 0.302495 0.537259 0.253751
Environmental Hostility 0.066157 0.098367 0.056539 -0.107104 0.483971 -0.091533
Environmental Dynamism 0.158865 0.112467 0.120343 0.162756 0.114036 0.12329
Technology distinctiveness*Host -0.016098 0.091788 -0.106585
Technology assimilation*Host 0.045863 0.110582 0.283547
R2 base 0.2122
ΔR20.001335
F(4,112) base 7.54***
F(6,110) with moderator 4.98***
* p < 0.05; ** p < 0.01; *** p < 0.001.
Base model Including moderator
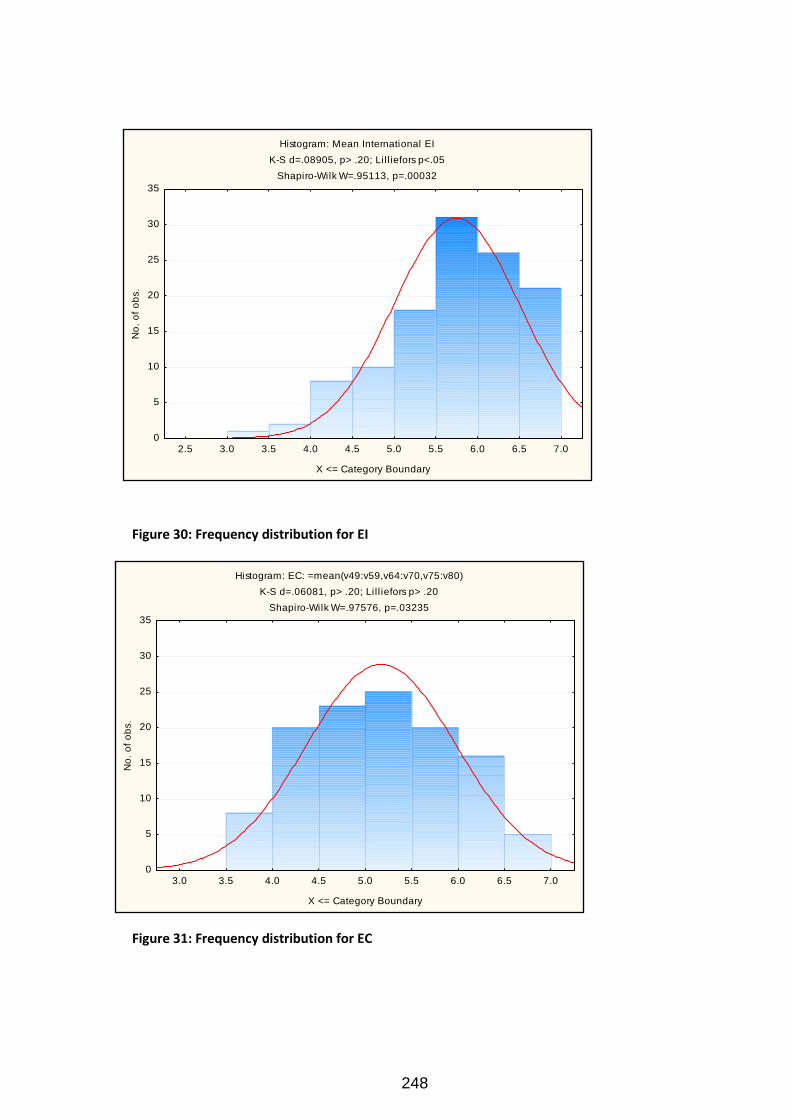
248
Figure 30: Frequency distribution for EI
Figure 31: Frequency distribution for EC
Histogram: Mean International EI
K-S d=.08905, p> .20; Lil l iefors p<.05
Shapiro-Wilk W=.95113, p=.00032
2.5 3.0 3.5 4.0 4.5 5.0 5.5 6.0 6.5 7.0
X <= Category Boundary
0
5
10
15
20
25
30
35
No
. o
f o
bs.
Histogram: EC: =mean(v49:v59,v64:v70,v75:v80)
K-S d=.06081, p> .20; Lil l iefors p> .20
Shapiro-Wilk W=.97576, p=.03235
3.0 3.5 4.0 4.5 5.0 5.5 6.0 6.5 7.0
X <= Category Boundary
0
5
10
15
20
25
30
35
No
. o
f o
bs.
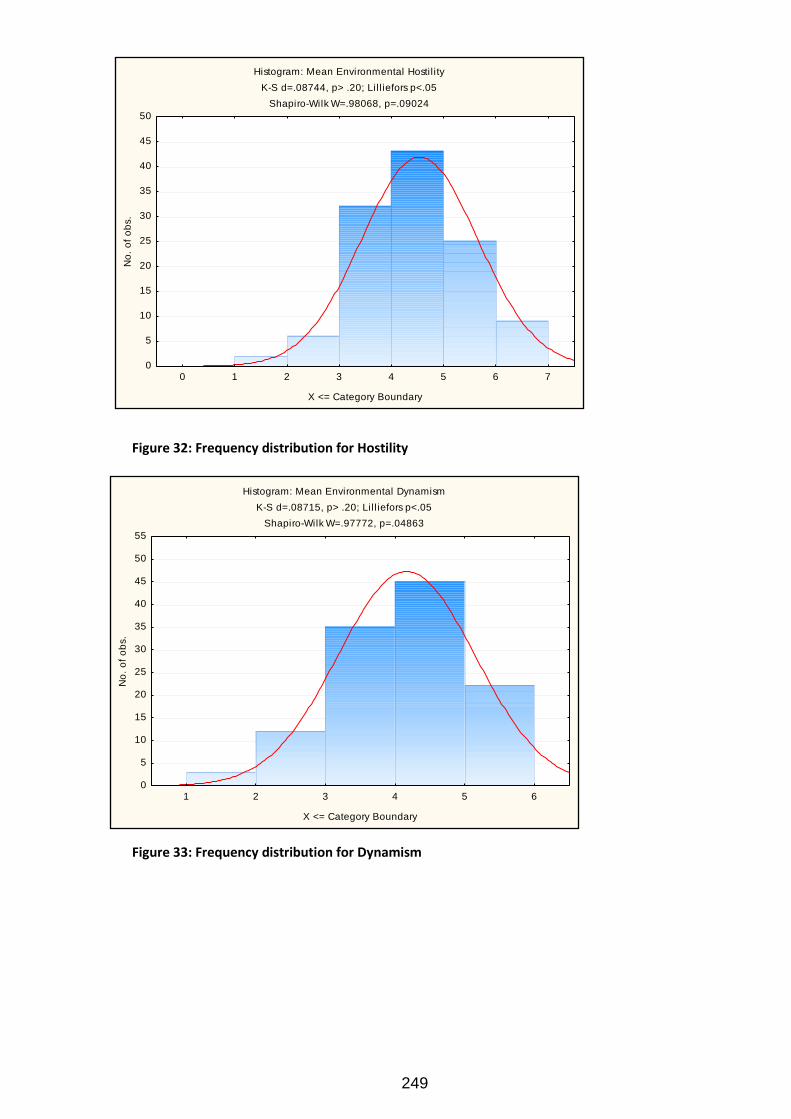
249
Figure 32: Frequency distribution for Hostility
Figure 33: Frequency distribution for Dynamism
Histogram: Mean Environmental Hostil ity
K-S d=.08744, p> .20; Lil l iefors p<.05
Shapiro-Wilk W=.98068, p=.09024
0 1 2 3 4 5 6 7
X <= Category Boundary
0
5
10
15
20
25
30
35
40
45
50N
o.
of
ob
s.
Histogram: Mean Environmental Dynamism
K-S d=.08715, p> .20; Lil l iefors p<.05
Shapiro-Wilk W=.97772, p=.04863
1 2 3 4 5 6
X <= Category Boundary
0
5
10
15
20
25
30
35
40
45
50
55
No
. o
f o
bs.
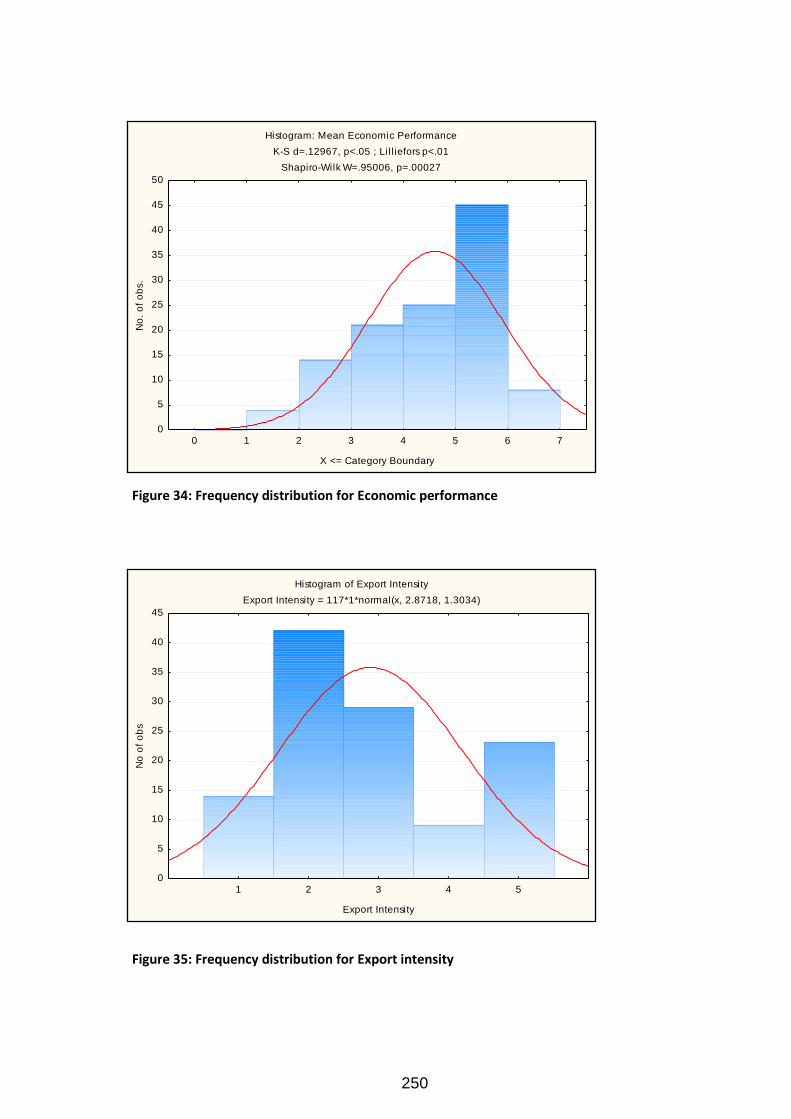
250
Figure 34: Frequency distribution for Economic performance
Figure 35: Frequency distribution for Export intensity
Histogram: Mean Economic Performance
K-S d=.12967, p<.05 ; Lil l iefors p<.01
Shapiro-Wilk W=.95006, p=.00027
0 1 2 3 4 5 6 7
X <= Category Boundary
0
5
10
15
20
25
30
35
40
45
50
No
. o
f o
bs.
Histogram of Export Intensity
Export Intensity = 117*1*normal(x, 2.8718, 1.3034)
1 2 3 4 5
Export Intensity
0
5
10
15
20
25
30
35
40
45
No
of
ob
s
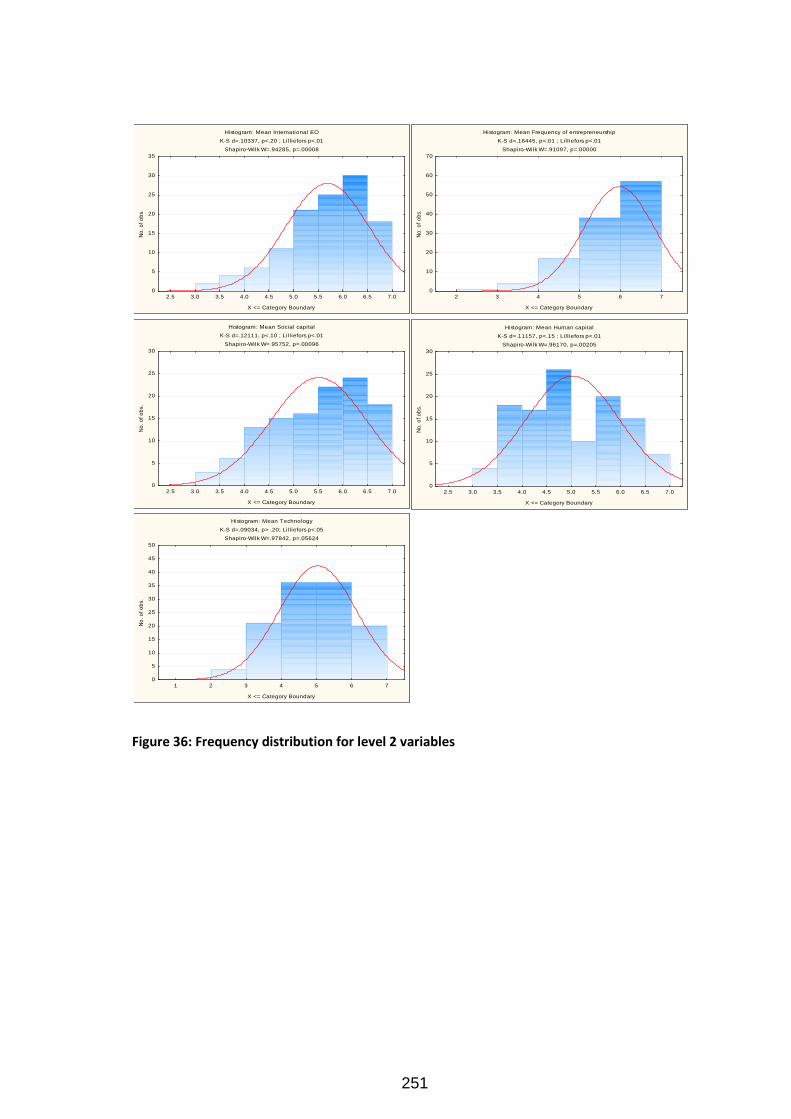
251
Figure 36: Frequency distribution for level 2 variables
Histogram: Mean Frequency of entrepreneurship
K-S d=.16445, p<.01 ; Lil l iefors p<.01
Shapiro-Wilk W=.91097, p=.00000
2 3 4 5 6 7
X <= Category Boundary
0
10
20
30
40
50
60
70
No
. o
f o
bs.
Histogram: Mean Human capital
K-S d=.11157, p<.15 ; Lil l iefors p<.01
Shapiro-Wilk W=.96170, p=.00205
2.5 3.0 3.5 4.0 4.5 5.0 5.5 6.0 6.5 7.0
X <= Category Boundary
0
5
10
15
20
25
30
No
. o
f o
bs.
Histogram: Mean Social capital
K-S d=.12111, p<.10 ; Lil l iefors p<.01
Shapiro-Wilk W=.95752, p=.00096
2.5 3.0 3.5 4.0 4.5 5.0 5.5 6.0 6.5 7.0
X <= Category Boundary
0
5
10
15
20
25
30
No
. o
f o
bs.
Histogram: Mean Technology
K-S d=.09034, p> .20; Lil l iefors p<.05
Shapiro-Wilk W=.97842, p=.05624
1 2 3 4 5 6 7
X <= Category Boundary
0
5
10
15
20
25
30
35
40
45
50
No
. o
f o
bs.
Histogram: Mean International EO
K-S d=.10337, p<.20 ; Lil l iefors p<.01
Shapiro-Wilk W=.94285, p=.00008
2.5 3.0 3.5 4.0 4.5 5.0 5.5 6.0 6.5 7.0
X <= Category Boundary
0
5
10
15
20
25
30
35
No
. o
f o
bs.
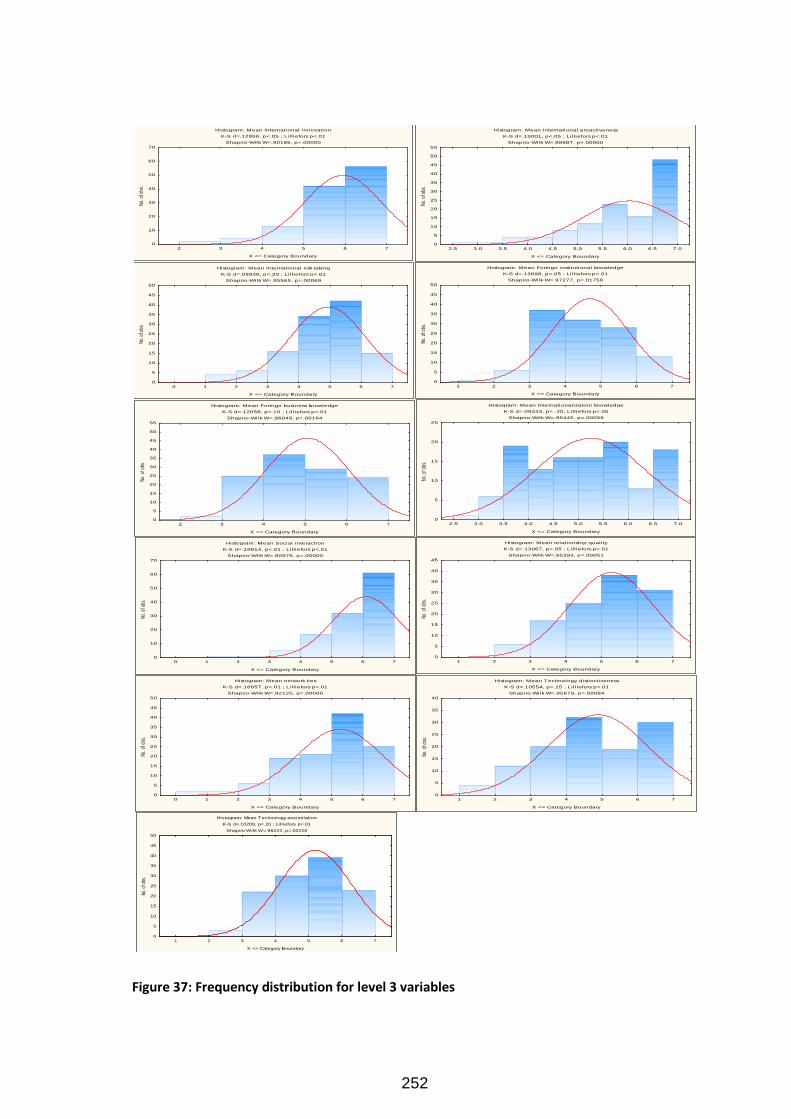
252
Figure 37: Frequency distribution for level 3 variables
Histogram: Mean International innovation
K-S d=.12956, p<.05 ; Lil l iefors p<.01
Shapiro-Wilk W=.90186, p=.00000
2 3 4 5 6 7
X <= Category Boundary
0
10
20
30
40
50
60
70
No. o
f obs
.
Histogram: Mean International proactiveness
K-S d=.15001, p<.05 ; Lil l iefors p<.01
Shapiro-Wilk W=.88887, p=.00000
2.5 3.0 3.5 4.0 4.5 5.0 5.5 6.0 6.5 7.0
X <= Category Boundary
0
5
10
15
20
25
30
35
40
45
50
55
No. o
f obs
.
Histogram: Mean International risk taking
K-S d=.09930, p<.20 ; Lil l iefors p<.01
Shapiro-Wilk W=.95565, p=.00069
0 1 2 3 4 5 6 7
X <= Category Boundary
0
5
10
15
20
25
30
35
40
45
50
No. o
f obs
.
Histogram: Mean Foreign institutional knowledge
K-S d=.13698, p<.05 ; Lil l iefors p<.01
Shapiro-Wilk W=.97277, p=.01756
1 2 3 4 5 6 7
X <= Category Boundary
0
5
10
15
20
25
30
35
40
45
50
No. o
f obs
.
Histogram: Mean Foreign business knowledge
K-S d=.12058, p<.10 ; Lil l iefors p<.01
Shapiro-Wilk W=.96049, p=.00164
2 3 4 5 6 7
X <= Category Boundary
0
5
10
15
20
25
30
35
40
45
50
55
No. o
f obs
.
Histogram: Mean Internationalization knowledge
K-S d=.09333, p> .20; Lil l iefors p<.05
Shapiro-Wilk W=.95445, p=.00056
2.5 3.0 3.5 4.0 4.5 5.0 5.5 6.0 6.5 7.0
X <= Category Boundary
0
5
10
15
20
25No
. of o
bs.
Histogram: Mean Social interaction
K-S d=.19814, p<.01 ; Lil l iefors p<.01
Shapiro-Wilk W=.80976, p=.00000
0 1 2 3 4 5 6 7
X <= Category Boundary
0
10
20
30
40
50
60
70
No. o
f obs
.
Histogram: Mean relationship quality
K-S d=.13067, p<.05 ; Lil l iefors p<.01
Shapiro-Wilk W=.95393, p=.00051
1 2 3 4 5 6 7
X <= Category Boundary
0
5
10
15
20
25
30
35
40
45
No. o
f obs
.
Histogram: Mean network ties
K-S d=.16657, p<.01 ; Lil l iefors p<.01
Shapiro-Wilk W=.92125, p=.00000
0 1 2 3 4 5 6 7
X <= Category Boundary
0
5
10
15
20
25
30
35
40
45
50
No. o
f obs
.
Histogram: Mean Technology distinctiveness
K-S d=.10554, p<.15 ; Lil l iefors p<.01
Shapiro-Wilk W=.95679, p=.00084
1 2 3 4 5 6 7
X <= Category Boundary
0
5
10
15
20
25
30
35
40
No. o
f obs
.
Histogram: Mean Technology assimilation
K-S d=.10209, p<.20 ; Lilliefors p<.01
Shapiro-Wilk W=.96222, p=.00226
1 2 3 4 5 6 7
X <= Category Boundary
0
5
10
15
20
25
30
35
40
45
50
No.
of o
bs.
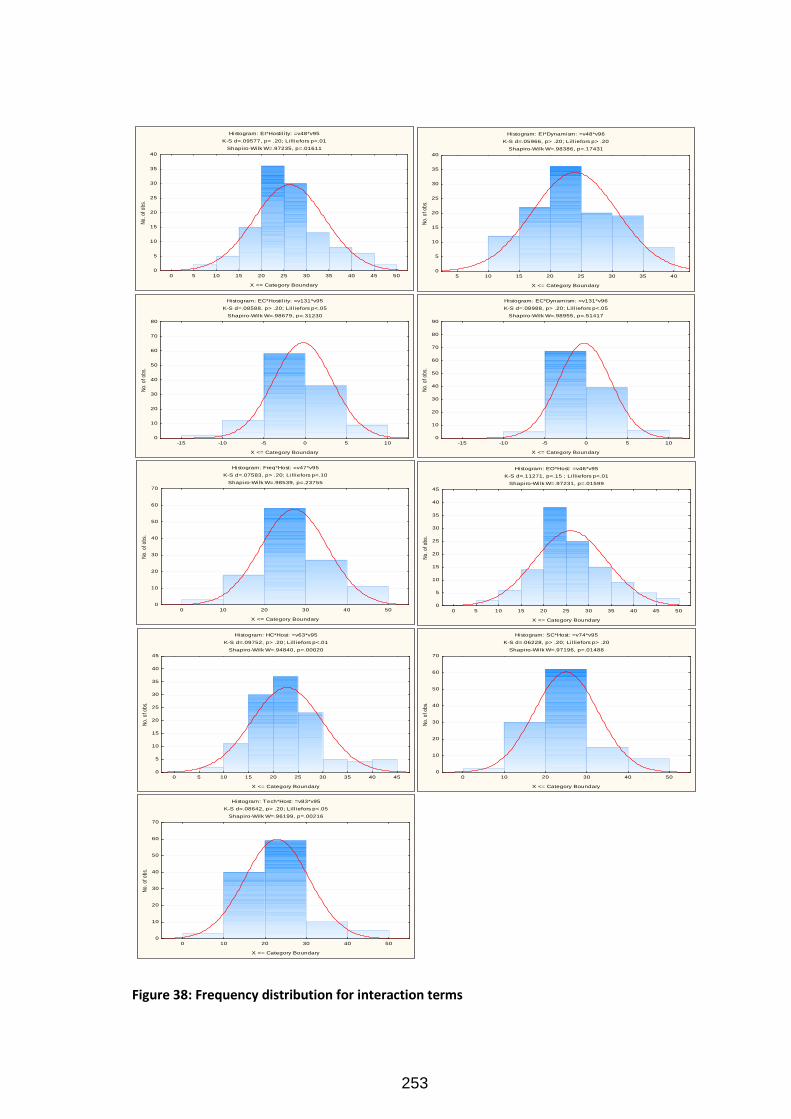
253
Figure 38: Frequency distribution for interaction terms
Histogram: EI*Hostil ity: =v48*v95
K-S d=.09577, p> .20; Lil l iefors p<.01
Shapiro-Wilk W=.97235, p=.01611
0 5 10 15 20 25 30 35 40 45 50
X <= Category Boundary
0
5
10
15
20
25
30
35
40
No
. o
f o
bs.
Histogram: EI*Dynamism: =v48*v96
K-S d=.05966, p> .20; Lil l iefors p> .20
Shapiro-Wilk W=.98386, p=.17431
5 10 15 20 25 30 35 40
X <= Category Boundary
0
5
10
15
20
25
30
35
40
No
. o
f o
bs.
Histogram: EC*Hostil ity: =v131*v95
K-S d=.08588, p> .20; Lil l iefors p<.05
Shapiro-Wilk W=.98679, p=.31230
-15 -10 -5 0 5 10
X <= Category Boundary
0
10
20
30
40
50
60
70
80
No
. o
f o
bs.
Histogram: EC*Dynamism: =v131*v96
K-S d=.08988, p> .20; Lil l iefors p<.05
Shapiro-Wilk W=.98955, p=.51417
-15 -10 -5 0 5 10
X <= Category Boundary
0
10
20
30
40
50
60
70
80
90
No
. o
f o
bs.
Histogram: Freq*Host: =v47*v95
K-S d=.07583, p> .20; Lil l iefors p<.10
Shapiro-Wilk W=.98539, p=.23755
0 10 20 30 40 50
X <= Category Boundary
0
10
20
30
40
50
60
70
No
. o
f o
bs.
Histogram: EO*Host: =v46*v95
K-S d=.11271, p<.15 ; Lil l iefors p<.01
Shapiro-Wilk W=.97231, p=.01599
0 5 10 15 20 25 30 35 40 45 50
X <= Category Boundary
0
5
10
15
20
25
30
35
40
45
No
. o
f o
bs.
Histogram: HC*Host: =v63*v95
K-S d=.09752, p> .20; Lil l iefors p<.01
Shapiro-Wilk W=.94840, p=.00020
0 5 10 15 20 25 30 35 40 45
X <= Category Boundary
0
5
10
15
20
25
30
35
40
45
No
. o
f o
bs.
Histogram: SC*Host: =v74*v95
K-S d=.06228, p> .20; Lil l iefors p> .20
Shapiro-Wilk W=.97196, p=.01488
0 10 20 30 40 50
X <= Category Boundary
0
10
20
30
40
50
60
70
No
. o
f o
bs.
Histogram: Tech*Host: =v83*v95
K-S d=.08642, p> .20; Lil l iefors p<.05
Shapiro-Wilk W=.96199, p=.00216
0 10 20 30 40 50
X <= Category Boundary
0
10
20
30
40
50
60
70
No
. o
f o
bs.
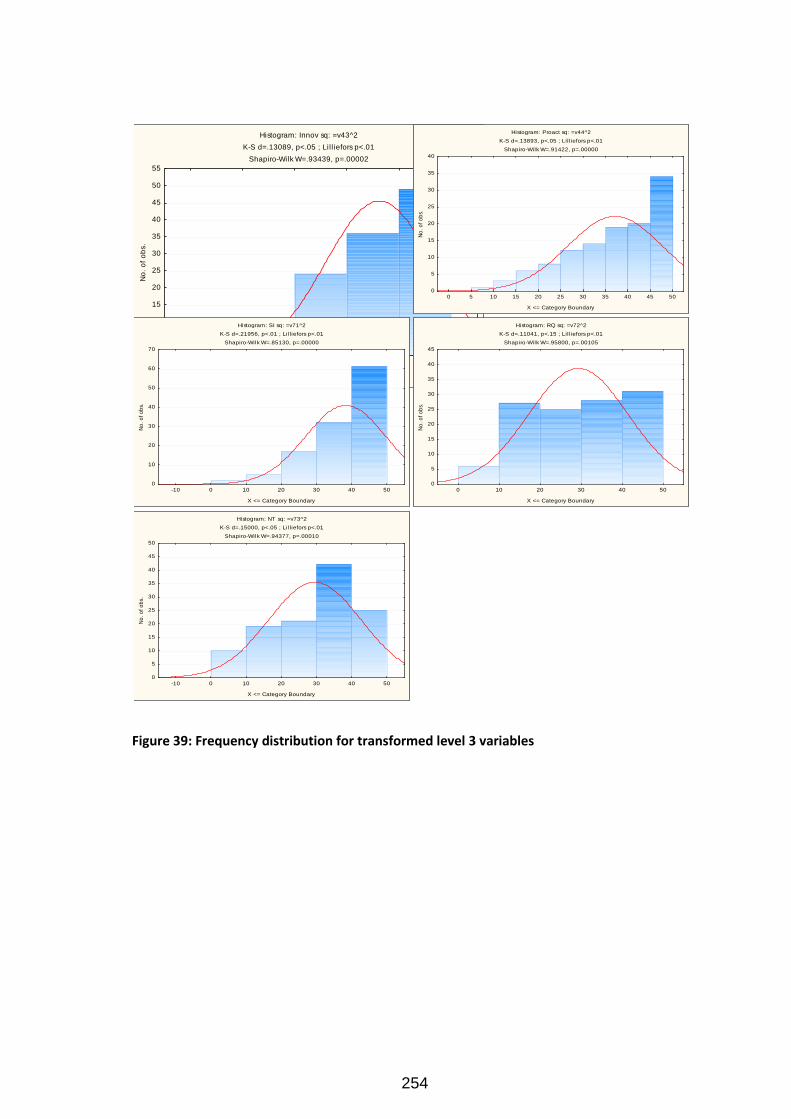
254
Figure 39: Frequency distribution for transformed level 3 variables
Histogram: Innov sq: =v43^2
K-S d=.13089, p<.05 ; Lil l iefors p<.01
Shapiro-Wilk W=.93439, p=.00002
0 10 20 30 40 50
X <= Category Boundary
0
5
10
15
20
25
30
35
40
45
50
55
No
. o
f o
bs.
Histogram: Proact sq: =v44^2
K-S d=.13893, p<.05 ; Lil l iefors p<.01
Shapiro-Wilk W=.91422, p=.00000
0 5 10 15 20 25 30 35 40 45 50
X <= Category Boundary
0
5
10
15
20
25
30
35
40
No
. o
f o
bs.
Histogram: SI sq: =v71^2
K-S d=.21956, p<.01 ; Lil l iefors p<.01
Shapiro-Wilk W=.85130, p=.00000
-10 0 10 20 30 40 50
X <= Category Boundary
0
10
20
30
40
50
60
70
No
. o
f o
bs.
Histogram: RQ sq: =v72^2
K-S d=.11041, p<.15 ; Lil l iefors p<.01
Shapiro-Wilk W=.95800, p=.00105
0 10 20 30 40 50
X <= Category Boundary
0
5
10
15
20
25
30
35
40
45
No
. o
f o
bs.
Histogram: NT sq: =v73^2
K-S d=.15000, p<.05 ; Lil l iefors p<.01
Shapiro-Wilk W=.94377, p=.00010
-10 0 10 20 30 40 50
X <= Category Boundary
0
5
10
15
20
25
30
35
40
45
50
No
. o
f o
bs.
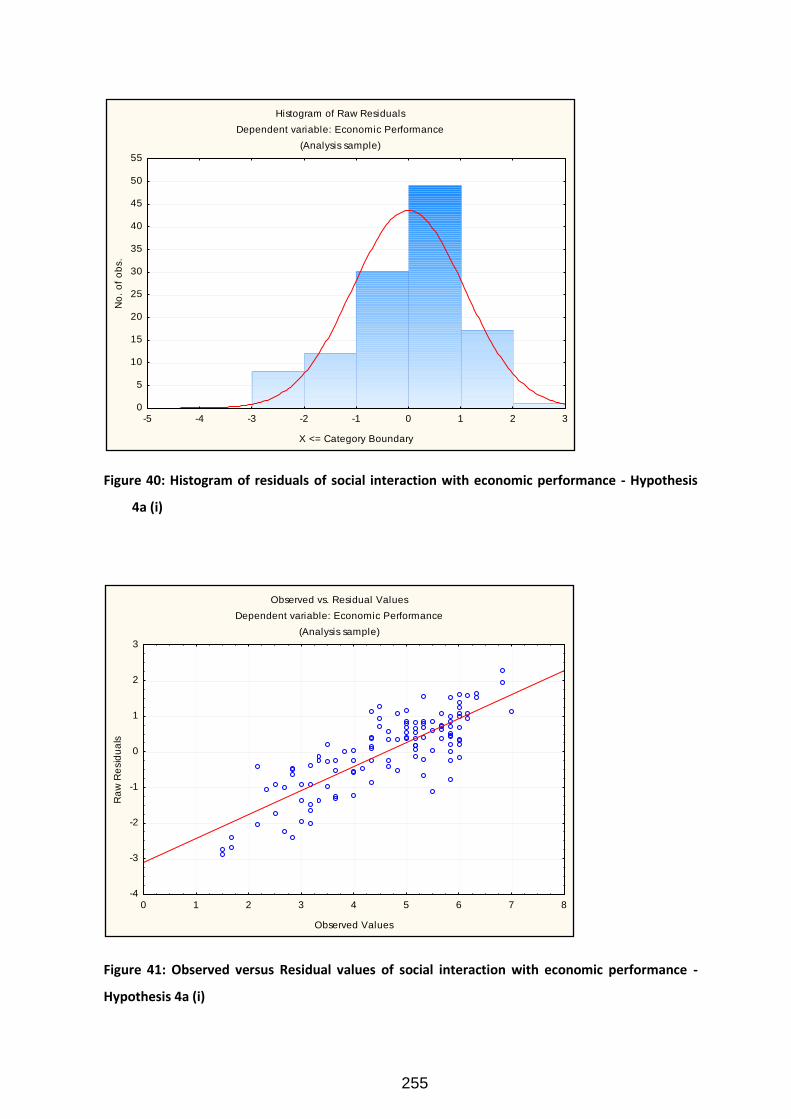
255
Figure 40: Histogram of residuals of social interaction with economic performance - Hypothesis
4a (i)
Figure 41: Observed versus Residual values of social interaction with economic performance -
Hypothesis 4a (i)
Histogram of Raw Residuals
Dependent variable: Economic Performance
(Analysis sample)
-5 -4 -3 -2 -1 0 1 2 3
X <= Category Boundary
0
5
10
15
20
25
30
35
40
45
50
55
No
. o
f o
bs.
Observed vs. Residual Values
Dependent variable: Economic Performance
(Analysis sample)
0 1 2 3 4 5 6 7 8
Observed Values
-4
-3
-2
-1
0
1
2
3
Ra
w R
esid
ua
ls
256
Figure 42: Histogram of residuals of internationalisation knowledge with
economic performance - Hypothesis 4a (i)
Figure 43: Observed versus Residual values of internationalisation knowledge
with economic performance - Hypothesis 4a (i)
Histogram of Raw Residuals
Dependent variable: Economic Performance
(Analysis sample)
-6 -5 -4 -3 -2 -1 0 1 2 3 4
X <= Category Boundary
0
5
10
15
20
25
30
35
40
45
50
No
. o
f o
bs.
Observed vs. Residual Values
Dependent variable: Economic Performance
(Analysis sample)
0 1 2 3 4 5 6 7 8
Observed Values
-5
-4
-3
-2
-1
0
1
2
3
4
Raw
Resid
uals
257
Figure 44: Histogram of residuals of proactiveness with export intensity -
Hypothesis 3b (i)
Figure 45: Observed versus Residual values of proactiveness with export
intensity - Hypothesis 3b (i)
Histogram of Raw Residuals
Dependent variable: Export Intensity
(Analysis sample)
-4 -3 -2 -1 0 1 2 3 4
X <= Category Boundary
0
5
10
15
20
25
30
35
40
No
. o
f o
bs.
Observed vs. Residual Values
Dependent variable: Export Intensity
(Analysis sample)
0.5 1.0 1.5 2.0 2.5 3.0 3.5 4.0 4.5 5.0 5.5
Observed Values
-3
-2
-1
0
1
2
3
4
Ra
w R
esi
du
als

258
(Covin and Slevin, 1990);(Lumpkin and Dess, 1996); (Lumpkin and Dess, 2001); (Zahra and
Garvis, 2000); (Wiklund and Shepherd, 2005);(Zhou, 2007); (Li et al., 2009); (Patel and D’Souza,
2009); (Frank et al., 2010); (Javalgi and Todd, 2010); (Bojica and Fuentes, 2011) (Lyon et al.,
2000) (Hansen, Deitz, Tokman, Marino and Weaver, 2011) (Scheepers et al., 2007) (Certo et al.,
2009) (Hornsby et al., 2002) (Heilbrunn, 2008) (Patel and D’Souza, 2009) (Scheepers et al.,
2008) (Urban, 2009b) (Urban et al., 2011) (Urban et al., 2011) (Morris et al., 2008); ((Kuratko et
al., 2007))(Venkataraman, 2004)
(Tang et al., 2010) (Camisón and Villar-López, 2010) (Javalgi and Todd, 2010) (McDougall et al.,
2003) (Casillas et al., 2010) (Fletcher and Harris, 2011) (Samiee and Walters, 1999)
(Weerawardena et al., 2007) (Casillas et al., 2009) (Fletcher and Harris, 2011) (Gimmon and
Levie, 2010) (Brennan and Garvey, 2009) (Haahti et al., 2005) (Hadley and Wilson, 2003)
(Vaghely and Julien, 2010) (Urban et al., 2008) (Ardichvili et al., 2003) (Bojica and Fuentes,
2011) (Bhagavatula et al., 2010) (Autio, 2005), (Urban, 2009b)
(BHAGAVATULA, et al 2010)(Bauernschuster et al., 2010) (Leiblein and Reuer, 2004) (Batjargal,
2007), (Bhagavatula et al., 2010) (Lindstrand et al., 2011) (Hoang and Antoncic, 2003)
,(Anderson and Miller, 2003) (Haeussler et al., 2010), (Parra-Requena et al., 2010) (Burt, 1992)
(Coviello, 2006) , (Uzzi, 1997). (Burt, 1992; Burt, 1997, 2000), (Burt, 2000), (Adler and Kwon,
2000) , (Bauernschuster et al., 2010) (Jones, Coviello and Tang, 2011) (Danis, De Clercq and
Petricevic, 2010) (Agndal et al., 2008) (Yli-Renko et al., 2002) (Casillas et al., 2010), Danis et al.,
2010 (Anderson et al., 2010) (Oviatt and McDougall, 2005) (Ulhøi, 2005) , (Jack, 2010), (Pirolo
and Presutti, 2010), (Walter et al., 2006), (Walter, Auer and Ritter, 2006), (Leung, Zhang, Wong
and Foo, 2006), (Zhou, 2007), (Haeussler et al., 2010), (Manolova et al., 2010), (Urban and
Shaw, 2010) (Gimmon and Levie, 2010) (Bojica and Fuentes, 2011)
(Leung et al., 2006; Walter et al., 2006) (Vaghely and Julien, 2010) (Therin, 2007) (Tang et al.,
2010) (Camisón and Villar-López, 2010)
(Wiklund and Shepherd, 2005) (Scheepers et al., 2007)


