Embed Size (px)
Citation preview


The experimental work presented in this thesis was carried out at the Laboratory of
Pharmacology, Faculty of Pharmacy, University of Coimbra and at the Health Sciences Research
Centre, Faculty of Health Sciences, University of Beira Interior, under the supervision of Professor
Amílcar Celta Falcão Ramos Ferreira and Professor Gilberto Lourenço Alves.
O trabalho experimental apresentado nesta tese foi realizado no Laboratório da Faculdade de
Farmácia da Universidade de Coimbra e no Centro de Investigação em Ciências da Saúde da
Faculdade de Ciências da Saúde da Universidade da Beira Interior, sob a orientação do Professor
Doutor Amílcar Celta Falcão Ramos Ferreira e do Professor Doutor Gilberto Lourenço Alves.


The work underlying the present thesis was supported by Fundação para a Ciência e a Tecnologia,
Portugal (SFRH/BD/64895/2009) through the POPH (Programa Operacional Potencial Humano)
which is co-funded by FSE (Fundo Social Europeu), European Union.
O trabalho subjacente à presente tese teve o apoio financeiro da Fundação para a Ciência e a
Tecnologia, Portugal (SFRH/BD/64895/2009) e do Programa Operacional Potencial Humano
(POPH) cofinanciado pelo Fundo Social Europeu (FSE), União Europeia.


Ao Miguel


Aos meus Pais


AGRADECIMENTOS
Na vida, tudo tem um princípio, um meio e um fim! Do entusiasmo e regozijo
inicial rapidamente se passa para um interminável reboliço de emoções à flor da pele
numa busca incessante pelo nosso “eu”, até ao culminar tranquilo e apaziguante de um
ciclo que se fecha. Foram cinco anos de puro crescimento, transformação e descoberta!
Uma autêntica montanha-russa de sentimentos, com alguns “altos” e muitos “baixos”,
um verdadeiro e longo período de aprendizagem, (des)conhecimento e adaptação
pessoal e profissional. Ao percorrer os últimos passos desta etapa, sou invadida por uma
enorme alegria e satisfação de “dever cumprido” e uma profunda gratidão por todos
aqueles que fizeram parte integrante ou que simplesmente me acompanharam no
decorrer desta jornada. A todos Vós o meu mais sincero e caloroso “Muito Obrigada”!
Ao Professor Amílcar Falcão, meu orientador,
agradeço em primeiro lugar o convite que me endereçou para a realização deste trabalho
de investigação com vista ao grau de Doutor. Foi com muito gosto (e um pequeno
friozinho na barriga, admito…) que o aceitei, não só pelo desafio, mas acima de tudo pela
admiração genuína que nutria por si enquanto Professor dotado de uma capacidade
ímpar na transmissão de conhecimento ao longo do meu percurso como estudante. Além
do incontestável apoio científico, queria deixar aqui um apreço especial por todo o
suporte humano. Obrigada pela amizade, afeto e carinho demonstrados durante toda
esta aventura e, mais importante que tudo, pela confiança que depositou em mim e nas
minhas competências. Muito obrigada por ter sempre acreditado em mim, mesmo
quando eu própria já não o fazia…
Ao Professor Gilberto Alves, meu co-orientador,
gostaria de dirigir a minha sincera gratidão pelo seu notável contributo e orientação
científica, fundamentais para a execução deste trabalho. Pela constante dedicação e
disponibilidade, pela perseverança, por todas as palavras de estímulo, incentivo e
motivação. Muito obrigada por todos os ensinamentos transmitidos, por ter abraçado
este projeto de corpo e alma e pela sua amizade.
À Ana Fortuna,
pelo acolhimento afável no laboratório de Farmacologia e pelo empenho na minha
iniciação e integração à investigação. Pelo apoio, suporte e acompanhamento desde os
meus “primeiros passos” até ao final! Pela presença permanente, pelo carinho e pelos

bons momentos de amizade partilhados. És um exemplo de trabalho árduo e prova de
que a luta e determinação são fatores essenciais para alcançar aquilo que ambicionamos.
Às minhas colegas e grandes amigas do Laboratório,
Joana Almeida e Sousa, Daniela Gonçalves e Joana Bicker,
um obrigado muito sentido e nostálgico pelas memórias que irei guardar de tudo o que
passámos juntas! É com uma ternura imensa (e uma lagrimita ao canto do olho…) que vos
dirijo estas palavras individualmente: Juanita, minha amiga do coração e de longa data,
contigo conheci o verdadeiro significado da Amizade! Sabes o quanto és importante para
mim e o quanto admiro a pessoa linda que és. Obrigada por estares sempre presente e
fazeres parte dos pequenos e grandes momentos da minha vida. Que possamos continuar
a traçar o nosso caminho assim, estando sempre por perto. Dani, obrigada por “injetares”
alegria e uma pequena dose de loucura no dia-a-dia rotineiro de laboratório. Pela inter-
ajuda, prontidão e socorro em todas as alturas de “crise”. Por seres espontânea e genuína
em tudo o que fazes e me contagiares com a tua determinação. Bicker, por ti nutro um
sentimento muito fraternal. Recordo-me do bom que foi descobrir o quanto tínhamos em
comum e éramos parecidas. Ficam os desabafos, as confissões e a cumplicidade. Obrigada
por te teres cruzado na minha vida e me mostrares que temos forças desconhecidas.
Ao João Abrantes,
pelo destino nos ter apresentado! Por seres um exemplo de persistência e conquista.
Saudades das nossas tertúlias… Que a nossa distância se resuma apenas e somente a
meros quilómetros!
A todos os meus colegas de Doutoramento,
pelo companheirismo e pelos grandes e bons momentos de convívio proporcionados ao
longo destes anos. Um agradecimento especial à Carla Vitorino pela amabilidade em se
demonstrar sempre disponível a ajudar.
À Ana Filipa Ferreira e
a todos aqueles com quem me cruzei nas minhas andanças pela UBI,
um grande bem-haja!
À Fundação para a Ciência e a Tecnologia,
pela atribuição de uma Bolsa de Doutoramento, tornando exequível este trabalho.

A toda a Família Serpa Oliva,
um agradecimento sentido por todas as demonstrações de afeto e preocupação.
Aos meus Sogros, Carmo e Luís,
pelo conforto paternal com que sempre me presentearam. Pelo apoio, pela paciência e
pela compreensão. Por transmitirem o quão importante é celebrar a vida!
Ao meu Irmão,
pelo que representa para mim! Por ser a minha estrela guia, por sempre me desafiar e
estimular a procurar e refletir sobre o “porquê” de tudo! Por me ter ajudado a crescer e
por ser o meu grande exemplo de vida! Obrigada pelo instinto protetor… Sim, porque eu
sei que apesar do esforço em manter a discrição, é muito importante para ti garantir o
meu bem-estar. Obrigada pelas horas infindáveis de debate sobre o tudo e o nada…
Queria também deixar um agradecimento especial à Andreia pela boa disposição e pelas
gargalhadas que invadiram os nossos convívios familiares. Pelas consultas “gratuitas” de
psicologia nas alturas mais críticas, pelas palavras aconchegantes e por todo o apreço.
Aos dois, um obrigado gigante por sempre me terem acolhido, reservando um cantinho
do vosso lar e tornando as minhas idas à Covilhã seguramente mais aprazíveis.
Aos meus queridos Pais,
agradeço a essência do que sou e conquistei! Agradeço por tão bem me conduzirem
nesta minha “viagem” pelo planeta Terra, mostrando que nem tudo é fácil, mas que
todos temos a força necessária para ultrapassar qualquer adversidade, e assim crescer!
Agradeço todo o Amor incondicional e dedicação! A sensatez e clarividência transmitidas,
e a luta incessante para que o otimismo se apodere definitivamente do meu ser. Aos
meus queridos Pais, a quem tudo devo, obrigada por serem quem são!
Ao Miguel,
simplesmente por Tudo… Pelo suporte, pelo apoio, pela compreensão incompreensível,
pelas lágrimas, pelos sorrisos, pelos mimos, pelo conforto, pelo equilíbrio! Pelo grande e
verdadeiro Amor que construímos e que nos une. Por esse Amor preencher os nossos
dias e por definir aquilo que hoje somos e o que, juntos, ambicionamos ser. Estás em
tudo o que faço e este projeto também tem um pedacinho de ti! Obrigada por nunca me
deixares desistir! Que venham novas aventuras…


TABLE OF CONTENTS
LIST OF ABBREVIATIONS, FIGURES & TABLES I
PUBLICATIONS I
ABSTRACT / RESUMO I
CHAPTER I - GENERAL INTRODUCTION 1
I. 1. EPILEPSY - Disease and Pharmacological Therapy 5
I. 1.1. HISTORICAL BACKGROUND 7
I. 1.2. EPIDEMIOLOGY 7
I. 1.3. EPILEPSY AND EPILEPTIC SEIZURES 8
I. 1.4. THERAPEUTIC APPROACH 12
I. 1.5. PHARMACORESISTANT EPILEPSY 19
I. 1.6. NEED FOR NEW THERAPEUTIC STRATEGIES 21
I. 1.6.1. DISCOVERY AND DEVELOPMENT OF NOVEL AEDs 21
I. 1.6.2. NEW METHODS FOR AED DELIVERY 23
I. 2. INTRANASAL DRUG DELIVERY 39
I. 2.1. ANATOMY AND PHYSIOLOGY OF THE NASAL CAVITY 43
I. 2.1.1. NASAL ANATOMY AND HISTOLOGY 43
I. 2.1.2. NASAL PHYSIOLOGY 49
I. 2.2. THE NOSE AS A SITE FOR DRUG DELIVERY – THERAPEUTIC APPLICATIONS 55
I. 2.2.1. LOCAL DELIVERY 57
I. 2.2.2. SYSTEMIC DELIVERY 58
I. 2.2.3. VACCINE DELIVERY 60
I. 2.2.4. CNS DELIVERY 61
I. 2.3. NOSE-TO-BRAIN DRUG DELIVERY 62
I. 2.3.1. PATHWAYS AND MECHANISMS OF TRANSPORT FROM NOSE TO BRAIN 64
I. 2.3.2. NOSE-TO-BRAIN ASSESSMENT – EXPERIMENTAL CONSIDERATIONS 68
I. 2.4. INTRANASAL ADMINISTRATION AND EPILEPSY 79
I. 3. AIMS 83
CHAPTER II - QUANTITATIVE DRUG ANALYSIS 87
II. 1. BIOANALYSIS - General Concepts 93
II. 1.1. INTRODUCTION 95
II. 1.2. BIOANALYTICAL METHOD DEVELOPMENT 97
Chromatographic Conditions 97
Sample Preparation 98

II. 1.3. BIOANALYTICAL METHOD VALIDATION 101
II. 1.3.1. TYPES OF METHOD VALIDATION 102
II. 1.3.2. VALIDATION PARAMETERS 103
II. 2. EXPERIMENTAL - Development and Validation of an HPLC-UV Method for the
Simultaneous Quantification of PB, PRM, PHT, CBZ, OXC, LTG and their Main Metabolites in
Human Plasma 109
II. 2.1. INTRODUCTION 111
II. 2.2. MATERIALS & METHODS 113
II. 2.2.1. Chemicals and Reagents 113
II. 2.2.2. Preparation of Standard Solutions 113
II. 2.2.3. Sample Preparation 114
II. 2.2.4. HPLC-UV Instrumentation and Chromatographic Conditions 114
II. 2.2.5. Method Validation 115
II. 2.2.6. Clinical Application 116
II. 2.3. RESULTS & DISCUSSION 117
II. 2.3.1. Development and Optimisation of Chromatographic Conditions 117
II. 2.3.2. Optimisation of the Sample Preparation Procedure 118
II. 2.3.3. Method Validation 119
II. 2.3.4. Clinical Application 126
II. 3. EXPERIMENTAL - HPLC-UV Methods for the Quantitative Determination of PHT, CBZ,
OXC, LTG and their Main Metabolites in Mouse Biological Matrices 129
II. 3.1. GENERAL INTRODUCTION 131
II. 3.2. HPLC-UV METHOD FOR THE QUANTITATIVE DETERMINATION OF CBZ, OXC, CBZ-E, LIC
AND PHT IN MOUSE PLASMA, BRAIN AND LIVER HOMOGENATES 133
II. 3.2.1. INTRODUCTION 133
II. 3.2.2. MATERIALS & METHODS 134
II. 3.2.3. RESULTS & DISCUSSION 138
II. 3.3. HPLC-UV METHOD FOR THE QUANTIFICATION OF LTG IN MOUSE PLASMA, BRAIN AND
LIVER HOMOGENATES 147
II. 3.3.1. INTRODUCTION 147
II. 3.3.2. MATERIALS & METHODS 147
II. 3.3.3. RESULTS & DISCUSSION 152
CHAPTER III - INTRANASAL ADMINISTRATION OF CARBAMAZEPINE 161
III. 1. CARBAMAZEPINE - Pharmacological Characterisation 165
III. 1.1. HISTORICAL BACKGROUND 167

III. 1.2. PHARMACEUTICAL INFORMATION 167
III. 1.3. PHARMACOKINETICS 169
Absorption 169
Distribution 170
Metabolism 170
Elimination 171
III. 1.4. PHARMACODYNAMICS 172
Mechanism of Action 172
III. 1.5. CLINICAL USE 172
Therapeutic Indications 172
Tolerability 173
Therapeutic Range 174
Drug Interactions 174
III. 2. EXPERIMENTAL - Intranasal Administration of CBZ to Mice: A Direct Delivery Pathway
for Brain Targeting 177
III. 2.1. INTRODUCTION 179
III. 2.2. MATERIALS & METHODS 181
III. 2.2.1. Chemicals and Reagents 181
III. 2.2.2. Animals 181
III. 2.2.3. Preparation of Carbamazepine Formulations 181
III. 2.2.4. IN and IV Administrations 182
III. 2.2.5. Pharmacokinetic Study 182
III. 2.2.6. Brain Biodistribution Study 183
III. 2.2.7. Drug Analysis 183
III. 2.2.8. Pharmacokinetic Analysis 185
III. 2.2.9. Statistical Analysis 186
III. 2.3. RESULTS 186
III. 2.3.1. Pharmacokinetics of Carbamazepine after IN and IV Administration 186
III. 2.3.2. Brain Biodistribution of Carbamazepine after IN and IV Administration 189
III. 2.4. DISCUSSION 192
CHAPTER IV - INTRANASAL ADMINISTRATION OF LAMOTRIGINE 197
IV. 1. LAMOTRIGINE - Pharmacological Characterisation 201
IV. 1.1. HISTORICAL BACKGROUND 203
IV. 1.2. PHARMACEUTICAL INFORMATION 204

IV. 1.3. PHARMACOKINETICS 204
Absorption 205
Distribution 205
Metabolism 206
Elimination 207
IV. 1.4. PHARMACODYNAMICS 207
Mechanism of Action 207
IV. 1.5. CLINICAL USE 208
Therapeutic Indications 208
Tolerability 209
Therapeutic Range 209
Drug Interactions 210
IV. 2. EXPERIMENTAL - Direct Nose-to-Brain Delivery of LTG Following Intranasal
Administration to Mice 211
IV. 2.1. INTRODUCTION 213
IV. 2.2. MATERIALS & METHODS 215
IV. 2.2.1. Chemicals and Reagents 215
IV. 2.2.2. Animals 215
IV. 2.2.3. Preparation of Lamotrigine Formulations 216
IV. 2.2.4. IN and IV Administrations 216
IV. 2.2.5. Pharmacokinetic Study 217
IV. 2.2.6. Brain Biodistribution Study 217
IV. 2.2.7. Drug Analysis 217
IV. 2.2.8. Pharmacokinetic Analysis 219
IV. 2.2.9. Statistical Analysis 220
IV. 2.3. RESULTS 220
IV. 2.3.1. Pharmacokinetics of Lamotrigine after IN and IV Administration 220
IV. 2.3.2. Brain Biodistribution of Lamotrigine after IN and IV Administration 223
IV. 2.4. DISCUSSION 226
CHAPTER V - GENERAL DISCUSSION 231
CHAPTER VI - CONCLUSIONS & FUTURE PERSPECTIVES 245
APPENDIX 251
REFERENCES 315

LIST OF ABBREVIATIONS,
FIGURES & TABLES


III
ABBREVIATIONS
A
AED Antiepileptic Drug
AUC Area Under the Concentration-time Curve
AUCinf AUC from Time Zero to Infinity
AUCext (%) Percentage of AUC Extrapolated from tlast to Infinity
AUCt AUC from Time Zero to the Time of the Last Quantifiable Drug
Concentration
B
BBB Blood-Brain Barrier
BCSFB Blood-Cerebrospinal Fluid Barrier
Bias Deviation from Nominal Value
C
C-974P Carbopol 974P
CBZ Carbamazepine
CBZ-E Carbamazepine-10,11-epoxide
Clast Last Quantifiable Drug Concentration
CL/F Apparent Clearance
Cmax Maximum Peak Concentration
CNS Central Nervous System
CSF Cerebrospinal Fluid
CV Coefficient of Variation
CYP Cytochrome P450
D
DGAV Food and Veterinary General Divison
DMSO Dimethyl Sulfoxide
DTE Drug Targeting Efficiency
DTP Direct Transport Percentage
E
EMA European Medicines Agency
F
F Absolute Bioavailability
FDA US Food and Drug Administration
G
GABA γ-Aminobutyric Acid

IV
H
HLB Hydrophilic-Lipophilic-Balanced Sorbent
HPLC High Performance Liquid Chromatography
HPMC Hydroxypropyl Methylcellulose
I
ILAE International League Against Epilepsy
IN Intranasal
IS Internal Standard
IV Intravenous
K
k Tissue Elimination Rate Constant
kel Apparent Elimination Rate Constant
L
Lic Licarbazepine
LLE Liquid-Liquid Extraction
LLOQ Lower Limit of Quantification
LOD Limit of Detection
LTG Lamotrigine
LogP Octanol/Water Partition Coefficient
M
MCC Mucociliary Clearance
MRT Mean Residence Time
MS Mass Spectrometry
O
OXC Oxcarbazepine
P
PB Phenobarbital
PF-127 Pluronic F-127
PHT Phenytoin
pKa Negative Decadic Logarithm of the Acid Dissociation Constant
PP Protein Precipitation
PRM Primidone
Q
QC Quality Control
R
r2 Coefficient of Determination
rpm Rotations per Minute
V
S
SEM Standard Error of the Mean
SPE Solid-Phase Extraction
T
TDM Therapeutic Drug Monitoring
TEA Triethylamine
t1/2 Tissue Elimination Half-Life
t1/2el Apparent Elimination Half-Life
tlast Time of the Last Quantifiable Drug Concentration
tmax Time to Achieve Maximum Peak Concentration
trans-diol 10,11-trans-dihydroxy-10,11-dihydrocarbamazepine
U
UGT Uridine 5’-diphosphate-glucuronosyltransferase
ULOQ Upper Limit of Quantification
UV Ultraviolet
V
VIP Vasoactive Intestinal Peptide

VI

VII
FIGURES
Figure I.1.1 Mechanisms of action of the main AEDs currently available on the
market
17
Figure I.1.2 Different methods of drug administration to the CNS 30
Figure I.2.1 Schematic representation of the human nasal cavity 44
Figure I.2.2 Schematic representation of the different cell types constitutive of the
nasal respiratory epithelium 46
Figure I.2.3 Schematic illustration of the various cell types representative of the
nasal olfactory epithelium 48
Figure I.2.4 Mechanisms of drug transport across nasal mucosa 52
Figure I.2.5 Schematic representation of the possible pathways involved in the
transport of drugs from nose to brain 64
Figure I.2.6 Schematic illustration of the anatomical neuronal connection between
the olfactory epithelium and the subarachnoid space of the brain 66
Figure II.2.1 Chemical structures of primidone (PRM), phenobarbital (PB),
phenytoin (PHT), carbamazepine (CBZ), oxcarbazepine (OXC),
lamotrigine (LTG), carbamazepine-10,11-epoxide (CBZ-E), 10,11-trans-
dihydroxy-10,11-dihydrocarbamazepine (trans-diol), licarbazepine
(Lic), and ketoprofen which was used as internal standard (IS) 112
Figure II.2.2 Typical chromatogram of an extracted human sample plasma spiked
with internal standard (IS) and analytes at intermediate
concentrations of the calibration ranges 117
Figure II.2.3 Typical chromatograms of extracted human plasma: (A) blank plasma;
(B1) plasma spiked with the internal standard (IS) and analytes at
concentrations of the LLOQ; (B2) expanded partial representation of
the chromatogram depicted in (B1) 120
Figure II.2.4 Representative chromatograms of plasma samples obtained from
epileptic patients treated with: (A) phenobarbital (PB); (B) phenytoin
(PHT) and (C) carbamazepine (CBZ) 127
Figure II.3.1 Chemical structures of carbamazepine (CBZ), oxcarbazepine (OXC),
phenytoin (PHT), carbamazepine-10,11-epoxide (CBZ-E), licarbazepine
(Lic) and 10,11-dihydro-carbamazepine which was used as internal
standard (IS) 133
Figure II.3.2 Representative chromatograms of extracted mouse plasma: (A) blank
plasma; (B) plasma spiked with licarbazepine (Lic), carbamazepine-
10,11-epoxide (CBZ-E), oxcarbazepine (OXC), carbamazepine (CBZ) and
internal standard (IS) at intermediate concentrations of the calibration
ranges; (C) plasma spiked with phenytoin (PHT) and IS at the
intermediate concentration of the calibration range 140

VIII
Figure II.3.3 Representative chromatograms of extracted mouse brain homogenate
supernatant: (A) supernatant of blank brain homogenate; (B)
supernatant of brain homogenate spiked with licarbazepine (Lic),
carbamazepine-10,11-epoxide (CBZ-E), oxcarbazepine (OXC),
carbamazepine (CBZ) and internal standard (IS) at intermediate
concentrations of the calibration ranges; (C) supernatant of brain
homogenate spiked with phenytoin (PHT) and IS at the intermediate
concentration of the calibration range
141
Figure II.3.4 Representative chromatograms of extracted mouse liver homogenate
supernatant: (A) supernatant of blank liver homogenate; (B)
supernatant of liver homogenate spiked with licarbazepine (Lic),
carbamazepine-10,11-epoxide (CBZ-E), oxcarbazepine (OXC),
carbamazepine (CBZ) and internal standard (IS) at intermediate
concentrations of the calibration ranges; (C) supernatant of liver
homogenate spiked with phenytoin (PHT) and IS at the intermediate
concentration of the calibration range 142
Figure II.3.5 Chemical structures of lamotrigine (LTG) and chloramphenicol which
was used as internal standard (IS) 147
Figure II.3.6 Representative chromatograms of extracted mouse plasma: (A) blank
plasma; (B) plasma spiked with lamotrigine (LTG) and internal
standard (IS) at intermediate concentration of the calibration range 154
Figure II.3.7 Representative chromatograms of extracted mouse brain homogenate
supernatant: (A) supernatant of blank brain homogenate; (B)
supernatant of brain homogenate spiked with lamotrigine (LTG) and
internal standard (IS) at the intermediate concentration of the
calibration range 155
Figure II.3.8 Representative chromatograms of extracted mouse liver homogenate
supernatant: (A) supernatant of blank liver homogenate; (B)
supernatant of liver homogenate spiked with lamotrigine (LTG) and
internal standard (IS) at the intermediate concentration of the
calibration range 156
Figure III.1.1 The major metabolic pathways of carbamazepine (CBZ) 171
Figure III.2.1 Concentration-time profiles of carbamazepine (CBZ) and
carbamazepine-10,11-epoxide (CBZ-E) in (A) plasma, (B) brain and (C)
liver tissues following IN thermoreversible gel and IV solution
administration of CBZ (0.4 mg/kg) to mice. Symbols represent the
mean values ± SEM of four determinations per time point (n = 4) 188
Figure III.2.2 Carbamazepine (CBZ) concentrations (mean ± SEM) up to 60 min post-
dosing in plasma and different brain regions (olfactory bulb, frontal
cortex and the remaining portion of the brain) after IN and IV
administration of CBZ (0.4 mg/kg) to mice (n = 4, at each time point) 190

IX
Figure III.2.3 Concentration-time profiles of carbamazepine (CBZ) in plasma and
brain following IN administration (0.4 mg/kg) to mice. Symbols
represent the mean values ± SEM of four determinations per time
point (n = 4)
194
Figure IV.1.1 The major metabolites of lamotrigine (LTG) 207
Figure IV.2.1 Concentration-time profiles of lamotrigine (LTG) up to 48 h post-
dosing in plasma (A1), brain (B1) and liver (C1) tissues following IN and
IV administration (4 mg/kg) to mice. The expanded partial
representation of the corresponding concentration-time profiles of
LTG up to 8 h post-dosing are also plotted for plasma (A2), brain (B2)
and liver (C2), respectively. Symbols represent the mean values ± SEM
of four determinations per time point (n = 4)
222
Figure IV.2.2 Lamotrigine (LTG) concentrations (mean ± SEM) up to 4 h post-dosing
in plasma and different brain regions (olfactory bulb, frontal cortex
and the remaining portion of the brain) after IN and IV administration
(4 mg/kg) to mice (n = 4, at each time point) 224
Figure IV.2.3 Relationship between tissue-to-plasma and tissue-to-remaining
portion of the brain concentration ratios obtained for lamotrigine
(LTG) at 0.083 h and 0.167 h following its IN and IV administration (4
mg/kg) to mice 225
Figure IV.2.4 Concentration-time profiles of lamotrigine (LTG) in plasma and brain
following intranasal (IN) and intravenous (IV) administration (4 mg/kg)
to mice: (A) from time zero to 48 h post-dosing; (B) from time zero to
8 h post-dosing. Symbols represent the mean values ± SEM of four
determinations per time point (n = 4) 227
APPENDIX
Figure B1.1 The major metabolic pathways of phenytoin (PHT) 269
Figure B1.2 The major metabolic pathways of oxcarbazepine (OXC) 272
Figure B2.1 Preliminary concentration-time profiles of oxcarbazepine (OXC) in
plasma and brain following IN and oral administration (40 mg/kg) to
mice: (A) Intranasal; (B) Oral; (C) Intranasal versus oral. OXC solution
was intranasally delivered in the form of drops at the opening of mice
nostrils using a micropipette 282
Figure B2.2 Preliminary concentration-time profile of oxcarbazepine (OXC) in
plasma and brain following IN administration (20 mg/kg) to mice. OXC
solution was intranasally delivered by inserting a flexible tube
attached to a microsyringe inside the nasal cavity of previously
anaesthetised mice 284
Figure B2.3 Schematic representation of the surgical procedure carried out in mice
to isolate the nasal cavity 285

X
Figure B2.4 Preliminary concentration-time profile of oxcarbazepine (OXC) in
plasma and brain following IN administration (20 mg/kg) to mice. The
IN administration of OXC solution was performed in mice previously
subjected to a surgical procedure to isolate the nasal cavity by using
the technique of flexible tubing insertion
286
Figure C1.1 Concentration-time profiles of carbamazepine (CBZ) in plasma and
brain following IN (0.4 mg/kg) and oral (4 mg/kg) administration to
mice. Symbols represent the mean values ± SEM (n = 4)
295
Figure C2.1 Concentration-time profiles of lamotrigine (LTG) in plasma and brain
following IN and oral administration (4 mg/kg) to mice: (A) from time
zero to 48 h post-dosing; (B) from time zero to 8 h post-dosing 297

XI
TABLES
Table I.1.1 Classification of epileptic seizures 10
Table I.1.2 Classification of epilepsies and epileptic syndromes 11
Table I.1.3 The main clinically approved AEDs 14
Table I.1.4 AEDs used in different seizure types and epilepsy syndromes 16
Table I.1.5 Summary of the main advantages and limitations of conventional (oral
and intravenous) and alternative routes for AED administration 26
Table I.2.1 The major advantages and limitations of IN drug delivery 56
Table I.2.2 Examples of commercially available nasal drug formulations for local
(topical) delivery 58
Table I.2.3 Examples of commercially available nasal drug formulations for
systemic delivery 59
Table I.2.4 Comparison of the anatomical and physiological characteristics of the
nasal cavity and cerebrospinal fluid (CSF) among different animal
species 71
Table II.1.1 Summary of the main validation parameter requirements according to
both US FDA and EMA guidelines on bioanalytical method validation 108
Table II.2.1 Mean calibration parameters (n = 5) of primidone (PRM), lamotrigine
(LTG), 10,11-trans-dihydroxy-10,11-dihydrocarbamazepine (trans-
diol), phenobarbital (PB), licarbazepine (Lic), carbamazepine-10,11-
epoxide (CBZ-E), oxcarbazepine (OXC), phenytoin (PHT) and
carbamazepine (CBZ) in human plasma 121
Table II.2.2 Inter- and intra-day precision (% CV) and accuracy (% Bias) of the
analytes in human plasma samples at the lower limit of quantification
(LLOQ) (n = 5) 122
Table II.2.3 Inter- and intra-day precision (% CV) and accuracy (% Bias) of the
analytes in human plasma samples at the low, medium and high
concentrations of the calibration ranges (n = 5) 123
Table II.2.4 Absolute recovery of primidone (PRM), lamotrigine (LTG), 10,11-trans-
dihydroxy-10,11-dihydrocarbamazepine (trans-diol), phenobarbital
(PB), licarbazepine (Lic), carbamazepine-10,11-epoxide (CBZ-E),
oxcarbazepine (OXC), phenytoin (PHT) and carbamazepine (CBZ) from
human plasma (n = 5) 124
Table II.2.5 Stability (values in percentage) of primidone (PRM), lamotrigine (LTG),
10,11-trans-dihydroxy-10,11-dihydrocarbamazepine (trans-diol),
phenobarbital (PB), licarbazepine (Lic), carbamazepine-10,11-epoxide
(CBZ-E), oxcarbazepine (OXC), phenytoin (PHT) and carbamazepine
(CBZ) under different conditions of sample handling and storage 125

XII
Table II.2.6 Characteristics of drug therapy instituted to the epileptic patients
whose plasma samples were analysed by the HPLC-UV method herein
developed and the respective measured concentrations obtained for
phenobarbital (PB), phenytoin (PHT), carbamazepine (CBZ) and
metabolites
126
Table II.3.1 Mean calibration parameters (n = 3) and inter-day precision (% CV)
and accuracy (% Bias) values at the lower limit of quantification (LLOQ)
(n = 3) of licarbazepine (Lic), carbamazepine-10,11-epoxide (CBZ-E),
oxcarbazepine (OXC), carbamazepine (CBZ) and phenytoin (PHT) in
mouse plasma, brain, olfactory bulb, frontal cortex and liver
homogenate supernatants 144
Table II.3.2 Inter-day precision (% CV) and accuracy (% Bias) of licarbazepine (Lic),
carbamazepine-10,11-epoxide (CBZ-E), oxcarbazepine (OXC),
carbamazepine (CBZ) and phenytoin (PHT) in mouse plasma and brain
samples at the low, medium and high concentrations of the
calibration ranges (n = 3) 145
Table II.3.3 Inter-day precision (% CV) and accuracy (% Bias) of oxcarbazepine
(OXC), carbamazepine (CBZ) and phenytoin (PHT) in mouse olfactory
bulb and frontal cortex samples at the low, medium and high
concentrations of the calibration ranges (n = 3) 145
Table II.3.4 Inter-day precision (% CV) and accuracy (% Bias) of licarbazepine (Lic),
carbamazepine-10,11-epoxide (CBZ-E), oxcarbazepine (OXC),
carbamazepine (CBZ) and phenytoin (PHT) in mouse liver samples at
the low, medium and high concentrations of the calibration ranges (n
= 3) 146
Table II.3.5 Mean calibration parameters (n = 3) and inter-day precision (% CV)
and accuracy (% Bias) values at the lower limit of quantification (LLOQ)
(n = 3) of lamotrigine (LTG) in mouse plasma, brain, olfactory bulb,
frontal cortex and liver homogenate supernatants 157
Table II.3.6 Inter- and intra-day precision (% CV) and accuracy (% Bias) of
lamotrigine (LTG) in mouse plasma, brain, olfactory bulb, frontal
cortex and liver samples at the low, medium and high concentrations
of the calibration range (n = 3) 158
Table II.3.7 Absolute recovery of lamotrigine (LTG) from mouse plasma, brain and
liver homogenate supernatants (n = 3) 159
Table III.1.1 Pharmaceutical information of carbamazepine 168
Table III.1.2 Summary of the main pharmacokinetic parameters of carbamazepine
in epileptic adult patients 169
Table III.2.1 Validation parameters of the HPLC method employed for the
quantification of carbamazepine (CBZ) and carbamazepine-10,11-
epoxide (CBZ-E) in plasma, brain, liver, olfactory bulb and frontal
cortex homogenate supernatants (n = 3) 184

XIII
Table III.2.2 Pharmacokinetic parameters of carbamazepine (CBZ) and
carbamazepine-10,11-epoxide (CBZ-E) in plasma, brain and liver
tissues following the administration of CBZ (0.4 mg/kg) to mice
through intranasal (IN) and intravenous (IV) routes
189
Table III.2.3 Tissue-to-plasma and tissue-to-remaining portion of the brain
concentration ratios of carbamazepine (CBZ) in different brain regions
following intranasal (IN) and intravenous (IV) administration to mice
(0.4 mg/kg) 191
Table IV.1.1 Pharmaceutical information of lamotrigine 204
Table VI.1.2 Summary of the main pharmacokinetic parameters of lamotrigine in
both adult healthy volunteers and patients with epilepsy 205
Table IV.2.1 Validation parameters of the HPLC method employed for the
quantification of lamotrigine (LTG) in plasma, brain, liver, olfactory
bulb and frontal cortex homogenate supernatants (n = 3) 218
Table IV.2.2 Pharmacokinetic parameters and tissues-to-plasma partitioning ratios
of lamotrigine (LTG) following its intranasal (IN) and intravenous (IV)
administration (4 mg/kg) to mice 221
Table IV.2.3 Tissue-to-plasma and tissue-to-remaining portion of the brain
concentration ratios of lamotrigine (LTG) in different brain regions
following intranasal (IN) and intravenous (IV) administration to mice (4
mg/kg) 225
APPENDIX
Table A1.1 Concentration of all the solutions used to prepare the corresponding calibration standards (CS) and quality control (QC) samples in plasma, brain, olfactory bulb, frontal cortex and liver tissues of mice
257
Table A1.2 Calibration standards and quality control samples prepared in mice plasma, brain, olfactory bulb, frontal cortex and liver homogenate supernatants
258
Table A2.1 Concentration of all the solutions used to prepare the corresponding calibration standards (CS) and quality control (QC) samples of lamotrigine (LTG) in plasma, brain, olfactory bulb, frontal cortex and liver tissues of mice
259
Table A2.2 Calibration standards and quality control samples of lamotrigine (LTG) prepared in mice plasma, brain, olfactory bulb, frontal cortex and liver homogenate supernatants
260
Table B1.1 Pharmaceutical information of phenytoin 265
Table B1.2 Pharmaceutical information of oxcarbazepine 266
Table B1.3 Summary of the main pharmacokinetic parameters of phenytoin after
oral administration 267

XIV
Table B1.4 Summary of the main pharmacokinetic parameters of oxcarbazepine
(OXC) and licarbazepine (Lic)
270
Table B2.1 Summary of the main experimental conditions applied in the first in
vivo preliminary study on OXC IN administration to mice 281
Table B2.2 Summary of the main experimental conditions applied in the second
in vivo preliminary study on OXC IN administration to mice 283
Table B2.3 Summary of the main experimental conditions applied in the fourth in
vivo preliminary study on OXC IN administration to mice 287
Table B2.4 Summary of the main experimental conditions applied in the first in
vivo preliminary study on PHT IN administration to mice 288
Table B2.5 Summary of the main experimental conditions applied in the second
in vivo preliminary study on PHT IN administration to mice 289
Table B2.6 Preliminary PHT concentrations determined in plasma (µg/mL) and
brain (µg/g) following IN and IV administrations (12 mg/kg) to mice 290
Table C1.1 Summary of the main experimental conditions employed in the preliminary comparative study on CBZ IN and oral administrations to mice 295
Table C1.2 The main pharmacokinetic parameters of CBZ following its intranasal (IN) (0.4 mg/kg) and oral (4 mg/kg) administration to mice 296
Table C2.1 Summary of the main experimental conditions employed in the preliminary comparative study on LTG IN and oral administrations to mice 297
Table C2.2 The main pharmacokinetic parameters of LTG following its intranasal (IN) and oral administration (4 mg/kg) to mice 298
Table D1.1 CBZ concentrations in plasma (µg/mL) at predefined time points following both intranasal (IN) and intravenous (IV) administrations (0.4 mg/kg) to mice 301
Table D1.2 CBZ concentrations in brain (µg/g) at predefined time points following both intranasal (IN) and intravenous (IV) administrations (0.4 mg/kg) to mice 302
Table D1.3 CBZ concentrations in liver (µg/g) at predefined time points following both intranasal (IN) and intravenous (IV) administrations (0.4 mg/kg) to mice 303
Table D2.1 CBZ concentrations in plasma (µg/mL), remaining portion of the brain (µg/g), frontal cortex (µg/g) and olfactory bulb (µg/g) at predefined time points following IN administration (0.4 mg/kg) to mice 305
Table D2.2 CBZ concentrations in plasma (µg/mL), remaining portion of the brain (µg/g), frontal cortex (µg/g) and olfactory bulb (µg/g) at predefined time points following IV administration (0.4 mg/kg) to mice 306
Table E1.1 LTG concentrations in plasma (µg/mL) at predefined time points following both intranasal (IN) and intravenous (IV) administrations (4 mg/kg) to mice 309

XV
Table E1.2 LTG concentrations in brain (µg/g) at predefined time points following both intranasal (IN) and intravenous (IV) administrations (4 mg/kg) to mice
310
Table E1.3 LTG concentrations in liver (µg/g) at predefined time points following both intranasal (IN) and intravenous (IV) administrations (4 mg/kg) to mice 311
Table E2.1 LTG concentrations in plasma (µg/mL), remaining portion of the brain (µg/g), frontal cortex (µg/g) and olfactory bulb (µg/g) at predefined time points following IN administration (4 mg/kg) to mice 313
Table E2.2 LTG concentrations in plasma (µg/mL), remaining portion of the brain (µg/g), frontal cortex (µg/g) and olfactory bulb (µg/g) at predefined time points following IV administration (4 mg/kg) to mice 314

XVI

PUBLICATIONS


XIX
PUBLICATIONS
SERRALHEIRO, A. [et al.] (2012) - Bioanalysis of small-molecule drugs in nasal and paranasal
tissues and secretions: current status and perspectives. Cent Eur J Chem. 10:3, 686-
702.
SERRALHEIRO, A. [et al.] (2013) - First HPLC-UV method for rapid and simultaneous
quantification of phenobarbital, primidone, phenytoin, carbamazepine,
carbamazepine-10,11-epoxide, 10,11-trans-dihydroxy-10,11-dihydrocarbamazepine,
lamotrigine, oxcarbazepine and licarbazepine in human plasma. J Chromatogr B.
925, 1-9.
SERRALHEIRO, A. [et al.] (2013) - Nose as a route for drug delivery. Nasal Physiology and
Pathophysiology of Nasal Disorders. Önerci, T.M. (Ed.). Springer, Chapter 15, pp.
191-216.
SERRALHEIRO, A. [et al.] (2014) - Intranasal administration of carbamazepine to mice: a
direct delivery pathway for brain targeting. Eur J Pharm Sci. 60, 32-39.
SERRALHEIRO, A. [et al.] (2015) - Direct nose-to-brain delivery of lamotrigine following
intranasal administration to mice. Int J Pharm. 490:1-2, 39-46.

XX

ABSTRACT / RESUMO


XXIII
ABSTRACT
Even though remarkable advances in the treatment of epilepsy have been made
over the last years, the currently available anticonvulsant pharmacotherapy is
unsatisfactory as it provides only the management of epileptic seizures, is not effective in
a significant percentage of patients, and is often associated to several adverse effects.
Therefore, the development of novel and alternative therapeutic approaches towards a
safer and more effective seizure control is urgently needed. The search for an ideal
antiepileptic drug (AED) that will be capable of preventing, delaying or modifying epilepsy
is still ongoing. However, since the process of discovery and development of new
chemical entities is very expensive and commonly accompanied by reduced rates of
success, the use of already existing AEDs by improving some of their formulation
properties, delivery systems or routes of administration aiming at allowing their efficient
and prompt delivery to the brain could also be an attractive strategy.
Owing to the unique anatomical connection between the nasal cavity and the
central nervous system, a great deal of interest has recently been focused on the
exploitation of the intranasal (IN) route for the delivery of therapeutics directly to the
brain by circumventing the blood-brain barrier (BBB). Indeed, the olfactory region is the
only site in the human body where the nervous system is in direct contact with the
surrounding environment, providing a great opportunity for drugs intranasally
administered to gain a quick and easy access to the brain, minimising their systemic
exposure.
The purpose of the present thesis was to assess and compare the pharmacokinetic
behaviour of phenytoin (PHT), carbamazepine (CBZ), oxcarbazepine (OXC) and
lamotrigine (LTG) administered via the IN and intravenous (IV) routes to mice and to
investigate whether a direct transport of the referred compounds from nose to brain
could be involved.
This project started with the development and validation of appropriate and
reliable bioanalytical techniques to support the execution of the intended
pharmacokinetic and brain biodistribution studies. In essence, two high performance
liquid chromatographic methods coupled with ultraviolet detection were properly
validated for the quantification of drugs and some of their respective main metabolites in
mouse plasma, brain (whole brain, olfactory bulb and frontal cortex) and liver matrices.
An additional technique developed in human plasma has also shown to be a useful tool to
be applied in clinical practice.
Due to unexpected difficulties encountered during the definition and optimisation
of the in vivo experimental setup, two of the four initially proposed test molecules were

XXIV
excluded from further investigation, which was performed only with CBZ and LTG. The
fairly comparable concentration-time profiles of both of these drugs obtained in plasma,
brain and liver following IN and IV administrations to mice, together with a high IN
absolute bioavailability, underscored the fact that a substantial absorption of the drugs
from the nasal vasculature into the systemic circulation has occurred. Conversely, the
uneven biodistribution profile after IN delivery of either CBZ or LTG, with the highest drug
concentration levels attained in the olfactory bulb contrasted with the homogeneous
biodistribution pattern typically observed following IV injection, strongly suggesting the
involvement of a pathway to directly transport these drugs from nose-to-brain, bypassing
the BBB.
According to our results, it seems that the IN route can be assumed as a suitable
and a valuable drug delivery strategy for the chronic treatment of epilepsy and, in the
specific case of CBZ, it gathers favourable conditions to be also applied in acute
convulsive emergencies. Considering all its inherent potential and indisputable
advantages, the IN administration may likewise emerge as a promising and a non-invasive
alternative approach for a prospective management of pharmacoresistance.

XXV
RESUMO
Apesar de, ao longo dos últimos anos, terem sido alcançados avanços notáveis no
que ao tratamento da epilepsia diz respeito, a terapêutica farmacológica
anticonvulsivante atualmente disponível não é satisfatória, uma vez que possibilita
apenas o controlo das crises epiléticas, não é eficaz numa percentagem muito
significativa de doentes e é frequentemente associada a vários efeitos adversos. Deste
modo, afigura-se urgente o desenvolvimento de abordagens terapêuticas novas e
alternativas com vista a um controlo mais seguro e eficaz das crises. A procura pelo
fármaco antiepilético (AED) ideal que permita prevenir, retardar ou modificar a doença
ainda permanece uma realidade. Porém, tendo em conta que o processo de descoberta e
desenvolvimento de novas entidades químicas é geralmente muito dispendioso e
acompanhado de uma reduzida taxa de sucesso, a otimização das propriedades de
formulação, sistemas de entrega ou vias de administração de AEDs já estabelecidos e
disponíveis na clínica também poderá constituir uma estratégia muito atrativa.
A ligação anatómica ímpar entre a cavidade nasal e o sistema nervoso central tem
recentemente suscitado um interesse particular na exploração da via intranasal (IN) para
a entrega de agentes terapêuticos diretamente para o cérebro, circunscrevendo a
barreira hemato-encefálica (BBB). De facto, a região olfativa representa o único local do
corpo humano onde o sistema nervoso se encontra em contacto direto com o meio
ambiente, oferecendo assim uma grande oportunidade aos fármacos administrados por
via IN de atingirem o cérebro de uma forma rápida e facilitada, minimizando a sua
exposição sistémica.
Com o trabalho de investigação subjacente à presente dissertação pretendeu-se
avaliar e comparar o comportamento farmacocinético da fenitoína (PHT), carbamazepina
(CBZ), oxcarbazepina (OXC) e lamotrigina (LTG) administrados por via IN e intravenosa (IV)
a murganhos, e investigar o eventual envolvimento de um transporte direto para estas
moléculas desde a cavidade nasal até ao cérebro.
Este projeto iniciou-se com o desenvolvimento e validação de técnicas
bioanalíticas adequadas e confiáveis para suportar a execução dos estudos
farmacocinéticos e de biodistribuição cerebral pretendidos. Para tal, foram validados dois
métodos de cromatografia líquida de alta eficiência acoplada a deteção ultravioleta para
a quantificação dos referidos fármacos e alguns dos seus principais metabolitos em
matrizes de plasma, cérebro (cérebro total, bolbo olfativo e córtex frontal) e fígado de
murganho. Uma técnica adicional em plasma humano foi ainda desenvolvida
demonstrando aplicabilidade na prática clínica.

XXVI
Face a dificuldades inesperadamente encontradas durante a definição e
otimização do protocolo experimental in vivo, apenas a CBZ e a LTG, de entre as quatro
moléculas teste inicialmente propostas, foram amplamente avaliadas neste trabalho. A
semelhança observada entre os perfis de concentração-tempo em plasma, cérebro e
fígado após a administração IN e IV a murganhos, juntamente com a elevada
biodisponibilidade absoluta IN indicaram a ocorrência de uma absorção substancial de
ambos os fármacos a partir da vasculatura nasal para a circulação sanguínea. Por outro
lado, em oposição a um padrão de biodistribuição cerebral homogéneo tipicamente
observado mediante administração IV, após administração IN foi obtido um perfil muito
heterogéneo com níveis de concentração de CBZ e LTG mais elevados no bolbo olfativo,
sugerindo assim o provável envolvimento de uma via de transporte direto desde a
cavidade nasal até ao cérebro contornando a BBB.
De acordo com os nossos resultados, pressupõe-se que a via IN seja assumida
como uma estratégia válida e apropriada para a administração continuada de ambos os
fármacos visando o tratamento crónico da epilepsia, reunindo no caso específico da CBZ
condições favoráveis para ser aplicada também em situações de emergência convulsiva.
Considerando todas as suas vantagens e potencial inerente, a administração IN poderá
igualmente representar uma abordagem alternativa, não-invasiva e promissora para um
controlo prospetivo da epilepsia farmacorresistente.

CHAPTER I
GENERAL INTRODUCTION


TABLE OF CONTENTS CHAPTER I - GENERAL INTRODUCTION 1
I. 1. EPILEPSY - Disease and Pharmacological Therapy 5
I. 1.1. HISTORICAL BACKGROUND 7
I. 1.2. EPIDEMIOLOGY 7
I. 1.3. EPILEPSY AND EPILEPTIC SEIZURES 8
I. 1.4. THERAPEUTIC APPROACH 12
I. 1.5. PHARMACORESISTANT EPILEPSY 19
I. 1.6. NEED FOR NEW THERAPEUTIC STRATEGIES 21
I. 1.6.1. DISCOVERY AND DEVELOPMENT OF NOVEL AEDs 21
I. 1.6.2. NEW METHODS FOR AED DELIVERY 23
Conventional and Unconventional Routes of Drug Delivery 23
Alternative Strategies for Direct CNS Drug Targeting 29
I. 2. INTRANASAL DRUG DELIVERY 39
I. 2.1. ANATOMY AND PHYSIOLOGY OF THE NASAL CAVITY 43
I. 2.1.1. NASAL ANATOMY AND HISTOLOGY 43
Respiratory Mucosa 45
Olfactory Mucosa 47
I. 2.1.2. NASAL PHYSIOLOGY 49
Nasal Mucus and Mucociliary Clearance 49
Nasal Metabolism 50
Nasal Permeability 51
I. 2.2. THE NOSE AS A SITE FOR DRUG DELIVERY – THERAPEUTIC APPLICATIONS 55
I. 2.2.1. LOCAL DELIVERY 57
I. 2.2.2. SYSTEMIC DELIVERY 58
I. 2.2.3. VACCINE DELIVERY 60
I. 2.2.4. CNS DELIVERY 61
I. 2.3. NOSE-TO-BRAIN DRUG DELIVERY 62
I. 2.3.1. PATHWAYS AND MECHANISMS OF TRANSPORT FROM NOSE TO BRAIN 64
I. 2.3.2. NOSE-TO-BRAIN ASSESSMENT – EXPERIMENTAL CONSIDERATIONS 68
Experimental Models 69
Study Design 72
Assessment Parameters 76
I. 2.4. INTRANASAL ADMINISTRATION AND EPILEPSY 79
I. 3. AIMS 83


I. 1. EPILEPSY
Disease and Pharmacological Therapy


Epilepsy I
7
I. 1.1. HISTORICAL BACKGROUND
Epilepsy is perhaps one of the oldest recorded medical illnesses in history (WAHAB,
2010). The earliest detailed account of epilepsy dates back to the Babylonian ancient
times, over 3000 years ago, when it was described as a condition representing an evil
state of mind or possession (GOLDENBERG, 2010; WAHAB, 2010). Epileptic attacks were once
thought to be the result of invasion and possession of the body by supernatural forces,
usually malign or evil influences, requiring spiritual treatment based on exorcism,
incantations or other religious or social approaches (WORLD HEALTH ORGANIZATION, 2005). At
about 500 B.C., this supernatural view was firstly challenged by Hippocrates who
suggested that the brain was the origin of epileptic seizure activity (WEIERGRÄBER et al.,
2010; WORLD HEALTH ORGANIZATION, 2005). Unfortunately, this concept was not widely
accepted and the first modern definition of epilepsy was only given in the 19th century
when it was recognised that seizures derived from disordered electrical discharges in the
brain, with consequences at the level of consciousness, sensation and behaviour (WAHAB,
2010). Since then, the discovery of human electroencephalography and the remarkable
advances in molecular biology, neurophysiology, genetics, functional imaging and
numerous neurochemical techniques have contributed to deep the understanding of the
basic mechanisms underlying seizures and epilepsy, allowing the exploitation of the
concepts behind excitation, inhibition, modulation, neurotransmission and
synchronisation (WORLD HEALTH ORGANIZATION, 2005). Despite these tremendous
developments, a complete characterisation of the pathophysiological mechanisms
involved in the initiation and propagation of seizures (ictogenesis), as well as those
involved in transforming the normal brain into a seizure-prone brain (epileptogenesis) still
remains to unveil.
I. 1.2. EPIDEMIOLOGY
Today, epilepsy is regarded as one of the most common serious neurological
disorders worldwide which is associated with an increased risk of morbidity and mortality
that significantly affects patients’ quality of life. With an estimated prevalence of 0.7%
(SCHMIDT and SCHACHTER, 2014), overall annual incidence of epilepsy ranges from 40 to 70
cases per 100,000 people in industrialised countries and up to 190 per 100,000 people in
developing countries (SANDER, 2003). Without any racial, geographical or social
boundaries, epilepsy affects individuals at all ages, regardless gender or social-economic
status; however, high incidence levels are observed in childhood and in the elderly since
in about 50% of the cases, the onset of epilepsy arise in these two extremes of life (BELL
and SANDER, 2001). Around 50 million people in the world have epilepsy (BANERJEE et al.,

I General Introduction
8
2009; NELIGAN et al., 2012). It is believed that approximately 10% of the general population
will experience at least one seizure at some point in their lives, and about a third of them
will go on to develop epilepsy (PERUCCA and TOMSON, 2011; WORLD HEALTH ORGANIZATION,
2006).
I. 1.3. EPILEPSY AND EPILEPTIC SEIZURES
According to the International League Against Epilepsy (ILAE), an epileptic seizure
is defined as “a transient occurrence of signs and/or symptoms due to abnormal excessive
or synchronous neuronal activity in the brain”; whereas epilepsy is assumed as “a disorder
of the brain characterized by an enduring predisposition to generate epileptic seizures and
by the neurobiological, cognitive, psychological, and social consequences of this
condition”, requiring the occurrence of at least one epileptic seizure (FISHER et al., 2005).
The above definitions were created in a document generated by an ILAE Task
Force in 2005 but currently, they are being considered conceptual (theoretical) and not
sufficiently detailed to provide guidance on how enduring predisposition should be
defined, particularly for those individuals presenting a single unprovoked seizure. In this
regard, the ILAE commissioned a second Task Force to formulate a more practical
(operational) definition of epilepsy. Several years of deliberations on this issue resulted in
new recommendations that have recently been published and adopted as a position of
the ILAE. According to the revised definition, “epilepsy is a disease of the brain defined by
any of the following conditions: (1) At least two unprovoked (or reflex) seizures occurring
greater than 24 h apart; (2) one unprovoked (or reflex) seizure and a probability of further
seizures similar to the general recurrence risk (at least 60%) after two unprovoked
seizures, occurring over the next 10 years; (3) diagnosis of an epilepsy syndrome” (FISHER et
al., 2014).
Generically, epilepsy is considered a chronic and often progressive brain disorder
as a result of recurrent, periodic, unpredictable and unprovoked seizures which can be
generated in response to a loss of balance between excitatory and inhibitory influences
within the central nervous system (CNS) (LASOŃ et al., 2013; LÖSCHER and POTSCHKA, 2002).
The underlying causes and the precise pathophysiological mechanisms behind the
incidence of epileptic seizures and the development of epilepsy are so far only partially
understood. Notwithstanding, the abnormal and sustained neuronal discharges may be
commonly associated with a variety of causative factors such as trauma, hypoxia,
infection, stroke, tumours, metabolic derangements or even genetic mutations (BIALER
and WHITE, 2010; ENGELBORGHS et al., 2000). It is due to these multifactorial aetiologies that
epilepsy is characterised as a complex and heterogeneous neurological disorder with

Epilepsy I
9
highly diversified symptomatology and manifestations. In fact, the term epilepsy is a
misnomer concept (DUNCAN, 2002). Epilepsy is not just one single pathological condition
but, otherwise, it is a varied family of brain disorders comprising many seizure types and
syndromes (FISHER et al., 2005; SCHMIDT and SCHACHTER, 2014). Each distinct form of epilepsy
has its own natural history and response to treatment. In this context, the determination
and identification of the different seizure types and syndromes is fundamental in order to
focus the diagnostic approach on a particular aetiology, select the appropriate
therapeutic option and provide vital information regarding the prognosis. With the aim of
providing an universal vocabulary that not only facilitates communication among
clinicians but also establishes a taxonomic foundation for performing quantitative clinical
and basic research on epilepsy, the ILAE afforded standardised classifications and
terminology for both epileptic seizures and syndromes (ENGEL JR., 2001).
Official ILAE classifications were firstly published in 1981 for epileptic seizures and
in 1989 for epileptic syndromes (COMMISSION ON CLASSIFICATION AND TERMINOLOGY OF THE ILAE,
1989, 1981). Over the past three decades, this international classification has been
extremely useful for both clinicians and researchers; nevertheless, new data from modern
neuroimaging techniques, molecular biology studies and genetics research have prompt
the continuous review of the adopted system, and new updated concepts and
terminology have been proposed in the last few years (BERG and SCHEFFER, 2011; BERG et
al., 2010; RUDZINSKI and SHIH, 2011). The most recent document on this matter was
published in 2010, emphasising the reduction of the existing dichotomy between focal
and generalised seizures and epilepsies (BERG and SCHEFFER, 2011; BERG et al., 2010).
Accordingly, a new network concept for the definition of focal (partial) and generalised
seizures is adopted, in which focal seizures are conceptualised as originating within
networks limited to one brain hemisphere, while generalised seizures are generated at
some point within, and rapidly engaging, bilaterally distributed networks (LEE, 2013). The
terms “generalised” and “focal” were also recommended to be abandoned as overall
classification categories for epilepsies (BERG and SCHEFFER, 2011). The aetiological
designations of idiopathic, symptomatic and cryptogenic were advocated to be replaced
by genetic, structural-metabolic and unknown aetiologies. A new database scheme of
epilepsies was suggested by separating the multiple diseases and syndromes into four
different groups: electroclinical syndromes, constellations, epilepsies associated with
structural or metabolic conditions and finally, epilepsies of unknown causes (LEE, 2013).
The list of the currently recognised seizures types and epilepsies are presented in Tables
I.1.1 and I.1.2, respectively.

I General Introduction
10
Table I.1.1 Classification of epileptic seizures (BERG et al., 2010; COMMISSION ON CLASSIFICATION AND
TERMINOLOGY OF THE ILAE, 1981; MATTSON, 2003; RUDZINSKI and SHIH, 2011).
Seizures types Characterisation
Focal Seizures Origin within networks limited to one hemisphere; only a
certain area of the body is usually involved.
Generalised Seizures Simultaneous arising from both cerebral hemispheres
with symptom manifestation bilaterally in the body.
Tonic-clonic (grand mal) Abrupt loss of consciousness followed by tonic
contraction of the muscles which then evolves to clonic
convulsive movements.
- Tonic phase: rigid, violent and sustained contraction
of whole body musculature. The upper extremities often
symmetrically abduct and flex at the elbows while the
lower extremities may briefly flex and adduct with the
toes pointed. Momentary cessation of breathing and
tongue biting.
- Clonic phase: repetitive spasms and rhythmic jerking
of the extremities. It is characterised by a progressive
muscle relaxation until the end of the ictal phase.
Absence (petit mal)
Typical
Atypical
Absence with special features
Sudden, brief lapses of consciousness without loss of
postural control.
Myoclonic Sudden, brief and arrhythmic muscle contractions that
may involve the whole body or certain focal areas.
Clonic Repetitive rhythmic clonic jerks with impairment of
consciousness and a short post-ictal phase.
Tonic Tonic contraction of the face, neck, axial, or appendicular
musculature lasting from 10 to 60 seconds. Usual
upward deviation of the eyes.
Atonic Sudden loss of postural muscle tone and consciousness
that usually cause abrupt falls.
Unknown Seizures that cannot be clearly diagnosed into one of the
preceding categories due to incomplete data.

Epilepsy I
11
Table I.1.2 Classification of epilepsies and epileptic syndromes (BERG et al., 2010).
Electroclinical Syndromes (arranged by typical age at onset)
Neonatal Period
Benign familial neonatal epilepsy
Early myoclonic encephalopathy
Ohtahara syndrome
Infancy
Benign infantile epilepsy
Benign familial infantile epilepsy
Dravet syndrome
Epilepsy of infancy with migrating focal seizure
Myoclonic encephalopathy in nonprogressive disorders
Myoclonic epilepsy in infancy
West syndrome
Childhood
Autosomal-dominant nocturnal frontal lobe epilepsy
Benign epilepsy with centrotemporal spikes
Childhood absence epilepsy
Early onset childhood occipital epilepsy (Panayiotopoulos syndrome)
Epilepsy with myoclonic atonic (previously astatic) seizures
Epilepsy with myoclonic absences
Epileptic encephalopathy with continuous spike-and-wave during sleep
Landau-Kleffner syndrome
Late onset childhood occipital epilepsy (Gastaut type)
Lennox-Gastaut syndrome
Adolescence – Adult
Autosomal dominant epilepsy with auditory features
Epilepsy with generalised tonic-clonic seizures alone
Juvenile absence epilepsy
Juvenile myoclonic epilepsy
Progressive myoclonus epilepsies
Other familial temporal lobe epilepsies
Less Specific Age Relationship
Familial focal epilepsy with variable foci
Reflex epilepsies
Distinctive Constellations
Gelastic seizures with hypothalamic hamartoma
Hemiconvulsion-hemiplegia-epilepsy
Mesial temporal lobe epilepsy with hippocampal sclerosis
Ramussen syndrome
Epilepsies Attributed to and Organised by Structural-Metabolic Causes
Malformations of cortical development (hemimegalencephaly, heterotopias, etc.)
Neurocutaneous syndromes (tuberous sclerosis comples, Sturge-Weber, etc.)
Tumour, infection, trauma, angioma, perinatal insults, stroke, etc.
Epilepsies of Unknown Cause

I General Introduction
12
I. 1.4. THERAPEUTIC APPROACH
The primary focus of care for patients with epilepsy is the prevention of further
seizures which may lead to additional morbidity or even mortality. The goal of treatment
should rely on the maintenance of a normal lifestyle, preferably by complete seizure
control without or with minimal side-effects, ultimately aiming to restore the functional
capacity of patients in what concerns to their usual psychosocial and vocational activities.
Currently, antiepileptic drug (AED) therapy is the mainstay of treatment for the
majority of patients with epilepsy. Non-pharmacological options include surgery, vagus
nerve stimulation and ketogenic diet which are primarily reserved for a few selected
cases, usually upon AED failure (SHETH et al., 2005). Overall, clinically available AEDs lead
to satisfactory control of seizures and a favourable risk-benefit balance for 60-70% of
newly diagnosed patients, albeit with considerable differences in response depending on
the type of seizure, epilepsy syndrome and rare serious adverse events (SCHMIDT, 2009).
Unfortunately, in about 30-40% of the patients, seizures persist regardless the choice of
an adequate AED and carefully monitored treatment (LÖSCHER and POTSCHKA, 2002).
The modern pharmacological treatment era of epilepsy began in 1857, over than
150 years ago, with the introduction of potassium bromide to provide seizure control
(BRODIE, 2010; SCHMIDT, 2009). Despite their limited efficacy and severe side-effects,
bromides were the only drugs available for the treatment of epilepsy at that time and
thus, they were regularly used for the following 50 years.
A major turning point in the management of epilepsy occurred in 1912 when
phenobarbital (PB) emerged. Its anticonvulsant properties were accidently discovered by
Alfred Hauptmann, who originally used the drug as an hypnotic and found that it also
attenuated epileptic attacks (BRODIE, 2010). Since then, PB has been worldwide employed,
still being the most widely prescribed AED in the developing world and remaining one of
the first popular choices in many industrialised countries partly due to its undeniable
efficacy, but especially because of its modest cost (BRODIE, 2010; PERUCCA, 2001). In the
ensuing 60 years, new molecules including phenytoin (PHT), primidone (PRM),
ethosuximide, carbamazepine (CBZ), valproic acid and a range of benzodiazepines
became available on the pharmaceutical market and nowadays, they are regarded as
“established” AEDs in clinical practice (BRODIE and DICHTER, 1996). Most of these
represented an important improvement over barbiturates since they displayed better
tolerability and, particularly in the case of valproate, also a broader spectrum of efficacy
against different seizure types (PERUCCA, 2001). While these agents remain the mainstay of
the modern treatment of epilepsy, they also have important shortcomings such as a
narrow therapeutic index, a highly variable and often non-linear pharmacokinetics,
suboptimal response rates, and a large propensity to cause significant adverse effects and

Epilepsy I
13
drug-drug interactions (PERUCCA, 2001). In an attempt to overcome at least in part the
above limitations, several efforts have been made in order to widen the CNS activity and
improve the efficacy, safety and/or tolerability of the existing old AEDs. Thus, focusing on
enhancing brain penetration, eliminating toxic metabolites and optimising
pharmacokinetic properties, a second generation of AEDs was developed and licensed by
the end of the 1990s, which it was mainly represented by zonisamide, lamotrigine (LTG),
oxcarbazepine (OXC), felbamate, gabapentin, topiramate and levetiracetam. Although
these new AEDs do not offer significant advantages in terms of efficacy compared to the
older ones, some benefits were ascertained concerning better tolerability, fewer drug
interactions and simpler pharmacokinetics. In general, modern AEDs have fewer and less
severe side-effects being also associated in a smaller extent to hypersensitivity reactions,
weight problems and teratogenic phenonema. Moreover, the lower plasma protein
binding and the absence or minimal hepatic enzyme-inducing properties reduce the
likelihood occurrence of undesirable drug interactions. Higher rates of compliance can be
achieved with new AEDs since most of them have long half-lives and therefore can be
administered only once or twice daily (WAHAB, 2010).
In spite of the encouraging and welcome advantages that new AEDs have brought
for the management of epilepsy, there is a growing concern that the efficacy of
pharmacological treatment of epilepsy has not substantially improved (LÖSCHER and
SCHMIDT, 2011). In fact, second generation of AEDs has often been promoted as having
advantages over the older ones; however no evidence that these new drugs are more
effective really exists. Altogether, their use leads to seizure freedom in no more than 15-
20% of patients with epilepsy who are refractory to old AEDs (PERUCCA et al., 2007).
Therefore, a novel and more effective third generation of AEDs was needed and since the
beginning of the 21st century, about seven new molecules (stiripentol, pregabalin,
rufinamide, lacosamide, eslicarbazepine acetate, retigabine and perampanel) have been
approved and are currently available on the market. Unlike previous generations in which
the most clinically effective AEDs have been empirically found by serendipitous screening
programmes or structural variation of already known drugs, third generation of AEDs has
been mainly characterised by a “rational” process of discovery and development (LÖSCHER
and SCHMIDT, 2011, 2002). Indeed, thanks to a better insight in the pathophysiology of
epilepsy and improved understanding on AED mechanisms of action, the designing of new
compounds is nowadays directed to novel therapeutic targets and mechanisms critically
involved in the occurrence of epileptic seizures.
A summary of the main clinically approved AEDs is presented in Table I.1.3.

I General Introduction
14
Table I.1.3 The main clinically approved AEDs.
First Generation Second Generation Third Generation
Phenobarbital (Oral, IV, IM) Zonisamide (Oral) Stiripentol (Oral)
Phenytoin (Oral, IV) Vigabatrin (Oral) Pregabalin (Oral)
Primidone (Oral) Lamotrigine (Oral) Rufinamide (Oral)
Ethosuximide (Oral) Oxcarbazepine (Oral) Lacosamide (Oral, IV)
Benzodiazepines Felbamate (Oral) Eslicarbazepine acetate (Oral)
Carbamazepine (Oral) Gabapentin (Oral) Retigabine (Oral)
Valproic Acid (Oral, IV) Topiramate (Oral) Perampanel (Oral)
Tiagabine (Oral)
Levetiracetam (Oral, IV)
IV, intravenous; IM, intramuscular.
The last decades have witnessed unprecedented progress in the pharmacotherapy
of epilepsy with the introduction of more than 20 anticonvulsant drugs and a
considerable advance in the understanding of how AEDs exert their effects at the cellular
level. This undoubtedly beneficial expansion of the pharmacological armamentarium
does, however, hamper the selection of the most suitable AED (or combination of AEDs)
for each patient individually (DECKERS et al., 2003). Because AED therapy is typically
maintained for several years and often for life, a decision to initiate treatment has far-
reaching consequences and needs to be based on thorough risk-benefit analyses (PERUCCA
and TOMSON, 2011).
The ultimate goal of AED treatment is the lasting freedom from seizures with
minimal adverse effects. AEDs differ in many important aspects ranging from efficacy
against different seizure types, side-effect profiles, potential for pharmacokinetic
interactions and ease of use. Moreover, there is evidence that each type of seizure has a
specific drug that usually proves to be the most effective and adequate (SHAJU and
ABRAHAM, 2013). Accurate seizure classification with judicious choice of pharmacological
treatment is imperative since some drugs that are effective in the treatment of one
seizure type may exacerbate another. In this context, several treatment guidelines were
established (FRENCH et al., 2004; GLAUSER et al., 2006; NATIONAL INSTITUTE FOR HEALTH AND CARE
EXCELLENCE, 2013), recommending a range of drugs as potential first-line treatments for
the variety of seizures types and epilepsy syndromes (Table I.1.4). Notwithstanding, the
choice of the AED among first-line agents always needs to be carefully individualised,
mainly on the basis of the patient profile regarding type of seizure, age, gender, co-
existing illnesses and concomitant medication. Tolerability, safety, ease of use,
pharmacokinetics and cost are fundamental elements that should also be taken into
account (SCHMIDT, 2009). Ideally, therapy should be initiated using a single appropriate
AED (GARNETT et al., 2009). If after gradual increasing of the dosage to the maximum

Epilepsy I
15
tolerated level the seizures remain or become uncontrolled, a progressive switching of
the first prescribed drug should be performed by an alternative AED that can also be used
as monotherapy (GARNETT et al., 2009; SHAJU and ABRAHAM, 2013). Combination therapy
may be considered when two or three AEDs given as monotherapy regimens fail.
Nevertheless, this therapeutic strategy is usually driven by concerns of excessive drug
load and increased toxicity by exposing the patient to a greater risk of drug interactions
and side-effects, compromising both the prognosis and compliance (KAMINSKI et al., 2009;
SHAJU and ABRAHAM, 2013). Even though there is still controversy over when and how
polytherapy approach could be used, the selection of AED combinations should invariably
be cautious and rational (FRENCH and FAUGHT, 2009; LEE and DWORETZKY, 2010; ST LOUIS,
2009). The concept of “rational polytherapy” presupposes that the association of AEDs
with different mechanisms of action is more effective and may provide better seizure
control than those which share similar mechanistic (ST LOUIS, 2009; STAFSTROM, 2010).
Intentionally, AED combinations should yield synergistic or, at least, additive clinical
effectiveness along with antagonistic adverse effects (STAFSTROM, 2010). Unfortunately,
the adherence to the above principles is not always fulfilled, often making the process of
selecting optimal drug combinations complex and challenging.

I General Introduction
16
Table I.1.4 AEDs used in different seizure types and epilepsy syndromes (DUNCAN et al., 2006;
NATIONAL INSTITUTE FOR HEALTH AND CARE EXCELLENCE, 2013; SCHMIDT and SCHACHTER, 2014; SHAJU and
ABRAHAM, 2013).
First-line AEDs Alternative AEDs
Seizure Type
Focal CBZ, LTG, LEV, OXC, VPA,
TPM
GBP*, PGB, TGB, ZNS, CLB, CLZ,
ESL, LCM, PB, PHT, VGB
Generalised
Tonic-clonic CBZ, LTG, OXC, VPA, TPM CLB*, LEV*, ZNS, CLZ, PB, PHT
Absence ESM, LTG, VPA CLB, CLZ, TPM, ZNS
Myoclonic LEV, VPA, TPM CLB, CLZ, LTG, ZNS
Tonic LTG, VPA CLB, CLZ, TPM, ZNS, FLB, LEV, PB,
PHT
Atonic LTG, VPA CLB, CLZ, TPM, ZNS, FLB, LEV, PB
Epileptic Syndrome
Childhood absence epilepsy ESM, LTG, VPA CLB, CLZ, LEV, TPM, ZNS
Dravet syndrome VPA, TPM CLB*, STP*
Benign epilepsy with
centrotemporal spikes
CBZ, LTG, LEV, OXC, VPA CLB*, GBP*, OXC*, TPM*, ESL,
LCM, PB, PHT, PGB, TGB, VGB, ZNS
Panayiotopoulos syndrome CBZ, LTG, LEV, OXC, VPA CLB*, GBP*, OXC*, TPM*, ESL,
LCM, PB, PHT, PGB, TGB, VGB, ZNS
Lennox-Gastaut syndrome VPA LTG*, FBM, RFM, TPM
Juvenile absence epilepsy ESM, LTG, VPA CLB, CLZ, LEV, TPM, ZNS
Juvenile myoclonic epilepsy LTG, LEV, VPA, TPM CLB, CLZ, ZNS
Epilepsy with generalised
tonic-clonic seizures alone
CBZ, LTG, OXC, VPA CLB*, LEV*, TPM*, CLZ, PB, PHT
* As adjunctive therapy. CBZ, carbamazepine; CLB, clobazam; CLZ, clonazepam; ESL, eslicarbazepine acetate; ESM,
ethosuximide; FLB, felbamate; GBP, gabapentin; LCM, lacosamide; LEV, levetiracetam; LTG, lamotrigine; OXC,
oxcarbazepine, PB, phenobarbital; PGB, pregabalin; PHT, phenytoin; RFM, rufinamide; STP, stiripentol; TGB,
tiagabine; TPM, topiramate; VGB, vigabatrin, VPA, valproic acid; ZNS, zonisamide.
Unlike other therapeutic classes, AEDs are not usually classified into categories
according to their respective modes of action (PERUCCA, 2005). While many AEDs have
been categorised in line with a single and principal mechanism of action, it is increasingly
recognised that several agents have multiple primary effects at therapeutic
concentrations, possessing more than one mechanism of action (CZAPIŃSKI et al., 2005;
DECKERS et al., 2003). Furthermore, most of them have less well-characterised additional
mechanisms and the fundamental pharmacology of others remains to be determined
(DECKERS et al., 2003).

Epilepsy I
17
Pharmacological treatment of epilepsy has traditionally relied on the control of
the symptoms, i.e. suppression of seizures, rather than correcting the cause or preventing
the development of the disease. Seizures can be generated either from excessively
hyperexcitatory processes or from hypoactivity of neuronal inhibition in a specific
neuronal cell population within the brain (LASOŃ et al., 2013). Although the mechanisms of
action of the currently marketed AEDs are still not completely understood, these agents
essentially redress the balance between neuronal excitation and inhibition. Therefore,
three major mechanisms are recognised at the cellular level: modulation of voltage-
dependent ion channels (Na+, Ca2+, K+), enhancement of γ-aminobutyric acid (GABA)-
mediated inhibitory neurotransmission, and attenuation of glutamate-mediated
excitatory neurotransmission (KWAN et al., 2001) (Figure I.1.1).
Figure I.1.1 Mechanisms of action of the main AEDs currently available on the market. AMPA, α-
amino-3-hydroxy-5 methyl-4-isoxazole propionic acid; GABA, γ-aminobutyric acid; GAT-1, sodium
dependent and chloride dependent GABA transporter 1; SV2A, synaptic vesicle glycoprotein 2A
(Adapted from SCHMIDT and SCHACHTER, 2014).

I General Introduction
18
Despite its undeniable importance, at the current state of knowledge, the
information upon how the various AEDs work has demonstrated limited value in
predicting their therapeutic efficacy and adverse effects. Inclusively, it has even been a
matter of debate whether the AEDs’ mechanism of action is relevant for their use as
epilepsy therapy (BRODIE et al., 2011; PERUCCA, 2011; SCHMIDT, 2011). Indeed, due to
incomplete understanding of the precise pathophysiologic mechanisms behind epilepsy
and seizure activity, most of the AEDs have been identified by screening compounds in
seizure models without targeting the specific mechanisms involved in ictogenesis or
epileptogenesis (LÖSCHER et al., 2013). As a result, the mechanism of action was only
determined after the discovery of anticonvulsive effects, hampering a mechanistically-
driven approach to drug therapy. So far, the AED selection has primarily relied on
clinically acquired evidence of efficacy spectrum and side-effect profile (PERUCCA, 2001).
Notwithstanding, evidence is starting to emerge whereby a clear relationship can
be ascertained between certain mechanisms of action and efficacy against specific types
of seizures and epileptic syndromes. Accordingly, it seems that focal seizures and primary
generalised tonic-clonic seizures respond well to sodium channel blockers (e.g. CBZ, PHT).
In contrast, T-type calcium channel blockers (e.g. ethosuximide) may be effective against
absence seizures, and GABAergic agents (e.g. PB, benzodiazepines) and AEDs with
multiple mechanisms of action (e.g. valproic acid) are more likely to exert broad-spectrum
protection over both focal and generalised seizure disorders (DECKERS et al., 2003; PERUCCA,
2011). Likewise, there are mechanisms of action apparently associated with potential
seizure aggravation. For example, some AEDs that block selectively sodium channels or
enhance the synaptic availability of GABA are commonly ineffective and may even
exacerbate myoclonic and absence seizures, respectively (PERUCCA, 2011). Apart from the
abovementioned, clinical activity of several AEDs cannot always be explained based
exclusively on their main mode of action. In fact, potentially subtle differences may exist
in the intimate molecular mechanisms by which AEDs interact with ion channels or
neurotransmission function, thus resulting in distinct therapeutic profiles.
In spite of the diversity of AED modes of action, it is interesting to note that the
antiepileptic efficacy of these drugs in initial add-on trials does not seem to differ
substantially, which indicates that seemingly similar anticonvulsant activity can be
obtained by different therapeutic targets (LÖSCHER et al., 2013). Moreover, the fact that
many new AEDs share similar mechanisms of action with older agents may account, to
some extent, why the vast majority of the patients who do not respond to older
generation AEDs also fail to achieve seizure freedom on the newer drugs (PERUCCA, 2001).
A deeper understanding of the AED pharmacology and the pathophysiological processes

Epilepsy I
19
underlying epileptic disorders may contribute to the identification of novel promising
pathways and potential new drug targets.
I. 1.5. PHARMACORESISTANT EPILEPSY
Drug resistant epilepsy is one of the most important unmet needs in the daily
management of epilepsy. Although the concept of drug resistant, also called as “medically
refractory/intractable” or “pharmacoresistant” epilepsy may appear self-explanatory and
intuitive, a precise definition has remained elusive (KWAN et al., 2010). Indeed, there is no
true or ideal definition of pharmacoresistant epilepsy. Several studies have defined it
according to the number of AEDs the patient has tried without success, the frequency of
seizures, the duration of illness, and the period of remission (WEAVER and POHLMANN-EDEN,
2013). Recently, an ILAE Task Force commission proposed a global consensus definition:
“failure of adequate trials of two tolerated and appropriately chosen and used AED
schedules (whether as monotherapies or in combination) to achieve sustained seizure
freedom” (KWAN et al., 2010). The above description is consistent with the clinical
observation that if complete seizure control is not accomplished with trials of two
appropriate AEDs, the likelihood of success with subsequent regimens is much reduced
(KWAN et al., 2011).
Pharmacoresistant epilepsy is a major health concern associated with increased
morbidity and mortality. Recurrent uncontrolled seizures and the exposure to high doses
of multiple ineffective medications result in an augmented risk of premature death,
physical injury, cognitive impairments, psychosocial dysfunctions and a reduced quality of
life (ALEXOPOULOS, 2013; KWAN et al., 2011; WEAVER and POHLMANN-EDEN, 2013). Effectively,
the recent introduction of various new generation AEDs in the market has not changed
the problem of intractable seizures to any significant extent. As a consequence,
approximately 20-40% of patients with primary generalised epilepsy, and up to 60% of
patients with focal epilepsies continue to manifest pharmacoresistance (ALEXOPOULOS,
2013). A striking obstacle in developing new strategies for treatment of refractory
epilepsy is that the regulatory events underlying drug resistance are only poorly
understood. Pharmacoresistance occurs besides the use of medications with distinct
pharmacologic properties and modes of action, suggesting that a non-specific mechanism
is involved in limiting the effectiveness of AEDs. This therapeutic failure is likely to be
regarded as a variable multifactorial process with many possible causes (KWAN et al.,
2011; LÖSCHER and POTSCHKA, 2002). In this context, three major pathomechanisms have
been advocated to explain medical refractoriness of epilepsy: disease-related, drug-
related and genetic-related mechanisms (SCHMIDT and LÖSCHER, 2005). Among all, the two

I General Introduction
20
key theories based on the target hypothesis and the multidrug-transporter hypothesis
have gained an increasing support (SCHMIDT and LÖSCHER, 2005). While the target
hypothesis postulates that acquired alterations in the structure and/or functionality of
target ion channels and neurotransmitter receptors result in loss of AED affinity and
efficacy; multidrug-transporter hypothesis suggests that an overexpression of efflux
proteins at the blood-brain barrier (BBB) restricts drug uptake into the brain leading to
insufficient AED levels at their target sites (LÖSCHER and SCHMIDT, 2011; REMY and BECK,
2006). Beyond that, other disease-related factors may also contribute to the different
clinical patterns of drug resistance, including the aetiology of seizures, progression of the
disease and structural brain alterations and/or network changes such as seizure induced
synaptic reorganisation (SCHMIDT and LÖSCHER, 2005). The development of pharmacologic
tolerance, i.e. the loss of anticonvulsant efficacy during treatment after initial control, is
likewise presented as a possible mechanism involved in inadequate seizure regulation
(SCHMIDT and LÖSCHER, 2005; WAHAB, 2010). Finally, genetic alterations like for example,
polymorphisms in genes encoding for drug targets, multidrug transporters or proteins
involved in pharmacokinetics and pharmacodynamics of AED action may be important to
explain why two patients with the same type of epilepsy or seizures may differ in their
initial responses to AEDs (LÖSCHER and SCHMIDT, 2011; SCHMIDT and LÖSCHER, 2005).
However, none of the current hypotheses is able to convincingly explain how drug
resistance arises in human epilepsy as a stand-alone theory (SCHMIDT and LÖSCHER, 2009).
Clinical evidence demonstrated that patients who are resistant on monotherapy with the
first AED have a chance of only about 10% or lower to be controlled by other AEDs, even
when they operate by diverse mechanisms of action (LÖSCHER and POTSCHKA, 2002). Hence,
it is now recognised that despite their better tolerability and safety profiles, the
therapeutic efficacy of modern AEDs has not substantially improved comparatively to the
older generation compounds, and the proportion of patients with drug resistant epilepsy
does not seem to have changed over the last decades (SCHMIDT, 2011). The multifaceted
nature of pharmacoresistant epilepsy dictates a multidisciplinary approach to future
research and therapeutic interventions. Regarding this, next generation of therapies must
necessarily evolve to include targets that specifically contribute to epileptogenesis and
drug resistance in relevant epilepsy models (LÖSCHER and SCHMIDT, 2011; WEAVER, 2013). A
major breakthrough in the pharmacological treatment of refractory epilepsy will only be
achieved when the development of drugs is directed towards the underlying cause of the
disease.

Epilepsy I
21
I. 1.6. NEED FOR NEW THERAPEUTIC STRATEGIES
Over the last years, remarkable advances in the treatment of epilepsy have been
made; however, the currently available antiepileptic therapies are unsatisfactory as they
provide only symptomatic relief, are not effective in a significant percentage of epileptic
patients, and are often accompanied by persistent adverse effects (LÖSCHER and SCHMIDT,
2002; SCHMIDT, 2009; WAHAB, 2010). Therefore, new concepts and alternative approaches
for developing safer and more effective therapeutic options are urgently needed.
In this regard, several strategies have been explored to improve the
pharmacological therapy of epilepsy: high throughput screening of potential new agents,
modification of existing compounds, optimisation of drug formulations, enhancing
delivery to the brain of current existing drugs, serendipitous discovery and rational drug
development as a result of better insight of the mechanisms underlying epilepsies and
epileptic seizures (DUNCAN, 2002; LÖSCHER et al., 2013; VENTOLA, 2014).
I. 1.6.1. DISCOVERY AND DEVELOPMENT OF NOVEL AEDs
Despite considerable progress in understanding the pathogenesis of seizures and
epilepsy, the cellular basis of human epilepsy remains a mystery. In the absence of a
specific aetiological comprehension, approaches to pharmacological therapy of epilepsy
must necessarily be directed at the control of symptoms. Nowadays, none of the old or
new AEDs appears to represent a “cure” for epilepsy or an efficacious mean for
preventing epilepsy or its progression (LÖSCHER and SCHMIDT, 2002). Among the various
therapeutic options, resective surgery is often considered as the only curative treatment
of the disease (LÖSCHER and SCHMIDT, 2002). Nevertheless, surgical procedures are
restricted to patients with focal epilepsy in which the epileptogenic focus can be
adequately identified and, in the majority of the cases, AED therapy has to be continued
even after surgery in order to avoid relapse and achieve complete seizure freedom. Thus,
the search for new drugs that are capable of preventing, delaying or modifying epilepsy is
clearly warranted.
Traditionally, the pharmacological treatment of epilepsy has been essentially
empirical often based on trial and error, aiming at suppressing initiation or propagation of
seizures rather than correcting the processes involved in the natural history of the disease
(LÖSCHER and SCHMIDT, 2002; SCHMIDT and SCHACHTER, 2014). There is no single drug of choice
in treating all types of seizures and no drug has solved the problem of intractable epilepsy
yet. Even though first-generation AEDs are potent anticonvulsants, most of them have
dose-limiting toxicity and/or unacceptable side-effects that usually prevent the

I General Introduction
22
achievement of adequate brain levels to attain a complete seizure control (GERLACH and
KRAJEWSKI, 2010). In contrast, second generation AEDs present an improved side-effect
and/or pharmacokinetic profile, but due to their close analogy to the original compounds
and the corresponding mechanisms of action, it is not expectable that their therapeutic
potential could be broadened (GERLACH and KRAJEWSKI, 2010).
From a clinical perspective, the ideal AED should meet the following criteria: great
efficacy in refractory epilepsy; ability to prevent, delay or modify the progression of the
disease; few adverse effects; acceptable tolerability; improved ease of use and favourable
pharmacokinetic properties (BIALER and WHITE, 2010; PERUCCA et al., 2007). Ultimately, the
most desirable pharmacokinetic profile of an AED is the one that has high bioavailability,
rapid brain penetration, a volume distribution with a single compartment, low and non-
saturable protein binding, no active or toxic metabolites, no autoinduction of enzymatic
biotransformation, an elimination half-life suitable for once or twice daily dosing, linear
elimination kinetics, and finally, lack of pharmacological interactions (PODELL, 2013). In
view of the numerous limitations and challenges that typify the current epilepsy
pharmacotherapy, it is mandatory to revisit conventional AED discovery and
development. There is an imperative need for the development of new strategies that
can address both the remaining unmet medical demands in epilepsy and also
simultaneously provide a favourable business case to be successfully executed by the
pharmaceutical industry (LÖSCHER et al., 2013).
In the 1990s, epilepsy conferred an opportunity to enter a therapeutic space in
which there was a good chance for investment return; however, these prior incentives on
AED development are now negatively balanced by the drug discovery and development
challenges that face industry overall (LÖSCHER et al., 2013). Indeed, the development of
new AEDs is costly and risky since the chances for a successful conclusion of the
development and the subsequent approval by the regulatory authorities are less than
10%, even for those drugs that are already at phase Ia of clinical research (PERUCCA et al.,
2007). The refund of the investment requires that future AEDs bring additional value or
differentiation to an already crowded and highly generic AED field. In essence, evidence
of better tolerability and safety profiles over the existing AEDs is not enough; thereby an
improvement in efficacy has to be necessarily demonstrated. In this way, efforts must be
conducted in a further research into the pathophysiologic mechanisms underlying both
epilepsy and drug resistance. Given the heterogeneity and complexity of seizures in
humans, it is unlikely that a single anticonvulsant animal model can be used to predict the
full therapeutic potential of an AED candidate (BIALER and WHITE, 2010). Moreover, once
the conventional preclinical models have been originally validated by old AEDs, there is a
growing conviction that they are likely to identify only more of the same new AEDs

Epilepsy I
23
without possessing significant advances concerning efficacy and toxicity (LÖSCHER and
SCHMIDT, 2002; PERUCCA et al., 2007). Through a greater understanding of the molecular
and genetic basis of different epilepsies and seizure types, new pharmacological targets
and more representative animal models are likely to arise and lead to the discovery of
novel and more effective therapies.
I. 1.6.2. NEW METHODS FOR AED DELIVERY
Since the process of discovery and development of new chemical entities is very
expensive and generally associated to high attrition rates, some possible strategies to
improve the performance of the pharmacological treatment of epilepsy may involve the
use of already existing AEDs by modifying and optimising some of their formulation
properties, delivery systems and/or routes of administration. Taking into account that a
considerable percentage of the epileptic patients are drug resistant to a wide range of
AEDs with different mechanistic, it may be profitable to consider other avenues beyond
the new mechanisms of drug action to improve seizure control (SCHMIDT and HOLMES,
2009). In this context, more effective drug delivery approaches towards the epileptogenic
brain tissue may enhance efficacy and decrease toxicity of AEDs (FISHER and CHEN, 2006;
FISHER and HO, 2002; SCHMIDT and HOLMES, 2009).
It seems that betting in new alternative methods to efficiently deliver AEDs to the
CNS could be an attractive business opportunity to the pharmaceutical industry. The
investment necessary for discovery and development would be markedly reduced and the
technical hurdles and regulatory data requirements would also be potentially minimised,
thereby upgrading the premises for a very positive business case. Thus, the topic of drug
delivery has become an intense point of interest not only for academy but also for
industry and clinicians. Biopharmaceutical scientists and drug delivery industries have
been searching for new ways to deliver drugs and explore innovative strategies aside
from the traditional oral or injectable routes of administration aiming at creating new
product opportunities and treatment paradigms (MATHIAS and HUSSAIN, 2010).
Conventional and Unconventional Routes of Drug Delivery
Oral administration remains the mainstay of AED therapy (FISHER and HO, 2002). At
present, numerous AED oral formulations are commercially available, ranging from
tablets and capsules to solutions, syrups and suspensions, and extended release products.
Although it is easier and more practical for daily chronic use, oral administration is
commonly associated to a variety of limiting factors, such as gastrointestinal absorption

I General Introduction
24
and hepatic first-pass metabolism, which may compromise drug bioavailability and
increase the possibility of high inter-subject variability regarding the relationship between
dose and plasma concentration (ANDERSON and SANETO, 2012). The passage of the drug
from the oral site of administration into the bloodstream is significantly influenced by the
physicochemical properties of the drug, the type of dosage formulation, the rate of
gastric emptying and the gastrointestinal motility. Therefore, oral administration of
medicines does not assure a quick and immediate onset of action which is invariably
demanded on acute seizure situations.
Unlike the slow and unreliable pharmacokinetics of oral administration,
intravenous (IV) injection provides a precise dosing through a direct delivery of the drug
to the systemic circulation, creating appropriate conditions to allow a better, faster and
less variable systemic incorporation and biodistribution. Typically, IV administration is
only applicable for drugs that are aqueous soluble. Due to poor water solubility, most of
the AEDs are only available in oral dosage forms, with the exception of PB, PHT and its
pro-drug fosphenytoin, valproic acid, levetiracetam, lacosamide and some
benzodiazepines (clonazepam, diazepam, lorazepam and midazolam) that can be
intravenously administered as parenteral formulations (ANDERSON and SANETO, 2012). IV
injection is frequently used when the oral administration is unavailable or a rapid clinical
response is required, being the route of choice for emergencies (e.g. status epilepticus)
(ANDERSON and SANETO, 2012; FISHER and HO, 2002). However, the establishment of an IV
access may entail delays and necessarily demands sterile equipment and skilled
personnel, often making it impractical and inconvenient to be used outside the hospital
setting.
The chronic management of epilepsy has commonly been performed using oral
administration of AEDs while in case of status epilepticus, IV benzodiazepines are the
first-line treatment option (ANDERSON and SANETO, 2012; MANNO, 2011; MEIERKORD et al.,
2010). Considering the above limitations, systemic delivery of drugs via alternative and
unconventional routes of administration appears to be a valuable strategy to circumvent
these inherent problems. Therapeutic-toxic ratio can be potentially improved and novel
opportunities to efficiently and safely treat out-of-hospital acute seizures can thus be
given to both patients and caregivers. In accordance, alternative routes of AED delivery
may include buccal/sublingual, intranasal, intramuscular, pulmonary, rectal and
subcutaneous/transdermal administrations. Each route has its own potential of
application which is determined by the corresponding advantages and limitations (Table
I.1.5). A recent consensus document from ILEA Task Force on Status Epilepticus
recommended the use of rectal diazepam, buccal midazolam or intranasal midazolam as
alternative emergency therapies for the early treatment of seizures outside the hospital
environment (SHORVON et al., 2008).

Epilepsy I
25
Transmucosal administration via buccal cavity, nasal passage and rectum generally
provides an efficient absorption of drugs by offering large areas of potentially accessible
mucosal surfaces that are rich in blood supply, yielding the means for rapid drug transport
to the systemic circulation and avoiding, in most cases, degradation by gastric and hepatic
first-pass metabolism (AMERICAN ACADEMY OF PEDIATRICS. COMMITEE ON DRUGS, 1997). Although
no AED is specifically approved for sublingual or buccal administration, such use has been
occasionally performed among patients in clinical practice. Off-label use attests to the
effectiveness of buccal/sublingual administration of benzodiazepines, but formal
controlled studies are actually few (FISHER and HO, 2002). Hence, lorazepam sublingual
tablet can be placed under the tongue at the start of a seizure in an attempt to interrupt
seizure clusters, and liquid formulation of midazolam can be squirted by using a syringe
between the gum and cheek for seizure prophylaxis. Recently, an oromucosal solution of
midazolam (Buccolam®) has been licensed by the European Medicines Agency (EMA) and
it is available in the European market for the paediatric treatment of prolonged acute
convulsive seizures (ANDERSON, 2013). For a significant period of time, rectal diazepam has
been the treatment of choice to attain the cessation of prolonged or serial seizures,
whereby, several studies have been conducted in order to compare buccal administration
of midazolam with the already established IV injection and rectal delivery of diazepam.
Clinical evidence shows that comparatively to rectal diazepam, buccal midazolam has
equal or greater efficacy in achieving seizure control without being associated to an
increased incidence of respiratory depression (MCINTYRE et al., 2005; SCOTT et al., 1999).
The comparison between buccal midazolam and IV diazepam revealed no remarkable
differences in terms of efficacy, notwithstanding the mean time to initiating treatment
was significantly shorter for the first one which makes it a viable alternative to IV
diazepam, especially when getting an IV line is problematic (TALUKDAR and CHAKRABARTY,
2009).

I General Introduction
26
Table I.1.5 Summary of the main advantages and limitations of conventional (oral and
intravenous) and alternative routes for AED administration (ANDERSON and SANETO, 2012; FISHER
and HO, 2002; MATHIAS and HUSSAIN, 2010).
Delivery Route Advantages Limitations
Oral - Convenient, practical, painless
- Well accepted by patients
- Variety of dosage forms available
- Non-invasive
- Gastrointestinal degradation
- Hepatic first-pass metabolism
- Unpredictable absorption
- Fluctuant bioavailability
- Delayed onset of action
- Pharmacokinetic variability
- Patient cooperation/consciousness is
required
- Not suitable for emergencies
Intravenous - Fast onset of action
- Precise dosing
- High bioavailability
- Avoidance of absorption and hepatic
first-pass metabolism
- Useful in case of emergency
- Requirement of an IV access
- Sterile equipment and skilled personnel
are essential
- Impractical to be used in out-of-hospital
acute seizure situations
- Painful, invasive
Buccal/
Sublingual
- Avoidance of first-pass metabolism
- Rapid absorption (due to the highly
vascularised area)
- A portion of the drug can be swallowed
- Incomplete bioavailability
- Patient cooperation is required
- Not feasible during an acute seizure
- The increased secretion of saliva during a
seizure can cause loss of the drug
Intranasal - Fast onset of action
- Avoidance of first-pass metabolism
- Convenient, practical, non-invasive
- Useful for treatment of prolonged and
acute seizures
- Self administration
- Limited dose, low dose volume
- AEDs must present excellent aqueous
solubility or could be formulated using
solubilising agents
- Potential irritation of nasal mucosa
- Mucociliary clearance
- Nasal congestion due to cold or allergy
Intramuscular - Useful when ready IV access is lacking
- Rapid administration
- Fast onset of therapeutic effect
- Irregular absorption
- Absorption is influenced by the degree of
vascularisation of the injection site
- Local irritation
- Generally inappropriate for the majority
of AEDs due to their poor solubility and
non-physiological pH of the formulation
- Painful, invasive
Pulmonary - Large surface area for absorption
- Thin epithelial barrier featuring
moderate permeability characteristics
- High blood perfusion
- Limited dose, low dose volume
- Drug deposition in mouth and
gastrointestinal tract
- Safety and lung function
Rectal - Partial avoidance of first-pass
metabolism
- Useful in children and when the oral
route is unavailable
- Erratic absorption
- Inconvenient, not socially accepted
Subcutaneous/
Transdermal
- Convenient, good patient compliance
- Large surface area
- Prolonged drug delivery
- Systemic effect
- Absorption is slow and incomplete
- Skin irritation

Epilepsy I
27
Despite its undeniable potential, some reservations have been put on the
feasibility and safety to use the buccal/sublingual administration of drugs during an acute
convulsive event. In fact, lowering the jaw to open the oral cavity might be difficult and
the increased salivary secretion that can occur may also cause a loss of the drug by
diverting it from the targeted absorption site (ANDERSON and SANETO, 2012; MCINTYRE et al.,
2005). In addition, as a portion of the drug can often be swallowed, the bioavailability can
be incomplete and the time to peak concentration delayed (ANDERSON and SANETO, 2012).
In patients receiving AED treatment, maintaining the therapeutic concentrations
of the drug is essential for optimal seizure control which must be guaranteed even when
the patient is unable to take medication orally or an IV access is lacking. Under these
circumstances, rectal administration of AEDs may represent an attractive alternative. The
rectal route has been used for transitory or long term administration of anticonvulsants
such as diazepam, valproic acid, PB and CBZ; however, the only medication approved by
the US Food and Drug Administration (FDA) for non-intravenous treatment of prolonged
seizures is the rectal gel of diazepam (Diastat®) (ANDERSON and SANETO, 2012; ANDERSON,
2013). In general, rectal absorption is relatively complete for many drugs, but it is usually
erratic and associated to a significant patient-to-patient variability. This irregular drug
uptake is reflected in a prolonged or delayed absorption in some cases, but in other
patients, a rapid drug uptake occurs, as an IV bolus had been administered. Therefore,
due to the prolonged rate of absorption, the achievement of CBZ therapeutic levels after
rectal administration is only attained within 5-10 h of initial dosing, which indicates that
rectally administered CBZ is effective as long-acting AED therapy for the maintenance of
seizure freedom rather than in the treatment of acute convulsive episodes (PATEL, V. et al.,
2014). In contrast, rectal administration of diazepam results in rapid and complete drug
absorption in which the time needed to accomplish seizure cessation ranges from 2 to 15
min (HOLSTI et al., 2010). Currently, and even though the social stigma, rectal diazepam is
still often one of the preferred choices among the first-line treatment options to control
cluster of seizures and status epilepticus (MCMULLAN et al., 2010; NATIONAL INSTITUTE FOR
HEALTH AND CARE EXCELLENCE, 2013).
Intranasal (IN) delivery is conceivably the most attractive option when first
considering a non-invasive and non-oral route of administration (MATHIAS and HUSSAIN,
2010). Traditionally, the nasal route has been exploited for the treatment of local diseases
like nasal allergy, rhinitis, sinusitis, nasal infections and nasal congestion; howbeit, the
high degree of vascularisation, the high permeability due to the porous endothelial
membrane and the large surface area of the nasal mucosa gather the conditions
necessary for a rapid and extensive drug absorption to the systemic circulation (GRASSIN-
DELYLE et al., 2012). Indeed, systemic delivery of drugs via the IN route has already proven
to be a valuable approach since often similar concentration-time profiles of drugs are

I General Introduction
28
observed in plasma following both IN and IV administrations, which leads to a rapid onset
of pharmacological action (GRASSIN-DELYLE et al., 2012; SINGH et al., 2013; UGWOKE et al.,
2001). Apart from being practical and convenient, one of the major advantages of the IN
route is the avoidance of both gastrointestinal and hepatic first-pass effects, constituting
a very profitable option for the administration of active principles with low oral
bioavailability (SINGH et al., 2013). Accordingly, given its characteristics, IN administration
seems to be potentially advantageous in the home treatment of prolonged seizures, in
the treatment of pre-hospital seizures by emergency medical technicians, and in the
treatment of severely behaviourally challenged and cognitively impaired patients whose
cooperation may be compromised (ANDERSON and SANETO, 2012). Conversely, some
limitations arise concerning the limited volume of the nasal cavity that restricts the total
amount of the formulation that can be administered, and the physicochemical properties
of the molecules which must allow a highly concentrated incorporation of the drug in the
formulation and, simultaneously, an easy and efficient permeation across the nasal
mucosa (GRASSIN-DELYLE et al., 2012). In theory, a drug candidate for IN administration
should possess among other features, high aqueous solubility, efficiency at low doses
(generally less than 25 mg), minimal nasal irritation and good nasal absorption
characteristics in order to provide adequate bioavailability and achieve the desired
therapeutic effects in terms of both intensity and onset of action (BEHL et al., 1998;
GRASSIN-DELYLE et al., 2012; SINGH et al., 2013; UGWOKE et al., 2001). The most often nasally
applied anticonvulsant drug has been the benzodiazepine midazolam. Several clinical
studies have been performed in order to evaluate its pharmacokinetics, demonstrating
the efficacy and safety of IN midazolam in the emergency treatment of prolonged
convulsive seizures (DE HAAN et al., 2010; GOLDENBERG, 2010; HASCHKE et al., 2010; HOLSTI et
al., 2010; IVATURI et al., 2009; THAKKER and SHANBAG, 2013). Overall, effective midazolam
serum concentrations are reached within less than 10 min after nasal application,
enabling a prompt control of the acute seizures either in medical centres or at home
(HASCHKE et al., 2010; HOLSTI et al., 2010).
Intramuscular administration is another alternative route that can be considered
for individuals who lack a ready IV access. Appropriate intramuscular formulations are
merely available for some benzodiazepines (diazepam, lorazepam and midazolam),
fosphenytoin and PB once the poor solubility and the non-physiological pH of the majority
of AEDs formulations render them unsuitable to be administered by this route (ANDERSON
and SANETO, 2012; FISHER and HO, 2002). Intramuscular injection usually delivers the exact
quantity of drug desired; nevertheless, it is painful and the rate and extent of absorption
is variable and not always complete being dependent on the degree of vascularisation at
the injection site (ANDERSON and SANETO, 2012).

Epilepsy I
29
AEDs are rarely administered subcutaneously. In exceptional circumstances such
as end-of-life palliative care, the continuous subcutaneous infusion of midazolam,
clonazepam and PB has been advocated (FISHER and HO, 2002). The idea of a subcutaneous
AED implant for the chronic management of epilepsy is attractive. However, the low
solubility, highly alkaline pH in solution and low potency of most AEDs make such
implants bulky and impractical (FISHER and HO, 2002). Moreover, most of the AEDs have a
relatively narrow therapeutic index which demands for little variability in release rates
from an implant.
Delivery of AEDs through transdermal or pulmonary routes has not been
conveniently exploited yet. Notwithstanding, the concept of a hypothetical AED
administration by means of skin patches or inhalators appears to be very interesting.
Alternative Strategies for Direct CNS Drug Targeting
As the brain is an organ structurally supplied with a large blood vessel network,
direct systemic delivery of drugs by avoiding first-pass metabolism has a great potential
to get their access to the brain by crossing the vascular barrier (Figure I.1.2).
Unfortunately, both the abovementioned conventional and unconventional drug
administration methods frequently fall short in delivering a number of therapeutic agents
efficiently to the brain. Brain availability of systemic drugs is largely affected by the half-
life of the drug in the plasma, rapid metabolism, level of non-specific binding to plasma
proteins and the permeability of the compound across the BBB and into peripheral tissues
(ALAM et al., 2010). Although the main function of the BBB is to protect the CNS against a
variety of pathogens and toxicants, it also plays a significant role on restricting the
transport of drugs/xenobiotics from the systemic circulation into the brain. It is
remarkable that approximately 98% of small-molecule and essentially 100% of large-
molecule drugs do not cross the BBB (PARDRIDGE, 2007). Hence, regardless of their high
potential, many neurotherapeutic agents may have been abandoned because of their
inability to achieve sufficient levels in the brain through systemic circulation, and the BBB
often turns out to be the sole reason for this clinical failure (PARDESHI and BELGAMWAR,
2013; PATHAN et al., 2009). Inevitably, a number of new alternative strategies have been
investigated and developed to circumvent the BBB and increase the CNS targeting of
drugs (Figure I.1.2). Such novel delivery approaches may, on one hand, enhance the
therapeutic properties of the existing AEDs, and on the other hand, enlarge the spectrum
of molecules with antiepileptic potential that were previously excluded from
experimental and clinical evaluation simply because they could not cross the BBB.

I General Introduction
30
Figure I.1.2 Different methods of drug administration to the CNS.
The brain is a delicate organ that plays a set of vital functions to maintain
convenient body homeostasis. Hence, its integrity is ensured by physiological barriers
and mechanisms of defence which efficiently protect and isolate the CNS from harmful
endogenous substances and external insults (e.g. xenobiotics and virus), while still
preserving the appropriate nutrient supply. Overall, there are two main physiological
barriers that separate the CNS environment from the systemic circulation, thereby
controlling the influx and efflux of endogenous and exogenous compounds: the epithelial
blood-cerebrospinal fluid barrier (BCSFB) and the endothelial BBB (ABBOTT, 2014).
The BCSFB separates the blood from the cerebrospinal fluid (CSF) that runs within
the subarachnoid space surrounding the brain (PAVAN et al., 2008). This barrier results
from the combined action of the arachnoid membrane with the choroid plexus which is
responsible for almost all the production of the CSF and is distributed throughout the
third, fourth and lateral ventricles of the brain (ABBOTT, 2014; ILLUM, 2000; MISRA et al.,
2003). Each choroid plexus comprises a secretory epithelium that is perfused by blood at
a local high perfusion rate (ILLUM, 2000). Although the capillaries of the choroid plexus are
non-continuous, fenestrated and have gaps between the endothelial cells allowing the
free-movement of small molecules, the adjacent choroid epithelial cells are closely held
together by tight junctions which carefully regulate the passage of substances from blood
into the CSF (DEEKEN and LÖSCHER, 2007).

Epilepsy I
31
The BBB represents one of the strictest structural and functional barriers in
segregating the brain interstitial fluid from the circulating blood. Its protective character
is due, among other features, to very specific morphological properties of the capillary
endothelial cells located in the brain. In contrast to the peripheral organs, brain
endothelial cells are absent of fenestrations, linked by continuous and strong tight
junctions, and exhibit very low pinocytic activity. Moreover, they are also surrounded by a
basal membrane and pericytes as well as astrocyte end-foot processes that encapsulate
the capillaries, restraining its permeability (ABBOTT, 2014; DEEKEN and LÖSCHER, 2007). Apart
from being a selective structural diffusion barrier, the BBB also displays an efficient
functional regulation. Owing to the presence of tight junctions between endothelial cells,
a very high transendothelial electric resistance of about 1500-2000 Ω.cm2 is found in the
brain capillaries compared to 3-33 Ω.cm2 of other tissues (e.g. skin, bladder, colon and
lung), which significantly hinders the entry of polar and ionic substances to the brain
(MISRA et al., 2003; VYAS et al., 2005). Furthermore, the high metabolic activity as well as
the expression of numerous carrier-mediated efflux transporters in the brain endothelial
cells, also contributes to the restrictive nature of the BBB (ANDERSON, 1996; RAUTIO et al.,
2008). Therefore, solutes crossing BBB cell membranes may be susceptible to enzymatic
degradation, or can be actively removed from brain endothelial cell cytoplasm returning
back to the bloodstream by means of a variety of efflux proteins, such as P-glycoprotein
or multidrug-resistance proteins.
It is undeniable the importance of the BBB role in the preservation of brain
integrity by creating a unique extracellular fluid environment within the CNS. Strikingly,
despite the extensive human brain capillary network with approximately 650 km in
length, BBB provides an efficient barrier against the diffusion of most substrates, making
the brain practically inaccessible for high molecular weight and hydrophilic compounds
such as polar molecules and small ions (MISRA et al., 2003). Unfortunately, the
mechanisms involved in the protection of the brain against intrusive chemicals are also
responsible for preventing the CNS delivery of beneficial therapeutic agents (TACHIKAWA et
al., 2014).
The stringent permeability of the BBB by restricting the entry of various
substances into the brain remains the key hurdle for a successful development of many
CNS drugs. To overcome the multitude of obstacles that commonly hampers the CNS
permeation of potential therapeutic agents, intense research efforts have recently
focused on the design and exploitation of new strategies to more effectively deliver drug
molecules into the brain. Thus, different approaches for enhanced CNS drug targeting
have been investigated in the last years and may be divided into three main categories:
(1) optimisation of systemic CNS acting drugs administration based on chemical or

I General Introduction
32
physiological non-invasive methods, (2) transient disruption of BBB and (3) direct delivery
of therapeutics into the brain by employing invasive administration techniques
(DWIBHASHYAM and NAGAPPA, 2008; MISRA et al., 2003).
(1) Optimisation of Systemic CNS Acting Drugs Administration Based on Chemical
or Physiological Non-Invasive Methods
A variety of non-invasive CNS drug delivery methods have been proposed making
use of the large brain blood vessel network to gain widespread drug distribution. Such
methods usually rely upon chemical manipulation of the molecules which may include
alterations as lipophilic analogues and pro-drugs, carrier-mediated and vector-mediated
drug delivery systems (PATHAN et al., 2009).
Delivery of therapeutic agents to the CNS is arguably a huge challenge. The
endothelial cells that line the BBB microvasculature are joined together by highly resistant
tight junctions thus preventing the paracellular passage of polar solutes; and BBB
capillaries allow minimum pinocytosis which makes the transcellular diffusion across the
cell membranes the only feasible passive route for entering the brain (RAUTIO et al., 2008).
Experimental observations dictate that CNS penetration is clearly favoured by low
molecular weight, lack of ionisation at the physiological pH and high lipophilicity (MISRA et
al., 2003). In point of fact, the majority of neurotherapeutics has molecular weight
between 150 and 500 Daltons and Log octanol/water partition coefficient values ranging
from -0.5 to 6.0 (BEGLEY, 2004). A direct correlation exists between BBB permeability and
the ability of a drug to passively diffuse through the cell membrane lipid bilayer, whereby,
chemical manipulation by modifying drug physicochemical properties in order to increase
its lipophilicity is a possible strategy to improve CNS uptake. The design of more lipophilic
analogues has however lead frequently to very disappointing results. In practice, simply
increasing the lipid solubility of a drug molecule may have undesirable effects as the
solubility and bioavailability in plasma decreases and the extent of plasma protein biding
increases, resulting in lower concentrations of drug available for diffusion into the CNS
(BEGLEY, 2004; MISRA et al., 2003). In addition, it has been recognised that highly lipophilic
molecules present a greater predisposition to be substrates of the ATP-binding cassette
group of efflux transporters (e.g. P-glycoprotein, multidrug-resistance proteins and breast
cancer resistance protein), which are responsible for the extrusion of the drugs from the
cerebral capillary endothelial cells and the CNS back into the blood against a
concentration gradient (BEGLEY, 2004; GABATHULER, 2010). Hence, when a systemic
administration of a CNS acting drug is considered, a delicate balance between cerebro-
vascular permeability and plasma solubility is required. Specifically, an optimum octanol-
water partition coefficient with a LogP value of approximately 1.5 to 2.5 is recommended

Epilepsy I
33
for a drug to be effective following the delivery via the circulatory system (DWIBHASHYAM
and NAGAPPA, 2008; MISRA et al., 2003).
An attractive lipidization strategy that has been successfully employed to improve
the CNS transport of poorly penetrating therapeutic agents is their transient chemical
modification by using the pro-drug approach. Pro-drugs are bioreversible derivatives of
drug molecules that must undergo a chemical or enzymatic biotransformation to the
active forms within the body, prior to exerting a pharmacological effect (RAUTIO et al.,
2008). The major goal in pro-drug design is to overcome the various physicochemical,
pharmaceutical, biopharmaceutical, and/or pharmacokinetic limitations of the parent
drug, which otherwise would hinder its clinical use (RAUTIO et al., 2008). Among several
problems, pro-drug technology may provide an effective tool in solving drug formulation
and delivery issues, such as poor water solubility or inadequate brain penetration. To
enhance drug permeation through the BBB, pro-drugs are often formulated by attaching
chemical moieties that increase the lipophilicity of the parent compound (DWIBHASHYAM
and NAGAPPA, 2008). Fairly lipid soluble pro-drugs can thus enter the CNS more readily,
and then be converted into the pharmacologically active form solely within the CNS.
Nevertheless, as it was mentioned before, while high lipophilicity may facilitate drug
movement across the BBB, it also tends to increase the efflux processes and the uptake
into other peripheral tissues, causing an augmented tissue burden. Furthermore, distinct
metabolic conversions can occur beyond the transition of the pro-drug into the parent
compound which may contribute to the formation of potential toxic products (MISRA et
al., 2003). Therefore, the low selectivity, the poor biophase retention and the possibility
of reactive metabolites generation often compromise the therapeutic index of
pharmacological agents masked as pro-drugs (MISRA et al., 2003).
CNS targeting of either drugs or pro-drugs can also be improved by taking
advantage of the physiologic nature of the BBB. Many polar molecules such as glucose,
amino acids, insulin, growth hormone, etc. are fundamental substances for the
maintenance of brain homeostasis which, unlike their low lipid solubility might suggest,
present high permeability through the BBB (BEGLEY, 2004; GABATHULER, 2010). In fact, these
molecules are recognised by specific endogenous receptors or transport mechanisms
expressed in the membranes of brain capillary endothelial cells that allow a carrier-
mediated entry of the compounds either by facilitated diffusion or energy-dependent
transport (BEGLEY, 2004; GABATHULER, 2010). Conjugation of drugs to ligands like
endogenous transporter substrates, modified proteins or anti-receptor specific
monoclonal antibodies results in a higher affinity of the compounds to the BBB influx
transporter systems, thus enabling an easier CNS penetration of molecules that would
otherwise have minimal access to the brain (BEGLEY, 2004; GABATHULER, 2010; RAUTIO et al.,

I General Introduction
34
2008). In general, these physiological strategies are promising, but need careful attention
to capacity and rates of transport versus plasma clearance (LO et al., 2001).
(2) Transient Disruption of BBB
Modulating the strength of the tight junctions between cerebral endothelial cells,
so that the paracellular route of access to the brain is either partially or completely
opened, is an approach that has been used to enhance BBB permeation of drugs.
Theoretically, the weakening of BBB intercellular connections provides an enhanced
endothelium extravasation of systemically administered drugs, leading to increased brain
parenchymal concentrations (MISRA et al., 2003; STENEHJEM et al., 2009). A variety of
different techniques that transiently disrupt the BBB integrity have been explored. An
often tested approach, primarily used for the treatment of brain tumours, is the osmotic
opening of the barrier involving the infusion via carotid artery of hyperosmolar
substances like mannitol or arabinose (LO et al., 2001; PARDRIDGE, 2007, 2005). The high
osmotic pressure imposed by the injection of hypertonic solutions into the cerebral
circulation leads to passive diffusion of water out of the cells causing brain endothelial
cell shrinkage. As a result, the disarrangement of extracellular domains of the proteins
forming and regulating the endothelium tight junctions occurs, which transiently
facilitates the entry of drugs paracellularly (ALAM et al., 2010). Pharmacological opening of
the BBB comprising the administration of bradykinin analogues and alkylglycerols has also
been proposed (ALAM et al., 2010; BEGLEY, 2004). More recently, the application of
ultrasound and electromagnetic radiation emerged as a very attractive BBB disruption
technique since it can be focused with some precision to a particular region of the brain,
allowing a selective modulation of the BBB at a preferred site, rather than globally
throughout the entire brain (BEGLEY, 2004; STENEHJEM et al., 2009).
Regardless the methodology employed, BBB disruption, even for brief periods of
time, is usually associated to vascular pathology and chronic neuropathological changes in
the brain (PARDRIDGE, 2007). Undermine BBB integrity by breaking down the
interendothelial tight junctions is, of course, a non-selective process and all serum
constituents, including albumin, viruses, toxicants and other potentially circulating
damaging substances may gain entry from blood to brain (ALAM et al., 2010; STENEHJEM et
al., 2009). Astrogliosis, as a result of astrogliatic reactions produced by plasma proteins
leakage like albumin to parenchymal compartment, is the most serious complication
(ALAM et al., 2010; PARDRIDGE, 2007). Owing to the induced brain vulnerability, BBB
disruption techniques always require patient hospitalisation in order to ensure an expert
administration and close medical monitoring (STENEHJEM et al., 2009).

Epilepsy I
35
(3) Direct Delivery of Therapeutics into the Brain by Employing Invasive
Administration Techniques
Despite advances in rational CNS drug design and BBB disruption techniques,
many potentially efficacious drug molecules still cannot penetrate into the brain
parenchyma at therapeutic concentrations. Therefore, a third class of strategies aiming at
enhancing CNS targeting has been explored based on direct delivery methodologies that
do not rely on the cardiovascular system. These approaches have the advantage of
delivering much higher concentrations of neurotherapeutics by directly administrating
the drug into the CSF or parenchymal space, subsequently reducing the drug distribution
throughout peripheral tissues and, as a consequence, the unwanted systemic side-effects
(ALAM et al., 2010). Intracranial techniques comprising intracerebral, intraventricular and
intrathecal administration routes are invasive delivery methods extensively studied both
in laboratory and clinical trials that afford a direct neurosurgical introduction of drugs into
the brain or CSF, bypassing both the BBB and BCSFB (ALAM et al., 2010; LO et al., 2001;
PARDRIDGE, 2005). In general, drug instillation can be achieved by first drilling a hole in the
skull and then, inserting an intrathecal catheter or a locally controlled release polymeric
implant (also called as wafer). Intracranial drug administration results in immediate high
drug concentrations and long drug half-life in the CSF due to the minimised protein
binding and decreased enzymatic activity comparatively to blood. Since CSF freely
exchanges molecules with the extracellular fluid of the brain parenchyma, direct
delivering of drugs into the CSF could theoretically be converted in therapeutic CNS drug
concentrations (MISRA et al., 2003). Regrettably, apart from the required surgical
intervention, transcranial delivery approaches are commonly associated to a number of
drawbacks that compromise their potential. The success of these methodologies is
restrained by the slow rate of drug distribution within the CSF, the limited diffusion
coefficient of the compounds from the depot site into the brain parenchyma, and the
brain tissue damage induced by the insertion of solid implants and rapid injection of fluids
into small ventricular volumes, increasing intracranial pressure and thereby, the incidence
of haemorrhage, CSF leaks, neurotoxicity and CNS infections (BEGLEY, 2004; LO et al., 2001;
MISRA et al., 2003; PARDRIDGE, 2007, 2005; PATHAN et al., 2009). The high turnover rate of
the CSF, with the entire volume being produced and completely absorbed into the venous
circulation every four to five hours, implies that, after intraventricular drug injection, the
compound is rapidly drained back into the blood, becoming essentially equivalent to a
slow IV infusion (LO et al., 2001; MOHANACHANDRAN et al., 2012; PARDRIDGE, 2007). Therefore,
intra-CSF drug injection is a suitable strategy to deliver therapeutic agents to the surface
of the brain but fail to result in drug accumulation in parenchymal structures of the deep

I General Introduction
36
brain which is highly essential for sustained drug release (ALAM et al., 2010;
MOHANACHANDRAN et al., 2012).
Although regarded as promising strategies, the aforementioned CNS direct drug
delivery techniques are not frequently applied in the clinic primarily because of their
complexity, invasiveness and associated risks. A great deal of interest has recently been
focused on the exploitation of the IN route for a non-invasive delivery of therapeutic
agents directly to the brain. Until not so long ago, due to the high vascularisation and
permeability of the nasal epithelium, IN route was assumed as a suitable and reliable
approach for systemic delivery of drugs, allowing a rapid and extensive absorption of the
compounds with plasma drug profiles sometimes almost identical to those obtained after
IV injection (GRASSIN-DELYLE et al., 2012). Nonetheless, the unique anatomical connection
between the nasal cavity and the CNS has been widely investigated during the last
decades in what concerns to its feasibility to directly transport therapeutics into the CSF
and brain by circumventing the BBB (MERKUS and VAN DEN BERG, 2007). Indeed, the
olfactory region is the only site in the human body where the nervous system is in direct
contact with the surrounding environment, providing a great opportunity for drugs
administered by the IN route to gain a quick and easy access to the brain, minimising their
systemic exposure (GRAFF and POLLACK, 2005; JOGANI et al., 2008).
IN administration has thus come to the forefront as an alternative to invasive
delivery methods like intracerebral or intraventricular injections to bypass the BBB and
rapidly target therapeutics directly to the CNS by using pathways along the olfactory and
trigeminal nerves innervating the nasal passages (SINGH et al., 2013). IN delivery not only
circumvents the BBB but also avoids hepatic first-pass and systemic dilution effects,
reduces drug delivery to non-targeted tissues, facilitates administration of low doses and
in turn minimises toxicity (JOGANI et al., 2008). Taking into account these merits allied to
the simple, practical, non-invasive and convenient way of drug delivery, IN administration
has been assigned as a relevant and promising route for CNS targeting of drugs.
The recognition of the nose-to-brain transport and the therapeutic viability of IN
route arouse a wide interest by the scientific community and currently, it is an area of
intense research. Physiological and histological data from animals and man have already
demonstrated that mucosa in the upper part of the nose is connected with the cerebral
perivascular and subarachnoid spaces of the brain olfactory lobes, which would make this
pathway for drug delivery feasible. Several experimental studies have been conducted to
establish the qualitative and quantitative transport of various low molecular weight drugs
as well as therapeutic peptides and proteins through the nasal mucosa to the brain. To
date, numerous evidences supporting the target-specific delivery of molecules from nasal
cavity to the CNS have been reported.

Epilepsy I
37
In many CNS disorders like Alzheimer’s disease, Parkinson’s disease, migraine, pain
and epilepsy, a rapid and/or specific targeting of drugs to the brain would definitely be
beneficial; whereby, a major therapeutic advantage from IN drug delivery could be taken
if the nose-to-brain pathway is confirmed. The question is whether this new route of drug
delivery is a real treatment option or merely a scientific claim. Unfortunately, the nose-to-
brain transport hypothesis is still controversial. While improved delivery to the brain via
the IN route has been accounted for some therapeutic molecules, there are other cases
for which no evidence of preferential delivery to the brain following IN dosing was found.
In this context, aware of the high potential that IN delivery has to offer and the
limitations of the current pharmacological therapy of epilepsy, we intend with the work
underlying the present thesis to investigate the feasibility of the IN delivery as an
alternative route for AED administration. Thus, in order to get a better understanding of
this possible transport route, a comprehensive characterisation of the nose and its
particular features will be thoroughly addressed in the next section.

I General Introduction
38

I. 2. INTRANASAL DRUG
DELIVERY


Intranasal Delivery I
41
I. 2. INTRANASAL DRUG DELIVERY
Oral delivery is undeniably the most desirable, preferred and convenient method
of drug administration whenever systemic effects are intended. However, low oral
bioavailability of some compounds due to extensive hepatic metabolism and
gastrointestinal degradation has prompted the search of more effective routes, apart
from the IV injection, to improve their systemic delivery (BEHL et al., 1998; PIRES et al.,
2009). Different transmucosal routes involving nasal, buccal, rectal and vaginal cavities
have demonstrated distinct advantages over peroral administration. Along with their
convenience, the avoidance of hepatic first-pass metabolism and pre-systemic elimination
in the gastrointestinal tract is the key attribute offered by these unconventional routes.
While rectal and vaginal routes are commonly less preferred as they usually cause
irritation and are less patient compliant, buccal administration frequently deals with the
problem of acceptability when an unpleasant taste of drug formulation is present (SINGH
et al., 2013). Thus, nasal cavity has been put forward as a highly promising site for drug
delivery, being now recognised as a useful and reliable alternative to both oral and
parenteral administrations.
The administration of therapeutic compounds via nose is actually not a totally new
approach for drug delivery (BHISE et al., 2008). Smelling salts, tobacco, and hallucinogens
have been used by inhalation for centuries by different cultures worldwide. Historically,
the delivery of drugs via the nasal route has received attention of mankind since ancient
time. This administration route was considered by various traditional systems of medicine
such as Unani, Ayurvedic as well as Persian (ZARSHENAS et al., 2013). Nasal therapy, also
called “Nasya Karma”, has been an established therapeutic procedure in the Ayurvedic
system of Indian medicine wherein herbal medicinal oils, powders, liquids or fumes are
administered through the nostrils for treating diseases affecting the head area (APPASAHEB
et al., 2013).
Conventionally, drugs have been administered intranasally for their local effect on
the mucosa, whereby the prevention and treatment of topical nasal conditions like
allergy, sinusitis, congestion and infections via the nose is a common routine practice
(BHISE et al., 2008; CHOUDHARY and GOSWAMI, 2013). Nevertheless, in the last few decades,
IN drug delivery has been given a new lease of life. As the market for the delivery of
topical drugs matures, the potential for IN administration of systemically-acting drugs is
developing at a remarkably fast pace (ILLUM, 2012; SOUTHALL and ELLIS, 2000). In fact, the
early 1980s saw the introduction of nasal route as a promising systemic delivery
alternative to other conventional drug delivery methods (ALSARRA et al., 2010). Many
drugs have been shown to achieve better systemic bioavailability through nasal route as
compared to oral administration. Inclusively, it has been reported that lipophilic drugs are

I General Introduction
42
generally well absorbed from the nasal cavity with pharmacokinetic profiles often
identical to those obtained after an IV injection and bioavailability approaching 100%
(ILLUM, 2003). The recognition of nasal mucosa as a therapeutically viable route for
systemic administration of drugs came from its high permeability and large surface area
providing a fast and extensive absorption of the compounds into the systemic circulation,
also avoiding the hepatic first-pass elimination. A special interest has been laid on those
drugs that are orally ineffective and must be administered by injection, as for instance
small polar molecules, peptides and proteins. Hence, the pharmaceutical world has seen
an increasing number of systemically acting drugs being marketed as nasal formulations
and many more are at various stages of development. Currently, IN delivery is being
employed in treatments for migraine, smoking cessation, acute pain relief, nocturnal
enuresis, osteoporosis and menopausal hormone replacement (ALAGUSUNDARAM et al.,
2010; ILLUM, 2012). Other examples of therapeutic areas under development or with
potential for IN delivery include cancer, epilepsy, nausea, rheumatoid arthritis and
insulin-dependent diabetes (ALAGUSUNDARAM et al., 2010).
Recent developments have highlighted the possibility of exploiting the nasal route
for direct transport of drugs from nose to brain by circumventing the BBB (CHAPMAN et al.,
2013; ILLUM, 2004). Although the ability of IN delivery to enhance systemic bioavailability
of drugs is remarkably important for some applications, the potential of bypassing the
systemic circulation and delivering drugs directly into the brain represents a particularly
novel, attractive but yet little understood feature (DJUPESLAND et al., 2014). Targeting the
brain via the olfactory epithelial region comes to offer a new favourable approach for
treating CNS disorders, in view of the unique anatomical connection between the brain
and nasal mucosa which may constitute a promising non-invasive pathway to deliver
therapeutic agents directly into the biophase (DJUPESLAND et al., 2014). Therefore, many
CNS-acting compounds that do not normally cross and even those that actually can
permeate the BBB upon systemic administration may likely find in the IN route a viable
option to be efficiently delivered to the brain (HANSON and FREY II, 2008). As a result, a
preferential drug uptake into the brain can be achieved and the peripheral exposure
minimised, improving not only the therapeutic efficacy but also tolerability.
IN administration is steadily gaining momentum since, in addition to local
application, its positive attributes also offer an important avenue to deliver drugs for
systemic and CNS effects. To comprehend the potential of the nasal cavity as a route for
drug delivery it is essential to understand the morphological structures and physiological
features affecting the uptake of drugs across the nasal mucosa. Thus, in the beginning of
this section, a brief description of the general anatomical, histological and physiological
characteristics of the human nose will be given. As the purpose of the present work

Intranasal Delivery I
43
mainly relies on the evaluation of the IN route potential to administer certain AEDs, a
special focus will be placed on nose-to-brain drug delivery. The theoretical concepts
underlying the hypothesis of CNS delivering of drugs via the nasal route will be presented.
At the end, several relevant and pertinent aspects concerning the experimental
procedures commonly employed in the assessment of nose to CNS drug transfer will also
be appropriately discussed.
I. 2.1. ANATOMY AND PHYSIOLOGY OF THE NASAL CAVITY
The nose as a drug delivery site has a number of unique features related to its
anatomy and physiology. In order to fully comprehend the intricacies of nasal drug
delivery and to make any rational assessment about the usefulness of the IN route either
for systemic or CNS applications, it is important to have an understanding of the most
relevant nasal cavity morphological and physiological factors affecting these functions.
I. 2.1.1. NASAL ANATOMY AND HISTOLOGY
The nose is a protruding structure in the face supported by a framework of bone
and cartilage which gives it a pyramidal conformation that can greatly differ in size and
shape depending on race. The human nasal cavity comprises the space between the base
of the skull and the roof of the mouth consisting of a chamber with about 12-14 cm long
and approximately 5 cm high, superiorly enclosed by the ethmoid and sphenoid, and
laterally, by the ethmoid, maxillary and inferior conchae bones (GIZURARSON, 2012; PIRES et
al., 2009). The total surface area of the human nasal cavity is about 150-160 cm2 and the
corresponding total volume is near 15-20 mL (GIZURARSON, 2012; LOCHHEAD and THORNE,
2012). The nose is longitudinally divided by a cartilaginous nasal septum in two
symmetrical and non-connected passages, each one opening at the face through nostrils
and extending posteriorly to the upper part of the throat at the level of the nasopharynx,
where the two halves of the airway join together.
According to its anatomical and histological characteristics, the nasal cavity is
mainly composed of three distinct functional areas which include the nasal vestibule, the
respiratory region and the olfactory region (Figure I.2.1).

I General Introduction
44
Figure I.2.1 Schematic representation of the human nasal cavity. (I) Longitudinal cross-section; (II)
Transversal cross-section; A. Nasal vestibule; B. Respiratory region; C. Olfactory region; 1. Inferior
turbinate; 2. Middle turbinate; 3. Superior turbinate; 4. Nasopharynx; 5. Sphenoid sinus; 6. Frontal
sinus; 7. Septal cartilage; 8. Ethmoid sinus; 9. Maxillary sinus (Adapted from SERRALHEIRO et al.,
2012).
The nasal vestibule is the most anterior part of the nasal cavity and corresponds to
the region just inside the nostrils with an area of about 0.6 cm2 (ILLUM, 2003). The luminal
surface is lined by a stratified squamous and keratinised epithelium containing nasal hairs
in addition to sebaceous and sweat glands, which is gradually converted into a posterior
pseudostratified ciliated columnar epithelium that covers the respiratory region (ILLUM,
2004; LOCHHEAD and THORNE, 2012). Being very similar to the external skin, the vestibular
area serves as a first barrier against airborne particles with poor vascularisation, affording
on one hand a desirable protection of the underlying tissues from atmospheric toxic
agents while limiting the absorption of drugs on the other (BITTER et al., 2011; PIRES et al.,
2009).
The respiratory region is the largest area of the nasal cavity comprising three nasal
turbinates (also called conchae): the inferior, the middle and the superior that are
projected from the nasal lateral walls into the airway lumen and play an important role in
filtering, humidification and warming of the inspired air (MYGIND and DAHL, 1998; PIRES et
al., 2009). These turbinates are part of a convoluted and folded structure which, by
increasing the resistance to the airflow through the nasal passages creates turbulence,
thus ensuring an intimate contact between the inhaled air and the mucosal surface
(GIZURARSON, 1990; ILLUM, 2003). Due to its large surface area and rich vascularisation, the

Intranasal Delivery I
45
respiratory mucosa provides the essential conditions for a significant drug absorption into
the systemic circulation (ALSARRA et al., 2010; ARORA et al., 2002).
The olfactory region is located in the roof of the nasal cavity, just below the
cribriform plate of the ethmoid bone, lying partly on the nasal septum and partly on the
superior turbinate (JONES, 2001; MISTRY et al., 2009). The cribriform plate is a horizontal
bone that separates the nasal chamber from the brain. Nevertheless, its perforated
structure by small vascular apertures, also called foramina, enables access for the nerve
endings to enter the outer surface at the olfactory mucosa (GIZURARSON, 2012). Similarly to
the respiratory epithelium, the olfactory one is highly vascularised and pseudostratified
but contains specialised olfactory receptor cells that are responsible for smell perception
(PIRES et al., 2009; WATELET and CAUWENBERGE, 1999). While humans have relatively simple
noses with breathing as the primary function, other mammals have more complex nasal
structures mainly targeted to olfaction (HARKEMA et al., 2006; REZNIK, 1990). Hence, the
area of the nasal cavity covered by olfactory mucosa in humans is restricted and
corresponds to less than 10% which is much smaller in comparison to dogs (~77%) and
rodents (~50%), whose sense of smell is extremely developed (ILLUM, 2004; LOCHHEAD and
THORNE, 2012). Owing to the unique direct connection between the nose and the brain,
absorption of drugs across the olfactory neuroepithelium appears to be a valuable option
to target therapeutics from the nasal cavity to the CNS.
Surrounding the nasal cavity there are paired air-filled spaces – the paranasal
sinuses – that are located inside the bones of the face and head. According to their
location and, therefore, the bone involved, paranasal sinuses can be divided in maxillary,
frontal, sphenoid and ethmoid sinus (JONES, 2001). Even though their intrinsic functions
have not been yet clarified, it is suggested that they form a collapsible framework to
protect the brain from trauma, act as auxiliary chambers to heat and humidify the
inspired air, also providing resonance to the voice (GIZURARSON, 2012).
Respiratory Mucosa
The nasal respiratory mucosa covers approximately 80-90% of the total nasal
cavity area in humans (LOCHHEAD and THORNE, 2012). It is constituted by a pseudostratified
columnar secretory epithelium resting on a collagen basement membrane and a lamina
propria which is a connective tissue richly supplied with blood vessels, nerves, glands,
lymphatic tissue and immune cells (PIRES et al., 2009).
The human respiratory epithelium is comprised of four major and dominant types
of cells which include ciliated and non-ciliated columnar cells, goblet cells and basal cells
(Figure I.2.2). The latter lie on the basement membrane and, unlike the remaining

I General Introduction
46
epithelial cells, do not extend sufficiently to the apical surface in order to reach the
airway lumen. Carrying the essential information on each of the other cell types, the basal
cells function as a reserve population by maintaining individual cell replacement in the
epithelium (GIZURARSON, 2012). Moreover, it is also believed that they help in the adhesion
of the other epithelial cells, specifically the columnar cells, to the basement membrane
(MYGIND and DAHL, 1998).
Figure I.2.2 Schematic representation of the different cell types constitutive of the nasal
respiratory epithelium (Adapted from GRASSIN-DELYLE et al., 2012).
Another cell type characteristic of the nasal respiratory epithelium is the goblet
cell, whose primary function is the secretion of the mucus that covers the epithelial cell
layer. These glandular cells are interspersed among the columnar cells throughout the
epithelium and differentiate by the presence of multiple granules filled with mucin on
their inside. Their contribution to the volume of nasal secretions is probably small
compared to that of the submucosal glands. Although little is known about their release
mechanisms, it seems that physical and chemical irritants of the environment as well as
biochemical mediators may stimulate goblet cell secretion (GIZURARSON, 2012; MYGIND and
DAHL, 1998).
The columnar cells correspond to the majority of the epithelium cells. Ciliated or
not, all of them are covered by numerous microvilli that are uniformly distributed over
the entire apical surface. These short and slender finger-like cytoplasmic expansions of

Intranasal Delivery I
47
the cell membrane considerably increase the surface area of the respiratory epithelium
available for systemic drug absorption, also preventing the surface from drying by
retaining the moisture essential for ciliary function (FORTUNA et al., 2014a; MYGIND and
DAHL, 1998). About 15-20% of the total number of respiratory cells display long
cytoplasmic mobile projections called cilia (ILLUM, 2000; MISTRY et al., 2009). Under
physiologic conditions, the cilia move in a coordinated way to propel mucus across the
epithelial surface towards the nasopharynx where it is either swallowed or expectorated.
This phenomenon, known as mucociliary clearance, is one of the main mechanisms of
defence of the nose and will be further discussed.
Owing to its vast surface area and richly supplied vascular nature, the respiratory
mucosa is considered the major site for drug absorption into the systemic circulation. The
blood supply of nasal mucosa comes mainly from ophthalmic, sphenopalatine and facial
arteries. The arterial blood flow irrigates a dense bed of capillaries and large venous
sinusoids that exist near the turbinate respiratory zone. The venous return involves the
ophthalmic, sphenopalatine and facial veins that convey into the internal jugular vein,
which in turn drains into the right heart chambers via the subclavian vein and the
superior vena cava (FORTUNA et al., 2014a; GRASSIN-DELYLE et al., 2012). These anatomical
features explain the absence of hepatic first-pass effect of drugs administered by the IN
route.
Olfactory Mucosa
The olfactory organ is the only externally exposed portion of the CNS, being
generally recognised as a “window to the brain” (ESCADA et al., 2009). The human
olfactory mucosa consists of a pseudostratified columnar epithelium resting on a
basement membrane and a highly cellular lamina propria (ESCADA et al., 2009). This
epithelium is a modified form of the respiratory epithelium and is predominantly
composed of three different cell types: ciliated olfactory receptor cells, sustentacular (or
supporting) cells and basal cells (Figure I.2.3).
The olfactory receptor cells are bipolar neurons primarily responsible for the
mediation of the sense of smell by conveying sensory information from the peripheral
environment to the CNS. They are appropriately interspersed among the sustentacular
cells, projecting a single dendrite to the surface of the olfactory neuroepithelium and a
single unmyelinated axon to the olfactory bulb (GIZURARSON, 2012; ILLUM, 2000). The
dendritic process, which extends to the free apical surface, terminates in a small knob
containing numerous non-motile cilia with specialised membrane chemical receptors for
odour molecules binding (ESCADA et al., 2009; MISTRY et al., 2009). The axon is gathered
together with other olfactory axons in small nerve bundles to pass through the lamina

I General Introduction
48
propria and the cribriform plate of the ethmoid bone towards the olfactory bulb, where it
establishes a synapse with a second order neuron by connecting to a mitral or a tufted
cell at the level of the olfactory glomerulus (NAGAYAMA et al., 2004) (Figure I.2.3). These
nerve bundles, also called fila olfactoria, are conveniently ensheathed by Schwann cells
(or glial cells) which, in addition to supporting the transition of the axons from the
peripheral olfactory epithelium to the CNS, also create continuous fluid-filled perineural
channels that act as ionic reservoirs for action potential propagation (ESCADA et al., 2009;
MISTRY et al., 2009).
Figure I.2.3 Schematic illustration of the various cell types representative of the nasal olfactory
epithelium.
The sustentacular cells are elongated columnar cells with their tapered bases
resting on the basement membrane and many long microvilli extending from their
luminal surface. They surround olfactory receptor neurons providing metabolic and
physical support and contributing to regulate and maintain the appropriate extracellular
potassium levels required for neuronal activity (GIZURARSON, 2012; JONES, 2001). Basal cells
are the only type of cells that do not project to the epithelial surface, being merely in
contact with the underlying basement membrane. They are a well-recognised distinct
stem cell population of the olfactory epithelium once they are capable to continuously
regenerate olfactory receptor neurons along the life span (ESCADA et al., 2009). Upon

Intranasal Delivery I
49
differentiation, these cells can replace the neuroepithelium approximately every 40 days
(JONES, 2001).
Beneath the olfactory epithelium there is the lamina propria which contains blood
and lymphatic vessels, olfactory axon bundles, autonomic and trigeminal nerve fibres and
mucus-secreting tubuloalveolar Bowman’s glands (ILLUM, 2000; MISTRY et al., 2009). These
exocrine acinar-type glands are under the control of the parasympathetic nervous system
to produce and secrete mucus that is essential for the olfactory transduction by acting as
a solvent for odour molecules.
I. 2.1.2. NASAL PHYSIOLOGY
The nose is a structurally and functionally complex organ of the upper respiratory
tract whose primary functions are breathing and olfaction. In addition to heating,
moistening and filtering the particles in suspension of the inhaled air, the nose also serves
as a first-line of defence against external insults, once it presents several physiological
mechanisms of protection that avoid the access of pathogenic agents, toxicants and
airborne pollutants to the lungs. Therefore, the absorption and delivery of drugs across
the nasal passages are likewise conditioned by such physiological barriers.
Nasal Mucus and Mucociliary Clearance
Under physiological conditions, the nasal respiratory epithelium is covered with a
thin layer of a watery and sticky fluid, the mucus, which is produced and secreted by
submucosal glands and goblet cells (SAHIN-YILMAZ and NACLERIO, 2011). Approximately 1.5-2
L of mucus is produced daily (UGWOKE et al., 2005). This nasal secretion consists of a
complex mixture of several materials mainly composed of water (95%), mucin (2%), other
proteins such as albumin, immunoglobulins, lysozyme and lactoferrin (1%), inorganic salts
(1%) and lipids (˂1%), presenting a pH value that ranges from 5.5 to 6.5 (JADHAV et al.,
2007; MYGIND and DAHL, 1998). Due to its adhesive characteristics, the nasal mucus acts as
a physical barrier of protection onto which particles, pathogens and xenobiotics in the
turbulent inhaled airstream can impact and be entrapped.
The continuous blanket of mucus lining the respiratory epithelium is a double
layer with about 10-15 µm thick consisting of an aqueous lower sol phase surrounding the
cilia and a superficial layer of viscous gel that covers the tips of the cilia (MYGIND and DAHL,
1998; SAHIN-YILMAZ and NACLERIO, 2011; UGWOKE et al., 2001). Through the action of the
coordinated cilia beating, the more viscous gel layer, together with deposited noxious
substances, is propelled posteriorly along the epithelial surface towards the nasopharynx
from where it can be swallowed or expectorated. The mucus flow rate has been

I General Introduction
50
measured in humans to be in the order of 5 mm/min, so that the renewal of the nasal
mucus layer is accomplished every 15-20 min (ILLUM, 1996).
The combination of the viscoelastic nasal mucus properties with the ciliary activity
of the respiratory epithelium results in an important and efficient physiologic mechanism
of defence that, by removing toxic materials from the nasal cavity, prevents them from
reaching the lower airways. This mechanism is designated as mucociliary clearance (MCC)
and it is fundamental to maintain the integrity of the respiratory tract. Unfortunately, it
also exerts a very significant impact on IN drug delivery by limiting the time available for
absorption to occur (UGWOKE et al., 2001).
MCC has been described as a “conveyer belt” wherein ciliated cells provide the
driving force and mucus functions as a tacky fluid that collects and disposes foreign
particles (MARTTIN et al., 1998). The efficiency of this cleansing system is therefore
dependent on the length, density and beat frequency of cilia as well as the viscoelastic
character and amount of mucus (JONES, 2001; MARTTIN et al., 1998; PIRES et al., 2009). Any
changes concerning mucus production, mucus composition or ciliary activity, whether by
environmental or pathological conditions, may influence the normal behaviour of the
MCC system. While in view of nasal drug delivery, a decrease in MCC rate would be
beneficial to increase the residence time of drugs within the nasal cavity thus enhancing
their permeation, a longer contact of the airway mucosa with irritant substances and
pathogenic microorganisms could eventually lead to local tissue damage and respiratory
infections (ARORA et al., 2002; MARTTIN et al., 1998).
The rapid MCC of drug formulations that are deposited in the nasal cavity is
inevitably considered an important factor underlying the low bioavailability of intranasally
administered compounds. In particular, polar drugs are the most affected since they are
highly soluble in mucus and their permeation across the nasal epithelium is very slow. In
order to attain a prolonged residence time of therapeutic agents within the nose, several
strategies have been performed; among them, the incorporation of bioadhesive
excipients into the pharmaceutical formulations seems to be a suitable approach (UGWOKE
et al., 2001).
Nasal Metabolism
It is generally accepted that the IN route circumvents the gastrointestinal
elimination and the hepatic first-pass metabolism associated with oral drug delivery.
However, the nasal mucosa has a defensive enzymatic barrier against the entry of
xenobiotics, and the original concept of nasal drug delivery without first-pass effect is no
longer applicable (SARKAR, 1992). In fact, the metabolic activity in nasal cavity plays an
important role in bioactivation and deactivation of inhaled or systemically applied

Intranasal Delivery I
51
toxicants, and therefore it can also be responsible for a possible reduction of the
intranasally administered drugs bioavailability, especially those containing peptides or
proteins (WONG and ZUO, 2010).
Drug-metabolising enzymes are present in nasal secretions, in nasal epithelial cells
(where they may be free or membrane bound), and in the lamina propria (HINCHCLIFFE and
ILLUM, 1999). Several oxidative phase I enzymes such as cytochrome P450 (CYP)
isoenzymes, carboxylesterases and epoxide hydrolases, and conjugative phase II enzymes
like glucuronyltransferases and glutathione S-transferases have been identified in human
nasal tissue (MINN et al., 2002; SARKAR, 1992). Particularly important is the high levels of
various CYP isoenzymes detected in both respiratory and olfactory mucosa, since, as it is
known, this catalytic system is largely implicated on the metabolism of a huge number of
drugs. Interestingly, it has been found that the specific content of CYP in nasal mucosa
was the second most abundant after the liver when it is expressed in relation to gram of
tissue, and its metabolic activity is actually more pronounced than in any other tissue
(ILLUM, 1996; SARKAR, 1992). Notwithstanding, due to the short period of contact time
between the drug and enzyme within the nasal cavity, as well as the higher drug-to-
enzyme ratio compared to the gastrointestinal tract and liver, no significant effect is
generally accounted on the extent of absorption of small molecule drugs administered by
the IN route (HUSSAIN, 1998). In contrast, the same aspect is no longer observed for
therapeutic peptides and proteins once enzymatic degradation, either by nasal
peptidases or proteases, has been suggested as one of the main barriers against the
absorption of many biocompounds (SARKAR, 1992; WONG and ZUO, 2010).
Regardless of its impact on drug disposition, the extensive enzymatic machinery
within the nose contributes to a “nasal first-pass effect” that affects the pharmacokinetic
and pharmacodynamic profiles of nasally applied drugs, and thus it should not be
neglected.
Nasal Permeability
For effective systemic or CNS effects, intranasally administered therapeutic
molecules have to primarily cross the mucus layer and nasal epithelial membranes before
reaching the blood circulation or the brain. The first step in nasal drug permeation is the
passage through the mucus. In general, small and uncharged particles can easily
permeate through this layer, whereas large or charged particles may find it more difficult
to cross (FORTUNA et al., 2014a). Indeed, a greater drug permeation is usually achieved at a
nasal pH that is lower than the drug’s pKa because under such conditions, the molecules
exist as unionised species (ARORA et al., 2002). On the other hand, the establishment of
intermolecular interactions between the drugs and the glycoprotein chains of the mucus

I General Introduction
52
may hamper their diffusion across the layer, becoming more difficult as the molecule size
increases.
After transposing the mucus, drugs have to transverse the nasal epithelial barrier.
Therapeutic agents are able to pass through the nasal mucosa by two different pathways
which include the transcellular route (across the cell) and the paracellular route (between
the cells) (Figure I.2.4).
Figure I.2.4 Mechanisms of drug transport across nasal mucosa. A. Transcellular passive diffusion;
B. Paracellular passive diffusion; C. Carrier-mediated transcellular transport; D. Vesicular-
mediated transcellular transport (Transcytosis).
The transcellular route mainly encompasses transport via a lipoidal pathway in
which drugs can cross the epithelial cell by a simple concentration-dependent passive
diffusion process, by receptor/carrier mediation or by vesicular transport mechanisms
(ILLUM, 2002; JADHAV et al., 2007) (Figure I.2.4). Therefore, lipophilic drugs may incorporate
into the lipid bilayer of the cell membrane, diffuse through it and transverse the cell
cytoplasm by a process of passive diffusion. The passive transcellular transport across the
nasal mucosa is mainly a function of the lipophilic nature of a drug compound and it
shows rate dependency on its lipophilicity, whereby, highly lipophilic drugs are expected
to have rapid and complete transnasal uptake (JADHAV et al., 2007; VYAS et al., 2005). An
active internalisation of the drugs can also be accomplished after recognition by carrier
transporters expressed at the membrane of epithelial cells. These carriers comprise
organic cation and amino acid transporters that mediate the influx of a wide variety of
drugs across the membrane (FORTUNA et al., 2014a; SINGH et al., 2013).
The paracellular route involves a slow and passive aqueous mode of transport via
gaps or pores between adjacent epithelial cells. The nasal epithelial cells are closely

Intranasal Delivery I
53
packed by intercellular connections consisting of tight junctions and desmosomes that
create a dynamic, adjustable and semi-permeable diffusion barrier between the cells,
hindering the paracellular passage of various hydrophilic compounds (ILLUM, 2004). In
general, tight junctions are observed in both respiratory and olfactory epithelium. They
are domains of occluded intercellular clefts composed by multiprotein complexes, whose
opening and closing is regulated by multiple cell signalling mechanisms (BALDA and MATTER,
1998; WOLBURG and LIPPOLDT, 2002). As their normal diameters in nasal mucosa vary
between 3.9 and 8.4 Å (ILLUM, 2007), the transport of drugs through the paracellular space
is strictly controlled, being highly dependent of their molecular weight. Hence, there is an
inverse relationship between nasal permeation and the molecular weight of water-
soluble compounds (ARORA et al., 2002). A poor bioavailability has been reported for drugs
presenting a molecular weight greater than 1000 Daltons (JADHAV et al., 2007; VYAS et al.,
2005).
The nose is a complex organ from a kinetic point of view since three different
processes – deposition, clearance and absorption of drugs occur concurrently within the
nasal cavity (JOGANI et al., 2008). Indeed, apart from the physicochemical properties of the
compound and formulation, drug transport across the nasal epithelium is largely affected
by several nasal physiological factors. The foremost obstacles to drug permeation relate
to the distribution and deposition site of drugs within the nasal cavity, the possible nasal
first-pass metabolism, and the rapid elimination of the drug from the absorption site as a
result of the MCC mechanism.
The permeability at the site where the formulation is deposited and the area of
the nasal cavity exposed are determinant factors that affect the efficiency of nasal
absorption (ARORA et al., 2002). Thus, while an anterior deposition at the vestibule may
prolong the nasal residence time, the absorption of drugs is relatively low. In opposition,
an enhanced permeability could be achieved if the drug was deposited in the respiratory
area, however, the rapid elimination of the dosage form due to the MCC process may
limit the time available for absorption to occur which significantly compromises its rate
and extension. A posterior distribution targeting the olfactory epithelium may facilitate
direct transport of the drug into the brain, but in case of susceptible compounds, it could
increases enzymatic degradation (UGWOKE et al., 2001). Therefore, according to the
intended therapeutic effect, deposition of nasally instilled substances in a specific region
should be regular and predictable in order to attain desirable results. Nonetheless, nasal
drug distribution and deposition are influenced by a myriad of determinants which may
include the type of formulation, administration device, particle size and pathological
condition of the nasal cavity (CHUGH et al., 2009; TALEGAONKAR and MISHRA, 2004).

I General Introduction
54
Another contributing, but often less considered factor to the low transport of
drugs across the nasal membrane is the possibility of an enzymatic degradation of the
molecules either within the lumen of the nasal cavity or during the passage through the
nasal epithelial barrier (UPADHYAY et al., 2011). In fact, as aforementioned, many
compounds, such as cocaine, nicotine, alcohols, decongestants and anaesthetics are
known to be metabolised by the nasal P450-dependent monoxygenase system (BEHL et
al., 1998). However, owing to the high expression of proteolytic enzymes in nasal tissues,
the effect on the stability of nasally administered peptides and proteins is generally much
more pronounced.
The general fast nasal removal of the administered drug formulations as a result of
the MCC mechanism is considered one of the most significant constraints underlying the
poor bioavailability of compounds administered by the IN route. This natural process of
defence severely limits the retention and the intimacy of the contact between the drug
and the mucosa, being especially critical for drugs that are not easily permeable across
the nasal membrane. Effectively, whenever a substance is nasally applied, it is rapidly
cleared from the nasal cavity with a clearance half-life of approximately 15-20 min
(MARTTIN et al., 1998). The consequences are not only restricted to the limited time
allowed for absorption; MCC also rules out the possibility for a controlled IN drug delivery
(UGWOKE et al., 2001).
Taking into account that absorption is a prelude to pharmacological effect, the
permeability of a drug across the nasal mucosa should be high enough in order to achieve
the therapeutic purpose. In this view and accordingly to the above considerations, several
strategies have been suggested to improve the nasal permeability of drugs which include,
among others, the use of pro-drugs, enzymatic inhibitors, absorption enhancers and
mucoadhesive delivery systems.

Intranasal Delivery I
55
I. 2.2. THE NOSE AS A SITE FOR DRUG DELIVERY – THERAPEUTIC APPLICATIONS
IN delivery represents an attractive and promising option for local, systemic and
CNS administration of a wide variety of therapeutic agents including not only small
molecules but also biocompounds. Clearly, the specific nature of the nasal mucosa
provides a series of unique attributes which render the nose both a therapeutic target
and a portal of entry for drug delivery.
The nose as a route for drug delivery offers a number of advantages (Table I.2.1)
that afford the maximisation of patient convenience, comfort and compliance (COSTANTINO
et al., 2007). Compared to other mucous membranes, the nasal mucosa is readily
accessible, highly vascularised and highly permeable, conferring a prompt and practical
doorway for small and large molecules. Its vast surface area allows a rapid onset of
pharmacological effect, an extensive systemic drug bioavailability and a potential
pathway for the transport of therapeutics directly into the CNS. By avoiding
gastrointestinal degradation and hepatic first-pass metabolism, the IN route is particularly
effective for drugs that are poorly orally absorbed or have to be given by injection
(BAHADUR and PATHAK, 2012). In addition, being non-invasive, essentially painless and easily
administered by patients or physicians, IN administration can be applied in both chronic
and emergency treatments and be potentially performed either inside or outside the
hospital environment (COSTANTINO et al., 2007).
Nevertheless, despite its multiple key benefits, the IN route also presents several
intrinsic limitations (Table I.2.1) that should be taken into account during the discovery
and development of new chemical entities/drug formulations intended for nasal
application. Such drawbacks relate to the specific anatomical, physiological and
pathological conditions of the nasal cavity that, together with physicochemical properties
of drugs and their final formulations, may compromise the extent of nasal drug
absorption and ultimately, the therapeutic efficacy (COSTANTINO et al., 2007; PIRES et al.,
2009).
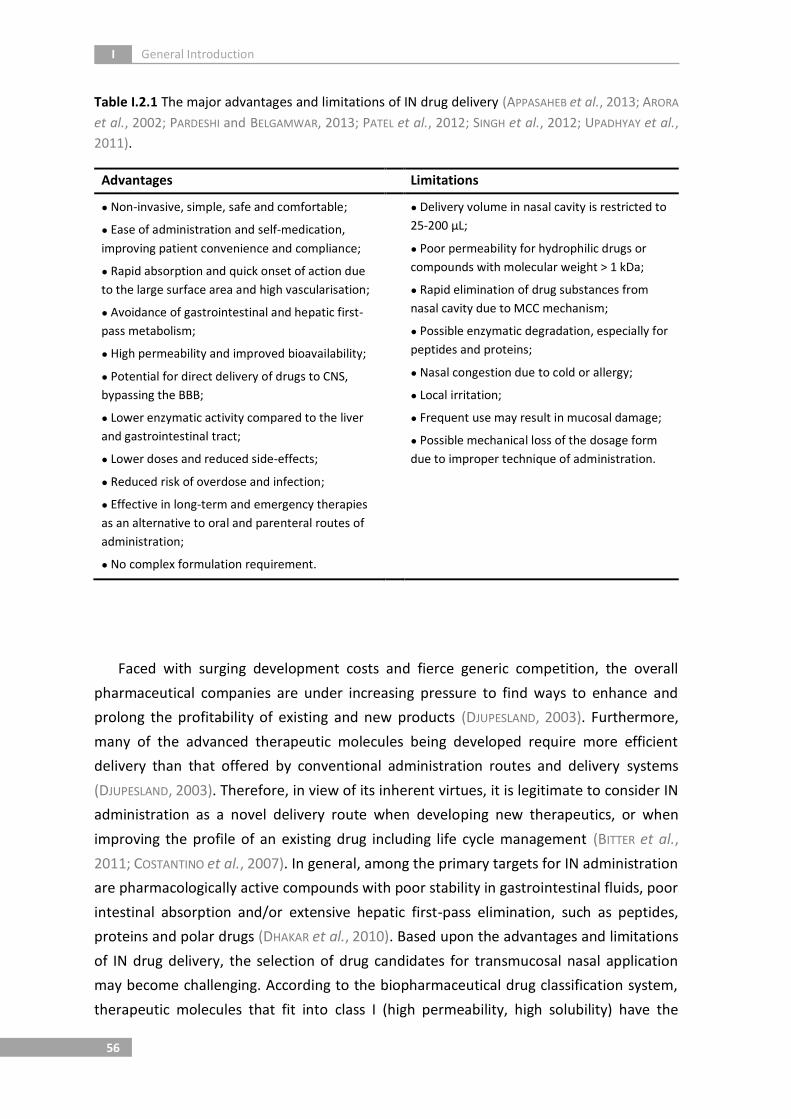
I General Introduction
56
Table I.2.1 The major advantages and limitations of IN drug delivery (APPASAHEB et al., 2013; ARORA
et al., 2002; PARDESHI and BELGAMWAR, 2013; PATEL et al., 2012; SINGH et al., 2012; UPADHYAY et al.,
2011).
Advantages Limitations
● Non-invasive, simple, safe and comfortable;
● Ease of administration and self-medication,
improving patient convenience and compliance;
● Rapid absorption and quick onset of action due
to the large surface area and high vascularisation;
● Avoidance of gastrointestinal and hepatic first-
pass metabolism;
● High permeability and improved bioavailability;
● Potential for direct delivery of drugs to CNS,
bypassing the BBB;
● Lower enzymatic activity compared to the liver
and gastrointestinal tract;
● Lower doses and reduced side-effects;
● Reduced risk of overdose and infection;
● Effective in long-term and emergency therapies
as an alternative to oral and parenteral routes of
administration;
● No complex formulation requirement.
● Delivery volume in nasal cavity is restricted to
25-200 µL;
● Poor permeability for hydrophilic drugs or
compounds with molecular weight > 1 kDa;
● Rapid elimination of drug substances from
nasal cavity due to MCC mechanism;
● Possible enzymatic degradation, especially for
peptides and proteins;
● Nasal congestion due to cold or allergy;
● Local irritation;
● Frequent use may result in mucosal damage;
● Possible mechanical loss of the dosage form
due to improper technique of administration.
Faced with surging development costs and fierce generic competition, the overall
pharmaceutical companies are under increasing pressure to find ways to enhance and
prolong the profitability of existing and new products (DJUPESLAND, 2003). Furthermore,
many of the advanced therapeutic molecules being developed require more efficient
delivery than that offered by conventional administration routes and delivery systems
(DJUPESLAND, 2003). Therefore, in view of its inherent virtues, it is legitimate to consider IN
administration as a novel delivery route when developing new therapeutics, or when
improving the profile of an existing drug including life cycle management (BITTER et al.,
2011; COSTANTINO et al., 2007). In general, among the primary targets for IN administration
are pharmacologically active compounds with poor stability in gastrointestinal fluids, poor
intestinal absorption and/or extensive hepatic first-pass elimination, such as peptides,
proteins and polar drugs (DHAKAR et al., 2010). Based upon the advantages and limitations
of IN drug delivery, the selection of drug candidates for transmucosal nasal application
may become challenging. According to the biopharmaceutical drug classification system,
therapeutic molecules that fit into class I (high permeability, high solubility) have the

Intranasal Delivery I
57
highest potential for nasal administration (BITTER et al., 2011; MATHIAS and HUSSAIN, 2010).
Ideally, the profile of a nasal drug candidate should fulfil the following criteria (ARORA et
al., 2002; BEHL et al., 1998; KUMAR et al., 2014; LO et al., 2001; SINGH et al., 2013):
Appropriate aqueous solubility to provide the desired dose in a 25-150 µL volume
formulation administered per nostril;
Appropriate nasal absorption properties – molecular weight ˂ 500 Da, LogP ˂ 5;
Suitable drug formulation characteristics – pH within 4.5-6.5, isotonic;
Low dose (generally less than 25 mg);
No nasal irritation;
No toxic nasal metabolites;
No offensive odours/aroma associated with the drug;
Convenient stability features.
I. 2.2.1. LOCAL DELIVERY
IN route is the logical natural delivery choice for the treatment of local (or topical)
nasal disorders. Typical examples for locally acting administered drugs are decongestants
for nasal cold symptoms relief, antihistamines and corticosteroids for allergic rhinitis, and
antimicrobials for nasal infections (BITTER et al., 2011; COSTANTINO et al., 2007). Since nasal
topical therapy enables direct delivery of drugs to the target organ (biophase), a quick
relief of the symptoms can be easily achieved with a very favourable adverse-event
profile (SALIB and HOWARTH, 2003). In fact, unlike systemic therapies, relatively low doses
are needed to be effective when administered locally which minimises the potential for
systemic toxic effects that are commonly associated to oral and parenteral
administrations (PIRES et al., 2009; SERRALHEIRO et al., 2013a). Currently, topical drug
formulations continue to represent the most significant portion of the total nasal
products available in the market (Table I.2.2).

I General Introduction
58
Table I.2.2 Examples of commercially available nasal drug formulations for local (topical) delivery
(BEHL et al., 1998; KUMAR et al., 2014; PIRES et al., 2009).
Drug Formulation Product Name Manufacturer Therapeutic Indication
Oxymethazoline Nasal drops Nasorhinathiol®
Nasex®
Sanofi Aventis
Johnson & Johnson
Nasal congestion Phenylephrine Nasal drops Neo-Sinefrina® GlaxoSmithKline
Tramazoline Nasal spray Rhinospray® Unilfarma
Xylometazoline Nasal drops
Nasal spray
Otrivina® Novartis
Azelastine Nasal spray Allergodil® Meda Pharma
Management of seasonal
and perennial (allergic)
rhinitis
Beclometasone Nasal spray Beconase® GlaxoSmithKline
Budesonide Nasal spray Pulmicort® AstraZeneca
Fluticasone
furoate
Nasal spray Avamys® GlaxoSmithKline
Levocabastine Nasal spray Livostin® Johnson & Johnson
Mometasone Nasal spray Nasomet® Schering-Plough
Olapatadine Nasal spray Patanase® Alcon Laboratories
Sodium
cromoglicate
Nasal spray Fenolip® Angelini
Triamcinolone
acetonide
Nasal spray Nasacort® Sanofi Aventis
Mupirocin Nasal ointment Bactroban® GlaxoSmithKline Eradication of nasal
staphylococci
I. 2.2.2. SYSTEMIC DELIVERY
The nasal respiratory region is considered to be the major site for nasal drug
absorption into the systemic circulation. Underlying the great potential of the IN route for
systemic drug delivery is the rapid and direct systemic absorption of compounds that, by
circumventing gastrointestinal and hepatic first-pass metabolism, enables a reduction of
the administered dose; a quick achievement of relevant therapeutic levels; a fast onset of
pharmacological action and fewer side-effects compared to conventional administration
routes (FORTUNA et al., 2014a). Consequently, the awareness that drugs may reach
widespread circulation in few minutes after nasal administration remarkably expanded
the number of systemically acting drugs marketed as nasal formulations (Table I.2.3) and
many more are in the pipeline. Examining the commercially available nasal products for
systemic delivery, it is evident that the majority of the approved therapies are for acute
and sub-chronic treatment regimens (MATHIAS and HUSSAIN, 2010). Accordingly, the rapid

Intranasal Delivery I
59
absorption and prompt onset of action of nasally administered drugs may suit the unmet
medical needs in crisis treatment such as acute pain, migraine, cardiovascular attacks,
erectile dysfunction, seizures, nausea and vomiting. On the other hand, the high nasal
bioavailability coupled with the ease of administration has provided another IN treatment
paradigm in the field of long-term illnesses that has gained significant success in the
management of several disorders like endometriosis, osteoporosis, fertility treatment,
prostate cancer and diabetes (MATHIAS and HUSSAIN, 2010).
Table I.2.3 Examples of commercially available nasal drug formulations for systemic delivery
(BITTER et al., 2011; FORTUNA et al., 2014a; GRASSIN-DELYLE et al., 2012; KUMAR et al., 2014; PIRES et
al., 2009; SINGH et al., 2013).
Drug Product Name Manufacturer Therapeutic Indication
Buserelin Suprefact® Sanofi Aventis Prostate cancer
Butorphanol Stadol NS® Bristol Myers Squibb Pain management;
Migraine
Cyanocobalamin Nascobal® Par Pharmaceutical Vitamin B12 deficiency
Desmopressin Desmospray® Ferring Nocturnal enuresis;
Diabetes insipidus
Dihydroergotamine Migranal® Novartis Migraine and cluster headaches
Estradiol Aerodiol®* Servier Laboratories Hormone replacement therapy
Fentanyl Instanyl® Takeda Pharma Breakthrough pain
in patients with cancer
Nafarelin Synarel® Pfizer Endometriosis
Nicotine Nicotrol NS® Pfizer Smoking cessation
Oxytocin Syntocinon® Novartis Labour induction;
Lactation stimulation
Salmon calcitonin Miacalcin® Novartis Osteoprorosis
Sumatriptan Imigran® GlaxoSmithKline Migraine and cluster headaches
Zolmitriptan Zomig® AstraZeneca Migraine and cluster headaches
* Discontinued in 2006 due to commercial reasons.

I General Introduction
60
I. 2.2.3. VACCINE DELIVERY
The vast majority of disease-causing bacteria, viruses and parasites reach the body
through mucosal surfaces by which it is natural that most of the immune system is either
located in or in direct contact with mucosal membranes, thus providing a “first-line of
defence” system against harmful microorganisms (BITTER et al., 2011). Hence, preventing
infection at these sites via mucosal immunisation seems to be a promising and rational
approach for vaccine development. In addition to being a rapid and non-invasive needle-
free option for antigen delivery, mucosal vaccination also provides an efficient
immunisation method by inducing both local and systemic immune responses, thus
emerging as an interesting alternative to the classic injection (SHARMA et al., 2009; ZAMAN
et al., 2013).
Among other mucosal routes, nasal delivery is becoming particularly attractive for
immunisation as the nasal epithelium is characterised by easy access, reasonable
permeability, low enzymatic activity and the presence of an important number of
immunocompetent cells (SLÜTTER et al., 2008). In upper airways, the local and systemic
immunological responses are mainly mediated by the nasal associated lymphoid tissue
which is an organised structure of cells located underneath the nasal epithelium and
composed of agglomerates of dendritic cells, T-cells and B-cells (SLÜTTER et al., 2008;
ZAMAN et al., 2013). As opposed to what could be expected, mucosal immunity after nasal
vaccination is, however, not only restricted to the upper airways affections. The detection
of significant immunoglobulin A levels in other mucosal secretions, following IN vaccine
administration, may account for a possible cross immune protection against non-
respiratory infections in distant mucosal organs, such as urogenital and gastrointestinal
tracts (PIRES et al., 2009; SLÜTTER et al., 2008).
Despite the promise of nasal vaccine delivery, only very few products are currently
approved for human use, indicating that advances towards new effective nasal vaccines
are still progressing slowly. An example of a fully developed and commercially available
option is the FluMist® by AstraZeneca, the first nasal trivalent vaccine for seasonal
influenza. Compared to the corresponding injection form, FluMist® conferred several
advantages in terms of ease of use, longer duration of protection, enhanced efficacy and
both mucosal and systemic immunity (ZAMAN et al., 2013).

Intranasal Delivery I
61
I. 2.2.4. CNS DELIVERY
According to a recent World Health Organization report (WORLD HEALTH
ORGANIZATION, 2006), neurological disorders like epilepsy, migraine, stroke, multiple
sclerosis, Alzheimer’s disease and Parkinson’s disease, are currently estimated to affect as
many as a billion people worldwide, being one of the leading causes of disability. Their
intricate pathophysiology and the difficulty of systemically administered therapeutics in
accessing the brain represent a great challenge in the development of efficacious agents
for central targets (DJUPESLAND et al., 2014). In spite of the intense research efforts, many
drugs are still not being effectively and efficiently delivered to the CNS, mainly due to the
impenetrable nature of BBB that restricts substances from entering the brain depending
on their lipophilicity, molecular size and charge (GRAFF and POLLACK, 2005; HANSON and FREY
II, 2008).
In the last decades, several different strategies have been attempted in order to
circumvent the BBB and improve the delivery of drugs to the brain for therapeutic and
diagnostic applications (ILLUM, 2000). Intranasal administration, especially to the olfactory
region located in the upper portion of the nasal passages, has been shown to
noninvasively deliver a wide variety of compounds from the nasal cavity directly to the
CNS, bypassing the BBB within few minutes. Increasing evidence of nose-to-brain
transport has been reported by numerous research studies wherein the levels of certain
drug molecules determined in CSF and olfactory bulb, after IN administration to rats,
were considerably higher than those observed following IV injection (VYAS et al., 2005).
The rapid and preferential distribution of drugs to the brain via the IN route may lead to
the reduction of systemic exposure and peripheral side-effects. Similarly, the dose and
frequency of dosing could be decreased, the toxicity minimised and the therapeutic
efficacy improved by achieving desired drug concentrations at the biophase (KUMAR et al.,
2008; SEJU et al., 2011).
Up to date, the investigations have attracted researchers to place the IN delivery
option for CNS drug targeting under the microscope. Even though the clinical potential of
this drug administration avenue still remains controversial, there is substantial curiosity in
exploring the nasal route for the treatment of common intra-cerebral diseases.
Having these premises in mind, the work underlying the present thesis was
structured and developed. In order to deepen the comprehension of the phenomena
inherent to the ability of the IN route to directly deliver therapeutic compounds to the
CNS, the following section (section I. 2.3.) will provide thorough information with
emphasis on this specific topic.

I General Introduction
62
I. 2.3. NOSE-TO-BRAIN DRUG DELIVERY
With the enlargement of life expectancy and ageing of populations, the incidence
of many chronic and progressive conditions including neurological disorders is expected
to increase significantly in the 21st century. Many CNS disorders affect individual’s
functioning resulting in disabilities that limit activities and restrict participation. Currently,
they are an important cause of mortality, constituting about 12% of total deaths globally
(WORLD HEALTH ORGANIZATION, 2006).
Recent advances in the fields of pharmacology and molecular neurobiology have
led to a better understanding of the CNS disease processes, allowing the development of
new therapeutic approaches. Nevertheless, drug discovery and development programs
have for too long been centred on selecting molecules with activity at a particular site or
receptor in the brain, disregarding the extent of the delivery of the compounds to the
biophase. For this reason, many promising molecules have been failing in the early stages
of clinical trials, simply because they are unable to cross the BBB in sufficient quantity to
be therapeutically effective (BEGLEY, 2004; GABATHULER, 2010; WAGER et al., 2011).
Traditionally, the management of neurologic disorders have been predominantly
performed through peripheral administration of medicines via oral or IV routes. However,
there are a variety of troublesome issues concerning the use of systemic drug delivery to
treat CNS diseases. Many drugs, and in particular macromolecules, are generally
degraded in the gastrointestinal tract and/or metabolised in the liver, severely reducing
their bioavailability to the point where only a small fraction of the active compound
actually reaches the circulatory system and ultimately the brain (CHAPMAN et al., 2013;
DJUPESLAND et al., 2014). Increasing the oral dose to compensate drug loss and direct
delivery of therapeutics into the blood via IV injection seem to be obvious alternatives to
overcome these limitations. Notwithstanding, the former option may cause unacceptable
peripheral adverse events, and the latter remains rather impractical and unattractive,
especially for treatments requiring frequent dosing or home administration (DJUPESLAND et
al., 2014). Beyond the above inconveniences, systemic administration of drug towards the
CNS invariably predicates the passage of the compounds from the bloodstream to the
brain by crossing the BBB which is not always an easy task, mainly for large and/or
charged molecules. In addition, plasma protein binding, another consequence of systemic
delivery, can also affect both the duration and intensity of a drug’s action, diminishing its
ability to efficiently permeate the BBB (CHAPMAN et al., 2013).
Although invasive strategies, such as intracerebroventricular injection, have been
stated as a viable solution to defeat BBB through the introduction of therapeutics directly
into the brain, these methods are therefore not realistic for clinical applications. Besides
being risky, they involve expensive techniques, demand surgical expertise and are not

Intranasal Delivery I
63
somehow appropriate for multiple dosing regimens (DHURIA et al., 2010; HANSON and FREY
II, 2008). In view of this fact, IN administration has been proposed as a promising non-
invasive, practical, safe and convenient delivery method which may allow an increased
CNS penetration of compounds that otherwise display limited brain uptake, by providing
a potential and efficient way to circumvent the BBB while minimising systemic exposure
(GRAFF et al., 2005; PARDESHI and BELGAMWAR, 2013).
The exploitation of the nasal cavity as a means of delivering therapeutic agents
preferentially to the brain has gained significant recent interest. Detailed pharmacokinetic
and pharmacodynamic studies, following IN delivery in both animals and humans, have
shown that a broad spectrum of compounds not only reach specific areas of the brain,
but also have effects on CNS-mediated behaviours within a short period of time (DHURIA et
al., 2010). Curiously, this route of administration has long been adopted by individuals
who consume cocaine illicitly. In fact, it is well known that after sniffing, cocaine is rapidly
absorbed from the nasal mucosa allowing the achievement of a state of euphoria within
only 3-5 min (ILLUM, 2002). Apart from a quick nasal absorption of the narcotic to the
systemic circulation, it was hypothesised that such rapid cocaine effects on CNS were
probably due to the presence of a direct pathway from the nasal cavity to the brain. Chow
and collaborators (1999) performed a study to determine whether cocaine could be
directly transported from nose to brain by comparing drug concentration-time profiles in
plasma and different brain regions, following both IN and IV administrations to rats. This
work revealed that, unlike what it was found with IV route, cocaine concentration in
samples collected within 60 min after IN administration, was considerably different
among distinct brain regions, showing the highest level in the olfactory bulb. Moreover, it
was also observed that brain-to-plasma ratios of cocaine in the olfactory bulb following IN
administration were significantly higher than those in other brain areas up to 60 min post-
dose. Inclusively, at 1 min after IN instillation, this parameter exhibited an order of
magnitude about 3 times greater comparatively to the IV injection. Thus, based on these
results, the authors concluded that a direct pathway from the nasal cavity to the brain
was probably involved in the delivery of cocaine when it was administered nasally; and
the transport of the referred abuse substance from nose to brain may have presumably
been carried out via the olfactory system.

I General Introduction
64
I. 2.3.1. PATHWAYS AND MECHANISMS OF TRANSPORT FROM NOSE TO BRAIN
While the precise mechanisms governing direct IN drug delivery to the CNS are still
not completely understood, an accumulating body of evidence has demonstrated that
pathways involving nerves connecting the nasal passages to the brain play an important
role. In general, there are mainly three possible pathways along which a drug
administered into the nasal cavity may travel and attain the CNS (Figure I.2.5). One of
these routes includes the systemic pathway by which part of the drug is absorbed to the
blood circulation and subsequently reaches the brain by crossing the BBB. The other two
enclose direct transfer of the compounds from nose to the CSF or brain tissue via
neuronal transport, which can be accomplished either through olfactory or trigeminal
nerves (MITTAL et al., 2014).
Figure I.2.5 Schematic representation of the possible pathways involved in the transport of drugs
from nose to brain (Adapted from SERRALHEIRO et al., 2013a).
When a drug formulation is nasally applied, it can be deposited in the respiratory
region from where, after escaping enzymatic degradation and the normal rapid clearance
by the MCC system, it may be absorbed to the bloodstream by successfully traversing the
mucus and nasal epithelial layers. Once in the systemic circulation, therapeutic
compounds can freely diffuse through the BBB and enter the CNS. Nevertheless, as
mentioned hereinbefore, the systemic delivery of drugs to the brain is highly conditioned

Intranasal Delivery I
65
by the permeability of the molecules across the BBB, which is subsequently dependent on
their lipid solubility, molecular size and charge. Hence, the absorption of substrates to the
systemic circulation after IN administration constitutes an indirect pathway for delivering
nasally administered drugs to the brain, and therefore it does not afford any preferential
advantage on CNS targeting (GRAFF and POLLACK, 2005; WONG and ZUO, 2010). Moreover,
some limiting factors such as plasma protein binding, plasma protease degradation,
systemic dilution and potential peripheral side-effects, also contribute to make it not
ideal for nose-to-brain delivery (DHURIA ET AL., 2010).
Taking into account that the olfactory region is a well-recognised direct portal of
entry for drug substances into the brain, several investigations have been made in order
to describe the mechanisms involved in the transport of molecules across the olfactory
epithelium. In theory, therapeutic agents can be transported from the nasal cavity
directly to CSF or brain parenchyma via two possible routes along the olfactory neurons:
the olfactory nerve pathway (intracellular axonal transport) and the olfactory epithelial
pathway (extracellular perineural transport) (LOCHHEAD and THORNE, 2012; MERKUS and VAN
DEN BERG, 2007).
The olfactory nerve pathway has been proposed as a feasible route to transfer
drugs directly to the brain via intracellular axonal transport along the olfactory sensory
neurons. Consistent evidences have been described by several authors for the uptake of
different substances into the olfactory neurons with subsequent distribution to the
olfactory bulb and other brain areas by the anterograde axoplasmic flow. Axonal
internalisation of numerous metal compounds, such as gold (DE LORENZO, 1970), nickel
(HENRIKSSON et al., 1997), mercury (HENRIKSSON and TJÄLVE, 1998), aluminium (PERL and
GOOD, 1987), manganese and cadmium (TJÄLVE et al., 1996) were reported to occur by
passive diffusion or different mechanisms of endocytosis. A study carried out in rats to
assess the possibility of transneuronal transport of wheat germ agglutinin-horseradish
peroxidase, after IN application, revealed that such substance was intra-axonally
delivered to the olfactory bulb following neuronal uptake through surface receptors
binding and subsequent adsorptive endocytosis (BAKER and SPENCER, 1986; THORNE et al.,
1995). Notwithstanding, despite the ability of the intracellular axonal route to deliver
agents to the olfactory bulb, distribution to other CNS regions beyond the olfactory
system is unclear. Furthermore, it is believed that such transport is slow, taking hours or
even days for drugs to reach the brain parenchymal tissue which, therefore, cannot
account for the rapid delivery of some therapeutics to the CNS that exhibit considerably
high concentrations in both CSF and brain almost immediately after or within an hour
post IN dosing (CHAPMAN et al., 2013; DHURIA et al., 2010; DJUPESLAND et al., 2014; THORNE
and FREY II, 2001). Hence, this pathway is not likely to explain the observed sudden

I General Introduction
66
appearance of certain drugs in the CNS like for example cocaine (CHOW et al., 1999), CBZ
(BARAKAT et al., 2006), PB (CZAPP et al., 2008), propiomazine (BJERRE et al., 1996),
hydroxyzine (CHOU and DONOVAN, 1997) and testosterone (BANKS et al., 2009) after nasal
administration. Accordingly, as an alternative to intracellular axonal uptake, it was
suggested that drugs, after traversing the olfactory epithelium, either by transcellular or
paracellular mechanisms, could make their way by entering into the lamina propria and
then diffusing into the perineural channels, which appear to be the result of continuous
subarachnoid extensions that surround the olfactory nerves from the base of the
epithelium to the brain by crossing the cribriform plate (Figure I.2.6).
Figure I.2.6 Schematic illustration of the anatomical neuronal connection between the olfactory
epithelium and the subarachnoid space of the brain.
This extracellular mechanism, also known as olfactory epithelial pathway, is
considered a faster route of nose-to-brain transfer as compounds are able to
paracelullarly cross the perineural epithelium into the fluid-filled perineuronal space,
requiring only few minutes (˂30 min) for drugs to travel, most likely by a bulk flow
transport phenomenon, along the olfactory axon up to the subarachnoid space filled with
CSF (DHURIA et al., 2010). Nevertheless, some controversial facts have been questioning

Intranasal Delivery I
67
the viability of this pathway since distinct directions and rates are ascertained between
the desired drug diffusion and the CSF flow, which creates a functional barrier against the
free movement of molecules from the subarachnoid space to the brain tissue (GRAFF and
POLLACK, 2005; ILLUM, 2004; PARDRIDGE, 2011). Furthermore, diffusion decreases
exponentially with the distance (PARDRIDGE, 2011), and in humans, CSF is continuously
renewed approximately every 5 hours, being totally replaced more than four times a day
(ILLUM, 2000). Thus, after reaching CSF, drugs can be rapidly cleared by drainage into the
lymphatic vessels and thereafter into the systemic circulation, hindering its penetration
into the brain parenchyma. Upon these facts, despite the intimate contact of the CSF and
the brain, one cannot assure that a thorough dynamic balance exists between both
compartments, and therefore the drug concentrations will not be equivalent (GRAFF and
POLLACK, 2005).
More recently, trigeminal nerve pathway has been suggested as another valid
route for the transport of molecules directly from the nasal cavity to the brain (ROSS et al.,
2004). The trigeminal nerve is the largest cranial nerve with both sensory and motor
functions, and its name derives from the fact that it has three major branches: the
mandibular, the maxillary and the ophthalmic nerve divisions. The last two are
particularly involved in nose-to-brain drug delivery, since their branches are directly
connected to the nasal mucosa, in contrast with the mandibular division which extends to
the lower jaw and teeth, away from the nasal cavity (DHURIA et al., 2010; PARDESHI and
BELGAMWAR, 2013). The maxillary ramification allows the innervation of the lateral walls of
the nasal mucosa, whereas the ophthalmic branch innervates both dorsal segment of
nasal mucosa and the anterior portion of the nose (DHURIA et al., 2010). The three
peripheral trigeminal branches meet at the trigeminal ganglion, yielding in a single
incoming nerve that ends in the brainstem, at the level of the pons (MISTRY et al., 2009).
The transport of nasally administered therapeutic agents via the trigeminal nerve
pathway was firstly demonstrated by Thorne and collaborators (2004) for insulin-like
growth factor I. Since then, similar mode of transport was also evidenced for other
proteins and peptides, including interferon-β1b (ROSS et al., 2004; THORNE et al., 2008) and
hypocretin-1 (DHURIA et al., 2009). Following IN instillation of the referred radiolabeled
compounds to animal models, higher levels of radioactivity were observed in the
trigeminal branches, trigeminal ganglion and pons, strongly indicating the involvement of
the trigeminal nerve in the delivery of drugs from the nasal passages to the CNS. Even
though no factual data have been reported on the ensheathing cells and channels
associated with the trigeminal nerve comparable to those observed with the olfactory
ones, there is a substantial conviction that these anatomical features may likewise be
present along the trigeminal pathway (PARDESHI and BELGAMWAR, 2013). Interestingly,

I General Introduction
68
unlike the fila olfactoria, trigeminal nerve extends from the respiratory epithelium and
enters the brain at two different sites: (1) the anterior lacerated foramen near the pons
and (2) the cribriform plate near the olfactory bulb, which allows for drug delivery to both
caudal and rostral areas of the brain (CHAPMAN et al., 2013; PARDESHI and BELGAMWAR, 2013).
Although several hypothetic mechanisms were described for the direct delivery of
drugs from nasal cavity to the CNS, the contributions underlying each one have not been
yet enlightened. Generally, the rapid appearance of a drug in the brain and CSF indicates
preferential involvement of the extracellular transport pathway rather than the olfactory
intraneural route. However, the possibility of occurring later axonal drug internalisation
cannot be entirely ruled out. In fact, the vast majority of the studies performed in animal
models was often conducted for limited periods of time (˂240 min) (ILLUM, 2004),
therefore preventing the opportunity to assess if, beyond the olfactory epithelial
pathway, the molecules would also explore the axonal transport to travel within the
neurons and reach the brain. Upon the above considerations, it is likely that drugs may
use one or a combination of various pathways in the transport from nose to CNS;
notwithstanding, so far, the extent of each mechanism still remains experimentally hard
to define.
I. 2.3.2. NOSE-TO-BRAIN ASSESSMENT – EXPERIMENTAL CONSIDERATIONS
The neuronal connection between the nasal cavity and the brain has been
extensively investigated on the hypothesis for CNS targeting of drugs. Albeit the
numerous examples that support the success and potential of the IN administration to
rapidly deliver a great diversity of neurotherapeutics into the brain, direct transport
following IN dosing is not always consistently demonstrated. Beyond that, some
contradictory results are occasionally encountered for the same tested molecule and
using equal experimental models. For instance, while van den Berg et al. (2004a)
concluded that IN estradiol held no advantage in drug targeting to the CSF over IV
injection, other research group has shown that, after IN application, the same compound
was transported into the CSF via olfactory neurons, confirming, for this particular case,
the existence of a direct transport route from the nasal cavity to the CSF (WANG et al.,
2006). Opposing results concerning the involvement of a direct nose-to-brain pathway
were likewise accounted for melatonin following IN administration to rats (BABU et al.,
2011; VAN DEN BERG et al., 2004b). These contrasting conclusions for similar drugs may be
due to differences in the methodologies employed which raise important issues in what
concerns to experimental and formulation factors that can significantly influence the
outcome of the studies and the interpretation of the obtained results. Therefore, the

Intranasal Delivery I
69
distinct methodologies used to study drug transport via the nasal route to the CNS will be
discussed below. Some relevant considerations will be given regarding the choice of the
experimental models, the definition of the study design and the application of the
assessment parameters.
Experimental Models
Many different experimental models are used in nasal drug delivery research
which include in vitro, in situ and in vivo techniques (AGU and UGWOKE, 2008; KIM, 2008).
Each model has its advantages and limitations that affect how the results obtained can be
interpreted and more importantly, how they can be extrapolated to the human situation.
In effect, it must not be forgotten that the ultimate goal of exploration the nose-to-brain
pathway is to be able to apply this administration route to humans, promoting an
efficient delivery of drugs to the CNS and, as a consequence, improving their therapeutic
efficacy.
With the intent of formulating a successful novel nasal drug delivery system,
testing with reliably in vitro, in situ and in vivo models is crucial, being their application
dependent on the aim of the study and the phase of the drug discovery and development
program (KIM, 2008). In vitro techniques present the ability to control a lot of variables,
are cheap, use low amounts of drug and animals, and allow high throughput screening of
a large number of compounds. These approaches comprise the use of nasal cell cultures
or excised tissues from different animal species and are extremely helpful in evaluating
the mechanistic aspects of nasal drug delivery, such as absorption, metabolism and
toxicity of drugs at the level of nasal epithelium (UGWOKE et al., 2001). Aware of the major
importance that the determination of drugs’ permeability across the nasal mucosal
membrane has to address their systemic exposure, and thereby, their therapeutic
potential, the usefulness of predictive nasal in vitro models at the early stages of research
and development process is unquestionable, contributing to optimise the selection of
drug candidates and formulations prior to further pre-clinical and clinical phases (AGU and
UGWOKE, 2008). However, owing to the simplistic environmental conditions under which
these models are frequently performed and their limitation with regard to the absence of
several physiologic factors, like for example the MCC mechanism, led to the need of
complementing the obtained experimental in vitro data with other information generated
from in situ models. By perfusing a drug solution through the nasal cavity of an
anaesthetised animal and monitoring the changes in drug concentration levels remaining
in the perfusate at specified time intervals, it is possible to estimate drug absorption
through nasal mucosa (HUSSAIN, 1998). Even though in situ techniques provide detailed
information about nasal drug absorption kinetics, they also have some drawbacks related

I General Introduction
70
to significant differences between experimental and real physiologic conditions. Among
other factors, the mucus layer is gradually eroded by the circulating solution, exposing the
epithelium and thus increasing the drug absorption rate. Additionally, comparing to the in
vivo situation, the nasal drug residence time is much more prolonged which would give a
false impression of improved absorption and/or increased toxicity of the drug (UGWOKE et
al., 2001).
Granted that the complete pharmacokinetics and pharmacodynamics of a drug
can only be evaluated in whole animal models, in vivo approaches have been employed in
more advanced stages of drug discovery and development programmes. Although they
are more expensive and labour-intensive, also involving a bigger number of animals, in
vivo techniques provide the most comprehensive pharmacological characterisation of the
fate and activity of drug molecules within the body, which is not possible to achieve
simply resorting to in vitro or in situ methods.
As with any biomedical area of research, the majority of the nasal delivery studies
has been preferably accomplished in animal models, such as rats, mice, rabbits, sheeps,
dogs and monkeys (ILLUM, 1996; KOZLOVSKAYA et al., 2014). Due to methodological and
ethical limitations, much less studies have been conducted in humans and therefore, to
date, very few investigations providing evidence for nose-to-brain drug delivery in man
have been reported. Since sampling of human CSF and brain tissue specimens is difficult
and risky, the indirect evaluation of pharmacodynamic effects [e.g. event-related brain
potentials (KERN et al., 1999; PIETROWSKY et al., 1996), attention (SMOLNIK et al., 1999) and
working memory function (SMOLNIK et al., 2000)] have been commonly described rather
than absolute measurements of CNS drug concentrations (ILLUM, 2004). Specialised
techniques like positron emission tomography (WALL et al., 2005; YATES et al., 2005),
neurosurgical CSF drainage (MERKUS et al., 2003), and intraspinal catheterisation (BORN et
al., 2002) have recently allowed CNS quantitative determinations after nasal
administration of drugs in human volunteers, but convincing unequivocal proof of the
nose-to-brain pathway via demonstration of mass transport is still lacking (DJUPESLAND et
al., 2014).
Taking into account the large amount of data obtained from nasal delivery studies
carried out in laboratory animals, the key question is lifted on whether these
experimental results can be applied or not to the human clinical situation (PADOWSKI and
POLLACK, 2010). As a matter of fact, there are valid reasons to be sceptical of the potential
for nose-to-brain transport in man based on evidence from animal research whereby, the
in vivo model used to study the transfer of drugs from nasal mucosa to the brain must be
properly selected in order to allow a feasible extrapolation of the results (DJUPESLAND et
al., 2014). Indeed, substantial differences exist between the nasal anatomy and

Intranasal Delivery I
71
physiology of humans and animals, which should be carefully considered when the results
are interpreted and compared, avoiding misleading conclusions (Table I.2.4).
Table I.2.4 Comparison of the anatomical and physiological characteristics of the nasal cavity and
cerebrospinal fluid (CSF) among different animal species (GIZURARSON, 2012, 1990; GROSS et al.,
1982; ILLUM, 2004, 2000; KAUR and KIM, 2008; LOCHHEAD and THORNE, 2012; UGWOKE et al., 2001).
Nasal Cavity Characteristics CSF Characteristics
Species Length
(cm)
Volume
(mL)
Surface
Area (cm2)
Olfactory
Area (cm2)
Clearance
Half-life (min)
Volume
(mL)
Turnover
Rate (mL/h)
Human 7.5 20.0 160.0 10.0 15.0 160.0 21.0
Monkey 5.3 8.0 62.0 9.0 10.0 NF 2.5
Sheep 18.0 114.0 327.0 NF 42.0 14.2 7.1
Dog 10.0 20.0 221.0 150.0 20.0 NF NF
Rabbit 5.2 6.0 61.0 6.0 10.0 2.3 0.6
Rat 2.3 0.4 14.0 7.0 5.0 0.15 0.18
Mouse 0.5 0.03 2.8 1.3 1.0 0.035 0.018
NF, not found.
In general, rodents are the most widely used animals for IN drug delivery
experiments (ILLUM, 1996; KAUR and KIM, 2008; KOZLOVSKAYA et al., 2014; MERKUS and VAN DEN
BERG, 2007). As mentioned in section I. 2.1.1., the amount of the nasal epithelium that
corresponds to the olfactory mucosa is proportionally smaller in humans (3-8%)
comparing to mice or rats (45-50%). In addition, the olfactory region in such animals
covers a large part of the nasal mucosa, whereas in man the olfactory epithelium is
restricted to a small area in the roof of the nasal cavity (HARKEMA et al., 2012). Therefore,
it is expected that the predisposition of rodents to olfactory deposition and transport of
compounds to the brain via the olfactory route may be significantly more pronounced. On
the other hand, the volume and renovation rate of the CSF are likewise distinct between
the two species once the CSF turnover in rodents is about five to six times higher
relatively to man (DJUPESLAND et al., 2014). These differences may have considerable
impact on nose-to-brain drug delivery, especially when the diffusion of compounds from
the CSF into the brain tissue is accounted.
Bearing in mind the above considerations, conclusions regarding the bioavailability
of a compound and the extent of its delivery to the brain in humans should not be
straightforwardly drawn from the results solely obtained in animal models. In order to
verify the actual feasibility of the IN route for CNS drug delivery, it is imperative to
compare data derived from both animal and human research studies. A realistic
comparison between humans and rats was performed using resembling experimental

I General Introduction
72
setups (MERKUS et al., 2003; VAN DEN BERG et al., 2004b, 2003). By administering identical IN
and IV drug formulations of melatonin and hydroxocobalamin and employing similar
sampling times, analogous results were obtained for both evaluated species. Even though
no evidence of direct transport of the compounds from the nasal cavity to the CSF has
been found, the comparison of these three studies demonstrated that, in this particular
case, rat experiments can be predictive for nose-to-CSF transport in humans,
strengthening the basis for extrapolating the results from animals to man.
Study Design
It is important to consider the different methodologies used in IN studies since
several experimental aspects such as delivery volume, administration technique, drug
formulation and anaesthesia, can all influence the distribution and deposition of drugs in
the nasal cavity and consequently, the pathways by which a drug may travel to the CNS
after IN administration. As discussed in section I. 2.1.2. – “Nasal Permeability”, following
IN delivery, the deposition of the drug within the nasal chamber should be appropriately
optimised for the intended therapeutic goal, whether it may be highly concentrated at
the olfactory mucosa for a CNS effect or low deposited in that area when a systemic
outcome is desired. Actually, the distance from the nostril to the olfactory epithelium is
very short; however its location in the slit-like olfactory cleft behind the narrow nasal
vestibule and at the end of a complex labyrinth of respiratory turbinates severely
complicates the access (DJUPESLAND et al., 2014). Expectably, deposition in adequate
innervated regions of the nasal cavity can therefore be a critical component of the overall
approach towards realising the full potential of nose-to-brain drug delivery (DJUPESLAND et
al., 2014).
Typically, the administration of drugs into the nose is most often performed by
using either a pipettor for delivering drops to alternating nostrils, a piece of tubing
attached to a microsyringe/micropipette for inserting within the nasal cavity, or a nasal
spray device (DHURIA et al., 2010; DJUPESLAND, 2013; MERKUS and VAN DEN BERG, 2007).
Placing the nasal drops at the opening of the nostrils allows the animal to sniff them into
the nasal cavity but the tendency to deposit on the nasal floor and be subjected to a rapid
MCC is elevated (DHURIA et al., 2010). Nasal sprays usually provide high reproducibility in
terms of the emitted dose and a widespread distribution of the drug within the nasal
cavity; nevertheless, the probability of deposition either in oesophagus and/or lungs is
much more augmented (DHURIA et al., 2010; DJUPESLAND, 2013). Conversely, the use of
flexible tubing, by giving the possibility of being inserted inside the nose, enables a
precise delivery of the drug formulation on a localised mucosal area, inasmuch the

Intranasal Delivery I
73
deposition in the respiratory and olfactory epithelia essentially depends on the length of
the tube (CHARLTON et al., 2007a; DHURIA et al., 2010).
The selection of the drug formulation is also a fundamental issue that should be
gingerly taken into account. A big part of the compounds intranasally applied is in the
form of simple solutions (KOZLOVSKAYA et al., 2014). Nasal drops are the simplest and the
most convenient pharmaceutical dosage form, but the precise dosing of drug delivered is
somewhat difficult to control in addition to be also associated to a rapid nasal drainage
(KUMAR et al., 2014). When using liquid formulations, a special concern must be
considered regarding the administration volume. Differences in delivery volumes are
closely related to the amount of the nasal surface area covered by the formulation,
affecting the deposition within the nasal cavity and the distribution to the CNS.
Depending on the experimental model used, the administration technique applied and
the therapeutic effect intended, the delivery nasal volume should be properly adjusted
and defined. Hence, delivery volumes that do not overload the total capacity of the nasal
cavity must be used, and should not exceed 5-10 µL/nostril in mice, 10-25 µL/nostril in
rats and 75-100 µL/nostril in humans (MERKUS and VAN DEN BERG, 2007). Although small
volumes may not be sufficient to reach and cover the desired area of the nasal mucosa,
an excessive dosage volume may cause loss of the drug formulation by resulting in
deposition at the nasopharynx with subsequent swallowing or drainage to the lower
respiratory tract, which in the latter case, it may give rise to respiratory distress and
eventually death (DHURIA et al., 2010; SOUTHAM et al., 2002). Aiming at preventing drainage
of nasally dosed drug solution, some researchers have employed the nasal cavity isolation
technique by applying an established surgical procedure in rodents (CHOW et al., 1999;
HUSSAIN et al., 2000; ISHIKAWA et al., 2002; RAGHAVAN and ABIMON, 2001; SINSWAT and
TENGAMNUAY, 2003; WANG et al., 2007; YOKOGAWA et al., 2006). Briefly, after an incision has
been made in the neck, trachea is cannulated to allow animal free breathing, the upper
part of the oesophagus is tied off to restrain swallowing, and the nasopalatine duct is
sealed to avoid any drug formulation from being cleared into the mouth. Since this
method involves a closed and confined system, the data obtained is very reproducible
and reliable providing more concrete information about the transport of the molecules
from nose to brain (DEY et al., 2011). Nonetheless, the use of such treatment would be
unrealistic, even unthinkable in humans and therefore, one should exercise caution in the
interpretation and extrapolation of these animal results to man (MERKUS and VAN DEN BERG,
2007).
Given the limitations described for liquid formulations, alternate semi-solid dosage
forms, such as gels, have been developed for a more precise drug delivery through the
nose. They reduce post-nasal drip and anterior leakage by maitaining the drug
formulation in nasal mucosa. This enhances the drug residence time inside the nasal

I General Introduction
74
cavity and diminishes MCC, thereby providing a better chance for the drug to be absorbed
and transported to the CNS (BEHL et al., 1998; PIRES et al., 2009). Recently, in situ nasal
gelling systems have emerged as a promising approach that benefit dual advantages from
both sol and gel and present themselves for more accurate dosing (SINGH et al., 2013;
SWAMY and ABBAS, 2012). Displaying low viscosity properties at the time of administration,
in situ gels are easily handled and precisely delivered. Following IN instillation, they
should readily undergo phase transition to form a gel that is strong enough to reside
within the nasal cavity for a prolonged period of time, thus preventing MCC and
enhancing drug bioavailability (SINGH et al., 2013).
Albeit most often depreciated, the influence of the anaesthesia on the rate and
extent of drug transport from nose to brain is another matter of debate. In effect, the
majority of the preclinical studies has been carried out in anaesthetised mice and rats in
order to facilitate nasal drug administration, so it seems possible that both the category
of anaesthetic and its delivery route could affect the drug pharmacokinetic profile (WONG
and ZUO, 2013; WU et al., 2008). Generally, compared with the conscious condition, the
anaesthetic state may result in a more effective contact time of the formulation with the
nasal mucosa, as well as higher absorption in the olfactory epithelium, which may further
increase brain drug uptake (WU et al., 2008). Even though few published records exist
regarding the influence of different types of anaesthesia on IN brain drug delivery, some
authors claim a probable decrease on nasal mucosa cilia clearance rate with the
consequent reduction of mucociliary activity (KAUR and KIM, 2008; MAYOR and ILLUM, 1997).
Ideally, to avoid any interference caused by the anaesthesia, the use of conscious animals
is clearly preferred; however, rodents commonly do not tolerate IN delivery without
being sedated and therefore, this experimental variable should also be appropriately
considered.
The design of the experimental setup to investigate nose-to-brain drug delivery
also involves the definition of the biological samples collected, the sampling times
analysed, the analytical methodologies used to measure the concentration of drugs in
different biocompartments and finally, the type of control or reference employed to
make comparisons. Overall, IN studies should include frequent sampling of, at least, both
plasma and brain tissue or CSF to enable calculation of the global drug exposure in those
specimens. In practice, the brain tissue is sampled by dissection; the organ is usually used
as a whole or divided in different anatomical regions after slicing. The analysis of whole
brain concentrations by treating the tissue as an entire piece may disguise the
contribution of direct neurological pathways to transport the drug from nose to brain;
instead, measuring the levels of drug distribution in specific target areas of the brain may
afford to more accurate determination of the routes by which the molecules have

Intranasal Delivery I
75
travelled (WONG and ZUO, 2013). When measurement of drug concentrations in brain
tissue is intended, one sample per animal per time point has to be taken which means
that several animals are needed to delineate a complete pharmacokinetic profile,
probably increasing the variability in the obtained data. On the contrary, similarly to
blood, serial sampling of CSF is also feasible provided by the replacement of the
withdrawn volume with artificial CSF via infusion into the lateral ventricle (CHOU and
DONOVAN, 1997). Serial CSF sampling is usually performed in rats by microdialysis (BAGGER
and BECHGAARD, 2004a, 2004b; CHOU and DONOVAN, 1998) or cisternal puncture (DAHLIN and
BJÖRK, 2001; KAO et al., 2000; ZHAO et al., 2008) and maximal care should be taken to avoid
contamination with blood. Mice are unsuitable for CSF sampling due to its extremely low
total volume (approximately 35 µL), but the relatively small amount of CSF samples (˂50
µL) that can be collected from rats generally imposes a major problem with respect to
drug analysis, requiring highly sensitive analytical methods (such as mass spectrometry)
for drug quantification (MERKUS and VAN DEN BERG, 2007). Nevertheless, the main
advantage of this procedure is the possibility of obtaining a drug concentration-time
profile in CSF from one single subject, which saves animals and reduces variability in data.
The importance of frequent and early sampling is highlighted by a study
performed by Chow et al. (1999) in which cocaine concentrations in rat brain tissue were
evaluated after IN and IV administrations. Interestingly, the area under the concentration-
time curve (AUC) of cocaine in the olfactory bulb following 60 min post-dose was lower
for IN comparatively to IV delivery; however, when calculated for times up to 4 min, the
AUC values determined after IN drug administration exceeded those obtained after IV
injection (CHOW et al., 1999). Hence, this indication of direct nose-to-brain transfer could
easily have been overlooked if samples had not been taken as soon as 1, 2 and 4 min. A
particular attention should be posed when the sampling times are selected.
By tracking the analytical methodologies commonly utilised in the assessment of
IN delivery it was found that the investigation of the potential for direct nose-to-brain
transport was accomplished either in a qualitative or a quantitative way. Several imaging
tools such as microscopy, radioactivity, fluorescence and gamma scintigraphy have been
frequently employed. Although microscopic analysis of brain tissue provides a qualitative
answer whether or not there is direct drug transfer, it does not give an indication about
the proportion of the administered drug that reaches the brain from the nasal cavity.
More sophisticated imaging techniques like autoradiographic and gamma scintigraphy
analysis, can otherwise enable a direct visualisation and quantification of where the drug
formulation has been delivered, what is doing, and whether or not it is behaving
according to its proposed rationale (NEWMAN and WILDING, 1998). Howbeit, it should be
noted that these imaging methods alone do not confirm the presence of intact, free or
biologically active drug present in the CNS tissues, besides their inability to distinguish

I General Introduction
76
between parent drug and active/inert metabolites (WONG and ZUO, 2013). Furthermore,
attaching radioligands to the drug might also alter the physicochemical and
pharmacological properties of the therapeutic agent, which may interfere with the
pharmacokinetic and pharmacodynamic outcomes of the experiments (WONG and ZUO,
2013). In view of these limitations, more accurate and specific assays such as liquid
chromatography coupled with different types of detection could be used, providing more
complete and definitive descriptions of the pharmacokinetic profiles of the intranasally
administered drug and the corresponding active metabolites formed in vivo. Currently,
high performance liquid chromatography (HPLC)-based techniques are the most
commonly applied analytical methods for drug separation and subsequent quantification
in a wide variety of biological matrices (KOZLOVSKAYA et al., 2014).
Taking into account that IN delivery is, in the majority of cases, considered as a
new route of drug administration, the experimental protocol should be designed to allow
the comparison of the obtained results with other alternative routes. In fact, some
compounds, even when administered non-nasally, can be preferentially distributed to the
olfactory mucosa and the olfactory bulbs (BERGSTRÖM et al., 2002), highlighting the need
for appropriate controls when designing studies in this field. In order to discriminate the
exact transport pathway by which the drug is transferred from nose to brain (either via
the BBB or the direct olfactory route), an adequate IV pharmacokinetic control has
commonly been included in the investigations as an experimental comparator. IV delivery
is definitively the most widely used alternative route to make comparisons with the IN
administration (DHURIA et al., 2010; MERKUS and VAN DEN BERG, 2007). Other parenteral
delivery routes like for instance, intramuscular or intraperitoneal, and even oral
administration, may also serve as comparators as long as the pharmacokinetic profiles are
properly measured and matched (DJUPESLAND et al., 2014).
Assessment Parameters
Investigating nose-to-brain drug targeting presupposes the assessment of the
relative distribution of the drug by determining and comparing its concentrations
attained on therapeutic sites of action (i.e. brain and/or CSF) with other non-targeted
biocompartments such as blood and other peripheral tissues. Bearing in mind that the
concentrations observed in the CNS after IN administration of drugs could be due not only
to the amount of drug directly transported to the brain via neuronal routes, but also to
the fraction that could be absorbed into the systemic circulation and reach the CNS by
crossing the BBB and BCSFB, IV delivery controls are required to determine the
contribution of this indirect vascular pathway on blood-mediated brain drug deposition
(DHURIA et al., 2010; MERKUS and VAN DEN BERG, 2007). Therefore, the measurement of drug

Intranasal Delivery I
77
exposure (given by AUC) in both CNS (brain and/or CSF) and blood (plasma or serum) as
well as the comparison of CNS-to-blood concentrations ratio after IN and IV
administrations provide an evaluation of the route of drug transport to the brain (CHOW et
al., 1999; MERKUS and VAN DEN BERG, 2007; PADOWSKI and POLLACK, 2010) (Equation 1). Hence,
when CNS-to-blood ratios following IN delivery are greater than that after IV
administration indicate that direct transport pathways either via epithelial and/or nerve
olfactory routes are primarily involved in the transfer of the compounds from the nasal
cavity to the brain. Conversely, when IN ratio is equal or lower than the IV one, it is
assumed that the concentrations observed in CNS derive mainly from the absorption into
the nasal vasculature with further systemic distribution.
Equation 1
With the aim of surveying the extent of drug delivery to the brain, specific indexes
have been suggested and broadly adopted by several researchers. In accordance, the
drug targeting efficiency (DTE) quantifies the overall tendency of the drug to accumulate
in the brain subsequently to IN vs. systemic administration (KOZLOVSKAYA et al., 2014). It
can be described as the ratio of the AUCCNS/AUCblood following IN administration
compared to that after IV injection (WANG et al., 2003) and it is calculated conforming to
Equation 2.
Equation 2
The value of DTE can range from zero to +∞, exhibiting a proportional relationship
to the efficiency of drug targeting to the brain. Thus, it can be assured that there is direct
transport of drugs from nose to the CNS whenever the DTE value is higher than 1, as it
was demonstrated by Wang and co-workers (2003) in their experiments with IN
administration of methotrexate to rats. Based on their results, the authors suggested that
this antineoplastic agent could be directly delivered from the nasal cavity to the CSF, since
the value of DTE achieved was 21.7, far greater than 1. By contrast, van den Berg et al.
(2004b) found a DTE value of only 0.76, demonstrating that there was no additional
transport of melatonin via the nose-CSF pathway in rats.
Another valuable used index is the nose-to-brain direct transport percentage
(DTP), which can be derived from the DTE expression and estimates the relative amount
of the drug that achieves the brain via direct neuronal routes (KOZLOVSKAYA et al., 2014).
DTP represents the percentage of drug directly transported via olfactory and/or
trigeminal pathways to the brain, subtracting from the total AUCCNS the fraction
(represented by Bx) which corresponds to the amount of drug administered intranasally

I General Introduction
78
that reaches the brain through the BBB by means of the systemic circulation (DHURIA et
al., 2010) (Equation 3). In fact, since the extent of drug in blood is proportional to the
AUC, it can be assumed that the AUCCNS fraction contributed by systemic circulation (Bx),
divided by AUCblood after nasal administration is equal to the same ratio following the IV
route (JOGANI et al., 2007) (Equation 4).
Equation 3
Equation 4
Overall, the DTP can range from -∞ to 100% with the values below zero indicating
more efficient drug delivery to the brain following IV injection as compared to the IN
administration (KOZLOVSKAYA et al., 2014).
The above described indexes are inter-dependent, so that, more efficient drug
uptake to the brain via direct routes will lead to higher values of both DTE and DTP. The
calculation of the referred parameters is based on several assumptions that should not be
entirely ignored. Specifically, the drug pharmacokinetics is assumed to be linear and the
analysed AUC values are pretended to reflect the pharmacologically relevant drug
concentrations in the brain and blood, despite the fact that the compound can exist in
several forms at these biocompartments (e.g. free, protein bound or encapsulated) and
different brain drug disposition patterns can result from distinct transport pathways from
nose to brain (KOZLOVSKAYA et al., 2014). Notwithstanding, it seems that these measures
are helpful in comparing findings across various studies conducted in different labs, also
being useful for assessing the effects of diverse formulations on enhancing IN delivery of
drugs to the CNS (DHURIA et al., 2010).
The determination of brain distribution profiles after IN and IV drug administration
also contributes to elucidate whether direct nose-to-brain transport pathways are
involved. The assessment of drug distribution is usually performed in animal models and
consists on analysing the drug exposure in different regions of the brain. Following drug
administration, animals are sacrificed and the whole brain is removed and sectioned in
sequential slices from rostral to caudal direction. Depending on drug physicochemical
properties and route of administration, distinct brain distribution patterns are observed.
In general, nasal delivery is characterised by preferential exposure in the rostral portions
of the brain (i.e. olfactory bulb and frontal cortex), whereas systemic administration
results in a more homogenous distribution of the substrate throughout the CNS
structures (GRAFF et al., 2005; WONG and ZUO, 2013). Interestingly, higher drug
concentrations can also be encountered in more distant and specific caudal brain areas.

Intranasal Delivery I
79
The quantitative analysis of lidocaine levels in multiple brain regions upon IN
administration to rats demonstrated that brain tissue drug content decreased in a rostral-
to-caudal direction from the cortex to the cerebellum; however, a considerable augment
was observed at the level of the olfactory bulb and brainstem, suggesting a direct delivery
of lidocaine to the CNS along the olfactory and trigeminal nerve pathways (Johnson et al.,
2010). Similar heterogeneous brain distribution patterns were likewise observed by
quantitative autoradiographic analysis after IN perfusion of the vasoactive intestinal
peptide (VIP) to rats (DUFES et al., 2003). Unlike the uniform brain distribution profile of
VIP when intravenously administered, an irregular deposition of the peptide in specific
areas of the brain was observed following IN delivery. Higher drug concentrations were
attained in sections corresponding to the cerebellum, midbrain, olfactory bulb and frontal
cortex. While elevated VIP levels in the olfactory bulb were due to effective delivery of
the peptide via the olfactory pathway, accumulation of the drug in distant brain areas
remains to be clarified. Apparently, preferential localisations of the peptide corresponded
to the brain structures particularly rich in VIP receptors. Authors hypothesised that
intranasally administered VIP could perhaps be redistributed from the nasal absorption
site into the brain blood microcirculation thus reaching these specific regions of the brain.
On the contrary, Kaur and Kim (2008) concluded that there was no evidence of direct
nose-to-brain transport of diazepam since apart from the lower DTE values, homogenous
distribution patterns were observed throughout the various regions of rat and rabbit
brain after both IN and IV administrations. The high lipophilicity value is probably the
cause for this rapid and extensive absorption of the substrate into the nasal vasculature.
I. 2.4. INTRANASAL ADMINISTRATION AND EPILEPSY
Whether manifested in the form of an acute isolated seizure, repetitive or
recurrent seizures and status epilepticus, all of them are deemed as medical emergencies.
Clearly, since mortality and neurological morbidity are directly associated with the
duration of seizure activity, patients experiencing epileptic seizures have a medical
emergency and require immediate medical care (WERMELING, 2009). A rapid medication is
essential to prevent the spread of the electrical discharge and subsequent brain damage,
but while epilepsy requires a long-term prophylactic treatment, status epilepticus
demands a prompt and quick management of seizures. In this context, several consensus
statements have been published describing pharmacologic treatment protocols for a
diversity of epileptic disorders. Oral administration of anticonvulsant drugs has generally
been associated with high systemic distribution into non-targeted tissues, peripheral
adverse effects and limited brain uptake. Moreover, patient’s physical condition
immediately after a convulsive episode is incompatible with the oral ingestion of a tablet

I General Introduction
80
dosage form. Although IV administration is probably the most rapid way to suppress
epileptic convulsions, an alternative route of drug delivery is needed when IV injection is
impractical and inconvenient since it depends upon sterile equipment and skilled
personnel which are only available in hospital setting (LI et al., 2000). In this respect, the
IN route of administration potentially offers a simple and non-invasive method for a
rapid, selective and efficient delivery of anticonvulsant drugs to the brain. Apart from its
advantages on the clinical emergencies in acute seizure situations, nasally administered
AEDs may represent a valuable approach for the long-term treatment of epilepsy by
allowing the decrease of the dose, frequency of dosing and related side-effects,
improving therapeutic efficacy and tolerability. Inclusively, it is hypothesised that the
possible direct nose-to-brain delivery might provide a valuable alternative means for
reversing AED resistance. By circumventing the BBB and reinforcing the delivery of
substrates to the brain, IN anticonvulsive treatment may yield a prospective management
of intractable epilepsy (TAN et al., 2008).
IV benzodiazepines, such as diazepam, clonazepam, lorazepam and midazolam
have been widely used as the first-line therapy for acute seizure activity termination
(MANNO, 2011; MEIERKORD et al., 2010). They act by enhancing the effectiveness of the
GABA inhibitory neurotransmitter within the CNS. However, IV dosing generally leads to
excessive systemic drug exposure which, in case of benzodiazepines, may unleash
hypotension, cardiac dysrhythmia and respiratory failure (LI et al., 2000). Aiming to
minimise the disadvantages and potentiate the therapeutic index of such drugs,
numerous studies have been carried out on the subject of IN benzodiazepine delivery.
Specifically, IN midazolam has been extensively investigated in epileptic patients and,
currently, it is already recommended in some consensus guidelines as a viable alternative
drug delivery technique for prompt abortive treatment of convulsive seizures
(MAZURKIEWICZ-BEŁDZIŃSKA et al., 2014; SHORVON et al., 2008; WOLFE and MACFARLANE, 2006).
Several preclinical studies involving various IN preparations of other benzodiazepines like
for example, clonazepam (ABDEL-BAR et al., 2013; VYAS et al., 2006a), clobazam (FLORENCE ET
AL., 2011), diazepam (KAUR AND KIM, 2008) and lorazepam (YAO et al., 2009; ZHAO et al.,
2012) have been broadly reported in literature presenting very promising results.
Likewise, the potential of the IN route for the administration of distinct antiepileptic
agents such as CBZ (BARAKAT et al., 2006; PATEL, R.B. et al., 2014), PB (CZAPP et al., 2008),
valproic acid (ESKANDARI et al., 2011) and even leptin (XU et al., 2008) has also been tested
in different animal models exhibiting similar encouraging outcome.
During the last years, scientific community has been striving to improve the care
of epileptic patients by developing and optimising novel and more efficient AED delivery
approaches to reduce the time of treatment and cessation of seizures. Up to now,

Intranasal Delivery I
81
increasing evidence from both experimental and clinical research has demonstrated the
enormous potential that the IN route has to offer in the field of pharmacological therapy
of epilepsy and epileptic disorders. Moreover, the nose-to-brain transport theory is
gradually gaining support. Despite the extraordinary progress that has been made since
the introduction of the IN administration to directly deliver therapeutics into the brain,
much more remains to be explored in this area.

I General Introduction
82

I. 3. AIMS


Aims I
85
I. 3. AIMS OF THIS THESIS
The pharmacological therapy has been, and is likely to remain, the mainstay of
treatment for the majority of epileptic patients. Regardless of the large number of
currently available AEDs, and albeit their broad spectrum of efficacy, these drugs have
revealed to be relatively insufficient to successfully attain the most basic assumptions of
epilepsy treatment, which are to provide a complete seizure control while maintaining
acceptable tolerability and safety profiles. Since the process of discovery and
development of new and more efficient AEDs is complex, laborious and expensive, it
seems that the exploitation of alternative strategies of drug delivery in order to improve
both the efficacy and toxicity of the existing pharmacological armamentarium could be a
very attractive approach. In this context, the main objective of the present work was to
evaluate the potential of the IN route for the administration of four AEDs, selected among
the various anticonvulsant agents that comprise the current therapeutic options of the
first- and second-drug generations: CBZ, PHT, OXC and LTG.
In essence, all the AEDs herein chosen are widely used in the clinic as first- or
second-line options for the management of a variety of different seizure types and
epileptic syndromes. Notwithstanding their high anticonvulsant activity, both CBZ and
PHT exhibit narrow therapeutic index, pronounced pharmacokinetic variability and large
propensity to cause relevant adverse effects and drug-drug interactions, hindering their
application in polytherapy regimens. Although neither OXC nor LTG offer significant
advantages in terms of efficacy compared to CBZ or PHT, some benefits were ascertained
in what concerns to tolerability and safety. Therefore it seems possible that, for any of
the considered AEDs, favourable pharmacokinetic profiles following IN administration
could potentially result in an improved therapeutic outcome.
A comparative study of the pharmacokinetics as well as the brain biodistribution
pattern of CBZ, PHT, OXC, and LTG after IN and IV administrations in mice may allow to
infer about the feasibility of the IN route to deliver the referred compounds and to
investigate the involvement of an hypothetical direct transport pathway of the drugs
from the nose to the brain. To make these goals achievable, appropriate analytical
methods must be conveniently developed and validated in different sample matrices in
order to obtain accurate and reliable quantitative data.

I General Introduction
86
The specific aims outlined for the implementation of this work were as follows:
Development and validation of an analytical high performance liquid
chromatographic method with ultraviolet detection (HPLC-UV) to
simultaneously quantify six AEDs [PRM, PB, CBZ, PHT, OXC and LTG] and
three of their main metabolites [carbamazepine-10,11-epoxide (CBZ-E),
10,11-trans-dihydroxy-10,11-dihydrocarbamazepine (trans-diol) and
licarbazepine (Lic)] in human plasma.
Laboratorial implementation of two analytical HPLC-UV methods to
quantify CBZ, CBZ-E, OXC, Lic, PHT and LTG in plasma, brain (whole brain,
olfactory bulb and frontal cortex) and liver tissue homogenates of mice.
Pharmacokinetic characterisation of CBZ, PHT, OXC and LTG following
single and individual IN and IV administrations to mice.
Assessment and comparison of the brain biodistribution patterns following
IN and IV administrations of CBZ, PHT, OXC and LTG to mice.

CHAPTER II
QUANTITATIVE DRUG ANALYSIS


TABLE OF CONTENTS
CHAPTER II - QUANTITATIVE DRUG ANALYSIS 87
II. 1. BIOANALYSIS - General Concepts 93
II. 1.1. INTRODUCTION 95
II. 1.2. BIOANALYTICAL METHOD DEVELOPMENT 97
Chromatographic Conditions 97
Sample Preparation 98
II. 1.3. BIOANALYTICAL METHOD VALIDATION 101
II. 1.3.1. TYPES OF METHOD VALIDATION 102
II. 1.3.2. VALIDATION PARAMETERS 103
Selectivity 103
Calibration Curve and Linearity 103
Precision and Accuracy 105
Limit of Quantification and Limit of Detection 105
Recovery 106
Stability 106
II. 2. EXPERIMENTAL - Development and Validation of an HPLC-UV Method for the
Simultaneous Quantification of PB, PRM, PHT, CBZ, OXC, LTG and their Main Metabolites in
Human Plasma 109
II. 2.1. INTRODUCTION 111
II. 2.2. MATERIALS & METHODS 113
II. 2.2.1. Chemicals and Reagents 113
II. 2.2.2. Preparation of Standard Solutions 113
II. 2.2.3. Sample Preparation 114
II. 2.2.4. HPLC-UV Instrumentation and Chromatographic Conditions 114
II. 2.2.5. Method Validation 115
II. 2.2.6. Clinical Application 116
II. 2.3. RESULTS & DISCUSSION 117
II. 2.3.1. Development and Optimisation of Chromatographic Conditions 117
II. 2.3.2. Optimisation of the Sample Preparation Procedure 118
II. 2.3.3. Method Validation 119
II. 2.3.3.1. Selectivity 119
II. 2.3.3.2. Linearity, LLOQ and LOD 119
II. 2.3.3.3. Precision and Accuracy 122

II. 2.3.3.4. Recovery 124
II. 2.3.3.5. Stability 125
II. 2.3.4. Clinical Application 126
II. 3. EXPERIMENTAL - HPLC-UV Methods for the Quantitative Determination of PHT, CBZ,
OXC, LTG and their Main Metabolites in Mouse Biological Matrices 129
II. 3.1. GENERAL INTRODUCTION 131
II. 3.2. HPLC-UV METHOD FOR THE QUANTITATIVE DETERMINATION OF CBZ, OXC, CBZ-E, LIC
AND PHT IN MOUSE PLASMA, BRAIN AND LIVER HOMOGENATES 133
II. 3.2.1. INTRODUCTION 133
II. 3.2.2. MATERIALS & METHODS 134
II. 3.2.2.1. Chemicals and Reagents 134
II. 3.2.2.2. Animals and Blank Biological Matrices 134
II. 3.2.2.3. Preparation of Standard Solutions 135
II. 3.2.2.4. Sample Preparation 135
II. 3.2.2.5. HPLC-UV Instrumentation and Chromatographic Conditions 136
II. 3.2.2.6. Method Validation 137
II. 3.2.3. RESULTS & DISCUSSION 138
II. 3.2.3.1. Optimisation of Chromatographic Conditions 138
II. 3.2.3.2. Optimisation of the Sample Preparation Procedure 139
II. 3.2.3.3. Method Validation 139
II. 3.2.3.3.1. Selectivity 139
II. 3.2.3.3.2. Linearity and LLOQ 143
II. 3.2.3.3.3. Precision and Accuracy 143
II. 3.3. HPLC-UV METHOD FOR THE QUANTIFICATION OF LTG IN MOUSE PLASMA, BRAIN AND
LIVER HOMOGENATES 147
II. 3.3.1. INTRODUCTION 147
II. 3.3.2. MATERIALS & METHODS 147
II. 3.3.2.1 Chemicals and Reagents 147
II. 3.3.2.2. Animals and Blank Biological Matrices 148
II. 3.3.2.3. Preparation of Standard Solutions 149
II. 3.3.2.4. Sample Preparation 149
II. 3.3.2.5. HPLC-UV Instrumentation and Chromatographic Conditions 150
II. 3.3.2.6. Method Validation 150
II. 3.3.3. RESULTS & DISCUSSION 152
II. 3.3.3.1. Optimisation of Chromatographic Conditions 152

II. 3.3.3.2. Optimisation of the Sample Preparation Procedure 152
II. 3.3.3.3. Method Validation 153
II. 3.3.3.3.1. Selectivity 153
II. 3.3.3.3.2. Linearity and LLOQ 157
II. 3.3.3.3.3. Precision and Accuracy 158
II. 3.3.3.3.4. Recovery 159


II. 1. BIOANALYSIS
General Concepts


Bioanalysis II
95
II. 1.1. INTRODUCTION
Bioanalysis includes the set of analytical techniques and procedures applied in the
characterisation and quantitative determination of drugs and their metabolites in various
biological matrices such as blood, plasma, serum, urine, other fluids (e.g. saliva, CSF) or
tissues. By generating reproducible and reliable data, bioanalytical methods are the key
determinants in the acquisition, evaluation and interpretation of the results derived from
non-clinical, clinical and biopharmaceutical studies, playing a critical role not only during
the process of drug discovery and development but also in implementing and monitoring
of therapy after drug approval (NOVÁKOVÁ and VLČKOVÁ, 2009; SHAH et al., 2000; WAL et al.,
2010). In effect, the quality of these studies, which are often used to support regulatory
filings or diagnosis, establish appropriate dosage schemes and monitor therapeutic
efficacy or safety, is directly related to the reliability of the underlying bioanalytical
outcome (NOVÁKOVÁ and VLČKOVÁ, 2009; VISWANATHAN et al., 2007). Thus, the employment
of well-characterised and fully validated analytical methods is essential to ensure that any
decision based on the obtained bioanalytical results can be taken with trust and
confidence (CHANDRAN and SINGH, 2007; SHAH et al., 2000).
Aiming at implementing a bioanalytical method for routine use, it must be first
conveniently developed, optimised and validated. Each analytical method has its own
characteristics, which in turn vary from analyte to analyte, and the appropriateness of the
technique may also be influenced by the ultimate goal of the study (SHAH et al., 2000). The
development phase is an inherently laborious and complex process that, depending on its
specific requirements, the stage of drug discovery and development process and the
analyst’s experience, can be conducted in multiple ways (ALVES et al., 2010; FORTUNA et al.,
2014b). Whereas at one extreme, it may simply involve the adaptation of an existing
method by making minor changes so that it is suitable for a new application, at the other
extreme, the analyst may start out with a few sketchy ideas and apply expertise to
develop a proper method (EURACHEM, 2014). During the optimisation stage, the initial sets
of conditions that were evolved along the method development proceedings are
improved and maximised in terms of the overall ability to quantify the specific analytes of
interest (DEVANSHU et al., 2010).
After developing and optimising analytical conditions, the method must be
properly validated in order to guarantee that it provides accurate, precise and
reproducible data throughout study-sample analysis. Bioanalytical method validation is
the systematic process of defining the analytical requirements and confirming that the
method under consideration has performance capabilities consistent with the demands
of its intended application (CHANDRAN and SINGH, 2007). Therefore, it includes all the
procedures required to demonstrate that a particular analytical method developed and

II Quantitative Drug Analysis
96
employed for the quantitative determination of the analytes in a given biological matrix is
suitable and reliable (SHAH et al., 2000). In essence, each methodological step should be
investigated to determine the extent to which environment, matrix or procedural
variables can affect the estimation of the analyte from the time of sample collection up to
the analysis and interpretation of the obtained results. The success of validation is a
reflection of a well performed bioanalytical method development and optimisation. In
fact, the development and validation of any bioanalytical method is an iterative process in
which there can be no demarcation between these two phases (CHANDRAN and SINGH,
2007). By carrying out preliminary validation studies during the phase of method
development it is possible to ascertain whether the established analytical conditions are
satisfactory or require additional alterations to successfully meet the standards of the
acceptance criteria.
This chapter sets up the beginning of the experimental work underlying the
present thesis. With the intent of evaluating the potential of CBZ, PHT, OXC and LTG to be
administered by the IN route to mice, the availability of appropriate and reliable
analytical tools that support the execution of comprehensive pharmacokinetic studies
was fundamental to enable the quantification of the drugs and their respective main
metabolites in different biological matrices. Accordingly, a bioanalytical method that
allows the simultaneous quantification of all the compounds of interest was initially
developed and validated in human plasma, which can be potentially applied in the clinic
for the therapeutic monitoring of the referred AEDs. Since the human plasma is a
relatively complex matrix, easily accessible, available in large quantities and associated
with few ethical constraints, its characteristics make it ideal for the optimisation of the
various analytical conditions that will form the basis for the subsequent development and
validation of the bioanalytical methods used for the quantitative drug determination in
animal matrices. Simple, rapid, sensitive, accurate and reproducible HPLC techniques
were developed in order to measure the concentration of the selected drugs and some of
their metabolites in plasma, brain and liver tissues of mice, allowing the analysis of the
samples derived from the in vivo pharmacokinetic experiments.
Prior to a further detailed description of the techniques herein employed, a brief
theoretical approach will be provided concerning the main concepts inherent to the
general process of development and validation of a chromatographic method for the
quantification of small drugs and/or metabolites in biological matrices.

Bioanalysis II
97
II. 1.2. BIOANALYTICAL METHOD DEVELOPMENT
A given compound can often be measured by several methods. Nowadays, HPLC
remains the methodology of choice as it is able to separate and quantify quite
complicated mixtures of compounds with low and high molecular weight, as well as
different polarities and acid-base properties in a variety of matrices (NOVÁKOVÁ and
VLČKOVÁ, 2009).
The development of a bioanalytical method is unique and specific for each drug
candidate and it depends, among various factors, on the analyte physicochemical
features (e.g. molecular weight, pKa and lipophilicity), nature of the matrix, sensitivity
required and the available instrumentation. Generally, it involves considerable trial and
error procedures to test and evaluate as much variables as possible in order to establish
the most suitable analytical conditions for the intended application. In essence, HPLC
method development comprises the consideration of all the parameters pertaining to
both the chromatographic conditions and sample preparation.
Chromatographic Conditions
Chromatographic analysis pursues the separation of all the compounds of interest
in a sample with good resolution, without interferences at the retention times of the
analytes and within a reasonable running time. Sharp, symmetrical and well resolved
peaks are crucial in quantitative analysis to attain low quantification limits, low relative
standard deviation between injections and reproducible retention times (WAL et al.,
2010). In general, the HPLC separation of the analytes is accomplished based on the
differences in affinity of the compounds between two phases: one mobile and the other
stationary. Since the majority of the drugs and metabolites are polar in nature, the
reversed-phase chromatography is the most commonly applied method in which the
mobile phase is polar, composed of a mixture of water/buffer and organic solvents
(acetonitrile or methanol); and the stationary phase is non-polar, consisting of
hydrocarbon chains chemically attached to the silica base packing of the column (e.g. C18
and C8). Hence, while polar compounds get eluted firstly, the non-polar ones are retained
in the column for a longer period of time and therefore, the separation of the analytes is
sorted according to their increasing molecular hydrophobicity.
There are many factors that should be taken into account during the process of
defining the most appropriate chromatographic conditions for a specific bioanalytical
method. Depending on the number and polarity of the compounds to be resolved or
separated, the mode of elution can be stipulated as isocratic or gradient. In opposition to
the gradient mode, isocratic elution is characterised by keeping the mobile phase

II Quantitative Drug Analysis
98
composition constant over time, being simpler and more reproducible (KUPIEC, 2004). The
main criterion in selection and optimisation of the mobile phase composition is to achieve
appropriate separation of all the analytes of interest from each other, as well as from
matrix endogenous substances or impurities (DEVANSHU et al., 2010). In most cases,
changing the polarity or pH of the mobile phase will alter the elution of the compounds
and, as a consequence, the resolution and the efficiency of separation can also be
affected. Buffers are needed when an analyte is ionic or ionisable under reversed-phase
conditions (pH values within the range 2-8) (WAL et al., 2010). In fact, pH changes as little
as 0.1 pH units might have a significant impact on peak symmetry and separation,
affecting the reproducibility of the results (WAL et al., 2010). The flow rate and
temperature of analysis may likewise have quite significant effects on the analytes’
resolution and retention time, whereby these are parameters that should not be
neglected during the chromatographic method development.
The choice of the most convenient system for the detection of the eluting
components essentially depends on the analytes’ properties. Different types of detectors,
such as ultraviolet (UV), fluorescence and mass spectrometry, are available to be used in
HPLC analysis. Even though, in general terms, either fluorescence or mass spectrometry
provide better sensitivity and selectivity than UV detection, the latter is cheaper, more
easily accessible and presents a broad spectrum of application; for these reasons, it still
being one of the most frequently employed detection techniques. The wavelength of the
UV incident light must be selected in accordance with the absorption characteristics of
the analyte. Theoretically, it should correspond to the value at which the maximum
absorbance occurs aiming to enhance sensitivity. Nonetheless, care should be taken to
minimise the absorption of potential interfering endogenous substances of the matrix,
providing a more specific detection of the compounds. UV detection often requires the
search for an optimal compromise between specificity/selectivity and sensitivity.
Sample Preparation
Samples obtained from biological materials are usually not directly compatible
with HPLC analyses due to their complexity and protein content (NOVÁKOVÁ and VLČKOVÁ,
2009). As a matter of fact, the overall biological matrices present a variable biochemical
nature comprised of numerous components like salts, acids, bases, proteins, cells and
lipids that can be problematic if not properly removed, potentially leading not only to an
undesirable interference with the analysis, but also to clogging and deterioration of the
stationary phase with the consequent reduction of the chromatographic efficiency (KOLE
et al., 2011; NOVÁKOVÁ and VLČKOVÁ, 2009).

Bioanalysis II
99
Sample preparation is one of the most important stages of the bioanalytical
method development since it includes all the procedures involved in the selective
isolation and/or pre-concentration of the target compounds from various matrices,
making them more suitable for separation, identification, detection and quantification in
chromatographic systems (ASHRI and ABDEL-REHIM, 2011; NOVÁKOVÁ and VLČKOVÁ, 2009). It is
the most labour-intensive and error-prone process in the overall bioanalytical
methodology, accounting for up to 80% of the total analysis time (KOLE et al., 2011).
Different strategies can be applied to clean up a sample before chromatographic analysis,
ranging from a simple dilution to more complex sample pre-treatment procedures, such
as protein precipitation (PP), liquid-liquid extraction (LLE) and solid-phase extraction
(SPE). Recently, several innovative sample preparation techniques have been developed
which include, among others, liquid-liquid micro-extraction, salting-out liquid-liquid
extraction, solid-phase micro-extraction, restricted access material, stir bar sorptive
extraction and micro-extraction by packed sorbent (KOLE et al., 2011; NOVÁKOVÁ and
VLČKOVÁ, 2009). The selection of the sample preparation technique relies essentially on
the chemical properties of the analyte, the nature of the biological matrix and the
detection mode employed (ASHRI and ABDEL-REHIM, 2011).
PP is the simplest and the least time-consuming sample pre-treatment technique
being the method of choice when fast and high throughput analysis of plasma or serum
specimens is desired (HENDRIKS, 2009; NOVÁKOVÁ and VLČKOVÁ, 2009). It consists in
denaturating the proteins present in the matrix by submitting the samples to an external
stress like the addition of an appropriate miscible organic solvent (e.g. acetonitrile,
methanol), strong acid (e.g. perchloric acid, trichloroacetic acid) or some salts of heavy
metals (e.g. zinc sulphate) (ASHRI and ABDEL-REHIM, 2011; KOLE et al., 2011). As denaturation
leads to the active change of protein structure, the drugs or analytes formerly bound to
proteins become freely soluble in the medium. After centrifugation, a pellet of denatured
proteins is formed while a clear supernatant containing the target compounds is
separated and used for chromatographic analysis, which can be performed either directly
or after dilution/concentration (HENDRIKS, 2009). Since PP is one of the most crude and
non-selective sample preparation techniques, analyte concentrations should be high
enough to achieve a signal that dominates the outcome of the endogenous material for
accurate determination, particularly if a concentration step is not performed (HENDRIKS,
2009). Precipitation efficiency and analyte recovery are remarkably influenced by the type
and amount of the precipitating agent used. Indeed, strong acids are considered the most
potent precipitating agents and among organic solvents, the acetonitrile appears to be
more effective in removing sample proteins comparatively to methanol (WAL et al., 2010).
Regardless of the precipitating agent employed, the risk of analyte co-precipitation
should always be considered. Complete deproteinisation is commonly achieved in a

II Quantitative Drug Analysis
100
volume acid:sample ratio of about (0.2-0.5):1.0 (v/v) whereas in case of organic solvents,
the required proportion of solvent to sample volumes frequently ranges within (1.0-
4.0):1.0 (v/v) (ASHRI and ABDEL-REHIM, 2011). For some analytes, PP may be the first pre-
treatment step which is frequently followed by purification and concentration by LLE or
SPE in order to achieve higher sensitivity (ASHRI and ABDEL-REHIM, 2011).
LLE is one of the most commonly used sample preparation techniques in
bioanalysis, affording clear samples with satisfactory recovery of the target compounds.
Separation of the analytes from interferences is based on the principle of their differential
solubility and partitioning equilibrium between two immiscible liquid phases: one
aqueous (the sample to be extracted) and the other organic (ASHRI and ABDEL-REHIM, 2011;
DEVANSHU et al., 2010). While hydrophilic compounds are retained in the polar aqueous
phase, the more hydrophobic ones are transferred to the organic component, being easily
recovered by evaporation of the extract and reconstitution of the residue with a small
volume of mobile phase. The efficiency of the extraction is highly influenced by the
polarity of the organic solvent and the pH of the sample (ASHRI and ABDEL-REHIM, 2011;
HENDRIKS, 2009). This technique is simple, rapid and has a relatively small cost factor per
sample when compared to SPE. Nevertheless, several shortcomings have been associated
to LLE such as the consumption of large amounts of toxic organic solvents, emulsion
formation, variable recovery, unsuitability for hydrophilic compounds and difficulty in
extracting a wide variety of analytes with different lipophilicities (KOLE et al., 2011;
NOVÁKOVÁ and VLČKOVÁ, 2009).
The precept of SPE is similar to the affinity-based separation mechanism of liquid
chromatography in which the analytes to be extracted are partitioned between a solid
phase (sorbent) and a liquid phase (sample) (KOLE et al., 2011; WAL et al., 2010). In general,
SPE technique involves a set of procedures comprising the conditioning of the sorbent to
allow efficient solvent compatibility with the incoming sample matrix; sample loading to
ensure the retention of the analytes in the sorbent; washing to eliminate impurities; and
finally, elution to extract the desired analytes (DEVANSHU et al., 2010). There is a wide
variety of currently available SPE sorbents whereby the retention of the compounds can
be established either through non-polar, polar or ionic interactions. The choice of the
ideal sorbent strongly depends on the physicochemical properties of the target analytes
and matrix components, thus having a significant impact on the selectivity and capacity of
the extraction (NOVÁKOVÁ and VLČKOVÁ, 2009). However, other parameters such as the
composition and volume of the washing and elution solutions also play a determinant
role for the extractive efficiency. Nowadays, SPE is unequivocally considered the leading
sample preparation methodology used in routine bioanalytical laboratories since it
provides an efficient isolation and extraction of the analytes with the highest recovery
values. In spite of all these advantages, SPE is time-consuming and relatively expensive, as

Bioanalysis II
101
the SPE cartridges are manufactured for a single use only. Moreover, it sometimes has
been associated with poor batch-to-batch reproducibility and still requires a significant
amount of harmful organic solvents (NOVÁKOVÁ and VLČKOVÁ, 2009).
As stated above, sample preparation is the most critical and error-prone process in
the overall bioanalytical methodology. Depending on the complexity of the extraction
technique employed, it may be necessary to use an internal standard (IS) to compensate
for any loss of the analytes during sample preparation, thereby minimising the error and
improving both the accuracy and precision of the analysis (ALVES et al., 2010; DADGAR et al.,
1995). Hence, a known and constant amount of IS must be added to the sample at the
earliest stage prior to the initiation of the pre-treatment procedures. The choice of the
appropriate IS is guided by its chromatographic behaviour, which should be similar to that
of the interest compounds, extraction recovery value, and potential interference with
analytes or endogenous substances of the biological matrix. Ideally, it must display similar
physicochemical properties to the analytes, be stable and unreactive with any of the
sample components. More importantly, it must not be present in the original sample
(ALVES et al., 2010; KUPIEC, 2004).
II. 1.3. BIOANALYTICAL METHOD VALIDATION
Before a bioanalytical method can be employed for routine use, it is widely
recognised that it must first be validated to demonstrate and document, through the
implementation of specific laboratory investigations, that the performance characteristics
of a particular method used for quantitative determination of analytes in a given
biological matrix are suitable, reliable and reproducible for the intended analytical
applications (PANDEY et al., 2010; US FOOD AND DRUG ADMINISTRATION, 2001). In essence, it is
crucial to assure that the analytical methods implemented generate accurate, precise and
consistent data in order to permit valid interpretation of the studies they support.
Owing to the undeniable importance of method validation in whole field of
bioanalysis, it was felt the need to standardise the overall validation parameters and
acceptance criteria by globally establishing appropriate guiding principles. In this context,
since 1990, a number of conferences have been held concerning this issue, resulting in
the publication of relevant reports (SHAH et al., 2000, 1992) which, in turn, served as a
base template for the definition of the current United Sates Food and Drug
Administration (US FDA) general recommendations on bioanalytical method validation
(US FOOD AND DRUG ADMINISTRATION, 2001). Originally issued in 2001, the US FDA guidance
has been revised to reflect the advances in science and technology and recently (in
September 2013), an updated draft (US FOOD AND DRUG ADMINISTRATION, 2013) of this

II Quantitative Drug Analysis
102
document has been made available for public review and comment before its
implementation. Although US FDA guidance is considered one of the most influential
guiding documents, other international guidelines have also come into force from various
regulatory entities, such as EMA, to facilitate the regulatory submissions in their
countries. The EMA guideline for validation of bioanalytical methods applied in the
quantitative analysis of samples from animal and human studies was released in July of
2011 (EUROPEAN MEDICINES AGENCY, 2011).
The validation of the analytical methodologies employed during the course of the
present thesis was performed in accordance to the general recommendations described
in both US FDA and EMA guidelines, which will be briefly discussed.
II. 1.3.1. TYPES OF METHOD VALIDATION
As aforementioned, method validation is the process through which the reliability
of a method to quantify a specific analyte in a certain matrix is demonstrated. There are
three different levels/types of validation whose application depends on the
circumstances in which the method was developed and how it is going to be used: full
validation, partial validation and cross validation (CHANDRAN and SINGH, 2007; EURACHEM,
2014; GONZÁLEZ et al., 2014).
When a bioanalytical method is developed and implemented for the first time or a
new drug/metabolite is included, a full validation is mandatory in which all the
fundamental parameters required to ensure the acceptability of the performance and the
reliability of the analytical results must be evaluated. In situations where minor
alterations are made to a previously validated method, such as transfer between
laboratories or analysts, changes in equipment, in species within matrix (e.g. rat plasma
to mouse plasma), in matrix within species (e.g. mice plasma to mice brain homogenate),
in sample processing procedures, in storage conditions, etc., a full validation may not be
necessary and therefore, a partial validation can be performed ranging from as little as
one intra-assay accuracy or precision determination to an almost full validation (GONZÁLEZ
et al., 2014; TIWARI and TIWARI, 2010). Finally, a cross validation consists in a comparison of
the validation parameters when two or more bioanalytical methods are used to generate
data within the same or across different studies conducted in distinct laboratories. In fact,
differences in sample preparation or the application of another analytical method may
result in variable outcomes among separate analytical sites (EUROPEAN MEDICINES AGENCY,
2011).

Bioanalysis II
103
II. 1.3.2. VALIDATION PARAMETERS
A full method validation demands rather high workload and, for that reason,
should only start when promising results are obtained for the explorative validation
performed during the early method development phase, i.e. when the preliminary
experiments indicate that the required quality will be achieved (HARTMANN et al., 1998).
There is a general agreement that at least the following validation parameters should be
evaluated for quantitative procedures: selectivity, calibration curve and linearity,
precision, accuracy, limit of quantification and limit of detection, recovery and stability.
Each parameter will be described below in detail. At the end, a summary of the main
validation procedures and requirements as well as the respective acceptance criteria
according to the US FDA and EMA recommendations will be provided in the Table II.1.1.
Selectivity
Selectivity is defined as the ability of an analytical method to unambiguously
quantify and differentiate the analyte(s) of interest from other interfering components
that may be expected to be present in the sample, typically, endogenous biological matrix
substances, metabolites, degradation products or co-administered drugs (BANSAL and
DESTEFANO, 2007; TIWARI and TIWARI, 2010). The general procedure to assess selectivity
consists in the comparison of the response of the analytes in biological sample at the
lower limit of quantification level (LLOQ) with that of blank matrix specimens, which
should not produce any significant interference at the retention time of the target
compounds and IS (BANSAL and DESTEFANO, 2007; KOLLIPARA et al., 2011).
Even though US FDA guidance does not provide specific recommendations for
selectivity, EMA guidelines states that the absence of interfering components is accepted
when the peak response in blank matrices at the retention time of the analyte(s) is less
than 20% of the response for the LLOQ samples, and lower than 5% for the IS (KOLLIPARA et
al., 2011).
Calibration Curve and Linearity
The selection of an appropriate calibration model that yields a well defined and
reproducible relationship between instrument response and known concentrations of the
analyte is fundamental for reliable quantification (HARTMANN et al., 1998; TIWARI and
TIWARI, 2010). Therefore, a calibration curve should be prepared in the same biological
matrix as the test samples by using six to eight standards, and should be plotted for each

II Quantitative Drug Analysis
104
analyte, covering the expected range of concentrations in the study (EUROPEAN MEDICINES
AGENCY, 2011; US FOOD AND DRUG ADMINISTRATION, 2001).
Analyte concentrations in unknown samples are typically interpolated using the
regression results obtained from calibration curves, being the linear regression the most
commonly adopted model (ALMEIDA et al., 2002). The linearity refers to the ability of a
method to produce a signal which is, either directly or by mathematical transformation,
proportional to the concentration of the analyte present in the sample over the entire
range of interest (CHANDRAN and SINGH, 2007; KOLLIPARA et al., 2011). Ideally, it should be
employed the simplest mathematical model that can properly explain the relationship
between concentration and detector response. The ordinary least square model is one of
the simplest linear regression models most commonly used; however it only can be
applied when the condition of homoscedasticity, i.e. constant variance over the whole
calibration range (assessed by plotting the residuals versus concentration values), is
confirmed for the analytical data (Hartmann et al., 1998; TIWARI and TIWARI, 2010). Indeed,
unlike pharmaceutical analysis, the concentration range in bioanalytical methods is
usually dynamic and broad in order to monitor drug concentrations effectively (ALMEIDA et
al., 2002). Inevitably, in broad calibration ranges, even relatively small deviations from an
assumed linear model can lead to substantial errors in the predicted concentrations at
the extremes of the calibration range (HARTMANN et al., 1998). As a result, larger
deviations at higher concentrations tend to influence the regression line more than slight
deviations at smaller concentrations, and thus the accuracy in the lower end of the
calibration range is impaired (ALMEIDA et al., 2002; GONZÁLEZ et al., 2014). When
heteroscedasticity (significant difference among variances at lowest and highest
concentration levels) is observed and the calibration range cannot be reduced, the use of
a weighted least squares linear regression is preferable and justified (ALMEIDA et al., 2002;
HARTMANN et al., 1998; KOLLIPARA et al., 2011).
Whether the applied calibration model is direct or whether it includes the use of
weighting factors, the linearity of the method should always be demonstrated.
Accordingly, a coefficient of determination (r2) greater than 0.990 is generally considered
as evidence of acceptable fit of the data to the regression line (CHANDRAN and SINGH, 2007;
KOLLIPARA et al., 2011). The quality of the calibration curve is guaranteed if the back
calculated concentrations of all the calibration standards do not deviate more than ±15%
of the nominal value with the exception of the LLOQ, whose deviation can be up to ±20%
(EUROPEAN MEDICINES AGENCY, 2011; US FOOD AND DRUG ADMINISTRATION, 2001).

Bioanalysis II
105
Precision and Accuracy
The precision and accuracy with which known concentrations of an analyte can be
determined in a certain biological matrix must be demonstrated, constituting one of the
most important factors in assessing method quality (SHAH et al., 2000). The precision of a
bioanalytical method is the ability to produce reproducible results between series of
determinations, i.e., describes the closeness of individual measures of an analyte when
the procedure is applied repeatedly to multiple aliquots of the same homogeneous
sample, being generally expressed as % coefficient of variation (% CV) (KOLLIPARA et al.,
2011; US FOOD AND DRUG ADMINISTRATION, 2001). The accuracy, also termed as trueness, is
defined as the closeness of the experimental value obtained by the method to the true or
nominal concentration of the analyte, and it is expressed as % Bias, deviation of the test
results from the accepted reference value (TIWARI and TIWARI, 2010).
The precision and accuracy should be determined both inter- and intra-daily by
analysing replicate sets of quality control (QC) samples prepared at the LLOQ and three
different concentration levels covering the whole dynamic range of the method: low
(equivalent to three times of LLOQ concentration), medium (somewhere within the
middle concentration value of the calibration range) and high (closer to the upper end of
the standard curve and ideally, it should not be greater than 80-90% of the upper limit of
quantification [ULOQ]) (BANSAL and DESTEFANO, 2007; KOLLIPARA et al., 2011). The
acceptance criteria for both the parameters establish that, at each QC level, either % CV
or % Bias should not exceed the absolute value of 15% with the exception of LLOQ, whose
deviations can reach values up to 20% (EUROPEAN MEDICINES AGENCY, 2011; US FOOD AND
DRUG ADMINISTRATION, 2001).
Limit of Quantification and Limit of Detection
The limit of quantification is the lowest concentration of the analyte in a sample
that can be quantitatively determined with acceptable precision and accuracy (% CV and
% Bias < 20%). In practice, it corresponds to the lowest point of the calibration curve and
should be determined by analysing at least five replicates of the sample at the LLOQ
concentration, independently of those used for construction of the calibration curve
(BANSAL and DESTEFANO, 2007). Quantification below LLOQ is, by definition, considered not
acceptable and thereby, for determinations accomplished under this minimum value, the
method can only produce semi-quantitative or qualitative data (TIWARI and TIWARI, 2010).
The limit of quantification is frequently identified directly with sensitivity when these
terms are actually conceptually different. Indeed, sensitivity refers to the capability of the
method to discriminate small differences in concentration of the analyte, reflecting the

II Quantitative Drug Analysis
106
slope of the calibration curve obtained when the chromatographic response is
represented versus concentration (GONZÁLEZ et al., 2014).
The limit of detection (LOD) is the lowest concentration of an analyte which can be
detected and reliably differentiated from background noise but not necessarily quantified
as an exact value. The LOD can be estimated using various procedures. Hence, LOD is
commonly determined for an analyte concentration at which the response signal-to-noise
ratio is equal or greater than three; however, simple visual examination after successive
dilutions of the LLOQ standard is also an approach very often performed (CHANDRAN and
SINGH, 2007; KOLLIPARA et al., 2011).
Recovery
Recovery is the parameter that reflects the extraction efficiency, in other words, it
corresponds to the ability of a bioanalytical method to extract the analyte(s) from the
biological matrix. According to US FDA guidelines, the extraction efficiency should be
determined by comparing the analytical response of replicate sets of extracted samples at
three concentration levels representative of the calibration range (low, medium and high)
with non-extracted standards containing the same amount of the analyte(s), which
represent 100% recovery (US FOOD AND DRUG ADMINISTRATION, 2001). It is important to point
out that there is not a minimum established recovery value either for the analyte or IS,
nevertheless, it should be precise, consistent and reproducible over the dynamic range of
the method (GONZÁLEZ et al., 2014; KOLLIPARA et al., 2011). Even though high recovery of
analyte(s) from the matrix is always desirable, sometimes, it may be necessary to
intentionally sacrifice the extraction efficiency in order to achieve better selectivity
(DADGAR et al., 1995). Factors such as organic solvent composition, buffer ionic strength
and pH, acid or base concentration and temperature are just some of the variables that
can be investigated and optimised to improve the extent of recovery (WAL et al., 2010).
Stability
The chemical stability of a drug/metabolite is a function of the physicochemical
properties of the compound, the storage conditions, the matrix components and the
container system (US FOOD AND DRUG ADMINISTRATION, 2001). In effect, the stability of the
analyte in biological matrices is often critical, and therefore, it is imperative to verify that
there is no relevant degradation between the time of samples collection and their
analysis that would compromise the reliability of the obtained results (HARTMANN et al.,
1998).

Bioanalysis II
107
Evaluation of stability should be carried out to ensure that every step taken during
sample preparation and analysis, as well as the storage conditions used, do not affect the
final concentration of the analyte (EUROPEAN MEDICINES AGENCY, 2011). Stability can be
tested by comparing the results of replicate sets of both low and high QC samples
analysed before (reference samples) and after (stability samples) being exposed to the
conditions for stability assessment. Although US FDA guidance does not specify
acceptance criteria for the stability exercises, EMA recommendations indicate that the
deviation between experimental and nominal values should be within ±15% (EUROPEAN
MEDICINES AGENCY, 2011). The conditions employed in stability experiments should cover all
the situations likely to be encountered during the whole analytical procedure which
include sample handling, storage and analysis:
Short-term (bench top) stability – Evaluates the stability of the analyte before
processing a sample, which is done at room temperature and/or 4°C for 4-24 h
based on the expected duration for which samples will be maintained at these
conditions from collection until sample preparation;
Long-term stability – Ensures the integrity of the drug in the biological matrix
stored in the freezer (-70°C and/or -20°C) since the date of the first sample
collection up to the date of the last sample analysis. It is advised to analyse the
samples at least on three different occasions to ensure enough stability data
before starting the study;
Freeze-thaw stability – It simulates situations of transport or re-analysis in which
samples are commonly frozen and thawed several times. Analyte stability is
determined for at least three freeze and thaw cycles wherein QC samples are
stored in the freezer for 24 h, thawed unassisted at room temperature and then
once again refrozen for 12-24 h under the same conditions. After completing
three freeze-thaw cycles, the samples are finally analysed;
Post-preparative stability – Assess the stability of the analyte in the final extract
during the anticipated maximum analysis time under the conditions of analysis
(e.g. residence time in the autosampler).

II Quantitative Drug Analysis
108
Table II.1.1 Summary of the main validation parameter requirements according to both US FDA
and EMA guidelines on bioanalytical method validation.
Validation Parameter Requirement - Acceptance Criteria
Selectivity Analysis of blank samples of the appropriate biological matrix should be obtained from at least six different sources. - Absence of interfering components is accepted when the response is < 20% of the LLOQ for the analyte and < 5% for the IS.
Calibration Curve/ Linearity
Should be prepared in the same biological matrix as the test samples by using six to eight calibration standards, covering the whole expected concentration range. - At least 3 calibration curves (generated in 3 different days) should be plotted. - r2 > 0.990; % Bias within ±15% (all concentrations) or ±20% (LLOQ).
Precision Should be evaluated inter- and intra-daily. A minimum of five replicates per concentration (LLOQ, low QC, medium QC and high QC) should be analysed. - % CV (QC samples) < 15%; % CV (LLOQ) < 20%.
Accuracy Should be evaluated inter- and intra-daily. A minimum of five replicates per concentration (LLOQ, low QC, medium QC and high QC) should be analysed. - % Bias (QC samples) within ±15%; % Bias (LLOQ) within ±20%.
LLOQ Should be determined by analysing at least five replicates. - % CV < 20%; % Bias within ±20%.
Recovery Should be performed at three concentration levels (low QC, medium QC and high QC) by comparing the analytical results of extracted samples with non-extracted standards, which represent 100% recovery. - Recovery should be precise, consistent and reproducible.
Stability Should be performed for at least three replicates of low and high QC samples. Stability evaluations should comprise short-term, long-term, freeze/thaw and post-preparative experiments. - % Deviation within ±15%.
Bias, deviation from nominal value; CV, coefficient of variation; IS, internal standard; LLOQ, lower limit of quantification;
QC, quality control; r2, coefficient of determination.

II. 2. EXPERIMENTAL
Development and Validation of an HLPC-UV
Method for the Simultaneous Quantification
of PB, PRM, PHT, CBZ, OXC, LTG and their
Main Metabolites in Human Plasma


Experimental II
111
II. 2.1. INTRODUCTION
Epilepsy is a chronic neurological disorder that affects approximately 50 million
people worldwide (BIALER and WHITE, 2010). Among several therapeutic approaches,
pharmacotherapy based on a wide variety of AEDs is the first-line treatment option to
achieve seizure control (GERLACH and KRAJEWSKI, 2010). Indeed, since the introduction of
PB, several molecules with anticonvulsant properties were developed and, presently,
more than twenty AEDs are patented in the world market, including older drugs such as
PHT, PRM, ethosuximide, CBZ and valproic acid; and newer AEDs like LTG, levetiracetam,
OXC, zonisamide and eslicarbazepine acetate.
Dealing with such a wide arsenal of AEDs does not make the clinical selection of
the best pharmacotherapy an easy task and, therefore, several guidelines have been
established (GLAUSER et al., 2006; PATSALOS et al., 2008). Although monotherapy is still the
preferred therapeutic approach in newly diagnosed epilepsy, it has failed in many
patients even when two or more different AEDs are attempted and gradually titrated to
the maximum tolerated dose (GARNETT et al., 2009). Thus, if an epileptic condition is
refractory to an initial monotherapy regimen, patients should be switched to
monotherapy with another AED or to polytherapy (ST LOUIS, 2010, 2009). However, to
ensure that therapeutic failure is due to the inadequate seizure control of the selected
AED monotherapy regimen rather than the inability to achieve the proper drug plasma
concentrations in the patient, therapeutic drug monitoring (TDM) of plasma/serum levels
remains necessary. Considering the variable nature of epilepsy, patient’s
pathophysiological features, comorbidities and co-medications, AED therapy must be
carefully optimised for each individual patient concerning both therapeutic and
toxicological profiles. Hence, the TDM of AEDs has become a routine practice in the
management of epilepsy (KRASOWSKI, 2010) not only when AED polytherapy combinations
are implemented, but also during the course of pharmacological conversion between
different AED monotherapies.
The present work aimed at developing a sensitive and fast bioanalytical method
able to simultaneously determine the plasma concentrations of PB, PRM, PHT, CBZ, LTG
and OXC as they represent the main frontline of old and new AEDs in the current clinic
(LANDMARK et al., 2007), but also some of their main metabolites, CBZ-E, trans-diol and Lic
(Figure II.2.1). Regarding the metabolic and pharmacotoxicological properties of such
metabolites, it is clear that they should also be quantified in several circumstances.
Specifically, PRM is mainly metabolised in the liver to PB, its active metabolite, and both
exhibit anticonvulsant activity. In humans, CBZ is mainly oxidised to CBZ-E which is the
main responsible for the toxic effects of the parent compound; then, the epoxide
undergoes microsomal hydrolysis and is converted to the inactive trans-diol (PATSALOS et

II Quantitative Drug Analysis
112
al., 2008). Although structurally similar to CBZ, OXC is extensively reduced to the
pharmacologically active metabolite Lic.
Bearing in mind that PB, PRM, PHT and CBZ are mainly metabolised by the hepatic
cytochrome P450 system, and that LTG and OXC are second-generation AEDs frequently
used when switching those first-generation AEDs, it is expected that during these
conversion processes drug-drug interactions may occur. Therefore, TDM is crucial
because abruptly stopping an existing baseline AED increases the risk of breakthrough
seizures, while introducing a new adjunctive AED too quickly can cause an exacerbation of
adverse effects (ST LOUIS, 2010). Hence, the availability of rapid, simple, sensitive, accurate
and reliable analytical techniques is primordial to support TDM of these drugs in clinical
routine.
During the last years, several HPLC methods coupled to UV detection or mass
spectrometry detection (HPLC-MS and HPLC-MS/MS) for the simultaneous determination
of AEDs and some of their metabolites have been reported in literature. Notwithstanding,
to the best of our knowledge, an HPLC-UV assay that provides a simultaneous
quantification of PB, PRM, PHT, CBZ, OXC, LTG and three of their main metabolites (CBZ-E,
trans-diol and Lic) in human plasma has not been published yet.
Figure II.2.1 Chemical structures of primidone (PRM), phenobarbital (PB), phenytoin (PHT),
carbamazepine (CBZ), oxcarbazepine (OXC), lamotrigine (LTG), 10,11-trans-dihydroxy-10,11-
dihydrocarbamazepine (trans-diol), carbamazepine-10,11-epoxide (CBZ-E), licarbazepine (Lic), and
ketoprofen which was used as internal standard (IS).

Experimental II
113
II. 2.2. MATERIALS & METHODS
II. 2.2.1. Chemicals and Reagents
PRM, PHT, CBZ, CBZ-E, OXC and ketoprofen, used as IS, were purchased from
Sigma-Aldrich (St Louis, MO, USA). Lic and trans-diol were kindly supplied by BIAL-Portela
& Cª S.A. (S. Mamede do Coronado, Portugal). LTG was kindly provided by Bluepharma
(Coimbra, Portugal). PB was commercially obtained from Labesfal (Campo de Besteiros,
Portugal). Methanol (HPLC gradient grade) was purchased from Fisher Scientific
(Leicestershire, UK), acetonitrile (HPLC gradient grade) from Lab-Scan (Sowinskiego,
Poland) and ultrapure water (HPLC grade, 18.2 MΩ.cm) was prepared by means of a Milli-
Q water apparatus from Millipore (Milford, MA, USA). Ethyl acetate and triethylamine
(TEA) were acquired from Fisher Scientific (Leicestershire, UK) and Merck KGaA
(Darmstadt, Germany) respectively, while ortho-phosphoric acid (85%) was purchased
from Panreac Química SA (Barcelona, Spain).
Blank human plasma samples from healthy donors were gently provided by the
Portuguese Blood Institute after written consent of each subject.
II. 2.2.2. Preparation of Standard Solutions
Stock solutions of PB (20 mg/mL), PRM (10 mg/mL), PHT (10 mg/mL), CBZ (10
mg/mL), LTG (10 mg/mL), OXC (5 mg/mL), CBZ-E (10 mg/mL), trans-diol (10 mg/mL), Lic
(20 mg/mL) and IS (1 mg/mL) were individually prepared by dissolving appropriate
amounts of each compound in methanol. These solutions were then adequately diluted
with methanol to obtain the corresponding intermediate solutions. Afterwards, stock and
intermediate solutions of drugs and metabolites were properly mixed to afford six
combined spiking solutions with final concentrations of 6.25, 12.5, 50, 250, 100 and 2500
µg/mL for PB; 10, 20, 50, 125, 500 and 1250 µg/mL for PRM; 12.5, 25, 50, 125, 500 and
1250 µg/mL for PHT; 2.5, 5, 12.5, 50, 250 and 1250 µg/mL for CBZ, LTG and CBZ-E; 2.5, 5,
12.5, 25, 125 and 625 µg/mL for OXC; 6.25, 12.5, 25, 50, 100 and 250 µg/mL for trans-diol
and 3.75, 7.5, 20, 100, 500 and 2000 µg/mL for Lic. Each combined solution was daily used
for spiking aliquots of blank human plasma in order to prepare six calibration standards in
the concentration ranges of 0.25-100 µg/mL for PB, 0.4-50 µg/mL for PRM, 0.5-50 µg/mL
for PHT, 0.1-50 µg/mL for CBZ, LTG and CBZ-E, 0.1-25 µg/mL for OXC, 0.25-10 µg/mL for
trans-diol and 0.15-80 µg/mL for Lic.
QC samples at three representative concentration levels (low, medium and high)
of the calibration curves were independently prepared in the same biological matrix.
Thus, aliquots of blank human plasma were spiked to attain final concentrations of 0.75,
50 and 90 µg/mL for PB; 1.2, 25 and 45 µg/mL for PRM; 1.5, 25 and 45 µg/mL for PHT; 0.3,

II Quantitative Drug Analysis
114
25, 45 µg/mL for CBZ, LTG and CBZ-E; 0.3, 12.5 and 22.5 µg/mL for OXC; 0.75, 5 and 9
µg/mL for trans-diol and 0.45, 40 and 72 µg/mL for Lic.
A methanolic IS working solution at 250 µg/mL was also prepared by dilution of an
appropriate volume of the respective stock solution.
All stock, intermediate and combined solutions were stored at 4°C and protected
from light, with the exception of the IS working solution which was daily prepared.
II. 2.2.3. Sample Preparation
An aliquot of human plasma (500 µL) added of 20 µL of the IS working solution
was mixed with 1 mL of methanol in order to precipitate plasma proteins. After
centrifuging at 13400 rpm for 10 min, the resulting supernatant was evaporated under a
gentle nitrogen stream at 80°C for 10 min; then, the residual volume of supernatant was
diluted with 1.5 mL of ultrapure water and vortex-mixed for 30 s. Afterwards, the pre-
treated sample was subjected to a SPE on the Waters Oasis® HLB cartridge (30 mg of
hydrophilic-lipophilic-balanced sorbent; 1 mL of capacity; from Milford, MA, USA), which
was previously conditioned with 1 mL of methanol, 1 mL of acetonitrile and 1 mL of
water-acetonitrile (95:5, v/v). The loaded cartridge was subsequently submitted to -60
kPa and washed four times with 1 mL of water. After drying the sorbent under airflow for
5 min, analytes were eluted with 1 mL of ethyl acetate using gentle vacuum. The eluate
was evaporated to dryness at 45°C under a gentle stream of nitrogen gas and
reconstituted with 500 µL of mobile phase by vortexing and ultrasonication. At last, 20 µL
of the final mixture were injected into the chromatographic system.
II. 2.2.4. HPLC-UV Instrumentation and Chromatographic Conditions
The chromatographic analysis was performed on a BAS-480 liquid chromatograph
equipped with a PM-80 pump, a Rheodyne manual injector with a 20 µL loop, a BAS UV-
116 UV-Vis detector, a BAS DA-5 chromatography control and a data system interface
(Bioanalytical Systems, West Lafayette, IN, USA). Data acquisition was achieved by means
of BAS Chromgraph Control and Chromgraph Report software version 2.30.
The chromatographic separation of all the six drugs, metabolites and IS was
carried out at room temperature on a reversed-phase LiChroCART® Purospher Star® C18
column (55 mm x 4 mm; 3 µm particle size) purchased from Merck KGaA (Darmstadt,
Germany). An isocratic elution was applied at a flow rate of 1.0 mL/min with a mobile
phase composed of water-methanol-acetonitrile-TEA (68.7:25:6:0.3, v/v/v/v) adjusted at
pH 6.5 with ortho-phosphoric acid 85%. The wavelength detection was set at 237 nm.

Experimental II
115
II. 2.2.5. Method Validation
The method was validated according to the international recommendations for
bioanalytical method validation regarding selectivity, linearity, precision, accuracy, limits
of quantification and detection, recovery and stability (EUROPEAN MEDICINES AGENCY, 2011;
US FOOD AND DRUG ADMINISTRATION, 2001).
Blank human plasma samples from six different subjects were used in order to
assess method selectivity, analysing the eventual interference of matrix endogenous
substances at the retention times of PB, PRM, PHT, CBZ, LTG, OXC, CBZ-E, trans-diol, Lic
and IS. Interferences from several commonly co-administered drugs were also tested and
included amitriptyline, chlorpromazine, clonazepam, dexamethasone, diazepam, digoxin,
fluoxetine, haloperidol, hydrochlorothiazide, ibuprofen, levetiracetam, lorazepam,
mirtazapine, naproxen, omeprazole, paracetamol, ranitidine, salicylic acid, sertraline,
theophylline, and venlafaxine.
The linearity of the method was evaluated within the defined plasma
concentration ranges, using calibration curves prepared on five different days (n = 5),
constructed with six spiked plasma calibration standards and plotting analyte-IS peak
height ratio versus the corresponding plasma nominal concentrations. The data were
subjected to a weighted linear regression analysis using 1/x2 as weighting factor, taking
the plots and the sums of absolute percentage of relative error into account (ALMEIDA et
al., 2002).
Inter-day precision and accuracy were investigated analysing each QC sample on
five consecutive days of the assay (n = 5), while the intra-day data were obtained by
analysing five sets of QC samples in a single day (n = 5). According to bioanalytical method
validation guidelines, the acceptance criterion for precision, which is expressed as % CV,
must be equal to or lower than 15%; whereas accuracy, which is expressed as % Bias,
must be within ±15%.
The LLOQ was defined as the lowest concentration of the calibration curve that
can be measured with adequate precision and accuracy. The LLOQ was stipulated
analysing plasma samples intra- and inter-daily (n = 5) and absolute deviations lower than
20% for both CV and Bias values were accepted. The LOD was determined for all the
compounds by analysing spiked plasma samples with known concentrations after
successive dilutions.
The absolute recovery of the compounds from human plasma samples submitted
to the treatment previously described was investigated at the three concentration levels

II Quantitative Drug Analysis
116
(low, medium and high) representative of the calibration range. It was calculated
comparing the analytes peak heights from extracted QC plasma samples with those
obtained after direct injection of non-extracted aqueous solutions at the same nominal
concentrations (n = 5). The absolute recovery of the IS was also determined by calculating
its peak height ratio between extracted samples and non-extracted aqueous solutions.
Human plasma stability of the nine analytes was investigated at low and high QC
concentration levels comparing the data of samples analysed before (reference samples)
and after being exposed to the conditions for stability assessment (stability samples).
Stability/reference samples ratio between 85-115% was defined as stability criterion (n =
5) according to the guidelines. Short-term and long-term stability were evaluated at room
temperature for 4 h, at 4°C for 24 h and at -30°C for up to 30 days in order to simulate
sample handling and storage time in the refrigerator and freezer before analysis (n = 5).
The effect of three freeze-thaw cycles on the stability of the compounds in human plasma
samples was additionally studied. For that, aliquots of spiked plasma samples were stored
at -30°C for 24 h, thawed unassisted at room temperature and then refrozen for 24 h
under the same conditions until completing the three cycles. In order to assess the post-
preparative stability of processed samples in usual autosampler conditions, the stability of
the analytes on the reconstituted extracts was also assessed at 4°C for 24 h.
II. 2.2.6. Clinical Application
After development and validation of the method, it was applied for the
quantification of parent compounds and main metabolites in real plasma samples of
epileptic patients treated with PB, PHT or CBZ who were being monitored at the Coimbra
University Hospital Centre (CHUC).

Experimental II
117
II. 2.3. RESULTS & DISCUSSION
II. 2.3.1. Development and Optimisation of Chromatographic Conditions
During the development and optimisation phase of the assay, several
chromatographic conditions were tested in order to achieve the best separation of the
compounds within the shortest running time. In the early stages, a mobile phase
composed of a mixture of water-methanol-acetonitrile in the proportion of 64:30:6
(v/v/v) was tested. However, the poor peak resolution of LTG concerning both shape and
symmetry demanded the incorporation of TEA to the mixture. Indeed, TEA saturates the
free silanol groups of the stationary phase, allowing the decrease of the asymmetry and
peak tailing phenomenon (SOUSA et al., 2012). The influence of mobile phase pH in the
separation and retention time of the analytes was also evaluated in the range of 3-10.
Hence, a mixture of water-methanol-acetonitrile-TEA in the proportion of 68.7:25:6:0.3
(v/v/v/v) and pH at 6.5 was chosen, as it provided a good separation and peak shape for
all compounds of interest (including AEDs, metabolites and IS). Under these analytical
conditions, the last-eluting analyte was CBZ, with a retention time of approximately 15
min, and the order of elution of the compounds was PRM, LTG, trans-diol, PB, Lic, CBZ-E,
OXC, IS, PHT and CBZ (Figure II.2.2).
Figure II.2.2 Typical chromatogram of an extracted human sample plasma spiked with internal
standard (IS) and analytes at intermediate concentrations of the calibration ranges. CBZ,
carbamazepine; CBZ-E, carbamazepine-10,11-epoxide; Lic, licarbazepine; LTG, lamotrigine; OXC,
oxcarbazepine; PB, phenobarbital; PHT, phenytoin; PRM, primidone; trans-diol, 10,11-trans-
dihydroxy-10,11-dihydrocarbamazepine.

II Quantitative Drug Analysis
118
The development of a practical and accessible HPLC method that could be broadly
applied in hospitals and clinical pharmacokinetic departments was our main concern.
Therefore, the use of UV detection and isocratic elution were preferred to mass
spectrometry (KIM et al., 2011; PAGLIA et al., 2007; SHIBATA et al., 2012; SUBRAMANIAN et al.,
2008) and gradient elution (JUERGENS, 1984; MAURER et al., 2002; SHIBATA et al., 2012), which
involve more complex and expensive equipments, and thus cannot be easily adopted by
the majority of clinical laboratories. Several wavelength values ranging from 210 nm to
250 nm were assessed and the best compromise in terms of sensitivity and selectivity was
achieved at 237 nm.
In order to select the appropriate IS, some compounds including amitriptyline,
chloramphenicol, naproxen, 10,11-dihydrocarbamazepine and ketoprofen were tested.
The latter was selected as it presented the most adequate retention time and it also
displayed a chromatographic behaviour and absolute recovery values similar to those
exhibited by the AEDs under investigation.
II. 2.3.2. Optimisation of the Sample Preparation Procedure
Sample pre-treatment methodology was initially investigated by plasma
precipitation with acetonitrile and methanol (BHATTI et al., 1998; CONTIN et al., 2010; PATIL
and BODHANKAR, 2005); however, no profitable results were achieved because the resulting
processed samples were relatively unclean, still presenting matrix endogenous
substances that interfered with the retention times of the analytes. As previous studies
(BUGAMELLI et al., 2002; FORTUNA et al., 2010) revealed that CBZ-E is easily degraded in acid
environments, the use of strong precipitation agents like perchloric and trichloroacetic
acids was herein excluded. Then, since SPE procedures are usually associated to high and
reliable extraction of AEDs from human plasma (ALVES et al., 2007; FORTUNA et al., 2010;
FRANCESCHI and FURLANUT, 2005; VERMEIJ and EDELBROEK, 2007), several SPE conditions were
tested, including washing steps and eluting solvents, but also without success. Thus, the
combination of a plasma deproteinisation with methanol followed by a SPE procedure
was tested and demonstrated to be the best option as it allowed a more effective
elimination of interfering substances and avoided sample dilution, improving the
selectivity and sensitivity of the analytical method. Furthermore, the sample preparation
methodology herein developed is faster, less cumbersome, less pollutant and affords
greater recovery values than LLE procedures reported in literature (BUDAKOVA et al., 2008;
KIMISKIDIS et al., 2007; OH et al., 2006).

Experimental II
119
II. 2.3.3. Method Validation
II. 2.3.3.1. Selectivity
Representative chromatograms of blank plasma and spiked human plasma
samples with IS and analytes at concentrations of the LLOQ are depicted in Figure II.2.3.
The analysis of blank plasma samples from six healthy volunteers confirmed the absence
of interfering peaks from matrix endogenous substances at the retention times of the
studied compounds.
In addition, none of the tested drugs potentially co-administered with the
considered AEDs were found to interfere with peaks of the analytes or IS.
II. 2.3.3.2. Linearity, LLOQ and LOD
The calibration curves prepared in human plasma for all the compounds at the
concentration ranges defined in section II. 2.2.2. were linear (r2 ≥ 0.992) and showed a
consistent correlation between analyte-IS peak height ratios and corresponding plasma
concentrations. The regression equations of the calibration curves and the corresponding
coefficients of determination attained for each AED and metabolites are summarised in
Table II.2.1. At this point, it is important to highlight that the concentration range for each
compound is much wider than its respective therapeutic window (PATSALOS et al., 2008),
allowing the applicability of this assay to both pharmacokinetic and toxicological
determinations.

II Quantitative Drug Analysis
120
Figure II.2.3 Typical chromatograms of extracted human plasma: (A) blank plasma; (B1) plasma
spiked with the internal standard (IS) and analytes at concentrations of the LLOQ; (B2) expanded
partial representation of the chromatogram depicted in (B1). CBZ, carbamazepine; CBZ-E,
carbamazepine-10,11-epoxide; Lic, licarbazepine; LTG, lamotrigine; OXC, oxcarbazepine; PB,
phenobarbital; PHT, phenytoin; PRM, primidone; trans-diol, 10,11-trans-dihydroxy-10,11-
dihydrocarbamazepine.

Experimental II
121
Table II.2.1 Mean calibration parameters (n = 5) of primidone (PRM), lamotrigine (LTG), 10,11-
trans-dihydroxy-10,11-dihydrocarbamazepine (trans-diol), phenobarbital (PB), licarbazepine (Lic),
carbamazepine-10,11-epoxide (CBZ-E), oxcarbazepine (OXC), phenytoin (PHT) and carbamazepine
(CBZ) in human plasma.
Calibration Parameters
Analyte Concentration Range (µg/mL)
Regression Equationa r2
PRM 0.40 - 50 Y = 0.0485x - 0.0012 0.992
LTG 0.10 - 50 Y = 0.5412x + 0.0031 0.994
trans-diol 0.25 - 10 Y = 0.2163x - 0.0073 0.994
PB 0.25 - 100 Y = 0.0995x + 0.0095 0.996
Lic 0.15 - 80 Y = 0.1898x + 0.0108 0.994
CBZ-E 0.10 - 50 Y = 0.2088x - 0.0005 0.996
OXC 0.10 - 25 Y = 0.2410x - 0.0032 0.993
PHT 0.50 - 50 Y = 0.0384x - 0.0030 0.992
CBZ 0.10 - 50 Y = 0.2132x - 0.0021 0.994
a Y represents analyte-IS peak height ratio (expressed in arbitrary height units); x represents
analyte concentration (expressed in µg/mL).
r2, coefficient of determination.
The LLOQ was experimentally defined as 0.50 µg/mL for PHT, 0.40 µg/mL for PRM,
0.25 µg/mL for PB and trans-diol, 0.15 µg/mL for Lic and 0.10 µg/mL for OXC, CBZ, CBZ-E
and LTG with acceptable precision (CV ≤ 18.27%) and accuracy (Bias varied from -13.93%
to 16.43%) as depicted in Table II.2.2. Interestingly, the LLOQs obtained with this method
are often lower than those achieved with other HPLC-UV techniques reported in
literature (BUDAKOVA et al., 2008; BUGAMELLI et al., 2002; FRANCESCHI and FURLANUT, 2005;
GREINER-SOSANKO et al., 2007; HEIDELOFF et al., 2010; KHOSCHSORUR et al., 2001; LEVERT et al.,
2002; MA et al., 2007).
After successive dilutions of the lowest calibration standard, the LOD was reliably
established at 0.050 µg/mL for PHT, 0.040 µg/mL for PRM, 0.025 µg/mL for PB and trans-
diol, 0.015 µg/mL for Lic and 0.010 µg/mL for OXC, CBZ, CBZ-E and LTG.

II Quantitative Drug Analysis
122
Table II.2.2 Inter- and intra-day precision (% CV) and accuracy (% Bias) of the analytes in human
plasma samples at the lower limit of quantification (LLOQ) (n = 5).
LLOQ
Inter-day
Intra-day
Analyte Nominal Concentration
Experimental Concentration
a % CV % Bias
Experimental
Concentrationa % CV % Bias
PRM 0.40 0.43 ± 0.055 13.48 7.38
0.41 ± 0.014 3.31 1.94
LTG 0.10 0.11 ± 0.017 14.95 5.78
0.12 ± 0.019 14.29 16.43
trans-diol 0.25 0.26 ± 0.022 9.60 5.46
0.27 ± 0.006 2.42 6.09
PB 0.25 0.25 ± 0.062 18.27 -1.58
0.22 ± 0.026 8.09 -13.93
Lic 0.15 0.14 ± 0.036 17.93 -5.28
0.16 ± 0.019 7.62 5.47
CBZ-E 0.10 0.11 ± 0.011 10.22 9.24
0.11 ± 0.011 10.41 10.87
OXC 0.10 0.11 ± 0.012 12.40 6.26
0.10 ± 0.007 7.04 0.43
PHT 0.50 0.51 ± 0.052 12.05 1.22
0.50 ± 0.021 4.66 -0.17
CBZ 0.10 0.11 ± 0.012 12.31 10.88
0.11 ± 0.017 14.85 14.74
a Mean ± Standard deviation, n = 5. Nominal and experimental concentrations are expressed in µg/mL. CBZ,
carbamazepine; CBZ-E, carbamazepine-10,11-epoxide; Lic, licarbazepine; LTG, lamotrigine; OXC, oxcarbazepine; PB,
phenobarbital; PHT, phenytoin; PRM, primidone; trans-diol, 10,11-trans-dihydroxy-10,11-dihydrocarbamazepine.
II. 2.3.3.3. Precision and Accuracy
The results of inter- and intra-day precision and accuracy analyses are reported in
Table II.2.3. The acceptance criteria were fulfilled for all the compounds at the three
concentration levels assessed, since the overall inter- and intra-day CV values were below
12.15% and Bias varied between -14.91% and 13.63%. These data clearly demonstrate
that the HPLC-UV method herein developed is reliable, accurate and reproducible.

Experimental II
123
Table II.2.3 Inter- and intra-day precision (% CV) and accuracy (% Bias) of the analytes in human
plasma samples at the low, medium and high concentrations of the calibration ranges (n = 5).
a Mean ± Standard deviation, n = 5. Nominal and experimental concentrations are expressed in µg/mL. CBZ,
carbamazepine; CBZ-E, carbamazepine-10,11-epoxide; Lic, licarbazepine; LTG, lamotrigine; OXC, oxcarbazepine;
PB, phenobarbital; PHT, phenytoin; PRM, primidone; trans-diol, 10,11-trans-dihydroxy-10,11-
dihydrocarbamazepine.
Inter-day
Intra-day
Nominal Concentration
Experimental Concentrationa % CV % Bias
Experimental
Concentrationa % CV % Bias
PRM
1.2 1.14 ± 0.110 9.90 -4.90 1.22 ± 0.133 10.76 1.43
25 25.54 ± 3.002 11.76 2.18 26.22 ± 1.167 4.45 4.88
45 42.49 ± 2.600 6.12 -5.57 43.95 ± 2.126 4.84 -2.34
LTG
0.3 0.28 ± 0.028 9.92 -6.42
0.27 ± 0.031 10.67 -8.96
25 24.83 ± 2.565 10.33 -0.66
24.46 ± 0.699 2.86 -2.16
45 45.96 ± 3.601 7.83 2.13
48.49 ± 2.890 5.96 7.76
trans-diol
0.75 0.70 ± 0.067 9.99 -6.56 0.69 ± 0.032 4.80 -8.62
5 4.95 ± 0.443 9.00 -0.94 4.89 ± 0.229 4.70 -2.11
9 9.40 ± 0.821 8.76 4.49 10.13 ± 0.431 4.27 12.55
PB
0.75 0.70 ± 0.096 12.08 -6.41
0.66 ± 0.051 6.67 -11.80
50 48.74 ± 4.300 8.80 -2.52
47.52 ± 1.496 3.14 -4.95
90 87.45 ± 7.313 8.35 -2.83
94.91 ± 6.040 6.36 5.46
Lic
0.45 0.45 ± 0.047 9.38 -0.33 0.46 ± 0.039 7.06 1.91
40 40.91 ± 4.061 9.91 2.28 40.54 ± 1.669 4.11 1.36
72 73.53 ± 5.700 7.75 2.12 76.63 ± 3.847 5.01 6.44
CBZ-E
0.3 0.27 ± 0.023 8.55 -8.97
0.27 ± 0.016 6.16 -10.92
25 25.28 ± 2.151 8.51 1.11
24.60 ± 1.004 4.08 -1.61
45 44.98 ± 2.833 6.30 -0.04
45.65 ± 2.469 5.41 1.45
OXC
0.3 0.27 ± 0.022 8.43 -9.63 0.27 ± 0.015 6.62 -10.57
12.5 13.61 ± 1.204 8.86 8.85 13.30 ± 0.523 3.93 6.43
22.5 25.57 ± 1.481 5.80 13.63 24.50 ± 1.471 6.01 8.90
PHT
1.5 1.34 ± 0.086 6.81 -10.79
1.32 ± 0.102 8.11 -12.22
25 24.46 ± 2.765 11.34 -2.15
23.72 ± 0.730 3.08 -5.14
45 46.99 ± 5.700 12.15 4.43
51.08 ± 4.370 9.13 13.50
CBZ
0.3 0.27 ± 0.027 10.57 -10.39 0.26 ± 0.025 9.76 -14.91
25 25.12 ± 2.590 10.31 0.47 24.94 ± 0.781 3.13 -0.25
45 46.16 ± 3.957 8.57 2.58 48.82 ± 3.266 9.69 8.48

II Quantitative Drug Analysis
124
II. 2.3.3.4. Recovery
The overall recovery values obtained using the sample preparation methodology
herein developed are presented in Table II.2.4. The absolute mean recoveries determined
for AEDs and metabolites ranged from 78.49% to 101.04% and showed CV values lower
than 10.54%; while the mean recovery of IS was of 69.07% and CV was lower than 7.57%.
These results undoubtedly demonstrate that the sample preparation methodology
employed is consistent, precise and reproducible.
Table II.2.4 Absolute recovery of primidone (PRM), lamotrigine (LTG), 10,11-trans-dihydroxy-
10,11-dihydrocarbamazepine (trans-diol), phenobarbital (PB), licarbazepine (Lic), carbamazepine-
10,11-epoxide (CBZ-E), oxcarbazepine (OXC), phenytoin (PHT) and carbamazepine (CBZ) from
human plasma (n = 5).
a
Mean ± Standard deviation, n = 5. CV, coefficient of variation.
Analyte Nominal Concentration (µg/mL)
Absolute Recovery (%)a Precision (% CV)
PRM 1.2 92.24 ± 3.99 4.33
25 80.17 ± 2.84 3.54
45 94.47 ± 2.80 2.96
LTG 0.3 84.87 ± 5.89 6.94
25 84.16 ± 3.20 3.81
45 85.96 ± 2.41 2.80
trans-diol 0.75 83.57 ± 3.94 4.71
5 83.13 ± 2.57 3.06
9 88.68 ± 2.48 2.79
PB 0.75 89.77 ± 4.77 5.32
50 81.35 ± 2.60 3.19
90 83.80 ± 2.60 3.10
Lic 0.45 101.04 ± 3.83 3.79
40 87.45 ± 3.05 3.49
72 91.42 ± 2.67 2.92
CBZ-E 0.3 89.43 ± 6.02 6.73
25 85.27 ± 3.05 3.57
45 90.46 ± 2.67 2.95
OXC 0.3 82.88 ± 1.95 2.36
12.5 86.96 ± 2.98 3.43
22.5 89.01 ± 2.47 2.77
PHT 1.5 84.19 ± 7.42 8.81
25 82.81 ± 3.63 4.39
45 78.49 ± 2.60 3.31
CBZ 0.3 88.89 ± 9.37 10.54
25 88.46 ± 3.35 3.78
45 86.37 ± 2.57 2.97

Experimental II
125
II. 2.3.3.5. Stability
The stability of the six AEDs and metabolites was assessed under the conditions
previously stated in section II. 2.2.5. and the results are reported in Table II.2.5.
Accordingly, all the analytes demonstrated to be stable in unprocessed plasma samples
for up to 4 h at room temperature, for 24 h at 4°C, for 1 month at -30°C and after three
freeze-thaw cycles. Stability of processed plasma samples was also ensured for at least 24
h at 4°C for all the compounds.
Table II.2.5 Stability (values in percentage) of primidone (PRM), lamotrigine (LTG), 10,11-trans-
dihydroxy-10,11-dihydrocarbamazepine (trans-diol), phenobarbital (PB), licarbazepine (Lic),
carbamazepine-10,11-epoxide (CBZ-E), oxcarbazepine (OXC), phenytoin (PHT) and carbamazepine
(CBZ) under different conditions of sample handling and storage.
Stability Conditions
Analyte
Concentration
(µg/mL)
Human Plasma
Mobile Phase
RT 4h 4°C 24 h -30°C
30 days Freeze/thaw (three cycles)
4°C 24 h
PRM
1.2 100.23 98.18 101.45 97.18
103.68
45 103.28 103.82 94.89 91.47
106.33
LTG
0.3 98.02 96.01 104.30 102.30
101.06
45 103.07 103.31 95.50 90.12
104.73
trans-diol
0.75 103.47 102.98 101.64 100.49
100.65
9 105.86 97.19 95.15 89.84
105.28
PB
0.75 105.78 100.78 102.05 104.53
99.87
90 103.88 105.08 95.30 94.97
105.31
Lic
0.45 107.49 98.14 104.20 93.70
101.39
72 104.60 101.15 95.06 89.62
105.30
CBZ-E
0.3 96.52 94.32 103.51 97.27
99.86
45 105.50 100.96 95.10 88.98
105.01
OXC
0.3 106.22 100.53 94.14 107.41
98.32
22.5 106.06 99.21 95.87 88.26
104.64
PHT
1.5 96.47 100.47 104.14 95.91
100.32
45 105.53 101.03 95.38 87.16
103.15
CBZ
0.3 99.69 100.39 104.73 98.52
100.64
45 106.56 99.82 95.64 87.18 103.73
RT, room temperature.

II Quantitative Drug Analysis
126
II. 2.3.4. Clinical Application
The method herein developed and fully validated was employed in the analysis of
some plasma samples from patients treated with PB, PHT or CBZ. Representative
chromatograms are shown in Figure II.2.4. Analytical results revealed good peak shape
and resolution and no interferences from endogenous matrix constituents were
observed. Drug plasma concentrations were calculated by interpolation on the
corresponding calibration curves and the experimental levels obtained were within the
concentration range established in the chromatographic technique (Table II.2.6).
Furthermore, even though the patients were co-treated with other drugs, no interfering
peaks were detected (Table II.2.6, Figure II.2.4). Therefore, the method showed to be
highly reliable and selective and thus it seems to be suitable for monitoring plasma
concentrations of the selected AEDs and metabolites.
Table II.2.6 Characteristics of drug therapy instituted to the epileptic patients whose plasma
samples were analysed by the HPLC-UV method herein developed and the respective measured
concentrations obtained for phenobarbital (PB), phenytoin (PHT), carbamazepine (CBZ) and
metabolites.
CBZ-E, carbamazepine-10,11-epoxide; trans-diol, 10,11-trans-dihydroxy-10,11-dihydrocarbamazepine.
Patient AED Therapy
Concentration (µg/mL)
Concomitant Administered Drugs
A PB PB – 32.34 azitromycin; acetylcisteine; enoxaparin sodium; ceftriaxone; furosemide; ipatropium bromide; pantoprazole; paracetamol; theophylline; salbutamol.
B PHT PHT – 8.24 amoxicillin; azitromycin; bromazepam; clonazepam; chlorpromazine; ipatropium bromide; lysine acetylsalicylate; olanzapine; omeprazole; metilprednisolone; paracetamol; risperidone; salbutamol; theophylline; valproic acid.
C CBZ trans-diol – 7.22 CBZ-E – 2.97 CBZ – 10.18
amoxicillin; azitromycin; acetylcisteine; diazepam; enoxaparin sodium; lactulose; pantoprazole; paracetamol; piracetam; valproic acid.

Experimental II
127
Figure II.2.4 Representative chromatograms of plasma samples obtained from epileptic patients
treated with: (A) Phenobarbital (PB); (B) phenytoin (PHT) and (C) carbamazepine (CBZ). IS, internal
standard.

II Quantitative Drug Analysis
128
A novel isocratic reversed-phase HPLC-UV method associated to a sample pre-
treatment methodology based on protein precipitation followed by SPE was herein
developed and fully validated for the simultaneous determination of PB, PRM, PHT, CBZ,
LTG, OXC and some of their main metabolites CBZ-E, trans-diol and Lic in human plasma.
The experimental results demonstrated that the reported bioanalytical method is
selective, precise, accurate and sensitive, yielding also an efficient and reproducible
sample extraction. Therefore, it can be applied in clinical settings as a useful tool for
routine TDM of patients treated with such AEDs either in monotherapy, transitional or
chronic polytherapy regimens, as well as in other pharmacokinetic-based studies
involving these drugs.

II. 3. EXPERIMENTAL
HLPC-UV Methods for the Quantitative
Determination of PHT, CBZ, OXC, LTG
and their Main Metabolites in
Mouse Biological Matrices


Experimental II
131
II. 3.1. GENERAL INTRODUCTION
To achieve the utmost objective of the work underlying the present thesis, it was
of paramount importance to have appropriate analytical techniques that enable the
quantification of PHT, CBZ, OXC, LTG and their main metabolites in various biological
matrices derived from the pharmacokinetic studies carried out in mice.
The chromatographic method previously described in section II. 2. for the
simultaneous quantitative determination of the referred compounds in human plasma
(SERRALHEIRO et al., 2013b) was developed and validated with the intent of providing not
only a suitable and useful tool for TDM of epileptic patients, but also to test and optimise
the analytical conditions that would serve as a basis for the development of the
bioanalytical methods applied in the quantification of drugs from the required animal
samples. In fact, taking into account that several mouse biological matrices, and
specifically mouse plasma, are commonly available in very limited amounts, the use of a
surrogate matrix like the human plasma, with all its inherent features, may be assumed as
a preferential approach during the first stages of any bioanalytical method optimisation.
As a result, the process of method development is considerably faster, the number of
animals needed is substantially lower and both the economical and ethical issues are
more advantageous.
Therefore, taking as a starting point the formerly optimised conditions of the
quantitative analytical method in human plasma, it was initially attempted the
development and validation of an HPLC-UV technique for the simultaneous quantification
of PHT, CBZ, OXC, LTG and some of their main metabolites (CBZ-E and Lic) in mouse
plasma, brain and liver homogenates. Indeed, to obtain reliable experimental results it is
essential that they are generated by properly developed and validated methods in the
same and each separate biological matrix (of the same animal species) of the real samples
to be analysed (SHAH et al., 2000). Unfortunately, during the preliminary validation
process, multiple and time-consuming difficulties have emerged which prevented the
achievement of consistent, precise and accurate data. Exploratory results indicated that
the transposition of the bioanalytical methodology from human plasma to mouse
specimens did not gather the appropriate performance characteristics essential to assure
a valid interpretation of the analytical outcome derived from the subsequent
pharmacokinetic studies and therefore, it could not be implemented with confidence into
our routine laboratory practice. On account of that, we decided to take advantage of
techniques already developed and validated in our laboratory (CASTEL-BRANCO et al., 2001;
FORTUNA et al., 2010) by introducing few adjustments to make them suitable for the
intended purposes. As referred in section II. 1.3.1., the inclusion of minor alterations in
the original methods commonly implies the accomplishment of a partial validation

II Quantitative Drug Analysis
132
procedure to ensure the reliability of the obtained results; for this reason, two basilar
analytical techniques were herein developed and partially validated enabling:
Quantification of CBZ, CBZ-E, OXC, Lic and PHT in mouse plasma, brain (whole
brain, olfactory bulb and frontal cortex) and liver tissues;
Quantification of LTG in mouse plasma, brain (whole brain, olfactory bulb and
frontal cortex) and liver tissues.
The next sections will provide a description of all the analytical procedures and results
concerning the quantitative HPLC-UV methods developed and validated to support the
analysis of the samples originated from the pharmacokinetic studies that will be
presented in the following chapters of this thesis.
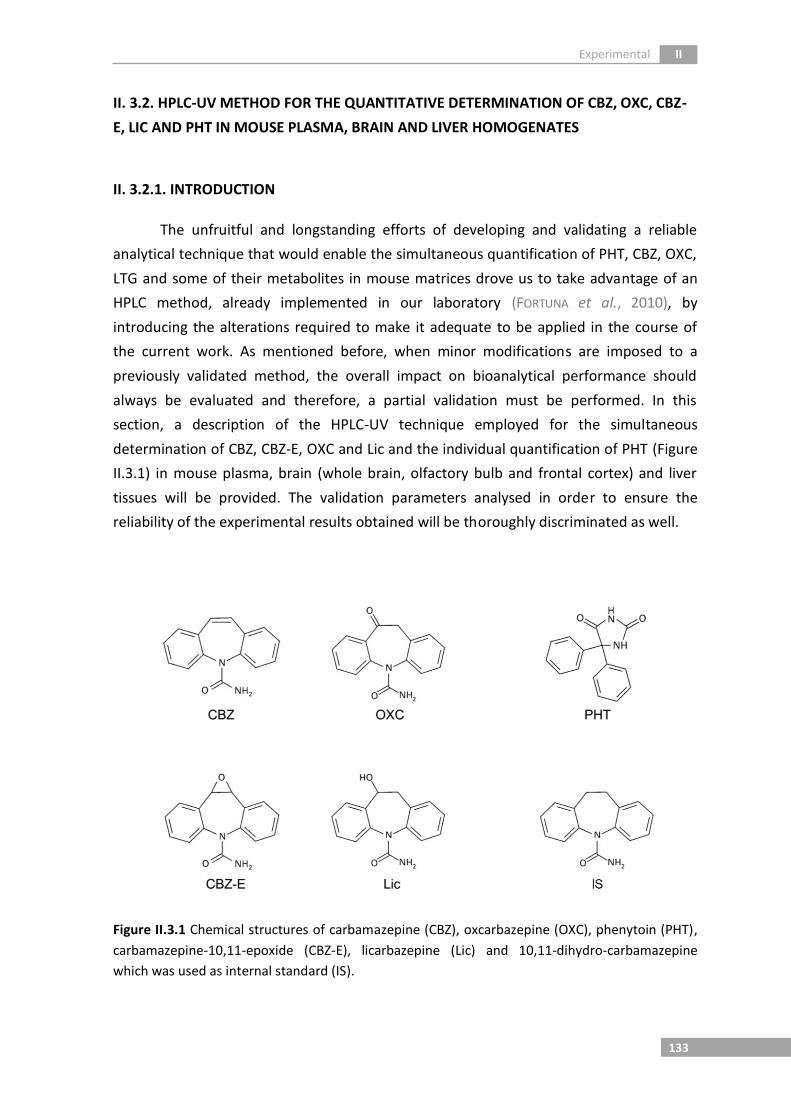
Experimental II
133
II. 3.2. HPLC-UV METHOD FOR THE QUANTITATIVE DETERMINATION OF CBZ, OXC, CBZ-
E, LIC AND PHT IN MOUSE PLASMA, BRAIN AND LIVER HOMOGENATES
II. 3.2.1. INTRODUCTION
The unfruitful and longstanding efforts of developing and validating a reliable
analytical technique that would enable the simultaneous quantification of PHT, CBZ, OXC,
LTG and some of their metabolites in mouse matrices drove us to take advantage of an
HPLC method, already implemented in our laboratory (FORTUNA et al., 2010), by
introducing the alterations required to make it adequate to be applied in the course of
the current work. As mentioned before, when minor modifications are imposed to a
previously validated method, the overall impact on bioanalytical performance should
always be evaluated and therefore, a partial validation must be performed. In this
section, a description of the HPLC-UV technique employed for the simultaneous
determination of CBZ, CBZ-E, OXC and Lic and the individual quantification of PHT (Figure
II.3.1) in mouse plasma, brain (whole brain, olfactory bulb and frontal cortex) and liver
tissues will be provided. The validation parameters analysed in order to ensure the
reliability of the experimental results obtained will be thoroughly discriminated as well.
Figure II.3.1 Chemical structures of carbamazepine (CBZ), oxcarbazepine (OXC), phenytoin (PHT),
carbamazepine-10,11-epoxide (CBZ-E), licarbazepine (Lic) and 10,11-dihydro-carbamazepine
which was used as internal standard (IS).

II Quantitative Drug Analysis
134
II. 3.2.2. MATERIALS & METHODS
II. 3.2.2.1. Chemicals and Reagents
CBZ, CBZ-E, OXC and PHT were purchased from Sigma-Aldrich (St Louis, MO, USA).
Lic and 10,11-dihydro-carbamazepine, used as IS, were kindly supplied by BIAL-Portela &
Cª S.A. (S. Mamede do Coronado, Portugal). Methanol (HPLC gradient grade) and ethyl
acetate were purchased from Fisher Scientific (Leicestershire, UK) while acetonitrile (HPLC
gradient grade) was acquired from Lab-Scan (Sowinskiego, Poland) and ultrapure water
(HPLC grade, 18.2 MΩ.cm) was obtained by means of a Milli-Q water apparatus from
Millipore (Milford, MA, USA). Sodium dihydrogen phosphate dihydrate, di-sodium
hydrogen phosphate dihydrate and hydrochloric acid fuming 37%, all used to prepare 0.1
M sodium phosphate buffer pH 5.0, were provided from Merck KGaA (Darmstadt,
Germany).
II. 3.2.2.2. Animals and Blank Biological Matrices
Adult male CD-1 mice weighting 30-40 g were obtained from local certified animal
facilities (Faculty of Healthy Sciences of the University of Beira Interior, Covilhã, Portugal)
and maintained under controlled environmental conditions (12 h light/dark cycle, at
20±2°C and relative humidity 50±5%) with free access to tap water and standard rodent
diet (4RF21, Mucedola, Italy). Mice not subjected to any pharmacological treatment were
used as the source of drug-free plasma, brain and liver tissues required for the method
optimisation and validation studies. Blank matrices were gathered after sacrificing the
animals by cervical dislocation followed by decapitation. Blood samples were collected
into heparinised tubes and plasma was separated by centrifugation at 4000 rpm for 10
min (4°C) and stored at -30°C until use. After exsanguination, mice brain and liver tissues
were quickly removed, weighed and homogenised with 0.1 M sodium phosphate buffer
pH 5.0 (4 mL per gram of tissue) using a THOMAS® Teflon pestle tissue homogeniser.
Tissue homogenates were then centrifuged at 4800 rpm for 15 min (4°C) and the
resultant supernatants were likewise frozen at -30°C until being used. In order to mimic
the sample processing of olfactory bulb and frontal cortex specimens, mice brains were
dissected in small tissue amounts weighing approximately 0.02 g and 0.1 g, respectively.
Each brain fragment was separately transferred into a 2.0 mL Eppendorf tube,
homogenised with 1 mL of 0.1 M sodium phosphate buffer pH 5.0 using an ULTRA-
TURRAX® device, and finally centrifuged for 15 min at 13400 rpm (4°C). The obtained
homogenate supernatants were conveniently packaged and stored according to the
conditions described above.

Experimental II
135
All the experiments involving the collection of mice blank matrices and their care
were conducted in conformity with the international regulations of the European
Directive (2010) regarding the protection of laboratory animals used for scientific
purposes (2010/63/EU) (EUROPEAN PARLIAMENT AND COUNCIL OF THE EUROPEAN UNION, 2010),
and the experimental procedures employed were reviewed and approved by the
Portuguese Food and Veterinary General Division (DGAV).
II. 3.2.2.3. Preparation of Standard Solutions
Stock solutions of CBZ, OXC, CBZ-E, Lic and PHT were individually prepared by
dissolving appropriate amounts of each compound in methanol and then adequately
diluted with the same solvent to obtain the corresponding intermediate solutions.
Afterwards, different volumes of drug/metabolite stock and intermediate solutions were
properly mixed and further diluted with methanol to afford six combined spiking
solutions of all the analytes at distinct concentrations in order to spike the biological
matrices always with the same volume of the appropriate combined spiking solution (10
µL). Thus, each combined solution was daily employed for spiking aliquots of mice blank
plasma and tissue (whole brain, olfactory bulb, frontal cortex and liver) homogenates
allowing the preparation of the calibration standards required to construct six-point
calibration curves in all the matrices considered. QC samples were likewise independently
prepared in the same biological matrices at the LLOQ and at three representative
concentration levels [low (QC1), medium (QC2) and high (QC3)] of the calibration ranges.
Two methanolic IS working solutions at the concentration of 200 µg/mL and 100
µg/mL were prepared by dilution of an appropriate volume of the respective stock
solution (1 mg/mL). All the stock, intermediate and combined solutions were stored at
4°C and protected from light, with exception of the IS working solutions which were
prepared in every day of analysis.
A summary of all the solutions, calibration standards and QC samples prepared in
the five biological matrices considered (plasma, brain, olfactory bulb, frontal cortex and
liver of mice) were presented in Appendix A1. (Tables A1.1 and A1.2).
II. 3.2.2.4. Sample Preparation
Sample preparation was performed by submitting mice plasma and tissue
homogenates to a SPE procedure according to the methodology formerly developed and
optimised by Fortuna et al. (2010) with slight modifications.

II Quantitative Drug Analysis
136
Aliquots of 200 µL of mice plasma spiked with 10 µL of IS methanolic working
solution (200 µg/mL) were added to 800 µL of 0.1 M sodium phosphate buffer (pH 5.0).
The samples were briefly vortex mixed and subsequently loaded into Waters Oasis® HLB
(30 mg, 1 mL) cartridges (Milford, MA, USA), previously conditioned with 1 mL of
methanol, 1 mL of acetonitrile and 1 mL of water-acetonitrile (95:5, v/v). Upon sample
elution, the SPE loaded cartridges were submitted to -30 kPa and washed four times with
1 mL of water followed by four more times with 1 mL of water-methanol (90:10, v/v);
then the sorbents were dried under airflow for about 5 min. Thereafter, analytes were
eluted with 1 mL of ethyl acetate applying a gentle vacuum and the eluates were
evaporated to dryness at 45°C under a moderate nitrogen stream. The resultant residues
were reconstituted with 100 µL of mobile phase, vortexed and placed in an ultrasonic
bath at room temperature for approximately 1 min each. At the end, 20 µL of the final
reconstituted extracts were injected into the HPLC system for analysis.
Posterior to thawing, tissue homogenates were centrifuged a second time at
13400 rpm for 30 min to obtain clearer samples, and 500 µL of brain and 250 µL of liver
supernatants were used after being added to an appropriate volume of 0.1 M sodium
phosphate buffer (pH 5.0) in order to make a total of 1 mL sample amount. All the brain
and liver tissue samples, including the olfactory bulb and frontal cortex homogenate
supernatants (1 mL) were spiked with 10 µL of IS working solution (100 µg/mL for the
olfactory bulb and 200 µg/mL for the remaining matrices), and then subjected to the
same SPE procedure already described for plasma. Finally, aliquots of 20 µL (brain, frontal
cortex and liver) or 40 µL (olfactory bulb) of the reconstituted extracts were likewise
injected into the chromatographic system to be analysed.
II. 3.2.2.5. HPLC-UV Instrumentation and Chromatographic Conditions
The HPLC analysis was carried out on a Shimadzu liquid chromatographic system
equipped with a GDU-20A5 degasser, a SIL-20AHT autosampler, a CTO-10ASVP column oven
and a SPD-M20A diode array detector, all from Shimadzu Corporation (Kyoto, Japan).
Data acquisition and instrumentation control were achieved by means of LCsolution
software (Shimadzu Corporation, Kyoto, Japan).
Chromatographic separation of drugs/metabolites and IS was accomplished at
40°C on a reversed-phase LiChroCART® Purospher Star® C18 column (55 mm x 4 mm, 3 µm;
Merck KGaD), using an isocratic elution with a mobile phase consisting of water-
methanol-acetonitrile (64:30:6, v/v/v) pumped at a flow rate of 1 mL/min. The analytes’
detection was performed at the wavelength of 235 nm and the total running time was set
at 10 min.

Experimental II
137
II. 3.2.2.6. Method Validation
Even though the present HPLC-UV technique stemmed from an existing and
already implemented bioanalytical method that has previously been fully validated
(FORTUNA et al., 2010), the reliability of this modified assay had to be necessarily
demonstrated through a partial validation process. Indeed, partial validations are usually
conducted to assess the validity of minor changes in a method with the intent of assuring
comparable performances (BRIGGS et al., 2014; DESILVA et al., 2003). Generally, a partial
validation can range from a single intra- or inter-assay precision and accuracy experiment
to nearly a full validation, being the extent essentially determined by the nature of the
modifications performed (BRIGGS et al., 2014; EUROPEAN MEDICINES AGENCY, 2011; US FOOD
AND DRUG ADMINISTRATION, 2001). In the absence of an established protocol, the partial
validation procedure inevitably relies on the criterion of the analyst (GONZÁLEZ et al.,
2014). Therefore, the selection of the parameters to be evaluated should be made using a
risk-based approach considering the potential impacts of any alterations in the method.
The decision process of whether to carry out particular validation experiments will
materially depend on the nature of changes to the method and their degree of
significance (BRIGGS et al., 2014). Taking all these considerations into account, the set of
validation parameters analysed were selectivity, linearity, inter-day precision, inter-day
accuracy and limit of quantification.
Selectivity was determined by evaluating the potential interference of mouse
plasma, brain and liver endogenous substances at the same retention times of the
analytes and IS. For that, all the considered blank matrices derived from six different mice
were analysed under the described chromatographic conditions, and the resultant
chromatograms were compared with those from spiked samples. In addition, possible
interferences from ketamine and xylazine, the specific anaesthetics that will be employed
during the pharmacokinetic studies conducted in mice, were also ascertained by injecting
standard solutions of these compounds.
The linearity was assessed in each biological matrix within the defined
concentration ranges, using six-point calibration curves prepared on three separate days
(n = 3) by plotting analyte-IS peak height ratio against the corresponding nominal
concentrations. The data were subjected to a weighted linear regression analysis using
1/x2 as weighting factor, which was selected taking the plots and the sums of absolute
percentage of relative error into account (ALMEIDA et al., 2002).
Inter-day precision and accuracy were investigated analysing each QC sample
(QC1, QC2 and QC3) on three consecutive days of the assay (n = 3). According to
II Quantitative Drug Analysis
138
bioanalytical method validation guidelines (EUROPEAN MEDICINES AGENCY, 2011; US FOOD AND
DRUG ADMINISTRATION, 2001), the acceptance criterion for precision, which is expressed as
% CV, must be equal to or lower than 15%; whereas accuracy, which is expressed as %
Bias, must be within ±15%.
The LLOQ was defined as the lowest concentration of the calibration curve that
can be measured with adequate precision and accuracy. It was stipulated by analysing
three replicates of each matrix spiked samples inter-daily (n = 3), wherein the absolute
deviations lower than 20% for both CV and Bias values were accepted.
II. 3.2.3. RESULTS & DISCUSSION
II. 3.2.3.1. Optimisation of Chromatographic Conditions
The analytical conditions herein applied to achieve chromatographic separation
and detection of CBZ, CBZ-E, OXC, Lic and PHT were the same to those employed in the
method developed by Fortuna and colaborators (2010). In a preliminary phase, the
potential for simultaneous quantification of CBZ, CBZ-E, OXC, Lic, PHT and IS was
investigated by injecting individual solutions of all the analytes in HPLC system and
subsequent comparison of their retention times with those obtained in a combined
solution. Chromatographic separation of all the compounds was attained in less than 9
min. The IS was the last-eluting analyte with a retention time of approximately 8 min, and
the order of elution of the remaining compounds was the following: Lic, CBZ-E, OXC, PHT
and CBZ. Unfortunately, a partial co-elution between CBZ and PHT was observed which
demanded the quantification of the latter separately.
Comparatively to the HPLC technique described before in section II. 2., this
method displays several important advantages in what concerns to the chromatographic
conditions used. The absence of buffer and salts in the mobile phase allows the reduction
of the back-pressure and prolong the column lifetime by avoiding the consequent
formation of precipitates due to the limited solubility of salts in organic modifiers. The
chromatographic separation was accomplished at 40°C, providing not only a good shape
and resolution of the peaks but also a decrease of the analytes’ overall retention times.
As a result, the total running time was reduced, diminishing the amount of expensive and
polluting solvents consumed.

Experimental II
139
II. 3.2.3.2. Optimisation of the Sample Preparation Procedure
The SPE methodology employed to isolate and extract the analytes of interest was
the same for all the biological matrices considered (plasma, brain, olfactory bulb, frontal
cortex and liver) and very similar to that developed by Fortuna et al. (2010), presenting
only one additional step in the washing phase. Since no significant changes to the sample
preparation procedure have been made, it was assumed that the extraction efficiency
remained unaffected thus not requiring the assessment of the recovery parameter
(BRIGGS et al., 2014).
Given that this assay is based on a single SPE procedure, minimal sample
manipulation is required which, in essence, reduces the time of handling and the source
of errors.
II. 3.2.3.3. Method Validation
II. 3.2.3.3.1. Selectivity
The analysis of drug-free mouse samples derived from six different animals
confirmed the absence of endogenous interferences at the retention times of the
analytes and IS for all the biological matrices under investigation (plasma, brain and liver
tissues). Moreover, none of the tested anaesthetics (ketamine and xylazine) were found
to interfere with the intended chromatographic analysis. Representative chromatograms
of blank and spiked mouse plasma and tissue homogenate samples are depicted in
Figures II.3.2, II.3.3 and II.3.4.

II Quantitative Drug Analysis
140
Figure II.3.2 Representative chromatograms of extracted mouse plasma: (A) blank plasma; (B)
plasma spiked with licarbazepine (Lic), carbamazepine-10,11-epoxide (CBZ-E), oxcarbazepine
(OXC), carbamazepine (CBZ) and internal standard (IS) at intermediate concentrations of the
calibration ranges; (C) plasma spiked with phenytoin (PHT) and IS at the intermediate
concentration of the calibration range.

Experimental II
141
Figure II.3.3 Representative chromatograms of extracted mouse brain homogenate supernatant:
(A) supernatant of blank brain homogenate; (B) supernatant of brain homogenate spiked with
licarbazepine (Lic), carbamazepine-10,11-epoxide (CBZ-E), oxcarbazepine (OXC), carbamazepine
(CBZ) and internal standard (IS) at intermediate concentrations of the calibration ranges; (C)
supernatant of brain homogenate spiked with phenytoin (PHT) and IS at the intermediate
concentration of the calibration range.

II Quantitative Drug Analysis
142
Figure II.3.4 Representative chromatograms of extracted mouse liver homogenate supernatant:
(A) supernatant of blank liver homogenate; (B) supernatant of liver homogenate spiked with
licarbazepine (Lic), carbamazepine-10,11-epoxide (CBZ-E), oxcarbazepine (OXC), carbamazepine
(CBZ) and internal standard (IS) at intermediate concentrations of the calibration ranges; (C)
supernatant of liver homogenate spiked with phenytoin (PHT) and IS at the intermediate
concentration of the calibration range.

Experimental II
143
II. 3.2.3.3.2. Linearity and LLOQ
Six-point calibration curves were constructed for each compound in all matrices,
plotting peak-height of analyte/IS ratios versus nominal concentrations and applying the
best-fit weighting factor of 1/x2 in order to compensate for heteroscedasticity. The mean
regression equations of the calibration curves and their determination coefficients are
summarised in Table II.3.1, demonstrating the good linearity (r2 ≥ 0.991) of the method
within the specified concentration ranges. As shown in Table II.3.1, the experimental
values of LLOQ defined for all the compounds in all the considered mouse matrices were
appropriately measured with acceptable inter-day precision and accuracy (% CV and %
Bias ≤ 20%).
II. 3.2.3.3.3. Precision and Accuracy
The data depicted in Tables II.3.2, II.3.3 and II.3.4 correspond to the values of
inter-day precision and accuracy determined at three different concentration levels (QC1,
QC2 and QC3) representative of the calibration range for all the compounds in mouse
plasma and tissue homogenate supernatants (brain, olfactory bulb, frontal cortex and
liver). The results revealed that the acceptance criteria of the international guidelines
were fulfilled since the overall CV values did not exceed 10.77% and Bias ranged from -
8.31% to 9.14%. These data indicate that, under the current analytical conditions,
excellent precision and accuracy can be achieved for the quantitative determination of
the referred drugs/metabolites in mouse biological matrices, being this HPLC-UV method
reliable, accurate and reproducible.

II Quantitative Drug Analysis
144
Table II.3.1 Mean calibration parameters (n = 3) and inter-day precision (% CV) and accuracy (%
Bias) values at the lower limit of quantification (LLOQ) (n = 3) of licarbazepine (Lic),
carbamazepine-10,11-epoxide (CBZ-E), oxcarbazepine (OXC), carbamazepine (CBZ) and phenytoin
(PHT) in mouse plasma, brain, olfactory bulb, frontal cortex and liver homogenate supernatants.
Calibration Parameters LLOQ
Analyte [] Range
Regression Equationa
r2
Nominal Concentration
Experimental Concentrationb
% CV % Bias
Plasma
Lic 0.2 - 60 Y = 0.2421x - 0.0035 0.996
0.2 0.210 ± 0.004 1.85 4.80
CBZ-E 0.4 - 30 Y = 0.3027x - 0.0191 0.999
0.4 0.421 ± 0.014 3.82 5.24
OXC 0.1 - 60 Y = 0.4109x - 0.0071 0.996
0.1 0.105 ± 0.003 2.84 5.26
CBZ 0.1 - 30 Y = 0.3296x - 0.0037 0.999
0.1 0.099 ± 0.006 6.67 -0.66
PHT 1.0 - 40 Y = 0.0512x - 0.0032 0.996
1.0 0.993 ± 0.024 2.55 -0.66
Brain
Lic 0.05 - 15 Y = 0.4601x - 0.0014 0.991
0.05 0.048 ± 0.003 7.17 -3.89
CBZ-E 0.05 - 15 Y = 0.5944x - 0.0058 0.996
0.05 0.052 ± 0.002 4.48 3.90
OXC 0.05 - 15 Y = 0.7826x - 0.0037 0.993
0.05 0.055 ± 0.007 14.49 9.74
CBZ 0.1 - 15 Y = 0.7101x - 0.0178 0.997
0.1 0.102 ± 0.006 7.89 2.25
PHT 0.2 - 15 Y = 0.1094x - 0.0058 0.996
0.2 0.219 ± 0.020 12.06 9.43
Olfactory Bulb
Lic - - - - - - -
CBZ-E - - - - - - -
OXC 0.01 - 4 Y = 3.5558x - 0.0011 0.992 0.01 0.009 ± 0.001 5.75 -5.14
CBZ 0.02 - 4 Y = 3.6064x - 0.0089 0.998 0.02 0.020 ± 0.001 3.63 -1.28
PHT 0.05 - 4 Y = 0.5923x - 0.0037 0.995 0.05 0.049 ± 0.001 1.76 -1.30
Frontal Cortex
Lic - - - - - - -
CBZ-E - - - - - - -
OXC 0.025 - 7.5 Y = 1.5652x - 0.0037 0.993 0.025 0.027 ± 0.004 14.49 9.74
CBZ 0.05 - 7.5 Y = 1.4202x - 0.0178 0.997 0.05 0.051 ± 0.003 7.89 2.25
PHT 0.1 - 7.5 Y = 0.2187x - 0.0058 0.996 0.1 0.109 ± 0.010 12.06 9.48
Liver
Lic 0.2 - 20 Y = 0.2785x - 0.0105 0.999 0.2 0.204 ± 0.011 6.31 2.13
CBZ-E 0.2 - 20 Y = 0.2976x - 0.0019 0.999 0.2 0.218 ± 0.012 5.82 9.18
OXC 0.2 - 20 Y = 0.4049x - 0.0154 0.997 0.2 0.208 ± 0.002 1.08 4.05
CBZ 0.2 - 20 Y = 0.3820x - 0.0079 0.999 0.2 0.203 ± 0.001 0.28 1.55
PHT 0.5 - 20 Y = 0.0524x - 0.0026 0.999 0.5 0.503 ± 0.015 3.36 0.51 a
Y represents analyte-IS peak height ratio (expressed in arbitrary height units); x represents analyte concentration
(expressed in µg/mL for plasma, brain and liver or µg for the olfactory bulb and frontal cortex samples). b Mean ±
Standard deviation, n = 3.
r2, coefficient of determination. Calibration range, nominal and experimental concentrations are expressed in µg/mL for
all matrices with the exception of olfactory bulb and frontal cortex, whose values are presented in µg.

Experimental II
145
Table II.3.2 Inter-day precision (% CV) and accuracy (% Bias) of licarbazepine (Lic), carbamazepine-
10,11-epoxide (CBZ-E), oxcarbazepine (OXC), carbamazepine (CBZ) and phenytoin (PHT) in mouse
plasma and brain samples at the low, medium and high concentrations of the calibration ranges (n
= 3).
Plasma
Brain
Analyte Nominal Value
Experimental Concentrationa % CV % Bias
Nominal
Value Experimental
Concentrationa % CV % Bias
Lic 0.6 0.579 ± 0.015 2.69 -3.54 0.15 0.146 ± 0.004 2.82 -2.95
30 30.675 ± 1.612 5.26 2.25 7.5 7.657 ± 0.186 2.43 2.10
54 57.910 ± 2.160 3.73 7.24 13.5 14.504 ± 0.391 2.70 7.43
CBZ-E 1.2 1.206 ± 0.046 4.06 0.54 0.15 0.141 ± 0.003 2.23 -6.04
15 15.335 ± 0.776 5.08 2.23 7.5 7.356 ± 0.221 3.02 -1.92
27 27.223 ± 0.920 3.39 0.83 13.5 14.086 ± 0.398 2.82 4.34
OXC 0.3 0.291 ± 0.009 3.16 -2.88 0.15 0.161 ± 0.014 9.10 7.55
30 30.589 ± 1.105 3.62 1.96 7.5 7.312 ± 0.215 2.94 -2.50
54 57.707 ± 1.465 2.54 6.87 13.5 13.482 ± 0.840 6.24 -0.13
CBZ 0.3 0.290 ± 0.003 1.10 -3.24 0.3 0.284 ± 0.010 3.90 -5.41
15 15.189 ± 0.401 2.64 1.26 7.5 7.263 ± 0.211 2.91 -3.17
27 27.607 ± 0.482 1.75 2.25 13.5 14.007 ± 0.222 1.59 3.75
PHT 3 3.037 ± 0.079 2.64 1.22 0.6 0.605 ± 0.010 1.75 0.79
20 20.107 ± 0.447 2.23 0.54 7.5 7.526 ± 0.390 5.22 0.35
36 34.829 ± 2.603 7.49 -3.25 13.5 12.843 ± 1.38 10.77 -4.87
a Mean ± Standard deviation, n = 3. Nominal and experimental concentrations are expressed in µg/mL.
Table II.3.3 Inter-day precision (% CV) and accuracy (% Bias) of oxcarbazepine (OXC),
carbamazepine (CBZ) and phenytoin (PHT) in mouse olfactory bulb and frontal cortex samples at
the low, medium and high concentrations of the calibration ranges (n = 3).
Olfactory Bulb Frontal Cortex
Analyte Nominal Value
Experimental Valuea
% CV % Bias Nominal
Value Experimental
Valuea % CV % Bias
OXC 0.03 0.029 ± 0.001 3.74 -3.79 0.075 0.081 ± 0.007 9.10 7.55
2 2.126 ± 0.091 4.30 6.30 3.75 3.656 ± 0.107 2.94 -2.50
3.6 3.929 ± 0.177 4.50 9.14 6.75 6.741 ± 0.420 6.24 -0.13
CBZ 0.06 0.060 ± 0.003 5.39 0.45 0.15 0.142 ± 0.005 3.90 -5.41
2 1.984 ± 0.054 2.75 -0.82 3.75 3.631 ± 0.105 2.91 -3.17
3.6 3.815 ± 0.103 2.69 5.98 6.75 7.003 ± 0.111 1.59 3.75
PHT 0.15 0.138 ± 0.003 2.02 -8.31 0.3 0.302 ± 0.005 1.75 0.83
2 1.931 ± 0.083 4.33 -3.45 3.75 3.765 ± 0.195 5.22 0.39
3.6 3.625 ± 0.384 10.62 0.71 6.75 6.425 ± 0.689 10.77 -4.82 a Mean ± Standard deviation, n = 3. Nominal and experimental values are expressed in µg.

II Quantitative Drug Analysis
146
Table II.3.4 Inter-day precision (% CV) and accuracy (% Bias) of licarbazepine (Lic), carbamazepine-
10,11-epoxide (CBZ-E), oxcarbazepine (OXC), carbamazepine (CBZ) and phenytoin (PHT) in mouse
liver samples at the low, medium and high concentrations of the calibration ranges (n = 3).
Liver
Analyte Nominal Value
Experimental Concentrationa
% CV % Bias
Lic 0.6 0.577 ± 0.008 1.57 -3.83
10 10.101 ± 0.422 4.20 1.01
18 17.992 ± 0.245 1.37 -0.05
CBZ-E 0.6 0.580 ± 0.019 3.27 -3.41
10 9.974 ± 0.449 4.50 -0.26
18 18.190 ± 0.174 0.96 1.06
OXC 0.6 0.571 ± 0.014 2.57 -4.81
10 10.534 ± 0.324 3.08 5.34
18 18.903 ± 0.138 0.73 5.02
CBZ 0.6 0.602 ± 0.016 2.77 0.28
10 10.136 ± 0.397 3.92 1.36
18 18.213 ± 0.154 0.84 1.18
PHT 1.5 1.455 ± 0.098 6.98 -3.00
10 10.426 ± 0.324 3.12 4.26
18 18.274 ± 0.214 1.17 1.52 a
Mean ± Standard deviation, n = 3.
Nominal and experimental concentrations are expressed in µg/mL.
The reversed-phase HPLC-UV technique associated to the SPE sample pre-
treatment procedure adapted from the method previously developed and fully validated
by Fortuna et al. (2010) was herein successfully employed for the quantification of CBZ,
CBZ-E, OXC, Lic and PHT in plasma and tissue (brain, olfactory bulb, frontal cortex and
liver) homogenates of mice. Partial validation results have demonstrated that this assay is
linear over the wide concentration ranges of each analyte in all the matrices analysed and
fulfils the fundamental international requirements, being selective, precise, accurate and
reproducible. Accordingly, it has been proven that the present method is suitable to
support and can be applied with confidence in the analysis of samples from the
subsequent pharmacokinetic studies underlying the work of the current thesis.

Experimental II
147
II. 3.3. HPLC-UV METHOD FOR THE QUANTIFICATION OF LTG IN MOUSE PLASMA, BRAIN
AND LIVER HOMOGENATES
II. 3.3.1. INTRODUCTION
The analytical methodology used for the quantitative determination of LTG in
biological matrices of mice was initially based on the assay already developed and
validated by Castel-Branco et al. (2001). The introduction of some changes to the original
method have been made with the intent of achieving the optimal experimental and
analytical conditions for the reliable quantification of LTG (Figure II.3.5) in mouse plasma,
brain (whole brain, olfactory bulb and frontal cortex) and liver tissues. Similarly to the
preceding section (section II. 3.2.), a thorough description of the HPLC-UV technique and
sample preparation procedure employed along with the validation parameters analysed
will also be herein supplied.
Figure II.3.5 Chemical structures of lamotrigine (LTG) and chloramphenicol which was used as
internal standard (IS).
II. 3.3.2. MATERIALS & METHODS
II. 3.3.2.1 Chemicals and Reagents
LTG was kindly supplied by Bluepharma (Coimbra, Portugal) whereas
chloramphenicol, used as IS, was commercially acquired from Sigma-Aldrich (St Louis,
MO, USA). Methanol (HPLC gradient grade) was purchased from Fisher Scientific
(Leicestershire, UK), acetonitrile (HPLC gradient grade) from Lab-Scan (Sowinskiego,
Poland) and ultrapure water (HPLC grade, 18.2 MΩ.cm) was prepared by means of a Milli-
Q water apparatus from Millipore (Milford, MA, USA). Ethyl acetate was acquired from

II Quantitative Drug Analysis
148
Fisher Scientific (Leicestershire, UK). TEA and potassium dihydrogen phosphate, as well as
sodium dihydrogen phosphate dihydrate, di-sodium hydrogen phosphate dihydrate and
hydrochloric acid fuming 37%, used to prepare 0.1 M sodium phosphate buffer pH 5.0,
were all obtained from Merck KGaA (Darmstadt, Germany).
II. 3.3.2.2. Animals and Blank Biological Matrices
Adult male CD-1 mice weighting 30-40 g were obtained from local certified animal
facilities (Faculty of Healthy Sciences of the University of Beira Interior, Covilhã, Portugal)
and maintained under controlled environmental conditions (12 h light/dark cycle, at
20±2°C and relative humidity 50±5%) with free access to tap water and standard rodent
diet (4RF21, Mucedola, Italy). Mice not subjected to any pharmacological treatment were
used as the source of drug-free plasma, brain and liver tissues required for the method
optimisation and validation studies. Blank matrices were gathered after sacrificing the
animals by cervical dislocation followed by decapitation. Blood samples were collected
into heparinised tubes and plasma was separated by centrifugation at 4000 rpm for 10
min (4°C) and stored at -30°C until use. After exsanguination, mice brain and liver tissues
were quickly removed, weighed and homogenised with 0.1 M sodium phosphate buffer
pH 5.0 (4 mL per gram of tissue) using a THOMAS® Teflon pestle tissue homogeniser.
Tissue homogenates were then centrifuged at 4800 rpm for 15 min (4°C) and the
resultant supernatants were likewise frozen at -30°C until being used. In order to mimic
the sample processing of olfactory bulb and frontal cortex specimens, mice brains were
dissected in small tissue amounts weighing approximately 0.02 g and 0.1 g, respectively.
Each brain fragment was separately transferred into a 2.0 mL Eppendorf tube,
homogenised with 0.5 mL of 0.1 M sodium phosphate buffer pH 5.0 using an ULTRA-
TURRAX® device, and finally centrifuged for 15 min at 13400 rpm (4°C). The obtained
homogenate supernatants were conveniently packaged and stored according to the
conditions described above.
All the experiments involving animals and their care were conducted in conformity
with the international regulations of the European Directive (2010) regarding the
protection of laboratory animals used for scientific purposes (2010/63/EU) (EUROPEAN
PARLIAMENT AND COUNCIL OF THE EUROPEAN UNION, 2010), and the experimental procedures
employed were reviewed and approved by the Portuguese DGAV.

Experimental II
149
II. 3.3.2.3. Preparation of Standard Solutions
Stock solutions of LTG were prepared by dissolving appropriate amounts of
compound powder in methanol, and then adequately diluted with the same solvent to
obtain the two corresponding intermediate solutions (intermediate solutions A and B).
Thereafter, different volumes of LTG stock and intermediate solutions were once again
properly diluted with methanol to afford six spiking solutions at distinct concentrations.
Calibration curves were daily constructed using the resultant calibration standards to
spike aliquots of all the mice matrices under investigation: plasma, brain (whole brain,
olfactory bulb and frontal cortex) and liver homogenates. QC samples were likewise
independently prepared in the same biological matrices at the LLOQ and at three
representative concentration levels [low (QC1), medium (QC2) and high (QC3)] of the
entire calibration range.
A methanolic stock solution of IS (2 mg/mL) was daily diluted in the same solvent
to afford a working solution at the concentration of 400 µg/mL. All the stock,
intermediate and spiking solutions were stored at 4°C and protected from light, with
exception of the IS working solution which was prepared in every day of analysis.
A summary of all the solutions, calibration standards and QC samples prepared in
the five biological matrices considered (plasma, brain, olfactory bulb, frontal cortex and
liver of mice) were presented in Appendix A2. (Tables A2.1 and A2.2).
II. 3.3.2.4. Sample Preparation
The pre-treatment of samples was performed by submitting mice plasma and
tissue homogenate supernatants to a LLE procedure optimised from the methodology
presented by Castel-Branco et al. (2001).
Each aliquot of 200 µL of mice plasma spiked with 10 µl of IS methanolic working
solution (400 µg/mL) was added to 500 µL of ethyl acetate (extraction solvent), vortex-
mixed for 1 min and then centrifuged during 5 min at 13400 rpm. The upper organic layer
was transferred to a clean glass tube while the residual aqueous phase was re-extracted
once again, applying the same experimental proceeding. The obtained organic extracts
were combined, evaporated to dryness under a gentle nitrogen stream at 45°C, and the
residue was further reconstituted with 100 µL of mobile phase. The reconstituted extracts
were transferred to a 1.5 mL Eppendorf tube, centrifuged (2 min, 13400 rpm) and
subjected to an additional 0.22 µm Spin-X filtration before injection. At the end, 20 µL of
the final filtrates were injected into the chromatographic system for analysis.

II Quantitative Drug Analysis
150
To extract LTG from tissue samples, 250 µL of liver and 500 µL of brain, olfactory
bulb and frontal cortex homogenate supernatants were used after being spiked with 10
µL of the IS working solution. While brain specimens (whole brain, olfactory bulb and
frontal cortex) were immediately submitted to the LLE procedure described above, liver
samples were firstly added to 250 µL of acetonitrile, vortex-mixed for 1 min and
centrifuged over 10 min at 13400 rpm in order to precipitate protein content. Then, the
resultant purified supernatants were likewise extracted according to the same pre-
treatment conditions aforementioned. In contrast with plasma, wherein a supplementary
filtration step was required prior to injection, following centrifugation (2 min, 13400 rpm),
20 µL of the final reconstituted extracts from all tissue samples were directly injected into
the HPLC apparatus to be analysed.
II. 3.3.2.5. HPLC-UV Instrumentation and Chromatographic Conditions
The HPLC analysis was carried out on a Shimadzu liquid chromatographic system
equipped with a GDU-20A5 degasser, a SIL-20AHT autosampler, a CTO-10ASVP column oven
and a SPD-M20A diode array detector, all from Shimadzu Corporation (Kyoto, Japan).
Data acquisition and instrumentation control were achieved by means of LCsolution
software (Shimadzu Corporation, Kyoto, Japan).
Chromatographic separation was performed at 25°C on a reversed-phase
LiChroCART® Purospher Star® C18 column (55 mm x 4 mm, 3 µm; Merck KGaD), using an
isocratic elution with a mobile phase composed of 0.05 M potassium dihydrogen
phosphate solution-methanol-acetonitrile-TEA (79.7:10:10:0.3, v/v/v/v) pumped at a flow
rate of 1 mL/min. LTG and IS were detected at the wavelength of 306 nm and the total
running time was set at 12 min.
II. 3.3.2.6. Method Validation
As previously mentioned in section II. 3.2.2.6., the scarcity of established
guidelines that would help to standardise the procedures of a partial validation protocol,
dictates that the selection of the parameters to be evaluated should essentially be made
using a risk-based approach in which the nature of all the changes imposed to the original
method, their potential impacts and degree of significance are taken into account.
Considering that a major change to the mobile phase in terms of composition and
proportion of constituents has been herein performed, the overall performance of the
assay should be critically assessed and therefore, the linearity, limit of quantification,
inter- and intra-day precision and accuracy have been the fundamental validation

Experimental II
151
parameters analysed. Given that a different IS has been used and few alterations were
introduced into the initial sample preparation methodology, the assessment of the
analytes’ recovery as well as the selectivity of the method also proved to be required.
Selectivity was determined by evaluating the potential interference of mouse
plasma, brain and liver endogenous substances at the same retention times of LTG and IS.
For that, all the considered blank matrices derived from six different mice were analysed
under the described chromatographic conditions, and the resultant chromatograms were
compared with those from spiked samples. In addition, possible interferences from
ketamine and xylazine, the specific anaesthetics that will be employed during the
pharmacokinetic studies conducted in mice, were also ascertained by injecting standard
solutions of these compounds.
The linearity was assessed in each biological matrix within the defined
concentration ranges, using six-point calibration curves prepared on three separate days
(n = 3) by plotting LTG-IS peak height ratio against the corresponding nominal
concentrations. The data were subjected to a weighted linear regression analysis using
1/x2 as weighting factor, which was selected taking the plots and the sums of absolute
percentage of relative error into account (ALMEIDA et al., 2002).
Precision and accuracy were investigated both inter-daily, by testing each QC
sample (QC1, QC2 and QC3) on three consecutive days of the assay (n = 3) and intra-daily,
through the analysis of three replicates of the each QC sample (QC1, QC2 and QC3) within
a single day (n = 3). According to bioanalytical method validation guidelines (EUROPEAN
MEDICINES AGENCY, 2011; US FOOD AND DRUG ADMINISTRATION, 2001), the acceptance criterion
for precision, which is expressed as % CV, must be equal to or lower than 15%; whereas
accuracy, which is expressed as % Bias, must be within ±15%.
The LLOQ was defined as the lowest concentration of the calibration curve that
can be measured with adequate precision and accuracy. It was stipulated by analysing
three replicates of each matrix spiked samples inter-daily (n = 3), wherein the absolute
deviations lower than 20% for both CV and Bias values were accepted.
The extraction efficiency of LTG from the overall biological matrices considered
was investigated at the three independent concentration levels (QC1, QC2 and QC3)
representative of the calibration range. The absolute recovery was calculated comparing
the analytes peak heights from extracted QC samples with those obtained after direct
injection of non-extracted aqueous solutions at the same nominal concentrations (n = 3).
The recovery of the IS was also determined at the concentration used in sample analysis.

II Quantitative Drug Analysis
152
II. 3.3.3. RESULTS & DISCUSSION
II. 3.3.3.1. Optimisation of Chromatographic Conditions
As a starting point, the chromatographic separation of LTG and IS was firstly
attempted applying analytical conditions similar to those originally employed by Castel-
Branco et al. (2001). A mobile phase consisting of 69.7% 0.1 M potassium dihydrogen
phosphate buffer, 30% of methanol and 0.3% of TEA pumped at a flow rate of 1 mL/min
provided a good shape and symmetry of the peaks and the elution of the compounds was
accomplished in a short period of time (< 5 min); however it was associated to a poor
peak resolution. Indeed, under these conditions, LTG and chloramphenicol did not
separate adequately whereby the adjustment of both the composition and proportion of
the mobile phase constituents was found to be necessary. Thus, a mixture composed of
0.05 M potassium dihydrogen phosphate solution-methanol-acetonitrile-TEA in the
proportion of 79.7:10:10:0.3 (v/v/v/v) demonstrated to give the best correlation in terms
of separation, resolution and retention time of the peaks in which LTG and IS eluted at
approximately 5.1 and 7.8 min, respectively. In fact, no significant differences concerning
the chromatographic response were ascertained between the use of 0.1 and 0.05 M
potassium dihydrogen phosphate buffer and the inclusion of acetonitrile, as a component
of the mobile phase, allowed the complete separation of the analytes within a convenient
running time.
The unfeasibility of using the structural analogue [3,5-diamino-6-(2-
methoxyphenyl)-1,2,4-triazine] of LTG as the IS led to the search for a suitable alternative
compound. Chlorampenicol was herein selected since it has already been successfully
used by Mattar et al. (1998) for the quantification of LTG in plasma samples and exhibited
an appropriate extractive and chromatographic behaviour in the course of our
preliminary experiments.
II. 3.3.3.2. Optimisation of the Sample Preparation Procedure
The sample preparation methodology implemented for the extraction of LTG and
IS from plasma and tissue homogenates of mice was essentially based on the
experimental procedures reported by Castel-Branco et al. (2001) with slight
modifications. In an early phase, a variety of LLE solvents, including chloroform, diethyl
ether, tert-butyl methyl ether, n-hexane and ethyl acetate were tested to extract the
analytes from mouse biological matrices but it was the latter that enabled the best
outcome in regard to selectivity (absence of endogenous interfering substances) and
recovery. The influence of sodium hydroxide addition onto the overall extractive

Experimental II
153
efficiency was investigated and no notable differences were observed between those
samples that were or were not previously basified. In opposition to a one-step LLE, the
multiple sample preparation procedure consisting of two partial extractions, using small
volumes of the organic solvent at a time, yielded higher recovery values.
Due to the more complex nature of liver tissue specimens, a combined sample
preparation methodology comprising a first PP followed by the LLE was required. Among
the distinct precipitating agents (20% trichloroacetic acid, methanol and acetonitrile)
investigated, the acetonitrile, in the proportion of 1:1 proved to be the most appropriate
one since it allowed an efficient sample deproteinisation by providing cleaner
chromatograms with minimal compound loss.
II. 3.3.3.3. Method Validation
II. 3.3.3.3.1. Selectivity
The selectivity of the method was established by analysing six independent
sources of the drug-free mouse samples. The tested blanks from all the biological
matrices under investigation (plasma, brain and liver tissues) confirmed the absence of
endogenous interferences at the retention times of the drug and IS. Furthermore, none of
the anaesthetics standard solutions tested (ketamine and xylazine) were found to
interfere with the intended chromatographic analysis. Representative chromatograms of
blank and spiked mouse plasma and tissue homogenate samples are depicted in Figures
II.3.6, II.3.7 and II.3.8.

II Quantitative Drug Analysis
154
Figure II.3.6 Representative chromatograms of extracted mouse plasma: (A) blank plasma; (B)
plasma spiked with lamotrigine (LTG) and internal standard (IS) at the intermediate concentration
of the calibration range.

Experimental II
155
Figure II.3.7 Representative chromatograms of extracted mouse brain homogenate supernatant:
(A) supernatant of blank brain homogenate; (B) supernatant of brain homogenate spiked with
lamotrigine (LTG) and internal standard (IS) at the intermediate concentration of the calibration
range.

II Quantitative Drug Analysis
156
Figure II.3.8 Representative chromatograms of extracted mouse liver homogenate supernatant:
(A) supernatant of blank liver homogenate; (B) supernatant of liver homogenate spiked with
lamotrigine (LTG) and internal standard (IS) at the intermediate concentration of the calibration
range.

Experimental II
157
II. 3.3.3.3.2. Linearity and LLOQ
Calibration curves of LTG in all the mouse biological matrices considered were
constructed on three consecutive days by plotting LTG-IS peak height ratios against the
corresponding nominal concentrations. The slope, intercept and determination
coefficient (r2) were calculated through a weighted least squares linear regression using
1/x2 as the best-fit weighting factor. Mean calibration parameters are summarised in
Table II.3.5, demonstrating the linearity (0.989 ≤ r2 ≤ 0.997) of the method over the LTG
concentration ranges studied. The LLOQ of the assay was experimentally set with
acceptable precision (% CV ≤ 6.97) and accuracy (3.94 ≤ % Bias ≤ 9.06) in all the matrices
under investigation, as shown in Table II.3.5.
Table II.3.5 Mean calibration parameters (n = 3) and inter-day precision (% CV) and accuracy (%
Bias) values at the lower limit of quantification (LLOQ) (n = 3) of lamotrigine (LTG) in mouse
plasma, brain, olfactory bulb, frontal cortex and liver homogenate supernatants.
Matrix
Plasma Brain Olfactory Bulb Frontal Cortex Liver
Calibration Parameters
Concentration Range 0.20 - 30 0.05 - 15 0.025 - 7.5 0.025 - 7.5 0.20 - 20
Regression Equationa
Slope
0.1254 0.2670 0.5536 0.5341 0.1677
Intercept
-0.0026 -0.0007 -0.0035 -0.0007 -0.0027
r2
0.997 0.992 0.993 0.992 0.989
LLOQ
Nominal Value
0.20 0.05 0.025 0.025 0.20
Experimental Valueb
0.218 ± 0.014 0.052 ± 0.002 0.0266 ± 0.0004 0.0260 ± 0.0010 0.217 ± 0.006
% CV
6.97 4.25 1.96 4.25 3.02
% Bias
9.06 3.95 6.36 3.94 8.58 a
Y = bx + a, where Y represents LTG-IS peak height ratio (expressed in arbitrary height units); b represents the slope of
the calibration curve; x represents LTG concentration (expressed in µg/mL for plasma, brain and liver or µg for the
olfactory bulb and frontal cortex samples); a represents the intercept with the origin. b Mean ± Standard deviation, n = 3.
r2, coefficient of determination. Calibration range, nominal and experimental concentrations are expressed in µg/mL for
all matrices with the exception of olfactory bulb and frontal cortex, whose values are presented in µg.

II Quantitative Drug Analysis
158
II. 3.3.3.3.3. Precision and Accuracy
The inter- and intra-day precision and accuracy were determined from three
replicate analysis (n = 3) of mouse plasma and tissue homogenate samples containing LTG
at three different concentrations covering the low, medium and high levels of the
calibration curves. According to the results depicted in Table II.3.6, the overall CV values
did not exceed 12.38% and Bias varied from -9.71% to 12.12%, fulfilling the acceptance
limits recommended by the international guidelines. Thus, these data demonstrate that
this HPLC-UV method is precise, accurate and reproducible, enabling the reliable
quantification of LTG in all the mouse matrices analysed.
Table II.3.6 Inter- and intra-day precision (% CV) and accuracy (% Bias) of lamotrigine (LTG) in
mouse plasma, brain, olfactory bulb, frontal cortex and liver samples at the low, medium and high
concentrations of the calibration range (n = 3).
Inter-day Intra-day
Matrix Nominal Value
Experimental Valuea % CV % Bias
Experimental Valuea % CV % Bias
Plasma
0.6 0.582 ± 0.005 0.89 -3.06 0.585 ± 0.007 1.15 -2.56
15 13.976 ± 0.533 3.82 -6.83 14.279 ± 0.189 1.33 -4.80
27 27.736 ± 0.086 0.31 2.72 27.525 ± 0.505 1.84 1.94
Brain
0.15 0.145 ± 0.002 1.46 -3.36 0.143 ± 0.002 9.10 -4.50
7.5 7.341 ± 0.351 4.78 -2.12 7.425 ± 0.153 2.06 -0.99
13.5 14.227 ± 0.300 2.11 5.38 14.781 ± 0.337 2.28 9.49
Olfactory Bulb
0.075 0.072 ± 0.008 12.38 -3.49 - - -
3.75 3.868 ± 0.373 9.66 3.16 - - -
6.75 7.234 ± 0.238 3.30 7.16 - - -
Frontal Cortex
0.075 0.072 ± 0.001 1.46 -3.37 - - -
3.75 3.670 ± 0.175 4.78 -2.14 - - -
6.75 7.112 ± 0.150 2.11 5.36 - - -
Liver
0.6 0.543 ± 0.013 2.44 -9.56 0.573 ± 0.010 1.78 -4.51
10 9.029 ± 0.617 6.84 -9.71 9.769 ± 0.160 1.64 -2.31
18 20.089 ± 0.569 2.83 11.60 20.181 ± 0.551 2.73 12.12 a Mean ± Standard deviation, n = 3. Nominal and experimental values are expressed in µg/mL for all matrices with
the exception of the olfactory bulb and frontal cortex samples in which the values are expressed in µg.

Experimental II
159
II. 3.3.3.3.4. Recovery
Absolute recoveries of LTG from plasma, brain and liver homogenates were
estimated by comparing the peak height of extracted samples with those obtained after
direct injection of standards at the same concentration levels in mobile phase. The results
are presented in Table II.3.7, indicating that the sample preparation methodology
employed is consistent precise and reproducible. Indeed, the overall absolute mean
recoveries of LTG ranged from 76.97% to 97.99% and CV values were lower than 8.53%.
Concerning the IS, an absolute mean recovery of 77.17% in plasma, 86.61% in brain and
90.33% in liver were found, exhibiting CV values below 7.01%.
Table II.3.7 Absolute recovery of lamotrigine (LTG) from mouse plasma, brain and liver
homogenate supernatants (n = 3).
Matrix Nominal Concentration (µg/mL)
Absolute Recovery (%)a Precision (% CV)
Plasma
0.6 86.28 ± 1.69 1.96
15 84.94 ± 1.84 2.17
27 83.81 ± 0.24 0.29
Brain
0.15 77.71 ± 6.63 8.53
7.5 76.97 ± 1.79 2.33
13.5 84.81 ± 2.47 2.92
Liver
0.6 97.99 ± 4.00 4.08
10 84.71 ± 2.72 3.21
18 85.62 ± 0.56 0.66 a
Mean ± Standard deviation, n = 3.
The LLE-HPLC technique optimised from the method previously developed and
validated by Castel-Branco et al. (2001) was herein successfully employed for the
quantification of LTG in plasma and tissue (brain, olfactory bulb, frontal cortex and liver)
homogenates of mice. Partial validation results have demonstrated that this assay is
linear over the entire concentration range of LTG in all the mouse matrices analysed and
fulfils the fundamental international requirements, being selective, precise, accurate and
reproducible, also yielding satisfactory and consistent recovery values. Accordingly, it has
been proven that the present method is suitable to support and can be applied with
confidence in the analysis of samples from the subsequent pharmacokinetic studies
underlying the work of the current thesis.

II Quantitative Drug Analysis
160

CHAPTER III
INTRANASAL ADMINISTRATION
OF CARBAMAZEPINE


TABLE OF CONTENTS
CHAPTER III - INTRANASAL ADMINISTRATION OF CARBAMAZEPINE 161
III. 1. CARBAMAZEPINE - Pharmacological Characterisation 165
III. 1.1. HISTORICAL BACKGROUND 167
III. 1.2. PHARMACEUTICAL INFORMATION 167
III. 1.3. PHARMACOKINETICS 169
Absorption 169
Distribution 170
Metabolism 170
Elimination 171
III. 1.4. PHARMACODYNAMICS 172
Mechanism of Action 172
III. 1.5. CLINICAL USE 172
Therapeutic Indications 172
Tolerability 173
Therapeutic Range 174
Drug Interactions 174
III. 2. EXPERIMENTAL - Intranasal Administration of CBZ to Mice: A Direct Delivery Pathway
for Brain Targeting 177
III. 2.1. INTRODUCTION 179
III. 2.2. MATERIALS & METHODS 181
III. 2.2.1. Chemicals and Reagents 181
III. 2.2.2. Animals 181
III. 2.2.3. Preparation of Carbamazepine Formulations 181
III. 2.2.4. IN and IV Administrations 182
III. 2.2.5. Pharmacokinetic Study 182
III. 2.2.6. Brain Biodistribution Study 183
III. 2.2.7. Drug Analysis 183
III. 2.2.8. Pharmacokinetic Analysis 185
III. 2.2.9. Statistical Analysis 186
III. 2.3. RESULTS 186
III. 2.3.1. Pharmacokinetics of Carbamazepine after IN and IV Administration 186
III. 2.3.2. Brain Biodistribution of Carbamazepine after IN and IV Administration 189
III. 2.4. DISCUSSION 192


III. 1. CARBAMAZEPINE
Pharmacological Characterisation


Carbamazepine III
167
III. 1.1. HISTORICAL BACKGROUND
CBZ was firstly synthesised by the chemist Walter Schindler at the Swiss
pharmaceutical firm Geigy in 1953 as part of a programme to investigate analogues of
imipramine and chlorpromazine for depression and psychosis (BRODIE, 2010; SHORVON,
2009A; TOLOU-GHAMARI ET AL., 2013). Notwithstanding, clinical evidence of its positive
effects on relieving neuropathic pain symptoms led it to be licensed and marketed in the
early sixties (1962) for the treatment of trigeminal neuralgia (SHORVON, 2009a). Its
antiepileptic properties were then later reported in 1964, following successful seizure
control had been achieved in 70 patients treated with CBZ who were refractory to
conventional drugs (JONGMANS, 1964). CBZ rapidly gained a reputation in Europe as a very
promising new AED and was approved for management of seizures in the United Kingdom
in 1965 (SHORVON, 2009a; TOLOU-GHAMARI et al., 2013). Its use as an anticonvulsant drug
was authorised in Portugal in 1966, but approval in the United States of America was
delayed until 1974 (TOLOU-GHAMARI et al., 2013). Shortly after being licensed, CBZ became
very widely used and, together with PHT, had evolved into the first choice drug to
manage psychomotor and grand mal epilepsy.
By the mid-1980s, CBZ was the most frequently prescribed AED in Europe and it
remains so up to the present day. After 50 years since it has been introduced in clinical
practice, CBZ is assigned as one of the first-line AEDs for simple or complex focal and
generalised tonic-clonic seizures, still being the gold standard for comparative studies of
antiepileptics and the drug to beat for any new compound (SHORVON, 2009a; VUCIĆEVIĆ et
al., 2007).
III. 1.2. PHARMACEUTICAL INFORMATION
CBZ (a first-generation AED) is an iminostilbene, a dibenzazepine derivative that is
chemically and pharmacologically related to tricyclic antidepressant agents (BAZIL and
PEDLEY, 2003). Structurally, the molecule consists of a tricyclic nucleus composed by two
benzene rings fused to an azepine group, bearing a carboxamide substituent at 5th
position which is responsible for its potent anticonvulsant activity (WANG and KETTER,
2005). CBZ is a white or almost white crystalline powder, practically insoluble in water.
This characteristic has hindered the development of a CBZ parenteral drug formulation,
and therefore, it is only commercially available in oral dosage forms. Detailed
pharmaceutical information of CBZ is summarised in Table III.1.1.

III Intranasal Administration of Carbamazepine
168
Table III.1.1 Pharmaceutical information of carbamazepine (DRUGBANK; NOVARTIS, 2014a;
PUBCHEM).
Drug Identification Physicochemical Properties
Generic Name Carbamazepine Phase State Solid / White powder
Chemical Name 5H-dibenz[b,f]azepine-5-carboxamide
Solubility in Water 0.018 mg/mL (at 25°C)
Chemical Formula C15H12N2O Solubility in Ethanol 20.8 mg/mL (at 25°C)
Molecular Weight 236.27 g/mol LogP 2.45
Molecular Structure
pKa 13.9
Drug Information
Brand Name Tegretol® Manufacturer Novartis
Dosage Forms Immediate-release tablet Extended-release tablet Chewable tablet Suspension
Route of Administration
Oral
LogP, octanol/water partition coefficient; pKa, negative decadic logarithm of the acid dissociation constant.

Carbamazepine III
169
III. 1.3. PHARMACOKINETICS
The pharmacokinetics of CBZ is complex and challenging from a clinical point of
view. It is influenced by the limited hydrosolubility of the drug and the autoinduction
phenomenon of its own metabolism by the hepatic microssomal enzymes (BAZIL and
PEDLEY, 2003). CBZ exhibits a non-linear kinetics and is commonly associated to high
pharmacological variability between and within patients (PERUCCA and JOHANNESSEN, 2003;
TOLOU-GHAMARI et al., 2013). This section and Table III.1.2 will provide a brief overview of
the CBZ pharmacokinetic profile.
Table III.1.2 Summary of the main pharmacokinetic parameters of carbamazepine in epileptic
adult patients (BERTILSSON, 1978; LANDMARK et al., 2012; NEELS et al., 2004; PATSALOS et al., 2008;
TOLOU-GHAMARI et al., 2013).
Pharmacokinetic Parameter Mean Value
tmax (h) 4-8, possible delay up to 24 h
F (%) 75-85
Plasma Protein Binding (%) 70-80
Vd/F (L/kg) 0.9-1.4
t1/2el (h) 8-20
CL (L/h) 1.5
CL, plasma clearance; F, absolute bioavailability; t1/2el, apparent elimination half-life; tmax,
time to achieve maximum peak concentration; Vd/F, apparent volume of distribution.
Absorption
The rate of CBZ absorption from the gastrointestinal tract is often relatively slow
and erratic probably due to its poor solubility in water (NEELS et al., 2004; VUCIĆEVIĆ et al.,
2007). Maximum concentration in plasma (Cmax) is usually attained within 4-8 h after oral
ingestion, but it may be delayed by as much as 24 h, especially following the
administration of a large dose (NEELS et al., 2004). Generally, the time required to reach
peak plasma concentrations is formulation-dependent since the suspension is absorbed
more quickly and the controlled-release tablet more slowly and less completely than the
conventional tablet (NOVARTIS, 2014a; PATSALOS et al., 2008). Upon long-term
administration, CBZ peak plasma levels occur at 1.5 h with the oral suspension, at 4-5 h
with immediate-release or chewable tablets, and at 3-12 h with the extended-release
formulation (BAZIL and PEDLEY, 2003; NOVARTIS, 2014a). Overall, the oral bioavailability of
CBZ ranges from 75-85% and it can be increased when the drug is taken together with
meals (BERTILSSON, 1978; LANDMARK et al., 2012; PATSALOS et al., 2008).

III Intranasal Administration of Carbamazepine
170
Distribution
CBZ is a neutral and highly lipophilic compound that easily diffuses through
biological membranes. Once absorbed, the drug is rapidly and fairly uniformly distributed
to all body tissues without any preferential affinity for particular organs (BAZIL and PEDLEY,
2003; BERTILSSON and TOMSON, 1986). The apparent volume of distribution (Vd/F) after
peroral administration varies from 0.9-1.4 L/kg and the degree of plasma protein binding
is of about 70-80% with very little inter-individual variation (PATSALOS et al., 2008; TOMSON,
1987).
Metabolism
CBZ undergoes extensive hepatic metabolism (Figure III.1.1), with only
approximately 2-3% of the dose orally given being excreted unchanged in the urine
(KETTER et al., 1999; NEELS et al., 2004). More than 30 different metabolites of CBZ have
been identified but the major metabolic pathway involves its oxidative conversion to CBZ-
E which appears to be mediated primarily by the hepatic CYP3A4, with a minor
contribution by CYP2C8 (KETTER et al., 1999). This metabolite accounts for about 40% of
CBZ disposition, being pharmacologically active and responsible for neurotoxic and
idiosyncratic adverse effects (KECK and MCELROY, 2002; KETTER et al., 1999; PELLOCK, 2002).
CBZ-E, in turn, undergoes almost complete hydrolysis via microsomal epoxide hydrolase
to 10,11-trans-dihydroxy-10,11-dihydrocarbamazepine, a trans-diol compound which is
inactive and the major metabolite of CBZ found in human urine, corresponding to near
20% of the administered dose (EADIE, 1991; LANDMARK et al., 2012). Other minor pathways
of CBZ metabolism include aromatic hydroxylation to 2- and 3-hydroxycarbazepine (25%)
apparently mediated by CYP1A2, and glucuronide conjugation of the carbamoyl side chain
(15%) by uridine 5’-diphosphate-glucuronosyltransferase (UGT) (KETTER et al., 1999; STONER
et al., 2007).
CBZ induces many enzyme systems such as CYP1A, CYP3A, CYP2C and UGT
resulting in the increase of the metabolism of many other co-administered drugs,
including its own (VUCIĆEVIĆ et al., 2007). Autoinduction of CBZ metabolism is observed
during the first 3 to 5 weeks after starting therapy, significantly reducing CBZ plasma
concentrations and elimination half-life, often demanding an upward dosage adjustment
(BERTILSSON and TOMSON, 1986; STONER et al., 2007; VUCIĆEVIĆ et al., 2007). The clinical effect
of autoinduction means that the process of introducing the drug can be tricky. Therapy
should be initiated with low doses and progressively increased the days afterwards. Once
autoinduction is complete, the relatively short and variable elimination half-life requires

Carbamazepine III
171
frequent daily dosing to maintain adequate blood levels and therapeutic outcome (BAZIL
and PEDLEY, 2003).
Figure III.1.1 The major metabolic pathways of carbamazepine (CBZ). CBZ-E, carbamazepine-10,
11-epoxide; trans-diol, 10,11-trans-dihydroxy-10,11-dihydrocarbamazepine.
Elimination
The elimination of CBZ follows a non-linear kinetics probably due to dose-
dependent autoinduction phenomenon since increments in CBZ dose can result in less
than proportional increases in drug concentrations (BERTILSSON, 1978; CLOYD and REMMEL,
2000; PERUCCA, 2005; STONER et al., 2007). As a consequence, whole plasma concentrations
of CBZ-E correlate more closely with CBZ dose than that of the parent compound (EADIE,
1991). Following a single oral dose, plasma elimination half-life in adults is approximately
30 h and the clearance is of about 1.5 L/kg. With multiple dosing, during maintenance CBZ
monotherapy, half-life values shorten by two-thirds to approximately 10 h and clearance
rises 3-fold to about 4.5 L/kg as a result of metabolism autoinduction, leading to a
progressive decrease in CBZ plasma levels (BAZIL and PEDLEY, 2003; WANG and KETTER, 2005).
CBZ elimination depends almost entirely on hepatic biotransformation (BAZIL and
PEDLEY, 2003; TOLOU-GHAMARI et al., 2013). The urinary excretion is the primarily route of
CBZ elimination with 72% of the administered dose being excreted in the urine mainly in
the form of epoxidated, hydroxylated and conjugated metabolites. The remaining 28%
are excreted in faeces, via biliary secretion (BERTILSSON, 1978; NOVARTIS, 2014a).

III Intranasal Administration of Carbamazepine
172
III. 1.4. PHARMACODYNAMICS
Mechanism of Action
A large body of evidence indicates that CBZ may interact with different types of
ion channels, receptors and signalling pathways, bearing clear that it does not act by a
single mechanism (AMBRÓSIO et al., 2002). Nonetheless, it is conceivable that prevention
or reduction of sustained repetitive firing of action potentials in depolarised neurons by
stabilising the inactive form of sodium channels in a use-, voltage- and frequency-
dependent manner may be its main mechanism of action (AMBRÓSIO et al., 2002; KWAN et
al., 2001). In fact, CBZ blocks voltage-sensitive sodium channels in a similar fashion to
PHT, promoting fast inactivation and increasing the number of channels in the inactivated
state (PORTER et al., 2012; POTSCHKA, 2013). However, while CBZ has a greater binding rate
constant, but lower affinity for the inactivated sodium channels, PHT produces a more
pronounced slowing of recovery from the fast inactivated state (KWAN et al., 2001).
Inhibition of glutamatergic neurotransmission and indirect facilitation of GABA
activity have also been ascribed to CBZ, albeit they are likely to be relatively minor
physiologic effects at therapeutic dosage levels (AMBRÓSIO et al., 2002; STONER et al., 2007).
Modulation of calcium currents by blocking voltage-sensitive calcium channels,
particularly those of the L-type, has likewise been indicated as a possible mechanism
implicated in the anticonvulsive activity of CBZ, even though this effect is apparently less
often observed at concentrations that are therapeutically relevant (AMBRÓSIO et al., 2002;
PORTER et al., 2012). Despite inconclusive experimental data, an interference of CBZ with
potassium conductance through modulation of potassium channels has also been
hypothesised (AMBRÓSIO et al., 2002; KECK and MCELROY, 2002). Such an action on
potassium currents is expected to oppose or diminish hyperexcitability, thus being
potentially relevant to seizure protection (PORTER et al., 2012).
III. 1.5. CLINICAL USE
Therapeutic Indications
CBZ is an anticonvulsant and mood-stabilizing drug that is commonly used in the
management of epilepsy, neuropathic pain (trigeminal neuralgia), mania and bipolar
affective disorders (NOVARTIS, 2014a; WANG and KETTER, 2005). It remains the first drug of
choice for the treatment of simple or complex focal (with or without secondary
generalisation) and generalised tonic-clonic seizures, but it is not effective against
absence, atonic and myoclonic seizures, which may actually be aggravated or exacerbated
(NOVARTIS, 2014a; PELLOCK, 2002; TOLEDANO and GIL-NAGEL, 2008).

Carbamazepine III
173
It can be given either as monotherapy or in combination with other anticonvulsant
agents. To date, any AED has demonstrated to be more effective than CBZ against focal-
onset seizures. Notwithstanding, besides being equally efficacious, several new AEDs are
often better tolerated and present more favourable pharmacokinetic properties (ABOU-
KHALIL and SCHMIDT, 2012).
Tolerability
CBZ therapy is associated with several noteworthy idiosyncratic adverse events
that range from commonly occurring but benign to rarely occurring but serious, often
requiring discontinuation of the drug. During long-term CBZ treatment, the most frequent
undesirable adverse effects are typically neurotoxic, and are dose- and titration-
dependent (PELLOCK, 2002; WANG and KETTER, 2005). Dose-related CNS side-effects includes
sedation, ataxia, diplopia, blurred vision, nystagmus, headache, dizziness and motor
incoordination that may appear early in the course of treatment during dose adjustment
(BAZIL and PEDLEY, 2003). Neurotoxicity can however be minimised and better tolerated if
the treatment is initiated at low doses with further progressive slow titration (NEELS et al.,
2004; TOLEDANO and GIL-NAGEL, 2008).
Mild to severe dermatological, haematological and hepatic dysfunctions are
likewise commonly associated to CBZ. Skin rash reactions of the morbiliform type are
frequently developed in around 10% of patients but life-threatening conditions like
Stevens-Johnson syndrome are less common or even very rare (PELLOCK, 2002; TOLEDANO
and GIL-NAGEL, 2008). Reversible modest leucopoenia can usually be detected in first two
months of treatment. This suppression of leukocyte count does not require
discontinuation of therapy unless there is evidence of infection or the decline continues
to values <3000 leucocytes/mm3 (WANG and KETTER, 2005; WARNER et al., 1998). Serious
cases of agranulocytosis or aplastic anaemia have occasionally been reported (TOLEDANO
and GIL-NAGEL, 2008; WARNER et al., 1998). Transient elevations of hepatic enzymes occur
at a frequency of 5-10% and are of no clinical significance; fulminant hepatitis is
exceedingly rare (BAZIL and PEDLEY, 2003; WANG and KETTER, 2005).
Since CBZ has anti-diuretic effects, the induction of hyponatremia and water
retention frequently occurs as a late complication (NEELS et al., 2004). This mild to
moderate reduction of plasma sodium concentrations is generally unimportant, although
it sometimes be related to patient complaints of dizziness, headache and nausea. Severe
hyponatremia can exacerbate seizures or contribute to congestive heart failure, being
particularly problematic in patients with compromised cardiac function (BAZIL and PEDLEY,
2003).

III Intranasal Administration of Carbamazepine
174
Therapeutic Range
The high inter-individual variation in plasma elimination half-lives, as well as the
differences concerning the extent to which CBZ induces its own metabolism among
distinct subjects hamper the prediction of drug concentrations achieved in plasma based
on the administered dose (BERTILSSON, 1978). In fact, plasma levels of CBZ may range from
0.5 to 25 µg/mL without an apparent relationship to the daily intake of the drug
(NOVARTIS, 2014a). Therefore, establishing a suitable dosing regimen of CBZ is generally
complicated not only due to its wide pharmacokinetic variability but also to a weak
relationship between plasma concentration and therapeutic effects (VUCIĆEVIĆ et al.,
2007). Generally, in order to attain an optimal management of seizures, the
recommended therapeutic concentrations for CBZ may be settled within the range of 4-
12 µg/mL (NEELS et al., 2004; NOVARTIS, 2014a; PATSALOS et al., 2008). Nevertheless,
achieving a specific therapeutic level is not an absolute goal of the therapy since some
patients respond differently to concentrations below or above this interval. At this point,
similar CBZ concentrations have inclusively been reported to provide seizure control in
certain individuals and adverse toxic effects in others (PATSALOS et al., 2008).
The unpredictable relationship between dose and CBZ plasma concentration, the
large inter- and intra-individual CBZ pharmacokinetic variability, its narrow therapeutic
index and its high predisposition to establish numerous clinically significant
pharmacological interactions support the need to monitor and adjust therapy individually
in order to optimise CBZ therapeutic/toxic ratio, thus improving patient’s clinical
outcome.
Drug Interactions
CBZ drug-drug interactions are predominantly pharmacokinetic. Since it is a
powerful inducer of catabolic enzymes, including various CYPs and UGTs, CBZ decreases
the serum concentrations of multiple co-administered medications, potentially
attenuating their clinical effects (JOHANNESSEN and LANDMARK, 2010; WANG and KETTER,
2005). Therefore, CBZ commonly accelerates the metabolic rate of numerous therapeutic
compounds such as valproic acid, LTG, topiramate, benzodiazepines, warfarin,
theophylline, haloperidol, ethinyl estradiol among others, often demanding appropriate
adjustments of their corresponding dose (JOHANNESSEN and LANDMARK, 2010; KETTER et al.,
1999; PATSALOS and PERUCCA, 2003). As a result, particular caution must be imposed when
CBZ is discontinued, since the effect of enzymatic stimulation is reduced, leading to an
unpredictable increase of plasma concentrations to levels that can be eventually toxic for

Carbamazepine III
175
other drugs whose catabolism is no longer induced (JOHANNESSEN and LANDMARK, 2010;
WANG and KETTER, 2005).
Even though CBZ mediates a large number of clinically significant pharmacological
interactions, its own metabolism may likewise be affected by the action of many
therapeutic compounds. Several drugs, including known inhibitors of CYP3A4, can
precipitate signs of CBZ toxicity by increasing its serum concentrations (JOHANNESSEN and
LANDMARK, 2010). Conversely, CBZ therapeutic efficacy can be potentially compromised
when potent enzyme-inducers, like for example PHT, PB or PRM are concomitantly
administered (BERTILSSON and TOMSON, 1986; KETTER et al., 1999; NEELS et al., 2004; WANG
and KETTER, 2005).

III Intranasal Administration of Carbamazepine
176

III. 2. EXPERIMENTAL
Intranasal Administration of CBZ to Mice:
A Direct Delivery Pathway
for Brain Targeting


Experimental III
179
III. 2.1. INTRODUCTION
Epilepsy is one of the most common and devastating neurological disorders which
is estimated to have a worldwide prevalence of about 0.7% (SCHMIDT and SCHACHTER, 2014).
There are several antiepileptic drugs currently available to control and suppress seizures.
However, despite the ongoing development of new pharmacological therapies, more than
30% of the patients do not become seizure free mainly due to the pharmacoresistance
phenomena (WEAVER and POHLMANN-EDEN, 2013). Moreover, conventional antiepileptic
drug administration via either oral or IV routes commonly exhibits high systemic drug
distribution into CNS and non-targeted tissues which can potentiate the occurrence of
drug-drug interactions and undesirable side effects that range from a CNS impairment
(e.g. somnolence, dizziness and ataxia) to more severe peripheral pathological conditions
such as skin reactions and hematologic, hepatic and renal dysfunctions (TOLEDANO and GIL-
NAGEL, 2008).
Arguably, the delivery of drugs to the CNS remains a great challenge owing to the
strict structural and functional BBB (GABATHULER, 2010). Thus, over the last decades,
different strategies have been attempted in order to circumvent the BBB and to deliver
drugs efficiently into the brain for therapeutic and diagnostic applications (GABATHULER,
2010; ILLUM, 2000). In fact, the development of new alternative drug delivery methods
could enhance the efficacy and minimise the toxicity of antiepileptic drugs, thereby
improving their therapeutic index (FISHER and HO, 2002). The IN administration has long
been widely used for the symptomatic relief and treatment of local nasal dysfunctions,
but recently, it has received a great attention as a convenient and reliable route for the
systemic administration of drugs (FORTUNA et al., 2014a; GRASSIN-DELYLE et al., 2012).
Nevertheless, assuming the olfactory region as a unique direct connection between the
nose and the brain, an increasing interest has been posed on the potential of the IN route
for the delivery of therapeutic agents directly to the CNS bypassing the BBB (ILLUM, 2004;
VYAS et al., 2005). Indeed, IN administration represents an attractive alternative to
parenteral and oral routes since, in addition to be non-invasive, it also avoids
gastrointestinal and hepatic first-pass metabolism. The rapid-onset of action and the
preferential delivery of drugs to the brain also enable the IN route to be successfully
applied in the management of emergency situations (LI et al., 2000; WOLFE and BERNSTONE,
2004).
CBZ is one of the first-line AEDs most commonly prescribed despite its narrow
therapeutic window, complex pharmacokinetic profile, potential for drug interactions and
severe side effects (GERLACH and KRAJEWSKI, 2010; NEELS et al., 2004; PATSALOS et al., 2008).
Currently, CBZ is only available in tablet or suspension oral dosage forms due to its poor
water solubility that prevents its incorporation in therapeutic dosages in aqueous

III Intranasal Administration of Carbamazepine
180
solutions for IV injection. Following oral administration, the absorption of CBZ is relatively
slow, erratic and formulation-dependent (LANDMARK et al., 2012); its oral bioavailability is
within the range 75-85% (LANDMARK et al., 2012) and the time to reach peak concentration
in plasma is approximately 4-8 h post-dosing but it may be delayed by as much as 24 h
with high doses (NEELS et al., 2004). Furthermore, CBZ undergoes extensive hepatic
metabolism and considerable enzymatic induction that result in unpredictable plasmatic
fluctuations and unexpected clearance increments which demand successive dose
adjustments (PATSALOS et al., 2008; TOMSON, 1987). Taking all those pharmacokinetic
limitations of CBZ oral administration into account, we do believe that this AED is a
promising candidate to be administered by the IN route. A prompt and efficient IN drug
delivery to the brain may decrease the systemic exposure, improving both efficacy and
tolerability profiles. The opportunity to control seizures by reducing the dose makes IN
administration of CBZ a valuable approach for long-term treatment of epilepsy. Likewise,
it could also give an attractive advantage in the management of acute and severe
convulsive seizure episodes. In fact, IV administration of benzodiazepines is the first-line
option for the treatment of status epilepticus (LOCKEY, 2002; MANNO, 2011); however, it is
generally associated with hypotension, cardiac dysrhythmia and respiratory failure.
Furthermore, IV injection requires sterile equipment and skilled personnel which often
makes it impractical and inconvenient to be used outside the hospital setting. Bearing in
mind that quick cessation of the seizures is essential to prevent serious neurological
damages, a rapid access and a high brain bioavailability of CBZ administered via IN route
may probably contribute to its recognition as a viable alternative to IV administration of
the drugs used in emergency conditions.
Interestingly, IN administration of CBZ has already been studied in rats by Barakat
and collaborators (2006), reporting high levels of drug penetration in the brain solely
based on the analysis of plasma and whole brain homogenates. Therefore, a
comprehensive pharmacokinetic characterisation of IN CBZ and its active metabolite
mainly responsible for the toxic effects (CBZ-E) is lacking. In this context, plasma, brain
and liver levels of both CBZ and CBZ-E, were, in this study, determined following IN and IV
administrations to mice, and the corresponding pharmacokinetic profiles were assessed
and compared. Additionally, in order to establish a more sustained basis for an hypothetic
direct transport of the drug from nose to brain via the olfactory pathway, CBZ
concentrations were also determined in different brain regions and the rostral-caudal
brain distribution of the drug was studied following the two routes of administration
considered.

Experimental III
181
III. 2.2. MATERIALS & METHODS
III. 2.2.1. Chemicals and Reagents
CBZ and 10,11-dihydrocarbamazepine, used as IS, as well as Pluronic F-127 (PF-
127) and propylene glycol were all purchased from Sigma-Aldrich (St. Louis, MO, USA).
Carbopol 974P (C-974P) was kindly supplied from Lubrizol (Wickliffe, OH, USA). Methanol
and acetonitrile of HPLC gradient grade were acquired from Fisher Scientific
(Leicestershire, UK) and Lab-Scan (Sowinskiego, Poland) respectively. Ultrapure water
(HPLC grade, 18.2 MΩ.cm) was prepared by means of a Milli-Q water apparatus from
Millipore (Milford, MA, USA). Ethyl acetate was obtained from Fisher Scientific
(Leicestershire, UK). Sodium dihydrogen phosphate dihydrate, di-sodium hydrogen
phosphate dihydrate and hydrochloric acid fuming 37%, all used to prepare 0.1 M sodium
phosphate buffer pH 5.0, were purchased from Merck KGaA (Darmstadt, Germany).
Ketamine (Imalgene 1000®, 100 mg/ml) and xylazine (Vetaxilaze 20®, 20 mg/ml) were
commercially acquired.
III. 2.2.2. Animals
Adult male CD-1 mice aged between 6 and 7 weeks and weighing 30-40 g were
obtained from local certified animal facilities (Faculty of Health Sciences of the University
of Beira Interior, Covilhã, Portugal). Mice were housed under controlled environmental
conditions (12 h light/dark cycle, at 20±2°C and relative humidity 50±5%) with free access
to tap water and standard rodent diet (4RF21, Mucedola, Italy). All the experiments
involving animals and their care were conducted in conformity with the international
regulations of the European Directive (2010) regarding the protection of laboratory
animals used for scientific purposes (2010/63/EU) (EUROPEAN PARLIAMENT AND COUNCIL OF THE
EUROPEAN UNION, 2010), and the experimental procedures employed were reviewed by the
Portuguese DGAV.
III. 2.2.3. Preparation of Carbamazepine Formulations
For IN administration, CBZ was previously dissolved in ethanol at the
concentration of 20 mg/mL. Then 50 µL of this ethanolic solution was incorporated in 950
µl of a thermoreversible nasal gel so that the final drug concentration was 1 mg/mL and
the total percentage of ethanol in the formulation was equivalent to 5%.
Thermoreversible gel was prepared using the cold method described by Schmolka (1972).
Briefly, 1.8 g of PF-127 was slowly added to 10 mL of distilled cold water (5-10°C), under

III Intranasal Administration of Carbamazepine
182
gentle magnetic stirring, to achieve an efficient hydration of the flakes and then, the
mixture was left at 4°C overnight to attain a complete dissolution of the polymer (18% PF-
127, w/v). Afterwards, according to the technique employed by Badgujar and co-workers
(2010), the mucoadhesive polymer C-974P was gradually dispersed in the prepared PF-
127 solution with continuous agitation, until a final concentration of 0.2% w/v was
reached. At this point, a nasal hydrogel formulation composed of 18% PF-127 and 0.2% C-
974P was obtained, exhibiting thermo-sensible properties. In fact, PF-127 is a triblock
copolymer of poly(ethylene oxide) and poly(propylene oxide) units that is fluid at or
below room temperature, but turns to a semisolid gel when the temperature increases,
as a consequence of the micelle packing disorder-order transition phenomenon (SWAMY
and ABBAS, 2012). This thermo-sensible behaviour makes the final formulation suitable for
gelation within the nasal cavity, providing a sustained residence of the drug at the
absorption site.
For the IV administration, a CBZ parenteral solution was prepared as a mixture of
propylene glycol-physiological saline solution (0.9% NaCl)-ethanol (5:3:2, v/v/v) at a final
drug concentration of 0.1 mg/mL.
III. 2.2.4. IN and IV Administrations
Before CBZ dosing, mice were always anaesthetised with an intraperitoneal
injection of a mixture of ketamine (100 mg/kg) and xylazine (10 mg/kg) and kept in a
heated environment to maintain the body temperature.
CBZ was intranasally and intravenously administered at the dose of 0.4 mg/kg. For
IN administration, mice were placed on one side and 12 µL of the nasal gel per 30 g of
mice body weight were instilled using a polyurethane tube (24G x 19 mm) attached to a
microliter syringe. The tube was inserted about 10 mm deep into one of the nares,
enabling the delivery of the formulation towards the roof of the nasal cavity. IV
administration of CBZ (0.4 mg/kg) was performed by means of a short and slow infusion
of the formulation for over 30 s into the lateral tail vein (120 µL per 30 g body weight)
using an appropriate syringe.
III. 2.2.5. Pharmacokinetic Study
Mice were randomly divided into two experimental groups of 40 animals each.
One of the groups received IN formulation whereas the other group was treated with the
IV dosage form. At predetermined time points (5, 10, 15, 30, 45, 60, 90, 120, 180 and 240
min) after CBZ dosing (4 animals per time point, n = 4), the mice were sacrificed by

Experimental III
183
cervical dislocation followed by decapitation and the blood was immediately collected
into heparinised tubes, while brain and liver tissues were quickly removed and weighed.
Blood samples were centrifuged at 4°C and 4000 rpm for 10 min to obtain plasma
supernatants that were stored at -30°C until analysis. Mice brain and liver tissues were
homogenised with 0.1 M sodium phosphate buffer pH 5.0 (4 mL per gram of tissue) using
a THOMAS® Teflon pestle tissue homogeniser. Tissue homogenates were centrifuged at
4800 rpm for 15 min (4°C) and the resultant supernatants were also frozen at -30°C until
analysis.
III. 2.2.6. Brain Biodistribution Study
Mice were divided at random into two experimental groups (20 animals each). The
animals were treated with CBZ (0.4 mg/kg) using the IN or IV formulations. After
administration, mice were sacrificed at 5, 10, 15, 30 and 60 min post-dosing (n = 4). Blood
samples were taken and plasma was separated as described above. Brains were removed
and carefully dissected with the help of a scalpel into three different regions: olfactory
bulb, frontal cortex and the remaining portion of the brain. The remaining portion of the
brain was homogenised and centrifuged in accordance to the procedure used for brain
and liver tissues, while olfactory bulb and frontal cortex specimens, regardless of the
weight, were homogenised with 1 mL of phosphate buffer using an ULTRA-TURRAX®
device and centrifuged at 4°C for 15 min at 13.400 rpm. The resultant homogenate
supernatants were conveniently packaged and stored at -30°C until analysis.
III. 2.2.7. Drug Analysis
Plasma and tissue (brain and liver) concentrations of CBZ and CBZ-E were
determined by using a SPE procedure followed by a reversed-phase HPLC analysis,
according to the method previously developed and fully validated by Fortuna et al. (2010)
with slight modifications (Chapter II, section II. 3.2.).
Briefly, aliquots of plasma (200 µL), brain (500 µL) and liver (250 µL) homogenate
supernatants were added to an appropriate volume of 0.1 M sodium phosphate buffer
(pH 5.0) to make a total of 1 mL sample amount. Regarding the matrices of brain specified
regions, 1 mL of both olfactory bulb and frontal cortex homogenate supernatants were
used. All the samples were spiked with 10 µL of the methanolic IS working solution (200
µg/mL for all matrices excluding for the olfactory bulb, which was 100 µg/mL). After
vortex mixed, samples were loaded into Waters Oasis® HLB (30 mg, 1 mL) cartridges
(Milford, MA, USA), which were previously conditioned with 1 mL of methanol, 1 mL of

III Intranasal Administration of Carbamazepine
184
acetonitrile and 1 mL of water-acetonitrile (95:5, v/v). Upon sample elution, the loaded
cartridges were submitted to -30 kPa and washed four times with 1 mL of water followed
by four more times with 1 mL of water-methanol (90:10, v/v). After drying the cartridge
under airflow for 5 min, the drugs were eluted with 1 mL of ethyl acetate applying a
gentle vacuum. The eluates were then evaporated to dryness at 45°C under moderate
nitrogen stream and reconstituted with 100 µL of mobile phase by vortexing and
ultrasonication. Finally, an aliquot of 20 µL (plasma, brain, liver and frontal cortex) or 40
µL (olfactory bulb) of each reconstituted extracts was injected into the chromatographic
system for analysis.
The HPLC analysis was carried out on a Shimadzu liquid chromatographic system
equipped with a GDU-20A5 degasser, a SIL-20AHT autosampler, a CTO-10ASVP column oven
and a SPD-M20A diode array detector, all from Shimadzu Corporation (Kyoto, Japan).
Data acquisition and instrumentation control were achieved by means of LCsolution
software (Shimadzu Corporation, Kyoto, Japan). Chromatographic separation was
performed at 40°C on a reversed-phase LiChroCART® Purospher Star® C18 column (55 mm x
4 mm, 3 µm; Merck KGaD), using an isocratic elution with a mobile phase consisting of
water-methanol-acetonitrile (64:30:6, v/v/v) pumped at a flow rate of 1 mL/min. CBZ and
CBZ-E were detected at the wavelength of 235 nm and the total running time was set at
10 min. The main partial validation parameters of the analytical method employed were
in agreement with the international guidelines (EUROPEAN MEDICINES AGENCY, 2011; US FOOD
AND DRUG ADMINISTRATION, 2001) and are summarised in Table III.2.1.
Table III.2.1 Validation parameters of the HPLC method employed for the quantification of
carbamazepine (CBZ) and carbamazepine-10, 11-epoxide (CBZ-E) in plasma, brain, liver, olfactory
bulb and frontal cortex homogenate supernatants (n = 3).
Drug Validation Parameters Plasma Brain Liver Olfactory Bulb
Frontal Cortex
Calibration Range (µg/mL) 0.10 - 30 0.10 - 15 0.20 - 20 0.02 - 4b 0.05 - 7.5
b
Coefficient of Determination (r2) 0.999 0.997 0.999 0.998 0.997
CBZ LLOQ (µg/mL) 0.10 0.10 0.20 0.02b 0.05
b
Precision (% CV)a
≤ 6.67 ≤ 7.89 ≤ 3.92 ≤ 5.39 ≤ 7.89
Accuracy (% Bias)a -0.66 - 2.25 -5.41 - 3.75 0.28 - 1.55 -1.28 - 5.98 -5.41 - 3.75
Calibration Range (µg/mL) 0.40 - 30 0.05 - 15 0.20 - 20 - -
Coefficient of Determination (r2) 0.999 0.996 0.999 - -
CBZ-E LLOQ (µg/mL) 0.40 0.05 0.20 - -
Precision (% CV)a ≤ 5.08 ≤ 4.48 ≤ 5.82 - -
Accuracy (% Bias)a 0.54 - 5.24 -6.04 - 4.34 -3.41 - 9.18 - -
a Inter-day values, n = 3;
b Values expressed in µg. Bias, deviation from nominal value; CV, coefficient of variation; LLOQ,
lower limit of quantification.

Experimental III
185
III. 2.2.8. Pharmacokinetic Analysis
The maximum peak concentration (Cmax) in plasma and tissues of CBZ and its main
metabolite (CBZ-E) and the corresponding time to reach Cmax (tmax) were directly derived
from the experimental data obtained. The remaining pharmacokinetic parameters were
estimated based on the mean concentration values (n = 4) determined at each time point
by a non-compartmental pharmacokinetic analysis employing the WinNonlin® version 5.2
(Pharsight Co, Mountain View, CA, USA). The pharmacokinetic parameters evaluated
were the area under the drug concentration time-curve (AUC) from time zero to the time
of the last quantifiable drug concentration (AUCt) which was calculated by the linear
trapezoidal rule; the AUC from time zero to infinity (AUC inf) that was calculated from AUCt
+ (Clast/kel), where Clast is the last quantifiable concentration and kel (or k) is the apparent
(or tissue) elimination rate constant estimated by log-linear regression of the terminal
segment of the concentration-time profile; the percentage of AUC extrapolated from tlast
to infinity [AUCextrap(%)], where tlast is the time of the Clast; the apparent terminal (or
tissue) elimination half-life (t1/2el or t1/2), and the mean residence time (MRT).
The absolute bioavailability [F (%)] of CBZ after IN administration was calculated as
follows (Eq. 1):
(Eq. 1)
where AUCinf IN and AUCinf IV are the areas under the drug concentration-time curves from
time zero to infinity following IN and IV administration, respectively; Dose IV and DoseIN are
the values of the CBZ dosage (mg/kg) given by IV and IN route to mice.
In order to assess brain targeting efficiency of nasally delivered CBZ, the DTE index
was calculated (WANG et al., 2003). DTE index represents the brain-to-plasma partitioning
ratio of the drug administered by IN route compared to that after IV injection and can be
calculated according to the following equation (Eq. 2):
(Eq. 2)
where AUCbrain and AUCplasma are the areas under the drug concentration-time curves for
brain and plasma after both IN and IV administration to mice. It is assured that
preferential transport of drug to the brain occurs when DTE index is greater than 1 (WANG
et al., 2003).
With the aim of evaluating the distribution of CBZ to specific brain regions
(olfactory bulb, frontal cortex and the remaining portion of the brain) after its IN and IV

III Intranasal Administration of Carbamazepine
186
administration, the drug concentrations in each specimen were determined at predefined
time points (n = 4). The corresponding tissue-to-plasma and tissue-to-remaining portion
of the brain CBZ concentration ratios were calculated and compared.
III. 2.2.9. Statistical Analysis
The data were expressed as mean ± standard error of the mean (SEM). Statistical
comparisons between IN and IV administration groups were performed using unpaired
two-tailed Student’s t-test. Differences were considered statistically significant for a p-
value lower than 0.05 (p < 0.05).
III. 2.3. RESULTS
III. 2.3.1. Pharmacokinetics of Carbamazepine after IN and IV Administration
The mean plasma, brain and liver concentration-time profiles of CBZ and CBZ-E
obtained in mice after a single dose of CBZ (0.4 mg/kg) administered as nasal gel and IV
solution are depicted in Figure III.2.1. The corresponding main pharmacokinetic
parameters estimated by non-compartmental analysis are summarised in Table III.2.2. It
is noteworthy that, in all the three biological matrices, the pharmacokinetic profiles
obtained after IN and IV administration are fairly comparable. As expected, the Cmax of the
parent drug (CBZ) was attained almost instantaneously (5 min) after IV administration,
and it occurred not only in plasma but also in brain and liver tissues. In comparison to IV
delivery, only a slight delay in the time to reach the Cmax of CBZ (tmax = 10 min) was
observed for IN administration. Particularly interesting is the resemblance found in the
magnitude of the peak concentrations of CBZ achieved in brain and plasma via IN and IV
delivery. After reaching the Cmax, CBZ concentrations in plasma, brain and liver decreased
similarly following the two administration routes. As shown in Table III.2.2, the extent of
systemic and brain exposure to CBZ was also comparable after either IN or IV
administration (as assessed by AUCt and AUCinf), whereas the extent of hepatic exposure
to CBZ was 1.4-fold greater after IV injection (as assessed by AUCt). Thus, the absolute
bioavailability estimated for CBZ delivered via the IN route was found to be very high
(107.6%), indicating that a comparable amount of the drug was easily and rapidly
accessible in the systemic circulation following both IN and IV administrations. Regarding
the MRT parameter presented in Table III.2.2, it can be noted that higher values were
attained for plasma and brain after IN administration comparatively to IV administration,
in contrast with the liver, where the highest MRT value was assigned to the IV route. The
DTE index calculated for IN delivery of CBZ was 0.98 which did not provide any

Experimental III
187
discriminative information of the potential for direct nose-to-brain transport of the drug
via IN route. In opposition, the estimated DTE value appears to suggest that the uptake of
CBZ into the CNS through the nasal cavity is predominantly achieved by crossing the BBB
after a quick nasal absorption of the drug to the systemic blood. Therefore, taking into
account these pharmacokinetic data, the impact of the direct nose-to-brain delivery of
CBZ after IN instillation was not evident when considering only the analysis of whole brain
homogenate concentrations.
The concentrations of CBZ-E were also simultaneously determined in the referred
matrices. Overall, the CBZ-E levels were near or below the LLOQ of the analytical method,
thus the estimation of the corresponding pharmacokinetic parameters was limited and
therefore their values are not very informative (Table III.2.2).

III Intranasal Administration of Carbamazepine
188
Figure III.2.1 Concentration-time profiles of carbamazepine (CBZ) and carbamazepine-10,11-
epoxide (CBZ-E) in (A) plasma, (B) brain and (C) liver tissues following IN thermoreversible gel and
IV solution administration of CBZ (0.4 mg/kg) to mice. Symbols represent the mean values ± SEM
of four determinations per time point (n = 4).

Experimental III
189
Table III.2.2 Pharmacokinetic parameters of carbamazepine (CBZ) and carbamazepine-10,11-
epoxide (CBZ-E) in plasma, brain and liver tissues following the administration of CBZ (0.4 mg/kg)
to mice through intranasal (IN) and intravenous (IV) routes.
Drug Pharmacokinetic Parametersa
Plasma Brain Liver
IN IV IN IV IN IV
CBZ
tmax (min) 10.0 5.0c
10.0 5.0 10.0 5.0
Cmax (µg/mL) 2.32 2.47d
2.14e 2.39
e 2.78
e 3.39
e
AUCt (µg.min/mL) 252.58 238.65 193.19f 185.71
f 204.15
f 288.88
f
AUCinf (µg.min/mL) 262.46 243.84 220.58f NC NC 304.33
f
AUCextrap (%) 3.76 2.13 12.4 NC NC 5.07
kel (min-1) 0.013 0.027 - - - -
k (min-1) - - 0.010 0.006 0.006 0.019
t1/2el (min) 55.2 25.3 - - - -
t1/2 (min) - - 70.8 127.1 112.1 35.7
MRT (min) 76.1 64.9 71.0 52.9 53.1 64.2
F (%)b 107.6 - - - - -
CBZ-E
tmax (min) 120.0 NA NA NA 120.0 90.0
Cmax (µg/mL) 0.60 NA NA NA 0.63e 0.48
e
AUCt (µg.min/mL) 45.99 NA NA NA 122.87f 50.40
f
AUCinf (µg.min/mL) NC NC NC NC NC NC
AUCextrap (%) NC NC NC NC NC NC
kel (min-1) NC NC - - - -
k (min-1) - - NC NC NC NC
t1/2el (min) NC NC - - - -
t1/2 (min) - - NC NC NC NC
MRT (min) NC NC NC NC NC NC a
Parameters were estimated using the mean concentration-time profiles obtained from four different animals per
time point (n = 4). b Absolute intranasal bioavailability (F) was calculated based on AUC inf values.
c tmax in plasma
after IV administration corresponds to the first sampling time point. d Cmax in plasma after IV administration is
equivalent to the maximum concentration value determined at the first sampling time point (5 min). e
Values
expressed in µg/g. f Values expressed in µg.min/g. AUCextrap, extrapolated area under the drug concentration time-
curve; AUCinf, area under the concentration time-curve from time zero to infinity; AUCt, area under the
concentration time-curve from time zero to the last quantifiable drug concentration; Cmax, maximum peak
concentration; k, tissue elimination rate constant; kel, apparent elimination rate constant; MRT, mean residence
time; NA, not available; NC, not calculated; t1/2, tissue elimination half-life; t1/2el, apparent terminal elimination half-
life; tmax, time to achieve the maximum peak concentration.
III. 2.3.2. Brain Biodistribution of Carbamazepine after IN and IV Administration
To achieve more specific and informative data on the rostral-caudal brain
biodistribution of CBZ following its IN and IV administration (0.4 mg/kg) to mice, some
particular brain regions (olfactory bulb, frontal cortex and the remaining portion of the
brain) were analysed as well as the plasma samples taken at the corresponding sampling
time points. The mean concentrations of CBZ in plasma, olfactory bulb, frontal cortex and

III Intranasal Administration of Carbamazepine
190
the remaining portion of the brain up to 60 min post-dosing are presented in Figure
III.2.2. Accordingly, CBZ concentrations attained in plasma and in the different brain
regions after IV administration of CBZ solution were very similar, assuming a homogenous
brain distribution pattern. In contrast, following IN administration of CBZ nasal gel,
different drug concentrations were observed throughout the specific brain regions
analysed. Indeed, at 10 min post-dosing, higher CBZ concentrations were determined in
the olfactory bulb (3.16 ± 0.09 µg/g) and frontal cortex (3.05 ± 0.09 µg/g) homogenates
comparatively to the remaining portion of the brain (2.58 ± 0.09 µg/g), showing an
uneven distribution of the drug from rostral to more caudal brain areas (Figure III.2.2).
Interestingly, this heterogeneous brain distribution of CBZ is more evident during the first
three time points (5, 10 and 15 min) after the IN instillation, whereas a more uniform
diffusion was accomplished from 30 min onwards. In fact, it is noteworthy that, up to 15
min, the highest concentrations of CBZ after IN administration were always found in the
olfactory bulb in comparison to plasma, frontal cortex and remaining portion of the brain,
sustaining a direct passage of the drug from nose to the brain.
Figure III.2.2 Carbamazepine (CBZ) concentrations (mean ± SEM) up to 60 min post-dosing in
plasma and different brain regions (olfactory bulb, frontal cortex and the remaining portion of the
brain) after IN and IV administration of CBZ (0.4 mg/kg) to mice (n = 4, at each time point).
Statistical significant differences (p < 0.05) between both delivery routes (IN vs IV) are marked
with (*).

Experimental III
191
The tissue-to-plasma and tissue-to-remaining portion of the brain concentration
ratios were calculated for the olfactory bulb and frontal cortex specimens following both
routes of administration (Table III.2.3). After IV injection, similar ratios were observed at
all sampling time points within the first hour post-dosing, while after IN administration,
discrepant values were ascertained, mainly up to 15 min. These results support the
hypothesis that a direct transfer of CBZ from nose to the brain may be involved. Focusing
particularly on the olfactory bulb-to-remaining portion of the brain ratios, it can be
inferred that a direct nose-to-brain transport of CBZ occurs and probably via the olfactory
pathway since the value of 1.29 ± 0.05 found at 5 min after IN delivery is significantly
higher (p < 0.05) than that achieved after IV injection (0.95 ± 0.07) (Table III.2.3).
Table III.2.3 Tissue-to-plasma and tissue-to-remaining portion of the brain concentration ratios of
carbamazepine (CBZ) in different brain regions following intranasal (IN) and intravenous (IV)
administration to mice (0.4 mg/kg).
Route Post-dosing Time (min)
CBZ Concentration Ratios
B/P FC/P OB/P FC/B OB/B
IN
5 0.76 ± 0.04§ 0.88 ± 0.05* 0.98 ± 0.04 1.17 ± 0.05
# 1.29 ± 0.05
#
10 0.91 ± 0.06 1.08 ± 0.04 1.11 ± 0.03 1.19 ± 0.05# 1.23 ± 0.07*
15 0.82 ± 0.07# 1.01 ± 0.03 1.03 ± 0.04 1.25 ± 0.09* 1.28 ± 0.06
#
30 0.90 ± 0.03# 0.83 ± 0.05
# 0.87 ± 0.04* 0.92 ± 0.03 0.96 ± 0.02
60 0.99 ± 0.07 0.97 ± 0.06 0.99 ± 0.06 0.98 ± 0.02 1.00 ± 0.03
IV
5 1.08 ± 0.02 1.04 ± 0.02 1.03 ± 0.09 0.96 ± 0.02 0.95 ± 0.07
10 1.03 ± 0.03 1.01 ± 0.03 0.97 ± 0.06 0.98 ± 0.02 0.94 ± 0.04
15 1.19 ± 0.07 1.11 ± 0.08 1.12 ± 0.11 0.94 ± 0.05 0.94 ± 0.07
30 1.08 ± 0.02 1.09 ± 0.02 1.04 ± 0.05 1.01 ± 0.03 0.96 ± 0.03
60 1.01 ± 0.02 1.03 ± 0.02 0.84 ± 0.08 1.02 ± 0.02 0.83 ± 0.08
Data are expressed as the mean values ± SEM of four animal determinations (n = 4). Statistically significant differences
between the two routes of administration (IN versus IV) are marked with an asterisk (*) for p < 0.05, (#) for p < 0.01 and
(§) for p < 0.001. B/P, remaining portion of the brain-to-plasma ratio; FC/B, frontal cortex-to-remaining portion of the
brain ratio; FC/P, frontal cortex-to-plasma ratio; OB/B, olfactory bulb-to-remaining portion of the brain ratio; OB/P,
olfactory bulb-to-plasma ratio.

III Intranasal Administration of Carbamazepine
192
III. 2.4. DISCUSSION
It is estimated that more than 98% of all small molecules and nearly 100% of large
molecular weight drugs systemically delivered to the CNS, either by oral or IV routes, do
not readily cross the BBB and reach the brain parenchyma at pharmacologically active
concentrations (PARDRIDGE, 2005). As a consequence, many promising therapeutic agents
may have been discarded due to its inability to effectively permeate BBB and others are
given at high systemic doses to attain therapeutic levels at the biophase, which
commonly lead to undesirable peripheral adverse effects and drug interactions.
In the light of the current knowledge, drug transport across the nasal mucosa into
the CNS depends on a variety of factors that can range from the physicochemical
properties of the drug to the formulation design and physiological conditions at the
absorption site (PIRES et al., 2009; VYAS et al., 2006b). Aware that nasal MCC is one of the
major limitations for nasal drug delivery (MARTTIN et al., 1998), the choice of a convenient
nasal dosage form that avoids the rapid nasal drainage and promotes the increase of drug
residence time within the nasal cavity is fundamental (MAJITHIYA et al., 2006). Therefore, in
order to avoid a fast MCC of the drug but to simultaneously keep an easy administration
form, a thermoreversible mucoadhesive gel composed of 18% PF-127 and 0.2% C-974P
was herein selected to incorporate and deliver CBZ by the IN route since, according to the
results reported by Badgujar et al. (2010), the viscous properties of this formulation offer
an appropriate and promising compromise between in situ gelling and ease of
administration. Being a liquid-like solution at room temperature but changing to a firm
gel at the physiological temperature within the nasal cavity (32-35°C) (BADGUJAR et al.,
2010), in situ thermoreversible mucoadhesive gel displays a huge advantage over the
conventional and more viscous hydrogels (BARAKAT et al., 2006; CZAPP et al., 2008)
concerning not only the ease of handling but also the accuracy of dosing (BASU and
BANDYOPADHYAY, 2010).
Although CBZ is only currently available in oral dosage forms, it seems that the use
of the IV route as a control is the most appropriate for this study. Indeed, due to the
direct delivery of the drugs to the systemic circulation, IV administration will be
responsible for the highest systemic exposure by comparison with any other route,
creating appropriate conditions to allow a less variable drug incorporation and
biodistribution. Moreover, considering that after IN administration drugs reach the CNS
either via systemic circulation or olfactory epithelium, the contribution of the blood-
mediated drug delivery to the brain can be inferred by employing IV injection and,
consequently, the fraction of the drug directly transported from nose to brain could be
more accurately discriminated.

Experimental III
193
The pharmacokinetic results herein described revealed that, similarly to what
happens following IV injection, the IN administration of CBZ nasal gel brought a rapid and
extensive systemic absorption of the drug (assessed by Cmax, tmax, AUCt and AUCinf). The
high CBZ concentrations attained in plasma after IN instillation, as well as the almost
parallel time course of plasma and brain concentrations (Figure III.2.3), clearly indicate
that a substantial fraction of the drug has effectively been absorbed to the systemic
circulation and reached the brain parenchymal tissue by crossing the BBB. In addition,
comparable parent drug plasma concentration-time profiles following IN and IV
administrations were also observed (Figure III.2.1), supporting a similar bioavailability
value (107.6%) achieved for the IN delivery of CBZ. These findings could be explained on
the basis of the high lipophilic nature of the drug which LogP value is 2.45. Indeed, small
lipophilic molecules nasally administered can be rapidly absorbed to the blood stream by
easily crossing the nasal membrane via transcellular diffusion and then enter into the
brain after traversing the BBB. Experimental data reported in other research studies using
both low molecular weight and lipophilic compounds such as diazepam (LogP = 2.8) (KAUR
and KIM, 2008), PB (LogP = 1.47) (CZAPP et al., 2008), NXX-066 (LogP = 4.35) (DAHLIN and
BJÖRK, 2001), progesterone (LogP = 4.03) and estradiol (LogP = 3.51) (VAN DEN BERG et al.,
2004a) underscored the fact that IN drug delivery occurred predominantly via the
systemic pathway. The higher MRT values observed for plasma and brain on one hand
and the lower MRT value attained in liver after IN administration comparatively to IV
injection on the other hand, could also underlie the high bioavailability achieved for CBZ
delivered by the IN route (Table III.2.2). In fact, according to these results, CBZ molecules
stayed for a longer time in plasma and brain after IN instillation in comparison with the IV
injection, which in turn led to a greater retention of the drug in the liver.

III Intranasal Administration of Carbamazepine
194
Figure III.2.3 Concentration-time profiles of carbamazepine (CBZ) in plasma and brain following IN
administration (0.4 mg/kg) to mice. Symbols represent the mean values ± SEM of four
determinations per time point (n = 4).
Apart from the indirect pathway via the systemic circulation, it is believed that,
there are two other different pathways by which a drug administered through the IN
route may reach the CNS: the olfactory and the trigeminal neuronal routes (DHURIA et al.,
2010). Although both of them provide a direct nose-to-brain delivery of the drug, the
uptake via the olfactory neurons affords a preferential drug delivery to the olfactory bulb
and rostral portion of the brain while the transference via the trigeminal nerve generally
yields a more distant drug distribution to caudal brain areas. Thus, aiming at evaluating
whether a direct transport of CBZ was occurring from nose to brain, the drug distribution
in different brain regions was characterised after IN and IV administration. Interestingly,
distinct distribution of CBZ through plasma, olfactory bulb, frontal cortex and remaining
portion of the brain following IN and IV administration was herein reported for the first
time. While a homogeneous brain distribution was observed for CBZ after IV injection, in
the case of IN administration, the CBZ concentrations were different according to the
respective brain area, presenting higher values in the rostral portion comparatively to the
cerebral caudal region. Given that the CBZ brain concentration ratios determined at 5 min
were 1.36-fold higher in the olfactory bulb and 1.22-fold higher in the frontal cortex
employing the nasal delivery route than those obtained for IV injection (Table III.2.3), it
seems probable that a direct transport of the drug from nose to brain may be involved
and that it occurred preferentially via the olfactory neuronal pathway. These findings
assume particular interest in the field of the pharmacoresistant epilepsy. Indeed, it is
nowadays scientifically accepted that the overexpression and/or upregulation of

Experimental III
195
multidrug efflux transporters in the BBB is one of the main mechanisms responsible for
the development of resistance to the AEDs (KWAN et al., 2011; LÖSCHER and POTSCHKA, 2002;
REMY and BECK, 2006). Overall, these transmembrane proteins pump the AEDs back to the
systemic circulation, restricting their access to the brain (LÖSCHER and POTSCHKA, 2002;
LUNA-TORTÓS et al., 2008). In this context, the results herein obtained, demonstrate that
the IN route may be considered as a novel approach to overcome the pharmacoresistance
phenomena since a direct delivery of CBZ from nose to brain was clearly evidenced and it
occurred in a considerable extent.
Pooling the data derived from both the pharmacokinetic and brain biodistribution
studies following IN administration, it seems that with the high plasma concentrations on
one hand and the superior delivery to the rostral regions of the brain on the other hand,
CBZ reached the CNS through a combination of routes. Even though it is not possible to
accurately quantify the contribution of each of these routes, we presume that a small
fraction of the drug is in fact delivered to the brain via the olfactory pathway, while the
most representative amount is still attributable to the systemic circulation. The 0.98 value
obtained for the DTE index also strengthens this hypothesis. Notwithstanding, a further
optimisation of the CBZ nasal formulation will probably contribute to a better exploitation
of the maximum potential that the IN route has to offer.
In summary, IN delivery seems to represent a suitable and promising alternative
route for the CBZ administration regarding not only its use on the chronic treatment of
epilepsy but also in the case of more severe and acute emergency situations, such as
status epilepticus. Indeed, the IN administration of CBZ allowed extensive plasma and
brain exposures to the drug as well as a fast and pronounced drug uptake in the brain.
Apart from being very practical and adequate to be used outside the hospital setting, the
uneven biodistribution pattern with the highest CBZ concentration levels attained in the
rostral areas of the brain, reinforces the potential of IN delivery to be employed in acute
convulsive emergencies.
From the pharmacokinetic point of view, IN and IV administration of CBZ exhibited
similar concentration-time profiles which probably point out to very similar
pharmacological responses. In order to foresee whether IN delivery of CBZ could became
clinically relevant, technological optimisation of the nasal drug formulation, as well as
further pre-clinical investigations are needed to evaluate the therapeutic efficacy attained
via this route.

III Intranasal Administration of Carbamazepine
196

CHAPTER IV
INTRANASAL ADMINISTRATION OF
LAMOTRIGINE


TABLE OF CONTENTS
CHAPTER IV - INTRANASAL ADMINISTRATION OF LAMOTRIGINE 197
IV. 1. LAMOTRIGINE - Pharmacological Characterisation 201
IV. 1.1. HISTORICAL BACKGROUND 203
IV. 1.2. PHARMACEUTICAL INFORMATION 204
IV. 1.3. PHARMACOKINETICS 204
Absorption 205
Distribution 205
Metabolism 206
Elimination 207
IV. 1.4. PHARMACODYNAMICS 207
Mechanism of Action 207
IV. 1.5. CLINICAL USE 208
Therapeutic Indications 208
Tolerability 209
Therapeutic Range 209
Drug Interactions 210
IV. 2. EXPERIMENTAL - Direct Nose-to-Brain Delivery of LTG Following Intranasal
Administration to Mice 211
IV. 2.1. INTRODUCTION 213
IV. 2.2. MATERIALS & METHODS 215
IV. 2.2.1. Chemicals and Reagents 215
IV. 2.2.2. Animals 215
IV. 2.2.3. Preparation of Lamotrigine Formulations 216
IV. 2.2.4. IN and IV Administrations 216
IV. 2.2.5. Pharmacokinetic Study 217
IV. 2.2.6. Brain Biodistribution Study 217
IV. 2.2.7. Drug Analysis 217
IV. 2.2.8. Pharmacokinetic Analysis 219
IV. 2.2.9. Statistical Analysis 220
IV. 2.3. RESULTS 220
IV. 2.3.1. Pharmacokinetics of Lamotrigine after IN and IV Administration 220
IV. 2.3.2. Brain Biodistribution of Lamotrigine after IN and IV Administration 223
IV. 2.4. DISCUSSION 226


IV. 1. LAMOTRIGINE
Pharmacological Characterisation


Lamotrigine IV
203
IV. 1.1. HISTORICAL BACKGROUND
LTG was firstly synthesised in the 1970s as part of a rational effort to develop and
test folic acid antagonists as possible anticonvulsants (MESSENHEIMER, 1995). In fact, since
the beginning of the 1960s, it had been hypothesised that the disturbances of folate
metabolism caused by some AEDs, such as PHT and PB, could be related to their
antiepileptic properties, and that folate could act as a pro-convulsing agent leading to an
exacerbation of seizures (BRODIE, 1992; RAMBECK and WOLF, 1993; SHORVON, 2009a).
Although this hypothesis was later proven to be incorrect, with the antifolate effects of
the two AEDs actually demonstrating no relevance to the corresponding anticonvulsive
action, it resulted in the development of numerous antifolate agents and their further
testing in various conventional animal models of epilepsy. Among a whole series of
compounds studied by the Wellcome Research Laboratories, a group of phenyltriazine
derivatives was deepen investigated, and of these, BW430C, later known as lamotrigine,
proved to be one of the most promising (SHORVON, 2009a). Ironically, structure-activity
studies subsequently revealed that little or no folic acid antagonism was indeed
associated to LTG, and therefore, the very weak antifolate activity could not be
responsible for its potent antiepileptic effects (GOA et al., 1993; MESSENHEIMER, 1995).
After its therapeutic effectiveness had been successfully demonstrated in a
number of studies performed on different laboratory animals and humans, LTG was
introduced into clinical practice in Europe in 1990 (LTG was licensed in Portugal in
December of 1994), and in the United States of America in 1994, as adjunctive treatment
for focal seizures with or without secondary generalisation in adults with refractory
epilepsy (SHORVON, 2009a). Several years after its launch, it became apparent that, in
addition to the therapeutic indication for which it had been originally licensed (focal-
onset seizures), the drug had also value in the treatment of generalised seizures, both
primary and secondary, and soon the drug was being hailed as an anticonvulsant with a
broad spectrum of activity (SHORVON, 2009a). Subsequent large scale controlled
comparative trials of LTG monotherapy with CBZ (BRODIE et al., 1995) and PHT (STEINER et
al., 1999) indicated that the former offered similar efficacy but better tolerability; since
then, LTG has been increasingly used as first-line monotherapy, particularly for
generalised epilepsy as an alternative to valproate (FITTON and GOA, 1995; SHORVON,
2009a).

IV Intranasal Administration of Lamotrigine
204
IV. 1.2. PHARMACEUTICAL INFORMATION
LTG, a second-generation AED, is a phenyltriazine derivative which is structurally,
chemically and pharmacologically unrelated to any established antiepileptic medication
(GARNETT, 1997; GOA et al., 1993). The molecule consists of a phenyl group with two
chloride substituents joined to a triazine structure with two amino substitutions (WALKER
and SANDER, 1999). It is a white to pale cream-colored powder with poor solubility in water
or ethanol, and similarly to CBZ, it is only available in formulations for oral administration.
LTG has lipophilic properties and is a weak base that in the presence of strong acids or
bases is hydrolysed and converted into a mono- or di-hydroxitriazine. Detailed
pharmaceutical information of LTG is summarised in Table IV.1.1.
Table IV.1.1 Pharmaceutical information of lamotrigine (DRUGBANK; GLAXOSMITHKLINE, 2013;
PUBCHEM).
Drug Identification Physicochemical Properties
Generic Name Lamotrigine Phase State Solid / White powder
Chemical Name 6-(2,3-dichlorophenyl)-1,2,4-triazine-3,5-diamine
Solubility in Water 0.17 mg/mL (at 25°C)
Chemical Formula C9H7Cl2N5 Solubility in Ethanol 4.1 mg/mL (at 25°C)
Molecular Weight 256.09 g/mol LogP 2.5
Molecular Structure
pKa 5.7
Drug Information
Brand Name Lamictal® Manufacturer GlaxoSmithKline
Dosage Forms Compressed tablet Chewable/dispersible tablet
Route of Administration
Oral
LogP, octanol/water partition coefficient; pKa, negative decadic logarithm of the acid dissociation constant.
IV. 1.3. PHARMACOKINETICS
The pharmacokinetic properties of LTG have been studied after its administration
as single and multiple oral dosing regimens to animals, healthy volunteers and patients
with epilepsy receiving concurrent antiepileptic medications. LTG exhibits a first-order
linear kinetics which varies considerably among different individuals and species (GARNETT,

Lamotrigine IV
205
1997; RAMSAY et al., 1991). This section and Table IV.1.2 will provide a brief overview of
the LTG pharmacokinetic profile.
Table VI.1.2 Summary of the main pharmacokinetic parameters of lamotrigine in both adult
healthy volunteers and patients with epilepsy (FITTON and GOA, 1995; GLAXOSMITHKLINE, 2013;
GOLDSMITH et al., 2003).
Pharmacokinetic Parameter Mean Value
tmax (h) 1-3
F (%) 98
Plasma Protein Binding (%) 55
Vd/F (L/kg) 0.9-1.4
t1/2el (h) 25-35
CL/F (L/h/kg) 0.021-0.035
CL/F, apparent plasma clearance; F, absolute bioavailability; t1/2el, apparent elimination
half-life; tmax, time to achieve maximum peak concentration; Vd/F, apparent volume of
distribution.
Absorption
Following oral administration, LTG is rapidly and almost completely absorbed with
negligible first-pass metabolism, displaying an absolute bioavailability of about 98%
(GARNETT, 1997; RAMBECK and WOLF, 1993). In the presence of food, the rate of absorption
is slightly reduced but the extent remains unchanged (GLAXOSMITHKLINE, 2013). Cmax is
typically achieved within 1 to 3 hours post-dosing, and a second peak or plateau may
occur at 4-6 hours, suggesting a possible enterohepatic recycling phenomenon (FITTON and
GOA, 1995; GARNETT, 1997). Over the range of 50-400 mg given as a single dose, a linear
relationship is ascertained between the dose administered, the Cmax and the AUC in
plasma (GLAXOSMITHKLINE, 2013; GOA et al., 1993). Linearity has also been reported for
doses up to 700 mg, indicating that the absorption of LTG is not saturable in clinical doses
(GARNETT, 1997).
Distribution
Due to its high lipophilicity, LTG is widely and uniformly distributed throughout all
organs and tissues. The Vd/F ranges from 0.9 to 1.4 L/kg and it is independent of dose,
dosage regimen and the presence or absence of epilepsy (BITON, 2006). The degree of
plasma protein binding is estimated to be constant at approximately 55% over LTG
plasma concentrations within 1-10 µg/mL, and therefore, clinically significant interactions

IV Intranasal Administration of Lamotrigine
206
with other drugs through competition for protein-binding sites are unlikely to occur
(BITON, 2006; GARNETT, 1997; GLAXOSMITHKLINE, 2013).
Metabolism
LTG is a weak base that is extensively metabolised in the liver predominantly by
glucuronic acid conjugation which appears to be the rate-limiting step in the elimination
of the drug (COHEN et al., 1987) (Figure IV.1.1). During the first 6-7 days after a single oral
dose of LTG, about 75% to 90% of the total dose administered is recovered in urine, of
which, 80-90% is found in the form of 2-N-glucuronide while the rest is eliminated as the
5-N-glucuronide (10%), 2-N-methyl (0.1%), unidentified metabolites and finally, the
unchanged parent drug (10%) (BITON, 2006; GOA et al., 1993; GOLDSMITH et al., 2003; WERZ,
2008). Glucuronidation reactions are catalysed by the UGTs. None of the metabolites are
pharmacologically active or associated to appreciably toxic effects (GARNETT, 1997;
GOLDSMITH et al., 2003; LU and UETRECHT, 2007).
Similarly to CBZ, LTG also exhibits an induction of its own metabolism, but in a
smaller extent. For most patients, autoinduction is complete within the first two weeks of
therapy and can be associated to a reduction of approximately 20% in LTG plasma
concentrations (JOHANNESSEN et al., 2003; KRASOWSKI, 2010). Nevertheless, since this
phenomenon occurs mainly in the early stages of treatment, when plasma concentrations
are rising to steady-state, and in view of the wide therapeutic margin of LTG, it is
commonly considered that such effect is devoid of clinical relevance (RAMBECK and WOLF,
1993; WALKER and SANDER, 1999).

Lamotrigine IV
207
Figure IV.1.1 The major metabolites of lamotrigine (LTG).
Elimination
As aforementionend, the elimination of LTG follows a first-order linear kinetics.
The plasma elimination half-life (t1/2el) of LTG in healthy adults is reported to be in the
range of 25-35 h, whereas the values of total clearance varies between 0.021-0.035
L/h/kg (GOA et al., 1993; GOLDSMITH et al., 2003).
The urinary excretion is the primarily route of LTG elimination with approximately
90% of total oral dose being recovered in urine. A very small amount of the drug (around
2%) could also be encountered in faeces, suggesting the involvement, although
insignificant, of a biliary excretion (GARNETT, 1997).
IV. 1.4. PHARMACODYNAMICS
Mechanism of Action
LTG shares a very similar mechanism of action with conventional AEDs such as CBZ
and PHT. Hence, it is suggested that LTG inhibits sustained repetitive firing of action
potentials by stabilising pre-synaptic neuronal membranes through the blockade of
voltage-sensitive sodium channels in a time- and use-dependent manner, preventing the

IV Intranasal Administration of Lamotrigine
208
release of excitatory neurotransmitters, particularly glutamate and aspartate (FITTON and
GOA, 1995; POTSCHKA, 2013). Identically to PHT, there is evidence that at therapeutic
concentrations, LTG binds slowly to the fast inactivated state of the sodium channels,
playing a key role on its selective effect against the sustained depolarisations and high
frequency discharges characteristic of epileptic foci without disturbing most of the normal
neuronal activities (FITTON and GOA, 1995; KUO and LU, 1997).
The LTG broader clinical spectrum of activity comparatively to other sodium
channel-blocking antiepileptic agents points out that the interaction with sodium voltage-
dependent channels is unlikely to be its sole antiseizure mechanism (PORTER et al., 2012).
Therefore, in addition to its inhibitory effect on sodium channels, LTG may also modify
voltage-gated calcium currents by blocking pre-synaptic N-type and P-type calcium
channels, resulting in decreased glutamate release (KWAN et al., 2001; PORTER et al., 2012).
Notwithstanding, it remains possible that supplementary unidentified mechanisms of
action for LTG may still exist.
LTG is also believed to act on serotonin reuptake, which may contribute to its
antidepressant effects (NG et al., 2007).
IV. 1.5. CLINICAL USE
Therapeutic Indications
LTG was initially approved for the add-on treatment of focal seizures in adults and
later in children above the age of two (WERZ, 2008). Clinically, the drug shows a broad
spectrum of antiepileptic activity proving to be highly effective against focal seizures with
or without generalisation and primarily generalised seizures, including tonic-clonic,
absence, atonic and drop attacks (FITTON and GOA, 1995; NEELS et al., 2004).
Similarly to other novel AEDs, LTG possesses comparable anticonvulsant efficacy
but exerts much less adverse effects when compared to conventional antiseizure drugs
(CZAPIŃSKI et al., 2005). It is indicated for use as adjunctive therapy for the management of
adult and paediatric patients with epilepsy who are not satisfactorily controlled; as
monotherapy following withdrawal of other AEDs (CBZ, PHT, PB, PRM and valproic acid)
and as adjunctive therapy for the management of generalised seizures associated with
Lennox-Gastaut syndrome (GLAXOSMITHKLINE, 2013). Recently, LTG was also licensed for
the maintenance treatment of bipolar disorder to delay the time to occurrence of mood
episodes (GOLDSMITH et al., 2003).

Lamotrigine IV
209
Tolerability
In comparison to older AEDs, LTG is generally associated to less clinically
significant neurological, cognitive, metabolic, hepatic or reproductive endocrine toxicity
in the majority of patients. Commonly reported adverse experiences of LTG administered
as mono- or adjunctive therapy are primarily CNS-related, including dizziness, diplopia,
ataxia, somnolence, blurred vision, headache and asthenia (10-14%) (GOA et al., 1993;
RAMBECK and WOLF, 1993). Likewise CBZ or PHT, LTG has also been associated with serious
hypersentivity reactions such as skin rash, which although very rare, is the most common
adverse event leading to discontinuation of therapy (BITON, 2006; GOA et al., 1993). Skin
rashes have been reported in about 10% of patients receiving LTG and they are usually of
the simple morbiliform type, benign and self-limited. Occasionally, more severe forms of
rash like Stevens-Johnson syndrome and toxic epidermal necrolysis have also been
described (BITON, 2006; FITTON and GOA, 1995; WERZ, 2008). Skin rash manifests almost
always within the first few weeks after initiation of LTG therapy but resolves quickly upon
treatment withdrawal (FITTON and GOA, 1995). It appeared to be associated with the use of
high initial doses, rapid dose-escalation and concomitant administration with valproic
acid (BITON, 2006; RAMBECK and WOLF, 1993). Accordingly, in order to reduce the risk of
rash development, it is recommended a gradual dose-titration from a low starting dose
and appropriate dose adjustments when LTG is administered to patients already receiving
valproate.
Therapeutic Range
There is not a clear-cut relationship between plasma concentrations of LTG and
clinical or toxic responses mainly due to a large pharmacokinetic interindividual variability
(PATSALOS et al., 2008). A tentative target range of 1-4 µg/mL was initially proposed,
however it later appeared not to correlate well with pharmacological effects (MORRIS et
al., 1998). Indeed, subsequent studies suggested that these former concentrations may
have been too low since some patients have tolerated concentrations above 10 µg/mL
with additional therapeutic benefits and without significant clinical toxicity (BRODIE, 1992).
Moreover, the incidence of toxic effects have considerably increased only when plasma
LTG levels exceed 15 µg/mL (KRASOWSKI, 2010; PATSALOS et al., 2008). Therefore, Morris et
al. (1998) suggested that an appropriate reference range of plasma concentrations for
LTG would be 3-14 µg/mL which is the therapeutic window currently adopted in clinical
practice.

IV Intranasal Administration of Lamotrigine
210
Drug Interactions
Since LTG does not appear to interfere with the hepatic mixed function oxidase
system and is not highly protein bound, it is therefore expected that the number and
extent of drug interactions will be reduced compared with classical AEDs (MESSENHEIMER,
1995). Nevertheless, although LTG itself generally does not affect the
metabolism/elimination of other AEDs, important alterations in LTG plasma
concentrations are ascertained in patients receiving other antiseizure medications. Thus,
in the presence of hepatic enzyme-inducing agents like for instance CBZ, PHT, PB and
PRM, the rate of LTG elimination is increased, resulting in a t1/2el reduction of
approximately one-half. Conversely, concomitant administration with valproic acid
provides a marked prolongation of LTG t1/2el for the double essentially due to competition
for hepatic glucuronidation sites (FITTON and GOA, 1995; JOHANNESSEN and LANDMARK, 2010).
Co-medication with newer AEDs such as felbamate, gabapentin, levetiracetam,
topiramate, vigabatrin and zonisamide does not have a significant impact on LTG
pharmacokinetics (WEINTRAUB et al., 2005).
Some relevant interactions between LTG and drugs other than antiepileptic agents
have also been described. While sertraline has shown to increase LTG concentrations
probably by inhibition of LTG glucuronidation, acetaminophen and rifampicin have been
reported to accelerate its metabolism (JOHANNESSEN et al., 2003). Plasma concentrations of
LTG can also be reduced by more than 50% on concomitant use with oral contraceptives.
This interaction is likely to be caused by glucuronidation induction by the steroids,
yielding a diminished seizure control in some women (JOHANNESSEN and LANDMARK, 2010).

IV. 2. EXPERIMENTAL
Direct Nose-to-Brain Delivery
of LTG Following Intranasal
Administration to Mice


Experimental IV
213
IV. 2.1. INTRODUCTION
The lifelong seizure freedom with tolerable adverse effects is considered the
ultimate goal of any therapeutic intervention for epilepsy. Although the pharmacological
treatment of epilepsy has made remarkable breakthroughs with the introduction of more
than 20 different AEDs, it has fallen short of expectations, with up to one-third of the
patients continuing to experience seizures or unacceptable medication-related side-
effects (CANEVINI et al., 2010; FRENCH, 2007). Indeed, pharmacoresistance has been
assumed as one of the major causes underlying the failure of the anticonvulsant therapy
and it is commonly associated with an increased risk of morbidity and mortality
(ALEXOPOULOS, 2013; WEAVER and POHLMANN-EDEN, 2013). Even though the regulatory events
that determine AED resistance have not been completely understood yet, important
insights regarding the pathophysiologic mechanisms of intractable epilepsy are emerging.
Therefore, considering that the biologic basis of refractoriness is likely to be multifactorial
and variable, several putative neurobiological processes have been identified and
suggested over recent years (KWAN and BRODIE, 2002; LÖSCHER and SCHMIDT, 2011). Among
distinct theories, the multidrug-transporter hypothesis has been gaining an increasing
support. Accumulating evidence demonstrate that various efflux transporters such as P-
glycoprotein and members of the multidrug resistant-associated protein family,
expressed in capillary endothelial cells of the BBB, are particularly upregulated in
epileptogenic brain tissue of refractory epileptic patients (LÖSCHER, 2007; POTSCHKA, 2010a;
SCHMIDT and LÖSCHER, 2005). This overexpression hampers the penetration of several AEDs
into the brain, limiting the amount of the drug that efficiently reaches the therapeutic
target, and consequently, it may lead to the reduction or even complete loss of
pharmacosensitivity at the biophase (LÖSCHER, 2007; POTSCHKA, 2010b).
LTG is a second-generation AED which exhibits a broad spectrum of efficacy and
tolerability, being effective against focal and generalised tonic-clonic seizures, either
alone or as adjunctive therapy (GOA et al., 1993; SCHILLER and KRIVOY, 2009). Although it has
been initially approved for the add-on treatment of patients with refractory focal-onset
epilepsy, only a modest or no significant improvement has been effectively demonstrated
on seizure control (SHORVON, 2009a). Inclusively, several recent reports have identified
LTG as a P-glycoprotein substrate, which may explain its limited access to the brain
throughout the treatment (LUNA-TORTÓS et al., 2008; POTSCHKA et al., 2002; ZHANG et al.
2012). Currently, LTG is only commercially available in tablet dosage forms for oral
delivery (BITON, 2006), requiring an extensive systemic absorption with further BBB
crossing to exert its therapeutic effect. Increasing the oral dose in an attempt to attain
therapeutic levels of LTG in the brain and appropriately manage the occurrence of
uncontrolled seizures is invariably associated to an augmentation of drug concentrations

IV Intranasal Administration of Lamotrigine
214
in the blood, thus enhancing the predisposition to develop undesirable peripheral
adverse events like severe skin rashes (BITON, 2006; SCHILLER and KRIVOY, 2009).
In this context, alternative administration strategies that provide a more efficient
delivery of LTG to the brain are undoubtedly required. A number of different invasive
approaches like intraparenchymal, intraventricular and intrathecal injections have
successfully been used to increase the CNS targeting of drugs. Through the introduction
of therapeutics directly into the brain, these techniques have revealed to be very
effective on drug delivery; however, they are considered impractical and unrealistic for
clinical application because they are complex, risky, expensive and not convenient for
multiple dosing regimens (DHURIA et al., 2010). On the other hand, the IN administration
as a means of delivering therapeutic agents preferentially to the brain has recently gained
significant interest (SERRALHEIRO et al., 2013a). In fact, the unique anatomical connection
between the nasal cavity and the CNS provides a great opportunity for drugs
administered by the IN route to reach a quick and easy access to the brain through
pathways along the olfactory and trigeminal nerves innervating the nasal passages
(LOCHHEAD and THORNE, 2014). In accordance, considering its undeniable potential, IN
delivery could be a favourable and promising alternative route to improve CNS targeting
of LTG. Besides circumventing the BBB, IN administration also avoids hepatic first-pass
and systemic dilution effects, facilitates administration of low doses and in turn reduces
peripheral drug exposure, minimising toxicity (JOGANI et al., 2008). Moreover, as
demonstrated in the previous chapter (Chapter III, section III. 2.), the IN administration of
CBZ allowed a rapid and extensive cerebral uptake, as well as an uneven biodistribution
pattern with the highest drug concentration levels achieved in the rostral areas of the
brain, strengthening the potential of this delivery route to be employed in acute
convulsive episodes (SERRALHEIRO et al., 2014). Thus, in the absence of a marketed LTG
formulation for IV administration, IN delivery may also be regarded as a useful and
valuable option in cases of emergency.
Curiously, some formulations for IN delivery of LTG have already been developed
and investigated (ALAM et al., 2015; DAVE and PUROHIT, 2013); notwithstanding, little or no
information really exists on its pharmacokinetics following administration through this
route. To the best of our knowledge, only one study has recently tested the efficacy of
the experimental IN formulation of LTG in vivo (ALAM et al., 2015), however the drug
concentrations determined in plasma and brain were not sufficient to set up a complete
pharmacokinetic profile. Aiming at evaluating the potential of LTG to be administered via
the IN route, a comprehensive characterisation of the pharmacokinetic behaviour of the
drug was herein performed. Hence, following both IN and IV administrations,
concentration levels of LTG in plasma, brain and liver tissues were determined and the
corresponding pharmacokinetic profiles were assessed and compared. The feasibility of
Experimental IV
215
the drug to be directly transported from nose to the brain, bypassing the BBB, was also
investigated. For this purpose, LTG concentrations were analysed in different dissected
brain regions and the rostral-caudal brain distribution patterns of the drug were
established for the two delivery routes considered.
IV. 2.2. MATERIALS & METHODS
IV. 2.2.1. Chemicals and Reagents
LTG was gently provided by Bluepharma (Coimbra, Portugal). Chloramphenicol,
used as IS, PF-127 and propylene glycol were all purchased from Sigma-Aldrich (St. Louis,
MO, USA). C-974P was kindly supplied from Lubrizol (Wickliffe, OH, USA). Methanol and
acetonitrile of HPLC gradient grade were acquired from Fisher Scientific (Leicestershire,
UK) and Lab-Scan (Sowinskiego, Poland), respectively. Ultrapure water (HPLC grade, 18.2
MΩ.cm) was prepared by means of a Milli-Q water apparatus from Millipore (Milford,
MA, USA). Ethyl acetate was obtained from Fisher Scientific (Leicestershire, UK). TEA and
potassium dihydrogen phosphate, as well as sodium dihydrogen phosphate dihydrate, di-
sodium hydrogen phosphate dihydrate and hydrochloric acid fuming 37%, used to
prepare 0.1 M sodium phosphate buffer pH 5.0, were all purchased from Merck KGaA
(Darmstadt, Germany). Ketamine (Imalgene 1000®, 100 mg/ml) and xylazine (Vetaxilaze
20®, 20 mg/ml) were commercially acquired.
IV. 2.2.2. Animals
A total of 160 adult male CD-1 mice, with approximately 6-7 weeks old and
weighting 30-40 g, were obtained from local certified animal facilities (Faculty of Health
Sciences of the University of Beira Interior, Covilhã, Portugal) to be used in this study.
Mice were housed under controlled environmental conditions (12 h light/dark cycle, at
20±2°C and relative humidity 50±5%) with free access to tap water and standard rodent
diet (4RF21, Mucedola, Italy). All the experiments involving animals and their care were
conducted in conformity with the international regulations of the European Directive
(2010) regarding the protection of laboratory animals used for scientific purposes
(2010/63/EU) (EUROPEAN PARLIAMENT AND COUNCIL OF THE EUROPEAN UNION, 2010), and the
experimental procedures employed were reviewed by the Portuguese DGAV.

IV Intranasal Administration of Lamotrigine
216
IV. 2.2.3. Preparation of Lamotrigine Formulations
For IN administration, LTG was previously dissolved in 100 µL of propylene glycol
and further incorporated in 900 µL of a thermoreversible nasal gel so that the final drug
concentration in the formulation was 10 mg/mL. The thermoreversible gel was prepared
using the cold method described by Schmolka (1972). Briefly, 1.8 g of PF-127 was slowly
added to 10 mL of distilled cold water (5-10°C), under gentle magnetic stirring, to achieve
an efficient hydration of the flakes and then, the mixture was left at 4°C overnight to
attain a complete dissolution of the polymer (18% PF-127, w/v). Afterwards, according to
the technique employed by Badgujar and co-workers (2010), the mucoadhesive polymer
C-974P was gradually dispersed in the prepared PF-127 solution with continuous
agitation, until a final concentration of 0.2% w/v has been reached. At this point, a nasal
hydrogel formulation composed of 18% PF-127 and 0.2% C-974P was obtained, exhibiting
thermo-sensible properties. In fact, PF-127 is a triblock copolymer of poly(ethylene oxide)
and poly(propylene oxide) units that is fluid at or below room temperature, but turns to a
semisolid gel when the temperature increases, as a consequence of the micelle packing
disorder-order transition phenomenon (SWAMY and ABBAS, 2012). This thermo-sensible
behaviour makes the final formulation suitable for gelation within the nasal cavity,
providing a sustained residence of the drug at the absorption site.
For the IV administration, LTG parenteral formulation was prepared as a mixture
of propylene glycol-physiological saline solution (NaCl 0.9%)-ethanol (5:3:2, v/v/v) at a
final drug concentration of 1 mg/mL.
IV. 2.2.4. IN and IV Administrations
Before LTG dosing, mice were anaesthetised with an intraperitoneal injection of a
mixture of ketamine (100 mg/kg) and xylazine (10 mg/kg) and kept in a heated
environment to maintain the body temperature.
LTG was intranasally and intravenously administered at the dose of 4 mg/kg. For
IN administration, mice were placed on one side and 12 µL of the nasal gel per 30 g of
mice body weight were instilled using a polyurethane tube (24G x 19 mm) attached to a
microliter syringe. The tube was inserted about 10 mm deep into one of the nares,
enabling the delivery of the formulation towards the roof of the nasal cavity. IV
administration of LTG (4 mg/kg) was performed by means of a short and slow infusion of
the formulation for over 30 s into the lateral tail vein (120 µL per 30 g body weight) using
an appropriate syringe.

Experimental IV
217
IV. 2.2.5. Pharmacokinetic Study
Mice were randomly divided into two experimental groups of 52 animals each.
One of the groups received IN formulation whereas the other group was treated with the
IV dosage form. At predetermined time points (0.083, 0.167, 0.25, 0.5, 0.75, 1, 2, 4, 8, 12,
24, 36 and 48 h) after LTG dosing (4 animals per time point, n = 4), the mice were
sacrificed by cervical dislocation followed by decapitation and the blood was immediately
collected into heparinised tubes, while brain and liver tissues were quickly removed and
weighed. Blood samples were centrifuged at 4°C and 4000 rpm for 10 min to obtain
plasma supernatants that were stored at -30°C until analysis. Mice brain and liver tissues
were homogenised with 0.1 M sodium phosphate buffer pH 5.0 (4 mL per gram of tissue)
using a THOMAS® Teflon pestle tissue homogeniser. Tissue homogenates were
centrifuged at 4800 rpm for 15 min (4°C) and the resultant supernatants were also frozen
at -30°C until analysis.
IV. 2.2.6. Brain Biodistribution Study
Mice were divided at random into two experimental groups (28 animals each). The
animals were treated with LTG (4 mg/kg) by IN or IV routes. After administration, mice
were sacrificed at 0.083, 0.167, 0.25, 0.5, 1, 2 and 4 h post-dosing (n = 4). Blood samples
were taken and plasma was separated as previously described. Brains were removed and
carefully dissected with the help of a scalpel into three different regions: olfactory bulb,
frontal cortex and the remaining portion of the brain. The remaining portion of the brain
was homogenised and centrifuged in accordance to the procedure used for brain and
liver tissues, while olfactory bulb and frontal cortex specimens, regardless of the weight,
were homogenised with 0.5 mL of phosphate buffer using an ULTRA-TURRAX® device and
centrifuged at 4°C for 15 min at 13400 rpm. The resultant homogenate supernatants
were conveniently packaged and stored at -30°C until analysis.
IV. 2.2.7. Drug Analysis
The concentrations of LTG in plasma, brain and liver tissues were determined by
using a LLE procedure followed by a reversed-phase HPLC analysis as detailed in Chapter
II, section II. 3.3.
Aliquots of plasma (200 µL), brain (500 µL), olfactory bulb (500 µL), frontal cortex
(500 µL) and liver (250 µL) homogenate supernatants were all spiked with 10 µL of the
methanolic IS working solution (chloramphenicol, 400 µg/mL). With the exception of liver
samples, which were previously added of 250 µL of acetonitrile, vortexed (1 min) and

IV Intranasal Administration of Lamotrigine
218
centrifuged at 13400 rpm for 10 min in order to precipitate protein content, the
remaining specimens were immediately submitted to the LLE process. Therefore, 500 µL
of ethyl acetate (extraction solvent) were added to samples and liver protein precipitation
resulting supernatant, vortex-mixed for 1 min and then centrifuged during 5 min at 13400
rpm. The upper organic layer was transferred to a clean glass tube while the residual
aqueous phase was re-extracted once again, applying the same experimental proceeding.
The whole organic extracts obtained were evaporated to dryness under a gentle nitrogen
stream at 45°C, and the residues were further reconstituted with 100 µL of mobile phase.
At the end, all the reconstituted extracts were transferred to a 1.5 mL Eppendorf tube,
centrifuged (2 min, 13400 rpm) and a 20 µL aliquot of each resultant supernatant was
injected into the chromatographic system. Particularly for plasma, the final supernatants
were subjected to an additional 0.22 µm Spin-X filtration before injection.
The HPLC analysis was carried out on a Shimadzu liquid chromatographic system
equipped with a GDU-20A5 degasser, a SIL-20AHT autosampler, a CTO-10ASVP column oven
and a SPD-M20A diode array detector, all from Shimadzu Corporation (Kyoto, Japan).
Data acquisition and instrumentation control were achieved by means of LCsolution
software (Shimadzu Corporation, Kyoto, Japan). Chromatographic separation was
performed at 25°C on a reversed-phase LiChroCART® Purospher Star® C18 column (55 mm x
4 mm, 3 µm; Merck KGaD), using an isocratic elution with a mobile phase consisting of
0.05 M potassium dihydrogen phosphate solution-methanol-acetonitrile-TEA
(79.7:10:10:0.3, v/v/v/v) pumped at a flow rate of 1 mL/min. LTG and IS were detected at
the wavelength of 306 nm and the total running time was set at 12 min. The main partial
validation parameters of the analytical method employed were in agreement with the
international guidelines (EUROPEAN MEDICINES AGENCY, 2011; US FOOD AND DRUG
ADMINISTRATION, 2001) and are summarised in Table IV.2.1.
Table IV.2.1 Validation parameters of the HPLC method employed for the quantification of
lamotrigine (LTG) in plasma, brain, liver, olfactory bulb and frontal cortex homogenate
supernatants (n = 3).
Validation Parameters Plasma Brain Liver Olfactory
Bulb Frontal Cortex
Calibration Range (µg/mL) 0.20 - 30 0.05 - 15 0.20 - 20 0.025 - 7.5b
0.025 - 7.5b
Coefficient of Determination (r2) 0.997 0.992 0.989 0.993 0.992
LLOQ (µg/mL) 0.20 0.05 0.20 0.025b
0.025b
Precision (% CV)a ≤ 7.0 ≤ 4.8 ≤ 6.8 ≤ 12.4 ≤ 4.8
Accuracy (% Bias)a -6.8 - 9.1 -3.4 - 5.4 -9.7 - 11.6 -3.5 - 7.2 -3.4 - 5.4
Absolute recovery (%) 83.6 - 88.0 73.5 - 87.2 82.5 - 100.8 - - a Inter-day values, n = 3.
b Values expressed in µg. Bias, deviation from nominal value; CV, coefficient of variation; LLOQ,
lower limit of quantification.

Experimental IV
219
IV. 2.2.8. Pharmacokinetic Analysis
The maximum concentration (Cmax) of LTG in plasma and tissues and the
corresponding time to reach Cmax (tmax) were directly derived from the experimental data
obtained. The remaining pharmacokinetic parameters were estimated based on the mean
concentration values (n = 4) determined at each time point by non-compartmental
pharmacokinetic analysis employing the WinNonlin® version 5.2 (Pharsight Co, Mountain
View, CA, USA). The pharmacokinetic parameters evaluated were the area under the drug
concentration time-curve (AUC) from time zero to the time of the last quantifiable drug
concentration (AUCt) which was calculated by the linear trapezoidal rule; the AUC from
time zero to infinity (AUCinf) that was calculated from AUCt + (Clast/kel), where Clast is the
last quantifiable concentration and kel (or k) is the apparent (or tissue) elimination rate
constant estimated by log-linear regression of the terminal segment of the concentration-
time profile; the percentage of AUC extrapolated from tlast to infinity [AUCextrap(%)], where
tlast is the time of the Clast; the apparent terminal (or tissue) elimination half-life (t1/2el or
t1/2), and the mean residence time (MRT).
The absolute bioavailability [F (%)] of LTG after IN administration was calculated as
follows (Eq. 1):
(Eq. 1)
where AUCinf IN and AUCinf IV are the areas under the drug concentration-time curves from
time zero to infinity following IN and IV administration, respectively; Dose IV and DoseIN are
the values of the LTG dosage (mg/kg) given by IV and IN route to mice.
In order to assess the overall tendency of the nasally administered LTG to achieve
the brain, the DTE index was calculated (KOZLOVSKAYA et al., 2014). DTE index represents
the brain-to-plasma partitioning ratio of the drug administered by IN route compared to
that after IV injection and can be calculated according to the following equation (Eq. 2):
(Eq. 2)
where AUCbrain and AUCplasma are the areas under the drug concentration-time curves for
brain and plasma after both IN and IV administration to mice. It is assured that
preferential transport of the drug to the brain occurs when DTE index is greater than 1
(WANG et al., 2003).
With the aim of evaluating the biodistribution of LTG to specific brain regions
(olfactory bulb, frontal cortex and the remaining portion of the brain) after IN and IV

IV Intranasal Administration of Lamotrigine
220
administrations, the drug concentrations in each specimen were determined at
predefined time points (n = 4). The corresponding tissue-to-plasma and tissue-to-
remaining portion of the brain concentration ratios of LTG were calculated and
compared.
IV. 2.2.9. Statistical Analysis
The data were expressed as mean ± standard error of the mean (SEM). Statistical
comparisons were performed between IN and IV administration groups using unpaired
two-tailed Student’s t-test. Differences were considered statistically significant for a p-
value lower than 0.05 (p < 0.05).
IV. 2.3. RESULTS
IV. 2.3.1. Pharmacokinetics of Lamotrigine after IN and IV Administration
The mean concentration-time profiles of LTG obtained in plasma, brain and liver
tissues of mice after a single dose administration of the drug (4 mg/kg) as nasal gel or IV
solution are depicted in Figure IV.2.1. The corresponding main pharmacokinetic
parameters estimated by non-compartmental analysis are summarised in Table IV.2.2.
Considering the pharmacokinetic profiles of LTG in the three biological matrices analysed,
a clear delay is observed between the tmax following IN versus IV administration.
Accordingly, despite the similarity in terms of magnitude, the mean Cmax of LTG in plasma
was attained significantly later after IN delivery comparatively to IV injection (0.75 h
versus 0.083 h), indicating the occurrence of an extensive and sustained absorption of the
drug from the nasal cavity. An even more remarkable delay was determined in liver (tmax
after IV and IN administrations was 0.167 h and 8 h, respectively) even though the extent
of hepatic exposure to LTG had been equivalent after IN or IV administration (as assessed
by AUCt and AUCinf). Importantly, the extent of systemic and brain exposures to the drug
was slightly greater after IN delivery (as assessed by AUCinf) and the absolute
bioavailability estimated for LTG delivered via the IN route was found to be very high
(116.5%), suggesting a complete absorption of the drug.
The mean Cmax of LTG achieved in the brain after IN instillation was significantly
lower (p < 0.001) in comparison to IV injection; however, regarding the total brain
exposure to the drug assessed by the AUCinf parameter, it should be noted that a higher
value was assigned to the IN route. Particularly interesting were the differences detected
between the values estimated for the pharmacokinetic parameters of elimination. In fact,

Experimental IV
221
contrasting with the other two matrices, the brain was the only one whose t1/2 and MRT
were higher following IN delivery than after IV injection (Table IV.2.2).
As shown in Table IV.2.2, the DTE index calculated for the intranasally
administered LTG amounted to 0.96 which does not provide any discriminative
information of the potential for direct nose-to-brain transport of the drug via the IN
route. Hence, the estimated DTE value appears to suggest that the uptake of LTG into the
CNS through the nasal cavity is predominantly accomplished by crossing the BBB after an
extensive nasal absorption of the drug to the bloodstream. Taking solely these
pharmacokinetic data into account, the impact of the direct nose-to-brain delivery of LTG
after IN instillation is not evident, which may probably be related to the fact that only the
analysis of whole brain homogenate concentrations has been considered.
Table IV.2.2 Pharmacokinetic parameters and tissues-to-plasma partitioning ratios of lamotrigine
(LTG) following its intranasal (IN) and intravenous (IV) administration (4 mg/kg) to mice.
Pharmacokinetic Parametersa
Plasma Brain Liver
IN IV IN IV IN IV
tmax (h) 0.750 0.083c 2.000 0.500 8.000 0.167
Cmax (µg/mL) 2.903 3.019d 1.290
e 1.756
e 2.145
e 3.137
e
AUCt (µg.h/mL) 52.633 44.794 25.410f 25.411
f 54.798
f 54.808
f
AUCinf (µg.h/mL) 54.835 47.053 30.149f 26.881
f 63.308
f 63.845
f
AUCextrap (%) 4.02 4.80 15.7 5.47 13.4 14.2
kel (h-1) 0.077 0.059 - - - -
k (h-1) - - 0.051 0.068 0.047 0.044
t1/2el (h) 9.0 11.8 - - - -
t1/2 (h) - - 13.6 10.2 14.7 15.7
MRT (h) 17.7 17.1 20.1 14.5 23.6 23.4
F (%)b 116.5 - - - - -
AUCinf Ratios IN IV IN/IV
AUCbrain/AUCplasma 0.55 0.57 0.96g
AUCliver/AUCplasma 1.15 1.36 0.85 a
Parameters were estimated using the mean concentration-time profiles obtained from four different animals per
time point (n = 4). b Absolute intranasal bioavailability (F) was calculated based on AUC inf values.
C tmax in plasma
after IV administration corresponds to the first sampling time point. d Cmax in plasma after IV administration is
equivalent to the maximum concentration value determined at the first sampling time point (0.083 h). e Values
expressed in µg/g. f Values expressed in µg.h/g.
g Drug targeting efficiency index. AUCextrap, extrapolated area under
the drug concentration time-curve; AUCinf, area under the concentration time-curve from time zero to infinity; AUCt,
area under the concentration time-curve from time zero to the last quantifiable drug concentration; Cmax, maximum
peak concentration; k, tissue elimination rate constant; kel, apparent elimination rate constant; MRT, mean
residence time; t1/2, tissue elimination half-life; t1/2el, apparent terminal elimination half-life; tmax, time to achieve
the maximum peak concentration.
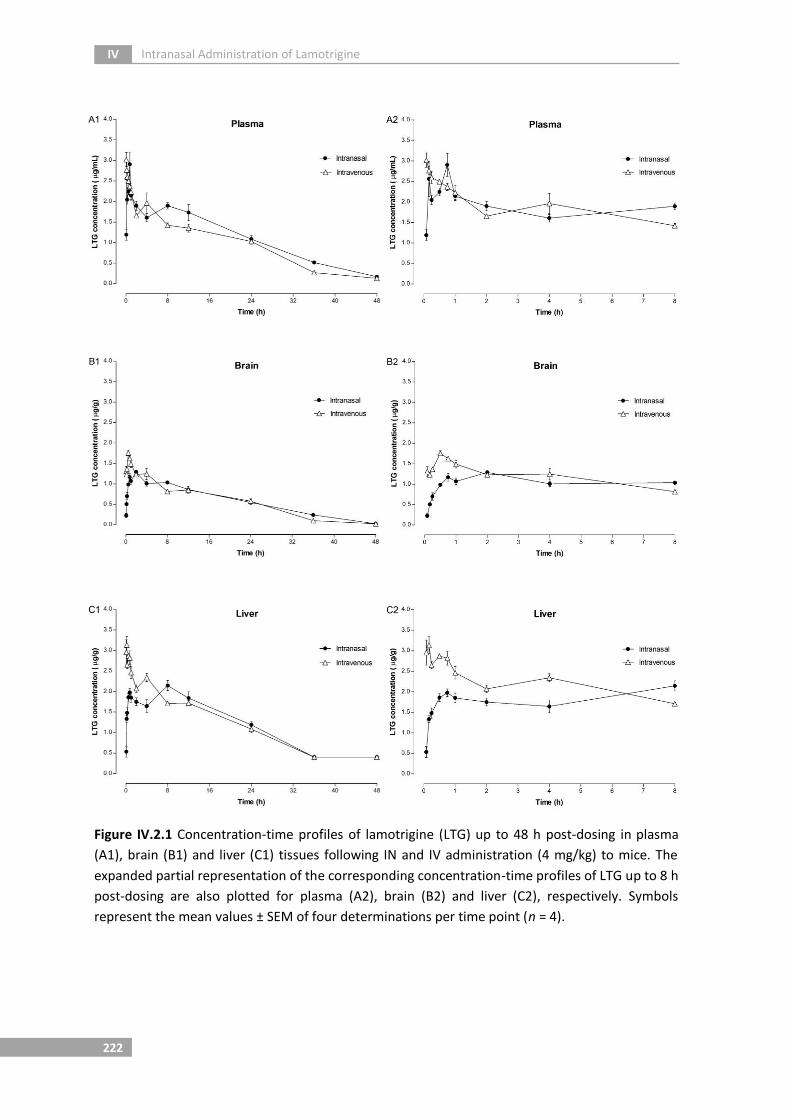
IV Intranasal Administration of Lamotrigine
222
Figure IV.2.1 Concentration-time profiles of lamotrigine (LTG) up to 48 h post-dosing in plasma
(A1), brain (B1) and liver (C1) tissues following IN and IV administration (4 mg/kg) to mice. The
expanded partial representation of the corresponding concentration-time profiles of LTG up to 8 h
post-dosing are also plotted for plasma (A2), brain (B2) and liver (C2), respectively. Symbols
represent the mean values ± SEM of four determinations per time point (n = 4).

Experimental IV
223
IV. 2.3.2. Brain Biodistribution of Lamotrigine after IN and IV Administration
In order to investigate the potential involvement of a direct nose-to-brain
transport pathway for LTG, more specific and informative data on the rostral-caudal brain
biodistribution pattern of the drug following its IN and IV administrations (4 mg/kg) were
evaluated in mice. Clearly, the mean LTG concentrations in plasma and two particular
brain regions, namely the olfactory bulb and frontal cortex, along with the remaining
portion of the brain were analysed at predefined time points up to 4 h post-dosing. The
results are illustrated in Figure IV.2.2 as well as the statistical significant differences
between both delivery routes (IN versus IV). In general, it becomes clear from Figure
IV.2.2 that the concentrations of LTG achieved in brain specimens after each
administration route are significantly different while those obtained in plasma are very
similar.
Particularly regarding the IV administration of LTG, even though higher drug
concentrations were achieved in the olfactory bulb comparatively to the frontal cortex
and the remaining portion of the brain, all the cerebral specimens evidenced similar drug
contents over time, suggesting a homogeneous pattern of brain biodistribution.
Conversely, a very heterogeneous and variable drug distribution in the brain was clearly
observed for LTG following its administration by the IN route (Figure IV.2.2). Indeed, after
IN instillation, higher LTG concentrations were always found in the olfactory bulb
relatively to frontal cortex or remaining portion of the brain. Specifically at 0.083 h post-
dosing, a mean concentration value of about 25-fold and 67-fold greater was determined
in the olfactory bulb (6.70 µg/g) in comparison to the frontal cortex (0.27 µg/g) and the
remaining portion of the brain (0.1 µg/g), showing a markedly uneven distribution of the
drug from rostral to more caudal cerebral areas (Figure IV.2.2). Interestingly, by analysing
the temporal evolution of LTG biodistribution following IN delivery it is possible to notice
a decrease of the mean drug concentrations in both plasma and olfactory bulb while a
progressive and gradual augment was observed in the frontal cortex and the remaining
portion of the brain from 0.083 h onwards.

IV Intranasal Administration of Lamotrigine
224
Figure IV.2.2 Lamotrigine (LTG) concentrations (mean ± SEM) up to 4 h post-dosing in plasma and
different brain regions (olfactory bulb, frontal cortex and the remaining portion of the brain) after
IN and IV administration (4 mg/kg) to mice (n = 4, at each time point). Statistical significant
differences between both delivery routes (IN vs IV) are marked with (*) for p < 0.05, (#) for p <
0.01 and (§) for p < 0.001.
The tissue-to-plasma and tissue-to-remaining portion of the brain concentration
ratios were calculated for the olfactory bulb and frontal cortex specimens following both
routes of administration. As depicted in Table IV.2.3, the concentration ratios of
intravenously administered LTG were roughly comparable at all sampling time points,
whereas following IN instillation, some discrepant values were ascertained mainly up to
0.167 h post-dosing. Statistically significant differences were found between IN and IV
delivery routes for the olfactory bulb-remaining portion of the brain concentration ratios
calculated at 0.083 h (p < 0.01) and 0.167 h (p < 0.05), supporting that a direct transfer of
LTG from nose to brain may be involved. Hence, taking into consideration the information
derived from Figure IV.2.3, it is evident that, particularly at the first sampling time point
(0.083 h), the ratio between LTG concentrations achieved in the olfactory bulb and the
remaining portion of the brain is about 32-fold higher after IN administration than IV
injection. Accordingly, it can be inferred that a direct nose-to-brain transport of LTG
occurs probably via the olfactory pathway.

Experimental IV
225
Table IV.2.3 Tissue-to-plasma and tissue-to-remaining portion of the brain concentration ratios of
lamotrigine (LTG) in different brain regions following intranasal (IN) and intravenous (IV)
administration to mice (4 mg/kg).
Route Post-dosing Time (h)
LTG Concentration Ratios
B/P FC/P OB/P FC/B OB/B
IN
0.083 0.07 ± 0.03§ 0.20 ± 0.09 3.62 ± 1.40 2.65 ± 0.46
# 67.04 ± 16.25
#
0.167 0.08 ± 0.02§ 0.08 ± 0.03
# 1.90 ± 1.15 1.01 ± 0.06 19.39 ± 5.79*
0.25 0.26 ± 0.03§ 0.24 ± 0.03
# 0.80 ± 0.07* 0.92 ± 0.07 3.20 ± 0.55
0.5 0.35 ± 0.04# 0.28 ± 0.02
# 1.81 ± 0.65 0.83 ± 0.08 4.87 ± 1.40
1 0.44 ± 0.05# 0.35 ± 0.01
# 2.09 ± 0.49 0.81 ± 0.05 5.08 ± 1.53
2 0.64 ± 0.03 0.50 ± 0.02* 1.23 ± 0.11 0.79 ± 0.07 1.93 ± 0.19
4 0.72 ± 0.04* 0.64 ± 0.06# 1.14 ± 0.19 0.89 ± 0.05* 1.56 ± 0.19
IV
0.083 0.35 ± 0.01 0.29 ± 0.02 0.73 ± 0.04 0.82 ± 0.06 2.09 ± 0.14
0.167 0.46 ± 0.04 0.35 ± 0.04 0.84 ± 0.07 0.77 ± 0.08 1.82 ± 0.13
0.25 0.52 ± 0.01 0.40 ± 0.01 1.00 ± 0.010 0.77 ± 0.04 1.93 ± 0.05
0.5 0.54 ± 0.02 0.44 ± 0.03 1.03 ± 0.06 0.82 ± 0.04 1.92 ± 0.09
1 0.66 ± 0.03 0.51 ± 0.03 1.16 ± 0.07 0.78 ± 0.06 1.78 ± 0.15
2 0.65 ± 0.04 0.44 ± 0.01 1.05 ± 0.05 0.68 ± 0.05 1.64 ± 0.16
4 0.59 ± 0.02 0.40 ± 0.01 0.86 ± 0.02 0.69 ± 0.02 1.47 ± 0.03
Data are expressed as the mean values ± SEM of four animal determinations (n = 4). Statistically significant differences
between both routes of administration (IN versus IV) are marked with (*) for p < 0.05, (#) for p < 0.01 and (§) for p <
0.001. B/P, remaining portion of the brain-to-plasma ratio; FC/B, frontal cortex-to-remaining portion of the brain ratio;
FC/P, frontal cortex-to-plasma ratio; OB/B, olfactory bulb-to-remaining portion of the brain ratio; OB/P, olfactory bulb-
to-plasma ratio.
Figure IV.2.3 Relationship between tissue-to-plasma and tissue-to-remaining portion of the brain
concentration ratios obtained for lamotrigine (LTG) at 0.083 h and 0.167 h following its intranasal
(IN) and intravenous (IV) administration (4 mg/kg) to mice. B/P, remaining portion of the brain-to-
plasma ratio; FC/B, frontal cortex-to-remaining portion of the brain; FC/P, frontal cortex-to-
plasma ratio; OB/B, olfactory bulb-to-remaining portion of the brain ratio; OB/P, olfactory bulb-
to-plasma ratio.

IV Intranasal Administration of Lamotrigine
226
IV. 2.4. DISCUSSION
The past two decades have witnessed the global licensing of several new AEDs
with different pharmacological properties and mechanisms of action. Despite the
encouraging and welcome advantages that these modern therapies have brought in
terms of tolerability and safety, it is however generally recognised that, concerning
therapeutic efficacy, no substantial improvement has effectively been introduced
(POTSCHKA and BRODIE, 2012). As a result, more than 30% of the epileptic patients continue
to experience uncontrolled seizures, and pharmacoresistant epilepsy is nowadays
considered a medical problem that urgently demands the development of more effective
therapeutic approaches (WEAVER and POHLMANN-EDEN, 2013; WEAVER, 2013). In this regard,
the present study was designed with the intent of assessing the potential of LTG to be
intranasally administered and investigating whether or not the drug was transferred
along the olfactory neuronal pathway directly into the brain.
The pharmacokinetic profiles of LTG herein characterised following both routes of
administration revealed that IN delivery provided an extensive but longstanding
absorption of the drug, reaching equivalent plasma Cmax values although later than IV
administration. The high LTG systemic exposure (AUCinf = 54.835 µg.h/mL) and the
existence of a clear delay between tmax in plasma and brain seems to indicate that,
likewise to what happens after IV administration, IN instillation enables the delivery of
drug to the brain predominantly through the vascular system (Figure IV.2.4). The absolute
bioavailability value achieved for intranasally administered LTG greater than 100% (F =
116.5%) is presumably related to the inter-individual variability among distinct
experimental animals since each mouse was assigned not only for one of the two
administration groups (IN or IV) but also to a unique sampling time point; though, it
underscores the fact that, a substantial fraction of the drug has effectively been absorbed
from the nasal cavity into the systemic circulation and gained access to the CNS by
crossing the BBB. These findings are in agreement with our previous study conducted
with CBZ, an AED that similarly to LTG, is characterised by a low molecular weight and
high lipophilicity (SERRALHEIRO et al., 2014). Indeed, the DTE index values calculated for
both CBZ (0.98) (SERRALHEIRO et al., 2014) and LTG (0.96) were almost equal to the unity,
suggesting no relevant contribution of the IN route to direct brain delivery of these drugs
from the nasal cavity. However, the investigations performed with CBZ (SERRALHEIRO et al.,
2014) revealed that the analysis of total brain concentrations by treating the organ as a
whole may dissipate the contribution of direct neuronal pathways to transport the drug
from nose to brain, and therefore, drug distribution levels in specific cerebral areas
should be measured in order to afford a more rigorous evaluation of the routes by which
molecules have travelled.

Experimental IV
227
Figure IV.2.4 Concentration-time profiles of lamotrigine (LTG) in plasma and brain following IN
and IV administration (4 mg/kg) to mice: (A) from time zero to 48 h post-dosing; (B) from time
zero to 8 h post-dosing. Symbols represent the mean values ± SEM of four determinations per
time point (n = 4).
Regarding the pharmacokinetic parameters of elimination, it deserves to be
mentioned that the brain was the single matrix in which the values estimated for t1/2 and
MRT were higher following IN delivery than IV injection. In fact, after IN instillation a
greater retention of LTG was accomplished in the brain, allowing the maintenance of
relevant levels of the drug for a longer period of time. Taking into account that tmax was
only achieved in the brain at 2 h post-IN dosing and that the respective rate of drug
elimination (assessed as k) is lower compared to the IV route, it appears that IN delivery
may establish itself as a valid approach for the chronic administration of LTG, more so
than for acute convulsive emergencies.

IV Intranasal Administration of Lamotrigine
228
With the purpose of evaluating whether a direct transport of LTG was occurring
from nose to the brain, drug concentration levels were determined in different cerebral
regions and the corresponding rostral-to-caudal biodistribution patterns were typified
following both routes of administration. According to the results herein found, after IV
injection, LTG was homogeneously distributed throughout the various parts of the brain,
in consonance with the pharmacokinetic data obtained for LTG intraperitoneally
administrated to rats (CASTEL-BRANCO, 2002; WALKER et al., 2000). Despite the CNS uptake
of LTG delivered by the IV route has remained constant over time and differed little
among distinct brain regions, a particular intriguing accumulation of the drug was,
howbeit, ascertained in the olfactory bulb (Figure IV.2.2). Curiously, a preferential
retention of some other therapeutic compounds, such as testosterone (BANKS et al., 2009)
and picolinic acid (BERGSTRÖM et al., 2002), has also been reported in the olfactory bulb
even when systemically administered, a phenomenon that is possibly related to regional
differences in receptor binding or efflux transporters expression.
Indeed, the LTG concentration levels attained in the olfactory bulb relatively to
other parts of the brain after IV administration were remarkably lower than those found
after IN administration (Figures IV.2.2 and IV.2.3), clearly suggesting the occurrence of a
direct nose-to-brain transfer of the drug by means of the olfactory neuroepithelium.
Effectively, the quick and striking appearance of LTG in the olfactory bulb immediately at
0.083-0.167 h post-IN dosing, with maximum concentration values of about 3-fold higher
than those achieved after IV injection seem to support the existence of a pathway that
enables the delivery of the drug to the brain from the olfactory nasal mucosa.
Furthermore, specifically at 0.083 h post-dosing, the calculated LTG concentration ratios
between the olfactory bulb and the remaining portion of the brain have shown a
significant discrepancy among IN and IV routes of administration (67.04 ± 16.25 vs 2.09 ±
0.14, respectively), thereby strengthening the potential of the IN delivery to improve LTG
CNS targeting.
Gathering the overall generated results, it can be assured that due to the high
plasma drug concentrations on one hand, and the superior drug distribution to the
olfactory bulb on the other hand, intranasally administered LTG reached the CNS through
a combination of both systemic and olfactory pathways. Although it is not possible to
accurately quantify the contribution of each pathway, we presume that a small fraction of
the drug is in fact delivered to the brain via the olfactory route, whereas the most
representative amount is most likely to be attributable to the systemic circulation.
Following IN delivery of LTG, the high plasma bioavailability value achieved and the
sustainment of relevant drug concentration levels in the brain for an extended period of
time seem to indicate an advantageous application of this alternative route in chronic

Experimental IV
229
treatment of epilepsy. In addition, strong evidence accounting for a direct transport of
LTG from nose to brain, by circumventing the BBB, may likewise render the IN route as a
promising and valuable drug delivery strategy for a prospective management of
pharmacoresistance.

IV Intranasal Administration of Lamotrigine
230

CHAPTER V
GENERAL DISCUSSION


General Discussion V
233
Currently, millions of people worldwide are affected by serious and debilitating
brain disorders, foreseeing that the discovery and development of novel CNS-acting drugs
will continue at a significant pace. Despite the advent of numerous new AEDs and the
more widespread use of non-pharmacological options like for example surgery, a
considerable percentage of epileptic patients continue to manifest seizures, thus
providing the impetus for the development of innovative and more efficient therapeutic
approaches. In fact, bearing in mind that about 30% of the patients are medically
refractory to a wide range of AEDs with different mechanisms of action, it may be
profitable to consider other avenues beyond the drug pharmacodynamics to improve
seizure control and tolerability. Therefore, it is imperative that novel therapeutic
regimens are able to attain relevant pharmacological targets within the CNS, whereby
more effective drug delivery strategies towards the epileptogenic brain tissue may
enhance efficacy and minimise toxicity of AEDs. The exploitation of the IN route as a
means of preferentially delivering therapeutic agents to the brain has steadily been
gaining momentum, notwithstanding, the mechanisms governing this uptake are not
completely elucidated yet. The work underlying this dissertation intended to assess the
feasibility of using the IN delivery as a promising alternative route for the administration
of CBZ, PHT, OXC, and LTG in mice and to investigate whether a direct transport of the
referred compounds from nose to brain is effectively involved.
In this section, a more integrative discussion of the various topics dealt within the
previous chapters will be addressed. A critical overview of the key subjects covering the
overall research work carried out to achieve the main objectives initially proposed at the
beginning of this thesis will be herein thoroughly provided. Thus, relevant considerations
about the HPLC-UV methods developed and validated to support the quantitative analysis
of the samples derived from the pharmacokinetic studies performed will be firstly given.
The paramount experimental issues concerning the optimisation of the study design will
be also discussed. Final remarks are reserved for the examination of the results obtained
from the pharmacokinetic and brain biodistribution studies conducted with IN
administration of both CBZ and LTG to mice.
Quantitative Drug Analysis
This project started with the development and validation of appropriate and
reliable bioanalytical techniques to support the execution of the intended
pharmacokinetic and brain biodistribution studies, ensuring an accurate, precise and
sensitive quantification of CBZ, PHT, OXC, LTG and their respective main metabolites in
different biological samples of mice. Among the analytical methodologies most commonly

V General Discussion
234
employed in the quantitative assessment of IN drug delivery, HPLC remains the method of
choice since it enables the separation and quantification of quite complicated mixtures of
several compounds within the same sample, and it is also able to determine very small
amounts of the analytes that are frequently attained during the pharmacokinetic studies
performed in animals. Hence, more extensive and comprehensive descriptions of the
pharmacokinetic profiles obtained for drugs intranasally administered can be achieved,
easily discriminating the presence of the parent drug from its correspondent metabolites
formed in vivo.
The beginning of this work was settled by the development and fully validation of
an HPLC-UV method for the simultaneous quantitative determination of PRM, PB, CBZ,
PHT, OXC, LTG and three of their main metabolites, CBZ-E, trans-diol and Lic in human
plasma. In point of fact, it is commonly argued that TDM is of particular value for the
pharmacological treatment optimisation of patients with epilepsy since the majority of
AEDs exhibit narrow therapeutic ranges, pronounced inter- and intra-individual
pharmacokinetic variability and high propensity to establish drug-drug interactions
(JOHANNESSEN and LANDMARK, 2008; NEELS et al., 2004; PATSALOS et al., 2008). Assuming that
drug concentration correlates better with therapeutic and/or toxic effects than the dose,
patients’ clinical outcome can be considerably improved by managing their medication
regimen with the assistance of measured drug concentrations in plasma (JOHANNESSEN et
al., 2003; PATSALOS et al., 2008). Being simple, rapid, sensitive, accurate and reliable, this
HPLC technique demonstrated suitability to be easily adopted by hospitals in order to
support routine TDM of patients treated with such AEDs either in mono-, transitional or
polytherapy regimens, also contributing as a useful tool to be applied in pharmacokinetic-
based studies involving these drugs. The use of an UV detection coupled with an isocratic
elution and a mobile phase essentially composed of water allowed to accomplish a
chromatographic separation of all the nine compounds in less than 16 min. Moreover, the
combination of PP with SPE resulted in a fast and reproducible sample preparation,
affording high values of recovery.
Apart from the undeniable applicability of this analytical assay in clinical TDM, the
major intent of developing a methodology that enabled the simultaneous quantification
of the referred AEDs in human plasma was to test and optimise the best analytical
conditions that could be subsequently transposed into the analysis of animal matrices. As
mentioned in Chapter II (sections II. 1.1 and II. 3.1.), due to its relative complexity, high
availability and easy access, the use of human plasma as a surrogate matrix enables to
expedite the process of method development, also minimising the number of animals
that would be necessarily sacrificed to obtain blank matrices.

General Discussion V
235
Therefore, based on the background knowledge acquired during the course of
optimising the first analytical technique, the development and validation of a new HPLC-
UV method for the simultaneous quantification of PHT, CBZ, OXC, LTG and some of their
main metabolites (CBZ-E and Lic) in mouse plasma, brain and liver homogenates was
initially attempted. In fact, rodents are the most widely used laboratory animals for IN
drug delivery experiments (KOZLOVSKAYA et al., 2014). Mice were herein preferred since, in
addition to be more convenient and ethically more appropriate for the purposes of the
current work (complete pharmacokinetic characterisation in plasma, brain and liver which
implies the sacrifice of the animals at each time point), they are commonly accessible,
less expensive, readily available and very easy to handle. Furthermore, the assessment of
drug concentrations in plasma, brain and liver tissues was chosen once these are
considered to be the matrices with the utmost relevance under the pharmacokinetic
point of view. The brain has a particular importance by corresponding on one hand to the
biophase and, on the other, to the hypothetical first portal of entry for drugs
administered via the IN route. In line with this, it was further recognised that the
measurement of drug concentrations in the anterior parts of the brain, such as olfactory
bulb and frontal cortex was pivotal to infer about the existence of a pathway to transport
drugs from the nasal cavity directly to the CNS.
Unfortunately, in spite of all the efforts carried out aiming the implementation of
a unique and reliable HPLC assay that would enable the simultaneous quantification of
the four AEDs and their respective metabolites in mouse matrices, this was not possible.
Indeed, the basic criteria internationally recommended for the preliminary validation
parameters evaluated were not entirely fulfilled, indicating that this method by not
guaranteeing the generation of accurate, precise and reproducible data did not gather
the appropriate performance characteristics to assure a valid interpretation of the
obtained analytical results. Facing such limitation and due to the need to comply with the
initially scheduled project tasks, it was decided to take advantage of techniques already
developed and fully validated in our laboratory by introducing the alterations required to
make them adequate for the purposes of the current work. Thereby, two distinct
methodologies were then successfully adjusted and partially validated in mouse plasma,
brain (whole brain, olfactory bulb and frontal cortex) and liver, constituting the basilar
bioanalytical tools to support the overall in vivo studies planned. One allowed the
quantification of CBZ, CBZ-E, OXC, Lic and PHT (Chapter II, section II. 3.2.), while the other
enabled the determination of LTG (Chapter II, section II. 3.3.). In essence, both techniques
display various favourable attributes, particularly the use of an aqueous mobile phase
pumped isocratically, an UV detection and a highly reproducible sample preparation
procedure (SPE or LLE) that provide a fast, sensitive and inexpensive analysis of the large
number of samples derived from the pharmacokinetic experiments performed. According

V General Discussion
236
to partial validation assessments, analytical results were proven to be confidently
accomplished, demonstrating accuracy, precision and reliability.
Study Design
Prior to initiating in vivo studies, several preliminary experiments were conducted
in order to test and define the optimum experimental conditions to be applied
throughout this investigation.
First of all and taking into account the objectives of our work, the most
appropriate experimental animal model had to be selected. As with any biomedical
research area, many of the studies performed to date on IN delivery of drugs have been
undertaken in rodents, being the rat and mouse the most frequently used species
(GIZURARSON, 1990; GRAFF and POLLACK, 2005; ILLUM, 1996; KOZLOVSKAYA et al., 2014). The
mouse was herein chosen because, as mentioned above, it seemed to be the most
adequate for the purpose of the current research. In addition to be cheap, promptly
accessible, easy to maintain and handle, mice are normally characterised by a quick
breeding and growth, also requiring only few amounts of drug to be administered.
Beyond that, it seems that the mouse, comparatively to rat, is the species more related to
humans regarding the metabolism of both CBZ and OXC (HAINZL et al., 2001; MYLLYNEN et
al., 1998). Therefore, adult male CD-1 mice with approximately 6-7 weeks old and
weighting between 30-40 g were used, ensuring that all the animals’ biological systems
were completely matured and that possible pharmacokinetic interferences from the
female hormonal cycle were avoided.
The search for the most suitable drug formulation, the ideal delivery volume and
the most favourable IN administration technique proved to be the critical stage of the
overall definition of the in vivo experimental setup. Indeed, the mouse nasal cavity
presents several intrinsic anatomical and physiological features that impose multiple
practical obstacles for an efficient and reproducible IN drug delivery. Since the mouse
nasal cavity constitutes a very small drug administration site (approximately 0.03 mL
average volume) (GIZURARSON, 1990; GROSS et al., 1982), the total amount of drug which
can be delivered by the nasal route is extremely limited. As a result, only a small volume
of a nasal dosage form can be administered without compromising the respiratory
function of mouse, an obligate nose-breather, and the magnitude of the dose is largely
affected by the physicochemical properties of the drugs. Hence, a delivery volume of 12
µL per 30 g of mouse body weight was established once it appeared to cover a
considerable extent of the nasal mucosa surface without evident signs of either anterior
leakage or animal respiratory distress. In opposition to the majority of the IN drug

General Discussion V
237
delivery studies reported in literature wherein fixed volumes of nasal formulation were
usually administered (DAHLIN et al., 2000; FLORENCE et al., 2011; JAIN et al., 2010; PATHAN et
al., 2009; VYAS et al., 2006A; WESTIN et al., 2006), it was decided to standardise the
experimental outcome as much as possible by settling down the delivery volume on the
basis of each animal body weight, thus minimising a factor that would easily contribute to
increase inter-individual variability. Bearing in mind that the reduced volume of IN
administration has invariably a significant impact on the dose that can be instilled, higher
doses demand the preparation of highly concentrated drug formulations. On top of that,
the low aqueous solubility inherent to a great number of therapeutic compounds has
generally been pointed out as the main limiting issue (BAHADUR and PATHAK, 2012; BEHL et
al., 1998; COSTANTINO et al., 2007). Being the AEDs under evaluation (CBZ, OXC, LTG and
PHT) highly lipophilic molecules, remarkable difficulties were encountered concerning the
incorporation of a sufficient amount of drugs into the desired nasal formulation. Even if in
the initial phases of the work higher doses were expected to be attained, the poor
solubility in water and/or ethanol of the referred test compounds stood up as the major
technological limitation, determining an administration of much lower values than those
expected. Thus, the doses had to be selected essentially based upon drug solubility,
corresponding to the maximum quantity of drug that was possible to be incorporated into
the nasal dosage form. Just as important as achieving therapeutic concentrations at the
biophase is guaranteeing that quantifiable levels of the drug are reached in all the key
biological samples analysed. While CBZ and LTG fulfilled this latter assumption, in the case
of OXC and PHT such requirement was not afforded (Appendix B.).
With the intent of assuring an accurate, precise and reproducible IN dosing, a
concerted relationship between the type of the pharmaceutical formulation used as a
delivery vehicle and the methodology employed for the IN drug administration was
herein successfully found. Aware of the notable influence that MCC mechanism has on
the bioavailability of intranasally administered compounds (MARTTIN et al., 1998; SCHIPPER
et al., 1991), the choice of an appropriate nasal formulation that could avoid the rapid
post-nasal drainage and promote the increase of drug residence time within the nasal
cavity was one of our foremost concerns. Accordingly, in order to prevent a quick
elimination of the drug from the nasal absorption site and to simultaneously keep a
practical administration dosage form, a thermoreversible mucoadhesive gel composed of
18% PF-127 and 0.2% C-974P (w/v) was selected to incorporate and deliver the four AEDs
by the IN route. Being a low viscosity solution at room temperature, this in situ nasal gel
was easily and accurately instilled as liquid drops into the nose where it has readily
undergone a phase transition to form a semi-solid gel, as a consequence of the increase in
temperature up to physiological levels (BADGUJAR et al., 2010; SINGH et al., 2013). Among
several advantages, this delivery system has demonstrated to minimise the anterior

V General Discussion
238
leakage and post-nasal drip and offer a favourable compromise between in situ gelling
and ease of syringeability, undeniably contributing not only for an improved precision and
accuracy of dosing but also to sustain the drug formulation within the nasal cavity for a
prolonged period of time. After evaluating the performance of distinct IN drug
administration techniques, the procedure of inserting a flexible polyurethane tube
attached to a microliter syringe inside the nasal cavity of previously anaesthetised mice
was adopted. Without causing visible signs of damage to the nasal mucosa, this technique
likewise allowed a more accurate and reproducible dosing by avoiding the anterior loss of
the administered formulation and providing a more efficient and localised deposition of
the drugs onto the desired olfactory area.
Upon the definition and optimisation of the experimental conditions, two different
in vivo protocols were designed in accordance with the main objectives outlined for this
thesis. Specifically, our work was divided into two research studies aiming to assess if CBZ
and LTG were promising drug candidates to be administered by the IN route. Thus, the
first study consisted in the evaluation of drug concentration-time profiles achieved in
plasma, brain (biophase) and liver (the major metabolic organ), with the intent of
characterising the pharmacokinetic behaviour of the referred test compounds following
IN delivery to mice. In the second one, the brain was sectioned in three different regions
(olfactory bulb, frontal cortex and remaining portion of the brain) and the cerebral
biodistribution pattern of the intranasally administered drugs was determined in order to
infer about the involvement of a direct transport pathway from nose-to-brain. In fact,
whole brain measurements of drug concentration generally underestimate the extent of
distribution because of dilution effects and do not provide any information concerning
the specific pathways and mechanisms underlying the CNS uptake following IN
administration (DHURIA et al., 2010). Theoretically, a heterogeneous distribution depicted
by a preferential drug exposure in the rostral areas of the brain may suggest the existence
of a close connection between the nose and the CNS through which molecules can travel.
Differing not only on the biological matrices collected, those studies also
presented some disparity in what concerns to the sampling times. In practice, regardless
of the study, the sampling times were always chosen in view of achieving the best
compromise between the sufficient number of points to attain a thorough
characterisation of the drug concentration-time profiles and the rational use of laboratory
animals, thereby reducing to a minimum the number of animals required for a proper
interpretation of the results. In the pharmacokinetic study, a broad sampling period
involving the use of a large number of time points and mice was needed to obtain a
complete and definitive description of the pharmacokinetic profiles, whereas in the brain

General Discussion V
239
biodistribution study this period was shorter on account of a presumably quick transfer of
drugs from nose-to-brain.
When investigating the potential of a new route for drug administration, such as
the IN route, it is imperative to compare the obtained experimental results with those
derived from other conventional delivery alternatives. Even though either CBZ or LTG are
only commercially available in oral dosage forms, the use of the IV injection as a control
seemed to be the most appropriate for the particular goals of our work. Due to the direct
delivery of drugs into the bloodstream, IV administration is responsible for the highest
systemic exposure by comparison with any other route, creating optimal conditions to
allow a less variable drug incorporation and biodistribution, thus being the reference for
absolute bioavailability calculations. On the other hand, bearing in mind that after IN
instillation, drugs can reach the CNS either via the systemic circulation, upon nasal
vasculature absorption and subsequent BBB crossing, or via the olfactory neuronal
epithelium (Chapter I, section I. 2.3.1.), the exact contribution of the blood-mediated drug
delivery to the brain can only be inferred by using IV injection, enabling a more accurate
discrimination of the fraction that could be directly transported from nose-to-brain.
Preliminary experiments comparing the pharmacokinetics of CBZ and LTG administered
by the IN and oral routes were actually initially attempted (Appendix C.). Nevertheless,
possibly owing to gastrointestinal degradation and hepatic first-pass metabolism, the
values of CBZ oral bioavailability determined were considerably lower than those
assumed as a reference for humans. Moreover, relatively to the IN administration, higher
doses of orally administered CBZ and LTG were necessarily required to attain quantifiable
drug levels in the relevant biosamples. Delivery of similar doses via both IN and IV routes
allowed a more direct comparison of the drug concentration-time profiles, attenuating
sources of error. The evidence of an equal or superior pharmacokinetic behaviour of
drugs administered by the IN route comparatively to the IV injection clearly reflects its
potential as a promising alternative approach, implicitly confirming its supremacy also
over the conventional oral delivery.
Pharmacokinetics and Brain Biodistribution
Pharmacokinetics is a branch of pharmacology that describes “what the body does
to the drug” by contrast with pharmacodynamics which corresponds to “what the drug
does to the body”. Therefore, the apprehension of the basic pharmacokinetic parameters
of a drug is fundamental to understand its disposition in the body, thereby enabling the
interpretation of the relationship between absorption, distribution, metabolism and
excretion with the onset, duration and intensity of the therapeutic effect. When analysing

V General Discussion
240
pharmacokinetic data, several approaches can be employed in order to determine
pharmacokinetic parameters. In this study, it was used the non-compartmental analysis
once it allows the estimation of the main pharmacokinetic parameters without fitting the
experimental results to a deterministic model. Indeed, if the primary requirement is to
determine the degree of exposure following the administration of a drug (such as AUC),
and the associated pharmacokinetic parameters like for instance tmax, Cmax, t1/2el, kel and
MRT, the non-compartmental pharmacokinetic analysis is generally the preferred
methodology to be used since it requires fewer assumptions than the model-based
approaches (GABRIELSSON and WEINER, 2012). In practice, the application of a certain
deterministic model could eventually hamper or disguise the real perception of possible
differences between the pharmacokinetic behaviour of the drug administered by the IN
and the IV routes, whereby processing the raw data seems to be the most appropriate
strategy.
Regarding the pharmacokinetic results obtained for CBZ and LTG following IN and
IV administrations to mice it was notorious that, in all the three biological matrices
analysed (plasma, brain and liver), the concentration-time profiles determined were fairly
comparable, even though in the case of LTG, a significant delay between the time to
reach the maximum peak concentration after IN comparatively to IV injection has been
observed. The high values of Cmax and AUCinf attained in plasma indicate that, following IN
instillation, both drugs have been efficiently and extensively absorbed to the systemic
circulation, exhibiting a very high absolute bioavailability, easily justifiable by the large
vascularisation of the nasal mucosa along with the physicochemical properties of the two
molecules considered: high lipophilicity and low molecular weight. Despite the fact that a
substantial fraction of either CBZ or LTG has effectively been absorbed from the nasal
cavity into the bloodstream, the IN absolute bioavailability values estimated, greater than
100%, revealed to be particularly intriguing. A possible explanation may be related to the
existence of an inherent inter-individual variability among animals. In effect, since a
complete pharmacokinetic characterisation of the drugs in plasma, brain and liver tissues
was intended, each mouse could only be assigned for a single time point of one of the
experimental groups investigated (IN or IV), whereby in this situation, it was necessary to
pool the data from multiple animals to delineate a thorough concentration-time curve. As
a result, there is intrinsically an error associated to the determination of the AUCs which
is inevitably reflected in the absolute bioavailability calculations. In general, the
measurement of drug concentrations following IN delivery was accompanied by higher
SEMs when compared to IV injection (Appendix D. and E.). In point of fact, the small size
of the nasal cavity may substantially limit the volume of dosing so that slight variations
concerning the amount of drug instilled as well as the site of deposition can contribute to

General Discussion V
241
increase the associated relative variability. Nonetheless, the overall SEM values
determined in this study are considered reasonably satisfactory on account of an assay
performed in vivo, allowing the interpretation of the experimental results with acceptable
confidence.
Investigating nose-to-brain drug targeting required the assessment of the relative
distribution of the drug by determining and comparing its concentration or total exposure
(given by AUC) in plasma and brain after both IN and IV administrations. Aiming at
surveying the overall tendency of the drugs to accumulate in the brain following IN CBZ
and LTG instillation, the DTE index was individually calculated. The estimated DTE indexes
amounted to values almost equal to the unity (DTECBZ = 0.98; DTELTG = 0.96), suggesting no
relevant contribution of the IN route to directly deliver any of these drugs from the nasal
cavity to the brain. Conversely, it seems that the CNS uptake of either intranasally
administered CBZ or LTG has been predominantly achieved by a pronounced nasal
absorption of the drugs into the systemic circulation with subsequent BBB crossing.
Interestingly, in opposition to what would be initially expected, the results derived from
the brain biodistribution study demonstrated that a direct pathway other than the
vasculature was actually involved in the transport of such compounds from the nasal
cavity to the brain. These findings come to illustrate the limitations associated to the
analysis of the total brain concentrations by treating the organ as a whole. As already
mentioned in this discussion, measurement of drug distribution levels in specific target
areas of the brain may afford to a more accurate discrimination of the pathways by which
the molecules have travelled, providing a more sustained proof-of-concept of the IN
route ability to improve CNS drug targeting.
Contrasting with a homogeneous brain distribution pattern typically attained after
IV drug administration, an uneven biodistribution profile was ascertained for both CBZ
and LTG following IN delivery, displaying a decreasing exposure to the drug from rostral
to caudal areas of the brain. The quick and striking appearance of the drugs in the
olfactory bulb immediately at 5-10 min post-IN dosing along with their considerably
higher concentrations comparatively to plasma and the remaining parts of the brain seem
to support the existence of a direct transport of the drugs from nose to brain, also
indicating that it has probably occurred via the olfactory neuronal pathway. The drug
concentration ratios between the olfactory bulb and the remaining portion of the brain
calculated for the first sampling time points have shown to be, in case of the IN delivery,
all greater than 1.0 presenting a significant discrepancy in terms of magnitude relatively
to IV injection. While for CBZ these differences between the two administration routes
have demonstrated to be more discreet, for LTG they were clearly overwhelming.
Notwithstanding, one has to be aware that once distinct doses have been delivered,

V General Discussion
242
direct comparisons among the two test compounds should be made with caution.
Apparently, the direct transfer of LTG from nose-to-brain occurred at a higher extent than
that of CBZ; however, further investigation would be needed in order to confirm such
conjecture.
Gathering the results generated from both pharmacokinetic and brain
biodistribution studies it can be stressed that due to the high drug concentrations
achieved in plasma, and the heterogeneous brain biodistribution pattern with superior
drug exposure in the olfactory bulb, the CNS access of intranasally administered CBZ and
LTG was gained through a combination of both systemic and olfactory neuronal
pathways.
The extensive plasma and brain drug exposures as well as the fast and pronounced
CNS uptake suggest that the delivery of CBZ by the IN route may represent a valuable
alternative regarding not only its use on the chronic treatment of epilepsy but also in the
case of emergencies. In fact, following IN administration of CBZ, the Cmax in the brain was
attained very quickly at 10 min post-dosing and the evidence of a direct transport of the
drug from nose-to-CNS has been demonstrated by the preferential drug distribution to
the rostral cerebral areas. Such data together with the practicality and non-invasiveness
of the IN route may assemble optimal conditions to promptly and efficiently manage
acute convulsive episodes.
In contrast, taking into account the high plasma bioavailability afforded and the
relevant drug concentration levels sustained for an extended period of time within the
brain, it appears that IN delivery may establish itself as a convenient approach for the
chronic administration of LTG, more so than for emergency situations. Accordingly, after
LTG IN instillation, among all the matrices analysed, the brain was the single one in which
the values estimated for t1/2 and MRT were higher relatively to IV injection. Furthermore,
tmax in the brain was only achieved at 2 h post-IN dosing and the respective rate of LTG
elimination (assessed as k) was lower when compared to the IV route. The heterogeneous
brain biodistribution profile observed following a single IN administration of LTG could
eventually be dissipated under a multi-dose therapeutic regimen, particularly when the
steady-state is accomplished.
Even though no pharmacodynamic evaluation has been performed in order to
assess the therapeutic efficacy of either CBZ or LTG administered by the IN route, the
resemblance encountered between the concentration-time profiles obtained in plasma
and brain after IN and IV drug delivery probably points out to very similar
pharmacological responses. Inclusively, it should be highlighted that considering the
magnitude of doses herein intranasally instilled, the maximum drug plasma
concentrations attained in mice were almost equal to or near the lower limit of the

General Discussion V
243
clinically defined therapeutic range of LTG (3-14 µg/mL) and CBZ (4-12 µg/mL),
respectively. Strong evidence accounting for the existence of a pathway that enables the
direct transport of both CBZ and LTG from nose-to-brain by circumventing the BBB, come
to offer new perspectives on a future development of more powerful therapeutic
strategies to improve the pharmacological management of refractory epilepsy.

V General Discussion
244

CHAPTER VI
CONCLUSIONS &
FUTURE PERSPECTIVES


Conclusions & Future Perspectives VI
247
In the last few years, nose-to-brain drug delivery has been widely investigated by
the scientific community from all over the world, exploiting the unique advantages that
the IN route has to offer. This thesis was designed with the aim of evaluating the
potential of the IN administration as a promising alternative strategy to improve CNS
targeting of some of the first-line AEDs, soundly established in the current clinical
practice. Therefore, a comparative study of the pharmacokinetic behaviour as well as the
brain biodistribution pattern of both CBZ and LTG after IN and IV administrations to mice
was herein performed to foresee whether a preferential delivery of the referred
compounds from the nasal cavity to the brain might be involved.
In summary, the most relevant key findings brought from all the experimental
work carried out under the scope of the present dissertation will be succinctly provided
below:
An HPLC-UV method to simultaneously quantify PB, PRM, PHT, CBZ, LTG,
OXC and some of their main metabolites, CBZ-E, trans-diol and Lic in
human plasma was successfully developed and fully validated. Being
simple, rapid, sensitive, reliable, accurate and precise within a wide range
of concentrations, this assay demonstrated suitability to be easily adopted
by hospitals and laboratories to support routine TDM and other
pharmacokinetic-based studies.
Owing to the unfeasibility of directly transpose the best analytical
conditions previously optimised in human plasma for the simultaneous
quantification of PHT, CBZ, OXC, LTG and some of their main metabolites in
mouse matrices, other chromatographic techniques already developed and
validated in our laboratory were employed, making the necessary
adjustments to render them appropriate for the intended purposes. Thus,
after few alterations have been introduced, two distinct HPLC
methodologies have been developed and partially validated enabling the
quantitative determination of: (1) CBZ, CBZ-E, OXC, Lic and PHT and (2) LTG
in plasma, brain (whole brain, olfactory bulb and frontal cortex) and liver of
mouse. Consisting on the basilar analytical tools of this entire work, these
assays were proven to be properly and confidently applied in the analysis
of samples derived from the pharmacokinetic and brain biodistribution
studies.
During the definition and optimisation of the in vivo experimental protocol,
multiple practical difficulties were faced, precluding the execution of the

VI Conclusions & Future Perspectives
248
studies with all the four molecules (CBZ, PHT, OXC and LTG) initially
proposed. The incorporation of the drugs into a thermoreversible in situ
gel along with the IN administration technique of inserting a flexible tubing
inside the mice nasal cavity guaranteed an accurate, precise and
reproducible IN dosing. IV injection was used as a control and proved to be
the most appropriate for the specific goals of this work, since it enables not
only the calculation of the IN absolute bioavailability but also the
determination of the exact contribution of the blood-mediated drug
delivery to the brain.
The concentration-time profiles obtained in plasma, brain and liver
following IN and IV administrations of CBZ and LTG to mice revealed to be
fairly comparable. After IN instillation, the high values of Cmax and AUCinf
observed in plasma indicated that both drugs were efficiently and
extensively absorbed from the nasal vasculature into the systemic
circulation, displaying a very high absolute bioavailability. The cerebral
exposure determined after IN delivery of the referred drugs was rather
similar to that estimated following IV injection; nevertheless, while the Cmax
of CBZ in the brain was achieved very quickly at 10 min post IN-dosing, in
the case of LTG it was only attained at 2 h.
Following IN administration of CBZ and LTG, the uneven brain
biodistribution profile with the highest drug concentration levels
determined at the olfactory bulb contrasted with the homogeneous
biodistribution pattern obtained after IV injection, strongly suggesting the
involvement of a pathway to directly transport the drugs from nose-to-
brain by circumventing the BBB.
Pooling the data derived from the pharmacokinetic and brain
biodistribution studies it can be inferred that following IN administration,
the CNS delivery of either CBZ or LTG was accomplished through a
combination of both systemic and olfactory neuronal pathways.
Taking into account all the results found during this work, it seems that IN
delivery represents a valuable and promising alternative route to
administer CBZ not only for the chronic treatment of epilepsy but also in
acute convulsive emergencies. On the other hand, intranasally
administered LTG gathers favourable conditions to be mainly applied in a

Conclusions & Future Perspectives VI
249
continuous therapeutic regimen. Strong evidences point out that this route
may be considered as an attractive drug delivery strategy for a prospective
management of pharmacoresistance.
Considering all its inherent and indisputable advantages, the non-invasive IN route
has been heralded as one of the most promising means to improve the delivery of drugs
to the CNS; therefore, it is not surprising that its potential will be exploited for the
development of novel and more efficient drug delivery systems in a near future, for which
this thesis represents a small but an important contribution. Despite the extraordinary
scientific breakthroughs achieved in the field of nose-to-brain drug delivery, there is still a
long road to travel before they can be translated into clinical setting. Further
development of the work herein presented could possibly focus on a deeper
characterisation of the brain biodistribution pattern of drugs including the areas
specifically involved in the initiation and propagation of seizures, as well as a
pharmacodynamic and a toxicological analysis in order to infer about the impact of the IN
route to the efficacy and safety of the antiepileptic pharmacological therapy.

VI Conclusions & Future Perspectives
250
APPENDIX


TABLE OF CONTENTS
APPENDIX 251
APPENDIX A. 255
APPENDIX B. 261
APPENDIX C. 293
APPENDIX D. 299
APPENDIX E. 307


APPENDIX A.


Appendix A
257
A1. HPLC-UV Method for the Quantitative Determination of CBZ, OXC, CBZ-E, Lic and
PHT in Mouse Plasma, Brain and Liver Homogenates – Preparation of Standard
Solutions
Table A1.1 Concentration of all the solutions used to prepare the corresponding calibration
standards (CS) and quality control (QC) samples in plasma, brain, olfactory bulb, frontal cortex and
liver tissues of mice.
Solutions
Matrix/
Analyte
Stock
(µg/mL)
Intermediate
(µg/mL) Combined (µg/mL)
A B CS1 CS2 CS3 CS4 CS5 CS6 LLOQ QC1 QC2 QC3
Plasma
Lic 4000.0 1000.0 100.0 4.0 8.0 20.0 100.0 400.0 1200.0 4.0 12.0 600.0 1080.0
CBZ-E 4000.0 1000.0 100.0 8.0 16.0 40.0 100.0 200.0 600.0 8.0 24.0 300.0 540.0
OXC 4000.0 1000.0 100.0 2.0 4.0 12.0 40.0 400.0 1200.0 2.0 6.0 600.0 1080.0
CBZ 4000.0 1000.0 100.0 2.0 4.0 12.0 40.0 200.0 600.0 2.0 6.0 300.0 540.0
PHTa 4000.0 1000.0 250.0 20.0 40.0 80.0 160.0 360.0 800.0 20.0 60.0 400.0 720.0
Brain
Lic 5000.0 1000.0 100.0 2.5 5.0 20.0 80.0 350.0 750.0 2.5 7.5 375.0 675.0
CBZ-E 5000.0 1000.0 100.0 2.5 5.0 20.0 80.0 350.0 750.0 2.5 7.5 375.0 675.0
OXC 5000.0 1000.0 100.0 2.5 5.0 20.0 80.0 350.0 750.0 2.5 7.5 375.0 675.0
CBZ 5000.0 1000.0 100.0 5.0 10.0 30.0 90.0 350.0 750.0 5.0 15.0 375.0 675.0
PHTa 5000.0 1000.0 100.0 10.0 20.0 40.0 100.0 350.0 750.0 10.0 30.0 375.0 675.0
Olfactory Bulb
Lic - - - - - - - - - - - - -
CBZ-E - - - - - - - - - - - - -
OXC 2000.0 1000.0 100.0 1.0 2.0 6.0 30.0 120.0 400.0 1.0 3.0 200.0 360.0
CBZ 2000.0 1000.0 100.0 2.0 4.0 12.0 40.0 160.0 400.0 2.0 6.0 200.0 360.0
PHTa 2000.0 1000.0 100.0 5.0 10.0 20.0 60.0 160.0 400.0 5.0 15.0 200.0 360.0
Frontal Cortex
Lic - - - - - - - - - - - - -
CBZ-E - - - - - - - - - - - - -
OXC 5000.0 1000.0 100.0 2.5 5.0 20.0 80.0 350.0 750.0 2.5 7.5 375.0 675.0
CBZ 5000.0 1000.0 100.0 5.0 10.0 30.0 90.0 350.0 750.0 5.0 15.0 375.0 675.0
PHTa 5000.0 1000.0 100.0 10.0 20.0 40.0 100.0 350.0 750.0 10.0 30.0 375.0 675.0
Liver
Lic 5000.0 1000.0 100.0 5.0 10.0 25.0 75.0 225.0 500.0 5.0 15.0 250.0 450.0
CBZ-E 5000.0 1000.0 100.0 5.0 10.0 25.0 75.0 225.0 500.0 5.0 15.0 250.0 450.0
OXC 4000.0 1000.0 100.0 5.0 10.0 25.0 75.0 225.0 500.0 5.0 15.0 250.0 450.0
CBZ 5000.0 1000.0 100.0 5.0 10.0 25.0 75.0 225.0 500.0 5.0 15.0 250.0 450.0
PHTa 5000.0 1000.0 100.0 12.5 25.0 50.0 100.0 225.0 500.0 12.5 37.5 250.0 450.0 a Phenytoin (PHT) combined solutions were prepared independently from the remaining analytes. CBZ, carbamazepine;
CBZ-E, carbamazepine-10,11-epoxide; Lic, licarbazepine; LLOQ, lower limit of quantification; OXC, oxcarbazepine.

Appendix A
258
Table A1.2 Calibration standards and quality control samples prepared in mice plasma, brain,
olfactory bulb, frontal cortex and liver homogenate supernatants.
Matrix/Analyte Calibration Standards (µg/mL) Quality Controls (µg/mL)
1 2 3 4 5 6 LLOQ 1 2 3
Plasma
Lic 0.2 0.4 1.0 5.0 20.0 60.0 0.2 0.6 30.0 54.0
CBZ-E 0.4 0.8 2.0 5.0 10.0 30.0 0.4 1.2 15.0 27.0
OXC 0.1 0.2 0.6 2.0 20.0 60.0 0.1 0.3 30.0 54.0
CBZ 0.1 0.2 0.6 2.0 10.0 30.0 0.1 0.3 15.0 27.0
PHTa 1.0 2.0 4.0 8.0 18.0 40.0 1.0 3.0 20.0 36.0
Brain
Lic 0.05 0.1 0.4 1.6 7.0 15.0 0.05 0.15 7.5 13.5
CBZ-E 0.05 0.1 0.4 1.6 7.0 15.0 0.05 0.15 7.5 13.5
OXC 0.05 0.1 0.4 1.6 7.0 15.0 0.05 0.15 7.5 13.5
CBZ 0.1 0.2 0.6 1.8 7.0 15.0 0.1 0.3 7.5 13.5
PHTa 0.2 0.4 0.8 2.0 7.0 15.0 0.2 0.6 7.5 13.5
Olfactory Bulbb
Lic - - - - - - - - - -
CBZ-E - - - - - - - - - -
OXC 0.01 0.02 0.06 0.3 1.2 4.0 0.01 0.03 2.0 3.6
CBZ 0.02 0.04 0.12 0.4 1.6 4.0 0.02 0.06 2.0 3.6
PHTa 0.05 0.1 0.2 0.6 1.6 4.0 0.05 0.15 2.0 3.6
Frontal Cortexb
Lic - - - - - - - - - -
CBZ-E - - - - - - - - - -
OXC 0.025 0.05 0.2 0.8 3.5 7.5 0.025 0.075 3.75 6.75
CBZ 0.05 0.1 0.3 0.9 3.5 7.5 0.05 0.15 3.75 6.75
PHTa 0.1 0.2 0.4 1.0 3.5 7.5 0.1 0.3 3.75 6.75
Liver
Lic 0.2 0.4 1.0 3.0 9.0 20.0 0.2 0.6 10.0 18.0
CBZ-E 0.2 0.4 1.0 3.0 9.0 20.0 0.2 0.6 10.0 18.0
OXC 0.2 0.4 1.0 3.0 9.0 20.0 0.2 0.6 10.0 18.0
CBZ 0.2 0.4 1.0 3.0 9.0 20.0 0.2 0.6 10.0 18.0
PHTa 0.5 1.0 2.0 4.0 9.0 20.0 0.5 1.5 10.0 18.0 a Phenytoin (PHT) calibration standards and quality control samples were prepared independently from the remaining
analytes. b Values are expressed in µg. CBZ, carbamazepine; CBZ-E, carbamazepine-10,11-epoxide; Lic, licarbazepine;
OXC, oxcarbazepine.

Appendix A
259
A2. HPLC-UV Method for the Quantification of LTG in Mouse Plasma, Brain and Liver
Homogenates – Preparation of Standard Solutions
Table A2.1 Concentration of all the solutions used to prepare the corresponding calibration
standards (CS) and quality control (QC) samples of lamotrigine (LTG) in plasma, brain, olfactory
bulb, frontal cortex and liver tissues of mice.
Solutiona Matrix
Plasma Brain Olfactory Bulb Frontal Cortex Liver
Stock 2000.0 3000.0 3000.0 3000.0 2500.0
Intermediate
A 1000.0 1000.0 1000.0 1000.0 1000.0
B 100.0 100.0 100.0 100.0 100.0
Spiking
CS1 4.0 2.5 2.5 2.5 5.0
CS2 8.0 5.0 5.0 5.0 10.0
CS3 20.0 20.0 20.0 20.0 25.0
CS4 40.0 80.0 80.0 80.0 75.0
CS5 200.0 400.0 400.0 400.0 225.0
CS6 600.0 1000.0 1000.0 1000.0 500.0
LLOQ 4.0 2.5 2.5 2.5 5.0
QC1 12.0 7.5 7.5 7.5 15.0
QC2 300.0 500.0 500.0 500.0 250.0
QC3 540.0 900.0 900.0 900.0 450.0 a
Concentration values are expressed in µg/mL. LLOQ, lower limit of quantification.

Appendix A
260
Table A2.2 Calibration standards and quality control samples of lamotrigine (LTG) prepared in
mice plasma, brain, olfactory bulb, frontal cortex and liver homogenate supernatants.
Matrix
Plasma Brain Olfactory Bulbb Frontal Cortexb Liver
Calibration Standards
a
1 0.2 0.05 0.025 0.025 0.2
2 0.4 0.1 0.05 0.05 0.4
3 1.0 0.4 0.2 0.2 1.0
4 2.0 1.6 0.8 0.8 3.0
5 10.0 7.0 3.5 3.5 9.0
6 30.0 15.0 7.5 7.5 20.0
Quality Controlsa
LLOQ 0.2 0.05 0.025 0.025 0.2
1 0.6 0.15 0.75 0.75 0.6
2 15.0 7.5 3.75 3.75 10.0
3 27.0 13.5 6.75 6.75 18.0 a Concentration values of calibration standards and quality controls are expressed in µg/mL for all the matrices with
the exception of the olfactory bulb and frontal cortex. b Values expressed in µg. LLOQ, lower limit of quantification.

APPENDIX B.


Appendix B
263
B. Intranasal Administration of Phenytoin and Oxcarbazepine
B1. Phenytoin / Oxcarbazepine – Pharmacological Characterisation
B1. 1. Historical Background
PHT was synthesised for the first time in 1908 by Biltz at the University of Kiel in
Germany, and later again in 1923 by the organic chemists Dox and Thomas, at the Parke-
Davis laboratories, who were searching for hypnotic drugs (SHORVON, 2009b). Unlike to
what would be expected, despite the structural similarity with barbituric acid, PHT did not
display any hypnotic properties and therefore it was ignored and shelved until 1936,
when it was luckily enrolled in the Putman’s and Merrit’s experiments with the intent of
screening various phenyl compounds to protect laboratory animals from electrically
induced convulsions (ANDERSON, 2009; SHORVON, 2009b). The impressive anticonvulsant
activity observed for PHT in this early investigation led to subsequent pre-clinical and
clinical studies, confirming its undeniable potential on managing patients with different
types of epileptic seizures, especially of “grand mal” and psychomotor seizures. In 1938,
PHT was brought to the market by Parke Davis company and, in 1939, the American
Medical Association Council on Pharmacy and Chemistry accepted it into its
pharmacological compendium (ANDERSON, 2009; SHORVON, 2009b). Since then, PHT’s
popularity grew very quickly and it becomes the predominant medication for the
treatment of epilepsy, remaining the first-choice AED until the 1980’s, when it was slowly
displaced by CBZ and valproic acid. Currently, besides all its faults in what concerns to
pharmacokinetic properties, drug interactions and adverse effects, PHT is still one of the
drugs most widely used in the world. Even though it has been now largely relegated to
second-line therapy, PHT persists as the drug of choice in case of emergency and in status
epilepticus.
OXC was first synthesised in 1966 (SHORVON, 2009a). The rationale behind its
original development was to use the parent molecule CBZ as a template with the intent of
producing a drug equally effective, but with an improved tolerability profile (SHORVON,
2000). The key difference between the two drugs is that OXC, due to the addition of an
extra oxygen atom on the dibenzazepine ring, is not metabolised to the epoxide
derivative mainly responsible for the toxic effects of CBZ (SHORVON, 2000, 2009a).
Although the antiepileptic action, spectrum of activity and efficacy of OXC are comparable
to that of CBZ, the adverse events associated with it tend to be less severe or frequent
and the propensity to establish drug interactions is significantly lower.
OXC was initially subjected to clinical trials in the 1980s, and it was firstly approved
for use as an anticonvulsant agent in Denmark in 1990 (SCHACHTER, 1999; SHORVON, 2000).
The introduction of OXC in Portugal was held in 1997, and in the United States only in

Appendix B
264
2000 (SHORVON, 2009a). Up to now, the drug is already registered and widely used in more
than 50 different countries worldwide; surprisingly, unlike to what was expected, it has
not generally superseded CBZ (MAY et al., 2003; SHORVON, 2009a).
B1. 2. Pharmaceutical Information
B1. 2.1. Phenytoin
PHT is the oldest non-sedative AED. It is structurally related to barbiturates,
consisting of two phenyl groups attached to a hydantoin ring which are responsible for its
anticonvulsive action (ANDERSON, 2009; BAUER, 2008). PHT is usually administered either as
the sodium salt or as the free acid (BAUER, 2008; RICHENS, 1979), being available in several
oral (tablet, capsule, suspension) and parenteral (IV injection) formulations (GALLOP,
2010). Due to its poor hydrosolubility, the dissolution and, consequently, the absorption
rate of PHT oral forms essentially depends on drug particle size rather than whether it is
in the acid or salt form (RICHENS, 1979). In order to concentrate the drug in a convenient
volume for parenteral administration, propylene glycol and ethanol are added to the
vehicle as well as sodium hydroxide to adjust the solution to a pH value between 10 and
12 (BAUER, 2008). Comparatively to an oral loading dose, PHT IV injection yields
therapeutic serum levels much faster; nevertheless, it may be associated to local
reactions at the infusion site along with serious cardiovascular complications such as
hypotension and bradycardia (GALLOP, 2010; PELLOCK, 2002). Detailed pharmaceutical
information of PHT is summarised in Table B1.1.

Appendix B
265
Table B1.1 Pharmaceutical information of phenytoin (DRUGBANK; PUBCHEM).
Drug Identification Physicochemical Properties
Generic Name Phenytoin Phase State Solid / White powder
Chemical Name 5,5-diphenylimidazolidine-2,4-dione
Solubility in Water 0.032 mg/mL (at 22°C)
Chemical Formula C15H12N2O2 Solubility in Ethanol 16.67 mg/mL
Molecular Weight 252.27 g/mol LogP 2.47
Molecular Structure
pKa 8.33
Drug Information
Brand Name Dilantin® Manufacturer Pfizer
Dosage Forms Immediate-release capsule Extended-release capsule Chewable tablet Suspension IV injection
Route of Administration
Oral and Intravenous
LogP, octanol/water partition coefficient; pKa, negative decadic logarithm of the acid dissociation constant.
B1. 2.2. Oxcarbazepine
OXC is a 10-keto analogue of CBZ with very similar chemical structure. Hence, in
comparison to CBZ, OXC has the same 5-carboxamide substituent, but it is structurally
different in the 10,11-position where an extra atom of oxygen is added (MAY et al., 2003).
It is a white to faintly orange powder, practically insoluble in ethanol and water (FLESCH,
2004; NOVARTIS, 2014b). Currently, OXC is available in the market only in the form of film-
coated tablets or suspension for oral administration. Detailed pharmaceutical information
of OXC is summarised in Table B1.2.

Appendix B
266
Table B1.2 Pharmaceutical information of oxcarbazepine (DRUGBANK; FLESCH, 2004; PUBCHEM).
Drug Identification Physicochemical Properties
Generic Name Oxcarbazepine Phase State Solid / White powder
Chemical Name 10,11-dihydro-10-oxo-5H-dibenz[b,f]azepine-5-carboxamide
Solubility in Water 0.30 mg/mL (at 25°C)
Chemical Formula C15H12N2O2 Solubility in Ethanol < 1 mg/mL (at 25°C)
Molecular Weight 252.27 g/mol LogP 1.5
Molecular Structure
pKa 10.7
Drug Information
Brand Name Trileptal® Manufacturer Novartis
Dosage Forms Tablet Suspension
Route of Administration
Oral
LogP, octanol/water partition coefficient; pKa, negative decadic logarithm of the acid dissociation constant.
B1. 3. Pharmacokinetics
B1. 3.1. Phenytoin
The pharmacokinetic characteristics of PHT are markedly influenced by its limited
aqueous solubility, variable absorption, high protein binding, saturable metabolism and
dose-dependent elimination (NEELS et al., 2004; PATSALOS et al., 2008). The complex and
non-linear kinetics of PHT makes the drug administration a real challenge to many
clinicians, having contributed to the implementation of TDM in epilepsy (PELLOCK, 2002;
SHORVON, 2009b). This section and the following Table B1.3 will provide a brief overview
of PHT pharmacokinetic profile.

Appendix B
267
Table B1.3 Summary of the main pharmacokinetic parameters of phenytoin after oral
administration (BAUER, 2008; KUTT and HARDEN, 1999; NEELS et al., 2004; PATSALOS et al., 2008;
RICHENS, 1979).
Pharmacokinetic Parameter Mean Value
tmax (h) 3-12
F (%) 70-100
Plasma Protein Binding (%) 90
Vd/F (L/kg) 0.7
t1/2el (h) 12-36
CL/F (L/kg/h) 0.015-0.065
CL/F, apparent plasma clearance; F, absolute bioavailability; t1/2el, apparent elimination
half-life; tmax, time to achieve maximum peak concentration; Vd/F, apparent volume of
distribution.
Absorption
PHT absorption is highly dependent on drug formulation, particle size and
pharmaceutical additives/excipients (PORTER and MELDRUM, 2015; RICHENS, 1979). In
general, PHT is slowly but almost completely absorbed when given orally, presenting tmax
values in plasma ranging from 3 to 12 h but a bioavailability of about 100% (BAUER, 2008;
GALLOP, 2010). At higher doses (single oral doses of 800 mg or more), the rate and extent
of absorption are affected, since longer times are needed for maximal drug
concentrations to be achieved and decreased bioavailability is frequently observed
(BAUER, 2008; PATSALOS et al., 2008).
Distribution
In adults, approximately 90% of plasma PHT is bound to albumin and the degree of
binding decreases in the presence of hypoalbuminemia, renal and liver insufficiency
(PATSALOS et al., 2008; RICHENS, 1979). PHT exhibits a Vd/F between 0.5 and 1.2 L/kg,
quickly diffusing into the tissues and accumulating in the brain, liver, muscle and fat
(NEELS et al., 2004; PORTER and MELDRUM, 2015). Since the penetration into the brain is
rapid, it has been commonly used in status epilepticus conditions. The drug binds to brain
tissue at about the same extent as it binds to plasma proteins whereby the brain and
serum concentrations are almost identical (RICHENS, 1979). On the other hand, drug
concentration in CSF mirrors the free plasma level (PORTER and MELDRUM, 2015).

Appendix B
268
Metabolism
Less than 5% of a PHT dose is excreted unchanged (BAUER, 2008; PATSALOS et al.,
2008). PHT is largely (>95%) metabolised in the liver primarily by CYP2C9 and in a less
extent by CYP2C19 to four oxidative metabolites with little or no anticonvulsant activity
(Figure B1.1) (BAUER, 2008; YAMAZAKI et al., 2001). Its major metabolite is 5-(4’-
hydroxyphenyl)-5-phenylhydantoin which is greatly conjugated with glucuronic acid and
subsequently excreted in the urine as a glucuronide (NEELS et al., 2004; RICHENS, 1979). The
metabolism of PHT is capacity limited within the therapeutic range, i.e. the drug
molecules overwhelms or saturates the enzymes’ ability to metabolise the drug (BAUER,
2008). Indeed, the rate of metabolism directly correlates with the amount of available
drug in plasma when the concentration is low, but a saturation and, consequently, a
decrease of the metabolic process is ascertained for plasmatic levels above 10 µg/mL
(BRODIE and DICHTER, 1996; NEELS et al., 2004). Therefore, increments in dosage, even
relatively small, may result in unpredictable and disproportionate large augments of PHT
plasma concentration, possibly leading to a quick development of toxicity symptoms
(NEELS et al., 2004; PATSALOS et al., 2008; PORTER and MELDRUM, 2015). In accordance, the
dose required to produce a concentration in the accepted therapeutic range is very close
to that which will cause intoxication, and thereby, this issue has important clinical
implications (RICHENS, 1979).

Appendix B
269
Figure B1.1 The major metabolic pathways of phenytoin (PHT). 4’-HPPH, 5-(4’-hydroxyphenyl)-5-
phenylhydantoin; 3’,4’-dihydrodiol, 5-(3’,4’-dihydroxy-1’,5’-cyclohexadien-1-yl)-5-phenylhydantoin;
3’-HPPH, 5-(3’-hydroxyphenyl)-5-phenylhydantoin; 3’,4’-diHPPH, 5-(3’,4’-dihydroxyphenyl)-5-
phenylhydantoin.
Elimination
PHT follows a Michaelis-Menten, saturable or non-linear pharmacokinetics which
means that elimination is dose-dependent. Accordingly, as the dose or concentration of
PHT increases, the enzymatic system becomes saturated, decreasing the rate of clearance
and markedly extending the drug half-life (BAUER, 2008). On average, the effective half-life
at very low PHT plasma levels is about 12 h, but it lengthens up to 46 h when the steady-
state concentration reaches the top of the therapeutic range (20 µg/mL) (RICHENS, 1979).
The time to achieve steady-state therapeutic levels depends upon the dose and the final
concentration attained, ranging from 5-7 days after initiation of therapy at a low dose to
4-6 weeks, if a higher dose is administered (PORTER and MELDRUM, 2015).

Appendix B
270
Most of the drug is excreted in the bile as inactive metabolites which are then
reabsorbed from the intestinal tract and subsequently eliminated via urinary excretion
(PFIZER, 2015).
B1. 3.2. Oxcarbazepine
Even though OXC is closely related to CBZ, its slight modification in the molecular
structure results in major differences regarding to biotransformation and
pharmacokinetics (BEYDOUN AND KUTLUAY, 2002). Unlike CBZ, which is oxidised by the
CYP450 oxidase system, OXC is rapidly and extensively reduced by cytosolic enzymes to
the non-toxic monohydroxy derivative, also known as licarbazepine that is responsible for
most of its anticonvulsant effect (BEYDOUN and KUTLUAY, 2002). Compared with Lic, the
concentrations of OXC in plasma are low and the metabolite is assumed to be the
clinically relevant compound (MAY et al., 2003). In essence, the pharmacological action of
the drug is primarily exerted by Lic, and OXC actually acts as a pro-drug (SHORVON, 2000).
This section and the following Table B1.4 will provide a brief overview of OXC
pharmacokinetic profile.
Table B1.4 Summary of the main pharmacokinetic parameters of oxcarbazepine (OXC)
and licarbazepine (Lic) (FLESCH, 2004; MAY et al., 2003; SHORVON, 2000; WELLINGTON and GOA,
2001).
Pharmacokinetic Parameter Mean Value
OXC Lic
tmax (h) 1-2 4-6
F (%) - >90
Plasma Protein Binding (%) 60-67 37-43
Vd/F (L/kg) - 0.75
t1/2el (h) 1-2.5 8-10
CL/F (L/h) - 0.71-1.26
CL/F, apparent plasma clearance; F, absolute bioavailability; t1/2el, apparent elimination half-
life; tmax, time to achieve maximum peak concentration; Vd/F, apparent volume of
distribution.
Absorption
Following oral administration to humans, OXC is almost completely absorbed
(>95%), being rapidly and extensively metabolised to the pharmacological active
metabolite Lic (FLESCH, 2004). Peak plasma concentration (Cmax) of OXC after a single dose
is reached within 1-2 h, whereas the maximal concentration of Lic is attained somewhat

Appendix B
271
later at approximately 4-6 h post-dosing (BEYDOUN and KUTLUAY, 2002; FLESCH, 2004). Since
OXC works as a pro-drug, only about 2% of the total systemic exposure is due to
unchanged OXC, while nearly 70% corresponds to Lic and the remainder is attributable to
minor secondary metabolites that are quickly eliminated (FLESCH, 2004). The rate and
extent of absorption seem to be not significantly affected by the presence of food
(WELLINGTON and GOA, 2001).
At steady-state, OXC pharmacokinetics is linear and shows dose proportionality
with plasma levels of the drug and its metabolite over the usual clinical dosage range 300-
2400 mg/day (NOVARTIS, 2014b; WELLINGTON and GOA, 2001).
Distribution
OXC and Lic are both neutral lipophilic compounds whereby they are able to easily
and reversibly diffuse across many biologic membranes, including the BBB (MAY et al.,
2003). The Lic Vd/F varies between 0.7-0.8 L/kg, and the plasma protein binding is around
40% (BEYDOUN and KUTLUAY, 2002; MAY et al., 2003). The binding of Lic to plasma proteins,
predominantly albumin, seems to be independent of serum concentrations within the
therapeutically relevant range (FLESCH, 2004). Because only a relatively small proportion of
Lic is protein bound, it is unlikely that clinically significant displacement by other AEDs
might occur (BEYDOUN and KUTLUAY, 2002; WELLINGTON and GOA, 2001).
Metabolism
In humans, once absorbed from the gastrointestinal tract, OXC almost
immediately undergoes a presystemic hepatic reduction mediated by non-inducible
cytosolic arylketone reductases to form the major active metabolite Lic (MAY et al., 2003;
SCHACHTER, 1999). The metabolic reduction of the 10-keto group of OXC is
enantioselective, resulting in the formation of an asymmetric carbon and, therefore, a
chiral molecule (WELLINGTON and GOA, 2001). From this highly stereoselective conversion,
two enantiomers of Lic in a ratio of 80% (S-Lic) to 20% (R-Lic) are produced, exhibiting
equivalent antiepileptic efficacy and tolerability, but different pharmacokinetic properties
(FLESCH, 2004; WELLINGTON and GOA, 2001). Both Lic enantiomers are further metabolised
by conjugation with glucuronic acid, or to a lesser extent, by oxidation, yielding to a
glucuronide conjugate and the inactive metabolite trans-diol, respectively (Figure B1.2)
(SCHACHTER, 1999; WELLINGTON and GOA, 2001).
Since the metabolism of OXC is mostly independent of CYP450 enzymes, the
induction or inhibition of this system by the presence of other AEDs will have little effect

Appendix B
272
on the conversion of OXC to Lic (SCHACHTER, 1999). In opposition to CBZ, OXC does not
undergo autoinduction (BEYDOUN and KUTLUAY, 2002; MAY et al., 2003).
Figure B1.2 The major metabolic pathways of oxcarbazepine (OXC) in humans. Lic,
licarbazepine; trans-diol, 10,11-trans-dihydroxy-10,11-dihydrocarbamazepine.
Elimination
OXC exhibits first-order linear kinetics during long-term administration (MAY et al.,
2003). The plasma elimination half-lives (t1/2el) range from about 1-2.5 h for OXC and from
8-10 h for Lic, illustrating the rapid and virtually complete conversion of the parent drug
to its active metabolite (WELLINGTON and GOA, 2001). More than 95% of the OXC’s
administered dose is excreted by the kidneys, the large majority in the form of inactive
metabolites and less than 1% as unchanged drug (FLESCH, 2004). Approximately 80% of the
dose appears in the urine as glucuronides of Lic (51%) or as unchanged Lic (28%), whereas
the inactive metabolite trans-diol accounts for nearly 3% and minor conjugates of Lic and
OXC amount for 13% of the dose (FLESCH, 2004; NOVARTIS, 2014b). Less than 4% of the
administered dose is cleared from the body via faecal excretion (NOVARTIS, 2014b).

Appendix B
273
B1. 4. Pharmacodynamics
Mechanism of Action
PHT is believed to exert its anticonvulsant effect primarily by the inhibition of
voltage-dependent sodium channels, binding to the fast inactivated state of the channels
after depolarisation and modifying their sodium permeability, thus reducing the
frequency of sustained repetitive firing of action potentials by prolonging the
depolarisation of neurons (COOK and BENSALEM-OWEN, 2011; KWAN et al., 2001). The
inhibitory potency of PHT is strongly use- and frequency-dependent, being the sodium
channel blockade more effective with prolonged or repetitive activation and at higher
frequencies of neuronal stimulation (KWAN et al., 2001; PORTER et al., 2012). Another
important feature of this blocking is its slow onset without affecting the time course of
fast sodium currents which enables that the action potentials evoked by synaptic
depolarisations of ordinary duration remain intact (PORTER et al., 2012; ROGAWSKI and
LÖSCHER, 2004).
Besides blocking the sodium channel during its peak current phases, an additional
impact on persistent late sodium currents has been suggested for PHT. The persistent
currents may critically regulate the firing properties of some neurons and could also play
a crucial role in epileptic activity (PORTER et al., 2012). Modulation of these currents might
delay repolarisation and affect the time span until the threshold potential is reached
again triggering the next action potential (POTSCHKA, 2013).
A blockade of high voltage-gated calcium channels and ionotropic glutamate
receptors has also been reported for PHT; however, it seems that this occurs only at
supratherapeutic drug concentration levels (KWAN et al., 2001; PORTER et al., 2012).
Like PHT and CBZ, OXC and its active metabolite Lic block the voltage-sensitive
sodium channels, thereby stabilising hyper-excited neuronal membranes, suppressing
high-frequency repetitive firing of action potentials and reducing the propagation of
synaptic impulses (FLESCH, 2004; PORTER et al., 2012). In addition, increased potassium
conductance as well as modulation of high-voltage activated calcium channels may also
contribute to their anticonvulsant effects (NOVARTIS, 2014b). In contrast to CBZ, which
modulates L-type calcium channels, OXC has been shown to inhibit the high-voltage N-
type, resulting in a dose-dependent inhibition of post-synaptic excitatory glutamatergic
transmission at striatal and cortical neurones (BEYDOUN and KUTLUAY, 2002; WELLINGTON and
GOA, 2001).

Appendix B
274
B1. 5. Clinical Use
B1. 5.1. Phenytoin
Therapeutic Indications
PHT is an effective second-line AED for the chronic management of focal and
generalised tonic-clonic seizures and it remains the drug of choice for the acute treatment
of repetitive seizures and status epilepticus (BAUER, 2008). Typical primary generalised
seizures such as absence or myoclonic seizures have commonly been reported to be
aggravated or precipitated (NEELS et al., 2004; TOLEDANO and GIL-NAGEL, 2008).
Other therapeutic applications of PHT include the treatment of cardiac
arrhythmias and trigeminal neuralgia, even though in the latter the use of CBZ is often
preferred (BAUER, 2008).
Tolerability
PHT is a drug with many potential side-effects and due to its non-linear or
saturable pharmacokinetics it is fairly easy to attain toxic concentrations with modest
changes in drug dosage. PHT toxic effects essentially depend on the administration route,
the duration of treatment as well as the dose/plasma concentration (ARONSON et al.,
1992).
The incidence of adverse effects with PHT intake is similar to that of CBZ, but the
cosmetic side-effects of gingival hyperplasia, hirsutism and coarsening of facial features
seem to be more prevalent after chronic administration, especially if high doses of PHT
are used (KUTT and HARDEN, 1999; PELLOCK, 2002). Diplopia, ataxia, nystagmus,
incoordination, confusion, lethargy and coma are the most common dose-related adverse
effects (BAUER, 2008; PELLOCK, 2002). Long-term use may also result in abnormalities of
vitamin D metabolism contributing to the development of osteomalacia. A modest
decline of folate levels as well as megaloblastic anemia have likewise been reported, but
clinical importance of these observations is unknown (PORTER and MELDRUM, 2015). Rare
idiosyncratic reactions include skin rash, Stevens-Johnson syndrome, lymphadenopathy
and blood dyscrasias (BAUER, 2008; PELLOCK, 2002; PORTER and MELDRUM, 2015).

Appendix B
275
Therapeutic Range
It is generally accepted that, in the majority of patients, optimal suppression of
seizures is usually achieved without clinical signs of toxicity when the total (bound +
unbound) plasma PHT concentration is within the range 10-20 µg/mL (ARONSON et al.,
1992; BAUER, 2008; PATSALOS et al., 2008). Notwithstanding, some patients attain complete
seizure control with PHT concentrations below this range, while others obtain benefit
from concentrations greater than 20 µg/mL without adverse effects or may be intolerant
for concentrations under this level (PATSALOS et al., 2008; RICHENS, 1979). This variability
appears to be related to the seizure type and severity of the underlying disorder (KUTT and
HARDEN, 1999; PATSALOS et al., 2008), the reason why drug concentrations must be
interpreted in the light of each patient’s clinical state, and the therapy should be
individually defined and monitored (PATSALOS et al., 2008; RICHENS, 1979).
There is a clear relationship between PHT concentration and clinical response
since seizure control improves with higher drug levels, unfortunately, at the cost of also
increasing the risk of concentration-dependent adverse effects such as ataxia, nystagmus,
diplopia and reduced cognition (BAUER, 2008; PATSALOS et al., 2008).
Drug Interactions
Drug interactions involving PHT are primarily related to metabolism or protein
binding. In fact, because PHT is so extensively metabolised in the liver and substantially
bound to plasma proteins, it is prone to drug interactions in which occurs the inhibition of
hepatic microsomal enzymes and the competitive displacement of the drug from its
plasma protein-binding sites (BAUER, 2008; PATSALOS et al., 2002). The unpredictable
relationship between dose and PHT concentration, as well as its narrow therapeutic index
make drug interactions with PHT important, both at pharmacokinetic and clinical levels
(PATSALOS et al., 2008; RICHENS, 1979).
An increase of plasma PHT concentration and the consequent risk of toxicity has
been reported when many CYP2C9 or CYP2C19 inhibitors such as fluoxetine, isoniazid,
cimetidine, amiodarone and omeprazole are concomitantly administered with PHT
(ARONSON et al., 1992; BAUER, 2008; PATSALOS et al., 2008). PHT can induce the oxidative
metabolism of several CYP450 metabolised drugs, including CBZ, warfarin, ciclosporin and
ethinyl estradiol (BAUER, 2008; BRODIE and DICHTER, 1996; RICHENS, 1979). Interactions
comprising protein-binding displacement are not clinically important unless it is
simultaneously accompanied by enzyme inhibition, producing a significant rise in plasma
PHT concentrations, as it occurs with valproic acid (NEELS et al., 2004; PATSALOS et al.,
2002).

Appendix B
276
B1. 5.2. Oxcarbazepine
Therapeutic Indications
Extensive clinical use and a series of clinical trials have proved the effectiveness of
OXC in the management of focal-onset seizures, with or without secondary
generalisation, and primary generalised tonic-clonic seizures, in adults and children, as
initial monotherapy, for conversion to monotherapy and as adjunctive therapy (MAY et al.,
2003; NOVARTIS, 2014b; SHORVON, 2000). Presenting equivalent anticonvulsant efficacy
when compared to standard AEDs such as CBZ, PHT and valproic acid, OXC undeniably
offers clinically relevant advantages both in terms of better tolerability and improved
pharmacokinetic profile (BEYDOUN and KUTLUAY, 2002; SHORVON, 2000).
Similarly to CBZ, strong data support the therapeutic efficacy of OXC also in the
treatment of patients with trigeminal neuralgia (BEYDOUN and KUTLUAY, 2002).
Tolerability
The type and frequency of adverse effects observed during therapy with OXC
depends on the total drug daily dose, whether it is used as monotherapy or adjunctive
therapy and on the age of the patient population being treated (BEYDOUN and KUTLUAY,
2002).
Overall, the tolerability profile of OXC is similar in nature to that of CBZ; however
the frequency and severity of side-effects have been shown to be less pronounced
(SHORVON, 2000). The most common dose-related adverse events associated with OXC are
somnolence, headache, dizziness, ataxia, nausea and vomiting (SHORVON, 2000;
WELLINGTON and GOA, 2001). Allergy in the form of skin rash appears to occur in less than
10% of patients exposed to OXC, being the main reason for discontinuation of the drug in
the comparative monotherapy studies (SHORVON, 2000). The risk of hyponatraemia (serum
sodium concentration level below 135 mmol/L), presumably due to an anti-diuretic
hormone-like effect, is greater with OXC (20%) than with CBZ (SCHACHTER, 1999; SHORVON,
2000) and is dose- and age-dependent, since it is extremely rare in childhood, increasing
to about 7% in the elderly population (BEYDOUN and KUTLUAY, 2002). Nevertheless, the
degree of hyponatraemia is usually mild and asymptomatic, having little or no clinical
importance (SHORVON, 2000; WELLINGTON and GOA, 2001).

Appendix B
277
Therapeutic Range
OXC exhibits a linear relationship between dosage and its active metabolite
plasma concentrations. The appropriate therapeutic range for Lic has not yet been well
defined since similar concentrations have been noted both in groups of patients with
optimal seizure suppression as well as in non-responders (JOHANNESSEN and TOMSON, 2006).
Even though the exact relation of Lic serum concentrations with efficacy and toxicity has
not be determined yet, it is known that adverse effects are particularly likely to start
occurring at levels within 35-40 µg/mL (MAY et al., 2003; PATSALOS et al., 2008). Therefore,
a tentative target index of 12-35 µg/mL has been suggested for Lic plasma concentrations
when patients are treated with therapeutic doses of OXC (JOHANNESSEN and TOMSON, 2006;
JOHANNESSEN et al., 2003).
Drug Interactions
Because the biotransformation of OXC to its active metabolite Lic is mediated by
non-inducible enzymes, the pharmacokinetic properties of the drug are largely unaffected
by induction or inhibition of the CYP system (WELLINGTON and GOA, 2001). Thus, the
potential for interactions with other AEDs that interfere with CYP450 isoenzymes is
reduced (NEELS et al., 2004). Despite its minimised propensity to establish pharmacological
interactions, it was shown that OXC does effectively interact with the hepatic mono-
oxygenase enzymes when used at higher dosages, being a weak but selective metabolic
modulator (BEYDOUN and KUTLUAY, 2002; JOHANNESSEN et al., 2003). Hence, inhibition of
CYP2C19 may result in increased PHT plasma concentrations by up to 40% (WELLINGTON
and GOA, 2001); and the induction of CYP3A4/5 is responsible for the efficacy loss of
dihydropyridine calcium antagonists and oral contraceptives (FLESCH, 2004; MAY et al.,
2003). A slight induction of the UGT has also been reported, explaining the moderate
decrease of LTG concentrations observed during the period of co-medication with OXC
comparatively to monotherapy (FLESCH, 2004; MAY et al., 2003).

Appendix B
278

Appendix B
279
B2. Preliminary Studies on Phenytoin and Oxcarbazepine Intranasal Administration to
Mice
B2. 1. General Introduction
In accordance with the objectives initially outlined at the beginning of this
dissertation, the assessment of the IN route potential for the administration of both PHT
and OXC was also part of the current work. Indeed, similarly to CBZ and LTG, the oral
administration exclusively remains the mainstay of OXC therapy. PHT can be given either
orally or intravenously, even though the latter is commonly associated to numerous
drawbacks. Effectively, due to poor aqueous solubility of PHT, the preparation of drug
parenteral formulation mandatorily requires the use of a hydroalcoholic vehicle,
composed of 40% propylene glycol and 10% of ethanol, adjusted to a pH of 12 with
sodium hydroxide in order to facilitate dissolution (BIALER, 2009; WANG and PATSALOS,
2003). However, despite enabling a prompt and effective seizure control, the presence of
such additives in this formulation is thought to be responsible for the venoirritant effects,
hypotension and cardiac dysrhythmias that are frequently observed after PHT injection
(KUTT and HARDEN, 1999; WANG and PATSALOS, 2003). As a result, with the intent of
attenuating these complications, IV delivery of PHT has invariably to be infused at a slow
rate underneath a close and careful monitoring (BAUER, 2008; WANG and PATSALOS, 2003).
Regardless of being administered either via oral or IV route, PHT displays some
unique and peculiar pharmacokinetic characteristics that markedly influence its
therapeutic and toxic outcome. Thus, the high protein binding (around 90%), the
saturable hepatic metabolism, the non-linear kinetics of elimination and the narrow
therapeutic index (10-20 µg/mL) make the use of PHT extremely susceptible to
undesirable drug-drug interactions and serious adverse effects, as a consequence of
unpredictable and disproportionate increments of drug concentration in plasma
(LANDMARK et al., 2012; PATSALOS et al., 2008). Conversely, OXC exhibits an improved
pharmacokinetic and tolerability profile when compared to CBZ and the majority of old
and established AEDs. However, no significant advantages in terms of anticonvulsant
efficacy have howbeit been demonstrated, since it is often needed an OXC dosage of
about 1.5-times higher than that of CBZ to achieve equivalent seizure control (PORTER and
MELDRUM, 2015). Moreover, several recent reports have identified OXC as a substrate of
multidrug efflux transporters, such as P-glycoprotein, which may probably explain the
pharmacological failure of OXC therapy in the management of pharmacoresistant
epilepsy (CLINCKERS et al., 2005; FORTUNA et al., 2012; MARCHI et al., 2005; ZHANG et al., 2012,
2011).

Appendix B
280
Therefore, taking all those therapeutic limitations into account and considering
the theoretical potential of the IN route to efficiently and directly deliver drugs into the
CNS, it was also pertinent to evaluate the feasibility of both PHT and OXC to be
intranasally administered. In line with this, several preliminary experiments have been
carried out to study the pharmacokinetic behaviour of the two referred compounds
following IN delivery to mice. Unfortunately, the overall obtained results were found to
be unpromising, and consequently, the investigations did not proceed to a more
advanced stage. Some possible reasons for that failure may be related to a number of
experimental difficulties, especially concerning the IN dosage form preparation, that
hindered the accomplishment of all the studies initially planned.
In true, the first exploratory in vivo experiments involving the IN route of drug
administration were performed using OXC as the test compound, whereby the long and
sinuous process of optimising the methodological conditions, that later allowed the
definition of the most appropriate experimental protocol to be applied in both CBZ and
LTG IN investigations, was essentially conducted based on OXC preliminary outcomes.
This section is intended to provide an overview of the main results obtained
during the preliminary studies on PHT and OXC IN administration to mice. The major
experimental problems encountered, the sequential course of experiments tested and
the reasons that led us to decline these two molecules will be herein concisely described
and discussed.

Appendix B
281
B2. 2. In Vivo Preliminary Studies on Intranasal Drug Delivery
B2. 2.1. Oxcarbazepine
As previously mentioned, the beginning of the studies involving the assessment of
the IN route potential to improve CNS targeting of the four AEDs considered (CBZ, PHT,
OXC and LTG) was settled by the exploratory trials conducted in vivo using OXC as the first
test compound.
Aiming at keeping the study design as simple as possible and avoiding the
inclusion of a large number of methodological variables that somehow could have a
marked impact and a considerable interference with the experimental outcome, the
incorporation of the drug in a simple solution with subsequent IN administration by
means of a micropipette was chosen as a starting point. Hence, a perfectly clean OXC
solution at the concentration of 100 mg/mL was initially prepared in dimethyl sulfoxide
(DMSO) enabling the IN administration of a dose of 40 mg/kg. Taking advantage of the
fact that mice are obligatory nose breathers (DHURIA et al., 2010; LOCHHEAD and THORNE,
2012), IN delivery was performed by placing the nasal drops formulation at the opening of
the mouse nostrils, allowing the animal to sniff them into the nasal cavity. The volume of
administration was established at 12 µL per 30 g of mouse body weight and all the
experiments were carried out in immobilised conscious animals. Following IN
administration, the animals were sacrificed at 5, 10, 15, 20, 25, 30, 40, 50 and 60 min
post-dosing (n = 1); blood and brain samples were collected and treated for further
chromatographic analysis. The OXC preliminary concentration-time profile achieved in
plasma and brain after IN administration was then compared with that obtained, in
parallel, after an oral delivery (300 µL/30 g body weight) of the drug at the same dose (40
mg/kg, n = 1) (Figure B2.1). A summary of the main experimental conditions applied in
this preliminary study with OXC is presented in Table B2.1.
Table B2.1 Summary of the main experimental conditions applied in the first in vivo preliminary
study on OXC IN administration to mice.
Dose 40 mg/kg
Formulation Solution
Administration Volume 12 µL/30 g body weight
Administration Technique Nasal drops delivered by means of a micropipette
Anaesthesia Not used
Sampling Times 5, 10, 15, 20, 25, 30, 40, 50 and 60 min
No. Animals/Time Point n = 1

Appendix B
282
Figure B2.1 Preliminary concentration-time profiles of oxcarbazepine (OXC) in plasma and brain
following IN and oral administration (40 mg/kg) to mice: (A) Intranasal; (B) Oral; (C) Intranasal
versus oral. OXC solution was intranasally delivered in the form of drops at the opening of mice
nostrils using a micropipette.
The concentration-time profiles of OXC obtained in plasma and brain after IN
administration to mice revealed to be fairly comparable between each other, without
exhibiting any advantage, under the pharmacokinetic point of view, over the oral delivery
(Figure B2.1). In effect, it is noteworthy that by administering the same dose (40 mg/kg),
the extent of systemic and brain exposures to the drug were considerably higher after
oral than IN administration. Furthermore, the highest OXC concentration level achieved in
plasma and brain following IN instillation was only attained at about 50 min post-dosing
which clearly indicate that no direct transport of the drug into the CNS was involved.
Instead, a slow absorption of OXC might have been occurred from the nasal cavity to the
systemic circulation with subsequent distribution to the brain upon BBB crossing. Bearing
in mind that the sampling size is very small (n = 1), special care should be imposed when
the results are interpreted, since these may not be sufficiently conclusive. Nonetheless,

Appendix B
283
we strongly believed that this outcome was greatly and primarily influenced by factors
related to practical issues. Accordingly, the technique of instillation drops by using a
micropipette in awake mice demonstrated to be difficult and inappropriate due to moving
and escaping of animals during drug administration. In fact, mice generally do not
tolerate IN delivery in the non-anaesthetised state (DHURIA et al., 2010; WONG et al., 2014).
Our attempts to intranasally administer OXC in the form of nasal drops resulted in loss of
a very significant amount of the formulation at the opening of the nostrils, thus
preventing an accurate, precise and reproducible dosing. On top of that, after IN delivery,
an appreciable number of animals displayed important signs of respiratory distress and
some of them have inclusively died, probably denoting the instillation of an excessive
volume of the liquid formulation that ultimately might have been drained to the lower
respiratory tract.
Taking all those shortcomings into consideration, we decided to make some
alterations in the initial experimental protocol. The OXC nasal formulation administered
was maintained, however, the IN delivery technique as well as the volume of
administration were adjusted in order to improve the accuracy of dosing and to avoid
both the anterior and post-nasal drip drainage (Table B2.2). Thus, the OXC IN
administration was accomplished in mice previously anaesthetised with an
intraperitoneal injection of ketamine (100 mg/kg)/xylazine (10 mg/kg), by inserting a
flexible tube attached to a microsyringe inside the nasal cavity, allowing a more efficient
and localised delivery of the drug solution onto the olfactory area. The administration
volume was reduced by half (6 µL/30g body weight) with the intent of eliminating issues
associated to respiratory distress (SOUTHAM et al., 2002).
Table B2.2 Summary of the main experimental conditions applied in the second in vivo
preliminary study on OXC IN administration to mice.
Dose 20 mg/kg
Formulation Solution
Administration Volume 6 µL/30 g body weight
Administration Technique Insertion of a flexible tube attached to a microsyringe
Anaesthesia Ketamine (100 mg/kg)/xylazine (10 mg/kg), IP
Sampling Times 2, 5, 10, 15, 20, 25, 30, 40, 50 and 60 min
No. Animals/Time Point n = 1
IP, intraperitoneal.
Even though the results obtained were far from being exceptional, considerable
improvements were made concerning the methodology previously employed to perform

Appendix B
284
IN administration. Indeed, the direct delivery of the formulation inside the nasal cavity
through the insertion of a flexible tubing enabled a more accurate and reproducible
dosing without any evidences of dosage form anterior leakage, and more importantly,
without signs of damage to the nasal mucosa. The supremacy of this alternative IN
administration technique seemed to be corroborated by the concentration-time profile
determined, since the instillation of a dose of 20 mg/kg yielded OXC concentration levels
in plasma and brain roughly equivalent to those formerly reached with a dose two-times
higher (40 mg/kg) (Figure B2.2). Notwithstanding, once again, the almost parallel time
course of plasma and brain OXC levels observed along with the highest peak
concentrations attained only at 60 min post-dosing did not evidence the occurrence of a
direct drug transport from nose to brain. As a matter of fact, based on these results, we
supposed that because of the low nasal solution viscosity allied to the IN delivery
technique used, the formulation was easily and rapidly removed from the nasal cavity
towards the nasopharynx, where it probably has been swallowed and subsequently
absorbed to the systemic circulation via the gastrointestinal tract.
Figure B2.2 Preliminary concentration-time profile of oxcarbazepine (OXC) in plasma and brain
following IN administration (20 mg/kg) to mice. OXC solution was intranasally delivered by
inserting a flexible tube attached to a microsyringe inside the nasal cavity of previously
anaesthetised mice.
Aiming at preventing posterior drainage of nasally dosed solution in mice we tried
to isolate the nasal cavity from both the respiratory and gastrointestinal tracts by
applying an established surgical procedure firstly described by Hussain et al. (1980), with
slight modifications (Figure B2.3).

Appendix B
285
Figure B2.3 Schematic representation of the surgical procedure carried out in mice to isolate the
nasal cavity.
Briefly, following an intraperitoneal injection of ketamine (100 mg/kg)/xylazine (10
mg/kg), the anaesthetised mice were placed on their back and an incision was made at
the neck to expose and sever the trachea. The upper tracheal segment was tied off with a
suture while the lower one was cannulated with a polyurethane tube (22 G) towards the
lungs in order to maintain free breathing. The oesophagus was occluded by tying it with a
suture thereby ensuring that no loss of the administered dose to the stomach might be
involved. Finally, the OXC IN administration was performed by implementing the same
experimental conditions employed in the second in vivo preliminary assay (Table B2.2).
The main asset of this methodology lies on its ability to provide a clear evaluation
of the real and exclusive contribution of the IN delivery to the pharmacokinetic behaviour
of drugs administered via this route, a reason why several authors have opted to use this
surgical technique in their research work (CHOU and DONOVAN, 1997; CHOW et al., 1999;
HUSSAIN et al., 2000; ISHIKAWA et al., 2002; RAGHAVAN and ABIMON, 2001; SINSWAT and
TENGAMNUAY, 2003; WANG et al., 2007; YOKOGAWA et al., 2006). Taking advantage of the
system tightness, by confining the formulation only to the isolated nasal cavity, it was
expected that a direct transport of the drug from nose to brain could be reliably assessed
without the interference of other physiological variables. Nevertheless, there are
important drawbacks that should be pointed out, namely the invasiveness and complexity
of the procedure, the need to keep the animals under the anaesthetised state throughout
the whole period of experiment and, most importantly, the complete mismatch between
the organism normal function and the unrealistic conditions created. Considering the
aforementioned limitations and the inconspicuous results obtained (Figure B2.4), it was
taken the decision of disregarding the possibility of applying this procedure in further and
more comprehensive studies.

Appendix B
286
Figure B2.4 Preliminary concentration-time profile of oxcarbazepine (OXC) in plasma and brain
following IN administration (20 mg/kg) to mice. The IN administration of OXC solution was
performed in mice previously subjected to a surgical procedure to isolate the nasal cavity by using
the technique of flexible tubing insertion.
Indeed, examining both plasma and brain concentration-time profiles achieved
after IN administration of OXC to mice submitted to the nasal cavity isolation technique, it
was still suggested that a direct transport of the drug from nose to brain was absent.
Based on these results, we strongly believed that the drug might have been absorbed into
the bloodstream through the nasal mucosa and gained access to the brain after traversing
the BBB (Figure B2.4).
With the concern of avoiding the early clearance of drug solution from the mice
nasal cavity, and at the same time, overcoming the overall limitations associated to the
surgical methodology previously described, our efforts were posed onto a new alternative
strategy which consisted on the incorporation of the drug into a vehicle with bioadhesive
properties. In theory, using such approach could solve a number of problems
encountered with IN delivery of simple liquid formulations by providing a localised
deposition and an increased contact time between the drug and the olfactory mucosa,
thus improving permeability and eventually promoting the preferential transport of drugs
from the olfactory region to the CNS (CHARLTON et al., 2007b; UGWOKE et al., 2001). In this
context, among several mucoadhesive drug delivery systems available, the selection of a
temperature-triggered in situ gel appeared to be the most appropriate. In essence, this
kind of formulation is characterised by a low viscosity at or below room temperature,
undergoing a phase transition into a semi-solid state within the nasal cavity, as a result of
the increase in temperature (SINGH et al., 2013). Accordingly, the main advantages rely in
the reduction of anterior leakage and post-nasal drainage, the ease and precision of

Appendix B
287
dosage form manipulation allowing for an accurate dosing, and the enhancement of the
residence time of the drug in contact with the nasal mucosa (NIRMAL et al., 2010; SINGH et
al., 2013).
Therefore, OXC was dissolved in 100 µL of ethanol and further incorporated in 900
µL of a thermoreversible gel, composed of 18% PF-127 and 0.2% C-974P (w/v), so that the
final concentration of the drug in the formulation was 0.4 mg/mL. IN administration was
performed employing the flexible tubing insertion technique and the volume delivered
was settled at 12 µL/30 g of mice body weight (Table B2.3).
Table B2.3 Summary of the main experimental conditions applied in the fourth in vivo preliminary
study on OXC IN administration to mice.
Dose 0.16 mg/kg
Formulation Thermoreversible in situ gel
Administration Volume 12 µL/30 g body weight
Administration Technique Insertion of a flexible tube attached to a microsyringe
Anaesthesia Ketamine (100 mg/kg)/xylazine (10 mg/kg), IP
Sampling Times 15 and 120 min
No. Animals/Time Point n = 1
IP, intraperitoneal.
The results revealed that in both sampling time points analysed (15 and 120 min),
the concentrations determined for OXC in plasma and brain were near or below the limit
of quantification established by the analytical method applied. Unfortunately, owing to
solubility issues, the maximum amount of drug that was possible to incorporate in the
nasal gel only enabled the administration of a dose of 0.16 mg/kg, which proved to be
clearly insufficient to attain quantifiable OXC levels in all the relevant biological matrices.
Although the preliminary data obtained for OXC were far from being encouraging,
the IN drug administration by means of a thermoreversible gel has shown potential and
seemed to be the most promising among all the experimental procedures attempted.
Notwithstanding, a more complex galenic development together with a deeper
optimisation of the nasal formulation in order to incorporate a greater amount of the
drug was definitely required, which revealed to be beyond the scope of the present work.
Since the essential conditions to carry out further studies with OXC were not successfully
met, it was decided to proceed the investigation with the remaining AEDs. Therefore, the
subsequent implementation of these experimental conditions to CBZ provided a more
positive outcome, as thoroughly documented in Chapter III.

Appendix B
288
B2. 2.2. Phenytoin
PHT was the third compound to be tested intranasally, subsequently to OXC and
CBZ. The preliminary in vivo trials of PHT began with the implementation of the same
experimental conditions successfully employed in the study carried out with CBZ. Thus,
PHT was dissolved in 50 µL of ethanol and further incorporated in 950 µL of the
thermoreversible nasal gel (18% PF-127 and 0.2% C-974P, w/v) so that the final drug
concentration was 1 mg/mL, affording the administration of a dose of 0.4 mg/kg. IN
delivery was performed in anaesthetised mice [intraperitoneal injection of ketamine (100
mg/kg)/xylazine (10 mg/kg)] by using the flexible tubing insertion technique, and the
volume of administration was fixed in 12 µL/30g of mouse body weight. Three
representative sampling time points (10, 30 and 240 min) were chosen to sacrifice the
animals (n = 1) and collect the corresponding relevant biological samples for analysis. A
summary of the main experimental conditions applied in this preliminary study with PHT
is presented in Table B2.4.
Table B2.4 Summary of the main experimental conditions applied in the first in vivo preliminary
study on PHT IN administration to mice.
Dose 0.4 mg/kg
Formulation Thermoreversible in situ nasal gel
Administration Volume 12 µL/30 g body weight
Administration Technique Insertion of a flexible tube attached to a microsyringe
Anaesthesia Ketamine (100 mg/kg)/xylazine (10 mg/kg), IP
Sampling Times 10, 30 and 240 min
No. Animals/Time Point n = 1
IP, intraperitoneal.
The first exploratory data on PHT IN delivery to mice denoted extremely low
concentration levels of the drug in plasma, wherein all the values determined were below
the limit of quantification. In addition, it was not even possible to detect any sign of PHT
in the brain samples analysed, thereby indicating that the dose administered (0.4 mg/kg)
was not enough to provide a desirable drug uptake into the biophase. Regrettably,
similarly to what was found with OXC, the poor solubility of PHT in ethanol remarkably
precluded the incorporation of a larger amount of the drug into the nasal gel, leading to
PHT concentration levels in blood and brain that were not quantifiable.

Appendix B
289
In line with this, an alternative delivery vehicle that would allow the
administration of a significantly higher dose of PHT was definitely needed. On account of
the unprofitable initial results obtained with IN administration of OXC in the form of a
simple solution, and aware of the importance of bioadhesiveness to avoid both the
anterior and posterior leakage of the formulation from the nasal cavity, the use of a
slightly viscous aqueous solution consisting of 0.8% hydroxypropyl methylcellulose
(HPMC) to incorporate and intranasally deliver PHT to mice was attempted. The
administration of a greater dose (12 mg/kg) was primarily achieved by dissolving the drug
firstly in DMSO. Hence, an appropriate amount of PHT was dissolved in 300 µL of DMSO
and further incorporated in 700 µL of 0.8% HPMC solution so that the final drug
concentration was 60 mg/mL and the total percentage of DMSO in the formulation was
equivalent to 30%. IN delivery was then accomplished applying the experimental
conditions outlined in Table B2.5. An IV administration of PHT [propylene glycol-NaCl
0.9%-ethanol (5:3:2, v/v/v); 120 µL/30g body weight; lateral tail vein injection] at the
same dose (12 mg/kg) was also undertaken to be used as a control.
Table B2.5 Summary of the main experimental conditions applied in the second in vivo
preliminary study on PHT IN administration to mice.
Dose 12 mg/kg
Formulation Slightly viscous aqueous solution
Administration Volume 6 µL/30 g body weight
Administration Technique Insertion of a flexible tube attached to a microsyringe
Anaesthesia Ketamine (100 mg/kg)/xylazine (10 mg/kg), IP
Sampling Times 10, 30 and 240 min
No. Animals/Time Point n = 2
IP, intraperitoneal.
PHT concentration values determined in plasma and brain at the three
representative sampling time points considered (10, 30 and 240 min) post-IN and IV
dosing were systematised in Table B2.6. Following IN administration, higher drug
concentrations were achieved in both plasma and brain enabling an accurate and reliable
quantitative analysis of the drug in these biological samples. Although the maximal
concentration levels of PHT observed in plasma and brain after IN delivery have been
fairly comparable to those obtained after IV injection, they were only attained at 240 min
post-dosing, suggesting that no preferential transport of the drug from nose to brain was
involved. Surprisingly, by analysing the temporal evolution of PHT concentrations

Appendix B
290
measured either in plasma or brain after IV administration, it was possible to notice that
consistent levels of drug were maintained throughout the whole period of sampling time
since no decrease in concentration was ascertained from 10 up to 240 min (Table B2.6). A
possible explanation for this fact may be related to the saturation of the enzymatic
system implied in PHT hepatic metabolism. In fact, at high PHT doses, the enzymes’ ability
to metabolise the drug can be easily overwhelmed, decreasing the rate of clearance and
markedly extending the drug half-life (BAUER, 2008).
Table B2.6 Preliminary PHT concentrations determined in plasma (µg/mL) and brain (µg/g)
following IN and IV administrations (12 mg/kg) to mice.
Post-dosing Time
Mouse Intranasal Intravenous
Plasma Brain Plasma Brain
10 min 0 2.242 BLQ 11.187 4.074
I 3.615 BLQ 11.047 3.408
30 min 0 3.165 0.979 - -
I 3.579 0.939 11.368 4.110
240 min 0 11.673 3.965 8.315 2.996
I 7.654 2.588 11.756 4.756
BLQ, below the limit of quantification.
In view of the paramount objectives underlying the present thesis, the use of the
IV route as a control to assess the potential of the IN administration to improve CNS
targeting of AEDs is undeniably the most appropriate. Additionally to providing the
determination of the IN absolute drug bioavailability, it is also crucial to figure out the
exact contribution of blood-mediated drug delivery to the CNS, allowing a more accurate
discrimination of the fraction that is directly transported into the brain from the nasal
cavity. In the particular case of PHT, the suitability of such approach is reinforced by the
fact that, among the four AEDs considered in our work, PHT is the only one that is
currently commercially available in both oral and parenteral dosage forms.
Given that it was necessary to administer very high doses of PHT via the IN route
to achieve measurable drug levels in all the relevant biological matrices analysed, keeping
the same order of magnitude for the IV administered dose would compromise a direct
comparison of the two pharmacokinetic behaviours. Indeed, probably due to the
enzymatic saturation phenomenon, a difference in the doses administered via each route
inevitably has to be adopted, introducing an undesirable associated margin of error that
ultimately interferes with the reliability of the assumptions. For this reason, the

Appendix B
291
progression of the research involving this molecule was considered unfeasible, turning
our efforts towards the exploitation of LTG IN delivery.

Appendix B
292

APPENDIX C.


Appendix C
295
C1. Preliminary Comparative Study of the Pharmacokinetics of CBZ Administered via
both IN (0.4 mg/kg) and Oral (4 mg/kg) Routes to Mice
In an early stage, the feasibility of using the oral route as a control was
investigated. A summary of the main experimental conditions applied as well as the
pharmacokinetic results obtained are herein summarised.
Table C1.1 Summary of the main experimental conditions employed in the preliminary
comparative study on CBZ IN and oral administrations to mice.
Experimental Conditions Intranasal Oral
Dose 0.4 mg/kg 4 mg/kg
Formulation Thermoreversible in situ gel 0.5% CMC:DMSO (95:5, v/v)
Administration Volume 12 µL/30 g body weight 300 µL/30 g body weight
No. Animals/Time Point n = 4 n = 4
CMC, carboxymethyl cellulose; DMSO, dimethyl sulfoxide.
Figure C1.1 Concentration-time profiles of carbamazepine (CBZ) in plasma and brain following IN
(0.4 mg/kg) and oral (4 mg/kg) administration to mice. Symbols represent the mean values ± SEM
(n = 4).

Appendix C
296
Table C1.2 The main pharmacokinetic parameters of CBZ following its intranasal (IN) (0.4 mg/kg)
and oral (4 mg/kg) administration to mice.
Pharmacokinetic Parameters
Plasma Brain Liver
IN Oral IN Oral IN Oral
tmax (min) 10.0 15.0 10.0 15.0 10.0 5.0
Cmax (µg/mL) 2.32 3.30 2.14b
2.32b 2.78
b 3.63
b
AUCt (µg.min/mL) 252.58 450.09 193.19c
337.10c
204.15c
499.14c
F (%)a 105.8 18.9 - - - - a
Absolute bioavailability was calculated based on AUCt values. b Values expressed in µg/g.
c Values expressed in
µg.min/g. AUCt, area under the concentration-time curve from time zero to the last quantifiable drug concentration;
Cmax, maximum peak concentration; F, absolute bioavailability; tmax, time to achieve Cmax.
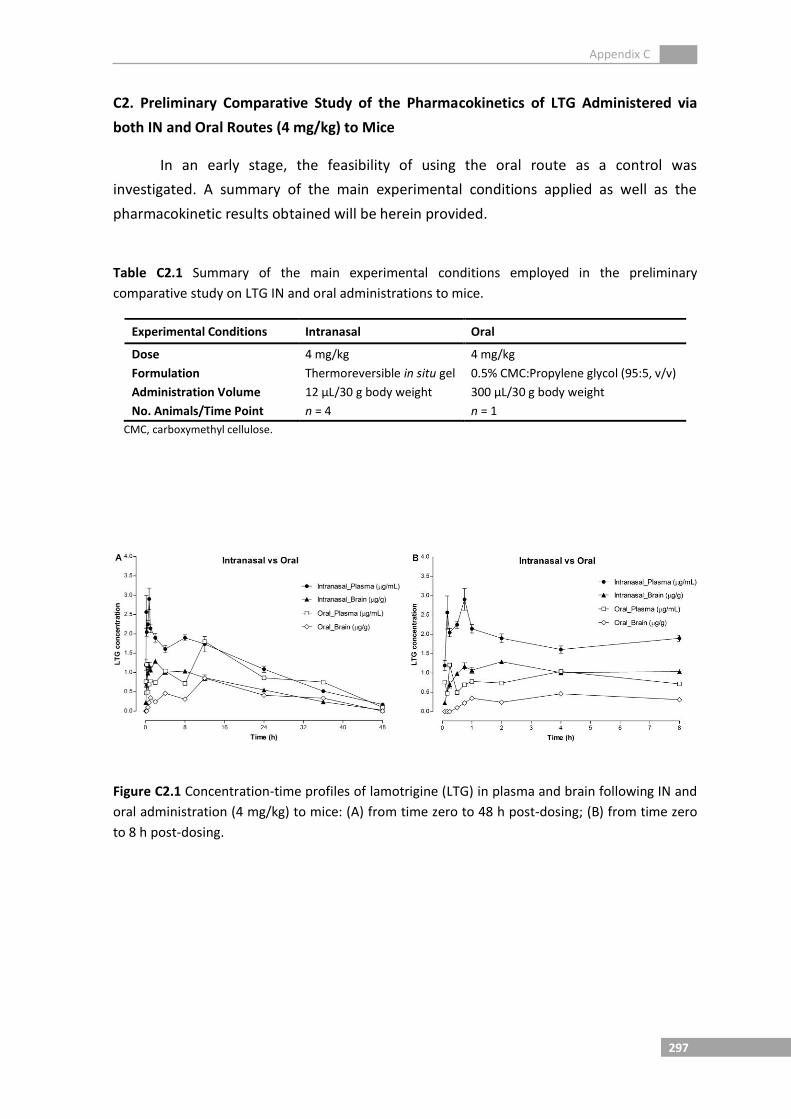
Appendix C
297
C2. Preliminary Comparative Study of the Pharmacokinetics of LTG Administered via
both IN and Oral Routes (4 mg/kg) to Mice
In an early stage, the feasibility of using the oral route as a control was
investigated. A summary of the main experimental conditions applied as well as the
pharmacokinetic results obtained will be herein provided.
Table C2.1 Summary of the main experimental conditions employed in the preliminary
comparative study on LTG IN and oral administrations to mice.
Experimental Conditions Intranasal Oral
Dose 4 mg/kg 4 mg/kg
Formulation Thermoreversible in situ gel 0.5% CMC:Propylene glycol (95:5, v/v)
Administration Volume 12 µL/30 g body weight 300 µL/30 g body weight
No. Animals/Time Point n = 4 n = 1
CMC, carboxymethyl cellulose.
Figure C2.1 Concentration-time profiles of lamotrigine (LTG) in plasma and brain following IN and
oral administration (4 mg/kg) to mice: (A) from time zero to 48 h post-dosing; (B) from time zero
to 8 h post-dosing.

Appendix C
298
Table C2.2 The main pharmacokinetic parameters of LTG following its intranasal (IN) and oral
administration (4 mg/kg) to mice.
Pharmacokinetic Parameters
Plasma Brain Liver
IN Oral IN Oral IN Oral
tmax (h) 0.75 12.0 2.00 12.0 8.00 12.0
Cmax (µg/mL) 2.90 1.80 1.29b
0.85b 2.15
b 1.67
b
AUCt (µg.h/mL) 52.63 42.50 25.41c
19.04c
54.80c
47.88c
F (%)a 117.5 94.9 - - - - a Absolute bioavailability was calculated based on AUCt values.
b Values expressed in µg/g.
c Values expressed in µg.h/g.
AUCt, area under the concentration-time curve from time zero to the last quantifiable drug concentration; Cmax,
maximum peak concentration; F, absolute bioavailability; tmax, time to achieve Cmax.

APPENDIX D.


Appendix D
301
D1. Pharmacokinetics of CBZ after IN and IV Administration to Mice
Table D1.1 CBZ concentrations in plasma (µg/mL) at predefined time points following both
intranasal (IN) and intravenous (IV) administrations (0.4 mg/kg) to mice.
Route Post-dosing Time (min)
Mouse Meana SD SEM % CV
0 I II III
IN
5 2.411 2.376 2.029 2.215 2.258 0.174 0.087 7.728
10 2.515 2.651 1.865 2.245 2.319 0.347 0.173 14.944
15 2.346 1.826 2.185 1.916 2.068 0.240 0.120 11.590
30 1.790 1.789 1.800 2.026 1.852 0.117 0.058 6.298
45 1.664 2.084 2.234 1.945 1.982 0.243 0.121 12.257
60 1.363 1.467 1.186 1.343 1.340 0.116 0.058 8.647
90 1.395 1.111 1.218 1.279 1.251 0.119 0.059 9.485
120 1.884 1.393 1.224 1.341 1.461 0.291 0.146 19.927
180 0.050* 0.753 0.050* 0.110 0.241 0.342 0.171 142.341
240 0.183 0.050* 0.261 - 0.124 0.120 0.060 97.071
IV
5 2.471 2.407 2.477 2.513 2.467 0.044 0.022 1.800
10 2.203 2.203 2.230 2.135 2.193 0.041 0.020 1.855
15 1.988 2.116 1.843 1.831 1.944 0.135 0.067 6.933
30 2.157 1.552 1.869 2.091 1.917 0.273 0.136 14.227
45 1.970 1.713 1.818 1.785 1.822 0.108 0.054 5.948
60 1.477 1.559 1.334 1.333 1.426 0.112 0.056 7.829
90 1.896 1.488 1.398 1.160 1.485 0.307 0.153 20.634
120 1.153 1.183 1.194 1.083 1.153 0.050 0.025 4.358
180 0.050* 0.050* 0.170 0.298 0.142 0.118 0.059 83.277
240 0.050* 0.050* - 0.050* 0.038 0.025 0.013 66.667 a
CBZ concentration mean values (n = 4). * Concentration below the limit of quantification (BLOQ) - these values were
assumed as 0.5xLLOQ = 0.050 µg/mL. SD, standard deviation; SEM, standard error of the mean; CV, coefficient of
variation.

Appendix D
302
Table D1.2 CBZ concentrations in brain (µg/g) at predefined time points following both intranasal
(IN) and intravenous (IV) administrations (0.4 mg/kg) to mice.
Route Post-dosing Time (min)
Mouse Meana SD SEM % CV
0 I II III
IN
5 2.133 2.164 1.708 1.948 1.988 0.210 0.105 10.567
10 2.337 2.549 1.530 2.145 2.140 0.439 0.220 20.516
15 2.036 1.412 1.805 1.523 1.694 0.282 0.141 16.637
30 1.105 1.256 1.403 1.420 1.296 0.147 0.074 11.351
45 1.250 1.669 1.780 1.500 1.550 0.231 0.115 14.881
60 1.142 1.046 0.934 1.102 1.056 0.090 0.045 8.539
90 1.134 0.880 1.029 1.056 1.025 0.106 0.053 10.386
120 1.629 1.034 0.860 0.955 1.119 0.347 0.174 31.020
180 0.200* 0.871 - - 0.268 0.413 0.206 154.264
240 0.200* 0.200* 0.200* 0.200* 0.200 - - -
IV
5 2.514 2.394 2.425 2.205 2.385 0.130 0.065 5.450
10 1.997 1.785 1.932 1.801 1.879 0.103 0.051 5.469
15 1.831 1.776 1.672 1.641 1.730 0.088 0.044 5.113
30 1.722 1.467 1.647 2.392 1.807 0.405 0.202 22.399
45 2.242 1.566 1.923 1.555 1.821 0.328 0.164 18.024
60 1.288 1.243 1.055 1.082 1.167 0.116 0.058 9.938
90 1.684 1.151 1.584 1.208 1.407 0.267 0.133 18.950
120 1.317 1.022 1.106 0.974 1.105 0.152 0.076 13.723
180 0.200* 0.200* 0.200* 0.200* 0.200 - - -
240 0.200* - 0.200* - 0.100 0.115 0.058 115.470 a
CBZ concentration mean values (n = 4). * Concentration below the limit of quantification (BLOQ) - these values were
assumed as 0.5xLLOQ = 0.200 µg/g. SD, standard deviation; SEM, standard error of the mean; CV, coefficient of
variation.

Appendix D
303
Table D1.3 CBZ concentrations in liver (µg/g) at predefined time points following both intranasal
(IN) and intravenous (IV) administrations (0.4 mg/kg) to mice.
Route Post-dosing Time (min)
Mouse Meana SD SEM % CV
0 I II III
IN
5 2.985 2.974 2.451 2.645 2.764 0.261 0.131 9.454
10 2.951 3.301 1.986 2.864 2.775 0.559 0.279 20.138
15 2.771 2.199 2.518 2.176 2.416 0.284 0.142 11.741
30 1.774 1.847 1.944 2.192 1.939 0.182 0.091 9.409
45 1.716 2.417 2.658 2.134 2.231 0.405 0.202 18.145
60 1.616 1.167 1.187 1.150 1.280 0.225 0.112 17.555
90 1.261 1.175 1.374 1.315 1.281 0.084 0.042 6.592
120 2.255 1.484 1.196 1.070 1.501 0.531 0.266 35.400
180 - 0.400* - 0.400* 0.200 0.231 0.115 115.470
240 0.400* 0.400* 0.400* - 0.300 0.200 0.100 66.667
IV
5 3.352 3.766 3.226 3.213 3.389 0.259 0.130 7.643
10 2.867 2.599 2.872 2.684 2.756 0.136 0.068 4.938
15 2.472 2.620 2.419 2.313 2.456 0.128 0.064 5.205
30 2.288 1.922 2.215 2.335 2.190 0.185 0.093 8.458
45 2.725 2.255 2.560 2.320 2.465 0.217 0.109 8.823
60 1.744 1.807 1.466 1.510 1.632 0.169 0.085 10.373
90 2.055 1.258 1.594 1.449 1.589 0.340 0.170 21.367
120 1.372 1.406 1.356 1.185 1.330 0.099 0.049 7.419
180 - 0.400* 0.400* 0.400* 0.300 0.200 0.100 66.667
240 - - - - - - - - a
CBZ concentration mean values (n = 4). * Concentration below the limit of quantification (BLOQ) - these values were
assumed as 0.5xLLOQ = 0.400 µg/g. SD, standard deviation; SEM, standard error of the mean; CV, coefficient of
variation.

Appendix D
304

Appendix D
305
D2. Brain Biodristribution of CBZ after IN and IV Administration to Mice
Table D2.1 CBZ concentrations in plasma (µg/mL), remaining portion of the brain (µg/g), frontal
cortex (µg/g) and olfactory bulb (µg/g) at predefined time points following IN administration (0.4
mg/kg) to mice.
a CBZ concentration mean values (n = 4).
SD,
standard deviation; SEM, standard error of the mean; CV, coefficient of
variation.
Matrix Post-dosing Time (min)
Mouse Meana SD SEM % CV
0 I II III
Plasma 5 2.938 2.082 3.074 2.989 2.771 0.463 0.231 16.700
10 2.705 3.079 2.753 2.842 2.845 0.166 0.083 5.848
15 2.684 2.604 2.704 2.709 2.675 0.049 0.024 1.826
30 2.689 2.095 2.005 1.952 2.185 0.341 0.170 15.597
60 2.515 2.268 2.252 1.443 2.120 0.467 0.233 22.016
Remaining Brain Portion
5 2.535 1.439 2.452 2.035 2.115 0.501 0.251 23.697
10 2.720 2.311 2.625 2.656 2.578 0.182 0.091 7.065
15 1.805 2.577 2.299 2.047 2.182 0.331 0.166 15.191
30 2.647 1.864 1.763 1.675 1.987 0.447 0.223 22.486
60 2.714 2.565 1.968 1.282 2.132 0.652 0.326 30.596
Frontal Cortex
5 2.634 1.679 3.144 2.392 2.462 0.609 0.305 24.741
10 2.839 2.963 3.167 3.246 3.054 0.186 0.093 6.094
15 2.665 2.847 2.560 2.674 2.687 0.119 0.059 4.413
30 2.665 1.589 1.628 1.487 1.842 0.552 0.276 29.950
60 2.658 2.451 1.843 1.327 2.070 0.604 0.302 29.188
Olfactory Bulb
5 3.004 2.026 3.183 2.608 2.705 0.512 0.256 18.940
10 3.283 3.327 2.940 3.080 3.158 0.181 0.090 5.727
15 2.568 2.937 2.767 2.758 2.758 0.151 0.075 5.469
30 2.673 1.809 1.663 1.544 1.922 0.512 0.256 26.640
60 2.699 2.493 1.876 1.374 2.110 0.603 0.301 28.569

Appendix D
306
Table D2.2 CBZ concentrations in plasma (µg/mL), remaining portion of the brain (µg/g), frontal
cortex (µg/g) and olfactory bulb (µg/g) at predefined time points following IV administration (0.4
mg/kg) to mice.
a CBZ concentration mean values (n = 4).
# Concentration below the limit of quantification (BLOQ) - these values were
assumed as 0.5xLLOQ = 0.010 µg. SD, standard deviation; SEM, standard error of the mean; CV, coefficient of variation.
Matrix Post-dosing Time (min)
Mouse Meana SD SEM % CV
0 I II III
Plasma 5 3.084 2.703 3.056 2.624 2.867 0.237 0.119 8.276
10 2.893 2.936 2.964 2.826 2.905 0.060 0.030 2.064
15 1.859 2.231 2.409 2.664 2.291 0.338 0.169 14.769
30 2.332 2.291 2.475 2.051 2.287 0.176 0.088 7.693
60 1.491 2.063 1.955 1.188 1.674 0.408 0.204 24.373
Remaining Brain Portion
5 3.429 2.939 3.149 2.866 3.096 0.252 0.126 8.154
10 3.209 3.040 2.807 2.928 2.996 0.171 0.086 5.711
15 2.375 2.639 2.715 3.071 2.700 0.287 0.144 10.637
30 2.517 2.476 2.535 2.352 2.470 0.082 0.041 3.339
60 1.478 2.018 2.065 1.187 1.687 0.427 0.213 25.289
Frontal Cortex
5 3.176 2.743 3.130 2.866 2.979 0.208 0.104 6.985
10 3.027 3.116 2.800 2.769 2.928 0.170 0.085 5.809
15 2.197 2.642 2.549 2.717 2.526 0.230 0.115 9.114
30 2.432 2.658 2.650 2.256 2.499 0.193 0.096 7.714
60 1.581 2.013 2.035 1.229 1.714 0.385 0.193 22.469
Olfactory Bulb
5 3.848 2.547 2.559 2.847 2.950 0.615 0.307 20.830
10 3.095 2.902 2.342 2.910 2.812 0.326 0.163 11.589
15 2.232 2.722 2.522 2.653 2.532 0.217 0.108 8.559
30 2.580 2.371 2.235 2.255 2.360 0.158 0.079 6.712
60 0.909# 1.713 1.797 1.190 1.402 0.425 0.212 30.286

APPENDIX E.


Appendix E
309
E1. Pharmacokinetics of LTG after IN and IV Administration to Mice
Table E1.1 LTG concentrations in plasma (µg/mL) at predefined time points following both
intranasal (IN) and intravenous (IV) administrations (4 mg/kg) to mice.
Route Post-dosing Time (h)
Mouse Meana SD SEM % CV
0 I II III
IN
0.083 1.410 1.436 1.002 0.919 1.192 0.270 0.135 22.627
0.167 1.981 3.825 2.081 2.366 2.563 0.857 0.428 33.425
0.25 2.131 2.013 1.762 2.280 2.046 0.219 0.109 10.697
0.5 2.365 2.430 2.033 2.166 2.249 0.183 0.091 8.121
0.75 3.121 2.510 3.595 2.386 2.903 0.562 0.281 19.356
1 2.030 2.129 1.961 2.449 2.142 0.216 0.108 10.085
2 2.089 2.086 1.654 1.764 1.898 0.223 0.112 11.767
4 1.654 1.466 1.455 1.852 1.607 0.187 0.093 11.638
8 1.849 2.049 1.699 1.989 1.897 0.156 0.078 8.238
12 1.813 2.257 1.426 1.437 1.733 0.393 0.196 22.665
24 1.095 1.022 1.303 0.916 1.084 0.164 0.082 15.079
36 0.476 0.548 0.618 0.428 0.517 0.083 0.042 16.072
48 0.216 0.100* 0.264 0.100* 0.170 0.083 0.042 48.935
IV
0.083 3.041 2.846 2.693 3.494 3.019 0.348 0.174 11.523
0.167 2.986 2.582 2.859 2.638 2.766 0.189 0.094 6.832
0.25 2.370 2.424 3.005 2.596 2.599 0.288 0.144 11.069
0.5 2.633 2.389 2.490 2.463 2.494 0.102 0.051 4.105
0.75 2.415 2.559 2.365 2.141 2.370 0.174 0.087 7.325
1 2.267 1.762 2.293 2.597 2.230 0.346 0.173 15.508
2 1.581 1.596 1.617 1.833 1.657 0.119 0.059 7.154
4 2.338 1.616 2.433 1.466 1.963 0.493 0.246 25.094
8 1.344 1.597 1.350 1.389 1.420 0.120 0.060 8.424
12 1.370 1.095 1.360 1.583 1.352 0.200 0.100 14.777
24 1.142 0.858 0.981 1.134 1.029 0.136 0.068 13.222
36 0.303 0.236 0.303 0.244 0.271 0.036 0.018 13.329
48 0.232 0.100* 0.100* 0.100* 0.133 0.066 0.033 49.654 a
LTG concentration mean values (n = 4). * Concentration below the limit of quantification (BLOQ) - these values were
assumed as 0.5xLLOQ = 0.100 µg/mL. SD, standard deviation; SEM, standard error of the mean; CV, coefficient of
variation.

Appendix E
310
Table E1.2 LTG concentrations in brain (µg/g) at predefined time points following both intranasal
(IN) and intravenous (IV) administrations (4 mg/kg) to mice.
Route Post-dosing Time (h)
Mouse Meana SD SEM % CV
0 I II III
IN
0.083 0.313 0.208 0.286 0.100* 0.227 0.095 0.048 42.085
0.167 0.423 0.559 0.598 0.446 0.507 0.086 0.043 16.882
0.25 0.699 0.572 0.958 0.573 0.701 0.182 0.091 25.944
0.5 0.952 1.091 0.930 0.971 0.986 0.072 0.036 7.303
0.75 0.920 1.287 1.127 1.346 1.170 0.191 0.095 16.282
1 1.144 0.880 1.016 1.242 1.070 0.157 0.079 14.694
2 1.281 1.335 1.253 1.293 1.290 0.034 0.017 2.659
4 1.149 0.882 0.942 1.063 1.009 0.120 0.060 11.904
8 0.982 1.051 1.054 1.057 1.036 0.036 0.018 3.504
12 0.913 1.042 0.786 0.710 0.862 0.146 0.073 16.890
24 0.536 0.523 0.691 0.442 0.548 0.104 0.052 18.979
36 0.239 0.245 0.263 0.217 0.241 0.019 0.010 7.934
48 - - 0.100* - 0.025 0.050 0.025 200.000
IV
0.083 1.169 1.270 1.156 1.653 1.312 0.233 0.117 17.763
0.167 1.280 1.155 1.269 1.224 1.232 0.057 0.028 4.605
0.25 1.253 1.414 1.362 1.423 1.363 0.078 0.039 5.727
0.5 1.672 1.873 1.632 1.846 1.756 0.122 0.061 6.922
0.75 1.580 1.753 1.614 1.541 1.622 0.092 0.046 5.687
1 1.516 1.255 1.706 1.483 1.490 0.185 0.093 12.426
2 1.302 1.134 1.230 1.257 1.231 0.071 0.035 5.756
4 1.626 1.038 1.281 1.044 1.247 0.277 0.138 22.206
8 0.784 0.873 0.808 0.798 0.816 0.039 0.020 4.823
12 0.811 0.701 0.826 1.067 0.851 0.154 0.077 18.077
24 0.743 0.451 0.537 0.580 0.578 0.123 0.061 21.211
36 0.100* 0.100* 0.100* 0.100* 0.100 - - -
48 0.100* - - - 0.025 0.050 0.025 200.000 a
LTG concentration mean values (n = 4). * Concentration below the limit of quantification (BLOQ) - these values were
assumed as 0.5xLLOQ = 0.100 µg/g. SD, standard deviation; SEM, standard error of the mean; CV, coefficient of
variation.

Appendix E
311
Table E1.3 LTG concentrations in liver (µg/g) at predefined time points following both intranasal
(IN) and intravenous (IV) administrations (4 mg/kg) to mice.
Route Post-dosing Time (h)
Mouse Meana SD SEM % CV
0 I II III
IN
0.083 0.937 0.400* 0.400* 0.400* 0.534 0.268 0.134 50.238
0.167 1.152 1.501 1.449 1.220 1.330 0.170 0.085 12.793
0.25 1.674 1.465 1.645 1.127 1.477 0.252 0.126 17.028
0.5 1.730 2.143 1.771 1.788 1.858 0.192 0.096 10.313
0.75 1.692 2.042 2.066 2.101 1.975 0.191 0.095 9.647
1 1.935 1.635 1.698 2.140 1.852 0.231 0.116 12.490
2 1.657 1.779 1.563 2.000 1.750 0.189 0.094 10.789
4 1.885 1.581 1.224 1.887 1.644 0.315 0.158 19.159
8 2.030 1.902 2.485 2.163 2.145 0.250 0.125 11.675
12 2.004 2.180 1.558 1.612 1.839 0.302 0.151 16.428
24 1.208 1.208 1.346 0.983 1.186 0.150 0.075 12.664
36 0.400* 0.400* 0.400* 0.400* 0.400 - - -
48 0.400* 0.400* 0.400* 0.400* 0.400 - - -
IV
0.083 2.636 2.570 2.749 3.867 2.956 0.612 0.306 20.719
0.167 3.689 2.682 3.056 3.120 3.137 0.416 0.208 13.262
0.25 2.511 2.690 2.875 2.517 2.648 0.173 0.086 6.524
0.5 2.764 2.963 2.803 2.950 2.870 0.101 0.051 3.529
0.75 2.822 3.271 2.746 2.440 2.820 0.343 0.171 12.160
1 2.465 2.088 2.834 2.463 2.463 0.305 0.152 12.368
2 2.072 1.878 2.006 2.327 2.071 0.189 0.094 9.119
4 2.493 2.142 2.534 2.200 2.342 0.200 0.100 8.538
8 1.785 1.772 1.698 1.579 1.709 0.094 0.048 5.523
12 1.723 1.590 1.672 1.886 1.718 0.125 0.062 7.258
24 1.215 0.871 1.063 1.178 1.082 0.155 0.077 14.306
36 0.400* 0.400* 0.400* 0.400* 0.400 - - -
48 0.400* 0.400* 0.400* 0.400* 0.400 - - - a
LTG concentration mean values (n = 4). * Concentration below the limit of quantification (BLOQ) - these values were
assumed as 0.5xLLOQ = 0.400 µg/g. SD, standard deviation; SEM, standard error of the mean; CV, coefficient of
variation.

Appendix E
312

Appendix E
313
E2. Brain Biodristribution of LTG after IN and IV Administration to Mice
Table E2.1 LTG concentrations in plasma (µg/mL), remaining portion of the brain (µg/g), frontal
cortex (µg/g) and olfactory bulb (µg/g) at predefined time points following IN administration (4
mg/kg) to mice.
a LTG concentration mean values (n = 4). * Concentration below the limit of quantification (BLOQ) - these values were
assumed as 0.5xLLOQ = 0.100 µg/g. # Concentration below the limit of quantification (BLOQ) - these values were
assumed as 0.5xLLOQ = 0.0125 µg. SD,
standard deviation; SEM, standard error of the mean; CV, coefficient of variation.
Matrix Post-dosing Time (h)
Mouse Meana SD SEM % CV
0 I II III
Plasma 0.083 0.757 9.517 2.274 1.109 3.414 4.120 2.060 120.672
0.167 6.872 2.229 4.650 8.136 5.472 2.598 1.299 47.477
0.25 2.694 1.933 1.912 2.233 2.193 0.365 0.182 16.633
0.5 3.421 2.240 2.431 2.057 2.537 0.609 0.304 23.992
1 3.504 3.085 2.056 2.558 2.801 0.630 0.315 22.479
2 2.136 1.708 1.697 2.636 2.044 0.445 0.222 21.752
4 1.277 1.520 1.291 1.827 1.479 0.258 0.129 17.433
Remaining Brain Portion
0.083 0.100* 0.100* 0.100* 0.100* 0.100 - - -
0.167 0.369 0.342 0.313 0.377 0.350 0.029 0.014 8.209
0.25 0.698 0.366 0.648 0.593 0.576 0.147 0.073 25.436
0.5 0.776 0.917 1.006 0.737 0.859 0.125 0.062 14.524
1 1.242 1.134 1.147 1.185 1.177 0.048 0.024 4.093
2 1.316 1.172 0.974 1.830 1.323 0.366 0.183 27.664
4 1.031 1.120 0.934 1.085 1.042 0.081 0.040 7.748
Frontal Cortex
0.083 0.327 0.148 0.346 0.240 0.265 0.091 0.046 34.328
0.167 0.363 0.371# 0.353 0.324 0.353 0.021 0.010 5.814
0.25 0.545 0.398 0.643 0.490 0.519 0.102 0.051 19.726
0.5 0.828 0.712 0.672 0.610 0.705 0.092 0.046 13.018
1 1.129 0.945 0.772 0.966 0.953 0.146 0.073 15.341
2 1.158 0.781 0.922 1.238 1.025 0.211 0.105 20.546
4 1.037 0.836 0.820 0.996 0.922 0.110 0.055 11.950
Olfactory Bulb
0.083 1.836 8.140 8.594 8.244 6.704 3.251 1.625 48.495
0.167 5.704 11.896 2.232 7.616 6.862 4.029 2.014 58.707
0.25 1.884 1.779 1.766 1.502 1.733 0.163 0.081 9.381
0.5 2.169 8.218 3.445 3.165 4.249 2.702 1.351 63.592
1 11.714 5.057 4.768 2.704 6.061 3.912 1.956 64.546
2 2.265 2.538 2.278 2.758 2.460 0.235 0.118 9.557
4 1.888 1.831 1.655 1.078# 1.613 0.370 0.185 22.964

Appendix E
314
Table E2.2 LTG concentrations in plasma (µg/mL), remaining portion of the brain (µg/g), frontal
cortex (µg/g) and olfactory bulb (µg/g) at predefined time points following IV administration (4
mg/kg) to mice.
a LTG concentration mean values (n = 4). SD, standard deviation; SEM, standard error of the mean; CV, coefficient of
variation.
Matrix Post-dosing Time (h)
Mouse Meana SD SEM % CV
0 I II III
Plasma 0.083 2.604 3.038 2.684 3.092 2.854 0.246 0.123 8.623
0.167 3.162 2.697 2.442 2.555 2.714 0.316 0.158 11.653
0.25 2.344 2.301 2.442 2.591 2.419 0.129 0.064 5.313
0.5 2.227 2.271 2.309 2.438 2.311 0.091 0.046 3.949
1 1.907 1.844 1.941 1.890 1.896 0.041 0.020 2.147
2 1.824 1.768 1.993 1.808 1.848 0.099 0.050 5.383
4 2.037 1.844 2.207 2.172 2.065 0.164 0.082 7.962
Remaining Brain Portion
0.083 0.907 0.976 0.990 1.104 0.994 0.082 0.041 8.203
0.167 1.261 1.073 1.282 1.355 1.243 0.120 0.060 9.653
0.25 1.297 1.173 1.186 1.359 1.254 0.089 0.045 7.131
0.5 1.154 1.218 1.393 1.195 1.240 0.105 0.053 8.501
1 1.163 1.193 1.234 1.376 1.242 0.094 0.047 7.584
2 1.266 1.174 1.392 0.987 1.205 0.171 0.085 14.166
4 1.261 1.132 1.243 1.189 1.206 0.058 0.029 4.815
Frontal Cortex
0.083 0.901 0.778 0.747 0.824 0.813 0.067 0.034 8.248
0.167 1.024 0.933 1.128 0.720 0.951 0.173 0.087 18.202
0.25 0.883 0.848 1.029 1.079 0.960 0.112 0.056 11.650
0.5 0.889 1.155 1.116 0.906 1.017 0.138 0.069 13.620
1 0.962 1.087 0.923 0.888 0.965 0.086 0.043 8.960
2 0.840 0.754 0.845 0.811 0.812 0.042 0.021 5.170
4 0.797 0.781 0.893 0.835 0.826 0.050 0.025 6.021
Olfactory Bulb
0.083 1.907 2.359 2.085 1.931 2.071 0.208 0.104 10.043
0.167 2.031 2.371 2.192 2.381 2.244 0.166 0.083 7.409
0.25 2.396 2.293 2.425 2.521 2.409 0.094 0.047 3.904
0.5 2.380 2.573 2.448 2.108 2.377 0.196 0.098 8.262
1 2.261 2.371 2.302 1.832 2.192 0.244 0.122 11.126
2 1.777 1.724 2.195 2.085 1.945 0.230 0.115 11.835
4 1.862 1.601 1.808 1.847 1.779 0.121 0.061 6.816

REFERENCES


References
317
REFERENCES
ABBOTT, N.J. (2014) - Anatomy and physiology of the blood-brain barriers. Drug Delivery to the
Brain - Physiological Concepts, Methodologies and Approaches. Hammarlund-Udenaes, M.;
de Lange, E.C.M.; Thorne, R.G. (Eds.). Springer, Chapter 1, pp. 3-21.
ABDEL-BAR, H.M. [et al.] (2013) - Evaluation of brain targeting and mucosal integrity of nasally
administrated nanostructured carriers of a CNS active drug, clonazepam. J Pharm Pharm Sci.
16:3, 456-469.
ABOU-KHALIL, B.; SCHMIDT, D. (2012) - Antiepileptic drugs: advantages and disadvantages.
Handbook of Clinical Neurology Epilepsy - Part II. Stefan, H.; Theodore, W.H. (Eds.). Elsevier,
Chapter 42, pp. 723-739.
AGU, R.U.; UGWOKE, M.I. (2008) - In situ and ex vivo nasal models for preclinical drug development
studies. Drug Absorption Studies - In Situ, In Vitro and In Silico Models. Ehrhardt, C.; Kim, K.
(Eds.). Springer, Chapter 5, pp. 112-134.
ALAGUSUNDARAM, M. [et al.] (2010) - Nasal drug delivery system - an overview. Int J Res Pharm Sci.
1:4, 454-465.
ALAM, M.I. [et al.] (2010) - Strategy for effective brain drug delivery. Eur J Pharm Sci. 40:5, 385-
403.
ALAM, T. [et al.] (2015) - Optimization of nanostructured lipid carriers of lamotrigine for brain
delivery: in vitro characterization and in vivo efficacy in epilepsy. Expert Opin Drug Deliv.
12:2, 181-194.
ALEXOPOULOS, A.V. (2013) - Pharmacoresistant epilepsy: definition and explanation. Epileptology.
1:1, 38-42.
ALMEIDA, A.M. [et al.] (2002) - Linear regression for calibration lines revisited: weighting schemes
for bioanalytical methods. J Chromatogr B. 774:2, 215-222.
ALSARRA, I.A. [et al.] (2010) - Vesicular systems for intranasal drug delivery. Drug Delivery to the
Central Nervous System. Jain, K.K. (Ed.). Humana Press, Chapter 8, pp. 175-203.
ALVES, G. [et al.] (2007) - Enantioselective HPLC-UV method for determination of eslicarbazepine
acetate (BIA 2-093) and its metabolites in human plasma. Biomed Chromatogr. 21:11, 1127-
1134.
ALVES, G. [et al.] (2010) - Bioanalysis in drug discovery and development: focus on
pharmacokinetic studies. J Drug Addict Educ Erad. 5:1-2, 1-22.
AMBRÓSIO, A.F. [et al.] (2002) - Mechanisms of action of carbamazepine and its derivatives,
oxcarbazepine, BIA 2-093, and BIA 2-024. Neurochem Res. 27:1-2, 121-130.
AMERICAN ACADEMY OF PEDIATRICS, COMMITEE ON DRUGS (1997) - Alternative routes of drug
administration - advantages and disadvantages. Pediatrics. 100:1, 143-152.
ANDERSON, B.D. (1996) - Prodrugs for improved CNS delivery. Adv Drug Deliv Rev. 19:2, 171-202.

References
318
ANDERSON, G.D.; SANETO, R.P. (2012) - Current oral and non-oral routes of antiepileptic drug
delivery. Adv Drug Deliv Rev. 64:10, 911-918.
ANDERSON, M. (2013) - Buccal midazolam for pediatric convulsive seizures: efficacy, safety, and
patient acceptability. Patient Prefer Adherence. 7, 27-34.
ANDERSON, R.J. (2009) - The little compound that could: how phenytoin changed drug discovery
and development. Mol Interv. 9:5, 208-214.
APPASAHEB, P.S. [et al.] (2013) - A review on intranasal drug delivery system. J Adv Pharm Educ Res.
3:4, 333-346.
ARONSON, J.K. [et al.] (1992) - ABC of monitoring drug therapy - phenytoin. Br Med J. 305:6863,
1215-1218.
ARORA, P. [et al.] (2002) - Permeability issues in nasal drug delivery. Drug Discov. Today. 7:18, 967-
975.
ASHRI, N.Y.; ABDEL-REHIM, M. (2011) - Sample treatment based on extraction techniques in
biological matrices. Bioanalysis. 3:17, 2003-2018.
BABU, R.J. [et al.] (2011) - Nose-to-brain transport of melatonin from polymer gel suspensions: a
microdialysis study in rats. J Drug Target. 19:9, 731-740.
BADGUJAR, S. [et al.] (2010) - Formulation and evaluation of sumatriptan succinate nasal in-situ gel
using fulvic acid as novel permeation enhancer. Int J Pharm Res Dev. 2:8, 39-52.
BAGGER, M.; BECHGAARD, E. (2004a) - A microdialysis model to examine nasal drug delivery and
olfactory absorption in rats using lidocaine hydrochloride as a model drug. Int J Pharm.
269:2, 311-322.
BAGGER, M.A.; BECHGAARD, E. (2004b) - The potential of nasal application for delivery to the central
brain - a microdialysis study of fluorescein in rats. Eur J Pharm Sci. 21:2-3, 235-242.
BAHADUR, S.; PATHAK, K. (2012) - Physicochemical and physiological considerations for efficient
nose-to-brain targeting. Expert Opin Drug Deliv. 9:1, 19-31.
BAKER, H.; SPENCER, R.F. (1986) - Transneuronal transport of peroxidase-conjugated wheat germ
agglutinin (WGA-HRP) from the olfactory epithelium to the brain of the adult rat. Exp Brain
Res. 63:3, 461-473.
BALDA, M.S.; MATTER, K. (1998) - Tight junctions. J Cell Sci. 111:Pt 5, 541-547.
BANERJEE, P.N. [et al.] (2009) - The descriptive epidemiology of epilepsy - a review. Epilepsy Res.
85:1, 31-45.
BANKS, W.A. [et al.] (2009) - Delivery of testosterone to the brain by intranasal administration:
comparison to intravenous testosterone. J Drug Target. 17:2, 91-97.
BANSAL, S.; DESTEFANO, A. (2007) - Key elements of bioanalytical method validation for small
molecules. AAPS J. 9:1, E109-E114.

References
319
BARAKAT, N.S. [et al.] (2006) - Carbamazepine uptake into rat brain following intra-olfactory
transport. J Pharm Pharmacol. 58:1, 63-72.
BASU, S.; BANDYOPADHYAY, A.K. (2010) - Development and characterization of mucoadhesive in situ
nasal gel of midazolam prepared with ficus carica mucilage. AAPS PharmSciTech. 11:3, 1223-
1231.
BAUER, L.A. (2008) - Phenytoin. Applied Clinical Pharmacokinetics. McGraw-Hill Medical, Chapter
10, pp. 485-547.
BAZIL, C.W.; PEDLEY, T.A. (2003) - Clinical pharmacology of antiepileptic drugs. Clin
Neuropharmacol. 26:1, 38-52.
BEGLEY, D.J. (2004) - Delivery of therapeutic agents to the central nervous system: the problems
and the possibilities. Pharmacol Ther. 104:1, 29-45.
BEHL, C.R. [et al.] (1998) - Effects of physicochemical properties and other factors on systemic
nasal drug delivery. Adv Drug Deliv Rev. 29:1-2, 89-116.
BELL, G.S.; SANDER, J.W. (2001) - The epidemiology of epilepsy: the size of the problem. Seizure.
10:4, 306-314.
BERG, A.T.; SCHEFFER, I.E. (2011) - New concepts in classification of the epilepsies: entering the 21st
century. Epilepsia. 52:6, 1058-1062.
BERG, A.T. [et al.] (2010) - Revised terminology and concepts for organization of seizures and
epilepsies: report of the ILAE commission on classification and terminology, 2005-2009.
Epilepsia. 51:4, 676-685.
BERGSTRÖM, U. [et al.] (2002) - Drug targeting to the brain: transfer of picolinic acid along the
olfactory pathways. J Drug Target. 10:6, 469-478.
BERTILSSON, L. (1978) - Clinical pharmacokinetics of carbamazepine. Clin Pharmacokinet. 3:2, 128-
143.
BERTILSSON, L.; TOMSON, T. (1986) - Clinical pharmacokinetics and pharmacological effects of
carbamazepine and carbamazepine-10,11-epoxide - an update. Clin. Pharmacokinet. 11:3,
177-198.
BEYDOUN, A.; KUTLUAY, E. (2002) - Oxcarbazepine. Expert Opin Pharmacother. 3:1, 59-71.
BHATTI, M.M. [et al.] (1998) - Simultaneous determination of phenytoin, carbamazepine, and
10,11-carbamazepine epoxide in human plasma by high-performance liquid chromatography
with ultraviolet detection. J Pharm Biomed Anal. 16:7, 1233-1240.
BHISE, S.B. [et al.] (2008) - Bioavailability of intranasal drug delivery system. Asian J Pharm. 2:4,
201-215.
BIALER, M. (2009) - Pharmacodynamic and pharmacokinetic characteristics of intravenous drugs in
status epilepticus. Epilepsia. 50:Suppl 12, 44-48.
BIALER, M.; WHITE, H.S. (2010) - Key factors in the discovery and development of new antiepileptic
drugs. Nat Rev Drug Discov. 9:1, 68-82.

References
320
BITON, V. (2006) - Pharmacokinetics, toxicology and safety of lamotrigine in epilepsy. Expert Opin
Drug Metab Toxicol. 2:6, 1009-1018.
BITTER, C. [et al.] (2011) - Nasal drug delivery in humans. Curr Probl Dermatol. 40, 20-35.
BJERRE, C. [et al.] (1996) - Bioavailability of the sedative propiomazine after nasal administration in
rats. Int J Pharm. 144:2, 217-224.
BORN, J. [et al.] (2002) - Sniffing neuropeptides: a transnasal approach to the human brain. Nat
Neurosci. 5:6, 514-516.
BRIGGS, R.J. [et al.] (2014) - Method transfer, partial validation, and cross validation:
recommendations for best practices and harmonization from the global bioanalysis
consortium harmonization team. AAPS J. 16:6, 1143-1148.
BRODIE, M.J. (1992) - Lamotrigine. Lancet. 339:8806, 1397-1400.
BRODIE, M.J. (2010) - Antiepileptic drug therapy the story so far. Seizure. 19:10, 650-655.
BRODIE, M.J.; DICHTER, M.A. (1996) - Drug therapy - antiepileptic drugs. N Engl J Med. 334:3, 168-
175.
BRODIE, M.J. [et al.] (1995) - Double-blind comparison of lamotrigine and carbamazepine in newly
diagnosed epilepsy. Lancet. 345:8948, 476-479.
BRODIE, M.J. [et al.] (2011) - Antiepileptic drug therapy: does mechanism of action matter?
Epilepsy Behav. 21:4, 331-341.
BUDAKOVA, L. [et al.] (2008) - Simultaneous determination of antiepileptic drugs and their two
active metabolites by HPLC. J Sep Sci. 31:1, 1-8.
BUGAMELLI, F. [et al.] (2002) - Simultaneous analysis of six antiepileptic drugs and two selected
metabolites in human plasma by liquid chromatography after solid-phase extraction. Anal
Chim Acta. 472:1-2, 1-10.
CANEVINI, M.P. [et al.] (2010) - Relationship between adverse effects of antiepileptic drugs,
number of coprescribed drugs, and drug load in a large cohort of consecutive patients with
drug-refractory epilepsy. Epilepsia. 51:5, 797-804.
CASTEL-BRANCO, M.M. (2002) - Caracterização neurofarmacocinética da lamotrigina em ratos. PhD
thesis, University of Coimbra, Coimbra, Portugal.
CASTEL-BRANCO, M.M. [et al.] (2001) - Lamotrigine analysis in blood and brain by high-performance
liquid chromatography. J Chromatogr B. 755:1-2, 119-127.
CHANDRAN, S.; SINGH, R.S. (2007) - Comparison of various international guidelines for analytical
method validation. Pharmazie. 62:1, 4-14.
CHAPMAN, C.D. [et al.] (2013) - Intranasal treatment of central nervous system dysfunction in
humans. Pharm Res. 30:10, 2475-2484.

References
321
CHARLTON, S.T. [et al.] (2007a) - Nasal administration of an angiotensin antagonist in the rat
model: effect of bioadhesive formulations on the distribution of drugs to the systemic and
central nervous systems. Int J Pharm. 338:1-2, 94-103.
CHARLTON, S.T. [et al.]. (2007b) - Evaluation of bioadhesive polymers as delivery systems for nose
to brain delivery: in vitro characterisation studies. J Control Release. 118:2, 225-234.
CHOU, K.; DONOVAN, M.D. (1997) - Distribution of antihistamines into the CSF following intranasal
delivery. Biopharm Drug Dispos. 18:4, 335-346.
CHOU, K.; DONOVAN, M.D. (1998) - Lidocaine distribution into the CNS following nasal and arterial
delivery: a comparison of local sampling and microdialysis techniques. Int J Pharm. 171:1,
53-61.
CHOUDHARY, R.; GOSWAMI, L. (2013) - Nasal route: a novelistic approach for targeted drug delivery
to CNS. Int Res J Pharm. 4:3, 59-62.
CHOW, H.H.S. [et al.] (1999) - Direct transport of cocaine from the nasal cavity to the brain
following intranasal cocaine administration in rats. J Pharm Sci. 88:8, 754-758.
CHUGH, Y. [et al.] (2009) - Intranasal drug delivery: a novel approach. Indian J Otolaryngol Head
Neck Surg. 61:2, 90-94.
CLINCKERS, R. [et al.] (2005) - Quantitative in vivo microdialysis study on the influence of multidrug
transporters on the blood-brain barrier passage of oxcarbazepine: concomitant use of
hippocampal monoamines as pharmacodynamic markers for the anticonvulsant activity. J
Pharmacol Exp Ther. 314:2, 725-731.
CLOYD, J.C.; REMMEL, R.P. (2000) - Antiepileptic drug pharmacokinetics and interactions: impact on
treatment of epilepsy. Pharmacotherapy. 20:8 Pt 2, 139S-151S.
COHEN, A.F. [et al.] (1987) - Lamotrigine, a new anticonvulsant: pharmacokinetics in normal
humans. Clin Pharmacol Ther. 42:5, 535-541.
COMMISSION ON CLASSIFICATION AND TERMINOLOGY OF THE ILAE (1981) - Proposal for revised clinical
and electroencephalographic classification of epileptic seizures. Epilepsia. 22:4, 489-501.
COMMISSION ON CLASSIFICATION AND TERMINOLOGY OF THE ILAE (1989) - Proposal for revised
classification of epilepsies and epileptic syndromes. Epilepsia. 30:4, 389-399.
CONTIN, M. [et al.] (2010) - Simultaneous HPLC-UV analysis of rufinamide, zonisamide, lamotrigine,
oxcarbazepine monohydroxy derivative and felbamate in deproteinized plasma of patients
with epilepsy. J Chromatogr B. 878:3-4, 461-465.
COOK, A.M.; BENSALEM-OWEN, M.K. (2011) - Mechanisms of action of antiepileptic drugs. Therapy.
8:3, 307-313.
COSTANTINO, H.R. [et al.] (2007) - Intranasal delivery: physicochemical and therapeutic aspects. Int
J Pharm. 337:1-2, 1-24.
CZAPIŃSKI, P. [et al.] (2005) - Mechanisms of action of antiepileptic drugs. Curr Top Med Chem. 5:1,
3-14.

References
322
CZAPP, M. [et al.] (2008) - Brain penetration and anticonvulsant efficacy of intranasal
phenobarbital in rats. Epilepsia. 49:7, 1142-1150.
DADGAR, D. [et al.] (1995) - Application issues in bioanalytical method validation, sample analysis
and data reporting. J Pharm Biomed Anal. 13:2, 89-97.
DAHLIN, M.; BJÖRK, E. (2001) - Nasal administration of a physostigmine analogue (NXX-066) for
Alzheimer’s disease to rats. Int J Pharm. 212:2, 267-274.
DAHLIN, M. [et al.] (2000) - Transfer of dopamine in the olfactory pathway following nasal
administration in mice. Pharm Res. 17:6, 737-742.
DAVE, K.; PUROHIT, S. (2013) - Formulation and in vitro characterization of intranasal mucoadhesive
microspheres of lamotrigine using chitosan by gluteraldehyde cross linking. Int J Pharma Bio
Sci. 4:3, 402-415.
DE HAAN, G. [et al.] (2010) - A comparison of midazolam nasal spray and diazepam rectal solution
for the residential treatment of seizure exacerbations. Epilepsia. 51:3, 478-482.
DE LORENZO, A.J.D. (1970) - The olfactory neuron and the blood-brain barrier. Taste and Smell in
Vertebrates. Wolstenhome, G.E.W.; Knight, J. (Eds.). Longman, Chapter 9, pp. 151-176.
DECKERS, C.L.P. [et al.] (2003) - Current limitations of antiepileptic drug therapy: a conference
review. Epilepsy Res. 53:1-2, 1-17.
DEEKEN, J.F.; LÖSCHER, W. (2007) - The blood-brain barrier and cancer: transporters, treatment, and
trojan horses. Clin Cancer Res. 13:6, 1663-1674.
DESILVA, B. [et al.] (2003) - Recommendations for the bioanalytical method validation of ligand-
binding assays to support pharmacokinetic assessments of macromolecules. Pharm Res.
20:11, 1885-1900.
DEVANSHU, S. [et al.] (2010) - Quantitative bioanalysis by LC-MS/MS: a review. J Pharm Biomed Sci.
7:1, 1-9.
DEY, S. [et al.] (2011) - Nasal drug delivery: an approach of drug delivery through nasal route. Der
Pharm Sin. 2:3, 94-106.
DHAKAR, R.C. [et al.] (2010) - A review on factors affecting the design of nasal drug delivery
system. Int Res J Pharm. 1:1, 29-42.
DHURIA, S.V. [et al.] (2009) - Intranasal drug targeting of hypocretin-1 (orexin-A) to the central
nervous system. J Pharm Sci. 98:7, 2501-2515.
DHURIA, S.V. [et al.] (2010) - Intranasal delivery to the central nervous system: mechanisms and
experimental considerations. J Pharm Sci. 99:4, 1654-1673.
DJUPESLAND, P.G. (2003) - Who nose how far nasal delivery can go? in:
http://www.optinose.com/wp-
content/uploads/2003/10/20040915172955_Who_nose_how_far.pdf. Accessed in
December 2014.

References
323
DJUPESLAND, P.G. (2013) - Nasal drug delivery devices: characteristics and performance in a clinical
perspective - a review. Drug Deliv Transl Res. 3:1, 42-62.
DJUPESLAND, P.G. [et al.] (2014) - The nasal approach to delivering treatment for brain diseases: an
anatomic, physiologic, and delivery technology overview. Ther Deliv. 5:6, 709-733.
DRUGBANK. in: http://www.drugbank.ca/. Accessed in January 2015.
DUFES, C. [et al.] (2003) - Brain delivery of vasoactive intestinal peptide (VIP) following nasal
administration to rats. Int J Pharm. 255:1-2, 87-97.
DUNCAN, J.S. (2002) - The promise of new antiepileptic drugs. Br J Clin Pharmacol. 53:2, 123-131.
DUNCAN, J.S. [et al.] (2006) - Adult epilepsy. Lancet. 367:9516, 1087-1100.
DWIBHASHYAM, V.S.N.M.; NAGAPPA, A.N. (2008) - Strategies for enhanced drug delivery to the
central nervous system. Indian J Pharm Sci. 70:2, 145-153.
EADIE, M.J. (1991) - Formation of active metabolites of anticonvulsant drugs - a review of their
pharmacokinetic and therapeutic significance. Clin Pharmacokinet. 21:1, 27-41.
ENGEL JR., J. (2001) - A proposed diagnostic scheme for people with epileptic seizures and with
epilepsy: report of the ILAE task force on classification and terminology. Epilepsia. 42:6, 796-
803.
ENGELBORGHS, S. [et al.] (2000) - Pathophysiology of epilepsy. Acta Neurol Belg. 100:4, 201-213.
ESCADA, P.A. [et al.] (2009) - The human olfactory mucosa. Eur Arch Otorhinolaryngol. 266:11,
1675-1680.
ESKANDARI, S. [et al.] (2011) - Brain delivery of valproic acid via intranasal administration of
nanostructured lipid carriers: in vivo pharmacodynamic studies using rat electroshock
model. Int J Nanomedicine. 6, 363-371.
EURACHEM (2014) - The fitness for purpose of analytical methods - a laboratory guide to method
validation and related topics. in:
https://www.eurachem.org/images/stories/Guides/pdf/MV_guide_2nd_ed_EN.pdf.
Accessed in March 2015.
EUROPEAN MEDICINES AGENCY (2011) - Guideline on bioanalytical method validation. in:
http://www.ema.europa.eu/docs/en_GB/document_library/Scientific_guideline/2011/08/W
C500109686.pdf. Accessed in March 2015.
EUROPEAN PARLIAMENT, COUNCIL OF THE EUROPEAN UNION (2010) - Directive 2010/63/EU of the
European Parliament and of the Council of 22 September 2010 on the protection of animals
used for scientifc purposes. Off J Eur Union. 276, 33-79.
FISHER, R.S.; CHEN, D.K. (2006) - New routes for delivery of anti-epileptic medications. Acta Neurol
Taiwan. 15:4, 225-231.
FISHER, R.S.; HO, J. (2002) - Potential new methods for antiepileptic drug delivery. CNS Drugs. 16:9,
579-593.

References
324
FISHER, R.S. [et al.] (2005) - Epileptic seizures and epilepsy: definitions proposed by the
International League Against Epilepsy (ILAE) and the International Bureau for Epilepsy (IBE).
Epilepsia. 46:4, 470-472.
FISHER, R.S. [et al.] (2014) - ILAE official report: a practical clinical definition of epilepsy. Epilepsia.
55:4, 475-482.
FITTON, A.; GOA, K.L. (1995) - Lamotrigine: an update of its pharmacology and therapeutic use in
epilepsy. Drugs. 50:4, 691-713.
FLESCH, G. (2004) - Overview of the clinical pharmacokinetics of oxcarbazepine. Clin Drug Investig.
24:4, 185-203.
FLORENCE, K. [et al.] (2011) - Intranasal clobazam delivery in the treatment of status epilepticus. J
Pharm Sci. 100:2, 692-703.
FORTUNA, A. [et al.] (2010) - Development and validation of an HPLC-UV method for the
simultaneous quantification of carbamazepine, oxcarbazepine, eslicarbazepine acetate and
their main metabolites in human plasma. Anal Bioanal Chem. 397:4, 1605-1615.
FORTUNA, A. [et al.] (2012) - Evaluation of the permeability and P-glycoprotein efflux of
carbamazepine and several derivatives across mouse small intestine by the ussing chamber
technique. Epilepsia. 53:3, 529-538.
FORTUNA, A. [et al.] (2014a) - Intranasal delivery of systemic-acting drugs: small-molecules and
biomacromolecules. Eur J Pharm Biopharm. 88:1, 8-27.
FORTUNA, A. [et al.] (2014b) - Chiral chromatographic resolution of antiepileptic drugs and their
metabolites: a challenge from the optimization to the application. Biomed Chromatogr. 28:1,
27-58.
FRANCESCHI, L.; FURLANUT, M. (2005) - A simple method to monitor plasma concentrations of
oxcarbazepine, carbamazepine, their main metabolites and lamotrigine in epileptic patients.
Pharmacol Res. 51:4, 297-302.
FRENCH, J.A. (2007) - Refractory epilepsy: clinical overview. Epilepsia. 48:Suppl 1, 3-7.
FRENCH, J.A.; FAUGHT, E. (2009) - Rational polytherapy. Epilepsia. 50:Suppl 8, 63-68.
FRENCH, J.A. [et al.] (2004) - Efficacy and tolerability of the new antiepileptic drugs, I: treatment of
new-onset epilepsy: report of the TTA and QSS subcommittees of the American Academy of
Neurology and the American Epilepsy Society. Epilepsia. 45:5, 401-409.
GABATHULER, R. (2010) - Approaches to transport therapeutic drugs across the blood-brain barrier
to treat brain diseases. Neurobiol Dis. 37:1, 48-57.
GABRIELSSON, J.; WEINER, D. (2012) - Non-compartmental analysis. Computational Toxicology.
Reisfeld, B.; Mayeno, A.N. (Eds.). Humana Press, Chapter 16, pp. 377-389.
GALLOP, K. (2010) - Phenytoin use and efficacy in the ED. Emerg Med Australas. 22:2, 108-118.
GARNETT, W.R. (1997) - Lamotrigine: pharmacokinetics. J Child Neurol. 12:Suppl 1, S10-S15.

References
325
GARNETT, W.R. [et al.] (2009) - Transitional polytherapy: tricks of the trade for monotherapy to
monotherapy AED conversions. Curr Neuropharmacol. 7:2, 83-95.
GERLACH, A.C.; KRAJEWSKI, J.L. (2010) - Antiepileptic drug discovery and development: what have
we learned and where are we going? Pharmaceuticals. 3:9, 2884-2899.
GIZURARSON, S. (1990) - Animal models for intranasal drug delivery studies - a review article. Acta
Pharm Nord. 2:2, 105-122.
GIZURARSON, S. (2012) - Anatomical and histological factors affecting intranasal drug and vaccine
delivery. Curr Drug Deliv. 9:6, 566-582.
GLAUSER, T. [et al.] (2006) - ILAE treatment guidelines: evidence-based analysis of antiepileptic
drug efficacy and effectiveness as initial monotherapy for epileptic seizures and syndromes.
Epilepsia. 47:7, 1094-1120.
GLAXOSMITHKLINE (2013) - Product monograph: Lamictal®. in: http://www.gsk.ca/english/docs-
pdf/product-monographs/Lamictal.pdf. Acessed in January 2015.
GOA, K.L. [et al.] (1993) - Lamotrigine - a review of its pharmacological properties and clinical
efficacy in epilepsy. Drugs. 46:1, 152-176.
GOLDENBERG, M.M. (2010) - Overview of drugs used for epilepsy and seizures etiology, diagnosis,
and treatment. P&T. 35:7, 392-415.
GOLDSMITH, D.R. [et al.] (2003) - Lamotrigine: a review of its use in bipolar disorder. Drugs. 63:19,
2029-2050.
GONZÁLEZ, O. [et al.] (2014) - Bioanalytical chromatographic method validation according to
current regulations, with a special focus on the non-well defined parameters limit of
quantification, robustness and matrix effect. J Chromatogr A. 1353, 10-27.
GRAFF, C.L.; POLLACK, G.M. (2005) - Nasal drug administration: potential for targeted central
nervous system delivery. J Pharm Sci. 94:6, 1187-1195.
GRAFF, C.L. [et al.] (2005) - Pharmacokinetics of substrate uptake and distribution in murine brain
after nasal instillation. Pharm Res. 22:2, 235-244.
GRASSIN-DELYLE, S. [et al.] (2012) - Intranasal drug delivery: an efficient and non-invasive route for
systemic administration - focus on opioids. Pharmacol Ther. 134:3, 366-379.
GREINER-SOSANKO, E. [et al.] (2007) - Simultaneous determination of lamotrigine, zonisamide, and
carbamazepine in human plasma by high-performance liquid chromatography. Biomed
Chromatogr. 21:3, 225-228.
GROSS, E.A. [et al.] (1982) - Comparative morphometry of the nasal cavity in rats and mice. J Anat.
135:1, 83-88.
HAINZL, D. [et al.] (2001) - Metabolism of two new antiepileptic drugs and their principal
metabolites S(+)- and R(-)-10,11-dihydro-10-hydroxy carbamazepine. Epilepsy Res. 44:2-3,
197-206.

References
326
HANSON, L.R.; FREY II, W.H. (2008) - Intranasal delivery bypasses the blood-brain barrier to target
therapeutic agents to the central nervous system and treat neurodegenerative disease. BMC
Neurosci. 9:Suppl 3, S5.
HARKEMA, J.R. [et al.] (2006) - The nose revisited: a brief review of the comparative structure,
function, and toxicologic pathology of the nasal epithelium. Toxicol Pathol. 34:3, 252-269.
HARKEMA, J.R. [et al.] (2012) - Nose, sinus, pharynx, and larynx. Comparative Anatomy and
Histology - A Mouse and Human Atlas. Treuting, P.M.; Dintzis, S.M. (Eds.). Elsevier, Chapter
6, pp. 71-94.
HARTMANN, C. [et al.] (1998) - Validation of bioanalytical chromatographic methods. J Pharm
Biomed Anal. 17:2, 193-218.
HASCHKE, M. [et al.] (2010) - Pharmacokinetics and pharmacodynamics of nasally delivered
midazolam. Br J Clin Pharmacol. 69:6, 607-616.
HEIDELOFF, C. [et al.] (2010) - A novel HPLC method for quantification of 10 antiepileptic drugs or
metabolites in serum/plasma using a monolithic column. Ther Drug Monit. 32:1, 102-106.
HENDRIKS, G. (2009) - Theoretical models in LC based bioanalytical method development. J Pharm
Biomed Anal. 49:1, 1-10.
HENRIKSSON, J.; TJÄLVE, H. (1998) - Uptake of inorganic mercury in the olfactory bulbs via olfactory
pathways in rats. Environ Res. 77:2, 130-140.
HENRIKSSON, J. [et al.] (1997) - Uptake of nickel into the brain via olfactory neurons in rats. Toxicol
Lett. 91:2, 153-162.
HINCHCLIFFE, M.; ILLUM, L. (1999) - Intranasal insulin delivery and therapy. Adv Drug Deliv Rev. 35:2-
3, 199-234.
HOLSTI, M. [et al.] (2010) - Intranasal midazolam vs rectal diazepam for the home treatment of
acute seizures in pediatric patients with epilepsy. Arch Pediatr Adolesc Med. 164:8, 747-753.
HUSSAIN, A. [et al.] (1980) - Nasal absorption of propranolol from different dosage forms by rats
and dogs. J Pharm Sci. 69:12, 1411-1413.
HUSSAIN, A.A. (1998) - Intranasal drug delivery. Adv Drug Deliv Rev. 29:1-2, 39-49.
HUSSAIN, A.A. [et al.] (2000) - Nasal absorption of ondansetron in rats: an alternative route of drug
delivery. Cancer Chemother Pharmacol. 45:5, 432-434.
ILLUM, L. (1996) - Nasal delivery. The use of animal models to predict performance in man. J Drug
Target. 3:6, 427-442.
ILLUM, L. (2000) - Transport of drugs from the nasal cavity to the central nervous system. Eur J
Pharm Sci. 11:1, 1-18.
ILLUM, L. (2002) - Nasal drug delivery: new developments and strategies. Drug Discov Today. 7:23,
1184-1189.

References
327
ILLUM, L. (2003) - Nasal drug delivery - possibilities, problems and solutions. J Control Release.
87:1-3, 187-198.
ILLUM, L. (2004) - Is nose-to-brain transport of drugs in man a reality? J Pharm Pharmacol. 56:1, 3-
17.
ILLUM, L. (2007) - Nanoparticulate systems for nasal delivery of drugs: a real improvement over
simple systems? J Pharm Sci. 96:3, 473-483.
ILLUM, L. (2012) - Nasal drug delivery - recent developments and future prospects. J Control
Release. 161:2, 254-263.
ISHIKAWA, F. [et al.] (2002) - Insoluble powder formulation as an effective nasal drug delivery
system. Pharm Res. 19:8, 1097-1104.
IVATURI, V.D. [et al.] (2009) - Pharmacokinetics and tolerability of intranasal diazepam and
midazolam in healthy adult volunteers. Acta Neurol Scand. 120:5, 353-357.
JADHAV, K.R. [et al.] (2007) - Nasal drug delivery system - factors affecting and applications. Curr
Drug Ther. 2:1, 27-38.
JAIN, R. [et al.] (2010) - Micellar nanocarriers: potential nose-to-brain delivery of zolmitriptan as
novel migraine therapy. Pharm Res. 27:4, 655-664.
JOGANI, V. [et al.] (2008) - Recent patents review on intranasal administration for CNS drug
delivery. Recent Pat Drug Deliv Formul. 2:1, 25-40.
JOGANI, V.V. [et al.] (2007) - Nose-to-brain delivery of tacrine. J Pharm Pharmacol. 59:9, 1199-
1205.
JOHANNESSEN, S.I.; LANDMARK, C.J. (2008) - Value of therapeutic drug monitoring in epilepsy. Expert
Rev Neurother. 8:6, 929-939.
JOHANNESSEN, S.I.; LANDMARK, C.J. (2010) - Antiepileptic drug interactions - principles and clinical
implications. Curr Neuropharmacol. 8:3, 254-267.
JOHANNESSEN, S.I.; TOMSON, T. (2006) - Pharmacokinetic variability of newer antiepileptic drugs:
when is monitoring needed? Clin Pharmacokinet. 45:11, 1061-1075.
JOHANNESSEN, S.I. [et al.] (2003) - Therapeutic drug monitoring of the newer antiepileptic drugs.
Ther Drug Monit. 25:3, 347-363.
JOHNSON, N.J. [et al.] (2010) - Trigeminal pathways deliver a low molecular weight drug from the
nose to the brain and orofacial structures. Mol Pharm. 7:3, 884-893.
JONES, N. (2001) - The nose and paranasal sinuses physiology and anatomy. Adv Drug Deliv Rev.
51:1-3, 5-19.
JONGMANS, J.W. (1964) - Report on the anti-epileptic action of tegretol. Epilepsia. 5:1, 74-82.
JUERGENS, U. (1984) - Routine determination of eight common anti-epileptic drugs and metabolites
by high-performance liquid chromatography using a column-switching system for direct
injection of serum samples. J Chromatogr. 310:1, 97-106.

References
328
KAMINSKI, R.M. [et al.] (2009) - Benefit of combination therapy in epilepsy: a review of the
preclinical evidence with levetiracetam. Epilepsia. 50:3, 387-397.
KAO, H.D. [et al.] (2000) - Enhancement of the systemic and CNS specific delivery of L-Dopa by the
nasal administration of its water soluble prodrugs. Pharm Res. 17:8, 978-984.
KAUR, P.; KIM, K. (2008) - Pharmacokinetics and brain uptake of diazepam after intravenous and
intranasal administration in rats and rabbits. Int J Pharm. 364:1, 27-35.
KECK, P.E.; MCELROY, S.L. (2002) - Clinical pharmacodynamics and pharmacokinetics of antimanic
and mood-stabilizing medications. J Clin Psychiatry. 63:Suppl 4, 3-11.
KERN, W. [et al.] (1999) - Central nervous system effects of intranasally administered insulin during
euglycemia in men. Diabetes. 48:3, 557-563.
KETTER, T.A. [et al.] (1999) - Metabolism and excretion of mood stabilizers and new
anticonvulsants. Cell Mol Neurobiol. 19:4, 511-532.
KHOSCHSORUR, G.A. [et al.] (2001) - Simple and rapid HPLC method for simultaneous determination
of multiple antiepileptic drugs in human serum. Chromatographia. 54:5-6, 345-349.
KIM, D. (2008) - In vitro cellular models for nasal drug absorption studies. Drug Absorption Studies
- In Situ, In Vitro and In Silico Models. Ehrhardt, C.; Kim, K. (Eds.). Springer, Chapter 9, pp.
216-234.
KIM, K. [et al.] (2011) - Simple and accurate quantitative analysis of ten antiepileptic drugs in
human plasma by liquid chromatography/tandem mass spectrometry. J Pharm Biomed Anal.
56:4, 771-777.
KIMISKIDIS, V. [et al.] (2007) - Development and validation of a high performance liquid
chromatographic method for the determination of oxcarbazepine and its main metabolites
in human plasma and cerebrospinal fluid and its application to pharmacokinetic study. J
Pharm Biomed Anal. 43:2, 763-768.
KOLE, P.L. [et al.] (2011) - Recent advances in sample preparation techniques for effective
bioanalytical methods. Biomed Chromatogr. 25:1-2, 199-217.
KOLLIPARA, S. [et al.] (2011) - International guidelines for bioanalytical method validation: a
comparison and discussion on current scenario. Chromatographia. 73:3-4, 201-217.
KOZLOVSKAYA, L. [et al.] (2014) - Quantitative analysis of drug delivery to the brain via nasal route. J
Control Release. 189, 133-140.
KRASOWSKI, M.D. (2010) - Therapeutic drug monitoring of the newer anti-epilepsy medications.
Pharmaceuticals. 3:6, 1909-1935.
KUMAR, A. [et al.] (2014) - Nasal-nanotechnology: revolution for efficient therapeutics delivery.
Drug Deliv. DOI: 10.3109/10717544.2014.920431.
KUMAR, M. [et al.] (2008) - Intranasal nanoemulsion based brain targeting drug delivery system of
risperidone. Int J Pharm. 358:1-2, 285-291.

References
329
KUO, C.; LU, L. (1997) - Characterization of lamotrigine inhibition of Na+ channels in rat
hippocampal neurones. Br J Pharmacol. 121:6, 1231-1238.
KUPIEC, T. (2004) - Quality-control analytical methods: high-performance liquid chromatography.
Int J Pharm Compd. 8:3, 223-227.
KUTT, H.; HARDEN, C.L. (1999) - Phenytoin and congeners. Handbook of Experimental Pharmacology
- Antiepileptic Drugs: Pharmacology and Therapeutics. Eadie, M.J.; Vajda, F.J.E. (Eds.).
Springer, Chapter 9, pp. 229-265.
KWAN, P.; BRODIE, M.J. (2002) - Refractory epilepsy: a progressive, intractable but preventable
condition? Seizure. 11:2, 77-84.
KWAN, P. [et al.] (2001) - The mechanisms of action of commonly used antiepileptic drugs.
Pharmacol Ther. 90:1, 21-34.
KWAN, P. [et al.] (2010) - Definition of drug resistant epilepsy: consensus proposal by the ad hoc
Task Force of the ILAE Commission on Therapeutic Strategies. Epilepsia. 51:6, 1069-1077.
KWAN, P. [et al.] (2011) - Drug-resistant epilepsy. N Engl J Med. 365:10, 919-926.
LANDMARK, C.J. [et al.] (2007) - Clinical use of antiepileptic drugs at a referral centre for epilepsy.
Seizure. 16:4, 356-364.
LANDMARK, C.J. [et al.] (2012) - Host factors affecting antiepileptic drug delivery - pharmacokinetic
variability. Adv Drug Deliv Rev. 64:10, 896-910.
LASOŃ, W. [et al.] (2013) - Research advances in basic mechanisms of seizures and antiepileptic
drug action. Pharmacol Reports. 65:4, 787-801.
LEE, B. (2013) - Classification of epileptic seizures and epilepsy syndromes. Neurol Asia. 18:Suppl 1,
1-4.
LEE, J.W.; DWORETZKY, B. (2010) - Rational polytherapy with antiepileptic drugs. Pharmaceuticals.
3:8, 2362-2379.
LEVERT, H. [et al.] (2002) - Simultaneous determination of four antiepileptic drugs in serum by
high-performance liquid chromatography. Biomed Chromatogr. 16:1, 19-24.
LI, L. [et al.] (2000) - Rapid-onset intranasal delivery of anticonvulsants: pharmacokinetic and
pharmacodynamic evaluation in rabbits. Int J Pharm. 199:1, 65-76.
LO, E.H. [et al.] (2001) - Drug delivery to damaged brain. Brain Res Rev. 38:1-2, 140-148.
LOCHHEAD, J.J.; THORNE, R.G. (2012) - Intranasal delivery of biologics to the central nervous system.
Adv Drug Deliv Rev. 64:7, 614-628.
LOCHHEAD, J.J.; THORNE, R.G. (2014) - Intranasal drug delivery to the brain. Drug Delivery to the
Brain - Physiological Concepts, Methodologies and Approaches. Hammarlund-Udenaes, M.;
de Lange, E.C.M.; Thorne, R.G. (Eds.). Springer, Chapter 14, pp. 401-431.
LOCKEY, A.S. (2002) - Emergency department drug therapy for status epilepticus in adults. Emerg
Med J. 19:2, 96-100.

References
330
LÖSCHER, W. (2007) - Drug transporters in the epileptic brain. Epilepsia. 48:Suppl 1, 8-13.
LÖSCHER, W.; POTSCHKA, H. (2002) - Role of multidrug transporters in pharmacoresistance to
antiepileptic drugs. J Pharmacol Exp Ther. 301:1, 7-14.
LÖSCHER, W.; SCHMIDT, D. (2002) - New horizons in the development of antiepileptic drugs. Epilepsy
Res. 50:1-2, 3-16.
LÖSCHER, W.; SCHMIDT, D. (2011) - Modern antiepileptic drug development has failed to deliver:
ways out of the current dilemma. Epilepsia. 52:4, 657-678.
LÖSCHER, W. [et al.] (2013) - New avenues for anti-epileptic drug discovery and development. Nat
Rev Drug Discov. 12:10, 757-776.
LU, W.; UETRECHT, J.P. (2007) - Possible bioactivation pathways of lamotrigine. Drug Metab Dispos.
35:7, 1050-1056.
LUNA-TORTÓS, C. [et al.] (2008) - Several major antiepileptic drugs are substrates for human P-
glycoprotein. Neuropharmacology. 55:8, 1364-1375.
MA, C. [et al.] (2007) - Isocratic reversed-phase HPLC for simultaneous separation and
determination of seven antiepileptic drugs and two of their active metabolites in human
plasma. Chromatographia. 65:5-6, 267-275.
MAJITHIYA, R.J. [et al.] (2006) - Thermoreversible-mucoadhesive gel for nasal delivery of
sumatriptan. AAPS PharmSciTech. 7:3, E1-E7.
MANNO, E.M. (2011) - Status epilepticus: current treatment strategies. Neurohospitalist. 1:1, 23-
31.
MARCHI, N. [et al.] (2005) - A pilot study on brain-to-plasma partition of 10,11-dyhydro-10-
hydroxy-5H-dibenzo(b,f)azepine-5-carboxamide and MDR1 brain expression in epilepsy
patients not responding to oxcarbazepine. Epilepsia. 46:10, 1613-1620.
MARTTIN, E. [et al.] (1998) - Nasal mucociliary clearance as a factor in nasal drug delivery. Adv Drug
Deliv Rev. 29:1-2, 13-38.
MATHIAS, N.R.; HUSSAIN, M.A. (2010) - Non-invasive systemic drug delivery: developability
considerations for alternate routes of administration. J Pharm Sci. 99:1, 1-20.
MATTAR, K.M. [et al.] (1998) - A rapid liquid chromatographic method for the determination of
lamotrigine in plasma. J Pharm Biomed Anal. 17:3, 525-531.
MATTSON, R.H. (2003) - Overview: idiopathic generalized epilepsies. Epilepsia. 44:Suppl 2, 2-6.
MAURER, H.H. [et al.] (2002) - Validated assay for quantification of oxcarbazepine and its active
dihydro metabolite 10-hydroxycarbazepine in plasma by atmospheric pressure chemical
ionization liquid chromatography/mass spectrometry. J Mass Spectrom. 37:7, 687-692.
MAY, T.W. [et al.] (2003) - Clinical pharmacokinetics of oxcarbazepine. Clin Pharmacokinet. 42:12,
1023-1042.

References
331
MAYOR, S.H.; ILLUM, L. (1997) - Investigation of the effect of anaesthesia on nasal absorption of
insulin in rats. Int J Pharm. 149:1, 123-129.
MAZURKIEWICZ-BEŁDZIŃSKA, M. [et al.] (2014) - Current treatment of convulsive status epilepticus - a
therapeutic protocol and review. Anaesthesiol Intensive Ther. 46:4, 293-300.
MCINTYRE, J. [et al.] (2005) - Safety and efficacy of buccal midazolam versus rectal diazepam for
emergency treatment of seizures in children: a randomised controlled trial. Lancet.
366:9481, 205-210.
MCMULLAN, J. [et al.] (2010) - Midazolam versus diazepam for the treatment of status epilepticus
in children and young adults: a meta-analysis. Acad Emerg Med. 17:6, 575-582.
MEIERKORD, H. [et al.] (2010) - EFNS guideline on the management of status epilepticus in adults.
Eur J Neurol. 17:3, 348-355.
MERKUS, F.W.H.M.; VAN DEN BERG, M.P. (2007) - Can nasal drug delivery bypass the blood-brain
barrier? Drugs R&D. 8:3, 133-144.
MERKUS, P. [et al.] (2003) - Direct access of drugs to the human brain after intranasal drug
administration? Neurology. 60:10, 1669-1671.
MESSENHEIMER, J.A. (1995) - Lamotrigine. CNS Drug Rev. 1:2, 190-203.
MINN, A. [et al.] (2002) - Drug transport into the mammalian brain: the nasal pathway and its
specific metabolic barrier. J Drug Target. 10:4, 285-296.
MISRA, A. [et al.] (2003) - Drug delivery to the central nervous system: a review. J Pharm Pharm
Sci. 6:2, 252-273.
MISTRY, A. [et al.] (2009) - Nanoparticles for direct nose-to-brain delivery of drugs. Int J Pharm.
379:1, 146-157.
MITTAL, D. [et al.] (2014) - Insights into direct nose to brain delivery: current status and future
perspective. Drug Deliv. 21:2, 75-86.
MOHANACHANDRAN, P.S. [et al.] (2012) - Recent trends in brain targeted drug delivery systems: an
overview. Pharm Glob Int J Compr Pharm. 3:10, 1-9.
MORRIS, R.G. [et al.] (1998) - Lamotrigine and therapeutic drug monitoring: retrospective survey
following the introduction of a routine service. Br J Clin Pharmacol. 46:6, 547-551.
MYGIND, N.; DAHL, R. (1998) - Anatomy, physiology and function of the nasal cavities in health and
disease. Adv Drug Deliv Rev. 29:1-2, 3-12.
MYLLYNEN, P. [et al.] (1998) - Microsomal metabolism of carbamazepine and oxcarbazepine in liver
and placenta. Hum Exp Toxicol. 17:12, 668-676.
NAGAYAMA, S. [et al.] (2004) - Mitral and tufted cells differ in the decoding manner of odor maps in
the rat olfactory bulb. J Neurophysiol. 91:6, 2532-2540.
NATIONAL INSTITUTE FOR HEALTH AND CARE EXCELLENCE (2013) - The epilepsies: the diagnosis and
management of the epilepsies in adults and children in primary and secondary care. in:

References
332
http://www.nice.org.uk/guidance/cg137/resources/guidance-the-epilepsies-the-diagnosis-
and-management-of-the-epilepsies-in-adults-and-children-in-primary-and-secondary-care-
pdf. Accessed in October 2014.
NEELS, H.M. [et al.] (2004) - Therapeutic drug monitoring of old and newer anti-epileptic drugs.
Clin Chem Lab Med. 42:11, 1228-1255.
NELIGAN, A. [et al.] (2012) - The epidemiology of the epilepsies. Handbook of Clinical Neurology
Epilepsy - Part I. Stefan, H.; Theodore, W.H. (Eds.). Elsevier, Chapter 6, pp. 113-133.
NEWMAN, S.P.; WILDING, I.R. (1998) - Gamma scintigraphy: an in vivo technique for assessing the
equivalence of inhaled products. Int J Pharm. 170:1, 1-9.
NG, F. [et al.] (2007) - The role of lamotrigine in the management of bipolar disorder.
Neuropsychiatr Dis Treat. 3:4, 463-474.
NIRMAL, H.B. [et al.] (2010) - In-situ gel: new trends in controlled and sustained drug delivery
system. Int J PharmTech Res. 2:2, 1398-1408.
NOVÁKOVÁ, L.; VLČKOVÁ, H. (2009) - A review of current trends and advances in modern bio-
analytical methods: chromatography and sample preparation. Anal Chim Acta. 656:1-2, 8-35.
NOVARTIS (2014a) - Prescribing Information: Tegretol®. in:
http://www.pharma.us.novartis.com/product/pi/pdf/tegretol.pdf. Accessed in March 2015.
NOVARTIS (2014b) - Prescribing Information: Trileptal®. in:
https://www.pharma.us.novartis.com/product/pi/pdf/trileptal.pdf. Accessed in June 2015.
OH, E.K. [et al.] (2006) - Analysis of carbamazepine and its active metabolite, carbamazepine-
10,11-epoxide, in human plasma using high-performance liquid chromatography. Anal
Bioanal Chem. 386:6, 1931-1936.
PADOWSKI, J.M.; POLLACK, G.M. (2010) - Examination of the ability of the nasal administration route
to confer a brain exposure advantage for three chemical inhibitors of P-glycoprotein. J
Pharm Sci. 99:7, 3226-3233.
PAGLIA, G. [et al.] (2007) - Development and validation of a LC/MS/MS method for simultaneous
quantification of oxcarbazepine and its main metabolites in human serum. J Chromatogr B.
860:2, 153-159.
PANDEY, S. [et al.] (2010) - Bioanalysis in drug discovery and development. Pharm Methods. 1:1,
14-24.
PARDESHI, C.V.; BELGAMWAR, V.S. (2013) - Direct nose to brain drug delivery via integrated nerve
pathways bypassing the blood-brain barrier: an excellent platform for brain targeting. Expert
Opin Drug Deliv. 10:7, 957-972.
PARDRIDGE, W.M. (2005) - The blood-brain barrier: bottleneck in brain drug development.
NeuroRx. 2:1, 3-14.
PARDRIDGE, W.M. (2007) - Blood-brain barrier delivery. Drug Discov Today. 12:1-2, 54-61.

References
333
PARDRIDGE, W.M. (2011) - Drug transport in brain via the cerebrospinal fluid. Fluids Barriers CNS.
8:1, 7.
PATEL, R.B. [et al.] (2014) - Microemulsion-based drug delivery system for transnasal delivery of
carbamazepine: preliminary brain-targeting study. Drug Deliv. DOI:
10.3109/10717544.2014.908980.
PATEL, V. [et al.] (2014) - Rectal carbamazepine as effective long-acting treatment after cluster
seizures and status epilepticus. Epilepsy Behav. 31, 31-33.
PATEL, Z. [et al.] (2012) - Nose to brain targeted drug delivery bypassing the blood-brain barrier: an
overview. Drug Invent Today. 4:12, 610-615.
PATHAN, S.A. [et al.] (2009) - CNS drug delivery systems: novel approaches. Recent Pat Drug Deliv
Formul. 3:1, 71-89.
PATIL, K.M.; BODHANKAR, S.L. (2005) - Simultaneous determination of lamotrigine, phenobarbitone,
carbamazepine and phenytoin in human serum by high-performance liquid chromatography.
J Pharm Biomed Anal. 39:1-2, 181-186.
PATSALOS, P.N.; PERUCCA, E. (2003) - Clinically important drug interactions in epilepsy: interactions
between antiepileptic drugs and other drugs. Lancet Neurol. 2:8, 473-481.
PATSALOS, P.N. [et al.] (2002) - The importance of drug interactions in epilepsy therapy. Epilepsia.
43:4, 365-385.
PATSALOS, P.N. [et al.] (2008) - Antiepileptic drugs - best practice guidelines for therapeutic drug
monitoring: a position paper by the subcommission on therapeutic drug monitoring, ILAE
Commission on Therapeutic Strategies. Epilepsia. 49:7, 1239-1276.
PAVAN, B. [et al.] (2008) - Progress in drug delivery to the central nervous system by the prodrug
approach. Molecules. 13:5, 1035-1065.
PELLOCK, J.M. (2002) - Treatment considerations: traditional antiepileptic drugs. Epilepsy Behav.
3:6S1, S18-S23.
PERL, D.P.; GOOD, P.F. (1987) - Uptake of aluminium into central nervous system along nasal-
olfactory pathways. Lancet. 1:8540, 1028.
PERUCCA, E. (2001) - Clinical pharmacology and therapeutic use of the new antiepileptic drugs.
Fundam Clin Pharmacol. 15:6, 405-417.
PERUCCA, E. (2005) - An introduction to antiepileptic drugs. Epilepsia. 46:Suppl 4, 31-37.
PERUCCA, E. (2011) - The pharmacology of new antiepileptic drugs: does a novel mechanism of
action really matter? CNS Drugs. 25:11, 907-912.
PERUCCA, E. [et al.] (2007) - Development of new antiepileptic drugs: challenges, incentives, and
recent advances. Lancet Neurol. 6:9, 793-804.
PERUCCA, E.; JOHANNESSEN, S.I. (2003) - The ideal pharmacokinetic properties of an antiepileptic
drug: how close does levetiracetam come? Epileptic Disord. 5:Suppl 1, S17-S26.

References
334
PERUCCA, E.; TOMSON, T. (2011) - The pharmacological treatment of epilepsy in adults. Lancet
Neurol. 10:5, 446-456.
PFIZER (2015) - Prescribing Information - Dilantin® in:
http://labeling.pfizer.com/ShowLabeling.aspx?format=PDF&id=546. Accessed in June 2015.
PIETROWSKY, R. [et al.] (1996) - Brain potential changes after intranasal vs. intravenous
administration of vasopressin: evidence for a direct nose-brain pathway for peptide effects
in humans. Biol Psychiatry. 39:5, 332-340.
PIRES, A. [et al.] (2009) - Intranasal drug delivery: how, why and what for? J Pharm Pharm Sci. 12:3,
288-311.
PODELL, M. (2013) - Antiepileptic drug therapy and monitoring. Top Companion Anim Med. 28:2,
59-66.
PORTER, R.J.; MELDRUM, B.S. (2015) - Antiseizure drugs. Basic & Clinical Pharmacology. Katzung,
B.G.; Trevor, A.J. (Eds.). McGrawHill Education, Chapter 24, pp. 538-571.
PORTER, R.J. [et al.] (2012) - Mechanisms of action of antiseizure drugs. Handbook of Clinical
Neurology Epilepsy - Part II. Stefan, H.; Theodore, W.H. (Eds.). Elsevier, Chapter 39, pp. 663-
681.
POTSCHKA, H. (2010a) - Transporter hypothesis of drug-resistant epilepsy: challenges for
pharmacogenetic approaches. Pharmacogenomics. 11:10, 1427-1438.
POTSCHKA, H. (2010b) - Targeting regulation of ABC efflux transporters in brain diseases: a novel
therapeutic approach. Pharmacol Ther. 125:1, 118-127.
POTSCHKA, H. (2013) - Pharmacological treatment strategies: mechanisms of antiepileptic drugs.
Epileptology. 1:1, 31–37.
POTSCHKA, H.; BRODIE, M.J. (2012) - Pharmacoresistance. Handbook of Clinical Neurology - Epilepsy
- Part II. Stefan, H.; Theodore, W.H. (Eds.). Elsevier, Chapter 43, pp. 741-757.
POTSCHKA, H. [et al.] (2002) - P-glycoprotein-mediated efflux of phenobarbital, lamotrigine, and
felbamate at the blood-brain barrier: evidence from microdialysis experiments in rats.
Neurosci Lett. 327:3, 173-176.
PUBCHEM. in: http://pubchem.ncbi.nlm.nih.gov/. Accessed in January 2015.
RAGHAVAN, C.V.; ABIMON, V.D. (2001) - Intranasal delivery of tenoxicam in rat. Int J Pharm. 221:1-2,
227-229.
RAMBECK, B.; WOLF, P. (1993) - Lamotrigine clinical pharmacokinetics. Clin Pharmacokinet. 25:6,
433-443.
RAMSAY, R.E. [et al.] (1991) - Pharmacokinetics and safety of lamotrigine (Lamictal®) in patients
with epilepsy. Epilepsy Res. 10:2-3, 191-200.
RAUTIO, J. [et al.] (2008) - Prodrug approaches for CNS delivery. AAPS J. 10:1, 92-102.

References
335
REMY, S.; BECK, H. (2006) - Molecular and cellular mechanisms of pharmacoresistance in epilepsy.
Brain. 129:Pt 1, 18-35.
REZNIK, G.K. (1990) - Comparative anatomy, physiology, and function of the upper respiratory
tract. Environ Health Perspect. 85, 171-176.
RICHENS, A. (1979) - Clinical pharmacokinetics of phenytoin. Clin Pharmacokinet. 4:3, 153-169.
ROGAWSKI, M.A.; LÖSCHER, W. (2004) - The neurobiology of antiepileptic drugs. Nat Rev Neurosci.
5:7, 553-564.
ROSS, T.M. [et al.] (2004) - Intranasal administration of interferon beta bypasses the blood-brain
barrier to target the central nervous system and cervical lymph nodes: a non-invasive
treatment strategy for multiple sclerosis. J Neuroimmunol. 151:1-2, 66-77.
RUDZINSKI, L.A.; SHIH, J.J. (2011) - The classification of seizures and epilepsy syndromes. Novel
Aspects on Epilepsy. Foyaca-Sibat, H. (Ed.). InTech, Chapter 5, pp. 69-88.
SAHIN-YILMAZ, A.; NACLERIO, R.M. (2011) - Anatomy and physiology of the upper airway. Proc Am
Thorac Soc. 8:1, 31-39.
SALIB, R.J.; HOWARTH, P.H. (2003) - Safety and tolerability profiles of intranasal antihistamines and
intranasal corticosteroids in the treatment of allergic rhinitis. Drug Saf. 26:12, 863-893.
SANDER, J.W. (2003) - The epidemiology of epilepsy revisited. Curr Opin Neurol. 16:2, 165-170.
SARKAR, M.A. (1992) - Drug metabolism in the nasal mucosa. Pharm Res. 9:1, 1-9.
SCHACHTER, S.C. (1999) - Oxcarbazepine. Handbook of Experimental Pharmacology - Antiepileptic
Drugs: Pharmacology and Therapeutics. Eadie, M.J.; Vajda, F.J.E. (Eds.). Springer, Chapter 11,
pp. 319-330.
SCHILLER, Y.; KRIVOY, N. (2009) - Safety and efficacy of lamotrigine in older adults with epilepsy and
co-morbid depressive symptoms. Clin Med Ther. 1, 825-833.
SCHIPPER, N.G.M. [et al.] (1991) - The nasal mucociliary clearance: relevance to nasal drug delivery.
Pharm Res. 8:7, 807-814.
SCHMIDT, D. (2009) - Drug treatment of epilepsy: options and limitations. Epilepsy Behav. 15:1, 56-
65.
SCHMIDT, D. (2011) - Antiepileptic drug discovery: does mechanism of action matter? Epilepsy
Behav. 21:4, 342-343.
SCHMIDT, D.; HOLMES, G.L. (2009) - Novel delivery approaches for antiepileptic drugs: hope and
hurdles. Neurotherapeutics. 6:2, 381-382.
SCHMIDT, D.; LÖSCHER, W. (2005) - Drug resistance in epilepsy: putative neurobiologic and clinical
mechanisms. Epilepsia. 46:6, 858-877.
SCHMIDT, D.; LÖSCHER, W. (2009) - New developments in antiepileptic drug resistance: an
integrative view. Epilepsy Curr. 9:2, 47-52.
SCHMIDT, D.; SCHACHTER, S.C. (2014) - Drug treatment of epilepsy in adults. Br Med J. 348, g254.

References
336
SCHMOLKA, I.R. (1972) - Artificial Skin I. Preparation and properties of pluronic F-127 gels for
treatment of burns. J Biomed Mater Res. 6:6, 571-582.
SCOTT, R.C. [et al.] (1999) - Buccal midazolam and rectal diazepam for treatment of prolonged
seizures in childhood and adolescence: a randomised trial. Lancet. 353:9153, 623-626.
SEJU, U. [et al.] (2011) - Development and evaluation of olanzapine-loaded PLGA nanoparticles for
nose-to-brain delivery: in vitro and in vivo studies. Acta Biomater. 7:12, 4169-4176.
SERRALHEIRO, A. [et al.] (2012) - Bioanalysis of small-molecule drugs in nasal and paranasal tissues
and secretions: current status and perspectives. Cent Eur J Chem. 10:3, 686-702.
SERRALHEIRO, A. [et al.] (2013a) - Nose as route for drug delivery. Nasal Physiology and
Pathophysiology of Nasal Disorders. Önerci, T.M. (Ed.). Springer, Chapter 15, pp. 191-215.
SERRALHEIRO, A. [et al.] (2013b) - First HPLC-UV method for rapid and simultaneous quantification
of phenobarbital, primidone, phenytoin, carbamazepine, carbamazepine-10,11-epoxide,
10,11-trans-dihydroxy-10,11-dihydrocarbamazepine, lamotrigine, oxcarbazepine and
licarbazepine in human plasma. J Chromatogr B. 925, 1-9.
SERRALHEIRO, A. [et al.] (2014) - Intranasal administration of carbamazepine to mice: a direct
delivery pathway for brain targeting. Eur J Pharm Sci. 60, 32-39.
SHAH, V.P. [et al.] (1992) - Analytical methods validation: bioavailability, bioequivalence and
pharmacokinetic studies. Int J Pharm. 82:1-2, 1-7.
SHAH, V.P. [et al.] (2000) - Bioanalytical method validation - a revisit with a decade of progress.
Pharm Res. 17:12, 1551-1557.
SHAJU, M.; ABRAHAM, S. (2013) - Innovations in epilepsy management - an overview. J Pharm
Pharm Sci. 16:4, 564-576.
SHARMA, S. [et al.] (2009) - Pharmaceutical aspects of intranasal delivery of vaccines using
particulate systems. J Pharm Sci. 98:3, 812-843.
SHETH, R.D. [et al.] (2005) - Nonpharmacological treatment options for epilepsy. Semin Pediatr
Neurol. 12:2, 106-113.
SHIBATA, M. [et al.] (2012) - Detection of 22 antiepileptic drugs by ultra-performance liquid
chromatography coupled with tandem mass spectrometry applicable to routine therapeutic
drug monitoring. Biomed Chromatogr. 26:12, 1519-1528.
SHORVON, S. (2000) - Oxcarbazepine: a review. Seizure. 9:2, 75-79.
SHORVON, S. [et al.] (2008) - The drug treatment of status epilepticus in Europe: consensus
document from a workshop at the first London colloquium on status epilepticus. Epilepsia.
49:7, 1277-1284.
SHORVON, S.D. (2009a) - Drug treatment of epilepsy in the century of the ILAE: the second 50
years, 1959-2009. Epilepsia. 50:Suppl 3, 93-130.
SHORVON, S.D. (2009b) - Drug treatment of epilepsy in the century of the ILAE: the first 50 years,
1909-1958. Epilepsia. 50:Suppl 3, 69-92.

References
337
SINGH, A.K. [et al.] (2012) - Nasal cavity: a promising transmucosal platform for drug delivery and
research approaches from nasal to brain targeting. J Drug Deliv Ther. 2:3, 22-33.
SINGH, R.M.P. [et al.] (2013) - Mucoadhesive in situ nasal gelling drug delivery systems for
modulated drug delivery. Expert Opin Drug Deliv. 10:1, 115-130.
SINSWAT, P.; TENGAMNUAY, P. (2003) - Enhancing effect of chitosan on nasal absorption of salmon
calcitonin in rats: comparison with hydroxypropyl- and dimethyl-β-cyclodextrins. Int J Pharm.
257:1-2, 15-22.
SLÜTTER, B. [et al.] (2008) - Rational design of nasal vaccines. J Drug Target. 16:1, 1-17.
SMOLNIK, R. [et al.] (1999) - Brain potentials and attention after acute and subchronic intranasal
administration of ACTH 4-10 and desacetyl-alpha-MSH in humans. Neuroendocrinology.
70:1, 63-72.
SMOLNIK, R. [et al.] (2000) - Event-related brain potentials and working memory function in
healthy humans after single-dose and prolonged intranasal administration of
adrenocorticotropin 4-10 and desacetyl-alpha-melanocyte stimulating hormone. J Clin
Psychopharmacol. 20:4, 445-454.
SOUSA, J. [et al.] (2012) - Analytical methods for determination of new fluoroquinolones in
biological matrices and pharmaceutical formulations by liquid chromatography: a review.
Anal Bioanal Chem. 403:1, 93-129.
SOUTHALL, J.; ELLIS, C. (2000) - Developments in nasal drug delivery. in:
http://www.iptonline.com/articles/public/iptfive110np.pdf. Accessed in November 2014.
SOUTHAM, D.S. [et al.] (2002) - Distribution of intranasal instillations in mice: effects of volume,
time, body position, and anesthesia. Am J Physiol Lung Cell Mol Physiol. 282:4, L833-L839.
ST LOUIS, E.K. (2009) - Truly “rational” polytherapy: maximizing efficacy and minimizing drug
interactions, drug load, and adverse effects. Curr Neuropharmacol. 7:2, 96-105.
ST LOUIS, E.K. (2010) - The art of managing conversions between antiepileptic drugs: maximizing
patient tolerability and quality of life. Pharmaceuticals. 3:9, 2956-2969.
STAFSTROM, C.E. (2010) - Mechanisms of action of antiepileptic drugs: the search for synergy. Curr
Opin Neurol. 23:2, 157-163.
STEINER, T.J. [et al.] (1999) - Lamotrigine monotherapy in newly diagnosed untreated epilepsy: a
double-blind comparison with phenytoin. Epilepsia. 40:5, 601-607.
STENEHJEM, D.D. [et al.] (2009) - Novel and emerging strategies in drug delivery for overcoming the
blood-brain barrier. Future Med Chem. 1:9, 1623-1641.
STONER, S.C. [et al.] (2007) - Historical review of carbamazepine for the treatment of bipolar
disorder. Pharmacotherapy. 27:1, 68-88.
SUBRAMANIAN, M. [et al.] (2008) - High-speed simultaneous determination of nine antiepileptic
drugs using liquid chromatography-mass spectrometry. Ther Drug Monit. 30:3, 347-356.

References
338
SWAMY, N.G.N.; ABBAS, Z. (2012) - Mucoadhesive in situ gels as nasal drug delivery systems: an
overview. Asian J Pharm Sci. 7:3, 168-180.
TACHIKAWA, M. [et al.] (2014) - Recent progress in blood-brain barrier and blood-CSF barrier
transport research: pharmaceutical relevance for drug delivery to the brain. Drug Delivery to
the Brain - Physiological Concepts, Methodologies and Approaches. Hammarlund-Udenaes,
M.; de Lange, E.C.M.; Thorne, R.G. (Eds.). Springer, Chapter 2, pp. 23-62.
TALEGAONKAR, S.; MISHRA, P.R. (2004) - Intranasal delivery: an approach to bypass the blood brain
barrier. Indian J Pharmacol. 36:3, 140-147.
TALUKDAR, B.; CHAKRABARTY, B. (2009) - Efficacy of buccal midazolam compared to intravenous
diazepam in controlling convulsions in children: a randomized controlled trial. Brain Dev.
31:10, 744-749.
TAN, L. [et al.] (2008) - Intranasal anticonvulsive treatment: a prospective management of
intractable epilepsy? Med Hypotheses. 71:4, 542-545.
THAKKER, A.; SHANBAG, P. (2013) - A randomized controlled trial of intranasal-midazolam versus
intravenous-diazepam for acute childhood seizures. J Neurol. 260:2, 470-474.
THORNE, R.G. [et al.] (1995) - Quantitative analysis of the olfactory pathway for drug delivery to
the brain. Brain Res. 692:1-2, 278-282.
THORNE, R.G. [et al.] (2001) - Delivery of neurotrophic factors to the central nervous system -
pharmacokinetic considerations. Clin Pharmacokinet. 40:12, 907-946.
THORNE, R.G. [et al.] (2004) - Delivery of insulin-like growth factor-I to the rat brain and spinal cord
along olfactory and trigeminal pathways following intranasal administration. Neuroscience.
127:2, 481-496.
THORNE, R.G. [et al.] (2008) - Delivery of interferon-beta to the monkey nervous system following
intranasal administration. Neuroscience. 152:3, 785-797.
TIWARI, G.; TIWARI, R. (2010) - Bioanalytical method validation: an updated review. Pharm
Methods. 1:1, 25-38.
TJÄLVE, H. [et al.] (1996) - Uptake of manganese and cadmium from the nasal mucosa into the
central nervous system via olfactory pathways in rats. Pharmacol Toxicol. 79:6, 347-356.
TOLEDANO, R.; GIL-NAGEL, A. (2008) - Adverse effects of antiepileptic drugs. Semin Neurol. 28:3,
317-327.
TOLOU-GHAMARI, Z. [et al.] (2013) - A quick review of carbamazepine pharmacokinetics in epilepsy
from 1953 to 2012. J Res Med Sci. 18:Suppl 1, S81–S85.
TOMSON, T. (1987) - Clinical pharmacokinetics of carbamazepine. Cephalalgia. 7:4, 219-223.
UGWOKE, M.I. [et al.] (2001) - The biopharmaceutical aspects of nasal mucoadhesive drug delivery.
J Pharm Pharmacol. 53:1, 3-21.
UGWOKE, M.I. [et al.] (2005) - Nasal mucoadhesive drug delivery: background, applications, trends
and future perspectives. Adv Drug Deliv Rev. 57:11, 1640-1665.

References
339
UPADHYAY, S. [et al.] (2011) - Intranasal drug delivery system - a glimpse to become maestro. J
Apllied Pharm Sci. 1:3, 34-44.
US FOOD AND DRUG ADMINISTRATION (2001) - Guidance for industry - bioanalytical method
validation. in:
http://www.fda.gov/downloads/Drugs/GuidanceComplianceRegulatoryInformation/Guidanc
es/ucm070107.pdf. Accessed in March 2015.
US FOOD AND DRUG ADMINISTRATION (2013) - Draft guidance for industry - bioanalytical method
validation. in:
http://www.fda.gov/downloads/drugs/guidancecomplianceregulatoryinformation/guidance
s/ucm368107.pdf. Accessed in March 2015.
VAN DEN BERG, M.P. [et al.] (2003) - Hydroxocobalamin uptake into the cerebrospinal fluid after
nasal and intravenous delivery in rats and humans. J Drug Target. 11:6, 325-331.
VAN DEN BERG, M.P. [et al.] (2004a) - Uptake of estradiol or progesterone into the CSF following
intranasal and intravenous delivery in rats. Eur J Pharm Biopharm. 58:1, 131-135.
VAN DEN BERG, M.P. [et al.] (2004b) - Uptake of melatonin into the cerebrospinal fluid after nasal
and intravenous delivery: studies in rats and comparison with a human study. Pharm Res.
21:5, 799-802.
VENTOLA, C.L. (2014) - Epilepsy management: newer agents, unmet needs, and future treatment
strategies. P&T. 39:11, 776-792.
VERMEIJ, T.A.C.; EDELBROEK, P.M. (2007) - Robust isocratic high performance liquid
chromatographic method for simultaneous determination of seven antiepileptic drugs
including lamotrigine, oxcarbazepine and zonisamide in serum after solid-phase extraction. J
Chromatogr B. 857:1, 40-46.
VISWANATHAN, C.T. [et al.] (2007) - Quantitative bioanalytical methods validation and
implementation: best practices for chromatographic and ligand binding assays. Pharm Res.
24:10, 1962-1973.
VUCIĆEVIĆ, K. [et al.] (2007) - Population pharmacokinetic model of carbamazepine derived from
routine therapeutic drug monitoring data. Ther Drug Monit. 29:6, 781-788.
VYAS, T.K. [et al.] (2005) - Intranasal drug delivery for brain targeting. Curr Drug Deliv. 2:2, 165-
175.
VYAS, T.K. [et al.] (2006a) - Intranasal mucoadhesive microemulsions of clonazepam: preliminary
studies on brain targeting. J Pharm Sci. 95:3, 570-580.
VYAS, T.K. [et al.] (2006b) - Formulation and physiological factors influencing CNS delivery upon
intranasal administration. Crit Rev Ther Drug Carrier Syst. 23:4, 319-347.
WAGER, T.T. [et al.] (2011) - Strategies to optimize the brain availability of central nervous system
drug candidates. Expert Opin Drug Discov. 6:4, 371-381.
WAHAB, A. (2010) - Difficulties in treatment and management of epilepsy and challenges in new
drug development. Pharmaceuticals. 3:7, 2090-2110.

References
340
WAL, P. [et al.] (2010) - Bioanalytical method development - determination of drugs in biological
fluids. J Pharm Sci Technol. 2:10, 333-347.
WALKER, M.C.; SANDER, J.W.A.S. (1999) - Lamotrigine. Handbook of Experimental Pharmacology -
Antiepileptic Drugs: Pharmacology and Therapeutics. Eadie, M.J.; Vajda, F.J.E. (Eds.).
Springer, Chapter 12, pp. 331-358.
WALKER, M.C. [et al.] (2000) - Comparison of serum, cerebrospinal fluid and brain extracellular
fluid pharmacokinetics of lamotrigine. Br J Pharmacol. 130:2, 242-248.
WALL, A. [et al.] (2005) - Distribution of zolmitriptan into the CNS in healthy volunteers - a positron
emission tomography study. Drugs R&D. 6:3, 139-147.
WANG, F. [et al.] (2003) - Profiles of methotrexate in blood and CSF following intranasal and
intravenous administration to rats. Int J Pharm. 263:1-2, 1-7.
WANG, P.W.; KETTER, T.A. (2005) - Clinical use of carbamazepine for bipolar disorders. Expert Opin
Pharmacother. 6:16, 2887-2902.
WANG, Q. [et al.] (2007) - Pharmacokinetics of gastrodin in rat plasma and CSF after i.n. and i.v. Int
J Pharm. 341:1-2, 20-25.
WANG, X.; PATSALOS, P.N. (2003) - A comparison of central brain (cerebrospinal and extracellular
fluids) and peripheral blood kinetics of phenytoin after intravenous phenytoin and
phosphenytoin. Seizure. 12:6, 330-336.
WANG, X. [et al.] (2006) - Evaluation of brain-targeting for the nasal delivery of estradiol by the
microdialysis method. Int J Pharm. 317:1, 40-46.
WARNER, A. [et al.] (1998) - Standards of laboratory practice: antiepileptic drug monitoring. Clin
Chem. 44:5, 1085-1095.
WATELET, J.B.; VAN CAUWENBERGE, P. (1999) - Applied anatomy and physiology of the nose and
paranasal sinuses. Allergy. 54:Suppl 57, 14-25.
WEAVER, D.F. (2013) - Design of innovative therapeutics for pharmacoresistant epilepsy:
challenges and needs. Epilepsia. 54:Suppl S2, 56-59.
WEAVER, D.F.; POHLMANN-EDEN, B. (2013) - Pharmacoresistant epilepsy: unmet needs in solving the
puzzle(s). Epilepsia. 54:Suppl S2, 80-85.
WEIERGRÄBER, M. [et al.] (2010) - Voltage-gated calcium channels in the etiopathogenesis and
treatment of absence epilepsy. Brain Res. Rev. 62:2, 245-271.
WEINTRAUB, D. [et al.] (2005) - Effect of antiepileptic drug comedication on lamotrigine clearance.
Arch Neurol. 62:9, 1432-1436.
WELLINGTON, K.; GOA, K.L. (2001) - Oxcarbazepine: an update of its efficacy in the management of
epilepsy. CNS Drugs. 15:2, 137-163.
WERMELING, D.P. (2009) - Intranasal delivery of antiepileptic medications for treatment of seizures.
Neurotherapeutics. 6:2, 352-358.

References
341
WERZ, M.A. (2008) - Pharmacotherapeutics of epilepsy: use of lamotrigine and expectations for
lamotrigine extended release. Ther Clin Risk Manag. 4:5, 1035-1046.
WESTIN, U.E. [et al.] (2006) - Direct nose-to-brain transfer of morphine after nasal administration
to rats. Pharm Res. 23:3, 565-572.
WOLBURG, H.; LIPPOLDT, A. (2002) - Tight junctions of the blood-brain barrier: development,
composition and regulation. Vascul Pharmacol. 38:6, 323-337.
WOLFE, T.R.; BERNSTONE, T. (2004) - Intranasal drug delivery: an alternative to intravenous
administration in selected emergency cases. J Emerg Nurs. 30:2, 141-147.
WOLFE, T.R.; MACFARLANE, T.C. (2006) - Intranasal midazolam therapy for pediatric status
epilepticus. Am J Emerg Med. 24:3, 343-346.
WONG, Y.C.; ZUO, Z. (2010) - Intranasal delivery - modification of drug metabolism and brain
disposition. Pharm Res. 27:7, 1208-1223.
WONG, Y.C.; ZUO, Z. (2013) - Brain disposition and catalepsy after intranasal delivery of loxapine:
role of metabolism in PK/PD of intranasal CNS drugs. Pharm Res. 30:9, 2368-2384.
WONG, Y.C. [et al.] (2014) - Pharmacokinetic comparison between the long-term anesthetized,
short-term anesthetized and conscious rat models in nasal drug delivery. Pharm Res. 31:8,
2107-2023.
WORLD HEALTH ORGANIZATION (2005) - Atlas - Epilepsy Care in the World. pp. 1-91.
WORLD HEALTH ORGANIZATION (2006) - Neurological Disorders - Public Health Challenges. pp. 1-218.
WU, H. [et al.] (2008) - From nose to brain: understanding transport capacity and transport rate of
drugs. Expert Opin Drug Deliv. 5:10, 1159-1168.
XU, L. [et al.] (2008) - Leptin inhibits 4-aminopyridine and pentylenetetrazole-induced seizures and
AMPAR-mediated synaptic transmission in rodents. J Clin Invest. 118:1, 272-280.
YAMAZAKI, H. [et al.] (2001) - Decreases in phenytoin hydroxylation activities catalyzed by liver
microsomal cytochrome P450 enzymes in phenytoin-treated rats. Drug Metab Dispos. 29:4
Pt 1, 427-434.
YAO, J. [et al.] (2009) - Preparation of lorazepam-loaded microemulsions for intranasal delivery
and its pharmacokinetics. Pharmazie. 64:10, 642-647.
YATES, R. [et al.] (2005) - Distribution of intranasal 11C-zolmitriptan assessed by positron emission
tomography. Cephalalgia. 25:12, 1103-1109.
YOKOGAWA, K. [et al.] (2006) - Pharmacokinetic advantage of an intranasal preparation of a novel
anti-osteoporosis drug, L-asp-hexapeptide-conjugated estradiol. Biol Pharm Bull. 29:6, 1229-
1233.
ZAMAN, M. [et al.] (2013) - Strategies for intranasal delivery of vaccines. Drug Deliv Transl Res. 3:1,
100-109.

References
342
ZARSHENAS, M.M. [et al.] (2013) - Nasal drug delivery in traditional persian medicine. Jundishapur J
Nat Pharm Prod. 8:3, 144-148.
ZHANG, C. [et al.] (2011) - In vitro transport profile of carbamazepine, oxcarbazepine,
eslicarbazepine acetate, and their active metabolites by human P-glycoprotein. Epilepsia.
52:10, 1894-1904.
ZHANG, C. [et al.] (2012) - The transport of antiepileptic drugs by P-glycoprotein. Adv Drug Deliv
Rev. 64:10, 930-942.
ZHAO, Y. [et al.] (2008) - Pharmacokinetics of tramadol in rat plasma and cerebrospinal fluid after
intranasal administration. J Pharm Pharmacol. 60:9, 1149-1154.
ZHAO, Y. [et al.] (2012) - Pharmacokinetic evaluation of intranasally administered vinyl polymer-
coated lorazepam microparticles in rabbits. AAPS J. 14:2, 218-224.


