Embed Size (px)
Citation preview
Intragenomic distribution of RTE retroelements suggestsintrachromosomal movement
Eugenia E. Montiel & Francisco J. Ruiz-Ruano & Josefa Cabrero &
Juan Alberto Marchal & Antonio Sánchez & Francisco Perfectti &María Dolores López-León & Juan Pedro M. Camacho
Received: 20 September 2014 /Revised: 25 November 2014 /Accepted: 18 December 2014# Springer Science+Business Media Dordrecht 2014
Abstract Much is known about the abundance of trans-posable elements (TEs) in eukaryotic genomes, but muchis still unknown on their behaviour within cells. We em-ploy here a combination of cytological, molecular and
genomic approaches providing information on theintragenomic distribution and behaviour of non-long ter-minal repeat (LTR) retrotransposon-like elements (RTE).We microdissected every chromosome in a single firstmeiotic metaphase cell of the grasshopper Eyprepocnemisplorans and polymerase chain reaction (PCR) amplified afragment of the RTE reverse transcriptase gene with spe-cific primers. PCR products were cloned and 139 cloneswere sequenced. Analysis of molecular variance(AMOVA) showed significant intragenomic structure forthese elements, with 4.6 % of molecular variance beingfound between chromosomes. Amaximum likelihood treebuilt with the RTE sequences revealed the frequent pres-ence of two or more elements showing very high similar-ity and being located on the same chromosome, thussuggesting intrachromosome movement. The 454 pyrose-quencing of genomic DNA gave strong support to themicrodissection results and provided evidence for theexistence of 5′ truncated elements. Our results thus indi-cate a tendency of RTE elements to reinsert into the samechromosome from where they were transcribed, whichcould be achieved if retrotranscription and insertion takesplace immediately after transcription.
Keywords 454 sequencing . Intrachromosomal .
Intragenomic .Microdissection . RTE . Transposableelements
AbbreviationsAMOVA Analysis of molecular variancedNTP Deoxynucleoside triphosphateLINE Long interspersed nuclear element
Chromosome ResDOI 10.1007/s10577-014-9461-5
Responsible Editor: Rachel O'Neill
Eugenia E. Montiel and Francisco J. Ruiz-Ruano contributedequally to this study.
Electronic supplementary material The online version of thisarticle (doi:10.1007/s10577-014-9461-5) contains supplementarymaterial, which is available to authorized users.
E. E. Montiel : F. J. Ruiz-Ruano : J. Cabrero : F. Perfectti :M. D. López-León : J. P. M. Camacho (*)Departamento de Genética, Facultad de Ciencias, Universidadde Granada, Granada 18071, Spaine-mail: [email protected]
E. E. Montiele-mail: [email protected]
F. J. Ruiz-Ruanoe-mail: [email protected]
J. Cabreroe-mail: [email protected]
F. Perfecttie-mail: [email protected]
M. D. López-Leóne-mail: [email protected]
J. A. Marchal :A. SánchezDepartamento de Biología Experimental, Facultad deCiencias Experimentales, Universidad de Jaén, Jaén, Spain
J. A. Marchale-mail: [email protected]
A. Sáncheze-mail: [email protected]
LTR Long terminal repeatORF Open reading framePCR Polymerase chain reactionRTE Non-LTR retrotransposon-like elementSINE Short interspersed nuclear elementTE Transposable element
Introduction
As evidenced by the genomes recently sequenced, eu-karyote genomes contain huge amounts of transposableelements (TEs): 15 % of the Drosophila melanogastergenome (Vieira et al. 1999), 45 % of the human genome(Lander et al. 2001) and up to 80 % in some plantgenomes (Charles et al. 2008; Tenaillon et al. 2011).TEs are usually classified as class I (retrotransposons),with an RNA intermediate, and class II (transposons)(Wicker et al. 2007). On the basis of the presence orabsence o f long te rmina l r epea t s (LTRs) ,retrotransposons are classified into LTR and non-LTRelements, respectively. The latter include short inter-spersed nuclear elements (SINEs) and long interspersednuclear elements (LINEs) which are the most wide-spread TEs in eukaryotes (Vitte and Bennetzen 2006).Retrotransposon-like element (RTE) is a non-LTRretrotransposon that is very abundant in most eukary-otes. It is a kind of LINE showing an integration mech-anism through target-primed reverse transcription whichfrequently generates 5′ truncated copies due to the inte-gration of prematurely terminated reverse transcripts(Malik and Eickbush 1998). This implies the simulta-neous reverse transcription and joining of the 5′ end ofthe first-strand complementary DNA (cDNA) with thegenome thus starting integration (Zingler et al. 2005).Since reverse transcription and integration occur simul-taneously, the logical consequence of reverse transcrip-tion interruption is the integration of 5′ truncated copies.It is known that non-LTR retrotransposons, includingLINE-1 in humans, perform reverse transcription in thenucleus, but the ultimate cause for 5′ truncation remainsmostly unknown (Zingler et al. 2005).
The intragenomic distribution of TEs could illumi-nate some obscure aspects of their behaviour. For thispurpose, we assay here a combination of the microdis-section of each chromosome in a single cell and subse-quent polymerase chain reaction (PCR) amplification ofpart of the RTE sequence, with sequence comparisons
between elements residing in different chromosomes.Chromosome microdissection was developed byScalenghe et al. (1981) in polytene chromosomes ofDrosophila, and shortly after, it was applied to humanchromosomes (Bates et al. 1986). From then on, manydifferent applications have emerged (Cannizzaro 1996;Zhou and Hu 2007). One of the main current uses ofchromosome microdissection is for chromosome paint-ing (Guan et al. 1994; Houben et al. 2001; Marchal et al.2004; Teruel et al. 2009), but it has rarely been used forthe analysis of specific DNA sequences from specificchromosomes (Cheng and Lin 2003; Lamb et al. 2005;Teruel et al. 2010), even though this latter approach maybe very useful for a broad range of genomic studies. Forinstance, clinical genetics has taken particular advantageof microdissection, facilitating genetic disease analysissuch as the identification of the affected genes in Prader-Willi syndrome (Buiting et al. 1990) or characterizationof marker chromosomes in prenatal diagnosis(Mahjoubi et al. 2005).
Here, we perform the microdissection of all chromo-somes in a single cell and amplify in them, by PCR, afragment of the RTE retrotransposon, in order to analysethe intragenomic distribution of these elements in thegrasshopper Eyprepocnemis plorans, a species with agigantic genome (Ruiz-Ruano et al. 2011) that is rich inmob i l e e l emen t s such as Gypsy and RTEretrotransposons and Mariner transposons (Montielet al. 2012). They are widely represented in euchromaticregions of all standard (A) chromosomes and, in a lesserextent, on B chromosomes (a kind of dispensableheterocromatic chromosomes) (Camacho 2005). We al-so performed 454 pyrosequencing of genomic DNA totest the reliability of the DNA sequences obtainedthrough microdissection and PCR amplification. Thecoding nature of RTE provided us with useful tools totest the action of purifying selection during the evolu-tionary dynamics of these elements.
Materials and methods
Microdissection and PCR-cloning experiment
We microdissected all chromosomes (11 autosomal bi-valents and X and B univalents) out of a previouslyphotographed single spermatocyte at first meiotic meta-phase (Fig. S1), from a B-carrying male captured inTorrox (Málaga, Spain). Chromosomes were stored into
E.E. Montiel et al.
separate 0.2-ml Eppendorf tubes with 1X Buffer Taqpolymerase (MBL) and 2 mg/ml proteinase K (Sigma),to be subsequently denatured at 50 °C for 1 h and at99 °C for 4 min. Chromosomes were named in order ofdecreasing area, excepting X and B univalents whichwere easily identified because of their differentialheteropycnosis, size and univalency. Chromosome areawas measured (in arbitrary units) using the ImageJ pro-gram, version 1.44p (http://imagej.nih.gov/ij). Measureswere repeated three times to corroborate the results.PCR reactions were performed on each chromosome,to amplify the YLG motive of region 7 of the reversetranscriptase gene of the RTE element (see Xiong andEickbush 1990), with the primers qPCR_RTEf (5′-AGATTG GGA AAC GAG GCA CTG-3′) and RTE_IntR(5′-CAT CCA TAC AAG GCA ACA CTC-3′), whichyielded a 218-bp fragment coding to the thumb region ofthe reverse transcriptase enzyme (Xiong and Eickbush1990; Montiel et al. 2012). The reaction mix was com-posed of 2 mM MgCl2, 0.16 mM deoxynucleosidetriphosphate (dNTP), 4 % DMSO, 0.4 μM of eachprimer and 1 U Taq polymerase (MBL). The reactionconditions consisted in an initial denaturation step at95 °C for 5 min followed by 30 cycles of 20 s at94 °C, 30 s at 55 °C and 45 s at 72 °C, and a finalextension for 8 min at 72 °C. PCR products were visu-alized in a 1 % agarose gel, and the fragment obtainedfrom each chromosome was extracted from the gel withthe GenElute Kit (Sigma), cloned into TOPO TAvector(Invitrogen) and transformed into One Shot TOP10 cell(Invitrogen). The insert of 17–28 clones per chromo-some was sequenced in both directions (Macrogen)using the standard M13 primers. DNA sequences(GenBank: JX244482-JX244770) were aligned withthe program BioEdit (Hall 1999) using ClustalW(Thompson et al. 1994). Saturation tests, performedfollowing the procedure described in (Xia et al. 2003),indicated the absence of saturation for RTE sequences.We built a phylogenetic tree by the maximum likelihoodmethod with the online version of PHYML (Dereeperet al. 2008), using a GTR evolutionary model,employing the α-LTR method (Anisimova andGascuel 2006) to calculate branch support, and usingthe SplitsTree4 program (Huson and Bryant 2006) toprocess the obtained tree. Arlequin 3.0 software(Excoffier et al. 2005) was used to test the genomicstructure of these sequences using the analysis of mo-lecular variance (AMOVA) test. For comparison, weperformed this same analysis to the data by Kejnovsky
et al. (2007) (accession numbers: DQ683758-969 andDQ922567-629).
Whole genome shotgun experiment
We performed a sampling of repetitive DNA sequencesin the E. plorans genome by means of 454 Rochepyrosequencing of total genomic DNA from a malecarrying two B chromosomes, captured at Torrox (Má-laga, Spain) (1/8 plate). We deposited the raw reads inthe NCBI’s SRA database (accession numberSRR1200829). After performing a quality trimmingwith Roche’s 454 GS Assembler, and excluding thosereads with a size lower than 200 nt, we cut the remainingreads into as many 200-nt-long fragments as possible.We applied the RepeatExplorer pipeline (Novák et al.2013) in order to perform a clustering of the resultingfragments according to their identity, and performed ade novo assembly in each individual cluster to get aconsensus sequence of the most frequent families ofRTE elements present in the E. plorans genome. Foreach of the two clusters found by RepeatExplorer, weselected the largest contig. To identify the 5′ and 3′ endsand determine the depth along all the element sequence,we mapped all the reads to the selected contigs of eachsubfamily with the Roche’s 454 GS Mapper, with de-faults options, i.e. with a minimum overlap length of40 bp and 90 % identity, and bearing in mind thedramatic decline in coverage at both ends, coincidingwith the end of the microsatellite region in the 3′ end.The coding region with the longest open reading frame(ORF) was considered representative for each RTE sub-family (GenBank: KF881086 and KF881087). To ana-lyse sequence conservation at protein level, we alignedthe putative amino acid sequence of the RTEretroelements with that reported for Bombyx mori (ac-cession number ADF18552).
We then extracted the reads, assigned them to one ofthe two clusters, and aligned them against the ORFregion of the representative nucleotide sequence foreach cluster with the RepeatMasker software (Smitet al. 2010). Using a custom Python script (https://github.com/fjruizruano/rmasker-processing), weprocessed the output to classify the reads as (i)completely aligned; (ii) partly aligned in the 5′ or 3′regions, thus including the beginning or the end ofRTE and (iii) partly aligned due to the presence ofinsertions or deletions. The aligned region of the readsbelonging to the first two groups was analysed in the
Intragenomic distribution of RTE retrotransposons
appropriate reading frame and only those lacking indelsand stop codons were considered as putatively function-al (non-defective). The third type of reads was consid-ered as defective.
Calculations of the number of RTE elements in theE. plorans genome were done at nucleotide level andthen converted to elements considering element length.The proportion of the genome represented by RTE ele-ments was calculated by dividing the RTE nucleotidesbetween total nucleotides in the trimmed library. Thenumber ofRTE elements in the library was calculated bydividing the total number of RTE nucleotides betweenORF length. The number of RTE elements in the 2Bmale was calculated by multiplying the number of ele-ments in the library by the total number of base pairs in a2B male (calculated as explained below) and dividingby the total number of nucleotides in the 454 library.The number of base pairs in a male genome from Torroxcarrying two B chromosomes was estimated bearing inmind (i) that the E. plorans C value, the DNA content ofthe X chromosome and that of the B chromosome in thispopulation are 1.78, 0.219 and 0.108 times the C valuein Locusta migratoria (Ruiz-Ruano et al. 2011), (ii) thatgrasshopper males are X0, and (iii) that full genomesequence in L. migratoria is 6.3 Gb (Wang et al.2014). Consequently, the number of base pairs in a 2Bmale is 2C−X+B×2=22.4 Gb. Divergence was calcu-lated by RepeatMasker as the percentage of differencesbetween each sequence read and the consensus se-quence in the matched region. The divergence of eachcluster was calculated as the mean divergence of readmatched regions weighted for their length in base pairs.
Comparative analysis between microdissectionand whole genome shotgun results
To validate the microdissection results, we repeated thesame analyses previously applied to the 139 clonesobtained through microdissection and PCR amplifica-tion but, in this case, with the same 178 nt DNA se-quences obtained through 454 pyrosequencing. To ana-lyse the similarity of the RTE sequences in these 139clones and those obtained through 454 pyrosequencing,we aligned them, along with the primers used for PCR(see above), using the Geneious v4.8 software(Drummond et al. 2009). For this purpose, we extractedthis 178 nt sequence for each RTE subfamily and used itas reference to map and select the 454 reads carrying thefull 178-nt region for the RTE-1_EP or the RTE-2_EP
subfamilies, using RepeatMasker and processing itsoutput with the above mentioned Python script. We thenperformed an analysis of nucleotide polymorphism withDnaSP v.5 (Librado and Rozas 2009), for the followingparameters: number of segregating sites (S), number ofhaplotypes (H), nucleotide diversity (π) and heterozy-gosity per site (Θ Watterson’s estimator) (Watterson1975). In addition, we tested for neutrality, positiveand purifying selection, based on the comparison ofthe number of synonymous and non-synonymous sub-stitutions per site by the codon-based tests of neutralityusing the Nei-Gojobori method (Nei and Gojobori1986) in MEGA 4.0 (Tamura et al. 2007). All positionscontaining gaps and missing data were eliminated fromthe dataset. Statistical analyses were performed with thesoftware STATISTICA 6.0.
Results
Intragenomic distribution of RTE elements
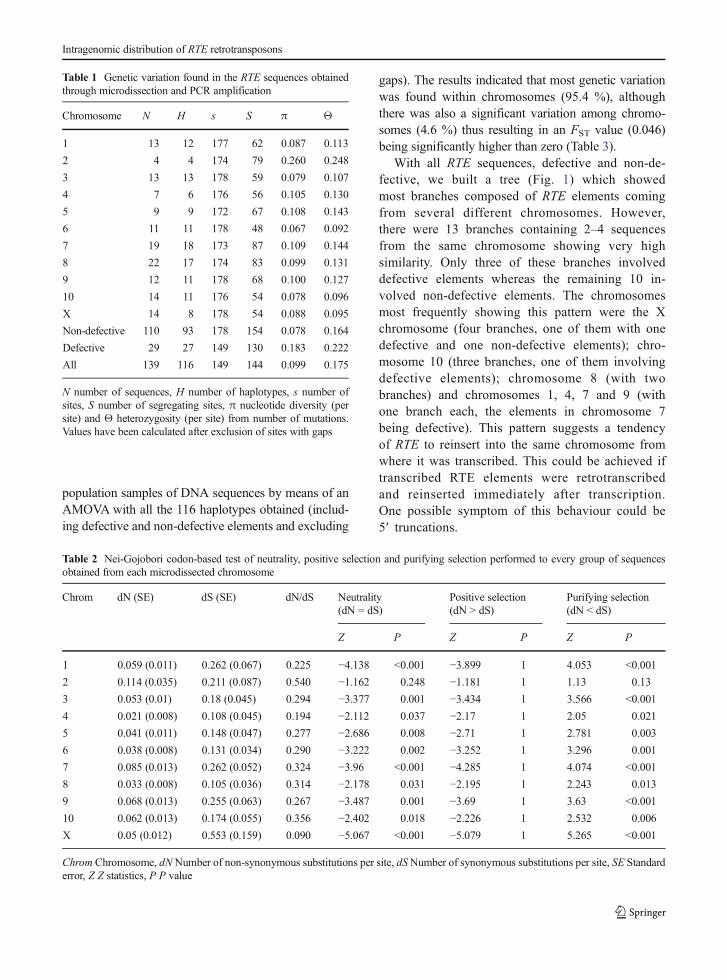
We obtained RTE amplification from 11 out of the 13microdissected chromosomes, the exceptions being thesmallest autosome (S11) and the B chromosome. ThePCR amplification product from each chromosome wascloned and sequenced in both directions. Afterdiscarding primer regions, a total of 178 bp from thereverse transcriptase domain of the RTE element wereobtained in 139 clones (Table 1), 79.1 % of whichlacked indels and stop codons, suggesting that they werenon-defective, and thus they could be putatively active.Defective sequences (i.e. those showing indels or stopcodons) showed more than twice nucleotide diversity(π) as non-defective ones, and their heterozygosity persite (Θ) was about 50 % higher (Table 1).
We also compared synonymous and non-synonymous substitutions in non-defective RTE se-quences to test whether selection was operating on themusing codon-based tests of neutrality. It showed that thepurifying selection was acting on these retroelements inmost chromosomes except chromosome 2 where neu-trality could not be rejected (Table 2), but this wasprobably due to the low number of sequences obtainedfrom this chromosome (see Table 1).
Considering that our collection of RTE elementscame from specific locations in the E. plorans genome(i.e. each of 10 chromosomes of the standard karyo-type), we analysed the genetic structure of these 10
E.E. Montiel et al.
population samples of DNA sequences by means of anAMOVA with all the 116 haplotypes obtained (includ-ing defective and non-defective elements and excluding
gaps). The results indicated that most genetic variationwas found within chromosomes (95.4 %), althoughthere was also a significant variation among chromo-somes (4.6 %) thus resulting in an FST value (0.046)being significantly higher than zero (Table 3).
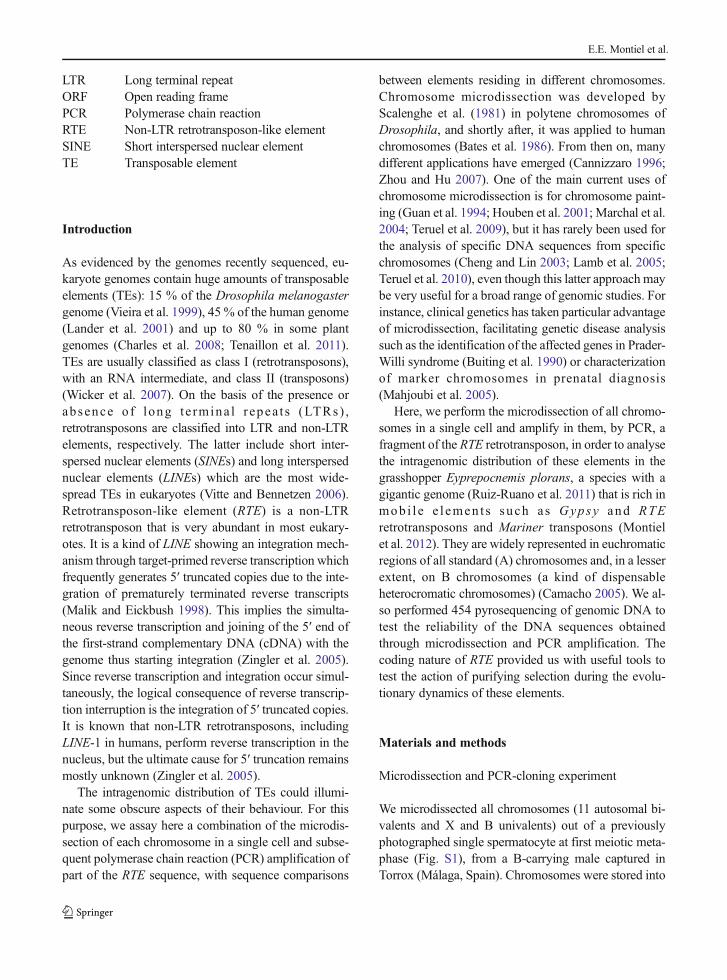
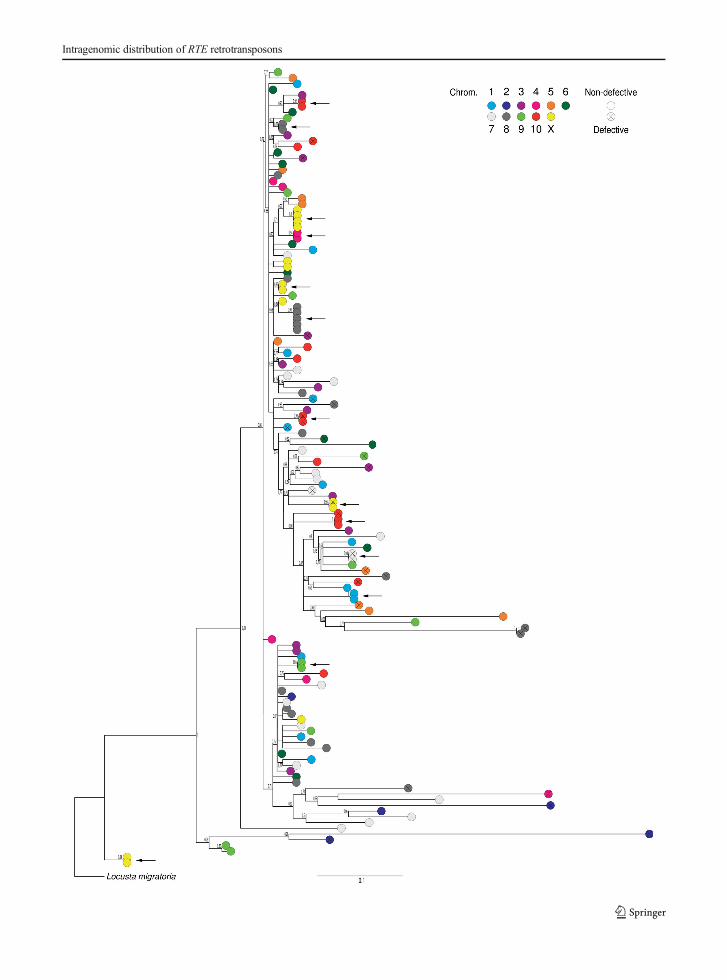
With all RTE sequences, defective and non-de-fective, we built a tree (Fig. 1) which showedmost branches composed of RTE elements comingfrom several different chromosomes. However,there were 13 branches containing 2–4 sequencesfrom the same chromosome showing very highsimilarity. Only three of these branches involveddefective elements whereas the remaining 10 in-volved non-defective elements. The chromosomesmost frequently showing this pattern were the Xchromosome (four branches, one of them with onedefective and one non-defective elements); chro-mosome 10 (three branches, one of them involvingdefective elements); chromosome 8 (with twobranches) and chromosomes 1, 4, 7 and 9 (withone branch each, the elements in chromosome 7being defective). This pattern suggests a tendencyof RTE to reinsert into the same chromosome fromwhere it was transcribed. This could be achieved iftranscribed RTE elements were retrotranscribedand reinserted immediately after transcription.One possible symptom of this behaviour could be5′ truncations.
Table 1 Genetic variation found in the RTE sequences obtainedthrough microdissection and PCR amplification
Chromosome N H s S π Θ
1 13 12 177 62 0.087 0.113
2 4 4 174 79 0.260 0.248
3 13 13 178 59 0.079 0.107
4 7 6 176 56 0.105 0.130
5 9 9 172 67 0.108 0.143
6 11 11 178 48 0.067 0.092
7 19 18 173 87 0.109 0.144
8 22 17 174 83 0.099 0.131
9 12 11 178 68 0.100 0.127
10 14 11 176 54 0.078 0.096
X 14 8 178 54 0.088 0.095
Non-defective 110 93 178 154 0.078 0.164
Defective 29 27 149 130 0.183 0.222
All 139 116 149 144 0.099 0.175
N number of sequences, H number of haplotypes, s number ofsites, S number of segregating sites, π nucleotide diversity (persite) and Θ heterozygosity (per site) from number of mutations.Values have been calculated after exclusion of sites with gaps
Table 2 Nei-Gojobori codon-based test of neutrality, positive selection and purifying selection performed to every group of sequencesobtained from each microdissected chromosome
Chrom dN (SE) dS (SE) dN/dS Neutrality(dN = dS)
Positive selection(dN > dS)
Purifying selection(dN < dS)
Z P Z P Z P
1 0.059 (0.011) 0.262 (0.067) 0.225 −4.138 <0.001 −3.899 1 4.053 <0.001
2 0.114 (0.035) 0.211 (0.087) 0.540 −1.162 0.248 −1.181 1 1.13 0.13
3 0.053 (0.01) 0.18 (0.045) 0.294 −3.377 0.001 −3.434 1 3.566 <0.001
4 0.021 (0.008) 0.108 (0.045) 0.194 −2.112 0.037 −2.17 1 2.05 0.021
5 0.041 (0.011) 0.148 (0.047) 0.277 −2.686 0.008 −2.71 1 2.781 0.003
6 0.038 (0.008) 0.131 (0.034) 0.290 −3.222 0.002 −3.252 1 3.296 0.001
7 0.085 (0.013) 0.262 (0.052) 0.324 −3.96 <0.001 −4.285 1 4.074 <0.001
8 0.033 (0.008) 0.105 (0.036) 0.314 −2.178 0.031 −2.195 1 2.243 0.013
9 0.068 (0.013) 0.255 (0.063) 0.267 −3.487 0.001 −3.69 1 3.63 <0.001
10 0.062 (0.013) 0.174 (0.055) 0.356 −2.402 0.018 −2.226 1 2.532 0.006
X 0.05 (0.012) 0.553 (0.159) 0.090 −5.067 <0.001 −5.079 1 5.265 <0.001
Chrom Chromosome, dNNumber of non-synonymous substitutions per site, dSNumber of synonymous substitutions per site, SE Standarderror, Z Z statistics, P P value
Intragenomic distribution of RTE retrotransposons
5′ truncations in RTE elements
The 454 sequencing experiment performed on genomicDNA from a 2B male yielded 128,572 reads summingup to 80,996,774 nt (N50=733 nt) after quality trim-ming and 117,694 reads summing up to 79,842,732 nt(N50=735 nt) after length trimming. Since theE. plorans genome consists of 11.21 Gb in the Torroxpopulation (Ruiz-Ruano et al. 2011) (see “Materials andmethods” section), the reads obtained implied a 0.0071×coverage per nucleotide. Although this is insignificantfor single-copy genes, it resulted as very informative forrepetitive DNA analysis where coverage is multipliedby the number of paralogous copies in the genome.Among the repetitive sequences assembled byRepeatExplorer, we found two subfamilies annotatedas RTE with 62.1 % pairwise identity. One of them(RTE-1_EP) represented 3.74 % of the sequenced nu-cleotides, and the other (RTE-2_EP), constituted 1.18 %of them. As a whole, the RTE retrotransposon was themost abundant repetitive element, representing 4.92 %of all sequenced nucleotides. In close resemblance to theRTE elements in other insect orders (Tay et al. 2010), wefound RTE-1_EP and RTE-2_EP elements in E. ploransbeing 3315 and 3360 pb long, respectively. In bothsubfamilies we found a 5′-UTR with 315 (RTE-1_EP)and 344 (RTE-2_EP) nt, a single ORF of 2961 and2970 bp (987 and 990 amino acids), respectively, witha TGA stop codon, and a 3′-UTR of 39 and 46 nt,respectively, with (CCA)11 and (A)42 terminal microsat-ellite regions in RTE-1_EP and RTE-2_EP, respectively.The alignment with the amino acidic sequence inB. mori indicated the presence of the apurinic endonu-clease domain (pfam03372) followed by the reversetranscriptase domain (pfam00078). We found no targetsite duplications because read size was smaller thanelement size and reads aligned in the ends of the
elements could come from insertions in different sites.The existence of these conserved regions in the RTEsequence genome and the high abundance of this ele-ment in the E. plorans genome suggest a recent orcurrent functionality of both RTE subfamilies.
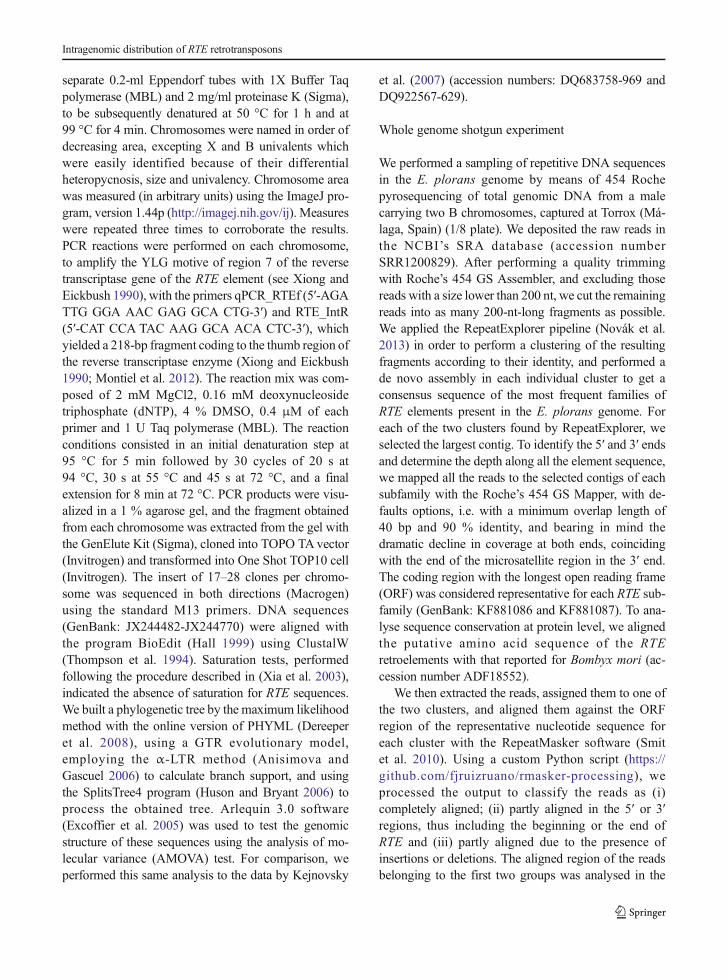
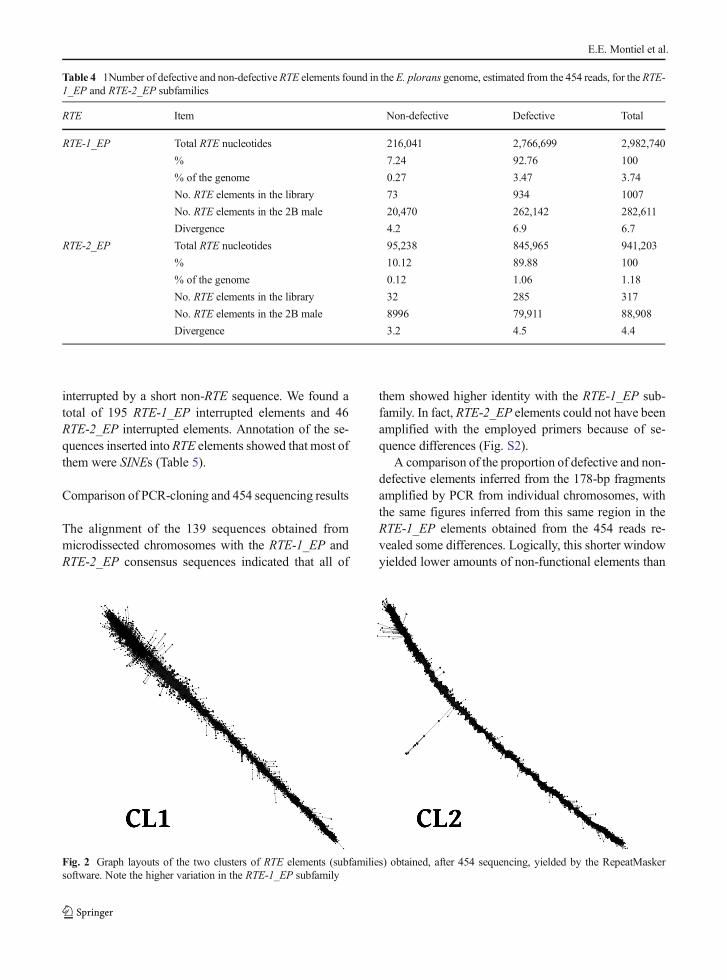
The analysis of the coded amino acid sequence indi-cated that at least 92.76 % of the RTE-1_EP and 89.88 %of the RTE-2_EP RTE reads showed stop codons thusbeing defective (Table 4). In both subfamilies, defectiveelements showed higher divergence in respect to theconsensus sequence used as reference (Novák et al.2013), and RTE-1_EP elements showed higher diver-gence than RTE-2_EP ones (Table 4 and Fig. 2).
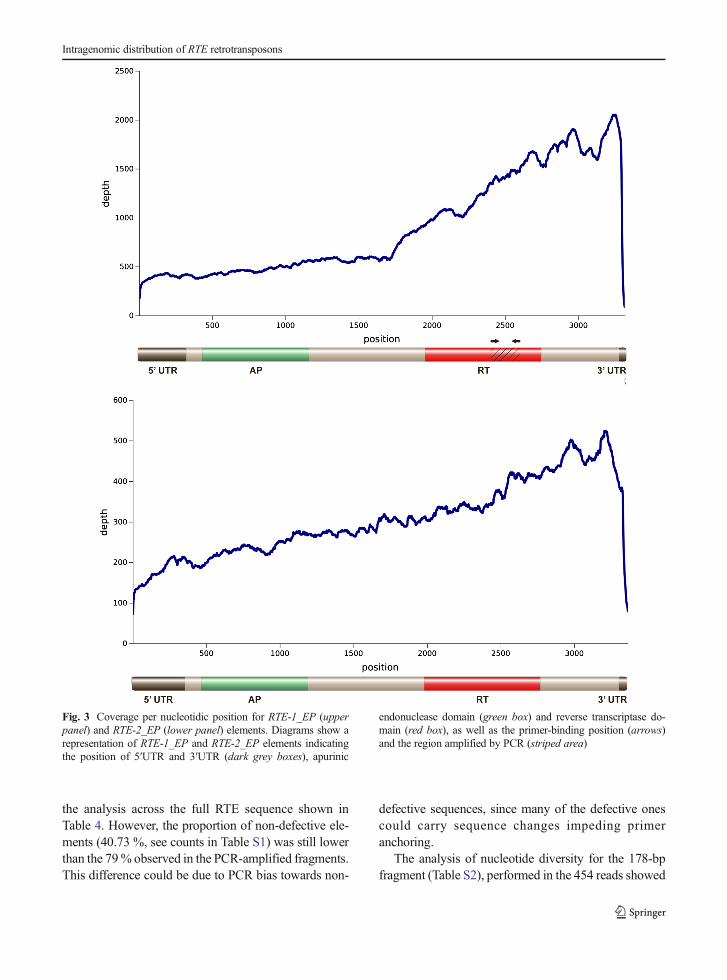
In non-LTR retrotransposons, the existence of 5′truncated copies is indicative of the integration of pre-maturely terminated reverse transcripts initiating at the3′ end of the RNA (Luan et al. 1993). If this behaviourwere frequent for RTE elements in the E. plorans ge-nome, we would expect lower coverage in 5′ regions,compared to 3′ ones. To test this hypothesis, we mappedthe 454 reads from the genomic library on the assembledRTE-1_EP and RTE-2_EP elements in order to estimatecoverage per nucleotide position (Fig. 3). In both cases,we observed lower coverage in the 5′ end in respect tothat in the 3′ end (sixfold bias for RTE-1_EP and three-fold bias for RTE-2_EP). This result is consistent withthe existence of 5′ truncated copies for RTE elements inthe E. plorans genome.
We finally searched for insertion of other elementswithin RTE elements, as evidenced by the presence oftwo consecutive RTE segments, within a same read,
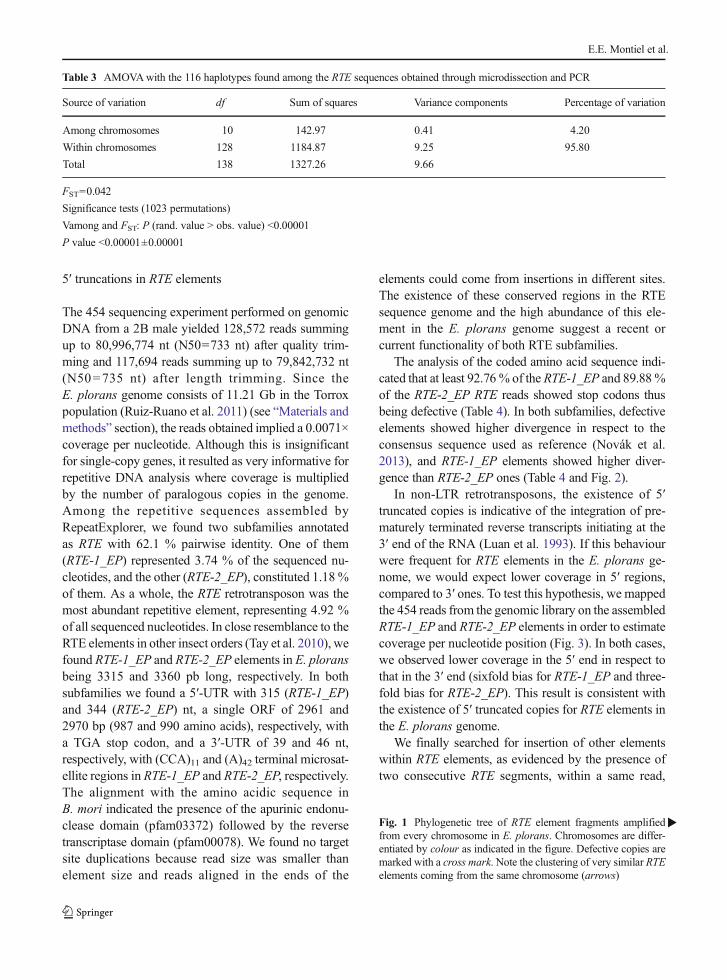
Table 3 AMOVAwith the 116 haplotypes found among the RTE sequences obtained through microdissection and PCR
Source of variation df Sum of squares Variance components Percentage of variation
Among chromosomes 10 142.97 0.41 4.20
Within chromosomes 128 1184.87 9.25 95.80
Total 138 1327.26 9.66
FST=0.042
Significance tests (1023 permutations)
Vamong and FST: P (rand. value > obs. value) <0.00001
P value <0.00001±0.00001
�Fig. 1 Phylogenetic tree of RTE element fragments amplifiedfrom every chromosome in E. plorans. Chromosomes are differ-entiated by colour as indicated in the figure. Defective copies aremarked with a cross mark. Note the clustering of very similar RTEelements coming from the same chromosome (arrows)
E.E. Montiel et al.
Intragenomic distribution of RTE retrotransposons
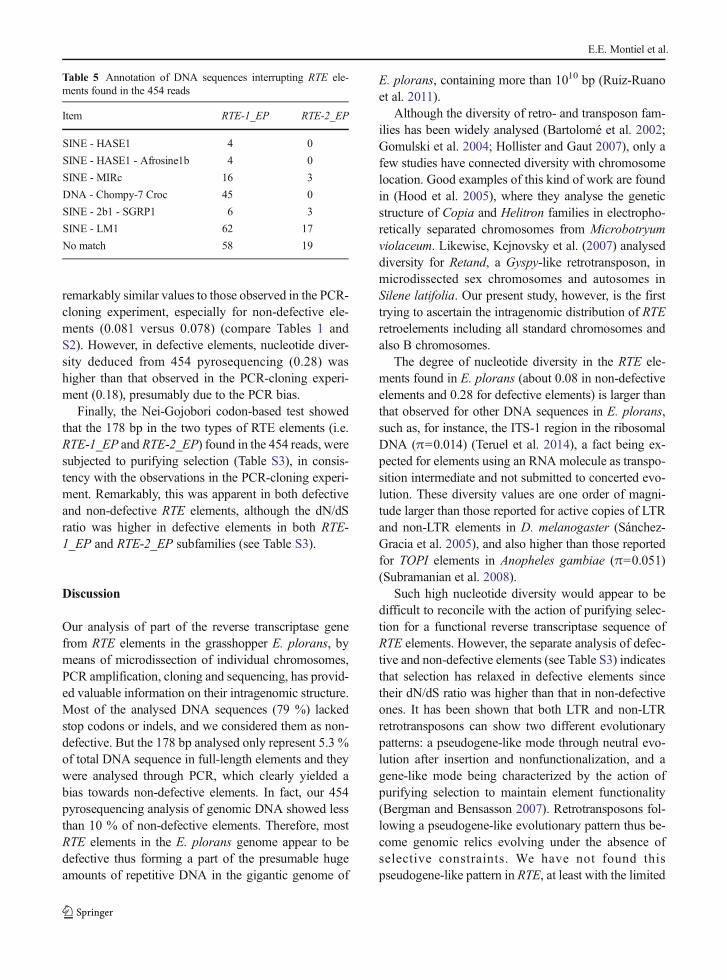
interrupted by a short non-RTE sequence. We found atotal of 195 RTE-1_EP interrupted elements and 46RTE-2_EP interrupted elements. Annotation of the se-quences inserted into RTE elements showed that most ofthem were SINEs (Table 5).
Comparison of PCR-cloning and 454 sequencing results
The alignment of the 139 sequences obtained frommicrodissected chromosomes with the RTE-1_EP andRTE-2_EP consensus sequences indicated that all of
them showed higher identity with the RTE-1_EP sub-family. In fact, RTE-2_EP elements could not have beenamplified with the employed primers because of se-quence differences (Fig. S2).
A comparison of the proportion of defective and non-defective elements inferred from the 178-bp fragmentsamplified by PCR from individual chromosomes, withthe same figures inferred from this same region in theRTE-1_EP elements obtained from the 454 reads re-vealed some differences. Logically, this shorter windowyielded lower amounts of non-functional elements than
Table 4 1Number of defective and non-defectiveRTE elements found in the E. plorans genome, estimated from the 454 reads, for the RTE-1_EP and RTE-2_EP subfamilies
RTE Item Non-defective Defective Total
RTE-1_EP Total RTE nucleotides 216,041 2,766,699 2,982,740
% 7.24 92.76 100
% of the genome 0.27 3.47 3.74
No. RTE elements in the library 73 934 1007
No. RTE elements in the 2B male 20,470 262,142 282,611
Divergence 4.2 6.9 6.7
RTE-2_EP Total RTE nucleotides 95,238 845,965 941,203
% 10.12 89.88 100
% of the genome 0.12 1.06 1.18
No. RTE elements in the library 32 285 317
No. RTE elements in the 2B male 8996 79,911 88,908
Divergence 3.2 4.5 4.4
Fig. 2 Graph layouts of the two clusters of RTE elements (subfamilies) obtained, after 454 sequencing, yielded by the RepeatMaskersoftware. Note the higher variation in the RTE-1_EP subfamily
E.E. Montiel et al.
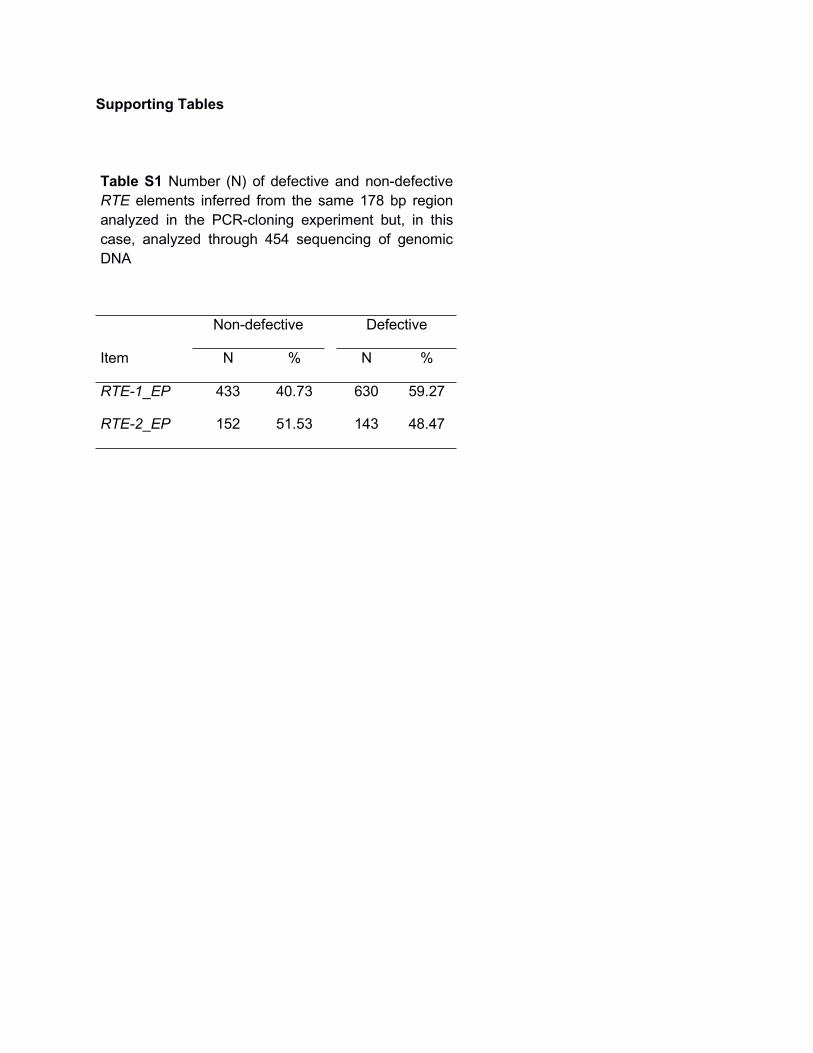
the analysis across the full RTE sequence shown inTable 4. However, the proportion of non-defective ele-ments (40.73 %, see counts in Table S1) was still lowerthan the 79% observed in the PCR-amplified fragments.This difference could be due to PCR bias towards non-
defective sequences, since many of the defective onescould carry sequence changes impeding primeranchoring.
The analysis of nucleotide diversity for the 178-bpfragment (Table S2), performed in the 454 reads showed
Fig. 3 Coverage per nucleotidic position for RTE-1_EP (upperpanel) and RTE-2_EP (lower panel) elements. Diagrams show arepresentation of RTE-1_EP and RTE-2_EP elements indicatingthe position of 5′UTR and 3′UTR (dark grey boxes), apurinic
endonuclease domain (green box) and reverse transcriptase do-main (red box), as well as the primer-binding position (arrows)and the region amplified by PCR (striped area)
Intragenomic distribution of RTE retrotransposons
remarkably similar values to those observed in the PCR-cloning experiment, especially for non-defective ele-ments (0.081 versus 0.078) (compare Tables 1 andS2). However, in defective elements, nucleotide diver-sity deduced from 454 pyrosequencing (0.28) washigher than that observed in the PCR-cloning experi-ment (0.18), presumably due to the PCR bias.
Finally, the Nei-Gojobori codon-based test showedthat the 178 bp in the two types of RTE elements (i.e.RTE-1_EP and RTE-2_EP) found in the 454 reads, weresubjected to purifying selection (Table S3), in consis-tency with the observations in the PCR-cloning experi-ment. Remarkably, this was apparent in both defectiveand non-defective RTE elements, although the dN/dSratio was higher in defective elements in both RTE-1_EP and RTE-2_EP subfamilies (see Table S3).
Discussion
Our analysis of part of the reverse transcriptase genefrom RTE elements in the grasshopper E. plorans, bymeans of microdissection of individual chromosomes,PCR amplification, cloning and sequencing, has provid-ed valuable information on their intragenomic structure.Most of the analysed DNA sequences (79 %) lackedstop codons or indels, and we considered them as non-defective. But the 178 bp analysed only represent 5.3 %of total DNA sequence in full-length elements and theywere analysed through PCR, which clearly yielded abias towards non-defective elements. In fact, our 454pyrosequencing analysis of genomic DNA showed lessthan 10 % of non-defective elements. Therefore, mostRTE elements in the E. plorans genome appear to bedefective thus forming a part of the presumable hugeamounts of repetitive DNA in the gigantic genome of
E. plorans, containing more than 1010 bp (Ruiz-Ruanoet al. 2011).
Although the diversity of retro- and transposon fam-ilies has been widely analysed (Bartolomé et al. 2002;Gomulski et al. 2004; Hollister and Gaut 2007), only afew studies have connected diversity with chromosomelocation. Good examples of this kind of work are foundin (Hood et al. 2005), where they analyse the geneticstructure of Copia and Helitron families in electropho-retically separated chromosomes from Microbotryumviolaceum. Likewise, Kejnovsky et al. (2007) analyseddiversity for Retand, a Gyspy-like retrotransposon, inmicrodissected sex chromosomes and autosomes inSilene latifolia. Our present study, however, is the firsttrying to ascertain the intragenomic distribution of RTEretroelements including all standard chromosomes andalso B chromosomes.
The degree of nucleotide diversity in the RTE ele-ments found in E. plorans (about 0.08 in non-defectiveelements and 0.28 for defective elements) is larger thanthat observed for other DNA sequences in E. plorans,such as, for instance, the ITS-1 region in the ribosomalDNA (π=0.014) (Teruel et al. 2014), a fact being ex-pected for elements using an RNA molecule as transpo-sition intermediate and not submitted to concerted evo-lution. These diversity values are one order of magni-tude larger than those reported for active copies of LTRand non-LTR elements in D. melanogaster (Sánchez-Gracia et al. 2005), and also higher than those reportedfor TOPI elements in Anopheles gambiae (π=0.051)(Subramanian et al. 2008).
Such high nucleotide diversity would appear to bedifficult to reconcile with the action of purifying selec-tion for a functional reverse transcriptase sequence ofRTE elements. However, the separate analysis of defec-tive and non-defective elements (see Table S3) indicatesthat selection has relaxed in defective elements sincetheir dN/dS ratio was higher than that in non-defectiveones. It has been shown that both LTR and non-LTRretrotransposons can show two different evolutionarypatterns: a pseudogene-like mode through neutral evo-lution after insertion and nonfunctionalization, and agene-like mode being characterized by the action ofpurifying selection to maintain element functionality(Bergman and Bensasson 2007). Retrotransposons fol-lowing a pseudogene-like evolutionary pattern thus be-come genomic relics evolving under the absence ofselective constraints. We have not found thispseudogene-like pattern in RTE, at least with the limited
Table 5 Annotation of DNA sequences interrupting RTE ele-ments found in the 454 reads
Item RTE-1_EP RTE-2_EP
SINE - HASE1 4 0
SINE - HASE1 - Afrosine1b 4 0
SINE - MIRc 16 3
DNA - Chompy-7 Croc 45 0
SINE - 2b1 - SGRP1 6 3
SINE - LM1 62 17
No match 58 19
E.E. Montiel et al.
information provided by the 178-bp sequence analysed,since the codon-based tests showed evidence for puri-fying selection in both non-defective and defective ele-ments. Interestingly, defective RTE elements appear toconserve the bias for synonymous substitutions promot-ed by purifying selection, a signal which could not beerased even after long periods of neutral evolution.
The observed intragenomic structure of RTE ele-ments in the E. plorans genome, and their tendency toshow a certain degree of intrachomosomal similarity,could be the result of RTE tendency to reinsert into thesame chromosome fromwhere it was transcribed, whichcould be more likely if the time between transcriptionand reverse transcription is short and the transcriptscarcely moves before reinsertion (i.e., space and timeare both small and short, respectively). This is feasiblesince chromosomes tend to occupy certain territories inthe interphase nucleus (Cremer and Cremer 2001), andis consistent with the fact that, in non-LTRretrotransposons, including LINE-1 in humans (Zingleret al. 2005), reverse transcription occurs in the nucleus,and the integration of prematurely terminated reversetranscripts generates 5′ truncated copies in the R2retrotransposon (Luan et al. 1993).We have consistentlyfound evidence for 5′ truncated copies for RTE elementsin E. plorans. It is thus conceivable that these features ofRTE behav iou r can fac i l i t a t e p re f e r en t i a lintrachromosome retrotransposition, the net result beingthe existence of some genomic structure for RTE chro-mosome location. Interestingly, it has recently beenshown that CoT-1 RNA including 5′ truncated LINE-1elements, is abundant and stably associated with thechromosome from which it was transcribed, with thelikely role of promoting open chromatin packaging(Hall et al. 2014). Our present results suggest that someof these LINE transcripts can be retrotranscribed andreinserted into the same chromosome while they are inits territory.
Alternatively, the intrachromosomal similarity ob-served for RTE elements in the E. plorans genomecould be the result of homogenizing gene conver-s i o n . K e j n o v s k y e t a l . ( 2 0 0 7 ) f o u n dintrachromosomal similarity for the Retand LTRretrotransposon in the plant S. latifolia, with ele-ments residing in the X and Y chromosomes show-ing higher intrachromosomal similarity. We per-formed the AMOVA test to these authors’ datawhich revealed very significant molecular structurefor these retrotransposons, with 30 % of molecular
variance among chromosomes (Table S4). Theseauthors ruled out the possibility of preferentialintrachromosome retrotransposition because, inLTR retroelements, reverse transcription occurs inthe cytoplasm thus making it unlikely reinsertinginto the same chromosome. Alternatively, they ex-plained this case by active gene conversion homog-enizing intrachromosomal copies. We believe thatthis explanation is not applicable to RTE inE. plorans since, in sexually reproducing organisms,the homogenization processes are accelerated bymeiotic recombination, and the gene conversion hy-pothesis would not be consistent with the fact thatthe X chromosome shows meiotic recombinationonly in females (males are X0) but that it showedthe highest number of cases of intrachromosomalsimilarity.
A second alternative explanation for these results israndom resampling of a single element from the samechromosome. This would be expected to occur morelikely in small chromosomes. However, the fact that thechromosome where most cases of very similar RTEelements were found was the X chromosome, which isone of the largest chromosomes in the E. plorans ge-nome, runs against this possibility.
The results of the 454 pyrosequencing showed thatthe RTE elements amplified on microdissected chromo-somes belong to the most abundant RTE subfamily(RTE-1_EP) in the E. plorans genome. Perhaps the factthat RTE is one of the most abundant repetitive elementsin the genome of E. plorans (Ruiz-Ruano et al., unpub-lished) facilitated very much the success of our presentmicrodissection experiments. In any case, it should beworth trying in other species.
Finally, the apparent absence of RTE elements inB chromosomes is not consistent with the predictionthat B chromosomes are havens for mobile elements(Camacho et al. 2000). This could be due to the factthat RTE elements are preferentially located at eu-chromatic regions in E. plorans (Montiel et al. 2012)and B chromosomes in this species are mostly het-erochromatic. In spite of this, a small amount ofRTE elements are still apparent in the B chromo-somes of this species (Montiel et al. 2012). Thiscould also be due to the PCR bias if most RTEelements in the B chromosome are defective. An-other conceivable explanation for the absence ofRTE elements in the B chromosomes comes fromthe fact that Bs probably derived from the smallest
Intragenomic distribution of RTE retrotransposons
autosome (S11) and, as our present results haveshown, RTE elements appear to be scarce in thelatter chromosome. This would be consistent withour recent finding that the ITS regions of the ribo-somal DNA contained in the B chromosome aremore similar to those in the S11 than to those inother A chromosomes (Teruel et al. 2014).
Conclusions
The analysis of intragenomic distribution of RTE ele-ments, by means of PCR amplification on DNA obtain-ed from individually microdissected chromosomes, in-dicated a tendency of RTE elements to reinsert into thesame chromosome from which they were transcribed.The analysis of 454 pyrosequenced genomic DNA sup-ported these results and provided evidence for abun-dance of 5′ truncations in the RTE elements occurringthrough premature termination of reverse transcription.All these results, together, suggest that, in some cases,RTE reinsertion takes place immediately after transcrip-tion, while the transcript is yet located in the territory ofthe same chromosome.
Acknowledgments We thank Karl R. Meunier for the Englishreview. This study was supported by the Plan Andaluz deInvestigación (P10-CVI-6649), and was partially performed byFEDER funds.
References
Anisimova M, Gascuel O (2006) Approximate likelihood-ratiotest for branches: a fast, accurate, and powerful alternative.Syst Biol 55:539–552
Bartolomé C,MasideX, Charlesworth B (2002)On the abundanceand distribution of transposable elements in the genome ofDrosophila melanogaster. Mol Biol Evol 19:926–937
Bates GP, Wainwright BJ, Williamson R, Brown SD (1986)Microdissection of and microcloning from the short arm ofhuman chromosome 2. Mol Cell Biol 6:3826–3830
Bergman CM, Bensasson D (2007) Recent LTR retrotransposoninsertion contrasts with waves of non-LTR insertion sincespeciation in Drosophila melanogaster. Proc Nat Acad SciUSA 104:11340–11345
Buiting K, Neumann M, Lüdecke HJ, Senger G, Claussen U,An t i ch J , Pa s s a rge E , Hor s themke B (1990 )Microdissection of the Prader-Willi syndrome chromosomeregion and identification of potential gene sequences.Genomics 6:521–527
Camacho JPM (2005) B Chromosomes. In The Evolution of theGenome. Edited by Gregory T R. San Diego, 223–286
Camacho JPM, Sharbel TF, Beukeboom LW (2000) B-chromosome evolution. Philos Trans R Soc Lond B 355:163–178
Cannizzaro LA (1996) Chromosomemicrodissection: a brief over-view. Cytogenet Cell Genet 74:157–160
Charles M, Belcram H, Just J, Huneau C, Viollet A, Couloux A,Segurens B, Carter M, Huteau V, Coriton O, Appels R,Samain S, Chalhoub B (2008) Dynamics and differentialproliferation of transposable elements during the evolutionof the B and A genomes of wheat. Genetics 180:1071–1086
Cheng YM, Lin BY (2003) Cloning and characterization of maizeB chromosome sequences derived from microdissection.Genetics 164:299–310
Cremer T, Cremer C (2001) Chromosome territories, nucleararchitecture and gene regulation in mammalian cells. NatRev Genet 2:292–301
Dereeper A, Guignon V, Blanc G, Audic S, Buffet S, Chevenet F,Dufayard JF, Guindon S, Lefort V, Lescot M, et al. (2008)Phylogeny.fr: robust phylogenetic analysis for the non-spe-cialist. Nucleic Acids Res 36(Web Server issue):W465-W469
DrummondAJ, Ashton B, CheungM, Heled J, KearseM,Moir R,Stones-Havas S, Thierer T, Wilson A (2009) Geneious v4.6.http://www.geneious.com/
Excoffier L, Laval G, Schneider S (2005) Arlequin (version 3.0):an integrated software package for population genetics dataanalysis. Evol Bioinforma Online 1:47–50
Gomulski LM, Torti C, Murelli V, Bonizzoni M, Gasperi G,Malacrida AR (2004) Medfly transposable elements: diver-sity, evolution, genomic impact and possible applications.Insect Biochem Mol 34:139–148
Guan XY,Meltzer PS, Trent JM (1994) Rapid generation of wholechromosome painting probes (WCPs) by chromosome mi-crodissection. Genomics 22:101–107
Hall TA (1999) BioEdit: a user-friendly biological sequence align-ment editor and analysis program for Windows 95/98/NT.Nucleic Acids Symp Ser 41:95–98
Hall LL, Carone DW, Gomez AV, Kolpa HJ, Byron M, Mehta N,Fackelmayer FO, Lawrence JB (2014) Stable CoT-1 repeatRNA is abundant and is associated with euchromatic inter-phase chromosomes. Cell 156:907–919
Hollister JD, Gaut BS (2007) Population and evolutionary dynam-ics of Helitron transposable elements in Arabidopsisthaliana. Mol Biol Evol 24:2515–2524
Hood ME, Katawczik M, Giraud T (2005) Repeat-induced pointmutation and the population structure of transposable ele-ments inMicrobotryum violaceum. Genetics 170:1081–1089
Houben A, Field BL, Saunders VA (2001) Microdissection andchromosome painting of plant B chromosomes. MethodsCell Sci 23:115–124
Huson DH, Bryant D (2006) Application of phylogenetic net-works in evolutionary studies. Mol Biol Evol 23:254–267
Kejnovsky E, Hobza R, Kubat Z,Widmer A,Marais GAB, VyskotB (2007) High intrachromosomal similar i ty ofretrotransposon long terminal repeats: evidence for homoge-nization by gene conversion on plant sex chromosomes?Gene 390:92–97
Lamb JC, Kato A, Birchler JA (2005) Sequences associated withA chromosome centromeres are present throughout themaizeB chromosome. Chromosoma 113:337–349
Lander ES, Linton LM, Birren B et al (2001) Initial sequencingand analysis of the human genome. Nature 409:860–921
E.E. Montiel et al.
Librado P, Rozas J (2009) DnaSP v5: a software for comprehen-sive analysis of DNA polymorphism data. Bioinformatics 25:1451–1452
Luan DD, Korman MH, Jakubczak JL, Eickbush TH (1993)Reverse transcription of R2Bm RNA is primed by a nick atthe chromosomal target site: a mechanism for non-LTRretrotransposition. Cell 72:595–605
Mahjoubi F, Peters GB, Malafiej P, Shalhoub C, Turner A, DanielA, Hill RJ (2005) An analphoid marker chromosome invdup(15)(q26.1qter), detected during prenatal diagnosis andcharacterized via chromosome microdissection. CytogenetGenome Res 109:485–490
Malik HS, Eickbush TH (1998) The RTE class of non-LTRretrotransposons is widely distributed in animals and is theorigin of many SINE elements. Mol Biol Evol 15:1123–1134
Marchal JA, Acosta MJ, Bullejos M, Guardia RD, Sánchez A(2004) A repeat DNA sequence from the Y chromosome inspecies of the genusMicrotus. Chromosome Res 12:757–765
Montiel EE, Cabrero J, Camacho JPM, López-León MD(2012) Gyspy, RTE and Mariner transposable elementspopulate Eyprepocnemis plorans genome. Genetica140:365–374
Nei M, Gojobori T (1986) Simple methods for estimating thenumbers of synonymous and nonsynonymous nucleotidesubstitutions. Mol Biol Evol 3:418–426
Novák P, Neumann P, Pech J, Steinhaisl J, Macas J (2013)RepeatExplorer: a Galaxy-based web server for genome-wide characterization of eukaryotic repetitive elements fromnext-generation sequence reads. Bioinformatics 29:792–793
Ruiz-Ruano FJ, Ruiz-Estévez M, Rodríguez-Pérez J, López-PinoJL, Cabrero J, Camacho JPM (2011) DNA Amount of X andB Chromosomes in the Grasshoppers Eyprepocnemisplorans and Locusta migratoria. Cytogenet Genome Res134:120–126
Sánchez-Gracia A, Maside X, Charlesworth B (2005) High rate ofhorizontal transfer of transposable elements in Drosophila.Trends Genet 21:200–20328
Scalenghe F, Turco E, Edstrom JE, Pirrotta V, Melli M (1981)Microdissection and cloning of DNA from a specific regionof Drosophila melanogaster polytene chromosomes.Chromosoma 82:205–216
Smit AFA, Hubley R, Green P (2010) RepeatMasker Open-3.0.1996–2010 <http://www.repeatmasker.org>
Subramanian RA, Akala OO, Adejinmi JO, O’Brochta DA (2008)Topi, an IS630/Tc1/mariner-type transposable element in theAfricanmalariamosquito, Anopheles gambiae.Gene 423:63–71
Tamura K, Dudley J, Masatoshi N, Kumar S (2007) MEGA4:molecular evolutionary genetics analysis (MEGA) softwareversion 4.0. Mol Biol Evol 24:1596–1599
Tay WT, Behere GT, Batterham P, Heckel DG (2010) Generationof microsatellite repeat families by RTE retrotransposons inlepidopteran genomes. BMC Evol Biol 10:144
Tenaillon MI, Hufford MB, Gaut BS, Ross-Ibarra J (2011)Genome size and transposable element content as determined
by high-throughput sequencing in maize and Zea luxurians.Genome Biol Evol 3:219–229
Teruel M, Cabrero J, Perfectti F, Acosta MJ, Sánchez A, CamachoJPM (2009) Microdissection and chromosome painting of Xand B chromosomes in the grasshopper Eyprepocnemisplorans. Cytogenet Genome Res 125:286–291
Teruel M, Cabrero J, Perfectti F, Camacho JPM (2010) B chro-mosome ancestry revealed by histone genes in the migratorylocust. Chromosoma 119:217–225
Teruel M, Ruíz-Ruano FJ, Marchal JA, Sánchez A, CabreroJ, Camacho JPM, Perfectti F (2014) Disparate molec-ular evolution of two types of repetitive DNA in thegenome of the grasshopper Eyprepocnemis plorans.Heredity 112:531–542
Thompson JD, Higgins DG, Gibson TJ (1994) CLUSTAL W im-proving the sensitivity of progressive multiple sequence align-ment through sequence weighting, position-specific gap penal-ties and weight matrix choice. Nucleic Acids Res 22:4673–4680
Vieira C, Lepetit D, Dumont S, Biemont C (1999) Wake up oftransposable elements followingDrosophila simulans world-wide colonization. Mol Biol Evol 16:1251–1255
Vitte C, Bennetzen JL (2006) Analysis of retrotransposon struc-tural diversity uncovers properties and propensities in angio-sperm genome evolution. Proc Natl Acad Sci U S A2006(103):17638–17643
Wang X, Fang X, Yang P, Jiang X, Jiang F, Zhao D, Li B, Cui F,Wei J, Ma C, Wang Y, He J, Luo Y, Wang Z, Guo X, GuoW,Wang X, Zhang Y, Yang M, Hao S, Chen B, Ma Z, Yu D,Xiong Z, ZhuY, Fan D, Han L,WangB, ChenY,Wang J et al(2014) The locust genome provides insight into swarm for-mation and long-distance flight. Nat Commun 5:2957
Watterson GA (1975) On the number of segregating sites ingenetical models without recombination. Theor Popul Biol7:256–276
Wicker T, Sabot F, Hua-Van A, Bennetzen JL, Capy P, ChalhoubB, Flavell A, Leroy P, Morgante M, Panaud O, Paux E,SanMiguel P, Schulman AH (2007) A unified classificationsystem for eukaryotic transposable elements. Nat Rev Genet8:973–982
Xia X, Xie Z, Salemi M, Chen L, Wang Y (2003) An index ofsubstitution saturation and its application. Mol PhylogenetEvol 26:1–7
Xiong Y, Eickbush TH (1990) Origin and evolution ofretroelements based upon their reverse transcriptase se-quences. EMBO J 9:3353–3362
Zhou RN, Hu ZM (2007) The development of chromosome mi-crodissection andmicrocloning technique and its applicationsin genomic research. Curr Genomics 8:67–72
Zingler N, Willhoeft U, Brose HP, Schoder V, Jahns T,Hanschmann KM, Morrish TA, Löwer J, Schumann GG(2005) Analysis of 5′ junctions of human LINE-1 and Aluretrotransposons suggests an alternative model for 5′-endattachment requiring microhomology-mediated end-joining.Genome Res 15:780–789
Intragenomic distribution of RTE retrotransposons
Supporting Tables
Table S1 Number (N) of defective and non-defectiveRTE elements inferred from the same 178 bp regionanalyzed in the PCR-cloning experiment but, in thiscase, analyzed through 454 sequencing of genomicDNA
Non-defective Defective
Item N % N %
RTE-1_EP 433 40.73 630 59.27
RTE-2_EP 152 51.53 143 48.47
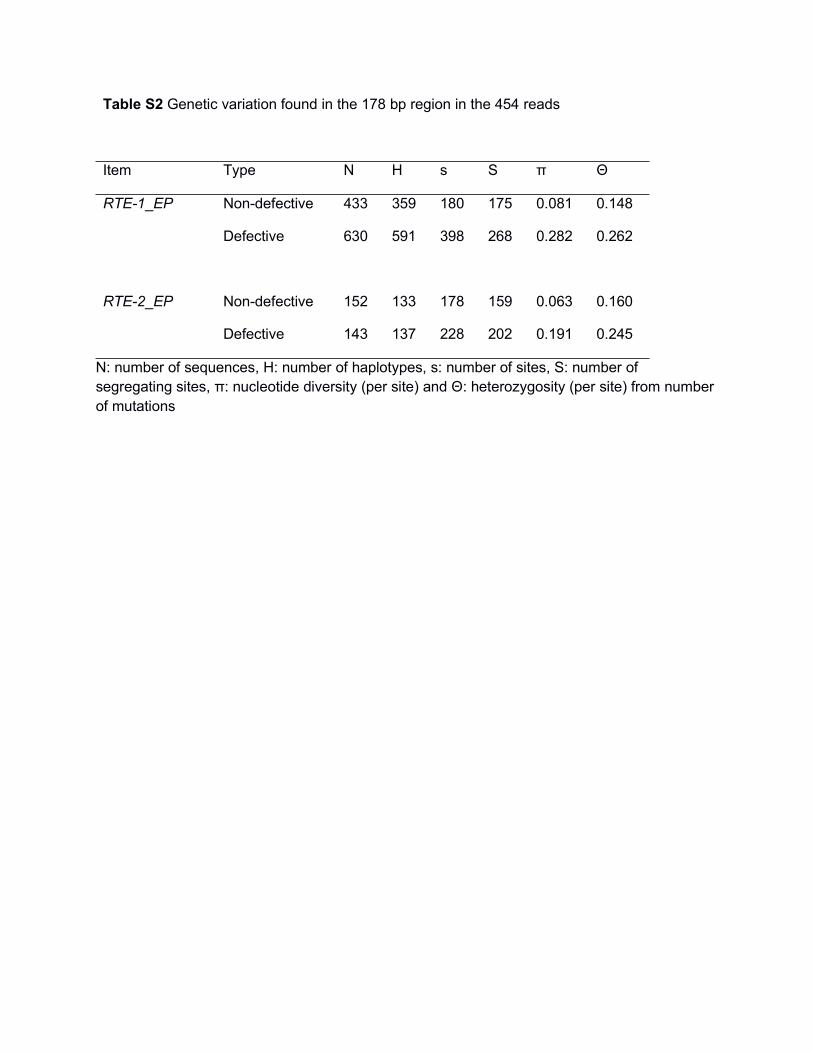
Table S2 Genetic variation found in the 178 bp region in the 454 reads
Item Type N H s S π Θ
RTE-1_EP Non-defective 433 359 180 175 0.081 0.148
Defective 630 591 398 268 0.282 0.262
RTE-2_EP Non-defective 152 133 178 159 0.063 0.160
Defective 143 137 228 202 0.191 0.245
N: number of sequences, H: number of haplotypes, s: number of sites, S: number ofsegregating sites, π: nucleotide diversity (per site) and Θ: heterozygosity (per site) from numberof mutations
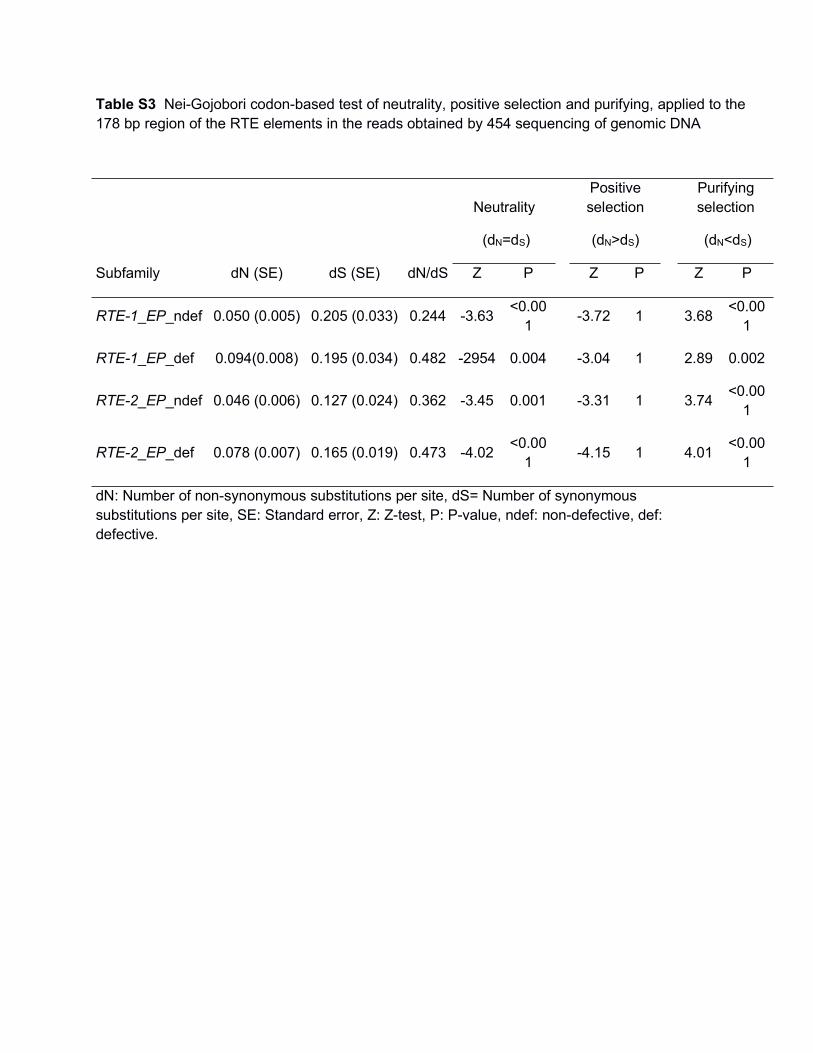
Table S3 Nei-Gojobori codon-based test of neutrality, positive selection and purifying, applied to the178 bp region of the RTE elements in the reads obtained by 454 sequencing of genomic DNA
NeutralityPositiveselection
Purifyingselection
(dN=dS) (dN>dS) (dN<dS)
Subfamily dN (SE) dS (SE) dN/dS Z P Z P Z P
RTE-1_EP_ndef 0.050 (0.005) 0.205 (0.033) 0.244 -3.63 <0.001 -3.72 1 3.68 <0.00
1
RTE-1_EP_def 0.094(0.008) 0.195 (0.034) 0.482 -2954 0.004 -3.04 1 2.89 0.002
RTE-2_EP_ndef 0.046 (0.006) 0.127 (0.024) 0.362 -3.45 0.001 -3.31 1 3.74 <0.001
RTE-2_EP_def 0.078 (0.007) 0.165 (0.019) 0.473 -4.02 <0.001 -4.15 1 4.01 <0.00
1
dN: Number of non-synonymous substitutions per site, dS= Number of synonymoussubstitutions per site, SE: Standard error, Z: Z-test, P: P-value, ndef: non-defective, def:defective.
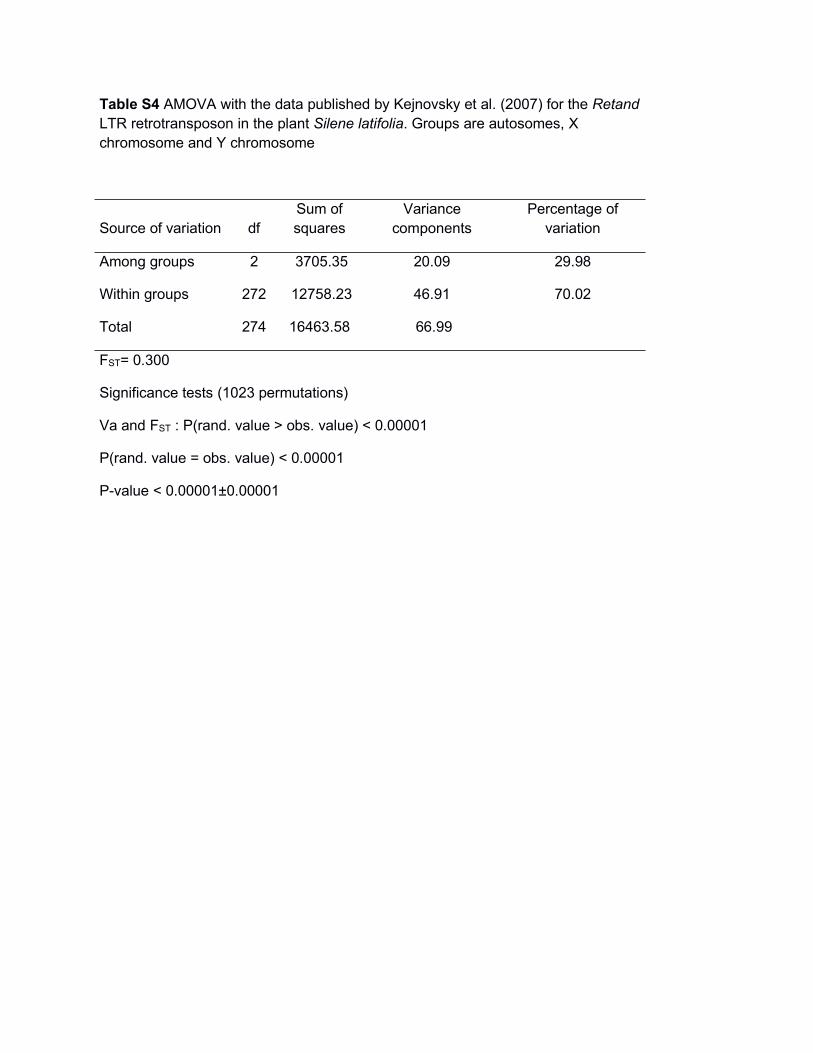
Table S4 AMOVA with the data published by Kejnovsky et al. (2007) for the RetandLTR retrotransposon in the plant Silene latifolia. Groups are autosomes, Xchromosome and Y chromosome
Source of variation dfSum ofsquares
Variancecomponents
Percentage ofvariation
Among groups 2 3705.35 20.09 29.98
Within groups 272 12758.23 46.91 70.02
Total 274 16463.58 66.99
FST= 0.300
Significance tests (1023 permutations)
Va and FST : P(rand. value > obs. value) < 0.00001
P(rand. value = obs. value) < 0.00001
P-value < 0.00001±0.00001


![EcZa]V eR]Rb _`h TcZ^Z_R] RTe - Daily Pioneer](https://img.dokumen.tips/doc/110x75/631d4fd8b8a98572c10d4d6e/eczav-errb-h-tczzr-rte-daily-pioneer.jpg)


