Embed Size (px)
Citation preview
Negi et al. BMC Public Health (2022) 22:544 https://doi.org/10.1186/s12889-022-12956-w
RESEARCH
Intersecting sex-related inequalities in self-reported testing for and prevalence of Non-Communicable Disease (NCD) risk factors in KeralaJyotsna Negi1*, Hari Sankar D2, Arun B. Nair3 and Devaki Nambiar2,4,5
Abstract
Background: Non-Communicable Diseases (NCDs) are among India’s top burdens, particularly in states like Kerala, which is at an advanced stage of the epidemiological transition. Evidence in India points towards intersectional ine-qualities in risk factors of NCDs and testing, both of which are understudied in Kerala. We estimated the self-reported testing and prevalence of key NCD risk factors—blood pressure (BP) and blood glucose (BG) comparing Kerala men and women across educational, wealth, religion, as well as caste and tribal status subgroups.
Method: A multistage random sample survey of 3398 women and 2982 men aged 30 years and over was admin-istered in 4 districts of Kerala from July to October 2019. Descriptive analysis for men and women was undertaken using survey weights. Slope index of Inequality and Relative Concentration Index for wealth and education related inequalities, and, Weighted Mean Difference from Mean and Index of Disparity for caste and tribal status, as well as religion related inequalities were calculated using World Health Organisation’s Health Equity Assessment Toolkit Plus and Stata 12.
Results: A significantly higher proportion of women reported BP and BG testing by medical personnel in the previous year than men (BP Testing among Women (BPTw): 90.3% vs BP Testing among Men (BPTM):80.8%, BG Test-ing among Women (BGTw): 86.2% vs BG Testing among Women (BGTM):78.3%). Among those tested, more women (11.2%) than men (7.9%) reported High Blood Pressure (HBP) but not High Blood Glucose (HBG). Testing for BP was concentrated among less-educated women while BG testing was concentrated among both less educated women and men. HBP and HBG were concentrated among less educated and wealthier groups. Although sex differences were insignificant across caste and tribal status and religion subgroups, magnitude of inequalities was high for HBP and HBG.
Conclusion: Distinct patterns of sex inequalities were present in self-reported testing and prevalence of NCD risk factors in Kerala. Education and wealth seem to be associated with testing while prevalence appeared to vary by religious groups. Given the low rates of illiteracy, it is encouraging but maybe a data artefact that a small population of less-educated persons was getting tested; however, exclusion of poor groups and inequalities by other dimensions raise concerns. Further exploration is needed to understand underlying mechanisms of these inequalities to ensure we leave no one behind.
© The Author(s) 2022. Open Access This article is licensed under a Creative Commons Attribution 4.0 International License, which permits use, sharing, adaptation, distribution and reproduction in any medium or format, as long as you give appropriate credit to the original author(s) and the source, provide a link to the Creative Commons licence, and indicate if changes were made. The images or other third party material in this article are included in the article’s Creative Commons licence, unless indicated otherwise in a credit line to the material. If material is not included in the article’s Creative Commons licence and your intended use is not permitted by statutory regulation or exceeds the permitted use, you will need to obtain permission directly from the copyright holder. To view a copy of this licence, visit http:// creat iveco mmons. org/ licen ses/ by/4. 0/. The Creative Commons Public Domain Dedication waiver (http:// creat iveco mmons. org/ publi cdoma in/ zero/1. 0/) applies to the data made available in this article, unless otherwise stated in a credit line to the data.
Open Access
*Correspondence: [email protected] Independent Consultant, 62 Stratford Road, Kensington, CA 94707, USAFull list of author information is available at the end of the article
Page 2 of 13Negi et al. BMC Public Health (2022) 22:544
BackgroundThe Sustainable Development Goals (SDGs), launched in 2015, identified Non-Communicable Diseases (NCDs) as a major threat to attain sustainable develop-ment and set a global target to reduce premature mor-tality by a third over the next 15 years [1]. The southern Indian state of Kerala ranked at the top of the country’s Sustainable Development Goal India Index in 2019 [2], besting other states for indicators like life expectancy, mortality and death rates. However, the morbidity lev-els in the state are comparatively much higher when compared with other Indian states, driven largely by NCDs burden [3–5]. A recent study reported that about 61% of households ailing from NCDs faced catastrophic health expenditures in Kerala, and in fact, absolute impoverishment for households due to NCDs burden in Kerala was the highest of any state in the country (20.7%) [6].
In light of this, the Government of Kerala has intro-duced state specific SDGs which include a target to reduce the prevalence of high blood pressure (HBP) by 30–40% and high blood glucose (HBG) by 18–20% among above 30 years of age group [7]. To achieve these state specific goals, Kerala has launched Aardram mis-sion with an objective to transform public health sys-tems placing special emphasis on increasing the scope and quality of primary care services. As a part of this mission, beginning in 2017, a number of the state’s Pri-mary Health Centres (PHC) were upgraded to Fam-ily Health Centres (FHC) by increasing staff, training, infrastructure and working hours. Additionally, the state has revised NCDs guidelines to provide opportun-istic screening for those aged above 30 for diabetes and above 18 years for hypertension [8].
Given these reforms, there was a need to identify population coverage at this early stage as a kind of base-line. As the FHC program was being rolled out, there was already evidence suggestive of inequalities: Kerala’s Economic Review 2018 reported sex differences in the prevalence of diabetes where 27% of adult males and 19% of adult females had diabetes [7].
Evidence from literature suggests variations in the prevalence of self-reported NCDs between men and women across countries [9–11], in India and Kerala [3, 12–27]. Sex, education, and income are associated with the prevalence of NCDs and their risk factors, leading to catastrophic disease burden among vulner-able populations [3, 9–14, 17–22, 25, 28]. A study pub-lished in 2012 found that Scheduled Caste (SC) status,
Scheduled Tribe (ST) status, higher education, higher wealth status and increasing age were associated with a higher prevalence of diabetes [10]. Studies in Kerala have shown that persons below poverty line group in rural areas were less likely to have diabetes, hyperten-sion or dyslipidaemia when compared with those above the poverty line [21], and also that sex differences exist in self-reported diabetes and are more prevalent among higher socio economic groups [20]. While self-reported prevalence of cardiometabolic risk factors has its limi-tations for drawing inferences on NCD outcomes [23], from a health systems perspective, this indicator can serve as a proxy of initial program outreach.
It is also the case that few of the aforementioned stud-ies using clinical measurement were able (or powered) to assess NCD testing and prevalence of risk factors in intersectional population groups (i.e. men and women across socio-economic, social, and other groups). Inter-sectional analyses have revealed important insights into groups that are uniquely affected by morbidity as well as the reach and programs of the health system [10, 14, 18, 20–24]. Filling this gap, we sought to examine inequali-ties in testing and self-reported prevalence of HBP and HBG by education, wealth, caste and tribes and religion separately for men and women in Kerala. We drew upon a health systems survey undertaken to monitor the per-formance of Kerala’s Aardram health reform initiatives as a part of a larger implementation research study assess-ing equity in Universal Health Coverage reforms in the state [29, 30].
Materials and methodsStudy design and settingA multistage, random sample survey was undertaken from July to October 2019, powered to assess sex dif-ferences in self-reported testing of Blood Pressure (BP)/Blood Glucose (BG) and prevalence for HBP/HBG in the previous year among those aged 30 or older in Kerala. The state’s 14 districts were categorised into four groups by deriving an index using principal component analysis, a dimension-reduction tool on health burden and sys-tems performance indicators from the National Family Health Survey (NFHS) Round 4 (2015–16) [31]. One dis-trict was chosen from each of the four groups randomly and two facilities per district were randomly selected. The sampling frame was reviewed and concurrence was received from state officials. Further details of the study design and sample size estimation methodology are pre-sented in Additional file 4.
Keywords: India, Kerala, NCDs, Inequalities, Screening, Hypertension, Diabetes
Page 3 of 13Negi et al. BMC Public Health (2022) 22:544
SamplingThe required sample size for this survey was calculated to allow an estimation of sex differences for BP testing in the previous year within a ± 8% margin of error with 95% confidence probability, in consultation with a senior bio-statistician. The proportion of eligible males and females of age greater than or equal to 30 years whose BP was measured in the previous year was obtained from data provided by NCD program of the Kerala Health Depart-ment. A conservative design effect of 2, was considered for the sample of our study. Health facility catchment areas were grouped by wards, the Primary Sampling Unit (PSU). All wards were selected in the five facilities where number of wards were less than equal to 20. In the remaining three facilities where the number of wards were more than 20, wards were stratified into 5 or 6 strata on the basis of population and four wards were selected randomly from these stratum such that total 20 wards are selected in each facility. Since most of the selected wards constituted more than 300 households per ward (total number of households in each ward in the previous year were obtained using estimates from Kerala’s electronic health information or E health platform), there was a requirement to create ward segmentations. With the help of ward members (elected representatives of the ward)/Junior Health Inspectors and locals, the field team cre-ated outline maps of each PSU with roads, major land-marks, and households plotted on the map. All PSUs of more than 300 households were divided into 2 or 3 seg-ments of roughly equal size (some variation in size was expected) and a number was assigned to each segment. Based on guidance from statisticians, we created, enu-merated and then randomly selected 20 non-overlapping, artificial ward segments from each ward within a selected PHC/FHC.
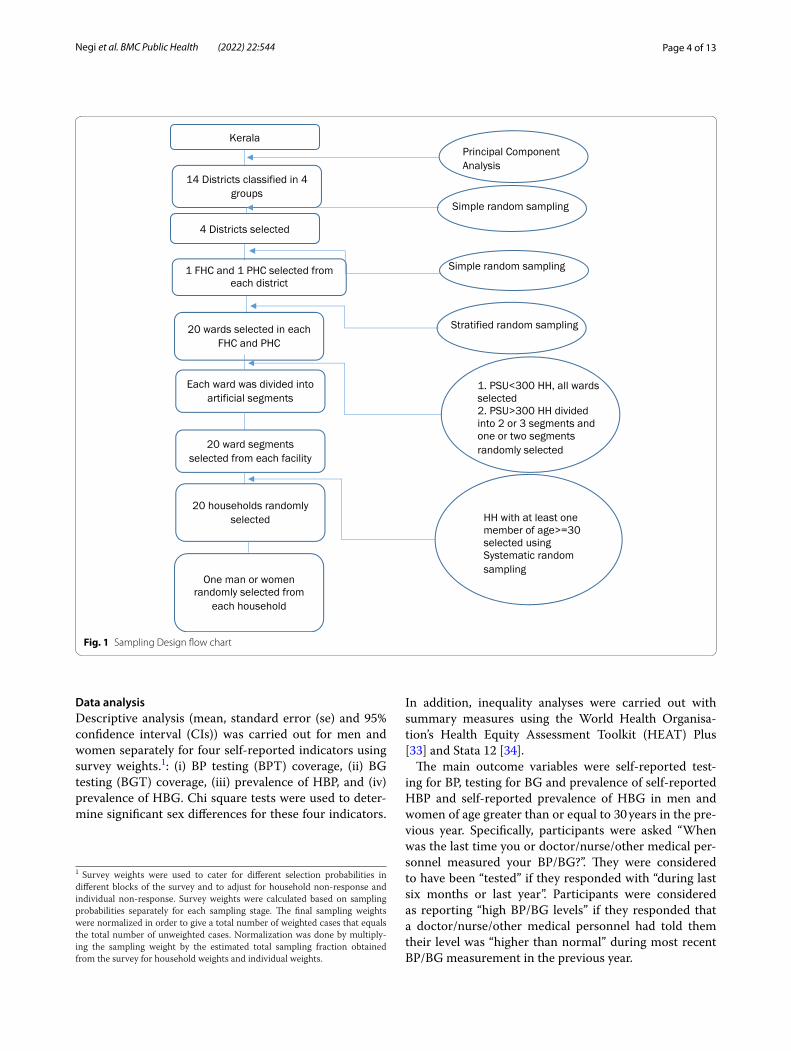
For the purpose of selecting households, since no read-ily available sampling frame existed, 20 households were selected from each selected ward segment using system-atic random sampling method. Households with at least one member in the age group 30 and above were eligible for selection. The definition of a household was similar to that used in NSSO 71st round on health: a group of persons normally living together and taking food from a common kitchen [32]. This included short-term stay-away (those whose total period of absence from the household was expected to be less than 6 months) but excluded temporary visitors and guests (expected total period of stay was less than 6 months). One person aged 30 or older was randomly selected from each household to get information on NCD testing and risk factors (HBP and HBG). Graphical representation of the sampling design is presented in the form of flow chart in Fig. 1.
Field team recruitment and trainingData collection of the study was done by hiring local field staff (eight field investigators, two supervisors and one co-ordinator). The field team was given a five-day resi-dential training in the local language (Malayalam) and a training manual. The investigators were familiarised with Kerala health system, services offered by health depart-ment, use of bilingual survey app for data collection and interview etiquettes. Mock drills were conducted among the group and field testing was done in a nearby ward of the training facility. Supervisors were also trained on creating outline maps and the ward segmentation proce-dure. During data collection, additional three field inves-tigators were hired, oriented and given basic training by supervisors followed by ‘ride alongs’ with their colleagues to further orient themselves on data collection.
Data collectionWe conducted an interviewer administered survey using electronic tabs through a web-enabled structured ques-tionnaire. The questionnaire was designed in Malayalam and English and field staff had the choice to select the language they were comfortable with. This questionnaire had 12 modules and captured information on household and individual socio-demographics, testing of BP/BG, and lifestyle attributes such as smoking, drinking, and physical activity. Additionally, information on hospitali-sation, outpatient and chronic expenses during the year prior to the survey was gathered, as well as data on satis-faction with FHC/PHC visits, and awareness of services under the Aardram mission specifically requested by department officials was also collected.
Ethics approval of the study was received from the institutional ethics committee of George Institute for Global Health (Project Number 05/2019). All partici-pants gave written informed consent before taking part in the study.
Data processingReal time data was collected through the tab and was automatically uploaded to a secure local server. Data exported from the server in excel format was cleaned, cross-checked and triangulated with multiple related questions by supervisors daily. Daily forms were provided to each investigator and supervisor to keep a quality check of the procured data. In case of discrepancies, data was re-entered in the tab by supervisors. Similar data collection procedure was used across all sites and for all respondents. The data collected as part of the study was stored in a secure server with access only to the research team members adhering to relevant national, state, and institutional data storage protocols.
Page 4 of 13Negi et al. BMC Public Health (2022) 22:544
Data analysisDescriptive analysis (mean, standard error (se) and 95% confidence interval (CIs)) was carried out for men and women separately for four self-reported indicators using survey weights.1: (i) BP testing (BPT) coverage, (ii) BG testing (BGT) coverage, (iii) prevalence of HBP, and (iv) prevalence of HBG. Chi square tests were used to deter-mine significant sex differences for these four indicators.
In addition, inequality analyses were carried out with summary measures using the World Health Organisa-tion’s Health Equity Assessment Toolkit (HEAT) Plus [33] and Stata 12 [34].
The main outcome variables were self-reported test-ing for BP, testing for BG and prevalence of self-reported HBP and self-reported prevalence of HBG in men and women of age greater than or equal to 30 years in the pre-vious year. Specifically, participants were asked “When was the last time you or doctor/nurse/other medical per-sonnel measured your BP/BG?”. They were considered to have been “tested” if they responded with “during last six months or last year”. Participants were considered as reporting “high BP/BG levels” if they responded that a doctor/nurse/other medical personnel had told them their level was “higher than normal” during most recent BP/BG measurement in the previous year.
Fig. 1 Sampling Design flow chart
1 Survey weights were used to cater for different selection probabilities in different blocks of the survey and to adjust for household non-response and individual non-response. Survey weights were calculated based on sampling probabilities separately for each sampling stage. The final sampling weights were normalized in order to give a total number of weighted cases that equals the total number of unweighted cases. Normalization was done by multiply-ing the sampling weight by the estimated total sampling fraction obtained from the survey for household weights and individual weights.
Page 5 of 13Negi et al. BMC Public Health (2022) 22:544
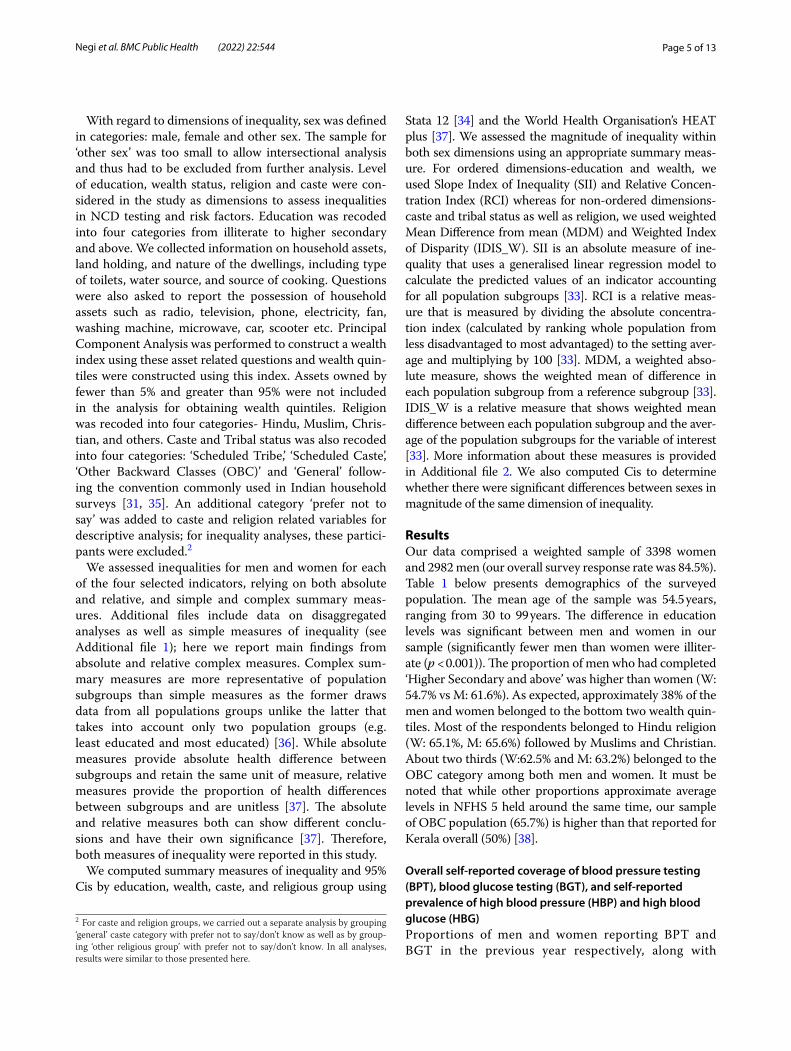
With regard to dimensions of inequality, sex was defined in categories: male, female and other sex. The sample for ‘other sex’ was too small to allow intersectional analysis and thus had to be excluded from further analysis. Level of education, wealth status, religion and caste were con-sidered in the study as dimensions to assess inequalities in NCD testing and risk factors. Education was recoded into four categories from illiterate to higher secondary and above. We collected information on household assets, land holding, and nature of the dwellings, including type of toilets, water source, and source of cooking. Questions were also asked to report the possession of household assets such as radio, television, phone, electricity, fan, washing machine, microwave, car, scooter etc. Principal Component Analysis was performed to construct a wealth index using these asset related questions and wealth quin-tiles were constructed using this index. Assets owned by fewer than 5% and greater than 95% were not included in the analysis for obtaining wealth quintiles. Religion was recoded into four categories- Hindu, Muslim, Chris-tian, and others. Caste and Tribal status was also recoded into four categories: ‘Scheduled Tribe,’ ‘Scheduled Caste’, ‘Other Backward Classes (OBC)’ and ‘General’ follow-ing the convention commonly used in Indian household surveys [31, 35]. An additional category ‘prefer not to say’ was added to caste and religion related variables for descriptive analysis; for inequality analyses, these partici-pants were excluded.2
We assessed inequalities for men and women for each of the four selected indicators, relying on both absolute and relative, and simple and complex summary meas-ures. Additional files include data on disaggregated analyses as well as simple measures of inequality (see Additional file 1); here we report main findings from absolute and relative complex measures. Complex sum-mary measures are more representative of population subgroups than simple measures as the former draws data from all populations groups unlike the latter that takes into account only two population groups (e.g. least educated and most educated) [36]. While absolute measures provide absolute health difference between subgroups and retain the same unit of measure, relative measures provide the proportion of health differences between subgroups and are unitless [37]. The absolute and relative measures both can show different conclu-sions and have their own significance [37]. Therefore, both measures of inequality were reported in this study.
We computed summary measures of inequality and 95% Cis by education, wealth, caste, and religious group using
Stata 12 [34] and the World Health Organisation’s HEAT plus [37]. We assessed the magnitude of inequality within both sex dimensions using an appropriate summary meas-ure. For ordered dimensions-education and wealth, we used Slope Index of Inequality (SII) and Relative Concen-tration Index (RCI) whereas for non-ordered dimensions-caste and tribal status as well as religion, we used weighted Mean Difference from mean (MDM) and Weighted Index of Disparity (IDIS_W). SII is an absolute measure of ine-quality that uses a generalised linear regression model to calculate the predicted values of an indicator accounting for all population subgroups [33]. RCI is a relative meas-ure that is measured by dividing the absolute concentra-tion index (calculated by ranking whole population from less disadvantaged to most advantaged) to the setting aver-age and multiplying by 100 [33]. MDM, a weighted abso-lute measure, shows the weighted mean of difference in each population subgroup from a reference subgroup [33]. IDIS_W is a relative measure that shows weighted mean difference between each population subgroup and the aver-age of the population subgroups for the variable of interest [33]. More information about these measures is provided in Additional file 2. We also computed Cis to determine whether there were significant differences between sexes in magnitude of the same dimension of inequality.
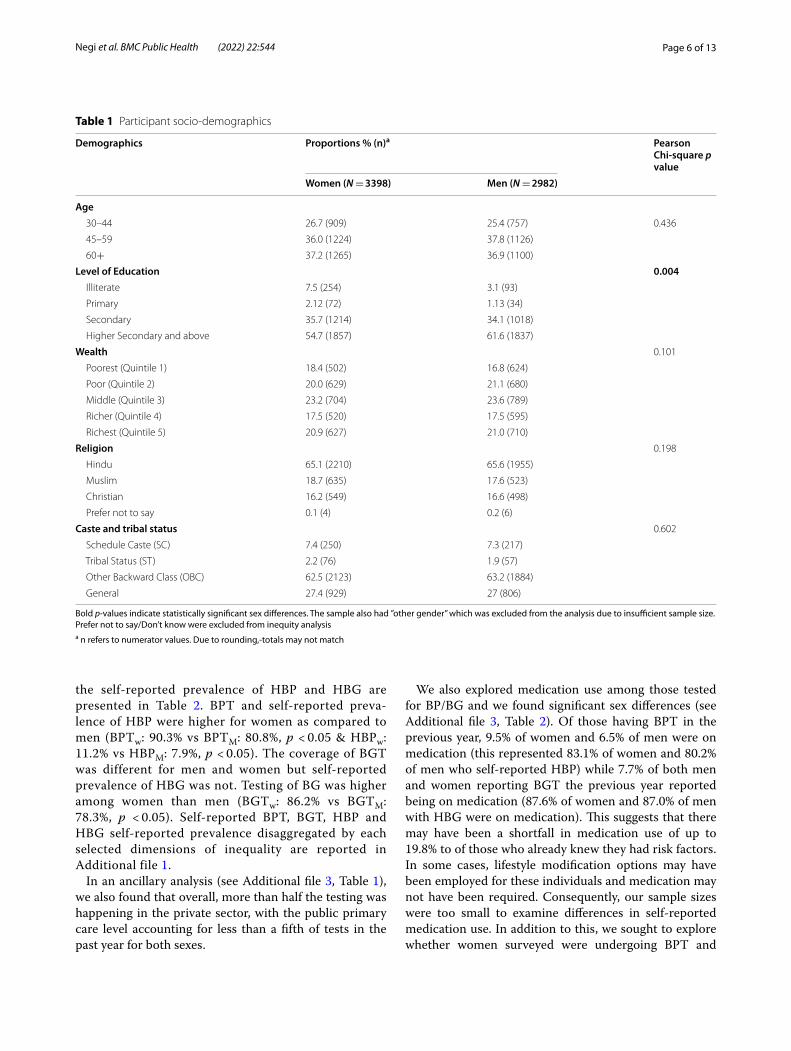
ResultsOur data comprised a weighted sample of 3398 women and 2982 men (our overall survey response rate was 84.5%). Table 1 below presents demographics of the surveyed population. The mean age of the sample was 54.5 years, ranging from 30 to 99 years. The difference in education levels was significant between men and women in our sample (significantly fewer men than women were illiter-ate (p < 0.001)). The proportion of men who had completed ‘Higher Secondary and above’ was higher than women (W: 54.7% vs M: 61.6%). As expected, approximately 38% of the men and women belonged to the bottom two wealth quin-tiles. Most of the respondents belonged to Hindu religion (W: 65.1%, M: 65.6%) followed by Muslims and Christian. About two thirds (W:62.5% and M: 63.2%) belonged to the OBC category among both men and women. It must be noted that while other proportions approximate average levels in NFHS 5 held around the same time, our sample of OBC population (65.7%) is higher than that reported for Kerala overall (50%) [38].
Overall self‑reported coverage of blood pressure testing (BPT), blood glucose testing (BGT), and self‑reported prevalence of high blood pressure (HBP) and high blood glucose (HBG)Proportions of men and women reporting BPT and BGT in the previous year respectively, along with
2 For caste and religion groups, we carried out a separate analysis by grouping ‘general’ caste category with prefer not to say/don’t know as well as by group-ing ‘other religious group’ with prefer not to say/don’t know. In all analyses, results were similar to those presented here.
Page 6 of 13Negi et al. BMC Public Health (2022) 22:544
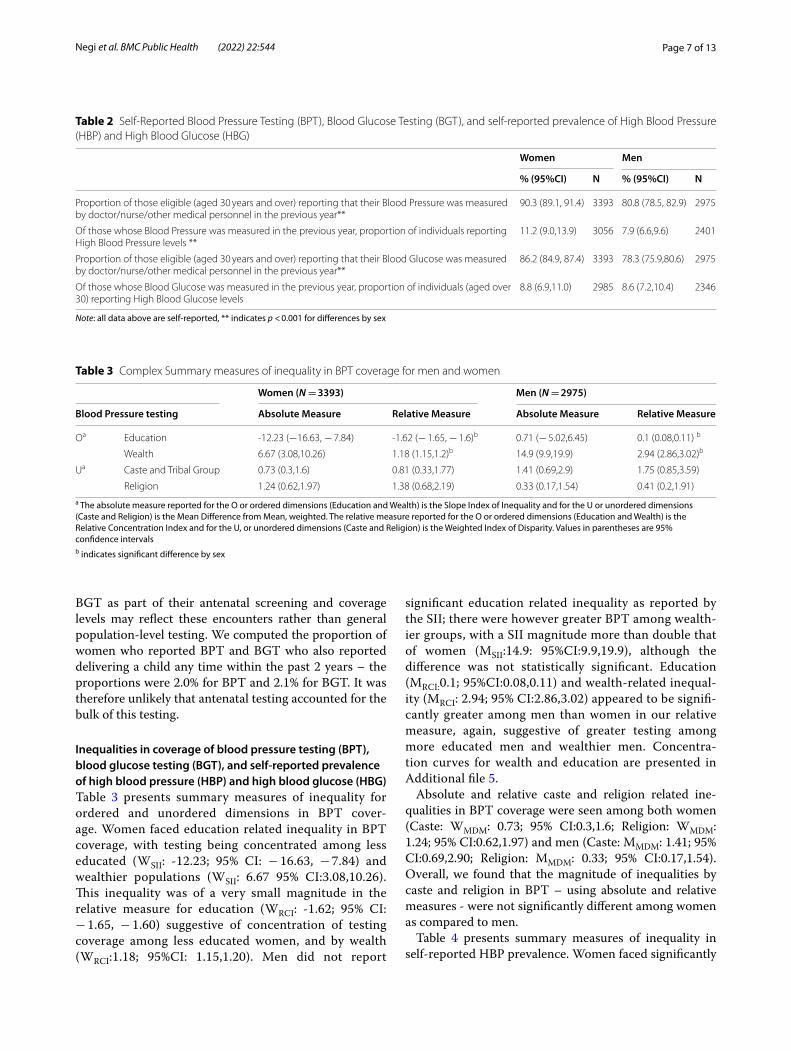
the self-reported prevalence of HBP and HBG are presented in Table 2. BPT and self-reported preva-lence of HBP were higher for women as compared to men (BPTw: 90.3% vs BPTM: 80.8%, p < 0.05 & HBPw: 11.2% vs HBPM: 7.9%, p < 0.05). The coverage of BGT was different for men and women but self-reported prevalence of HBG was not. Testing of BG was higher among women than men (BGTw: 86.2% vs BGTM: 78.3%, p < 0.05). Self-reported BPT, BGT, HBP and HBG self-reported prevalence disaggregated by each selected dimensions of inequality are reported in Additional file 1.
In an ancillary analysis (see Additional file 3, Table 1), we also found that overall, more than half the testing was happening in the private sector, with the public primary care level accounting for less than a fifth of tests in the past year for both sexes.
We also explored medication use among those tested for BP/BG and we found significant sex differences (see Additional file 3, Table 2). Of those having BPT in the previous year, 9.5% of women and 6.5% of men were on medication (this represented 83.1% of women and 80.2% of men who self-reported HBP) while 7.7% of both men and women reporting BGT the previous year reported being on medication (87.6% of women and 87.0% of men with HBG were on medication). This suggests that there may have been a shortfall in medication use of up to 19.8% to of those who already knew they had risk factors. In some cases, lifestyle modification options may have been employed for these individuals and medication may not have been required. Consequently, our sample sizes were too small to examine differences in self-reported medication use. In addition to this, we sought to explore whether women surveyed were undergoing BPT and
Table 1 Participant socio-demographics
Bold p-values indicate statistically significant sex differences. The sample also had ”other gender” which was excluded from the analysis due to insufficient sample size. Prefer not to say/Don’t know were excluded from inequity analysisa n refers to numerator values. Due to rounding,-totals may not match
Demographics Proportions % (n)a Pearson Chi‑square p value
Women (N = 3398) Men (N = 2982)
Age 30–44 26.7 (909) 25.4 (757) 0.436
45–59 36.0 (1224) 37.8 (1126)
60+ 37.2 (1265) 36.9 (1100)
Level of Education 0.004 Illiterate 7.5 (254) 3.1 (93)
Primary 2.12 (72) 1.13 (34)
Secondary 35.7 (1214) 34.1 (1018)
Higher Secondary and above 54.7 (1857) 61.6 (1837)
Wealth 0.101
Poorest (Quintile 1) 18.4 (502) 16.8 (624)
Poor (Quintile 2) 20.0 (629) 21.1 (680)
Middle (Quintile 3) 23.2 (704) 23.6 (789)
Richer (Quintile 4) 17.5 (520) 17.5 (595)
Richest (Quintile 5) 20.9 (627) 21.0 (710)
Religion 0.198
Hindu 65.1 (2210) 65.6 (1955)
Muslim 18.7 (635) 17.6 (523)
Christian 16.2 (549) 16.6 (498)
Prefer not to say 0.1 (4) 0.2 (6)
Caste and tribal status 0.602
Schedule Caste (SC) 7.4 (250) 7.3 (217)
Tribal Status (ST) 2.2 (76) 1.9 (57)
Other Backward Class (OBC) 62.5 (2123) 63.2 (1884)
General 27.4 (929) 27 (806)
Page 7 of 13Negi et al. BMC Public Health (2022) 22:544
BGT as part of their antenatal screening and coverage levels may reflect these encounters rather than general population-level testing. We computed the proportion of women who reported BPT and BGT who also reported delivering a child any time within the past 2 years – the proportions were 2.0% for BPT and 2.1% for BGT. It was therefore unlikely that antenatal testing accounted for the bulk of this testing.
Inequalities in coverage of blood pressure testing (BPT), blood glucose testing (BGT), and self‑reported prevalence of high blood pressure (HBP) and high blood glucose (HBG)Table 3 presents summary measures of inequality for ordered and unordered dimensions in BPT cover-age. Women faced education related inequality in BPT coverage, with testing being concentrated among less educated (WSII: -12.23; 95% CI: − 16.63, − 7.84) and wealthier populations (WSII: 6.67 95% CI:3.08,10.26). This inequality was of a very small magnitude in the relative measure for education (WRCI: -1.62; 95% CI: − 1.65, − 1.60) suggestive of concentration of testing coverage among less educated women, and by wealth (WRCI:1.18; 95%CI: 1.15,1.20). Men did not report
significant education related inequality as reported by the SII; there were however greater BPT among wealth-ier groups, with a SII magnitude more than double that of women (MSII:14.9: 95%CI:9.9,19.9), although the difference was not statistically significant. Education (MRCI:0.1; 95%CI:0.08,0.11) and wealth-related inequal-ity (MRCI: 2.94; 95% CI:2.86,3.02) appeared to be signifi-cantly greater among men than women in our relative measure, again, suggestive of greater testing among more educated men and wealthier men. Concentra-tion curves for wealth and education are presented in Additional file 5.
Absolute and relative caste and religion related ine-qualities in BPT coverage were seen among both women (Caste: WMDM: 0.73; 95% CI:0.3,1.6; Religion: WMDM: 1.24; 95% CI:0.62,1.97) and men (Caste: MMDM: 1.41; 95% CI:0.69,2.90; Religion: MMDM: 0.33; 95% CI:0.17,1.54). Overall, we found that the magnitude of inequalities by caste and religion in BPT – using absolute and relative measures - were not significantly different among women as compared to men.
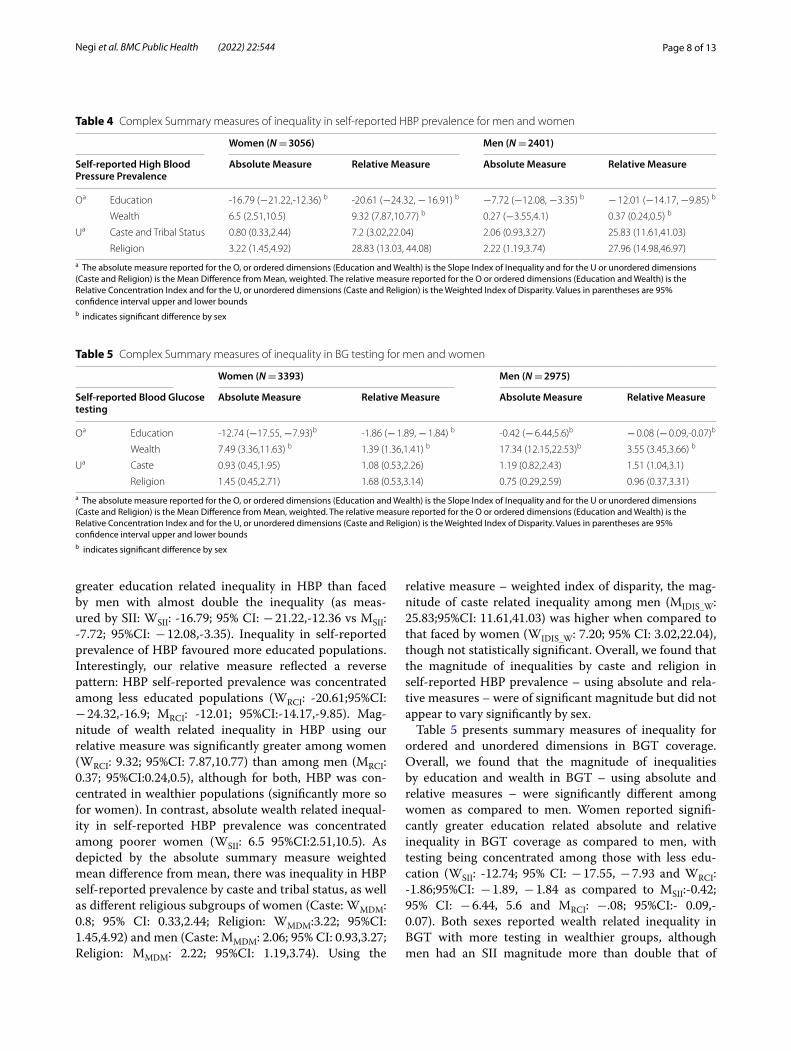
Table 4 presents summary measures of inequality in self-reported HBP prevalence. Women faced significantly
Table 2 Self-Reported Blood Pressure Testing (BPT), Blood Glucose Testing (BGT), and self-reported prevalence of High Blood Pressure (HBP) and High Blood Glucose (HBG)
Note: all data above are self-reported, ** indicates p < 0.001 for differences by sex
Women Men
% (95%CI) N % (95%CI) N
Proportion of those eligible (aged 30 years and over) reporting that their Blood Pressure was measured by doctor/nurse/other medical personnel in the previous year**
90.3 (89.1, 91.4) 3393 80.8 (78.5, 82.9) 2975
Of those whose Blood Pressure was measured in the previous year, proportion of individuals reporting High Blood Pressure levels **
11.2 (9.0,13.9) 3056 7.9 (6.6,9.6) 2401
Proportion of those eligible (aged 30 years and over) reporting that their Blood Glucose was measured by doctor/nurse/other medical personnel in the previous year**
86.2 (84.9, 87.4) 3393 78.3 (75.9,80.6) 2975
Of those whose Blood Glucose was measured in the previous year, proportion of individuals (aged over 30) reporting High Blood Glucose levels
8.8 (6.9,11.0) 2985 8.6 (7.2,10.4) 2346
Table 3 Complex Summary measures of inequality in BPT coverage for men and women
a The absolute measure reported for the O or ordered dimensions (Education and Wealth) is the Slope Index of Inequality and for the U or unordered dimensions (Caste and Religion) is the Mean Difference from Mean, weighted. The relative measure reported for the O or ordered dimensions (Education and Wealth) is the Relative Concentration Index and for the U, or unordered dimensions (Caste and Religion) is the Weighted Index of Disparity. Values in parentheses are 95% confidence intervalsb indicates significant difference by sex
Women (N = 3393) Men (N = 2975)
Blood Pressure testing Absolute Measure Relative Measure Absolute Measure Relative Measure
Oa Education -12.23 (−16.63, − 7.84) -1.62 (− 1.65, − 1.6)b 0.71 (− 5.02,6.45) 0.1 (0.08,0.11) b
Wealth 6.67 (3.08,10.26) 1.18 (1.15,1.2)b 14.9 (9.9,19.9) 2.94 (2.86,3.02)b
Ua Caste and Tribal Group 0.73 (0.3,1.6) 0.81 (0.33,1.77) 1.41 (0.69,2.9) 1.75 (0.85,3.59)
Religion 1.24 (0.62,1.97) 1.38 (0.68,2.19) 0.33 (0.17,1.54) 0.41 (0.2,1.91)
Page 8 of 13Negi et al. BMC Public Health (2022) 22:544
greater education related inequality in HBP than faced by men with almost double the inequality (as meas-ured by SII: WSII: -16.79; 95% CI: − 21.22,-12.36 vs MSII: -7.72; 95%CI: − 12.08,-3.35). Inequality in self-reported prevalence of HBP favoured more educated populations. Interestingly, our relative measure reflected a reverse pattern: HBP self-reported prevalence was concentrated among less educated populations (WRCI: -20.61;95%CI: − 24.32,-16.9; MRCI: -12.01; 95%CI:-14.17,-9.85). Mag-nitude of wealth related inequality in HBP using our relative measure was significantly greater among women (WRCI: 9.32; 95%CI: 7.87,10.77) than among men (MRCI: 0.37; 95%CI:0.24,0.5), although for both, HBP was con-centrated in wealthier populations (significantly more so for women). In contrast, absolute wealth related inequal-ity in self-reported HBP prevalence was concentrated among poorer women (WSII: 6.5 95%CI:2.51,10.5). As depicted by the absolute summary measure weighted mean difference from mean, there was inequality in HBP self-reported prevalence by caste and tribal status, as well as different religious subgroups of women (Caste: WMDM: 0.8; 95% CI: 0.33,2.44; Religion: WMDM:3.22; 95%CI: 1.45,4.92) and men (Caste: MMDM: 2.06; 95% CI: 0.93,3.27; Religion: MMDM: 2.22; 95%CI: 1.19,3.74). Using the
relative measure – weighted index of disparity, the mag-nitude of caste related inequality among men (MIDIS_W: 25.83;95%CI: 11.61,41.03) was higher when compared to that faced by women (WIDIS_W: 7.20; 95% CI: 3.02,22.04), though not statistically significant. Overall, we found that the magnitude of inequalities by caste and religion in self-reported HBP prevalence – using absolute and rela-tive measures – were of significant magnitude but did not appear to vary significantly by sex.
Table 5 presents summary measures of inequality for ordered and unordered dimensions in BGT coverage. Overall, we found that the magnitude of inequalities by education and wealth in BGT – using absolute and relative measures – were significantly different among women as compared to men. Women reported signifi-cantly greater education related absolute and relative inequality in BGT coverage as compared to men, with testing being concentrated among those with less edu-cation (WSII: -12.74; 95% CI: − 17.55, − 7.93 and WRCI: -1.86;95%CI: − 1.89, − 1.84 as compared to MSII:-0.42; 95% CI: − 6.44, 5.6 and MRCI: −.08; 95%CI:- 0.09,-0.07). Both sexes reported wealth related inequality in BGT with more testing in wealthier groups, although men had an SII magnitude more than double that of
Table 4 Complex Summary measures of inequality in self-reported HBP prevalence for men and women
a The absolute measure reported for the O, or ordered dimensions (Education and Wealth) is the Slope Index of Inequality and for the U or unordered dimensions (Caste and Religion) is the Mean Difference from Mean, weighted. The relative measure reported for the O or ordered dimensions (Education and Wealth) is the Relative Concentration Index and for the U, or unordered dimensions (Caste and Religion) is the Weighted Index of Disparity. Values in parentheses are 95% confidence interval upper and lower boundsb indicates significant difference by sex
Women (N = 3056) Men (N = 2401)
Self‑reported High Blood Pressure Prevalence
Absolute Measure Relative Measure Absolute Measure Relative Measure
Oa Education -16.79 (−21.22,-12.36) b -20.61 (−24.32, − 16.91) b −7.72 (−12.08, −3.35) b − 12.01 (−14.17, −9.85) b
Wealth 6.5 (2.51,10.5) 9.32 (7.87,10.77) b 0.27 (−3.55,4.1) 0.37 (0.24,0.5) b
Ua Caste and Tribal Status 0.80 (0.33,2.44) 7.2 (3.02,22.04) 2.06 (0.93,3.27) 25.83 (11.61,41.03)
Religion 3.22 (1.45,4.92) 28.83 (13.03, 44.08) 2.22 (1.19,3.74) 27.96 (14.98,46.97)
Table 5 Complex Summary measures of inequality in BG testing for men and women
a The absolute measure reported for the O, or ordered dimensions (Education and Wealth) is the Slope Index of Inequality and for the U or unordered dimensions (Caste and Religion) is the Mean Difference from Mean, weighted. The relative measure reported for the O or ordered dimensions (Education and Wealth) is the Relative Concentration Index and for the U, or unordered dimensions (Caste and Religion) is the Weighted Index of Disparity. Values in parentheses are 95% confidence interval upper and lower boundsb indicates significant difference by sex
Women (N = 3393) Men (N = 2975)
Self‑reported Blood Glucose testing
Absolute Measure Relative Measure Absolute Measure Relative Measure
Oa Education -12.74 (−17.55, −7.93)b -1.86 (− 1.89, − 1.84) b -0.42 (− 6.44,5.6)b − 0.08 (− 0.09,-0.07)b
Wealth 7.49 (3.36,11.63) b 1.39 (1.36,1.41) b 17.34 (12.15,22.53)b 3.55 (3.45,3.66) b
Ua Caste 0.93 (0.45,1.95) 1.08 (0.53,2.26) 1.19 (0.82,2.43) 1.51 (1.04,3.1)
Religion 1.45 (0.45,2.71) 1.68 (0.53,3.14) 0.75 (0.29,2.59) 0.96 (0.37,3.31)
Page 9 of 13Negi et al. BMC Public Health (2022) 22:544
women (MSII:17.34; 95%CI:12.15,22.54; WSII: 7.49: 95% CI:3.36,11.63). This trend was observed in our rela-tive measure ((WRCI: 1.39;95%CI: 1.36,1.41, MRCI: 3.55 95% CI;3.45,3.66), again, suggestive of greater testing reported among wealthier populations. Caste and reli-gion related inequality were apparent among women (Caste: WMDM: 0.93; 95% CI:0.45,1.95; Religion: WMDM: 1.45; 95% CI:0.45,2.71) and men (Caste: MMDM: 1.19; 95% CI:0.92,2.43; Religion: MMDM: 0.75; 95% CI:0.29,2.59) although the magnitudes were not high (as was the case with BPT). For these dimensions of inequality, both absolute and relative measures were suggestive of no sex related inequality.
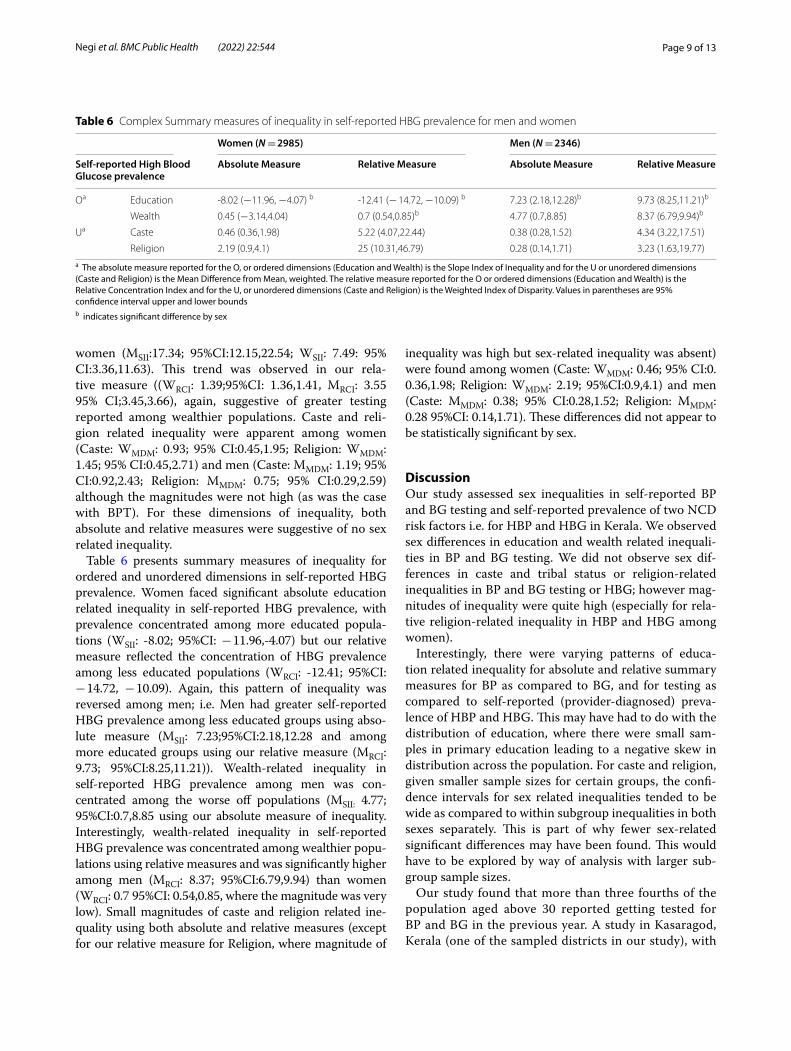
Table 6 presents summary measures of inequality for ordered and unordered dimensions in self-reported HBG prevalence. Women faced significant absolute education related inequality in self-reported HBG prevalence, with prevalence concentrated among more educated popula-tions (WSII: -8.02; 95%CI: − 11.96,-4.07) but our relative measure reflected the concentration of HBG prevalence among less educated populations (WRCI: -12.41; 95%CI: − 14.72, − 10.09). Again, this pattern of inequality was reversed among men; i.e. Men had greater self-reported HBG prevalence among less educated groups using abso-lute measure (MSII: 7.23;95%CI:2.18,12.28 and among more educated groups using our relative measure (MRCI: 9.73; 95%CI:8.25,11.21)). Wealth-related inequality in self-reported HBG prevalence among men was con-centrated among the worse off populations (MSII: 4.77; 95%CI:0.7,8.85 using our absolute measure of inequality. Interestingly, wealth-related inequality in self-reported HBG prevalence was concentrated among wealthier popu-lations using relative measures and was significantly higher among men (MRCI: 8.37; 95%CI:6.79,9.94) than women (WRCI: 0.7 95%CI: 0.54,0.85, where the magnitude was very low). Small magnitudes of caste and religion related ine-quality using both absolute and relative measures (except for our relative measure for Religion, where magnitude of
inequality was high but sex-related inequality was absent) were found among women (Caste: WMDM: 0.46; 95% CI:0. 0.36,1.98; Religion: WMDM: 2.19; 95%CI:0.9,4.1) and men (Caste: MMDM: 0.38; 95% CI:0.28,1.52; Religion: MMDM: 0.28 95%CI: 0.14,1.71). These differences did not appear to be statistically significant by sex.
DiscussionOur study assessed sex inequalities in self-reported BP and BG testing and self-reported prevalence of two NCD risk factors i.e. for HBP and HBG in Kerala. We observed sex differences in education and wealth related inequali-ties in BP and BG testing. We did not observe sex dif-ferences in caste and tribal status or religion-related inequalities in BP and BG testing or HBG; however mag-nitudes of inequality were quite high (especially for rela-tive religion-related inequality in HBP and HBG among women).
Interestingly, there were varying patterns of educa-tion related inequality for absolute and relative summary measures for BP as compared to BG, and for testing as compared to self-reported (provider-diagnosed) preva-lence of HBP and HBG. This may have had to do with the distribution of education, where there were small sam-ples in primary education leading to a negative skew in distribution across the population. For caste and religion, given smaller sample sizes for certain groups, the confi-dence intervals for sex related inequalities tended to be wide as compared to within subgroup inequalities in both sexes separately. This is part of why fewer sex-related significant differences may have been found. This would have to be explored by way of analysis with larger sub-group sample sizes.
Our study found that more than three fourths of the population aged above 30 reported getting tested for BP and BG in the previous year. A study in Kasaragod, Kerala (one of the sampled districts in our study), with
Table 6 Complex Summary measures of inequality in self-reported HBG prevalence for men and women
a The absolute measure reported for the O, or ordered dimensions (Education and Wealth) is the Slope Index of Inequality and for the U or unordered dimensions (Caste and Religion) is the Mean Difference from Mean, weighted. The relative measure reported for the O or ordered dimensions (Education and Wealth) is the Relative Concentration Index and for the U, or unordered dimensions (Caste and Religion) is the Weighted Index of Disparity. Values in parentheses are 95% confidence interval upper and lower boundsb indicates significant difference by sex
Women (N = 2985) Men (N = 2346)
Self‑reported High Blood Glucose prevalence
Absolute Measure Relative Measure Absolute Measure Relative Measure
Oa Education -8.02 (−11.96, −4.07) b -12.41 (− 14.72, −10.09) b 7.23 (2.18,12.28)b 9.73 (8.25,11.21)b
Wealth 0.45 (−3.14,4.04) 0.7 (0.54,0.85)b 4.77 (0.7,8.85) 8.37 (6.79,9.94)b
Ua Caste 0.46 (0.36,1.98) 5.22 (4.07,22.44) 0.38 (0.28,1.52) 4.34 (3.22,17.51)
Religion 2.19 (0.9,4.1) 25 (10.31,46.79) 0.28 (0.14,1.71) 3.23 (1.63,19.77)
Page 10 of 13Negi et al. BMC Public Health (2022) 22:544
a sample size of 375 respondents aged 30 years and over found that over 62% had undergone NCD screen-ing [16]. Given such relatively high rates of screening, high testing rates in our study may be related to the prior exposure to the health system. This exposure is gendered: a 1993 study in the US examining fac-tors associated with health screening among women of reproductive age group found this to be the case [39]. Following from this, higher BP and BG testing among women could also be because women usually get screened during their pregnancy to screen for pre-eclampsia; this has lifetime implications for manage-ment of chronic disease [40]. There is clearly a closer need to understand why this sex difference was found in our study, how it may relate to population-based screening, and whether it reflects a broader pattern or not.
Our study found that provider-diagnosed prevalence of HBP, not HBG, was higher among women than men. These sex differences in self-reported prevalence of HBP and HBG have also been reported in other stud-ies conducted in Kerala and India. For instance, a cross sectional survey conducted in 2016 among 1154 adults (above 30) found that the prevalence of hypertension was higher among women compared to men [41]. Fur-thermore, results from NSSO data (71st round, survey data) examining self-reported prevalence of NCDs in India and Kerala also found higher NCDs risk among women than men [3]. Although, women in developing country settings tend to report their symptoms more than men, leading to a higher prevalence rate of self-reported diseases as compared to men [3], we found not sex difference in self-reported HBG prevalence.
Interestingly, a newly released NFHS-5 fact sheet for Kerala, 2019 reported that the proportion of women with mildly and moderately or severely HBP were 15.5 and 6.6% respectively; these values were 19.2 and 6.7% among men. In our study, the self-reported prevalence of HBP among women and men was 11.2 and 7.9% respectively. This seems to suggest undetected HBP, although given the current unavailability of raw NFHS 5 data, we are not able to ascertain if our values were significantly different. Regarding BG, NFHS 5 reported that the proportion of women with “high” (141–160 mg/dl) and “very high” (> 160 mg/dl) BG levels was 8.3 and 13.1% respectively; the values for men were 9.8 and 13.8% respectively. In our survey, HBG was reported by 8.8% of women and 8.6% of men, but it is unclear if self-reported data is indicative of clinically measured “high “or “very high” levels. However, the lack of sex differ-ence was also seen in our study.
Our study suggests that education and wealth related inequalities exist in testing for BP and BG as well as
self-reported prevalence of HBP and HBG among both men and women. Sex differences in socio-economic pat-terns of NCD testing and prevalence have been found globally. A European study examining educational ine-qualities in the use of BP and cholesterol screening in nine countries found a positive gradient (i.e. greater screening among higher educated groups) with Hungary being the only country where the least educated group was more likely to be screened [25]. The study attributed the higher rate to the effect of general health: screen-ing rates were higher among those with poor health and poor health is concentrated among lower socioeconomic groups [25]. A Japanese study examining educational inequalities in NCD incidence using data from a longi-tudinal survey of middle aged respondents found lower education level was positively associated with diabetes incidence in both genders, but with hypertension only among women [42].
We found pro-rich inequalities across men and women, in which wealthier groups had greater access to testing with significant sex differences depicting higher inequal-ity among men than women. Varying patterns for wealth and education, suggests they are not collinear – i.e. there may be lower income males with higher education who may be missing out on testing. More granular data pow-ered for intersectional analysis of wealth by education could help unravel the cause of such varying patterns. Wealth related inequality in HBG showed significant sex differences with greater inequality among men and HBG concentration among the wealthier groups. Similar to our findings, a study conducted in Kerala 2012 reported that the proportion of self-reported diabetes was highest (at 11.1%) in the group with the highest socioeconomic sta-tus, when compared with 3.1% in lower socioeconomic positioned groups. Similar proportions were observed in both sexes [20].
In our study, absolute and relative measures reflected distinct patterns of inequality where on one hand, using our absolute measure HBP prevalence was concentrated among more educated and lower income groups, on the other hand, the relative measure showed the opposite: concentration among higher-income and less-educated groups. Additionally, using the absolute measure, self-reported HBG prevalence was also concentrated among more-educated women but a reversed scenario among men, it was concentrated among less-educated popula-tions, but again our relative measure displayed an oppo-site pattern. These findings reflect that the education and wealth inequalities in self- reported HBP and HBG differ using absolute and relative measures of inequality. Other similar studies have also found contrasting magnitude and directions of inequalities using absolute and relative measures [43–45] reflecting the importance of reporting
Page 11 of 13Negi et al. BMC Public Health (2022) 22:544
both summary measures. SII is sensitive to variation in distribution of population among different socioeco-nomic groups [46]: Illiterate population in our sample was low which might have resulted in a biased estimate. Similar to our findings for relative measures, a national study using NSSO 71st round data found that prevalence of NCDs was reportedly higher among illiterate or low educated women as compared to men with same educa-tion level [3]. Further, a paper using the study on Global Ageing and Adult Health, 2007 of 12,198 adult respond-ents found that self-reported and clinically measured hypertension were concentrated among the affluent and educated in India. This paper also found that the magni-tude of inequality using standardised measures was much lower when compared to the magnitude of inequality using self-reported measures indicating under-diagnosis and under-reporting among poor [22].
We found that sex-related inequalities by religion and caste in testing and prevalence of NCD risk factors (HBP and HBG) were not statistically significant. Testing cov-erage was highest among women belonging to ‘other backward class group’. Magnitudes of inequality in HBP and HBG by caste and tribal status, particularly using our relative measure, were high for both sexes. Studies have found that NCD mortality and the prevalence of risk factors are high among tribal populations. A study on Kani tribal groups in Kerala found out that prevalence of hypertension was higher among Kani tribes-people when compared to general population [18]. A national study examining gender difference in the prevalence of NCDs drawing NSSO 71st round data found that prevalence of NCDs was higher among women from illiterate, OBC and other castes, Christians and wealthier groups when compared to their men counterparts [3].
Our study had some major limitations. Firstly, we relied on self-reported data to estimate the prevalence of HBP and HBG rather than clinical measurement. Results from self-reported health illness in sample surveys (small or large) should be interpreted with caution, as they can – and in our case likely - underestimate prevalence [24]. Secondly, our data did not include younger respond-ents (below 30 years). However, this would have a lim-ited impact on the findings, as most of the conditions we studied occur largely in adults, 15 million of 41 mil-lion deaths are due to NCDs between the ages of 30 and 69 years [47]. Thirdly, while conducting the survey, some-times participants reported on behalf of other members who were not present in the house during survey. So, this may have under/overestimated the results. Lastly, we had 13 individuals in our sample overall who self-identified as transpersons. We were not able to explore/analyse inequalities comparing this group using three groups or other forms of gender analysis or disaggregation given
the limitations of the frequentist approach used in our analysis. This should certainly be explored in the future.
Our study suggests complex patterns of self-reported testing for BP and BG in Kerala. Wealthier populations seem to have had greater access to testing overall. The relationship of educational status to testing appears to be vexed, however – this could be because very small pro-portions of the population are uneducated – but in rela-tive terms, less educated men and women do seem to be left out from testing. Targeted testing for populations with low literacy may be considered. Moreover, policies may consider education around NCD risk factors across religious groups because it seems that Muslim and Hindu populations have greater testing (as seen in National Family Health Survey data as well). There is some indi-cation that working with religious and community lead-ers can yield greater community-level buy in. Further research and policy should examine NCD risk factor ser-vice coverage and prevalence across genders (beyond cis categories). Regular clinical measurement of BP and BG alongside information on testing in the system will also be necessary to determine what is the unmet need for testing as well as screening and how ongoing programs are faring at filling gaps in outreach. There are ongo-ing studies in Kerala of this nature, it is possible that if data from these studies is pooled, it can be made readily available to link up to decision-making with a focus on inclusion.
ConclusionWe found sex related inequalities by wealth and educa-tion in both testing indicators and self-reported preva-lence indicators for blood pressure and blood glucose. High income groups reported higher levels of testing and provider diagnosed prevalence of high blood pres-sure and blood glucose. Magnitude of wealth-related inequalities were greater among men than women overall except for prevalence of high blood pressure, where rela-tive inequalities were greater among women. In relative terms, educational attainment and wealth seem to be associated with greater testing while self-reported preva-lence appears to vary by religious groups. These patterns require further exploration to understand contexts and pathways to ensure program design leaves no one behind.
AbbreviationsNCDs: Non-Communicable Diseases; BP: Blood Pressure; BG: Blood Glucose; RCI: Relative, Concentration Index; BPT: Blood Pressure Screening; BGT: Blood Glucose Screening HBP: High Blood Pressure; HBG: High Blood Glucose; CVD: Cardiovascular diseases; NPCDCS: National Programme for Prevention and Control of Cancer, Diabetes, CVD and Stroke; SDGs: Sustainable Development Goals; FHC: Family Health Centre; PHC: Primary Health Centre; PSU: Primary Sampling Unit; NSSO: National Sample Survey Office; SII: Slope Index of Inequality; MDM: Weighted Mean difference from Mean; IDIS_W: Weighted
Page 12 of 13Negi et al. BMC Public Health (2022) 22:544
Index of Disparity; NFHS: National Family Health Survey; Lb: Lower Bound; Ub: Upper Bound.
Supplementary InformationThe online version contains supplementary material available at https:// doi. org/ 10. 1186/ s12889- 022- 12956-w.
Additional file 1. Descriptive analysis and simple measures of inequality for men and women in each of the four selected indicators.
Additional file 2. Definitions and Interpretations of the summary meas-ures used to measure inequality in each of the four selected indicators.
Additional file 3. Additional information on selected NCD risk indicators.
Additional file 4. Additional information on the study design, sampling methodology and data collection.
Additional file 5. Concentration Curves for Blood Pressure and Glucose testing and self-reported prevalence for High Blood Pressure and Glucose by education and wealth.
AcknowledgementsWe acknowledge the whole Department of Health and Family Welfare, Government of Kerala, special thanks to Sh. Rajan Khobragade IAS and Dr. Saritha RL Aardram Task Force, Dr. PK Jameela and Dr. Jagadeesan, State Health Systems Resource Centre, Kerala, especially Dr. Shinu and Dr. Rekha, Program Directors and Officers, as well as Medical Officers in charge and primary health care teams at FHCs Aroor Perumon, Kayyur, and Karakulam, and PHCs Purak-kad, Thevalakkara, Olat, Kuttichal, Ward Members and Panchayat leadership supporting our study in the selected districts. We are thankful to Josekutty Thomas, and Akhtarul Munim at Health Systems Research Initiative India for project coordination. We thank Mr. Rakesh Ramakrishnan and the Design Team at D-Inventions Technologies for assisting with developing the applica-tion for the survey. The contribution by TGI field research team led by Rajinesh T and Sanalkumar KB, comprising Akhil Raj, Reshma KR, Anusree P, Ashila A, Soumya TR, Sneha RK, Abhishek GS, Aruna S, Midhuja MJ, Amritha KR and Neeraja R was commendable, and we are thankful for that. We acknowledge Dr. Arpita Ghosh at the George Institute for Global Health and Dr. Santanu Pra-manik at National Council for Applied Economic Research for their guidance on carrying out the sampling design. We are grateful to Anne Schlotheuber and Dr. Ahmadreza Hosseinpoor from the Health Equity Monitoring Team at World Health Organization for reviewing the first draft of this paper. This work would not be possible without the support and vision of Sh. Rajeev Sadanan-dan IAS (Retd.), former Additional Chief Secretary, Government of Kerala.
Authors’ contributionsJN: survey design, training, monitoring, data cleaning and validation, data analysis and manuscript preparation; HS: training, field implementation. Data cleaning and validation, manuscript review: AN: supervision, validation, manu-script review; DN: fund acquisition, conceptualization, survey design, training, monitoring, supervision, manuscript preparation and review. All the authors read and approved the manuscript.
FundingThis work was supported by The Wellcome Trust/DBT India Alliance Fellowship (grant number IA/CPHI/16/1/502653) awarded to Dr. Devaki Nambiar.
Availability of data and materialsAll datasets used for supporting the conclusions of this paper are available from the corresponding author on request.
Declarations
Ethics approval and consent to participateEthics approval of the study was received from the institutional ethics com-mittee of George Institute for Global Health (Project Number 05/2019). All participants gave written informed consent before taking part in the study including Illiterate participants in the survey who were read out and explained the consent form in the local language. Thereafter, they were able to sign
their names. The ethics committee that approved the study also approved this procedure of obtaining written informed consent from these participants. All methods were carried out in accordance with relevant guidelines and regulations.
Consent for publicationNot applicable.
Competing interestsThe authors declare that they have no competing interests.
Author details1 Independent Consultant, 62 Stratford Road, Kensington, CA 94707, USA. 2 The George Institute for Global Health, New Delhi, India. 3 Health Systems Research India Initiative, Thiruvananthapuram, Kerala, India. 4 Faculty of Medicine, University of New South Wales, Sydney, Australia. 5 Prasanna School of Public Health, Manipal Academy of Higher Education, Manipal, India.
Received: 25 May 2021 Accepted: 4 March 2022
References 1. Transforming our world: the 2030 agenda for sustainable development;
United Nations 2015. 2. SDG India Index and Dashboard; NITI Aayog 2019. Available at: http:// 14.
139. 60. 153/ handle/ 12345 6789/ 13652. 3. Patra S, Bhise MD. Gender differentials in prevalence of self-reported
non-communicable diseases (NCDs) in India: evidence from recent NSSO survey. J Public Health. 2016;24(5):375–85.
4. Ministry of Statistics and ProgrammeImplementation, Government of India: Key Indicators of Social Consumption in India: Health, NSS 75th Round. 2019.
5. Ottapura Prabhakaran A. Burden of noncommunicable disease in Kerala; 2015.
6. Verma VR, Kumar P, Dash U. Assessing the household economic burden of non-communicable diseases in India: evidence from repeated cross-sectional surveys. BMC Public Health. 2021;21(1):1–22.
7. Kerala GO. Economic Review, Kerala State Planning Board. In: Thiruvanan-thapuram, Kerala, India, vol. 1; 2018.
8. Health and Family Welfare Department, Government of Kerala. Non Com-municable Disease Prevention and Control. Thiruvananthapuram, Health and Family Welfare Department, Government of Kerala; 2020. Available at: https:// www. dhs. kerala. gov. in/ wp- conte nt/ uploa ds/ 2021/ 01/ NCD- BULLE TIN- latest- Janua ry- 2021. pdf.
9. Teh JK, Tey NP, Ng ST. Ethnic and gender differentials in non-com-municable diseases and self-rated health in Malaysia. PLoS One. 2014;9(3):e91328. https:// doi. org/ 10. 1371/ journ al. pone. 00913 28.
10. Corsi DJ, Subramanian SV. Association between socioeconomic status and self-reported diabetes in India: a cross-sectional multilevel analysis. BMJ Open. 2012;2(4):e000895.
11. Malta DC, Bernal RTI. de Souza MF, Szwarcwald CL, Lima MG, Barros MB. Social inequalities in the prevalence of self-reported chronic non-com-municable diseases in Brazil: National Health Survey 2013. Int J Equity Health. 2016;15(1):153. https:// doi. org/ 10. 1186/ s12939- 016- 0427-4.
12. Thankappan K, Shah B, Mathur P, Sarma P, Srinivas G, Mini G, et al. Risk factor profile for chronic non-communicable diseases: results of a community-based study in Kerala, India. Indian J Med Res. 2010;131(1):53.
13. Sarma PS, Sadanandan R, Thulaseedharan JV, Soman B, Srinivasan K, Varma RP, et al. Prevalence of risk factors of non-communicable diseases in Kerala, India: results of a cross-sectional study. BMJ Open. 2019;9(11):e027880.
14. Sugathan T, Soman C, Sankaranarayanan K. Behavioural risk factors for non communicable diseases among adults in Kerala, India. Indian J Med Res. 2008;127(6).
15. Srivastava R, Bachani D. Burden of NCDs, policies and programme for prevention and control of NCDs in India. Indian J Community Med. 2011;36(Suppl1):S7.
Page 13 of 13Negi et al. BMC Public Health (2022) 22:544
• fast, convenient online submission
•
thorough peer review by experienced researchers in your field
• rapid publication on acceptance
• support for research data, including large and complex data types
•
gold Open Access which fosters wider collaboration and increased citations
maximum visibility for your research: over 100M website views per year •
At BMC, research is always in progress.
Learn more biomedcentral.com/submissions
Ready to submit your researchReady to submit your research ? Choose BMC and benefit from: ? Choose BMC and benefit from:
16. Bhagyalakshmi C, Kodali P. Utilization of noncommunicable disease ser-vices provided by public health facilities in Kasaragod, Kerala. Arch Med Health Sci. 2019;7(1):18–24.
17. Menon J, Joseph J, Thachil A, Attacheril TV, Banerjee A. Surveillance of noncommunicable diseases by community health workers in Kerala: the epidemiology of noncommunicable diseases in rural areas (ENDIRA) study. Glob Heart. 2014;9(4):409–17.
18. Sajeev P, Soman B. Prevalence of noncommunicable disease risk factors among the Kani tribe in Thiruvananthapuram district, Kerala. Indian Heart J. 2018;70(5):598–603.
19. Menon VU, Kumar KV, Gilchrist A, Sugathan T, Sundaram K, Nair V, et al. Prevalence of known and undetected diabetes and associated risk factors in Central Kerala—ADEPS. Diabetes Res Clin Pract. 2006;74(3):289–94.
20. Safraj S, Anish T, Vijayakumar K, Kutty VR, Soman CR. Socioeconomic posi-tion and prevalence of self-reported diabetes in rural Kerala, India: results from the PROLIFE study. Asia Pac J Public Health. 2012;24(3):480–6.
21. Menon J, Vijayakumar N, Joseph JK, David P, Menon M, Mukundan S, et al. Below the poverty line and non-communicable diseases in Kerala: the epidemiology of non-communicable diseases in rural areas (ENDIRA) study. Int J Cardiol. 2015;187:519–24.
22. Vellakkal S, Subramanian S, Millett C, Basu S, Stuckler D, Ebrahim S. Socioeconomic inequalities in non-communicable diseases prevalence in India: disparities between self-reported diagnoses and standardized measures. PLoS One. 2013;8(7).
23. Vellakkal S, Millett C, Basu S, Khan Z, Aitsi-Selmi A, Stuckler D, et al. Are estimates of socioeconomic inequalities in chronic disease artefactually narrowed by self-reported measures of prevalence in low-income and middle-income countries? Findings from the WHO-SAGE survey. Epide-miol Community Health. 2015;69(3):218–25.
24. Mahal A, Karan A, Engelgau M. The economic implications of non-com-municable disease for India. HNP discussion paper; 2010.
25. Rodin D, Stirbu I, Ekholm O, Dzurova D, Costa G, Mackenbach JP, et al. Educational inequalities in blood pressure and cholesterol screen-ing in nine European countries. Epidemiol Community Health. 2012;66(11):1050–5.
26. Thakur J, Prinja S, Garg CC, Mendis S, Menabde N, Medicine S. Social and economic implications of noncommunicable diseases in India. Indian J Community Med. 2011;36(Suppl1):S13.
27. Kinra S, Bowen LJ, Lyngdoh T, Prabhakaran D, Reddy KS, Ramakrishnan L, et al. Sociodemographic patterning of non-communicable disease risk factors in rural India: a cross sectional study. BMJ. 2010;341:c4974.
28. Allen L, Williams J, Townsend N, Mikkelsen B, Roberts N, Foster C, et al. Socioeconomic status and non-communicable disease behavioural risk factors in low-income and lower-middle-income countries: a systematic review. Lancet Glob Health. 2017;5(3):e277–89.
29. Nambiar D, Sankar DH, Negi J, Nair A, Sadanandan R. Monitoring universal health coverage reforms in primary health care facilities: creating a framework, selecting and field-testing indicators in Kerala, India. PLoS One. 2020;15(8):e0236169.
30. Nambiar D, Sankar H, Negi J, Nair A, Sadanandan R. Field-testing of primary health-care indicators, India. Bull World Health Organ. 2020;98(11):747.
31. Ministry of Health and Family Welfare. National Family Health Survey (NFHS-4). Mumbai: IIPS; 2015–16.
32. Ministry of Statistics and Program Implementation, Government of India. Schedule 25.0: Household Social Consumption: Health, Instructions to Field Staff, Vol. I: NSS 75th Round. 2019. Available at: https:// www. mospi. gov. in/ docum ents/ 213904/ 533217/ Chapt er- 41602 84319 2754. pdf.
33. Hosseinpoor AR, Nambiar D, Schlotheuber Anne, Reidpath, Daniel, et al. Health Equity Assessment Toolkit (HEAT): software for exploring and comparing health inequalities in countries. BMC Med Res Methodol. 16(141):2016. https:// doi. org/ 10. 1186/ s12874- 016- 0229-9.
34. StataCorp. Stata statistical software: release 12. College Station: StataCorp LLC; 2010.
35. Ministry of Statistics and ProgrammeImplementation, Government of India: Household social consumption in India: Health, NSS 75th round 2019.
36. Hosseinpoor AR, Bergen N. Health inequality monitoring: a practical application of population health monitoring. In: Population Health Monitoring: Switzerland: Springer, Cham; 2019. p. 151–73. https:// doi. org/ 10. 1007/ 978-3- 319- 76562-4_8.
37. Health Equity Assessment Toolkit (HEAT). Software for exploring and comparing health inequalities in countries. Built-in database edition Ver-sion 2.1. Geneva: World Health Organization; 2018.
38. International Institute for Population Sciences [IIPS]. National Family Health Survey (NFHS-5), India, 2019–20: Kerala. Mumbai: IIPS; 2021.
39. Wilcox LS, Mosher WD. Factors associated with obtaining health screening among women of reproductive age. Public Health Rep. 1993;108(1):76.
40. Bagga R, Aggarwal N, Chopra V, Saha S, Prasad G, Dhaliwal L. Pregnancy complicated by severe chronic hypertension: a 10-year analysis from a developing country. Hypertens Pregnancy. 2007;26(2):139–49.
41. Sebastian N, Jesha M, Haveri SP, Nath A. Hypertension in Kerala: a study of prevalence, control, and knowledge among adults. Int J Med Sci Public Health Rep. 2016;5(10):2041–7.
42. Oshio T, Kan M. Educational level as a predictor of the incidences of non-communicable diseases among middle-aged Japanese: a hazards-model analysis. BMC Public Health. 2019;19(1):852.
43. van Zon SK, Bültmann U, Mendes de Leon CF, Reijneveld SA. Absolute and relative socioeconomic health inequalities across age groups. PLoS One. 2015;10(12):e0145947.
44. Ernstsen L, Strand BH, Nilsen SM, Espnes GA, Krokstad S. Trends in abso-lute and relative educational inequalities in four modifiable ischaemic heart disease risk factors: repeated cross-sectional surveys from the Nord-Trøndelag health study (HUNT) 1984–2008. BMC Public Health. 2012;12(1):1–10.
45. Dudal P, Bracke P. Absolute and relative educational inequalities in depression in Europe. Int J Public Health. 2016;61(7):787–95.
46. Regidor E. Measures of health inequalities: part 2. J Epidemiol Commu-nity Health. 2004;58:900–3.
47. Global Status Report on Noncommunicable Diseases. Geneva: World Health Organization; 2014.
Publisher’s NoteSpringer Nature remains neutral with regard to jurisdictional claims in pub-lished maps and institutional affiliations.


