Embed Size (px)
Citation preview
Nanoscale
PAPER
Publ
ishe
d on
09
Oct
ober
201
3. D
ownl
oade
d on
10/
12/2
013
15:4
0:43
.
View Article OnlineView Journal | View Issue
aDepartamento de Fısica, Facultad de Cienc
s/n, 33007, Oviedo, Spain. E-mail: nataliaribInstituto Nacional del Carbon (CSIC), AparcCITIMAC, Facultad de Ciencias, UniversidadUniv. Basque Country, EHU, Dept. Elect & E
SpaineSincrotrone Trieste S.C.p.A., S.S. 14 Km 16
† Electronic supplementary informationnormalized XAS spectra, variation of thesize reduction and ZFC-FC curves at 0.1 k
Cite this: Nanoscale, 2014, 6, 457
Received 30th July 2013Accepted 2nd October 2013
DOI: 10.1039/c3nr03961g
www.rsc.org/nanoscale
This journal is © The Royal Society of C
Interplay between microstructure and magnetismin NiO nanoparticles: breakdown of theantiferromagnetic order†
N. Rinaldi-Montes,*a P. Gorria,a D. Martınez-Blanco,a A. B. Fuertes,b L. FernandezBarquın,c J. Rodrıguez Fernandez,c I. de Pedro,c M. L. Fdez-Gubieda,d J. Alonso,d
L. Olivi,e G. Aquilantie and J. A. Blancoa
The possibility of tuning the magnetic behaviour of nanostructured 3d transition metal oxides has opened
up the path for extensive research activity in the nanoscale world. In this work we report on how the
antiferromagnetism of a bulk material can be broken when reducing its size under a given threshold. We
combined X-ray diffraction, high-resolution transmission electron microscopy, extended X-ray
absorption fine structure and magnetic measurements in order to describe the influence of the
microstructure and morphology on the magnetic behaviour of NiO nanoparticles (NPs) with sizes
ranging from 2.5 to 9 nm. The present findings reveal that size effects induce surface spin frustration
which competes with the expected antiferromagnetic (AFM) order, typical of bulk NiO, giving rise to a
threshold size for the AFM phase to nucleate. Ni2+ magnetic moments in 2.5 nm NPs seem to be in a
spin glass (SG) state, whereas larger NPs are formed by an uncompensated AFM core with a net
magnetic moment surrounded by a SG shell. The coupling at the core–shell interface leads to an
exchange bias effect manifested at low temperature as horizontal shifts of the hysteresis loop (�1 kOe)
and a coercivity enhancement (�0.2 kOe).
Introduction
The steadily increasing interest in magnetic nanoparticles(NPs) over the past decade has been motivated by the unusualsize-dependent magnetic behaviours and by their numerousapplications in modern nano-electronics, magnetic separationor biomedical areas.1–7 The growing research activity inthis eld has been propelled by the development of newchemical routes that allowed the synthesis of NPs with tune-able size distributions and being embedded in differentinsulating matrices.8–16 It is worth noting that NPs of the samematerial and similar size but synthetized using differentfabrication routes show a strong dependence of themagnetic properties on the morphology, microstructure orthe nature of the matrix.1,8,10,13 Moreover, 3d metal oxideNPs with different core–shell morphologies are also good
ias, Universidad de Oviedo, Calvo Sotelo
tado 73, 33080, Oviedo, Spain
d de Cantabria, 39005, Santander, Spain
lect. and BCMaterials, E – 48080, Bilbao,
3.5, 34149 Basovizza, Trieste, Italy
(ESI) available: TEM size distributions,coordination number due to cluster
Oe. See DOI: 10.1039/c3nr03961g
hemistry 2014
candidates for a number of applications due to the possibilityof tuning the magnetic response and/or the coating with afunctional layer.2,4,13–15 Therefore, a comprehensive studycombining advanced structural characterization techniquesand meticulous magnetic measurements is needed to eluci-date the microstructure–magnetism interplay at thenanoscale.
Nickel oxide (NiO) has been under extensive research fordecades due to its importance in numerous technologicalapplications (i.e., catalysis, batteries, ceramics, etc.). Nowa-days, nanosized NiO particles have generated a renewedinterest because the combination of their unique properties(i.e., high surface area, short diffusional paths, exceptionalmagnetic properties, etc.) opens an avenue for their use inelds as diverse as catalysis,17–19 anodic electrochromism,20
capacitors,21 smart windows,22 fuel and solar cells23,24 orbiosensors.25 Specially intense research effort is being madeto combine NiO with graphene in order to develop highlyfunctional energy storage systems26,27 and electrochemicalsensors.28
From a magnetic standpoint, bulk NiO is an antiferromag-netic (AFM) material with a Neel temperature (TN) of�523 K. Anintriguing aspect is that when the size of magnetic materials isreduced down to the nanometric scale they start to exhibit amagnetic behaviour that may differ markedly from theirmassive counterparts.7,12,17,29 If the crystallite size is reduced,
Nanoscale, 2014, 6, 457–465 | 457
Nanoscale Paper
Publ
ishe
d on
09
Oct
ober
201
3. D
ownl
oade
d on
10/
12/2
013
15:4
0:43
. View Article Online
the ratio between surface and volume atoms increases andthe surface coordination number is modied. Frequently, thepresence of defects and broken bonds is detected not only forthe atoms sitting at the surface but also in the rst submergedlayers. The magnetic structure of materials with a negativeexchange coupling between magnetic sublattices (antiferro-magnetic, AFM, and ferrimagnetic, FMI, in general) is particu-larly sensitive to this local periodicity-breaking.30–34 Lowtemperature high net magnetic moment and hysteresis,35–45
together with training and exchange bias (EB) effects46,47 havebeen reported as unusual features in NiO NPs. This anomalousmagnetic scenario has been modelled in different ways.Kodama rst proposed a theoretical multi-sublattice structurebased on Monte Carlo calculations.39 Recently, several experi-mental works have considered that each NP would be formed bya spin–glass (SG) shell strongly coupled to the AFM core. Thecore–shell morphology is also consistent with the reportedpresence of two peaks in the zero-eld-cooling magnetizationcurve.35–38,40–42,44
Unfortunately, previous works on NiO NPs were limited tofocus either on the structure of the NPs48–50 or on their magneticbehaviour.35–47 Moreover, studies covering both aspects arescarce and mainly devoted to the defect structure at the surfaceof NPs of a given size.51–53 This neglects other structural possi-bilities to explain the general trend and, what is more, the use ofa single sample refrains the establishment of NP size effects onthe magnetism of the system, only possible through a system-atic study of a series of samples with different size distributions.Consequently, our conviction is that microstructure andmagnetic properties are so intimately linked at the nanoscalethat only a joint analysis combining experimental techniquescan provide a global approach. In order to achieve this purpose,we have prepared three samples with controlled sizes (2.5, 4 and9 nm); characterized their crystal structure and microstructureby X-ray diffraction (XRD), high-resolution transmission elec-tron microscopy (HRTEM) and X-ray absorption spectroscopy(XAS); and studied the magnetic properties through thetemperature and magnetic eld dependences of themagnetization.
ExperimentalPreparation of the materials
A commercial activated carbon (AC) was used as a nano-template for the synthesis of NiO NPs. The AC material,supplied by Osaka Gas (Japan), has a large Brunauer–Emmett–Teller (BET) surface area of 2350 m2 g�1, a high pore volume of1.47 cm3 g�1 and porosity made up of mesopores of up to 6–7nm in diameter (�2.5 nm in average). The synthetic method isbased on a pyrolysis process that takes place within therestricted volume formed by the AC porosity. In a typicalfabrication procedure, 1 g of AC was impregnated with a solu-tion formed by 1 g nickel(II) nitrate hexahydrate in 4 mL ofethanol. The impregnated sample was vacuum dried at 323 Kfor several hours and subsequently heat-treated in N2 atmo-sphere or air up to the xed temperature. In the case of the S1sample, the heat treatment was carried out under N2 up to 573 K
458 | Nanoscale, 2014, 6, 457–465
and kept at this temperature for 1 h. Under these conditions, Nisalt decomposed into NiO and the obtained sample consisted ofvery small NiO aggregates inserted into a carbon matrix, whichconstituted 80 wt%. If the temperature is increased, NiO willreduce by means of carbon and Ni NPs will be formed. SamplesS2 and S3, were obtained by heat treatment in air at 573 K for 3 hand at 673 K for 1 h, respectively. By following this later path,NiO nucleates forming larger NPs as the heating temperatureincreases and, at the same time, the gasication of the carbonmatrix occurs (C + O2 / CO2), which is promoted by the cata-lytic action of NiO NPs. In the case of the S3 sample, the carbonmatrix was completely removed, while the S2 sample stillcontains around 25 wt% of carbon as deduced from thermo-gravimetric analysis.
Characterization methods
The crystalline structure of the samples was investigated bymeans of room temperature X-ray powder diffraction(XRD). The patterns were collected on a Philips X’Pert PROMPD diffractometer operating at 45 kV and 40 mA, equippedwith a germanium Johansson monochromator that providesCu Ka1 radiation (l ¼ 1.5406 A), and a PIXcel solid angledetector.
High-resolution TEM (HRTEM) images were recorded on aJEOL-JEM-2100F microscope (200 kV). The samples wereprepared by sprinkling a small amount of powder over ethanoland then several drops of this solution were deposited ontocarbon lms, which were placed on copper grids. In order todetermine the size distribution of each sample, around 10 000NPs were counted, using the PSA macro for ImageJ,54 andmodelled with a lognormal distribution t.
X-Ray absorption ne structure (XAFS) spectroscopy tech-nique probes the local environment surrounding theabsorbing atom. XAFS experiment is both local, due to theshort (�10 A) mean free path of the photoelectron, andessentially instantaneous, given that the lifetime of the hole inthe atomic core is only on the order of 10�16 to 10�15 s. Theroom temperature Ni K-edge XANES (X-ray absorption near-edge structure) and EXAFS (extended X-ray absorption nestructure) spectra were obtained in transmission mode, at theXAS beamline at Elettra-Sincrotrone Trieste (Italy) usingstandard ionization chambers for the detection of intensities.Ni metal foil spectrum was also recorded simultaneously tocalibrate the energy. In order to achieve the best signal-to-noise ratio, the powdered samples were deposited homoge-neously onto a Kapton tape and layers were added until thedesired transmission value was obtained. The absorptionspectra were analysed according to standard procedures usingIFFEFIT package.55 Data reduction, background removal andnormalization were carried out using the Athena soware andthe spectra were modelled using Artemis, ATOMS and FEFF6soware.55
The M(T) and M(H) curves were measured using a QuantumDesign PPMS-9T magnetometer. First, the sample was cooled inzero-eld (ZFC) from 300 K down to 2 K. Then a magnetic eld(Happl) was applied and kept constant, and aerward the
This journal is © The Royal Society of Chemistry 2014
Paper Nanoscale
Publ
ishe
d on
09
Oct
ober
201
3. D
ownl
oade
d on
10/
12/2
013
15:4
0:43
. View Article Online
MZFC(T) curve was measured by increasing the temperaturefrom 2 K to 300 K. Finally, the MFC(T) curve was recorded whilecooling the sample starting from 300 K down to 2 K. Themagnetization vs. applied magnetic eld cycles, M(H), wasmeasured between �85 and 85 kOe at low (2 K) and room (300K) temperatures. In order to study the EB effect, the sampleunder a constant applied magnetic eld (Hcool) of 10 kOewas cooled down from 300 to 2 K. Aer that, a M(H) cycle wasrecorded between �85 and 85 kOe. The EB eld (HEB)was dened as the horizontal shi of the central point of theloop measured at a given Hcool, relative to theHcool ¼ 0 loop, i.e.,HEB ¼ �(HC1 + HC2)/2, where HC1 and HC2 are the le and rightcoercive elds.
Results and discussionStructural characterization
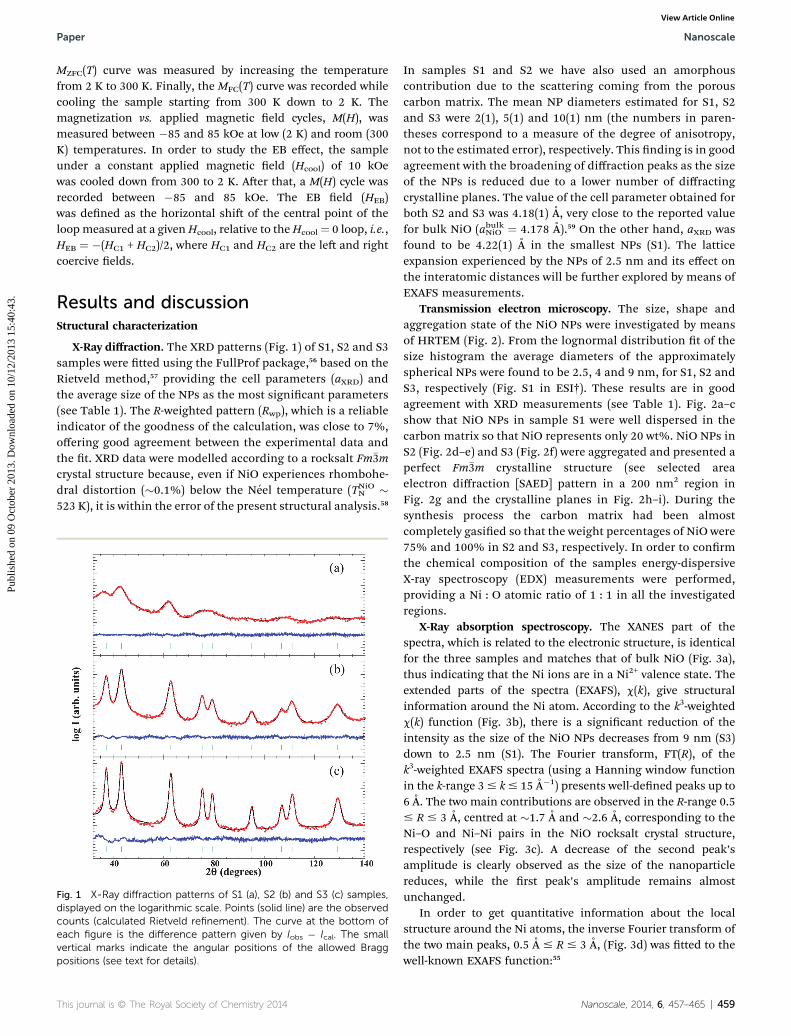
X-Ray diffraction. The XRD patterns (Fig. 1) of S1, S2 and S3samples were tted using the FullProf package,56 based on theRietveld method,57 providing the cell parameters (aXRD) andthe average size of the NPs as the most signicant parameters(see Table 1). The R-weighted pattern (Rwp), which is a reliableindicator of the goodness of the calculation, was close to 7%,offering good agreement between the experimental data andthe t. XRD data were modelled according to a rocksalt Fm�3mcrystal structure because, even if NiO experiences rhombohe-dral distortion (�0.1%) below the Neel temperature (TNiON �523 K), it is within the error of the present structural analysis.58
Fig. 1 X-Ray diffraction patterns of S1 (a), S2 (b) and S3 (c) samples,displayed on the logarithmic scale. Points (solid line) are the observedcounts (calculated Rietveld refinement). The curve at the bottom ofeach figure is the difference pattern given by Iobs � Ical. The smallvertical marks indicate the angular positions of the allowed Braggpositions (see text for details).
This journal is © The Royal Society of Chemistry 2014
In samples S1 and S2 we have also used an amorphouscontribution due to the scattering coming from the porouscarbon matrix. The mean NP diameters estimated for S1, S2and S3 were 2(1), 5(1) and 10(1) nm (the numbers in paren-theses correspond to a measure of the degree of anisotropy,not to the estimated error), respectively. This nding is in goodagreement with the broadening of diffraction peaks as the sizeof the NPs is reduced due to a lower number of diffractingcrystalline planes. The value of the cell parameter obtained forboth S2 and S3 was 4.18(1) A, very close to the reported valuefor bulk NiO (abulkNiO ¼ 4.178 A).59 On the other hand, aXRD wasfound to be 4.22(1) A in the smallest NPs (S1). The latticeexpansion experienced by the NPs of 2.5 nm and its effect onthe interatomic distances will be further explored by means ofEXAFS measurements.
Transmission electron microscopy. The size, shape andaggregation state of the NiO NPs were investigated by meansof HRTEM (Fig. 2). From the lognormal distribution t of thesize histogram the average diameters of the approximatelyspherical NPs were found to be 2.5, 4 and 9 nm, for S1, S2 andS3, respectively (Fig. S1 in ESI†). These results are in goodagreement with XRD measurements (see Table 1). Fig. 2a–cshow that NiO NPs in sample S1 were well dispersed in thecarbon matrix so that NiO represents only 20 wt%. NiO NPs inS2 (Fig. 2d–e) and S3 (Fig. 2f) were aggregated and presented aperfect Fm�3m crystalline structure (see selected areaelectron diffraction [SAED] pattern in a 200 nm2 region inFig. 2g and the crystalline planes in Fig. 2h–i). During thesynthesis process the carbon matrix had been almostcompletely gasied so that the weight percentages of NiO were75% and 100% in S2 and S3, respectively. In order to conrmthe chemical composition of the samples energy-dispersiveX-ray spectroscopy (EDX) measurements were performed,providing a Ni : O atomic ratio of 1 : 1 in all the investigatedregions.
X-Ray absorption spectroscopy. The XANES part of thespectra, which is related to the electronic structure, is identicalfor the three samples and matches that of bulk NiO (Fig. 3a),thus indicating that the Ni ions are in a Ni2+ valence state. Theextended parts of the spectra (EXAFS), c(k), give structuralinformation around the Ni atom. According to the k3-weightedc(k) function (Fig. 3b), there is a signicant reduction of theintensity as the size of the NiO NPs decreases from 9 nm (S3)down to 2.5 nm (S1). The Fourier transform, FT(R), of thek3-weighted EXAFS spectra (using a Hanning window functionin the k-range 3# k# 15 A�1) presents well-dened peaks up to6 A. The two main contributions are observed in the R-range 0.5# R # 3 A, centred at �1.7 A and �2.6 A, corresponding to theNi–O and Ni–Ni pairs in the NiO rocksalt crystal structure,respectively (see Fig. 3c). A decrease of the second peak’samplitude is clearly observed as the size of the nanoparticlereduces, while the rst peak’s amplitude remains almostunchanged.
In order to get quantitative information about the localstructure around the Ni atoms, the inverse Fourier transform ofthe two main peaks, 0.5 A # R # 3 A, (Fig. 3d) was tted to thewell-known EXAFS function:55
Nanoscale, 2014, 6, 457–465 | 459
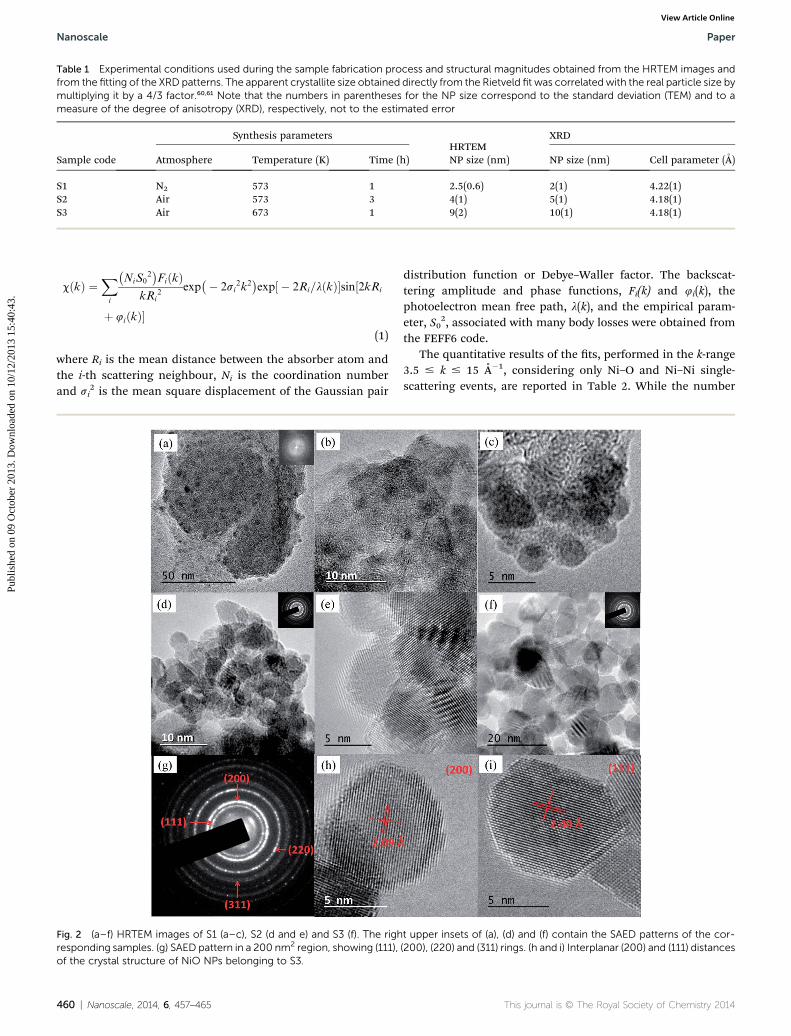
Table 1 Experimental conditions used during the sample fabrication process and structural magnitudes obtained from the HRTEM images andfrom the fitting of the XRD patterns. The apparent crystallite size obtained directly from the Rietveld fit was correlated with the real particle size bymultiplying it by a 4/3 factor.60,61 Note that the numbers in parentheses for the NP size correspond to the standard deviation (TEM) and to ameasure of the degree of anisotropy (XRD), respectively, not to the estimated error
Sample code
Synthesis parametersHRTEM
XRD
Atmosphere Temperature (K) Time (h) NP size (nm) NP size (nm) Cell parameter (A)
S1 N2 573 1 2.5(0.6) 2(1) 4.22(1)S2 Air 573 3 4(1) 5(1) 4.18(1)S3 Air 673 1 9(2) 10(1) 4.18(1)
Nanoscale Paper
Publ
ishe
d on
09
Oct
ober
201
3. D
ownl
oade
d on
10/
12/2
013
15:4
0:43
. View Article Online
cðkÞ ¼X
i
�NiS0
2�FiðkÞ
kRi2
exp�� 2si
2k2�exp½ � 2Ri=lðkÞ�sin½2kRi
þ 4iðkÞ�(1)
where Ri is the mean distance between the absorber atom andthe i-th scattering neighbour, Ni is the coordination numberand si
2 is the mean square displacement of the Gaussian pair
Fig. 2 (a–f) HRTEM images of S1 (a–c), S2 (d and e) and S3 (f). The righresponding samples. (g) SAED pattern in a 200 nm2 region, showing (111),of the crystal structure of NiO NPs belonging to S3.
460 | Nanoscale, 2014, 6, 457–465
distribution function or Debye–Waller factor. The backscat-tering amplitude and phase functions, Fi(k) and 4i(k), thephotoelectron mean free path, l(k), and the empirical param-eter, S0
2, associated with many body losses were obtained fromthe FEFF6 code.
The quantitative results of the ts, performed in the k-range3.5 # k # 15 A�1, considering only Ni–O and Ni–Ni single-scattering events, are reported in Table 2. While the number
t upper insets of (a), (d) and (f) contain the SAED patterns of the cor-(200), (220) and (311) rings. (h and i) Interplanar (200) and (111) distances
This journal is © The Royal Society of Chemistry 2014
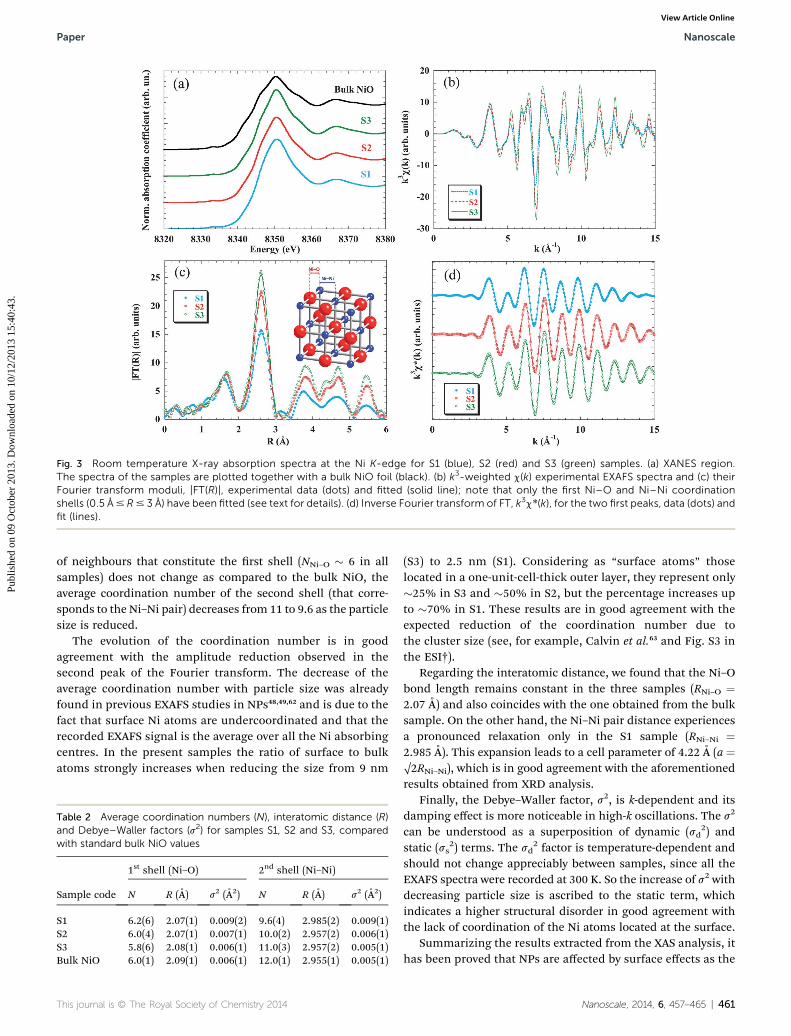
Fig. 3 Room temperature X-ray absorption spectra at the Ni K-edge for S1 (blue), S2 (red) and S3 (green) samples. (a) XANES region.The spectra of the samples are plotted together with a bulk NiO foil (black). (b) k3-weighted c(k) experimental EXAFS spectra and (c) theirFourier transform moduli, |FT(R)|, experimental data (dots) and fitted (solid line); note that only the first Ni–O and Ni–Ni coordinationshells (0.5 A# R# 3 A) have been fitted (see text for details). (d) Inverse Fourier transform of FT, k3c*(k), for the two first peaks, data (dots) andfit (lines).
Paper Nanoscale
Publ
ishe
d on
09
Oct
ober
201
3. D
ownl
oade
d on
10/
12/2
013
15:4
0:43
. View Article Online
of neighbours that constitute the rst shell (NNi–O � 6 in allsamples) does not change as compared to the bulk NiO, theaverage coordination number of the second shell (that corre-sponds to the Ni–Ni pair) decreases from 11 to 9.6 as the particlesize is reduced.
The evolution of the coordination number is in goodagreement with the amplitude reduction observed in thesecond peak of the Fourier transform. The decrease of theaverage coordination number with particle size was alreadyfound in previous EXAFS studies in NPs48,49,62 and is due to thefact that surface Ni atoms are undercoordinated and that therecorded EXAFS signal is the average over all the Ni absorbingcentres. In the present samples the ratio of surface to bulkatoms strongly increases when reducing the size from 9 nm
Table 2 Average coordination numbers (N), interatomic distance (R)and Debye–Waller factors (s2) for samples S1, S2 and S3, comparedwith standard bulk NiO values
Sample code
1st shell (Ni–O) 2nd shell (Ni–Ni)
N R (A) s2 (A2) N R (A) s2 (A2)
S1 6.2(6) 2.07(1) 0.009(2) 9.6(4) 2.985(2) 0.009(1)S2 6.0(4) 2.07(1) 0.007(1) 10.0(2) 2.957(2) 0.006(1)S3 5.8(6) 2.08(1) 0.006(1) 11.0(3) 2.957(2) 0.005(1)Bulk NiO 6.0(1) 2.09(1) 0.006(1) 12.0(1) 2.955(1) 0.005(1)
This journal is © The Royal Society of Chemistry 2014
(S3) to 2.5 nm (S1). Considering as “surface atoms” thoselocated in a one-unit-cell-thick outer layer, they represent only�25% in S3 and �50% in S2, but the percentage increases upto �70% in S1. These results are in good agreement with theexpected reduction of the coordination number due tothe cluster size (see, for example, Calvin et al.63 and Fig. S3 inthe ESI†).
Regarding the interatomic distance, we found that the Ni–Obond length remains constant in the three samples (RNi–O ¼2.07 A) and also coincides with the one obtained from the bulksample. On the other hand, the Ni–Ni pair distance experiencesa pronounced relaxation only in the S1 sample (RNi–Ni ¼2.985 A). This expansion leads to a cell parameter of 4.22 A (a ¼O2RNi–Ni), which is in good agreement with the aforementionedresults obtained from XRD analysis.
Finally, the Debye–Waller factor, s2, is k-dependent and itsdamping effect is more noticeable in high-k oscillations. The s2
can be understood as a superposition of dynamic (sd2) and
static (ss2) terms. The sd
2 factor is temperature-dependent andshould not change appreciably between samples, since all theEXAFS spectra were recorded at 300 K. So the increase of s2 withdecreasing particle size is ascribed to the static term, whichindicates a higher structural disorder in good agreement withthe lack of coordination of the Ni atoms located at the surface.
Summarizing the results extracted from the XAS analysis, ithas been proved that NPs are affected by surface effects as the
Nanoscale, 2014, 6, 457–465 | 461
Nanoscale Paper
Publ
ishe
d on
09
Oct
ober
201
3. D
ownl
oade
d on
10/
12/2
013
15:4
0:43
. View Article Online
particle size decreases, this feature being especiallypronounced in smaller NPs (S1), whereas larger ones (S3)exhibit almost bulk-like behaviour. Surface effects consist ofaverage undercoordination, bond relaxation and staticdisorder and should be understood as arising from thebreaking of the periodicity that the lattice experiences at theboundary of the particle. No evidence of crystallinity loss canbe deduced from EXAFS data.
Magnetic characterization
The temperature dependence of the magnetization was inves-tigated in ZFC and FC regimes under an applied magnetic eld
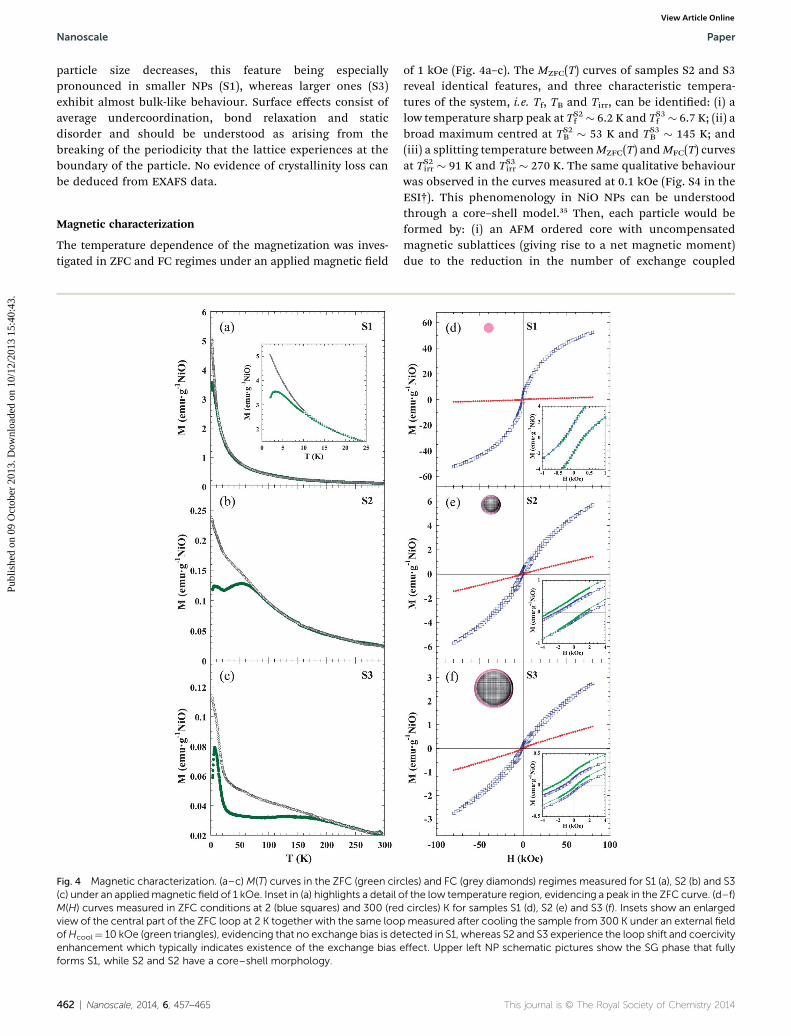
Fig. 4 Magnetic characterization. (a–c)M(T) curves in the ZFC (green cir(c) under an appliedmagnetic field of 1 kOe. Inset in (a) highlights a detail oM(H) curves measured in ZFC conditions at 2 (blue squares) and 300 (redview of the central part of the ZFC loop at 2 K together with the same looofHcool¼ 10 kOe (green triangles), evidencing that no exchange bias is deenhancement which typically indicates existence of the exchange biasforms S1, while S2 and S2 have a core–shell morphology.
462 | Nanoscale, 2014, 6, 457–465
of 1 kOe (Fig. 4a–c). The MZFC(T) curves of samples S2 and S3reveal identical features, and three characteristic tempera-tures of the system, i.e. Tf, TB and Tirr, can be identied: (i) alow temperature sharp peak at TS2
f � 6.2 K and TS3f � 6.7 K; (ii) abroad maximum centred at TS2
B � 53 K and TS3B � 145 K; and
(iii) a splitting temperature betweenMZFC(T) andMFC(T) curvesat TS2
irr � 91 K and TS3irr � 270 K. The same qualitative behaviour
was observed in the curves measured at 0.1 kOe (Fig. S4 in theESI†). This phenomenology in NiO NPs can be understoodthrough a core–shell model.35 Then, each particle would beformed by: (i) an AFM ordered core with uncompensatedmagnetic sublattices (giving rise to a net magnetic moment)due to the reduction in the number of exchange coupled
cles) and FC (grey diamonds) regimes measured for S1 (a), S2 (b) and S3f the low temperature region, evidencing a peak in the ZFC curve. (d–f)circles) K for samples S1 (d), S2 (e) and S3 (f). Insets show an enlarged
pmeasured after cooling the sample from 300 K under an external fieldtected in S1, whereas S2 and S3 experience the loop shift and coercivityeffect. Upper left NP schematic pictures show the SG phase that fully
This journal is © The Royal Society of Chemistry 2014
Paper Nanoscale
Publ
ishe
d on
09
Oct
ober
201
3. D
ownl
oade
d on
10/
12/2
013
15:4
0:43
. View Article Online
moments caused by nite size effects; and (ii) a magneticallydisordered shell, which thermally uctuates as a SG-likesystem.36–38,40–42,44 In this context, the magnetically orderedcores will exhibit SPM behaviour above a certain temperature.When the particle size is not monodispersed there is a distri-bution in the anisotropy energy barriers, and the NP magneticmoments become blocked progressively, each one at a block-ing temperature Tb � KV/25kB, as explained by the Neel–Brownmodel for uniaxial and non-interacting NPs. In our case, TB isusually associated with the mean value of Tb and Tirr is theirreversible temperature, which determines the highest valuefor the Tb in the system. The latter explains why in S2 and S3both TB and Tirr increase as the particle size is raised. On theother hand, Tf would correspond to the temperature for theSG-like freezing of the surface spins due to a disorderedmagnetic moment arrangement. In order to support thisassumption, low temperature (2–20 K) AC susceptibilitymeasurements were carried out at ve different frequencies (f)between 1 Hz and 1 kHz. The preliminary data analysis of thefrequency shi of Tf give values between 0.03 and 0.06 for theU parameter [U ¼ DTf/Tf D(log10 f )], which are within theexpected range for SG (0.004–0.06) rather than that for SPM(0.1–0.3) systems.64
The S1 sample exhibits markedly different behaviour withrespect to S2 and S3 samples. Only TS1
f � 3 K and T S1irr � 15 K can
be identied in the ZFC and FC curves, whereas there is not anymaximum that could be ascribed to a blocking temperature(TB). The latter seems to suggest that, while in S2 and S3 thedisordered region is limited to the surface shell, in S1 the NPsare so small that all the spins in the particle are inuenced bysurface effects and a magnetically-ordered core is not formed(see NP schematic pictures in Fig. 4d–f). The fact that sample S1is more affected by size effects than S2 and S3 is in goodagreement with EXAFS results. In the case of S1, the non-coincidence of TS1
f and TS1irr would arise from the fact that
there is a distribution in the particle size.Furthermore, the magnetic eld dependence of magnetiza-
tion can be understood on the basis of the previously statedmicrostructural picture that can be summarized as follows. S2and S3 NPs consist of an ordered uncompensated AFM corewith a net magnetic moment, and a surface disordered shell,both components having two different regimes: blocked/SPM,separated by TB for the core, and SG/paramagnetic separatedby Tf for the shell. Fig. 4d–f shows theM(H) curves of S1, S2 andS3 measured under ZFC conditions at low (2 K) and room(300 K) temperatures. The most relevant magnetic magnitudesare presented in Table 3.
The value of the magnetization measured at 80 kOe(M2K–ZFC
80kOe ) in S1 is more than one order of magnitude largerthan the corresponding values of S2 and S3, due to thehigher number of disordered magnetic moments present inthe NPs of 2.5 nm compared to larger ones. At T ¼ 2 K thethree samples exhibit remanence (M2K–ZFC
r ) and coercivity(H2K–ZFC
C ), due to the blocked/frozen states of all the magneticentities. The observed value of M2K–ZFC
r is roughly one orderof magnitude higher for the S1 sample respect to those forS2 and S3, and could be ascribed to the formation of Ni2+
This journal is © The Royal Society of Chemistry 2014
clusters below Tf. The high H2K–ZFCC value in S2 and S3,
compared to S1, is due to the interfacial anisotropy that thefrozen surface SG exerts on the core magnetic moment of theNP. The importance of interfacial effects was further proved bythe hysteresis loops measured at T ¼ 2 K in FC conditions(Hcool ¼ 10 kOe).
The S2 and S3 samples show characteristic features of the EBeffect, namely a shi toward the negative eld axis (H2K–FC
EB ) andcoercivity enhancement (H2K–FC
C ). The EB is a phenomenonassociated with the exchange anisotropy created at the interfacebetween materials with different anisotropy energies, typicallyan AFM and a FM,65 but EB has also been studied in differentcombinations of magnetic components (FM, AFM, ferrimag-netic, SG).31,66
The EB in the studied samples is attributed to the magneticcoupling between the NP core net magnetic moment, whichbehaves as a SPM macrospin above TB, and the spins at the NPshell.67,68 When the NPs are cooled down from T > TB to Tf < T <TB under an external magnetic eld, the core moment lines upalong the eld direction, while SG spins remain random. Inthis situation, the core blocked macrospin is able to follow theapplied eld when it reverses its direction. Further coolingdown to T < Tf gives rise to the exchange coupling between theinterfacial SG spins and the adjacent spins belonging to thecore blocked macrospin. This magnetic interaction deter-mines the direction along which the spins become oriented.Therefore, when the applied eld is reversed (at T < Tf), amicroscopic torque at the core–shell interface appears, tend-ing to keep the core blocked macrospin in its originaldirection.
When comparing these results with previous studies onNiO NPs,47 we observed a similar trend of HEB growth with theparticle diameter. On the other hand, we found higher valuesof H2K
C in the 4 nm NPs (S2) than in the 9 nm ones (S3), both inZFC and FC regimes. The research developed by Ali et al. onexchange-biased bilayered FM/SG systems revealed that HEB
increased monotonically with the SG thickness until it issaturated at a certain value, while HC exhibits a maximum wellbelow the saturation point of HEB.67 Therefore, in the case ofFM/SG interfaces, the degree by which a region of the glass isbound to the FM depends on the characteristics of the spinconguration at the interface. The HEB is provided by theglassy regions that remain largely intact on reversal the FM,whereas those that change on reversal of the FM contribute toHC. Thus, we believe that the values of HEB and HC in NiO NPsdepend not only on the particle size, but also strongly on thecharacteristics of the surface shell. The topological structureof the surface is associated with the degree of magnetic frus-tration, which determines the thickness of the SG shell andalso the roughness and magnetic coupling at the core–shellinterface.
In brief, the AF coupling in nanoscale NiO is found insideeach NP core when the particle size is larger than 4 nm. On theother hand, surface disordered magnetic moments are at theorigin of SG behaviour, which dominates the magnetic responseof the shell and also that of the whole NP when the particle sizeis �2 to 3 nm.
Nanoscale, 2014, 6, 457–465 | 463
Table 3 Characteristic magnitudes obtained from the dependences of the magnetization on temperature and applied magnetic field. Freezing(Tf), blocking (TB) and irreversibility (Tirr) temperatures were determined in the ZFC–FC curves measured under an applied field of 1 kOe.Magnetization measured at 80 kOe (M2K–ZFC
80kOe ), remanent magnetization (M2K–ZFCr ) and coercivity (H2K–ZFC
C ) were extracted from the hysteresisloops measured at 2 K in ZFC conditions. When measuring the 2 K loop after cooling the sample down from 300 K under an applied field of 10kOe, both a loop shift (H2K–FC
EB ) and a coercivity enhancement (H2K–FCC ) can be observed only in S2 and S3, thus indicating the presence of
exchange bias effect. Note that magnitudes obtained from the M(H) curves are considered to have a relative error of 2%
Sample code
Temperature dependence, M(T) Field dependence, M(H)
Tf (K) TB (K) Tirr (K)M2K–ZFC
80kOe
(emu g�1 NiO)M2K–ZFC
r
(emu g�1 NiO)H2K–ZFCC
(kOe)H2K–FCC
(kOe)H2K–FCEB
(kOe)
S1 3.0(1) — 15(1) 52.4 1.80 0.27 0.27 0S2 6.2(1) 53(5) 91(3) 5.7 0.30 2.04 2.18 0.86S3 6.7(1) 145(15) 270(10) 2.8 0.12 1.13 1.41 1.14
Nanoscale Paper
Publ
ishe
d on
09
Oct
ober
201
3. D
ownl
oade
d on
10/
12/2
013
15:4
0:43
. View Article Online
Conclusions
The inuence of the microstructure on the magnetic propertiesof three nanosized NiO samples with diameters of 2.5, 4 and 9nm was studied. The EXAFS technique allowed proving thatsurface effects became more relevant as the particle size wasreduced, even if crystallinity still remained. Magneticmeasurements revealed that there was a competition betweensurface spin disorder and antiferromagnetism, leading to adifferent magnetic arrangement in smaller NPs as compared tolarger ones. In the NiO NPs of 2.5 nm frustration prevailed andNi2+ magnetic moments were found to be in a SG state; while asthe particle size increased, the nucleation of an AFM corebecame favourable and only the shell exhibited a magnetically-disordered SG state (NPs of 4 and 9 nm). The existence of anuncompensated AFM core was indirectly detected through thepresence of a net magnetic moment arising from the reductionin the number of exchange coupled moments caused by nitesize effects, which behaved as a superparamagnet. Interestingly,only NPs with an AFM core exhibited an exchange bias effect,which was described by a SPM/SG model in which the NP corenet magnetic moments were pinned by the frozen magneticmoments at the surface disordered shell. The dependence ofHEB and HC on the particle size was strongly affected by thecharacteristics of the surface shell.
The disappearance of the AFM core when NiO NPs are smallenough and the variation of HEB and HC with the topologicalstructure of the surface and the roughness at the core–shellinterface conrm the deep interplay between the structure andthe magnetism of materials at the nanoscale and suggest that itis possible to tune their magnetic properties by controlling themorphological aspects. The present ndings could be of specialinterest in NPs made of materials that are AFM in their bulkform, but could present unique physical–chemical propertiesthat may be valuable at the nanoscale in the production of smalland smart materials.
Acknowledgements
N. Rinaldi-Montes is thankful to Ministerio de Educacion,Cultura y Deporte (MECD) for doctoral grant FPU12/03381. Thiswork was accomplished with nancial support from project
464 | Nanoscale, 2014, 6, 457–465
MAT2011-27573-C04. Thanks are due to Carlos Alvarez Villa andZakariae Amghouz (SCT’s Univ. Oviedo) for their help inobtaining TEM and HRTEM images, respectively; Beatriz Val-lina (SCT’s Univ. Oviedo) for providing assistance with XRDmeasurements and Elettra-Sincrotrone Trieste (Italy) for allo-cating beam time for EXAFS experiments.
References
1 D. L. Huber, Small, 2005, 1, 482.2 Q. A. Pankhurst, J. Connolly, S. K. Jones and J. Dobson, J.Phys. D: Appl. Phys., 2003, 36, R167.
3 A. B. Fuertes and P. Tartaj, Chem. Mater., 2006, 18, 1675.4 A. H. Haviv, J. M. Greneche and J.-P. Lellouche, J. Am. Chem.Soc., 2010, 132, 12519.
5 P. Gorria, M. Sevilla, J. A. Blanco and A. B. Fuertes, Carbon,2006, 44, 1954.
6 C. T. Meneses, W. H. Flores and J. M. Sasaki, Chem. Mater.,2007, 19, 1024.
7 M. P. Fernandez-Garcia, P. Gorria, M. Sevilla, A. B. Fuertes,R. Boada, J. Chaboy, G. Aquilanti and J. A. Blanco, Phys.Chem. Chem. Phys., 2011, 13, 927.
8 A. C. Johnston-Peck, J. Wang and J. B. Tracy, ACS Nano, 2009,3, 1077.
9 P. Gorria, M. P. Fernandez-Garcia, M. Sevilla, J. A. Blanco andA. B. Fuertes, Phys. Status Solidi RRL, 2009, 3, 4.
10 G. Salazar-Alvarez, J. Qin, V. Sepelak, I. Bergmann,M. Vasilakaki, K. N. Trohidou, J. D. Ardisson,W. a. A. Macedo, M. Mikhaylova, M. Muhammed,M. D. Baro and J. Nogues, J. Am. Chem. Soc., 2008, 130, 13234.
11 Y. Mao, J. Parsons and J. S. McCloy, Nanoscale, 2013, 5, 4720.12 M. P. Fernandez-Garcia, P. Gorria, J. A. Blanco, A. B. Fuertes,
M. Sevilla, R. Boada, J. Chaboy, D. Schmool andJ. M. Greneche, Phys. Rev. B, 2010, 81, 094418.
13 A. A. El-Gendy, E. M. M. Ibrahim, V. O. Khavrus,Y. Krupskaya, S. Hampel, A. Leonhardt, B. Buechner andR. Klingeler, Carbon, 2009, 47, 2821.
14 A. B. Davila-Ibanez, N. J. Buurma and V. Salgueirino,Nanoscale, 2013, 5, 4797.
15 B. R. Knappett, P. Abdulkin, E. Ringe, D. A. Jefferson,S. Lozano-Perez, T. C. Rojas, A. Fernandez andA. E. H. Wheatley, Nanoscale, 2013, 5, 5765.
This journal is © The Royal Society of Chemistry 2014
Paper Nanoscale
Publ
ishe
d on
09
Oct
ober
201
3. D
ownl
oade
d on
10/
12/2
013
15:4
0:43
. View Article Online
16 M. P. Fernandez-Garcia, P. Gorria, M. Sevilla, M. P. Proenca,R. Boada, J. Chaboy, A. B. Fuertes and J. A. Blanco, J. Phys.Chem. C, 2011, 115, 5294.
17 J. Park, E. Kang, S. U. Son, H. M. Park, M. K. Lee, J. Kim,K. W. Kim, H. J. Noh, J. H. Park, C. J. Bae, J. G. Park andT. Hyeon, Adv. Mater., 2005, 17, 429.
18 J. Xiao, B. Chen, X. Liang, R. Zhang and Y. Li, Catal. Sci.Technol., 2011, 1, 999.
19 Y. H. Pai and S. Y. Fang, J. Power Sources, 2013, 230, 321.20 H. Zeng, J. Li, J. P. Liu, Z. L. Wang and S. H. Sun, Nature,
2002, 420, 395.21 X. Yan, X. Tong, J. Wang, C. Gong, M. Zhang and L. Liang,
Mater. Lett., 2013, 95, 1.22 J. M. Tarascon and M. Armand, Nature, 2001, 414, 359.23 X. Wang, L. Li, Y. Zhang, S. Wang, Z. Zhang, L. Fei and
Y. Qian, Cryst. Growth Des., 2006, 6, 2163.24 E. A. Gibson, M. Awais, D. Dini, D. P. Dowling, M. T. Pryce,
J. G. Vos, G. Boschloo and A. Hagfeldt, Phys. Chem. Chem.Phys., 2013, 15, 2411.
25 M. Tyagi, M. Tomar and V. Gupta, Biosens. Bioelectron., 2013,41, 110.
26 Y. Jiang, D. Chen, J. Song, Z. Jiao, Q. Ma, H. Zhang, L. Cheng,B. Zhao and Y. Chu, Electrochim. Acta, 2013, 91, 173.
27 G. Zhou, D. W. Wang, L. C. Yin, N. Li, F. Li and H. M. Cheng,ACS Nano, 2012, 6, 3214.
28 X. Zhu, Q. Jiao, C. Zhang, X. Zuo, X. Xiao, Y. Liang and J. Nan,Microchim. Acta, 2013, 180, 477.
29 Magnetic Properties of Fine Particles, J. L. Dormann and D.Fiorani, North Holland, Amsterdam, 1992.
30 S. Morup, D. E. Madsen, C. Frandsen, C. R. H. Bahl andM. F. Hansen, J. Phys.: Condens. Matter, 2007, 19, 213202.
31 J. Nogues, J. Sort, V. Langlais, V. Skumryev, S. Surinach,J. S. Munoz and M. D. Baro, Phys. Rep., 2005, 422, 65.
32 V. Skumryev, S. Stoyanov, Y. Zhang, G. Hadjipanayis,D. Givord and J. Nogues, Nature, 2003, 423, 850.
33 O. Iglesias, A. Labarta and X. Batlle, J. Nanosci. Nanotechnol.,2008, 8, 2761.
34 Q. Pankhurst, L. Fernandez Barquın, J. S. Lord, A. Amato andU. Zimmermann, Phys. Rev. B, 2012, 85, 174437.
35 E. Winkler, R. D. Zysler, M. V. Mansilla, D. Fiorani,D. Rinaldi, M. Vasilakaki and K. N. Trohidou,Nanotechnology, 2008, 19, 185702.
36 E. Winkler, R. D. Zysler, M. V. Mansilla and D. Fiorani, Phys.Rev. B, 2005, 72, 132409.
37 M. P. Proenca, C. T. Sousa, A. M. Pereira, P. B. Tavares,J. Ventura, M. Vazquez and J. P. Araujo, Phys. Chem. Chem.Phys., 2011, 13, 9561.
38 S. Thota and J. Kumar, J. Phys. Chem. Solids, 2007, 68, 1951.39 R. H. Kodama, S. A. Makhlouf and A. E. Berkowitz, Phys. Rev.
Lett., 1997, 79, 1393.40 S. D. Tiwari and K. P. Rajeev, Phys. Rev. B, 2005, 72, 104433.41 M. Ghosh, K. Biswas, A. Sundaresan and C. N. R. Rao, J.
Mater. Chem., 2006, 16, 106.
This journal is © The Royal Society of Chemistry 2014
42 C. T. Meneses, J. G. S. Duque, E. de Biasi, W. C. Nunes,S. K. Sharma andM. Knobel, J. Appl. Phys., 2010, 108, 013909.
43 M. Tadic, M. Panjan, D. Markovic, I. Milosevic andV. Spasojevic, J. Alloys Compd., 2011, 509, 7134.
44 W. J. Duan, S. H. Lu, Z. L. Wu and Y. S. Wang, J. Phys. Chem.C, 2012, 116, 26043.
45 Y. G. Morozov, D. Ortega, O. V. Belousova, I. P. Parkin andM. V. Kuznetsov, J. Alloys Compd., 2013, 572, 150.
46 S. Sabyasachi, S. Majumdar and S. Giri, Solid State Commun.,2011, 151, 1515.
47 S. A. Makhlouf, H. Al-Attar and R. H. Kodama, Solid StateCommun., 2008, 145, 1.
48 M. A. Peck and M. A. Langell, Chem. Mater., 2012, 24, 4483.49 A. Anspoks, A. Kuzmin, A. Kalinko and J. Timoshenko, Solid
State Commun., 2010, 150, 2270.50 F. Jiao, A. H. Hill, A. Harrison, A. Berko, A. V. Chadwick and
P. G. Bruce, J. Am. Chem. Soc., 2008, 130, 5262.51 S. Mandal, K. S. R. Menon, S. K. Mahatha and S. Banerjee,
Appl. Phys. Lett., 2011, 99, 232507.52 S. Mandal, S. Banerjee and K. S. R. Menon, Phys. Rev. B, 2009,
80, 214420.53 A. Anspoks, A. Kalinko, R. Kalendarev and A. Kuzmin, Phys.
Rev. B, 2012, 86, 174114.54 R. A. Sperling, P. Rivera Gil, F. Zhang, M. Zanella and
W. J. Parak, Chem. Soc. Rev., 2008, 37, 1896.55 B. Ravel and M. Newville, J. Synchrotron Radiat., 2005, 12,
537.56 J. Rodriguez-Carvajal., Satellite Meeting on Powder Diffraction
of the XV IUCr Congress, 1990, vol. 127.57 H. Rietveld, J. Appl. Crystallogr., 1969, 2, 65.58 M. Towler, N. Allan, N. Harrison, V. Saunders, W. Mackrodt
and E. Apra, Phys. Rev. B, 1994, 50, 5041.59 S. Sasaki, K. Fujino and Y. Takeuchi, Proc. Jpn. Acad., Ser. B,
Phys. Biol. Sci., 1979, 55, 43.60 J. I. Langford, D. Louer and P. Scardi, J. Appl. Crystallogr.,
2000, 33, 964.61 D. Martinez-Blanco, P. Gorria, J. A. Blanco, M. J. Perez and
J. Campo, J. Phys.: Condens. Matter, 2008, 20, 335213.62 A. I. Frenkel, C. W. Hills and R. G. Nuzzo, J. Phys. Chem. B,
2001, 105, 12689.63 S. Calvin, M. M. Miller, R. Goswami, S. F. Cheng,
S. P. Mulvaney, L. J. Whitman and V. G. Harris, J. Appl.Phys., 2003, 94, 778.
64 J. A. Mydosh, Spin Glasses: An Experimental Introduction,Taylor & Francis, London, 1993.
65 J. Nogues and I. K. Schuller, J. Magn. Magn. Mater., 1999, 192,203.
66 S. Giri, M. Patra and S. Majumdar, J. Phys.: Condens. Matter,2011, 23, 073201.
67 M. Ali, P. Adie, C. H. Marrows, D. Greig, B. J. Hickey andR. L. Stamps, Nat. Mater., 2007, 6, 70.
68 F. T. Yuan, J. K. Lin, Y. D. Yao and S. F. Lee, Appl. Phys. Lett.,2010, 96, 162502.
Nanoscale, 2014, 6, 457–465 | 465


