Embed Size (px)
Citation preview
A STUDY ON CUSTOMER SATISFICATION ON THE KERALA FEED LTD.
INTERNSHIP REPORT ON
A STUDY ON CUSTOMER SATISFACTION ON THE KERALA FEED LTD.
AT
KERALA FEEDS,KALLETTUMKARA,THRISSUR,KERALA
BY
YADHU.J.MENON
USN NO : 1NZ13MBA56
Submitted to
VISVESVARAYA TECHNOLOGICAL UNIVERSITY,BELGAUM
In partial fulfillment of the requirements for the award of the degree of
MASTER OF BUSINESS ADMINISTRATION
Under the guidance of
INTERNAL GUIDE EXTERNAL GUIDE
Dr. SHEELAN MISRA Mr. SANKAR.P
HOD,PROFESSER, ASST.MARKETING MANAGER
DEPARTMENT OF MANAGEMENT STUDIES
NEW HORIZONCOLLEGE OF ENGINEERING
Outer Ring Road, Bellandur Post, Near Marathalli ,Bangalore-560103
A STUDY ON CUSTOMER SATISFICATION ON THE KERALA FEED LTD.
A STUDY ON CUSTOMER SATISFICATION ON THE KERALA FEED LTD.
A STUDY ON CUSTOMER SATISFICATION ON THE KERALA FEED LTD.
A STUDY ON CUSTOMER SATISFICATION ON THE KERALA FEED LTD.
ACKNOWLEDGEMENT
I thank the almighty God for the blessing that have been showered upon me to complete the
project successfully.
I am extremely thankful to the Managing Director Dr. Ani S. Das and , SANKAR.P ,Marketing
Manager, Kerala feed Ltd. Kallettumkara, Thrissur the valuable suggestions, observation,
and encouragement, which helped me a great deal in accomplishment of this project work.
I express my sincere thanks to Dr. MANJUNATHA, Principal of NEW HORIZON COLLEGE
OF ENGINEERING for providing me the opportunity to conduct this research project.
I express by deep sense of gratitude to Dr. SHEELAN MISRA , Director of Dept. of
management studies and my internal guide Dr. SHEELAN MISRA Department of
management studies, and my dear colleagues for their valuable inputs.
I also express thanks to my family members and friends for the love and support that they gave
me during the time of the project.
Place: YADHU.J.MENON
Date : 1NZ13MBA56
A STUDY ON CUSTOMER SATISFICATION ON THE KERALA FEED LTD.
TABLE OF CONTENT
SL.NO
PARTICULARS
PAGE NO.
EXECUTIVE SUMMARY
CHAPTER
1.
1.1 INTRODUCTION
1.2 TOPIC CHOSEN FOR THE STUDY
1.3 NEED OF THE STUDY
1.4 OBJECTIVES OF STUDY
1.5 SCOPE OF THE STUDY
1.6 RESEARCH METHODOLOGY
1.7 LITERATURE REVIEW
1.8 LIMITATIONS OF THE STUDY
1
1
2
2
2
2
3
5
8
CHAPTER
2.
2.1 INDUSTRY PROFILE
2.2 COMPANY PROFILES
2.3 SWOT ANALYSIS
2.4 FINANCIAL STATEMENT
9
17
31
34
CHAPTER
3.
3.1 THEORETICAL CONCEPTS
36
CHAPTER
4.
4.1DATA ANALYSIS AND INTERPRETATION
41
CHAPTER
5.
5.1 FINDINGS
5.2 SUGGESTIONS
5.3 CONCLUSION
72
74
75
6. BIBLIOGRAPHY
7. ANNEXURE
A STUDY ON CUSTOMER SATISFICATION ON THE KERALA FEED LTD.
LIST OF TABLE
TABLE NO. TITLE PAGE NO
1 Table showing the number of years the customer are use the product with Kerala feeds
41
2 Table showing the customer satisfaction with the quality of the product
43
3 Table showing the factors that influenced to the purchasing the product.
45
4 Table showing the weather customer have used any other company products
47
5 Table showing the customer satisfied with the price of the product
49
6 Table sowing the respondents regarding the recommend of product the other customer
51
7 Table showing the need of more promotional activities for the company’s products
53
8 Table showing the response regarding the purchasing frequency of products at Kerala feed Ltd
55
9 Table showing the response regarding the rate of marketing potential and demand for the products at Kerala feed Ltd
57
10 Table showing the satisfaction level regarding rate of distribution system provided by Kerala feed Ltd
59
11 Table showing the what is the most common promotional method of Kerala feed Ltd
61
12 Table showing the response regarding the rating of packaging quality of products at Kerala feed Ltd
62
13 Table showing the category of products at Kerala feed Ltd. is having the demand in the market
64
14 Table showing the medium through which customer came to know about this product
66
15 Table showing the suggestion regarding improving the performance of product sale by Kerala feed Ltd
68
16 Table showing the satisfaction level regarding the overall performance of Kerala feed Ltd
70
A STUDY ON CUSTOMER SATISFICATION ON THE KERALA FEED LTD.
TABLE OF GRAPH
TABLE NO. TITLE PAGE NO
1 Graph showing the number of years the customer are use the product with Kerala feeds
42
2 Graph showing the customer satisfaction with the quality of the product
44
3 Graph showing the factors that influenced to the purchasing the product.
46
4 Graph showing the weather customer have used any other company products
48
5 Graph showing the customer satisfied with the price of the product
50
6 Graph showing the respondents regarding the recommend of product the other customer
52
7 Graph showing the need of more promotional activities for the company’s products
54
8 Graph showing the response regarding the purchasing frequency of products at Kerala feed Ltd
56
9 Graph showing the response regarding the rate of marketing potential and demand for the products at Kerala feed Ltd
58
10 Graph showing the satisfaction level regarding rate of distribution system provided by Kerala feed Ltd
60
11 Graph showing the what is the most common promotional method of Kerala feed Ltd
61
12 Graph showing the response regarding the rating of packaging quality of products at Kerala feed Ltd
63
13 Graph showing the category of products at Kerala feed Ltd. is having the demand in the market
65
14 Graph showing the medium through which customer came to know about this product
67
15 Graph showing the suggestion regarding improving the performance of product sale by Kerala feed Ltd
69
16 Graph showing the satisfaction level regarding the overall performance of Kerala feed Ltd
71
A STUDY ON CUSTOMER SATISFICATION ON THE KERALA FEED LTD.
EXECUTIVESUMMARY
The project titled “CUSTOMER SATISFACTION ON THE KERALA FEED. LTD” is
undertaken in Kerala feed Ltd. The Customer’s satisfaction is essential and which companies
should focus on, in any business that does not succeed in satisfying its customers, there is very
high tendency that the customers may not patronize the business again. Satisfied customers are
likely to be loyal and continue patronizing than dissatisfied customers.
All business is build based on relationships Understanding customer relationship management or
relationship marketing has become a necessity for understanding how to manage businesses in
the service competition. When building customer relationship or loyalty it is important to have
customer satisfaction Therefore, in order to build customer loyalty or relationships, businesses
have to work hard on customer satisfaction. In a win-win situation, business focus on profit and
happy customers; and customers try to satisfy their needs. For this study the area for survey was
all over 3 villages surrounding the factory namely Kallettumkara, Kodakara and Muriyaad. The
data collected by researcher through surveys and other sources are analyzed with the help of
statistical tools and techniques for the purpose of getting a final and accurate findings and
conclusions.
The first chapter give a brief introduction about the internship, topic chosen and the research
methodologies. The second chapter gives a brief summary of industry and company profile. The
third chapter is basically on the theoretical background and details on customer satisfaction. The
fourth chapter is on the analysis on survey and graphical representation and interpretation.
The last chapter is on the findings on survey and some suggestions that could be made as to
introduce the customer satisfaction.
A STUDY ON CUSTOMER SATISFICATION ON THE KERALA FEED LTD.
CHAPTER 1
A STUDY ON CUSTOMER SATISFICATION ON THE KERALA FEED LTD.
1
1.1 INTRODUCTION
Cattle feed industry, a major ingredient of animal feed industry is currently evolving from a
fragmented industry into an organized sector. The feed manufactures are using increasingly
modern and sophisticated methods in an effort to incorporate best global practices. Cattle feed
industry has got high potential for growth, given that India is the world’s leading producer of
milk, and production is expected to grow at compounded annual growth rate of 4 per cent.
It is Both primary and secondary data are collected for the study and collect various details
about the customer satisfaction process of Kerala feeds in Kallettumkara. So customer
satisfaction process helps an organization to find out the area where the company should improve
and to find out the factors which affect the organization. It also use for comparing performance
of company for different customers.
Marketing strategy is the total and unbeatable instrument or a plan shaped design specifically for
attaining the marketing objectives of a firm and also to understand about the importance and the
role of the marketing department plays in the organization. So, this study is essential to analyze
the effectiveness of the marketing department in the organization and also to understand about
the importance and the role of functions that performed by the marketing department in the
organization. A fair marketing study will help the organization to develop further. So, the
suggestions given by the organization very high systematic manner
1.2Topic chosen for the study
The topic chosen is “customer satisfaction of Kerala Feeds ltd.
The research was undertaken to study and analyze the consumer’s preference towards the Kerala
feed ltd. There are various factors that adversely affect the consumer’s buying behavior to Kerala
feed Ltd. This study helped to identify the specific factors, which influence the consumers
A STUDY ON CUSTOMER SATISFICATION ON THE KERALA FEED LTD.
2
1.3NEED FOR THE STUDY
The research was undertaken to study and analyze the consumer’s preference towards the Kerala
feed ltd. There are various factors that adversely affect the consumer’s buying behavior to Kerala
feed Ltd. This study helped to identify the specific factors, which influence the consumers.
Consumer’s preference involves perceptions about the products, so different organization try to
keep their products with different prospective qualities, may have different products. This study
has helped to understand the consumer’s response towards the Kerala feed Ltd.
1.4 OBJECTIVES OF STUDY
Objectives of project work is:
To analyse the customer satisfaction of the productsof Kerala feeds Ltd.
To find out the factorseffecting customer buying behaviour of Kerala feeds ltd.
To understandthe promotional strategies of the organisation.
To understand effectivenessof the distribution system of Kerala Feeds Ltd.
1.5 SCOPE OF THE STUDY
The customer is the person or group of the person, who decide what to buy and what not to buy.
In competitive Environment one cannot thrust a product on consumer. He has to produce what is
demanded. The marketing personnel study on consumers towards the Kerala feed Ltd.
After study on consumer preference towards the Kerala feed Ltd, manufacturer tries to find out
what changes are required in existing products, how sales can be pushed of existing products,
what changes required to get larger market share.
A STUDY ON CUSTOMER SATISFICATION ON THE KERALA FEED LTD.
3
The responds of consumers of Kerala feeds Ltd would be relevant for the Kerala feed Ltd
industries for adapting their marketing strategy to the changed marketing environment
1.6 RESEARCH METHODOLOGY
RESEARCH TYPE
The type of research design used for this study is the descriptive research design. Descriptive
research for fact finding. The major use of descriptive research is the state of affairs, as it exists
present.
TYPE OF DATA
The task of collection begins after a research problem has been defined and research chalked out.
While deciding about the method of data collection to be used for study, the researcher should
keep in mind 2 types of data, they are
1. Primary data
2. Secondary data
Primary data:-
Primary data are those, which are collected afresh and for the first time this happen to be original
in character. Primary data can be obtained either through observation or through direct
communication with respondents is one from to another through personal interview. In this
project work the researcher, collected Primary data mainly through questionnaire and response
were taken trough face- to –face approaches
Secondary Data:-
Secondary Data is the data that already exists and in ready to use format and gathered by
somebody else. This data can be in the form of articles in magazines, journals, government
reports or any other historical data. It might even be the different articles in newspaper and on
the internet blogs. Secondary Data that would be used by researcher in the research process as
supportive documents are from the various newspaper articles, magazines related to specific
industry, books and company internet sites.
A STUDY ON CUSTOMER SATISFICATION ON THE KERALA FEED LTD.
4
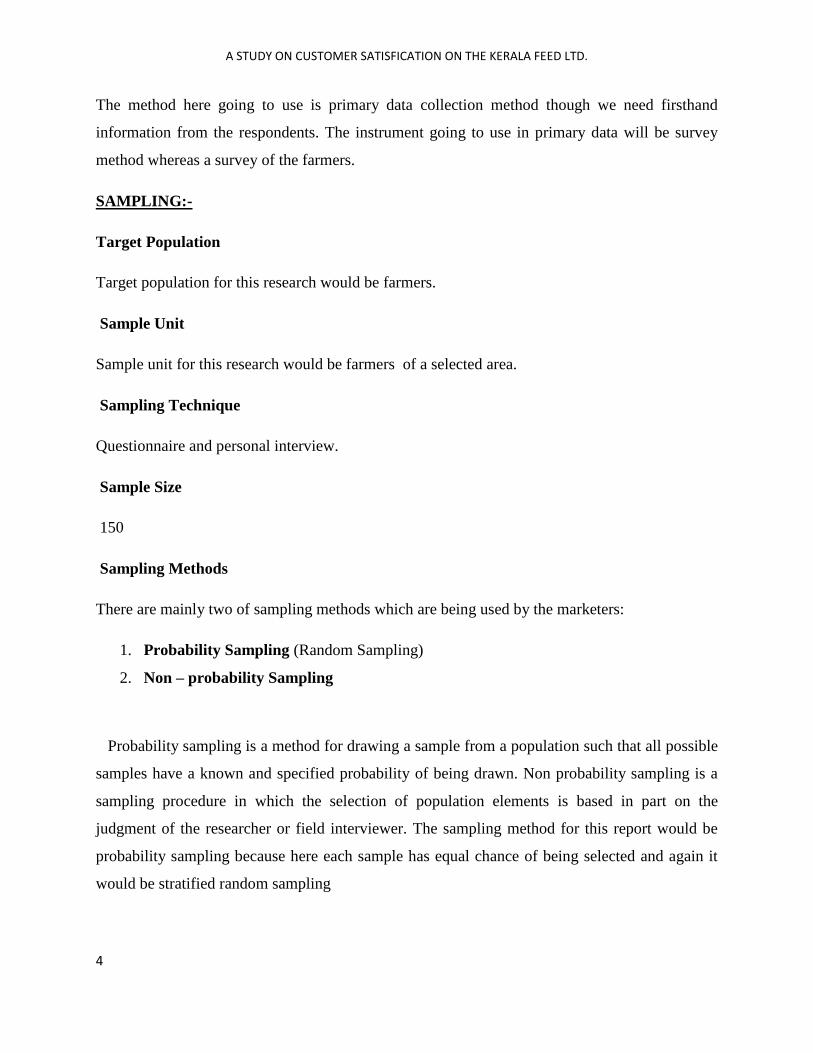
The method here going to use is primary data collection method though we need firsthand
information from the respondents. The instrument going to use in primary data will be survey
method whereas a survey of the farmers.
SAMPLING:-
Target Population
Target population for this research would be farmers.
Sample Unit
Sample unit for this research would be farmers of a selected area.
Sampling Technique
Questionnaire and personal interview.
Sample Size
150
Sampling Methods
There are mainly two of sampling methods which are being used by the marketers:
1. Probability Sampling (Random Sampling)
2. Non – probability Sampling
Probability sampling is a method for drawing a sample from a population such that all possible
samples have a known and specified probability of being drawn. Non probability sampling is a
sampling procedure in which the selection of population elements is based in part on the
judgment of the researcher or field interviewer. The sampling method for this report would be
probability sampling because here each sample has equal chance of being selected and again it
would be stratified random sampling
A STUDY ON CUSTOMER SATISFICATION ON THE KERALA FEED LTD.
5
1.7 LITERATURE REVIEW
The literature review is about customer expectations, customer perceptions, customer satisfaction
and their association with the service they receive. The literature describes customer satisfaction
as a problem which has become a major issue.
Consumer satisfaction has gained increasing attention in recent years (e.g. Peterson and
Wilson,1992 ;Fomelle/ al., 1996; Spreng and Mackoy ; 1996 ; Bernhardt et al., 2000 ; Ofir and
Simonson , 2005) . Most writers agree that satisfied consumers represent a value for A1
Company. In fact Peterson and Wilson (1992) point out that “satisfying customers is the primary
obligation of a company “. Previous research indicates that satisfaction has impact on ROI
(Anderson al., 1994), shareholder value (Ittner and Larcker , 1996), higher market share and
profit (Fomell, 1992 ; homburg and Rudolph,2001), customer loyalty (Bearder and teal , 1983 ;
Kristensene? Al., 2000), and overall firm performance (Anderson and Sullivan , 1993).
The companies while making business strategies, incorporates a strategy to achieve customer
satisfaction (Reichheld&Sasser , 1990 ; Rust&Zahorik, 1993). Drucker (1973) states it as the
reason of successful business and according to clay comp & martin (2002) customer satisfaction
is a basis principle of relationship marketing and management .Anderson et al (1994) think that
customer satisfaction is a helpful factor in giving organizations an edge over their customers.
According to (Reichheld&Sassar , 1990, Anderson et al, 1997 concepts of corporate profitability
, customer satisfaction and customer loyalty , and customer retention are interlinked . there is
strong and positive relationship between customer satisfaction and corporate profitability . it has
been seen in many industries that the companies who achieve greater customer satisfaction , rare
are the chances of losing their customers which means customer satisfaction leads to customer
retention and they flourish economically .
A STUDY ON CUSTOMER SATISFICATION ON THE KERALA FEED LTD.
6
Another study states that the customer become the loyal customer (Anderson &Sullivan , 1993,
Fomell , 1992 , The more the loyalty of the customer would be the better would be the profit gain
(Reichheld& teal ,1996).
Customer expectation if not fulfilled, leads to three stages and then customer complaints. This
complaining is the post purchase behavior. These three stages are delight, satisfaction and
dissatisfaction. If the customer is pleased , satisfied and delighted , he / she admires the services
(Leventhal , 2006). When the customer is not satisfied he/she express disappointment and
complains about the quality of service (santos&boote,2003).
(Ojasalo,2001) noted that , fuzzy expectations are those that are formed when customers are
uncertain about the things they are expecting , they want something but they fail to comprehend
what they want actually . If these expectations are not met, customers are dissatisfied but they do
not understand why it happened and what they wanted. Such customers are more prone towards
switching behavior and switch to other service provider without realizing the reason and benefits.
The opposite of this concept is precise expectations. (Ojasalo , 2001)
(ojasalo,2001), also observed that implicit expectations are associated with situations when the
products are meant to be delivered just according to the expectations of customers and customers
do not want to even think about it what will happen if the services will not be delivered the way
they are expecting . If these expectations are not met, they become prominent and are felt by the
customers. Explicit expectations, on the other hand are well defined in customers mind.
Customers are conscious about these expectations and about whether they are met or not.
In short term the customer satisfaction is achieved immediately but it does not last for a long
time while in long time, the satisfaction doesn’t. Come immediately but lasts over a long period
of these two, long term quality holds significance in order to have lasting relationship with the
customers (Ojasalo , 19999).
A STUDY ON CUSTOMER SATISFICATION ON THE KERALA FEED LTD.
7
According to (mick and Fournier , 1999), most studies on customer satisfaction have been
conducted within the comparison standards (CS) paradigm , which posits that consumers hold
preconception preferences , observe product , performance , compare performance with their
standards. Form confirmation or disconfirmation perceptions, combine these perceptions with
standards level, and then form summary satisfaction judgment.
According to (Churchill and Suprenant , 1982 ) consumers form expectations toward a product
on the basis of some internal and external cues. The product is then experienced and evaluated,
and the outcome (i.e., performance of the product) is then compared with the expectations. As a
result of the expectations are either confirmed or disconfirmed. In the case of negative
disconfirmation the consumer becomes more or less unsatisfied which may have negative
consequences for the repeat purchase of the product. When the expectations are confirmed, or
perhaps even exceeding leading to positive disconfirmation, the consumer becomes satisfied.
Which may have positive consequences for the repeat purchase of the product .
In addition Spreng and Meckoy (1996) and Montfortet al. (2000) among others found that
expectations had a direct influence on perception on performance.
According to (Szymanski and Henard (2001)), they propose that modelling performance as a
separate predictor of satisfaction follows directly from the notion of value percept diversity ; that
is , customers are likely to be more satisfied with the offering as the ability of the offering to
provide consumers what they need , want , or desire increases relative to costs incurred “
According to (Anderson 1994 , Andersonand Sullivan 1993 , Bryant and cha 1996 , gronholdt et
al . 2000 , homburg and Giering 2001 Mittal and Kamakura 2001) they have concluded that
customer , firm and industry differences result in varying levels of customer satisfaction ,
customer loyalty association (i.e. , the sensitivity of a change in loyalty according to a change in
satisfaction ) . Thus failure to account for these competitive setting differences is likely to be the
primary reason for the relatively modest predictive power of customer satisfaction over customer
loyalty and heterogeneity with respect to the satisfaction loyalty relationship.
A STUDY ON CUSTOMER SATISFICATION ON THE KERALA FEED LTD.
8
(Anderson19994) has concluded that consumer satisfaction can be an essential measure used to
oversee business outcomes, decide on limited resource allocation and provide rewards to
management.
Bowen and Chen (2001) state that an individual may reside at a hotel because it has the most
convenient location. Nevertheless, an individual may also change to a new hotel when it is
located across the street and provides better deals .as this example illustrates, repeat purchase
behavior does not always indicate commitment,rather, it many signify a random actual repeat
purchase or spurious loyalty . Yet, the superior’s loyalty can be disregarded when attitudinal
loyalty is the construct of interest.
1.8Limitations of the study
1. This survey is concentrated only at the region that are in close proximity to
Thrissur . So, when it comes to generalization for a state, based upon this data, it
will be meaningless.
2. Random sampling method is chosen for this purpose, as a result there can be
elements of bias derived from the choice of places and locations from where I
collect the data
3. Generally the respondents were busy in their work and were not interested in
responding rightly, and some of the respondents had some problems reading the
questionnaire.
4. Most respondents may be lacking proper knowledge / usage experiences of
various products offered by the company so they were unable to provide exact
information

A STUDY ON CUSTOMER SATISFICATION ON THE KERALA FEED LTD.
CHAPTER 2
A STUDY ON CUSTOMER SATISFICATION ON THE KERALA FEED LTD.
9
2.1INDUSTRY PROFILE
The feed industry has modern computerized plants and the latest equipment for analytical
procedures and least coat ratio formulation and it employs the latest manufacturing technology.
The organized sector of the compound feed industry is facing serious problems resulting from
huge idle capacity, to extent of 50% or more. Global participants of the feed business and by
national as well as multinational integrators are adding new capacities.
The nature of animal feed and the poultry feed industry has completely changed. Production of
cattle feed is an important activity in rural and semi-urban area. Even today in rural india
particularly eastern region, agriculture is very largely cattle based. Very little activity is
mechanized. A part from farming activity, a large part of rural livelihood depends on cattle .
It is only source of milk. Organic manure and fuel requirement is met from the extra of the cattle.
Entire diary industry and meat is depending on the cattle raring. Therefore, the requirement of
cattle feed for both a domestic animal as well as commercial cattle is huge. The beginning of the
industrial scale production of animal feeds can be traced back to the late 1800s, this is around the
time that advances in human and animal nutrition was unable to identify of a balanced diet, by
processing certain raw materials.
Afterwards world feed producer purina feeds was established in 1894 by William H. Dan Forth.
Cargill which was mainly dealing in grains from its beginnings in1865, started to deal in feed at
about 1884. The feed industry expanded rapidly in first quarter of the 1900s with “purina”
expanding its operations into Canada, and opened its first feed mill in 1927(which is in
operation). In 1928 the feed industry was revolutionized by the introduction of the first selected
feeds-purina checkers.
India is one of the largest population of cattle in the world. Feed manufacturing on a commercial
and scientific basis started around 1965 with the setting up of medium sized feed plants in India.
It is restricted to dairy and poultry sector. Given the important of feed ingredients, Indian
scientists have worked on various aspects of research and development in the field of animal
A STUDY ON CUSTOMER SATISFICATION ON THE KERALA FEED LTD.
10
feeds and feeding. In the 1960s, all Indian raw material were analyzed for their proximate
composition, metabolically energy values and deleterious factors.
During the 1970s. the government sanctioned special projects to study the use of by products in
animal feeds. Various by-products were considered and their nutritional parameters studied.
Indian scientists analyzed ingredients for their chemical values and studied their biological
values , and this information was useful to the industry in the initial stages of growth. In the
1970s and 1980s subsequent research was conducted on the energy-protein and energy-amino
acid ratios and the vitamin and mineral requirements of animals.
2.1.1PRESENT STATUS OF THE INDUSTRY:-
The feed industry modern computerized plants and the latest equipment for analytical procedures
and least-cost rations formulation, and it employs the latest manufacturing technology. In India,
most research work on animal feeds is practical and focuses on the use of by products, the
upgrading of ingredients and the enhancing of productivity. The quality standards of Indian
feeds are high and up to international levels.
Raw materials for feed are adequately available in India. The industry’s production is about 3.0
million tones, which represents only 5 percent of the total potential, and feed exports are not very
high. The country has entered in to a period of liberalization and this is bound to influence the
livestock industry. The per capita consumption of milk, eggs and broiler meat will grow. The
Indian feed industry is undergoing a very exciting phase of growth for the next decade. Today,
the Indian feed industry is worth approximately Rs 45 billion, that is about US$1 billion.
Dairy cattle:
Worldwide, India is number one in milk production, at 78.0 million tons per annum, and the
dairy industry is spread across the whole country. India has one of the largest populations of
cattle and buffalo in the world. In a total of 288 million head, there are 10 million cross-bred
cows, 15 million good milk cows of local varieties and 36 million buffaloes of good milk
varieties.
A STUDY ON CUSTOMER SATISFICATION ON THE KERALA FEED LTD.
11
The reminder of the cattle populations of a non-descript variety and a sizeable proportion
consists of bullocks. The remainder of the cattle population is of non-descript variety and a
sizeable proportion consists of bullocks. The cross-bred population is either Jersey or Holstein-
Friesian, crossed with local cows. Cross-breeding was a natural solution to upgrading the milk
yield in the absence of high value imported varieties of pure-bred animals.
The buffalo breeds are unique to India, and produce milk with a fat content of 7 to 8 percent.
Milk is seen as a health drink and a variety of Indian sweets are prepared from milk. The ice-
cream market is growing. Farms are located on the outskirts of cities and within cities. Almost
all villages have number of cattle, but there are only a few organized dairy farms. In India, diary
is not so much an industry as a smallholder faming activity.
Growth in the milk sector has occurred mainly through cooperative efforts. Cooperatives started
by supplying milk collection centers, where milk was collected from villagers in quantities as
small as 1 liter, and gradually started to provide other services to farmers, including education,
artificial insemination, veterinary health support and feeding. The small farmers became
prosperous, loan facilities were made available through banks and member farmers started to
share the profits from cooperatives.
Cooperatives also set up their own modern comprised feed plants. They have modern milk
processing plants from which they produce and market pasteurized milk, butter, butter oil,
chocolate, ice-cream and milk sweets, which are very popular with Indian consumers. Today, the
feed production from cooperative is about 0.6 million tons per year.
The national Dairy Development Board (NDDB), which has excellent facilities for research on
breeding , nutrition and health care, has played a pivotal role in setting up cooperatives. Without
NDDB and several of the existing diary cooperatives, the milk sector in India would have
suffered. The dairy industry in India is expected to grow, but growth will be restricted to
individual small farmers. It is unlikely that India will see the advent of large, organized dairy
farming in the near future.
A STUDY ON CUSTOMER SATISFICATION ON THE KERALA FEED LTD.
12
2.1.2FEEDSTUFFS AND INGREDIENTS IN ANIMAL FEEDS:-
India is currently self-sufficient in livestock feeds and does not depend on imports. Instead, the
country exports large quantities of solvent extracted meals, which are a major source of foreign
exchange earnings
Creates and grains
Maize, sorghum and bajra ( a type of millet) are commonly used in animal feeds. Wheat and rice
are mainly retained for human consumption.
Cakes and meals
Commonly used commodities of this kind are soybean, groundnut, rapeseed, sesame and
sunflower meals in poultry feed. In cattle feed, in addition to these meals, others such as
cottonseed and copra are used as premium ingredients.
Feeds of animal origin
Meat meal, fishmeal, bone-meal and declaim phosphate of bone origin are the common raw
materials available for animal feeding. It is interesting to note that, with the exception of some
bone-based declaim phosphate, the Indian feed industry does not use materials of animal origin
in dairy cattle feed.
This was not out of fear of any zootomic problems but the result of deep –rooted beliefs that the
cow is sacred and must therefore be vegetarian. Now even the use of bone based declaim
phosphate is used instead.
Fishmeal and meat-meal were popularly used in poultry feed, but the increased production,
improver availability and better awareness of soybean meal has led to its replacing fishmeal and
meat meal in most poultry rations. It should be mentioned that farmers have faced production
problems owning to the bacterial contaminations of fishmeal and meat-meal. The quality of
fishmeal is also very poor.
A STUDY ON CUSTOMER SATISFICATION ON THE KERALA FEED LTD.
13
Popular by – products
Some by – products are very nutritious and palatable to cattle, and these products from the bulk
of cattle feed. They include wheat bran, rice bran and oil-extracted rice bran tapioca, guar meal,
safflower meal, maize gluten and molasses.
A special mention should be made of Indian cattle feed’s unique use of hulls or shells, popularly
known as chunis in the local language. These shells come from pulses: horse gram, black gram,
mung bean and pigeon pea
Minerals and vitamins
Cattle feed is necessarily enriched with vitamins A and D3, and trace minerals such as iron, zinc,
manganese, copper, cobalt and iodine. Calcium and phosphorus are also included. Poultry feed is
enriched with all of these and all of the B complex vitamins.
Feed additives and supplements
Feed additives and supplements have played a very important role in enhancing the performance
of diary animals and , even more so , poultry. Today they are necessary in any feed formulation
and essential for the formulation of a balanced diet.
The additives and supplements used are antibiotic growth promoters (their usage is not banned in
India) prebiotics, enzymes, mould inhibitors, toxin binders, anti-coccidian supplements,
acidifiers, amino acids, by-pass fat, by-pass protein, non-antibiotic growth promoters, milk
boosters, antioxidants, feed flavors and herbal preparations of Indian origin. A number of these
products are imported from developed countries.
2.1.3FEED STANDARDS AND SPECIFICATIONS:-
For cattle and poultry, nutritional standards have been prepared with respect to the genotype,
environment, and quality of available raw materials, maintenance methods, production and
reproduction requirements, production capacity and phase of production.
A STUDY ON CUSTOMER SATISFICATION ON THE KERALA FEED LTD.
14
The bureau of Indian Standards (BIS) is a central government organization that facilities
discussion between scientists and industry and prepares guidelines and specifications.
2.1.4FEEDING PRACTICES AND THE USE OF COMPOUND FEED:-
In India, the term “compound feed” refers to feed that is nutritionally balanced and has been
manufactured using the facilities of an analytical laboratory and under the supervision of
nutritionists. There are also a large number of small –scale feed mixers who produce feed for
local consumption. Such feed is termed “ self-mixed feed’ or “home-mixed feed”
2.1.5Cattle feed
Cattle feeding practices are very traditional. Farmers choose their own ingredients and prepare
their own formulations, believing that by these means they are able to pay more individual
attention to their cattle. The productivity of the cattle is limited because of their poor genetic
make-up, so high-quality compound feed (industry feed) may not necessarily generate a
significant improvement in productivity and this has hampered growth of the cattle feed industry
because most farmers are reluctant to use compound feed fully.
Instead they compromise by using such feed in proportions of 5 to 60% making up the balance
with their own formulations. It is only in the case of highly productive animals that compound
feed has been able to show its real potential and the importance of technology has been
demonstrated.
The share of compound cattle feed manufactured by the industry, in relation to the overall
potential, is low for the following reasons:
The cattle populations is fragmented and spread over large parts of the country. Farmers
low level of education and strong traditional beliefs mean that there is generally little
awareness if compound cattle feed.
More than 50% of the country’s total milk production comes from a very large number
of low –yielding cows and buffaloes. A further 25% of milk production comes from
A STUDY ON CUSTOMER SATISFICATION ON THE KERALA FEED LTD.
15
buffaloes and only the remaining 25% of the total is produced by cross-bred and
improved cows.
Industrially manufactured compound cattle feed has proved its value for crossbred cows
and buffaloes but not for low-yielding cattle because of their genetic limitations. Home-
mixed feed is very frequently used for buffaloes and low yielding cattle.
The quality assurance of compound feed
The Indian feed industry employs the services of qualified nutritionist. Members of the industry
have their own analytical laboratories and either have their own research and development
facilities or have access to the research laboratories of agricultural universities or government
institutions.
The industry is fully committed to quality and its technical staff is knowledgeable about the
nutrition of cattle, buffaloes, layers and broilers. As well as the normal proximate principles,
other analyses are regularly carried out, such as amino acids, aflatoxin, ochratoxin, castor,
tannins and unease activity. There is a high degree of awareness of feed microbiology among
the millers of feed.
Feed raw materials and finished products are subjected to microbial counts, Salmonella and
Escherichia coli testing and mould count, and contaminated materials are rejected and sometimes
destroyed. Insurance cover is available. The feed millers have acquired the latest technologies
and modern equipment such as high-pressure liquid chromatography (HPLC) and near-infrared
(NIR) analyzers.
All vitamins, minerals and other feed additives are regularly analyzed using modern analytical
techniques. Regular seminars are conducted, short-term courses are arranged and Indian
scientists are constantly working to upgrade the quality of Indian feed and make it completely
safe for animal feeding.
A STUDY ON CUSTOMER SATISFICATION ON THE KERALA FEED LTD.
16
The quality of Indian feed can be compared with that of any Western feed. Today it is common
to achieve a chicken house average of 310 eggs in 52 weeks, in layers, and body weights of 2.0
kg in less than six weeks, with a feed conversion ratio of between 1.8 and 1.9, in broilers. Dairy
feed can use the genetic potential of Indian cattle at is maximum. The quality of Indian feed is
satisfactory and innovation will continue.
2.1.6FUTURE SCOPE OF THE INDUSTRY:-
At the beginning of the twenty first century, Indian has a population of 1 billion people.
Although the annual growth rate has slowed from 2 to 1.8 percent, the bases is so broad that
changes in population dynamics are not perceptible. The population may stabilize by sometime
between 2030 to 2040 if all sections of society support family planning wholeheartedly.
The purchasing power of the middle class is growing (the middle class accounts for
approximately 300 million people ) and food habits are also changing. The Indian economic is
growing at the rate of 6 to 8 percent per annum. The livestock industry in Indian is the second
large contributor to gross domestic product(GDP), after agriculture, and account for 9 percent of
the total.
Consumption is likely to increase as follower per capita milk from 240 to 450g per year, per
capita eggs from 40 to 100 per years; and per capita broiler meat from 1000 to 2000g per year. A
major change is occurring in Indian on the economic front. The country has adopted a model
that leis midway between liberal and public sector production, but growth has been affected by
the poor performance of most of the public sector units, rising government costs and fiscal
deficit, and the economy has suffered.
A process of liberalization was set in motion by the government and has been implemented for
the last 8 to 10 years. This has caused India to open up and invite investment from
multinationals, liberalize imports, reduce government expenditure and remove public sector
businesses. It also means that the days of nationalization, unnecessary government controls and
restrictions will soon be over thanks to progress in the country’s economy.
A STUDY ON CUSTOMER SATISFICATION ON THE KERALA FEED LTD.
17
India has entered into an agreement with its trade partners under the World Trade
Organization(WTO). The changes brought about by the liberalization process will be slow but
certain. The government is opening up import in a phased manner, and it is expected that this
process will be completed by April 2003. In the meantime, about 930 items, including
agricultural products, will be open for import under open general license from April 2001,
making it possible to import dressed chicken, milk and milk products.
Various livestock industry associations have taken issue with such imports in an attempt to
protect their members. If the livestock industry is affected, the feed industry will also be affected.
The government of India has raised the tariff on all poultry and poultry products from 35 percent
to the WTO boundary level of 100 percent. It therefore appears that there will be a level playing
field.
2.2COMPANY PROFILES
Kerala Feeds Ltd., a Kerala Government Company, was set up in 1995, incorporated under the
Companies Act. The total project cost was approximately Rs. 3,240 lakhs, out of which Rs.
2,109 lakh is Government equity, Rs. 631 lakhs is shareholding of various co-operative/Public
Sector Undertakings and Rs.500 lakhs is term loan from Nationalized bank. The Company is
headed by a Board of Directors. The plant was commissioned in late 1998 and commercial
production could start in January 1999, with one shift only. The second and third shift operations
commenced in June 1999 and July 2000 respectively.
The unit is located in Kallettumkara Village in ChalakudyTaluk of Thrissur District, Kerala, The
plant is situated in 27 acres of land.
Being an ISO 9001-2008 Company, all the process and technology in Kerala Feeds Limited,
meets international standards. Kerala Feeds Limited is also an ISI certificate holder Company in
India. Kerala Feeds Limited was also selected by the State Government for the most Result-
Oriented energy conservation drives during 2002-03.
A STUDY ON CUSTOMER SATISFICATION ON THE KERALA FEED LTD.
18
The design of the plant is based on European Standards. Only dumping of raw materials and
stacking of Finished Feed is manual while the other processes are fully automated and controlled
from the plant Control Room. The plant has a dedicated PLC software controlling all the
activities of the plant from dumping up to bagging. One interesting feature of the plant is that the
design incorporates a post milling technology, where the entire batch is passed through Hammer
Mills and particles necessary for grinding are ground to a fine powder. This technology has been
marketed by us in the form of MMCP. The Pellet Mills, the Batch Mixer, the Hammer Mills and
the Molasses Mixer are imported from Netherlands.
The specialty of the plant is the high levels of automation that has been incorporated and this
automation has been helpful in attaining the consistency in quality through the repeatability of
the formulation during the batching process. The organization has procured and developed
material handling systems in tune with its requirements to lighten the burden of the employees.
Company has started another cattle feed manufacturing unit in Karunagapally and is in the
process of setting up units in Kozhikode and Thodupuzha. A mineral Mixture Plant has been set
up at Athavanad and a Densified Fodder Block Manufacturing Unit has been Set up at
Muthalamada.
Since raw materials account for more than 80% of the cost of production, purchase of raw
materials at competitive rates is the most crucial part of operation in cattle feed plant. All the raw
materials are seasonal and therefore are subject to frequent fluctuations in prices.
2.2.1 Company products:-
1. Kerala Feeds Plus
Enrich with energy sources
2 Kerala feeds special
3 Keramin
Balanced Mineral Mixture for Cattle
A STUDY ON CUSTOMER SATISFICATION ON THE KERALA FEED LTD.
19
Mineral Mixture helps improving the growth in young calves
Mineral Mixture feeding improves milk and fat in dairy cows
Mineral Mixture feeding regulates production functions
Mineral supplement helps reducing inter calving period.
4 Kerabbit
Rabbit Feed
5 Kerala Feeds Rich
6 Kerala Feeds Elite
7 Calf starter feed
2.2.2 Vision
“Kerala feeds is committed to provide quality livestock feed and services to farmers at a
lower cost.”
2.2.3 Mission
Increase the production of balance compounded cattle feed in pellet form 650MT to
950MT per day.
To produce 300MT per day of other stock feed(goat, buffalo, elephant, laboratory
animals and pet feed) and poultry feed.
To manufacture appropriate type of feed and supplement of different stages of live
stocks.
To become a market driving company from market driven company.
Educate and train livestock farmers to practice scientific feeding to optimize livestock
productivity.
To support the development of knowledge based network on feed related activities.
A STUDY ON CUSTOMER SATISFICATION ON THE KERALA FEED LTD.
20
To offer consultancy service for procurement of feed ingredients, logistic solutions, feeds
manufacturing setting up analytical labs.
To evolve a culture of innovation and creativity amongst the employees.
2.2.4 Objectives of the Kerala feeds limited:-
Kerala feeds ltd is committed to produce and market livestock feed in the pellet form and
enhance customer satisfaction through a quality system which registers continual improvements
by setting and reviewing function wise quality objectives.
The main objectives of Kerala feeds limited are:
Increase the production of balance compounded cattel feed in pellet form from 650 MT
per day.
To produce 300 MT per day of other liv stock feed (goat, buffalo, elephant, laboratory
animal and pet feed) and poultry feed.
To manufacture appropriate type of feed supplements for different stages of livestock.
To become a market driving company from market driven company.
To support the development of knowledge based network on feed related activities.
To offer consultancy services for procurement of feed ingredients logistic solutions feed
manufacturing setting up of feed analytical labs.
To achieve a turnover of Rs .
To evolve a culture of innovation and creativity amongst the employees.
To be an active partner in community development programs.
To produce and make available good compounded cattle feed at optimum price.
Create awareness of on feeding methods.
Educate farmers about the needs for quality feeding.
Supplement minerals and vitamins in their feed 2 level the inadequacy in natural feed
compound.
A STUDY ON CUSTOMER SATISFICATION ON THE KERALA FEED LTD.
21
2.2.5FEATURES:-
The only balanced cattle feed which is produced by M.M.C.P.(milling, mixing, cooking,
and pelleting) technology.
Cooking of the feed up to 80 degree Celsius remove the moisture hence increases the life
of feed and helps easy digestion of the feed.
The raw materials are tested for quality at the fully equipped laboratory which also ensure
that least loss occurs while handling the feed, which in turn assures cleanliness.
Raw materials like coconut cake, cotton seed cake, etc. in the compounded feed. Hence it
is not necessary to feed the cattle separately with the items.
For increasing the milk yield protein, fat, vitamin and minerals are included in the correct
proportion.
Kerala feeds ltd, being a government undertaking is committed to continual improvement
of the product.
2.2.6ADVANDAGES OF KERALA FEEDS:-
1. Baked cattle feed helps the cattle’s for easy digestion
2. Imperishable in nature
3. Free from adulteration
4. Easy to handle
5. It contains standard proportion of fat, minerals & vitamins, which enhanced the milk
productivity.
6. Completely free from contamination
7. Production under the guidance of Kerala government
8. Price equality of the product regularly.
9. Fully computerized production process.
Improves quality of the product regularly
A STUDY ON CUSTOMER SATISFICATION ON THE KERALA FEED LTD.
22
2.2.7Capital of the company:-
Capital refers to the money or money’s worth introduced or invested by the owner into business.
The authorized capital of the company is shares 30000of the Rs. 10000 each with power to
increase, reduce, alter or re-organize the capital as provided in the companies Act 1956. The
export sales are also used to functioning of the company. Current capital of the company is Rs
274050000, 27405 equity shares at Rs 10000 each.
2.2.8FUTURE SCOPE OF THE ORGANIZATION:-
Kerala feeds Ltd aims to provide a wholesome diet to ensure the health and wellbeing of cattle
and consequent increase in yield of milk.
The proposed hi – tech cattle feed plant at Karunagappally in Kollam is expected to ensure to
better availability of cattle feed to dairy farms in southern Kerala. The project is begin
implemented at a rapid place and the plant is expected to be operational. The plant and
machinery were now being put in place for the unit which is scheduled to be functional by
December KFL annual cattle feed production will go up from 195000 tons to 285000 when the
new unit becomes operational and its market share in Kerala will increase from 120 to 130
percentage.
Technology
The design of the plant is based on European standards. Only dumping of raw materials and
stacking of finished feed of manual while the other processes are fully automated and controlled
from the plant control room. The plant has dedicated PLC software controlling all the activities
of the plant from dumping up to bagging.
One interesting future of the plant is that the design incorporates a post milling technology,
where the entire batch is passed through hammer mills and particles necessary for grinding are
group to a fine powder. This technology has been marketed by US in the form of MMCP. The
A STUDY ON CUSTOMER SATISFICATION ON THE KERALA FEED LTD.
23
pellet mills, the Batch Mixer , the hammer mills and the molasses mixer are imported from
Netherland.
The specialty of the plant is high levels of automation that has been incorporated and this
automation has been helpful in attaining the consistency in the quality through the repeatability
of the formulation during the batching process. The organization has procured and developed
material handling system in tune with its requirements to lighten the burden of the employees.
Quality policy
Our quality is produce and distributed good quality compounded cattle feed in the pellet form,
mineral mixture and other and fodder materials through a quality system, which registers
continual improvement by setting and reviewing functional quality objective aimed to create
enhanced customer satisfaction. The quality policy will be communicated to all and will be
reviewed periodically for continual suitably. The management and staffs are determined and
committed to achieve this quality policy and to make dairying.
Quality Management Principles:-
Leadership
Involvement of People
Process approach
System approach to management
Continual improvement
Factual approach in decision making
Mutually beneficial supplier relationship
A STUDY ON CUSTOMER SATISFICATION ON THE KERALA FEED LTD.
24
The management of the KFL recognizes that measurement and monitoring of customer
satisfaction. As a vital tool for evaluating the performance of the KFL. Customer complaints
received customer care cell (CCC) are properly monitored for prompt redresses in the best
possible ways to ensure customer delights and thus keep up the quality level.
The financial and accounts department tries to improve the effectiveness and efficiency of the
quality management system by providing positively the finance result to the concerned and
suggest them for suitable improvement actions in the monthly performance reviewing meeting.
2.2.9COMPETITORS:-
KSE (Kerala solvent extraction)
Milma
SKM
Godrej
2.2.10DEPARTMENTS
1.PROJECTS
Functions:
1. Project Identification
2. Project Preparation ( Feasibility Study)
3. Project Appraisal ( Scrutiny & Selection )
4. Project Programming (Detailing )
5. Project Implementation
6. Project Completion & Commissioning
A STUDY ON CUSTOMER SATISFICATION ON THE KERALA FEED LTD.
25
2. PURCHASE
Functions:
Planning and procurement of Raw Materials and Packing Materials required for Manufacture of
Cattle Feed & Mineral Mixture Plant, Spares and Capital items required for Engineering Stores,
Lab Equipments , Glass wares and Chemicals, Furniture and Fixtures, other miscellaneous
itemsAll purchases of materials other than that of local purchases pertaining to the units are
centralized at the Corporate Office at Kallettumkara.
3. MARKETING
Advertisement, Marketing & Sales Promotion activities:
Functions:
1. Advertisement, Marketing & Sales Promotion activities coming under the purview of
Marketing Department shall be centralised.
2. Preparation of proposals/agenda items for the Board Meeting relating to the area of
work allotted to him and implementation of Board’s Decision.
3. Preparation of correspondences with the Govt. relating to the area of work allotted to
him and submission of the same for Managing Director’s approval.
Selling & Distribution activities:
Functions:
1. Selling and distribution activities of finished goods from various locations coming
under the purview of Marketing Department shall be centralized.
2. Preparation of proposals/agenda items for the Board Meeting relating to the area of
work allotted to him and implementation of Board’s Decision.
A STUDY ON CUSTOMER SATISFICATION ON THE KERALA FEED LTD.
26
3. Preparation of correspondences with the Govt. relating to the area of work allotted to him and
submission of the same for Managing Director’s approval.
4. PERSONNEL & ADMINISTRATION
Functions:
The following corporate functions entrusted shall be centralized.
1. Recruitment, Induction and placement.
2. Framing Personnel Policies and Rules.
3. Creation and Abolition of Posts
4. Promotions, Transfers and Postings
5. Disciplinary Actions
6. Resignations, Retirements and Superannuation
7. Annual Performance appraisals
8. Maintenance of Service Records and Personnel Files.
9. Issue of Salary/ Service/Experience certificate to employees
10. Framing and maintenance Gratuity of employees
11. Framing of welfare schemes such as provident fund, ESI, Gratuity Medical Benefits,
Group Personnel Accident Insurance, Deposits linked insurance, Incentive schemes,
Bonus, Pension etc.
12. Trade Union Matters.
13. Industrial relations.
A STUDY ON CUSTOMER SATISFICATION ON THE KERALA FEED LTD.
27
14. Administrative functions of the Company.
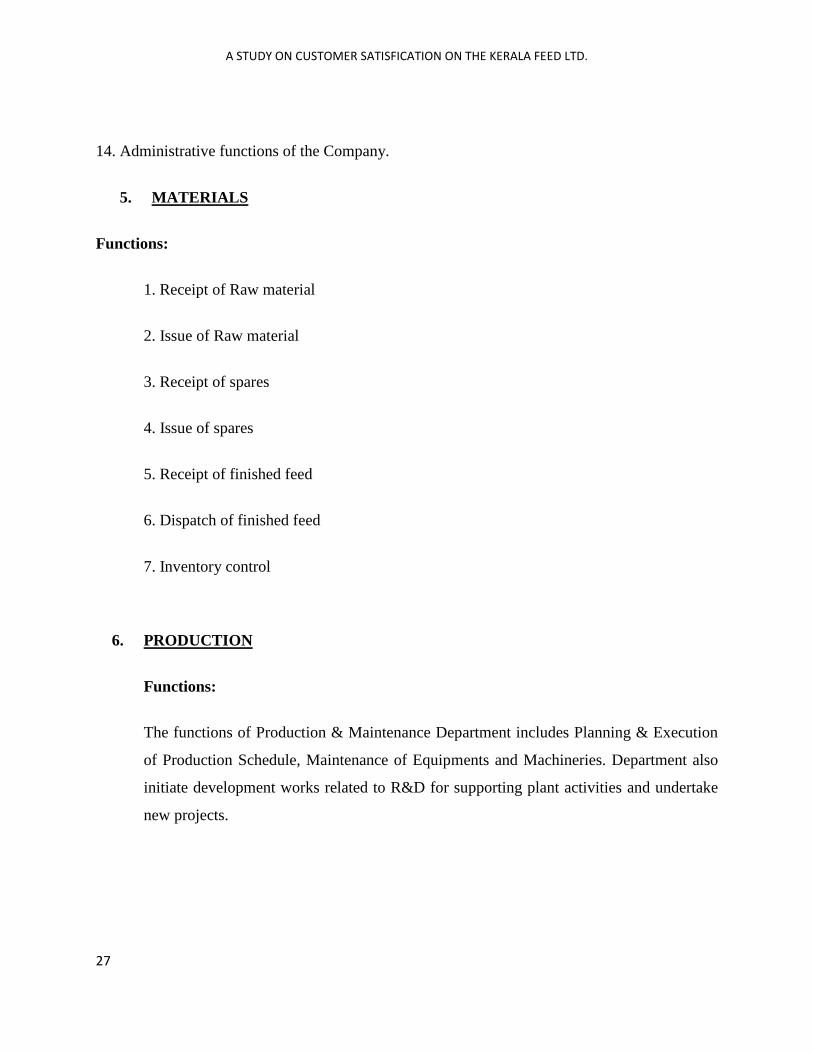
5. MATERIALS
Functions:
1. Receipt of Raw material
2. Issue of Raw material
3. Receipt of spares
4. Issue of spares
5. Receipt of finished feed
6. Dispatch of finished feed
7. Inventory control
6. PRODUCTION
Functions:
The functions of Production & Maintenance Department includes Planning & Execution
of Production Schedule, Maintenance of Equipments and Machineries. Department also
initiate development works related to R&D for supporting plant activities and undertake
new projects.
A STUDY ON CUSTOMER SATISFICATION ON THE KERALA FEED LTD.
28
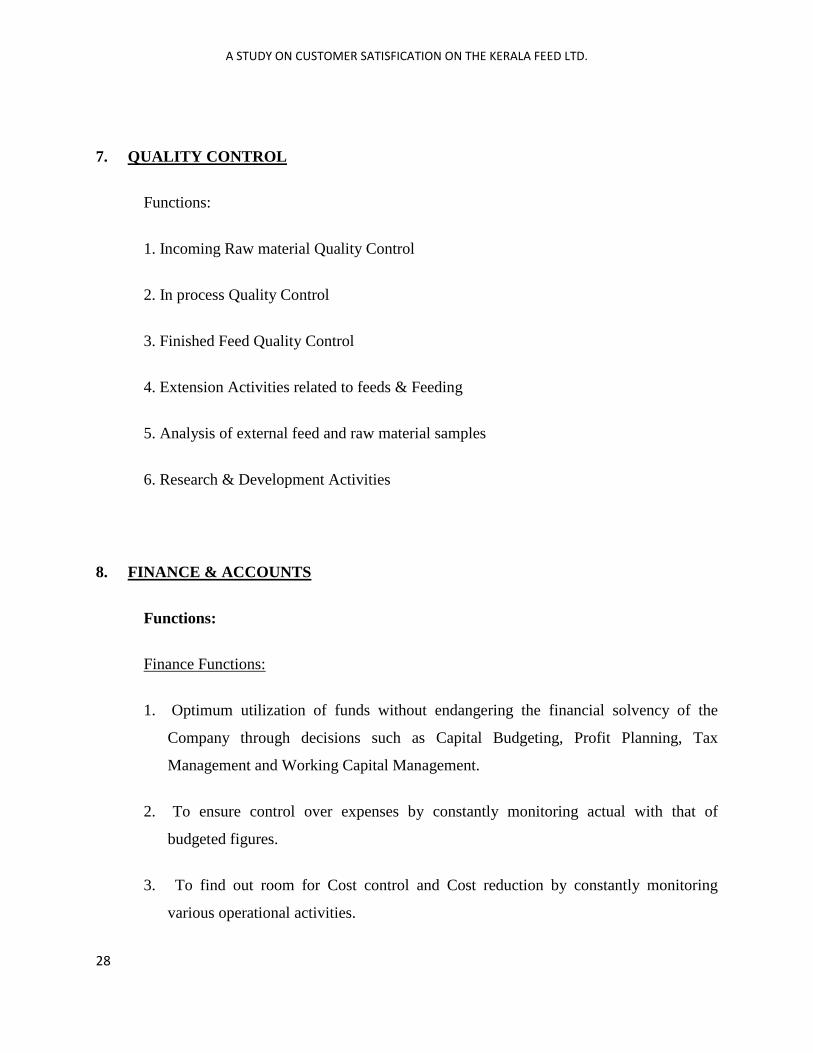
7. QUALITY CONTROL
Functions:
1. Incoming Raw material Quality Control
2. In process Quality Control
3. Finished Feed Quality Control
4. Extension Activities related to feeds & Feeding
5. Analysis of external feed and raw material samples
6. Research & Development Activities
8. FINANCE & ACCOUNTS
Functions:
Finance Functions:
1. Optimum utilization of funds without endangering the financial solvency of the
Company through decisions such as Capital Budgeting, Profit Planning, Tax
Management and Working Capital Management.
2. To ensure control over expenses by constantly monitoring actual with that of
budgeted figures.
3. To find out room for Cost control and Cost reduction by constantly monitoring
various operational activities.
A STUDY ON CUSTOMER SATISFICATION ON THE KERALA FEED LTD.
29
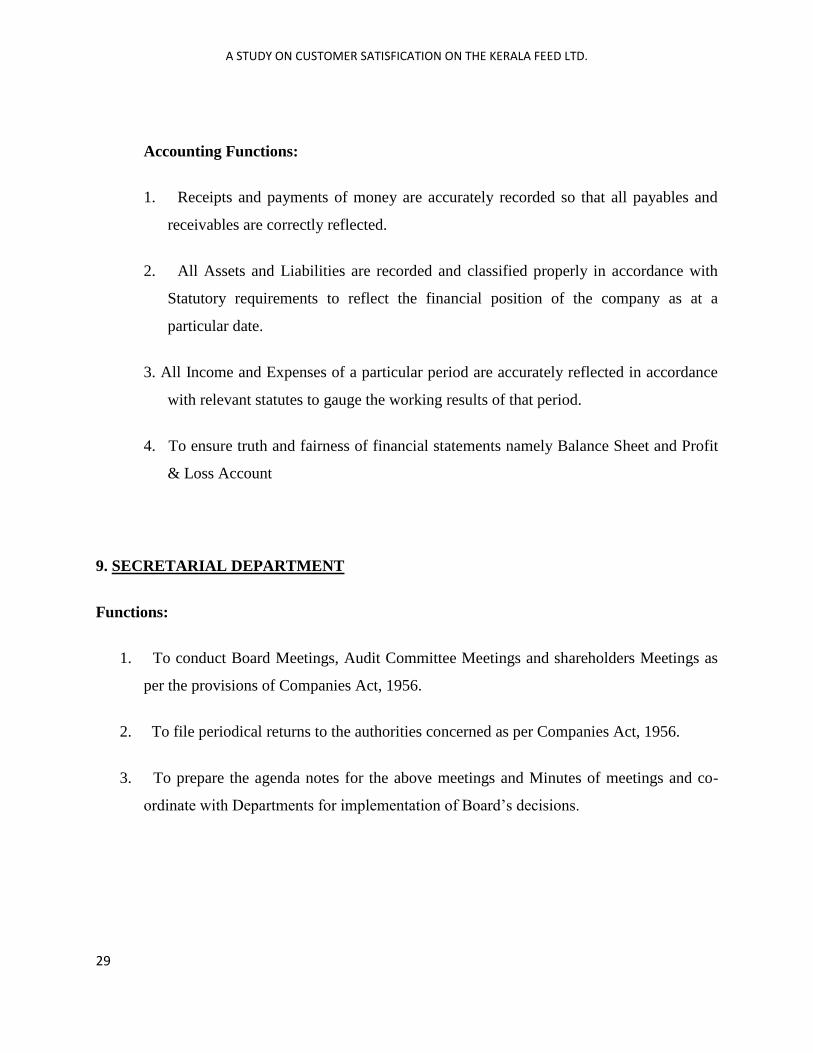
Accounting Functions:
1. Receipts and payments of money are accurately recorded so that all payables and
receivables are correctly reflected.
2. All Assets and Liabilities are recorded and classified properly in accordance with
Statutory requirements to reflect the financial position of the company as at a
particular date.
3. All Income and Expenses of a particular period are accurately reflected in accordance
with relevant statutes to gauge the working results of that period.
4. To ensure truth and fairness of financial statements namely Balance Sheet and Profit
& Loss Account
9. SECRETARIAL DEPARTMENT
Functions:
1. To conduct Board Meetings, Audit Committee Meetings and shareholders Meetings as
per the provisions of Companies Act, 1956.
2. To file periodical returns to the authorities concerned as per Companies Act, 1956.
3. To prepare the agenda notes for the above meetings and Minutes of meetings and co-
ordinate with Departments for implementation of Board’s decisions.
A STUDY ON CUSTOMER SATISFICATION ON THE KERALA FEED LTD.
30
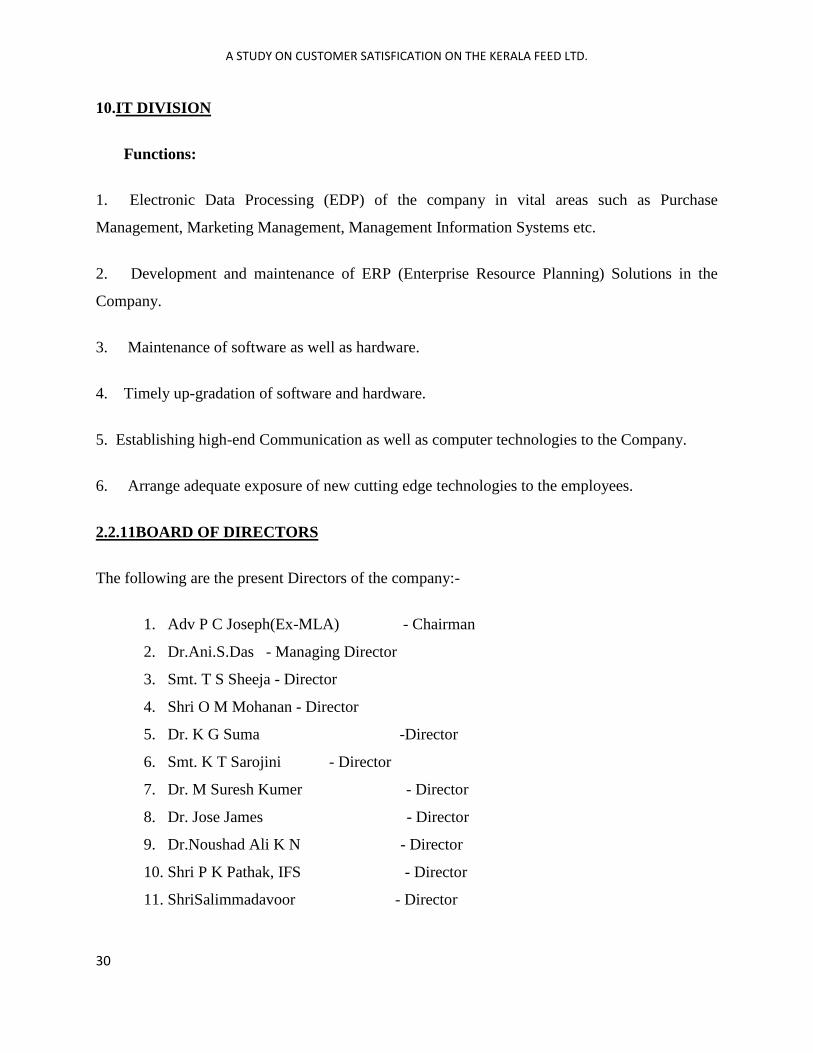
10.IT DIVISION
Functions:
1. Electronic Data Processing (EDP) of the company in vital areas such as Purchase
Management, Marketing Management, Management Information Systems etc.
2. Development and maintenance of ERP (Enterprise Resource Planning) Solutions in the
Company.
3. Maintenance of software as well as hardware.
4. Timely up-gradation of software and hardware.
5. Establishing high-end Communication as well as computer technologies to the Company.
6. Arrange adequate exposure of new cutting edge technologies to the employees.
2.2.11BOARD OF DIRECTORS
The following are the present Directors of the company:-
1. Adv P C Joseph(Ex-MLA) - Chairman
2. Dr.Ani.S.Das - Managing Director
3. Smt. T S Sheeja - Director
4. Shri O M Mohanan - Director
5. Dr. K G Suma -Director
6. Smt. K T Sarojini - Director
7. Dr. M Suresh Kumer - Director
8. Dr. Jose James - Director
9. Dr.Noushad Ali K N - Director
10. Shri P K Pathak, IFS - Director
11. ShriSalimmadavoor - Director
A STUDY ON CUSTOMER SATISFICATION ON THE KERALA FEED LTD.
31
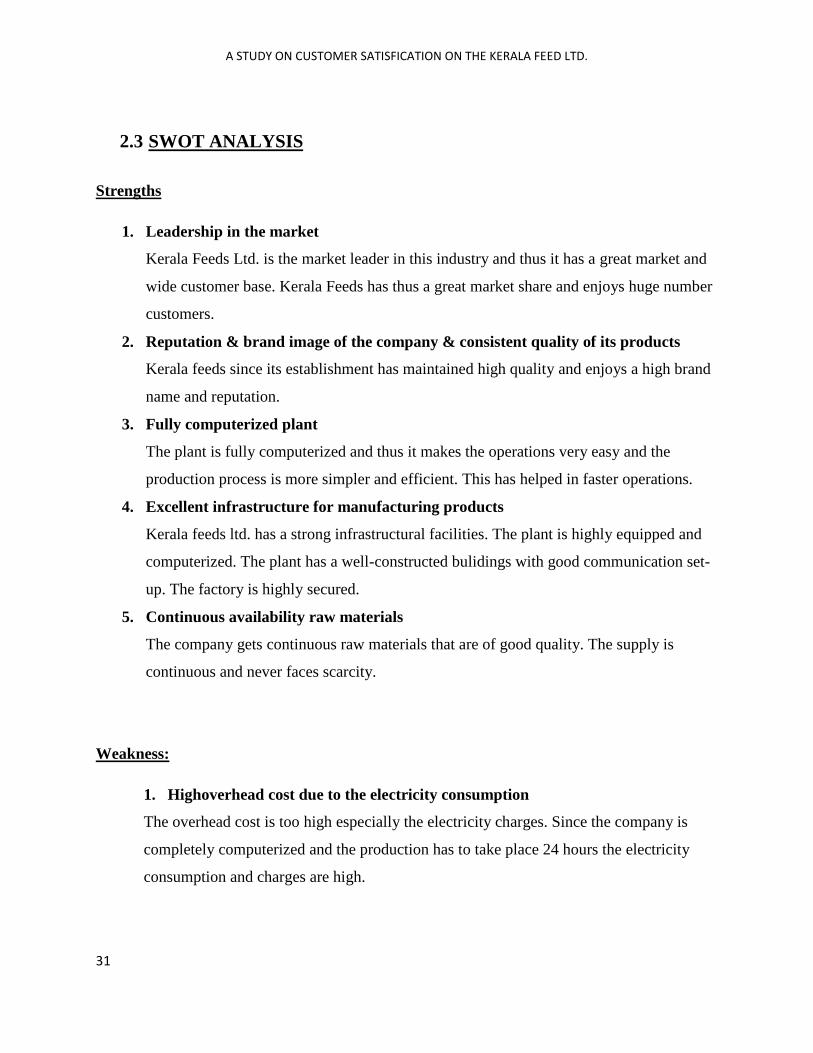
2.3 SWOT ANALYSIS
Strengths
1. Leadership in the market
Kerala Feeds Ltd. is the market leader in this industry and thus it has a great market and
wide customer base. Kerala Feeds has thus a great market share and enjoys huge number
customers.
2. Reputation & brand image of the company & consistent quality of its products
Kerala feeds since its establishment has maintained high quality and enjoys a high brand
name and reputation.
3. Fully computerized plant
The plant is fully computerized and thus it makes the operations very easy and the
production process is more simpler and efficient. This has helped in faster operations.
4. Excellent infrastructure for manufacturing products
Kerala feeds ltd. has a strong infrastructural facilities. The plant is highly equipped and
computerized. The plant has a well-constructed bulidings with good communication set-
up. The factory is highly secured.
5. Continuous availability raw materials
The company gets continuous raw materials that are of good quality. The supply is
continuous and never faces scarcity.
Weakness:
1. Highoverhead cost due to the electricity consumption
The overhead cost is too high especially the electricity charges. Since the company is
completely computerized and the production has to take place 24 hours the electricity
consumption and charges are high.
A STUDY ON CUSTOMER SATISFICATION ON THE KERALA FEED LTD.
32
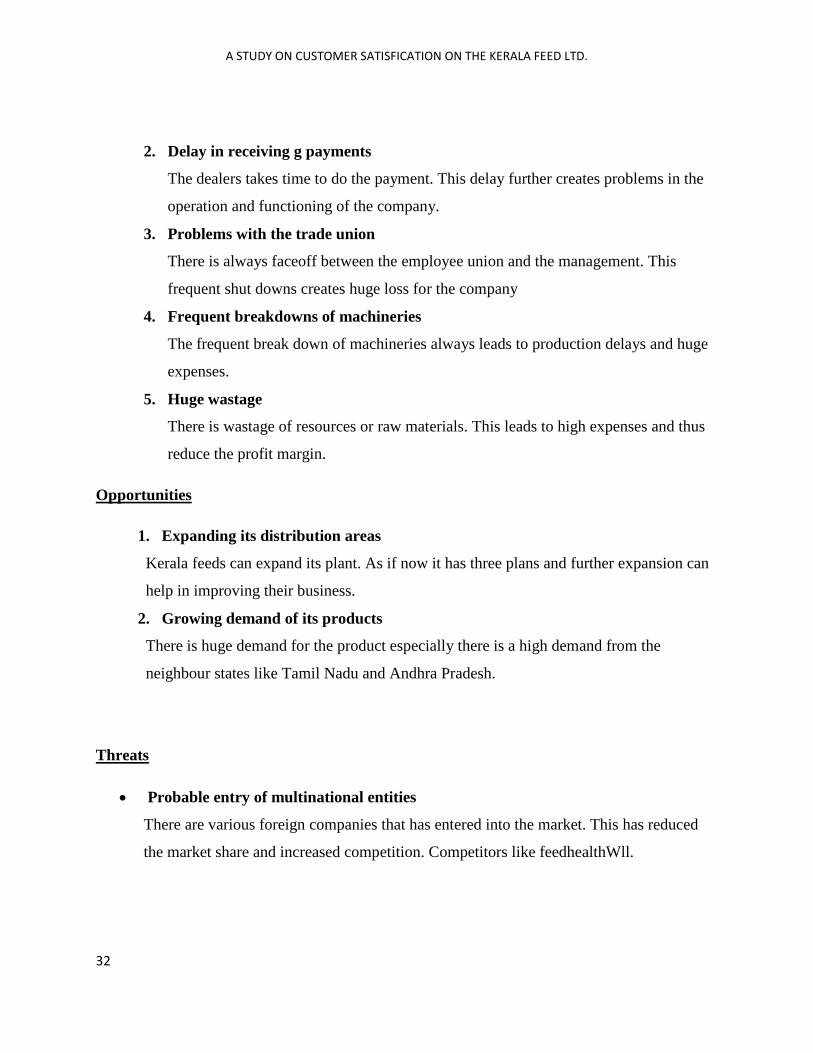
2. Delay in receiving g payments
The dealers takes time to do the payment. This delay further creates problems in the
operation and functioning of the company.
3. Problems with the trade union
There is always faceoff between the employee union and the management. This
frequent shut downs creates huge loss for the company
4. Frequent breakdowns of machineries
The frequent break down of machineries always leads to production delays and huge
expenses.
5. Huge wastage
There is wastage of resources or raw materials. This leads to high expenses and thus
reduce the profit margin.
Opportunities
1. Expanding its distribution areas
Kerala feeds can expand its plant. As if now it has three plans and further expansion can
help in improving their business.
2. Growing demand of its products
There is huge demand for the product especially there is a high demand from the
neighbour states like Tamil Nadu and Andhra Pradesh.
Threats
Probable entry of multinational entities
There are various foreign companies that has entered into the market. This has reduced
the market share and increased competition. Competitors like feedhealthWll.
A STUDY ON CUSTOMER SATISFICATION ON THE KERALA FEED LTD.
33
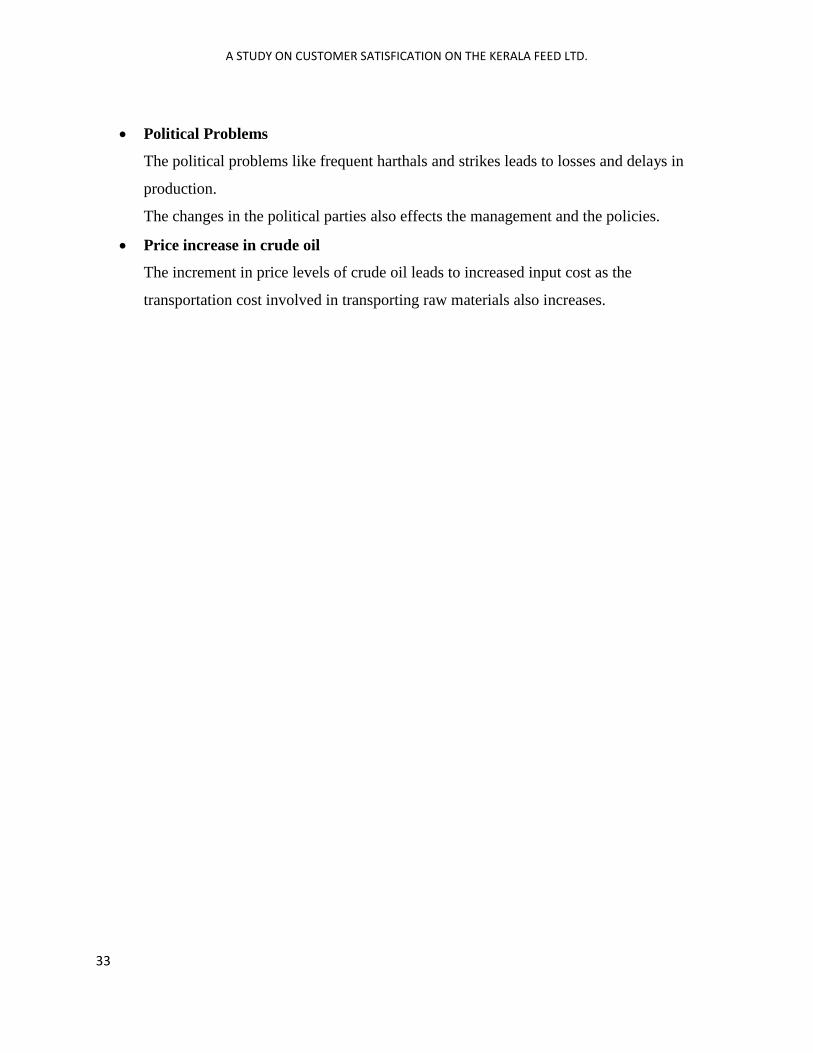
Political Problems
The political problems like frequent harthals and strikes leads to losses and delays in
production.
The changes in the political parties also effects the management and the policies.
Price increase in crude oil
The increment in price levels of crude oil leads to increased input cost as the
transportation cost involved in transporting raw materials also increases.
A STUDY ON CUSTOMER SATISFICATION ON THE KERALA FEED LTD.
34
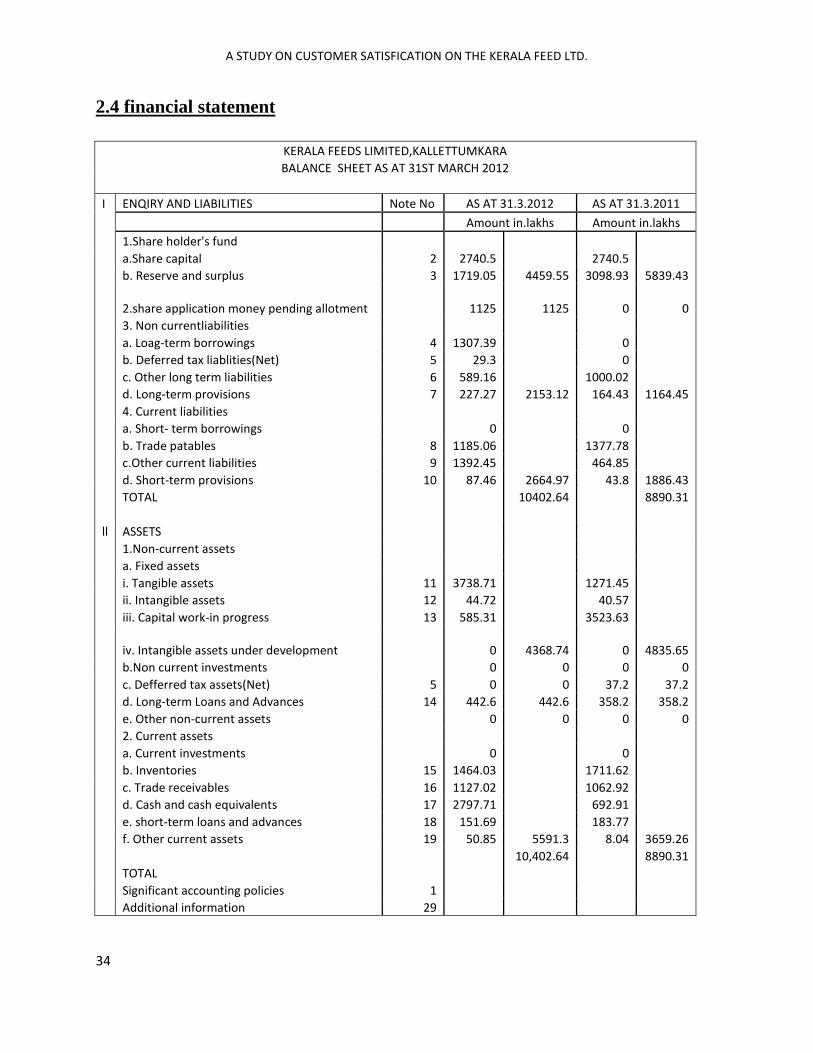
2.4 financial statement
KERALA FEEDS LIMITED,KALLETTUMKARA
BALANCE SHEET AS AT 31ST MARCH 2012
I ENQIRY AND LIABILITIES Note No AS AT 31.3.2012 AS AT 31.3.2011
Amount in.lakhs Amount in.lakhs
1.Share holder's fund
a.Share capital 2 2740.5 2740.5
b. Reserve and surplus 3 1719.05 4459.55 3098.93 5839.43
2.share application money pending allotment 1125 1125 0 0
3. Non currentliabilities
a. Loag-term borrowings 4 1307.39 0
b. Deferred tax liablities(Net) 5 29.3 0
c. Other long term liabilities 6 589.16 1000.02
d. Long-term provisions 7 227.27 2153.12 164.43 1164.45
4. Current liabilities
a. Short- term borrowings 0 0
b. Trade patables 8 1185.06 1377.78
c.Other current liabilities 9 1392.45 464.85
d. Short-term provisions 10 87.46 2664.97 43.8 1886.43
TOTAL 10402.64 8890.31
ll ASSETS
1.Non-current assets
a. Fixed assets
i. Tangible assets 11 3738.71 1271.45
ii. Intangible assets 12 44.72 40.57
iii. Capital work-in progress 13 585.31 3523.63
iv. Intangible assets under development 0 4368.74 0 4835.65
b.Non current investments 0 0 0 0
c. Defferred tax assets(Net) 5 0 0 37.2 37.2
d. Long-term Loans and Advances 14 442.6 442.6 358.2 358.2
e. Other non-current assets 0 0 0 0
2. Current assets
a. Current investments 0 0
b. Inventories 15 1464.03 1711.62
c. Trade receivables 16 1127.02 1062.92
d. Cash and cash equivalents 17 2797.71 692.91
e. short-term loans and advances 18 151.69 183.77
f. Other current assets 19 50.85 5591.3 8.04 3659.26
10,402.64 8890.31
TOTAL
Significant accounting policies 1
Additional information 29
A STUDY ON CUSTOMER SATISFICATION ON THE KERALA FEED LTD.
35
KERALA FEEDS LIMITED, KALLETTUMKARA
PROFIT &LOSS STATEMENT FOR THE YEAR 31 ST MARCH 2012
I REVENUE Note. No AS AT 31.3.2012 AS AT 31.3.2011
Amount in. Lakha Amount in. Lakha
l Revenue from operations 20 26723.2
7 26723.2
7 22664.2
3 22664.2
3
ll Other Income 21 318.74 318.74 206.45 206.45
lll Total Revenue(l+ll) 27042.0
1 22870.6
8
EXPENSES
1.Cost if materials consumed 22 20 937.04
20937.04
19257.09
19257.09
2.Changes in inventories of finished goods 23 143.77 143.77 -142.08 -142.08
3.Employee benefit expenses 24 1027.74 1027.74 763.14 763.14
4.Finance costs 0 0 0 0
5.Depreciation and amortisation expenses 25 210.42 210.42 210.06 210.06
6. Other expenses 26 3514.41 3514.41 3024.14 3024.14
IV Total Expenses 25833.3
8 23112.3
5
V Profit before exceptional and extraordinary items and tax (lll - lV) 1208.63 -241.67
VI Exceptional items 0 0 0 0
VII profit before extraordinary items and tax (V -Vl) 1208.63 -241.67
VIII Extraordinary items 0 0 0 0
IX Profit/(loss)for the year (VII - VIII) 1208.63 -241.67
X add: Prior period adjustments 27 8.63 8.63 9.4 9.4
XI Profit/(loss) befor tax (IX+X) 1217.26
XII Tax expenses
1. Current tax 282.41 0
2. Deferred tax 66.49 -11.59
3. Mat Credit Availed 33.31 382.21 0 -11.59
XIII Profit/(loss) for the period from continuing operations (XI - XII) 835.05 -220.68
XIV Profit/(loss) from discontinuing operations 0 0
XV Tax expenses of discontinuing operations 0 0 0 0
XVI Profit/(loss) from discontinuing operations (after tax ) (XIV + XVI) 0 0
XVII Profit/(loss) for the year (XIII + XVI) 835.05 -220.68 XVIII Basic and diluted earnings per equity share(R.s) 28 3047.05 -805.24
Nominal value per equity share(R.s) 10000 10000
Significant accounting policies 1
Additional information 29
A STUDY ON CUSTOMER SATISFICATION ON THE KERALA FEED LTD.
CHAPTER 3
A STUDY ON CUSTOMER SATISFICATION ON THE KERALA FEED LTD.
36
3.1 THEORETICAL CONCEPTS
MARKET
The market consists of all potential customers having particular needs and wants that might be
willing and able to engage in exchange to satisfy that needs and wants. In traditionally a market
was the place where buyers and sellers gather to exchange their goods.
MARKETING
Marketing is the process of communicating the value of a product or service to customers, for the
purpose of selling that product or service. Marketing can be looked at as an organizational
function and a set of processes for creating, delivering and communicating value to customer
relationship management that also benefits to the organization. It is the science of choosing the
target market through market analysis and market segmentation, as well as understanding
consumer behavior and providing superior customer value.
SCOPE OF MARKETING
Marketing is typically seen as the task of creating, promoting and delivering goods and services
to consumers and businesses. Marketing are skilled in stimulating demand for a company’s
product and logistics professionals are responsible for supply management, marketers are
responsible for demand management. Marketing managers seeks to influence the level, timing
and composition of demand to meet the organization’s objectives.
CUSTOMER
Any person who buys merchandise from a store or other marketer. The customer of a retail
establishment is the ultimate consumer.
A STUDY ON CUSTOMER SATISFICATION ON THE KERALA FEED LTD.
37
CONSUMERS
Consumers are used in respect of organization who consumers a particular product or service on
the basis of their consumption habit. Consumer is the most important part of a business. Without
consumer no marketing takes place consumer is the key to marketing and hence consumer is the
king.
MARKETING MIX
The marketing manager concentrates on four major decision areas while planning the marketing
activities, namely 1. Product, 2. Price, 3. Place, 4. Promotion. These 4p’s are called as elements,
of marketing and together they constitute the marketing mix. All these are inter-related because a
decision in one area affects decisions in other areas.
According to Philip kotler“Marketing Mix is the set of controllable variables that the firm can
use to influence the buyer’s response”. The controllable variables in this context refer to the
4p’s.
1.Product
Product refers to the good and services offered by the organization. Example:- A pair of
shoes, a plant of dahi-vada all are products. These are purchased because they satisfy one or
more of our needs. We are paying nit for the tangible products but foe the benefits it will
provide. Product can be described as a bundle of benefits which a marketer offers to the
consumer for a price.
2. Price
Price is the amount charged for a product or service. It is the second most important element
in the marketing mix. Fixing the price of the product is a tricky job. Many factors like demand
A STUDY ON CUSTOMER SATISFICATION ON THE KERALA FEED LTD.
38
for a product, cost involved, consumer’s ability to pay, price charged by competitors for similar
products, government restrictions ect. Have to be kept in mind while fixing the price.
The price is the value of a product paid by the customer. Price of any product depends upon the
cost of raw material consumed, production cost, packing cost and transportation cost etc.
Kerala feed Ltd. is also fixing the price with proper reference of all the above aspects. The price
of specific products cost is high comparatively with other products.
3. place
Goods are produced to be sold to the consumers. They must be made available to the consumers
at a place where they can conveniently make the purchase. Example : - woolens are
manufactured on large scale in Ludhiana and purchase them at a store from the nearby market in
your town. The organization has to decide whether to sell them directly to the retailer or through
the distributors or wholesalers.
4. Promotion
If the product is manufactured keeping the consumer needs in mind, is rightly priced and made
available at outlets conveniently, to them but the consumer is not made aware about its price,
features and availability etc. it’s marketing effort may not be successful. Therefore, promotion is
an important ingredient of marketing mix as it refers to a process of informing, persuading and
influencing a consumer to make the choice of the product to be bought. Promotion is done
through men’s of personal selling, advertising, publicity and sales promotion.
A STUDY ON CUSTOMER SATISFICATION ON THE KERALA FEED LTD.
39
BRAND
Brand is the “name, term, design, symbol or any other feature that identifies one seller’s product
distinct from those of other sellers. Brands are used in business, marketing and advertising. A
modern example of a brand is Coca Cola which belongs to the Coca Cola company. Brand
owners manage their brans carefully to create shareholders value and band valuation is an
important management technique that describes money value to a brand and allows marketing
investment to be managed to maximize shareholder’s value .
BRANDING
It is important to know what brans are. A brand is the idea or images of a specific product or
service that consumers connect with, by identifying the name, logo, slogan or design of the
company who owns the idea or image. Branding is when that idea or image is marketed. So that
when there are many other companies offering the same service or product. Advertising
professionals works on branding not only to build brand recognition, but also to build good
reputations and a set of standards, which the company should strive to maintain or surpass .
Any person who carries on business in purchasing, selling, supplying or distributing goods and
also includes works contractor, company, cooperative society, broker, commission agent,
auctioneer or any other mercantile agent for the consideration of cash, commission and deferred
payment.
CUTOMERS SATISFACTION
Satisfaction in level of persons felt stat resulting form company’s products perceives
performance in relational to the person’s expectations. Satisfaction is a function of the difference
between the perceived performance and expectations. Company seeks to win in today’s market.
The must track their dealers expectations, perceive company performance and dealers
satisfaction.
While assessing the satisfaction level a company must not conclude that it can get full picture of
customers satisfaction and dissatisfaction by simply running complaints and suggestions. As
A STUDY ON CUSTOMER SATISFICATION ON THE KERALA FEED LTD.
40
sometimes customers may feel that their complaints are minor or that they will be made to feel
unhappy or that normally will be offered the result is that the company has need Lesley lost
customers.
Therefore companies instead of using complaints level as measure of customer’s satisfaction,
obtaining a direct measure of customers satisfaction of conduction the periodic survey would
provide more appropriate measures. The questionnaire can be made to a random sample of their
recent customers.
To find out how they fell about various aspect of the company’s performance. They can also
solicit dealers view on the competitor’s performance.
The respondents can be asked to list out problems they have, had with the offer and to list out
improvements they could suggest companies would also ask the respondents to rate various
elements of the offer in terms of the importance of each element and how well the company has
performed.
Exclusive customers needed to bring customers satisfaction. Many dealers like to develop
exclusive channels for their products. The strategy in which the producer allows only certain
concepts to carry its products is called exclusive design when the producer requires that these
dealers should not handle expeditor products its strategy is called exclusive dealing, both parties
benefits from exclusive arrangements.

A STUDY ON CUSTOMER SATISFICATION ON THE KERALA FEED LTD.
CHAPTER 4
A STUDY ON CUSTOMER SATISFICATION ON THE KERALA FEED LTD.
41
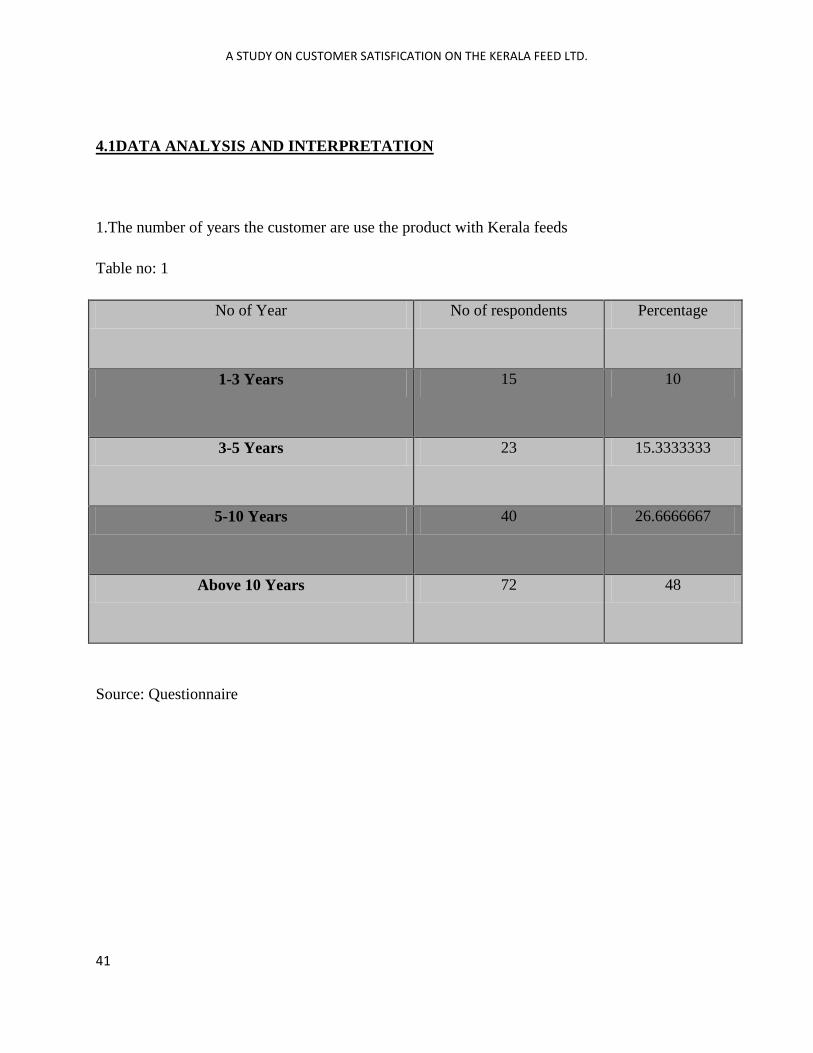
4.1DATA ANALYSIS AND INTERPRETATION
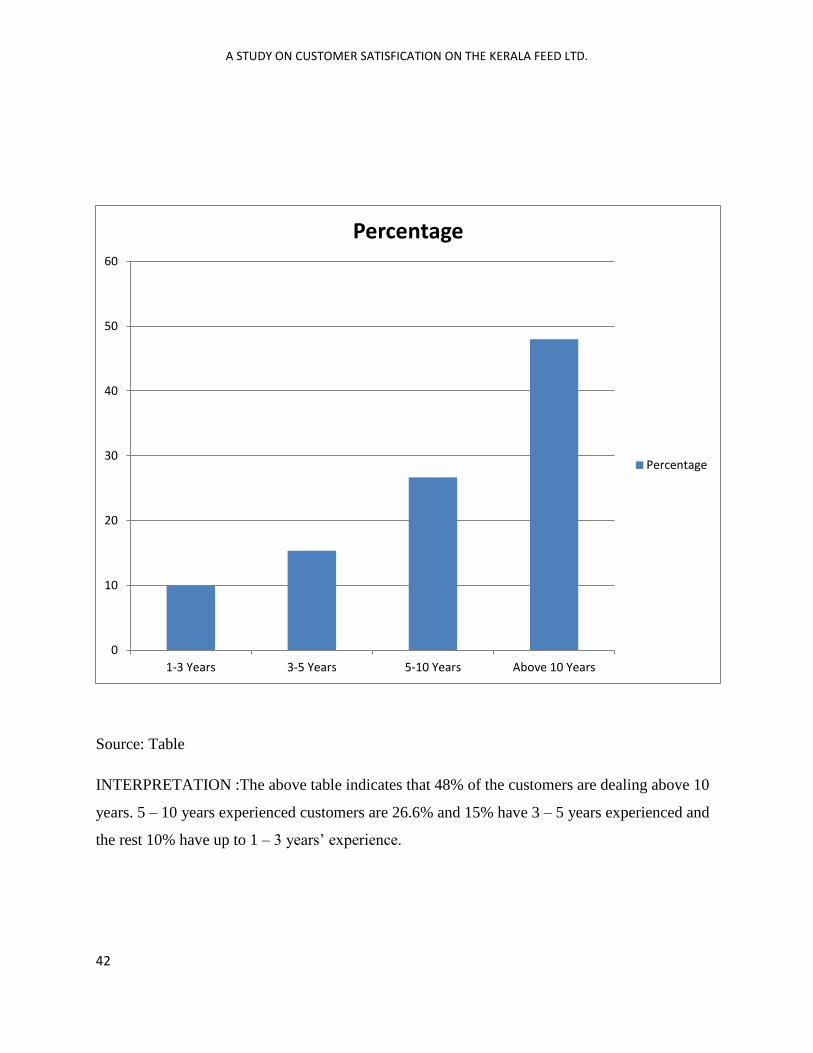
1.The number of years the customer are use the product with Kerala feeds
Table no: 1
No of Year No of respondents Percentage
1-3 Years 15 10
3-5 Years 23 15.3333333
5-10 Years 40 26.6666667
Above 10 Years 72 48
Source: Questionnaire
A STUDY ON CUSTOMER SATISFICATION ON THE KERALA FEED LTD.
42
Source: Table
INTERPRETATION :The above table indicates that 48% of the customers are dealing above 10
years. 5 – 10 years experienced customers are 26.6% and 15% have 3 – 5 years experienced and
the rest 10% have up to 1 – 3 years’ experience.
0
10
20
30
40
50
60
1-3 Years 3-5 Years 5-10 Years Above 10 Years
Percentage
Percentage
A STUDY ON CUSTOMER SATISFICATION ON THE KERALA FEED LTD.
43
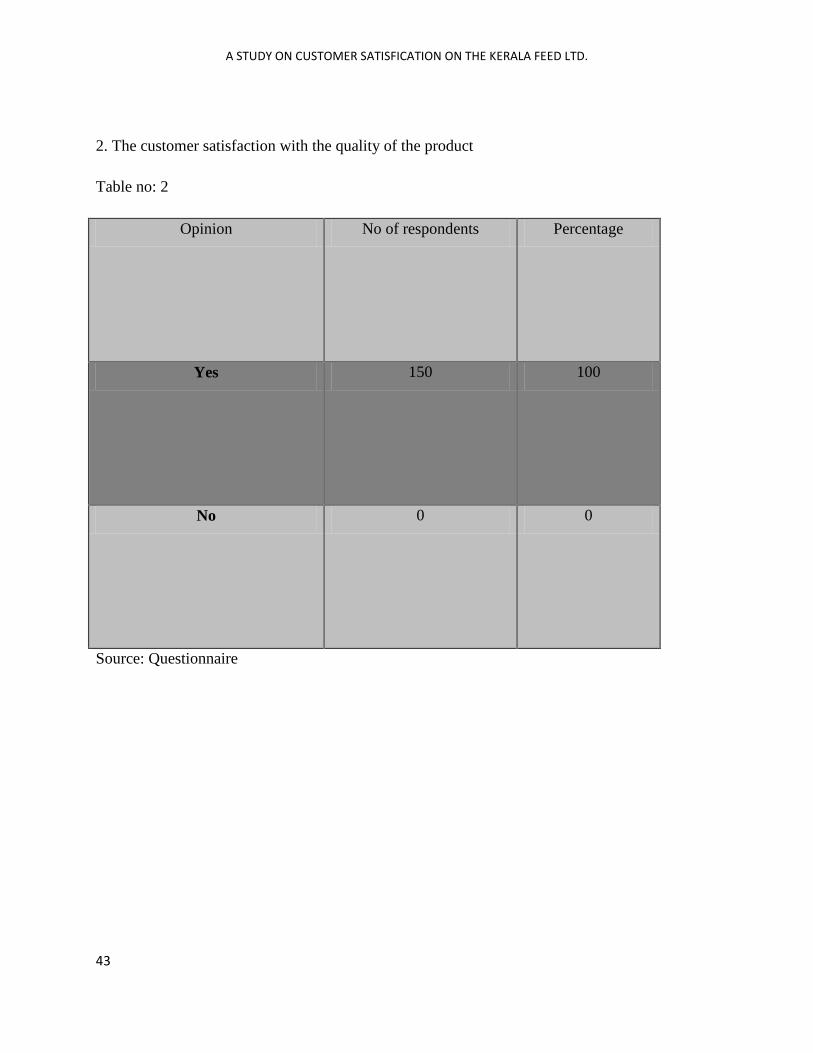
2. The customer satisfaction with the quality of the product
Table no: 2
Opinion No of respondents Percentage
Yes 150 100
No 0 0
Source: Questionnaire
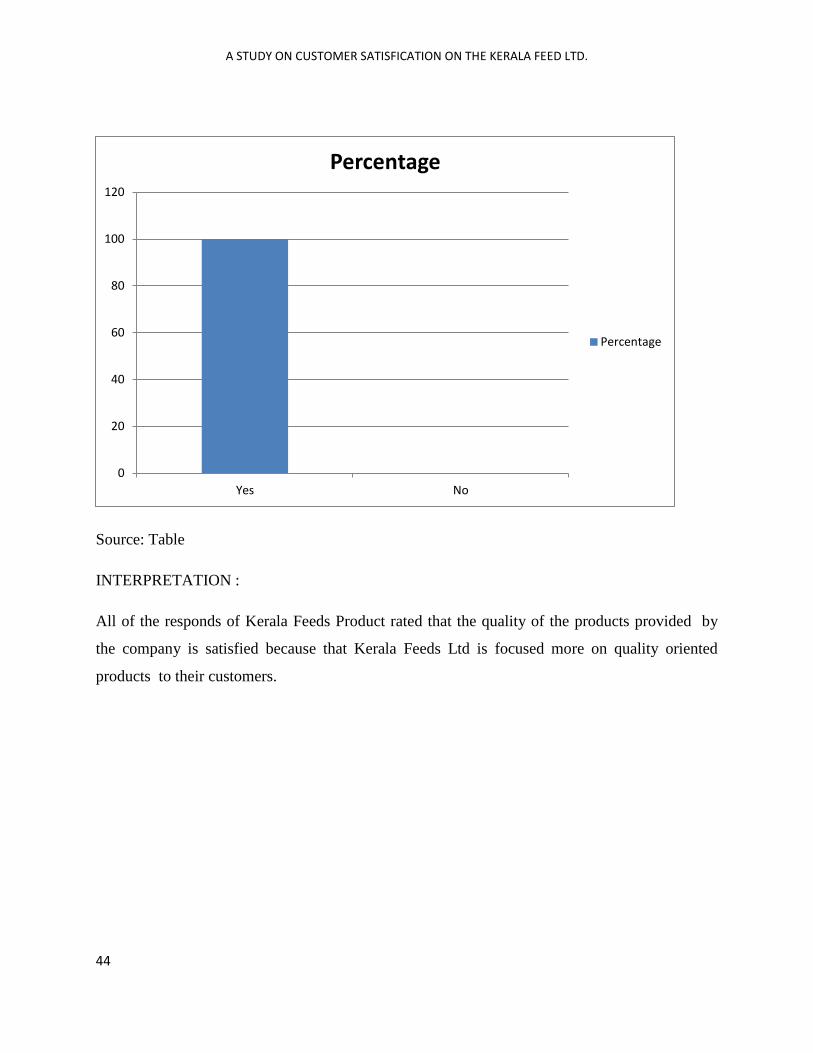
A STUDY ON CUSTOMER SATISFICATION ON THE KERALA FEED LTD.
44
Source: Table
INTERPRETATION :
All of the responds of Kerala Feeds Product rated that the quality of the products provided by
the company is satisfied because that Kerala Feeds Ltd is focused more on quality oriented
products to their customers.
0
20
40
60
80
100
120
Yes No
Percentage
Percentage
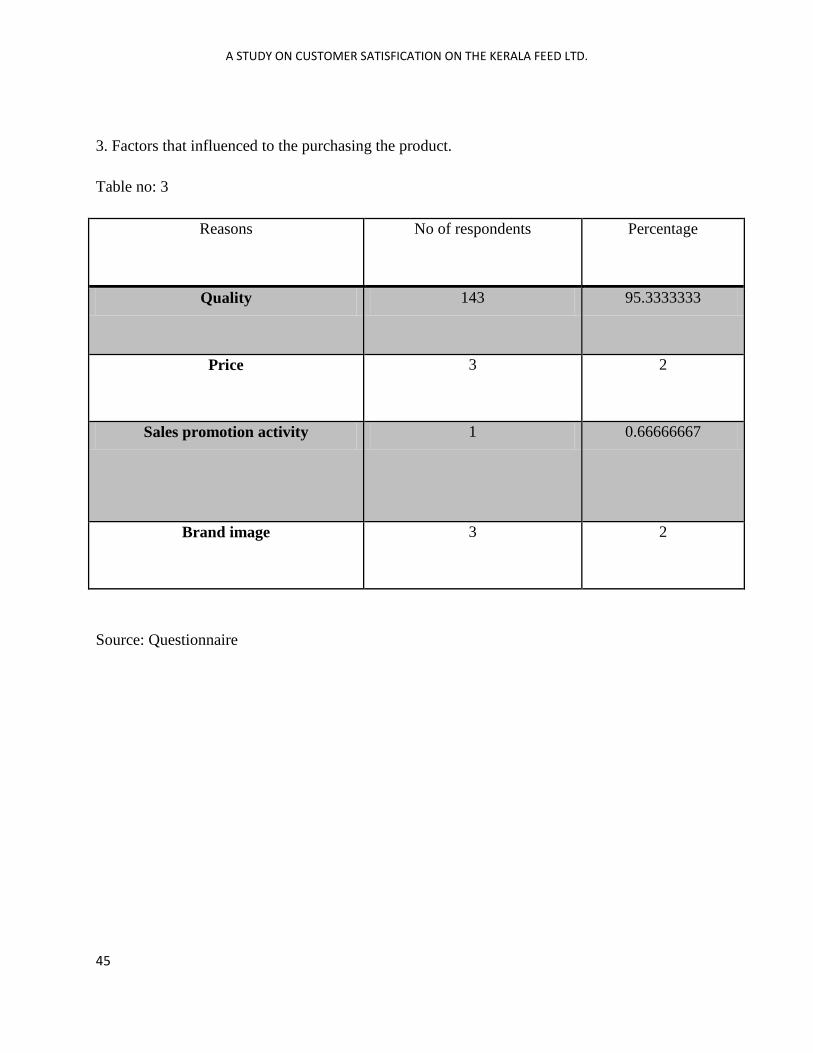
A STUDY ON CUSTOMER SATISFICATION ON THE KERALA FEED LTD.
45
3. Factors that influenced to the purchasing the product.
Table no: 3
Reasons No of respondents Percentage
Quality 143 95.3333333
Price 3 2
Sales promotion activity 1 0.66666667
Brand image 3 2
Source: Questionnaire
A STUDY ON CUSTOMER SATISFICATION ON THE KERALA FEED LTD.
46
Source: Table
INTERPRETATION :
95% of the respondents suggested that the quality is most important factors which motivate the
customers of Kerala Feeds Ltd. 2% each of them said that price and brand image are the most
important factor which motivate the customers of the company, remaining 1% of the opinioned
that sales promotional scheme.
0
20
40
60
80
100
120
Quality Price Sales promotion activity
Brand image
Percentage
Percentage
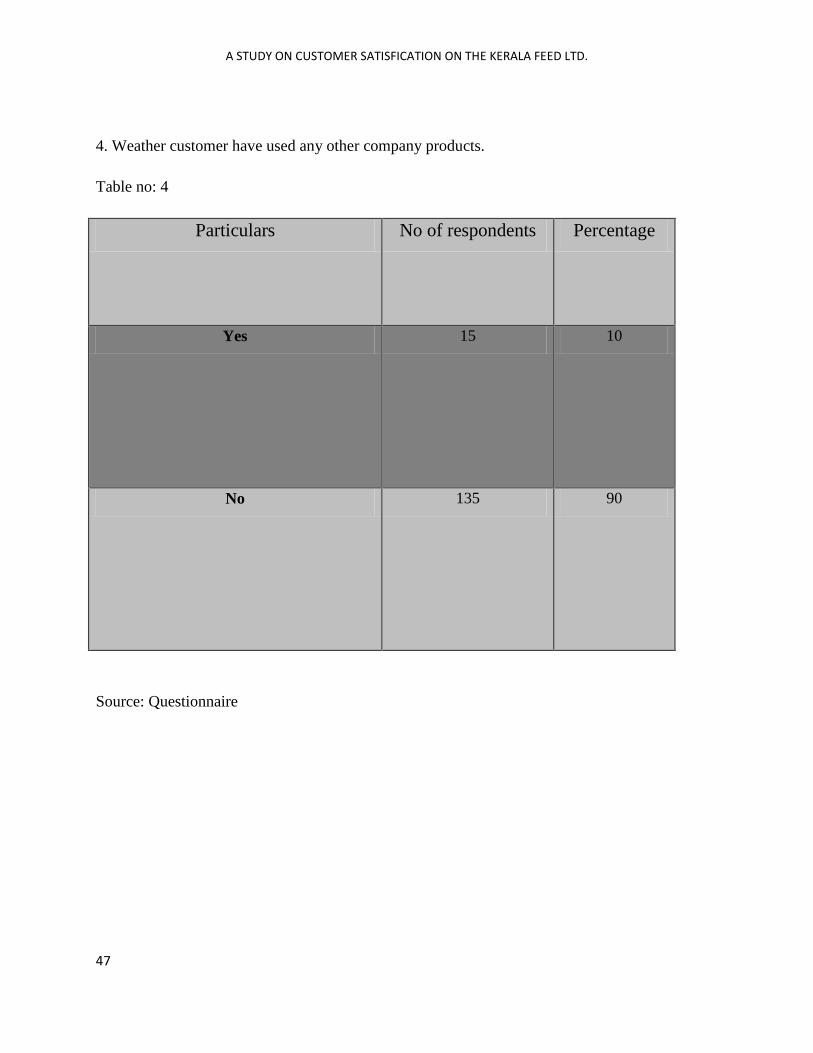
A STUDY ON CUSTOMER SATISFICATION ON THE KERALA FEED LTD.
47
4. Weather customer have used any other company products.
Table no: 4
Particulars No of respondents Percentage
Yes 15 10
No 135 90
Source: Questionnaire
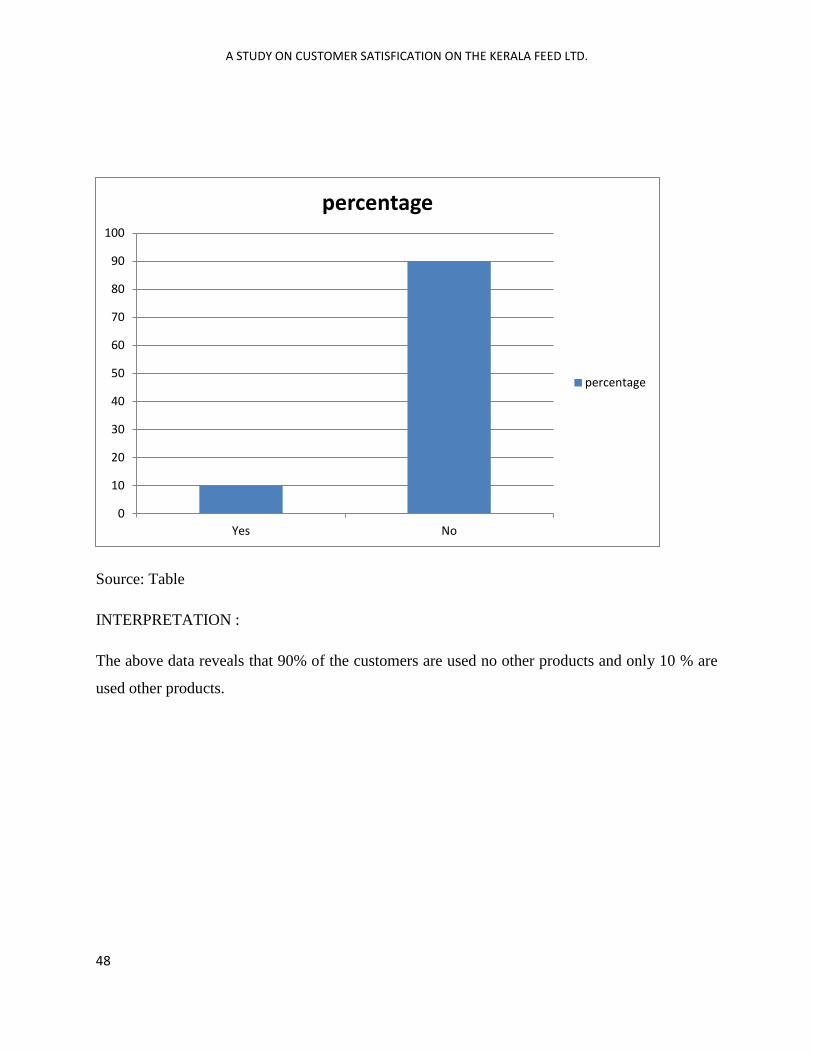
A STUDY ON CUSTOMER SATISFICATION ON THE KERALA FEED LTD.
48
Source: Table
INTERPRETATION :
The above data reveals that 90% of the customers are used no other products and only 10 % are
used other products.
0
10
20
30
40
50
60
70
80
90
100
Yes No
percentage
percentage
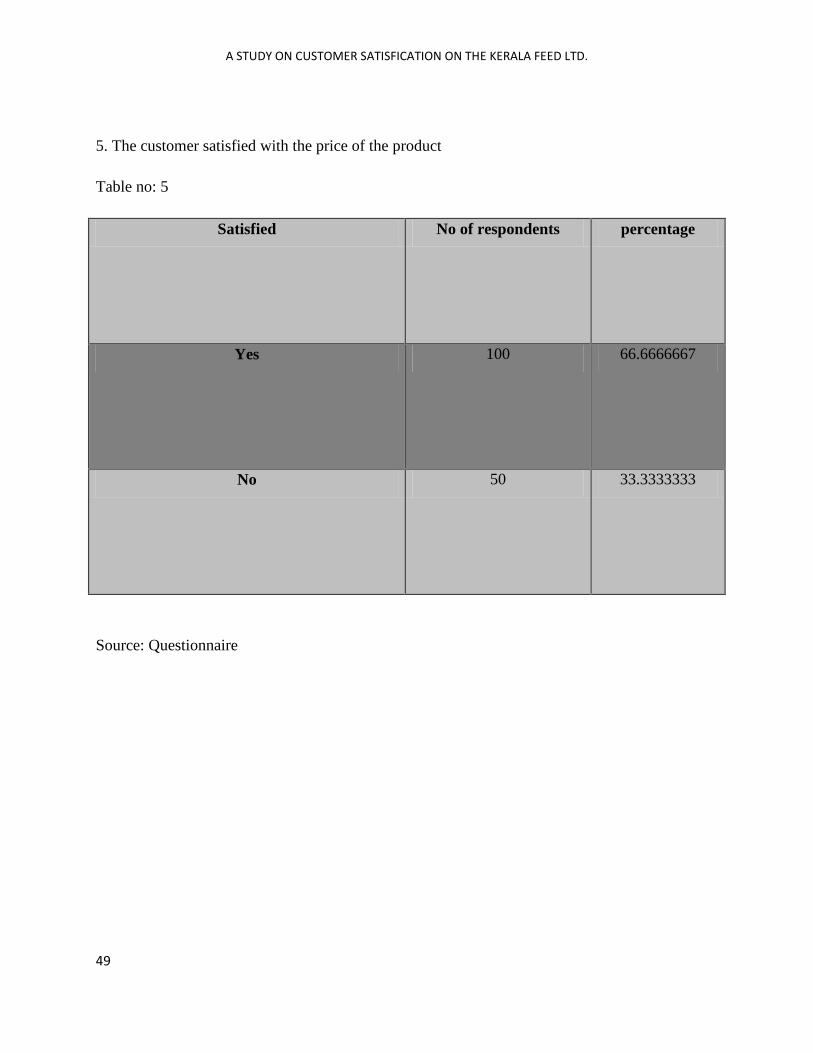
A STUDY ON CUSTOMER SATISFICATION ON THE KERALA FEED LTD.
49
5. The customer satisfied with the price of the product
Table no: 5
Satisfied No of respondents percentage
Yes 100 66.6666667
No 50 33.3333333
Source: Questionnaire
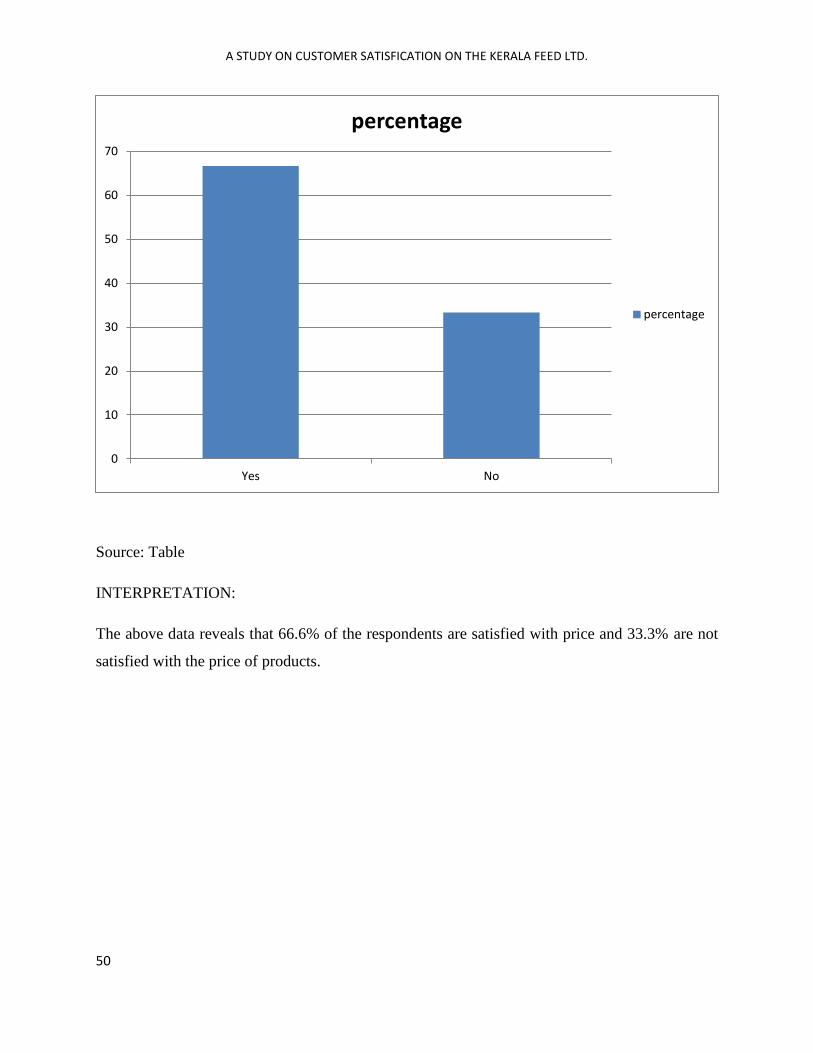
A STUDY ON CUSTOMER SATISFICATION ON THE KERALA FEED LTD.
50
Source: Table
INTERPRETATION:
The above data reveals that 66.6% of the respondents are satisfied with price and 33.3% are not
satisfied with the price of products.
0
10
20
30
40
50
60
70
Yes No
percentage
percentage
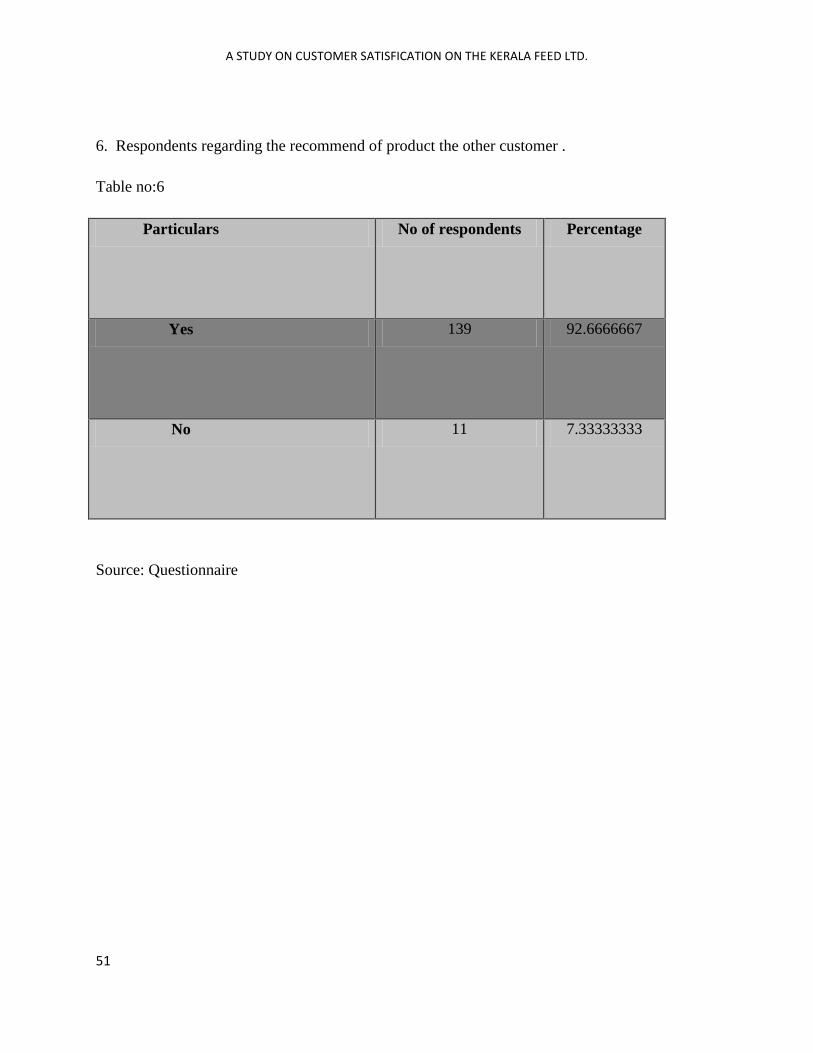
A STUDY ON CUSTOMER SATISFICATION ON THE KERALA FEED LTD.
51
6. Respondents regarding the recommend of product the other customer .
Table no:6
Particulars No of respondents Percentage
Yes 139 92.6666667
No 11 7.33333333
Source: Questionnaire
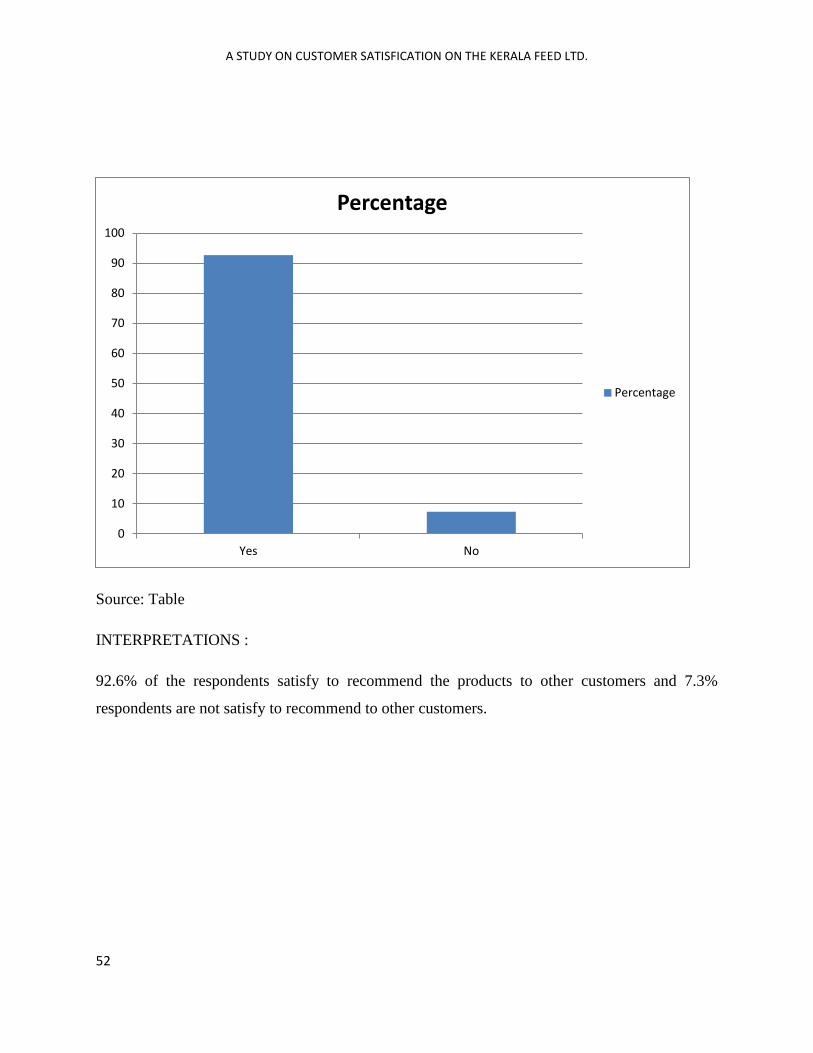
A STUDY ON CUSTOMER SATISFICATION ON THE KERALA FEED LTD.
52
Source: Table
INTERPRETATIONS :
92.6% of the respondents satisfy to recommend the products to other customers and 7.3%
respondents are not satisfy to recommend to other customers.
0
10
20
30
40
50
60
70
80
90
100
Yes No
Percentage
Percentage
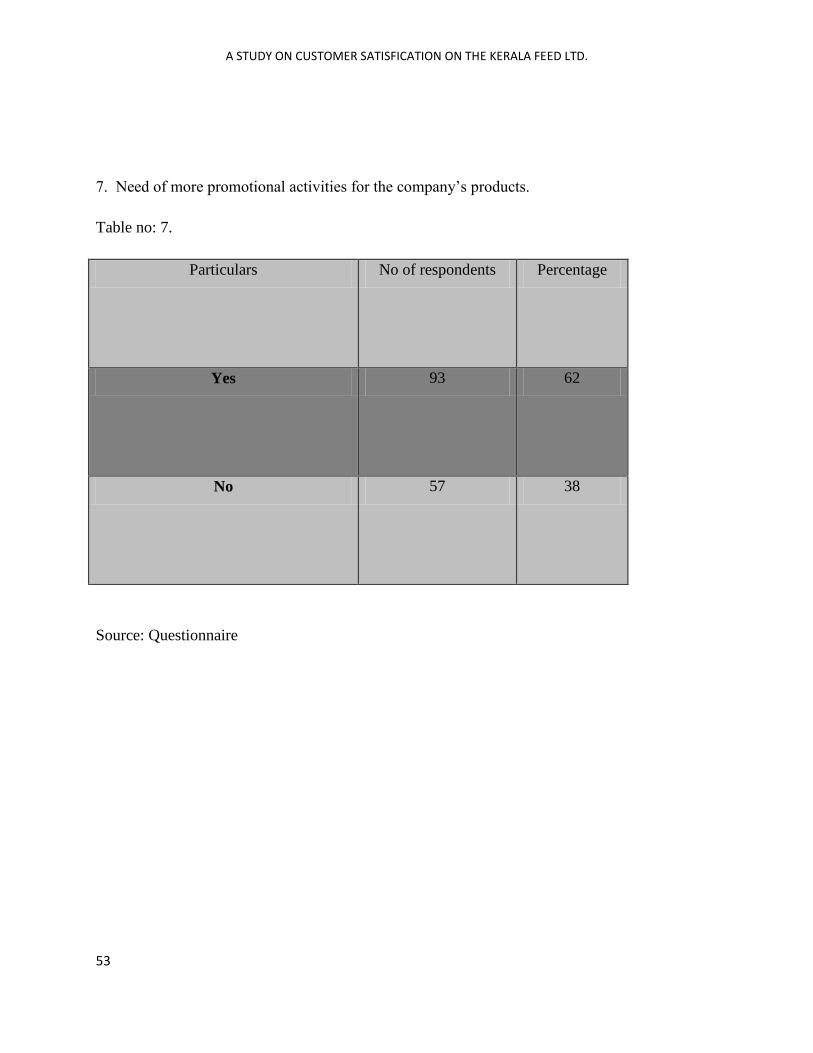
A STUDY ON CUSTOMER SATISFICATION ON THE KERALA FEED LTD.
53
7. Need of more promotional activities for the company’s products.
Table no: 7.
Particulars No of respondents Percentage
Yes 93 62
No 57 38
Source: Questionnaire
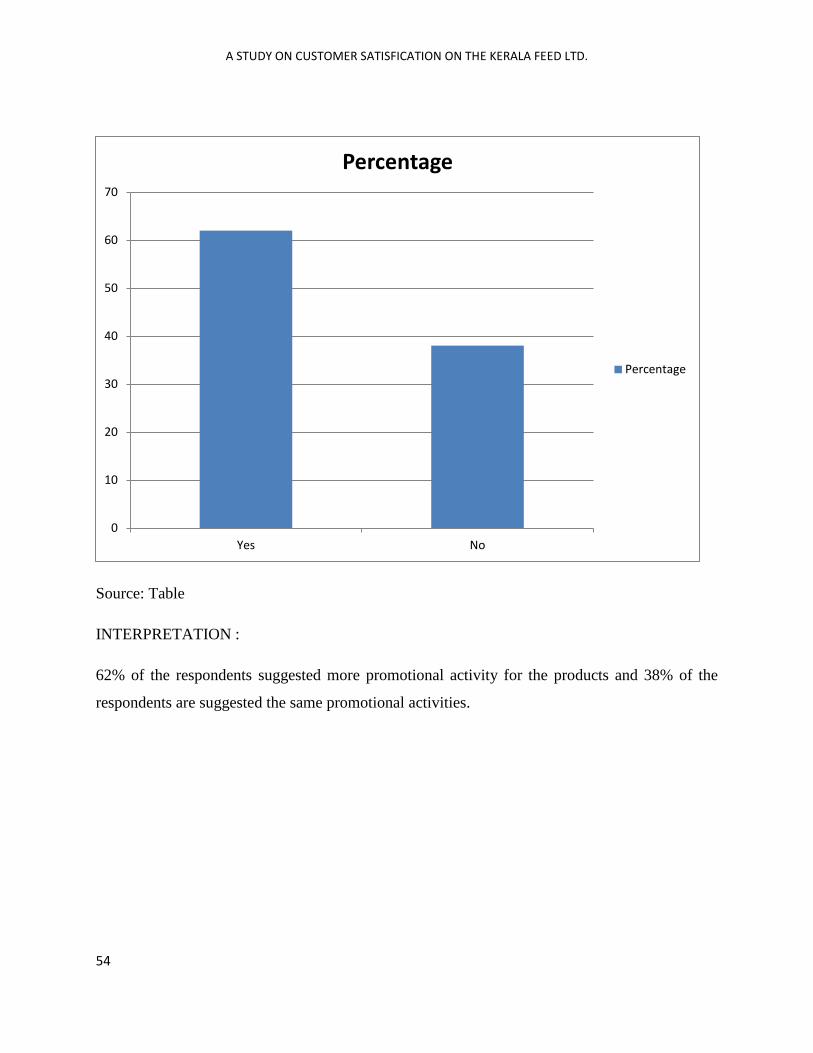
A STUDY ON CUSTOMER SATISFICATION ON THE KERALA FEED LTD.
54
Source: Table
INTERPRETATION :
62% of the respondents suggested more promotional activity for the products and 38% of the
respondents are suggested the same promotional activities.
0
10
20
30
40
50
60
70
Yes No
Percentage
Percentage
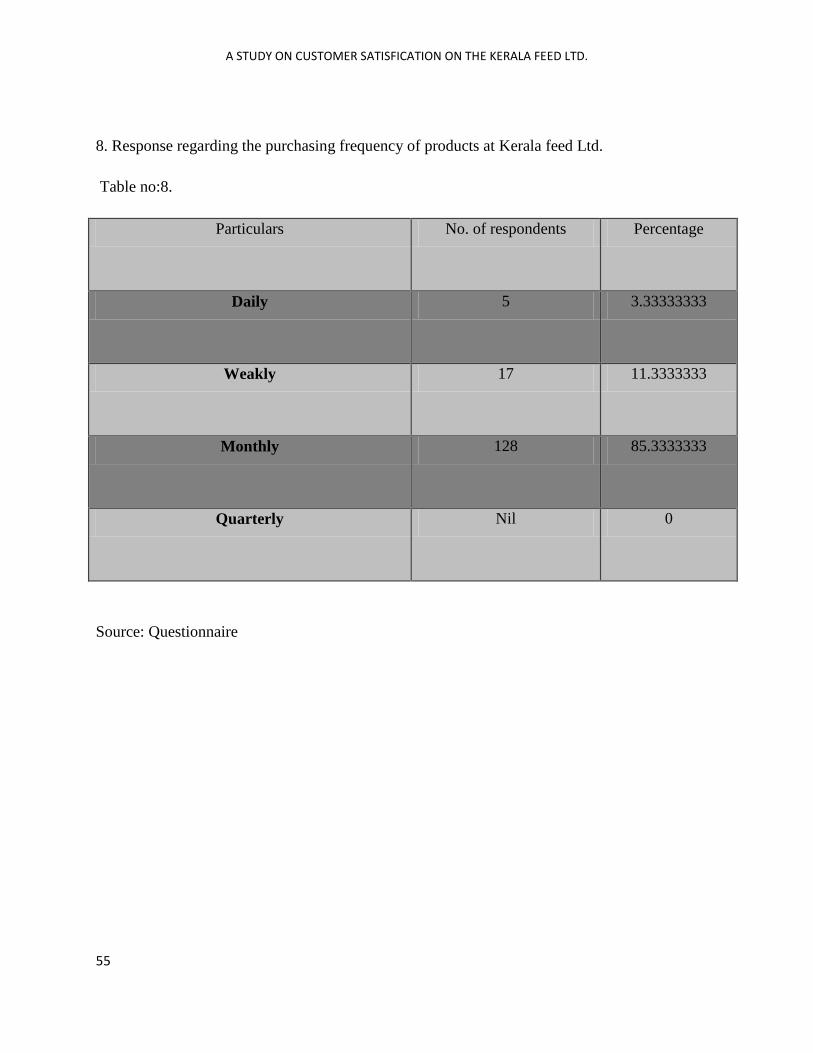
A STUDY ON CUSTOMER SATISFICATION ON THE KERALA FEED LTD.
55
8. Response regarding the purchasing frequency of products at Kerala feed Ltd.
Table no:8.
Particulars No. of respondents Percentage
Daily 5 3.33333333
Weakly 17 11.3333333
Monthly 128 85.3333333
Quarterly Nil 0
Source: Questionnaire
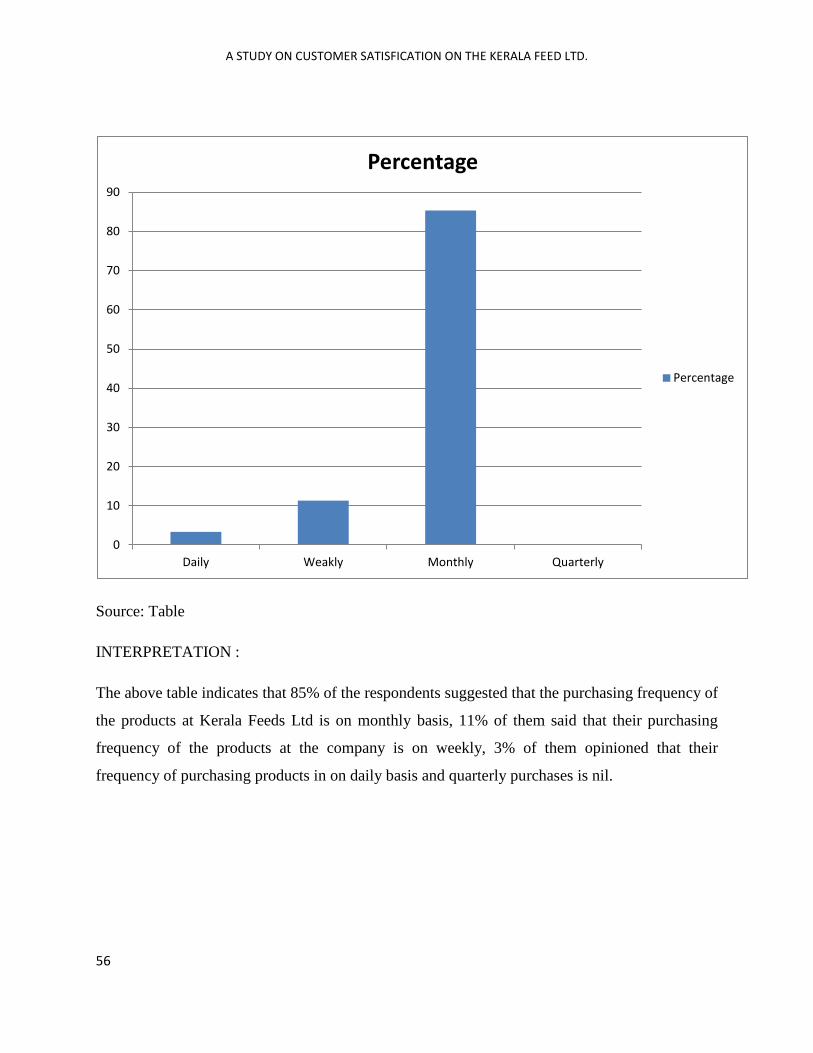
A STUDY ON CUSTOMER SATISFICATION ON THE KERALA FEED LTD.
56
Source: Table
INTERPRETATION :
The above table indicates that 85% of the respondents suggested that the purchasing frequency of
the products at Kerala Feeds Ltd is on monthly basis, 11% of them said that their purchasing
frequency of the products at the company is on weekly, 3% of them opinioned that their
frequency of purchasing products in on daily basis and quarterly purchases is nil.
0
10
20
30
40
50
60
70
80
90
Daily Weakly Monthly Quarterly
Percentage
Percentage
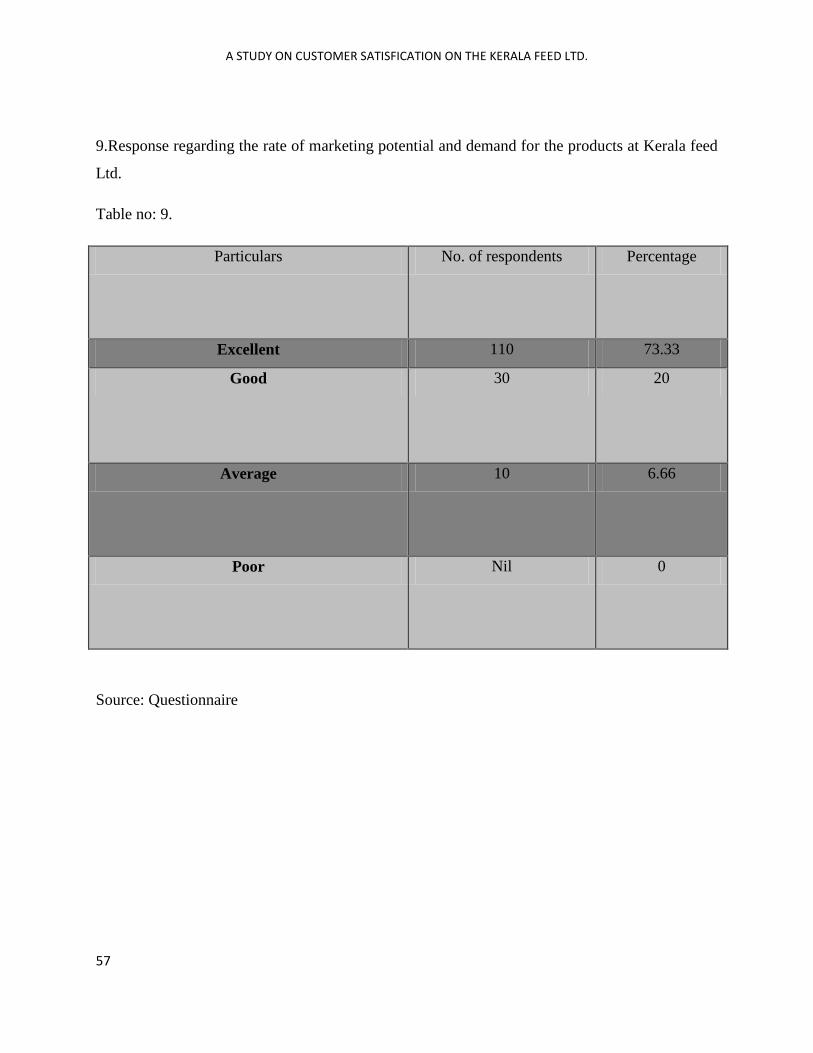
A STUDY ON CUSTOMER SATISFICATION ON THE KERALA FEED LTD.
57
9.Response regarding the rate of marketing potential and demand for the products at Kerala feed
Ltd.
Table no: 9.
Particulars No. of respondents Percentage
Excellent 110 73.33
Good 30 20
Average 10 6.66
Poor Nil 0
Source: Questionnaire
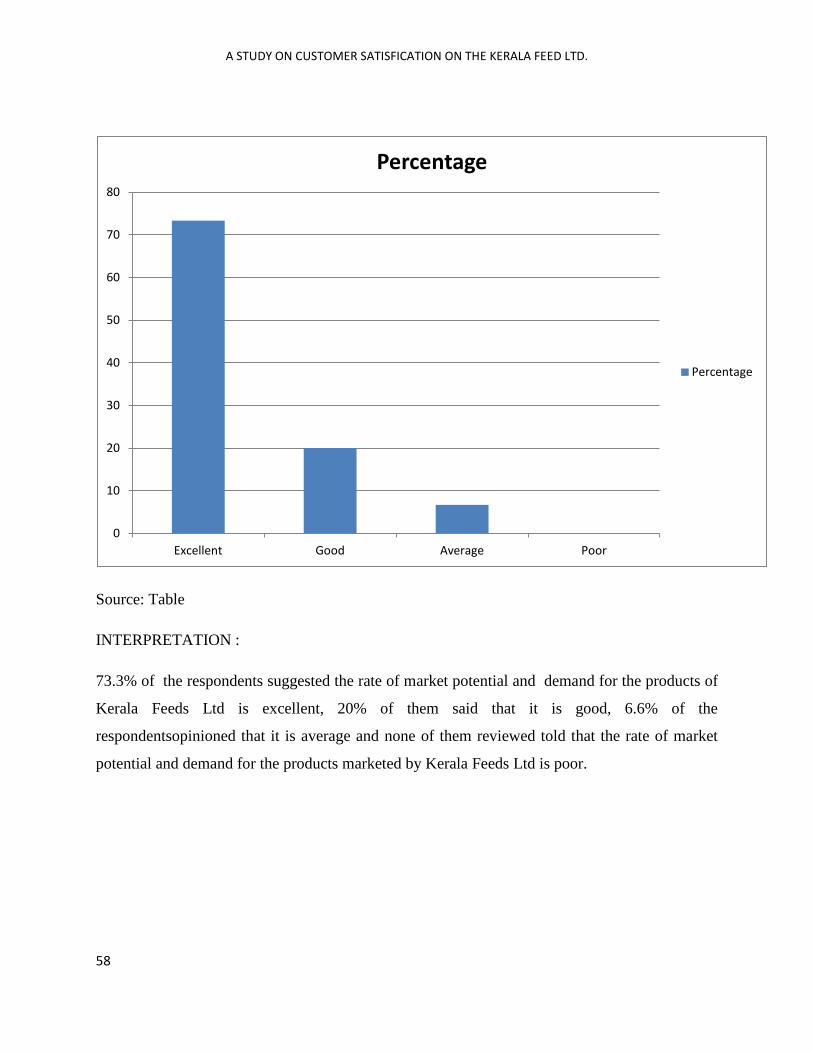
A STUDY ON CUSTOMER SATISFICATION ON THE KERALA FEED LTD.
58
Source: Table
INTERPRETATION :
73.3% of the respondents suggested the rate of market potential and demand for the products of
Kerala Feeds Ltd is excellent, 20% of them said that it is good, 6.6% of the
respondentsopinioned that it is average and none of them reviewed told that the rate of market
potential and demand for the products marketed by Kerala Feeds Ltd is poor.
0
10
20
30
40
50
60
70
80
Excellent Good Average Poor
Percentage
Percentage
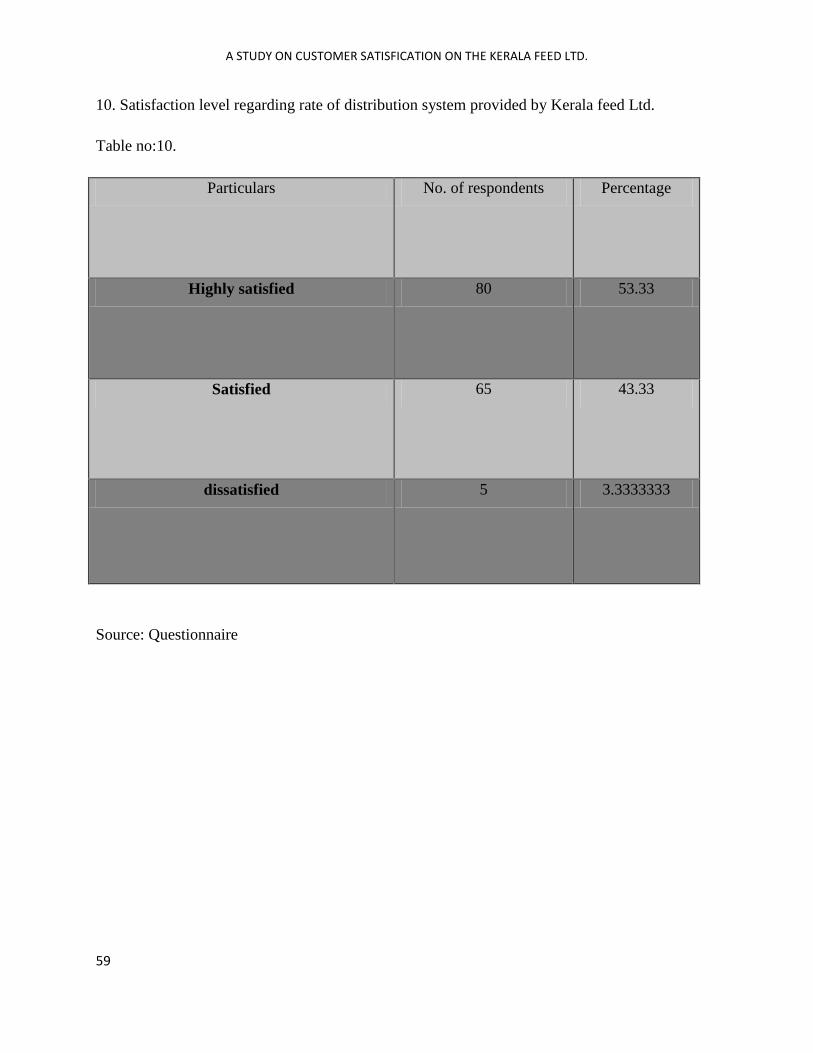
A STUDY ON CUSTOMER SATISFICATION ON THE KERALA FEED LTD.
59
10. Satisfaction level regarding rate of distribution system provided by Kerala feed Ltd.
Table no:10.
Particulars No. of respondents Percentage
Highly satisfied 80 53.33
Satisfied 65 43.33
dissatisfied 5 3.3333333
Source: Questionnaire
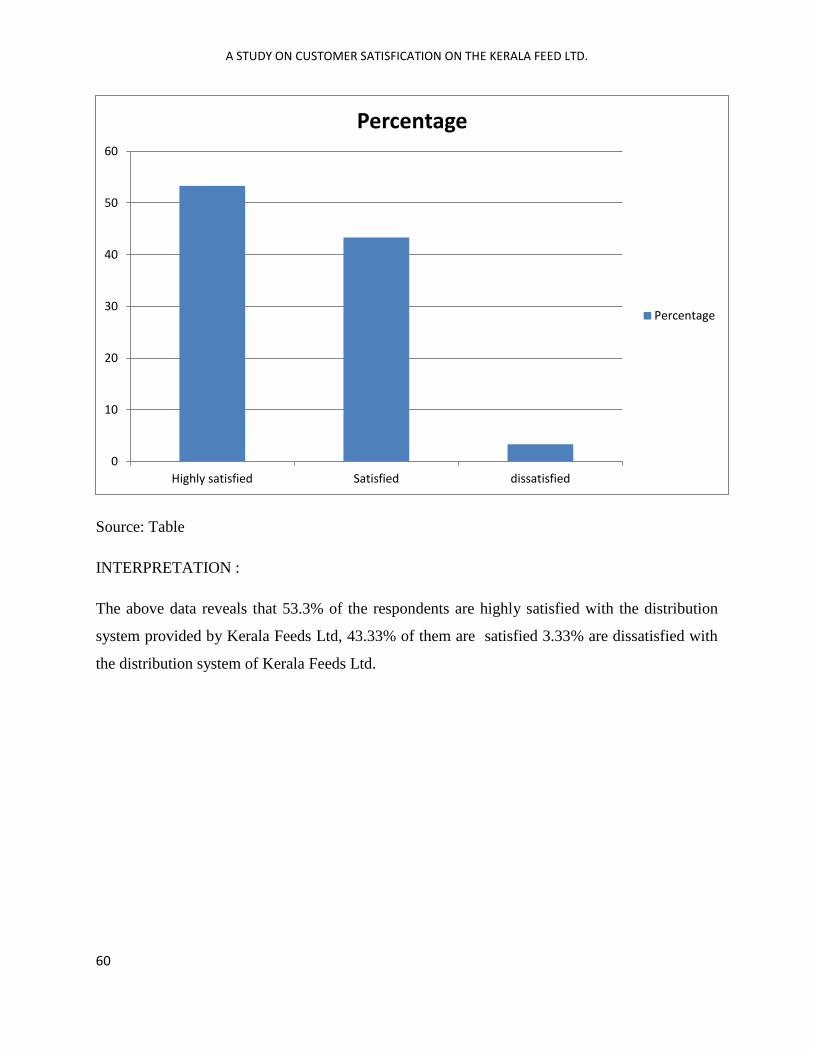
A STUDY ON CUSTOMER SATISFICATION ON THE KERALA FEED LTD.
60
Source: Table
INTERPRETATION :
The above data reveals that 53.3% of the respondents are highly satisfied with the distribution
system provided by Kerala Feeds Ltd, 43.33% of them are satisfied 3.33% are dissatisfied with
the distribution system of Kerala Feeds Ltd.
0
10
20
30
40
50
60
Highly satisfied Satisfied dissatisfied
Percentage
Percentage
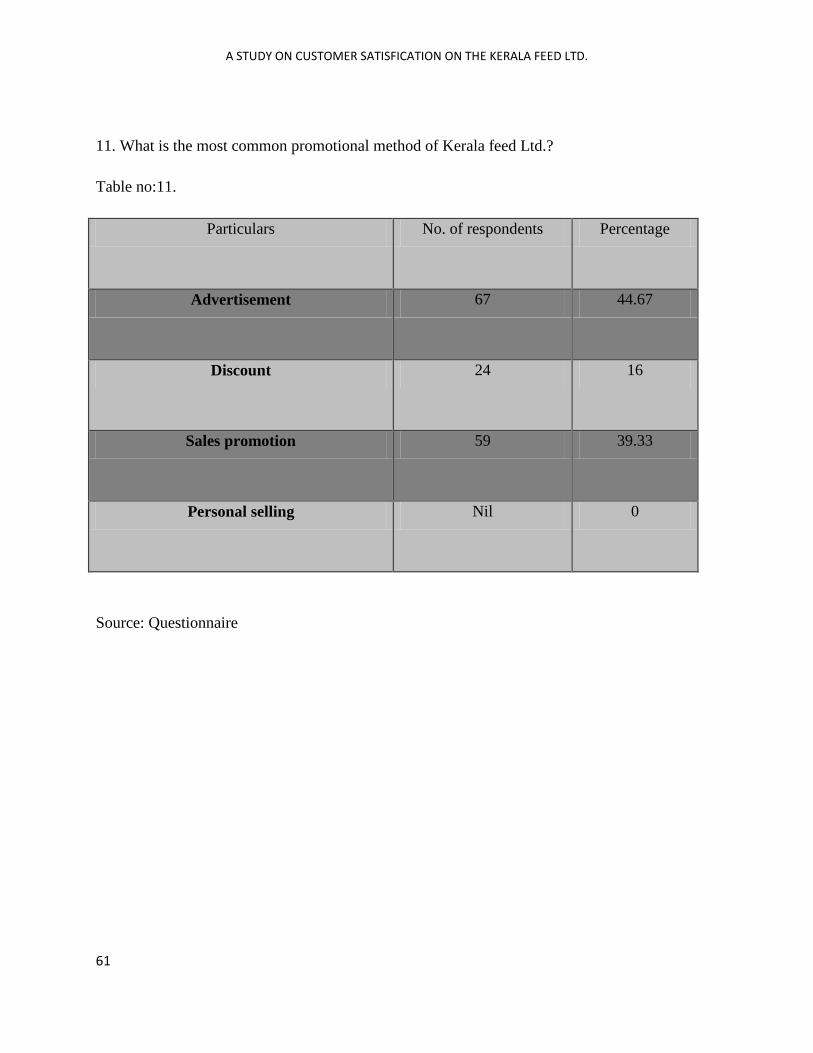
A STUDY ON CUSTOMER SATISFICATION ON THE KERALA FEED LTD.
61
11. What is the most common promotional method of Kerala feed Ltd.?
Table no:11.
Particulars No. of respondents Percentage
Advertisement 67 44.67
Discount 24 16
Sales promotion 59 39.33
Personal selling Nil 0
Source: Questionnaire
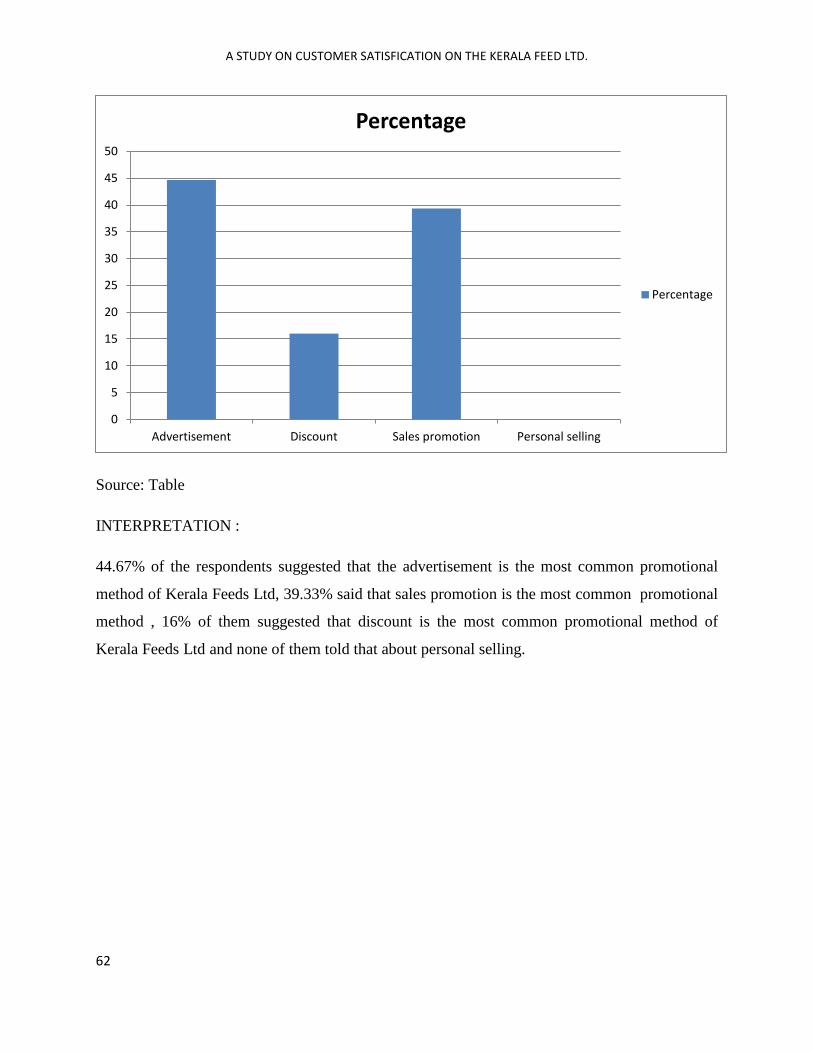
A STUDY ON CUSTOMER SATISFICATION ON THE KERALA FEED LTD.
62
Source: Table
INTERPRETATION :
44.67% of the respondents suggested that the advertisement is the most common promotional
method of Kerala Feeds Ltd, 39.33% said that sales promotion is the most common promotional
method , 16% of them suggested that discount is the most common promotional method of
Kerala Feeds Ltd and none of them told that about personal selling.
0
5
10
15
20
25
30
35
40
45
50
Advertisement Discount Sales promotion Personal selling
Percentage
Percentage
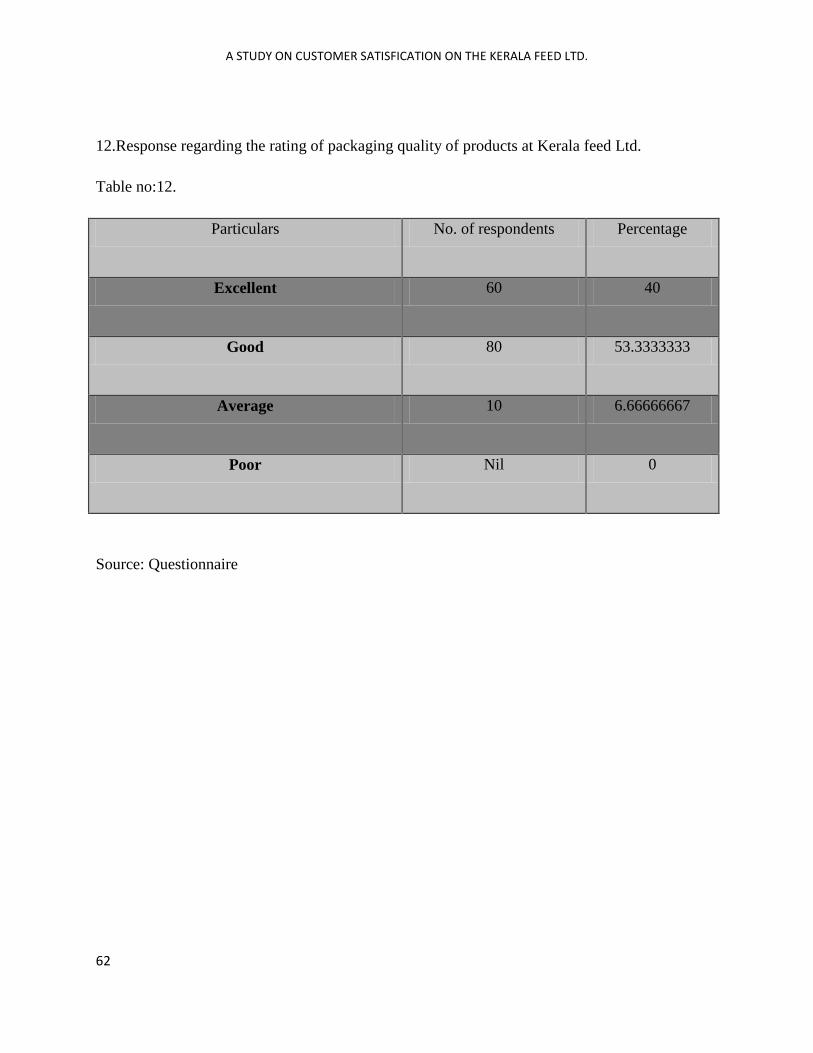
A STUDY ON CUSTOMER SATISFICATION ON THE KERALA FEED LTD.
62
12.Response regarding the rating of packaging quality of products at Kerala feed Ltd.
Table no:12.
Particulars No. of respondents Percentage
Excellent 60 40
Good 80 53.3333333
Average 10 6.66666667
Poor Nil 0
Source: Questionnaire
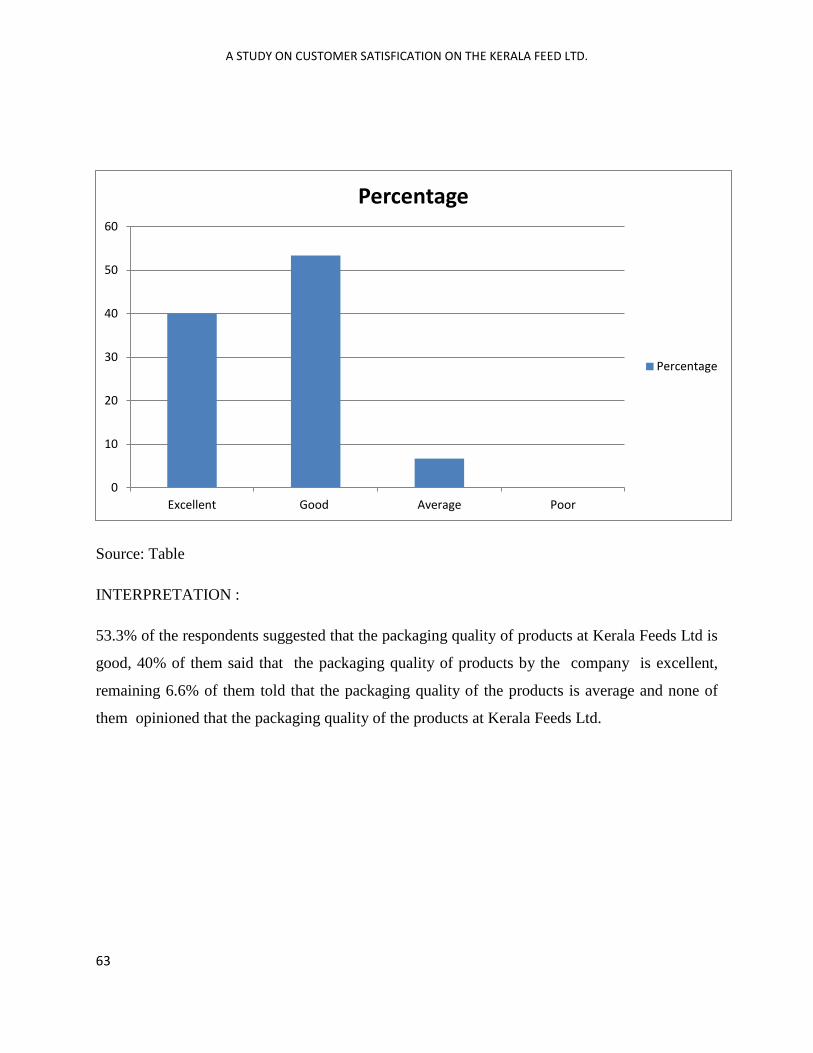
A STUDY ON CUSTOMER SATISFICATION ON THE KERALA FEED LTD.
63
Source: Table
INTERPRETATION :
53.3% of the respondents suggested that the packaging quality of products at Kerala Feeds Ltd is
good, 40% of them said that the packaging quality of products by the company is excellent,
remaining 6.6% of them told that the packaging quality of the products is average and none of
them opinioned that the packaging quality of the products at Kerala Feeds Ltd.
0
10
20
30
40
50
60
Excellent Good Average Poor
Percentage
Percentage
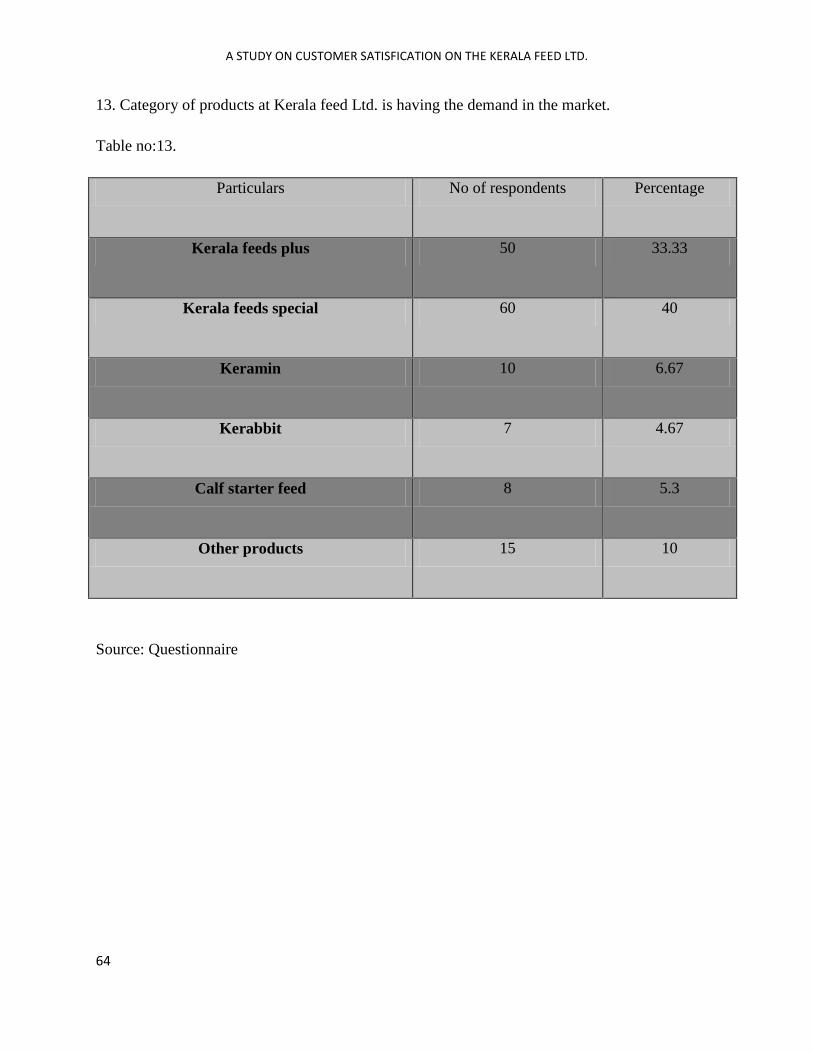
A STUDY ON CUSTOMER SATISFICATION ON THE KERALA FEED LTD.
64
13. Category of products at Kerala feed Ltd. is having the demand in the market.
Table no:13.
Particulars No of respondents Percentage
Kerala feeds plus 50 33.33
Kerala feeds special 60 40
Keramin 10 6.67
Kerabbit 7 4.67
Calf starter feed 8 5.3
Other products 15 10
Source: Questionnaire
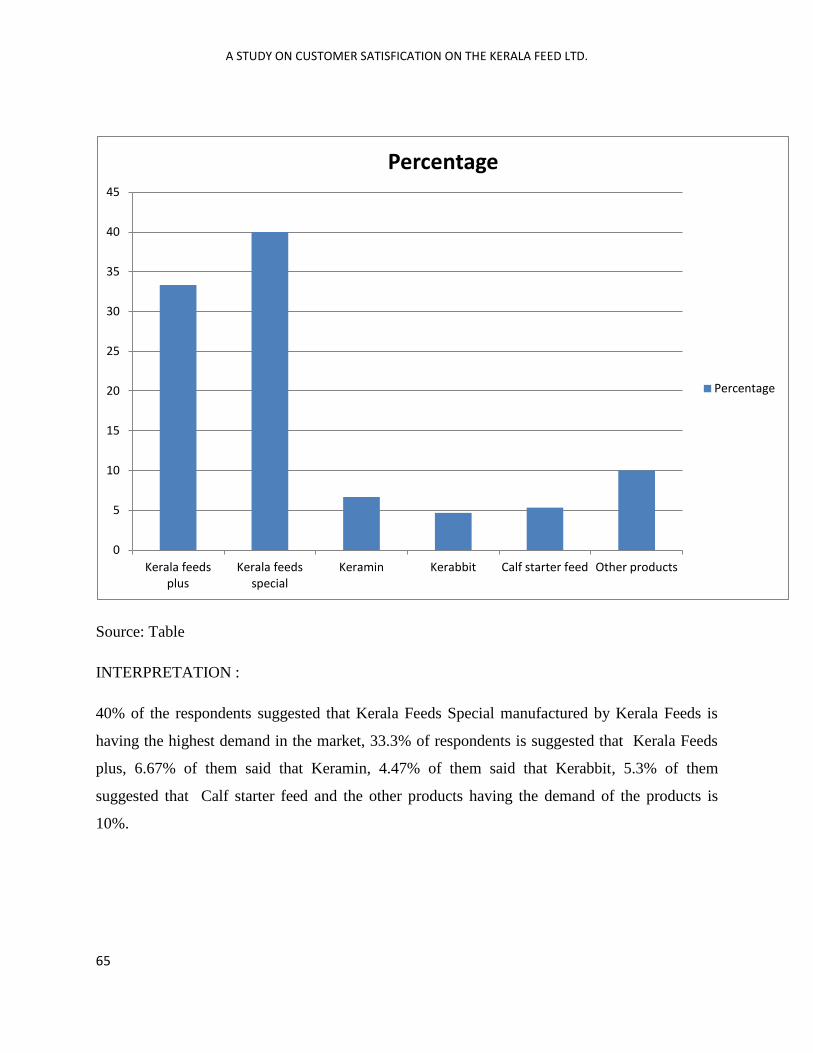
A STUDY ON CUSTOMER SATISFICATION ON THE KERALA FEED LTD.
65
Source: Table
INTERPRETATION :
40% of the respondents suggested that Kerala Feeds Special manufactured by Kerala Feeds is
having the highest demand in the market, 33.3% of respondents is suggested that Kerala Feeds
plus, 6.67% of them said that Keramin, 4.47% of them said that Kerabbit, 5.3% of them
suggested that Calf starter feed and the other products having the demand of the products is
10%.
0
5
10
15
20
25
30
35
40
45
Kerala feeds plus
Kerala feeds special
Keramin Kerabbit Calf starter feed Other products
Percentage
Percentage
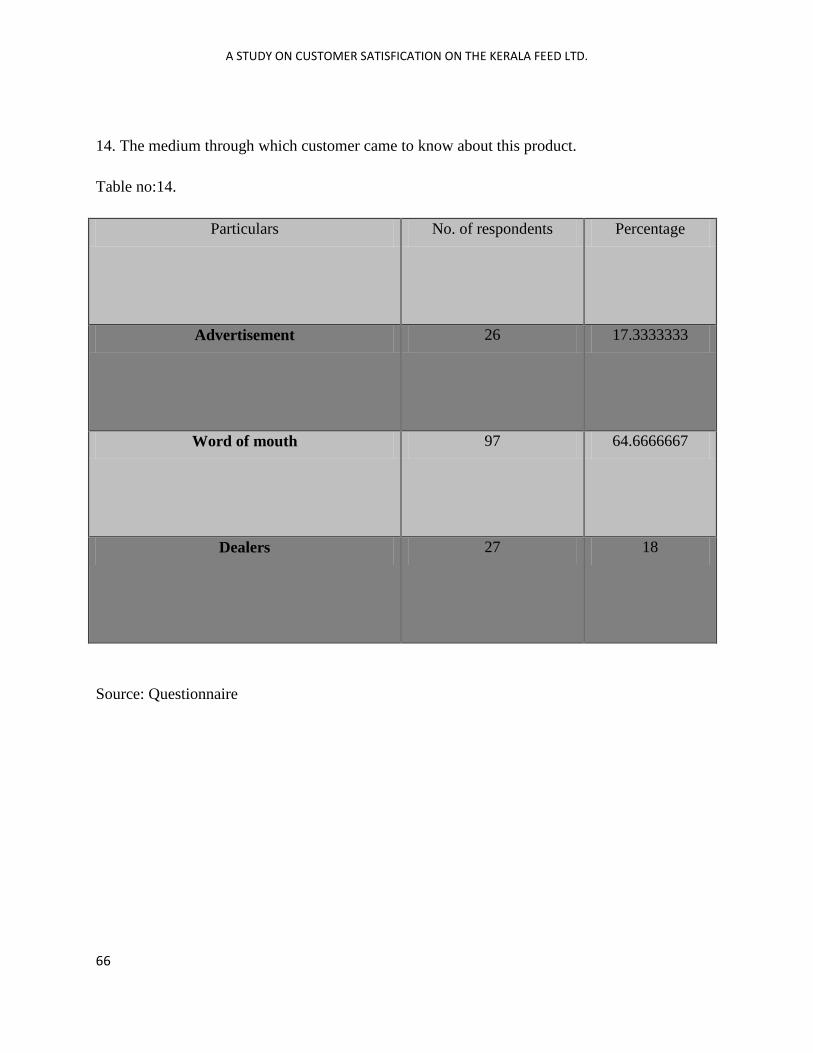
A STUDY ON CUSTOMER SATISFICATION ON THE KERALA FEED LTD.
66
14. The medium through which customer came to know about this product.
Table no:14.
Particulars No. of respondents Percentage
Advertisement 26 17.3333333
Word of mouth 97 64.6666667
Dealers 27 18
Source: Questionnaire
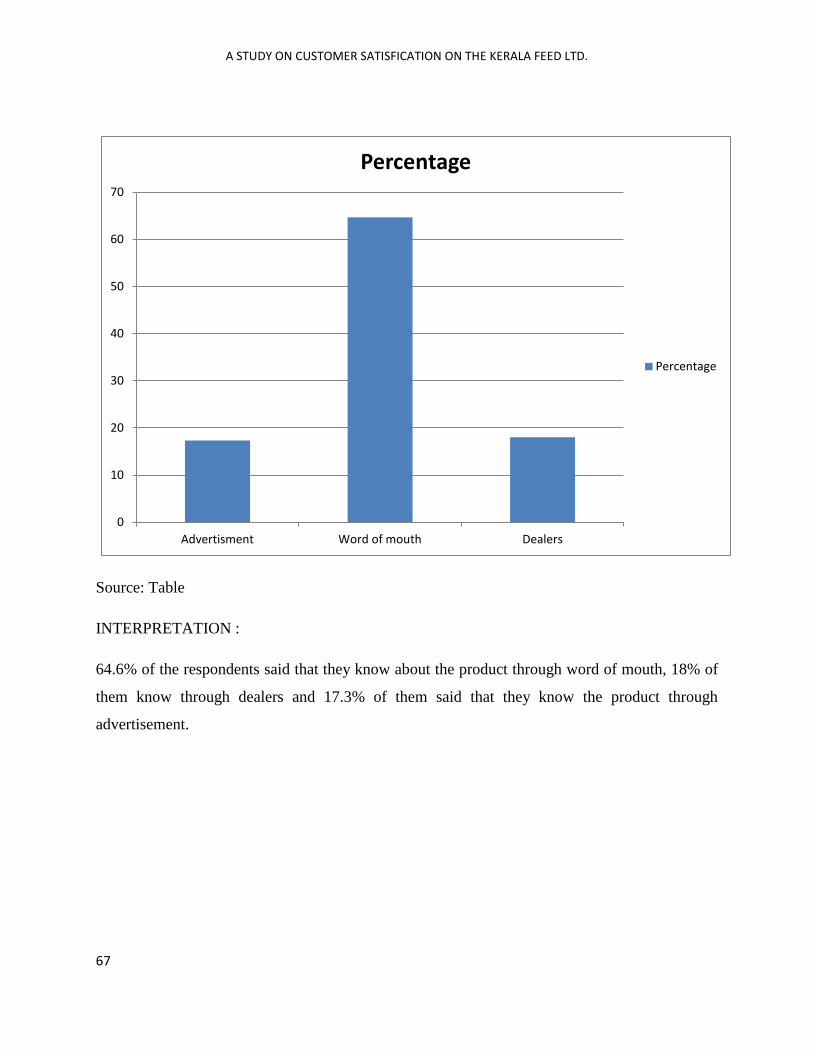
A STUDY ON CUSTOMER SATISFICATION ON THE KERALA FEED LTD.
67
Source: Table
INTERPRETATION :
64.6% of the respondents said that they know about the product through word of mouth, 18% of
them know through dealers and 17.3% of them said that they know the product through
advertisement.
0
10
20
30
40
50
60
70
Advertisment Word of mouth Dealers
Percentage
Percentage
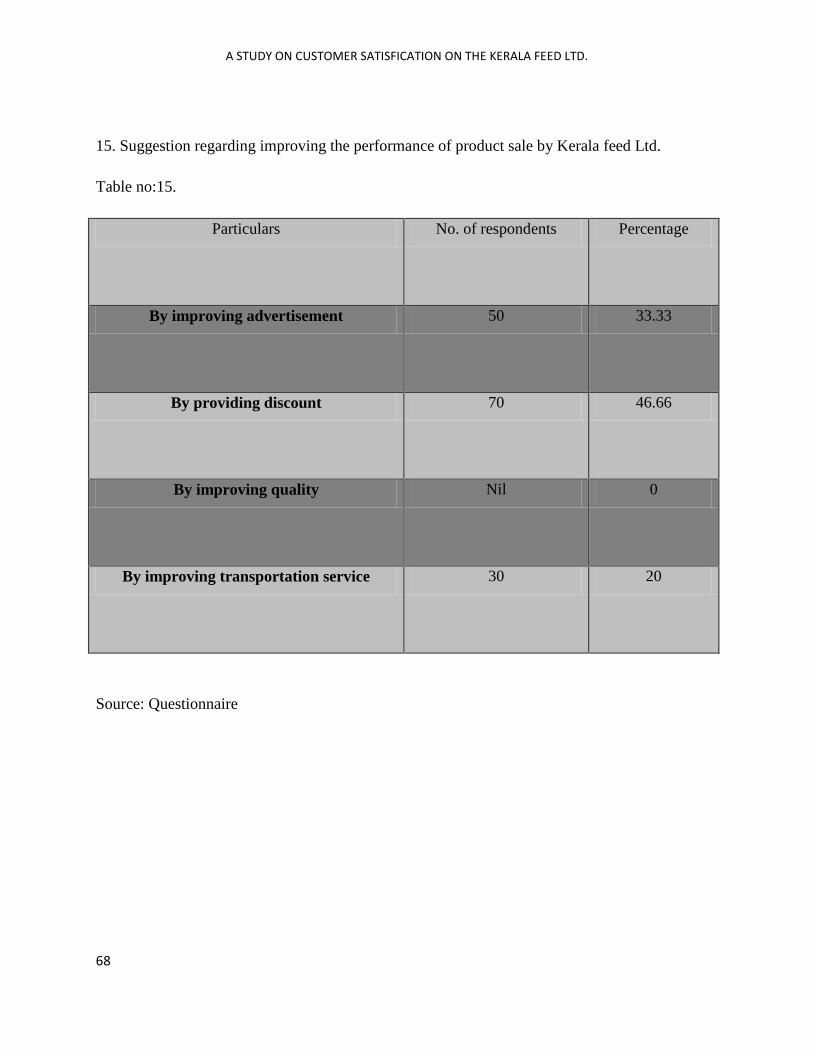
A STUDY ON CUSTOMER SATISFICATION ON THE KERALA FEED LTD.
68
15. Suggestion regarding improving the performance of product sale by Kerala feed Ltd.
Table no:15.
Particulars No. of respondents Percentage
By improving advertisement 50 33.33
By providing discount 70 46.66
By improving quality Nil 0
By improving transportation service 30 20
Source: Questionnaire
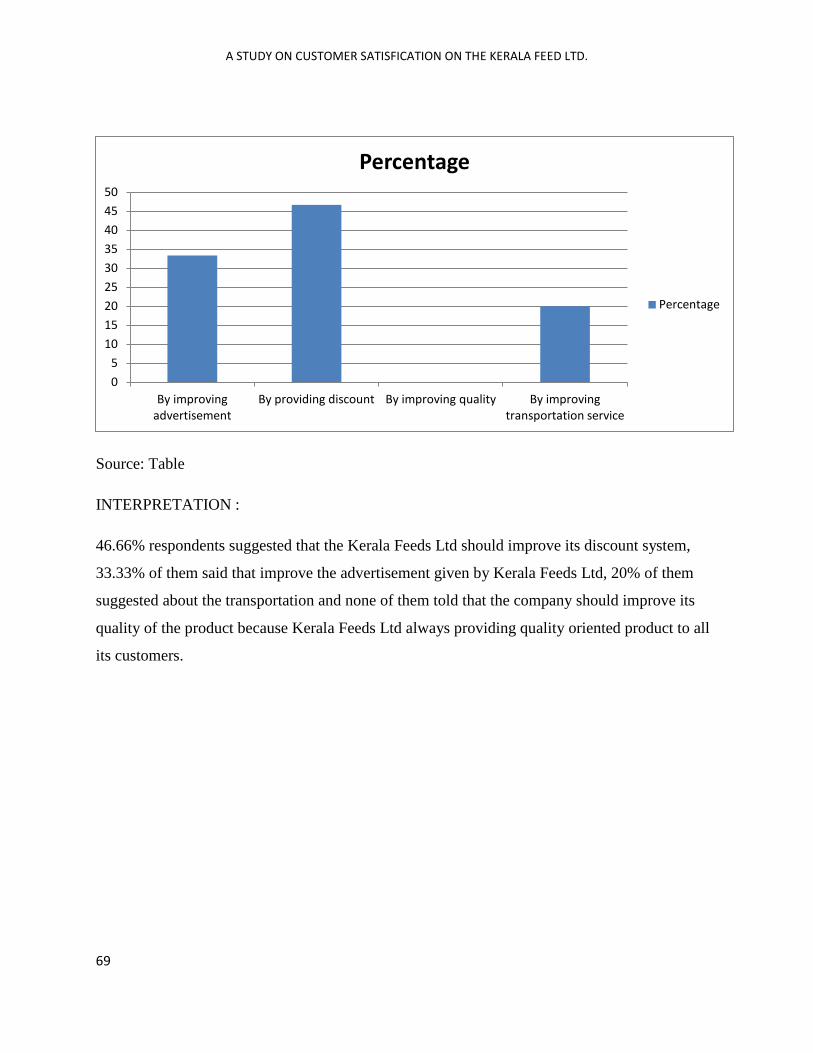
A STUDY ON CUSTOMER SATISFICATION ON THE KERALA FEED LTD.
69
Source: Table
INTERPRETATION :
46.66% respondents suggested that the Kerala Feeds Ltd should improve its discount system,
33.33% of them said that improve the advertisement given by Kerala Feeds Ltd, 20% of them
suggested about the transportation and none of them told that the company should improve its
quality of the product because Kerala Feeds Ltd always providing quality oriented product to all
its customers.
0
5
10
15
20
25
30
35
40
45
50
By improving advertisement
By providing discount By improving quality By improving transportation service
Percentage
Percentage
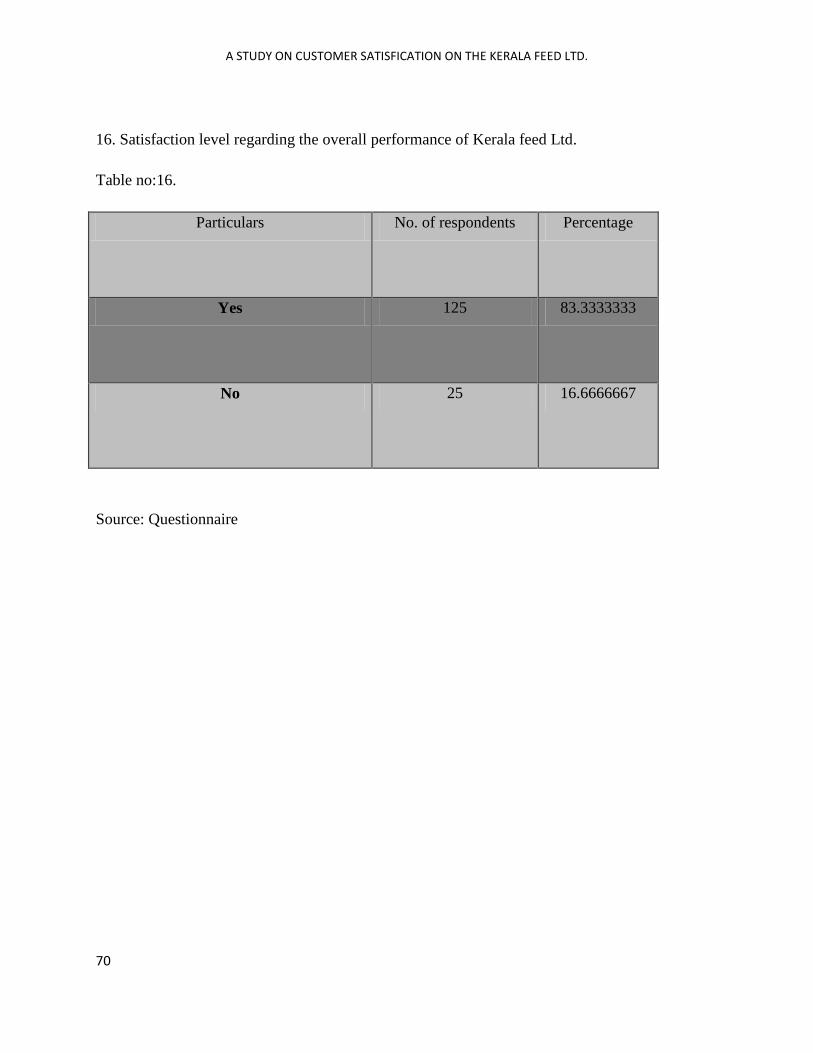
A STUDY ON CUSTOMER SATISFICATION ON THE KERALA FEED LTD.
70
16. Satisfaction level regarding the overall performance of Kerala feed Ltd.
Table no:16.
Particulars No. of respondents Percentage
Yes 125 83.3333333
No 25 16.6666667
Source: Questionnaire
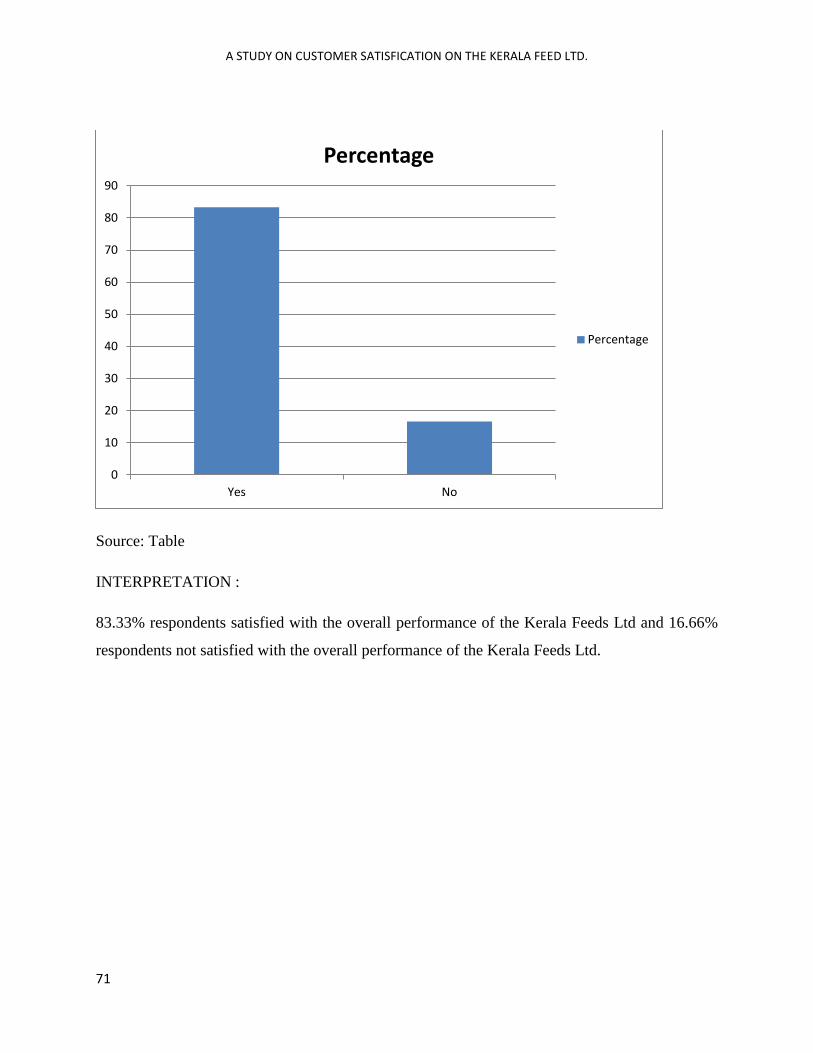
A STUDY ON CUSTOMER SATISFICATION ON THE KERALA FEED LTD.
71
Source: Table
INTERPRETATION :
83.33% respondents satisfied with the overall performance of the Kerala Feeds Ltd and 16.66%
respondents not satisfied with the overall performance of the Kerala Feeds Ltd.
0
10
20
30
40
50
60
70
80
90
Yes No
Percentage
Percentage
A STUDY ON CUSTOMER SATISFICATION ON THE KERALA FEED LTD.
CHAPTER 5
A STUDY ON CUSTOMER SATISFICATION ON THE KERALA FEED LTD.
72
5.1FINDINGS
To analyse the customer satisfaction of the products of Kerala Feeds Ltd.:
1. It’s found that all the respondents are satisfied with the quality of Kerala Feeds
products. 83.33% of the respondents were satisfied with the overall performance and
products of Kerala feeds. ltd.
To find out the factors effecting customer buying behaviour of Kerala Feeds Ltd.
1. 95% of the respondents suggested that the quality is most important factors which
motivate the customers of Kerala Feeds Ltd. 2% each of them said that price and brand
image are the most important factor which motivates the customers of the company,
remaining 1% of the respondents were of the opinion that sales promotional schemes
helps in making purchase decision.
To understand the promotional strategies of the organisation.
1. 62% of the respondents suggested that Kerala Feeds Ltd needs more promotional
activities for the products and 38% of the respondents suggested that the existing
promotional activities are satisfactory.
2.44.67% of the respondents suggested that the advertisement is the most common
promotional method of Kerala Feeds Ltd, 39.33% said that sales promotion is the most
common promotional method , 16% of them suggested that discount is the most common
promotional method of Kerala Feeds Ltd. There is no mode of personal selling in Kerala
Feeds Ltd.
3. 53.3% of the respondents suggested that the packaging quality of products at Kerala
Feeds Ltd is good, 40% of them said that the packaging quality of products by the
company is excellent, remaining 6.6% of them told that the packaging quality of the
products is average.
4. 64.6% of the respondents said that they know about the product through word of
mouth, 18% of them know through dealers and 17.3% of them said that they know the
product through advertisements.
A STUDY ON CUSTOMER SATISFICATION ON THE KERALA FEED LTD.
73
To understand whether the distribution system is effective or not.
1. The survey showed that 53.3% of the respondents are highly satisfied with the
distribution system provided by Kerala Feeds Ltd, 43.33% of them are satisfied and
3.33% are dissatisfied with the distribution system of Kerala Feeds Ltd.
Other findings
1. The survey reveals that 66.6% of the respondents are satisfied with price and 33.3%
are not satisfied with the price of products.
2. 73.3% of the respondents suggested the rate of market potential and demand for the
products of Kerala Feeds Ltd is excellent, 20% of them said that it is good, 6.6% of the
respondents opinioned that it is average and none of them reviewed told that the rate of
market potential and demand for the products marketed by Kerala Feeds Ltd is poor.
3. 83% were satisfied with the overall performance of Kerala Feeds Ltd.
A STUDY ON CUSTOMER SATISFICATION ON THE KERALA FEED LTD.
74
5.2 SUGGESTIONS
1. The main plus point of Kerala Feeds Ltd is its quality, so the company should maintain
the quality of products and apply more innovative techniques in this field.
2. When marketing distribution increase , sales volume also increases so distribution
channel has to be improved.
3. Continuous and powerful advertisement are to be given in order to face the competition
effectively and efficiently
4. The company should improve the transportation services as to make sure customers are
delivered on time hence are satisfied.
5. Company should start the personal selling for improving the sales.
6. Company should develop their sales out of Kerala expanded to all India level. If needed
establish subsidiary unit warehouse unit.
7. May be a new product can be developed for home pets especially for cats and dogs .
8. Maintain good relation with the trade union so that shut down and strike could be avoided
and production doesn’t get effected.
9. Online booking order could be initiated. This helps in bulk booking.
10. Make sufficient changes in production to avoid wastage and thus the profit could be
increased.
A STUDY ON CUSTOMER SATISFICATION ON THE KERALA FEED LTD.
75
5.3 CONCLUSION:
To conclude, Kerala Feeds Ltd enjoys a high level of customer satisfaction with regards
to its cattle feed products and majority of consumers surveyed preferred Kerala Feeds
Brand. It is well known in the market for its quality. From the survey I have understand
that the most of the consumers are highly satisfied with the quality of the products. The
survey was an analytical study in an organization namely Kerala feeds ltd., Thrissur with
specialization in marketing department, concentration of the study is on one of the area of
marketing function namely consumer preference towards the Kerala feed ltd.
The survey helped in knowing whether the customer are satisfied with the products or
not. And it was found that most of the respondents are satisfied with the Kerala products.
It also helped in identifying the factors that is most important for the customers in making
purchase decisions.
It also tried to understand the promotional strategies of the organisation and the
customers perception. It also analysed the responses to understand whether the
distribution system is effective or not.
A STUDY ON CUSTOMER SATISFICATION ON THE KERALA FEED LTD.
BIBLIOGRAPHY
WEBSITE
www.Keralafeeds.com
www.Google.com cattle feed industry
http://www.academia.edu/1956762/project_report
http://keralafeeds.com/RTI-act.htm
http://www.researchgate.net/publication/259451483_Cattle_Feed_Market_in_Kerala_A_Study_of_
Purchasing_Pattern_and_Buyer_Behaviour
http://en.wikipedia.org/wiki/Animal_feed
http://www.ijsrp.org/research-journal-0613.php
http://www.slideshare.net/supabuoy/0601006-study-on-customer-satisfaction
PUBLICATIONS
Company profile
Records of Kerala feed Ltd.
Kerala feeds manuals
Kerala feeds annual report
REFERENCE BOOKS
PHILIP KOTLER, ”marketing management ”, “principle of marketing”
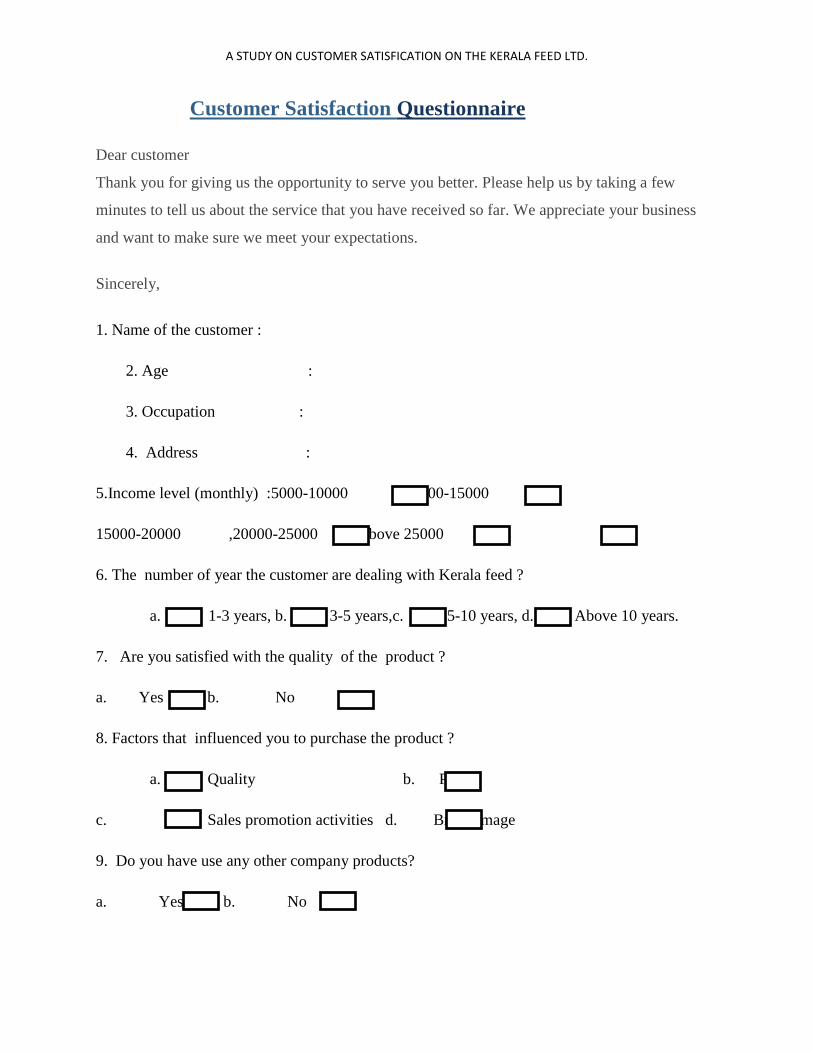
A STUDY ON CUSTOMER SATISFICATION ON THE KERALA FEED LTD.
Customer Satisfaction Questionnaire
Dear customer
Thank you for giving us the opportunity to serve you better. Please help us by taking a few
minutes to tell us about the service that you have received so far. We appreciate your business
and want to make sure we meet your expectations.
Sincerely,
1. Name of the customer :
2. Age :
3. Occupation :
4. Address :
5.Income level (monthly) :5000-10000 , 10000-15000 ,
15000-20000 ,20000-25000 ,above 25000 .
6. The number of year the customer are dealing with Kerala feed ?
a. . 1-3 years, b. 3-5 years,c. 5-10 years, d. Above 10 years.
7. Are you satisfied with the quality of the product ?
a. Yes b. No
8. Factors that influenced you to purchase the product ?
a. Quality b. Price
c. Sales promotion activities d. Brand image
9. Do you have use any other company products?
a. Yes b. No
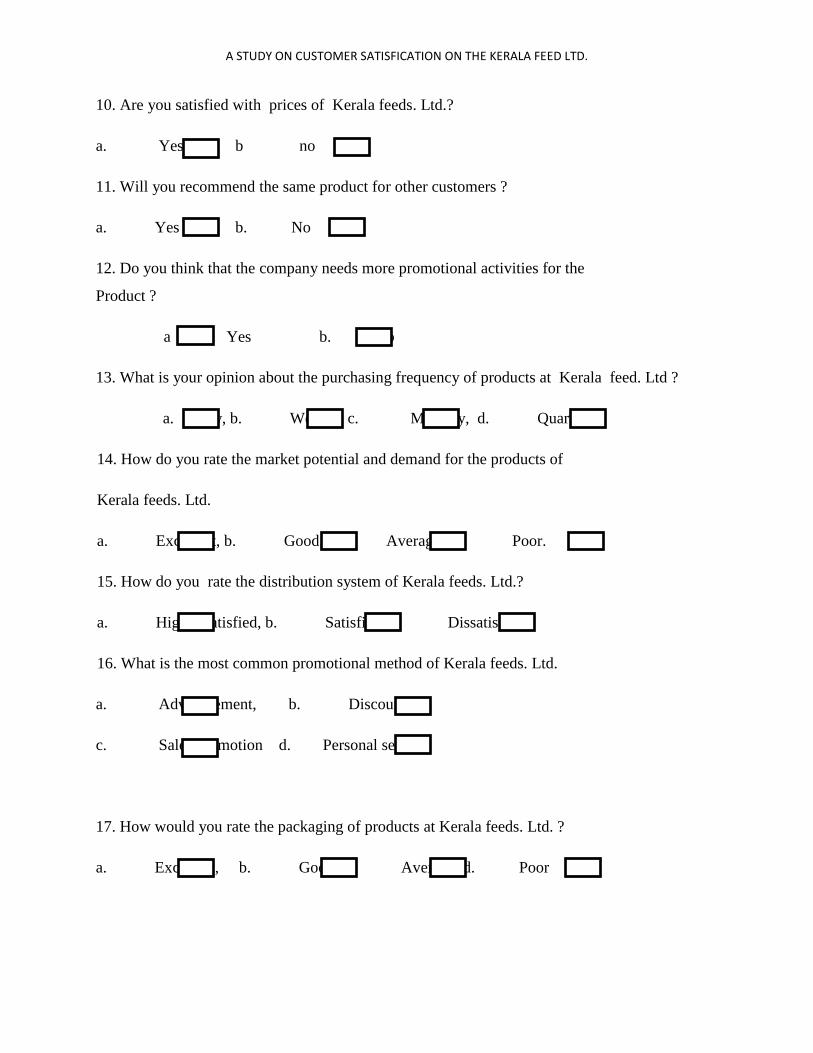
A STUDY ON CUSTOMER SATISFICATION ON THE KERALA FEED LTD.
10. Are you satisfied with prices of Kerala feeds. Ltd.?
a. Yes , b no
11. Will you recommend the same product for other customers ?
a. Yes b. No
12. Do you think that the company needs more promotional activities for the
Product ?
a Yes b. No
13. What is your opinion about the purchasing frequency of products at Kerala feed. Ltd ?
a. Daily, b. Weakly, c. Monthly, d. Quarterly
14. How do you rate the market potential and demand for the products of
Kerala feeds. Ltd.
a. Excellent, b. Good, c. Average, d. Poor.
15. How do you rate the distribution system of Kerala feeds. Ltd.?
a. Highly satisfied, b. Satisfied, c. Dissatisfied
16. What is the most common promotional method of Kerala feeds. Ltd.
a. Advertisement, b. Discount,
c. Sales promotion d. Personal selling
17. How would you rate the packaging of products at Kerala feeds. Ltd. ?
a. Excellent, b. Good, c. Average, d. Poor
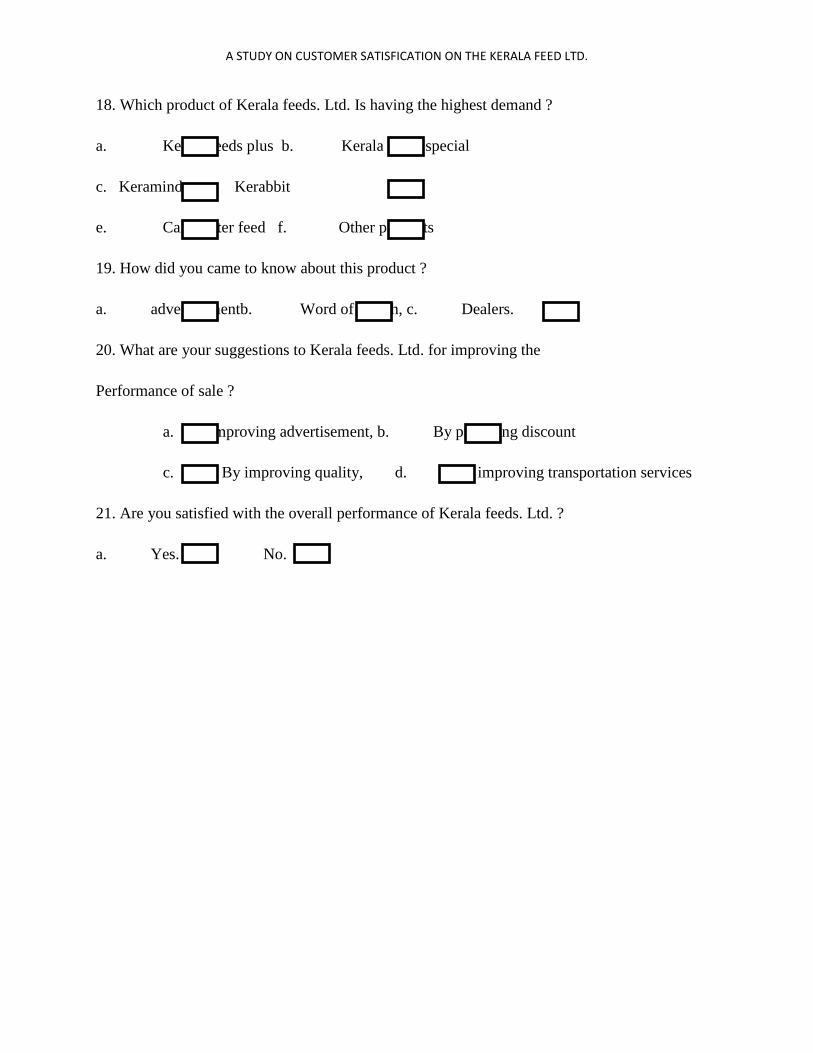
A STUDY ON CUSTOMER SATISFICATION ON THE KERALA FEED LTD.
18. Which product of Kerala feeds. Ltd. Is having the highest demand ?
a. Kerala feeds plus b. Kerala feeds special
c. Keramind. Kerabbit
e. Calf starter feed f. Other products
19. How did you came to know about this product ?
a. advertisementb. Word of mouth, c. Dealers.
20. What are your suggestions to Kerala feeds. Ltd. for improving the
Performance of sale ?
a. By improving advertisement, b. By providing discount
c. By improving quality, d. By improving transportation services
21. Are you satisfied with the overall performance of Kerala feeds. Ltd. ?
a. Yes. b. No.

A STUDY ON CUSTOMER SATISFICATION ON THE KERALA FEED LTD.


