Embed Size (px)
Citation preview
A N N U A L R E P O R T 2 0 0 7
L E T T E R T O S H A R E H O L D E R S A N D R E V I E W O F A C T I V I T I E S
i n t e r n a t i o n a l h y d r o c a r b o n e x p l o r a t i o n & p r o d u c t i o n
�A
VER
Y R
ESO
UR
CES
IN
C.
AN
NU
AL
REP
OR
T 20
07
Avery’s fiscal year was an exciting one as we continued to execute on our hydrocarbon exploration program in Australia.
LETTER TO SHAREHOLDERS
One of the best moments for me was the commencement of our first Australian production when our Toparoa-� well came on stream in October 2006. The well contributed $2.3 million of revenue in 2007, with high field netbacks averaging $53.�9 per barrel. This has given us the ability to fully fund our overheads, closing the year with cash flow from operations in excess of $�.6 million.
The market recognized our success at Toparoa and we were able to raise $�0 million of equity through Paradigm Capital Inc., on very favourable terms, allowing us to continue to fund our busy exploration program. Our plans are to drill up to nine wells in the Cooper Basin and one in the Timor Sea over the next �8 months, with a proposed capital budget of up to A$23 million, including related seismic surveys.
Another exciting recent milestone is the completion of the Schwarzer offshore 3D seismic survey in April 2007. The survey was conducted using a brand-new ship,
the Veritas Voyager. It covered 68� square kilometres including the 272 square kilometre AC/P 24 Katandra permit. The aim of the 3D seismic survey is to locate a well that would establish commerciality of Katandra. A commercial discovery at Katandra could be very significant for Avery, considering that the permit is on strike with the Jabiru oilfield 30 kilometres to the southwest. Jabiru has produced over ��0 million barrels of oil to date.
Our ongoing drilling program, while not producing any new oil discoveries in the past year, allowed us to meet our farm-in commitments with two of the five operators that we have partnered with in the Cooper Basin, and provided additional data that will be employed to improve the success rates of future exploratory wells. In August we completed the Light Fingers-� exploration well, located 2.8 kilometres from our oil discovery at Toparoa-�, completing our commitments to Stuart Petroleum to gain a 35 percent working interest in the 53 square kilometre
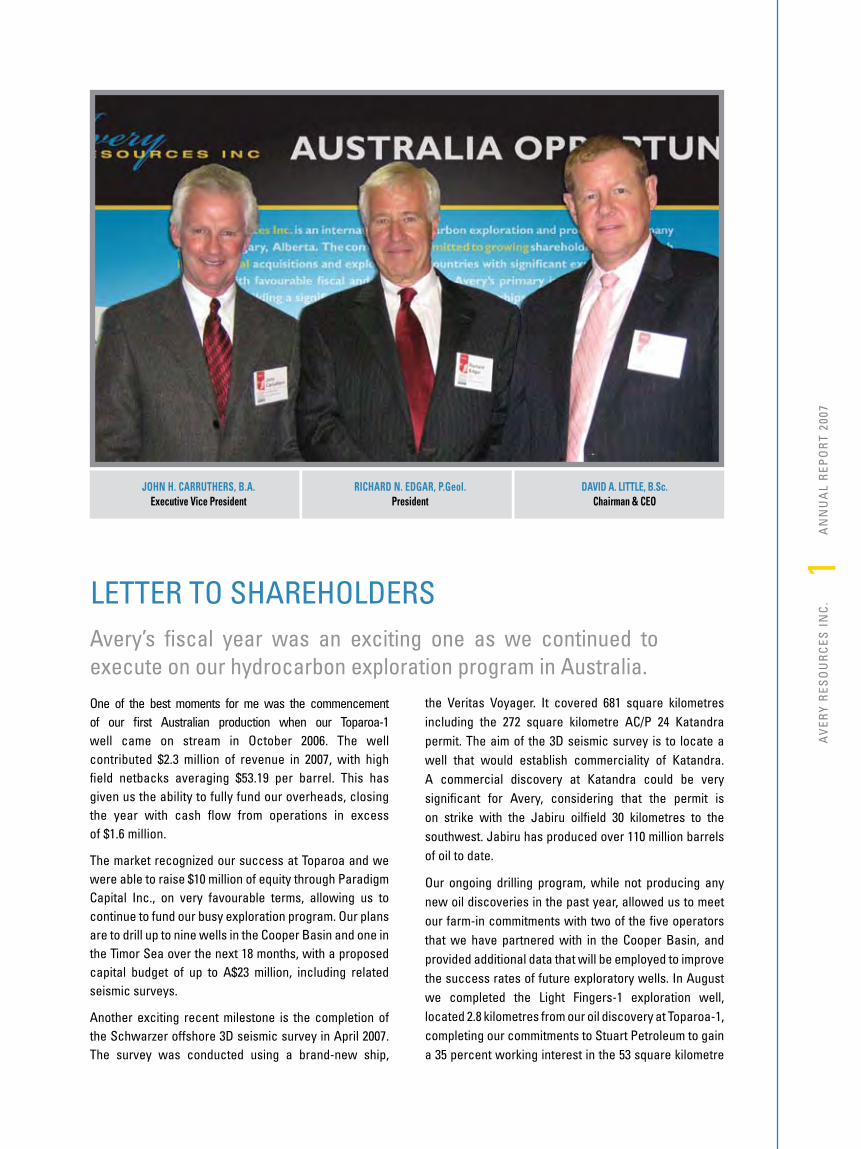
JOHN H. CARRUTHERS, B.A.Executive Vice President
DAVID A. LITTLE, B.Sc. Chairman & CEO
RICHARD N. EDGAR, P.Geol. President
oil-prone Murteree sub-block of the highly prospective Petroleum Exploration License (PEL) ��3. Light Fingers was ‘wet’, the oil apparently having migrated out of the structure. In January and February 2007 we drilled two wells, Marracoonda-2 and Gamma-�, earning a 30 percent interest in the 958 square kilometres Authority to Prospect (ATP) 752P Wompi Block. The payzone in Marracoonda was too thin to be economic. Gamma-� seismic showed a clear time high which did not exist. We are planning to fund an additional well in the fall of 2007 to increase our working interest in the block to 50 percent.
We also grew our land position in the Cooper Basin when we gained entry to another large land block in western Queensland along the highly prospective southeastern oil rim of the basin. In May 2006 we executed an agreement with Sunshine Gas Limited on ATP 789P. By late 2007, with a recently purchased seismic survey and the drilling of one well, we expect to have earned a 40 percent interest in the entire �,478 acre block, which shares its western boundary with oilfields that have produced �8 million barrels of oil to date.
In our head office in Calgary and our regional office in Brisbane, Australia, we continued to attract high quality people to enable us to execute our strategy:
Judith Stripling, CA, was appointed to our Board in November 2006, filling the vacancy created by the resignation of Bradley Johnson. Judith is Executive Vice President and Chief Financial Officer of Midnight Oil Exploration Ltd., a junior oil and gas exploration company located in Calgary. She was also cofounder and Vice President, Finance and Chief Financial Officer of Midnight Oil & Gas Ltd., a predecessor of Daylight Energy Trust which spun out Midnight Oil Exploration Ltd. Judith, with a wealth of financial oil and gas executive experience, serves on Avery’s Audit Committee.
Bryan Goudie, CA, was appointed Avery’s Chief Financial Officer, effective April �, 2006. Before joining Avery, Bryan was Chief Financial Officer of Emerging Equities Inc., a full service investment and brokerage firm specializing in the junior and intermediate financial markets. Prior to his six years at Emerging Equities, he accumulated over �0 years of experience in senior accounting and managerial positions with publicly-traded oil and gas companies.
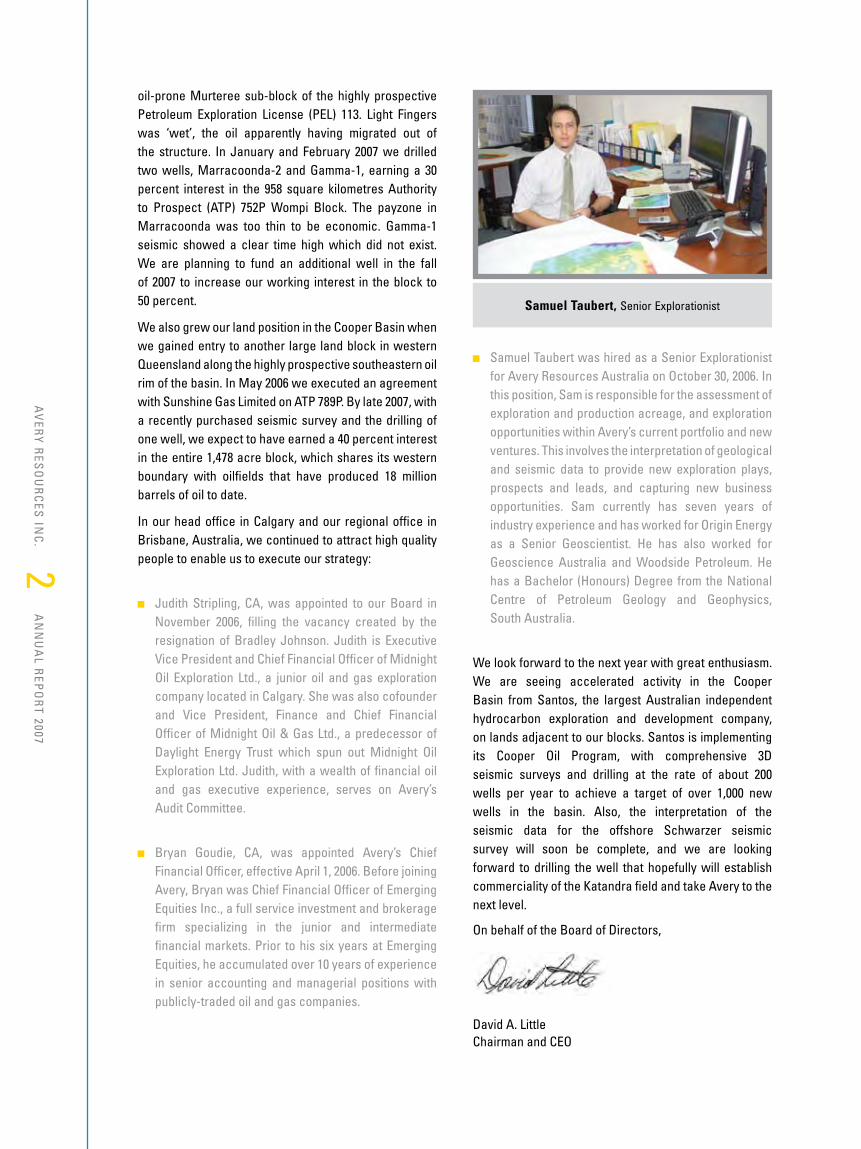
Samuel Taubert was hired as a Senior Explorationist for Avery Resources Australia on October 30, 2006. In this position, Sam is responsible for the assessment of exploration and production acreage, and exploration opportunities within Avery’s current portfolio and new ventures. This involves the interpretation of geological and seismic data to provide new exploration plays, prospects and leads, and capturing new business opportunities. Sam currently has seven years of industry experience and has worked for Origin Energy as a Senior Geoscientist. He has also worked for Geoscience Australia and Woodside Petroleum. He has a Bachelor (Honours) Degree from the National Centre of Petroleum Geology and Geophysics, South Australia.
We look forward to the next year with great enthusiasm. We are seeing accelerated activity in the Cooper Basin from Santos, the largest Australian independent hydrocarbon exploration and development company, on lands adjacent to our blocks. Santos is implementing its Cooper Oil Program, with comprehensive 3D seismic surveys and drilling at the rate of about 200 wells per year to achieve a target of over �,000 new wells in the basin. Also, the interpretation of the seismic data for the offshore Schwarzer seismic survey will soon be complete, and we are looking forward to drilling the well that hopefully will establish commerciality of the Katandra field and take Avery to the next level.
On behalf of the Board of Directors,
David A. Little Chairman and CEO
Samuel Taubert, Senior Explorationist
2A
VER
Y RES
OU
RC
ES IN
C.
AN
NU
AL R
EPO
RT 2007
3A
VER
Y R
ESO
UR
CES
IN
C.
AN
NU
AL
REP
OR
T 20
07
STRATEGY
Avery’s strategy is to grow shareholder value through increasing the production and reserves of its international inventory of oil and gas projects. Management’s objective is to build an international hydrocarbon exploration and production company that is highly valued by investors, partners and potential acquirers, with an ultimate target market cap of approximately $500 million, production of 5,000 to 7,000 barrels of oil equivalent per day (boepd), and reserves of approximately 20 million barrels of oil equivalent (MMboe).
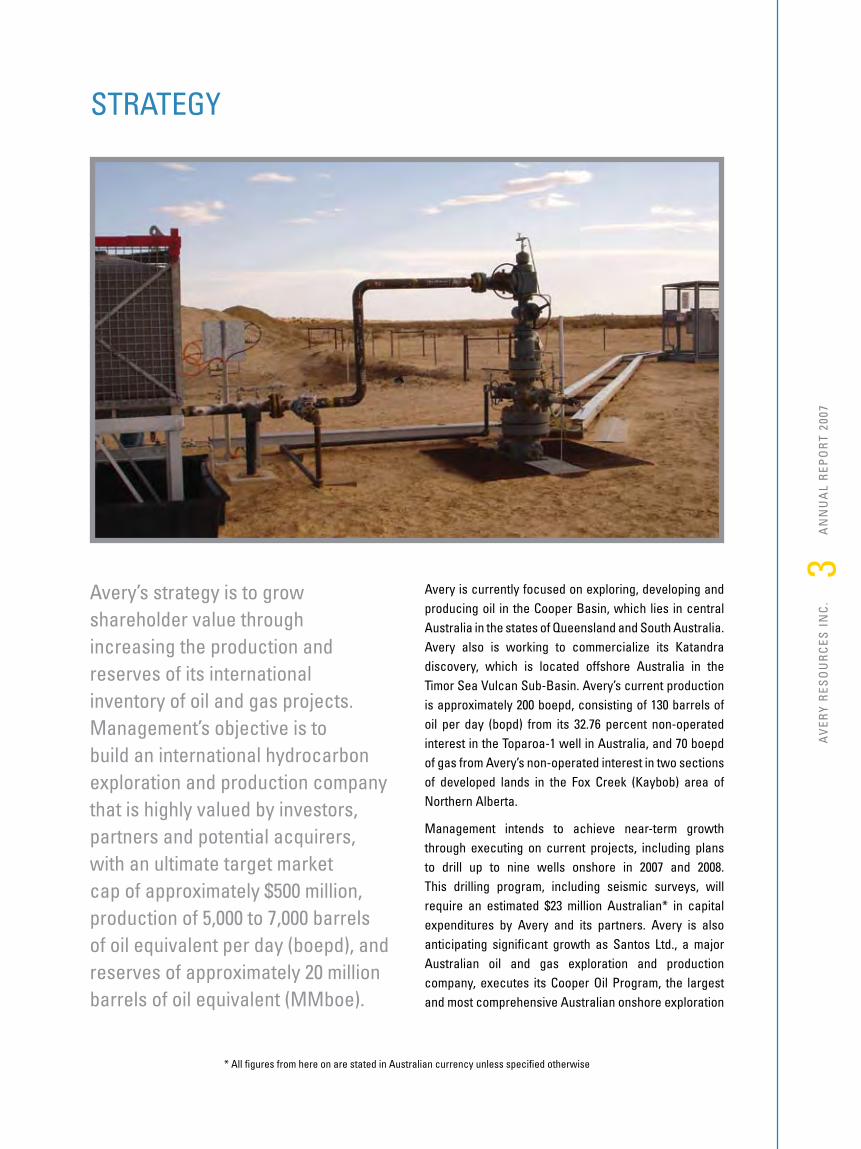
Avery is currently focused on exploring, developing and producing oil in the Cooper Basin, which lies in central Australia in the states of Queensland and South Australia. Avery also is working to commercialize its Katandra discovery, which is located offshore Australia in the Timor Sea Vulcan Sub-Basin. Avery’s current production is approximately 200 boepd, consisting of �30 barrels of oil per day (bopd) from its 32.76 percent non-operated interest in the Toparoa-� well in Australia, and 70 boepd of gas from Avery’s non-operated interest in two sections of developed lands in the Fox Creek (Kaybob) area of Northern Alberta.
Management intends to achieve near-term growth through executing on current projects, including plans to drill up to nine wells onshore in 2007 and 2008. This drilling program, including seismic surveys, will require an estimated $23 million Australian* in capital expenditures by Avery and its partners. Avery is also anticipating significant growth as Santos Ltd., a major Australian oil and gas exploration and production company, executes its Cooper Oil Program, the largest and most comprehensive Australian onshore exploration
* All figures from here on are stated in Australian currency unless specified otherwise
program ever, on lands adjacent to Avery’s blocks. The Company is also evaluating several new production and exploration growth opportunities.
Avery is managing the risk of its exploration and production programs through seeking joint venture partners and utilizing modern technology including leading-edge 3D seismic acquisition and processing in under-explored portions of the basins. For example, a 3D seismic survey was recently completed to further define the Katandra discovery in the Timor Sea, another was recently acquired to refine drilling targets in the ATP 752P Wompi Block, a third is planned in November 2007 in the ATP 732P Magellan Block, and a fourth is planned in mid-2008 in the PEL �03 South Candra Block.
Why Australia?
Avery is focused on Australia because of its transparent legal framework, progressive fiscal regime, proven but under-exploited basins, high exploratory success rates for onshore basins (in the 30 to 40 percent range), prolific offshore reservoirs, and light sweet oil with high field netbacks. The maximum government royalty on oil and gas production in Australia is �� percent, which is at the low end of international oil and gas taxation and less than Canada and the United States. Both the Cooper Basin and the Timor Sea Vulcan Sub-Basin have been successfully explored and exploited but they continue to offer significant potential for multi-million barrel commercial discoveries. Avery’s Toparoa discovery is producing sweet, light 42 degree API oil, and the Katandra discovery tested 48 degree API oil. The oil
commands premium to TAPIS pricing, which in turn is at a premium to WTI pricing.
Avery’s focus on the Cooper Basin is driven by the fact that it is a proven light oil and natural gas basin with large acreage spreads available, up to 40 percent exploratory well success rates, moderate drill depths, and drill targets of � million barrels (MMbbls) to 50 MMbbls. Avery has gained access through farm-ins to several partners with proven track records in the Cooper Basin. As well Santos’ Cooper Oil Program is generating much excitement in the area, placing Avery, with large land positions adjacent to the Santos blocks, in an advantageous position to attract new partners to accelerate its exploration program.
Avery’s �0 percent interest in the offshore Katandra project gives the company significant upside because the scale of a potential discovery in the Timor Sea Vulcan Sub-Basin is much larger than Avery’s onshore plays. For comparison, the analogous Jabiru oilfield, which is about 30 kilometres to the southwest, discovered a 70 metre vertical oil column, and has produced over ��0 MMbo to date.
AVERY’S COMPETITIVE ADVANTAGE
1 PROVEN TEAM OF DEALMAKERS AND OIL AND GAS FINDERS 4 STRONG DEAL FLOW
3 DRILLING WORLD-CLASS OIL TARGETS 6 LONGER-TERM HIGH IMPACT OFFSHORE AUSTRALIA DRILLING
2 ACCESS TO BIG LAND POSITIONS 5 NEAR-TERM DRILLING OF COOPER BASIN PROPERTIES
4A
VER
Y RES
OU
RC
ES IN
C.
AN
NU
AL R
EPO
RT 2007
5A
VER
Y R
ESO
UR
CES
IN
C.
AN
NU
AL
REP
OR
T 20
07
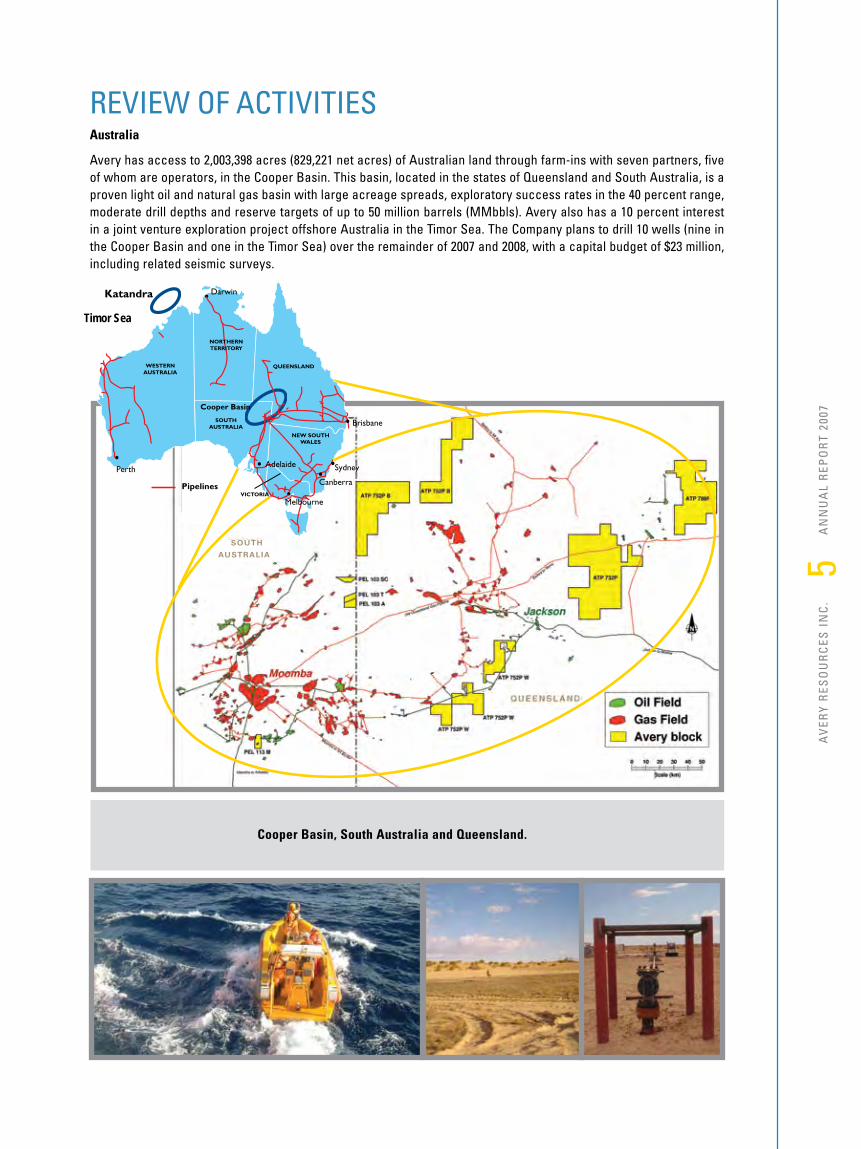
REVIEW OF ACTIVITIESAustralia
Avery has access to 2,003,398 acres (829,22� net acres) of Australian land through farm-ins with seven partners, five of whom are operators, in the Cooper Basin. This basin, located in the states of Queensland and South Australia, is a proven light oil and natural gas basin with large acreage spreads, exploratory success rates in the 40 percent range, moderate drill depths and reserve targets of up to 50 million barrels (MMbbls). Avery also has a �0 percent interest in a joint venture exploration project offshore Australia in the Timor Sea. The Company plans to drill �0 wells (nine in the Cooper Basin and one in the Timor Sea) over the remainder of 2007 and 2008, with a capital budget of $23 million, including related seismic surveys.
Cooper Basin, South Australia and Queensland.
Timor Sea
Perth
Brisbane
Sydney
Canberra
Katandra Darwin
Pipelines
WESTERNAUSTRALIA
N
SOUTHAUSTRALIA
QUEENSLAND
NEW SOUTHWALES
VICTORIA
Cooper Basin
Adelaide
NORTHERTERRITORY
Melbourne
South
AuStrAliA
PEL 113 - Stuart Farm-In, Murteree Block
In the 2007 fiscal year, Avery completed its obligations under its 2005 farm-in agreement with Stuart Petroleum Limited of Australia, a junior oil and gas producer. Avery has earned a 35 percent interest in the 53 square kilometre (�3,�00 acre) oil-prone Murteree sub-block of the highly prospective Petroleum Exploration License (PEL) ��3 in the South Australia sector of the Cooper Basin. The block is located on the southwest end of the Murteree High oil trend, which has produced approximately nine MMbbls to date. Avery had agreed to contribute to funding a seismic survey plus the drilling of two wells on the block. The 3D seismic survey for the block was acquired in 2005 and Avery drilled the first of the two wells, Toparoa-�, in February 2006. The well tested light 42 degree API oil at a rate of �,8�4 barrels per day (bopd). In July and August 2006, Avery drilled the second well in its farm-in program on PEL ��3, Light Fingers-�, located 2.8 kilometres from Toparoa-�. In August 2006 testing of the well was completed and a decision was made to plug and abandon the well.
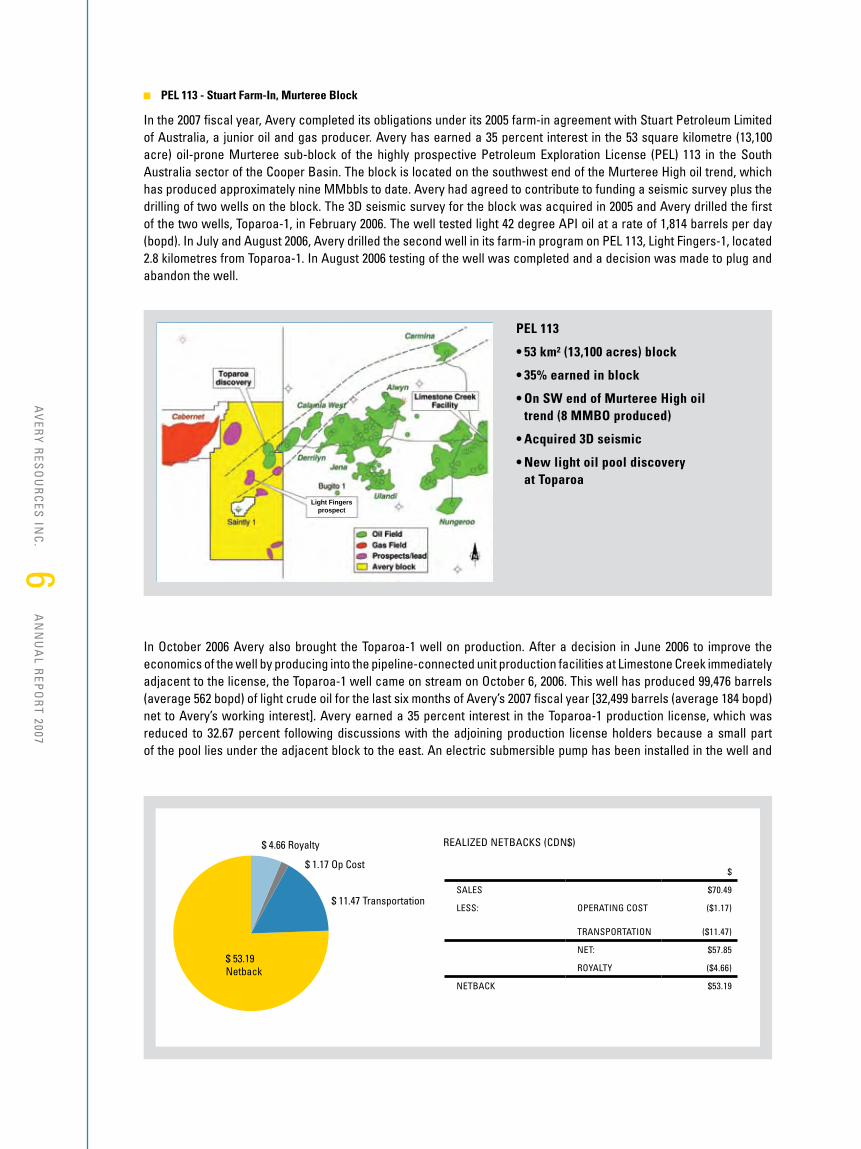
In October 2006 Avery also brought the Toparoa-� well on production. After a decision in June 2006 to improve the economics of the well by producing into the pipeline-connected unit production facilities at Limestone Creek immediately adjacent to the license, the Toparoa-� well came on stream on October 6, 2006. This well has produced 99,476 barrels (average 562 bopd) of light crude oil for the last six months of Avery’s 2007 fiscal year [32,499 barrels (average �84 bopd) net to Avery’s working interest]. Avery earned a 35 percent interest in the Toparoa-� production license, which was reduced to 32.67 percent following discussions with the adjoining production license holders because a small part of the pool lies under the adjacent block to the east. An electric submersible pump has been installed in the well and
$
SALES $70.49
LESS: OPERATING COST ($�.�7)
TRANSPORTATION ($��.47)
NET: $57.85
ROYALTY ($4.66)
NETBACK $53.�9
REALIZED NETBACKS (CDN$)$ 4.66 Royalty
$ 1.17 Op Cost
$ 11.47 Transportation
$ 53.19Netback
6A
VER
Y RES
OU
RC
ES IN
C.
AN
NU
AL R
EPO
RT 2007
PEL 113
• 53 km² (13,100 acres) block
• 35% earned in block
• On SW end of Murteree High oil trend (8 MMBO produced)
• Acquired 3D seismic
• New light oil pool discovery at Toparoa
Light Fingersprospect
7A
VER
Y R
ESO
UR
CES
IN
C.
AN
NU
AL
REP
OR
T 20
07
production has stabilized at approximately 300 bopd (�00 bopd net to Avery’s working interest). Production is projected to continue beyond 20�0. Pricing for the well’s oil production is based on the Tapis crude oil price, an Asian index similar to WTI and Brent. The field netback (sales less field operating costs, transportation and government royalties) for the production has averaged C$53.�9 per barrel. The structure is located approximately one kilometre southwest of the Derrilyn Oil Field, which is currently producing approximately �,000 bopd.
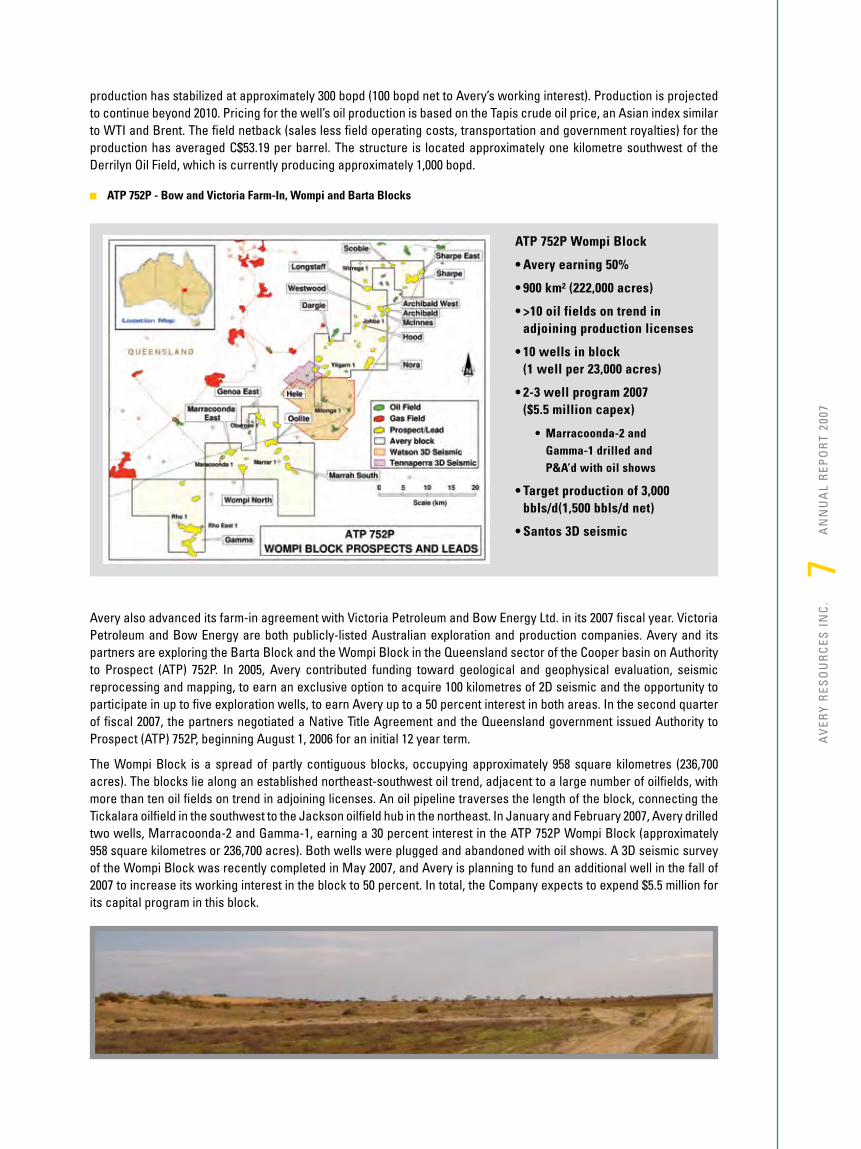
ATP 752P - Bow and Victoria Farm-In, Wompi and Barta Blocks
Avery also advanced its farm-in agreement with Victoria Petroleum and Bow Energy Ltd. in its 2007 fiscal year. Victoria Petroleum and Bow Energy are both publicly-listed Australian exploration and production companies. Avery and its partners are exploring the Barta Block and the Wompi Block in the Queensland sector of the Cooper basin on Authority to Prospect (ATP) 752P. In 2005, Avery contributed funding toward geological and geophysical evaluation, seismic reprocessing and mapping, to earn an exclusive option to acquire �00 kilometres of 2D seismic and the opportunity to participate in up to five exploration wells, to earn Avery up to a 50 percent interest in both areas. In the second quarter of fiscal 2007, the partners negotiated a Native Title Agreement and the Queensland government issued Authority to Prospect (ATP) 752P, beginning August �, 2006 for an initial �2 year term.
The Wompi Block is a spread of partly contiguous blocks, occupying approximately 958 square kilometres (236,700 acres). The blocks lie along an established northeast-southwest oil trend, adjacent to a large number of oilfields, with more than ten oil fields on trend in adjoining licenses. An oil pipeline traverses the length of the block, connecting the Tickalara oilfield in the southwest to the Jackson oilfield hub in the northeast. In January and February 2007, Avery drilled two wells, Marracoonda-2 and Gamma-�, earning a 30 percent interest in the ATP 752P Wompi Block (approximately 958 square kilometres or 236,700 acres). Both wells were plugged and abandoned with oil shows. A 3D seismic survey of the Wompi Block was recently completed in May 2007, and Avery is planning to fund an additional well in the fall of 2007 to increase its working interest in the block to 50 percent. In total, the Company expects to expend $5.5 million for its capital program in this block.
ATP 752P Wompi Block
• Avery earning 50%
• 900 km² (222,000 acres)
• >10 oil fields on trend in adjoining production licenses
• 10 wells in block (1 well per 23,000 acres)
• 2-3 well program 2007 ($5.5 million capex)
• Marracoonda-2 and Gamma-1 drilled and P&A’d with oil shows
• Target production of 3,000 bbls/d(1,500 bbls/d net)
• Santos 3D seismic
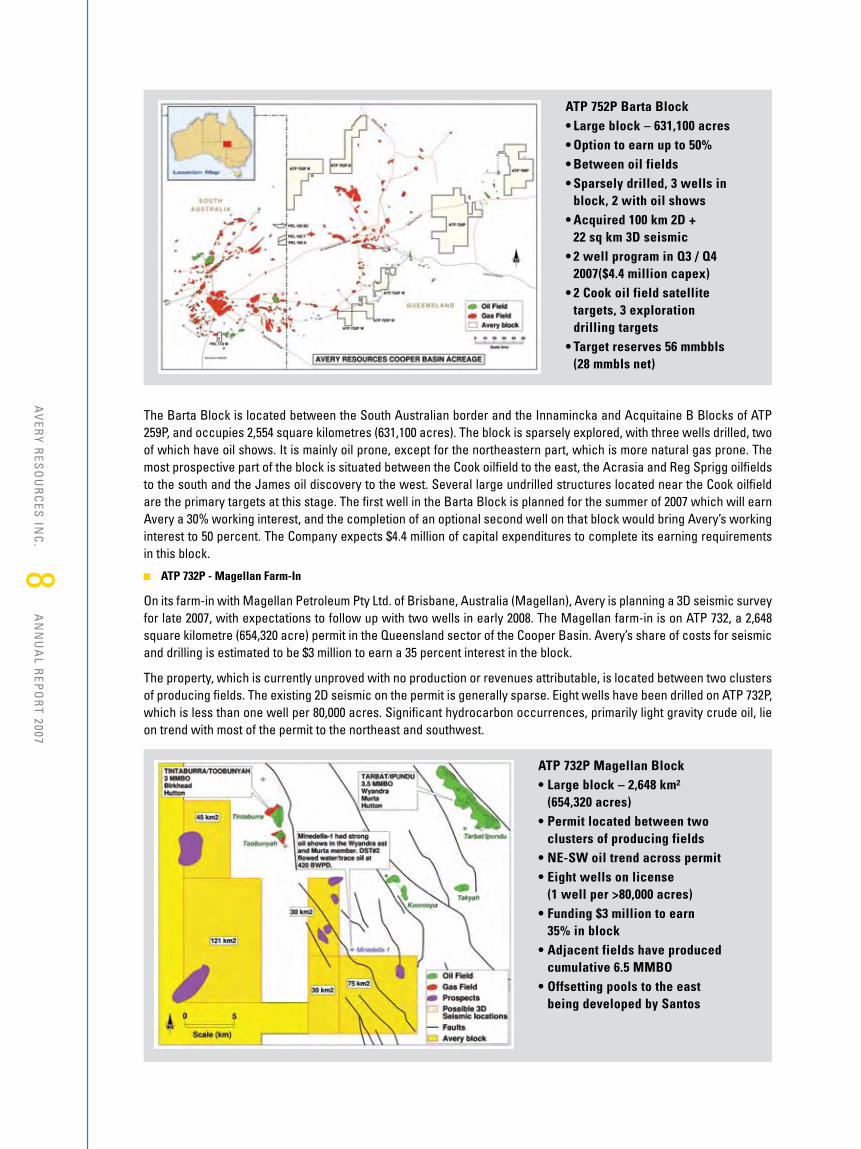
The Barta Block is located between the South Australian border and the Innamincka and Acquitaine B Blocks of ATP 259P, and occupies 2,554 square kilometres (63�,�00 acres). The block is sparsely explored, with three wells drilled, two of which have oil shows. It is mainly oil prone, except for the northeastern part, which is more natural gas prone. The most prospective part of the block is situated between the Cook oilfield to the east, the Acrasia and Reg Sprigg oilfields to the south and the James oil discovery to the west. Several large undrilled structures located near the Cook oilfield are the primary targets at this stage. The first well in the Barta Block is planned for the summer of 2007 which will earn Avery a 30% working interest, and the completion of an optional second well on that block would bring Avery’s working interest to 50 percent. The Company expects $4.4 million of capital expenditures to complete its earning requirements in this block.
ATP 732P - Magellan Farm-In
On its farm-in with Magellan Petroleum Pty Ltd. of Brisbane, Australia (Magellan), Avery is planning a 3D seismic survey for late 2007, with expectations to follow up with two wells in early 2008. The Magellan farm-in is on ATP 732, a 2,648 square kilometre (654,320 acre) permit in the Queensland sector of the Cooper Basin. Avery’s share of costs for seismic and drilling is estimated to be $3 million to earn a 35 percent interest in the block.
The property, which is currently unproved with no production or revenues attributable, is located between two clusters of producing fields. The existing 2D seismic on the permit is generally sparse. Eight wells have been drilled on ATP 732P, which is less than one well per 80,000 acres. Significant hydrocarbon occurrences, primarily light gravity crude oil, lie on trend with most of the permit to the northeast and southwest.
8A
VER
Y RES
OU
RC
ES IN
C.
AN
NU
AL R
EPO
RT 2007
ATP 732P Magellan Block• Large block – 2,648 km² (654,320 acres)• Permit located between two clusters of producing fields• NE-SW oil trend across permit• Eight wells on license (1 well per >80,000 acres)• Funding $3 million to earn 35% in block• Adjacent fields have produced cumulative 6.5 MMBO• Offsetting pools to the east being developed by Santos
ATP 752P Barta Block• Large block – 631,100 acres• Option to earn up to 50%• Between oil fields• Sparsely drilled, 3 wells in block, 2 with oil shows• Acquired 100 km 2D + 22 sq km 3D seismic• 2 well program in Q3 / Q4 2007($4.4 million capex)• 2 Cook oil field satellite targets, 3 exploration drilling targets• Target reserves 56 mmbbls (28 mmbls net)
9A
VER
Y R
ESO
UR
CES
IN
C.
AN
NU
AL
REP
OR
T 20
07
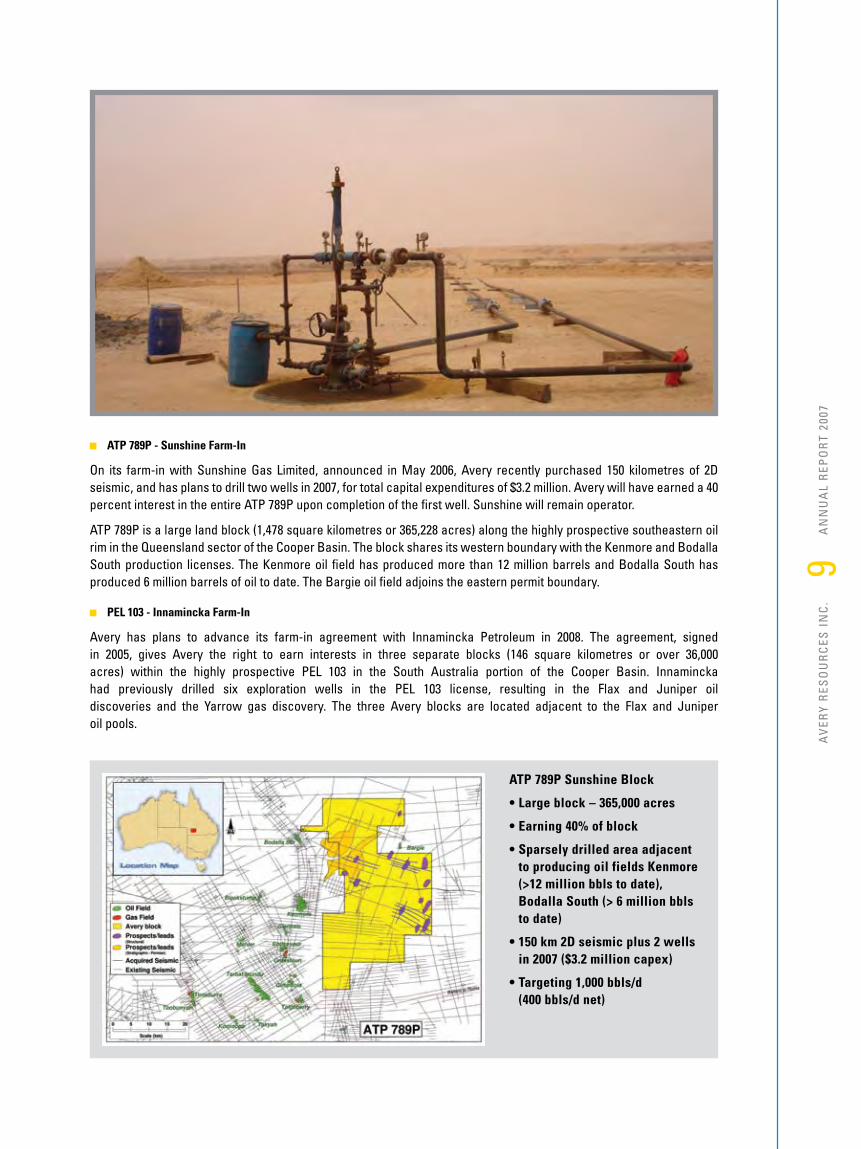
ATP 789P - Sunshine Farm-In
On its farm-in with Sunshine Gas Limited, announced in May 2006, Avery recently purchased �50 kilometres of 2D seismic, and has plans to drill two wells in 2007, for total capital expenditures of $3.2 million. Avery will have earned a 40 percent interest in the entire ATP 789P upon completion of the first well. Sunshine will remain operator.
ATP 789P is a large land block (�,478 square kilometres or 365,228 acres) along the highly prospective southeastern oil rim in the Queensland sector of the Cooper Basin. The block shares its western boundary with the Kenmore and Bodalla South production licenses. The Kenmore oil field has produced more than �2 million barrels and Bodalla South has produced 6 million barrels of oil to date. The Bargie oil field adjoins the eastern permit boundary.
PEL 103 - Innamincka Farm-In
Avery has plans to advance its farm-in agreement with Innamincka Petroleum in 2008. The agreement, signed in 2005, gives Avery the right to earn interests in three separate blocks (�46 square kilometres or over 36,000 acres) within the highly prospective PEL �03 in the South Australia portion of the Cooper Basin. Innamincka had previously drilled six exploration wells in the PEL �03 license, resulting in the Flax and Juniper oil discoveries and the Yarrow gas discovery. The three Avery blocks are located adjacent to the Flax and Juniper oil pools.
ATP 789P Sunshine Block
• Large block – 365,000 acres
• Earning 40% of block
• Sparsely drilled area adjacent to producing oil fields Kenmore (>12 million bbls to date), Bodalla South (> 6 million bbls to date)
• 150 km 2D seismic plus 2 wells in 2007 ($3.2 million capex)
• Targeting 1,000 bbls/d (400 bbls/d net)
In November and December 2005, Avery drilled, plugged and abandoned two wells under this agreement, earning a 25 percent interest in the Aspen Block (approximately �3,590 acres) and partially earning a 25 percent interest in the South Candra Block. Avery plans to drill a second well in the South Candra Block (approximately ��,370 acres) in the second half of 2008 to complete its 25 percent earning requirements in that block. Avery also intends to contribute to the cost of a 3D seismic survey to earn a 35 percent interest in the Turban Block (also approximately ��,370 acres).
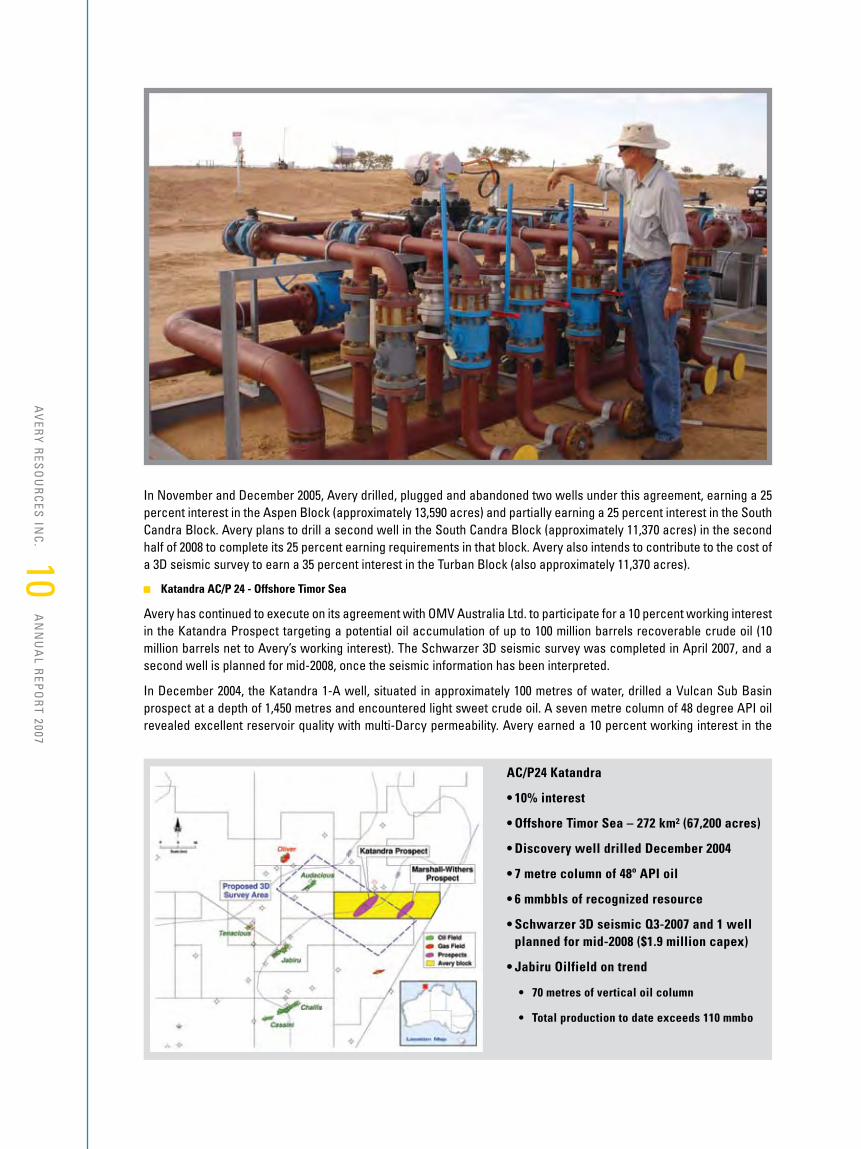
Katandra AC/P 24 - Offshore Timor Sea
Avery has continued to execute on its agreement with OMV Australia Ltd. to participate for a �0 percent working interest in the Katandra Prospect targeting a potential oil accumulation of up to �00 million barrels recoverable crude oil (�0 million barrels net to Avery’s working interest). The Schwarzer 3D seismic survey was completed in April 2007, and a second well is planned for mid-2008, once the seismic information has been interpreted.
In December 2004, the Katandra �-A well, situated in approximately �00 metres of water, drilled a Vulcan Sub Basin prospect at a depth of �,450 metres and encountered light sweet crude oil. A seven metre column of 48 degree API oil revealed excellent reservoir quality with multi-Darcy permeability. Avery earned a �0 percent working interest in the
AC/P24 Katandra
• 10% interest
• Offshore Timor Sea – 272 km² (67,200 acres)
• Discovery well drilled December 2004
• 7 metre column of 48º API oil
• 6 mmbbls of recognized resource
• Schwarzer 3D seismic Q3-2007 and 1 well planned for mid-2008 ($1.9 million capex)
• Jabiru Oilfield on trend
• 70 metres of vertical oil column
• Total production to date exceeds 110 mmbo
�0A
VER
Y RES
OU
RC
ES IN
C.
AN
NU
AL R
EPO
RT 2007
��A
VER
Y R
ESO
UR
CES
IN
C.
AN
NU
AL
REP
OR
T 20
07
discovery and the entire 272 square kilometre (67,200 acre) permit, AC/P 24. In May 2005, the license on AC/P 24 was renewed for a further five-year term.
The Katandra Prospect lies on strike with the Jabiru Oilfield, 28 kilometres to the southwest, which has production to date of over ��0 million barrels. It is also on trend with Challis and Casini oil fields, all of which produce from Jurassic and Triassic age reservoirs.
Canada
Avery owns a non-operated interest in two sections (�,280 acres) of developed lands in the Fox Creek area of Northern Alberta. These lands include four producing gas wells netting production to Avery of approximately 63 barrels of oil equivalent per day (boepd).
Corporate
In October 2006 Avery engaged Paradigm Capital Inc. to act as agent in connection with a private placement of Avery common shares. After marketing the financing in several cities in Canada and the US, on October 3� it was priced at $0.50 per share, and on November �5 the financing was completed, raising gross proceeds of $�0 million. Proceeds from the offering are being used to fund Avery’s Australian exploration and development program.
LISA MELNYK Asst Corp Secretary
KRISTIN MacGREGOR Administration
AUDITORS
KPMG LLP • Calgary, Canada
LEGAL COUNSEL
Borden Ladner Gervais • Calgary, Canada
BANKERS
Royal Bank of Canada • Calgary, Canada
West Pac Bank • Brisbane, Australia
Commonwealth Bank • Brisbane, Australia
REGISTRAR AND TRANSFER AGENT
Valiant Trust Corporation • Calgary, Canada
INVESTOR RELATIONS
Bryan Mills Iradesso • Calgary, Canada
DIRECTORS
David A. Little (Chairman)
Richard N. Edgar
John H. Carruthers
Judith Stripling
Stephen Peacock
Ian Towers
James Howe
GOVERNANCE AND DISCLOSURE COMMITTEE
All Directors are members of the Committee
BRYAN GOUDIE Chief Financial Officer
CORPORATE INFORMATIONAUDIT COMMITTEE
James Howe
Ian Towers
Judith Stripling
RESERVES COMMITTEE
Ian Towers
Stephen Peacock
Richard Edgar
COMPENSATION COMMITTEE
Stephen Peacock
Judith Stripling
Ian Towers
OFFICERS
David A. Little, Chief Executive Officer
Richard N. Edgar, President
John H. Carruthers, Executive Vice President
Paul Lipski, Managing Director, Australia
Bryan Goudie, Chief Financial Officer
Melinda Park, Secretary
STOCK EXCHANGE LISTING
TSX Venture Exchange: ARY
Designed & Produced by Bryan Mills Iradesso
�2A
VER
Y RES
OU
RC
ES IN
C.
AN
NU
AL R
EPO
RT 2007
ANNUAL GENERAL MEETING
Avery’s annual meeting of shareholders will be held at �0am on August 29th in the 5th floor auditorium, 7�5 – 5th Avenue SW. All shareholders are encouraged to complete and return their form of proxy to ensure their vote is counted. All shareholders are invited to attend the meeting.
1
Contents
Managements Discussion and Analysis – 2
Consolidated Financial Statements – 14
Notes to Financial Statements – 20
2
Management’s Discussion and Analysis Management’s Discussion and Analysis (MD&A) is dated July 5, 2007. The MD&A should be read in conjunction with Avery Resources Inc.’s (“Avery” or the “Corporation’s”) audited consolidated financial statements and notes thereto as at and for the year ended March 31, 2007 and 2006. BASIS OF PRESENTATION The financial data presented below has been prepared in accordance with Canadian Generally Accepted Accounting Principles (“GAAP”). The interim unaudited consolidated financial information for the three months ended March 31, 2007 and 2006 and December 31, 2006 has not been reviewed by the Company’s auditors. The reporting and the measuring currency is the Canadian dollar. FORWARD-LOOKING STATEMENTS Certain statements herein may constitute forward-looking statements, which can generally be identified as such because of the context of the statements, including words such as believes, anticipates, expects, plans, estimates or words of a similar nature. The forward-looking statements are based on current expectations and are subject to known and unknown risks, uncertainties and other factors that may cause the actual results, performance or achievements of the Company to be materially different from any future results. All such forward-looking information is based on certain assumptions and analyses made by Avery in light of the Corporation’s experience and perception of historical trends, current conditions and expected future developments, as well as other factors Avery believes are appropriate in the circumstances. The risks, uncertainties, and assumptions are difficult to predict and may affect operations, including, without limitation: the risks of foreign operations; foreign exchange fluctuations; commodity prices; equipment and labour shortages; inflationary costs; general economic conditions; industry conditions; changes in applicable environmental, taxation and other laws and regulations as well as how such laws and regulations are interpreted and enforced; the ability of oil and natural gas companies to raise capital; the effect of weather conditions on operations and facilities; the existence of operating risks; volatility of oil and natural gas prices; oil and natural gas product supply and demand; uncertainties associated with estimating reserves; incorrect assessments of the value of acquisitions; geological, technical, drilling and processing problems; risks inherent in the ability to generate sufficient cash flow from operations to meet current and future obligations; increased competition; stock market volatility; opportunities available to or pursued by Avery and other factors, many of which are beyond the Corporation’s control. The foregoing factors are not exhaustive and are further discussed herein under the heading “Business Risks” and under the heading “Risk Factors” in the Annual Information Form of Avery filed on SEDAR at www.sedar.com. Additional information about the Corporation can also be found on our website at www.averyresources.com. NON-GAAP MEASURES Included in this report are references to terms commonly used in the oil and gas industry, such as funds flow from operations and operating netback, which are not recognized measures under Canadian GAAP and therefore may not be comparable to performance measures presented by others. The term funds flow from operations represents cash flow from operating activities prior to changes in non-cash working capital. Operating netbacks represent petroleum and natural gas sales less royalties, operating and transportation costs. Management believes that in addition to net income (loss), funds flow from operations and operating netback are useful supplemental measures as they provide an indication of Avery’s operating performance, leverage and liquidity. Investors should be cautioned, however, that these measures should not be construed as an alternative to net income determined in accordance with GAAP as an indication of Avery’s performance. In conformity with National Instrument 51-101, Standards of Disclosure for Oil and Gas Activities, natural gas volumes have been converted to barrels of oil equivalent (“boe”) using a conversion ratio of six thousand cubic feet (“mcf”) of natural gas to one barrel (“bbl”) of oil. This ratio is based on an energy equivalency conversion method primarily applicable at the burner tip and does not represent a value equivalency at the wellhead. Readers are cautioned that boe’s may be misleading, particularly if used in isolation.
3
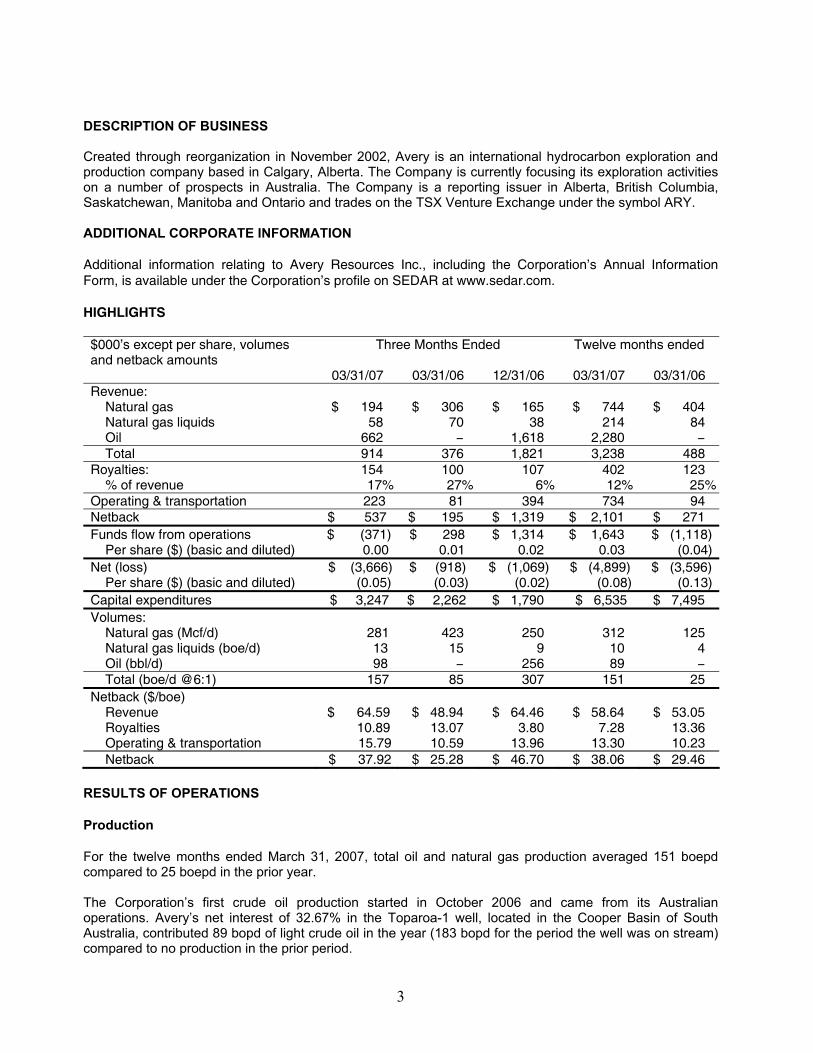
DESCRIPTION OF BUSINESS Created through reorganization in November 2002, Avery is an international hydrocarbon exploration and production company based in Calgary, Alberta. The Company is currently focusing its exploration activities on a number of prospects in Australia. The Company is a reporting issuer in Alberta, British Columbia, Saskatchewan, Manitoba and Ontario and trades on the TSX Venture Exchange under the symbol ARY. ADDITIONAL CORPORATE INFORMATION Additional information relating to Avery Resources Inc., including the Corporation’s Annual Information Form, is available under the Corporation’s profile on SEDAR at www.sedar.com. HIGHLIGHTS $000’s except per share, volumes and netback amounts
Three Months Ended Twelve months ended
03/31/07 03/31/06 12/31/06 03/31/07 03/31/06 Revenue:
Natural gas $ 194 $ 306 $ 165 $ 744 $ 404 Natural gas liquids 58 70 38 214 84 Oil 662 − 1,618 2,280 − Total 914 376 1,821 3,238 488
Royalties: 154 100 107 402 123 % of revenue 17% 27% 6% 12% 25%
Operating & transportation 223 81 394 734 94 Netback $ 537 $ 195 $ 1,319 $ 2,101 $ 271 Funds flow from operations $ (371) $ 298 $ 1,314 $ 1,643 $ (1,118)
Per share ($) (basic and diluted) 0.00 0.01 0.02 0.03 (0.04)Net (loss) $ (3,666) $ (918) $ (1,069) $ (4,899) $ (3,596)
Per share ($) (basic and diluted) (0.05) (0.03) (0.02) (0.08) (0.13)Capital expenditures $ 3,247 $ 2,262 $ 1,790 $ 6,535 $ 7,495 Volumes:
Natural gas (Mcf/d) 281 423 250 312 125 Natural gas liquids (boe/d) 13 15 9 10 4 Oil (bbl/d) 98 − 256 89 − Total (boe/d @6:1) 157 85 307 151 25
Netback ($/boe) Revenue $ 64.59 $ 48.94 $ 64.46 $ 58.64 $ 53.05 Royalties 10.89 13.07 3.80 7.28 13.36 Operating & transportation 15.79 10.59 13.96 13.30 10.23 Netback $ 37.92 $ 25.28 $ 46.70 $ 38.06 $ 29.46
RESULTS OF OPERATIONS Production For the twelve months ended March 31, 2007, total oil and natural gas production averaged 151 boepd compared to 25 boepd in the prior year. The Corporation’s first crude oil production started in October 2006 and came from its Australian operations. Avery’s net interest of 32.67% in the Toparoa-1 well, located in the Cooper Basin of South Australia, contributed 89 bopd of light crude oil in the year (183 bopd for the period the well was on stream) compared to no production in the prior period.
4
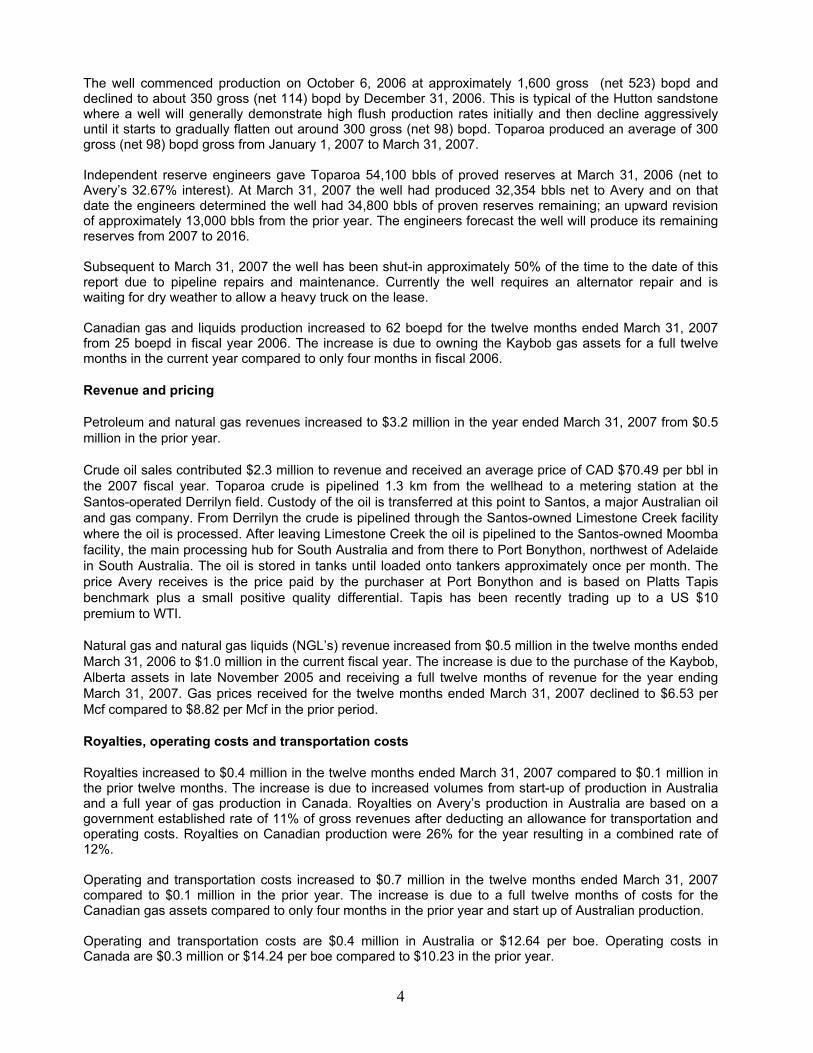
The well commenced production on October 6, 2006 at approximately 1,600 gross (net 523) bopd and declined to about 350 gross (net 114) bopd by December 31, 2006. This is typical of the Hutton sandstone where a well will generally demonstrate high flush production rates initially and then decline aggressively until it starts to gradually flatten out around 300 gross (net 98) bopd. Toparoa produced an average of 300 gross (net 98) bopd gross from January 1, 2007 to March 31, 2007. Independent reserve engineers gave Toparoa 54,100 bbls of proved reserves at March 31, 2006 (net to Avery’s 32.67% interest). At March 31, 2007 the well had produced 32,354 bbls net to Avery and on that date the engineers determined the well had 34,800 bbls of proven reserves remaining; an upward revision of approximately 13,000 bbls from the prior year. The engineers forecast the well will produce its remaining reserves from 2007 to 2016. Subsequent to March 31, 2007 the well has been shut-in approximately 50% of the time to the date of this report due to pipeline repairs and maintenance. Currently the well requires an alternator repair and is waiting for dry weather to allow a heavy truck on the lease. Canadian gas and liquids production increased to 62 boepd for the twelve months ended March 31, 2007 from 25 boepd in fiscal year 2006. The increase is due to owning the Kaybob gas assets for a full twelve months in the current year compared to only four months in fiscal 2006. Revenue and pricing Petroleum and natural gas revenues increased to $3.2 million in the year ended March 31, 2007 from $0.5 million in the prior year. Crude oil sales contributed $2.3 million to revenue and received an average price of CAD $70.49 per bbl in the 2007 fiscal year. Toparoa crude is pipelined 1.3 km from the wellhead to a metering station at the Santos-operated Derrilyn field. Custody of the oil is transferred at this point to Santos, a major Australian oil and gas company. From Derrilyn the crude is pipelined through the Santos-owned Limestone Creek facility where the oil is processed. After leaving Limestone Creek the oil is pipelined to the Santos-owned Moomba facility, the main processing hub for South Australia and from there to Port Bonython, northwest of Adelaide in South Australia. The oil is stored in tanks until loaded onto tankers approximately once per month. The price Avery receives is the price paid by the purchaser at Port Bonython and is based on Platts Tapis benchmark plus a small positive quality differential. Tapis has been recently trading up to a US $10 premium to WTI. Natural gas and natural gas liquids (NGL’s) revenue increased from $0.5 million in the twelve months ended March 31, 2006 to $1.0 million in the current fiscal year. The increase is due to the purchase of the Kaybob, Alberta assets in late November 2005 and receiving a full twelve months of revenue for the year ending March 31, 2007. Gas prices received for the twelve months ended March 31, 2007 declined to $6.53 per Mcf compared to $8.82 per Mcf in the prior period. Royalties, operating costs and transportation costs Royalties increased to $0.4 million in the twelve months ended March 31, 2007 compared to $0.1 million in the prior twelve months. The increase is due to increased volumes from start-up of production in Australia and a full year of gas production in Canada. Royalties on Avery’s production in Australia are based on a government established rate of 11% of gross revenues after deducting an allowance for transportation and operating costs. Royalties on Canadian production were 26% for the year resulting in a combined rate of 12%. Operating and transportation costs increased to $0.7 million in the twelve months ended March 31, 2007 compared to $0.1 million in the prior year. The increase is due to a full twelve months of costs for the Canadian gas assets compared to only four months in the prior year and start up of Australian production. Operating and transportation costs are $0.4 million in Australia or $12.64 per boe. Operating costs in Canada are $0.3 million or $14.24 per boe compared to $10.23 in the prior year.
5
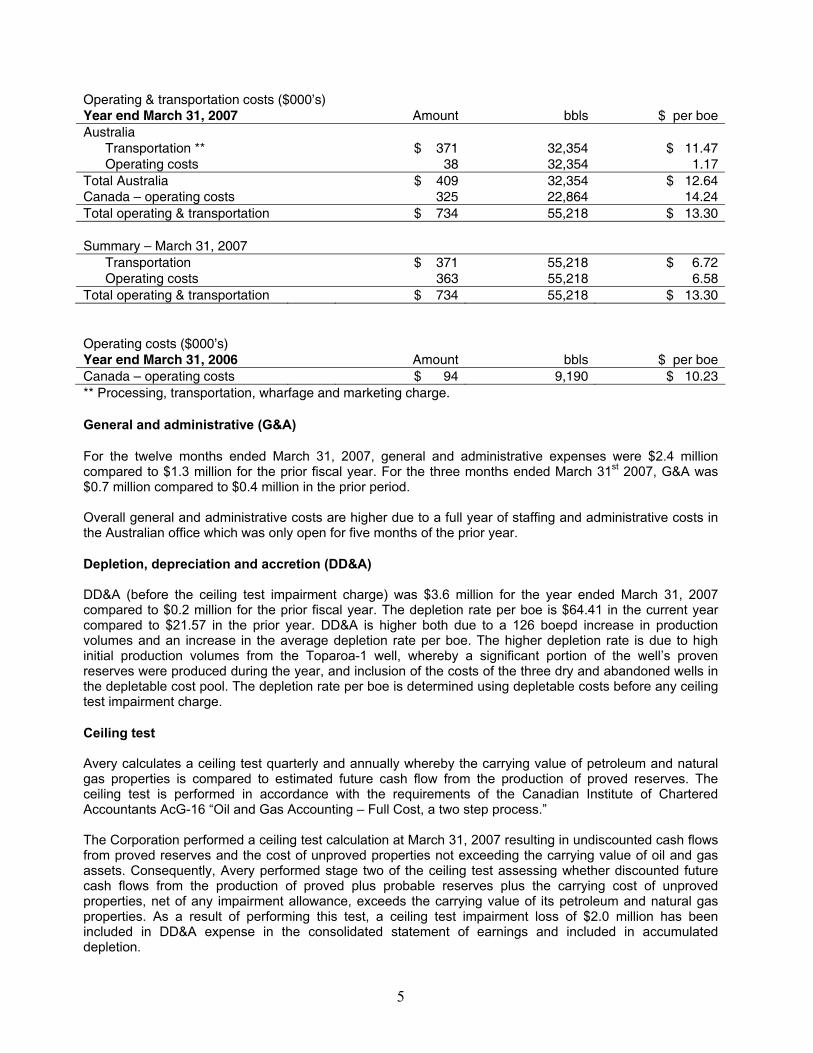
Operating & transportation costs ($000’s) Year end March 31, 2007 Amount bbls $ per boeAustralia
Transportation ** $ 371 32,354 $ 11.47Operating costs 38 32,354 1.17
Total Australia $ 409 32,354 $ 12.64Canada – operating costs 325 22,864 14.24Total operating & transportation $ 734 55,218 $ 13.30 Summary – March 31, 2007
Transportation $ 371 55,218 $ 6.72Operating costs 363 55,218 6.58
Total operating & transportation $ 734 55,218 $ 13.30 Operating costs ($000’s) Year end March 31, 2006 Amount bbls $ per boeCanada – operating costs $ 94 9,190 $ 10.23** Processing, transportation, wharfage and marketing charge. General and administrative (G&A) For the twelve months ended March 31, 2007, general and administrative expenses were $2.4 million compared to $1.3 million for the prior fiscal year. For the three months ended March 31st 2007, G&A was $0.7 million compared to $0.4 million in the prior period. Overall general and administrative costs are higher due to a full year of staffing and administrative costs in the Australian office which was only open for five months of the prior year. Depletion, depreciation and accretion (DD&A) DD&A (before the ceiling test impairment charge) was $3.6 million for the year ended March 31, 2007 compared to $0.2 million for the prior fiscal year. The depletion rate per boe is $64.41 in the current year compared to $21.57 in the prior year. DD&A is higher both due to a 126 boepd increase in production volumes and an increase in the average depletion rate per boe. The higher depletion rate is due to high initial production volumes from the Toparoa-1 well, whereby a significant portion of the well’s proven reserves were produced during the year, and inclusion of the costs of the three dry and abandoned wells in the depletable cost pool. The depletion rate per boe is determined using depletable costs before any ceiling test impairment charge. Ceiling test Avery calculates a ceiling test quarterly and annually whereby the carrying value of petroleum and natural gas properties is compared to estimated future cash flow from the production of proved reserves. The ceiling test is performed in accordance with the requirements of the Canadian Institute of Chartered Accountants AcG-16 “Oil and Gas Accounting – Full Cost, a two step process.” The Corporation performed a ceiling test calculation at March 31, 2007 resulting in undiscounted cash flows from proved reserves and the cost of unproved properties not exceeding the carrying value of oil and gas assets. Consequently, Avery performed stage two of the ceiling test assessing whether discounted future cash flows from the production of proved plus probable reserves plus the carrying cost of unproved properties, net of any impairment allowance, exceeds the carrying value of its petroleum and natural gas properties. As a result of performing this test, a ceiling test impairment loss of $2.0 million has been included in DD&A expense in the consolidated statement of earnings and included in accumulated depletion.
6
In the prior year DD&A includes an impairment charge of $1.7 million associated with the drilling of two dry holes in the Pine/Aspen area in the Cooper Basin of Australia. Accretion of convertible term note On March 6, 2006 the Term Note was converted to 987,667 common shares. During the twelve months ended March 31, 2006 $31,379 of accretion on the Term Note of $592,600 face value was expensed. There are no similar charges for the current fiscal year. Stock based compensation For the twelve month period ended March 31, 2007, stock-based compensation expense was $1.0 million compared with $0.6 million for the prior fiscal year. The increase over the prior year is a result of an increase in the number of options granted in the current fiscal year over the prior year – see share capital section below. Mitigation payment In recognition of production delays related to one of Avery’s joint ventures in Australia and in accordance with the related production arrangement, the Corporation received a one-time payment of $1.4 million in the year ended March 31, 2007. FOURTH QUARTER RESULTS Production volumes increased to 157 boepd in the fourth quarter ended March 31, 2007 compared to 85 boepd in the same period of the prior year. Volumes in the fourth quarter of fiscal 2007 declined to 157 boepd from 307 boepd in the third quarter ended December 31, 2006 as a result of prolific Toparoa production in quarter three which has resulted in significant drainage of the pool. Natural gas production in the fourth quarter ended March 31, 2007 decreased to 281 mcf per day from 423 mcf per day in the prior period as a result of natural decline of the four Kaybob gas wells acquired in November 2005. Crude oil and natural gas liquids volumes increased to 111 boepd compared to 15 boepd in the prior period as a result of start up of Australian oil production on October 6, 2006. Natural gas and liquids revenue for the fourth quarter ended March 31, 2007 was $0.3 million compared to $0.4 million in the prior period. The average price received for the fourth quarter of 2007 was $7.70 per mcf for gas and $72.38 per barrel for liquids compared to $8.04 and $51.85 for gas and liquids respectively in the prior period. Royalties for the fourth quarter of 2007 were $0.2 million or 17 percent of revenue compared to $0.1 million or 27% in the prior period. On a per barrel basis royalties were $10.89 per boe compared to $13.07 per boe in the prior period. Royalty expense increased due to addition of Australian crude production but declined per boe as effective royalties in Australia are approximately 7%. Operating and transportation costs were $0.2 million for the fourth quarter of fiscal 2007 or $15.79 per boe compared to $0.1 million or $10.59 in the fourth quarter ended March 31, 2006. The increase in operating costs is also due to start up of Australian crude oil production. On a boe basis costs went up due to a general increase in costs of production in Alberta. Depletion, depreciation and accretion (before ceiling test write-down) increased to $1.2 million for the quarter ended March 31, 2007 from $0.2 million in the comparable period of 2006. The increase is due to start up of production from Kaybob on November 24, 2005 and start-up of Australian production on October 6, 2006. A ceiling test impairment charge of $2.0 million was recorded in the fourth quarter ended March 31, 2007 with no similar charge in the prior period.
7
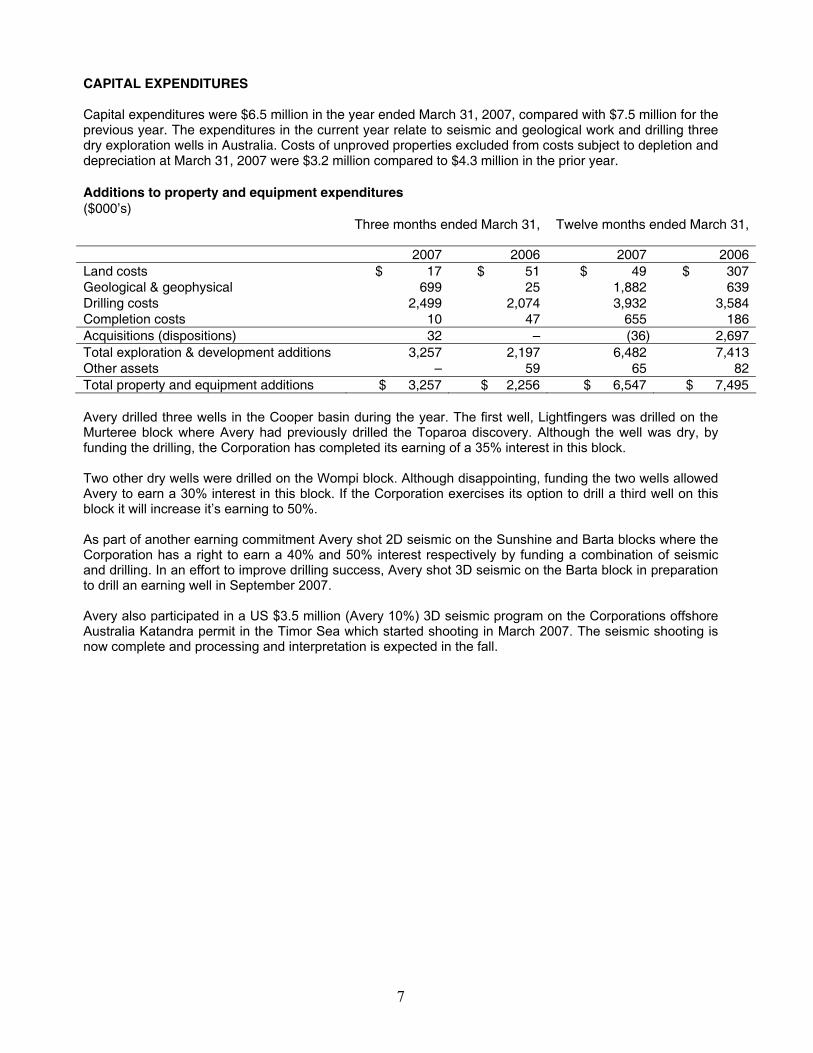
CAPITAL EXPENDITURES Capital expenditures were $6.5 million in the year ended March 31, 2007, compared with $7.5 million for the previous year. The expenditures in the current year relate to seismic and geological work and drilling three dry exploration wells in Australia. Costs of unproved properties excluded from costs subject to depletion and depreciation at March 31, 2007 were $3.2 million compared to $4.3 million in the prior year. Additions to property and equipment expenditures ($000’s) Three months ended March 31, Twelve months ended March 31,
2007 2006 2007 2006Land costs $ 17 $ 51 $ 49 $ 307Geological & geophysical 699 25 1,882 639Drilling costs 2,499 2,074 3,932 3,584Completion costs 10 47 655 186Acquisitions (dispositions) 32 – (36) 2,697Total exploration & development additions 3,257 2,197 6,482 7,413Other assets – 59 65 82Total property and equipment additions $ 3,257 $ 2,256 $ 6,547 $ 7,495 Avery drilled three wells in the Cooper basin during the year. The first well, Lightfingers was drilled on the Murteree block where Avery had previously drilled the Toparoa discovery. Although the well was dry, by funding the drilling, the Corporation has completed its earning of a 35% interest in this block. Two other dry wells were drilled on the Wompi block. Although disappointing, funding the two wells allowed Avery to earn a 30% interest in this block. If the Corporation exercises its option to drill a third well on this block it will increase it’s earning to 50%. As part of another earning commitment Avery shot 2D seismic on the Sunshine and Barta blocks where the Corporation has a right to earn a 40% and 50% interest respectively by funding a combination of seismic and drilling. In an effort to improve drilling success, Avery shot 3D seismic on the Barta block in preparation to drill an earning well in September 2007. Avery also participated in a US $3.5 million (Avery 10%) 3D seismic program on the Corporations offshore Australia Katandra permit in the Timor Sea which started shooting in March 2007. The seismic shooting is now complete and processing and interpretation is expected in the fall.
8
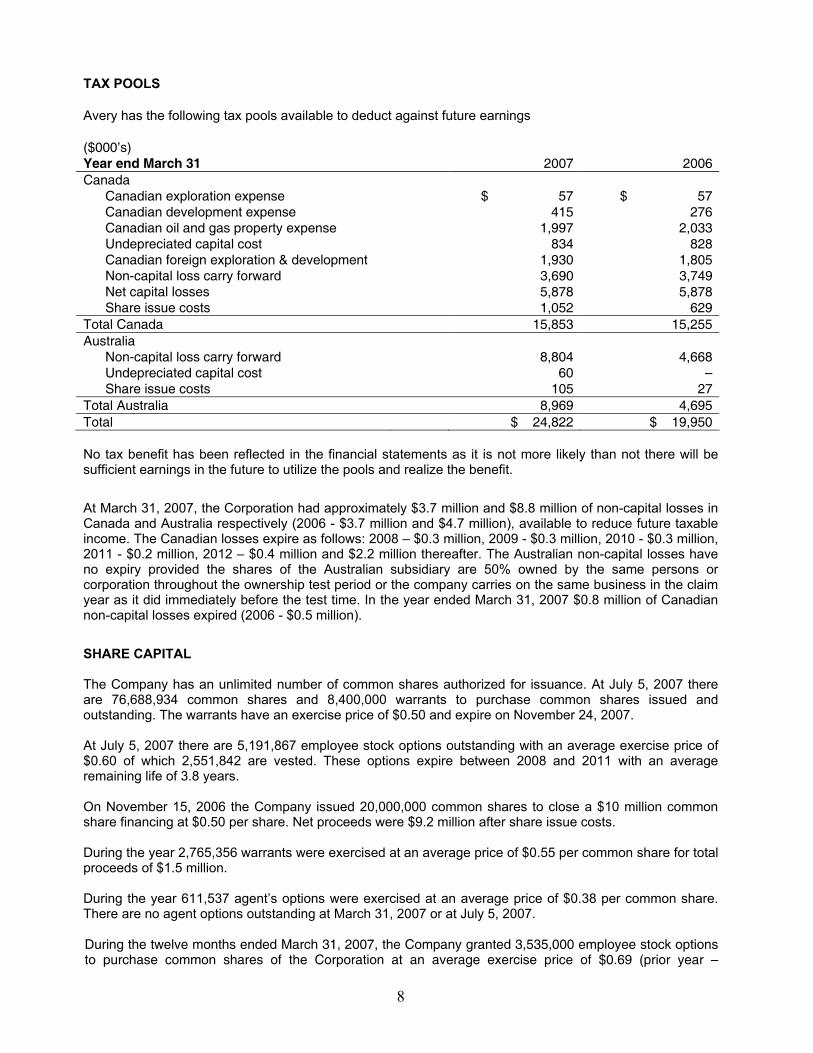
TAX POOLS Avery has the following tax pools available to deduct against future earnings ($000’s) Year end March 31 2007 2006Canada
Canadian exploration expense $ 57 $ 57Canadian development expense 415 276Canadian oil and gas property expense 1,997 2,033Undepreciated capital cost 834 828Canadian foreign exploration & development 1,930 1,805Non-capital loss carry forward 3,690 3,749Net capital losses 5,878 5,878Share issue costs 1,052 629
Total Canada 15,853 15,255Australia
Non-capital loss carry forward 8,804 4,668Undepreciated capital cost 60 – Share issue costs 105 27
Total Australia 8,969 4,695 Total $ 24,822 $ 19,950 No tax benefit has been reflected in the financial statements as it is not more likely than not there will be sufficient earnings in the future to utilize the pools and realize the benefit.
At March 31, 2007, the Corporation had approximately $3.7 million and $8.8 million of non-capital losses in Canada and Australia respectively (2006 - $3.7 million and $4.7 million), available to reduce future taxable income. The Canadian losses expire as follows: 2008 – $0.3 million, 2009 - $0.3 million, 2010 - $0.3 million, 2011 - $0.2 million, 2012 – $0.4 million and $2.2 million thereafter. The Australian non-capital losses have no expiry provided the shares of the Australian subsidiary are 50% owned by the same persons or corporation throughout the ownership test period or the company carries on the same business in the claim year as it did immediately before the test time. In the year ended March 31, 2007 $0.8 million of Canadian non-capital losses expired (2006 - $0.5 million).
SHARE CAPITAL The Company has an unlimited number of common shares authorized for issuance. At July 5, 2007 there are 76,688,934 common shares and 8,400,000 warrants to purchase common shares issued and outstanding. The warrants have an exercise price of $0.50 and expire on November 24, 2007. At July 5, 2007 there are 5,191,867 employee stock options outstanding with an average exercise price of $0.60 of which 2,551,842 are vested. These options expire between 2008 and 2011 with an average remaining life of 3.8 years. On November 15, 2006 the Company issued 20,000,000 common shares to close a $10 million common share financing at $0.50 per share. Net proceeds were $9.2 million after share issue costs. During the year 2,765,356 warrants were exercised at an average price of $0.55 per common share for total proceeds of $1.5 million. During the year 611,537 agent’s options were exercised at an average price of $0.38 per common share. There are no agent options outstanding at March 31, 2007 or at July 5, 2007. During the twelve months ended March 31, 2007, the Company granted 3,535,000 employee stock options to purchase common shares of the Corporation at an average exercise price of $0.69 (prior year –
9
1,225,000 options granted at an average exercise price of $0.44). These options were granted to officers and directors of the Corporation and have a five year term. LIQUIDITY AND CAPITAL RESOURCES The Company had working capital of $9.1 million at March 31, 2007 compared to working capital of $3.1 million at March 31, 2006. As the Company is in the early stages of exploration and development and is just beginning to generate significant operating revenue, most activities to date have been funded through the issuance of share capital, convertible debt, and shareholder loans. It is expected that further equity financings will be used to fund ongoing operations and the Corporation’s projected capital program, supplemented by cash flow from operations, working capital and debt when the level of operations provide borrowing capacity. OUTLOOK Exploration activity The Corporation continues to build its inventory of drilling projects in both the onshore Cooper Basin and offshore in the Timor Sea regions of Australia. The Corporation expects to have ongoing quarterly drilling activity commencing in the late third quarter of 2007. Current plans show a total of 10 drilling locations in inventory with a net capital cost to Avery of approximately $18 million. Additional seismic programs are planned with a net cost to Avery of $5 million. The Corporation expects to finance these expenditures through a combination of existing cash, incremental cash flow and third party participation. Recent activity
• In the last quarter two wells were drilled at the Marracoonda and Gamma prospects in the Wompi project area of the Cooper Basin. The wells were plugged and abandoned after failing to find hydrocarbons. Prior to location selection and future drilling in the Wompi block three dimensional (3D) seismic is being acquired with completion of acquisition and processing expected by August of 2007.
• The previously announced Schwarzer 3D seismic acquisition program over the Katandra discovery was completed in late April and processing and interpretation are underway with an expected completion date late in the third quarter.
• Seismic acquisition of 150 line kilometers of 2D was completed on the Sunshine block and interpretation is expected to be completed during the third quarter with drilling of up to a two well program scheduled for the fourth quarter.
• Final interpretation and location selection for the first well on the Barta block has been completed. A drilling rig has been contracted with drilling planned for September.
• Evaluation of 3D seismic acquired over the Innamincka block is ongoing. • Gazettal of Native Land Claims resolution was initiated in late April of 2007 for the Magellan block
and barring intervention the process will conclude in late August of 2007. OFF BALANCE SHEET TRANSACTIONS The Company does not have any off balance sheet transactions. CONTRACTUAL ARRANGEMENTS The Corporation is committed to minimum annual operating lease payments on its premises in Canada and Australia in the amount of $0.2 million over each of the next four years. The Corporation also has asset retirement obligations with respect to the abandonment and reclamation of wells and facilities owned by the Corporation. Avery includes the present value of the estimated liabilities for such costs on its balance sheet. The total estimated discounted cost of these liabilities at March 31, 2007 was $0.1 million.
10
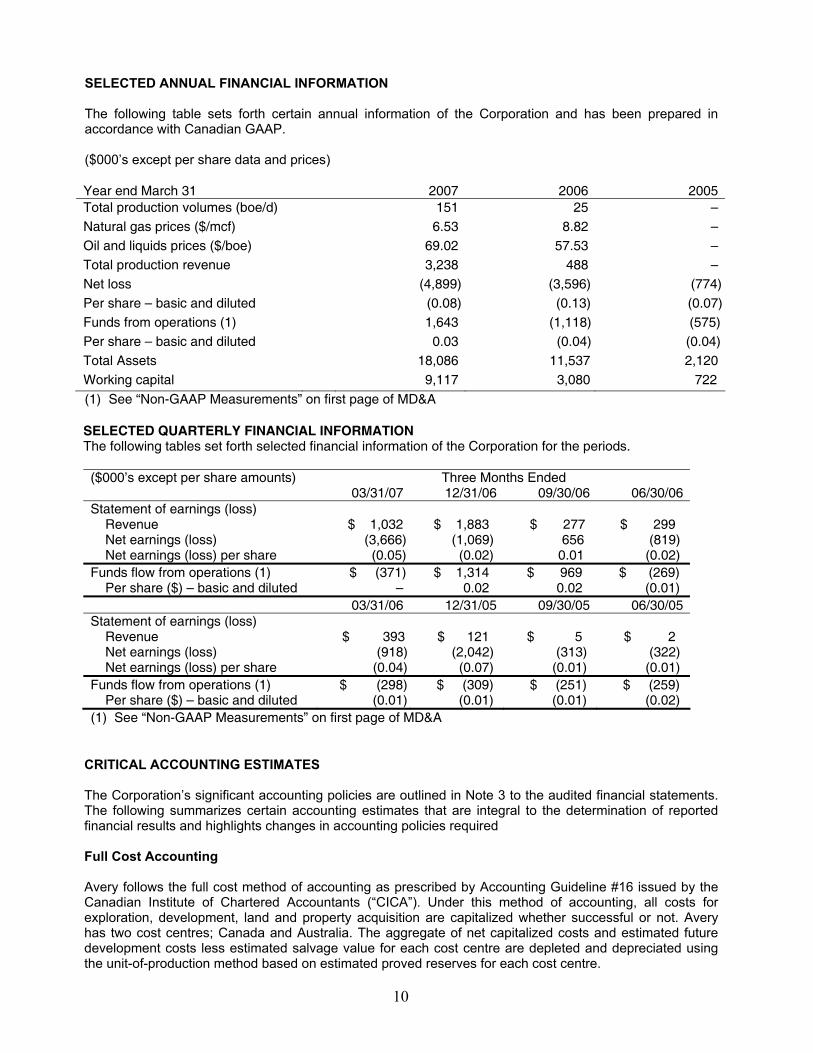
SELECTED ANNUAL FINANCIAL INFORMATION The following table sets forth certain annual information of the Corporation and has been prepared in accordance with Canadian GAAP. ($000’s except per share data and prices) Year end March 31 2007 2006 2005Total production volumes (boe/d) 151 25 –Natural gas prices ($/mcf) 6.53 8.82 –Oil and liquids prices ($/boe) 69.02 57.53 –Total production revenue 3,238 488 –Net loss (4,899) (3,596) (774)Per share – basic and diluted (0.08) (0.13) (0.07)Funds from operations (1) 1,643 (1,118) (575)Per share – basic and diluted 0.03 (0.04) (0.04)Total Assets 18,086 11,537 2,120Working capital 9,117 3,080 722 (1) See “Non-GAAP Measurements” on first page of MD&A SELECTED QUARTERLY FINANCIAL INFORMATION The following tables set forth selected financial information of the Corporation for the periods. ($000’s except per share amounts) Three Months Ended 03/31/07 12/31/06 09/30/06 06/30/06Statement of earnings (loss)
Revenue $ 1,032 $ 1,883 $ 277 $ 299 Net earnings (loss) (3,666) (1,069) 656 (819) Net earnings (loss) per share (0.05) (0.02) 0.01 (0.02)
Funds flow from operations (1) $ (371) $ 1,314 $ 969 $ (269) Per share ($) – basic and diluted – 0.02 0.02 (0.01)
03/31/06 12/31/05 09/30/05 06/30/05Statement of earnings (loss)
Revenue $ 393 $ 121 $ 5 $ 2 Net earnings (loss) (918) (2,042) (313) (322) Net earnings (loss) per share (0.04) (0.07) (0.01) (0.01)
Funds flow from operations (1) $ (298) $ (309) $ (251) $ (259) Per share ($) – basic and diluted (0.01) (0.01) (0.01) (0.02)
(1) See “Non-GAAP Measurements” on first page of MD&A CRITICAL ACCOUNTING ESTIMATES The Corporation’s significant accounting policies are outlined in Note 3 to the audited financial statements. The following summarizes certain accounting estimates that are integral to the determination of reported financial results and highlights changes in accounting policies required Full Cost Accounting Avery follows the full cost method of accounting as prescribed by Accounting Guideline #16 issued by the Canadian Institute of Chartered Accountants (“CICA”). Under this method of accounting, all costs for exploration, development, land and property acquisition are capitalized whether successful or not. Avery has two cost centres; Canada and Australia. The aggregate of net capitalized costs and estimated future development costs less estimated salvage value for each cost centre are depleted and depreciated using the unit-of-production method based on estimated proved reserves for each cost centre.
11
Withheld Costs Certain costs related to unproved properties and major development projects may be excluded from costs subject to depletion until proved reserves have been determined or their value is impaired. These properties are reviewed quarterly and any impairment is transferred to the costs being depleted. Impairment of Long-Lived Assets The Corporation is required to review the carrying value of all property, plant and equipment, including the carrying value of oil and gas assets, for potential impairment. Impairment is indicated if the carrying value of the long-lived asset or oil and gas cost centre is not recoverable by the future undiscounted cash flows. If impairment is indicated, the amount by which the carrying value exceeds the estimated fair value of the long-lived asset is charged to earnings. Reserves Avery has engaged independent petroleum engineers to evaluate all of its reserves. Reserve determinations involve forecasts of future commodity prices, production rates, operating costs and timing of capital investments, all of which are subject to interpretation. Reserve estimates are used in the calculation of depletion and depreciation expense, and in determining the ceiling test amounts. Revisions to reported reserve estimates may have a significant impact on reported depletion and depreciation expense and could potentially result in a ceiling test write-down. Asset Retirement Obligations The Corporation utilizes the fair value method to provide for asset retirement obligations relating to its properties. Under this method the fair value of future asset retirement obligations is based on current regulations, costs, technology and industry standards. The reported liability is the present value of the future estimate of asset retirement costs. The amount of the liability is affected by factors such as the timing of future expenditures, the discount rate used, the number of properties and future changes in legislation. All of these estimates are subject to change and may impact the depletion and depreciation rate and the reported future liability. A revision of future costs and changes in the estimated timing of expenditures may result in a change in the reported liability and the depletion and depreciation rate. Stock-based Compensation The Corporation has a stock option plan whereby certain officers, directors and employees are granted options to purchase common shares. The exercise price of each option equals the market price of the common shares on the date of grant. Options granted under the plan have a maximum term of five years and vest one-third in the date of grant and one-third on each of the next two annual anniversaries of the grant. Avery utilizes the fair value method of accounting for stock options granted. In determining the fair value of stock options granted, the Black-Scholes model is used and assumptions regarding interest rates, underlying volatility of the Corporation’s stock and expected life of the options are made. NEW ACCOUNTING PRONOUNCEMENTS The Accounting Standards Board of the CICA continually amends and improves certain standards or guidelines contained in the CICA Handbook. We monitor these changes as they are proposed and will make changes to our accounting policies and disclosures as necessary.
12
Comprehensive Income The CICA issued section 1530 of the CICA Handbook, Comprehensive Income. The section is effective for fiscal years beginning on or after October 1, 2006. It describes how to report and disclose comprehensive income and its components. An integral part of the accounting standards on recognition and measurement of financial instruments is the ability to present certain gains and losses outside net income, in other comprehensive income. This standard requires that a company should present comprehensive income and its components in a financial statement displayed with the same prominence as other financial statements that constitute a complete set of statements, in both annual and interim financial statements. The CICA also made changes to section 3250 of the CICA Handbook, Surplus, and reissued it as section 3251, Equity. The section is also effective for fiscal years beginning after October 1, 2006. The changes in how to report and disclose equity are consistent with the new requirements of section 1530, Comprehensive Income. Avery will adopt this section effective April 1, 2007 but we do not expect this section to have a material impact on our consolidated financial statements. Financial Instruments – Recognition and Measurement The CICA issued section 3855 of the CICA Handbook, Financial Instruments – Recognition and Measurement. The section is effective for fiscal years beginning on or after October 1, 2006. It describes the standards for recognizing and measuring financial assets, financial liabilities and non-financial derivatives. This section requires that (i) all financial assets be measured at fair value, with some exceptions, such as loans and investments that are classified as held-to-maturity; (ii) all financial liabilities be measured at fair value if they are derivatives or classified as held for trading purposes (other financial liabilities are measured at their carrying values); and (iii) all derivative financial instruments be measured at fair value, even when they are part of a hedging relationship. Avery will adopt this section effective April 1, 2007 but we do not expect this section to have a material impact on our consolidated financial statements. Hedges The CICA issued section 3865 of the CICA Handbook, Hedges. The section is effective for fiscal years beginning on or after October 1, 2006, and describes when and how hedge accounting can be used. Hedging is an activity used by a company to change an exposure to one or more risks by creating an offset between changes in the fair value of a hedged item and a hedging item; changes in the cash flows attributable to a hedged item and a hedging item; or changes resulting from a risk exposure relating to a hedged item and a hedging item. Hedge accounting ensures that all gains, losses, revenues and expenses from the derivative and the item it hedges are recorded in the income statement in the same period. Avery will adopt this section effective April 1, 2007 but we do not expect this section to have a material impact on our consolidated financial statements. INTERNAL CONTROLS OVER FINANCIAL REPORTING The Chief Executive Officer and the Chief Financial Officer of Avery are responsible for designing a system of internal controls over financial reporting, or causing them to be designed under their supervision, in order to provide reasonable assurance regarding the reliability of financial reporting and the preparation of financial statements for external reporting purposes in accordance with Canadian generally accepted accounting principles. Management of Avery has designed and implemented a system of internal controls over financial reporting as of March 31, 2007 which it believes is effective for a Corporation of its size. During the review and design of the Corporation’s control system over financial reporting it was noted that, due to the limited number of staff at Avery, it is not feasible to achieve complete segregation of incompatible duties. The limited number of staff may also result in identifying weaknesses in accounting for complex and / or non-
13
routine transactions due to a lack of technical resources within the Corporation. While management of Avery has put in place certain procedures to mitigate the risk of material misstatement in the Corporation’s financial reporting, a system of internal controls can provide only reasonable, not absolute, assurance that the objectives of the control system are met, no matter how well conceived or operated. DISCLOSURE CONTROLS AND PROCEDURES Avery has implemented a disclosure policy, and has designed controls and procedures, to ensure that information required to be disclosed by the Corporation is accumulated and communicated to the Corporation’s management to allow timely decisions regarding required disclosure. The Chief Executive Officer and the Chief Financial Officer of Avery have concluded, based on their evaluation at March 31, 2007, that the Corporation’s disclosure controls and procedures are effective to provide reasonable assurance that material information related to the issuer, including its consolidated subsidiaries, is made known to them by others within those entities. It should be noted that while the Corporation’s Chief Executive Officer and the Chief Financial Officer believe that the Corporation’s disclosure controls and procedures provide a reasonable level of assurance that they are effective, they do not expect that the disclosure controls and procedures or internal control over financial reporting will prevent all errors or fraud. A system of internal controls can provide only reasonable, not absolute, assurance that the objectives of the control system are met, no matter how well conceived or operated. BUSINESS RISKS The business of exploring for, developing, acquiring, producing and marketing crude oil and natural gas is subject to many risks and uncertainties, several of which are beyond the control of the Corporation. These risks are operational, financial and regulatory in nature. A summary of certain risk factors relating to our business are discussed below, a more exhaustive list is provided in the Risk Factors Section of our Annual Information Form filed on SEDAR. Operational risks include exploration and development of economic crude oil and natural gas reserves, unsuccessful exploration and development drilling activity, reservoir performance, safety and environmental concerns, access to cost effective contract services, escalating industry costs for contracted services and equipment, product marketing and hiring and retaining qualified employees. Avery employs a team of highly motivated and experienced staff skilled in managing these risks and uncertainties, Management is familiar with operations and has extensive industry experience to put together a defined plan to find, acquire and develop reserves in areas with access to markets. The Corporation also maintains an insurance program commensurate with its levels and scope of operations to protect against loss from destruction of assets, pollution, blowouts or other industry standard losses. Financial risks include fluctuations in commodity prices, exchange rates and interest rates, all of which are beyond the control of the Corporation. Avery actively manages its working capital to ensure the Corporation conducts its activities in accordance with its plan. The Corporation may be required to use future equity issues or take on debt if appropriate to maintain its financial position or raise funds necessary to carry out significant capital expenditure programs. Avery is subject to a variety of regulatory risks that it does not control. Government and Securities regulations are monitored on an ongoing basis to ensure the Corporation continues to be in compliance.
14
Consolidated Financial Statements of
Years ended March 31, 2007 and 2006
15
MANAGEMENT'S REPORT TO SHAREHOLDERS The accompanying consolidated financial statements of Avery Resources Inc. have been approved by the Board of Directors and have been prepared in accordance with Canadian generally accepted accounting principles. The financial information contained elsewhere in this report has been reviewed to ensure consistency with these consolidated financial statements. In preparing this report, the Corporation undertakes steps to ensure the information presented is accurate and conforms to applicable laws and standards, including: • Management maintains accounting control systems designed to provide reasonable assurance that
assets are safeguarded, transactions are properly authorized, financial records are accurately maintained and statements are generated in a timely manner.
• The Board of Directors oversees the management of the business and the affairs for the Corporation including ensuring management fulfills its responsibility for financial reporting, and is ultimately responsible for reviewing and approving the consolidated financial statements. The Board carries out this responsibility principally through its Audit Committee.
• The Audit Committee of the Board of Directors, comprised of three members considered to be “outside and unrelated” directors, has reviewed the consolidated financial statements with management and the external auditors.
• Management, with the participation of the Chief Executive Officer and Chief Financial Officer, has evaluated the effectiveness of the Corporation’s disclosure controls and procedures (as defined in the rules of the Canadian Securities Administrators - CSA) and has concluded that such disclosure controls and procedures are effective.
• An independent firm of chartered accountants, appointed as external auditors by the shareholders, has audited the consolidated financial statements and its report is included below.
David A. Little Bryan C. Goudie Chief Executive Officer Chief Financial Officer July 5, 2007
16
AUDITORS' REPORT TO THE SHAREHOLDERS We have audited the consolidated balance sheets of Avery Resources Inc. as at March 31, 2007 and 2006 and the consolidated statements of loss and deficit and cash flows for the years then ended. These financial statements are the responsibility of the Corporation’s management. Our responsibility is to express an opinion on these financial statements based on our audits.
We conducted our audits in accordance with Canadian generally accepted auditing standards. Those standards require that we plan and perform an audit to obtain reasonable assurance whether the financial statements are free of material misstatement. An audit includes examining, on a test basis, evidence supporting the amounts and disclosures in the financial statements. An audit also includes assessing the accounting principles used and significant estimates made by management, as well as evaluating the overall financial statement presentation.
In our opinion, these consolidated financial statements present fairly, in all material respects, the financial position of the Corporation as at March 31, 2007 and 2006 and the results of its operations and its cash flows for the years then ended in accordance with Canadian generally accepted accounting principles.
Chartered Accountants Calgary, Canada July 5, 2007
17
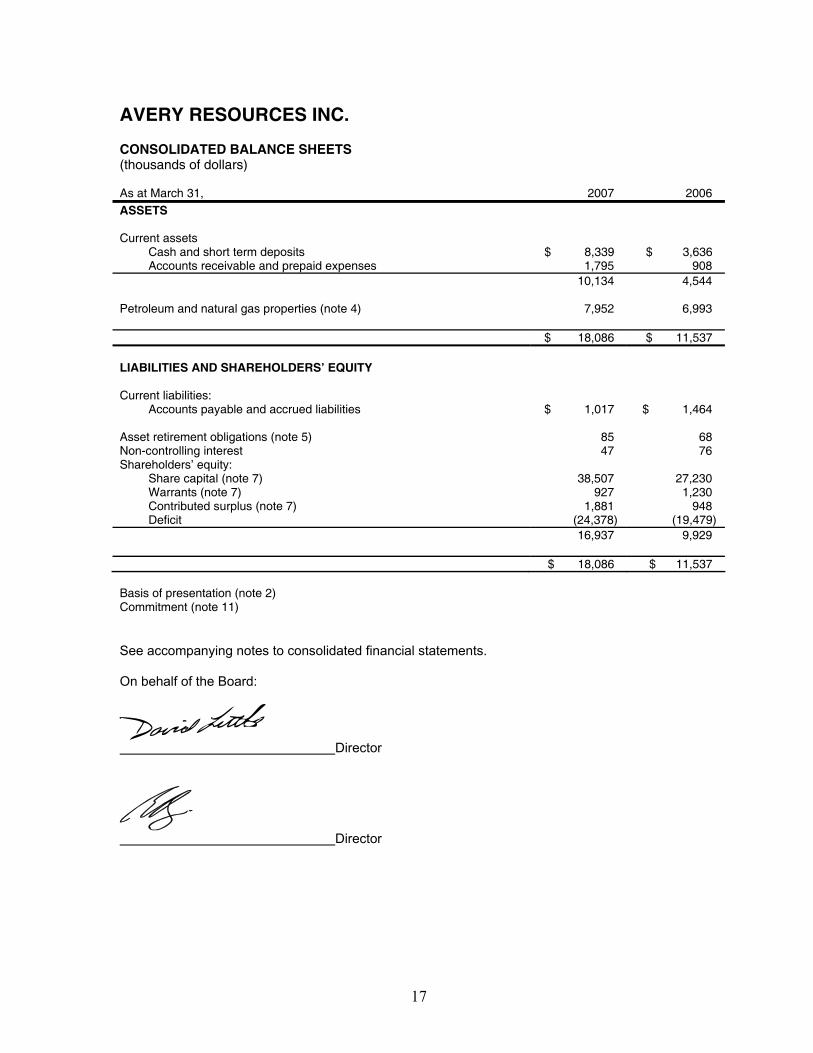
AVERY RESOURCES INC. CONSOLIDATED BALANCE SHEETS (thousands of dollars) As at March 31,
2007
2006
ASSETS
Current assets Cash and short term deposits $ 8,339 $ 3,636 Accounts receivable and prepaid expenses 1,795 908
10,134 4,544
Petroleum and natural gas properties (note 4)
7,952 6,993
$ 18,086 $ 11,537 LIABILITIES AND SHAREHOLDERS’ EQUITY
Current liabilities: Accounts payable and accrued liabilities
$ 1,017
$ 1,464
Asset retirement obligations (note 5) 85 68 Non-controlling interest 47 76 Shareholders’ equity:
Share capital (note 7) 38,507 27,230 Warrants (note 7) 927 1,230 Contributed surplus (note 7) 1,881 948 Deficit (24,378) (19,479)
16,937 9,929
$ 18,086 $ 11,537
Basis of presentation (note 2) Commitment (note 11) See accompanying notes to consolidated financial statements. On behalf of the Board:
Director
Director
18
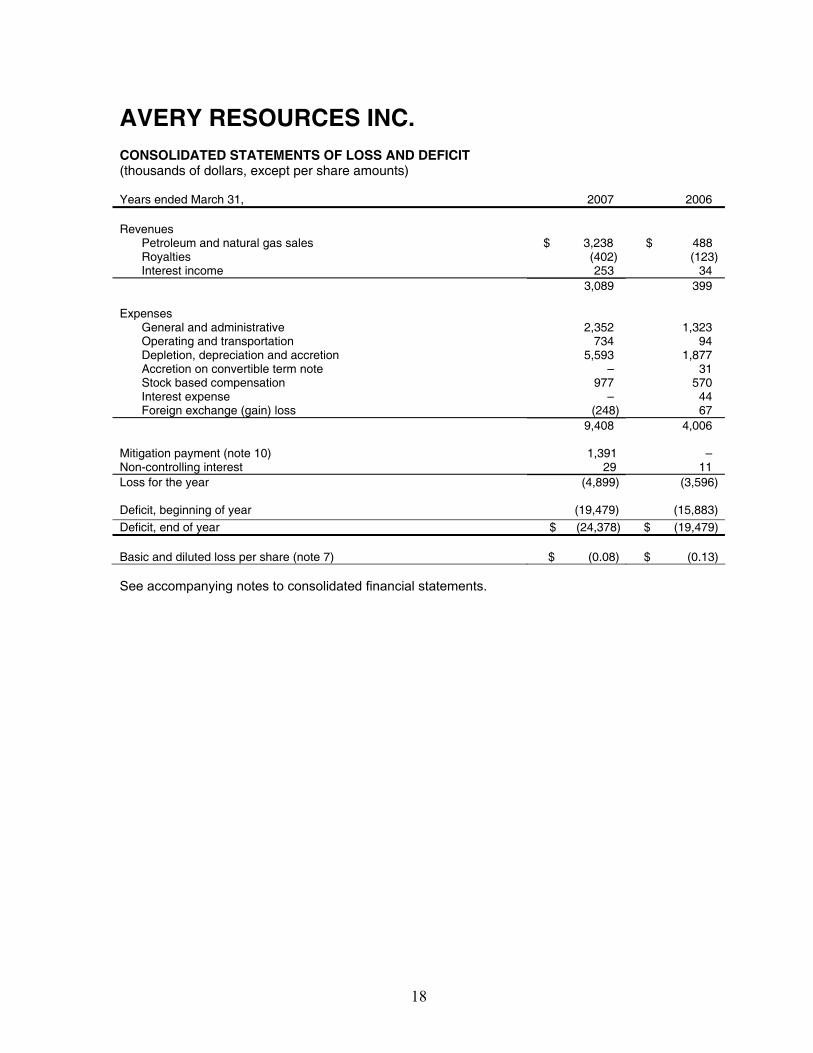
AVERY RESOURCES INC. CONSOLIDATED STATEMENTS OF LOSS AND DEFICIT (thousands of dollars, except per share amounts) Years ended March 31, 2007 2006 Revenues
Petroleum and natural gas sales $ 3,238 $ 488 Royalties (402) (123) Interest income 253 34
3,089 399
Expenses General and administrative 2,352 1,323 Operating and transportation 734 94 Depletion, depreciation and accretion 5,593 1,877 Accretion on convertible term note – 31 Stock based compensation 977 570 Interest expense – 44 Foreign exchange (gain) loss (248) 67
9,408 4,006
Mitigation payment (note 10) 1,391 – Non-controlling interest 29 11 Loss for the year
(4,899) (3,596)
Deficit, beginning of year (19,479) (15,883) Deficit, end of year $ (24,378) $ (19,479) Basic and diluted loss per share (note 7) $ (0.08) $ (0.13) See accompanying notes to consolidated financial statements.
19
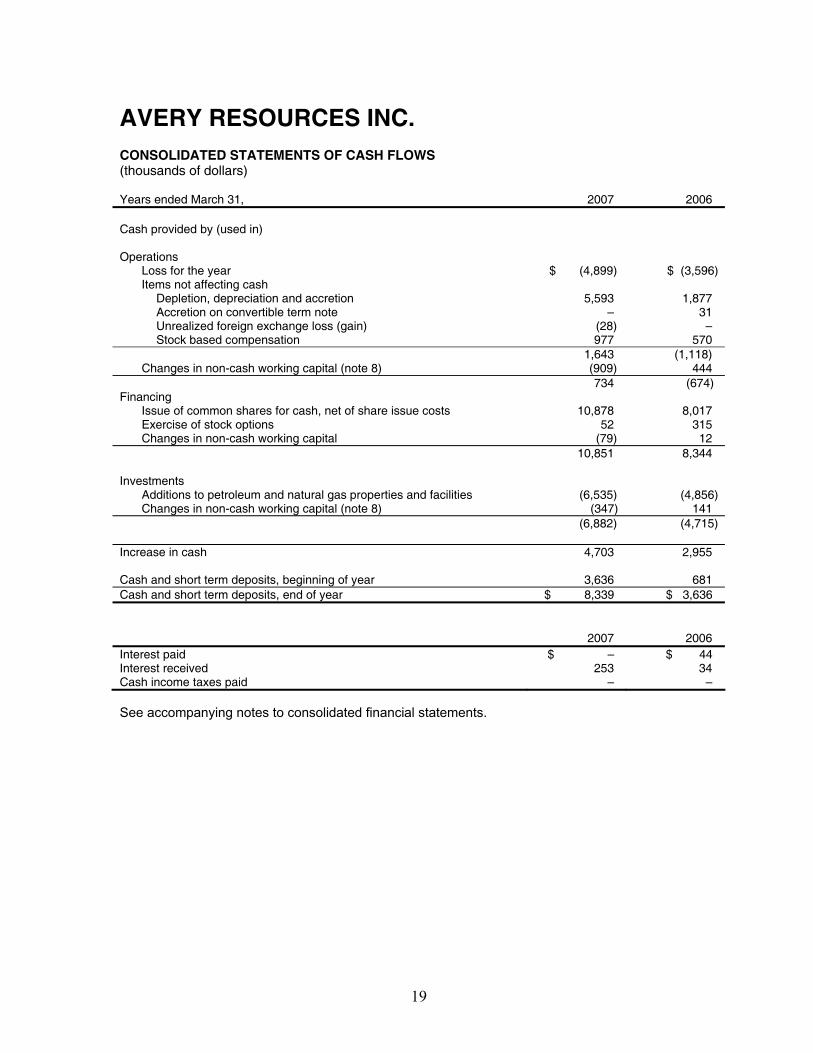
AVERY RESOURCES INC. CONSOLIDATED STATEMENTS OF CASH FLOWS (thousands of dollars) Years ended March 31, 2007 2006 Cash provided by (used in) Operations
Loss for the year $ (4,899) $ (3,596) Items not affecting cash
Depletion, depreciation and accretion 5,593 1,877 Accretion on convertible term note – 31 Unrealized foreign exchange loss (gain) (28) – Stock based compensation 977 570 1,643 (1,118)
Changes in non-cash working capital (note 8) (909) 444 734 (674)
Financing Issue of common shares for cash, net of share issue costs 10,878 8,017 Exercise of stock options 52 315 Changes in non-cash working capital (79) 12
10,851 8,344
Investments Additions to petroleum and natural gas properties and facilities (6,535) (4,856) Changes in non-cash working capital (note 8) (347) 141
(6,882) (4,715)
Increase in cash
4,703 2,955
Cash and short term deposits, beginning of year 3,636 681 Cash and short term deposits, end of year $ 8,339 $ 3,636
2007 2006 Interest paid $ – $ 44 Interest received 253 34 Cash income taxes paid – – See accompanying notes to consolidated financial statements.
20
AVERY RESOURCES INC. Notes to Consolidated Financial Statements Years ended March 31, 2007 and 2006
1. INCORPORATION Avery Resources Inc (“the Corporation”) is incorporated under the laws of the Province of Alberta and is involved in the exploration for and development of oil and gas reserves in Canada, Australia and elsewhere.
2. BASIS OF PRESENTATION
The consolidated financial statements of Avery Resources Inc. have been prepared by management in accordance with accounting principles generally accepted in Canada. The reporting and measurement currency is the Canadian dollar. The preparation of financial statements in conformity with generally accepted accounting principles requires management to make estimates and assumptions that affect the reported amounts of assets and liabilities and disclosure of contingent assets and liabilities, at the date of the financial statements and the reported amount of revenues and expenses during the reporting period. Actual results could differ from estimates.
Certain prior period figures have been reclassified to conform with current period presentation.
3. SIGNIFICANT ACCOUNTING POLICES
(a) Principles of consolidation:
These consolidated financial statements include the accounts of the Corporation and it’s wholly and majority owned subsidiaries, Avery Resources Australia (Pty) Ltd, Avery Resources (Northern Ireland) Ltd. and Northstar Energy Pty Ltd respectively.
(b) Petroleum and natural gas properties:
The full cost method of accounting is followed for petroleum and natural gas properties whereby all costs relating to the acquisition of, exploration for and development of petroleum and natural gas reserves are capitalized into a cost centre for each respective country in which the Corporation has operations. Such costs include lease acquisitions, geological and geophysical activities, lease rentals on undeveloped properties, the drilling of productive and non-productive wells, and directly related overhead charges.
Total capitalized costs are depleted and depreciated using the unit of production method based on the Corporation's share of estimated gross proved oil and gas reserves as determined by independent reservoir engineers. For purposes of the depletion and depreciation calculation, proved oil and gas reserves are converted to a common unit of measure on the basis of their approximate relative energy content. The carrying value of unproved properties, including the cost of remote exploratory test wells, is excluded from the depletion calculation.
Proceeds from the sale of petroleum and natural gas properties are applied against capitalized costs, with no gain or loss recognized except where the sale results in a change in the rate of depletion and depreciation by 20% or more.
The Corporation applies a cost recovery impairment test (“ceiling test”) to capitalized costs in each cost centre. Future net revenues are estimated using expected future product prices. When the carrying value of capitalized costs is determined to be not recoverable, an impairment loss is recognized to the extent that the value of discounted future net revenues from production of proved and probable reserves plus the cost of unproved properties net of
AVERY RESOURCES INC. Notes to Consolidated Financial Statements Years ended March 31, 2007 and 2006
21
any impairment allowance exceeds the carrying value. Any such impairment loss is charged to depletion and depreciation in the period.
The costs (including remote exploratory dry holes) in cost centers from which there has been no commercial production are not subject to depletion until commercial production commences. The capitalized costs are periodically assessed to determine whether it is likely such costs will be recovered in the future. To the extent there are costs, which are unlikely to be recovered in the future, they are written off.
Other assets are depreciated on a declining basis at rates ranging from 20% to 33%.
(c) Asset retirement obligations:
The Corporation uses the fair value method to provide for asset retirement obligations. The fair value of an asset retirement obligation is recognized in the period in which it is incurred when a reasonable estimate of fair value can be made. The fair value is based on estimated reserve life, inflation and discount rates. The provision is recorded as a long-term liability, with a corresponding increase in the carrying value of the associated asset. The capitalized amount is depleted on a unit-of-production basis. The liability amount is increased each reporting period due to the passage of time with this accretion charged to earnings in the period. Subsequent to the initial measurement of the asset retirement obligations the obligations are adjusted at the end of each period to reflect the passage of time and changes in the estimated future cash flows underlying the obligation. The liability amount is decreased for actual abandonment costs incurred.
(d) Use of estimates:
The amounts recorded for depletion, depreciation and amortization of petroleum and natural gas properties and equipment and the provision for asset retirement obligation are based on estimates. The ceiling test is based on estimates of proved reserves, production rates, oil and gas prices, future costs and other relevant assumptions. By their nature, these estimates are subject to measurement uncertainty and the effect on the financial statements of changes in such estimates in future periods could be significant.
(e) Foreign currency translation:
The Corporation translates the accounts of its Australian and Irish subsidiaries, which are considered integrated, by the temporal method whereby monetary assets and liabilities are translated at the rates of exchange at the balance sheet dates, non-monetary assets and liabilities are translated at the rates in effect at the dates the assets or liabilities were acquired and revenues and expenses are translated at the average rates of exchange during the month in which they are recognized. Resulting gains or losses are included in operations.
(f) Stock-based compensation plans:
The Corporation uses the fair value method of accounting for stock options granted. At the date of the grant, the fair value of the stock options is estimated. This fair value is recorded as an expense over the vesting period of the option with a corresponding increase to contributed surplus. In determining the fair value of the stock options granted, the Black-Scholes option pricing model is used and assumptions regarding interest rates, underlying volatility of the Corporation’s stock and expected life of the options are made. Upon the exercise of stock options, consideration received together with the amount previously recognized in contributed surplus is recorded as an increase to share capital.
AVERY RESOURCES INC. Notes to Consolidated Financial Statements Years ended March 31, 2007 and 2006
22
(g) Per share amounts:
Basic per share amounts are computed by dividing earnings (losses) by the weighted average number of common shares outstanding for the period. Diluted per share amounts are calculated giving effect to the potential dilution that would occur if stock options or other dilutive instruments were exercised or converted to common shares. The treasury stock method assumes that any proceeds upon the exercise or conversion of dilutive instruments would be used to purchase common shares at the average market price of the common shares during the period
(h) Future income taxes:
The Corporation accounts for income taxes using the asset and liability method. Under this method income taxes are recognized for the estimated income taxes payable for the current year and future income taxes are recognized for temporary differences between the tax and accounting bases of assets and liabilities and for the benefit of losses available to be carried forward for tax purposes that are likely to be realized. Future income tax liabilities and assets are measured using tax rates expected to apply in the years in which temporary differences are expected to be recovered or settled. Any change to the net future income tax assets and liabilities is included in operations in the period it occur
i) Revenue recognition:
Revenues from the sale of natural gas, natural gas liquids and crude oil owned by the Corporation are recognized when title passes from the Corporation to its customers.
(j) Joint operations:
Significant portions of the Corporation’s oil and gas activities are conducted jointly with others and accordingly, these financial statements reflect only the Corporation’s proportionate interest in such activities.
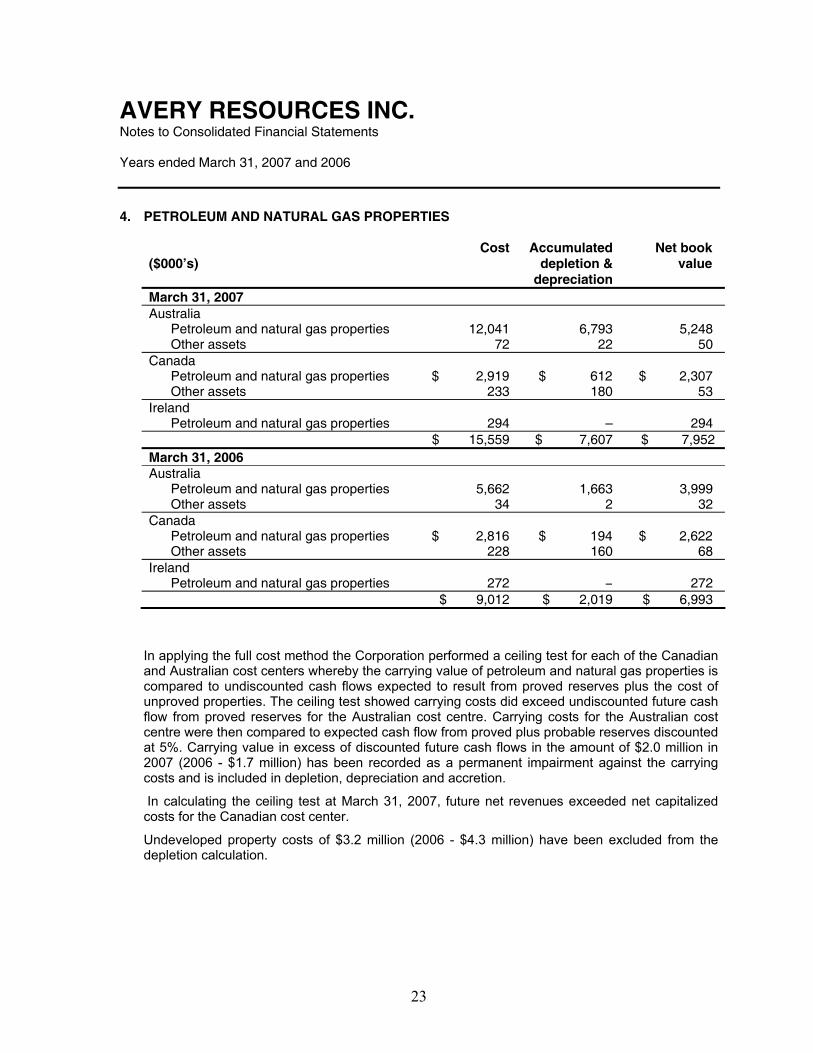
AVERY RESOURCES INC. Notes to Consolidated Financial Statements Years ended March 31, 2007 and 2006
23
4. PETROLEUM AND NATURAL GAS PROPERTIES ($000’s)
Cost Accumulated depletion &
depreciation
Net book value
March 31, 2007 Australia
Petroleum and natural gas properties 12,041 6,793 5,248 Other assets 72 22 50
Canada Petroleum and natural gas properties $ 2,919 $ 612 $ 2,307 Other assets 233 180 53
Ireland Petroleum and natural gas properties 294 – 294
$ 15,559 $ 7,607 $ 7,952 March 31, 2006 Australia
Petroleum and natural gas properties 5,662 1,663 3,999 Other assets 34 2 32
Canada Petroleum and natural gas properties $ 2,816 $ 194 $ 2,622 Other assets 228 160 68
Ireland Petroleum and natural gas properties 272 − 272
$ 9,012 $ 2,019 $ 6,993
In applying the full cost method the Corporation performed a ceiling test for each of the Canadian and Australian cost centers whereby the carrying value of petroleum and natural gas properties is compared to undiscounted cash flows expected to result from proved reserves plus the cost of unproved properties. The ceiling test showed carrying costs did exceed undiscounted future cash flow from proved reserves for the Australian cost centre. Carrying costs for the Australian cost centre were then compared to expected cash flow from proved plus probable reserves discounted at 5%. Carrying value in excess of discounted future cash flows in the amount of $2.0 million in 2007 (2006 - $1.7 million) has been recorded as a permanent impairment against the carrying costs and is included in depletion, depreciation and accretion.
In calculating the ceiling test at March 31, 2007, future net revenues exceeded net capitalized costs for the Canadian cost center.
Undeveloped property costs of $3.2 million (2006 - $4.3 million) have been excluded from the depletion calculation.
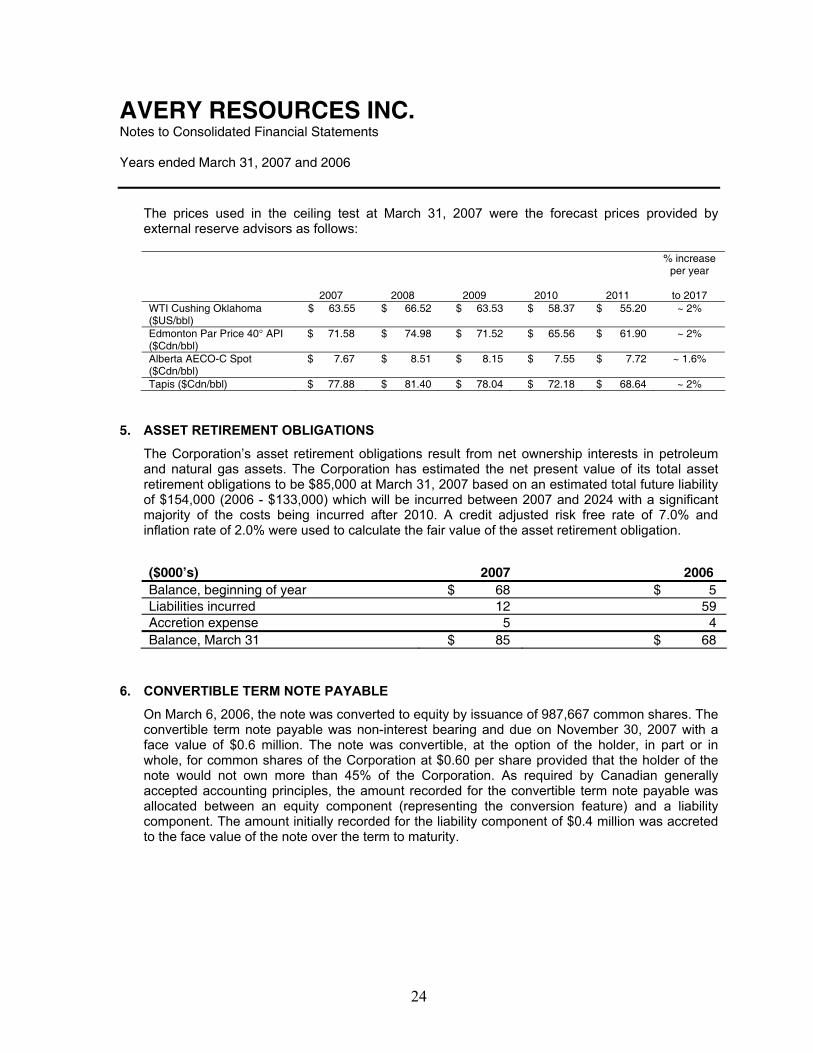
AVERY RESOURCES INC. Notes to Consolidated Financial Statements Years ended March 31, 2007 and 2006
24
The prices used in the ceiling test at March 31, 2007 were the forecast prices provided by external reserve advisors as follows: % increase
per year
2007 2008 2009 2010 2011 to 2017 WTI Cushing Oklahoma ($US/bbl)
$ 63.55 $ 66.52 $ 63.53 $ 58.37 $ 55.20 ~ 2%
Edmonton Par Price 40° API ($Cdn/bbl)
$ 71.58 $ 74.98 $ 71.52 $ 65.56 $ 61.90 ~ 2%
Alberta AECO-C Spot ($Cdn/bbl)
$ 7.67 $ 8.51 $ 8.15 $ 7.55 $ 7.72 ~ 1.6%
Tapis ($Cdn/bbl) $ 77.88 $ 81.40 $ 78.04 $ 72.18 $ 68.64 ~ 2%
5. ASSET RETIREMENT OBLIGATIONS
The Corporation’s asset retirement obligations result from net ownership interests in petroleum and natural gas assets. The Corporation has estimated the net present value of its total asset retirement obligations to be $85,000 at March 31, 2007 based on an estimated total future liability of $154,000 (2006 - $133,000) which will be incurred between 2007 and 2024 with a significant majority of the costs being incurred after 2010. A credit adjusted risk free rate of 7.0% and inflation rate of 2.0% were used to calculate the fair value of the asset retirement obligation.
($000’s) 2007 2006 Balance, beginning of year $ 68 $ 5 Liabilities incurred 12 59 Accretion expense 5 4 Balance, March 31 $ 85 $ 68
6. CONVERTIBLE TERM NOTE PAYABLE
On March 6, 2006, the note was converted to equity by issuance of 987,667 common shares. The convertible term note payable was non-interest bearing and due on November 30, 2007 with a face value of $0.6 million. The note was convertible, at the option of the holder, in part or in whole, for common shares of the Corporation at $0.60 per share provided that the holder of the note would not own more than 45% of the Corporation. As required by Canadian generally accepted accounting principles, the amount recorded for the convertible term note payable was allocated between an equity component (representing the conversion feature) and a liability component. The amount initially recorded for the liability component of $0.4 million was accreted to the face value of the note over the term to maturity.
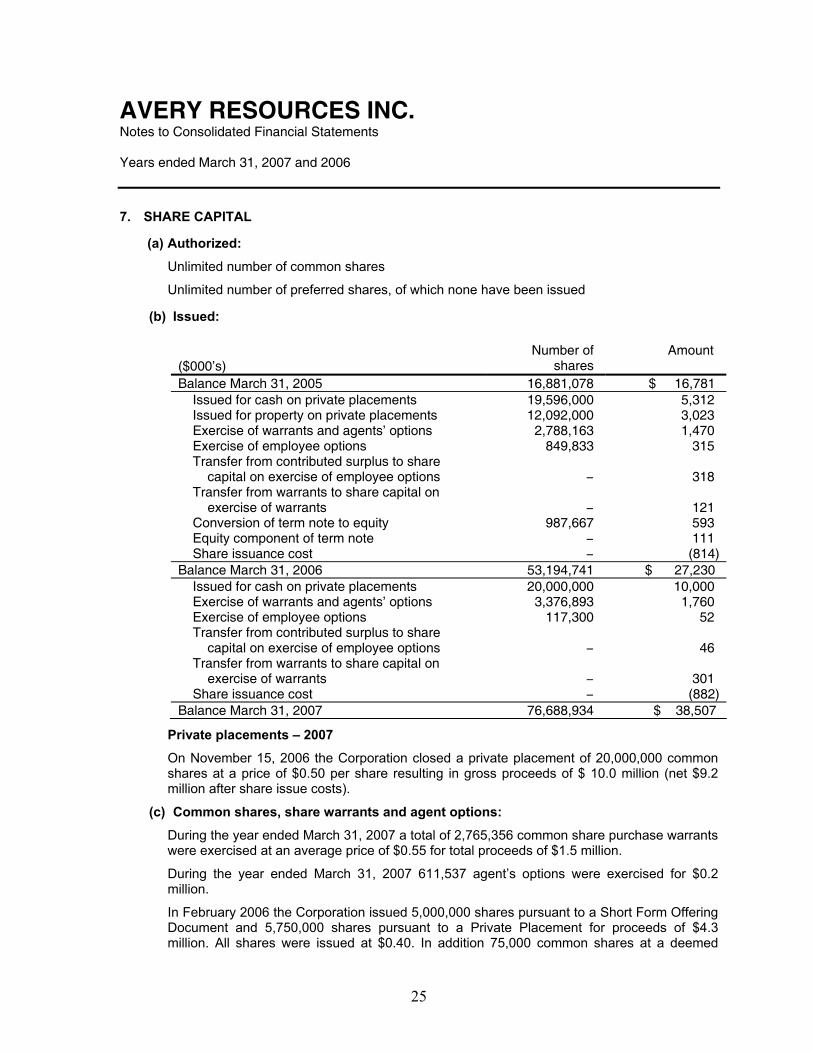
AVERY RESOURCES INC. Notes to Consolidated Financial Statements Years ended March 31, 2007 and 2006
25
7. SHARE CAPITAL
(a) Authorized:
Unlimited number of common shares
Unlimited number of preferred shares, of which none have been issued
(b) Issued:
($000’s)
Number of shares
Amount
Balance March 31, 2005 16,881,078 $ 16,781 Issued for cash on private placements 19,596,000 5,312 Issued for property on private placements 12,092,000 3,023 Exercise of warrants and agents’ options 2,788,163 1,470 Exercise of employee options 849,833 315 Transfer from contributed surplus to share
capital on exercise of employee options
−
318 Transfer from warrants to share capital on
exercise of warrants
−
121 Conversion of term note to equity 987,667 593 Equity component of term note − 111 Share issuance cost − (814)
Balance March 31, 2006 53,194,741 $ 27,230 Issued for cash on private placements 20,000,000 10,000 Exercise of warrants and agents’ options 3,376,893 1,760 Exercise of employee options 117,300 52 Transfer from contributed surplus to share
capital on exercise of employee options
−
46 Transfer from warrants to share capital on
exercise of warrants
−
301 Share issuance cost − (882)
Balance March 31, 2007 76,688,934 $ 38,507
Private placements – 2007
On November 15, 2006 the Corporation closed a private placement of 20,000,000 common shares at a price of $0.50 per share resulting in gross proceeds of $ 10.0 million (net $9.2 million after share issue costs).
(c) Common shares, share warrants and agent options:
During the year ended March 31, 2007 a total of 2,765,356 common share purchase warrants were exercised at an average price of $0.55 for total proceeds of $1.5 million.
During the year ended March 31, 2007 611,537 agent’s options were exercised for $0.2 million.
In February 2006 the Corporation issued 5,000,000 shares pursuant to a Short Form Offering Document and 5,750,000 shares pursuant to a Private Placement for proceeds of $4.3 million. All shares were issued at $0.40. In addition 75,000 common shares at a deemed
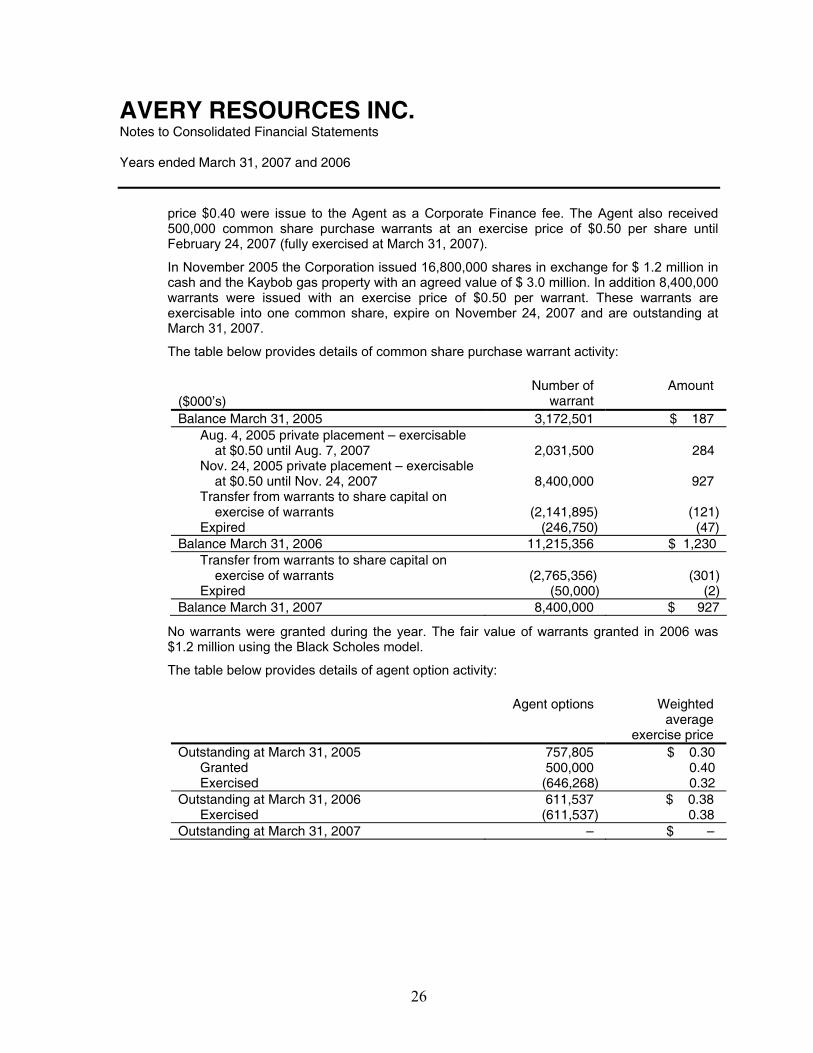
AVERY RESOURCES INC. Notes to Consolidated Financial Statements Years ended March 31, 2007 and 2006
26
price $0.40 were issue to the Agent as a Corporate Finance fee. The Agent also received 500,000 common share purchase warrants at an exercise price of $0.50 per share until February 24, 2007 (fully exercised at March 31, 2007).
In November 2005 the Corporation issued 16,800,000 shares in exchange for $ 1.2 million in cash and the Kaybob gas property with an agreed value of $ 3.0 million. In addition 8,400,000 warrants were issued with an exercise price of $0.50 per warrant. These warrants are exercisable into one common share, expire on November 24, 2007 and are outstanding at March 31, 2007.
The table below provides details of common share purchase warrant activity:
($000’s)
Number of warrant
Amount
Balance March 31, 2005 3,172,501 $ 187 Aug. 4, 2005 private placement – exercisable
at $0.50 until Aug. 7, 2007
2,031,500
284 Nov. 24, 2005 private placement – exercisable
at $0.50 until Nov. 24, 2007
8,400,000
927 Transfer from warrants to share capital on
exercise of warrants
(2,141,895)
(121)Expired (246,750) (47)
Balance March 31, 2006 11,215,356 $ 1,230 Transfer from warrants to share capital on
exercise of warrants
(2,765,356)
(301)Expired (50,000) (2)
Balance March 31, 2007 8,400,000 $ 927
No warrants were granted during the year. The fair value of warrants granted in 2006 was $1.2 million using the Black Scholes model.
The table below provides details of agent option activity:
Agent options Weighted average
exercise price Outstanding at March 31, 2005 757,805 $ 0.30
Granted 500,000 0.40 Exercised (646,268) 0.32
Outstanding at March 31, 2006 611,537 $ 0.38 Exercised (611,537) 0.38
Outstanding at March 31, 2007 – $ –
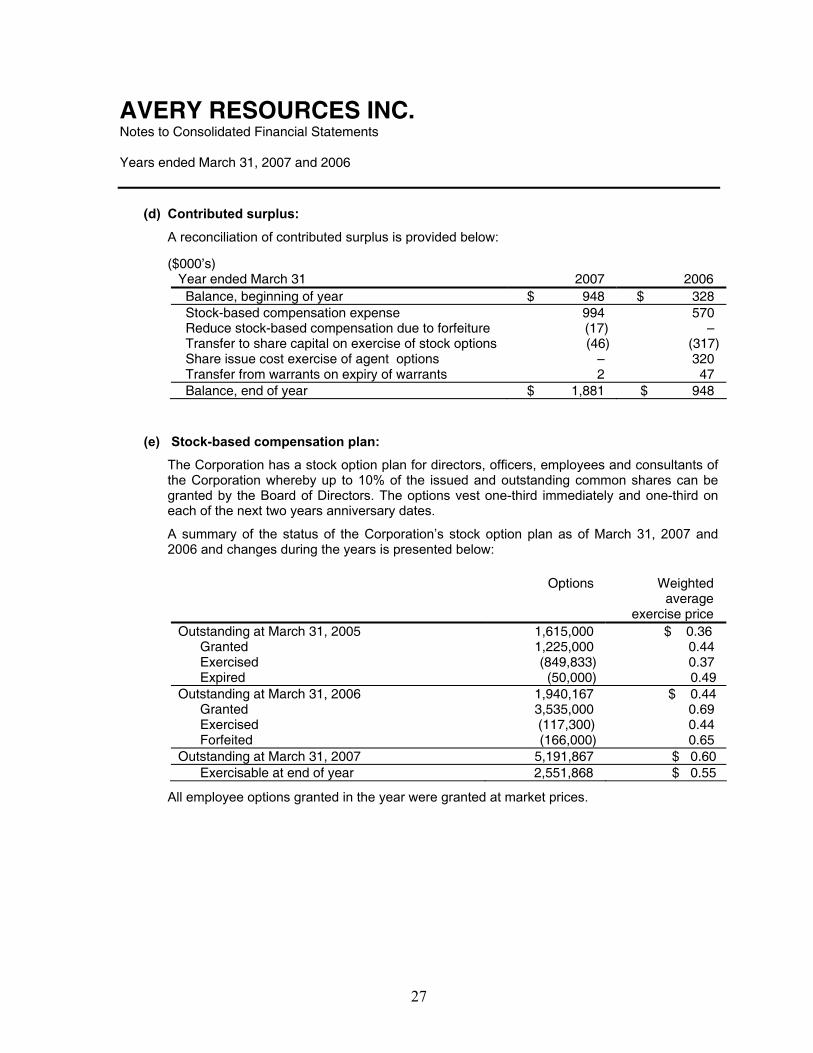
AVERY RESOURCES INC. Notes to Consolidated Financial Statements Years ended March 31, 2007 and 2006
27
(d) Contributed surplus:
A reconciliation of contributed surplus is provided below:
($000’s) Year ended March 31 2007 2006
Balance, beginning of year $ 948 $ 328 Stock-based compensation expense 994 570 Reduce stock-based compensation due to forfeiture (17) – Transfer to share capital on exercise of stock options (46) (317) Share issue cost exercise of agent options – 320 Transfer from warrants on expiry of warrants 2 47 Balance, end of year $ 1,881 $ 948
(e) Stock-based compensation plan:
The Corporation has a stock option plan for directors, officers, employees and consultants of the Corporation whereby up to 10% of the issued and outstanding common shares can be granted by the Board of Directors. The options vest one-third immediately and one-third on each of the next two years anniversary dates.
A summary of the status of the Corporation’s stock option plan as of March 31, 2007 and 2006 and changes during the years is presented below:
Options Weighted average
exercise price Outstanding at March 31, 2005 1,615,000 $ 0.36
Granted 1,225,000 0.44 Exercised (849,833) 0.37 Expired (50,000) 0.49
Outstanding at March 31, 2006 1,940,167 $ 0.44 Granted 3,535,000 0.69 Exercised (117,300) 0.44 Forfeited (166,000) 0.65
Outstanding at March 31, 2007 5,191,867 $ 0.60 Exercisable at end of year 2,551,868 $ 0.55
All employee options granted in the year were granted at market prices.
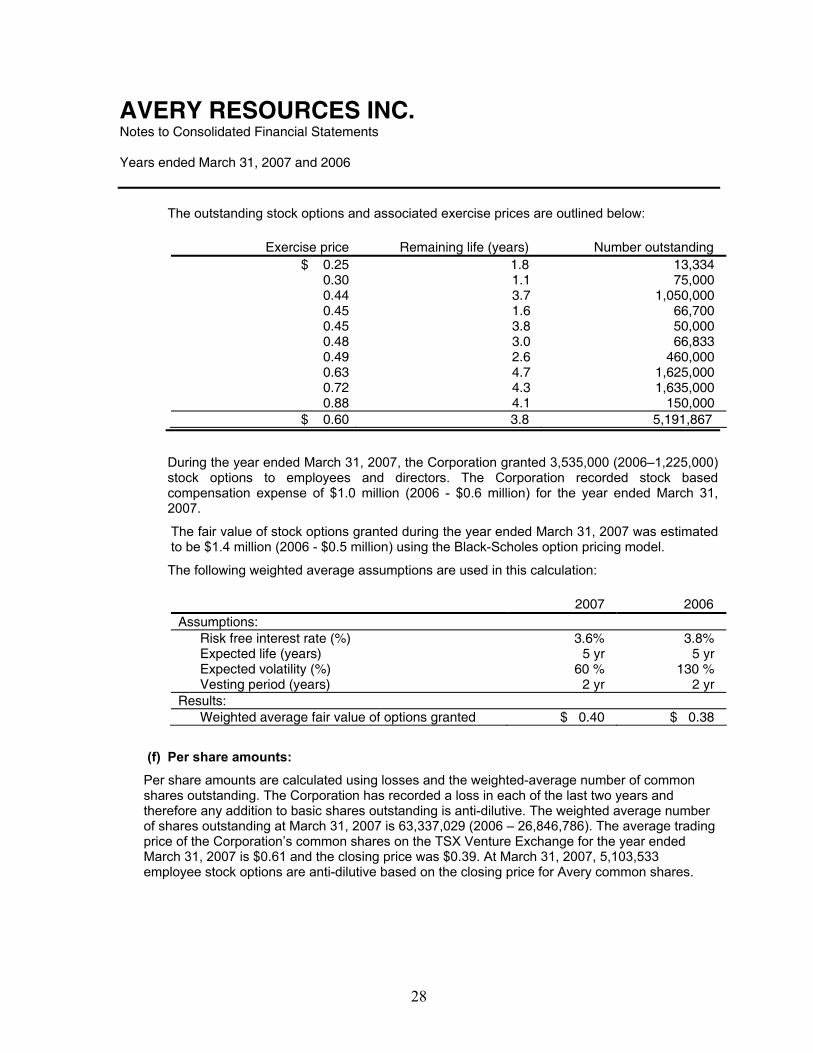
AVERY RESOURCES INC. Notes to Consolidated Financial Statements Years ended March 31, 2007 and 2006
28
The outstanding stock options and associated exercise prices are outlined below:
Exercise price Remaining life (years) Number outstanding $ 0.25 1.8 13,334
0.30 1.1 75,000 0.44 3.7 1,050,000 0.45 1.6 66,700 0.45 3.8 50,000 0.48 3.0 66,833 0.49 2.6 460,000 0.63 4.7 1,625,000 0.72 4.3 1,635,000 0.88 4.1 150,000
$ 0.60 3.8 5,191,867
During the year ended March 31, 2007, the Corporation granted 3,535,000 (2006–1,225,000) stock options to employees and directors. The Corporation recorded stock based compensation expense of $1.0 million (2006 - $0.6 million) for the year ended March 31, 2007.
The fair value of stock options granted during the year ended March 31, 2007 was estimated to be $1.4 million (2006 - $0.5 million) using the Black-Scholes option pricing model.
The following weighted average assumptions are used in this calculation:
2007 2006 Assumptions:
Risk free interest rate (%) 3.6% 3.8% Expected life (years) 5 yr 5 yr Expected volatility (%) 60 % 130 % Vesting period (years) 2 yr 2 yr
Results: Weighted average fair value of options granted $ 0.40 $ 0.38
(f) Per share amounts:
Per share amounts are calculated using losses and the weighted-average number of common shares outstanding. The Corporation has recorded a loss in each of the last two years and therefore any addition to basic shares outstanding is anti-dilutive. The weighted average number of shares outstanding at March 31, 2007 is 63,337,029 (2006 – 26,846,786). The average trading price of the Corporation’s common shares on the TSX Venture Exchange for the year ended March 31, 2007 is $0.61 and the closing price was $0.39. At March 31, 2007, 5,103,533 employee stock options are anti-dilutive based on the closing price for Avery common shares.
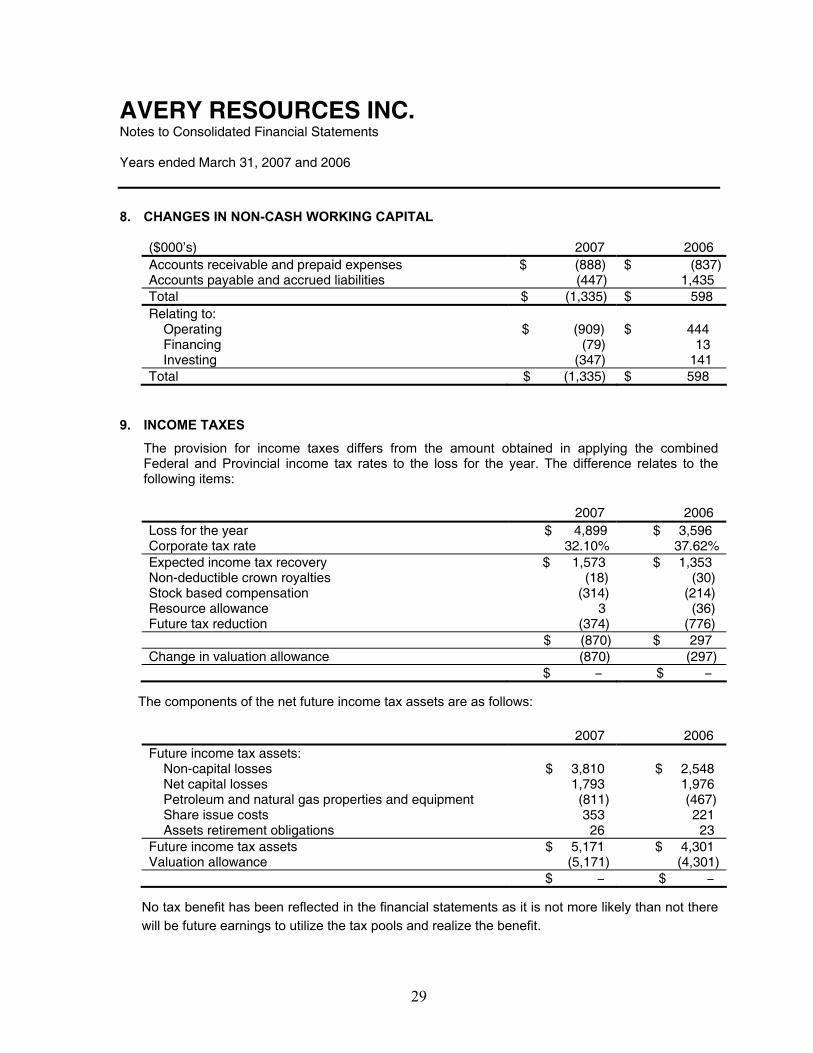
AVERY RESOURCES INC. Notes to Consolidated Financial Statements Years ended March 31, 2007 and 2006
29
8. CHANGES IN NON-CASH WORKING CAPITAL ($000’s) 2007 2006 Accounts receivable and prepaid expenses $ (888) $ (837)Accounts payable and accrued liabilities (447) 1,435 Total $ (1,335) $ 598 Relating to:
Operating $ (909) $ 444 Financing (79) 13 Investing (347) 141
Total $ (1,335) $ 598
9. INCOME TAXES
The provision for income taxes differs from the amount obtained in applying the combined Federal and Provincial income tax rates to the loss for the year. The difference relates to the following items: 2007 2006 Loss for the year $ 4,899 $ 3,596 Corporate tax rate 32.10% 37.62% Expected income tax recovery $ 1,573 $ 1,353 Non-deductible crown royalties (18) (30) Stock based compensation (314) (214) Resource allowance 3 (36) Future tax reduction (374) (776) $ (870) $ 297 Change in valuation allowance (870) (297) $ − $ −
The components of the net future income tax assets are as follows: 2007 2006 Future income tax assets:
Non-capital losses $ 3,810 $ 2,548 Net capital losses 1,793 1,976 Petroleum and natural gas properties and equipment (811) (467) Share issue costs 353 221 Assets retirement obligations 26 23
Future income tax assets $ 5,171 $ 4,301 Valuation allowance (5,171) (4,301) $ − $ −
No tax benefit has been reflected in the financial statements as it is not more likely than not there will be future earnings to utilize the tax pools and realize the benefit.
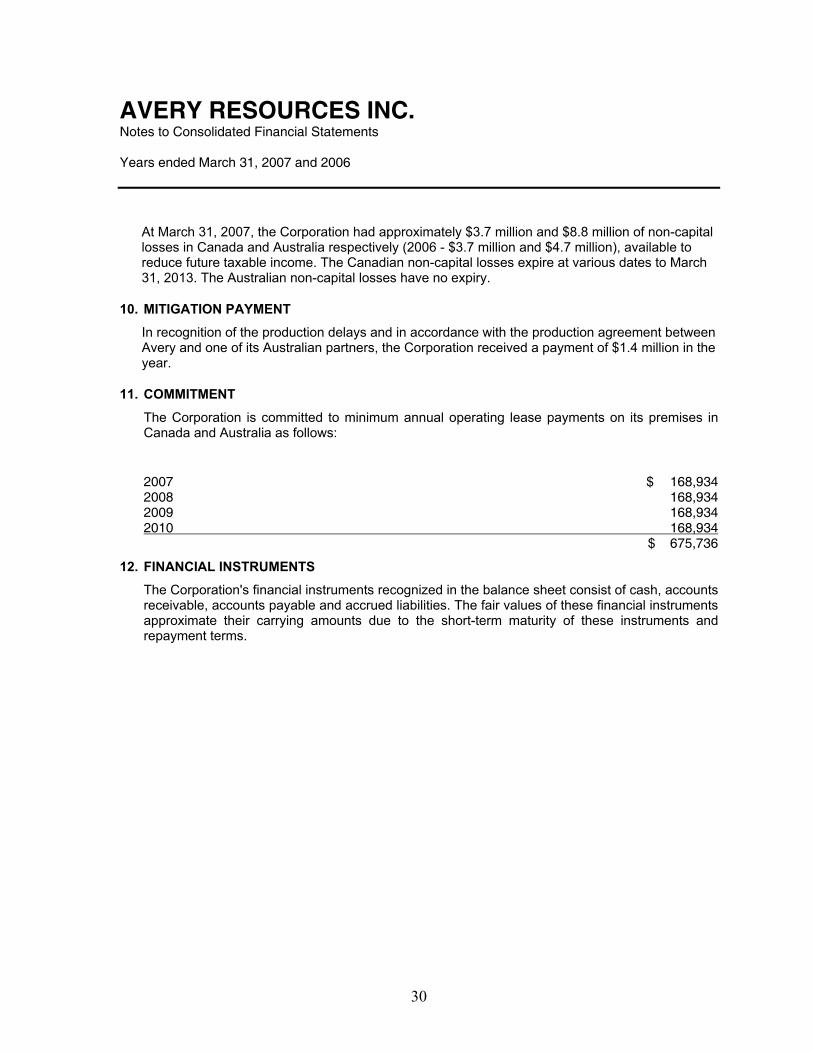
AVERY RESOURCES INC. Notes to Consolidated Financial Statements Years ended March 31, 2007 and 2006
30
At March 31, 2007, the Corporation had approximately $3.7 million and $8.8 million of non-capital losses in Canada and Australia respectively (2006 - $3.7 million and $4.7 million), available to reduce future taxable income. The Canadian non-capital losses expire at various dates to March 31, 2013. The Australian non-capital losses have no expiry.
10. MITIGATION PAYMENT
In recognition of the production delays and in accordance with the production agreement between Avery and one of its Australian partners, the Corporation received a payment of $1.4 million in the year.
11. COMMITMENT
The Corporation is committed to minimum annual operating lease payments on its premises in Canada and Australia as follows:
2007 $ 168,934 2008 168,934 2009 168,934 2010 168,934 $ 675,736
12. FINANCIAL INSTRUMENTS
The Corporation's financial instruments recognized in the balance sheet consist of cash, accounts receivable, accounts payable and accrued liabilities. The fair values of these financial instruments approximate their carrying amounts due to the short-term maturity of these instruments and repayment terms.
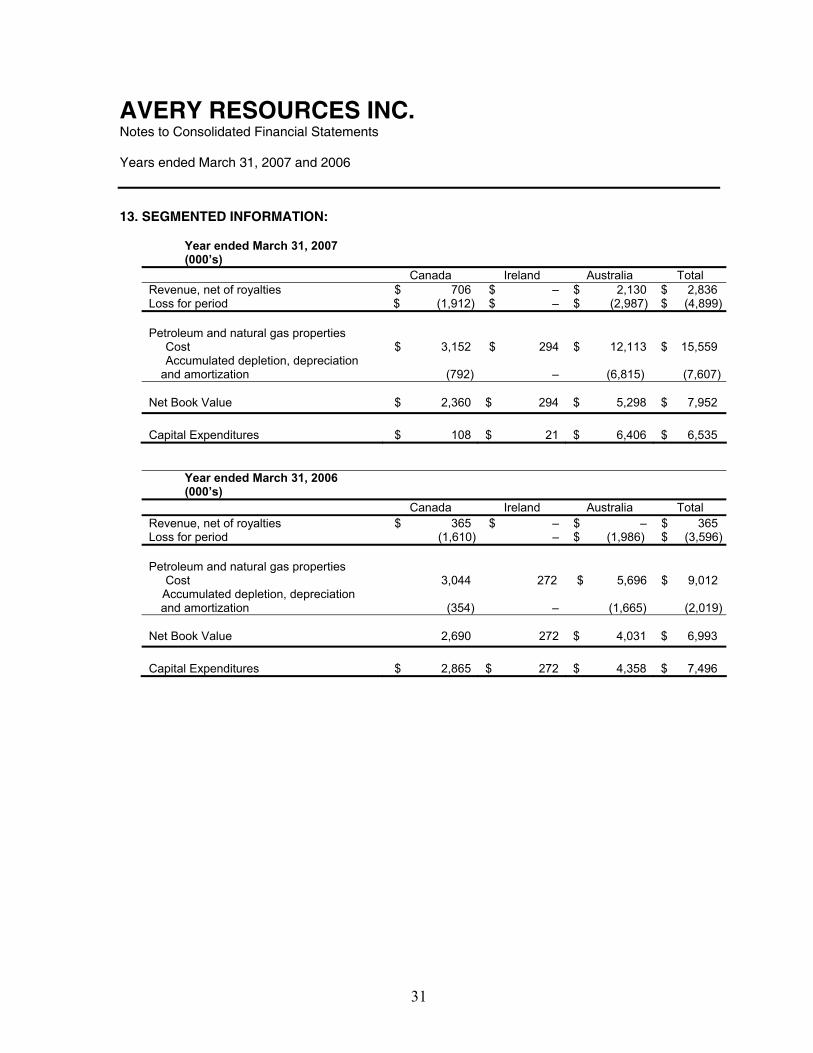
AVERY RESOURCES INC. Notes to Consolidated Financial Statements Years ended March 31, 2007 and 2006
31
13. SEGMENTED INFORMATION:
Year ended March 31, 2007 (000’s)
Canada Ireland Australia Total Revenue, net of royalties $ 706 $ – $ 2,130 $ 2,836 Loss for period $ (1,912) $ – $ (2,987) $ (4,899) Petroleum and natural gas properties Cost $ 3,152 $ 294 $ 12,113 $ 15,559 Accumulated depletion, depreciation
and amortization
(792)
– (6,815)
(7,607)
Net Book Value
$ 2,360
$ 294
$ 5,298
$ 7,952
Capital Expenditures
$ 108
$ 21
$ 6,406
$ 6,535
Year ended March 31, 2006 (000’s)
Canada Ireland Australia Total Revenue, net of royalties $ 365 $ – $ – $ 365 Loss for period (1,610) – $ (1,986) $ (3,596) Petroleum and natural gas properties Cost 3,044 272 $ 5,696 $ 9,012 Accumulated depletion, depreciation
and amortization
(354)
–
(1,665)
(2,019) Net Book Value
2,690
272
$ 4,031
$ 6,993
Capital Expenditures
$ 2,865
$ 272
$ 4,358
$ 7,496
AUDITORS
KPMG LLP • Calgary, Canada
LEGAL COUNSEL
Borden Ladner Gervais • Calgary, Canada
BANKERS
Royal Bank of Canada • Calgary, Canada
West Pac Bank • Brisbane, Australia
Commonwealth Bank • Brisbane, Australia
REGISTRAR AND TRANSFER AGENT
Valiant Trust Corporation • Calgary, Canada
INVESTOR RELATIONS
Bryan Mills Iradesso • Calgary, Canada
DIRECTORS
David A. Little (Chairman)
Richard N. Edgar
John H. Carruthers
Judith Stripling
Stephen Peacock
Ian Towers
James Howe
GOVERNANCE AND DISCLOSURE COMMITTEE
All Directors are members of the Committee
CORPORATE INFORMATIONAUDIT COMMITTEE
James Howe
Ian Towers
Judith Stripling
RESERVES COMMITTEE
Ian Towers
Stephen Peacock
Richard Edgar
COMPENSATION COMMITTEE
Stephen Peacock
Judith Stripling
Ian Towers
OFFICERS
David A. Little, Chief Executive Offi cer
Richard N. Edgar, President
John H. Carruthers, Executive Vice President
Paul Lipski, Managing Director, Australia
Bryan Goudie, Chief Financial Offi cer
Melinda Park, Secretary
STOCK EXCHANGE LISTING
TSX Venture Exchange: ARY
Designed & Produced by Bryan Mills Iradesso
ANNUAL GENERAL MEETING
Avery’s annual meeting of shareholders will be held at 10am on August 29th in the 5th fl oor auditorium, 715 – 5th Avenue SW. All shareholders are encouraged to complete and return their form of proxy to ensure their vote is counted. All shareholders are invited to attend the meeting.


