Embed Size (px)
Citation preview

Marine Chemistry, 29 (1990) 47-62 47 Elsevier Science Publishers B.V., Amsterdam -- Printed in The Netherlands
Interlaboratory Calibration and Sample Analysis of Dimethyl Sulphide in Water
SUZANNE M. TURNER and GILLIAN MALIN
School o[ Environmental Sciences, University o[ East Anglia, Norwich NR4 7TJ (Gt. Britain)
LARS ERIK B]kGANDER ' and CAROLINE LECK 2
1Department o[ Geology, Section o[ Microbial Geochemistry and 2Department o[ Meteorology, University o[ Stockholm, S-106 91 Stockholm (Sweden)
(Received June 26, 1989; revision accepted October 17, 1989)
ABSTRACT
Turner, S.M., Malin, G., B~gander, L.E. and Leck, C., 1990. Interlaboratory calibration and sam- ple analysis of dimethyl sulphide in water. Mar. Chem., 29: 47-62.
An intercalibration exercise carried out by the Universities of Stockholm and East Anglia, for the determination of natural levels of dimethyl sulphide in aqueous samples, is described. Good agreement between the two groups was obtained for natural samples, but for cultures containing high numbers of marine phytoplankton some differences were observed. The problems associated with the analysis of samples with high densities of phytoplankton are discussed. Four calibration techniques were tested, and their relative merits are assessed.
INTRODUCTION
Over the last few years, increasingly more at tention has been focused on dimethyl sulphide (CH3SCH3, DMS) , as its significance in the global sulphur cycle and in precipitation chemistry was realized and a possible role in climate control invoked (Charlson and Rodhe, 1982; Andreae, 1986; Charlson et al., 1987). As a result, more laboratories are making measurements to determine DMS concentrations in air and water. For water determinations most labora- tories use analytical systems tha t are essentially similar; DMS is extracted from the water and pre-concentrated, then measured using gas chromato- graphy with, most commonly, a flame photometric detector.
In May 1988 two groups, from the Universi ty of Stockholm (UoS) and the University of Eas t Anglia (UEA), met to compare their analytical techniques. This paper describes the results obtained by the two laboratories for indepen- dent DMS determinations on the same natural water samples and marine phy- toplankton cultures. A comparison of a number of different calibration tech-
0304-4203/90/$03.50 © 1990 Elsevier Science Publishers B.V.

48 S.M. TURNER ET AL.
niques is described and some of the problems associated with the analysis of natural samples are discussed.
METHODS
Samples were processed simultaneously by the two groups, both working at UEA. Because of the inherent analytical differences between the two systems, however, the UEA samples were analysed immediately whereas the UoS sam- ples were stored cryogenically before determination in Stockholm. There was no exchange of data until all the analyses had been completed.
Sample preparation and analysis; University of Stockholm (UoS)
The UoS method was primarily designed to suit the constraints of sea sur- face sampling from a helicopter, where a large area can be covered in a short time. The procedure is divided into two separate operations. The first step involves field sampling, cryogenic trapping and preservation, and the second step is the analysis which is carried out in the laboratory, where analytical conditions are stable. The entire experimental system is shown in Fig. 1 and was fully described by Leck and B~gander (1988).
N 2
I - - " ' - -WA S T E - -
8 ~.C. I I
9
Fig. I. University of Stockholm equipment. (- - - ) Field apparatus, ( ) analytical apparatus; (1) sample bottle, (2) filter, (3) peristaltic pump, (4) six-port Teflon valve (- - -, inject; --, load), (5) sample chamber, (6) purge chamber, (7) cold trap, (8) Dewar flask, (9) laboratory jack, (10) six-port Valco valve, (11) GC, (12) column, (13) FPD. Reprinted with permission from Analytical Chemistry, 60 ( 17 ): p. 1681. Copyright (1988) American Chemical Society.

INTERCALIBRATION OF DIMETHYL SULPHIDE IN WATER 49
Sample preparation and storage Water samples were loaded into the Pyrex glass sample chamber (200 cm ~
for natural samples, 5-10 cm 3 for cultures) via a depth filter (Millipore, AP25) using a peristaltic pump. A new filter was used for each sample. The sample was then transferred to the purge chamber (300 cm 3 for natural samples, 50 cm 3 for cultures) through a fritted glass diffuser under the force of a nitrogen stream. The reduced sulphur compounds were then stripped from the sample using nitrogen gas (600 cm 3 min-1 for natural samples, 50 cm ~ min-1 for cul- tures) and held in the cold trap which had been placed in liquid nitrogen im- mediately before the sample was transferred to the purge chamber. During the stripping procedure the trap was slowly lowered into the liquid nitrogen Dewar using a motorized laboratory jack to avoid the formation of ice plugs from the water-saturated gas stream. After 20 rain, the cold trap (still in the Dewar flask) was tightly sealed with Teflon end plugs and placed in a portable freezer. Liquid nitrogen levels were checked every 12 h and replenished when neces- sary. In tests, reduced sulphur concentrations in samples stored using this method did not change over a 2-week period (Leck and B~gander, 1988).
Analytical procedure Laboratory analyses were made using a Hewlett-Packard 5880A gas chro-
matograph (GC) with a flame photometric detector (FPD 100 AT, Meloy Lab., Inc. ). A Chromosi1330, FEP Teflon column (10 ft × 1/8 in. o.d.) was used. The GC oven was equipped with a liquid carbon dioxide device for sub-ambient temperatures. The oven was operated in a two-level temperature programme (1-100 °C). The detector signal was recorded with a Hewlett-Packard Model 3393A integrator.
For sample analysis, the cold trap (still in liquid nitrogen) was connected to the GC six-port valve in the load position. Before injection the valve was switched to the inject position. Injection was initiated by starting the GC tem- perature programme. After 15 s, the Dewar flask was removed, and the cold trap heating coil was turned on for 90 s so that the reduced sulphur compounds were swept directly onto the column. The six-port valve was then switched back to the load position.
This analytical method allowed simultaneous analysis of DMS, dimethyl disulphide (CH3SSCH3, DMDS), carbon disulphide (CS2), methyl mercaptan (CH3SH) and hydrogen sulphide (H2S) in a single water sample.
Sample preparation and analysis; University of East Anglia (UEA)
The analytical system described in Turner and Liss (1985) has since been modified, hence a full description of the current system is given in this paper. This method has been used extensively for seagoing research. Samples were analysed immediately to avoid possible increases in DMS concentration such

50 S.M. TURNER ET AL.
N2
b ×
Ic i
oo
oo q
oo°o
N2
/ q
m
-Q
Fig. 2. University of East Anglia equipment. (a) Gas scrubber, (b) needle valve, (c) purge cham- ber, (d) flow meter, (e) water trap, (f) Nation drier, (g) cold trap, (h) six-port valve, (j,k) two- way valves, (1) Dewar, (m) temperature controller, (n) temperature probe, (p) 47-• resistor, (q) GC with FPDs, (r) integrators.
as have been observed in stored samples from areas of high phytoplankton biomass (Turner et al., 1988). The configuration of the equipment is shown schematically in Fig. 2 and can be divided into two parts; sample preparation and sample analysis.
Sample preparation Nitrogen (BOC; oxygen-free grade) purge-gas was passed through a scrub-
ber unit (a) containing activated charcoal, into the purge chamber (c). The flow rate was controlled by means of a needle valve (b) and monitored using a bubble-flowmeter (d). The purge chamber had a glass frit at the base and a ground-glass joint at the top. Two sizes of purge chamber, to accommodate volumes of 50-100 and 5-20 cm 3, were used to maximize the path length of the nitrogen bubbles through the sample. The removable glass cap incorporated the water sample inlet (a Teflon tube fitted with a two-way valve and luer connection) and the purge-gas outlet (Teflon tubing, mounted in the purge chamber at a point above the level of the sample inlet ). After the purge-nitro- gen had bubbled through the water sample, it passed through a short section of glass tubing containing glass wool (e), which removed any water droplets carried by the gas stream. Water vapour, which could otherwise form ice block- ages in the cold trap, was removed using a 'DRY-PERM' (NAFION) drier (f) (International Science Consultants, Gt. Britain). The gas stream then passed into the cold trap (g) through a six-port switching valve (h). Two two-way valves (j and k) positioned on either side and as close as possible to the six-

INTERCALIBRATION OF DIMETHYL SULPHIDE IN WATER 51
port valve, served to isolate this valve from the rest of the system. The cold trap was made of 60-cm, 1/8-inch-o.d. P T F E Teflon tubing and about 15 cm below the connections to the six-port valve, the tubing was looped twice to form a coil of 5 cm diameter. During purging, the cold trap was suspended in a capped Dewar (1) of liquid nitrogen, such that the bottom of the loop was about 1 cm above the level of the cryogen. The temperature of this headspace was maintained at - 1 5 0 + 5 ° C, using an automated control unit (m) based on a feedback system (Environmental Sciences Electronics Workshop, UEA): a temperature probe (n) was mounted level with the base of the cold trap and a 47-~ vitreous resistor (p) was suspended in the liquid nitrogen. If the temper- ature at the base of the trap exceeded the set upper limit, current was applied to the resistor (5 W) until the liquid nitrogen had produced sufficient vapour to decrease the temperature to the set lower limit. Samples were trapped at - 150 ° C to prevent the formation of liquid oxygen, which might affect the flow dynamics of the cold trap, and also, if pulses of oxygen elute from the chro- matographic column, the characteristics of the flame photometric detector. After a sample had been trapped it was thawed and injected into the analytical system by means of the switching valve. This system was duplicated on the other side of the gas chromatograph.
Analytical procedure The analytical system consisted of a Varian 3700 gas chromatograph (Fig.
2, q) fitted with two flame photometric detectors (FPD: Aerograph dual flame detectors with 365-nm filters). Two columns of Chromosil 330 in Teflon (6 f t × 1/8 in. o.d. ) were operated isothermally at 40°C. DMS was well resolved and eluted at 2.8 rain. The detector outputs were monitored on Hewlett-Pack- ard 3390A reporting integrators (r). With purge-nitrogen flowing through the extraction system (60 cm 3 rain -1), the cold trap was placed in the Dewar, which was raised so that the cold trap was rapidly cooled by immersion in the liquid nitrogen for about 5 s or until violent boiling had ceased. The Dewar was lowered and the cold trap was then automatically maintained at - 1 5 0 ° C in the liquid nitrogen headspace. A small amount of water sample was drawn into a glass syringe and then expelled, so that the syringe was rinsed and no air remained. The sample was then taken (20-100 cm ~ for natural samples, 2-10 cm 3 for cultures) and injected into the purge chamber, against the flow of ni- trogen, through a two-way luer valve. After purging for 20 min, the two-way valve was opened (purge-gas vented to air) and the cold trap isolated (valves (j) and (k) closed). The cold trap was removed from the Dewar and immersed in a beaker of hot water (80°C) for about 5 s. The six-port sample valve was then switched so that the GC carrier gas swept the thawed sample onto the chromatographic column. After 1 min the valve was returned to its previous position, the purge chamber was emptied and the flow of purge-nitrogen re- sumed. After a few minutes the system was ready to receive the next sample.

52 S.M. TURNER ET AL.
The degassing efficiencies for 100, 50 and 20 (or less) cm 3 volumes of sample were 80, 90 and 100% respectively.
The duplicate sample preparation and GC facilities allowed simultaneous analyses, which enabled determination of DMS and DMSP from the same sample. However, as coordination of sample injections on each side of the GC was not possible, the GC oven was operated isothermally. Therefore, the range of sulphur gases resolved was limited. For analysis of suites of samples with low DMS concentrations the detector response was optimized by doping the air supply to the flame with about 2 p.p.m, of carbonyl sulphide, according to the method of Jones and Penkett (1980).
Test samples
Five water samples were obtained by boat at different sites along the estuary at Great Yarmouth, Norfolk, Gt. Britain, and one sample from the freshwater lake on the UEA campus. The six samples covered a range of salinity of 0- 33.55%o. Replicate ground-glass-stoppered sample bottles were filled at each site by immersion in the water. Care was taken to leave only minimum head- space. On return to the laboratory, half the replicates were stored at 5 ° C and the rest at ambient temperature. Although storage may have affected the ab- solute DMS concentrations and is not to be recommended in normal practice, the integrity of the samples was not considered paramount, as they were to be used for a comparative study only.
Four species of marine phytoplankton, Gyrodinium aureolum, Phaeocystis pouchetii, Pleurochrysis carterae and Scrippsiella trochoidea, were used (ob- tained from Center for the Culture of Marine Phytoplankton, Bigelow Labo- ratory for Ocean Sciences, Maine, U.S.A.; clone designations KT3, 677-3, COCCOII and PERI, respectively). Cultures were grown in F/2-enriched sea- water medium (Guillard, 1975), except for P. pouchetii which was grown in F/50 to maintain colony formation. They were analysed in the mid to late exponential phase of growth.
Aliquots for analysis were taken after the natural water samples had been shaken and cultures gently agitated. This step was particularly important for cultures as the cells of some species often settle out or congregate at the me- dium surface, according to species. UoS and UEA aliquots were taken from the same bottle or flask, with sampling intakes at the same level. As the UoS sub- sampling for the natural samples took longer than that of UEA, the latter sampling was taken at a half-way stage.
Calibration techniques
Four calibration procedures were examined: UoS compared a DMS permea- tion device, DMS in ethylene glycol (Andreae and Barnard, 1983) and DMSP

INTERCALIBRATION OF DIMETHYL SULPHIDE IN WATER 5 3
standards; UEA compared alkali hydrolysis of DMSP standards (Challenger, 1959) with DMS gas dilution (a method modified from Penkett et al., 1979).
Permeation tubes (UoS)
DMS permeation devices with permeation rates in the range 0.46-5.94 nmol DMS rain- 1 were prepared in the laboratory. Pure DMS liquid (Aldrich Chem- ical Company Inc., Milwaukee, WI, U.S.A.) was put into an aluminium cup which was then sealed with an FEP Teflon membrane. The total weight of the tube was less than 1 g. The device was kept in a constant-temperature vessel (Fig. lb ) connected to a water-bath held at 30 + 0.05 ° C. Purified nitrogen gas was used to flush the vessel continuously. Permeation rates were measured gravimetrically every 14 days (Cahn 21 microbalance, precision + 1% of the mean value ). To calibrate, a six-port valve equipped with TFE Teflon standard loops ranging from 1 to 15 cm 3 was used to inject standards into the cold trap, via degassed seawater in the purge chamber to reflect the procedure used for natural samples.
DMS in ethylene glycol (UoS)
Primary standards were made by adding DMS liquid to a bottle containing a known weight of ethylene glycol. The bottle was immediately sealed and shaken for 20 rain to ensure complete mixing. The mass concentration of the standard was gravimetrically determined. Microlitre volumes were injected into known weights of ethylene glycol to produce secondary standards in the range 0.016-0.031 nmol DMS #1-1. Microlitre volumes of the secondary standards were injected via Teflon-coated silicon septa, directly into degassed seawater in the purge chamber.
Gas dilution (UEA)
An aliquot (0.1-0.2 ml) of the headspace (ambient temperature and pres- sure) of a bottle of DMS (BDH Chemicals Ltd., Poole ) was injected through a septum, into a special aluminium chamber (99 125 cm 3) which had previ- ously been flushed with scrubbed (activated charcoal ) laboratory air. The con - tents were well mixed by means of a magnetically driven Teflon propeller. After about 5 rain, different volumes (normally 3-70 cm a ) of the standard were withdrawn by syringe and injected into the purge chamber and the normal sample procedure followed, but with only 5 rain cryo-trapping. Tests showed that the standard was stable for approximately 2 h, but to ensure its integrity, calibration samples were used for only 1 h after initial injection of DMS va- pour. As the lifetime of the standard was short, the normal 25-rain sample preparation time severely limited the number of points in the calibration curve.

54 S.M. TURNER ET AL.
However, tests had shown that there was no difference between standards in- jected into water (20-rain purge) and direct trapping (5-rain purge), so the direct trapping procedure was adopted.
The concentration of the standard was calculated using the vapour pressure derived from the equation
logloP= ( -0.2185 A/K) +B
where P is pressure (Torr), A is molar heat of vaporization (6742.3 cal g tool- 1 ), K is temperature (K) and B is a constant (=7.589 for DMS; Schlessinger, 1970).
Hydrolysis of dimethylsulphoniopropionate (DMSP) (UEA and UoS)
Dimethylsulphoniopropionate (DMSP) is the natural precursor of DMS which is found in certain species of marine phytoplankton and macroalgae. It is readily cleaved by the action of strong alkali at room temperature, to produce DMS and acrylic acid in a 1 : 1 ratio (Challenger, 1959). This reaction was used to produce aqueous DMS standards, which were analysed as for water samples. Two sources of DMSP were tested; commercial DMSP (Research Plus Inc., U.S.A. ) and DMSP synthesized in the laboratory (supplied by David Dickson, University College of North Wales, Bangor, Wales). Primary standards were made by dissolving approximately 7 mg of DMSP (accurate to two decimal places) in 50 cm 3 of distilled water. Although DMSP solutions are chemically stable at neutral pH, accidental contamination by common bacteria can lead to rapid decomposition (Dacey and Blough, 1987). Hence, primary standards were filter sterilized (0.22 #m) and subsequently maintained in a sterile con- dition. UoS used sterile aliquots of the commercial DMSP primary standard prepared by UEA. Secondary standards were prepared by diluting the primary 100-fold, again in distilled water. For this study, working standards in the range 0.016-0.438 nmol DMSP cm -3 were made up in distilled water, aged and fil- tered coastal seawater and F/2-enriched seawater culture medium. The stan- dards were hydrolysed in 36-cm a ground-glass-stoppered bottles containing 1 cm 3 of 10 M NaOH solution, with minimum headspace. The final pH of the solution was 12 and reaction was complete in under 6 h after which 5- or 10- cm 3 aliquots were analysed. The standards were stable for at least 3 days (as long as the ground-glass stoppers effected a good seal), and are usually inter- spersed with series of water or culture sample analyses. Alternatively, it has been found that standards can be analysed immediately by injecting an aliquot into the purge tube containing 2 cm a of 10 M NaOH. In this case, the reaction is complete within the 20-rain purge time. All parts of the system which had been in contact with the alkaline solutions were rinsed thoroughly with dilute hydrochloric acid and distilled water to prevent inadvertent hydrolysis of DMSP present in subsequent water samples.

INTERCALIBRATION OF DIMETHYL SULPHIDE IN WATER 55
RESULTS
Sample analysis
Table i shows the DMS concentration results for the natural water samples. The analytical errors observed by UEA and UoS were within the ranges _+ 6 and _+ 5% respectively, as quoted previously (Leck and B~gander, 1988; Turner et al., 1988). There also appeared to be no consistent differences between the two analytical systems, as the mean concentration ratio (UoS/UEA) for all the samples was equal to 100% (range= 74-134% ). Replicate samples from the same site did not always give the same DMS concentrations (i.e. Table 1; samples 7, 8 and 11, 12). However, samples were selected for analysis in a random order over the course of a day and hence, changes in concentration probably relate to different storage times.
Table 2 shows the results of DMS determinations for the algal cultures. The DMS concentrations determined by UEA were on average 30% higher than those measured by UoS. Even allowing for the analytical errors of each system,
TABLE 1
Comparison of DMS concentrations determined by UoS and UEA for natural water samples cov- ering a range of salinities
Salinity Sample DMS (nmol U o S / U E A ° (%0) l -~)
UoS UEA
0 1 0.36 0.34 106 0 2 0.31 0,42 74
8.3 3 0.81 0.81 100 8.3 4 0.81 0.75 108
14.5 5 1.67 1.59 105 14.5 6 lost 1.61
20.8 7 2.29 2.38 96 20.8 8 2.62 2.72 96
27.4 9 1.96 2.12 92 27.4 10 2.00 1.92 104
33.8 11 2.42 1.84 132 33.8 12 2.70 3.08 88
aRatio of the concentration determined by UoS divided by that found by UEA expressed as a percentage. The mean of these values is 100%.
56 S.M. TURNER ET AL.
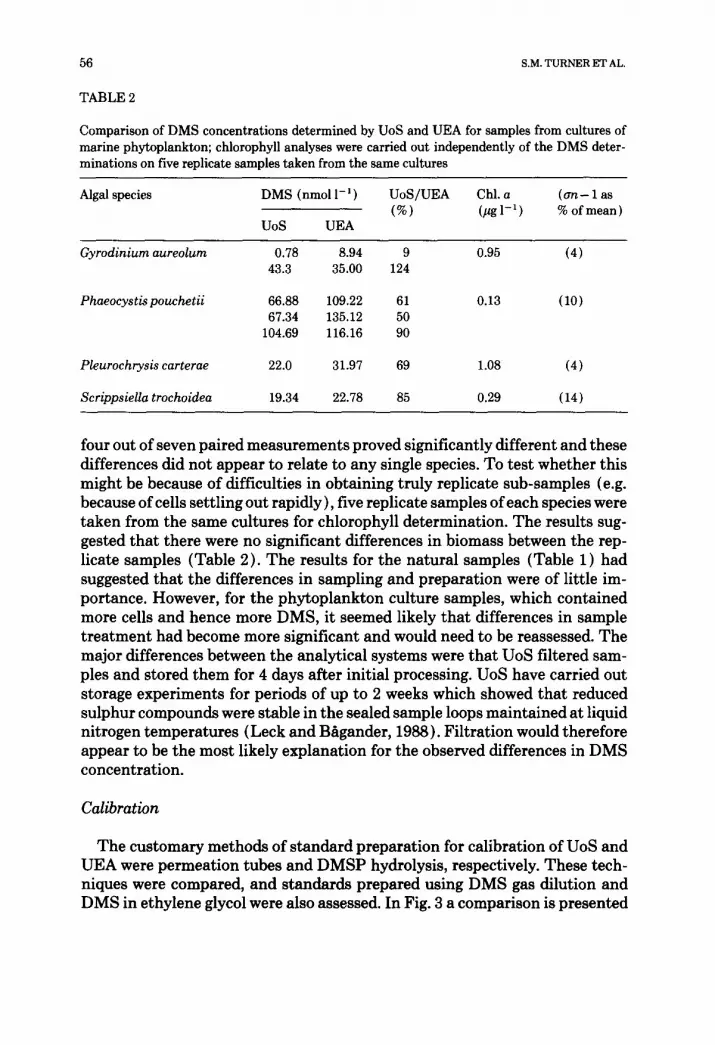
TABLE 2
Comparison of DMS concentrations determined by UoS and UEA for samples from cultures of marine phytoplankton; chlorophyll analyses were carried out independently of the DMS deter- minations on five replicate samples taken from the same cultures
Algal species DMS (nmol l - 1 ) UoS/UEA Chl. a (an - 1 as (%) (pg1-1 ) % of mean)
UoS UEA
Gyrodiniumaureolum 0.78 8.94 9 0.95 (4) 43.3 35.00 124
Phaeocyst~pouchetii 66.88 109.22 61 0.13 (10) 67.34 135.12 50
104.69 116.16 90
Pleurochrysis carterae 22.0 31.97 69 1.08 (4)
Scrippsiella trochoidea 19.34 22.78 85 0.29 (14)
four out of seven paired measurements proved significantly different and these differences did not appear to relate to any single species. To test whether this might be because of difficulties in obtaining truly replicate sub-samples (e.g. because of cells settling out rapidly), five replicate samples of each species were taken from the same cultures for chlorophyll determination. The results sug- gested that there were no significant differences in biomass between the rep- licate samples (Table 2). The results for the natural samples (Table 1) had suggested that the differences in sampling and preparation were of little im- portance. However, for the phytoplankton culture samples, which contained more cells and hence more DMS, it seemed likely that differences in sample treatment had become more significant and would need to be reassessed. The major differences between the analytical systems were that UoS filtered sam- ples and stored them for 4 days after initial processing. UoS have carried out storage experiments for periods of up to 2 weeks which showed that reduced sulphur compounds were stable in the sealed sample loops maintained at liquid nitrogen temperatures (Leck and B~gander, 1988). Filtration would therefore appear to be the most likely explanation for the observed differences in DMS concentration.
Calibration
The customary methods of standard preparation for calibration of UoS and UEA were permeation tubes and DMSP hydrolysis, respectively. These tech- niques were compared, and standards prepared using DMS gas dilution and DMS in ethylene glycol were also assessed. In Fig. 3 a comparison is presented

INTERCALIBRATION OF DIMETHYL SULPHIDE IN WATER 57
10-'
10 ~
10;
[]
[]
10 ( I 0.1 1 10
DMS nmo l
Fig. 3. Comparison of standards by UoS: permeation tube ([]), DMS (liquid) in ethylene glycol ( A ), DMSP hydrolysis ( + ).
of the three different calibration techniques used on the UoS analytical system: DMS permeation device, DMS standards in ethylene glycol and hydrolysis of DMSP. There was no difference between the three types of standard covering the range 0.16-2.2 nmol DMS. Within this range the log of the peak area was a linear function of the log of the amount of DMS up to about 0.94 nmol, which is well above the normal working range. Above 0.94 nmol, deviation from lin- earity was observed, which could plausibly be explained by non-optimal flame conditions. Using the data from Fig. 3, the maximum difference in concentra- tion between the different calibration methods was + 4% over the entire con- centration range tested.
Figure 4 compares the curves for aqueous DMSP and gaseous DMS stan- dards. There was very little difference between the curves and the square root of the detector response was linear over the range 0.17-2.0 nmol DMS in both cases. The difference in concentrations determined using the two techniques was about + 7% at the lower and + 3% at the upper extreme of the concentra- tion range. The curve for DMSP was composed of standards prepared using commercial and laboratory-synthesized DMSP; there was no significant dif- ference between the two batches of DMSP {Fig. 4).
Figure 5 shows the results for DMSP standards prepared using different aqueous media: distilled water, filtered seawater and F/2-enriched seawater culture medium. It is obvious from the regression equations that the type of medium produces no significant differences between the curves. The use of

58 S.M. TURNER ET AL.
3000
~, 20oo
1000
O
!
O A
!
o
o O
0 L I I I I 0 0.5 1.0 1.5 2.0
DMS nmol
Fig. 4. Comparison of calibration techniques by UEA. Gas dilution ( • ): peak area = - 39.5 + 1553 nmol DMS, r = 1.000, DMSP hydrolysis; commercial DMSP ( • ): peak area= 6.1 + 1584 nmol DMS, r = 0.997; laboratory DMSP (C)): peak area = 22.3 + 1574 nmol DMS, r = 1.000.
1500
1000
500
DISTILLED WATER
,~pa=5,05+1609 n tool corr=1.000
E 1 I 0 0.5 1.0
SEAWATER
~ " pa=5"80+1613 n ~ Jl~ = .
I I
0.5 1.0
DMS nmol
F/2 MEDIUM
~'1~=7.13+1598 n tool ~
I I
0.5 1.0
Fig. 5. Comparison of DMSP standards in distilled water, seawater and F/2 culture medium (UEA).

INTERCALIBRATION OF DIMETHYL SULPHIDE IN WATER 59
fresh seawater for preparation of DMSP standards is not recommended, as the water could contain a significant amount of natural DMSP.
DISCUSSION
Sample analysis
Comparison of the data for DMS concentration in natural water samples shows that the two laboratories were able to make DMS measurements that are in good agreement. For the marine phytoplankton culture samples how- ever, there are, in some cases, significant deviations. These differences do not appear to be systematic, and are probably dependent on the phytoplankton species and the exact stage of the growth phase; i.e. 'healthy' cells may not leach as much DMS and/or DMSP (enzymatically cleaved to produce DMS) into the medium during analysis as dying cells or cell fragments (see later discussion). The problems found in the analysis of laboratory cultures might be extended to natural samples from phytoplankton blooms. The limited data presented in this paper suggest that sample filtration might be preferable, as the DMS concentrations measured using the UEA analytical system were gen- erally higher than those measured by UoS.
It is, however, also possible that filtration per se stimulates DMS production during analysis, as cells forced into a filter could also experience sufficient stress to increase the DMS concentration as the sample passes through the increasing mass of impacted cells. The adverse effects of filtration on phyto- plankton cells from natural populations and laboratory-grown cultures are well documented in the literature. From primary productivity experiments, Gold- man and Dennett (1985) and Furnas (1987) found that microflagellates were most severely affected by filtration. However, in these two studies the nutrient status of the cells, sampling depth in the natural environment, light or dark incubation and type of filter were also important factors in influencing the effect of filtration on the uptake of [ 14C ] bicarbonate. Furnas (1987) also noted that the measurement of filtration artefacts was confounded by 'between and within experiment variability'. The open filtration systems used by these au- thors would not be compatible with the closed systems required for trace gas analysis, but they serve to illustrate why the effects of filtration and non-fil- tration on DMS determinations are far from clear.
Barnard et al. (1982) found that the DMS concentrations in unfiltered sam- ples were approximately double those of filtered samples. Previous data from field samples obtained by UEA had also suggested that filtration could increase DMS concentrations in some situations. Table 3 shows that for the Scheldt, filtered samples (0.45-/~m membrane filters) appeared to contain twice the DMS concentration of unfiltered samples. The limited number of North Sea samples, however, show lower concentrations for filtered samples (GF/C ill-

60 S.M. TURNER ET AL.
TABLE 3
Dimethyl sulphide concentrations determined by UEA for filtered and unfiltered seawater and culture samples
Sample type Mean DMS (nmol l - 1)a n F/UF (%)
Filtered (F) Unfiltered (UF)
Seawater E and W Scheldt b 9.31 (6.47) 4.62 {2.25) 34 202 North Sea (stored) 9.78 {0.31) 14.62 (0.84) 3 67
Culture P. pouchetii 16.00 (0.75) 67.72 (1.31) 3 24
aan-- 1 in parentheses. bit should be noted that all these samples contained P. pouchetii as the dominant species.
ters). The P. pouchetii culture, analysed after the intercalibration exercise, also gave lower concentrations for filtered samples (Millipore, AP25 depth filters). In all cases a new filter was used for each sample. The differences observed for these data may well relate to the types of filter used, and the physiological condition of the algal cells may also be an important considera- tion. The latter may be indicated by the differences between the filtered and unfiltered (F/UF) ratio for P. pouchetii in Table 3 and the UoS/UEA ratio for the same species in Table 2. In conclusion, it is clear that the problems asso- ciated with sample pre-treatment in the determination of DMS concentration in natural samples containing abundant phytoplankton warrant further study.
Calibration
The comparison of different calibration methods for DMS analysis sug- gested that there were no systematic differences between the four techniques. However, all the techniques have potential disadvantages which may make them more or less applicable in particular circumstances:
The addition of microlitre volumes of DMS in ethylene glycol to much larger volumes of seawater simulate natural samples as closely as possible and the influence of ethylene glycol on the solubility of DMS in seawater can be ig- nored. A possible disadvantage of DMS in ethylene glycol standards is their temporal instability due to microbiological activity. However, this can be cir- cumvented by storing the standards in a freezer (M.O. Andreae, personal com- munication 1989). When making sulphur standards which are not liquid (e.g. H2S, CH3SH) at room temperature, the use of permeation gas standards is more suitable.
Permeation devices represent a relatively simple calibration method, as

INTERCALIBRATION OF DIMETHYL SULPHIDE IN WATER 61
changing the gas flow rate (measured using a soap bubble flow meter) or the standard loop volume can be used to produce a wide range of standard concen- trations. An advantage of the permeation device is its longevity and stability. A possible disadvantage is the need for a precision balance, which requires stable laboratory facilities. Permeation standards are suitable for the calibra- tion of both water and atmospheric samples.
The preparation of standards by gas dilution requires the construction of a large-volume container with injection ports and some means of rapid mixing. The material used must be suitable for the gas under investigation, e.g. for DMS, materials containing silicone rubber must be avoided because of adsorp- tion effects. The volume of the dilution chamber must be large enough to dilute the DMS to environmental levels. Size constraints become particularly impor- tant when space is limited, such as onboard research vessels. A reasonable compromise on dimensions results in having to use aliquots of DMS vapour rather than liquid. If the headspace above DMS liquid is to be used as the source of DMS vapour, then very careful manipulation and accurate measure- ments of temperature and pressure are essential. Perhaps the greatest draw- back of this method is that the primary standard is stable for only a short time. Additionally, the time required to purge the container before standard prepa- ration means that immediate standards may not be readily available. The method is, however, suitable for calibration of both aqueous and atmospheric measurements.
The preparation of standards from DMSP requires no special equipment or handling of volatiles. Standards can be hydrolysed either during analysis or in tightly sealed glass bottles, which can be stored for several days. However, primary aqueous standards of DMSP must be maintained in a sterile condition as bacterial contamination can lead to significant loss of DMSP. Also, any equipment in contact with standards containing sodium hydroxide must be cleaned before the introduction of samples, otherwise spuriously high DMS concentrations may be observed because of unintentional cleavage of natural DMSP. This method may not be suitable for the calibration of atmospheric samples.
CONCLUSION
In conclusion, the intercalibration showed that two separate groups using significantly different analytical systems could produce DMS measurements which were in good agreement with each other. Additionally, valuable insights were gained into the perennial problem of whether or not to filter natural water samples before analysis and the relative merits of the different calibration methods which can be used in analytical systems to measure reduced sulphur compounds.

62 S.M. TURNER ET AL.
ACKNOWLEDGEMENTS
The UEA group was supported by research grants from the Natural Envi- ronment Research Council and the Department of the Environment. The UoS group was funded by the Swedish Natural Science Research Council.
We thank Mrs. J. Stevenson and Mr. L.A. Jackson for collecting the natural water samples, Mr. P. Judge for drawing the diagrams (except Fig. 1 ) and Prof. P.S. Liss for useful discussion during the preparation of the manuscript. We also thank Dr. M.O. Andreae for his review of the manuscript.
REFERENCES
Andreae, M.O., 1986. The ocean as a source of atmospheric compounds. In: P. Buat-Mdnard (Ed- itor), The Role of Air-Sea Exchange in Geochemical Cycling. D. Reidel, Dordrecht, pp. 331- 362.
Andreae, M.O. and Barnard, W.R., 1983. Determination of trace quantities of dimethyl sulfide in aqueous solutions. Anal. Chem., 55: 608-612.
Barnard, W.R., Andreae, M.O., Watkins, W.E., Bingemer, H. and Georgii, H.-W., 1982. The flux of dimethylsulfide from the oceans to the atmosphere. J. Geophys. Res., 87 (cll): 8787-8793.
Challenger, F., 1959. Aspects of the Organic Chemistry of Sulphur. Butterworths, London. Charlson, R.J. and Rodhe, H., 1982. Factors controlling the acidity of natural rainfall. Nature
(London), 295: 683-685. Charlson, R.J., Lovelock, J.E., Andreae, M.O. and Warren, S.G., 1987. Oceanic phytoplankton,
atmospheric sulphur, cloud albedo and climate. Nature, 326: 655-661. Dacey, J.W.H. and Blough, N.V., 1987. Hydroxide decomposition of dimethylsulfoniopropionate
to form dimethylsulfide. Geophys. Res. Lett., 14: 1246-1249. Furnas, M.J., 1987. Effects of prescreening on productivity of size-fractionated phytoplankton.
Limnol. Oceanogr., 32 (2): 483-491. Goldman, J.C. and Dennett, M.R., 1985. Susceptibility of some marine phytoplankton. Limnol.
Oceanogr., 32 (2): 483-491. Goldman, J.C. and Dennett, M.R., 1985. Susceptibility of some marine phytoplankton species to
cell breakage during filtration and post-filtration rinsing. J. Exp. Mar. Biol. Ecol., 86: 47-58. Guillard, R.R.L., 1975. Culture of phytoplankton for feeding marine invertebrates. In: W.L. Smith
and M.H. Chanley (Editors), Culture of Marine Invertebrate Animals. Academic Press, New York, pp. 29-60.
Jones, B.M.R. and Penkett, S.A., 1980. Improvements to a flame photometric detector to allow measurement of sulphur gases in ambient air. AERE Report R9764. HMSO, London, 11 pp.
Leck, C. and B~gander, L.E., 1988. Determination of reduced sulfur compounds in aqueous solu- tions using gas chromatography flame photometric detection. Anal. Chem., 60: 1680-1683.
Penkett, S.A., Brice, K.A., Derwent, R.G. and Eggleton, A.E.J., 1979. Measurement of CCI3F and CCI4 at Harwell over the period January 1974-November 1977. Atmos. Environ., 13: 1011- 1019.
Schlessinger, G.G., 1970. Vapor pressures, critical temperatures and critical pressures of organic compounds. In: R.C. Weast (Editor), Handbook of Chemistry and Physics, 51st Edn. The Chemical Rubber Co., Cleveland, OH, pp. D146-D172.
Turner, S.M. and Liss, P.S., 1985. Measurement of various sulphur gases in a coastal marine environment. J. Atmos. Chem., 2: 223-232.
Turner, S.M., Malin, G., Liss, P.S., Harbour, D.S. and Holligan, P.M., 1988. The seasonal varia-
tion of dimethyl sulfide and dimethylsulfoniopropionate concentrations in nearshore waters. Limnol. Oceanogr., 33: 364-375.


