Embed Size (px)
Citation preview
Matas A/S, Rørmosevej 1, DK-3450 Allerød. CVR no. 27 52 84 06 | Interim Report H1 2019/20 | page 1 of 26
Company announcement 10 2019/20 – INSIDE INFORMATION
Allerød, 30 October 2019
Interim report – H1 2019/20 (1 April – 30 September 2019)
Growth and stable earnings
Revenue grew by 5.8% over Q2 2018/19, and earnings came to DKK 107 million before IFRS 16 (EBITDA before special
items) or DKK 154 million after IFRS 16.
“Earnings remained stable compared to the same period of last year despite our continued digital build-up and
store upgrades, and for the sixth consecutive quarter, we grew online sales on matas.dk by at least 50% year-on-
year. We intend to maintain this momentum by investing additional resources in the digital build-up,” states Gregers
Wedell-Wedellsborg, CEO of Matas A/S, and he adds:
”At the same time, the store upgrade programme has gathered momentum with 15 roll-outs so far this year. The
upgrades give us a fresher and more welcoming appearance, and our customers are responding well to this.
Expanding, relocating or merging stores in connection with upgrades produces the most positive effect on our sales
and earnings, because this enables us to offer our customers a larger selection of products and even better service.
Going forward, we will therefore prioritise such upgrades and retail network adjustments, although they will take
longer to implement.”
Due to the revised plan for the retail network adjustments, the Group has lowered its 2019/20 CAPEX target to DKK
150 – 170 million (previously DKK 200 – 220 million).
At the same time, Matas is narrowing its financial targets for total revenue growth and underlying revenue growth for
2019/20 in light of a less positive sales growth in Q2 2019/20 than expected. Total revenue is expected to grow by 3.5
– 5.5% (previously 3.5 – 6.5%), while underlying like-for-like revenue is expected to increase by 0.5 – 1.5% (previously 0.5
– 2.5%). The efficiency measures implemented in Q2 2019/20 as part of the Group’s strategy will have a favourable
impact of some DKK 25 million in the financial year 2019/20, and the target for the 2019/20 EBITDA margin before
special items is reiterated.
The interim report for Q2 2019/20 is presented in accordance with IFRS 16. However, key financials are also presented
before IFRS 16 in order to enable y-o-y comparisons with 2018/19. IFRS 16 implementation primarily affects EBITDA and
EBIT as well as cash flows from operating and financing activities. Revenue and gross margin are not affected by IFRS
16 implementation.
Q2 2019/20 highlights
▪ Revenue grew by 5.8% over Q2 2018/19, while underlying like-for-like sales, i.e. sales in stores operated by the
Group in both Q2 2019/20 and Q2 2018/19, were up by 0.3% in Q2 2019/20.
▪ Revenue was favourably affected by the extra trading day compared to Q2 2018/19. This positive calendar
effect is estimated at 0.5% for the quarter but was partially offset by a less favourable distribution of trading days
in the quarter. Adjusted for this effect, underlying sales are estimated to have fallen slightly in the quarter in the
wake of a decline in sunscreen sales from last year’s record-high.
▪ Online sales via matas.dk were ahead by 53% over the year-earlier period, while overall online sales, including
revenue acquired from Firtal, surged by 180% to make up 12.0% of Q2 2019/20 revenue from 4.6% in Q2 2018/19.
▪ The gross margin was 43.5%, compared with 44.9% in Q2 2018/19. The lower gross margin was primarily driven by
non-recurring effects in connection with the Kosmolet acquisition (see note 5 for more information). Adjusted for
this, the gross margin was 44.7%.
The below cost and earnings comments are based on pre-IFRS 16 numbers.
▪ As part of the Group’s strategy, the second quarter of the financial year saw the implementation of an
efficiency programme that successfully reduced underlying costs. The positive effects of this programme will
continue into the second half of the financial year and are expected to amount to a total of approximately
DKK 25 million for the full financial year.

Matas A/S, Rørmosevej 1, DK-3450 Allerød. CVR no. 27 52 84 06 | Interim Report H1 2019/20 | page 2 of 26
▪ Impacted by costs added by Firtal and Kosmolet and by costs associated with the rapid online growth, overall
costs before special items were up by DKK 20.1 million, while overall costs were up by DKK 14.8 million year-on-
year. Other external costs were up by DKK 1.5 million and staff costs rose by DKK 13.3 million.
▪ EBITDA before special items and including normalisations came to DKK 107.4 million, compared with DKK 108.6
million in Q2 2018/19. The EBITDA margin before special items and including normalisations was 13.1%, down
from 14.0% in Q2 2018/19.
▪ Cash generated from operations was an inflow of DKK 62.8 million in Q2 2019/20, against an inflow of DKK 46.6
million in Q2 2018/19. The free cash flow for Q2 2019/20 was an inflow of DKK 12.7 million against an inflow of DKK
5.8 million in the year-earlier period.
▪ The ratio of net interest-bearing debt to EBITDA before special items and including normalisations was 3.3x
compared with 2.9x at 30 September 2018. The increase was driven primarily by the acquisition of Kosmolet A/S.
A pro forma gearing ratio including LTM EBITDA from Kosmolet and Firtal calculates at 3.1x.
H1 2019/20 highlights
▪ Revenue grew by 4.8% over H1 2018/19, while underlying like-for-like sales, i.e. sales in stores operated by the
Group in both H1 2019/20 and H1 2018/19, were down by 0.5%.
▪ Revenue was adversely affected by the one trading day less than in H1 2018/19 (two days fewer in Q1 and one
day more in Q2). Moreover, the distribution of trading days in the second quarter was not as favourable as in
the year-earlier period. The total negative calendar effect is estimated at about 1.5% for the period.
▪ Online sales via matas.dk were ahead by 59% year-on-year, while overall online sales, including revenue
acquired from Firtal, surged by 192% to make up 11.5% of H1 2019/20 revenue from 4.1% in H1 2018/19.
▪ The gross margin was 44.3%, compared with 45.1% in H1 2018/19. Adjusted (normalised) for non-recurring effects
relating to the acquisition of Kosmolet A/S, the gross margin was 44.9%.
The below cost and earnings comments are based on pre-IFRS 16 numbers.
▪ Total costs increased by DKK 43.3 million relative to the year-earlier period. Costs added from the acquisitions of
Firtal and Kosmolet drove other external costs up by DKK 22.5 million and staff costs by DKK 11.6 million. The rest
of the increase was driven by the continued digital build-up on matas.dk, increased marketing activity plus, to a
lesser extent, transaction costs incurred in connection with the acquisition of Kosmolet.
▪ H1 2019/20 EBITDA before special items and including normalisations was DKK 227.3 million against DKK 246.9
million the year before. The decline was driven by higher costs.
▪ The EBITDA margin before special items and including normalisations was 13.4%, down from 15.2% in H1 2018/19.
▪ Not taking the acquisition of Kosmolet into account, the free cash flow was down by DKK 73.1 million on the
year-earlier period, driven by lower operating income and larger inventories, the latter caused primarily by
inventories added from Firtal and Kosmolet which were only partially offset by increases in other working capital
items. The free cash flow was also affected by larger investments in the first half of 2019/20 than in the year-
earlier period. Factoring in the acquisition of Kosmolet (outflow of DKK 122.7 million), the free cash flow was an
outflow of DKK 117.0 million in H1 2019/20, compared with an inflow of DKK 78.7 million in H1 2018/19.
After IFRS 16 Bef. IFRS 16 Bef. IFRS 16 After IFRS 16 Bef. IFRS 16 Bef. IFRS 16
2019/20 2019/20 2018/19 2019/20 2019/20 2018/19
(DKKm) Q2 Q2 Q2 H1 H1 H1
Revenue 822.5 822.5 777.2 1,698.1 1,698.1 1,621.0
Gross profit 357.5 357.5 349.0 751.5 751.5 730.7
EBITDA before special items 153.6 107.4 108.6 316.9 227.3 246.9
EBIT 45.7 46.5 55.9 116.5 119.5 151.0
Adjusted profit after tax 56.1 60.7 61.0 122.1 132.7 150.7
Free cash flow 58.9 12.7 5.8 (27.4) (117.0) 78.7
Revenue growth 5.8% 5.8% (1.6)% 4.8% 4.8% 0.0%
Underlying like-for-like revenue growth 0.3% 0.3% (1.9)% (0.5)% (0.5)% (0.3)%
Gross margin 43.5% 43.5% 44.9% 44.3% 44.3% 45.1%
EBITDA margin before special items 18.7% 13.1% 14.0% 18.7% 13.4% 15.2%
NIBD debt/EBITDA b. special items n.a. 3.3 2.9
Matas A/S, Rørmosevej 1, DK-3450 Allerød. CVR no. 27 52 84 06 | Interim Report H1 2019/20 | page 3 of 26
Financial targets
In light of a less positive sales growth in Q2 2019/20 than expected, the Group’s financial targets for 2019/20 have
been narrowed on two accounts (total revenue growth and underlying revenue growth) relative to the targets
announced in connection with the release of the financial statements for 2018/19 (see company announcement no.
2 2019/2).
At the same time, the target for 2019/20 CAPEX has been reduced against the background of the adjusted store
upgrade schedule.
The overall financial targets for financial year 2019/20 are as follows:
▪ Overall revenue growth of 3.5-5.5% (previously 3.5-6.5%)
▪ Underlying like-for-like revenue growth of 0.5-1.5% (previously 0.5-2.5%)
▪ CAPEX of DKK 150-170 million (lowered from DKK 200-220 million)
The following target is unchanged:
▪ EBITDA margin before special items of 14-15% (before effects of IFRS 16)
The Group’s financial targets for financial year 2019/20 reflect the full-year effects of the Firtal acquisition (closing at
13 November 2018), which is included in underlying revenue growth from December 2019, and the Kosmolet A/S
acquisition (closing at 11 June 2019).
The Group’s financial targets for 2019/20 are based on assumptions of slightly growing customer demand for beauty,
health and personal care products, a continuing decline in physical store footfall and persistently intensive
competition in the beauty, health and personal care market.
The Group’s long-term financial ambitions are unchanged.
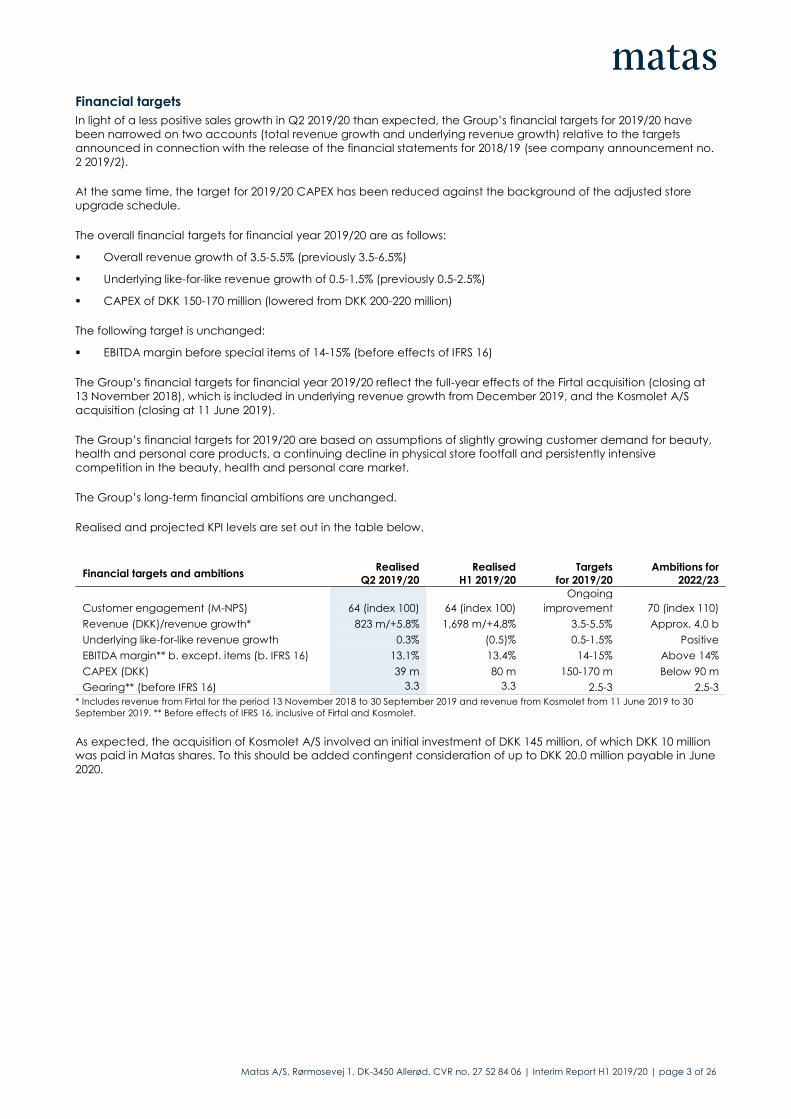
Realised and projected KPI levels are set out in the table below.
* Includes revenue from Firtal for the period 13 November 2018 to 30 September 2019 and revenue from Kosmolet from 11 June 2019 to 30
September 2019. ** Before effects of IFRS 16, inclusive of Firtal and Kosmolet.
As expected, the acquisition of Kosmolet A/S involved an initial investment of DKK 145 million, of which DKK 10 million
was paid in Matas shares. To this should be added contingent consideration of up to DKK 20.0 million payable in June
2020.
Financial targets and ambitions Realised
Q2 2019/20
Realised
H1 2019/20
Targets
for 2019/20
Ambitions for
2022/23
Ongoing
Customer engagement (M-NPS) 64 (index 100) 64 (index 100) improvement 70 (index 110)
Revenue (DKK)/revenue growth* 823 m/+5.8% 1,698 m/+4.8% 3.5-5.5% Approx. 4.0 b
Underlying like-for-like revenue growth 0.3% (0.5)% 0.5-1.5% Positive
EBITDA margin** b. except. items (b. IFRS 16) 13.1% 13.4% 14-15% Above 14%
CAPEX (DKK) 39 m 80 m 150-170 m Below 90 m
Gearing** (before IFRS 16) 3.3 3.3 2.5-3 2.5-3

Matas A/S, Rørmosevej 1, DK-3450 Allerød. CVR no. 27 52 84 06 | Interim Report H1 2019/20 | page 4 of 26
Conference call
Matas will host a conference call for investors and analysts on Wednesday, 30 October 2019 at 10:00 a.m. CET.
The conference call and the presentation can be accessed on our investor website: www.investor.en.matas.dk.
Conference call access numbers for investors and analysts:
DK: +45 32 72 80 42
UK: +44 (0) 844 571 8892
US: +1 631 510 7495
Event code: 9390208
Link to webcast: https://edge.media-server.com/mmc/p/au8gmirq
Contacts
Gregers Wedell-Wedellsborg Anders Skole-Sørensen
CEO, tel +45 48 16 55 55 CFO, tel +45 48 16 55 55
Elisabeth Toftmann Klintholm Klaus Fridorf
Head of Investor Relations & Corp. Affairs, tel +45 48 16 55 48 Head of Communication, tel +45 61 20 19 97
Forward-looking statements
This interim report contains statements relating to the future, including statements regarding the Matas Group's future
operating results, financial position, cash flows, business strategy and future targets. Such statements are based on
management’s reasonable expectations and forecasts at the time of release of the interim report. Forward-looking
statements are subject to risks and uncertainties and a number of other factors, many of which are beyond the
Matas Group's control. This may have the effect that actual results may differ significantly from the expectations
expressed in the interim report. Without being exhaustive, such factors include general economic and commercial
factors, including market and competitive conditions, supplier issues and financial and regulatory issues.

Matas A/S, Rørmosevej 1, DK-3450 Allerød. CVR no. 27 52 84 06 | Interim Report H1 2019/20 | page 5 of 26
Key financials After IFRS 16 Bef. IFRS 16 Bef. IFRS 16 After IFRS 16 Bef. IFRS 16 Bef. IFRS 16
2019/20 2019/20 2018/19 2019/20 2019/20 2018/19
(DKK m) Q2 Q2 Q2 H1 H1 H1
Statement of comprehensive income
Revenue 822.5 822.5 777.2 1,698.1 1,698.1 1,621.0
Gross profit 357.5 357.5 349.0 751.5 751.5 730.7
EBITDA 139.0 92.8 99.1 299.5 209.9 232.4
EBIT 45.7 46.5 55.9 116.5 119.5 151.0
Net financials (10.2) (6.4) (5.0) (19.9) (12.3) (9.3)
Profit before tax 35.5 40.1 50.9 96.6 107.2 141.7
Profit for the period after tax 26.0 30.6 36.6 72.0 82.6 107.4
Special items/normalisation 14.6 14.6 9.5 17.4 17.4 14.5
EBITDA before special items 153.6 107.4 108.6 316.9 227.3 246.9
Adjusted profit after tax 56.1 60.7 61.0 122.1 132.7 150.7
Statement of financial position
Total assets 6,537.3 5,665.1 5,256.2
Total equity 2,640.1 2,650.6 2,494.2
Net working capital (32.6) (32.6) (29.7)
Net interest-bearing debt 2,591.9 1,736.5 1,636.5
Statement of cash flows
Cash flow from operating activities 103.4 57.2 42.0 180.9 91.3 140.1
Cash flow from investing activities (44.5) (44.5) (36.2) (208.3) (208.3) (61.4)
Free cash flow 58.9 12.7 5.8 (27.4) (117.0) 78.7
Ratios
Revenue growth 5.8% 5.8% (1.6)% 4.8% 4.8% 0.0%
Underlying like-for-like revenue growth 0.3% 0.3% (1.9)% (0.5)% (0.5)% (0.3)%
Gross margin 43.5% 43.5% 44.9% 44.3% 44.3% 45.1%
EBITDA margin 16.9% 11.3% 12.8% 17.6% 12.4% 14.3%
EBITDA margin before special items 18.7% 13.1% 14.0% 18.7% 13.4% 15.2%
EBIT margin 5.6% 5.7% 7.2% 6.9% 7.0% 9.3%
Cash conversion n.a. 33.7% 17.4% n.a. 15.9% 41.4%
Earnings per share, DKK 0.68 0.80 0.97 1.89 2.17 2.85
Diluted earnings per share, DKK 0.68 0.80 0.97 1.87 2.15 2.84
Share price, end of period, DKK 50.5 50.5 62.8
ROIC before tax n.a. 10.3% 11.2%
Net working capital as a percentage of
LTM revenue (0.9)% (0.9)% (0.9)%
Investments as a percentage of revenue 5.4% 5.4% 4.7% 12.3% 12.3% 3.8%
Net interest-bearing debt/EBITDA before
special items n.a. 3.3 2.9
Number of transactions (millions) 4.8 4.8 5.0 9.8 9.8 10.3
Average basket size (DKK) 159.9 159.9 154.0 162.5 162.5 155.8
Average no. of employees 2,180 2,180 2,099 2,177 2,177 2,091
For definitions of key financials, see pages 99-100 of the 2018/19 Annual Report. Q2 special items include a normalisation concerning
Kosmolet. See note 5 for additional information.
Firtal and Kosmolet were consolidated as of the date of closing, i.e. 13 November 2018 and 11 June 2019, respectively. However, the figures
showing number of transactions and average basket size solely reflect transactions completed by Matas and are thus net of figures for Firtal
and sales by Kosmolet outside of Matas.
The Q2 2019/20 and H1 2019/20 figures in the “Before IFRS 16” column have been restated to exclude the effects of IFRS 16 imp lementation.

Matas A/S, Rørmosevej 1, DK-3450 Allerød. CVR no. 27 52 84 06 | Interim Report H1 2019/20 | page 6 of 26
Management’s review
Implementing the “Renewing Matas” strategy
The “Renewing Matas” strategy sets the course for the Group’s business initiatives going forward to 2023. The strategy
builds on five strategic focus areas: Matas’ purpose, three growth areas and the Group’s unwavering focus on
developing new ways of working. The strategy pursues three key ambitions going forward to 2023: lift customer
engagement, grow revenue and secure earnings.
Ambitions for
2022/23
Targets for
2019/20
Realised for
H1 2019/20
Lift customer engagement (M-NPS) 70 (index 110) Ongoing
improvement 64 (index 100)
Grow revenue* Approx. DKK 4.0 bn Growth of 3.5-5.5% Growth of 4.8%
Secure earnings (EBITDA margin b. except. items)** Above 14% 14-15% 13.4%
* Includes revenue from Firtal for the period 13 November 2018 to 30 September 2019 and revenue from Kosmolet from 11 June 2019 to 30
September 2019. ** Before effects of IFRS 16, inclusive of Firtal and Kosmolet.
The work to implement and execute the strategy is progressing according to plan, and the efforts to implement a
range of measures within each of the five strategic focus areas continued in H1 2019/20. This included the acquisition
of Kosmolet A/S, the owner of the successful Danish makeup brand Nilens Jord; the development of the new Matas
Life store concept; product range renewal and further development of matas.dk
1. Live our purpose
Together, Matas’ purpose, ’Beauty and wellbeing for life’, and its six carefully selected guideposts set the course for
the strategy and the Group’s efforts to lift customer engagement through, among other things, an improved
customer experience. The six guideposts aim to make the Matas profile more personal; more green; more Danish;
more sensuous; more simple and more for everyone.
Work to develop a range of business initiatives to lift customer engagement continued in the second quarter. A
number of new brands were introduced – green as well as professional, Danish as well as international – while at the
same time the new subscription service on matas.dk was expanded to include more products and products from the
Mass Beauty category, and the development of the online customer service offering personalised advice continued.
As part of its CSR strategy, the Group launched two sustainability projects in the second quarter, both of which set
out to reduce the use of plastic bags. In September, Matas started charging for plastic bags with a view to reducing
the use of bags by at least 50% within a period of 12 months. Subsequently, Matas launched a non-profit tote bag
with a strong CSR profile.
Lastly, a YouGov survey published in October 2019 showed that Matas, advancing second-most of all 400 brands,
has strongly improved its popularity among young people between the ages of 18 and 34.
2. Win online
Matas aims to be the undisputed online market leader in the Danish market for beauty and wellbeing by 2023. To
achieve this goal, the Group is making targeted efforts to enhance the customer experience.
In Q4 2018/19, Matas launched a customised subscription service, and in Q2 2019/20, we expanded the number of
products offered through this service by 350 to the effect that some 800 products, primarily within the health,
wellbeing and mass beauty categories, are currently available on a subscription basis.
In H1 2019/20, Matas launched a service offering personal online advice, followed by the introduction in early
October 2019 of the Matas Skin Consultation on matas.dk, which offers customers personal online advice by a
trained materialist.
In September, matas.dk relocated to new premises in Humlebæk north of Copenhagen. With the improved set-up,
the web shop is better equipped to deal with online sales growth and secure fast delivery to customers.
In FDIH, the Danish E-commerce Association’s, annual survey of Danish consumers’ preferred web shops, matas.dk
advanced eight places from no. 16 in 2018 to no. 8 in 2019.

Matas A/S, Rørmosevej 1, DK-3450 Allerød. CVR no. 27 52 84 06 | Interim Report H1 2019/20 | page 7 of 26
Matas continued its efforts to expand the personal dialogue with customers through its digital channels in the second
quarter of the financial year. By the end of September 2019, our customers were able to follow 266 Matas stores on
Facebook. These stores shared a total of 9,000 posts generating almost 7 million views.
The Q2 2019/20 performance was driven by continued strong growth in Matas’ online sales. In Q2 2019/20, 12% of
revenue came from online sales, of which 6.5% was generated by matas.dk and 5.5% by Firtal. In Q2 2018/19, 4.6% of
revenue was generated by online sales (only matas.dk).
3. Reignite store growth
The work to test and implement the new Matas Life store concept continued in the second quarter of the financial
year. An additional two stores were upgraded to the new concept, one in Fredericia (merger of two stores at a new
location) and one in Amager (renovation). After the end of the quarter, in October four Matas Life stores opened in
existing premises, in Ringsted, Esbjerg, Hellerup and Odder, while a fifth store opened in Viborg at a new location. This
took the total number of Matas Life stores to 15.
Overall, more than 35 stores have been renovated over the past three years.
Customers are generally responding well to the new concept, and tests show that the largest effect on sales and
earnings is achieved when Matas upgrades stores in connection with an expansion, a relocation or a merger as this
allows Matas to offer customers a larger selection of products and better service. Such upgrades will therefore be
prioritised in the upcoming period, although it will slow down the pace of Matas Life roll-outs. Whether a store is
upgraded will also depend on whether the landlord (lessor) contributes to funding the upgrade. Lastly, the ongoing
process of refreshing existing stores will continue.
An additional seven Matas Life stores – five combined mergers and relocations with a full concept upgrade and two
renovations of existing stores – are scheduled to open by the end of 2019. In addition, plans are in place to upgrade
up to 10 Matas stores to Matas Life stores during Q4 2019/20, taking the number of Matas Life stores to about 30 by
the end of the financial year.
Overall, the updated roll-out schedule translates into an overall lower CAPEX for store upgrades in 2019/20 than
previously estimated.
Matas commitment to continuously renew the product range was reflected in the introduction of a number of new
brands during the second quarter, including two Danish brands, Meraki (life style) and Sandstone (makeup), and
international luxury brands such as Italy’s Bottega Veneta (fragrances), America’s Kiehl’s and PERRICONE MD
(skincare).
In addition, selected OTC drugs, including “quit-smoking” products, were made available as self-service products.
Towards the end of the quarter, a new store set-up where product range and brand composition are aligned with
the role and customer base of the individual store was rolled out to ten stores on a test basis.
The “Beautiful brands – sharp prices” concept, which was launched in Q1 2019/20, was further developed and
adjusted during the second quarter. Just under 300 carefully selected products across all categories are marketed
under this concept, some of which are sold at “Everyday low prices”.
4. Open new growth tracks
The Group has identified a number of areas in which its assets may be brought into play in new ways in order to
secure growth and earnings by strengthening the Group's position on the green market, which is growing rapidly on
the back of increasing customer demand for clean products produced with care and consideration for human
health, the environment and inner beauty, and by increasing the share of revenue generated by private labels and
brands with exclusive rights.
In Q1 2019/20, the Group acquired Kosmolet A/S, the owner of the Danish makeup brand Nilens Jord. The acquisition
was announced on 28 May 2019 and completed on 11 June 2019. Nilens Jord is known for its allergy-friendly and
natural profile, and the acquisition has given Matas a stronger position and a more powerful organisation in the
green market. Through the acquisition of Kosmolet A/S, the Group has increased the share of revenue generated by
private labels and brands with exclusive rights to 18.0% in Q2 2019/20from 16.0% in Q2 2018/19.
5. Change how we work
With a view to supporting the Group’s financial ambitions going forward to 2022/23, an efficiency programme that
successfully reduced underlying costs was implemented in the second quarter of the financial year.
In addition, the work to rethink and simplify how we work and develop our culture, processes and employees
continued in the second quarter with a view to sustaining our ability to predict and adapt to market changes.

Matas A/S, Rørmosevej 1, DK-3450 Allerød. CVR no. 27 52 84 06 | Interim Report H1 2019/20 | page 8 of 26
Q2 2019/20 and H1 2019/20 performance
IFRS 16, Leases
Matas implemented IFRS 16, Leases effective 1 April 2019. This affected the interim report for H1 2019/20, mainly
because leased stores used to be classified as operating leases and were therefore not included in the statement of
financial position. In accordance with IFRS 16, leased stores have been recognised in the statement of financial
position at 30 September 2019 at DKK 849.3 million under lease assets and at DKK 855.4 million under lease liabilities.
IFRS 16 implementation primarily affects EBITDA and EBIT as well as cash flows from operating and financing activities.
EBITDA increased by DKK 46.2 million as operating lease expenses are now recognised as depreciation of lease
assets and interest on lease liabilities, as opposed to previously, when they were presented as rent under other
external costs. EBIT was affected in the amount of DKK 0.8 million as a result of increased depreciation. Cash flows for
Q2 2019/20 were unchanged as the DKK 46.2 million increase in cash flows from operating activities was offset by a
corresponding decline in cash flows from financing activities. See note 1 to the financial statements for more
information.
Revenue
The Group generated total revenue of DKK 822.5 million in Q2 2019/20, an increase of 5.8% compared with DKK 777.2
million in the same period of last year. Net growth was primarily driven by the addition of revenue from Firtal. Net
growth in retail sales from Matas was slightly positive with the increase in online sales offsetting the decline in physical
store sales.
Sales in stores (including matas.dk) operated by the Group in both Q2 2019/20 and Q2 2018/19 were up by 0.3%
(underlying like-for-like growth).
Online sales on matas.dk were up by 53% in Q2 2019/20 year-on-year. Overall online sales accounted for 12.0% of Q2
revenue, with matas.dk contributing 6.5% and Firtal 5.5%.
The Q2 revenue performance was supported by improved Beauty, Vital and MediCare sales, whereas the Material
category reported lower sales compared with the year-earlier period. Revenue was favourably affected by an extra
trading day compared to the same quarter of last year, but adversely affected by the distribution of trading days in
the quarter. The overall trading day effect is estimated to have lifted underlying revenue by about 0.5%. This increase
was offset by lower sales of sunscreen products compared with Q2 2018/19.
The number of transactions via Matas stores and matas.dk was down by 3.5% in Q2 2019/20 year-on-year. Adjusted
for new and closed stores, the decline was 3.2%. The average basket size grew by 3.9% or DKK 5.9. These figures are
net of Firtal transactions and basket sizes and Kosmolet sales to non-Matas customers.
Overall, the Beauty category grew revenue by 3.5% over Q2 2018/19. Sales of High-End Beauty products were up by
5.0% and Mass Beauty sales by 2.0%. High-End Beauty accounted for 34.1% of Q2 retail sales, while Mass Beauty
accounted for 32.9%. Skincare reported the strongest sales growth. Sunscreen sales, on the other hand, were down
from the record-high level reported in Q2 2018/19.
Revenue by categories and sales channels 2019/20 2018/19 2019/20 2018/19
(DKKm) Q2 Q2 Growth H1 H1 Growth
Beauty 545.6 527.0 3.5% 1,155.1 1,125.3 2.6%
Vital 136.2 105.1 29.6% 267.1 203.1 31.5%
Material 82.3 85.8 (4.1)% 163.0 174.4 (6.5)%
MediCare 48.0 46.8 2.5% 94.1 93.2 0.9%
Other 2.5 3.0 (18.2)% 4.3 6.0 (29.3)%
Total retail sales (own stores and web shops) 814.6 767.7 6.1% 1,683.5 1,602.0 5.1%
Wholesale sales etc. (including Kosmolet) 7.9 9.5 (16.2)% 14.6 19.0 (23.0)%
Total revenue 822.5 777.2 5.8% 1,698.1 1,621.0 4.8%
Physical store 87.0% 94.2% 87.6% 94.7%
Web shops (matas.dk and Firtal) 12.0% 4.6% 11.5% 4.1%
Wholesale sales etc. (including Kosmolet) 1.0% 1.2% 0.9% 1.2%
Matas A/S, Rørmosevej 1, DK-3450 Allerød. CVR no. 27 52 84 06 | Interim Report H1 2019/20 | page 9 of 26
The Beauty category accounted for 67.0% of overall Q2 retail sales against 68.6% in Q2 2018/19.
The Vital category boosted sales by an impressive 29.6%. The increase was driven mainly by the inclusion of revenue
from Firtal, but sales were up in Matas even when disregarding acquired revenue.
The Material category reported revenue down by 4.1%, impacted mainly by lower sales of seasonal products due to
weather conditions and intensified competition. The MediCare category, which offers OTC medicine and nursing
products, reported sales up by an overall 2.5%.
Overall sales of Matas’ private labels, including Kosmolet, made up 18.0% of Q2 2019/20 revenue against 16.0% in the
year-earlier period. The increase was driven mainly by the addition of revenue from Kosmolet, which was included for
the full period.
Wholesale sales, including wholesale sales attributable to Kosmolet, fell by DKK 1.5 million year-on-year. Revenue
from Club Matas relating to partners, value adjustments of Club Matas points and B2B are also included in this item.
At 30 September 2019, Club Matas had a membership of 1.6 million and thus retained its position as one of
Denmark’s largest customer clubs. More than 70% of all Danish women between the ages of 18 and 65 are members
of Club Matas. Of the 1.6 million members, 1.5 million had consented to being contacted by the club, while 1.4
million are active, shopping members. At 30 September 2019, more than 740,000 members had downloaded the
Club Matas app.
Customer satisfaction among Club Matas members was 3.79 in Q2 2019/20 on a scale of 1-4 with 1 being very
dissatisfied and 4 being very satisfied. This was unchanged from Q2 2018/19.
At 64, the Matas Net Promoter Score (M-NPS) was unchanged at the end of Q2 2019/20 compared with the end of
Q1 2019/20.
At 30 September 2019, the Club Matas partner programme had 25 external partners, who offer Club Matas members
benefits in the categories of Travel, Shopping, Adventure, Home and Personal Care.
Costs and operating performance
Gross profit for Q2 2019/20 was DKK 357.5 million, against DKK 349.0 million in Q2 2018/19.
The gross margin for Q2 2019/20 was 43.5%, down from 44.9% in Q2 2018/19. The lower gross margin was primarily
driven by non-recurring effects in connection with the Kosmolet acquisition with profits on Nilens Jord products being
recognised only when sold in Matas stores. Before the acquisition, Kosmolet recognised profits on the sale of products
to the Matas Group. As a result, during a transitional period, profits on sales of Kosmolet products will not be
Sales channels
At 30 September 2019, the Matas Group consisted of 275 physical stores, including the associated store in Greenland. 87%
of revenue was generated by the Group’s physical stores.
In addition, Matas was present online through matas.dk and stylebox.dk and through a number of web shops run by Firtal,
including helsebixen.dk, jala-helsekost.dk and made4men.dk. 12% of revenue was generated through the Group’s online
channels.
Wholesale sales, including wholesale sales from Kosmolet, accounted for 1% of overall sales.
The Group has no physical activities outside Denmark as the store in the Faroe Islands and the associated store in
Greenland are considered Danish stores in this context.
Categories
Matas is characterised by its wide product range within beauty, personal care, healthcare and problem-solving
household products. This broad product range creates a unique one-stop retail value proposition for our customers in the
shape of four categories (shops-in-shop).
Beauty: Everyday and luxury beauty products and personal care, including cosmetics, fragrances, skincare and haircare
products.
Vital: Vitamins, minerals, supplements, specialty foods and herbal medicinal products.
Material: Household and personal care products, including household cleaning and maintenance products, babycare,
footcare and sports-related products.
MediCare: OTC medicine, nursing products, etc.

Matas A/S, Rørmosevej 1, DK-3450 Allerød. CVR no. 27 52 84 06 | Interim Report H1 2019/20 | page 10 of 26
recognised. This non-recurring effect has been included as a normalisation. See note 5 to the financial statements for
more information. Adjusted for this, the gross margin was 44.7%.
The underlying small drop of 0.2 percentage point in the gross margin was caused mainly by lower sales of sunscreen
products.
The second quarter of the financial year saw the implementation of an efficiency programme that successfully
reduced underlying costs. While mainly targeted at physical stores, the efficiency measures also comprised head
office administrative functions. The programme is expected to trim costs by an overall DKK 25 million in financial year
2019/20.
Driven by costs added from Firtal and Kosmolet and increased activity on matas.dk, leading to higher operating
costs, overall costs before IFRS 16 increased by DKK 20.1 million.
Other external costs before IFRS 16 amounted to DKK 86.1 million in Q2 2019/20, up from DKK 84.6 million in Q2
2018/19. Adjusted for special items, which amounted to DKK 9.5 million in Q2 2018/19, other external costs were up by
DKK 10.1 million. The acquisitions of Firtal and Kosmolet caused a DKK 12.8 million increase in other external costs.
Taking this into consideration there was an underlying decrease in Other external costs of DKK 2.7 million in the
quarter.
IFRS 16 adoption caused a DKK 46.2 million decline in other external costs as rent is now recognised as depreciation
of lease assets and is therefore no longer included in other external costs.
Q2 2019/20 staff costs amounted to DKK 178.6 million, up from DKK 165.3 million in the year-earlier period. The DKK
13.3 million increase was driven by staff costs attributable to Firtal and Kosmolet in the amount of DKK 6.5 million, non-
recurring severance costs for managers in the amount of DKK 3.3 million and higher payroll costs for the operation
and development of matas.dk.
After IFRS 16 Before IFRS 16 Before IFRS 16
Costs, Q2 2019/20 2019/20 2018/19
(DKKm) Q2 Q2 Q2 Growth
Other external costs 39.9 86.1 84.6 1.8%
- of which special items 0.9 0.9 9.5
As a percentage of revenue 4.9% 10.5% 10.9%
Staff costs 178.6 178.6 165.3 8.0%
- of which special items 3.3 3.3 0.0
As a percentage of revenue 21.7% 21.7% 21.3%
Other external costs and staff costs include Kosmolet for the period 11 June – 30 September 2019.
The Q2 2019/20 and H1 2019/20 figures in the ”Before IFRS 16” columns have been restated to exclude the effects of IFRS 16 implementation.
After IFRS 16 Before IFRS 16 Before IFRS 16
Costs, H1 2019/20 2019/20 2018/19
(DKKm) H1 H1 H1 Growth
Other external costs 90.4 180.0 158.1 13.9%
- of which special items 3.7 3.7 9.7
As a percentage of revenue 5.3% 10.6% 9.8%
Staff costs 361.6 361.6 340.2 6.3%
- of which special items 3.3 3.3 4.8
As a percentage of revenue 21.3% 21.3% 21.0%
Other external costs and staff costs include Kosmolet for the period 11 June – 30 September 2019.
The Q2 2019/20 and H1 2019/20 figures in the ”Before IFRS 16” columns have been restated to exclude the effects of IFRS 16 implementation.
Staff costs amounted to 21.7% of Q2 2019/20 revenue, against 21.3% in the year-earlier period.
Q2 2019/20 staff costs included DKK 2.0 million related to the company’s long-term share compensation programme,
of which DKK 0.7 million were classified as special items.
The positive effects of the efficiency programme on other external costs and staff costs will continue into the second
half of the financial year.

Matas A/S, Rørmosevej 1, DK-3450 Allerød. CVR no. 27 52 84 06 | Interim Report H1 2019/20 | page 11 of 26
Before IFRS 16, Q2 2019/20 EBITDA was DKK 92.8 million against DKK 99.1 million in Q2 2018/19. EBITDA before special
items and including normalisations came to DKK 107.4 million for an EBITDA margin before special items and including
normalisations of 13.1% against 14.0% in Q2 2018/19.
After IFRS 16, Q2 2019/20 EBITDA was DKK 139.0 million, while EBITDA before special items and including normalisations
was DKK 153.6 million.
Amortisation, depreciation and impairment
Total amortisation, depreciation and impairment charges before IFRS 16 were up by DKK 3.1 million to DKK 46.3 million
in Q2 2019/20, driven by increased depreciation of investments made as part of the Group’s strategy.
Amortisation, depreciation After IFRS 16 Bef. IFRS 16 Bef. IFRS 16 After IFRS 16 Bef. IFRS 16 Bef. IFRS 16
and impairment 2019/20 2019/20 2018/19 2019/20 2019/20 2018/19
(DKKm) Q2 Q2 Q2 H1 H1 H1
Amortisation, depreciation
and impairment 93.3 46.3 43.2 183.0 90.4 81.4 The Q2 2019/20 and H1 2019/20 figures in the ”Before IFRS 16” columns have been restated to exclude the effects of IFRS 16 implementation.
Total amortisation, depreciation and impairment charges after IFRS 16 were DKK 93.3 million. The DKK 47.0 million
increase was attributable to increased depreciation of lease assets.
Net financials
Net financial expenses – before IFRS 16 – were up by DKK 1.4 million to DKK 6.4 million in Q2 2019/20, against DKK 5.0
million in Q2 2018/19.
After IFRS 16, net financial expenses came to DKK 10.2 million, the increase being attributable to interest on lease
liabilities in the amount of DKK 3.8 million.
After IFRS 16 Bef. IFRS 16 Bef. IFRS 16 After IFRS 16 Bef. IFRS 16 Bef. IFRS 16
Net financial expenses 2019/20 2019/20 2018/19 2019/20 2019/20 2018/19
(DKKm) Q2 Q2 Q2 H1 H1 H1
Net financial expenses 10.2 6.4 5.0 19.9 12.3 9.3
Fair value adjustment of
interest rate swap 0.0 0.0 0.0 0.0 0.0 2.9
Net financial expenses,
adjusted for swap 10.2 6.4 5.0 19.9 12.3 12.2 The Q2 2019/20 and H1 2019/20 figures in the ”Before IFRS 16” columns have been restated to exclude the effects of IFRS 16 implementation.
Profit for the period
The effective tax rate before IFRS 16 was 23.7% in Q2 2019/20, equivalent to a tax expense of DKK 9.5 million. Profit for
the period after tax and before IFRS 16 was DKK 30.6 million, and Adjusted profit after tax and before IFRS 16 was DKK
60.7 million against DKK 61.0 million in Q2 2018/19.
Statement of financial position
Total assets amounted to DKK 6,537.3 million at 30 September 2019, up from DKK 5,256.2 million at 30 September 2018.
The increase was driven mainly by the recognition of lease assets at DKK 849.3 million and lease liabilities at DKK 855.4
million, see note 1 on the effects of implementing IFRS 16, Leases.
Kosmolet’s assets and liabilities were consolidated based on a provisional purchase price allocation, see note 5,
comprising mainly goodwill of DKK 80.4 million and trademarks of DKK 58.9 million. The carrying amount of trademarks
at 30 September 2019 was DKK 57.1 million after amortisation.
Current assets totalled DKK 1,115.6 million, a year-on-year increase of DKK 161.2 million. The increase was attributable
partly to larger inventories as a result of additions from Firtal and Kosmolet and a change in corporation tax
receivable.
Inventories were DKK 119.6 million larger at the end of Q2 2019/20 than at the end of Q2 2018/19. The increase was
primarily caused by the addition of inventories in Firtal and Kosmolet as well as inventories in the new web shop in
Humlebæk, in total approximately DKK 75 million.

Matas A/S, Rørmosevej 1, DK-3450 Allerød. CVR no. 27 52 84 06 | Interim Report H1 2019/20 | page 12 of 26
Inventories accounted for 25.4% of LTM revenue at 30 September 2019 compared with 23.0% at 30 September 2018.
Trade receivables increased by DKK 5.0 million to DKK 14.7 million. Trade payables increased by DKK 93.1 million from
30 September 2018, and thus financed a significant part of the increase in inventories over the period
Net working capital excluding deposits stood at minus DKK 32.6 million at 30 September 2019, compared with minus
DKK 29.7 million at 30 September 2018.
Cash and cash equivalents stood at DKK 46.5 million, down from DKK 54.9 million the year before.
Equity was DKK 2,640.1 million at 30 September 2019, compared with DKK 2,494.2 million at 30 September 2018.
Net interest-bearing debt before IFRS 16 was DKK 1,736.5 million at 30 September 2019, a year-on-year increase of
DKK 100.0 million – equalling 3.3 times LTM EBITDA before special items and including normalisations, which was
above – but not significantly above – the long-term target of a level between 2.5 and 3. The corresponding figure at
30 September 2018 was 2.9. The increase was mainly attributable to the acquisition of Kosmolet A/S at 11 June 2019
and, to a lesser extent, the acquisition of Firtal in November 2018. This kind of acquisition shows up in debts right
away, whereas the positive earnings effect will only materialise over time. A pro forma gearing ratio including LTM
EBITDA from Kosmolet and Firtal calculates at 3.1.
Gross interest-bearing debt stood at DKK 2,638.4 million at 30 September 2019, including lease liabilities of DKK 855.4
million.
Net interest-bearing debt, comprising debt to credit institutions, including current and non-current lease liabilities and
other interest-bearing debt less cash and cash equivalents, amounted to DKK 2,591.9 million at 30 September 2019
after IFRS 16.
At 30 September 2019, the company’s share capital consisted of 38,291,492 shares of DKK 2.50 each, corresponding
to a share capital of DKK 95.728.730. After disposing of 140,567 shares in Q1 in connection with the acquisition of
Kosmolet A/S and 52,217 shares in connection with the exercise of the 2016/17 incentive programme, Matas held
103,977 treasury shares at 30 September 2019. Treasury shares are held with a view to meeting the obligations under
the long-term management incentive programme.
Statement of cash flows
Cash generated from operations was an inflow of DKK 62.8 million before IFRS 16 in Q2 2019/20 against an inflow of
DKK 46.6 million in Q2 2018/19.
The free cash flow for Q2 2019/20 was an inflow of DKK 12.7 million against an inflow of DKK 5.8 million in the year-
earlier period. The increase in CAPEX was driven primarily by Matas Life investments and, to a lesser degree, the
establishment of the new web shop in Humlebæk.
Disregarding the acquisition of Kosmolet A/S, the free cash flow in H1 2019/20 was down by DKK 73.1 million on the
year-earlier period, driven by lower operating income and larger inventories caused primarily by inventories added
by Firtal and Kosmolet. This was only partially offset by increases in other working capital items. The free cash flow was
also affected by larger investments in the first half of 2019/20 than in the year-earlier period. Factoring in the
acquisition of Kosmolet A/S (outflow of DKK 122.7 million), the free cash flow was an outflow of DKK 117.0 million in H1
2019/20, compared with an inflow of DKK 78.7 million in H1 2018/19.
After IFRS 16 Bef. IFRS 16 Bef. IFRS 16 After IFRS 16 Bef. IFRS 16 Bef. IFRS 16
Cash flows 2019/20 2019/20 2018/19 2019/20 2019/20 2018/19
(DKKm) Q2 Q2 Q2 H1 H1 H1
Cash generated from operations 109.0 62.8 46.6 191.8 102.2 151.9
Free cash flow 58.9 12.7 5.8 (27.4) (117.0) 78.7
Free cash flow net of acquisitions 58.9 12.7 5.8 95.3 5.7 78.7
Cash flows from financing activities (174.5) (128.3) (145.2) (87.0) 2.6 (110.2) The Q2 2019/20 and H1 2019/20 figures in the ”Before IFRS 16” columns have been restated to exclude the effects of IFRS 16 implementation.
The cash flow effect of IFRS 16 implementation was a DKK 46.2 million increase in cash generated from operations as
costs are no longer affected by lease liabilities in the form of rent.

Matas A/S, Rørmosevej 1, DK-3450 Allerød. CVR no. 27 52 84 06 | Interim Report H1 2019/20 | page 13 of 26
Return on invested capital
The return on LTM invested capital before tax and before IFRS 16 was 10.3%, compared with 11.2% a year earlier. The
return on invested capital cannot be calculated after IFRS 16 due to a lack of historical EBITA numbers after IFRS 16
implementation.
Events after the date of the statement of financial position
No significant events have occurred after the date of the statement of financial position.
Significant risks
As stated in the 2018/19 Annual Report, no significant operational risks are deemed to exist other than what is normal
for the industry. Matas is to some extent exposed to different types of financial risk such as interest rate, liquidity and
credit risk.

Matas A/S, Rørmosevej 1, DK-3450 Allerød. CVR no. 27 52 84 06 | Interim Report H1 2019/20 | page 14 of 26
Statement by the Board of Directors and the
Executive Management
The Board of Directors and the Executive Management today considered and approved the interim report of Matas
A/S for the period 1 April to 30 September 2019.
The interim report, which has been neither audited nor reviewed by the company’s auditors, has been prepared in
accordance with IAS 34 ‘Interim Financial Reporting’ as adopted by the EU and additional disclosure requirements of
the Danish Financial Statements Act.
In our opinion, the interim report gives a true and fair view of the Group’s assets and liabilities and financial position at
30 September 2019 and of the results of the Group’s operations and cash flows for the period 1 April to 30 September
2019.
Furthermore, in our opinion, the management’s review includes a fair review of the development and performance
of the business, the results for the period and of the Group’s financial position in general and describes the principal
risks and uncertainties that the Group faces.
Allerød, 30 October 2019
Executive Management
Gregers Wedell-Wedellsborg Anders Skole-Sørensen
CEO CFO
Board of Directors
Lars Vinge Frederiksen Lars Frederiksen Signe Trock Hilstrøm
Chairman Deputy Chairman
Mette Maix Christian Mariager Birgitte Nielsen

Matas A/S, Rørmosevej 1, DK-3450 Allerød. CVR no. 27 52 84 06 | Interim Report H1 2019/20 | page 15 of 26
Additional information
Financial calendar
The financial year covers the period 1 April – 31 March, and the following dates have been fixed for releases etc. in
the remainder of financial year 2019/20:
8 January 2020 Trading update for Q3 2019/20
27 February 2020 Interim report – Q3 2019/20
27 May 2020 Annual report 2019/20
30 June 2020 Annual general meeting for 2019/20
Company information
Matas A/S
Rørmosevej 1
3450 Allerød, Denmark
Tel.: +45 48 16 55 55
www.matas.dk
investor.en.matas.dk
Company reg. (CVR) no. 27 52 84 06
Matas A/S, Rørmosevej 1, DK-3450 Allerød. CVR no. 27 52 84 06 | Interim Report H1 2019/20 | page 16 of 26
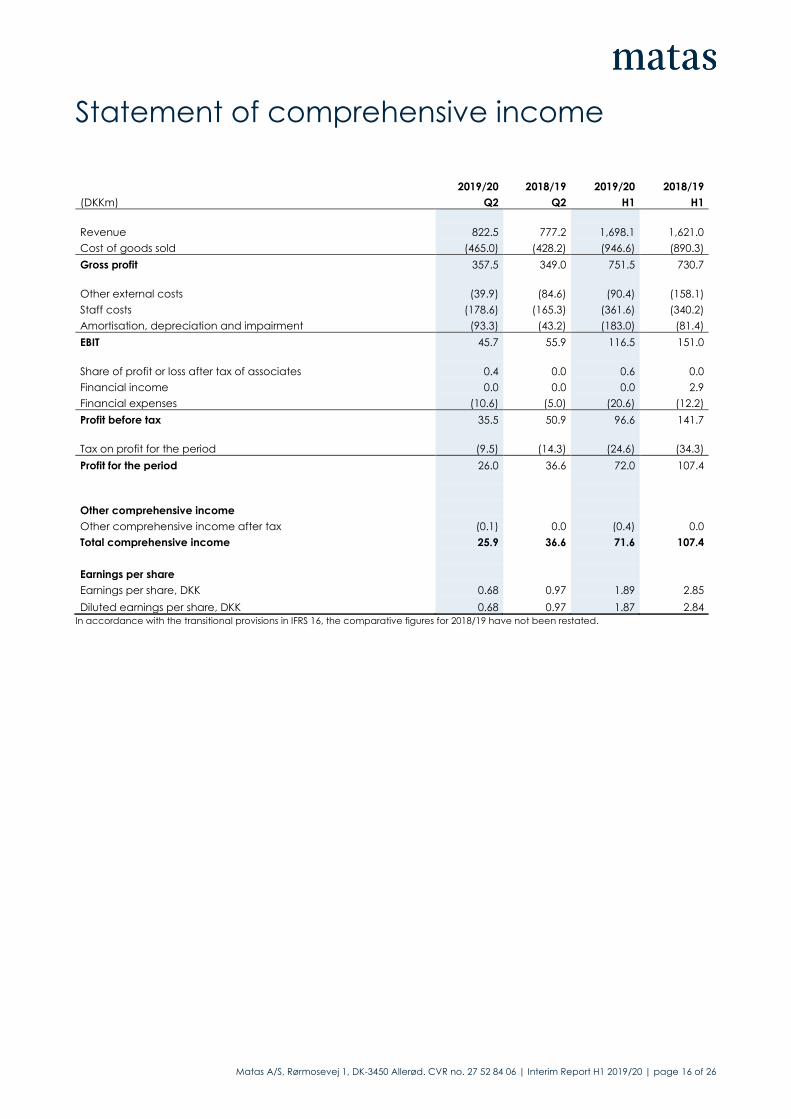
Statement of comprehensive income
2019/20 2018/19 2019/20 2018/19
(DKKm) Q2 Q2 H1 H1
Revenue 822.5 777.2 1,698.1 1,621.0
Cost of goods sold (465.0) (428.2) (946.6) (890.3)
Gross profit 357.5 349.0 751.5 730.7
Other external costs (39.9) (84.6) (90.4) (158.1)
Staff costs (178.6) (165.3) (361.6) (340.2)
Amortisation, depreciation and impairment (93.3) (43.2) (183.0) (81.4)
EBIT 45.7 55.9 116.5 151.0
Share of profit or loss after tax of associates 0.4 0.0 0.6 0.0
Financial income 0.0 0.0 0.0 2.9
Financial expenses (10.6) (5.0) (20.6) (12.2)
Profit before tax 35.5 50.9 96.6 141.7
Tax on profit for the period (9.5) (14.3) (24.6) (34.3)
Profit for the period 26.0 36.6 72.0 107.4
Other comprehensive income
Other comprehensive income after tax (0.1) 0.0 (0.4) 0.0
Total comprehensive income 25.9 36.6 71.6 107.4
Earnings per share
Earnings per share, DKK 0.68 0.97 1.89 2.85
Diluted earnings per share, DKK 0.68 0.97 1.87 2.84
In accordance with the transitional provisions in IFRS 16, the comparative figures for 2018/19 have not been restated.

Matas A/S, Rørmosevej 1, DK-3450 Allerød. CVR no. 27 52 84 06 | Interim Report H1 2019/20 | page 17 of 26
Statement of cash flows
2019/20 2018/19 2019/20 2018/19
(DKKm) Q2 Q2 H1 H1
Profit before tax 35.5 50.9 96.6 141.7
Adjustment for non-cash operating items etc.:
Amortisation, depreciation and impairment 93.3 43.2 183.0 81.4
Other non-cash operating items, net 2.1 1.0 3.2 2.7
Share of profit or loss after tax of associates (0.4) 0.0 (0.6) 0.0
Financial income 0.0 0.0 0.0 (2.9)
Financial expenses 10.6 5.0 20.6 12.2
Cash generated from operations before changes in working capital 141.1 100.1 302.8 235.1
Changes in working capital (32.1) (53.5) (111.0) (83.2)
Cash generated from operations 109.0 46.6 191.8 151.9
Interest paid (5.6) (4.6) (10.9) (11.8)
Cash flow from operating activities 103.4 42.0 180.9 140.1
Acquisition of intangible assets (14.3) (17.4) (30.1) (27.5)
Acquisition of property, plant and equipment (24.8) (18.8) (50.1) (33.9)
Acquisition of securities/investments (5.4) 0.0 (5.4) 0.0
Acquisition of subsidiaries and operations 0.0 0.0 (122.7) 0.0
Cash flow from investing activities (44.5) (36.2) (208.3) (61.4)
Free cash flow 58.9 5.8 (27.4) 78.7
Debt raised and settled with credit institutions (13.7) 97.7 117.2 132.7
Repayment of lease liabilities (46.2) 0.0 (89.6) 0.0
Dividend paid (114.6) (237.1) (114.6) (237.1)
Acquisition of hedging instrument 0.0 (5.8) 0.0 (5.8)
Cash flow from financing activities (174.5) (145.2) (87.0) (110.2)
Net cash flow from operating, investing and financing activities (115.6) (139.4) (114.4) (31.5)
Cash and cash equivalents, beginning of period 162.0 194.3 160.9 86.4
Cash and cash equivalents, end of period 46.5 54.9 46.5 54.9
In accordance with the transitional provisions in IFRS 16, the comparative figures for 2018/19 have not been restated.
The above cannot be derived directly from the income statement and the statement of financial position.

Matas A/S, Rørmosevej 1, DK-3450 Allerød. CVR no. 27 52 84 06 | Interim Report H1 2019/20 | page 18 of 26
Assets
(DKKm) 30.09 2019 30.09 2018 31.03 2019
NON-CURRENT ASSETS
Goodwill 3,918.5 3,731.7 3,838.1
Trademarks and trade names 266.0 251.0 247.6
Other intangible assets 89.7 67.0 82.3
Total intangible assets 4,274.2 4,049.7 4,168.0
Property, plant and equipment
Lease assets 849.3 0.0 0.0
Land and buildings 86.1 86.8 86.4
Other fixtures and fittings, tools and equipment 107.8 88.4 91.7
Leasehold improvements 52.7 13.7 16.8
Total property, plant and equipment 1,095.9 188.9 194.9
Investments in associates 0.7 0.0 0.7
Deferred tax assets 0.0 22.6 0.0
Deposits 44.8 39.9 42.6
Other securities and investments 6.1 0.7 0.7
Total other non-current assets 51.6 63.2 44.0
Total non-current assets 5,421.7 4,301.8 4,406.9
CURRENT ASSETS
Inventories 918.3 798.7 785.5
Trade receivables 14.7 9.7 11.4
Corporation tax receivable 20.7 59.3 51.8
Other receivables 85.6 12.0 90.1
Prepayments 29.8 19.8 32.2
Cash and cash equivalents 46.5 54.9 160.9
Total current assets 1,115.6 954.4 1,131.9
TOTAL ASSETS 6,537.3 5,256.2 5,538.8
In accordance with the transitional provisions in IFRS 16, the comparative figures for 2018/19 have not been restated.

Matas A/S, Rørmosevej 1, DK-3450 Allerød. CVR no. 27 52 84 06 | Interim Report H1 2019/20 | page 19 of 26
Equity and liabilities
(DKKm) 30.09 2019 30.09 2018 31.03 2019
EQUITY
Share capital 95.7 95.7 95.7
Hedging reserve (3.0) 0.3 (2.6)
Translation reserve 0.3 0.3 0.3
Treasury share reserve (11.8) (73.7) (33.3)
Retained earnings 2,558.9 2,471.6 2,494.9
Proposed dividend for the financial year 0.0 0.0 114.9
Total equity 2,640.1 2,494.2 2,669.9
LIABILITIES
Deferred tax 213.9 200.7 209.4
Lease liabilities 671.3 0.0 0.0
Provisions 27.4 0.0 0.0
Contingent consideration 16.1 0.0 15.2
Credit institutions 1,775.8 1,594.2 1,665.0
Other payables 6.6 0.0 0.0
Total non-current liabilities 2,711.0 1,794.9 1,889.6
Credit institutions 7.2 97.2 0.0
Lease liabilities 184.1 0.0 0.0
Prepayments from customers 149.1 148.9 156.0
Trade payables 666.7 573.6 638.9
Dividend 0.0 0.0 0.0
Other payables 179.0 147.4 185.0
Total current liabilities 1,186.1 967.1 979.3
Total liabilities 3,897.2 2,762.0 2,868.9
TOTAL EQUITY AND LIABILITIES 6,537.3 5,256.2 5,538.8
In accordance with the transitional provisions in IFRS 16, the comparative figures for 2018/19 have not been restated.

Matas A/S, Rørmosevej 1, DK-3450 Allerød. CVR no. 27 52 84 06 | Interim Report H1 2019/20 | page 20 of 26
Statement of changes in equity
Share
capital
Hedging
reserve
Translation
reserve
Treasury
share
reserve
Proposed
dividend
Retained
earnings Total
Equity at 1 April 2019 95.7 (2.6) 0.3 (33.3) 114.9 2,949.9 2,669.9
Value adjustment of hedging instrument 0.0 (0.5) 0.0 0.0 0.0 0.0 (0.5)
Tax on value adjustment 0.0 0.1 0.0 0.0 0.0 0.0 0.1
Other comprehensive income 0.0 (0.4) 0.0 0.0 0.0 0.0 (0.4)
Profit for the period 0.0 0.0 0.0 0.0 0.0 72.0 72.0
Total comprehensive income 0.0 (0.4) 0.0 0.0 0.0 72.0 71.6
Transactions with owners
Dividend transferred to liabilities 0.0 0.0 0.0 0.0 (114.6) 0.0 (114.6)
Dividend on treasury shares 0.0 0.0 0.0 0.0 (0.3) 0.3 0.0
Exercise of incentive programme 0.0 0.0 0.0 5.9 0.0 (5.9) 0.0
Disposal of treasury shares for purchase of
Kosmolet 0.0 0.0 0.0 15.6 0.0 (5.6) 10.0
Share-based payment 0.0 0.0 0.0 0.0 0.0 3.2 3.2
Total transactions with owners 0.0 0.0 0.0 21.5 (114.9) (8.0) (101.4)
Equity at 30 September 2019 95.7 (3.0) 0.3 (11.8) 0.0 2,558.9 2,640.1
In accordance with the transitional provisions in IFRS 16, the comparative figures for 2018/19 have not been restated.
Share
capital
Hedging
reserve
Translation
reserve
Treasury
share
reserve
Proposed
dividend
Retained
earnings Total
Equity at 1 April 2018 95.7 0.0 0.3 (73.7) 241.2 2,357.4 2,620.9
Value adjustment of hedging instrument 0.0 0.4 0.0 0.0 0.0 0.0 0.4
Tax on value adjustment 0.0 (0.1) 0.0 0.0 0.0 0.0 (0.1)
Other comprehensive income 0.0 0.3 0.0 0.0 0.0 0.0 0.3
Profit for the period 0.0 0.0 0.0 0.0 0.0 107.4 107.4
Total comprehensive income 0.0 0.3 0.0 0.0 0.0 107.4 107.7
Transactions with owners
Dividend paid 0.0 0.0 0.0 0.0 (237.1) 0.0 (237.1)
Dividend on treasury shares 0.0 0.0 0.0 0.0 (4.1) 4.1 0.0
Share-based payment 0.0 0.0 0.0 0.0 0.0 2.7 2.7
Total transactions with owners 0.0 0.0 0.0 0.0 (241.2) 6.8 (234.4)
Equity at 30 September 2018 95.7 0.3 0.3 (73.7) 0.0 2,471.6 2,494.2
In accordance with the transitional provisions in IFRS 16, the comparative figures for 2018/19 have not been restated.

Matas A/S, Rørmosevej 1, DK-3450 Allerød. CVR no. 27 52 84 06 | Interim Report H1 2019/20 | page 21 of 26
Notes to the financial statements
Note 1 – Accounting policies
The interim report is presented in accordance with IAS 34, Interim Financial Reporting as adopted by the EU and
additional disclosure requirements of the Danish Financial Statements Act.
Except as set out below, the accounting policies are unchanged from the accounting policies applied in the
consolidated financial statements for 2018/19, to which reference is made.
Changes of accounting policies Matas implemented IFRS 16, Leases effective 1 April 2019. The impacts of adopting the standard are described
below.
All other amendments to standards and interpretations issued since the release of the consolidated financial
statements for 2018/19 have been implemented. None of these have affected recognition and measurement or
presentation, nor are they expected to materially affect the Group.
Impacts of IFRS 16 implementation The standard is effective for annual reporting periods beginning on or after 1 January 2019 and is thus effective for
Matas as of 1 April 2019. Opting to apply the simplified implementation method, Matas has recognised lease assets
and lease liabilities as from 1 April 2019 and has not restated comparative figures for earlier periods.
Under the new rules, Matas must, with a few exceptions, recognise all leases, including previous operating leases, in
the statement of financial position. This means that a lease liability, measured as the present value of expected
future lease payments as described below, is recognised together with a corresponding lease asset adjusted for
payments made to the lessor prior to commencement of the lease and any incentives received from the lessor. In
pursuance of the exemption clauses in IFRS 16, Matas has opted not to recognise leases with a term of less than 12
months or of low value. The Group has also decided to apply the same discount rate to a portfolio of leases with
similar characteristics. Matas’ leases primarily consist of store leases.
For purposes of assessing the expected lease term, Matas identifies the non-cancellable lease term of the
agreement plus periods comprised by an extension option which Matas reasonably expects to exercise and plus
periods comprised by a termination option. In accordance with Danish tenancy legislation, the majority of Matas’
leases contain short non-cancellable periods. Accordingly, management has prepared an estimate of the lease
term that may reasonably be expected, taking into account factors such as current retail market developments in
Denmark and the Group’s strategy.
A number of store leases contain options entitling Matas to extend the lease in pursuance of Danish tenancy law. On
initial recognition of the lease liability, Matas considers whether it reasonably expects to exercise the extension
option, which estimate is reassessed upon the occurrence of a significant event or a significant change in
circumstances that is within the Group’s control. Upon expiry of the non-cancellable period, the individual leases are
assessed in consideration of Matas’ strategy.
In connection with the recognition of leases in accordance with IFRS 16, taking into account factors such as the
current Danish retail market and the Group’s strategy, the Group estimated its leasehold reinstatement liabilities,
based partly on the lease term estimated on recognition of store leases. A liability of DKK 27.0 million was recognised
at 1 April 2019 pertaining to Matas’ obligation to reinstate leased premises on vacation.
The total impact of IFRS 16 adoption on the statement of financial position at 1 April 2019 and 30 September 2019 is
as follows:
(DKKm) At 1 April 2019
At 30
September
2019
Lease assets
Leased stores etc. 890.3 842.0
Cars and other leases 6.4 7.3
Lease assets 896.7 849.3
Leasehold improvements 27.0 22.9
Total property, plant and equipment 923.7 872.2
Total lease liabilities 896.7 855.4
Provision for leasehold reinstatement 27.0 27.4

Matas A/S, Rørmosevej 1, DK-3450 Allerød. CVR no. 27 52 84 06 | Interim Report H1 2019/20 | page 22 of 26
Lease assets recognised at 1 April 2019 compare with the Group’s liabilities under operating leases at 31 March 2019
as follows:
(DKKm)
Operating lease liabilities at 31 March 2019 160.6
Lease liabilities for periods comprised by extension options which Matas reasonably expects to exercise 786.6
Discounted at alternative borrowing rate at 1 April 2019 (50.5)
Lease assets at 1 April 2019 896.7
Lease assets are depreciated on a straight-line basis over the estimated lease term, which is:
(Years)
Leased stores etc. 2-8
Cars and other leases 3
In measuring the lease liability, Matas applied an alternative borrowing rate for purposes of discounting future lease
payments, which is 1.3 – 1.9% for leased premises and 1.1% for cars and other leases.
Implementing IFRS 16 affected Matas’ interim financial statements in that store leases, which were previously
classified as operating leases and therefore not recognised in the statement of financial position, are now
recognised in the statement of financial position as lease assets under property, plant and equipment and as lease
liabilities.
EBITDA increased because operating lease expenses are now recognised as depreciation of lease assets and
interest on lease liabilities.
Cash flows were unchanged as the increase in cash flows from operating activities was offset by the decrease in
cash flows from financing activities.
The impact of IFRS 16 adoption on Matas’ interim report for Q2 2019/20 and H1 2019/20 is shown below.
After IFRS 16 Bef. IFRS 16 After IFRS 16 Bef. IFRS 16
2019/20 IFRS 16 2019/20 2019/20 IFRS 16 2019/20
(DKKm) Q2 impact Q2 H1 impact H1
EBITDA 139.0 (46.2) 92.8 299.5 (89.6) 209.9
EBITDA before special items 153.6 (46.2) 107.4 316.9 (89.6) 227.3
EBITDA margin 16.9% (5.6)% 11.3% 17.6% (5.3)% 12.4%
EBITDA margin b. special items 18.7% (5.6)% 13.1% 18.7% (5.3)% 13.4%
Amortisation and depreciation 93.3 47.0 46.3 183.0 (92.6) 90.4
EBIT 45.7 (0.8) 46.5 116.5 3.0 119.5
Net financial items (10.2) (3.8) (6.4) (19.9) 7.6 (12.3)
EBT 35.5 4.6 40.1 96.6 10.6 107.2
Free cash flow 58.9 (46.2) 12.7 (27.4) (89.6) (117.0)
Total assets 6,537.3 (872.2) 5,665.1 6,537.3 (872.2) 5,665.1
Net interest-bearing debt 2,591.9 (855.4) 1,736.5 2,591.9 (855.4) 1,736.5
Contingent liabilities in the form of liabilities under operating leases are disclosed in notes 28 and 30 to the financial
statements in the 2018/19 Annual Report. This liability has been reduced to an insignificant level as a result of the
recognition of lease assets in the statement of financial position.

Matas A/S, Rørmosevej 1, DK-3450 Allerød. CVR no. 27 52 84 06 | Interim Report H1 2019/20 | page 23 of 26
Note 2 – Accounting estimates and judgments
The preparation of interim financial statements requires management to make accounting judgments and estimates
that affect the application of accounting policies and recognised assets, liabilities, income and expenses. Actual
results may differ from these estimates.
Based on the implementation of IFRS 16, management has made the following judgments and estimates concerning
leases.
The lease term covers the non-cancellable period of the lease plus periods comprised by an extension option which
Matas reasonably expects to exercise and plus periods comprised by a termination option which Matas reasonably
expects not to exercise. Matas’ store leases often contain options entitling Matas to extend the lease in pursuance of
Danish tenancy law. On initial recognition of the lease liability, Matas considers whether it reasonably expects to
exercise the extension option and estimates the expected lease term, which estimates are reassessed upon the
occurrence of a significant event or a significant change in circumstances that is within the Group’s control. Upon
expiry of the non-cancellable period, the individual leases are assessed in consideration of Matas’ strategy.
Matas applies an alternative borrowing rate for purposes of measuring the present value of future lease payments. In
determining this alternative borrowing rate, Matas divides its portfolio of lease assets into categories with similar
characteristics and risk profiles. The alternative borrowing rate is determined on initial recognition and in connection
with subsequent changes resulting from Matas revising its assessment as to whether it reasonably expects to exercise
a purchase, extension or termination option or from the lease being modified.
The critical accounting estimates and judgments applied are consistent with those applied in the consolidated
financial statements for 2018/19.
Note 3 – Seasonality
Except for fluctuations in the number of trading days, the Group’s activities in the interim period were only to a
limited extent affected by seasonal or cyclical fluctuations.
Note 4 – Revenue
(DKKm) 2019/20 2018/19 2019/20 2018/19
Q2 Q2 H1 H1
Retail sales, physical stores 715.6 732.3 1,488.9 1,535.4
Retail sales, online 99.0 35.4 194.6 66.6
Wholesale sales etc. 7.9 9.5 14.6 19.0
Total revenue 822.5 777.2 1,698.1 1,621.0
Revenue breaks down by product groups as follows:
(DKKm) 2019/20 2018/19 2019/20 2018/19
Q2 Q2 H1 H1
Beauty 545.6 527.0 1,155.1 1,125.3
Vital 136.2 105.1 267.1 203.1
Material 82.3 85.8 163.0 174.4
MediCare 48.0 46.8 94.1 93.2
Other 2.5 3.0 4.3
Wholesale sales etc. 7.9 9.5 14.6
Total revenue 822.5 777.2 822.5 1,621.0
The product groups are as follows:
▪ Beauty comprises every day and luxury beauty products and personal care, including cosmetics, fragrances,
skincare and haircare products.
▪ Vital comprises vitamins, minerals, supplements, specialty foods and herbal medicinal products.
▪ Material comprises household and personal care products, including household cleaning and maintenance
products, baby care, footcare and sports-related products.

Matas A/S, Rørmosevej 1, DK-3450 Allerød. CVR no. 27 52 84 06 | Interim Report H1 2019/20 | page 24 of 26
▪ Medicare comprises OTC medicine, nursing products, etc.
▪ Wholesale sales etc. comprise sales concerning the associated Matas store, Club Matas partners, value
adjustments of Club Matas points and wholesale sales from Matas (B2B) and Kosmolet.
Revenue is generated by the sale of Matas products. Revenue from sales of products through Matas stores is
recognised when a store sells the product to the customer. Payment is usually received when the customer receives
the product, or, if the customer pays by credit card, a few days later. Revenue from sales through Matas web shops
is recognised and payment is received when the product is sent to the customer.
A small proportion of Matas’ revenue is invoiced, e.g. wholesale sales, in which connection a receivable is
recognised.
For the Club Matas customer loyalty programme, a performance obligation is recognised at the date of recognition
of the sale triggering the allocation of Club Matas points and stripes. The performance obligation is measured at the
estimated fair value of the Club Matas points and stripes allocated and amounted to DKK 71.9 million at 30
September 2019 (30 September 2018: DKK 73.1 million). The estimated fair value is inherently subject to some
uncertainty with respect to actual future redemption and considering the flexibility of the customer loyalty
programme. Revenue is recognised when the customer uses points/stripes, usually over an average period of three
months. Customers have the option of returning products, but the volume of returns at 30 September 2019 is
insignificant, as is the amount of guarantee commitments.
Geographical information The Matas Group operates almost exclusively in Denmark.
Note 5 – Acquisition of Kosmolet A/S (Nilens Jord)
On 11 June 2019, Matas acquired all shares and all voting rights in the Danish company Kosmolet A/S. Kosmolet A/S
owns the trademark Nilens Jord. Matas did not hold shares in the company prior to the acquisition.
Transaction costs in the amount of DKK 3.4 million were incurred in connection with the acquisition, which have been
recognised in the income statement under other external costs. Of this amount, DKK 0.7 million was recognised in Q2
2019/20.
The pre-acquisition balance sheet includes assets of DKK 119.9 million, including trademarks of DKK 58.9 million,
property, plant and equipment and lease assets of DKK 25.0 million, inventories of DKK 14.7 million, trade receivables
of DKK 19.5 million and cash and cash equivalents of DKK 0.2 million. Liabilities amount to DKK 47.4 million. The fair
value of acquired net assets is DKK 72.5 million.
As the work to complete the pre-acquisition balance sheet is still ongoing, the values stated above are provisional.
The total purchase price includes contingent consideration of up to DKK 20.0 million, which was recognised at a fair
value of DKK 20.0 million at the date of acquisition. The fair value was calculated based on assumptions which are
not observable in the market (level 3 in the fair value hierarchy). Management expects the conditions to be met, in
which case the contingent consideration becomes payable in June 2020.
The total consideration amounted to DKK 152.9 million, and goodwill arising on the acquisition of Kosmolet A/S was
thus DKK 80.4 million.
The cash flow from the acquisition of Kosmolet A/S was DKK 122.7 million in Q1 2019/20, excluding the fair value of
contingent consideration (DKK 20.0 million) and treasury shares (DKK 10.0 million) as well as cash and cash
equivalents (DKK 0.2 million).
The consolidated gross margin for Q2 2019/20 was adversely affected by the elimination of intra-group revenue and
profits relating to Kosmolet A/S. Following the acquisition of Kosmolet A/S, all transactions between Kosmolet A/S and
the Matas Group are classified as intra-group transactions, for which a normalisation is made for intra-group profits.
As a result, profits on inventories of Nilens Jord products at 30 September 2019 were not recognised in Q2 as all Nilens
Jord inventories were stated at the cost recognised by Kosmolet.
Nilens Jord inventories have an average turnover rate of four months, as a result of which there was no contribution
margin on sales of Nilens Jord products in Matas stores and on matas.dk in the second quarter. Only wholesale sales
of Nilens Jord products generated positive contribution margins in the second quarter, while all costs relating to the
operation of Nilens Jord were recognised as usual. The negative gross margin impact is of a non-recurring nature and
will primarily affect the second quarter of the financial year as the reversed profits will be recognised as income as
the products are sold to customers.

Matas A/S, Rørmosevej 1, DK-3450 Allerød. CVR no. 27 52 84 06 | Interim Report H1 2019/20 | page 25 of 26
Description of the acquired activities Kosmolet A/S is the owner of Nilens Jord, a successful Danish makeup brand. Known for its allergy-friendly and natural
profile, Nilens Jord is the best-selling makeup brand carried by Matas. The brand has a dedicated and loyal customer
group spanning all age groups. Nilens Jord and Matas have had a close and fruitful collaboration through three
decades. Nilens Jord was a first-mover in making completely perfume-free makeup products and has evolved into
one of the most popular Danish makeup brands. Especially through the past ten years, Danish consumers have
shown a growing preference for truly allergy-friendly products. Kosmolet A/S is remarkable for its continuous growth
and product innovation and won this year’s Danish Beauty Award for the world's first allergy-certified lipstick.
With the acquisition of Nilens Jord, Matas has added the best-selling makeup brand carried by Matas to its private
label portfolio and is now in a position to accelerate product innovation, expand the product range and provide
improved accessibility in the years ahead. With the acquisition, Matas has welcomed a prosperous and financially
sound business with strong development potential and a competent organisation to its family.
The acquisition of Kosmolet A/S and Nilens Jord was a natural step in the Group’s strategy, “Renewing Matas”.
Goodwill Goodwill has been recognised at the amount by which the purchase price exceeds the fair value of the identifiable
net assets. Goodwill is attributable to potential synergies within sales, marketing and procurement. The amount of
goodwill recognised is not tax deductible.
Goodwill related to the acquisition of Kosmolet A/S was recognised at DKK 80.4 million in Q1 2019/20, taking
consolidated goodwill to DKK 3,918.5 million (31 March 2019: DKK 3,838.1 million).
Note 6 – Transactions with related parties
Pursuant to Matas A/S’ Remuneration Policy, a total of 52,217 Performance Share Units (PSUs) related to the
company’s long-term incentive programme (LTIP) for 2016 vested at 14 June 2019. The PSUs vested in the form of
10,469 shares being granted to CFO Anders Skole-Sørensen and 41,748 shares being granted to the rest of the
executive team, including resigned managers.
The PSUs were granted free of charge to vest in the form of shares in Matas A/S.
PSUs vested at 75% of the original grant, which means that a total of 17,406 PSUs were cancelled. The PSUs vested
represented a total value of DKK 3.7 million based on the 13 June 2019 closing price of DKK 70.7 per share.
It is noted that vested PSUs are subject to taxation and that Anders Skole-Sørensen decided to sell 4,000 of the shares
granted to him to cover the tax payment.
PSUs have been granted under the long-term incentive programme for 2019. A total of 61,365 PSUs were granted to
Gregers Wedell-Wedellsborg and a total of 32,294 to Anders Skole-Sørensen.
Matas A/S, Rørmosevej 1, DK-3450 Allerød. CVR no. 27 52 84 06 | Interim Report H1 2019/20 | page 26 of 26
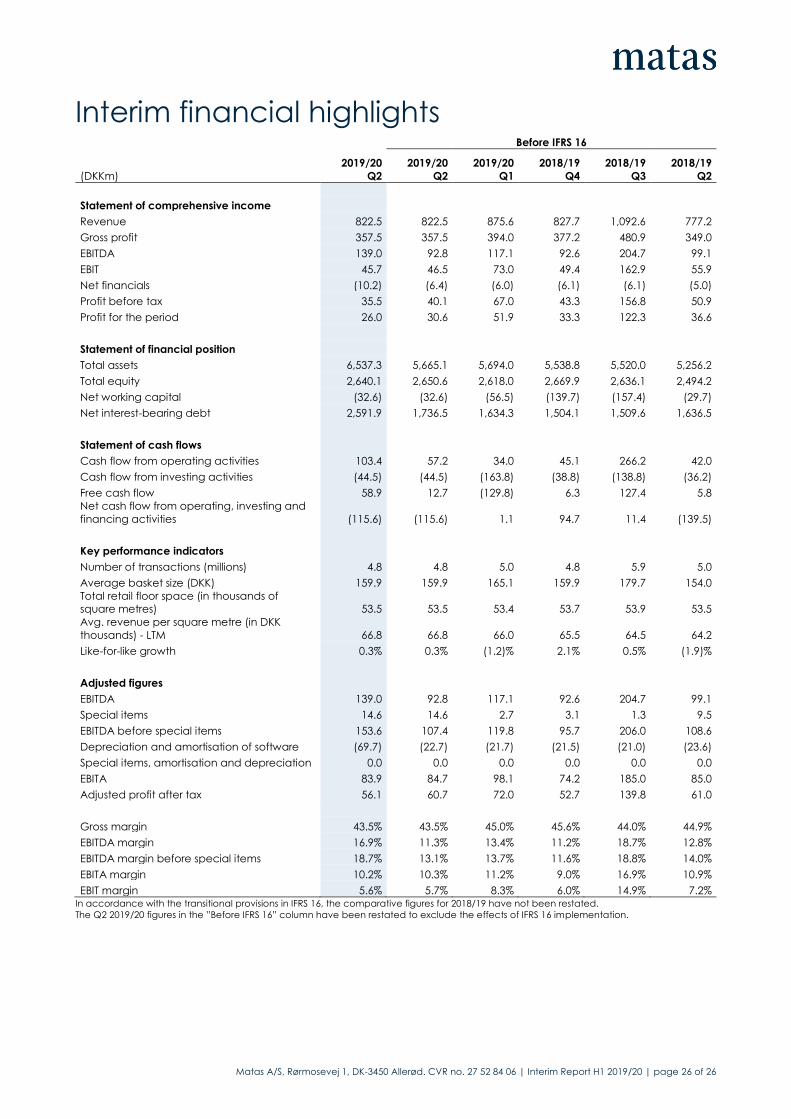
Interim financial highlights Before IFRS 16
2019/20 2019/20 2019/20 2018/19 2018/19 2018/19
(DKKm) Q2 Q2 Q1 Q4 Q3 Q2
Statement of comprehensive income
Revenue 822.5 822.5 875.6 827.7 1,092.6 777.2
Gross profit 357.5 357.5 394.0 377.2 480.9 349.0
EBITDA 139.0 92.8 117.1 92.6 204.7 99.1
EBIT 45.7 46.5 73.0 49.4 162.9 55.9
Net financials (10.2) (6.4) (6.0) (6.1) (6.1) (5.0)
Profit before tax 35.5 40.1 67.0 43.3 156.8 50.9
Profit for the period 26.0 30.6 51.9 33.3 122.3 36.6
Statement of financial position
Total assets 6,537.3 5,665.1 5,694.0 5,538.8 5,520.0 5,256.2
Total equity 2,640.1 2,650.6 2,618.0 2,669.9 2,636.1 2,494.2
Net working capital (32.6) (32.6) (56.5) (139.7) (157.4) (29.7)
Net interest-bearing debt 2,591.9 1,736.5 1,634.3 1,504.1 1,509.6 1,636.5
Statement of cash flows
Cash flow from operating activities 103.4 57.2 34.0 45.1 266.2 42.0
Cash flow from investing activities (44.5) (44.5) (163.8) (38.8) (138.8) (36.2)
Free cash flow 58.9 12.7 (129.8) 6.3 127.4 5.8
Net cash flow from operating, investing and
financing activities (115.6) (115.6) 1.1 94.7 11.4 (139.5)
Key performance indicators
Number of transactions (millions) 4.8 4.8 5.0 4.8 5.9 5.0
Average basket size (DKK) 159.9 159.9 165.1 159.9 179.7 154.0
Total retail floor space (in thousands of
square metres)
53.5 53.5 53.4
53.7
53.9
53.5
Avg. revenue per square metre (in DKK
thousands) - LTM 66.8 66.8 66.0 65.5 64.5 64.2
Like-for-like growth 0.3% 0.3% (1.2)% 2.1% 0.5% (1.9)%
Adjusted figures
EBITDA 139.0 92.8 117.1 92.6 204.7 99.1
Special items 14.6 14.6 2.7 3.1 1.3 9.5
EBITDA before special items 153.6 107.4 119.8 95.7 206.0 108.6
Depreciation and amortisation of software (69.7) (22.7) (21.7) (21.5) (21.0) (23.6)
Special items, amortisation and depreciation 0.0 0.0 0.0 0.0 0.0 0.0
EBITA 83.9 84.7 98.1 74.2 185.0 85.0
Adjusted profit after tax 56.1 60.7 72.0 52.7 139.8 61.0
Gross margin 43.5% 43.5% 45.0% 45.6% 44.0% 44.9%
EBITDA margin 16.9% 11.3% 13.4% 11.2% 18.7% 12.8%
EBITDA margin before special items 18.7% 13.1% 13.7% 11.6% 18.8% 14.0%
EBITA margin 10.2% 10.3% 11.2% 9.0% 16.9% 10.9%
EBIT margin 5.6% 5.7% 8.3% 6.0% 14.9% 7.2% In accordance with the transitional provisions in IFRS 16, the comparative figures for 2018/19 have not been restated.
The Q2 2019/20 figures in the ”Before IFRS 16” column have been restated to exclude the effects of IFRS 16 implementation.


