Embed Size (px)
Citation preview
MANAGEMENT SCIENCEVol. 52, No. 5, May 2006, pp. 757–772issn 0025-1909 �eissn 1526-5501 �06 �5205 �0757
informs ®
doi 10.1287/mnsc.1050.0495©2006 INFORMS
Interdependency, Competition, andthe Distribution of Firm and Industry Profits
Michael J. Lenox, Scott F. Rockart, Arie Y. LewinFuqua School of Business, Duke University, P.O. Box 90210, Durham, North Carolina 27708
{[email protected], [email protected], [email protected]}
Coordination of interdependencies among firms’ productive activities has been advanced as a promisingexplanation for sustained heterogeneity in capabilities among firms. In this paper, we extend this line of
research to determine the industry structures and patterns of expected firm profits for the case when difficultyoptimizing interdependent activities does, in fact, generate and sustain capability heterogeneity among firms.We combine a widely used agent-based model where firms search to discover sets of activities that complementone another (reducing overall costs or raising product quality) with traditional economic models of competitionamong profit-maximizing firms. The agent-based model produces a distribution of performance (interpreted asvariable cost or product quality) among firms and the competition models determine resulting industry out-comes including patterns of entry, exit, and profits. The integration of economic models of competition amongfirms with an agent-based model of search for improvement by firms reveals a rich relationship between inter-dependencies in production functions and industry structure, firm profits, and industry average profitability.
Key words : dynamic capabilities; interdependencies; computational model; searchHistory : Accepted by Pankaj Ghemawat, business strategy; received January 18, 2005. This paper was with theauthors 3 1
2 months for 2 revisions.
1. IntroductionA critical question in the field of strategy is: Whyaren’t the profits that accrue to favorable config-urations of firm resources and activities competedaway? Recently, interdependencies among the prac-tices that comprise a firm’s production function havebeen advanced as a promising explanation for sus-tained heterogeneity among firms (Levinthal 1997,Rivkin 2000). In this paper, we build on and extendthis research by determining the patterns of firm andindustry profits that would emerge given differentdegrees of interdependencies in industry productionfunctions. In doing so, we explore fundamental issuesthat arise at the intersection of search, firm practices,and competition.Interest in interdependencies among firm activi-
ties has been growing in the strategy literature inrecent years (Porter 1996, Levinthal 1997, Rivkin 2000,Siggelkow 2002). Levinthal (1997) demonstrated thatinterdependencies among a firm’s activities “pro-vide an important source of diversity” among firms.Levinthal explored a general form of interdependen-cies where “the value of a particular feature of theorganization depends on a variety of other features[of that organization]” (Levinthal 1997, p. 936). Cen-tral to Levinthal’s argument is that firms seek out bet-ter sets of practices by evaluating and adjusting theirpractices over time. Levinthal showed that even when
all firms are initially similar and engaged in similarsearch strategies for improvement, minor differencesin the order of adjustment in the presence of inter-dependencies among multiple activities lead to theemergence of substantial differences in practices.Milgrom and Roberts (1990) highlighted a specific
kind of interdependencies among a firm’s activities:interdependencies where sets of activities are comple-mentary.1 Two activities are complementary when themarginal value of engaging in each one is increasedby engaging in the other. The potential for comple-mentarity among a firm’s activities may lead indi-vidual firms to adopt a host of specific practices inconcert and result in “distinctly separated clustersof firm characteristics” (Milgrom and Roberts 1990,p. 527). Milgrom and Roberts (1995) proposed thatthe potential for such complementarities may in partexplain the emergence of highly profitable indus-try leaders. Citing the success of Lincoln Electric inthe arc-welding business, they observed that LincolnElectric had adopted “a system of mutually enhancing
1 Milgrom and Roberts (1990) expanded the definition of comple-mentarity from the “traditional sense of a relation between pairs ofinputs” to “a relation among groups of activities” (p. 514). They oper-ationalized complementarity with supermodularity thus restrict-ing their model to groups of activities in which all possible pairsof activities are complementary (see Milgrom and Roberts 1990,p. 517).
757
Lenox et al.: Interdependency, Competition, and the Distribution of Firm and Industry Profits758 Management Science 52(5), pp. 757–772, © 2006 INFORMS
elements, and that one cannot simply pick out a singleelement, graft it onto a different system without thecomplementary features, and expect positive results”(Milgrom and Roberts 1995, p. 204).Rivkin (2000) advanced this line of analysis by
showing that differences in firm practices will notonly emerge but persist. Rivkin argued that while iso-lated practices may be easily imitated, competitorswill have difficulty understanding and thus imitat-ing an entire system of mutually enhancing prac-tices (especially if some are tacit) without some error.When interdependencies are great, even small errorsin imitation can lead to large differences in perfor-mance on dimensions such as cost or quality. Rivkin’sargument is consistent with the empirical literatureon complementarities that has found that the complexinteraction of firm activities and resources serves tolimit effective imitation (Milgrom and Roberts 1995,Cockburn and Henderson 1996, Ichniowski et al. 1997,Bresnahan et al. 2002). To the extent that interdepen-dencies limit imitation, firms that discover and adoptsets of highly complementary practices will likely out-perform rivals.In this paper, we explore how interdependencies
in activity sets will affect industry average profitsand industry variance in profits both within andacross industries. We focus on an industry’s poten-tial for interdependency among activities (PIA). The linkbetween an industry’s PIA and the distribution ofan industry’s profits remains largely unexplored. Allelse being equal, the greater the interdependencies inthe production function, the greater the potential forproductive activities to be complementary. One mightconclude that industries where activity sets are highlyinterdependent and the resulting potential for com-plementarity is high would develop into highly prof-itable industries dominated by a handful of efficientfirms that expanded faster than worse-performingrivals (Demsetz 1973). However, previous scholarshiphas not formally modeled the broader industry andcompetitive environment in which firms interact asthey adjust their activities in pursuit of more com-plementary sets of activities. Thus, we do not have aclear picture of the link from PIA to firm and industryprofits.There is reason to question the existence of a simple
and direct relationship between the potential for inter-dependency among firms’ activities within an indus-try and the distribution of industry profits. Greatervariance among firms in high-PIA industries shouldboost industry profits, as Demsetz (1973) has argued.However, the difficulty firms have in discoveringhighly complementary sets of activities in high-PIAindustries will likely lower average quality or raiseaverage costs, and thus reduce profits. In addition,changes in the distribution of costs and quality among
competitors may raise or lower the number of viablecompetitors, and these changes in industry participa-tion further complicate the relationship between thepotential for interdependency among activities andindustry profits.To predict how industry PIA influences the distri-
bution of industry profits, it is necessary to explicitlymap firms’ individual costs or quality to profits asan endogenous outcome of competition. This has notbeen done in previous models. We combine two mod-els to accomplish it here. We start with the widelyapplied NK model of interdependency, where each ofN activities interacts with K other activities, to deter-mine the distribution of firms’ activities and resultingcost or quality of firms within an industry. Given thisdistribution, we then extend prior research by explic-itly modeling competition among firms in an indus-try. Mapping the cost or quality distribution fromthe NK model to competitive outcomes reveals newdimensions of the effects of interdependent activitieson industry structure and enriches our understandingof the relationship between an industry’s potential forinterdependency among activities and average firmprofits in that industry. This mapping also enrichesour understanding of the range of behavior we canexpect from traditional and widely used models ofcompetition.Analyzing our model, we find that the relationship
between industry PIA and profits does not conformto a simple or direct relationship. Industry PIA bothraises and lowers expected industry profits and shiftsthe relationship between productivity, heterogeneity,and industry profits in clear but unexpected ways.Most notably, we observe that expected industry aver-age profits first rise with industry PIA as expected(Demsetz 1973), but then peak and later fall for indus-tries with higher levels of PIA. We find that expectedprofits are highest in industries with intermediate PIAbecause very efficient or high-quality sets of prac-tices are found by some but not all firms. Profits arelower in low- and high-PIA industries because veryeasy learning leads to great competitive intensity, andvery difficult learning leads to low efficiency and lowquality. Importantly, we also find that moderate lev-els of imitation in the search process actually improverather than degrade expected industry profits.
2. The ModelThe overall model advanced in this paper has twomain components: (1) a model of interdependenciesamong a firm’s resources and practices that deter-mines firm performance in terms of cost or quality,and (2) a model of competition among firms thatmaps this distribution of firm cost or quality to firmand industry profits. For the model of interdependen-cies, we adopt a general representation of interdepen-dencies among activities that allows for interactions
Lenox et al.: Interdependency, Competition, and the Distribution of Firm and Industry ProfitsManagement Science 52(5), pp. 757–772, © 2006 INFORMS 759
consistent with Kauffman’s (1993) NK model, whichhas been introduced into the strategic managementfield by Levinthal (1997) and Rivkin (2000). For themodel of competition, we consider two alternativemodels widely used in economic theory and strate-gic management research. The first model of com-petition addresses an undifferentiated market whereindustry price depends on demand conditions andtotal industry output. The second model of compe-tition addresses an industry where competitors aredifferentiated in quality, and thus each firm’s salesdepend on demand conditions as well as the qualityand price offered by that firm and every other com-petitor. In both competition models, consumers areassumed to make choices among firms that maximizetheir own utility and firms that act to maximize theirprofits. The competition models provide a mechanismto determine how the relative cost or quality of firmswithin an industry (determined by the NK model)affects firm and industry profitability. Two competi-tive models are used to provide a richer sense for howthe analysis can be applied to different settings.
2.1. The Competitive Models
2.1.1. Undifferentiated Competition. In undiffer-entiated competition there are two common ways tothink about noncollusive firm decision making. One isthe pricing behavior that leads to Bertrand-Nash equi-librium. There firms fail to recognize how competitorswill react to their decisions, and thus undercut eachother on price until no firm produces a profit or onlythe lowest-cost player remains. Because adopting thisassumption about firm behavior would limit us to thestudy of oligopolies where firms had identical costsand no profits or monopolies, we investigate the mostcommon alternative model, Cournot competition. TheCournot model assumes that firms recognize theirinterdependence and choose output quantities thatmaximize their profits given the expected output oftheir rivals. This model generally leads to oligopoly,but also produces monopoly as a special case whenfixed costs are particularly high or one firm has a sub-stantial variable cost advantage over all rivals.To operationalize our model of competition, we first
assume that demand is a linear function of price:
Q= �1 − �1/��p or alternatively
p�Q�= �−�Q(1)
where Q is total industry output, p is price, and �and � are the intercept and slope, respectively, of theinverse demand function. The profit function for anyfirm i is
�i = p�Q�qi − ci�qi� (2)
where �i is the profit for firm i, qi is the sales quantityfor firm i, and ci�qi� is the cost of producing qi. Forsimplicity, we assume a linear cost function,
ci�qi�= ciqi + cf (3)
where ci is firm-specific marginal cost and cf repre-sents fixed industry-specific costs.Each firm chooses output to maximize profits:
maxq
�i =(�−�
∑qi
)qi − ciqi − cf � (4)
Given this decision problem, a rational oligopolist willset quantity such that
q∗i =
(�+∑
ci
)/��n+ 1�− ci/� (5)
where n is the number of competitors and∑
ci isthe sum of marginal costs across all firms (see theproof in supplemental Appendix A; all appendicesare available at http://mansci.pubs.informs.org/ecompanion.html). Thus, firms with lower variablecosts will have higher output and greater profits.In this undifferentiated competition model, the
advantages of being a low-cost producer vary bothwith the magnitude of one’s cost advantage and withthe number of firms in the market. Ultimately, aver-age industry profitability is a function of both averageindustry marginal costs and the distribution of thesemarginal costs across firms within the industry. Forexample, if marginal costs are distributed uniformlyamongst firms, average industry profits will increaseat an increasing rate as dispersion between firms’marginal cost positions increases. This highlights theimportance of an explicit treatment of the competitiveenvironment when exploring the effects of an indus-try’s potential for interdependency in activities onprofit heterogeneity. The relationship between a firm’sprofits and its efficiency depends on the number ofcompetitors and the distribution of efficiency amongthose competitors, which also changes with the indus-try’s potential for interdependency in activities.
2.1.2. Competition with Quality Differentiation.To model quality differentiation, we assume that firmssearch for combinations of activities that enhanceproduct quality rather than search for combinations ofactivities that reduce costs. Firms profit from higherquality because customers value quality. Specifically,we apply a random utility model so that the utility aconsumer j derives from firm i is
Ui j = �+ xi − pi + �i j (6)
where � is the value any consumer derives from abasic reference good, xi is a firm-specific outcome ofthe NK model representing the amount by which thequality of the good from firm i exceeds the quality of
Lenox et al.: Interdependency, Competition, and the Distribution of Firm and Industry Profits760 Management Science 52(5), pp. 757–772, © 2006 INFORMS
this basic good, pi is the price charged by firm i, and�i j captures randomly distributed consumer prefer-ences for specific goods.2
The random utility model implies that customershave firm-specific preferences that are randomlydistributed in the population of consumers, notthat consumers choose randomly. When consumerschoose among all goods (including a none-of-the-above option) to maximize their own utility and therandomly distributed preferences fall in a double-negative exponential distribution, demand for eachfirm i �qi� follows the multinomial logit (MNL) equa-tion widely used in economics (McFadden 1974):
qi =e�Ui∑
n=1N e�Un +� (7)
where � captures the utility of the none-of-the-aboveoption (saving the expense for future periods orbuying a different kind of good) and � determinesthe strength of the randomly distributed preferences.Larger values of �, lower quality, and higher pricesfor the goods will all shrink the overall demand real-ized by firms in the industry as consumers chooseto spend their money on other goods. Low valuesof � indicate a larger effect of outside preferences onutility, and thus tend to equalize share across com-petitors. High values of � indicate smaller outsidepreferences so that market share differences amongfirms are more responsive to differences in the firms’prices and quality.To determine the firms’ profit-maximizing prices,
we start with the profit function for any firm i:
�i = piqi�xi pi�− ci�qi� (8)
where �i is the profit for firm i, qi is the sales quantityfor firm i, and ci�qi� is the cost of producing qi. Forsimplicity, we assume a linear cost function as we didwith our Cournot model (see Equation (3)) except thatall firms have the same marginal cost �ci = cm�. Giventhe distribution of quality levels, each firm choosesthe price that maximizes profits:
maxp
�i = piqi�xi pi�− cmqi�xi pi�− cf � (9)
A rational firm will set price such that
p̃∗i =
1�
�1− qi�−1 + cm� (10)
(See the proof in supplemental Appendix B.) Becausefirm demand �qi� is a function of price, Equation (10)
2 The randomly distributed component of consumer preferencesin random utility models has been used by psychologists to cap-ture inconsistencies in individual preferences over time, and byeconomists to account for unobservable differences in tastes amongindividuals (Anderson et al. 1992).
is not a complete analytic solution to the optimalpricing decision. Unfortunately, the multinomial logitdemand function makes a complete closed solutionfor the optimal price intractable. However, embed-ded in an iterative model subroutine, Equation (10)quickly converges to provide the optimal pricingdecision.Firms’ outputs and profits in this model depend
on their own quality and the quality of their rivals.If all firms produced products of the same quality,then all firms would choose the same price and splitthe market evenly. In markets where firms differ inquality, firms with higher-quality goods enjoy higherdemand and charge higher prices. Average industryprofitability will fall with the number of players inthe industry as each firm gains a smaller share andprices more aggressively (Equations (7) and (10)), andrise with quality variance as some firms are able tocommand a greater share at a greater price premium.Industry profits will also rise with average industryquality as the industry is able to take more demandfrom customers’ outside do-nothing option.
2.2. NK Model of InterdependenciesTo the extent that standard competitive models con-sider cost or quality differences among firms, theytend to treat such differences as stable and exogenous.We augment these competitive models of competi-tion by assuming that firms adopt new practices andexperiment with existing operations in an attemptto either lower marginal costs or improve quality(Lippman and Rumelt 1982). In particular, we assumethat this process affects cost or quality by alteringthe mix of tasks or activities that the firm engages.This improvement process is consistent with practi-cal experience. Manufacturing firms do not choosetheir marginal cost or product quality directly. Rather,marginal cost and product quality result from howthe firms conduct activities in the production processand the extent to which they capture complementari-ties among interdependent activities.To capture differences in PIA among industries
and to translate realized interdependency betweenfirm activities into marginal costs and quality, weemploy the assumptions, machinery, and imagery ofthe widely applied NK model of interdependencies(Kauffman 1993). The NK model as applied in man-agement research is effectively a complex productionfunction. The production function is based not onlyon aggregate supplies of capital and labor, but alsoon a firm’s specific mix of activities, practices, andresources.3 The N in the NK model refers to the num-ber of potential activities that a firm may adopt or
3 For the sake of simplicity, we refer to activities, practices, andresources simply as activities and the possible combinations ofactivities, practices, and resources as “activity sets.”
Lenox et al.: Interdependency, Competition, and the Distribution of Firm and Industry ProfitsManagement Science 52(5), pp. 757–772, © 2006 INFORMS 761
employ. The K in the NK model refers to the numberof activities that interact with each of these N activi-ties. When K is high, there are many combinations ofactivities that could complement one another in thesense that together these activities would produce adistinctly higher quality or lower cost than would beachieved from slight variations in those activity sets.As an illustration, consider that among the many
things a manufacturing firm needs to decide arewhether it is going to use just-in-time logistics, piece-rate payments, sampling techniques to control quality,work teams, and stock options as incentives. In somemanufacturing industries, the cost of using a just-in-time system may depend on several but not all ofthese other activities. For example, in a study of steel-finishing lines, researchers found evidence that firmsadopting incentive pay, teams, flexible job assign-ment, employment security, and training had sub-stantially higher productivity than would be expectedfrom the sum of the individual activities (Ichniowskiet al. 1997).To operationalize the NK model, we represent each
firm’s activity set as a vector of N binary activitydecisions, si. For example, a firm that adopts just-in-time supply logistics forgoes piece-rate payments,uses quality sampling, encourages integrated workteams, and refuses to offer stock options may have anactivity set as follows: si = �10110�. To represent inter-actions between activity choices, each activity deci-sion is assigned one of 2K+1 potential costs or qualityvalues corresponding to the two possible values forthat activity decision and the K − 1 related practiceswith which it interacts. For example, if each activitydecision interacts with two other decisions, there areeight �22+1� potential combinations of activities, andeach one is assigned a unique cost or quality coeffi-cient randomly drawn from a uniform U�01� distri-bution. A coefficient is then assigned to each activitydecision from the resulting N by 2K+1 coefficient arraybased on the overall activity set, and the mean ofthese assigned coefficients becomes the firm’s overallmarginal cost or quality.Echoing Ghemawat and Levinthal (2000), one of the
desirable aspects of the NK specification is that it cap-tures interdependencies in a more general sense thanemployed by Milgrom and Roberts (1990). Milgromand Roberts examine interdependencies where allpossible pairs of activities are complementary in thesense that more of each activity enhances the value ofmore of the other. This assumption allows for closed-form comparative static results using the concepts oflattice theory and supermodularity. In contrast, theNK specification “avoids imposing a specific struc-ture on the linkages among choices” and “allowsthe richness of such linkages to vary across situa-tions” (Ghemawat and Levinthal 2000, p. 17). The NK
specification allows consideration of more generalresource combinations that include both complementsand substitutes. In some instances, for example, thevalue of an individual practice in an NK model willincrease in the absence of another practice.Interdependencies in activity sets captured by the
NK model create a difficult optimization problemfor firms. Imagine mapping all possible activity setsalong a two-dimensional plane where the cost or qual-ity corresponding to a particular activity set appearsas the height of a three-dimensional surface or “land-scape.” The firm’s objective in such a world is to findthe highest “peak” in that landscape.4 When thereare no interdependencies among activities, the land-scape is concave; there is a continuous slope up toa single globally optimal peak. A firm can find thispeak by evaluating whether its efficiency or qualityimproves when it alters one of the activities inde-pendent of any other changes. However, as interde-pendencies increase, the landscape becomes a ruggedsurface with many peaks (local optima) and no rapidalgorithmic solution can be devised to find the high-est peak (Rivkin 2000).The optimal activity set in an NK landscape can
be found by exhaustive computational search once thecost or quality coefficients are known. In practice, thisqualification about information is crucial. Firms mustengage in costly and time-consuming data gatheringand trial-and-error discovery to determine the natureof the interdependencies among activities that deter-mine the cost coefficients. Not knowing these costcoefficients, firms are unable to quickly calculate aglobally optimal decision and are forced to rely onexperiments to evaluate how changes in activities willaffect and be affected by other activities.Because any given landscape must be learned by
exploration, we specify a repeated evolutionary gamewhere firms search for and implement changes inbusiness activities as they receive feedback on cost orquality. In the first period, we assume that all firmswithin an industry choose an initial set of activitiesand observe their own cost or quality relative to com-petitors. In subsequent periods, firms search for activ-ity sets that will improve their cost or quality andhopefully raise their profits. Improvements in cost orquality do not guarantee increases in profits, however,as improvements by competitors may offset any gainsmade by a firm.Although numerous names and variants have been
employed, previous research has considered two pri-mary categories of search—innovation and imita-tion (Nelson and Winter 1982, Massini et al. 2005).
4 We will refer to the highest peak as being the most efficient pointto sustain the imagery, although in fact firms are seeking the lowestmarginal cost in the undifferentiated competitive model.
Lenox et al.: Interdependency, Competition, and the Distribution of Firm and Industry Profits762 Management Science 52(5), pp. 757–772, © 2006 INFORMS
We consider the effects of interdependencies givenboth types of search strategies as well as hybrid strate-gies combining innovation and imitation. Search toimprove or innovate new practices generally followsthree key tenets: Firms search only a fraction of theenormous number of possible changes to their activitysets; firms concentrate search on “local” alternativesthat attempt modifications to one or a few activi-ties at a time because incremental modifications arelikely to be the easiest to evaluate; and firms adoptchanges when their analysis suggests that changeswill improve cost or quality. Recognizing that thereis an infinite number of variants possible on innova-tive search rules that follow these tenets, we adopt thebasic innovative search model employed by Levinthal(1997), where firms consider only one change in anactivity at a time and adopt any change that repre-sents an improvement.5 Imitation is conducted in asimilar manner to innovation in that firms only evalu-ate a subset of all possible changes at any given time,but imitation differs in that firms adopt changes thatwill make them more like the best firm even if doingso lowers quality or raises costs.6
As a practical matter, imitation involves an ele-ment of independent (innovative) search (Westney1987, Szulanski 2000). To test hybrid strategies, weassign each firm a parameter ��� bounded betweenzero and one that captures the relative likelihood thata firm pursues an innovation or imitation logic in anygiven period when making changes to activities. Afirm with � equal to zero will rely purely on inter-nal innovation. A firm with � equal to one will relypurely on imitation. Search progresses over time aseach firm in each period considers altering each indi-vidual activity with probability �.7 In the model, firmsadjust their activity sets, then we recalculate marginal
5 Variants on this innovative search strategy have been employedby other researchers. Rivkin (2000) broadens the search and focuseschanges by assuming that firms evaluate all alternative activitysets with up to M changes from the current activity set and selectthe very best one. Levinthal (1997) also considers the possibility ofinnovative “long-jumps,” where a firm considers a single randomlydrawn alternative where as many as all elements of the activityset may change. Rivkin and Siggelkow (2005) and others also con-sider the effects of organizational structures that divide search andevaluation into subsets of firms’ activities.6 Imitation, like innovation, has been modeled in varying ways. Forexample, Rivkin (2000) allows firms to imitate on many dimensionsat once, but with error.7 In each period, a firm has the potential to consider altering eachof its resource decisions. Given the probability ��� of consideringone resource decision, the probability of considering all resourcedecisions is �N . Thus, for � = 0�10 and N = 10, the likelihood ofconsidering altering at least one decision is 65% �1− �1− ��N �, andall decisions is 0.00000001%. We emphasize that considering alter-ing a resource decision does not necessarily mean a firm will altera decision.
cost, quality, total cost, quantities produced, prices,and profits for each firm, and repeat.To review, firms begin with randomly generated
sets of activities. A firm first decides whether toupdate activities before the next period based on alogic of imitation (chosen with probability �) or alogic of innovation that will be applied to all activ-ity decisions for that period. Then, with probability �,the firm considers changing its first activity using thechosen logic. If a firm considers changing the activ-ity and is following an imitation logic, the firm willmimic the activity choice of the most profitable firmin the industry. If a firm considers changing the activ-ity and is following an innovation logic, the firmwill change its activity choice if and only if it willimprove its profitability in the industry, given the cur-rent state of the world.8 The firm continues throughits set of activities in this manner so that it may con-sider changing no activities, a few activities, or poten-tially all activities. The same logic is applied to eachactivity considered, and the firm takes into accountany changes made in the activity set so far.We assume that firms will enter and exit the indus-
try depending on the attractiveness of the industryand the attractiveness of their position within theindustry. At any time t, we assume that there existsa pool of potential entrants to the industry. The like-lihood that a potential entrant will attempt to enterin a given time period is determined in part by theattractiveness of the industry; thus,
P (entry)=min�" ��#1� (11)
where �� is average industry profits and " �" ≥ 0�and # �# ∈ 01� are parameters. If we set # = 0, thenthe likelihood of attempted entry is constant at " andindependent of average industry profitability. If weset # = 1, higher average industry profits attract morepotential entrants. At high levels of average industryprofits when # = 1, all potential entrants attempt toenter.While a firm will attempt entry, it will not necessar-
ily stay in the market. Upon attempting entry, a firmcalculates its expected profits given its marginal cost(or product quality) and the marginal cost (or prod-uct quality) of all other competing firms. We assumefirms enter (or remain in) the market if they expect tomake positive profits by producing in the followingperiod. Similarly, existing players within the industrywill calculate expected profits given the distributionof marginal costs (or product quality) and will exit themarket if their optimal decision is to not produce.9
8 All else being equal, improvements in cost or quality will lead toincreases in profits. Thus, the results are identical if firms chooseactivities that improve cost or quality rather than profits.9 We experimented with profit hurdle rates greater than zero andfound that they have no effect on the results presented in this
Lenox et al.: Interdependency, Competition, and the Distribution of Firm and Industry ProfitsManagement Science 52(5), pp. 757–772, © 2006 INFORMS 763
3. Analysis and ResultsDue to the analytical intractability of our model,we rely on computational methods for analyzing themodel. For each of our competitive models, we sim-ulated 55,000 test cases created by varying the updat-ing heuristics firms use and the potential for inter-dependency of the industry. Heuristics were equallyrepresented, ranging from industries where all firmsonly innovate �� = 0� to industries where all firmsonly imitate one another �� = 1�.10 For each test case,we assigned the rate of change ���, the parametersN and K (which determine the potential for interde-pendency of the industry), demand parameters (�, �,and �),11 and entry parameters (", #).12 We generatean industry production function (i.e., a cost or qualitylandscape) by randomly drawing marginal cost equa-tion coefficients from a uniform distribution rangingfrom zero to one.13 Finally, we randomly initializedfirms’ activity sets �si� such that each activity decisionwas equally likely to assume a value of zero or one.During the course of our computational experi-
ments, firms compete on cost or quality and search for
paper. While higher hurdle rates decrease the likelihood of entryand increase the likelihood of exit, they do not affect the generalrelationships between average industry profits and PIA presentedhere. The discussion section considers how more sophisticated rulesfor entry and exit might affect the main results presented in thispaper.10 We ran 5,000 computational experiments for �s between 0 and1 in increments of 0.1. With 5,000 experiments for each case, wefelt confident that the summary statistics had converged. Analysisfound that summary statistics based on 1,000 experiments wereidentical to those from 5,000 experiments.11 For the Cournot model, we assume that �= 1 and �= 1. Assum-ing � = 1 is simply a scaling of the overall demand curve anddoes not, therefore, limit generalizability of the results. If one sub-stitutes the individual production quantity function (Equation (5))into the profit function (Equation (4)), it is clear that the slope ofthe demand curve � directly raises or lowers the output and grossmargin for firms, but does not change the relative output or relativegross margins among firms. By scaling gross margins up or down,however, more elastic demand will increase the disparity in profitsamong firms when there are positive fixed costs. This result willbe revisited later in the paper as it becomes relevant to reportedresults.For the differentiation model, we assume that �= 1, �= 0�1, and
�= 2.12 For the results presented, we assume a pool of 20 potentialentrants. Assuming a likelihood of attempted entry of 50%, theprobability that all 20 firms would attempt to enter simultaneouslyis 0.000001. We experimented with larger and smaller pools andfound that they did not substantively affect the results reported.13 It is important to note that the comparison we are noting isamong industries with different levels of potential for interde-pendency. Casual conversation sometimes suggests that innova-tive firms or technologies “create” new complementarities. We treatsuch innovations as occurring within the model whenever three ormore activities interact �K > 2� and a firm changes one of theseactivities so that it is now more valuable to do two other activitiesin a given way than it was before.
more productive combinations of activities. We gen-erate the variation and selection of activity sets foreach firm in the population according to its updat-ing heuristic. We calculate the marginal cost, qual-ity, total cost, quantities produced, prices, and profitsfor each firm according to one of our two competi-tive models. Finally, firms enter and exit the indus-try according to the specification described above. Foreach test environment, this process is repeated for 100time periods.14
One of the interesting features of NK environmentsis that the greater the PIA, the better the best possiblelow-cost (or high-quality) configurations of activities(Kauffman 1989). In other words, the best positionachievable (the global optima) improves as the num-ber of interactions �K� among activities rises. Thisis explainable from a purely statistical standpoint.A greater number of interdependencies increases thenumber of random draws selected for each activ-ity, and more draws will generate more extrememinimum and maximum values. Simply put, moreinteractions produce more unique configurations, andthus raise the likelihood of a highly efficient globaloptimum.One could make a compelling argument that this
trait of NK models has a nice analogy to actual experi-ence: the greater the potential for complementarities,the greater the possibility of low-cost or high-qualityconfigurations of activities, thus improving the bestcost or quality achievable in an industry. We decided,however, to eliminate this feature of the NK speci-fication by expressing individual firm marginal costor quality as a percentage of the global optimal.15 Indoing so, we standardize each of our test environ-ments such that the lowest cost or highest qualityattainable is the same in each test environment. Stan-dardizing helps create a level field between test envi-ronments and simplifies inference from our results.In the final analysis, this decision has a conservativeeffect on our results by dampening the general pat-terns presented.Below, we first consider the results for undifferen-
tiated competition and then consider the results forcompetition with quality differentiation.
3.1. Complementary Potential and IndustryAverage Profits in an Undifferentiated Market
Analyzing the undifferentiated competitive model, wefind a curvilinear relationship between the potential
14 We experimented with other time lengths with no differences inthe results. Nearly all runs (>99%) stabilize within 100 periods.15 In the case of our Cournot competitive model, we expressmarginal cost as one, less the percent of the global optimumattained, plus a constant so that higher values indicate lower cost.A constant is included to assure that the best achievable marginalcost is greater than zero. Varying this constant has no bearing onour results.
Lenox et al.: Interdependency, Competition, and the Distribution of Firm and Industry Profits764 Management Science 52(5), pp. 757–772, © 2006 INFORMS
Figure 1 The Effect of Interdependency on Industry Average Profits(Cournot)
0
0.01
0.02
0.03
0.04
0.05
0.06
1 2 3 4 5 6 7 8 9 10 11 12 13 14 15 16 17 18 19 20
Interdependency (K )
Ind
ust
ry a
vera
ge
pro
fit
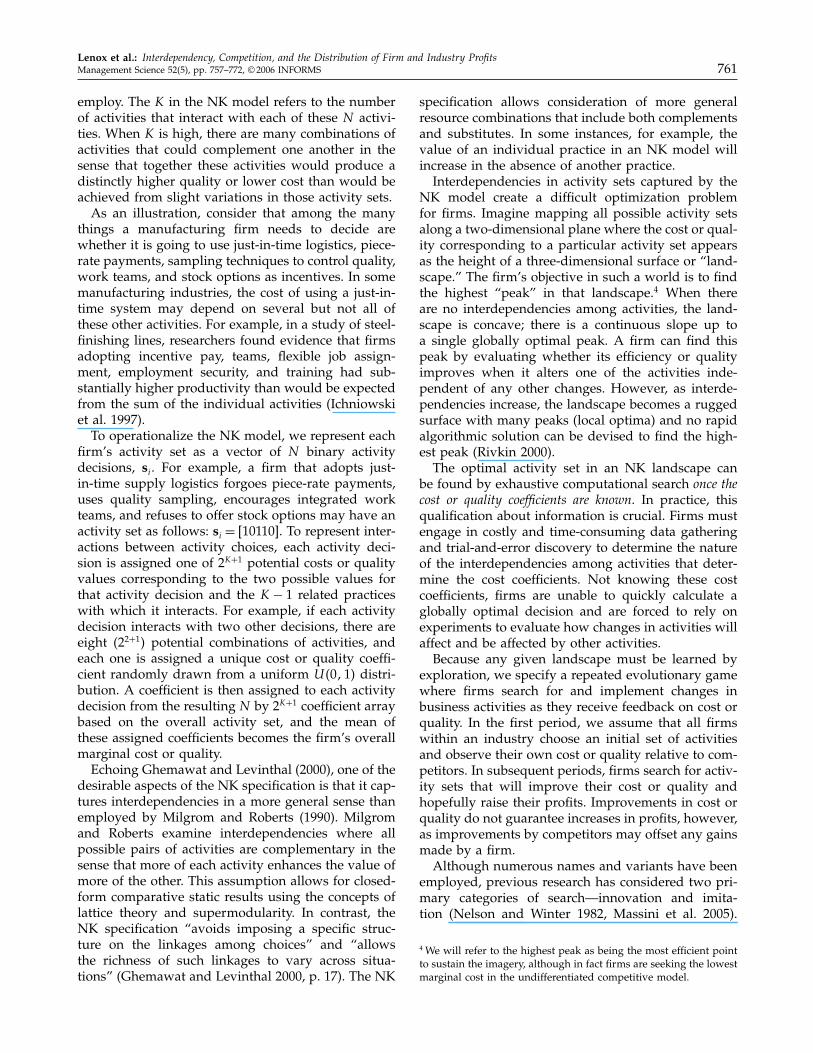
Notes. The solid line in this graph presents the industry average profits asso-ciated with a given level of interdependency �K�. The top and bottom dottedlines present the average profits of the best firm in the industry and the restof the firms in the industry, respectively. These results are those found atthe end of 100 iterations across a range of search strategies �0≤ � ≤ 1�. By100 iterations, firms almost uniformly �>99%� have reached a stable equi-librium where they are unable to improve their cost or quality by alteringone of their activity decisions (i.e., a local optima). To increase compara-bility, we graphed the results from simulations with firms making decisionsabout 20 critical business practices �N = 20�, where the practices range fromcompletely independent �K = 1� to completely interdependent �K = N�. Sen-sitivity analysis found that the general patterns presented persist at variousparameter values.
for interdependency of an industry (manipulated bychanging K) and expected industry average profits(see the solid line in Figure 1).16 At higher levels ofPIA, we observe increasing variance in industry prof-its, yet declining average profits (see the dotted linesin Figure 1). This rise and fall of average profits andthe increase in variance in profits is robust to thenumber of potential firms within the industry, thesearch strategies pursued ���, the number of activitiesunder consideration �N �, and the likelihood of updat-ing activities ���.What causes the nonmonotonic relationship
between PIA and industry average firm profits?This curvilinear relationship results in part fromthe trade-off between (1) the greater difficulty firmshave in finding superior low-cost positions (seeGraph A of Figure 2), and (2) the greater variancein marginal costs among players within the industry(see Graph B of Figure 2) as industry PIA increases.With respect to the former, if industry profits weredriven primarily by average firm efficiency, thenindustry profits would be monotonically decreasing
16 We present industry average profits weighted by sales so asnot to dilute industry average profits due to the presence ofa number of marginal (i.e., high-cost, low-output) firms. Usingunweighted industry average profits does not affect the generalresults presented. Industry average profits continue to decrease asPIA increases, although not at the same rate.
with PIA. As PIA increases, average firm costsrise because the increase in the sheer number oflocal optima makes it less likely that firms willfind globally optimal activity sets (Kauffman 1989),and because with increasing conflicts among theactivities the local optima available for firms tofind become less efficient (Weinberger 1991). Withrespect to the latter, if industry average profits weredriven by variance in firm efficiency, as Demsetz(1973) hypothesized, industry average profits wouldbe monotonically increasing with PIA. Variance inmarginal costs increases naturally with PIA becausethere are a greater number of stable efficiency levels(local optima) upon which firms get stuck as thenumber of interactions increase (Rivkin 2000).Examining the industry profit function provides
insight into why the factors that raise industry aver-age profits dominate at low levels of PIA, but not athigh levels of PIA. If we assume firms’ costs are dis-tributed uniformly over a range �c̄− d c̄+ d�, we candetermine an exact analytical equation relating aver-age firm profits within the industry to average firmmarginal cost �c̄�, the dispersion of cost �d�, and thenumber of competitors �n�:
E��i�=1�
(��− c̄�2
�1+n�2+ d2
3n
)− cf (12)
(see supplemental Appendix C for the proof). Weobserve that industry profits rise with increased dis-persion of cost �d� and with reductions in the num-ber of competitors �n�, but fall with rising averagecosts �c̄�.At low levels of PIA, industries have low disper-
sion and the potential salutary effect of increasing dis-persion is small. However, the impact of variance inmarginal costs on industry concentration is large. Asvariance increases, more firms find it unprofitable toremain in the industry and exit (see Graph C of Fig-ure 2). The initial boost to profits from decreasing thenumber of competitors is greater than the reductionin profits directly caused by rising average costs. Forexample, a reduction from nine firms to eight firmsincreases average firm profits by nearly 25%. Industryaverage marginal costs would need to be cut by morethan half to provide the same rise in industry averageprofits as the reduction of a single competitor.17
Why does the average number of firms within anindustry decline and then rise (see Graph C of Figure2) with PIA?18 At low levels of PIA, marginal costs
17 Conditional on average firm marginal costs at low PIA beingequal to 10% of the greatest willingness-to-pay �c̄ = �/10�. Thisis the case in the runs presented, and seems to be a reasonableassumption for a low-PIA/low-cost industry.18 This result persists when varying the entry parameters: the base-line level of entry �"� and sensitivity to average industry profits �#�.
Lenox et al.: Interdependency, Competition, and the Distribution of Firm and Industry ProfitsManagement Science 52(5), pp. 757–772, © 2006 INFORMS 765
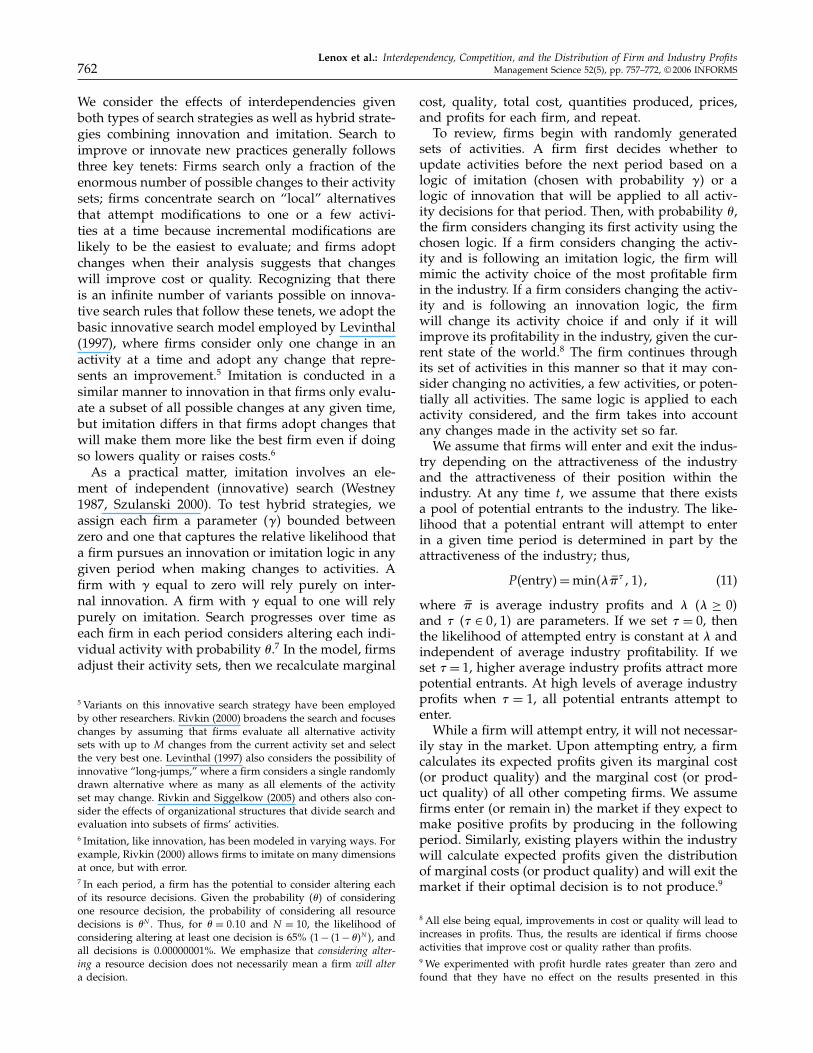
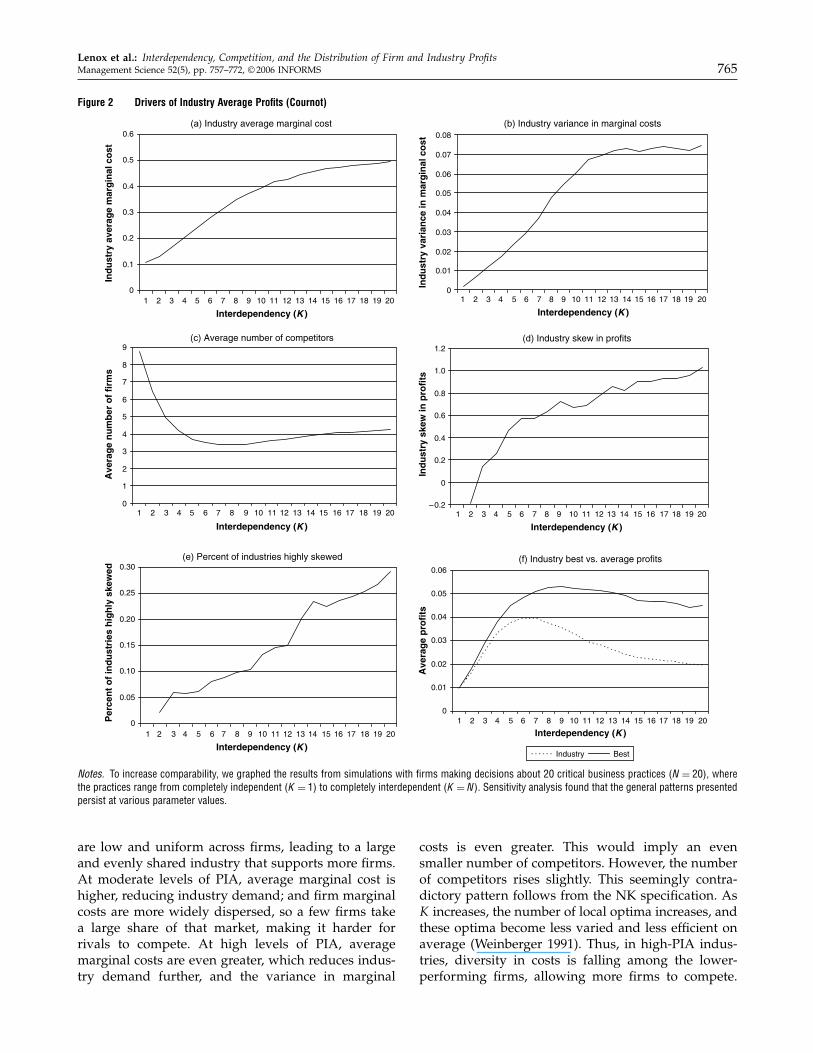
Figure 2 Drivers of Industry Average Profits (Cournot)
(a) Industry average marginal cost
0
0.1
0.2
0.3
0.4
0.5
0.6
Ind
ust
ry a
vera
ge
mar
gin
al c
ost
(b) Industry variance in marginal costs
0
0.01
0.02
0.03
0.04
0.05
0.06
0.07
0.08
Ind
ust
ry v
aria
nce
in m
arg
inal
co
st
(c) Average number of competitors
0
1
2
3
4
5
6
7
8
9
Ave
rag
e n
um
ber
of
firm
s
(d) Industry skew in profits
–0.2
0
0.2
0.4
0.6
0.8
1.0
1.2
Ind
ust
ry s
kew
in p
rofi
ts
(e) Percent of industries highly skewed
0
0.05
0.10
0.15
0.20
0.25
0.30
Per
cen
t o
f in
du
stri
es h
igh
ly s
kew
ed
(f) Industry best vs. average profits
0
0.01
0.02
0.03
0.04
0.05
0.06
Ave
rag
e p
rofi
ts
Best
1 2 3 4 5 6 7 8 9 10 11 12 13 14 15 16 17 18 19 20
Interdependency (K )
1 2 3 4 5 6 7 8 9 10 11 12 13 14 15 16 17 18 19 20
Interdependency (K )
1 2 3 4 5 6 7 8 9 10 11 12 13 14 15 16 17 18 19 20
Interdependency (K )
1 2 3 4 5 6 7 8 9 10 11 12 13 14 15 16 17 18 19 20
Interdependency (K )
1 2 3 4 5 6 7 8 9 10 11 12 13 14 15 16 17 18 19 20
Interdependency (K )
1 2 3 4 5 6 7 8 9 10 11 12 13 14 15 16 17 18 19 20
Interdependency (K )Industry
Notes. To increase comparability, we graphed the results from simulations with firms making decisions about 20 critical business practices �N = 20�, wherethe practices range from completely independent �K = 1� to completely interdependent �K = N�. Sensitivity analysis found that the general patterns presentedpersist at various parameter values.
are low and uniform across firms, leading to a largeand evenly shared industry that supports more firms.At moderate levels of PIA, average marginal cost ishigher, reducing industry demand; and firm marginalcosts are more widely dispersed, so a few firms takea large share of that market, making it harder forrivals to compete. At high levels of PIA, averagemarginal costs are even greater, which reduces indus-try demand further, and the variance in marginal
costs is even greater. This would imply an evensmaller number of competitors. However, the numberof competitors rises slightly. This seemingly contra-dictory pattern follows from the NK specification. AsK increases, the number of local optima increases, andthese optima become less varied and less efficient onaverage (Weinberger 1991). Thus, in high-PIA indus-tries, diversity in costs is falling among the lower-performing firms, allowing more firms to compete.
Lenox et al.: Interdependency, Competition, and the Distribution of Firm and Industry Profits766 Management Science 52(5), pp. 757–772, © 2006 INFORMS
More firms compete in high-PIA environments, eventhough the higher profits in the mid-PIA environ-ments attract more potential entrants.We observe increasing variance with PIA because
the reduction in cost dispersion among the lower-performing firms happens alongside an increase indisparity between the best firms and the rest (seeGraph F of Figure 2). This results in an increase inthe positive skew of marginal costs as PIA increases(see Graph D of Figure 2). For low levels of PIA, weobserve little skew, which means that firms clusteraround similar profits levels. For high-PIA industries,we expect a few high performers and a relativelylarge number of laggards. High levels of PIA produceindustries where most firms cluster around low profitlevels and a few firms occasionally achieve vastlysuperior profits.For empirical research and normative conclusions,
it is important to note that a strong skew is apparentin only a minority of the industry runs. Examining thepercentage of runs in which the distribution of indus-try profits is highly positively skewed (skew> 1), wefind that the percent of skewed runs is increasing withPIA, but high skew occurs in less than a third of thecases (see Graph E of Figure 2). As a result of thisminority of runs, we observe that the variance in thenumber of competitors is increasing, on average, withPIA. However, the number of industries with a smallset of high-performing firms is much greater for high-PIA environments than for mid-PIA environments.Combining our results on average industry profits
with the results on the variance and skew in indus-try profits, we observe a pattern where leading firmsare an increasingly poor guide to likely profits in theindustry. Industry average profitability decreases withPIA (after an initial rise), but the average profitabilityof the best firm in the industry stabilizes (see Graph Fof Figure 2). The best firms’ profits remain strong inthe face of rising PIA despite worse marginal coststhan those of the best firms in low-PIA industries. Thebest firms’ profits stay high because the rest of thefirms in the industry become even less efficient. Thisleads to highly concentrated, but inefficient, indus-tries. It also means that the key drivers of individualfirm profits are conditioned by the level of PIA. Inlow-PIA industries, individual firm profits are drivenby the ability of all firms to find low-cost positionsabsolutely; while in high-PIA industries, individualfirm profits are driven by the ability of the best firmsto find better cost positions relative to those of rivals.
3.2. Complementary Potential and IndustryAverage Profits in a Differentiated Market
Analyzing the quality differentiation model of com-petition, we find a similar curvilinear relationship
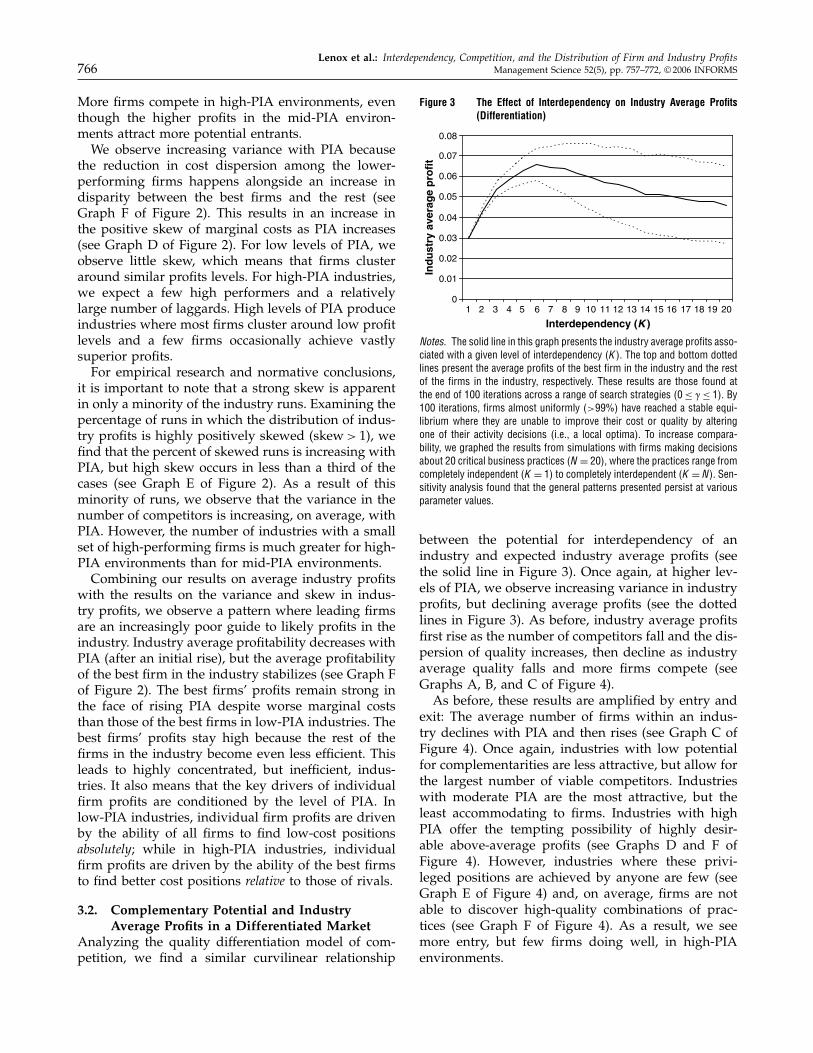
Figure 3 The Effect of Interdependency on Industry Average Profits(Differentiation)
0
0.01
0.02
0.03
0.04
0.05
0.06
0.07
0.08
Ind
ust
ry a
vera
ge
pro
fit
1 2 3 4 5 6 7 8 9 10 11 12 13 14 15 16 17 18 19 20
Interdependency (K )
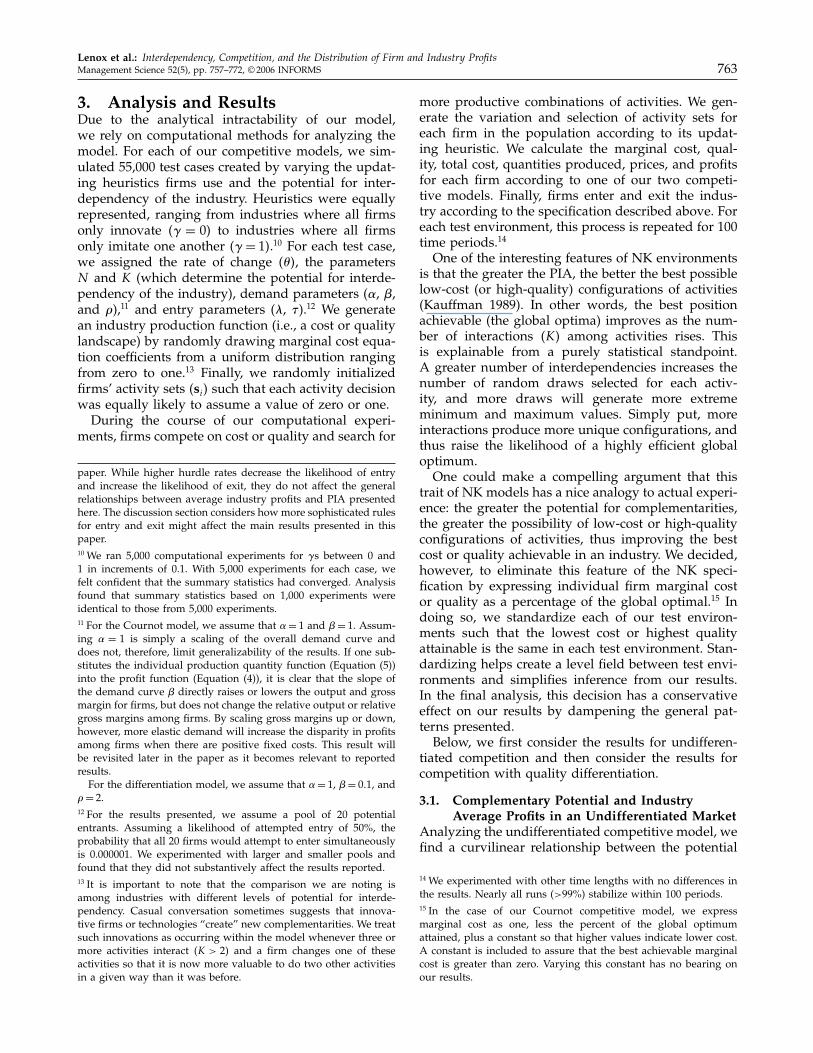
Notes. The solid line in this graph presents the industry average profits asso-ciated with a given level of interdependency �K�. The top and bottom dottedlines present the average profits of the best firm in the industry and the restof the firms in the industry, respectively. These results are those found atthe end of 100 iterations across a range of search strategies �0≤ � ≤ 1�. By100 iterations, firms almost uniformly �>99%� have reached a stable equi-librium where they are unable to improve their cost or quality by alteringone of their activity decisions (i.e., a local optima). To increase compara-bility, we graphed the results from simulations with firms making decisionsabout 20 critical business practices �N = 20�, where the practices range fromcompletely independent �K = 1� to completely interdependent �K = N�. Sen-sitivity analysis found that the general patterns presented persist at variousparameter values.
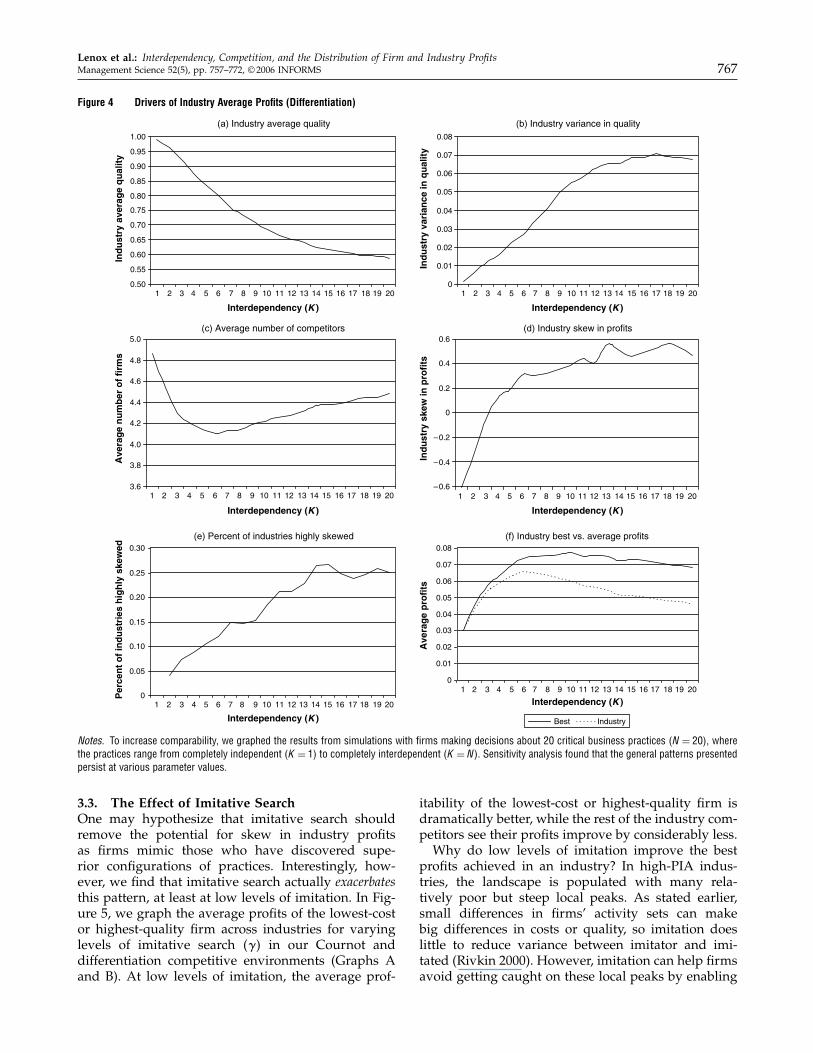
between the potential for interdependency of anindustry and expected industry average profits (seethe solid line in Figure 3). Once again, at higher lev-els of PIA, we observe increasing variance in industryprofits, but declining average profits (see the dottedlines in Figure 3). As before, industry average profitsfirst rise as the number of competitors fall and the dis-persion of quality increases, then decline as industryaverage quality falls and more firms compete (seeGraphs A, B, and C of Figure 4).As before, these results are amplified by entry and
exit: The average number of firms within an indus-try declines with PIA and then rises (see Graph C ofFigure 4). Once again, industries with low potentialfor complementarities are less attractive, but allow forthe largest number of viable competitors. Industrieswith moderate PIA are the most attractive, but theleast accommodating to firms. Industries with highPIA offer the tempting possibility of highly desir-able above-average profits (see Graphs D and F ofFigure 4). However, industries where these privi-leged positions are achieved by anyone are few (seeGraph E of Figure 4) and, on average, firms are notable to discover high-quality combinations of prac-tices (see Graph F of Figure 4). As a result, we seemore entry, but few firms doing well, in high-PIAenvironments.
Lenox et al.: Interdependency, Competition, and the Distribution of Firm and Industry ProfitsManagement Science 52(5), pp. 757–772, © 2006 INFORMS 767
Figure 4 Drivers of Industry Average Profits (Differentiation)
(a) Industry average quality
0.50
0.55
0.60
0.65
0.70
0.75
0.80
0.85
0.90
0.95
1.00
Ind
ust
ry a
vera
ge
qu
alit
y(b) Industry variance in quality
0
0.01
0.02
0.03
0.04
0.05
0.06
0.07
0.08
Ind
ust
ry v
aria
nce
in q
ual
ity
(c) Average number of competitors
3.6
3.8
4.0
4.2
4.4
4.6
4.8
5.0
Ave
rag
e n
um
ber
of
firm
s
(d) Industry skew in profits
–0.2
–0.4
–0.6
0
0.2
0.4
0.6
Ind
ust
ry s
kew
in p
rofi
ts
(e) Percent of industries highly skewed
0
0.05
0.10
0.15
0.20
0.25
0.30
Per
cen
t o
f in
du
stri
es h
igh
ly s
kew
ed
(f) Industry best vs. average profits
0
0.01
0.02
0.03
0.04
0.05
0.06
0.07
0.08
Ave
rag
e p
rofi
ts
Best Industry
1 2 3 4 5 6 7 8 9 10 11 12 13 14 15 16 17 18 19 20
Interdependency (K )
1 2 3 4 5 6 7 8 9 10 11 12 13 14 15 16 17 18 19 20
Interdependency (K )
1 2 3 4 5 6 7 8 9 10 11 12 13 14 15 16 17 18 19 20
Interdependency (K )
1 2 3 4 5 6 7 8 9 10 11 12 13 14 15 16 17 18 19 20
Interdependency (K )
1 2 3 4 5 6 7 8 9 10 11 12 13 14 15 16 17 18 19 20
Interdependency (K )
1 2 3 4 5 6 7 8 9 10 11 12 13 14 15 16 17 18 19 20
Interdependency (K )
Notes. To increase comparability, we graphed the results from simulations with firms making decisions about 20 critical business practices �N = 20�, wherethe practices range from completely independent �K = 1� to completely interdependent �K = N�. Sensitivity analysis found that the general patterns presentedpersist at various parameter values.
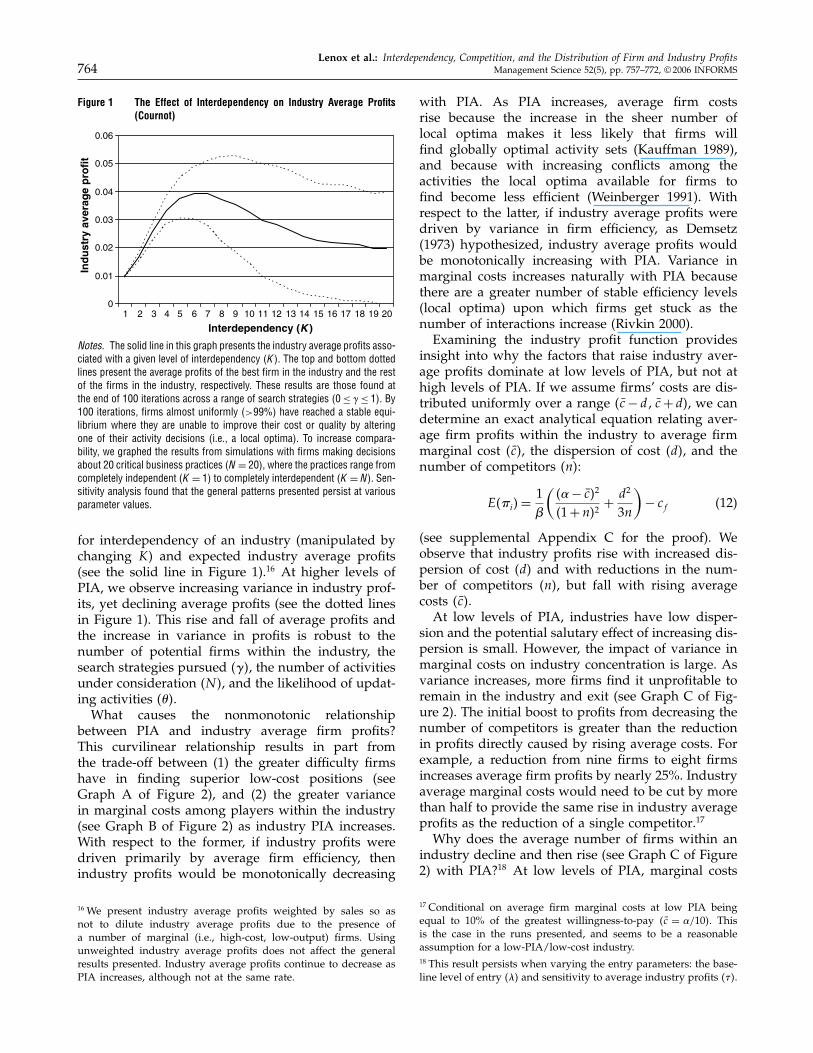
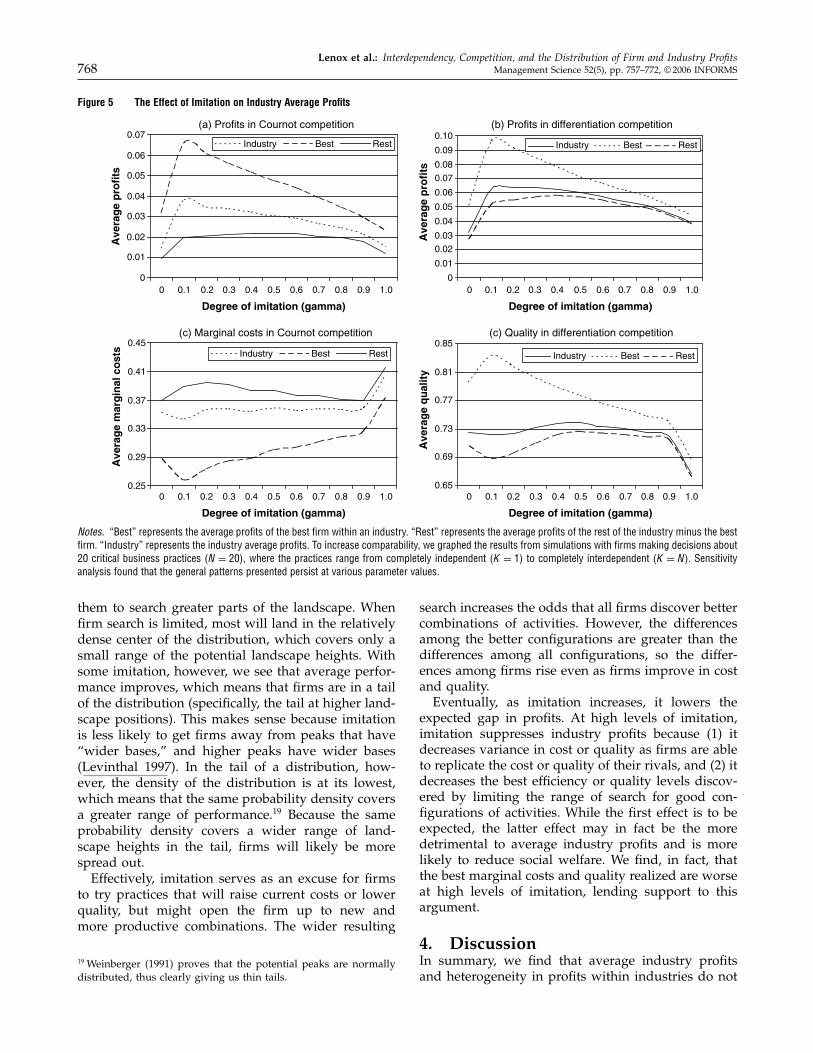
3.3. The Effect of Imitative SearchOne may hypothesize that imitative search shouldremove the potential for skew in industry profitsas firms mimic those who have discovered supe-rior configurations of practices. Interestingly, how-ever, we find that imitative search actually exacerbatesthis pattern, at least at low levels of imitation. In Fig-ure 5, we graph the average profits of the lowest-costor highest-quality firm across industries for varyinglevels of imitative search ��� in our Cournot anddifferentiation competitive environments (Graphs Aand B). At low levels of imitation, the average prof-
itability of the lowest-cost or highest-quality firm isdramatically better, while the rest of the industry com-petitors see their profits improve by considerably less.Why do low levels of imitation improve the best
profits achieved in an industry? In high-PIA indus-tries, the landscape is populated with many rela-tively poor but steep local peaks. As stated earlier,small differences in firms’ activity sets can makebig differences in costs or quality, so imitation doeslittle to reduce variance between imitator and imi-tated (Rivkin 2000). However, imitation can help firmsavoid getting caught on these local peaks by enabling
Lenox et al.: Interdependency, Competition, and the Distribution of Firm and Industry Profits768 Management Science 52(5), pp. 757–772, © 2006 INFORMS
Figure 5 The Effect of Imitation on Industry Average Profits
(a) Profits in Cournot competition
0
0.01
0.02
0.03
0.04
0.05
0.06
0.07
0 0.1 0.2 0.3 0.4 0.5 0.6 0.7 0.8 0.9 1.0
Degree of imitation (gamma)
0 0.1 0.2 0.3 0.4 0.5 0.6 0.7 0.8 0.9 1.0
Degree of imitation (gamma)
0 0.1 0.2 0.3 0.4 0.5 0.6 0.7 0.8 0.9 1.0
Degree of imitation (gamma)
0 0.1 0.2 0.3 0.4 0.5 0.6 0.7 0.8 0.9 1.0
Degree of imitation (gamma)
Ave
rag
e p
rofi
ts
Industry Best Rest
Industry Best Rest
Industry Best Rest
(b) Profits in differentiation competition
0
0.01
0.02
0.03
0.04
0.05
0.06
0.07
0.08
0.09
0.10
Ave
rag
e p
rofi
ts
Industry Best Rest
(c) Marginal costs in Cournot competition
0.25
0.29
0.33
0.37
0.41
0.45
Ave
rag
e m
arg
inal
co
sts
(c) Quality in differentiation competition
0.65
0.69
0.73
0.77
0.81
0.85
Ave
rag
e q
ual
ity
Notes. “Best” represents the average profits of the best firm within an industry. “Rest” represents the average profits of the rest of the industry minus the bestfirm. “Industry” represents the industry average profits. To increase comparability, we graphed the results from simulations with firms making decisions about20 critical business practices �N = 20�, where the practices range from completely independent �K = 1� to completely interdependent �K = N�. Sensitivityanalysis found that the general patterns presented persist at various parameter values.
them to search greater parts of the landscape. Whenfirm search is limited, most will land in the relativelydense center of the distribution, which covers only asmall range of the potential landscape heights. Withsome imitation, however, we see that average perfor-mance improves, which means that firms are in a tailof the distribution (specifically, the tail at higher land-scape positions). This makes sense because imitationis less likely to get firms away from peaks that have“wider bases,” and higher peaks have wider bases(Levinthal 1997). In the tail of a distribution, how-ever, the density of the distribution is at its lowest,which means that the same probability density coversa greater range of performance.19 Because the sameprobability density covers a wider range of land-scape heights in the tail, firms will likely be morespread out.Effectively, imitation serves as an excuse for firms
to try practices that will raise current costs or lowerquality, but might open the firm up to new andmore productive combinations. The wider resulting
19 Weinberger (1991) proves that the potential peaks are normallydistributed, thus clearly giving us thin tails.
search increases the odds that all firms discover bettercombinations of activities. However, the differencesamong the better configurations are greater than thedifferences among all configurations, so the differ-ences among firms rise even as firms improve in costand quality.Eventually, as imitation increases, it lowers the
expected gap in profits. At high levels of imitation,imitation suppresses industry profits because (1) itdecreases variance in cost or quality as firms are ableto replicate the cost or quality of their rivals, and (2) itdecreases the best efficiency or quality levels discov-ered by limiting the range of search for good con-figurations of activities. While the first effect is to beexpected, the latter effect may in fact be the moredetrimental to average industry profits and is morelikely to reduce social welfare. We find, in fact, thatthe best marginal costs and quality realized are worseat high levels of imitation, lending support to thisargument.
4. DiscussionIn summary, we find that average industry profitsand heterogeneity in profits within industries do not
Lenox et al.: Interdependency, Competition, and the Distribution of Firm and Industry ProfitsManagement Science 52(5), pp. 757–772, © 2006 INFORMS 769
simply rise with the industry’s potential for inter-dependency in activities. Intermediate levels of PIAproduce the highest-expected average industry profitsbecause here the potential for preferable sets of busi-ness practices combines with a lower likelihood thatall firms will be able to discover these desirable setsof practices. This leads to a small and efficient set ofprofitable competitors. This beneficial combination ofhigh efficiency and low competition is not evident atlow or high levels of PIA. Low-PIA industries sufferfrom intense competition because potential demandis large and cost or quality differences among firmsare small. High-PIA industries have fewer competi-tors, but profits are restrained because firms are lessefficient on average and similar in their level of ineffi-ciency. These results are consistent with Schoemaker’sproposition that the potential for economic rents ishighest when the complexity of the underlying pro-duction decision problem is neither so simple thatimitation is rampant nor so “hopelessly complex” thatfirms struggle to find good resource configurations(Schoemaker 1990, p. 1184).We further find that in high-PIA industries the
potential exists for an individual firm to discover ahighly efficient configuration of business practices rel-ative to rivals and to realize profits well above theindustry average. Thus, the average profits in high-PIA industries are bolstered by the occasional highlysuccessful firm. As Rivkin (2000) showed, imitativesearch does not necessarily suppress this possibil-ity. In fact, our results highlight the potential benefitof low levels of imitation because it leads to widersearch, raising the likelihood that a firm will finda highly efficient configuration. While the existenceof this kind of skewed profit distribution is strikingwhen observed, it remains a relatively infrequent out-come even in high-PIA industries. Rivkin (2001) high-lights the gap between a firm’s ability to replicate itsown successful set of activities and its rivals’ abilityto imitate that set of activities. If expanding to takeadvantage of their success is particularly difficult,profit in high potential for interdependency industrieswould be even lower.While we recognize the difficulties in measuring
the potential for interdependency among activities ofindustries, our results do provide a path for empir-ical testing. One route is through “as-if” testing. Weshould see some industries (those with low PIA) withlow average profits where firms have similar cost orquality, profits, and practices. We should see otherindustries (those with intermediate levels of PIA)with high average profits, in which firms have con-siderable differences in cost or quality, profits, andpractices. Finally, we should see industries (those withhigh levels of PIA) with low average industry profitswhere most firms have minimal differences in cost or
quality and profits despite wide variety in practices.Paradoxically, it is within these otherwise unattractiveindustries that we are most likely to observe an out-standing firm that is both high performing and highlyprofitable.These patterns have important implications for the
industrial organization literature and antitrust con-siderations. In our model, we do not observe indus-tries with high average profits and low variance inactivities, cost, and quality. If high industry averageprofits were associated with low variance in prac-tices and efficiency, this would strongly suggest thatprofit was driven by other factors, such as barriersto entry. On the other hand, if we see high industryaverage profits coupled with high variance in prac-tices and efficiency, this suggests that some firms havesimply figured out efficient ways of operating. Thus,the existence of high industry average profits is notnecessarily an indicator of undesirable market power.When average profits are high, differences in prac-tices among firms may signal that success is based oninherent complementarities between interdependentactivities and consequent efficiency advantages, andis not based on the exercise of monopoly power.Another route for empirical testing is more direct
and detailed. Armed with a theory for the relation-ship between interdependency potential and the dis-tribution of profits among and within industries, itis natural to move beyond looking for patterns (as-iftesting) and to test the theory against (and control-ling for) alternative theories. These results provide atheoretical justification for a positive main effect ofPIA and a negative squared effect of PIA on indus-try profit. The major hurdle facing such empiricalstudies is the development of an industry-level mea-sure of interdependency potential. We believe thatthe development of such a systematic measure, whilelaborious, is feasible. Notably, Siggelkow (2001, 2002)describes a systematic process of archival and inter-view research for mapping interdependencies amongcore and elaborating activities within firms. Repeatedfor one or more firms across several industries, therelative density of such systematically collected mapscould serve as an ordinal measure of PIA amongindustries.Comparing the density of these maps among
industries will only be possible if managers and/orresearchers are able to identify more interactionswhen interactions are stronger or more numerous.However, it will not be necessary that managers orresearchers fully understand the nature of these inter-actions nor—critically in light of the search processesposited—that they are able to determine the bestway of combining practices. With a large sample,cruder means of collecting similar information, suchas through surveys, might suffice for the purpose of
Lenox et al.: Interdependency, Competition, and the Distribution of Firm and Industry Profits770 Management Science 52(5), pp. 757–772, © 2006 INFORMS
mapping potential complementarities onto the distri-bution of profits.Models always involve a large number of simplify-
ing assumptions. We could introduce any number ofadditional factors to our model, such as adjustmentcosts or learning errors or different forms of inno-vation and imitation strategies (Lewin and Massini2003). While such changes will surely shift the numer-ical results, we do not expect them to interact withPIA in a way that would alter the overall pattern ofresults presented. For example, both adjustment costsand learning errors will simply reinforce the advan-tage of privileged firms relative to their rivals in high-PIA industries, while simultaneously making it moredifficult for any firm to find highly efficient configu-rations of business practices.For our analysis, we assume that managers strug-
gle to find optimal configurations of activities thatlower cost or raise quality, yet are able to calcu-late the optimal price and output. We believe thatthese behavioral assumptions are not inconsistent orcontradictory. In both cases, we assume that man-agers can optimize over a well-defined concave func-tion. In the case of cost and quality, managers face ahighly nonlinear decision problem that violates con-cavity (at least in the presence of high interdepen-dency). As argued earlier, even experimentation isunlikely to guarantee optimal configurations in a rea-sonable time period. In the case of price and out-put, managers face a far simpler decision problem forwhich the calculation of the optimal is feasible. If weassume that firms’ managers have some sense of theindustry demand and the average industry marginalcost/quality, then the calculation of optimal pricingand output is straightforward. If managers do notknow average industry marginal cost or quality withcertainty, our results will generally hold in expecta-tion. Even a systematic bias in managers’ estimateswill not affect our results as long as the extent ofbias is not correlated with a firm’s own productiv-ity. We do not expect substantively different resultseven if we relax our behavioral assumption that man-agers explicitly calculate the optimal price or quan-tity. Firms are likely to receive much faster feedbackabout the viability of pricing and output decisionsthan about the viability of individual activity deci-sions, and thus are likely to quickly adjust price andoutput to near-optimal levels.The results we report for the undifferentiated
competition model assume a specific demand slope��= 1�. As shown in Equation (12), a more or lessstrongly sloped demand curve would lower or raiseaverage firm profits, but do so by affecting allprofit components that change with PIA (numberof firms, average cost, and dispersion of cost) equally.Absent any reason to expect a systematic relationship
between industry PIA and demand elasticity, there-fore, different assumptions about price sensitivity willaffect the scale but not the shape of the reported profitresults.There are other potential variants on the compet-
itive model that could be explored. The most dra-matic might be to link activities to differentiationin kind as well as differentiation in quality. Activ-ities that only created differences in kind wouldlikely encourage firms to “spread out” in a way thatsoftens competition and raises profits for all levels ofPIA without shifting the results of the models pre-sented (Schmalansee 1978). If we consider that someactivities might play a dual role—affecting both dif-ferentiation in kind and differentiation in costs orquality—we might find that differentiation in kind isa positive by-product of a search for quality that soft-ens competition and increases profits, particularly athigher levels of PIA. We may also encounter “dancinglandscapes” (Kauffman 1995), where improvement byeach competitor not only reduces the absolute prof-itability of all possible sets of practices, and stretchesor compresses the profit differences among sets ofpractices (as they do in the undifferentiated and qual-ity differentiation models presented here), but alsochanges the sign of the profit differences among setsof practices. Capturing differentiation in kind wouldrequire an explicit model of the distribution of tastes,as they are linked to activities and an explicit model-ing of customers (and not just firms) as agents makingindividual choices. Capturing this effect in an empir-ical study would require controls for cross-price elas-ticity among firms within the industry.There is a wide range of alternative assumptions
that might be employed to model entry and exit.We modeled entry and exit with a relatively sim-ple rule, where firms enter or exit based on theirexpected profits in the following period. On the oppo-site extreme, firms might enter or exit based on amuch more sophisticated rule, where they estimateand discount expected profits over time. We believe itis unlikely that such a rule would change the reportedresults. The higher realized firm profits at intermedi-ate levels of PIA will invite entry only up to the pointthat they are balanced by higher risk. Unlike low-PIAindustries where firms are certain (or nearly certain)of improving rapidly toward the best possible set ofactivities, and unlike high-PIA industries where firmsreaching any local optima can expect to be compet-itive with the bulk of rivals, medium-PIA industriespresent firms with a very real potential for competingfor a long period without becoming competitive.Entry and exit are important to understanding mar-
ket dynamics and equilibrium outcomes for severalreasons. First, entry and exit change the number ofcompetitors, and thus affect the market power of
Lenox et al.: Interdependency, Competition, and the Distribution of Firm and Industry ProfitsManagement Science 52(5), pp. 757–772, © 2006 INFORMS 771
firms. Any model exploring variables that changethe number of viable competitors will thus bene-fit from considering entry and exit. Second, entryand exit may change the nature of competitors(Mitchell 1994). Models that explore situations wherea firm’s history influences its future (e.g., throughaccumulations of learning, tendency toward localsearch, founding conditions, or through irreversibleinvestments in assets or reputations) almost cer-tainly benefit from understanding when history-ladenincumbents will be replaced by entrants either lessconstrained by history or simply quite dissimilar toincumbents. We believe that exploring the differencesbetween entrants and exiting incumbents will be a fer-tile future ground for the use of NK models embed-ded in competitive structures.In a similar vein, we believe that how firms search
for more efficient sets of business practices is a cru-cial uncertainty to explore. For this reason, we exam-ined results where firms engage in a range of mixesof innovative and imitative search. The overall resultthat average industry profits are highest for interme-diate levels of PIA proves robust from one extremeof pure innovation to the opposite extreme of pureimitation. Interestingly, the results show that imitationdoes not deserve its reputation as solely a destroyerof variance. Some imitation at high levels of PIA doeslittle to allow firms to close gaps in their efficiency,but leads to wider exploration and thus a concomi-tantly wider range of efficiency.
5. ConclusionsInterdependencies among resources and practiceshave increasingly played a central role in explana-tions of how organizations discover more efficientbusiness practices; why differences in efficiency, onceestablished, continue to persist across firms; and whydifferences in efficiency among firms develop intodifferences in average profits across industries. Wepresent a model in this paper that brings those threetraditions together to develop a more complete under-standing of how differences in potential productioninterdependency within industries affects the distri-bution of profits that we expect to find within andamong industries.This examination reveals that potential interdepen-
dency among activities has several mechanisms forinfluencing industry cost or quality. The potential forinterdependency affects the distribution of potentialefficiency and quality levels attainable, the difficultyof finding better cost or quality levels, and whetherimitation narrows or expands overall search. As aresult of this interplay of factors, profits and hetero-geneity in profits do not rise or fall uniformly depend-ing on PIA in industries where firms differ in cost
or quality. Instead, for these kinds of industries weexpect a sweet spot where industries with intermedi-ate levels of PIA enjoy the greatest expected efficiencyand profits, while high-PIA industries hold out thepossibility that a firm finds a highly efficient set ofbusiness practices that allows the firm to stand outrelative to competitors and generate significant eco-nomic rents.These results are important for understanding not
only the role of PIA in generating profit heterogene-ity, but for our larger understanding of the sources ofcompetitive advantage. Our results provide guidancefor identifying likely industries where competitiveadvantage accrues to a chosen few firms that havevaluable, rare, nonsubstitutable, and hard-to-imitateresources and capabilities that allow for favorablemarket positions relative to rivals. In this way, inter-dependencies provide an explanation not only forwhat sustains profit heterogeneity within and acrossindustries, but why it emerges in the first place insome industries more than in others. By recognizingthat industries can vary in terms of potential inter-dependency due to technology and other structuralfactors, we also see the beginning of a reconnection offirm-level and industry-level analyses. To the extentthat the potential for interdependency is driven bystructural elements of an industry, industry structurecan be used to explain differences in firms’ resources,capabilities, and profits.Our coupling of a model of interdependency
among firm activities with standard models of com-petition is useful in addressing a number of funda-mental questions concerning industry structure andevolution. There has been a great deal of interestamong economists in how firm heterogeneity mayaffect the structural evolution of industries. Jovanovic(1982) proposed a formal model where competingfirms are heterogeneous at founding. In this model,each firm is uncertain about its own type, whichis revealed over time. Klepper (1996) introduced amodel where firm growth is the result of investmentsbased on their beliefs about their type, and theseinvestments then change their type over time. Pakesand Ericson (1998) explore the empirical implicationsof more passive learning models such as Jovanovic’sand more active learning models such as Klep-per’s. The integrated model in this paper is similarlydirected toward understanding how firm heterogene-ity arises and how that affects industry structure andfirm profits. Our model differs from earlier models byproviding a rich structure to the learning environmentfaced by firms and by introducing the mediating roleof industry potential for interdependency.Our approach of marrying a model of interdepen-
dency among firm activities with an explicit modelof competition may prove fruitful for a number of
Lenox et al.: Interdependency, Competition, and the Distribution of Firm and Industry Profits772 Management Science 52(5), pp. 757–772, © 2006 INFORMS
research domains. For example, researchers study-ing the effects of search routines on organizationaladaptation may find that the dual consideration ofinterdependency and competition provides additionalinsight into managerial incentives to search, intostrategic considerations when choosing search meth-ods, as well as insights into the survival chancesof firms that engage in change efforts. Those study-ing processes of creative destruction may gain newinsights by seeing how the interaction of complex-ity and competitive intensity within industry envi-ronments affects whether or not incumbents shouldor can change without destroying themselves in theprocess. Those who are concerned with public policymay find that a model such as ours provides insightsinto how mergers and firm failures affect not onlycompetitive intensity but also how it affects searchand average industry productivity or quality. Perhapsmost promising, those studying industry dynamicsmay find that a more explicit treatment of interde-pendency provides new insights into the structuralevolution of industries.An online supplement to this paper is available on
the Management Science website (http://mansci.pubs.informs.org/ecompanion.html).
ReferencesAnderson, S. P., A. De Palma, J. F. Thisse. 1992. Discrete Choice The-
ory of Product Differentiation. MIT Press, Cambridge, MA.
Bresnahan, T., E. Brynjolfsson, L. Hitt. 2002. Information technol-ogy, workplace organization and the demand for skilled labor:Firm level evidence. Quart. J. Econom. 117(1) 339–376.
Cockburn, I., R. M. Henderson. 1996. Scale, scope, and spillovers:Determinants of research productivity in the pharmaceuticalindustry. RAND J. Econom. 27(1) 32–59.
Demsetz, H. 1973. Industry structure, market rivalry, and publicpolicy. J. Law Econom. 16 1–9.
Ghemawat, P., D. Levinthal. 2000. Choice structures, business strat-egy and performance: A generalized NK-simulation approach.Working paper no. 01-0111, Harvard Business School, Boston,MA.
Ichniowski, C., K. Shaw, G. Prennushi. 1997. The effects of humanresource management practices on productivity: A study ofsteel finishing lines. Amer. Econom. Rev. 87(3) 291–313.
Jovanovic, B. 1982. Selection and the evolution of industry. Econo-metrica 50(3) 649–670.
Kauffman, S. A. 1989. Adaptation on rugged fitness landscapes.D. Stein, ed. Lectures in the Sciences of Complexity. Addison-Wesley, Reading, MA.
Kauffman, S. A. 1993. The Origins of Order: Self-Organization andSelection in Evolution. Oxford University Press, Oxford, UK.
Kauffman, S. A. 1995. At Home in the Universe. Oxford UniversityPress, Oxford, UK.
Klepper, S. 1996. Entry, exit, growth, and innovation over the prod-uct life cycle. Amer. Econom. Rev. 86(3) 562–583.
Levinthal, D. A. 1997. Adaptation on rugged landscapes. Manage-ment Sci. 43(7) 934–950.
Lewin, Arie Y., Silvia Massini. 2003. Knowledge creation andorganizational capabilities of innovating and imitating firms.H. Tsoukas, N. Mylonopoulos, eds. Organizations as KnowledgeSystems. Palgrave, 209–237.
Lippman, S. A., R. P. Rumelt. 1982. Uncertain imitability: An analy-sis of interfirm differences in efficiency under competition. BellJ. Econom. 13(2) 418–438.
Massini, S., A. Y. Lewin, H. Greve. 2005. Innovators and imita-tors: Organizational reference groups and adoption of organi-zational routines. Res. Policy. 34 1550–1569.
McFadden, D. 1974. Conditional logit analysis of qualitative choicebehavior. P. Zarembka, ed. Frontiers in Econometrics. AcademicPress, New York, 105–142.
McGahan, A. M., M. E. Porter. 1997. How much does industry mat-ter, really? Strategic Management J. 18(Special Summer Issue)15–30.
Milgrom, P., J. Roberts. 1990. The economics of modern manufac-turing: Technology, strategy and organization. Amer. Econom.Rev. 83(3) 511–529.
Milgrom, P., J. Roberts. 1995. Complementarities and fit: Strat-egy, structure, and organizational change in manufacturing.J. Accounting Econom. 19 179–208.
Mitchell, W. 1994. The dynamics of evolving markets: The effects ofbusiness sales and age on dissolutions and divestitures. Admin.Sci. Quart. 39 575–602.
Nelson, R. R., S. G. Winter. 1982. An Evolutionary Theory of EconomicChange. Harvard University Press, Cambridge, MA.
Pakes, A., R. Ericson. 1998. Empirical implications of alternativemodels of firm dynamics. J. Econom. Theory 79 1–45.
Porter, M. 1996. What is strategy? Harvard Bus. Rev. (November–December) 61–78.
Rivkin, J. 2000. Imitation of complex strategies. Management Sci.46(6) 824–844.
Rivkin, J. 2001. Reproducing knowledge: Replication without imi-tation at moderate complexity. Organ. Sci. 12(3) 274–293.
Rivkin, J., N. Siggelkow. 2005. Patterned interactions in complexsystems: Implications for exploration. Presented at the 2005Academy of Management Conference, Honolulu, HI.
Schmalansee, R. 1978. Entry deterrence in the ready-to-eat breakfastcereal industry. Bell J. Econom. 9(Autumn) 305–327.
Schmalansee, R. 1985. Do markets differ much? Amer. Econom. Rev.75 341–351.
Schoemaker, P. 1990. Strategy, complexity, and economic rent.Management Sci. 36(10) 1178–1192.
Siggelkow, N. 2001. Change in the presence of fit: The rise, the fall,and the renaissance of Liz Claiborne. Acad. Management J. 44(4)838–857.
Siggelkow, N. 2002. Evolution toward fit. Admin. Sci. Quart. 47(1)125–159.
Szulanski, G. 2000. The process of knowledge transfer: A diachronicanalysis of stickiness. Organ. Behavior Human Decision Processes82(1) 9–27.
Weinberger, E. D. 1991. Local properties of Kauffman’s N -k model:A tunably rugged energy landscape. Physical Rev. A 44(10)6399–6413.
Westney, D. E. 1987. Imitation and Innovation. Harvard UniversityPress, Cambridge, MA.