Embed Size (px)
Citation preview

345
Th e European Nitrogen Assessment, ed. Mark A. Sutton, Clare M. Howard, Jan Willem Erisman, Gilles Billen, Albert Bleeker, Peringe Grennfelt, Hans van Grinsven and Bruna Grizzetti. Published by Cambridge University Press. © Cambridge University Press 2011, with sections © authors/European Union.
ChapterChapter
Executive summary
Nature of the problem Environmental problems related to nitrogen concern all economic sectors and impact all media: atmosphere, pedosphere, hydrosphere • and anthroposphere. Th erefore, the integration of fl uxes allows an overall coverage of problems related to reactive nitrogen (N • r ) in the environment, which is not accessible from sectoral approaches or by focusing on specifi c media.
Approaches Th is chapter presents a set of high resolution maps showing key elements of the N fl ux budget across Europe, including N • 2 and N r fl uxes. Comparative nitrogen budgets are also presented for a range of European countries, highlighting the most effi cient strategies for mitigat-• ing N r problems at a national scale. A new European Nitrogen Budget (EU-27) is presented on the basis of state-of-the-art Europe-wide models and databases focusing on diff erent segments of Europe’s society.
Key fi ndings From • c . 18 Tg N r yr −1 input to agriculture in the EU-27, only about 7 Tg N r yr −1 fi nd their way to the consumer or are further processed by industry. Some 3.7 Tg N • r yr −1 is released by the burning of fossil fuels in the EU-27, whereby the contribution of the industry and energy sectors is equal to that of the transport sector. More than 8 Tg N r yr −1 are disposed of to the hydrosphere, while the EU-27 is a net exporter of react-ive nitrogen through atmospheric transport of c . 2.3 Tg N r yr −1 . Th e largest single sink for N • r appears to be denitrifi cation to N 2 in European coastal shelf regions (potentially as large as the input of min-eral fertilizer, about 11 Tg N yr –1 for the EU-27); however, this sink is also the most uncertain, because of the uncertainty of N r import from the open ocean.
Major uncertainties National nitrogen budgets are diffi cult to compile using a large range of data sources and are currently available only for a limited number • of countries. Modelling approaches have been used to fi ll in the data gaps in some of these budgets, but it became obvious during this study that further • research is needed in order to collect necessary data and make national nitrogen budgets inter-comparable across Europe. In some countries, due to inconsistent or contradictory information coming from diff erent data sources, closure of the nitrogen budget • was not possible.
Recommendations Th e large variety of problems associated with the excess of N • r in the European environment, including adverse impacts, requires an inte-grated nitrogen management approach that would allow for creation and closure of N budgets within European environments. Development of nitrogen budgets nationwide, their assessment and management could become an eff ective tool to prioritize measures • and prevent unwanted side eff ects.
Chapter
16 Chapter
Integrating nitrogen fl uxes at the European scale Lead author: Adrian Leip
Contributing authors: Beat Achermann , Gilles Billen , Albert Bleeker , Alexander F. Bouwman , Wim de Vries , Ulli Dragosits , Ulrike Döring , Dave Fernall , Markus Geupel , Jürg Herolstab, Penny Johnes , Anne Christine Le Gall , Suvi Monni , Rostislav Nevečeřal , Lorenzo Orlandini , Michel Prud’homme , Hannes I. Reuter , David Simpson , Guenther Seufert , Till Spranger , Mark A. Sutton , John van Aardenne , Maren Voß and Wilfried Winiwarter

Integrating nitrogen fl uxes at the European scale
346
16.1 Introduction Th e concept of the nitrogen cascade was introduced to describe the ‘[…] multiple linkages among the ecological and human eff ects of reactive nitrogen molecules as they move from one environmental system to another’ (Galloway et al ., 2003 ). Th e quantifi cation of the nitrogen cascade requires accurate estimation of the fl uxes across the sectoral and media boundaries for a large geographic entity, from regional to national, continental and global scale. Such a complete nitrogen (N)-budget was fi rst presented for Europe by van Egmond et al . ( 2002 ). In this chapter, an update is given of the information on complete N-budgets, including all major N 2 and reactive nitrogen (N r ) fl uxes, both at country and at continental level.
Th e European Nitrogen Assessment (ENA) provides an overview of the processes and pathways associated with the cascade of N r through the environment, and also the order of magnitude of the associated problems, based on recent scien-tifi c literature and latest available model results. Each of the chapters focuses on one specifi c sector (for example de Vries et al ., Chapter 15 , on the N fl uxes from agriculture and nat-ural ecosystems and Svirejeva-Hopkins et al ., Chapter 12 , on the eff ect of urbanization), on one specifi c medium (such as for example Simpson et al ., Chapter 14 , on the transport of N r in the atmosphere and Billen et al ., Chapter 13 , looking at nitrogen from the perspective of watersheds or on one specifi c aspect in the nitrogen cascade (for example the transform-ation processes in soils in Butterbach-Bahl et al ., Chapter 6 , or chemical reactions occurring in the atmosphere in Hertel et al ., Chapter 9) .
Th e inter-connections between these specifi c assess-ments are manifold and refl ect the interactions that nitrogen undergoes in the environment across the borders of scales, sectors and media. Th e present chapter stands at the inter-face between the sections describing nitrogen issues and those explaining nitrogen problems and suggesting nitrogen solutions.
Two objectives are identifi ed. (i) To give an overview of the most important N-fl uxes in
Europe in a gridded representation, i.e. compiling a number of ‘key maps’ that help the understanding of regional diff erences of the main N-indicators.
(ii) To show aggregated fl uxes of nitrogen across media and sectors, i.e. integrated national N-budgets for those countries where they have already been established and a new ‘European Nitrogen Budget’ based on the evidence compiled and the fi lling in of gaps according to the latest scientifi c knowledge.
Th e second goal, in particular, is a challenging one, as most research is done in individual disciplines and only a few ‘inte-grated’ models exist today that are able to give a comprehensive overview of the nitrogen budget at a national scale. However, while some decades ago the focus of research was on individual fl uxes (e.g. nitrate concentrations in rivers), and specifi c tools (e.g. models of N 2 O fl uxes from agricultural soils), in recent
years progress has been made in developing tools and databases which cross sector- and media-boundaries and are able to con-sider eff ects such as ‘pollution swapping’ and to evaluate trade-off s. Th e need to mitigate environmental problems related to nitrogen in an integrated way has led to the development of ‘national nitrogen budgets’ aimed at helping to fi nd the most effi cient and cost-eff ective solutions to abate these problems.
Still, the establishment of a nitrogen budget requires (i) the co-operation of experts from diff erent disciplines and/or (ii) the integration of various dedicated models. Nitrogen budgeting at the national scale oft en relies on the fi rst solution, as the density of experimental observations at the national scale might be suffi cient to come up with good estimates of nitrogen fl uxes between sub-systems, and model-results can (if needed) be used to fi ll gaps. Such national or (in the case of Europe) supra-national nitrogen budgets are increasingly recognized to be a very useful tool for visualizing the complexity of nitro-gen issues, also in relation to society as a whole. Th ese national nitrogen budgets help to support prioritization of policies and provide a fi rst assessment of the impact a policy might have at various points in the nitrogen cascade.
In order to understand the fl uxes that are included in the establishment of European and national nitrogen budgets, we employ a number of models covering partial aspects of an overall budget. Each model has its strengths and weaknesses. Th erefore combining the best features of these models pro-vides a means for the construction of a cross-sector, cross-media European Nitrogen Budget. Th e following sections give an overview of the main data sources and models used for the key-maps presented in Section 16.3 as well as for the European Nitrogen Budget (for the EU-27) presented in Section 16.4 , where we also present national N-budgets developed by coun-try experts on the basis of national data sources.
16.2 Data sources For the assessment of key nitrogen fl uxes at the European scale and the development of a European Nitrogen Budget, one cannot rely on statistical or observational data as they do not exist for most of the fl uxes that need to be considered. Observational data are scarce and unevenly distributed over the European area, so that a statistical up-scaling is oft en not possible. Instead, models are needed that extrapolate nitrogen (and other) fl uxes at large scales on the basis of existing envir-onmental or statistical information. Here, we make use of the results of such models. Th e models were selected on the basis of the following criteria: (i) applicability at the European scale; (ii) a high spatial data resolution, the European scale notwith-standing; and (iii) a focus in the parameterization of nitrogen fl uxes in the compartments considered (see also de Vries et al ., 2011 , Chapter 15 this volume).
Th e CAPRI-DNDC-based Integrated Database for European Agriculture ( IDEAg) gives currently the most com-plete information on the fl ow of nitrogen into and through the agricultural sector in Europe, calculating also reactive nitrogen and greenhouse gas fl uxes (Leip et al ., 2008 ; Leip et al ., 2010a ). Th e Indicator Database for European Agriculture builds mainly

Adrian Leip
347
on the results from the economic model for agriculture CAPRI (Britz and Witzke, 2008 ) and the biophysical model for soil nutrient turnover DNDC (Li, 2000 ) through a meta-modelling approach (Britz and Leip, 2009 ). IDEAg covers all nitrogen fl uxes related to agricultural activities in Europe. It has recently been extended to cover also N r emissions from sewerage sys-tems in accordance with the methodology developed for the IMAGE model (Bouwman et al ., 2006 ).
Th e INTEGRATOR model is an integrated model specif-ically designed to help developing integrated policies. It has been developed to assess responses of nitrogen and greenhouse gas (GHG) emissions to European-scale changes in land use, land management and climate. INTEGRATOR links modules calculating N and GHG emissions from housing and manure storage systems, agricultural and non-agricultural soils and surface waters, while accounting for the interaction between diff erent sources through an emission–deposition model for NH 3 and NO x . It uses relatively simple and transparent model calculations based on the use and adaptation of available model approaches, including empirical model approaches and statis-tical relations between model outputs and environmental vari-ables. Th e model focuses on the derivation of high resolution spatially explicit data (De Vries et al ., 2009 ).
Th e Emission Database for Global Atmospheric Research (EDGAR) calculates emissions of air pollutants and green-house gases on a grid for use in atmospheric circulation models covering all relevant anthropogenic emission sectors (Olivier et al ., 2005 ; Van Aardenne et al ., 2001 ). EDGAR was used as the standard database for deriving emission estimates as it provides a consistent emission calculation of emissions for the whole territory considered and a sophisticated downscaling proced-ure to map emissions at high spatial resolution, including ship and aviation emissions and detailed sub-sector disaggregation. Two datasets have been applied in this report. N 2 O emissions have been taken from EDGARv4.0 (JRC/PBL, 2009 ) and the NO x and NH 3 emissions are taken from the EDGAR-CIRCE dataset (Van Aardenne et al ., 2009 ).
Th e Unifi ed EMEP model is used to estimate atmospheric transport and deposition as calculated by the European-scale EMEP MSC-W Chemical transport model (European Monitoring and Evaluation Programme, Meteorological Synthesizing Centre – West). Th e EMEP models have been instrumental to the development of air quality policies in Europe since the late seventies, mainly through their support to the strategy work under the Convention on Long-range Transboundary Air Pollution, and became the reference atmos-pheric dispersion model for use in the Integrated Assessment Models supporting the development of air quality polices under the EU Commission. Th e Unifi ed EMEP model is designed to calculate air concentrations and deposition fi elds for major acidifying and eutrophying pollutants, photo-oxidants and particulate matter (Simpson et al ., 2006 ).
Additional information on these models can be found in the supplementary material (see supplementary material Chapter 15 and 16) including also a comparison of total atmos-pheric N r emissions fl uxes by various data sets. Details on the data sets used by these models to estimate N r fl uxes is given in
de Vries et al . ( 2011 , Chapter 15 , this volume). A summary of the models used and the main data obtained from each of these models is given in Table 16.1 . Each model focuses on diff erent sectors and the models are thus complementary. Information for agriculture is available also from INTEGRATOR and EDGAR; because the IDEAg is the most complete source of information for agriculture the data in this chapter is taken from this model. Th is avoids most inconsistencies between the data presented. However, inconsistencies cannot be completely excluded and are mainly due to: (i) diff erent atmospheric deposition data used in the IDEAg and INTEGRATOR model and the EMEP deposition data used in this chapter; and (ii) N r fl uxes from coastal areas which are not included in any of the Europe-wide models.
Covering complex processes on a continental scale, the models are bound to rely on simplifying assumptions regard-ing input data sets, and the parameterization of the processes and the results presented here are consequently associated with large uncertainties. A proper assessment of these uncer-tainties, however, is very diffi cult as independent data that can be used to quantify the uncertainties are missing. An attempt to quantify the uncertainty of these (and other) models is currently being done within the European integrated project NitroEurope-IP (Sutton et al ., 2007 ; NitroEurope, 2010 ). So far, the best approximation at an uncertainty assessment is done by comparing the in- and outputs of a wide range of models, as done by de Vries et al . ( 2011 , Chapter 15 this volume).
16.3 Key maps of nitrogen fl uxes in Europe Th e purpose of this section is to present the spatial distribu-tion of various types of key nitrogen fl uxes over Europe that are
Table 16.1 Overview table of main models used in this chapter to generate the key maps and the European Nitrogen Budget (ENB)
Model Nitrogen fl uxes estimated for the ENB
IDEAg emissions and nitrogen leaching and run-off from agriculture
exchange of nitrogen between the soil and the livestock sectors
application of mineral fertilizer to agricultural soils
feed and food trade land productivity, consumption of nitrogen nitrogen input to and emissions from sewage
treatment systems
INTEGRATOR emissions and nitrogen leaching from forests and rough grazing
EDGAR emissions from stationary combustion (energy sector, industry, residential sector) and industrial processes
emissions from transport nitrogen input to solid waste management emissions from solid waste management
EMEP atmospheric deposition

Integrating nitrogen fl uxes at the European scale
348
responsible for environmental problems. Maps are derived on the basis of fi ne scale resolution data (1 km × 1 km). Th e only way to obtain data on such a high resolution was to apply mod-els and combine their results with measurements where avail-able. Most of the models and data sources used have already been presented and explained in detail in earlier chapters. All together, 11 such key maps are selected. Th ey can be grouped into three categories. (i) Drivers for and pressures of nitrogen in terrestrial
ecosystems, including both agricultural and non-agricultural systems. Here the total load of nitrogen on agricultural soils ( Figure 16.1 ) and the gross soil nitrogen budget for agricultural ( Figure 16.2 ) and non-agricultural soils ( Figure 16.3 ) can be regarded as key-indicators. Input of nitrogen through atmospheric deposition ( Figure 16.4 ) is a major pressure on (semi-) natural ecosystems.
(ii) Emissions of reactive nitrogen to the atmosphere and to the hydrosphere. Th is is a very important pressure for environmental problems related to nitrogen. We show separate maps on NH 3 ( Figure 16.5 ), NO x ( Figure 16.6 ), and N 2 O ( Figure 16.7 ) emissions across Europe. Each of these compounds is dominated by diff erent source categories (energy/transport for NO x , the livestock sector for NH 3 , soils for N 2 O), so that the distinction between these compounds gives also an idea of the spatial distribution of the main driving forces for reactive nitrogen generation. Emissions of nitrogen towards aquatic systems are presented in Figure 16.8 .
(iii) Secondary nitrogen indicators. Th ree indicators have been selected: the total productivity of agricultural land ( Figure 16.9 ), and the total consumption of reactive nitrogen by humans ( Figure 16.10 ) and by animals
Figure 16.1 Nitrogen input to agricultural soils in EU27 for the year 2002. The map shows total reactive N input to agricultural soils (cropland and grassland) yr –1 for a grid at 1 km × 1 km, the values are in kg N per total pixel area [kg N km −2 yr −1 total area]. The pie diagram at the right side gives the split of N input [Gg N rounded to 10 Gg N yr –1 ] for EU27: mineral fertilizer, manure (intentionally applied manure and manure deposited by grazing animals), atmospheric deposition, biological nitrogen fi xation and crop residues returned to the soil. The histogram shows the split of N input [Gg N year −1 , rounded to 10 Gg N year −1 ] by country. Basis: Indicator Database for European Agriculture (IDEAg) V1, 2009. Method: Mineral fertilizer data are obtained from FAO at the national level and are distributed to crops and regions by the CAPRI model using information from IFA/FAO. Distribution to the grid is done on the basis of estimated crop N requirements using information of the potential and water-limited yield for the soil-climate conditions and N supply from biological fi xation, atmospheric deposition, and manure nitrogen supply. Manure N supply is estimated from manure availability on the basis of a livestock density map, crop demand and typical share of nitrogen supply by organic nitrogen. The data are net of nitrogen losses occurring before the application of manure to the soil. All data are estimated in consistence with regional values using the highest posterior density approach (Heckelei et al ., 2005 ). Nitrogen deposition data are from EMEP ( 2008 ). Biological nitrogen fi xation is estimated as a crop-dependent fraction of above-ground nitrogen. Crop residues are estimated from crop-specifi c fraction and N-content of crop residues. Details on the distribution algorithm can be found in Leip et al . ( 2008 ) and Britz and Leip ( 2009 ).

Adrian Leip
349
( Figure 16.11 ). While the fi rst indicator shows the potential of the land to feed its population in Europe, the other two indicators give a good idea of the ‘life style’ of citizens. Taken together, these indicators give information on the sustainability of land use and are the basis for the watershed assessment discussed in Chapter 13 (Billen et al ., 2011 , Chapter 13 this volume).
16.3.1 Drivers for and pressures of nitrogen in terrestrial ecosystems We select two indicators describing drivers for the environmen-tal load of N r and two indicators for the pressure of N r on the environment. Th e total N r input to agricultural soils includes intentionally applied (organic or mineral) fertilizer and manure from grazing livestock as well as biological nitrogen-fi xation and atmospheric deposition. Also crop residues returned to the soil are included in total N r -inputs. Reactive nitrogen additions
are required to fulfi l the needs of plants without compromising the productivity of the soil. At the same time, however, exces-sive N r additions to agricultural soils lead to high pressures on the environment. Atmospheric deposition is the main source of N r for natural land and forests. Atmospheric deposition is fuelled mainly by the emissions of NO x from energy-related sources and NH 3 lost from agriculture. Th ere is limited cap-acity in natural ecosystem to absorb N r . While initial N r add-itions to forests can lead to a stimulation of plant growth and the build-up of soil organic matter, additions to N r -saturated systems have adverse eff ects on the system’s functioning and most N r is leached (Aber, 1992 ; Butterbach Bahl et al ., 2011, Chapter 6 this volume). We defi ne nitrogen surplus as the diff erence between total N r inputs to a system and the useful outputs following the defi nition of the soil-system approach (de Vries et al ., 2011 , Chapter 15 this volume). Inputs are total N r -input as defi ned above, while useful N r outputs are harvested crops, including crop residues, and grazed grass. Changes of
Figure 16.2 Soil system nitrogen surplus for agricultural soils in EU27 for the year 2002. The map shows reactive N surplus for a grid of 1 km × 1 km, the values are in kg N per total pixel area [kg N km −2 yr −1 total area]. The pie diagram at the right side gives the split of surplus [Gg N year −1 , rounded to 10 Gg N year −1 ] for EU27 into the loss pathways: NH3 emissions from soils, NO x emissions from soils N 2 O emissions from soils N 2 emissions from soils, N leaching and runoff . The histogram shows the split of the N surplus [Gg N yr −1 ] into diff erent loss pathways by country. Basis: Indicator Database for European Agriculture V1, 2009. Method: Nitrogen input to agricultural soils is estimated as given in Figure 16.1 . Removal of nitrogen by crops and harvested or grazed grass is estimated from regional and national Eurostat statistics, downscaled to the grid on the basis of potential yield from (Genovese et al ., 2007 ). Total N surplus at the grid scale is split into individual fl uxes on the basis of the MITERRA approach (NH3 emissions and run-off ) as implemented in CAPRI (Britz and Witzke, 2008 ; Velthof et al ., 2009 ) and the DNDC-CAPRI meta-model (Britz and Leip, 2009 ) for N 2 , N 2 O, NO x and N-leaching. The spatial distribution is done on the basis of the nitrogen input data. Changes in soil-nitrogen stocks are also estimated with the DNDC-CAPRI meta-model; according to the soil-system approach they are nitrogen output as thus not included in the split of the N-surplus. A closed nitrogen budget is obtained according to the method described by Leip et al . ( 2009a ).

Integrating nitrogen fl uxes at the European scale
350
soil N r stocks can occur in both a positive direction (fi lling-up the nitrogen pool) and negative direction (depletion of the N r pool). Th is is a transient process and can be reversed by chang-ing farm management. According to the soil-system approach, changes in soil N r stocks adjust the accountable quantity of use-ful outputs. Th ey have an equal impact on the N r surplus, how-ever, not being part of a detailed split of the fate of N-surplus (for a detailed discussion see Leip et al ., 2010a ). Nitrogen sur-plus on forest soils is defi ned by analogy: N r -inputs are fertilizer application, atmospheric nitrogen deposition and biological nitrogen fi xation, while N r -outputs are nitrogen uptake by the plants and N r immobilization in the soil.
Th e input of N r to agricultural soils is dominated by the input of mineral fertilizer. Worldwide, the production of min-eral fertilizer is the most important source (about 65%) of the net increase of N r in the environment. While already for the glo-bal nitrogen cycle, human infl uence is larger than the natural dimensions of the nitrogen cycle (Galloway and Cowling, 2002 ).
In Europe the anthropogenic eff ect is even stronger. Application rates of mineral fertilizer and manure per hectare of utilized agricultural land is shown in Figure 15.7 (de Vries et al ., 2011 , Chapter 15 this volume). Th e pattern in the map in Figure 16.1 , which shows the input of nitrogen for total surface area, is dif-ferent from the maps presented in Chapter 15 as it gives an idea of the share of utilized agricultural area (UAA) across Europe. High shares of UAA up to more than 90% are found in inten-sive farming areas, such as the Po Valley in Italy, Central Spain, Western France and Romania (Leip et al ., 2008 ). For other regions, such as Finland, the Baltic countries or mountainous regions, low shares of agricultural land of generally below 10% yield low N input data even though the application rates per hectare of cultivated land can reach high values, as is the case in certain Finnish regions.Th e range of manure input is very large, and covers values from 7 kg N per hectare UAA in Romania, to over 230 kg N (ha UAA) −1 in the Netherlands. For some coun-tries, extensive rearing of ruminant animals predominates and
Figure 16.3 Soil system nitrogen surplus for forest soils (forests, scrublands, heather) in EU-27 for the year 2000. The map shows total reactive N surplus for a grid of 1 km × 1 km, the values are in kg N per total pixel area [kg N km −2 yr −1 total area]. The pie diagram at the right side gives the split of surplus [Gg N year −1 , rounded to 10 Gg N year −1 ] for EU27 into the loss pathways: emissions of NH 3 , NO x , N 2 O and N 2 and N leaching. The histogram shows the split of the N surplus [Gg N yr −1 ] into the loss pathways by country. Basis: INTEGRATOR, 2009. Method: Nitrogen surplus is estimated as the sum of gaseous nitrogen fl uxes and nitrogen leaching. Nitrogen leaching is calculated in INTEGRATOR from the diff erence of total N input, via N-deposition, biological nitrogen fi xation and manure input where relevant, and the previously estimated nitrogen losses, via uptake by plant growth, NH 3 losses, nitrifi cation/denitrifi cation gas losses, and net nitrogen immobilization. However, a minimum nitrogen leaching rate is postulated which is obtained from the water fl ux and a concentration of 0.02 mg N l −1 (Stoddard, 1994 ). A check is made if the minimum N-leaching rate is achieved; otherwise this is obtained following pre-defi ned rules as described by de Vries et al . ( 2009 ).

Adrian Leip
351
the input of organic nitrogen occurs mainly through deposition of manure by grazing animals, e.g. 86% for Ireland and Greece according to CAPRI model estimates while this is only 20% and less in countries such as Poland, Slovenia and Denmark.
Atmospheric deposition and biological nitrogen fi xation account together for only 12% of total N r -input to agricultural soils. Generally, biological N-fi xation decreases with increasing N r input due to increasing competitiveness of non-leguminous crops (Weigelt et al ., 2009 ). However, as CAPRI estimates bio-logical N-fi xation to be a constant fraction of above-ground crop N r uptake (75% for leguminous crops and 5% for grass), this eff ect is not considered and leads to a likely over- estimation of biological N-fi xation in intensive regions such as North France and the Netherlands in comparison to extensive grass-land areas such as in Poland and Romania.
Th e size of the N surplus in the agricultural sector ( Figure 16.2 ) is a measure of the sustainability of the agricultural production
process, since a surplus will eventually lead to shift ing the environmental problems to other places outside of the agri-cultural sector or abroad, including a possible time lag. Th e contribution of nitrogen leaching to the fate of total N-surplus varies from 26% to 73%. N-leaching is mainly a function of soil texture: heavy clay soils in Central and South Europe off er larger opportunities for denitrifi cation than soils with high organic carbon content and sandy soils, which are less resist-ant to nitrogen losses to the water. Consequently, losses of N 2 are negatively correlated to N-leaching. Fluxes of N 2 are very diffi cult to measure and therefore treated in most models as residual loss-pathway. In the IDEAg, N 2 fl ux estimates are based on results of the DNDC model, but constrained by estimates of NH 3 fl uxes calculated as in the MITERRA model (Velthof et al ., 2009 , see also Chapter 15 this volume) and estimates of N-leaching, N 2 O and NO x fl uxes from the same DNDC meta-model. Nevertheless, the ratio of N 2 /N 2 O has a range between
Figure 16.4 Atmospheric nitrogen deposition to in EU-27 for the year 2001. The map shows total reactive N deposition for a grid at 1 km × 1 km, the values are in kg N per total pixel area [kg N km −2 yr −1 total area]. The pie diagram at the right side gives the split of N deposition to the diff erent ecosystems [Gg N yr −1 , rounded to 10 Gg N yr −1 ] for EU27: coniferous forests, deciduous forests, cropland, seminatural land, and inland water surfaces as well as deposition to the coastal shelf and the deep ocean, which are not shown in the map. The histogram shows the split of N deposition [Gg N yr −1 ] by country. Basis: EMEP MSC-W model, rv3_3, 2009. Method: Atmospheric N-deposition is calculated with the European-scale EMEP MSC-W Chemical transport model (European Monitoring and Evaluation Programme, Meteorological Synthesizing Centre – West). The EMEP model was designed primarily for the calculation of acidifying substances, ozone and particles over Europe (Simpson et al ., 2003 , see also www.emep.int ; Simpson et al ., 2011 , Chapter 14 ). The chemical scheme uses about 140 reactions between 70 species (see Andersson-Sköld et al ., 1999 , and references therein), and makes use of the Equilibrium Simplifi ed Aerosol Module (EQSAM) of Metzger et al . ( 2002 ) to describe equilibria between the inorganic aerosol components. Routine N-deposition fi elds from the EMEP model are available at ww.emep.int. The model uses a sub-grid calculation procedure (so-called ‘mosaic’ approach) to calculate deposition separately to 19 diff erent land-cover categories, taking into account vegetation cover, phenology and surface-characteristics. Calculations of forest-specifi c deposition estimates, also exploring the role of forest soil-NO emissions from Kesik et al . ( 2005 ), were presented in Simpson et al . ( 2006 ).

Integrating nitrogen fl uxes at the European scale
352
5 and 30 (EU27-average 11.6) in-line with current understand-ing of the nitrogen cycle (Butterbach-Bahl et al ., 2011, Chapter 6 this volume; Seitzinger et al ., 2006 ). Fluxes of NH 3 contribute between 6% and 17% to the total soil N-surplus and depend on the type of manure or mineral fertilizer nitrogen applied, which is also country-specifi c. Countries with a high share of urea applied and/or a high livestock density have high losses of nitrogen to the atmosphere as NH 3 . Unlike agricultural soils, the most important nitrogen change for forest soils and soils under semi-natural land (see Figure 16.3 ) is N r accumulation in the soil (about 50% for forest soils and 30% for semi-natural land). Th e most important N r loss-pathways for forest soils are N 2 and nitrogen leaching. As the map shows the N-surplus calculated per square kilometre total area, it shows the spatial
variation of two important factors: the N surplus per hectare of forest area, which is mainly aff ected by the water balance and soil properties, and the forest area itself, which is particularly high in mountains and in Northern Europe. Th erefore, the spa-tial pattern of nitrogen surplus in forests mimics to a certain degree the topography of Europe, and is as such in contrast to agricultural N surplus.
NH 3 emissions are not a signifi cant loss pathway of N r from forest soils, as the input of mineral fertilizer and manure to for-est soils is negligible in many countries, but it accounts for one third of the N r losses from rough grazing land. NH 3 emissions include volatilization from urine, livestock manures (slurry and solid manure) and background emissions (see Simpson et al ., ( 1999 )).
Figure 16.5 Total NH 3 emissions in EU27 around the year 2000. The map shows the sum of NH 3 emissions from terrestrial ecosystems, industry and waste management for a grid of 1 km × 1 km, the values are in kg N per total pixel area [kg N km − 2 yr −1 total area]. The pie diagram at the right side gives the split of total NH3 emissions [Gg N yr −1 , values for agriculture are rounded to 10 Gg N yr −1 ] for EU27: agricultural soils including manure application, manure in housing systems and manure management systems excluding manure application, forest soils, emissions from waste, mainly composting of solid waste, energy, and the chemical industry. The histogram shows the split of NH 3 emissions [Gg N yr −1 ] by country. Basis: Agriculture: Indicator Database for European Agriculture V1, 2009; forest soils: INTEGRATOR, 2009; industrial processes and waste management: EDGAR-CIRCE (Van Aardenne et al ., 2009 ). Method: (i) Agriculture: emissions are estimated for manure and mineral fertilizer as described by Weiss (2010). Manure emissions are estimated for animal housing and manure management systems and following application on the basis of a mass-conserving approach. NH 3 loss factors are taken from the GAINS model for liquid and solid manure and the emission is reduced according to an assumed implementation level for NH 3 emission reduction measures using again default GAINS data (Klimont and Brink, 2004 ; Velthof et al ., 2009 ). Emissions from mineral fertilizer nitrogen are calculated separately for urea and non-urea fertilizers. (ii) Forest soils: emissions are calculated using a constant natural background fl ux (after Simpson et al ., 1999 ). (iii) Industrial processes: production data are from US geological survey statistics, UN industrial commodity statistics and data from SRI Consulting (2005). The emission factors are EMEP/EEA ( 2009 ). Emissions from industrial processes are allocated spatially based on point source maps for the most important source categories, and using population density for the remaining categories. (iv) Waste management: the amount of solid waste composted is estimated based on national reports to the UNFCCC (2008) and on data from European Compost Network (ECN, 2008 ). The emission factor is from EMEP/EEA ( 2009 ). Emissions from the waste sector are spatially distributed based on human population density.

Adrian Leip
353
Figure 16.6 Total NO x emissions in EU-27 around the year 2000. The map shows the sum of NOx emissions from agriculture (both agricultural soils and manure in housing and manure management systems), forest soils, industrial processes, combustion (stationary and mobile) sources, and waste management (incineration) for a grid at of 1 km × 1 km. The values are in kg N per total pixel area [kg N km −2 yr −1 total area]. The pie diagram on the right side gives the split of total NOx emissions [Gg N yr −1 , rounded to 10 Gg N yr −1 ] for EU27: agriculture, forests, combustion in industry and residential combustion, industrial emissions, road and other transport. The histogram shows the split of NO x emissions [Gg N yr −1 ] by country. The map shows also the emissions from international aviation (red) and navigation (blue) which are not included in the national totals. Values are less than 40 kg N km −2 yr −1 . Basis: Agriculture: Indicator Database for European Agriculture V1, 2009; forest soils: INTEGRATOR, 2009; industrial processes, combustion and fugitive emissions, and waste management: EDGAR-CIRCE (Van Aardenne et al. , 2009 ). Method: (i) Agriculture: emissions are calculated with the DNDC meta-model as described in Britz and Leip ( 2009 ). In the Indicator Database for European Agriculture, a correction of the NO x fl uxes is applied only if a closed N-budget cannot be obtained through adjustment of N 2 fl uxes (considered as the weakest term in the DNDC meta-model) and N-leaching within the bounds set. Then, the loss terms NO x , N 2 O, N 2 , and N-leaching are scaled to obtain a closed N-budget. (ii) Forest soils: based on results with the model PnET-N-DNDC for European forest (Kesik et al ., 2005 ) an NO x /N 2 O ratio of 1.25 is used. N2O emissions are estimated from a meta-model based on PnET-N-DNDC simulations (Kesik et al. , 2005). (iii) Industrial processes: production data are from statistics of the US geological survey, UN industrial commodity statistics and data from SRI Consulting (SRIC, 2005 ). The emission factors are from EMEP/EEA ( 2009 ). emissions from industrial processes are allocated spatially based on point source maps for the most important source categories, and using population density for the remaining categories. (iv) Combustion and fugitive emissions: fuel consumption data by sector and fuel type (stationary) or transport mode and fuel type (mobile) is obtained from International Energy Agency (IEA) statistics (IEA/OECD, 2007 ). Production of crude oil is estimated based on IEA statistics (IEA/OECD, 2007 ), and venting/fl aring is estimated based on data from the Carbon Dioxide Information Analysis Center (CDIAC, 2008 ), supplemented by reporting of the countries to the United Nations Framework Convention on Climate Change (UNFCCC). The emission factors are based on IPCC ( 2006 )), EMEP/EEA ( 2009 ) and Amann et al . ( 2007 ). The emissions from stationary combustion are spatially distributed using point source maps for power plants, steel production plants, and oil refi neries, and maps on urban and rural population density for the other sectors. (v) Combustion transport: emissions from transportation include road and rail transportation, domestic and international navigation, domestic and international aviation and other transportation. The fuel use by each transport mode and fuel type is from IEA statistics (IEA/OECD, 2007 ). The fuel use in international navigation is divided between sea and port activities of 15 ships types based on Dalsøren et al . ( 2009 ). Fuel consumption in aviation is divided between landing and take-off ; climbing and descent; cruise; and super-sonic based on gridded data from the AERO2K project (Eyers et al ., 2004 ). A detailed split of the fuel used in road transportation is used in the EDGAR database considering heavy and light duty vehicles, passenger cars, buses, mopeds, and motorcycles by applying country-specifi c fl eet distribution calculated based on registration, number of vehicles, and driven vehicle kilometres from International Road Federation (IRF, 2007 ). The impact of emission control measures is calculated based on European emissions standards (EURO 0 – EURO 4) and other regional standards, with data from CONCAWE ( 2001 ) and EMEP/EEA ( 2009 ). The emission factors are based on EMEP/EEA ( 2009 ), EIPPC BREF, IPCC ( 2006 ) and scientifi c literature. Emissions from aviation are spatially allocated based on AERO2K project, and presented separately for domestic and international aviation. Emissions from road transportation are spatially allocated using road density map, weighted with population in the case of passenger cars. Emissions from international navigation are spatially allocated using a ship traffi c density map of Wang et al . ( 2007 ). Other transport emissions are gridded using population density. (vi) Waste management: the amount of solid waste incinerated without energy recovery is estimated based on the reporting of the countries to the UNFCCC. The emission factors for solid waste are from EMEP/EEA ( 2009 ). Emissions from the waste sector are spatially distributed based on human population density.

Integrating nitrogen fl uxes at the European scale
354
Figure 16.7 Total N2O emissions in EU-27 around the year 2000. The map shows total N 2 O emissions from terrestrial ecosystems, industry, energy and waste for a grid of 1 km × 1 km. The values are in kg N per total pixel area [kg N km −2 total area]. The pie diagram at the right side gives the split of total N 2 O emissions [Gg N year −1 , rounded to 10 Gg N year −1 ] for EU-27: agricultural soils, manure management excluding manure spreading on soils, forest soils, energy (large scale and domestic), industry (mainly chemical industry), waste (wastewater treatment and other waste) and transport (road and non-road). The histogram shows the split of N 2 O emissions [Gg N yr −1 ] by country. Basis: Agriculture: Indicator Database for European Agriculture V1, 2009; forest soils: INTEGRATOR, 2009; industrial processes, combustion, and solid waste management: EDGARv4 (JRC/PBL, 2009 ); waste water systems: Indicator database for European Agriculture V1, 2009. Method: (i) Agriculture: emissions are calculated with the DNDC meta-model as described in Britz and Leip ( 2009 ). In the Indicator Database for European Agriculture, N 2 O fl uxes are corrected to obtain a closed N-budget only in case the correction of N 2 fl uxes (considered as the weakest term in the DNDC meta-model) and N-leaching alone is not possible within the bounds set. In this case, the loss terms NO x , N 2 O, N 2 , and N-leaching are scaled to obtain a closed N-budget. (ii) Forest soils: emissions are estimated from a meta-model based on simulation results for European forest soils with the model PnET-N-DNDC (Kesik et al. , 2005). (iii) Industrial processes: production data are from statistics of the US geological survey, UN industrial commodity statistics and data from SRI Consulting (SRIC, 2005 ). Abatement of N2O emissions from nitric acid and adipic acid emissions is included based on the reporting of countries to the UNFCCC. The emission factors are from IPCC ( 2006 ). Emissions from industrial processes are allocated spatially based on point source maps for the most important source categories, and using population density for the remaining categories. (iv) Combustion and fugitive emissions: fuel consumption data by sector and fuel type (stationary) or transport mode and fuel type (mobile) is obtained from International Energy Agency (IEA) statistics (IEA/OECD, 2007 ). The emission factors are based on IPCC ( 2006 ) and other sources. The emissions from stationary combustion are spatially distributed using point source maps for power plants. (v) Combustion transport: emissions from transportation include road and rail transportation, domestic and international navigation, domestic and international aviation and other transportation. The fuel use by each transport mode and fuel type is from IEA statistics (IEA/OECD, 2007 ). The fuel use in international navigation is divided between sea and port activities of 15 ships types based on Dalsøren et al . ( 2009 ). Fuel consumption in aviation is divided between landing and take-off ; climbing and descent; cruise; and super-sonic based on gridded data from the AERO2K project (Eyers et al ., 2004 ). A detailed split of the fuel used in road transportation is used in the EDGAR database considering heavy and light duty vehicles, passenger cars, buses, mopeds, and motorcycles by applying country-specifi c fl eet distribution calculated based on registration, number of vehicles, and driven vehicle kilometres from International Road Federation (IRF, 2007 ). The impact of emission control measures is calculated based on European emissions standards (EURO 0 – EURO 4) and other regional standards, with data from CONCAWE ( 2001 ) and EMEP/EEA ( 2009 ). The emission factors are based on IPCC ( 2006 ). Emissions from aviation are spatially allocated based on AERO2K project, and presented separately for domestic and international aviation. Emissions from road transportation are spatially allocated using road density map, weighted with population in the case of passenger cars. Emissions from international navigation are spatially allocated using a ship traffi c density map of Wang et al . ( 2007 ). Other transport emissions are gridded using population density. (vi) Solid waste management: the amount of solid waste composted and incinerated is estimated based on the reporting of the countries to the UNFCCC. Composting data are complemented with information from European Compost Network (ECN, 2008 ). The emission factors for solid waste are from IPCC ( 2006 ). Emissions from the waste sector are spatially distributed based on human population density. (vii) Waste-water systems: emissions from nitrogen in effl uents (0.005 kg N 2 O-N kg −1 N) as well as emissions from advanced sewage treatments systems (3.2 g N 2 O person −1 yr −1 ) are from IPCC ( 2006 ).

Adrian Leip
355
N 2 O emissions take a larger share of the total denitrifi ca-tion losses with generally narrow N 2 /N 2 O ratios around 3–4 in forest soils, but higher values for rough grazing. Th e forest type is very important in determining the rate and also the type of N r emissions, due to its impact on litter quality and soil pH. Pilegaard et al . ( 2006 ) carried out a detailed study of N r fl uxes in 15 forest sites throughout a year and across Europe and found that coniferous forest soils had much higher NO emissions than deciduous forest soils. On the other hand, N 2 O emissions were slightly higher in deciduous forests compared to coniferous ones.
Atmospheric transport and atmospheric deposition is dis-cussed in detail by Simpson et al . ( 2011 , Chapter 14 this vol-ume). In contrast to the fi gures presented there, we show here
absolute deposition fl uxes per area of grid cell ( Figure 16.4 ). For the contributions of N-deposition by ecosystem shown in the pie diagram and the histogram, the share of the vari-ous ecosystems at the grid scale is taken into account also. Even though cropland covers a smaller area in EU27 than for-ests, about 40% of deposition fl uxes on the continent go on cropland, more than on forest land, because European forests are predominantly located in areas with smaller atmospheric N r concentrations. Forests are the main receptor ecosystem for atmospheric N r deposition in Scandinavian countries (Finland 70% and Sweden 66%) and alpine regions as Austria (55%). Deposition over semi-natural land is important in Mediterranean countries (Greece 35%, Spain 30%), but also in countries where conditions are too wet for other land uses
Figure 16.8 Total reactive N input to the hydrosphere (rivers and groundwater) in EU-27 for the year 2002. The map shows total N r point sources from sewerage systems and diff use sources from agriculture and forest soils and atmospheric N r deposition to inland water surfaces for a grid at of 1 km × 1 km. The values are in kg N per total pixel area [kg N km −2 yr −1 total area]. The pie diagram at the right side gives the split of N input to the hydrosphere [Gg N year −1 , rounded to 10 Gg N year −1 ] for EU27: point sources (sewage systems) and diff use sources (agriculture leaching, run-off , and forest soils). The histogram shows the split of N r input to the hydrosphere [Gg N year –1] by country. Basis: Sewage systems and agriculture: Indicator Database for European Agriculture V1, 2009; forest soils: INTEGRATOR, 2009. Method: (i) Sewage systems: nitrogen in agricultural products is estimated with CAPRI, N from fi sh is obtained from Eurostat fi sh statistics and a mean N-content of 2.6%. Non-consumed proteins (waste) are assumed to be 30%. N retention in sewage systems is calculated from the percentage of people connected to sewage systems (for rural and urban population) with mechanic, biological or advance treatment and corresponding retention effi ciencies is obtained from Van Drecht et al . ( 2009 ). According to IPCC ( 2006 ), industrial wastewater is assumed to be 25% of domestic nitrogen (in advanced treatment systems). Spatial downscaling is done according to the population density. (ii) Agriculture: total nitrogen leaching and runoff of nitrogen from agricultural soils is estimated from the DNDC-CAPRI meta-model (2009) and integrated into the IDEAg according to Leip et al . ( 2009b ). In addition to the data presented in Figure 16.2 , the data presented here include run-off from livestock housing and manure management systems, which are estimated using the MITERRA approach (Britz and Witzke, 2008 ; Velthof et al ., 2009 ). Spatial distribution is in accordance with the livestock density per grid cell by animal group. (iii) Forest soils: nitrogen Nr leaching from forest soils is estimated as described in Figure 16.3 . (iv) Atmospheric deposition: Atmospheric N r -deposition is calculated with the European-scale EMEP MSC-W Chemical transport model (European Monitoring and Evaluation Programme, Meteorological Synthesizing Centre – West) as described in Figure 16.4 .
Integrating nitrogen fl uxes at the European scale
356
(UK 54%, Ireland 76%). Croplands are the main receptor for atmospheric N r deposition in Denmark (58%), Poland (52%) and Lithuania (51%). Th e map shows also deposition fl uxes over European shelf regions and deep ocean waters, which are of equal magnitude. Together they receive about 40% of the N r deposited over the continent. Th e size of the total deposition is largely controlled by agricultural emissions of NH 3 , which are transported over shorter distances than NO x and strongly infl uence local deposition rates. High depos-ition regions with deposition rates over 20 kg N ha −1 yr −1 are therefore associated with intensive livestock production, such as in the Netherlands and the Po Valley in Northern Italy. High deposition rates of >10 kg N ha −1 yr −1 are found almost throughout Central Europe.
16.3.2 Emissions of reactive nitrogen to the atmosphere and hydrosphere Emissions of reactive nitrogen to the atmosphere and the hydrosphere are caused by both agricultural and other land-use
activities as well as by fuel combustion and industrial processes. Detailed maps of the spatial distribution of total emissions of N r to these media are helpful for understanding the occurrence of hot-spots and could be the fi rst step in identifying appropriate and well-targeted mitigation measures. We show here the most important fl uxes of N r , i.e. total emissions of NH 3 ( Figure 16.5 ), total emissions of NO x ( Figure 16.6 ) and total emissions of N 2 O ( Figure 16.7 ) to the atmosphere, as well as total N r emissions to the hydrosphere ( Figure 16.8 ).
About 95% of NH 3 emissions originate from the agriculture sector. Th e contribution of agriculture is rather stable across the countries in EU27, with a highest contribution in countries such as Ireland, Spain or Hungary (98%). Th e importance of soil/fi eld emissions (from fi eld application of manures, graz-ing and fertilizers) versus emissions from manure management systems (animal housing and manure storage) varies between 40% of emissions from soils in Denmark and 67% of emis-sions from soils estimated for Ireland. Th e reason is, of course, the importance as well as the structure of the livestock sector (grazing versus housing of the animals). As manure has higher
Figure 16.9 Total land productivity of agricultural land in EU-27 for the year 2002. The map shows total agricultural land productivity for a grid of 1 km × 1 km. The values are in kg N per total pixel area [kg N km −2 total area]. The pie diagram at the right side gives the split of N productivity [Gg N yr −1 , rounded to 10 Gg N year −1 ] for EU27: crop products, fodder (fodder maize fodder beet and other fodder on arable land), grass and other (fl owers, nurseries, etc.). The histogram shows the split of N productivity [Gg N yr −1 ] by country. Basis: Indicator Database for European Agriculture V1, 2009. Method: Land productivity is based on CAPRI regional statistics on agricultural and grassland yield with crop-specifi c nitrogen contents. The data include crop residues that are returned to the soil. As statistics on grassland yields are scarce, these are estimated within CAPRI on the basis of the energy requirement of livestock and energy supply from other feed available (concentrates, fodder). Spatial allocation is done on the basis of simulation results for crop-potential yields (Genovese et al., 2007 ) under given climatic and soil conditions.

Adrian Leip
357
volatilization fractions for NH 3 than mineral fertilizer, we fi nd hotspots of NH 3 fl uxes where the livestock density is high, both in intensive production systems with housed animals such as in the Po Valley, Italy, Denmark, and the Netherlands, as well as in regions with a predominance of grazing animals such as in Ireland. Intensive animal production systems have mainly developed in the vicinity of large metropolitan areas, as the ban-lieue of the Paris area, but also west of Berlin. Th e metropoli-tan areas themselves however, are usually low emitters of NH 3 . Hotspots of NH 3 fl uxes are found in the major European plains such as the Po Valley, North Germany, the Netherlands and Bretagne, but also in hilly regions such as the Alps in Southern Germany or also, for example, the north of Andalucia.
NO x emissions arise mainly from industrial and energy-sources accounting for 96% of emissions. Only 4% of NO x emissions are formed biogenically, with 3% from agriculture and 1% from forests, according to the estimates presented here. Butterbach-Bahl et al . ( 2008 ) give a range of 48.8–128.9 Gg N yr −1 for NO x emissions from agricultural soils depending on the methodology used, which matches well with the presented number of 76 Gg N yr −1 from agricultural soils (including
emissions from pasture), to which about 32 Gg N yr −1 emis-sions of NO x from manure management systems are added. For forest soils, Butterbach-Bahl et al . use the process-based model Forest-DNDC as the only approach and give a number of 75 Gg N yr −1 , which is about twice as large as the 32 Gg N yr −1 in our estimate from the INTEGRATOR model. Th e num-bers do not include NO x emissions from forest fi res and burn-ing of agricultural residues, which are available in the Global Fire Emissions Database (GFED) (van der Werft et al ., 2010 ). According to these data, about 11 Gg of NO x -N are released to the atmosphere by burning of woodland and forests (about 75%) and agricultural waste (25%).
Th e bulk of NO x emissions originate from combustion processes – about equal amounts of NO x -N are emitted from stationary combustion (industry and residential combustion) and mobile combustion (mainly road transport) with 42% of total emissions or about 1.5 Tg N yr −1 each. It is important to note that emissions from aviation and navigation are divided between domestic and international transport. While the emis-sions from international navigation/aviation are included in the spatially allocated emissions, they do not appear in national
Figure 16.10 Total human N consumption of reactive nitrogen in EU-27 for the year 2002. The map shows human nitrogen consumption of agricultural products including food waste for a grid at of 1 km × 1 km. The values are in kg N per total pixel area [kg N km −2 total area]. The pie diagram at the right side gives the split of human N consumption [Gg N yr −1 , rounded to 10 Gg N year −1 ] for EU-27: crop products, animal products, fi sh products (incl. shellfi sh), and the N in non-edible products (peelings, bones) and food waste. The histogram shows the split of human N consumption [Gg N yr −1 ] by country. Basis: Indicator Database for European Agriculture V1, 2009. Method: Consumption is based on CAPRI regional statistics. Spatial allocation is done on the basis of livestock density.

Integrating nitrogen fl uxes at the European scale
358
totals. Military emissions, which are estimated to be small, are not included. Additional details on the transport sector are given in Section 16.4 .
Th e highest share of industry-combustion to total NO x emis-sions is observed in Central-Eastern European countries such as Romania (43%), Poland (47%), or the Czech Republic (48%). In Poland, residential combustion is also considerable (21% of total NO x emissions). Th e importance of residential NO x emissions depends on the fuel mix and the energy effi ciency; the share of residential emissions to total NO x emissions in Italy and France are relatively high with 15% and 20%, respectively, and low in Finland and Estonia (both 7%). Accordingly, the map of total NO x emissions shows high values in centres of energy-intensive industry, such as Sachsen-Anhalt in Germany, North Italy, the Netherlands, or along intensive traffi c lines. In many cases, both have been developed along major river streams as can be observed for the Rhine where we fi nd large industry complexes but also an important traffi c axis.
Th e main sources of N 2 O are biogenic sources including agri-cultural soils, manure management, as well as forest soils and
the waste sector, accounting together for 74% of all N 2 O fl uxes in EU27. Processes leading to N 2 O formation in soils, as well as the upscaling of N 2 O fl uxes from these sources for both agricul-tural and non-agricultural terrestrial sources, are discussed in Chapters 6 and 15 (Butterbach-Bahl et al ., 2011 , this volume; De Vries et al ., 2011 , this volume). Agricultural soils are the main source contributing 73% of biogenic N 2 O sources with manure management systems, forests and the waste sector contributions at 7%, 8% and 2%, respectively. Th e contribution of the waste sector to biogenic N 2 O emissions ranges from 1%, for example in Finland, the Netherlands and Poland, to 16% in Denmark. Agricultural soils contribute to almost 90% of biogenic N 2 O emissions in Hungary, Greece and Finland, while the smallest contribution of soils being estimated for Estonia (45%).
Th e most important non-biogenic sources of N 2 O are indus-trial processes, which are not caused by fuel combustion, but by the industrial processes themselves. Th e chemical industry is an important source of N 2 O emissions accounting for 20% of EU27 N 2 O emissions. Globally, nitric acid production is the most important N 2 O source within the chemical industry,
Figure 16.11 Total livestock N consumption of reactive nitrogen in EU-27 for the year 2002. The map shows human nitrogen consumption of agricultural products including food waste for a grid at of 1 km × 1 km. The values are in kg N per total pixel area [kg N km −2 total area]. The pie diagram at the right side gives the split of livestock N consumption [Gg N yr −1 , rounded to 10 Gg N year −1 ] for EU-27: grass (cutting and grazing), fodder (fodder maize, fodder beet and other fodder on arable land), crops (cereals and other non-fodder crops, mainly leguminous crops and oilseeds), concentrates (energy-rich and protein-rich concentrates, oilseed cakes, milk powder, molasse, etc.) and other (straw, animal products). The histogram shows the split of livestock N consumption [Gg N yr −1 ] by country. Basis: Indicator Database for European Agriculture V1, 2009. Method: Consumption is based on CAPRI regional statistics and Eurostat national statistics for fi sh products with crop-specifi c nitrogen contents. Spatial allocation is done on the basis of population or livestock density for the consumption of food or feed, respectively.

Adrian Leip
359
followed by adipic acid, caprolactam and glyoxal production. As industrial plants are point sources with an uneven distribu-tion, the signifi cance of industry ranges from 0% of national N 2 O emissions in Poland, Portugal and the UK to more than 60% in Denmark. Additionally, N 2 O is used in anaesthesia and in aerosol spray cans.
Th e spatial structure of N 2 O emissions is thus a combination of the one observed for NH 3 (mainly livestock) and NO x (mainly energy and transport). Th us, we fi nd those areas which were already identifi ed for both other gases such as the Po Valley, the Netherlands, and Sachsen-Anhalt, but also identify high fl uxes from rural agricultural areas such as Hungary or Poland.
Th e map of N 2 O fl uxes is further complicated by its large dependency on environmental conditions. Th e soil type is a particularly important factor, which tends to increase fl uxes in Northern Europe, where soils with a high content of organic carbon prevail, and leads to lower fl uxes in Southern Europe with soils of lower organic carbon content, but this trend is overlaid with the infl uence of soil moisture and temperature (see Leip et al ., 2010b ).
Th e input of reactive nitrogen to European aquatic systems is dominated by point sources through sewage systems, includ-ing industrial fl uxes and diff use sources from agriculture. Th us, the N r load to rivers is highly correlated with population density as can be seen from Figure 13.10 in Billen et al . ( 2011 , Chapter 13 this volume). Th is is superimposed on the pattern of agricultural nitrogen leaching, which is similar to the spatial pattern of agricultural nitrogen surplus shown in Figure 16.2 . Runoff in agricultural systems from stables or manure manage-ment systems and leaching from forest soils are estimated to be of minor importance.
Data on the distribution of sewage systems are available for most European countries from EUROSTAT, EEA (1998), Wieland ( 2003 ) and Jeppsson et al . ( 2002 ). Th e overall values for these removal fractions for a country are calculated as the weighted average of the four classes as compiled for the IMAGE model by Van Drecht et al . ( 2009 ). In the IMAGE model it is assumed that N r emitted by people not connected to sewerage systems will be retained and does not enter the hydrosphere. In rural areas of Europe, however, the majority of human wastes will be discharged to unmonitored small sewage plants, or to septic tank/soakaway facilities. In the UK, for example, these are the dominant point sources in most rural catchments, in comparison to the major sewage treatment plants in larger towns or cities. We assumed that the N r from such unmoni-tored small sewage plants or septic tanks/soakaways undergoes a ‘biological-treatment’ like transport to the river/groundwater system.
A detailed study on the nitrogen removal effi ciency of sew-age treatment systems in the UK (Johnes, 1996 ) takes in to account the fact that although the process is optimized in larger sewage treatment plants in urban areas, in many of the older treatment systems, in rural areas and in most of the coastal towns and villages, volumes treated have exceeded initial design capacity through local population growth or migration. As a consequence, only mechanical treatment is available for part of the N r , with little biological treatment of wastes, particularly
during cold, wet periods. Th e same is true for peak seasons, for example in tourist regions (e.g. alpine ski resorts in the winter; beach and lake vacation regions in the summer and spring), when the N r input to sewage systems exceeds their capacity.
16.3.3 Secondary nitrogen indicators In this section we present secondary reactive nitrogen indica-tors that answer two important questions: what is the amount of proteins (nitrogen) that European crop- and grasslands can currently produce and what is the amount of proteins (nitro-gen) that European inhabitants (humans and livestock) con-sume? Th e fi rst map shows total land productivity ( Figure 16.9 ), defi ned as the sum of harvested crops, and grazed bio-mass according to the soil system budget. Included in the total productivity are crop residues that are or are not used for other purposes (as animal feed or bedding material, biofuels or burned), which is in contrast to the defi nition of nitrogen autotrophy (see Billen et al ., 2011 , Chapter 13 this volume), which gives its production of food and feed only (harvested and grazed products; Billen et al ., 2007 , 2008 ).
Th e second and third map show human consumption of nitrogen ( Figure 16.10 ) and the consumption of nitrogen by livestock ( Figure 16.11 ). Both are split by the main protein-sources, i.e. crops, livestock products and fi shery products for human consumption and grass, crops/fodder and concentrates for livestock consumption. Th e sum of both maps gives the nitrogen heterotrophy in Europe.
A large part of rural Europe is characterized by a high degree of regional specialization of agricultural activities. In most traditional agrarian systems in Europe, livestock farm-ing used to be a critical component, providing a way to ensure cropland fertility by bringing to it, N r extracted from semi-natural N 2 fi xing areas in the form of manure. During the past half century, in parallel with increasing urbanization, many lowland rural areas of Europe have shift ed either towards exclusive crop production, with very little cattle breeding, or to intensive livestock farming, supported to a large extent by feed importation. Mixed farming areas are restricted to highland or mountainous regions. As a result of this specialization, the exchange of food and feed over long distances has considerably increased and now oft en represents quite a signifi cant share in the nitrogen budget of regions, or even of countries.
Still, the total productivity of agricultural land is particularly high in the hinterland of large metropolitan areas (e.g. Paris, Berlin, London) and in areas of intensive animal production (the Netherlands, Belgium, Po Valley, Italy, many areas of England and Ireland). About 45% of the productivity yields crop prod-ucts, while the other 50% of nitrogen are distributed over dedi-cated fodder production (20%, fodder maize and fodder beet) and grassland (25%). Th e signifi cance of grass varies largely between 5% in Denmark and 60% in Ireland while the import-ance of feed production varies between 10% (Bulgaria, Greece) to over 40% (Sweden, Estonia).
Human consumption obviously peaks in metropolitan areas like Paris, London and Berlin which are clearly visible in the map and consume more than 15 Mg N yr −1 per square kilometre. Outside

Integrating nitrogen fl uxes at the European scale
360
these hotspots, human N r -consumption is generally between 200 and 2000 kg N yr −1 km −2 . Th ere is about 36% consumption of crop products and 33% consumption of animal products, with a small fraction (3%) of fi sh products consumed. Th e last third is estimated to be either non-edible or wasted. In many central-western coun-tries intake from animal proteins dominales while in countries like Greece, Romania and Bulgaria about 70% of protein intake is from vegetable sources.
Livestock N r -consumption follows the livestock density and thus the same regions with high/low rates can be iden-tifi ed that were already visible particularly in the NH 3 map ( Figure 16.5 ). Th e consumption of crop products by livestock is more than double the consumption of crop products by the human population, a value that increases to 3.8 and 9.3 in Ireland and Denmark. About the same amount of concentrates is being fed to animals as crop products, and about 40% of ani-mal feed is stemming from grass and fodder. However, we fi nd large diff erences in animal nutrition across the countries with some countries feeding almost 50% with concentrates, as in the Netherlands, Portugal and Denmark, while this share is only 12%–13% in Latvia, Romania countries and the Czech Republic. Th e share of grass is naturally high in mountainous countries like Austria, but also in lowland countries such as Ireland and the UK. In all cases, grass contributes to more than 40% of the protein requirements of animals.
Urban areas, where food is consumed but not produced, are obviously heterotrophic. Rural regions specialized into crop production are autotrophic and export nitrogen as food and/or feed, while those characterized by intensive animal farm-ing sustained by imported feed are usually heterotrophic as in those regions the import of feed is usually not balanced by exported food products.
16.4 Integrated nitrogen budgets Integrated nitrogen budgets are defi ned here as the quantifi -cation of all major nitrogen fl uxes across sectors and media within given boundaries, and fl uxes across these boundaries, on an annual basis. Th ey provide a valuable tool for optimiz-ing the benefi ts of policies addressing imbalances evident in the nitrogen cascade. Th ese policies have oft en been designed to achieve a specifi c goal, neglecting unwanted side eff ects such as pollution swapping. Integrated nitrogen budgets per se do not directly give a quantifi cation of the risk of such pollu-tion swapping eff ects, as these are determined by mechanistic eff ects and require an understanding of the dynamics of the nitrogen fl uxes. However, in many instances, integrated nitro-gen budgets can give a good indication of where N r pollution is most severe and where swapping problems from one medium to another might occur.
Here, a standardized integrated Nitrogen Budget (iNB) approach has been implemented to derive a suite of national integrated nitrogen budgets (NiNB) as well as the European Nitrogen Budget (ENB). Each of the NiNBs has been compiled by national experts from each country, using data available at national scale. For each iNB, fi ve sectors are diff erenti-ated: industry and energy, transport, agriculture, forestry and
natural terrestrial ecosystems, and waste. Each sector has a pool of N r and is connected to the others by three transport media: the atmosphere, the hydrosphere, and the consumers who transport, for example, agricultural products to the waste management systems. Pools of N r are hard to quantify and are oft en not incorporated; however stock changes are important indicators to detect possible accumulation or depletion of N r and their implications for soil productivity, biodiversity or the development of human health problems.
Conceptually, the ENB contains the same kind of informa-tion as NiNBs and they can thus be discussed together. From a methodological point of view, however, the ENB is largely model-based (see Section 16.4.2 ) as robust and consistent esti-mates for many elements of a NiNB at the European level are not currently available.
16.4.1 National integrated nitrogen budgets National integrated nitrogen budgets (NiNB) help in visualiz-ing the main elements of the N cascade within a country into a fi gure that might transmit its main messages at a quick glance, but nevertheless contains suffi cient detailed information for further analysis. Th erefore, a NiNB is regarded as a very effi -cient policy instrument and an important tool to help prioritize policies. In particular, NiNBs can serve fi ve objectives: (i) they are an effi cient instrument for visualizing the N cascade and its potential impact and thus help to raise awareness; (ii) NiNBs provide policy makers with information for developing effi -cient emission reduction measure; (iii) more importantly, they can provide a tool for monitoring the impact and environmen-tal integrity of implemented policies; (iv) NiNBs are useful for comparisons across countries; and (v) they can help pinpoint knowledge gaps and thus contribute to improving our scientifi c understanding of the N cascade.
Oft en, NiNBs have to rely on information of diff erent origin and quality, and therefore it may not be possible to ‘close’ the budget for one or several sectors. N fl uxes presented in NiNBs are ideally based on a suffi ciently dense network of observa-tional data or on detailed models calibrated and validated on national conditions; however, oft en data gaps have to be fi lled from simpler models of a broader scope such as the models used for the European Nitrogen Budget.
To build a NiNB is thus a challenging task and many ele-ments of a budget will only be quantifi able within a very high uncertainty range, for example the amount of nitrogen denitrifi ed and released as the stable and harmless N 2 gas; or sedimented and stored for potential future release in the oceans. Th e magnitude of the uncertainty itself is usually unquantifi ed.
Despite these diffi culties, NiNBs have been developed for some countries or are in the process of being developed.
• Switzerland formulated environmental targets for agriculture in 1996 based on the observation that additional eff orts were required to minimize pollution of soil, air and water and to maintain biodiversity. Measures in the agriculture sector were found to be particularly cost-effi cient. Th e recommendations built on the Swiss N-budget that had been

Adrian Leip
361
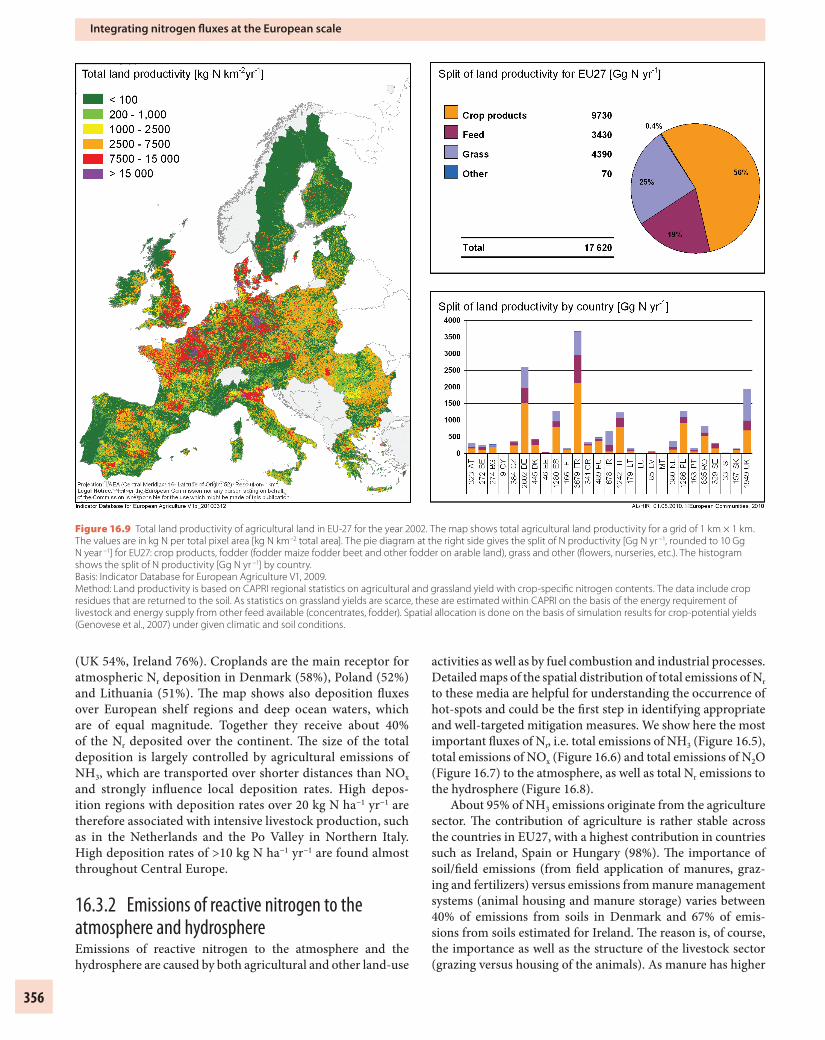
developed for the year 1994. Th e Swiss N-budget was updated for the year 2005 and published by the Federal Offi ce for the Environment (BAFU, 2010). • Th e Netherlands is a country facing signifi cant N r pollution problems, such as particularly high nitrate concentrations in the groundwater, as well as a decrease in biodiversity and forest vitality, high atmospheric NO x and NH 3 concentrations leading to human health eff ects, and algal blooms in the North Sea (Erisman et al ., 2005 ). Th e Dutch nitrogen budget was estimated by Erisman et al . ( 2005 ) on the basis of an analysis by van Grinsven et al . ( 2003 ) and also proposed a list of measures to address the N r pollution problems in the Netherlands. In • Germany the Federal Environment Agency (UBA) released a draft national nitrogen budget as background information to the Integrated Strategy for the Reduction of Nitrogen Emissions in April 2009 (Umweltbundesamt, 2009a,b), motivated by the fact that despite major eff orts most environmental targets (halting loss of biodiversity, national emission ceilings for NO x and NH 3 , concentration of nitrate in drinking water, mitigation of global climate change) appeared unlikely to be met and that only an integrated approach would support the development of cost-effi cient and eff ective solutions. Whereas the strategy contains a set of measures, the budget contains very detailed information on all quantifi able nitrogen fl uxes across sectors and interfaces between environmental media above 1 Gg N yr −1 . In France, the construction of the nitrogen budget has • been initiated with the aim of developing an overarching vision of the nitrogen cascade between industrial sectors and environmental compartments through cooperation between various French research institutes and agencies. Th e development of the N-budget is ongoing and results are preliminary. Th e • United Kingdom has built a national N-budget using the iNB approach, based on a detailed N-budget for agriculture following the OECD approach (DEFRA, 2008 ), national scale N fl ux modelling to freshwater and coastal systems and to and from the atmospheric N pool, and published data on non-agricultural sectoral fl uxes. Further work is warranted to refi ne and update the initial budget presented here. Th e • Czech Republic has launched a project to estimate all N-fl uxes following the German example. To that purpose, the Czech Hydrometeorological Institute (CHMI) is cooper-ating with the Ministry of Agriculture and with the Central Institute for Supervising and Testing in Agriculture. CHMI is providing a range of emission and deposition data. Other institutions calculate N fl uxes with regard to, for example, feed, manure, agricultural products, waste and leaching. Cooperation with the Institute of Geology and other insti-tutes is planned.
Other countries, like Turkey have recently started develop-ing a national N-budget.
Figures 16.12 – 16.17 show the national integrated nitrogen budgets for countries in Europe available to date. Each NiNB is constructed from nationally available information and thus the budgets are not directly comparable. For example, river export has not been estimated in Germany, while it constitutes a sig-nifi cant fl ux in the Netherlands and Switzerland. Additional details on the data sources of the NiNBs and the outcomes of the respective projects are given in the supplementary informa-tion (see supplementary material Chapter 16, Section A).
As the NiNBs are not constructed with a harmonized or even comparable methodology, a comparison of single fl ux estimates must be done with care. Nevertheless, they highlight the general diff erences across the countries, as can be seen by ranking emissions by sector and dominant N r form of emis-sions. Such an assessment is shown in Figures 16.18 – 16.20 . For example, nitrogen fl uxes in the Netherlands are dominated by industrial N r fi xation. Th e export of N r , mainly as fertilizer, is by far the largest N-fl ux and feed-imports are higher than the input of mineral fertilizer. By contrast, in Switzerland the com-bined estimate of atmospheric N r deposition plus biological N fi xation to agriculture is higher than the input of mineral fertilizer and feed imports. Both countries have an important exchange of N r with other countries or the sea through river fl ow. In the Netherlands, the N r transit through the coun-try as import and export are roughly the same. However, in Switzerland, river export is the single most important sink for the country exporting more N r than is applied to agricultural soils as mineral fertilizer.
A summary of the national N-budgets presented above by main compartment or sector ( Table 16.2 ) shows that balance is not closed for most sectors. Th ese N-budgets give aggregated data for countries, without a spatial dimension such as was shown in the key maps above. Not all nitrogen fl uxes have been (or could be) estimated yet, and, secondly, the data for diff er-ent compartments and sectors have been taken from the best available, but to some extent inconsistent, data sets. Examples include atmospheric deposition (which in many countries has been obtained from the EMEP model) and atmospheric emis-sions, which can have data sources which are partly inconsist-ent with the information used in the EMEP model. Th e main gap between the sum of N r emissions to and removals from the atmosphere is due to fl uxes of molecular nitrogen (N 2 ) through N fi xation and denitrifi cation, which are diffi cult to estimate and have not been quantifi ed for many countries/compart-ments. Th erefore a negative balance is observed for most coun-tries. Th e agriculture sector, which is in many countries one of the best-described sectors as gross nitrogen balance calcula-tions have been made with the OECD methodology (OECD/Eurostat, 2003 ), ideally gives a closed soil N-budget, yet the link to consumers and/or the industry has oft en been obtained from diff erent sources. Un-quantifi ed stock changes in agricul-tural soils can potentially account for part of the positive (accu-mulation) or negative (depletion) balance in agriculture. Th e French NiNB does not yet include fl uxes from agriculture to the consumer or to the hydrosphere and the data show there-fore a considerable gap.

Integrating nitrogen fl uxes at the European scale
362
One of the largest fl uxes is the generation of N r in the indus-try and energy sector. Th is N r has three important sources: (a) nitrogen fi xation with the Haber–Bosch process, (b) release of nitrogen from fossil energy carriers such as coal, and (c) thermal generation of N r at high temperatures during the burning process. For the NiNBs presented, total industrial/energy N-fi xation has been estimated as the diff erence between total estimated N-outputs and inputs in these sectors, to give an indication of the order of magnitude of this N-fl ux.
A positive N-balance is found for the consumers. While food input and N-output to sewage systems is quantifi ed in most cases, the underlying assumptions may diff er. Not all biomass produced is edible; not all edible parts will be consumed; and assumptions on the fate of the produced biomass are associated with considerable uncertainty (see discussion on the European Nitrogen Budget). Th e waste-streams are oft en poorly quanti-fi ed in the NiNBs presented. Th e consumer has a central role in national N-budgets: with excess-supply in most European countries the incentives for ‘nitrogen-effi cient’ behaviour are not currently well developed to aff ect consumers’ behav-iour. Th e choices of consumers nonetheless steer the societal machinery with major consequences for the nitrogen budget.
In addition to input of nitrogen as biomass, the con-sumer receives also signifi cant amount of industrial nitro-gen, as plastics, pigments or other chemical products. Th e
fate of these products is not yet quantifi ed and appears as a (positive) balance as these substances accumulate in the anthroposphere.
An overview of emissions to the atmosphere is given in Figure 16.18 . Generally, agriculture is the main emitter of N r to the atmosphere and to the hydrosphere ( Figure 16.19 ), but taking all combustion sources together (incl. industry), atmos-pheric emissions from combustion are roughly at the same level as agricultural emissions, with the exception of the United Kingdom. Th e United Kingdom is the country where indus-trial and energy emissions play the biggest role: emissions to the atmosphere from combustion sources are almost twice as large as the emissions from agricultural sources. Nevertheless, as extensive agricultural activities involves high mineral fertil-izer input (more than 1 Tg N yr −1 ), many livestock and high precipitation, this country estimates the highest leaching rate to waters (almost 0.5 Tg N yr −1 ).
Emissions to the hydrosphere have not been estimated yet in the French N-budget, however, this country is characterized by extensive agricultural activity refl ected both in the input of mineral fertilizer nitrogen (2.5 Tg N yr −1 ) and high atmos-pheric emissions (> 0.7 Tg N yr −1 ). Th e high land productiv-ity throughout almost the whole territory of France (see also Figure 16.9 ) makes the country independent of feed-imports (only 7% of mineral fertilizer-input or 175 Gg N yr −1 ).
Figure 16.12 A national integrated nitrogen budget for Switzerland, derived from a study that was carried out between 1994 and 1996 based on a mandate of the Departments of Economic Aff airs and Home Aff airs of the Swiss government. The project aimed at identifying the most important N fl uxes between the all compartments, at assessing the fl uxes with respect to the exceedance of eff ects-based environmental and health quality criteria, and at elaborating a strategy for a stepwise reduction of emissions of reactive nitrogen. The results of the work of the project group are summarized in the report. “Strategy for the Reduction of Nitrogen Emissions” (BUWAL, 1996 ).

Adrian Leip
363
Figure 16.14 The national nitrogen budget for Germany has been calculated by the Federal Environment Agency (Umweltbundesamt, 2009). The data is compiled of offi cial, national emission, deposition and fl ux data sets for the years 2000–2004. The most important fl uxes are emissions to atmosphere, deposition, input into hydrosphere and following export to coastal ecosystems.
Figure 16.13 The Dutch national nitrogen budget is based on information from diff erent publications, mainly originating from the National Bureau of Statistics. The data shown represent the average situation of 1995, 1997, 1998 and 1999 (van Grinsven et al., 2003 ).

Integrating nitrogen fl uxes at the European scale
364
Th e split of atmospheric emissions over the three reactive nitrogen gases NO x , NH 3 , and N 2 O refl ects again the weight of the energy versus the agriculture sectors of the considered countries (see Figure 16.20 ).
16.4.2 The European Nitrogen Budget (ENB) Galloway et al. ( 2008 ) formulated fi ve vexing questions that should guide the direction of nitrogen research in the near future. Th e fi rst of them relates to the ultimate fate of reactive nitrogen, and particularly the role of denitrifi cation in soils and freshwater systems that are not well constrained. Based on the information presented above and in previous chap-ters, the development of an integrated N-budget for Europe is attempted. Th is European Nitrogen Budget. It covers the ter-ritory of the EU27 countries, with the exception of Malta and Cyprus (limited by the availability of data from the Indicator Database for European Agriculture).
Th e European Nitrogen Budget, in contrast to most national N-budgets, is almost completely model-based, combining a model for agriculture, forestry, industrial emissions and atmospheric deposition into a common framework as given in Table 16.1 . Th e restriction to a few models reduces the number of confl icting data as each of the models ensures consistency in the data sets used and N r fl uxes estimated. Inconsistencies at the interfaces between the models can not be excluded, though
they are usually small as the models deal with complementary sectors. For example, the nitrogen deposition fl uxes to agricul-tural and (semi-) natural soils obtained from the latest simu-lations of the EMEP model for the year 2000 diff er from the fi gure used in the IDEAg and INTEGRATOR models, based on slightly older versions. Th is points towards the need for a better fi ne-tuning and integration of the models, even though the diff erences are not large. Surprisingly, the atmospheric compartment shows a good match of total N r emissions with total N r deposition plus net export of nitrogen, even though the emission data are obtained from the above-mentioned mod-els and the EDGAR-CIRCE database for industrial and energy sources, which are to some extent independent of the emission data used for the EMEP model. We are not aware of a Europe-wide model estimating N r fl uxes for surface waters and coastal areas and here the ENB had to be complemented by individual fl ux estimates taken from literature. In this chapter, we focus on nitrogen fl uxes in the present time (year 2000). Nevertheless, a European nitrogen budget for the year 1900 has been devel-oped too and is presented in the supplementary information (see supplementary material Chapter 16, Section B).
When looking at the ENB, one has to keep in mind that the numbers presented are associated with large uncertainties which are diffi cult to quantify. Th e extent to which errors or biases in input data, model assumptions and model parameterizations propagate to the aggregated model output is hard to assess. In
Figure 16.15 National nitrogen budget for France calculated with data gathered between 2003 and 2007 (Personal Communication Groupe de travail français sur l’azote réactif, or French working group on reactive nitrogen). The construction of the French national N-budget is an ongoing process, and the fi gures are therefore preliminary results which are bound to be modifi ed.
Adrian Leip
365
the absence of suffi cient observational data that allow the con-struction of independent estimates, two routes are possible: (i) the comparison of model results driven by the same set of input data (see de Vries et al ., 2011 , Chapter 15 this volume) and (ii) a systematic assessment of the uncertainty of input data and model structural parameters and their impact on the model out-come at the large scale with Monte Carlo analysis. Both routes are currently followed in the NitroEurope Integrated Project and the results will shed some light on the reliability of estimated N r fl uxes. Additionally, for some N r fl uxes, it is indeed possible to use data from atmospheric concentration measurements to quantify the strength of total N r emissions for some components (e.g. N 2 O) using inversion tools which are independent of the models used in the construction of the ENB; also this route is followed in the NitroEurope project (Sutton et al ., 2007 ).
Figure 16.22 gives the nitrogen budget for the main sec-tors and compartments considered in the ENB. Th e atmos-pheric compartment comprises only fl uxes of NH 3 and NO x as input and wet- and dry deposition as output. Th e large fl uxes of molecular nitrogen, in particular N-fi xation in the industry and energy sectors and denitrifi cation in terrestrial and aquatic ecosystems are poorly quantifi ed and would add another 20–30 Tg N yr −1 in input and output. Nitrogen fi xation occurs through biological N-fi xation and through the Haber–Bosch process, but there is also input of N r from fossil energy car-riers and newly formed N r through thermal reaction. Th ese
fl uxes are included in the number presented for N-fi xation in the energy and industry sector, but are not quantifi ed for the other sectors.
Consumers and the waste sector store an unquantifi ed amount of N r in products, but most of the consumed N r will accumulate in the wider environment, be land-fi lled or inciner-ated. Indeed, according to the numbers presented, more than 50% of the N r made available to consumers appears to have a purpose other than nutrition. While some information on the fate of this N r might be available, so far we were not able inte-grate robust data into the European Nitrogen Budget.
At the European scale, budgets of industry and energy exceed those of agriculture. Agricultural soils can act as a source or a sink for carbon and nitrogen if organic matter is being depleted or accumulated. Our data suggest that a sig-nifi cant part of the nitrogen lost from the agriculture sector originates from mineralization of soil organic matter. A large exchange of nitrogen takes place in coastal areas, which act as a sink of oceanic nitrogen that is denitrifi ed to N 2 and N 2 O in the shelf regions of Europe. As a consequence, the fl ux of the N 2 from these regions might be the largest single nitrogen fl ux in absolute terms and also the estimate for the N 2 O fl ux from the shelf regions is very high and exceeds, in absolute terms, fl uxes from other sectors including agriculture.
Th e split of atmospheric emissions in EU27 countries by sectors for three reactive gases (NO x , NH 3 , N 2 O) and the total is
Figure 16.16 The integrated nitrogen budget of the United Kingdom builds on the UK TAPAS modelling for agriculture (DEFRA), providing data on mineral fertilizer application rates and manure management and on the national food and feed balance modelling (DEFRA, 2008 ), national N fl ux modelling to freshwaters and the coastal zone (Johnes and Butterfi eld, 2002 ), the UK national emissions inventory and atmospheric transport and deposition modelling and a range of literature sources for UK waters. The data sets are not, however, co-incident in time, and the present budget represents the period from 1995–2005. Work is currently underway to update the budget.

Integrating nitrogen fl uxes at the European scale
366
shown in Figure 16.23 . Th e fi gure shows that NO x fl uxes dom-inate the emissions from energy-related sources, NH 3 fl uxes are the strongest for agricultural sources; the waste sector and aquatic systems emit mainly de-nitrifi cation products (N 2 , N 2 O). Overall, the emissions for NO x and NH 3 are roughly at the same level, with 3.5 Tg NO x -N yr −1 and 3.2 Tg NH 3 -N yr −1 , respectively.
N 2 O contributes 1.2 Tg N 2 O-N yr −1 . Th e global warming potential of this greenhouse gas is 580 Tg CO 2-eq (using a GWP of 298; IPCC, 2007 ). Th is is higher than the emissions of N 2 O
estimated in the European GHG inventory (EEA, 2010 ) for the year 2000 (412 Mt CO 2-eq ) which decreased to 364 Mt CO 2-eq in the year 2008. However, it should be kept in mind that the ENB emissions include both anthropogenic and natural sources while the greenhouse gas inventories are restricted to anthropo-genic emissions only. For example, it is likely that a signifi cant portion of the coastal N 2 O fl uxes of 500 Gg N 2 O-N yr −1 (or 230 CO 2-eq yr −1 ) originates from nitrogen in incoming oceanic water. In addition, there are methodological diff erences that infl uence calculations. IPCC methodology includes indirect emissions
Figure 16.17 The integrated nitrogen budget of the Czech Republic is being constructed by the Hydrometeorological Institute (CHMI) in cooperation with the Ministry of Agriculture and with the Central Institute for Supervising and Testing in Agriculture on the basis of data from diff erent sources (e.g. National Statistical Offi ce) for the years 2004–2008, but mainly for 2007.
0
100
200
300
400
500
600
700
800
Industry+Energy
Transport Consumer Agriculture (Semi-)natural
Waste Aquatic
Switzerland
Netherlands
Germany
United Kingdom
France
Czech Republic
Em
issi
ons
[Gg
N y
r-1 ]
Figure 16.18 Absolute nitrogen emissions to the atmosphere for the main sectors/compartments.
0
100
200
300
400
500
600
Industry +Energy
Transport Consumer Agriculture (Semi-)natural
Waste Aquatic
Switzerland
Netherlands
Germany
United Kingdom
France
Czech Republic
Em
issi
ons
[Gg
N y
r-1 ]
Figure 16.19 Absolute nitrogen emissions to the hydrosphere for the main sectors/compartments.

Adrian Leip
367
from agricultural soils only, while the estimates presented here cover virtually all available land and include implicitly all indirect N 2 O emissions, including those caused by deposition of NO x fl uxes from the combustion processes. To account for indirect emissions from industrial and energy sources, roughly 20 Mt CO 2-eq should be added. Direct N 2 O emissions from agri-cultural soils for EU27 in 2002 are estimated as 380 Tg N 2 O, which is about 35 Tg N 2 O yr −1 (or 15 Tg CO 2-eq yr −1 ) more than reported by UNFCCC for the categories ‘direct soil emissions’ (4D1) and ‘pasture, range and paddock manure’ (4D2) (EEA, 2010 ). Th us, agreement for EU27 is satisfying, even though dif-ferences are larger for individual countries.
Most of the data used for the ENB are based on the same models as also used for the key maps in Section 16.3 . Th us the spatial variability of the most important fl uxes is shown in Figures 16.1 – 16.11 .
In the following sections, the main fi gures presented in the European Nitrogen Budget are briefl y reviewed, emphasizing those numbers and sectors which have not yet been introduced in detail elsewhere in the European Nitrogen Assessment.
Industry sector Th e motivation for the invention of the Haber–Bosch process to synthesize reactive nitrogen (ammonia) from atmospheric molecular nitrogen was the urgent need for nitrogen to enable suffi cient agricultural food production and the provision of raw material for explosives (Erisman et al ., 2008 ; Sutton et al ., 2011 , Chapter 1 this volume). As of 2008 around 48% is the nitrogen synthesized globally by the Haber–Bosch process (121 Tg N; Erisman et al ., 2008 ). About 24 Tg N is used in various indus-trial processes and the production of non-fertilizer products (IFA Statistics, 2010).
Several ammonia-based products are used as fertilizers, in industrial processes and in chemical products. Besides some ammonia salts, other ammonia-based industrial products that are not used as fertilizers include nitric acid, adipic acid, hydro-gen cyanides, diisocyanates, acrylonitrile, melamine and others (Domene and Robert, 2001 ). For Europe, it is estimated that about 30% of the N r fi xed with the Haber–Bosch process is used for non-agricultural purposes, including about 4.5 Tg N in
Western Europe in 2007, and 0.7 Tg N in Central Europe, total-ling about 5.2 Tg N (see Winiwarter et al ., 2011 , Chapter 24 this volume). An accounting of the production of nitrogen-con-taining substances in Europe is provided in the supplementary information (see supplementary material Chapter 16, Section C). Th e fate of these products is unknown. Th e total net trade of EU27 for total N (fertilizer and non-fertilizer) is estimated to be 1631 Gg N net import. Table 16.3 shows that the trade is dominated by the import of ammonia and urea, while derived products have a slight export-surplus.
Transport sector According to the European Environment Agency (EEA) the transport sector accounts for around one third of all fi nal energy consumption in the EEA member countries and for more than a fi ft h of greenhouse gas emissions (EEA, 2009b ). Transport is represented by international and domestic air, sea and inland waterway, off -road and pipeline transport, rail and road transport. It is mainly characterized by the road trans-port sector, which, in the year 2005 contributed more than 73% to global transport fuel consumption (EDGARv4, EIA, 2007 ; IEA/OECD, 2007 ) followed by air transport (≈ 11%), sea and inland waterways (≈ 9%), rail transport (≈ 4%) and other transport (≈ 3%).
In Europe, road transport has been the dominating source for NO x emissions since 1970 (Vestreng et al ., 2009 ). With the implementation of strict measures and action plans in the early 1990s within the framework of the Convention on Long-range Transboundary Air Pollution, European NO x emissions were continuously reduced (Pulles et al ., 2007 ). Th ese early measures in Europe complemented clean air initiatives in the US (CONCAWE, 1997 ) and investigations in the automobile industry enforced by legislation.
Th e main contributors in road transport producing high NO x emissions are heavy duty vehicles (HDV) using diesel fuel and light duty vehicles using gasoline (EMEP/EEA, 2009 ). With the introduction of EURO standards for light (considering pas-senger cars) and heavy duty vehicles emission reduction has led to a substantial NO x emissions decrease for all vehicles types in Europe. In Western Europe, NO x emissions of heavy duty vehicles have been cut by 86% compared with levels in the 1990s (ACEA, 2009 ). In contrast, NH 3 and N 2 O emissions generally increased in the last years due to the worldwide turnover of vehicle fl eets equipped with EURO 3/III standards. Although new emissions standards introduced signifi cant NO x emissions reductions, the age structure of a national fl eet causes a signifi cant time lag until the new standard can show an eff ect. Moreover, increas-ing diesel consumption and increasing growth rates in freight transport volume on a national base (see Lambrecht et al ., 2009 ) prevent further NO x emissions decreases. Furthermore, one of the reasons why some air quality problems still persist, even though vehicles have become far cleaner, is that emissions in real driving conditions tend to be higher than emissions under test conditions.
Consequently, of the EU27 Member States, only 15 (up from 10 in 2007) expect to be at, or below, their respective
0%
10%
20%
30%
40%
50%
60%
70%
Switzerland Netherlands Germany United Kingdom
France CzechRepublic
NOx
NH3
N2O
Figure 16.20 Split of total atmospheric emissions over the three reactive gases NO x , NH 3 , and N 2 O.

Integrating nitrogen fl uxes at the European scale
368
Table 16.2 Summary of nitrogen input, output, stock changes and the nitrogen balance for the main compartments/sectors for the National integrated Nitrogen Budgets of the Netherlands, Germany, Switzerland, France, and the United Kingdom. The numbers are summarized from the above fi gures, thus input and output are the sums of arrows pointing to or from the respective compartments with the exception of nitrogen fi xation of N 2 (both in industry and biological N-fi xation), which is regarded as new N r input. Stock changes refer only to quantifi ed stock changes in terrestrial ecosystems (soil stock changes or standing biomass in forests) and aquatic systems (sedimentation in lakes or marine waters)
Switzerland Input New N r Output Stock change Balance
Atmosphere 254 0 255.5 0 −2
Industry +Energy +Transport 33 53 86 0 0
Consumer 12 0 0 0 12
Agriculture 92 57 171 0 −22
(Semi-) natural land 0 0 29 0 −29
Waste 0 0 48 0 −48
Freshwater 112 0 100 14 −2
Marine water 0 0 0 0 0
Netherlands Input New N r Output Stock change Balance
Atmosphere 791 0 2975 0 −2184
Industry +Energy +Transport 0 2600 2876 0 −276
Consumer 419 0 82 0 337
Agriculture 885 13 785 0 113
(Semi-) natural land 62 0 4 0 58
Waste 90 0 90 0 0
Freshwater 515 0 378 125 12
Marine water 378 0 0 0 378
Germany Input New N r Output Stock change Balance
Atmosphere 2263 0 4096 0 −1833
Industry +Energy +Transport 0 2052 2052 0 0
Consumer 1010 0 498 0 512
Agriculture 2202 233 2373 0 62
(Semi-) natural land 0 70 118 0 −48
Waste 514 0 489 0 25
Freshwater 687 0 688 0 −1
Marine water 492 0 0 0 492
France Input New N r Output Stock change Balance
Atmosphere 1178 0 3401.26 0 −2223
Industry +Energy +Transport 0 2683 2683 0 0
Consumer 0 0 0 0 0
Agriculture 2681 569 716 0 2534
(Semi-) natural land 0 0 88 0 −88
Waste 0 0 42.53 0 −43
Freshwater 0 0 797 0 −797
Marine water 797 0 0 0 797
United Kingdom Input New N r Output Stock change Balance
Atmosphere 1110 0 2347 0 −1238
Industry +Energy +Transport 0 1417 1417 0 0
Consumer 728 0 243 0 485
Agriculture 1178 0 1478 0 −300

Adrian Leip
369
emission ceilings by 2010 (NEC Directive status report 2008, EEA, 11/2009) and NO x emissions will be higher than expected. In addition, global emissions are likely to increase due to the strong economic growth in regions such as East Asia (Streets
and Waldhoff , 2000 ), Central Europe and Southeast Asia (e.g. Th ailand). Emissions will also increase in the Middle East and Africa, where less policy regulations are in place (Cofala et al ., 2007 ).
United Kingdom Input New N r Output Stock change Balance
(Semi-) natural land 0 0 72 0 −72
Waste 260 0 200.7 0 59
Freshwater 719 0 721 0 −2
Marine water 605 0 0 0 605
Czech Republic Input New N r Output Stock change Balance
Atmosphere 219 0 629 0 −409
Industry +Energy +Transport 0 408 408 0 0
Consumer 46 0 51 0 −4
Agriculture 360 38 137 0 261
(Semi-) natural land 0 0 0 0 0
Waste 51 0 13 0 37
Freshwater 0 0 70 0 −70
Marine water 0 0 0 0 0
Figure 16.21 Nitrogen budget for Europe (European Nitrogen Budget) for EU-27 compiled with data for the period around the year 2000. Basis: (i) atmospheric transport and atmospheric deposition: EMEP Unifi ed model, rv3.1, 2009. Atmospheric transport is obtained from the source-receptor matrix available at http://www.emep.int/ ; (ii) atmospheric emissions from industry and energy, transport and solid waste systems: EDGAR-CIRCE (Van Aardenne et al ., 2009 ), (iii) industrial trade and non-fertilizer products: Prud’homme, 2009 ; (iv) agricultural nitrogen fl uxes incl. mineral fertilizer use and food and feed trade: Indicator Database for European Agriculture, V1, 2009; (v) (semi-)natural systems: INTEGRATOR, 2009. Export of forestry products: FAOSTAT; (vi) fi shery data: Eurostat, 2009 ( http://epp.eurostat.ec.europa.eu/portal/page/portal/statistics/search _database); (vii) sewage system fl uxes including input of nitrogen and emissions: Indicator Database for European Agriculture, V1, 2009; (viii) fl uxes to groundwater and surface water systems including fl ux from surface waters to coastal zones: IMAGE, 2009; (ix) N 2 O emissions from coastal zones: Bange ( 2008 ); (x) other fl uxes from coastal zones; see text.
Table 16.2 (cont.)

Integrating nitrogen fl uxes at the European scale
370
A particular concern is aviation, which is the fastest- growing transport sector. Th is growth is partly driven by increasing wealth and low prices (for aviation, fuel tax is currently not considered), which underpin strong growth in tourism travel. Aviation now accounts for more than 10% of greenhouse gas emissions.
Emission standards for ships and aviation are dealt with by the respective UN organizations (International Maritime Organization, IMO, and International Civil Aviation Organization, ICAO) and by international conventions includ-ing the Convention on Long-range Transboundary Air Pollution which also addresses other sectors in addition to transport. Present measures regulate emissions (NO x ) on the Landing and Take Off cycle and were designed to address airport air quality problems. Th e Committee on Aviation Environmental Protection (CAEP) is pursuing new certifi cation methodolo-gies that also take account of the fl ight mode as well.
Table 16.4 shows that N r emissions from civil aviation (Annex 1 countries) increased by 3.5% from 2000 to 2005, and
globally by 9%. Th e corresponding values for navigation are 13.3% (Annex 1 countries) and 16.4% (worldwide). Also the emissions from railway transport will increase with increasing freight transport, which has been restructured in the past 20 years.
Agriculture sector Agriculture is the sector with the largest source of reactive nitrogen emissions in Europe as a whole and for each of its countries. We fi nd a high recycling of N r between crop pro-duction and manure excretion; the livestock sector receives about the same amount of N r in the form of domestically produced and imported feed than the grass- and crop-sec-tor. About 60% of agricultural products (consumed or used in industry) originate from crop production. Th e nitrogen use effi ciency (defi ned as N r in useful products relative to N r inputs) for cultivation on soils is about 60% (considering also N-input through atmospheric deposition and biological nitrogen fi xation), while the nitrogen use effi ciency for a farm N-budget including animal products drops to about 30% (Leip et al ., 2010a ).
Productivity in Europe is high, as has been shown; how-ever, to supply the protein requirements of European citi-zens, about 400 Gg N yr −1 of agricultural products for food and about 3 Tg N yr −1 for feed or industrial use have to be imported. For comparison, Galloway et al . ( 2008 ; UNEP and WHRC, 2007 ) estimate is a signifi cant global trade in fertil-izer (31 Tg N), grain (12 Tg N) and meat (0.8 Tg N), and a net import of vegetal products (2367 Gg N) and meat (110 Gg N) to Europe. Th e authors include in their data Eastern Europe, a region which is a large producer and exporter of mineral fertilizer. Th erefore, Europe is shown to be a net exporter of fertilizer (5376 Gg N), neglecting a large internal trade in the European Union (see Table 16.5 ).
Forestry Forests are currently undergoing net growth with net immobilization of N r in the soil of about 810 Gg N yr −1 and a N r uptake into the above-ground biomass of 320 Gg N yr −1 (estimated with the INTEGRATOR model). National
Table 16.3 Net trade of nitrogen of Europe (EU27). Values are net export in Gg N yr −1 . Negative values indicate a net import towards the European Union
Product Net export
Urea −845
AS 298
AN 215
CAN 141
NPK (estimate) 26
NH 3 −1536
UAN (estimate) 70
Total − 1631 –5,000
0
5,000
10,000
15,000
20,000
25,000
30,000
Atmosphere Industry+Energy
+Transport
Consumer Agriculture Forests Waste Freshwater Marinewater
Em
issi
on
s [G
g N
yr–1
]
N input
N output
New N
Stock changes
Figure 16.22 Nitrogen balance by main sectors/compartments for EU27 around the year 2000. The contribution of newly generated nitrogen to the N-input as well as the contribution of changes in nitrogen stocks to the N-output (for example sedimentation in lakes and in estuaries) are also shown.
0%
10%
20%
30%
40%
50%
60%
70%
80%
90%
100%
Industry+Energy
Transport Consumer Agriculture Forests Waste Aquatic Total
NH3 N2ONOx
Figure 16.23 Split of atmospheric emissions in EU27 around the year 2000 by sector into the three reactive gases NO x , NH 3 , and N 2 O.

Adrian Leip
371
estimates of carbon sequestration in the land use/land use change and forestry (LULUCF) sector are about 25 Tg CO 2-eq (EEA, 2009a ). The main uncertainty in converting this value into sequestered N r (or stock changes in forests) is the ratio of sequestered carbon in above-ground material and soils, which differ considerably on the C/N ratio. As a rough assumption we use 50% of carbon sequestered in soils, giv-ing stock changes of about 300 Gg N for EU27. From FAO statistics and national data we obtain a figure of 380 mil-lion m 3 of total roundwood production in EU27 for the year 2000. Converted to nitrogen uptake/removal from for-ests this gives approximately 190 Gg N, using a basic wood density of 0.4 for average temperate and boreal trees (see IPCC, 2006 ), a carbon/dry-biomass ratio of 0.5 and a C/N ratio around 400 (see Katri et al ., 2004 ). Part of this wood is used for domestic burning and the resulting emissions are included in the energy/industry figures calculated in the EDGAR database. The remaining biomass will be used in paper and wood products. However, these numbers might be an under-estimation of the real removal of wood, as a comparison between satellite imagery and forest statistics in Italy has shown (Corona et al ., 2007 ).
Waste sector Th ere is little quantitative information on sewage sludge applied to agricultural fi elds. Th e value indicated in the fi gure above has been obtained from the national GHG inventories of European counties to the UNFCCC. In EU15, only seven countries report that domestic or industrial sewage sludge is applied to agricul-tural soils. Th e total of 45 Gg N per year is only a small fraction of the 0.7 Tg N of sewage sludge that is assumed to enter the solid waste sector. We do not distinguish here landfi lling and waste burning.
Th e input to the waste sector is mainly determined by house-hold wastes; the estimate for the input to the solid waste systems includes currently only agricultural wastes. Th e IMAGE model uses a nitrogen factor of 3–4 kg N capita −1 yr −1 , a value which is also confi rmed from data which gave a value of 3.94 kg N per capita for over 60 catchments in the UK (Johnes, 2007 ). Th e IMAGE data are based on measured nitrogen infl uent to waste-water treatment plants, divided by the number of connected people. Th erefore, the estimate based on human diet may be higher. For example, Billen et al . ( 2008 ) estimate an annual food intake of 8.2 kg N capita −1 yr −1 from national French domestic consumption data; the estimate based on household consump-tion fi gures may be higher. Th ese include products bought but not ingested, the fate of which is solid wastes instead of wastewa-ter. Th e CAPRI data used here suggest higher values with about 5 Tg N off ered to the consumers. Th is contains 6% nitrogen in non-edible products and an assumed 30% of food wastes. Th us the actual annual nitrogen consumption in Europe including consumption by pets is estimated to be 6.3 kg N capita −1 yr −1 in the input of nitrogen from consumer to the waste water treat-ment systems is estimated to be 3.1 Tq N yr –1 .
Aquatic systems We defi ne coastal areas as the shelf regions with a water depth of less than 200 m (Uher, 2006 ). Th is includes most of the shallow Baltic and most of the North Sea, as well as the Adriatic Sea, but excludes most of the Mediterranean Sea such as the Balearic, Ligurian and Tyrrhenian Seas. Also only narrow strips of the Atlantic coast in Spain and Portugal are included.
Budgeting nitrogen fl uxes in aquatic systems is one of the most diffi cult parts of the European Nitrogen Budget.
We assume that N • r leached from soils enters the groundwater, however, sub-surface fl ow does also occur but has not yet been estimated for Europe.
Table 16.5 Trade of nitrogen in fertilizer, vegetal products and meat with (West, Central and East) Europe (Gg N yr −1 )
Export from Europe
Import to Europe
Fertilizer North America 2352
South America 2268
Africa 359 639
SE-Asia 977
Australia 59
Grain North America 423
South America 2318
Africa 193
Russia 81
SE-Asia 100
Meat South America 82
Russia 28
Source: From Galloway et al ., 2008.
Table 16.4 Reactive N emission in the years 2000 and 2005 for civil aviation, global aviation, marine activities and navigation and the development in percent from 2000 to 2005
Sector Unit 2000 2005 Change (% ) Reference
Civil aviation Gg N yr −1 98 101 3.5 UNFCCC
Global aviation Gg N yr −1 820 894 9.1 EDGAR-CIRCE
Marine and navigation Gg N yr −1 1966 2229 13.3 UNFCCC
Global shipping Gg N yr −1 3398 3954 16.4 EDGAR-CIRCE

Integrating nitrogen fl uxes at the European scale
372
Atmospheric N • r deposition has been estimated on an ‘area-fraction’ basis. However, N r deposition in sealed and non-sealed urban soils will enter the aquatic system either directly or via sewage treatment systems. Th is has not been accounted for. Th e models predict total N • r leaching fl uxes; their diff eren-tiation between nitrate and organic nitrogen from diff use sources is not possible at the moment.
Voss et al . ( 2011 , Chapter 8 , this volume) have made an attempt to quantify the global nitrogen balance in shelf regions. Most of the fl ux terms are associated with considerable uncer-tainty. However, burial in sediments and biological nitrogen fi x-ation are both relatively small fl ux terms; in Europe, biological nitrogen fi xation occurs mainly in the Baltic Sea and thus the value shown in the fi gure above is the estimate reported for the Baltic Sea (Rahm et al ., 2000 ; Schneider et al ., 2003 ). However, the contribution of benthic nitrogen fi xation is not considered in this value, as estimates are lacking. Burial in sediments is likely to be a small loss term, which we are not able to quantify for European shelf regions.
16.5 Conclusion Environmental problems related to nitrogen concern all eco-nomic sectors and impact all media: atmosphere, pedosphere, hydrosphere and anthroposphere. Th erefore, the integration of fl uxes presented in depth in earlier chapters for individual sec-tors/media is needed to get a picture of the overall problem. Th is chapter presents a set of high resolution maps showing key elements of the N fl ux budget across Europe. Additionally, comparative nitrogen budgets are presented for a range of European countries. A European Nitrogen Budget is presented on the basis of state-of-the-art Europe-wide models and data-bases focusing on diff erent parts of Europe’s society.
Key maps of nitrogen fl uxes have been plotted from fi ve models and databases covering together all sectors and media in Europe. Th ese models combine a large spatial extent with a high spatial resolution of the data and a focus on nitro-gen fl uxes. Th e maps show high pressure on the environ-ment in regions used intensively for agriculture such as the Netherlands, the Po Valley, Brittany, but also in the banlieue of large metropolitan areas such as Paris, Berlin and London. Th ese areas have high N-input and agricultural surplus as well as NH 3 and N 2 O fl uxes. NO x emissions, on the other hand, are dominated by industrial and combustion sources and their distribution refl ects the degree of industrialization and popu-lation density. Th e map shows hotspots in centres of energy-intensive industry, such as Sachsen-Anhalt in Germany, North Italy, the Netherlands, or along intensive traffi c lines. Th e spa-tial distribution of N 2 O fl uxes shows elements of both patterns, but it is further complicated by the strong dependence of N 2 O emissions from soil properties and meteorological conditions. Land productivity in Europe is high and could be suffi cient to sustain the protein requirement of European population. However, a large part of these resources is invested to feed the livestock, which consume three times the nitrogen that
humans consume but deliver only about 50% of the proteins in human’s diet in EU-27. As a consequence, large amount of feedstuff must be imported to Europe.
National nitrogen budgets are diffi cult to compile using a wide range of data sources and are currently available only for a limited number of countries. Th e summary of the national N-budgets shows that the balance is not closed for several sec-tors. Th is is partly because not all nitrogen fl uxes have yet been (or could be) estimated, and partly because the data for dif-ferent compartments and sectors have been taken from best available, but partly inconsistent, data sets. Overall, national N-budgets have already shown themselves to be useful tools to identify the most important N-fl uxes in a country, to provide an effi cient visualization of the complexity of a problem and to elaborate effi cient mitigation strategies. Furthermore, through the integration of data from diff erent and independent sources, data gaps and sometimes contradicting scientifi c understand-ing of processes have been highlighted.
Modelling approaches have been used to fi ll in the data gaps in some of these budgets, but it became obvious during this study that further research is needed in order to collect neces-sary data and make national nitrogen budgets inter-comparable across Europe. Th e European Nitrogen Budget is largely model-based and provided a challenge in combining fi ve Europe-wide models and databases. Results suggest that European agricul-ture (EU-27) receives c . 18 Tg N yr −1 reactive nitrogen, out of which only c . 7 Tg N yr −1 fi nd their way to the consumer or are further processed in industry. Some 3.7 Tg N yr −1 of reactive nitrogen are released by the burning of fossil fuel, out of about 16 Tg N yr −1 of N 2 which is fi xed into N r each year in industry and energy generation. Th e contribution in emissions of react-ive nitrogen of the industry and energy sectors is comparable to that of the transport sector.
More than 8 Tg N yr −1 of reactive nitrogen are disposed of to the hydrosphere; Europe is a net exporter of N r through atmospheric transport of c . 2.3 Tg N yr −1 . Th e largest single sink for N r appears to be denitrifi cation to N 2 in European shelf regions. However, this sink is also the most uncertain one as it concerns also N r that is imported through the exchange with the open ocean which is potentially as large as the input of N r in mineral fertilizer.
In contrast to most chapters in this assessment, the current chapter presents considerable new information that has been just lately compiled, estimated or calculated with recently improved models. Th e European Nitrogen Assessment aims at providing a comprehensive assessment of nitrogen, its related problems and possible solutions, but also at raising awareness on nitrogen issues and promoting the idea of inte-grated assessment as an important prerequisite for success-ful solutions. Th e large variety of problems associated with the excess of reactive nitrogen in the European environment requires such an integrated nitrogen management approach that would allow for creation and closure of N budgets within European environments.
Th e fi rst steps to reach this goal have already been taken in the process of assembling the assessment, jointly with the

Adrian Leip
373
contemporarily formed Task Force on Reactive Nitrogen under the UN-CLRTAP and the NitroEurope-Integrated Project. Th e progress of this joint eff ort is refl ected in this chapter.
Acknowledgements Th e authors gratefully acknowledge support from the European Commission for the NitroEurope Integrated Project, and from the European Science Foundation for the Nitrogen in Europe (NinE) programme and COST 729.
Supplementary materials Supplementary materials (as referenced in the chapter) are available online through both Cambridge University Press: www.cambridge.org/ena and the Nitrogen in Europe website: www.nine-esf.org/ena .
References Aber , J. D. ( 1992 ). Nitrogen cycling and nitrogen saturation in
temperate forest ecosystems . Trends Ecol., Evol., 7, 220 –224. ACEA ( 2009 ). Historical series 1990 – 2008, average car age in
Europe, publications 2009, European Automobile Manufacturers Association. Available at http://www.acea.be/index.php/collection/statistics .
Amann , M. , Asman , W. , Bertok , I. et al . ( 2007 ). Cost-eff ective emission reductions to meet the Environmental Targets of the Th ematic Strategy on Air Pollution under diff erent greenhouse gas constraints NEC, Scenario Analysis Report Nr. 5. IIASA, June 2007.
Andersson-Sköld , Y. and Simpson , D. ( 1999 ). Comparison of the chemical schemes of the EMEP MSC-W and the IVL photochemical trajectory models . Atmos. Env., 33, 1111 –1129.
BAFU 2010: Sticksloff fl üsse in der Schweiz, Stoff fl ussanalyse für das Jahr 2005, Heldstab J., Reusimann J., Bledermann R., Len D. Im Auft rag des Bundesamis für ummett BAFU, limwett Hissen Nr. 1018. Bern.
Bange , H. W. ( 2008 ). Gaseous nitrogen compounds (NO, N 2 O, N 2 , NH 3 ) in the ocean. In: Nitrogen in the Marine Environment , 2nd edition. Capone , D. G. , Bronk , D. A. , Mulholland , M. R. and Carpenter , E. J. (eds.), Elsevier , Amsterdam , pp. 51–94.
Billen , G. , Garnier , J. , Mouchel , J.-M. and Silvestre , M. ( 2007 ). Th e Seine System: introduction to a multidisciplinary approach of the functioning of a regional river system . Sci. Total Environ., 375 , 1 –12.
Billen , G. , Barles , S. , Garnier , J. , Rouillard , J. and Benoit , P. ( 2008 ). Th e food-print of Paris: long-term reconstruction of the nitrogen fl ows imported into the city from its rural hinterland. Region. Environ.Change , http://dx.doi.org/10.1007/s10113 –008–0051-y
Billen , G. , Silvestre , M. , Grizzetti , B. et al . ( 2011 ). Nitrogen fl ows from European watersheds to coastal marine waters. In: Th e European Nitrogen Assessment, ed. M. A. Sutton , C. M. Howard , J. W. Erisman et al ., Cambridge University Press .
Bouwman , A. F. , Kram , T. and Klein Goldewijk , K. ( 2006 ). Integrated modelling of global environmental change: an overview of IMAGE 2.4, Netherlands Environmental Assessment Agency (MNP): Bilthoven, Th e Netherlands.
Britz , W. and Leip , A. ( 2009 ). Development of marginal emission factors for N losses from agricultural soils with the DNDC-CAPRI meta-model . Agric. Ecosyst. Environ ., 133 , 267 –279.
Britz , W. and Witzke , H.-P. (eds.) ( 2008 ). CAPRI Model Documentation 2008: Version 2 p. Institute for Food and Resource Economics, University of Bonn: Bonn (available at http://www.capri-model.org/docs/capri _documentation.pdf)
Butterbach-Bahl , K. , Kahl , M. , Mykhayliv , L. et al . ( 2008 ). A European wide inventory of soil NO emissions using the biogeochemical models DNDC/ Forest DNDC . Atmos. Environ ., 43 , 1392 –1402.
Butterbach-Bahl , K. , Gundersen , P. , Ambus , P. et al . ( 2011 ). Nitrogen processes in terrestrial ecosystems. In: Th e European Nitrogen Assessment, ed. M. A. Sutton , C. M. Howard , J. W. Erisman , et al ., Cambridge University Press .
BUWAL ( 1996 ). Strategie zur Reduktion der Stickstoff emissionen. Bericht der Projektgruppe Stickstoffh aushalt Schweiz, Schrift enreihe Umwelt Nr. 273, Bundesamt für Umwelt, Wald und Landschaft (BUWAL) and Bundesamt für Landwirtschaft (BLW): Bern, Switzerland.
CDIAC ( 2008 ). Fossil-fuel CO 2 emissions. http://cdiac.ornl.gov/trends/emis/meth _reg.html. Last accessed on 11.08.2009.
Cofala , J. , Amann , M. , Klimont , Z. , Kupiainen , K. and Höglund-Isaksson , L. ( 2007 ). Scenarios of global anthropogenic emissions of air pollutants and methane until 2030 . Atmos. Environ ., 41, 8486 –8499.
CONCAWE ( 1997 ). Motor vehicle emission regulations and fuel specifi cation – part 2, detailed information and historic reviews (1970 – 1996), report 6/1997.
CONCAWE ( 2001 ). Motor Vehicle emission regulations and fuel specifi cation – part 2, detailed information and historic reviews (1996 – 2000), report 2/2001.
Corona , P. , Giuliarelli , D. , Lamonaca , A. et al . ( 2007 ). Confronto sperimentale tra superfi ci a ceduo tagliate a raso osservate mediante immagini satellitari ad alta risoluzione e tagliate riscontrate amministrativamente . Forest, 4 , 324 –332.
Dalsøren , S. B. , Eide , M. S. , Endresen , Ø. et al . ( 2009 ). Update on emissions and environmental impacts from the international fl eet of ships. Th e contribution from major ship types and ports . Atmos. Chem. Phys., 9, 2171 –2194.
De Vries W. , Kros , J. , Reinds, G. J. et al . ( 2009 ). INTEGRATOR: a modelling tool for European-wide assessments of nitrogen and greenhouse gas fl uxes in response to changes in land cover, land management and climate – calculation procedures, application methodology and examples of scenario results, Alterra Report, Alterra Wageningen UR: Wageningen, Th e Netherlands.
de Vries , W. , Leip , A. , Reinds , G. J. et al . ( 2011 ). Geographic variation in terrestrial nitrogen budgets across Europe. In: Th e European Nitrogen Assessment, ed. M. A. Sutton , C. M. Howard , J. W. Erisman et al ., Cambridge University Press .
DEFRA ( 2008 ). Summary of Food and Farming in the UK , HMSO : London .
Domene , L. A. F. and Robert , U. A. ( 2001 ). Nitrogen’s role in industrial systems . J. Industr. Ecol., 5 , 77 –103.
ECN ( 2008 ). European Compost Network: Webpages EU Biowaste Treatment and Country presentations. http://www.compostnetwork.info/ . Last accessed on 11.08.2009.
EEA ( 1998 ). Annual topic update 1997. Topic report 02/98, European Environment Agency and European Topic Centre on Coastal and Marine Environment: Copenhagen.

Integrating nitrogen fl uxes at the European scale
374
EEA ( 2009 a). NEC Directive status report 2008, Reporting by the Member States under Directive 2001/81/EC of the European Parliament and of the Council of 23 October 2001 on national emission ceilings for certain atmospheric pollutants EEA Technical report series: European Environment Agency: Copenhagen.
EEA ( 2009 b). Annual European Community greenhouse gas inventory 1990–2007 and inventory report 2009, submission to the UNFCCC Secretariat, European Environment Agency: Copenhagen.
EEA ( 2010 ). Annual European Community greenhouse gas inventory 1990–2008 and inventory report 2010, submission to the UNFCCC secretariat, European Environment Agency: Copenhagen.
EIA ( 2007 ). International energy statistics. U.S. Energy Information Administration: Washington DC, USA. http://www.eia.doe.gov/emeu/international/contents.html . Last accessed on 2007.
EMEP ( 2008 ). EMEP measurement database. Th e Co-operative Programme for the Monitoring and Evaluation of the Long-Range Transmission of Air Pollutants in Europe. Available at http://www.emep.int /.
EMEP/EEA ( 2009 ). EMEP/EEA air pollutant emission inventory guidebook: 2009, EEA Technical Report. Available at http://www.eea.europa.eu/publications/emep-eea-emission-inventory-guidebook-2009 .
Erisman , J. W. , Domburg , P. , de Haan , B. J. et al. ( 2005 ). Th e Dutch nitrogen cascade in the European perspective, ECN-C – 05–007, Energy Research Centre of the Netherlands (ECN): Petten, Th e Netherlands.
Erisman , J. W. , Sutton , M. A. , Galloway , J. , Klimont , Z. and Winiwarter , W. ( 2008 ). How a century of ammonia synthesis changed the world . Nature Geosci., 1 , 636 –639.
Eyers , C. J. , Addleton , D. , Atkinson , K. et al. ( 2004 ). AERO2k Global Aviation Emissions Inventories for 2002 and 2025, QINETIQ/04/01113, December 2004. Available at http://www.cate.mmu.ac.uk/aero2kreports/AERO _2k_Global_Aviation_Emissions_Inventories_for_2002_and_2025_V1_1.pdf.
Galloway , J. N. and Cowling E. B. ( 2002 ). Reactive nitrogen and the world: 200 years of change . Ambio, 31 , 64 –71.
Galloway J. N. , Cowling E. B. and Kessler E. ( 2002 ). Reactive nitrogen . Ambio 31 , 59 .
Galloway , J. N. , Aber , J. D. , Erisman , J. W. et al. ( 2003 ). Th e Nitrogen Cascade . BioScience, 53 , 341 –356.
Galloway , J. N. , Townsend , A. R. , Erisman , J. W. et al. ( 2008 ). Transformation of the nitrogen cycle: recent trends, questions, and potential solutions . Science, 320 , 889 –892 .
Genovese , G. , Baruth , B. , Royer , A. and Burger , A. ( 2007 ). Crop and yield monitoring activities: MARS STAT action of the European Commission . Geoinformatics, 10 , 20 –22.
Heckelei , T. , Mittelhammer , R. C. and Britz , W. ( 2005 ). A Bayesian alternative to generalized cross entropy solutions to underdetermined models. In: 89th EAAE Symposium Modelling Agricultural Policies: State of the Art and New Challanges , 3–5 February, Parma, Italy.
Hertel , O. , Reis , S. , Skjøth , C. A. et al. ( 2011 ). Nitrogen turnover processes in the atmosphere. In: Th e European Nitrogen Assessment , ed. M. A. Sutton, C. M. Howard, J. W. Erismon et al ., Cambridge University Press.
IEA/OECD ( 2007 ). Energy balances of OECD and non-OECD countries on-line data service, 20037 http://data.iea.org .
IFA (2010). Global Fertilizers and Raw Materials Supply and Supply/Demand Balances, 2010–2014. Prud’homme, M., June 2010.
IPCC ( 2006 ). 2006 IPCC guidelines for national greenhouse gas inventories, prepared by the National Greenhouse Gas Inventories Programme , IGES: Tokyo, Japan.
IPCC ( 2007 ). Fourth Assessment Report of the Intergovernmental Panel on Climate Change. Working Group I – Th e Physical Science Basis . Summary for policymakers. Available at http://www.ipcc.ch/WG1 _SPM_17Apr07.pdf.
IRF ( 2007 ). World Road Statistics 2007. Jeppsson , U. , Alex , J. , Pons , M. N. , Spanjers , H. and Vanrolleghem , P. A.
( 2002 ). Status and future trends of ICA in waste water treatment- a European perspective . Water Sci. Technol., 45, 485 –494.
Johnes , P. D. ( 1996 ). Evaluation and management of the impact of land use change on the nitrogen and phosphorus load delivered to surface waters: the export coeffi cient modelling approach . J. Hydrol., 183 , 323 –349.
Johnes , P. J. ( 2007 ). Meeting ecological restoration targets in European waters: a challenge for animal agriculture. In: Redesigning Animal Agriculture , ed. D. Swain , E. Charmley , J. Steel and S. Coff ey , CAB International: Wallingford, UK, pp. 185–203.
Johnes , P. J. and Butterfi eld , D. ( 2002 ). Landscape, regional and global estimates of N fl ux from land to ocean: errors and uncertainties . Biogeochemistry, 57 / 58 , 429 –476.
JRC/PBL ( 2009 ). Th e EDGAR database EDGAR v4.0, available at http:\\edgar.jrc.ec.europa.eu\
Katri , K. , Seija , K. , Pekka , S. et al. ( 2004 ). Eff ect of elevated [CO2 ] on stem wood properties of mature Norway spruce grown at diff erent soil nutrient availability . Glob. Change Biol., 10 , 1526 –1538.
Kesik , M. , Ambus , P. , Baritz , R. et al. ( 2005 ). Inventory of N2O and NO emissions from European forest soils . Biogeosciences, 2, 353 –357.
Klimont , Z. and Brink , C. ( 2004 ). Modelling of emissions of air pollutants and greenhouse gases from agricultural sources in Europe, IIASA Interim Report IR-04–048, International Institute for Applied Systems Analysis: Laxenburg, Austria.
Lambrecht , M. , Erdmenger , C. , Bölke , M. et al. ( 2009 ). Strategie für einen nachhaltigen Güterverkehr (Summary: Strategy for Sustainable Freight Transport in English), UBA Texte 18/2009.
Leip , A. , Marchi , G. , Koeble, R. et al . ( 2008 ). Linking an economic model for European agriculture with a mechanistic model to estimate nitrogen and carbon losses from arable soils in Europe . Biogeosciences, 5 , 73 –94.
Leip , A. , Weiss , F. and Britz , W. ( 2009 a). Agri-environmental nitrogen indicators for EU27. In: Proceedings of the Conference on Integrated Assessment of Agriculture and Sustainable Development: Setting the Agenda for Science and Policy (AgSAP 2009). Egmond aan Zee, Th e Netherlands, 10–12 March 2009, ed. M. K. Van Ittersum , J. Wolf and H. H. Van Laar , Wageningen University and Research Centre: Wageningen, the Netherlands, pp. 184–185.
Leip , A. , Weiss , F., Orlandini, L. and Marchi , G. ( 2009 b). Nitrous oxide emissions from agriculture in Europe as calculated within the Indicator Database for European Agriculture. In: Fift h International Symposium on Non-CO 2 Greenhouse Gases (NCGG-5) Science, Reduction Policy and Implementation , Wageningen, the Netherlands, 30 June – 3 July, 2009.
Leip A. , Britz W. , de Vries W. and Weiss F. ( 2011 ). Farm, land, and soil nitrogen budgets for agriculture in Europe. Environ. Pollu. (in press).
Leip , A. , Busto , M. and Winiwarter , W. ( 2010 b). Developing stratifi ed N 2 O emission factors for Europe. Environ. Pollut. (in press).

Adrian Leip
375
Li , C. ( 2000 ). Modeling trace gas emissions from agricultural ecosystems . Nutr. Cycl. Agroecosyst., 58, 259 –276.
Metzger , S. M. , Dentener , F. J. , Lelieveld , J. and Pandis , S. N. ( 2002 ). Gas/aerosol partitioning 1. A computionally effi cient model . J. Geophys. Res ., 107 (ACH16).
NitroEurope ( 2010 ) http://www.nitroeurope.eu/ (accessed 1 June 2010).
OECD/Eurostat ( 2003 ). OECD/Eurostat gross nitrogen balances handbook. Organisation for Economic Co-operation and Development, Paris.
Olivier , J. G. J. , van Aardenne , J. , Dentener , F. et al. ( 2005 ). Recent trends in global greenhouse gas emissions: regional trends 1970–2000 and spatial distribution of key sources in 2000 . Environ. Sci., 2 , 81 –99.
Pilegaard , K. , Skiba , U. , Ambus , P. et al. ( 2006 ). Factors controlling regional diff erences in forest soil emission of nitrogen oxides (NO and N 2 O) . Biogeosciences, 3, 651 –661.
Prud ’ homme , M. ( 2009 ). IFA Production and International Trade Committee, personal communication.
Pulles , T. , van het Bolscher , M. , Brandt , R. and Visschedijk , A. ( 2007 ). Assessment of global emissions from fuel combustions in the fi nal decades of the 20th century DG Research, Retro Project, No. 034.64145, TNO report, 2007-A-R0132/B. p. 41.
Rahm , L. et al . ( 2000 ). Nitrogen fi xation in the Baltic proper: an empirical study . J. Mar. Sys., 25, 239 –248.
Schneider , B. et al . ( 2003 ). Th e surface water CO2 budget for the Baltic Proper: a new way to determine nitrogen fi xation . J. Mar. Syst., 42, 53 –64.
Seitzinger , S. , Harrison , J. A. , Böhlke , J. K. et al. ( 2006 ). Denitrifi cation across landscapes and waterscapes: a synthesis . Ecol. Appl ., 16, 2064 –2090.
Simpson , D. , Winiwarter , W. , Börjesson , G. et al. ( 1999 ). Inventorying emissions from nature in Europe . J. Geophys. Res., D104 , 8113 –8152.
Simpson , D. , Fagerli , H. , Jonson , J. et al. ( 2003 ). Th e EMEP unifi ed Eulerian model. model description, EMEP Report 1/2003, Th e Norwegian Meteorological Institute, Oslo, Norway.
Simpson , D. , Butterbach-Bahl , K. , Fagerli H. et al . ( 2006 ). Deposition and emissions of reactive nitrogen over European forests: a modelling study . Atmos. Environ ., 40, 5712 –5726.
Simpson , D. , Aas , W. , Bartnicki , J. et al . ( 2011 ). Atmospheric transport and deposition of nitrogen in Europe. In: Th e European Nitrogen Assessment , ed. M. A. Sutton , C. M. Howard , J. W. Erisman et al ., Cambridge University Press .
SRIC ( 2005 ). Adipic acid, nitric acid and caprolactam production data 1974–2004, Tables from the Directory of Chemical Producers, dated 2 December 2005. SRI Consulting, Gaithersburg, MD.
Stoddard , J. L. ( 1994 ). Long-term changes in watershed retention of nitrogen: its causes and aquatic consequences. In: Environmental Chemistry of Lakes and Reservoirs , ed. L. A. Baker . Washington (DC): American Chemical Society, pp. 223–284.
Streets , D. G. and Waldhoff , S. T. ( 2000 ). Present and future emissions of air pollutants in China: SO2, NOx, and CO . Atmos. Environ., 34 , 363 –374.
Sutton , M. A. , Nemitz , E. , Erisman , J. W. et al . ( 2007 ). Challenges in quantifying biosphere–atmosphere exchange of nitrogen species . Environ. Pollu., 150 , 125 –139.
Sutton , M. A. , Howard , C. M. , Erisman J. W. et al . ( 2011 ). Assessing our nitrogen inheritance. In: Th e European Nitrogen Assessment, ed. M. A. Sutton , C. M. Howard , J. W. Erisman et al ., Cambridge University Press .
Svirejeva-Hopkins , A. , Reis , S. , Nardoto G. et al . ( 2011 ). Nitrogen fl ows and fate in urban landscapes. In: Th e European Nitrogen Assessment, ed. M. A. , Sutton , C. M. Howard , J. W. Erisman et al. Cambridge University Press .
Uher , G. ( 2006 ). Distribution and air-sea exchange of reduced sulphur gases in European coastal waters . Estuar. Coast. Shelf Sci., 70 , 338 –360.
Umweltbundesamt ( 2009 a). Integrierte Strategie zur Minderung von Stickstoff emissionen, Umweltbundesamt. Available at http://www.umweltbundesamt.de/luft /downloads/emissionen/stickstoff emissionsminderungsstrategie.pdf , last accessed on 26.11.2008.
Umweltbundesamt ( 2009 b). Hintergrundpapier zu einer multimedialen Stickstoff emissionsminderungsstrategie, Umweltbundesamt. Available at http://www.umweltbundesamt.de/luft /downloads/emissionen/hg-stickstoff emissionsminderungsstrategie.pdf , last accessed on 26.11.2008.
UNEP and WHRC ( 2007 ). Reactive nitrogen in the environment: too much or too little of a good thing : United Nations Environment Programme : Paris .
Van Aardenne , J. A. , Dentener , F. J. , Olivier , J. G. J. , Klein Goldewijk , C. G. M. and Lelieveld , J. ( 2001 ). A high resolution dataset of historical anthropogenic trace gas emissions for the period 1890–1990 . Glob. Biogeochem. Cycles, 15 , 909 –928.
Van Aardenne , J. , Doering , U. , Monni , S. et al. ( 2009 ). Emission Inventory for period 1990–2005 on 0.1x0.1 grid. Report to the Sixth Framework Programme Project No. 036961-CIRCE, 23 January 2009.
Van der Werft , G. et al . ( 2010 ). http://www.falw.vu/ ~gwerf/GFED/index.html (site accessed 1 June 2010).
Van Drecht , G. , Bouwman , A. F. , Harrison , J. and Knoop , J. M. ( 2009 ). Global nitrogen and phosphate in urban wastewater, between 1970 and 2050 . Glob. Biogeochem. Cycles, 23 (GB 0 A03).
van Egmond , K. , Bresser , T. and Bouwman , L. ( 2002 ). Th e European Nitrogen Case . Ambio, 31 , 72 –78.
van Grinsven , J. J. M. , van Schijndel , M. W. , Schotten , C. G. J. and van Zeijts , H. ( 2003 ). Integrale analyse van stikstofstromen en stikstof beleid in Nederland , RIVM report 500003001, RIVM , Bilthoven, Th e Netherlands .
Velthof , G. , Oudendaag , D. , Witzke , H.-P. et al. ( 2009 ). Integrated assessment of nitrogen emissions from agriculture in EU-27 using MITERRA-EUROPE . J. Environ. Qual ., 38, 402 –417.
Vestreng , V. , Ntziachristos , L. , Semb , A. et al. ( 2009 ). Evolution of NOx emissions in Europe with focus on road transport control measures . Atmos. Chem. Phys ., 9 , 1503 –1520.
Voss , M. , Baker , A. Bange , H. W. ( 2011 ). Nitrogen processes in coastal and marine systems. In: Th e European Nitrogen Assessment , ed. M. A. Sutton , C. M. Howard , J. W. Erisman et al ., Cambridge University Press .
Wang , C. , Corbett , J. J. and Firestone , J. ( 2007 ). Improving spatial representation of global ship emissions inventories . Environ. Sci. Technol ., 42 , 193 –199.
Weigelt , A. , Weisser , W. W. , Buchmann , N. and Scherer-Lorenzen , M. ( 2009 ). Biodiversity for multifunctional grasslands: equal
Integrating nitrogen fl uxes at the European scale
376
productivity in high-diversity low-input and low-diversity high-input systems . Biogeosciences , 6, 1695 –1706.
Weiss, F., Leip, A., 2010. Methodology for quantifi cation of greenhouse gas and ammonia emissions from the livestock sector in EU27. In: Leip, A., Weiss, F., Wassenaar, T., Pexz, I., Fullmann, T., Londjani, P., Tubiesso, F., Grandgirand, D., Monni, S., Bicüa, K. (eds.) Evaluation of the livestock sector’s contribution to the EU greenhouse gas emissions (GGELS) – fi nal report. European Commission, Joint Research Centre.
Wieland , U. ( 2003 ). Water use and waste water treatment in the EU and in candidate countries. Statistics in Focus , Th eme 8–13/2003, Eurostat.
Winiwarter , W. , Hettelingh , J. P. , Bouwman , L. et al . ( 2011 ). Future scenarios of nitrogen in Europe. In: Th e European Nitrogen Assessment, ed. M. A. Sutton , C. M. Howard , J. W. Erisman et al ., Cambridge University Press .