Embed Size (px)
Citation preview
Energy Procedia 37 ( 2013 ) 7078 – 7090
1876-6102 © 2013 The Authors. Published by Elsevier Ltd.Selection and/or peer-review under responsibility of GHGTdoi: 10.1016/j.egypro.2013.06.644
GHGT-11
Integrating Calcium Looping CO2 Capture with the Manufacture of Cement
Charles Deana, Thomas Hillsa, Nick Florina,b, Denis Dugwella, Paul S. Fennella,b* aDepartment of Chemical Engineering, Imperial College London
bGrantham Institute for Climate Change
Abstract
This paper investigates the trace element content of calcium oxide sorbent after repeated cycles of calcination and carbonation in the presence of fuel combustion during the calcination step. The trace element content of the sorbent was measured using ICP-OES after a wet acid digestion procedure. The weight % of alite, the cement phase responsible for short-term strength of the cement, has been measured using XRD for cement prepared in the laboratory from single cycled and repeatedly cycled sorbent. The results indicate that repeated cycling does lead to an increase in the concentration of some trace elements entering the sorbent from the fuel. However the increase in these concentrations was not enough to impact upon the weight % of alite in the resulting clinkers produced from the sorbent. © 2013 The Authors. Published by Elsevier Ltd. Selection and/or peer-review under responsibility of GHGT Keywords: Calcium Looping, Cement Manufacture; Trace Element Analysis; X-ray diffraction
1. Introduction
The Calcium Looping Cycle is an emerging CO2 capture process which uses natural limestone cycled in a twin circulating fluidised bed (CFB) reactor system. The process has been reviewed elsewhere [1, 2] along with estimates for economic costing and efficiency penalty of different potential configurations [3]. The process offers several important benefits over competing CO2 capture options including the use of natural, environmentally benign sorbent, a lower energy penalty and a potential integration with cement manufacture [4]. A number of pilot-scale facilities demonstrating the technology are operational ranging from 10 kWth 1 MWth [5]. The residual reactivity of the sorbent degrades over repeated cycles [6]. Reactivation strategies and the design of synthetic sorbents [7] have been investigated in an attempt to
* Corresponding author. Tel.: +44 (0)20 7594 6637; fax: +44 (0)20 7594 5638;. E-mail address: [email protected].
Available online at www.sciencedirect.com
© 2013 The Authors. Published by Elsevier Ltd.Selection and/or peer-review under responsibility of GHGT
Charles Dean et al. / Energy Procedia 37 ( 2013 ) 7078 – 7090 7079
increase the final reactivity. However, the purged material, if removed from the calciner as CaO, can be used as a feed to cement production to replace limestone. This replacement immediately mitigates ~ 50 % of total cement CO2 emissions by avoiding the CO2 released from calcination of the limestone during the precalciner stage of a modern cement process (Eq. 1). Assuming a 7 % proportion of anthropogenic CO2 emissions attributable to cement manufacture [8], this would equate to the mitigation of ~ 0.75 Gt CO2 globally. CaCO3 CaO + CO2 (1) 1 kg 0 56 kg + 0 44 kg
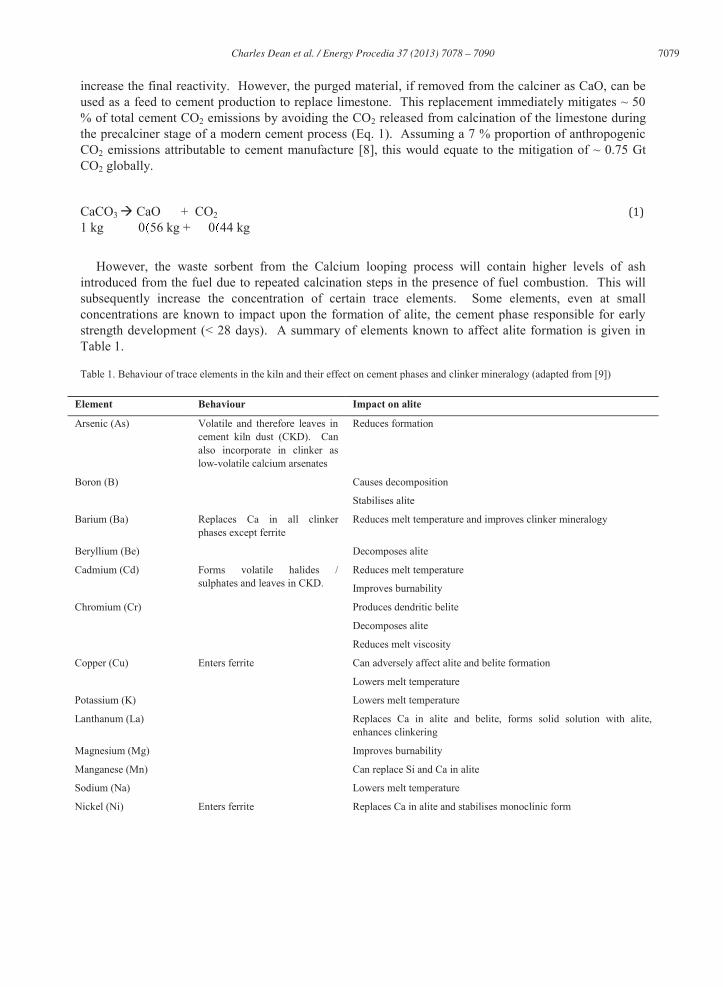
However, the waste sorbent from the Calcium looping process will contain higher levels of ash introduced from the fuel due to repeated calcination steps in the presence of fuel combustion. This will subsequently increase the concentration of certain trace elements. Some elements, even at small concentrations are known to impact upon the formation of alite, the cement phase responsible for early strength development (< 28 days). A summary of elements known to affect alite formation is given in Table 1.
Table 1. Behaviour of trace elements in the kiln and their effect on cement phases and clinker mineralogy (adapted from [9])
Element Behaviour Impact on alite
Arsenic (As) Volatile and therefore leaves in cement kiln dust (CKD). Can also incorporate in clinker as low-volatile calcium arsenates
Reduces formation
Boron (B) Causes decomposition
Stabilises alite
Barium (Ba) Replaces Ca in all clinker phases except ferrite
Reduces melt temperature and improves clinker mineralogy
Beryllium (Be) Decomposes alite
Cadmium (Cd) Forms volatile halides / sulphates and leaves in CKD.
Reduces melt temperature
Improves burnability
Chromium (Cr) Produces dendritic belite
Decomposes alite
Reduces melt viscosity
Copper (Cu) Enters ferrite Can adversely affect alite and belite formation
Lowers melt temperature
Potassium (K) Lowers melt temperature
Lanthanum (La) Replaces Ca in alite and belite, forms solid solution with alite, enhances clinkering
Magnesium (Mg) Improves burnability
Manganese (Mn) Can replace Si and Ca in alite
Sodium (Na) Lowers melt temperature
Nickel (Ni) Enters ferrite Replaces Ca in alite and stabilises monoclinic form
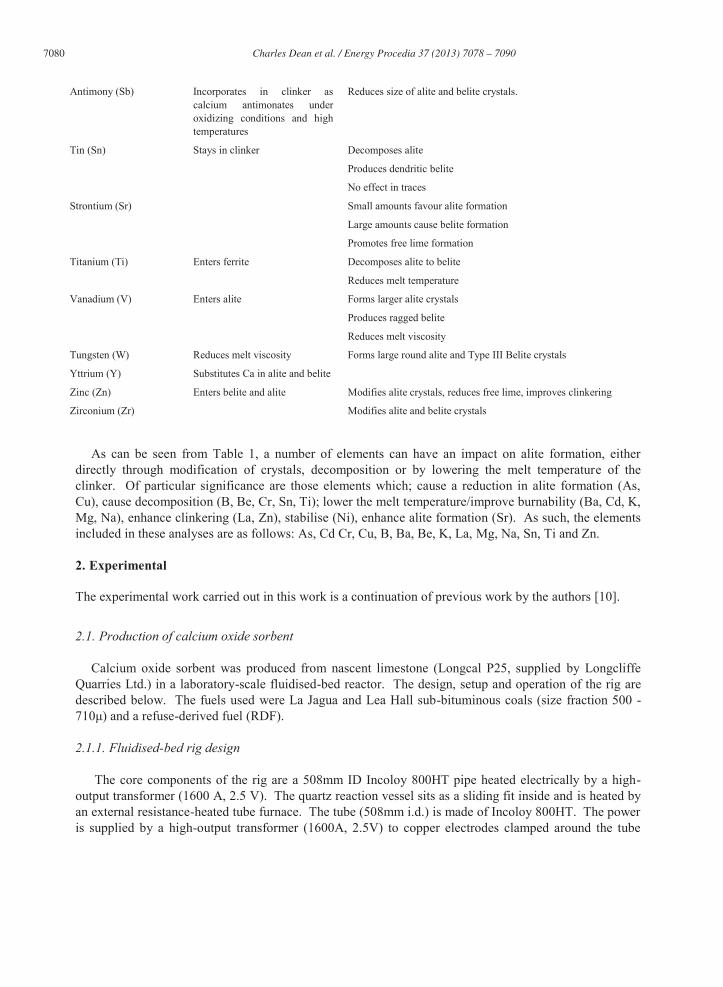
7080 Charles Dean et al. / Energy Procedia 37 ( 2013 ) 7078 – 7090
Antimony (Sb) Incorporates in clinker as calcium antimonates under oxidizing conditions and high temperatures
Reduces size of alite and belite crystals.
Tin (Sn) Stays in clinker Decomposes alite
Produces dendritic belite
No effect in traces
Strontium (Sr) Small amounts favour alite formation
Large amounts cause belite formation
Promotes free lime formation
Titanium (Ti) Enters ferrite Decomposes alite to belite
Reduces melt temperature
Vanadium (V) Enters alite Forms larger alite crystals
Produces ragged belite
Reduces melt viscosity
Tungsten (W) Reduces melt viscosity Forms large round alite and Type III Belite crystals
Yttrium (Y) Substitutes Ca in alite and belite
Zinc (Zn) Enters belite and alite Modifies alite crystals, reduces free lime, improves clinkering
Zirconium (Zr) Modifies alite and belite crystals
As can be seen from Table 1, a number of elements can have an impact on alite formation, either directly through modification of crystals, decomposition or by lowering the melt temperature of the clinker. Of particular significance are those elements which; cause a reduction in alite formation (As, Cu), cause decomposition (B, Be, Cr, Sn, Ti); lower the melt temperature/improve burnability (Ba, Cd, K, Mg, Na), enhance clinkering (La, Zn), stabilise (Ni), enhance alite formation (Sr). As such, the elements included in these analyses are as follows: As, Cd Cr, Cu, B, Ba, Be, K, La, Mg, Na, Sn, Ti and Zn.
2. Experimental
The experimental work carried out in this work is a continuation of previous work by the authors [10].
2.1. Production of calcium oxide sorbent
Calcium oxide sorbent was produced from nascent limestone (Longcal P25, supplied by Longcliffe Quarries Ltd.) in a laboratory-scale fluidised-bed reactor. The design, setup and operation of the rig are described below. The fuels used were La Jagua and Lea Hall sub-bituminous coals (size fraction 500 -
-derived fuel (RDF).
2.1.1. Fluidised-bed rig design
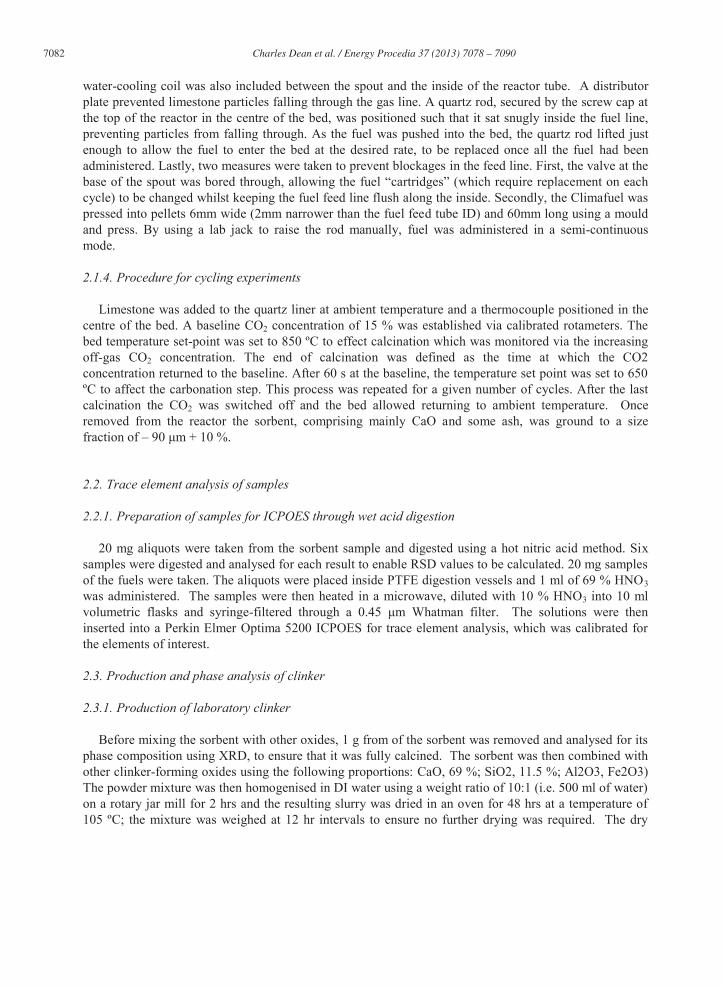
The core components of the rig are a 508mm ID Incoloy 800HT pipe heated electrically by a high-output transformer (1600 A, 2.5 V). The quartz reaction vessel sits as a sliding fit inside and is heated by an external resistance-heated tube furnace. The tube (508mm i.d.) is made of Incoloy 800HT. The power is supplied by a high-output transformer (1600A, 2.5V) to copper electrodes clamped around the tube
Charles Dean et al. / Energy Procedia 37 ( 2013 ) 7078 – 7090 7081
through two sets of ten copper cables (75mm2 cross-section, 800mm length). The electrodes have been positioned to ensure that the bed of limestone sits at the hottest part of the reaction vessel, as indicated by the arrows on Fig. 1 below. The power to the electrodes is controlled by a power control unit. The
monitored, along with the CO2 software. The program allows PID control of the bed temperature to a user inputted setpoint. The tube and the electrodes are insulated with three layers of Superwool® 607 Max blanket. The heat shrink used on the copper cables and the rubber sheath closest to the electrodes are water-cooled by a series of soft
of the cable.
2.1.2. Rig setup procedure: Coal Experiments
The quartz liner was first rinsed with deionised water and dried overnight. The supporting tube was put into position at the base of the reactor. Before placing the liner into the reactor down towards the supporting tube, a small square piece of Superwool was pushed onto the base of the cone to prevent the liner from cracking during the experiment. Next, a 100 g batch of 500 m Longcal P25 was dropped into the liner to form the bed. A type K thermocouple was secured such that the tip was located at the centre of the bed in both horizontal and vertical planes (25mm from the top of the sintered disc for a bed height of 50mm) and the off-gas line was secured in place at the top of the quartz liner. For the coal experiments, a fuel feed line and associated apparatus was put in position (See below). The fluidising gas line was connected to the base of the quartz liner using a Unex clip, the water-cooling to the electrical cables (and fuel feed line) was switched on at a total flow rate of 2.7 litres / minute and the extractor hood was placed over the top of the entire setup, secured in place by four wing-nuts. For the coal experiments the fuel feed line (quartz) was secured in place such that the tip reached 10 mm into the bed; ideally the line would be placed such that the tip reached closer to the base of the bed to enable more efficient mixing; however it was found that any further and the water-cooling passing through the fuel feed line prevented the bed from reaching calcination temperature. A sweep-gas line positioned underneath the hopper ensured that the falling coal particles were entrained into the bed. The fuel feed line was positioned off-centre to ensure that the fluidising gas did not prevent the sweep-gas from entraining the granules into the bed. The fuel hopper was attached to the feed line using electrical heat-shrink insulation material. During the cycling experiment, fuel was started to be fed from the point at which calcination could be detected, based on the initial rise in CO2 concentration. Coal was fed at a rate of 0.5 g / minute over a period of 16 minutes (8 g of coal in total for each cycle) based on flowsheeting work which predicted the ratio of coal to limestone in a full-scale plant.
2.1.3. Modifications for RDF: feeder design & procedure
To enable underbed feeding of RDF, it was necessary to switch to a spouted bed design rather than a fluidised bed. This was because the highly inhomogenous and fibrous RDF, known as Climafuel, could not be fed using the standard fuel feeder. A novel design for the spout was developed. The spout
had base; the fluidising gas travelled base of the quartz liner, serving two functions. Firstly, it allowed the fluidising gas to reach the bed whilst
gas. Secondly, by having the fluidising gas travel up the outside of the fuel feeding tube, the gas served as cooling air, hindering any potential for combustion/pyrolysis of the fuel before reaching
7082 Charles Dean et al. / Energy Procedia 37 ( 2013 ) 7078 – 7090
water-cooling coil was also included between the spout and the inside of the reactor tube. A distributor plate prevented limestone particles falling through the gas line. A quartz rod, secured by the screw cap at the top of the reactor in the centre of the bed, was positioned such that it sat snugly inside the fuel line, preventing particles from falling through. As the fuel was pushed into the bed, the quartz rod lifted just enough to allow the fuel to enter the bed at the desired rate, to be replaced once all the fuel had been administered. Lastly, two measures were taken to prevent blockages in the feed line. First, the valve at the base of the spout was bo cartridges (which require replacement on each cycle) to be changed whilst keeping the fuel feed line flush along the inside. Secondly, the Climafuel was pressed into pellets 6mm wide (2mm narrower than the fuel feed tube ID) and 60mm long using a mould and press. By using a lab jack to raise the rod manually, fuel was administered in a semi-continuous mode.
2.1.4. Procedure for cycling experiments
Limestone was added to the quartz liner at ambient temperature and a thermocouple positioned in the centre of the bed. A baseline CO2 concentration of 15 % was established via calibrated rotameters. The bed temperature set-point was set to 850 ºC to effect calcination which was monitored via the increasing off-gas CO2 concentration. The end of calcination was defined as the time at which the CO2 concentration returned to the baseline. After 60 s at the baseline, the temperature set point was set to 650 ºC to affect the carbonation step. This process was repeated for a given number of cycles. After the last calcination the CO2 was switched off and the bed allowed returning to ambient temperature. Once removed from the reactor the sorbent, comprising mainly CaO and some ash, was ground to a size fraction of m + 10 %.
2.2. Trace element analysis of samples
2.2.1. Preparation of samples for ICPOES through wet acid digestion
20 mg aliquots were taken from the sorbent sample and digested using a hot nitric acid method. Six samples were digested and analysed for each result to enable RSD values to be calculated. 20 mg samples of the fuels were taken. The aliquots were placed inside PTFE digestion vessels and 1 ml of 69 % HNO3 was administered. The samples were then heated in a microwave, diluted with 10 % HNO3 into 10 ml volumetric flasks and syringe-filtered through a 0.45 m Whatman filter. The solutions were then inserted into a Perkin Elmer Optima 5200 ICPOES for trace element analysis, which was calibrated for the elements of interest.
2.3. Production and phase analysis of clinker
2.3.1. Production of laboratory clinker
Before mixing the sorbent with other oxides, 1 g from of the sorbent was removed and analysed for its phase composition using XRD, to ensure that it was fully calcined. The sorbent was then combined with other clinker-forming oxides using the following proportions: CaO, 69 %; SiO2, 11.5 %; Al2O3, Fe2O3) The powder mixture was then homogenised in DI water using a weight ratio of 10:1 (i.e. 500 ml of water) on a rotary jar mill for 2 hrs and the resulting slurry was dried in an oven for 48 hrs at a temperature of 105 ºC; the mixture was weighed at 12 hr intervals to ensure no further drying was required. The dry
Charles Dean et al. / Energy Procedia 37 ( 2013 ) 7078 – 7090 7083
mixture was then pressed into a brick pellet using a metal mould to a pressure of 100 bar and fired in the centre of a tube furnace in a platinum boat at 1450 ºC for 2 hrs. Air was passed through the tube furnace at 2 l / min. At the end of the heating program the brick was pushed directly from the centre of the furnace into a cooling chamber where air was blown onto the sample at a flow rate of until cool enough to be removed by hand. The resulting brick was then broken up and ground to -
Fig. 1. Fluidised-bed rig setup with coal-granule feeder
7084 Charles Dean et al. / Energy Procedia 37 ( 2013 ) 7078 – 7090
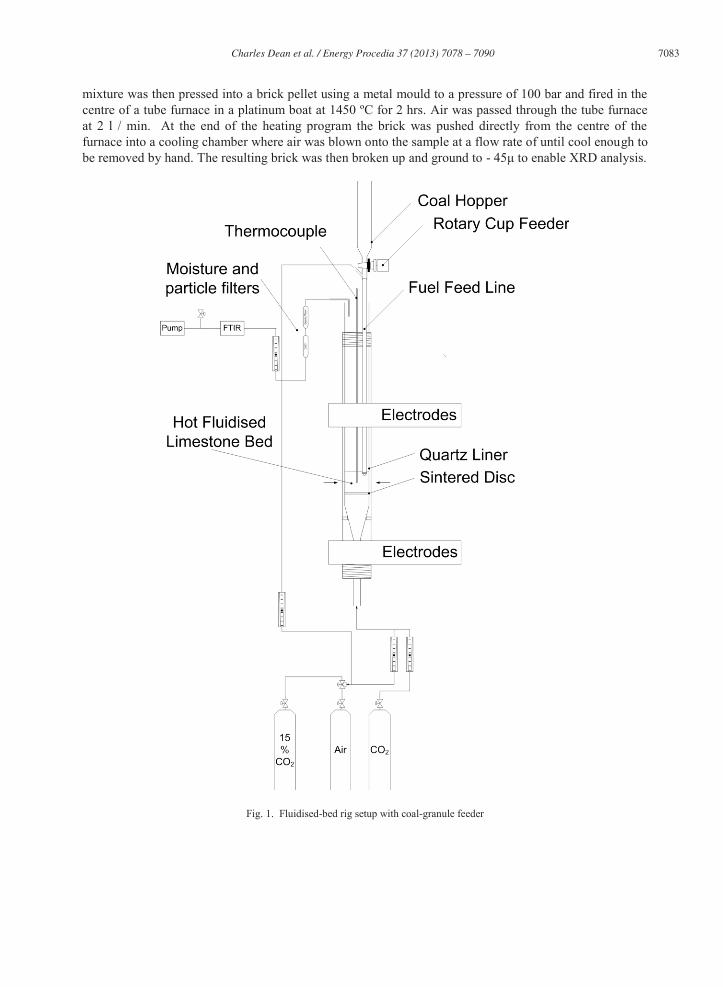
Fig. 2. a) Mixed oxide pellet before firing b) clinker after firing. The coin in both cases is a UK five pence piece, diameter 18mm.
Charles Dean et al. / Energy Procedia 37 ( 2013 ) 7078 – 7090 7085
2.4. Determining the proportion of alite in the clinkers
A calibration curve for alite was produced by producing alite in pure form and mixing with CeO2 as an internal standard. Pure alite was produced by mixing a commercial clinker with limestone powder, pressing into a brick, firing at 1450º C and cooling rapidly. This was to convert any belite residing in the
moved using a hot KOH-sugar selective extraction procedure [11], leaving just the alite phase. The pure alite was then mixed using Fe2O3 as a matrix and a small proportion of CeO2. The ratio of the two peak intensities (alite and CeO2) were plotted against the weight % alite to enable a calibration curve to be produced. All clinker samples were mixed with CeO2 in the same proportion. The ratio of the two peak intensities (the alite and CeO2 peak) was multiplied by the slope of the calibration curve to five the % alite in the unknown samples.
3. Results and Discussion
3.1. Trace element results of fuels
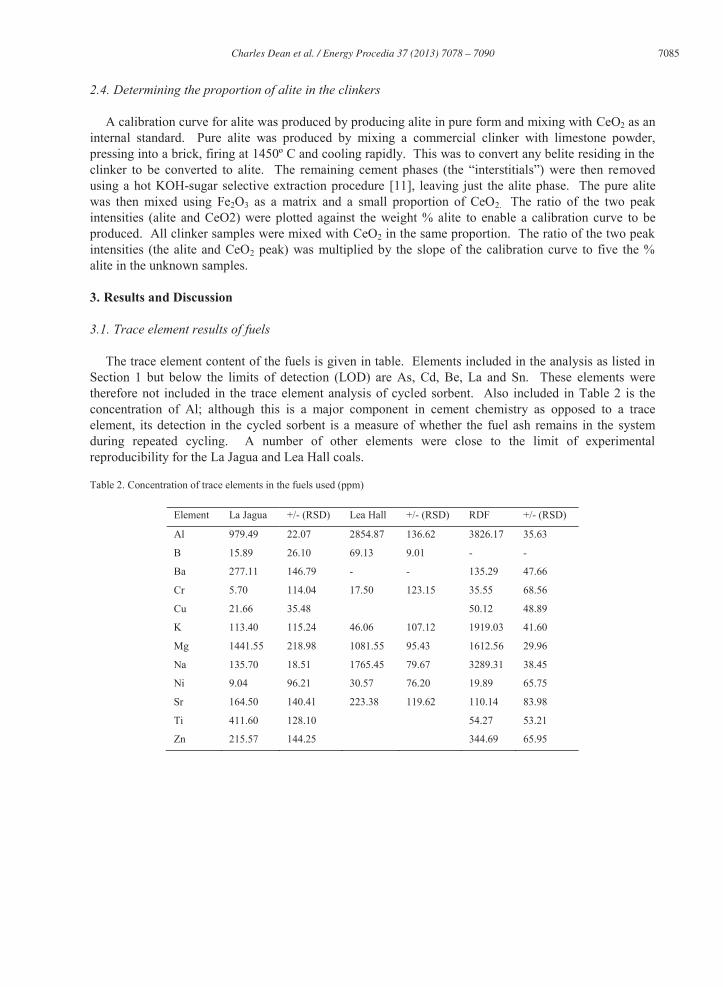
The trace element content of the fuels is given in table. Elements included in the analysis as listed in Section 1 but below the limits of detection (LOD) are As, Cd, Be, La and Sn. These elements were therefore not included in the trace element analysis of cycled sorbent. Also included in Table 2 is the concentration of Al; although this is a major component in cement chemistry as opposed to a trace element, its detection in the cycled sorbent is a measure of whether the fuel ash remains in the system during repeated cycling. A number of other elements were close to the limit of experimental reproducibility for the La Jagua and Lea Hall coals.
Table 2. Concentration of trace elements in the fuels used (ppm)
Element La Jagua +/- (RSD) Lea Hall +/- (RSD) RDF +/- (RSD)
Al 979.49 22.07 2854.87 136.62 3826.17 35.63
B 15.89 26.10 69.13 9.01 - -
Ba 277.11 146.79 - - 135.29 47.66
Cr 5.70 114.04 17.50 123.15 35.55 68.56
Cu 21.66 35.48 50.12 48.89
K 113.40 115.24 46.06 107.12 1919.03 41.60
Mg 1441.55 218.98 1081.55 95.43 1612.56 29.96
Na 135.70 18.51 1765.45 79.67 3289.31 38.45
Ni 9.04 96.21 30.57 76.20 19.89 65.75
Sr 164.50 140.41 223.38 119.62 110.14 83.98
Ti 411.60 128.10 54.27 53.21
Zn 215.57 144.25 344.69 65.95
7086 Charles Dean et al. / Energy Procedia 37 ( 2013 ) 7078 – 7090
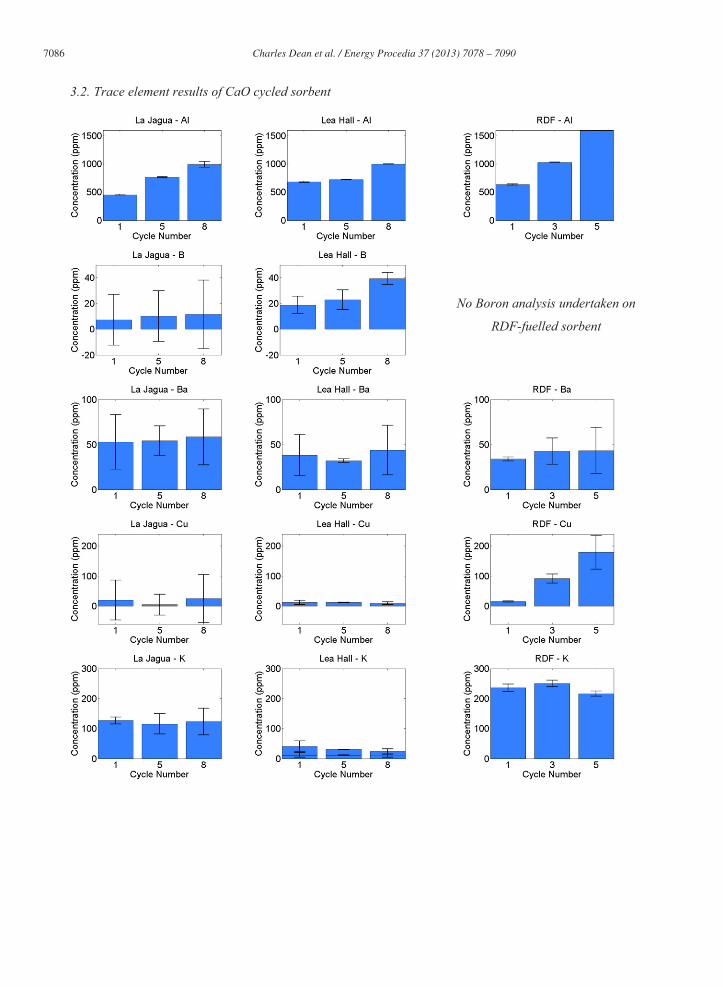
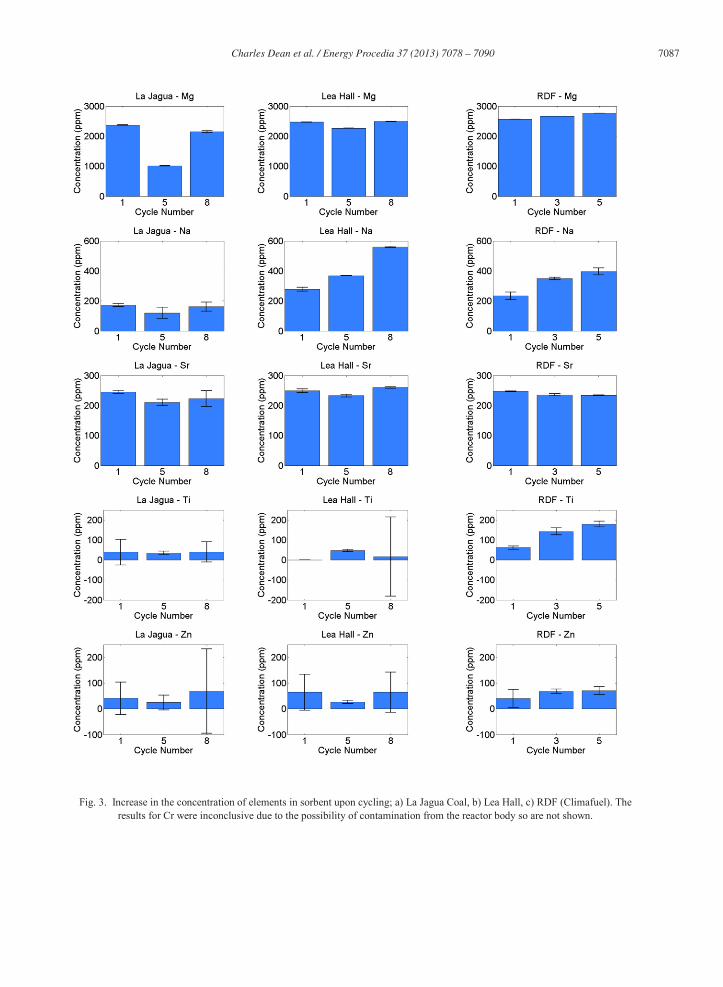
3.2. Trace element results of CaO cycled sorbent
No Boron analysis undertaken on
RDF-fuelled sorbent
Charles Dean et al. / Energy Procedia 37 ( 2013 ) 7078 – 7090 7087
Fig. 3. Increase in the concentration of elements in sorbent upon cycling; a) La Jagua Coal, b) Lea Hall, c) RDF (Climafuel). The results for Cr were inconclusive due to the possibility of contamination from the reactor body so are not shown.
7088 Charles Dean et al. / Energy Procedia 37 ( 2013 ) 7078 – 7090
Fig. 3 indicates that based on the increase in Al content, the ash is interacting with the sorbent.
However for most other elements the concentration remains (within the limits of experimental error) the same upon cycling. This may be due to the small amount of ash in the system in relation to the amount of CaO, making any increases in concentration difficult to detect.
Elements which did increase during cycling for all fuels included were Ba, Cr, K, Mg, Ni, Sr and Zn
(some plots indicate a small increase however these increases are within the error bounds and therefore not a clear indication of a concentration increase). The concentration of B is clearly seen to increase for the La Jagua experiments, however not for Lea Hall (B was not found to be present in the RDF). The Cu concentration remained the same for the two coals fuels but clearly increased in the RDF experiments. Na remained the same for the La Jagua experiments but increased for both the Lea Hall coal and the RDF case. Ti remained the same for La Jagua but saw a clear increase in the RDF case.
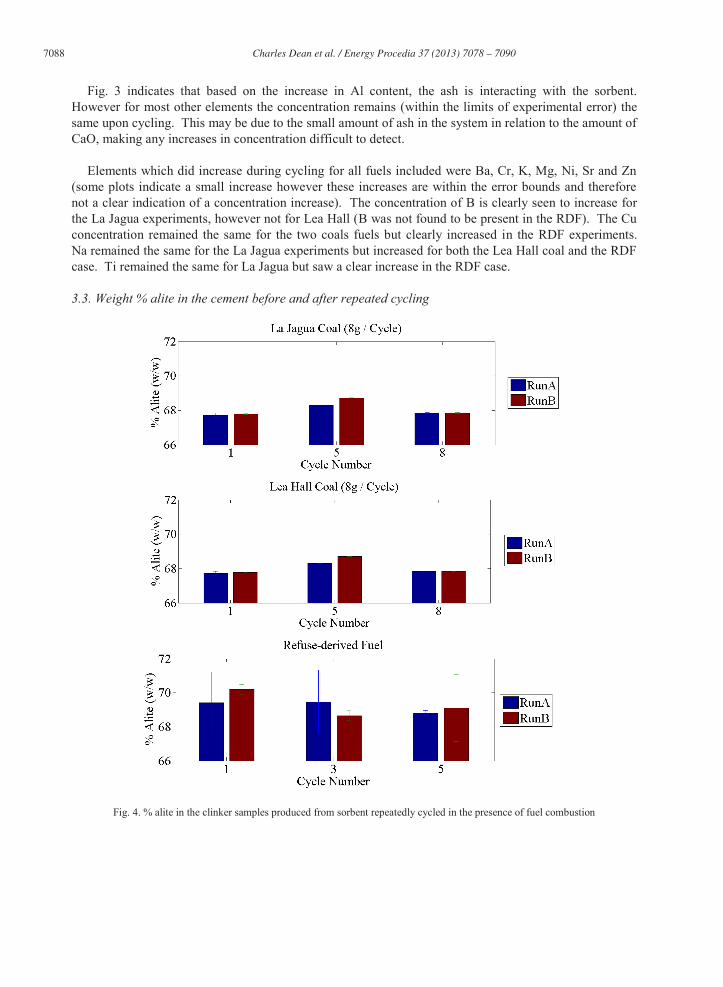
3.3. Weight % alite in the cement before and after repeated cycling
Fig. 4. % alite in the clinker samples produced from sorbent repeatedly cycled in the presence of fuel combustion
Charles Dean et al. / Energy Procedia 37 ( 2013 ) 7078 – 7090 7089
The results for weight % alite in the clinker samples produced from sorbent repeatedly cycled in the presence of fuel combustion (Fig. 4) indicate that the increase in concentration of some trace elements known to impact on the formation of alite crystals, the concentration increases were not sufficient to affect a change in % alite in these experiments.
4. Conclusions
Methods have been developed to enable the production of cycled CaO sorbent similar to that purged from a real Calcium looping process and to be converted into cement clinker. The results indicate that ash is entering the sorbent as indicated by an increase in Al concentration. Though most trace element concentrations do not increase upon repeated cycling, B, Cu, Na and Ti all saw increases in concentration upon cycling for at least one fuel. However these increases were too small to affect any change in the weight % of alite in the clinkers produced. One significant issue is the small quantities of fuels tested for trace element content making determination of the trace element inventory challenging.
5. Copyright
Acknowledgements
The authors would like to thank the EPSRC for a DTA studentship for Mr Dean and CEMEX UK Operations Limited for additional funding and technical information. Additional thanks to Dr Nick Florin and the Grantham Institute for Climate Change at Imperial College London for support.
References
1. Blamey, J., et al., The calcium looping cycle for large-scale CO2 capture. Progress in Energy and Combustion Science. 36(2): p. 260-279.
2. Anthony, E.J., Solid Looping Cycles: A New Technology for Coal Conversion. Industrial & Engineering Chemistry Research, 2008. 47(6): p. 1747-1754.
3. Abanades, J.C., et al., Fluidized Bed Combustion Systems Integrating CO2 Capture with CaO. 2005. p. 2861-2866.
4. Bosoaga, A., O. Masek, and J.E. Oakey, CO2 Capture Technologies for Cement Industry. Energy Procedia, 2009. 1(1): p. 133-140.
5. Dean, C.C., et al., The calcium looping cycle for CO2 capture from power generation, cement manufacture and hydrogen production. Chemical Engineering Research and Design, 2011. 89(6): p. 836-855.
6. Fennell, P.S., et al., The Effects of Repeated Cycles of Calcination and Carbonation on a Variety of Different Limestones, as Measured in a Hot Fluidized Bed of Sand, in Energy and Fuels. 2007. p. 2072-2081.
7. Florin, N. and P. Fennell, Synthetic CaO-based sorbent for CO2 capture. Energy Procedia, 2011. 4(0): p. 830-838.
8. Worrell, E., et al., Carbon dioxide emissions from the global cement industry. Annual Review of Energy and the Environment, 2001. 26: p. 303-329.
9. Bhatty, J.I., F.M. Miller, and S.H. Kosmatka, Innovations in Portland Cement Manufacturing. Portland Cement Association, Illinois, USA, 2004.

7090 Charles Dean et al. / Energy Procedia 37 ( 2013 ) 7078 – 7090
10. Dean, C.C., D. Dugwell, and P.S. Fennell, Investigation into potential synergy between power generation, cement manufacture and CO2 abatement using the calcium looping cycle. Energy & Environmental Science, 2011. 4(6): p. 2050-2053.
11. Stutzman, P.E., Guide for X-Ray Powder Diffraction Analysis of Portland Cement and Clinker. 1996, National Institute of Standards and Technology.


