Embed Size (px)
Citation preview
1
Institutional context of soil information in
India
2
Table of Contents
Table of Contents ............................................................................................................................................ 2
Table of Tables ................................................................................................................................................. 4
Table of Figures ............................................................................................................................................... 5
CHAPTER I ........................................................................................................................................................ 6
Main problems in Indian agriculture ................................................................................................................ 6
1.1. Objectives of the Study ..................................................................................................................... 7
1.2. Scope ................................................................................................................................................... 7
1.3. Methodology ....................................................................................................................................... 7
1.4. Description of study area .................................................................................................................. 8
CHAPTER II .....................................................................................................................................................11
2.1. Soil degradation .....................................................................................................................................11
2.2.1. Government administrative machinery at national level .........................................................12
2.2.2. Soil health management (SHM) programmes .............................................................................13
2.2.3. Research, education and extension on soil health management .........................................15
2.2.4. Watershed Development Programme (WDP) ..............................................................................15
CHAPTER III ....................................................................................................................................................31
Institutional and political obstacles in soil health management ......................................................31
3.1.1. Production of fertilizers ....................................................................................................................31
3.1.2. Subsidies ..............................................................................................................................................31
3.1.3. Prices .....................................................................................................................................................32
CHAPTER IV ....................................................................................................................................................39
4.1. Types of training institutes .................................................................................................................39
4.1.1. Key training institutes .......................................................................................................................39
4.1.2. Agricultural universities ...................................................................................................................40
4.2. Types of training activities ..................................................................................................................42
4.2.1. Training courses .................................................................................................................................42
4.2.2. Number of training courses by SAMETIs .....................................................................................42
4.2.3. Course content....................................................................................................................................43
4.2.4. Training inputs on SHM ....................................................................................................................43
3
4.3. Private training institutes ....................................................................................................................44
4.4. Extension personnel .............................................................................................................................44
4.4.1. Status in MP and Maharashtra ........................................................................................................45
4.4.2. Technical knowledge .........................................................................................................................47
4.4.3. Constraints ...........................................................................................................................................47
CHAPTER V .....................................................................................................................................................49
5.1. National level training programmes .................................................................................................49
5.2. Farmer soil management strategies .................................................................................................51
5.3. Two-way process ...................................................................................................................................51
5.4. Incorporation of farmer strategies in training courses ...............................................................52
CHAPTER VI ....................................................................................................................................................52
6.1. Government initiatives .........................................................................................................................52
6.2. Private initiatives ...................................................................................................................................53
6.3. General observations ...........................................................................................................................54
Summary ..........................................................................................................................................................55
Annexes ...........................................................................................................................................................61
4
Table of Tables
Table 1. Demographic Features and Land Utilization Pattern ........................................................... 8
Table 2. Key Ministries and Departments at National Level ............................................................ 13
Table 3. A Broad Estimate of Investment in Key Programmes........................................................ 16
Table 4. Investment in Major Agriculture and WDP programmes in MP and Maharashtra .............. 18
Table 5. Soil Testing Infrastructure and Progress in Soil Health Cards ........................................... 21
Table 6. Production, Imports and Consumption of Chemical Fertilizers in Million Tonnes ............... 26
Table 7. Training/Education Agencies ............................................................................................ 39
Table 8. Extension Personnel Status in MP and Maharashtra ........................................................ 46
Table 9. Research and Training Institutes ...................................................................................... 49
5
Table of Figures
Figure 1 Agro Climatic Zones ................................................................................................................................ 9
Figure 2. Soils on Madhya Pradesh and Maharashtra ........................................................................................10
Figure 3. Organization Structure of State Agriculture Departments in Madhya Pradesh and Maharashtra
............................................................................................................................... Error! Bookmark not defined.
6
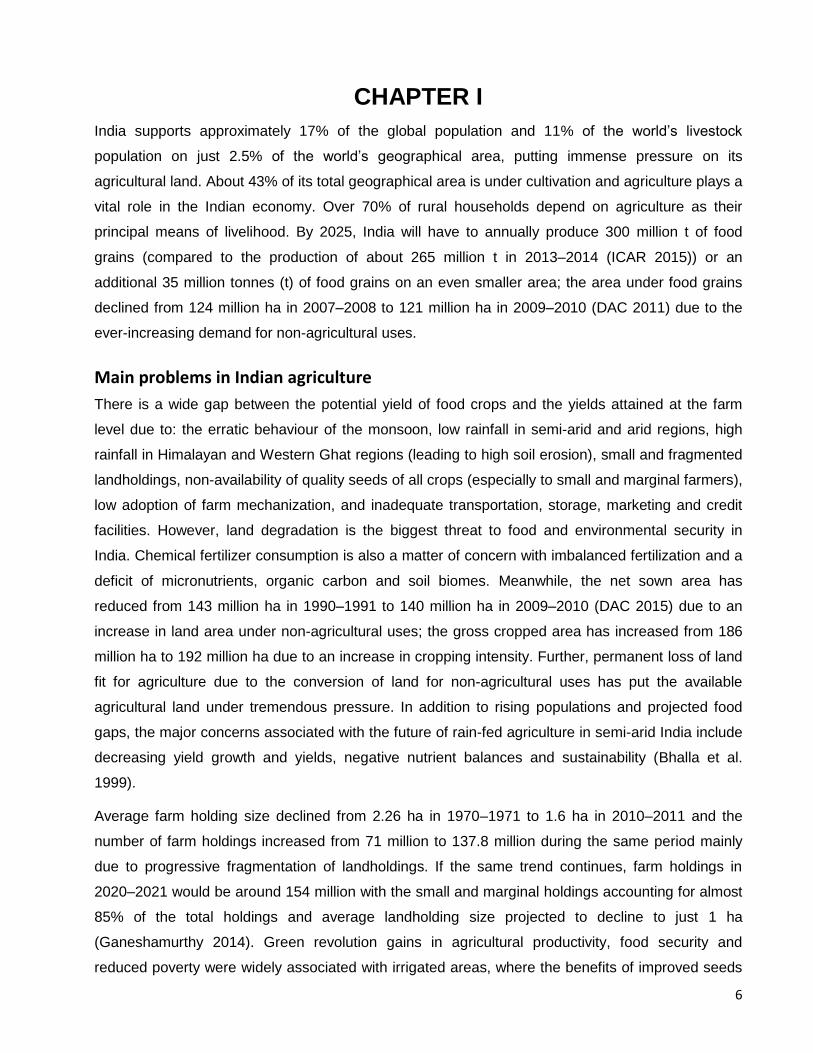
CHAPTER I
India supports approximately 17% of the global population and 11% of the world’s livestock
population on just 2.5% of the world’s geographical area, putting immense pressure on its
agricultural land. About 43% of its total geographical area is under cultivation and agriculture plays a
vital role in the Indian economy. Over 70% of rural households depend on agriculture as their
principal means of livelihood. By 2025, India will have to annually produce 300 million t of food
grains (compared to the production of about 265 million t in 2013–2014 (ICAR 2015)) or an
additional 35 million tonnes (t) of food grains on an even smaller area; the area under food grains
declined from 124 million ha in 2007–2008 to 121 million ha in 2009–2010 (DAC 2011) due to the
ever-increasing demand for non-agricultural uses.
Main problems in Indian agriculture
There is a wide gap between the potential yield of food crops and the yields attained at the farm
level due to: the erratic behaviour of the monsoon, low rainfall in semi-arid and arid regions, high
rainfall in Himalayan and Western Ghat regions (leading to high soil erosion), small and fragmented
landholdings, non-availability of quality seeds of all crops (especially to small and marginal farmers),
low adoption of farm mechanization, and inadequate transportation, storage, marketing and credit
facilities. However, land degradation is the biggest threat to food and environmental security in
India. Chemical fertilizer consumption is also a matter of concern with imbalanced fertilization and a
deficit of micronutrients, organic carbon and soil biomes. Meanwhile, the net sown area has
reduced from 143 million ha in 1990–1991 to 140 million ha in 2009–2010 (DAC 2015) due to an
increase in land area under non-agricultural uses; the gross cropped area has increased from 186
million ha to 192 million ha due to an increase in cropping intensity. Further, permanent loss of land
fit for agriculture due to the conversion of land for non-agricultural uses has put the available
agricultural land under tremendous pressure. In addition to rising populations and projected food
gaps, the major concerns associated with the future of rain-fed agriculture in semi-arid India include
decreasing yield growth and yields, negative nutrient balances and sustainability (Bhalla et al.
1999).
Average farm holding size declined from 2.26 ha in 1970–1971 to 1.6 ha in 2010–2011 and the
number of farm holdings increased from 71 million to 137.8 million during the same period mainly
due to progressive fragmentation of landholdings. If the same trend continues, farm holdings in
2020–2021 would be around 154 million with the small and marginal holdings accounting for almost
85% of the total holdings and average landholding size projected to decline to just 1 ha
(Ganeshamurthy 2014). Green revolution gains in agricultural productivity, food security and
reduced poverty were widely associated with irrigated areas, where the benefits of improved seeds
7
and increased use of inorganic fertilizers could be realized. However, there is less potential for
expansion of irrigated agriculture as it is increasingly expensive to bring new land under irrigation –
water resources are limited and there are widespread problems associated with over-exploitation of
groundwater. Under the above circumstances, soil health management (SHM) has a key role to play
in sustaining the agricultural sector in the country.
1.1. Objectives of the Study
To study the institutional context of soil information in India, research, investments, training and
extension systems and produce a report with focus on Madhya Pradesh and Maharashtra states
To offer insights into the status of soil sampling, nutrient analysis, the fertilizer availability
scenario and constraints associated with it, governmental advisory and extension services,
training and awareness activities taken up by the government institutions
To give a broad understanding of the implementation of relevant government programmes and
activities and whether two states under the study conform to the national plans
To study the role played by the private players in the above context
1.2. Scope
The study has attempted to broadly analyse the institutional context within which soil research,
management and extension take place in India by studying various programmes that are being
implemented by the Government of India (GOI), state agricultural departments of Madhya Pradesh
(MP) and Maharashtra and the Indian Council of Agricultural Research (ICAR) system. The analysis
tries to throw light on whether soil fertility and degradation issues appear in national policy and
strategy documents, how the two states under study may or may not integrate soils into overall
agricultural planning, and how much difference may be there per state when they conform to the
national plans. Key issues such as soil testing and SHM, inorganic fertilizer availability, extension
services, training, knowledge availability-updating and sharing, innovative initiatives and adoption of
sustainable agriculture are discussed to understand the status of the institutional framework and
the capacity of agricultural entities to promote SHM.
1.3. Methodology
The study consists of four components: literature and policy review (for providing the background
information and conceptual framework); secondary data collection from studying annual reports;
policy briefs; and official websites and information obtained either from the concerned organizations
officially or individuals working in those organizations through interviews and interactions and report
writing. Available agricultural statistics has been examined keeping the context in mind. Discussions
were held with administrators, academicians, scientists, CSOs etc. to get a broad understanding of
8
policy focus on the subject, the activities of training and extension and constraints being faced at
present in implementing related government programmes effectively.
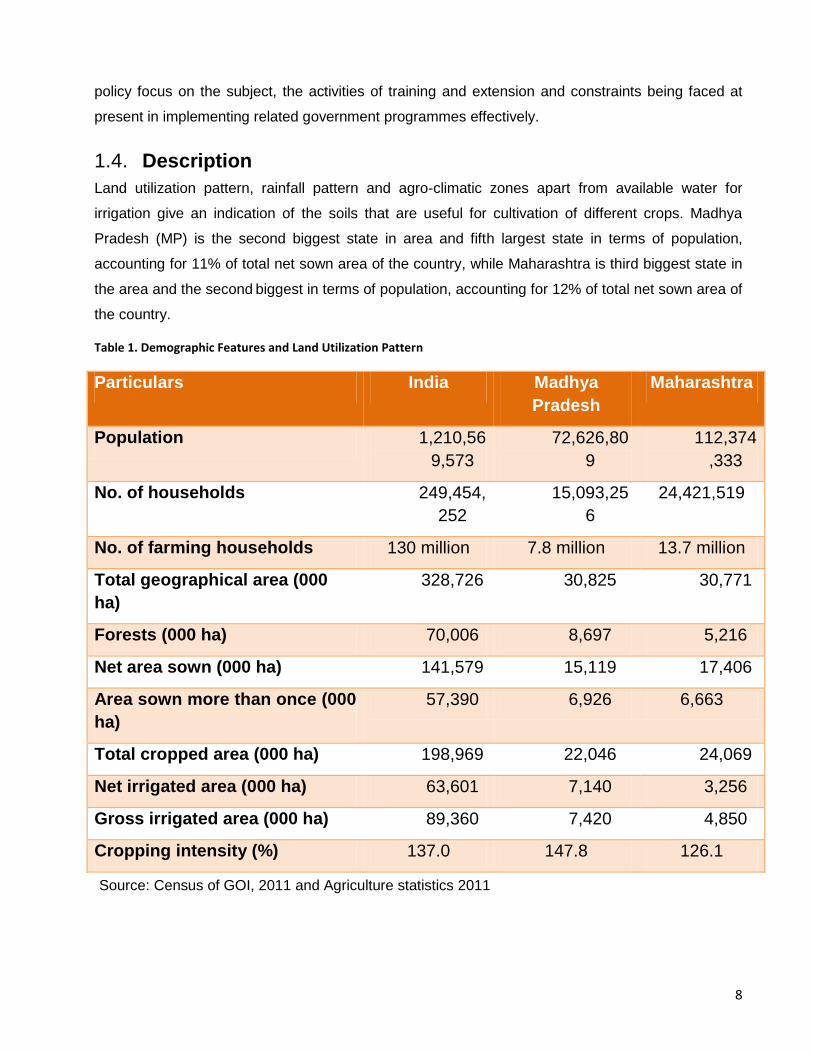
1.4. Description of study area
Land utilization pattern, rainfall pattern and agro-climatic zones apart from available water for
irrigation give an indication of the soils that are useful for cultivation of different crops. Madhya
Pradesh (MP) is the second biggest state in area and fifth largest state in terms of population,
accounting for 11% of total net sown area of the country, while Maharashtra is third biggest state in
the area and the second biggest in terms of population, accounting for 12% of total net sown area of
the country.
Table 1. Demographic Features and Land Utilization Pattern
Particulars India Madhya
Pradesh
Maharashtra
Population 1,210,56
9,573
72,626,80
9
112,374
,333
No. of households 249,454,
252
15,093,25
6
24,421,519
No. of farming households 130 million 7.8 million 13.7 million
Total geographical area (000
ha)
328,726 30,825 30,771
Forests (000 ha) 70,006 8,697 5,216
Net area sown (000 ha) 141,579 15,119 17,406
Area sown more than once (000
ha)
57,390 6,926 6,663
Total cropped area (000 ha) 198,969 22,046 24,069
Net irrigated area (000 ha) 63,601 7,140 3,256
Gross irrigated area (000 ha) 89,360 7,420 4,850
Cropping intensity (%) 137.0 147.8 126.1
Source: Census of GOI, 2011 and Agriculture statistics 2011
9
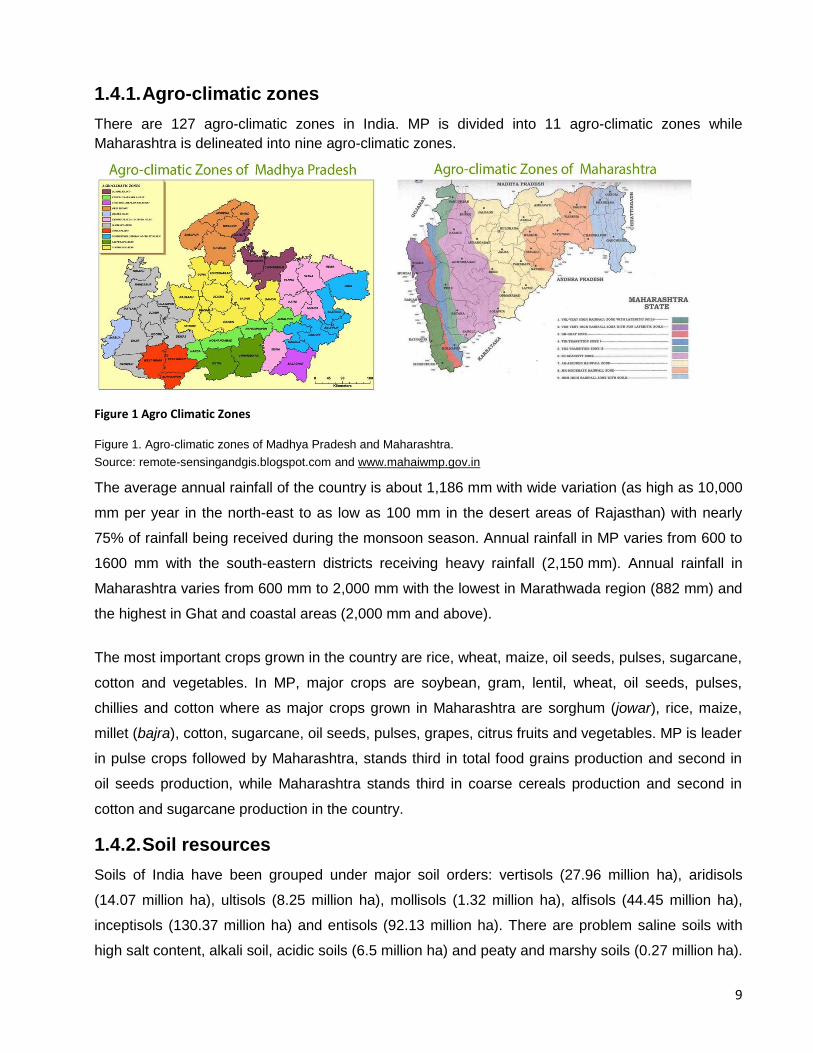
1.4.1. Agro-climatic zones
There are 127 agro-climatic zones in India. MP is divided into 11 agro-climatic zones while
Maharashtra is delineated into nine agro-climatic zones.
Figure 1 Agro Climatic Zones
Figure 1. Agro-climatic zones of Madhya Pradesh and Maharashtra.
Source: remote-sensingandgis.blogspot.com and www.mahaiwmp.gov.in
The average annual rainfall of the country is about 1,186 mm with wide variation (as high as 10,000
mm per year in the north-east to as low as 100 mm in the desert areas of Rajasthan) with nearly
75% of rainfall being received during the monsoon season. Annual rainfall in MP varies from 600 to
1600 mm with the south-eastern districts receiving heavy rainfall (2,150 mm). Annual rainfall in
Maharashtra varies from 600 mm to 2,000 mm with the lowest in Marathwada region (882 mm) and
the highest in Ghat and coastal areas (2,000 mm and above).
The most important crops grown in the country are rice, wheat, maize, oil seeds, pulses, sugarcane,
cotton and vegetables. In MP, major crops are soybean, gram, lentil, wheat, oil seeds, pulses,
chillies and cotton where as major crops grown in Maharashtra are sorghum (jowar), rice, maize,
millet (bajra), cotton, sugarcane, oil seeds, pulses, grapes, citrus fruits and vegetables. MP is leader
in pulse crops followed by Maharashtra, stands third in total food grains production and second in
oil seeds production, while Maharashtra stands third in coarse cereals production and second in
cotton and sugarcane production in the country.
1.4.2. Soil resources
Soils of India have been grouped under major soil orders: vertisols (27.96 million ha), aridisols
(14.07 million ha), ultisols (8.25 million ha), mollisols (1.32 million ha), alfisols (44.45 million ha),
inceptisols (130.37 million ha) and entisols (92.13 million ha). There are problem saline soils with
high salt content, alkali soil, acidic soils (6.5 million ha) and peaty and marshy soils (0.27 million ha).
10
Indian soils contain only 0.05% nitrogen (N), 0.6% of organic carbon, and 1.03% of organic matter
on average due to the tropical climate. Red soils are generally deficient in N, phosphate (P), humus
and lime with varying depth and fertility and produce a large variety of crops under rain-fed or
irrigated conditions. Lateritic soils are deficient in potash (K), P and lime and are important for rice.
Black soils are deficient in N, P and organic matter and are suitable for cotton cultivation. Alluvial
soils are the most fertile amongst the Indian soils and they support a variety of crops, including rice,
wheat and sugarcane (NAAS 2012).
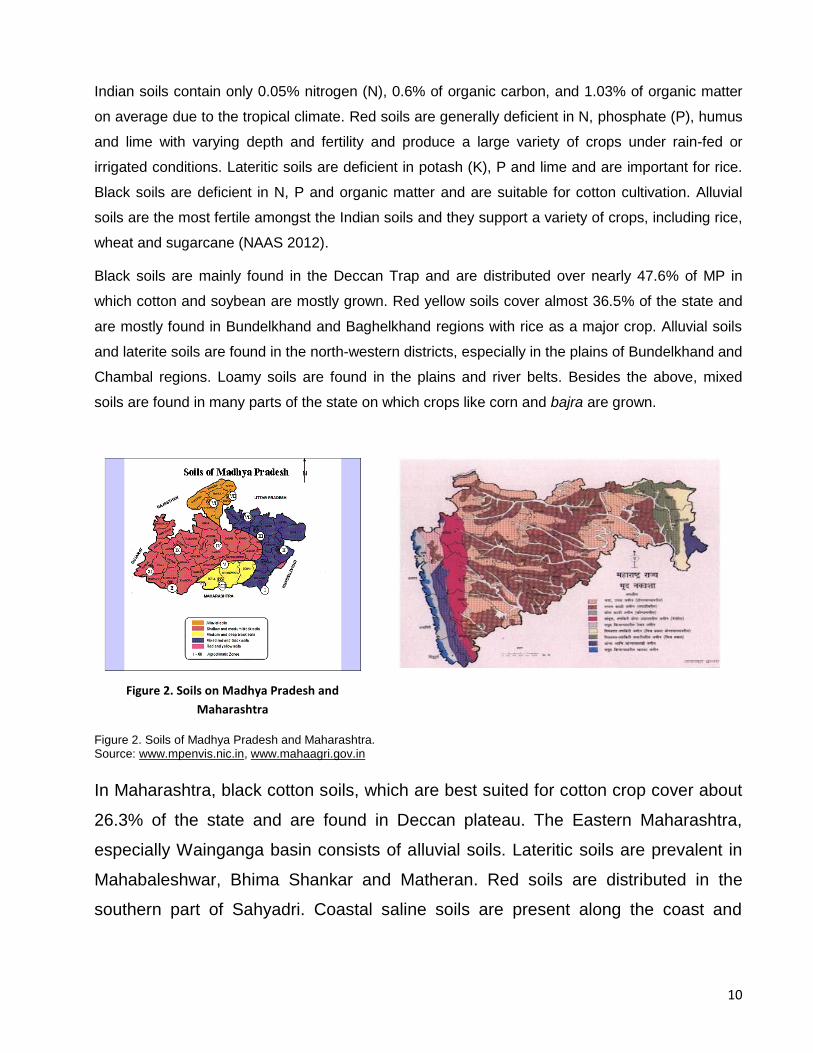
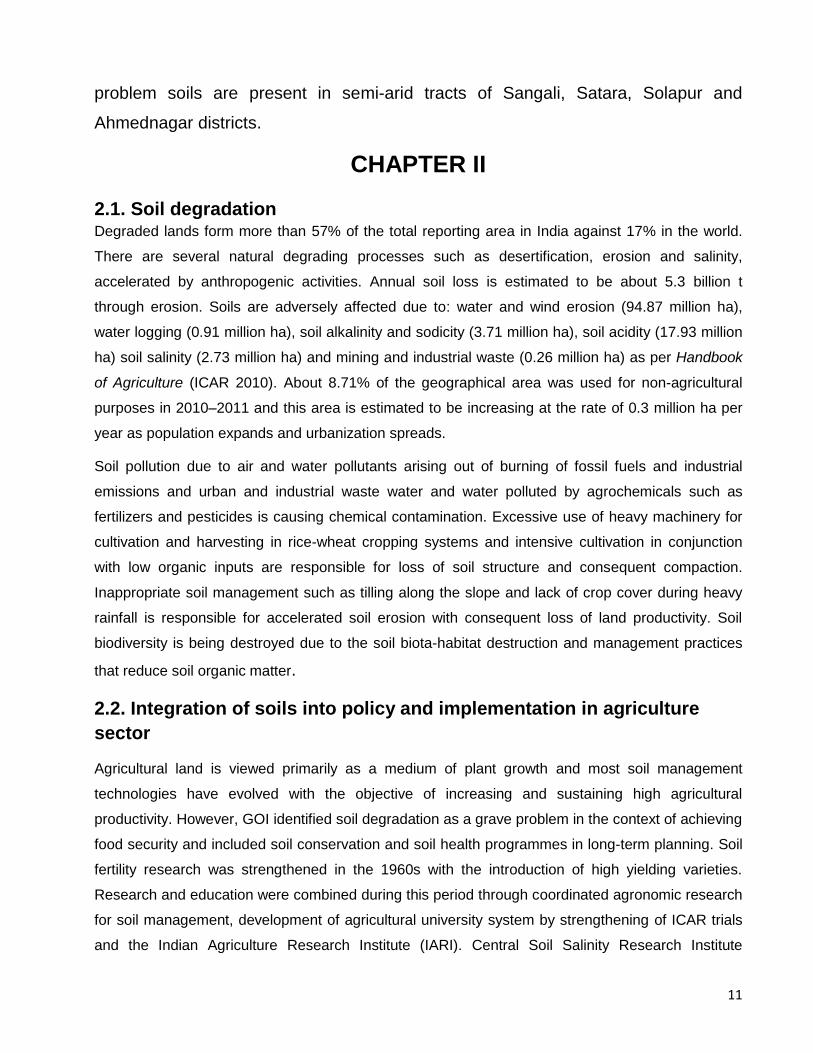
Black soils are mainly found in the Deccan Trap and are distributed over nearly 47.6% of MP in
which cotton and soybean are mostly grown. Red yellow soils cover almost 36.5% of the state and
are mostly found in Bundelkhand and Baghelkhand regions with rice as a major crop. Alluvial soils
and laterite soils are found in the north-western districts, especially in the plains of Bundelkhand and
Chambal regions. Loamy soils are found in the plains and river belts. Besides the above, mixed
soils are found in many parts of the state on which crops like corn and bajra are grown.
Figure 2. Soils on Madhya Pradesh and
Maharashtra
Figure 2. Soils of Madhya Pradesh and Maharashtra. Source: www.mpenvis.nic.in, www.mahaagri.gov.in
In Maharashtra, black cotton soils, which are best suited for cotton crop cover about
26.3% of the state and are found in Deccan plateau. The Eastern Maharashtra,
especially Wainganga basin consists of alluvial soils. Lateritic soils are prevalent in
Mahabaleshwar, Bhima Shankar and Matheran. Red soils are distributed in the
southern part of Sahyadri. Coastal saline soils are present along the coast and
11
problem soils are present in semi-arid tracts of Sangali, Satara, Solapur and
Ahmednagar districts.
CHAPTER II
2.1. Soil degradation Degraded lands form more than 57% of the total reporting area in India against 17% in the world.
There are several natural degrading processes such as desertification, erosion and salinity,
accelerated by anthropogenic activities. Annual soil loss is estimated to be about 5.3 billion t
through erosion. Soils are adversely affected due to: water and wind erosion (94.87 million ha),
water logging (0.91 million ha), soil alkalinity and sodicity (3.71 million ha), soil acidity (17.93 million
ha) soil salinity (2.73 million ha) and mining and industrial waste (0.26 million ha) as per Handbook
of Agriculture (ICAR 2010). About 8.71% of the geographical area was used for non-agricultural
purposes in 2010–2011 and this area is estimated to be increasing at the rate of 0.3 million ha per
year as population expands and urbanization spreads.
Soil pollution due to air and water pollutants arising out of burning of fossil fuels and industrial
emissions and urban and industrial waste water and water polluted by agrochemicals such as
fertilizers and pesticides is causing chemical contamination. Excessive use of heavy machinery for
cultivation and harvesting in rice-wheat cropping systems and intensive cultivation in conjunction
with low organic inputs are responsible for loss of soil structure and consequent compaction.
Inappropriate soil management such as tilling along the slope and lack of crop cover during heavy
rainfall is responsible for accelerated soil erosion with consequent loss of land productivity. Soil
biodiversity is being destroyed due to the soil biota-habitat destruction and management practices
that reduce soil organic matter.
2.2. Integration of soils into policy and implementation in agriculture
sector
Agricultural land is viewed primarily as a medium of plant growth and most soil management
technologies have evolved with the objective of increasing and sustaining high agricultural
productivity. However, GOI identified soil degradation as a grave problem in the context of achieving
food security and included soil conservation and soil health programmes in long-term planning. Soil
fertility research was strengthened in the 1960s with the introduction of high yielding varieties.
Research and education were combined during this period through coordinated agronomic research
for soil management, development of agricultural university system by strengthening of ICAR trials
and the Indian Agriculture Research Institute (IARI). Central Soil Salinity Research Institute
12
(CSSRI), Karnal was established to examine saline soil related issues. In 1970s, emphasis was
placed on nutrient balance and soil fertilizer management in multiple cropping systems. Central
Research Institute for Dryland Agriculture (CRIDA) was established at Hyderabad in 1970 while the
Potash Research Institute of India was established at Gurgaon in 1977. The fertilizer manufacturing
industry also expanded, with the Fertilizer Association of India playing a key role. An exclusive
department was formed to examine fertilizer manufacturing, imports, subsidies and quality control
related issues.
Meanwhile, micronutrient research received greater attention in the 1980s once zinc deficiency was
detected in intensive cropping systems. During this period, an international symposium was
organized on “soil fertility evaluation” which was a landmark in soil fertility research and
management in India; this led to an inventory of soil resources and coordinated research projects on
correlation of soil tests with crop response, research on micronutrients and biological nitrogen
fixation as well as long-term fertilizer experiments. This paved the way for establishing the Indian
Institute of Soil Science (IISS) in 1988 to focus on research, evaluation and management of soils.
Further, with the increasing concerns about food quality, groundwater quality, soil biodiversity etc.,
there appears to be a reorientation and integration of different soil management technologies. Thus,
soil fertility and degradation became major considerations in national and state policy documents.
National policy for farmers (2007) stated soil health management as one of its major goals to
improve farm productivity by emphasising organic farming and integrated nutrient management. The
current national agriculture policy: Vision 2020 mentions sustainable agriculture, promoting organic
manures and bio-fertilizers to optimize efficiency of nutrient base and precision farming. Integrated
nutrient management (INM) occupies a prime place in the policy which includes; enhancing soil
testing services, improving supply and distribution of fertilizers, balanced and optimum use of
fertilizers, correcting distortion in relative prices of primary fertilizers and location specific research
on efficient fertilizer practices.
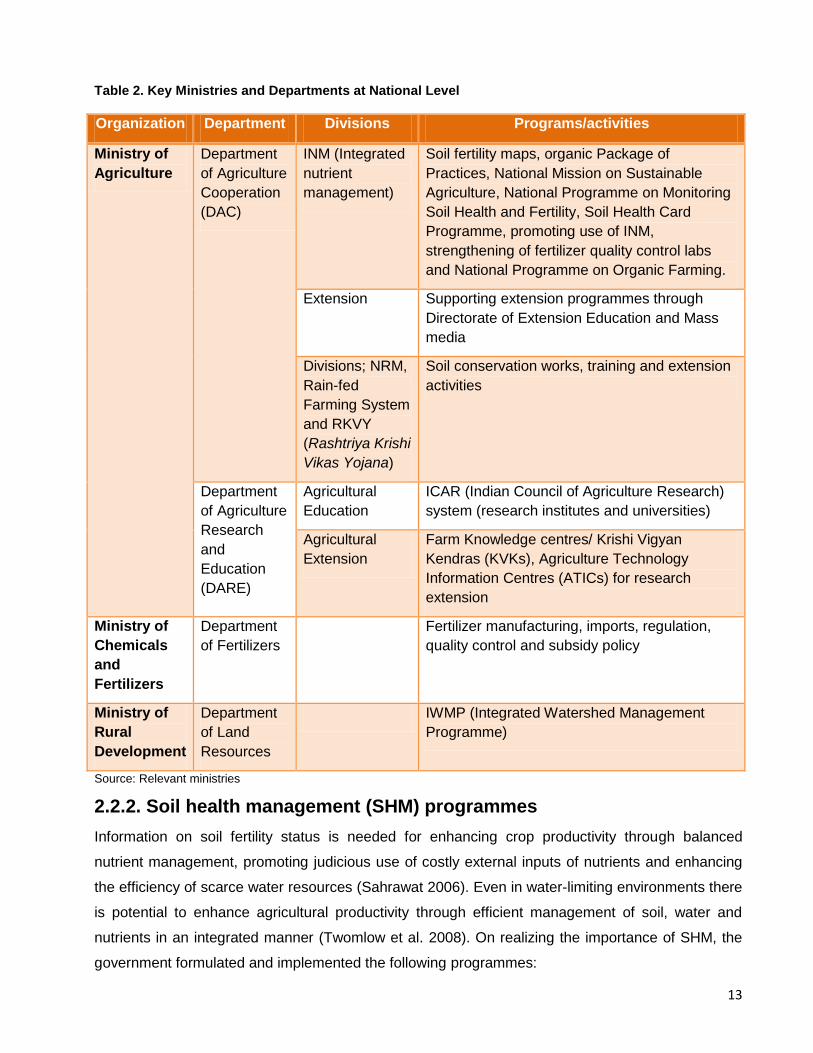
2.2.1. Government administrative machinery at national level
Certain departments and divisions within relevant ministries have been established by GOI to focus
on SHM, to formulate programmes and schemes, and to develop strategies and monitoring
mechanisms.
13
Table 2. Key Ministries and Departments at National Level
Organization Department Divisions Programs/activities
Ministry of
Agriculture
Department
of Agriculture
Cooperation
(DAC)
INM (Integrated
nutrient
management)
Soil fertility maps, organic Package of
Practices, National Mission on Sustainable
Agriculture, National Programme on Monitoring
Soil Health and Fertility, Soil Health Card
Programme, promoting use of INM,
strengthening of fertilizer quality control labs
and National Programme on Organic Farming.
Extension Supporting extension programmes through
Directorate of Extension Education and Mass
media
Divisions; NRM,
Rain-fed
Farming System
and RKVY
(Rashtriya Krishi
Vikas Yojana)
Soil conservation works, training and extension
activities
Department
of Agriculture
Research
and
Education
(DARE)
Agricultural
Education
ICAR (Indian Council of Agriculture Research)
system (research institutes and universities)
Agricultural
Extension
Farm Knowledge centres/ Krishi Vigyan
Kendras (KVKs), Agriculture Technology
Information Centres (ATICs) for research
extension
Ministry of
Chemicals
and
Fertilizers
Department
of Fertilizers
Fertilizer manufacturing, imports, regulation,
quality control and subsidy policy
Ministry of
Rural
Development
Department
of Land
Resources
IWMP (Integrated Watershed Management
Programme)
Source: Relevant ministries
2.2.2. Soil health management (SHM) programmes
Information on soil fertility status is needed for enhancing crop productivity through balanced
nutrient management, promoting judicious use of costly external inputs of nutrients and enhancing
the efficiency of scarce water resources (Sahrawat 2006). Even in water-limiting environments there
is potential to enhance agricultural productivity through efficient management of soil, water and
nutrients in an integrated manner (Twomlow et al. 2008). On realizing the importance of SHM, the
government formulated and implemented the following programmes:
14
National Project on Organic Farming (NPOF) was started during 2004–2005 under the
supervision of the National Centre of Organic Farming (NCOF) with the mandate to provide training
to stakeholders on organic farming, conduct statutory quality analysis of bio-fertilizers and organic
fertilizers under Fertilizer Control Order (FCO), 1985 and extend support for organic input
production units under capital investment back-ended subsidy scheme in collaboration with the
National Bank for Agriculture and Rural Development (NABARD).
Rashtriya krishi Vikas Yojana (RKVY) launched in 2008 provides funds for establishment
of fertilizer testing labs and soil testing laboratories, preparation of soil fertility maps and a soil
fertility index, and the establishment of fertilizer testing labs.
National project on management of soil health and fertility (NPMSHF) was started
during 2008–2009 for facilitating and promoting INM through judicious use of chemical fertilizers,
including secondary and micronutrients, in conjunction with organic manures and bio-fertilizers for
improving soil health and its productivity. The focus areas included: strengthening soil-testing
facilities to provide soil test-based recommendations to farmers, ensuring effective implementation
of (FCO 1985) and upgrading the skill and knowledge of soil testing lab (STL) staff, extension staff
and farmers.
National Mission on Sustainable Agriculture (NMSA) was launched during 2014–
2015 with the aim of making agriculture more productive, sustainable and climate resilient.
SHM was an important intervention through strengthening of existing STLs for micronutrient
analysis, setting up new STLs and mobile soil testing laboratories (MSTLs), capacity building at
various levels, establishment of fertilizer testing facilities, creation of a data bank for site-specific
balanced use of fertilizers, preparation of digital district soil maps and the development of soil fertility
monitoring system.
A Soil Health Card (SHC) scheme was launched during 2015–2016 for issuing soil health
cards (SHCs) once in 3 years at the rate of one sample in 10 ha for rain-fed land and 2.5 ha for
irrigated land. SHC consists of details of major nutrients, secondary nutrients, micronutrients and
physical parameters along with advice on corrective measures. Government has planned to issue
SHCs to all farmers in 15 states in 100 districts that consume 50% of total fertilizers in the country.
Besides the above, programmes such as Dryland Agriculture Mission, National Food Security
Mission (NFSM), National Horticulture Mission (NHM) and crop specific programmes also
addressed soil health issues as part of integrated crop management.
15
2.2.3. Research, education and extension on soil health management
Research and education on soil issues is the responsibility of the Indian Council of Agriculture
Research (ICAR) with its 108 research institutes working on various themes and 42 state
agricultural universities (SAUs), one central university (Manipur) and one university – Indian
Agricultural Research Institute (IARI) spread across the country. Specifically NRM (natural
research management) institutes of ICAR focus on soil and water related issues. Research
extension takes place through ATICs (Agricultural Technology Information Centres) which are
established in ICAR institutions and SAUs to provide greater coordination and intensive interaction
between the researchers and technology users in contributing towards the dissemination of
information.
Agriculture Technology Management Agency (ATMA) programme was launched
during 2005–2006 under ‘Support to State Extension Programs for Extension Reforms’ scheme to
provide dedicated manpower support at state, district and block levels and strengthening of the
training component. Release of funds under ATMA scheme is based on the state extension work
plans prepared by the state governments based on number of farm households and administrative
blocks. At present, 640 ATMAs are functioning (one in each district) in the country.
2.2.4. Watershed Development Programme (WDP)
Watershed programmes address soil degradation issues: they conduct soil moisture conservation
works and capacity building of rural communities. National Watershed Development Programme in
Rain-fed Areas (NWDPRA) of Union Agriculture Ministry and NABARD-funded WDP implemented
watershed activities on a large scale. Integrated Watershed Management Programme
(IWMP) implemented by the Department of Land Resources (DOLR), Ministry of Rural Development
was launched during 2009–2010 as a follow-up of Drought Prone Areas Programme, Desert
Development Programme and Integrated Wastelands Development Programme. Production
systems, institution and capacity building and NRM components of IWMP are important from soil
conservation and fertility management point of view.
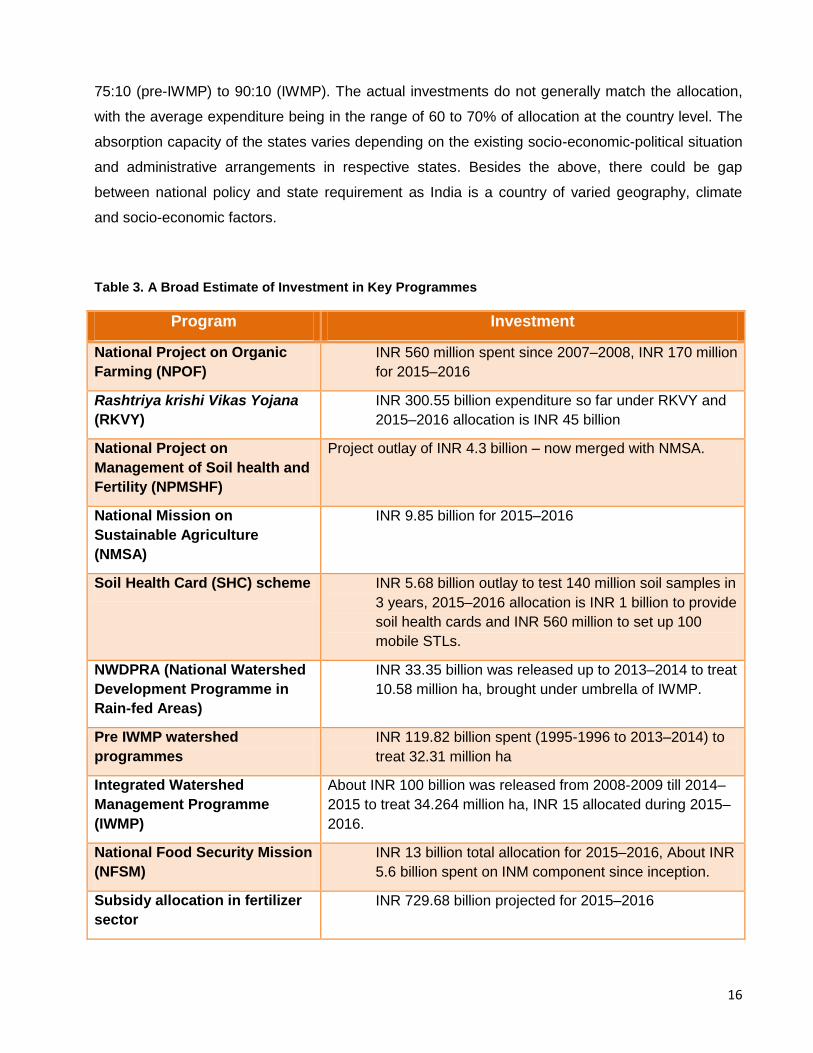
2.3. Investment
Under soil specific programmes, total investment goes toward SHM. However, under other
programmes, roughly 5 to 10% might directly go toward SHM-related activities and related training
component. In the case of watershed programmes, roughly 20% of the funds go toward soil
moisture conservation works and the rest goes towards water harvesting works, plantation activities
etc. All major SHM schemes are fully funded by GOI. Hence, GOI initiatives are very important to
gear up state machinery toward SHM. In case of WDP, the centre state investment ratio varies from
16
75:10 (pre-IWMP) to 90:10 (IWMP). The actual investments do not generally match the allocation,
with the average expenditure being in the range of 60 to 70% of allocation at the country level. The
absorption capacity of the states varies depending on the existing socio-economic-political situation
and administrative arrangements in respective states. Besides the above, there could be gap
between national policy and state requirement as India is a country of varied geography, climate
and socio-economic factors.
Table 3. A Broad Estimate of Investment in Key Programmes
Program Investment
National Project on Organic
Farming (NPOF)
INR 560 million spent since 2007–2008, INR 170 million
for 2015–2016
Rashtriya krishi Vikas Yojana
(RKVY)
INR 300.55 billion expenditure so far under RKVY and
2015–2016 allocation is INR 45 billion
National Project on
Management of Soil health and
Fertility (NPMSHF)
Project outlay of INR 4.3 billion – now merged with NMSA.
National Mission on
Sustainable Agriculture
(NMSA)
INR 9.85 billion for 2015–2016
Soil Health Card (SHC) scheme INR 5.68 billion outlay to test 140 million soil samples in
3 years, 2015–2016 allocation is INR 1 billion to provide
soil health cards and INR 560 million to set up 100
mobile STLs.
NWDPRA (National Watershed
Development Programme in
Rain-fed Areas)
INR 33.35 billion was released up to 2013–2014 to treat
10.58 million ha, brought under umbrella of IWMP.
Pre IWMP watershed
programmes
INR 119.82 billion spent (1995-1996 to 2013–2014) to
treat 32.31 million ha
Integrated Watershed
Management Programme
(IWMP)
About INR 100 billion was released from 2008-2009 till 2014–
2015 to treat 34.264 million ha, INR 15 allocated during 2015–
2016.
National Food Security Mission
(NFSM)
INR 13 billion total allocation for 2015–2016, About INR
5.6 billion spent on INM component since inception.
Subsidy allocation in fertilizer
sector
INR 729.68 billion projected for 2015–2016
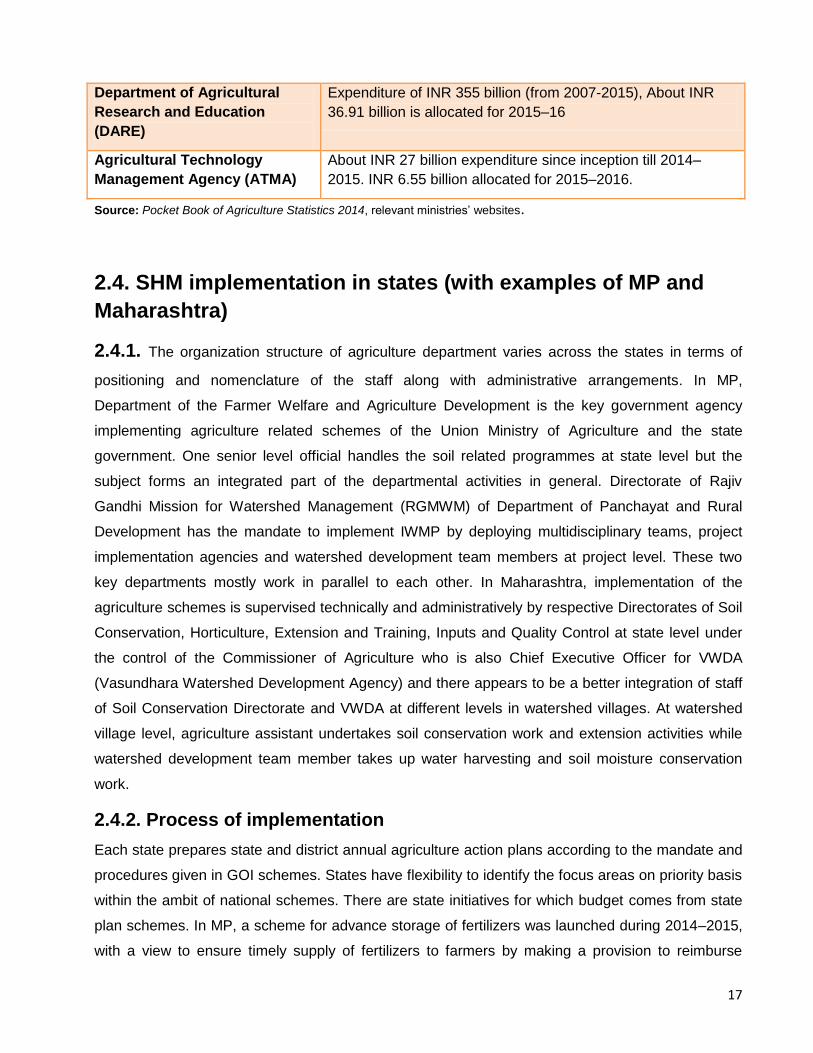
17
Department of Agricultural
Research and Education
(DARE)
Expenditure of INR 355 billion (from 2007-2015), About INR
36.91 billion is allocated for 2015–16
Agricultural Technology
Management Agency (ATMA)
About INR 27 billion expenditure since inception till 2014–
2015. INR 6.55 billion allocated for 2015–2016.
Source: Pocket Book of Agriculture Statistics 2014, relevant ministries’ websites.
2.4. SHM implementation in states (with examples of MP and
Maharashtra)
2.4.1. The organization structure of agriculture department varies across the states in terms of
positioning and nomenclature of the staff along with administrative arrangements. In MP,
Department of the Farmer Welfare and Agriculture Development is the key government agency
implementing agriculture related schemes of the Union Ministry of Agriculture and the state
government. One senior level official handles the soil related programmes at state level but the
subject forms an integrated part of the departmental activities in general. Directorate of Rajiv
Gandhi Mission for Watershed Management (RGMWM) of Department of Panchayat and Rural
Development has the mandate to implement IWMP by deploying multidisciplinary teams, project
implementation agencies and watershed development team members at project level. These two
key departments mostly work in parallel to each other. In Maharashtra, implementation of the
agriculture schemes is supervised technically and administratively by respective Directorates of Soil
Conservation, Horticulture, Extension and Training, Inputs and Quality Control at state level under
the control of the Commissioner of Agriculture who is also Chief Executive Officer for VWDA
(Vasundhara Watershed Development Agency) and there appears to be a better integration of staff
of Soil Conservation Directorate and VWDA at different levels in watershed villages. At watershed
village level, agriculture assistant undertakes soil conservation work and extension activities while
watershed development team member takes up water harvesting and soil moisture conservation
work.
2.4.2. Process of implementation
Each state prepares state and district annual agriculture action plans according to the mandate and
procedures given in GOI schemes. States have flexibility to identify the focus areas on priority basis
within the ambit of national schemes. There are state initiatives for which budget comes from state
plan schemes. In MP, a scheme for advance storage of fertilizers was launched during 2014–2015,
with a view to ensure timely supply of fertilizers to farmers by making a provision to reimburse
18
certain expenditure incurred on loans taken by cooperative societies towards improving storage
facilities. State-funded projects on soil conservation and water harvesting such as farm ponds and
cement check dams are mostly implemented through the Soil Conservation Directorate of
Agriculture Department in Maharashtra. State initiatives include: distribution of zinc sulphate and
ferrous sulphate with 50% subsidy in 175 Zn deficient blocks and 106 Fe deficient blocks in
Maharashtra. The number of watershed projects sanctioned is much higher in Maharashtra than in
MP since Maharashtra has been a leader in watershed activity for several decades and the state
has large chunks of its area classed as arid and semi-arid. MP’s organic farming policy pays special
attention to the tribal areas where organic farming has been in practice naturally; Maharashtra’s
organic farming policy has a target of increasing 10,000 ha of organic farming per year by
encouraging intercropping of pulses in all major cereal crops and assessing district fertilizer demand
on the basis of fertility status. MP has adopted a concept called bio farming through bio-villages for
the promotion of organic farming. Bio-farming is implemented in 1,565 villages selected from 313
blocks of 48 districts. Major crops grown under organic farming are: soybean, wheat, lentil, maize,
pigeon pea, vegetables and sugarcane. Mostly large and medium farmers are involved in organic
farming compared to small farmers although in tribal areas, farmers practice natural organic farming
as a norm.
2.4.3. Investment
Most of the investment in SHM comes from GOI-funded schemes. However, the absorption capacity
depends on efficiency of planning and implementation of the respective states. Maharashtra’s
absorption capacity appears to be higher than that of MP due to better staff strength and
infrastructure of agriculture department.
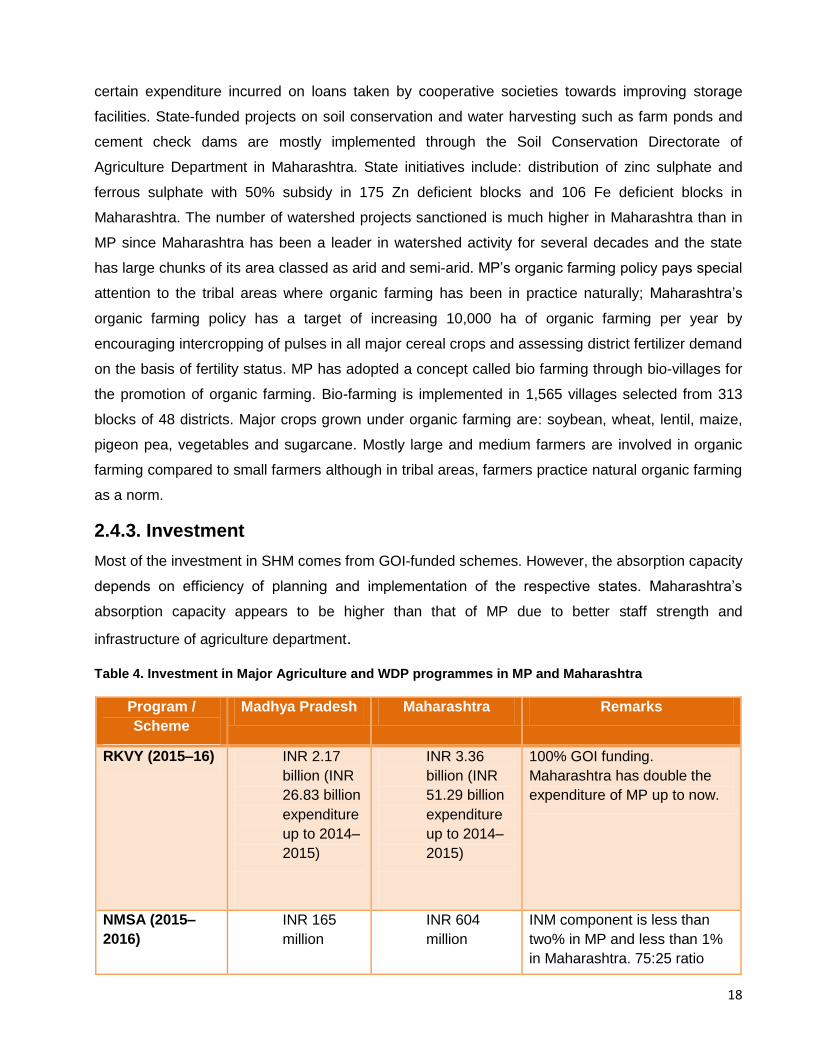
Table 4. Investment in Major Agriculture and WDP programmes in MP and Maharashtra
Program /
Scheme
Madhya Pradesh Maharashtra Remarks
RKVY (2015–16) INR 2.17
billion (INR
26.83 billion
expenditure
up to 2014–
2015)
INR 3.36
billion (INR
51.29 billion
expenditure
up to 2014–
2015)
100% GOI funding.
Maharashtra has double the
expenditure of MP up to now.
NMSA (2015–
2016)
INR 165
million
INR 604
million
INM component is less than
two% in MP and less than 1%
in Maharashtra. 75:25 ratio
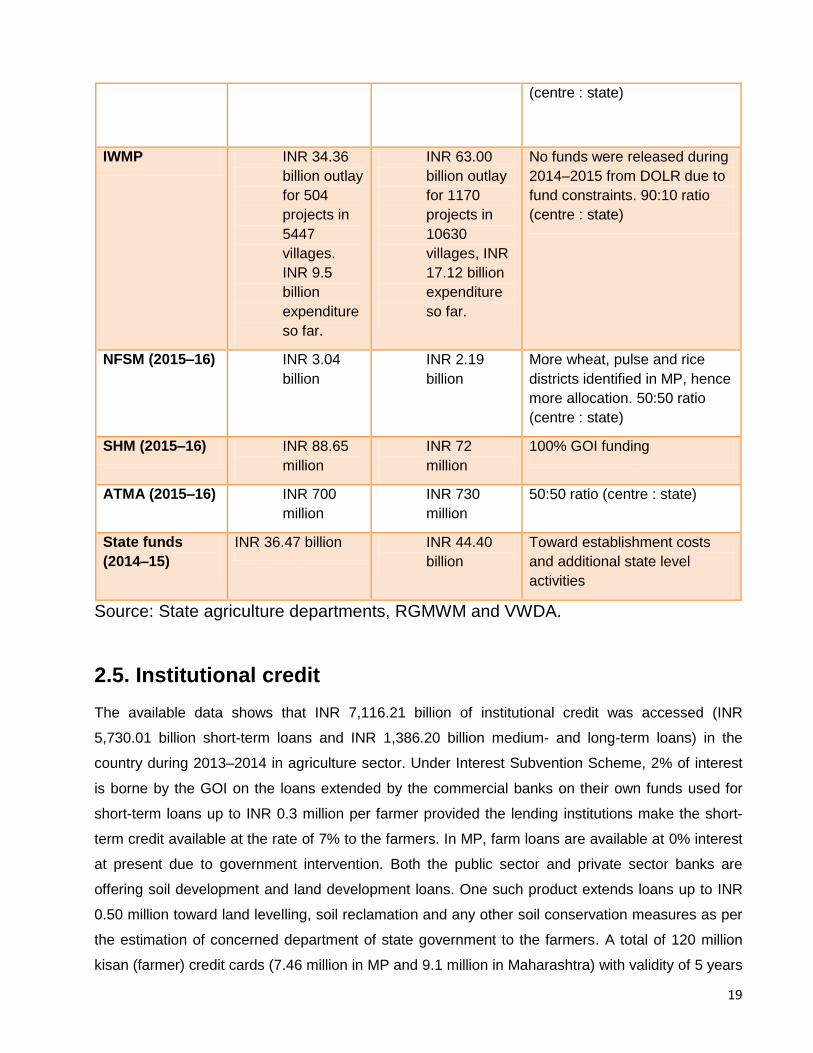
19
(centre : state)
IWMP INR 34.36
billion outlay
for 504
projects in
5447
villages.
INR 9.5
billion
expenditure
so far.
INR 63.00
billion outlay
for 1170
projects in
10630
villages, INR
17.12 billion
expenditure
so far.
No funds were released during
2014–2015 from DOLR due to
fund constraints. 90:10 ratio
(centre : state)
NFSM (2015–16) INR 3.04
billion
INR 2.19
billion
More wheat, pulse and rice
districts identified in MP, hence
more allocation. 50:50 ratio
(centre : state)
SHM (2015–16) INR 88.65
million
INR 72
million
100% GOI funding
ATMA (2015–16) INR 700
million
INR 730
million
50:50 ratio (centre : state)
State funds
(2014–15)
INR 36.47 billion INR 44.40
billion
Toward establishment costs
and additional state level
activities
Source: State agriculture departments, RGMWM and VWDA.
2.5. Institutional credit
The available data shows that INR 7,116.21 billion of institutional credit was accessed (INR
5,730.01 billion short-term loans and INR 1,386.20 billion medium- and long-term loans) in the
country during 2013–2014 in agriculture sector. Under Interest Subvention Scheme, 2% of interest
is borne by the GOI on the loans extended by the commercial banks on their own funds used for
short-term loans up to INR 0.3 million per farmer provided the lending institutions make the short-
term credit available at the rate of 7% to the farmers. In MP, farm loans are available at 0% interest
at present due to government intervention. Both the public sector and private sector banks are
offering soil development and land development loans. One such product extends loans up to INR
0.50 million toward land levelling, soil reclamation and any other soil conservation measures as per
the estimation of concerned department of state government to the farmers. A total of 120 million
kisan (farmer) credit cards (7.46 million in MP and 9.1 million in Maharashtra) with validity of 5 years
20
along with insurance coverage were issued from 1998–1999 to March 2013–2014. But there is no
specific data available on how much credit might have gone toward SHM.
2.6. Extension and training
Public extension in agriculture formed a part of national policy and has evolved over a period of
time. The training and visit system introduced in the mid-1970s focused on giving quality training
and exposure inputs (with a focus on food grains) to agriculture extension officers (AEOs) and
increasing the coordination among farmers, subject matter specialists and extension workers.
However, extension goes beyond helping the farmers to solve their problems in India. More has to
be invested in human resource development of the clients, teaching the farmers the management
and decision-making skills, leadership and organizational skills (Swanson and Clarr 1984).
State extension officials undergo different types of training programmes categorized as national,
skill development, refresher, foundation and special technical training programmes. Senior officials
undergo national level training courses and middle to village level officials take part in the rest of
the training courses. State-level training and extension institutes (SAMETIs) provide training to
AEOs as per the training calendars prepared by them. Extension education institutes working
under Directorate of Extension, DAC and national-level training and research institutes provide
training to AEOs, but in smaller numbers. Certain training courses are organized exclusively on
SHM and general training courses usually include one or two sessions on SHM. They curriculum
includes sustainable soil management in specific training programmes on SHM, organic farming
and sustainable agriculture and general training courses including a few sessions on the subject.
However, the formal training inputs received on SHM do not appear to be sufficient since it is
difficult for the available training infrastructure to cater to the needs of the staff. The regular target-
driven review meetings in the agriculture department on SHM are the key providers of information
to the extension officials but technical orientation courses are in severe shortage. Watershed
programmes have huge funding but usually training is confined to watershed functionaries only.
2.7. Special government initiatives to address SHM
2.7.1. Soil testing as a priority
The soil testing programme was started in India during 1955–1956 with the establishment of 16 soil
testing laboratories (STLs) under the Indo-US operational agreement for determination of soil
fertility and fertilizer use. In 1965, the existing laboratories were strengthened and nine new
laboratories were established to serve the intensive agricultural district programme in selected
districts. Further, 25 new STLs and 34 mobile STLs were added in 1970. Assessment of nutrient
21
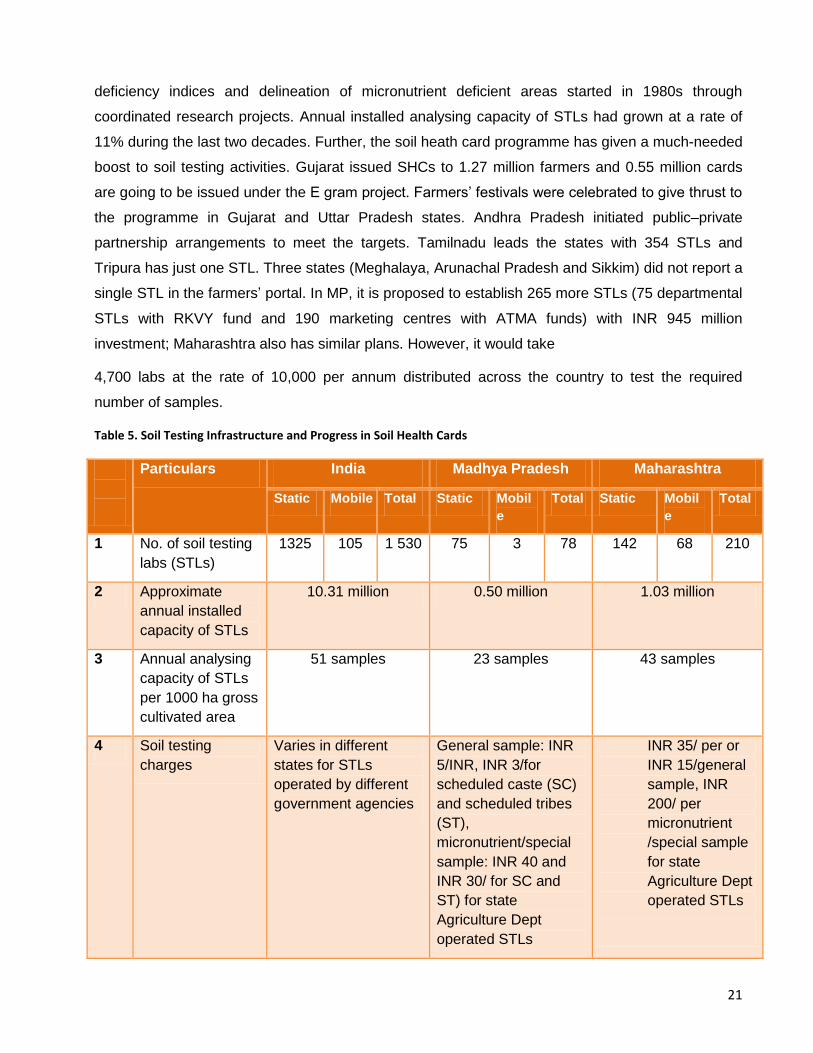
deficiency indices and delineation of micronutrient deficient areas started in 1980s through
coordinated research projects. Annual installed analysing capacity of STLs had grown at a rate of
11% during the last two decades. Further, the soil heath card programme has given a much-needed
boost to soil testing activities. Gujarat issued SHCs to 1.27 million farmers and 0.55 million cards
are going to be issued under the E gram project. Farmers’ festivals were celebrated to give thrust to
the programme in Gujarat and Uttar Pradesh states. Andhra Pradesh initiated public–private
partnership arrangements to meet the targets. Tamilnadu leads the states with 354 STLs and
Tripura has just one STL. Three states (Meghalaya, Arunachal Pradesh and Sikkim) did not report a
single STL in the farmers’ portal. In MP, it is proposed to establish 265 more STLs (75 departmental
STLs with RKVY fund and 190 marketing centres with ATMA funds) with INR 945 million
investment; Maharashtra also has similar plans. However, it would take
4,700 labs at the rate of 10,000 per annum distributed across the country to test the required
number of samples.
Table 5. Soil Testing Infrastructure and Progress in Soil Health Cards
N
o
.
Particulars India Madhya Pradesh Maharashtra
Static Mobile Total Static Mobil
e
Total Static Mobil
e
Total
1 No. of soil testing
labs (STLs)
1325 105 1 530 75 3 78 142 68 210
2 Approximate
annual installed
capacity of STLs
10.31 million 0.50 million 1.03 million
3 Annual analysing
capacity of STLs
per 1000 ha gross
cultivated area
51 samples 23 samples 43 samples
4 Soil testing
charges
Varies in different
states for STLs
operated by different
government agencies
General sample: INR
5/INR, INR 3/for
scheduled caste (SC)
and scheduled tribes
(ST),
micronutrient/special
sample: INR 40 and
INR 30/ for SC and
ST) for state
Agriculture Dept
operated STLs
INR 35/ per or
INR 15/general
sample, INR
200/ per
micronutrient
/special sample
for state
Agriculture Dept
operated STLs
22
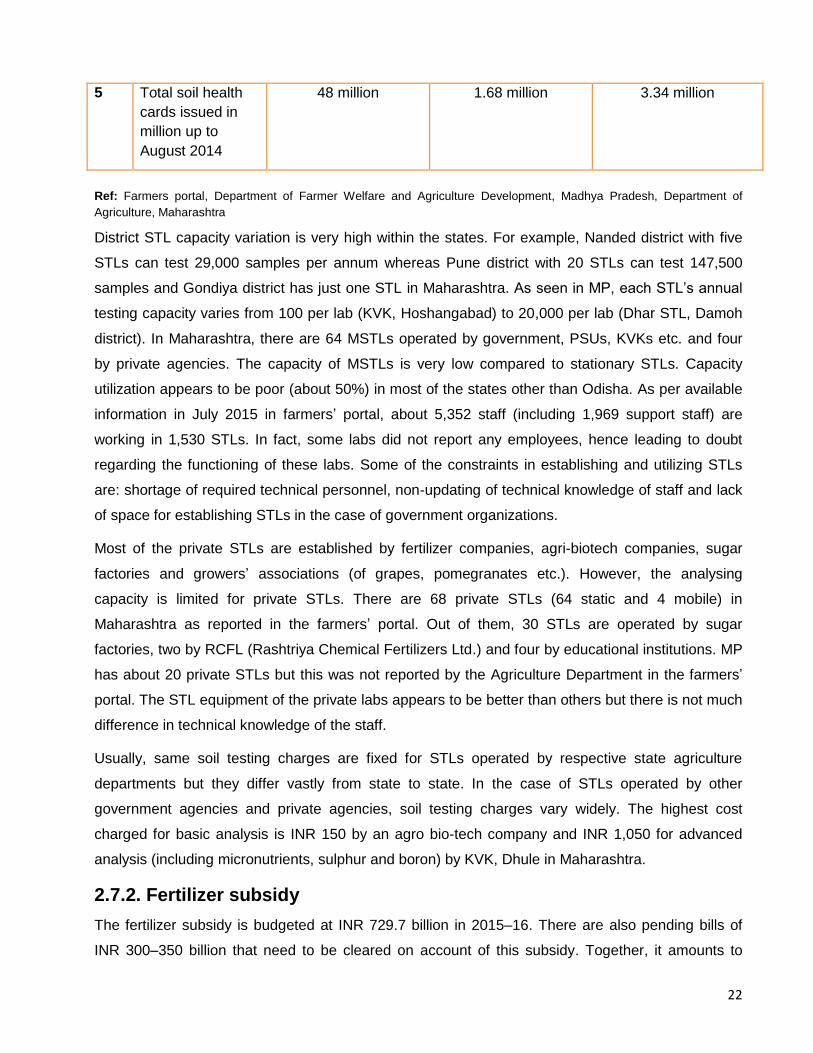
5 Total soil health
cards issued in
million up to
August 2014
48 million 1.68 million 3.34 million
Ref: Farmers portal, Department of Farmer Welfare and Agriculture Development, Madhya Pradesh, Department of
Agriculture, Maharashtra
District STL capacity variation is very high within the states. For example, Nanded district with five
STLs can test 29,000 samples per annum whereas Pune district with 20 STLs can test 147,500
samples and Gondiya district has just one STL in Maharashtra. As seen in MP, each STL’s annual
testing capacity varies from 100 per lab (KVK, Hoshangabad) to 20,000 per lab (Dhar STL, Damoh
district). In Maharashtra, there are 64 MSTLs operated by government, PSUs, KVKs etc. and four
by private agencies. The capacity of MSTLs is very low compared to stationary STLs. Capacity
utilization appears to be poor (about 50%) in most of the states other than Odisha. As per available
information in July 2015 in farmers’ portal, about 5,352 staff (including 1,969 support staff) are
working in 1,530 STLs. In fact, some labs did not report any employees, hence leading to doubt
regarding the functioning of these labs. Some of the constraints in establishing and utilizing STLs
are: shortage of required technical personnel, non-updating of technical knowledge of staff and lack
of space for establishing STLs in the case of government organizations.
Most of the private STLs are established by fertilizer companies, agri-biotech companies, sugar
factories and growers’ associations (of grapes, pomegranates etc.). However, the analysing
capacity is limited for private STLs. There are 68 private STLs (64 static and 4 mobile) in
Maharashtra as reported in the farmers’ portal. Out of them, 30 STLs are operated by sugar
factories, two by RCFL (Rashtriya Chemical Fertilizers Ltd.) and four by educational institutions. MP
has about 20 private STLs but this was not reported by the Agriculture Department in the farmers’
portal. The STL equipment of the private labs appears to be better than others but there is not much
difference in technical knowledge of the staff.
Usually, same soil testing charges are fixed for STLs operated by respective state agriculture
departments but they differ vastly from state to state. In the case of STLs operated by other
government agencies and private agencies, soil testing charges vary widely. The highest cost
charged for basic analysis is INR 150 by an agro bio-tech company and INR 1,050 for advanced
analysis (including micronutrients, sulphur and boron) by KVK, Dhule in Maharashtra.
2.7.2. Fertilizer subsidy
The fertilizer subsidy is budgeted at INR 729.7 billion in 2015–16. There are also pending bills of
INR 300–350 billion that need to be cleared on account of this subsidy. Together, it amounts to
23
more than INR 1,000 billion, which is more than 10% of the centre’s tax revenue, putting a
substantial pressure on the State exchequer (Ashok Gulati, 2014). Urea is the only fertilizer where
pricing and distribution is controlled statutorily by the government. Unduly low prices of urea, at INR
5,360 per tonne account for nearly two-thirds of this subsidy and Government of India announced
that this cost would not be enhanced for the next 4 years. Nutrient-based subsidy (NBS) is extended
for decontrolled phosphate (P) and potassium (K) fertilizers with effect from April 2010 with a view to
promote balanced fertilization. The latest circular on NBS indicates a fixing subsidy of INR 20.875,
INR 18.679, INR 15.500 and INR 1.677 per kg of N, P, K and S respectively (MOCF 2014). At
present, 22 grades of P and K fertilizers and 16 grades of complex (NPK) fertilizers are covered
under NBS policy. The government provides assistance on fertilizers fortified with zinc and boron
under the NBS scheme. Concession on urea, decontrolled P and K fertilizers including imported di-
ammonium phosphate (DAP) and muriate of potash (MOP) is payable only on the quantities sold for
agricultural purposes; hence states are given the responsibility of certifying the sales. No subsidy is
available on fertilizer mixtures (Annex 1).
2.7.3. Fertilizer quality control (FQC)
In order to check the quality of the fertilizers sold in the country, 78 fertilizer quality testing control
laboratories (FQTLs) have been established with an annual analytical capacity of testing 152,470
samples. FQC system provides information on the quality of imported fertilizers at ports and checks
the quality of indigenously manufactured fertilizers. There are four FQTLs located at Jabalpur,
Indore, Gwalior and Bhopal, with an analysing capacity of 16,000 per annum in MP, while 5 FQTLs
are located at Pune, Nashik, Aurangabad, Amaravati and Kolhapur in Maharashtra with analysing
capacity of 18,000 per annum. They test samples of chemical and bio-fertilizers and heavy metals
as per the norms of National Accreditation Board for Testing and Calibration Laboratories (NABL).
The samples are analysed and results are dispatched to concerned fertilizer inspectors usually
within a month. At present, 26 straight fertilizers (13 N, 8 P, 5 K and 2 sulphur), 19 NPK complex
fertilizers and 16 NP complex fertilizers, 29 customized fertilizers, 14 fortified fertilizers, 17 water
soluble fertilizers and 16 micronutrient fertilizers are notified under FCO, 1985. Phosphogypsum, a
by-product of the fertilizer industry containing 16% S and 21% Ca is incorporated in FCO, 1985. To
encourage use of bio-fertilizers, Rhizobium, Azotobacter, Azospirillum, phosphate solubilizing
bacteria (PSB), potash mobilizing bacteria (KMB), zinc solubilizing bacteria (ZnSB), Mycorrhizae,
Acetobacter and a consortia of bio-fertilizers are incorporated in FCO, 1985. Generalized
specifications of organic manures, vermillion compost and phosphate rich organic manure are also
included.
24
2.7.4. Integrated nutrient management (INM) and balanced fertilization
Government is promoting integrated nutrient management (INM), advocating soil test-based
balanced and judicious use of chemical fertilizers in conjunction with use of fertilizers fortified with
micronutrients, organic sources and bio-fertilizers for improving soil fertility, especially soil carbon for
achieving better fertilizer use deficiency (FUE). Encouragement is given for establishing vermillion
compost units and biogas slurry units under different schemes. Up to INR 500 per ha is provided
under NFSM, NPMSHF and oilseed production programme and up to INR 1,000 per ha under
centrally sponsored sugarcane development scheme towards the supply of gypsum, lime and
micronutrients.
2.7.5. Incentives for organic farming
There is a provision of 25% of total financial outlay subject to the maximum of INR 4 million per unit,
whichever is less for establishing bio-fertilizers-bio-pesticides unit and 33% of total financial outlay
subject to the maximum of INR 6 million per unit, whichever is less for establishing fruit and
vegetable market waste compost unit under the Capital Input Subsidy Scheme and National Project
on Organic Farming. Work Plan Organic Farming Scheme provides INR 50,000 per project in the
case of group farming. National Horticulture Mission provides INR 10,000 per ha for adoption of
organic farming. Farmers can avail of 50% cost of cultivation or INR 100 per ha (whichever is less)
towards the supply of Rhizobium and PSB under the Work Plan Organic Farming scheme. This
scheme also provides support of INR 2,500 per unit toward establishing a vermillion compost unit
and INR 15,000 per unit for supply of a neem grinder for the preparation of neemark. There are
about 0.72 million ha, 0.23 million ha and 0.08 million ha under certified organic farming in India, MP
and Maharashtra respectively. In MP, organic farming policy focuses on tribal farmers who practice
organic farming naturally, by including them in organic certification scheme where a 50% subsidy is
extended on a certification fee to the farmers.
2.7.6. Loans for establishing STL
To establish additional STLs under public–private partnership mode, there is a general provision of
50% of project cost limited to maximum of INR 3 million as a one-time subsidy and in the case of
mobile STLs, it is 75% of project cost limited to INR 3 million as a one-time subsidy under NPMSHF.
It takes at least INR 7.5 million to establish a fully equipped STL and now some agencies and
individuals are coming forward to establish STLs by availing of bank loans. National Bank for
Agriculture and Rural Development (NABARD) refinances commercial banks toward bank loans
extended to the tune of INR 1.08 million for establishing STL and a soil health counselling facility.
Some banks such as Bank of Maharashtra (Bhigwan) promoted STL in collaboration with RCFL, a
fertilizer company. However, consolidated details are not available on this.
25
2.8. Civil society organization (CSO) initiatives
CSOs are an important source of support for farmers in India, mostly by forming self-help groups or
farmer-based organizations. Professional Assistance for Development Action (PRADAN) focuses on
productivity enhancement with a focus on land and water development; they have an association
with the Government of MP to implement various activities under RKVY and ATMA. The Bharatia
Agro-Industries Foundation (BAIF) is working in the agricultural sector in 12 states with a focus on
soil and water conservation works on degraded lands, composting and agroforestry. BAIF facilitated
formation of farmers’ cooperatives and federations of self-help groups, which formed the
Vasundhara Agri-horti Producers Company Ltd. for imparting knowledge on package of practices
including soil fertility management for raising crops. Watershed Development Trust (WOTR) also
works in watershed sector and few of their projects have SHM focus. In Maharashtra, CSOs like
AFARM (Action for Agriculture renewal in Maharashtra), Agriculture Development Front, NARI
(Nimbkar Agricultural Research Institute), appropriate rural technology institute (ARTI) works in
association with KVKs, and links between research and training centres and farmers. LEISA India
(Low External Input and Sustainable Agriculture India) organizes short-duration learning workshops
and long-duration customized programmes on sustainable farming. The Centre for Sustainable
Agriculture (CSA) advocates sustainable practices as well. Some watershed projects are
implemented by CSOs as project implementing agencies and in some other cases they act as
resource agencies. The RKVY programme encourages CSO participation in arranging demos,
establishing farmer field schools and facilitating training activities in association with the agriculture
department. The CSOs’ reach of farmers is modest but where they have a reach, high quality
knowledge inputs are given to farmers. The general observations on government system by CSOs
are: collection of wrong soil samples, improper timing of soil sample collection, not communicating
the results on time and not supplying the fertilizers on time.
2.9. Access to chemical fertilizers
2.9.1. Production and imports
Consumption of N, P and K chemical fertilizers has increased since 1966–1967 and at present, the
demand is expected to grow annually by 5 to 7% since they are the immediate source of nutrients in
soils. The all-India average consumption of fertilizers has increased from 105.5 kg per ha in 2005–
2006 to 144 kg per ha in 2011–2012. Theemand for chemical fertilizers (in thousands of tonnes) is
projected to be 33,754, 12,764, 6,476 and 4,934 for urea, DAP, single super phosphate (SSP) and
MOP respectively for direct consumption in 2017–2018 as per the Working Group Report on
Fertilizer Industry for Twelfth Five-Year Plan. A policy has been adopted by GOI which involves mix
of three options, i.e. domestic production based on indigenous/imported rock phosphate, imported
26
sulphur and ammonia; domestic production based on indigenous/imported intermediates, i.e.
ammonia and phosphoric acid; and third, import of finished fertilizers. India imports 25% of urea,
90% of DAP and 100% of MOP. The installed capacity has reached 13.26 million t for N and 7.06
million t for P in the year 2014–15, making India the third largest fertilizer producer in the world. The
rapid build-up of fertilizer production capacity in the country has been achieved as a result of a
favourable policy environment facilitating large investments in the public (10 public sector units), co-
operative and private sectors.
There are 30 large urea plants, 21 units manufacturing DAP and complex fertilizers and 2 units
manufacturing ammonium sulphate as a by-product. There are also 97 medium and small-scale
units in operation producing SSP. Under the new pricing regime for urea units, economically
efficient units are being permitted to produce beyond their re-assessed capacity to substitute or
minimize imports. The government notified the new investment policy in 2012 followed by an
amendment in 2014 to facilitate fresh investment in the urea sector to make India self-sufficient.
Manufacturers are allowed to sell at a price up to 5% higher than the maximum retail price of the
subsidized coated (e.g. neem or sulphur coated urea) and fortified fertilizers and 10% higher for
zincated urea and boronated SSP. There are 153 micronutrient manufacturing units and 16 units
manufacturing a 100% water soluble solid NPK mixture at present. Most popular fertilizers are urea,
DAP, SSP, MOP followed by complex fertilizers in the case of major nutrients and it is ferrous
sulphate, zinc sulphate and manganese sulphate in the case of micronutrients and this trend is
almost similar in all the states.
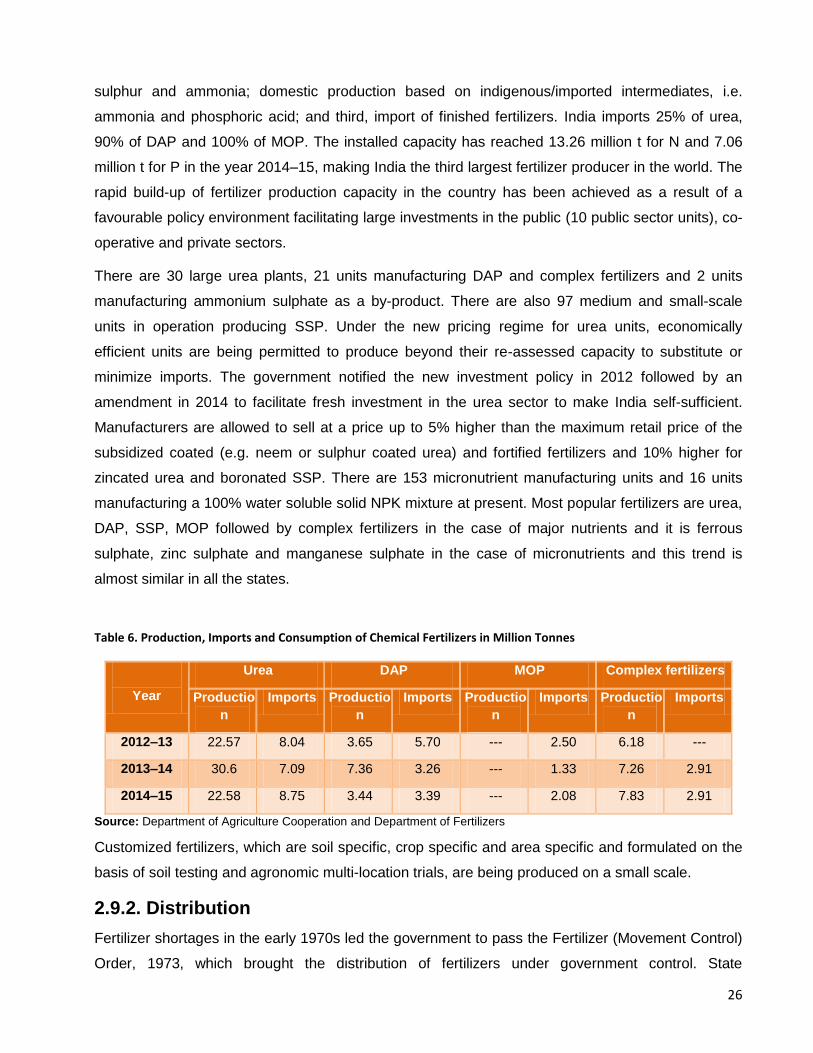
Table 6. Production, Imports and Consumption of Chemical Fertilizers in Million Tonnes
Year
Urea DAP MOP Complex fertilizers
Productio
n
Imports Productio
n
Imports Productio
n
Imports Productio
n
Imports
2012–13 22.57 8.04 3.65 5.70 --- 2.50 6.18 ---
2013–14 30.6 7.09 7.36 3.26 --- 1.33 7.26 2.91
2014–15 22.58 8.75 3.44 3.39 --- 2.08 7.83 2.91
Source: Department of Agriculture Cooperation and Department of Fertilizers
Customized fertilizers, which are soil specific, crop specific and area specific and formulated on the
basis of soil testing and agronomic multi-location trials, are being produced on a small scale.
2.9.2. Distribution
Fertilizer shortages in the early 1970s led the government to pass the Fertilizer (Movement Control)
Order, 1973, which brought the distribution of fertilizers under government control. State
27
Cooperative Marketing Federation Ltd (MARKFED), District cooperative societies, village level
cooperative societies and private agencies are part of the network. State agro-industries
corporations and state commodity federations also take part in this in some places. The ratio of
participation of cooperatives and private agencies is around 30:70 and the distribution network,
consisting of wholesalers and retailers, has about 261,824 dealers. Approximately 75% of fertilizer
is transported by rail and 25% by road. Production is continuous while consumption is seasonal with
two distinct agricultural seasons (kharif from April to September and rabi from October to
September), so storage is very important. Food Corporation of India and Co-operatives have
established warehouses to store about 38 million t (for all goods) while the rest is taken care of by
private agencies. In MP, to ensure timely supply of fertilizers, government has proposed to
reimburse the interest on the loans taken for advance storage of the fertilizers through construction
of new warehouses by MARKFED and cooperative societies. Some fertilizer companies such as
Indian Farmers Fertilizer Co-operative Limited (IFFCO) offer insurance coverage for the fertilizer
purchased.
2.9.3. Access to bio-fertilizers
Rhizobium group, Azotobacter group and Azospirillum group strains, PSB/PSM (phosporus soluble
bacteria), Zinc solubilizing bacteria and K mobilizing bacteria are the main ingredients of
commercially available bio-fertilizers. GOI notified six bio-fertilizers under FCO 1985. Bio-fertilizer
production was 65,528 t during 2013–14. Generally, southern states produce maximum quantity of
bio-fertilizers with the least production happening in north-eastern states. Approximately 25% of
total bio-fertilizer production in the country took place in Tamilnadu while MP and Maharashtra
produced 1,408 t and 5,898 t respectively in 2012–2013 according to the National Centre for
Organic Farming (NCOF) which works on bio-fertilizer related aspects, quality control, standards
formulation, training and extension, developing culture banks and production and distribution of bio-
fertilizers.
2.10. Conservation agriculture and sustainable agriculture
Conservation agriculture technologies involve minimum soil disturbance, permanent soil cover
through crop residues or cover crops and crop rotation for achieving higher productivity. In recent
years, adoption of zero tillage and CA has expanded to cover about 1.5 million ha, mostly as zero-
till wheat in the rice-wheat system of the indo-gangetic plains and zero-till maize in some states.
Under sustainable agriculture, management practices such as split application, placement of
fertilizers at crop root, use of slow release N fertilizers and nitrification inhibitors,
mixed/intercropping of pulses, agroforestry measures and non-pesticide management can enhance
soil health. Generalized specifications of organic fertilizers (city compost, vermin compost,
28
phosphate-rich organic matter) and composition of castor de-oiled cake are brought under FCO,
1985. However, adoption of these practices depends on the efficiency of the extension system and
awareness building among the farmers.
2.11. Access to soil management options
The sources of information accessed by farmers in India are varied. The latest National Situation
Assessment Survey of 35,000 agricultural households across India reveals that over 59% of the
households received no assistance from either government or private extension services. Of the
41% households which received extension assistance, only 11% of services came from the physical
government machinery of the government extension agents, Krishi Vigyan Kendras (KVKs)/farm
science centres and state agricultural universities (SAUs). Many farmers depended on other
farmers (20%) and mass media (19.6%) and 7.4% depended on private commercial agents (NSSO
2014). Public extension plays an important role in providing soil health information since the
progressive/contact farmers or mass media also receive soil health information from the research
and public extension system. In fact, farmer friends/contact farmers are encouraged to gain
agricultural knowledge as part of the public extension strategy.
2.11.1. Public extension
Sources such as functionaries of agriculture department, KVKs, SAUs, research and training
institutes of the ICAR and state governments form important public extension system. The
extension activity of the SAUs and ICAR institutes happens through state-level agricultural entities,
but sometimes reaches out to the farmers directly. A call centre facility was provided by ICAR-NRM
institutes to receive queries from farmers and give them the required advice. The activities include
demonstrations, farmer field schools (FFS), farmer–scientist meetings, village fairs, farmers’ training
courses and study tours at district, state and outside the state levels. KVKs conducted 4,189 on-
farm trials on 537 technologies during 2014–2015 under different farming systems. The Agriculture
Technology Management Agency (ATMA) provides funding for training the farmers. Besides ATMA,
Work Plan Organic Farming Scheme provided INR 20,000 per farmer field school (FFS) to train
farmers and provided funds to conduct study tours within and outside the state. About 7,250 and
17,652 interactions were held in FFS in MP and Maharashtra respectively during 2014–2015.
2.11.2. Mass media
The “Mass Media Support to Agriculture Extension” and “Focused Advertisement Campaign”
schemes fund Doordarshan (national television) and All India Radio (AIR) to make the farmers
aware of modern technologies and research on agriculture and allied areas. An exclusive kisan TV
channel was started in 2015 but it is yet to take off. Community radio stations (CRS) are gaining
29
popularity. MP has eight CRSs and Maharashtra has 15 CRSs. The tribal welfare department of MP
started Bhili CRS to cater to a tribal community and several more CRSs are in the pipeline that aim
to provide information in various tribal dialects. Soil health information is also covered under the
general agriculture theme in the mass media.
2.11.3. Soil information services
There are a number of information services that provide for soil related information. “Farmers’
portal” provides soil fertility maps and fertilizer status in respective states and this portal enables
state agriculture departments (up to block level) to upload information, provide services and give
advisories to farmers in their own languages. KRISHINET is the farmers’ portal managed by the
government of Maharashtra with about INR 78 million investment: it can be used to send mobile
messages to farmers on soil and water testing. In Buldhana district of Maharashtra alone, 45,550
farmers are registered with mKisan-farmers portal. Bhoom Software is developed by KVK Kalwade,
Satara district. AGRISNET is a dynamic soil testing module operating in MP. Indian Institute of Rice
Research is maintaining a state specific rice knowledge management portal to cater to the needs of
rice soils. “My Agriculture information bank” is another website which offers information services.
Kisan Call Centres (KCCs) operate from 14 locations in the country and arrange interaction of
farmers with senior experts on toll-free numbers to facilitate accessibility to KCC services through
mobile phones from 6 a.m. to 10 p.m. 365 days a year. MP has KCC at Indore while it is at Mumbai
in Maharashtra. Private media (print and electronic) also have programmes for sending information
to the farmers. Periodicals on agriculture in Hindi and in vernacular languages also contribute to
dissemination of the information.
2.12. Private Service providers
The private sector in the form of progressive farmers, crop science industry, companies, primary
cooperative societies and output buyers/processors is important, especially for large farmers and
farmers growing cash crops.
2.12.1. Farmers’ associations
Contact intensity is the highest in farmers’ associations. Maharashtra Organic Farmers Federation
(MOFF) is a confederation of 120 CSOs and 142,000 farmers which forms organic groups of 20
farmers each, advocates and conducts training activities in nutrient management practices in
organic crop cultivation (composting, bio-fertilizers, liquid organic manures etc.). In MP, Organic
Farming Association of India is an important player. Grape Growers Association and Pomegranate
Growers Association have a good outreach for reaching soil management related information to
30
their members in Maharashtra. These associations are quite strong in Maharashtra compared to
Madhya Pradesh.
2.12.2. Commercial companies
The commercial companies follow a variety of models for delivering and financing extension.
Commercial companies (seed, fertilizer, micro-irrigation etc.) supply extension to farmers or farmer-
based organizations by offering information services and inputs. This may include sending
agronomists into farmers’ fields and developing partnerships with NGOs, consultants, research
institutes or universities, as well as public providers of extension.
The Mahindra Krishi Vihar, a one-stop farm solution centre by the Mahindra and Mahindra Ltd.
tractor and utility vehicle company, Hariyali Kisaan Bazaar, run by DCM Shriram Consolidated Ltd.,
a fertilizer, seed and sugar conglomerate, a one-stop farmer solution shop of Tata Kisan Sansar by
Tata Chemicals Ltd, Godrej Agrovet model and Jain micro-irrigation provide knowledge on soil
health information as part of a general package. Contract farming in wheat is practiced in Madhya
Pradesh by Hindustan Lever Ltd. Rallis and Industrial Credit and Investment Corporation of India
(ICICI). PepsiCo, Adani Agrifresh, and FieldFresh Foods Private Ltd. all encourage contract farming
with respect to certain crops in certain areas where soil health information is part of the package.
Fertilizer companies such as RCFL, IFFCO, Krishak Bharati Cooperative Limited (KRIBHCO) and
Coromandal are taking up extension activities in nutrient management and are independently
conducting soil-testing activities, although on a small scale. RCFL established six STLs in 1967 and
provided three MSTLs for issuing soil reports and health cards. Seed companies also give
information on soil nutrition based on the crop requirement as part of their package of practices.
However, private information services often don’t target the SHM in a holistic way as they focus
mostly on crop productivity enhancement.
2.12.3. Independent entrepreneurs/agencies
Progressive and big farmers are willing to pay for delivery of an integrated set of services that give
them access to quality inputs, credit procurement services and field-based advice on technology
use. Some agri-business entrepreneurs also established STLs for offering services. “India Mart”
provides soil-testing services at Mumbai, Thane, Nagpur (Maharashtra) through an e-transaction
portal. A prescribed amount can be paid toward the services. Vision Mark Biotech provides services
and supplies bio-fertilizers in Maharashtra. However, the general trend is that farmers prefer to pay
for a package of services rather than specifically for soil-testing services or soil health information.
Also, they prefer to pay for cash crops rather than for food crops.
2.13. Fertilizer mixtures and their availability
31
Various types of approved fertilizer mixtures are available based on crop, soil and agro-climatic
conditions. The mixtures are usually consumed in the same state where they are prepared and they
vary from one combination in Odisha to 29 combinations in Tamilnadu (Annex 2 a). In Madhya
Pradesh and Maharashtra, six combinations of fertilizer mixtures are approved (Annex 2 b).
Maharashtra has more fertilizer mixture companies than MP (Annex 3).
CHAPTER III
Institutional and political obstacles in soil health management According to the Vision 2030 report prepared by IISS, Bhopal, soil fertility has dropped to a third of
what it was in just 35 years, indicating the reduction of the partial productivity of the fertilizers from
15 kg of the food grains per kg of NPK in 1970 to 5 kg of food grains in 2005. Most of the important
soil-based production systems are showing a declining trend of total factor productivity and low
nutrient use efficiency due to deterioration of soil health (Ganeshamurthy 2014). Fertilizer
consumption in India is highly skewed with wide inter-state, inter-district and inter-crop variations.
The consumption ranged from 250 kg per ha in Punjab to 2 kg per ha in Arunachal Pradesh while it
is 84.7 kg per ha in Madhya Pradesh and 102.7 kg per ha in Maharashtra as assessed in 2012–
2013. During 2013–2014, total NPK consumption in India was 244.82 kg per ha. While per hectare
consumption is 243.56 kg in Punjab and 266.11 kg in Andhra Pradesh, it is comparatively low in MP
(88.36 kg). Inter district variation in consumption is also clearly visible according to the district level
information obtained from Maharashtra. While Ahmednagar has consumption figures of 123 N, 13.6
P and 6.3 K kg per ha, Buldana has only 16.5 N, 8.77 P and 4.69 kg per ha and similar situation
exists in all the states. The NPK ratio, a measure of balanced use of fertilizer shows wide interstate
and inter-district disparity as well. All India NPK Ratio was 8.2:3.2:1 in 2012–13 where as it was
15:10:1 in MP (due to low K consumption) and 3.5:1.9:1 in Maharashtra in the same year.
3.1. Policy issues
3.1.1. Production of fertilizers
Fertilizer production costs are high and the government subsidizes producers in order to make sure
fertilizer is available to farmers at low, controlled prices (even so prices have risen and are out of
reach of many farmers). Meanwhile, K and P fertilizers have been decontrolled. As a result,
domestic investments in the fertilizer industry have lagged behind and imports have surged.
Promotion of complex fertilizers increased tremendously which is leading to imbalanced nutrition.
There is inadequate availability of straight fertilizers other than N, P, K and Zn.
3.1.2. Subsidies
32
The fertilizer industry not the farmers, receives the subsidy; this means that farmers can’t buy
whatever they want. Fertilizer subsidies need to be comprehensively re-examined to improve
balanced nutrition and to target the subsidy more to the smaller farmers, for example, by limiting the
subsidy to a fixed quantity to be given per farmer, with the rest of the market being decontrolled.
The Ministry of Agriculture is preparing proposals for extending subsidy to the farmers through
direct cash transfer which is estimated to save 32% of total fertilizer subsidy, however, it has not yet
materialized.
3.1.3. Prices
With the implementation of the nutrient-based subsidy (NBS) policy, the prices of DAP and MOP
shot up during 2012–2013 to almost four times that of urea due to open market prices, resulting in
overuse of urea and imbalanced NPK ratio (8.2 : 3.2:1). This reduces the grain to fertilizer response
ratio, leading to much lower returns from fertilizer application.
3.1.4. Other government promoted interventions
Chemical fertilizers are subject to aggressive promotion by the government coupled with
commercial salesmen. It is further associated with government-promoted interventions that include
the introduction of chemical responsive varieties in crops like sugarcane, sunflower, potato, cotton
etc. and most of the seeds and subsidies for these crops come with a package of fertilizers and
pesticides. If one accepts the crop, one also has to accept the package to access credit that is
linked to subsidy. Every time there is a crop loss or natural disaster, one of the first things
government offers is free chemical fertilizers.
3.2. Production of customized and fortified fertilizers
Owing to lack of demand by farmers combined with commercial and economical constraints,
(particularly the problem of procurement of raw materials), many manufacturers are not producing
customized, blended and fortified fertilizers. The fertility status varies even from plot to plot due to
variation in types of crops grown and inputs used. It is not possible to analyse every farmer’s field
for soil fertility purposes. Hence, fertilizer companies are preparing customized fertilizer grades
based on nutrient indexing at district level but the larger the area under nutrient indexing, the higher
will be the deviation from site specificity, making the results erroneous.
3.3. Quality assurance
Major areas of concern are the big range of complex fertilizers with nearly 50% of inert filler
(concealed adulteration) and poor quality of micronutrient fertilizers. Fertilizer Quality Control
33
portal’s product wise sample analysis during 2012–2013 indicated that 71.4% of NPK mixtures, and
60% of micronutrient fertilizers were found to be non-standard (CFQCTI 2015). About 5% of straight
fertilizers were found to be non-standard during 2013–2014 as per DAC (2015). Central Fertilizer
Quality Control training Institute has regional laboratories at Pune and Indore respectively in
Maharashtra and MP for conducting quality checks but there is a felt need to develop or nominate
reputed agencies as referral laboratories to improve the quality of fertilizer testing and to increase
sample size. The feedback tells us that the existing FQTLs (four in MP and five in Maharashtra) are
not sufficient to handle large number of fertilizer samples. This is true in other states as well.
3.4. Diversion of fertilizers
Indian urea is the lowest priced in the large economies of the world coupled with lack of a proper
regulatory mechanism is leading to the diversion of urea to non-agricultural uses that might range
between 10–20% of urea distributed in the country. Urea is diverted for various industrial and
commercial applications such as producing some types of plastics, glues, animal feed, plywood,
automobile industry lubricants and pesticides within the country. MOCF officials say that there are
cases of subsidized urea being siphoned off by manufacturers (largely in Maharashtra, Gujarat,
Tamilnadu and Haryana) to mostly the chemical industry. Estimates suggest that at least 1 million
tonne of urea is illegally diverted for industrial use. It is being smuggled into neighbouring countries
(Bangladesh and Nepal) from states such as Uttar Pradesh and Bihar urea prices are higher in
those countries. One proposal given by the Agriculture Ministry to control the black market is to
make 100% urea neem coated instead of the current practice of 30% urea being neem coated,
which may save INR 45 billion to the government by reducing the subsidy as well as the imports
(TOI 2015). Neem coated urea is unfit for industrial use but is good for soil, crop and beneficial to
the farmer through less wastage and less groundwater pollution. Further, officials reveal that a good
chunk of potash, a key chemical entirely imported, is pilfered and diverted to the firecracker
industries – or worse, repacked and exported. Lack of accountability and awareness among the
famers that they would face action if they are caught selling subsidized urea to industrial units is
another concern. Inflated sales are conducted compared to the actual requirement by fertilizer
companies in connivance with some agricultural department officials, which leads to the sale of the
fertilizers at higher prices on the black market when demand exceeds supply. However, subsidies
are released to fertilizer companies only on certification (quantity, quality or transportation distance)
from the local agriculture officers, so there are questions about the efficiency of the monitoring
system.
The diversion of subsidized fertilizer to wealthier farmers also takes place but in negligible
quantities. As the wealthy farmers perform agriculture on a commercial basis, they invest more in
34
fertilizers by procuring them in advance in large quantities by assessing the demand during the
sowing season. Thereby, their accumulation of fertilizers leads to more utilization of fertilizer subsidy
and excessive application (sometimes more than required) compared to the small and marginal
farmers. There are cases where the big farmers loan the fertilizer in kind to the poor farmers and
charge interest on the estimated cost of the fertilizer.
3.5. Dominance of middlemen (distributors and dealers)
The fertilizer industry is well organized in terms of its distribution system. Farmers are not customers
of the fertilizer producers, but rather customers (with the low bargaining power) of the local fertilizer
dealers. Distributors remain under the influence of a few large producers who exercise the right to
induce their market practices over distributors and the right to expel non-compliant distributors from
their network. Sometimes, the fertilizer companies force the dealers to sell their other products such
as bio-pesticides and complex fertilizers along with urea which puts a financial burden on the
farmers and forces them to make use of unwanted or non-essential chemicals on their farms. The
influence of middlemen (distributors) is negligible compared to the role of fertilizer companies as
well as the regulatory mechanism. However, the local dealers heavily influence extension, thus
driving the farmers to go for crops and fertilizers (type, quantity etc.) according to the dealers’
choice and business requirement.
3.6. Soil testing constraints
Soil testing capacity of various MSTLs/STLs is about 10 million per year to cover about 138 million
land holdings. The prevalence of smallholding systems of farming as well as a lack of infrastructure
is a deterrent for extensive soil testing (Sen et al. 2008). Inadequate soil testing facilities means that
farmers must travel far to get their soils tested and wait for a long time (1 to 4 months) to get the
results and recommendations. Most of the farmers don't usually get their soils tested in the labs
since they generally cannot understand the soil test results and don't know what parameters and
measures that need to be taken to improve soil fertility. A study by Patel and Chauhan (2012) found
that only 31% of the farmers had shown a favourable attitude while 37% had shown an
unfavourable attitude and 35% were neutral in their reaction to the SHC programme. The lack of
availability of sufficient number of qualified and trained manpower at STLs and among the extension
staff is another concern.
3.7. Fertilizer use efficiency (FUE)
Soil organic carbon is important for the function of ecosystems, microbial population and agro-
ecosystems having a major influence on the physical structure of the soil, its water holding capacity
and its ability to form complexes with metal ions and supply nutrients. Depletion in soil organic
35
carbon leads to poor FUE of the soil which on average is estimated to be 30 to 50% for N (due to
immobilization, volatilization, leaching and denitrification), 15 to 20% for P (due to fixation), 70 to
80% for K (due to fixation), 8 to 10% for S (due to immobilization and leaching) and 1 to 2% for
micronutrients (due to fixation) as per DOC (2015). The fertilizer product patterns, time and method
of application of fertilizer, cropping patterns with no rational crop nutrition schedules and no site-
specific nutrient management and faulty agronomic practices are aggravating the situation.
Important links between use of fertilizers and other inputs such as improved seeds and irrigation
against a set of varying agro-climatic situation are generally ignored when taking soil fertility
decisions. Complex fertilizers which cannot guarantee the release of each nutrient according to the
specific crop needs are hugely popular among the farmers due to the government policy and
aggressive marketing by the manufacturers.
3.8. Resistance to use inorganic fertilizers
Although the majority of the farmers in most parts of the country always use chemical fertilizers,
there is some resistance to their use in remote areas, especially where tribal farmers practice
shifting cultivation or subsistence agriculture. Inorganic fertilizer consumption is very low in north-
eastern states. Here farmers are reluctant, if not resistant, to use chemical fertilizers and adopt
improved agronomic practices. Factors such as inadequate supply of and access to fertilizers
combined with poor extension adds further to the apathy of the farmers towards the use of
fertilizers. In arid areas and in the semi-arid tropics where rain-fed crops are grown, small and
marginal farmers use very little chemical fertilizers due to lack of investment capacity and
uncertainty of crop output or fear of crop failure due to unfavourable weather conditions. Recently
with the onset of the sustainable agriculture concept, farmers who are aware of ill-effects of
excessive usage of chemical fertilizers are opting to use inorganic fertilizers (farmyard manure
[FYM]) and non-chemical pesticide management.
3.9. Adoption of conservation agriculture (CA) and Sustainable
agriculture (SA)
For sustaining high productivity with NPK, integrated use of fertilizers with organic manure
(farmyard manure at 10–15 t half year) is necessary under intensive cropping systems (Nambiar
and AhroI 1989). However, attitudinal change among the stakeholders is necessary to know the
potential and adopt CA. The main limitations are: a lack of site-specific knowledge, lack of
appropriate seeders especially for small/medium farmers, widespread use of crop residues for
livestock feed and fuel, and burning of crop residues etc. Also, farmers prefer their lands to be
prepared instead of going for zero tillage so that they can apply fertilizers. Small and marginal
farmers who do not own livestock don’t have manures (except for some poultry manure) and
36
compost. There is also lack of awareness and indifference among all stakeholders toward the
negative impacts of the exclusive and excessive use of chemical fertilizers on soil properties, soil
pollution and health and environmental issues. Moreover, chemical fertilizers are easy to transport
and operate. Further, there are no subsidies for organic manures such as farmyard manure,
compost and bio-fertilizers although certain schemes encourage their usage. Although there are
some concerns among the farmers about the loss in soil quality when chemical fertilizers are used,
the prospect of instant results in the form of high yields dominates their decisions. National Mission
on Sustainable Agriculture has not yet taken off but is expected to bring an attitudinal change in
farmers who are driven by markets and choice of crops rather than the soil health requirement.
3.10. Limited use of bio-fertilizers
The majority of farmers are not aware of bio-fertilizers. There is a supply of spurious products in the
market with no proper quality checking mechanism and timely availability of standard quality bio-
fertilizers, which can withstand high temperatures, is not yet streamlined. There is also a view
among the extension agents and farmers that inconsistent results are reported on their use and
farmers are not yet confident about the concept. Hence, dealers are also not keen to store and
supply bio-fertilizers to the farmers.
3.11. Access to credit
Lack of access to credit and indebtedness pushes many farmers to purchase inputs from local
dealers who often provide substandard inputs and whatever inputs they wish to sell. Maharashtra
has registered highest farmers suicide deaths (2,568) against the total number of such deaths
(5,650) in the country during 2014 and Madhya Pradesh reported 826 according to the official
figures available (NCRB 2015). One reason for farm distress is lack of ownership records leading to
lack of access to institutional credit and exploitation by the middlemen who charge exorbitant
interest rates on the loans extended to farmers ( apart from the stress from the frequent droughts
and crop failures experienced). A number of co-operative societies also have weak financial status,
hence requiring substantial credit to invest in procuring fertilizers for further distribution to the
farmers.
3.12. Extension system
Loopholes in extension are leading to a wide gap in dissemination of knowledge about the benefits
of soil testing and balanced fertilization according to the requirements of individual farmers. Less
exposure of public extension officials to advances in crop nutrition has mean that officials have a
37
limited focus on the subject. Small and marginal farmers and farmers located in remote areas do not
receive much attention in the extension system in spite of certain initiatives by the government.
Moreover, input dealers, who have narrow commercial interests have emerged as the main vehicle
for technology diffusion. Private extension is useful and viable alternative for medium and large-
scale farmers growing cash crops but is likely to discriminate against the poor, especially the
passive poor.
3.13. Access to inputs and services
Physical access to inputs, services (infrastructure, credit, fertilizers and reliable information) and
markets is required by improving rural roads and transport to play a positive role in improving the
supply of inputs and services by private companies. Fertilizer transportation costs are currently
borne by the government payable to the companies (eligible up to 1 400 km by trains and 500 km
by road) but remote areas suffer as in case of north-eastern states and remote villages/blocks in all
the states. In certain cases, additional charges over maximum retail price (INR 16 per 50 kg of urea)
are collected from farmers by local dealers. Fertilizer companies transport the fertilizers in bulk up to
one point and from there on, farmers have to pay additional charges of INR 30 to INR 50 per bag
depending on the distance they are from the distribution point. Sometimes, fertilizer distributors
resort to road transportation although train transportation is available as it is a convenient
arrangement for them. Reportedly, fertilizer companies located in south India are demanding
payment based on average cost of production instead of distance but companies from north India
are favouring the present arrangement and a policy decision is yet to be taken on this by the
government.
3.14. Social and economic inequality
Inequality in land distribution and insecurity of tenure, different forms of social discrimination and
domination based on gender, caste and tribal affiliation affect the soil fertility management decisions
at individual farm level. About 84% of the farmers in MP (marginal, small and medium) farm less
than 10 ha land. In Maharashtra, the average size of a landholding is just 1.44 ha. The agricultural
land diverted for non-agricultural (industrial, construction etc.) purposes is permanently lost, thus
bringing under plough the marginal lands which are unsuitable for agriculture according to the land-
use capability classification. These marginal lands are usually located in the ridge areas and are
being distributed to the poor, thereby destroying the whole watershed catchment, thus aggravating
the soil erosion and silting up the water bodies. Poor farmers have neither the knowledge of proper
agronomic practices nor the required investment to suitably raise the crops, buy inorganic fertilizers
38
or take soil fertility decisions. They lack access to manure and compost as well. There is resistance
to the use of inorganic fertilizers in tribal areas, especially where primitive agriculture practices are
being followed. Here, language gap appears to be a major problem for agriculture extension.
3.15. Coordination gaps in policy and implementation
3.15.1. There is a lack of coordination according to senior officials of DAC, DARE and DCF since
schemes/programmes are usually implemented in parallel to each other without an orchestrated
feedback mechanism. Combined reviews of related issues do not happen on regular basis to
identify policy and strategy gaps and address the same in an appropriate way.
3.15.2. The absorption capacity of the states in terms of gearing up administrative machinery for
developing strategies and use of funds varies a lot, hence the performance of SHM programmes of
GOI also vary accordingly. For example, during 2015–2016, only 3.4 million SHCs have been
issued so far out of a target of 8.4 million with states such as Andhra Pradesh leading (1.65 million
SHCs) while quite a number of states (Arunachal Pradesh, Goa, Gujarat, Haryana, Kerala,
Mizoram, Sikkim, Tamilnadu, Uttarakhand and West Bengal) have not distributed a single SHC so
far and some states have not even started collecting soil samples. Tamilnadu and Punjab have
exceeded their targets in soil sample collection but have not issued SHCs yet (The Hindu 2015).
3.15.3. Missing linkages among different agencies involved in agriculture related schemes
implementation is clearly visible. Coordination between agriculture and watershed programme
implementing agencies is either not strong (e.g. Maharashtra) or lacking (e.g. MP), thus we are
unable to tap the watershed staff, funds and flexibility for soil fertility enhancement. The agriculture
department also implements its schemes according to the administrative jurisdiction of staff and not
on a watershed basis. At present, natural resource management and production enhancement
components of IWMP are not focusing much on soil fertility management. Soil testing is prescribed
on a sample basis in farmers’ lands in all watershed villages but it is not strictly adhered to; even if
sample soil testing is done, the results are not analysed properly to give recommendations and to
do follow up. The productivity enhancement component received much less attention (less than
40% and 20% expenditure out of available funds in MP and Maharashtra respectively) though this
component has an enormous scope for carrying out SHM-related activities. Ideally, the funds and
staff of watershed and agriculture wings/departments must be pooled to carry out activities at block
and district levels in coordination with each other.
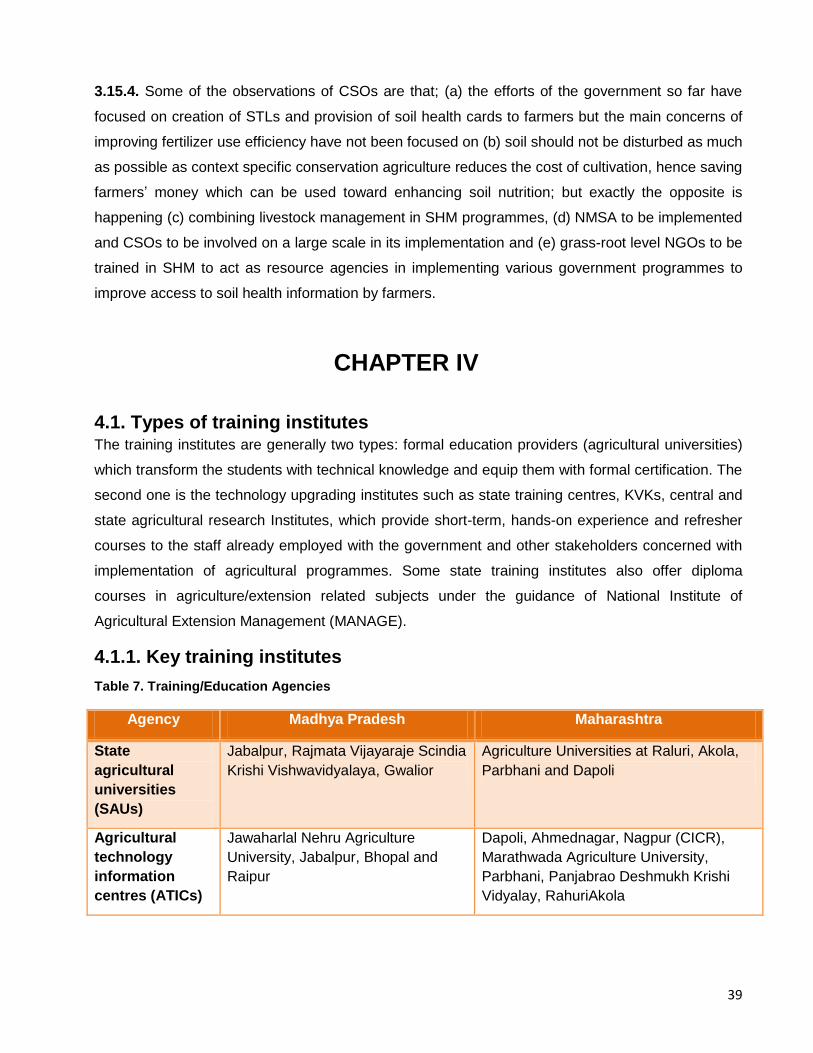
39
3.15.4. Some of the observations of CSOs are that; (a) the efforts of the government so far have
focused on creation of STLs and provision of soil health cards to farmers but the main concerns of
improving fertilizer use efficiency have not been focused on (b) soil should not be disturbed as much
as possible as context specific conservation agriculture reduces the cost of cultivation, hence saving
farmers’ money which can be used toward enhancing soil nutrition; but exactly the opposite is
happening (c) combining livestock management in SHM programmes, (d) NMSA to be implemented
and CSOs to be involved on a large scale in its implementation and (e) grass-root level NGOs to be
trained in SHM to act as resource agencies in implementing various government programmes to
improve access to soil health information by farmers.
CHAPTER IV
4.1. Types of training institutes The training institutes are generally two types: formal education providers (agricultural universities)
which transform the students with technical knowledge and equip them with formal certification. The
second one is the technology upgrading institutes such as state training centres, KVKs, central and
state agricultural research Institutes, which provide short-term, hands-on experience and refresher
courses to the staff already employed with the government and other stakeholders concerned with
implementation of agricultural programmes. Some state training institutes also offer diploma
courses in agriculture/extension related subjects under the guidance of National Institute of
Agricultural Extension Management (MANAGE).
4.1.1. Key training institutes
Table 7. Training/Education Agencies
Agency Madhya Pradesh Maharashtra
State
agricultural
universities
(SAUs)
Jabalpur, Rajmata Vijayaraje Scindia
Krishi Vishwavidyalaya, Gwalior
Agriculture Universities at Raluri, Akola,
Parbhani and Dapoli
Agricultural
technology
information
centres (ATICs)
Jawaharlal Nehru Agriculture
University, Jabalpur, Bhopal and
Raipur
Dapoli, Ahmednagar, Nagpur (CICR),
Marathwada Agriculture University,
Parbhani, Panjabrao Deshmukh Krishi
Vidyalay, RahuriAkola
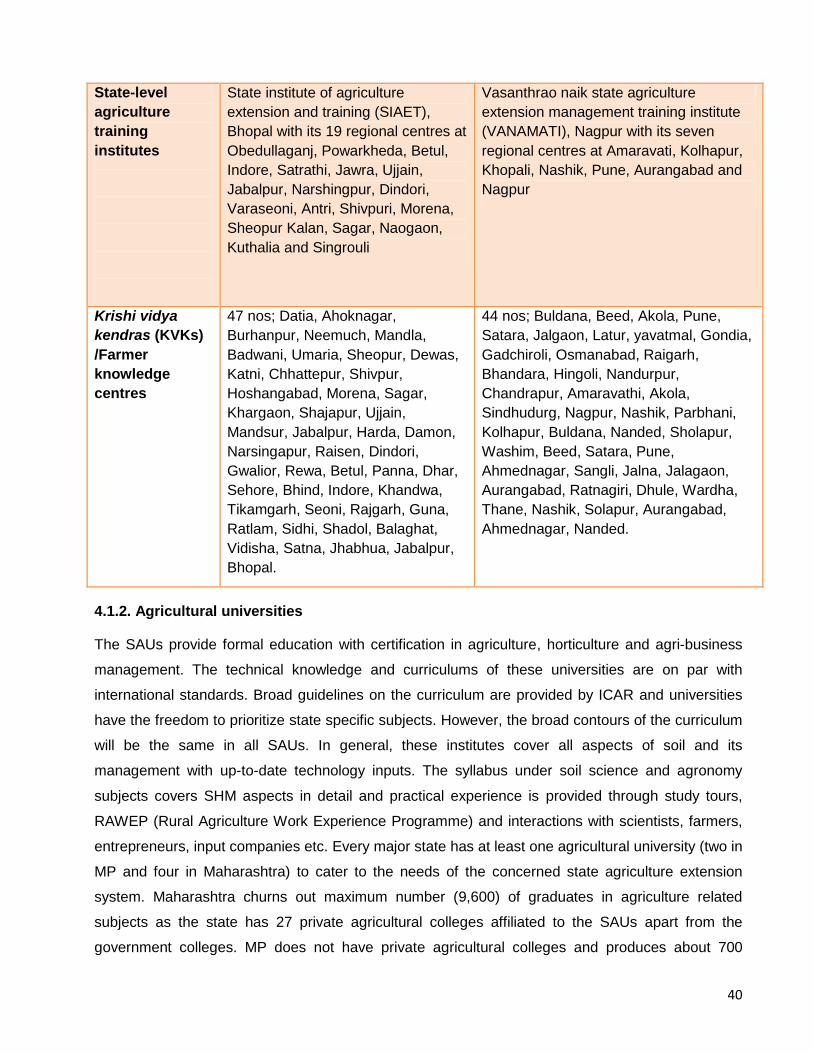
40
State-level
agriculture
training
institutes
State institute of agriculture
extension and training (SIAET),
Bhopal with its 19 regional centres at
Obedullaganj, Powarkheda, Betul,
Indore, Satrathi, Jawra, Ujjain,
Jabalpur, Narshingpur, Dindori,
Varaseoni, Antri, Shivpuri, Morena,
Sheopur Kalan, Sagar, Naogaon,
Kuthalia and Singrouli
Vasanthrao naik state agriculture
extension management training institute
(VANAMATI), Nagpur with its seven
regional centres at Amaravati, Kolhapur,
Khopali, Nashik, Pune, Aurangabad and
Nagpur
Krishi vidya
kendras (KVKs)
/Farmer
knowledge
centres
47 nos; Datia, Ahoknagar,
Burhanpur, Neemuch, Mandla,
Badwani, Umaria, Sheopur, Dewas,
Katni, Chhattepur, Shivpur,
Hoshangabad, Morena, Sagar,
Khargaon, Shajapur, Ujjain,
Mandsur, Jabalpur, Harda, Damon,
Narsingapur, Raisen, Dindori,
Gwalior, Rewa, Betul, Panna, Dhar,
Sehore, Bhind, Indore, Khandwa,
Tikamgarh, Seoni, Rajgarh, Guna,
Ratlam, Sidhi, Shadol, Balaghat,
Vidisha, Satna, Jhabhua, Jabalpur,
Bhopal.
44 nos; Buldana, Beed, Akola, Pune,
Satara, Jalgaon, Latur, yavatmal, Gondia,
Gadchiroli, Osmanabad, Raigarh,
Bhandara, Hingoli, Nandurpur,
Chandrapur, Amaravathi, Akola,
Sindhudurg, Nagpur, Nashik, Parbhani,
Kolhapur, Buldana, Nanded, Sholapur,
Washim, Beed, Satara, Pune,
Ahmednagar, Sangli, Jalna, Jalagaon,
Aurangabad, Ratnagiri, Dhule, Wardha,
Thane, Nashik, Solapur, Aurangabad,
Ahmednagar, Nanded.
4.1.2. Agricultural universities
The SAUs provide formal education with certification in agriculture, horticulture and agri-business
management. The technical knowledge and curriculums of these universities are on par with
international standards. Broad guidelines on the curriculum are provided by ICAR and universities
have the freedom to prioritize state specific subjects. However, the broad contours of the curriculum
will be the same in all SAUs. In general, these institutes cover all aspects of soil and its
management with up-to-date technology inputs. The syllabus under soil science and agronomy
subjects covers SHM aspects in detail and practical experience is provided through study tours,
RAWEP (Rural Agriculture Work Experience Programme) and interactions with scientists, farmers,
entrepreneurs, input companies etc. Every major state has at least one agricultural university (two in
MP and four in Maharashtra) to cater to the needs of the concerned state agriculture extension
system. Maharashtra churns out maximum number (9,600) of graduates in agriculture related
subjects as the state has 27 private agricultural colleges affiliated to the SAUs apart from the
government colleges. MP does not have private agricultural colleges and produces about 700
41
graduates each year. Distant education courses are also offered in agricultural extension by
YCMOU (Yashwantarao Chavan Maharashtra Open University) through its 45 study centres located
in KVKs. These students get placements in state agriculture departments (although not on a regular
basis), fertilizer companies, biotech companies, seed companies etc.
4.1.3. SAMETIs (State Agricultural Management and Extension Training Institutes)
SAMETIs are autonomous state institutes with a mandate to conduct training on agricultural
technology, management, gender, extension reforms and information technology. SAMETIs also
provide extension management inputs for extension functionaries of the Agriculture Department and
conduct workshops, reviews and studies on extension gaps etc. Their technical knowledge and
resource persons (serving or retired) come from universities and research institutes. MP’s State
institute of Agriculture Extension Training (SIAET) located at Bhopal has 19 regional centres (some
of them are attached to SIAET recently). The physical infrastructure at Bhopal is good but it is in
poor shape in the regional centres. Maharashtra’s Vasantrao Naik state agriculture extension
management and training institute (VANAMATI) is located at Nagpur and has seven Regional
Agricultural Extension Management and Training Institutes (RAMETIs). The physical infrastructure
is satisfactory at all the centres but there are not enough staff in the faculty to meet the training
requirement. At all levels, the services of external faculty and resource persons are used.
4.1.4. Research Institutes and Extension Education Institute (EEI)
Every year, training courses are allocated by the Directorate of Extension to various research and
training institutes and each state is allocated some seats. Research institutes also conduct training
courses out of their own funds. Four regional EEIs organized 198 training courses (108 on-campus
and 90 off-campus) with an allocation of INR 150 million during 2014–2015. Indian Institute of Soil
and Water Conservation, Dehradun organized 8-day courses to train 170 officers and 113
watershed functionaries and one 4-month-long course on watershed approaches for 22 officers.
Other research institutes also organized training courses in a similar way although the duration of
the courses varies according to the requirement. The MANAGE coordinated Diploma in Agriculture
Extension for Input Dealers (DAESI) module spreading over 52 Sundays (1 day a week in a year)
gives authentic information on agriculture related aspects and imparts ethical values. So far, 580
input dealers have been trained in five states at a cost of INR 20,000 per trainee. States have
different arrangements for financing the training. In Andhra Pradesh, 100% of the cost is borne by
the trainees while in Jharkhand and Tamilnadu, state government contributed 75% of the cost from
RKVY funds. States such as Orissa have subsidized the agri-clinics and agribusiness centres
(ACABC) training courses (coordinated by MANAGE) by releasing INR 15,000 per candidate from
42
RKVY funds and the balance was borne by the candidates. The annual target is 12,000 for ACABC
training although under DAESI, there are no fixed targets.
4.1.5. KVKs and ATICs
The main focus of KVKs is on farmers but they also organize training courses for extension
personnel catering to specific themes as required by the state agriculture department subject to
fund availability. KVKs utilize services of CSOs and some CSOs handle KVKs themselves. KVKs
are farmer knowledge centres and they organized 61,495 training courses for 1.6 million farmers
and extended mobile advisory services to 30, 752 registered farmers during 2013–14. During 2013–
14, KVKs organized 5,430 training courses for a total of 11.8 million extension personnel. About 334
interface meetings were conducted during 2014 for scientists and district officials by ATICs to give
AEOs an opportunity to interact with scientists and to gain knowledge on the latest technologies.
However, regular training courses do not take place in ATICs. Some training courses deal with
organic farming, sustainable agriculture and balanced nutrition.
4.2. Types of training activities
Skill development training courses are organized to train agriculture officials on subjects of special
importance. Refresher training courses are organized from time to time to improve the quality of
knowledge and in turn quality of work at state training centres, KVKs, agriculture colleges etc. The
courses are designed based on the priorities of the state agriculture department. Special technical
training programmes are designed to focus on specialized themes in relevant institutes. Extension
reforms monitoring system of GOI requires SAMETIs to enter training details in its training
information system.
4.2.1. Training courses
The SAMETIs offer short-term courses to existing extension staff on different subjects. The course
calendars generally cover soil health management, fertilizer quality control, integrated nutrient
management, soil and water conservation, fertigation, input management, fertilizer quality control,
soil health and nutrition management, strategies to improve fertilizer and water use efficiency,
watershed management etc. based on the priorities of the state agriculture department. Refresher
courses of 3 to 5 days duration, for 30 to 45 individuals at a time are organized. The faculty of
SIAET is mainly from Indian Institute of Soil Science, Bhopal in case of SHM subjects and in case of
VANAMATI, experts come from Agriculture College, Nagpur. The curriculum is loosely structured for
all the courses and it varies depending on the training centre and the availability of resource
persons (Annex 4). The methodology mainly consists of expert lectures and field visits.
4.2.2. Number of training courses by SAMETIs
43
During 2015–16, SIAET planned 32 courses out of which six courses of 3 to 5 days duration are
relevant to SHM and 21 training courses (30 per batch) were organized under these courses. About
480 extension officials of different cadres can be trained; the trainee attendance was around 75%.
SIAET also organizes a 1-year postgraduate diploma course in agriculture extension management
for ATMA functionaries in distance learning mode. This course has two semesters with 32 credits.
Another diploma course is organized on agriculture extension services for input dealers (DAESI) to
make them aware of technical issues in agriculture; this is important since dealers are an important
extension channel in the country. A total of about 1,209 officials were trained during 2014–2015.
Regional centres of SIAET also organize SHM training courses (roughly 400 trainees) but they are
not well equipped from an infrastructural point of view. Regional centres are mostly focusing on
integrated plant nutrient management system, farming system approaches for sustainable
agriculture and diversified farming. VANAMATI planned to organize six courses (45 per batch) and
15 training courses on SHM related subjects. VANAMATI has six faculty members and services of
external faculties are engaged on regular basis. On average, 14 training courses per month are
planned. During 2014–2015, about 61 training courses were conducted to train 1,549 officials with
average attendance of 74%. RAMETIs train about 300 officials on SHM courses. In each regional
centre, one soil-testing officer is positioned to focus on soil fertility issues. The services of CSOs are
mostly used in providing resource persons in organic farming and sustainable agriculture.
Sometimes, funds are provided to CSOs to organize/facilitate training courses, especially on the
above two themes.
4.2.3. Course content
SIAET organized 21 training courses covering six courses on SHM-related subjects; dryland
farming, SHM and INM, organic farming and policy, IWMP, sustainable agriculture and quality
control of fertilizers. Two courses of horticulture management were organized in horticulture crops
management where one session focuses on crop nutrition and one TOT (training of trainers) is also
planned. About 13 training courses covering six courses; drip irrigation and fertilization, micro-
irrigation and fertigation, organic farming and certification, participatory watershed management,
quality control and legal provisions for agricultural inputs, soil and water conservation treatments,
were organized by VANAMATI.
4.2.4. Training inputs on SHM
Agriculture department officials report that soil (not water) is likely to be a more talked about subject
in the future, hence there needs to be a focus on SHM. Various aspects of SHM are touched on in
the training courses and the best approach is considered to be a mix of organic and inorganic
nutrition combined with good agronomic practices for restoration of soil health. Chemical fertilizers
are discussed as part of crop management and soil nutrition but there is no specific promotion of
44
them in the training courses. There is knowledge of farmer soil management strategies, which is
discussed during teaching though it does not find a place in the formal curriculum except in organic
farming and sustainable agriculture. The techniques for improving organic matter and soil
biodiversity are also taught. Conservation farming is not a favoured topic as the faculty members or
the trainees don't have any strong belief in the subject. However, while teaching organic farming
and sustainable agriculture subjects, some aspects of conservation agriculture are covered. Soil
testing and quality of soil testing are taught in the respective courses. Training institutes also have
good interface with SAUs and central and state research institutes which helps in obtaining the
latest information on research. There are soil testing labs and officials to teach the soil testing skills
in-house in RAMETIs in Maharashtra where as other training centres provide that training at the
nearest available government STL. The theme content is similar for similar training courses in all the
states although the content varies a bit. Training is mostly confined to the immediate needs of the
agriculture department and agriculture issues in respective states rather than the country as a
whole. Trainees attend short study visits and interact with scientists, farmers and companies
depending on the course requirement. Where required, discussions take place on soil information
systems such as farmers’ portal, from where information on availability of fertilizers, details of
private service providers etc., can be obtained.
4.3. Private training institutes Some CSOs, growers associations and fertilizer companies have training facilities but training
courses are mostly conducted for farmers, input dealers and their own staff; very rarely, agriculture
department officials undergo training conducted by private organizations. However, there are some
links between the respective state government and private organizations. Sometimes, state
governments sponsor the training courses to be facilitated by CSOs, especially on subjects such as
sustainable agriculture and organic farming. CSOs are considered to be good at adopting suitable
training methodologies and their services should be used more often. Sometimes, experienced
CSO personnel are utilized as resource persons to take certain sessions in the training activities
organized by government training institutes.
4.4. Extension personnel The total extension cadre is about 143,863 positions in the Department of Agriculture in all the
states put together. The ratio of farmers to extension workers is as low as 1,000:1. This ratio is also
not effective because at least 25% of extension workers are administrators/ supervisors who are not
directly in touch with farmers (GFRAS 2012). Under programmes such as the Agriculture
Technology Management Agency (ATMA), there is provision for recruiting extension staff on a
contract basis. There are 5,618 blocks in 640 districts of the country where ATMA is implemented.
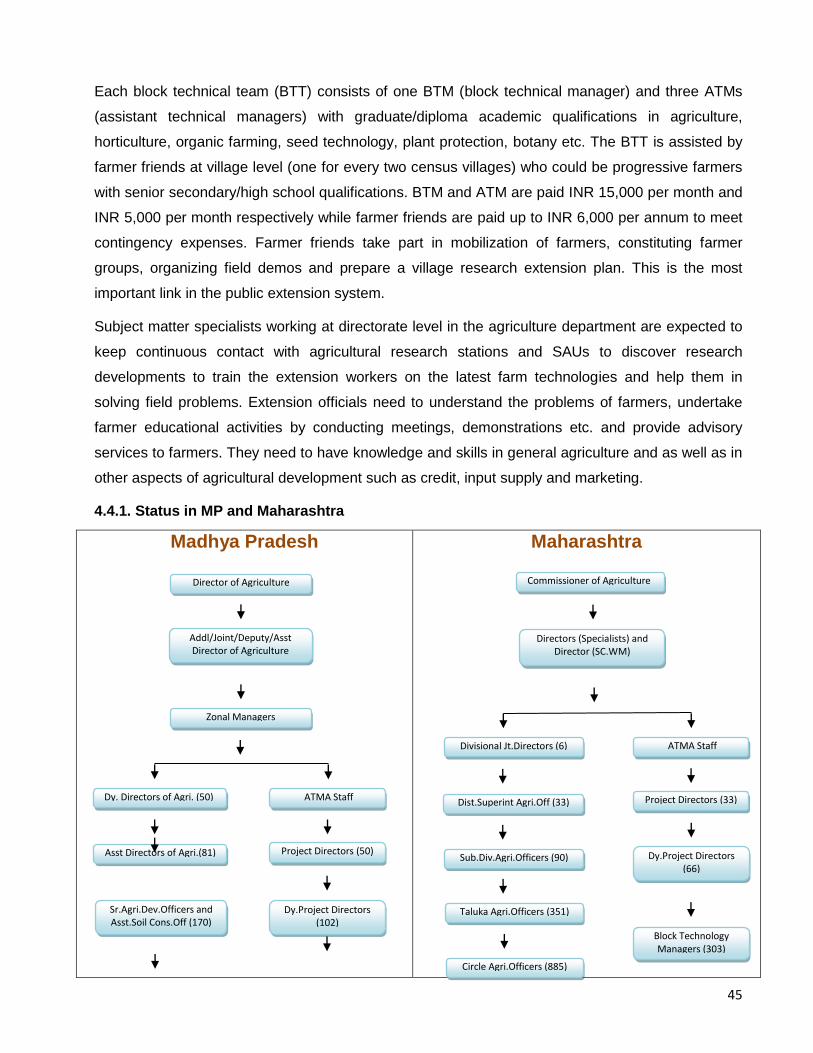
45
Each block technical team (BTT) consists of one BTM (block technical manager) and three ATMs
(assistant technical managers) with graduate/diploma academic qualifications in agriculture,
horticulture, organic farming, seed technology, plant protection, botany etc. The BTT is assisted by
farmer friends at village level (one for every two census villages) who could be progressive farmers
with senior secondary/high school qualifications. BTM and ATM are paid INR 15,000 per month and
INR 5,000 per month respectively while farmer friends are paid up to INR 6,000 per annum to meet
contingency expenses. Farmer friends take part in mobilization of farmers, constituting farmer
groups, organizing field demos and prepare a village research extension plan. This is the most
important link in the public extension system.
Subject matter specialists working at directorate level in the agriculture department are expected to
keep continuous contact with agricultural research stations and SAUs to discover research
developments to train the extension workers on the latest farm technologies and help them in
solving field problems. Extension officials need to understand the problems of farmers, undertake
farmer educational activities by conducting meetings, demonstrations etc. and provide advisory
services to farmers. They need to have knowledge and skills in general agriculture and as well as in
other aspects of agricultural development such as credit, input supply and marketing.
4.4.1. Status in MP and Maharashtra
Madhya Pradesh
Maharashtra
Divisional Jt.Directors (6)
Dist.Superint Agri.Off (33)
Sub.Div.Agri.Officers (90)
Taluka Agri.Officers (351)
Circle Agri.Officers (885)
Commissioner of Agriculture
Directors (Specialists) and Director (SC.WM)
Director of Agriculture
Addl/Joint/Deputy/Asst Director of Agriculture
Zonal Managers
Dy. Directors of Agri. (50) (33)
Asst Directors of Agri.(81) )
Sr.Agri.Dev.Officers and Asst.Soil Cons.Off (170)
ATMA Staff
Project Directors (50)
Dy.Project Directors (102)
ATMA Staff
Project Directors (33)
Dy.Project Directors (66)
Block Technology Managers (303)
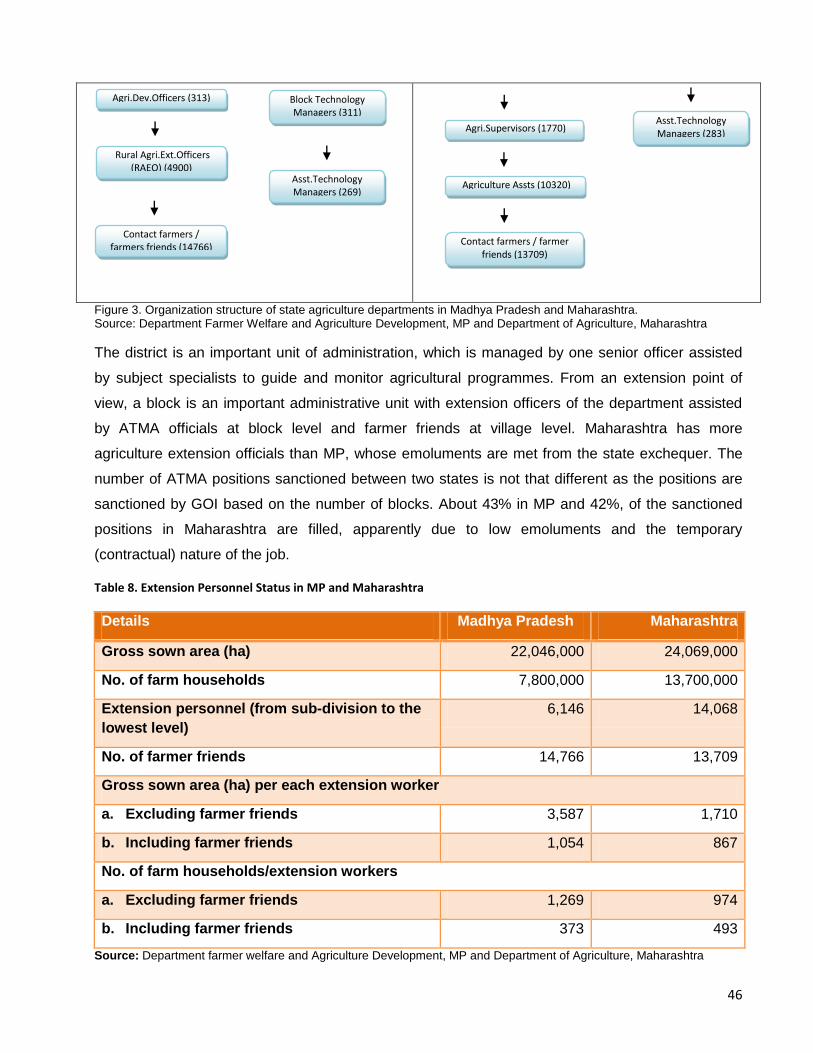
46
Figure 3. Organization structure of state agriculture departments in Madhya Pradesh and Maharashtra. Source: Department Farmer Welfare and Agriculture Development, MP and Department of Agriculture, Maharashtra
The district is an important unit of administration, which is managed by one senior officer assisted
by subject specialists to guide and monitor agricultural programmes. From an extension point of
view, a block is an important administrative unit with extension officers of the department assisted
by ATMA officials at block level and farmer friends at village level. Maharashtra has more
agriculture extension officials than MP, whose emoluments are met from the state exchequer. The
number of ATMA positions sanctioned between two states is not that different as the positions are
sanctioned by GOI based on the number of blocks. About 43% in MP and 42%, of the sanctioned
positions in Maharashtra are filled, apparently due to low emoluments and the temporary
(contractual) nature of the job.
Table 8. Extension Personnel Status in MP and Maharashtra
Details Madhya Pradesh Maharashtra
Gross sown area (ha) 22,046,000 24,069,000
No. of farm households 7,800,000 13,700,000
Extension personnel (from sub-division to the
lowest level)
6,146 14,068
No. of farmer friends 14,766 13,709
Gross sown area (ha) per each extension worker
a. Excluding farmer friends 3,587 1,710
b. Including farmer friends 1,054 867
No. of farm households/extension workers
a. Excluding farmer friends 1,269 974
b. Including farmer friends 373 493
Source: Department farmer welfare and Agriculture Development, MP and Department of Agriculture, Maharashtra
Agri.Supervisors (1770)
Agriculture Assts (10320)
Contact farmers / farmer friends (13709)
Agri.Dev.Officers (313)
Rural Agri.Ext.Officers (RAEO) (4900)
Contact farmers / farmers friends (14766)
Block Technology Managers (311)
Asst.Technology Managers (269)
Asst.Technology Managers (283)
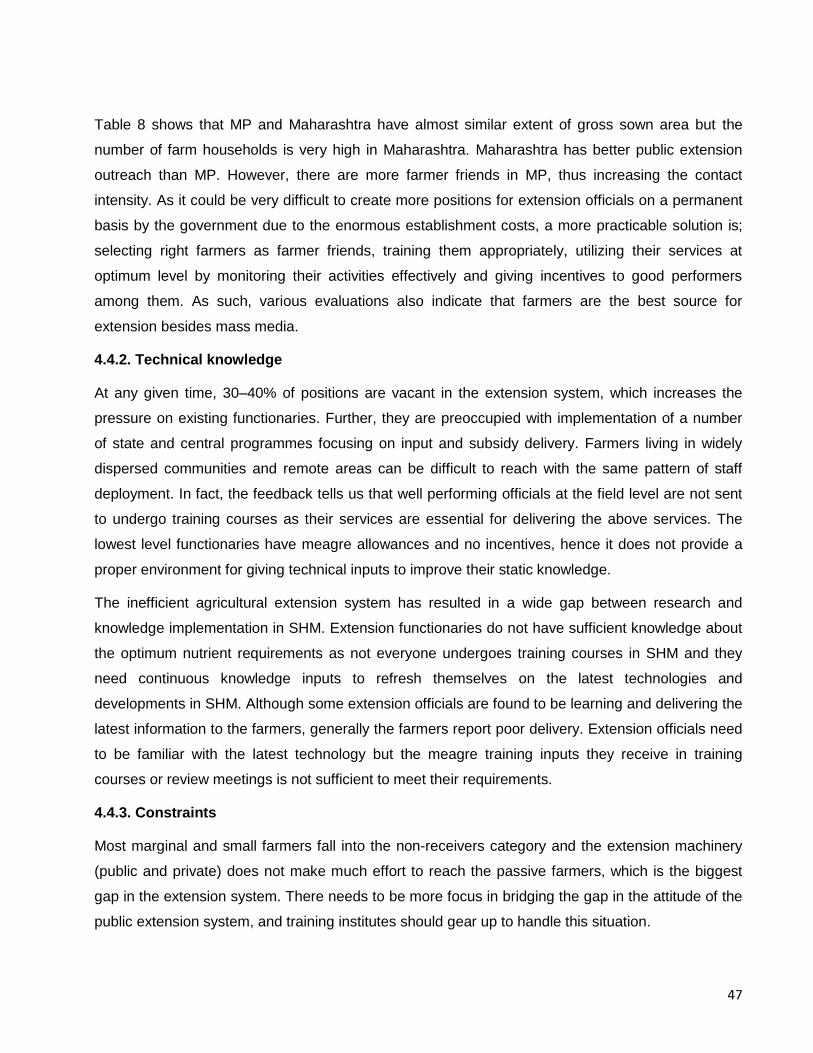
47
Table 8 shows that MP and Maharashtra have almost similar extent of gross sown area but the
number of farm households is very high in Maharashtra. Maharashtra has better public extension
outreach than MP. However, there are more farmer friends in MP, thus increasing the contact
intensity. As it could be very difficult to create more positions for extension officials on a permanent
basis by the government due to the enormous establishment costs, a more practicable solution is;
selecting right farmers as farmer friends, training them appropriately, utilizing their services at
optimum level by monitoring their activities effectively and giving incentives to good performers
among them. As such, various evaluations also indicate that farmers are the best source for
extension besides mass media.
4.4.2. Technical knowledge
At any given time, 30–40% of positions are vacant in the extension system, which increases the
pressure on existing functionaries. Further, they are preoccupied with implementation of a number
of state and central programmes focusing on input and subsidy delivery. Farmers living in widely
dispersed communities and remote areas can be difficult to reach with the same pattern of staff
deployment. In fact, the feedback tells us that well performing officials at the field level are not sent
to undergo training courses as their services are essential for delivering the above services. The
lowest level functionaries have meagre allowances and no incentives, hence it does not provide a
proper environment for giving technical inputs to improve their static knowledge.
The inefficient agricultural extension system has resulted in a wide gap between research and
knowledge implementation in SHM. Extension functionaries do not have sufficient knowledge about
the optimum nutrient requirements as not everyone undergoes training courses in SHM and they
need continuous knowledge inputs to refresh themselves on the latest technologies and
developments in SHM. Although some extension officials are found to be learning and delivering the
latest information to the farmers, generally the farmers report poor delivery. Extension officials need
to be familiar with the latest technology but the meagre training inputs they receive in training
courses or review meetings is not sufficient to meet their requirements.
4.4.3. Constraints
Most marginal and small farmers fall into the non-receivers category and the extension machinery
(public and private) does not make much effort to reach the passive farmers, which is the biggest
gap in the extension system. There needs to be more focus in bridging the gap in the attitude of the
public extension system, and training institutes should gear up to handle this situation.
48
Funds are not a major constraint to conducting more training courses though funding is required for
improving infrastructure and faculty strength at state training institutes and their regional centres.
Training institutes design their training calendar based on: which scheme can fund them, what are
its priorities and what are the state agriculture department’s priorities etc., rather than what is
actually required in the field and what issues have to be handled immediately. The training needs of
the individuals also might not match with the content of the course module. The needs of the
outreach vary based on the total area under crops, types of crops (cash crops or food grains crops),
irrigated/dryland agriculture, types of farmers (small, marginal, medium or large) etc. Mostly the
focus is on plant protection, seeds, fertilizers, technology and marketing but very less attention is
paid to soil health related information, especially soil testing and interpretation of the soil testing
results.
The training is focused on a few topics but does not discuss the problems faced by farmers such as
access to fertilizers soil management options as the training institutes think that these are issues
that should be handled by the state agriculture department. Even if the faculty has an understanding
of the issues at field level, they mostly give technical inputs according to the prescribed course
structure. The training group consists of all cadres of agriculture officials. ATMA staff members
come from different backgrounds and might not have a formal degree in agriculture. Most of the
training courses are just for 3 to 5 days; they can only orient or refresh the knowledge of the
trainees; it is not possible for trainees to fully imbibe the knowledge in this time. Continuous training
of agriculture extension workers is essential but this is not possible in the current setting.
It is not the training courses but constant persuasion and monitoring from senior staff that help the
officials to focus on SHM. State agriculture departments need to attach importance to providing
quality training courses in SHM by mainstreaming it as a core area rather than viewing it as the
mandate of SAMETIs. Each state should have strong policy and strategy to meet the training needs
of the agriculture extension staff. To offset the disadvantage of lack of sufficient physical
infrastructure and human resources, training courses can be outsourced to selected CSOs and
other relevant agencies, which can also improve the qualitative aspects. Stronger links between
training and research institutions are required to get practicable applications of research knowledge
through increased interaction. Also, farmer friends are the most important village level links in the
ATMA system because of their accessibility that helps them to increase the contact intensity.
Hence, training courses and exposure visits should be conducted for farmer friends by using various
approaches and methodologies and building monitoring systems so that quality information can
reach as many farmers as possible.
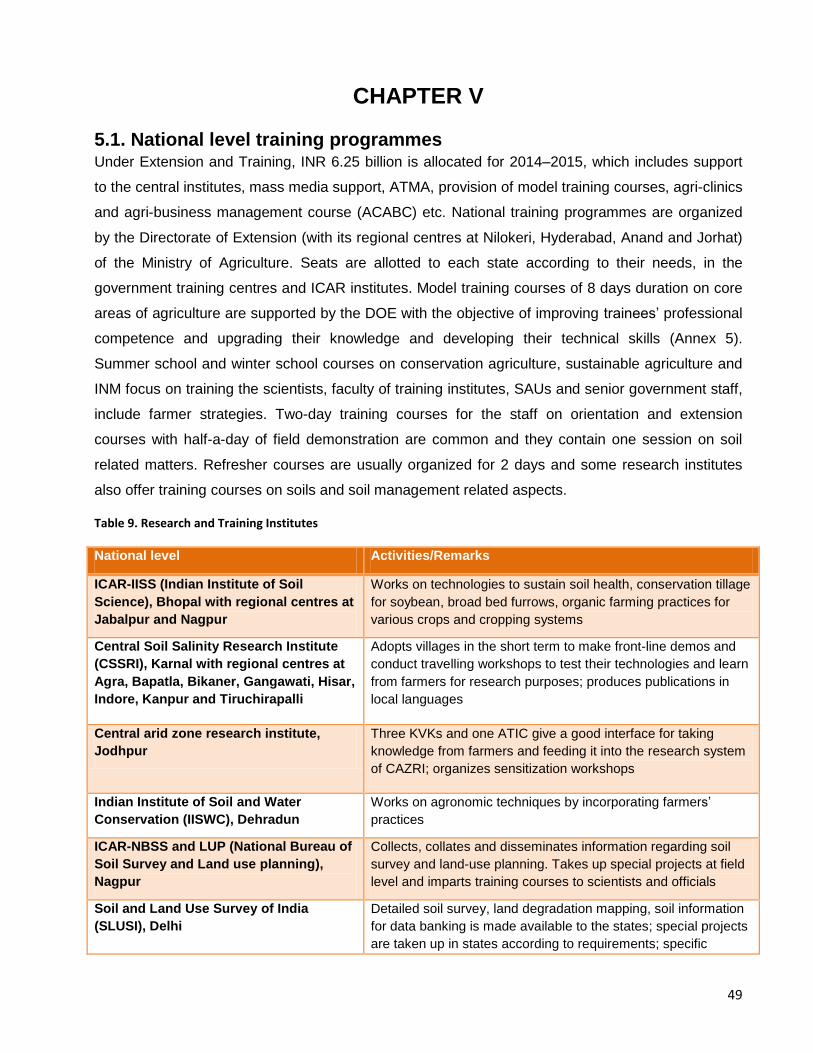
49
CHAPTER V
5.1. National level training programmes Under Extension and Training, INR 6.25 billion is allocated for 2014–2015, which includes support
to the central institutes, mass media support, ATMA, provision of model training courses, agri-clinics
and agri-business management course (ACABC) etc. National training programmes are organized
by the Directorate of Extension (with its regional centres at Nilokeri, Hyderabad, Anand and Jorhat)
of the Ministry of Agriculture. Seats are allotted to each state according to their needs, in the
government training centres and ICAR institutes. Model training courses of 8 days duration on core
areas of agriculture are supported by the DOE with the objective of improving trainees’ professional
competence and upgrading their knowledge and developing their technical skills (Annex 5).
Summer school and winter school courses on conservation agriculture, sustainable agriculture and
INM focus on training the scientists, faculty of training institutes, SAUs and senior government staff,
include farmer strategies. Two-day training courses for the staff on orientation and extension
courses with half-a-day of field demonstration are common and they contain one session on soil
related matters. Refresher courses are usually organized for 2 days and some research institutes
also offer training courses on soils and soil management related aspects.
Table 9. Research and Training Institutes
National level Activities/Remarks
ICAR-IISS (Indian Institute of Soil
Science), Bhopal with regional centres at
Jabalpur and Nagpur
Works on technologies to sustain soil health, conservation tillage
for soybean, broad bed furrows, organic farming practices for
various crops and cropping systems
Central Soil Salinity Research Institute
(CSSRI), Karnal with regional centres at
Agra, Bapatla, Bikaner, Gangawati, Hisar,
Indore, Kanpur and Tiruchirapalli
Adopts villages in the short term to make front-line demos and
conduct travelling workshops to test their technologies and learn
from farmers for research purposes; produces publications in
local languages
Central arid zone research institute,
Jodhpur
Three KVKs and one ATIC give a good interface for taking
knowledge from farmers and feeding it into the research system
of CAZRI; organizes sensitization workshops
Indian Institute of Soil and Water
Conservation (IISWC), Dehradun
Works on agronomic techniques by incorporating farmers’
practices
ICAR-NBSS and LUP (National Bureau of
Soil Survey and Land use planning),
Nagpur
Collects, collates and disseminates information regarding soil
survey and land-use planning. Takes up special projects at field
level and imparts training courses to scientists and officials
Soil and Land Use Survey of India
(SLUSI), Delhi
Detailed soil survey, land degradation mapping, soil information
for data banking is made available to the states; special projects
are taken up in states according to requirements; specific
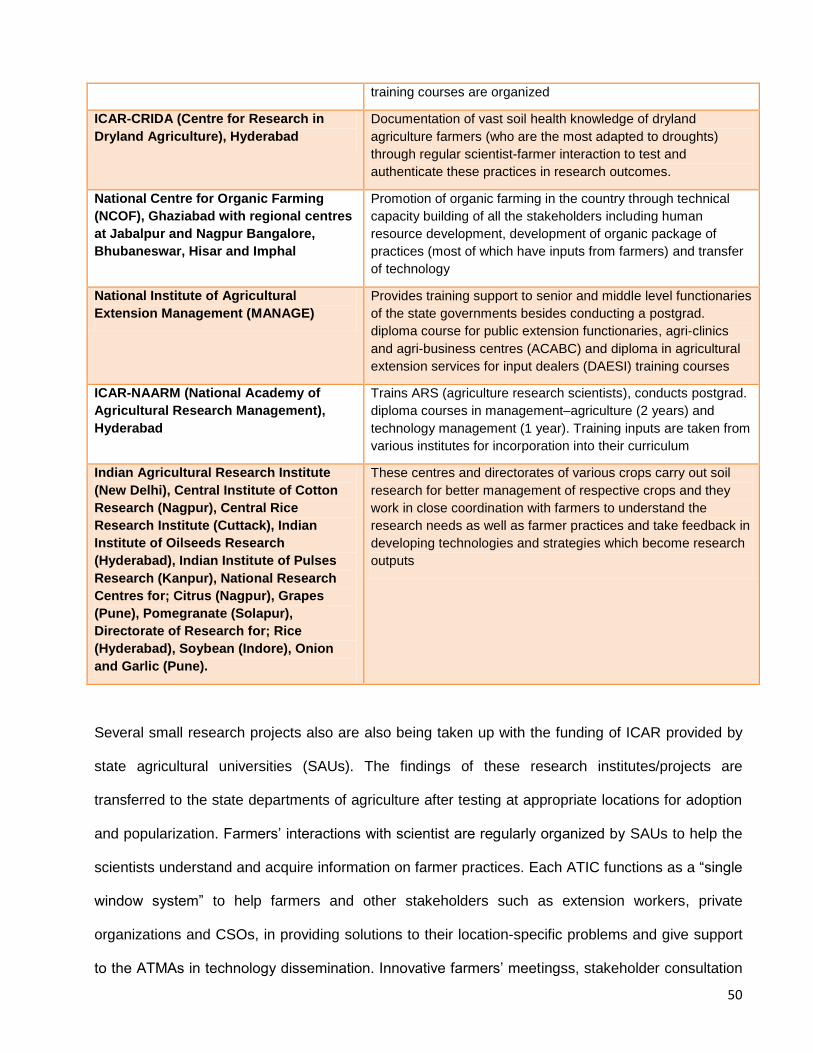
50
training courses are organized
ICAR-CRIDA (Centre for Research in
Dryland Agriculture), Hyderabad
Documentation of vast soil health knowledge of dryland
agriculture farmers (who are the most adapted to droughts)
through regular scientist-farmer interaction to test and
authenticate these practices in research outcomes.
National Centre for Organic Farming
(NCOF), Ghaziabad with regional centres
at Jabalpur and Nagpur Bangalore,
Bhubaneswar, Hisar and Imphal
Promotion of organic farming in the country through technical
capacity building of all the stakeholders including human
resource development, development of organic package of
practices (most of which have inputs from farmers) and transfer
of technology
National Institute of Agricultural
Extension Management (MANAGE)
Provides training support to senior and middle level functionaries
of the state governments besides conducting a postgrad.
diploma course for public extension functionaries, agri-clinics
and agri-business centres (ACABC) and diploma in agricultural
extension services for input dealers (DAESI) training courses
ICAR-NAARM (National Academy of
Agricultural Research Management),
Hyderabad
Trains ARS (agriculture research scientists), conducts postgrad.
diploma courses in management–agriculture (2 years) and
technology management (1 year). Training inputs are taken from
various institutes for incorporation into their curriculum
Indian Agricultural Research Institute
(New Delhi), Central Institute of Cotton
Research (Nagpur), Central Rice
Research Institute (Cuttack), Indian
Institute of Oilseeds Research
(Hyderabad), Indian Institute of Pulses
Research (Kanpur), National Research
Centres for; Citrus (Nagpur), Grapes
(Pune), Pomegranate (Solapur),
Directorate of Research for; Rice
(Hyderabad), Soybean (Indore), Onion
and Garlic (Pune).
These centres and directorates of various crops carry out soil
research for better management of respective crops and they
work in close coordination with farmers to understand the
research needs as well as farmer practices and take feedback in
developing technologies and strategies which become research
outputs
Several small research projects also are also being taken up with the funding of ICAR provided by
state agricultural universities (SAUs). The findings of these research institutes/projects are
transferred to the state departments of agriculture after testing at appropriate locations for adoption
and popularization. Farmers’ interactions with scientist are regularly organized by SAUs to help the
scientists understand and acquire information on farmer practices. Each ATIC functions as a “single
window system” to help farmers and other stakeholders such as extension workers, private
organizations and CSOs, in providing solutions to their location-specific problems and give support
to the ATMAs in technology dissemination. Innovative farmers’ meetingss, stakeholder consultation
51
workshops and interaction forums with farmers help in giving required feedback to research and
training institutes. MANAGE works through CSOs; Sarashwath sethi vikas pratishtan, Shriram
Pratishtan mandal and Krishna Valley Advanced Agriculture Foundation, selected KVKs and other
government institutes in Maharashtra and Indian Society of Agri-business Professionals and
Institute of Cooperative Management and Agriculture University, Jabalpur in MP to conduct ACABC
training. In ACABC training module, there is no special focus on soil testing and SHM but certain
sessions and exposure visits are included. So far, 41,734 persons have been trained under ACABC
out of whom, about 40% established agri-ventures till 2014. MANAGE was given a target of
conducting 208 training courses and 60 MTCs with an allocation of INR 240 million. The self-
financing 1-year distance education course, DAESI, is also organized by MANAGE to cater for the
agriculture extension requirement (Annex 6). There is no consolidated information on how many
training courses have focused on SHM but rough estimates say that it is not more than 5%.
5.2. Farmer soil management strategies Farmer soil management strategies can be categorized under the themes: adding more nutrients
into the farm system (e.g. regular application of 8 to 10 t FYM per ha to supply organic matter);
minimizing unproductive losses of nutrients from the system (e.g. certain agronomic practices);
maximizing the recycling of nutrients within the farm (e.g. ploughing back the crop residues into the
soil to supply K); and increasing the efficacy of nutrient uptake and using soil amendments to
improve soil fertility and soil biophysical properties.
5.3. Two-way process Farmers are reached by KVKs, ATICs and SAUs who take essential feedback from farmers’
experiences and pass it on to the research and training institutes. Subject matter specialists at
agriculture department directorate level are expected to share current recommendations and
findings related to farm production and management by maintaining continuous contact with
agricultural research stations, SAUs and provide feedback to the research system about farmers’
problems. Research and training institutes also use farmer field schools, telephone query system
and mass media interactions for taking information from farmers on their knowledge and
requirements. They use the knowledge and experience gained to investigate and develop new
approaches of soil nutrient management that benefit farmers.
52
5.4. Incorporation of farmer strategies in training courses The feedback from research and training institutes is that the research outcome from the above two-
way process is incorporated in training programmes relevant to SHM. Farmers have knowledge of
fertility indicator plants, soil drainage, soil texture, reasons for stunted growth, soil type, soil salinity,
water holding capacity, “where-what crops”, soil colour, soil biological activity, soil smell etc. They
also have knowledge of management practices for soil nutrition and agronomic interventions. At
research level, this could be in the form of technology interventions or a package of practices.
However, the training material or curriculum does not indicate the links to farmer strategies. Also,
the terminology is scientific, so it is difficult to make out the inputs from farmer strategies except in
the case of organic farming and sustainable agriculture training courses, (which use the farmers’
knowledge to a great extent and terminology to a lesser extent). Links among different research and
training agencies dealing with soil related issues for creating a comprehensive platform to
document, share and acknowledge the farmer strategies are required. There is also a need to
restructure agricultural curriculums and pedagogic methodologies to incorporate farmer soil
management strategies.
CHAPTER VI
In India, there are about 138 million small landholdings and the number is growing year by year.
According to some estimates, a public extension person spends an average of 40 minutes per year
on each farmer (Dileep kumar 2012). With this kind of minimal contact intensity, a complementary
service is needed by the country’s farmers. India has about 980 million telephone subscribers and
300 million Internet subscribers. So, innovative methods are added to agriculture extension system
involving mass transfer with one-way or two- way transfer of technology by government (on its own
or in public-private partnership mode) and private organizations in mobile and Internet media.
Important initiatives with respect to soil information delivery are mentioned below.
6.1. Government initiatives National e-governance plan in agriculture (NeGP-A) aims to achieve good outreach in the
agricultural sector through ICT-enabled multiple delivery channels such as the Internet, government
offices, KVKs, Kisan call centres (KCCs), agri-clinics, and mobile phones for providing integrated
ICT-based services to farmers. Knowledge-based information is being provided to farmers through
a number of Internet- and mobile-based applications including the farmers’ portal, mKisan portal
and KCCs. At least 80 portals, applications and websites have been developed by the Department
of Agriculture and Cooperation (DAC), primarily in collaboration with National Informatics Centre.
53
6.1.1. Kisan call centres (KCC) was launched by DAC in 2005 to deliver extension services in 22
local languages to the farming community across the country by responding instantly to the issues
raised through an effective call centre service based on a dynamic database and regularly updated
knowledge by linking farmers to experts in the research and extension system. These services were
relaunched during 2014 in association with IKSL (IFFCO Kisan Sanchar Limited) with a total revamp
of the infrastructure, constitution of state-level monitoring committees and strengthening of
knowledge management system for KCC agents. Calls are toll-free and are handled in two
categories. Roughly 0.6 million calls are made per year. Level 1 agents answer most of the calls.
On Level 2, subject matter experts answer the more difficult items within a prescribed number of
hours. The queries include information relating to fertilizer application, sourcing of quality inputs and
credit. The KCCs function from 14 locations: Ahmedabad, Bengaluru, Bhubaneswar, Chandigarh,
Coimbatore, Guwahati, Hyderabad, Jammu, Jaipur, Jabalpur, Kanpur, Kolkata, Patna and Pune
which are accessible by dialling a single nation-wide toll free number 1800–180–1551 through the
landline as well via mobile phone (all networks) from 6.00 a.m. to 10.00 p.m., 7 days a week
including holidays.
6.1.2. Farmers’ portal is an excellent initiative for providing top-down information on STLs, soil
testing reports, state and fertilizer stock availability, wholesaler and dealer network details by
integrating with websites and portals of relevant departments and institutes (Department of
Fertilizers, IISS, DAC, mKisan etc.) on a single platform (one-stop-shop for farmers). There is a link
to an exclusive SHC web portal that was launched in July 2015, which allows for registration and
collection of soil samples along with testing in approved labs. Information on different crops is
available on the portal and it builds up a database on soil health for future use in research and
planning.
6.1.3. MKisan extends mobile-based services for farmers and other stakeholders through
government organizations working up to the block level. The farmers registered for receiving SMS
messages are grouped based on the blocks, crops and activities selected by respective farmers.
6.2. Private initiatives There are several private initiatives which charge cost for services and some offer free services.
However, almost all initiatives cater to the general needs of the farmers and soil information
services may go as part of the total package only. Digital Green in collaboration with CSOs like
BAIF and PRADAN disseminates agricultural information to the small and marginal farmers through
digital videos by accessing the library and using films sequentially to build farming capacity over
time. Another Internet-based discussion portal aAqua provides an open forum with SMS as an
additional service. The users have created more than 90% of the content themselves, uploading
54
text, photographs and videos to the site. A farmer can ask a question on aAqua from a kiosk or
cyber café; other farmers or experts view the question and reply (in English, Hindi or Marathi). A
fee-for-service application of Tata Consultancy Services mKrishi combines multiple technologies to
bring information on fertilizer requirements based on soil conditions and soil and water conservation
to the farmer’s low-end mobile handset in Maharashtra pilot projects. It allows farmers to send
queries, images and voice-activated SMSs (to help illiterate farmers) and provides customized
responses in relevant language within 24 hours.
6.3. General observations An evaluation study asserts that farmers aged 29 to 48 years were the biggest user group of the
KCC helpline. In terms of academic background, farmers with a minimum exposure of 6 to 7 years
to formal schooling and relatively inexperienced farmers with less than 10 years of experience were
the ones who utilized KCC support most (Hanumankar 2011). This shows the broad outline of the
type of farmers using mobile applications, necessitating effective extension of these services both in
government and private domains. Internet-based solutions may not be very accessible to the
majority of the semi-literate and illiterate farmers although one third of total Internet connections are
located in rural India but voice and visual applications can receive a good response. The limitations
in these applications are: impracticality of advice provided by the point persons due to obsolete or
limited knowledge and inability to comprehend local accents and dialects, delayed access to
experts, lack of awareness about these services among the majority of the farmers and poor
telecom and Internet connectivity, particularly in remote villages. Often, private initiatives do not get
scaled up and remain as pilots. The government, with its wide network of physical and human
infrastructure coupled with its capacity to invest in soil information related subjects is the best soil
information provider besides the mass media, especially to the small, marginal and medium farmers
but the government needs to fully gear up its machinery to achieve its objectives.
55
Chapter VII
Summary The major factors affecting the soil fertility decisions of the farmer are: fertilizer availability
(suppliers, price); crop choice (availability of inputs); FYM availability (availability of livestock and
grazing lands); crop residues availability for livestock and mulching; and knowledge of soil fertility
and transport facilities. Hence, either the government machinery or CSOs working in the sector
should examine these factors and improve the existing situation.
7.1. Role of the government
The government approach should examine: the harmonization of databases and relevant funding
schemes for utilization of the funds on time through effective convergence strategies; and
addressing soil health needs through differential policies for big and small farmers by carrying out
the required mapping and regulating the quality of private services. A better policy instrument would
be to make it possible for farmers to access credit so they can purchase whichever form of fertilizer
(FYM, bio-fertilizer, vermin-compost or chemical fertilizer) they want. This would go a long way in
helping small and marginal farmers to steer clear of purchasing chemical fertilizers because they
are the only inputs available on credit.
Soil fertility maps developed through soil surveys and broad soil sample testing analysis are no
substitute for individual soil analysis-based fertilizer recommendations which consider the cropping
systems, level of fertilizer use in previous crops and management level of individual farmers.
Instead of just increasing the number of STLs, the establishment of new STLs with quality
equipment and properly trained personnel is very important. The STL unit could also engage in
providing guidance to the farmers in the areas of land reclamation, compost-making, use of bio-
fertilizer etc.
Quality checks on fertilizers and soil testing is essential for increasing the credibility of SHM
schemes. Fertilizer subsidies must be comprehensively re-examined to provide balanced nutrition
and ensure that more of subsidy goes to the smaller landholdings – for example, by limiting the
subsidy to a fixed quantity to be given to each farmer, with the rest of the market being decontrolled.
Agricultural extension needs to be strengthened by increasing the number of extension personnel,
enhancing the technical knowledge of the AEOs and farmer friends and emphasising that SHM is
the most important issue for farmers and can’t be ignored any longer.
56
7.2. Scope for CSOs
The gaps in the existing set-up need to be studied in specific states and specific locations within the
states to provide any meaningful interventions. The government has a huge presence, but it is
limited in critical areas of extension and training. Private agencies/information services don’t really
address SHM in a holistic way as they focus mostly on crop productivity enhancement and SHM
activities (e.g. soil water conservation, safe use of fertilizers and pesticides etc.). It is here that
responsible CSOs need to play a key role in bridging the gaps. Further, they need to bring in much-
needed quality in various aspects by imparting knowledge to the stakeholders through training
courses and capacity building activities. State specific strategies have to be evolved at a broader
level for shifting the immediate focus of farmers from merely getting instant yields to getting
sustainable yields. For example, Maharashtra has very high number of farmland holdings and more
area under commercial crops with the presence of strong farmer associations and input companies,
whereas MP is more open to CSOs in encouraging organic farming and building collaborations with
CSOs.
Schemes and associations: Schemes with scope for involving CSOs in taking up SHM and
related extension activities are: RKVY, NMSA, ATMA, IWMP, SHC and NFSM. Good rapport should
be built with the Agriculture Department and provisions available under different programmes need
to be studied in detail to ensure that available funds are utilized properly and don’t lapse towards
the end of the financial year. Building strong associations with relevant research and training
institutes such as KVKs, ATICs, SAUs and state training institutes is essential for updating the
technical knowledge of CSO staff so as to provide the knowledge to farmers and farmer friends in
an appropriate way.
Training and extension needs: These needs have to be attended on a top priority basis through:
demonstrations, farmer field schools; exposure visits; facilitating relevant training courses on SHM
and acting as resource agencies; playing a role in improving the course syllabus; engaging the
AEOs working at the cutting edge level for imparting technical knowledge in crop nutrition; focusing
more on farmer friends; and training the grass-root level CSOs. Investment in human resource
development is important to facilitate attitudinal changes among the farmers so that they can make
right decisions on soil fertility and adopt sustainable agriculture practices. Training courses such as
DAESI can be facilitated to impart technical knowledge and inculcate ethical values among the input
dealers. Collaborations/associations with growers/farmers associations, input companies and
independent entrepreneurs must be developed for making appropriate interventions. There should
be a focus on: remote and inaccessible areas, tribal areas, language barriers and poor and passive
farmers. The facilities of the mass media and CRS (if already existing) can be utilized effectively;
even establishing a new CRS can be considered, if required.
57
Village platform: Farmer SHGs, women SHGs and their federations, Panchayat Raj Institutions
(PRIs) which are important for village administration and watershed associations/committees need
to be brought together on a common platform so that information can be accessed in an effective
way. Small and marginal farmers need to be grouped together in viable units for imparting
knowledge and farm distress counselling needs to be taken up as part of outreach activities in
adverse situations.
Agronomic practices and choices: Crop choices must be based on soil suitability and water
availability subject to the existence of congenial meteorological conditions. The farmers choice of
crop varieties, proper agronomic practices to improve soil organic matter and soil structure,
conservation agriculture, sustainable agriculture, agroforestry measures, combining livestock
management with agriculture, composting, bio-fertilizers, micronutrients, precision farming (in the
case of horticulture crops), reducing the cost of cultivation, FUE enhancement etc. An
understanding of inter- and intra- district variation (fertilizer consumption, ST facilities etc.) is
essential to attend to the local problems in selected pockets. There must be awareness of
micronutrient deficiency, unfavourable NPK ratio due to imbalanced nutrition and the ill-effects of
excessive usage of urea and complex fertilizers.
Soil testing: Efforts are required in: facilitating the collection of the correct samples at the right
time, communicating the results on time, interpreting the results in an appropriate way so that
farmers can comprehend the issues, enhancing the technical knowledge of STL staff and linking
them with the field requirement. Above all, making the soil testing to go along with the regular
package of practices to mainstream it (if a sufficient no. of STLs is established in the near future) is
an important task.
Soil health information: Efforts should be made to link farmers with available soil health
information channels such as: farmers’ portal, mKisan, Kisan call centres, mass media, community
radio stations, KVKs and private initiatives so as to increase the outreach and contact intensity.
Interventions can be made to improve the quality of the information disseminated through these
channels as well.
Access to credit: Access to credit can be improved through initiatives such as establishing farmer
groups, women SHGs and their federations and linking them with the banks and cooperatives.
Certain examples of collective efforts (BAIF initiative in Maharashtra) for cutting down the cost of
cultivation through collective procurement of inputs and reducing the marketing costs through
collective procurement of the produce can help in building the confidence of the farmers in CSO
initiatives that can be used to focus on SHM.
58
Watershed links: Watershed institutions should be fully aligned with the agriculture departmental
activities in watershed project areas where CSOs are acting as PIAs or resource agencies so as to
bring synergies through combined strength of watershed and agriculture functionaries. Natural
resource management, institution and capacity building and productivity enhancement components
of the watershed projects need to be explored to utilize the funds properly to bring in required SHM
initiatives and take up training and capacity building activities.
Advocacy: CSOs need to take up strong advocacy measures by giving feedback from their
experiences to the government at different levels on appropriate forums and by bringing CSO
networks together to discuss and lobby for positive changes in the policy environment which could
help in revisiting the existing policy and implementation framework in soil health management.
59
References
Ashok Gulati, 2014. “Unshackling the fertilizer sector”, published in Financial express dtd 11/12/2014. http://www.financialexpress.com/article/fe-columnist/column-unshackling-the-fertiliser-sector/17818/.
Bhalla GS, Hazell P & Kerr J, 1999. Prospects for India’s cereal supply and demand to 2020, 2020 Brief 63, IFPRI, Washington.
CFQCTI, 2015.Central fertilizer Quality Control and Training Institute at www.cfqcti.dacnet.nic.in
DAC, 2011. www.eands.dacnet.nic.in/LUS-2010-11/all-india-7.pdf
DAC, 2013. Pocket book on agricultural statistics, 2013, published by Department of Agriculture Cooperation and Directorate of Economics & Statistics, New Delhi.
DAC, 2014. State of Indian agriculture 2012-13, Department of Agriculture and Cooperation, Government of India, New Delhi.
DAC, 2015. Annual Report 2014-15 and soil health compendium published by Department of Agriculture cooperation at http://agricoop.nic.in/Annualreport2014-15/EnglishAR2732015.pdf, http://agricoop.nic.in/imagedefault/Comsoilhealth28612.pdf,
Dileep Kumar G, 2012. ICT innovations for agriculture and rural development, presented in the 8th Convention of Grameen Gyan Abhiyan-Rural knowledge movement, role of ICT , 2012, available at www.mission2007.in/8th_convention/pdf/session-3/MSSRF/Dileep.pdf
Farmers portal, 2015. http://farmer.gov.in/stlrpt.aspx
FCO, 1985. THE FERTILISER (CONTROL) ORDER 1985 issued vide No.11-3/83-STU dated 25th September 1985, Government of India, Ministry of Agriculture and Rural Development (Department of Agriculture and Cooperation), New Delhi, at http://agricoop.nic.in/seed/Fertiliser241209.pdf
Ganeshamurthy A N, 2014. “Towards a National Soil Policy for Food and Nutritional security”, Indian Journal of Fertilizers, Vol 10 (12), pp 62-67.
GFRAS, 2012. Global forum for Rural Advisory Services, Position paper, June, 2012 at
http://www.farmingfirst.org/wordpress/wp-content/uploads/2012/06/Global-Forum-for-Rural-Advisory-Services_Fact-Sheet-on-Extension-Services.pdf.
Hanumankar and Hemantharao, 2011. Application of ICT in agriculture extension: An evaluation study of Kissan Call Centers (KCCs), in Saravanan, Karthiresan C and Indra devi T (Eds). Information and communication of technology for agriculture and rural development, New India Publishing Agency, New Delhi
ICAR, 2010. Handbook of Indian Agriculture, published by ICAR, New Delhi.
ICAR, 2015. http://www.icar.org.in/files/ICAR-Vision-2030.pdf
MOCF, 2014. Office Memorandum No.23011/27/2013-MPR dated 31/3/2014 issued by Ministry of Chemicals & Fertilizers, Government of India.
NAAS, 2012. Sustaining Agricultural Productivity through Integrated Soil Management. Policy Paper No. 56, National Academy of Agricultural Sciences, New Delhi. 24 p.
Nambiar KKM and Ahrol IP, (1989). Long term fertilizer experiments in India - An overview. Fert. News 34 (4), 11-20 & 26
60
NCRB, 2015. http://ncrb.nic.in/ADSI2014/chapter-2A%20farmer%20suicides.pdf
NSSO, 2014. Situation Assessment Survey of agricultural households in India, National Sample Survey Organization, Government of India.
Patel JK and Chauhan NB, 2012. Attitude of farmers toward SHC program. Asian Journal of Soil Science, 7 (1), pp 114-116.
Sahrawat KL, 2006. Plant nutrients: sufficiency and requirements. In Encyclopedia of Soil Science, Second Edition, ed. R. Lal, 1306-1310. Philadelphia, PA, USA:
Sen PK, Majumdar and Sulewski GD, 2008. Indian Journal of Fertilizers, 4 (11): 43-50.
Swanson BE and Clarr JB 1984. Agricultural extension-a reference manual, FAO, Rome
The Hindu, 2015.The Hindu daily dated July 17, p 11.
TOI, 2015.Times of India, Hyderabad dated May 21, 2015, p 10.
Twomlow S, Love D and Walker S, 2008.The nexus between integrated natural resources management and integrated water resources management in southern Africa. Physics and Chemistry of the Earth 33:889-898.
Websites
www.agricoop.nic.in
www.agriculturesnetwork.org
www.censusindia.gov.in
http://cfqcti.dacnet.nic.in
www.crida.in
www.cssri.org
http://dare.nic.in/
http://dolr.nic.in/
www.farmer.gov.in
http://fert.nic.in/
www.iari.res.in/
www.icar.org.in
www.iiss.nic.in
www.mahaagri.gov.in
www.manage.gov.in
www.mKisan.com
www.moffindia.org
www.mp.gov.in
www.mpkrishi.org
www.naarm.ernet.in
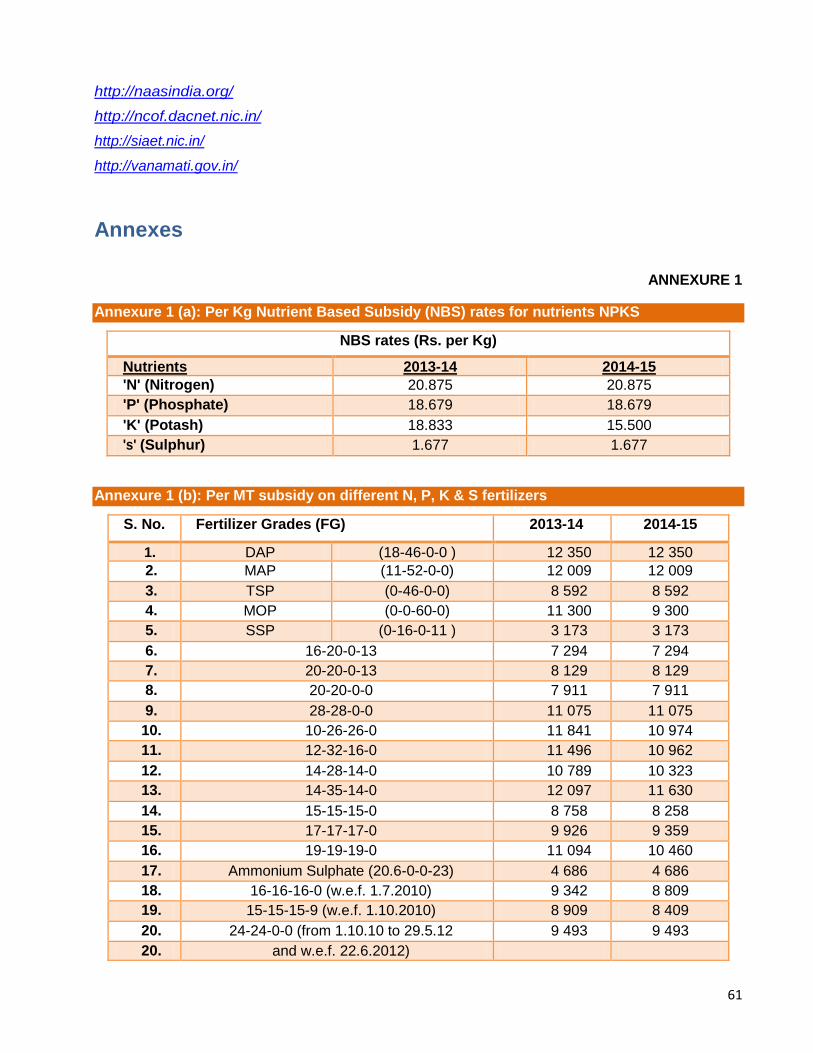
61
http://naasindia.org/
http://ncof.dacnet.nic.in/
http://siaet.nic.in/
http://vanamati.gov.in/
Annexes
ANNEXURE 1
Annexure 1 (a): Per Kg Nutrient Based Subsidy (NBS) rates for nutrients NPKS
NBS rates (Rs. per Kg)
Nutrients 2013-14 2014-15
'N' (Nitrogen) 20.875 20.875
'P' (Phosphate) 18.679 18.679
'K' (Potash) 18.833 15.500
's' (Sulphur) 1.677 1.677
Annexure 1 (b): Per MT subsidy on different N, P, K & S fertilizers
S. No. Fertilizer Grades (FG) 2013-14 2014-15
1. DAP (18-46-0-0 ) 12 350 12 350
2. MAP (11-52-0-0) 12 009 12 009
3. TSP (0-46-0-0) 8 592 8 592
4. MOP (0-0-60-0) 11 300 9 300
5. SSP (0-16-0-11 ) 3 173 3 173
6. 16-20-0-13 7 294 7 294
7. 20-20-0-13 8 129 8 129
8. 20-20-0-0 7 911 7 911
9. 28-28-0-0 11 075 11 075
10. 10-26-26-0 11 841 10 974
11. 12-32-16-0 11 496 10 962
12. 14-28-14-0 10 789 10 323
13. 14-35-14-0 12 097 11 630
14. 15-15-15-0 8 758 8 258
15. 17-17-17-0 9 926 9 359
16. 19-19-19-0 11 094 10 460
17. Ammonium Sulphate (20.6-0-0-23) 4 686 4 686
18. 16-16-16-0 (w.e.f. 1.7.2010) 9 342 8 809
19. 15-15-15-9 (w.e.f. 1.10.2010) 8 909 8 409
20. 24-24-0-0 (from 1.10.10 to 29.5.12 9 493 9 493
20.
and w.e.f. 22.6.2012)
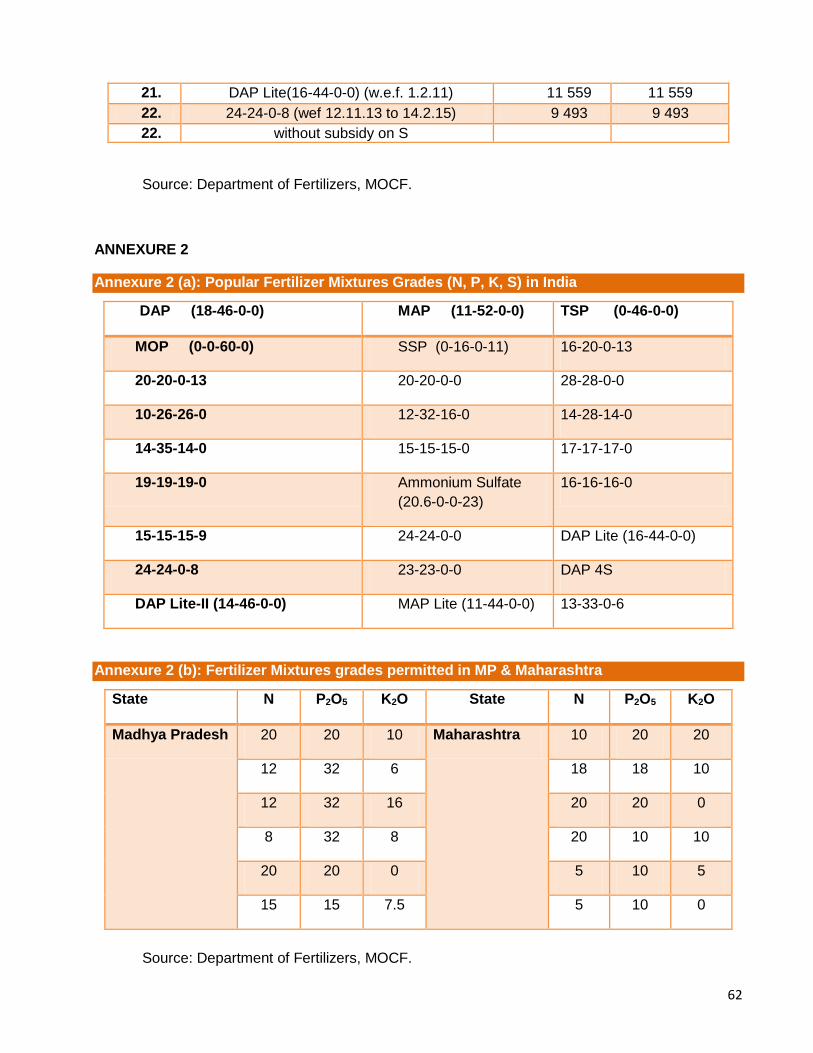
62
21. DAP Lite(16-44-0-0) (w.e.f. 1.2.11) 11 559 11 559
22. 24-24-0-8 (wef 12.11.13 to 14.2.15) 9 493 9 493
22.
without subsidy on S
Source: Department of Fertilizers, MOCF.
ANNEXURE 2
Annexure 2 (a): Popular Fertilizer Mixtures Grades (N, P, K, S) in India
DAP (18-46-0-0) MAP (11-52-0-0) TSP (0-46-0-0)
MOP (0-0-60-0) SSP (0-16-0-11) 16-20-0-13
20-20-0-13 20-20-0-0 28-28-0-0
10-26-26-0 12-32-16-0 14-28-14-0
14-35-14-0 15-15-15-0 17-17-17-0
19-19-19-0 Ammonium Sulfate
(20.6-0-0-23)
16-16-16-0
15-15-15-9 24-24-0-0 DAP Lite (16-44-0-0)
24-24-0-8 23-23-0-0 DAP 4S
DAP Lite-II (14-46-0-0) MAP Lite (11-44-0-0) 13-33-0-6
Annexure 2 (b): Fertilizer Mixtures grades permitted in MP & Maharashtra
State N P2O5 K2O State N P2O5 K2O
Madhya Pradesh 20 20 10 Maharashtra 10 20 20
12 32 6 18 18 10
12 32 16 20 20 0
8 32 8 20 10 10
20 20 0 5 10 5
15 15 7.5 5 10 0
Source: Department of Fertilizers, MOCF.
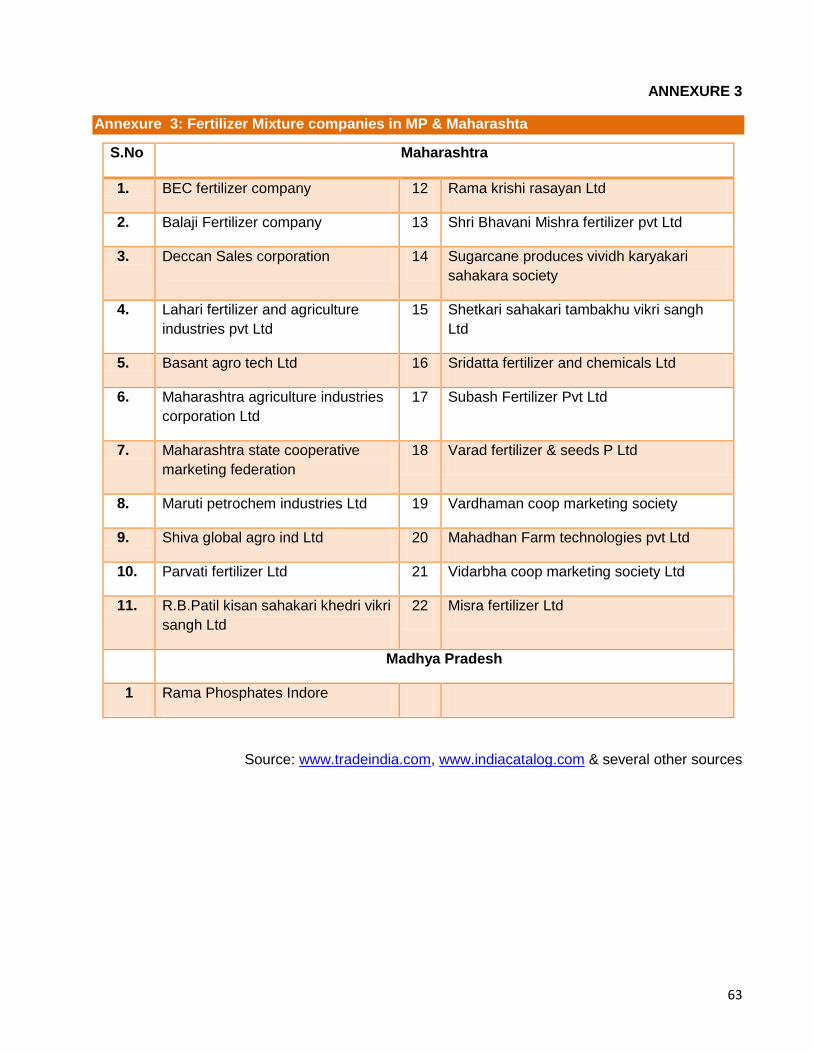
63
ANNEXURE 3
Annexure 3: Fertilizer Mixture companies in MP & Maharashta
S.No Maharashtra
1. BEC fertilizer company 12 Rama krishi rasayan Ltd
2. Balaji Fertilizer company 13 Shri Bhavani Mishra fertilizer pvt Ltd
3. Deccan Sales corporation 14 Sugarcane produces vividh karyakari
sahakara society
4. Lahari fertilizer and agriculture
industries pvt Ltd
15 Shetkari sahakari tambakhu vikri sangh
Ltd
5. Basant agro tech Ltd 16 Sridatta fertilizer and chemicals Ltd
6. Maharashtra agriculture industries
corporation Ltd
17 Subash Fertilizer Pvt Ltd
7. Maharashtra state cooperative
marketing federation
18 Varad fertilizer & seeds P Ltd
8. Maruti petrochem industries Ltd 19 Vardhaman coop marketing society
9. Shiva global agro ind Ltd 20 Mahadhan Farm technologies pvt Ltd
10. Parvati fertilizer Ltd 21 Vidarbha coop marketing society Ltd
11. R.B.Patil kisan sahakari khedri vikri
sangh Ltd
22 Misra fertilizer Ltd
Madhya Pradesh
1 Rama Phosphates Indore
Source: www.tradeindia.com, www.indiacatalog.com & several other sources
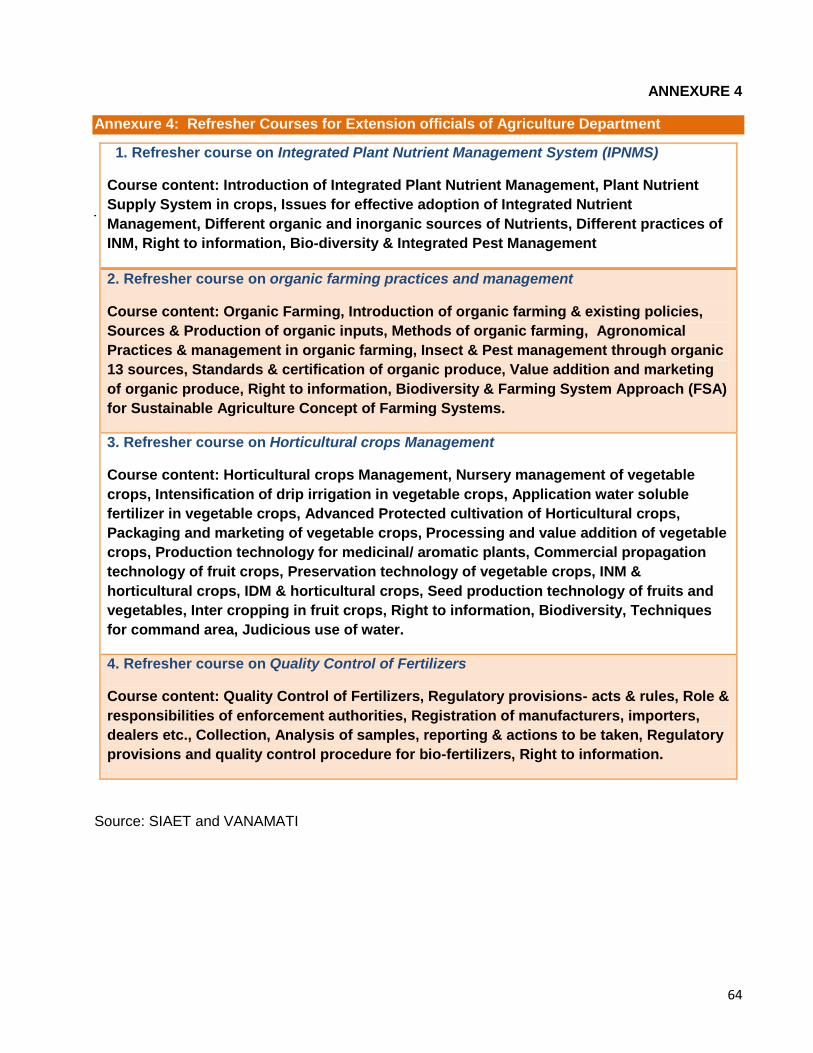
64
ANNEXURE 4
Annexure 4: Refresher Courses for Extension officials of Agriculture Department
1. Refresher course on Integrated Plant Nutrient Management System (IPNMS)
Course content: Introduction of Integrated Plant Nutrient Management, Plant Nutrient
Supply System in crops, Issues for effective adoption of Integrated Nutrient
Management, Different organic and inorganic sources of Nutrients, Different practices of
INM, Right to information, Bio-diversity & Integrated Pest Management
2. Refresher course on organic farming practices and management
Course content: Organic Farming, Introduction of organic farming & existing policies,
Sources & Production of organic inputs, Methods of organic farming, Agronomical
Practices & management in organic farming, Insect & Pest management through organic
13 sources, Standards & certification of organic produce, Value addition and marketing
of organic produce, Right to information, Biodiversity & Farming System Approach (FSA)
for Sustainable Agriculture Concept of Farming Systems.
3. Refresher course on Horticultural crops Management
Course content: Horticultural crops Management, Nursery management of vegetable
crops, Intensification of drip irrigation in vegetable crops, Application water soluble
fertilizer in vegetable crops, Advanced Protected cultivation of Horticultural crops,
Packaging and marketing of vegetable crops, Processing and value addition of vegetable
crops, Production technology for medicinal/ aromatic plants, Commercial propagation
technology of fruit crops, Preservation technology of vegetable crops, INM &
horticultural crops, IDM & horticultural crops, Seed production technology of fruits and
vegetables, Inter cropping in fruit crops, Right to information, Biodiversity, Techniques
for command area, Judicious use of water.
4. Refresher course on Quality Control of Fertilizers
Course content: Quality Control of Fertilizers, Regulatory provisions- acts & rules, Role &
responsibilities of enforcement authorities, Registration of manufacturers, importers,
dealers etc., Collection, Analysis of samples, reporting & actions to be taken, Regulatory
provisions and quality control procedure for bio-fertilizers, Right to information.
Source: SIAET and VANAMATI
65
ANNEXURE 5
Annexure 5 : Training courses on soil health management-curriculum details
1. Model Training Course on Sustainable conservation technologies for enhancing
resource use efficiency in rain-fed farming conducted by CRIDA, Hyderabad
Participants & duration: 20 Senior and middle level extension personnel of the rank of
Joint Directors, Deputy Directors, Agricultural Officers and Assistant Agricultural
Officers of the line departments for 8 days.
Curriculum: Observation of natural resources through management and strategies of
rainwater management, crops & cropping systems, farm implements, soil health,
intercropping systems, integrated farming systems, in situ moisture conservation
technology, water harvesting and recycling, mulching practices in vegetable crops etc.
Specific topics on use of polymers, tank silt application, site specific soil testing,
application of decision support system for pest forecasting, use of Bio-chars, custom
hiring services and agro-advisory services, increasing livelihood security of rural
farmers livestock technologies like integrated farming systems modules, pasture
management and exposure visits to Hayatnagar Research farm, Gunegal Research
Farms and Fodder Research Station (Mamidipally).
2. Model Training Course on Soil Quality Assessment in Semi-arid Tropics of Central
India organized by NBSS & LUP (ICAR)
Participants & duration: 20 Agriculture officers of the state Agriculture departments of
different levels, extension, training and research officers for 8 days.
Curriculum: Importance of soil quality, variation aspects of soil quality, Assessing soil
quality, determination of soil quality indices, Minimum datasets required for soil quality
assessment, soil quality as a vital parameter for land quality, monitoring soil quality vis-
à-vis climate change, Hands on exercise for soil quality assessment.
3. Winter school course on Soil- Plant- Water Relations under Conservation Tillage
Practices for Sustainable Agriculture organized by IARI (sponsored by ICAR)
Participants & duration: Asst. Professors /Scientists or above in the National Agricultural
Research System (NARS) for 21 days.
Course Content: Conservation tillage practice, Common standard and available
equipments, Plant available water: New concepts and measurement methods, Soil
compaction under zero tillage, Preferential flow under no/reduced tillage: Role of macro
pores, Residue as mulch: Modification of soil water and thermal regime, Field and profile
water balance under conservation agricultural practices, Nutrient management under no
tillage condition, Modeling soil hydraulic properties and nutrient dynamics: Field scale
simulation and distributed modeling with GIS, Soil aggregation and organic C under
conservation tillage and residue retention, Modeling tillage effects on crop water use and
yield, Framework for evaluating physical quality of tropical and sub-tropical soils,
Optical, near-infrared and thermal remote sensing applications for crop growth
66
monitoring. contd..
4. Summer school on Recent Innovations for Improving Nutrient Use Efficiency through
Integrated Nutrient Management in Major Field Crops organized by IARI and sponsored
by ICAR.
Participants & Duration: 25 researchers / teachers/ scientists in ICAR Institutes/
SAUs / Agricultural colleges in the rank of Scientists/ Asst. Prof. or above for 21
days.
Course Content: Nutrient use efficiency, An overview, Integrated nutrient
management: objectives, principles and practices for sustainable crop production,
Agronomic bio-fortification of zinc and iron in major crops, Integrated nutrient
management in cereal-based cropping systems, Soil health/quality and its
management, Estimation of nutrient use-efficiencies viz., Partial factor productivity,
agronomic use efficiency, recovery efficiency, physiological use efficiency, nutrient
harvest index, nutrient mobilization index etc., Recent strategies for integrated
nutrient management in rain-fed crops, INM and nutritional quality of farm produce.
Ref: Respective institutes
67
ANNEXURE 6
Annexure 6: Training courses organized by MANAGE on extension services and agri-
business:
1. ACBAC (Agri clinics and Agri business centers) training Module organized by
MANAGE
Participants & Duration: 25 Interested private individuals/entrepreneurs for 60 days with
training cost Rs 35000 per person
Course content: I week-Orientation, Agro-ecological situation, farm mechanization,
irrigation techniques, seed production technologies, seed testing, seed treatment, soil
types, soil sampling, soil testing, soil testing based advisory, macro and micro nutrient
deficiency, corrective measures, fertilizers, manures, bio-fertilizers (types,
recommendations, time and method of application, problematic soils and their
management, integrated nutrient management, organic farming, rain-fed farming and
watershed management, II week- Important pests, causes, symptoms, plant protection
measures, visit to farmers’ fields, package of practices, post harvest technology, legal
aspects, III week- Animal husbandry, fisheries, sericulture, visit to KVK/Agricultural
university/college, organizing extension events, exhibitions, kisan melas, vegetable and
fruit shows, IV week- Resources analysis, market survey, extension reforms, visit to
kisan call centre, V to VIII weeks- Exposure visits (Agri-ventures), interaction on all the
above subjects, Agri-business management, wrapping up.
2. Post graduate diploma in Agriculture Extension Management (PGDAEM)
Participants: the extension personnel from the districts
Duration and other details: one year spreading over two semesters with thirty-two credit
load. In each semester, contact classes will be held at State training institute of
Agriculture department/ an identified institute within the State. The program is conducted
in distance learning mode supported by printed study material, contact classes,
provision of e-content and assignment. The candidate is required to complete one
assignment in each course in a semester. This training is organized by SAMETIs or
identified institutes.
Course content: Introduction to Agricultural Extension Management (4 credits),
Communication and Diffusion of Agricultural Innovations (3 Credits), Principles and
Practices of Extension Management (3 credits), Participatory Approaches in Agricultural
Extension (2 Credits), Research Methods in Agricultural Extension (2 Credits), Market led
Extension (4 Credits), Basics of Market Led Extension, Policies and Act for Promotion of
Agricultural Marketing, Agri-Business and Entrepreneurship Development (3 Credits),
Project Management in Agricultural Extension (2 Credits), Information and
Communication Technologies for Agricultural Development (3 Credits), Sustainable
Livelihoods in Agriculture, Project work (3 Credits), any one of the above elective
courses.
68
Contd….
3. Diploma in Agricultural Extension Services for Input Dealers (DAESI)
Participants: Input dealers with 10+2 academic qualification.
Duration and other details: One year in distance mode with classroom interactions and
field visits on every Sunday (Market Holiday) for 48 Sundays approximately, supply of
study material, using multi-media instructional devices with the help of experts in the
field as resource persons
Course content: Agro-climatic conditions, soils analysis, land use planning, Integrated
Nutrient Management (INM), Integrated Pest Management (IPM) and Crop Production
Technology in respect of major crops including horticultural crops, vegetable crops,
floriculture, Farm Mechanization, Business Principles, Business Ethics, General topics
like National Integration, Privatization, Liberalization, Globalization, WTO regime etc,
laws related to Agricultural Inputs, E.C. Act, Consumer Protection Act, Limitation Act,
Civil Procedure Code (C.P.C.) and Criminal Procedure Code (Cr. P.C.) etc, Technical;
Role of weather in Agriculture, Gaps in Production and schemes to overcome them, soil
survey, land use planning , classification of soils, soil sampling analysis & interpretation
of results, management of problematic soils, Rain-fed farming, Integrated Nutrient
Management (INM), Integrated Pest Management (IPM), Crop Production Technology of
important crops in the district, Farm Mechanization, Water Management, Irrigation
System, Post – Harvest Technology, Extension Management ; Communication Skills,
Negotiation Skills , New Dimensions in Agricultural Extension, FTCs, KVKs, ATMA, AC &
ABCS, RMGs, Market Led Extension, Cyber Extension etc., Setting up of stall in an
agricultural Exhibition/Kisan Mela , Individual Management; Orientation to Mediation for
mind control, Business Development on Ethical Foundation, Globalization, Liberalization
and Privatization , National Integration, Legal; Basics about Law, Seed Act, Seed Rules
and Seed (Control) Order, Fertilizer (Control) Order, Insecticides Act, Insecticides Rules,
Insecticides (Price: stocks display and submission of reports) Order, Other Related Acts,
Consumer Protection Act, WALTA Act, Limitation Act and Act on Production and
Distribution of Bio-Fertilizers, Besides Criminal Procedure Code, Civil Procedure Code .
Source: MANAGE


