Embed Size (px)
Citation preview
Index-I 2004 Annual Report
CONTENTS
OUTPUT 1 Genetic base of cassava and related Manihot species evaluated and available for cassava improvement: higher nutritional quality
Variation of quality traits in cassava roots evaluated in landraces and improved clones (Euphytica).
1-1
Variation in crude protein content in cassava (Manihot esculenta Crantz) roots.
1-9
Reduction or delay of post-harvest physiological deterioration in high-carotene cassava roots.
1-12
Effect of processing on carotenes present in cassava roots. 1-17 Evaluation of different storage conditions of carotenes from fresh and
processed cassava roots. 1-24
Measurement of genotype by environment effect on carotene, Fe and Zn contents in cassava roots.
1-25
OUTPUT 2 Genetic base of cassava and related Manihot species evaluated and available for cassava improvement: higher commercial value
A cassava-breeding scheme based on the production of doubled-haploids 2-5 Mutagenesis and the “TILLING” system. 2-7 Recurrent selection to increase and reduce amylose proportion in the root
starch of cassava. 2-9
High-capacity starch quality laboratory 2-11 OUTPUT 3 Development of new genetic stocks and improved gene pools for their evaluation in key target environments
Selection of progenitors based on previous cycle results and information from other outputs (i.e., resistance/tolerance, root quality traits, etc.).
3-1
Establishment of crossing blocks and production of recombinant seed from previously established blocks.
3-4
Generation and distribution of advanced breeding materials for National Programs.
3-6
Selection of recombinant progenies for broad and specific adaptation within major agro-ecosystems.
3-8
Precision of selection in early stages of cassava genetic improvement. (Manuscript submitted to Crop Science)
3-13
OUTPUT 4 Development of genetic stocks and improved gene pools adapted to the sub-humid environments
Evaluations and selections in the sub-humid environment. 4-1
Index-II 2004 Annual Report
OUTPUT 5 Development of genetic stocks and improved gene pools adapted to the sub-humid environments
Evaluations and selections in the Acid Soils Environment 5-1 OUTPUT 6 Development of genetic stocks and improved gene pools adapted to the sub-humid environments
Evaluations and selections in the Mid-altitude Valleys 6-1 OUTPUT 7 Development of genetic stocks and improved gene pools adapted to the sub-humid environments
Evaluations and selections in Córdoba and Sucre Departments 7-1 Evaluations and selections in Middle-Magdalena River Region. 7-4 Evaluations and selections in Tolima-Huila Departments Region. 7-6 Evaluations and selections in the Highlands Region. 7-7 OUTPUT 8 Collaboration with other institutions, scientific meetings, and publications
Support national programs that have traditionally collaborated with CIAT in the development and improvement of cassava.
8-1
Development of collaborative projects with partners in Africa, Asia and Latin America and the Caribbean.
8-3
The collaboration with Colombia. 8-5 Scientific meetings and publications. 8-10 OUTPUT 9 Activities related with the maintenance of the germplasm bank of cassava and other Manihot species. Basic genetic studies
Maintenance of Manihot germplasm bank in the field. 9-1 Evaluation of M. esculenta and related species from the germplasm
collection for useful traits, particularly for higher protein content in the roots.
9-4
Evaluation of segregation of carotene content in self-pollinated progenies from selected clones.
9-5
Evaluation of segregation of traits related to Post-Harvest Physiological Deterioration.
9-7
Development of a quantitative genetics estimate of the standard error for test for epistasis.
9-8
Index-III 2004 Annual Report
OUTPUT 10 Breeding for insect and other arthropods resistance and development of alternative methods for their control
Evaluation of cassava germplasm for resistance to whiteflies (Aleurotrachelus socialis) during 2003-2004.
10-1
Evaluation of whitefly (Aleurotrachelus socialis) populations and damage on cassava genotypes from GM and CM families (developed for genome mapping studies for root dry matter) at Santander de Quilichao, 2004.
10-12
Intrinsic rate of increase of Biotype “B” Bemisia tabaci on two African cassava genotypes MNg 2 and MNg 11.
10-13
Studies on the biology and behavior of biotype “B” of Bemisia tabaci on a wild Manihot sp, M. flabellifolia.
10-19
Evaluation of cassava germplasm in several breeding and genetic trials for insect and mite pest damage at several localities on the Colombia Atlantic Coast.
10-23
Observations on the incidence, damage and behavior of whitefly (A. socialis), mites (O. peruvianus) and other arthropod pests in germplasm (breeding) trials on the Atlantic Coast of Colombia.
10-38
Cassava germplasm evaluations to identify resistance to the cassava green mite, Mononychellus tanajoa.
10-39
Testing of transgenic cassava (Africa genotype TMS 60444) plants displaying indications of resistance to the cassava hornworm, Erinnyis ello.
10-48
Determining the plant metabolites involved in whitefly (Aleurotrachelus socialis) resistant cassava varieties, MEcu 64, MEcu 72 and MPer 334.
10-51
OUTPUT 11 Disease Resistance in Cassava
Characterizing cassava genotypes for their reaction to super-elongation disease (SED) under greenhouse conditions, using different isolates
11-1
Characterizing cassava genotypes for their reaction to cassava bacterial blight (CBB) under greenhouse conditions, using different isolates
11-3
Evaluating cassava genotypes for their resistance to super-elongation disease (SED) in Santander de Quilichao, Department of Cauca, Colombia
11-6
Evaluating cassava genotypes growing in Pescador, Department of Cauca, Colombia, for their resistance to Phytophthora root rots (PRRs)
11-7
Evaluating of cassava genotypes growing in the departments of Sucre and Córdoba, for their resistance to FSD and SED.
11-8
Identifying the association between foliar resistance and root resistance to Phytophthora tropicalis. Determining resistance in roots and leaves to P. tropicalis during its penetration and post-penetration phases.
11-8
Determining the biochemical markers and agronomic traits associated with resistance to root rot caused by Phytophthora tropicalis
11-17
Determining the QTLs that most contribute to phenotypic variance of resistance to Phytophthora root rots, and identifying the linkage group(s) where they are located
11-36
Detecting phytoplasmas in cassava affected by frogskin disease (FSD), using nested PCR.
11-39
Index-IV 2004 Annual Report
Identifying phytoplasmas by sequencing PCR products 11-44 Designing specific primers for high-specificity detection of a phytoplasma
associated with frogskin disease (FSD) of cassava 11-48
Detecting phytoplasmas by electron microscopy 11-50 To develop and validate sustainable methods to prevent and control FSD
and SED. 11-53
Multiplying cassava genotypes to ensure sufficient cuttings for disease-resistance evaluations
11-53
DNA sequence analysis of specific regions of cassava resistance genes analogs (RGAs).
11-53
Training researchers from Latin America, the Caribbean, and Africa on managing cassava diseases and research technology
11-55
Train students, farmers, technicians, and researchers through field days and meetings on modern, sustainable, cassava production systems in different regions of Colombia to manage major cassava diseases, emphasizing selection of stem cuttings
11-56
Publications in 2004 11-57 Two postgraduate theses in cassava for the Universidad Nacional de
Colombia (Palmira) and the Universidad de los Andes (Bogotá, Colombia) 11-58
Two undergraduate theses currently being undertaken in cassava for the Universidad de Caldas, Manizales, Colombia
11-59
Concept notes and projects developed. 11-59 OUTPUT 12 Development and use of biotechnology tools for cassava improvement
Molecular Marker-Assisted Breeding for Resistance to the Cassava Mosaic Disease in Latin American Cassava Gene Pools
12-1
Molecular Marker-Assisted and Farmer Participatory Improvement of Cassava Germplasm for Farmer/Market Preferred Traits in Tanzania
12-3
Genetic Mapping of Genes Involved in the Biosynthesis of Beta-carotene 12-10 Progress in Genetic Mapping of Dry Matter Content (DMC) in Cassava 12-12 QTL Mapping of Cyanogenic Glucoside Content in a S1 Population derived
from MTAI8 and Candidate Gene Mapping of Two Cytochrome P-450 Biosynthetic Genes (CYP79D1 Y CYP79D2)
12-18
Development of Mapping Populations for Gene Tagging of Post Harvest Physiological Deterioration (PPD), Resistance to Hornworms and Whiteflies Found in Wild Relatives of Cassava
12-22
Generation Challenge Program: Comparison of Simple Sequence Repeats (SSR) and Diversity Array Technology (DArT) Markers for Structural Characterization of Diversity in Cassava
12-24
Generation Challenge Program: Assembling Germplasm and Molecular Markers Sets for Analysis of Structural Diversity in Cassava
12-28
Analysis of genetic diversity in a cassava germplasm collection from Cuba using SSR markers
12-34
Studies in Market Preferences of Cassava Cultivars in Malawi using SSR Markers
12-38
Data base of the Molecular Diversity Network of Cassava (MOLCAS) 12-41 Mining the Primary Gene Pool of Cassava: Introgression of High Root Protein
from Accessions of Manihot esculenta sub spp Fabellifolia and Manihot 12-42
Index-V 2004 Annual Report
Tristis into Cassava Mining the Primary Gene Pool: Green Mites (CGM) Resistance Genes from
Manihot tristis. 12-48
Identification of Naturally Occurring and Irradiation-Induced Mutant GBSSI Alleles of Cassava in a Heterozygous Genetic Background
12-50
Molecular Characterization of A Putative Waxy Cassava Starch GMO Obtained by Anti-sense Mediated Silencing of the Granule Bound Starch Synthase I (GBSSI) gene
12-55
Modification of Flowering in Cassava 12-58 Construction of a TME-3 Bacterial Artificial Chromosome (BAC) Library and
Development of a BAC Contig around a CMD Resistance Gene 12-61
Isolation of Full-Length cDNA Clones of Transcripts Differentially Expressed Between Full-Sib Genotyped Resistant and Susceptible to the Cassava Mosaic Disease (CMD).
12-65
Embryo Rescue of Sexual Seeds from BC2 Families for Molecular Marker-Assisted Selection (MAS) for Resistance to Cassava Green Mites (CGM) and the Cassava Mosaic Disease (CMD)
12-68
Dissemination of Improved Cassava Varieties and Management of Genetic Stocks as Tissue Culture Plantlets
12-71
A Simple Method for the Rapid Multiplication of Clean Cassava Planting Material
12-74
Training 12-77 Trips 12-78 Publications 12-78 Project Funded and in Review with Donors 12-79 OUTPUT 13 Integrated cassava-based cropping systems in Asia: Widespread adoption of farming practices that enhance sustainability
Soil fertility maintenance through the application of chemical fertilizers, or the use of intercropping, green manuring, alley cropping and crop rotations.
13-1
Development of efficient and economical soil preparation practices. 13-4 Determination of the response to various methods of application of Zn in
calcareous soils. 13-8
Evaluation of cassava varieties and determination of optimum plant spacing for cassava leaf production.
13-10
Conducting FPR trials on varieties, fertilization, weed control, green manures, intercropping, erosion control and pig feeding in Thailand, Vietnam and China.
13-14
Enhancing adoption of new varieties and improved management practices through farmer participatory research (FPR) and extension (FPE) activities.
13-21
Assessing the impact of the project on adoption of new technologies in Thailand and Vietnam
13-23
Exploring institutional arrangements for collaboration in the new Nippon Foundation-funded cassava project in Laos and Cambodia, and the ACIAR-funded cassava project in Indonesia and East Timor.
13-27
Implementing the new Nippon Foundation-funded Cassava Project in Lao PDR and Cambodia
13-29
Output 1-1 2004 Annual Report
OUTPUT 1
Genetic base of cassava and related Manihot species evaluated and available for cassava improvement: higher nutritional quality.
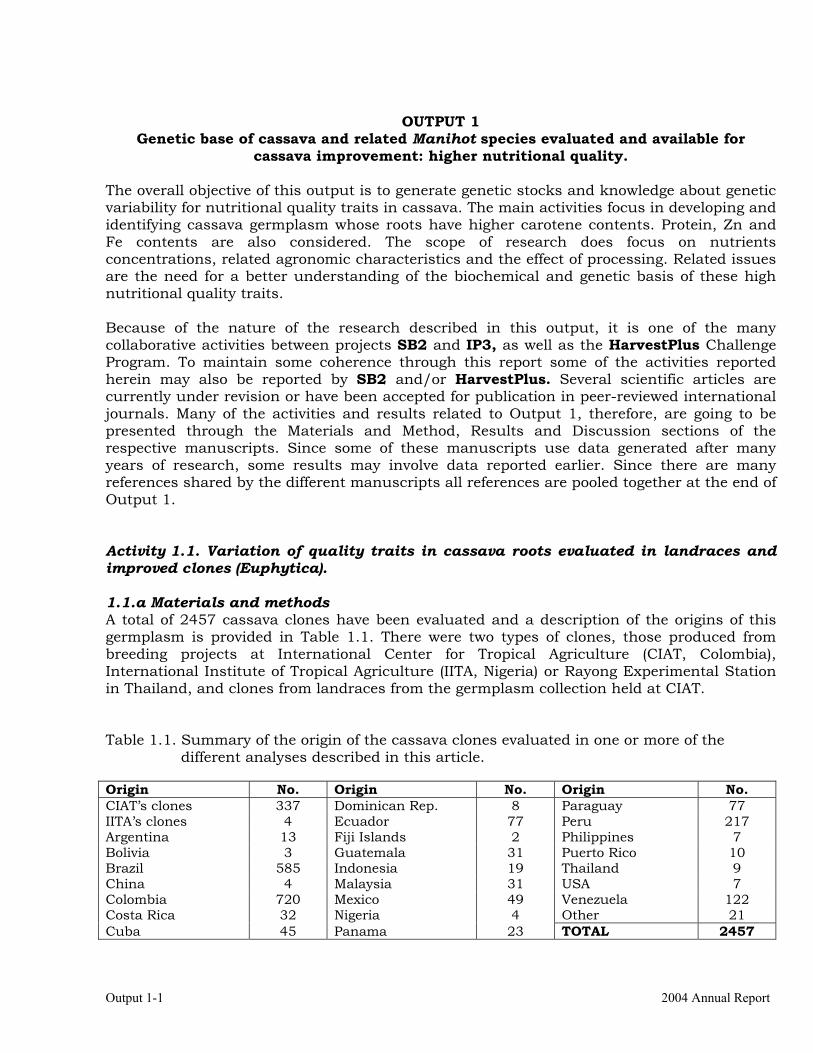
The overall objective of this output is to generate genetic stocks and knowledge about genetic variability for nutritional quality traits in cassava. The main activities focus in developing and identifying cassava germplasm whose roots have higher carotene contents. Protein, Zn and Fe contents are also considered. The scope of research does focus on nutrients concentrations, related agronomic characteristics and the effect of processing. Related issues are the need for a better understanding of the biochemical and genetic basis of these high nutritional quality traits. Because of the nature of the research described in this output, it is one of the many collaborative activities between projects SB2 and IP3, as well as the HarvestPlus Challenge Program. To maintain some coherence through this report some of the activities reported herein may also be reported by SB2 and/or HarvestPlus. Several scientific articles are currently under revision or have been accepted for publication in peer-reviewed international journals. Many of the activities and results related to Output 1, therefore, are going to be presented through the Materials and Method, Results and Discussion sections of the respective manuscripts. Since some of these manuscripts use data generated after many years of research, some results may involve data reported earlier. Since there are many references shared by the different manuscripts all references are pooled together at the end of Output 1. Activity 1.1. Variation of quality traits in cassava roots evaluated in landraces and improved clones (Euphytica). 1.1.a Materials and methods A total of 2457 cassava clones have been evaluated and a description of the origins of this germplasm is provided in Table 1.1. There were two types of clones, those produced from breeding projects at International Center for Tropical Agriculture (CIAT, Colombia), International Institute of Tropical Agriculture (IITA, Nigeria) or Rayong Experimental Station in Thailand, and clones from landraces from the germplasm collection held at CIAT. Table 1.1. Summary of the origin of the cassava clones evaluated in one or more of the
different analyses described in this article. Origin No. Origin No. Origin No. CIAT’s clones 337 Dominican Rep. 8 Paraguay 77 IITA’s clones 4 Ecuador 77 Peru 217 Argentina 13 Fiji Islands 2 Philippines 7 Bolivia 3 Guatemala 31 Puerto Rico 10 Brazil 585 Indonesia 19 Thailand 9 China 4 Malaysia 31 USA 7 Colombia 720 Mexico 49 Venezuela 122 Costa Rica 32 Nigeria 4 Other 21 Cuba 45 Panama 23 TOTAL 2457
Project IP3: improving cassava for the developing world Output 1-2
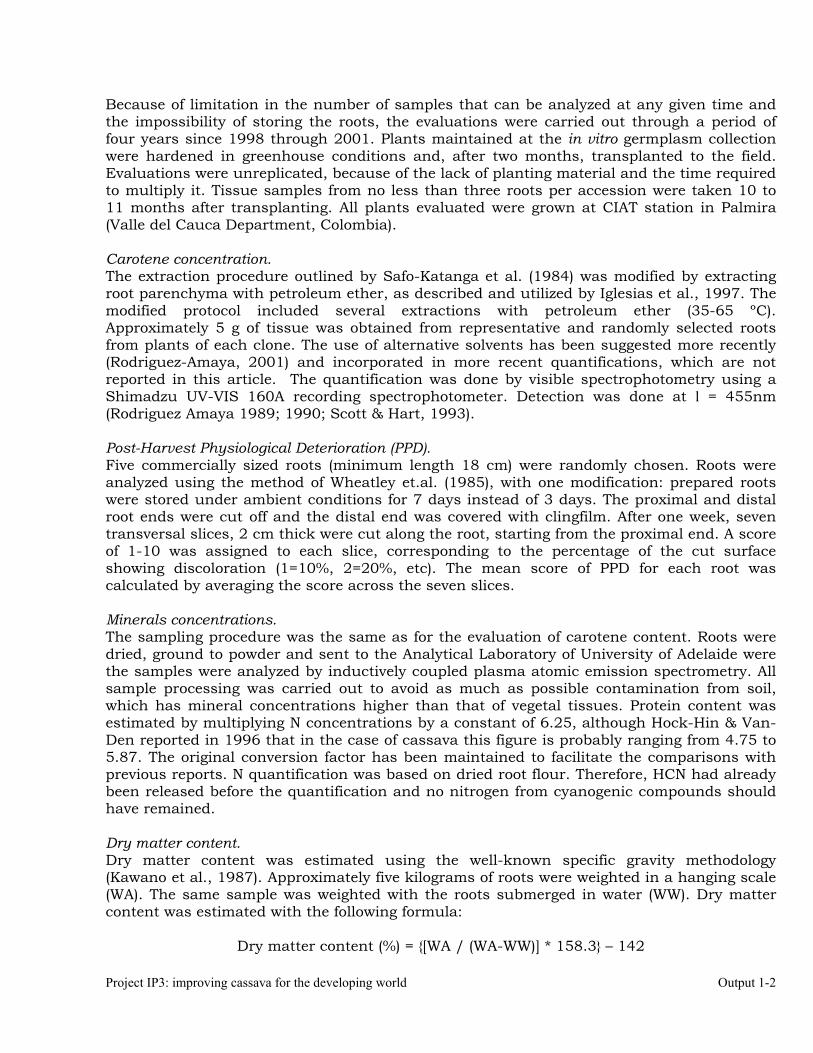
Because of limitation in the number of samples that can be analyzed at any given time and the impossibility of storing the roots, the evaluations were carried out through a period of four years since 1998 through 2001. Plants maintained at the in vitro germplasm collection were hardened in greenhouse conditions and, after two months, transplanted to the field. Evaluations were unreplicated, because of the lack of planting material and the time required to multiply it. Tissue samples from no less than three roots per accession were taken 10 to 11 months after transplanting. All plants evaluated were grown at CIAT station in Palmira (Valle del Cauca Department, Colombia). Carotene concentration. The extraction procedure outlined by Safo-Katanga et al. (1984) was modified by extracting root parenchyma with petroleum ether, as described and utilized by Iglesias et al., 1997. The modified protocol included several extractions with petroleum ether (35-65 ºC). Approximately 5 g of tissue was obtained from representative and randomly selected roots from plants of each clone. The use of alternative solvents has been suggested more recently (Rodriguez-Amaya, 2001) and incorporated in more recent quantifications, which are not reported in this article. The quantification was done by visible spectrophotometry using a Shimadzu UV-VIS 160A recording spectrophotometer. Detection was done at l = 455nm (Rodriguez Amaya 1989; 1990; Scott & Hart, 1993). Post-Harvest Physiological Deterioration (PPD). Five commercially sized roots (minimum length 18 cm) were randomly chosen. Roots were analyzed using the method of Wheatley et.al. (1985), with one modification: prepared roots were stored under ambient conditions for 7 days instead of 3 days. The proximal and distal root ends were cut off and the distal end was covered with clingfilm. After one week, seven transversal slices, 2 cm thick were cut along the root, starting from the proximal end. A score of 1-10 was assigned to each slice, corresponding to the percentage of the cut surface showing discoloration (1=10%, 2=20%, etc). The mean score of PPD for each root was calculated by averaging the score across the seven slices. Minerals concentrations. The sampling procedure was the same as for the evaluation of carotene content. Roots were dried, ground to powder and sent to the Analytical Laboratory of University of Adelaide were the samples were analyzed by inductively coupled plasma atomic emission spectrometry. All sample processing was carried out to avoid as much as possible contamination from soil, which has mineral concentrations higher than that of vegetal tissues. Protein content was estimated by multiplying N concentrations by a constant of 6.25, although Hock-Hin & Van-Den reported in 1996 that in the case of cassava this figure is probably ranging from 4.75 to 5.87. The original conversion factor has been maintained to facilitate the comparisons with previous reports. N quantification was based on dried root flour. Therefore, HCN had already been released before the quantification and no nitrogen from cyanogenic compounds should have remained. Dry matter content. Dry matter content was estimated using the well-known specific gravity methodology (Kawano et al., 1987). Approximately five kilograms of roots were weighted in a hanging scale (WA). The same sample was weighted with the roots submerged in water (WW). Dry matter content was estimated with the following formula:
Dry matter content (%) = {[WA / (WA-WW)] * 158.3} – 142
Output 1-3 2004 Annual Report
where WA= weight in the air and WW= weight in water. Root coloration and other measurements. A 1 to 9 scale for the visual estimation of root coloration was developed and printed for a uniform estimation of color intensity. The color of root parenchyma can vary from white, cream, yellow, and orange. Pinkish roots (score 9) have also been observed in cassava. Total and reducing sugars were estimated following the procedure outlined by Cronim & Smith in 1979. Cyanide potential (HCN) was quantified following the colorimetric procedure suggested by Essers et al. (1994). 1.1.b Results Table 1.2 presents a summary of measurements for dry matter, HCN, total carotene for roots and leaves, as well as color, PPD and sugars in the roots. Descriptive statistics make use of all the data available for each variable. However, for the association between two traits, only data taken on the same roots for the traits whose association is analyzed were used. The observed values for dry matter content and HCN in roots agree with those reported in the literature (Buitrago, 1990). The average for PPD was 24.47%, with individual values ranging from 0 to 100%. Distribution of PPD was asymmetrical with a longer tail to the right, and concentration of frequencies around the low-PPD values. Table 1.2. Descriptive parameters for root traits of industrial relevance in accessions from the
Cassava Germplasm Bank and the Breeding Project at CIAT.
Variable Sample size (No.)
Minimum Maximum Average Standard Deviation
Root dry matter (%)
2022 10.72 57.23 34.27 6.95
HCN (ppm)
2022 13.9 2561.7 263.7 324.2
Carotene (µg / g FT)
1789 1.02 10.40 2.457 1.351
Root color (1 to 9)
788 1 8 2.26 1.46
PPD (%)
1374 0 100 24.47 19.63
Total sugars (%)
1755 0.2 15 2.876 2.028
Reducing sugars (%)
1755 0.0 12.9 0.753 0.957
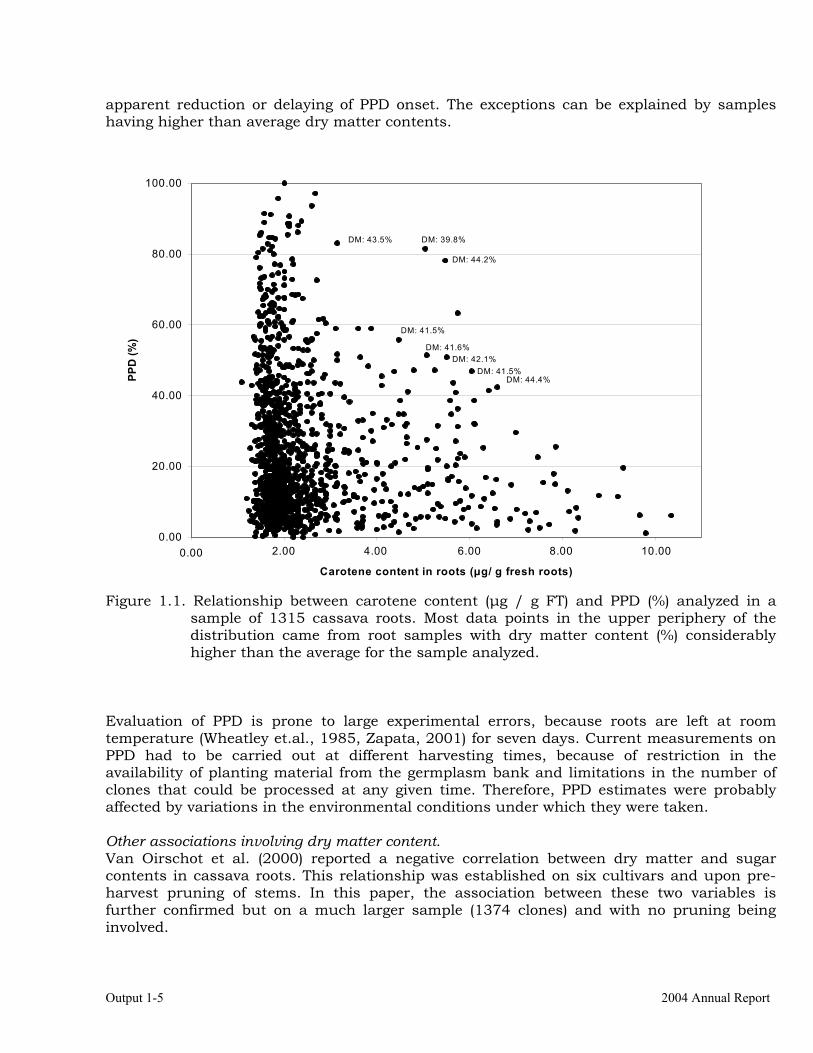
Carotenes in the roots and related traits. Carotene content in the roots ranged from 1.02 to 10.40 µg / g fresh tissue (FT), demonstrating the potential of cassava clones with yellow roots to contribute overcoming VAD in regions of the world where this malady is a chronic problem. There was a clear asymmetrical distribution for carotene in the roots, which concentrated frequencies in the lower values to the left of the plot (Figure 1.1), and a long tale to the right (skewness value =
Project IP3: improving cassava for the developing world Output 1-4
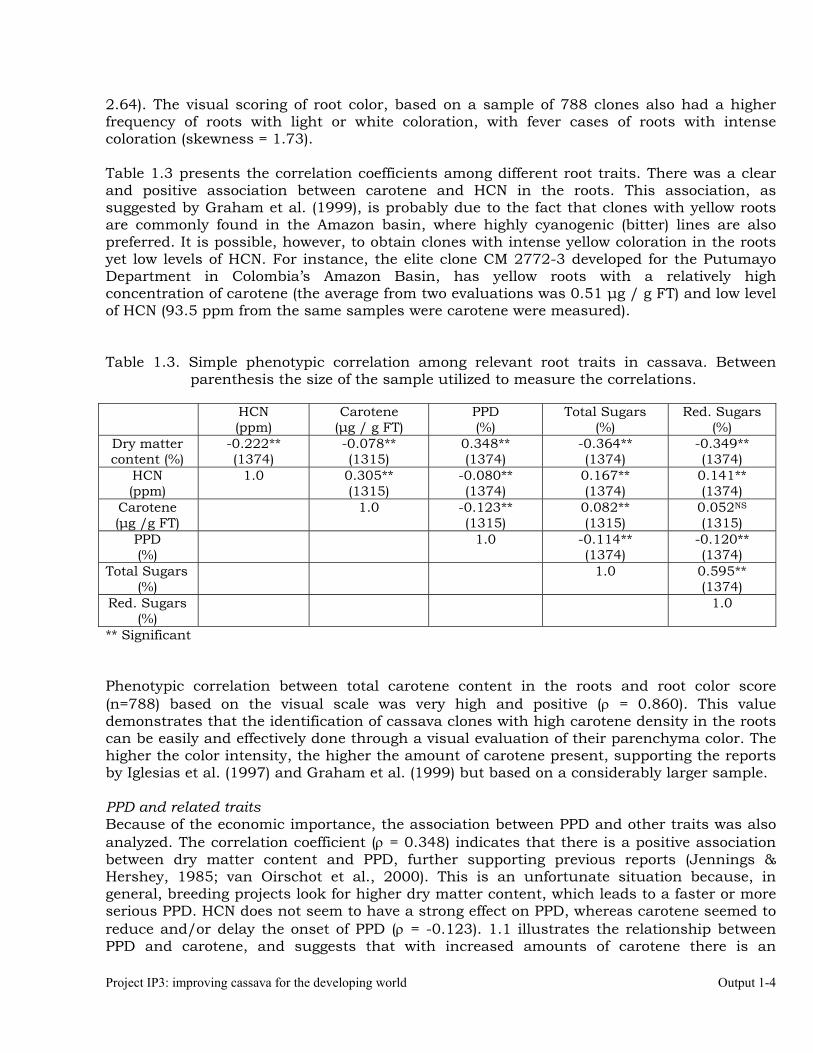
2.64). The visual scoring of root color, based on a sample of 788 clones also had a higher frequency of roots with light or white coloration, with fever cases of roots with intense coloration (skewness = 1.73). Table 1.3 presents the correlation coefficients among different root traits. There was a clear and positive association between carotene and HCN in the roots. This association, as suggested by Graham et al. (1999), is probably due to the fact that clones with yellow roots are commonly found in the Amazon basin, where highly cyanogenic (bitter) lines are also preferred. It is possible, however, to obtain clones with intense yellow coloration in the roots yet low levels of HCN. For instance, the elite clone CM 2772-3 developed for the Putumayo Department in Colombia’s Amazon Basin, has yellow roots with a relatively high concentration of carotene (the average from two evaluations was 0.51 µg / g FT) and low level of HCN (93.5 ppm from the same samples were carotene were measured). Table 1.3. Simple phenotypic correlation among relevant root traits in cassava. Between
parenthesis the size of the sample utilized to measure the correlations.
HCN (ppm)
Carotene (µg / g FT)
PPD (%)
Total Sugars (%)
Red. Sugars (%)
Dry matter content (%)
-0.222** (1374)
-0.078** (1315)
0.348** (1374)
-0.364** (1374)
-0.349** (1374)
HCN (ppm)
1.0 0.305** (1315)
-0.080** (1374)
0.167** (1374)
0.141** (1374)
Carotene (µg /g FT)
1.0 -0.123** (1315)
0.082** (1315)
0.052NS (1315)
PPD (%)
1.0 -0.114** (1374)
-0.120** (1374)
Total Sugars (%)
1.0 0.595** (1374)
Red. Sugars (%)
1.0
** Significant Phenotypic correlation between total carotene content in the roots and root color score (n=788) based on the visual scale was very high and positive (ρ = 0.860). This value demonstrates that the identification of cassava clones with high carotene density in the roots can be easily and effectively done through a visual evaluation of their parenchyma color. The higher the color intensity, the higher the amount of carotene present, supporting the reports by Iglesias et al. (1997) and Graham et al. (1999) but based on a considerably larger sample. PPD and related traits Because of the economic importance, the association between PPD and other traits was also analyzed. The correlation coefficient (ρ = 0.348) indicates that there is a positive association between dry matter content and PPD, further supporting previous reports (Jennings & Hershey, 1985; van Oirschot et al., 2000). This is an unfortunate situation because, in general, breeding projects look for higher dry matter content, which leads to a faster or more serious PPD. HCN does not seem to have a strong effect on PPD, whereas carotene seemed to reduce and/or delay the onset of PPD (ρ = -0.123). 1.1 illustrates the relationship between PPD and carotene, and suggests that with increased amounts of carotene there is an
Output 1-5 2004 Annual Report
apparent reduction or delaying of PPD onset. The exceptions can be explained by samples having higher than average dry matter contents.
Figure 1.1. Relationship between carotene content (µg / g FT) and PPD (%) analyzed in a sample of 1315 cassava roots. Most data points in the upper periphery of the distribution came from root samples with dry matter content (%) considerably higher than the average for the sample analyzed.
Evaluation of PPD is prone to large experimental errors, because roots are left at room temperature (Wheatley et.al., 1985, Zapata, 2001) for seven days. Current measurements on PPD had to be carried out at different harvesting times, because of restriction in the availability of planting material from the germplasm bank and limitations in the number of clones that could be processed at any given time. Therefore, PPD estimates were probably affected by variations in the environmental conditions under which they were taken. Other associations involving dry matter content. Van Oirschot et al. (2000) reported a negative correlation between dry matter and sugar contents in cassava roots. This relationship was established on six cultivars and upon pre-harvest pruning of stems. In this paper, the association between these two variables is further confirmed but on a much larger sample (1374 clones) and with no pruning being involved.
0.00
20.00
40.00
60.00
80.00
100.00
0.00 0.20 0.40 0.60 0.80 1.00
Carotene content in roots (µg/ g fresh roots)
PPD
(%)
DM: 44.2%
DM: 39.8%DM: 43.5%
DM: 44.4%DM: 41.5%
DM: 42.1%DM: 41.6%
DM: 41.5%
2.00 4.00 6.00 8.00 10.00
Project IP3: improving cassava for the developing world Output 1-6
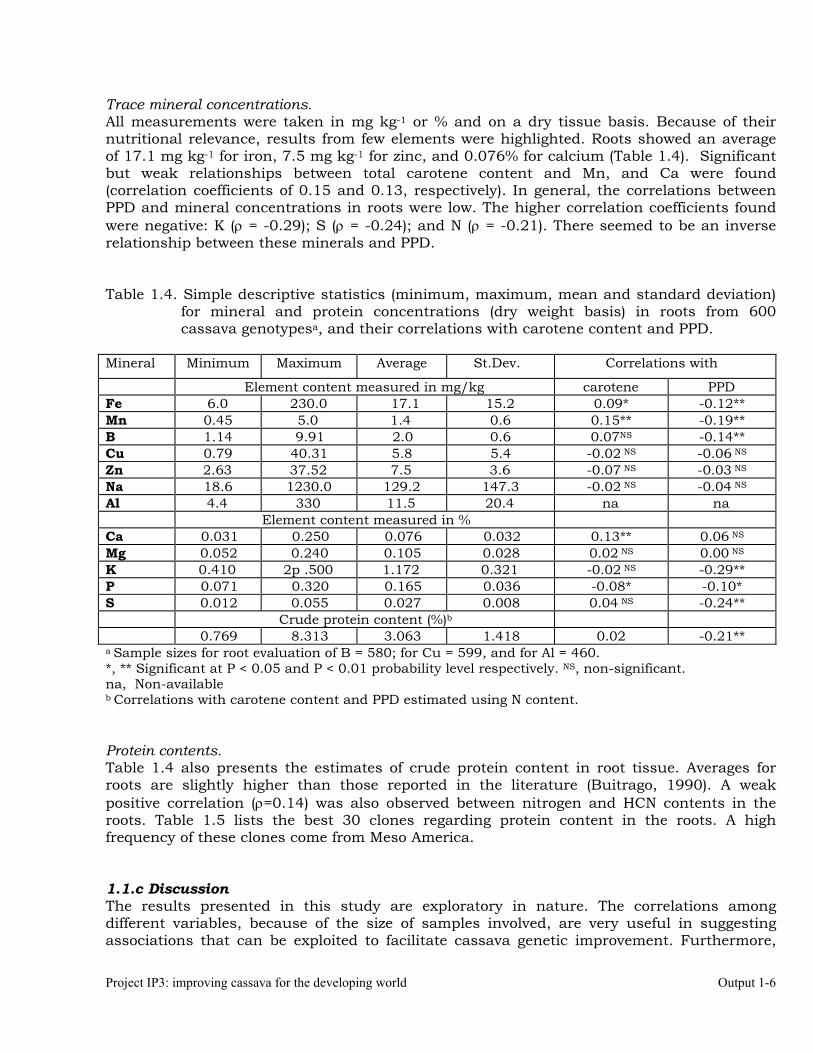
Trace mineral concentrations. All measurements were taken in mg kg-1 or % and on a dry tissue basis. Because of their nutritional relevance, results from few elements were highlighted. Roots showed an average of 17.1 mg kg-1 for iron, 7.5 mg kg-1 for zinc, and 0.076% for calcium (Table 1.4). Significant but weak relationships between total carotene content and Mn, and Ca were found (correlation coefficients of 0.15 and 0.13, respectively). In general, the correlations between PPD and mineral concentrations in roots were low. The higher correlation coefficients found were negative: K (ρ = -0.29); S (ρ = -0.24); and N (ρ = -0.21). There seemed to be an inverse relationship between these minerals and PPD. Table 1.4. Simple descriptive statistics (minimum, maximum, mean and standard deviation)
for mineral and protein concentrations (dry weight basis) in roots from 600 cassava genotypesa, and their correlations with carotene content and PPD.
Mineral Minimum Maximum Average St.Dev. Correlations with
Element content measured in mg/kg carotene PPD Fe 6.0 230.0 17.1 15.2 0.09* -0.12** Mn 0.45 5.0 1.4 0.6 0.15** -0.19** B 1.14 9.91 2.0 0.6 0.07NS -0.14** Cu 0.79 40.31 5.8 5.4 -0.02 NS -0.06 NS Zn 2.63 37.52 7.5 3.6 -0.07 NS -0.03 NS Na 18.6 1230.0 129.2 147.3 -0.02 NS -0.04 NS Al 4.4 330 11.5 20.4 na na
Element content measured in % Ca 0.031 0.250 0.076 0.032 0.13** 0.06 NS Mg 0.052 0.240 0.105 0.028 0.02 NS 0.00 NS K 0.410 2p .500 1.172 0.321 -0.02 NS -0.29** P 0.071 0.320 0.165 0.036 -0.08* -0.10* S 0.012 0.055 0.027 0.008 0.04 NS -0.24**
Crude protein content (%)b 0.769 8.313 3.063 1.418 0.02 -0.21**
a Sample sizes for root evaluation of B = 580; for Cu = 599, and for Al = 460. *, ** Significant at P < 0.05 and P < 0.01 probability level respectively. NS, non-significant. na, Non-available b Correlations with carotene content and PPD estimated using N content. Protein contents. Table 1.4 also presents the estimates of crude protein content in root tissue. Averages for roots are slightly higher than those reported in the literature (Buitrago, 1990). A weak positive correlation (ρ=0.14) was also observed between nitrogen and HCN contents in the roots. Table 1.5 lists the best 30 clones regarding protein content in the roots. A high frequency of these clones come from Meso America. 1.1.c Discussion The results presented in this study are exploratory in nature. The correlations among different variables, because of the size of samples involved, are very useful in suggesting associations that can be exploited to facilitate cassava genetic improvement. Furthermore,
Output 1-7 2004 Annual Report
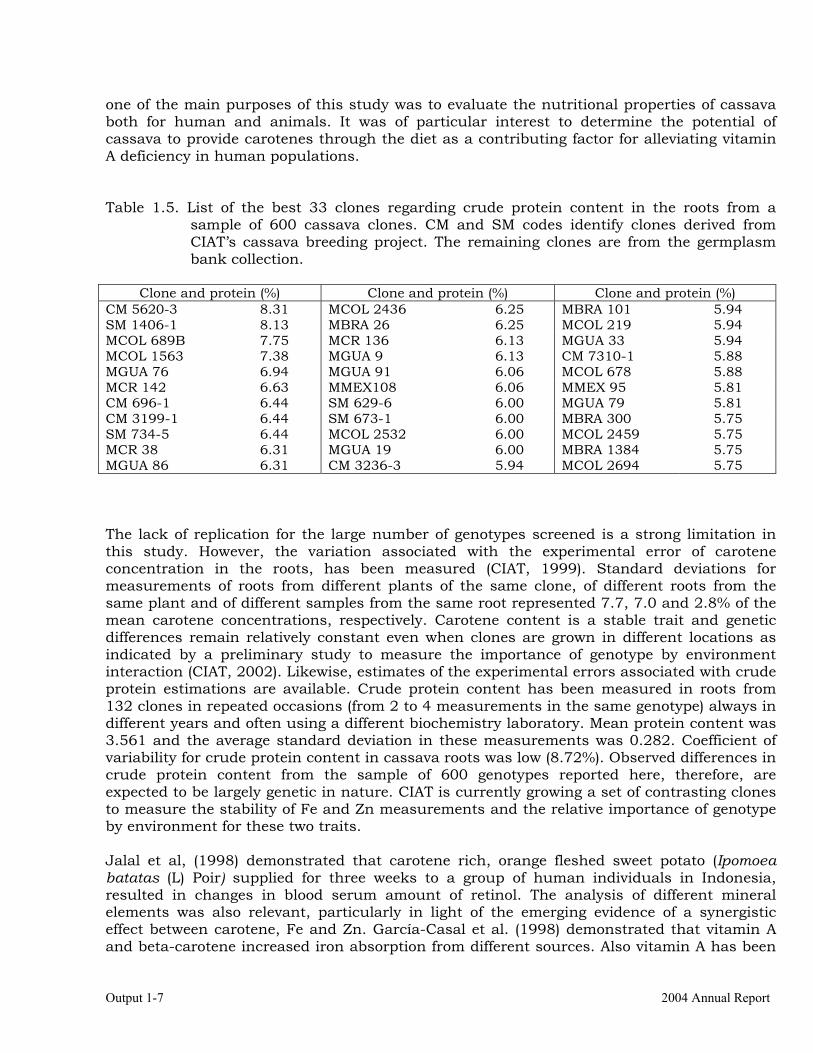
one of the main purposes of this study was to evaluate the nutritional properties of cassava both for human and animals. It was of particular interest to determine the potential of cassava to provide carotenes through the diet as a contributing factor for alleviating vitamin A deficiency in human populations. Table 1.5. List of the best 33 clones regarding crude protein content in the roots from a
sample of 600 cassava clones. CM and SM codes identify clones derived from CIAT’s cassava breeding project. The remaining clones are from the germplasm bank collection.
Clone and protein (%) Clone and protein (%) Clone and protein (%)
CM 5620-3 8.31 MCOL 2436 6.25 MBRA 101 5.94 SM 1406-1 8.13 MBRA 26 6.25 MCOL 219 5.94 MCOL 689B 7.75 MCR 136 6.13 MGUA 33 5.94 MCOL 1563 7.38 MGUA 9 6.13 CM 7310-1 5.88 MGUA 76 6.94 MGUA 91 6.06 MCOL 678 5.88 MCR 142 6.63 MMEX108 6.06 MMEX 95 5.81 CM 696-1 6.44 SM 629-6 6.00 MGUA 79 5.81 CM 3199-1 6.44 SM 673-1 6.00 MBRA 300 5.75 SM 734-5 6.44 MCOL 2532 6.00 MCOL 2459 5.75 MCR 38 6.31 MGUA 19 6.00 MBRA 1384 5.75 MGUA 86 6.31 CM 3236-3 5.94 MCOL 2694 5.75 The lack of replication for the large number of genotypes screened is a strong limitation in this study. However, the variation associated with the experimental error of carotene concentration in the roots, has been measured (CIAT, 1999). Standard deviations for measurements of roots from different plants of the same clone, of different roots from the same plant and of different samples from the same root represented 7.7, 7.0 and 2.8% of the mean carotene concentrations, respectively. Carotene content is a stable trait and genetic differences remain relatively constant even when clones are grown in different locations as indicated by a preliminary study to measure the importance of genotype by environment interaction (CIAT, 2002). Likewise, estimates of the experimental errors associated with crude protein estimations are available. Crude protein content has been measured in roots from 132 clones in repeated occasions (from 2 to 4 measurements in the same genotype) always in different years and often using a different biochemistry laboratory. Mean protein content was 3.561 and the average standard deviation in these measurements was 0.282. Coefficient of variability for crude protein content in cassava roots was low (8.72%). Observed differences in crude protein content from the sample of 600 genotypes reported here, therefore, are expected to be largely genetic in nature. CIAT is currently growing a set of contrasting clones to measure the stability of Fe and Zn measurements and the relative importance of genotype by environment for these two traits. Jalal et al, (1998) demonstrated that carotene rich, orange fleshed sweet potato (Ipomoea batatas (L) Poir) supplied for three weeks to a group of human individuals in Indonesia, resulted in changes in blood serum amount of retinol. The analysis of different mineral elements was also relevant, particularly in light of the emerging evidence of a synergistic effect between carotene, Fe and Zn. García-Casal et al. (1998) demonstrated that vitamin A and beta-carotene increased iron absorption from different sources. Also vitamin A has been
Project IP3: improving cassava for the developing world Output 1-8
shown to contribute increasing hemoglobin content (a typical symptom of Fe-deficiency) as reported by Kolsteren et al.(1999) and Mwanri et al. (2000). Results observed in the large samples analyzed demonstrate that cassava roots are a valuable source of carotene, which can help alleviating chronic vitamin A deficiency in human populations suffering from it. Although the negative association between carotene content and PPD is still preliminary it is a relevant issue: if higher carotenes in the roots reduce or delay PPD, this would encourage farmers to grow cassava clones with yellow roots, therefore helping to overcome the frequent reluctance by subsistence farmers to adopt new varieties. Further studies, under better-controlled conditions for measuring PPD, however, are needed for corroborating the preliminary evidence already found and are already underway. The range of variation observed in the 1789 measurements was narrower than that reported by Iglesias et al. (1997). The highest value observed in the current analysis was 10.40 µg / g FT, whereas in the previous report as much as 25.5 µg / g FT have been reported for MBRA 516. In the current analysis, carotene content in the clone MBRA 516 was measured in two different opportunities providing values of 7.8 and 8.3 µg / g FT. After Iglesias et al. (1997) publication, which was a preliminary report, carotene quantification was changed to be based on the spectrophotometry because of problems with the HPLC protocol employed that had became evident through time. The current results, therefore, are more consistent and reliable than those of Iglesias et al. (1997). Regarding protein content in the roots (estimated through N measurements), the mean crude content of 3.06 % agrees with those reported in the literature. However, the few clones with high protein content (ranging from 5.75 to 8.31%) are remarkable. New root samples from the same clones will be evaluated again to confirm current expectations, and to have a better estimation of the effect of genotype by environment interaction in the expression of this trait. The weak correlation between nitrogen content and cyanogenic potential would suggest that a fraction of the nitrogen detected originated in the cyanogenic glucosides. This association, if confirmed, seems to be low enough to allow for the possibility of developing clones with high protein and low HCN in their roots. A remarkable feature regarding protein content in the roots is that 12 out of the best 30 clones originated in Meso-America: Costa Rica, Guatemala and Mexico (Table 1.5). This proportion (40 %) is much higher than that of clones representing this region (6.3%) in the total sample of 600 clones. This would suggest that a genetic introgression from Meso-American, non-cultivated Manihot species might have occurred, resulting in a high frequency of cassava clones with increased protein content in their roots. About a dozen Manihot species grow wild in Meso- America (mainly M. aesculifolia, M. gualanensis, M. isoloba, M pringlei, and M. oaxacana), and can readily cross with M. esculenta (Brücher, 1989). Distinctive characteristics of cassava clones from this region (particularly Guatemala) have been reported using simple sequence repeat markers (CIAT, 2001). Cassava clones from this region are currently recovered from the in vitro collection and will be carefully analyzed for their protein content in the roots in November 2004. If only a few of these clones did reproduce the high concentrations (above 5%) reported in this study, it would already be a major finding in cassava research with enormous potential in Asia, Africa and Latin America.
Output 1-9 2004 Annual Report
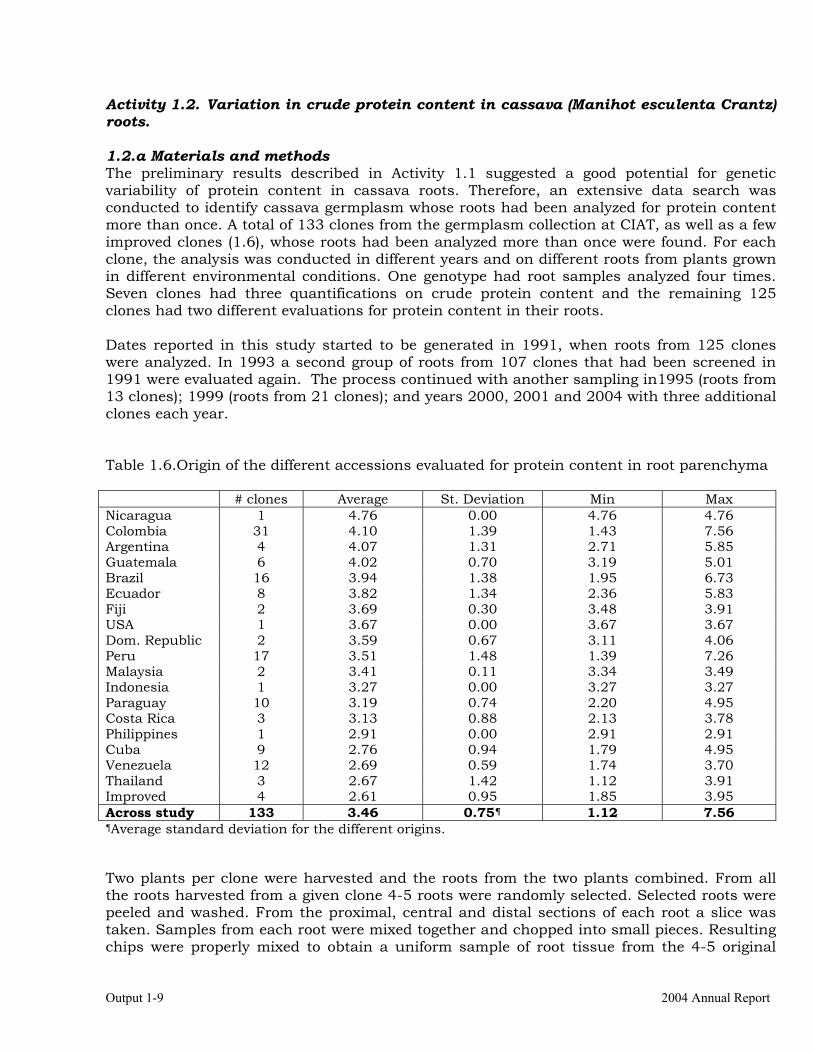
Activity 1.2. Variation in crude protein content in cassava (Manihot esculenta Crantz) roots. 1.2.a Materials and methods The preliminary results described in Activity 1.1 suggested a good potential for genetic variability of protein content in cassava roots. Therefore, an extensive data search was conducted to identify cassava germplasm whose roots had been analyzed for protein content more than once. A total of 133 clones from the germplasm collection at CIAT, as well as a few improved clones (1.6), whose roots had been analyzed more than once were found. For each clone, the analysis was conducted in different years and on different roots from plants grown in different environmental conditions. One genotype had root samples analyzed four times. Seven clones had three quantifications on crude protein content and the remaining 125 clones had two different evaluations for protein content in their roots. Dates reported in this study started to be generated in 1991, when roots from 125 clones were analyzed. In 1993 a second group of roots from 107 clones that had been screened in 1991 were evaluated again. The process continued with another sampling in1995 (roots from 13 clones); 1999 (roots from 21 clones); and years 2000, 2001 and 2004 with three additional clones each year. Table 1.6.Origin of the different accessions evaluated for protein content in root parenchyma # clones Average St. Deviation Min Max Nicaragua 1 4.76 0.00 4.76 4.76 Colombia 31 4.10 1.39 1.43 7.56 Argentina 4 4.07 1.31 2.71 5.85 Guatemala 6 4.02 0.70 3.19 5.01 Brazil 16 3.94 1.38 1.95 6.73 Ecuador 8 3.82 1.34 2.36 5.83 Fiji 2 3.69 0.30 3.48 3.91 USA 1 3.67 0.00 3.67 3.67 Dom. Republic 2 3.59 0.67 3.11 4.06 Peru 17 3.51 1.48 1.39 7.26 Malaysia 2 3.41 0.11 3.34 3.49 Indonesia 1 3.27 0.00 3.27 3.27 Paraguay 10 3.19 0.74 2.20 4.95 Costa Rica 3 3.13 0.88 2.13 3.78 Philippines 1 2.91 0.00 2.91 2.91 Cuba 9 2.76 0.94 1.79 4.95 Venezuela 12 2.69 0.59 1.74 3.70 Thailand 3 2.67 1.42 1.12 3.91 Improved 4 2.61 0.95 1.85 3.95 Across study 133 3.46 0.75¶ 1.12 7.56 ¶Average standard deviation for the different origins. Two plants per clone were harvested and the roots from the two plants combined. From all the roots harvested from a given clone 4-5 roots were randomly selected. Selected roots were peeled and washed. From the proximal, central and distal sections of each root a slice was taken. Samples from each root were mixed together and chopped into small pieces. Resulting chips were properly mixed to obtain a uniform sample of root tissue from the 4-5 original
Project IP3: improving cassava for the developing world Output 1-10
selected roots. A 100 g sample was then taken and dried in an oven with forced ventilation at 60 °C for 24 hours. Dried samples were then grinded in a mill with stainless steel grinding tool. All sample processing was carried out to avoid as much as possible contamination from soil or any other source. All solid samples were analyzed on an oven-dried basis. In the year 2000, root samples were sent to the Analytical Laboratory of University of Adelaide where the samples were analyzed using the total combustion gas chromatograph or Dumas method (Colombo and Giazzi, 1982). A Carlo Erba Instrument (model is NA 1500 series 2 Total Combustion Gas Chromatograph) was used in the quantification on 10-15 milligrams of samples. The limit of determination for the sample is calculated as 10 X the standard deviation of the blank. All the remaining samples were analyzed at the plant tissue analytical laboratory at CIAT. Nitrogen determination was based on a modification of the Kjeldahl method (Skalar, 1995). The root samples were digested with a mixture of sulphuric acid, selenium and salicylic acid. The salicylic acid forms a compound with the nitrates present to prevent losses of nitrate nitrogen. The digestion of the samples started with hydrogen peroxide and with this step the larger part of the organic matter is oxidized. After decomposition of the excess of H2O2, the digestion is completed by concentrated sulphuric acid at elevated temperature (330 °C) with selenium as catalyst (Walinga et al. 1989; Novozamsky et al. 1983). Nitrogen was quantified colorimetrically on a Segmented Flow Analyzer. In the coloring process, salicylate, nitroprusside (catalyst) and active chlorine are added to form a green colored complex with the ammonium ion. The absortion was measured at 660 nm (Krom, 1980; Searle, 1984). Protein content was estimated by multiplying N concentrations by a constant of 6.25, although Hock-Hin & Van-Den reported in 1996 that in the case of cassava this figure is probably ranging from 4.75 to 5.87. The original conversion factor has been maintained to facilitate the comparisons with previous reports. N quantification was based on dried root flour. Therefore, HCN had already been released before the quantification and no nitrogen (or trace amounts) from cyanogenic compounds should have remained. Statistical analysis was made using the square root transformation because the original data ranged from 1 to 8% (Gomez and Gomez, 1984). Because roots from one clone were measured in four different occasions, roots from seven clones in three occasions and the remaining 125 clones were evaluated only once, the harmonic mean (2.04), rather that the actual average was used in the estimation of a common standard error for the comparison of the means of two different clones. 1.2.b Results. Table 1.6 describes the origin of the 133 clones evaluated and main statistical parameters for clones grouped depending on their origin. The samples of clones evaluated should not be considered as representative of each country within the accessions included in the cassava germplasm collection at CIAT. Perhaps the only relevant information about the grouping of clones made for Table 1.6 is the remarkably low levels of proteins in improved cassava germplasm. The important information from Table 1.6 is the range of variation for protein content in the germplasm evaluated. The highest level was observed in an accession from Colombia with 7.56 % of crude protein. The lowest level was observed in a Thai variety with only 1.12% crude protein.
Output 1-11 2004 Annual Report
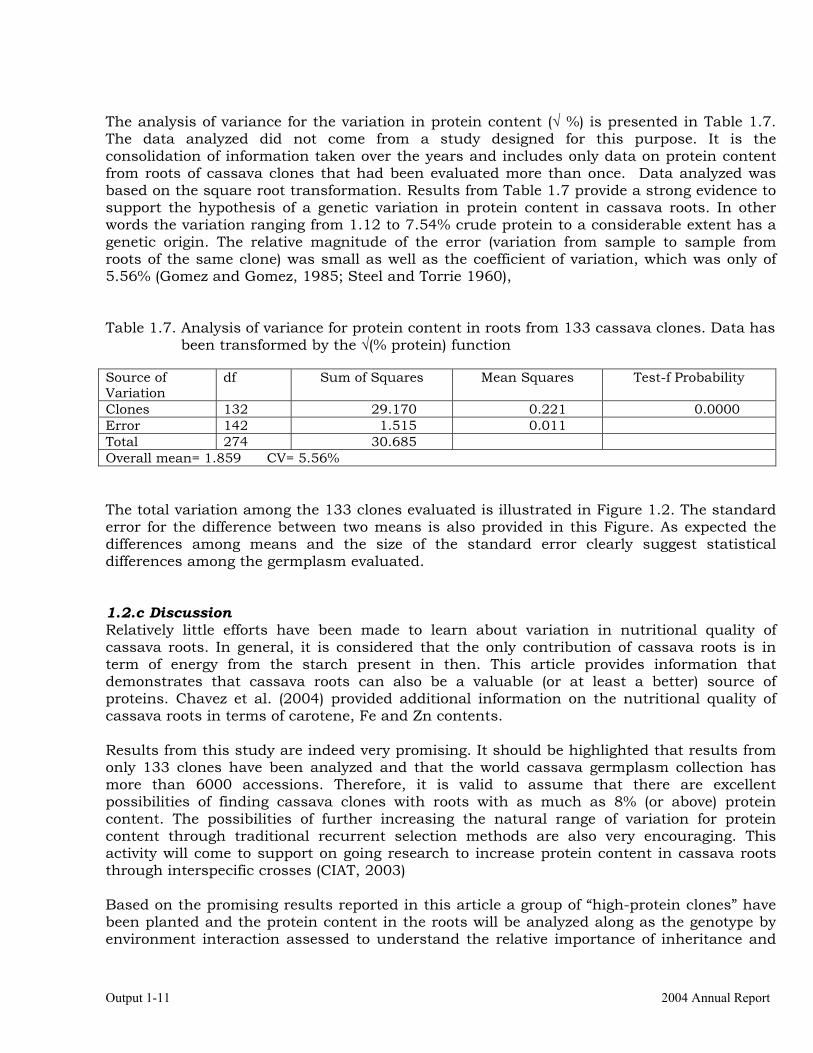
The analysis of variance for the variation in protein content (√ %) is presented in Table 1.7. The data analyzed did not come from a study designed for this purpose. It is the consolidation of information taken over the years and includes only data on protein content from roots of cassava clones that had been evaluated more than once. Data analyzed was based on the square root transformation. Results from Table 1.7 provide a strong evidence to support the hypothesis of a genetic variation in protein content in cassava roots. In other words the variation ranging from 1.12 to 7.54% crude protein to a considerable extent has a genetic origin. The relative magnitude of the error (variation from sample to sample from roots of the same clone) was small as well as the coefficient of variation, which was only of 5.56% (Gomez and Gomez, 1985; Steel and Torrie 1960), Table 1.7. Analysis of variance for protein content in roots from 133 cassava clones. Data has
been transformed by the √(% protein) function Source of Variation
df Sum of Squares Mean Squares Test-f Probability
Clones 132 29.170 0.221 0.0000 Error 142 1.515 0.011 Total 274 30.685 Overall mean= 1.859 CV= 5.56% The total variation among the 133 clones evaluated is illustrated in Figure 1.2. The standard error for the difference between two means is also provided in this Figure. As expected the differences among means and the size of the standard error clearly suggest statistical differences among the germplasm evaluated. 1.2.c Discussion Relatively little efforts have been made to learn about variation in nutritional quality of cassava roots. In general, it is considered that the only contribution of cassava roots is in term of energy from the starch present in then. This article provides information that demonstrates that cassava roots can also be a valuable (or at least a better) source of proteins. Chavez et al. (2004) provided additional information on the nutritional quality of cassava roots in terms of carotene, Fe and Zn contents. Results from this study are indeed very promising. It should be highlighted that results from only 133 clones have been analyzed and that the world cassava germplasm collection has more than 6000 accessions. Therefore, it is valid to assume that there are excellent possibilities of finding cassava clones with roots with as much as 8% (or above) protein content. The possibilities of further increasing the natural range of variation for protein content through traditional recurrent selection methods are also very encouraging. This activity will come to support on going research to increase protein content in cassava roots through interspecific crosses (CIAT, 2003) Based on the promising results reported in this article a group of “high-protein clones” have been planted and the protein content in the roots will be analyzed along as the genotype by environment interaction assessed to understand the relative importance of inheritance and

Project IP3: improving cassava for the developing world Output 1-12
environment in the expression of protein content in the roots. Amino acid profiling of the protein in these roots will also be attempted. It was surprising to observe the poor performance (for protein content) of the four improved clones included in this study. Although this is not conclusive evidence, these results would suggest that improving cassava for higher productivity might result in a gradual loss of high protein content originally present in the landraces, unless proper efforts are made to quantify and use protein content as criterion in the selection process.
Figure 1.2. Variation in protein content (values transformed by the √(% protein) function) in roots from 133 cassava accessions evaluated. The standard error for the difference between means is included in the plot. The horizontal line shows the average protein content across the entire set of clones evaluated.
Activity 1.3. Reduction or delay of post-harvest physiological deterioration in high-carotene cassava roots. 1.3.a Materials and methods Roots from a total of 101 cassava clones have been evaluated and a description of the origins of this germplasm is provided in Table 1.8. There were two types of clones, those produced from breeding projects at International Center for Tropical Agriculture (CIAT, Colombia) and clones from landraces from the germplasm collection held at CIAT. Carotene concentration. Randomly selected roots from plants of each clone were harvested after 11 months of planting and the carotene analysis was done immediately after harvest.
1.00
1.20
1.40
1.60
1.80
2.00
2.20
2.40
2.60
2.80
1 4 7 10 13 16 19 22 25 28 31 34 37 40 43 46 49 52 55 58 61 64 67 70 73 76 79 82 85 88 91 94 97 100
103
106
109
112
115
118
121
124
127
130
133
Accesion number
Sqrt
(% p
rote
in)
sd
Output 1-13 2004 Annual Report
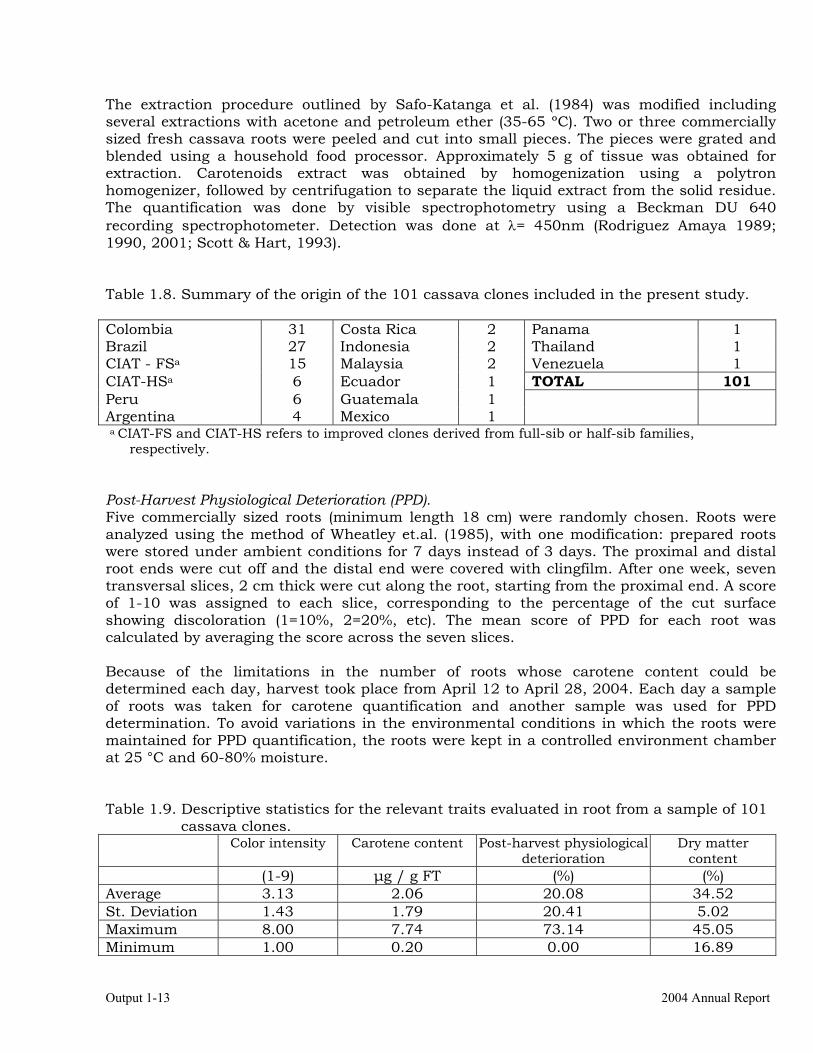
The extraction procedure outlined by Safo-Katanga et al. (1984) was modified including several extractions with acetone and petroleum ether (35-65 ºC). Two or three commercially sized fresh cassava roots were peeled and cut into small pieces. The pieces were grated and blended using a household food processor. Approximately 5 g of tissue was obtained for extraction. Carotenoids extract was obtained by homogenization using a polytron homogenizer, followed by centrifugation to separate the liquid extract from the solid residue. The quantification was done by visible spectrophotometry using a Beckman DU 640 recording spectrophotometer. Detection was done at λ= 450nm (Rodriguez Amaya 1989; 1990, 2001; Scott & Hart, 1993). Table 1.8. Summary of the origin of the 101 cassava clones included in the present study. Colombia 31 Costa Rica 2 Panama 1 Brazil 27 Indonesia 2 Thailand 1 CIAT - FSa 15 Malaysia 2 Venezuela 1 CIAT-HSa 6 Ecuador 1 TOTAL 101 Peru 6 Guatemala 1 Argentina 4 Mexico 1 a CIAT-FS and CIAT-HS refers to improved clones derived from full-sib or half-sib families,
respectively. Post-Harvest Physiological Deterioration (PPD). Five commercially sized roots (minimum length 18 cm) were randomly chosen. Roots were analyzed using the method of Wheatley et.al. (1985), with one modification: prepared roots were stored under ambient conditions for 7 days instead of 3 days. The proximal and distal root ends were cut off and the distal end were covered with clingfilm. After one week, seven transversal slices, 2 cm thick were cut along the root, starting from the proximal end. A score of 1-10 was assigned to each slice, corresponding to the percentage of the cut surface showing discoloration (1=10%, 2=20%, etc). The mean score of PPD for each root was calculated by averaging the score across the seven slices. Because of the limitations in the number of roots whose carotene content could be determined each day, harvest took place from April 12 to April 28, 2004. Each day a sample of roots was taken for carotene quantification and another sample was used for PPD determination. To avoid variations in the environmental conditions in which the roots were maintained for PPD quantification, the roots were kept in a controlled environment chamber at 25 °C and 60-80% moisture. Table 1.9. Descriptive statistics for the relevant traits evaluated in root from a sample of 101
cassava clones. Color intensity Carotene content Post-harvest physiological
deterioration Dry matter
content (1-9) µg / g FT (%) (%) Average 3.13 2.06 20.08 34.52 St. Deviation 1.43 1.79 20.41 5.02 Maximum 8.00 7.74 73.14 45.05 Minimum 1.00 0.20 0.00 16.89
Project IP3: improving cassava for the developing world Output 1-14
Dry matter content. Dry matter content was estimated by weighting 20-30 g of chopped fresh roots and, then, drying them in an oven at 60 °C for 24 h. The relationship between dry and fresh weights (expressed as percentage) was used for estimating dry matter contents. Root coloration and other measurements. A 1 to 9 scale for the visual estimation of root coloration was developed and printed for a uniform estimation of color intensity. The color of root parenchyma can vary from white, cream, yellow, and orange. Pinkish roots (score 9) have also been observed in cassava. Statistical analysis The relationship between variables was evaluated through regression analysis Different alternative models were considered for each case and the best one selected to be presented. In the case of PPD, a variable measured as percentage which presented many cases of values between 0-10 %, data was transformed using the Arcsin √ percentage transformation (Steel and Torrie, 1960). Dry matter content is also expressed as percentage. However, no data below 17% (only one data point) was found and, therefore, the Arcsin √ percentage transformation was considered not necessary.
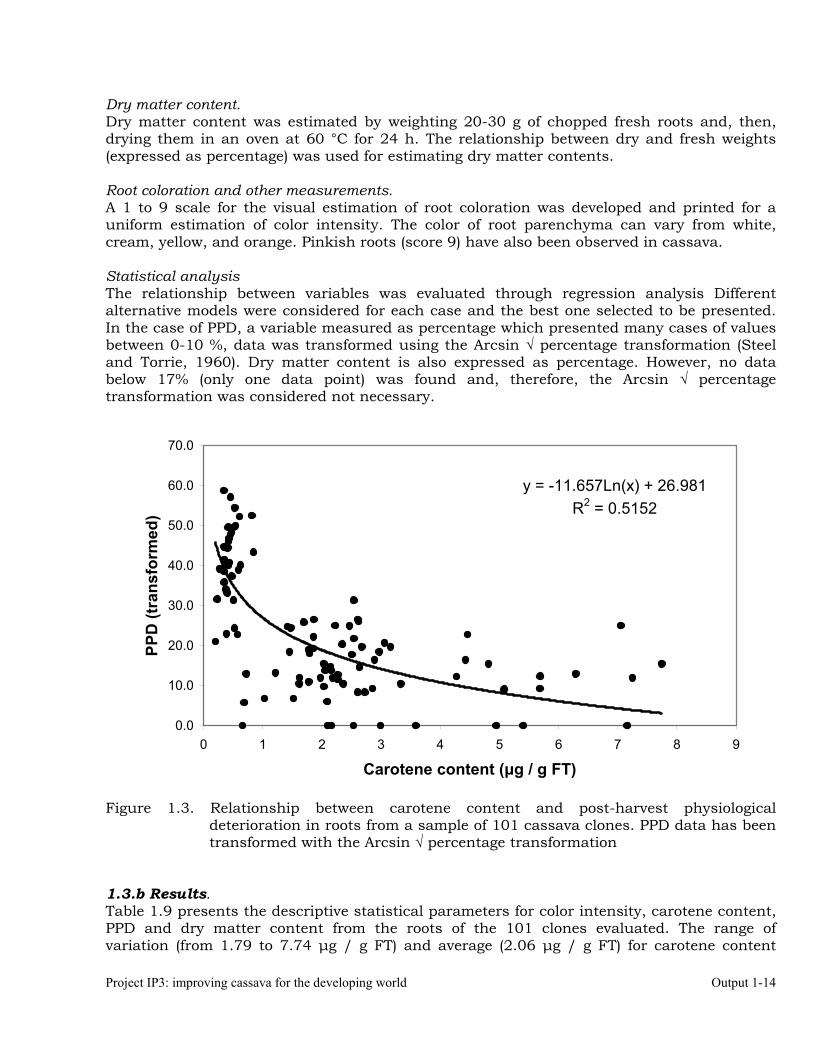
Figure 1.3. Relationship between carotene content and post-harvest physiological deterioration in roots from a sample of 101 cassava clones. PPD data has been transformed with the Arcsin √ percentage transformation
1.3.b Results. Table 1.9 presents the descriptive statistical parameters for color intensity, carotene content, PPD and dry matter content from the roots of the 101 clones evaluated. The range of variation (from 1.79 to 7.74 µg / g FT) and average (2.06 µg / g FT) for carotene content
y = -11.657Ln(x) + 26.981R2 = 0.5152
0.0
10.0
20.0
30.0
40.0
50.0
60.0
70.0
0 1 2 3 4 5 6 7 8 9
Carotene content (µg / g FT)
PPD
(tra
nsfo
rmed
)
Output 1-15 2004 Annual Report
agree with those reported earlier (Chávez et al., 2004). Average PPD (20.08) and dry matter content (34.52%) also agree with previous results (Chávez et al. 2004; Cortés et al. 2002). Figure 1.3 depicts the general relationship between post-harvest physiological deterioration and carotene content in the roots. As expected, roots with low carotene content (white parenchyma) were more frequent resulting in a clear asymmetrical distribution for carotene in the roots, which concentrated frequencies in the lower values to the left of the plot, and a long tale to the right (skewness value = 1.34).
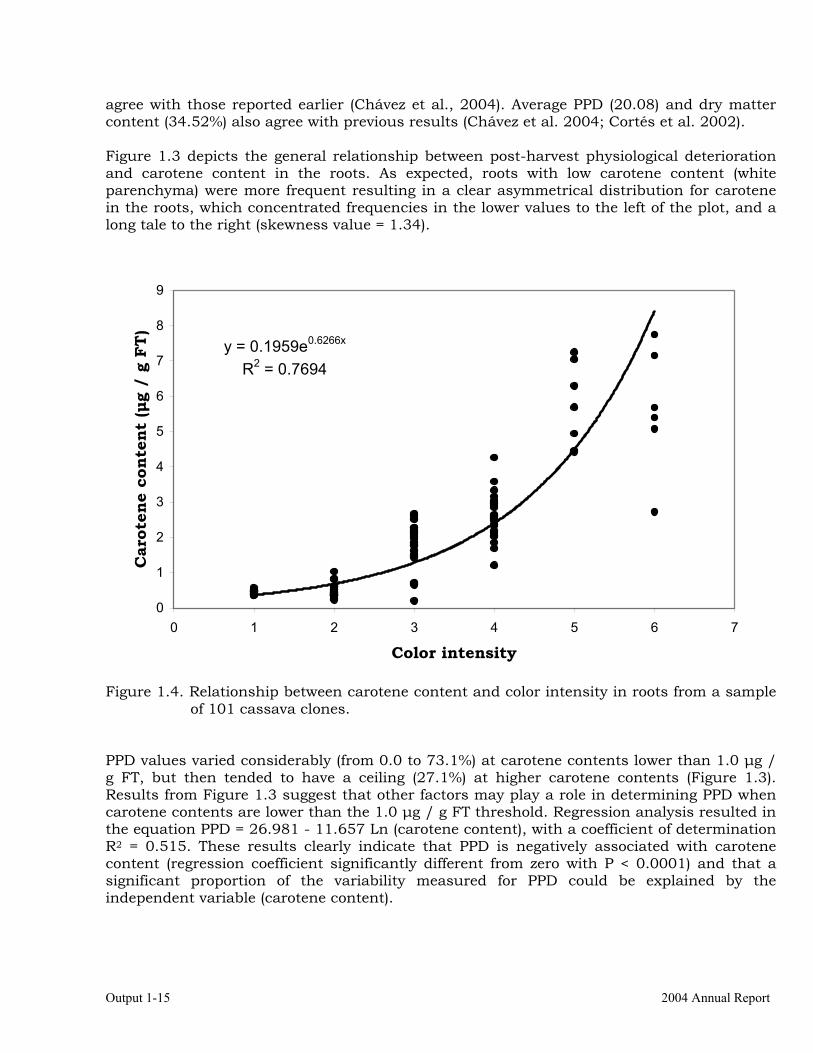
Figure 1.4. Relationship between carotene content and color intensity in roots from a sample of 101 cassava clones.
PPD values varied considerably (from 0.0 to 73.1%) at carotene contents lower than 1.0 µg / g FT, but then tended to have a ceiling (27.1%) at higher carotene contents (Figure 1.3). Results from Figure 1.3 suggest that other factors may play a role in determining PPD when carotene contents are lower than the 1.0 µg / g FT threshold. Regression analysis resulted in the equation PPD = 26.981 - 11.657 Ln (carotene content), with a coefficient of determination R2 = 0.515. These results clearly indicate that PPD is negatively associated with carotene content (regression coefficient significantly different from zero with P < 0.0001) and that a significant proportion of the variability measured for PPD could be explained by the independent variable (carotene content).
y = 0.1959e0.6266x
R2 = 0.7694
0
1
2
3
4
5
6
7
8
9
0 1 2 3 4 5 6 7
Color intensity
Car
oten
e co
nten
t (µ
g /
g FT
)
Project IP3: improving cassava for the developing world Output 1-16
Figure 1.4 illustrates the relationship between carotene content and color intensity in the root parenchyma. In this analysis one data point (color score = 8; carotene content 4.81 µg / g FT) was clearly outlying and was not considered in the analysis. The regression analysis suggested an exponential relationship (carotene content = 0.196 e0.627(color intensity), with a coefficient of determination R2 = 0.769.
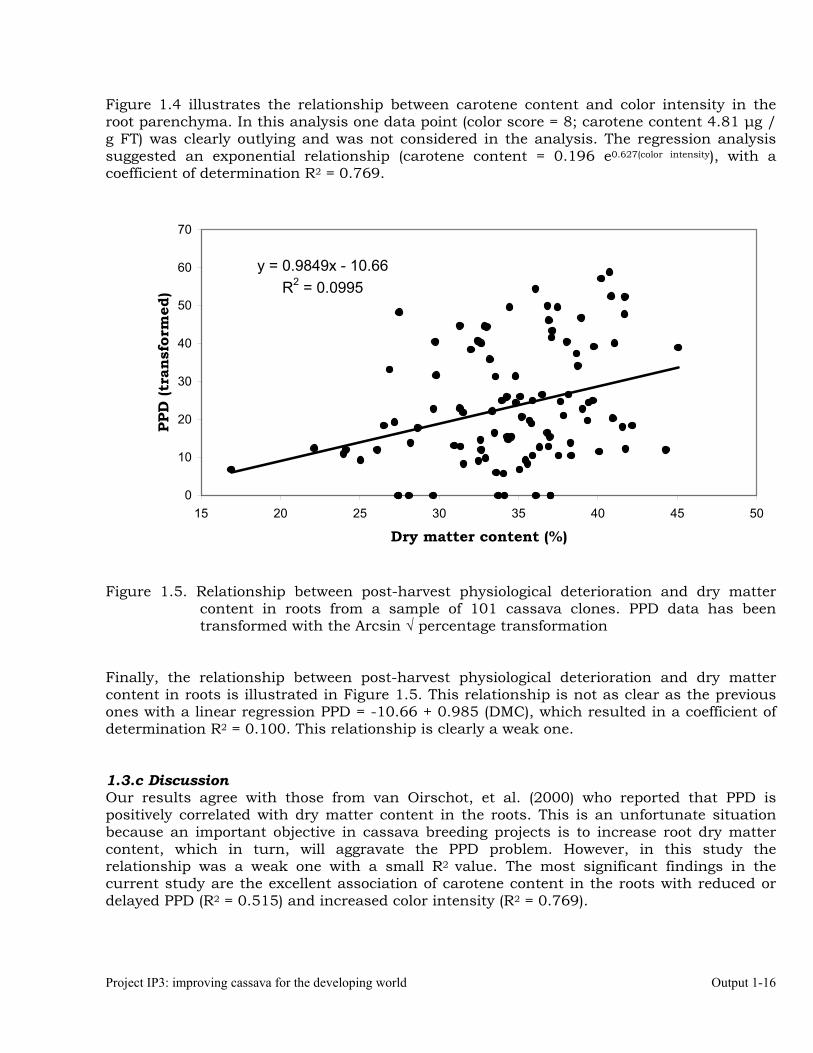
Figure 1.5. Relationship between post-harvest physiological deterioration and dry matter
content in roots from a sample of 101 cassava clones. PPD data has been transformed with the Arcsin √ percentage transformation
Finally, the relationship between post-harvest physiological deterioration and dry matter content in roots is illustrated in Figure 1.5. This relationship is not as clear as the previous ones with a linear regression PPD = -10.66 + 0.985 (DMC), which resulted in a coefficient of determination R2 = 0.100. This relationship is clearly a weak one. 1.3.c Discussion Our results agree with those from van Oirschot, et al. (2000) who reported that PPD is positively correlated with dry matter content in the roots. This is an unfortunate situation because an important objective in cassava breeding projects is to increase root dry matter content, which in turn, will aggravate the PPD problem. However, in this study the relationship was a weak one with a small R2 value. The most significant findings in the current study are the excellent association of carotene content in the roots with reduced or delayed PPD (R2 = 0.515) and increased color intensity (R2 = 0.769).
y = 0.9849x - 10.66R2 = 0.0995
0
10
20
30
40
50
60
70
15 20 25 30 35 40 45 50
Dry matter content (%)
PPD
(tra
nsfo
rmed
)

Output 1-17 2004 Annual Report
The negative association between carotene content and PPD is very promising because it suggests that yellow, high-carotene cassava roots are not only more nutritious, but also would have a better marketability because their reduced or delayed PPD. It should be mentioned, however, that high-carotene roots could have an increased shelf life of just one or two additional days. The beneficial effect of carotenes, in other words, is far from enough for overcoming this serious problem for marketing cassava roots. On the other hand this beneficial effect should encourage farmers to grow yellow rooted cassava clones. The relationship between carotene content in the roots and color intensity is also relevant. Adequate laboratory facilities for the quantification of carotene contents in many developing countries and, particularly, in those regions where cassava is an important crop, are missing. The association between color intensity and carotene content clearly indicates that a simple selection based on visual scoring of color intensity should be enough for an initial selection of clones with high carotene content in their roots. Because of the exponential nature of this association, efforts should be directed at improving the color chart on which the color intensity score was based, particularly from scores ranging from 4 to 8. Activity 1.4. Effect of processing on carotenes present in cassava roots. 1.4.a Materials and methods Two similar experiments were conducted for two consecutive years. The first one involved the evaluation of roots from four cassava clones. The second experiment was conducted on root samples from three different cassava clones. In both experiments, carotene contents were measured in fresh roots and after processing through different methodologies: boiling, oven-drying, sun-drying, Gari, shadow drying, and lyophilized (lyophilized results are reported only for the first experiment and shadow drying only for the second one). M easurement of carotene concentration through the colorimetric method. Randomly selected roots from plants of each clone were harvested after 11 months of planting and the carotene analysis was done immediately after harvest. The extraction procedure outlined by Safo-Katanga et al. (1984) was modified including several extractions with acetone and petroleum ether (35-65 ºC). Two or three commercially sized fresh cassava roots were peeled and cut into small pieces. The pieces were grated and blended using a household food processor. Approximately 5 g of tissue was obtained for extraction. Carotenoids extract was obtained by homogenization using a polytron homogenizer, followed by centrifugation to separate the liquid extract from the solid residue. The quantification was done by visible spectrophotometry using a Beckman DU 640 recording spectrophotometer. Detection was done at λ= 450nm (Rodriguez Amaya 1989; 1990, 2001; Scott & Hart, 1993). M easurement of carotene concentration through the HPLC method. From the reading performed with the spectrophotometric quantification of total carotenes, aliquots (15 ml) of petroleum extract were partially dried by rota-evaporation and completely dried by nitrogen flux. Immediately before injection, the dry extract was dissolved in 1 ml of HPLC grade acetone and filtrated through 0.22 µm PTFE syringe filter. Twenty microliters were injected in the HPLC system using a YMC-C30 Carotenoid S 5µm (250 mm x 4.6mm, Waters) column. Separation was performed by a isocratic elution with a mobile phase of methanol:methyl-t-butylether, 85:15 v/v, during 90 minutes at 0.8 ml min-1 and 23°C. β-
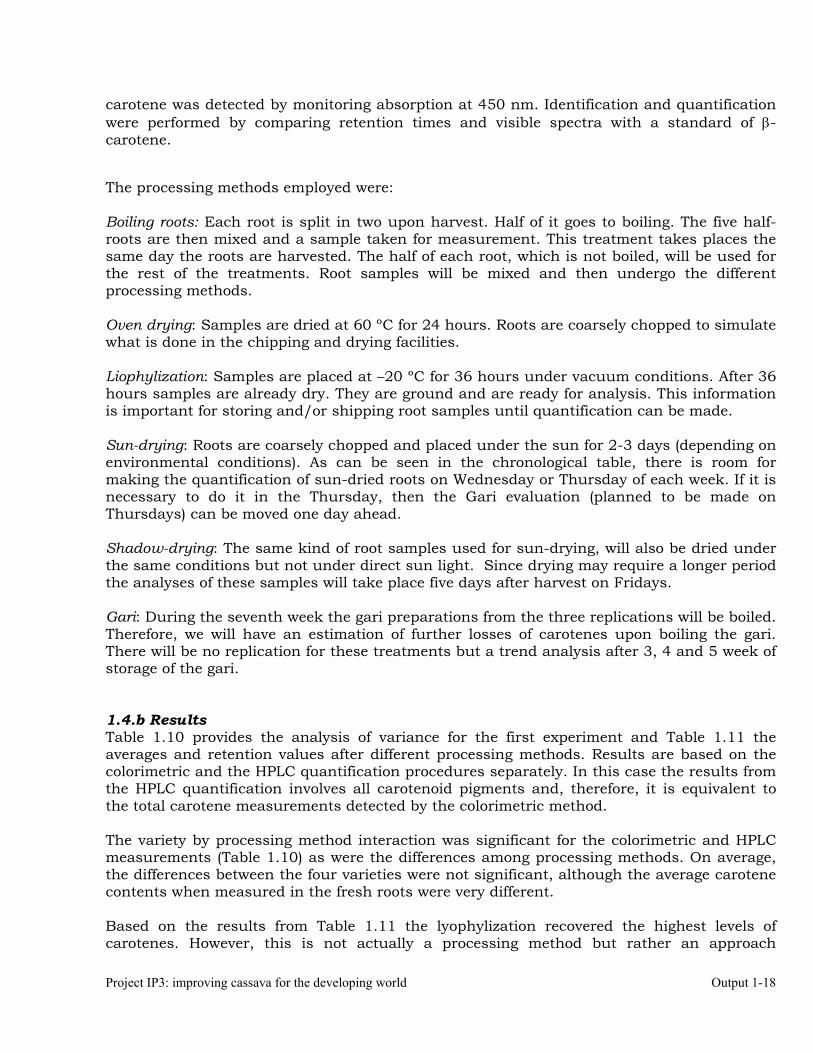
Project IP3: improving cassava for the developing world Output 1-18
carotene was detected by monitoring absorption at 450 nm. Identification and quantification were performed by comparing retention times and visible spectra with a standard of β-carotene. The processing methods employed were: Boiling roots: Each root is split in two upon harvest. Half of it goes to boiling. The five half-roots are then mixed and a sample taken for measurement. This treatment takes places the same day the roots are harvested. The half of each root, which is not boiled, will be used for the rest of the treatments. Root samples will be mixed and then undergo the different processing methods. Oven drying: Samples are dried at 60 ºC for 24 hours. Roots are coarsely chopped to simulate what is done in the chipping and drying facilities. Liophylization: Samples are placed at –20 ºC for 36 hours under vacuum conditions. After 36 hours samples are already dry. They are ground and are ready for analysis. This information is important for storing and/or shipping root samples until quantification can be made. Sun-drying: Roots are coarsely chopped and placed under the sun for 2-3 days (depending on environmental conditions). As can be seen in the chronological table, there is room for making the quantification of sun-dried roots on Wednesday or Thursday of each week. If it is necessary to do it in the Thursday, then the Gari evaluation (planned to be made on Thursdays) can be moved one day ahead. Shadow-drying: The same kind of root samples used for sun-drying, will also be dried under the same conditions but not under direct sun light. Since drying may require a longer period the analyses of these samples will take place five days after harvest on Fridays. Gari: During the seventh week the gari preparations from the three replications will be boiled. Therefore, we will have an estimation of further losses of carotenes upon boiling the gari. There will be no replication for these treatments but a trend analysis after 3, 4 and 5 week of storage of the gari. 1.4.b Results Table 1.10 provides the analysis of variance for the first experiment and Table 1.11 the averages and retention values after different processing methods. Results are based on the colorimetric and the HPLC quantification procedures separately. In this case the results from the HPLC quantification involves all carotenoid pigments and, therefore, it is equivalent to the total carotene measurements detected by the colorimetric method. The variety by processing method interaction was significant for the colorimetric and HPLC measurements (Table 1.10) as were the differences among processing methods. On average, the differences between the four varieties were not significant, although the average carotene contents when measured in the fresh roots were very different. Based on the results from Table 1.11 the lyophylization recovered the highest levels of carotenes. However, this is not actually a processing method but rather an approach
Output 1-19 2004 Annual Report
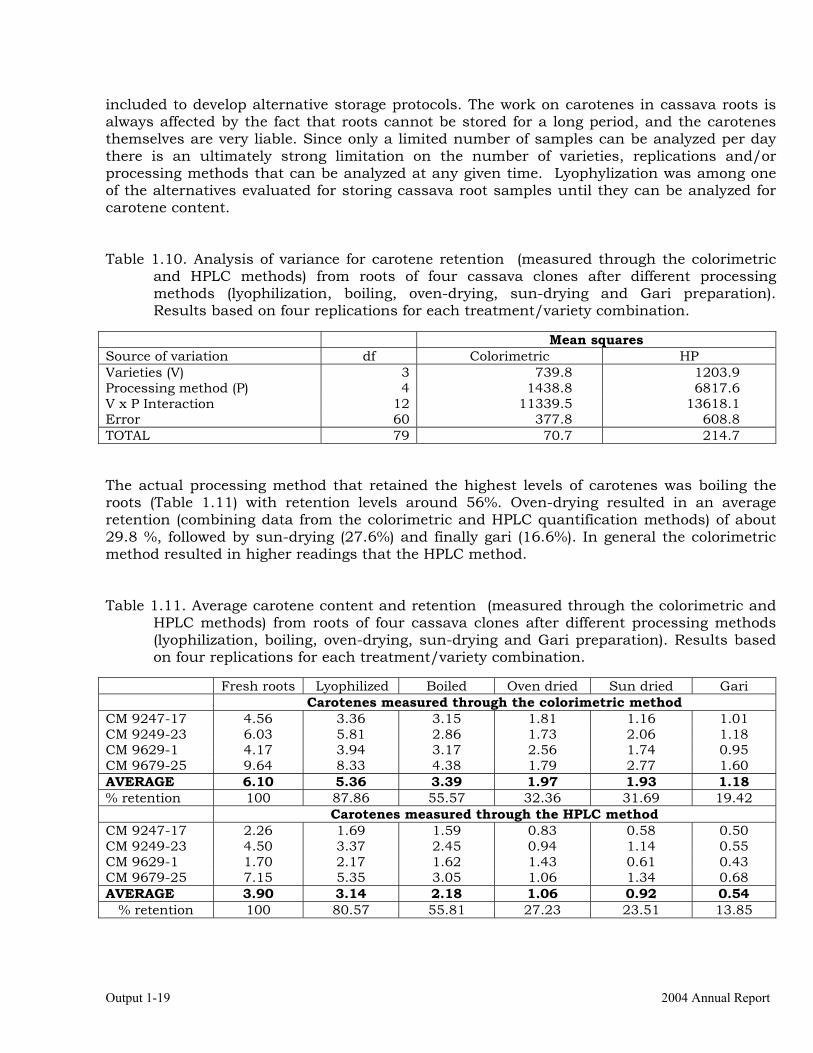
included to develop alternative storage protocols. The work on carotenes in cassava roots is always affected by the fact that roots cannot be stored for a long period, and the carotenes themselves are very liable. Since only a limited number of samples can be analyzed per day there is an ultimately strong limitation on the number of varieties, replications and/or processing methods that can be analyzed at any given time. Lyophylization was among one of the alternatives evaluated for storing cassava root samples until they can be analyzed for carotene content. Table 1.10. Analysis of variance for carotene retention (measured through the colorimetric
and HPLC methods) from roots of four cassava clones after different processing methods (lyophilization, boiling, oven-drying, sun-drying and Gari preparation). Results based on four replications for each treatment/variety combination.
Mean squares Source of variation df Colorimetric HP Varieties (V) 3 739.8 1203.9 Processing method (P) 4 1438.8 6817.6 V x P Interaction 12 11339.5 13618.1 Error 60 377.8 608.8 TOTAL 79 70.7 214.7 The actual processing method that retained the highest levels of carotenes was boiling the roots (Table 1.11) with retention levels around 56%. Oven-drying resulted in an average retention (combining data from the colorimetric and HPLC quantification methods) of about 29.8 %, followed by sun-drying (27.6%) and finally gari (16.6%). In general the colorimetric method resulted in higher readings that the HPLC method. Table 1.11. Average carotene content and retention (measured through the colorimetric and
HPLC methods) from roots of four cassava clones after different processing methods (lyophilization, boiling, oven-drying, sun-drying and Gari preparation). Results based on four replications for each treatment/variety combination.
Fresh roots Lyophilized Boiled Oven dried Sun dried Gari Carotenes measured through the colorimetric method CM 9247-17 4.56 3.36 3.15 1.81 1.16 1.01 CM 9249-23 6.03 5.81 2.86 1.73 2.06 1.18 CM 9629-1 4.17 3.94 3.17 2.56 1.74 0.95 CM 9679-25 9.64 8.33 4.38 1.79 2.77 1.60 AVERAGE 6.10 5.36 3.39 1.97 1.93 1.18 % retention 100 87.86 55.57 32.36 31.69 19.42 Carotenes measured through the HPLC method CM 9247-17 2.26 1.69 1.59 0.83 0.58 0.50 CM 9249-23 4.50 3.37 2.45 0.94 1.14 0.55 CM 9629-1 1.70 2.17 1.62 1.43 0.61 0.43 CM 9679-25 7.15 5.35 3.05 1.06 1.34 0.68 AVERAGE 3.90 3.14 2.18 1.06 0.92 0.54
% retention 100 80.57 55.81 27.23 23.51 13.85
Project IP3: improving cassava for the developing world Output 1-20
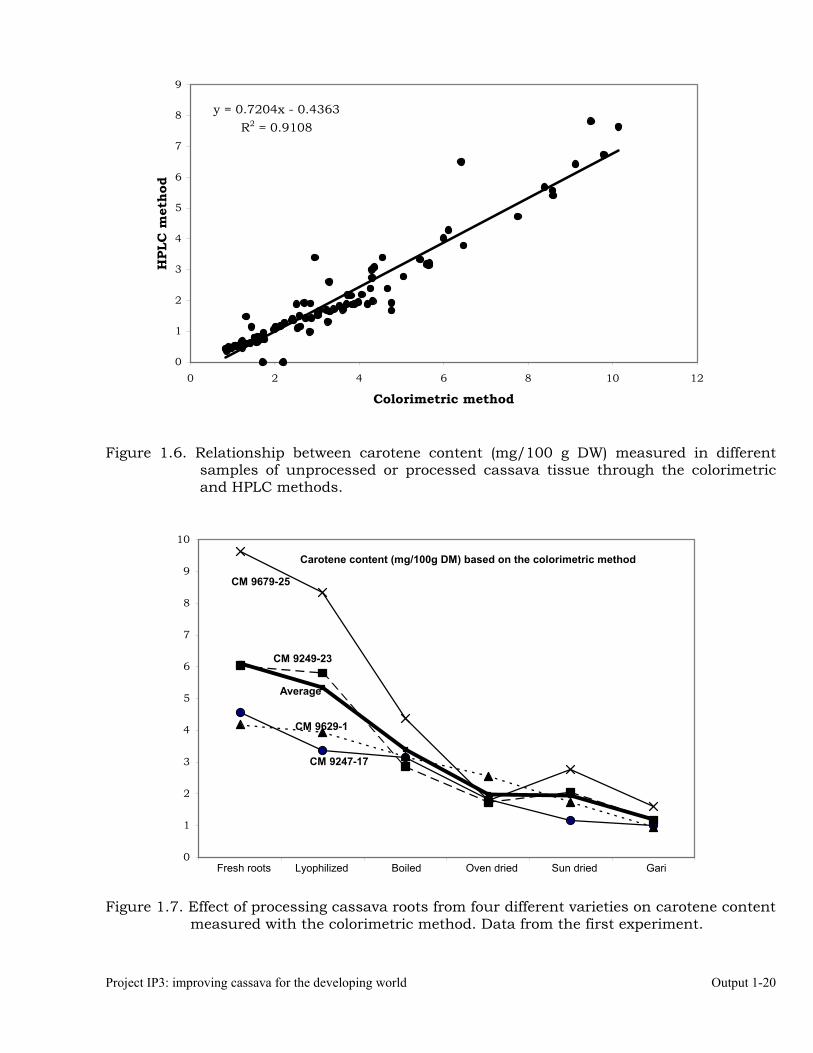
Figure 1.6. Relationship between carotene content (mg/100 g DW) measured in different
samples of unprocessed or processed cassava tissue through the colorimetric and HPLC methods.
Figure 1.7. Effect of processing cassava roots from four different varieties on carotene content measured with the colorimetric method. Data from the first experiment.
y = 0.7204x - 0.4363R2 = 0.9108
0
1
2
3
4
5
6
7
8
9
0 2 4 6 8 10 12
Colorimetric method
HPL
C m
etho
d
0
1
2
3
4
5
6
7
8
9
10
1 2 3 4 5 6Fresh roots Lyophilized Boiled Oven dried Sun dried Gari
CM 9679-25
CM 9249-23
Average
CM 9247-17
CM 9629-1
Carotene content (mg/100g DM) based on the colorimetric method
Output 1-21 2004 Annual Report
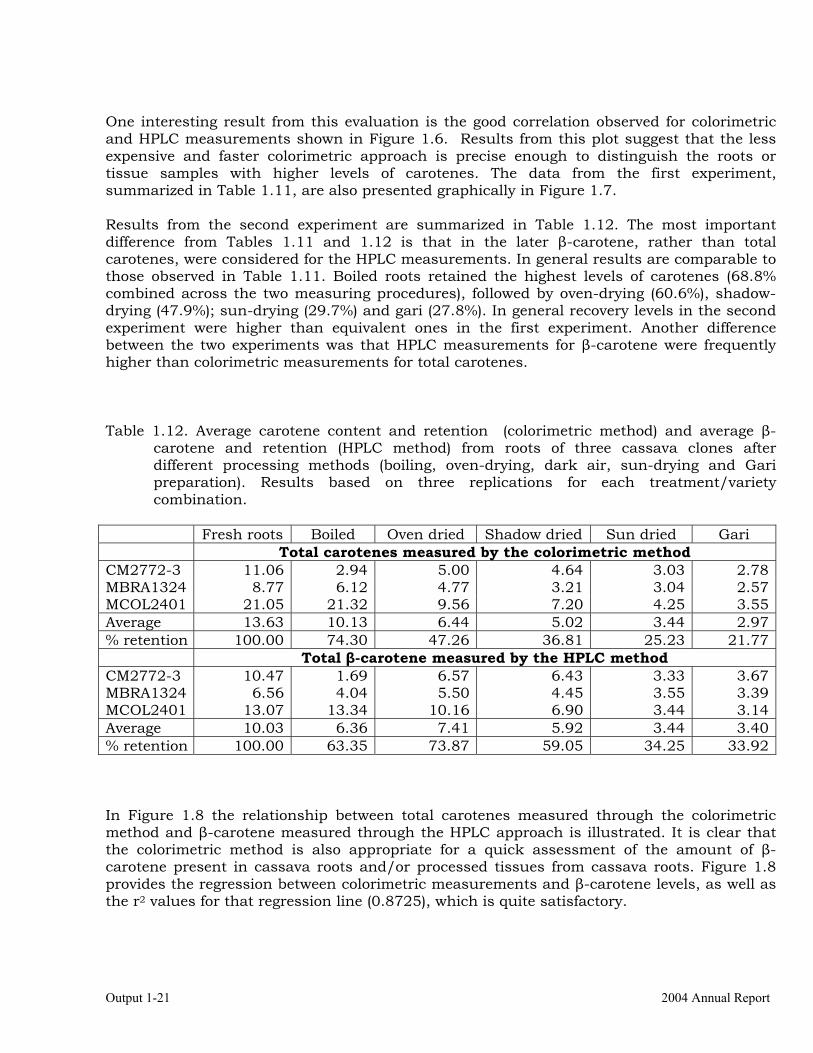
One interesting result from this evaluation is the good correlation observed for colorimetric and HPLC measurements shown in Figure 1.6. Results from this plot suggest that the less expensive and faster colorimetric approach is precise enough to distinguish the roots or tissue samples with higher levels of carotenes. The data from the first experiment, summarized in Table 1.11, are also presented graphically in Figure 1.7. Results from the second experiment are summarized in Table 1.12. The most important difference from Tables 1.11 and 1.12 is that in the later β-carotene, rather than total carotenes, were considered for the HPLC measurements. In general results are comparable to those observed in Table 1.11. Boiled roots retained the highest levels of carotenes (68.8% combined across the two measuring procedures), followed by oven-drying (60.6%), shadow-drying (47.9%); sun-drying (29.7%) and gari (27.8%). In general recovery levels in the second experiment were higher than equivalent ones in the first experiment. Another difference between the two experiments was that HPLC measurements for β-carotene were frequently higher than colorimetric measurements for total carotenes. Table 1.12. Average carotene content and retention (colorimetric method) and average β-
carotene and retention (HPLC method) from roots of three cassava clones after different processing methods (boiling, oven-drying, dark air, sun-drying and Gari preparation). Results based on three replications for each treatment/variety combination.
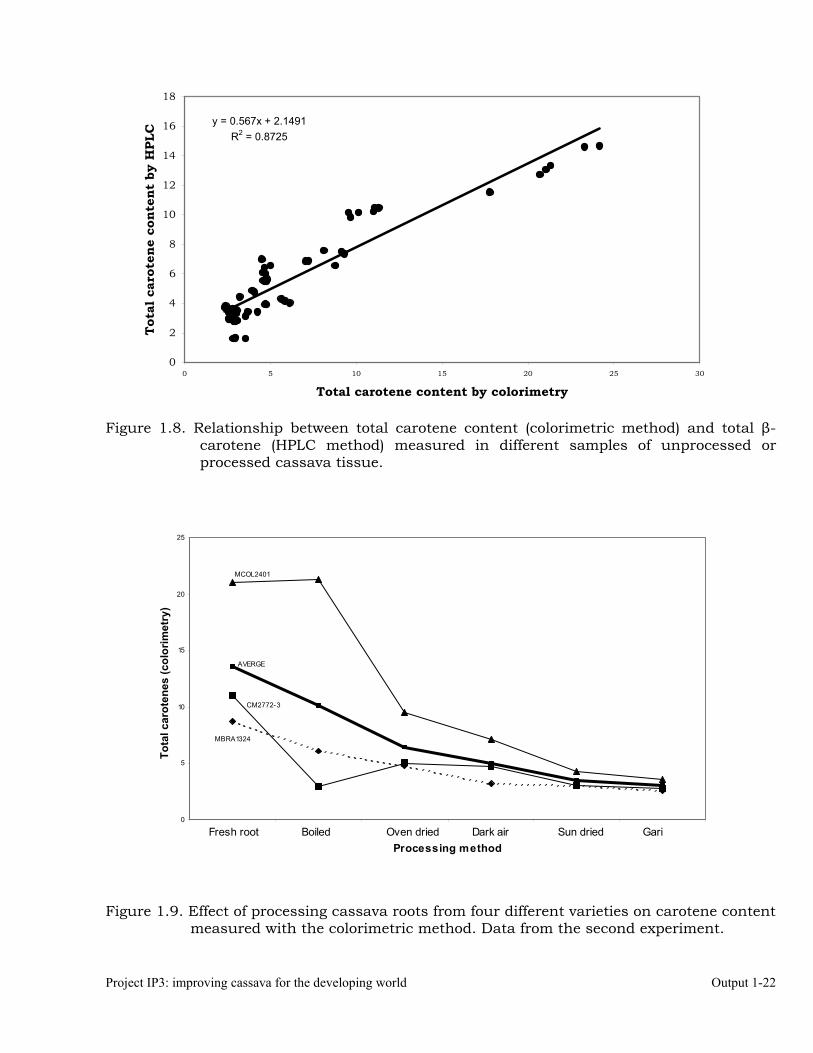
Fresh roots Boiled Oven dried Shadow dried Sun dried Gari Total carotenes measured by the colorimetric method CM2772-3 11.06 2.94 5.00 4.64 3.03 2.78 MBRA1324 8.77 6.12 4.77 3.21 3.04 2.57 MCOL2401 21.05 21.32 9.56 7.20 4.25 3.55 Average 13.63 10.13 6.44 5.02 3.44 2.97 % retention 100.00 74.30 47.26 36.81 25.23 21.77 Total β-carotene measured by the HPLC method CM2772-3 10.47 1.69 6.57 6.43 3.33 3.67 MBRA1324 6.56 4.04 5.50 4.45 3.55 3.39 MCOL2401 13.07 13.34 10.16 6.90 3.44 3.14 Average 10.03 6.36 7.41 5.92 3.44 3.40 % retention 100.00 63.35 73.87 59.05 34.25 33.92 In Figure 1.8 the relationship between total carotenes measured through the colorimetric method and β-carotene measured through the HPLC approach is illustrated. It is clear that the colorimetric method is also appropriate for a quick assessment of the amount of β-carotene present in cassava roots and/or processed tissues from cassava roots. Figure 1.8 provides the regression between colorimetric measurements and β-carotene levels, as well as the r2 values for that regression line (0.8725), which is quite satisfactory.
Project IP3: improving cassava for the developing world Output 1-22
Figure 1.8. Relationship between total carotene content (colorimetric method) and total β-carotene (HPLC method) measured in different samples of unprocessed or processed cassava tissue.
Figure 1.9. Effect of processing cassava roots from four different varieties on carotene content
measured with the colorimetric method. Data from the second experiment.
y = 0.567x + 2.1491R2 = 0.8725
0
2
4
6
8
10
12
14
16
18
0 5 10 15 20 25 30
Total carotene content by colorimetry
Tota
l car
oten
e co
nten
t by
HPL
C
0
5
10
15
20
25
1 2 3 4 5 6
Processing method
Tota
l car
oten
es (c
olor
imet
ry)
MCOL2401
CM2772-3
AVERGE
MBRA1324
Fresh root Boiled Oven dried Dark air Sun dried Gari
Output 1-23 2004 Annual Report
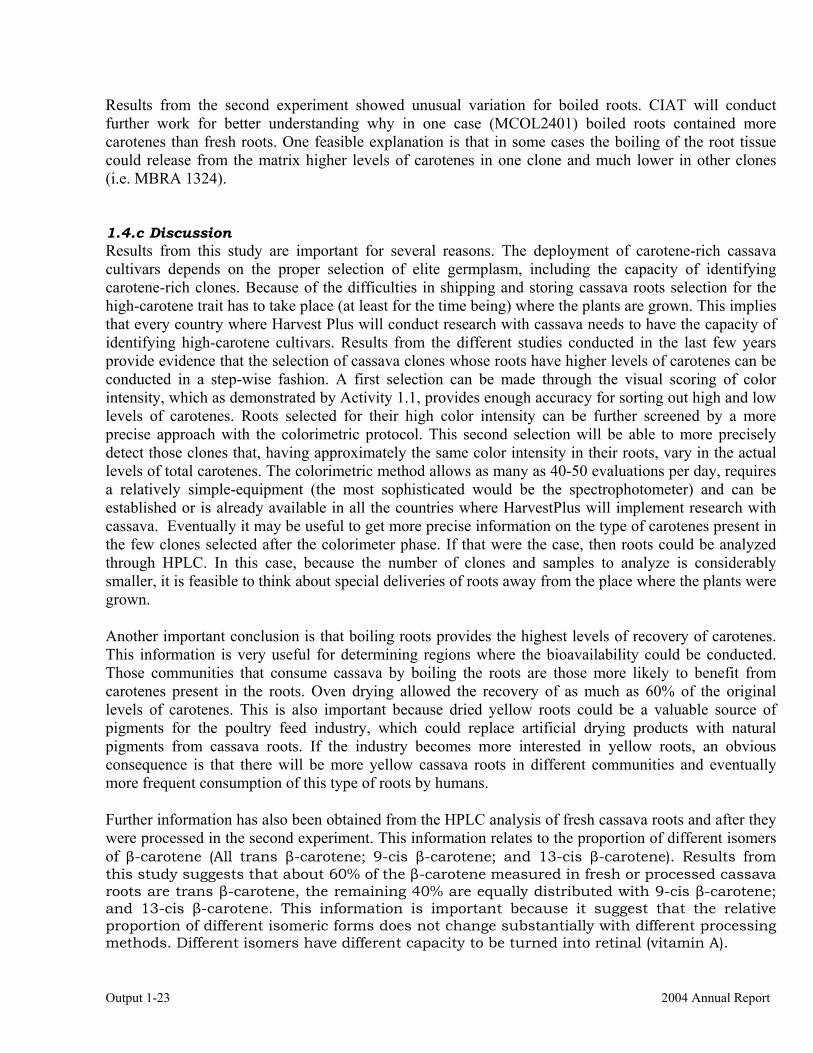
Results from the second experiment showed unusual variation for boiled roots. CIAT will conduct further work for better understanding why in one case (MCOL2401) boiled roots contained more carotenes than fresh roots. One feasible explanation is that in some cases the boiling of the root tissue could release from the matrix higher levels of carotenes in one clone and much lower in other clones (i.e. MBRA 1324).
1.4.c Discussion Results from this study are important for several reasons. The deployment of carotene-rich cassava cultivars depends on the proper selection of elite germplasm, including the capacity of identifying carotene-rich clones. Because of the difficulties in shipping and storing cassava roots selection for the high-carotene trait has to take place (at least for the time being) where the plants are grown. This implies that every country where Harvest Plus will conduct research with cassava needs to have the capacity of identifying high-carotene cultivars. Results from the different studies conducted in the last few years provide evidence that the selection of cassava clones whose roots have higher levels of carotenes can be conducted in a step-wise fashion. A first selection can be made through the visual scoring of color intensity, which as demonstrated by Activity 1.1, provides enough accuracy for sorting out high and low levels of carotenes. Roots selected for their high color intensity can be further screened by a more precise approach with the colorimetric protocol. This second selection will be able to more precisely detect those clones that, having approximately the same color intensity in their roots, vary in the actual levels of total carotenes. The colorimetric method allows as many as 40-50 evaluations per day, requires a relatively simple-equipment (the most sophisticated would be the spectrophotometer) and can be established or is already available in all the countries where HarvestPlus will implement research with cassava. Eventually it may be useful to get more precise information on the type of carotenes present in the few clones selected after the colorimeter phase. If that were the case, then roots could be analyzed through HPLC. In this case, because the number of clones and samples to analyze is considerably smaller, it is feasible to think about special deliveries of roots away from the place where the plants were grown. Another important conclusion is that boiling roots provides the highest levels of recovery of carotenes. This information is very useful for determining regions where the bioavailability could be conducted. Those communities that consume cassava by boiling the roots are those more likely to benefit from carotenes present in the roots. Oven drying allowed the recovery of as much as 60% of the original levels of carotenes. This is also important because dried yellow roots could be a valuable source of pigments for the poultry feed industry, which could replace artificial drying products with natural pigments from cassava roots. If the industry becomes more interested in yellow roots, an obvious consequence is that there will be more yellow cassava roots in different communities and eventually more frequent consumption of this type of roots by humans. Further information has also been obtained from the HPLC analysis of fresh cassava roots and after they were processed in the second experiment. This information relates to the proportion of different isomers of β-carotene (All trans β-carotene; 9-cis β-carotene; and 13-cis β-carotene). Results from this study suggests that about 60% of the β-carotene measured in fresh or processed cassava roots are trans β-carotene, the remaining 40% are equally distributed with 9-cis β-carotene; and 13-cis β-carotene. This information is important because it suggest that the relative proportion of different isomeric forms does not change substantially with different processing methods. Different isomers have different capacity to be turned into retinal (vitamin A).
Project IP3: improving cassava for the developing world Output 1-24
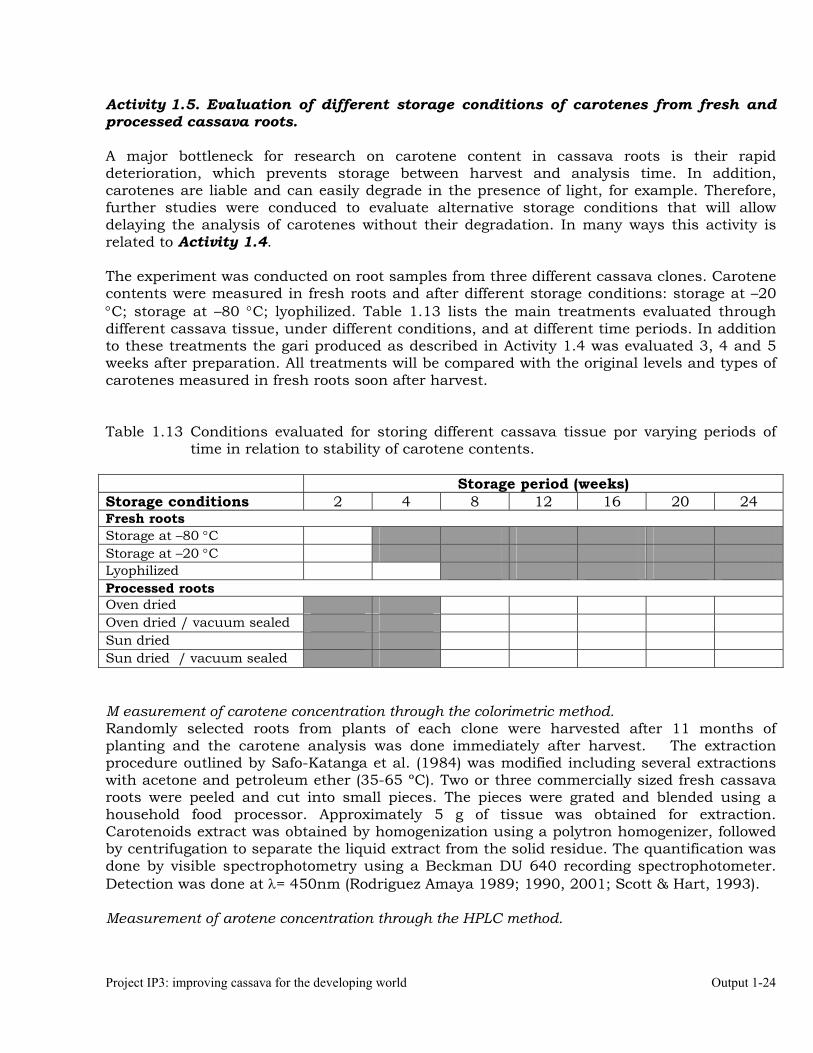
Activity 1.5. Evaluation of different storage conditions of carotenes from fresh and processed cassava roots. A major bottleneck for research on carotene content in cassava roots is their rapid deterioration, which prevents storage between harvest and analysis time. In addition, carotenes are liable and can easily degrade in the presence of light, for example. Therefore, further studies were conduced to evaluate alternative storage conditions that will allow delaying the analysis of carotenes without their degradation. In many ways this activity is related to Activity 1.4. The experiment was conducted on root samples from three different cassava clones. Carotene contents were measured in fresh roots and after different storage conditions: storage at –20 °C; storage at –80 °C; lyophilized. Table 1.13 lists the main treatments evaluated through different cassava tissue, under different conditions, and at different time periods. In addition to these treatments the gari produced as described in Activity 1.4 was evaluated 3, 4 and 5 weeks after preparation. All treatments will be compared with the original levels and types of carotenes measured in fresh roots soon after harvest. Table 1.13 Conditions evaluated for storing different cassava tissue por varying periods of
time in relation to stability of carotene contents. Storage period (weeks) Storage conditions 2 4 8 12 16 20 24 Fresh roots Storage at –80 °C Storage at –20 °C Lyophilized Processed roots Oven dried Oven dried / vacuum sealed Sun dried Sun dried / vacuum sealed M easurement of carotene concentration through the colorimetric method. Randomly selected roots from plants of each clone were harvested after 11 months of planting and the carotene analysis was done immediately after harvest. The extraction procedure outlined by Safo-Katanga et al. (1984) was modified including several extractions with acetone and petroleum ether (35-65 ºC). Two or three commercially sized fresh cassava roots were peeled and cut into small pieces. The pieces were grated and blended using a household food processor. Approximately 5 g of tissue was obtained for extraction. Carotenoids extract was obtained by homogenization using a polytron homogenizer, followed by centrifugation to separate the liquid extract from the solid residue. The quantification was done by visible spectrophotometry using a Beckman DU 640 recording spectrophotometer. Detection was done at λ= 450nm (Rodriguez Amaya 1989; 1990, 2001; Scott & Hart, 1993). Measurement of arotene concentration through the HPLC method.
Output 1-25 2004 Annual Report
From the reading performed with the spectrophotometric quantification of total carotenes, aliquots (15 ml) of petroleum extract were partially dried by rota-evaporation and completely dried by nitrogen flux. Immediately before injection, the dry extract was dissolved in 1 ml of HPLC grade acetone and filtrated through 0.22 µm PTFE syringe filter. Twenty microliters were injected in the HPLC system using a YMC-C30 Carotenoid S 5µm (250 mm x 4.6mm, Waters) column. Separation was performed by a isocratic elution with a mobile phase of methanol:methyl-t-butylether, 85:15 v/v, during 90 minutes at 0.8 ml min-1 and 23°C. β-carotene was detected by monitoring absorption at 450 nm. Identification and quantification were performed by comparing retention times and visible spectra with a standard of β-carotene. Harvest of the roots began in May and the last quantification of carotene contents (after 24 weeks) will take place during November, 2004. The evaluations evolved without major problem or unexpected difficulties. As soon as the last samples are measured the results of the chromatograms will be integrated for final analysis and publication in a refereed journal. Since no data has been completely analyzed, no conclusion can be mentioned regarding the results. However, it should be emphasized that the information generated by this study will be very useful for facilitating the logistics of research of carotene content in cassava roots. For example, by the end of year 2004 a collection of intensely pigmented roots in the North Eastern State of Maranhão in Brazil has been planned. Carotene data from the many samples to be hopefully harvested was highly desirable. Otherwise an additional year would be required to grow the plants from the collected stakes. However, the conditions where collection is expected to take place do not allow for the proper and immediate analysis of root samples. Knowing about the effect of different storage conditions would greatly facilitate this work. Activities 1.4 and 1.5 were technically supported by P. Nestel (Nutrition Coordinator, HarvestPlus) and D. Rodriguez Amaya (expert in carotene measurements at Universidad de São Paulo, Campinas, Brazil). Their contributions are herein acknowledged and thanked. Activity 1.6. Measurement of genotype by environment effect on carotene, Fe and Zn contents in cassava roots. As described in the article presented as Activity 1.1, interesting results were observed for Fe and Zn contents in cassava roots. These results would suggest that there is ample genetic variation for these traits and, therefore, hopes for developing and deploying high-Fe and or High-Zn cassava cultivars. One major problem of the data so far generated, however, is that they were based on single flour samples. This activity aims at measuring the relative importance of environment and genotype in the amount of Fe and Zn in cassava roots from different clones. Crosses for genetic studies A group of clones was selected because of their contrasting levels of Fe and Zn in their roots (Table 1.14). These clones will be used for further studies to measure the heritability of the trait, genotype by environment interaction, and eventually in breeding work. Below is the result of the most important characteristics of the four groups identified and selected. Carotenoid content was not considered as a selection criterion, but was measured in these

Project IP3: improving cassava for the developing world Output 1-26
samples, nonetheless. These clones are currently recovered from the germplasm bank to produce planting material and are hardened in greenhouse conditions. By October 2004 the hardened seedlings will be moved to the screen-house and early 2005 will be transplanted to the field for evaluation. Harvest will take place during the second semester, 2005. Table 1.14. Fe, Zn and carotene contents in roots from a group of cassava clones contrasting
for these traits.
µg/100 fresh weight Fe and Zn contents
Number of clones Carotene Fe Zn
Dry matter content (%)
High-High 5 2.1 91.4 26.1 25.62 High-Low 5 2.6 64.8 5.1 35.93 Low-High 5 2.0 118 17.0 37.64 Low-Low 6 2.8 7.6 3.2 43.02 Overall 21 2.4 16.9 7.5 35.91 Measurement of the effects of environment of Fe and Zn accumulation in the roots. The purpose of the study is to quantify the relative importance of GxE interactions in carotene, Fe and Zn contents in cassava roots. A group of ten clones were planted in four diverse environmental conditions, with three replications per location. Trials will be harvested in November 2004. Clones that have yellow roots (with certain variation in intensity) were included. Among the clones planted one has been found to contain higher than average Fe in its roots, and two lower than average Fe in their roots. It is important that soil samples are taken from each location as well, so soil samples will also be analyzed for their mineral contents.
Output 1-27 2004 Annual Report
References ACC/SCN, 1992. Second report on the world nutrition situation. United Nations, Administrative
Committee on Coordination, Subcommittee on nutrition. Geneva. ACC/SCN in collaboration with IFPRI.
ACC/SCN, 2000. Forth report on the world nutrition situation. United Nations, Administrative Committee on Coordination, Subcommittee on nutrition. Geneva. ACC/SCN in collaboration with IFPRI.
Allen C., A. 1994. the origin of Manihot esculenta Crantz (Euphorbiaceae). Genetic Resources and Crop Evolution 41:133-150.
Babu, L., & S.R. Chatterjee, 1999. Protein content and amino acid composition of cassava tubers and leaves. J. Root Crops Vol.25 (20) 163-168.
Beaton, G.H., R. Martorell, K.J. Aronso, B. Edmonston, G. McCabe, A.C. Ross, & B. Harvey, 1993. Effectiveness of vitamin A supplementation in the control of young child morbidity and mortality in developing countries. ACC/SCN State of the arts series, Nutrition Policy Paper Nº 13. Geneva.
Beeching, J.R., H. Yuanhuai, R. Gómez-Vázquez, R.C. Day, & R.M. Cooper, 1998. Wound and defense responses in cassava as related to post-harvest physiological deterioration. In: J.T.Romeo, K.R. Downum & R. Verpporte (Eds.) Recent Advances in Phytochemistry. Phytochemical Signals in Plant-Microbe Interactions. Plenum Press, New York-London. Vol. 32:231-248.
Brücher, H. 1989. Useful plants of neotropical origin and their wild relatives. Springer-Verlag. Berlin and New York. 296 p.
Buitrago A., J.A., 1990. La yuca en la alimentación animal. Centro Internacional de Agricultura Tropical (CIAT), Cali, Colombia 446 p.
Buschmann, H., M.X.Rodriguez, J. Tohme, & J.R. Beeching, 2000. Accumulation of hydroxycoumarins during post-harvest deterioration of tuberous roots of cassava (Manihot esculenta Crantz). Annals of Botany 86:1153-1160.
Chávez, A.L.,T. Sánchez, G. Jaramillo, J. M.l Bedoya, J. Echeverry, E. A. Bolaños, H. Ceballos, and C.A. Iglesias. 2004. Variation of quality traits in cassava roots evaluated in landraces and improved clones. Euphytica (In press).
Chutharatkul, C. 2002. The new outlook for cassava in Thailand. 7th Casssava Regional Workshop. Bangkok, Thailand, October 2002.
CIAT, 1999. Improved cassava for the developing world. Annual Report, 1999. CIAT, 2001. Improved cassava for the developing world. Annual Report, 2001. CIAT, 2002. Improved cassava for the developing world. Annual Report, 2002. CIAT, 2003. Improved cassava for the developing world. Annual Report, 2003. pp 8:59-8:65 Cock, J., 1985. Cassava. New potential for a neglected crop. Westview Press. Boulder, CO., USA. Colombo, B., and G. Giazzi. 1982. Total automatic nitrogen determination. American Laboratory, 38-45. Combs, G.F. 1998. The vitamins. Fundamental aspects in nutrition and health. Academic Press. 618 pp Cortés, D.F., K. Reilly, E. Okogbenin, J.R. Beeching, C. Iglesias and J. Tohme. 2002. Mapping wound-
response genes involved in post-harvest physiological deterioration (PPD) of cassava (Manihot esculenta Crantz).
Cronin, D.A. & S. Smith 1979. A simple and rapid procedure for the analysis of reducing, total and individual sugars in potatoes. Potato Res. 22:99-105.
Curtis Hannah, L. 2000. Starch biosynthesis and genetic potential. In: C.F. Murphy and D. M. Peterson (eds.) Designing crops for added value. American Society of Agronomy. Madison, WI, USA.
El-Sharkawy, M.A., 1993. Drought-tolerant cassava for Africa, Asia and Latin America. BioScience 43:441-451.
Essers, A.J.A.M., R.M. Bosveld, R.M. van der Gift, & A.G.J. Voragen. 1994. A new chromogen for the assay of cyanogens in cassava products. In: M.O. Akoroda (Ed.) Root crops for food security in Africa. Proceedings of the fifth Triennal Symposium of the International Society for Tropical Root
Project IP3: improving cassava for the developing world Output 1-28
Crops, African Branch (ISTRC-AB), The Technical Centre for Agricultural and Rural Cooperation (CTA) and International Institute of Tropical Agriculture (IITA). Ibadan, Nigeria. Pp. 314-317
FAO / FIDA, 2000. La economía mundial de la yuca. Hechos, tendencias y perspectivas. Fondo Internacional de Desarrollo Agrícola. Organización de las Naciones Unidas para la Agricultura y la Alimentación. Roma, Italia.
García-Casal, M.N., M. Layrisse, L. Solano, M.A. Baron, F. Arguello, D. Llovera, J. Ramirez, I. Leets, & E. Tropper, 1998. Vitamin A and beta-carotene can improve nonheme iron absorption from rice, wheat, and corn by humans. J. Nutr. Bethesda 128(3):646-650.
Gomez, K. A. and A.A. Gomez. 1984. Statistical procedures for agricultural research. Wiley-Interscience Publication. New York. Pp 304-306.
Gomez, G., J. Santos, & M. Valdivieso, 1983. Utilización de raíces y productos de yuca en alimentación animal. In: C.E. Domínguez (Ed.). Yuca: investigación, producción y utilización. Working Document No. 50. Centro Internacional de Agricultura Tropical (CIAT), Cali, Colombia.
Graham, R. D., & J.M. Rosser, 2000. Carotenoids in staple foods: their potential to improve human nutrition. Food and Nutrition Bulletin Vol. 21 Number 4:404-409.
Graham, R.D., D. Senadhira, S. Beebe, C. Iglesias, & I. Monasterio, 1999. Breeding for micronutrient density in edible portions of staple food crops: conventional approaches. Field Crop Res., 60, 57-80.
Han, Y., H. Li, R.M. Cooper and J.R. Beeching. 2000. Isolation of post-harvest physiological deterioration related cDNA clones from cassava. In: L.J.C.B. Barvalho, A.M. Thro and E.D. Vilarinhos (Eds.) Cassava Biotechnology, pp. 526-536. 4th International Scientific Meeting of Cassava Biotechnology Network. Salvador, Brazil, Brasilia EMBRAPA.
Han, Y., R. Gómez-Vásquez, K. Reilly, H. Li, J. Tohme, R.M. Cooper, and J.R. Beeching. 2001. Hydroxyproline-rich glycoprotein expressed during stress responses in cassava. Euphytica 120:59-70.
Hirose, S., E.S. Data, and M.A. Quevedo. 1984. Changes in respiration and ethylene production in cassava roots in relation to postharvest deterioration. In: I. Uritani and E.D. Reyes (Eds). Tropical Root Crops: Postharvest Physiology and Processing JSSP. Tokyo. Pp 83-98.
Hock-Hin,Y., & T. Van-Den, 1996. Protein contents, amino acid compositions and nitrogen-to protein conversion factors for cassava roots. J. Sci. Food Agric. 70:51-54.
Iglesias, C., J. Mayer , A.L. Chávez, & F. Calle, 1997. Genetic potential and stability of carotene content in cassava roots. Euphytica 94:367-373.
Jalal, F, M.C. Nesheim, Z. Agus, D. Sanjur, & J.P. Habitch, 1998. Serum retinol concentrations in children are affected by food sources of beta-carotene, fat intake, and anthelmintic drug treatment. J. Clinical Nutr. 68(3):623-629.
Jennings, D.L., & C.H. Hershey, 1985. Cassava breeding: a decade of progress from international programs. In: G.E. Russell (Ed.). Progress in Plant Breeding. pp 89-116. Butterworths. London, Boston.
Jennings D.LO. and C. Iglesias. 2002. Breeding fro crop improvement. In: R.J. Hillocks, J.M. Tresh and A.C. Bellotti (Eds.) Cassava: biology, production and utilization. CABI Publishing Oxon, UK and New York, USA. Pp 40-54.
Kakes. P. 1990.Properties and functions of the cyanogenic sustem in higher plants. Euphytica 48:25-43.
Kawano, K. 1980. Cassava. In: Fehr W.R. and Hadley H.H. (eds) Hybridization of Crop Plants. ASA, CSSA. Madison, Wisconsin, pp 225-233.
Kawano, K., K. Narintaraporn, P. Narintaraporn, S. Sarakarn, A. Limsila, J. Limsila, D. Suparhan, & W. Watananonta, 1998. Yield improvement in a multistage breeding program for cassava. Crop Sci. 38:325-332.
Kawano, K.,W.M. Gonçalvez Fukuda, & U. Cenpukdee, 1987. Genetic and environmental effects on dry matter content of cassava root. Crop Sci. 27:69-74.
Kawano, K., K. Narintaraporn, P. Narintaraporn, S. Sarakarn, A. Limsila, J. Limsila, D. Suparhan, & W. Watananonta, 1998. Yield improvement in a multistage breeding program for cassava. Crop Sci. 38:325-332.
Kawano, K. 2003. Thirty years of cassava breeding for productivity- biological and social factors for success. Crop Sci. 43:1325-1335.
Output 1-29 2004 Annual Report
Kolsteren, P., S.R. Rahman, K. Hilderbrand, & A. Diniz, 1999. Treatment for iron deficiency anemia with combined supplementation of iron, vitamin A and zinc in women of Dinajpur, Bangladesh. Euro J. Clin Nutr 53(2):102-106.
Krom, M. 1980. Spectrophotometric determination of ammonia; a study of modified Bethelot reaction using salicylate and cichloroisocyanurate. The analyist 105: 305-316.
McCallum, C. M., Comai, L., Greene, E.A., and Henikoff, S. 2000. Targeting induced local lesions in genomes (TILLLING) for plant functional genomics. Plant Physiology, 123: 439–442.
MI/UNICEF/Tulane University, 1998. Progress in controlling vitamin A deficiency. Ottawa: Micronutrients Initiative.
Mwanri, L., A. Worsley, P. Ryan, & J. Masika, 2000. Supplemental vitamin A improves anemic school children in Tanzania. Journal Nutrition. 130:2691-2696.
Novozamsky, I., V.J.G. Houba, R. van Eck and W. van Vark. 1983. A novel digestion technique for multi-element analysis. Commun. Soil Sci. Plant Anal. 14:239-249.
Olsen, K.M., & B.A. Schaal, 2001. Microsatellite variation in cassava (Manihot esculenta, Euphorbiaceae) and its wild relatives: further evidence for a southern Amanzonian origin of domestication. American Journal of Botany 88:131-142.
Perry, J.A., Wang, T.L., Welham, T.J., Gardner, S., Pike, J.M., Yoshida, S., and Parniske, M. 2003. A TILLING reverse genetics tool and a web-accessible collection of mutants of the legume Lotus japonicas. Plant Physiol. Vol.131.
Reilly K., Han J., Iglesias C., and Beeching J. 2000. Oxidative stress related genes on cassava post-harvest physiological deterioration. In: L.J.C.B. Barvalho, A.M. Thro and E.D. Vilarinhos (Eds.) Cassava Biotechnology, pp. 560-571. 4th International Scientific Meeting of Cassava Biotechnology Network. Salvador, Brazil, Brasilia EMBRAPA.
Reilly, K., Y. Han, J. Tohme and J.R. Beeching. 2001. Isolation and characterization of a cassava catalase expressed during post-harvest physiological deterioration. Biochemical et Biophysica Acta 1518:317-323.
Renvoize, B.S.,1972. The area of origin of Manihot esculenta as a crop plant - a review of the evidence. Econ Bot 26: 352-360.
Rickard, J.E. 1985. Physiological deterioration of cassava roots. J Sci Food Agric 36:167-176. Rickard, J.E., J. Marriott, and P.B. Gahan. 1979. Occlusions in cassava xylem vessels associated with
vascular discoloration. Ann. Bot. 43:523-526. Rodriguez Amaya, D. 1989. Critical review of provitamin A determination in plant Foods. Journal of
Micronutrient Analysis 5, 191-225. Rodriguez Amaya, D. 1990. Provitamin A determination problems and possible solutions. Food and
Nutrition Bulletin 12 No. 3: 246-250. Rodriguez-Amaya, D.B. 2001. A guide to carotenoid analysis in foods. ILSI Press, Washington. 64pp. Safo-Katanga, O., P. Aboagye, S.A. Amartey, & J.H. Olaham, 1984. Studies on the content of yellow-
pigmented cassava. In: E.R. Terry, E.V. Doku, O.B. Arene, & N.M. Mahungu (Eds). Tropical Roots Crops Production and Uses in Africa. pp.103-104. IDRC, Ottawa, Canada.
Scott K.J. & D.J. Hart, 1993. Further observations on problems associated with the analysis of carotenoids by HPLC. Food Chemistry. 47, 403-40
Scott, G.J., M.K. Rosegrant, & C. Ringler, 2000. Global projections for root and tuber crops to the year 2020. Food Policy 25:561-597.Searle, P.L. 1984. The Berthelot or indophenol reaction and its use in the analysis chemistry of nitrogen. The Analyist 109:549-565
Skalar, 1995. The SANplus Segmented Flow Analyzer. Soil & Plant Analysis. Skalar Analytical B.V. P.O. Box 3237, 4800 De Breda, The Netherlands. pp 70-72
Steel , R.G.D. and Torrie, J.H. 1960. Principles and procedures of statisitics. McGraw-Hill Book Company. New York. USA., pp 39-40.
Till,B.J., Reynolds, S.H., Greene, E.A., Codomo, C. A., Enns, L.C, Johnson, J.E., Burtner, C., Odden, A.R., Young, K., Taylor, N.E., Henikoff, J.G., Comai, L., and Henikoff, S. 2003. Large-scale discovery of induced point mutations with high-throughput TILLING. Genome Research 13:524–530.
Uritani, I., E.S. Data and Y. Tanaka. 1984. Biochemistry of postharvest deterioration of cassava ans sweet potato roots. In: I. Uritani and E.D. Reyes (Eds). Tropical Root Crops: Postharvest Physiology and Processing JSSP. Tokyo. Pp 61-75.
Project IP3: improving cassava for the developing world Output 1-30
Van Oirschot, Q. E. A., G.M. O’Brien, D. Dufour D., M.A. El-Sharkawy, & E. Mesa, 2000. The effect of pre-harvest pruning of cassava upon root deterioration and quality characteristics. J. Sci. Food Agric. 80:1866-1873.
Walinga, I., W. van Vark, V.J.G. Houba, J.J. van der Lee. 1989. Plant analysis procedures, Part 7. Department of Soil Science and Plant Nutrition. Wageningen Agricultural University. Syllabus 1989, pp 197-200.
West, K.R. Jr., 2001. The magnitude of vitamin A deficiency disorders: overview. XX IVACG Meeting. Hanoi, Vietnam. February 12-15.
Wheatley, C., C. Lozano, & G. Gomez, 1985. Post-harvest deterioration of cassava roots, In: Cock, J. H., Reyes, J. A. (Eds). Cassava: Research, Production and Utilization. Pp. 655-671. UNDP-CIAT, Cali.
WHO/UNICEF, 1995. Global prevalence of vitamin A deficiency. Micronutrient Deficiency Information System Working Paper 2. Geneva WHO.
Zapata, G., 2001.Disminución de deterioro fisiológico postcosecha en raíces de yuca (Manihot esculenta Crantz) mediante almacenamiento controlado. B.S. Thesis, Universidad de San Buenaventura, Facultad de Ingeniería Agroindustrial. Cali, Colombia.
Output 2-1 2004 Annual Report
OUTPUT 2 Genetic base of cassava and related Manihot species evaluated and available for
cassava improvement: higher commercial value.
The overall objective of this output is to generate genetic stocks and knowledge about genetic variability for starch quality traits. The main activities focus in developing and identifying high-value cassava germplasm. Traits involving higher commercial value turn particularly around novel starch types. Related issues are the need for a better understanding of the biochemical and genetic basis of these high-value traits. Because of the scarcity of institutions conducting research on cassava new methods for assessing, identifying and exploiting genetic variability are required and need to be developed by CIAT. Rationale Cassava roots are valued for their starchy properties. They are used for fresh consumption, fermentation and drying, rasping and drying, chipping, pelleting, starch extraction and alcohol production. More recently high value-added products, such as precooked, frozen croquettes and fried chips, have been developed and have an increasing presence in urban markets. High starch content is an important component of root quality for nearly all uses of cassava (Jennings and Hershey, 1985). A limiting characteristic for the human or animal consumption of cassava roots is their content of cyanogenic glucosides (Kakes, 1990). Cyanide is largely removed by the traditional processing methods of grating, fermenting and/or drying. Cultivars with less than 100 mg HCN per kg of fresh root are considered to be ‘sweet’. Several factors have limited the actual impact of this crop in tropical agriculture. On the biological side, cassava breeding is cumbersome and slow and little genetic variability has been found for key economic traits particularly for those determining starch quality. Cultural biases have also affected cassava. For several decades, public and private sector investment was biased favoring investments for research and development in cereals such as maize, rice, wheat and sorghum (Cock, 1985). In spite of the problems mentioned above, the globalization of the economies and new technological breakthroughs are offering a new opportunity for cassava, which was never available to the crop during the past. Tropical production of maize is facing increasing problems to compete with maize produced in temperate regions. This situation has prompted government and private sector of many tropical countries to turn to cassava as a competitive alternative to imported maize. In addition, advances in molecular biology, genetic engineering, plant-tissue culture protocols and starch technologies provide important tools that will allow bridging the main gaps between cassava and the cereals. Two major constraints are to be solved in relation to the objectives of this output. Genetic improvement of cassava Genetic improvement of cassava has not been as consistent and efficient as in other crops and has some constraints. As in every crop improvement project, elite cassava clones are crossed to produce new segregating families. Each individual produced, as well as the parental clones used, is highly heterozygous. Once a superior genotype is identified (a process that requires no less than six years), it is vegetatively multiplied to take advantage of the reproductive habits of this crop (Kawano et al., 1998; Jennings and Iglesias, 2002). This
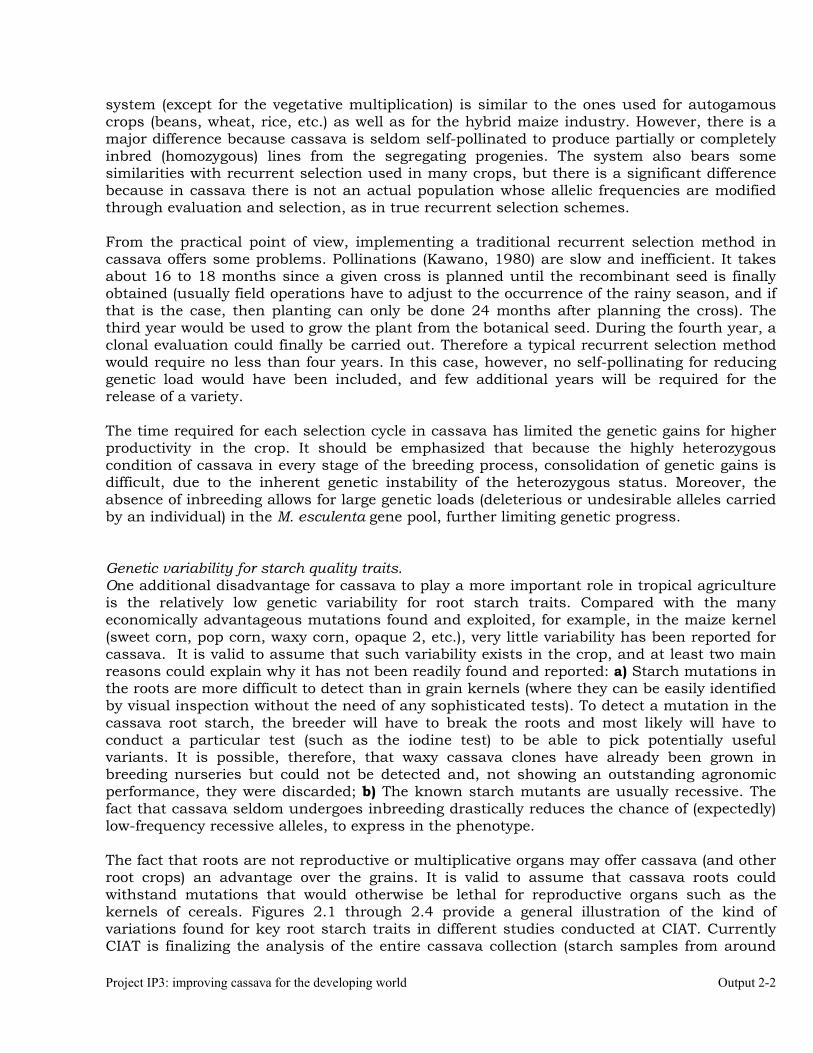
Project IP3: improving cassava for the developing world Output 2-2
system (except for the vegetative multiplication) is similar to the ones used for autogamous crops (beans, wheat, rice, etc.) as well as for the hybrid maize industry. However, there is a major difference because cassava is seldom self-pollinated to produce partially or completely inbred (homozygous) lines from the segregating progenies. The system also bears some similarities with recurrent selection used in many crops, but there is a significant difference because in cassava there is not an actual population whose allelic frequencies are modified through evaluation and selection, as in true recurrent selection schemes. From the practical point of view, implementing a traditional recurrent selection method in cassava offers some problems. Pollinations (Kawano, 1980) are slow and inefficient. It takes about 16 to 18 months since a given cross is planned until the recombinant seed is finally obtained (usually field operations have to adjust to the occurrence of the rainy season, and if that is the case, then planting can only be done 24 months after planning the cross). The third year would be used to grow the plant from the botanical seed. During the fourth year, a clonal evaluation could finally be carried out. Therefore a typical recurrent selection method would require no less than four years. In this case, however, no self-pollinating for reducing genetic load would have been included, and few additional years will be required for the release of a variety. The time required for each selection cycle in cassava has limited the genetic gains for higher productivity in the crop. It should be emphasized that because the highly heterozygous condition of cassava in every stage of the breeding process, consolidation of genetic gains is difficult, due to the inherent genetic instability of the heterozygous status. Moreover, the absence of inbreeding allows for large genetic loads (deleterious or undesirable alleles carried by an individual) in the M. esculenta gene pool, further limiting genetic progress. Genetic variability for starch quality traits. One additional disadvantage for cassava to play a more important role in tropical agriculture is the relatively low genetic variability for root starch traits. Compared with the many economically advantageous mutations found and exploited, for example, in the maize kernel (sweet corn, pop corn, waxy corn, opaque 2, etc.), very little variability has been reported for cassava. It is valid to assume that such variability exists in the crop, and at least two main reasons could explain why it has not been readily found and reported: a) Starch mutations in the roots are more difficult to detect than in grain kernels (where they can be easily identified by visual inspection without the need of any sophisticated tests). To detect a mutation in the cassava root starch, the breeder will have to break the roots and most likely will have to conduct a particular test (such as the iodine test) to be able to pick potentially useful variants. It is possible, therefore, that waxy cassava clones have already been grown in breeding nurseries but could not be detected and, not showing an outstanding agronomic performance, they were discarded; b) The known starch mutants are usually recessive. The fact that cassava seldom undergoes inbreeding drastically reduces the chance of (expectedly) low-frequency recessive alleles, to express in the phenotype. The fact that roots are not reproductive or multiplicative organs may offer cassava (and other root crops) an advantage over the grains. It is valid to assume that cassava roots could withstand mutations that would otherwise be lethal for reproductive organs such as the kernels of cereals. Figures 2.1 through 2.4 provide a general illustration of the kind of variations found for key root starch traits in different studies conducted at CIAT. Currently CIAT is finalizing the analysis of the entire cassava collection (starch samples from around
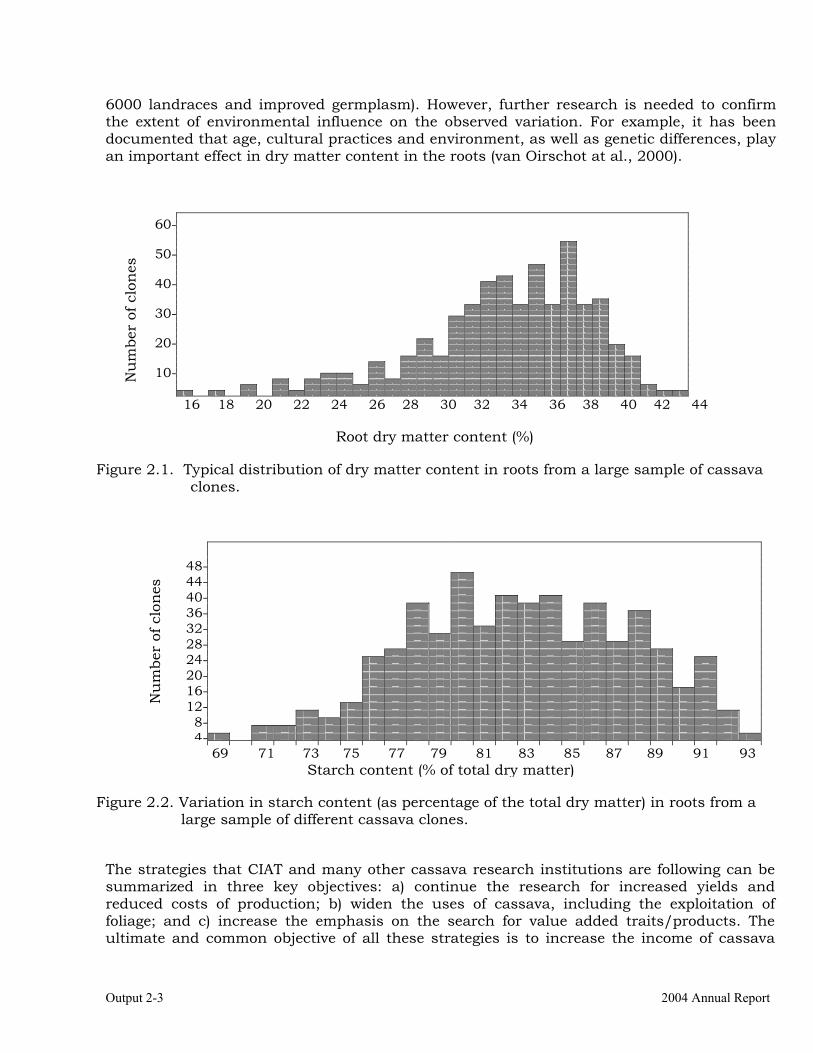
Output 2-3 2004 Annual Report
6000 landraces and improved germplasm). However, further research is needed to confirm the extent of environmental influence on the observed variation. For example, it has been documented that age, cultural practices and environment, as well as genetic differences, play an important effect in dry matter content in the roots (van Oirschot at al., 2000).
Nu
mbe
r of
clo
nes
60-
50-
40-
30-
20-
10-
16 18 20 22 24 26 28 30 32 34 36 38 40 42 44
Root dry matter content (%)
Figure 2.1. Typical distribution of dry matter content in roots from a large sample of cassava clones.
Nu
mbe
r of
clo
nes
48-44-40-36-32-28-24-20-16-12-8-4- 69 71 73 75 77 79 81 83 85 87 89 91 93
Starch content (% of total dry matter)
Figure 2.2. Variation in starch content (as percentage of the total dry matter) in roots from a large sample of different cassava clones.
The strategies that CIAT and many other cassava research institutions are following can be summarized in three key objectives: a) continue the research for increased yields and reduced costs of production; b) widen the uses of cassava, including the exploitation of foliage; and c) increase the emphasis on the search for value added traits/products. The ultimate and common objective of all these strategies is to increase the income of cassava
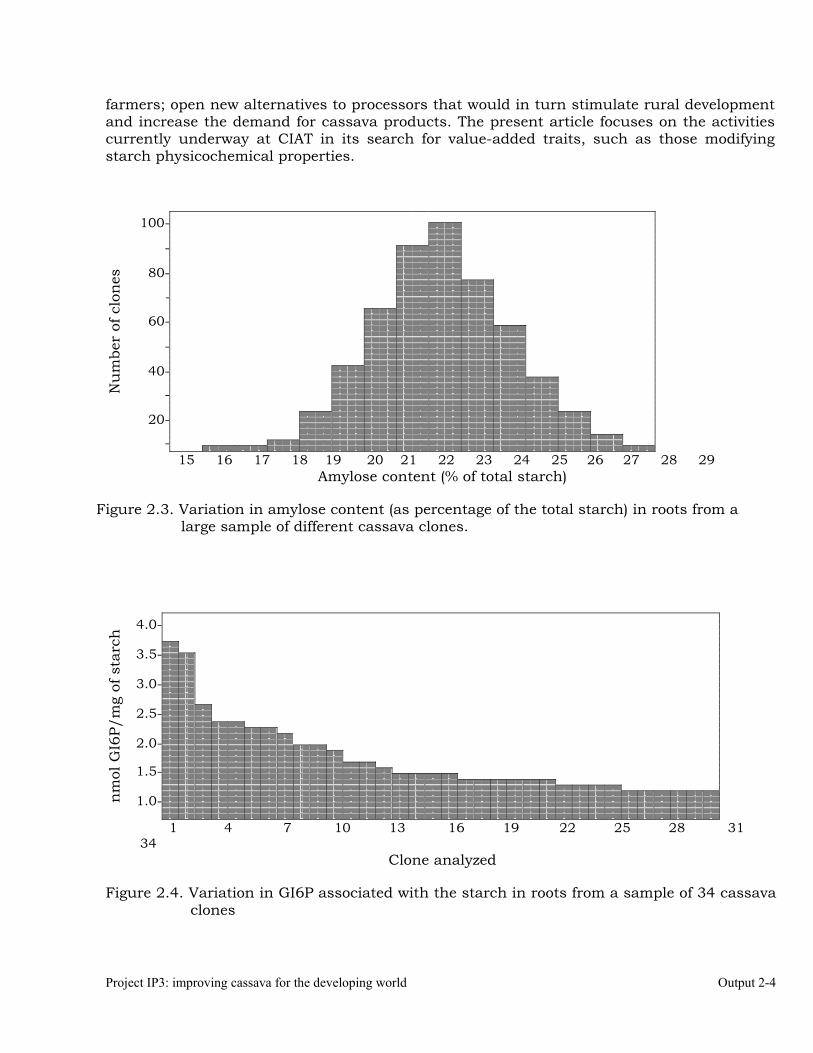
Project IP3: improving cassava for the developing world Output 2-4
farmers; open new alternatives to processors that would in turn stimulate rural development and increase the demand for cassava products. The present article focuses on the activities currently underway at CIAT in its search for value-added traits, such as those modifying starch physicochemical properties.
Nu
mbe
r of
clo
nes
100-
-
80-
-
60-
-
40-
-
20-
- 15 16 17 18 19 20 21 22 23 24 25 26 27 28 29
Amylose content (% of total starch)
Figure 2.3. Variation in amylose content (as percentage of the total starch) in roots from a large sample of different cassava clones.
nm
ol G
I6P/
mg
of s
tarc
h 4.0-
3.5-
3.0-
2.5-
2.0-
1.5-
1.0- 1 4 7 10 13 16 19 22 25 28 31
34 Clone analyzed
Figure 2.4. Variation in GI6P associated with the starch in roots from a sample of 34 cassava
clones
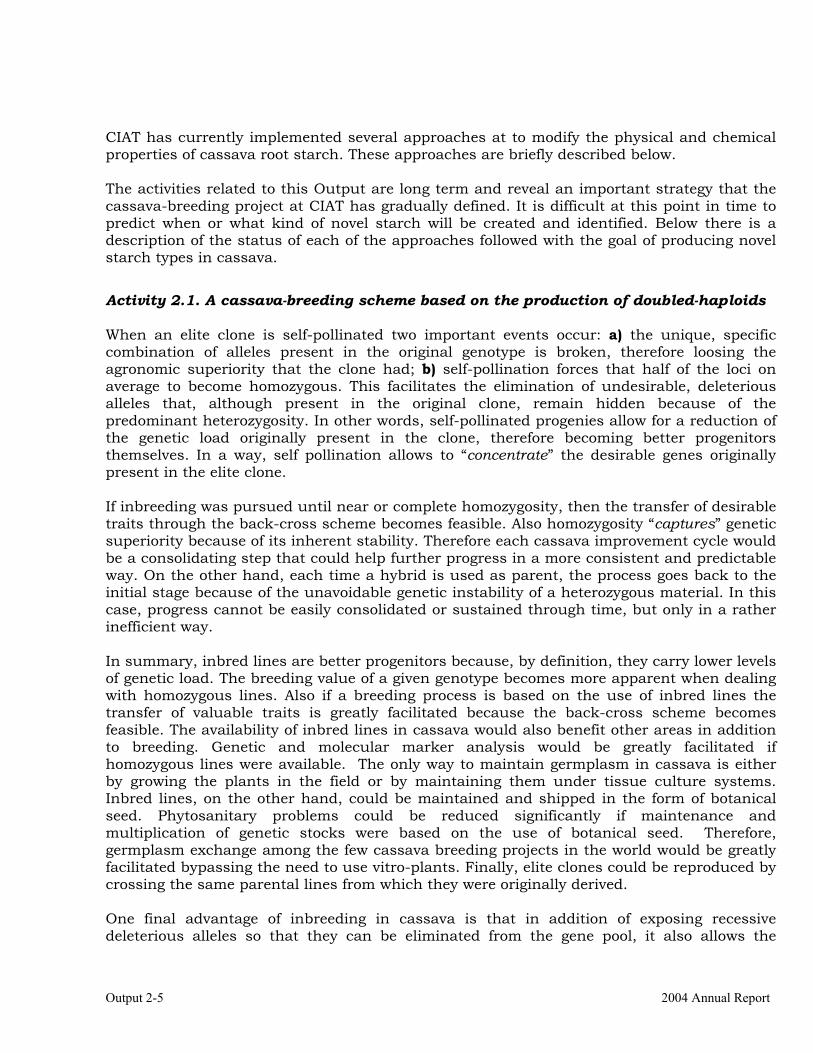
Output 2-5 2004 Annual Report
CIAT has currently implemented several approaches at to modify the physical and chemical properties of cassava root starch. These approaches are briefly described below. The activities related to this Output are long term and reveal an important strategy that the cassava-breeding project at CIAT has gradually defined. It is difficult at this point in time to predict when or what kind of novel starch will be created and identified. Below there is a description of the status of each of the approaches followed with the goal of producing novel starch types in cassava.
Activity 2.1. A cassava-breeding scheme based on the production of doubled-haploids When an elite clone is self-pollinated two important events occur: a) the unique, specific combination of alleles present in the original genotype is broken, therefore loosing the agronomic superiority that the clone had; b) self-pollination forces that half of the loci on average to become homozygous. This facilitates the elimination of undesirable, deleterious alleles that, although present in the original clone, remain hidden because of the predominant heterozygosity. In other words, self-pollinated progenies allow for a reduction of the genetic load originally present in the clone, therefore becoming better progenitors themselves. In a way, self pollination allows to “concentrate” the desirable genes originally present in the elite clone. If inbreeding was pursued until near or complete homozygosity, then the transfer of desirable traits through the back-cross scheme becomes feasible. Also homozygosity “captures” genetic superiority because of its inherent stability. Therefore each cassava improvement cycle would be a consolidating step that could help further progress in a more consistent and predictable way. On the other hand, each time a hybrid is used as parent, the process goes back to the initial stage because of the unavoidable genetic instability of a heterozygous material. In this case, progress cannot be easily consolidated or sustained through time, but only in a rather inefficient way. In summary, inbred lines are better progenitors because, by definition, they carry lower levels of genetic load. The breeding value of a given genotype becomes more apparent when dealing with homozygous lines. Also if a breeding process is based on the use of inbred lines the transfer of valuable traits is greatly facilitated because the back-cross scheme becomes feasible. The availability of inbred lines in cassava would also benefit other areas in addition to breeding. Genetic and molecular marker analysis would be greatly facilitated if homozygous lines were available. The only way to maintain germplasm in cassava is either by growing the plants in the field or by maintaining them under tissue culture systems. Inbred lines, on the other hand, could be maintained and shipped in the form of botanical seed. Phytosanitary problems could be reduced significantly if maintenance and multiplication of genetic stocks were based on the use of botanical seed. Therefore, germplasm exchange among the few cassava breeding projects in the world would be greatly facilitated bypassing the need to use vitro-plants. Finally, elite clones could be reproduced by crossing the same parental lines from which they were originally derived. One final advantage of inbreeding in cassava is that in addition of exposing recessive deleterious alleles so that they can be eliminated from the gene pool, it also allows the
Project IP3: improving cassava for the developing world Output 2-6
identification of useful recessive traits (such as the starch quality mutants found in different crops), which would lead to the development of value-added genetic stocks. There are, however, two major obstacles for the incorporation of inbreeding in cassava genetic improvement. Because of the large genetic load expected to be present in most cassava gene pools, inbreeding may lead to a rapid loss of vigor and, eventually, to non-viable plants. This is a common process known as inbreeding depression. Maize showed strong inbreeding depression and tolerance to it had to be gradually developed in maize adapted to temperate (early 1900s), and tropical (during the 1960s) regions. A similar approach will be used in cassava. Elite germplasm will be self-pollinated successively until vigor becomes too low. Then sister lines derived from the same elite clone will be crossed, generating several populations. Each population (or lineage) will be composed by the progenies derived from the same elite clone. By default, they will carry reduced genetic load and increased tolerance to inbreeding. A second problem still remains even if inbreeding depression was negligible. It would require about ten years to develop highly homozygous inbred lines through successive self-pollinations. This period is too long and would not allow cassava to sustain the genetic progress rate observed in other crops with which cassava competes. Therefore, an alternative and faster method for the production of homozygous lines needs to be developed. Tissue culture protocols for the production of doubled-haploid lines from anthers (occasionally from ovules) have been developed for many different crops and are routinely used for their genetic improvement. The production of doubled haploids in cassava provides an appealing option for a feasible introduction of inbreeding in cassava genetic improvement. This technology does not involve the use of transgenesis. CIAT, with the valuable support of UNDP and Rockefeller Foundation, and in collaboration with several cassava breeding programs (including Thailand) began in 2004 a research project to simultaneously improve tolerance to inbreeding in elite cassava germplasm. Jointly with Wageningen University from The Netherlands, CIAT is also coordinating a project to develop the anther culture protocol for the production of doubled haploids. As soon as partially inbred lines are produced the search of novel starch types will immediately began. The elite germplasm that is included in the crossing nurseries every year has been self-pollinated as well as used for the production of new hybrids. During the past year a total of 2793 botanical seed (615 S1s and 2178 S2s) were germinated. Eventually only 1995 seedlings derived from these botanical seeds were vigorous enough to be transplanted in the field (348 S1s and 1647 S2s) where they will be used for yet another round of self-pollinations to increase even further the level of inbreeding and also as source of stakes. Each partially inbred produced will be clonally kept for further phenotypic, genetic and/or molecular studies. During the past year, therefore, a heavy emphasis was invested in the production partially inbred cassava germplasm. A total of 8436 self-pollinations were made to produce S1 botanical seed (50% average homozygosity); 3645 self-pollinations to produce S2 seed (75% average homozygosity) and 391 self-pollinations to produce S3 seed (87.3% average homozygosity). As soon as the starch quality laboratory reaches its capacity to process the thousands of genotypes developed, the starch derived from them will be carefully screened in search of useful mutants.
Output 2-7 2004 Annual Report
Activity 2.2 Mutagenesis and the “TILLING” system. There are few alternative approaches when no immediate genetic variability is available for the breeders to develop a desired product. Obviously the first approach is to identify a genetic source for the desired trait within the same gene pool (for instance M. esculenta). If this approach is unsuccessful, breeders have frequently sought for the desired trait in the gene pool of related wild relatives. For instance some of the sources of resistance to the African Cassava Mosaic Disease seem to have originated in crosses between M. esculenta and M. glaziovii. This approach has the disadvantage that along with the desired trait, many undesirable ones are also introduced from the wild relative species. Many years of additional work are usually required to eliminate undesirable genes while maintaining the useful trait. Another traditional approach used by many breeders (particularly in the decades of the 1950s and 1960s) was the induction of genetic variability through the use of mutagenic agents (chemical products such as EMS or irradiation such as gamma rays). Mutation breeding has few drawbacks. Events are totally random, so thousand of genotypes need to be evaluated until a useful mutation in the desired gene can be found. Furthermore, since mutations typically take place at individual cells, a large frequency of chimeras is very common. Chimeras will lead to drastic changes in the following generations, until the desired mutant can be stabilized. Finally, the common recessive nature of the mutations made it difficult to identify them through the phenotypes. With the advent of molecular biology tools, an interesting system was developed to renew the interest in mutation breeding. DNA TILLING (for Targeted Induced Local Lesions in Genome) has been successfully used in different plant species (McCallum et al. 2000; Perry et al. 2003; Till et al. 2003). Sexual seeds are mutagenized and, to avoid ambiguities caused by chimeras in the first generation (M1), plants are self-pollinated and the resulting M2 plants evaluated. DNA is extracted from each M2 plant. For screening, DNAs are pooled eightfold to maximize the efficiency of mutation detection. PCR is performed using 5’- end labeled gene-specific primers to target the desired locus, and heteroduplexes are formed by heating and cooling the PCR products. CEL I nuclease is used to cleave at base mismatches, and products representing induced mutations are visualized with denaturing polyacrylamide gel electrophoresis (description of the TILLING method adapted from Till et al., 2003). CIAT is participating in a project lead by Universidad Nacional de Colombia, which is supported by the IAEA (International Atomic Energy Agency). About 4000 seeds from six different cassava clones were irradiated at IAEA facilities at Seibersdorf, Austria. Half the seeds were irradiated with gamma rays (using a Cobalt 60 source with a dosage level of 200 Gy) and the remaining half, with fast neutrons. Seeds were germinated and transplanted to the field early in 2004 (Table 2.1). By years end the plants will have been carefully evaluated in search of promising mutant forms (although it is recognized that the occurrence of chimeras and the lack of expression of recessive mutations will certainly reduce the probabilities of finding such mutants at the M1 stage). Also, as soon as plants start to produce viable flowers they will be self-pollinated as indicated in Table 2.1. In the meantime the granule bound starch synthase GBSS I (Curtis Hannah, 2000) will be analyzed and key sequence(s) PCR-amplified for their use in the TILLING system.
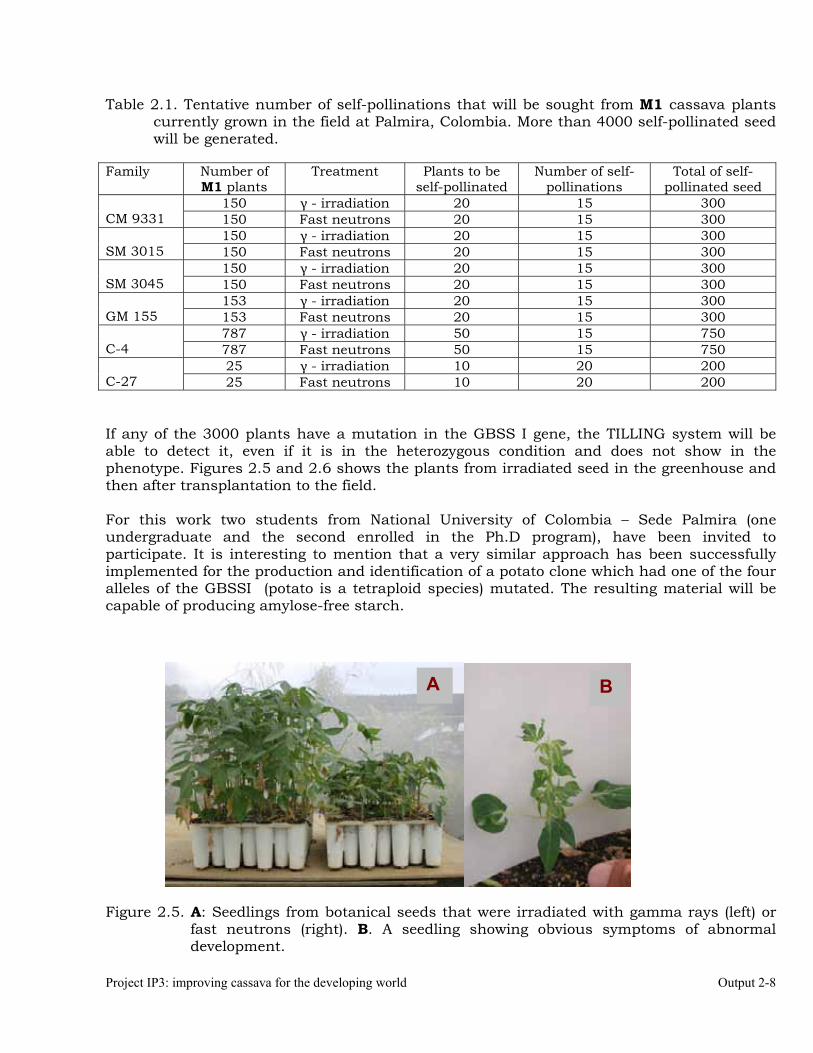
Project IP3: improving cassava for the developing world Output 2-8
Table 2.1. Tentative number of self-pollinations that will be sought from M1 cassava plants currently grown in the field at Palmira, Colombia. More than 4000 self-pollinated seed will be generated.
Family Number of
M1 plants Treatment Plants to be
self-pollinated Number of self-
pollinations Total of self-
pollinated seed 150 γ - irradiation 20 15 300
CM 9331 150 Fast neutrons 20 15 300 150 γ - irradiation 20 15 300
SM 3015 150 Fast neutrons 20 15 300 150 γ - irradiation 20 15 300
SM 3045 150 Fast neutrons 20 15 300 153 γ - irradiation 20 15 300
GM 155 153 Fast neutrons 20 15 300 787 γ - irradiation 50 15 750
C-4 787 Fast neutrons 50 15 750 25 γ - irradiation 10 20 200
C-27 25 Fast neutrons 10 20 200 If any of the 3000 plants have a mutation in the GBSS I gene, the TILLING system will be able to detect it, even if it is in the heterozygous condition and does not show in the phenotype. Figures 2.5 and 2.6 shows the plants from irradiated seed in the greenhouse and then after transplantation to the field. For this work two students from National University of Colombia – Sede Palmira (one undergraduate and the second enrolled in the Ph.D program), have been invited to participate. It is interesting to mention that a very similar approach has been successfully implemented for the production and identification of a potato clone which had one of the four alleles of the GBSSI (potato is a tetraploid species) mutated. The resulting material will be capable of producing amylose-free starch.
Figure 2.5. A: Seedlings from botanical seeds that were irradiated with gamma rays (left) or
fast neutrons (right). B. A seedling showing obvious symptoms of abnormal development.
A B
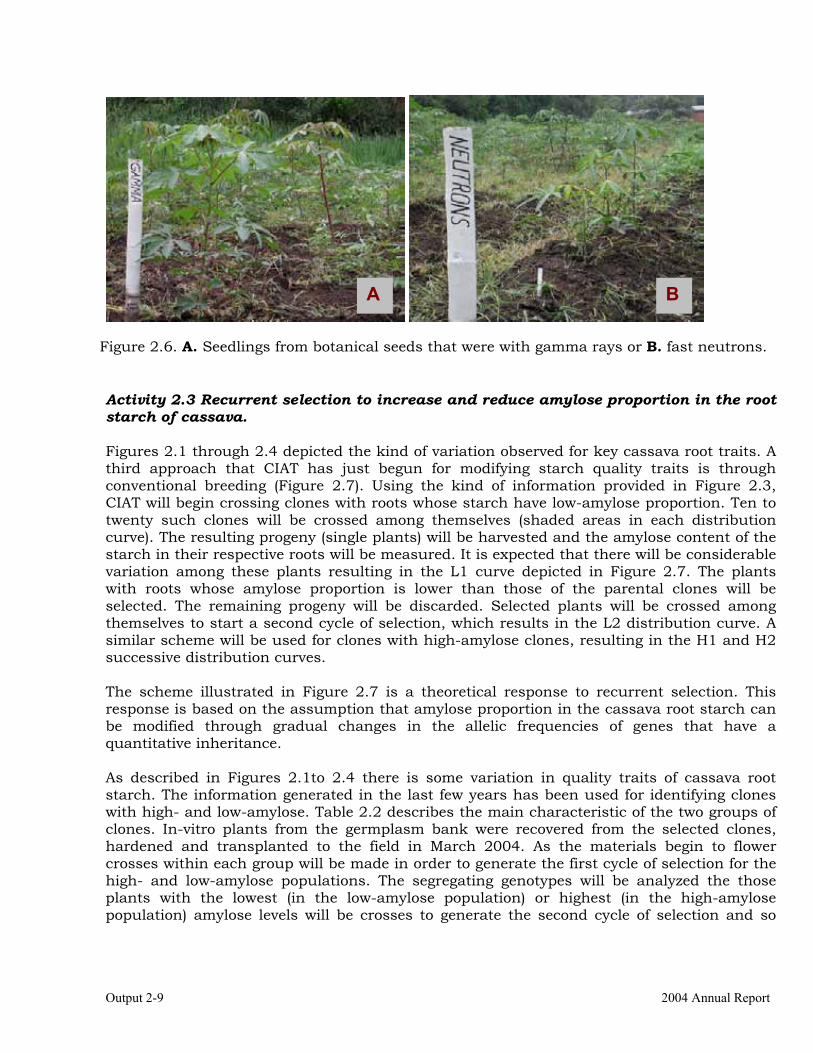
Output 2-9 2004 Annual Report
Figure 2.6. A. Seedlings from botanical seeds that were with gamma rays or B. fast neutrons. Activity 2.3 Recurrent selection to increase and reduce amylose proportion in the root starch of cassava. Figures 2.1 through 2.4 depicted the kind of variation observed for key cassava root traits. A third approach that CIAT has just begun for modifying starch quality traits is through conventional breeding (Figure 2.7). Using the kind of information provided in Figure 2.3, CIAT will begin crossing clones with roots whose starch have low-amylose proportion. Ten to twenty such clones will be crossed among themselves (shaded areas in each distribution curve). The resulting progeny (single plants) will be harvested and the amylose content of the starch in their respective roots will be measured. It is expected that there will be considerable variation among these plants resulting in the L1 curve depicted in Figure 2.7. The plants with roots whose amylose proportion is lower than those of the parental clones will be selected. The remaining progeny will be discarded. Selected plants will be crossed among themselves to start a second cycle of selection, which results in the L2 distribution curve. A similar scheme will be used for clones with high-amylose clones, resulting in the H1 and H2 successive distribution curves. The scheme illustrated in Figure 2.7 is a theoretical response to recurrent selection. This response is based on the assumption that amylose proportion in the cassava root starch can be modified through gradual changes in the allelic frequencies of genes that have a quantitative inheritance. As described in Figures 2.1to 2.4 there is some variation in quality traits of cassava root starch. The information generated in the last few years has been used for identifying clones with high- and low-amylose. Table 2.2 describes the main characteristic of the two groups of clones. In-vitro plants from the germplasm bank were recovered from the selected clones, hardened and transplanted to the field in March 2004. As the materials begin to flower crosses within each group will be made in order to generate the first cycle of selection for the high- and low-amylose populations. The segregating genotypes will be analyzed the those plants with the lowest (in the low-amylose population) or highest (in the high-amylose population) amylose levels will be crosses to generate the second cycle of selection and so
A B

Project IP3: improving cassava for the developing world Output 2-10
forth. Eventually, some crosses between high- and low-amylose genotypes will be made to conduct genetic studies on the inheritance of this trait.
Nu
mbe
r of
clo
nes
-
-
-
-
-
-
-
-
-
- 0 4 8 12 16 20 24 28 32 36 40 44
Amylose content (% of total starch) Figure 2.7. Variation in amylose content (as percentage of the total starch) in roots as a
result of a divergent recurrent selection scheme. C0: Original cycle; L1 and L2: two consecutive cycles for lower amylose content; H1 and H2: two consecutive cycles for higher amylose content.
In addition to the crosses and selection process described above stability and genetic studies will be conducted to determine how much of the phenotypic observations that originated the selection of clones described in Table 2.2 is genetic and how much is environmental. Table 2.2. Description of cassava clones planted to make crosses aiming at a divergent
recurrent selection for high- and low-amylose content in the root starch Parameter Low-amylose High-amylose
Average 11.17 22.74
St.Deviation 0.58 2.07
Minimum 9.66 21.82
Maximum 12.10 26.39
Number of clones 29 35
C0
L1 L2 H1 H2
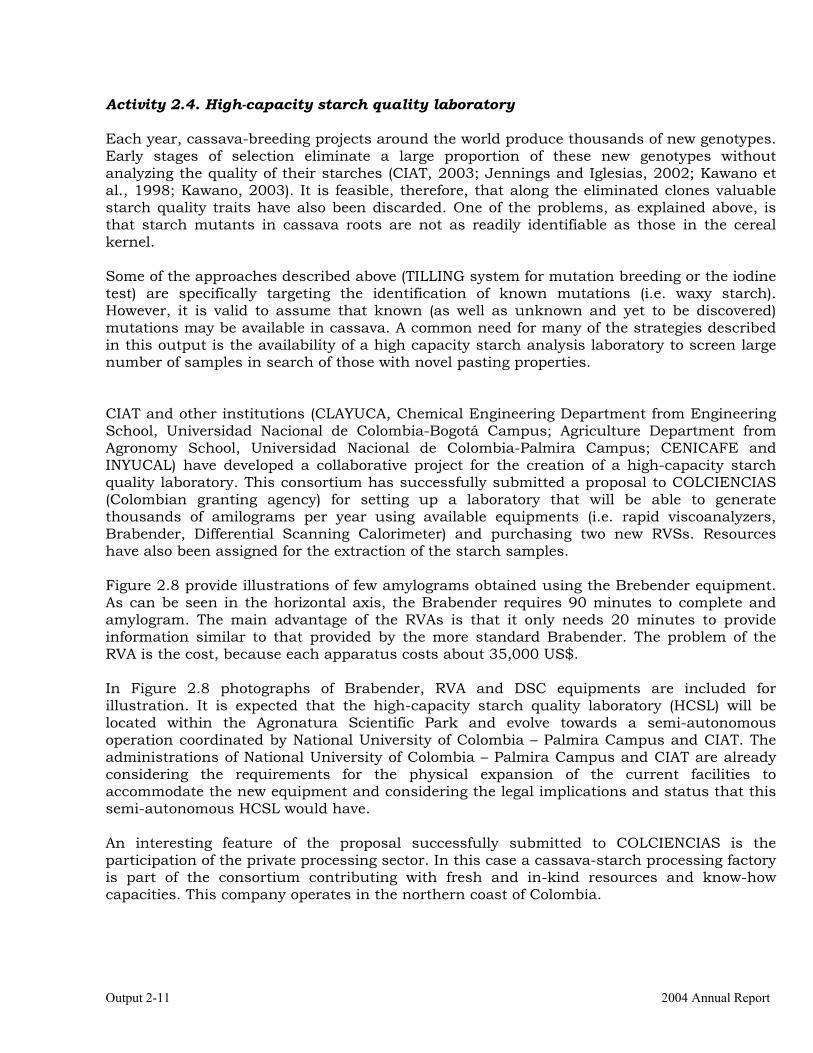
Output 2-11 2004 Annual Report
Activity 2.4. High-capacity starch quality laboratory Each year, cassava-breeding projects around the world produce thousands of new genotypes. Early stages of selection eliminate a large proportion of these new genotypes without analyzing the quality of their starches (CIAT, 2003; Jennings and Iglesias, 2002; Kawano et al., 1998; Kawano, 2003). It is feasible, therefore, that along the eliminated clones valuable starch quality traits have also been discarded. One of the problems, as explained above, is that starch mutants in cassava roots are not as readily identifiable as those in the cereal kernel. Some of the approaches described above (TILLING system for mutation breeding or the iodine test) are specifically targeting the identification of known mutations (i.e. waxy starch). However, it is valid to assume that known (as well as unknown and yet to be discovered) mutations may be available in cassava. A common need for many of the strategies described in this output is the availability of a high capacity starch analysis laboratory to screen large number of samples in search of those with novel pasting properties. CIAT and other institutions (CLAYUCA, Chemical Engineering Department from Engineering School, Universidad Nacional de Colombia-Bogotá Campus; Agriculture Department from Agronomy School, Universidad Nacional de Colombia-Palmira Campus; CENICAFE and INYUCAL) have developed a collaborative project for the creation of a high-capacity starch quality laboratory. This consortium has successfully submitted a proposal to COLCIENCIAS (Colombian granting agency) for setting up a laboratory that will be able to generate thousands of amilograms per year using available equipments (i.e. rapid viscoanalyzers, Brabender, Differential Scanning Calorimeter) and purchasing two new RVSs. Resources have also been assigned for the extraction of the starch samples. Figure 2.8 provide illustrations of few amylograms obtained using the Brebender equipment. As can be seen in the horizontal axis, the Brabender requires 90 minutes to complete and amylogram. The main advantage of the RVAs is that it only needs 20 minutes to provide information similar to that provided by the more standard Brabender. The problem of the RVA is the cost, because each apparatus costs about 35,000 US$. In Figure 2.8 photographs of Brabender, RVA and DSC equipments are included for illustration. It is expected that the high-capacity starch quality laboratory (HCSL) will be located within the Agronatura Scientific Park and evolve towards a semi-autonomous operation coordinated by National University of Colombia – Palmira Campus and CIAT. The administrations of National University of Colombia – Palmira Campus and CIAT are already considering the requirements for the physical expansion of the current facilities to accommodate the new equipment and considering the legal implications and status that this semi-autonomous HCSL would have. An interesting feature of the proposal successfully submitted to COLCIENCIAS is the participation of the private processing sector. In this case a cassava-starch processing factory is part of the consortium contributing with fresh and in-kind resources and know-how capacities. This company operates in the northern coast of Colombia.
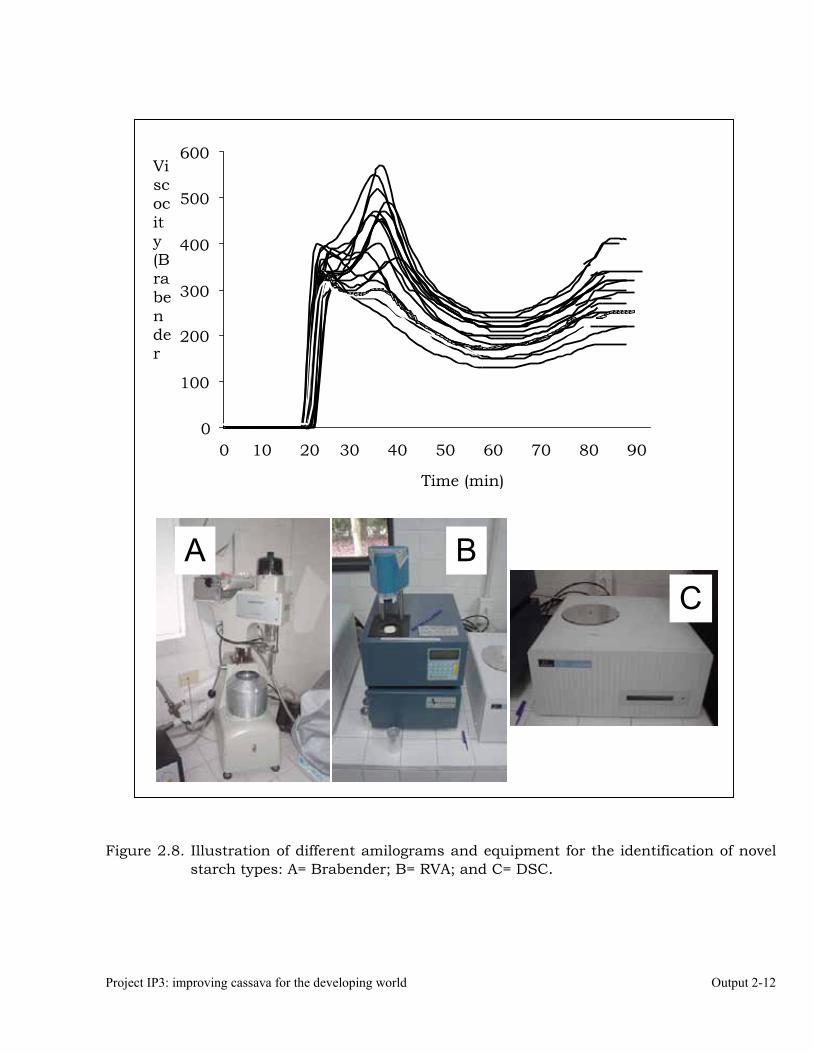
Project IP3: improving cassava for the developing world Output 2-12
Figure 2.8. Illustration of different amilograms and equipment for the identification of novel starch types: A= Brabender; B= RVA; and C= DSC.
Viscocity (Brabender
Time (min)
0
100
200
300
400
500
600
0 10 20 30 40 50 60 70 80 90
A BC
Output 2-13 2004 Annual Report
Conslusions Cassava is an important crop for the agriculture of many tropical and subtropical countries. It remains one of the most relevant commodities for subsistence farming as food security, and it is acquiring an increasing role in rural development as raw material for many processing pathways. Starch production from cassava roots is clearly one of the most important examples of industrial uses in cassava, particularly in Asia (Chutharatkul, 2002). To maintain this trend and make cassava even more competitive several approaches have to be taken simultaneously: increased yields and reduced costs of production; widened uses of cassava (i.e. exploitation of foliage); and increased emphasis on the search for value added traits/products. The justification for this strategy can be found in the maize productive chain. Maize is a commodity directly competing with cassava in many areas, including starch. Corn, for example offers the case of “waxy maize”, a mutation that inhibits the synthesis of amylose. Therefore waxy starch is only made up of amylopectin. Farmers growing waxy maize receive a 30% additional return for their efforts. This is a very appealing situation because the modification to degrade amylose or separate it from amylopectin is not made in a factory by chemical and/or physical means but in the plant using the metabolism of a useful genetic mutation. The environment, therefore, benefits because there is a reduced impact in the modification of native starches on one hand, and the farmer benefit from a considerably higher return. Similar benefits are expected to happen from the novel starch types that this activity aims at creating and identifying.

Project IP3: improving cassava for the developing world Output 2-14
References Allen C., A. 1994. the origin of Manihot esculenta Crantz (Euphorbiaceae). Genetic Resources and Crop
Evolution 41:133-150. CIAT, 2003. Improved cassava for the developing world. Annual Report, 2003. Chutharatkul, C. 2002. The new outlook for cassava in Thailand. 7th Casssava Regional Workshop.
Bangkok, Thailand, October 2002. Curtis Hannah, L. 2000. Starch biosynthesis and genetic potential. In: C.F. Murphy and D. M.
Peterson (eds.) Designing crops for added value. American Society of Agronomy. Madison, WI, USA.
Iglesias, C., Mayer J., Chávez A.L., Calle, F., 1997. Genetic potential and stability of carotene content in cassava roots. Euphytica 94:367-373.
Jennings, D.L. C.H. Hershey, C.H., 1985. Cassava breeding: a decade of progress from international programs. In: G.E. Russell (Ed.). Progress in Plant Breeding. Butterworths. London, Boston. pp 89-116.
Jennings D.LO. and C. Iglesias. 2002. Breeding fro crop improvement. In: R.J. Hillocks, J.M. Tresh and A.C. Bellotti (Eds.) Cassava: biology, production and utilization. CABI Publishing Oxon, UK and New York, USA. Pp 40-54.
Kawano, K. 1980. Cassava. In: Fehr W.R. and Hadley H.H. (eds) Hybridization of Crop Plants. ASA, CSSA. Madison, Wisconsin, pp 225-233.
Kawano, K. Narintaraporn K., Narintaraporn P., Sarakarn S., Limsila A., Limsila J., Suparhan D., Watananonta W., 1998. Yield improvement in a multistage breeding program for cassava. Crop Sci. 38:325-332.
Kawano, K. 2003. Thirty years of cassava breeding for productivity- biological and social factors for success. Crop Sci. 43:1325-1335.
Kakes. P. 1990.Properties and functions of the cyanogenic sustem in higher plants. Euphytica 48:25-43.
McCallum, C. M., Comai, L., Greene, E.A., and Henikoff, S. 2000. Targeting induced local lesions in genomes (TILLLING) for plant functional genomics. Plant Physiology, 123: 439–442.
Olsen, K.M., Schaal, B.A., 2001. Microsatellite variation in cassava (Manihot esculenta, Euphorbiaceae) and its wild relatives: further evidence for a southern Amanzonian origin of domestication. American Journal of Botany 88:131-142.
Perry, J.A., Wang, T.L., Welham, T.J., Gardner, S., Pike, J.M., Yoshida, S., and Parniske, M. 2003. A TILLING reverse genetics tool and a web-cccessible collection of mutants of the legume Lotus japonicus. Plant Physiol. Vol.131.
Till, B.J., Reynolds, S.H., Greene, E.A., Codomo, C. A., Enns, L.C, Johnson, J.E., Burtner, C., Odden, A.R., Young, K., Taylor, N.E., Henikoff, J.G., Comai, L., and Henikoff, S. 2003. Large-scale discovery of induced point mutations with high-throughput TILLING. Genome Research 13:524–530.
van Oirschot, Q. E. A., O’Brien G.M., Dufour D., El-Sharkawy M.A. and Mesa E., 2000. The effect of pre-harvest pruning of cassava upon root deterioration and quality characteristics. J. Sci. Food Agric. 80:1866-1873.
Output 3-1 2004 Annual Report
OUTPUT 3 Development of new genetic stocks and improved gene pools for their evaluation in
key target environments. The overall objective of this output is to produce genetically improved cassava germplasm, by recombining selected parental genotypes and then evaluating the segregating progenies under adequate environmental conditions. Recombinant seed and/or vegetative propagules from elite clones are then shipped to our collaborators in Africa, Asia and Latin America. The activities described below may not follow the exact order used to describe them in the respective work plan. This change has been made for being more logical and, hopefully, to make it easier to understand the description of the research carried out. In addition to germplasm we are also producing knowledge and developing technologies that will make the breeding process more efficient. Activity 3.1 Selection of progenitors based on previous cycle results and information from other outputs (i.e., resistance/tolerance, root quality traits, etc.). Rationale The selection of parents to build populations for future breeding work represents the core of our improvement efforts, since it will be the source of the genetic progress we will achieve in the future. There are two types of populations developed: open pollinated and controlled crosses. We generally employ open pollination (polycrosses) to develop populations for target ecosystems. We have consistently developed polycrosses for the sub-humid tropics, acid soil savannas, semi-arid tropics, mid-altitude and highland tropics, and sub-tropics. In the case of controlled crosses, yhey are to develop progenies for specific traits, special studies or the combination of elite experimental material with local landraces that need to be improved, but they can also be used for adaptation to target ecosystems as well. Specific Objectives a) To identify, a set of elite clones, based on information from evaluation trials at several
locations, and new objectives defined for the project. These clones are recombined to start a new cycle of selection.
b) To include as progenitor, for each agro-ecological zone, at least one genotype with high-carotene, yellow roots
c) To base the selection of parental lines increasingly on information from the performance of their progenies (≈ general combining ability or breeding value).
Materials and Methods Only genotypes that have been selected over 2 consecutive years in Advanced Yield Trials are selected to participate as parents for the following generation. Among those genotypes, clones with outstanding performance for the most important agronomic traits are selected. After the analysis of results is conducted with data across two years, those genotypes exceeding at least one standard deviation from the overall mean are considered as parents for the next generation. Sometimes, landraces or already released cultivars that can contribute special features to the progenies generated are also included. Lately, thanks to the modifications introduced to the evaluation process selection of parents is greatly affected by data of the progenies they produce (≈ general combining ability). It is envisioned that about 15-20% of the parental lines will be changed, eliminating those with poor general combining ability and introducing new clones that have had outstanding performance per se in
Project IP3: improving cassava for the developing world Output 3-2
Advanced Yield Trials to assess their breeding value. The information provided by pathologists, entomologists and quality specialists in relation to sources of resistance or special traits is used to select genotypes for controlled crosses. These controlled crosses are developed upon specific requests from National Programs that want their main landrace, or released varieties, crossed to genotypes with specific traits; or requests from CIAT scientists that want to pyramid genes, or develop segregating progenies for gene tagging. As will be described below, one of the major changes introduced in the cassava breeding scheme at CIAT has been to take and record data on all progenies starting at the first evaluation stage (Clonal Evaluation Trials). The kind of information obtained allows a gross estimation of general combining ability (simply defined, it is the capacity of an individual to produce a good progeny) of parental lines employed in generating the clones included in those trials. This information is increasingly influencing the decisions of materials that will continue to be used as parents and those that will not. Significant changes were introduced during the 2002-2003 growing season by blocking the Clonal Evaluation Trials to reduce the large effects that the environmental variation within these large trials had on the average performance of each family. Basically this chages follow the ideas described by Gardner in 1961 for stratified phenotypic mass selection. Results The parents selected for the development of gene pools targeted to specific ecosystems is presented in Table 3.1. The agronomic performance of these materials is described further down in this document. Seed will be harvested from July, 2005 through December, 2005. F1 plants will grow until the planting of the trials early in 2006. A major decision to take in the genetic improvement of crops is how to choose materials for use as parents that will produce new varieties with increased production potential and adequate adaptation to the environmental conditions under which they will be cultivated. The principal criterion for selecting parents to date has been their performance per se. Unfortunately, however, good clones do not necessarily give rise to good progeny, hence the need to precisely estimate the traits that the progeny of each individual will produce. Until now, data was recorded starting at the Preliminary Yield Trials, which meant that no balanced information was available on all progeny produced by a given individual, but only on those that had passed the first stages of selection. The new modality implies taking data for all and each clone evaluated, whether or not it will be eventually selected. This permits the development of a solid database for selecting parents in terms of the progeny they produce (which, from the genetic viewpoint, is what really matters) and not merely based on their innate traits, as was done in the past. During this year, the genotypes listed in Table 3.1 were selected to produce a new generation of crosses. These materials had stood out for their excellent performance per se, and for demonstrating good levels of general combining ability in relation to the results observed in the respective Clonal Evaluation Trials. The agronomic performance of some of these materials per se is also described below. At the bottom of the table parental lines for special purpose crosses have also been listed. The seed produced from the current crossings will be harvested until December 2005.
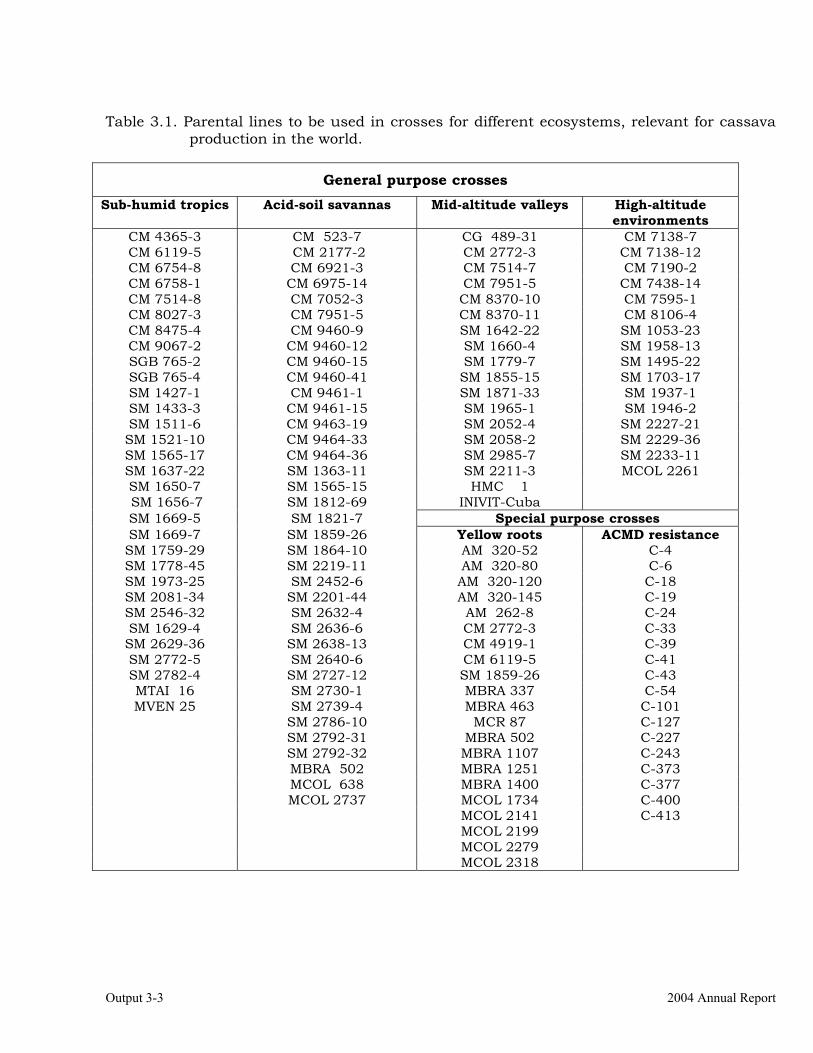
Output 3-3 2004 Annual Report
Table 3.1. Parental lines to be used in crosses for different ecosystems, relevant for cassava
production in the world.
General purpose crosses Sub-humid tropics Acid-soil savannas Mid-altitude valleys High-altitude
environments CM 4365-3 CM 523-7 CG 489-31 CM 7138-7 CM 6119-5 CM 2177-2 CM 2772-3 CM 7138-12 CM 6754-8 CM 6921-3 CM 7514-7 CM 7190-2 CM 6758-1 CM 6975-14 CM 7951-5 CM 7438-14 CM 7514-8 CM 7052-3 CM 8370-10 CM 7595-1 CM 8027-3 CM 7951-5 CM 8370-11 CM 8106-4 CM 8475-4 CM 9460-9 SM 1642-22 SM 1053-23 CM 9067-2 CM 9460-12 SM 1660-4 SM 1958-13 SGB 765-2 CM 9460-15 SM 1779-7 SM 1495-22 SGB 765-4 CM 9460-41 SM 1855-15 SM 1703-17 SM 1427-1 CM 9461-1 SM 1871-33 SM 1937-1 SM 1433-3 CM 9461-15 SM 1965-1 SM 1946-2 SM 1511-6 CM 9463-19 SM 2052-4 SM 2227-21 SM 1521-10 CM 9464-33 SM 2058-2 SM 2229-36 SM 1565-17 CM 9464-36 SM 2985-7 SM 2233-11 SM 1637-22 SM 1363-11 SM 2211-3 MCOL 2261 SM 1650-7 SM 1565-15 HMC 1 SM 1656-7 SM 1812-69 INIVIT-Cuba SM 1669-5 SM 1821-7 Special purpose crosses SM 1669-7 SM 1859-26 Yellow roots ACMD resistance SM 1759-29 SM 1864-10 AM 320-52 C-4 SM 1778-45 SM 2219-11 AM 320-80 C-6 SM 1973-25 SM 2452-6 AM 320-120 C-18 SM 2081-34 SM 2201-44 AM 320-145 C-19 SM 2546-32 SM 2632-4 AM 262-8 C-24 SM 1629-4 SM 2636-6 CM 2772-3 C-33 SM 2629-36 SM 2638-13 CM 4919-1 C-39 SM 2772-5 SM 2640-6 CM 6119-5 C-41 SM 2782-4 SM 2727-12 SM 1859-26 C-43 MTAI 16 SM 2730-1 MBRA 337 C-54 MVEN 25 SM 2739-4 MBRA 463 C-101
SM 2786-10 MCR 87 C-127 SM 2792-31 MBRA 502 C-227 SM 2792-32 MBRA 1107 C-243 MBRA 502 MBRA 1251 C-373 MCOL 638 MBRA 1400 C-377 MCOL 2737 MCOL 1734 C-400 MCOL 2141 C-413 MCOL 2199 MCOL 2279 MCOL 2318
Project IP3: improving cassava for the developing world Output 3-4
Planting materials were also selected from these parents to seed the F1 in July 2004. In addition to crossing, these lines were also self-pollinated to begin an S2 recurrent selection scheme to improve each of them for tolerance to inbreeding. The justification for this approach is given later when the description of a cassava-breeding scheme based on the production of doubled-haploids described in Output 2. Because project activities expanded to areas where CIAT had not previously worked intensely (e.g., Middle Magdalena River and Tolima/Huila Departments, in Colombia), hybridizations for these areas will, this year, be conducted as follows: (1) polycrosses and crosses for the two most important cassava-producing regions (Sub-humid and Acid Soil Savannas). Similar needs exist for inter-Andean valleys that can be fulfilled by materials for the Acid Soil Savannas. (2) For new regions, for which the project had not developed specifically adapted materials, production of interregional crosses, combining the best five materials of the North Coast with clones adapted to the Acid Soil Savannas and vice versa. These progenies are also expected to produce germplasm with broad adaptation. For environments affected by white flies a source carrying resistance to whitefly (MECU 72) has been included. This pest has become the one true constraint to cassava cultivation in that region of Colombia. For the high-altitude tropics, crosses will be carried out within a group of clones recently identified as excellent based on their cooking quality and good acceptability to farmers. Activity 3.2 Establishment of crossing blocks and production of recombinant seed from previously established blocks. Rationale Populations developed for specific ecosystems represent the basis for our cooperation with National Programs and IITA (International Institute of Tropical Agriculture, Ibadan, Nigeria). The development of genetic stocks is gaining importance through the years. Genetic stocks are produced based on the recombination of a set of genotypes that excel for a particular trait, and we would like to upgrade that trait beyond its natural range of variation (i.e. look for transgressive segregation in broader adaptation). Stocks developed for inheritance studies or to support molecular mapping of specific traits are constructed by the recombination of contrasting genotypes (i.e. resistance to ACMV, African Cassava Mosaic Virus). Often times our aim is to pyramid genes responsible for different sources of resistance (i.e. bacterial blight). As we shift our emphasis from applied breeding to more basic research supporting breeding (i.e. molecular marker assisted selection or MAS) genetic stocks will become even more important. Parental population development in the future will concentrate more in targeting specific crosses between genotypes selected by NARS and complementary sources of genetic information from our genetic enhancement program or our global germplasm collection. Specific Objectives a) To produce large number of seed by sexual crosses (either polycrosses or controlled)
recombining desirable traits from selected parental materials, and deliver them to NARS in Africa, Asia and Latin America.
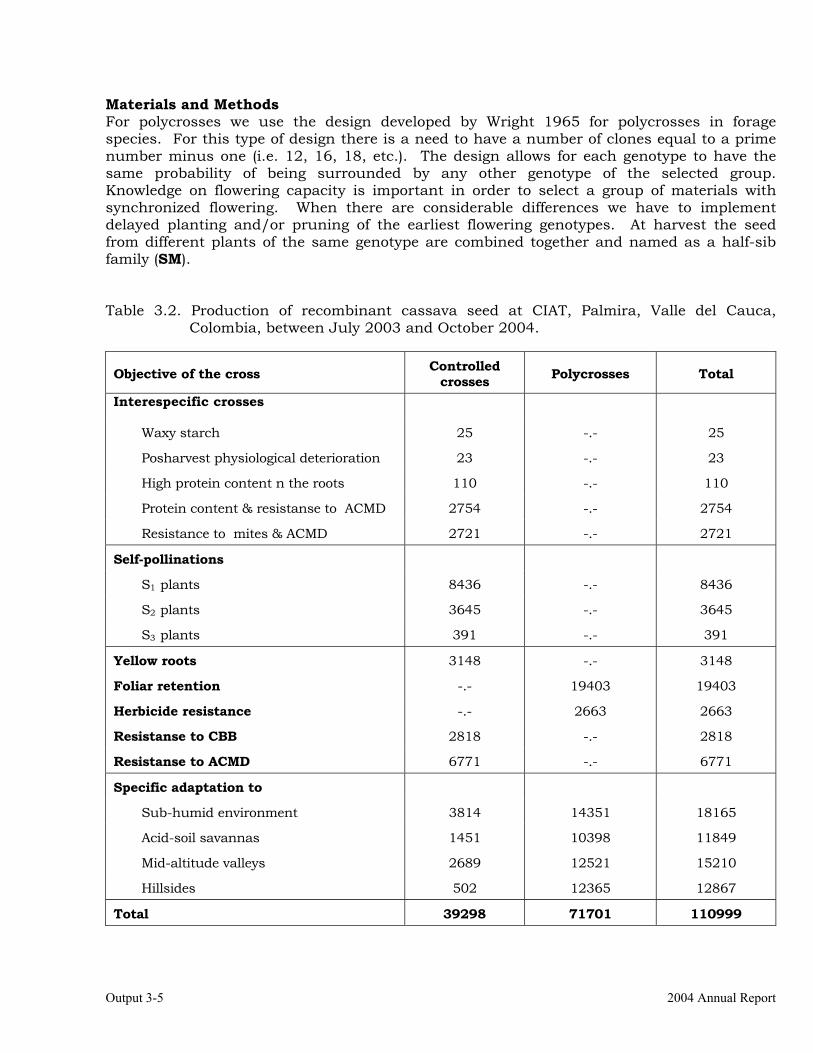
Output 3-5 2004 Annual Report
Materials and Methods For polycrosses we use the design developed by Wright 1965 for polycrosses in forage species. For this type of design there is a need to have a number of clones equal to a prime number minus one (i.e. 12, 16, 18, etc.). The design allows for each genotype to have the same probability of being surrounded by any other genotype of the selected group. Knowledge on flowering capacity is important in order to select a group of materials with synchronized flowering. When there are considerable differences we have to implement delayed planting and/or pruning of the earliest flowering genotypes. At harvest the seed from different plants of the same genotype are combined together and named as a half-sib family (SM). Table 3.2. Production of recombinant cassava seed at CIAT, Palmira, Valle del Cauca,
Colombia, between July 2003 and October 2004.
Objective of the cross Controlled crosses Polycrosses Total
Interespecific crosses
Waxy starch 25 -.- 25
Posharvest physiological deterioration 23 -.- 23
High protein content n the roots 110 -.- 110
Protein content & resistanse to ACMD 2754 -.- 2754
Resistance to mites & ACMD 2721 -.- 2721
Self-pollinations
S1 plants 8436 -.- 8436
S2 plants 3645 -.- 3645
S3 plants 391 -.- 391
Yellow roots 3148 -.- 3148
Foliar retention -.- 19403 19403
Herbicide resistance -.- 2663 2663
Resistanse to CBB 2818 -.- 2818
Resistanse to ACMD 6771 -.- 6771
Specific adaptation to
Sub-humid environment 3814 14351 18165
Acid-soil savannas 1451 10398 11849
Mid-altitude valleys 2689 12521 15210
Hillsides 502 12365 12867
Total 39298 71701 110999
Project IP3: improving cassava for the developing world Output 3-6
For controlled crosses, we plant 10 to 20 plants depending on the flowering capacity of the genotype in question. The fruit developed from each flower has the potential to produce 3 seeds, but in average we obtain no more than 1 seed per pollination. This is due to the sensitivity of the stigma to the manipulation during pollination. Seeds from the same cross are mixed together and name as a full-sib family (CM). Because the number of CM families produced in the last few years has reached 10,000, we began utilizing a new code for full-sib families (GM). Results More than 110,000 recombinant cassava seeds were produced at CIAT’s Experiment Station, Palmira, during July 2003 to October 2004 period (Table 3.2). Although the recombinant seed was produced at CIAT, the generated seedlings used to be transplanted to fields outside the Experiment Station and under conditions of isolation from other cassava crops. Thus, the generated F1 plants grew and were maintained under conditions where possibilities of contamination from frogskin disease were minimized. This strategy, as can be seen in the description of results from different Clonal Evaluation Trials, has been highly successful in virtually eliminating the incidence of this disease from the nurseries for cassava improvement at CIAT. The production of botanical seed within the CIAT Experiment Station did not represent high risk because this disease, which is probably induced by a virus, viroid or phytoplasm, is not likely to be transmitted through botanical seed. Activity 3.3 Generation and distribution of advanced breeding materials for National Programs. Rationale Breeding for Asia has mainly centered on the issue of increased productivity of dry matter per hectare. Yield and root dry matter concentration have been the primary traits for selection, with almost no emphasis given to pests and diseases, or cooking quality. The results obtained in Asia for 15 years, has revealed the possibility to select for broader adaptation of genotypes. We have the case of Rayong 60 and Kasetsart 50 with good performance in a range of Asian countries. The production of germplasm for Asia has been moved from Thailand to Colombia due to budget constraints. However, because of the development attained by several NARS in Asia, the provision of recombinant material from Colombia can satisfy their needs. A CIAT soil scientist based in Thailand still coordinates the cassava network for Asia, but covering a broader spectrum of activities. For Africa, our breeding efforts have been traditionally channeled through our collaboration with the International Institute of Tropical Agriculture (IITA) in Nigeria. As a result extensive germplasm with Latin American “blood” has been introduced to Africa in a long introgression project financed by the International Fund for Agriculture Development (IFAD). The purpose of this special project was, among several others, to introgress Latin American cassava germplasm into Africa, in order to increase the genetic base of the crop in that continent, particularly for drought tolerance. This introgression process requires crosses to combine the desirable traits of Latin American germplasm, with resistance to the African Cassava Mosaic Virus (ACMV) disease.
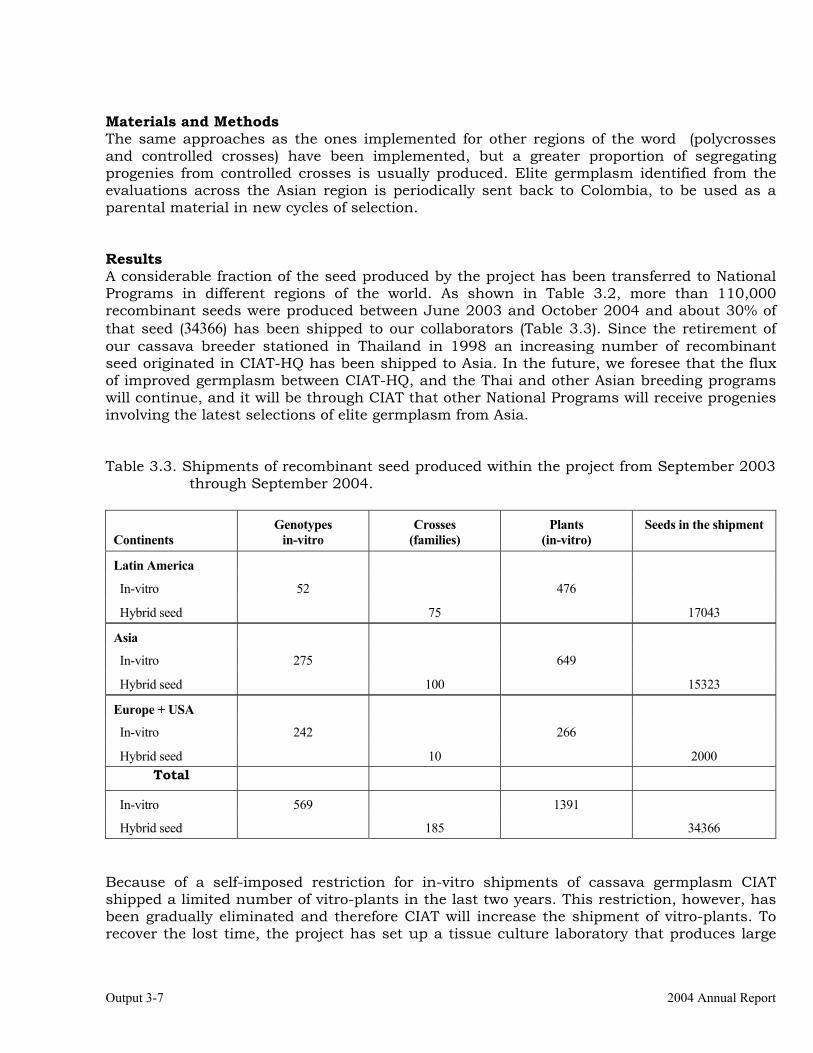
Output 3-7 2004 Annual Report
Materials and Methods The same approaches as the ones implemented for other regions of the word (polycrosses and controlled crosses) have been implemented, but a greater proportion of segregating progenies from controlled crosses is usually produced. Elite germplasm identified from the evaluations across the Asian region is periodically sent back to Colombia, to be used as a parental material in new cycles of selection. Results A considerable fraction of the seed produced by the project has been transferred to National Programs in different regions of the world. As shown in Table 3.2, more than 110,000 recombinant seeds were produced between June 2003 and October 2004 and about 30% of that seed (34366) has been shipped to our collaborators (Table 3.3). Since the retirement of our cassava breeder stationed in Thailand in 1998 an increasing number of recombinant seed originated in CIAT-HQ has been shipped to Asia. In the future, we foresee that the flux of improved germplasm between CIAT-HQ, and the Thai and other Asian breeding programs will continue, and it will be through CIAT that other National Programs will receive progenies involving the latest selections of elite germplasm from Asia.
Table 3.3. Shipments of recombinant seed produced within the project from September 2003 through September 2004.
Continents
Genotypes in-vitro
Crosses (families)
Plants (in-vitro)
Seeds in the shipment
Latin America
In-vitro 52 476
Hybrid seed 75 17043
Asia
In-vitro 275 649
Hybrid seed 100 15323
Europe + USA
In-vitro 242 266
Hybrid seed 10 2000 Total
In-vitro 569 1391
Hybrid seed 185 34366 Because of a self-imposed restriction for in-vitro shipments of cassava germplasm CIAT shipped a limited number of vitro-plants in the last two years. This restriction, however, has been gradually eliminated and therefore CIAT will increase the shipment of vitro-plants. To recover the lost time, the project has set up a tissue culture laboratory that produces large
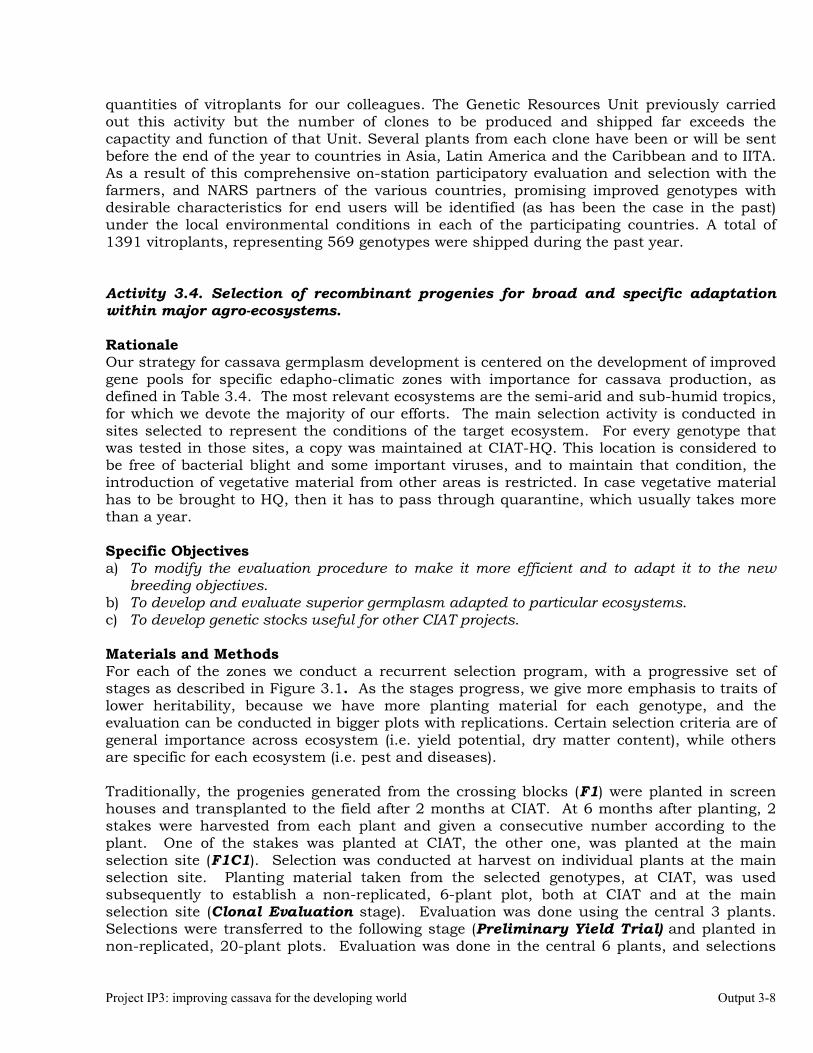
Project IP3: improving cassava for the developing world Output 3-8
quantities of vitroplants for our colleagues. The Genetic Resources Unit previously carried out this activity but the number of clones to be produced and shipped far exceeds the capactity and function of that Unit. Several plants from each clone have been or will be sent before the end of the year to countries in Asia, Latin America and the Caribbean and to IITA. As a result of this comprehensive on-station participatory evaluation and selection with the farmers, and NARS partners of the various countries, promising improved genotypes with desirable characteristics for end users will be identified (as has been the case in the past) under the local environmental conditions in each of the participating countries. A total of 1391 vitroplants, representing 569 genotypes were shipped during the past year. Activity 3.4. Selection of recombinant progenies for broad and specific adaptation within major agro-ecosystems. Rationale Our strategy for cassava germplasm development is centered on the development of improved gene pools for specific edapho-climatic zones with importance for cassava production, as defined in Table 3.4. The most relevant ecosystems are the semi-arid and sub-humid tropics, for which we devote the majority of our efforts. The main selection activity is conducted in sites selected to represent the conditions of the target ecosystem. For every genotype that was tested in those sites, a copy was maintained at CIAT-HQ. This location is considered to be free of bacterial blight and some important viruses, and to maintain that condition, the introduction of vegetative material from other areas is restricted. In case vegetative material has to be brought to HQ, then it has to pass through quarantine, which usually takes more than a year. Specific Objectives a) To modify the evaluation procedure to make it more efficient and to adapt it to the new
breeding objectives. b) To develop and evaluate superior germplasm adapted to particular ecosystems. c) To develop genetic stocks useful for other CIAT projects. Materials and Methods For each of the zones we conduct a recurrent selection program, with a progressive set of stages as described in Figure 3.1. As the stages progress, we give more emphasis to traits of lower heritability, because we have more planting material for each genotype, and the evaluation can be conducted in bigger plots with replications. Certain selection criteria are of general importance across ecosystem (i.e. yield potential, dry matter content), while others are specific for each ecosystem (i.e. pest and diseases). Traditionally, the progenies generated from the crossing blocks (F1) were planted in screen houses and transplanted to the field after 2 months at CIAT. At 6 months after planting, 2 stakes were harvested from each plant and given a consecutive number according to the plant. One of the stakes was planted at CIAT, the other one, was planted at the main selection site (F1C1). Selection was conducted at harvest on individual plants at the main selection site. Planting material taken from the selected genotypes, at CIAT, was used subsequently to establish a non-replicated, 6-plant plot, both at CIAT and at the main selection site (Clonal Evaluation stage). Evaluation was done using the central 3 plants. Selections were transferred to the following stage (Preliminary Yield Trial) and planted in non-replicated, 20-plant plots. Evaluation was done in the central 6 plants, and selections
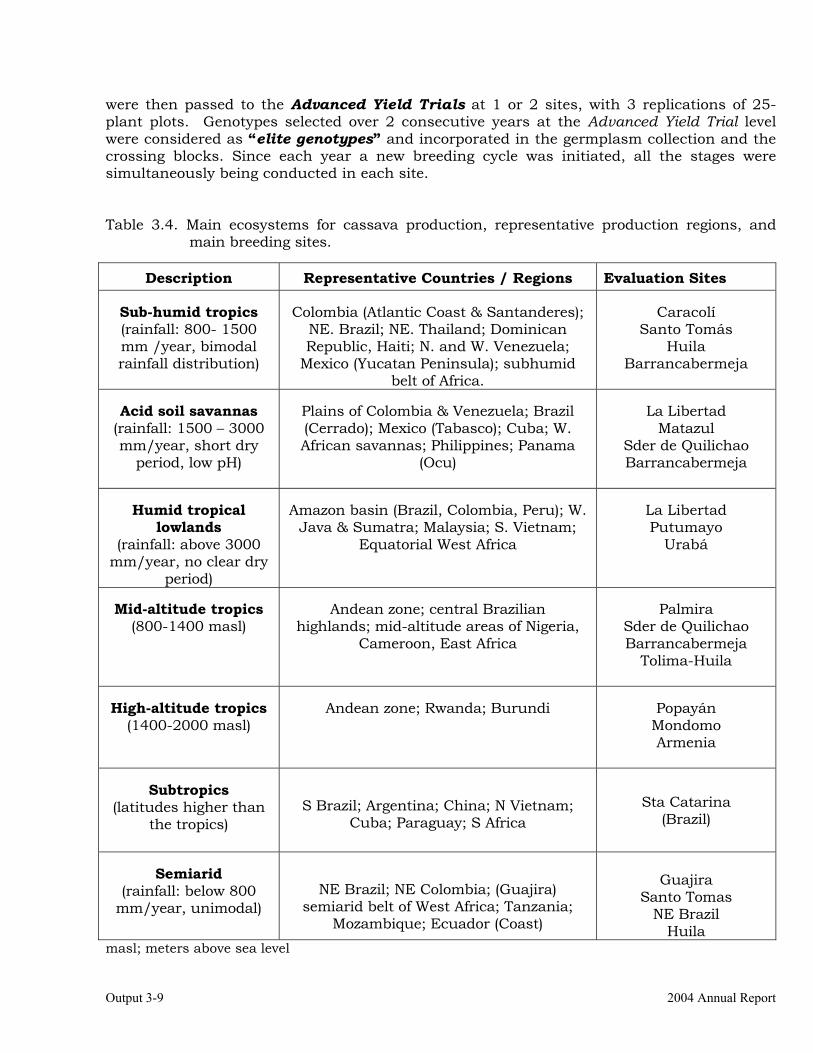
Output 3-9 2004 Annual Report
were then passed to the Advanced Yield Trials at 1 or 2 sites, with 3 replications of 25-plant plots. Genotypes selected over 2 consecutive years at the Advanced Yield Trial level were considered as “elite genotypes” and incorporated in the germplasm collection and the crossing blocks. Since each year a new breeding cycle was initiated, all the stages were simultaneously being conducted in each site. Table 3.4. Main ecosystems for cassava production, representative production regions, and
main breeding sites.
Description Representative Countries / Regions Evaluation Sites
Sub-humid tropics (rainfall: 800- 1500 mm /year, bimodal rainfall distribution)
Colombia (Atlantic Coast & Santanderes);
NE. Brazil; NE. Thailand; Dominican Republic, Haiti; N. and W. Venezuela;
Mexico (Yucatan Peninsula); subhumid belt of Africa.
Caracolí
Santo Tomás Huila
Barrancabermeja
Acid soil savannas
(rainfall: 1500 – 3000 mm/year, short dry
period, low pH)
Plains of Colombia & Venezuela; Brazil (Cerrado); Mexico (Tabasco); Cuba; W. African savannas; Philippines; Panama
(Ocu)
La Libertad
Matazul Sder de Quilichao Barrancabermeja
Humid tropical lowlands
(rainfall: above 3000 mm/year, no clear dry
period)
Amazon basin (Brazil, Colombia, Peru); W.
Java & Sumatra; Malaysia; S. Vietnam; Equatorial West Africa
La Libertad Putumayo
Urabá
Mid-altitude tropics
(800-1400 masl)
Andean zone; central Brazilian
highlands; mid-altitude areas of Nigeria, Cameroon, East Africa
Palmira
Sder de Quilichao Barrancabermeja
Tolima-Huila
High-altitude tropics
(1400-2000 masl)
Andean zone; Rwanda; Burundi
Popayán
Mondomo Armenia
Subtropics (latitudes higher than
the tropics)
S Brazil; Argentina; China; N Vietnam; Cuba; Paraguay; S Africa
Sta Catarina (Brazil)
Semiarid (rainfall: below 800
mm/year, unimodal)
NE Brazil; NE Colombia; (Guajira) semiarid belt of West Africa; Tanzania;
Mozambique; Ecuador (Coast)
Guajira
Santo Tomas NE Brazil
Huila masl; meters above sea level
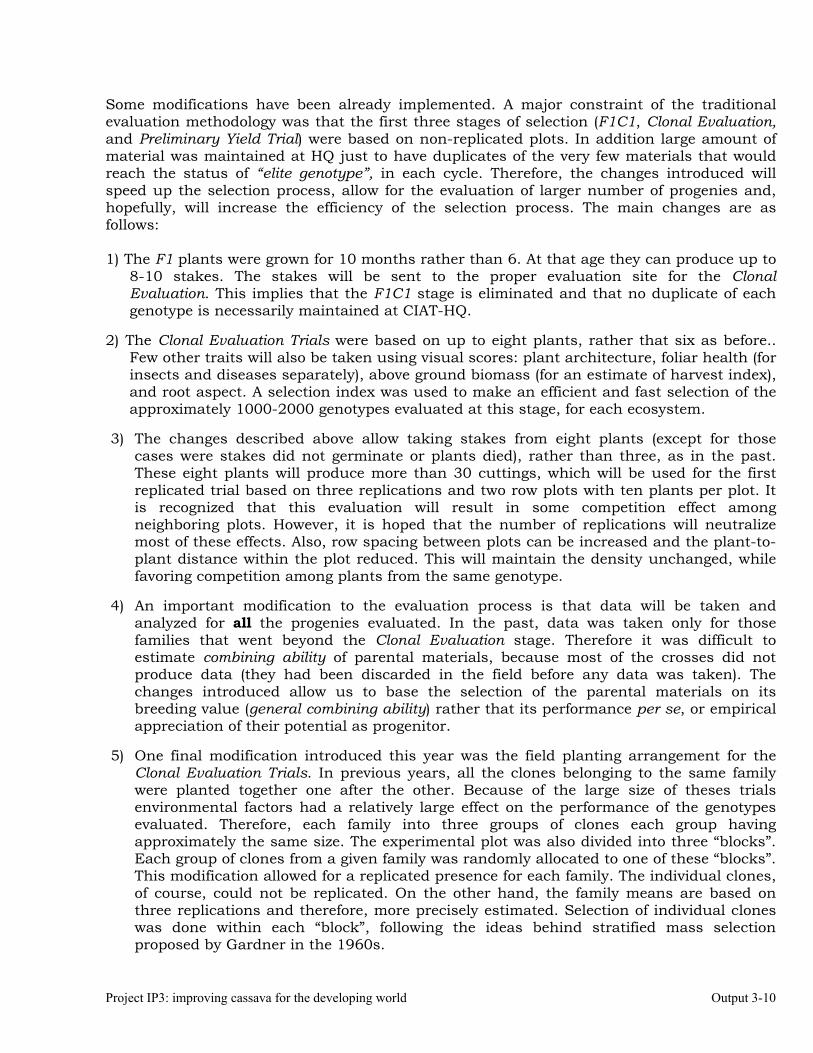
Project IP3: improving cassava for the developing world Output 3-10
Some modifications have been already implemented. A major constraint of the traditional evaluation methodology was that the first three stages of selection (F1C1, Clonal Evaluation, and Preliminary Yield Trial) were based on non-replicated plots. In addition large amount of material was maintained at HQ just to have duplicates of the very few materials that would reach the status of “elite genotype”, in each cycle. Therefore, the changes introduced will speed up the selection process, allow for the evaluation of larger number of progenies and, hopefully, will increase the efficiency of the selection process. The main changes are as follows: 1) The F1 plants were grown for 10 months rather than 6. At that age they can produce up to
8-10 stakes. The stakes will be sent to the proper evaluation site for the Clonal Evaluation. This implies that the F1C1 stage is eliminated and that no duplicate of each genotype is necessarily maintained at CIAT-HQ.
2) The Clonal Evaluation Trials were based on up to eight plants, rather that six as before..
Few other traits will also be taken using visual scores: plant architecture, foliar health (for insects and diseases separately), above ground biomass (for an estimate of harvest index), and root aspect. A selection index was used to make an efficient and fast selection of the approximately 1000-2000 genotypes evaluated at this stage, for each ecosystem.
3) The changes described above allow taking stakes from eight plants (except for those
cases were stakes did not germinate or plants died), rather than three, as in the past. These eight plants will produce more than 30 cuttings, which will be used for the first replicated trial based on three replications and two row plots with ten plants per plot. It is recognized that this evaluation will result in some competition effect among neighboring plots. However, it is hoped that the number of replications will neutralize most of these effects. Also, row spacing between plots can be increased and the plant-to-plant distance within the plot reduced. This will maintain the density unchanged, while favoring competition among plants from the same genotype.
4) An important modification to the evaluation process is that data will be taken and
analyzed for all the progenies evaluated. In the past, data was taken only for those families that went beyond the Clonal Evaluation stage. Therefore it was difficult to estimate combining ability of parental materials, because most of the crosses did not produce data (they had been discarded in the field before any data was taken). The changes introduced allow us to base the selection of the parental materials on its breeding value (general combining ability) rather that its performance per se, or empirical appreciation of their potential as progenitor.
5) One final modification introduced this year was the field planting arrangement for the
Clonal Evaluation Trials. In previous years, all the clones belonging to the same family were planted together one after the other. Because of the large size of theses trials environmental factors had a relatively large effect on the performance of the genotypes evaluated. Therefore, each family into three groups of clones each group having approximately the same size. The experimental plot was also divided into three “blocks”. Each group of clones from a given family was randomly allocated to one of these “blocks”. This modification allowed for a replicated presence for each family. The individual clones, of course, could not be replicated. On the other hand, the family means are based on three replications and therefore, more precisely estimated. Selection of individual clones was done within each “block”, following the ideas behind stratified mass selection proposed by Gardner in the 1960s.
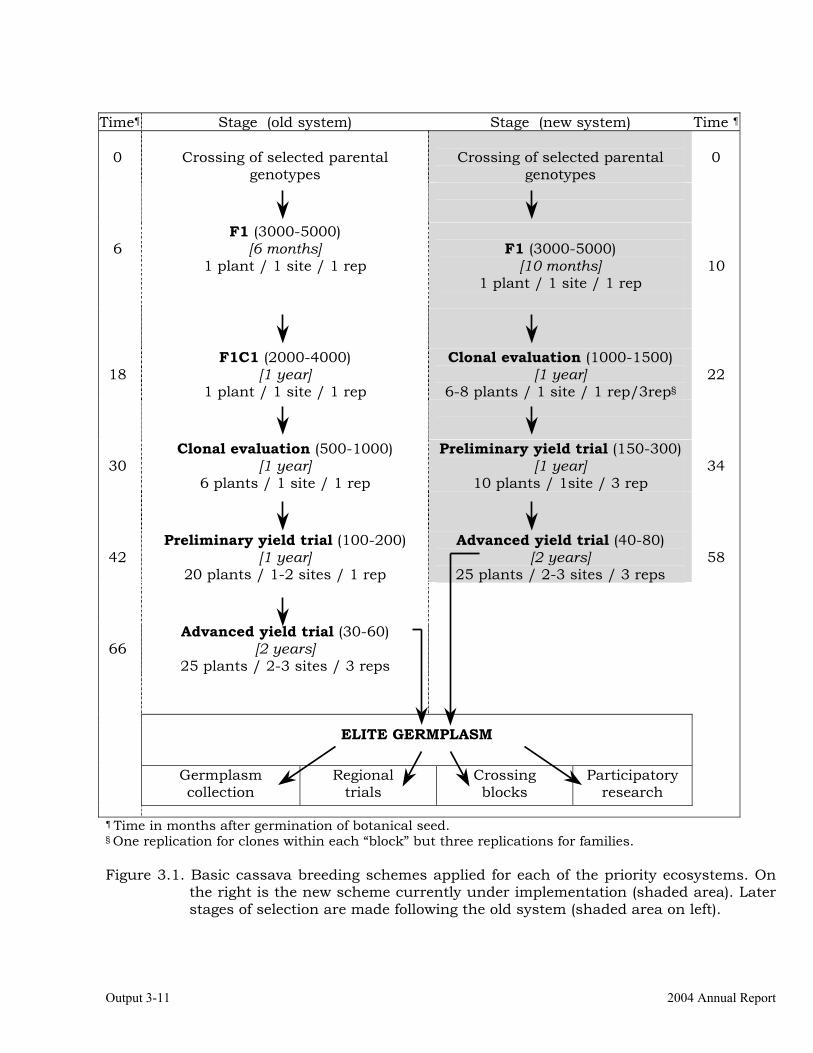
Output 3-11 2004 Annual Report
Time¶ Stage (old system) Stage (new system) Time ¶
0
Crossing of selected parental
genotypes
Crossing of selected parental
genotypes
0
6
F1 (3000-5000) [6 months]
1 plant / 1 site / 1 rep
F1 (3000-5000)
[10 months] 1 plant / 1 site / 1 rep
10
18
F1C1 (2000-4000) [1 year]
1 plant / 1 site / 1 rep
Clonal evaluation (1000-1500) [1 year]
6-8 plants / 1 site / 1 rep/3rep§
22
30
Clonal evaluation (500-1000) [1 year]
6 plants / 1 site / 1 rep
Preliminary yield trial (150-300) [1 year]
10 plants / 1site / 3 rep
34
42
Preliminary yield trial (100-200) [1 year]
20 plants / 1-2 sites / 1 rep
Advanced yield trial (40-80) [2 years]
25 plants / 2-3 sites / 3 reps
58
66
Advanced yield trial (30-60) [2 years]
25 plants / 2-3 sites / 3 reps
ELITE GERMPLASM
Germplasm collection
Regional trials
Crossing blocks
Participatory research
¶ Time in months after germination of botanical seed. § One replication for clones within each “block” but three replications for families. Figure 3.1. Basic cassava breeding schemes applied for each of the priority ecosystems. On
the right is the new scheme currently under implementation (shaded area). Later stages of selection are made following the old system (shaded area on left).
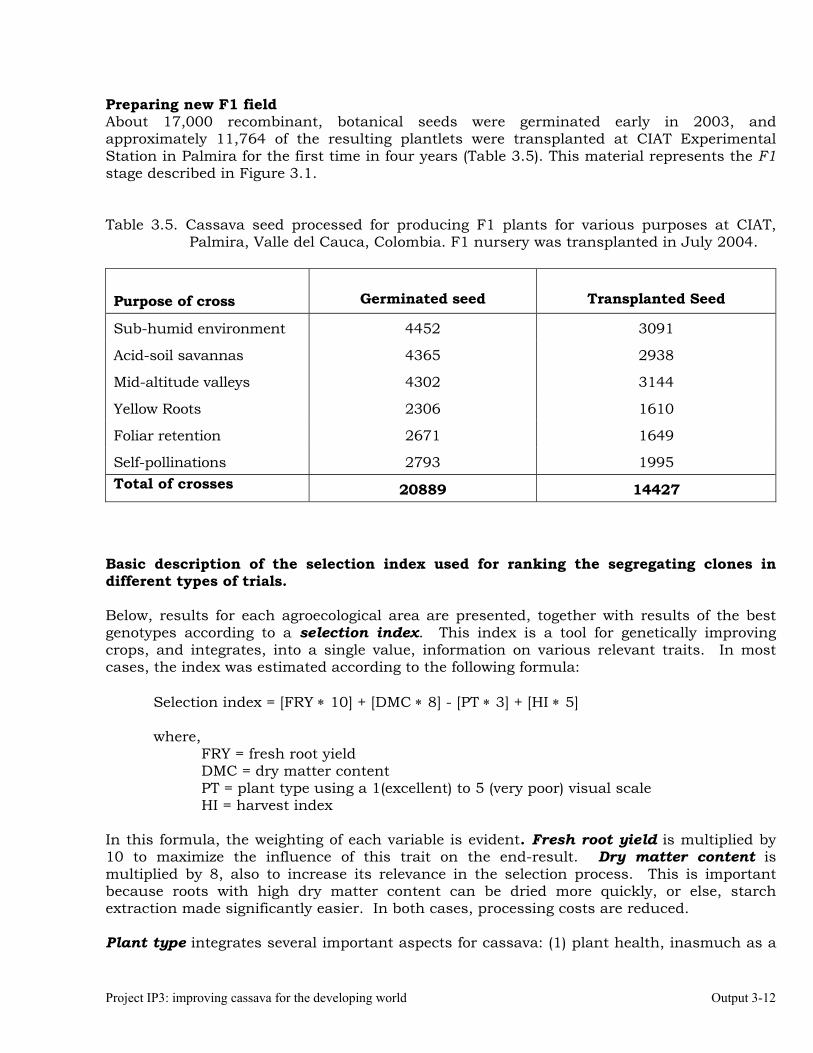
Project IP3: improving cassava for the developing world Output 3-12
Preparing new F1 field About 17,000 recombinant, botanical seeds were germinated early in 2003, and approximately 11,764 of the resulting plantlets were transplanted at CIAT Experimental Station in Palmira for the first time in four years (Table 3.5). This material represents the F1 stage described in Figure 3.1. Table 3.5. Cassava seed processed for producing F1 plants for various purposes at CIAT,
Palmira, Valle del Cauca, Colombia. F1 nursery was transplanted in July 2004. Purpose of cross
Germinated seed
Transplanted Seed
Sub-humid environment 4452 3091
Acid-soil savannas 4365 2938
Mid-altitude valleys 4302 3144
Yellow Roots 2306 1610
Foliar retention 2671 1649
Self-pollinations 2793 1995 Total of crosses 20889 14427
Basic description of the selection index used for ranking the segregating clones in different types of trials. Below, results for each agroecological area are presented, together with results of the best genotypes according to a selection index. This index is a tool for genetically improving crops, and integrates, into a single value, information on various relevant traits. In most cases, the index was estimated according to the following formula:
Selection index = [FRY ∗ 10] + [DMC ∗ 8] - [PT ∗ 3] + [HI ∗ 5] where, FRY = fresh root yield DMC = dry matter content PT = plant type using a 1(excellent) to 5 (very poor) visual scale HI = harvest index
In this formula, the weighting of each variable is evident. Fresh root yield is multiplied by 10 to maximize the influence of this trait on the end-result. Dry matter content is multiplied by 8, also to increase its relevance in the selection process. This is important because roots with high dry matter content can be dried more quickly, or else, starch extraction made significantly easier. In both cases, processing costs are reduced.
Plant type integrates several important aspects for cassava: (1) plant health, inasmuch as a
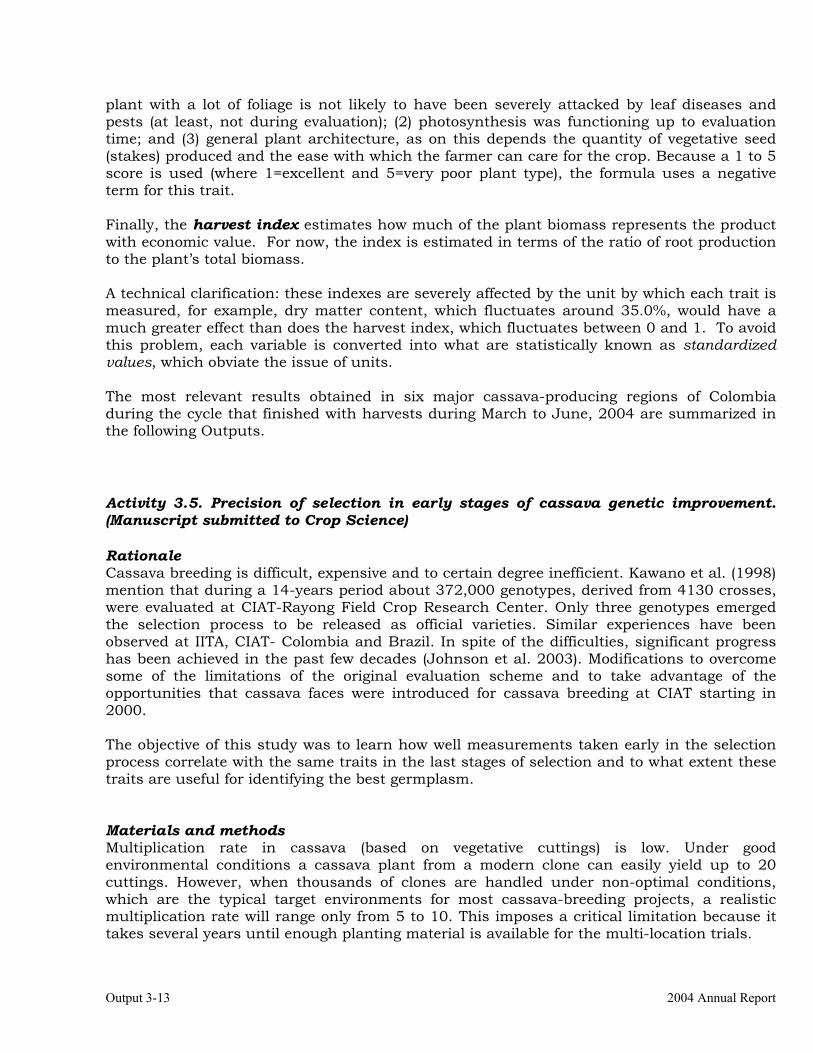
Output 3-13 2004 Annual Report
plant with a lot of foliage is not likely to have been severely attacked by leaf diseases and pests (at least, not during evaluation); (2) photosynthesis was functioning up to evaluation time; and (3) general plant architecture, as on this depends the quantity of vegetative seed (stakes) produced and the ease with which the farmer can care for the crop. Because a 1 to 5 score is used (where 1=excellent and 5=very poor plant type), the formula uses a negative term for this trait. Finally, the harvest index estimates how much of the plant biomass represents the product with economic value. For now, the index is estimated in terms of the ratio of root production to the plant’s total biomass.
A technical clarification: these indexes are severely affected by the unit by which each trait is measured, for example, dry matter content, which fluctuates around 35.0%, would have a much greater effect than does the harvest index, which fluctuates between 0 and 1. To avoid this problem, each variable is converted into what are statistically known as standardized values, which obviate the issue of units. The most relevant results obtained in six major cassava-producing regions of Colombia during the cycle that finished with harvests during March to June, 2004 are summarized in the following Outputs. Activity 3.5. Precision of selection in early stages of cassava genetic improvement. (Manuscript submitted to Crop Science) Rationale Cassava breeding is difficult, expensive and to certain degree inefficient. Kawano et al. (1998) mention that during a 14-years period about 372,000 genotypes, derived from 4130 crosses, were evaluated at CIAT-Rayong Field Crop Research Center. Only three genotypes emerged the selection process to be released as official varieties. Similar experiences have been observed at IITA, CIAT- Colombia and Brazil. In spite of the difficulties, significant progress has been achieved in the past few decades (Johnson et al. 2003). Modifications to overcome some of the limitations of the original evaluation scheme and to take advantage of the opportunities that cassava faces were introduced for cassava breeding at CIAT starting in 2000. The objective of this study was to learn how well measurements taken early in the selection process correlate with the same traits in the last stages of selection and to what extent these traits are useful for identifying the best germplasm. Materials and methods Multiplication rate in cassava (based on vegetative cuttings) is low. Under good environmental conditions a cassava plant from a modern clone can easily yield up to 20 cuttings. However, when thousands of clones are handled under non-optimal conditions, which are the typical target environments for most cassava-breeding projects, a realistic multiplication rate will range only from 5 to 10. This imposes a critical limitation because it takes several years until enough planting material is available for the multi-location trials.
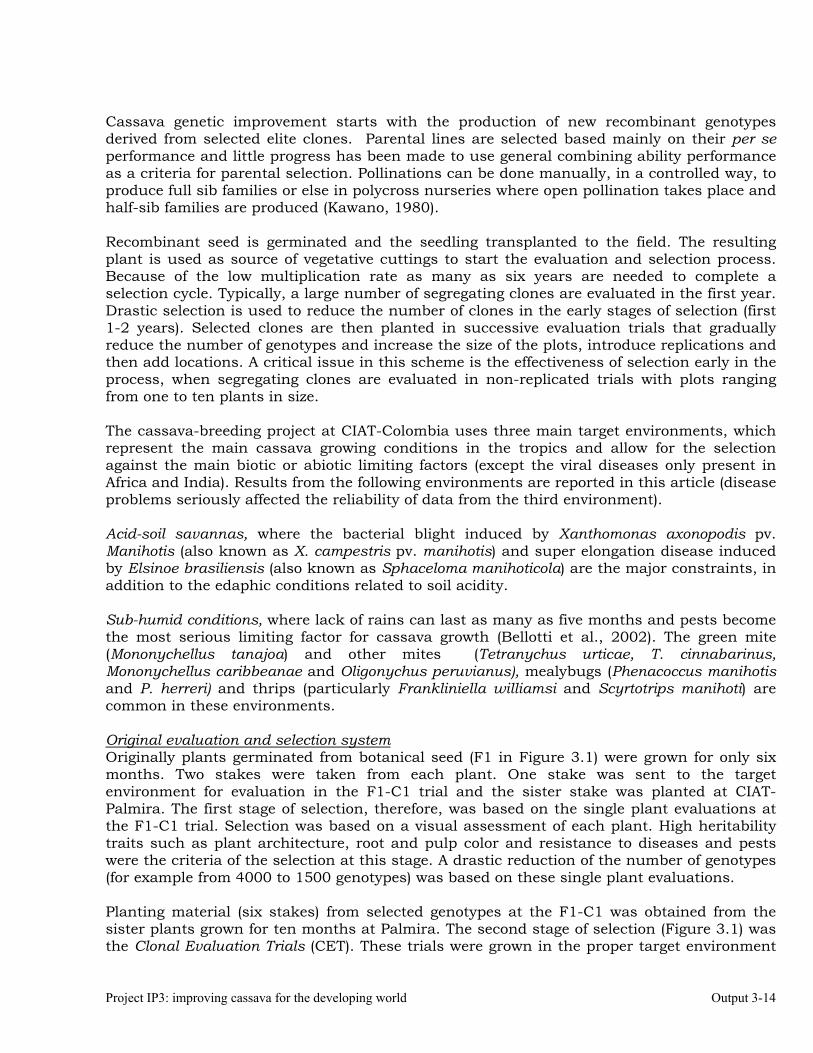
Project IP3: improving cassava for the developing world Output 3-14
Cassava genetic improvement starts with the production of new recombinant genotypes derived from selected elite clones. Parental lines are selected based mainly on their per se performance and little progress has been made to use general combining ability performance as a criteria for parental selection. Pollinations can be done manually, in a controlled way, to produce full sib families or else in polycross nurseries where open pollination takes place and half-sib families are produced (Kawano, 1980). Recombinant seed is germinated and the seedling transplanted to the field. The resulting plant is used as source of vegetative cuttings to start the evaluation and selection process. Because of the low multiplication rate as many as six years are needed to complete a selection cycle. Typically, a large number of segregating clones are evaluated in the first year. Drastic selection is used to reduce the number of clones in the early stages of selection (first 1-2 years). Selected clones are then planted in successive evaluation trials that gradually reduce the number of genotypes and increase the size of the plots, introduce replications and then add locations. A critical issue in this scheme is the effectiveness of selection early in the process, when segregating clones are evaluated in non-replicated trials with plots ranging from one to ten plants in size. The cassava-breeding project at CIAT-Colombia uses three main target environments, which represent the main cassava growing conditions in the tropics and allow for the selection against the main biotic or abiotic limiting factors (except the viral diseases only present in Africa and India). Results from the following environments are reported in this article (disease problems seriously affected the reliability of data from the third environment). Acid-soil savannas, where the bacterial blight induced by Xanthomonas axonopodis pv. Manihotis (also known as X. campestris pv. manihotis) and super elongation disease induced by Elsinoe brasiliensis (also known as Sphaceloma manihoticola) are the major constraints, in addition to the edaphic conditions related to soil acidity. Sub-humid conditions, where lack of rains can last as many as five months and pests become the most serious limiting factor for cassava growth (Bellotti et al., 2002). The green mite (Mononychellus tanajoa) and other mites (Tetranychus urticae, T. cinnabarinus, Mononychellus caribbeanae and Oligonychus peruvianus), mealybugs (Phenacoccus manihotis and P. herreri) and thrips (particularly Frankliniella williamsi and Scyrtotrips manihoti) are common in these environments. Original evaluation and selection system Originally plants germinated from botanical seed (F1 in Figure 3.1) were grown for only six months. Two stakes were taken from each plant. One stake was sent to the target environment for evaluation in the F1-C1 trial and the sister stake was planted at CIAT-Palmira. The first stage of selection, therefore, was based on the single plant evaluations at the F1-C1 trial. Selection was based on a visual assessment of each plant. High heritability traits such as plant architecture, root and pulp color and resistance to diseases and pests were the criteria of the selection at this stage. A drastic reduction of the number of genotypes (for example from 4000 to 1500 genotypes) was based on these single plant evaluations. Planting material (six stakes) from selected genotypes at the F1-C1 was obtained from the sister plants grown for ten months at Palmira. The second stage of selection (Figure 3.1) was the Clonal Evaluation Trials (CET). These trials were grown in the proper target environment
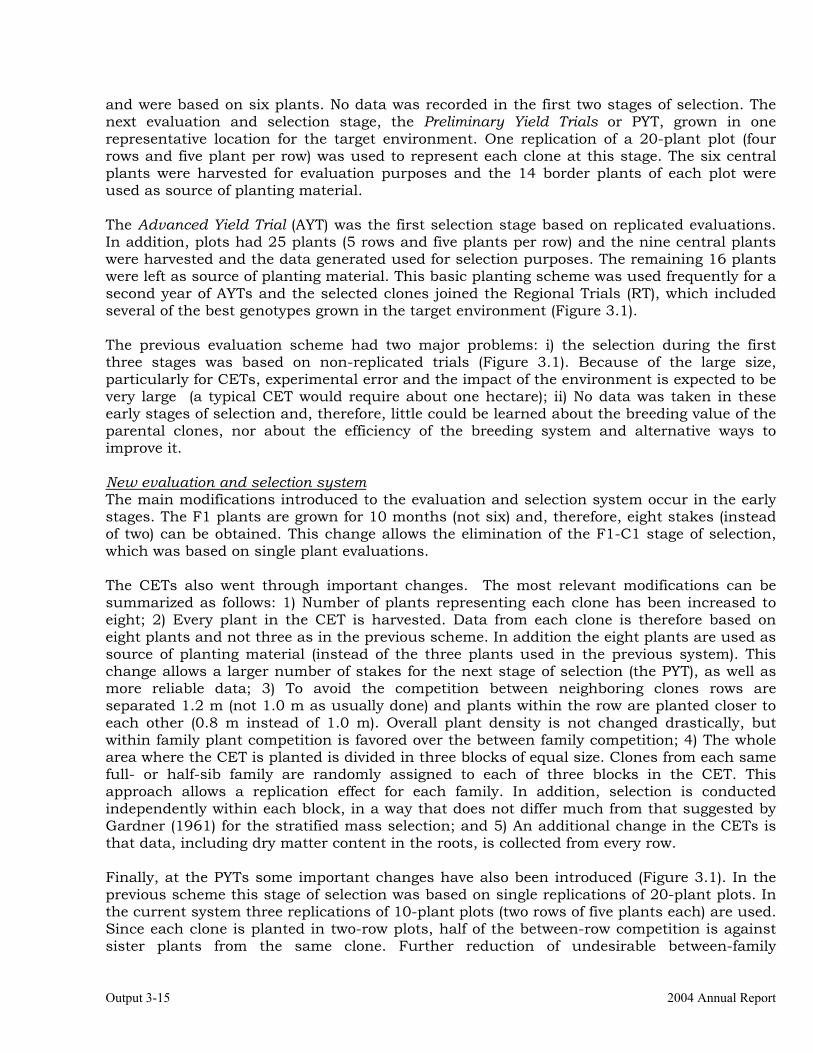
Output 3-15 2004 Annual Report
and were based on six plants. No data was recorded in the first two stages of selection. The next evaluation and selection stage, the Preliminary Yield Trials or PYT, grown in one representative location for the target environment. One replication of a 20-plant plot (four rows and five plant per row) was used to represent each clone at this stage. The six central plants were harvested for evaluation purposes and the 14 border plants of each plot were used as source of planting material. The Advanced Yield Trial (AYT) was the first selection stage based on replicated evaluations. In addition, plots had 25 plants (5 rows and five plants per row) and the nine central plants were harvested and the data generated used for selection purposes. The remaining 16 plants were left as source of planting material. This basic planting scheme was used frequently for a second year of AYTs and the selected clones joined the Regional Trials (RT), which included several of the best genotypes grown in the target environment (Figure 3.1). The previous evaluation scheme had two major problems: i) the selection during the first three stages was based on non-replicated trials (Figure 3.1). Because of the large size, particularly for CETs, experimental error and the impact of the environment is expected to be very large (a typical CET would require about one hectare); ii) No data was taken in these early stages of selection and, therefore, little could be learned about the breeding value of the parental clones, nor about the efficiency of the breeding system and alternative ways to improve it. New evaluation and selection system The main modifications introduced to the evaluation and selection system occur in the early stages. The F1 plants are grown for 10 months (not six) and, therefore, eight stakes (instead of two) can be obtained. This change allows the elimination of the F1-C1 stage of selection, which was based on single plant evaluations. The CETs also went through important changes. The most relevant modifications can be summarized as follows: 1) Number of plants representing each clone has been increased to eight; 2) Every plant in the CET is harvested. Data from each clone is therefore based on eight plants and not three as in the previous scheme. In addition the eight plants are used as source of planting material (instead of the three plants used in the previous system). This change allows a larger number of stakes for the next stage of selection (the PYT), as well as more reliable data; 3) To avoid the competition between neighboring clones rows are separated 1.2 m (not 1.0 m as usually done) and plants within the row are planted closer to each other (0.8 m instead of 1.0 m). Overall plant density is not changed drastically, but within family plant competition is favored over the between family competition; 4) The whole area where the CET is planted is divided in three blocks of equal size. Clones from each same full- or half-sib family are randomly assigned to each of three blocks in the CET. This approach allows a replication effect for each family. In addition, selection is conducted independently within each block, in a way that does not differ much from that suggested by Gardner (1961) for the stratified mass selection; and 5) An additional change in the CETs is that data, including dry matter content in the roots, is collected from every row. Finally, at the PYTs some important changes have also been introduced (Figure 3.1). In the previous scheme this stage of selection was based on single replications of 20-plant plots. In the current system three replications of 10-plant plots (two rows of five plants each) are used. Since each clone is planted in two-row plots, half of the between-row competition is against sister plants from the same clone. Further reduction of undesirable between-family
Project IP3: improving cassava for the developing world Output 3-16
competition originating in differences in plant vigor can be achieved because the planting distances between-row is reduced to favor of within-row competition (as done for CETs). Significant consequences of the modifications introduced are: i) the second (not the fourth) stage of selection is based on replicated evaluations. Only one stage of selection (CET) is based on non-replicated evaluations, not three as in the previous scheme (F1-C1, CET and PYT). ii) Data was taken at every stage of selection (except at the F1 which is carried out in Palmira, not in the target environment and where the only selection criterion is capacity to produce the eight stakes required for the CET). Data is used for a selection index integrating the most relevant variables as described in Activity 3.4. Harvest index has been consistently favored as one relevant variable to be included in early stages of selection such as at CETs (Kawano et al. 1998; Kawano, 2003) and is estimated as the ratio between root-weight over the total biomass of the plant. Plant type has been reported to play an important role in early stages of selection (Hahn et al, 1979). In our case we use a 1 to 5 scale, where 1 represents an excellent plant type and 5 a poor one. The plant type score integrates plant architecture (erect, non branching types), plant height (intermediate types 2-3 m tall), plant health, and foliage retention. Because the lower scores represent the desired phenotype, a negative sign is assigned to plant type in the selection index above. In areas where disease resistance is very important (such as the acid-soil savannas) the weight for plant type may be as high as five. In other areas where the main trait affecting plant type is its architecture the weight may be reduced down to three. Since SI is estimated using the standardized values, a positive SI means a performance better than the average, while a negative one means a poor performance. The more negative the worse performance. Results from two different types of evaluations were obtained and analyzed: the normal five-year recurrent selection cycle, and data from a diallel study. Normal five-year recurrent selection cycle. Results from different trials in these three agro-ecosystems are analyzed in this article. Because of the unexpected problems faced during its implementation, occasionally the scheme is modified and does not follow the normal step-by-step scheme described in Figure 3.1. In the sub-humid conditions, the lack of rains at planting time may affect the sprouting of the stakes, resulting in poor plant stands. When this happens the selection process is interrupted and a multiplication of the surviving planting material is conducted instead. This causes a one-year delay in the selection process but guarantees good and uniform planting densities and vigor for later stages of selection. Data from diallel studies During the July 2001- April 2002 evaluation cycle in addition to the standard evaluations, a group of clones representing a diallel set of crosses was planted in the sub-humid and acid soil savannas. In a way this evaluation could be envisioned as a CET trial, except that the six plants representing each clone were distributed in two locations (Pitalito and Stanto Tomás in the sub-humid environment and at two contrasting soil types in the acid-soil savannas) with three replications at each location. Mean performance of each clone, therefore, was much less affected by environmental error and genotype by environment interaction. Data from the diallel set was analyzed to learn about the inheritance of the most important variables, but the best performing clones, across the two locations for each agro-ecological
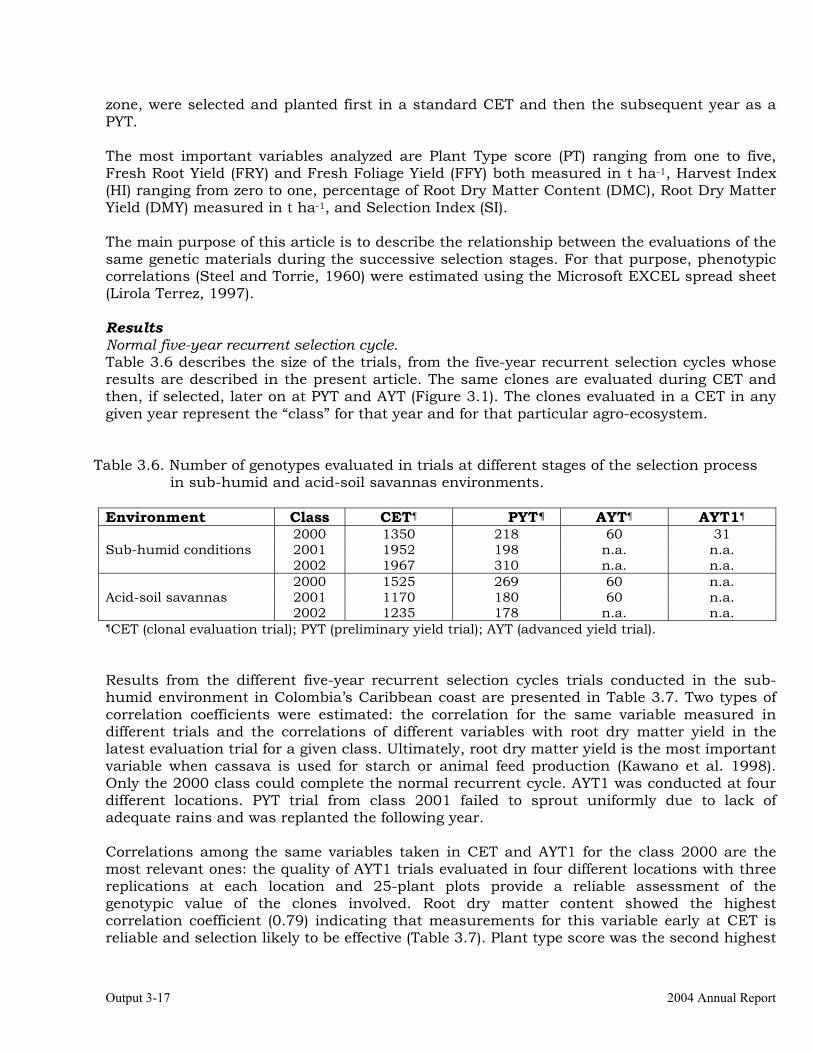
Output 3-17 2004 Annual Report
zone, were selected and planted first in a standard CET and then the subsequent year as a PYT. The most important variables analyzed are Plant Type score (PT) ranging from one to five, Fresh Root Yield (FRY) and Fresh Foliage Yield (FFY) both measured in t ha-1, Harvest Index (HI) ranging from zero to one, percentage of Root Dry Matter Content (DMC), Root Dry Matter Yield (DMY) measured in t ha-1, and Selection Index (SI). The main purpose of this article is to describe the relationship between the evaluations of the same genetic materials during the successive selection stages. For that purpose, phenotypic correlations (Steel and Torrie, 1960) were estimated using the Microsoft EXCEL spread sheet (Lirola Terrez, 1997). Results Normal five-year recurrent selection cycle. Table 3.6 describes the size of the trials, from the five-year recurrent selection cycles whose results are described in the present article. The same clones are evaluated during CET and then, if selected, later on at PYT and AYT (Figure 3.1). The clones evaluated in a CET in any given year represent the “class” for that year and for that particular agro-ecosystem.
Table 3.6. Number of genotypes evaluated in trials at different stages of the selection process in sub-humid and acid-soil savannas environments.
Environment Class CET¶ PYT¶ AYT¶ AYT1¶ 2000 1350 218 60 31 Sub-humid conditions 2001 1952 198 n.a. n.a. 2002 1967 310 n.a. n.a. 2000 1525 269 60 n.a. Acid-soil savannas 2001 1170 180 60 n.a. 2002 1235 178 n.a. n.a. ¶CET (clonal evaluation trial); PYT (preliminary yield trial); AYT (advanced yield trial). Results from the different five-year recurrent selection cycles trials conducted in the sub-humid environment in Colombia’s Caribbean coast are presented in Table 3.7. Two types of correlation coefficients were estimated: the correlation for the same variable measured in different trials and the correlations of different variables with root dry matter yield in the latest evaluation trial for a given class. Ultimately, root dry matter yield is the most important variable when cassava is used for starch or animal feed production (Kawano et al. 1998). Only the 2000 class could complete the normal recurrent cycle. AYT1 was conducted at four different locations. PYT trial from class 2001 failed to sprout uniformly due to lack of adequate rains and was replanted the following year. Correlations among the same variables taken in CET and AYT1 for the class 2000 are the most relevant ones: the quality of AYT1 trials evaluated in four different locations with three replications at each location and 25-plant plots provide a reliable assessment of the genotypic value of the clones involved. Root dry matter content showed the highest correlation coefficient (0.79) indicating that measurements for this variable early at CET is reliable and selection likely to be effective (Table 3.7). Plant type score was the second highest
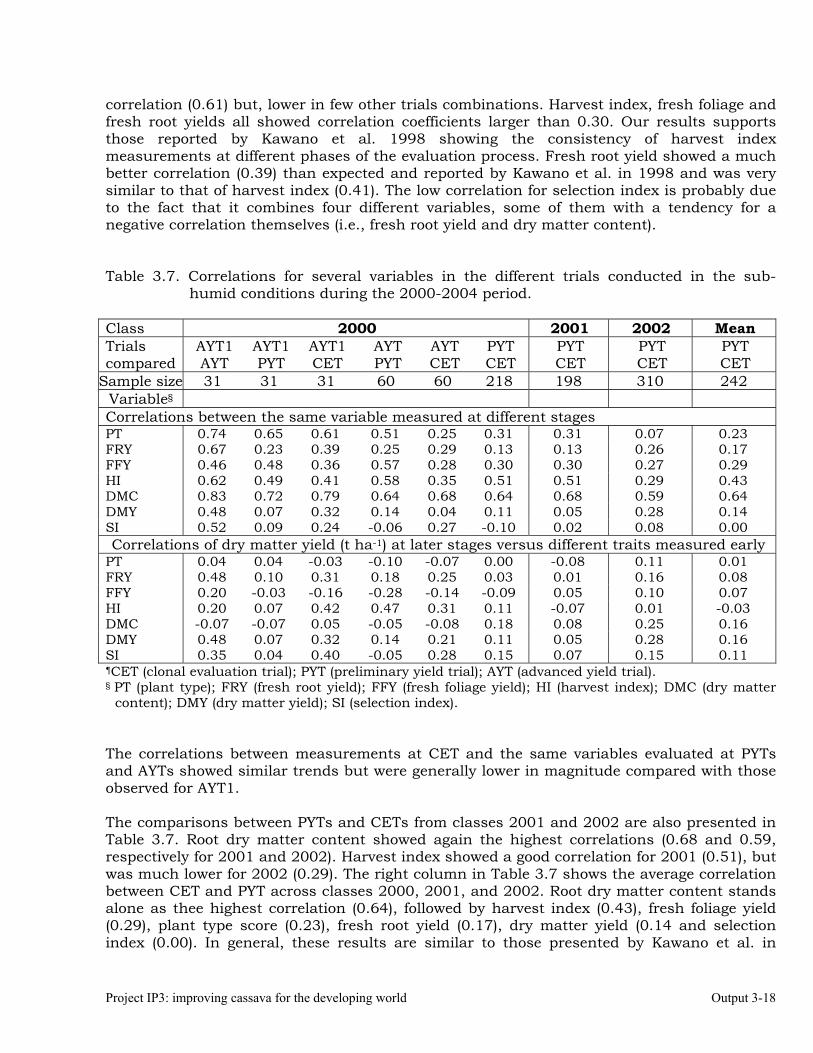
Project IP3: improving cassava for the developing world Output 3-18
correlation (0.61) but, lower in few other trials combinations. Harvest index, fresh foliage and fresh root yields all showed correlation coefficients larger than 0.30. Our results supports those reported by Kawano et al. 1998 showing the consistency of harvest index measurements at different phases of the evaluation process. Fresh root yield showed a much better correlation (0.39) than expected and reported by Kawano et al. in 1998 and was very similar to that of harvest index (0.41). The low correlation for selection index is probably due to the fact that it combines four different variables, some of them with a tendency for a negative correlation themselves (i.e., fresh root yield and dry matter content). Table 3.7. Correlations for several variables in the different trials conducted in the sub-
humid conditions during the 2000-2004 period. Class 2000 2001 2002 Mean Trials compared
AYT1 AYT
AYT1 PYT
AYT1 CET
AYT PYT
AYT CET
PYT CET
PYT CET
PYT CET
PYT CET
Sample size 31 31 31 60 60 218 198 310 242 Variable§ Correlations between the same variable measured at different stages PT 0.74 0.65 0.61 0.51 0.25 0.31 0.31 0.07 0.23 FRY 0.67 0.23 0.39 0.25 0.29 0.13 0.13 0.26 0.17 FFY 0.46 0.48 0.36 0.57 0.28 0.30 0.30 0.27 0.29 HI 0.62 0.49 0.41 0.58 0.35 0.51 0.51 0.29 0.43 DMC 0.83 0.72 0.79 0.64 0.68 0.64 0.68 0.59 0.64 DMY 0.48 0.07 0.32 0.14 0.04 0.11 0.05 0.28 0.14 SI 0.52 0.09 0.24 -0.06 0.27 -0.10 0.02 0.08 0.00 Correlations of dry matter yield (t ha-1) at later stages versus different traits measured early
PT 0.04 0.04 -0.03 -0.10 -0.07 0.00 -0.08 0.11 0.01 FRY 0.48 0.10 0.31 0.18 0.25 0.03 0.01 0.16 0.08 FFY 0.20 -0.03 -0.16 -0.28 -0.14 -0.09 0.05 0.10 0.07 HI 0.20 0.07 0.42 0.47 0.31 0.11 -0.07 0.01 -0.03 DMC -0.07 -0.07 0.05 -0.05 -0.08 0.18 0.08 0.25 0.16 DMY 0.48 0.07 0.32 0.14 0.21 0.11 0.05 0.28 0.16 SI 0.35 0.04 0.40 -0.05 0.28 0.15 0.07 0.15 0.11 ¶CET (clonal evaluation trial); PYT (preliminary yield trial); AYT (advanced yield trial). § PT (plant type); FRY (fresh root yield); FFY (fresh foliage yield); HI (harvest index); DMC (dry matter
content); DMY (dry matter yield); SI (selection index). The correlations between measurements at CET and the same variables evaluated at PYTs and AYTs showed similar trends but were generally lower in magnitude compared with those observed for AYT1. The comparisons between PYTs and CETs from classes 2001 and 2002 are also presented in Table 3.7. Root dry matter content showed again the highest correlations (0.68 and 0.59, respectively for 2001 and 2002). Harvest index showed a good correlation for 2001 (0.51), but was much lower for 2002 (0.29). The right column in Table 3.7 shows the average correlation between CET and PYT across classes 2000, 2001, and 2002. Root dry matter content stands alone as thee highest correlation (0.64), followed by harvest index (0.43), fresh foliage yield (0.29), plant type score (0.23), fresh root yield (0.17), dry matter yield (0.14 and selection index (0.00). In general, these results are similar to those presented by Kawano et al. in
Output 3-19 2004 Annual Report
1998, but have the additional information on root dry matter content which was not measured by these authors at CET trials. Overall, correlations between fresh root yield at different stages of the selection cycle tended to be higher than those reported by Kawano et al. (1998). As expected, correlations among measurements of the same variable at later stages of the evaluation cycle (for instance AYT vs. AYT1), were generally higher than those among earlier trials (Table 3.7). As in the previous comparisons, root dry matter content was the most consistent variable (correlation of 0.83), followed by plant type score (0.74), fresh root yield (0.67), harvest index (0.62), selection index (0.52), dry matter yield (0.48), and fresh foliage yield (0.46). The most noticeable change in this comparison is the excellent correlations observed for selection index and fresh root yield. These results also agree with those presented by Kawano et al. in 1998. The most important information in Table 3.7, however, are those in the lower half of the table, where the correlations among different variables in early stages of selection and dry root yield at the latest available stage of evaluation are shown. For class 2000, harvest index (measured at CET) showed the highest correlation with dry matter yield (measured at AYT1). Selection index showed the second highest correlation (0.40), followed by dry matter yield and fresh root yield (0.32 and 0.31, respectively). As expected plant type score showed a negative correlation, since the lower score indicates the best plant type. It is worth emphasizing the good correlation of selection index at CET and dry root yield at AYT1 (0.40). The selection index incorporates the plant type score that is not always correlated with high root productivity as illustrated by the small negative correlation (-0.03) shown in Table 3.7. Plant type score includes plant architecture, which is an important criteria for cassava farmers, but does not necessarily contributes to higher productivity. It is also interesting to note that the correlation between selection index at early stages of evaluation and dry matter productivity at later stages of selection increased from CET vs. PYT (0.15), to CET vs. AYT (0.28), to CET vs. AYT1 (0.40). The bottom of the right column in Table 3.7 shows the average correlation between different variables (measured at CET) and dry matter productivity (measured at PYT) across classes 2000, 2001, and 2002. Results are very contrasting with the correlations between CET and AYT1, with coefficients generally much lower in magnitude. The highest correlations were for dry matter content and dry matter yield (both at 0.16), followed by selection index (0.11). Correlation coefficients for fresh root yield and fresh foliage yield at CET and dry matter yield at PYT where higher (0.08 and 0.07, respectively), than for harvest index (-0.03). Results from the different five-year recurrent selection cycles trials conducted in the acid-soils environment are presented in Table 3.8. Because of lack of enough planting material, the AYT1 trial from class 2000 was delayed for a year. As it was the case for the sub-humid environment, root dry matter content showed excellent correlations between early and late measurements. Across years the correlation for root dry matter between measurements at CET and then at the AYT was 0.61, followed by fresh foliage yield (0.46), harvest index (0.44), plant type score (0.43), fresh root yield (0.34), dry matter yield (0.28) and selection index (0.21).
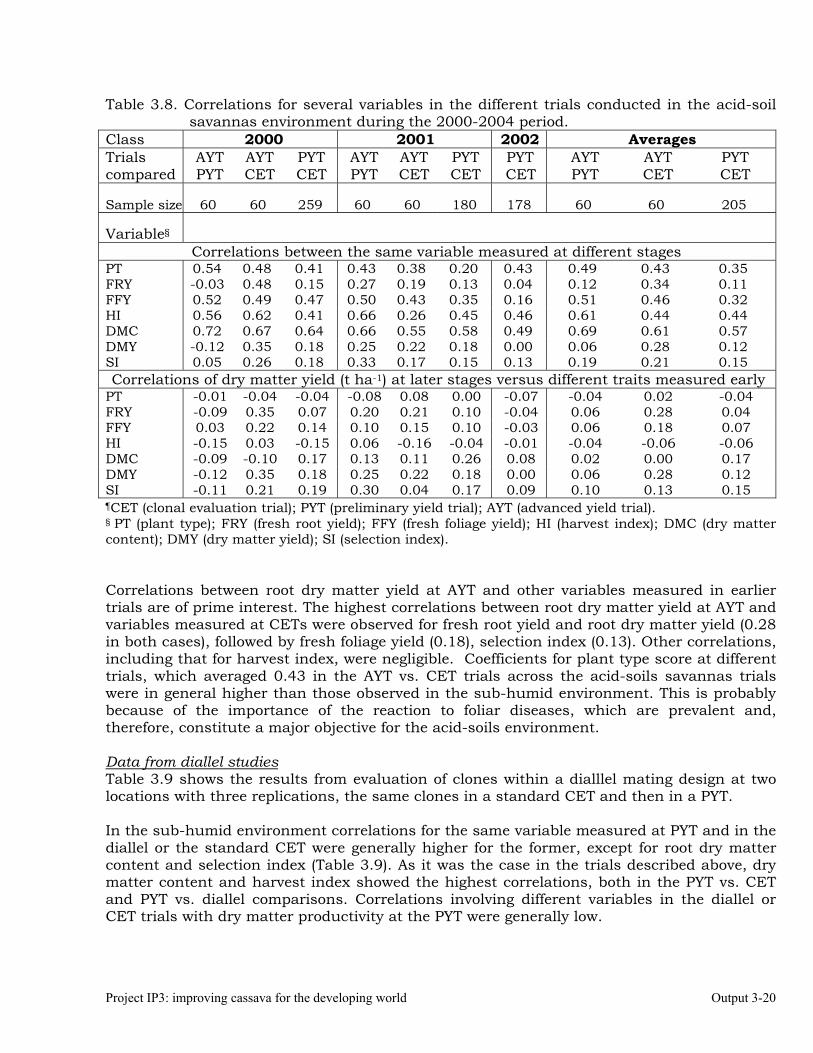
Project IP3: improving cassava for the developing world Output 3-20
Table 3.8. Correlations for several variables in the different trials conducted in the acid-soil savannas environment during the 2000-2004 period.
Class 2000 2001 2002 Averages Trials compared
AYT PYT
AYT CET
PYT CET
AYT PYT
AYT CET
PYT CET
PYT CET
AYT PYT
AYT CET
PYT CET
Sample size 60 60 259 60 60 180 178 60 60 205
Variable§ Correlations between the same variable measured at different stages
PT 0.54 0.48 0.41 0.43 0.38 0.20 0.43 0.49 0.43 0.35 FRY -0.03 0.48 0.15 0.27 0.19 0.13 0.04 0.12 0.34 0.11 FFY 0.52 0.49 0.47 0.50 0.43 0.35 0.16 0.51 0.46 0.32 HI 0.56 0.62 0.41 0.66 0.26 0.45 0.46 0.61 0.44 0.44 DMC 0.72 0.67 0.64 0.66 0.55 0.58 0.49 0.69 0.61 0.57 DMY -0.12 0.35 0.18 0.25 0.22 0.18 0.00 0.06 0.28 0.12 SI 0.05 0.26 0.18 0.33 0.17 0.15 0.13 0.19 0.21 0.15 Correlations of dry matter yield (t ha-1) at later stages versus different traits measured early
PT -0.01 -0.04 -0.04 -0.08 0.08 0.00 -0.07 -0.04 0.02 -0.04 FRY -0.09 0.35 0.07 0.20 0.21 0.10 -0.04 0.06 0.28 0.04 FFY 0.03 0.22 0.14 0.10 0.15 0.10 -0.03 0.06 0.18 0.07 HI -0.15 0.03 -0.15 0.06 -0.16 -0.04 -0.01 -0.04 -0.06 -0.06 DMC -0.09 -0.10 0.17 0.13 0.11 0.26 0.08 0.02 0.00 0.17 DMY -0.12 0.35 0.18 0.25 0.22 0.18 0.00 0.06 0.28 0.12 SI -0.11 0.21 0.19 0.30 0.04 0.17 0.09 0.10 0.13 0.15 ¶CET (clonal evaluation trial); PYT (preliminary yield trial); AYT (advanced yield trial). § PT (plant type); FRY (fresh root yield); FFY (fresh foliage yield); HI (harvest index); DMC (dry matter content); DMY (dry matter yield); SI (selection index). Correlations between root dry matter yield at AYT and other variables measured in earlier trials are of prime interest. The highest correlations between root dry matter yield at AYT and variables measured at CETs were observed for fresh root yield and root dry matter yield (0.28 in both cases), followed by fresh foliage yield (0.18), selection index (0.13). Other correlations, including that for harvest index, were negligible. Coefficients for plant type score at different trials, which averaged 0.43 in the AYT vs. CET trials across the acid-soils savannas trials were in general higher than those observed in the sub-humid environment. This is probably because of the importance of the reaction to foliar diseases, which are prevalent and, therefore, constitute a major objective for the acid-soils environment. Data from diallel studies Table 3.9 shows the results from evaluation of clones within a dialllel mating design at two locations with three replications, the same clones in a standard CET and then in a PYT. In the sub-humid environment correlations for the same variable measured at PYT and in the diallel or the standard CET were generally higher for the former, except for root dry matter content and selection index (Table 3.9). As it was the case in the trials described above, dry matter content and harvest index showed the highest correlations, both in the PYT vs. CET and PYT vs. diallel comparisons. Correlations involving different variables in the diallel or CET trials with dry matter productivity at the PYT were generally low.
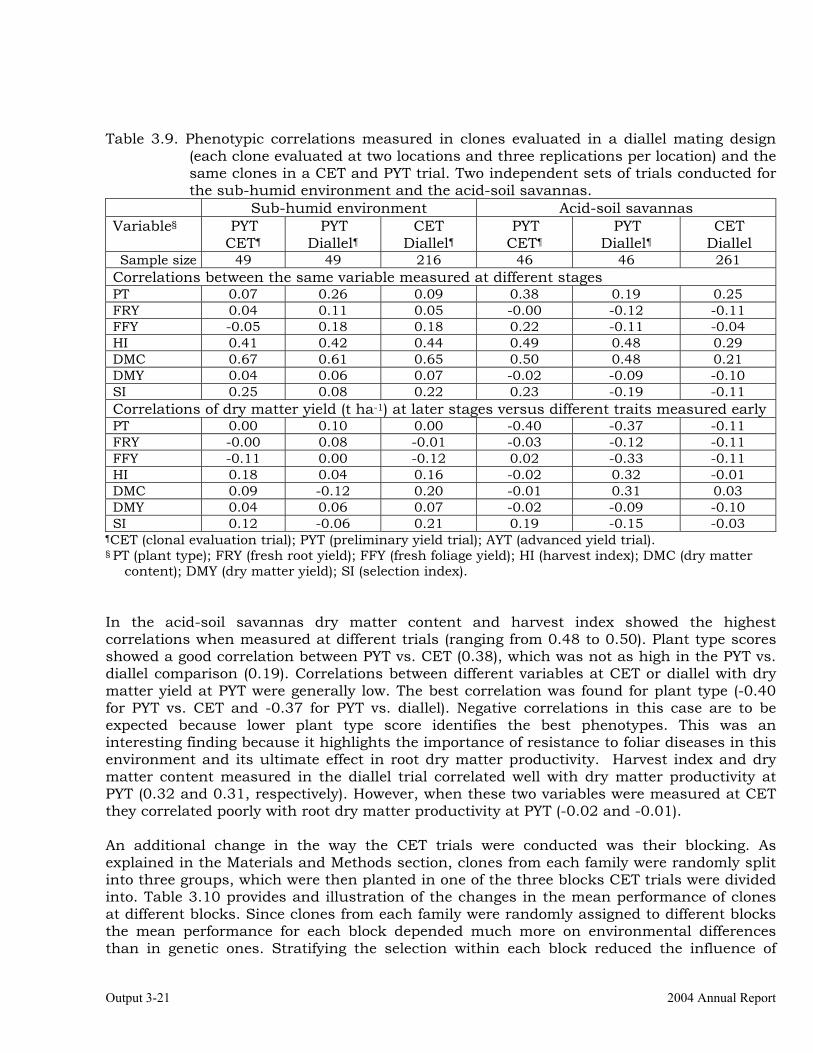
Output 3-21 2004 Annual Report
Table 3.9. Phenotypic correlations measured in clones evaluated in a diallel mating design
(each clone evaluated at two locations and three replications per location) and the same clones in a CET and PYT trial. Two independent sets of trials conducted for the sub-humid environment and the acid-soil savannas.
Sub-humid environment Acid-soil savannas Variable§ PYT
CET¶ PYT
Diallel¶ CET
Diallel¶ PYT
CET¶ PYT
Diallel¶ CET
Diallel Sample size 49 49 216 46 46 261
Correlations between the same variable measured at different stages PT 0.07 0.26 0.09 0.38 0.19 0.25 FRY 0.04 0.11 0.05 -0.00 -0.12 -0.11 FFY -0.05 0.18 0.18 0.22 -0.11 -0.04 HI 0.41 0.42 0.44 0.49 0.48 0.29 DMC 0.67 0.61 0.65 0.50 0.48 0.21 DMY 0.04 0.06 0.07 -0.02 -0.09 -0.10 SI 0.25 0.08 0.22 0.23 -0.19 -0.11 Correlations of dry matter yield (t ha-1) at later stages versus different traits measured early PT 0.00 0.10 0.00 -0.40 -0.37 -0.11 FRY -0.00 0.08 -0.01 -0.03 -0.12 -0.11 FFY -0.11 0.00 -0.12 0.02 -0.33 -0.11 HI 0.18 0.04 0.16 -0.02 0.32 -0.01 DMC 0.09 -0.12 0.20 -0.01 0.31 0.03 DMY 0.04 0.06 0.07 -0.02 -0.09 -0.10 SI 0.12 -0.06 0.21 0.19 -0.15 -0.03
¶CET (clonal evaluation trial); PYT (preliminary yield trial); AYT (advanced yield trial). § PT (plant type); FRY (fresh root yield); FFY (fresh foliage yield); HI (harvest index); DMC (dry matter
content); DMY (dry matter yield); SI (selection index). In the acid-soil savannas dry matter content and harvest index showed the highest correlations when measured at different trials (ranging from 0.48 to 0.50). Plant type scores showed a good correlation between PYT vs. CET (0.38), which was not as high in the PYT vs. diallel comparison (0.19). Correlations between different variables at CET or diallel with dry matter yield at PYT were generally low. The best correlation was found for plant type (-0.40 for PYT vs. CET and -0.37 for PYT vs. diallel). Negative correlations in this case are to be expected because lower plant type score identifies the best phenotypes. This was an interesting finding because it highlights the importance of resistance to foliar diseases in this environment and its ultimate effect in root dry matter productivity. Harvest index and dry matter content measured in the diallel trial correlated well with dry matter productivity at PYT (0.32 and 0.31, respectively). However, when these two variables were measured at CET they correlated poorly with root dry matter productivity at PYT (-0.02 and -0.01). An additional change in the way the CET trials were conducted was their blocking. As explained in the Materials and Methods section, clones from each family were randomly split into three groups, which were then planted in one of the three blocks CET trials were divided into. Table 3.10 provides and illustration of the changes in the mean performance of clones at different blocks. Since clones from each family were randomly assigned to different blocks the mean performance for each block depended much more on environmental differences than in genetic ones. Stratifying the selection within each block reduced the influence of
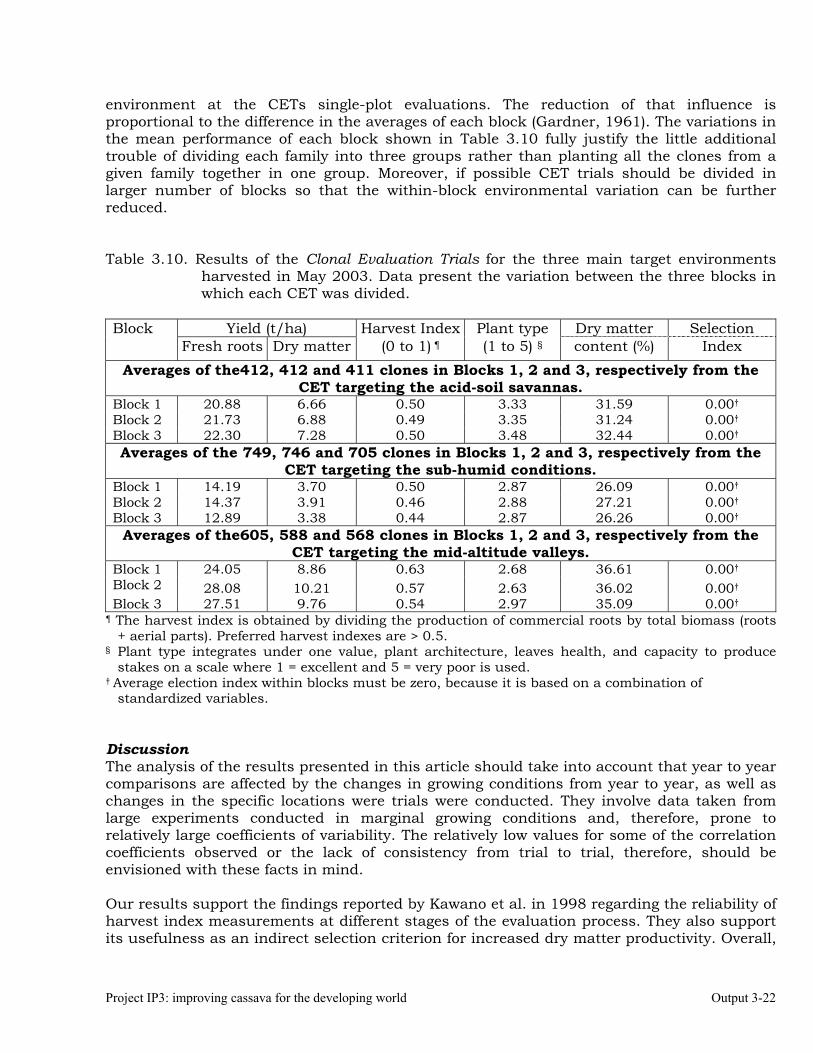
Project IP3: improving cassava for the developing world Output 3-22
environment at the CETs single-plot evaluations. The reduction of that influence is proportional to the difference in the averages of each block (Gardner, 1961). The variations in the mean performance of each block shown in Table 3.10 fully justify the little additional trouble of dividing each family into three groups rather than planting all the clones from a given family together in one group. Moreover, if possible CET trials should be divided in larger number of blocks so that the within-block environmental variation can be further reduced. Table 3.10. Results of the Clonal Evaluation Trials for the three main target environments
harvested in May 2003. Data present the variation between the three blocks in which each CET was divided.
Block Yield (t/ha) Harvest Index Plant type Dry matter Selection Fresh roots Dry matter (0 to 1) ¶ (1 to 5) § content (%) Index
Averages of the412, 412 and 411 clones in Blocks 1, 2 and 3, respectively from the CET targeting the acid-soil savannas.
Block 1 20.88 6.66 0.50 3.33 31.59 0.00† Block 2 21.73 6.88 0.49 3.35 31.24 0.00† Block 3 22.30 7.28 0.50 3.48 32.44 0.00† Averages of the 749, 746 and 705 clones in Blocks 1, 2 and 3, respectively from the
CET targeting the sub-humid conditions. Block 1 14.19 3.70 0.50 2.87 26.09 0.00† Block 2 14.37 3.91 0.46 2.88 27.21 0.00† Block 3 12.89 3.38 0.44 2.87 26.26 0.00†
Averages of the605, 588 and 568 clones in Blocks 1, 2 and 3, respectively from the CET targeting the mid-altitude valleys.
Block 1 24.05 8.86 0.63 2.68 36.61 0.00† Block 2 28.08 10.21 0.57 2.63 36.02 0.00† Block 3 27.51 9.76 0.54 2.97 35.09 0.00†
¶ The harvest index is obtained by dividing the production of commercial roots by total biomass (roots + aerial parts). Preferred harvest indexes are > 0.5.
§ Plant type integrates under one value, plant architecture, leaves health, and capacity to produce stakes on a scale where 1 = excellent and 5 = very poor is used.
† Average election index within blocks must be zero, because it is based on a combination of standardized variables.
Discussion The analysis of the results presented in this article should take into account that year to year comparisons are affected by the changes in growing conditions from year to year, as well as changes in the specific locations were trials were conducted. They involve data taken from large experiments conducted in marginal growing conditions and, therefore, prone to relatively large coefficients of variability. The relatively low values for some of the correlation coefficients observed or the lack of consistency from trial to trial, therefore, should be envisioned with these facts in mind. Our results support the findings reported by Kawano et al. in 1998 regarding the reliability of harvest index measurements at different stages of the evaluation process. They also support its usefulness as an indirect selection criterion for increased dry matter productivity. Overall,
Output 3-23 2004 Annual Report
however, the importance of this variable in our work is lower that that reported previously. There are two feasible explanations for this situation: i) harvest index has been improved during the last twenty years and cassava breeding populations are now nearing the ideal harvest index level, compared with the populations reported in Kawano and co-workers’ article; ii) changes in planting distances increased the within clone competition and reduced the between clone competition, therefore reducing one of the problems that harvest index could help overcoming. Changes introduced in the planting distances may also explain the better relationship between fresh root yield at CETs and dry root yield at later stages of the evaluation process, compared with previous reports. This is the case, for instance in the acid soil environment were fresh root yield at CET had a much better average correlation with dry root yield at AYT (0.28) than harvest index (-0.06). Dry matter content was consistently the most reliable trait measured at different stages of the evaluation process. Our results indicate that high dry matter content can be properly identified and selected for at the CET trials. Dry matter content is important because of its direct effect of dry matter productivity. It is also important because cassava-processing industries (starch and root drying for animal feed) would frequently penalize or reject roots with lower than optimum dry matter contents. These results justify the additional costs involved in measuring dry matter content in large trials such as CETs. A major consequence of this finding is the future increase in the relative value of dry matter content in the selection index used by the cassava-breeding project at CIAT at CETs The comparison of data from the diallels and the normal recurrent selections suggests that there is not much advantage in splitting the CET trials so that the plants of each clone can be planted in replicated trials in more than one location. It is clear that results such as those from the diallels are less affected by genotype by environment interactions. However, the amount of data taken and handled is six-fold larger (individual data from each of six plants rather than totals of a six-plant row) and thus prone to larger experimental errors and more frequent mistakes. There was no clear evidence that the additional complications of planting CETs in ways similar to the diallels approach would result in significant gains in the precision of the information. The analysis of the relationship between variables at different stages of the selection process through their correlation coefficients should be taken with caution. One major change throughout the selection process is, precisely, the selection of genotypes, which unavoidably will have an effect on the performances of the successive trials and may eventually affect the values of the correlations obtained. The number of genotypes in later stages of selection is considerably smaller than in early stages of selection, so there are fewer degrees of freedom for their respective correlations. The magnitude and nature of this influence, however, is difficult to assess. The stratification of CETs into three blocks was useful for highlighting the large environmental variation within these large trials. The little additional effort to split clones from a given family into three groups to be randomly allocated to each block is justified based on the large differences in the averages measured at each block. Furthermore, this approach allows for a replication effect for family means and a more precise estimation of their mean performance, which in turn results in more reliable data on the general combining ability of parental lines used to generate each CET.

Project IP3: improving cassava for the developing world Output 3-24
References Allem, A.C. 2002. The originis and taxonomy of cassava. In: Hillocks, R.J., Tres, J.M. and Bellotti, A.C.
(Eds.). Cassava: biology, production and utilization. CABI Publishing, pp 1-16. Bellotti, A.C. 2002. Arthropod pests. In: Hillocks, R.J., J.M. Thresh and A.C. Bellotti (Eds.). Cassava:
biology, production and utilization. CABI Publishing pp 209-235. CIAT (International Center for Tropical Agriculture), 2003. Annual Report Project IP3: Improved
cassava for the developing world. Cali, Colombia. Cock, J., 1985. Cassava. New potential for a neglected crop. Westview Press. Boulder, CO., USA. El-Sharkawy, M.A. 1993. Drought-tolerant cassava for Africa, Asia and Latin America. BioScience
43:441-451. FAO / FIDA, 2000. La economía mundial de la yuca. Hechos, tendencias y perspectivas. Fondo
Internacional de Desarrollo Agrícola. Organización de las Naciones Unidas para la Agricultura y la Alimentación. Roma, Italy.
Gardner, C.O. 1961. An evaluation of effects of mass selection and seed irradiation with thermal neutrons on yields of corn. Crop Sci. 1:241-245.
Hahn, S.K., E.R. Terry, K. Leuschner, I.O. Akobundu, C. Okali, and R. Lal. 1979. Cassava improvement in Africa. Field Crops Research 2: 193-226.
Hallauer, A.R. and J.B. Miranda Fo. 1988. Quantitative Genetics in Maize Breeding. Second Edition. Iowa State University Press. USA.
Iglesias, C.A., J. Mayer, J., A.L. Chávez, and F. Calle. 1997. Genetic potential and stability of carotene content in cassava roots. Euphytica 94:367-373.
Jennings D.L and C. Iglesias. 2002. Breeding for crop improvement. In: Hillocks, R.J., J.M. Thresh and A.C. Bellotti (Eds.). Cassava: biology, production and utilization. CABI Publishing pp 149-166.
Johnson, N.L., V.M. Manyong, A.G.O. Dixon and D. Pachico. The impact of IARC Genetic improvement programmes on cassava. In: R.E. Evenson and D. Gollin (Eds.) Crop variety improvement and its effect on productivity. CABI Publishing. Wallingford, UK. p337-355.
Kawano, K. 1980. Cassava. In: Fehr W.R. and Hadley H.H. (eds) Hybridization of Crop Plants. ASA, CSSA. Madison, Wisconsin, pp 225-233.
Kawano, K. 2003. Thirty years of cassava breeding for productivity- biological and social factors for success. Crop Sci. 43:1325-1335.
Kawano K, K. Narintaraporn, P. Narintaraporn, S. Sarakarn, A. Limsila, J. Limsila, D. Suparhan, V. Sarawat, and W. Watananonta. 1998. Yield improvement in a multistage breeding program for cassava. Crop Sci 38 (2): 325-332.
Lirola Terrez, A. 1997. Microsoft Office 97. Mc Graw-Hill/Interamericana de España Publishers. P 99-172
Pandey, S. and C.O. Gardner. 1992. Recurrent selection for population, variety and hybrid improvement of tropical maize. Advances in Agronomy 48:1-87.
Olsen, K.M. and B.A. Schaal. 2001. Microsatellite variation in cassava (Manihot esculenta, Euphorbiaceae) and its wild relatives: further evidence for a southern Amanzonian origin of domestication. American Journal of Botany 88:131-142.
Scott, G.J., M.K. Rosegrant, and C. Ringler. 2000. Global projections for root and tuber crops to the year 2020. Food Policy 25:561-597.
Steel, R.G.D. and J. H. Torrie. 1960. Principles and procedures of statistics. McGraw-Hill Book Company. New York, Toronto, London. 481 pp
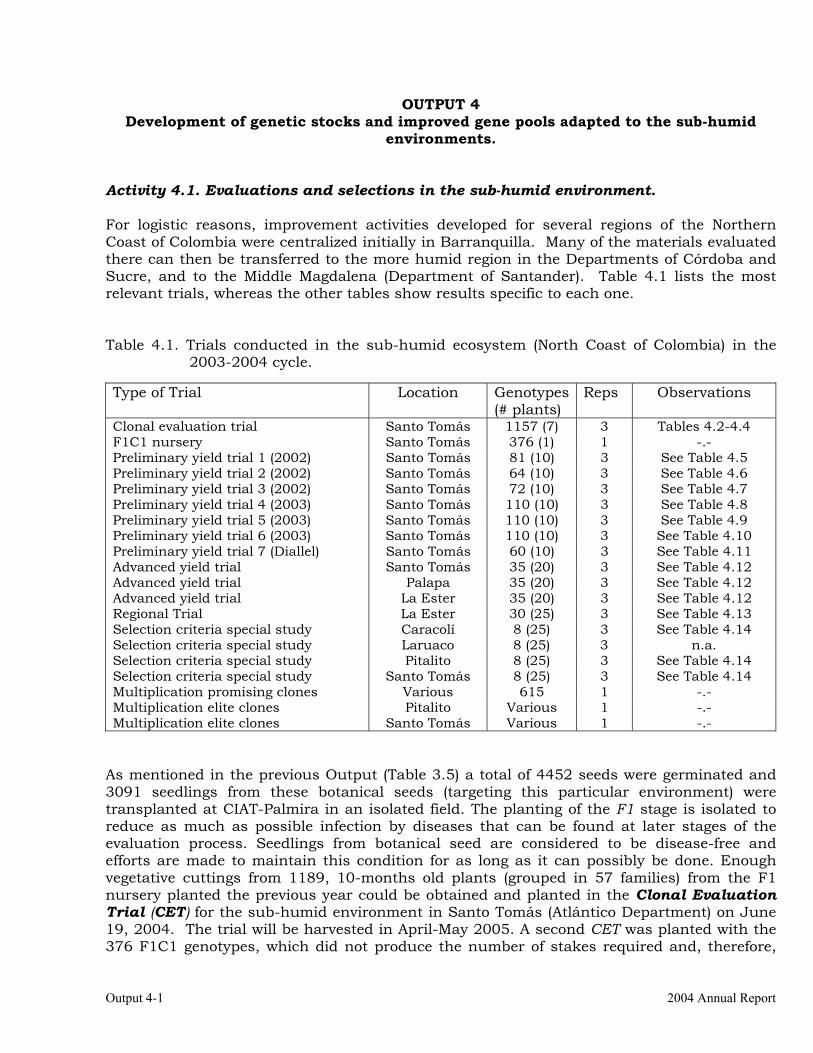
Output 4-1 2004 Annual Report
OUTPUT 4 Development of genetic stocks and improved gene pools adapted to the sub-humid
environments. Activity 4.1. Evaluations and selections in the sub-humid environment. For logistic reasons, improvement activities developed for several regions of the Northern Coast of Colombia were centralized initially in Barranquilla. Many of the materials evaluated there can then be transferred to the more humid region in the Departments of Córdoba and Sucre, and to the Middle Magdalena (Department of Santander). Table 4.1 lists the most relevant trials, whereas the other tables show results specific to each one. Table 4.1. Trials conducted in the sub-humid ecosystem (North Coast of Colombia) in the
2003-2004 cycle. Type of Trial Location Genotypes
(# plants) Reps Observations
Clonal evaluation trial Santo Tomás 1157 (7) 3 Tables 4.2-4.4 F1C1 nursery Santo Tomás 376 (1) 1 -.- Preliminary yield trial 1 (2002) Santo Tomás 81 (10) 3 See Table 4.5 Preliminary yield trial 2 (2002) Santo Tomás 64 (10) 3 See Table 4.6 Preliminary yield trial 3 (2002) Santo Tomás 72 (10) 3 See Table 4.7 Preliminary yield trial 4 (2003) Santo Tomás 110 (10) 3 See Table 4.8 Preliminary yield trial 5 (2003) Santo Tomás 110 (10) 3 See Table 4.9 Preliminary yield trial 6 (2003) Santo Tomás 110 (10) 3 See Table 4.10 Preliminary yield trial 7 (Diallel) Santo Tomás 60 (10) 3 See Table 4.11 Advanced yield trial Santo Tomás 35 (20) 3 See Table 4.12 Advanced yield trial Palapa 35 (20) 3 See Table 4.12 Advanced yield trial La Ester 35 (20) 3 See Table 4.12 Regional Trial La Ester 30 (25) 3 See Table 4.13 Selection criteria special study Caracolí 8 (25) 3 See Table 4.14 Selection criteria special study Laruaco 8 (25) 3 n.a. Selection criteria special study Pitalito 8 (25) 3 See Table 4.14 Selection criteria special study Santo Tomás 8 (25) 3 See Table 4.14 Multiplication promising clones Various 615 1 -.- Multiplication elite clones Pitalito Various 1 -.- Multiplication elite clones Santo Tomás Various 1 -.-
As mentioned in the previous Output (Table 3.5) a total of 4452 seeds were germinated and 3091 seedlings from these botanical seeds (targeting this particular environment) were transplanted at CIAT-Palmira in an isolated field. The planting of the F1 stage is isolated to reduce as much as possible infection by diseases that can be found at later stages of the evaluation process. Seedlings from botanical seed are considered to be disease-free and efforts are made to maintain this condition for as long as it can possibly be done. Enough vegetative cuttings from 1189, 10-months old plants (grouped in 57 families) from the F1 nursery planted the previous year could be obtained and planted in the Clonal Evaluation Trial (CET) for the sub-humid environment in Santo Tomás (Atlántico Department) on June 19, 2004. The trial will be harvested in April-May 2005. A second CET was planted with the 376 F1C1 genotypes, which did not produce the number of stakes required and, therefore,
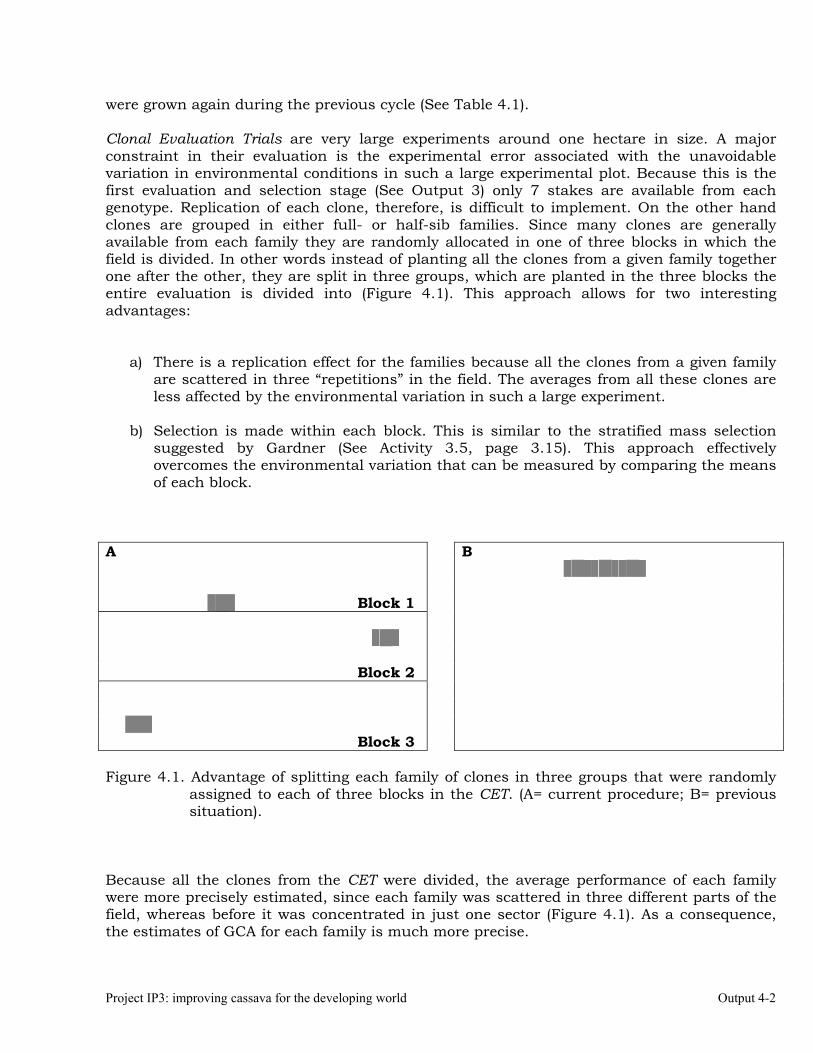
Project IP3: improving cassava for the developing world Output 4-2
were grown again during the previous cycle (See Table 4.1). Clonal Evaluation Trials are very large experiments around one hectare in size. A major constraint in their evaluation is the experimental error associated with the unavoidable variation in environmental conditions in such a large experimental plot. Because this is the first evaluation and selection stage (See Output 3) only 7 stakes are available from each genotype. Replication of each clone, therefore, is difficult to implement. On the other hand clones are grouped in either full- or half-sib families. Since many clones are generally available from each family they are randomly allocated in one of three blocks in which the field is divided. In other words instead of planting all the clones from a given family together one after the other, they are split in three groups, which are planted in the three blocks the entire evaluation is divided into (Figure 4.1). This approach allows for two interesting advantages:
a) There is a replication effect for the families because all the clones from a given family are scattered in three “repetitions” in the field. The averages from all these clones are less affected by the environmental variation in such a large experiment.
b) Selection is made within each block. This is similar to the stratified mass selection
suggested by Gardner (See Activity 3.5, page 3.15). This approach effectively overcomes the environmental variation that can be measured by comparing the means of each block.
A B Block 1 Block 2 Block 3 Figure 4.1. Advantage of splitting each family of clones in three groups that were randomly
assigned to each of three blocks in the CET. (A= current procedure; B= previous situation).
Because all the clones from the CET were divided, the average performance of each family were more precisely estimated, since each family was scattered in three different parts of the field, whereas before it was concentrated in just one sector (Figure 4.1). As a consequence, the estimates of GCA for each family is much more precise.
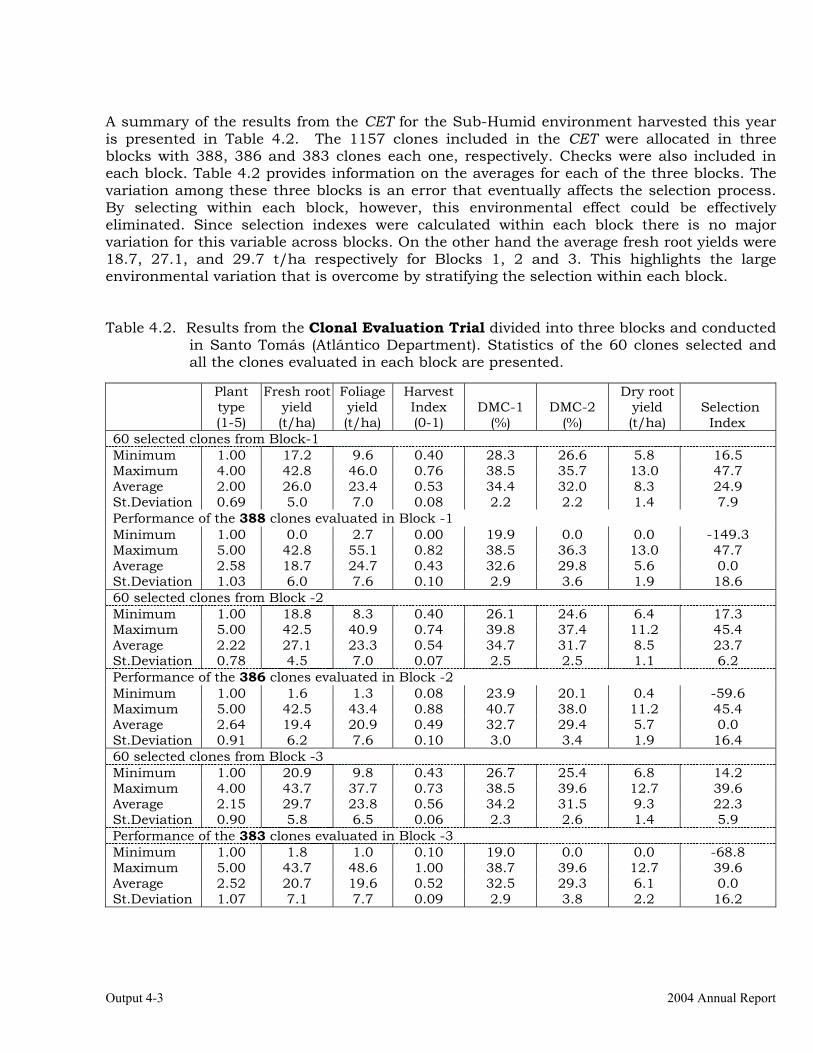
Output 4-3 2004 Annual Report
A summary of the results from the CET for the Sub-Humid environment harvested this year is presented in Table 4.2. The 1157 clones included in the CET were allocated in three blocks with 388, 386 and 383 clones each one, respectively. Checks were also included in each block. Table 4.2 provides information on the averages for each of the three blocks. The variation among these three blocks is an error that eventually affects the selection process. By selecting within each block, however, this environmental effect could be effectively eliminated. Since selection indexes were calculated within each block there is no major variation for this variable across blocks. On the other hand the average fresh root yields were 18.7, 27.1, and 29.7 t/ha respectively for Blocks 1, 2 and 3. This highlights the large environmental variation that is overcome by stratifying the selection within each block. Table 4.2. Results from the Clonal Evaluation Trial divided into three blocks and conducted
in Santo Tomás (Atlántico Department). Statistics of the 60 clones selected and all the clones evaluated in each block are presented.
Plant type (1-5)
Fresh root yield (t/ha)
Foliage yield (t/ha)
Harvest Index (0-1)
DMC-1 (%)
DMC-2 (%)
Dry root yield (t/ha)
Selection Index
60 selected clones from Block-1 Minimum 1.00 17.2 9.6 0.40 28.3 26.6 5.8 16.5 Maximum 4.00 42.8 46.0 0.76 38.5 35.7 13.0 47.7 Average 2.00 26.0 23.4 0.53 34.4 32.0 8.3 24.9 St.Deviation 0.69 5.0 7.0 0.08 2.2 2.2 1.4 7.9 Performance of the 388 clones evaluated in Block -1 Minimum 1.00 0.0 2.7 0.00 19.9 0.0 0.0 -149.3 Maximum 5.00 42.8 55.1 0.82 38.5 36.3 13.0 47.7 Average 2.58 18.7 24.7 0.43 32.6 29.8 5.6 0.0 St.Deviation 1.03 6.0 7.6 0.10 2.9 3.6 1.9 18.6 60 selected clones from Block -2 Minimum 1.00 18.8 8.3 0.40 26.1 24.6 6.4 17.3 Maximum 5.00 42.5 40.9 0.74 39.8 37.4 11.2 45.4 Average 2.22 27.1 23.3 0.54 34.7 31.7 8.5 23.7 St.Deviation 0.78 4.5 7.0 0.07 2.5 2.5 1.1 6.2 Performance of the 386 clones evaluated in Block -2 Minimum 1.00 1.6 1.3 0.08 23.9 20.1 0.4 -59.6 Maximum 5.00 42.5 43.4 0.88 40.7 38.0 11.2 45.4 Average 2.64 19.4 20.9 0.49 32.7 29.4 5.7 0.0 St.Deviation 0.91 6.2 7.6 0.10 3.0 3.4 1.9 16.4 60 selected clones from Block -3 Minimum 1.00 20.9 9.8 0.43 26.7 25.4 6.8 14.2 Maximum 4.00 43.7 37.7 0.73 38.5 39.6 12.7 39.6 Average 2.15 29.7 23.8 0.56 34.2 31.5 9.3 22.3 St.Deviation 0.90 5.8 6.5 0.06 2.3 2.6 1.4 5.9 Performance of the 383 clones evaluated in Block -3 Minimum 1.00 1.8 1.0 0.10 19.0 0.0 0.0 -68.8 Maximum 5.00 43.7 48.6 1.00 38.7 39.6 12.7 39.6 Average 2.52 20.7 19.6 0.52 32.5 29.3 6.1 0.0 St.Deviation 1.07 7.1 7.7 0.09 2.9 3.8 2.2 16.2
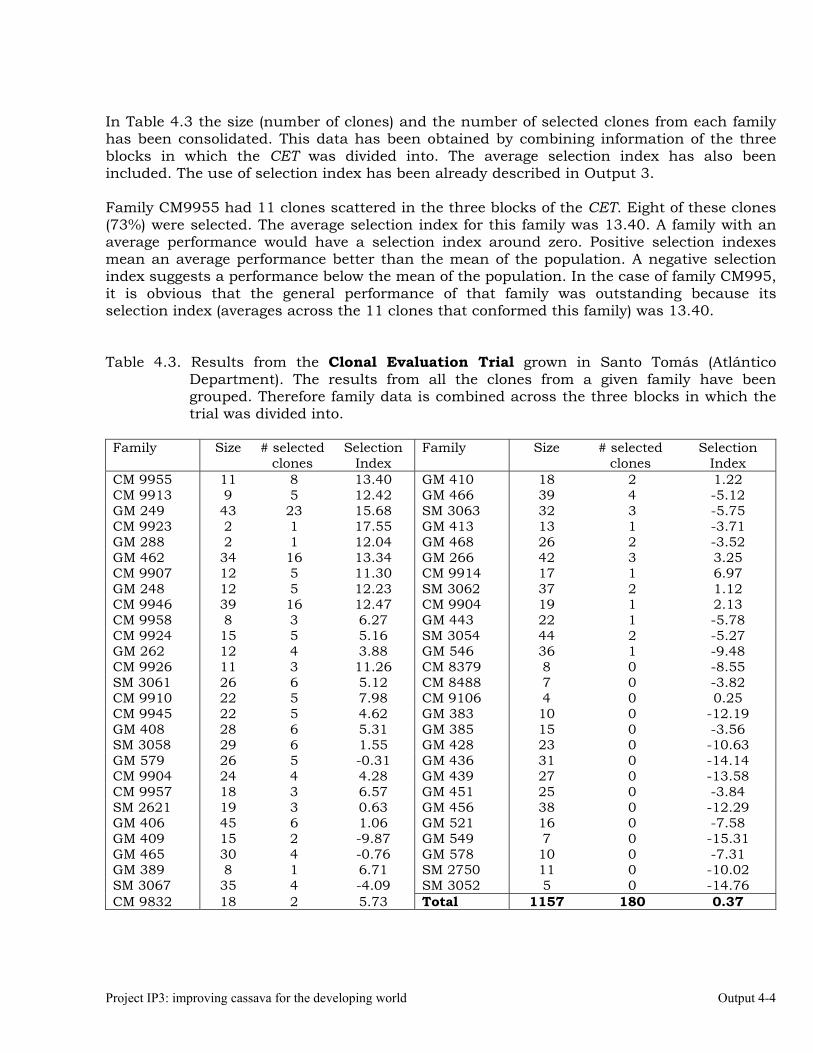
Project IP3: improving cassava for the developing world Output 4-4
In Table 4.3 the size (number of clones) and the number of selected clones from each family has been consolidated. This data has been obtained by combining information of the three blocks in which the CET was divided into. The average selection index has also been included. The use of selection index has been already described in Output 3. Family CM9955 had 11 clones scattered in the three blocks of the CET. Eight of these clones (73%) were selected. The average selection index for this family was 13.40. A family with an average performance would have a selection index around zero. Positive selection indexes mean an average performance better than the mean of the population. A negative selection index suggests a performance below the mean of the population. In the case of family CM995, it is obvious that the general performance of that family was outstanding because its selection index (averages across the 11 clones that conformed this family) was 13.40. Table 4.3. Results from the Clonal Evaluation Trial grown in Santo Tomás (Atlántico
Department). The results from all the clones from a given family have been grouped. Therefore family data is combined across the three blocks in which the trial was divided into.
Family Size # selected
clones Selection
Index Family Size # selected
clones Selection
Index CM 9955 11 8 13.40 GM 410 18 2 1.22 CM 9913 9 5 12.42 GM 466 39 4 -5.12 GM 249 43 23 15.68 SM 3063 32 3 -5.75 CM 9923 2 1 17.55 GM 413 13 1 -3.71 GM 288 2 1 12.04 GM 468 26 2 -3.52 GM 462 34 16 13.34 GM 266 42 3 3.25 CM 9907 12 5 11.30 CM 9914 17 1 6.97 GM 248 12 5 12.23 SM 3062 37 2 1.12 CM 9946 39 16 12.47 CM 9904 19 1 2.13 CM 9958 8 3 6.27 GM 443 22 1 -5.78 CM 9924 15 5 5.16 SM 3054 44 2 -5.27 GM 262 12 4 3.88 GM 546 36 1 -9.48 CM 9926 11 3 11.26 CM 8379 8 0 -8.55 SM 3061 26 6 5.12 CM 8488 7 0 -3.82 CM 9910 22 5 7.98 CM 9106 4 0 0.25 CM 9945 22 5 4.62 GM 383 10 0 -12.19 GM 408 28 6 5.31 GM 385 15 0 -3.56 SM 3058 29 6 1.55 GM 428 23 0 -10.63 GM 579 26 5 -0.31 GM 436 31 0 -14.14 CM 9904 24 4 4.28 GM 439 27 0 -13.58 CM 9957 18 3 6.57 GM 451 25 0 -3.84 SM 2621 19 3 0.63 GM 456 38 0 -12.29 GM 406 45 6 1.06 GM 521 16 0 -7.58 GM 409 15 2 -9.87 GM 549 7 0 -15.31 GM 465 30 4 -0.76 GM 578 10 0 -7.31 GM 389 8 1 6.71 SM 2750 11 0 -10.02 SM 3067 35 4 -4.09 SM 3052 5 0 -14.76 CM 9832 18 2 5.73 Total 1157 180 0.37
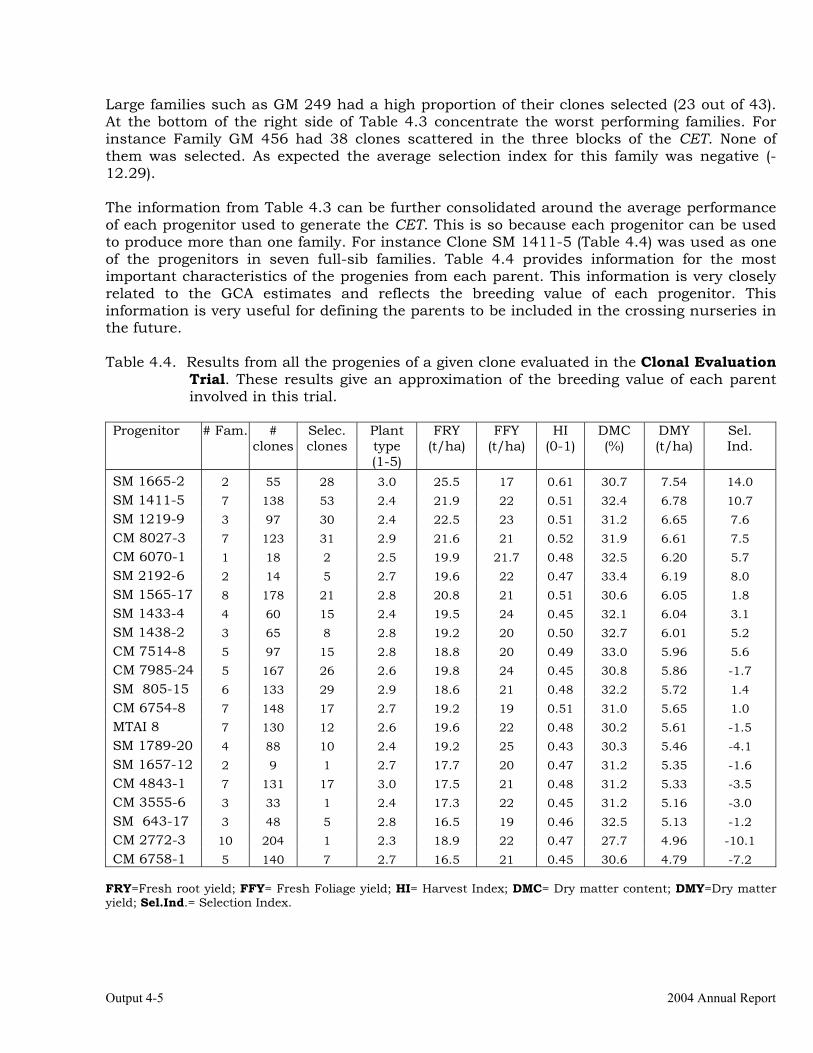
Output 4-5 2004 Annual Report
Large families such as GM 249 had a high proportion of their clones selected (23 out of 43). At the bottom of the right side of Table 4.3 concentrate the worst performing families. For instance Family GM 456 had 38 clones scattered in the three blocks of the CET. None of them was selected. As expected the average selection index for this family was negative (-12.29). The information from Table 4.3 can be further consolidated around the average performance of each progenitor used to generate the CET. This is so because each progenitor can be used to produce more than one family. For instance Clone SM 1411-5 (Table 4.4) was used as one of the progenitors in seven full-sib families. Table 4.4 provides information for the most important characteristics of the progenies from each parent. This information is very closely related to the GCA estimates and reflects the breeding value of each progenitor. This information is very useful for defining the parents to be included in the crossing nurseries in the future. Table 4.4. Results from all the progenies of a given clone evaluated in the Clonal Evaluation
Trial. These results give an approximation of the breeding value of each parent involved in this trial.
Progenitor # Fam. #
clones Selec. clones
Plant type (1-5)
FRY (t/ha)
FFY (t/ha)
HI (0-1)
DMC (%)
DMY (t/ha)
Sel. Ind.
SM 1665-2 2 55 28 3.0 25.5 17 0.61 30.7 7.54 14.0 SM 1411-5 7 138 53 2.4 21.9 22 0.51 32.4 6.78 10.7 SM 1219-9 3 97 30 2.4 22.5 23 0.51 31.2 6.65 7.6 CM 8027-3 7 123 31 2.9 21.6 21 0.52 31.9 6.61 7.5 CM 6070-1 1 18 2 2.5 19.9 21.7 0.48 32.5 6.20 5.7 SM 2192-6 2 14 5 2.7 19.6 22 0.47 33.4 6.19 8.0 SM 1565-17 8 178 21 2.8 20.8 21 0.51 30.6 6.05 1.8 SM 1433-4 4 60 15 2.4 19.5 24 0.45 32.1 6.04 3.1 SM 1438-2 3 65 8 2.8 19.2 20 0.50 32.7 6.01 5.2 CM 7514-8 5 97 15 2.8 18.8 20 0.49 33.0 5.96 5.6 CM 7985-24 5 167 26 2.6 19.8 24 0.45 30.8 5.86 -1.7 SM 805-15 6 133 29 2.9 18.6 21 0.48 32.2 5.72 1.4 CM 6754-8 7 148 17 2.7 19.2 19 0.51 31.0 5.65 1.0 MTAI 8 7 130 12 2.6 19.6 22 0.48 30.2 5.61 -1.5 SM 1789-20 4 88 10 2.4 19.2 25 0.43 30.3 5.46 -4.1 SM 1657-12 2 9 1 2.7 17.7 20 0.47 31.2 5.35 -1.6 CM 4843-1 7 131 17 3.0 17.5 21 0.48 31.2 5.33 -3.5 CM 3555-6 3 33 1 2.4 17.3 22 0.45 31.2 5.16 -3.0 SM 643-17 3 48 5 2.8 16.5 19 0.46 32.5 5.13 -1.2 CM 2772-3 10 204 1 2.3 18.9 22 0.47 27.7 4.96 -10.1 CM 6758-1 5 140 7 2.7 16.5 21 0.45 30.6 4.79 -7.2
FRY=Fresh root yield; FFY= Fresh Foliage yield; HI= Harvest Index; DMC= Dry matter content; DMY=Dry matter yield; Sel.Ind.= Selection Index.
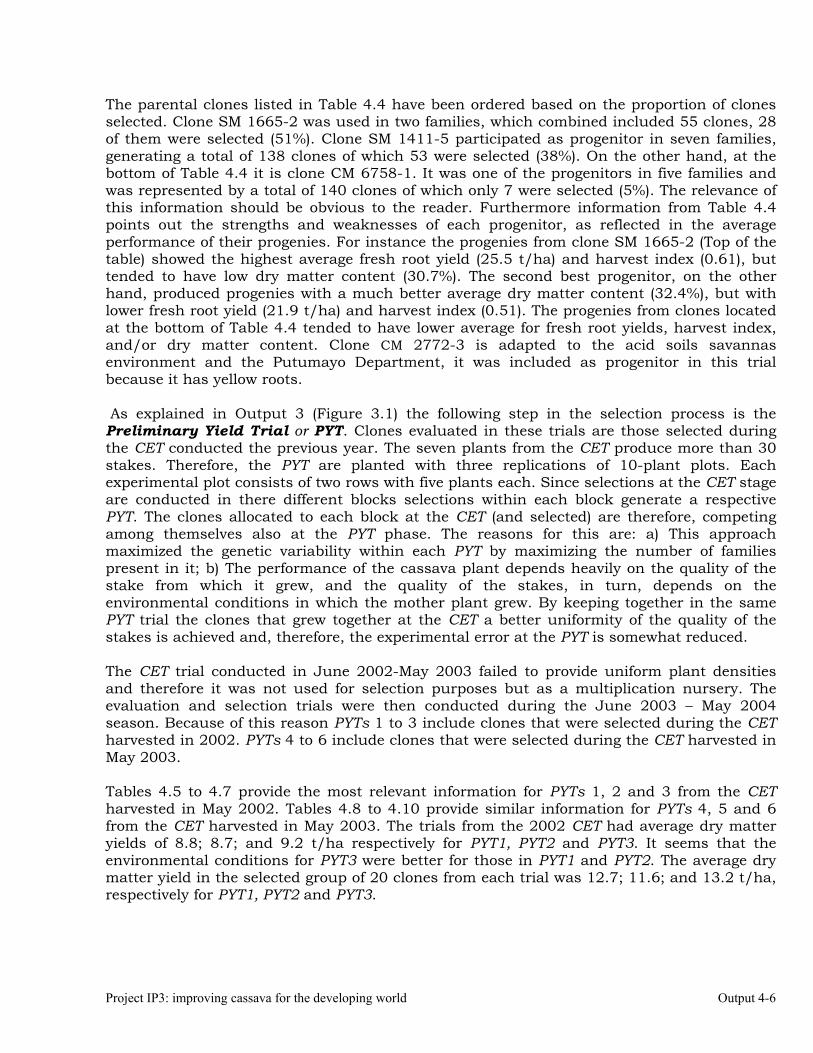
Project IP3: improving cassava for the developing world Output 4-6
The parental clones listed in Table 4.4 have been ordered based on the proportion of clones selected. Clone SM 1665-2 was used in two families, which combined included 55 clones, 28 of them were selected (51%). Clone SM 1411-5 participated as progenitor in seven families, generating a total of 138 clones of which 53 were selected (38%). On the other hand, at the bottom of Table 4.4 it is clone CM 6758-1. It was one of the progenitors in five families and was represented by a total of 140 clones of which only 7 were selected (5%). The relevance of this information should be obvious to the reader. Furthermore information from Table 4.4 points out the strengths and weaknesses of each progenitor, as reflected in the average performance of their progenies. For instance the progenies from clone SM 1665-2 (Top of the table) showed the highest average fresh root yield (25.5 t/ha) and harvest index (0.61), but tended to have low dry matter content (30.7%). The second best progenitor, on the other hand, produced progenies with a much better average dry matter content (32.4%), but with lower fresh root yield (21.9 t/ha) and harvest index (0.51). The progenies from clones located at the bottom of Table 4.4 tended to have lower average for fresh root yields, harvest index, and/or dry matter content. Clone CM 2772-3 is adapted to the acid soils savannas environment and the Putumayo Department, it was included as progenitor in this trial because it has yellow roots. As explained in Output 3 (Figure 3.1) the following step in the selection process is the Preliminary Yield Trial or PYT. Clones evaluated in these trials are those selected during the CET conducted the previous year. The seven plants from the CET produce more than 30 stakes. Therefore, the PYT are planted with three replications of 10-plant plots. Each experimental plot consists of two rows with five plants each. Since selections at the CET stage are conducted in there different blocks selections within each block generate a respective PYT. The clones allocated to each block at the CET (and selected) are therefore, competing among themselves also at the PYT phase. The reasons for this are: a) This approach maximized the genetic variability within each PYT by maximizing the number of families present in it; b) The performance of the cassava plant depends heavily on the quality of the stake from which it grew, and the quality of the stakes, in turn, depends on the environmental conditions in which the mother plant grew. By keeping together in the same PYT trial the clones that grew together at the CET a better uniformity of the quality of the stakes is achieved and, therefore, the experimental error at the PYT is somewhat reduced. The CET trial conducted in June 2002-May 2003 failed to provide uniform plant densities and therefore it was not used for selection purposes but as a multiplication nursery. The evaluation and selection trials were then conducted during the June 2003 – May 2004 season. Because of this reason PYTs 1 to 3 include clones that were selected during the CET harvested in 2002. PYTs 4 to 6 include clones that were selected during the CET harvested in May 2003. Tables 4.5 to 4.7 provide the most relevant information for PYTs 1, 2 and 3 from the CET harvested in May 2002. Tables 4.8 to 4.10 provide similar information for PYTs 4, 5 and 6 from the CET harvested in May 2003. The trials from the 2002 CET had average dry matter yields of 8.8; 8.7; and 9.2 t/ha respectively for PYT1, PYT2 and PYT3. It seems that the environmental conditions for PYT3 were better for those in PYT1 and PYT2. The average dry matter yield in the selected group of 20 clones from each trial was 12.7; 11.6; and 13.2 t/ha, respectively for PYT1, PYT2 and PYT3.
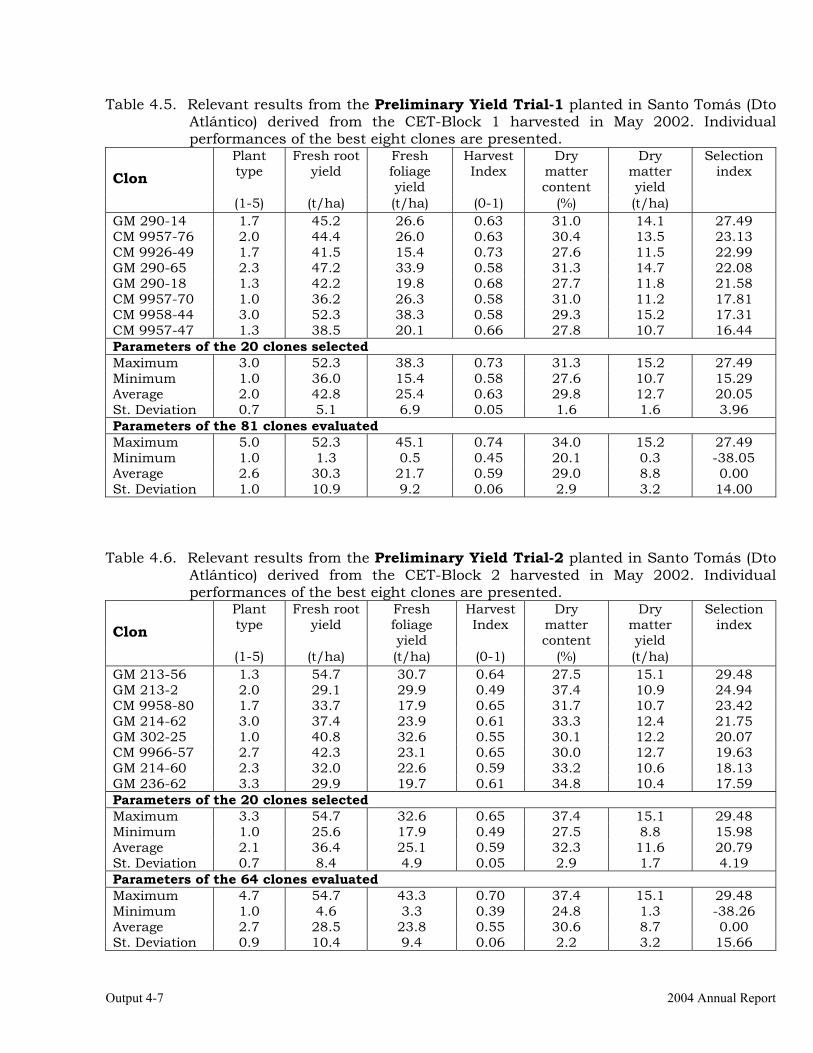
Output 4-7 2004 Annual Report
Table 4.5. Relevant results from the Preliminary Yield Trial-1 planted in Santo Tomás (Dto Atlántico) derived from the CET-Block 1 harvested in May 2002. Individual performances of the best eight clones are presented.
Plant type
Fresh root yield
Fresh foliage yield
Harvest Index
Dry matter content
Dry matter yield
Selection index
Clon
(1-5) (t/ha) (t/ha) (0-1) (%) (t/ha) GM 290-14 1.7 45.2 26.6 0.63 31.0 14.1 27.49 CM 9957-76 2.0 44.4 26.0 0.63 30.4 13.5 23.13 CM 9926-49 1.7 41.5 15.4 0.73 27.6 11.5 22.99 GM 290-65 2.3 47.2 33.9 0.58 31.3 14.7 22.08 GM 290-18 1.3 42.2 19.8 0.68 27.7 11.8 21.58 CM 9957-70 1.0 36.2 26.3 0.58 31.0 11.2 17.81 CM 9958-44 3.0 52.3 38.3 0.58 29.3 15.2 17.31 CM 9957-47 1.3 38.5 20.1 0.66 27.8 10.7 16.44 Parameters of the 20 clones selected Maximum 3.0 52.3 38.3 0.73 31.3 15.2 27.49 Minimum 1.0 36.0 15.4 0.58 27.6 10.7 15.29 Average 2.0 42.8 25.4 0.63 29.8 12.7 20.05 St. Deviation 0.7 5.1 6.9 0.05 1.6 1.6 3.96 Parameters of the 81 clones evaluated Maximum 5.0 52.3 45.1 0.74 34.0 15.2 27.49 Minimum 1.0 1.3 0.5 0.45 20.1 0.3 -38.05 Average 2.6 30.3 21.7 0.59 29.0 8.8 0.00 St. Deviation 1.0 10.9 9.2 0.06 2.9 3.2 14.00
Table 4.6. Relevant results from the Preliminary Yield Trial-2 planted in Santo Tomás (Dto
Atlántico) derived from the CET-Block 2 harvested in May 2002. Individual performances of the best eight clones are presented.
Plant type
Fresh root yield
Fresh foliage yield
Harvest Index
Dry matter content
Dry matter yield
Selection index
Clon
(1-5) (t/ha) (t/ha) (0-1) (%) (t/ha) GM 213-56 1.3 54.7 30.7 0.64 27.5 15.1 29.48 GM 213-2 2.0 29.1 29.9 0.49 37.4 10.9 24.94 CM 9958-80 1.7 33.7 17.9 0.65 31.7 10.7 23.42 GM 214-62 3.0 37.4 23.9 0.61 33.3 12.4 21.75 GM 302-25 1.0 40.8 32.6 0.55 30.1 12.2 20.07 CM 9966-57 2.7 42.3 23.1 0.65 30.0 12.7 19.63 GM 214-60 2.3 32.0 22.6 0.59 33.2 10.6 18.13 GM 236-62 3.3 29.9 19.7 0.61 34.8 10.4 17.59 Parameters of the 20 clones selected Maximum 3.3 54.7 32.6 0.65 37.4 15.1 29.48 Minimum 1.0 25.6 17.9 0.49 27.5 8.8 15.98 Average 2.1 36.4 25.1 0.59 32.3 11.6 20.79 St. Deviation 0.7 8.4 4.9 0.05 2.9 1.7 4.19 Parameters of the 64 clones evaluated Maximum 4.7 54.7 43.3 0.70 37.4 15.1 29.48 Minimum 1.0 4.6 3.3 0.39 24.8 1.3 -38.26 Average 2.7 28.5 23.8 0.55 30.6 8.7 0.00 St. Deviation 0.9 10.4 9.4 0.06 2.2 3.2 15.66
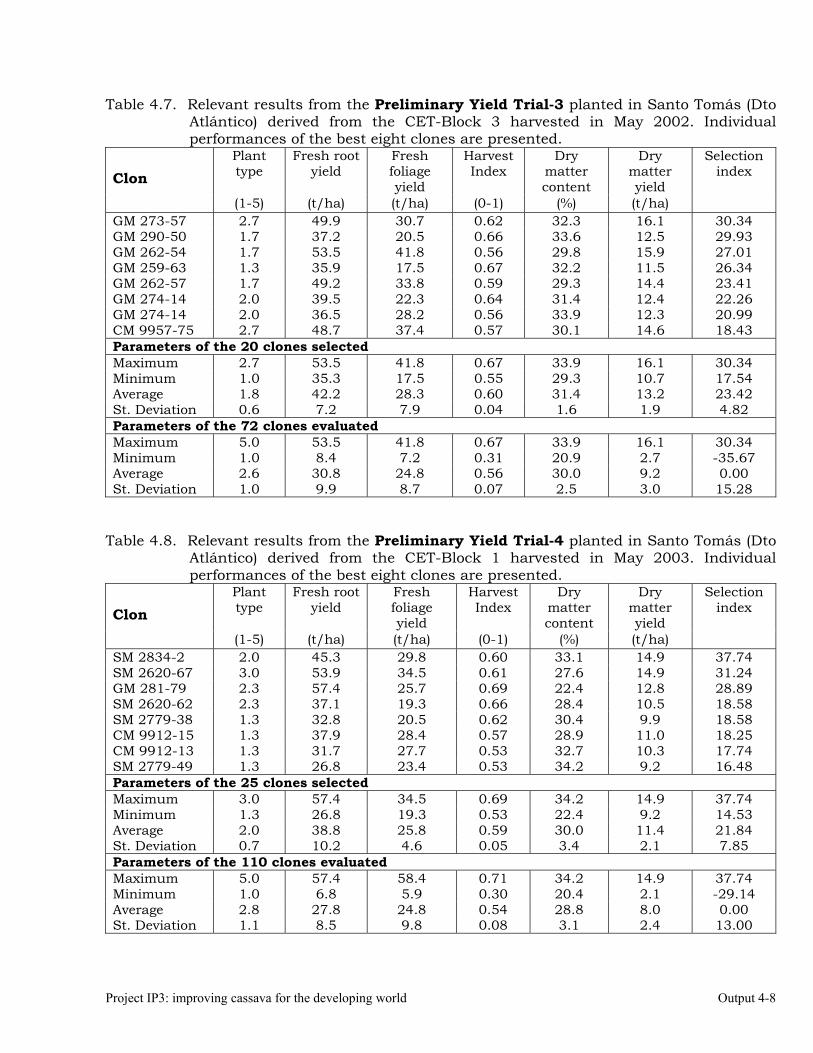
Project IP3: improving cassava for the developing world Output 4-8
Table 4.7. Relevant results from the Preliminary Yield Trial-3 planted in Santo Tomás (Dto Atlántico) derived from the CET-Block 3 harvested in May 2002. Individual performances of the best eight clones are presented.
Plant type
Fresh root yield
Fresh foliage yield
Harvest Index
Dry matter content
Dry matter yield
Selection index
Clon
(1-5) (t/ha) (t/ha) (0-1) (%) (t/ha) GM 273-57 2.7 49.9 30.7 0.62 32.3 16.1 30.34 GM 290-50 1.7 37.2 20.5 0.66 33.6 12.5 29.93 GM 262-54 1.7 53.5 41.8 0.56 29.8 15.9 27.01 GM 259-63 1.3 35.9 17.5 0.67 32.2 11.5 26.34 GM 262-57 1.7 49.2 33.8 0.59 29.3 14.4 23.41 GM 274-14 2.0 39.5 22.3 0.64 31.4 12.4 22.26 GM 274-14 2.0 36.5 28.2 0.56 33.9 12.3 20.99 CM 9957-75 2.7 48.7 37.4 0.57 30.1 14.6 18.43 Parameters of the 20 clones selected Maximum 2.7 53.5 41.8 0.67 33.9 16.1 30.34 Minimum 1.0 35.3 17.5 0.55 29.3 10.7 17.54 Average 1.8 42.2 28.3 0.60 31.4 13.2 23.42 St. Deviation 0.6 7.2 7.9 0.04 1.6 1.9 4.82 Parameters of the 72 clones evaluated Maximum 5.0 53.5 41.8 0.67 33.9 16.1 30.34 Minimum 1.0 8.4 7.2 0.31 20.9 2.7 -35.67 Average 2.6 30.8 24.8 0.56 30.0 9.2 0.00 St. Deviation 1.0 9.9 8.7 0.07 2.5 3.0 15.28
Table 4.8. Relevant results from the Preliminary Yield Trial-4 planted in Santo Tomás (Dto
Atlántico) derived from the CET-Block 1 harvested in May 2003. Individual performances of the best eight clones are presented.
Plant type
Fresh root yield
Fresh foliage yield
Harvest Index
Dry matter content
Dry matter yield
Selection index
Clon
(1-5) (t/ha) (t/ha) (0-1) (%) (t/ha) SM 2834-2 2.0 45.3 29.8 0.60 33.1 14.9 37.74 SM 2620-67 3.0 53.9 34.5 0.61 27.6 14.9 31.24 GM 281-79 2.3 57.4 25.7 0.69 22.4 12.8 28.89 SM 2620-62 2.3 37.1 19.3 0.66 28.4 10.5 18.58 SM 2779-38 1.3 32.8 20.5 0.62 30.4 9.9 18.58 CM 9912-15 1.3 37.9 28.4 0.57 28.9 11.0 18.25 CM 9912-13 1.3 31.7 27.7 0.53 32.7 10.3 17.74 SM 2779-49 1.3 26.8 23.4 0.53 34.2 9.2 16.48 Parameters of the 25 clones selected Maximum 3.0 57.4 34.5 0.69 34.2 14.9 37.74 Minimum 1.3 26.8 19.3 0.53 22.4 9.2 14.53 Average 2.0 38.8 25.8 0.59 30.0 11.4 21.84 St. Deviation 0.7 10.2 4.6 0.05 3.4 2.1 7.85 Parameters of the 110 clones evaluated Maximum 5.0 57.4 58.4 0.71 34.2 14.9 37.74 Minimum 1.0 6.8 5.9 0.30 20.4 2.1 -29.14 Average 2.8 27.8 24.8 0.54 28.8 8.0 0.00 St. Deviation 1.1 8.5 9.8 0.08 3.1 2.4 13.00
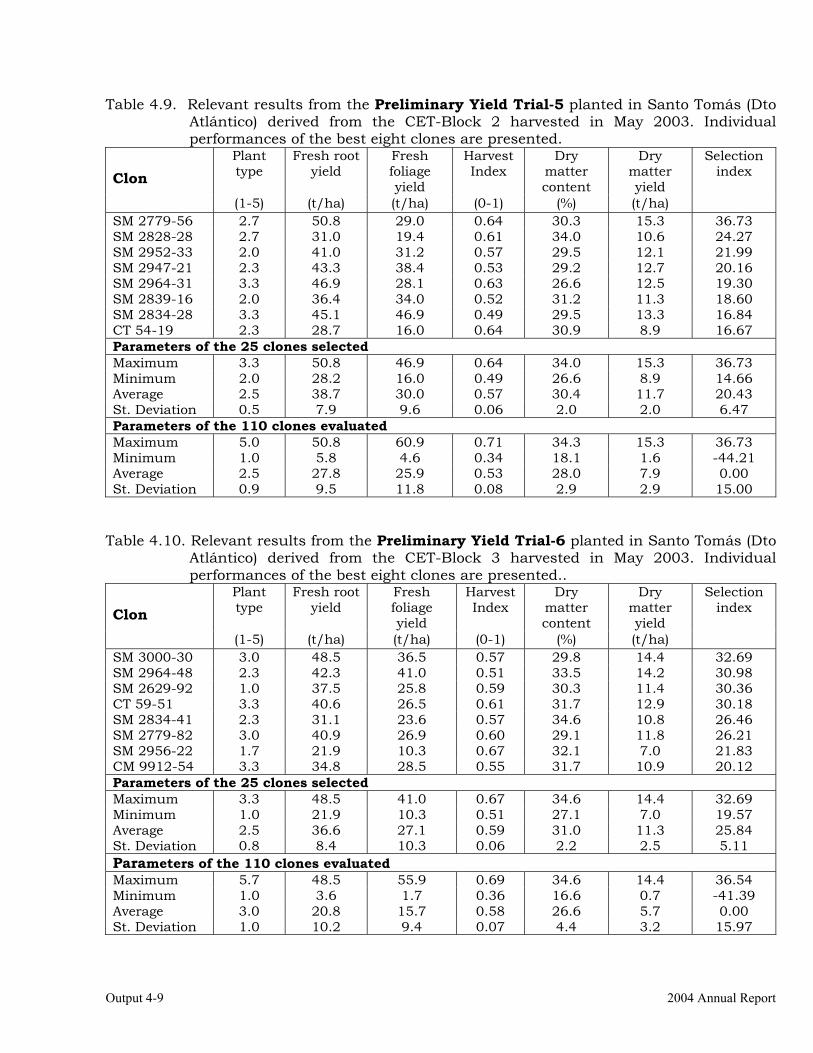
Output 4-9 2004 Annual Report
Table 4.9. Relevant results from the Preliminary Yield Trial-5 planted in Santo Tomás (Dto Atlántico) derived from the CET-Block 2 harvested in May 2003. Individual performances of the best eight clones are presented.
Plant type
Fresh root yield
Fresh foliage yield
Harvest Index
Dry matter content
Dry matter yield
Selection index
Clon
(1-5) (t/ha) (t/ha) (0-1) (%) (t/ha) SM 2779-56 2.7 50.8 29.0 0.64 30.3 15.3 36.73 SM 2828-28 2.7 31.0 19.4 0.61 34.0 10.6 24.27 SM 2952-33 2.0 41.0 31.2 0.57 29.5 12.1 21.99 SM 2947-21 2.3 43.3 38.4 0.53 29.2 12.7 20.16 SM 2964-31 3.3 46.9 28.1 0.63 26.6 12.5 19.30 SM 2839-16 2.0 36.4 34.0 0.52 31.2 11.3 18.60 SM 2834-28 3.3 45.1 46.9 0.49 29.5 13.3 16.84 CT 54-19 2.3 28.7 16.0 0.64 30.9 8.9 16.67 Parameters of the 25 clones selected Maximum 3.3 50.8 46.9 0.64 34.0 15.3 36.73 Minimum 2.0 28.2 16.0 0.49 26.6 8.9 14.66 Average 2.5 38.7 30.0 0.57 30.4 11.7 20.43 St. Deviation 0.5 7.9 9.6 0.06 2.0 2.0 6.47 Parameters of the 110 clones evaluated Maximum 5.0 50.8 60.9 0.71 34.3 15.3 36.73 Minimum 1.0 5.8 4.6 0.34 18.1 1.6 -44.21 Average 2.5 27.8 25.9 0.53 28.0 7.9 0.00 St. Deviation 0.9 9.5 11.8 0.08 2.9 2.9 15.00
Table 4.10. Relevant results from the Preliminary Yield Trial-6 planted in Santo Tomás (Dto
Atlántico) derived from the CET-Block 3 harvested in May 2003. Individual performances of the best eight clones are presented..
Plant type
Fresh root yield
Fresh foliage yield
Harvest Index
Dry matter content
Dry matter yield
Selection index
Clon
(1-5) (t/ha) (t/ha) (0-1) (%) (t/ha) SM 3000-30 3.0 48.5 36.5 0.57 29.8 14.4 32.69 SM 2964-48 2.3 42.3 41.0 0.51 33.5 14.2 30.98 SM 2629-92 1.0 37.5 25.8 0.59 30.3 11.4 30.36 CT 59-51 3.3 40.6 26.5 0.61 31.7 12.9 30.18 SM 2834-41 2.3 31.1 23.6 0.57 34.6 10.8 26.46 SM 2779-82 3.0 40.9 26.9 0.60 29.1 11.8 26.21 SM 2956-22 1.7 21.9 10.3 0.67 32.1 7.0 21.83 CM 9912-54 3.3 34.8 28.5 0.55 31.7 10.9 20.12 Parameters of the 25 clones selected Maximum 3.3 48.5 41.0 0.67 34.6 14.4 32.69 Minimum 1.0 21.9 10.3 0.51 27.1 7.0 19.57 Average 2.5 36.6 27.1 0.59 31.0 11.3 25.84 St. Deviation 0.8 8.4 10.3 0.06 2.2 2.5 5.11 Parameters of the 110 clones evaluated Maximum 5.7 48.5 55.9 0.69 34.6 14.4 36.54 Minimum 1.0 3.6 1.7 0.36 16.6 0.7 -41.39 Average 3.0 20.8 15.7 0.58 26.6 5.7 0.00 St. Deviation 1.0 10.2 9.4 0.07 4.4 3.2 15.97

Project IP3: improving cassava for the developing world Output 4-10
The trials from the 2003 CET had average dry matter yields of 8.0; 7.9; and 5.7 t/ha respectively for PYT4, PYT5 and PYT6. It seems that the environmental conditions for PYT6 were in this case much worse that those for PYT1 and PYT2. The average dry matter yield in the selected group of 20 clones from each trial was 11.4; 11.7; and 11.3 t/ha, respectively for PYT4, PYT5 and PYT6. An interesting feature from the PYTs described in Tables 4.5 to 4.7 is the frequency of clones from a given family selected. Families CM 9957 and GM 290 had 7 of their clones selected (across the three PYT experiments). Family CM 9958 had four clones selected and families GM 274, GM 262 and CM 9966 had three. During the June 2001-May 2002 season a Diallel Study was conducted. That trial was used for generating valuable quantitative genetics information regarding the inheritance of the most relevant traits in cassava. The trial was also used for selection purposes and the best clones from that experiment were included in a CET during the June 2002 – May 2003 and the selected clones were grouped for a PYT whose results are presented in Table 4.11. It is worth to mention, for example the outstanding performance of family GM 258, which had three of its clones selected from PYT-7 (Table 11). Families CM 9954 and GM 246 had two of their clones selected. Table 4.11. Relevant results from the Preliminary Yield Trial-7 planted in Santo Tomás (Dto
Atlantico) involving the best germplasm in the Diallel Study harvested in May 2002. The trial included 60 genotypes, evaluated in three replications with 10-plant plots. Individual performances of the 12 clones selected are presented.
Plant type
Fresh root yield
Fresh foliage yield
Harvest Index
Dry matter content
Dry matter yield
Selection index
Clon
(1-5) (t/ha) (t/ha) (0-1) (%) (t/ha) GM 258-3 1.0 43.1 25.4 0.63 29.92 12.87 34.06 GM 280-15 1.7 39.1 25.6 0.60 31.00 12.21 28.31 GM 236-26 3.0 46.6 33.3 0.59 31.15 14.52 26.53 GM 272-20 3.0 46.2 37.9 0.55 30.65 14.16 22.40 GM 291-26 3.0 41.4 31.9 0.57 30.85 12.84 20.33 CM 9954-16 2.3 44.1 39.5 0.52 29.31 12.90 19.09 GM 246-6 2.0 40.3 22.4 0.64 25.94 10.48 18.73 GM 258-2 2.5 18.6 12.4 0.60 34.65 6.42 16.02 GM 247-15 2.7 44.6 34.8 0.56 26.48 11.96 13.79 GM 258-24 1.0 27.6 16.8 0.63 25.91 7.10 12.81 GM 246-15 2.3 28.9 20.1 0.58 28.81 8.54 9.96 CM 9954-23 3.0 12.9 8.6 0.60 34.83 4.49 9.87 Parameters of the 12 clones selected Maximum 3.0 46.6 39.5 0.64 34.83 14.52 34.06 Minimum 1.0 12.9 8.6 0.52 25.91 4.49 9.87 Average 2.3 36.1 25.7 0.59 29.96 10.71 19.32 St. Deviation 0.7 11.4 10.1 0.04 2.95 3.29 7.52 Parameters of the 60 clones evaluated Maximum 5.0 46.6 45.9 0.73 34.83 14.52 34.06 Minimum 1.0 3.9 2.2 0.42 18.96 1.11 -29.62 Average 2.9 24.2 18.9 0.58 27.36 6.70 0.00 St. Deviation 1.0 12.9 11.9 0.07 3.49 3.76 14.26
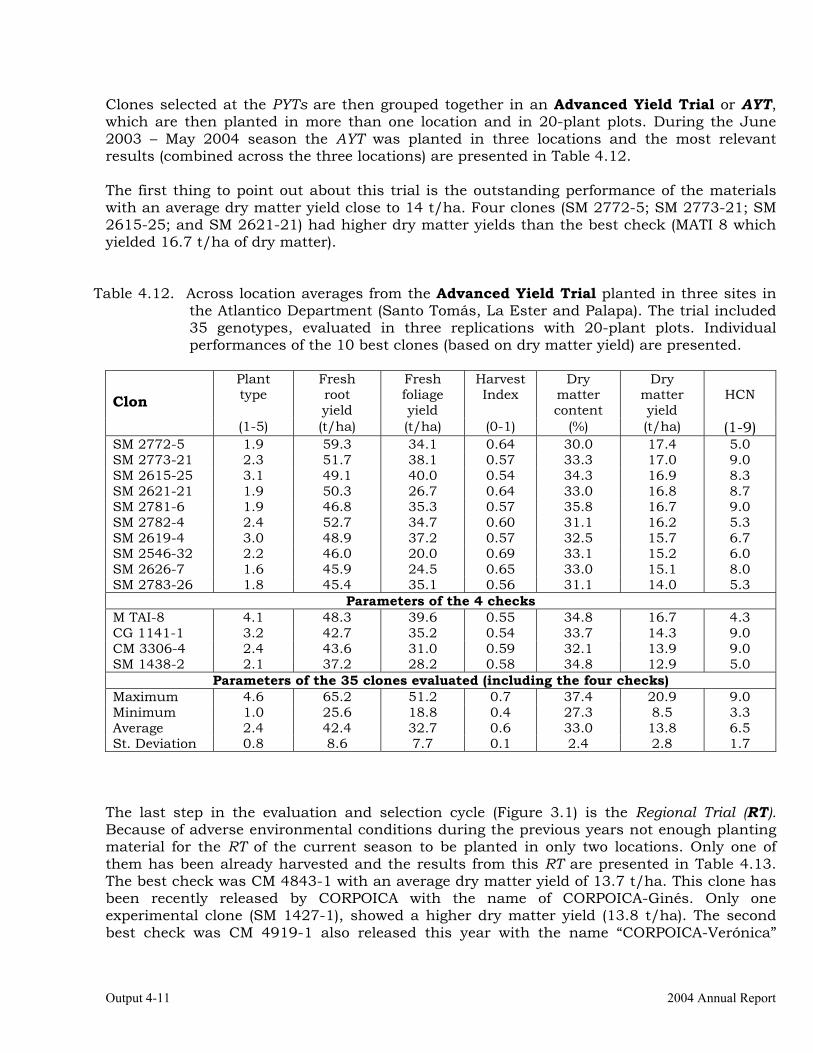
Output 4-11 2004 Annual Report
Clones selected at the PYTs are then grouped together in an Advanced Yield Trial or AYT, which are then planted in more than one location and in 20-plant plots. During the June 2003 – May 2004 season the AYT was planted in three locations and the most relevant results (combined across the three locations) are presented in Table 4.12. The first thing to point out about this trial is the outstanding performance of the materials with an average dry matter yield close to 14 t/ha. Four clones (SM 2772-5; SM 2773-21; SM 2615-25; and SM 2621-21) had higher dry matter yields than the best check (MATI 8 which yielded 16.7 t/ha of dry matter).
Table 4.12. Across location averages from the Advanced Yield Trial planted in three sites in the Atlantico Department (Santo Tomás, La Ester and Palapa). The trial included 35 genotypes, evaluated in three replications with 20-plant plots. Individual performances of the 10 best clones (based on dry matter yield) are presented.
Plant type
Fresh root yield
Fresh foliage yield
Harvest Index
Dry matter content
Dry matter yield
HCN
Clon
(1-5) (t/ha) (t/ha) (0-1) (%) (t/ha) (1-9) SM 2772-5 1.9 59.3 34.1 0.64 30.0 17.4 5.0 SM 2773-21 2.3 51.7 38.1 0.57 33.3 17.0 9.0 SM 2615-25 3.1 49.1 40.0 0.54 34.3 16.9 8.3 SM 2621-21 1.9 50.3 26.7 0.64 33.0 16.8 8.7 SM 2781-6 1.9 46.8 35.3 0.57 35.8 16.7 9.0 SM 2782-4 2.4 52.7 34.7 0.60 31.1 16.2 5.3 SM 2619-4 3.0 48.9 37.2 0.57 32.5 15.7 6.7 SM 2546-32 2.2 46.0 20.0 0.69 33.1 15.2 6.0 SM 2626-7 1.6 45.9 24.5 0.65 33.0 15.1 8.0 SM 2783-26 1.8 45.4 35.1 0.56 31.1 14.0 5.3
Parameters of the 4 checks M TAI-8 4.1 48.3 39.6 0.55 34.8 16.7 4.3 CG 1141-1 3.2 42.7 35.2 0.54 33.7 14.3 9.0 CM 3306-4 2.4 43.6 31.0 0.59 32.1 13.9 9.0 SM 1438-2 2.1 37.2 28.2 0.58 34.8 12.9 5.0
Parameters of the 35 clones evaluated (including the four checks) Maximum 4.6 65.2 51.2 0.7 37.4 20.9 9.0 Minimum 1.0 25.6 18.8 0.4 27.3 8.5 3.3 Average 2.4 42.4 32.7 0.6 33.0 13.8 6.5 St. Deviation 0.8 8.6 7.7 0.1 2.4 2.8 1.7
The last step in the evaluation and selection cycle (Figure 3.1) is the Regional Trial (RT). Because of adverse environmental conditions during the previous years not enough planting material for the RT of the current season to be planted in only two locations. Only one of them has been already harvested and the results from this RT are presented in Table 4.13. The best check was CM 4843-1 with an average dry matter yield of 13.7 t/ha. This clone has been recently released by CORPOICA with the name of CORPOICA-Ginés. Only one experimental clone (SM 1427-1), showed a higher dry matter yield (13.8 t/ha). The second best check was CM 4919-1 also released this year with the name “CORPOICA-Verónica”
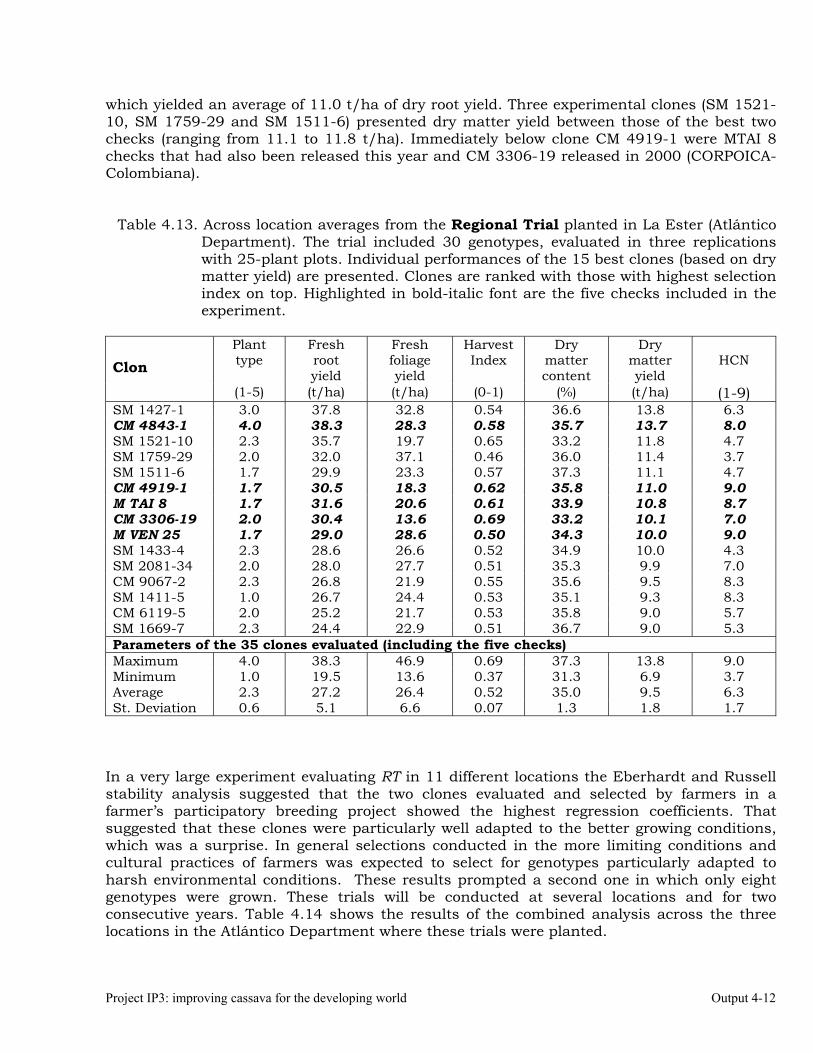
Project IP3: improving cassava for the developing world Output 4-12
which yielded an average of 11.0 t/ha of dry root yield. Three experimental clones (SM 1521-10, SM 1759-29 and SM 1511-6) presented dry matter yield between those of the best two checks (ranging from 11.1 to 11.8 t/ha). Immediately below clone CM 4919-1 were MTAI 8 checks that had also been released this year and CM 3306-19 released in 2000 (CORPOICA-Colombiana).
Table 4.13. Across location averages from the Regional Trial planted in La Ester (Atlántico Department). The trial included 30 genotypes, evaluated in three replications with 25-plant plots. Individual performances of the 15 best clones (based on dry matter yield) are presented. Clones are ranked with those with highest selection index on top. Highlighted in bold-italic font are the five checks included in the experiment.
Plant type
Fresh root yield
Fresh foliage yield
Harvest Index
Dry matter content
Dry matter yield
HCN
Clon
(1-5) (t/ha) (t/ha) (0-1) (%) (t/ha) (1-9) SM 1427-1 3.0 37.8 32.8 0.54 36.6 13.8 6.3 CM 4843-1 4.0 38.3 28.3 0.58 35.7 13.7 8.0 SM 1521-10 2.3 35.7 19.7 0.65 33.2 11.8 4.7 SM 1759-29 2.0 32.0 37.1 0.46 36.0 11.4 3.7 SM 1511-6 1.7 29.9 23.3 0.57 37.3 11.1 4.7 CM 4919-1 1.7 30.5 18.3 0.62 35.8 11.0 9.0 M TAI 8 1.7 31.6 20.6 0.61 33.9 10.8 8.7 CM 3306-19 2.0 30.4 13.6 0.69 33.2 10.1 7.0 M VEN 25 1.7 29.0 28.6 0.50 34.3 10.0 9.0 SM 1433-4 2.3 28.6 26.6 0.52 34.9 10.0 4.3 SM 2081-34 2.0 28.0 27.7 0.51 35.3 9.9 7.0 CM 9067-2 2.3 26.8 21.9 0.55 35.6 9.5 8.3 SM 1411-5 1.0 26.7 24.4 0.53 35.1 9.3 8.3 CM 6119-5 2.0 25.2 21.7 0.53 35.8 9.0 5.7 SM 1669-7 2.3 24.4 22.9 0.51 36.7 9.0 5.3 Parameters of the 35 clones evaluated (including the five checks) Maximum 4.0 38.3 46.9 0.69 37.3 13.8 9.0 Minimum 1.0 19.5 13.6 0.37 31.3 6.9 3.7 Average 2.3 27.2 26.4 0.52 35.0 9.5 6.3 St. Deviation 0.6 5.1 6.6 0.07 1.3 1.8 1.7
In a very large experiment evaluating RT in 11 different locations the Eberhardt and Russell stability analysis suggested that the two clones evaluated and selected by farmers in a farmer’s participatory breeding project showed the highest regression coefficients. That suggested that these clones were particularly well adapted to the better growing conditions, which was a surprise. In general selections conducted in the more limiting conditions and cultural practices of farmers was expected to select for genotypes particularly adapted to harsh environmental conditions. These results prompted a second one in which only eight genotypes were grown. These trials will be conducted at several locations and for two consecutive years. Table 4.14 shows the results of the combined analysis across the three locations in the Atlántico Department where these trials were planted.
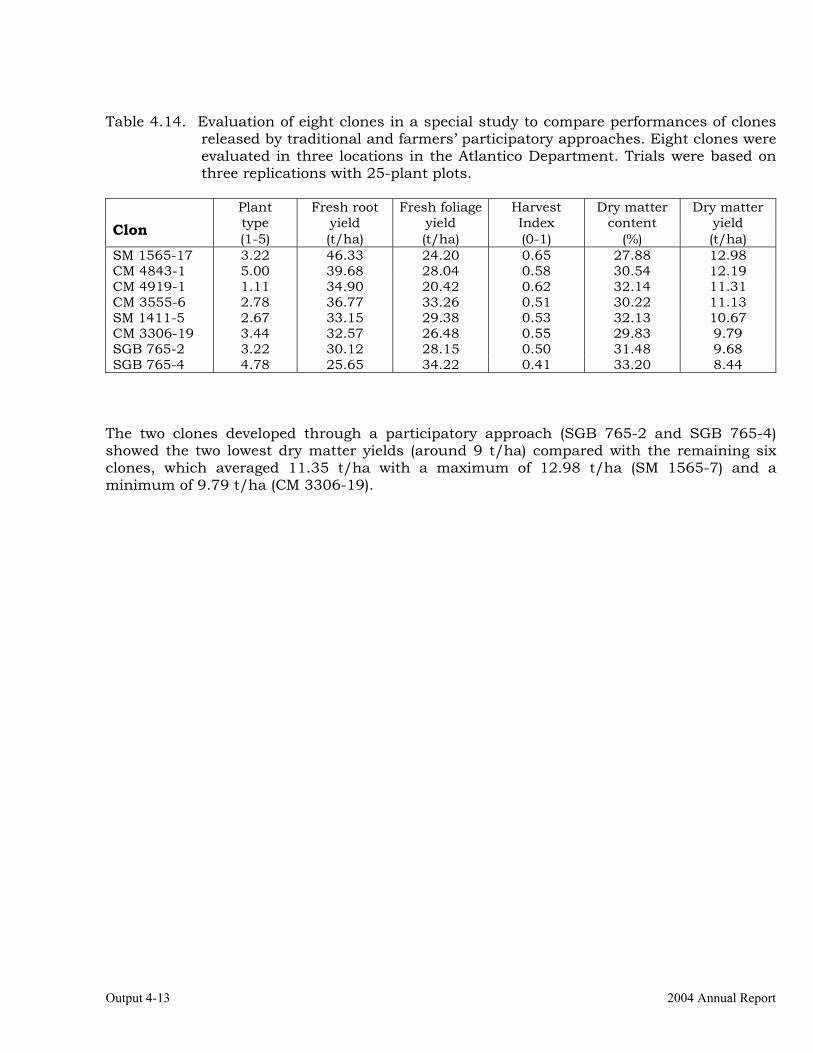
Output 4-13 2004 Annual Report
Table 4.14. Evaluation of eight clones in a special study to compare performances of clones
released by traditional and farmers’ participatory approaches. Eight clones were evaluated in three locations in the Atlantico Department. Trials were based on three replications with 25-plant plots.
Plant type
Fresh root yield
Fresh foliage yield
Harvest Index
Dry matter content
Dry matter yield
Clon (1-5) (t/ha) (t/ha) (0-1) (%) (t/ha) SM 1565-17 3.22 46.33 24.20 0.65 27.88 12.98 CM 4843-1 5.00 39.68 28.04 0.58 30.54 12.19 CM 4919-1 1.11 34.90 20.42 0.62 32.14 11.31 CM 3555-6 2.78 36.77 33.26 0.51 30.22 11.13 SM 1411-5 2.67 33.15 29.38 0.53 32.13 10.67 CM 3306-19 3.44 32.57 26.48 0.55 29.83 9.79 SGB 765-2 3.22 30.12 28.15 0.50 31.48 9.68 SGB 765-4 4.78 25.65 34.22 0.41 33.20 8.44
The two clones developed through a participatory approach (SGB 765-2 and SGB 765-4) showed the two lowest dry matter yields (around 9 t/ha) compared with the remaining six clones, which averaged 11.35 t/ha with a maximum of 12.98 t/ha (SM 1565-7) and a minimum of 9.79 t/ha (CM 3306-19).
Output 5-1 2004 Annual Report
OUTPUT 5 Development of genetic stocks and improved gene pools adapted to the sub-humid
environments. Activity 5.1. Evaluations and selections in the Acid Soils Environment Activities developed for the acid-soil savannas environment were centralized initially in CORPOICA – La Libertad in Villavicencio, Meta Department. Table 5.1 lists the most relevant trials, whereas the other tables show results specific to each one. Table 5.1. Trials conducted in the acid-soil savannas environment during the 2003-2004
cycle. Type of Trial Location Genotypes
(# plants) Reps Observations
Clonal evaluation trial La Libertad 1071 (7) 3 Tables 5.2-5.4 F1C1 nursery Santo Tomás 720 (1) 1 -.- Preliminary yield trial 1 (CET-2003) La Libertad 64 (10) 3 See Table 5.5 Preliminary yield trial 2 (CET-2003) La Libertad 64 (10) 3 See Table 5.6 Preliminary yield trial 3 (CET-2003) La Libertad 64 (10) 3 See Table 5.7 Preliminary yield trial 4 (Diallel-2002) La Libertad 50 (10) 3 See Table 5.8 Advanced yield trial La Libertad-L 64 (25) 3 See Table 5.9 Advanced yield trial La Libertad-L 64 (25) 3 See Table 5.9 Advanced yield trial La Libertad-P 64 (25) 3 See Table 5.9 Advanced yield trial (old clones) La Libertad-L 34 (25) 3 See Table 5.10 Advanced yield trial (old clones) La Libertad-P 34 (25) 3 See Table 5.10 Regional Trial La Libertad-L 30 (20) 3 See Table 5.11 Regional Trial La Libertad-P 30 (20) 3 See Table 5.11
To take advantage of the crosses made that resulted in F1 plants grown at Palmira that failed to produce enough stakes to be included in the Clonal Evaluation Trial (CET) an F1C1 trial was planted. In the case of the Acid Soil Savannas 720 genotypes were in this situation (Table 5.1) and were, therefore, planted in a trial that is actually a multiplication nursery. There is very little selection in these “trial” within the new scheme of selection and evaluation. For the acid soils environment plants that are obviously susceptible to super elongation disease (SED) or bacterial blight (CBB) will be eliminated and stakes from them will not be collected. As mentioned in Output 3 (Table 3.5) a total of 4365 seeds were germinated and 2938 seedlings from these botanical seeds (targeting this particular environment) were transplanted at CIAT-Palmira in an isolated field. The planting of the F1 stage is isolated to reduce as much as possible infection by diseases that can be found at later stages of the
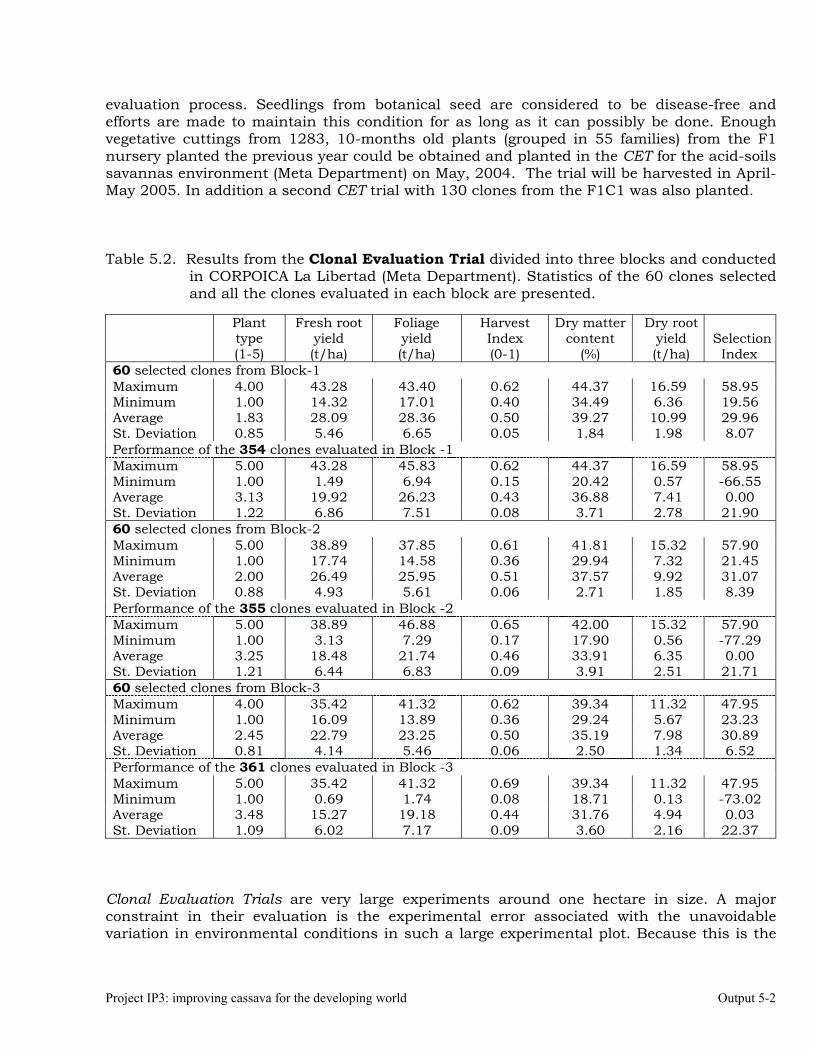
Project IP3: improving cassava for the developing world Output 5-2
evaluation process. Seedlings from botanical seed are considered to be disease-free and efforts are made to maintain this condition for as long as it can possibly be done. Enough vegetative cuttings from 1283, 10-months old plants (grouped in 55 families) from the F1 nursery planted the previous year could be obtained and planted in the CET for the acid-soils savannas environment (Meta Department) on May, 2004. The trial will be harvested in April-May 2005. In addition a second CET trial with 130 clones from the F1C1 was also planted. Table 5.2. Results from the Clonal Evaluation Trial divided into three blocks and conducted
in CORPOICA La Libertad (Meta Department). Statistics of the 60 clones selected and all the clones evaluated in each block are presented.
Plant type (1-5)
Fresh root yield (t/ha)
Foliage yield (t/ha)
Harvest Index (0-1)
Dry matter content
(%)
Dry root yield (t/ha)
Selection Index
60 selected clones from Block-1 Maximum 4.00 43.28 43.40 0.62 44.37 16.59 58.95 Minimum 1.00 14.32 17.01 0.40 34.49 6.36 19.56 Average 1.83 28.09 28.36 0.50 39.27 10.99 29.96 St. Deviation 0.85 5.46 6.65 0.05 1.84 1.98 8.07 Performance of the 354 clones evaluated in Block -1 Maximum 5.00 43.28 45.83 0.62 44.37 16.59 58.95 Minimum 1.00 1.49 6.94 0.15 20.42 0.57 -66.55 Average 3.13 19.92 26.23 0.43 36.88 7.41 0.00 St. Deviation 1.22 6.86 7.51 0.08 3.71 2.78 21.90 60 selected clones from Block-2 Maximum 5.00 38.89 37.85 0.61 41.81 15.32 57.90 Minimum 1.00 17.74 14.58 0.36 29.94 7.32 21.45 Average 2.00 26.49 25.95 0.51 37.57 9.92 31.07 St. Deviation 0.88 4.93 5.61 0.06 2.71 1.85 8.39 Performance of the 355 clones evaluated in Block -2 Maximum 5.00 38.89 46.88 0.65 42.00 15.32 57.90 Minimum 1.00 3.13 7.29 0.17 17.90 0.56 -77.29 Average 3.25 18.48 21.74 0.46 33.91 6.35 0.00 St. Deviation 1.21 6.44 6.83 0.09 3.91 2.51 21.71 60 selected clones from Block-3 Maximum 4.00 35.42 41.32 0.62 39.34 11.32 47.95 Minimum 1.00 16.09 13.89 0.36 29.24 5.67 23.23 Average 2.45 22.79 23.25 0.50 35.19 7.98 30.89 St. Deviation 0.81 4.14 5.46 0.06 2.50 1.34 6.52 Performance of the 361 clones evaluated in Block -3 Maximum 5.00 35.42 41.32 0.69 39.34 11.32 47.95 Minimum 1.00 0.69 1.74 0.08 18.71 0.13 -73.02 Average 3.48 15.27 19.18 0.44 31.76 4.94 0.03 St. Deviation 1.09 6.02 7.17 0.09 3.60 2.16 22.37
Clonal Evaluation Trials are very large experiments around one hectare in size. A major constraint in their evaluation is the experimental error associated with the unavoidable variation in environmental conditions in such a large experimental plot. Because this is the
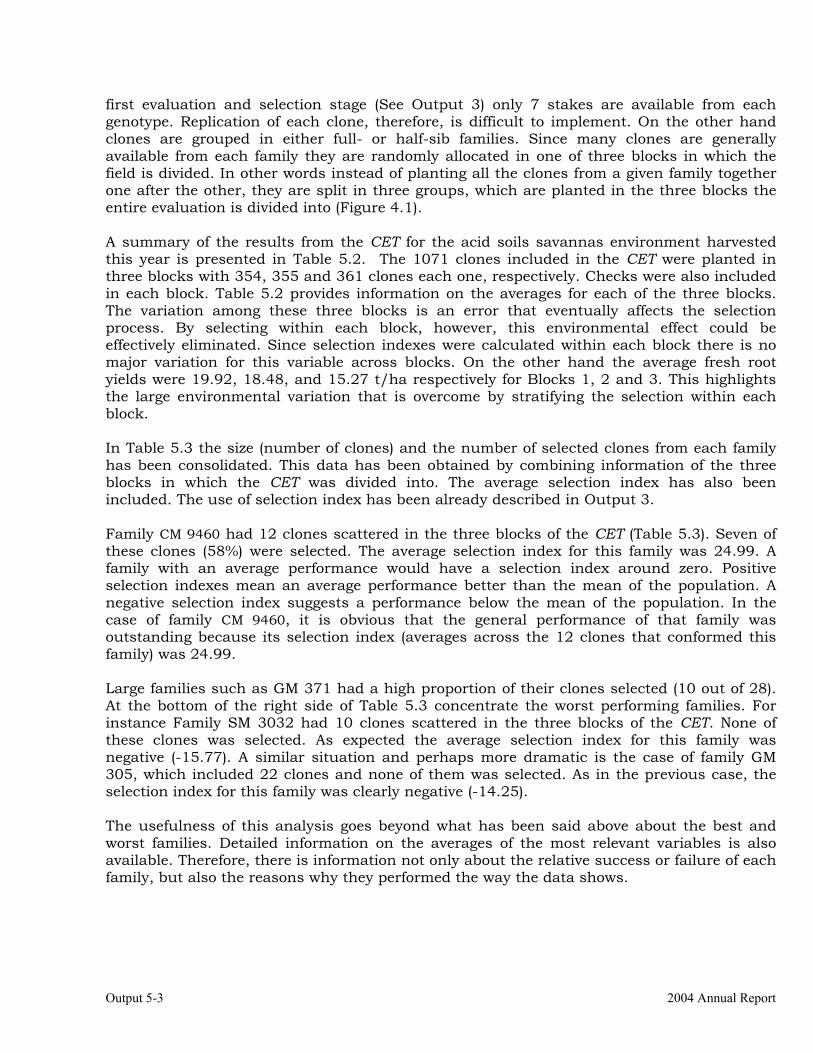
Output 5-3 2004 Annual Report
first evaluation and selection stage (See Output 3) only 7 stakes are available from each genotype. Replication of each clone, therefore, is difficult to implement. On the other hand clones are grouped in either full- or half-sib families. Since many clones are generally available from each family they are randomly allocated in one of three blocks in which the field is divided. In other words instead of planting all the clones from a given family together one after the other, they are split in three groups, which are planted in the three blocks the entire evaluation is divided into (Figure 4.1). A summary of the results from the CET for the acid soils savannas environment harvested this year is presented in Table 5.2. The 1071 clones included in the CET were planted in three blocks with 354, 355 and 361 clones each one, respectively. Checks were also included in each block. Table 5.2 provides information on the averages for each of the three blocks. The variation among these three blocks is an error that eventually affects the selection process. By selecting within each block, however, this environmental effect could be effectively eliminated. Since selection indexes were calculated within each block there is no major variation for this variable across blocks. On the other hand the average fresh root yields were 19.92, 18.48, and 15.27 t/ha respectively for Blocks 1, 2 and 3. This highlights the large environmental variation that is overcome by stratifying the selection within each block. In Table 5.3 the size (number of clones) and the number of selected clones from each family has been consolidated. This data has been obtained by combining information of the three blocks in which the CET was divided into. The average selection index has also been included. The use of selection index has been already described in Output 3. Family CM 9460 had 12 clones scattered in the three blocks of the CET (Table 5.3). Seven of these clones (58%) were selected. The average selection index for this family was 24.99. A family with an average performance would have a selection index around zero. Positive selection indexes mean an average performance better than the mean of the population. A negative selection index suggests a performance below the mean of the population. In the case of family CM 9460, it is obvious that the general performance of that family was outstanding because its selection index (averages across the 12 clones that conformed this family) was 24.99. Large families such as GM 371 had a high proportion of their clones selected (10 out of 28). At the bottom of the right side of Table 5.3 concentrate the worst performing families. For instance Family SM 3032 had 10 clones scattered in the three blocks of the CET. None of these clones was selected. As expected the average selection index for this family was negative (-15.77). A similar situation and perhaps more dramatic is the case of family GM 305, which included 22 clones and none of them was selected. As in the previous case, the selection index for this family was clearly negative (-14.25). The usefulness of this analysis goes beyond what has been said above about the best and worst families. Detailed information on the averages of the most relevant variables is also available. Therefore, there is information not only about the relative success or failure of each family, but also the reasons why they performed the way the data shows.
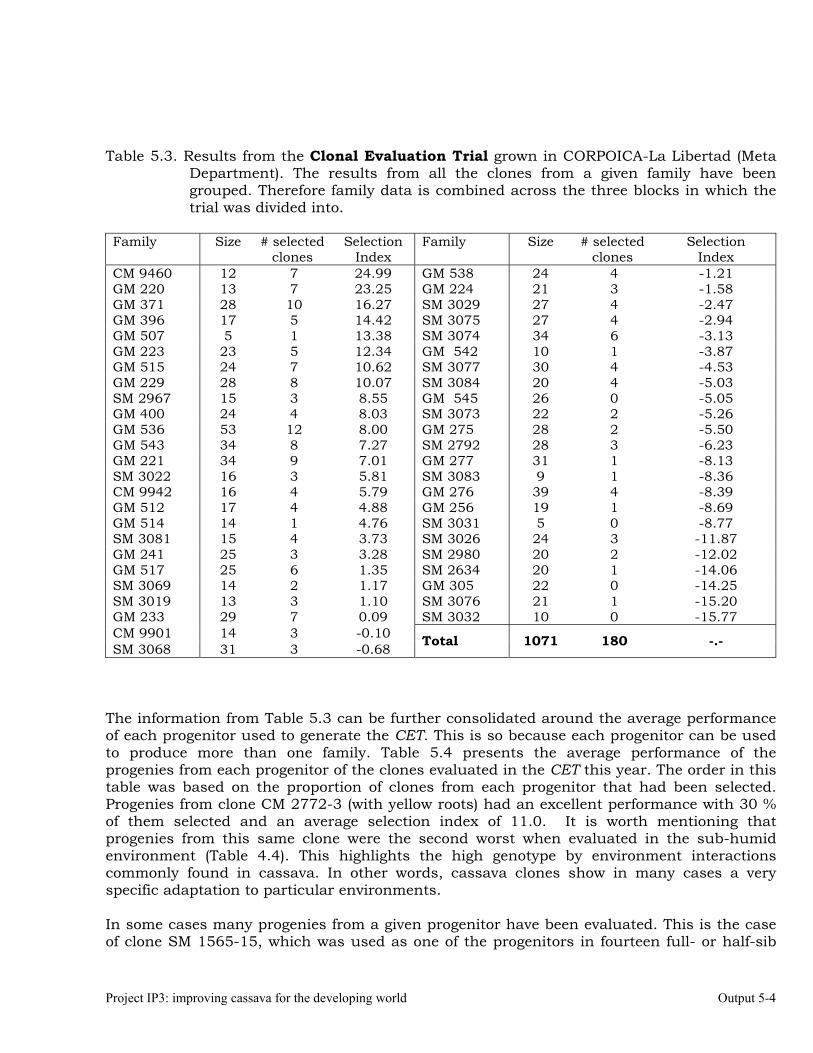
Project IP3: improving cassava for the developing world Output 5-4
Table 5.3. Results from the Clonal Evaluation Trial grown in CORPOICA-La Libertad (Meta
Department). The results from all the clones from a given family have been grouped. Therefore family data is combined across the three blocks in which the trial was divided into.
Family Size # selected
clones Selection
Index Family Size # selected
clones Selection
Index CM 9460 12 7 24.99 GM 538 24 4 -1.21 GM 220 13 7 23.25 GM 224 21 3 -1.58 GM 371 28 10 16.27 SM 3029 27 4 -2.47 GM 396 17 5 14.42 SM 3075 27 4 -2.94 GM 507 5 1 13.38 SM 3074 34 6 -3.13 GM 223 23 5 12.34 GM 542 10 1 -3.87 GM 515 24 7 10.62 SM 3077 30 4 -4.53 GM 229 28 8 10.07 SM 3084 20 4 -5.03 SM 2967 15 3 8.55 GM 545 26 0 -5.05 GM 400 24 4 8.03 SM 3073 22 2 -5.26 GM 536 53 12 8.00 GM 275 28 2 -5.50 GM 543 34 8 7.27 SM 2792 28 3 -6.23 GM 221 34 9 7.01 GM 277 31 1 -8.13 SM 3022 16 3 5.81 SM 3083 9 1 -8.36 CM 9942 16 4 5.79 GM 276 39 4 -8.39 GM 512 17 4 4.88 GM 256 19 1 -8.69 GM 514 14 1 4.76 SM 3031 5 0 -8.77 SM 3081 15 4 3.73 SM 3026 24 3 -11.87 GM 241 25 3 3.28 SM 2980 20 2 -12.02 GM 517 25 6 1.35 SM 2634 20 1 -14.06 SM 3069 14 2 1.17 GM 305 22 0 -14.25 SM 3019 13 3 1.10 SM 3076 21 1 -15.20 GM 233 29 7 0.09 SM 3032 10 0 -15.77 CM 9901 14 3 -0.10 SM 3068 31 3 -0.68 Total
1071
180
-.-
The information from Table 5.3 can be further consolidated around the average performance of each progenitor used to generate the CET. This is so because each progenitor can be used to produce more than one family. Table 5.4 presents the average performance of the progenies from each progenitor of the clones evaluated in the CET this year. The order in this table was based on the proportion of clones from each progenitor that had been selected. Progenies from clone CM 2772-3 (with yellow roots) had an excellent performance with 30 % of them selected and an average selection index of 11.0. It is worth mentioning that progenies from this same clone were the second worst when evaluated in the sub-humid environment (Table 4.4). This highlights the high genotype by environment interactions commonly found in cassava. In other words, cassava clones show in many cases a very specific adaptation to particular environments. In some cases many progenies from a given progenitor have been evaluated. This is the case of clone SM 1565-15, which was used as one of the progenitors in fourteen full- or half-sib

Output 5-5 2004 Annual Report
families. A total of 413 experimental clones evaluated in the CET were derived from SM 1565-15 as one of the progenitors. Out of these 413 clones 62 were selected (15%) which is a slightly smaller proportion of selections across the whole experiment (17%). This information, therefore, suggests that the progenies from SM 1565-15 had about an average performance. A statement further supported by the average selection index of these 413 clones of –1. Progenies from MTAI 8 (a clone adapted to the sub-humid environment) and MCOL 2758 were very poor. None of the clones produced by them was selected and they had very negative average selection indexes (-14.2 and -15.8, respectively). Table 5.4 provides information for the most important characteristics of the progenies from each parent. This information is very closely related to the GCA estimates and reflects the breeding value of each progenitor. This information is very useful for defining the parents to be included in the crossing nurseries in the future. Table 5.4. Results from all the progenies of a given clone evaluated in the Clonal Evaluation
Trial. These results give an approximation of the breeding value of each parent involved in this trial.
Progenitor # Fam. #
clones Selec. clones
Plant type (1-5)
FRY (t/ha)
FFY (t/ha)
HI (0-1)
DMC (%)
DMY (t/ha)
Sel. Ind.
CM 2772-3 2 44 13 2.6 22.7 22.4 0.49 32.1 7.4 11.0 SM 1862-25 3 73 19 3.2 19.2 21.2 0.48 35.2 6.9 7.2 SM 653-14 1 16 4 3.1 17.4 19.4 0.48 36.0 6.4 5.8 CM 6740-7 6 121 30 3.1 19.1 23.5 0.44 34.9 6.9 4.1 CM 4574-7 9 228 55 2.7 20.5 25.9 0.44 35.4 7.3 10.6 CM 523-7 1 13 3 3.9 19.0 21.7 0.46 34.6 6.6 1.1 SM 1219-9 12 225 51 3.2 20.2 22.5 0.47 34.4 7.1 6.0 SM 1741-1 2 43 8 3.4 16.7 19.4 0.46 35.7 6.1 1.4 CM 2772-3 2 29 5 3.1 18.6 20.9 0.47 35.7 6.7 6.1 SM 1565-15 14 413 62 3.0 16.7 23.0 0.42 34.2 5.8 -1.0 SM 1820-8 1 30 4 3.7 15.8 18.2 0.46 34.4 5.5 -4.5 SM 1779-8 2 38 5 3.9 18.3 22.1 0.44 33.5 6.4 -5.2 MCOL 2737 4 76 10 4.0 17.7 22.7 0.43 34.9 6.3 -4.4 SM 1859-26 3 48 6 2.8 18.4 23.2 0.44 33.7 6.3 3.0 SM 2219-11 6 148 18 3.6 17.0 20.5 0.45 32.5 5.7 -7.2 MBRA 383 1 9 1 4.3 16.5 20.4 0.44 34.6 5.9 -8.4 CM 7033-3 3 55 6 3.1 17.6 22.6 0.43 32.7 5.9 -3.0 HMC 1 2 52 4 3.9 17.1 23.4 0.42 34.9 6.0 -4.9 SM 2058-2 1 28 2 3.2 17.7 24.6 0.42 32.0 5.8 -5.5 CM 6438-14 1 20 1 4.0 15.0 24.4 0.37 34.1 5.3 -14.1 MTAI 8 1 22 0 4.3 14.8 17.4 0.46 32.3 4.8 -14.2 MCOL 2758 1 10 0 4.8 16.8 19.7 0.45 31.6 5.4 -15.8
FRY=Fresh root yield; FFY= Fresh Foliage yield; HI= Harvest Index; DMC= Dry matter content; DMY=Dry matter yield; Sel.Ind.= Selection Index.
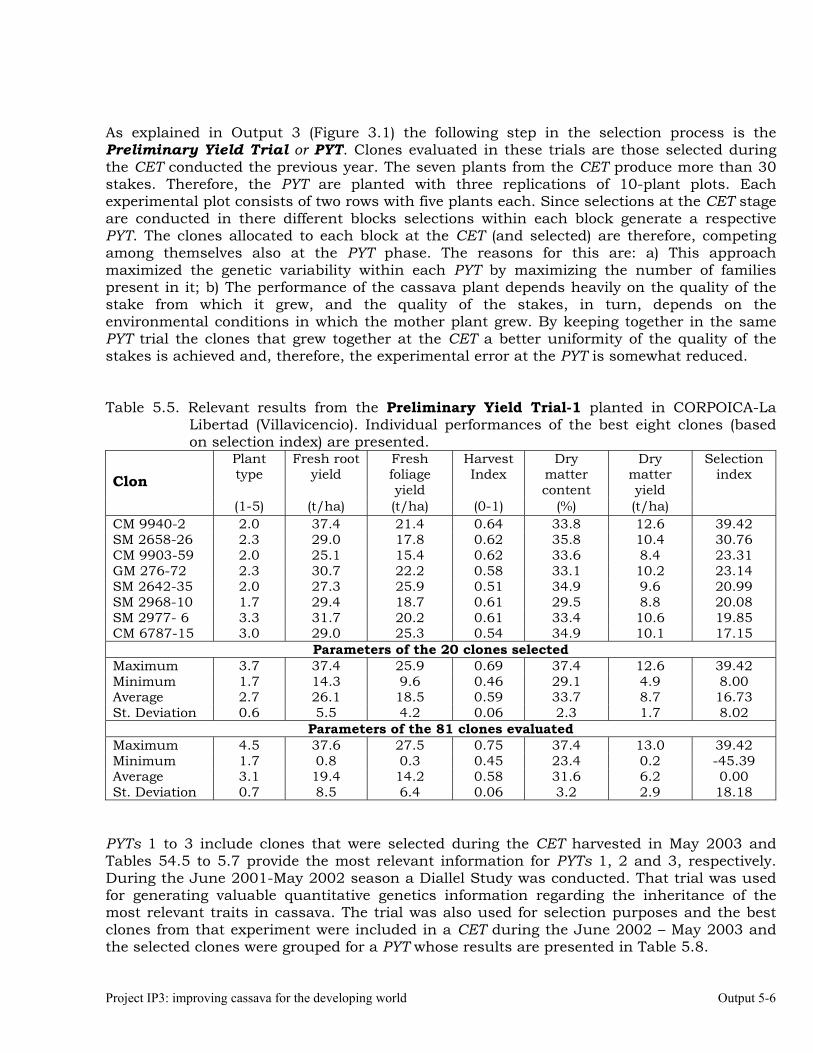
Project IP3: improving cassava for the developing world Output 5-6
As explained in Output 3 (Figure 3.1) the following step in the selection process is the Preliminary Yield Trial or PYT. Clones evaluated in these trials are those selected during the CET conducted the previous year. The seven plants from the CET produce more than 30 stakes. Therefore, the PYT are planted with three replications of 10-plant plots. Each experimental plot consists of two rows with five plants each. Since selections at the CET stage are conducted in there different blocks selections within each block generate a respective PYT. The clones allocated to each block at the CET (and selected) are therefore, competing among themselves also at the PYT phase. The reasons for this are: a) This approach maximized the genetic variability within each PYT by maximizing the number of families present in it; b) The performance of the cassava plant depends heavily on the quality of the stake from which it grew, and the quality of the stakes, in turn, depends on the environmental conditions in which the mother plant grew. By keeping together in the same PYT trial the clones that grew together at the CET a better uniformity of the quality of the stakes is achieved and, therefore, the experimental error at the PYT is somewhat reduced. Table 5.5. Relevant results from the Preliminary Yield Trial-1 planted in CORPOICA-La
Libertad (Villavicencio). Individual performances of the best eight clones (based on selection index) are presented.
Plant type
Fresh root yield
Fresh foliage yield
Harvest Index
Dry matter content
Dry matter yield
Selection index
Clon
(1-5) (t/ha) (t/ha) (0-1) (%) (t/ha) CM 9940-2 2.0 37.4 21.4 0.64 33.8 12.6 39.42 SM 2658-26 2.3 29.0 17.8 0.62 35.8 10.4 30.76 CM 9903-59 2.0 25.1 15.4 0.62 33.6 8.4 23.31 GM 276-72 2.3 30.7 22.2 0.58 33.1 10.2 23.14 SM 2642-35 2.0 27.3 25.9 0.51 34.9 9.6 20.99 SM 2968-10 1.7 29.4 18.7 0.61 29.5 8.8 20.08 SM 2977- 6 3.3 31.7 20.2 0.61 33.4 10.6 19.85 CM 6787-15 3.0 29.0 25.3 0.54 34.9 10.1 17.15
Parameters of the 20 clones selected Maximum 3.7 37.4 25.9 0.69 37.4 12.6 39.42 Minimum 1.7 14.3 9.6 0.46 29.1 4.9 8.00 Average 2.7 26.1 18.5 0.59 33.7 8.7 16.73 St. Deviation 0.6 5.5 4.2 0.06 2.3 1.7 8.02
Parameters of the 81 clones evaluated Maximum 4.5 37.6 27.5 0.75 37.4 13.0 39.42 Minimum 1.7 0.8 0.3 0.45 23.4 0.2 -45.39 Average 3.1 19.4 14.2 0.58 31.6 6.2 0.00 St. Deviation 0.7 8.5 6.4 0.06 3.2 2.9 18.18
PYTs 1 to 3 include clones that were selected during the CET harvested in May 2003 and Tables 54.5 to 5.7 provide the most relevant information for PYTs 1, 2 and 3, respectively. During the June 2001-May 2002 season a Diallel Study was conducted. That trial was used for generating valuable quantitative genetics information regarding the inheritance of the most relevant traits in cassava. The trial was also used for selection purposes and the best clones from that experiment were included in a CET during the June 2002 – May 2003 and the selected clones were grouped for a PYT whose results are presented in Table 5.8.
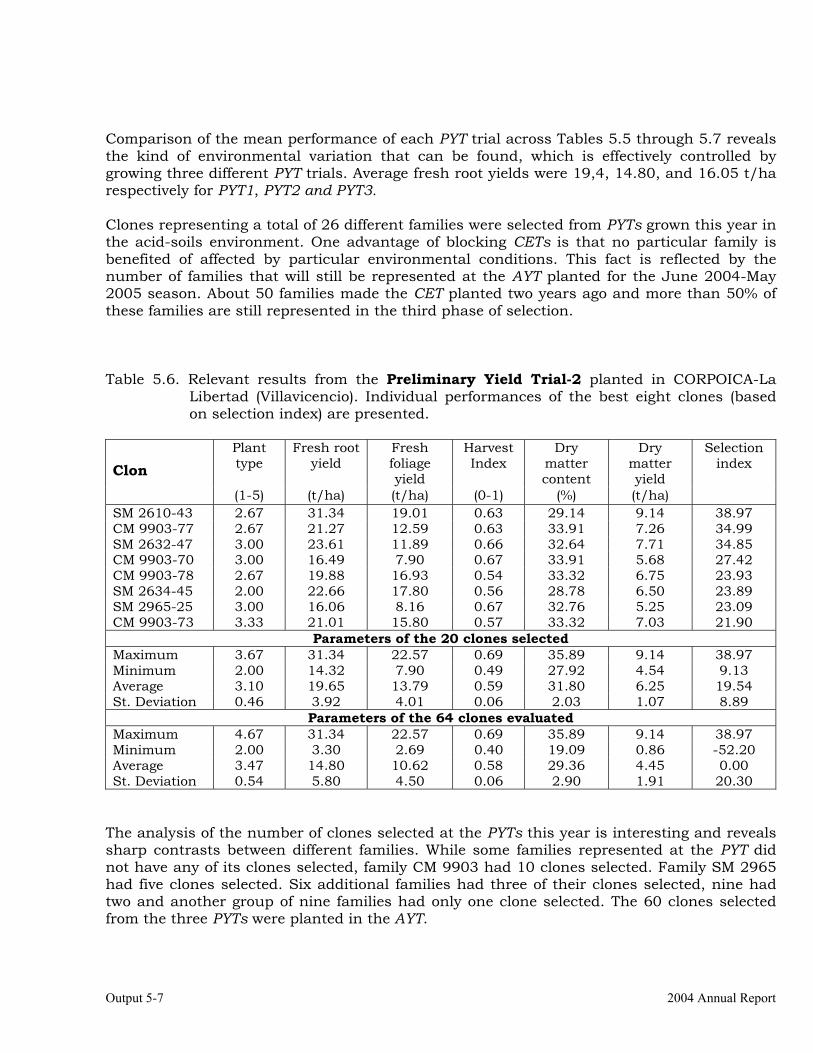
Output 5-7 2004 Annual Report
Comparison of the mean performance of each PYT trial across Tables 5.5 through 5.7 reveals the kind of environmental variation that can be found, which is effectively controlled by growing three different PYT trials. Average fresh root yields were 19,4, 14.80, and 16.05 t/ha respectively for PYT1, PYT2 and PYT3. Clones representing a total of 26 different families were selected from PYTs grown this year in the acid-soils environment. One advantage of blocking CETs is that no particular family is benefited of affected by particular environmental conditions. This fact is reflected by the number of families that will still be represented at the AYT planted for the June 2004-May 2005 season. About 50 families made the CET planted two years ago and more than 50% of these families are still represented in the third phase of selection. Table 5.6. Relevant results from the Preliminary Yield Trial-2 planted in CORPOICA-La
Libertad (Villavicencio). Individual performances of the best eight clones (based on selection index) are presented.
Plant type
Fresh root yield
Fresh foliage yield
Harvest Index
Dry matter content
Dry matter yield
Selection index
Clon
(1-5) (t/ha) (t/ha) (0-1) (%) (t/ha) SM 2610-43 2.67 31.34 19.01 0.63 29.14 9.14 38.97 CM 9903-77 2.67 21.27 12.59 0.63 33.91 7.26 34.99 SM 2632-47 3.00 23.61 11.89 0.66 32.64 7.71 34.85 CM 9903-70 3.00 16.49 7.90 0.67 33.91 5.68 27.42 CM 9903-78 2.67 19.88 16.93 0.54 33.32 6.75 23.93 SM 2634-45 2.00 22.66 17.80 0.56 28.78 6.50 23.89 SM 2965-25 3.00 16.06 8.16 0.67 32.76 5.25 23.09 CM 9903-73 3.33 21.01 15.80 0.57 33.32 7.03 21.90
Parameters of the 20 clones selected Maximum 3.67 31.34 22.57 0.69 35.89 9.14 38.97 Minimum 2.00 14.32 7.90 0.49 27.92 4.54 9.13 Average 3.10 19.65 13.79 0.59 31.80 6.25 19.54 St. Deviation 0.46 3.92 4.01 0.06 2.03 1.07 8.89
Parameters of the 64 clones evaluated Maximum 4.67 31.34 22.57 0.69 35.89 9.14 38.97 Minimum 2.00 3.30 2.69 0.40 19.09 0.86 -52.20 Average 3.47 14.80 10.62 0.58 29.36 4.45 0.00 St. Deviation 0.54 5.80 4.50 0.06 2.90 1.91 20.30
The analysis of the number of clones selected at the PYTs this year is interesting and reveals sharp contrasts between different families. While some families represented at the PYT did not have any of its clones selected, family CM 9903 had 10 clones selected. Family SM 2965 had five clones selected. Six additional families had three of their clones selected, nine had two and another group of nine families had only one clone selected. The 60 clones selected from the three PYTs were planted in the AYT.
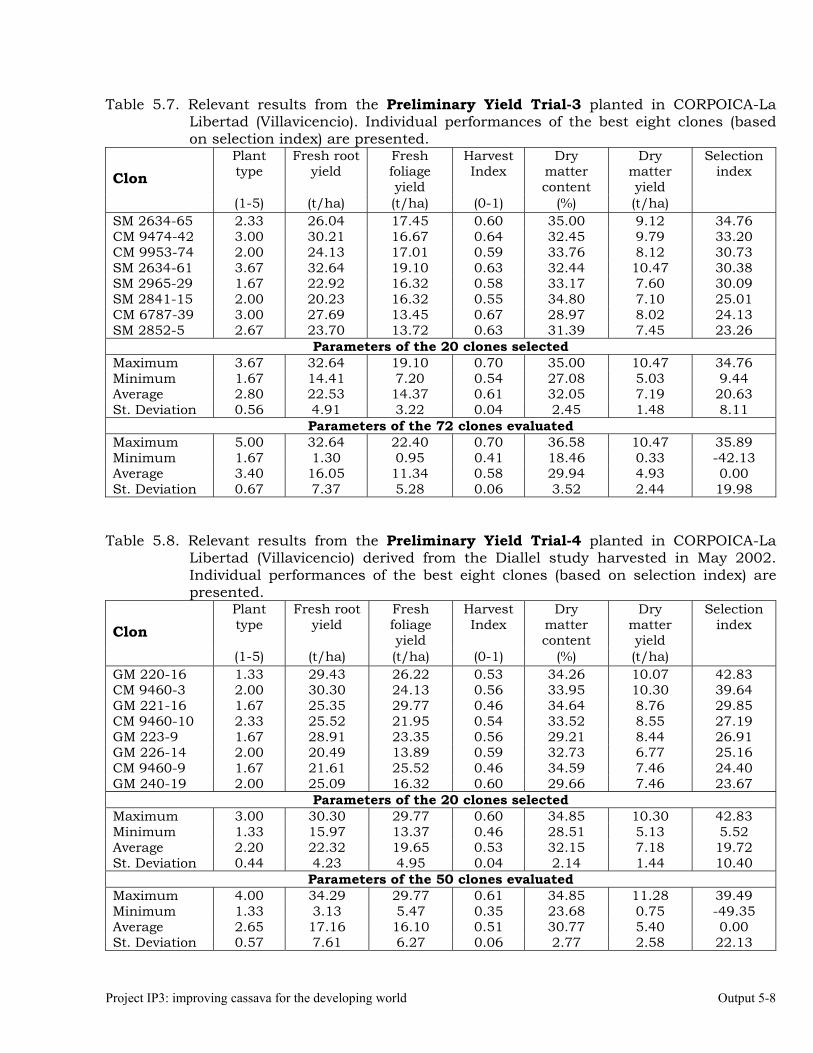
Project IP3: improving cassava for the developing world Output 5-8
Table 5.7. Relevant results from the Preliminary Yield Trial-3 planted in CORPOICA-La Libertad (Villavicencio). Individual performances of the best eight clones (based on selection index) are presented.
Plant type
Fresh root yield
Fresh foliage yield
Harvest Index
Dry matter content
Dry matter yield
Selection index
Clon
(1-5) (t/ha) (t/ha) (0-1) (%) (t/ha) SM 2634-65 2.33 26.04 17.45 0.60 35.00 9.12 34.76 CM 9474-42 3.00 30.21 16.67 0.64 32.45 9.79 33.20 CM 9953-74 2.00 24.13 17.01 0.59 33.76 8.12 30.73 SM 2634-61 3.67 32.64 19.10 0.63 32.44 10.47 30.38 SM 2965-29 1.67 22.92 16.32 0.58 33.17 7.60 30.09 SM 2841-15 2.00 20.23 16.32 0.55 34.80 7.10 25.01 CM 6787-39 3.00 27.69 13.45 0.67 28.97 8.02 24.13 SM 2852-5 2.67 23.70 13.72 0.63 31.39 7.45 23.26
Parameters of the 20 clones selected Maximum 3.67 32.64 19.10 0.70 35.00 10.47 34.76 Minimum 1.67 14.41 7.20 0.54 27.08 5.03 9.44 Average 2.80 22.53 14.37 0.61 32.05 7.19 20.63 St. Deviation 0.56 4.91 3.22 0.04 2.45 1.48 8.11
Parameters of the 72 clones evaluated Maximum 5.00 32.64 22.40 0.70 36.58 10.47 35.89 Minimum 1.67 1.30 0.95 0.41 18.46 0.33 -42.13 Average 3.40 16.05 11.34 0.58 29.94 4.93 0.00 St. Deviation 0.67 7.37 5.28 0.06 3.52 2.44 19.98
Table 5.8. Relevant results from the Preliminary Yield Trial-4 planted in CORPOICA-La
Libertad (Villavicencio) derived from the Diallel study harvested in May 2002. Individual performances of the best eight clones (based on selection index) are presented.
Plant type
Fresh root yield
Fresh foliage yield
Harvest Index
Dry matter content
Dry matter yield
Selection index
Clon
(1-5) (t/ha) (t/ha) (0-1) (%) (t/ha) GM 220-16 1.33 29.43 26.22 0.53 34.26 10.07 42.83 CM 9460-3 2.00 30.30 24.13 0.56 33.95 10.30 39.64 GM 221-16 1.67 25.35 29.77 0.46 34.64 8.76 29.85 CM 9460-10 2.33 25.52 21.95 0.54 33.52 8.55 27.19 GM 223-9 1.67 28.91 23.35 0.56 29.21 8.44 26.91 GM 226-14 2.00 20.49 13.89 0.59 32.73 6.77 25.16 CM 9460-9 1.67 21.61 25.52 0.46 34.59 7.46 24.40 GM 240-19 2.00 25.09 16.32 0.60 29.66 7.46 23.67
Parameters of the 20 clones selected Maximum 3.00 30.30 29.77 0.60 34.85 10.30 42.83 Minimum 1.33 15.97 13.37 0.46 28.51 5.13 5.52 Average 2.20 22.32 19.65 0.53 32.15 7.18 19.72 St. Deviation 0.44 4.23 4.95 0.04 2.14 1.44 10.40
Parameters of the 50 clones evaluated Maximum 4.00 34.29 29.77 0.61 34.85 11.28 39.49 Minimum 1.33 3.13 5.47 0.35 23.68 0.75 -49.35 Average 2.65 17.16 16.10 0.51 30.77 5.40 0.00 St. Deviation 0.57 7.61 6.27 0.06 2.77 2.58 22.13
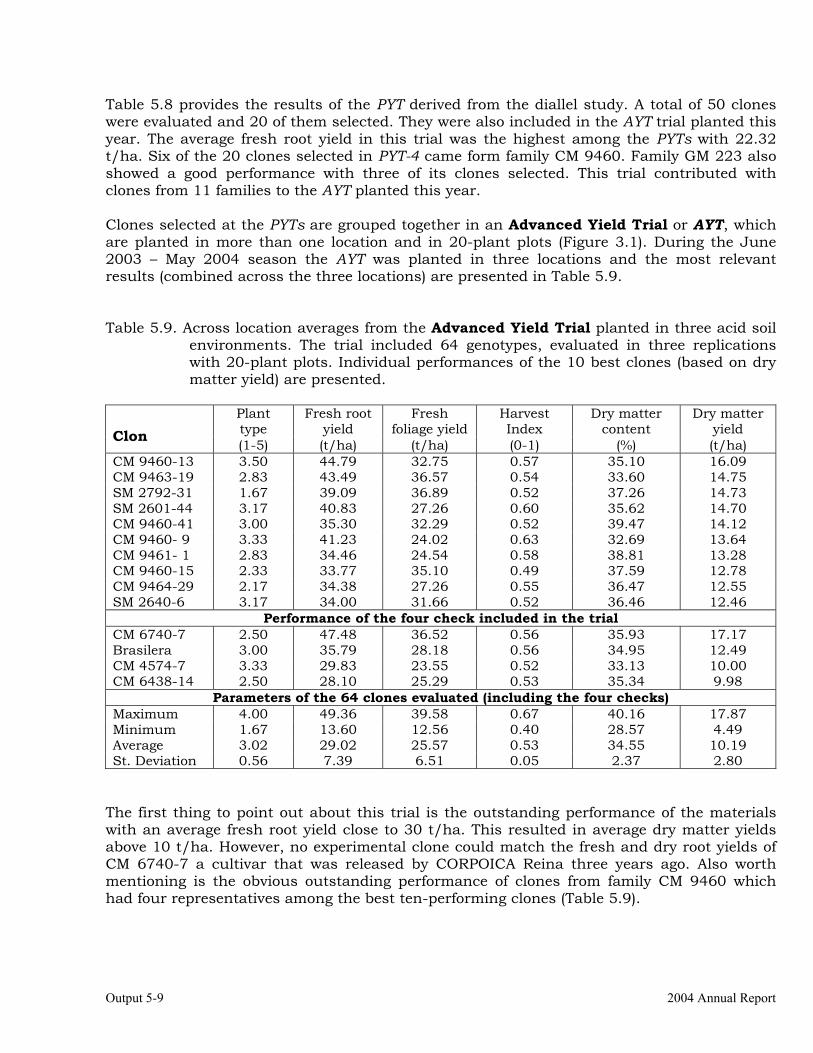
Output 5-9 2004 Annual Report
Table 5.8 provides the results of the PYT derived from the diallel study. A total of 50 clones were evaluated and 20 of them selected. They were also included in the AYT trial planted this year. The average fresh root yield in this trial was the highest among the PYTs with 22.32 t/ha. Six of the 20 clones selected in PYT-4 came form family CM 9460. Family GM 223 also showed a good performance with three of its clones selected. This trial contributed with clones from 11 families to the AYT planted this year. Clones selected at the PYTs are grouped together in an Advanced Yield Trial or AYT, which are planted in more than one location and in 20-plant plots (Figure 3.1). During the June 2003 – May 2004 season the AYT was planted in three locations and the most relevant results (combined across the three locations) are presented in Table 5.9. Table 5.9. Across location averages from the Advanced Yield Trial planted in three acid soil
environments. The trial included 64 genotypes, evaluated in three replications with 20-plant plots. Individual performances of the 10 best clones (based on dry matter yield) are presented.
Plant type
Fresh root yield
Fresh foliage yield
Harvest Index
Dry matter content
Dry matter yield
Clon (1-5) (t/ha) (t/ha) (0-1) (%) (t/ha) CM 9460-13 3.50 44.79 32.75 0.57 35.10 16.09 CM 9463-19 2.83 43.49 36.57 0.54 33.60 14.75 SM 2792-31 1.67 39.09 36.89 0.52 37.26 14.73 SM 2601-44 3.17 40.83 27.26 0.60 35.62 14.70 CM 9460-41 3.00 35.30 32.29 0.52 39.47 14.12 CM 9460- 9 3.33 41.23 24.02 0.63 32.69 13.64 CM 9461- 1 2.83 34.46 24.54 0.58 38.81 13.28 CM 9460-15 2.33 33.77 35.10 0.49 37.59 12.78 CM 9464-29 2.17 34.38 27.26 0.55 36.47 12.55 SM 2640-6 3.17 34.00 31.66 0.52 36.46 12.46
Performance of the four check included in the trial CM 6740-7 2.50 47.48 36.52 0.56 35.93 17.17 Brasilera 3.00 35.79 28.18 0.56 34.95 12.49 CM 4574-7 3.33 29.83 23.55 0.52 33.13 10.00 CM 6438-14 2.50 28.10 25.29 0.53 35.34 9.98
Parameters of the 64 clones evaluated (including the four checks) Maximum 4.00 49.36 39.58 0.67 40.16 17.87 Minimum 1.67 13.60 12.56 0.40 28.57 4.49 Average 3.02 29.02 25.57 0.53 34.55 10.19 St. Deviation 0.56 7.39 6.51 0.05 2.37 2.80
The first thing to point out about this trial is the outstanding performance of the materials with an average fresh root yield close to 30 t/ha. This resulted in average dry matter yields above 10 t/ha. However, no experimental clone could match the fresh and dry root yields of CM 6740-7 a cultivar that was released by CORPOICA Reina three years ago. Also worth mentioning is the obvious outstanding performance of clones from family CM 9460 which had four representatives among the best ten-performing clones (Table 5.9).
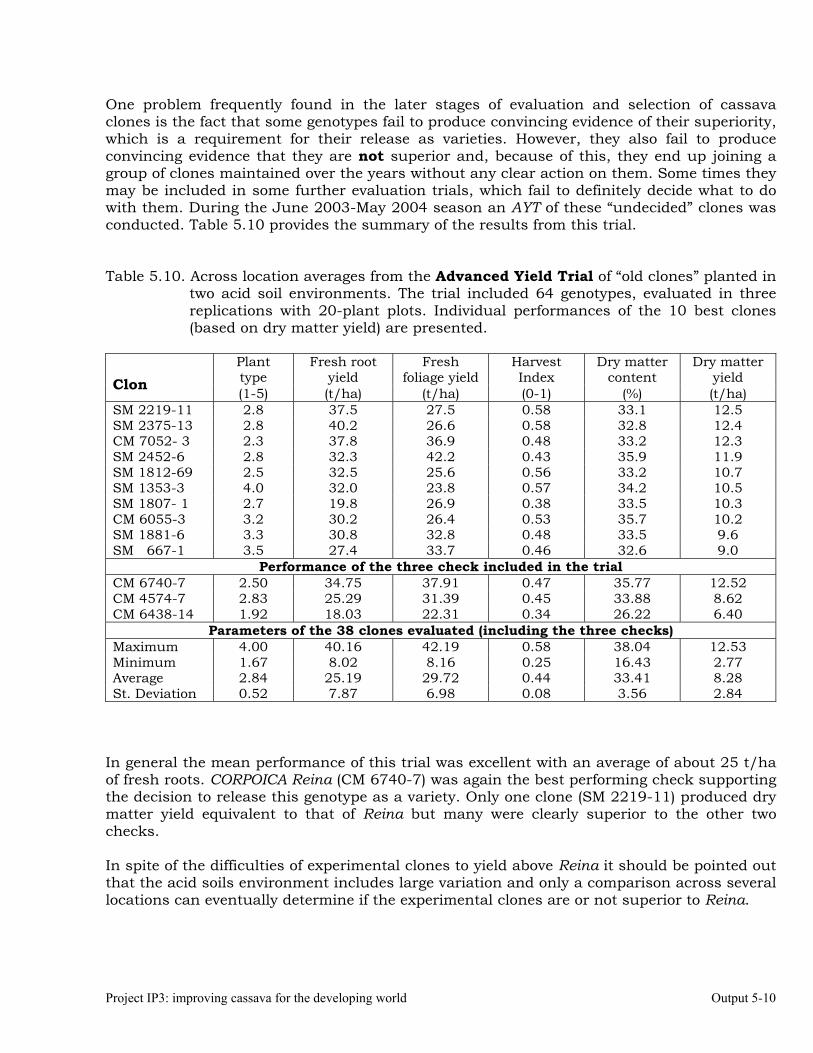
Project IP3: improving cassava for the developing world Output 5-10
One problem frequently found in the later stages of evaluation and selection of cassava clones is the fact that some genotypes fail to produce convincing evidence of their superiority, which is a requirement for their release as varieties. However, they also fail to produce convincing evidence that they are not superior and, because of this, they end up joining a group of clones maintained over the years without any clear action on them. Some times they may be included in some further evaluation trials, which fail to definitely decide what to do with them. During the June 2003-May 2004 season an AYT of these “undecided” clones was conducted. Table 5.10 provides the summary of the results from this trial. Table 5.10. Across location averages from the Advanced Yield Trial of “old clones” planted in
two acid soil environments. The trial included 64 genotypes, evaluated in three replications with 20-plant plots. Individual performances of the 10 best clones (based on dry matter yield) are presented.
Plant type
Fresh root yield
Fresh foliage yield
Harvest Index
Dry matter content
Dry matter yield
Clon (1-5) (t/ha) (t/ha) (0-1) (%) (t/ha) SM 2219-11 2.8 37.5 27.5 0.58 33.1 12.5 SM 2375-13 2.8 40.2 26.6 0.58 32.8 12.4 CM 7052- 3 2.3 37.8 36.9 0.48 33.2 12.3 SM 2452-6 2.8 32.3 42.2 0.43 35.9 11.9 SM 1812-69 2.5 32.5 25.6 0.56 33.2 10.7 SM 1353-3 4.0 32.0 23.8 0.57 34.2 10.5 SM 1807- 1 2.7 19.8 26.9 0.38 33.5 10.3 CM 6055-3 3.2 30.2 26.4 0.53 35.7 10.2 SM 1881-6 3.3 30.8 32.8 0.48 33.5 9.6 SM 667-1 3.5 27.4 33.7 0.46 32.6 9.0
Performance of the three check included in the trial CM 6740-7 2.50 34.75 37.91 0.47 35.77 12.52 CM 4574-7 2.83 25.29 31.39 0.45 33.88 8.62 CM 6438-14 1.92 18.03 22.31 0.34 26.22 6.40
Parameters of the 38 clones evaluated (including the three checks) Maximum 4.00 40.16 42.19 0.58 38.04 12.53 Minimum 1.67 8.02 8.16 0.25 16.43 2.77 Average 2.84 25.19 29.72 0.44 33.41 8.28 St. Deviation 0.52 7.87 6.98 0.08 3.56 2.84
In general the mean performance of this trial was excellent with an average of about 25 t/ha of fresh roots. CORPOICA Reina (CM 6740-7) was again the best performing check supporting the decision to release this genotype as a variety. Only one clone (SM 2219-11) produced dry matter yield equivalent to that of Reina but many were clearly superior to the other two checks. In spite of the difficulties of experimental clones to yield above Reina it should be pointed out that the acid soils environment includes large variation and only a comparison across several locations can eventually determine if the experimental clones are or not superior to Reina.
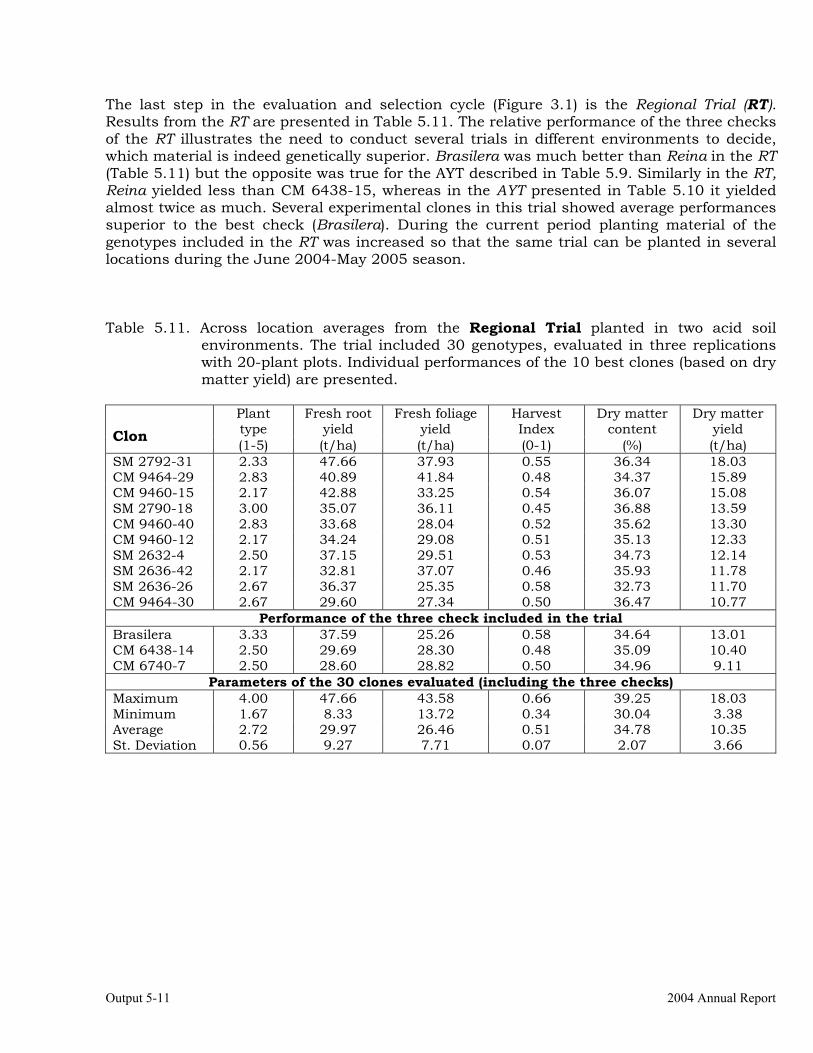
Output 5-11 2004 Annual Report
The last step in the evaluation and selection cycle (Figure 3.1) is the Regional Trial (RT). Results from the RT are presented in Table 5.11. The relative performance of the three checks of the RT illustrates the need to conduct several trials in different environments to decide, which material is indeed genetically superior. Brasilera was much better than Reina in the RT (Table 5.11) but the opposite was true for the AYT described in Table 5.9. Similarly in the RT, Reina yielded less than CM 6438-15, whereas in the AYT presented in Table 5.10 it yielded almost twice as much. Several experimental clones in this trial showed average performances superior to the best check (Brasilera). During the current period planting material of the genotypes included in the RT was increased so that the same trial can be planted in several locations during the June 2004-May 2005 season. Table 5.11. Across location averages from the Regional Trial planted in two acid soil
environments. The trial included 30 genotypes, evaluated in three replications with 20-plant plots. Individual performances of the 10 best clones (based on dry matter yield) are presented.
Plant type
Fresh root yield
Fresh foliage yield
Harvest Index
Dry matter content
Dry matter yield
Clon (1-5) (t/ha) (t/ha) (0-1) (%) (t/ha) SM 2792-31 2.33 47.66 37.93 0.55 36.34 18.03 CM 9464-29 2.83 40.89 41.84 0.48 34.37 15.89 CM 9460-15 2.17 42.88 33.25 0.54 36.07 15.08 SM 2790-18 3.00 35.07 36.11 0.45 36.88 13.59 CM 9460-40 2.83 33.68 28.04 0.52 35.62 13.30 CM 9460-12 2.17 34.24 29.08 0.51 35.13 12.33 SM 2632-4 2.50 37.15 29.51 0.53 34.73 12.14 SM 2636-42 2.17 32.81 37.07 0.46 35.93 11.78 SM 2636-26 2.67 36.37 25.35 0.58 32.73 11.70 CM 9464-30 2.67 29.60 27.34 0.50 36.47 10.77
Performance of the three check included in the trial Brasilera 3.33 37.59 25.26 0.58 34.64 13.01 CM 6438-14 2.50 29.69 28.30 0.48 35.09 10.40 CM 6740-7 2.50 28.60 28.82 0.50 34.96 9.11
Parameters of the 30 clones evaluated (including the three checks) Maximum 4.00 47.66 43.58 0.66 39.25 18.03 Minimum 1.67 8.33 13.72 0.34 30.04 3.38 Average 2.72 29.97 26.46 0.51 34.78 10.35 St. Deviation 0.56 9.27 7.71 0.07 2.07 3.66
Output 6-1 2004 Annual Report
OUTPUT 6 Development of genetic stocks and improved gene pools adapted to the sub-humid
environments. Activity 6.1. Evaluations and selections in the Mid-altitude Valleys Environment Activities developed for the Mid-altitude Valleys environment were centralized initially in CIAT Experimental Station, in Palmira Valle del Cauca Department. Table 6.1 lists the most relevant trials, whereas the other tables show results specific to each one. Table 6.1. Trials conducted in the Mid-altitude Valleys environment during the 2003-2004
cycle. Type of Trial Location Genotypes
(# plants) Reps Observations
Clonal evaluation trial Palmira 882 (7) 3 Tables 6.2-6.4 F1C1 nursery Palmira 884 (1) 1 -.- Preliminary yield trial 1 Palmira 100 (10) 3 See Table 6.5 Preliminary yield trial 2 Palmira 100 (10) 3 See Table 6.6 Preliminary yield trial 3 Palmira 100 (10) 3 See Table 6.7 Preliminary yield trial 4 Palmira 36 (10) 3 See Table 6.8 Preliminary yield trial 5 Palmira 36 (10) 3 See Table 6.9 Preliminary yield trial 6 Palmira 36 (10) 3 See Table 6.10 Regional Trial La Dolores 28 (20) 3 See Table 5.12 Regional Trial Montelindo 20 (20) 3 See Table 6.13
To take advantage of the crosses made that resulted in F1 plants grown at Palmira that failed to produce enough stakes to be included in the Clonal Evaluation Trial (CET) an F1C1 trial is planted. In the case of the Mid-altitude Valleys Environment 884 genotypes were in this situation (Table 6.1) and were, therefore, planted in a trial that is actually a multiplication nursery. There is very little selection in these “trial” within the new scheme of selection and evaluation. For the Mid-altitude Valleys environment plants that show any symptom resembling those of Frog Skin Disease are discarded and stakes from them are not collected. As mentioned in Output 3 (Table 3.5) a total of 4302 seeds were germinated and 3144 seedlings from these botanical seeds (targeting this particular environment) were transplanted at CIAT-Palmira in an isolated field. The planting of the F1 stage is isolated to reduce as much as possible infection by diseases that can be found at later stages of the evaluation process. Seedlings from botanical seed are considered to be disease-free and efforts are made to maintain this condition for as long as it can possibly be done. Enough vegetative cuttings from 1050 10-months old plants (grouped in 51 families) from the F1 nursery planted the previous year could be obtained and planted in the CET for the mid-altitude valleys (Valle del Cauca Department) on June, 2004. The trial will be harvested in April-May 2005. In addition a second CET trial with 369 clones from the F1C1 was also planted.
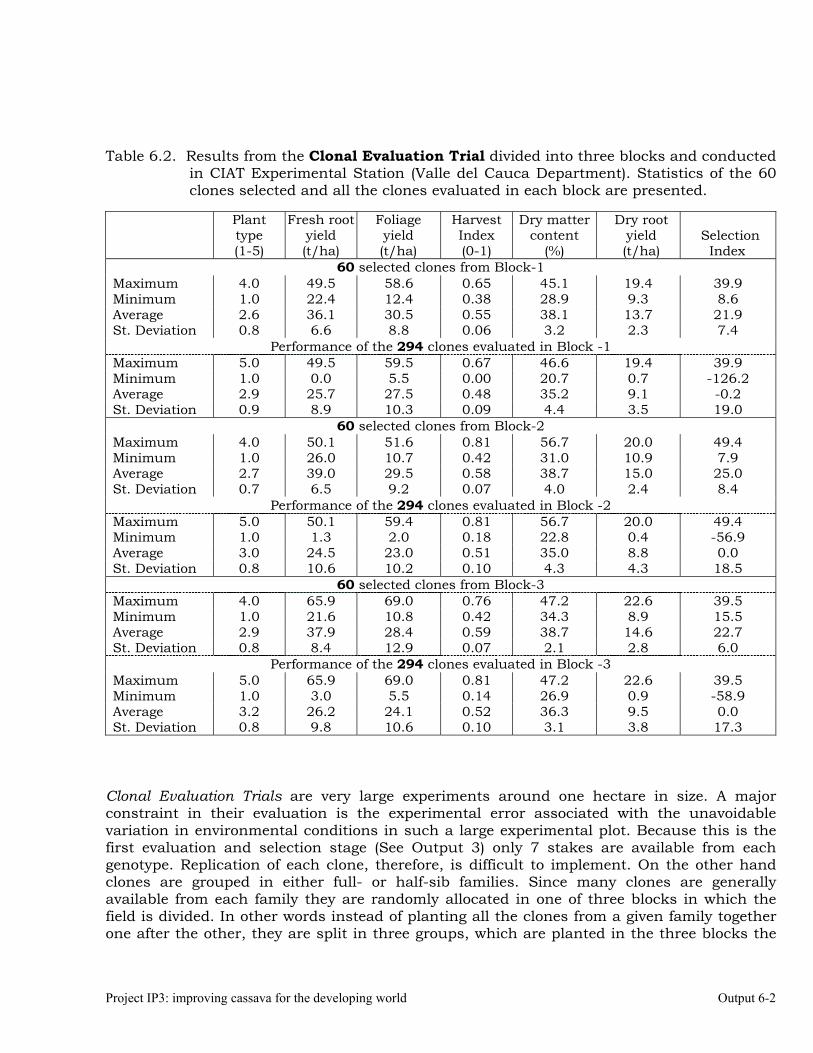
Project IP3: improving cassava for the developing world Output 6-2
Table 6.2. Results from the Clonal Evaluation Trial divided into three blocks and conducted
in CIAT Experimental Station (Valle del Cauca Department). Statistics of the 60 clones selected and all the clones evaluated in each block are presented.
Plant type (1-5)
Fresh root yield (t/ha)
Foliage yield (t/ha)
Harvest Index (0-1)
Dry matter content
(%)
Dry root yield (t/ha)
Selection Index
60 selected clones from Block-1 Maximum 4.0 49.5 58.6 0.65 45.1 19.4 39.9 Minimum 1.0 22.4 12.4 0.38 28.9 9.3 8.6 Average 2.6 36.1 30.5 0.55 38.1 13.7 21.9 St. Deviation 0.8 6.6 8.8 0.06 3.2 2.3 7.4
Performance of the 294 clones evaluated in Block -1 Maximum 5.0 49.5 59.5 0.67 46.6 19.4 39.9 Minimum 1.0 0.0 5.5 0.00 20.7 0.7 -126.2 Average 2.9 25.7 27.5 0.48 35.2 9.1 -0.2 St. Deviation 0.9 8.9 10.3 0.09 4.4 3.5 19.0
60 selected clones from Block-2 Maximum 4.0 50.1 51.6 0.81 56.7 20.0 49.4 Minimum 1.0 26.0 10.7 0.42 31.0 10.9 7.9 Average 2.7 39.0 29.5 0.58 38.7 15.0 25.0 St. Deviation 0.7 6.5 9.2 0.07 4.0 2.4 8.4
Performance of the 294 clones evaluated in Block -2 Maximum 5.0 50.1 59.4 0.81 56.7 20.0 49.4 Minimum 1.0 1.3 2.0 0.18 22.8 0.4 -56.9 Average 3.0 24.5 23.0 0.51 35.0 8.8 0.0 St. Deviation 0.8 10.6 10.2 0.10 4.3 4.3 18.5
60 selected clones from Block-3 Maximum 4.0 65.9 69.0 0.76 47.2 22.6 39.5 Minimum 1.0 21.6 10.8 0.42 34.3 8.9 15.5 Average 2.9 37.9 28.4 0.59 38.7 14.6 22.7 St. Deviation 0.8 8.4 12.9 0.07 2.1 2.8 6.0
Performance of the 294 clones evaluated in Block -3 Maximum 5.0 65.9 69.0 0.81 47.2 22.6 39.5 Minimum 1.0 3.0 5.5 0.14 26.9 0.9 -58.9 Average 3.2 26.2 24.1 0.52 36.3 9.5 0.0 St. Deviation 0.8 9.8 10.6 0.10 3.1 3.8 17.3
Clonal Evaluation Trials are very large experiments around one hectare in size. A major constraint in their evaluation is the experimental error associated with the unavoidable variation in environmental conditions in such a large experimental plot. Because this is the first evaluation and selection stage (See Output 3) only 7 stakes are available from each genotype. Replication of each clone, therefore, is difficult to implement. On the other hand clones are grouped in either full- or half-sib families. Since many clones are generally available from each family they are randomly allocated in one of three blocks in which the field is divided. In other words instead of planting all the clones from a given family together one after the other, they are split in three groups, which are planted in the three blocks the
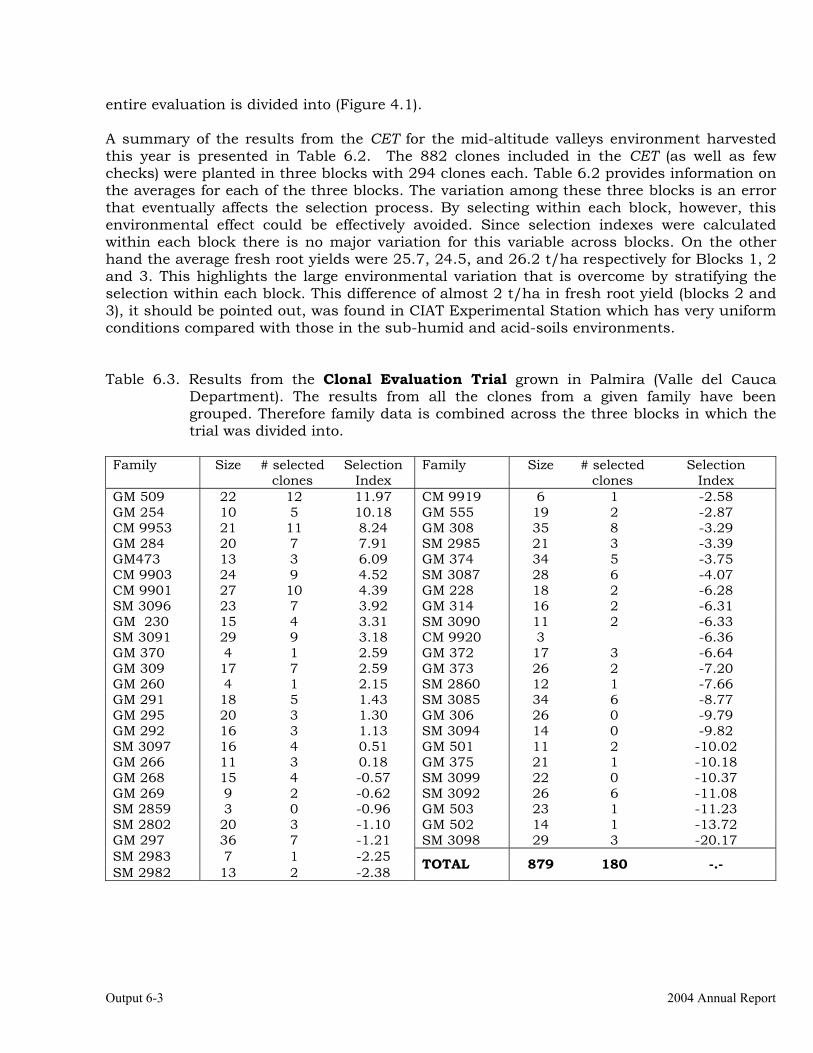
Output 6-3 2004 Annual Report
entire evaluation is divided into (Figure 4.1). A summary of the results from the CET for the mid-altitude valleys environment harvested this year is presented in Table 6.2. The 882 clones included in the CET (as well as few checks) were planted in three blocks with 294 clones each. Table 6.2 provides information on the averages for each of the three blocks. The variation among these three blocks is an error that eventually affects the selection process. By selecting within each block, however, this environmental effect could be effectively avoided. Since selection indexes were calculated within each block there is no major variation for this variable across blocks. On the other hand the average fresh root yields were 25.7, 24.5, and 26.2 t/ha respectively for Blocks 1, 2 and 3. This highlights the large environmental variation that is overcome by stratifying the selection within each block. This difference of almost 2 t/ha in fresh root yield (blocks 2 and 3), it should be pointed out, was found in CIAT Experimental Station which has very uniform conditions compared with those in the sub-humid and acid-soils environments. Table 6.3. Results from the Clonal Evaluation Trial grown in Palmira (Valle del Cauca
Department). The results from all the clones from a given family have been grouped. Therefore family data is combined across the three blocks in which the trial was divided into.
Family Size # selected
clones Selection
Index Family Size # selected
clones Selection
Index GM 509 22 12 11.97 CM 9919 6 1 -2.58 GM 254 10 5 10.18 GM 555 19 2 -2.87 CM 9953 21 11 8.24 GM 308 35 8 -3.29 GM 284 20 7 7.91 SM 2985 21 3 -3.39 GM473 13 3 6.09 GM 374 34 5 -3.75 CM 9903 24 9 4.52 SM 3087 28 6 -4.07 CM 9901 27 10 4.39 GM 228 18 2 -6.28 SM 3096 23 7 3.92 GM 314 16 2 -6.31 GM 230 15 4 3.31 SM 3090 11 2 -6.33 SM 3091 29 9 3.18 CM 9920 3 -6.36 GM 370 4 1 2.59 GM 372 17 3 -6.64 GM 309 17 7 2.59 GM 373 26 2 -7.20 GM 260 4 1 2.15 SM 2860 12 1 -7.66 GM 291 18 5 1.43 SM 3085 34 6 -8.77 GM 295 20 3 1.30 GM 306 26 0 -9.79 GM 292 16 3 1.13 SM 3094 14 0 -9.82 SM 3097 16 4 0.51 GM 501 11 2 -10.02 GM 266 11 3 0.18 GM 375 21 1 -10.18 GM 268 15 4 -0.57 SM 3099 22 0 -10.37 GM 269 9 2 -0.62 SM 3092 26 6 -11.08 SM 2859 3 0 -0.96 GM 503 23 1 -11.23 SM 2802 20 3 -1.10 GM 502 14 1 -13.72 GM 297 36 7 -1.21 SM 3098 29 3 -20.17 SM 2983 7 1 -2.25 SM 2982 13 2 -2.38 TOTAL
879
180
-.-
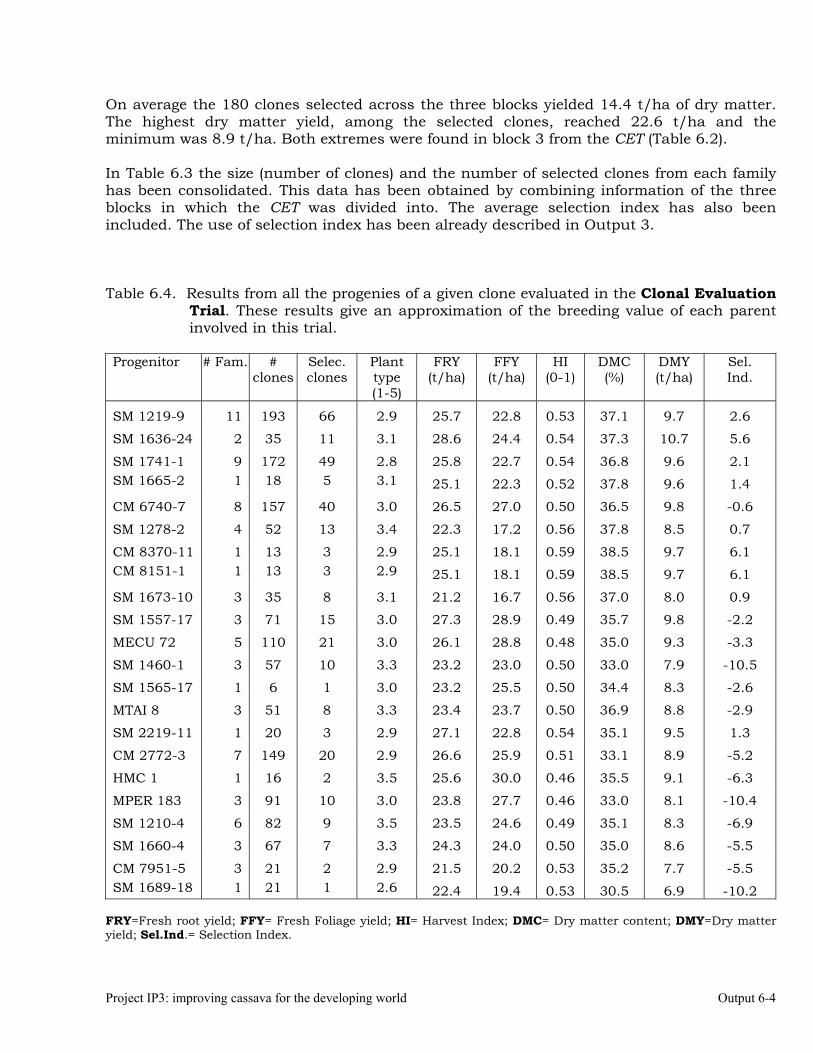
Project IP3: improving cassava for the developing world Output 6-4
On average the 180 clones selected across the three blocks yielded 14.4 t/ha of dry matter. The highest dry matter yield, among the selected clones, reached 22.6 t/ha and the minimum was 8.9 t/ha. Both extremes were found in block 3 from the CET (Table 6.2). In Table 6.3 the size (number of clones) and the number of selected clones from each family has been consolidated. This data has been obtained by combining information of the three blocks in which the CET was divided into. The average selection index has also been included. The use of selection index has been already described in Output 3. Table 6.4. Results from all the progenies of a given clone evaluated in the Clonal Evaluation
Trial. These results give an approximation of the breeding value of each parent involved in this trial.
Progenitor # Fam. #
clones Selec. clones
Plant type (1-5)
FRY (t/ha)
FFY (t/ha)
HI (0-1)
DMC (%)
DMY (t/ha)
Sel. Ind.
SM 1219-9 11 193 66 2.9 25.7 22.8 0.53 37.1 9.7 2.6
SM 1636-24 2 35 11 3.1 28.6 24.4 0.54 37.3 10.7 5.6
SM 1741-1 9 172 49 2.8 25.8 22.7 0.54 36.8 9.6 2.1 SM 1665-2 1 18 5 3.1 25.1 22.3 0.52 37.8 9.6 1.4
CM 6740-7 8 157 40 3.0 26.5 27.0 0.50 36.5 9.8 -0.6
SM 1278-2 4 52 13 3.4 22.3 17.2 0.56 37.8 8.5 0.7
CM 8370-11 1 13 3 2.9 25.1 18.1 0.59 38.5 9.7 6.1 CM 8151-1 1 13 3 2.9 25.1 18.1 0.59 38.5 9.7 6.1
SM 1673-10 3 35 8 3.1 21.2 16.7 0.56 37.0 8.0 0.9
SM 1557-17 3 71 15 3.0 27.3 28.9 0.49 35.7 9.8 -2.2
MECU 72 5 110 21 3.0 26.1 28.8 0.48 35.0 9.3 -3.3
SM 1460-1 3 57 10 3.3 23.2 23.0 0.50 33.0 7.9 -10.5
SM 1565-17 1 6 1 3.0 23.2 25.5 0.50 34.4 8.3 -2.6
MTAI 8 3 51 8 3.3 23.4 23.7 0.50 36.9 8.8 -2.9
SM 2219-11 1 20 3 2.9 27.1 22.8 0.54 35.1 9.5 1.3
CM 2772-3 7 149 20 2.9 26.6 25.9 0.51 33.1 8.9 -5.2
HMC 1 1 16 2 3.5 25.6 30.0 0.46 35.5 9.1 -6.3
MPER 183 3 91 10 3.0 23.8 27.7 0.46 33.0 8.1 -10.4
SM 1210-4 6 82 9 3.5 23.5 24.6 0.49 35.1 8.3 -6.9
SM 1660-4 3 67 7 3.3 24.3 24.0 0.50 35.0 8.6 -5.5
CM 7951-5 3 21 2 2.9 21.5 20.2 0.53 35.2 7.7 -5.5 SM 1689-18 1 21 1 2.6 22.4 19.4 0.53 30.5 6.9 -10.2
FRY=Fresh root yield; FFY= Fresh Foliage yield; HI= Harvest Index; DMC= Dry matter content; DMY=Dry matter yield; Sel.Ind.= Selection Index.
Output 6-5 2004 Annual Report
Family GM 509 had 22 clones scattered in the three blocks of the CET. Twelve of these clones (55%) were selected (Table 6.3). The average selection index for this family was 11.97. A family with an average performance would have a selection index around zero. Positive selection indexes mean an average performance better than the mean of the population. A negative selection index, on the other hand, suggests a performance below the mean of the population. In the case of family GM 509, it is obvious that the general performance of that family was outstanding because its selection index (averages across the 22 clones that conformed this family) was 11.97. Moreover, the average selection pressure in the whole CET was 20% and this family had a much higher percentage of selected clones (55%). At the bottom of the right side of Table 6.3 concentrate the worst performing families. For instance Family SM 3098 had 29 clones scattered in the three blocks of the CET. Only three of them were selected (10%). As expected the average selection index for this family was negative (-20.17). The information from Table 6.3 can be further consolidated around the average performance of each progenitor used to generate the CET. This is so because each progenitor can be used to produce more than one family. For instance Clone SM 1219-9 (Table 6.4) was used as one of the progenitors in eleven full- or half-sib families. Table 6.4 provides information for the most important characteristics of the progenies from each parent. This information is very closely related to the GCA estimates and reflects the breeding value of each progenitor. This information is very useful for defining the parents to be included in the crossing nurseries in the future. The parental clones listed in Table 6.4 have been ordered based on the proportion of clones selected. Clone SM 1219-9 was used, as stated above, in eleven families, which combined included a total of 193 clones, 66 of them were selected (34%). On the other hand, at the bottom of Table 6.4 it is clone SM 1689-18. This clone participated in just one family with 21 clones with an average selection index of –10.2. As expected, a low proportion of clones making up this family were selected (one clone out of the 21 evaluated). As explained in Output 3 (Figure 3.1) the following step in the selection process is the Preliminary Yield Trial or PYT. Clones evaluated in these trials are those selected during the CET conducted the previous year. The seven plants from the CET produce more than 30 stakes. Therefore, they are planted with three replications of 10-plant plots. Each experimental plot consists of two rows with five plants each. Since selections at the CET stage are conducted in there different blocks selections within each block generate a respective PYT. The clones allocated to each block at the CET (and selected) are therefore, competing among themselves also at the PYT stage. The reasons for this are: a) This approach maximized the genetic variability within each by maximizing the number of families present in it; b) The performance of the cassava plant depends heavily on the quality of the stake from which it grew, and the quality of the stakes, in turn, depends on the environmental conditions in which the mother plant grew. By keeping together in the same trial the clones that grew together at the CET a better uniformity of the quality of the stakes is achieved and, therefore, the experimental error at the PYT is somewhat reduced.
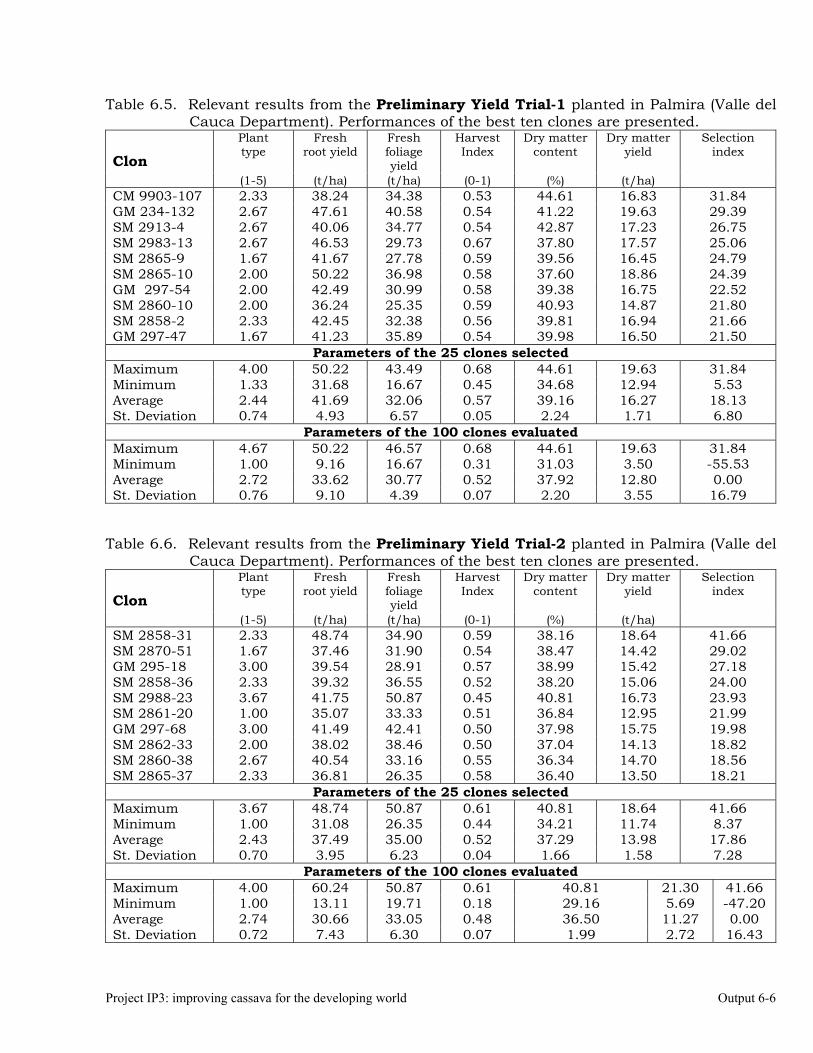
Project IP3: improving cassava for the developing world Output 6-6
Table 6.5. Relevant results from the Preliminary Yield Trial-1 planted in Palmira (Valle del Cauca Department). Performances of the best ten clones are presented.
Plant type
Fresh root yield
Fresh foliage yield
Harvest Index
Dry matter content
Dry matter yield
Selection index
Clon (1-5) (t/ha) (t/ha) (0-1) (%) (t/ha)
CM 9903-107 2.33 38.24 34.38 0.53 44.61 16.83 31.84 GM 234-132 2.67 47.61 40.58 0.54 41.22 19.63 29.39 SM 2913-4 2.67 40.06 34.77 0.54 42.87 17.23 26.75 SM 2983-13 2.67 46.53 29.73 0.67 37.80 17.57 25.06 SM 2865-9 1.67 41.67 27.78 0.59 39.56 16.45 24.79 SM 2865-10 2.00 50.22 36.98 0.58 37.60 18.86 24.39 GM 297-54 2.00 42.49 30.99 0.58 39.38 16.75 22.52 SM 2860-10 2.00 36.24 25.35 0.59 40.93 14.87 21.80 SM 2858-2 2.33 42.45 32.38 0.56 39.81 16.94 21.66 GM 297-47 1.67 41.23 35.89 0.54 39.98 16.50 21.50
Parameters of the 25 clones selected Maximum 4.00 50.22 43.49 0.68 44.61 19.63 31.84 Minimum 1.33 31.68 16.67 0.45 34.68 12.94 5.53 Average 2.44 41.69 32.06 0.57 39.16 16.27 18.13 St. Deviation 0.74 4.93 6.57 0.05 2.24 1.71 6.80
Parameters of the 100 clones evaluated Maximum 4.67 50.22 46.57 0.68 44.61 19.63 31.84 Minimum 1.00 9.16 16.67 0.31 31.03 3.50 -55.53 Average 2.72 33.62 30.77 0.52 37.92 12.80 0.00 St. Deviation 0.76 9.10 4.39 0.07 2.20 3.55 16.79
Table 6.6. Relevant results from the Preliminary Yield Trial-2 planted in Palmira (Valle del
Cauca Department). Performances of the best ten clones are presented. Plant type
Fresh root yield
Fresh foliage yield
Harvest Index
Dry matter content
Dry matter yield
Selection index
Clon (1-5) (t/ha) (t/ha) (0-1) (%) (t/ha)
SM 2858-31 2.33 48.74 34.90 0.59 38.16 18.64 41.66 SM 2870-51 1.67 37.46 31.90 0.54 38.47 14.42 29.02 GM 295-18 3.00 39.54 28.91 0.57 38.99 15.42 27.18 SM 2858-36 2.33 39.32 36.55 0.52 38.20 15.06 24.00 SM 2988-23 3.67 41.75 50.87 0.45 40.81 16.73 23.93 SM 2861-20 1.00 35.07 33.33 0.51 36.84 12.95 21.99 GM 297-68 3.00 41.49 42.41 0.50 37.98 15.75 19.98 SM 2862-33 2.00 38.02 38.46 0.50 37.04 14.13 18.82 SM 2860-38 2.67 40.54 33.16 0.55 36.34 14.70 18.56 SM 2865-37 2.33 36.81 26.35 0.58 36.40 13.50 18.21
Parameters of the 25 clones selected Maximum 3.67 48.74 50.87 0.61 40.81 18.64 41.66 Minimum 1.00 31.08 26.35 0.44 34.21 11.74 8.37 Average 2.43 37.49 35.00 0.52 37.29 13.98 17.86 St. Deviation 0.70 3.95 6.23 0.04 1.66 1.58 7.28
Parameters of the 100 clones evaluated Maximum 4.00 60.24 50.87 0.61 40.81 21.30 41.66 Minimum 1.00 13.11 19.71 0.18 29.16 5.69 -47.20 Average 2.74 30.66 33.05 0.48 36.50 11.27 0.00 St. Deviation 0.72 7.43 6.30 0.07 1.99 2.72 16.43
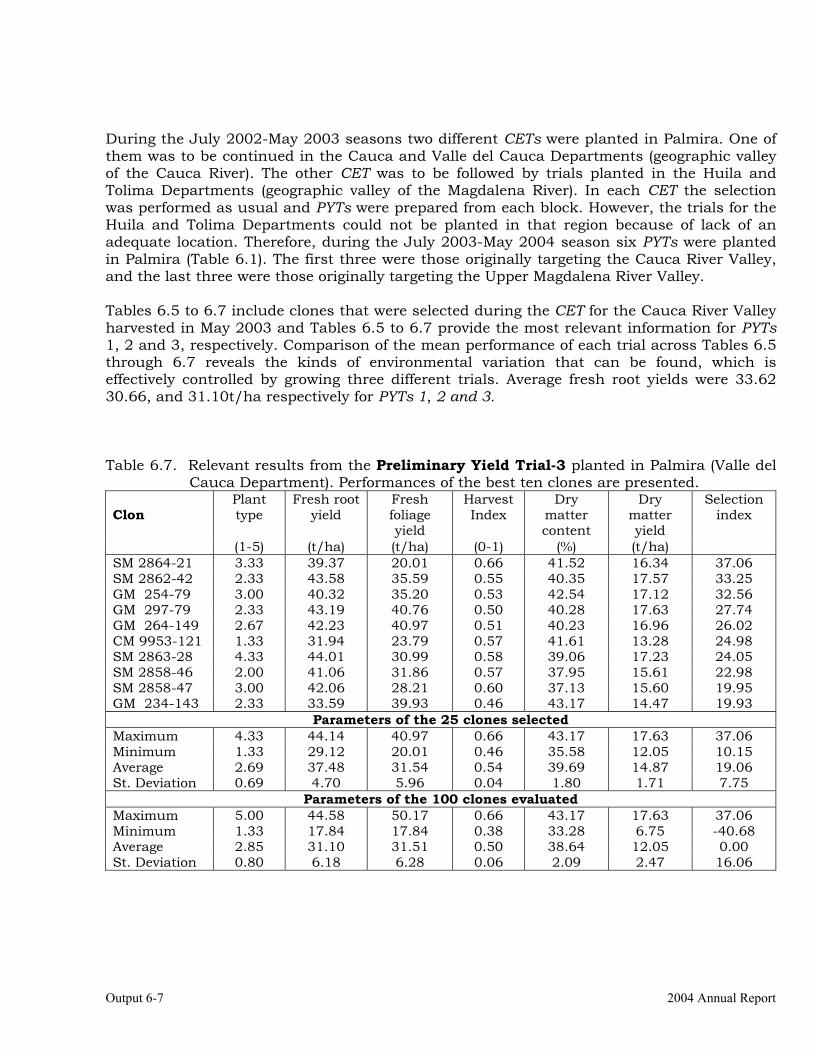
Output 6-7 2004 Annual Report
During the July 2002-May 2003 seasons two different CETs were planted in Palmira. One of them was to be continued in the Cauca and Valle del Cauca Departments (geographic valley of the Cauca River). The other CET was to be followed by trials planted in the Huila and Tolima Departments (geographic valley of the Magdalena River). In each CET the selection was performed as usual and PYTs were prepared from each block. However, the trials for the Huila and Tolima Departments could not be planted in that region because of lack of an adequate location. Therefore, during the July 2003-May 2004 season six PYTs were planted in Palmira (Table 6.1). The first three were those originally targeting the Cauca River Valley, and the last three were those originally targeting the Upper Magdalena River Valley. Tables 6.5 to 6.7 include clones that were selected during the CET for the Cauca River Valley harvested in May 2003 and Tables 6.5 to 6.7 provide the most relevant information for PYTs 1, 2 and 3, respectively. Comparison of the mean performance of each trial across Tables 6.5 through 6.7 reveals the kinds of environmental variation that can be found, which is effectively controlled by growing three different trials. Average fresh root yields were 33.62 30.66, and 31.10t/ha respectively for PYTs 1, 2 and 3. Table 6.7. Relevant results from the Preliminary Yield Trial-3 planted in Palmira (Valle del
Cauca Department). Performances of the best ten clones are presented. Plant type
Fresh root yield
Fresh foliage yield
Harvest Index
Dry matter content
Dry matter yield
Selection index
Clon
(1-5) (t/ha) (t/ha) (0-1) (%) (t/ha) SM 2864-21 3.33 39.37 20.01 0.66 41.52 16.34 37.06 SM 2862-42 2.33 43.58 35.59 0.55 40.35 17.57 33.25 GM 254-79 3.00 40.32 35.20 0.53 42.54 17.12 32.56 GM 297-79 2.33 43.19 40.76 0.50 40.28 17.63 27.74 GM 264-149 2.67 42.23 40.97 0.51 40.23 16.96 26.02 CM 9953-121 1.33 31.94 23.79 0.57 41.61 13.28 24.98 SM 2863-28 4.33 44.01 30.99 0.58 39.06 17.23 24.05 SM 2858-46 2.00 41.06 31.86 0.57 37.95 15.61 22.98 SM 2858-47 3.00 42.06 28.21 0.60 37.13 15.60 19.95 GM 234-143 2.33 33.59 39.93 0.46 43.17 14.47 19.93
Parameters of the 25 clones selected Maximum 4.33 44.14 40.97 0.66 43.17 17.63 37.06 Minimum 1.33 29.12 20.01 0.46 35.58 12.05 10.15 Average 2.69 37.48 31.54 0.54 39.69 14.87 19.06 St. Deviation 0.69 4.70 5.96 0.04 1.80 1.71 7.75
Parameters of the 100 clones evaluated Maximum 5.00 44.58 50.17 0.66 43.17 17.63 37.06 Minimum 1.33 17.84 17.84 0.38 33.28 6.75 -40.68 Average 2.85 31.10 31.51 0.50 38.64 12.05 0.00 St. Deviation 0.80 6.18 6.28 0.06 2.09 2.47 16.06
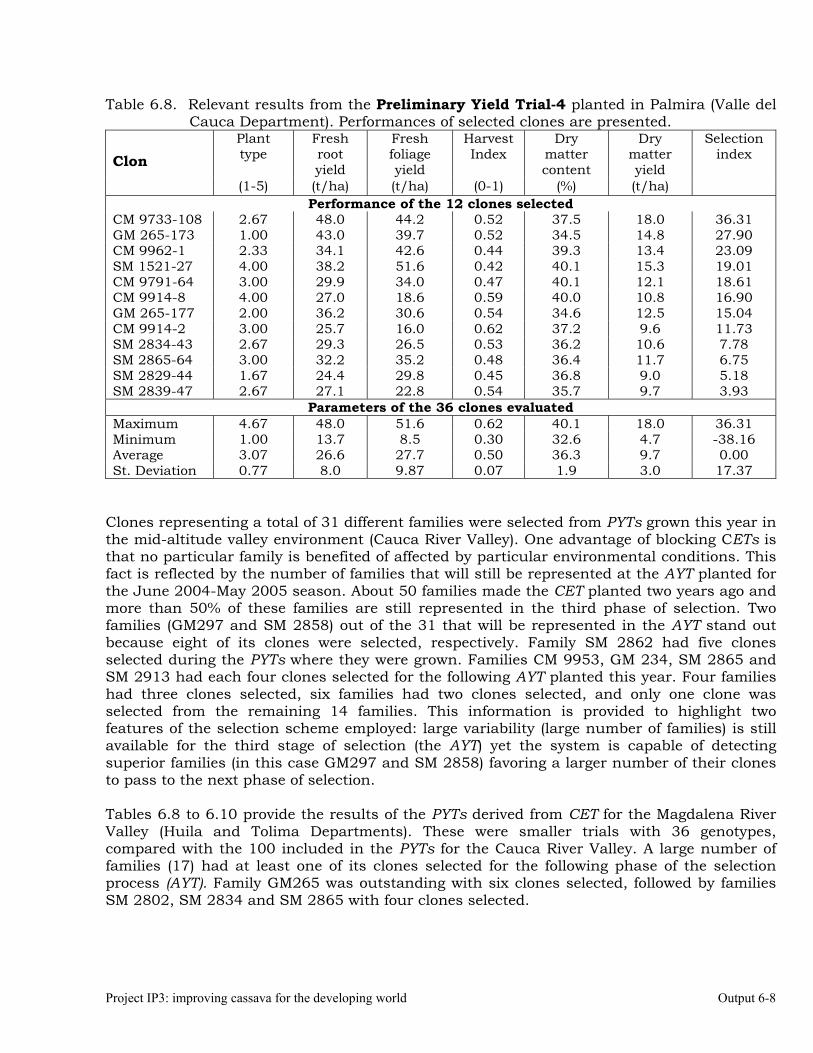
Project IP3: improving cassava for the developing world Output 6-8
Table 6.8. Relevant results from the Preliminary Yield Trial-4 planted in Palmira (Valle del Cauca Department). Performances of selected clones are presented.
Plant type
Fresh root yield
Fresh foliage yield
Harvest Index
Dry matter content
Dry matter yield
Selection index
Clon
(1-5) (t/ha) (t/ha) (0-1) (%) (t/ha) Performance of the 12 clones selected
CM 9733-108 2.67 48.0 44.2 0.52 37.5 18.0 36.31 GM 265-173 1.00 43.0 39.7 0.52 34.5 14.8 27.90 CM 9962-1 2.33 34.1 42.6 0.44 39.3 13.4 23.09 SM 1521-27 4.00 38.2 51.6 0.42 40.1 15.3 19.01 CM 9791-64 3.00 29.9 34.0 0.47 40.1 12.1 18.61 CM 9914-8 4.00 27.0 18.6 0.59 40.0 10.8 16.90 GM 265-177 2.00 36.2 30.6 0.54 34.6 12.5 15.04 CM 9914-2 3.00 25.7 16.0 0.62 37.2 9.6 11.73 SM 2834-43 2.67 29.3 26.5 0.53 36.2 10.6 7.78 SM 2865-64 3.00 32.2 35.2 0.48 36.4 11.7 6.75 SM 2829-44 1.67 24.4 29.8 0.45 36.8 9.0 5.18 SM 2839-47 2.67 27.1 22.8 0.54 35.7 9.7 3.93
Parameters of the 36 clones evaluated Maximum 4.67 48.0 51.6 0.62 40.1 18.0 36.31 Minimum 1.00 13.7 8.5 0.30 32.6 4.7 -38.16 Average 3.07 26.6 27.7 0.50 36.3 9.7 0.00 St. Deviation 0.77 8.0 9.87 0.07 1.9 3.0 17.37
Clones representing a total of 31 different families were selected from PYTs grown this year in the mid-altitude valley environment (Cauca River Valley). One advantage of blocking CETs is that no particular family is benefited of affected by particular environmental conditions. This fact is reflected by the number of families that will still be represented at the AYT planted for the June 2004-May 2005 season. About 50 families made the CET planted two years ago and more than 50% of these families are still represented in the third phase of selection. Two families (GM297 and SM 2858) out of the 31 that will be represented in the AYT stand out because eight of its clones were selected, respectively. Family SM 2862 had five clones selected during the PYTs where they were grown. Families CM 9953, GM 234, SM 2865 and SM 2913 had each four clones selected for the following AYT planted this year. Four families had three clones selected, six families had two clones selected, and only one clone was selected from the remaining 14 families. This information is provided to highlight two features of the selection scheme employed: large variability (large number of families) is still available for the third stage of selection (the AYT) yet the system is capable of detecting superior families (in this case GM297 and SM 2858) favoring a larger number of their clones to pass to the next phase of selection. Tables 6.8 to 6.10 provide the results of the PYTs derived from CET for the Magdalena River Valley (Huila and Tolima Departments). These were smaller trials with 36 genotypes, compared with the 100 included in the PYTs for the Cauca River Valley. A large number of families (17) had at least one of its clones selected for the following phase of the selection process (AYT). Family GM265 was outstanding with six clones selected, followed by families SM 2802, SM 2834 and SM 2865 with four clones selected.
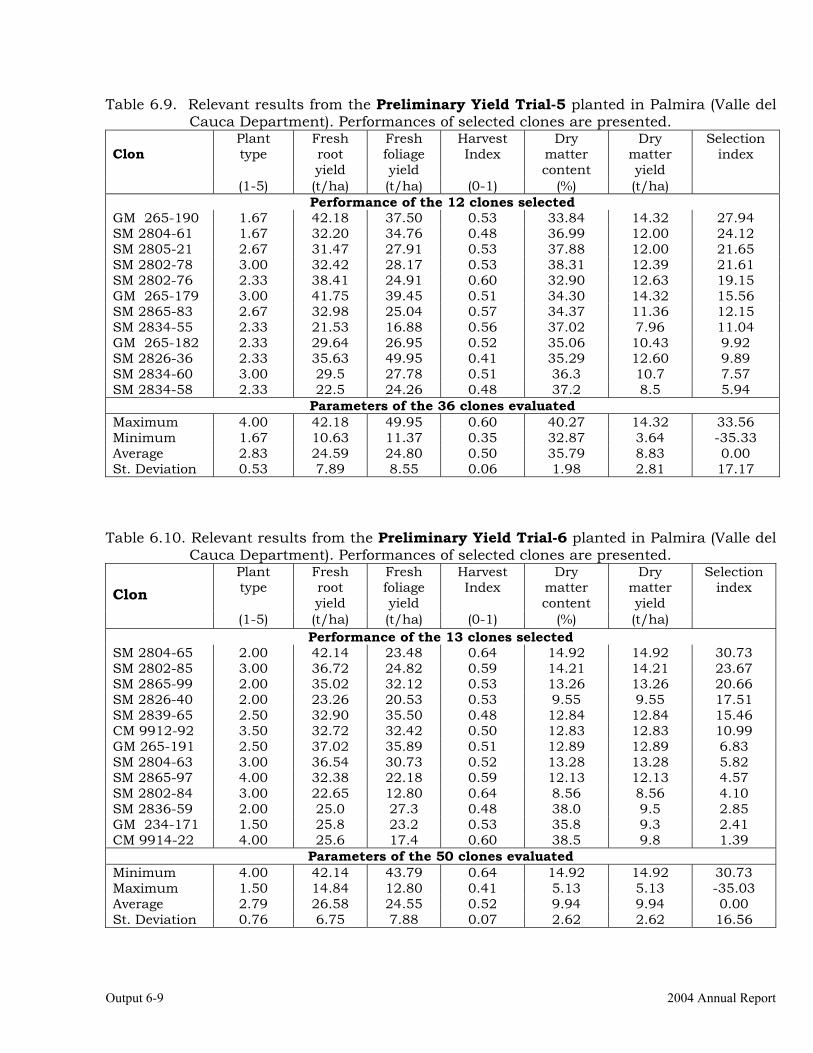
Output 6-9 2004 Annual Report
Table 6.9. Relevant results from the Preliminary Yield Trial-5 planted in Palmira (Valle del Cauca Department). Performances of selected clones are presented.
Plant type
Fresh root yield
Fresh foliage yield
Harvest Index
Dry matter content
Dry matter yield
Selection index
Clon
(1-5) (t/ha) (t/ha) (0-1) (%) (t/ha) Performance of the 12 clones selected
GM 265-190 1.67 42.18 37.50 0.53 33.84 14.32 27.94 SM 2804-61 1.67 32.20 34.76 0.48 36.99 12.00 24.12 SM 2805-21 2.67 31.47 27.91 0.53 37.88 12.00 21.65 SM 2802-78 3.00 32.42 28.17 0.53 38.31 12.39 21.61 SM 2802-76 2.33 38.41 24.91 0.60 32.90 12.63 19.15 GM 265-179 3.00 41.75 39.45 0.51 34.30 14.32 15.56 SM 2865-83 2.67 32.98 25.04 0.57 34.37 11.36 12.15 SM 2834-55 2.33 21.53 16.88 0.56 37.02 7.96 11.04 GM 265-182 2.33 29.64 26.95 0.52 35.06 10.43 9.92 SM 2826-36 2.33 35.63 49.95 0.41 35.29 12.60 9.89 SM 2834-60 3.00 29.5 27.78 0.51 36.3 10.7 7.57 SM 2834-58 2.33 22.5 24.26 0.48 37.2 8.5 5.94
Parameters of the 36 clones evaluated Maximum 4.00 42.18 49.95 0.60 40.27 14.32 33.56 Minimum 1.67 10.63 11.37 0.35 32.87 3.64 -35.33 Average 2.83 24.59 24.80 0.50 35.79 8.83 0.00 St. Deviation 0.53 7.89 8.55 0.06 1.98 2.81 17.17
Table 6.10. Relevant results from the Preliminary Yield Trial-6 planted in Palmira (Valle del
Cauca Department). Performances of selected clones are presented. Plant type
Fresh root yield
Fresh foliage yield
Harvest Index
Dry matter content
Dry matter yield
Selection index
Clon
(1-5) (t/ha) (t/ha) (0-1) (%) (t/ha) Performance of the 13 clones selected
SM 2804-65 2.00 42.14 23.48 0.64 14.92 14.92 30.73 SM 2802-85 3.00 36.72 24.82 0.59 14.21 14.21 23.67 SM 2865-99 2.00 35.02 32.12 0.53 13.26 13.26 20.66 SM 2826-40 2.00 23.26 20.53 0.53 9.55 9.55 17.51 SM 2839-65 2.50 32.90 35.50 0.48 12.84 12.84 15.46 CM 9912-92 3.50 32.72 32.42 0.50 12.83 12.83 10.99 GM 265-191 2.50 37.02 35.89 0.51 12.89 12.89 6.83 SM 2804-63 3.00 36.54 30.73 0.52 13.28 13.28 5.82 SM 2865-97 4.00 32.38 22.18 0.59 12.13 12.13 4.57 SM 2802-84 3.00 22.65 12.80 0.64 8.56 8.56 4.10 SM 2836-59 2.00 25.0 27.3 0.48 38.0 9.5 2.85 GM 234-171 1.50 25.8 23.2 0.53 35.8 9.3 2.41 CM 9914-22 4.00 25.6 17.4 0.60 38.5 9.8 1.39
Parameters of the 50 clones evaluated Minimum 4.00 42.14 43.79 0.64 14.92 14.92 30.73 Maximum 1.50 14.84 12.80 0.41 5.13 5.13 -35.03 Average 2.79 26.58 24.55 0.52 9.94 9.94 0.00 St. Deviation 0.76 6.75 7.88 0.07 2.62 2.62 16.56
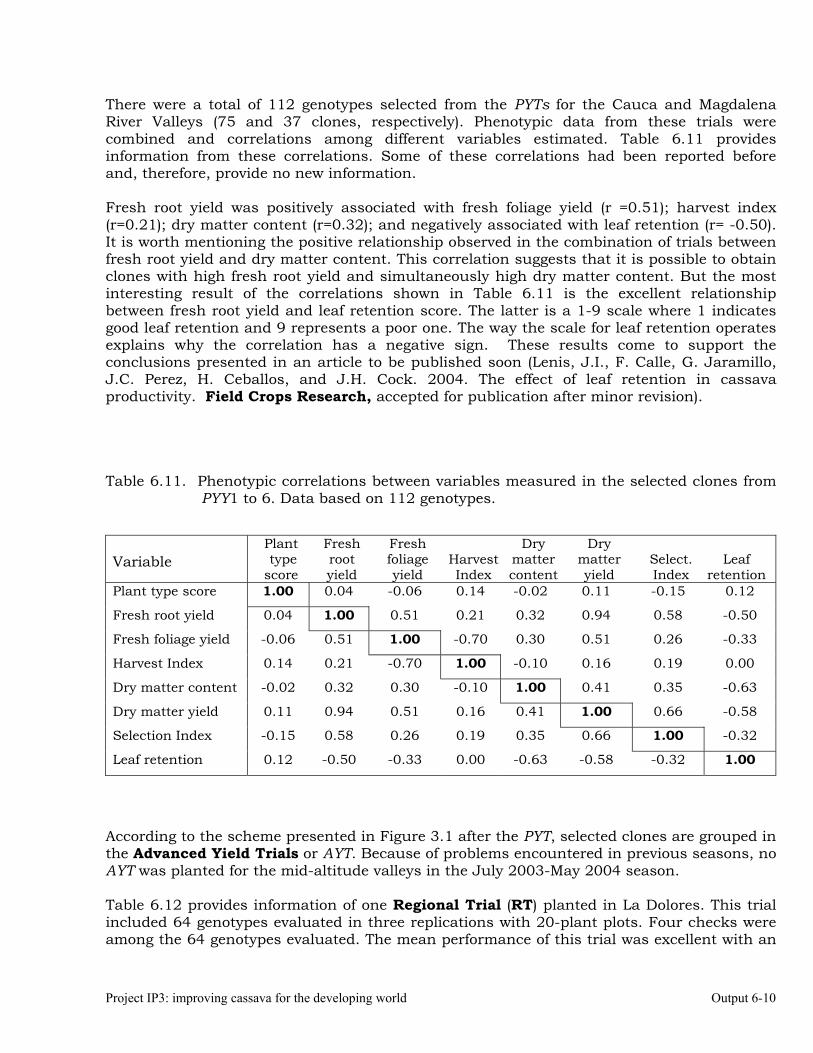
Project IP3: improving cassava for the developing world Output 6-10
There were a total of 112 genotypes selected from the PYTs for the Cauca and Magdalena River Valleys (75 and 37 clones, respectively). Phenotypic data from these trials were combined and correlations among different variables estimated. Table 6.11 provides information from these correlations. Some of these correlations had been reported before and, therefore, provide no new information. Fresh root yield was positively associated with fresh foliage yield (r =0.51); harvest index (r=0.21); dry matter content (r=0.32); and negatively associated with leaf retention (r= -0.50). It is worth mentioning the positive relationship observed in the combination of trials between fresh root yield and dry matter content. This correlation suggests that it is possible to obtain clones with high fresh root yield and simultaneously high dry matter content. But the most interesting result of the correlations shown in Table 6.11 is the excellent relationship between fresh root yield and leaf retention score. The latter is a 1-9 scale where 1 indicates good leaf retention and 9 represents a poor one. The way the scale for leaf retention operates explains why the correlation has a negative sign. These results come to support the conclusions presented in an article to be published soon (Lenis, J.I., F. Calle, G. Jaramillo, J.C. Perez, H. Ceballos, and J.H. Cock. 2004. The effect of leaf retention in cassava productivity. Field Crops Research, accepted for publication after minor revision).
Table 6.11. Phenotypic correlations between variables measured in the selected clones from PYY1 to 6. Data based on 112 genotypes.
Variable
Plant type score
Fresh root yield
Fresh foliage yield
Harvest Index
Dry matter content
Dry matter yield
Select. Index
Leaf retention
Plant type score 1.00 0.04 -0.06 0.14 -0.02 0.11 -0.15 0.12
Fresh root yield 0.04 1.00 0.51 0.21 0.32 0.94 0.58 -0.50
Fresh foliage yield -0.06 0.51 1.00 -0.70 0.30 0.51 0.26 -0.33
Harvest Index 0.14 0.21 -0.70 1.00 -0.10 0.16 0.19 0.00
Dry matter content -0.02 0.32 0.30 -0.10 1.00 0.41 0.35 -0.63
Dry matter yield 0.11 0.94 0.51 0.16 0.41 1.00 0.66 -0.58
Selection Index -0.15 0.58 0.26 0.19 0.35 0.66 1.00 -0.32
Leaf retention 0.12 -0.50 -0.33 0.00 -0.63 -0.58 -0.32 1.00
According to the scheme presented in Figure 3.1 after the PYT, selected clones are grouped in the Advanced Yield Trials or AYT. Because of problems encountered in previous seasons, no AYT was planted for the mid-altitude valleys in the July 2003-May 2004 season. Table 6.12 provides information of one Regional Trial (RT) planted in La Dolores. This trial included 64 genotypes evaluated in three replications with 20-plant plots. Four checks were among the 64 genotypes evaluated. The mean performance of this trial was excellent with an
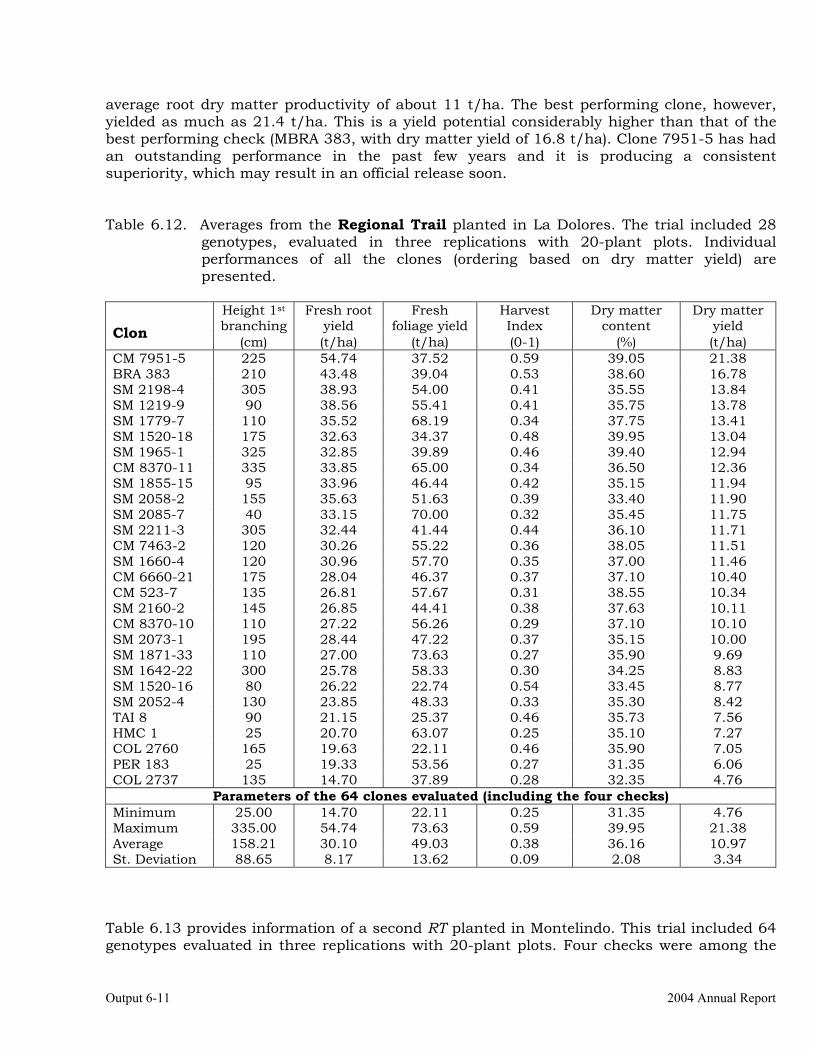
Output 6-11 2004 Annual Report
average root dry matter productivity of about 11 t/ha. The best performing clone, however, yielded as much as 21.4 t/ha. This is a yield potential considerably higher than that of the best performing check (MBRA 383, with dry matter yield of 16.8 t/ha). Clone 7951-5 has had an outstanding performance in the past few years and it is producing a consistent superiority, which may result in an official release soon. Table 6.12. Averages from the Regional Trail planted in La Dolores. The trial included 28
genotypes, evaluated in three replications with 20-plant plots. Individual performances of all the clones (ordering based on dry matter yield) are presented.
Height 1st branching
Fresh root yield
Fresh foliage yield
Harvest Index
Dry matter content
Dry matter yield
Clon (cm) (t/ha) (t/ha) (0-1) (%) (t/ha) CM 7951-5 225 54.74 37.52 0.59 39.05 21.38 BRA 383 210 43.48 39.04 0.53 38.60 16.78 SM 2198-4 305 38.93 54.00 0.41 35.55 13.84 SM 1219-9 90 38.56 55.41 0.41 35.75 13.78 SM 1779-7 110 35.52 68.19 0.34 37.75 13.41 SM 1520-18 175 32.63 34.37 0.48 39.95 13.04 SM 1965-1 325 32.85 39.89 0.46 39.40 12.94 CM 8370-11 335 33.85 65.00 0.34 36.50 12.36 SM 1855-15 95 33.96 46.44 0.42 35.15 11.94 SM 2058-2 155 35.63 51.63 0.39 33.40 11.90 SM 2085-7 40 33.15 70.00 0.32 35.45 11.75 SM 2211-3 305 32.44 41.44 0.44 36.10 11.71 CM 7463-2 120 30.26 55.22 0.36 38.05 11.51 SM 1660-4 120 30.96 57.70 0.35 37.00 11.46 CM 6660-21 175 28.04 46.37 0.37 37.10 10.40 CM 523-7 135 26.81 57.67 0.31 38.55 10.34 SM 2160-2 145 26.85 44.41 0.38 37.63 10.11 CM 8370-10 110 27.22 56.26 0.29 37.10 10.10 SM 2073-1 195 28.44 47.22 0.37 35.15 10.00 SM 1871-33 110 27.00 73.63 0.27 35.90 9.69 SM 1642-22 300 25.78 58.33 0.30 34.25 8.83 SM 1520-16 80 26.22 22.74 0.54 33.45 8.77 SM 2052-4 130 23.85 48.33 0.33 35.30 8.42 TAI 8 90 21.15 25.37 0.46 35.73 7.56 HMC 1 25 20.70 63.07 0.25 35.10 7.27 COL 2760 165 19.63 22.11 0.46 35.90 7.05 PER 183 25 19.33 53.56 0.27 31.35 6.06 COL 2737 135 14.70 37.89 0.28 32.35 4.76
Parameters of the 64 clones evaluated (including the four checks) Minimum 25.00 14.70 22.11 0.25 31.35 4.76 Maximum 335.00 54.74 73.63 0.59 39.95 21.38 Average 158.21 30.10 49.03 0.38 36.16 10.97 St. Deviation 88.65 8.17 13.62 0.09 2.08 3.34
Table 6.13 provides information of a second RT planted in Montelindo. This trial included 64 genotypes evaluated in three replications with 20-plant plots. Four checks were among the
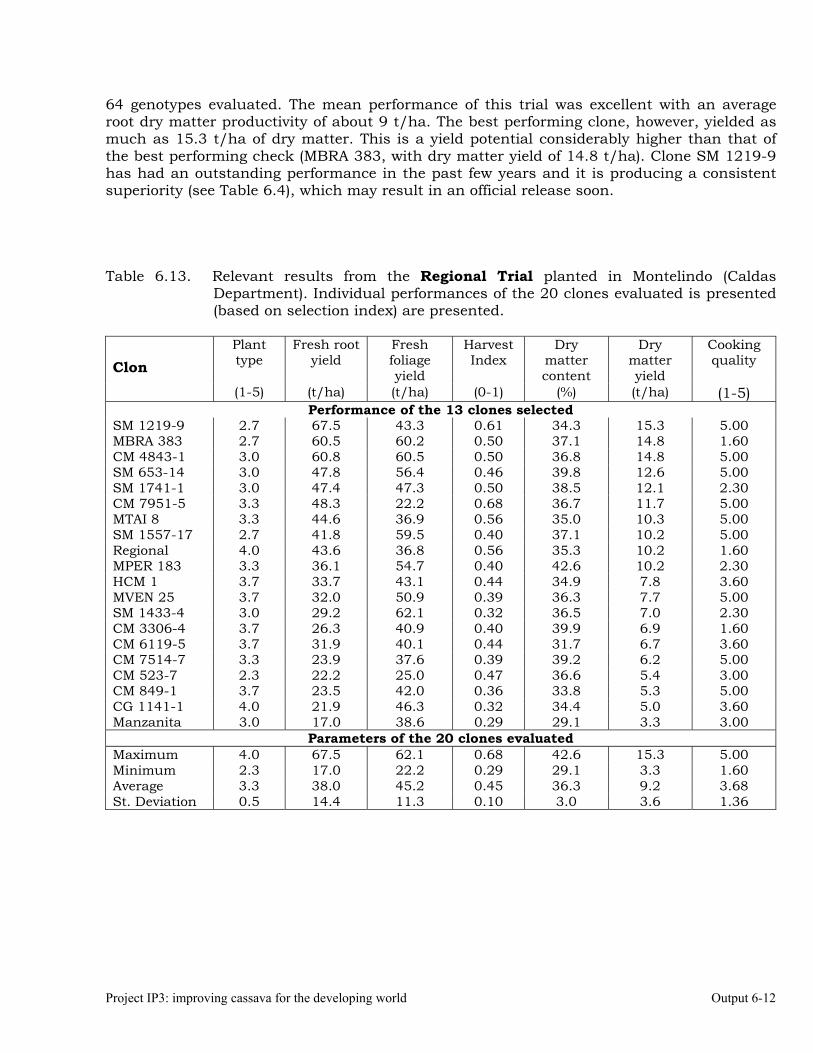
Project IP3: improving cassava for the developing world Output 6-12
64 genotypes evaluated. The mean performance of this trial was excellent with an average root dry matter productivity of about 9 t/ha. The best performing clone, however, yielded as much as 15.3 t/ha of dry matter. This is a yield potential considerably higher than that of the best performing check (MBRA 383, with dry matter yield of 14.8 t/ha). Clone SM 1219-9 has had an outstanding performance in the past few years and it is producing a consistent superiority (see Table 6.4), which may result in an official release soon. Table 6.13. Relevant results from the Regional Trial planted in Montelindo (Caldas
Department). Individual performances of the 20 clones evaluated is presented (based on selection index) are presented.
Plant type
Fresh root yield
Fresh foliage yield
Harvest Index
Dry matter content
Dry matter yield
Cooking quality
Clon
(1-5) (t/ha) (t/ha) (0-1) (%) (t/ha) (1-5) Performance of the 13 clones selected
SM 1219-9 2.7 67.5 43.3 0.61 34.3 15.3 5.00 MBRA 383 2.7 60.5 60.2 0.50 37.1 14.8 1.60 CM 4843-1 3.0 60.8 60.5 0.50 36.8 14.8 5.00 SM 653-14 3.0 47.8 56.4 0.46 39.8 12.6 5.00 SM 1741-1 3.0 47.4 47.3 0.50 38.5 12.1 2.30 CM 7951-5 3.3 48.3 22.2 0.68 36.7 11.7 5.00 MTAI 8 3.3 44.6 36.9 0.56 35.0 10.3 5.00 SM 1557-17 2.7 41.8 59.5 0.40 37.1 10.2 5.00 Regional 4.0 43.6 36.8 0.56 35.3 10.2 1.60 MPER 183 3.3 36.1 54.7 0.40 42.6 10.2 2.30 HCM 1 3.7 33.7 43.1 0.44 34.9 7.8 3.60 MVEN 25 3.7 32.0 50.9 0.39 36.3 7.7 5.00 SM 1433-4 3.0 29.2 62.1 0.32 36.5 7.0 2.30 CM 3306-4 3.7 26.3 40.9 0.40 39.9 6.9 1.60 CM 6119-5 3.7 31.9 40.1 0.44 31.7 6.7 3.60 CM 7514-7 3.3 23.9 37.6 0.39 39.2 6.2 5.00 CM 523-7 2.3 22.2 25.0 0.47 36.6 5.4 3.00 CM 849-1 3.7 23.5 42.0 0.36 33.8 5.3 5.00 CG 1141-1 4.0 21.9 46.3 0.32 34.4 5.0 3.60 Manzanita 3.0 17.0 38.6 0.29 29.1 3.3 3.00
Parameters of the 20 clones evaluated Maximum 4.0 67.5 62.1 0.68 42.6 15.3 5.00 Minimum 2.3 17.0 22.2 0.29 29.1 3.3 1.60 Average 3.3 38.0 45.2 0.45 36.3 9.2 3.68 St. Deviation 0.5 14.4 11.3 0.10 3.0 3.6 1.36
Output 7-1 2004 Annual Report
OUTPUT 7 Development of genetic stocks and improved gene pools adapted to the sub-humid
environments. Cassava genetic improvement at CIAT has three main target environments: in the sub-humid (Output 4), acid-soil savannas (Output 5) and mid-altitude valleys (Output 6). Additional activities are conduced in the Córdoba – Sucre Departments (Activity 7.1); Middle-Magdalena River Region (Activity 7.2); Tolima-Huila Departments (Activity 7.3); and the highlands (Activity 7.4). Below there is a brief description of the most important results from these regions. Activity 7.1. Evaluations and selections in Córdoba and Sucre Departments The activities in the Sucre and Córdoba Departments are closely associated with those from the Atlántico and Magdalena Departments described in Output 4. In the former, however, precipitations are higher than in the latter. The main biotic stress in Córdoba and Sucre is the Bacterial Blight (Xanthomonas axonopodis pv. Manihotis also known as X. campestris pv. manihotis) and to a lesser degree the super elongation disease induced by Elsinoe brasiliensis (also known as Sphaceloma manihoticola). In the Atlántico and Magdalena regions, on the other hand the main biotic stress is induced by mites in addition to the abiotic stress resulting from the long period without rains (from late December to early May). Many cassava genotypes will show a good performance across these two environments. Table 7.1 lists the 32 clones included in one Regional Trial evaluated in three locations in the Córdoba and Sucre Departments. These trials were based on three replications of 25-plant plots. Bold highlighted in the table are two traditional clones for this region (CG 1141-1 and CM 3306-4). Average dry matter productivity was close to 13 t/ha, highlighting the huge potential that cassava has to compete with other (imported) commodities such as maize. Moreover, five clones yielded more than 15 t/ha of root dry matter and nine clones yielded more than the best check (CG 1141-1 = 13.88 t/ha). Two clones from family SM 2775 were among the best six clones. Also showing a good performance was clone CM 4919-9 ranked 11th based on its dry matter productivity (13.63 t/ha). This clone was recently released as CORPOICA-Verónica.
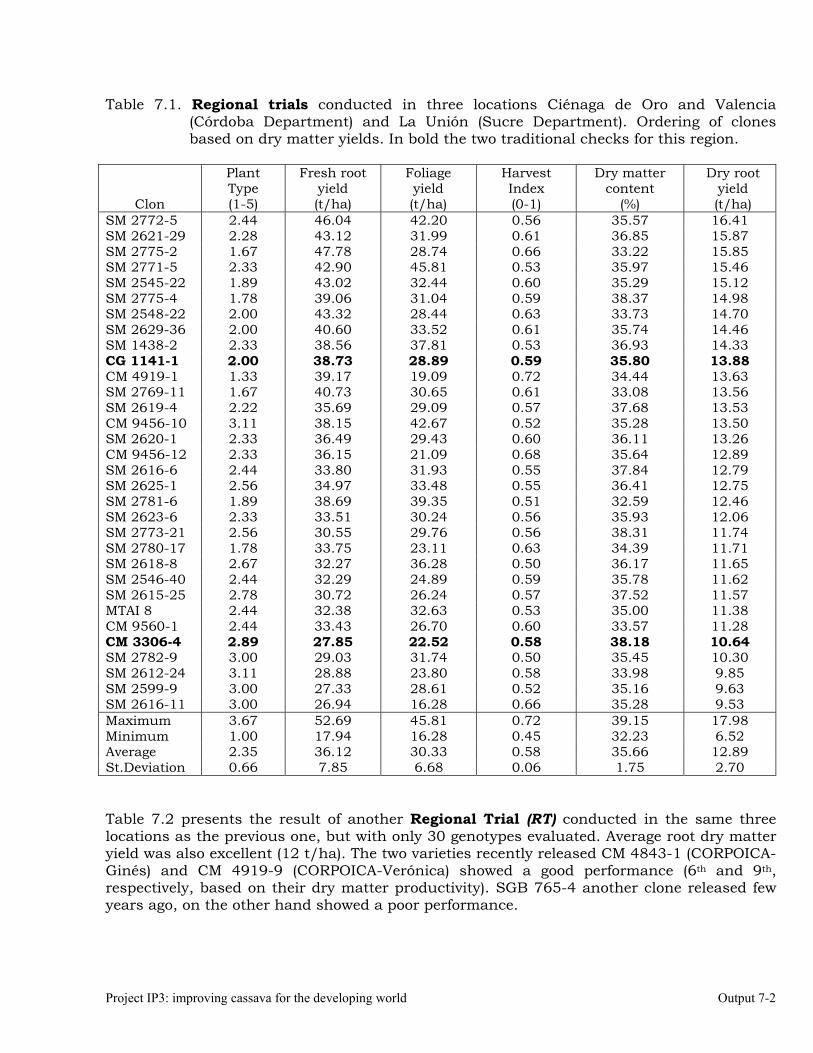
Project IP3: improving cassava for the developing world Output 7-2
Table 7.1. Regional trials conducted in three locations Ciénaga de Oro and Valencia (Córdoba Department) and La Unión (Sucre Department). Ordering of clones based on dry matter yields. In bold the two traditional checks for this region.
Clon
Plant Type (1-5)
Fresh root yield (t/ha)
Foliage yield (t/ha)
Harvest Index (0-1)
Dry matter content
(%)
Dry root yield (t/ha)
SM 2772-5 2.44 46.04 42.20 0.56 35.57 16.41 SM 2621-29 2.28 43.12 31.99 0.61 36.85 15.87 SM 2775-2 1.67 47.78 28.74 0.66 33.22 15.85 SM 2771-5 2.33 42.90 45.81 0.53 35.97 15.46 SM 2545-22 1.89 43.02 32.44 0.60 35.29 15.12 SM 2775-4 1.78 39.06 31.04 0.59 38.37 14.98 SM 2548-22 2.00 43.32 28.44 0.63 33.73 14.70 SM 2629-36 2.00 40.60 33.52 0.61 35.74 14.46 SM 1438-2 2.33 38.56 37.81 0.53 36.93 14.33 CG 1141-1 2.00 38.73 28.89 0.59 35.80 13.88 CM 4919-1 1.33 39.17 19.09 0.72 34.44 13.63 SM 2769-11 1.67 40.73 30.65 0.61 33.08 13.56 SM 2619-4 2.22 35.69 29.09 0.57 37.68 13.53 CM 9456-10 3.11 38.15 42.67 0.52 35.28 13.50 SM 2620-1 2.33 36.49 29.43 0.60 36.11 13.26 CM 9456-12 2.33 36.15 21.09 0.68 35.64 12.89 SM 2616-6 2.44 33.80 31.93 0.55 37.84 12.79 SM 2625-1 2.56 34.97 33.48 0.55 36.41 12.75 SM 2781-6 1.89 38.69 39.35 0.51 32.59 12.46 SM 2623-6 2.33 33.51 30.24 0.56 35.93 12.06 SM 2773-21 2.56 30.55 29.76 0.56 38.31 11.74 SM 2780-17 1.78 33.75 23.11 0.63 34.39 11.71 SM 2618-8 2.67 32.27 36.28 0.50 36.17 11.65 SM 2546-40 2.44 32.29 24.89 0.59 35.78 11.62 SM 2615-25 2.78 30.72 26.24 0.57 37.52 11.57 MTAI 8 2.44 32.38 32.63 0.53 35.00 11.38 CM 9560-1 2.44 33.43 26.70 0.60 33.57 11.28 CM 3306-4 2.89 27.85 22.52 0.58 38.18 10.64 SM 2782-9 3.00 29.03 31.74 0.50 35.45 10.30 SM 2612-24 3.11 28.88 23.80 0.58 33.98 9.85 SM 2599-9 3.00 27.33 28.61 0.52 35.16 9.63 SM 2616-11 3.00 26.94 16.28 0.66 35.28 9.53 Maximum 3.67 52.69 45.81 0.72 39.15 17.98 Minimum 1.00 17.94 16.28 0.45 32.23 6.52 Average 2.35 36.12 30.33 0.58 35.66 12.89 St.Deviation 0.66 7.85 6.68 0.06 1.75 2.70 Table 7.2 presents the result of another Regional Trial (RT) conducted in the same three locations as the previous one, but with only 30 genotypes evaluated. Average root dry matter yield was also excellent (12 t/ha). The two varieties recently released CM 4843-1 (CORPOICA-Ginés) and CM 4919-9 (CORPOICA-Verónica) showed a good performance (6th and 9th, respectively, based on their dry matter productivity). SGB 765-4 another clone released few years ago, on the other hand showed a poor performance.
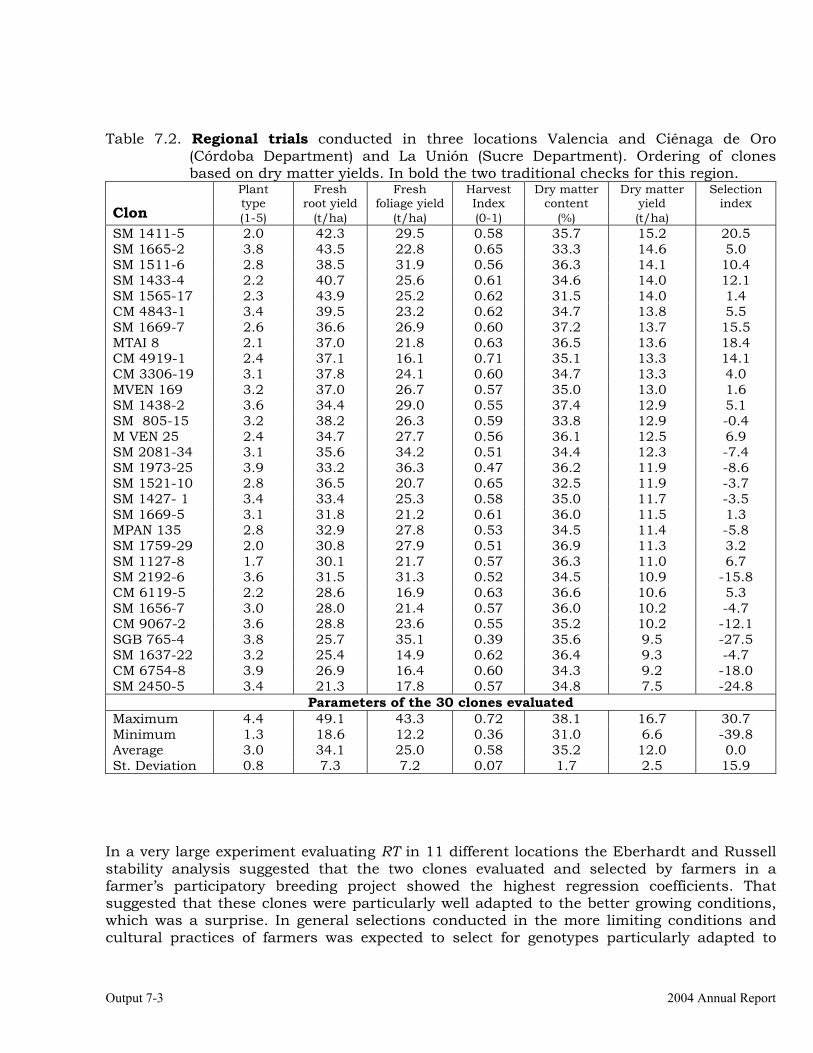
Output 7-3 2004 Annual Report
Table 7.2. Regional trials conducted in three locations Valencia and Ciénaga de Oro
(Córdoba Department) and La Unión (Sucre Department). Ordering of clones based on dry matter yields. In bold the two traditional checks for this region.
Plant type
Fresh root yield
Fresh foliage yield
Harvest Index
Dry matter content
Dry matter yield
Selection index
Clon (1-5) (t/ha) (t/ha) (0-1) (%) (t/ha) SM 1411-5 2.0 42.3 29.5 0.58 35.7 15.2 20.5 SM 1665-2 3.8 43.5 22.8 0.65 33.3 14.6 5.0 SM 1511-6 2.8 38.5 31.9 0.56 36.3 14.1 10.4 SM 1433-4 2.2 40.7 25.6 0.61 34.6 14.0 12.1 SM 1565-17 2.3 43.9 25.2 0.62 31.5 14.0 1.4 CM 4843-1 3.4 39.5 23.2 0.62 34.7 13.8 5.5 SM 1669-7 2.6 36.6 26.9 0.60 37.2 13.7 15.5 MTAI 8 2.1 37.0 21.8 0.63 36.5 13.6 18.4 CM 4919-1 2.4 37.1 16.1 0.71 35.1 13.3 14.1 CM 3306-19 3.1 37.8 24.1 0.60 34.7 13.3 4.0 MVEN 169 3.2 37.0 26.7 0.57 35.0 13.0 1.6 SM 1438-2 3.6 34.4 29.0 0.55 37.4 12.9 5.1 SM 805-15 3.2 38.2 26.3 0.59 33.8 12.9 -0.4 M VEN 25 2.4 34.7 27.7 0.56 36.1 12.5 6.9 SM 2081-34 3.1 35.6 34.2 0.51 34.4 12.3 -7.4 SM 1973-25 3.9 33.2 36.3 0.47 36.2 11.9 -8.6 SM 1521-10 2.8 36.5 20.7 0.65 32.5 11.9 -3.7 SM 1427- 1 3.4 33.4 25.3 0.58 35.0 11.7 -3.5 SM 1669-5 3.1 31.8 21.2 0.61 36.0 11.5 1.3 MPAN 135 2.8 32.9 27.8 0.53 34.5 11.4 -5.8 SM 1759-29 2.0 30.8 27.9 0.51 36.9 11.3 3.2 SM 1127-8 1.7 30.1 21.7 0.57 36.3 11.0 6.7 SM 2192-6 3.6 31.5 31.3 0.52 34.5 10.9 -15.8 CM 6119-5 2.2 28.6 16.9 0.63 36.6 10.6 5.3 SM 1656-7 3.0 28.0 21.4 0.57 36.0 10.2 -4.7 CM 9067-2 3.6 28.8 23.6 0.55 35.2 10.2 -12.1 SGB 765-4 3.8 25.7 35.1 0.39 35.6 9.5 -27.5 SM 1637-22 3.2 25.4 14.9 0.62 36.4 9.3 -4.7 CM 6754-8 3.9 26.9 16.4 0.60 34.3 9.2 -18.0 SM 2450-5 3.4 21.3 17.8 0.57 34.8 7.5 -24.8
Parameters of the 30 clones evaluated Maximum 4.4 49.1 43.3 0.72 38.1 16.7 30.7 Minimum 1.3 18.6 12.2 0.36 31.0 6.6 -39.8 Average 3.0 34.1 25.0 0.58 35.2 12.0 0.0 St. Deviation 0.8 7.3 7.2 0.07 1.7 2.5 15.9
In a very large experiment evaluating RT in 11 different locations the Eberhardt and Russell stability analysis suggested that the two clones evaluated and selected by farmers in a farmer’s participatory breeding project showed the highest regression coefficients. That suggested that these clones were particularly well adapted to the better growing conditions, which was a surprise. In general selections conducted in the more limiting conditions and cultural practices of farmers was expected to select for genotypes particularly adapted to

Project IP3: improving cassava for the developing world Output 7-4
harsh environmental conditions. This study prompted a second one in which only eight genotypes were grown. These trials will be conducted at several locations and for two consecutive years. Table 4.14 showed the results of the combined analysis across the three locations in the Atlántico Department where these trials were planted. Table 7.3 below presents the results from the same experiment for four locations in the Córdoba and Sucre Departments. The two clones developed through a participatory approach (SGB 765-2 and SGB 765-4) showed the two lowest dry matter yields (around 7-8 t/ha) and only CM 3306-19 showed lower dry matter yields. The two clones recently released (CM 4843-1 and CM 4919-9) had a considerably better performance with dry matter yields around 10 t/ha. Table 7.3. Evaluation of eight clones in a special study to compare performances of clones
released by traditional and farmers’ participatory approaches. Trials were based on three replications with 25-plant plots and planted in four locations Ciénaga de Oro, and Sahagun (Córdoba Department) and La Unión, and Sincelejo (Sucre Department).
Plant type
Fresh root yield
Fresh foliage yield
Harvest Index
Dry matter content
Dry matter yield
Clon (1-5) (t/ha) (t/ha) (0-1) (%) (t/ha) SM 1411-5 1.92 32.03 24.00 0.58 35.28 11.29 SM 1565-17 2.67 35.85 19.30 0.67 30.60 11.04 CM 4843-1 4.58 31.23 19.16 0.63 34.37 10.74 CM 4919-1 1.17 28.00 11.94 0.71 34.72 9.74 CM 3555-6 1.88 28.83 20.57 0.59 32.46 9.13 SGB 765-2 3.67 22.12 20.09 0.54 35.30 7.82 SGB765-4 3.67 19.78 24.29 0.46 35.57 7.03 CM 3306-19 2.42 20.19 12.51 0.63 33.65 6.70
Parameters of the 8 clones evaluated Maximum 4.58 35.85 24.29 0.71 35.57 11.29 Minimum 1.17 19.78 11.94 0.46 30.60 6.70 Average 2.74 27.25 18.98 0.60 33.99 9.19 St. Deviation 1.14 5.95 4.61 0.08 1.71 1.82
Activity 7.2. Evaluations and selections in Middle-Magdalena River Region. The middle Magdalena River region is important for two reasons. It includes economically poor regions, with very little development options and plagued with social unrest. Cassava can play an important role in reducing the poverty and social problems and tension. A second important fact about this region is that it also includes the most important poultry –related activities in the country. The large poultry facilities in the region are ideal markets for the commodities produced by the Trapiches Yuqueros (see Output 8) that have been or will be set up in the region. A CET was planted during the 2002-2003 season in San Pablo (Norte de Santander Department) from which a total of 144 clones were selected. During the 2003-2004 season these 144 clones were planted in three different PYT trials with 48 clones each. Tables 7.4 to 7.6 describe the most important results from these PYT trials.
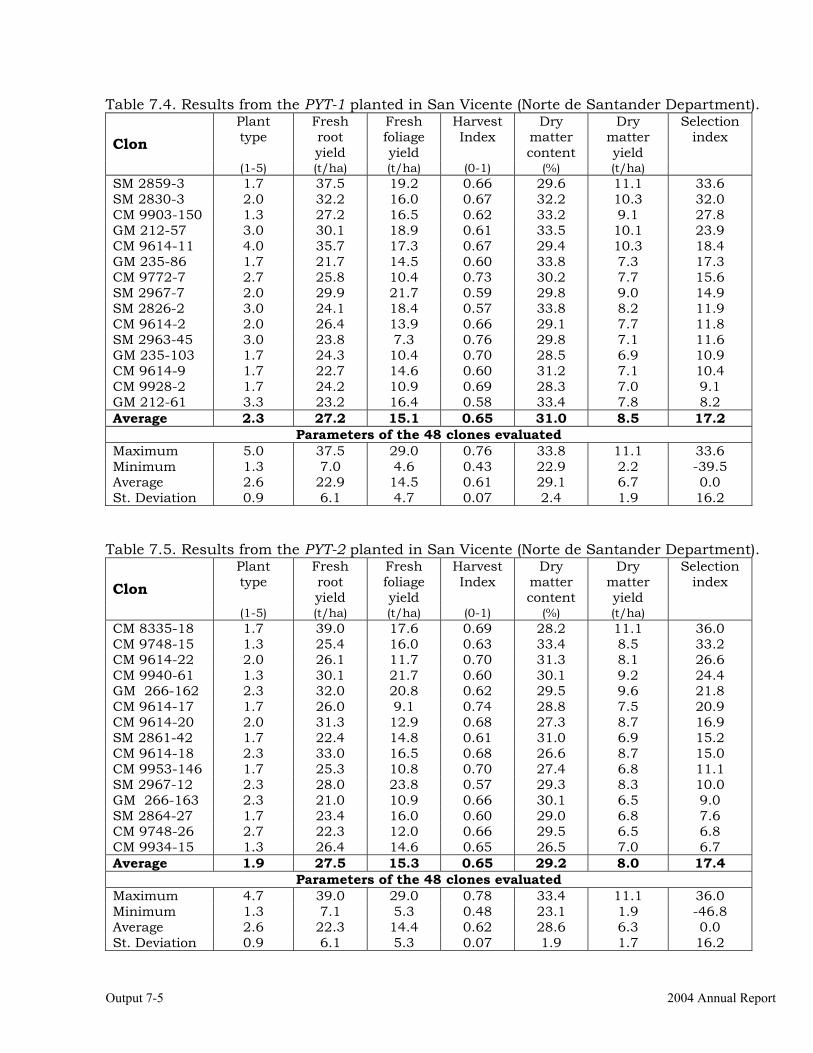
Output 7-5 2004 Annual Report
Table 7.4. Results from the PYT-1 planted in San Vicente (Norte de Santander Department). Plant type
Fresh root yield
Fresh foliage yield
Harvest Index
Dry matter content
Dry matter yield
Selection index
Clon
(1-5) (t/ha) (t/ha) (0-1) (%) (t/ha) SM 2859-3 1.7 37.5 19.2 0.66 29.6 11.1 33.6 SM 2830-3 2.0 32.2 16.0 0.67 32.2 10.3 32.0 CM 9903-150 1.3 27.2 16.5 0.62 33.2 9.1 27.8 GM 212-57 3.0 30.1 18.9 0.61 33.5 10.1 23.9 CM 9614-11 4.0 35.7 17.3 0.67 29.4 10.3 18.4 GM 235-86 1.7 21.7 14.5 0.60 33.8 7.3 17.3 CM 9772-7 2.7 25.8 10.4 0.73 30.2 7.7 15.6 SM 2967-7 2.0 29.9 21.7 0.59 29.8 9.0 14.9 SM 2826-2 3.0 24.1 18.4 0.57 33.8 8.2 11.9 CM 9614-2 2.0 26.4 13.9 0.66 29.1 7.7 11.8 SM 2963-45 3.0 23.8 7.3 0.76 29.8 7.1 11.6 GM 235-103 1.7 24.3 10.4 0.70 28.5 6.9 10.9 CM 9614-9 1.7 22.7 14.6 0.60 31.2 7.1 10.4 CM 9928-2 1.7 24.2 10.9 0.69 28.3 7.0 9.1 GM 212-61 3.3 23.2 16.4 0.58 33.4 7.8 8.2 Average 2.3 27.2 15.1 0.65 31.0 8.5 17.2
Parameters of the 48 clones evaluated Maximum 5.0 37.5 29.0 0.76 33.8 11.1 33.6 Minimum 1.3 7.0 4.6 0.43 22.9 2.2 -39.5 Average 2.6 22.9 14.5 0.61 29.1 6.7 0.0 St. Deviation 0.9 6.1 4.7 0.07 2.4 1.9 16.2
Table 7.5. Results from the PYT-2 planted in San Vicente (Norte de Santander Department).
Plant type
Fresh root yield
Fresh foliage yield
Harvest Index
Dry matter content
Dry matter yield
Selection index
Clon
(1-5) (t/ha) (t/ha) (0-1) (%) (t/ha) CM 8335-18 1.7 39.0 17.6 0.69 28.2 11.1 36.0 CM 9748-15 1.3 25.4 16.0 0.63 33.4 8.5 33.2 CM 9614-22 2.0 26.1 11.7 0.70 31.3 8.1 26.6 CM 9940-61 1.3 30.1 21.7 0.60 30.1 9.2 24.4 GM 266-162 2.3 32.0 20.8 0.62 29.5 9.6 21.8 CM 9614-17 1.7 26.0 9.1 0.74 28.8 7.5 20.9 CM 9614-20 2.0 31.3 12.9 0.68 27.3 8.7 16.9 SM 2861-42 1.7 22.4 14.8 0.61 31.0 6.9 15.2 CM 9614-18 2.3 33.0 16.5 0.68 26.6 8.7 15.0 CM 9953-146 1.7 25.3 10.8 0.70 27.4 6.8 11.1 SM 2967-12 2.3 28.0 23.8 0.57 29.3 8.3 10.0 GM 266-163 2.3 21.0 10.9 0.66 30.1 6.5 9.0 SM 2864-27 1.7 23.4 16.0 0.60 29.0 6.8 7.6 CM 9748-26 2.7 22.3 12.0 0.66 29.5 6.5 6.8 CM 9934-15 1.3 26.4 14.6 0.65 26.5 7.0 6.7 Average 1.9 27.5 15.3 0.65 29.2 8.0 17.4
Parameters of the 48 clones evaluated Maximum 4.7 39.0 29.0 0.78 33.4 11.1 36.0 Minimum 1.3 7.1 5.3 0.48 23.1 1.9 -46.8 Average 2.6 22.3 14.4 0.62 28.6 6.3 0.0 St. Deviation 0.9 6.1 5.3 0.07 1.9 1.7 16.2
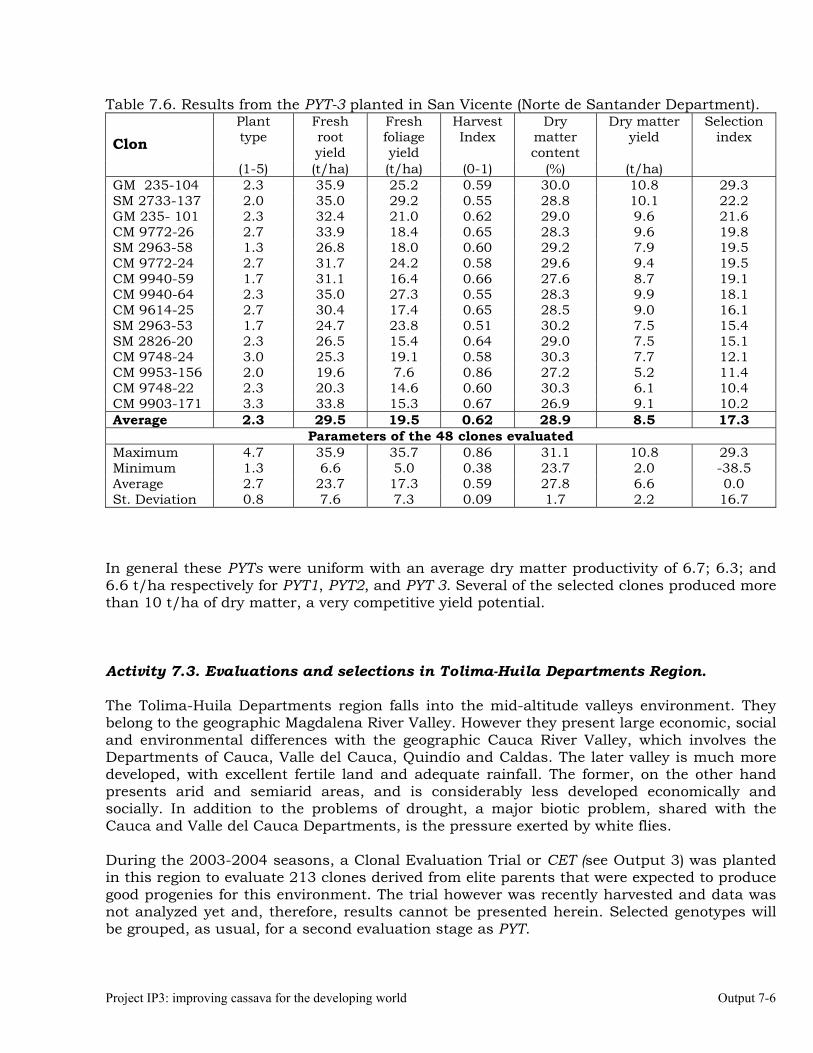
Project IP3: improving cassava for the developing world Output 7-6
Table 7.6. Results from the PYT-3 planted in San Vicente (Norte de Santander Department). Plant type
Fresh root yield
Fresh foliage yield
Harvest Index
Dry matter content
Dry matter yield
Selection index
Clon
(1-5) (t/ha) (t/ha) (0-1) (%) (t/ha) GM 235-104 2.3 35.9 25.2 0.59 30.0 10.8 29.3 SM 2733-137 2.0 35.0 29.2 0.55 28.8 10.1 22.2 GM 235- 101 2.3 32.4 21.0 0.62 29.0 9.6 21.6 CM 9772-26 2.7 33.9 18.4 0.65 28.3 9.6 19.8 SM 2963-58 1.3 26.8 18.0 0.60 29.2 7.9 19.5 CM 9772-24 2.7 31.7 24.2 0.58 29.6 9.4 19.5 CM 9940-59 1.7 31.1 16.4 0.66 27.6 8.7 19.1 CM 9940-64 2.3 35.0 27.3 0.55 28.3 9.9 18.1 CM 9614-25 2.7 30.4 17.4 0.65 28.5 9.0 16.1 SM 2963-53 1.7 24.7 23.8 0.51 30.2 7.5 15.4 SM 2826-20 2.3 26.5 15.4 0.64 29.0 7.5 15.1 CM 9748-24 3.0 25.3 19.1 0.58 30.3 7.7 12.1 CM 9953-156 2.0 19.6 7.6 0.86 27.2 5.2 11.4 CM 9748-22 2.3 20.3 14.6 0.60 30.3 6.1 10.4 CM 9903-171 3.3 33.8 15.3 0.67 26.9 9.1 10.2 Average 2.3 29.5 19.5 0.62 28.9 8.5 17.3
Parameters of the 48 clones evaluated Maximum 4.7 35.9 35.7 0.86 31.1 10.8 29.3 Minimum 1.3 6.6 5.0 0.38 23.7 2.0 -38.5 Average 2.7 23.7 17.3 0.59 27.8 6.6 0.0 St. Deviation 0.8 7.6 7.3 0.09 1.7 2.2 16.7
In general these PYTs were uniform with an average dry matter productivity of 6.7; 6.3; and 6.6 t/ha respectively for PYT1, PYT2, and PYT 3. Several of the selected clones produced more than 10 t/ha of dry matter, a very competitive yield potential. Activity 7.3. Evaluations and selections in Tolima-Huila Departments Region. The Tolima-Huila Departments region falls into the mid-altitude valleys environment. They belong to the geographic Magdalena River Valley. However they present large economic, social and environmental differences with the geographic Cauca River Valley, which involves the Departments of Cauca, Valle del Cauca, Quindío and Caldas. The later valley is much more developed, with excellent fertile land and adequate rainfall. The former, on the other hand presents arid and semiarid areas, and is considerably less developed economically and socially. In addition to the problems of drought, a major biotic problem, shared with the Cauca and Valle del Cauca Departments, is the pressure exerted by white flies. During the 2003-2004 seasons, a Clonal Evaluation Trial or CET (see Output 3) was planted in this region to evaluate 213 clones derived from elite parents that were expected to produce good progenies for this environment. The trial however was recently harvested and data was not analyzed yet and, therefore, results cannot be presented herein. Selected genotypes will be grouped, as usual, for a second evaluation stage as PYT.
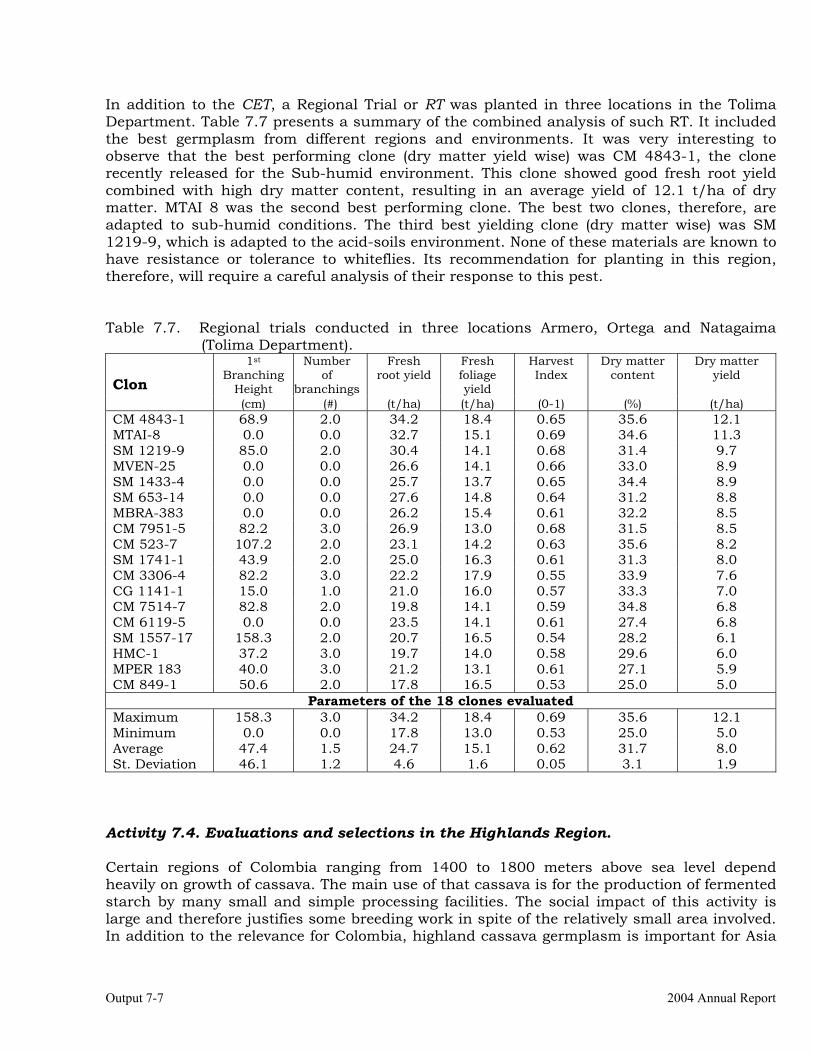
Output 7-7 2004 Annual Report
In addition to the CET, a Regional Trial or RT was planted in three locations in the Tolima Department. Table 7.7 presents a summary of the combined analysis of such RT. It included the best germplasm from different regions and environments. It was very interesting to observe that the best performing clone (dry matter yield wise) was CM 4843-1, the clone recently released for the Sub-humid environment. This clone showed good fresh root yield combined with high dry matter content, resulting in an average yield of 12.1 t/ha of dry matter. MTAI 8 was the second best performing clone. The best two clones, therefore, are adapted to sub-humid conditions. The third best yielding clone (dry matter wise) was SM 1219-9, which is adapted to the acid-soils environment. None of these materials are known to have resistance or tolerance to whiteflies. Its recommendation for planting in this region, therefore, will require a careful analysis of their response to this pest. Table 7.7. Regional trials conducted in three locations Armero, Ortega and Natagaima
(Tolima Department). 1st
Branching Height
Number of
branchings
Fresh root yield
Fresh foliage yield
Harvest Index
Dry matter content
Dry matter yield
Clon (cm) (#) (t/ha) (t/ha) (0-1) (%) (t/ha)
CM 4843-1 68.9 2.0 34.2 18.4 0.65 35.6 12.1 MTAI-8 0.0 0.0 32.7 15.1 0.69 34.6 11.3 SM 1219-9 85.0 2.0 30.4 14.1 0.68 31.4 9.7 MVEN-25 0.0 0.0 26.6 14.1 0.66 33.0 8.9 SM 1433-4 0.0 0.0 25.7 13.7 0.65 34.4 8.9 SM 653-14 0.0 0.0 27.6 14.8 0.64 31.2 8.8 MBRA-383 0.0 0.0 26.2 15.4 0.61 32.2 8.5 CM 7951-5 82.2 3.0 26.9 13.0 0.68 31.5 8.5 CM 523-7 107.2 2.0 23.1 14.2 0.63 35.6 8.2 SM 1741-1 43.9 2.0 25.0 16.3 0.61 31.3 8.0 CM 3306-4 82.2 3.0 22.2 17.9 0.55 33.9 7.6 CG 1141-1 15.0 1.0 21.0 16.0 0.57 33.3 7.0 CM 7514-7 82.8 2.0 19.8 14.1 0.59 34.8 6.8 CM 6119-5 0.0 0.0 23.5 14.1 0.61 27.4 6.8 SM 1557-17 158.3 2.0 20.7 16.5 0.54 28.2 6.1 HMC-1 37.2 3.0 19.7 14.0 0.58 29.6 6.0 MPER 183 40.0 3.0 21.2 13.1 0.61 27.1 5.9 CM 849-1 50.6 2.0 17.8 16.5 0.53 25.0 5.0
Parameters of the 18 clones evaluated Maximum 158.3 3.0 34.2 18.4 0.69 35.6 12.1 Minimum 0.0 0.0 17.8 13.0 0.53 25.0 5.0 Average 47.4 1.5 24.7 15.1 0.62 31.7 8.0 St. Deviation 46.1 1.2 4.6 1.6 0.05 3.1 1.9
Activity 7.4. Evaluations and selections in the Highlands Region. Certain regions of Colombia ranging from 1400 to 1800 meters above sea level depend heavily on growth of cassava. The main use of that cassava is for the production of fermented starch by many small and simple processing facilities. The social impact of this activity is large and therefore justifies some breeding work in spite of the relatively small area involved. In addition to the relevance for Colombia, highland cassava germplasm is important for Asia
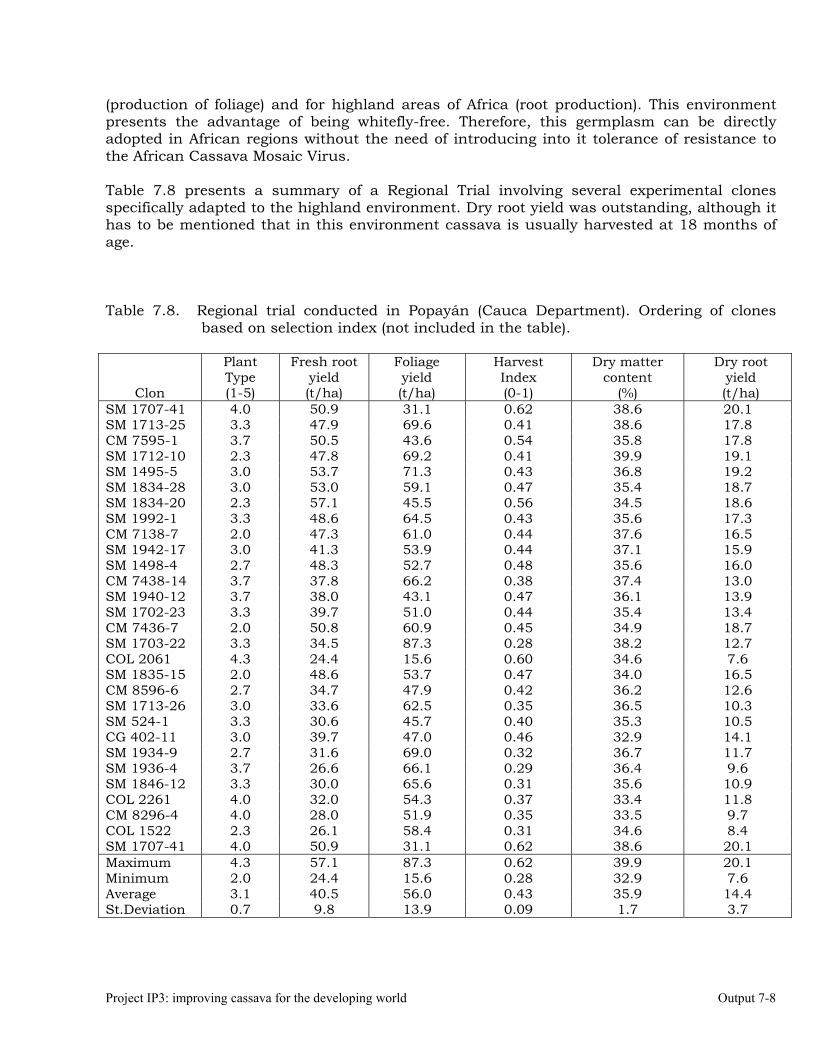
Project IP3: improving cassava for the developing world Output 7-8
(production of foliage) and for highland areas of Africa (root production). This environment presents the advantage of being whitefly-free. Therefore, this germplasm can be directly adopted in African regions without the need of introducing into it tolerance of resistance to the African Cassava Mosaic Virus. Table 7.8 presents a summary of a Regional Trial involving several experimental clones specifically adapted to the highland environment. Dry root yield was outstanding, although it has to be mentioned that in this environment cassava is usually harvested at 18 months of age. Table 7.8. Regional trial conducted in Popayán (Cauca Department). Ordering of clones
based on selection index (not included in the table).
Clon
Plant Type (1-5)
Fresh root yield (t/ha)
Foliage yield (t/ha)
Harvest Index (0-1)
Dry matter content
(%)
Dry root yield (t/ha)
SM 1707-41 4.0 50.9 31.1 0.62 38.6 20.1 SM 1713-25 3.3 47.9 69.6 0.41 38.6 17.8 CM 7595-1 3.7 50.5 43.6 0.54 35.8 17.8 SM 1712-10 2.3 47.8 69.2 0.41 39.9 19.1 SM 1495-5 3.0 53.7 71.3 0.43 36.8 19.2 SM 1834-28 3.0 53.0 59.1 0.47 35.4 18.7 SM 1834-20 2.3 57.1 45.5 0.56 34.5 18.6 SM 1992-1 3.3 48.6 64.5 0.43 35.6 17.3 CM 7138-7 2.0 47.3 61.0 0.44 37.6 16.5 SM 1942-17 3.0 41.3 53.9 0.44 37.1 15.9 SM 1498-4 2.7 48.3 52.7 0.48 35.6 16.0 CM 7438-14 3.7 37.8 66.2 0.38 37.4 13.0 SM 1940-12 3.7 38.0 43.1 0.47 36.1 13.9 SM 1702-23 3.3 39.7 51.0 0.44 35.4 13.4 CM 7436-7 2.0 50.8 60.9 0.45 34.9 18.7 SM 1703-22 3.3 34.5 87.3 0.28 38.2 12.7 COL 2061 4.3 24.4 15.6 0.60 34.6 7.6 SM 1835-15 2.0 48.6 53.7 0.47 34.0 16.5 CM 8596-6 2.7 34.7 47.9 0.42 36.2 12.6 SM 1713-26 3.0 33.6 62.5 0.35 36.5 10.3 SM 524-1 3.3 30.6 45.7 0.40 35.3 10.5 CG 402-11 3.0 39.7 47.0 0.46 32.9 14.1 SM 1934-9 2.7 31.6 69.0 0.32 36.7 11.7 SM 1936-4 3.7 26.6 66.1 0.29 36.4 9.6 SM 1846-12 3.3 30.0 65.6 0.31 35.6 10.9 COL 2261 4.0 32.0 54.3 0.37 33.4 11.8 CM 8296-4 4.0 28.0 51.9 0.35 33.5 9.7 COL 1522 2.3 26.1 58.4 0.31 34.6 8.4 SM 1707-41 4.0 50.9 31.1 0.62 38.6 20.1 Maximum 4.3 57.1 87.3 0.62 39.9 20.1 Minimum 2.0 24.4 15.6 0.28 32.9 7.6 Average 3.1 40.5 56.0 0.43 35.9 14.4 St.Deviation 0.7 9.8 13.9 0.09 1.7 3.7
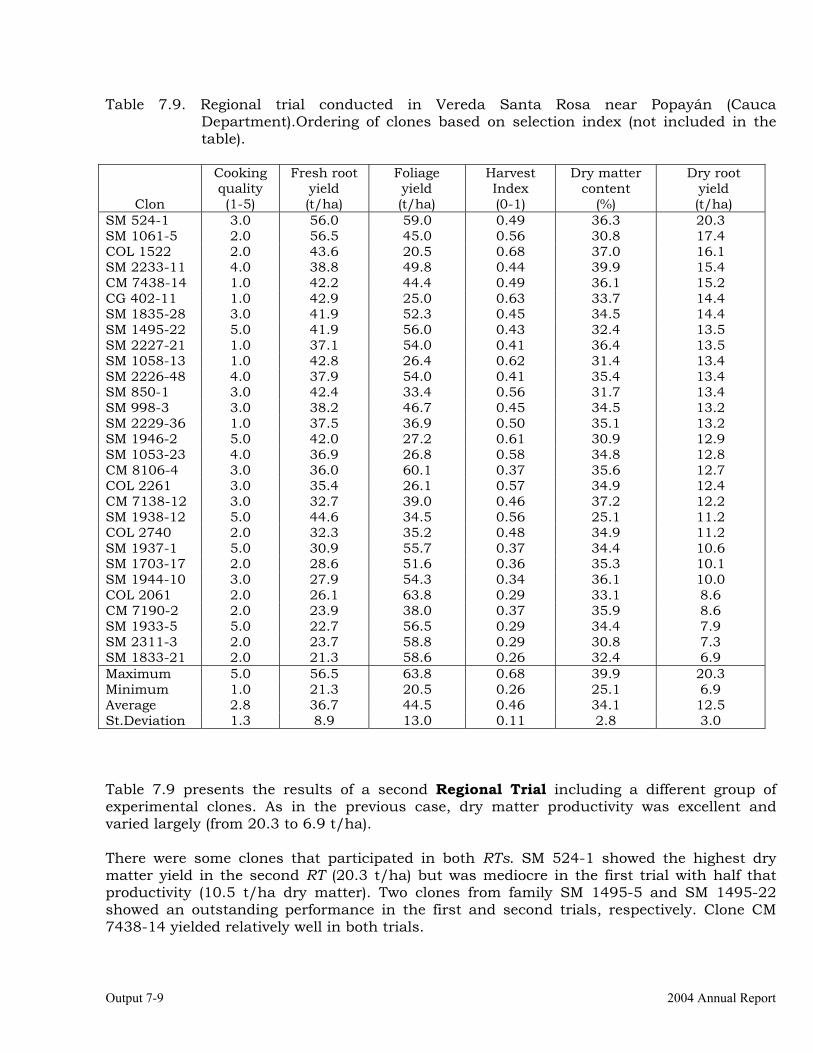
Output 7-9 2004 Annual Report
Table 7.9. Regional trial conducted in Vereda Santa Rosa near Popayán (Cauca Department).Ordering of clones based on selection index (not included in the table).
Clon
Cooking quality (1-5)
Fresh root yield (t/ha)
Foliage yield (t/ha)
Harvest Index (0-1)
Dry matter content
(%)
Dry root yield (t/ha)
SM 524-1 3.0 56.0 59.0 0.49 36.3 20.3 SM 1061-5 2.0 56.5 45.0 0.56 30.8 17.4 COL 1522 2.0 43.6 20.5 0.68 37.0 16.1 SM 2233-11 4.0 38.8 49.8 0.44 39.9 15.4 CM 7438-14 1.0 42.2 44.4 0.49 36.1 15.2 CG 402-11 1.0 42.9 25.0 0.63 33.7 14.4 SM 1835-28 3.0 41.9 52.3 0.45 34.5 14.4 SM 1495-22 5.0 41.9 56.0 0.43 32.4 13.5 SM 2227-21 1.0 37.1 54.0 0.41 36.4 13.5 SM 1058-13 1.0 42.8 26.4 0.62 31.4 13.4 SM 2226-48 4.0 37.9 54.0 0.41 35.4 13.4 SM 850-1 3.0 42.4 33.4 0.56 31.7 13.4 SM 998-3 3.0 38.2 46.7 0.45 34.5 13.2 SM 2229-36 1.0 37.5 36.9 0.50 35.1 13.2 SM 1946-2 5.0 42.0 27.2 0.61 30.9 12.9 SM 1053-23 4.0 36.9 26.8 0.58 34.8 12.8 CM 8106-4 3.0 36.0 60.1 0.37 35.6 12.7 COL 2261 3.0 35.4 26.1 0.57 34.9 12.4 CM 7138-12 3.0 32.7 39.0 0.46 37.2 12.2 SM 1938-12 5.0 44.6 34.5 0.56 25.1 11.2 COL 2740 2.0 32.3 35.2 0.48 34.9 11.2 SM 1937-1 5.0 30.9 55.7 0.37 34.4 10.6 SM 1703-17 2.0 28.6 51.6 0.36 35.3 10.1 SM 1944-10 3.0 27.9 54.3 0.34 36.1 10.0 COL 2061 2.0 26.1 63.8 0.29 33.1 8.6 CM 7190-2 2.0 23.9 38.0 0.37 35.9 8.6 SM 1933-5 5.0 22.7 56.5 0.29 34.4 7.9 SM 2311-3 2.0 23.7 58.8 0.29 30.8 7.3 SM 1833-21 2.0 21.3 58.6 0.26 32.4 6.9 Maximum 5.0 56.5 63.8 0.68 39.9 20.3 Minimum 1.0 21.3 20.5 0.26 25.1 6.9 Average 2.8 36.7 44.5 0.46 34.1 12.5 St.Deviation 1.3 8.9 13.0 0.11 2.8 3.0 Table 7.9 presents the results of a second Regional Trial including a different group of experimental clones. As in the previous case, dry matter productivity was excellent and varied largely (from 20.3 to 6.9 t/ha). There were some clones that participated in both RTs. SM 524-1 showed the highest dry matter yield in the second RT (20.3 t/ha) but was mediocre in the first trial with half that productivity (10.5 t/ha dry matter). Two clones from family SM 1495-5 and SM 1495-22 showed an outstanding performance in the first and second trials, respectively. Clone CM 7438-14 yielded relatively well in both trials.
Output 8-1 2004 Annual Report
OUTPUT 8
Collaboration with other institutions, scientific meetings, and publications.
Activity 8.1 Support national programs that have traditionally collaborated with CIAT in the development and improvement of cassava. Rationale: CIAT has the responsibility to contribute with cassava research worldwide. In the past, this was achieved through the collaboration of National Agriculture Research Programs (NARs), and in the case of Africa, with the valuable collaboration with IITA. This scenario has changed drastically through the last decade, when the NARs in most of the tropical countries weakened consistently. However, new institutions and partners are assuming a leading role and CIAT is actively searching for these new partners. In this activity, at least for Latin America, we are closely collaborating with CLAYUCA. In the implementation of industrial uses of cassava, because of the convenience of our location, most of the validation and adaptive research is carried out in Colombia. Once the technology (for instance, for the artificial drying of cassava roots) is evaluated and offers acceptable results, it can be moved out to other countries. This strategy implies that a considerable portion of our research is carried out in Colombia. However, this does not imply that cassava projects at CIAT are restricting their activities only to Colombia. Specific Objectives: a) To promote the use of cassava and the adoption of new technologies and germplasm by
cassava growing countries of the world. b) To contribute to the training of personnel involved with cassava research. c) To identify new partners in each country. Results A major thrust in CIAT’s strategy to achieve the stated objectives has been through training and visits to NARs, in addition to the provision of germplasm described in Output 3 to Output 7. A summary of the most important events in which personnel from the project participated is provided. Although some of these events were scientific meetings, it should be pointed out that the list involves only those events leading to the development of research proposal or else were part of ongoing collaborative efforts. There are many more specific activities and contributions that cannot be mentioned because of their informal nature. An important activity in this regard is the continuous consulting from producers, students, researchers and processors from Colombia and other countries. An important amount of energy is dedicated to satisfy the demand for information and products through these requests.
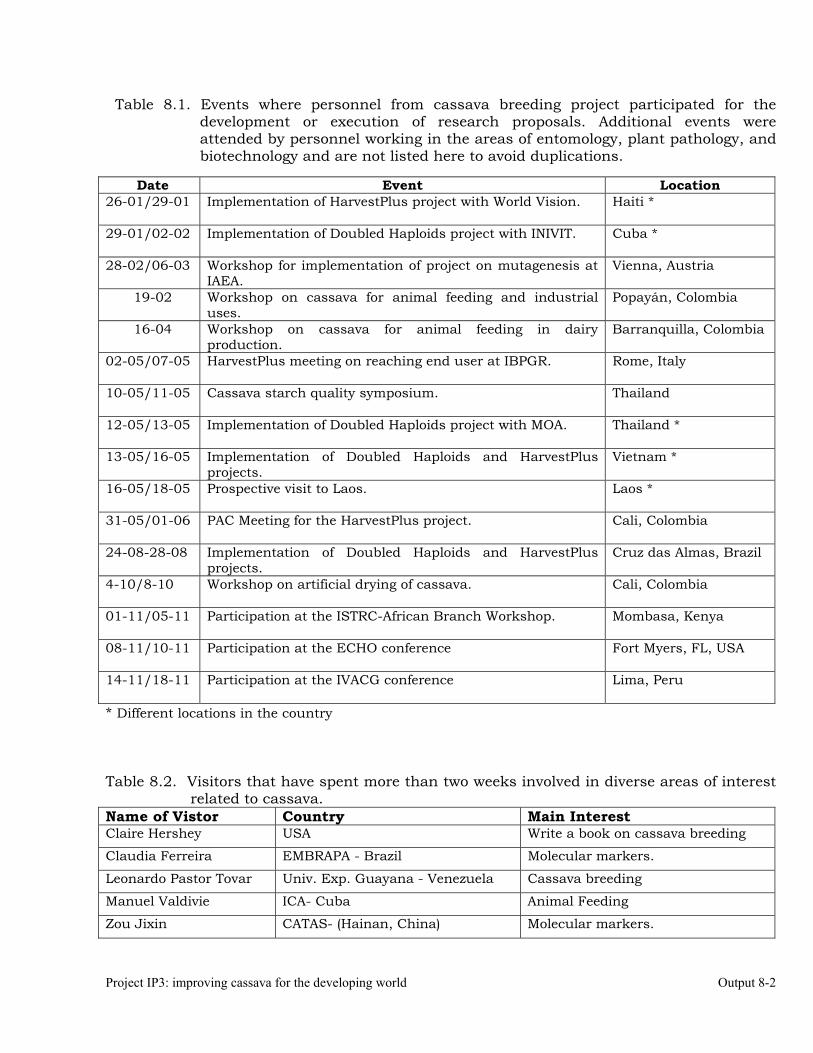
Project IP3: improving cassava for the developing world Output 8-2
Table 8.1. Events where personnel from cassava breeding project participated for the development or execution of research proposals. Additional events were attended by personnel working in the areas of entomology, plant pathology, and biotechnology and are not listed here to avoid duplications.
Date Event Location
26-01/29-01 Implementation of HarvestPlus project with World Vision. Haiti *
29-01/02-02 Implementation of Doubled Haploids project with INIVIT. Cuba *
28-02/06-03 Workshop for implementation of project on mutagenesis at IAEA.
Vienna, Austria
19-02 Workshop on cassava for animal feeding and industrial uses.
Popayán, Colombia
16-04 Workshop on cassava for animal feeding in dairy production.
Barranquilla, Colombia
02-05/07-05 HarvestPlus meeting on reaching end user at IBPGR. Rome, Italy
10-05/11-05 Cassava starch quality symposium. Thailand
12-05/13-05 Implementation of Doubled Haploids project with MOA. Thailand *
13-05/16-05 Implementation of Doubled Haploids and HarvestPlus projects.
Vietnam *
16-05/18-05 Prospective visit to Laos. Laos *
31-05/01-06 PAC Meeting for the HarvestPlus project.
Cali, Colombia
24-08-28-08 Implementation of Doubled Haploids and HarvestPlus projects.
Cruz das Almas, Brazil
4-10/8-10 Workshop on artificial drying of cassava.
Cali, Colombia
01-11/05-11 Participation at the ISTRC-African Branch Workshop. Mombasa, Kenya
08-11/10-11 Participation at the ECHO conference Fort Myers, FL, USA
14-11/18-11 Participation at the IVACG conference Lima, Peru
* Different locations in the country Table 8.2. Visitors that have spent more than two weeks involved in diverse areas of interest
related to cassava. Name of Vistor Country Main Interest Claire Hershey USA Write a book on cassava breeding
Claudia Ferreira EMBRAPA - Brazil Molecular markers.
Leonardo Pastor Tovar Univ. Exp. Guayana - Venezuela Cassava breeding
Manuel Valdivie ICA- Cuba Animal Feeding
Zou Jixin CATAS- (Hainan, China) Molecular markers.
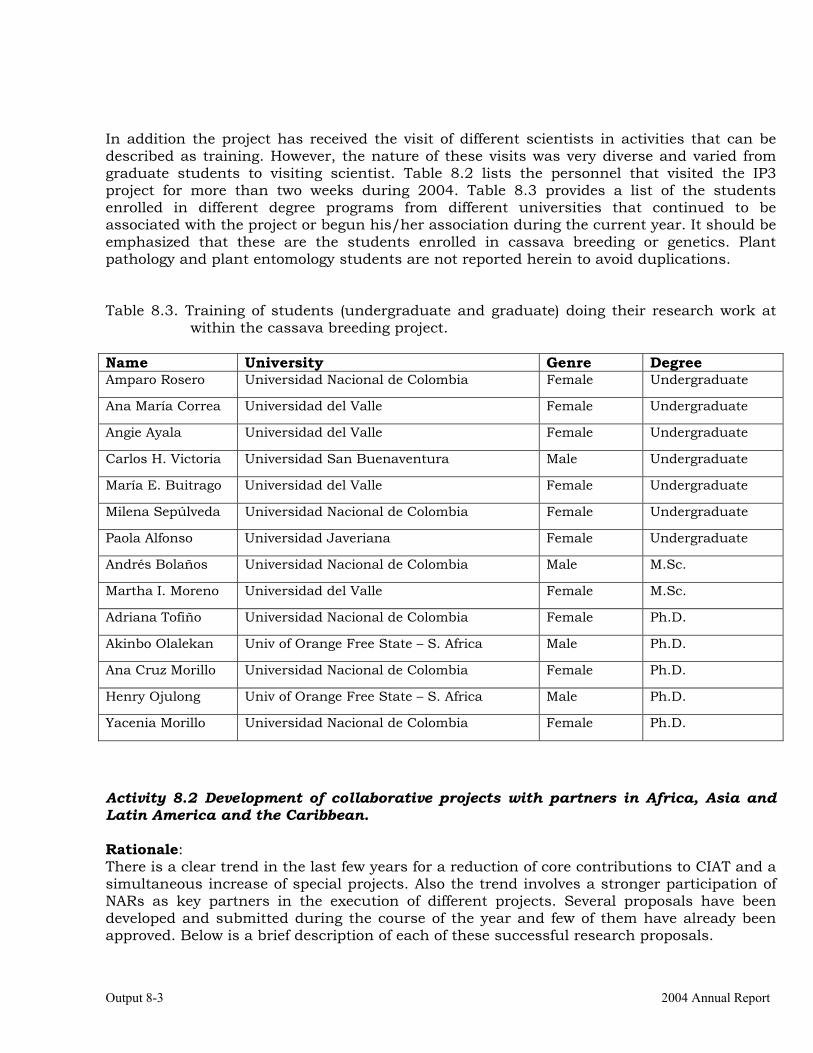
Output 8-3 2004 Annual Report
In addition the project has received the visit of different scientists in activities that can be described as training. However, the nature of these visits was very diverse and varied from graduate students to visiting scientist. Table 8.2 lists the personnel that visited the IP3 project for more than two weeks during 2004. Table 8.3 provides a list of the students enrolled in different degree programs from different universities that continued to be associated with the project or begun his/her association during the current year. It should be emphasized that these are the students enrolled in cassava breeding or genetics. Plant pathology and plant entomology students are not reported herein to avoid duplications. Table 8.3. Training of students (undergraduate and graduate) doing their research work at
within the cassava breeding project. Name University Genre Degree Amparo Rosero Universidad Nacional de Colombia Female Undergraduate
Ana María Correa Universidad del Valle Female Undergraduate
Angie Ayala Universidad del Valle Female Undergraduate
Carlos H. Victoria Universidad San Buenaventura Male Undergraduate
María E. Buitrago Universidad del Valle Female Undergraduate
Milena Sepúlveda Universidad Nacional de Colombia Female Undergraduate
Paola Alfonso Universidad Javeriana Female Undergraduate
Andrés Bolaños Universidad Nacional de Colombia Male M.Sc.
Martha I. Moreno Universidad del Valle Female M.Sc.
Adriana Tofiño Universidad Nacional de Colombia Female Ph.D.
Akinbo Olalekan Univ of Orange Free State – S. Africa Male Ph.D.
Ana Cruz Morillo Universidad Nacional de Colombia Female Ph.D.
Henry Ojulong Univ of Orange Free State – S. Africa Male Ph.D.
Yacenia Morillo Universidad Nacional de Colombia Female Ph.D.
Activity 8.2 Development of collaborative projects with partners in Africa, Asia and Latin America and the Caribbean. Rationale: There is a clear trend in the last few years for a reduction of core contributions to CIAT and a simultaneous increase of special projects. Also the trend involves a stronger participation of NARs as key partners in the execution of different projects. Several proposals have been developed and submitted during the course of the year and few of them have already been approved. Below is a brief description of each of these successful research proposals.
Project IP3: improving cassava for the developing world Output 8-4
High carotene cassava roots. This is the cassava component of the Biofortification Initiative (now Harvest Plus). After more than ten years developing the basic data that allowed the initiative to move forward, full activities begun in 2004. In Africa the activities will be coordinated by IITA and several countries will eventually join the field activities for the development, multiplication, and promotion of elite germplasm with yellow, high-carotene roots. EMBRAPA-CNPMF (Brazil) and CIAT will produce vitroplants of elite clones with high carotene, drought resistance and other desirable characteristics and then ship them to IITA for their introduction and incorporation in the breeding programs in Africa. Eventually some clones could be released if they prove to have outstanding performance. EMBRAPA-CNPMF will also produce sexual seed and share it with other collaborators. EMBRAPA has been a very important and traditional partner for CIAT in the area of cassava research. This project will benefit and continue with this history of collaboration between the two institutions. In Latin America and the Caribbean two key countries will participate in the initiative: Brazil and Haiti. The target region in Brazil is the North East region where cassava is important and poverty and vitamin A deficiency are common. EMBRAPA – CNPMF as well as other EMBRAPA institutes such as CENARGEN in Brazilia and CTAA in Rio de Janeiro. Haiti is the second target country for the deployment of cassava clones with yellow roots. In that case CIAT will work together with World Vision in the Central Plateau. A variety (Yema de Huevo) has already been identified and the initial reaction has been very positive because of its excellent cooking quality. As part of the collaborative activities in this areas visits to Haiti and Brazil took place during the year (Table 8.1) In Asia, also two countries have been targeted based on the prevalence of human consumption of cassava and vitamin A deficiency on one hand and an assessment of the possibilities of attaining success. The countries are India and Vietnam. India has an excellent root and tuber program lead by the Central Tuber Crops Research Institute (CTCRI) in Kerala State, Southern India. CTCRI will participate within Harvest Plus not only in the area of cassava research but also on sweet potato. In Vietnam the higher human consumption of cassava takes place in the central region (for example Hue Province). CIAT will introduce cassava germplasm with yellow roots into Vietnam since not much such germplasm exists currently. The main collaborator in Vietnam for this particular initiative is Thai Nguyen University of Agriculture and Forestry. As part of the collaborative activities a visit to Vietnam took place during the year as well as a prospective trip to Laos (Table 8.1). Doubled-Haploids for cassava genetic improvement. The introduction of inbreeding in cassava has been an evolving idea for a few years now. The year 2004 the project for the introduction of inbreeding in cassava started with the support of Rockefeller Foundation. A technical description of the project was provided in Output 2 (Activity 2.1). There will be several countries participating in the project mainly in the process of producing segregating populations with varying levels of inbreeding. The main objective is to improve tolerance to inbreeding in elite cassava germplasm and to eventually identify useful recessive
Output 8-5 2004 Annual Report
traits that could offer commercial advantages. For the implementation of this project visits to Cuba, Thailand, Vietnam and Brazil took place during the year (Table 8.1). In addition CIAT has initiated contacts with Uganda (National Agricultural and Animal Research Institute) in Eastern Africa and Ghana (Council for Scientific and Industrial Research and Crops Research Institute) in Western Africa. CLAYUCA As stated in the Annual Reports from previous years the creation of CLAYUCA has been a very positive development of the cassava project at CIAT. CLAYUCA is effectively helping in the technology transfer and in south-to-south collaboration among the participating countries. Through CLAYUCA, CIAT maintains a close association with many countries in the Region. During the workshop on modern technologies for the artificial drying of cassava roots, CIAT participated actively. Mutagenesis project with IAEA As mentioned in Output 2 (Activity 2.2) CIAT and the National University of Colombia started a collaborative project on mutagenesis in cassava. The project is financed by the International Atomic Energy Agency and will last for five years. The resources of this project are mostly invested in training students from that University. Development of research proposal within Challenge Programs. Two new global challenge programs have been approved within the CG system one is the Water Challenge Program and the second is the Genetic Resources Global Challenge Program (GRGCP). Because of their very nature these research proposals involve close collaboration with different NARs and NGOs. In the GRGCP, however, two pre-proposals have been successfully submitted. Many of them involve join activities with EMBRAPA and CORPOICA, representing respectively Brazil and Colombia, two key countries from the cassava genetic biodiversity point of view. Activity 8.3. The collaboration with Colombia. Project IP3 has a special relationship with Colombia. As host country for CIAT it is in Colombia where a large proportion of the research on cassava is conducted. But the relationship with Colombia goes well beyond this point. Colombia has been a key financial supporter of the projects turning around industrial uses of cassava both from the Government (Ministry of Agriculture) and the private sector (Poultry Growers Association). There are too many events developed in Colombia to be listed. Instead, what is happening with the idea of Trapiches Yuqueros will be used as an illustration of the intensity and success of the activities developed in the country. A Trapiche Yuquero is basically a centralized facility for artificial (or mixed) drying of cassava roots and foliage, surrounded by 300-1000 hectares of cassava grown by many farmers. Frequently the farmers growing the cassava are also part owners of the drying facility.
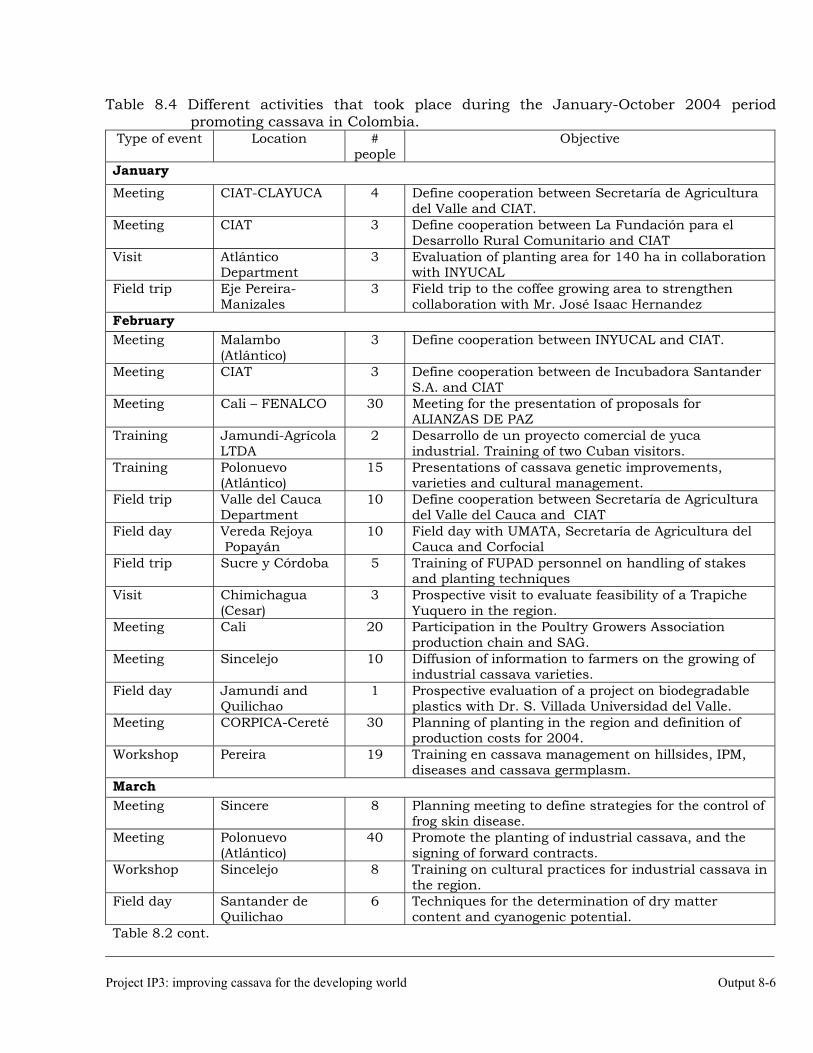
Project IP3: improving cassava for the developing world Output 8-6
Table 8.4 Different activities that took place during the January-October 2004 period promoting cassava in Colombia.
Type of event Location # people
Objective
January Meeting CIAT-CLAYUCA 4 Define cooperation between Secretaría de Agricultura
del Valle and CIAT. Meeting CIAT 3 Define cooperation between La Fundación para el
Desarrollo Rural Comunitario and CIAT Visit Atlántico
Department 3 Evaluation of planting area for 140 ha in collaboration
with INYUCAL Field trip Eje Pereira-
Manizales 3 Field trip to the coffee growing area to strengthen
collaboration with Mr. José Isaac Hernandez February Meeting Malambo
(Atlántico) 3 Define cooperation between INYUCAL and CIAT.
Meeting CIAT 3 Define cooperation between de Incubadora Santander S.A. and CIAT
Meeting Cali – FENALCO 30 Meeting for the presentation of proposals for ALIANZAS DE PAZ
Training Jamundí-Agrícola LTDA
2 Desarrollo de un proyecto comercial de yuca industrial. Training of two Cuban visitors.
Training Polonuevo (Atlántico)
15 Presentations of cassava genetic improvements, varieties and cultural management.
Field trip Valle del Cauca Department
10 Define cooperation between Secretaría de Agricultura del Valle del Cauca and CIAT
Field day Vereda Rejoya Popayán
10 Field day with UMATA, Secretaría de Agricultura del Cauca and Corfocial
Field trip Sucre y Córdoba 5 Training of FUPAD personnel on handling of stakes and planting techniques
Visit Chimichagua (Cesar)
3 Prospective visit to evaluate feasibility of a Trapiche Yuquero in the region.
Meeting Cali 20 Participation in the Poultry Growers Association production chain and SAG.
Meeting Sincelejo 10 Diffusion of information to farmers on the growing of industrial cassava varieties.
Field day Jamundí and Quilichao
1 Prospective evaluation of a project on biodegradable plastics with Dr. S. Villada Universidad del Valle.
Meeting CORPICA-Cereté 30 Planning of planting in the region and definition of production costs for 2004.
Workshop Pereira 19 Training en cassava management on hillsides, IPM, diseases and cassava germplasm.
March Meeting Sincere 8 Planning meeting to define strategies for the control of
frog skin disease. Meeting Polonuevo
(Atlántico) 40 Promote the planting of industrial cassava, and the
signing of forward contracts. Workshop Sincelejo 8 Training on cultural practices for industrial cassava in
the region. Field day Santander de
Quilichao 6 Techniques for the determination of dry matter
content and cyanogenic potential. Table 8.2 cont.
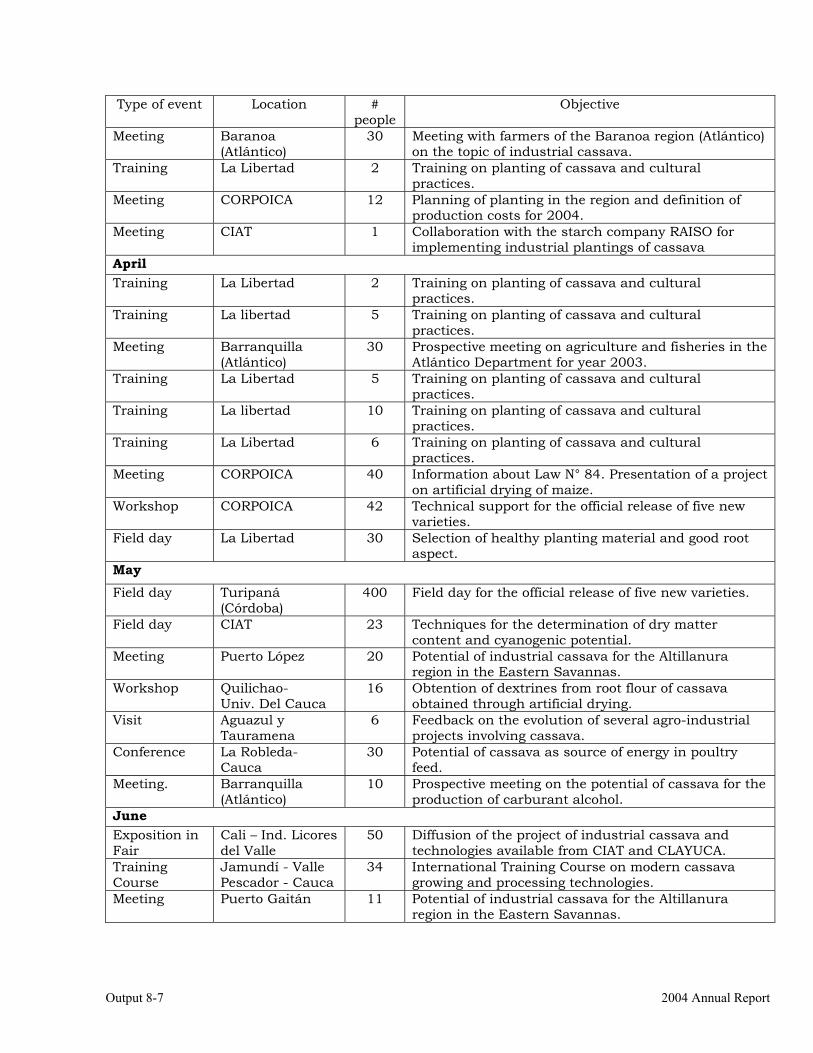
Output 8-7 2004 Annual Report
Type of event Location # people
Objective
Meeting Baranoa (Atlántico)
30 Meeting with farmers of the Baranoa region (Atlántico) on the topic of industrial cassava.
Training La Libertad 2 Training on planting of cassava and cultural practices.
Meeting CORPOICA 12 Planning of planting in the region and definition of production costs for 2004.
Meeting CIAT 1 Collaboration with the starch company RAISO for implementing industrial plantings of cassava
April Training La Libertad 2 Training on planting of cassava and cultural
practices. Training La libertad 5
Training on planting of cassava and cultural practices.
Meeting Barranquilla (Atlántico)
30 Prospective meeting on agriculture and fisheries in the Atlántico Department for year 2003.
Training La Libertad 5 Training on planting of cassava and cultural practices.
Training La libertad 10 Training on planting of cassava and cultural practices.
Training La Libertad 6 Training on planting of cassava and cultural practices.
Meeting CORPOICA 40 Information about Law N° 84. Presentation of a project on artificial drying of maize.
Workshop CORPOICA 42 Technical support for the official release of five new varieties.
Field day La Libertad
30 Selection of healthy planting material and good root aspect.
May Field day Turipaná
(Córdoba) 400 Field day for the official release of five new varieties.
Field day CIAT 23 Techniques for the determination of dry matter content and cyanogenic potential.
Meeting
Puerto López 20 Potential of industrial cassava for the Altillanura region in the Eastern Savannas.
Workshop Quilichao- Univ. Del Cauca
16 Obtention of dextrines from root flour of cassava obtained through artificial drying.
Visit Aguazul y Tauramena
6
Feedback on the evolution of several agro-industrial projects involving cassava.
Conference La Robleda- Cauca
30 Potential of cassava as source of energy in poultry feed.
Meeting. Barranquilla (Atlántico)
10 Prospective meeting on the potential of cassava for the production of carburant alcohol.
June Exposition in Fair
Cali – Ind. Licores del Valle
50 Diffusion of the project of industrial cassava and technologies available from CIAT and CLAYUCA.
Training Course
Jamundí - Valle Pescador - Cauca
34 International Training Course on modern cassava growing and processing technologies.
Meeting
Puerto Gaitán 11 Potential of industrial cassava for the Altillanura region in the Eastern Savannas.
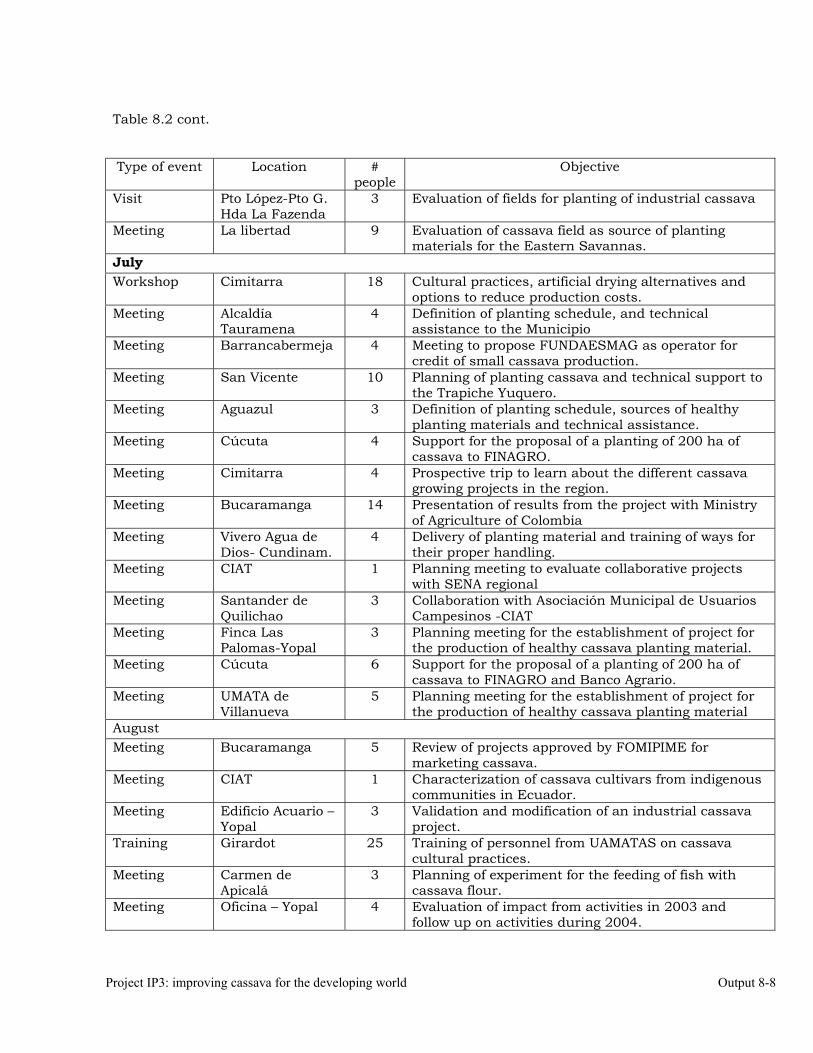
Project IP3: improving cassava for the developing world Output 8-8
Table 8.2 cont. Type of event Location #
people Objective
Visit Pto López-Pto G. Hda La Fazenda
3 Evaluation of fields for planting of industrial cassava
Meeting La libertad 9 Evaluation of cassava field as source of planting materials for the Eastern Savannas.
July Workshop Cimitarra 18 Cultural practices, artificial drying alternatives and
options to reduce production costs. Meeting Alcaldía
Tauramena 4 Definition of planting schedule, and technical
assistance to the Municipio Meeting Barrancabermeja 4 Meeting to propose FUNDAESMAG as operator for
credit of small cassava production. Meeting San Vicente 10 Planning of planting cassava and technical support to
the Trapiche Yuquero. Meeting Aguazul 3 Definition of planting schedule, sources of healthy
planting materials and technical assistance. Meeting Cúcuta 4 Support for the proposal of a planting of 200 ha of
cassava to FINAGRO. Meeting Cimitarra 4 Prospective trip to learn about the different cassava
growing projects in the region. Meeting Bucaramanga 14 Presentation of results from the project with Ministry
of Agriculture of Colombia Meeting Vivero Agua de
Dios- Cundinam. 4 Delivery of planting material and training of ways for
their proper handling. Meeting CIAT 1 Planning meeting to evaluate collaborative projects
with SENA regional Meeting Santander de
Quilichao 3 Collaboration with Asociación Municipal de Usuarios
Campesinos -CIAT Meeting Finca Las
Palomas-Yopal 3 Planning meeting for the establishment of project for
the production of healthy cassava planting material. Meeting Cúcuta 6 Support for the proposal of a planting of 200 ha of
cassava to FINAGRO and Banco Agrario. Meeting UMATA de
Villanueva 5 Planning meeting for the establishment of project for
the production of healthy cassava planting material August Meeting Bucaramanga 5 Review of projects approved by FOMIPIME for
marketing cassava. Meeting CIAT 1 Characterization of cassava cultivars from indigenous
communities in Ecuador. Meeting Edificio Acuario –
Yopal 3 Validation and modification of an industrial cassava
project. Training Girardot 25 Training of personnel from UAMATAS on cassava
cultural practices. Meeting Carmen de
Apicalá 3 Planning of experiment for the feeding of fish with
cassava flour. Meeting Oficina – Yopal 4 Evaluation of impact from activities in 2003 and
follow up on activities during 2004.
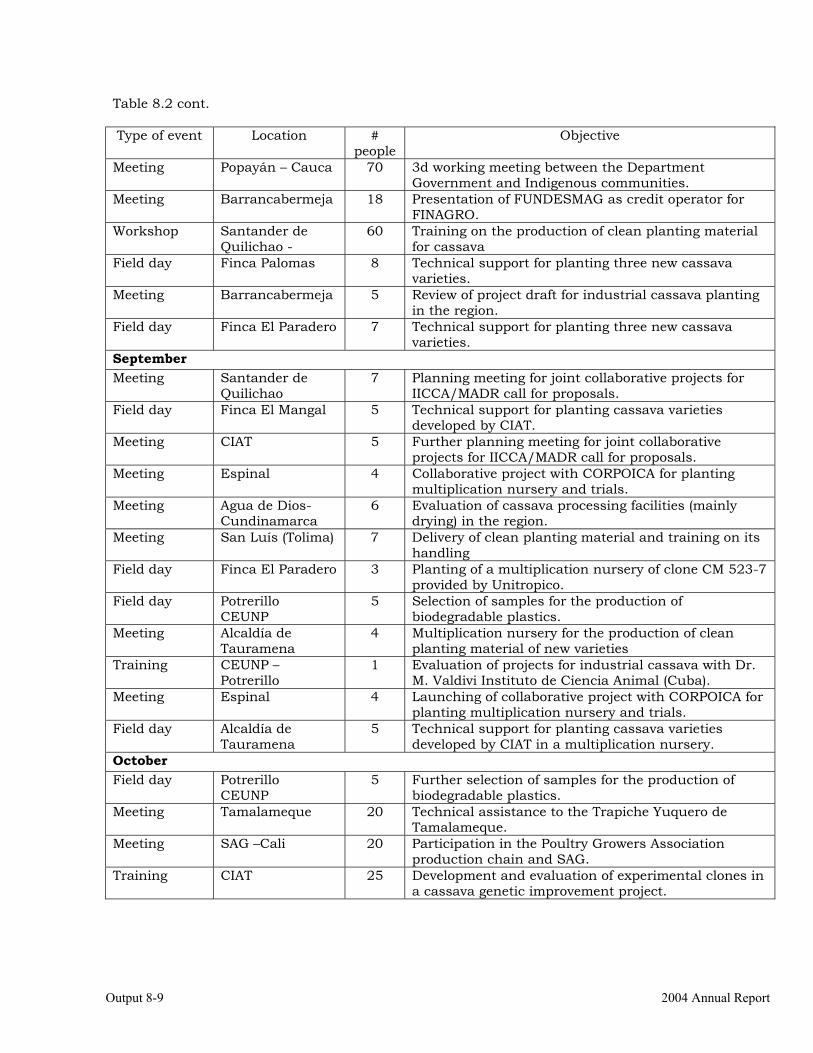
Output 8-9 2004 Annual Report
Table 8.2 cont. Type of event Location #
people Objective
Meeting Popayán – Cauca 70 3d working meeting between the Department Government and Indigenous communities.
Meeting Barrancabermeja 18 Presentation of FUNDESMAG as credit operator for FINAGRO.
Workshop Santander de Quilichao -
60 Training on the production of clean planting material for cassava
Field day Finca Palomas 8 Technical support for planting three new cassava varieties.
Meeting Barrancabermeja 5 Review of project draft for industrial cassava planting in the region.
Field day Finca El Paradero 7 Technical support for planting three new cassava varieties.
September Meeting Santander de
Quilichao 7 Planning meeting for joint collaborative projects for
IICCA/MADR call for proposals. Field day Finca El Mangal 5 Technical support for planting cassava varieties
developed by CIAT. Meeting CIAT 5 Further planning meeting for joint collaborative
projects for IICCA/MADR call for proposals. Meeting Espinal 4 Collaborative project with CORPOICA for planting
multiplication nursery and trials. Meeting Agua de Dios-
Cundinamarca 6 Evaluation of cassava processing facilities (mainly
drying) in the region. Meeting San Luís (Tolima) 7 Delivery of clean planting material and training on its
handling Field day Finca El Paradero 3 Planting of a multiplication nursery of clone CM 523-7
provided by Unitropico. Field day Potrerillo
CEUNP 5 Selection of samples for the production of
biodegradable plastics. Meeting Alcaldía de
Tauramena 4 Multiplication nursery for the production of clean
planting material of new varieties Training CEUNP –
Potrerillo 1 Evaluation of projects for industrial cassava with Dr.
M. Valdivi Instituto de Ciencia Animal (Cuba). Meeting Espinal 4 Launching of collaborative project with CORPOICA for
planting multiplication nursery and trials. Field day Alcaldía de
Tauramena 5 Technical support for planting cassava varieties
developed by CIAT in a multiplication nursery. October Field day Potrerillo
CEUNP 5 Further selection of samples for the production of
biodegradable plastics. Meeting Tamalameque 20 Technical assistance to the Trapiche Yuquero de
Tamalameque. Meeting SAG –Cali 20 Participation in the Poultry Growers Association
production chain and SAG. Training CIAT 25 Development and evaluation of experimental clones in
a cassava genetic improvement project.
Project IP3: improving cassava for the developing world Output 8-10
CIAT and CLAYUCA have been promoting the creation of Trapiches Yuqueros for three years now. To materialize the idea two main issues had to be dealt with. The year 2003 was a turning point for cassava in Colombia because not only the first Trapiche Yuquero was created that year, but also because ten additional Trapiches followed. This idea has been adopted by many different communities, which further developed or modified the original idea to adapt it to local conditions. CLAYUCA and CIAT are very proud of these developments. Although this is taking place only in Colombia at this point, the idea has generated enough interest in other countries in the Region (Nicaragua, Venezuela, Ecuador) as well as outside the Region (Nigeria). During the year 2004 the fieldwork begun in many of these Trapiches Yuqueros and both CLAYUCA and CIAT are contributing to their activities, providing planting material and technical supervision on their operations. In addition to the specific involvement with the operations of Trapiches Yuqueros IP3 project successfully presented a proposal to COLCIENCIAS for a collaborative project (private sector, National University of Colombia, CENICAFE, CIAT and CLAYUCA) for the creation of a high-capacity starch quality laboratory, which was described in Output 2 (Activity 2.4). A major factor contributing to the success in the area of collaboration with NARs from Latin American Countries has been the complementation and collaboration between CIAT and CLAYUCA, which is dully acknowledged here. Table 8.4 lists the most important activities conducted in Colombia for the promotion and/or technical development of cassava in which personnel from IP3 actively participated. Activity 8.4. Scientific meetings and publications. Scientific publications: 1. Reddy, BVS, AF Rangel, B. Ramaiah and R. Ortiz. A research amd network strategy for
sustainable sorghum production systems for Latin America. 2004. In MCS Bantilan, UK Deb, CLL Gowda, BVS Reddy, AB Obilana and RE Evenson (Eds.) Sorghum Genetic Enhancement: research process, dissemination and impacts. ICRISAT, Patancheru 502 324, Andhra Pradesh, India pp. 139-148.
2. Ceballos, H., C.A. Iglesias, J. C. Pérez, & A.G.O. Dixon, 2004. Cassava breeding:
opportunities and challenges. Plant Molecular Biology (in press). 3. Jaramillo, G., N. Morante, J.C. Perez, F. Calle, H. Ceballos*, B. Arias and A.C. Bellotti.
2004. Diallel analysis in cassava (Manihot esculenta Crantz) adapted to the mid-altitude valleys environment. Crop Science (in press)
4. Lenis, J.I., F. Calle, G. Jaramillo, J.C. Perez, H.Ceballos, and J.H. Cock. 2004. The effect of
leaf retention in cassava productivity. (Submitted to Field Crops Research and accepted for publication after minor changes).
5. Chávez, A.L., T. Sánchez, G. Jaramillo, J. M.l Bedoya, J. Echeverry, E. A. Bolaños , H. Ceballos, & C.A. Iglesias. 2004. Variation of quality traits in cassava roots evaluated in
Output 8-11 2004 Annual Report
landraces and improved clones. (Submitted to Euphytica and accepted for publication after minor changes).
6. Ceballos, H, T. Sánchez, A.L. Chávez, C. Iglesias, D.Debouck, G. Mafla, and J. Tohme.
2004. Variation in crude protein content in cassava (Manihot esculenta Crantz) roots. (Submitted to Journal of Food Composition and Analysis).
7. Sánchez, T., A.L. Chávez, H. Ceballos, D.B. Rodriguez-Amaya, P. Nestel and M. Ishitami.
2004. Reduction or delay of post-harvest physiological deterioration in high-carotene cassava roots. (Submitted to Journal of the Science of Food and Agriculture).
8. Morante, N., X. Moreno, J.C. Perez, F. Calle, J.I. Lenis, E. Ortega, G.Jaramillo and H.
Ceballos. 2004. Precision of selection in early stages of cassava genetic improvement. (Submitted to Crop Science).
9. Cach, N.T., J.I. Lenis, J.C. Perez, N. Morante, F. Calle and H. Ceballos. 2004. Inheritance
of relevant traits in cassava (Manihot esculenta Crantz) for sub-humid conditions. (Submitted to Plant Breeding).
10. Calle, F., J.C. Perez, W. Gaitán, N. Morante, H. Ceballos, G.Llano & E.Alvarez. Genetics of
relevant traits in cassava (Manihot esculenta Crantz) adapted to acid-soil savannas. (Submitted to Euphytica).
11. Nguyen Thi Cach, JC Perez, JI Lenis, F Calle, N Morante and H. Ceballos. 2004. Epistasis
in the expression of relevant traits in cassava (Manihot esculenta Crantz) for sub-humid conditions (Submitted to Journal of Heredity).
12. Perez, J.C., H. Ceballos, F.Calle, W. Gaitán, N. Morante, G.Llano & E.Alvarez. Additive,
dominance and epistatic effects of relevant traits in cassava (Manihot esculenta Crantz) adapted to acid-soil savannas. (Submitted to Theoretical and Applied Genetics).
13. Perez, J.C., H. Ceballos, Jaramillo, G., N. Morante, F. Calle, B. Arias and A.C. Bellotti.
2004. Analysis of the relative importance of epistasis in cassava (Manihot esculenta Crantz) adapted to the mid-altitude valleys environment. (Submitted to Crop Science).
14. Perez Velázquez, J.C. C.L. Souza Jr. L.A. Narro, S. Pandey, and C. De León. Genetic
effects for maize traits under acid and non-acid soils. (Submitted to Euphytica) Scientific Presentations: 1. Rao, I., Ayarza, M., Trouche, G., Ceballos, H., Alves, A., Miles, J., Argel, P., Schmidt, A.,
Peters, M., Holman, F., Lundy, M., Quirós, C., Rondon, M., Monneveux, P., and Córdoba, H. Improving crop and forage adaptation to dry conditions of Central America. Climate Change Workshop. Catie, Costa Rica. March 16-18, 2004.
2. Perez J.C.; Ceballos H; Lenis J.I.; Ortega E.; Calle F. and Morante N. Stability and
genotype by environment analysis in cassava. Sixth International Scientific Meeting of the Cassava Biotechnology Network. Cali, Colombia March 8-14, 2004.
3. Perez J.C.; Ceballos H; Lenis J.I.; Ortega E.; and Morante N. Heritability of agronomically
relevant traits in cassava. Sixth International Scientific Meeting of the Cassava Biotechnology Network. Cali, Colombia March 8-14, 2004.
Project IP3: improving cassava for the developing world Output 8-12
4. Ceballos H; Perez J.C.; Calle F.; Morante N.; Lenis J.I. and Jaramillo G. Alternative for estimating general combining ability in cassava beeding. Sixth International Scientific Meeting of the Cassava Biotechnology Network. Cali, Colombia March 8-14, 2004.
5. Ceballos H.; Lentini Z.; Perez J.C. and Fregene M. Introduction of inbreeding in cassava
through the production of doubled haploids. Sixth International Scientific Meeting of the Cassava Biotechnology Network. Cali, Colombia March 8-14, 2004.
6. Ceballos H; Perez J.C.; Jaramillo G.; Morante N.; Calle F. and Lenis J.I. Inheritance of
agronomically relevant traits in cassava. Sixth International Scientific Meeting of the Cassava Biotechnology Network. Cali, Colombia March 8-14, 2004.
7. Perez J.C.; Ceballos H; Ortega E.; Lenis J.I.; Calle F. and Morante N. Phenotypic and
genetic correlations among agronomically relevant traits in cassava. Sixth International Scientific Meeting of the Cassava Biotechnology Network. Cali, Colombia March 8-14, 2004.
8. Perez J.C.; Ceballos H; Ortega E. and Lenis J.I. Analysis of genotype by environment
interactions in cassava using the AMMI model. Sixth International Scientific Meeting of the Cassava Biotechnology Network. Cali, Colombia March 8-14, 2004.
9. Egesi C.; Castelblanco, W.; Morante N.; Mba C.; Ceballos H. and Fregene M. Identification
of naturally occurring and irradiation-induced mutant GBSSI alleles of cassava in a heterozygous genetic background. Sixth International Scientific Meeting of the Cassava Biotechnology Network. Cali, Colombia March 8-14, 2004.
10. Morante N.; Sánchez T.; Marin J.; Ospina C.; Gutiérrez J.; Barrera E.; Ceballos H.; Alzate
A.; Moreno S. and Fregene M. Mining the primary gene pool of cassava: introgression of resistance to the cassava green mite andhigh root protein from accessions of Manihot esculenta sub spp flabellifolia and Manihot tristis into cassava. Sixth International Scientific Meeting of the Cassava Biotechnology Network. Cali, Colombia March 8-14, 2004.
11. Loke J.B.; Alvarez E.; Corredor J. A.; Folgueras M.; Jaramillo G. and Ceballos H.
Preliminary evidence of correlation between foliar and root resistance to root rot caused by Phytophtthora tropicalis in cassava. Sixth International Scientific Meeting of the Cassava Biotechnology Network. Cali, Colombia March 8-14, 2004.
12. Kullaya A.; Mtunda K.; Kulembeka H.; Ferguson M.; Marin J.; Ospina C.; Barrera E.;
Jarvis A.; Morante M.; Ceballos H.; Tohme J. and Fregene M. Molecular marker-assisted and farmer participatory improvement of cassava germplasm for farmer/market preferred traits in Tanzania. Sixth International Scientific Meeting of the Cassava Biotechnology Network. Cali, Colombia March 8-14, 2004.
13. Chavez A. L.; Sánchez T.; Tohme J.; Ishitani M. and Ceballos H. Sampling variability in
cassava roots for total carotene content. Sixth International Scientific Meeting of the Cassava Biotechnology Network. Cali, Colombia March 8-14, 2004.
14. Chavez A. L.; Sánchez T.; Tohme J.; Ishitani M. and Ceballos H. Effect of processing on B-
carotene content of cassava roots. Sixth International Scientific Meeting of the Cassava Biotechnology Network. Cali, Colombia March 8-14, 2004.
Output 8-13 2004 Annual Report
15. Ceballos H.; Fregene M.; Mejía S.; Castelblanco W.; and Morante N. Mutagenesis of cassava (Manihot esculenta Crantz) for the generation, identification and molecular analysis of novel traits. First FAO/IAEA Research Coordination Meeting on “Effects of mutagenic agents on the DNA sequence in plants” Vienna, Austria, 1-5 March 2004.
16. Ceballos, H.; Fregene, M.;Sánchez, T.; Pérez J.C.; and Lentini, Z. Approaches for
modifications of starch quality traits in cassava through conventional breeding. Workshop on starch biosynthesis and cassava biotechnology. Chulalongkorn University. Bangkok, Thailand. May 10-12, 2004.
17. Maziya-Dixon, B., A. G. O. Dixon, R. Asiedu, R. Kapinga, M. Andrade, M. Bonierbale, and H. Ceballos. 2004. Biofortification of Root and Tuber Crops: A Novel Approach. ISTRC-African Branch. Nairobi, Kenya. November 1-5, 2004.
18. Jaramillo, G., J.I. Lenis, F.Calle, N. Morante, E. Ortega, J.C. Perez and H. Ceballos. 2004. Relationship between traits measured at different stages of the selection process in cassava. ISTRC-African Branch. ISTRC-African Branch. Nairobi, Kenya. November 1-5, 2004.
19. Morante, N., T. Sanchez, J. Marin, C. Ospina, J. Gutierrez, E. Barrera, H. Ceballos, A. Alzate, S. Moreno, M. Fregene. 2004. High Root Protein Content in Accessions of Wild Manihot species and Manihot esculenta land races from Guatemala. ISTRC-African Branch. ISTRC-African Branch. Nairobi, Kenya. November 1-5, 2004.
20. Ceballos, H., J.C. Perez, A.L. Chávez, T. Sánchez, F. Calle, N. Morante, G. Jaramillo. 2004. Cassava research and nutrition value. ECHO Agricultural Missions Conference. Fort Myers, Florida, USA. November 8-10, 2004
21. Ceballos, H., A.L. Chávez, and T. Sánchez. 2004. Improving cassava nutritional value through the Harvest Plus Challenge Program. IVACG Meeting. Lima, Peru. November 15-17, 2004.
Prepared Manuscripts not yet submitted: 1. Perez, J.C., M. Espitia, H. Ceballos,.J.I. Lenis, and E. Ortega.. Genetic, phenotypic and
environmental relationships between different traits in cassava (Manihot esculenta Crantz). (to be submitted to Crop Science).
2. Chávez, A.L., T. Sánchez, A.L., H. Ceballos, P. Nestel, D.B. Rodriguez-Amaya, and M.
Ishitami. Effect of processing on carotenes present in cassava (Manihot esculenta Crantz) roots (to be submitted to Journal of the Science of Food and Agriculture).
3. Sánchez, T., A.L. Chávez,, H. Ceballos, P. Nestel, D.B. Rodriguez-Amaya, and M. Ishitami.
Effect of different storage conditions on carotenes present in cassava (Manihot esculenta Crantz) roots (to be submitted to Euphytica).
2004 Annual Report Output 9-1
OUTPUT 9
Activities related with the maintenance of the germplasm bank of cassava and other Manihot species. Basic genetic studies.
CIAT has been trusted with the maintenance of the cassava world germplasm bank, which includes more than 6000 accessions of Manihot esculenta and other Manihot species. In the following pages a summary of activities related to the germplasm bank and other basic genetic studies will be described. It is important to emphasize that all these activities are also reported as part of the joint work between IP3 and SB2 projects. The inclusion of this Output in the IP3 Annual Report is just to provide a whole picture of research and results around cassava at CIAT. Activity 9.1. Maintenance of Manihot germplasm bank in the field. Rationale The Genetic Resources Unit is officially in charge of the maintenance of the cassava germplasm bank, both in vitro and in the field. However, for practical reasons, the field operations are coordinated by IP3 project. Since year 2000 an extensive activity to clean up from frogskin disease, the germplasm bank has been carried out. Plots from the germplasm bank maintained in the field, because of its very nature, could not be eliminated even if frogskin disease appeared in some of the plants. Eventually the incidence of the disease increased to unacceptable levels. In order to reduce the costs of maintenance of the germplasm collection and because of the problems associated with frog skin disease it was decided that the collection will be moved from the field and be maintained using the “bonsai system” under greenhouse conditions. This is an activity described in more detail in the respective report from the Germplasm Collections and will not be further discussed herein. Because the Germplasm Collection is no longer in the field during this period, a set of clones has been regenerated in order to produce enough roots for the evaluation of different traits, particularly novel starch quality traits. IP3 project is trying to produce plants from as many as 2000 clones from the germplasm collection. These plants are produced from stocks that have been certified to be frog skin free. In addition the core collection (about 600 clones) has been shipped to Thailand so there is a duplicate of this important group of clones. The core collection will be phenotypically characterized in Thailand and also in Colombia. This evaluation will allow a measurement of the relative stability or sensitivity to genotype by environment interaction of the morphological descriptors used in the Genetic Resources Unit for cassava. Specific Objectives:
a) To grow plantlets from the in vitro core collection. b) To grow plantlet from in vitro plants of the germplasm bank for starch quality
evaluations.
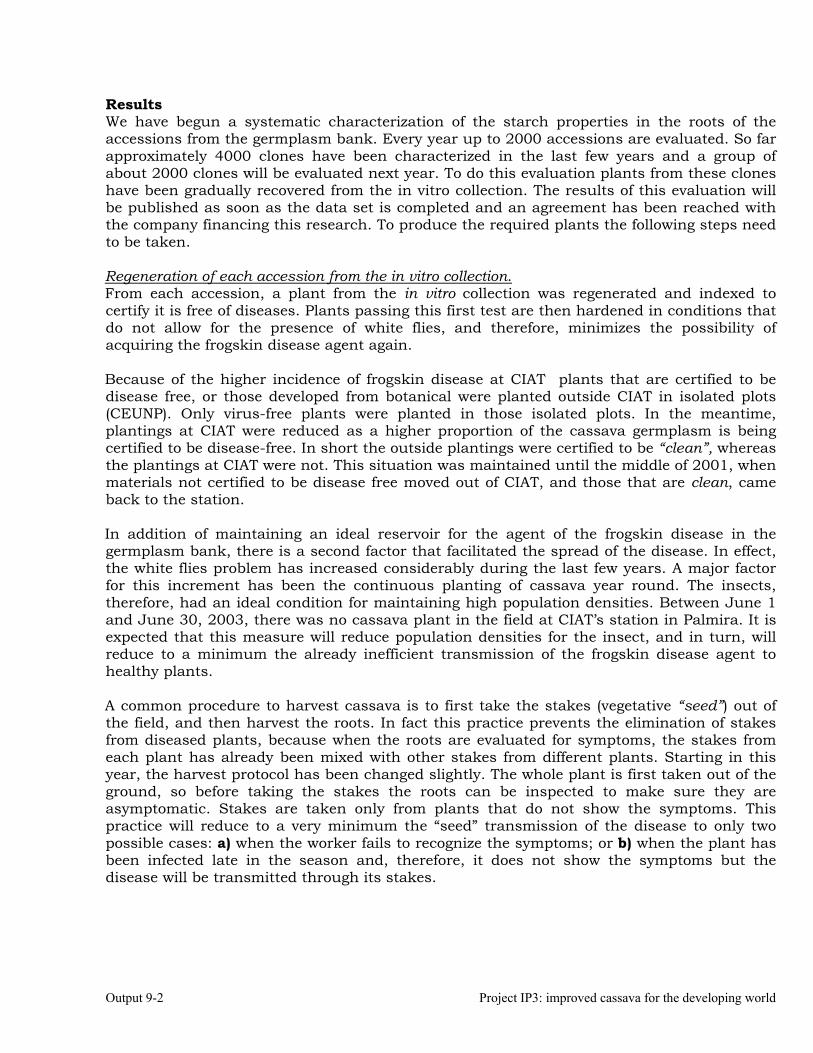
Output 9-2 Project IP3: improved cassava for the developing world
Results We have begun a systematic characterization of the starch properties in the roots of the accessions from the germplasm bank. Every year up to 2000 accessions are evaluated. So far approximately 4000 clones have been characterized in the last few years and a group of about 2000 clones will be evaluated next year. To do this evaluation plants from these clones have been gradually recovered from the in vitro collection. The results of this evaluation will be published as soon as the data set is completed and an agreement has been reached with the company financing this research. To produce the required plants the following steps need to be taken. Regeneration of each accession from the in vitro collection. From each accession, a plant from the in vitro collection was regenerated and indexed to certify it is free of diseases. Plants passing this first test are then hardened in conditions that do not allow for the presence of white flies, and therefore, minimizes the possibility of acquiring the frogskin disease agent again. Because of the higher incidence of frogskin disease at CIAT plants that are certified to be disease free, or those developed from botanical were planted outside CIAT in isolated plots (CEUNP). Only virus-free plants were planted in those isolated plots. In the meantime, plantings at CIAT were reduced as a higher proportion of the cassava germplasm is being certified to be disease-free. In short the outside plantings were certified to be “clean”, whereas the plantings at CIAT were not. This situation was maintained until the middle of 2001, when materials not certified to be disease free moved out of CIAT, and those that are clean, came back to the station. In addition of maintaining an ideal reservoir for the agent of the frogskin disease in the germplasm bank, there is a second factor that facilitated the spread of the disease. In effect, the white flies problem has increased considerably during the last few years. A major factor for this increment has been the continuous planting of cassava year round. The insects, therefore, had an ideal condition for maintaining high population densities. Between June 1 and June 30, 2003, there was no cassava plant in the field at CIAT’s station in Palmira. It is expected that this measure will reduce population densities for the insect, and in turn, will reduce to a minimum the already inefficient transmission of the frogskin disease agent to healthy plants. A common procedure to harvest cassava is to first take the stakes (vegetative “seed”) out of the field, and then harvest the roots. In fact this practice prevents the elimination of stakes from diseased plants, because when the roots are evaluated for symptoms, the stakes from each plant has already been mixed with other stakes from different plants. Starting in this year, the harvest protocol has been changed slightly. The whole plant is first taken out of the ground, so before taking the stakes the roots can be inspected to make sure they are asymptomatic. Stakes are taken only from plants that do not show the symptoms. This practice will reduce to a very minimum the “seed” transmission of the disease to only two possible cases: a) when the worker fails to recognize the symptoms; or b) when the plant has been infected late in the season and, therefore, it does not show the symptoms but the disease will be transmitted through its stakes.
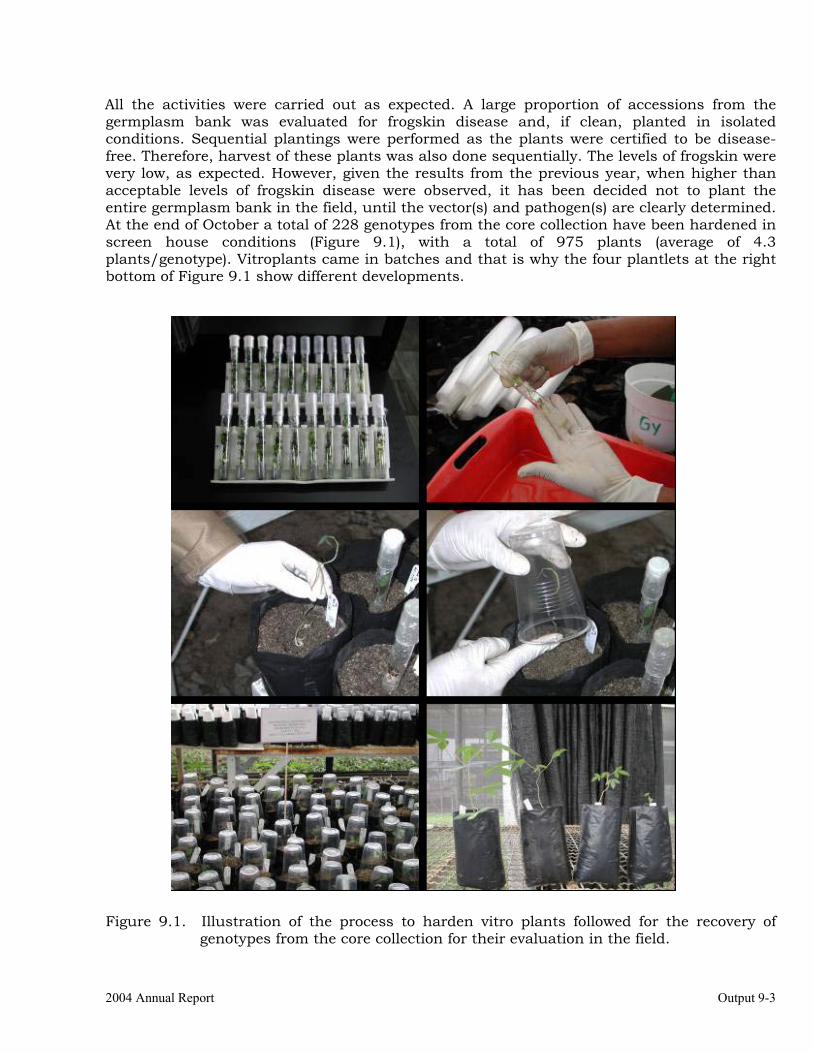
2004 Annual Report Output 9-3
All the activities were carried out as expected. A large proportion of accessions from the germplasm bank was evaluated for frogskin disease and, if clean, planted in isolated conditions. Sequential plantings were performed as the plants were certified to be disease-free. Therefore, harvest of these plants was also done sequentially. The levels of frogskin were very low, as expected. However, given the results from the previous year, when higher than acceptable levels of frogskin disease were observed, it has been decided not to plant the entire germplasm bank in the field, until the vector(s) and pathogen(s) are clearly determined. At the end of October a total of 228 genotypes from the core collection have been hardened in screen house conditions (Figure 9.1), with a total of 975 plants (average of 4.3 plants/genotype). Vitroplants came in batches and that is why the four plantlets at the right bottom of Figure 9.1 show different developments. Figure 9.1. Illustration of the process to harden vitro plants followed for the recovery of
genotypes from the core collection for their evaluation in the field.
Output 9-4 Project IP3: improved cassava for the developing world
Activity 9.2. Evaluation of M. esculenta and related species from the germplasm collection for useful traits, particularly for higher protein content in the roots. Rationale Many of the activities related to the evaluation of the introgression of useful genetic variability from wild relatives of cassava is described in Otuput 12 and also in Output 1. In this activity, however, a particular action will be described because of its relevance. In a previous Annual Report (2002) it was reported that a few clones more commonly from Central America had been found to have high levels of crude protein in the roots. These clones were properly identified and were recovered from the germplasm collection to be evaluated again to confirm their protein content in the roots. One important feature that will be evaluated is the stability of that trait through multi-location evaluations and also the effect of the age of the plant. Specific Objectives: a) To grow plants recovered from the in vitro collection and measure protein content in their
roots. Results. Plants from 21 clones were hardened and grown in the field. At eight months of age one root was taken from the plants in the field and flour obtained from them. N content was measured at CIAT’s analytical laboratory and multiplied by the standard 6.25 factor to obtain % of crude protein content in the roots. Figure 9.2 shows the results from these measurements (at eight months of age) as well as the original data from a 1999 evaluation on 10-month old plants. The results presented in Figure 9.2 are preliminary. The fact that the quantifications were made at two different laboratories should not have an effect based on the results presented in Output 1. The major difference between the two evaluations is the age of the plants. These plants will be kept in the field for few more months and toots taken at 10 months of age for yet another quantification of protein content. In spite of the obvious disagreement between the two analyses depicted in Figure 9.2, it is obvious that at least five clones showed again protein levels above 5%, which is about twice as much as the content traditionally considered for cassava. These plants are in the field to be crossed and self-pollinated, and constitute a very valuable and promising germplasm.
2004 Annual Report Output 9-5
Figure 9.2. Results of crude protein content in roots from 21 cassava clones evaluated in 1999 at 10 months of age (quantification made at White’s Analytical Laboratory, Adelaide University) and again in 2004 at 8 months of age (quantification at CIAT’s Analytical Laboratory).
Activity 9.3. Evaluation of segregation of carotene content in self-pollinated progenies from selected clones. Rationale In reports from previous years the results of self-pollinations of the elite clone MTAI 8 (Rayong 60) illustrated the advantages of inbreeding cassava for research purposes. One of the surprises of this early work was the apparent recessive behavior of carotene content in cassava roots. Further evaluation of self-pollinated progenies was therefore, pursued. Specific Objectives:
a) Produce self-pollinated progenies from elite cassava clones. b) Evaluate these progenies for carotene content in their roots.
Results. Self-pollinated progenies from three elite clones were harvested. The most profusely sampled genotype was MTAI 8 (slightly colored roots) with a total of 181 S1 plants, followed by yellow-
0.00
1.00
2.00
3.00
4.00
5.00
6.00
7.00
8.00
9.00
CM 32
36-
3
MCOL 243
6
MBRA 300
MCOL 21
9
MCOL 243
6
MGUA 79
MCOL 245
9
SM 7
34-
5
MCR 136
MGUA 86
SM 14
06-
1
SM 7
34-
5
MCOL 269
4
MGU 76
MCOL 67
8
MMEX 95
MCOL 67
8
SM 6
73-
1
MMEX 108
MGUA 91
MBRA 101
Clon
% C
rude
pro
tein
con
tent
1999 quantification on 10-month old plants (Australia laboratory)
2004 quantification on 8-month old plants (CIAT laboratory)
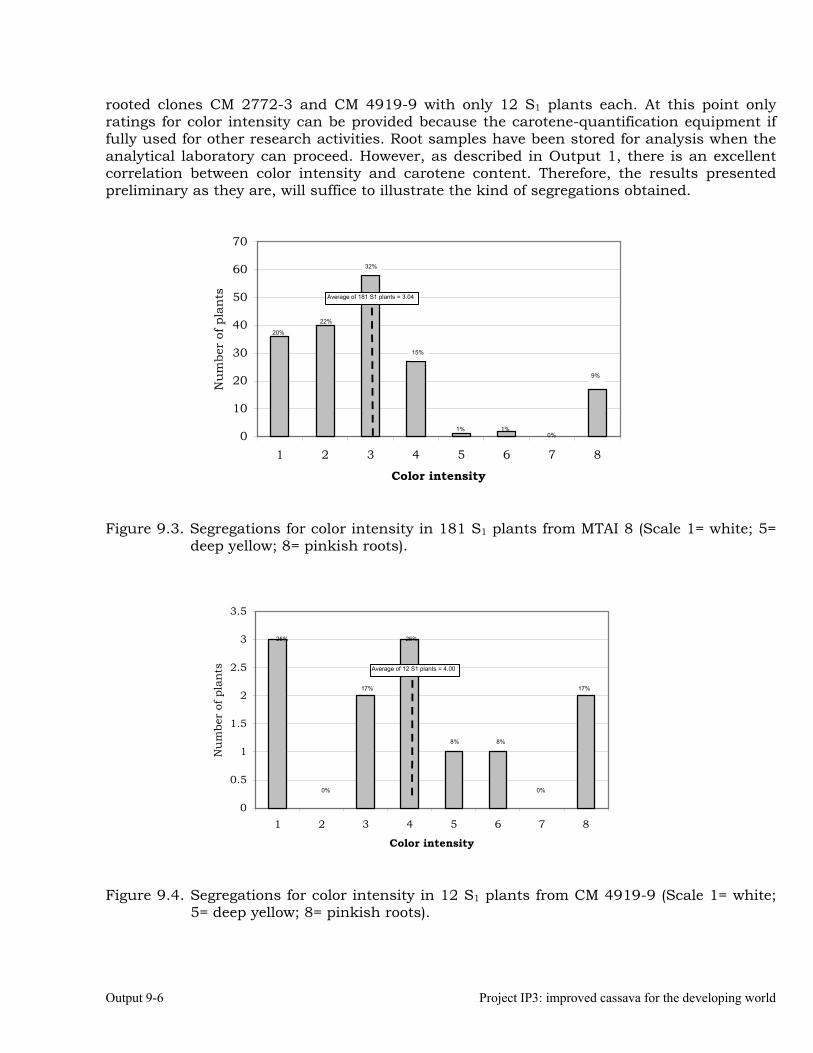
Output 9-6 Project IP3: improved cassava for the developing world
rooted clones CM 2772-3 and CM 4919-9 with only 12 S1 plants each. At this point only ratings for color intensity can be provided because the carotene-quantification equipment if fully used for other research activities. Root samples have been stored for analysis when the analytical laboratory can proceed. However, as described in Output 1, there is an excellent correlation between color intensity and carotene content. Therefore, the results presented preliminary as they are, will suffice to illustrate the kind of segregations obtained.
Figure 9.3. Segregations for color intensity in 181 S1 plants from MTAI 8 (Scale 1= white; 5=
deep yellow; 8= pinkish roots).
Figure 9.4. Segregations for color intensity in 12 S1 plants from CM 4919-9 (Scale 1= white;
5= deep yellow; 8= pinkish roots).
0
10
20
30
40
50
60
70
1 2 3 4 5 6 7 8
Color intensity
Nu
mbe
r of
pla
nts
20%
22%
32%
15%
1% 1%0%
9%
Average of 181 S1 plants = 3.04
0
0.5
1
1.5
2
2.5
3
3.5
1 2 3 4 5 6 7 8
Color intensity
Nu
mbe
r of
pla
nts
25%
0%
17%
8%
25%
17%
8%
0%
Average of 12 S1 plants = 4.00
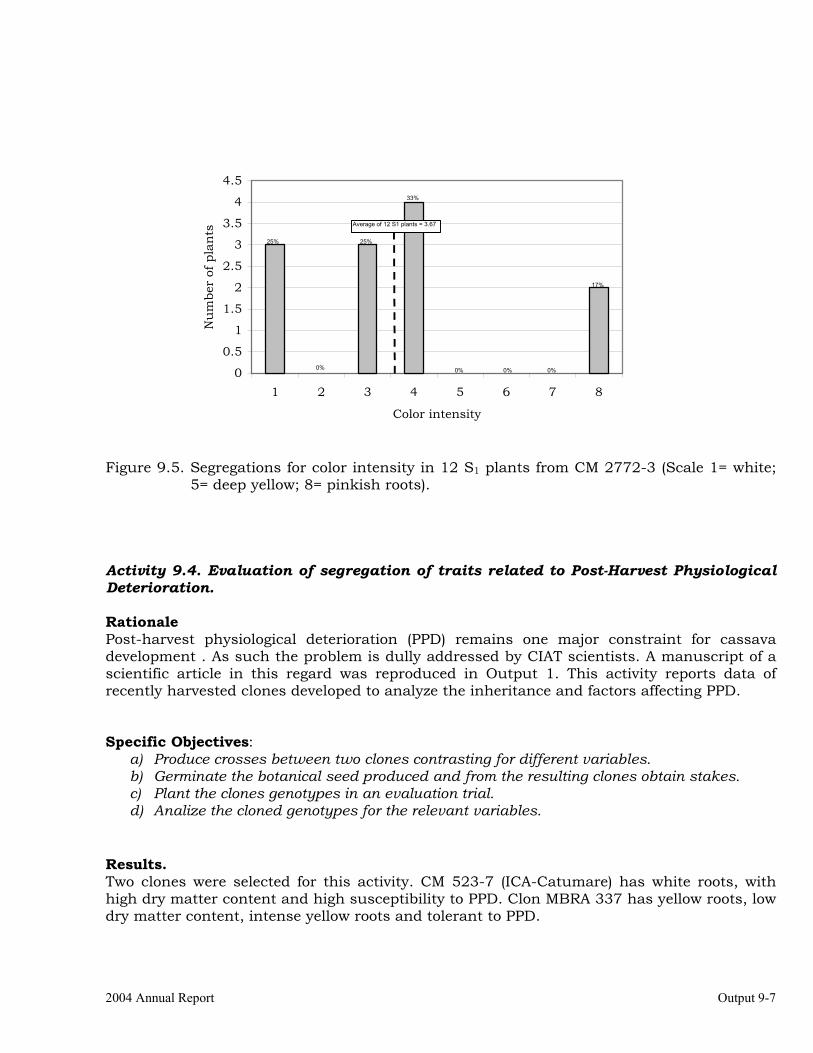
2004 Annual Report Output 9-7
Figure 9.5. Segregations for color intensity in 12 S1 plants from CM 2772-3 (Scale 1= white;
5= deep yellow; 8= pinkish roots). Activity 9.4. Evaluation of segregation of traits related to Post-Harvest Physiological Deterioration. Rationale Post-harvest physiological deterioration (PPD) remains one major constraint for cassava development . As such the problem is dully addressed by CIAT scientists. A manuscript of a scientific article in this regard was reproduced in Output 1. This activity reports data of recently harvested clones developed to analyze the inheritance and factors affecting PPD. Specific Objectives:
a) Produce crosses between two clones contrasting for different variables. b) Germinate the botanical seed produced and from the resulting clones obtain stakes. c) Plant the clones genotypes in an evaluation trial. d) Analize the cloned genotypes for the relevant variables.
Results. Two clones were selected for this activity. CM 523-7 (ICA-Catumare) has white roots, with high dry matter content and high susceptibility to PPD. Clon MBRA 337 has yellow roots, low dry matter content, intense yellow roots and tolerant to PPD.
0
0.5
1
1.5
2
2.5
3
3.5
4
4.5
1 2 3 4 5 6 7 8
Color intensity
Nu
mbe
r of
pla
nts
25% 25%
0% 0% 0% 0%
33%
17%
Average of 12 S1 plants = 3.67
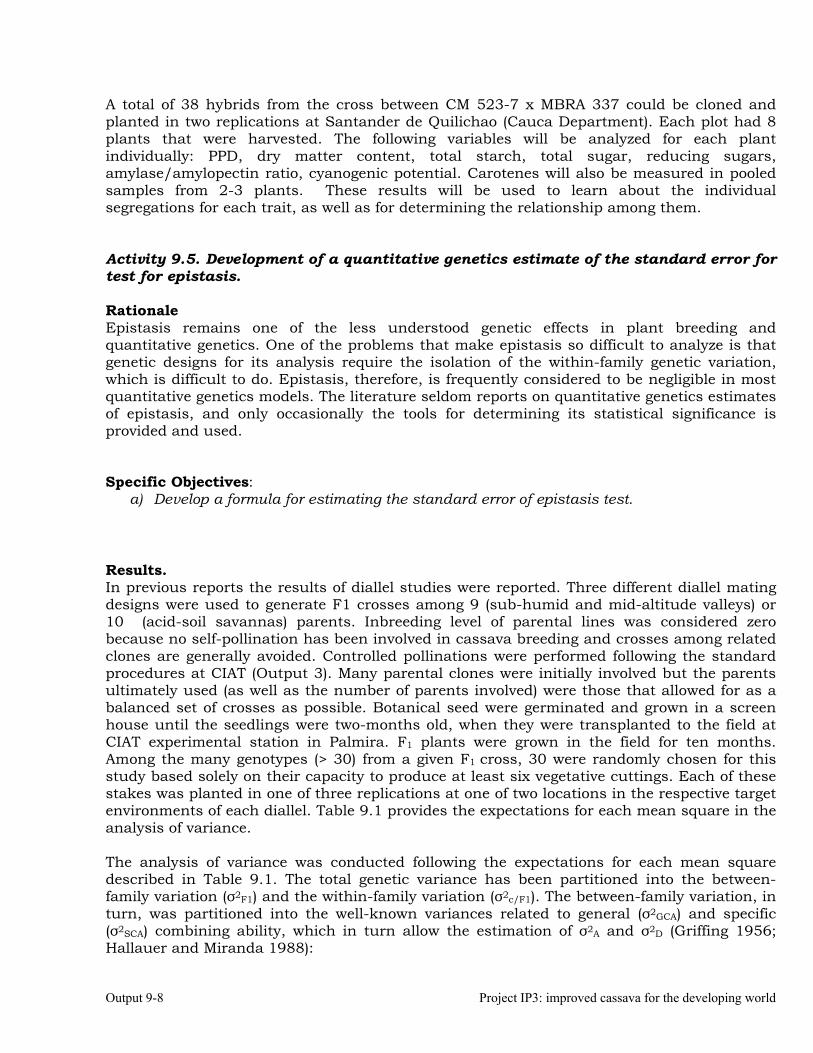
Output 9-8 Project IP3: improved cassava for the developing world
A total of 38 hybrids from the cross between CM 523-7 x MBRA 337 could be cloned and planted in two replications at Santander de Quilichao (Cauca Department). Each plot had 8 plants that were harvested. The following variables will be analyzed for each plant individually: PPD, dry matter content, total starch, total sugar, reducing sugars, amylase/amylopectin ratio, cyanogenic potential. Carotenes will also be measured in pooled samples from 2-3 plants. These results will be used to learn about the individual segregations for each trait, as well as for determining the relationship among them. Activity 9.5. Development of a quantitative genetics estimate of the standard error for test for epistasis. Rationale Epistasis remains one of the less understood genetic effects in plant breeding and quantitative genetics. One of the problems that make epistasis so difficult to analyze is that genetic designs for its analysis require the isolation of the within-family genetic variation, which is difficult to do. Epistasis, therefore, is frequently considered to be negligible in most quantitative genetics models. The literature seldom reports on quantitative genetics estimates of epistasis, and only occasionally the tools for determining its statistical significance is provided and used. Specific Objectives:
a) Develop a formula for estimating the standard error of epistasis test.
Results. In previous reports the results of diallel studies were reported. Three different diallel mating designs were used to generate F1 crosses among 9 (sub-humid and mid-altitude valleys) or 10 (acid-soil savannas) parents. Inbreeding level of parental lines was considered zero because no self-pollination has been involved in cassava breeding and crosses among related clones are generally avoided. Controlled pollinations were performed following the standard procedures at CIAT (Output 3). Many parental clones were initially involved but the parents ultimately used (as well as the number of parents involved) were those that allowed for as a balanced set of crosses as possible. Botanical seed were germinated and grown in a screen house until the seedlings were two-months old, when they were transplanted to the field at CIAT experimental station in Palmira. F1 plants were grown in the field for ten months. Among the many genotypes (> 30) from a given F1 cross, 30 were randomly chosen for this study based solely on their capacity to produce at least six vegetative cuttings. Each of these stakes was planted in one of three replications at one of two locations in the respective target environments of each diallel. Table 9.1 provides the expectations for each mean square in the analysis of variance. The analysis of variance was conducted following the expectations for each mean square described in Table 9.1. The total genetic variance has been partitioned into the between-family variation (σ2F1) and the within-family variation (σ2c/F1). The between-family variation, in turn, was partitioned into the well-known variances related to general (σ2GCA) and specific (σ2SCA) combining ability, which in turn allow the estimation of σ2A and σ2D (Griffing 1956; Hallauer and Miranda 1988):
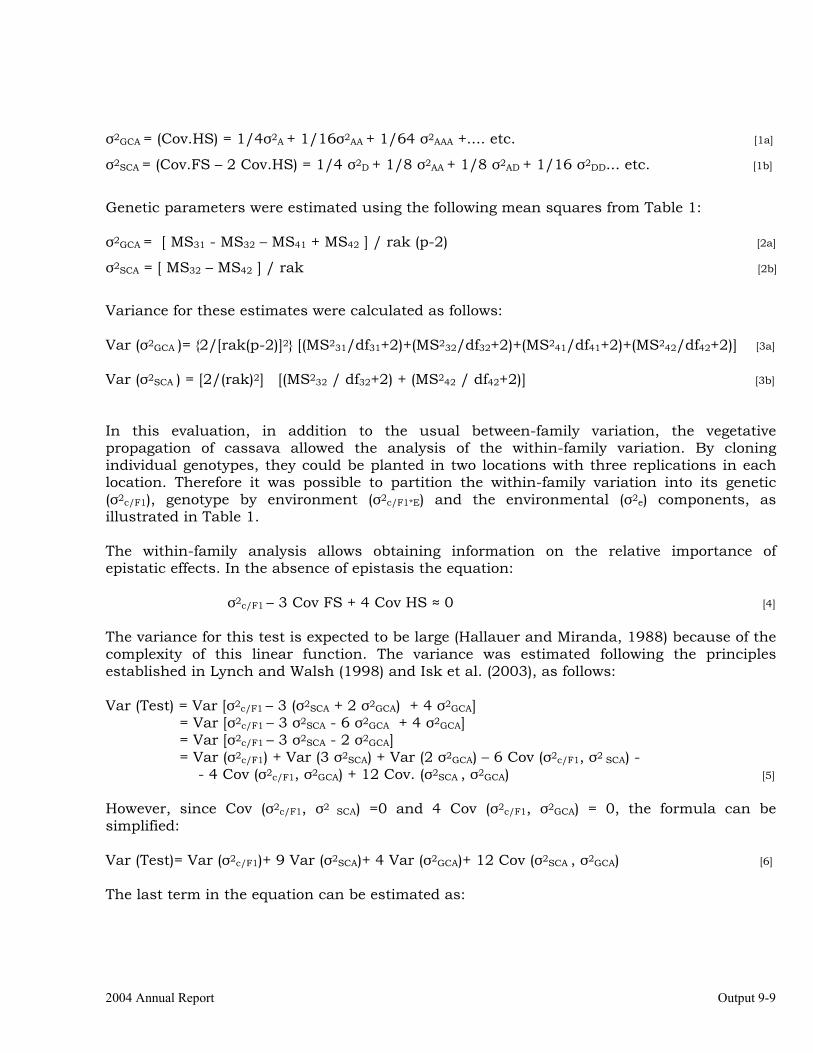
2004 Annual Report Output 9-9
σ2GCA = (Cov.HS) = 1/4σ2A + 1/16σ2AA + 1/64 σ2AAA +.... etc. [1a]
σ2SCA = (Cov.FS – 2 Cov.HS) = 1/4 σ2D + 1/8 σ2AA + 1/8 σ2AD + 1/16 σ2DD... etc. [1b]
Genetic parameters were estimated using the following mean squares from Table 1: σ2GCA = [ MS31 - MS32 – MS41 + MS42 ] / rak (p-2) [2a]
σ2SCA = [ MS32 – MS42 ] / rak [2b]
Variance for these estimates were calculated as follows: Var (σ2GCA )= {2/[rak(p-2)]2} [(MS231/df31+2)+(MS232/df32+2)+(MS241/df41+2)+(MS242/df42+2)] [3a]
Var (σ2SCA ) = [2/(rak)2] [(MS232 / df32+2) + (MS242 / df42+2)] [3b]
In this evaluation, in addition to the usual between-family variation, the vegetative propagation of cassava allowed the analysis of the within-family variation. By cloning individual genotypes, they could be planted in two locations with three replications in each location. Therefore it was possible to partition the within-family variation into its genetic (σ2c/F1), genotype by environment (σ2c/F1*E) and the environmental (σ2e) components, as illustrated in Table 1. The within-family analysis allows obtaining information on the relative importance of epistatic effects. In the absence of epistasis the equation: σ2c/F1 – 3 Cov FS + 4 Cov HS ≈ 0 [4] The variance for this test is expected to be large (Hallauer and Miranda, 1988) because of the complexity of this linear function. The variance was estimated following the principles established in Lynch and Walsh (1998) and Isk et al. (2003), as follows: Var (Test) = Var [σ2c/F1 – 3 (σ2SCA + 2 σ2GCA) + 4 σ2GCA]
= Var [σ2c/F1 – 3 σ2SCA - 6 σ2GCA + 4 σ2GCA] = Var [σ2c/F1 – 3 σ2SCA - 2 σ2GCA] = Var (σ2c/F1) + Var (3 σ2SCA) + Var (2 σ2GCA) – 6 Cov (σ2c/F1, σ2 SCA) - - 4 Cov (σ2c/F1, σ2GCA) + 12 Cov. (σ2SCA , σ2GCA) [5]
However, since Cov (σ2c/F1, σ2 SCA) =0 and 4 Cov (σ2c/F1, σ2GCA) = 0, the formula can be simplified: Var (Test)= Var (σ2c/F1)+ 9 Var (σ2SCA)+ 4 Var (σ2GCA)+ 12 Cov (σ2SCA , σ2GCA) [6] The last term in the equation can be estimated as:
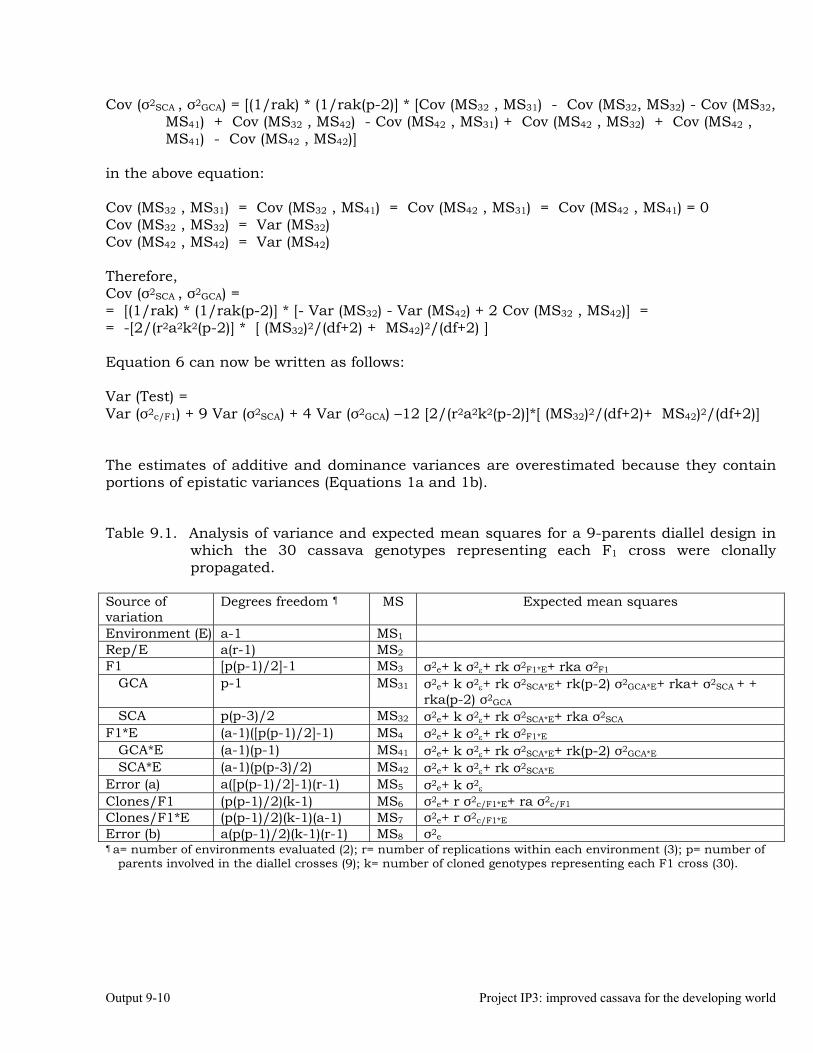
Output 9-10 Project IP3: improved cassava for the developing world
Cov (σ2SCA , σ2GCA) = [(1/rak) * (1/rak(p-2)] * [Cov (MS32 , MS31) - Cov (MS32, MS32) - Cov (MS32, MS41) + Cov (MS32 , MS42) - Cov (MS42 , MS31) + Cov (MS42 , MS32) + Cov (MS42 , MS41) - Cov (MS42 , MS42)]
in the above equation: Cov (MS32 , MS31) = Cov (MS32 , MS41) = Cov (MS42 , MS31) = Cov (MS42 , MS41) = 0 Cov (MS32 , MS32) = Var (MS32) Cov (MS42 , MS42) = Var (MS42) Therefore, Cov (σ2SCA , σ2GCA) = = [(1/rak) * (1/rak(p-2)] * [- Var (MS32) - Var (MS42) + 2 Cov (MS32 , MS42)] = = -[2/(r2a2k2(p-2)] * [ (MS32)2/(df+2) + MS42)2/(df+2) ] Equation 6 can now be written as follows: Var (Test) = Var (σ2c/F1) + 9 Var (σ2SCA) + 4 Var (σ2GCA) –12 [2/(r2a2k2(p-2)]*[ (MS32)2/(df+2)+ MS42)2/(df+2)] The estimates of additive and dominance variances are overestimated because they contain portions of epistatic variances (Equations 1a and 1b). Table 9.1. Analysis of variance and expected mean squares for a 9-parents diallel design in
which the 30 cassava genotypes representing each F1 cross were clonally propagated.
Source of variation
Degrees freedom ¶ MS Expected mean squares
Environment (E) a-1 MS1 Rep/E a(r-1) MS2 F1 [p(p-1)/2]-1 MS3 σ2e+ k σ2
ε+ rk σ2F1*E+ rka σ2F1 GCA p-1 MS31 σ2e+ k σ2
ε+ rk σ2SCA*E+ rk(p-2) σ2GCA*E+ rka+ σ2SCA + + rka(p-2) σ2GCA
SCA p(p-3)/2 MS32 σ2e+ k σ2ε+ rk σ2SCA*E+ rka σ2SCA
F1*E (a-1)([p(p-1)/2]-1) MS4 σ2e+ k σ2ε+ rk σ2F1*E
GCA*E (a-1)(p-1) MS41 σ2e+ k σ2ε+ rk σ2SCA*E+ rk(p-2) σ2GCA*E
SCA*E (a-1)(p(p-3)/2) MS42 σ2e+ k σ2ε+ rk σ2SCA*E
Error (a) a([p(p-1)/2]-1)(r-1) MS5 σ2e+ k σ2ε
Clones/F1 (p(p-1)/2)(k-1) MS6 σ2e+ r σ2c/F1*E+ ra σ2c/F1 Clones/F1*E (p(p-1)/2)(k-1)(a-1) MS7 σ2e+ r σ2c/F1*E Error (b) a(p(p-1)/2)(k-1)(r-1) MS8 σ2e ¶ a= number of environments evaluated (2); r= number of replications within each environment (3); p= number of
parents involved in the diallel crosses (9); k= number of cloned genotypes representing each F1 cross (30).
Output 10-1 2004 Annual Report
OUTPUT 10
Breeding for insect and other arthropods resistance and development of alternative methods for their control
Activity 10.1. Evaluation of cassava germplasm for resistance to whiteflies (Aleurotrachelus socialis) during 2003-2004. Rationale Stable HPR (Host Plant Resistance) in cassava offers a practical, low-cost, long-term solution for reducing whitefly populations below economic damage levels. Whiteflies are major pests of many cassava growing regions of the Neotropics where 11 species are reported. As direct-feeding pests or as virus vectors, whiteflies can reduce cassava yield considerably. In the Americas two species cause yield losses; Aleurotrachelus socialis predominates in northern South America (Colombia, Venezuela and Ecuador), reducing cassava yields by 5 to 79%, depending on the duration of the attack. In Brazil, especially Northeast Brazil, Aleurothrixus aepim is found in high populations and reducing cassava yields by ≈ 40%. Cassava farmers will apply pesticides for whitefly control, often needing 6 to 8 applications to achieve acceptable results. Studies by CIAT with cassava producers in the Cauca Department show that pesticide application is un-economical for the small farmers (1-3 ha) and barely economical for the larger cassava grows. Host plant resistance to whiteflies is rare in cultivated crops. The large-scale screening or evaluation of an extensive collection of genotypes or selected wild or cultivated species for whitefly resistance has been limited. In recent years, due to the importance and economic damage caused by Bemisia tabaci across a wide range of crop species, HPR activities with whiteflies has increased. However, in general a narrow range of germplasm has been evaluated and there are few deliberate germplasm improvement program designed to identify and select resistant parental genotypes to combine with genotypes of high agronomic value and produce quality cultivars with resistance to whiteflies. The CIAT Cassava Improvement Project (IP-3) in collaboration with the IPDM project (PE-1) is paying special attention to the need to develop high yielding cassava cultivars that contain resistance to whiteflies. The CIAT Cassava Germplasm Bank contains nearly 6000 accessions; 93% of these are landraces (locally selected cultivars), many collected from farmers’ fields and national program germplasm collections, in the tropical regions of the world, especially the Neotropics. We have now systematically screened more than 5400 landrace cultivars from this germplasm collection for resistance to A. socialis. We have identified numerous resistant genotypes and combined with a comprehensive breeding scheme, whitefly resistance has been incorporated into a commercial hybrid (Figure 10.1). During March of 2003, CORPOICA (Colombia MADR) officially released the whitefly (A. socialis) resistant cassava cultivar, Nataima-31 (CG 489-31; CIAT Breeding Code). Nataima-31 was originally developed to meet the farmers demand in the Tolima Valley region of Colombia, where whitefly populations are consistently high, causing yield reduction (± 35% in local farmers cultivars, and often obligating farmers to apply costly insecticides. Cassava producers in other regions of Colombia have requested Nataima-31; the cultivar has now been distributed to farmers in the Cauca regions as well as the Tolima Valley. Preliminary response from farmers growing Nataima-31, indicate that it has good whitefly resistance and
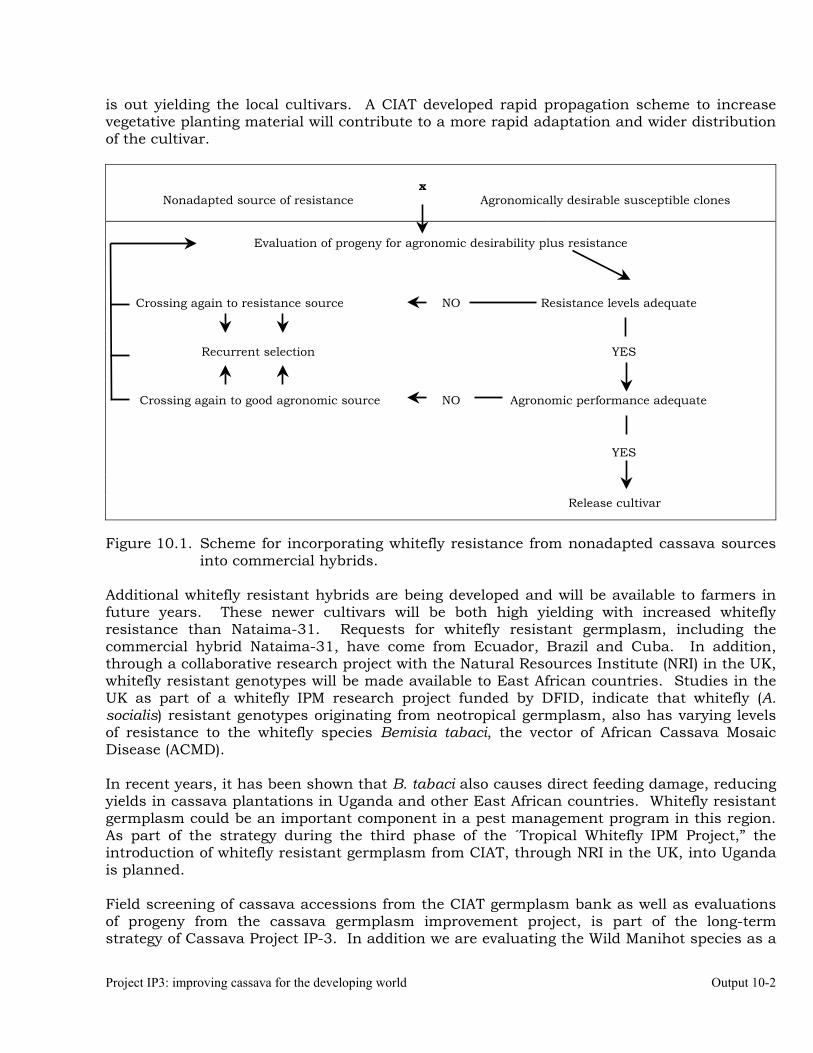
Project IP3: improving cassava for the developing world Output 10-2
is out yielding the local cultivars. A CIAT developed rapid propagation scheme to increase vegetative planting material will contribute to a more rapid adaptation and wider distribution of the cultivar.
Nonadapted source of resistance
x
Agronomically desirable susceptible clones
Evaluation of progeny for agronomic desirability plus resistance
Crossing again to resistance source NO Resistance levels adequate
Recurrent selection YES
Crossing again to good agronomic source
NO Agronomic performance adequate
YES
Release cultivar
Figure 10.1. Scheme for incorporating whitefly resistance from nonadapted cassava sources
into commercial hybrids. Additional whitefly resistant hybrids are being developed and will be available to farmers in future years. These newer cultivars will be both high yielding with increased whitefly resistance than Nataima-31. Requests for whitefly resistant germplasm, including the commercial hybrid Nataima-31, have come from Ecuador, Brazil and Cuba. In addition, through a collaborative research project with the Natural Resources Institute (NRI) in the UK, whitefly resistant genotypes will be made available to East African countries. Studies in the UK as part of a whitefly IPM research project funded by DFID, indicate that whitefly (A. socialis) resistant genotypes originating from neotropical germplasm, also has varying levels of resistance to the whitefly species Bemisia tabaci, the vector of African Cassava Mosaic Disease (ACMD). In recent years, it has been shown that B. tabaci also causes direct feeding damage, reducing yields in cassava plantations in Uganda and other East African countries. Whitefly resistant germplasm could be an important component in a pest management program in this region. As part of the strategy during the third phase of the ´Tropical Whitefly IPM Project,” the introduction of whitefly resistant germplasm from CIAT, through NRI in the UK, into Uganda is planned. Field screening of cassava accessions from the CIAT germplasm bank as well as evaluations of progeny from the cassava germplasm improvement project, is part of the long-term strategy of Cassava Project IP-3. In addition we are evaluating the Wild Manihot species as a
Output 10-3 2004 Annual Report
source of resistance genes to whiteflies as well as other major cassava pests. We have also developed a mapping population of genotypes suitable for identifying molecular markers for whitefly resistant traits, using MEcu 72 as the resistant parent and MCol 2246 as the susceptible parent (Fam: CM 8996). This NZAID (New Zealand Agency for International Development) funded project has resulted in a preliminary cassava framework map of MEcu 72 for resistance to A. socialis. During 2004, a research project has been initiated to determine the biochemical factors involved in whitefly resistance. This USAID (United States Agency for International Development) funded project includes a close collaboration with the USDA Laboratories in Ft Pierce, Florida, USA. Data and observations from these projects are included in the activities of this report. Specific Objectives A. Evaluation of the family CM 8996 for a genetic study for whitefly (A. socialis)
resistance at CORPOICA, Nataima, Tolima (2003-04). The screening of cassava germplasm for whitefly (A. socialis) resistance is carried out primarily at two sites, the CORPOICA field station “Nataima,” at El Espinal, Tolima, and at the CIAT farm in Santander de Quilichao. Both sites are characterized by usually having high whitefly field populations, facilitating germplasm evaluations. The family CM 8996 was developed from a cross of the A. socialis resistant cultivar MEcu 72 and the susceptible MCol 2246; the progeny from this cross (approximately 700 genotypes) are being evaluated for whitefly feeding damage as part of a study to determine the genetics and inheritance of resistance. These progeny have also been evaluated since 2002 for yield, dry matter content, plant type and other agronomic characteristics. Selections are made each year for whitefly resistance combined with the abovementioned qualities. The ultimate goal of this phase of the project is to identify progeny that may eventually be released as a whitefly resistant commercial cultivar. Results from the release for Nataima-31, indicate that hybrids developed for the Tolima Valley agroecosystems, will also perform well in additional regions such as Cauca and the Atlantic Coast of Colombia. In 2002, 718 progeny from the MEcu 72 x MCol 2246 cross were planted and evaluated; 332 genotypes were selected for whitefly resistance and yield and sown in 2003 and 263 were harvested (some genotypes were lost due to poor quality planting material or poor adaptation. Methodology Methodologies employed for planting cassava genotypes and whitefly resistance evaluations are similar at the Nataima, Tolima and the Santander de Quilichao, Cauca sites. The Tolima site is 420 m.a.s.l., with an average temperature of 27°C; soils are sandy and annual average rainfall is 1000 to 1300 mm. The 273 genotypes were planted in one replication, seven plants to the row; a control clone, CMC 40 (MCol 1468) is sown every 15 to 20 rows, as an indicator for whitefly population levels and distribution. The five control plants of each row are harvested and data recorded on variables such as total number of roots, number of commercial roots, total and commercial root weight (t/ha), aerial plant weight and harvest index. Three whitefly (A. socialis) population and damage evaluations were performed during the crop cycle. A 1 to 6-whitefly damage and population scale was employed (Table 10.1) where 1 indicates the absence of whiteflies and damage, and 6 indicates severe damage and maximum populations. Populations of adults, nymphs, pupae and eggs are recorded at
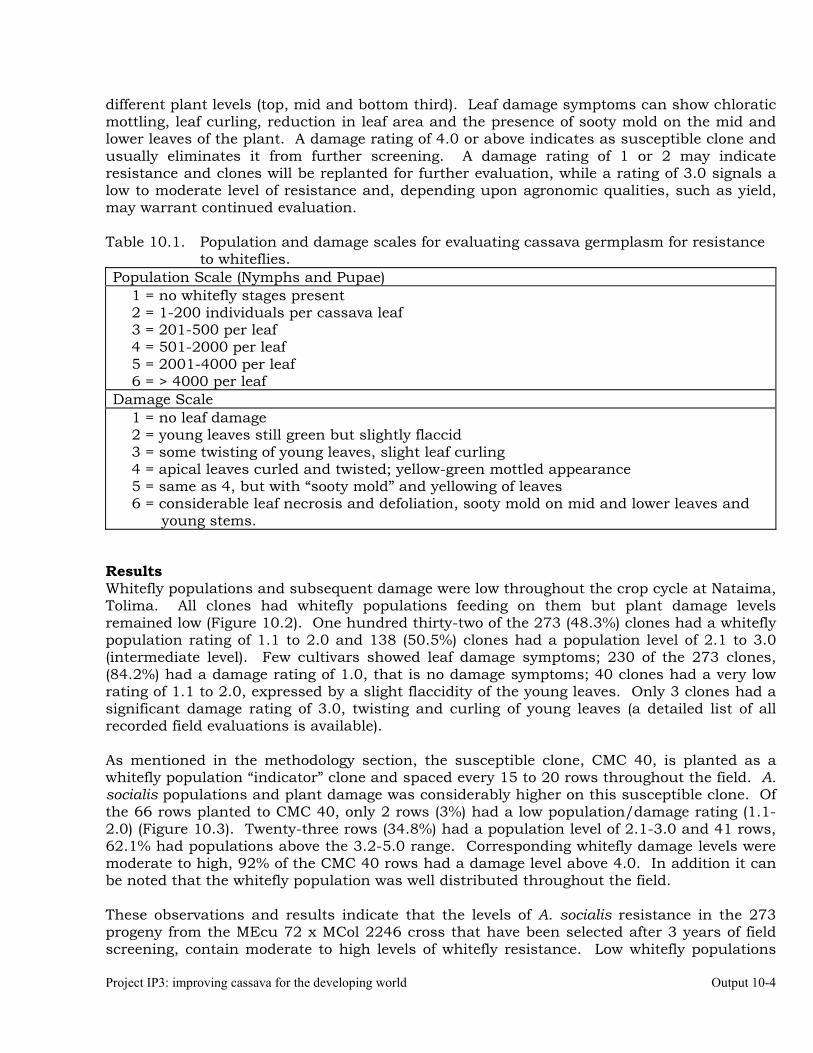
Project IP3: improving cassava for the developing world Output 10-4
different plant levels (top, mid and bottom third). Leaf damage symptoms can show chloratic mottling, leaf curling, reduction in leaf area and the presence of sooty mold on the mid and lower leaves of the plant. A damage rating of 4.0 or above indicates as susceptible clone and usually eliminates it from further screening. A damage rating of 1 or 2 may indicate resistance and clones will be replanted for further evaluation, while a rating of 3.0 signals a low to moderate level of resistance and, depending upon agronomic qualities, such as yield, may warrant continued evaluation. Table 10.1. Population and damage scales for evaluating cassava germplasm for resistance
to whiteflies. Population Scale (Nymphs and Pupae) 1 = no whitefly stages present 2 = 1-200 individuals per cassava leaf 3 = 201-500 per leaf 4 = 501-2000 per leaf 5 = 2001-4000 per leaf 6 = > 4000 per leaf Damage Scale 1 = no leaf damage 2 = young leaves still green but slightly flaccid 3 = some twisting of young leaves, slight leaf curling 4 = apical leaves curled and twisted; yellow-green mottled appearance 5 = same as 4, but with “sooty mold” and yellowing of leaves 6 = considerable leaf necrosis and defoliation, sooty mold on mid and lower leaves and
young stems. Results Whitefly populations and subsequent damage were low throughout the crop cycle at Nataima, Tolima. All clones had whitefly populations feeding on them but plant damage levels remained low (Figure 10.2). One hundred thirty-two of the 273 (48.3%) clones had a whitefly population rating of 1.1 to 2.0 and 138 (50.5%) clones had a population level of 2.1 to 3.0 (intermediate level). Few cultivars showed leaf damage symptoms; 230 of the 273 clones, (84.2%) had a damage rating of 1.0, that is no damage symptoms; 40 clones had a very low rating of 1.1 to 2.0, expressed by a slight flaccidity of the young leaves. Only 3 clones had a significant damage rating of 3.0, twisting and curling of young leaves (a detailed list of all recorded field evaluations is available). As mentioned in the methodology section, the susceptible clone, CMC 40, is planted as a whitefly population “indicator” clone and spaced every 15 to 20 rows throughout the field. A. socialis populations and plant damage was considerably higher on this susceptible clone. Of the 66 rows planted to CMC 40, only 2 rows (3%) had a low population/damage rating (1.1-2.0) (Figure 10.3). Twenty-three rows (34.8%) had a population level of 2.1-3.0 and 41 rows, 62.1% had populations above the 3.2-5.0 range. Corresponding whitefly damage levels were moderate to high, 92% of the CMC 40 rows had a damage level above 4.0. In addition it can be noted that the whitefly population was well distributed throughout the field. These observations and results indicate that the levels of A. socialis resistance in the 273 progeny from the MEcu 72 x MCol 2246 cross that have been selected after 3 years of field screening, contain moderate to high levels of whitefly resistance. Low whitefly populations
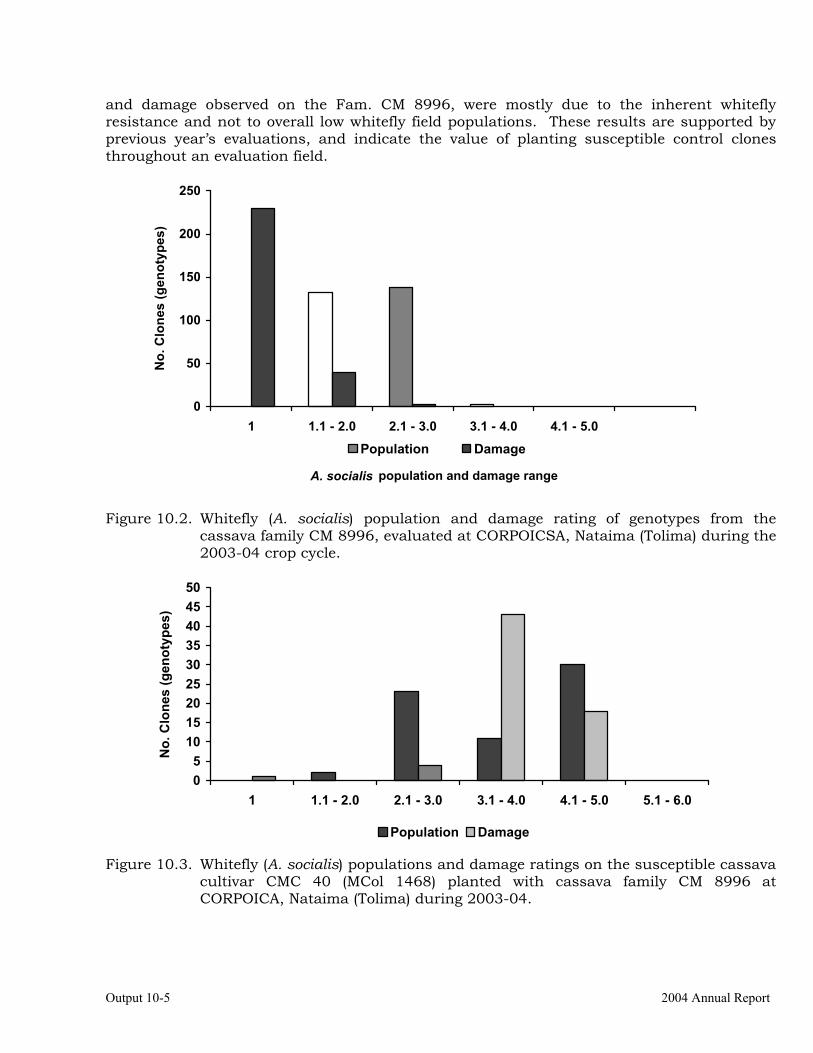
Output 10-5 2004 Annual Report
and damage observed on the Fam. CM 8996, were mostly due to the inherent whitefly resistance and not to overall low whitefly field populations. These results are supported by previous year’s evaluations, and indicate the value of planting susceptible control clones throughout an evaluation field.
0
50
100
150
200
250
1 1.1 - 2.0 2.1 - 3.0 3.1 - 4.0 4.1 - 5.0
A. socialis population and damage range
No.
Clo
nes
(gen
otyp
es)
Population Damage
Figure 10.2. Whitefly (A. socialis) population and damage rating of genotypes from the
cassava family CM 8996, evaluated at CORPOICSA, Nataima (Tolima) during the 2003-04 crop cycle.
05
101520253035404550
1 1.1 - 2.0 2.1 - 3.0 3.1 - 4.0 4.1 - 5.0 5.1 - 6.0
No.
Clo
nes
(gen
otyp
es)
Population Damage
Figure 10.3. Whitefly (A. socialis) populations and damage ratings on the susceptible cassava cultivar CMC 40 (MCol 1468) planted with cassava family CM 8996 at CORPOICA, Nataima (Tolima) during 2003-04.
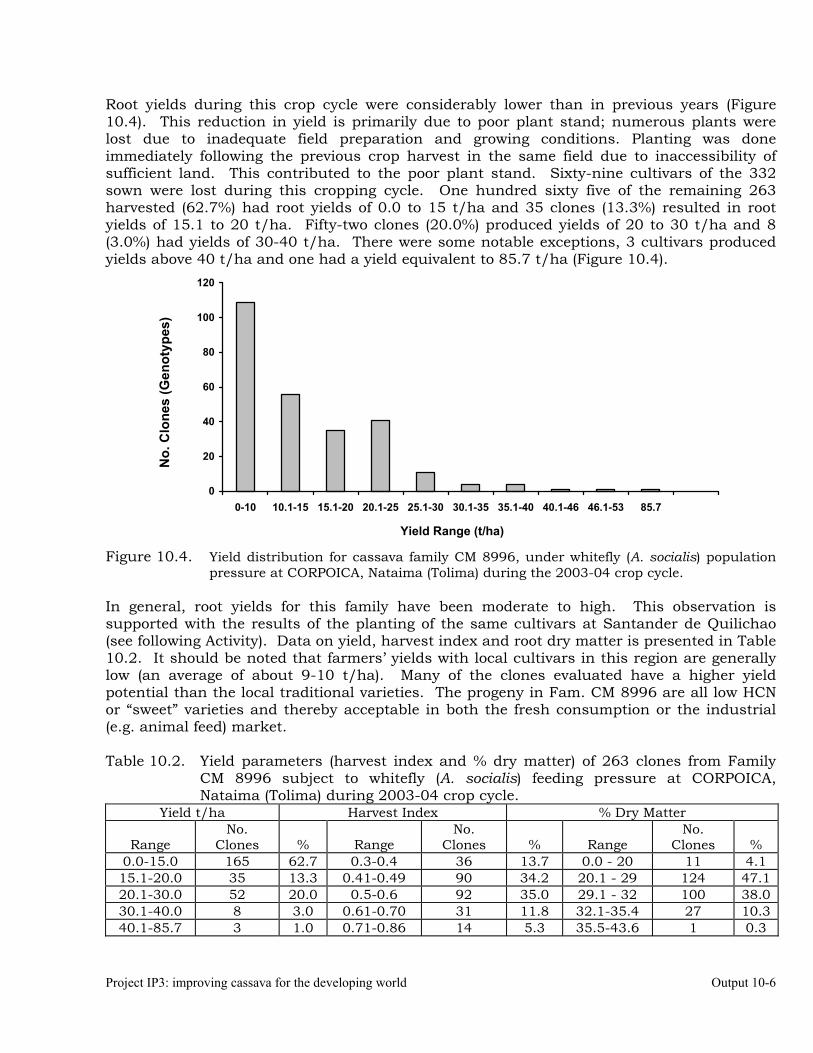
Project IP3: improving cassava for the developing world Output 10-6
Root yields during this crop cycle were considerably lower than in previous years (Figure 10.4). This reduction in yield is primarily due to poor plant stand; numerous plants were lost due to inadequate field preparation and growing conditions. Planting was done immediately following the previous crop harvest in the same field due to inaccessibility of sufficient land. This contributed to the poor plant stand. Sixty-nine cultivars of the 332 sown were lost during this cropping cycle. One hundred sixty five of the remaining 263 harvested (62.7%) had root yields of 0.0 to 15 t/ha and 35 clones (13.3%) resulted in root yields of 15.1 to 20 t/ha. Fifty-two clones (20.0%) produced yields of 20 to 30 t/ha and 8 (3.0%) had yields of 30-40 t/ha. There were some notable exceptions, 3 cultivars produced yields above 40 t/ha and one had a yield equivalent to 85.7 t/ha (Figure 10.4).
0
20
40
60
80
100
120
0-10 10.1-15 15.1-20 20.1-25 25.1-30 30.1-35 35.1-40 40.1-46 46.1-53 85.7
Yield Range (t/ha)
Figure 10.4. Yield distribution for cassava family CM 8996, under whitefly (A. socialis) population pressure at CORPOICA, Nataima (Tolima) during the 2003-04 crop cycle.
In general, root yields for this family have been moderate to high. This observation is supported with the results of the planting of the same cultivars at Santander de Quilichao (see following Activity). Data on yield, harvest index and root dry matter is presented in Table 10.2. It should be noted that farmers’ yields with local cultivars in this region are generally low (an average of about 9-10 t/ha). Many of the clones evaluated have a higher yield potential than the local traditional varieties. The progeny in Fam. CM 8996 are all low HCN or “sweet” varieties and thereby acceptable in both the fresh consumption or the industrial (e.g. animal feed) market. Table 10.2. Yield parameters (harvest index and % dry matter) of 263 clones from Family
CM 8996 subject to whitefly (A. socialis) feeding pressure at CORPOICA, Nataima (Tolima) during 2003-04 crop cycle.
Yield t/ha Harvest Index % Dry Matter
Range No.
Clones % Range No.
Clones % Range No.
Clones % 0.0-15.0 165 62.7 0.3-0.4 36 13.7 0.0 - 20 11 4.1 15.1-20.0 35 13.3 0.41-0.49 90 34.2 20.1 - 29 124 47.1 20.1-30.0 52 20.0 0.5-0.6 92 35.0 29.1 - 32 100 38.0 30.1-40.0 8 3.0 0.61-0.70 31 11.8 32.1-35.4 27 10.3 40.1-85.7 3 1.0 0.71-0.86 14 5.3 35.5-43.6 1 0.3
No.
Clo
nes
(Gen
otyp
es)
Output 10-7 2004 Annual Report
B. Evaluation of the cassava family CM 8996 for a genetic study of whitefly (A. socialis) resistance and genotype yield at CIAT, Santander de Quilichao (Cauca) (2003-04).
Since 2001 the CIAT farm at Santander de Quilichao has been used as a site to evaluate the progeny from the MEcu 72 x MCol 2246 cross (Fam. CM 8996). This collaborative project involving three CIAT projects, Biotechnology (SB2), Cassava Improvement (IP-3) and IPDM (PE-1) proposes to determine the genetic inheritance of whitefly (A. socialis) resistance in cassava. The results and progress in this study is reported as a separate Activity (see Annual Report SB-2, 2004). Selected progeny from Family CM 8996 are planted separately and evaluated for additional agronomic characteristics, especially yield, dry matter content and culinary qualities, as well as whitefly resistance. Whitefly populations at Santander de Quilichao are usually high enough to exert sufficient selection pressure for adequate resistance screening. Cassava plantings at Santander de Quilichao, however, are sometimes complicated by the occurrence of Cassava Frogskin Disease (CFSD). CFSD damages cassava roots, reducing yield and quality. Methodology The methodologies used in germplasm evaluation at Santander de Quilichao are similar to those described for CORPOICA, Nataima. This site differs from Nataima, Tolima in that it is at a higher altitude, 1100 m.a.s.l. and soils are acid (calcium is applied at a rate of 30 grams per plant). In April 2003, 324 clones from the CM 8996 family were sown in one replication with 8 plants in each row. The susceptible control or “indicator” cultivar (CMC 40) was planted every 15 to 20 rows throughout the experimental plot. At harvest the middle 6 plants of the 8-plant row was harvested and data on root yield, dry matter content, harvest index, etc. as described in the previous activity was recorded. During the crop cycle, three whitefly population and damage evaluations were carried out; one in each of the months of July, August and September, 2003, when whitefly populations are high. The damage and populations scale described in Table 10.3 of the previous activity was employed. Evaluations are done on the six central plants of each clone (row). Data was analyzed by combining the recording from the three evaluations. The highest damage rating is considered the most important and most indicative of resistance or susceptibility levels. Results Whitefly (A. socialis), at varying population levels was observed on all of the cultivars evaluated (Figure 10.5). However, 127 (37.5%) of the 339 clones evaluated presented no damage symptoms. Whitefly populations were low, between 1.1 and 2.5 (1 to 6 population scale), on 255 or 75.2% of the cultivars. One hundred cultivars (29.5%) showed some apical leaf curling damage symptoms and 74 (21.8%) cultivars had a damage rating of 3 to 3.5. Forty cultivars resulted in severe damage symptoms, a rating of 4.0 to 6.0 on the damage scale. This latter group can be classified as very susceptible to A. socialis. Whitefly (A. socialis) populations on the susceptible control CMC 40 were high and damage symptoms severe (Table 10.3). Damage ratings on the upper, middle and lower leaves ranged from a low of 3.0 to a high of 4.5 on the damage scale. This data also indicates that the high whitefly populations were relatively uniform throughout the experimental plot. These results also lead us to conclude that the lower A. socialis populations and damage recorded on the cultivars in family CM 8996, are due to the higher levels of whitefly resistance contained in many of these cultivars, as can be observed in Photo 1.
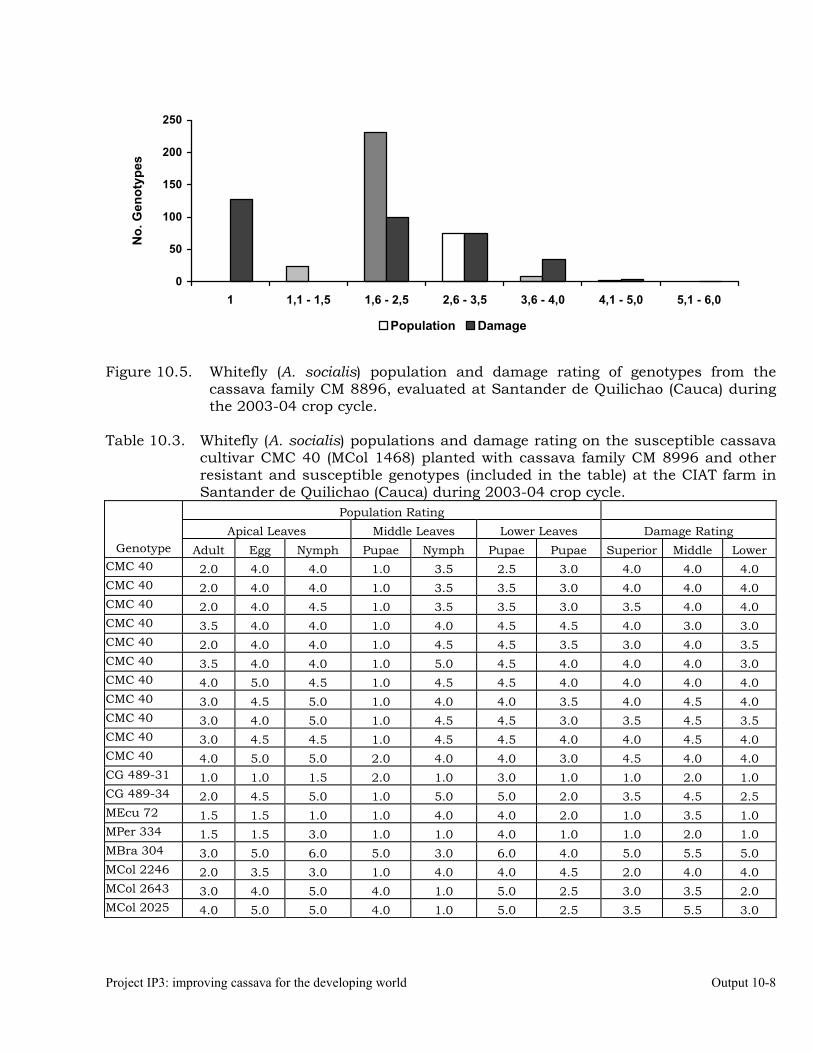
Project IP3: improving cassava for the developing world Output 10-8
0
50
100
150
200
250
1 1,1 - 1,5 1,6 - 2,5 2,6 - 3,5 3,6 - 4,0 4,1 - 5,0 5,1 - 6,0
No.
Gen
otyp
es
Population Damage
Figure 10.5. Whitefly (A. socialis) population and damage rating of genotypes from the
cassava family CM 8896, evaluated at Santander de Quilichao (Cauca) during the 2003-04 crop cycle.
Table 10.3. Whitefly (A. socialis) populations and damage rating on the susceptible cassava
cultivar CMC 40 (MCol 1468) planted with cassava family CM 8996 and other resistant and susceptible genotypes (included in the table) at the CIAT farm in Santander de Quilichao (Cauca) during 2003-04 crop cycle.
Population Rating Apical Leaves Middle Leaves Lower Leaves Damage Rating
Genotype Adult Egg Nymph Pupae Nymph Pupae Pupae Superior Middle Lower CMC 40 2.0 4.0 4.0 1.0 3.5 2.5 3.0 4.0 4.0 4.0 CMC 40 2.0 4.0 4.0 1.0 3.5 3.5 3.0 4.0 4.0 4.0 CMC 40 2.0 4.0 4.5 1.0 3.5 3.5 3.0 3.5 4.0 4.0 CMC 40 3.5 4.0 4.0 1.0 4.0 4.5 4.5 4.0 3.0 3.0 CMC 40 2.0 4.0 4.0 1.0 4.5 4.5 3.5 3.0 4.0 3.5 CMC 40 3.5 4.0 4.0 1.0 5.0 4.5 4.0 4.0 4.0 3.0 CMC 40 4.0 5.0 4.5 1.0 4.5 4.5 4.0 4.0 4.0 4.0 CMC 40 3.0 4.5 5.0 1.0 4.0 4.0 3.5 4.0 4.5 4.0 CMC 40 3.0 4.0 5.0 1.0 4.5 4.5 3.0 3.5 4.5 3.5 CMC 40 3.0 4.5 4.5 1.0 4.5 4.5 4.0 4.0 4.5 4.0 CMC 40 4.0 5.0 5.0 2.0 4.0 4.0 3.0 4.5 4.0 4.0 CG 489-31 1.0 1.0 1.5 2.0 1.0 3.0 1.0 1.0 2.0 1.0 CG 489-34 2.0 4.5 5.0 1.0 5.0 5.0 2.0 3.5 4.5 2.5 MEcu 72 1.5 1.5 1.0 1.0 4.0 4.0 2.0 1.0 3.5 1.0 MPer 334 1.5 1.5 3.0 1.0 1.0 4.0 1.0 1.0 2.0 1.0 MBra 304 3.0 5.0 6.0 5.0 3.0 6.0 4.0 5.0 5.5 5.0 MCol 2246 2.0 3.5 3.0 1.0 4.0 4.0 4.5 2.0 4.0 4.0 MCol 2643 3.0 4.0 5.0 4.0 1.0 5.0 2.5 3.0 3.5 2.0 MCol 2025 4.0 5.0 5.0 4.0 1.0 5.0 2.5 3.5 5.5 3.0
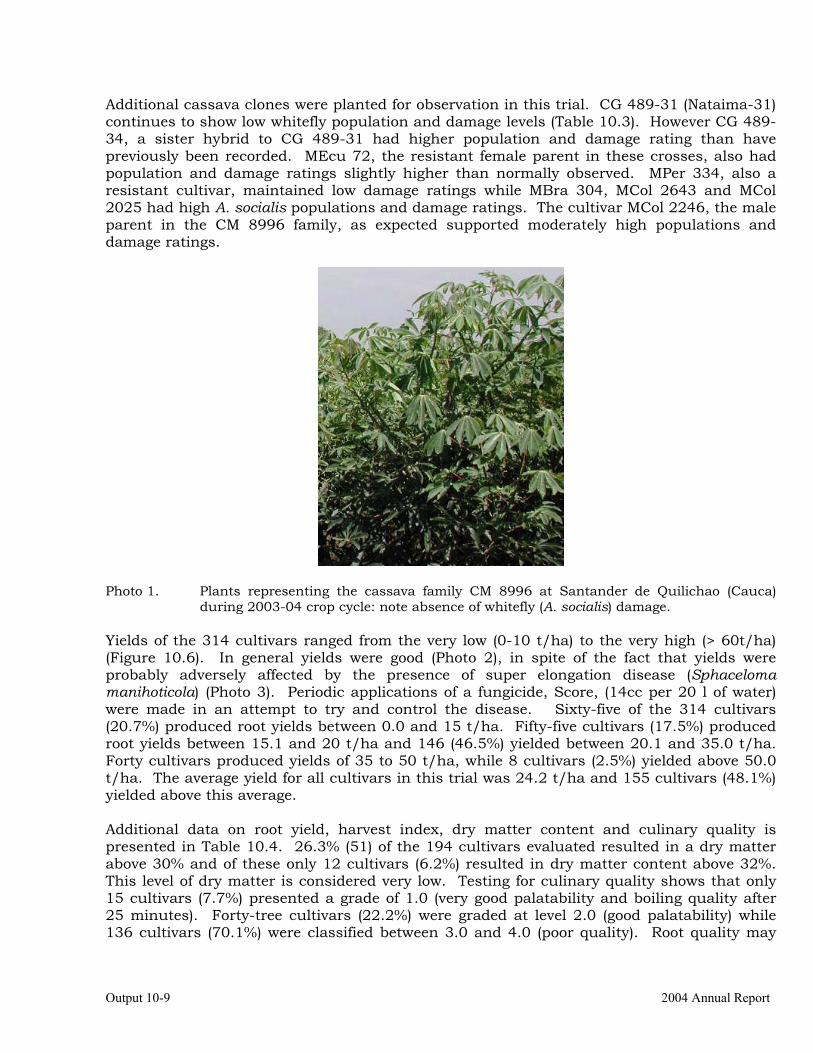
Output 10-9 2004 Annual Report
Additional cassava clones were planted for observation in this trial. CG 489-31 (Nataima-31) continues to show low whitefly population and damage levels (Table 10.3). However CG 489-34, a sister hybrid to CG 489-31 had higher population and damage rating than have previously been recorded. MEcu 72, the resistant female parent in these crosses, also had population and damage ratings slightly higher than normally observed. MPer 334, also a resistant cultivar, maintained low damage ratings while MBra 304, MCol 2643 and MCol 2025 had high A. socialis populations and damage ratings. The cultivar MCol 2246, the male parent in the CM 8996 family, as expected supported moderately high populations and damage ratings.
Photo 1. Plants representing the cassava family CM 8996 at Santander de Quilichao (Cauca)
during 2003-04 crop cycle: note absence of whitefly (A. socialis) damage. Yields of the 314 cultivars ranged from the very low (0-10 t/ha) to the very high (> 60t/ha) (Figure 10.6). In general yields were good (Photo 2), in spite of the fact that yields were probably adversely affected by the presence of super elongation disease (Sphaceloma manihoticola) (Photo 3). Periodic applications of a fungicide, Score, (14cc per 20 l of water) were made in an attempt to try and control the disease. Sixty-five of the 314 cultivars (20.7%) produced root yields between 0.0 and 15 t/ha. Fifty-five cultivars (17.5%) produced root yields between 15.1 and 20 t/ha and 146 (46.5%) yielded between 20.1 and 35.0 t/ha. Forty cultivars produced yields of 35 to 50 t/ha, while 8 cultivars (2.5%) yielded above 50.0 t/ha. The average yield for all cultivars in this trial was 24.2 t/ha and 155 cultivars (48.1%) yielded above this average. Additional data on root yield, harvest index, dry matter content and culinary quality is presented in Table 10.4. 26.3% (51) of the 194 cultivars evaluated resulted in a dry matter above 30% and of these only 12 cultivars (6.2%) resulted in dry matter content above 32%. This level of dry matter is considered very low. Testing for culinary quality shows that only 15 cultivars (7.7%) presented a grade of 1.0 (very good palatability and boiling quality after 25 minutes). Forty-tree cultivars (22.2%) were graded at level 2.0 (good palatability) while 136 cultivars (70.1%) were classified between 3.0 and 4.0 (poor quality). Root quality may
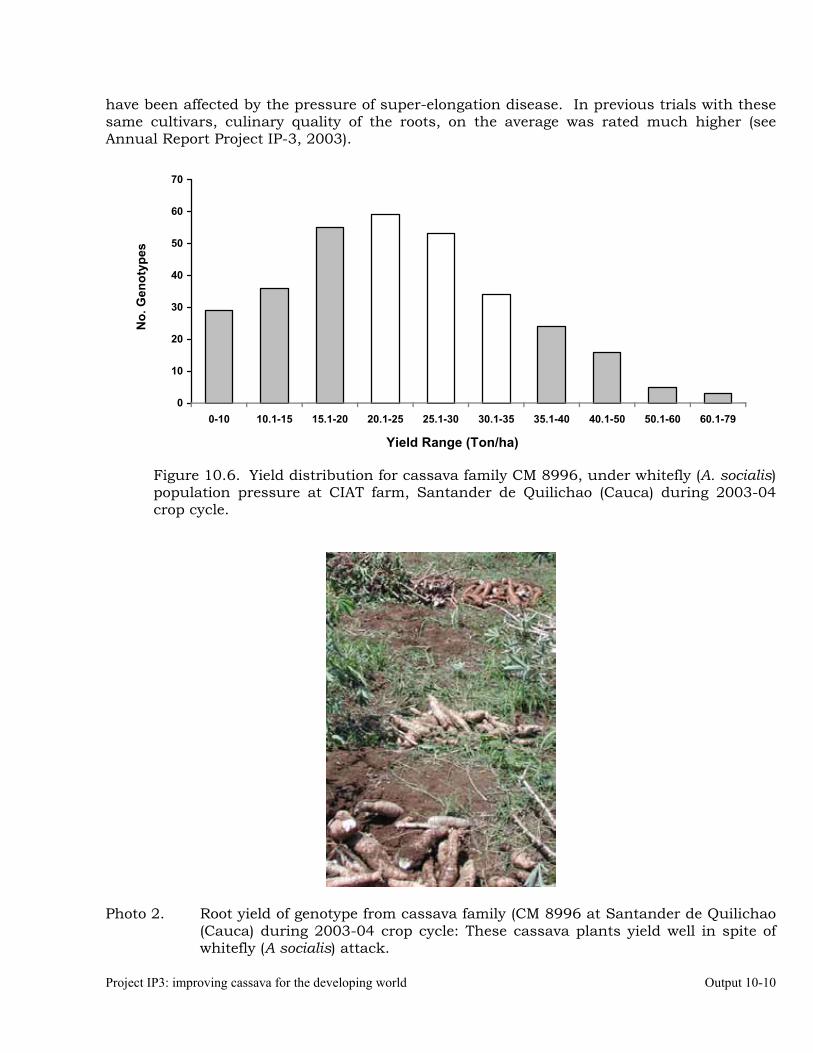
Project IP3: improving cassava for the developing world Output 10-10
have been affected by the pressure of super-elongation disease. In previous trials with these same cultivars, culinary quality of the roots, on the average was rated much higher (see Annual Report Project IP-3, 2003).
0
10
20
30
40
50
60
70
0-10 10.1-15 15.1-20 20.1-25 25.1-30 30.1-35 35.1-40 40.1-50 50.1-60 60.1-79
Yield Range (Ton/ha)
No.
Gen
otyp
es
Figure 10.6. Yield distribution for cassava family CM 8996, under whitefly (A. socialis) population pressure at CIAT farm, Santander de Quilichao (Cauca) during 2003-04 crop cycle.
Photo 2. Root yield of genotype from cassava family (CM 8996 at Santander de Quilichao
(Cauca) during 2003-04 crop cycle: These cassava plants yield well in spite of whitefly (A socialis) attack.
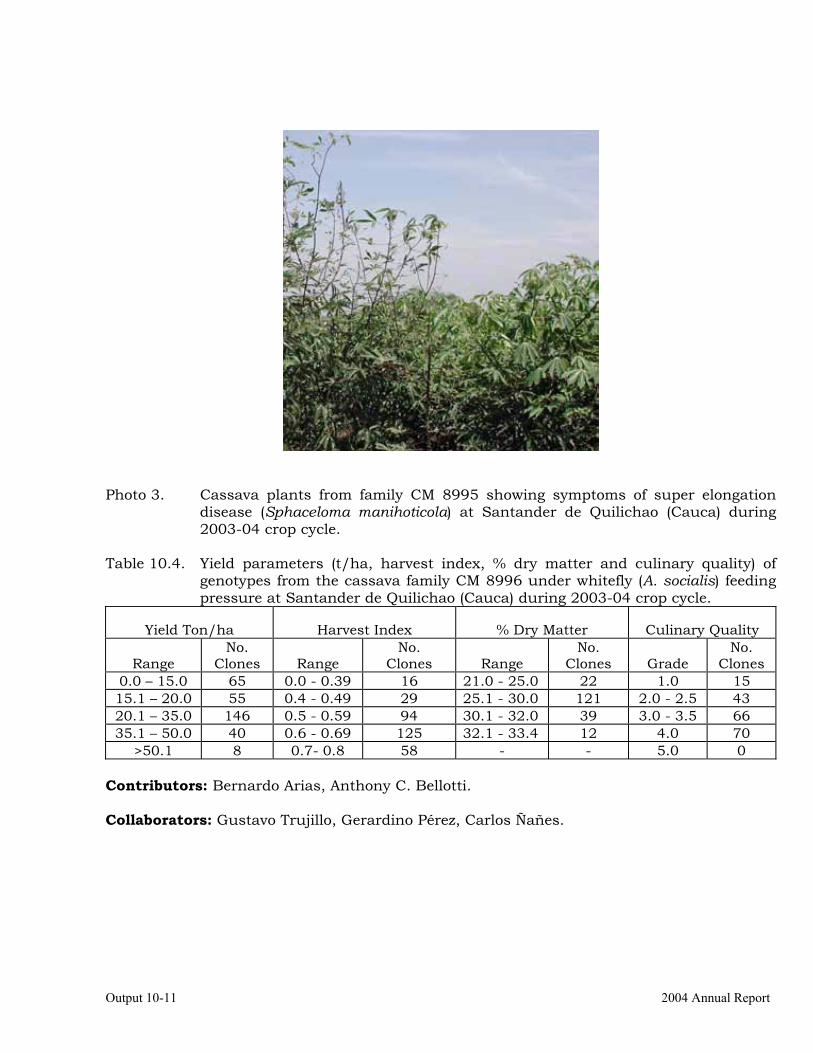
Output 10-11 2004 Annual Report
Photo 3. Cassava plants from family CM 8995 showing symptoms of super elongation disease (Sphaceloma manihoticola) at Santander de Quilichao (Cauca) during 2003-04 crop cycle.
Table 10.4. Yield parameters (t/ha, harvest index, % dry matter and culinary quality) of
genotypes from the cassava family CM 8996 under whitefly (A. socialis) feeding pressure at Santander de Quilichao (Cauca) during 2003-04 crop cycle.
Yield Ton/ha Harvest Index % Dry Matter Culinary Quality
Range No.
Clones Range No.
Clones Range No.
Clones Grade No.
Clones 0.0 – 15.0 65 0.0 - 0.39 16 21.0 - 25.0 22 1.0 15 15.1 – 20.0 55 0.4 - 0.49 29 25.1 - 30.0 121 2.0 - 2.5 43 20.1 – 35.0 146 0.5 - 0.59 94 30.1 - 32.0 39 3.0 - 3.5 66 35.1 – 50.0 40 0.6 - 0.69 125 32.1 - 33.4 12 4.0 70
>50.1 8 0.7- 0.8 58 - - 5.0 0 Contributors: Bernardo Arias, Anthony C. Bellotti. Collaborators: Gustavo Trujillo, Gerardino Pérez, Carlos Ñañes.
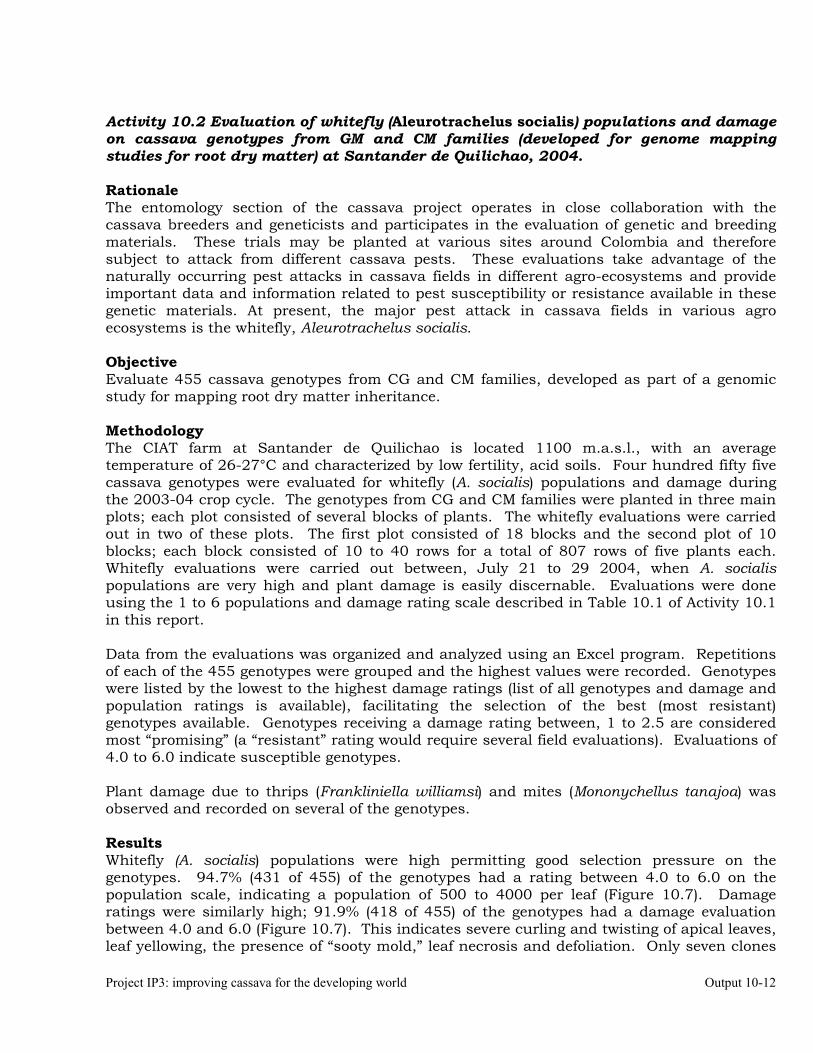
Project IP3: improving cassava for the developing world Output 10-12
Activity 10.2 Evaluation of whitefly (Aleurotrachelus socialis) populations and damage on cassava genotypes from GM and CM families (developed for genome mapping studies for root dry matter) at Santander de Quilichao, 2004. Rationale The entomology section of the cassava project operates in close collaboration with the cassava breeders and geneticists and participates in the evaluation of genetic and breeding materials. These trials may be planted at various sites around Colombia and therefore subject to attack from different cassava pests. These evaluations take advantage of the naturally occurring pest attacks in cassava fields in different agro-ecosystems and provide important data and information related to pest susceptibility or resistance available in these genetic materials. At present, the major pest attack in cassava fields in various agro ecosystems is the whitefly, Aleurotrachelus socialis. Objective Evaluate 455 cassava genotypes from CG and CM families, developed as part of a genomic study for mapping root dry matter inheritance. Methodology The CIAT farm at Santander de Quilichao is located 1100 m.a.s.l., with an average temperature of 26-27°C and characterized by low fertility, acid soils. Four hundred fifty five cassava genotypes were evaluated for whitefly (A. socialis) populations and damage during the 2003-04 crop cycle. The genotypes from CG and CM families were planted in three main plots; each plot consisted of several blocks of plants. The whitefly evaluations were carried out in two of these plots. The first plot consisted of 18 blocks and the second plot of 10 blocks; each block consisted of 10 to 40 rows for a total of 807 rows of five plants each. Whitefly evaluations were carried out between, July 21 to 29 2004, when A. socialis populations are very high and plant damage is easily discernable. Evaluations were done using the 1 to 6 populations and damage rating scale described in Table 10.1 of Activity 10.1 in this report. Data from the evaluations was organized and analyzed using an Excel program. Repetitions of each of the 455 genotypes were grouped and the highest values were recorded. Genotypes were listed by the lowest to the highest damage ratings (list of all genotypes and damage and population ratings is available), facilitating the selection of the best (most resistant) genotypes available. Genotypes receiving a damage rating between, 1 to 2.5 are considered most “promising” (a “resistant” rating would require several field evaluations). Evaluations of 4.0 to 6.0 indicate susceptible genotypes. Plant damage due to thrips (Frankliniella williamsi) and mites (Mononychellus tanajoa) was observed and recorded on several of the genotypes. Results Whitefly (A. socialis) populations were high permitting good selection pressure on the genotypes. 94.7% (431 of 455) of the genotypes had a rating between 4.0 to 6.0 on the population scale, indicating a population of 500 to 4000 per leaf (Figure 10.7). Damage ratings were similarly high; 91.9% (418 of 455) of the genotypes had a damage evaluation between 4.0 and 6.0 (Figure 10.7). This indicates severe curling and twisting of apical leaves, leaf yellowing, the presence of “sooty mold,” leaf necrosis and defoliation. Only seven clones
Output 10-13 2004 Annual Report
(1.5%) had a damage rating between 1.1 to 2.5. These genotypes should be further evaluated in subsequent crop cycles to verify if this is actual resistance and not escapes. These clones are GM 315-57, GM 312-10, GM 311-14, GM 312-65, GM 306-1, GM 312-9 and GM 313-15. If these genotypes are also high yielding and with high dry matter, they could should be further evaluated and may be of value in a germplasm development program for the Cauca and Valle del Cauca departments.
0
50
100
150
200
250
300
1 1.1- 2.5 2.6- 3.5 3.6- 4.0 4.1- 5.0 5.1- 6
No.
Gen
otyp
es
Population Damage
Figure 10.7. Whitefly (Aleurotrachelus socialis) population ratings on genotypes of cassava
families GM and CM, developed for genetic mapping studies on root dry matter content at Santander de Quilichao (Cauca, Colombia), CIAT, 2003-04.
Contributors: Bernardo Arias, Anthony C. Bellotti. Collaborators: Gerardino Pérez. Activity 10.3 Intrinsic rate of increase of Biotype “B” Bemisia tabaci on two African cassava genotypes MNg 2 and MNg 11. Bemisia tabaci (Homoptera: Aleyrodidae) as the vector of Africa Cassava Mosaic Disease (CMD), caused by a geminivirus (CMGs) (Legg et al, 2002), causes yield loss reported as ranging from 12-25% of the cassava crop in Africa (Thresh et al, 1997). It has been speculated that the absence of CMD in the Americas is related to the inability of B. tabaci to colonize cassava in the Neotropics (Costa and Russell, 1975). However, in the early 1990’s a new biotype “B” of B. tabaci was collected feeding on cassava in the Americas. Biotype “B” is considered by some authors and taxonomists to be a separate species, Bemisia argentifolii (Bellows and Perring) (Bellows et al, 1994). B. tabaci “B” is now viewed as a possible threat to vector CMD (or other geminiviruses) in the Americas if the disease were inadvertently introduced; traditional landrace cassava varieties cultivated in the Americas are considered highly susceptible to CMD (Bellotti and Arias, 2001). In addition, cassava damage evaluation caused by the increase in a B. tabaci population in East and Central Africa indicate yield losses above 50% due to direct feeding by whiteflies, even on varieties known to be resistant to CMD (CIAT, 2003-2004). Those reports thereby indicate that cassava varieties that contain resistance only to CMD may not be adequate to resist yield losses due to the direct feeding damage caused by B. tabaci.
Project IP3: improving cassava for the developing world Output 10-14
The search for resistance (HPR) to the whitefly, B. tabaci, in cassava genotypes offers an alternative and additional low cost and stable option for maintaining lower populations of the whitefly and reducing crop losses. Research experiments were designed to measure and compare the development of “B” biotype of B. tabaci populations found in Colombia, on two African cassava genotypes, TMS 30572 (MNg 2) and TMS 60444 (MNg 11). These genotypes were developed during the 1950 as part of a project to identify germplasm resistant to CMD (CIAT, 2004). Objective: Determine the intrinsic rate of increase of populations of Biotype “B” of B. tabaci on two African cassava genotypes, MNg 2 and MNg 11. Methodology 1. Genotypes of Manihot esculenta: In vitro plantlets (20) of the M. esculenta genotypes
MNg 2 (TMS 30572) and MNg 11 (TMS 60444) were obtained from the CIAT Biotechnology Project (Agrobiodiversity and Biotechnology SB-2). Plantlets were subsequently planted in plastic bags and pots. Eight, 40 day old plants of each genotype were placed in nylon mesh, wooden framed cages (1m x 1m x 1m).
2. Bemisia tabaci: The source of B. tabaci was obtained from a CIAT colony established on Jatropha gossypiifolia (Euphorbiacea). The colony had been established for 15 generations on J. gossypiifolia in the previously described cages under growth chamber conditions (25±2°C, 70±5% RH and 12:12 photoperiod). The colony is periodically checked for species purity by RAPD-OCR of adult specimens (CIAT, 1999).
3. Biological and demographic parameters of B. tabaci on MNg 2 and MNg 11. Longevity and fecundity: Forty pairs (40 males: 40 females) of recently emerged B. tabaci adults were collected from J. gossypiifolia using a technique described by Eichelkraut and Cardona (1989). One pair was placed in clip-cages (2.5 mm diameter x 2.0 mm depth) and attached to cassava leaves of MNg 2 and MNg 11 so that whiteflies fed on the leaf undersurface. Every 48 hours, the whiteflies were moved to a different area of the leaf. This procedure was repeated throughout the study until the natural death of the females; males were replaced whenever they perished before their mate. Fecundity was estimated by recording the number of eggs oviposited by each female during the 48 hour periods, while longevity was calculated as the time (days) that the female survived. Development time, rate of survival and proportion of females: Fifty two day old B. tabaci adults (male and females) were removed from J. gossypiifolia plants with the aid of a buccal aspirator (constructed with a Pasteur pipette). Adults are then placed in small clip cages (2.5 cm diameter x 3.0 cm depth) and attached to the undersides of MNg 2 and MNg 11 leaves. Adults are allowed to oviposit for six hours before being removed and 300 eggs are selected at random. The development time from egg to adult is obtained and survival rate of the immature stages and proportion of females is determined. Demographic parameters: Data on development time is combined with experimental data on reproduction ‘1x-mx,’ generating life tables which are used to calculate the demographic parameters as defined by Price (1975): 1) Net reproduction rate (Ro), the average number of females descendents produced by one female per generation; 2) generational time (T),
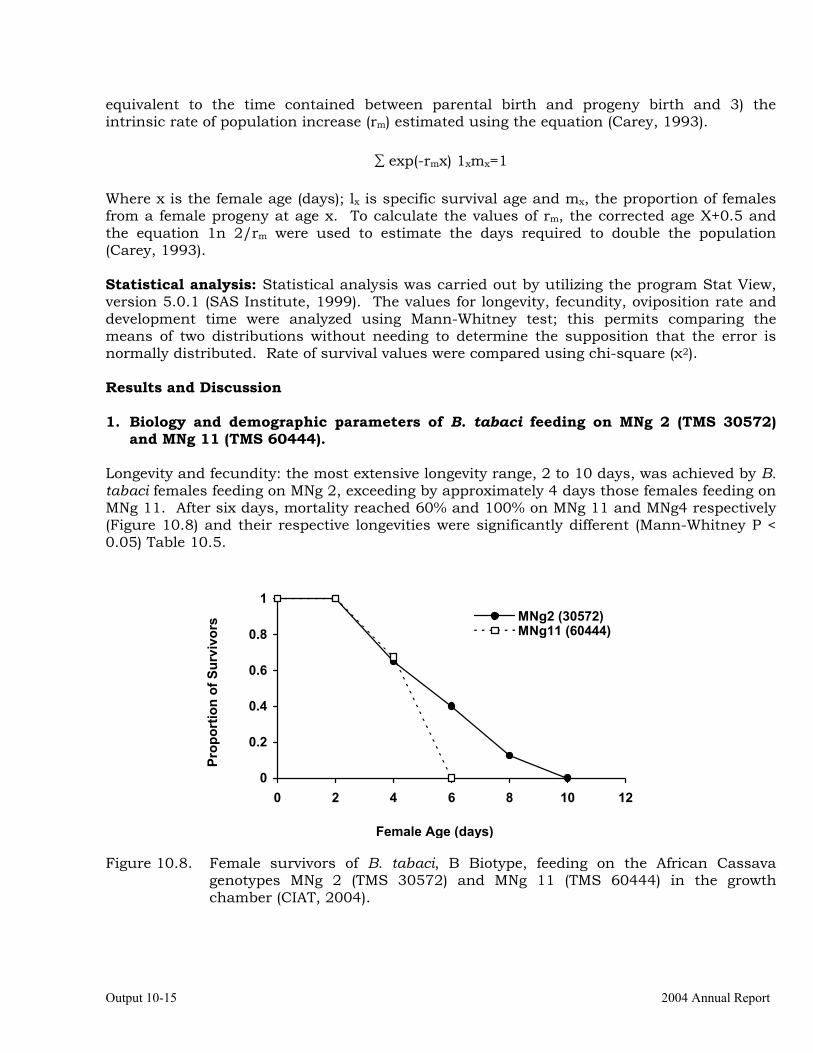
Output 10-15 2004 Annual Report
equivalent to the time contained between parental birth and progeny birth and 3) the intrinsic rate of population increase (rm) estimated using the equation (Carey, 1993).
∑ exp(-rmx) 1xmx=1 Where x is the female age (days); lx is specific survival age and mx, the proportion of females from a female progeny at age x. To calculate the values of rm, the corrected age X+0.5 and the equation 1n 2/rm were used to estimate the days required to double the population (Carey, 1993). Statistical analysis: Statistical analysis was carried out by utilizing the program Stat View, version 5.0.1 (SAS Institute, 1999). The values for longevity, fecundity, oviposition rate and development time were analyzed using Mann-Whitney test; this permits comparing the means of two distributions without needing to determine the supposition that the error is normally distributed. Rate of survival values were compared using chi-square (χ2). Results and Discussion 1. Biology and demographic parameters of B. tabaci feeding on MNg 2 (TMS 30572)
and MNg 11 (TMS 60444). Longevity and fecundity: the most extensive longevity range, 2 to 10 days, was achieved by B. tabaci females feeding on MNg 2, exceeding by approximately 4 days those females feeding on MNg 11. After six days, mortality reached 60% and 100% on MNg 11 and MNg4 respectively (Figure 10.8) and their respective longevities were significantly different (Mann-Whitney P < 0.05) Table 10.5.
0
0.2
0.4
0.6
0.8
1
0 2 4 6 8 10 12
MNg2 (30572)MNg11 (60444)
Figure 10.8. Female survivors of B. tabaci, B Biotype, feeding on the African Cassava
genotypes MNg 2 (TMS 30572) and MNg 11 (TMS 60444) in the growth chamber (CIAT, 2004).
Prop
ortio
n of
Sur
vivo
rs
Female Age (days)
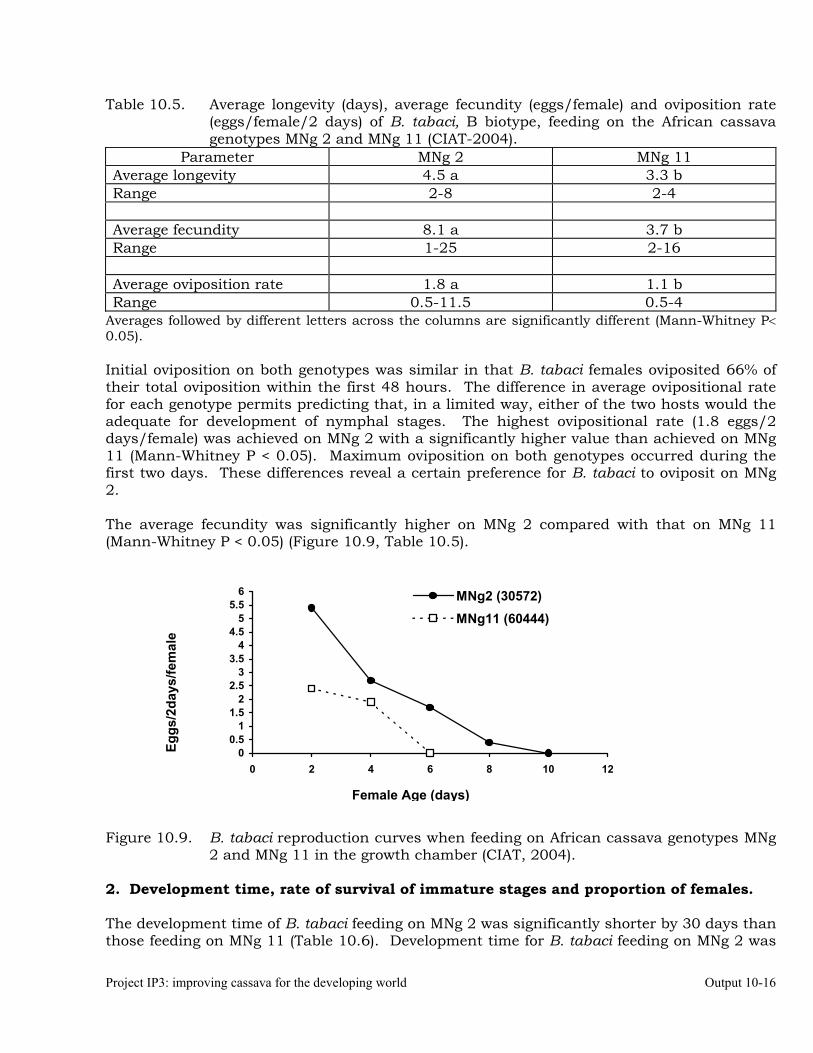
Project IP3: improving cassava for the developing world Output 10-16
Table 10.5. Average longevity (days), average fecundity (eggs/female) and oviposition rate (eggs/female/2 days) of B. tabaci, B biotype, feeding on the African cassava genotypes MNg 2 and MNg 11 (CIAT-2004).
Parameter MNg 2 MNg 11 Average longevity 4.5 a 3.3 b Range 2-8 2-4 Average fecundity 8.1 a 3.7 b Range 1-25 2-16 Average oviposition rate 1.8 a 1.1 b Range 0.5-11.5 0.5-4
Averages followed by different letters across the columns are significantly different (Mann-Whitney P< 0.05). Initial oviposition on both genotypes was similar in that B. tabaci females oviposited 66% of their total oviposition within the first 48 hours. The difference in average ovipositional rate for each genotype permits predicting that, in a limited way, either of the two hosts would the adequate for development of nymphal stages. The highest ovipositional rate (1.8 eggs/2 days/female) was achieved on MNg 2 with a significantly higher value than achieved on MNg 11 (Mann-Whitney P < 0.05). Maximum oviposition on both genotypes occurred during the first two days. These differences reveal a certain preference for B. tabaci to oviposit on MNg 2. The average fecundity was significantly higher on MNg 2 compared with that on MNg 11 (Mann-Whitney P < 0.05) (Figure 10.9, Table 10.5).
00.5
11.5
22.5
33.5
44.5
55.5
6
0 2 4 6 8 10 12
MNg2 (30572)MNg11 (60444)
Figure 10.9. B. tabaci reproduction curves when feeding on African cassava genotypes MNg
2 and MNg 11 in the growth chamber (CIAT, 2004). 2. Development time, rate of survival of immature stages and proportion of females. The development time of B. tabaci feeding on MNg 2 was significantly shorter by 30 days than those feeding on MNg 11 (Table 10.6). Development time for B. tabaci feeding on MNg 2 was
Female Age (days)
Eggs
/2da
ys/fe
mal
e
Output 10-17 2004 Annual Report
37.9 days, and 68.0 days while feeding on MNg 11. The highest levels of nymphal mortality occurred in the first instar on both genotypes. Mortality also occurred during the second and third instars feeding on MNg 2, but only occurred during the second instar for those feeding on MNg 11. In each case, nymphs entered into a latent state without reaching the adult stage. These results suggest B. tabaci biologically adapts more readily on the genotype MNg 2. B. tabaci survival rates for immature stages were significantly different on the two genotypes (Chi-Square = 44.58, 1d.f., P < 0.0001) Table 10.6). Results show that of the 200 B. tabaci eggs, 45 individuals survived to adult stage when feeding on MNg 2; compared to only 2 adults surviving on MNg 11. This parameter is a good indication of the potential capacity of B. tabaci to develop higher populations on MNg 2, compared to that on MNg 11. In general, the proportion of females and males was not affected by genotype. Table 10.6. Development time, survival and proportions of female B. tabaci feeding on two
African genotypes, MNg 2 and MNg 11 (CIAT, 2004). Parameter MNg 2 MNg 11
Development time (days)∗ No. Insects
37.9 b 45
68 a 2
Survival rate (%)♣
No. Insects 22.5 a 200
1 b 200
Proportion of females (%) No. Insects
60 45
50 2
* Averages followed by different letters across columns are significantly different Mann-Whitney P<0.05.
♣ Chi-Square = 44.58, 1d.f., P<0.0001 (CIAT, 2004). 2. Demographic parameters. The net rate of reproduction (Ro) allows us to estimate that, on average, at the end of a generation, B. tabaci populations could multiply 8.1 times (individual/individual) on MNg 2 (Table 10.7), this being 1.9 times greater than on MNg 11. One generation of B. tabaci would be completed in 39.6 and 68.8 days on MNg 2 and MNg 11 respectively (Table 10.7). These results allow us to predict that B. tabaci would complete nine generations per year on MNg 2, while only five generations on MNg 11. The results are equally consistent when comparing the intrinsic rate of increase (rm). This analysis shows a greater population build up on MNg 2, 62% greater than on MNg 11. Likewise, the value of rm reflects the time of population doubling. On MNg 2, B. tabaci requires 21 days less to duplicate its population compared to MNg 11 (Table 10.7). Table 10.7. Demographic parameters of biotype B of Bemisia tabaci feeding on MNg 2 (TMS
30572) and MNg 11 (TMS 60444) in the growth chamber (CIAT, 2004). Parameter MNg 2 MNg 11
Net reproduction rate (Ro) Σlxmx 8.1 4.2 Generation time (T) 39.6 68.8 Intrinsic rate of increase (rm) 0.053 0.02 Days to duplicate population (TD) ln2/rm 13 34.5
Results on longevity, fecundity, development time, survival rate and demographic parameters, suggest that the genotype MNg 11 (TMS 60444) is not a suitable host for biotype
Project IP3: improving cassava for the developing world Output 10-18
B of B. tabaci in Colombia. These results, however, do differ than those reported by Costa and Russell (1975), where none of the M. esculenta genotypes tested permitted survival or reproduction of B. tabaci. Bird (1957) also reported that he was not able to rear B. tabaci on M. esculenta, with whiteflies previously reared on J. gossypiifolia. In addition, the results from this study suggest that the African genotypes of M. esculenta are potential hosts of the B biotype of B. tabaci found in Colombia. In recent experiments with the genotype TMS 60444 (MNg 11), resistance to the cassava hornworm, Erinnyis ello, was observed on this genotype (Chavarriaga et al, unpublished data) (Activity 10.8). E. ello is an important cassava pest in the Neotropics (Bellotti, 1981). The TMS 60444 genotype was developed in Nigeria in the 1950’s by using the third backcross derived from an interspecific cross between M. esculenta and M. glaziovii, as a source of resistance to CMD (CIAT, 2003). The other progeny TMS 30572, also derived from the backcross with M. glaziovii was used to construct the genetic map of cassava (Fregene et al, 1997) and shows genomic regions that are probably inherited from M. glaziovii. One of their regions is found in ligament D, which shows QTLs for resistance associated with CMD and CBB (CIAT, 2003). These findings, together with the results of this study permit speculating about a possible resistance in TMS 60444 (MNg 11) to biotype B of B. tabaci found in Colombia. This could be related to that region on the genome for the QTL’s previously mentioned. References Bellotti, A.C.; Arias, B. 2001. Host plant resistance to whiteflies with emphasis on cassava as
a case study. Crop Prot. 20:813-823. Bellotti, A.C. 1981. Cassava hornworm. In: Lozano, J.C., Bellotti, A.C., Reyes, J.A., Howeler
R., Leihner, D., and Doll J. (eds) Field Problems in Cassava. CIAT, Cali Colombia. pp. 84-85.
Bellows, T.S. Jr.; Perring, T.M.; Gill, R.J.; Headrick, D.H. 1994. Description of a species of
Bemisia (Homoptera: Aleyrodidae). Ann. Entomol. Soc. Am. 87:195-206. Bird, J. 1957. A whitefly-transmitted mosaic of Jatropha gossypiifolia. Univ. Puerto Rico,
Agric., Exp. Stn., 22-35. Carey, J.R. 1993. Applied demography for biologist. Nueva York. Oxford University Press.
206 p. CIAT (Centro Internacional de Agricultura Tropical) 1999. Integrated pest and disease
management in mayor agroecosystems: Annual Report, Project PE-1. Cali, CO. 386 pp. CIAT (Centro Internacional de Agricultura Tropical) 2004. Sustainable Integrated
Management of Whiteflies Through Host plant Resistance: Progress Report, 2003-2004. Cali, CO. 77 p.
Costa, A.S.; Russell, L.M. 1975. Failure of Bemisia tabaci to breed on cassava plants in Brazil
(Homoptera: Aleyrodidae). Cienc. Cult. Sao Paulo 27:388-390.
Output 10-19 2004 Annual Report
Development and use of biotechnology tools for cassava improvement. Output 8. 2003. In: CIAT (Centro Internacional de Agricultura Tropical) 2003. Improved Cassava for the developing World: Summary Annual Report, Project IP-3. Cali, CO. p 1-104.
Eichelkraut, K; Cardona, C. 1989. Biología, cría masal y aspectos ecológicos de la mosca
blanca Bemisia tabaci (Gennadius) (Homoptera: Aleyrodidae), como plaga del frijol común. Turrialba. 39:55-62.
Fregene, M.A.; Angel, F.; Gómez, R.; Rodríguez, F.; Roca, W.; Tohme, J.; M. Bonierbale. 1997.
A molecular genetic map of cassava (Manihot esculenta Crantz). Theor. And Appl. Genet. TAG 95(3):431-441.
Legg, J.P.; French, R.; Rogan, D.; Okao-Okuja, G.; Brown, K. 2002. A distinct Bemisia tabaci
(Gennadius) (Hemiptera: Sternorrhyncha: Aleyrodidae) genotype cluster is associated with the epidemic of severe cassava mosaic virus disease in Uganda. Molecular Ecology 11:1219-1229.
Price, P. 1975. Insect Ecology. John Wiley & Sons, New York. 514 p. SAS Institute, 1999. SAS Institute, Cary, N.C. USA. Thresh, J.M.; Otim-Nape, G.W.; Legg, J.P.; Fargette, D. 1997. African cassava mosaic virus
disease: the magnitude of the problem. African Journal of Root and Tuber Crops 2:13-19. Contributors: Arturo Carabalí, Adriano Muñoz, Anthony C. Bellotti. Activity 10.4 Studies on the biology and behavior of biotype “B” of Bemisia tabaci on a wild Manihot sp, M. flabellifolia. Whiteflies are a major agricultural pest group, attacking a wide range of crop species. As direct feeding pests or virus vectors, whiteflies cause yield losses in cassava based agroecosystems in the Americas, Africa and Asia. The origin of cassava (Manihot esculenta) is in the neotropics and two whitefly species cause considerable crop damage in the region; Aleurotrachelus socialis predominates in northern South America (Colombia, Venezuela and Ecuador), while Aleurothrixus aepim is the major species in Brazil. Bemisia tabaci is a pantropical species that is the vector of Africa Cassava Mosaic Disease (CMD) in Africa and parts of Asia. Biotype “B” of Bemisia tabaci has been collected feeding on cassava in the Americas but has not been reported, nor observed, transmitting virus diseases on cassava in the neotropics. Host plant resistance in cassava to whiteflies is seen as a practical, low cost, long-term solution for reducing whitefly populations and damage. The wild species within the genus Manihot are seen as potential source of genes for resistance in the control of major cassava pests (see 2003 Annual Report; Project IP-3). There is a precedence for this in that resistance to CMD resulted from an interspecific cross between M. esculenta and M. glaziovii. However, apart from this one successful case, wild Manihot species have not been exploited as a source of resistance to cassava pests and diseases (also see Activity 10.8).
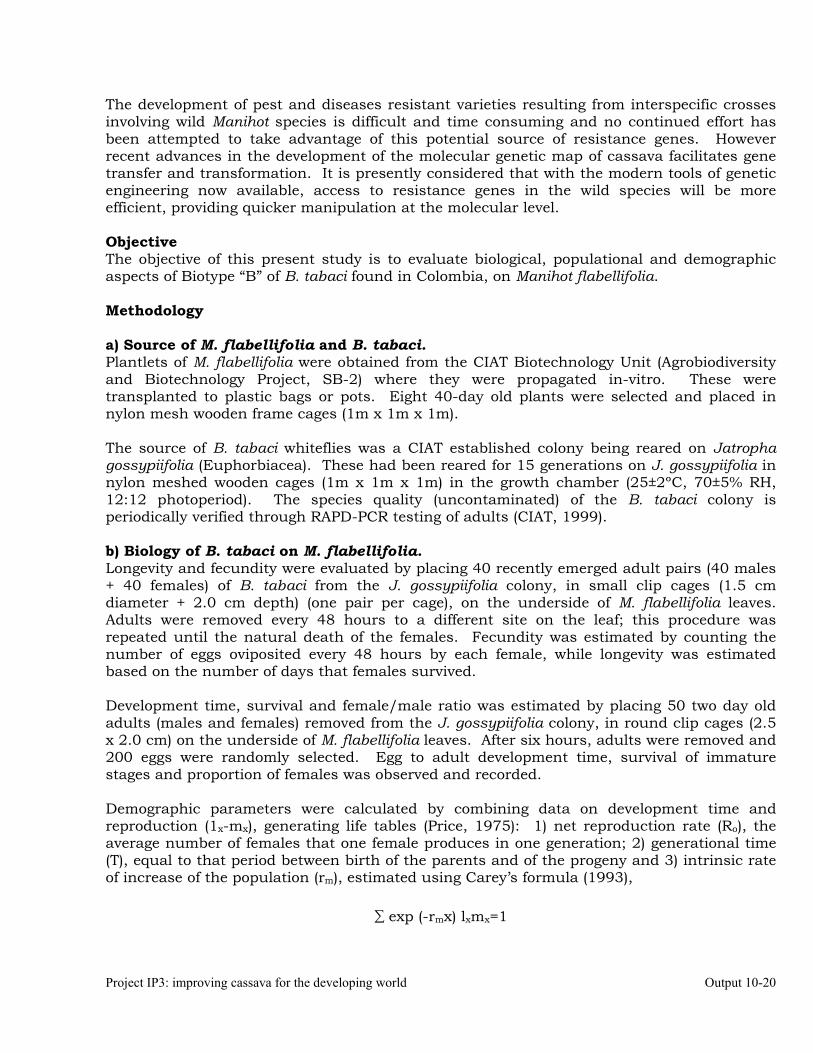
Project IP3: improving cassava for the developing world Output 10-20
The development of pest and diseases resistant varieties resulting from interspecific crosses involving wild Manihot species is difficult and time consuming and no continued effort has been attempted to take advantage of this potential source of resistance genes. However recent advances in the development of the molecular genetic map of cassava facilitates gene transfer and transformation. It is presently considered that with the modern tools of genetic engineering now available, access to resistance genes in the wild species will be more efficient, providing quicker manipulation at the molecular level. Objective The objective of this present study is to evaluate biological, populational and demographic aspects of Biotype “B” of B. tabaci found in Colombia, on Manihot flabellifolia. Methodology a) Source of M. flabellifolia and B. tabaci. Plantlets of M. flabellifolia were obtained from the CIAT Biotechnology Unit (Agrobiodiversity and Biotechnology Project, SB-2) where they were propagated in-vitro. These were transplanted to plastic bags or pots. Eight 40-day old plants were selected and placed in nylon mesh wooden frame cages (1m x 1m x 1m). The source of B. tabaci whiteflies was a CIAT established colony being reared on Jatropha gossypiifolia (Euphorbiacea). These had been reared for 15 generations on J. gossypiifolia in nylon meshed wooden cages (1m x 1m x 1m) in the growth chamber (25±2ºC, 70±5% RH, 12:12 photoperiod). The species quality (uncontaminated) of the B. tabaci colony is periodically verified through RAPD-PCR testing of adults (CIAT, 1999). b) Biology of B. tabaci on M. flabellifolia. Longevity and fecundity were evaluated by placing 40 recently emerged adult pairs (40 males + 40 females) of B. tabaci from the J. gossypiifolia colony, in small clip cages (1.5 cm diameter + 2.0 cm depth) (one pair per cage), on the underside of M. flabellifolia leaves. Adults were removed every 48 hours to a different site on the leaf; this procedure was repeated until the natural death of the females. Fecundity was estimated by counting the number of eggs oviposited every 48 hours by each female, while longevity was estimated based on the number of days that females survived. Development time, survival and female/male ratio was estimated by placing 50 two day old adults (males and females) removed from the J. gossypiifolia colony, in round clip cages (2.5 x 2.0 cm) on the underside of M. flabellifolia leaves. After six hours, adults were removed and 200 eggs were randomly selected. Egg to adult development time, survival of immature stages and proportion of females was observed and recorded. Demographic parameters were calculated by combining data on development time and reproduction (1x-mx), generating life tables (Price, 1975): 1) net reproduction rate (Ro), the average number of females that one female produces in one generation; 2) generational time (T), equal to that period between birth of the parents and of the progeny and 3) intrinsic rate of increase of the population (rm), estimated using Carey’s formula (1993),
∑ exp (-rmx) lxmx=1
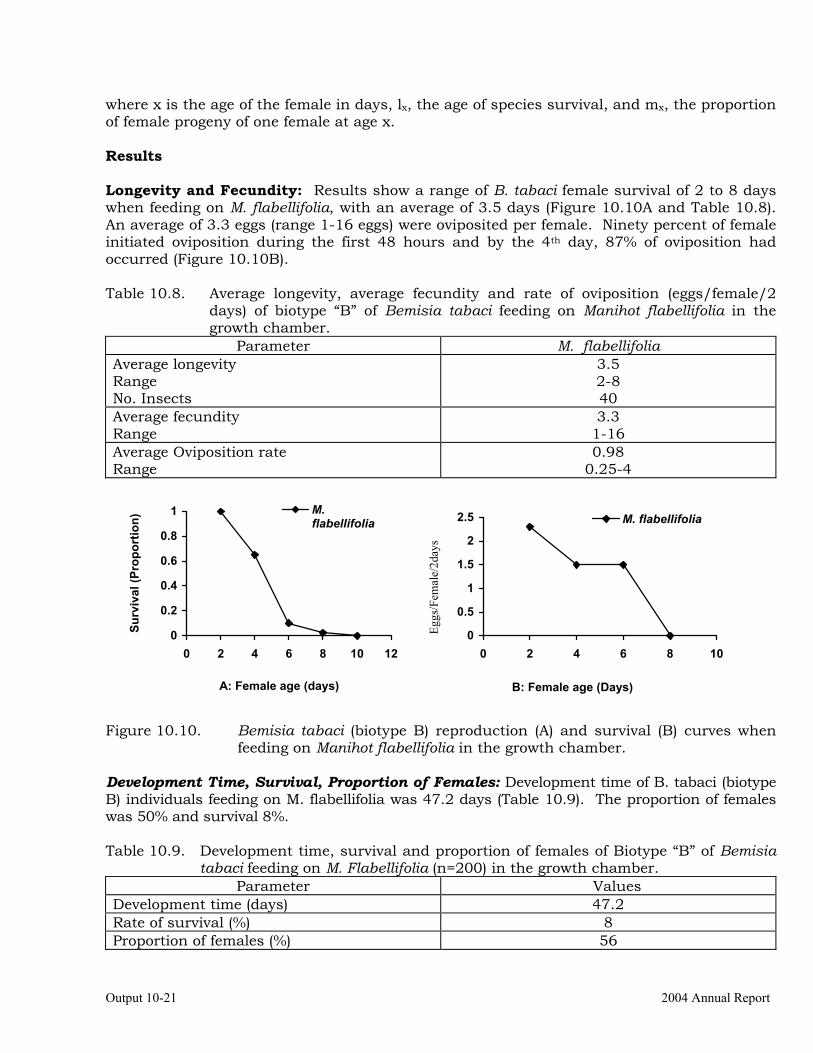
Output 10-21 2004 Annual Report
where x is the age of the female in days, lx, the age of species survival, and mx, the proportion of female progeny of one female at age x. Results Longevity and Fecundity: Results show a range of B. tabaci female survival of 2 to 8 days when feeding on M. flabellifolia, with an average of 3.5 days (Figure 10.10A and Table 10.8). An average of 3.3 eggs (range 1-16 eggs) were oviposited per female. Ninety percent of female initiated oviposition during the first 48 hours and by the 4th day, 87% of oviposition had occurred (Figure 10.10B). Table 10.8. Average longevity, average fecundity and rate of oviposition (eggs/female/2
days) of biotype “B” of Bemisia tabaci feeding on Manihot flabellifolia in the growth chamber.
Parameter M. flabellifolia Average longevity Range No. Insects
3.5 2-8 40
Average fecundity Range
3.3 1-16
Average Oviposition rate Range
0.98 0.25-4
0
0.2
0.4
0.6
0.8
1
0 2 4 6 8 10 12
M.flabellifolia
0
0.5
1
1.5
2
2.5
0 2 4 6 8 10
M. flabellifolia
Figure 10.10. Bemisia tabaci (biotype B) reproduction (A) and survival (B) curves when
feeding on Manihot flabellifolia in the growth chamber. Development Time, Survival, Proportion of Females: Development time of B. tabaci (biotype B) individuals feeding on M. flabellifolia was 47.2 days (Table 10.9). The proportion of females was 50% and survival 8%. Table 10.9. Development time, survival and proportion of females of Biotype “B” of Bemisia
tabaci feeding on M. Flabellifolia (n=200) in the growth chamber. Parameter Values
Development time (days) 47.2 Rate of survival (%) 8 Proportion of females (%) 56
Surv
ival
(Pro
port
ion)
A: Female age (days) B: Female age (Days)
Eggs
/Fem
ale/
2day
s
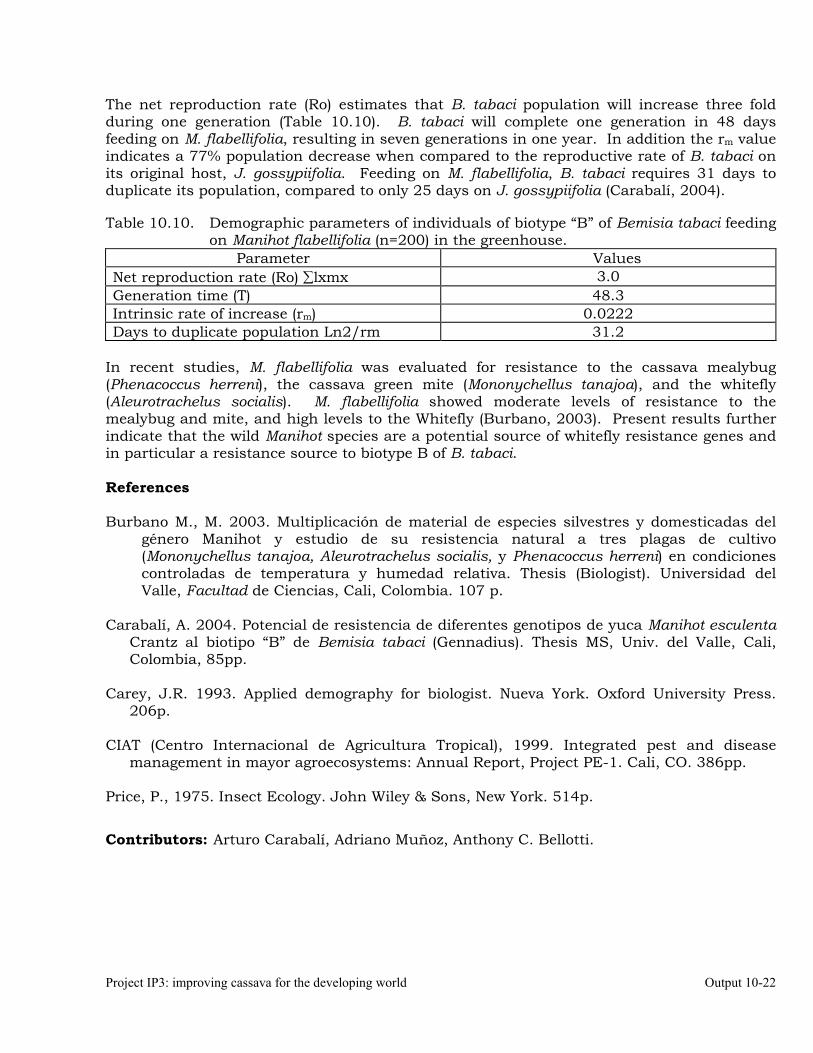
Project IP3: improving cassava for the developing world Output 10-22
The net reproduction rate (Ro) estimates that B. tabaci population will increase three fold during one generation (Table 10.10). B. tabaci will complete one generation in 48 days feeding on M. flabellifolia, resulting in seven generations in one year. In addition the rm value indicates a 77% population decrease when compared to the reproductive rate of B. tabaci on its original host, J. gossypiifolia. Feeding on M. flabellifolia, B. tabaci requires 31 days to duplicate its population, compared to only 25 days on J. gossypiifolia (Carabalí, 2004). Table 10.10. Demographic parameters of individuals of biotype “B” of Bemisia tabaci feeding
on Manihot flabellifolia (n=200) in the greenhouse. Parameter Values
Net reproduction rate (Ro) ∑lxmx 3.0 Generation time (T) 48.3 Intrinsic rate of increase (rm) 0.0222 Days to duplicate population Ln2/rm 31.2
In recent studies, M. flabellifolia was evaluated for resistance to the cassava mealybug (Phenacoccus herreni), the cassava green mite (Mononychellus tanajoa), and the whitefly (Aleurotrachelus socialis). M. flabellifolia showed moderate levels of resistance to the mealybug and mite, and high levels to the Whitefly (Burbano, 2003). Present results further indicate that the wild Manihot species are a potential source of whitefly resistance genes and in particular a resistance source to biotype B of B. tabaci. References Burbano M., M. 2003. Multiplicación de material de especies silvestres y domesticadas del
género Manihot y estudio de su resistencia natural a tres plagas de cultivo (Mononychellus tanajoa, Aleurotrachelus socialis, y Phenacoccus herreni) en condiciones controladas de temperatura y humedad relativa. Thesis (Biologist). Universidad del Valle, Facultad de Ciencias, Cali, Colombia. 107 p.
Carabalí, A. 2004. Potencial de resistencia de diferentes genotipos de yuca Manihot esculenta
Crantz al biotipo “B” de Bemisia tabaci (Gennadius). Thesis MS, Univ. del Valle, Cali, Colombia, 85pp.
Carey, J.R. 1993. Applied demography for biologist. Nueva York. Oxford University Press.
206p. CIAT (Centro Internacional de Agricultura Tropical), 1999. Integrated pest and disease
management in mayor agroecosystems: Annual Report, Project PE-1. Cali, CO. 386pp. Price, P., 1975. Insect Ecology. John Wiley & Sons, New York. 514p.
Contributors: Arturo Carabalí, Adriano Muñoz, Anthony C. Bellotti.
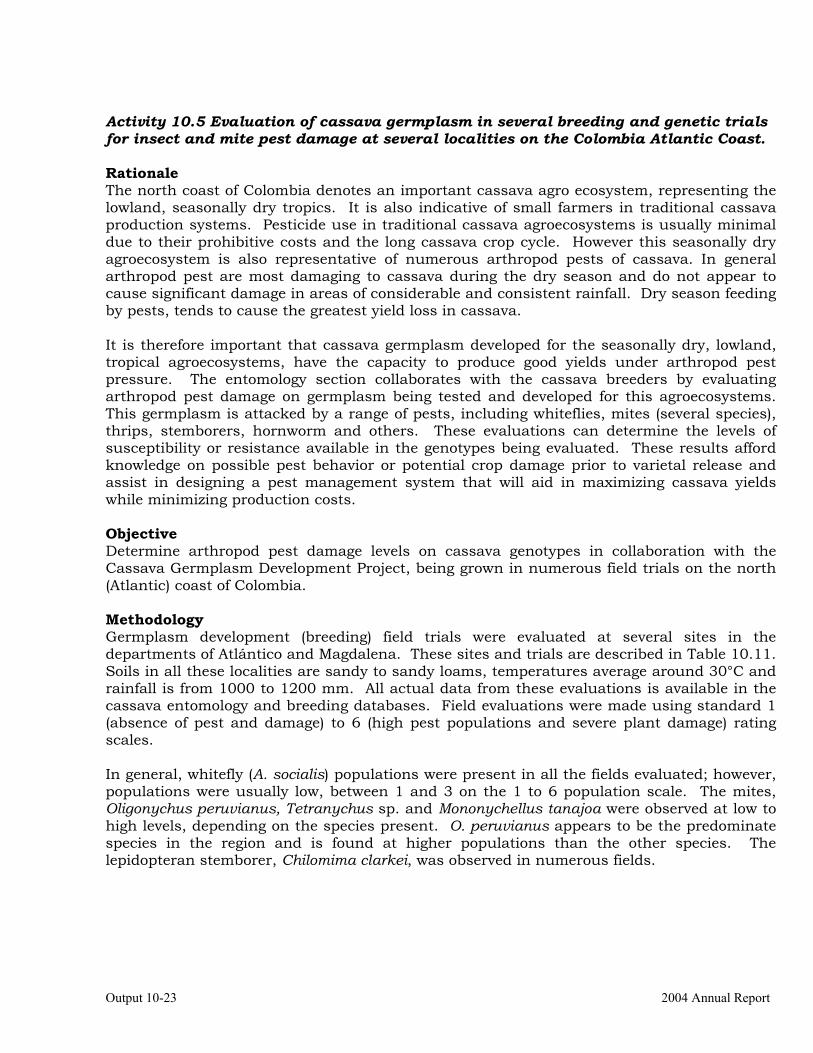
Output 10-23 2004 Annual Report
Activity 10.5 Evaluation of cassava germplasm in several breeding and genetic trials for insect and mite pest damage at several localities on the Colombia Atlantic Coast. Rationale The north coast of Colombia denotes an important cassava agro ecosystem, representing the lowland, seasonally dry tropics. It is also indicative of small farmers in traditional cassava production systems. Pesticide use in traditional cassava agroecosystems is usually minimal due to their prohibitive costs and the long cassava crop cycle. However this seasonally dry agroecosystem is also representative of numerous arthropod pests of cassava. In general arthropod pest are most damaging to cassava during the dry season and do not appear to cause significant damage in areas of considerable and consistent rainfall. Dry season feeding by pests, tends to cause the greatest yield loss in cassava. It is therefore important that cassava germplasm developed for the seasonally dry, lowland, tropical agroecosystems, have the capacity to produce good yields under arthropod pest pressure. The entomology section collaborates with the cassava breeders by evaluating arthropod pest damage on germplasm being tested and developed for this agroecosystems. This germplasm is attacked by a range of pests, including whiteflies, mites (several species), thrips, stemborers, hornworm and others. These evaluations can determine the levels of susceptibility or resistance available in the genotypes being evaluated. These results afford knowledge on possible pest behavior or potential crop damage prior to varietal release and assist in designing a pest management system that will aid in maximizing cassava yields while minimizing production costs. Objective Determine arthropod pest damage levels on cassava genotypes in collaboration with the Cassava Germplasm Development Project, being grown in numerous field trials on the north (Atlantic) coast of Colombia. Methodology Germplasm development (breeding) field trials were evaluated at several sites in the departments of Atlántico and Magdalena. These sites and trials are described in Table 10.11. Soils in all these localities are sandy to sandy loams, temperatures average around 30°C and rainfall is from 1000 to 1200 mm. All actual data from these evaluations is available in the cassava entomology and breeding databases. Field evaluations were made using standard 1 (absence of pest and damage) to 6 (high pest populations and severe plant damage) rating scales. In general, whitefly (A. socialis) populations were present in all the fields evaluated; however, populations were usually low, between 1 and 3 on the 1 to 6 population scale. The mites, Oligonychus peruvianus, Tetranychus sp. and Mononychellus tanajoa were observed at low to high levels, depending on the species present. O. peruvianus appears to be the predominate species in the region and is found at higher populations than the other species. The lepidopteran stemborer, Chilomima clarkei, was observed in numerous fields.
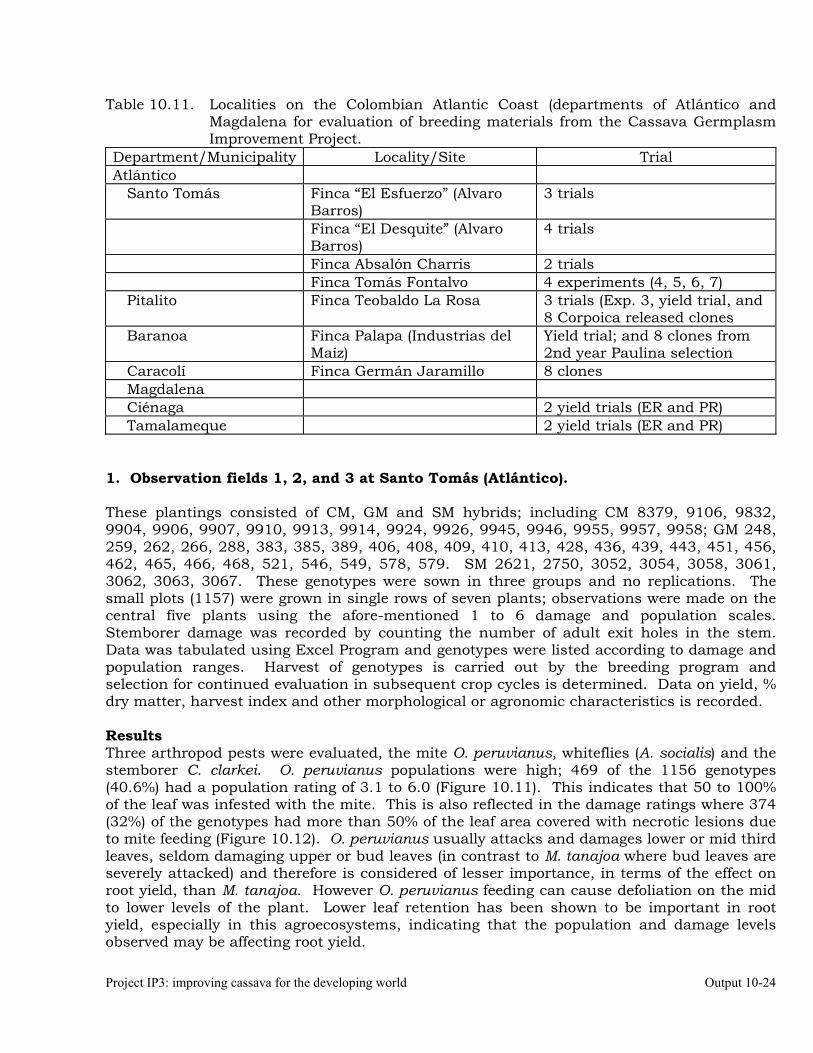
Project IP3: improving cassava for the developing world Output 10-24
Table 10.11. Localities on the Colombian Atlantic Coast (departments of Atlántico and Magdalena for evaluation of breeding materials from the Cassava Germplasm Improvement Project.
Department/Municipality Locality/Site Trial Atlántico Santo Tomás Finca “El Esfuerzo” (Alvaro
Barros) 3 trials
Finca “El Desquite” (Alvaro Barros)
4 trials
Finca Absalón Charris 2 trials Finca Tomás Fontalvo 4 experiments (4, 5, 6, 7) Pitalito Finca Teobaldo La Rosa 3 trials (Exp. 3, yield trial, and
8 Corpoica released clones Baranoa Finca Palapa (Industrias del
Maíz) Yield trial; and 8 clones from 2nd year Paulina selection
Caracolí Finca Germán Jaramillo 8 clones Magdalena Ciénaga 2 yield trials (ER and PR) Tamalameque 2 yield trials (ER and PR)
1. Observation fields 1, 2, and 3 at Santo Tomás (Atlántico). These plantings consisted of CM, GM and SM hybrids; including CM 8379, 9106, 9832, 9904, 9906, 9907, 9910, 9913, 9914, 9924, 9926, 9945, 9946, 9955, 9957, 9958; GM 248, 259, 262, 266, 288, 383, 385, 389, 406, 408, 409, 410, 413, 428, 436, 439, 443, 451, 456, 462, 465, 466, 468, 521, 546, 549, 578, 579. SM 2621, 2750, 3052, 3054, 3058, 3061, 3062, 3063, 3067. These genotypes were sown in three groups and no replications. The small plots (1157) were grown in single rows of seven plants; observations were made on the central five plants using the afore-mentioned 1 to 6 damage and population scales. Stemborer damage was recorded by counting the number of adult exit holes in the stem. Data was tabulated using Excel Program and genotypes were listed according to damage and population ranges. Harvest of genotypes is carried out by the breeding program and selection for continued evaluation in subsequent crop cycles is determined. Data on yield, % dry matter, harvest index and other morphological or agronomic characteristics is recorded. Results Three arthropod pests were evaluated, the mite O. peruvianus, whiteflies (A. socialis) and the stemborer C. clarkei. O. peruvianus populations were high; 469 of the 1156 genotypes (40.6%) had a population rating of 3.1 to 6.0 (Figure 10.11). This indicates that 50 to 100% of the leaf was infested with the mite. This is also reflected in the damage ratings where 374 (32%) of the genotypes had more than 50% of the leaf area covered with necrotic lesions due to mite feeding (Figure 10.12). O. peruvianus usually attacks and damages lower or mid third leaves, seldom damaging upper or bud leaves (in contrast to M. tanajoa where bud leaves are severely attacked) and therefore is considered of lesser importance, in terms of the effect on root yield, than M. tanajoa. However O. peruvianus feeding can cause defoliation on the mid to lower levels of the plant. Lower leaf retention has been shown to be important in root yield, especially in this agroecosystems, indicating that the population and damage levels observed may be affecting root yield.
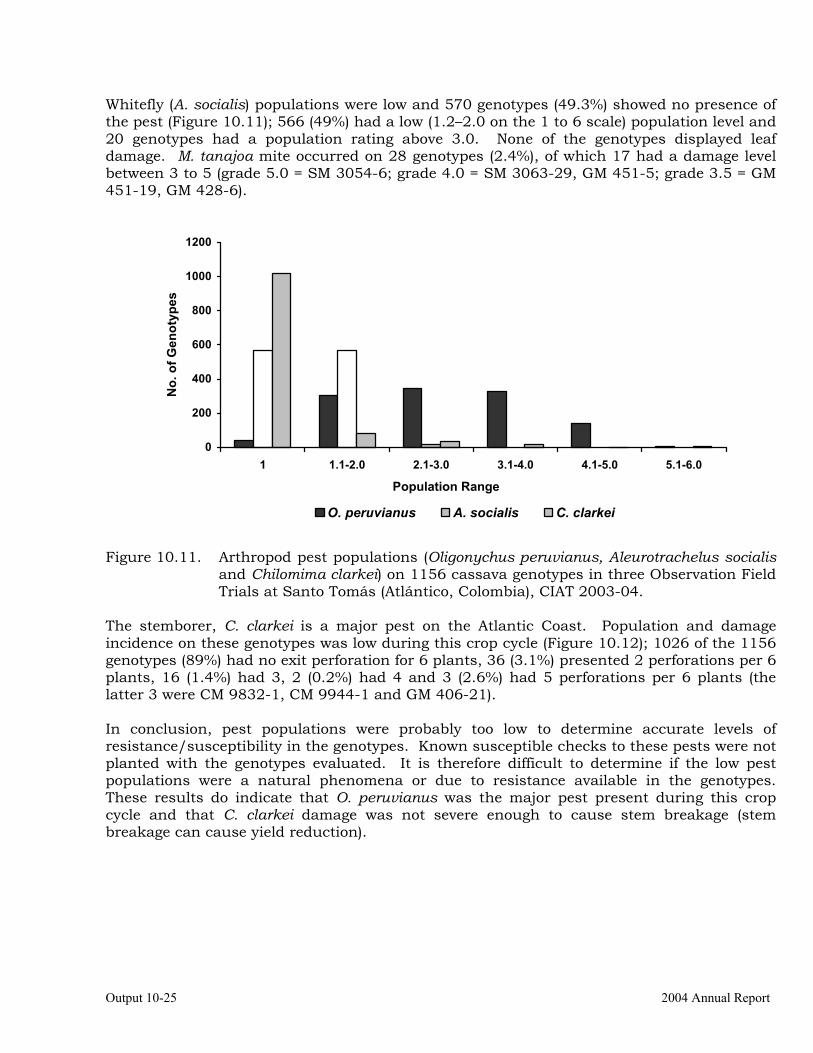
Output 10-25 2004 Annual Report
Whitefly (A. socialis) populations were low and 570 genotypes (49.3%) showed no presence of the pest (Figure 10.11); 566 (49%) had a low (1.2–2.0 on the 1 to 6 scale) population level and 20 genotypes had a population rating above 3.0. None of the genotypes displayed leaf damage. M. tanajoa mite occurred on 28 genotypes (2.4%), of which 17 had a damage level between 3 to 5 (grade 5.0 = SM 3054-6; grade 4.0 = SM 3063-29, GM 451-5; grade 3.5 = GM 451-19, GM 428-6).
0
200
400
600
800
1000
1200
1 1.1-2.0 2.1-3.0 3.1-4.0 4.1-5.0 5.1-6.0
Population Range
No.
of G
enot
ypes
O. peruvianus A. socialis C. clarkei
Figure 10.11. Arthropod pest populations (Oligonychus peruvianus, Aleurotrachelus socialis
and Chilomima clarkei) on 1156 cassava genotypes in three Observation Field Trials at Santo Tomás (Atlántico, Colombia), CIAT 2003-04.
The stemborer, C. clarkei is a major pest on the Atlantic Coast. Population and damage incidence on these genotypes was low during this crop cycle (Figure 10.12); 1026 of the 1156 genotypes (89%) had no exit perforation for 6 plants, 36 (3.1%) presented 2 perforations per 6 plants, 16 (1.4%) had 3, 2 (0.2%) had 4 and 3 (2.6%) had 5 perforations per 6 plants (the latter 3 were CM 9832-1, CM 9944-1 and GM 406-21). In conclusion, pest populations were probably too low to determine accurate levels of resistance/susceptibility in the genotypes. Known susceptible checks to these pests were not planted with the genotypes evaluated. It is therefore difficult to determine if the low pest populations were a natural phenomena or due to resistance available in the genotypes. These results do indicate that O. peruvianus was the major pest present during this crop cycle and that C. clarkei damage was not severe enough to cause stem breakage (stem breakage can cause yield reduction).
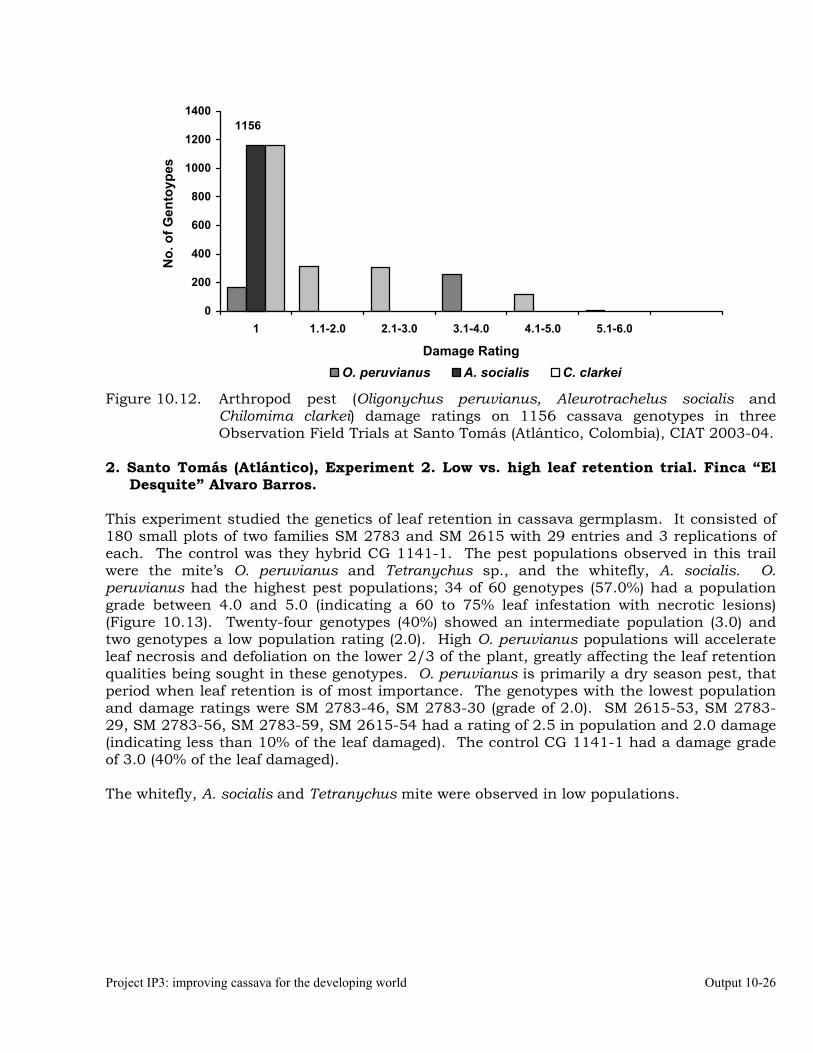
Project IP3: improving cassava for the developing world Output 10-26
1156
0
200
400
600
800
1000
1200
1400
1 1.1-2.0 2.1-3.0 3.1-4.0 4.1-5.0 5.1-6.0
Damage Rating
No.
of G
ento
ypes
O. peruvianus A. socialis C. clarkei
Figure 10.12. Arthropod pest (Oligonychus peruvianus, Aleurotrachelus socialis and Chilomima clarkei) damage ratings on 1156 cassava genotypes in three Observation Field Trials at Santo Tomás (Atlántico, Colombia), CIAT 2003-04.
2. Santo Tomás (Atlántico), Experiment 2. Low vs. high leaf retention trial. Finca “El
Desquite” Alvaro Barros. This experiment studied the genetics of leaf retention in cassava germplasm. It consisted of 180 small plots of two families SM 2783 and SM 2615 with 29 entries and 3 replications of each. The control was they hybrid CG 1141-1. The pest populations observed in this trail were the mite’s O. peruvianus and Tetranychus sp., and the whitefly, A. socialis. O. peruvianus had the highest pest populations; 34 of 60 genotypes (57.0%) had a population grade between 4.0 and 5.0 (indicating a 60 to 75% leaf infestation with necrotic lesions) (Figure 10.13). Twenty-four genotypes (40%) showed an intermediate population (3.0) and two genotypes a low population rating (2.0). High O. peruvianus populations will accelerate leaf necrosis and defoliation on the lower 2/3 of the plant, greatly affecting the leaf retention qualities being sought in these genotypes. O. peruvianus is primarily a dry season pest, that period when leaf retention is of most importance. The genotypes with the lowest population and damage ratings were SM 2783-46, SM 2783-30 (grade of 2.0). SM 2615-53, SM 2783-29, SM 2783-56, SM 2783-59, SM 2615-54 had a rating of 2.5 in population and 2.0 damage (indicating less than 10% of the leaf damaged). The control CG 1141-1 had a damage grade of 3.0 (40% of the leaf damaged). The whitefly, A. socialis and Tetranychus mite were observed in low populations.
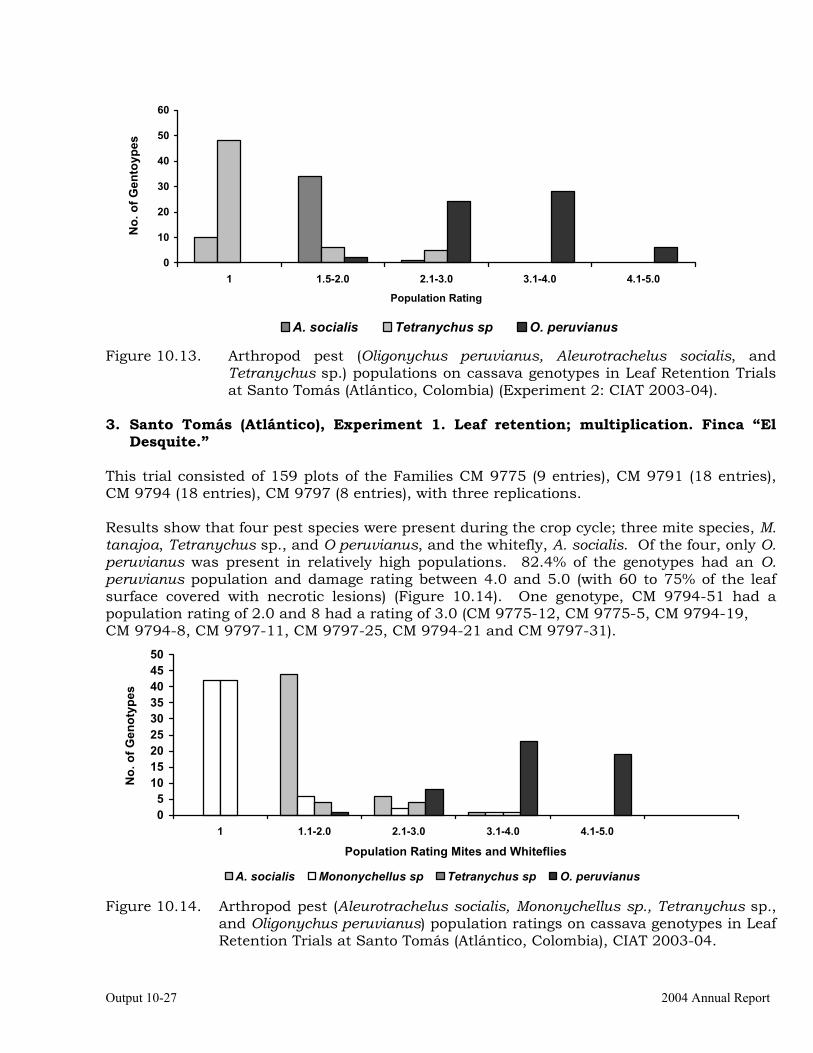
Output 10-27 2004 Annual Report
0
10
20
30
40
50
60
1 1.5-2.0 2.1-3.0 3.1-4.0 4.1-5.0
Population Rating
No.
of G
ento
ypes
A. socialis Tetranychus sp O. peruvianus
Figure 10.13. Arthropod pest (Oligonychus peruvianus, Aleurotrachelus socialis, and Tetranychus sp.) populations on cassava genotypes in Leaf Retention Trials at Santo Tomás (Atlántico, Colombia) (Experiment 2: CIAT 2003-04).
3. Santo Tomás (Atlántico), Experiment 1. Leaf retention; multiplication. Finca “El
Desquite.” This trial consisted of 159 plots of the Families CM 9775 (9 entries), CM 9791 (18 entries), CM 9794 (18 entries), CM 9797 (8 entries), with three replications. Results show that four pest species were present during the crop cycle; three mite species, M. tanajoa, Tetranychus sp., and O peruvianus, and the whitefly, A. socialis. Of the four, only O. peruvianus was present in relatively high populations. 82.4% of the genotypes had an O. peruvianus population and damage rating between 4.0 and 5.0 (with 60 to 75% of the leaf surface covered with necrotic lesions) (Figure 10.14). One genotype, CM 9794-51 had a population rating of 2.0 and 8 had a rating of 3.0 (CM 9775-12, CM 9775-5, CM 9794-19, CM 9794-8, CM 9797-11, CM 9797-25, CM 9794-21 and CM 9797-31).
05
101520253035404550
1 1.1-2.0 2.1-3.0 3.1-4.0 4.1-5.0
Population Rating Mites and Whiteflies
No.
of G
enot
ypes
A. socialis Mononychellus sp Tetranychus sp O. peruvianus
Figure 10.14. Arthropod pest (Aleurotrachelus socialis, Mononychellus sp., Tetranychus sp., and Oligonychus peruvianus) population ratings on cassava genotypes in Leaf Retention Trials at Santo Tomás (Atlántico, Colombia), CIAT 2003-04.
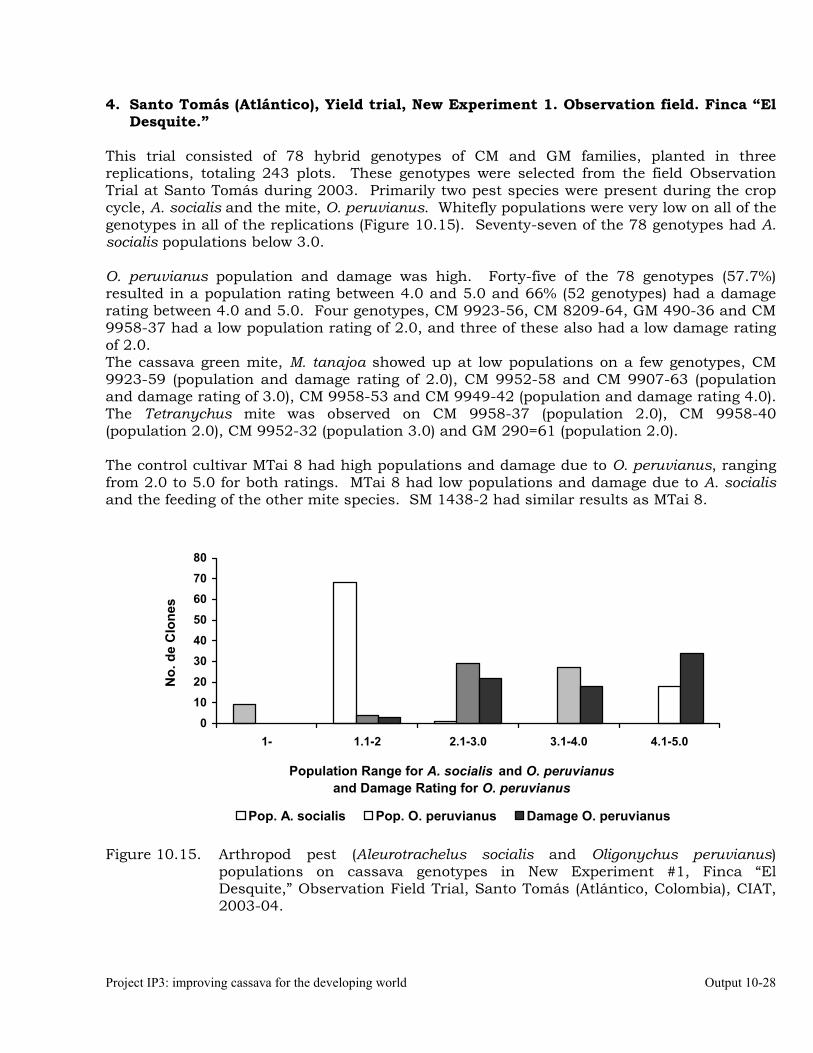
Project IP3: improving cassava for the developing world Output 10-28
4. Santo Tomás (Atlántico), Yield trial, New Experiment 1. Observation field. Finca “El Desquite.”
This trial consisted of 78 hybrid genotypes of CM and GM families, planted in three replications, totaling 243 plots. These genotypes were selected from the field Observation Trial at Santo Tomás during 2003. Primarily two pest species were present during the crop cycle, A. socialis and the mite, O. peruvianus. Whitefly populations were very low on all of the genotypes in all of the replications (Figure 10.15). Seventy-seven of the 78 genotypes had A. socialis populations below 3.0. O. peruvianus population and damage was high. Forty-five of the 78 genotypes (57.7%) resulted in a population rating between 4.0 and 5.0 and 66% (52 genotypes) had a damage rating between 4.0 and 5.0. Four genotypes, CM 9923-56, CM 8209-64, GM 490-36 and CM 9958-37 had a low population rating of 2.0, and three of these also had a low damage rating of 2.0. The cassava green mite, M. tanajoa showed up at low populations on a few genotypes, CM 9923-59 (population and damage rating of 2.0), CM 9952-58 and CM 9907-63 (population and damage rating of 3.0), CM 9958-53 and CM 9949-42 (population and damage rating 4.0). The Tetranychus mite was observed on CM 9958-37 (population 2.0), CM 9958-40 (population 2.0), CM 9952-32 (population 3.0) and GM 290=61 (population 2.0). The control cultivar MTai 8 had high populations and damage due to O. peruvianus, ranging from 2.0 to 5.0 for both ratings. MTai 8 had low populations and damage due to A. socialis and the feeding of the other mite species. SM 1438-2 had similar results as MTai 8.
0
1020
3040
50
6070
80
1- 1.1-2 2.1-3.0 3.1-4.0 4.1-5.0
Population Range for A. socialis and O. peruvianusand Damage Rating for O. peruvianus
No.
de
Clo
nes
Pop. A. socialis Pop. O. peruvianus Damage O. peruvianus
Figure 10.15. Arthropod pest (Aleurotrachelus socialis and Oligonychus peruvianus)
populations on cassava genotypes in New Experiment #1, Finca “El Desquite,” Observation Field Trial, Santo Tomás (Atlántico, Colombia), CIAT, 2003-04.
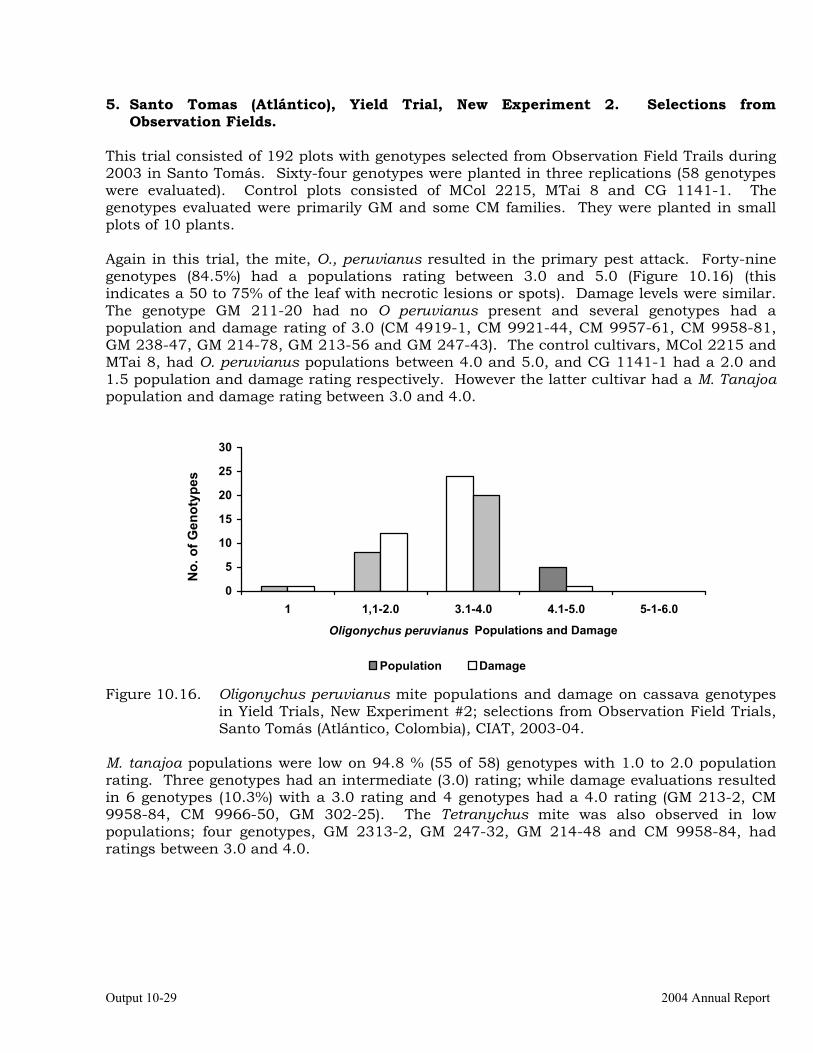
Output 10-29 2004 Annual Report
5. Santo Tomas (Atlántico), Yield Trial, New Experiment 2. Selections from Observation Fields.
This trial consisted of 192 plots with genotypes selected from Observation Field Trails during 2003 in Santo Tomás. Sixty-four genotypes were planted in three replications (58 genotypes were evaluated). Control plots consisted of MCol 2215, MTai 8 and CG 1141-1. The genotypes evaluated were primarily GM and some CM families. They were planted in small plots of 10 plants. Again in this trial, the mite, O., peruvianus resulted in the primary pest attack. Forty-nine genotypes (84.5%) had a populations rating between 3.0 and 5.0 (Figure 10.16) (this indicates a 50 to 75% of the leaf with necrotic lesions or spots). Damage levels were similar. The genotype GM 211-20 had no O peruvianus present and several genotypes had a population and damage rating of 3.0 (CM 4919-1, CM 9921-44, CM 9957-61, CM 9958-81, GM 238-47, GM 214-78, GM 213-56 and GM 247-43). The control cultivars, MCol 2215 and MTai 8, had O. peruvianus populations between 4.0 and 5.0, and CG 1141-1 had a 2.0 and 1.5 population and damage rating respectively. However the latter cultivar had a M. Tanajoa population and damage rating between 3.0 and 4.0.
0
5
10
15
20
25
30
1 1,1-2.0 3.1-4.0 4.1-5.0 5-1-6.0
Oligonychus peruvianus Populations and Damage
No.
of G
enot
ypes
Population Damage
Figure 10.16. Oligonychus peruvianus mite populations and damage on cassava genotypes in Yield Trials, New Experiment #2; selections from Observation Field Trials, Santo Tomás (Atlántico, Colombia), CIAT, 2003-04.
M. tanajoa populations were low on 94.8 % (55 of 58) genotypes with 1.0 to 2.0 population rating. Three genotypes had an intermediate (3.0) rating; while damage evaluations resulted in 6 genotypes (10.3%) with a 3.0 rating and 4 genotypes had a 4.0 rating (GM 213-2, CM 9958-84, CM 9966-50, GM 302-25). The Tetranychus mite was also observed in low populations; four genotypes, GM 2313-2, GM 247-32, GM 214-48 and CM 9958-84, had ratings between 3.0 and 4.0.
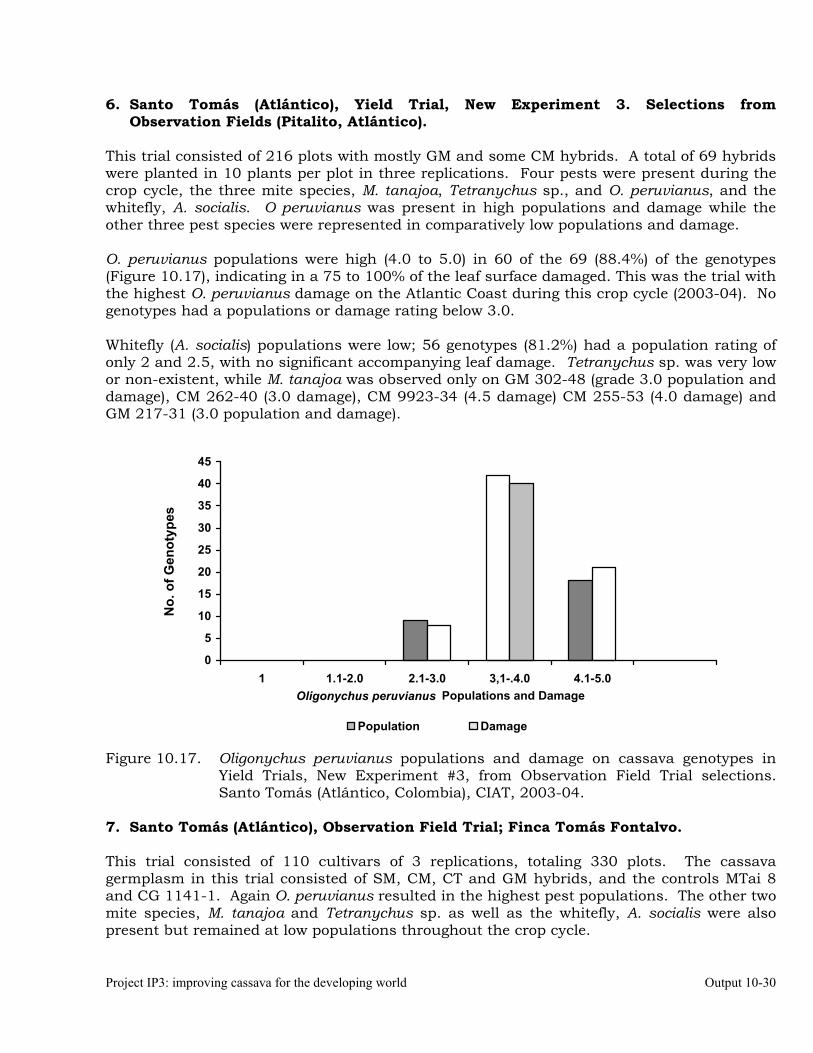
Project IP3: improving cassava for the developing world Output 10-30
6. Santo Tomás (Atlántico), Yield Trial, New Experiment 3. Selections from Observation Fields (Pitalito, Atlántico).
This trial consisted of 216 plots with mostly GM and some CM hybrids. A total of 69 hybrids were planted in 10 plants per plot in three replications. Four pests were present during the crop cycle, the three mite species, M. tanajoa, Tetranychus sp., and O. peruvianus, and the whitefly, A. socialis. O peruvianus was present in high populations and damage while the other three pest species were represented in comparatively low populations and damage. O. peruvianus populations were high (4.0 to 5.0) in 60 of the 69 (88.4%) of the genotypes (Figure 10.17), indicating in a 75 to 100% of the leaf surface damaged. This was the trial with the highest O. peruvianus damage on the Atlantic Coast during this crop cycle (2003-04). No genotypes had a populations or damage rating below 3.0. Whitefly (A. socialis) populations were low; 56 genotypes (81.2%) had a population rating of only 2 and 2.5, with no significant accompanying leaf damage. Tetranychus sp. was very low or non-existent, while M. tanajoa was observed only on GM 302-48 (grade 3.0 population and damage), CM 262-40 (3.0 damage), CM 9923-34 (4.5 damage) CM 255-53 (4.0 damage) and GM 217-31 (3.0 population and damage).
0
5
10
15
20
25
30
35
40
45
1 1.1-2.0 2.1-3.0 3,1-.4.0 4.1-5.0Oligonychus peruvianus Populations and Damage
No.
of G
enot
ypes
Population Damage
Figure 10.17. Oligonychus peruvianus populations and damage on cassava genotypes in Yield Trials, New Experiment #3, from Observation Field Trial selections. Santo Tomás (Atlántico, Colombia), CIAT, 2003-04.
7. Santo Tomás (Atlántico), Observation Field Trial; Finca Tomás Fontalvo. This trial consisted of 110 cultivars of 3 replications, totaling 330 plots. The cassava germplasm in this trial consisted of SM, CM, CT and GM hybrids, and the controls MTai 8 and CG 1141-1. Again O. peruvianus resulted in the highest pest populations. The other two mite species, M. tanajoa and Tetranychus sp. as well as the whitefly, A. socialis were also present but remained at low populations throughout the crop cycle.
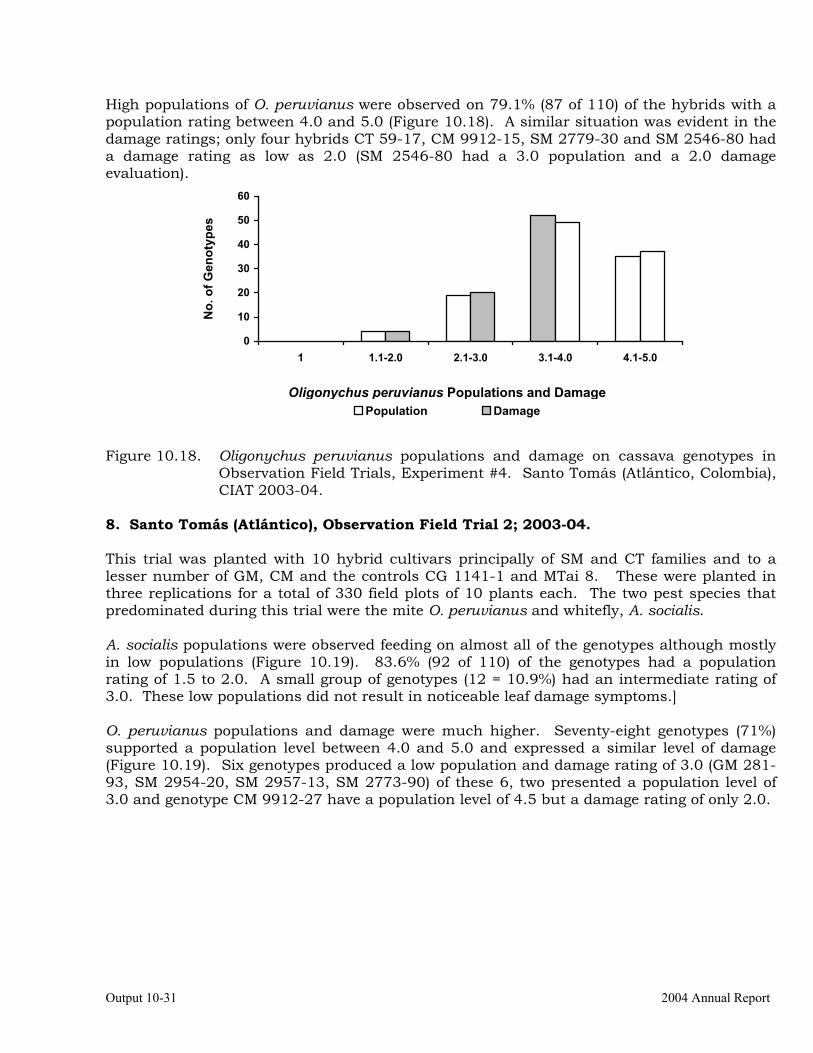
Output 10-31 2004 Annual Report
High populations of O. peruvianus were observed on 79.1% (87 of 110) of the hybrids with a population rating between 4.0 and 5.0 (Figure 10.18). A similar situation was evident in the damage ratings; only four hybrids CT 59-17, CM 9912-15, SM 2779-30 and SM 2546-80 had a damage rating as low as 2.0 (SM 2546-80 had a 3.0 population and a 2.0 damage evaluation).
0
10
20
30
40
50
60
1 1.1-2.0 2.1-3.0 3.1-4.0 4.1-5.0
No.
of G
enot
ypes
Population Damage
Figure 10.18. Oligonychus peruvianus populations and damage on cassava genotypes in
Observation Field Trials, Experiment #4. Santo Tomás (Atlántico, Colombia), CIAT 2003-04.
8. Santo Tomás (Atlántico), Observation Field Trial 2; 2003-04. This trial was planted with 10 hybrid cultivars principally of SM and CT families and to a lesser number of GM, CM and the controls CG 1141-1 and MTai 8. These were planted in three replications for a total of 330 field plots of 10 plants each. The two pest species that predominated during this trial were the mite O. peruvianus and whitefly, A. socialis. A. socialis populations were observed feeding on almost all of the genotypes although mostly in low populations (Figure 10.19). 83.6% (92 of 110) of the genotypes had a population rating of 1.5 to 2.0. A small group of genotypes (12 = 10.9%) had an intermediate rating of 3.0. These low populations did not result in noticeable leaf damage symptoms.] O. peruvianus populations and damage were much higher. Seventy-eight genotypes (71%) supported a population level between 4.0 and 5.0 and expressed a similar level of damage (Figure 10.19). Six genotypes produced a low population and damage rating of 3.0 (GM 281-93, SM 2954-20, SM 2957-13, SM 2773-90) of these 6, two presented a population level of 3.0 and genotype CM 9912-27 have a population level of 4.5 but a damage rating of only 2.0.
Oligonychus peruvianus Populations and Damage
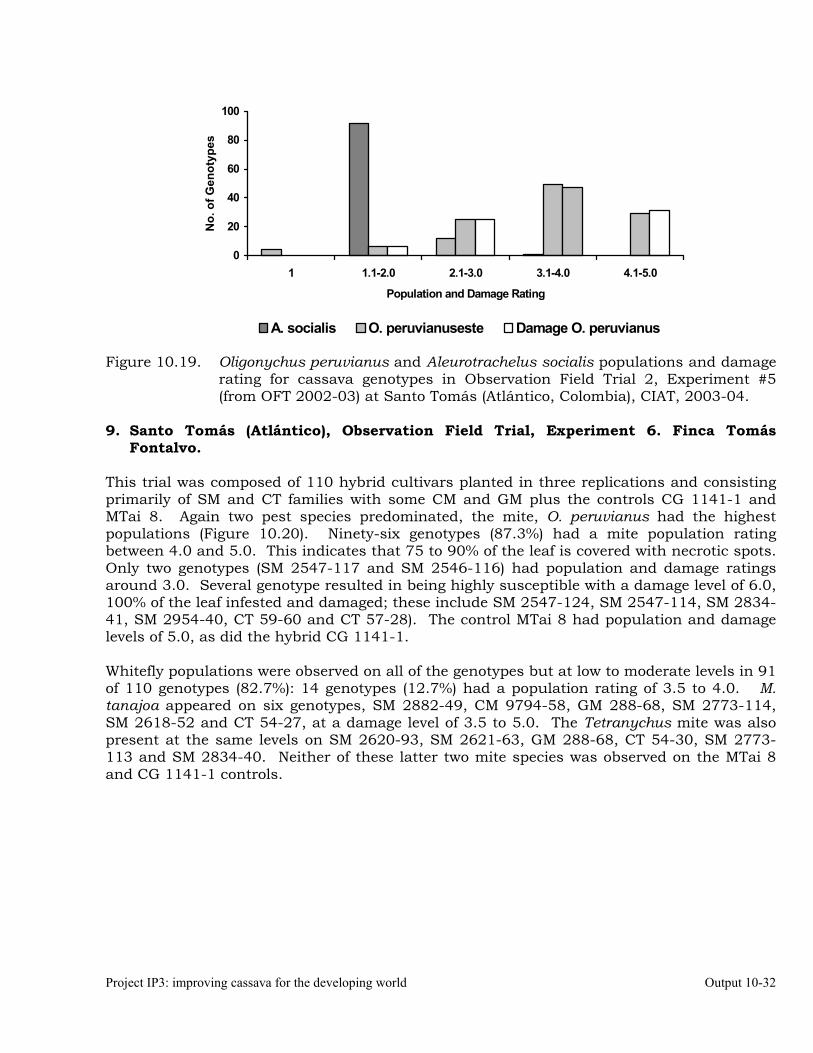
Project IP3: improving cassava for the developing world Output 10-32
0
20
40
60
80
100
1 1.1-2.0 2.1-3.0 3.1-4.0 4.1-5.0
Population and Damage Rating
No.
of G
enot
ypes
A. socialis O. peruvianuseste Damage O. peruvianus
Figure 10.19. Oligonychus peruvianus and Aleurotrachelus socialis populations and damage rating for cassava genotypes in Observation Field Trial 2, Experiment #5 (from OFT 2002-03) at Santo Tomás (Atlántico, Colombia), CIAT, 2003-04.
9. Santo Tomás (Atlántico), Observation Field Trial, Experiment 6. Finca Tomás
Fontalvo. This trial was composed of 110 hybrid cultivars planted in three replications and consisting primarily of SM and CT families with some CM and GM plus the controls CG 1141-1 and MTai 8. Again two pest species predominated, the mite, O. peruvianus had the highest populations (Figure 10.20). Ninety-six genotypes (87.3%) had a mite population rating between 4.0 and 5.0. This indicates that 75 to 90% of the leaf is covered with necrotic spots. Only two genotypes (SM 2547-117 and SM 2546-116) had population and damage ratings around 3.0. Several genotype resulted in being highly susceptible with a damage level of 6.0, 100% of the leaf infested and damaged; these include SM 2547-124, SM 2547-114, SM 2834-41, SM 2954-40, CT 59-60 and CT 57-28). The control MTai 8 had population and damage levels of 5.0, as did the hybrid CG 1141-1. Whitefly populations were observed on all of the genotypes but at low to moderate levels in 91 of 110 genotypes (82.7%): 14 genotypes (12.7%) had a population rating of 3.5 to 4.0. M. tanajoa appeared on six genotypes, SM 2882-49, CM 9794-58, GM 288-68, SM 2773-114, SM 2618-52 and CT 54-27, at a damage level of 3.5 to 5.0. The Tetranychus mite was also present at the same levels on SM 2620-93, SM 2621-63, GM 288-68, CT 54-30, SM 2773-113 and SM 2834-40. Neither of these latter two mite species was observed on the MTai 8 and CG 1141-1 controls.
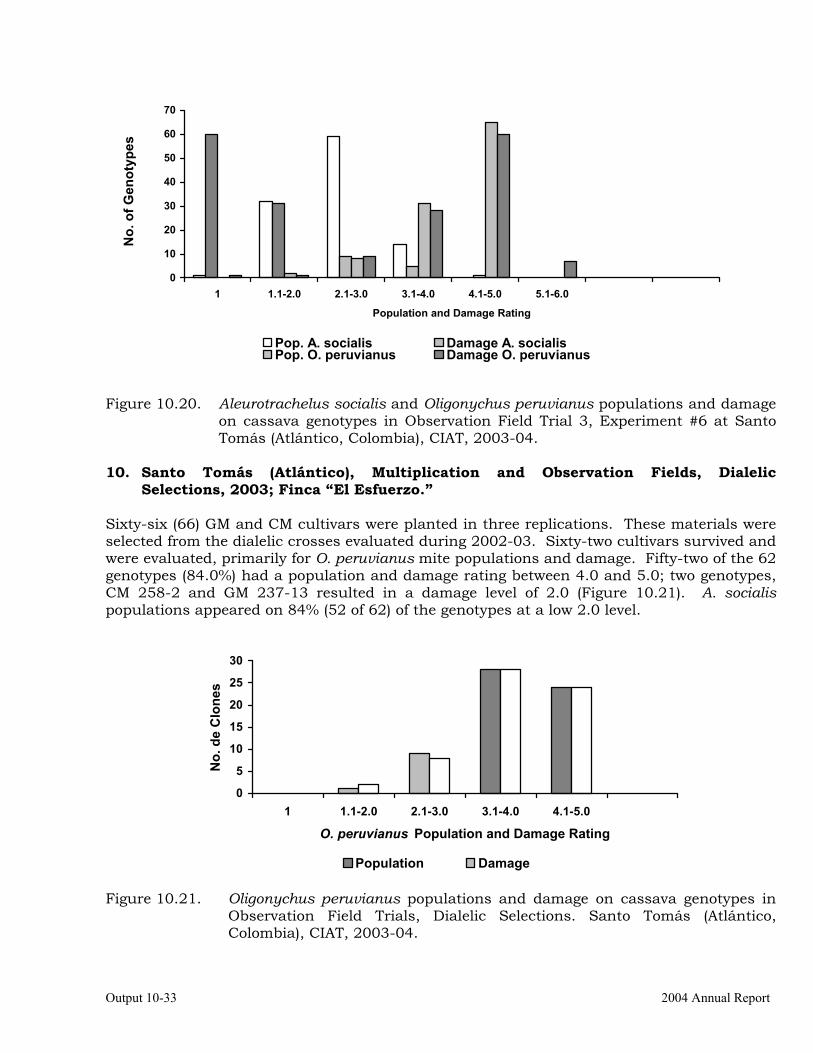
Output 10-33 2004 Annual Report
0
10
20
30
40
50
60
70
1 1.1-2.0 2.1-3.0 3.1-4.0 4.1-5.0 5.1-6.0
Population and Damage Rating
Pop. A. socialis Damage A. socialisPop. O. peruvianus Damage O. peruvianus
Figure 10.20. Aleurotrachelus socialis and Oligonychus peruvianus populations and damage
on cassava genotypes in Observation Field Trial 3, Experiment #6 at Santo Tomás (Atlántico, Colombia), CIAT, 2003-04.
10. Santo Tomás (Atlántico), Multiplication and Observation Fields, Dialelic
Selections, 2003; Finca “El Esfuerzo.” Sixty-six (66) GM and CM cultivars were planted in three replications. These materials were selected from the dialelic crosses evaluated during 2002-03. Sixty-two cultivars survived and were evaluated, primarily for O. peruvianus mite populations and damage. Fifty-two of the 62 genotypes (84.0%) had a population and damage rating between 4.0 and 5.0; two genotypes, CM 258-2 and GM 237-13 resulted in a damage level of 2.0 (Figure 10.21). A. socialis populations appeared on 84% (52 of 62) of the genotypes at a low 2.0 level.
0
5
10
15
20
25
30
1 1.1-2.0 2.1-3.0 3.1-4.0 4.1-5.0
O. peruvianus Population and Damage Rating
No.
de
Clo
nes
Population Damage
Figure 10.21. Oligonychus peruvianus populations and damage on cassava genotypes in Observation Field Trials, Dialelic Selections. Santo Tomás (Atlántico, Colombia), CIAT, 2003-04.
No.
of G
enot
ypes
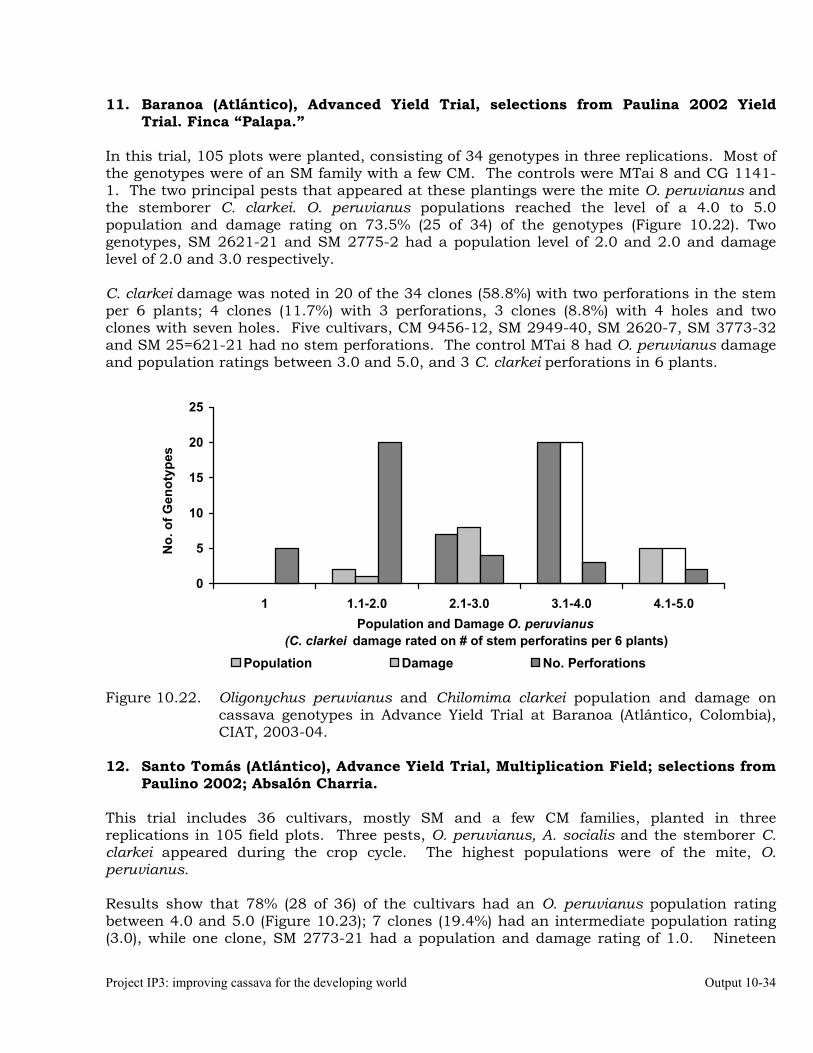
Project IP3: improving cassava for the developing world Output 10-34
11. Baranoa (Atlántico), Advanced Yield Trial, selections from Paulina 2002 Yield Trial. Finca “Palapa.”
In this trial, 105 plots were planted, consisting of 34 genotypes in three replications. Most of the genotypes were of an SM family with a few CM. The controls were MTai 8 and CG 1141-1. The two principal pests that appeared at these plantings were the mite O. peruvianus and the stemborer C. clarkei. O. peruvianus populations reached the level of a 4.0 to 5.0 population and damage rating on 73.5% (25 of 34) of the genotypes (Figure 10.22). Two genotypes, SM 2621-21 and SM 2775-2 had a population level of 2.0 and 2.0 and damage level of 2.0 and 3.0 respectively. C. clarkei damage was noted in 20 of the 34 clones (58.8%) with two perforations in the stem per 6 plants; 4 clones (11.7%) with 3 perforations, 3 clones (8.8%) with 4 holes and two clones with seven holes. Five cultivars, CM 9456-12, SM 2949-40, SM 2620-7, SM 3773-32 and SM 25=621-21 had no stem perforations. The control MTai 8 had O. peruvianus damage and population ratings between 3.0 and 5.0, and 3 C. clarkei perforations in 6 plants.
0
5
10
15
20
25
1 1.1-2.0 2.1-3.0 3.1-4.0 4.1-5.0Population and Damage O. peruvianus
(C. clarkei damage rated on # of stem perforatins per 6 plants)
No.
of G
enot
ypes
Population Damage No. Perforations
Figure 10.22. Oligonychus peruvianus and Chilomima clarkei population and damage on cassava genotypes in Advance Yield Trial at Baranoa (Atlántico, Colombia), CIAT, 2003-04.
12. Santo Tomás (Atlántico), Advance Yield Trial, Multiplication Field; selections from
Paulino 2002; Absalón Charria. This trial includes 36 cultivars, mostly SM and a few CM families, planted in three replications in 105 field plots. Three pests, O. peruvianus, A. socialis and the stemborer C. clarkei appeared during the crop cycle. The highest populations were of the mite, O. peruvianus. Results show that 78% (28 of 36) of the cultivars had an O. peruvianus population rating between 4.0 and 5.0 (Figure 10.23); 7 clones (19.4%) had an intermediate population rating (3.0), while one clone, SM 2773-21 had a population and damage rating of 1.0. Nineteen
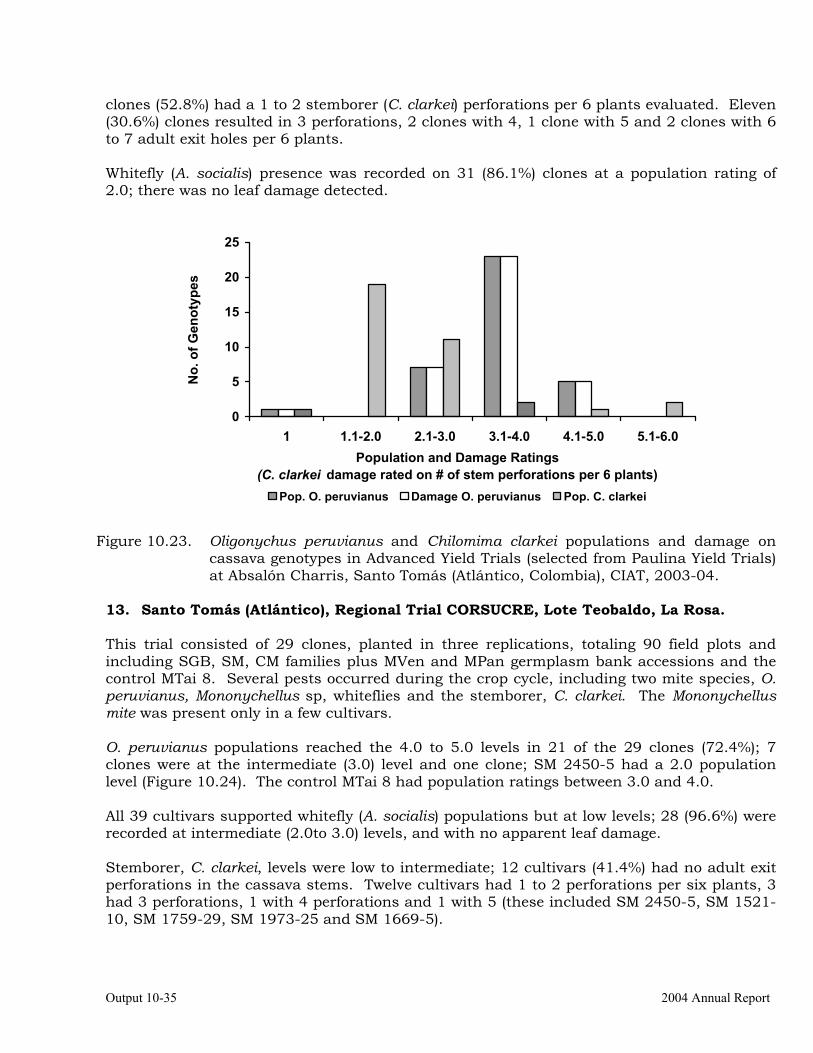
Output 10-35 2004 Annual Report
clones (52.8%) had a 1 to 2 stemborer (C. clarkei) perforations per 6 plants evaluated. Eleven (30.6%) clones resulted in 3 perforations, 2 clones with 4, 1 clone with 5 and 2 clones with 6 to 7 adult exit holes per 6 plants. Whitefly (A. socialis) presence was recorded on 31 (86.1%) clones at a population rating of 2.0; there was no leaf damage detected.
0
5
10
15
20
25
1 1.1-2.0 2.1-3.0 3.1-4.0 4.1-5.0 5.1-6.0Population and Damage Ratings
(C. clarkei damage rated on # of stem perforations per 6 plants)
No.
of G
enot
ypes
Pop. O. peruvianus Damage O. peruvianus Pop. C. clarkei
Figure 10.23. Oligonychus peruvianus and Chilomima clarkei populations and damage on
cassava genotypes in Advanced Yield Trials (selected from Paulina Yield Trials) at Absalón Charris, Santo Tomás (Atlántico, Colombia), CIAT, 2003-04.
13. Santo Tomás (Atlántico), Regional Trial CORSUCRE, Lote Teobaldo, La Rosa. This trial consisted of 29 clones, planted in three replications, totaling 90 field plots and including SGB, SM, CM families plus MVen and MPan germplasm bank accessions and the control MTai 8. Several pests occurred during the crop cycle, including two mite species, O. peruvianus, Mononychellus sp, whiteflies and the stemborer, C. clarkei. The Mononychellus mite was present only in a few cultivars. O. peruvianus populations reached the 4.0 to 5.0 levels in 21 of the 29 clones (72.4%); 7 clones were at the intermediate (3.0) level and one clone; SM 2450-5 had a 2.0 population level (Figure 10.24). The control MTai 8 had population ratings between 3.0 and 4.0. All 39 cultivars supported whitefly (A. socialis) populations but at low levels; 28 (96.6%) were recorded at intermediate (2.0to 3.0) levels, and with no apparent leaf damage. Stemborer, C. clarkei, levels were low to intermediate; 12 cultivars (41.4%) had no adult exit perforations in the cassava stems. Twelve cultivars had 1 to 2 perforations per six plants, 3 had 3 perforations, 1 with 4 perforations and 1 with 5 (these included SM 2450-5, SM 1521-10, SM 1759-29, SM 1973-25 and SM 1669-5).
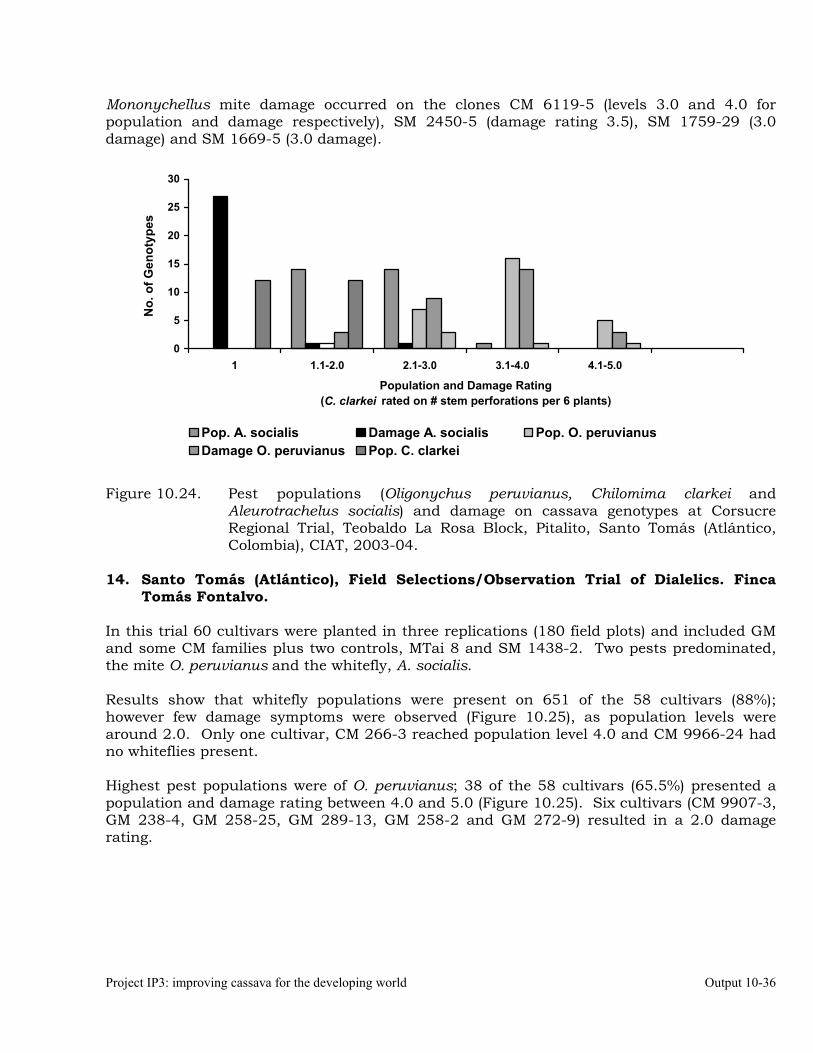
Project IP3: improving cassava for the developing world Output 10-36
Mononychellus mite damage occurred on the clones CM 6119-5 (levels 3.0 and 4.0 for population and damage respectively), SM 2450-5 (damage rating 3.5), SM 1759-29 (3.0 damage) and SM 1669-5 (3.0 damage).
0
5
10
15
20
25
30
1 1.1-2.0 2.1-3.0 3.1-4.0 4.1-5.0
Population and Damage Rating(C. clarkei rated on # stem perforations per 6 plants)
No.
of G
enot
ypes
Pop. A. socialis Damage A. socialis Pop. O. peruvianusDamage O. peruvianus Pop. C. clarkei
Figure 10.24. Pest populations (Oligonychus peruvianus, Chilomima clarkei and
Aleurotrachelus socialis) and damage on cassava genotypes at Corsucre Regional Trial, Teobaldo La Rosa Block, Pitalito, Santo Tomás (Atlántico, Colombia), CIAT, 2003-04.
14. Santo Tomás (Atlántico), Field Selections/Observation Trial of Dialelics. Finca
Tomás Fontalvo. In this trial 60 cultivars were planted in three replications (180 field plots) and included GM and some CM families plus two controls, MTai 8 and SM 1438-2. Two pests predominated, the mite O. peruvianus and the whitefly, A. socialis. Results show that whitefly populations were present on 651 of the 58 cultivars (88%); however few damage symptoms were observed (Figure 10.25), as population levels were around 2.0. Only one cultivar, CM 266-3 reached population level 4.0 and CM 9966-24 had no whiteflies present. Highest pest populations were of O. peruvianus; 38 of the 58 cultivars (65.5%) presented a population and damage rating between 4.0 and 5.0 (Figure 10.25). Six cultivars (CM 9907-3, GM 238-4, GM 258-25, GM 289-13, GM 258-2 and GM 272-9) resulted in a 2.0 damage rating.
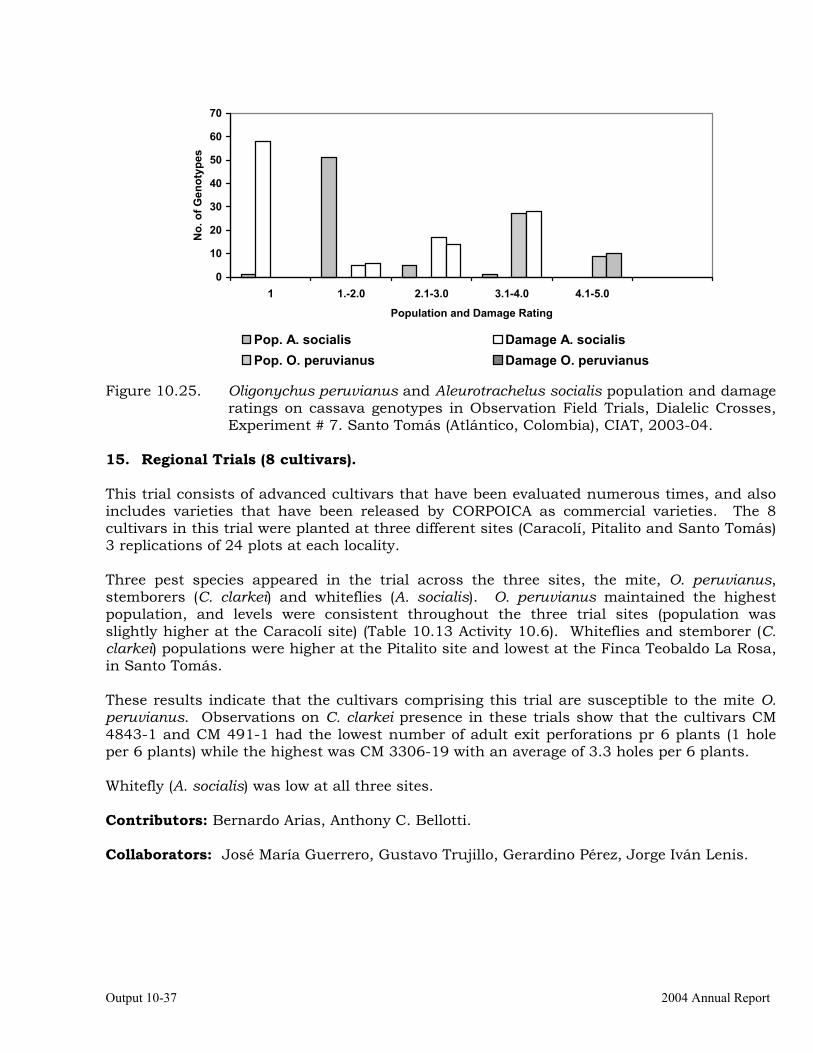
Output 10-37 2004 Annual Report
0
10
20
30
40
50
60
70
1 1.-2.0 2.1-3.0 3.1-4.0 4.1-5.0
Population and Damage Rating
No.
of G
enot
ypes
Pop. A. socialis Damage A. socialisPop. O. peruvianus Damage O. peruvianus
Figure 10.25. Oligonychus peruvianus and Aleurotrachelus socialis population and damage
ratings on cassava genotypes in Observation Field Trials, Dialelic Crosses, Experiment # 7. Santo Tomás (Atlántico, Colombia), CIAT, 2003-04.
15. Regional Trials (8 cultivars). This trial consists of advanced cultivars that have been evaluated numerous times, and also includes varieties that have been released by CORPOICA as commercial varieties. The 8 cultivars in this trial were planted at three different sites (Caracolí, Pitalito and Santo Tomás) 3 replications of 24 plots at each locality. Three pest species appeared in the trial across the three sites, the mite, O. peruvianus, stemborers (C. clarkei) and whiteflies (A. socialis). O. peruvianus maintained the highest population, and levels were consistent throughout the three trial sites (population was slightly higher at the Caracolí site) (Table 10.13 Activity 10.6). Whiteflies and stemborer (C. clarkei) populations were higher at the Pitalito site and lowest at the Finca Teobaldo La Rosa, in Santo Tomás. These results indicate that the cultivars comprising this trial are susceptible to the mite O. peruvianus. Observations on C. clarkei presence in these trials show that the cultivars CM 4843-1 and CM 491-1 had the lowest number of adult exit perforations pr 6 plants (1 hole per 6 plants) while the highest was CM 3306-19 with an average of 3.3 holes per 6 plants. Whitefly (A. socialis) was low at all three sites. Contributors: Bernardo Arias, Anthony C. Bellotti. Collaborators: José María Guerrero, Gustavo Trujillo, Gerardino Pérez, Jorge Iván Lenis.
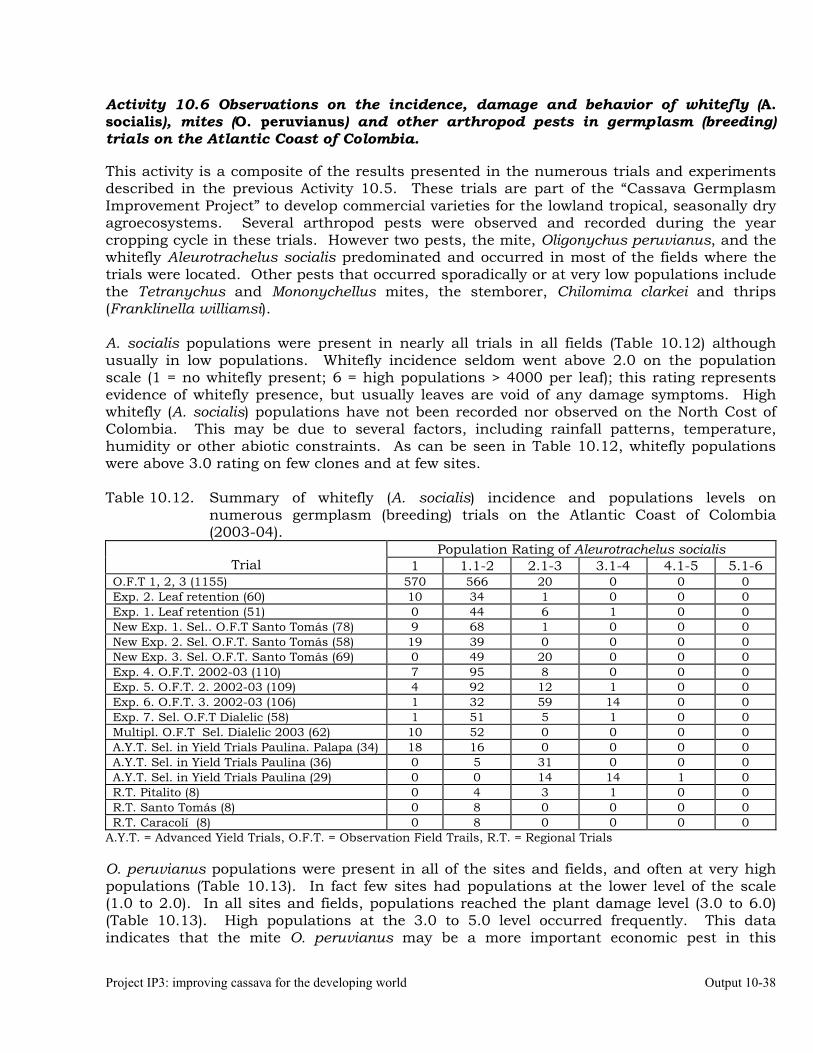
Project IP3: improving cassava for the developing world Output 10-38
Activity 10.6 Observations on the incidence, damage and behavior of whitefly (A. socialis), mites (O. peruvianus) and other arthropod pests in germplasm (breeding) trials on the Atlantic Coast of Colombia. This activity is a composite of the results presented in the numerous trials and experiments described in the previous Activity 10.5. These trials are part of the “Cassava Germplasm Improvement Project” to develop commercial varieties for the lowland tropical, seasonally dry agroecosystems. Several arthropod pests were observed and recorded during the year cropping cycle in these trials. However two pests, the mite, Oligonychus peruvianus, and the whitefly Aleurotrachelus socialis predominated and occurred in most of the fields where the trials were located. Other pests that occurred sporadically or at very low populations include the Tetranychus and Mononychellus mites, the stemborer, Chilomima clarkei and thrips (Franklinella williamsi). A. socialis populations were present in nearly all trials in all fields (Table 10.12) although usually in low populations. Whitefly incidence seldom went above 2.0 on the population scale (1 = no whitefly present; 6 = high populations > 4000 per leaf); this rating represents evidence of whitefly presence, but usually leaves are void of any damage symptoms. High whitefly (A. socialis) populations have not been recorded nor observed on the North Cost of Colombia. This may be due to several factors, including rainfall patterns, temperature, humidity or other abiotic constraints. As can be seen in Table 10.12, whitefly populations were above 3.0 rating on few clones and at few sites. Table 10.12. Summary of whitefly (A. socialis) incidence and populations levels on
numerous germplasm (breeding) trials on the Atlantic Coast of Colombia (2003-04).
Population Rating of Aleurotrachelus socialis Trial 1 1.1-2 2.1-3 3.1-4 4.1-5 5.1-6
O.F.T 1, 2, 3 (1155) 570 566 20 0 0 0 Exp. 2. Leaf retention (60) 10 34 1 0 0 0 Exp. 1. Leaf retention (51) 0 44 6 1 0 0 New Exp. 1. Sel.. O.F.T Santo Tomás (78) 9 68 1 0 0 0 New Exp. 2. Sel. O.F.T. Santo Tomás (58) 19 39 0 0 0 0 New Exp. 3. Sel. O.F.T. Santo Tomás (69) 0 49 20 0 0 0 Exp. 4. O.F.T. 2002-03 (110) 7 95 8 0 0 0 Exp. 5. O.F.T. 2. 2002-03 (109) 4 92 12 1 0 0 Exp. 6. O.F.T. 3. 2002-03 (106) 1 32 59 14 0 0 Exp. 7. Sel. O.F.T Dialelic (58) 1 51 5 1 0 0 Multipl. O.F.T Sel. Dialelic 2003 (62) 10 52 0 0 0 0 A.Y.T. Sel. in Yield Trials Paulina. Palapa (34) 18 16 0 0 0 0 A.Y.T. Sel. in Yield Trials Paulina (36) 0 5 31 0 0 0 A.Y.T. Sel. in Yield Trials Paulina (29) 0 0 14 14 1 0 R.T. Pitalito (8) 0 4 3 1 0 0 R.T. Santo Tomás (8) 0 8 0 0 0 0 R.T. Caracolí (8) 0 8 0 0 0 0
A.Y.T. = Advanced Yield Trials, O.F.T. = Observation Field Trails, R.T. = Regional Trials O. peruvianus populations were present in all of the sites and fields, and often at very high populations (Table 10.13). In fact few sites had populations at the lower level of the scale (1.0 to 2.0). In all sites and fields, populations reached the plant damage level (3.0 to 6.0) (Table 10.13). High populations at the 3.0 to 5.0 level occurred frequently. This data indicates that the mite O. peruvianus may be a more important economic pest in this
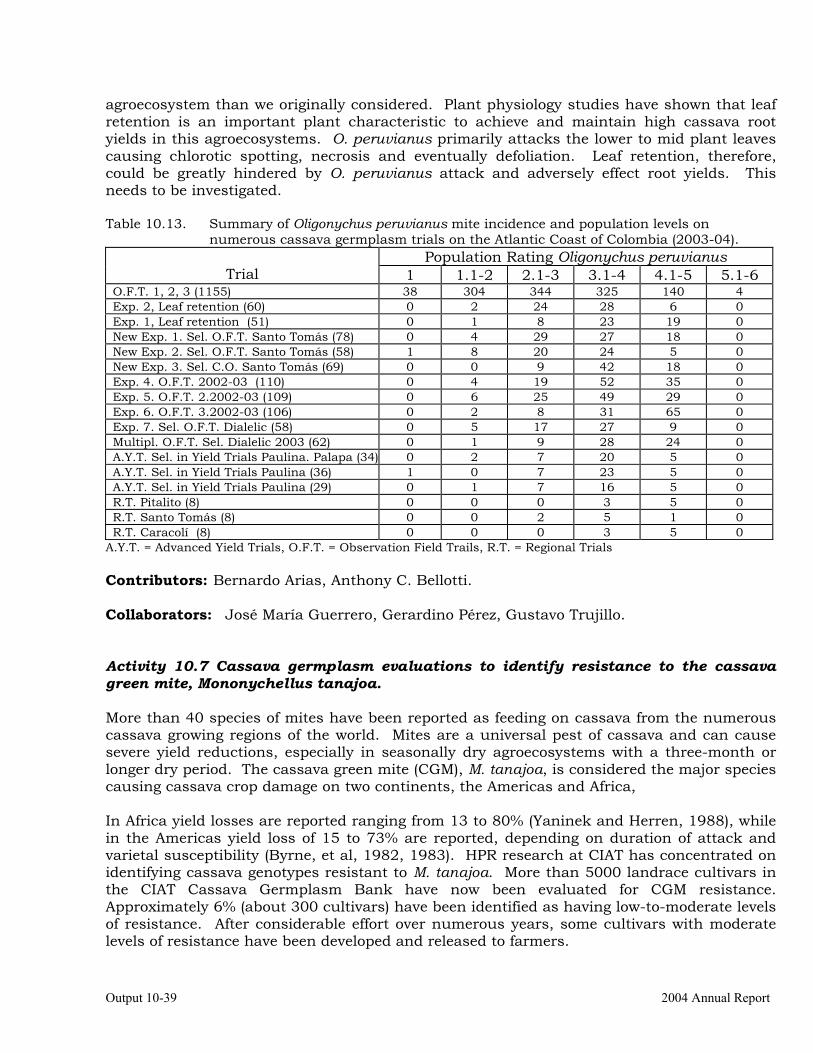
Output 10-39 2004 Annual Report
agroecosystem than we originally considered. Plant physiology studies have shown that leaf retention is an important plant characteristic to achieve and maintain high cassava root yields in this agroecosystems. O. peruvianus primarily attacks the lower to mid plant leaves causing chlorotic spotting, necrosis and eventually defoliation. Leaf retention, therefore, could be greatly hindered by O. peruvianus attack and adversely effect root yields. This needs to be investigated. Table 10.13. Summary of Oligonychus peruvianus mite incidence and population levels on
numerous cassava germplasm trials on the Atlantic Coast of Colombia (2003-04). Population Rating Oligonychus peruvianus
Trial 1 1.1-2 2.1-3 3.1-4 4.1-5 5.1-6 O.F.T. 1, 2, 3 (1155) 38 304 344 325 140 4 Exp. 2, Leaf retention (60) 0 2 24 28 6 0 Exp. 1, Leaf retention (51) 0 1 8 23 19 0 New Exp. 1. Sel. O.F.T. Santo Tomás (78) 0 4 29 27 18 0 New Exp. 2. Sel. O.F.T. Santo Tomás (58) 1 8 20 24 5 0 New Exp. 3. Sel. C.O. Santo Tomás (69) 0 0 9 42 18 0 Exp. 4. O.F.T. 2002-03 (110) 0 4 19 52 35 0 Exp. 5. O.F.T. 2.2002-03 (109) 0 6 25 49 29 0 Exp. 6. O.F.T. 3.2002-03 (106) 0 2 8 31 65 0 Exp. 7. Sel. O.F.T. Dialelic (58) 0 5 17 27 9 0 Multipl. O.F.T. Sel. Dialelic 2003 (62) 0 1 9 28 24 0 A.Y.T. Sel. in Yield Trials Paulina. Palapa (34) 0 2 7 20 5 0 A.Y.T. Sel. in Yield Trials Paulina (36) 1 0 7 23 5 0 A.Y.T. Sel. in Yield Trials Paulina (29) 0 1 7 16 5 0 R.T. Pitalito (8) 0 0 0 3 5 0 R.T. Santo Tomás (8) 0 0 2 5 1 0 R.T. Caracolí (8) 0 0 0 3 5 0
A.Y.T. = Advanced Yield Trials, O.F.T. = Observation Field Trails, R.T. = Regional Trials Contributors: Bernardo Arias, Anthony C. Bellotti. Collaborators: José María Guerrero, Gerardino Pérez, Gustavo Trujillo. Activity 10.7 Cassava germplasm evaluations to identify resistance to the cassava green mite, Mononychellus tanajoa. More than 40 species of mites have been reported as feeding on cassava from the numerous cassava growing regions of the world. Mites are a universal pest of cassava and can cause severe yield reductions, especially in seasonally dry agroecosystems with a three-month or longer dry period. The cassava green mite (CGM), M. tanajoa, is considered the major species causing cassava crop damage on two continents, the Americas and Africa, In Africa yield losses are reported ranging from 13 to 80% (Yaninek and Herren, 1988), while in the Americas yield loss of 15 to 73% are reported, depending on duration of attack and varietal susceptibility (Byrne, et al, 1982, 1983). HPR research at CIAT has concentrated on identifying cassava genotypes resistant to M. tanajoa. More than 5000 landrace cultivars in the CIAT Cassava Germplasm Bank have now been evaluated for CGM resistance. Approximately 6% (about 300 cultivars) have been identified as having low-to-moderate levels of resistance. After considerable effort over numerous years, some cultivars with moderate levels of resistance have been developed and released to farmers.
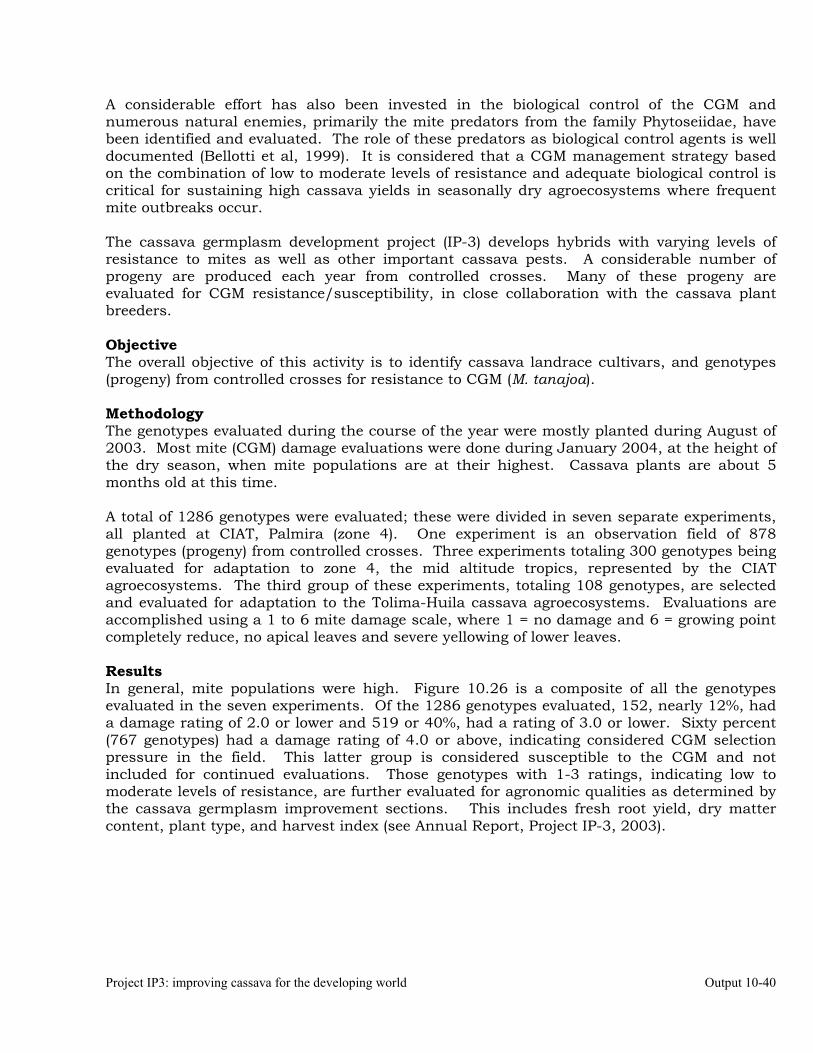
Project IP3: improving cassava for the developing world Output 10-40
A considerable effort has also been invested in the biological control of the CGM and numerous natural enemies, primarily the mite predators from the family Phytoseiidae, have been identified and evaluated. The role of these predators as biological control agents is well documented (Bellotti et al, 1999). It is considered that a CGM management strategy based on the combination of low to moderate levels of resistance and adequate biological control is critical for sustaining high cassava yields in seasonally dry agroecosystems where frequent mite outbreaks occur. The cassava germplasm development project (IP-3) develops hybrids with varying levels of resistance to mites as well as other important cassava pests. A considerable number of progeny are produced each year from controlled crosses. Many of these progeny are evaluated for CGM resistance/susceptibility, in close collaboration with the cassava plant breeders. Objective The overall objective of this activity is to identify cassava landrace cultivars, and genotypes (progeny) from controlled crosses for resistance to CGM (M. tanajoa). Methodology The genotypes evaluated during the course of the year were mostly planted during August of 2003. Most mite (CGM) damage evaluations were done during January 2004, at the height of the dry season, when mite populations are at their highest. Cassava plants are about 5 months old at this time. A total of 1286 genotypes were evaluated; these were divided in seven separate experiments, all planted at CIAT, Palmira (zone 4). One experiment is an observation field of 878 genotypes (progeny) from controlled crosses. Three experiments totaling 300 genotypes being evaluated for adaptation to zone 4, the mid altitude tropics, represented by the CIAT agroecosystems. The third group of these experiments, totaling 108 genotypes, are selected and evaluated for adaptation to the Tolima-Huila cassava agroecosystems. Evaluations are accomplished using a 1 to 6 mite damage scale, where 1 = no damage and 6 = growing point completely reduce, no apical leaves and severe yellowing of lower leaves. Results In general, mite populations were high. Figure 10.26 is a composite of all the genotypes evaluated in the seven experiments. Of the 1286 genotypes evaluated, 152, nearly 12%, had a damage rating of 2.0 or lower and 519 or 40%, had a rating of 3.0 or lower. Sixty percent (767 genotypes) had a damage rating of 4.0 or above, indicating considered CGM selection pressure in the field. This latter group is considered susceptible to the CGM and not included for continued evaluations. Those genotypes with 1-3 ratings, indicating low to moderate levels of resistance, are further evaluated for agronomic qualities as determined by the cassava germplasm improvement sections. This includes fresh root yield, dry matter content, plant type, and harvest index (see Annual Report, Project IP-3, 2003).
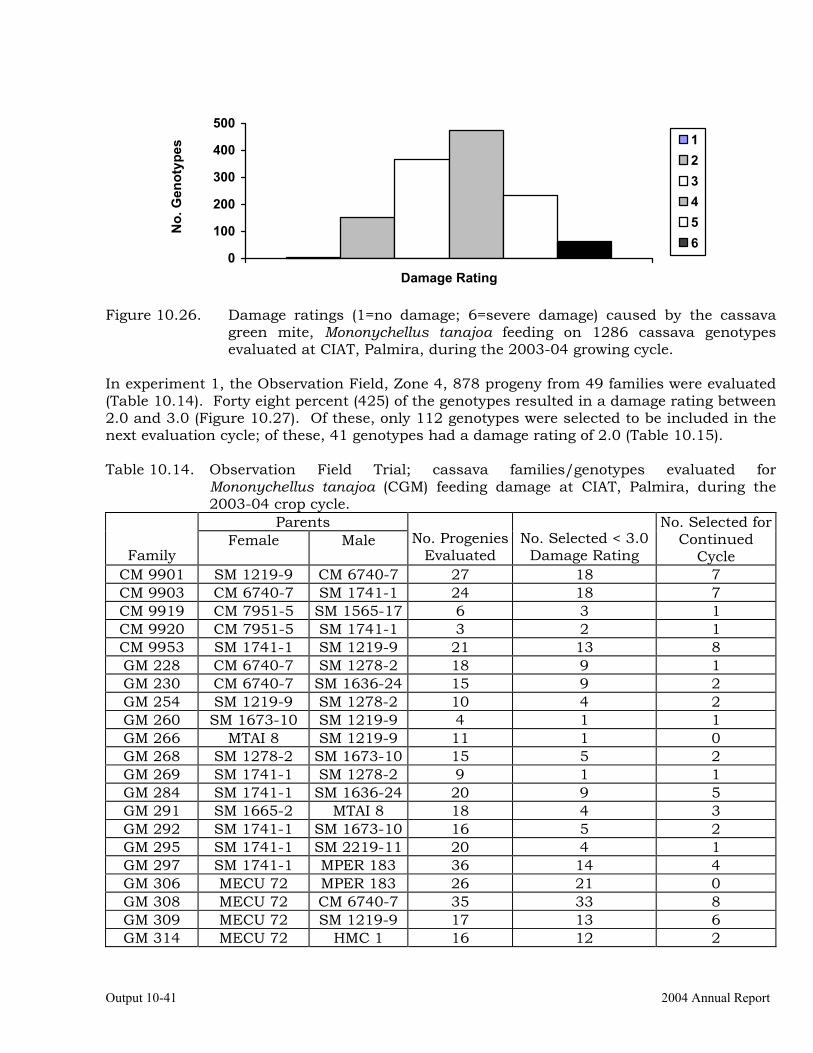
Output 10-41 2004 Annual Report
0
100
200
300
400
500
Damage Rating
123456
Figure 10.26. Damage ratings (1=no damage; 6=severe damage) caused by the cassava
green mite, Mononychellus tanajoa feeding on 1286 cassava genotypes evaluated at CIAT, Palmira, during the 2003-04 growing cycle.
In experiment 1, the Observation Field, Zone 4, 878 progeny from 49 families were evaluated (Table 10.14). Forty eight percent (425) of the genotypes resulted in a damage rating between 2.0 and 3.0 (Figure 10.27). Of these, only 112 genotypes were selected to be included in the next evaluation cycle; of these, 41 genotypes had a damage rating of 2.0 (Table 10.15). Table 10.14. Observation Field Trial; cassava families/genotypes evaluated for
Mononychellus tanajoa (CGM) feeding damage at CIAT, Palmira, during the 2003-04 crop cycle.
Parents
Family Female Male No. Progenies
Evaluated No. Selected < 3.0
Damage Rating
No. Selected for Continued
Cycle CM 9901 SM 1219-9 CM 6740-7 27 18 7 CM 9903 CM 6740-7 SM 1741-1 24 18 7 CM 9919 CM 7951-5 SM 1565-17 6 3 1 CM 9920 CM 7951-5 SM 1741-1 3 2 1 CM 9953 SM 1741-1 SM 1219-9 21 13 8 GM 228 CM 6740-7 SM 1278-2 18 9 1 GM 230 CM 6740-7 SM 1636-24 15 9 2 GM 254 SM 1219-9 SM 1278-2 10 4 2 GM 260 SM 1673-10 SM 1219-9 4 1 1 GM 266 MTAI 8 SM 1219-9 11 1 0 GM 268 SM 1278-2 SM 1673-10 15 5 2 GM 269 SM 1741-1 SM 1278-2 9 1 1 GM 284 SM 1741-1 SM 1636-24 20 9 5 GM 291 SM 1665-2 MTAI 8 18 4 3 GM 292 SM 1741-1 SM 1673-10 16 5 2 GM 295 SM 1741-1 SM 2219-11 20 4 1 GM 297 SM 1741-1 MPER 183 36 14 4 GM 306 MECU 72 MPER 183 26 21 0 GM 308 MECU 72 CM 6740-7 35 33 8 GM 309 MECU 72 SM 1219-9 17 13 6 GM 314 MECU 72 HMC 1 16 12 2
No.
Gen
otyp
es
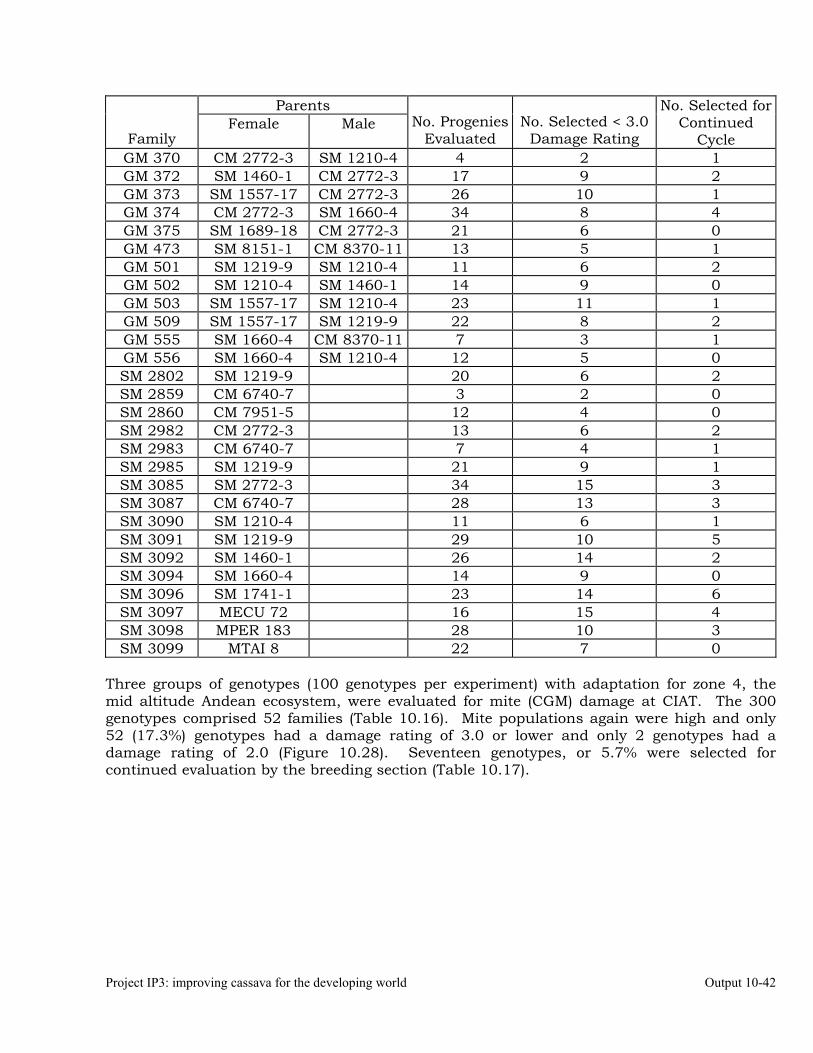
Project IP3: improving cassava for the developing world Output 10-42
Parents
Family Female Male No. Progenies
Evaluated No. Selected < 3.0
Damage Rating
No. Selected for Continued
Cycle GM 370 CM 2772-3 SM 1210-4 4 2 1 GM 372 SM 1460-1 CM 2772-3 17 9 2 GM 373 SM 1557-17 CM 2772-3 26 10 1 GM 374 CM 2772-3 SM 1660-4 34 8 4 GM 375 SM 1689-18 CM 2772-3 21 6 0 GM 473 SM 8151-1 CM 8370-11 13 5 1 GM 501 SM 1219-9 SM 1210-4 11 6 2 GM 502 SM 1210-4 SM 1460-1 14 9 0 GM 503 SM 1557-17 SM 1210-4 23 11 1 GM 509 SM 1557-17 SM 1219-9 22 8 2 GM 555 SM 1660-4 CM 8370-11 7 3 1 GM 556 SM 1660-4 SM 1210-4 12 5 0 SM 2802 SM 1219-9 20 6 2 SM 2859 CM 6740-7 3 2 0 SM 2860 CM 7951-5 12 4 0 SM 2982 CM 2772-3 13 6 2 SM 2983 CM 6740-7 7 4 1 SM 2985 SM 1219-9 21 9 1 SM 3085 SM 2772-3 34 15 3 SM 3087 CM 6740-7 28 13 3 SM 3090 SM 1210-4 11 6 1 SM 3091 SM 1219-9 29 10 5 SM 3092 SM 1460-1 26 14 2 SM 3094 SM 1660-4 14 9 0 SM 3096 SM 1741-1 23 14 6 SM 3097 MECU 72 16 15 4 SM 3098 MPER 183 28 10 3 SM 3099 MTAI 8 22 7 0
Three groups of genotypes (100 genotypes per experiment) with adaptation for zone 4, the mid altitude Andean ecosystem, were evaluated for mite (CGM) damage at CIAT. The 300 genotypes comprised 52 families (Table 10.16). Mite populations again were high and only 52 (17.3%) genotypes had a damage rating of 3.0 or lower and only 2 genotypes had a damage rating of 2.0 (Figure 10.28). Seventeen genotypes, or 5.7% were selected for continued evaluation by the breeding section (Table 10.17).

Output 10-43 2004 Annual Report
050
100150200250300350
Damage Rating
123456
Figure 10.27. Damage rating (1 = no damage; 6 = severe damage) for Mononychellus
tanajoa feeding on 878 genotypes from Field Observational Trials for zone 4 (mid- altitude tropics) at CIAT, Palmira, during 2003-04 crop cycle.
Table 10.15. Field Observation Trials: Cassava genotypes showing moderate levels of
resistance to Mononychellus tanajoa and selected for further field evaluations at CIAT (2003-04). Genotype Genotype
CM 9901-167 GM 314-64 CM 9901-172 GM 372-4 CM 9903-201 GM 373-5 CM 9953-163 GM 374-22 CM 9953-173 GM 374-23 CM 9953-177 GM 503-22 CM 9953-178 GM 509-3 GM 230-74 SM 2802-104 GM 254-91 SM 2982-77 GM 260-90 SM 2982-79 GM 284-89 SM 2983-48 GM 292-48 SM 3085-8 GM 297-113 SM 3087-5 GM 308-52 SM 3087-18 GM 308-61 SM 3092-6 GM 308-78 SM 3092-10 GM 308-79 SM 3097-8 GM 308-84 SM 3097-9 GM 308-85 SM 3097-13 GM 308-86 SM 3098-13 GM 309-84
The three groups of genotypes (experiments) selected for the Tolima-Huila agroecosystems were evaluated for M. tanajoa resistance at CIAT, Palmira. Twenty-seven families consisting of 108 genotypes were evaluated (Table 10.18). Forty-two genotypes resulted in a 1-3 damage rating (Figure 10.29) and of these 18 genotypes were selected for further planting and evaluation (Table 10.19).
No.
Gen
otyp
es
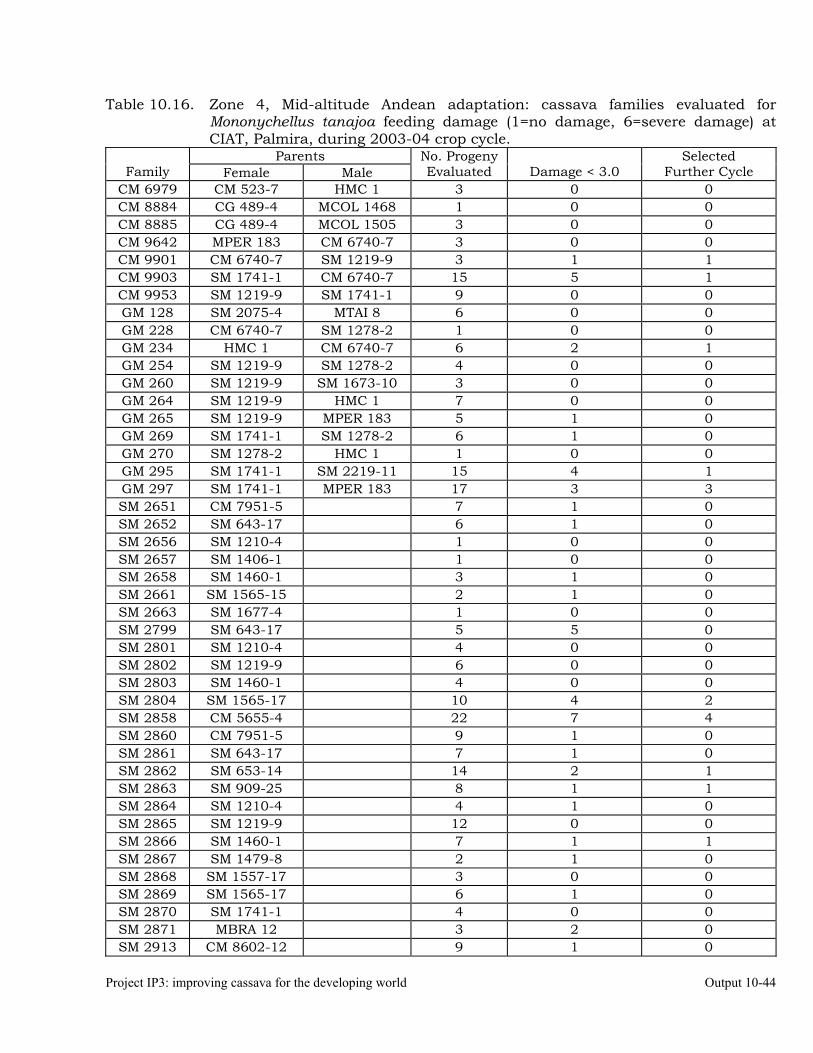
Project IP3: improving cassava for the developing world Output 10-44
Table 10.16. Zone 4, Mid-altitude Andean adaptation: cassava families evaluated for Mononychellus tanajoa feeding damage (1=no damage, 6=severe damage) at CIAT, Palmira, during 2003-04 crop cycle.
Parents Family Female Male
No. Progeny Evaluated Damage < 3.0
Selected Further Cycle
CM 6979 CM 523-7 HMC 1 3 0 0 CM 8884 CG 489-4 MCOL 1468 1 0 0 CM 8885 CG 489-4 MCOL 1505 3 0 0 CM 9642 MPER 183 CM 6740-7 3 0 0 CM 9901 CM 6740-7 SM 1219-9 3 1 1 CM 9903 SM 1741-1 CM 6740-7 15 5 1 CM 9953 SM 1219-9 SM 1741-1 9 0 0 GM 128 SM 2075-4 MTAI 8 6 0 0 GM 228 CM 6740-7 SM 1278-2 1 0 0 GM 234 HMC 1 CM 6740-7 6 2 1 GM 254 SM 1219-9 SM 1278-2 4 0 0 GM 260 SM 1219-9 SM 1673-10 3 0 0 GM 264 SM 1219-9 HMC 1 7 0 0 GM 265 SM 1219-9 MPER 183 5 1 0 GM 269 SM 1741-1 SM 1278-2 6 1 0 GM 270 SM 1278-2 HMC 1 1 0 0 GM 295 SM 1741-1 SM 2219-11 15 4 1 GM 297 SM 1741-1 MPER 183 17 3 3 SM 2651 CM 7951-5 7 1 0 SM 2652 SM 643-17 6 1 0 SM 2656 SM 1210-4 1 0 0 SM 2657 SM 1406-1 1 0 0 SM 2658 SM 1460-1 3 1 0 SM 2661 SM 1565-15 2 1 0 SM 2663 SM 1677-4 1 0 0 SM 2799 SM 643-17 5 5 0 SM 2801 SM 1210-4 4 0 0 SM 2802 SM 1219-9 6 0 0 SM 2803 SM 1460-1 4 0 0 SM 2804 SM 1565-17 10 4 2 SM 2858 CM 5655-4 22 7 4 SM 2860 CM 7951-5 9 1 0 SM 2861 SM 643-17 7 1 0 SM 2862 SM 653-14 14 2 1 SM 2863 SM 909-25 8 1 1 SM 2864 SM 1210-4 4 1 0 SM 2865 SM 1219-9 12 0 0 SM 2866 SM 1460-1 7 1 1 SM 2867 SM 1479-8 2 1 0 SM 2868 SM 1557-17 3 0 0 SM 2869 SM 1565-17 6 1 0 SM 2870 SM 1741-1 4 0 0 SM 2871 MBRA 12 3 2 0 SM 2913 CM 8602-12 9 1 0
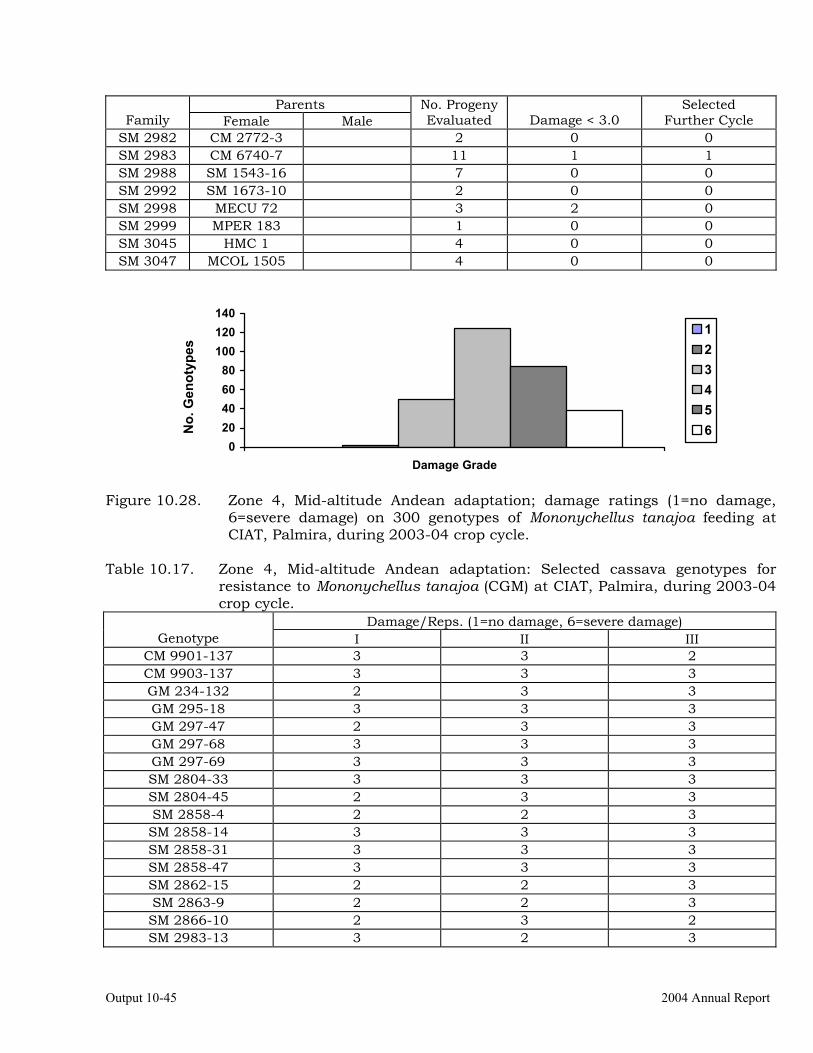
Output 10-45 2004 Annual Report
Parents Family Female Male
No. Progeny Evaluated Damage < 3.0
Selected Further Cycle
SM 2982 CM 2772-3 2 0 0 SM 2983 CM 6740-7 11 1 1 SM 2988 SM 1543-16 7 0 0 SM 2992 SM 1673-10 2 0 0 SM 2998 MECU 72 3 2 0 SM 2999 MPER 183 1 0 0 SM 3045 HMC 1 4 0 0 SM 3047 MCOL 1505 4 0 0
020406080
100120140
Damage Grade
123456
Figure 10.28. Zone 4, Mid-altitude Andean adaptation; damage ratings (1=no damage,
6=severe damage) on 300 genotypes of Mononychellus tanajoa feeding at CIAT, Palmira, during 2003-04 crop cycle.
Table 10.17. Zone 4, Mid-altitude Andean adaptation: Selected cassava genotypes for
resistance to Mononychellus tanajoa (CGM) at CIAT, Palmira, during 2003-04 crop cycle.
Damage/Reps. (1=no damage, 6=severe damage) Genotype I II III
CM 9901-137 3 3 2 CM 9903-137 3 3 3 GM 234-132 2 3 3 GM 295-18 3 3 3 GM 297-47 2 3 3 GM 297-68 3 3 3 GM 297-69 3 3 3 SM 2804-33 3 3 3 SM 2804-45 2 3 3 SM 2858-4 2 2 3 SM 2858-14 3 3 3 SM 2858-31 3 3 3 SM 2858-47 3 3 3 SM 2862-15 2 2 3 SM 2863-9 2 2 3 SM 2866-10 2 3 2 SM 2983-13 3 2 3
No.
Gen
otyp
es
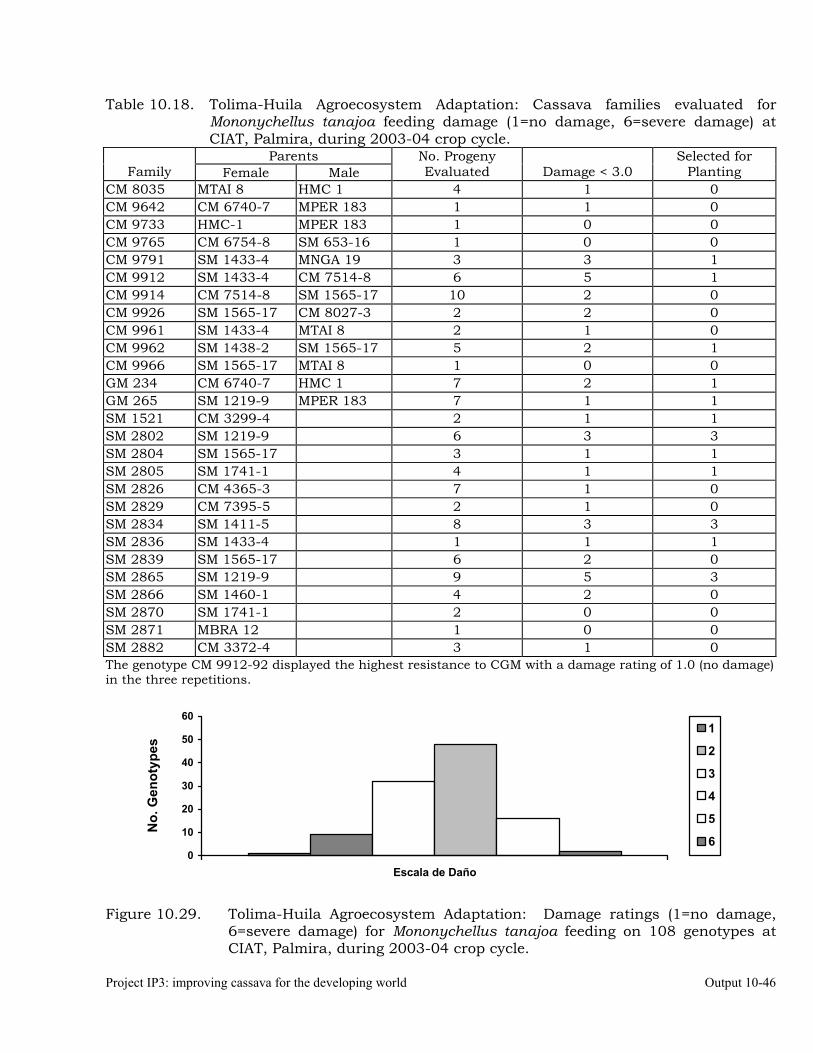
Project IP3: improving cassava for the developing world Output 10-46
Table 10.18. Tolima-Huila Agroecosystem Adaptation: Cassava families evaluated for Mononychellus tanajoa feeding damage (1=no damage, 6=severe damage) at CIAT, Palmira, during 2003-04 crop cycle.
Parents Family Female Male
No. Progeny Evaluated Damage < 3.0
Selected for Planting
CM 8035 MTAI 8 HMC 1 4 1 0 CM 9642 CM 6740-7 MPER 183 1 1 0 CM 9733 HMC-1 MPER 183 1 0 0 CM 9765 CM 6754-8 SM 653-16 1 0 0 CM 9791 SM 1433-4 MNGA 19 3 3 1 CM 9912 SM 1433-4 CM 7514-8 6 5 1 CM 9914 CM 7514-8 SM 1565-17 10 2 0 CM 9926 SM 1565-17 CM 8027-3 2 2 0 CM 9961 SM 1433-4 MTAI 8 2 1 0 CM 9962 SM 1438-2 SM 1565-17 5 2 1 CM 9966 SM 1565-17 MTAI 8 1 0 0 GM 234 CM 6740-7 HMC 1 7 2 1 GM 265 SM 1219-9 MPER 183 7 1 1 SM 1521 CM 3299-4 2 1 1 SM 2802 SM 1219-9 6 3 3 SM 2804 SM 1565-17 3 1 1 SM 2805 SM 1741-1 4 1 1 SM 2826 CM 4365-3 7 1 0 SM 2829 CM 7395-5 2 1 0 SM 2834 SM 1411-5 8 3 3 SM 2836 SM 1433-4 1 1 1 SM 2839 SM 1565-17 6 2 0 SM 2865 SM 1219-9 9 5 3 SM 2866 SM 1460-1 4 2 0 SM 2870 SM 1741-1 2 0 0 SM 2871 MBRA 12 1 0 0 SM 2882 CM 3372-4 3 1 0 The genotype CM 9912-92 displayed the highest resistance to CGM with a damage rating of 1.0 (no damage) in the three repetitions.
0
10
20
30
40
50
60
Escala de Daño
1
2
3
4
5
6
Figure 10.29. Tolima-Huila Agroecosystem Adaptation: Damage ratings (1=no damage,
6=severe damage) for Mononychellus tanajoa feeding on 108 genotypes at CIAT, Palmira, during 2003-04 crop cycle.
No.
Gen
otyp
es
Output 10-47 2004 Annual Report
Table 10.19. Tolima-Huila Agroecosystem Adaptation: Selected cassava genotypes for resistance to Mononychellus tanajoa (CGM) at CIAT, Palmira, during 2003-04 crop cycle.
Damage/Reps. Genotypes I II III
CM 9791-64 2 2 2 CM 9912-92 1 1 1 CM 9962-1 2 2 2
GM 234-171 3 3 3 GM 265-173 3 3 3 SM 1521-27 1 2 2 SM 2802-76 3 3 3 SM 2802-78 2 3 3 SM 2802-84 2 2 2 SM 2804-63 2 2 3 SM 2805-21 2 2 3 SM 2834-43 2 3 3 SM 2834-55 3 3 3 SM 2834-60 3 3 3 SM 2836-59 3 3 3 SM 2865-64 3 3 2 SM 2865-97 2 2 2 SM 2865-99 3 3 2
It should be noted that mite populations in the field seldom display an even or uniform distribution. Therefore, genotypes that might appear as resistant in one crop cycle evaluation might result in a high (susceptible) damage rating in a subsequent evaluation. For this reason, damage ratings from numerous field evaluations are required before confirming CGM resistance in a particular cassava genotype. Laboratory or growth chamber studies can be used to support field observations. References Bellotti, A.C.; Smith, L.; Lapointe, S.L. 1999. Recent advances in cassava pest management.
Annu. Rev. Entomol. 44:343-70. Byrne, D.H.; Guerrero, J.M.; Bellotti, A.C.; Gracen, V.E. 1982. Yield and plant growth
responses of Mononychellus mite resistant and susceptible cassava cultivars under protected vs. Infected conditions. Crop Science 22(5-6):486-550.
Byrne, D.H.; Bellotti, A.C.; Guerrero, J.M. 1983. The cassava mites. Tropical Pest
Management 29(4):378-394. Yaninek, J.S.; Heren, H.R. 1988. Introduction and spread of the cassava green mite,
Mononychellus tanajoa (Bondar) (Acari: Tetranychidae), an exotic pest in Africa, and the search for appropriate control methods: A review. Bulletin of Entomological Research 78:1-13.
Contributors: José María Guerrero, Fernando Calle, Anthony C. Bellotti.
Project IP3: improving cassava for the developing world Output 10-48
Activity 10.8 Testing of transgenic cassava (Africa genotype TMS 60444) plants displaying indications of resistance to the cassava hornworm, Erinnyis ello. Erinnyis ello, the cassava hornworm, is one of the most serious cassava pests in the neotropics (Bellotti et al, 1992). It has a broad geographic range, extending from the southern cone (Brazil, Argentina and Paraguay) of South America to the Caribbean Basin and southern USA. Hornworm larval feeding will defoliate cassava plants causing considerable yield reductions, especially if repeated attacks occur. Based on extensive research of this pest by CIAT and NAR’s scientists an IPM program for hornworm control has been developed. The basis of this program is centered around biological control, especially the use of a baculovirus that has recently been developed as a commercial biopesticide (CIAT Annual Report, Project PE-1, 2002 and 2003). The CIAT cassava germplasm bank consists of nearly 6,000 genotypes. Most accessions are traditional land race cultivars collected from farmers’ fields and this material offers entomologists and breeders a potential pool of pest resistant genes. A high (60 to 70%) percentage of genotypes in this germplasm bank are consistently being grown in the field and subject to pest attack. Periodic evaluations of these genotypes when hornworm attacks have occurred have indicated that genetic resistance to E. ello is not available in cultivated cassava, Manihot esculenta. Several years ago CIAT initiated research based on introducing insect resistant Bacillus thuringiensis (Bt) genes (Cry 1Ab) through Agrobacterium-mediated transformation into cassava embryonic tissue to develop lepidopteran resistant cultivars. Transgenic plants of the model variety of African origin, TMS 60444 (MNg 11) have been developed. This genotype is the progeny of an interspecific cross of the wild species Manihot glaziovii and M. esculenta. M. glaziovii is also the source of resistance to ACMD (African Cassava Mosaic Disease), and in preliminary evaluations at CIAT has displayed resistance to other pests such us whiteflies. TMS 60444 was selected because of its high transformation capacity and relatively rapid regeneration (Bellotti et al, 2002). Objective 1. Determine the leaf consumption rate of the cassava hornworm, E. ello, on different
genetically modified lines the variety TMS 60444. 2. Quantify the effect of the Gen Cry 1Ab in transgenic lines on the behavior and feeding of
the cassava hornworm. Methodology Hornworm larvae were obtained from the laboratory/field colony maintained at CIAT. The cassava variety CMC-40, a susceptible genotype was grown out in farmers and CIAT fields. TMS 60444, non-modified genetically and resistant to the hornworm was grown at CIAT. The genetically modified lines L27, L80 and L92, originally from TMS 60444 were produced at CIAT. The cassava hornworm, E. ello, colony is maintained by placing adults (male and females) in large field cages (2m x 2m x 2m) where females can readily oviposit on growing cassava plants. Eggs are removed to the laboratory where larval instars (5) develop in cages while feeding on cassava leaves. Recently emerged first instar larvae were used in all experiments; the first leaves fed-upon were those of each respective treatment.
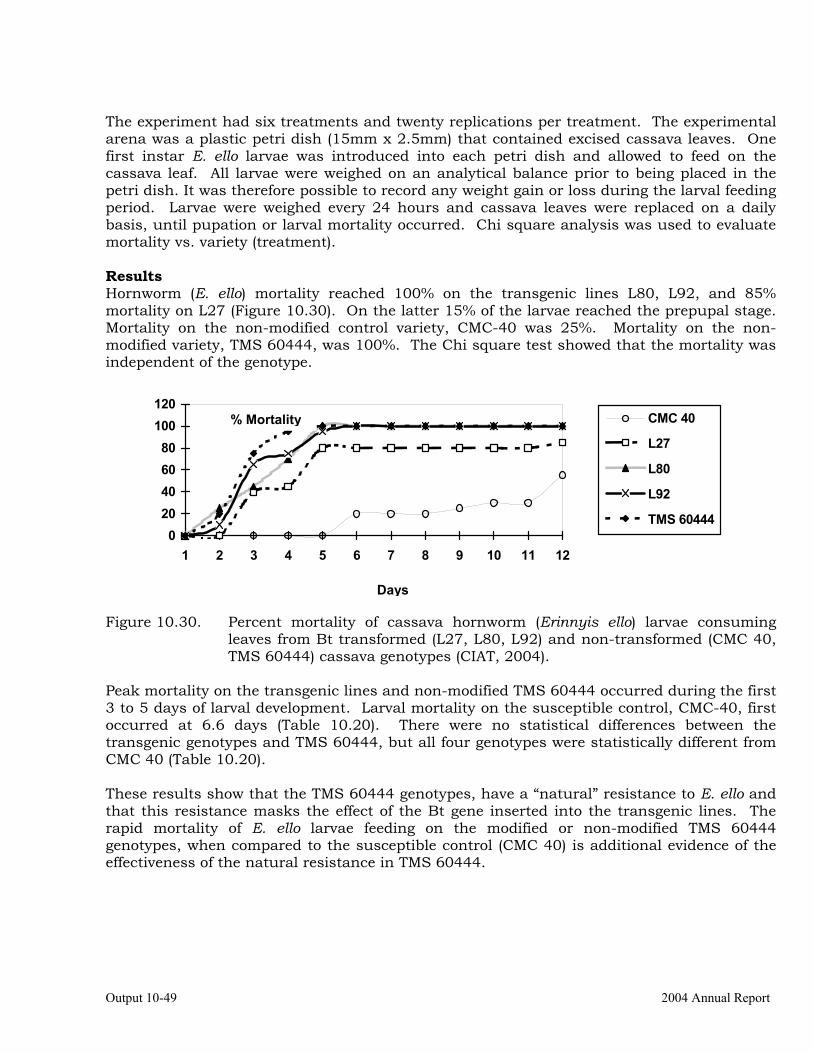
Output 10-49 2004 Annual Report
The experiment had six treatments and twenty replications per treatment. The experimental arena was a plastic petri dish (15mm x 2.5mm) that contained excised cassava leaves. One first instar E. ello larvae was introduced into each petri dish and allowed to feed on the cassava leaf. All larvae were weighed on an analytical balance prior to being placed in the petri dish. It was therefore possible to record any weight gain or loss during the larval feeding period. Larvae were weighed every 24 hours and cassava leaves were replaced on a daily basis, until pupation or larval mortality occurred. Chi square analysis was used to evaluate mortality vs. variety (treatment). Results Hornworm (E. ello) mortality reached 100% on the transgenic lines L80, L92, and 85% mortality on L27 (Figure 10.30). On the latter 15% of the larvae reached the prepupal stage. Mortality on the non-modified control variety, CMC-40 was 25%. Mortality on the non-modified variety, TMS 60444, was 100%. The Chi square test showed that the mortality was independent of the genotype.
020406080
100120
1 2 3 4 5 6 7 8 9 10 11 12
CMC 40
L27
L80
L92
TMS 60444
Figure 10.30. Percent mortality of cassava hornworm (Erinnyis ello) larvae consuming
leaves from Bt transformed (L27, L80, L92) and non-transformed (CMC 40, TMS 60444) cassava genotypes (CIAT, 2004).
Peak mortality on the transgenic lines and non-modified TMS 60444 occurred during the first 3 to 5 days of larval development. Larval mortality on the susceptible control, CMC-40, first occurred at 6.6 days (Table 10.20). There were no statistical differences between the transgenic genotypes and TMS 60444, but all four genotypes were statistically different from CMC 40 (Table 10.20). These results show that the TMS 60444 genotypes, have a “natural” resistance to E. ello and that this resistance masks the effect of the Bt gene inserted into the transgenic lines. The rapid mortality of E. ello larvae feeding on the modified or non-modified TMS 60444 genotypes, when compared to the susceptible control (CMC 40) is additional evidence of the effectiveness of the natural resistance in TMS 60444.
Days
% Mortality
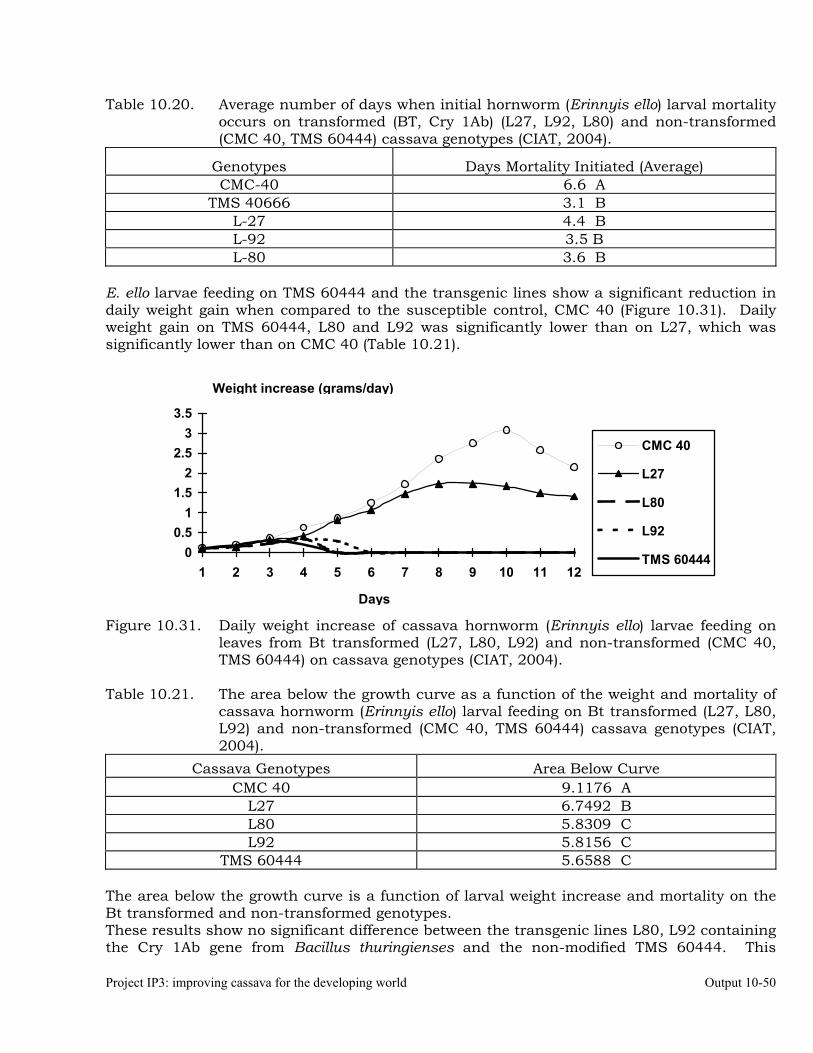
Project IP3: improving cassava for the developing world Output 10-50
Table 10.20. Average number of days when initial hornworm (Erinnyis ello) larval mortality occurs on transformed (BT, Cry 1Ab) (L27, L92, L80) and non-transformed (CMC 40, TMS 60444) cassava genotypes (CIAT, 2004).
Genotypes Days Mortality Initiated (Average) CMC-40 6.6 A
TMS 40666 3.1 B L-27 4.4 B L-92 3.5 B L-80 3.6 B
E. ello larvae feeding on TMS 60444 and the transgenic lines show a significant reduction in daily weight gain when compared to the susceptible control, CMC 40 (Figure 10.31). Daily weight gain on TMS 60444, L80 and L92 was significantly lower than on L27, which was significantly lower than on CMC 40 (Table 10.21).
00.5
11.5
22.5
33.5
1 2 3 4 5 6 7 8 9 10 11 12
CMC 40
L27
L80
L92
TMS 60444
Figure 10.31. Daily weight increase of cassava hornworm (Erinnyis ello) larvae feeding on
leaves from Bt transformed (L27, L80, L92) and non-transformed (CMC 40, TMS 60444) on cassava genotypes (CIAT, 2004).
Table 10.21. The area below the growth curve as a function of the weight and mortality of
cassava hornworm (Erinnyis ello) larval feeding on Bt transformed (L27, L80, L92) and non-transformed (CMC 40, TMS 60444) cassava genotypes (CIAT, 2004).
Cassava Genotypes Area Below Curve CMC 40 9.1176 A
L27 6.7492 B L80 5.8309 C L92 5.8156 C
TMS 60444 5.6588 C The area below the growth curve is a function of larval weight increase and mortality on the Bt transformed and non-transformed genotypes. These results show no significant difference between the transgenic lines L80, L92 containing the Cry 1Ab gene from Bacillus thuringienses and the non-modified TMS 60444. This
Weight increase (grams/day)
Days
Output 10-51 2004 Annual Report
indicates that the TMS 60444 genotype has genes independent of Cry 1Ab that expresses resistance to the cassava hornworm, E. ello. As stated earlier, numerous years of observation (at least 30) of the CIAT M. esculenta germplasm bank did not detect any resistance to E. ello. This leads to the speculation that the source of the “natural” resistance found in TMS 60444 originated from the interspecific cross with M. glaziovii, a parent in its development in Africa nearly 70 years ago. A genetic study is needed to identify the gene or gene sequence responsible for the E. ello resistance detected in the TMS 60444 lines. References CIAT (Centro Internacional de Agricultura Tropical). 2002. Integrated pest and disease
management in major agroecosystems. Annual report, Project PE-1, Cali, CO. 264 p. CIAT (Centro Internacional de Agricultura Tropical). 2003. Integrated pest and disease
management in major agroecosystems. Annual report, Project PE-1, Cali, CO. 258 p. Bellotti, A.C.; Arias, B. Guzmán, O.L. 1992. Biological Control of the Cassava Hornworm,
Erinnyis ello (Lepidoptera: Sphingidae). Florida Entomology. 75:506-515. Bellotti, A.C.; Roca, W.; Tohme, J.; Chavarriaga, P.; Escobar, R.; Herrera, C.J. 2002.
Biotecnología para el manejo de plagas en la producción de semilla limpia. In: La yuca en el tercer milenio; sistema moderno de producción, procesamiento, utilización y comercialización. Centro Internacional de Agricultura Tropical (CIAT), Clayuca, Cali, CO. p. 255-268.
Collaborators: Carlos Julio Herrera, Anthony C. Bellotti, Paul Chavarriaga, Danilo López. Activity 10.9 Determining the plant metabolites involved in whitefly (Aleurotrachelus socialis) resistant cassava varieties, MEcu 64, MEcu 72 and MPer 334. The whitefly, Aleurotrachelus socialis, is a major pest of cassava, reducing root yield and the formation of cassava planting material (cuttings or stakes). Field evaluations during a 1, 6- and 11-month attack resulted in yield losses of 5, 42 and 79% respectively (Bellotti and Vargas, 1986). Whiteflies cause direct damage to cassava by feeding on the phloem of leaves, inducing leaf chlorosis and abscission, which results in reduction in root yield if feeding is prolonged (Bellotti, 2002). Additional yield reduction can be caused by the growth of a “sooty-mold” that grows on whitefly exudates deposited on cassava leaves and deters photosynthesis (Bellotti and Vargas, 1986). The CIAT cassava germplasm bank contains nearly 6000 accessions, of which 93% are landraces (locally selected cultivars), collected from tropical and subtropical regions of the world, but mainly from the Neotropics. This germplasm collection has been extensively screened in the field for whitefly (A. socialis) resistance, more than 5400 landrace cultivars have been evaluated. Sources of resistance to A. socialis have now been identified. The clone “MEcu 72” has consistently expressed high level of resistance. Several additional cultivars, including “MEcu 64; MPer 334, MPer 415, MPer 317, MPer216, MPer 221, MPer 266 and
Project IP3: improving cassava for the developing world Output 10-52
MPer 365, have expressed moderate to high levels of resistance. These results also indicate that A. socialis resistance may be concentrated in Peruvian and Ecuadorian germplasm. In greenhouse and field studies show that A. socialis feeding on resistant clones had less oviposition, longer development period reduced size and higher mortality than those feeding on susceptible one (Arias, 1995). A. socialis nymphal instars feeding on MEcu 72 suffered a 72.5% mortality, mostly in the early instars (Arias, 1995, Bellotti and Arias, 2001). Recent studies under controlled conditions in the growth chamber, A. socialis had a longer development cycle when feeding on MEcu 64, MEcu 72 and MPer 344 when compared to the susceptible control, CMC 40. Nymphal mortality was highest on MPer 334 (77.5%), followed by MEcu 64 and MEcu 72 with 68.5% and 68.0% respectively. In addition genomic sequences possibly involved in A. socialis resistance have been detected in MEcu 72 using AFLP and microsatelite markers (Bellotti, et al, 2003). Plant strategies for resisting insect attack often involved biochemical factors or activities. Studies were therefore initiated to determine what plant metabolites might be involved in the development of A. socialis resistance found in the resistant genotypes. MEcu 64, MEcu 72 and MPer 334. Materials and Methods Electrophoresis, employing polyacrylamide gels (PAGE) has proven to be a very useful technique for the analysis and characterization of complex protein mixtures. Nevertheless, since access into the interior of protein matrixes is limited, information generated about the individual components is usually restricted to molecular weight and isoelectric dots. The transfer of proteins by PAGE to an unfixed membrane, permits the utilization of diverse tests for an improved characterization. One of the more precise applications for the transfer of proteins to membranes, is through inmunodetection which consists of the identification and characterization of a fixed antigen by means of antibody tests (Timmons and Dunbar, 1990); Garfin, 1990; Anderson, 1988; Hames and Richwood, 1988; Dunbar, 1987), Inmune-detection permits estimating by semiquantitative means, the mass or abundance of a specific protein in a determinate tissue. This technique is regularly employed in experimental studies in which the objective is to detect a specified protein or to observe its variation under diverse conditions. It was decided that the first stage of this study would be carried out to determine if a relationship exists between leaf proteins in the resistant genotypes, MEcu 64, MEcu 72 and MPer 334, and the resistant characteristics they display to A. socialis; the susceptible genotype CMC 40 was used as the control. The plan includes obtaining polyclonal antibodies from the immunization of rabbits against protein extracts for each of the materials, and later to determine by means of immunodetection, and the combination of Western Blot and 2D SDS-PAGE techniques, the differences between each of the protein extracts. This process will be carried out using healthy plants (non-infested), and plants infested with A. socialis, for each of the genotypes, to see if a proteic response occurs in infested plants. In addition, A. socialis feeding on resistant plants will be examined for the presence of a plant protein. Total Protein Extraction To extract the total protein, cassava leaves (without petioles) were macerated in liquid nitrogen, obtaining a very fine powder that was subsequently homogenized for five hours at
Output 10-53 2004 Annual Report
4ºC with the buffer Tris HCL, pH 8.0, and containing 1mM of EDTA (metalloprotease inhibitor), 5 mM of DTT (reduction agent), 1% PVP (antiphenolic), and 5 mM of PMSF (serine protease inhibitor) at a proportion of 1g macerated leaf to 3ml of buffer. The following step consisted of filtering this mixture and centrifuging it at 15000 rpm for 30 minutes at 4ºC, to clarify the extract and eliminate vegetative tissue. The supernadant is dialyzed with a dialysis membrane of W.M. Co. 3.5 Kd and finally lyophilized to obtain an extract in powder form, in order to manipulate the concentration by weight units. Immunization and Production of Polyclonal Antibodies against Cassava Proteins Polyclonal antibodies were used as they contain different sub-classes of antibodies, including IgG, IGM, IGE, IgA and IgD. Each antibody represents the product of only one stimulated lymphocyte and its clonal progeny. An antigen complex such as a protein can contain several distinct or epitopes or determinant antigens, each of which is specifically recognized by antibodies from only one clonal lymphocyte (Dunbar and Schwoebel, 1990). To produce polyclonal antibodies the following steps were developed: Two milligrams of each protein was dissolved in 1 ml of the buffer Tris-Glicina pH 6.8 and
later emulsified with one ml of Freund’s complete adjuvant. Four New Zealand breed rabbits were employed. Each of them was subcutaneously
injected four times with 0.5 ml of each of the prepared proteins. The injections were applied to the animal’s loin. After three weeks, the four applications were repeated on each rabbit, but at this time the
proteins were emulsified with 1ml of Freund’s incomplete adjuvant. Two of the injections were intermuscular. Ten days after the last injections, the animals were bled, obtaining 15-20 ml of blood from
each. The collected blood was left at room temperature for 24 hours, then centrifuged and the
serum was stored coagulated in aliquots for later analysis. Test for Antibody Recognition using the Dot Blot Technique A test for antibody recognition using the Dot Blot technique was carried out to verify that the antibodies produced were in good condition. The following steps were developed: One milligram of each of the proteins was dissolved with 200 µl of Tris Glycine (pH 6.8)
buffer. On each nitrocellulose membrane 5 µl of the stock solution was applied to each of the proteins. Blockage of the nitrocellulose membrane with the sample in TBS containing 1% gelatine. Exposure of the membrane to 30 µl of the first antibody dissolved in 30 ml of blockage
solution. Four washings of the membrane of 15-minutes each. The first three with TTBS (TBS
containing 1% tween 20) and the last with TBS. Exposure of the membrane in 30 µl of the second antibody (Bound to PER) dissolved in
30 ml of the blockage solution. Four washings of the membrane of 15-minutes each. The first three with TTBS (TBS
containing 1% tween 20) and the last with TBS. Addition of 5 ml of revealed solution (40 ml of TBS, 3 µl of hydrogen peroxide and 30 mg
of 4 Chloro-1-Naphtol dissolved in 10 ml of methanol). This solution is preheated at 35°C.
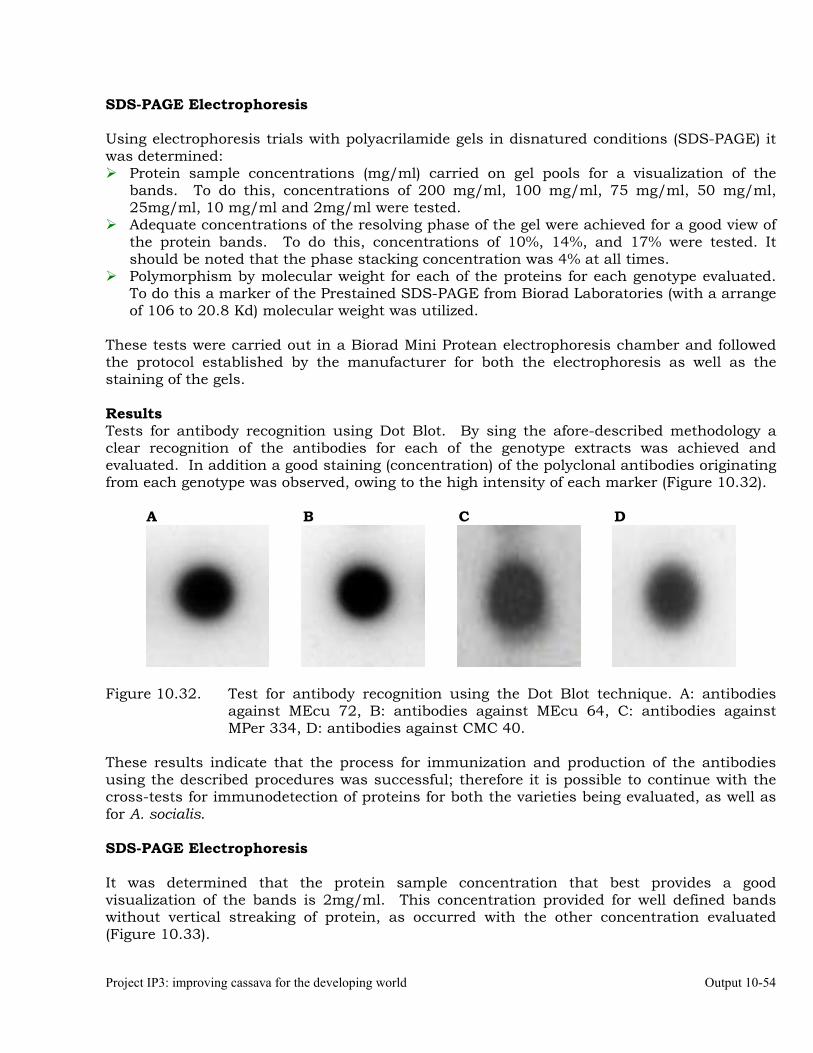
Project IP3: improving cassava for the developing world Output 10-54
SDS-PAGE Electrophoresis Using electrophoresis trials with polyacrilamide gels in disnatured conditions (SDS-PAGE) it was determined: Protein sample concentrations (mg/ml) carried on gel pools for a visualization of the
bands. To do this, concentrations of 200 mg/ml, 100 mg/ml, 75 mg/ml, 50 mg/ml, 25mg/ml, 10 mg/ml and 2mg/ml were tested. Adequate concentrations of the resolving phase of the gel were achieved for a good view of
the protein bands. To do this, concentrations of 10%, 14%, and 17% were tested. It should be noted that the phase stacking concentration was 4% at all times. Polymorphism by molecular weight for each of the proteins for each genotype evaluated.
To do this a marker of the Prestained SDS-PAGE from Biorad Laboratories (with a arrange of 106 to 20.8 Kd) molecular weight was utilized.
These tests were carried out in a Biorad Mini Protean electrophoresis chamber and followed the protocol established by the manufacturer for both the electrophoresis as well as the staining of the gels. Results Tests for antibody recognition using Dot Blot. By sing the afore-described methodology a clear recognition of the antibodies for each of the genotype extracts was achieved and evaluated. In addition a good staining (concentration) of the polyclonal antibodies originating from each genotype was observed, owing to the high intensity of each marker (Figure 10.32).
A B C D
Figure 10.32. Test for antibody recognition using the Dot Blot technique. A: antibodies
against MEcu 72, B: antibodies against MEcu 64, C: antibodies against MPer 334, D: antibodies against CMC 40.
These results indicate that the process for immunization and production of the antibodies using the described procedures was successful; therefore it is possible to continue with the cross-tests for immunodetection of proteins for both the varieties being evaluated, as well as for A. socialis. SDS-PAGE Electrophoresis It was determined that the protein sample concentration that best provides a good visualization of the bands is 2mg/ml. This concentration provided for well defined bands without vertical streaking of protein, as occurred with the other concentration evaluated (Figure 10.33).
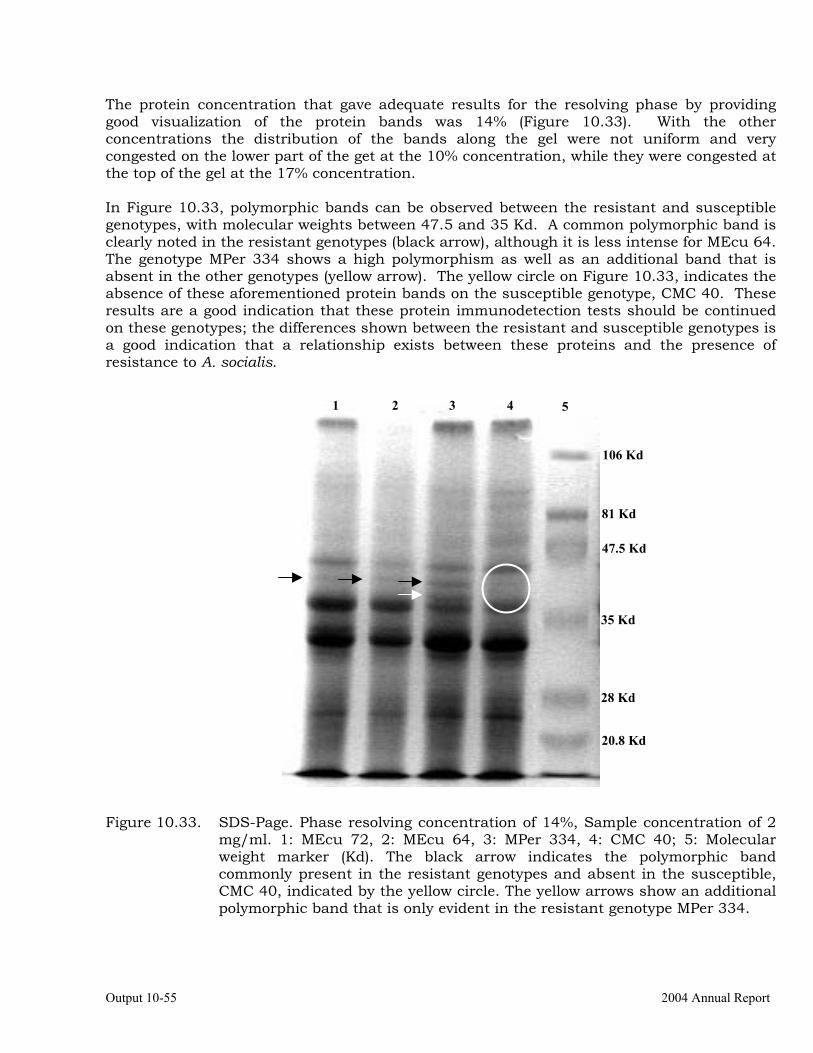
Output 10-55 2004 Annual Report
The protein concentration that gave adequate results for the resolving phase by providing good visualization of the protein bands was 14% (Figure 10.33). With the other concentrations the distribution of the bands along the gel were not uniform and very congested on the lower part of the get at the 10% concentration, while they were congested at the top of the gel at the 17% concentration. In Figure 10.33, polymorphic bands can be observed between the resistant and susceptible genotypes, with molecular weights between 47.5 and 35 Kd. A common polymorphic band is clearly noted in the resistant genotypes (black arrow), although it is less intense for MEcu 64. The genotype MPer 334 shows a high polymorphism as well as an additional band that is absent in the other genotypes (yellow arrow). The yellow circle on Figure 10.33, indicates the absence of these aforementioned protein bands on the susceptible genotype, CMC 40. These results are a good indication that these protein immunodetection tests should be continued on these genotypes; the differences shown between the resistant and susceptible genotypes is a good indication that a relationship exists between these proteins and the presence of resistance to A. socialis.
Figure 10.33. SDS-Page. Phase resolving concentration of 14%, Sample concentration of 2
mg/ml. 1: MEcu 72, 2: MEcu 64, 3: MPer 334, 4: CMC 40; 5: Molecular weight marker (Kd). The black arrow indicates the polymorphic band commonly present in the resistant genotypes and absent in the susceptible, CMC 40, indicated by the yellow circle. The yellow arrows show an additional polymorphic band that is only evident in the resistant genotype MPer 334.
1 2 3 4 5
106 Kd
81 Kd
47.5 Kd
35 Kd
28 Kd
20.8 Kd
Project IP3: improving cassava for the developing world Output 10-56
Projections With the polycloned antibodies tested and the standardization of conditions for the SDS-PAGE achieved, we can proceed to develop cross-immunodetection tests of the genotypes and A. socialis utilizing the Western Blot and 2D SDS-PAGE techniques. References Anderson, L. 1988. Two-dimensional electrophoresis: Operation of the ISO-DALT System.
Large scale Biol. Press, Washington, D.C. Arias, B. 1995. Estudio sobre el comportamiento de la mosca blanca Aleurotrachelus socialis
Bondar (Homóptera: Aleyrodidae) en diferentes genotipos de yuca Manihot esculenta Crantz. Tesis (Maestría en fitomejoramineto). Universidad Nacional de Colombia, Palmira, Colombia. 164 p.
Bellotti, A.C. 2002. Arthropod pests. In: Eds. R.J. Hillocks, J.M. Thresh and A.C. Bellotti.
CASSAVA: Biology, Production and Utilization. CABI Publishing, UK. p. 209-235. Bellotti, A.C.; Arias, B. 2001. Host plant resístanse to whiteflies with emphasis on cassava as
a case study. Crop Protection 20:813-823. Bellotti, A.C.; Bohórquez, A.; Arias, B.; Vargas, J.; Vargas, H.L.; Mba, Ch.; Duque, M.C.;
Tohme, J. 2003. Avances recientes en la identificación de genes de resistencia a mosca blanca, Aleurotrachelus socialis Bondar (Homoptera: Aleyrodidae) en yuca (Manihot esculenta Crantz). Memorias XXX Congreso Sociedad Colombiana de Entomología, SOCOLEN. July 17-19, Cali, Colombia.
Bellotti, A.C.; Vargas, O. 1986. Mosca blanca del cultivo de la yuca: Biología y control
[Conjunto audiotutorial]. Centro Internacional de Agricultura Tropical (CIAT). Cali, Colombia.
Dunbar, B.S. 1987. Two-dimensional electrophoresis and imnmunological techniques.
Planum, New York. 372 p. Dunbar, B.S.; Schwoebel E. D. 1990. Preparation of polyclonal antibodies. En: Methods in
enzymology Vol. 182. Guide to protein purification. Academic press, INC. San Diego, CA, USA. p 663-670.
Garfin, D.E. 1990. One-dimensional gel electrophoresis. En: Methods in enzymology Vol.
182. Guide to protein purification. Academic press, INC. San Diego, CA, USA. p 459-477. Hames, B.D; Rickwood, D. 1988. Gel electrophoresis of proteins: A practical approach. IRL.
Press, Washington, D.C. 383 p. Timmons T.M.; Dunbar, B.S. 1990. Protein blotting and inmunodetection. En: Methods in
enzymology Vol. 182. Guide to protein purification. Academic press, INC. San Diego, CA, USA. p 679-688.
Output 10-57 2004 Annual Report
Collaborators: Diego Fernando Múnera S., Anthony C. Bellotti, Arnubio Valencia. Universidad de Caldas, Manizales, Colombia, Stephen L. Lapointe. United States Department of Agriculture (USDA), Paul-André Calatayud, IRD, France.
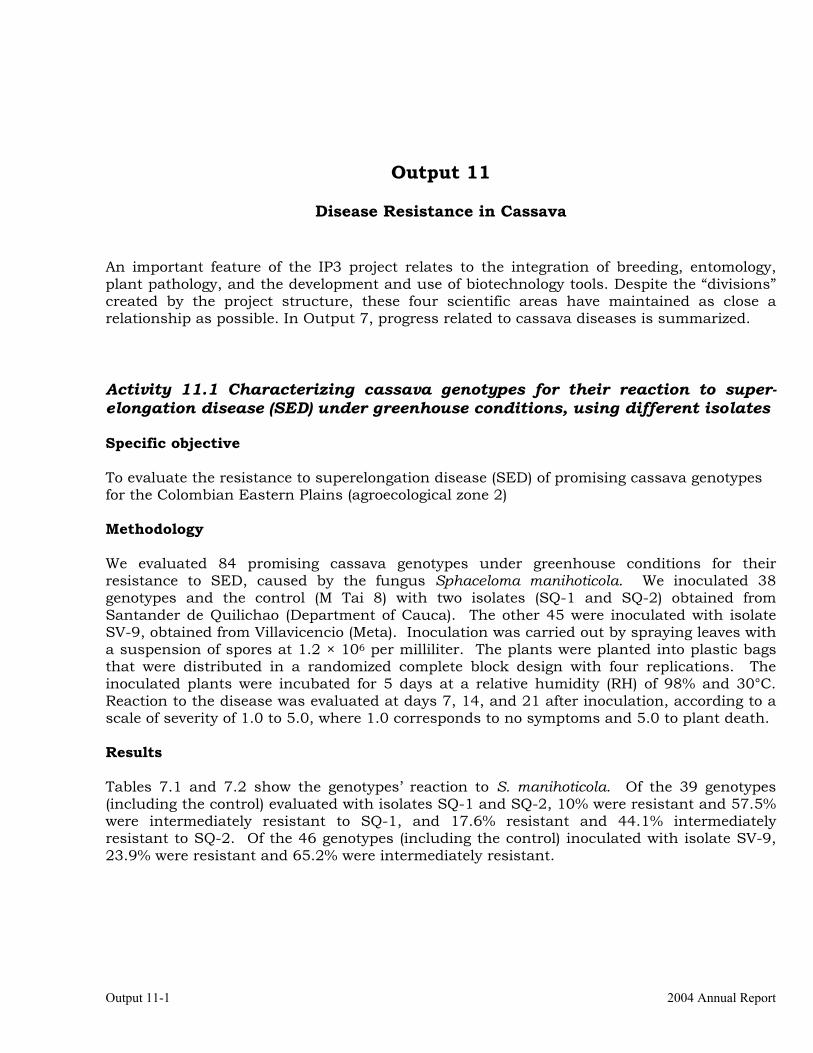
Output 11-1 2004 Annual Report
Output 11
Disease Resistance in Cassava
An important feature of the IP3 project relates to the integration of breeding, entomology, plant pathology, and the development and use of biotechnology tools. Despite the “divisions” created by the project structure, these four scientific areas have maintained as close a relationship as possible. In Output 7, progress related to cassava diseases is summarized. Activity 11.1 Characterizing cassava genotypes for their reaction to super-elongation disease (SED) under greenhouse conditions, using different isolates Specific objective To evaluate the resistance to superelongation disease (SED) of promising cassava genotypes for the Colombian Eastern Plains (agroecological zone 2) Methodology We evaluated 84 promising cassava genotypes under greenhouse conditions for their resistance to SED, caused by the fungus Sphaceloma manihoticola. We inoculated 38 genotypes and the control (M Tai 8) with two isolates (SQ-1 and SQ-2) obtained from Santander de Quilichao (Department of Cauca). The other 45 were inoculated with isolate SV-9, obtained from Villavicencio (Meta). Inoculation was carried out by spraying leaves with a suspension of spores at 1.2 × 10⁶ per milliliter. The plants were planted into plastic bags that were distributed in a randomized complete block design with four replications. The inoculated plants were incubated for 5 days at a relative humidity (RH) of 98% and 30°C. Reaction to the disease was evaluated at days 7, 14, and 21 after inoculation, according to a scale of severity of 1.0 to 5.0, where 1.0 corresponds to no symptoms and 5.0 to plant death. Results Tables 7.1 and 7.2 show the genotypes’ reaction to S. manihoticola. Of the 39 genotypes (including the control) evaluated with isolates SQ-1 and SQ-2, 10% were resistant and 57.5% were intermediately resistant to SQ-1, and 17.6% resistant and 44.1% intermediately resistant to SQ-2. Of the 46 genotypes (including the control) inoculated with isolate SV-9, 23.9% were resistant and 65.2% were intermediately resistant.
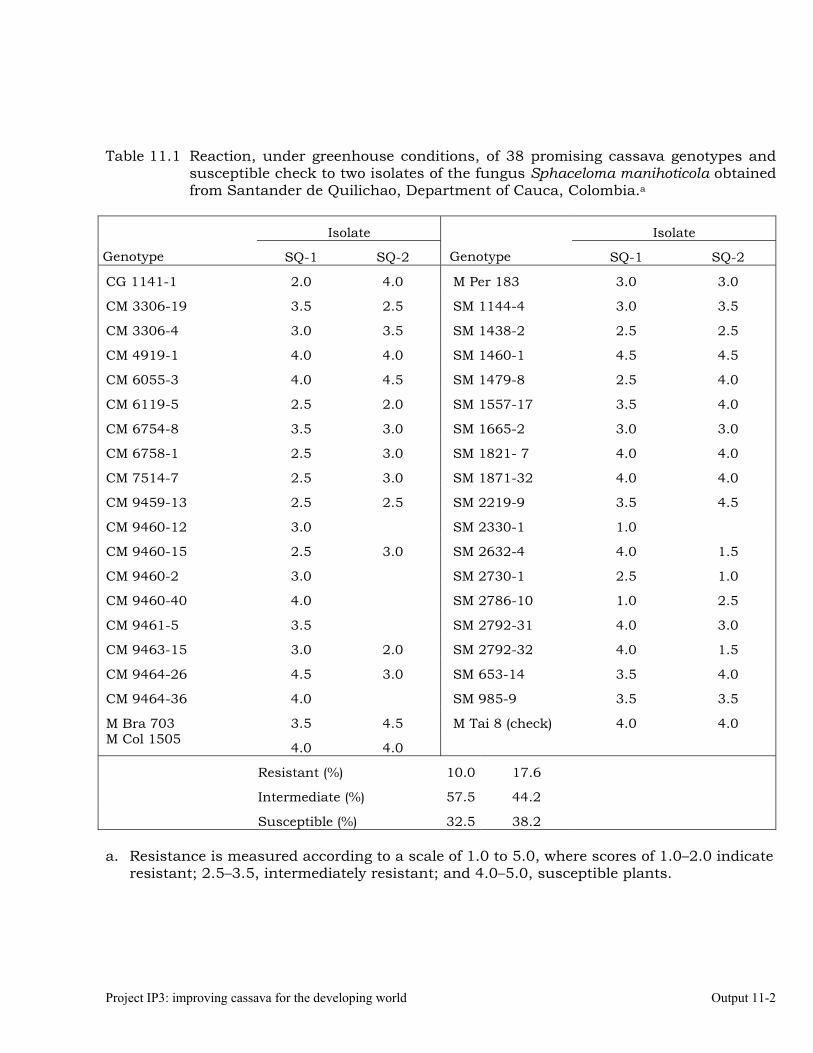
Project IP3: improving cassava for the developing world Output 11-2
Table 11.1 Reaction, under greenhouse conditions, of 38 promising cassava genotypes and
susceptible check to two isolates of the fungus Sphaceloma manihoticola obtained from Santander de Quilichao, Department of Cauca, Colombia.a
Isolate Isolate
Genotype SQ-1 SQ-2 Genotype SQ-1 SQ-2
CG 1141-1 2.0 4.0 M Per 183 3.0 3.0
CM 3306-19 3.5 2.5 SM 1144-4 3.0 3.5
CM 3306-4 3.0 3.5 SM 1438-2 2.5 2.5
CM 4919-1 4.0 4.0 SM 1460-1 4.5 4.5
CM 6055-3 4.0 4.5 SM 1479-8 2.5 4.0
CM 6119-5 2.5 2.0 SM 1557-17 3.5 4.0
CM 6754-8 3.5 3.0 SM 1665-2 3.0 3.0
CM 6758-1 2.5 3.0 SM 1821- 7 4.0 4.0
CM 7514-7 2.5 3.0 SM 1871-32 4.0 4.0
CM 9459-13 2.5 2.5 SM 2219-9 3.5 4.5
CM 9460-12 3.0 SM 2330-1 1.0
CM 9460-15 2.5 3.0 SM 2632-4 4.0 1.5
CM 9460-2 3.0 SM 2730-1 2.5 1.0
CM 9460-40 4.0 SM 2786-10 1.0 2.5
CM 9461-5 3.5 SM 2792-31 4.0 3.0
CM 9463-15 3.0 2.0 SM 2792-32 4.0 1.5
CM 9464-26 4.5 3.0 SM 653-14 3.5 4.0
CM 9464-36 4.0 SM 985-9 3.5 3.5
M Bra 703 3.5 4.5 M Tai 8 (check) 4.0 4.0 M Col 1505 4.0 4.0
Resistant (%) 10.0 17.6
Intermediate (%) 57.5 44.2
Susceptible (%) 32.5 38.2 a. Resistance is measured according to a scale of 1.0 to 5.0, where scores of 1.0–2.0 indicate
resistant; 2.5–3.5, intermediately resistant; and 4.0–5.0, susceptible plants.
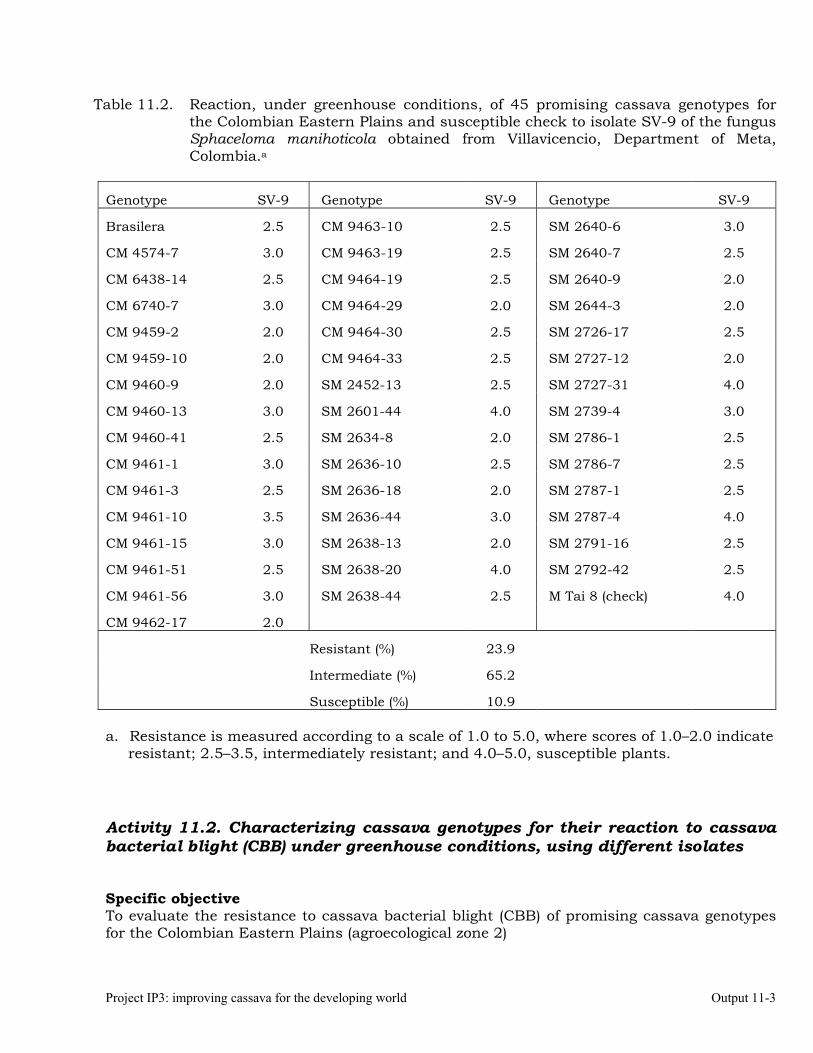
Project IP3: improving cassava for the developing world Output 11-3
Table 11.2. Reaction, under greenhouse conditions, of 45 promising cassava genotypes for the Colombian Eastern Plains and susceptible check to isolate SV-9 of the fungus Sphaceloma manihoticola obtained from Villavicencio, Department of Meta, Colombia.a
Genotype SV-9 Genotype SV-9 Genotype SV-9
Brasilera 2.5 CM 9463-10 2.5 SM 2640-6 3.0
CM 4574-7 3.0 CM 9463-19 2.5 SM 2640-7 2.5
CM 6438-14 2.5 CM 9464-19 2.5 SM 2640-9 2.0
CM 6740-7 3.0 CM 9464-29 2.0 SM 2644-3 2.0
CM 9459-2 2.0 CM 9464-30 2.5 SM 2726-17 2.5
CM 9459-10 2.0 CM 9464-33 2.5 SM 2727-12 2.0
CM 9460-9 2.0 SM 2452-13 2.5 SM 2727-31 4.0
CM 9460-13 3.0 SM 2601-44 4.0 SM 2739-4 3.0
CM 9460-41 2.5 SM 2634-8 2.0 SM 2786-1 2.5
CM 9461-1 3.0 SM 2636-10 2.5 SM 2786-7 2.5
CM 9461-3 2.5 SM 2636-18 2.0 SM 2787-1 2.5
CM 9461-10 3.5 SM 2636-44 3.0 SM 2787-4 4.0
CM 9461-15 3.0 SM 2638-13 2.0 SM 2791-16 2.5
CM 9461-51 2.5 SM 2638-20 4.0 SM 2792-42 2.5
CM 9461-56 3.0 SM 2638-44 2.5 M Tai 8 (check) 4.0
CM 9462-17 2.0
Resistant (%) 23.9
Intermediate (%) 65.2
Susceptible (%) 10.9
a. Resistance is measured according to a scale of 1.0 to 5.0, where scores of 1.0–2.0 indicate resistant; 2.5–3.5, intermediately resistant; and 4.0–5.0, susceptible plants.
Activity 11.2. Characterizing cassava genotypes for their reaction to cassava bacterial blight (CBB) under greenhouse conditions, using different isolates Specific objective To evaluate the resistance to cassava bacterial blight (CBB) of promising cassava genotypes for the Colombian Eastern Plains (agroecological zone 2)
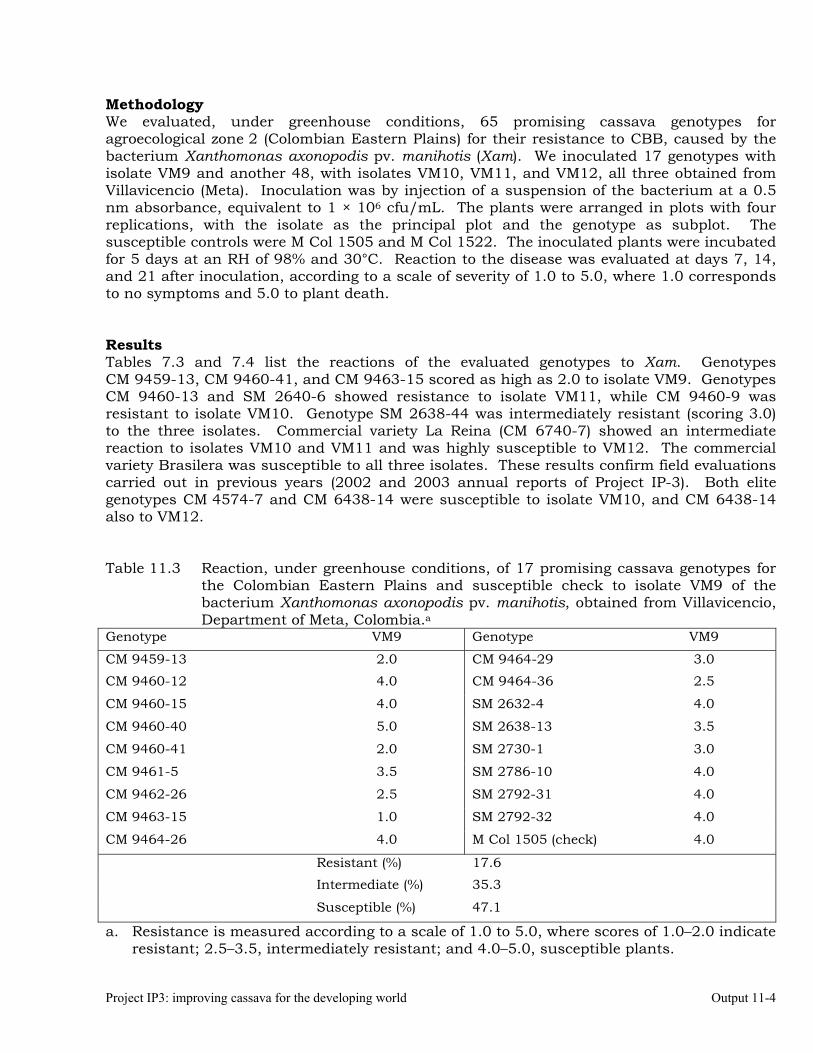
Project IP3: improving cassava for the developing world Output 11-4
Methodology We evaluated, under greenhouse conditions, 65 promising cassava genotypes for agroecological zone 2 (Colombian Eastern Plains) for their resistance to CBB, caused by the bacterium Xanthomonas axonopodis pv. manihotis (Xam). We inoculated 17 genotypes with isolate VM9 and another 48, with isolates VM10, VM11, and VM12, all three obtained from Villavicencio (Meta). Inoculation was by injection of a suspension of the bacterium at a 0.5 nm absorbance, equivalent to 1 × 10⁶ cfu/mL. The plants were arranged in plots with four replications, with the isolate as the principal plot and the genotype as subplot. The susceptible controls were M Col 1505 and M Col 1522. The inoculated plants were incubated for 5 days at an RH of 98% and 30°C. Reaction to the disease was evaluated at days 7, 14, and 21 after inoculation, according to a scale of severity of 1.0 to 5.0, where 1.0 corresponds to no symptoms and 5.0 to plant death. Results Tables 7.3 and 7.4 list the reactions of the evaluated genotypes to Xam. Genotypes CM 9459-13, CM 9460-41, and CM 9463-15 scored as high as 2.0 to isolate VM9. Genotypes CM 9460-13 and SM 2640-6 showed resistance to isolate VM11, while CM 9460-9 was resistant to isolate VM10. Genotype SM 2638-44 was intermediately resistant (scoring 3.0) to the three isolates. Commercial variety La Reina (CM 6740-7) showed an intermediate reaction to isolates VM10 and VM11 and was highly susceptible to VM12. The commercial variety Brasilera was susceptible to all three isolates. These results confirm field evaluations carried out in previous years (2002 and 2003 annual reports of Project IP-3). Both elite genotypes CM 4574-7 and CM 6438-14 were susceptible to isolate VM10, and CM 6438-14 also to VM12. Table 11.3 Reaction, under greenhouse conditions, of 17 promising cassava genotypes for
the Colombian Eastern Plains and susceptible check to isolate VM9 of the bacterium Xanthomonas axonopodis pv. manihotis, obtained from Villavicencio, Department of Meta, Colombia.a
Genotype VM9 Genotype VM9
CM 9459-13 2.0 CM 9464-29 3.0
CM 9460-12 4.0 CM 9464-36 2.5
CM 9460-15 4.0 SM 2632-4 4.0
CM 9460-40 5.0 SM 2638-13 3.5
CM 9460-41 2.0 SM 2730-1 3.0
CM 9461-5 3.5 SM 2786-10 4.0
CM 9462-26 2.5 SM 2792-31 4.0
CM 9463-15 1.0 SM 2792-32 4.0
CM 9464-26 4.0 M Col 1505 (check) 4.0
Resistant (%) 17.6
Intermediate (%) 35.3
Susceptible (%) 47.1
a. Resistance is measured according to a scale of 1.0 to 5.0, where scores of 1.0–2.0 indicate resistant; 2.5–3.5, intermediately resistant; and 4.0–5.0, susceptible plants.
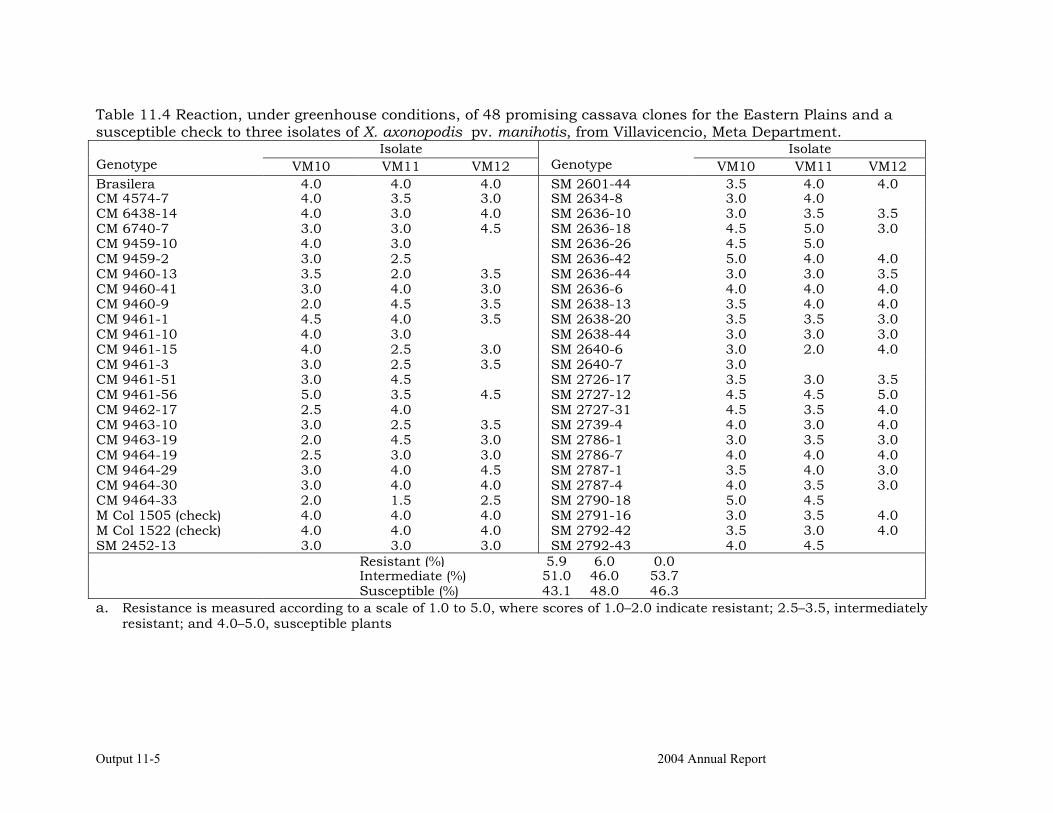
Output 11-5 2004 Annual Report
Table 11.4 Reaction, under greenhouse conditions, of 48 promising cassava clones for the Eastern Plains and a susceptible check to three isolates of X. axonopodis pv. manihotis, from Villavicencio, Meta Department.
Isolate Isolate Genotype VM10 VM11 VM12
Genotype VM10 VM11 VM12
Brasilera 4.0 4.0 4.0 SM 2601-44 3.5 4.0 4.0 CM 4574-7 4.0 3.5 3.0 SM 2634-8 3.0 4.0 CM 6438-14 4.0 3.0 4.0 SM 2636-10 3.0 3.5 3.5 CM 6740-7 3.0 3.0 4.5 SM 2636-18 4.5 5.0 3.0 CM 9459-10 4.0 3.0 SM 2636-26 4.5 5.0 CM 9459-2 3.0 2.5 SM 2636-42 5.0 4.0 4.0 CM 9460-13 3.5 2.0 3.5 SM 2636-44 3.0 3.0 3.5 CM 9460-41 3.0 4.0 3.0 SM 2636-6 4.0 4.0 4.0 CM 9460-9 2.0 4.5 3.5 SM 2638-13 3.5 4.0 4.0 CM 9461-1 4.5 4.0 3.5 SM 2638-20 3.5 3.5 3.0 CM 9461-10 4.0 3.0 SM 2638-44 3.0 3.0 3.0 CM 9461-15 4.0 2.5 3.0 SM 2640-6 3.0 2.0 4.0 CM 9461-3 3.0 2.5 3.5 SM 2640-7 3.0 CM 9461-51 3.0 4.5 SM 2726-17 3.5 3.0 3.5 CM 9461-56 5.0 3.5 4.5 SM 2727-12 4.5 4.5 5.0 CM 9462-17 2.5 4.0 SM 2727-31 4.5 3.5 4.0 CM 9463-10 3.0 2.5 3.5 SM 2739-4 4.0 3.0 4.0 CM 9463-19 2.0 4.5 3.0 SM 2786-1 3.0 3.5 3.0 CM 9464-19 2.5 3.0 3.0 SM 2786-7 4.0 4.0 4.0 CM 9464-29 3.0 4.0 4.5 SM 2787-1 3.5 4.0 3.0 CM 9464-30 3.0 4.0 4.0 SM 2787-4 4.0 3.5 3.0 CM 9464-33 2.0 1.5 2.5 SM 2790-18 5.0 4.5 M Col 1505 (check) 4.0 4.0 4.0 SM 2791-16 3.0 3.5 4.0 M Col 1522 (check) 4.0 4.0 4.0 SM 2792-42 3.5 3.0 4.0 SM 2452-13 3.0 3.0 3.0 SM 2792-43 4.0 4.5
Resistant (%) 5.9 6.0 0.0 Intermediate (%) 51.0 46.0 53.7 Susceptible (%) 43.1 48.0 46.3 a. Resistance is measured according to a scale of 1.0 to 5.0, where scores of 1.0–2.0 indicate resistant; 2.5–3.5, intermediately
resistant; and 4.0–5.0, susceptible plants
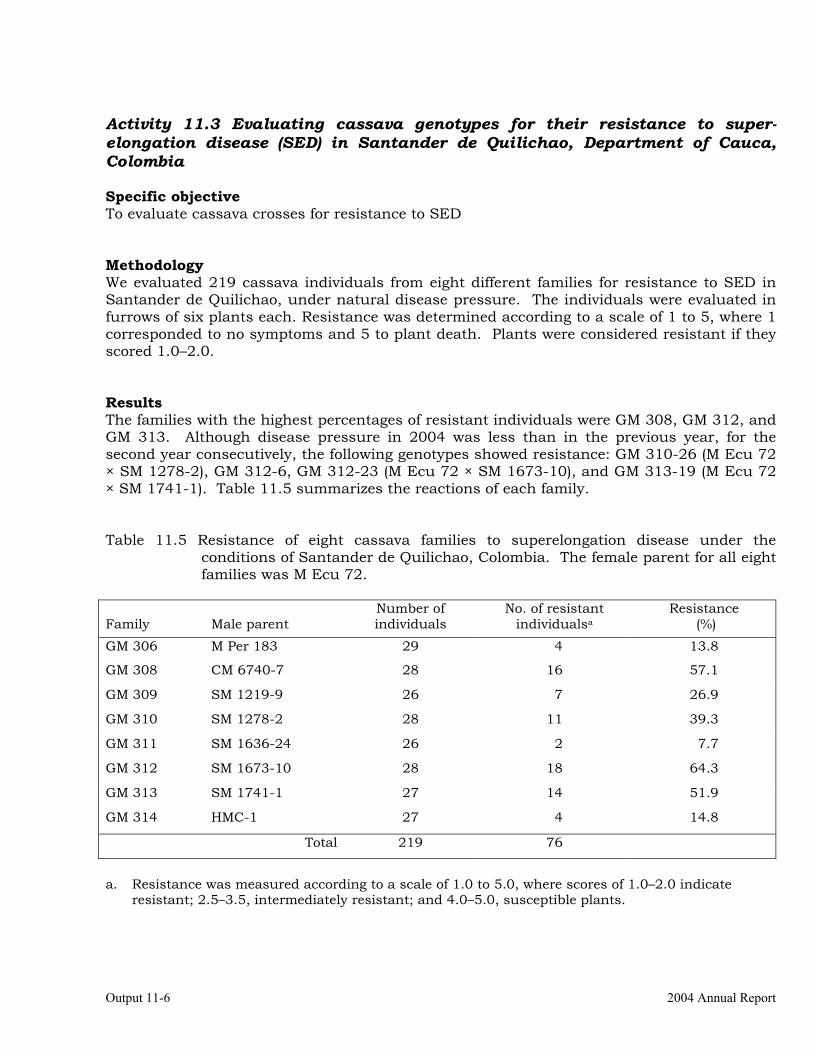
Output 11-6 2004 Annual Report
Activity 11.3 Evaluating cassava genotypes for their resistance to super-elongation disease (SED) in Santander de Quilichao, Department of Cauca, Colombia Specific objective To evaluate cassava crosses for resistance to SED Methodology We evaluated 219 cassava individuals from eight different families for resistance to SED in Santander de Quilichao, under natural disease pressure. The individuals were evaluated in furrows of six plants each. Resistance was determined according to a scale of 1 to 5, where 1 corresponded to no symptoms and 5 to plant death. Plants were considered resistant if they scored 1.0–2.0. Results The families with the highest percentages of resistant individuals were GM 308, GM 312, and GM 313. Although disease pressure in 2004 was less than in the previous year, for the second year consecutively, the following genotypes showed resistance: GM 310-26 (M Ecu 72 × SM 1278-2), GM 312-6, GM 312-23 (M Ecu 72 × SM 1673-10), and GM 313-19 (M Ecu 72 × SM 1741-1). Table 11.5 summarizes the reactions of each family. Table 11.5 Resistance of eight cassava families to superelongation disease under the
conditions of Santander de Quilichao, Colombia. The female parent for all eight families was M Ecu 72.
Family
Male parent
Number of individuals
No. of resistant individualsa
Resistance (%)
GM 306 M Per 183 29 4 13.8
GM 308 CM 6740-7 28 16 57.1
GM 309 SM 1219-9 26 7 26.9
GM 310 SM 1278-2 28 11 39.3
GM 311 SM 1636-24 26 2 7.7
GM 312 SM 1673-10 28 18 64.3
GM 313 SM 1741-1 27 14 51.9
GM 314 HMC-1 27 4 14.8
Total 219 76
a. Resistance was measured according to a scale of 1.0 to 5.0, where scores of 1.0–2.0 indicate
resistant; 2.5–3.5, intermediately resistant; and 4.0–5.0, susceptible plants.
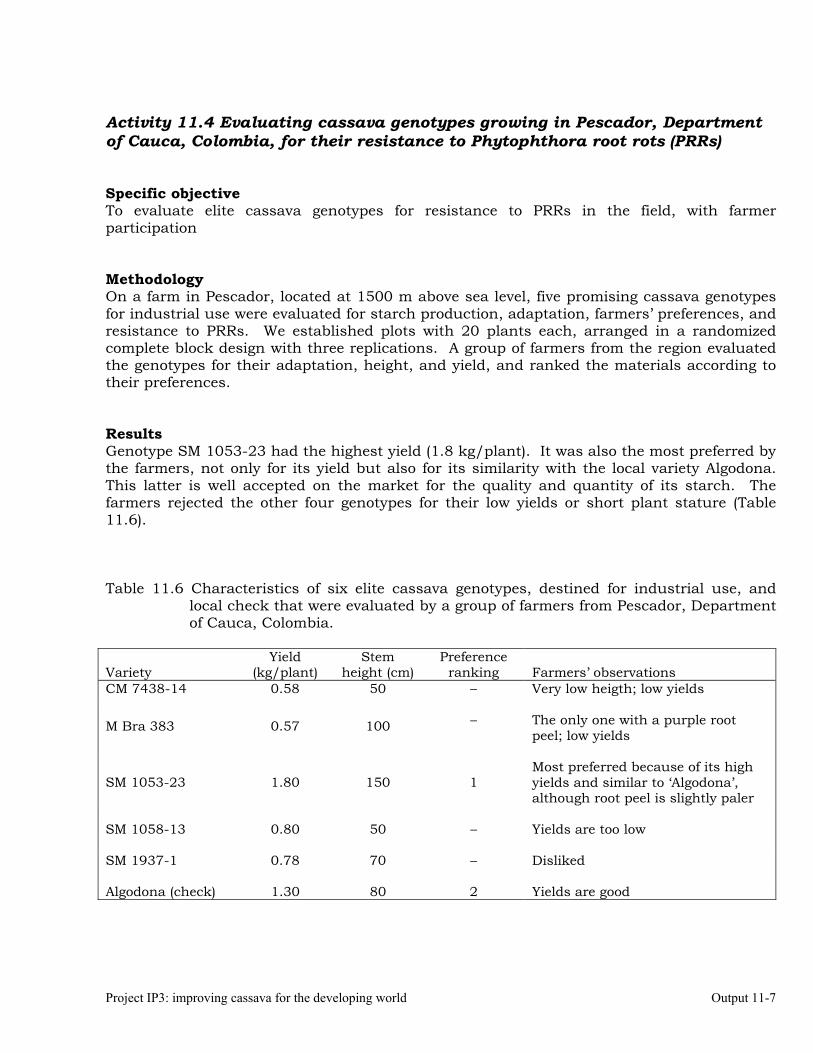
Project IP3: improving cassava for the developing world Output 11-7
Activity 11.4 Evaluating cassava genotypes growing in Pescador, Department of Cauca, Colombia, for their resistance to Phytophthora root rots (PRRs) Specific objective To evaluate elite cassava genotypes for resistance to PRRs in the field, with farmer participation Methodology On a farm in Pescador, located at 1500 m above sea level, five promising cassava genotypes for industrial use were evaluated for starch production, adaptation, farmers’ preferences, and resistance to PRRs. We established plots with 20 plants each, arranged in a randomized complete block design with three replications. A group of farmers from the region evaluated the genotypes for their adaptation, height, and yield, and ranked the materials according to their preferences. Results Genotype SM 1053-23 had the highest yield (1.8 kg/plant). It was also the most preferred by the farmers, not only for its yield but also for its similarity with the local variety Algodona. This latter is well accepted on the market for the quality and quantity of its starch. The farmers rejected the other four genotypes for their low yields or short plant stature (Table 11.6). Table 11.6 Characteristics of six elite cassava genotypes, destined for industrial use, and
local check that were evaluated by a group of farmers from Pescador, Department of Cauca, Colombia.
Variety Yield
(kg/plant) Stem
height (cm) Preference
ranking Farmers’ observations CM 7438-14 0.58 50 – Very low heigth; low yields
M Bra 383
0.57
100 – The only one with a purple root peel; low yields
SM 1053-23
1.80
150
1
Most preferred because of its high yields and similar to ‘Algodona’, although root peel is slightly paler
SM 1058-13 0.80 50 – Yields are too low SM 1937-1 0.78 70 – Disliked Algodona (check) 1.30 80 2 Yields are good
Project IP3: improving cassava for the developing world Output 11-8
Activity 11.5. Evaluating of cassava genotypes growing in the departments of Sucre and Córdoba, for their resistance to FSD and SED. We evaluated a total of 145 cassava clones for their resistance to frogskin disease (FSD) and superelongation disease (SED). At Montería, Córdoba, 81 clones from an Advanced Yield Trial were planted and, at La Unión, Sucre, 64 clones from a Preliminary Yield Trial. The experimental design was random complete blocks with three replications. Plant germination was evaluated at day 30 after planting, and showed rates between 3% and 100%. No symptoms of the two diseases were observed. For SED, further evaluations will be made when the plants are 6, 9, and 12 months old and, for FSD, at harvest.
Activities 11.6 and 11.7 Identifying the association between foliar resistance and root resistance to Phytophthora tropicalis. Determining resistance in roots and leaves to P. tropicalis during its penetration and post-penetration phases. Objective To identify different types of resistance of 22 cassava clones to Phytophthora tropicalis, a causal agent of root rots. Introduction A methodology was developed to evaluate resistance of cassava roots and leaves to P. tropicalis during its penetration and post-penetration phases. The methodology was then validated in 22 cassava clones. Finally, the relationship between root resistance and leaf resistance was established in terms of the pathogen’s two infection phases. Methodology Plant materials. In Palmira (Department of Valle del Cauca, Colombia), roots were selected from 10-month-old plants of 26 cassava clones. The roots of clones CM 523-7, CM 7951-5, HMC-1, M Per 183, SM 1855-15, and SM 2160-2 were evaluated, with two replications over time, because they showed contrasting reactions to infection by P. tropicalis when both leaves and roots were inoculated. Roots were harvested and washed with potable water, disinfested with 1% sodium hypochlorite for 5 min, followed by 50% ethanol for 5 min, and then washed again in sterilized deionized water. Leaves nos. 3, 4, and 5, taken from the apical part of the stem of 22 clones, were harvested in Palmira and Jamundí (Valle del Cauca, Colombia), disinfested in 10% ethanol, and washed twice in deionized water. In addition to the two evaluations of leaves from the field, leaves were also taken from clones CM 523-7, CM 7463-2, HMC-1, M Col 2760, SM 1219-9, SM 1642-22, and SM 1660-4 grown for 1 month in a screen house located at CIAT, Palmira. These clones had contrasting reactions to P. tropicalis during the first two evaluations.
Project IP3: improving cassava for the developing world Output 11-9
Phytophthora tropicalis. For the experiments, we used isolate no. 44 from the collection held at CIAT and identified as P. tropicalis. Inoculum for leaf lobes. Zoospores on disks of cassava leaves inoculated with isolate no. 44 were obtained as follows: disks, with 8-mm diameters, of cassava leaves were taken from 1-month-old plants growing in a screen house at Palmira. They were then disinfected by immersion for 1 min in 10% ethanol and then washed with deionized water. Eight disks, placed on two slides, were added to each of one petri dish per clon, holding moist paper toweling. The slides kept the leaf disks away from the towel. The disks were then inoculated with fragments of mycelium in suspension, grown in nutritive broth. The petri dishes were incubated in the laboratory at temperatures between 25°C and 28°C and in alternating 12 h light and 12 h dark. The presence of sporangia was checked daily. Sporangia were harvested with a needle and then suspended in water containing 0.01% of Tween® 80. To liberate the zoospores, the suspension was then incubated for 37 min at about 4°C. To inoculate the leaf lobes, a concentration of 1 × 10⁴ zoospores/mL of inoculum was used. This concentration was selected as optimal through a test of serial dilutions that had previously been carried out. The concentration of inoculum was ascertained by counting the zoospores in a hemacytometer under a light microscope. Inoculum for roots. The pathogenicity of the isolate was recovered by a re-isolation of inoculated roots. The roots were inoculated by placing a fragment of culture, 5 mm in diameter, in a perforation made with a punch (López and Lozano 1992). Re-isolation was obtained 5 days after inoculation by planting infected tissue in V8A medium modified with antibiotics and fungicides (Sánchez 1998). The root fragments were disinfested in 50% ethanol for 30 s or 60 s. The inoculum (hyphae) was obtained from the margins of colonies growing in V8 agar culture medium containing penicillin. Genetic resistance to P. tropicalis. Resistance to the penetration phase was determined according to the percentage of lesions with diameters greater than 5 mm, obtained at several inoculation sites in leaves and roots. The area covered by the lesion was used to indicate the degree of resistance during the post-penetration phase of infection in roots and leaves. Determining resistance to P. tropicalis in cassava roots. Cassava roots were inoculated without wounding by placing 3 to 9 disks of mycelial growth of P. tropicalis on each root’s surface at several sites. The disks measured 5 mm in diameter and 1 mm thick. Each disk was then covered with masking tape. Each root was placed on a sterilized, moistened paper towel in a plastic bag. We evaluated four roots per cassava clone and incubated them at temperatures between 20°C and 25°C in the dark. As checks, one root per cassava clone was inoculated with a disk of medium culture with no mycelial growth. The 22 clones were organized according to a randomized complete block design.
Project IP3: improving cassava for the developing world Output 11-10
At days 6, 9, and 12 after inoculation, transverse cuts were made to one (days 6 and 9) or two (day 12) roots per clone at the site where the inoculum was placed. The number of lesions was determined, and the infected area estimated (%). To determine the area infected by the pathogen, we took into account the area showing fluorescence under ultraviolet light at 365 nm (Spectroline®, Lonlife™ Filter, Ultraviolet Fluorescence Analysis Cabinet). To evaluate resistance to post-penetration, roots were inoculated by perforating the peel. Evaluation was carried out 6, 9, and 12 days later by making a transverse cut through each root section and determining the percentage of area infected, according to the symptoms described above. Determining resistance to P. tropicalis in leaves. From each clone, two leaves (four lobes), 5 cm long, were taken. Their extremes were covered in paraffin and the lobes placed on two slides in a petri dish containing moistened paper toweling. Evaluating resistance to P. tropicalis during infection of leaf epidermis. To determine resistance to penetration by the pathogen, 3 drops of 30 µL each of the suspension of zoospores (1 × 10⁴ zoospores/mL) were deposited on the lower surface of the leaf lobe without wounding, using a 200-µL micropipette. Each drop was covered with a sterilized disk of filter paper (Whatman® No. 1), measuring 6 mm in diameter. Evaluating resistance to P. tropicalis in the post-penetration phase of leaf infection. To determine the resistance of leaf tissue, the midrib and blade of each leaf lobe was perforated with a punch with a 1-mm diameter. On the lower side of the lobe, the perforation was covered with a piece of sticky tape with a 6-mm diameter to prevent loss of the inoculum. Each lobe was inoculated with 30 µL of a suspension of P. tropicalis at a concentration of about 1 × 10⁴ zoospores/mL placed within the perforation, using a 200-µL micropipette. As negative checks, two leaf lobes of each clone were inoculated with sterilized distilled water. All the lobes were incubated in the laboratory at temperatures between 20°C and 25°C. At 72, 96, 120, and 144 h of incubation, the lobes were evaluated in terms of the number of lesions formed and severity, using a semi-quantitative scale. Experimental design. Roots. We evaluated 26 cassava clones inoculated with P. tropicalis, using four roots per clone and organized according to a randomized complete block design. Each root was inoculated between three and nine sites, which were each evaluated separately. The experimental unit was one root. The roots—from clones CM 523-7, CM 7951-5, HMC-1, M Per 183, SM 1855-15, and SM 2160-2—were evaluated twice (both times harvested from the same place) because they showed contrasting reactions to infection by P. tropicalis through leaf inoculation. For the first evaluation, six roots per clone were used and the roots organized according to the randomized complete block design. For the second inoculation, four roots per clone were evaluated, using the same design.
Project IP3: improving cassava for the developing world Output 11-11
Lobes. Leaf lobes of the clones (in all, 21 clones were evaluated) were organized according to the randomized complete block design. For each clone, four lobes (cut from two plants) were inoculated on their lower side at three inoculation sites, each of which was evaluated separately. The upper surface of the lobe, which had the perforation, had only one inoculation site. The 21 clones were evaluated twice: leaves from Cali (one method of inoculation—perforation of lobe) and then those from Jamundí (two methods of inoculation—with and without perforation of lobe). In addition to the two evaluations of leaves from the field, we also evaluated leaves from clones CM 523-7, CM 7463-2, HMC-1, M Col 2760, SM 1219-9, SM 1642-22, and SM 1660-4, cultivated in a screen house at CIAT, Palmira. These clones contrasted in their reaction to P. tropicalis during the first two evaluations. Statistical analysis. The roots were evaluated on 3 separate days (days 6, 9, and 12 after inoculation). Observations made on the infected area of root parenchyma were standardized to generate an average per clone. It should be pointed out that each evaluation was destructive, preventing repeated evaluations of a root. To determine the significance of differences found between the reactions of clones in resisting the different phases of infection by P. tropicalis in roots and leaves, we carried out an analysis of variance and a LSD or Tukey’s test, using the analytical package STATISTIX 8.0 (1985–2003). The relationship between reaction at penetration and at post-penetration was proven by regression analysis. Results Evaluating resistance to P. tropicalis during infection of root peel and leaf epidermis. Without wounding the roots, we obtained infection in all 26 clones inoculated with P. tropicalis (Figures 7.1 and 7.2). Differences were significant (P < 0.05) among the clones evaluated for root-peel resistance in the penetration phase, according to the percentage of observed lesions. By clone, lesions per root averaged between 18.8% (M Bra 383), and 97.3% (SM 1642-22). Table 11.7. The percentage of lesions was relatively high in commercial varieties such as CM 523-7 (ICA Catumare, 66.2%), SM 2160-2 (59.8%), and M Per 183 (42.2%). Few lesions were recorded for M Col 2737 (26.8%), SM 1855-15 (31.9%), SM 1219-9 (23.8%), and CM 7951-5 (57.0%). These clones formed a cluster at the level of intermediate resistance (Tukey’s test, = 0.05).
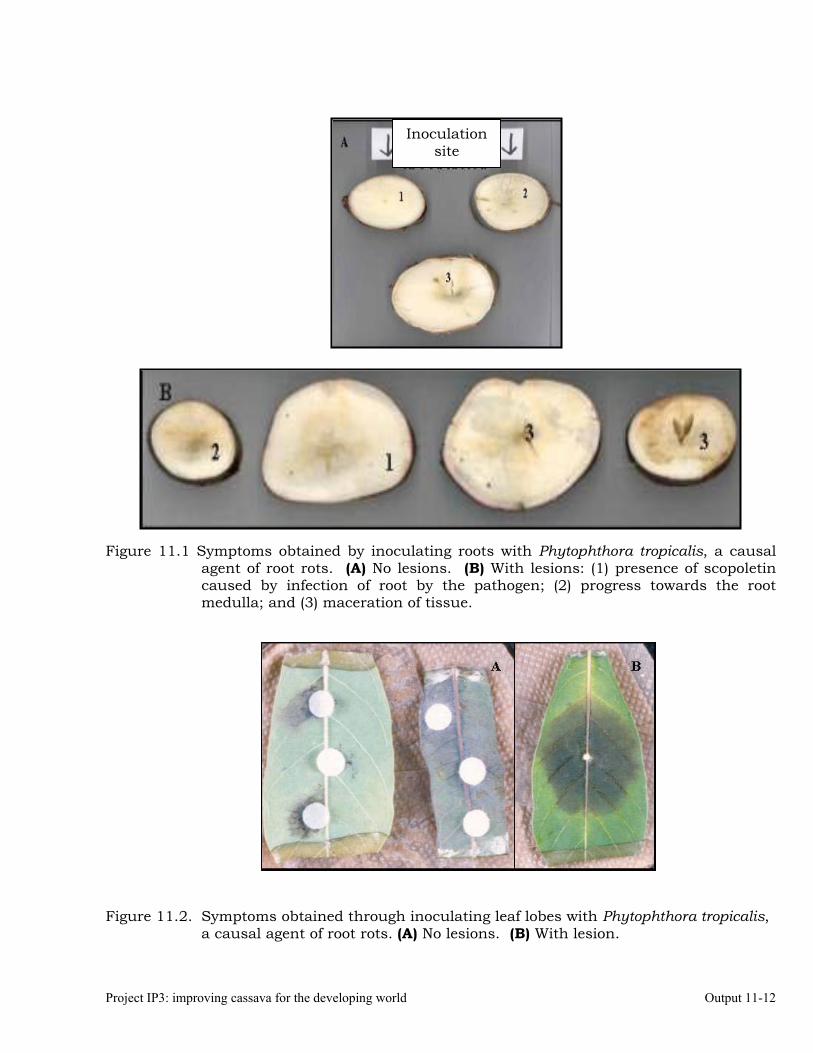
Project IP3: improving cassava for the developing world Output 11-12
Figure 11.1 Symptoms obtained by inoculating roots with Phytophthora tropicalis, a causal
agent of root rots. (A) No lesions. (B) With lesions: (1) presence of scopoletin caused by infection of root by the pathogen; (2) progress towards the root medulla; and (3) maceration of tissue.
Figure 11.2. Symptoms obtained through inoculating leaf lobes with Phytophthora tropicalis,
a causal agent of root rots. (A) No lesions. (B) With lesion.
Inoculation site
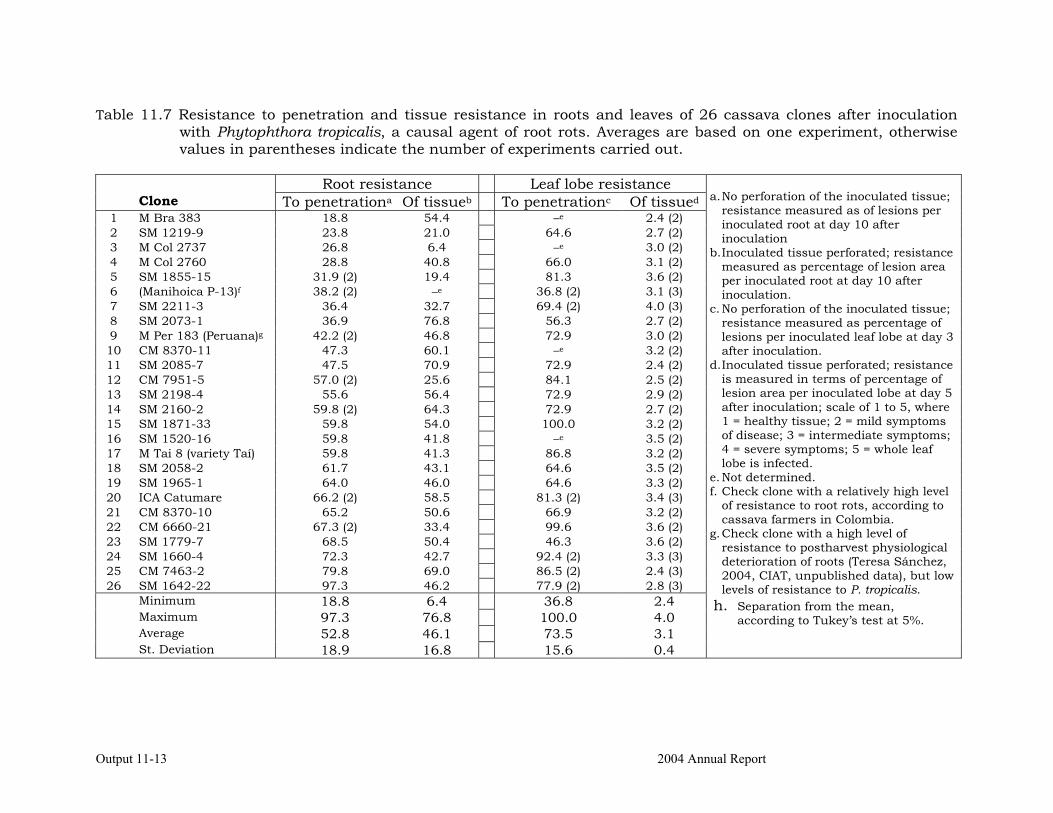
Output 11-13 2004 Annual Report
Table 11.7 Resistance to penetration and tissue resistance in roots and leaves of 26 cassava clones after inoculation with Phytophthora tropicalis, a causal agent of root rots. Averages are based on one experiment, otherwise values in parentheses indicate the number of experiments carried out.
Root resistance Leaf lobe resistance Clone To penetrationa Of tissueb To penetrationc Of tissued 1 M Bra 383 18.8 54.4 –e 2.4 (2) 2 SM 1219-9 23.8 21.0 64.6 2.7 (2) 3 M Col 2737 26.8 6.4 –e 3.0 (2) 4 M Col 2760 28.8 40.8 66.0 3.1 (2) 5 SM 1855-15 31.9 (2) 19.4 81.3 3.6 (2) 6 (Manihoica P-13)f 38.2 (2) –e 36.8 (2) 3.1 (3) 7 SM 2211-3 36.4 32.7 69.4 (2) 4.0 (3) 8 SM 2073-1 36.9 76.8 56.3 2.7 (2) 9 M Per 183 (Peruana)g 42.2 (2) 46.8 72.9 3.0 (2) 10 CM 8370-11 47.3 60.1 –e 3.2 (2) 11 SM 2085-7 47.5 70.9 72.9 2.4 (2) 12 CM 7951-5 57.0 (2) 25.6 84.1 2.5 (2) 13 SM 2198-4 55.6 56.4 72.9 2.9 (2) 14 SM 2160-2 59.8 (2) 64.3 72.9 2.7 (2) 15 SM 1871-33 59.8 54.0 100.0 3.2 (2) 16 SM 1520-16 59.8 41.8 –e 3.5 (2) 17 M Tai 8 (variety Taí) 59.8 41.3 86.8 3.2 (2) 18 SM 2058-2 61.7 43.1 64.6 3.5 (2) 19 SM 1965-1 64.0 46.0 64.6 3.3 (2) 20 ICA Catumare 66.2 (2) 58.5 81.3 (2) 3.4 (3) 21 CM 8370-10 65.2 50.6 66.9 3.2 (2) 22 CM 6660-21 67.3 (2) 33.4 99.6 3.6 (2) 23 SM 1779-7 68.5 50.4 46.3 3.6 (2) 24 SM 1660-4 72.3 42.7 92.4 (2) 3.3 (3) 25 CM 7463-2 79.8 69.0 86.5 (2) 2.4 (3) 26 SM 1642-22 97.3 46.2 77.9 (2) 2.8 (3) Minimum 18.8 6.4 36.8 2.4 Maximum 97.3 76.8 100.0 4.0 Average 52.8 46.1 73.5 3.1 St. Deviation 18.9 16.8 15.6 0.4
a. No perforation of the inoculated tissue;
resistance measured as of lesions per inoculated root at day 10 after inoculation
b. Inoculated tissue perforated; resistance measured as percentage of lesion area per inoculated root at day 10 after inoculation.
c. No perforation of the inoculated tissue; resistance measured as percentage of lesions per inoculated leaf lobe at day 3 after inoculation.
d. Inoculated tissue perforated; resistance is measured in terms of percentage of lesion area per inoculated lobe at day 5 after inoculation; scale of 1 to 5, where 1 = healthy tissue; 2 = mild symptoms of disease; 3 = intermediate symptoms; 4 = severe symptoms; 5 = whole leaf lobe is infected.
e. Not determined. f. Check clone with a relatively high level
of resistance to root rots, according to cassava farmers in Colombia.
g. Check clone with a high level of resistance to postharvest physiological deterioration of roots (Teresa Sánchez, 2004, CIAT, unpublished data), but low levels of resistance to P. tropicalis.
h. Separation from the mean, according to Tukey’s test at 5%.
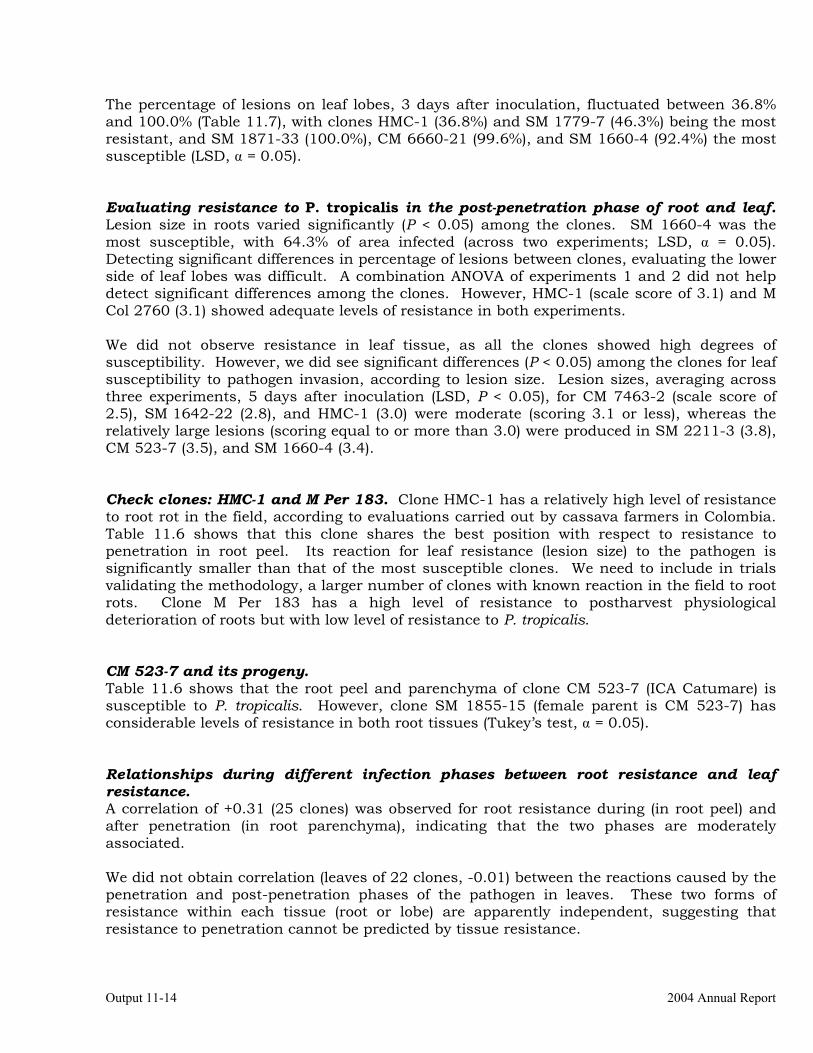
Output 11-14 2004 Annual Report
The percentage of lesions on leaf lobes, 3 days after inoculation, fluctuated between 36.8% and 100.0% (Table 11.7), with clones HMC-1 (36.8%) and SM 1779-7 (46.3%) being the most resistant, and SM 1871-33 (100.0%), CM 6660-21 (99.6%), and SM 1660-4 (92.4%) the most susceptible (LSD, = 0.05). Evaluating resistance to P. tropicalis in the post-penetration phase of root and leaf. Lesion size in roots varied significantly (P < 0.05) among the clones. SM 1660-4 was the most susceptible, with 64.3% of area infected (across two experiments; LSD, = 0.05). Detecting significant differences in percentage of lesions between clones, evaluating the lower side of leaf lobes was difficult. A combination ANOVA of experiments 1 and 2 did not help detect significant differences among the clones. However, HMC-1 (scale score of 3.1) and M Col 2760 (3.1) showed adequate levels of resistance in both experiments. We did not observe resistance in leaf tissue, as all the clones showed high degrees of susceptibility. However, we did see significant differences (P < 0.05) among the clones for leaf susceptibility to pathogen invasion, according to lesion size. Lesion sizes, averaging across three experiments, 5 days after inoculation (LSD, P < 0.05), for CM 7463-2 (scale score of 2.5), SM 1642-22 (2.8), and HMC-1 (3.0) were moderate (scoring 3.1 or less), whereas the relatively large lesions (scoring equal to or more than 3.0) were produced in SM 2211-3 (3.8), CM 523-7 (3.5), and SM 1660-4 (3.4). Check clones: HMC-1 and M Per 183. Clone HMC-1 has a relatively high level of resistance to root rot in the field, according to evaluations carried out by cassava farmers in Colombia. Table 11.6 shows that this clone shares the best position with respect to resistance to penetration in root peel. Its reaction for leaf resistance (lesion size) to the pathogen is significantly smaller than that of the most susceptible clones. We need to include in trials validating the methodology, a larger number of clones with known reaction in the field to root rots. Clone M Per 183 has a high level of resistance to postharvest physiological deterioration of roots but with low level of resistance to P. tropicalis. CM 523-7 and its progeny. Table 11.6 shows that the root peel and parenchyma of clone CM 523-7 (ICA Catumare) is susceptible to P. tropicalis. However, clone SM 1855-15 (female parent is CM 523-7) has considerable levels of resistance in both root tissues (Tukey’s test, = 0.05). Relationships during different infection phases between root resistance and leaf resistance. A correlation of +0.31 (25 clones) was observed for root resistance during (in root peel) and after penetration (in root parenchyma), indicating that the two phases are moderately associated. We did not obtain correlation (leaves of 22 clones, -0.01) between the reactions caused by the penetration and post-penetration phases of the pathogen in leaves. These two forms of resistance within each tissue (root or lobe) are apparently independent, suggesting that resistance to penetration cannot be predicted by tissue resistance.
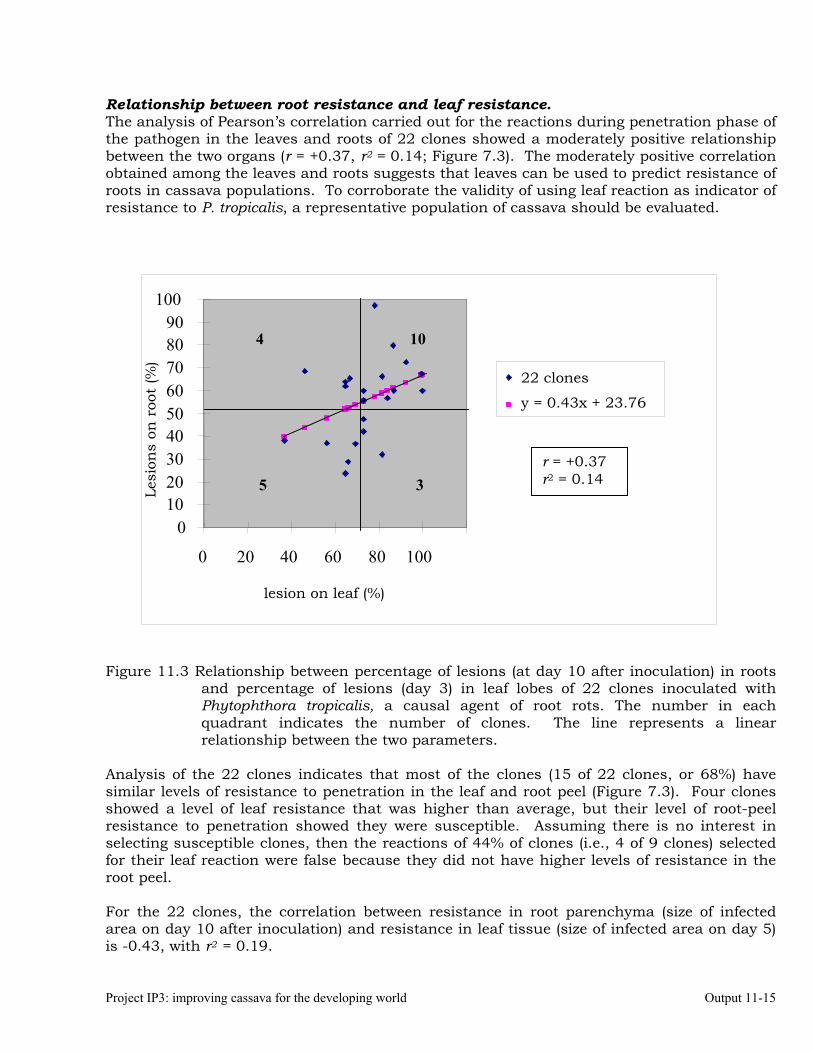
Project IP3: improving cassava for the developing world Output 11-15
Relationship between root resistance and leaf resistance. The analysis of Pearson’s correlation carried out for the reactions during penetration phase of the pathogen in the leaves and roots of 22 clones showed a moderately positive relationship between the two organs (r = +0.37, r2 = 0.14; Figure 7.3). The moderately positive correlation obtained among the leaves and roots suggests that leaves can be used to predict resistance of roots in cassava populations. To corroborate the validity of using leaf reaction as indicator of resistance to P. tropicalis, a representative population of cassava should be evaluated. Figure 11.3 Relationship between percentage of lesions (at day 10 after inoculation) in roots
and percentage of lesions (day 3) in leaf lobes of 22 clones inoculated with Phytophthora tropicalis, a causal agent of root rots. The number in each quadrant indicates the number of clones. The line represents a linear relationship between the two parameters.
Analysis of the 22 clones indicates that most of the clones (15 of 22 clones, or 68%) have similar levels of resistance to penetration in the leaf and root peel (Figure 7.3). Four clones showed a level of leaf resistance that was higher than average, but their level of root-peel resistance to penetration showed they were susceptible. Assuming there is no interest in selecting susceptible clones, then the reactions of 44% of clones (i.e., 4 of 9 clones) selected for their leaf reaction were false because they did not have higher levels of resistance in the root peel. For the 22 clones, the correlation between resistance in root parenchyma (size of infected area on day 10 after inoculation) and resistance in leaf tissue (size of infected area on day 5) is -0.43, with r2 = 0.19.
0 10 20 30 40 50 60 70 80 90
100
0 20 40 60 80 100
lesion on leaf (%)
Lesi
ons
on r
oot
(%)
22 clones
y = 0.43x + 23.76
35
4 10
r = +0.37 r2 = 0.14
Project IP3: improving cassava for the developing world Output 11-16
Discussion and conclusions Agrios (1988) specified that resistance can be effective at the site of the pathogen’s entry (i.e., penetration) or during its development within the host’s tissue (i.e., post-penetration). In our study, the different cassava clones analyzed demonstrated that different levels of susceptibility exist for both phases of penetration and post-penetration during infection of leaves and roots by P. tropicalis. Such results occur according to inoculation method, suggesting that mechanisms of resistance operating in the penetration and post-penetration phases of the pathogen are different (Iwaro et al. 1997). We observed high clonal variation in the resistance of root peel and parenchyma of cassava. No previous research has demonstrated that unlesioned cassava roots can serve as sites of infection for Phytophthora. This is the first report to determine resistance to Phytophthora in root peel. Although the responsible factors for P. tropicalis infection of root and leaf should be characterized completely, results suggest that two levels of resistance possibly exist in the roots. This implies that the selection of clones for resistance to root rot caused by Phytophthora should be carried out independently for penetration and for post-penetration, so that their combination may be used for breeding, thus increasing existing levels of resistance in cassava to P. tropicalis. The low correlation obtained between resistance of root peel to penetration and resistance of root parenchyma to post-penetration indicates that the mechanism conferring resistance is not systemic within the root. In several clones, we observed reductions in the size and number of root lesions, which may indicate quantitative resistance to P. tropicalis. Quantitative resistance is basically characterized by reduced growth rate, size, and number of lesions, latent period, and capacity to sporulate. These are controlled by several quantitative heredity genes (Parlevliet 2003). We found a negative correlation of -0.43 (r2 = 0.19) between resistance of leaf tissue and resistance of root parenchyma. A biological reason may be that the translocation of photosynthetic products, which varies according to the physiological phases of the cassava plant, probably interferes with the level of resistance to P. tropicalis in leaves and roots. This study indicates that resistance in root peel may be predicted by calculating the percentage of lesions found in leaf lobes inoculated in the laboratory or obtained from field plants. Thus, large populations of progenies can be evaluated during the plants’ first phase in the field, hence, saving time and costs. The methodology developed for pre-selecting clones resistant to root rots by evaluating leaf lobes inoculated with P. tropicalis results in greater efficiency of cassava genetic-improvement programs. Adult roots, which may take a year to develop, are not required. Another advantage is the possibility of evaluating clones in the greenhouse (e.g., for transgenic plants) or clones that are not adapted to the agroecological zones where germplasm banks are located. Obtaining leaves is easier than obtaining adult roots, especially in the greenhouse.
Project IP3: improving cassava for the developing world Output 11-17
The lack of a relationship between leaf reactions and root reactions in the post-penetration phase of the pathogen suggests that selection for this component of resistance is in the roots’ enlargement phase. In Activity 11.8 we discuss the close relationship between fluorescence of uninoculated roots and resistance to root rot caused by P. tropicalis, enabling evaluation to be more efficient. References Agrios GN. 1988. Fitopatología. 3rd ed. Prensa Académica, San Diego, CA. Iwaro AD; Sreenivasan TN; Umaharan P. 1997. Foliar resistance to Phytophthora palmivora
as an indicator of pod resistance in Theobroma cacao. Plant Dis 81:619–624. López C; Lozano T, JC. 1992. Evaluación sobre resistencia a Phytophthora nicotianae var.
nicotianae en yuca (Manihot esculenta Crantz). Fitopatol Colomb 16(1-2):113–119. Parlevliet JE. http://www.dpw.wau.nl/pv/projects/preduza/. Selección de componentes de
resistencia parcial. Plant Breeding Department, Wageningen Agricultural University, Wageningen, Netherlands. (Accessed 15 Nov 2003.)
Sánchez NJ. 1998. Caracterización de Phytophthora spp., agente causal de pudrición en raíz de
yuca (Manihot esculenta Crantz) utilizando pruebas de patogenicidad y técnicas moleculares. BSc thesis. Faculty of Sciences, Department of Biology, Universidad Nacional de Colombia, Santafé de Bogotá, Colombia. 205 p.
STATISTIX 8.0. 1985–2003. Analytical software. Activity 11.8 Determining the biochemical markers and agronomic traits associated with resistance to root rot caused by Phytophthora tropicalis 11.8.1. Palmira. Objective To optimize the selection of cassava clones resistant to root rot caused by P. tropicalis through the use of biochemical and morphological markers Methodology Plant materials. In Palmira (Department of Valle del Cauca, Colombia), roots of 10-month-old plants were selected from 26 cassava clones. Biochemical markers. The cassava roots were washed with running water to eliminate soil residues, peeled with a
Project IP3: improving cassava for the developing world Output 11-18
steel knife, and the peel then dried for 2 days at 40°C in an incubator. A mill was used to pulverize the peel. For each clone, iron and manganese contents were determined by atomic absorption spectrophotometry. Fluorescence (scopoletin) in root parenchyma. Once harvested, six roots of each clone were washed with running water, then disinfected with 1% sodium hypochlorite for 1 min and 50% ethanol for 5 min, and given a final wash with sterilized deionized water. Each root received three 3-cm-long incisions to a depth of 1 cm. Three centimeters were cut off each end of the root and the new ends covered with cellophane. Each root was wrapped in moist, sterilized, paper toweling, placed in a plastic bag, and incubated at 20°C to 25°C in the dark. To determine the area presenting fluorescence (scopoletin), the percentage of the fluorescent area was evaluated 10 days after harvest, based on seven transverse cuts made on each root on the day of evaluation. To measure the fluorescence in the roots, we used a dark booth with ultraviolet light at 365 nm (Spectroline®, LonglifeTM Filter, Ultraviolet Fluorescence Analysis Cabinet). Resistance to root rot caused by P. tropicalis. Two types of resistance were evaluated: (1) resistance of peel to penetration, based on the frequency of lesions in the parenchyma with diameters greater than 1 mm, and obtained at several points of inoculation on the root; and (2) the size of lesion area was used to indicate resistance after the pathogen penetrated the parenchyma. Statistical analysis. We carried out analyses of variance, using STATISTIX 8.0 (1985–2003), to determine significant differences among the clones for area of fluorescence (scopoletin). Correlations were calculated between resistance and the following parameters: iron, manganese, iron-to-manganese ratio, and fluorescence (scopoletin). The correlations were then evaluated according to Pearson’s coefficient and r2. Results Relationship between iron and manganese contents in root cortex and resistance to P. tropicalis. Iron content in the root peel of the 16 clones is highly variable, fluctuating between 78.5 and 413.6 ppm (Table 11.8). A coefficient of correlation was estimated as being -0.28 between Fe content and resistance (% of lesions in roots) to P. tropicalis. Although Mn is found in relatively low quantities—between 3.6 and 26.0 ppm (Table 11.8)—in the root peel and parenchyma of the 16 clones, positive correlation was found with resistance to P. tropicalis (r = +0.21). This indicated a slight tendency for the percentage of lesions to increase with higher Mn content. A correlation of -0.53 (r2 = 0.28) was found between resistance to penetration (% lesions on day 10) and Fe and Mn contents (in ppm) in the peel of 16 of the clones (Figure 7.4). The correlation between Fe and Mn contents is +0.42. Iron and manganese contents in the peel are not associated with resistance to P. tropicalis in the parenchyma.
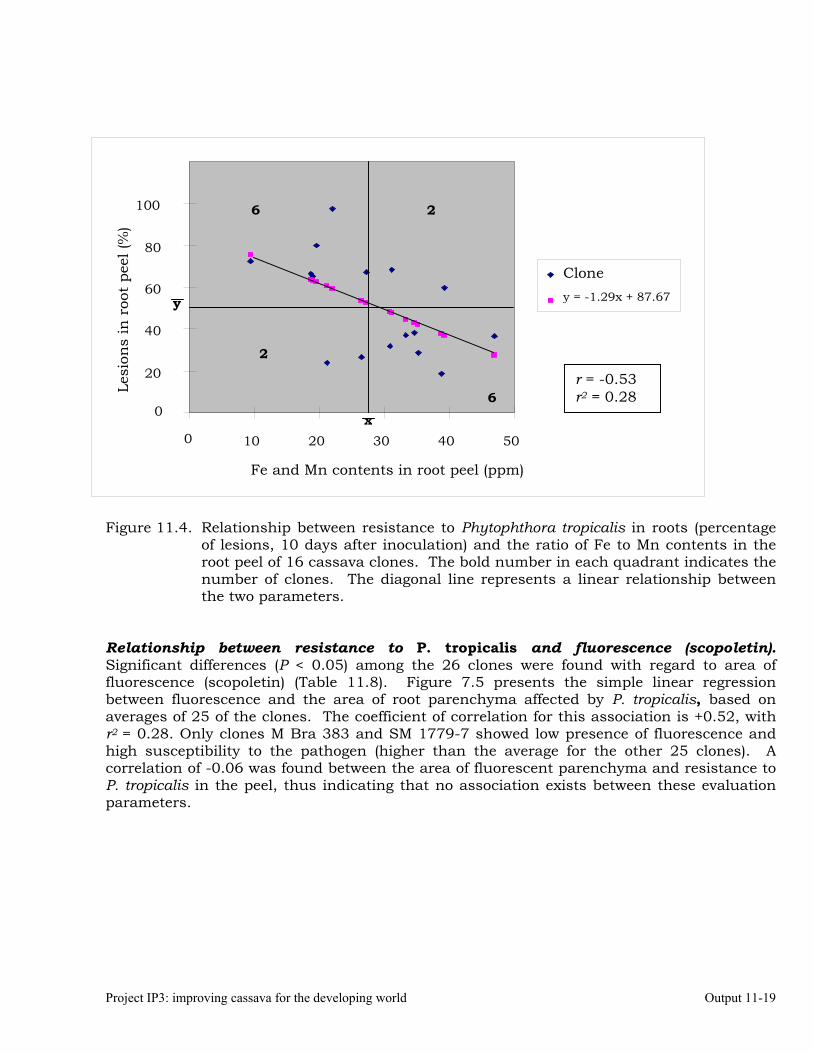
Project IP3: improving cassava for the developing world Output 11-19
Figure 11.4. Relationship between resistance to Phytophthora tropicalis in roots (percentage
of lesions, 10 days after inoculation) and the ratio of Fe to Mn contents in the root peel of 16 cassava clones. The bold number in each quadrant indicates the number of clones. The diagonal line represents a linear relationship between the two parameters.
Relationship between resistance to P. tropicalis and fluorescence (scopoletin). Significant differences (P < 0.05) among the 26 clones were found with regard to area of fluorescence (scopoletin) (Table 11.8). Figure 7.5 presents the simple linear regression between fluorescence and the area of root parenchyma affected by P. tropicalis, based on averages of 25 of the clones. The coefficient of correlation for this association is +0.52, with r2 = 0.28. Only clones M Bra 383 and SM 1779-7 showed low presence of fluorescence and high susceptibility to the pathogen (higher than the average for the other 25 clones). A correlation of -0.06 was found between the area of fluorescent parenchyma and resistance to P. tropicalis in the peel, thus indicating that no association exists between these evaluation parameters.
y
x
0
20
40
60
80
100
0 10 20 30 40 50
Fe and Mn contents in root peel (ppm)
Lesi
ons
in r
oot
peel
(%)
Clone y = -1.29x + 87.67
6 2
2
6 r = -0.53 r2 = 0.28
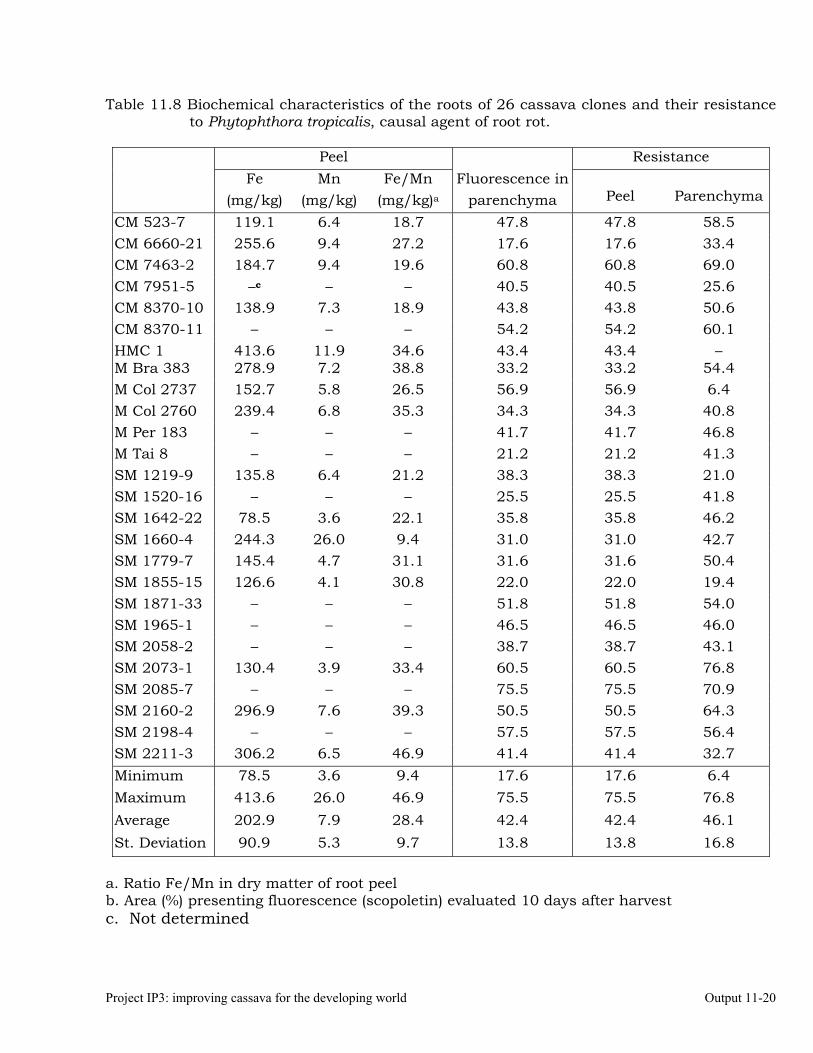
Project IP3: improving cassava for the developing world Output 11-20
Table 11.8 Biochemical characteristics of the roots of 26 cassava clones and their resistance to Phytophthora tropicalis, causal agent of root rot.
Peel Resistance Fe Mn Fe/Mn Fluorescence in (mg/kg) (mg/kg) (mg/kg)a parenchyma
Peel
Parenchyma
CM 523-7 119.1 6.4 18.7 47.8 47.8 58.5 CM 6660-21 255.6 9.4 27.2 17.6 17.6 33.4 CM 7463-2 184.7 9.4 19.6 60.8 60.8 69.0 CM 7951-5 –c – – 40.5 40.5 25.6 CM 8370-10 138.9 7.3 18.9 43.8 43.8 50.6 CM 8370-11 – – – 54.2 54.2 60.1 HMC 1 413.6 11.9 34.6 43.4 43.4 – M Bra 383 278.9 7.2 38.8 33.2 33.2 54.4 M Col 2737 152.7 5.8 26.5 56.9 56.9 6.4 M Col 2760 239.4 6.8 35.3 34.3 34.3 40.8 M Per 183 – – – 41.7 41.7 46.8 M Tai 8 – – – 21.2 21.2 41.3 SM 1219-9 135.8 6.4 21.2 38.3 38.3 21.0 SM 1520-16 – – – 25.5 25.5 41.8 SM 1642-22 78.5 3.6 22.1 35.8 35.8 46.2 SM 1660-4 244.3 26.0 9.4 31.0 31.0 42.7 SM 1779-7 145.4 4.7 31.1 31.6 31.6 50.4 SM 1855-15 126.6 4.1 30.8 22.0 22.0 19.4 SM 1871-33 – – – 51.8 51.8 54.0 SM 1965-1 – – – 46.5 46.5 46.0 SM 2058-2 – – – 38.7 38.7 43.1 SM 2073-1 130.4 3.9 33.4 60.5 60.5 76.8 SM 2085-7 – – – 75.5 75.5 70.9 SM 2160-2 296.9 7.6 39.3 50.5 50.5 64.3 SM 2198-4 – – – 57.5 57.5 56.4 SM 2211-3 306.2 6.5 46.9 41.4 41.4 32.7 Minimum 78.5 3.6 9.4 17.6 17.6 6.4 Maximum 413.6 26.0 46.9 75.5 75.5 76.8 Average 202.9 7.9 28.4 42.4 42.4 46.1 St. Deviation 90.9 5.3 9.7 13.8 13.8 16.8
a. Ratio Fe/Mn in dry matter of root peel b. Area (%) presenting fluorescence (scopoletin) evaluated 10 days after harvest c. Not determined
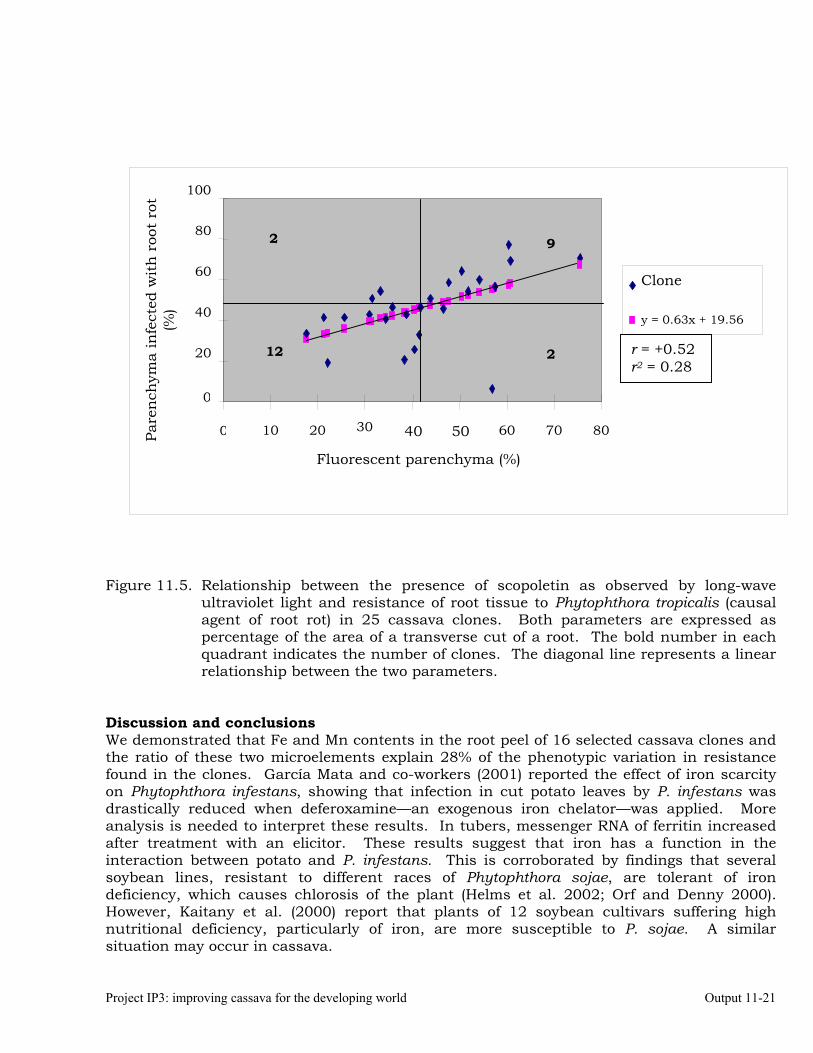
Project IP3: improving cassava for the developing world Output 11-21
Figure 11.5. Relationship between the presence of scopoletin as observed by long-wave
ultraviolet light and resistance of root tissue to Phytophthora tropicalis (causal agent of root rot) in 25 cassava clones. Both parameters are expressed as percentage of the area of a transverse cut of a root. The bold number in each quadrant indicates the number of clones. The diagonal line represents a linear relationship between the two parameters.
Discussion and conclusions We demonstrated that Fe and Mn contents in the root peel of 16 selected cassava clones and the ratio of these two microelements explain 28% of the phenotypic variation in resistance found in the clones. García Mata and co-workers (2001) reported the effect of iron scarcity on Phytophthora infestans, showing that infection in cut potato leaves by P. infestans was drastically reduced when deferoxamine—an exogenous iron chelator—was applied. More analysis is needed to interpret these results. In tubers, messenger RNA of ferritin increased after treatment with an elicitor. These results suggest that iron has a function in the interaction between potato and P. infestans. This is corroborated by findings that several soybean lines, resistant to different races of Phytophthora sojae, are tolerant of iron deficiency, which causes chlorosis of the plant (Helms et al. 2002; Orf and Denny 2000). However, Kaitany et al. (2000) report that plants of 12 soybean cultivars suffering high nutritional deficiency, particularly of iron, are more susceptible to P. sojae. A similar situation may occur in cassava.
0
20
40
60
80
100
0 10 20 30 40 50 60 70 80
Fluorescent parenchyma (%)
Pare
nch
yma
infe
cted
wit
h r
oot
rot
(%)
Clone
y = 0.63x + 19.56
9
12 2
2
r = +0.52 r2 = 0.28
Project IP3: improving cassava for the developing world Output 11-22
In our study, a close relationship was found between the absence of scopoletin—a coumarin found in very low concentrations in fresh roots but which increases considerably after harvest (Rickard 1982)—and resistance to P. tropicalis in cassava roots. This discovery will make preselection of clones simpler and faster because inoculating root parenchyma with P. tropicalis will not be necessary. The use of this evaluation parameter in relation to resistance to Phytophthora is unknown for plants. However, the relationship between fluorescence of an area and deterioration is reported by Rickard (1982). Agrios (1988) mentions scopoletin in relation to resistance. We recommend integrating genetic improvement of cassava for biofortification, resistance to root rot caused by P. tropicalis, and postharvest deterioration. The magnitude of the genotype-by-environment interaction for iron and manganese contents and area of root parenchyma with scopoletin is currently under study. References Agrios GN. 1988. Fitopatología. 3rd ed. Prensa Académica, San Diego, CA. García Mata C; Lamattina L; Cassia RO. 2001. Involvement of iron and ferritin in the potato-
Phytophthora infestans interaction. Eur J Plant Pathol 107:557–562. Helms TC; Nelson BD; Goos RJ. 2002. Registration of 'Walsh' soybean. Crop Sci 42:1379–
1380. Kaitany R; Melakeberhan H; Bird GW; Safir G. 2000. Association of Phytophthora sojae with
Heterodera glycines and nutrient-stressed soybeans. Nematropica 30:193–199. Orf JH; Denny RL. 2000. Registration of 'MN1401' soybean. Crop Sci 40:1825. Rickard JE. 1982. Investigation into post-harvest behavior of cassava roots and their
response to wounding. PhD dissertation. University of London. 161 p. STATISTIX 8.0 1985–2003. Analytical Software. 11.8.2 Jamundí and Rozo. Objective To validate the relationship between percentage of scopoletin and morphological traits of roots with two types of resistance to root rots caused by Phytophthora tropicalis and with resistance to physiological deterioration in 60 cassava clones
Project IP3: improving cassava for the developing world Output 11-23
Methodology Plant materials. Roots were harvested from 34 cassava clones from a 14-month-old crop growing in the village district of Rozo, Municipality of Palmira, Department of Valle del Cauca, Colombia. Roots were also harvested from 26 cassava clones from a 12-month-old crop growing in Jamundí, Valle del Cauca. Root morphology. For the study, a detailed analysis was carried out of the root. Three sections of the root were evaluated separately: proximal (the part closest to the stem), central part, and distal part (the part corresponding to the root’s growing point). For each of these sections, evaluations of the variables described below were carried out. Inoculum. Isolate no. 44 from the CIAT collection, identified as Phytophthora tropicalis, was used. It had grown for 5 days in a V8 culture medium that was modified with antibiotics and fungicides. The medium without pathogen growth was also used as a negative control. Resistance to Phytophthora tropicalis. Based on previous field evaluations (Loke 2004), four categories of resistance were defined according to the damage observed: resistant, with less than 10% of root area infected; moderately resistant, with 10% to 30% infected; susceptible, with 30% to 60%; and highly susceptible, with more than 60%. These categories were used to differentiate the clones according to their resistance to the pathogen. Two types of resistance to P. tropicalis were evaluated, according to Iwaro et al. (1997a). The first is resistance to the pathogen’s penetration phase, and the second is resistance to the pathogen’s post-penetration phase. The methodology is described in detail in Activity 11.8.1. Roots were organized in an experimental design of random complete blocks, with 10 replications and two roots as negative control. The experimental unit consisted of one root with three inoculation points corresponding to the root’s proximal, central, and distal parts. The roots evaluated for resistance to penetration were inoculated without perforating the peel. Ten days later, the presence or absence of rot in the parenchyma was recorded, expressed as (1) percentage of lesions with respect to the total number of inoculation points for each root section; and (2) percentage of area infected in each root section, making a transverse cut and evaluating the percentage of damage as determined by tissue maceration, yellowing, and a smell of fermentation, which are typical symptoms of P. tropicalis infection (Loke 2004). To evaluate resistance to post-penetration, roots were inoculated by perforating the peel. Evaluation was carried out 5 days later by making a transverse cut through each root section and determining the percentage of area infected, according to the symptoms described above.
Project IP3: improving cassava for the developing world Output 11-24
Resistance to postharvest physiological deterioration. Ten roots per clone were disinfected by immersing for 5 min in a solution of 1% sodium hypochlorite and then again for 5 min in 50% ethanol. About 2 cm were cut off from each end of each root and each distal extreme was covered with a film of PVC that was secured with a rubber band. Deterioration thus began in the proximal part of the root, permitting evaluation according to a scale for physiological deterioration (Wheatley et al. 1985). The disinfected roots were placed in sterilized plastic bags containing moist paper towelling. The bags were arranged according to a random complete block design with 10 replications. The experimental unit was one root. Deterioration was evaluated at 10 days, measuring the advance of deterioration through the parenchyma by making five transverse cuts through the root and using Wheatley’s scale (1985) of 11 values, as follows:
Scale
Percentage
0 to 0 (no damage) 1 to 10 2 to 20 3 to 30 4 to 40 5 to 50
and so forth until 10 corresponds to 100%. This last value indicates a total change of color in the parenchymatous tissues and xylem bundles from white to bluish maroon in the form of vascular streaks. Scopoletin. We evaluated the percentage of fluorescence appearing in the transverse cuts of the roots seen in a dark box under ultraviolet light at 365 nm. The roots were inoculated with P. tropicalis, using the non-perforation method. Five transverse cuts were made to roots exposed to physiological deterioration. An adjustment was made to also determine the presence of scopoletin in the parenchyma, that is, the sum of the percentage of macerated tissue caused by inoculation (no perforation) of the peel and the percentage of fluorescent tissue determined under ultraviolet light. This adjustment was applied because where maceration of the parenchyma occurred because of P. tropicalis, scopoletin also appeared. To analyze results, we used a random complete blocks design with 10 replications and two negative controls. The experimental unit was one root. Peel thickness. Thickness was determined, using five roots per clone and making two measurements in each section (proximal, central, and distal) of the root with a precision calibrator on fresh roots
Project IP3: improving cassava for the developing world Output 11-25
from the field. The experimental design was random complete blocks, with five replications; and the experimental unit was one root. Root hardness. Hardness was determined in five roots per clone, using a penetrometer that measured resistance in kilograms per square centimeters. Two evaluations were made for each root, in each of the proximal, central, and distal sections of each root. An experimental design of random complete blocks was used, with five replications. The experimental unit was one root. Moisture content. To determine the percentage of moisture in the roots, the peel (i.e., outer peel and bark) and parenchyma were removed from three roots per clone. The tissues were then broken up into tiny pieces and dried at 60°C for 2 days. To calculate the percentage of moisture, the samples were weighed immediately after being fragmented, and again immediately after having been removed from the oven, and the weights compared. Colors of outer peel, bark, and parenchyma. Five roots per clone were evaluated for the colors of these tissues according to Fukuda and Guevara (1998): External color of root: 1 = white or cream; 2 = yellow; 3 = pale maroon;
4 = dark maroon Bark color: 1 = white or cream; 2 = yellow; 3 = pink; 4 = red Color of root parenchyma: 1 = white; 2 = cream; 3 = yellow; 4 = pink Data analysis. Results were processed through the statistical analysis program. The following analyses were carried out: analysis of variance; separation of means, using Tukey’s comparison test; and correlations between variables at 5% significance. Values of resistance to the pathogen, and resistance to physiological deterioration, were transformed by standardizing the normal curve because inoculations had to be done over different seasons, as the number of clones did not permit execution at one date. Results Resistance to P. tropicalis during the pathogen’s penetration phase. Tables 7.9a, 7.9b, 7.10a, 7.10b indicate that results for the non-perforation method were as follows: the most resistant clones in the crop from Jamundí were SM 1871-33 (0% of area was infected), SM 2211-3 (1.33%), SM 1855-15 (3%), and SM 2141-1 (7%), among which no significant differences were observed, according to Tukey’s means test (α = 5%).
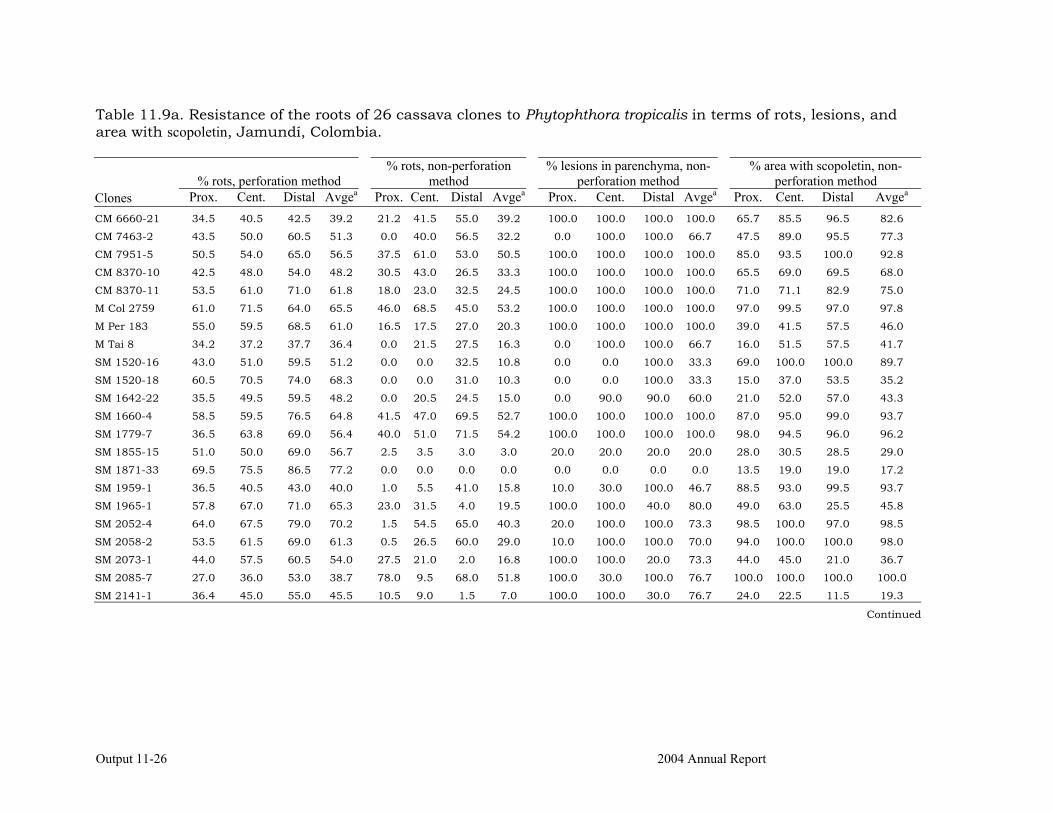
Output 11-26 2004 Annual Report
Table 11.9a. Resistance of the roots of 26 cassava clones to Phytophthora tropicalis in terms of rots, lesions, and area with scopoletin, Jamundí, Colombia.
% rots, perforation method % rots, non-perforation
method % lesions in parenchyma, non-
perforation method % area with scopoletin, non-
perforation method Clones Prox. Cent. Distal Avgea
Prox. Cent. Distal Avgea Prox. Cent. Distal Avgea
Prox. Cent. Distal Avgea CM 6660-21 34.5 40.5 42.5 39.2 21.2 41.5 55.0 39.2 100.0 100.0 100.0 100.0 65.7 85.5 96.5 82.6
CM 7463-2 43.5 50.0 60.5 51.3 0.0 40.0 56.5 32.2 0.0 100.0 100.0 66.7 47.5 89.0 95.5 77.3
CM 7951-5 50.5 54.0 65.0 56.5 37.5 61.0 53.0 50.5 100.0 100.0 100.0 100.0 85.0 93.5 100.0 92.8
CM 8370-10 42.5 48.0 54.0 48.2 30.5 43.0 26.5 33.3 100.0 100.0 100.0 100.0 65.5 69.0 69.5 68.0
CM 8370-11 53.5 61.0 71.0 61.8 18.0 23.0 32.5 24.5 100.0 100.0 100.0 100.0 71.0 71.1 82.9 75.0
M Col 2759 61.0 71.5 64.0 65.5 46.0 68.5 45.0 53.2 100.0 100.0 100.0 100.0 97.0 99.5 97.0 97.8
M Per 183 55.0 59.5 68.5 61.0 16.5 17.5 27.0 20.3 100.0 100.0 100.0 100.0 39.0 41.5 57.5 46.0
M Tai 8 34.2 37.2 37.7 36.4 0.0 21.5 27.5 16.3 0.0 100.0 100.0 66.7 16.0 51.5 57.5 41.7
SM 1520-16 43.0 51.0 59.5 51.2 0.0 0.0 32.5 10.8 0.0 0.0 100.0 33.3 69.0 100.0 100.0 89.7
SM 1520-18 60.5 70.5 74.0 68.3 0.0 0.0 31.0 10.3 0.0 0.0 100.0 33.3 15.0 37.0 53.5 35.2
SM 1642-22 35.5 49.5 59.5 48.2 0.0 20.5 24.5 15.0 0.0 90.0 90.0 60.0 21.0 52.0 57.0 43.3
SM 1660-4 58.5 59.5 76.5 64.8 41.5 47.0 69.5 52.7 100.0 100.0 100.0 100.0 87.0 95.0 99.0 93.7
SM 1779-7 36.5 63.8 69.0 56.4 40.0 51.0 71.5 54.2 100.0 100.0 100.0 100.0 98.0 94.5 96.0 96.2
SM 1855-15 51.0 50.0 69.0 56.7 2.5 3.5 3.0 3.0 20.0 20.0 20.0 20.0 28.0 30.5 28.5 29.0
SM 1871-33 69.5 75.5 86.5 77.2 0.0 0.0 0.0 0.0 0.0 0.0 0.0 0.0 13.5 19.0 19.0 17.2
SM 1959-1 36.5 40.5 43.0 40.0 1.0 5.5 41.0 15.8 10.0 30.0 100.0 46.7 88.5 93.0 99.5 93.7
SM 1965-1 57.8 67.0 71.0 65.3 23.0 31.5 4.0 19.5 100.0 100.0 40.0 80.0 49.0 63.0 25.5 45.8
SM 2052-4 64.0 67.5 79.0 70.2 1.5 54.5 65.0 40.3 20.0 100.0 100.0 73.3 98.5 100.0 97.0 98.5
SM 2058-2 53.5 61.5 69.0 61.3 0.5 26.5 60.0 29.0 10.0 100.0 100.0 70.0 94.0 100.0 100.0 98.0
SM 2073-1 44.0 57.5 60.5 54.0 27.5 21.0 2.0 16.8 100.0 100.0 20.0 73.3 44.0 45.0 21.0 36.7
SM 2085-7 27.0 36.0 53.0 38.7 78.0 9.5 68.0 51.8 100.0 30.0 100.0 76.7 100.0 100.0 100.0 100.0
SM 2141-1 36.4 45.0 55.0 45.5 10.5 9.0 1.5 7.0 100.0 100.0 30.0 76.7 24.0 22.5 11.5 19.3
Continued
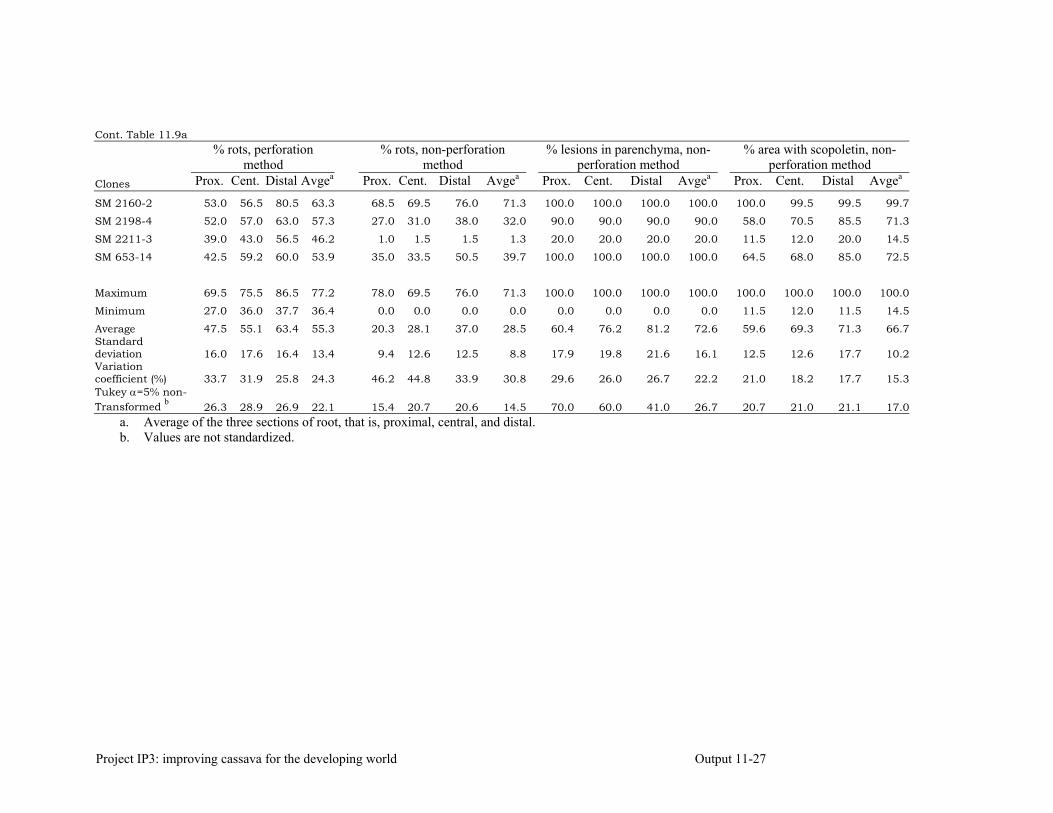
Project IP3: improving cassava for the developing world Output 11-27
Cont. Table 11.9a
% rots, perforation method
% rots, non-perforation method
% lesions in parenchyma, non-perforation method
% area with scopoletin, non-perforation method
Clones Prox. Cent. Distal Avgea Prox. Cent. Distal Avgea Prox. Cent. Distal Avgea Prox. Cent. Distal Avgea
SM 2160-2 53.0 56.5 80.5 63.3 68.5 69.5 76.0 71.3 100.0 100.0 100.0 100.0 100.0 99.5 99.5 99.7
SM 2198-4 52.0 57.0 63.0 57.3 27.0 31.0 38.0 32.0 90.0 90.0 90.0 90.0 58.0 70.5 85.5 71.3
SM 2211-3 39.0 43.0 56.5 46.2 1.0 1.5 1.5 1.3 20.0 20.0 20.0 20.0 11.5 12.0 20.0 14.5
SM 653-14 42.5 59.2 60.0 53.9 35.0 33.5 50.5 39.7 100.0 100.0 100.0 100.0 64.5 68.0 85.0 72.5
Maximum 69.5 75.5 86.5 77.2 78.0 69.5 76.0 71.3 100.0 100.0 100.0 100.0 100.0 100.0 100.0 100.0
Minimum 27.0 36.0 37.7 36.4 0.0 0.0 0.0 0.0 0.0 0.0 0.0 0.0 11.5 12.0 11.5 14.5
Average 47.5 55.1 63.4 55.3 20.3 28.1 37.0 28.5 60.4 76.2 81.2 72.6 59.6 69.3 71.3 66.7Standard deviation 16.0 17.6 16.4 13.4 9.4 12.6 12.5 8.8 17.9 19.8 21.6 16.1 12.5 12.6 17.7 10.2Variation coefficient (%) 33.7 31.9 25.8 24.3 46.2 44.8 33.9 30.8 29.6 26.0 26.7 22.2 21.0 18.2 17.7 15.3Tukey α=5% non- Transformed b 26.3 28.9 26.9 22.1 15.4 20.7 20.6 14.5 70.0 60.0 41.0 26.7 20.7 21.0 21.1 17.0
a. Average of the three sections of root, that is, proximal, central, and distal. b. Values are not standardized.
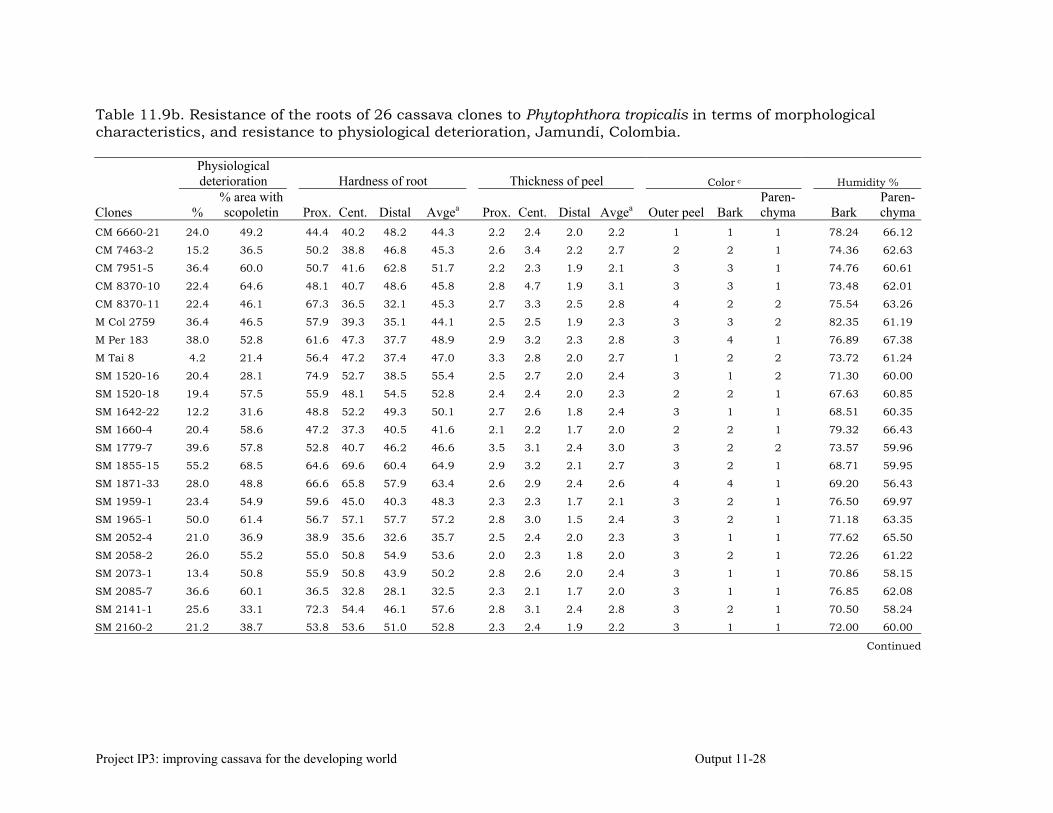
Project IP3: improving cassava for the developing world Output 11-28
Table 11.9b. Resistance of the roots of 26 cassava clones to Phytophthora tropicalis in terms of morphological characteristics, and resistance to physiological deterioration, Jamundí, Colombia.
Physiological deterioration Hardness of root Thickness of peel Color c Humidity %
Clones % % area with scopoletin Prox. Cent. Distal Avgea Prox. Cent. Distal Avgea Outer peel Bark
Paren-chyma Bark
Paren-chyma
CM 6660-21 24.0 49.2 44.4 40.2 48.2 44.3 2.2 2.4 2.0 2.2 1 1 1 78.24 66.12
CM 7463-2 15.2 36.5 50.2 38.8 46.8 45.3 2.6 3.4 2.2 2.7 2 2 1 74.36 62.63
CM 7951-5 36.4 60.0 50.7 41.6 62.8 51.7 2.2 2.3 1.9 2.1 3 3 1 74.76 60.61
CM 8370-10 22.4 64.6 48.1 40.7 48.6 45.8 2.8 4.7 1.9 3.1 3 3 1 73.48 62.01
CM 8370-11 22.4 46.1 67.3 36.5 32.1 45.3 2.7 3.3 2.5 2.8 4 2 2 75.54 63.26
M Col 2759 36.4 46.5 57.9 39.3 35.1 44.1 2.5 2.5 1.9 2.3 3 3 2 82.35 61.19
M Per 183 38.0 52.8 61.6 47.3 37.7 48.9 2.9 3.2 2.3 2.8 3 4 1 76.89 67.38
M Tai 8 4.2 21.4 56.4 47.2 37.4 47.0 3.3 2.8 2.0 2.7 1 2 2 73.72 61.24
SM 1520-16 20.4 28.1 74.9 52.7 38.5 55.4 2.5 2.7 2.0 2.4 3 1 2 71.30 60.00
SM 1520-18 19.4 57.5 55.9 48.1 54.5 52.8 2.4 2.4 2.0 2.3 2 2 1 67.63 60.85
SM 1642-22 12.2 31.6 48.8 52.2 49.3 50.1 2.7 2.6 1.8 2.4 3 1 1 68.51 60.35
SM 1660-4 20.4 58.6 47.2 37.3 40.5 41.6 2.1 2.2 1.7 2.0 2 2 1 79.32 66.43
SM 1779-7 39.6 57.8 52.8 40.7 46.2 46.6 3.5 3.1 2.4 3.0 3 2 2 73.57 59.96
SM 1855-15 55.2 68.5 64.6 69.6 60.4 64.9 2.9 3.2 2.1 2.7 3 2 1 68.71 59.95
SM 1871-33 28.0 48.8 66.6 65.8 57.9 63.4 2.6 2.9 2.4 2.6 4 4 1 69.20 56.43
SM 1959-1 23.4 54.9 59.6 45.0 40.3 48.3 2.3 2.3 1.7 2.1 3 2 1 76.50 69.97
SM 1965-1 50.0 61.4 56.7 57.1 57.7 57.2 2.8 3.0 1.5 2.4 3 2 1 71.18 63.35
SM 2052-4 21.0 36.9 38.9 35.6 32.6 35.7 2.5 2.4 2.0 2.3 3 1 1 77.62 65.50
SM 2058-2 26.0 55.2 55.0 50.8 54.9 53.6 2.0 2.3 1.8 2.0 3 2 1 72.26 61.22
SM 2073-1 13.4 50.8 55.9 50.8 43.9 50.2 2.8 2.6 2.0 2.4 3 1 1 70.86 58.15
SM 2085-7 36.6 60.1 36.5 32.8 28.1 32.5 2.3 2.1 1.7 2.0 3 1 1 76.85 62.08
SM 2141-1 25.6 33.1 72.3 54.4 46.1 57.6 2.8 3.1 2.4 2.8 3 2 1 70.50 58.24
SM 2160-2 21.2 38.7 53.8 53.6 51.0 52.8 2.3 2.4 1.9 2.2 3 1 1 72.00 60.00
Continued
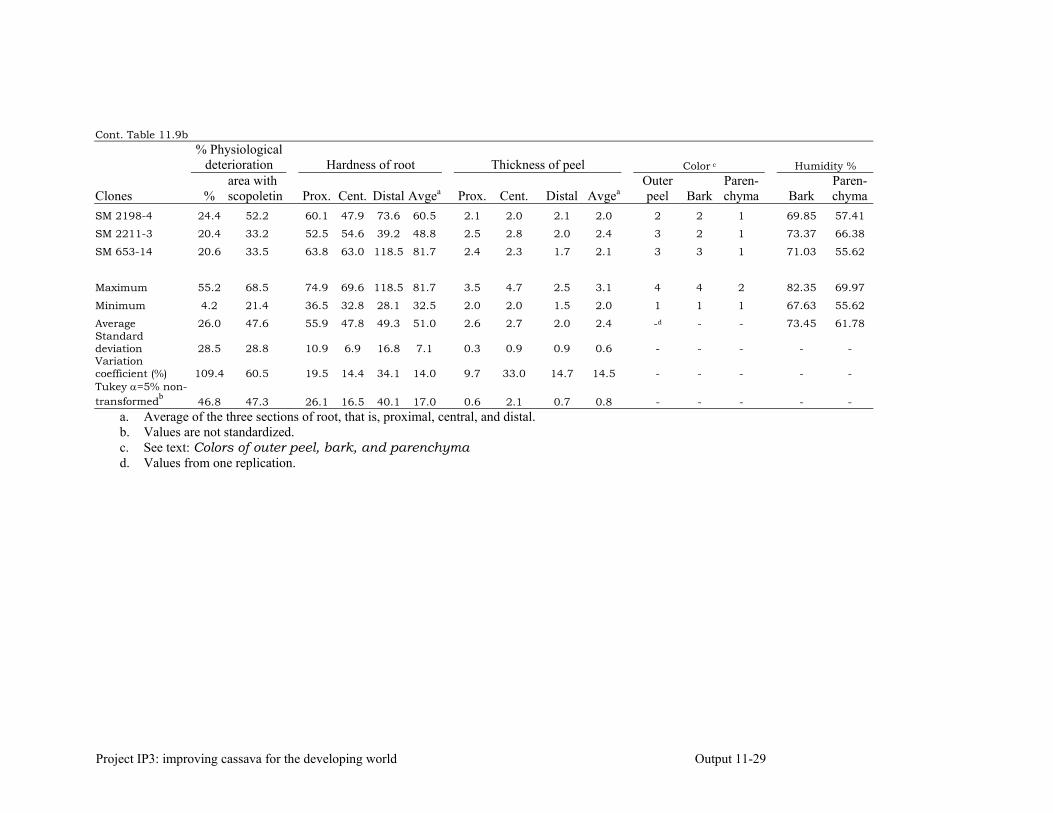
Project IP3: improving cassava for the developing world Output 11-29
Cont. Table 11.9b
% Physiological
deterioration Hardness of root Thickness of peel Color c Humidity %
Clones % area with scopoletin Prox. Cent. Distal Avgea Prox. Cent. Distal Avgea
Outer peel Bark
Paren-chyma Bark
Paren-chyma
SM 2198-4 24.4 52.2 60.1 47.9 73.6 60.5 2.1 2.0 2.1 2.0 2 2 1 69.85 57.41
SM 2211-3 20.4 33.2 52.5 54.6 39.2 48.8 2.5 2.8 2.0 2.4 3 2 1 73.37 66.38
SM 653-14 20.6 33.5 63.8 63.0 118.5 81.7 2.4 2.3 1.7 2.1 3 3 1 71.03 55.62
Maximum 55.2 68.5 74.9 69.6 118.5 81.7 3.5 4.7 2.5 3.1 4 4 2 82.35 69.97
Minimum 4.2 21.4 36.5 32.8 28.1 32.5 2.0 2.0 1.5 2.0 1 1 1 67.63 55.62
Average 26.0 47.6 55.9 47.8 49.3 51.0 2.6 2.7 2.0 2.4 -d - - 73.45 61.78 Standard deviation 28.5 28.8 10.9 6.9 16.8 7.1 0.3 0.9 0.9 0.6 - - - - - Variation coefficient (%) 109.4 60.5 19.5 14.4 34.1 14.0 9.7 33.0 14.7 14.5 - - - - - Tukey α=5% non- transformedb 46.8 47.3 26.1 16.5 40.1 17.0 0.6 2.1 0.7 0.8 - - - - -
a. Average of the three sections of root, that is, proximal, central, and distal. b. Values are not standardized. c. See text: Colors of outer peel, bark, and parenchyma d. Values from one replication.
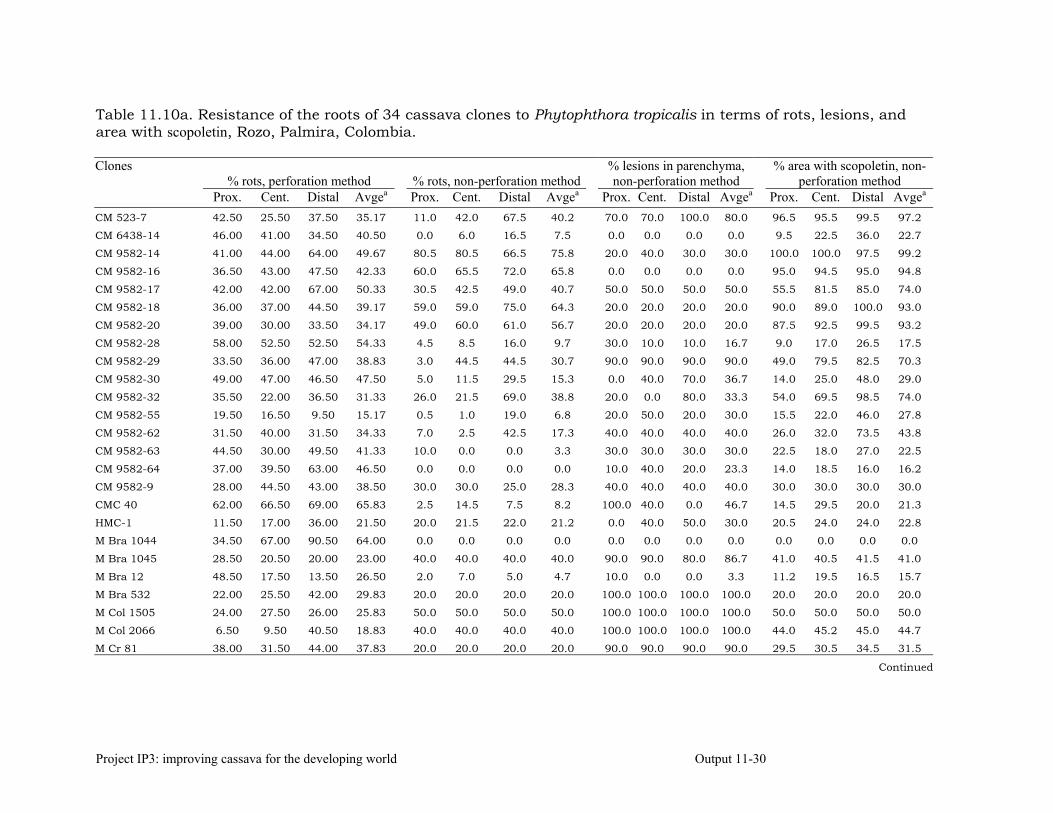
Project IP3: improving cassava for the developing world Output 11-30
Table 11.10a. Resistance of the roots of 34 cassava clones to Phytophthora tropicalis in terms of rots, lesions, and area with scopoletin, Rozo, Palmira, Colombia.
% rots, perforation method % rots, non-perforation method % lesions in parenchyma, non-perforation method
% area with scopoletin, non-perforation method
Clones
Prox. Cent. Distal Avgea Prox. Cent. Distal Avgea Prox. Cent. Distal Avgea Prox. Cent. Distal Avgea
CM 523-7 42.50 25.50 37.50 35.17 11.0 42.0 67.5 40.2 70.0 70.0 100.0 80.0 96.5 95.5 99.5 97.2
CM 6438-14 46.00 41.00 34.50 40.50 0.0 6.0 16.5 7.5 0.0 0.0 0.0 0.0 9.5 22.5 36.0 22.7
CM 9582-14 41.00 44.00 64.00 49.67 80.5 80.5 66.5 75.8 20.0 40.0 30.0 30.0 100.0 100.0 97.5 99.2
CM 9582-16 36.50 43.00 47.50 42.33 60.0 65.5 72.0 65.8 0.0 0.0 0.0 0.0 95.0 94.5 95.0 94.8
CM 9582-17 42.00 42.00 67.00 50.33 30.5 42.5 49.0 40.7 50.0 50.0 50.0 50.0 55.5 81.5 85.0 74.0
CM 9582-18 36.00 37.00 44.50 39.17 59.0 59.0 75.0 64.3 20.0 20.0 20.0 20.0 90.0 89.0 100.0 93.0
CM 9582-20 39.00 30.00 33.50 34.17 49.0 60.0 61.0 56.7 20.0 20.0 20.0 20.0 87.5 92.5 99.5 93.2
CM 9582-28 58.00 52.50 52.50 54.33 4.5 8.5 16.0 9.7 30.0 10.0 10.0 16.7 9.0 17.0 26.5 17.5
CM 9582-29 33.50 36.00 47.00 38.83 3.0 44.5 44.5 30.7 90.0 90.0 90.0 90.0 49.0 79.5 82.5 70.3
CM 9582-30 49.00 47.00 46.50 47.50 5.0 11.5 29.5 15.3 0.0 40.0 70.0 36.7 14.0 25.0 48.0 29.0
CM 9582-32 35.50 22.00 36.50 31.33 26.0 21.5 69.0 38.8 20.0 0.0 80.0 33.3 54.0 69.5 98.5 74.0
CM 9582-55 19.50 16.50 9.50 15.17 0.5 1.0 19.0 6.8 20.0 50.0 20.0 30.0 15.5 22.0 46.0 27.8
CM 9582-62 31.50 40.00 31.50 34.33 7.0 2.5 42.5 17.3 40.0 40.0 40.0 40.0 26.0 32.0 73.5 43.8
CM 9582-63 44.50 30.00 49.50 41.33 10.0 0.0 0.0 3.3 30.0 30.0 30.0 30.0 22.5 18.0 27.0 22.5
CM 9582-64 37.00 39.50 63.00 46.50 0.0 0.0 0.0 0.0 10.0 40.0 20.0 23.3 14.0 18.5 16.0 16.2
CM 9582-9 28.00 44.50 43.00 38.50 30.0 30.0 25.0 28.3 40.0 40.0 40.0 40.0 30.0 30.0 30.0 30.0
CMC 40 62.00 66.50 69.00 65.83 2.5 14.5 7.5 8.2 100.0 40.0 0.0 46.7 14.5 29.5 20.0 21.3
HMC-1 11.50 17.00 36.00 21.50 20.0 21.5 22.0 21.2 0.0 40.0 50.0 30.0 20.5 24.0 24.0 22.8
M Bra 1044 34.50 67.00 90.50 64.00 0.0 0.0 0.0 0.0 0.0 0.0 0.0 0.0 0.0 0.0 0.0 0.0
M Bra 1045 28.50 20.50 20.00 23.00 40.0 40.0 40.0 40.0 90.0 90.0 80.0 86.7 41.0 40.5 41.5 41.0
M Bra 12 48.50 17.50 13.50 26.50 2.0 7.0 5.0 4.7 10.0 0.0 0.0 3.3 11.2 19.5 16.5 15.7
M Bra 532 22.00 25.50 42.00 29.83 20.0 20.0 20.0 20.0 100.0 100.0 100.0 100.0 20.0 20.0 20.0 20.0
M Col 1505 24.00 27.50 26.00 25.83 50.0 50.0 50.0 50.0 100.0 100.0 100.0 100.0 50.0 50.0 50.0 50.0
M Col 2066 6.50 9.50 40.50 18.83 40.0 40.0 40.0 40.0 100.0 100.0 100.0 100.0 44.0 45.2 45.0 44.7
M Cr 81 38.00 31.50 44.00 37.83 20.0 20.0 20.0 20.0 90.0 90.0 90.0 90.0 29.5 30.5 34.5 31.5
Continued
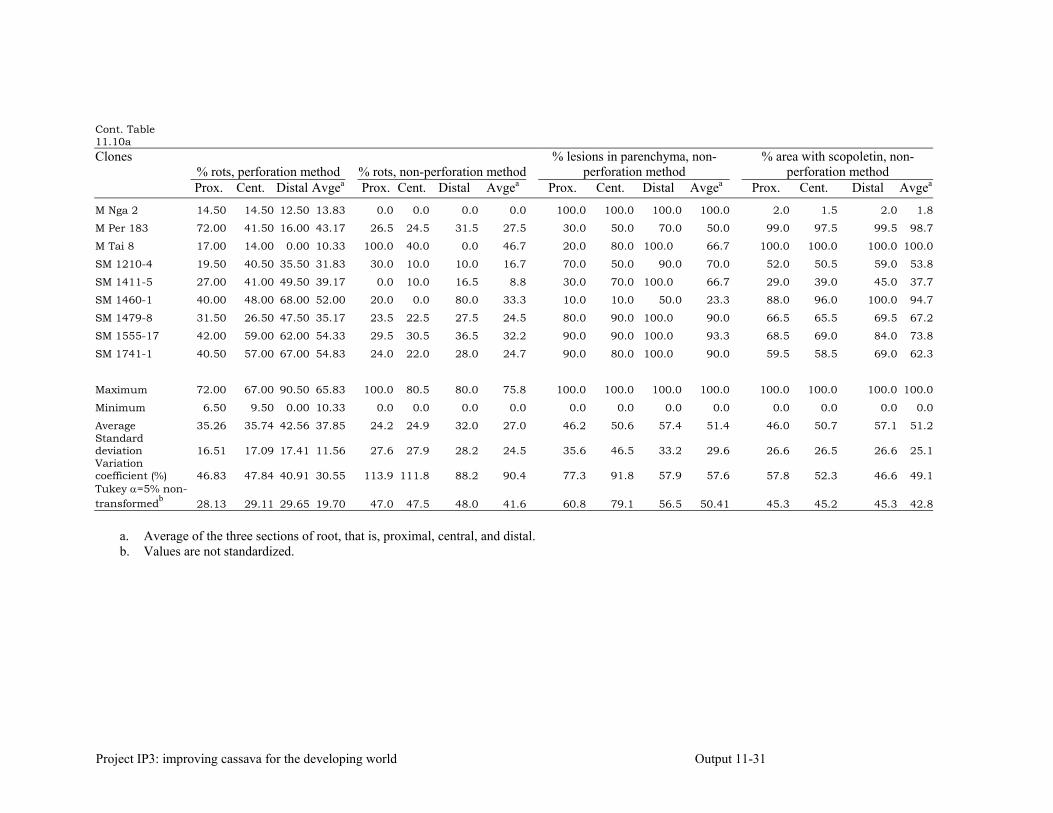
Project IP3: improving cassava for the developing world Output 11-31
Cont. Table 11.10a
% rots, perforation method % rots, non-perforation method % lesions in parenchyma, non-
perforation method % area with scopoletin, non-
perforation method Clones
Prox. Cent. Distal Avgea Prox. Cent. Distal Avgea Prox. Cent. Distal Avgea Prox. Cent. Distal Avgea
M Nga 2 14.50 14.50 12.50 13.83 0.0 0.0 0.0 0.0 100.0 100.0 100.0 100.0 2.0 1.5 2.0 1.8
M Per 183 72.00 41.50 16.00 43.17 26.5 24.5 31.5 27.5 30.0 50.0 70.0 50.0 99.0 97.5 99.5 98.7
M Tai 8 17.00 14.00 0.00 10.33 100.0 40.0 0.0 46.7 20.0 80.0 100.0 66.7 100.0 100.0 100.0 100.0
SM 1210-4 19.50 40.50 35.50 31.83 30.0 10.0 10.0 16.7 70.0 50.0 90.0 70.0 52.0 50.5 59.0 53.8
SM 1411-5 27.00 41.00 49.50 39.17 0.0 10.0 16.5 8.8 30.0 70.0 100.0 66.7 29.0 39.0 45.0 37.7
SM 1460-1 40.00 48.00 68.00 52.00 20.0 0.0 80.0 33.3 10.0 10.0 50.0 23.3 88.0 96.0 100.0 94.7
SM 1479-8 31.50 26.50 47.50 35.17 23.5 22.5 27.5 24.5 80.0 90.0 100.0 90.0 66.5 65.5 69.5 67.2
SM 1555-17 42.00 59.00 62.00 54.33 29.5 30.5 36.5 32.2 90.0 90.0 100.0 93.3 68.5 69.0 84.0 73.8
SM 1741-1 40.50 57.00 67.00 54.83 24.0 22.0 28.0 24.7 90.0 80.0 100.0 90.0 59.5 58.5 69.0 62.3
Maximum 72.00 67.00 90.50 65.83 100.0 80.5 80.0 75.8 100.0 100.0 100.0 100.0 100.0 100.0 100.0 100.0
Minimum 6.50 9.50 0.00 10.33 0.0 0.0 0.0 0.0 0.0 0.0 0.0 0.0 0.0 0.0 0.0 0.0
Average 35.26 35.74 42.56 37.85 24.2 24.9 32.0 27.0 46.2 50.6 57.4 51.4 46.0 50.7 57.1 51.2Standard deviation 16.51 17.09 17.41 11.56 27.6 27.9 28.2 24.5 35.6 46.5 33.2 29.6 26.6 26.5 26.6 25.1Variation coefficient (%) 46.83 47.84 40.91 30.55 113.9 111.8 88.2 90.4 77.3 91.8 57.9 57.6 57.8 52.3 46.6 49.1Tukey α=5% non- transformedb 28.13 29.11 29.65 19.70 47.0 47.5 48.0 41.6 60.8 79.1 56.5 50.41 45.3 45.2 45.3 42.8
a. Average of the three sections of root, that is, proximal, central, and distal. b. Values are not standardized.
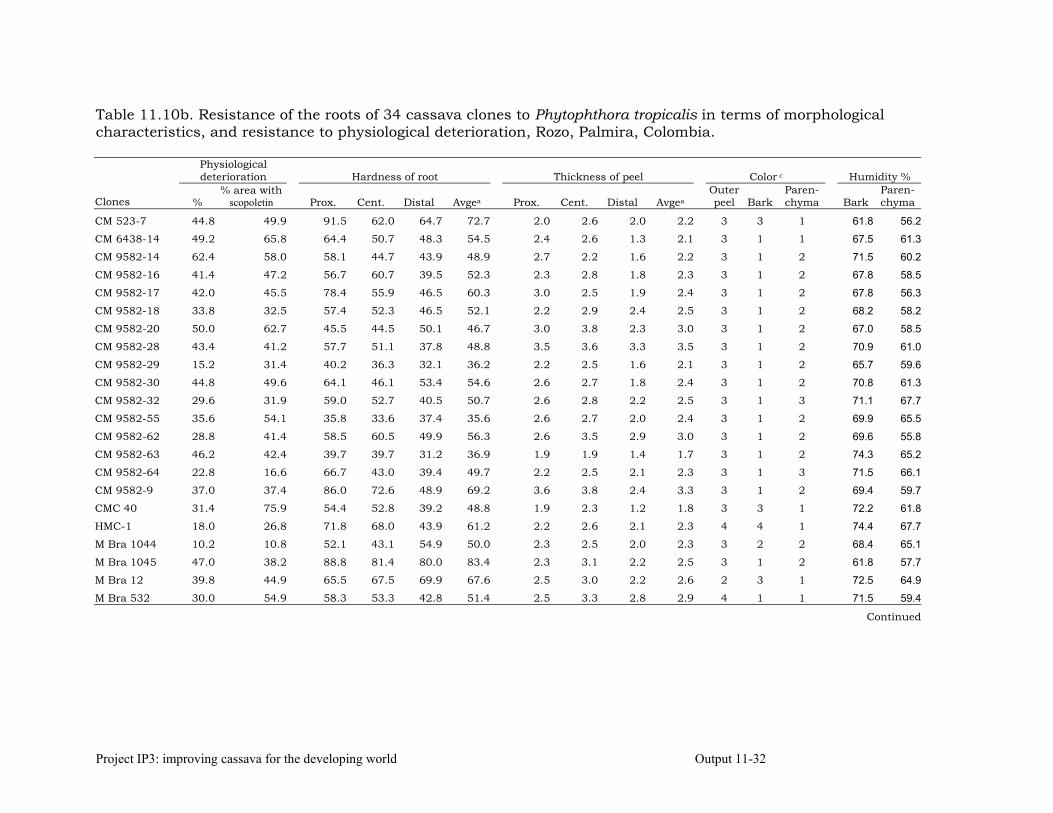
Project IP3: improving cassava for the developing world Output 11-32
Table 11.10b. Resistance of the roots of 34 cassava clones to Phytophthora tropicalis in terms of morphological characteristics, and resistance to physiological deterioration, Rozo, Palmira, Colombia.
Physiological deterioration Hardness of root Thickness of peel Color c Humidity %
Clones % % area with
scopoletin Prox. Cent. Distal Avgea Prox. Cent. Distal Avgea Outer peel Bark
Paren-chyma Bark
Paren-chyma
CM 523-7 44.8 49.9 91.5 62.0 64.7 72.7 2.0 2.6 2.0 2.2 3 3 1 61.8 56.2
CM 6438-14 49.2 65.8 64.4 50.7 48.3 54.5 2.4 2.6 1.3 2.1 3 1 1 67.5 61.3
CM 9582-14 62.4 58.0 58.1 44.7 43.9 48.9 2.7 2.2 1.6 2.2 3 1 2 71.5 60.2
CM 9582-16 41.4 47.2 56.7 60.7 39.5 52.3 2.3 2.8 1.8 2.3 3 1 2 67.8 58.5
CM 9582-17 42.0 45.5 78.4 55.9 46.5 60.3 3.0 2.5 1.9 2.4 3 1 2 67.8 56.3
CM 9582-18 33.8 32.5 57.4 52.3 46.5 52.1 2.2 2.9 2.4 2.5 3 1 2 68.2 58.2
CM 9582-20 50.0 62.7 45.5 44.5 50.1 46.7 3.0 3.8 2.3 3.0 3 1 2 67.0 58.5
CM 9582-28 43.4 41.2 57.7 51.1 37.8 48.8 3.5 3.6 3.3 3.5 3 1 2 70.9 61.0
CM 9582-29 15.2 31.4 40.2 36.3 32.1 36.2 2.2 2.5 1.6 2.1 3 1 2 65.7 59.6
CM 9582-30 44.8 49.6 64.1 46.1 53.4 54.6 2.6 2.7 1.8 2.4 3 1 2 70.8 61.3
CM 9582-32 29.6 31.9 59.0 52.7 40.5 50.7 2.6 2.8 2.2 2.5 3 1 3 71.1 67.7
CM 9582-55 35.6 54.1 35.8 33.6 37.4 35.6 2.6 2.7 2.0 2.4 3 1 2 69.9 65.5
CM 9582-62 28.8 41.4 58.5 60.5 49.9 56.3 2.6 3.5 2.9 3.0 3 1 2 69.6 55.8
CM 9582-63 46.2 42.4 39.7 39.7 31.2 36.9 1.9 1.9 1.4 1.7 3 1 2 74.3 65.2
CM 9582-64 22.8 16.6 66.7 43.0 39.4 49.7 2.2 2.5 2.1 2.3 3 1 3 71.5 66.1
CM 9582-9 37.0 37.4 86.0 72.6 48.9 69.2 3.6 3.8 2.4 3.3 3 1 2 69.4 59.7
CMC 40 31.4 75.9 54.4 52.8 39.2 48.8 1.9 2.3 1.2 1.8 3 3 1 72.2 61.8
HMC-1 18.0 26.8 71.8 68.0 43.9 61.2 2.2 2.6 2.1 2.3 4 4 1 74.4 67.7
M Bra 1044 10.2 10.8 52.1 43.1 54.9 50.0 2.3 2.5 2.0 2.3 3 2 2 68.4 65.1
M Bra 1045 47.0 38.2 88.8 81.4 80.0 83.4 2.3 3.1 2.2 2.5 3 1 2 61.8 57.7
M Bra 12 39.8 44.9 65.5 67.5 69.9 67.6 2.5 3.0 2.2 2.6 2 3 1 72.5 64.9
M Bra 532 30.0 54.9 58.3 53.3 42.8 51.4 2.5 3.3 2.8 2.9 4 1 1 71.5 59.4
Continued
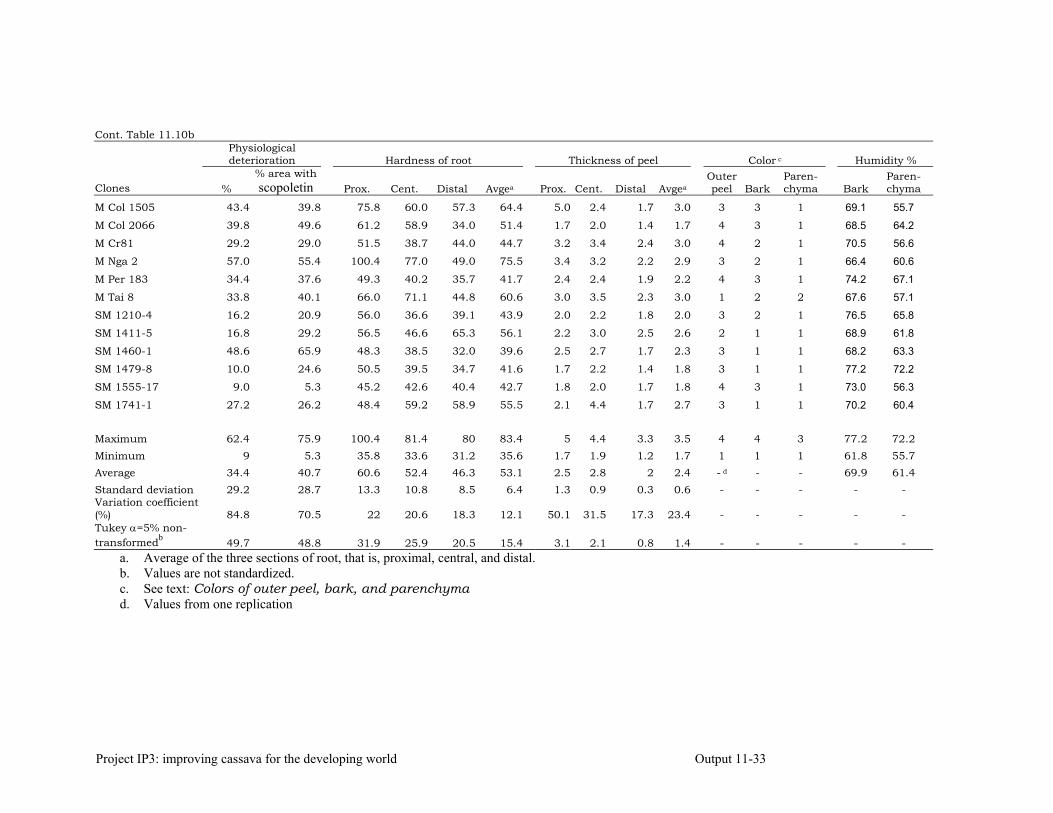
Project IP3: improving cassava for the developing world Output 11-33
Cont. Table 11.10b
Physiological deterioration Hardness of root Thickness of peel Color c Humidity %
Clones % % area with scopoletin Prox. Cent. Distal Avgea Prox. Cent. Distal Avgea
Outer peel Bark
Paren-chyma Bark
Paren-chyma
M Col 1505 43.4 39.8 75.8 60.0 57.3 64.4 5.0 2.4 1.7 3.0 3 3 1 69.1 55.7
M Col 2066 39.8 49.6 61.2 58.9 34.0 51.4 1.7 2.0 1.4 1.7 4 3 1 68.5 64.2
M Cr81 29.2 29.0 51.5 38.7 44.0 44.7 3.2 3.4 2.4 3.0 4 2 1 70.5 56.6
M Nga 2 57.0 55.4 100.4 77.0 49.0 75.5 3.4 3.2 2.2 2.9 3 2 1 66.4 60.6
M Per 183 34.4 37.6 49.3 40.2 35.7 41.7 2.4 2.4 1.9 2.2 4 3 1 74.2 67.1
M Tai 8 33.8 40.1 66.0 71.1 44.8 60.6 3.0 3.5 2.3 3.0 1 2 2 67.6 57.1
SM 1210-4 16.2 20.9 56.0 36.6 39.1 43.9 2.0 2.2 1.8 2.0 3 2 1 76.5 65.8
SM 1411-5 16.8 29.2 56.5 46.6 65.3 56.1 2.2 3.0 2.5 2.6 2 1 1 68.9 61.8
SM 1460-1 48.6 65.9 48.3 38.5 32.0 39.6 2.5 2.7 1.7 2.3 3 1 1 68.2 63.3
SM 1479-8 10.0 24.6 50.5 39.5 34.7 41.6 1.7 2.2 1.4 1.8 3 1 1 77.2 72.2
SM 1555-17 9.0 5.3 45.2 42.6 40.4 42.7 1.8 2.0 1.7 1.8 4 3 1 73.0 56.3
SM 1741-1 27.2 26.2 48.4 59.2 58.9 55.5 2.1 4.4 1.7 2.7 3 1 1 70.2 60.4 Maximum 62.4 75.9 100.4 81.4 80 83.4 5 4.4 3.3 3.5 4 4 3 77.2 72.2 Minimum 9 5.3 35.8 33.6 31.2 35.6 1.7 1.9 1.2 1.7 1 1 1 61.8 55.7 Average 34.4 40.7 60.6 52.4 46.3 53.1 2.5 2.8 2 2.4 - d - - 69.9 61.4 Standard deviation 29.2 28.7 13.3 10.8 8.5 6.4 1.3 0.9 0.3 0.6 - - - - - Variation coefficient (%) 84.8 70.5 22 20.6 18.3 12.1 50.1 31.5 17.3 23.4 - - - - - Tukey α=5% non- transformedb 49.7 48.8 31.9 25.9 20.5 15.4 3.1 2.1 0.8 1.4 - - - - -
a. Average of the three sections of root, that is, proximal, central, and distal. b. Values are not standardized. c. See text: Colors of outer peel, bark, and parenchyma d. Values from one replication
Output 11-34 2004 Annual Report
For the clones established at Rozo, the most resistant to the disease were M Bra 1044 (0%), CM 9582-16 (0%), CM 6438-14 (0%), M Bra 532 (3.3%), CM 9582-55 (4.66%), SM 1460-1 (6.83%), HMC-1 (7.5%), CM 9582-64 (8.16%), CM 9582-30 (8.83%), and M Per 183 (9.66%). No significant differences were observed (Tukey’s, α = 5%). These results confirmed observations made by CIAT (1999) on the resistance in the field of M Bra 1044, M Bra 532, and HMC-1. Moreover, the parents and various individuals of the family CM 9582 (M CR 81 × M Bra 1045) were reported as resistant by Llano (2003). Clone CM 6438-14 (‘Vergara’) is an elite line for agroecological zone 2 (Eastern Plains). The other clones of Jamundí showed variation in infected area between 10.33% and 71.33%, whereas the clones established in Rozo showed a range between 15.33% and 75.83% of the area affected by the pathogen. Tables 11.9 and11.10 show the percentages of lesions in the parenchyma for each root section (proximal, central, distal, and the mean of the three). The most resistant of the Jamundí clones for the penetration phase showed the lowest average of lesions (less than 20% of inoculation points). The exception was SM 2141-1, which showed 76.7% of lesions in the parenchyma, indicating that the mechanism for resistance to penetration in the peel of this clone was different to that of the others. The Rozo clones with resistance to the pathogen’s penetration phase—M Bra 1044, CM 9582-16, CM 6438-14, and M Bra 532—also had low average percentages for lesions in the parenchyma (less than 3.33%), indicating that they would also have resistance to the post-penetration phase. The other clones, resistant to the penetration phase, had percentages of lesions between 23.33% and 50%, indicating that variation existed between clones in terms of mechanisms of resistance in the peel. Resistance to P. tropicalis during the pathogen’s post-penetration phase. Evaluations of resistance to P. tropicalis in its post-penetration phase (with the perforation method) showed that none of the genotypes established at Jamundí were resistant. In Rozo, clones M Tai 8, M Nga 2, CM 9582-55, M Col 2066, HMC-1, and M Bra 532, among others, were moderately resistant, having a percentage of damage that was less than 20% Tables 11.9 and 11.10. The results obtained with the last two clones confirmed that the peel is an important factor in cassava’s resistance to P. tropicalis. Resistance to postharvest physiological deterioration. The clones established in Jamundí showed 4.2% to 55.2% physiological deterioration, with clone M Tai 8 being the least affected. No significant differences were observed, however, with clones showing 50% deterioration. Similar results were observed for the Rozo clones, where SM 1555-17 showed 9% deterioration and M Nga 2 showed 57%, a not-significant difference according to Tukey’s (α = 5%). Root morphology. No significant correlations were observed between evaluations for resistance to physiological deterioration and rot caused by P. tropicalis, and the morphological traits studied. These findings corroborated those reported by Iwaro et al. (1997b) for cacao. The lack of association of morphological traits with resistance to P. tropicalis corroborates the studies conducted by Alvarez et al. (2003), which indicated that resistance to P. tropicalis is controlled by minor genes, with considerable influence from the environment.
Project IP3: improving cassava for the developing world Output 11-35
Scopoletin. Tables 11.9 and 11.10 show the percentages of root area with scopoletin in the 60 clones evaluated in Jamundí and Rozo. The correlation of presence of scopoletin with damage caused by P. tropicalis was found to be +0.6 between the area of parenchyma affected and the area with scopoletin. Likewise, the correlation of percentage of root area with scopoletin with postharvest physiological deterioration was +0.7. The correlations observed for scopoletin with P. tropicalis inoculated by the non-perforation method with physiological deterioration show that scopoletin is an expression of root deterioration, whether microbial or physiological (Agrios 1978; Wheatley et al. 1985). References Agrios NG. 1978. Plant pathology. 2nd ed. Academic Press, New York. pp 79–85. Alvarez E; Loke JB; Rivera S; Llano GA. 2003. Genética de la resistencia a pudrición causada
por Phytophthora tropicalis en dos poblaciones segregantes de yuca (Manihot esculenta Crantz). Rev Fitopatol Colomb 26(2):61–66.
CIAT. 1999. Integrated pest and disease management in major agroecosystems Annual
Report 1999 Project PE-1. pp 96-105 Fukuda WMNG; Guevara CL. 1998. Descritores morfologicos e agronomicos para la
caracterização de mandioca (Manihot esculenta Crantz.). Document 78. EMBRAPA–CNPMF, Cruz das Almas, Brazil. 38 p.
Iwaro AD; Sreenivasan TN; Umaharan P. 1997a. Foliar resistance to Phytophthora palmivora
as an indicator of pod resistance in Theobroma cacao. Plant Dis 81:619–624. Iwaro AD; Sreenivasan TN; Umaharan P. 1997b. Phytophthora resistance in cacao
(Theobroma cacao): influence of pod morphology. Plant Pathol 46:557–565. Llano GA. 2003 Identificación de genes análogos de resistencia a enfermedades en yuca,
Manihot esculenta Crantz y su relación con la resistencia a tres especies de Phytophthora. M.Sc. thesis. Palmira, Colombia: Universidad Nacional de Colombia. 119 pp.
Loke JB. 2004. Resistencia foliar, marcadores bioquímicos y QTLs como indicadores para la
resistencia a pudrición de raíz (Phytophthora tropicalis) en yuca (Manihot esculenta Crantz). MSc thesis in Agricultural Sciences with emphasis on Plant Breeding. Faculty of Agricultural and Livestock Sciences, Universidad Nacional de Colombia—Palmira. 143 p.
STATISTIX 8 . 1985–2003. Analytical Software. Wheatley C; Lozano C; Gómez G. 1985. Post-harvest deterioration of cassava roots. In Cock
JH; Reyes Q, JA, eds. Cassava: research, production and utilization: material used in the cassava training courses offered by CIAT. Preliminary edn. Cassava Program, CIAT, Cali, Colombia. pp 655–671.
Project IP3: improving cassava for the developing world Output 11-36
Activity 11.9 Determining the QTLs that most contribute to phenotypic variance of resistance to Phytophthora root rots, and identifying the linkage group(s) where they are located Objective To locate the QTLs associated with resistance to root rots caused by Phytophthora tropicalis in the parental maps of cassava family K Introduction Deciphering the complexity of genetic resistance is a key element of plant breeding, particularly for diseases such as cassava root rot. We evaluated individuals of cassava family K for their reaction to root rots to better understand the genetics of resistance to P. tropicalis. Genetic improvement for resistance to the disease can be more quickly and effectively achieved by using molecular markers. Methodology Plant materials. In 2000 and 2001, we inoculated and evaluated the roots of 92 cassava clones belonging to family K (M Nga 2 × CM 2177-2) from Santander de Quilichao, Department of Cauca, Colombia. Pathogen. We used isolate 44 as inoculum. It was identified as P. tropicalis by sequencing the ITS region of its ribosomal DNA. Inoculation. We inoculated 10 to 12-month-old cassava roots, and extracted a cylinder of root, using a punch with an 8-mm diameter. A disk of mycelial growth, measuring 5 mm in diameter, was deposited in the orifice, which was then covered with the fragment of root just extracted. Each inoculated root was placed in a plastic bag and on a plastic tray, and incubated at 22ºC in the dark for 7 days. Evaluation. Each inoculated root was cut transversely and the following measurements made: lengths and widths of lesion and cut, root length, and depth of inoculum in the root. The data were then processed through the Excel program. Data analysis. For analysis, the experimental unit was a root. Analyzing for QTLs.
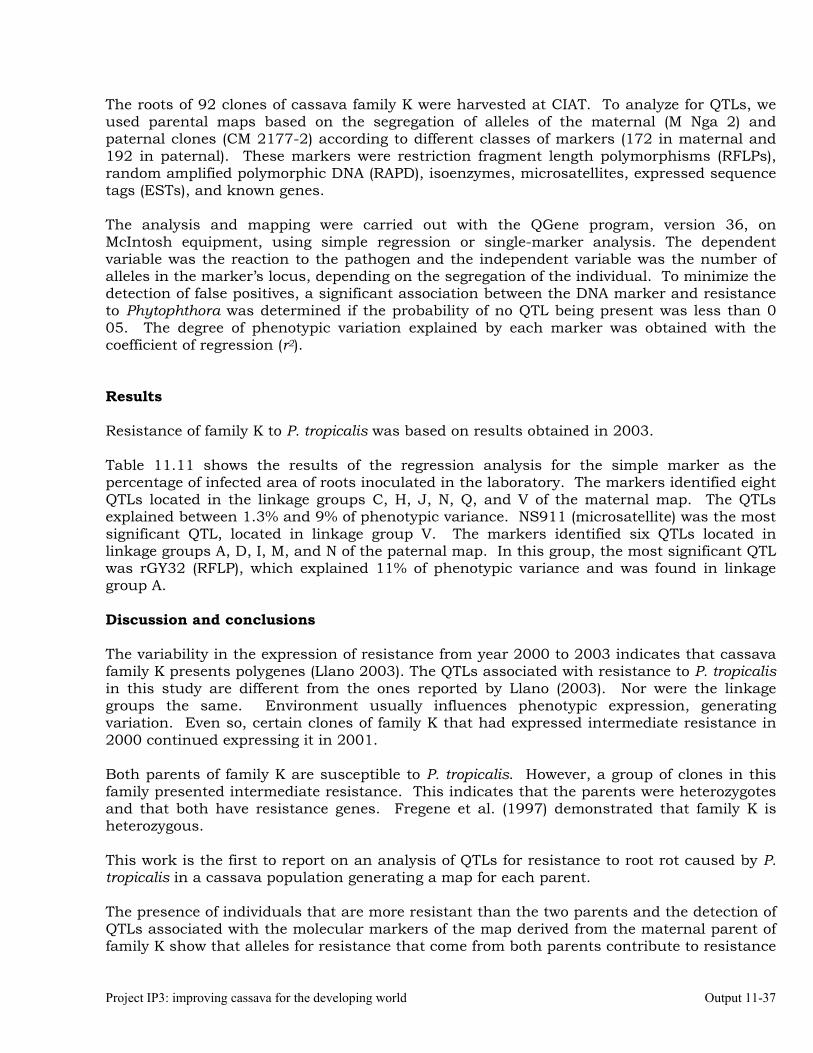
Project IP3: improving cassava for the developing world Output 11-37
The roots of 92 clones of cassava family K were harvested at CIAT. To analyze for QTLs, we used parental maps based on the segregation of alleles of the maternal (M Nga 2) and paternal clones (CM 2177-2) according to different classes of markers (172 in maternal and 192 in paternal). These markers were restriction fragment length polymorphisms (RFLPs), random amplified polymorphic DNA (RAPD), isoenzymes, microsatellites, expressed sequence tags (ESTs), and known genes. The analysis and mapping were carried out with the QGene program, version 36, on McIntosh equipment, using simple regression or single-marker analysis. The dependent variable was the reaction to the pathogen and the independent variable was the number of alleles in the marker’s locus, depending on the segregation of the individual. To minimize the detection of false positives, a significant association between the DNA marker and resistance to Phytophthora was determined if the probability of no QTL being present was less than 0 05. The degree of phenotypic variation explained by each marker was obtained with the coefficient of regression (r2). Results Resistance of family K to P. tropicalis was based on results obtained in 2003. Table 11.11 shows the results of the regression analysis for the simple marker as the percentage of infected area of roots inoculated in the laboratory. The markers identified eight QTLs located in the linkage groups C, H, J, N, Q, and V of the maternal map. The QTLs explained between 1.3% and 9% of phenotypic variance. NS911 (microsatellite) was the most significant QTL, located in linkage group V. The markers identified six QTLs located in linkage groups A, D, I, M, and N of the paternal map. In this group, the most significant QTL was rGY32 (RFLP), which explained 11% of phenotypic variance and was found in linkage group A. Discussion and conclusions The variability in the expression of resistance from year 2000 to 2003 indicates that cassava family K presents polygenes (Llano 2003). The QTLs associated with resistance to P. tropicalis in this study are different from the ones reported by Llano (2003). Nor were the linkage groups the same. Environment usually influences phenotypic expression, generating variation. Even so, certain clones of family K that had expressed intermediate resistance in 2000 continued expressing it in 2001. Both parents of family K are susceptible to P. tropicalis. However, a group of clones in this family presented intermediate resistance. This indicates that the parents were heterozygotes and that both have resistance genes. Fregene et al. (1997) demonstrated that family K is heterozygous. This work is the first to report on an analysis of QTLs for resistance to root rot caused by P. tropicalis in a cassava population generating a map for each parent. The presence of individuals that are more resistant than the two parents and the detection of QTLs associated with the molecular markers of the map derived from the maternal parent of family K show that alleles for resistance that come from both parents contribute to resistance
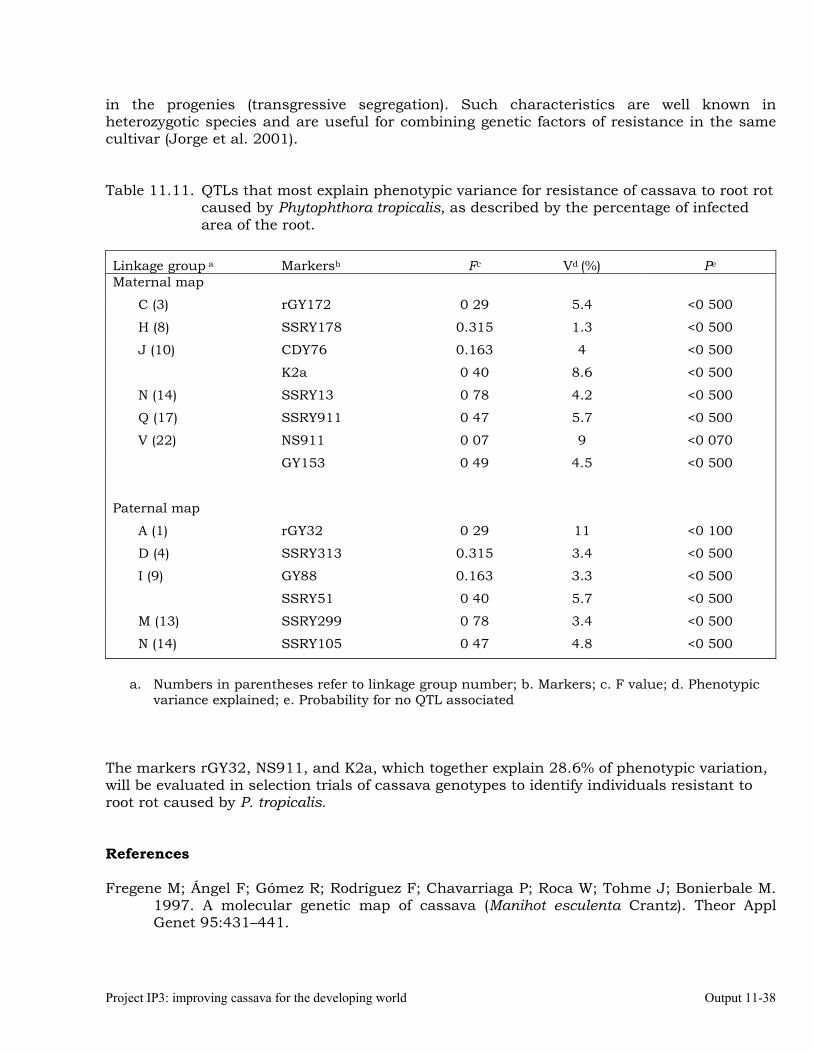
Project IP3: improving cassava for the developing world Output 11-38
in the progenies (transgressive segregation). Such characteristics are well known in heterozygotic species and are useful for combining genetic factors of resistance in the same cultivar (Jorge et al. 2001). Table 11.11. QTLs that most explain phenotypic variance for resistance of cassava to root rot
caused by Phytophthora tropicalis, as described by the percentage of infected area of the root.
Linkage group a Markersb Fc Vd (%) Pe Maternal map
C (3) rGY172 0 29 5.4 <0 500
H (8) SSRY178 0.315 1.3 <0 500
J (10) CDY76 0.163 4 <0 500
K2a 0 40 8.6 <0 500
N (14) SSRY13 0 78 4.2 <0 500
Q (17) SSRY911 0 47 5.7 <0 500
V (22) NS911 0 07 9 <0 070
GY153 0 49 4.5 <0 500
Paternal map
A (1) rGY32 0 29 11 <0 100
D (4) SSRY313 0.315 3.4 <0 500
I (9) GY88 0.163 3.3 <0 500
SSRY51 0 40 5.7 <0 500
M (13) SSRY299 0 78 3.4 <0 500
N (14) SSRY105 0 47 4.8 <0 500
a. Numbers in parentheses refer to linkage group number; b. Markers; c. F value; d. Phenotypic
variance explained; e. Probability for no QTL associated The markers rGY32, NS911, and K2a, which together explain 28.6% of phenotypic variation, will be evaluated in selection trials of cassava genotypes to identify individuals resistant to root rot caused by P. tropicalis. References Fregene M; Ángel F; Gómez R; Rodríguez F; Chavarriaga P; Roca W; Tohme J; Bonierbale M.
1997. A molecular genetic map of cassava (Manihot esculenta Crantz). Theor Appl Genet 95:431–441.
Project IP3: improving cassava for the developing world Output 11-39
Jorge, V., Fregene, M. Vélez, C. M., Duque, M. C., Tohme, J. And Verdier, V. 2001. QTL Analysis of field resistance to Xanthomonas axonopodis pv. manihotis in cassava. Theor Appl Genet 102: 564 – 571.
Llano GA. 2003 Identificación de genes análogos de resistencia a enfermedades en yuca,
Manihot esculenta Crantz y su relación con la resistencia a tres especies de Phytophthora. M.Sc. thesis. Palmira, Colombia: Universidad Nacional de Colombia. 119 pp.
Activity 11.10 Detecting phytoplasmas in cassava affected by frogskin disease (FSD),
using nested PCR. Specific objective To detect phytoplasmas in cassava plants affected by frogskin disease (FSD) Methodology Plant tissues. Asexual planting materials (stakes) from 40 plants of the commercial cassava varieties Catumare and Manzana were obtained. Twenty of the plants came from Rozo and Palmira, Department of Valle del Cauca, Colombia, and were either moderately infected (Catumare) or severely affected (Manzana) by FSD. The other 20 plants were disease-free and came from Montenegro, Department of Quindío, Colombia. The stakes, 20 cm long, were planted in plastic bags containing pasteurized soil that was free of FSD. The bags were placed on plates to prevent contamination during watering. All the plants were fertilized periodically and left in anti-aphid cages. The plants and cages were fumigated periodically, rotating the following products: Vertimec® 1.8% CE (abamectin at 0.5 cc/L of the commercial product), Malathion® (malathion at 1 cc/L), and Sistemin® (dimethoate at 3 cc/L). As control we used healthy ‘Secundina’ from in vitro plants, placing them in the cages with the varieties being evaluated. They also functioned as monitors for the presence of insect vectors. The trials were established in a greenhouse and screen house under different conditions of relative humidity and temperature. The greenhouse had an RH of 31% to 98%, and temperatures varied from 19°C to 28°C. Four replications of 10 plants were used per variety in each of the greenhouse and screen house, and placed in the same cages of their respective varieties. Healthy plants from Armenia, Quindío, were also established under equal conditions in the same greenhouse and screen house but in separate cages. Insects.
Project IP3: improving cassava for the developing world Output 11-40
In a separate experiment, Homopterans (Scaphytopius marginelineatus) were collected from cassava crops infected with FSD, and breeding was established in cages containing diseased plants. After a couple of generations, adult insects were transferred to healthy plants to test for transmission of disease (CIAT Cassava Entomology Section, personal communication, 2004). DNA extraction. Total DNA was extracted as described by Gilbertson et al. (1983). Nested-PCR analysis. We amplified 50 ng of genomic DNA, using nested PCR with the universal primers R16F2/R16R2 and the primers specific to the 16SrIII group (X-disease), R16(III)F2/R16(III)R1. The cocktail was prepared with 2 mM dNTPs, 1X Taq buffer, 2.5 mM MgCl2, 1 U Taq polymerase, and 10 µM of each primer. The conditions for amplification were 94°C for the initial denaturation for 2 min, 35 cycles of denaturation at 94°C for 1 min, annealing at 50°C for 2 min, extension at 72°C for 3 min, and a final extension at 72°C for 10 min. PCR products were analyzed by electrophoresis on 1.5% agarose gel. RFLP analyses. All amplified PCR products were digested with the restriction endonucleases AluI, RsaI, and TaqI to confirm the presence of a single group of phytoplasmas associated with the disease. The restriction products were analyzed by electrophoresis on 5% polyacrylamide gel. These enzymes had been used previously to classify FSD phytoplasmas. DNA sequencing. The amplified PCR products were cleaned, using a purification kit (QIAGEN) and then sequenced by automated dideoxy sequencing (ABI PRISM® 377-96 DNA Sequencer, Applied Biosystems). The sequences obtained were homologized with the sequences reported in GenBank to identify the organism detected in the evaluated samples. Results DNA extraction. A total of 320 DNA samples were obtained from infected plant tissues —160 from roots and 160 from leaf midribs and petioles—and another 80 from healthy tissues. All samples were from the varieties Catumare and Manzana (Table 11.12). In addition, 17 samples were extracted from tissues at different developmental stages of the insect S. marginelineatus, processing 1 to 2 individuals per sample (Table 11.13). Nested-PCR analysis. Of the 320 infected-plant-tissue samples evaluated, 262 were detected as having a phytoplasma (82%); of the 17 samples from insects fed on diseased plants, 50% showed amplification; and of the 80 healthy plant tissues, no amplifications were obtained.
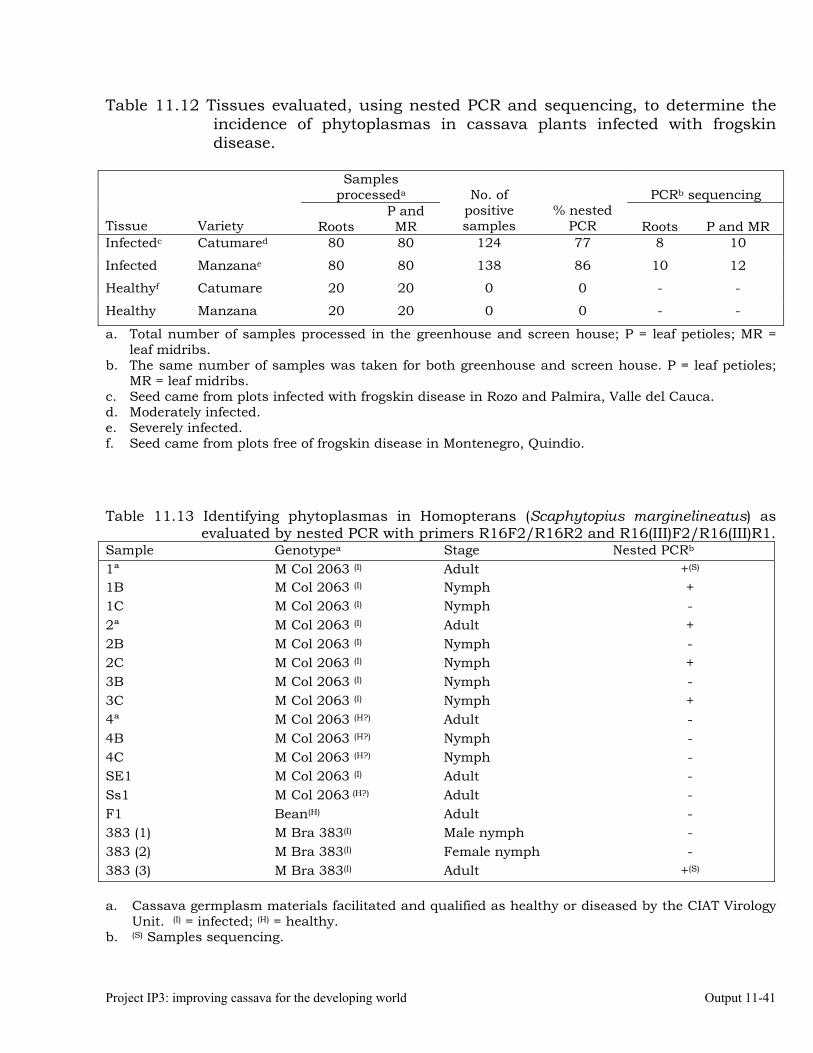
Project IP3: improving cassava for the developing world Output 11-41
Table 11.12 Tissues evaluated, using nested PCR and sequencing, to determine the incidence of phytoplasmas in cassava plants infected with frogskin disease.
Samples
processeda PCRb sequencing
Tissue Variety Roots P and MR
No. of positive samples
% nested PCR Roots P and MR
Infectedc Catumared 80 80 124 77 8 10
Infected Manzanae 80 80 138 86 10 12
Healthyf Catumare 20 20 0 0 - -
Healthy Manzana 20 20 0 0 - -
a. Total number of samples processed in the greenhouse and screen house; P = leaf petioles; MR = leaf midribs.
b. The same number of samples was taken for both greenhouse and screen house. P = leaf petioles; MR = leaf midribs.
c. Seed came from plots infected with frogskin disease in Rozo and Palmira, Valle del Cauca. d. Moderately infected. e. Severely infected. f. Seed came from plots free of frogskin disease in Montenegro, Quindío. Table 11.13 Identifying phytoplasmas in Homopterans (Scaphytopius marginelineatus) as
evaluated by nested PCR with primers R16F2/R16R2 and R16(III)F2/R16(III)R1. Sample Genotypea Stage Nested PCRb
1ª M Col 2063 (I) Adult +(S)
1B M Col 2063 (I) Nymph + 1C M Col 2063 (I) Nymph - 2ª M Col 2063 (I) Adult + 2B M Col 2063 (I) Nymph - 2C M Col 2063 (I) Nymph + 3B M Col 2063 (I) Nymph - 3C M Col 2063 (I) Nymph + 4ª M Col 2063 (H?) Adult - 4B M Col 2063 (H?) Nymph - 4C M Col 2063 (H?) Nymph - SE1 M Col 2063 (I) Adult - Ss1 M Col 2063 (H?) Adult - F1 Bean(H) Adult - 383 (1) M Bra 383(I) Male nymph - 383 (2) M Bra 383(I) Female nymph - 383 (3) M Bra 383(I) Adult +(S)
a. Cassava germplasm materials facilitated and qualified as healthy or diseased by the CIAT Virology
Unit. (I) = infected; (H) = healthy. b. (S) Samples sequencing.
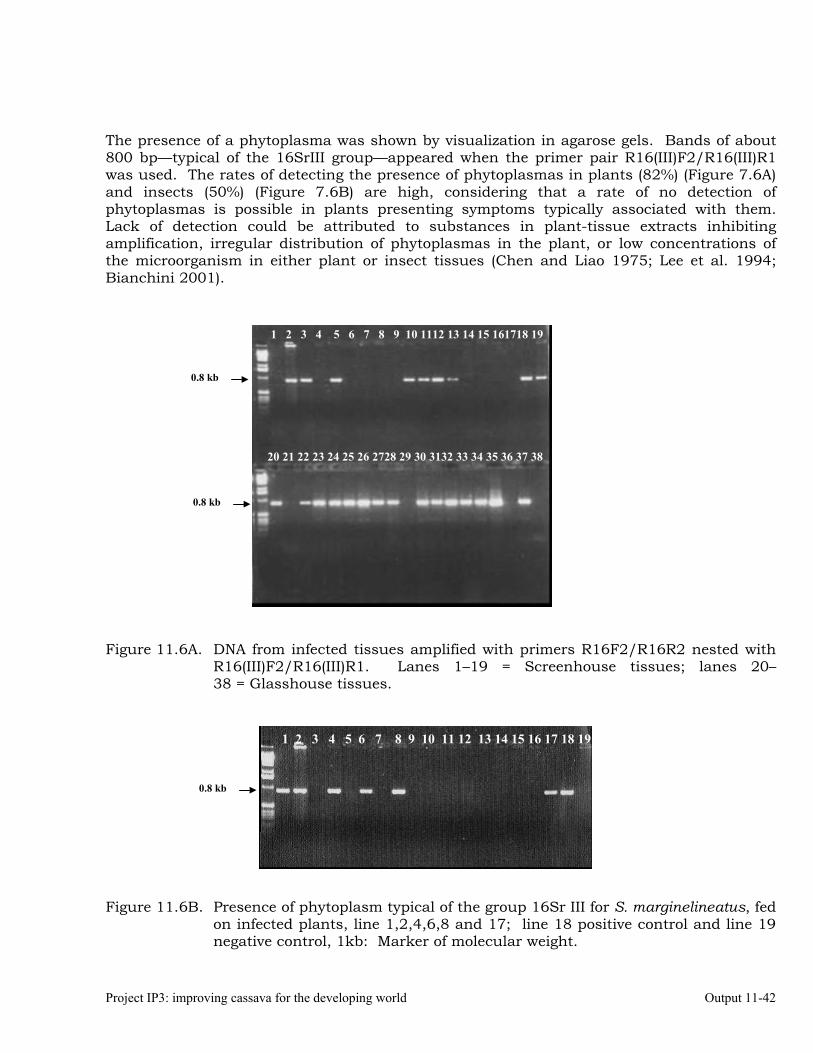
Project IP3: improving cassava for the developing world Output 11-42
The presence of a phytoplasma was shown by visualization in agarose gels. Bands of about 800 bp—typical of the 16SrIII group—appeared when the primer pair R16(III)F2/R16(III)R1 was used. The rates of detecting the presence of phytoplasmas in plants (82%) (Figure 7.6A) and insects (50%) (Figure 7.6B) are high, considering that a rate of no detection of phytoplasmas is possible in plants presenting symptoms typically associated with them. Lack of detection could be attributed to substances in plant-tissue extracts inhibiting amplification, irregular distribution of phytoplasmas in the plant, or low concentrations of the microorganism in either plant or insect tissues (Chen and Liao 1975; Lee et al. 1994; Bianchini 2001). Figure 11.6A. DNA from infected tissues amplified with primers R16F2/R16R2 nested with
R16(III)F2/R16(III)R1. Lanes 1–19 = Screenhouse tissues; lanes 20–38 = Glasshouse tissues.
Figure 11.6B. Presence of phytoplasm typical of the group 16Sr III for S. marginelineatus, fed
on infected plants, line 1,2,4,6,8 and 17; line 18 positive control and line 19 negative control, 1kb: Marker of molecular weight.
1kb 1 2 3 4 5 6 7 8 9 10 11 12 13 14 15 16 17 18 19
0.8 kb
1 2 3 4 5 6 7 8 9 10 1112 13 14 15 161718 19
20 21 22 23 24 25 26 2728 29 30 3132 33 34 35 36 37 38
0.8 kb
0.8 kb
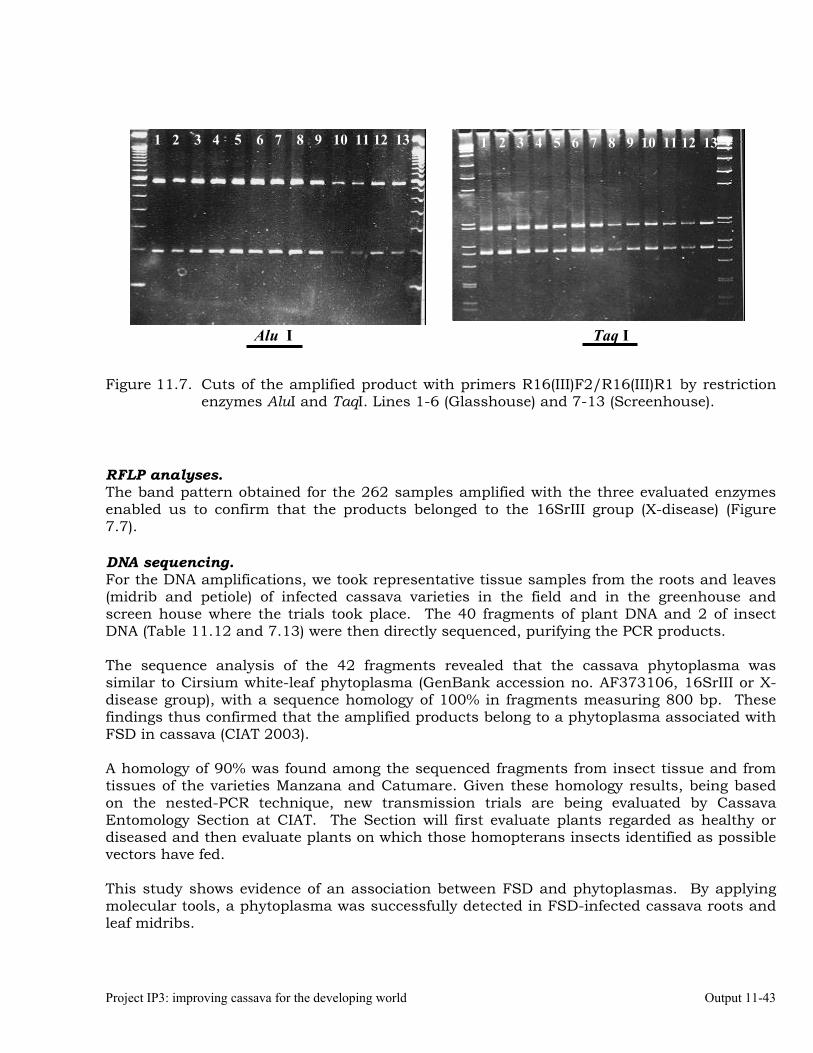
Project IP3: improving cassava for the developing world Output 11-43
Figure 11.7. Cuts of the amplified product with primers R16(III)F2/R16(III)R1 by restriction
enzymes AluI and TaqI. Lines 1-6 (Glasshouse) and 7-13 (Screenhouse). RFLP analyses. The band pattern obtained for the 262 samples amplified with the three evaluated enzymes enabled us to confirm that the products belonged to the 16SrIII group (X-disease) (Figure 7.7). DNA sequencing. For the DNA amplifications, we took representative tissue samples from the roots and leaves (midrib and petiole) of infected cassava varieties in the field and in the greenhouse and screen house where the trials took place. The 40 fragments of plant DNA and 2 of insect DNA (Table 11.12 and 7.13) were then directly sequenced, purifying the PCR products. The sequence analysis of the 42 fragments revealed that the cassava phytoplasma was similar to Cirsium white-leaf phytoplasma (GenBank accession no. AF373106, 16SrIII or X-disease group), with a sequence homology of 100% in fragments measuring 800 bp. These findings thus confirmed that the amplified products belong to a phytoplasma associated with FSD in cassava (CIAT 2003). A homology of 90% was found among the sequenced fragments from insect tissue and from tissues of the varieties Manzana and Catumare. Given these homology results, being based on the nested-PCR technique, new transmission trials are being evaluated by Cassava Entomology Section at CIAT. The Section will first evaluate plants regarded as healthy or diseased and then evaluate plants on which those homopterans insects identified as possible vectors have fed. This study shows evidence of an association between FSD and phytoplasmas. By applying molecular tools, a phytoplasma was successfully detected in FSD-infected cassava roots and leaf midribs.
1 2 3 4 5 6 7 8 9 10 11 12 3
Alu I Taq I
1 2 3 4 5 6 7 8 9 10 11 12 13 1 2 3 4 5 6 7 8 9 10 11 12 13
Project IP3: improving cassava for the developing world Output 11-44
References Bianchini, L 2001. Identificacao molecular de isolados do fitoplasma do enfezamento
vermelho do milho coletados no estado de Sao Paulo. Universidade de Sao Paulo, teses de Mestre, Piracicaba, Estado de Sao Paulo-Brasil, Dezembro 2001.
CIAT (Centro Internacional de Agricultura Tropical). 2003. IP-3 Annual Report. Cali,
Colombia. Gilbertson L and Dellaporta SL 1983. Molecular extraction DNA protocols. In: Molecular
biology of plants. Cold Spring Harbor Laboratory, Cold Spring Harbor, NY. pp 395–397.
Lee I-M, Gundersen DE, Hammond RW, Davis RE. 1994. Use of mycoplasmalike organism
(MLO) group-specific oligonucleotide primers for nested-PCR assays to detect mixed-MLO infections in a single host plant. Phytopathology 84:559-66
Chen, T.A and Liao, C.H.1975. Corn stunt spiroplasma: isolation, cultivation, and proof of
pathogenicity. Science, v.188, p.1015-1017. Acknowledgments We thank the following people for their support: Robert Zeigler, Kansas State University; Tulio Rodríguez, CIAT Virology Unit; Bernardo Arias, Pilar Hernández, and Claudia Holguín, CIAT Cassava Entomology; and Agrovélez S.A., Jamundí, Valle del Cauca. Activity 11.11 Identifying phytoplasmas by sequencing PCR products Specific objective To identify, through DNA sequencing, the phytoplasma associated with frogskin disease (FSD) of cassava. Methodology Plant tissues. Roots, petioles, and leaf midribs of both FSD-infected and healthy cassava plants, grown in the field and greenhouse, were processed. We evaluated 41 samples from cassava genotypes and varieties of three areas of Colombia—Atlantic Coast, Valle del Cauca, and Cauca—where FSD has high incidence. The goal was to confirm the presence of phytoplasmas in plants showing symptoms of FSD (Table 11.14).
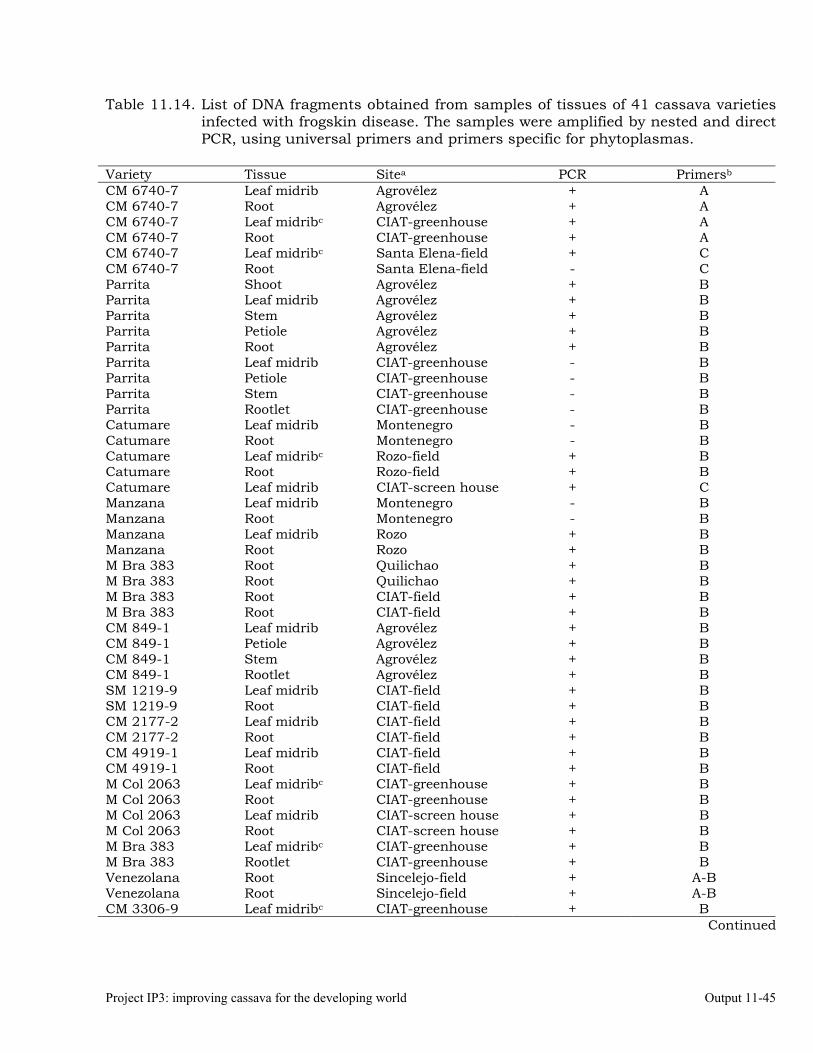
Project IP3: improving cassava for the developing world Output 11-45
Table 11.14. List of DNA fragments obtained from samples of tissues of 41 cassava varieties infected with frogskin disease. The samples were amplified by nested and direct PCR, using universal primers and primers specific for phytoplasmas.
Variety Tissue Sitea PCR Primersb
CM 6740-7 Leaf midrib Agrovélez + A CM 6740-7 Root Agrovélez + A CM 6740-7 Leaf midribc CIAT-greenhouse + A CM 6740-7 Root CIAT-greenhouse + A CM 6740-7 Leaf midribc Santa Elena-field + C CM 6740-7 Root Santa Elena-field - C Parrita Shoot Agrovélez + B Parrita Leaf midrib Agrovélez + B Parrita Stem Agrovélez + B Parrita Petiole Agrovélez + B Parrita Root Agrovélez + B Parrita Leaf midrib CIAT-greenhouse - B Parrita Petiole CIAT-greenhouse - B Parrita Stem CIAT-greenhouse - B Parrita Rootlet CIAT-greenhouse - B Catumare Leaf midrib Montenegro - B Catumare Root Montenegro - B Catumare Leaf midribc Rozo-field + B Catumare Root Rozo-field + B Catumare Leaf midrib CIAT-screen house + C Manzana Leaf midrib Montenegro - B Manzana Root Montenegro - B Manzana Leaf midrib Rozo + B Manzana Root Rozo + B M Bra 383 Root Quilichao + B M Bra 383 Root Quilichao + B M Bra 383 Root CIAT-field + B M Bra 383 Root CIAT-field + B CM 849-1 Leaf midrib Agrovélez + B CM 849-1 Petiole Agrovélez + B CM 849-1 Stem Agrovélez + B CM 849-1 Rootlet Agrovélez + B SM 1219-9 Leaf midrib CIAT-field + B SM 1219-9 Root CIAT-field + B CM 2177-2 Leaf midrib CIAT-field + B CM 2177-2 Root CIAT-field + B CM 4919-1 Leaf midrib CIAT-field + B CM 4919-1 Root CIAT-field + B M Col 2063 Leaf midribc CIAT-greenhouse + B M Col 2063 Root CIAT-greenhouse + B M Col 2063 Leaf midrib CIAT-screen house + B M Col 2063 Root CIAT-screen house + B M Bra 383 Leaf midribc CIAT-greenhouse + B M Bra 383 Rootlet CIAT-greenhouse + B Venezolana Root Sincelejo-field + A-B Venezolana Root Sincelejo-field + A-B CM 3306-9 Leaf midribc CIAT-greenhouse + B
Continued
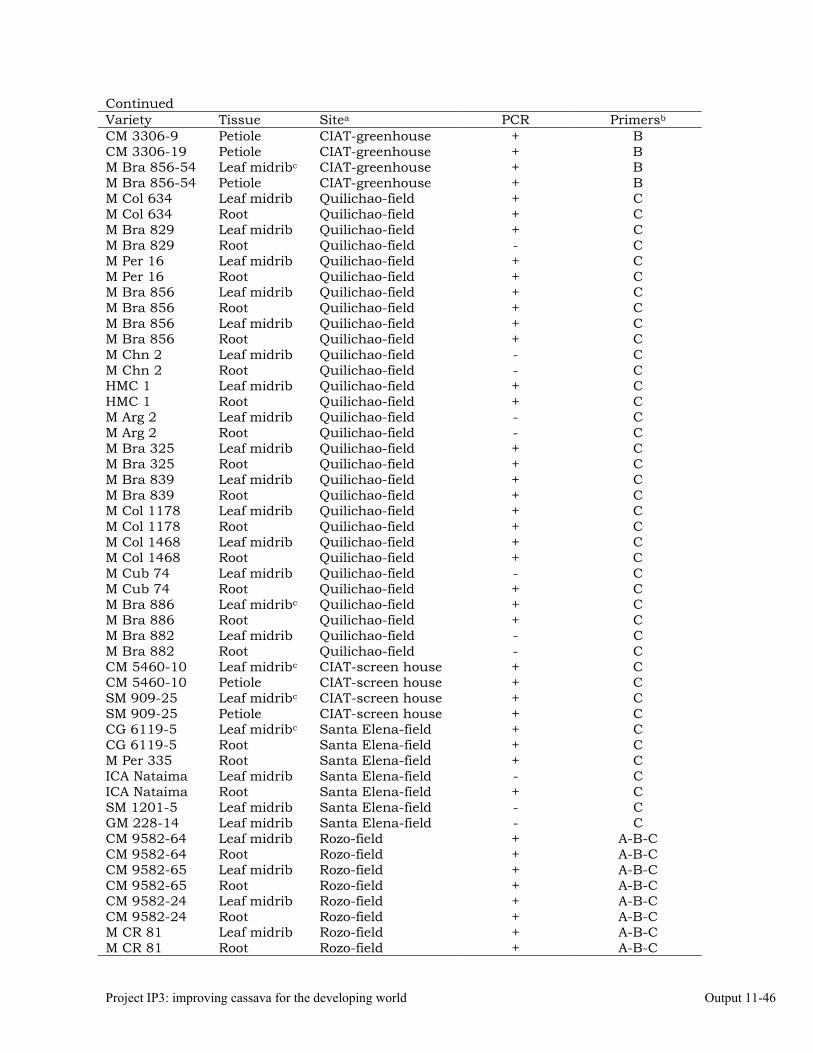
Project IP3: improving cassava for the developing world Output 11-46
Continued Variety Tissue Sitea PCR Primersb
CM 3306-9 Petiole CIAT-greenhouse + B CM 3306-19 Petiole CIAT-greenhouse + B M Bra 856-54 Leaf midribc CIAT-greenhouse + B M Bra 856-54 Petiole CIAT-greenhouse + B M Col 634 Leaf midrib Quilichao-field + C M Col 634 Root Quilichao-field + C M Bra 829 Leaf midrib Quilichao-field + C M Bra 829 Root Quilichao-field - C M Per 16 Leaf midrib Quilichao-field + C M Per 16 Root Quilichao-field + C M Bra 856 Leaf midrib Quilichao-field + C M Bra 856 Root Quilichao-field + C M Bra 856 Leaf midrib Quilichao-field + C M Bra 856 Root Quilichao-field + C M Chn 2 Leaf midrib Quilichao-field - C M Chn 2 Root Quilichao-field - C HMC 1 Leaf midrib Quilichao-field + C HMC 1 Root Quilichao-field + C M Arg 2 Leaf midrib Quilichao-field - C M Arg 2 Root Quilichao-field - C M Bra 325 Leaf midrib Quilichao-field + C M Bra 325 Root Quilichao-field + C M Bra 839 Leaf midrib Quilichao-field + C M Bra 839 Root Quilichao-field + C M Col 1178 Leaf midrib Quilichao-field + C M Col 1178 Root Quilichao-field + C M Col 1468 Leaf midrib Quilichao-field + C M Col 1468 Root Quilichao-field + C M Cub 74 Leaf midrib Quilichao-field - C M Cub 74 Root Quilichao-field + C M Bra 886 Leaf midribc Quilichao-field + C M Bra 886 Root Quilichao-field + C M Bra 882 Leaf midrib Quilichao-field - C M Bra 882 Root Quilichao-field - C CM 5460-10 Leaf midribc CIAT-screen house + C CM 5460-10 Petiole CIAT-screen house + C SM 909-25 Leaf midribc CIAT-screen house + C SM 909-25 Petiole CIAT-screen house + C CG 6119-5 Leaf midribc Santa Elena-field + C CG 6119-5 Root Santa Elena-field + C M Per 335 Root Santa Elena-field + C ICA Nataima Leaf midrib Santa Elena-field - C ICA Nataima Root Santa Elena-field + C SM 1201-5 Leaf midrib Santa Elena-field - C GM 228-14 Leaf midrib Santa Elena-field - C CM 9582-64 Leaf midrib Rozo-field + A-B-C CM 9582-64 Root Rozo-field + A-B-C CM 9582-65 Leaf midrib Rozo-field + A-B-C CM 9582-65 Root Rozo-field + A-B-C CM 9582-24 Leaf midrib Rozo-field + A-B-C CM 9582-24 Root Rozo-field + A-B-C M CR 81 Leaf midrib Rozo-field + A-B-C M CR 81 Root Rozo-field + A-B-C
Project IP3: improving cassava for the developing world Output 11-47
Continuation of Table 11.14 a. Agrovélez S.A., CIAT, Rozo, and Santa Elena are found in the Department of Valle del Cauca;
Quilichao in Cauca; Sincelejo in Atlántico; and Montenegro in Quindío. b. Primers used for amplification were (A) P1/P7–R16F2N/R16R2, (B) R16mF2/R16mR1–
R16F2N/R16R2, and (C) R16F2/R16R2–R16(III)F2/R16(III)R1. c. Also showing foliar symptoms of mosaic and deformation of leaf blade. Sequencing the 16S rRNA region. DNA obtained from plants with symptoms of FSD was used to amplify fragments of the 16S region of ribosomal DNA, using polymerase chain reaction (PCR) and two pairs of universal primers P1/P7 and R16mF2/R16mR1. The products were re-amplified, using nested PCR and primers R16F2N/R16FR2, to detect and confirm that the phytoplasma is associated with the disease. The products of the nested PCR (1.2 kb) were digested with the enzymes AluI, MseI, RsaI, and TaqI. The band patterns obtained with the restriction fragment length polymorphism (RFLP) technique made it possible to locate the group to which the phytoplasma belongs. These results were confirmed by re-amplifying the products R16F2/R16R2 with primers R16(III)F2/R16(III)R1 (0.8 kb) specific to the 16SrIII group. The fragments of 1.2 kb and 0.8 kb were cloned and sequenced. Purified PCR products were ligated in pGEM®-T Easy Vector, which was introduced into the Escherichia coli strain DH5-α by electroporation at 2.4 kV/cm2. Transformants were selected on a blue-white screen by plating on an LB/ampicillin/IPTG/Xgal medium. Positive inserts were observed with plasmid restriction with EcoRI and electrophoresis in 1.5% agarose gel. Different-sized fragments were selected and sequenced by automated dideoxy sequencing (ABI PRISM® 377-96 DNA Sequencer, Applied Biosystems). Results A phytoplasma was successfully detected, using nested PCR, in all FSD-infected tissues. Of the methods used in this study, PCR was the most sensitive for detecting, identifying, and classifying phytoplasmas. A sequence from a cloned fragment, obtained from an infected cassava plant, showed a 99% homology with the Chinaberry yellows phytoplasma and 100% with that of Cirsium white leaf. These results allow us to infer that a phytoplasma possibly plays a role in this disease. As criteria, we took the number of correctly read bases of the amplified fragment, amplifications of the characteristic symptoms of the disease, and differences of genotype, and obtained two complete sequences, measuring 1260 and 1298 bp of 16Sr DNA gene region of two different cassava varieties, M Col 2063 (Y17) (leaf midrib and petiole) and SM 1219-9 (Y29) (external phloem from roots), which were classified and reported in GenBank with the accession numbers AY737646 (1260 bp) and AY737647 (1298 bp).
Project IP3: improving cassava for the developing world Output 11-48
Acknowledgments We thank the following people for their support: Tom Harrington, Joe Steimel, and Gary Polking, Iowa State University, for DNA sequencing analysis; the CIAT Virology Unit and Cassava Entomology for facilitating some cassava genotypes; and Agrovélez S.A., Jamundí, Valle del Cauca. Activity 11.12/Designing specific primers for high-specificity detection of a
phytoplasma associated with frogskin disease (FSD) of cassava Specific objective To obtain high specificity in the technique and improve it for detecting phytoplasmas in cassava plants with symptoms of FSD, weeds, and potential insect vectors Methodology Sequencing and analyzing phytoplasma rDNA. We previously described obtaining complete sequences of DNA fragments through PCR from samples of two cassava varieties. They were reported to GenBank, which gave them accession numbers AY737646 and AY737647 (CIAT 2004). We conducted analyses of homology with these sequences against 24 sequences of the 16SrIII group and accessions of phytoplasmas representing at least 14 primary phytoplasma groups, using multiple alignments among the sequences (DNAMAN, version 5.2.2, Lynnon BioSoft). Specific differences in nucleotides were sought, seeking a series of bases that would be specific to the cassava phytoplasma. The homology of the sequences was calculated (in %) by taking the identical number of bases over the difference of aligned sequences and total size of gaps (in %). “Gap (%)” is the number of gaps of all sequences over the size of aligned sequences. We used the option “Quick Alignment” to perform pairwise alignment with all sequences, using the method developed by Wilbur and Lipman (1983). With this method, DNAMAN aligns each pair of sequences, constructs a homology tree from the results of pairwise alignment, and finally builds up alignment based on the homology tree with the previously established alignment. This tree is set up with the distance matrix, using the UPGMA method (Sneath and Sokal 1973). The matrix can be built up only with Observed Divergence (this method uses directly unmatched residues divided by compared length between two sequences. No correction is applied to distances). After the tree is constructed, dynamic programming is finally used to optimize group alignment (Feng and Doolittle 1987; Thompson et al. 1994). The phylogenetic analysis was constructed with the distance matrix, using the neighbor-joining method (Saitou and Nei 1987). Bootstrapping statistically shows typical variations (Felsenstein 1985). It involves creating a new data set by sampling randomly with replacements, so that the resulting data set has the same size as the original, but some characters have been left out and others are duplicated. The method assumes that the characters evolve independently. Phylogenetic analysis of the 16Sr RNA sequences was
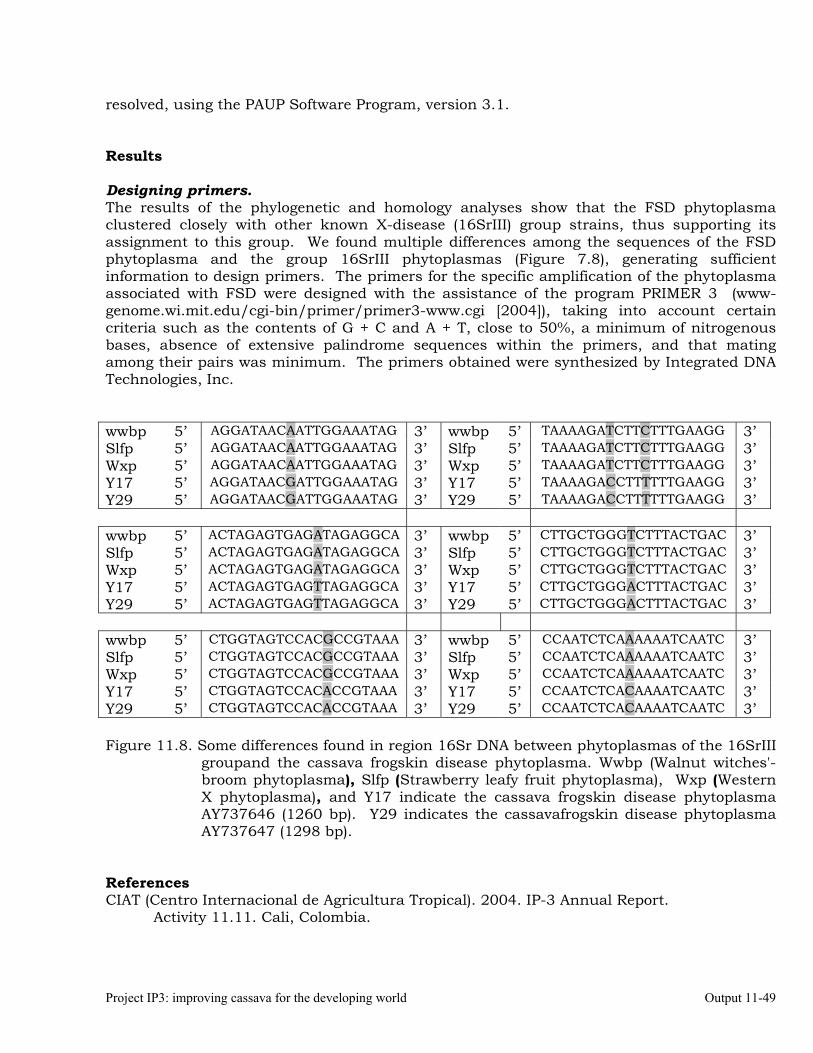
Project IP3: improving cassava for the developing world Output 11-49
resolved, using the PAUP Software Program, version 3.1. Results Designing primers. The results of the phylogenetic and homology analyses show that the FSD phytoplasma clustered closely with other known X-disease (16SrIII) group strains, thus supporting its assignment to this group. We found multiple differences among the sequences of the FSD phytoplasma and the group 16SrIII phytoplasmas (Figure 7.8), generating sufficient information to design primers. The primers for the specific amplification of the phytoplasma associated with FSD were designed with the assistance of the program PRIMER 3 (www-genome.wi.mit.edu/cgi-bin/primer/primer3-www.cgi [2004]), taking into account certain criteria such as the contents of G + C and A + T, close to 50%, a minimum of nitrogenous bases, absence of extensive palindrome sequences within the primers, and that mating among their pairs was minimum. The primers obtained were synthesized by Integrated DNA Technologies, Inc. wwbp 5’ AGGATAACAATTGGAAATAG 3’ wwbp 5’ TAAAAGATCTTCTTTGAAGG 3’ Slfp 5’ AGGATAACAATTGGAAATAG 3’ Slfp 5’ TAAAAGATCTTCTTTGAAGG 3’ Wxp 5’ AGGATAACAATTGGAAATAG 3’ Wxp 5’ TAAAAGATCTTCTTTGAAGG 3’ Y17 5’ AGGATAACGATTGGAAATAG 3’ Y17 5’ TAAAAGACCTTTTTTGAAGG 3’ Y29 5’ AGGATAACGATTGGAAATAG 3’ Y29 5’ TAAAAGACCTTTTTTGAAGG 3’ wwbp 5’ ACTAGAGTGAGATAGAGGCA 3’ wwbp 5’ CTTGCTGGGTCTTTACTGAC 3’ Slfp 5’ ACTAGAGTGAGATAGAGGCA 3’ Slfp 5’ CTTGCTGGGTCTTTACTGAC 3’ Wxp 5’ ACTAGAGTGAGATAGAGGCA 3’ Wxp 5’ CTTGCTGGGTCTTTACTGAC 3’ Y17 5’ ACTAGAGTGAGTTAGAGGCA 3’ Y17 5’ CTTGCTGGGACTTTACTGAC 3’ Y29 5’ ACTAGAGTGAGTTAGAGGCA 3’ Y29 5’ CTTGCTGGGACTTTACTGAC 3’ wwbp 5’ CTGGTAGTCCACGCCGTAAA 3’ wwbp 5’ CCAATCTCAAAAAATCAATC 3’ Slfp 5’ CTGGTAGTCCACGCCGTAAA 3’ Slfp 5’ CCAATCTCAAAAAATCAATC 3’ Wxp 5’ CTGGTAGTCCACGCCGTAAA 3’ Wxp 5’ CCAATCTCAAAAAATCAATC 3’ Y17 5’ CTGGTAGTCCACACCGTAAA 3’ Y17 5’ CCAATCTCACAAAATCAATC 3’ Y29 5’ CTGGTAGTCCACACCGTAAA 3’ Y29 5’ CCAATCTCACAAAATCAATC 3’ Figure 11.8. Some differences found in region 16Sr DNA between phytoplasmas of the 16SrIII
groupand the cassava frogskin disease phytoplasma. Wwbp (Walnut witches'-broom phytoplasma), Slfp (Strawberry leafy fruit phytoplasma), Wxp (Western X phytoplasma), and Y17 indicate the cassava frogskin disease phytoplasma AY737646 (1260 bp). Y29 indicates the cassavafrogskin disease phytoplasma AY737647 (1298 bp).
References CIAT (Centro Internacional de Agricultura Tropical). 2004. IP-3 Annual Report. Activity 11.11. Cali, Colombia.
Project IP3: improving cassava for the developing world Output 11-50
Felsenstein J. 1985. Confidence limits on phylogenies: an approach using the bootstrap. Evolution 39:783.
Feng DF; Doolittle RF. 1987. Progressive sequence alignment as a prerequisite to correct
phylogenetic trees. J Mol Evol 25:351. Saitou and Nei. 1987. The Neighbor-joining Method: A new Method for Reconstructing
Phylogenetic Trees. Mol. Biol. Evol. 4: 406 Sneath and Sokal. 1973. Numerical Taxonomy, San Francisco, USA. Thompson JD; Higgins DG; Gibson TJ. 1994. CLUSTALW: improving the sensitivity of
progressive multiple sequence alignment through sequence weighting position-specific gap penalties and weight matrix choice. Nucleic Acids Res 22:4673.
Wilbur WJ; Lipman DJ. 1983. Rapid similarity searches of nucleic acid and protein data
banks. Proc Natl Acad Sci 80:726. www-genome.wi.mit.edu/cgi-bin/primer/primer3-www.cgi 2004. Acknowledgments We thank the following people for their support: Tom Harrington and Joe Steimel of the Plant Pathology Department, and Gary Polking of the DNA Sequencing and Synthesis Facility, Iowa State University. Activity 11.13 Detecting phytoplasmas by electron microscopy Specific objective To detect, through electron microscopy, phytoplasma structures in tissues infected with FSD that was positive to nested PCR Methodology Tissues. Portions of roots exhibiting typical FSD symptoms were chosen from four different cassava genotypes. Typical symptoms are small longitudinal fissures distributed all over the root. On healing, these fissures develop “lips”. The root portions for each variety comprised different cuts directed mainly at the phloem. Healthy plant samples were also processed to act as control (Table 11.15). We also processed Homopteran insects (S. marginelineatus) collected from cassava crops infected with FSD and bred them in cages with different susceptible cassava genotypes that would show severe symptoms of the disease. Three individuals per developmental stage of the insect were taken as samples (Table 11.15) (CIAT Cassava Entomology, personal
Project IP3: improving cassava for the developing world Output 11-51
communication, 2004). The tissue fragments were cut into 1 × 2 mm pieces to be prefixed in 2%–3% glutaraldehyde (0.1 M phosphate buffer, pH 7.3). Complete insects were also fixed in the same buffer. Table 11.15. Processed samples of insects (Scaphytopius marginelineatus) and cassava plant
tissues for detecting phytoplasmas by electron microscopy. Tissue sample Insect’s developmental stage Cassava genotype Electron microscopy Insect SE1 Adult M Col 2063 In process Insect Ss1a Adult M Col 2063 In process Insect 383 (1) Male nymph M Bra 383 In process Insect 383 (2) Female nymph M Bra 383 In process Insect 383 (3) Adult M Bra 383 In process Roots CM 9582-64 + Roots CM 9582-65 + Roots CM 9582-24 + Roots M CR 81 + a. Tissues in this sample were healthy, whereas tissues in the other samples were infected. Electron microscopy. The samples for electron microscopy were prepared by making ultra-thin (60–90 nm) sections with a Reichert Ultracut S ultramicrotome (North Central Instruments, Plymouth, MN). After post-fixation and precontrasting in uranyl acetate, they were dehydrated in an acetone series 50, 70, 90 (15 min each) and 100% (15 min, three times), and were embedded in Spurr’s resin. A previous 18-h infiltration with acetone-Spurr (1:1) was done to facilitate the entry of resin into the tissues. The ultra-thin sections were mounted on copper grills, and images taken, using a Megaview III digital camera system with SIS software (Soft Imaging System Corp., Lakewood, CO) on a JEOL 1200EX woburn, MA scanning/transmission electron microscope (Japan Electron Optics Laboratory, Peabody, MA). Results In the previous studies, diverse tissues (stem, leaf midrib, petioles, and roots) were evaluated for numerous cassava plants, but only some could be compared with the results obtained for nested PCR. In this study, guided by the results of the nested PCR, root tissues of four cassava genotypes susceptible to FSD were first examined. These showed severe symptoms of the disease. Cells characteristic of phytoplasmas were detected in root phloem. The phytoplasma structures observed were pleomorphic, comprising round, elongate, dumbbell, and ring-shaped elements, mostly 150 to 250 nm wide and 1000 nm long (Figure 7.9). The phytoplasma structures were limited only to phloem tubes and were never seen in large quantities (Andersen et al. 2001). The insect-tissue samples are still being processed.
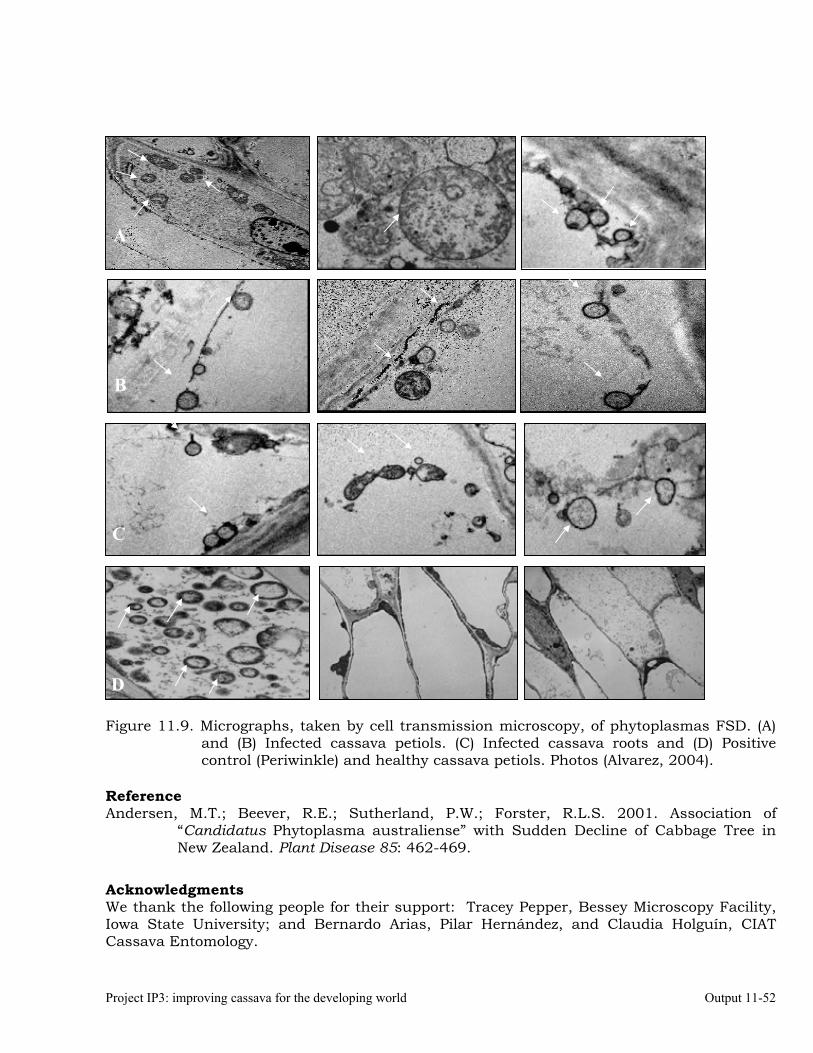
Project IP3: improving cassava for the developing world Output 11-52
Figure 11.9. Micrographs, taken by cell transmission microscopy, of phytoplasmas FSD. (A)
and (B) Infected cassava petiols. (C) Infected cassava roots and (D) Positive control (Periwinkle) and healthy cassava petiols. Photos (Alvarez, 2004).
Reference Andersen, M.T.; Beever, R.E.; Sutherland, P.W.; Forster, R.L.S. 2001. Association of
“Candidatus Phytoplasma australiense” with Sudden Decline of Cabbage Tree in New Zealand. Plant Disease 85: 462-469.
Acknowledgments We thank the following people for their support: Tracey Pepper, Bessey Microscopy Facility, Iowa State University; and Bernardo Arias, Pilar Hernández, and Claudia Holguín, CIAT Cassava Entomology.
A
B
C
D
Project IP3: improving cassava for the developing world Output 11-53
Activity 11.14 To develop and validate sustainable methods to prevent and control FSD and SED. To determine the effect of sustainable methods of preventing and controlling FSD and SED, experiments on thermotherapy and fertilization are recently started or ongoing. Objective To examine the effect of heat treatment on stakes of cassava plants affected by superelongation disease (SED), their germination, and yield Methodology We used thermotherapy to treat six stakes from each of 168 cassava genotypes taken from a field affected by SED. The stakes were immersed in hot water at 49°C for 49 min and then planted at Santander de Quilichao. The percentage of germination and yield were estimated, and the data analyzed by T test. Results The group of genotypes treated with thermotherapy had a germination rate of 90.2%, and yield was 22.2 t/ha, whereas the untreated group had a germination rate of 98.5%, and yield was 22.9 t/ha. The T test for germination gave a value of 1.79 and a probability of 0 77, whereas for yield the value was 0.41 and the probability of 0.66. The results indicated that there were no significant differences between the two treatments. Acknowledgments Bernardo Arias, Cassava Entomology, CIAT. Activity 11.15 Multiplying cassava genotypes to ensure sufficient cuttings for disease-resistance evaluations
We propagated 220 promising cassava genotypes on a farm located in Rozo, Palmira (Department of Valle del Cauca, Colombia) for use in greenhouse experiments on varietal resistance, genetic studies, and disease management. The group included two populations for studies on resistance to Phytophthora spp., causal agents of PRRs. Activity 11.16 DNA sequence analysis of specific regions of cassava resistance
genes analogs (RGAs). Objective Report in GenBank sequences of resistence gene analogs isolated from cassava.
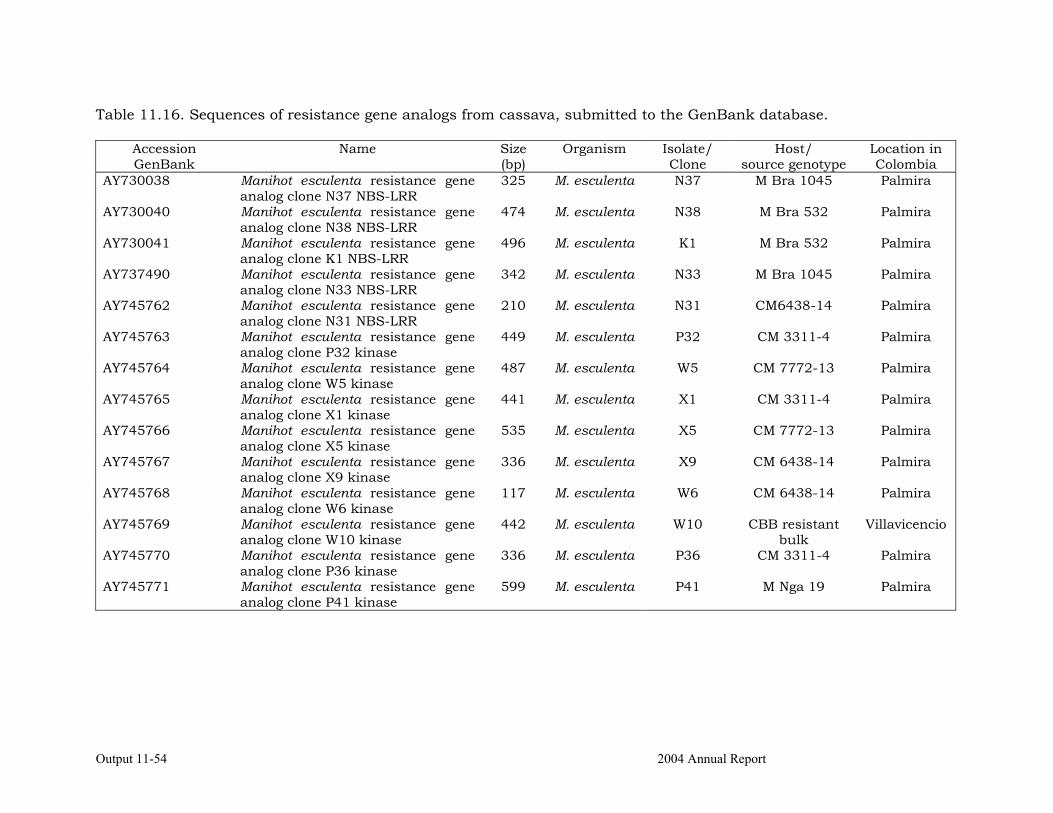
Output 11-54 2004 Annual Report
Table 11.16. Sequences of resistance gene analogs from cassava, submitted to the GenBank database.
Accession GenBank
Name Size (bp)
Organism Isolate/ Clone
Host/ source genotype
Location in Colombia
AY730038 Manihot esculenta resistance gene analog clone N37 NBS-LRR
325 M. esculenta N37 M Bra 1045 Palmira
AY730040 Manihot esculenta resistance gene analog clone N38 NBS-LRR
474 M. esculenta N38 M Bra 532 Palmira
AY730041 Manihot esculenta resistance gene analog clone K1 NBS-LRR
496 M. esculenta K1 M Bra 532 Palmira
AY737490 Manihot esculenta resistance gene analog clone N33 NBS-LRR
342 M. esculenta N33 M Bra 1045 Palmira
AY745762 Manihot esculenta resistance gene analog clone N31 NBS-LRR
210 M. esculenta N31 CM6438-14 Palmira
AY745763 Manihot esculenta resistance gene analog clone P32 kinase
449 M. esculenta P32 CM 3311-4 Palmira
AY745764 Manihot esculenta resistance gene analog clone W5 kinase
487 M. esculenta W5 CM 7772-13 Palmira
AY745765 Manihot esculenta resistance gene analog clone X1 kinase
441 M. esculenta X1 CM 3311-4 Palmira
AY745766 Manihot esculenta resistance gene analog clone X5 kinase
535 M. esculenta X5 CM 7772-13 Palmira
AY745767 Manihot esculenta resistance gene analog clone X9 kinase
336 M. esculenta X9 CM 6438-14 Palmira
AY745768 Manihot esculenta resistance gene analog clone W6 kinase
117 M. esculenta W6 CM 6438-14 Palmira
AY745769 Manihot esculenta resistance gene analog clone W10 kinase
442 M. esculenta W10 CBB resistant bulk
Villavicencio
AY745770 Manihot esculenta resistance gene analog clone P36 kinase
336 M. esculenta P36 CM 3311-4 Palmira
AY745771 Manihot esculenta resistance gene analog clone P41 kinase
599 M. esculenta P41 M Nga 19 Palmira
Output 11-55 2004 Annual Report
Methodology Conserved regions of DNA corresponding to resistance genes analogs from cassava resistant varieties to Phytophthora sp. .— MBra 532, MBra 1045, and MCr 81— and Xanthomonas axonopodis pv manihotis— CM 3311-4, CM 7772-13, CM 6438-14, CM 7772-13, M Bra 1045, and M Nga 19— were amplified using degenerated primers amplifying of DNA, using PCR with degenerated NBS (nucleotide-binding sites) and Pto kinase primers. Amplified DNA was purified and then was ligated in pGEM-T Easy vector, which was introduced into the Escherichia coli strain DH5-a by electroporation at 2.4 kV/cm2. Transformants were selected on blue/white color screening by plating on LB/ampicillin/IPTG/X-gal media. Positive inserts were observed by plasmid restriction with EcoRI and electrophoresis in 1.5% agarose gel. Different-sized fragments were selected for sequencing by automated dideoxy sequencing (ABI Prism 377-96 DNA Sequencer), using a DNA-sequencing kit from Applied Biosystems. Using the DNAMAN software with the option Assambly, different fragments of each microorganism or gen were aligned to obtain complete sequences. In order to report the sequences in the GenBank the read bases and their taxonomic classification at morphologic and molecular level were analyzed of each species. Clones sequenced were homologated with known resistance genes, using the Blastx tool, in the NCBI (National Center for Biotechnology Information, www.ncbi.nlm.nih.gov) database. With this tool, we identify that clones as resistance gene analogs, wich were submitted in that database (Table 11.16). Activity 11.17 Training researchers from Latin America, the Caribbean, and
Africa on managing cassava diseases and research technology 2003 23 October. Philipp Aerni, Senior Researcher, Center for Comparative and
International Studies (CIS) of the Swiss Federal Institute of Technology (ETH) at Zürich Disease diagnosis, molecular characterization of pathogens, molecular markers
associated with resistance to cassava diseases, and management of cassava diseases 2004 10 February. José Ventura and Ernesto Espinoza, INIVIT, Cuba Disease detection and diagnosis in cassava 15 February. Natali Cortés, Student, Tver State University, Moscow, Russia Applied biotechnology to detect and control phytopathogenic agents 15 March. Okechukwu Eke-Okoro (Nigeria), Titus Alicai (Uganda), Christopher Omongo
(Uganda), William Sserubombwe (Uganda), Mayanne Apok (Uganda), Steven Tumwesigye (Uganda)
Disease diagnosis, molecular characterization of pathogens, molecular markers associated with resistance to cassava diseases, management of cassava diseases
20 May. Colombo–Japanese Association (15 participants)
Integrated management of diseases for cassava, plantain, palm, and flowers 31 May to 12 June. CIAT (30 participants)
Project IP3: improving cassava for the developing world Output 11-56
International course on modern systems of cassava production, processing, and use Organized by CLAYUCA 9 September. Reinaldo Tovar. Universidad Nacional Experimental de Guayana. Puerto Ordaz, Venezuela Thermotherapy for in vitro production of cassava plantlets 30 September. Manuel Valdivié Instituto de Ciencia Animal (ICA), Cuba
Management of cassava diseases 1 October. Gustavo Córdova. Instituto Nicaragüense de Tecnología Agropecuaria. Managua, Nicaragua. Biological control of pathogens Activity 11.18 Train students, farmers, technicians, and researchers through
field days and meetings on modern, sustainable, cassava production systems in different regions of Colombia to manage major cassava diseases, emphasizing selection of stem cuttings
2003 4 November. Five people from Chemonics International and farmers of Putumayo. Disease
diagnosis and management for cassava and plantain 2004 February. Lorena Escobar. Universidad Nacional de Colombia. Isolation of Phytophthora
species from chili pepper March. Liliana Cadavid and Susana Mejía, Biology Students, Universidad del
Valle, Cali, Colombia. Isolation, detection, and pathogenicity tests of pathogens 29 February. 18 participants, including farmers and students from Pereira, Department of
Risaralda Disease diagnosis and management for cassava 12 March. 12 participants, including Chemonics International, Fundación Futuro
Ambiental, and Fundación Catatumbo, and farmers. Disease diagnosis and management for cassava, rubber, cacao, and vanilla.
24 March. Meeting with Nicolás Cock Duque in Ecoflora Integrated management of diseases through plant extracts 16 May. 30 participants, including farmers, functionaries from national bodies, and NGOs in Orito, Department of Putumayo Diagnosis and management of frogskin and other cassava diseases 18 May. Dr Octavio Vargas, Mitsui & Co., Ltd. Natural products in disease management
Project IP3: improving cassava for the developing world Output 11-57
4 June. 37 Students, University of Caldas Cassava and plantain diseases 5 June. 350 participants, including farmers, functionaries from national bodies, and private
enterprises in Montería, Department of Córdoba, at the release of new cassava varieties
Management of cassava diseases, with a presentation on the diagnosis and management of frogskin disease
1 July. 6 farmers, Pescador, Department of Cauca Diagnosis and management of cassava diseases 22 July. Visitors from the Colombian Association of Banana Growers
(AUGURA) and CENIBANANO, including Luis Fernando Patiño, León Toné Gaviria, and Ramiro Jaramillo Sosa of the Board of Directors of CENIBANANO
Integrated management of diseases for plantain, cassava, and oil palm 26 July to 6 August. Hernán Zapata, Agrobiológicos SAFER (Natural Control)
Isolation and conservation of pathogens and biocontrollers, inoculum preparation, and pathogenicity tests
Attendance at meetings in 2004 8–14 March. Sixth International Scientific Meeting of the Cassava Biotechnology Network,
Cali, Colombia 31 July to 4 August. Annual Meeting of the American Phytopathological Society (APS),
Anaheim, CA 13–15 August. XXV National Congress of Phytopathology, Cali, Colombia (held by ASCOLFI) Activity 11.19. Publications in 2004 Articles Calle F; Pérez JC; Gaitán W; Morante N; Ceballos H; Llano GA; Alvarez E. Genetics of relevant
traits in cassava (Manihot esculenta Crantz) adapted to acid-soil savannas. Euphytica. (In press.)
Hurtado PX; Alvarez E. Búsqueda de genes análogos de resistencia asociados con la
resistencia al añublo bacterial de la yuca. Fitopatol Colomb 27(2):59–64. Hurtado PX; Alvarez E; Fregene M; Llano GA. Detección de marcadores microsatélites
asociados con la resistencia a Xanthomonas axonopodis pv. manihotis en una familia de yuca (bc1). Rev Fitopatol Colomb. (In press.)
Project IP3: improving cassava for the developing world Output 11-58
Llano GA; Alvarez E; Muñoz JE; Fregene M. Identificación de genes análogos de resistencia a enfermedades en yuca (Manihot esculenta Crantz), y su relación con la resistencia a tres especies de Phytophthora. Acta Agron 53(1/2). (In press.)
Loke JB; Alvarez E; Vallejo FA; Marín J; Fregene M; Rivera S; Llano GA. Análisis de QTLs de
la resistencia a pudrición de raíz causada por Phytophthora tropicalis en una población segregante de yuca (Manihot esculenta Crantz). Acta Agron. (In press.)
Presentations at meetings in 2004 8–14 March. Llano GA; Alvarez E; Fregene M; Muñoz JE. Identification of resistance-gene
analogs in cassava (Manihot esculenta), and their relationship to three Phytophthora species. Poster presented at the Sixth International Scientific Meeting of the Cassava Biotechnology Network, Cali, Colombia. Page 121.
8-14 March. Loke JB; Alvarez E; Corredor JA; Folgueras M; Jaramillo G; Ceballos H.
Preliminary evidence between foliar and root resistance to root rot caused by Phytophthora tropicalis in cassava. Poster presented at the Sixth International Scientific Meeting of the Cassava Biotechnology Network, Cali, Colombia. Page.79.
8–14 March. Loke JB; Alvarez E; Fregene M; Marín J; Rivera S; Llano GA; Mejía JF. QTL
mapping for resistance to root rot caused by Phytophthora tropicalis in cassava. Poster presented at the Sixth International Scientific Meeting of the Cassava Biotechnology Network, Cali, Colombia. Page 158.
5 June. Loke JB; Pérez JC; Alvarez E; Cuervo M; Mejía JF; Llano G.; Pineda B.
Cuero de Sapo: Una Enfermedad de la Yuca -Once Preguntas Muy Interesantes de Agricultores-. Poster presented during the release of new cassava varieties. Montería, Córdoba.
11–13 August. Alvarez E; Mejía JF; Llano GA; Loke JB. Detección de un fitoplasma asociado
a cuero de sapo de yuca (Manihot esculenta Crantz) en Colombia. Paper presented at the XXV ASCOLFI Congress, Cali.
Activity 11.20 Two postgraduate theses in cassava for the Universidad Nacional de Colombia (Palmira) and the Universidad de los Andes (Bogotá, Colombia) Paula X. Hurtado. Evaluación de marcadores microsatélites y genes análogos, asociados a la
resistencia de yuca a Xanthomonas axonopodis pv. manihotis. Universidad de los Andes—Bogotá. For a Master’s in Biology, emphasizing Plant Molecular Biology.
John B. Loke. Análisis genético de la resistencia de yuca (Manihot esculenta Crantz) a
Phytophthora tropicalis, causante de pudrición radical. Universidad Nacional de Colombia—Palmira. For a Master’s in Plant Breeding.
Project IP3: improving cassava for the developing world Output 11-59
Activity 11.21 Two undergraduate theses currently being undertaken in cassava for the Universidad de Caldas, Manizales, Colombia Alejandro Corredor. Evaluación de la asociación de Marcadores bioquímicos y morfológicos
con la resistencia a pudrición de raíz (Phytophthora tropicalis) y el deterioro fisiológico en yuca (Manihot esculenta Crantz). Universidad de Caldas, Manizales. For a degree in Agronomy.
Activity 11.22 Concept notes and projects developed. Identification of insect vectors and alternative hosts of phytoplasmas causing cassava frogskin disease. Presented to USAID. Funds requested: US$ 12 00 for 1 year. Approved. Desarrollo de estrategias de manejo de cuero de sapo y superalargamiento en yuca, mediante investigación participativa. Presented to Ministerio de Agricultura y Desarrollo de Colombia. Funds requested: US$ 14.546 for 1 year. Approved. Combating Hidden Hunger in Latin America: Biofortified crops with improved Vitamina A, Essential Minerals and Quality Protein (English). Presented to CIDA. Funds requested: US$ 122.880 for 6 years. Approved. Manejo Integrado de Enfermedades del Cultivo de Yuca. Presented to Ministerio de Agricultura y Desarrollo de Colombia and IICA. Funds requested: US$ 77.700. Submitted. Pest and disease resistance, drought tolerance and increased shelf life genes from wild relatives of cassava and the development of low-cost technologies to pyramid them into elite progenitors. Presented to The generation challenge programme. Funds requested: US$ 289.200 per year, for 3 years. Submitted. Personnel Staff Elizabeth Alvarez John B. Loke Germán A. Llano Martin Fregene Herney Rengifo Zulma Zamora Juan Fernando Mejía Paula Hurtado
Project IP3: improving cassava for the developing world Output 11-60
Students and Technicians Universidad de los Andes, Bogotá: Paula Ximena Hurtado 3 months
Universidad de Caldas, Manizales: Alejandro Corredor 5 months
Técnico Agroforestal, Mitú, Vaupés: Gabriel Paiva 2 months
INIVIT (Cuba): Mariluz Folgueiras 2 months
Colegio Bolívar, Cali: Cristina Londoño 3 months
Universidad del Valle, Cali Adriana Arenas Diana Carolina López Liliana Cadavid Susana Mejía
Linkages with CIAT’s Partner Institutions CLAYUCA COLCIENCIAS IICA Instituto de Investigaciones de Viandas Tropicales (INIVIT, Cuba) IPRA (based at CIAT, Colombia) Secretaría de Agricultura del Vaupés (at Mitú) UMATAs (Mitú, La Tebaida, and Montenegro) Universidad Nacional de Colombia—Palmira (Valle del Cauca, Colombia) Donors Ministerio de Agricultura y Desarrollo Rural PRONATTA USAID CIDA Collaborators Local CLAYUCA (based at CIAT, Dr B. Ospina) CORPOICA “La Libertad” (Villavicencio) Corporación para el Desarrollo Sostenible del Norte y Oriente Amazónico (CDA, Vaupés, Dr E. Polo and R. Peña) CRIVA—Consejo Regional Indígena del Vaupés (Mitú) ICA—Quindío and Valle (Drs E. Vargas, F. Varón, and C. Huertas) Magro S. A. Secretaría de Agricultura del Vaupés (at Mitú, Dr G. Arbeláez) Special (La Tebaida, Mr S. González) UMATAs (Drs O. Holguín, L. Muñoz, and W. Ospina) Universidad de Caldas—Manizales Universidad de los Andes—Bogotá Universidad del Valle—Cali Universidad Nacional de Colombia—Palmira
Project IP3: improving cassava for the developing world Output 11-61
International Iowa State University (Dr T. Harrington, Dr T. Pepper) Syngenta (Dr Germán Hoyos) Kansas State University (Dr Robert Zeigler)
Output 12-1 2004 Annual Report
OUTPUT 12 Development and use of biotechnology tools for cassava improvement
Activity 12.1 Molecular Marker-Assisted Breeding for Resistance to the Cassava Mosaic Disease in Latin American Cassava Gene Pools Collaborators: Cesar Ospina, Jaime Marín, Edgar Barrera, Nelson Morante, Hernán Ceballos, Martin Fregene (CIAT) Funding: The Rockefeller Foundation and CIAT Important Outputs Molecular marker analysis of 1291 BC2 progenies and identification of genotypes that combine resistance to CMD and CGM. Testing of FTA paper leaf squashes as a replacement for the DNA isolation step in MAS. Rationale Perhaps the most powerful use of MAS in cassava breeding is in selection of recombinants that combine many genes, for example resistance to CMD and CGM, without the need for field trials. This could accelerate efforts to combine many traits into elite varieties. During the second year of the implementation of MAS at CIAT, we attempted to combine CMD and CGM resistance, derived from a wild relative of cassava, into genotypes that can serve as parents for introgression of the two traits. This year we also sought to address some of the most labor-intensive steps of MAS, namely the tedious DNA isolation step and identification of markers that are useful in a wide range of germplasm. A low cost method for MAS could be PCR amplification of leaf squashes on FTA paper (Whatmann PLC, UK). An attempt was also made to evaluate the feasibility of this approach for MAS on cassava. Methodology Four inter-specific F1 hybrids with resistance to CGM were crossed extensively to MTAI8, SM1741-1, SM1669-5, SM121-9, CM3306-4, and SM1460-1, elite parents of CIAT’s cassava gene pools. BC1 progenies having resistance to CGM, from field evaluations, were crossed to CMD donor parents at CIAT, a total of 1490 BC2 sexual seeds from into 43 families were obtained. The sexual seeds were germinated from embryo rescue and multiplied (Activity 12.18, this report). DNA isolation and molecular marker analysis was with a SCAR marker obtained from the RAPD marker RME1 located at less than 4cM from the CMD resistance gene (CIAT 2003) or SSR markers, NS74, NS217 and NS260, associated with CGM and 1 or 2 in vitro plantlets as described earlier (Mba et al. 2001).
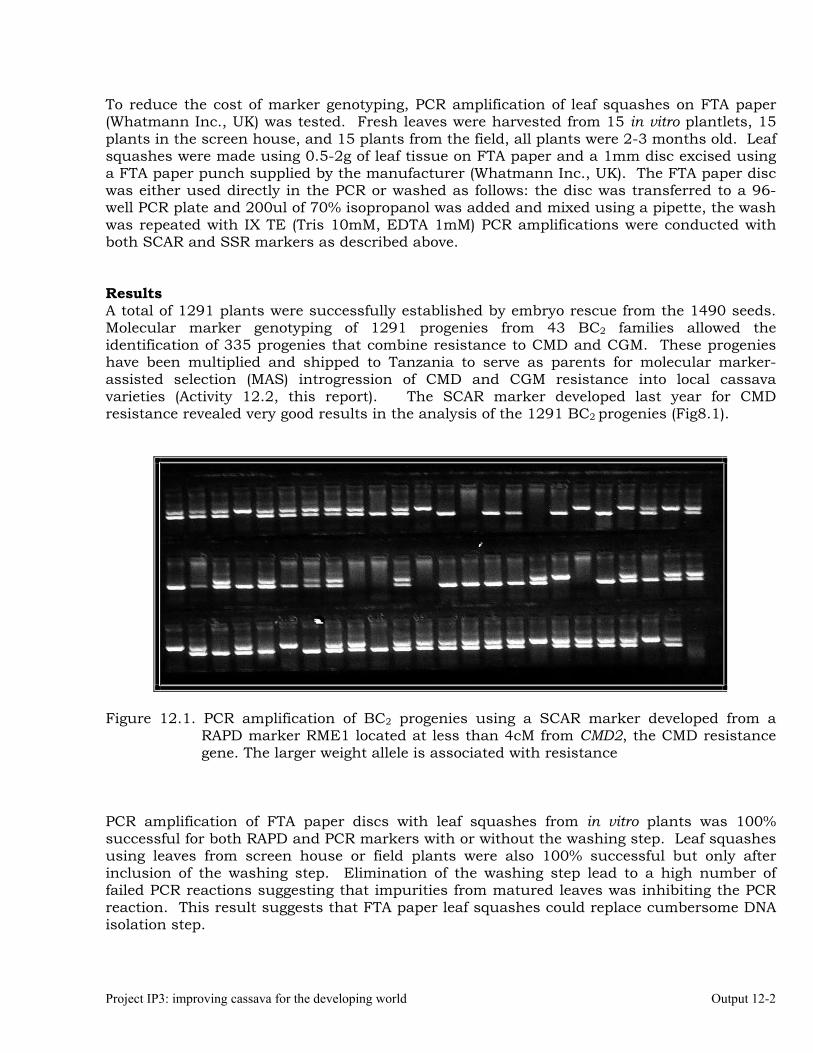
Project IP3: improving cassava for the developing world Output 12-2
To reduce the cost of marker genotyping, PCR amplification of leaf squashes on FTA paper (Whatmann Inc., UK) was tested. Fresh leaves were harvested from 15 in vitro plantlets, 15 plants in the screen house, and 15 plants from the field, all plants were 2-3 months old. Leaf squashes were made using 0.5-2g of leaf tissue on FTA paper and a 1mm disc excised using a FTA paper punch supplied by the manufacturer (Whatmann Inc., UK). The FTA paper disc was either used directly in the PCR or washed as follows: the disc was transferred to a 96-well PCR plate and 200ul of 70% isopropanol was added and mixed using a pipette, the wash was repeated with IX TE (Tris 10mM, EDTA 1mM) PCR amplifications were conducted with both SCAR and SSR markers as described above. Results A total of 1291 plants were successfully established by embryo rescue from the 1490 seeds. Molecular marker genotyping of 1291 progenies from 43 BC2 families allowed the identification of 335 progenies that combine resistance to CMD and CGM. These progenies have been multiplied and shipped to Tanzania to serve as parents for molecular marker-assisted selection (MAS) introgression of CMD and CGM resistance into local cassava varieties (Activity 12.2, this report). The SCAR marker developed last year for CMD resistance revealed very good results in the analysis of the 1291 BC2 progenies (Fig8.1).
Figure 12.1. PCR amplification of BC2 progenies using a SCAR marker developed from a
RAPD marker RME1 located at less than 4cM from CMD2, the CMD resistance gene. The larger weight allele is associated with resistance
PCR amplification of FTA paper discs with leaf squashes from in vitro plants was 100% successful for both RAPD and PCR markers with or without the washing step. Leaf squashes using leaves from screen house or field plants were also 100% successful but only after inclusion of the washing step. Elimination of the washing step lead to a high number of failed PCR reactions suggesting that impurities from matured leaves was inhibiting the PCR reaction. This result suggests that FTA paper leaf squashes could replace cumbersome DNA isolation step.
Output 12-3 2004 Annual Report
Conclusion and Future Perspective Molecular marker-assisted selection of 1291 BC2 genotypes lead to the identification of 335 lines that combine resistance to CMD and CGM. A low cost method for MAS, PCR amplification of leaf squashes on FTA paper, was also evaluated and found to be feasible. We intend to extend these preliminary experiments to many more plants and also to see the effects on PCR amplification of the storage of FTA paper leaf squashes at room temperature for extended periods. References CIAT 2003. Annual Report IP3. Improved cassava for the developing world. Pp8-68 to 8-70
Mba R. E.C., P. Stephenson, K. Edwards, S. Melzer, J. Nkumbira, U. Gullberg, K. Apel, M. Gale, J. Tohme, and M. Fregene (2001) Simple Sequence Repeat (SSR) Markers Survey of the Cassava (Manihot esculenta Crantz) Genome: Towards a SSR-Based Molecular Genetic Map of Cassava. Theor and Appl Genet 102:21-31
Activity 12.2 Molecular Marker-Assisted and Farmer Participatory Improvement of Cassava Germplasm for Farmer/Market Preferred Traits in Tanzania Collaborators: Alois Kullaya, Julius Mugini (ARI Mikocheni, Tanzania), Heneriko Kulembeka (ARI, Ukiriguru , Tanzania), Kiddo Mtunda, Esther Masumba (ARI, Kibaha, Tanzania), Morag Ferguson (IITA-ICRISAT, Nairobi, Tanzania), Luis Fernando Cadavid (CLAYUCA), Jaime Marín, Cesar Ospina, Edgar Barrera, Nelson Morante, Hernán Ceballos, Reinhardt Howeler, Martin Fregene (CIAT). Funding: The Rockeller Foundation Important Outputs 1) Shipment to Tanzania of 191 genotypes with resistance to the cassava mosaic disease (CMD) and 335 genotypes that combine resistance to CMD and to the cassava green mites (CGM) (derived from a wild relative), up to 10 plants each per genotype. The plants were derived from embryo axes from mature sexual seeds 2) Molecular diagnostics of the introduced material for frog skin disease (FSD) and transfer of the introductions to the field in Tanzania 3) Collection and evaluation of local varieties in Tanzania for crosses to the introductions to introduce resistance to the cassava mosaic disease and green mites into the local varieties. Rationale The Tanzanian MAS project funded by the Rockefeller foundation seeks to massively improve farmer-preferred varieties for CMD and CGM resistance by crossing introductions resistant to the above disease and pest to local varieties collected all over the country. The resulting large sized segregating populations are reduced with markers and the best genotypes, from the point of view of the farmer and breeder are selected over 2 cycles of parallel evaluations at
Project IP3: improving cassava for the developing world Output 12-4
the research stations and in farmer’s field. We report here progress in the project this year. A total of 335 BC2 progenies (AR lines) that combine resistance to CMD and to the cassava green mites (CGM), derived from a wild relative, and 207 genotypes (CR lines) obtained from crossing CIAT elite parents and CMD resistant lines were introduced from Colombia to Tanzania in three shipments this year. They were transferred to the screen house and while there evaluated for frog skin disease (FSD) and then transferred to the field. They will be evaluated later this season and no less than 60 genotypes selected based on evaluation of highly heritable agronomic traits to be crossed to 90 local varieties selected from all over the country. Molecular markers associated with CMD and CGM will be used to discard much of the resulting segregating populations so that the breeder and farmers can concentrate on a small number of progeny having resistance to the principal pest and disease and farmer/end-user preferred traits. The Tanzanian MAS project seeks to transfer useful variability from the crop’s center of diversity of cassava to Africa. The concept is already being extended to additional NARs in Africa, the AR and CR lines have been shipped to Uganda and Nigeria already in preparation for crossing to local varieties. Several concept notes have been prepared to fund the above efforts this year and if successful should begin next year. Methodology Following a decision made by CIAT management to permit direct transfer of cassava germplasm to African NARs without going through a third party, a committee was set up at CIAT to draw up guidelines for the safe transfer of cassava germplasm to Africa. The following recommendations were made by the committee: 1)A request for cassava materials with information regarding the quarantine requirements of the receiving country. 2) Only seeds from mother plants that are free of cassava frogskin disease (FSD) will be used. The mother plants will be inspected for root symptoms in the field. A significant sample of the mother plants will be tested using a diagnostic method appropriate for CFSD. 3) A record of the results of testing will be kept, and one copy will be sent to ICA quarantine officer. 4) Only plants that are placed in vitro through somatic embryo rescue will be exported. 5) Permission to export plants must be obtained from ICA. 6) All seed shipments from CIAT are accompanied by a Material Transfer Agreement (MTA). 7) The receiving country will have a quarantine period before the release of these materials in the field. The quarantine facilities should be insect proof in order to be sure that no biological agents from the receiving country are introduced during the quarantine period. Two different sets of germplasm were shipped: first 191 F1 genotypes derived from crosses of elite CIAT lines to CMD resistant parents followed by MAS for CMD resistance (CR lines) and 335 BC2 genotypes obtained crossing CMD resistant lines to BC1 derivatives of a wild close relative of cassava introgressed with elite CIAT parents (AR Lines). This second set of genotypes combines resistance to CMD and cassava green mites (CGM). Between 5 and 10 plants per genotype were shipped. The tissue culture plantlets were shipped in three batches, November 15 (CR plants), March 23 (AR first batch), and April 29 (AR second batch), to avoid over-loading facilities at ARI-Kibaha where the plants were sent to. On arrival in Dar es Salaam the plants were received by plant quarantine officials from the Tropical Pesticide Research Institute (TPRI, Arusha) and transferred to the tissue culture growth room of ARI-Mikocheni. After 7 days to allow the plants recover, they were moved to the screen house at ARI-Kibaha for hardening according to standard methods laid down at CIAT (Roca et al.
Output 12-5 2004 Annual Report
1984). The plants were inspected after one month in the screen house by TPRI officials and at 2 months just before transfer to the field. After the second inspection and further molecular diagnostics, the plants were transferred to the field at the Alawi estate, a 4000ha sisal plantation owned by the Mohammed Enterprises who are now interested in producing cassava for starch. In shipping germplasm to Tanzania, the conditions laid down by the CIAT committee on shipment of germplasm to Africa were strictly adhered to. Nevertheless molecular diagnostics for the presence of frog skin disease was carried out while the plants where in the green house to ensure that there was no escape in the germplasm. A molecular diagnostic method for the detection of CFSD based on hybridization of an FSD cDNA clone CFSV-S5 was used. The method is a modification at CIAT of the to dsRNA extraction the Morris and Dodds method (1993??). Briefly, three grams of young leaves or petioles were frozen with liquid nitrogen and homogenized with two volumes of extraction buffer (2X STE, 10% SDS, 1% bentonite, and 0.5% 2-mercaptoethanol) and 0.5 volumes of chloroform:pentanol (24:1). The extracts were centrifuged for 10 min at 8,000 G, and the aqueous phase was collected. Ethanol was added to a final volume of 16.5%, and for each gram of tissue 0.1 g CF-11 cellulose was added. The slurries were stirred for 30-60 minutes and poured into columns and drained completely. The columns were rinsed with 100 ml of 1X STE containing 16.5% ethanol. The column was rinsed with 0.1 ml of 1X STE, and the ds-RNAs were eluted using three 0.1 ml aliquots of 1X STE. The nucleic acids were precipitated with 2.5 volumes of absolute ethanol followed by centrifugation. The pellets were dried and then resuspended in sterile water. The extracted products are run on 1% agarose gels using TAE 1X. The cDNA CFSD-S5 clone is run on the gels as the positive control. These are denatured in the gel by treatment with 0.05M NaOH and 0.15M, NaCl followed by neutralization in 0.1M Tris-HCl and 0.15M NaCl and transferred to nitrocellulose membranes using buffer 20X SSC. The labeling and detection was done with the Pierce chemiluminescent hybridization and detection kit with CSPD according to the manufacturer’s instructions. The hybridization temperature is 42ºC and highly stringent conditions are used to wash the filter (68ºC), after which it was exposed to film for 15min to 1h. Local cassava cultivars were this year collected from the principal growing regions by NARS partners in Tanzania. Germplasm collected from the Eastern zone, around Tanga, Kibaha and the coastal areas of Dar es Salaam were established at the Alawi estate in Kibaha. Collections from the south, Matwara, Lindi and Nachigwea districts were established at the Alawi estate in Kibaha, those from the Lake region around Geita, Musoma, Tarime, Muleba and Kasulu districts were established at ARI-Maruku. The experimental design of the trials was a random complete block design with 3 blocks and 10 plants per block. Farmers from the different regions will be invited during evaluations of these collections at harvest to determine the best local land races after their own criteria. Evaluations will be undertaken in September/October 2004. Selections will be planted in a crossing block early next year at the Alawi estate and ARI-Naliendele for genetic crossing. Results A total of 191 CR and 335 AR genotypes were successfully shipped to Tanzania. A description of the germplasm shipped and their parents are shown in Tables 12.1 and 12.2 More than 85% of all plants, and 100% of all genotypes were successfully established in the
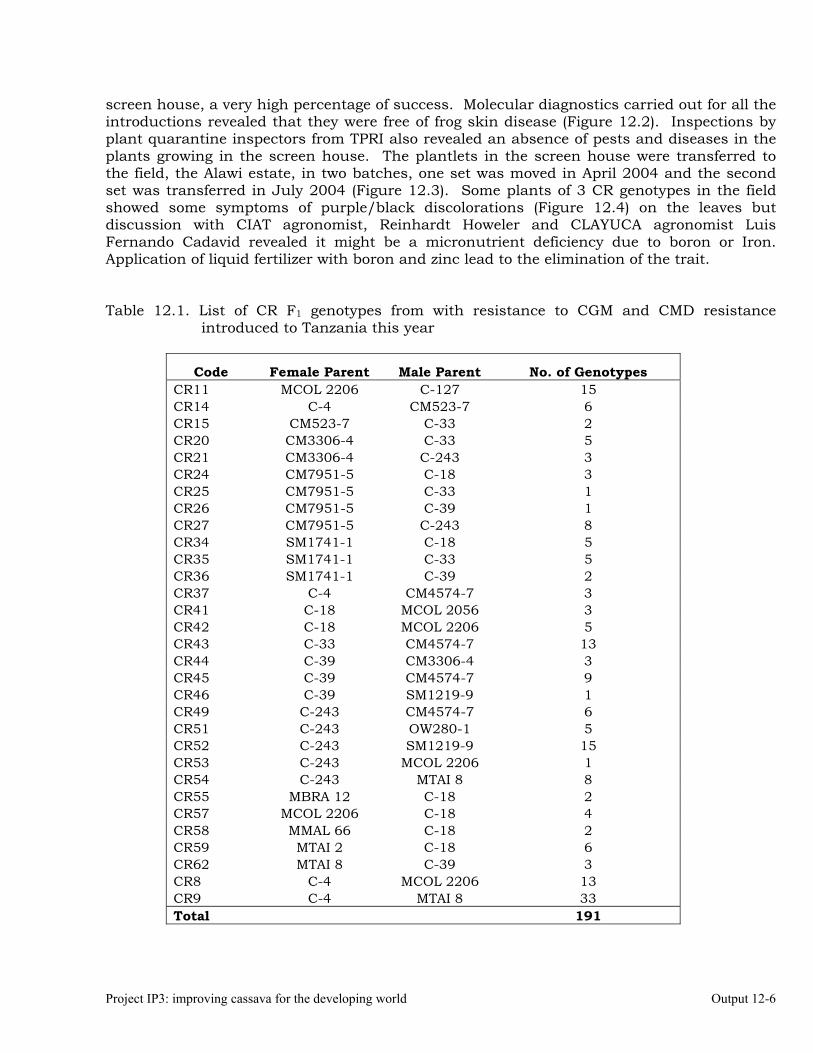
Project IP3: improving cassava for the developing world Output 12-6
screen house, a very high percentage of success. Molecular diagnostics carried out for all the introductions revealed that they were free of frog skin disease (Figure 12.2). Inspections by plant quarantine inspectors from TPRI also revealed an absence of pests and diseases in the plants growing in the screen house. The plantlets in the screen house were transferred to the field, the Alawi estate, in two batches, one set was moved in April 2004 and the second set was transferred in July 2004 (Figure 12.3). Some plants of 3 CR genotypes in the field showed some symptoms of purple/black discolorations (Figure 12.4) on the leaves but discussion with CIAT agronomist, Reinhardt Howeler and CLAYUCA agronomist Luis Fernando Cadavid revealed it might be a micronutrient deficiency due to boron or Iron. Application of liquid fertilizer with boron and zinc lead to the elimination of the trait. Table 12.1. List of CR F1 genotypes from with resistance to CGM and CMD resistance
introduced to Tanzania this year
Code Female Parent Male Parent No. of Genotypes CR11 MCOL 2206 C-127 15 CR14 C-4 CM523-7 6 CR15 CM523-7 C-33 2 CR20 CM3306-4 C-33 5 CR21 CM3306-4 C-243 3 CR24 CM7951-5 C-18 3 CR25 CM7951-5 C-33 1 CR26 CM7951-5 C-39 1 CR27 CM7951-5 C-243 8 CR34 SM1741-1 C-18 5 CR35 SM1741-1 C-33 5 CR36 SM1741-1 C-39 2 CR37 C-4 CM4574-7 3 CR41 C-18 MCOL 2056 3 CR42 C-18 MCOL 2206 5 CR43 C-33 CM4574-7 13 CR44 C-39 CM3306-4 3 CR45 C-39 CM4574-7 9 CR46 C-39 SM1219-9 1 CR49 C-243 CM4574-7 6 CR51 C-243 OW280-1 5 CR52 C-243 SM1219-9 15 CR53 C-243 MCOL 2206 1 CR54 C-243 MTAI 8 8 CR55 MBRA 12 C-18 2 CR57 MCOL 2206 C-18 4 CR58 MMAL 66 C-18 2 CR59 MTAI 2 C-18 6 CR62 MTAI 8 C-39 3 CR8 C-4 MCOL 2206 13 CR9 C-4 MTAI 8 33 Total 191
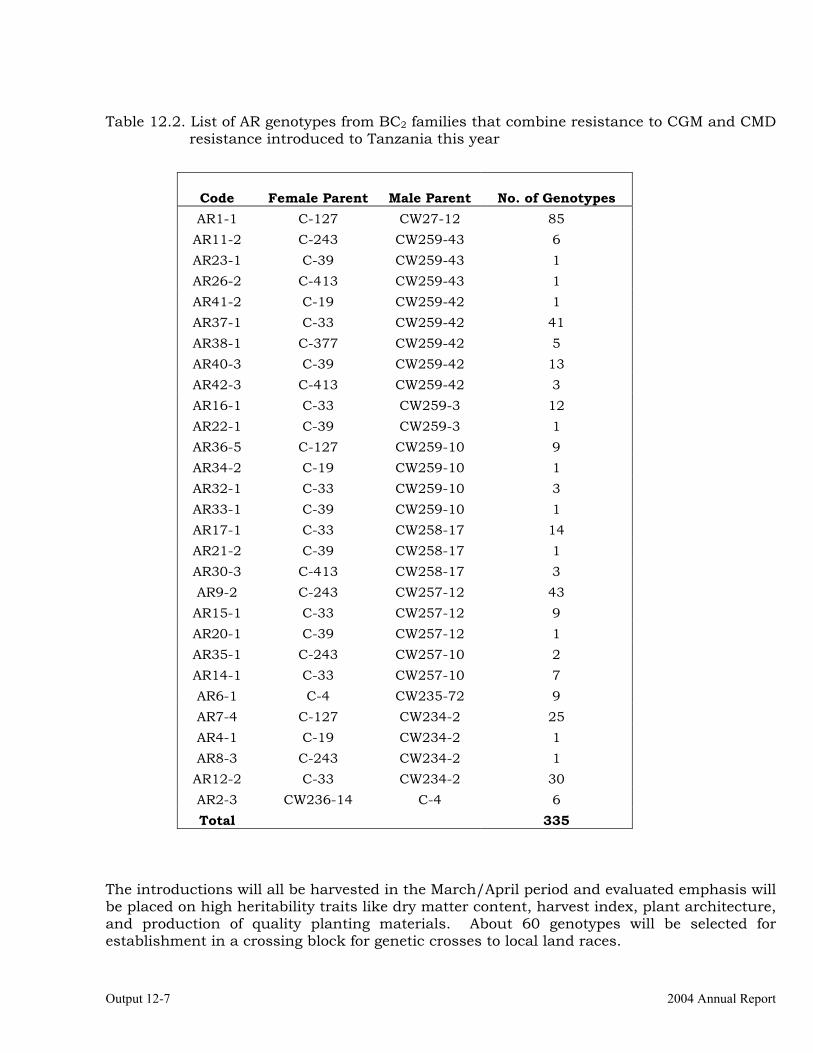
Output 12-7 2004 Annual Report
Table 12.2. List of AR genotypes from BC2 families that combine resistance to CGM and CMD
resistance introduced to Tanzania this year
Code Female Parent Male Parent No. of Genotypes AR1-1 C-127 CW27-12 85 AR11-2 C-243 CW259-43 6 AR23-1 C-39 CW259-43 1 AR26-2 C-413 CW259-43 1 AR41-2 C-19 CW259-42 1 AR37-1 C-33 CW259-42 41 AR38-1 C-377 CW259-42 5 AR40-3 C-39 CW259-42 13 AR42-3 C-413 CW259-42 3 AR16-1 C-33 CW259-3 12 AR22-1 C-39 CW259-3 1 AR36-5 C-127 CW259-10 9 AR34-2 C-19 CW259-10 1 AR32-1 C-33 CW259-10 3 AR33-1 C-39 CW259-10 1 AR17-1 C-33 CW258-17 14 AR21-2 C-39 CW258-17 1 AR30-3 C-413 CW258-17 3 AR9-2 C-243 CW257-12 43 AR15-1 C-33 CW257-12 9 AR20-1 C-39 CW257-12 1 AR35-1 C-243 CW257-10 2 AR14-1 C-33 CW257-10 7 AR6-1 C-4 CW235-72 9 AR7-4 C-127 CW234-2 25 AR4-1 C-19 CW234-2 1 AR8-3 C-243 CW234-2 1 AR12-2 C-33 CW234-2 30 AR2-3 CW236-14 C-4 6 Total 335
The introductions will all be harvested in the March/April period and evaluated emphasis will be placed on high heritability traits like dry matter content, harvest index, plant architecture, and production of quality planting materials. About 60 genotypes will be selected for establishment in a crossing block for genetic crosses to local land races.
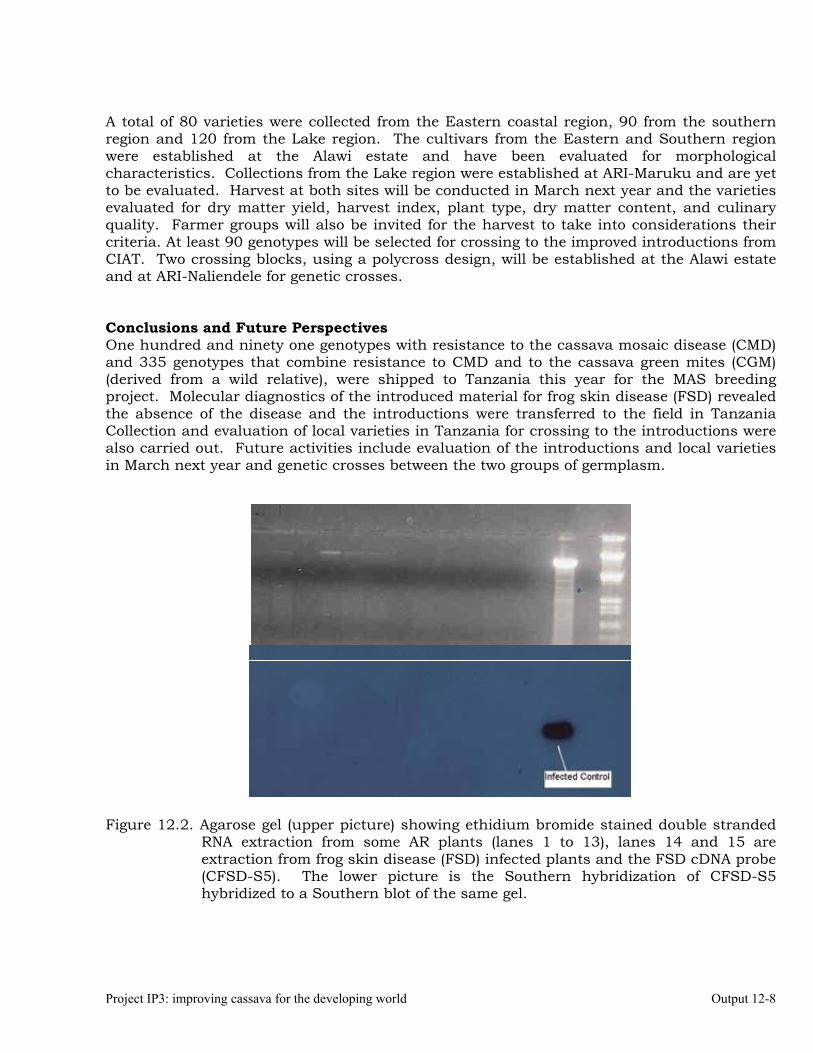
Project IP3: improving cassava for the developing world Output 12-8
A total of 80 varieties were collected from the Eastern coastal region, 90 from the southern region and 120 from the Lake region. The cultivars from the Eastern and Southern region were established at the Alawi estate and have been evaluated for morphological characteristics. Collections from the Lake region were established at ARI-Maruku and are yet to be evaluated. Harvest at both sites will be conducted in March next year and the varieties evaluated for dry matter yield, harvest index, plant type, dry matter content, and culinary quality. Farmer groups will also be invited for the harvest to take into considerations their criteria. At least 90 genotypes will be selected for crossing to the improved introductions from CIAT. Two crossing blocks, using a polycross design, will be established at the Alawi estate and at ARI-Naliendele for genetic crosses. Conclusions and Future Perspectives One hundred and ninety one genotypes with resistance to the cassava mosaic disease (CMD) and 335 genotypes that combine resistance to CMD and to the cassava green mites (CGM) (derived from a wild relative), were shipped to Tanzania this year for the MAS breeding project. Molecular diagnostics of the introduced material for frog skin disease (FSD) revealed the absence of the disease and the introductions were transferred to the field in Tanzania Collection and evaluation of local varieties in Tanzania for crossing to the introductions were also carried out. Future activities include evaluation of the introductions and local varieties in March next year and genetic crosses between the two groups of germplasm.
Figure 12.2. Agarose gel (upper picture) showing ethidium bromide stained double stranded
RNA extraction from some AR plants (lanes 1 to 13), lanes 14 and 15 are extraction from frog skin disease (FSD) infected plants and the FSD cDNA probe (CFSD-S5). The lower picture is the Southern hybridization of CFSD-S5 hybridized to a Southern blot of the same gel.
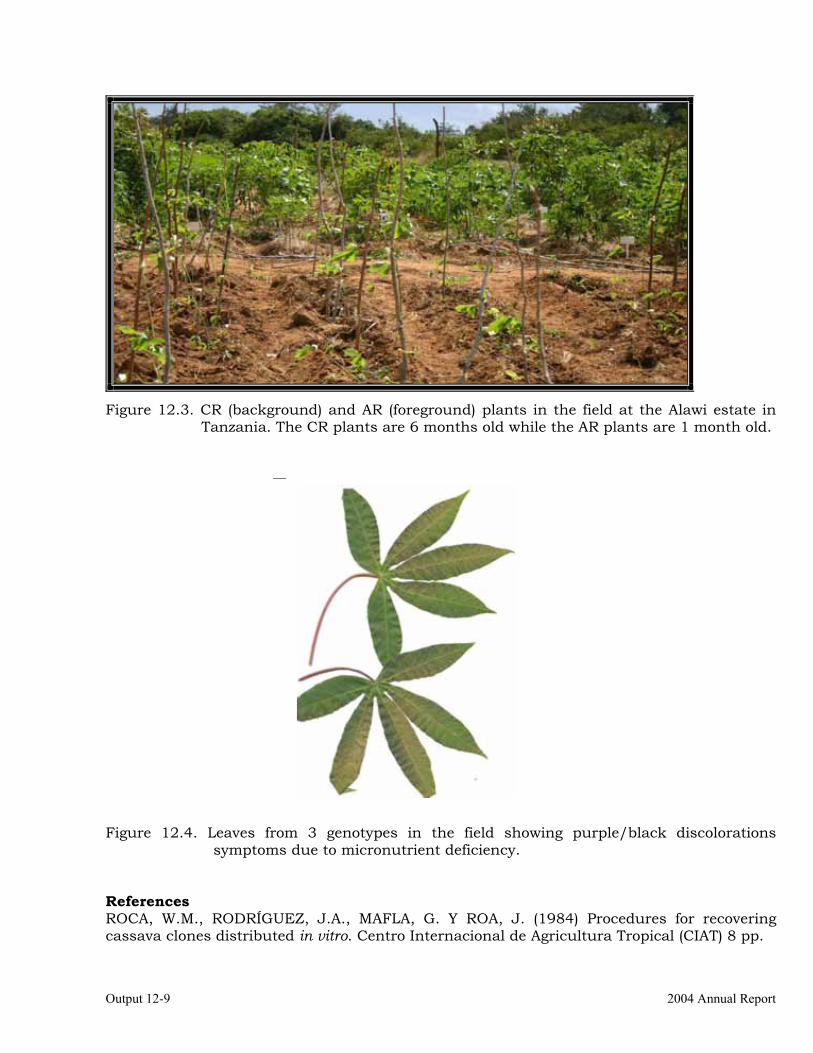
Output 12-9 2004 Annual Report
Figure 12.3. CR (background) and AR (foreground) plants in the field at the Alawi estate in
Tanzania. The CR plants are 6 months old while the AR plants are 1 month old.
Figure 12.4. Leaves from 3 genotypes in the field showing purple/black discolorations
symptoms due to micronutrient deficiency. References ROCA, W.M., RODRÍGUEZ, J.A., MAFLA, G. Y ROA, J. (1984) Procedures for recovering cassava clones distributed in vitro. Centro Internacional de Agricultura Tropical (CIAT) 8 pp.
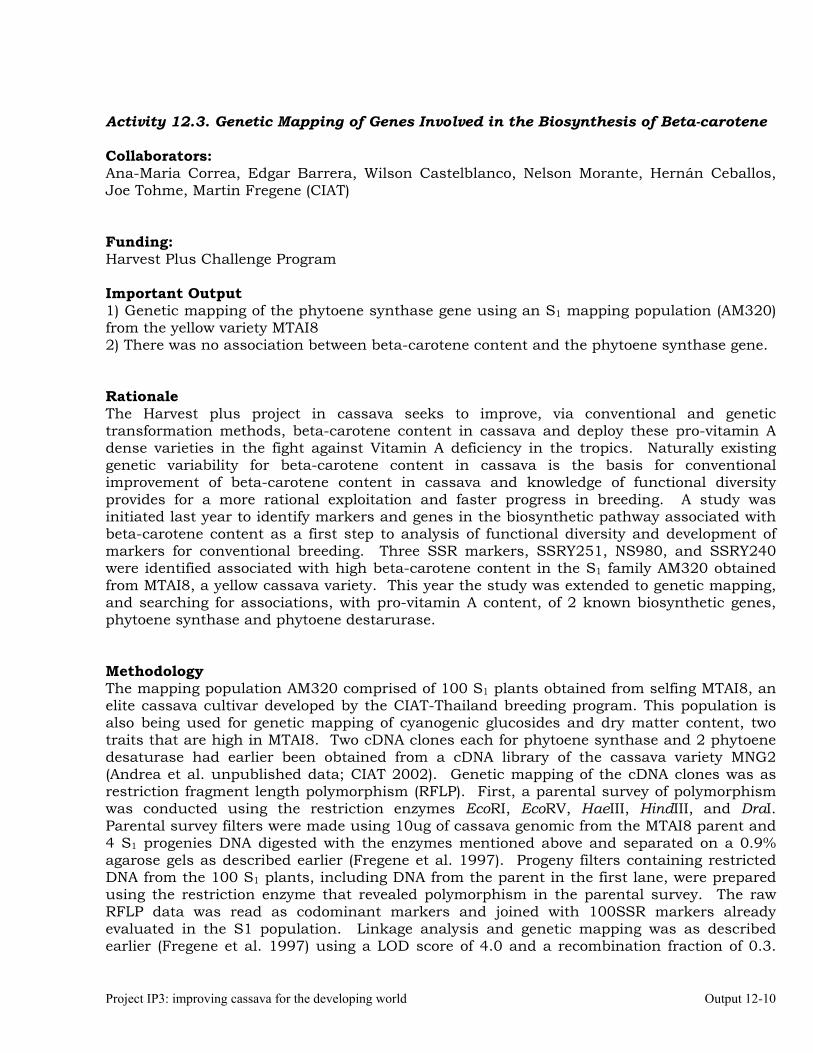
Project IP3: improving cassava for the developing world Output 12-10
Activity 12.3. Genetic Mapping of Genes Involved in the Biosynthesis of Beta-carotene Collaborators: Ana-Maria Correa, Edgar Barrera, Wilson Castelblanco, Nelson Morante, Hernán Ceballos, Joe Tohme, Martin Fregene (CIAT) Funding: Harvest Plus Challenge Program Important Output 1) Genetic mapping of the phytoene synthase gene using an S1 mapping population (AM320) from the yellow variety MTAI8 2) There was no association between beta-carotene content and the phytoene synthase gene. Rationale The Harvest plus project in cassava seeks to improve, via conventional and genetic transformation methods, beta-carotene content in cassava and deploy these pro-vitamin A dense varieties in the fight against Vitamin A deficiency in the tropics. Naturally existing genetic variability for beta-carotene content in cassava is the basis for conventional improvement of beta-carotene content in cassava and knowledge of functional diversity provides for a more rational exploitation and faster progress in breeding. A study was initiated last year to identify markers and genes in the biosynthetic pathway associated with beta-carotene content as a first step to analysis of functional diversity and development of markers for conventional breeding. Three SSR markers, SSRY251, NS980, and SSRY240 were identified associated with high beta-carotene content in the S1 family AM320 obtained from MTAI8, a yellow cassava variety. This year the study was extended to genetic mapping, and searching for associations, with pro-vitamin A content, of 2 known biosynthetic genes, phytoene synthase and phytoene destarurase. Methodology The mapping population AM320 comprised of 100 S1 plants obtained from selfing MTAI8, an elite cassava cultivar developed by the CIAT-Thailand breeding program. This population is also being used for genetic mapping of cyanogenic glucosides and dry matter content, two traits that are high in MTAI8. Two cDNA clones each for phytoene synthase and 2 phytoene desaturase had earlier been obtained from a cDNA library of the cassava variety MNG2 (Andrea et al. unpublished data; CIAT 2002). Genetic mapping of the cDNA clones was as restriction fragment length polymorphism (RFLP). First, a parental survey of polymorphism was conducted using the restriction enzymes EcoRI, EcoRV, HaeIII, HindIII, and DraI. Parental survey filters were made using 10ug of cassava genomic from the MTAI8 parent and 4 S1 progenies DNA digested with the enzymes mentioned above and separated on a 0.9% agarose gels as described earlier (Fregene et al. 1997). Progeny filters containing restricted DNA from the 100 S1 plants, including DNA from the parent in the first lane, were prepared using the restriction enzyme that revealed polymorphism in the parental survey. The raw RFLP data was read as codominant markers and joined with 100SSR markers already evaluated in the S1 population. Linkage analysis and genetic mapping was as described earlier (Fregene et al. 1997) using a LOD score of 4.0 and a recombination fraction of 0.3.
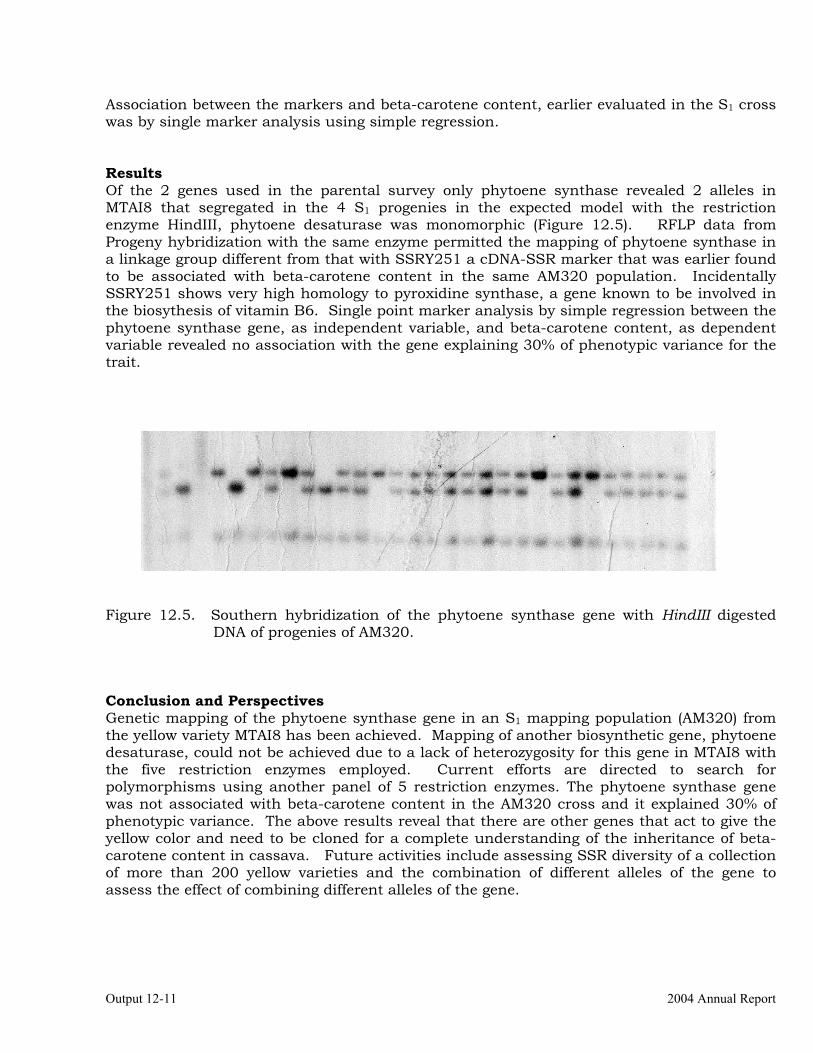
Output 12-11 2004 Annual Report
Association between the markers and beta-carotene content, earlier evaluated in the S1 cross was by single marker analysis using simple regression. Results Of the 2 genes used in the parental survey only phytoene synthase revealed 2 alleles in MTAI8 that segregated in the 4 S1 progenies in the expected model with the restriction enzyme HindIII, phytoene desaturase was monomorphic (Figure 12.5). RFLP data from Progeny hybridization with the same enzyme permitted the mapping of phytoene synthase in a linkage group different from that with SSRY251 a cDNA-SSR marker that was earlier found to be associated with beta-carotene content in the same AM320 population. Incidentally SSRY251 shows very high homology to pyroxidine synthase, a gene known to be involved in the biosythesis of vitamin B6. Single point marker analysis by simple regression between the phytoene synthase gene, as independent variable, and beta-carotene content, as dependent variable revealed no association with the gene explaining 30% of phenotypic variance for the trait.
Figure 12.5. Southern hybridization of the phytoene synthase gene with HindIII digested
DNA of progenies of AM320. Conclusion and Perspectives Genetic mapping of the phytoene synthase gene in an S1 mapping population (AM320) from the yellow variety MTAI8 has been achieved. Mapping of another biosynthetic gene, phytoene desaturase, could not be achieved due to a lack of heterozygosity for this gene in MTAI8 with the five restriction enzymes employed. Current efforts are directed to search for polymorphisms using another panel of 5 restriction enzymes. The phytoene synthase gene was not associated with beta-carotene content in the AM320 cross and it explained 30% of phenotypic variance. The above results reveal that there are other genes that act to give the yellow color and need to be cloned for a complete understanding of the inheritance of beta-carotene content in cassava. Future activities include assessing SSR diversity of a collection of more than 200 yellow varieties and the combination of different alleles of the gene to assess the effect of combining different alleles of the gene.
Project IP3: improving cassava for the developing world Output 12-12
References CIAT 2003
Fregene, M.A., F. Angel, R. Gómez, F. Rodríguez, W. Roca, J. Tohme, and M. Bonierbale (1997). A molecular genetic map of cassava (Manihot esculenta Crantz). Theor. and Appl. Genet. TAG 95 (3) 431-441.
Activity 12.4. Progress in Genetic Mapping of Dry Matter Content (DMC) in Cassava Collaborators: Henry Ojulong, Nelson Morante, Jaime Marin, Edgar Barrera, Cesar Ospina, Martin Fregene (CIAT) Funding: Rockefeller Foundation, CIAT Important Outputs: 1) Analysis of dry matter content (DMC) in 23 F1 families from a diallel experiment over a 3-year period 2) Putative markers SSRY160 and SSRY150 found to be associated with dry matter content (DMC) in the GM313 family are also linked with the trait in other families 3) Discovery of a inter-specific hybrid family with a very wide segregation for dry matter content and initiation of bulked segregant analysis (BSA) for the identification of markers Rationale In 2002 a diallel experiment was initiated to provide information on the genetics of traits of agronomic interest in cassava (CIAT 2003). Based upon GCA estimates in the parents and high standard deviation of dry matter content (DMC), 23 families were selected for further evaluation of dry matter content (DMC). Two families, GM313 and GM312, of the 23 were also used for bulked segregant analysis of DMC and 2 SSR markers SSRY160 and SSR150 were found to be associated with the trait (CIAT 2003). The utility of these markers in the other 21 families was tested in the past year. Due to the small sizes of families in the original diallel experiment, 30-50 progenies, that are inadequate for QTL mapping, larger sized families for 9 of the pair-wise combinations of parents were also generated for QTL mapping. A seedling trial of more than 1,500 genotypes from these families is currently in the field this year. Also during the year, an inter-specific family CW208, a cross between MTAI8 and Manihot tristis was identified with a very wide segregation for DMC. This family is part of a large-scale evaluation of inter-specific between cassava and several wild Manihot species started in 2001. We describe here completion of evaluation of the 23 families of the diallel experiment, association of the SSR markers 160 and 150 with DMC in the other 21 families, and initiation of bulk segregant analysis (BSA) of CW208 using 600 SSR markers. Methodology Genotypes from 23 families selected based on large standard deviation for DMC in the 2002 harvest was planted in Santander de Quilichao in October 2002 and harvested in October 2003. The experiment consisted of six plants per genotype planted in a completely
Output 12-13 2004 Annual Report
randomized block design. Plants were harvested and bulked per genotype for measurement of percent dry matter content (DMC) using the standard CIAT procedure of weighing in air and water and calculating specific gravity. Plants were observed for incidence of frog skin disease (FSD) and rated as absent (0) or present (1), all genotypes showing any signs of frog skin infection were discarded. In November 2003 these families were re-planted in a trial with 4 x 5 plant plots and four replications in a randomized block design. Harvesting was done in August 2004, the central eight plants from each plot were harvested and bulked. Data was taken as described above, this time severity of frog skin disease (FSD) was rated on a 0-5 scale with 0 signifying no observed symptoms and 5 very severe. Data was subjected to ANOVA having as sources of variation genotypes and replication, a Generalized Linear Model (GLM) analysis was also carried out using the 3-year data, due to uneven number of observations across years; variation due to years was included as a source of variation. Randomly amplified polymorphic DNA (RAPD) was employed in bulked segregant analysis in a search for more markers associated with DMC in the families GM313 and GM312. A total of 492 10-nucleotide random primers available at CIAT Cassava Genetics laboratory were evaluated in two sets of bulks, high and low for DMC respectively, from the families GM 312 and GM 313. RAPD analysis was as described earlier (CIAT 2003). PCR product was run on 1.5% agarose gels at 240 volts for about one hour, stained with ethidium bromide and photographed. Polymorphic markers in the bulks were analyzed in individuals of the bulks, and markers that remained polymorphic between individuals high and low in dry matter content were analyzed in all genotypes of the cross. The SSR marker SSR 160 and SSR150 were also analyzed in the remaining 21 families, to assess the utility of these markers in different genetic background. DNA samples from all genotypes were extracted from 1g of oven dried (48h at 50oC) leaves using a mini-prep version of the Dellaporta et al., (1983) protocol. Between 500µg to 1000µg of high quality DNA was obtained from each extraction and quantified using flourometer, the samples where then diluted to 10ng/µl for PCR amplification. SSR analysis was as described earlier by Mba et al. (2001). Bulk segregation analysis (BSA) of DMC in the inter-specific family CW208 was also carried out using SSR markers as described earlier (CIAT 2003). Results 2003 harvest During the 2003 harvest number of tubers per plant ranged from 0.30 to 31.00 in GM 283-8 and GM 267-5 respectively with an average of 9.49 (Table 12.3). They tended to be affected by FSD as infected plants had many undeveloped tubers. Fresh root yield greatly varied with the lowest, GM 306-21 having as low as 0.2 ton/ha and the highest CM 9642-26, 111.8 ton/ha. Percent dry matter content had values ranging from 16.09 in GM 284-23 and GM 309-9 and as high as 51.07% and 69.07% in GM 313-23 and GM 311-15 respectively, while dry yield values ranged from 0.08 ton/ha in GM 306-21 and GM 309-39 to 39.26 t/ha in CM 9642-26. High incidence of frog skin disease was observed with 23% of the genotypes showing symptoms, simple correlation analysis in infected genotypes revealed significant negative estimates with all the yield parameters. Highest estimate was obtained with percentage dry matter (-0.33) followed by harvest index (-0.24), dry tuber yield and number of commercial roots (-0.23), fresh tuber yield and number of tubers (-0.20). Correlation between the 2002
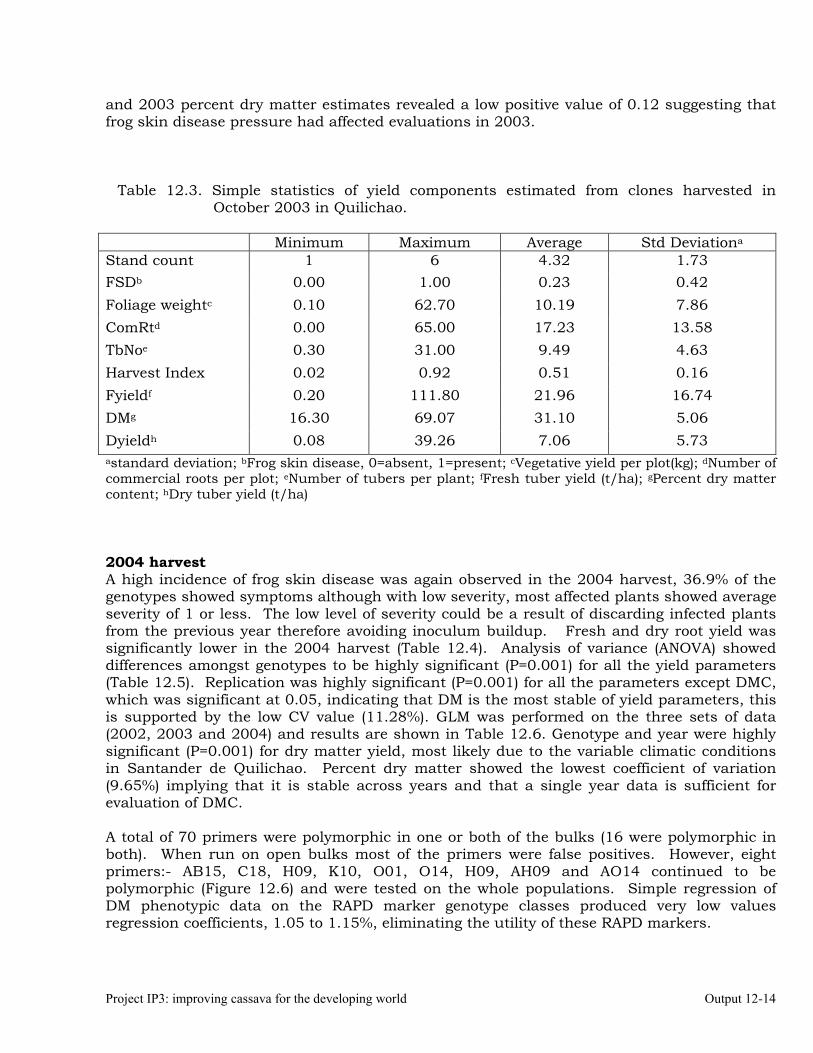
Project IP3: improving cassava for the developing world Output 12-14
and 2003 percent dry matter estimates revealed a low positive value of 0.12 suggesting that frog skin disease pressure had affected evaluations in 2003.
Table 12.3. Simple statistics of yield components estimated from clones harvested in October 2003 in Quilichao.
Minimum Maximum Average Std Deviationa
Stand count 1 6 4.32 1.73 FSDb 0.00 1.00 0.23 0.42 Foliage weightc 0.10 62.70 10.19 7.86 ComRtd 0.00 65.00 17.23 13.58 TbNoe 0.30 31.00 9.49 4.63 Harvest Index 0.02 0.92 0.51 0.16 Fyieldf 0.20 111.80 21.96 16.74 DMg 16.30 69.07 31.10 5.06 Dyieldh 0.08 39.26 7.06 5.73 astandard deviation; bFrog skin disease, 0=absent, 1=present; cVegetative yield per plot(kg); dNumber of commercial roots per plot; eNumber of tubers per plant; fFresh tuber yield (t/ha); gPercent dry matter content; hDry tuber yield (t/ha) 2004 harvest A high incidence of frog skin disease was again observed in the 2004 harvest, 36.9% of the genotypes showed symptoms although with low severity, most affected plants showed average severity of 1 or less. The low level of severity could be a result of discarding infected plants from the previous year therefore avoiding inoculum buildup. Fresh and dry root yield was significantly lower in the 2004 harvest (Table 12.4). Analysis of variance (ANOVA) showed differences amongst genotypes to be highly significant (P=0.001) for all the yield parameters (Table 12.5). Replication was highly significant (P=0.001) for all the parameters except DMC, which was significant at 0.05, indicating that DM is the most stable of yield parameters, this is supported by the low CV value (11.28%). GLM was performed on the three sets of data (2002, 2003 and 2004) and results are shown in Table 12.6. Genotype and year were highly significant (P=0.001) for dry matter yield, most likely due to the variable climatic conditions in Santander de Quilichao. Percent dry matter showed the lowest coefficient of variation (9.65%) implying that it is stable across years and that a single year data is sufficient for evaluation of DMC. A total of 70 primers were polymorphic in one or both of the bulks (16 were polymorphic in both). When run on open bulks most of the primers were false positives. However, eight primers:- AB15, C18, H09, K10, O01, O14, H09, AH09 and AO14 continued to be polymorphic (Figure 12.6) and were tested on the whole populations. Simple regression of DM phenotypic data on the RAPD marker genotype classes produced very low values regression coefficients, 1.05 to 1.15%, eliminating the utility of these RAPD markers.
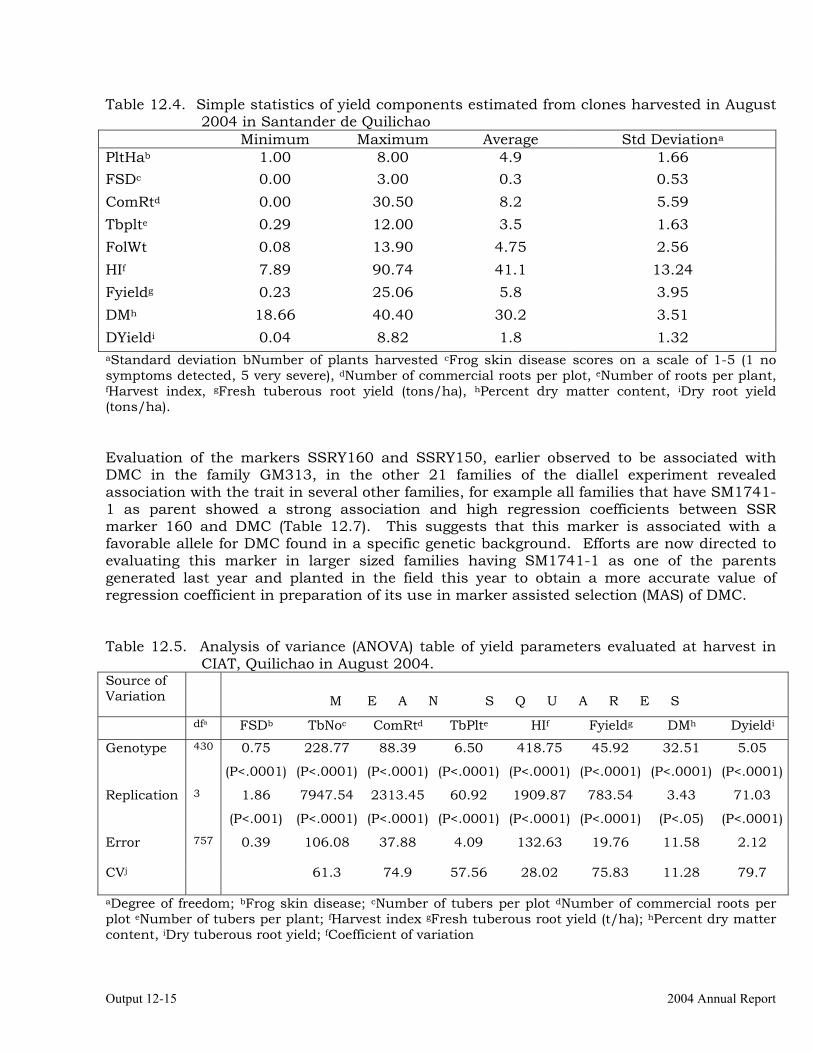
Output 12-15 2004 Annual Report
Table 12.4. Simple statistics of yield components estimated from clones harvested in August 2004 in Santander de Quilichao
Minimum Maximum Average Std Deviationa PltHab 1.00 8.00 4.9 1.66 FSDc 0.00 3.00 0.3 0.53 ComRtd 0.00 30.50 8.2 5.59 Tbplte 0.29 12.00 3.5 1.63 FolWt 0.08 13.90 4.75 2.56 HIf 7.89 90.74 41.1 13.24 Fyieldg 0.23 25.06 5.8 3.95 DMh 18.66 40.40 30.2 3.51 DYieldi 0.04 8.82 1.8 1.32 aStandard deviation bNumber of plants harvested cFrog skin disease scores on a scale of 1-5 (1 no symptoms detected, 5 very severe), dNumber of commercial roots per plot, eNumber of roots per plant, fHarvest index, gFresh tuberous root yield (tons/ha), hPercent dry matter content, iDry root yield (tons/ha). Evaluation of the markers SSRY160 and SSRY150, earlier observed to be associated with DMC in the family GM313, in the other 21 families of the diallel experiment revealed association with the trait in several other families, for example all families that have SM1741-1 as parent showed a strong association and high regression coefficients between SSR marker 160 and DMC (Table 12.7). This suggests that this marker is associated with a favorable allele for DMC found in a specific genetic background. Efforts are now directed to evaluating this marker in larger sized families having SM1741-1 as one of the parents generated last year and planted in the field this year to obtain a more accurate value of regression coefficient in preparation of its use in marker assisted selection (MAS) of DMC. Table 12.5. Analysis of variance (ANOVA) table of yield parameters evaluated at harvest in
CIAT, Quilichao in August 2004. Source of Variation
M E A N S Q U A R E S
dfa FSDb TbNoc ComRtd TbPlte HIf Fyieldg DMh Dyieldi
Genotype 430 0.75
(P<.0001)
228.77
(P<.0001)
88.39
(P<.0001)
6.50
(P<.0001)
418.75
(P<.0001)
45.92
(P<.0001)
32.51
(P<.0001)
5.05
(P<.0001)
Replication 3 1.86
(P<.001)
7947.54
(P<.0001)
2313.45
(P<.0001)
60.92
(P<.0001)
1909.87
(P<.0001)
783.54
(P<.0001)
3.43
(P<.05)
71.03
(P<.0001)
Error 757 0.39 106.08 37.88 4.09 132.63 19.76 11.58 2.12
CVj 61.3 74.9 57.56 28.02 75.83 11.28 79.7
aDegree of freedom; bFrog skin disease; cNumber of tubers per plot dNumber of commercial roots per plot eNumber of tubers per plant; fHarvest index gFresh tuberous root yield (t/ha); hPercent dry matter content, iDry tuberous root yield; fCoefficient of variation
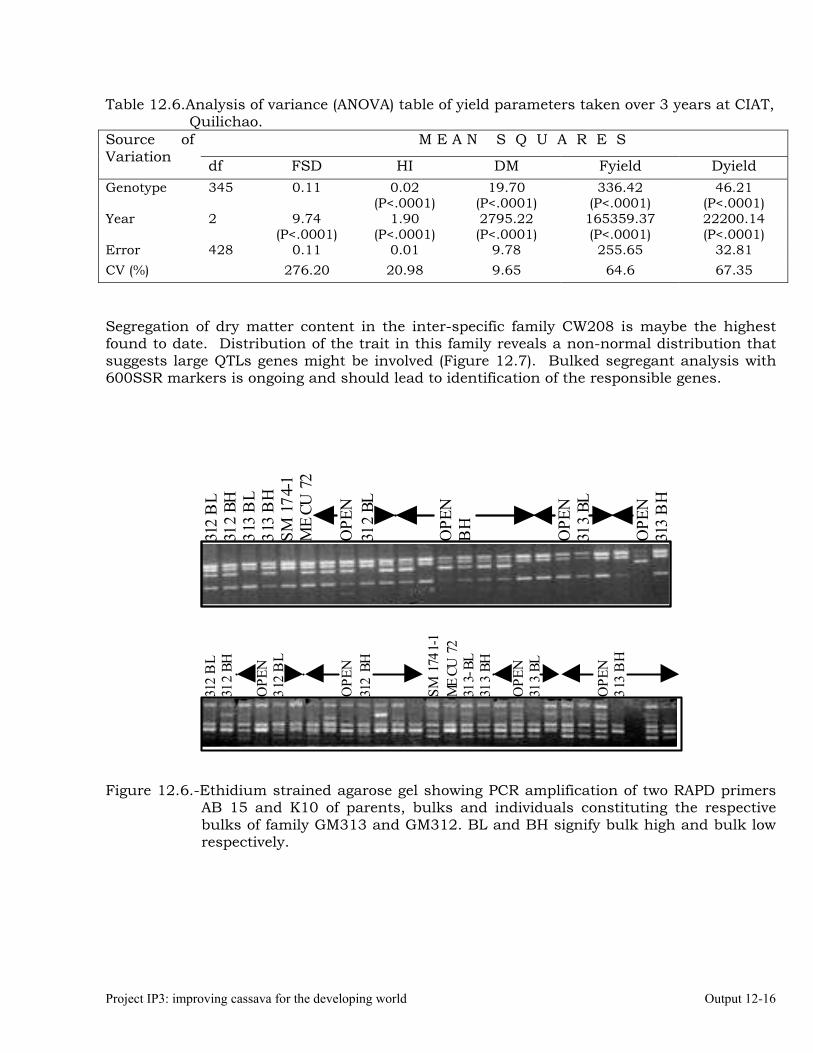
Project IP3: improving cassava for the developing world Output 12-16
Table 12.6.Analysis of variance (ANOVA) table of yield parameters taken over 3 years at CIAT, Quilichao.
M E A N S Q U A R E S Source of Variation df FSD HI DM Fyield Dyield Genotype 345 0.11 0.02
(P<.0001) 19.70
(P<.0001) 336.42
(P<.0001) 46.21
(P<.0001) Year 2 9.74
(P<.0001) 1.90
(P<.0001) 2795.22 (P<.0001)
165359.37 (P<.0001)
22200.14 (P<.0001)
Error 428 0.11 0.01 9.78 255.65 32.81 CV (%) 276.20 20.98 9.65 64.6 67.35
Segregation of dry matter content in the inter-specific family CW208 is maybe the highest found to date. Distribution of the trait in this family reveals a non-normal distribution that suggests large QTLs genes might be involved (Figure 12.7). Bulked segregant analysis with 600SSR markers is ongoing and should lead to identification of the responsible genes.
Figure 12.6.-Ethidium strained agarose gel showing PCR amplification of two RAPD primers
AB 15 and K10 of parents, bulks and individuals constituting the respective bulks of family GM313 and GM312. BL and BH signify bulk high and bulk low respectively.
312
BL
312
BH
OPE
N31
2 B
L
OPE
N31
2 BH
SM 1
741-
1M
ECU
72
313-
BL31
3 BH
OPE
N31
3 BL
OPE
N31
3 B
H
312
BL
312
BH31
3 B
L31
3 B
HSM
174
-1M
ECU
72
OPE
N31
2 BL
OPE
NB
H
OPE
N
313
BL
OPE
N31
3 B
H
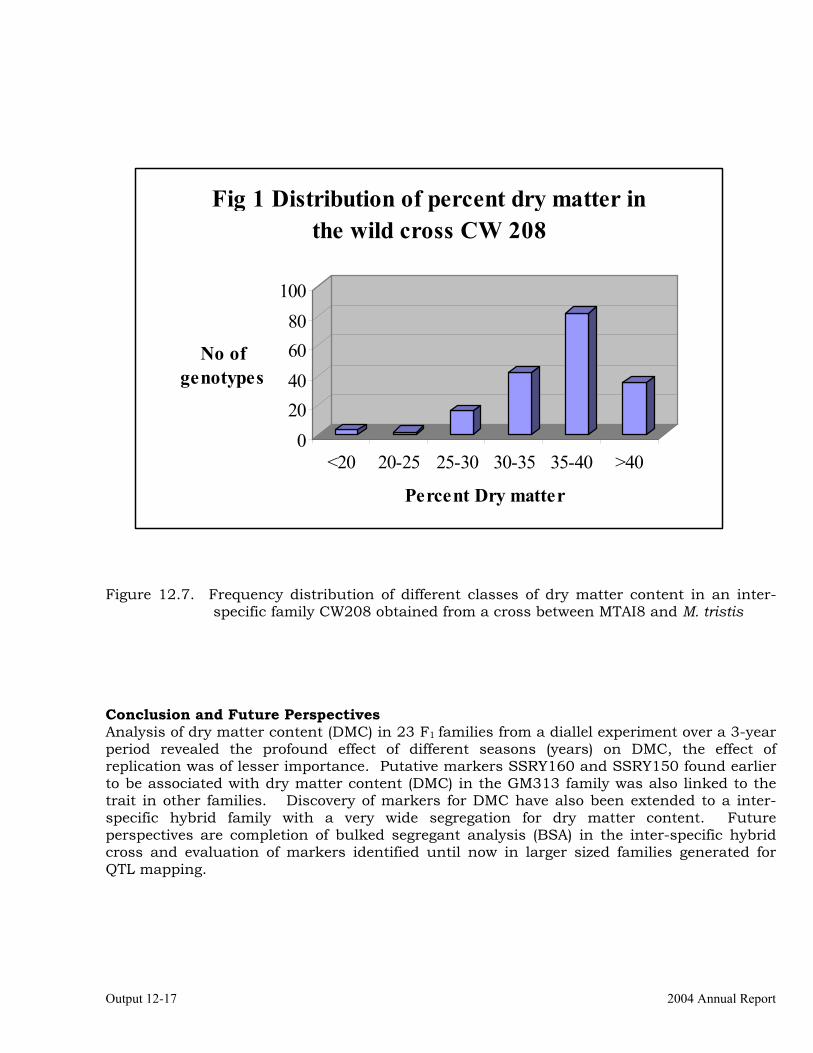
Output 12-17 2004 Annual Report
Figure 12.7. Frequency distribution of different classes of dry matter content in an inter-
specific family CW208 obtained from a cross between MTAI8 and M. tristis Conclusion and Future Perspectives Analysis of dry matter content (DMC) in 23 F1 families from a diallel experiment over a 3-year period revealed the profound effect of different seasons (years) on DMC, the effect of replication was of lesser importance. Putative markers SSRY160 and SSRY150 found earlier to be associated with dry matter content (DMC) in the GM313 family was also linked to the trait in other families. Discovery of markers for DMC have also been extended to a inter-specific hybrid family with a very wide segregation for dry matter content. Future perspectives are completion of bulked segregant analysis (BSA) in the inter-specific hybrid cross and evaluation of markers identified until now in larger sized families generated for QTL mapping.
020406080
100
No of genotypes
<20 20-25 25-30 30-35 35-40 >40
Percent Dry matter
Fig 1 Distribution of percent dry matter in the wild cross CW 208
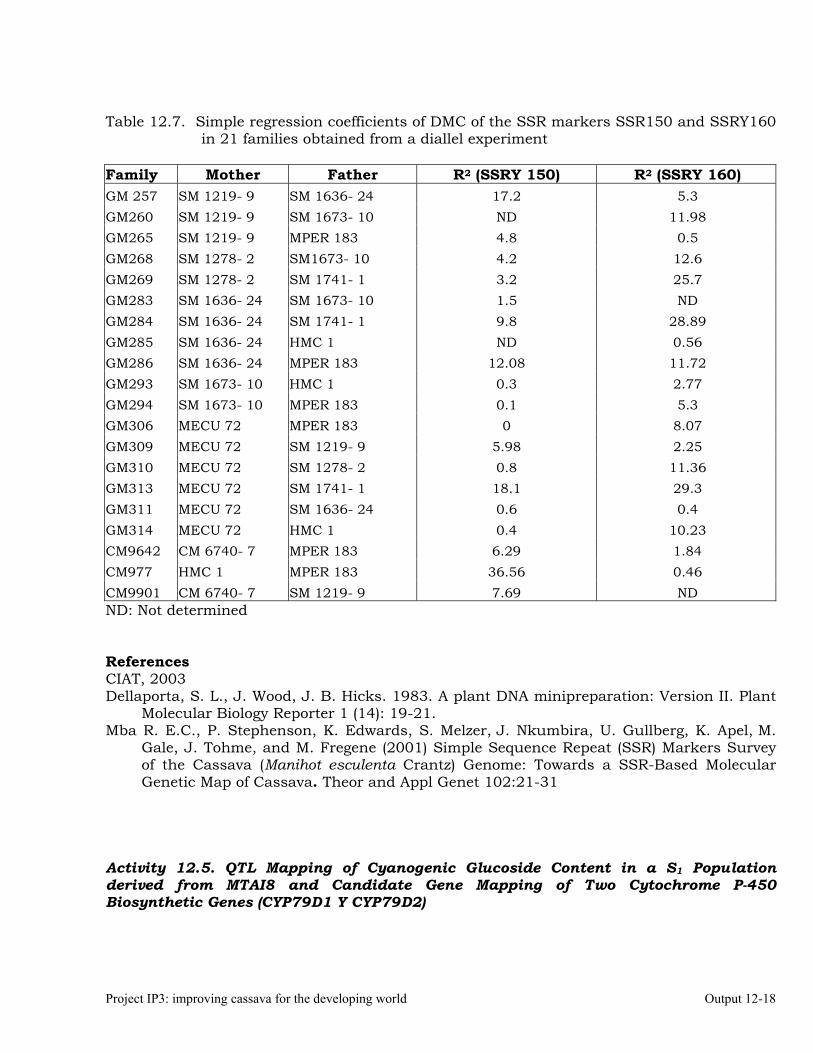
Project IP3: improving cassava for the developing world Output 12-18
Table 12.7. Simple regression coefficients of DMC of the SSR markers SSR150 and SSRY160
in 21 families obtained from a diallel experiment
Family Mother Father R2 (SSRY 150) R2 (SSRY 160) GM 257 SM 1219- 9 SM 1636- 24 17.2 5.3 GM260 SM 1219- 9 SM 1673- 10 ND 11.98 GM265 SM 1219- 9 MPER 183 4.8 0.5 GM268 SM 1278- 2 SM1673- 10 4.2 12.6 GM269 SM 1278- 2 SM 1741- 1 3.2 25.7 GM283 SM 1636- 24 SM 1673- 10 1.5 ND GM284 SM 1636- 24 SM 1741- 1 9.8 28.89 GM285 SM 1636- 24 HMC 1 ND 0.56 GM286 SM 1636- 24 MPER 183 12.08 11.72 GM293 SM 1673- 10 HMC 1 0.3 2.77 GM294 SM 1673- 10 MPER 183 0.1 5.3 GM306 MECU 72 MPER 183 0 8.07 GM309 MECU 72 SM 1219- 9 5.98 2.25 GM310 MECU 72 SM 1278- 2 0.8 11.36 GM313 MECU 72 SM 1741- 1 18.1 29.3 GM311 MECU 72 SM 1636- 24 0.6 0.4 GM314 MECU 72 HMC 1 0.4 10.23 CM9642 CM 6740- 7 MPER 183 6.29 1.84 CM977 HMC 1 MPER 183 36.56 0.46 CM9901 CM 6740- 7 SM 1219- 9 7.69 ND ND: Not determined References CIAT, 2003 Dellaporta, S. L., J. Wood, J. B. Hicks. 1983. A plant DNA minipreparation: Version II. Plant
Molecular Biology Reporter 1 (14): 19-21. Mba R. E.C., P. Stephenson, K. Edwards, S. Melzer, J. Nkumbira, U. Gullberg, K. Apel, M.
Gale, J. Tohme, and M. Fregene (2001) Simple Sequence Repeat (SSR) Markers Survey of the Cassava (Manihot esculenta Crantz) Genome: Towards a SSR-Based Molecular Genetic Map of Cassava. Theor and Appl Genet 102:21-31
Activity 12.5. QTL Mapping of Cyanogenic Glucoside Content in a S1 Population derived from MTAI8 and Candidate Gene Mapping of Two Cytochrome P-450 Biosynthetic Genes (CYP79D1 Y CYP79D2)
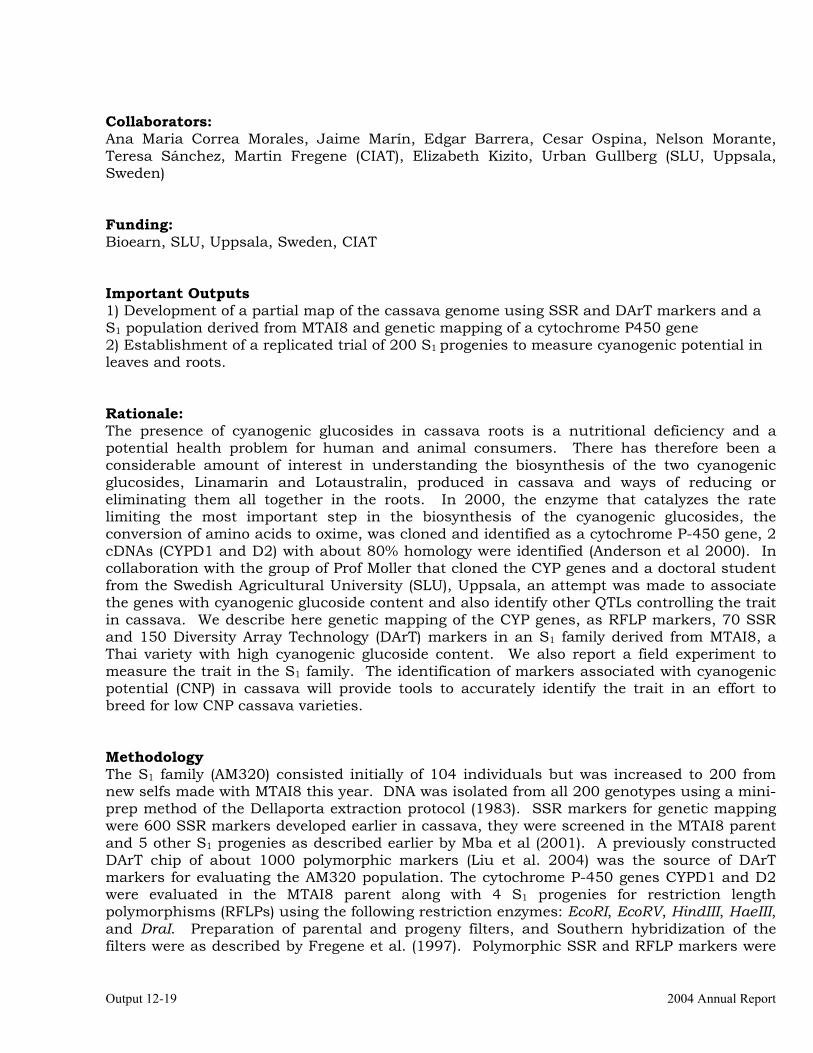
Output 12-19 2004 Annual Report
Collaborators: Ana Maria Correa Morales, Jaime Marín, Edgar Barrera, Cesar Ospina, Nelson Morante, Teresa Sánchez, Martin Fregene (CIAT), Elizabeth Kizito, Urban Gullberg (SLU, Uppsala, Sweden) Funding: Bioearn, SLU, Uppsala, Sweden, CIAT Important Outputs 1) Development of a partial map of the cassava genome using SSR and DArT markers and a S1 population derived from MTAI8 and genetic mapping of a cytochrome P450 gene 2) Establishment of a replicated trial of 200 S1 progenies to measure cyanogenic potential in leaves and roots. Rationale: The presence of cyanogenic glucosides in cassava roots is a nutritional deficiency and a potential health problem for human and animal consumers. There has therefore been a considerable amount of interest in understanding the biosynthesis of the two cyanogenic glucosides, Linamarin and Lotaustralin, produced in cassava and ways of reducing or eliminating them all together in the roots. In 2000, the enzyme that catalyzes the rate limiting the most important step in the biosynthesis of the cyanogenic glucosides, the conversion of amino acids to oxime, was cloned and identified as a cytochrome P-450 gene, 2 cDNAs (CYPD1 and D2) with about 80% homology were identified (Anderson et al 2000). In collaboration with the group of Prof Moller that cloned the CYP genes and a doctoral student from the Swedish Agricultural University (SLU), Uppsala, an attempt was made to associate the genes with cyanogenic glucoside content and also identify other QTLs controlling the trait in cassava. We describe here genetic mapping of the CYP genes, as RFLP markers, 70 SSR and 150 Diversity Array Technology (DArT) markers in an S1 family derived from MTAI8, a Thai variety with high cyanogenic glucoside content. We also report a field experiment to measure the trait in the S1 family. The identification of markers associated with cyanogenic potential (CNP) in cassava will provide tools to accurately identify the trait in an effort to breed for low CNP cassava varieties. Methodology The S1 family (AM320) consisted initially of 104 individuals but was increased to 200 from new selfs made with MTAI8 this year. DNA was isolated from all 200 genotypes using a mini-prep method of the Dellaporta extraction protocol (1983). SSR markers for genetic mapping were 600 SSR markers developed earlier in cassava, they were screened in the MTAI8 parent and 5 other S1 progenies as described earlier by Mba et al (2001). A previously constructed DArT chip of about 1000 polymorphic markers (Liu et al. 2004) was the source of DArT markers for evaluating the AM320 population. The cytochrome P-450 genes CYPD1 and D2 were evaluated in the MTAI8 parent along with 4 S1 progenies for restriction length polymorphisms (RFLPs) using the following restriction enzymes: EcoRI, EcoRV, HindIII, HaeIII, and DraI. Preparation of parental and progeny filters, and Southern hybridization of the filters were as described by Fregene et al. (1997). Polymorphic SSR and RFLP markers were
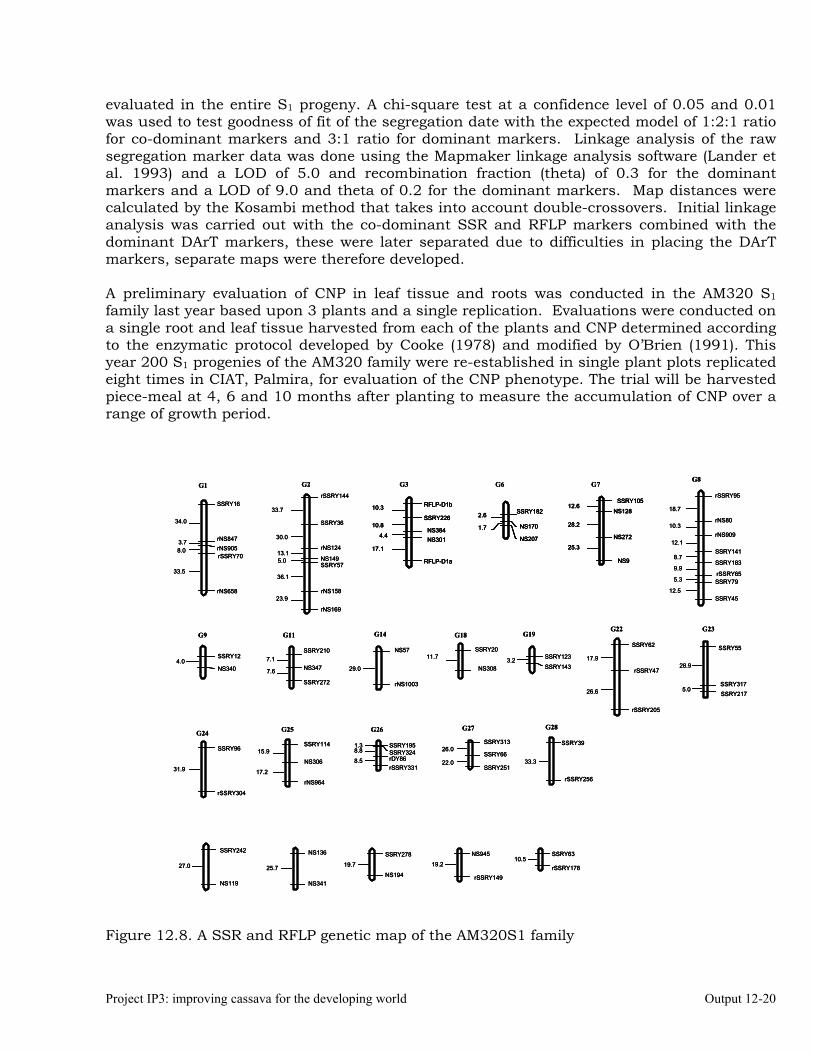
Project IP3: improving cassava for the developing world Output 12-20
evaluated in the entire S1 progeny. A chi-square test at a confidence level of 0.05 and 0.01 was used to test goodness of fit of the segregation date with the expected model of 1:2:1 ratio for co-dominant markers and 3:1 ratio for dominant markers. Linkage analysis of the raw segregation marker data was done using the Mapmaker linkage analysis software (Lander et al. 1993) and a LOD of 5.0 and recombination fraction (theta) of 0.3 for the dominant markers and a LOD of 9.0 and theta of 0.2 for the dominant markers. Map distances were calculated by the Kosambi method that takes into account double-crossovers. Initial linkage analysis was carried out with the co-dominant SSR and RFLP markers combined with the dominant DArT markers, these were later separated due to difficulties in placing the DArT markers, separate maps were therefore developed. A preliminary evaluation of CNP in leaf tissue and roots was conducted in the AM320 S1 family last year based upon 3 plants and a single replication. Evaluations were conducted on a single root and leaf tissue harvested from each of the plants and CNP determined according to the enzymatic protocol developed by Cooke (1978) and modified by O’Brien (1991). This year 200 S1 progenies of the AM320 family were re-established in single plant plots replicated eight times in CIAT, Palmira, for evaluation of the CNP phenotype. The trial will be harvested piece-meal at 4, 6 and 10 months after planting to measure the accumulation of CNP over a range of growth period.
Figure 12.8. A SSR and RFLP genetic map of the AM320S1 family
SSRY16
34.0
rNS8473.7rNS9058.0rSSRY70
33.5
rNS658
G1 G3
RFLP-D1b10.3
SSRY22610.8
NS3844.4
NS30117.1
RFLP-D1a
G2rSSRY144
33.7
SSRY36
30.0
rNS12413.1
NS1495.0SSRY57
36.1
rNS15823.9
rNS169
SSRY2011.7
NS308
G18SSRY62
17.9
rSSRY47
26.6
rSSRY205
G22
SSRY55
28.9
SSRY3175.0
SSRY217
G23
SSRY2107.1
NS3477.6
SSRY272
G11
SSRY11415.9
NS306
17.2
rNS964
G25
SSRY1951.3SSRY3248.8rDY868.5rSSRY331
G26
NS136
25.7
NS341
SSRY242
27.0
NS119
SSRY278
19.7
NS194
NS945
19.2
rSSRY149
SSRY6310.5
rSSRY178
rSSRY95
18.7
rNS8010.3
rNS90912.1
SSRY1418.7
SSRY1839.9
rSSRY655.3 SSRY79
12.5SSRY45
G8
NS57
29.0
rNS1003
G14
SSRY1233.2SSRY143
G19
SSRY124.0
NS340
G9
SSRY31326.0
SSRY6622.0
SSRY251
G27
SSRY10512.6
NS128
28.2
NS272
25.3
NS9
G7
SSRY1822.6
NS1701.7
NS207
G6
SSRY96
31.9
rSSRY304
G24SSRY39
33.3
rSSRY256
G28
SSRY16
34.0
rNS8473.7rNS9058.0rSSRY70
33.5
rNS658
G1
SSRY16
34.0
rNS8473.7rNS9058.0rSSRY70
33.5
rNS658
G1 G3
RFLP-D1b10.3
SSRY22610.8
NS3844.4
NS30117.1
RFLP-D1a
G3
RFLP-D1b10.3
SSRY22610.8
NS3844.4
NS30117.1
RFLP-D1a
RFLP-D1b10.3
SSRY22610.8
NS3844.4
NS30117.1
RFLP-D1a
G2rSSRY144
33.7
SSRY36
30.0
rNS12413.1
NS1495.0SSRY57
36.1
rNS15823.9
rNS169
G2rSSRY144
33.7
SSRY36
30.0
rNS12413.1
NS1495.0SSRY57
36.1
rNS15823.9
rNS169
SSRY2011.7
NS308
G18
SSRY2011.7
NS308
G18SSRY62
17.9
rSSRY47
26.6
rSSRY205
G22
SSRY62
17.9
rSSRY47
26.6
rSSRY205
G22
SSRY55
28.9
SSRY3175.0
SSRY217
G23
SSRY55
28.9
SSRY3175.0
SSRY217
G23
SSRY2107.1
NS3477.6
SSRY272
G11
SSRY2107.1
NS3477.6
SSRY272
G11
SSRY11415.9
NS306
17.2
rNS964
G25
SSRY11415.9
NS306
17.2
rNS964
G25
SSRY1951.3SSRY3248.8rDY868.5rSSRY331
G26
SSRY1951.3SSRY3248.8rDY868.5rSSRY331
G26
NS136
25.7
NS341
NS136
25.7
NS341
SSRY242
27.0
NS119
SSRY242
27.0
NS119
SSRY278
19.7
NS194
SSRY278
19.7
NS194
NS945
19.2
rSSRY149
NS945
19.2
rSSRY149
SSRY6310.5
rSSRY178
SSRY6310.5
rSSRY178
rSSRY95
18.7
rNS8010.3
rNS90912.1
SSRY1418.7
SSRY1839.9
rSSRY655.3 SSRY79
12.5SSRY45
G8
rSSRY95
18.7
rNS8010.3
rNS90912.1
SSRY1418.7
SSRY1839.9
rSSRY655.3 SSRY79
12.5SSRY45
G8
NS57
29.0
rNS1003
G14
NS57
29.0
rNS1003
G14
SSRY1233.2SSRY143
G19
SSRY1233.2SSRY143
G19
SSRY124.0
NS340
G9
SSRY124.0
NS340
G9
SSRY31326.0
SSRY6622.0
SSRY251
G27
SSRY31326.0
SSRY6622.0
SSRY251
G27
SSRY10512.6
NS128
28.2
NS272
25.3
NS9
G7
SSRY10512.6
NS128
28.2
NS272
25.3
NS9
SSRY10512.6
NS128
28.2
NS272
25.3
NS9
G7
SSRY1822.6
NS1701.7
NS207
G6
SSRY1822.6
NS1701.7
NS207
SSRY1822.6
NS1701.7
NS207
G6
SSRY96
31.9
rSSRY304
G24
SSRY96
31.9
rSSRY304
G24SSRY39
33.3
rSSRY256
G28
SSRY39
33.3
rSSRY256
G28
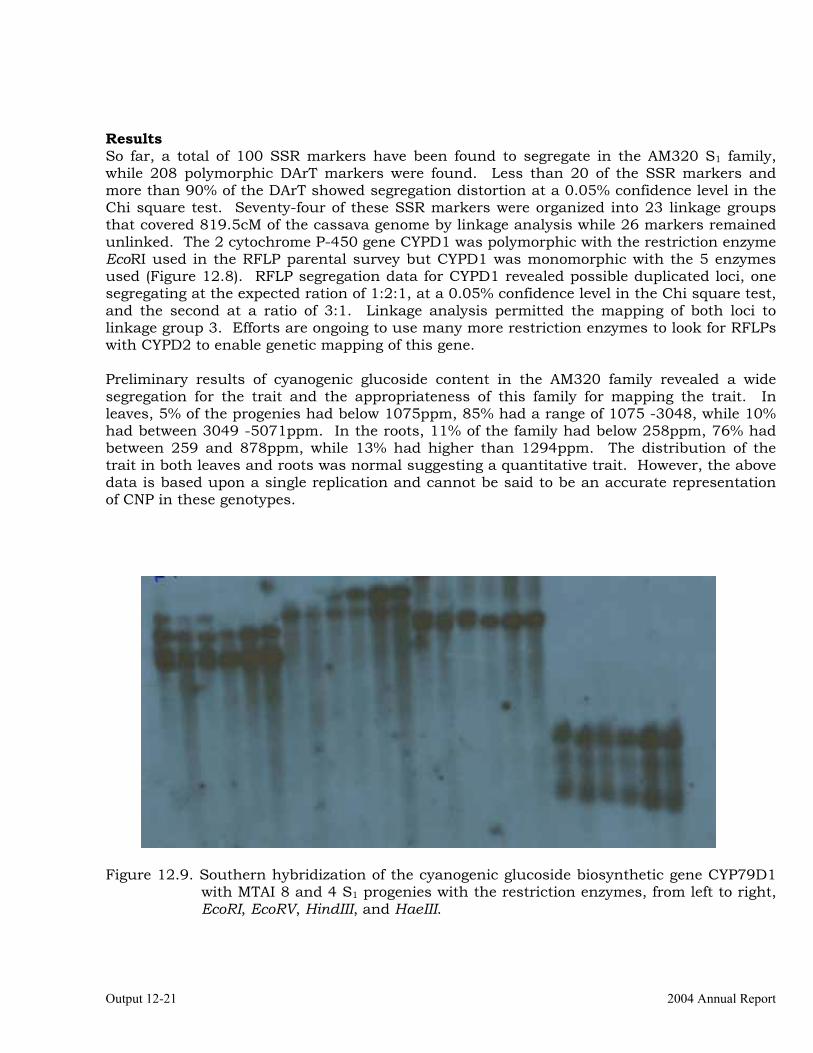
Output 12-21 2004 Annual Report
Results So far, a total of 100 SSR markers have been found to segregate in the AM320 S1 family, while 208 polymorphic DArT markers were found. Less than 20 of the SSR markers and more than 90% of the DArT showed segregation distortion at a 0.05% confidence level in the Chi square test. Seventy-four of these SSR markers were organized into 23 linkage groups that covered 819.5cM of the cassava genome by linkage analysis while 26 markers remained unlinked. The 2 cytochrome P-450 gene CYPD1 was polymorphic with the restriction enzyme EcoRI used in the RFLP parental survey but CYPD1 was monomorphic with the 5 enzymes used (Figure 12.8). RFLP segregation data for CYPD1 revealed possible duplicated loci, one segregating at the expected ration of 1:2:1, at a 0.05% confidence level in the Chi square test, and the second at a ratio of 3:1. Linkage analysis permitted the mapping of both loci to linkage group 3. Efforts are ongoing to use many more restriction enzymes to look for RFLPs with CYPD2 to enable genetic mapping of this gene. Preliminary results of cyanogenic glucoside content in the AM320 family revealed a wide segregation for the trait and the appropriateness of this family for mapping the trait. In leaves, 5% of the progenies had below 1075ppm, 85% had a range of 1075 -3048, while 10% had between 3049 -5071ppm. In the roots, 11% of the family had below 258ppm, 76% had between 259 and 878ppm, while 13% had higher than 1294ppm. The distribution of the trait in both leaves and roots was normal suggesting a quantitative trait. However, the above data is based upon a single replication and cannot be said to be an accurate representation of CNP in these genotypes.
Figure 12.9. Southern hybridization of the cyanogenic glucoside biosynthetic gene CYP79D1 with MTAI 8 and 4 S1 progenies with the restriction enzymes, from left to right, EcoRI, EcoRV, HindIII, and HaeIII.
Project IP3: improving cassava for the developing world Output 12-22
Conclusions and Perspectives A partial molecular genetic map of cassava has been constructed using SSR and RFLP markers and the cytochrome P-450 gene CYPD1, in the S1 family AM320 derived from MTAI8. Preliminary evaluation of cyanogenic glucoside content in this family revealed wide segregation of the trait. A proper evaluation of the trait is being carried out this year in preparation for association of cyanogenic glucosides content with the biosynthetic genes and QTL mapping. Work is also ongoing to identify RFLPs for the second gene, CYPD2 so that it can also be placed on the genetic map. References ANDERSEN, M.D., P. K. BUSK, I. SVENDSEN, B. L. MØLLER. 2000. Cytochrome P-450 from
Cassava (Manihot esculenta Crantz) Catalyzing the First Steps in the Biosynthesis of the Cyanogenic Glucosides Linamarin and Lotaustralin. The Journal of Biological Chemistry 275 (3): 1966-1975.
COOKE, R. D. 1978. An enzymatic assay for the total cyanide content of cassava (Manihot esculenta Crantz). J. Sci. Food. Agric. 29: 345-352.
DELLAPORTA, S. L., J. WOOD, J. B. HICKS. 1983. A plant DNA minipreparation: Version II. Plant Molecular Biology Reporter 1 (14): 19-21. O’BRIEN, G. M., A. J. TAYLOR, N. H. POULTER. 1991. Improved enzymatic assay for cyanogens in fresh and processed cassava. J. Sci. Food Agric. 56: 277-289. Activity 12.6. Development of Mapping Populations for Gene Tagging of Post Harvest Physiological Deterioration (PPD), Resistance to Hornworms and Whiteflies Found in Wild Relatives of Cassava Collaborators: A. Lopez, N.Morante, O.Akinbo, H.Ceballos, A. Bellotti, M. Fregene. Funding: CIAT Important Outputs 1) Development of 8 populations for QTL mapping of post-harvest deterioration (PHD), resistance to whiteflies and hornworm. Rationale Post harvest physiological deterioration (PPD) and arthropod pests are severe marketing and production constraints respectively in cassava. It has been estimated that cassava farmers, typically resource-poor farmers, lose 48 million tons of fresh root valued at US$1.4billion every year to pests, diseases, and PPD; some 30% of total world production. Wild relatives of cassava are important sources of genes for resistance to pests and diseases and longer shelf life. The only source of dramatically delayed PPD has been identified in an inter-specific hybrid between cassava and Manihot walkerae (Sanchez et al. 2003, unpublished data). The delayed PPD trait, originally from the wild Manihot parent, was successfully transferred to an F1 inter-
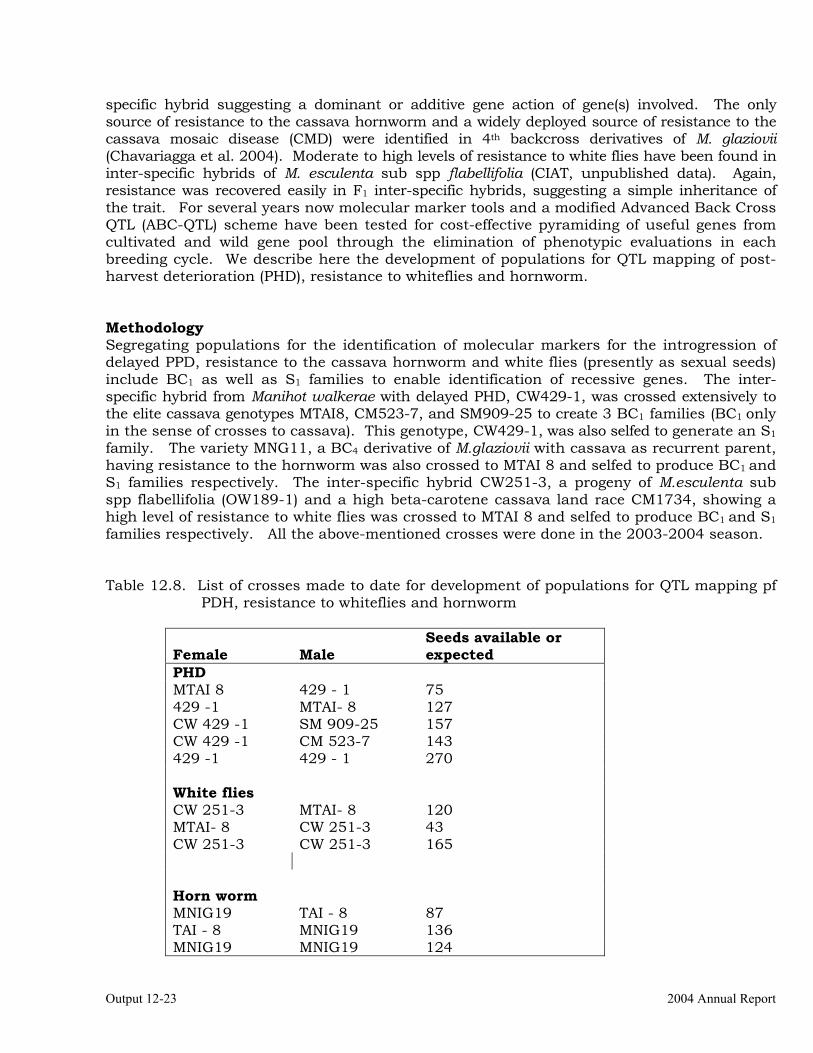
Output 12-23 2004 Annual Report
specific hybrid suggesting a dominant or additive gene action of gene(s) involved. The only source of resistance to the cassava hornworm and a widely deployed source of resistance to the cassava mosaic disease (CMD) were identified in 4th backcross derivatives of M. glaziovii (Chavariagga et al. 2004). Moderate to high levels of resistance to white flies have been found in inter-specific hybrids of M. esculenta sub spp flabellifolia (CIAT, unpublished data). Again, resistance was recovered easily in F1 inter-specific hybrids, suggesting a simple inheritance of the trait. For several years now molecular marker tools and a modified Advanced Back Cross QTL (ABC-QTL) scheme have been tested for cost-effective pyramiding of useful genes from cultivated and wild gene pool through the elimination of phenotypic evaluations in each breeding cycle. We describe here the development of populations for QTL mapping of post-harvest deterioration (PHD), resistance to whiteflies and hornworm. Methodology Segregating populations for the identification of molecular markers for the introgression of delayed PPD, resistance to the cassava hornworm and white flies (presently as sexual seeds) include BC1 as well as S1 families to enable identification of recessive genes. The inter-specific hybrid from Manihot walkerae with delayed PHD, CW429-1, was crossed extensively to the elite cassava genotypes MTAI8, CM523-7, and SM909-25 to create 3 BC1 families (BC1 only in the sense of crosses to cassava). This genotype, CW429-1, was also selfed to generate an S1 family. The variety MNG11, a BC4 derivative of M.glaziovii with cassava as recurrent parent, having resistance to the hornworm was also crossed to MTAI 8 and selfed to produce BC1 and S1 families respectively. The inter-specific hybrid CW251-3, a progeny of M.esculenta sub spp flabellifolia (OW189-1) and a high beta-carotene cassava land race CM1734, showing a high level of resistance to white flies was crossed to MTAI 8 and selfed to produce BC1 and S1 families respectively. All the above-mentioned crosses were done in the 2003-2004 season. Table 12.8. List of crosses made to date for development of populations for QTL mapping pf
PDH, resistance to whiteflies and hornworm
Female Male Seeds available or expected
PHD MTAI 8 429 - 1 75 429 -1 MTAI- 8 127 CW 429 -1 SM 909-25 157 CW 429 -1 CM 523-7 143 429 -1 429 - 1 270 White flies CW 251-3 MTAI- 8 120 MTAI- 8 CW 251-3 43 CW 251-3 CW 251-3 165 Horn worm MNIG19 TAI - 8 87 TAI - 8 MNIG19 136 MNIG19 MNIG19 124
Project IP3: improving cassava for the developing world Output 12-24
Results Between 50 and 150 crosses per cross combinations have been made for the development of BC1 and S1 gene tagging populations for PHD, resistance to whiteflies and hornworm (Table 12.8). Sexual seeds will be harvested later in the season in preparation for in vitro establishment next year. At least 200 progenies, including reciprocals, of each BC1 and S1 populations will be established in vitro from embryo axes and multiplied to obtain 10 plants per genotype. The tissue culture plantlets will be transferred to the screen house and then to the field as a single row trial (SRT) of ten plants. The following year progenies will be re-established in a QTL mapping trial of single row plots of 8 plant with 5 replications in one location. Great efforts will be made to ensure that the trials are kept free of weeds, pests, diseases, and nutritional deficiencies to minimize environmental variation. Conclusions and Future Perspectives Eight populations have been developed for QTL mapping of post-harvest deterioration (PHD), resistance to whiteflies and hornworm. The segregating populations will be established early next year from embryo axes and multiplied in preparation for field evaluations of PHD and green house evaluations of hornworm and whiteflies resistance. Based on the results of the phenotypic evaluations, bulks of extreme phenotypes will be made for bulk segregant analysis (BSA) with 600 SSR and RAPD markers as described earlier. Polymorphic markers will be evaluated in individuals of the segregating populations and strength of association measured by simple regression. Should BSA fail to identify markers, then a standard QTL procedure, including development of a genetic map with SSR markers, will be followed. References
Chavarriaga P.; S. Prieto; C.J. Herrera; D. López; A. Bellotti1; J. Tohme (2004). Screening transgenics unveils apparent resistance to hornworm (E. ello) in the non-transgenic, African cassava clone 60444. In: Alves and Tohme. Adding Value to a Small-Farmer Crop: Proceedings of the Sixth International Scientific Meeting of the Cassava Biotechnology Network. 8-14 March 2004, CIAT, Cali Colombia. Book of Abstracts Pp4.
Activity 12.7 Generation Challenge Program: Comparison of Simple Sequence Repeats (SSR) and Diversity Array Technology (DArT) Markers for Structural Characterization of Diversity in Cassava Collaborators: P. Hurtado, C. Buitrago, C. Ospina, J. Marin, C. De Vicente, M. Fregene (CIAT) (IPGRI), Prapit Wongtiem (Field Crop Research Station, Rayong, Thailand), Andrzej Killian, P. Wenzel (CAMBIA, Canberra, Australia)
Output 12-25 2004 Annual Report
Funding: Generation Challenge Program (GCP) Important Outputs 1) Structural characterization of genetic diversity in cassava with 251 polymorphic dominant DArT markers compared to that with 36 SSR co-dominant markers 2) A clear trade-off between number of loci and amount of information provided by each locus Rationale At the heart of the Generation Challenge Programme (GCP) is a vision to harness advances in molecular biology and the rich natural variation found in crop genetic resources to create a new generation of hardy crops for small farmers. Characterizing structural and functional diversity of 11 mandate crops: Barley, Maize, Rice, Sorghum, Wheat, Chickpea, Cowpea, Common Bean, Cassava, Potato and Musa, is the entry point of the GCP. SP1 is the subprogram in charge of ensuring a scientifically sound scheme to put germplasm collections to work for the discovery of new genes and alleles that will contribute to solve the important challenges of modern agriculture. By examining the genetic structure of a large and representative sample of a collection revealed with molecular markers, SP1 proposes to re-sample the original germplasm and select a subset that will be subject to fine phenotyping and association studies. For many reasons up to date, the markers of choice for germplasm characterization have been microsatellites (SSR). SSR are abundant in most genomes, highly polymorphic and easily assayed. SSR marker mutations are formed by slipped strand mis-pairings. A newer marker tool, Diversity Array Technology (DArT) is a DNA hybridization-based system based on single nucleotide polymorphisms, insertion-deletions and DNA methylation changes. DArT offers the highest throughput available up to date at a fraction of the cost of SSR markers and allows for whole genome scanning in a speedy manner. A pilot experiment was designed to test the usefulness of DArT markers as an alternative to SSR for detecting structural variation in a more cost-effective way. A randomly selected set of 436 accessions of cassava (Manihot esculenta Crantz) were analyzed with DArT and SSR markers and results compared. The hypothesis is whether DArT markers are more adept at uncovering genetic diversity structure. Methodology Plant material for the pilot study included accessions from the International Institute of Tropical Agriculture (IITA) in Nigeria, principally local varieties from West Africa and elite IITA varieties, and from CIAT, selected at random from South and Central American varieties held at the world germplasm collection. DArT analysis was conducted at the Center for the Application of Molecular Biology to Agriculture (CAMBIA), Canberra, Australia in collaboration with IPGRI and CIAT. A National Program Scientist, Ms Prapit Wongtiem, of the Field Crop Research Station, Rayong, Thailand, participated in the DArT analysis. A cassava DArT array of approximately 1000 polymorphic clones constructed earlier (Ling et al. 2004) was the source of markers. The cassava DArT chip was developed using DNA from accessions originating from 17 different countries, improved varieties from CIAT and IITA, and wild accessions of Manihot esculenta sub spp flabellifolia, M. carthaginensis and M. walkerae. At
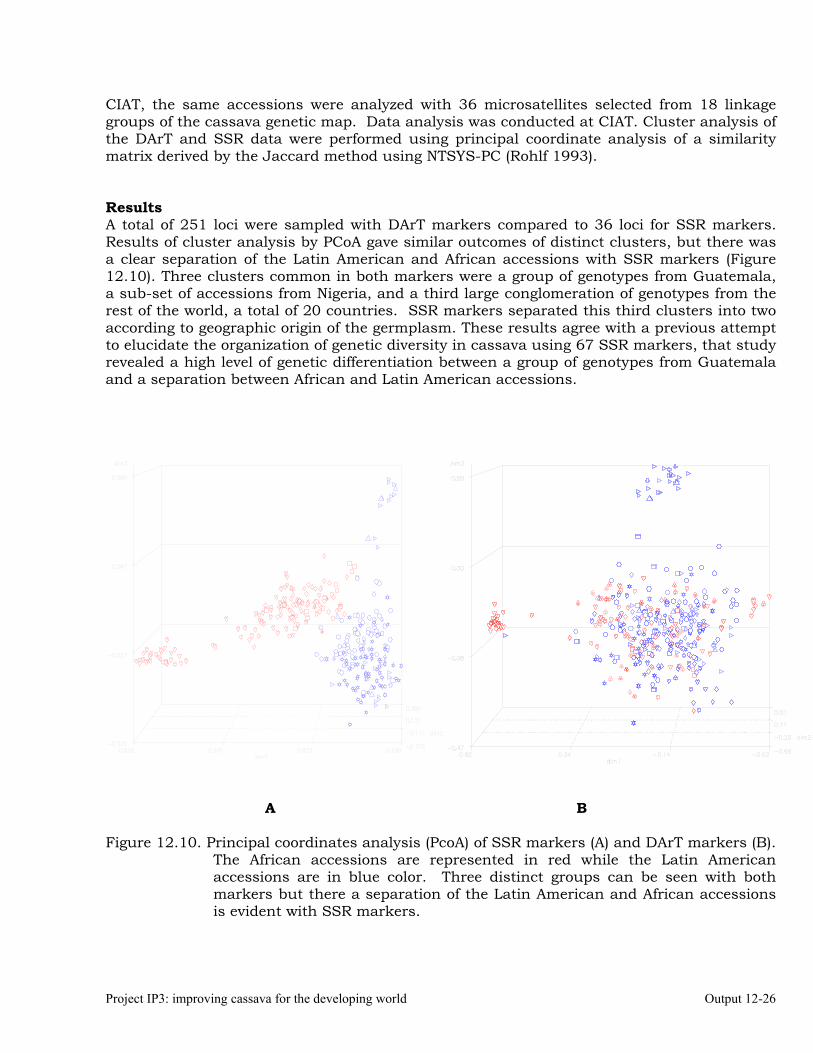
Project IP3: improving cassava for the developing world Output 12-26
CIAT, the same accessions were analyzed with 36 microsatellites selected from 18 linkage groups of the cassava genetic map. Data analysis was conducted at CIAT. Cluster analysis of the DArT and SSR data were performed using principal coordinate analysis of a similarity matrix derived by the Jaccard method using NTSYS-PC (Rohlf 1993). Results A total of 251 loci were sampled with DArT markers compared to 36 loci for SSR markers. Results of cluster analysis by PCoA gave similar outcomes of distinct clusters, but there was a clear separation of the Latin American and African accessions with SSR markers (Figure 12.10). Three clusters common in both markers were a group of genotypes from Guatemala, a sub-set of accessions from Nigeria, and a third large conglomeration of genotypes from the rest of the world, a total of 20 countries. SSR markers separated this third clusters into two according to geographic origin of the germplasm. These results agree with a previous attempt to elucidate the organization of genetic diversity in cassava using 67 SSR markers, that study revealed a high level of genetic differentiation between a group of genotypes from Guatemala and a separation between African and Latin American accessions.
A B Figure 12.10. Principal coordinates analysis (PcoA) of SSR markers (A) and DArT markers (B).
The African accessions are represented in red while the Latin American accessions are in blue color. Three distinct groups can be seen with both markers but there a separation of the Latin American and African accessions is evident with SSR markers.
Output 12-27 2004 Annual Report
Possible sources of the observed structure could be founder effects (geographic dispersal to the old world), selection (especially for diseases prevalent in Africa), small effective sample sizes (as in the case of spread of cassava to Africa from Latin America), migration (introgression from wild relatives), independent domestication events especially for the Guatemalan accessions, and mutations. The possibilities of introgression from wild relatives into accessions from Guatemala is quite high, the geographical origin of these Guatemalan accessions overlaps with that of 2 Manihot species unique to Central America. It is also remotely possible that the accessions from Guatemala represent a second center of domestication, similar to other crops like common beans (Phaseolus vulgaris) and pepper (Capsicum spp.) that were independently domesticated in Central and South America. The separation between the African and Latin American accessions could be due to selection and/or small effective sample sizes, suggesting that Africa could yet benefit from introgression of germplasm from Latin America. The cluster made up of some Nigerian accessions was also observed in an earlier study (Raji 2002, unpublished data), these accessions are from the Northern part of the country and it is not clear if this is due to small effective sample sizes and selection for tolerance to drought prevalent in the Northern part of the country, this again suggests a need to broaden the germplasm base in this part of the country. A large number of alleles were detected by each SSR loci (an average of 10 alleles per locus) compared to DArT markers (2 per loci) although DArT markers sampled many more loci (251) of the genome compared to SSR (36) in this study. This suggests a trade-off between information and number of loci. Because DArT loci can be significantly increased up to 1000 with minimal additional costs for molecular characterization it can be speculated that the level of resolution obtained with DArT could be increased to a similar level as SSR markers. Furthermore, given that the investment (labor and consumables) for development of both marker systems is approximately similar, even if both technologies provided a similar level of resolution, DArT would appear as an attractive marker alternative. This is so because of the cost per assay (lots of data points in one single assay vs two data points per assay with SSR), which would make DArT especially interesting for orphan crop species that do not count on existing marker systems. Conclusion and perspectives In conclusion, diversity estimated with 36 co-dominant SSR markers is more efficient than 251 DArT dominant markers. These results reveal a trade-off between amount of information and number of loci provided by each locus, in this study DArT sampled a larger number of loci of the genome, but they are dominant markers and consequently have less information compared to co-dominant SSR markers. But the hypothesis that DArT markers are more useful than SSR markers in detecting structural variation cannot be accepted, more conclusive evidence will have to await analysis using a denser DArT array and a larger data set of accessions from each country and region. References Ling Xia, Kaiman Peng, Yang Shiying, Peter Wenzl, M Carmen de Vicente, Martin Fregene,
Andrzej Kilian (2004) DArT for High-Throughput Genotyping of Cassava (Manihot esculenta) and its Wild Relatives. Theor Appl Genet (in review)
Project IP3: improving cassava for the developing world Output 12-28
Activity 12.8 Generation Challenge Program: Assembling Germplasm and Molecular Markers Sets for Analysis of Structural Diversity in Cassava Collaborators: Paula Hurtado, C. Buitrago ,Cesar Ospina, Jaime Marín, Paola Alfonso, Graciela Mafla, Alfredo Alves, Daniel Debouck, Hernán Ceballos, Joe Tohme, Martin Fregene (CIAT) Funding: Generation Challenge Program Important Outputs 1) Selection of a set of 3000 cassava accessions for structural diversity characterization using SSR markers 2) Selection of 36 SSR markers for molecular analysis of the germplasm set. Rationale The objective of sub-programme 1 of the GCP is the selection of a representative sub-set of germplasm and the molecular analysis of structural diversity to identify population structures as a guide for future association mapping studies. At a meeting to select marker systems for target GCP crops held at the Plant and Animal (PAG) genome 2004 it was decided that 3000 cassava accessions, represented by 1500 accessions from CIAT’s world germplasm collection, 1000 accessions from Africa (IITA) and 500 accessions from EMBRAPA will be selected for the study. DNA from these accessions will be extracted at each institution and sent to CIAT for re-distribution to all three participating institutions. Molecular markers for analysis of structural diversity will be 36 SSR markers, 2 each from the 18 linkage groups of the cassava map, that gave clear and reproducible allele patterns and high PIC will be used. IITA and CIAT will analyze 14 and 16 SSR markers respectively while CNPMF will analyze 6 SSR markers, in the 3000 accessions. CIAT will sub contract CNPMF. Following the PAG meeting and further discussions with SP1 colleagues, a pilot study was proposed to analyze, a sub set, 500 genotypes, of the larger selection with SSR and DArT markers to fine-tune final selection criteria for the larger set of germplasm. The pilot study was also to compare the power of DArT and SSR markers to detect underlying genetic diversity structure. The DArT analysis was to be carried out by a young female national program scientist from Thailand at CAMBIA, Canberra, Australia in collaboration with IPGRI, CIAT. Selections for the pilot study were in the same proportions as the full set of 3000 genotypes, in other words170, 80, and 250 accessions from IITA, CNPMF and CIAT respectively. The comparison of SSR and DArT analysis of the 436 accessions was presented as one of the ‘success story’ at the GCP annual meeting in Brisbane. Result of the pilot study is also reported in Activity 12.17 of this report. We describe here selection of the set of 3000 accessions, selection of 36 SSR markers and work carried out so far on SSR analysis of genetic diversity in the selected germplasm.
Output 12-29 2004 Annual Report
Methodology The selection of a set of 3000 cassava accession was based on a selection criteria that emphasizes a very broad genetic diversity and key agronomic traits such as Drought tolerance, resistance to major pests and diseases, adaptation to different ecologies, etc. The complete set of criteria used to select the germplasm set is listed in Table 12.9. Table 12.9 Description of selection criteria for assembly of 3000 cassava accessions for SSR
analysis Selection Criteria 1 CIAT and IITA Core Collections
2 CIAT and IITA Elite Clones
3 Officially released varieties from CIAT, IITA, and CNPMF
4 Drought tolerance
5 Tolerance to all major cassava pests and diseases worldwide
6 Good culinary quality
7 Tolerance to acid soils and low phosphorus soils
8 High beta-carotene varieties (yellow varieties)
9 Low and high level of amylose and amylopectin
10 Low and high level of carotene, Iron, Zinc and HCN in the root
11 High level of protein in the root
12 Good adaptation to different tropical and sub-tropical agro-ecologies of South and Central, America, Southeast Asia and sub-Saharan Africa
13 Dwarf accessions
14 Wild accessions (no more than 5% of total number)
For selection of molecular marker sets, criteria was a marker system with: 1. High level of information or polymorphism information content (PIC) per locus 2. Easily assayed in most cassava research labs around the world, for example PCR-based 3. Have been used previously in analyzing cassava diversity and can resolve close relationships in cassava germplasm 4. Amenable to automation
Project IP3: improving cassava for the developing world Output 12-30
The marker system that best fits the above criteria in cassava is by far simple sequence repeat (SSR) markers. More than 600 of these markers exist for cassava of which about 200 are mapped, 67 of these markers have also been used to assess diversity in a sub-set of 300 genotypes from all over the world, in other words PIC values exist for them. The cassava team also agreed to do a pilot study to compare another marker system, DArTs with SSRs in assessing structural diversity using a random sub-set of 426 accessions from the larger collection of 3000 accessions. The result of this study is reported in Activity 12.7 of this report. Leaf tissue from the CIAT selection was obtained from tissue culture plantlets from the genetic resources unit (GRU) or plants maintained in the field or screen house. DNA isolation from the selected germplasm was by a Dellaporta (1983) mini prep extraction method. DNA extracted from selections at CIAT, IITA and CNPMF was shipped to CIAT for re-distribution to all three participating institutions and also to CAMBIA for DArT analysis. CIAT as lead institute will collate and analyze the molecular data from all markers and all accessions, as well as compile passport data, including the local names, source (Country/State/Province/Region/Village), geographical position (Longitude, Latitude, Altitude) and the main agronomic traits, from all accessions into a data base that is accessible to the entire cassava research community. Results A total of 3000 accessions were selected for SSR analysis: 1500 at CIAT, 1000 at IITA and 500 at CNPMF, an excel file of the selection can be viewed at www.ciat.cgiar.org/molcas. Due to a delay in obtaining a permit from the Brazilian GR council to access materials from CNPMF, in the best of circumstances it could take 4-5 months to obtain a permit, another list of 500 accessions from CNPMF held in the CIAT world cassava collection was made for immediate access and molecular analysis. This new Brazilian germplasm set has 200 in common with the one selected at CNPMF. An agreement has been reached with CNPMF to analyze the CIAT selection with the participation of a CNPMF scientist and later analyze the 300 outstanding CNPMF accessions in Brazil. DNA samples from 170 accessions were received from IITA, Ibadan of which 155 had sufficient quantity and quality for molecular analysis, and DNA from 281 genotypes were prepared at CIAT for the pilot study (Figure 12.11). An aliquot of all 426 DNA samples were sent to IITA Nairobi (ILRI-Bioscience facility) where molecular analysis will be conducted. No DNA samples were sent to CNPMF because an agreement on access to CNPMF’s germplasm, a pre-requisite for release of funds from CIAT for CNPMF’s sub-contract, could not be reached due to delays in obtaining a permit from the Brazilian genetic resources (GR) council. SSR analysis of the 436 accessions was carried out only in CIAT due to technical problems with the genotyping facility at IITA-Nairobi. All DNA samples from the complete set of 1000 accessions selected at IITA, Ibadan have been received at CIAT. At CIAT, DNA isolation is been conducted as materials are received from the genetic resource unit (GRU), to date DNA isolation has been completed for roughly half of the 2000 selection: 1500 from CIAT and 500 from CNPMF. DNA extraction is expected to be complete by the second week in October.
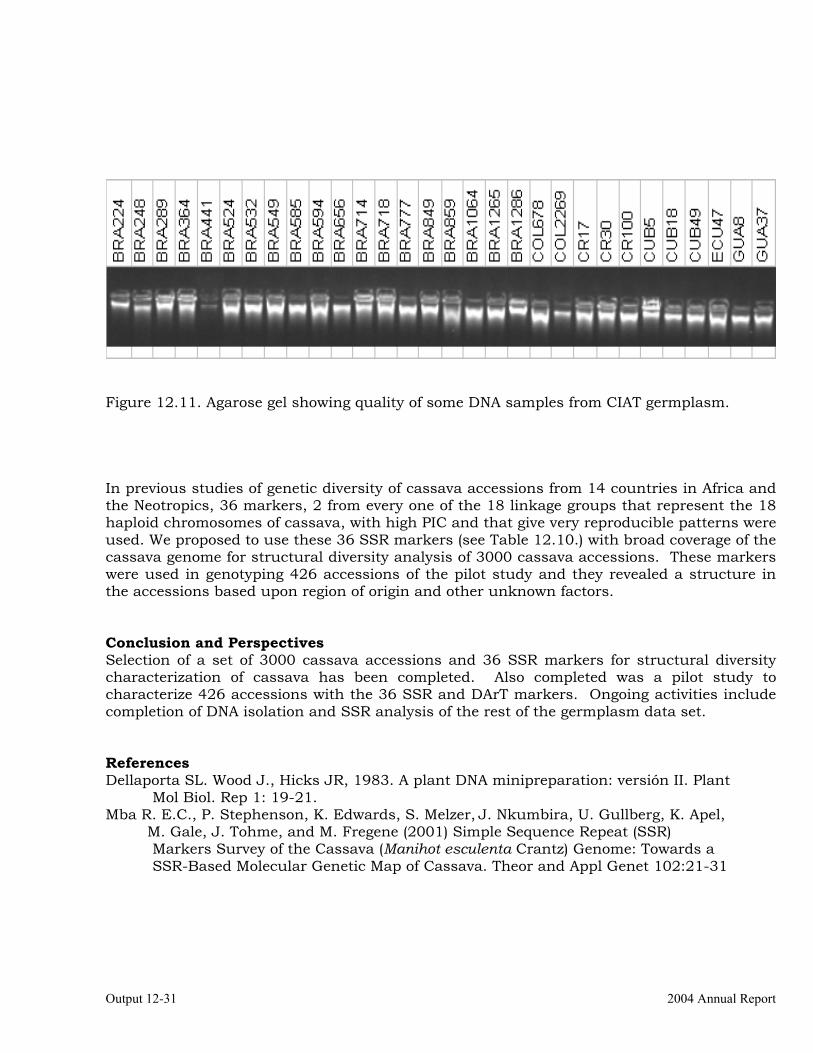
Output 12-31 2004 Annual Report
Figure 12.11. Agarose gel showing quality of some DNA samples from CIAT germplasm. In previous studies of genetic diversity of cassava accessions from 14 countries in Africa and the Neotropics, 36 markers, 2 from every one of the 18 linkage groups that represent the 18 haploid chromosomes of cassava, with high PIC and that give very reproducible patterns were used. We proposed to use these 36 SSR markers (see Table 12.10.) with broad coverage of the cassava genome for structural diversity analysis of 3000 cassava accessions. These markers were used in genotyping 426 accessions of the pilot study and they revealed a structure in the accessions based upon region of origin and other unknown factors. Conclusion and Perspectives Selection of a set of 3000 cassava accessions and 36 SSR markers for structural diversity characterization of cassava has been completed. Also completed was a pilot study to characterize 426 accessions with the 36 SSR and DArT markers. Ongoing activities include completion of DNA isolation and SSR analysis of the rest of the germplasm data set. References Dellaporta SL. Wood J., Hicks JR, 1983. A plant DNA minipreparation: versión II. Plant Mol Biol. Rep 1: 19-21. Mba R. E.C., P. Stephenson, K. Edwards, S. Melzer, J. Nkumbira, U. Gullberg, K. Apel, M. Gale, J. Tohme, and M. Fregene (2001) Simple Sequence Repeat (SSR) Markers Survey of the Cassava (Manihot esculenta Crantz) Genome: Towards a SSR-Based Molecular Genetic Map of Cassava. Theor and Appl Genet 102:21-31
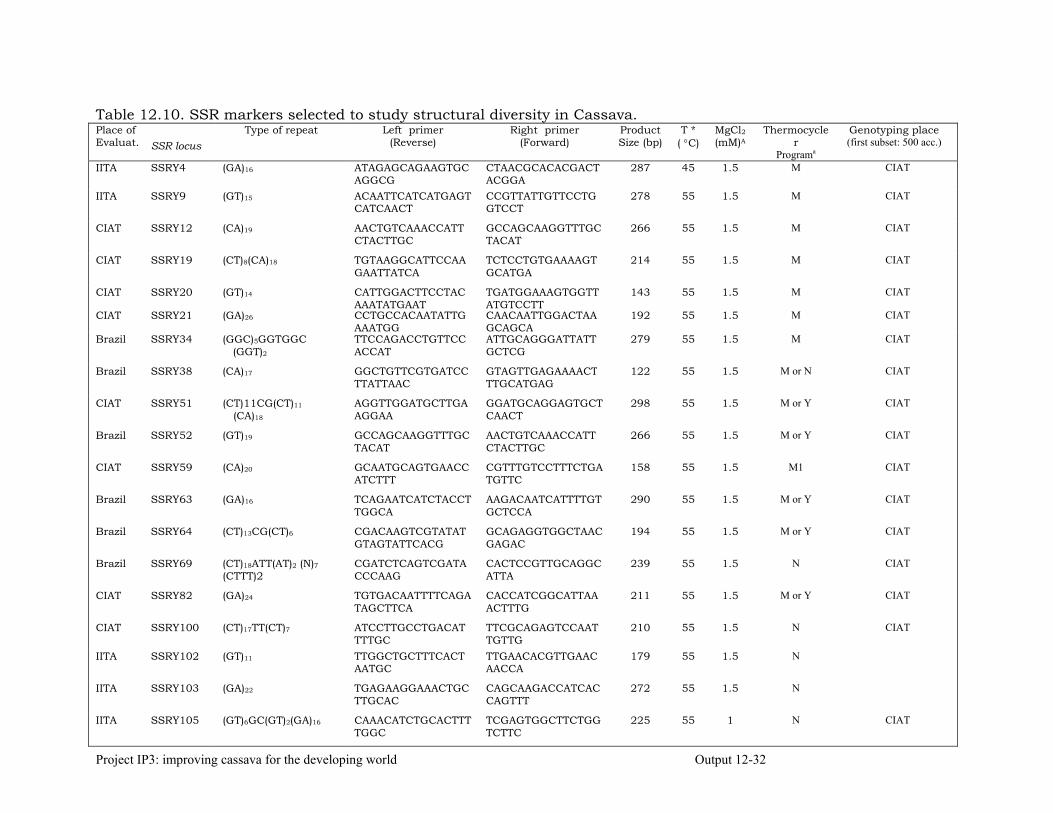
Project IP3: improving cassava for the developing world Output 12-32
Table 12.10. SSR markers selected to study structural diversity in Cassava. Place of Evaluat. SSR locus
Type of repeat Left primer (Reverse)
Right primer (Forward)
Product Size (bp)
T * ( °C)
MgCl2
(mM)A Thermocycle
r Programa
Genotyping place (first subset: 500 acc.)
IITA SSRY4 (GA)16 ATAGAGCAGAAGTGCAGGCG
CTAACGCACACGACTACGGA
287 45 1.5 M CIAT
IITA SSRY9 (GT)15 ACAATTCATCATGAGTCATCAACT
CCGTTATTGTTCCTGGTCCT
278 55 1.5 M CIAT
CIAT SSRY12 (CA)19 AACTGTCAAACCATTCTACTTGC
GCCAGCAAGGTTTGCTACAT
266 55 1.5 M CIAT
CIAT SSRY19 (CT)8(CA)18
TGTAAGGCATTCCAAGAATTATCA
TCTCCTGTGAAAAGTGCATGA
214 55 1.5 M CIAT
CIAT SSRY20 (GT)14 CATTGGACTTCCTACAAATATGAAT
TGATGGAAAGTGGTTATGTCCTT
143 55 1.5 M CIAT
CIAT SSRY21 (GA)26 CCTGCCACAATATTGAAATGG
CAACAATTGGACTAAGCAGCA
192 55 1.5 M CIAT
Brazil SSRY34 (GGC)5GGTGGC (GGT)2
TTCCAGACCTGTTCCACCAT
ATTGCAGGGATTATTGCTCG
279 55 1.5 M CIAT
Brazil SSRY38 (CA)17 GGCTGTTCGTGATCCTTATTAAC
GTAGTTGAGAAAACTTTGCATGAG
122 55 1.5 M or N CIAT
CIAT SSRY51 (CT)11CG(CT)11
(CA)18 AGGTTGGATGCTTGAAGGAA
GGATGCAGGAGTGCTCAACT
298 55 1.5 M or Y CIAT
Brazil SSRY52 (GT)19 GCCAGCAAGGTTTGCTACAT
AACTGTCAAACCATTCTACTTGC
266 55 1.5 M or Y CIAT
CIAT SSRY59 (CA)20 GCAATGCAGTGAACCATCTTT
CGTTTGTCCTTTCTGATGTTC
158 55 1.5 M1 CIAT
Brazil
SSRY63 (GA)16 TCAGAATCATCTACCTTGGCA
AAGACAATCATTTTGTGCTCCA
290 55 1.5 M or Y CIAT
Brazil SSRY64 (CT)13CG(CT)6 CGACAAGTCGTATATGTAGTATTCACG
GCAGAGGTGGCTAACGAGAC
194 55 1.5 M or Y CIAT
Brazil SSRY69 (CT)18ATT(AT)2 (N)7
(CTTT)2 CGATCTCAGTCGATACCCAAG
CACTCCGTTGCAGGCATTA
239 55 1.5 N CIAT
CIAT SSRY82 (GA)24 TGTGACAATTTTCAGATAGCTTCA
CACCATCGGCATTAAACTTTG
211 55 1.5 M or Y CIAT
CIAT SSRY100 (CT)17TT(CT)7 ATCCTTGCCTGACATTTTGC
TTCGCAGAGTCCAATTGTTG
210 55 1.5 N CIAT
IITA SSRY102 (GT)11 TTGGCTGCTTTCACTAATGC
TTGAACACGTTGAACAACCA
179 55 1.5 N
IITA SSRY103 (GA)22 TGAGAAGGAAACTGCTTGCAC
CAGCAAGACCATCACCAGTTT
272 55 1.5 N
IITA SSRY105 (GT)6GC(GT)2(GA)16 CAAACATCTGCACTTTTGGC
TCGAGTGGCTTCTGGTCTTC
225 55 1 N CIAT

Output 12-33 2004 Annual Report
cont. Table 12.10. Place of Evaluat. SSR locus
Type of repeat Left primer (Reverse)
Right primer (Forward)
Product Size (bp)
T * ( °C)
MgCl2
(mM)A Thermocycle
r Programa
Genotyping place (first subset: 500 acc.)
CIAT SSRY106 (CT)24 GGAAACTGCTTGCACAAAGA
CAGCAAGACCATCACCAGTTT
270 55 1.5 N CIAT
CIAT SSRY108 (CT)24CCT ACGCTATGATGTCCAAAGGC
CATGCCACATAGTTCGTGCT
203 55 1.5 M or Y CIAT
CIAT SSRY110 (GT)12 TTGAGTGGTGAATGCGAAAG
AGTGCCACCTTGAAAGAGCA
247 55 1.5 N CIAT
IITA SSRY135 (CT)16 CCAGAAACTGAAATGCATCG
AACATGTGCGACAGTGATTG
253 45 1.5 Y CIAT
IITA SSRY147 GTACATCACCACCAACGGGC
AGAGCGGTGGGGCGAAGAGC
113 45 1.5 Y
IITA SSRY148 GGCTTCATCATGGAAAAACC
CAATGCTTTACGGAAGAGCC
114 45 1.5 Y
CIAT SSRY151 AGTGGAAATAAGCCATGTGATG
CCCATAATTGATGCCAGGTT
182 45 1.5 N CIAT
CIAT SSRY155 CGTTGATAAAGTGGAAAGAGCA
ACTCCACTCCCGATGCTCGC
158 55 1 Y CIAT
IITA SSRY161 (CT)11TT(CT)21(CA)19 AAGGAACACCTCTCCTAGAATCA
CCAGCTGTATGTTGAGTGAGC
220 55 1.5 Y
CIAT SSRY164 (GA)29 TCAAACAAGAATTAGCAGAACTGG
TGAGATTTCGTAATATTCATTTCACTT
187 45 1.5 N CIAT
CIAT SSRY169 (GA)19(A)3(GAA)2 ACAGCTCTAAAAACTGCAGCC
AACGTAGGCCCTAACTAACCC
100 55 1 Y CIAT
CIAT SSRY171 (TA)5CATA(GATA)8
GC(GA)23 ACTGTGCCAAAATAGCCAAATAGT
TCATGAGTGTGGGATGTTTTTATG
291 55 1.5 N CIAT
IITA SSRY177 (CCT)6CT(N)65(CT)4
AT(CT)18 ACCACAAACATAGGCACGAG
CACCCAATTCACCAATTACCA
268 45 1.5 Y
IITA SSRY179 (GA)28 CAGGCTCAGGTGAAGTAAAGG
GCGAAAGTAAGTCTACAACTTTTCTAA
226 55 1.5 M
IITA SSRY180 (GA)16(G)4(GA)5 CCTTGGCAGAGATGAATTAGAG
GGGGCATTCTACATGATCAATAA
163 55 1.5 M
IITA SSRY181 (GA)22(G)3C(GA)3GGAA(GA)4
GGTAGATCTGGATCGAGGAGG
CAATCGAAACCGACGATACA
199 55 1.5 Y IITA
IITA SSRY182 (CA)17(N)31GAGG (GA)8 GGAATTCTTTGCTTATGATGCC
TTCCTTTACAATTCTGGACGC
253
55 1.5 Y IITA
T*: Annealing Temperature. A : MgCl2 final concentration per PCR reaction (final volume in the PCR reaction: 25µ a M= MICROBC1; N= NEWBC1; Y= YUCADIV
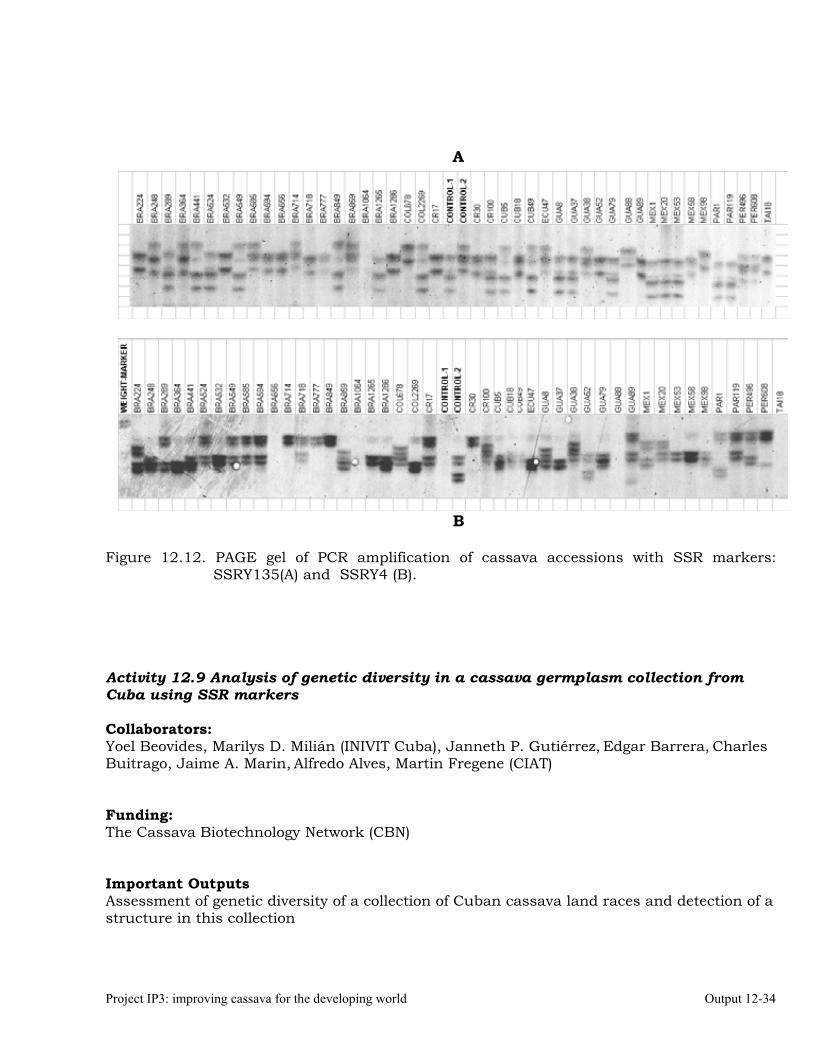
Project IP3: improving cassava for the developing world Output 12-34
A
B Figure 12.12. PAGE gel of PCR amplification of cassava accessions with SSR markers:
SSRY135(A) and SSRY4 (B). Activity 12.9 Analysis of genetic diversity in a cassava germplasm collection from Cuba using SSR markers Collaborators: Yoel Beovides, Marilys D. Milián (INIVIT Cuba), Janneth P. Gutiérrez, Edgar Barrera, Charles Buitrago, Jaime A. Marin, Alfredo Alves, Martin Fregene (CIAT) Funding: The Cassava Biotechnology Network (CBN) Important Outputs Assessment of genetic diversity of a collection of Cuban cassava land races and detection of a structure in this collection
Output 12-35 2004 Annual Report
Rationale The assessment of genetic diversity of cassava germplasm from Cuba using 36 SSR markers was started last year. The study, concluded this year, seeks to understand the organization of diversity and genetic differentiation, with respect to germplasm from the rest of the world, of local cassava varieties from Caribbean island in light of evidence of a possible second center of diversity of cassava in Central America. A second objective was to provide cassava breeders in Cuba information to better exploit genetic diversity in their cassava collection. The study was carried out as collaboration with INIVIT, Cuba, with funding from the cassava biotechnology network (CBN) Methodology Plant material was 94 accessions selected from a collection of cassava held at INIVIT in Cuba, selection criteria were the economic importance and origin in Cuba. A set of 54 clones from Africa and the Neotropics: 12 from Nigeria, 10 from Tanzania, 12 from Guatemala, 20 from South America, and 13 improved genotypes from CIAT, were included. These genotypes a representative of a larger set of germplasm from these countries based upon previous SSR studies (Fregene et al 2003), were included for estimation of genetic differentiation. DNA from all accessions was obtained using the Dellaporta et al. method (1983). Concentration and quality of the DNA was checked by flourometer and agarose gel electrophoresis respectively. The DNA samples were diluted to a working concentration of 10ng/ul for subsequent PCR amplification. PCR amplification, gel analysis and date collection of the DNA samples with 36 SSR markers were as described earlier (CIAT 2003; Mba et al. 2003). The raw SSR data was used to calculate estimates of genetic diversity and differentiation using the computer package GENSURVEY (Vekeman et al 1997). Genetic differentiation was estimated using the statistic FST (theta) and GST (Nei 1978) using the FSTAT computer program (Goudet 1990). Confidence intervals of FST and GST were calculated by jackknifing (200 replications) or by bootstrapping (1000 bootstraps). Pair-wise values of FST between countries were used in drawing a dendogram by the UPGMA method and the program NTSYS-PC (Rohlf 1993). Other analyses conducted with the SSR data include calculation of pair-wise genetic distance based upon the proportion of shared alleles (PSA), using the computer microsat (Minch 1993, http://www.lotka.stanford.edu/microsat.html) and cluster analysis of the genetic distance matrix using principal coordinate analysis (PCoA) and multiple correspondence analysis (MCA), using the computer package NTSYS-PC (Rohlf 1993). Results The evaluation of 36 SSR markers in 142 accessions yielded a high level of polymorphism, with the exception of 2 (SSRY127 and SSRY132) that were monomorphic. Number of alleles for the polymorphic markers ranged from 2 to 10 for each SSR loci. Seventeen alleles unique to accessions from Cuba were identified in the following SSR markers: SSRY 4 (0.04), SSRY 20 (0.006), SSRY 38 (0.005), SSRY 59 (0.006 y 0.079), SSRY 63 (0.033), SSRY 69 (0.023), SSRY 100 (0.011), SSRY 103 (0.052, 0.012, 0.012 and 0.006), SSRY135 (0.005), SSRY 151 (0.05), SSRY 171 (0.012 and 0.036) and SSRY 177 (0.014). Unique alleles were also found in some genotypes from Colombia (6), Nigeria (3), Tanzania (3) and Guatemala (1). Average gene diversity was high, with an average of 0.6292 ± 0.0120, for all the samples analyzed but highest for those from Cuba and Tanzania (Table 12.11)
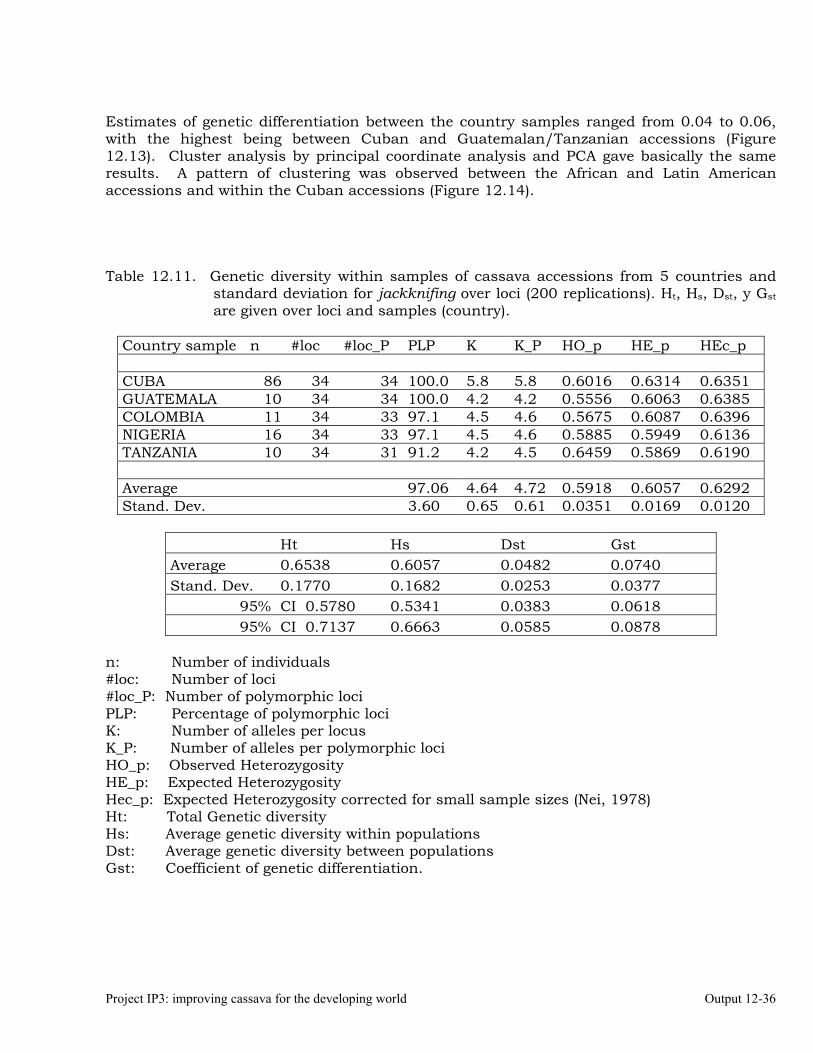
Project IP3: improving cassava for the developing world Output 12-36
Estimates of genetic differentiation between the country samples ranged from 0.04 to 0.06, with the highest being between Cuban and Guatemalan/Tanzanian accessions (Figure 12.13). Cluster analysis by principal coordinate analysis and PCA gave basically the same results. A pattern of clustering was observed between the African and Latin American accessions and within the Cuban accessions (Figure 12.14). Table 12.11. Genetic diversity within samples of cassava accessions from 5 countries and
standard deviation for jackknifing over loci (200 replications). Ht, Hs, Dst, y Gst
are given over loci and samples (country).
Country sample n #loc #loc_P PLP K K_P HO_p HE_p HEc_p CUBA 86 34 34 100.0 5.8 5.8 0.6016 0.6314 0.6351 GUATEMALA 10 34 34 100.0 4.2 4.2 0.5556 0.6063 0.6385 COLOMBIA 11 34 33 97.1 4.5 4.6 0.5675 0.6087 0.6396 NIGERIA 16 34 33 97.1 4.5 4.6 0.5885 0.5949 0.6136 TANZANIA 10 34 31 91.2 4.2 4.5 0.6459 0.5869 0.6190 Average 97.06 4.64 4.72 0.5918 0.6057 0.6292 Stand. Dev. 3.60 0.65 0.61 0.0351 0.0169 0.0120
Ht Hs Dst Gst Average 0.6538 0.6057 0.0482 0.0740 Stand. Dev. 0.1770 0.1682 0.0253 0.0377
95% CI 0.5780 0.5341 0.0383 0.0618 95% CI 0.7137 0.6663 0.0585 0.0878
n: Number of individuals #loc: Number of loci #loc_P: Number of polymorphic loci PLP: Percentage of polymorphic loci K: Number of alleles per locus K_P: Number of alleles per polymorphic loci HO_p: Observed Heterozygosity HE_p: Expected Heterozygosity Hec_p: Expected Heterozygosity corrected for small sample sizes (Nei, 1978) Ht: Total Genetic diversity Hs: Average genetic diversity within populations Dst: Average genetic diversity between populations Gst: Coefficient of genetic differentiation.
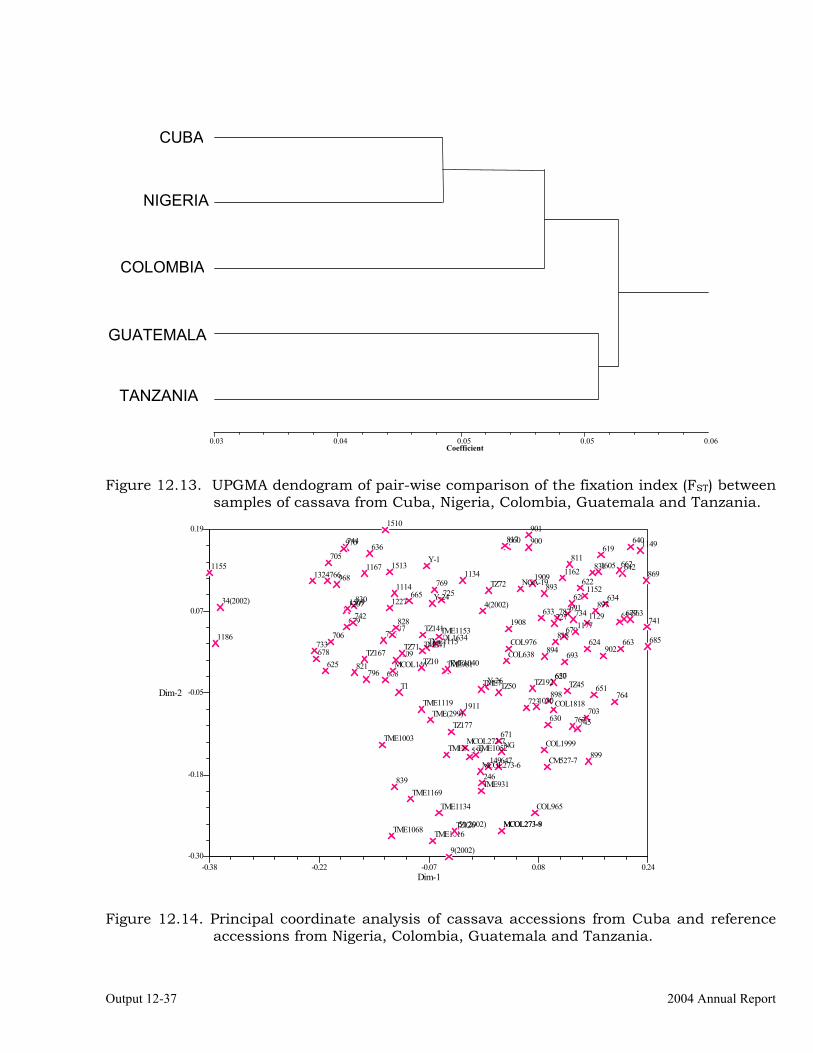
Output 12-37 2004 Annual Report
Figure 12.13. UPGMA dendogram of pair-wise comparison of the fixation index (FST) between
samples of cassava from Cuba, Nigeria, Colombia, Guatemala and Tanzania.
Figure 12.14. Principal coordinate analysis of cassava accessions from Cuba and reference
accessions from Nigeria, Colombia, Guatemala and Tanzania.
CUBA
NIGERIA
COLOMBIA
GUATEMALA
TANZANIA
Coefficient0.03 0.04 0.05 0.05 0.06
Dim-1-0.38 -0.22 -0.07 0.08 0.24
Dim-2
-0.30
-0.18
-0.05
0.07
0.19
622
624
629
630
634
636640
642
651
655
660
662
665
670
677679
691
705
725
734
744
766
775
787
811
817
818
821
830
831869
898
897
619900901
893968
970
Y-26
1114
1129
1134
1149
1152
1155 11621167
11771186
1207 1227
1324
1509
1510
1513 1605
1908
1909
1911
Y-1
Y-24
625
633
637
647
657
663
671
678685
688
693
703
706
723
727
733
741742
745
764
767
769
796
828863
899
9021109
620
894
34(2002)
149
T1
246
1030
51(2002)
839
559
4(2002)
9(2002)
COL638COL976COL1634
COL1999
MCOL146
MCOL273-6
MCOL273-7
COL965
COL1818
CM527-7
MCOL273-8MCOL273-9
NG
NGA-19
TME981TME1040
TME1115TME1153
TME41
TME(299)
TME931
TME1003
TME1016
TME1052
TME1068
TME1119
TME1134
TME1169
TME8
TME7
TZ10
TZ45TZ50
TZ71
TZ72
TZ141
TZ167
TZ126
TZ177
TZ192
Project IP3: improving cassava for the developing world Output 12-38
Conclusion and Perspectives Genetic Diversity of cassava in the Caribbean island of Cuba follows diversity found for cassava in the rest of the world, a high genetic diversity and low genetic differentiation. However a structure was observed within the Cuban collection using cluster analysis. This structure is the basis of future work on linkage disequilibrium mapping of dry matter content using candidate starch biosynthesis genes. References Fregene M, Suárez M, Mkumbira J, Kulembeka H, Ndedya E, Kulaya A, Mitchel S, Gullberg U, Dixon AGO, Dean R, Kresovich S (2003) Simple sequence repeats marker diversity in cassava landraces: genetic diversity and differentiation in an asexually propagated crop. Theoretical and Applied Genetics, accepted. Mba REC, Stephenson P, Edwards K, Melzer S, Mkumbira J, Gullberg U, Apel K, Gale M, Tohme J, Fregene MA (2001) Simple Sequence Repeat (SSR) Markers Survey of the cassava (Manihot esculenta Crantz) Genome: Towards an SSSR-Based Molecular Genetic Map of Cassava. Theoretical and Applied Genetics. 102: 21-31. Minch (1993), http://www.lotka.stanford.edu/microsat.html Dellaporta SL, Wood J, Hicks JR (1983) A plant DNA minipreparation: version II. Plant Mol Biol Rep 1:19-21. Goudert J (1995) FSTAT (version 1.2): a computer program to calculate F-statistics. J Hered 86:485-486. Kimura M, Crow JT (1964) The number of alleles that can be maintained in a finite population. Genetics 49:725738. Nei M (1978) Estimation of average heterozygosity and genetics distances from a small number of individuals. Genetics 89:583-590. Rohlf DJ (1993) NTSYS-PC numerical taxonomy and multivariate analysis system. Version 1.8 Exeter Publ., Setauket, New York, USA. Vekemans X, Lefebvre C (1997) On the evolution of heavy metal tolerant populations in Armeria maritima: evidence from allozyme variation and reproductive barriers. J Evol Biol 10:175-199. Wright S (1951) The genetic structure of populations. Ann Eugen 15:323-354. Activity 12.10 Studies in Market Preferences of Cassava Cultivars in Malawi using SSR Markers Collaborators: Linley Chiwona Karltun (SLU, Uppsala, Sweden), Prof Janice Jiggins (WAU, Wageningen, Netherlands) A. Akerbolm (IPICs, Sweden), C. Buitrago, F. Rojas, J. Marin, C. Ospina, M. Fregene (CIAT) Funding: SAREC, IPICs, Uppsala, Sweden
Output 12-39 2004 Annual Report
Important Outputs: 1) Identification of 54 unique genotypes that form 3 broad clusters that might represent market classes of cassava in Northern and Southern Malawi Rationale Cassava is the second most important staple crop after maize in Malawi. Two other factors have emerged in Africa that will further increase the role of cassava as a staple crop: 1) The increasingly unpredictable rain pattern causing large fluctuations in maize harvests and 2) a large increase in prices of chemical fertilizers and hybrid maize seeds make maize growing a less viable, or even impossible, alternative, for the smallholder farmer. As in many parts of Africa, the growing of cassava has increased considerably over the past years in Malawi. From 1992 to 1996 cassava production in Malawi is officially reported to have increased from about 100 000 tons/yr to more than 500 000 tons/yr. Since the cassava mosaic and mealy bug outbreak in the 1980s there has been a rapid shift in cassava cultivars and there is an obvious need for new cassava varieties with resistance to the major pests and diseases. Major disease outbreaks, like the one caused by the mealy bug in the eighties in Malawi or the cassava mosaic virus outbreak in Uganda, could be less devastating if resistant cassava material was available and accepted by the farmers within their farming systems. We conceive that the methods for provision of new cultivars to farmers can be considerably improved. A project to identify, evaluate and discover traits that make certain local varieties popular amongst consumers was developed and funded by SAREC. We describe here Molecular marker technology for tracking gene flow in trading of cassava cultivars and to explore how molecular markers can be used to identify cultivar preferences in urban cassava markets Methodology The study was conducted in two geographic areas, in the north and the south of Malawi, respectively. In the north, Nkhata-Bay close to Lake Malawi and has a fairly long dry period, mean daily temperature (DMT) during the growing season, above 20°C, and relatively low population density. The area in the south, Mulanje, is less dry and more densely populated. In each area, 5 farmers who are recognized by other farmers as cassava farming enthusiasts were recruited into the study. Using a combination of interviews, cassava cultivars were collected from markets in the above areas and planted at the Namiganzi farm center, Malawi. A total of 54 cultivars were collected. The cultivars were subjected to molecular analysis using 36 SSR markers for cultivar identification. SSR marker and data analysis were as described earlier Fregene et al. (2003). Results The 54 cultivars collected from Malawi revealed a fairly high amount of SSR allele diversity (Figure 12.15). The total number of alleles per locus ranged between 3 and 7. The fairly large number of alleles per locus enabled the unique identification of every single cultivar collected. Analysis of genetic relationships between the clones revealed that they formed 3 loose clusters that appear to represent market classes of cassava in Malawi (Fig8.16). Detailed and conclusive interpretation of the above results will have to wait for agronomic data of the cultivars from the replicated trial at the Namiganzi farm center to be collected later in the year and additional information collected during the interviews.

Project IP3: improving cassava for the developing world Output 12-40
Figure 12.15. Silver stained PAGE gel electrophoresis of PCR amplification of the cassava
genotypes collected in Malawi using the primers SSRY51 and SSRY63. Figure 12.16. Principal component analysis (PCA) of pairwise genetic distances based on
proportion of shared alleles (PSA) between the cassava accessions from Malawi
Conclusions and Future Perspective An attempt has been made to use molecular markers in the identification of cultivar and therefore their preferences in urban cassava markets in Malawi. Using 36 SSR markers, 54
-8
-6
-4
-2
0
2
4
6
8
-6 -4 -2 0 2 4 6 8 10 12Series1
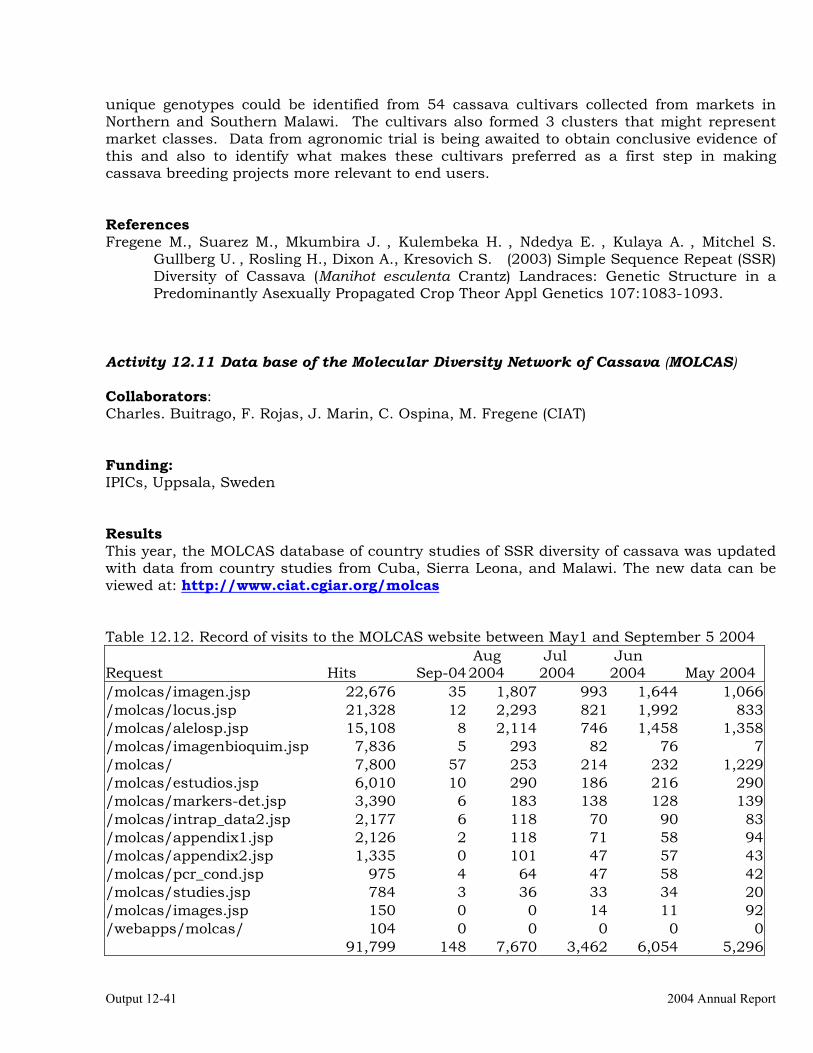
Output 12-41 2004 Annual Report
unique genotypes could be identified from 54 cassava cultivars collected from markets in Northern and Southern Malawi. The cultivars also formed 3 clusters that might represent market classes. Data from agronomic trial is being awaited to obtain conclusive evidence of this and also to identify what makes these cultivars preferred as a first step in making cassava breeding projects more relevant to end users. References Fregene M., Suarez M., Mkumbira J. , Kulembeka H. , Ndedya E. , Kulaya A. , Mitchel S.
Gullberg U. , Rosling H., Dixon A., Kresovich S. (2003) Simple Sequence Repeat (SSR) Diversity of Cassava (Manihot esculenta Crantz) Landraces: Genetic Structure in a Predominantly Asexually Propagated Crop Theor Appl Genetics 107:1083-1093.
Activity 12.11 Data base of the Molecular Diversity Network of Cassava (MOLCAS) Collaborators: Charles. Buitrago, F. Rojas, J. Marin, C. Ospina, M. Fregene (CIAT) Funding: IPICs, Uppsala, Sweden Results This year, the MOLCAS database of country studies of SSR diversity of cassava was updated with data from country studies from Cuba, Sierra Leona, and Malawi. The new data can be viewed at: http://www.ciat.cgiar.org/molcas Table 12.12. Record of visits to the MOLCAS website between May1 and September 5 2004
Request Hits Sep-04 Aug 2004
Jul 2004
Jun 2004 May 2004
/molcas/imagen.jsp 22,676 35 1,807 993 1,644 1,066/molcas/locus.jsp 21,328 12 2,293 821 1,992 833/molcas/alelosp.jsp 15,108 8 2,114 746 1,458 1,358/molcas/imagenbioquim.jsp 7,836 5 293 82 76 7/molcas/ 7,800 57 253 214 232 1,229/molcas/estudios.jsp 6,010 10 290 186 216 290/molcas/markers-det.jsp 3,390 6 183 138 128 139/molcas/intrap_data2.jsp 2,177 6 118 70 90 83/molcas/appendix1.jsp 2,126 2 118 71 58 94/molcas/appendix2.jsp 1,335 0 101 47 57 43/molcas/pcr_cond.jsp 975 4 64 47 58 42/molcas/studies.jsp 784 3 36 33 34 20/molcas/images.jsp 150 0 0 14 11 92/webapps/molcas/ 104 0 0 0 0 0 91,799 148 7,670 3,462 6,054 5,296
Project IP3: improving cassava for the developing world Output 12-42 Continued
The MOLCAS web-site is increasingly becoming a useful asset for the research community as demonstrated by the over 260% increment in the visits to the MOLCAS this year, a total of 91,799 visits between May and September this year, compared to a total of 34,477 visits the same period of time in 2003 (Table 12.12). Activity 12.12 Mining the Primary Gene Pool of Cassava: Introgression of High Root Protein from Accessions of Manihot esculenta sub spp Fabellifolia and Manihot Tristis into Cassava Collaborators: J. Gutierrez, O. Akinbo, N. Morante, T. Sanchez, J. Marin, C. Ospina, H. Ceballos, L. Santos, A. Alzate, S. Moreno, M. Fregene (CIAT) Funding: CIAT core funds Important outputs 1) Generation of back cross families for QTL mapping and development of improved varieties with high protein content. 2) Evaluation of protein content in Ghana of varieties from Central America confirms the high protein content observed earlier 3) Standardization of a SDS-PAGE analysis method towards a proper characterization of the proteins contained in high protein content cassava and inter-specific genotypes Rationale As a major staple throughout the tropics, cassava can serve as a cheap means of deploying adequate protein requirement amongst poor people as well as for animal feeds. An advanced back cross QTL (ABC-QTL) to introgress high protein content genes from wild relatives into cassava is in its third year at CIAT. Similarly high protein content cassava varieties mostly from Central America were re-evaluated in another environment, Wenchi, Ghana, this year. The cassava varieties have also been re-established in the field at CIAT for a second year of evaluation. Genetic crosses of these high protein varieties are being made to elite parents of the CIAT cassava gene pools for breeding for high protein content and for QTL mapping studies. Other activities continued this year include standardization of the SDS-PAGE methodology for the determination of kind and size of proteins found in high protein accessions.
Output 13-1 2004 Annual Report
OUTPUT 13 Integrated cassava-based cropping systems in Asia: Widespread adoption of farming
practices that enhance sustainability
The overall objective of this output is to increase the income and agricultural sustainability in less favored upland areas by developing, together with farmers, efficient and effective integrated cassava-based cropping and livestock production systems that optimize total farm productivity, improve livelihoods and contribute to the long-term sustainability of cassava-based cropping systems in Asia.
Activity 13.1 Soil fertility maintenance through the application of chemical fertilizers, or the use of intercropping, green manuring, alley cropping and crop rotations. Rationale Because of the near absence of diseases and pest problems in Asia, cassava is often grown continuously on the same land for many years. But, most cassava soils have a low inherent fertility. The opening up of land for cultivation of annual crops leads to exposure of the soil surface to high temperatures resulting in rapid decomposition of organic matter, while the direct impact of rainfall on the soil surface may destroy soil aggregates and lead to runoff and erosion. Continuous cropping with the removal of cassava roots (and sometimes stems and leaves as well) will lead to depletion of soil nutrients. Unless these nutrients are replaced in the form of chemical fertilizers, animal manures or green manures, soil fertility will decrease and productivity decline. Specific Objectives a) To determine the immediate and long-term effect of various combinations of N, P and K
applied annually on cassava yields and starch content, as well as on soil fertility. b) To determine the long-term effect of various green manures on cassava yields and soil fertility. Activity 13.1.1 Long-term NPK trials Due to the termination of the NF project in China and Vietnam, and the resulting termination of funding, only three of the four long-term NPK trials could be continued, while the one in Hainan, China was discontinued. The three remaining trials are in Thai Nguyen
Project IP3: improving cassava for the developing world Output 13-2
University in North Vietnam, at Hung Loc Agric. Research Center in south Vietnam, and at Tamanbogo in Lampung province on Sumatra island of Indonesia. Most of these experiments have completed 12-14 consecutive years of cropping. The methodology has been described in the 2003 Annual Report. Results Figure 13.1 shows the effect of annual application of various combinations of N, P and K on the cassava root yield and leaf life (at 3 MAP) of two varieties during the 14th year of planting at Thai Nguyen University. Without fertilizer application, the yields of both varieties had further decreased to only 1-2 t/ha while with high levels of NPK application yields were 21-24 t/ha. Among the three major plant nutrients, K was the most important in increasing yields, followed by N and then P. There was a significant response only to the first increment of 20 kg P2O5/ha, and to the 2nd increment of N corresponding to 80 kg N/ha; it is likely, however that yields and yield responses to N and P were constraint by an inadequate level of 80 kg K2O/ha. To maintain high yields, an annual application of at least 160 kg N, 80 kg P2O5 and 160 kg K2O/ha are required. These high rates are necessary because all plant parts were removed from the field with each harvest, which is a common practice in Vietnam. While all these plant parts are fully utilized, this practice does result in high levels of nutrient removal, which may lead to nutrient depletion and a deterioration of soil productivity. Figure 13.1 also shows that the improved variety KM 60 produced consistently higher yields than the local variety Vinh Phu, both in the absence and presence of fertilizers. Interestingly, Vinh Phu had a longer leaf life than KM 60; in both varieties leaf life greatly increased with increasing K application, while N or P had only a slight positive effect. Similarly, in eight FPR fertilizer trials conducted by farmers in Dong Rang village in Hoa Binh province (Table 13.1), highest yields and net income were consistently obtained with the highest rates of N, P and K applied, i.e. either 40 kg N, 40 P2O5 and 80 K2O/ha or 60 kg N, 60 P2O5 and 120 K2O/ha. In this location all three nutrients are important, but N and K were required at higher rates than P. Similar results were obtained in FPR fertilizer trials conducted by five farmers in Kieu Tung village in Phu Tho province of Vietnam. The application of 60 kg N, 40 P2O5 and 120 K2O/ha combined with 10 t/ha of pig manure produced the highest average yields and net income (Table 13.2). These FPR fertilizer trials conducted by farmers on their own fields are an excellent way to show the importance of the right balance of nutrients for each crop; this helps to enhance adoption of improved fertilization practices, which in turn leads to higher yields and income. The combination of high-yielding varieties (such as KM 98-7 in Table 13.1) with adequate and well-balanced fertilization is generally the most important factors to increase cassava yields in Asia. In Vietnam, the rapid expansion of new varieties and the greater use of chemical fertilizers markedly increased cassava yields in the country, from about 8.3 t/ha in 2000 to 14.1 t/ha in 2003.
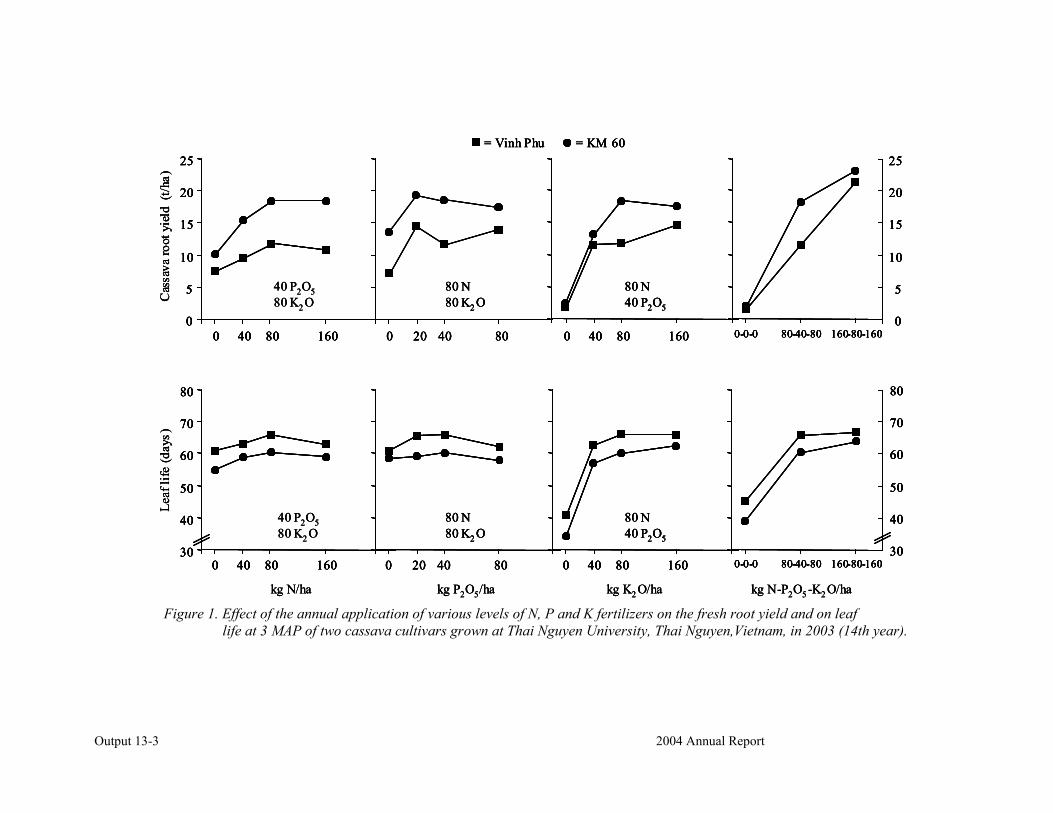
Output 13-3 2004 Annual Report
0
5
10
15
20
25
0 40 80 160
40 P2O580 K2 OC
assa
va ro
ot y
ield
(t/h
a)
= Vinh Phu = KM 60
0 20 40 80
80 N80 K2 O
0 40 80 160
80 N40 P2O5
0-0-0 80-40-80 160-80-1600
5
10
15
20
25
kg N/ha kg P2O5/ha kg K2 O/ha kg N-P2O5 -K2 O/ha
Leaf
life
(day
s)
0 20 40 80
80 N80 K2 O
40 P2O580 K2 O
0 40 80 160
80 N40 P2O5
30
40
50
60
70
80
0 40 80 16030
40
50
60
70
80
0-0-0 80-40-80 160-80-160
0
5
10
15
20
25
0 40 80 160
40 P2O580 K2 OC
assa
va ro
ot y
ield
(t/h
a)
= Vinh Phu = KM 60
0 20 40 80
80 N80 K2 O
0 40 80 160
80 N40 P2O5
0-0-0 80-40-80 160-80-1600
5
10
15
20
25
0
5
10
15
20
25
0 40 80 1600
5
10
15
20
25
0
5
10
15
20
25
0 40 80 1600 40 80 160
40 P2O580 K2 OC
assa
va ro
ot y
ield
(t/h
a)
= Vinh Phu = KM 60= Vinh Phu = KM 60
0 20 40 80
80 N80 K2 O
0 20 40 800 20 40 80
80 N80 K2 O
0 40 80 160
80 N40 P2O5
0 40 80 1600 40 80 160
80 N40 P2O5
0-0-0 80-40-80 160-80-1600
5
10
15
20
25
0-0-0 80-40-80 160-80-1600-0-0 80-40-80 160-80-1600
5
10
15
20
25
0
5
10
15
20
25
kg N/ha kg P2O5/ha kg K2 O/ha kg N-P2O5 -K2 O/ha
Leaf
life
(day
s)
0 20 40 80
80 N80 K2 O
40 P2O580 K2 O
0 40 80 160
80 N40 P2O5
30
40
50
60
70
80
0 40 80 16030
40
50
60
70
80
0-0-0 80-40-80 160-80-160
kg N/ha kg P2O5/ha kg K2 O/ha kg N-P2O5 -K2 O/ha
Leaf
life
(day
s)
0 20 40 80
80 N80 K2 O
0 20 40 800 20 40 80
80 N80 K2 O
40 P2O580 K2 O
0 40 80 160
80 N40 P2O5
0 40 80 1600 40 80 160
80 N40 P2O5
30
40
50
60
70
80
0 40 80 16030
40
50
60
70
80
30
40
50
60
70
80
0 40 80 1600 40 80 16030
40
50
60
70
80
0-0-0 80-40-80 160-80-16030
40
50
60
70
80
30
40
50
60
70
80
0-0-0 80-40-80 160-80-1600-0-0 80-40-80 160-80-160
Figure 1. Effect of the annual application of various levels of N, P and K fertilizers on the fresh root yield and on leaf life at 3 MAP of two cassava cultivars grown at Thai Nguyen University, Thai Nguyen,Vietnam, in 2003 (14th year).
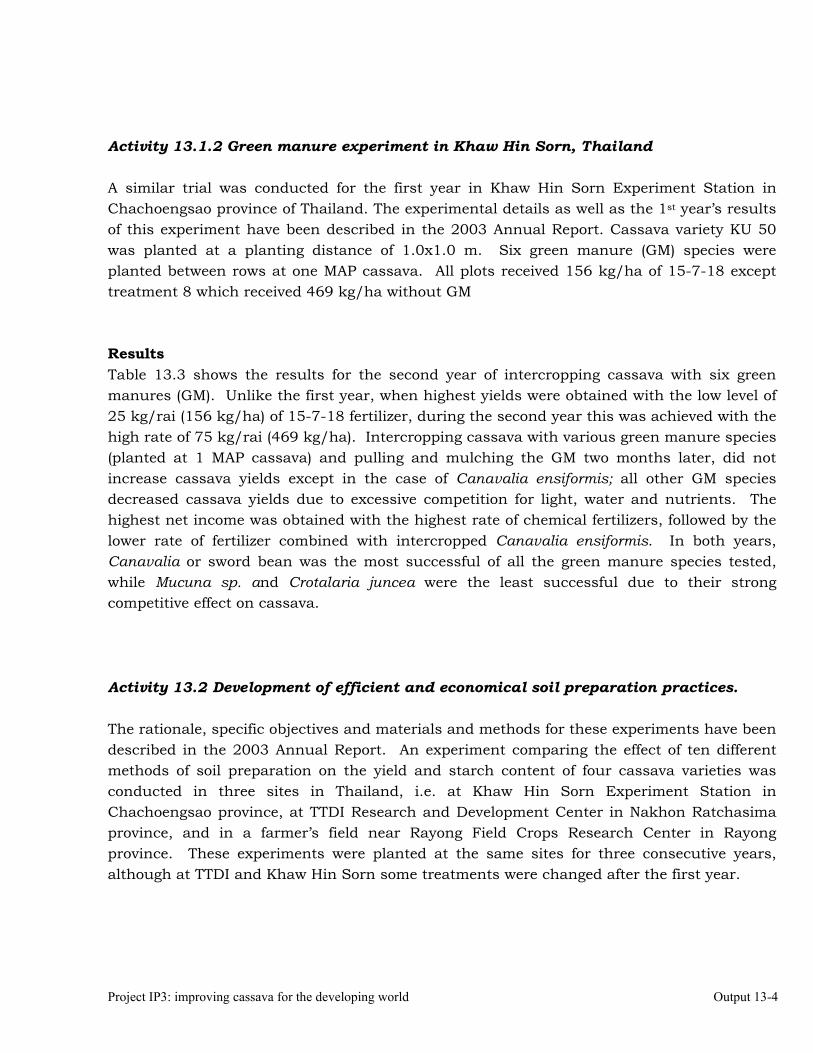
Project IP3: improving cassava for the developing world Output 13-4
Activity 13.1.2 Green manure experiment in Khaw Hin Sorn, Thailand A similar trial was conducted for the first year in Khaw Hin Sorn Experiment Station in Chachoengsao province of Thailand. The experimental details as well as the 1st year’s results of this experiment have been described in the 2003 Annual Report. Cassava variety KU 50 was planted at a planting distance of 1.0x1.0 m. Six green manure (GM) species were planted between rows at one MAP cassava. All plots received 156 kg/ha of 15-7-18 except treatment 8 which received 469 kg/ha without GM Results Table 13.3 shows the results for the second year of intercropping cassava with six green manures (GM). Unlike the first year, when highest yields were obtained with the low level of 25 kg/rai (156 kg/ha) of 15-7-18 fertilizer, during the second year this was achieved with the high rate of 75 kg/rai (469 kg/ha). Intercropping cassava with various green manure species (planted at 1 MAP cassava) and pulling and mulching the GM two months later, did not increase cassava yields except in the case of Canavalia ensiformis; all other GM species decreased cassava yields due to excessive competition for light, water and nutrients. The highest net income was obtained with the highest rate of chemical fertilizers, followed by the lower rate of fertilizer combined with intercropped Canavalia ensiformis. In both years, Canavalia or sword bean was the most successful of all the green manure species tested, while Mucuna sp. and Crotalaria juncea were the least successful due to their strong competitive effect on cassava. Activity 13.2 Development of efficient and economical soil preparation practices. The rationale, specific objectives and materials and methods for these experiments have been described in the 2003 Annual Report. An experiment comparing the effect of ten different methods of soil preparation on the yield and starch content of four cassava varieties was conducted in three sites in Thailand, i.e. at Khaw Hin Sorn Experiment Station in Chachoengsao province, at TTDI Research and Development Center in Nakhon Ratchasima province, and in a farmer’s field near Rayong Field Crops Research Center in Rayong province. These experiments were planted at the same sites for three consecutive years, although at TTDI and Khaw Hin Sorn some treatments were changed after the first year.
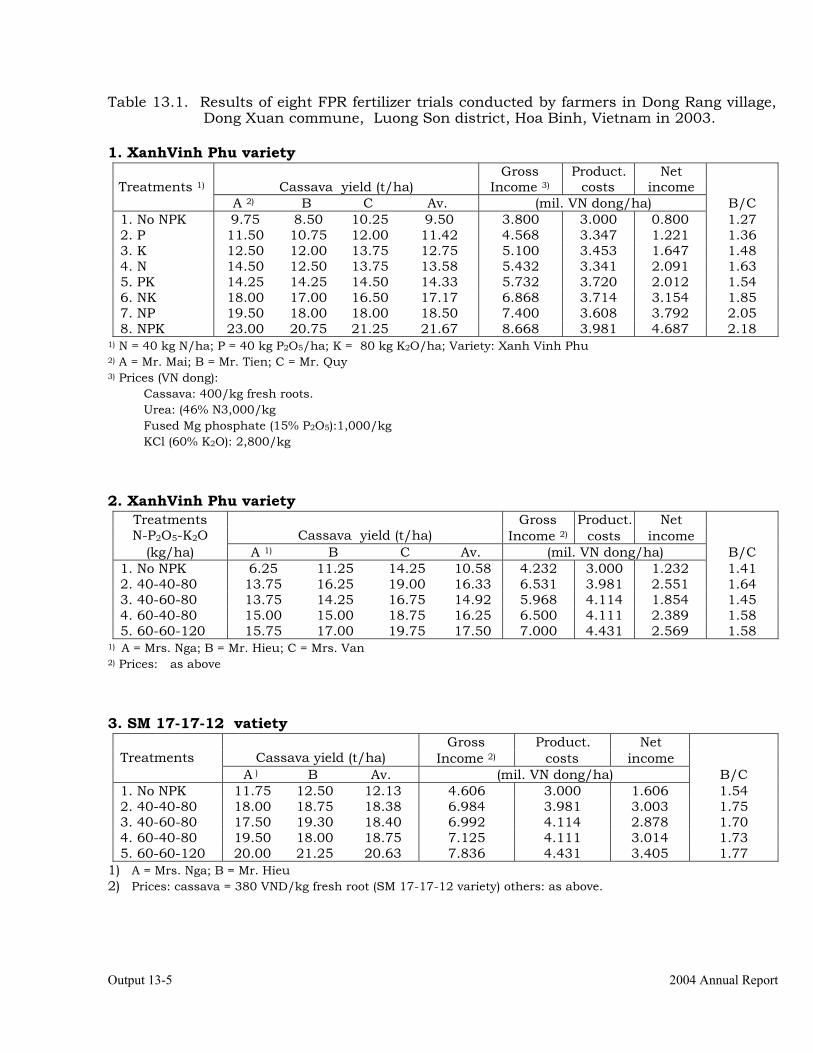
Output 13-5 2004 Annual Report
Table 13.1. Results of eight FPR fertilizer trials conducted by farmers in Dong Rang village, Dong Xuan commune, Luong Son district, Hoa Binh, Vietnam in 2003.
1. XanhVinh Phu variety
Gross Product. Net Cassava yield (t/ha) Income 3) costs income
Treatments 1)
A 2) B C Av. (mil. VN dong/ha) B/C 1. No NPK 9.75 8.50 10.25 9.50 3.800 3.000 0.800 1.27 2. P 11.50 10.75 12.00 11.42 4.568 3.347 1.221 1.36 3. K 12.50 12.00 13.75 12.75 5.100 3.453 1.647 1.48 4. N 14.50 12.50 13.75 13.58 5.432 3.341 2.091 1.63 5. PK 14.25 14.25 14.50 14.33 5.732 3.720 2.012 1.54 6. NK 18.00 17.00 16.50 17.17 6.868 3.714 3.154 1.85 7. NP 19.50 18.00 18.00 18.50 7.400 3.608 3.792 2.05 8. NPK 23.00 20.75 21.25 21.67 8.668 3.981 4.687 2.18
1) N = 40 kg N/ha; P = 40 kg P2O5/ha; K = 80 kg K2O/ha; Variety: Xanh Vinh Phu 2) A = Mr. Mai; B = Mr. Tien; C = Mr. Quy 3) Prices (VN dong):
Cassava: 400/kg fresh roots. Urea: (46% N3,000/kg Fused Mg phosphate (15% P2O5):1,000/kg KCl (60% K2O): 2,800/kg
2. XanhVinh Phu variety
Gross Product. Net Treatments N-P2O5-K2O
Cassava yield (t/ha) Income 2) costs income
(kg/ha) A 1) B C Av. (mil. VN dong/ha) B/C 1. No NPK 6.25 11.25 14.25 10.58 4.232 3.000 1.232 1.41 2. 40-40-80 13.75 16.25 19.00 16.33 6.531 3.981 2.551 1.64 3. 40-60-80 13.75 14.25 16.75 14.92 5.968 4.114 1.854 1.45 4. 60-40-80 15.00 15.00 18.75 16.25 6.500 4.111 2.389 1.58 5. 60-60-120 15.75 17.00 19.75 17.50 7.000 4.431 2.569 1.58
1) A = Mrs. Nga; B = Mr. Hieu; C = Mrs. Van 2) Prices: as above 3. SM 17-17-12 vatiety
Gross Product. Net Treatments
Cassava yield (t/ha) Income 2) costs income
A ) B Av. (mil. VN dong/ha) B/C 1. No NPK 11.75 12.50 12.13 4.606 3.000 1.606 1.54 2. 40-40-80 18.00 18.75 18.38 6.984 3.981 3.003 1.75 3. 40-60-80 17.50 19.30 18.40 6.992 4.114 2.878 1.70 4. 60-40-80 19.50 18.00 18.75 7.125 4.111 3.014 1.73 5. 60-60-120 20.00 21.25 20.63 7.836 4.431 3.405 1.77
1) A = Mrs. Nga; B = Mr. Hieu 2) Prices: cassava = 380 VND/kg fresh root (SM 17-17-12 variety) others: as above.
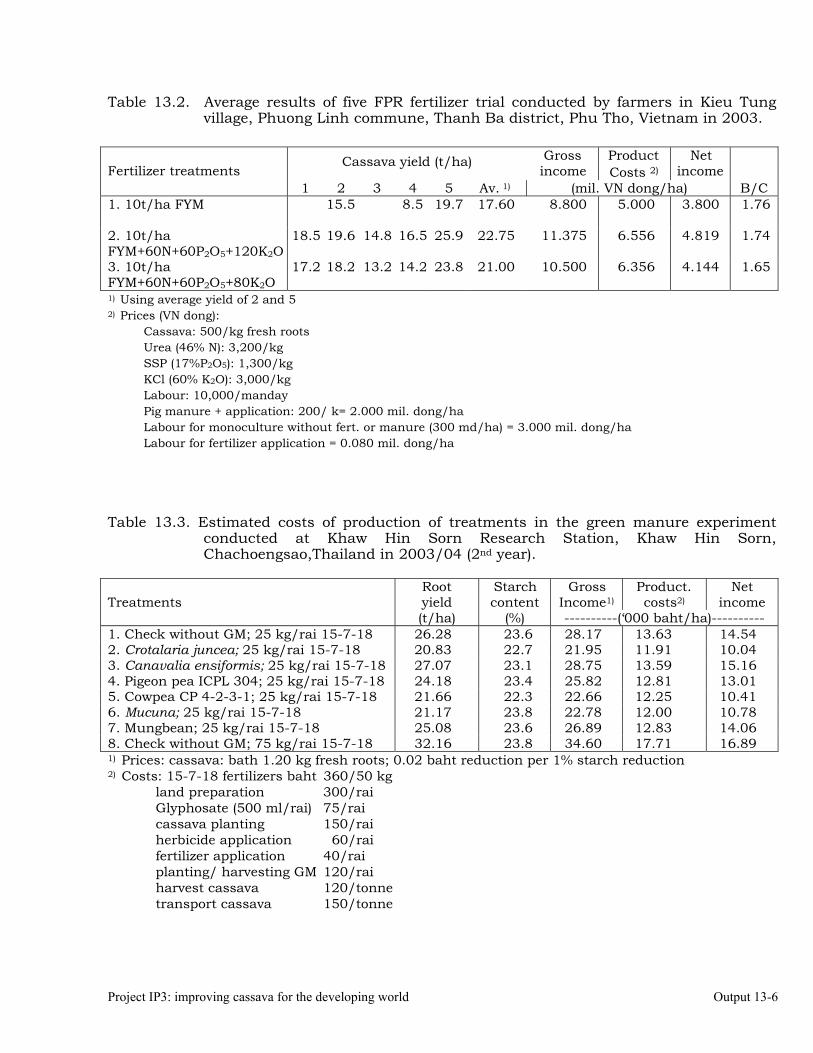
Project IP3: improving cassava for the developing world Output 13-6
Table 13.2. Average results of five FPR fertilizer trial conducted by farmers in Kieu Tung village, Phuong Linh commune, Thanh Ba district, Phu Tho, Vietnam in 2003.
Gross Product Net
Fertilizer treatments
Cassava yield (t/ha) income Costs 2) income
1 2 3 4 5 Av. 1) (mil. VN dong/ha) B/C 1. 10t/ha FYM
15.5 8.5 19.7 17.60 8.800 5.000 3.800 1.76
2. 10t/ha FYM+60N+60P2O5+120K2O
18.5 19.6 14.8 16.5 25.9 22.75 11.375 6.556 4.819 1.74
3. 10t/ha FYM+60N+60P2O5+80K2O
17.2 18.2 13.2 14.2 23.8 21.00 10.500 6.356 4.144 1.65
1) Using average yield of 2 and 5 2) Prices (VN dong):
Cassava: 500/kg fresh roots Urea (46% N): 3,200/kg SSP (17%P2O5): 1,300/kg KCl (60% K2O): 3,000/kg Labour: 10,000/manday Pig manure + application: 200/ k= 2.000 mil. dong/ha Labour for monoculture without fert. or manure (300 md/ha) = 3.000 mil. dong/ha Labour for fertilizer application = 0.080 mil. dong/ha
Table 13.3. Estimated costs of production of treatments in the green manure experiment
conducted at Khaw Hin Sorn Research Station, Khaw Hin Sorn, Chachoengsao,Thailand in 2003/04 (2nd year).
Root Starch Gross Product. Net yield content Income1) costs2) income
Treatments
(t/ha) (%) ----------(‘000 baht/ha)---------- 1. Check without GM; 25 kg/rai 15-7-18 26.28 23.6 28.17 13.63 14.54 2. Crotalaria juncea; 25 kg/rai 15-7-18 20.83 22.7 21.95 11.91 10.04 3. Canavalia ensiformis; 25 kg/rai 15-7-18 27.07 23.1 28.75 13.59 15.16 4. Pigeon pea ICPL 304; 25 kg/rai 15-7-18 24.18 23.4 25.82 12.81 13.01 5. Cowpea CP 4-2-3-1; 25 kg/rai 15-7-18 21.66 22.3 22.66 12.25 10.41 6. Mucuna; 25 kg/rai 15-7-18 21.17 23.8 22.78 12.00 10.78 7. Mungbean; 25 kg/rai 15-7-18 25.08 23.6 26.89 12.83 14.06 8. Check without GM; 75 kg/rai 15-7-18 32.16 23.8 34.60 17.71 16.89 1) Prices: cassava: bath 1.20 kg fresh roots; 0.02 baht reduction per 1% starch reduction 2) Costs: 15-7-18 fertilizers baht 360/50 kg land preparation 300/rai Glyphosate (500 ml/rai) 75/rai cassava planting 150/rai herbicide application 60/rai fertilizer application 40/rai planting/ harvesting GM 120/rai harvest cassava 120/tonne transport cassava 150/tonne
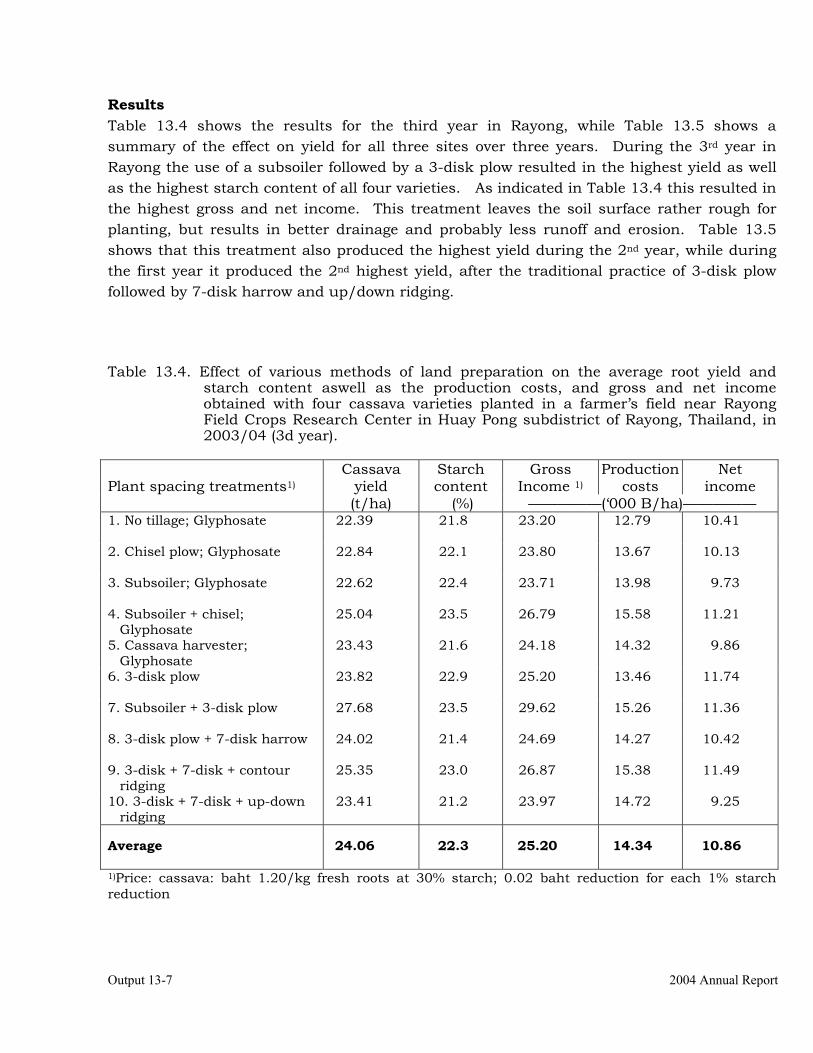
Output 13-7 2004 Annual Report
Results Table 13.4 shows the results for the third year in Rayong, while Table 13.5 shows a summary of the effect on yield for all three sites over three years. During the 3rd year in Rayong the use of a subsoiler followed by a 3-disk plow resulted in the highest yield as well as the highest starch content of all four varieties. As indicated in Table 13.4 this resulted in the highest gross and net income. This treatment leaves the soil surface rather rough for planting, but results in better drainage and probably less runoff and erosion. Table 13.5 shows that this treatment also produced the highest yield during the 2nd year, while during the first year it produced the 2nd highest yield, after the traditional practice of 3-disk plow followed by 7-disk harrow and up/down ridging. Table 13.4. Effect of various methods of land preparation on the average root yield and
starch content aswell as the production costs, and gross and net income obtained with four cassava varieties planted in a farmer’s field near Rayong Field Crops Research Center in Huay Pong subdistrict of Rayong, Thailand, in 2003/04 (3d year).
Cassava Starch Gross Production Net
yield content Income 1) costs income Plant spacing treatments1)
(t/ha) (%) —————(‘000 B/ha)————— 1. No tillage; Glyphosate
22.39 21.8 23.20 12.79 10.41
2. Chisel plow; Glyphosate
22.84 22.1 23.80 13.67 10.13
3. Subsoiler; Glyphosate
22.62 22.4 23.71 13.98 9.73
4. Subsoiler + chisel; Glyphosate
25.04 23.5 26.79 15.58 11.21
5. Cassava harvester; Glyphosate
23.43 21.6 24.18 14.32 9.86
6. 3-disk plow
23.82 22.9 25.20 13.46 11.74
7. Subsoiler + 3-disk plow
27.68 23.5 29.62 15.26 11.36
8. 3-disk plow + 7-disk harrow
24.02 21.4 24.69 14.27 10.42
9. 3-disk + 7-disk + contour ridging
25.35 23.0 26.87 15.38 11.49
10. 3-disk + 7-disk + up-down ridging
23.41 21.2 23.97 14.72 9.25
Average
24.06
22.3
25.20
14.34
10.86
1)Price: cassava: baht 1.20/kg fresh roots at 30% starch; 0.02 baht reduction for each 1% starch reduction
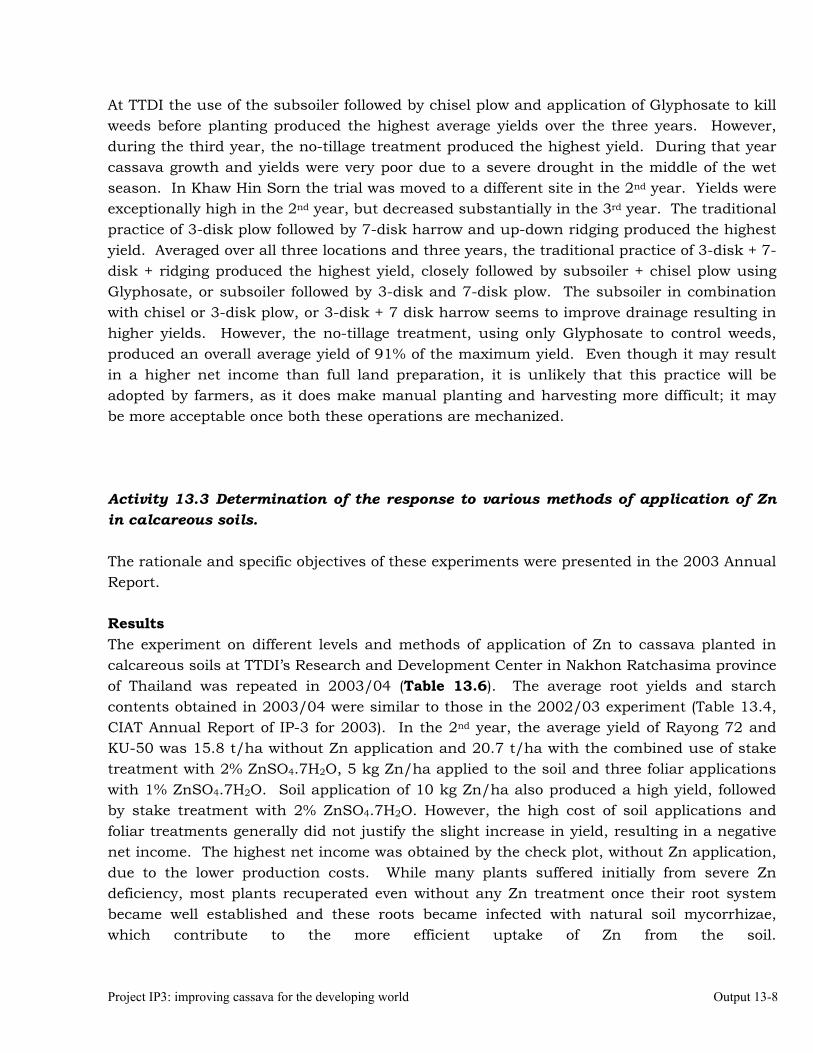
Project IP3: improving cassava for the developing world Output 13-8
At TTDI the use of the subsoiler followed by chisel plow and application of Glyphosate to kill weeds before planting produced the highest average yields over the three years. However, during the third year, the no-tillage treatment produced the highest yield. During that year cassava growth and yields were very poor due to a severe drought in the middle of the wet season. In Khaw Hin Sorn the trial was moved to a different site in the 2nd year. Yields were exceptionally high in the 2nd year, but decreased substantially in the 3rd year. The traditional practice of 3-disk plow followed by 7-disk harrow and up-down ridging produced the highest yield. Averaged over all three locations and three years, the traditional practice of 3-disk + 7-disk + ridging produced the highest yield, closely followed by subsoiler + chisel plow using Glyphosate, or subsoiler followed by 3-disk and 7-disk plow. The subsoiler in combination with chisel or 3-disk plow, or 3-disk + 7 disk harrow seems to improve drainage resulting in higher yields. However, the no-tillage treatment, using only Glyphosate to control weeds, produced an overall average yield of 91% of the maximum yield. Even though it may result in a higher net income than full land preparation, it is unlikely that this practice will be adopted by farmers, as it does make manual planting and harvesting more difficult; it may be more acceptable once both these operations are mechanized. Activity 13.3 Determination of the response to various methods of application of Zn in calcareous soils. The rationale and specific objectives of these experiments were presented in the 2003 Annual Report. Results The experiment on different levels and methods of application of Zn to cassava planted in calcareous soils at TTDI’s Research and Development Center in Nakhon Ratchasima province of Thailand was repeated in 2003/04 (Table 13.6). The average root yields and starch contents obtained in 2003/04 were similar to those in the 2002/03 experiment (Table 13.4, CIAT Annual Report of IP-3 for 2003). In the 2nd year, the average yield of Rayong 72 and KU-50 was 15.8 t/ha without Zn application and 20.7 t/ha with the combined use of stake treatment with 2% ZnSO4.7H2O, 5 kg Zn/ha applied to the soil and three foliar applications with 1% ZnSO4.7H2O. Soil application of 10 kg Zn/ha also produced a high yield, followed by stake treatment with 2% ZnSO4.7H2O. However, the high cost of soil applications and foliar treatments generally did not justify the slight increase in yield, resulting in a negative net income. The highest net income was obtained by the check plot, without Zn application, due to the lower production costs. While many plants suffered initially from severe Zn deficiency, most plants recuperated even without any Zn treatment once their root system became well established and these roots became infected with natural soil mycorrhizae, which contribute to the more efficient uptake of Zn from the soil.
Output 13-9 2004 Annual Report
Table 13.5. Summary of results of a soil preparation experiment conducted for three consecutive years in three sites in Thailand from 2001/02 to 2003/04. Rayong TTDI Khaw Hin Sorn Average Average 3 2d+3d
year Treatments 1st
year 2d
year 3d
year Av. 1st
year 2d
year 3d
year Av. 1st
year 2d
year 3d
year Av. Loc. 2 Loc.
1. No tillage; Glyphosate 11.46 23.94 22.39 19.26 19.91 26.07 15.14 20.37 21.45 32.71 24.90 26.35 21.99 24.70 2. Chisel plow; Glyphosate
12.03 24.92 22.84 19.93 17.78 25.10 10.93 17.94 20.56 34.18 21.80 25.51 21.13 23.00
3. Subsoiler; Glyphosate 13.70 24.21 22.62 20.18 16.31 24.32 10.10 16.91 19.20 33.01 24.48 25.56 20.88 22.98 4. Subsoil+chisel; Glyphosate
14.85 25.99 25.04 21.96 21.87 28.71 14.20 21.59 19.07 37.65 23.12 26.61 23.39 25.92
5. Cassava harvester; Glyphosate
14.60 25.82 23.43 21.28 16.08 25.52 12.52 18.04 18.56 39.50 26.66 28.24 22.52 26.05
6. 3disk plow 13.66 22.76 23.82 20.08 18.00 - - - 18.81 - - - - - 7. Subsoiler+3disk plow 17.57 28.54 27.68 24.60 16.59 - - - 24.71 - - - - - 8. 3disk plow+7disk harrow
11.93 23.00 24.02 19.65 18.15 23.31 8.92 16.79 21.27 41.99 27.67 30.31 22.25 25.47
9. 3disk+7disk+contour ridging
17.47 24.60 5.35 22.47 18.32 26.57 8.53 17.81 24.88 46.35 25.40 32.21 24.16 26.71
10. 3disk+7disk+up/down ridging
19.50 25.86 23.41 22.92 17.52 - - - 23.25 - - - - -
11. Subsoiler+7disk; Glyphosate
- - - - - 25.35 11.91 - - 36.24 26.42 - - 24.98
12. Subsoiler+7disk harrow
- - - - - 24.90 10.04 - - 28.65 28.39 - - 23.00
13. Subsoiler+3disk+7disk
- - - - - 26.40 10.88 - - 38.95 29.16 - - 26.35
Average 16.68 24.96 24.06 21.23 18.05 25.63 11.32 - 21.18 36.92 25.80 - - 26.35
Project IP3: improving cassava for the developing world Output 13-10
Activity 13.4 Evaluation of cassava varieties and determination of optimum plant spacing for cassava leaf production. Rationale Cassava root pellets are widely used in Europe for animal feeding. In Thailand this is not yet widely practiced due to the availability of other cheap raw materials for the production of animal feed, such as broken rice and maize. The low protein content of cassava roots and the inadequate local supply of soybean limits the local use of cassava in animal feed rations. However, cassava leaves are known to contain high levels of crude protein with a good amino acid spectrum. Recent research indicate that the low-medium tannin content of cassava leaves actually improves protein digestibility. Thus, intensive research was initiated to identify the best varieties for leaf production and to determine the most economic way of producing high yields of leaves as well as roots. Specific Objective a) To determine the best varieties and cultural practices for obtaining high leaf and root yields and maximize net farm income. Results Varietal evaluation: Table 13.7 shows the results of a varietal trial for leaf production conducted at TTDI Research and Development Center in Nakhon Ratchasima province, one of three such trials conducted in Thailand in 2003/04. This year both leaf and root production were markedly reduced due to a prolonged drought during the wet season. The total dry leaf yield, the sum of four cuts, averaged only 5.58 t/ha at TTDI, as compared to 15.3 t/ha last year in Rayong and 11.5 t/ha in Khon Kaen. Among the 25 varieties/lines tested, the highest dry leaf yield of 9.55 t/ha was obtained with the breeding line CMR 41-61-59, while high leaf yields were also obtained with the newly released variety Huay Bong 60 and Rayong 90, as well as the line CMR 41-111-129. Root yields this year were also low, on average 10.89 t/ha. These low yields are partially due to incomplete plant stands due to the lack of good quality planting material of some lines. The highest root yield was obtained with the two recommended varieties, Rayong 90 and Rayong 5, followed by CMR 41-61-59 and Huay Bong 60. These and many new breeding lines are being further evaluated in 2004/05. For farmers, the production of cassava leaves for animal feed is only economically profitable if the selected varieties produce both high yields of dry leaves with high crude protein content, as well as high yields of roots with adequate starch contents.
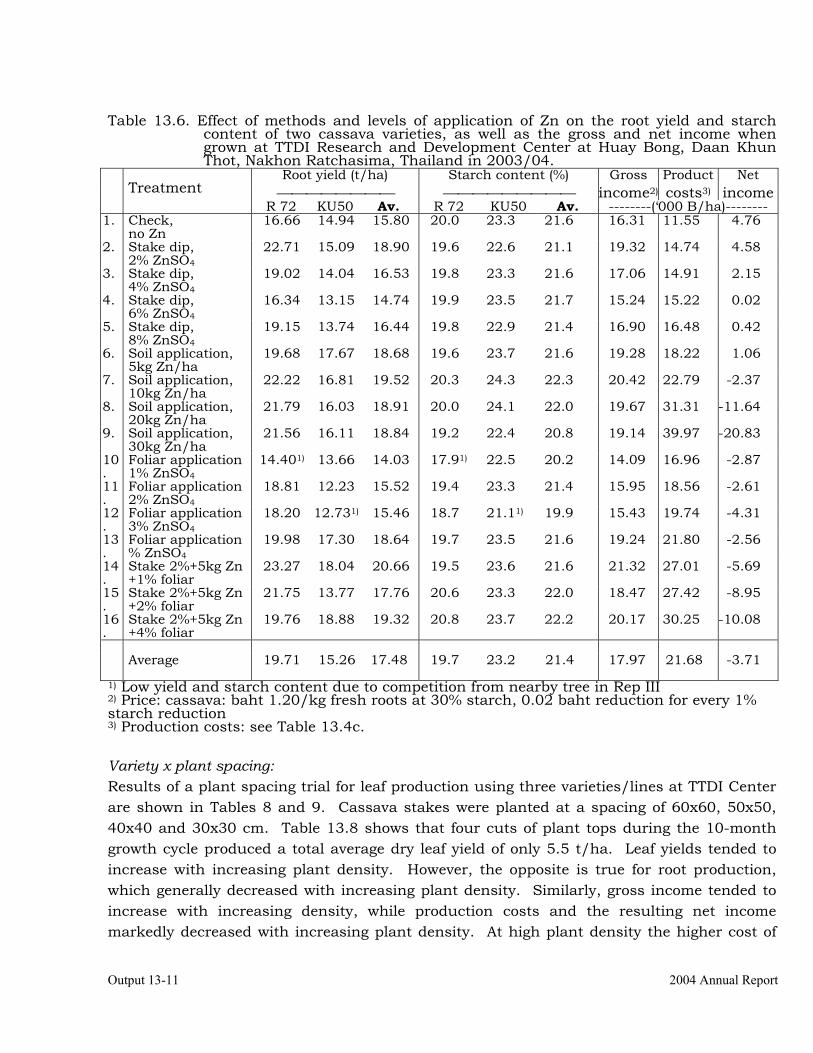
Output 13-11 2004 Annual Report
Table 13.6. Effect of methods and levels of application of Zn on the root yield and starch
content of two cassava varieties, as well as the gross and net income when grown at TTDI Research and Development Center at Huay Bong, Daan Khun Thot, Nakhon Ratchasima, Thailand in 2003/04.
Root yield (t/ha) Starch content (%) Gross Product Net income2) costs3) income
Treatment
R 72 KU50 Av. R 72 KU50 Av. --------(‘000 B/ha)-------- 1. Check,
no Zn 16.66 14.94 15.80 20.0 23.3 21.6 16.31 11.55 4.76
2. Stake dip, 2% ZnSO4
22.71 15.09 18.90 19.6 22.6 21.1 19.32 14.74 4.58
3. Stake dip, 4% ZnSO4
19.02 14.04 16.53 19.8 23.3 21.6 17.06 14.91 2.15
4. Stake dip, 6% ZnSO4
16.34 13.15 14.74 19.9 23.5 21.7 15.24 15.22 0.02
5. Stake dip, 8% ZnSO4
19.15 13.74 16.44 19.8 22.9 21.4 16.90 16.48 0.42
6. Soil application, 5kg Zn/ha
19.68 17.67 18.68 19.6 23.7 21.6 19.28 18.22 1.06
7. Soil application, 10kg Zn/ha
22.22 16.81 19.52 20.3 24.3 22.3 20.42 22.79 -2.37
8. Soil application, 20kg Zn/ha
21.79 16.03 18.91 20.0 24.1 22.0 19.67 31.31 -11.64
9. Soil application, 30kg Zn/ha
21.56 16.11 18.84 19.2 22.4 20.8 19.14 39.97 -20.83
10.
Foliar application 1% ZnSO4
14.401) 13.66 14.03 17.91) 22.5 20.2 14.09 16.96 -2.87
11.
Foliar application 2% ZnSO4
18.81 12.23 15.52 19.4 23.3 21.4 15.95 18.56 -2.61
12.
Foliar application 3% ZnSO4
18.20 12.731) 15.46 18.7 21.11) 19.9 15.43 19.74 -4.31
13.
Foliar application % ZnSO4
19.98 17.30 18.64 19.7 23.5 21.6 19.24 21.80 -2.56
14.
Stake 2%+5kg Zn +1% foliar
23.27 18.04 20.66 19.5 23.6 21.6 21.32 27.01 -5.69
15.
Stake 2%+5kg Zn +2% foliar
21.75 13.77 17.76 20.6 23.3 22.0 18.47 27.42 -8.95
16.
Stake 2%+5kg Zn +4% foliar
19.76 18.88 19.32 20.8 23.7 22.2 20.17 30.25 -10.08
Average 19.71 15.26 17.48 19.7
23.2
21.4
17.97
21.68
-3.71
1) Low yield and starch content due to competition from nearby tree in Rep III 2) Price: cassava: baht 1.20/kg fresh roots at 30% starch, 0.02 baht reduction for every 1% starch reduction 3) Production costs: see Table 13.4c. Variety x plant spacing: Results of a plant spacing trial for leaf production using three varieties/lines at TTDI Center are shown in Tables 8 and 9. Cassava stakes were planted at a spacing of 60x60, 50x50, 40x40 and 30x30 cm. Table 13.8 shows that four cuts of plant tops during the 10-month growth cycle produced a total average dry leaf yield of only 5.5 t/ha. Leaf yields tended to increase with increasing plant density. However, the opposite is true for root production, which generally decreased with increasing plant density. Similarly, gross income tended to increase with increasing density, while production costs and the resulting net income markedly decreased with increasing plant density. At high plant density the higher cost of
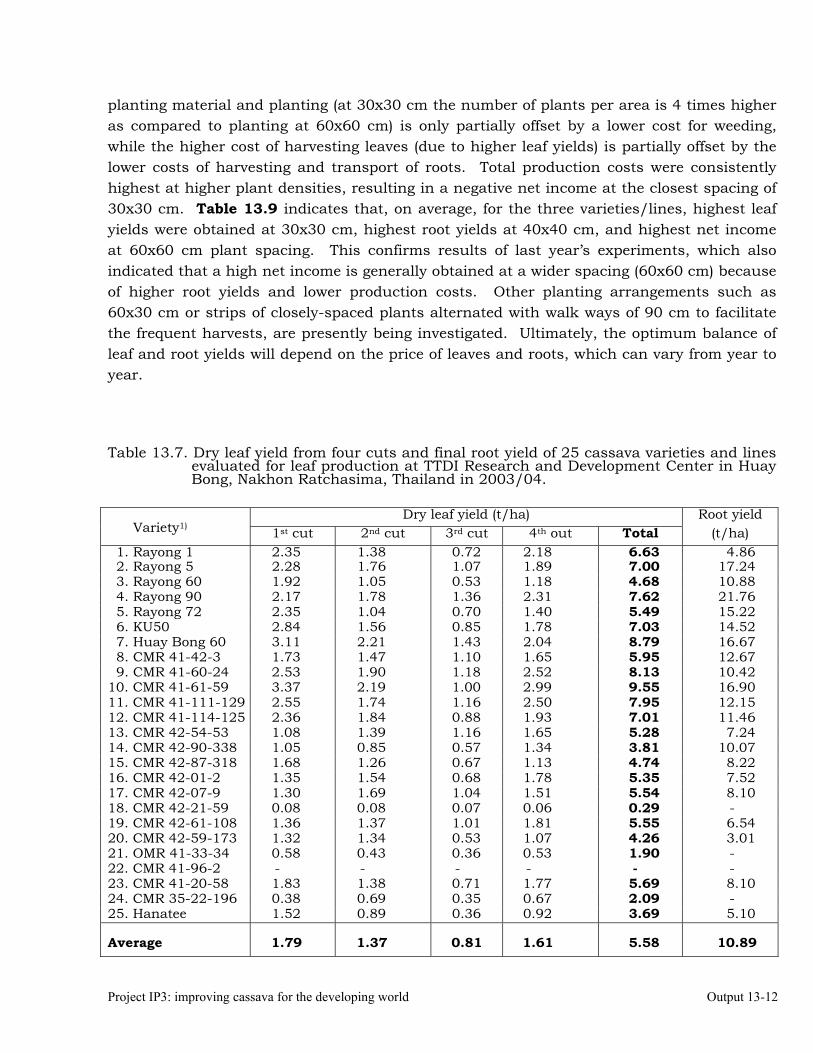
Project IP3: improving cassava for the developing world Output 13-12
planting material and planting (at 30x30 cm the number of plants per area is 4 times higher as compared to planting at 60x60 cm) is only partially offset by a lower cost for weeding, while the higher cost of harvesting leaves (due to higher leaf yields) is partially offset by the lower costs of harvesting and transport of roots. Total production costs were consistently highest at higher plant densities, resulting in a negative net income at the closest spacing of 30x30 cm. Table 13.9 indicates that, on average, for the three varieties/lines, highest leaf yields were obtained at 30x30 cm, highest root yields at 40x40 cm, and highest net income at 60x60 cm plant spacing. This confirms results of last year’s experiments, which also indicated that a high net income is generally obtained at a wider spacing (60x60 cm) because of higher root yields and lower production costs. Other planting arrangements such as 60x30 cm or strips of closely-spaced plants alternated with walk ways of 90 cm to facilitate the frequent harvests, are presently being investigated. Ultimately, the optimum balance of leaf and root yields will depend on the price of leaves and roots, which can vary from year to year. Table 13.7. Dry leaf yield from four cuts and final root yield of 25 cassava varieties and lines
evaluated for leaf production at TTDI Research and Development Center in Huay Bong, Nakhon Ratchasima, Thailand in 2003/04.
Dry leaf yield (t/ha) Root yield
Variety1) 1st cut 2nd cut 3rd cut 4th out Total (t/ha) 1. Rayong 1 2.35 1.38 0.72 2.18 6.63 4.86 2. Rayong 5 2.28 1.76 1.07 1.89 7.00 17.24 3. Rayong 60 1.92 1.05 0.53 1.18 4.68 10.88 4. Rayong 90 2.17 1.78 1.36 2.31 7.62 21.76 5. Rayong 72 2.35 1.04 0.70 1.40 5.49 15.22 6. KU50 2.84 1.56 0.85 1.78 7.03 14.52 7. Huay Bong 60 3.11 2.21 1.43 2.04 8.79 16.67 8. CMR 41-42-3 1.73 1.47 1.10 1.65 5.95 12.67 9. CMR 41-60-24 2.53 1.90 1.18 2.52 8.13 10.42 10. CMR 41-61-59 3.37 2.19 1.00 2.99 9.55 16.90 11. CMR 41-111-129 2.55 1.74 1.16 2.50 7.95 12.15 12. CMR 41-114-125 2.36 1.84 0.88 1.93 7.01 11.46 13. CMR 42-54-53 1.08 1.39 1.16 1.65 5.28 7.24 14. CMR 42-90-338 1.05 0.85 0.57 1.34 3.81 10.07 15. CMR 42-87-318 1.68 1.26 0.67 1.13 4.74 8.22 16. CMR 42-01-2 1.35 1.54 0.68 1.78 5.35 7.52 17. CMR 42-07-9 1.30 1.69 1.04 1.51 5.54 8.10 18. CMR 42-21-59 0.08 0.08 0.07 0.06 0.29 - 19. CMR 42-61-108 1.36 1.37 1.01 1.81 5.55 6.54 20. CMR 42-59-173 1.32 1.34 0.53 1.07 4.26 3.01 21. OMR 41-33-34 0.58 0.43 0.36 0.53 1.90 - 22. CMR 41-96-2 - - - - - - 23. CMR 41-20-58 1.83 1.38 0.71 1.77 5.69 8.10 24. CMR 35-22-196 0.38 0.69 0.35 0.67 2.09 - 25. Hanatee 1.52 0.89 0.36 0.92 3.69 5.10 Average
1.79
1.37
0.81
1.61
5.58
10.89
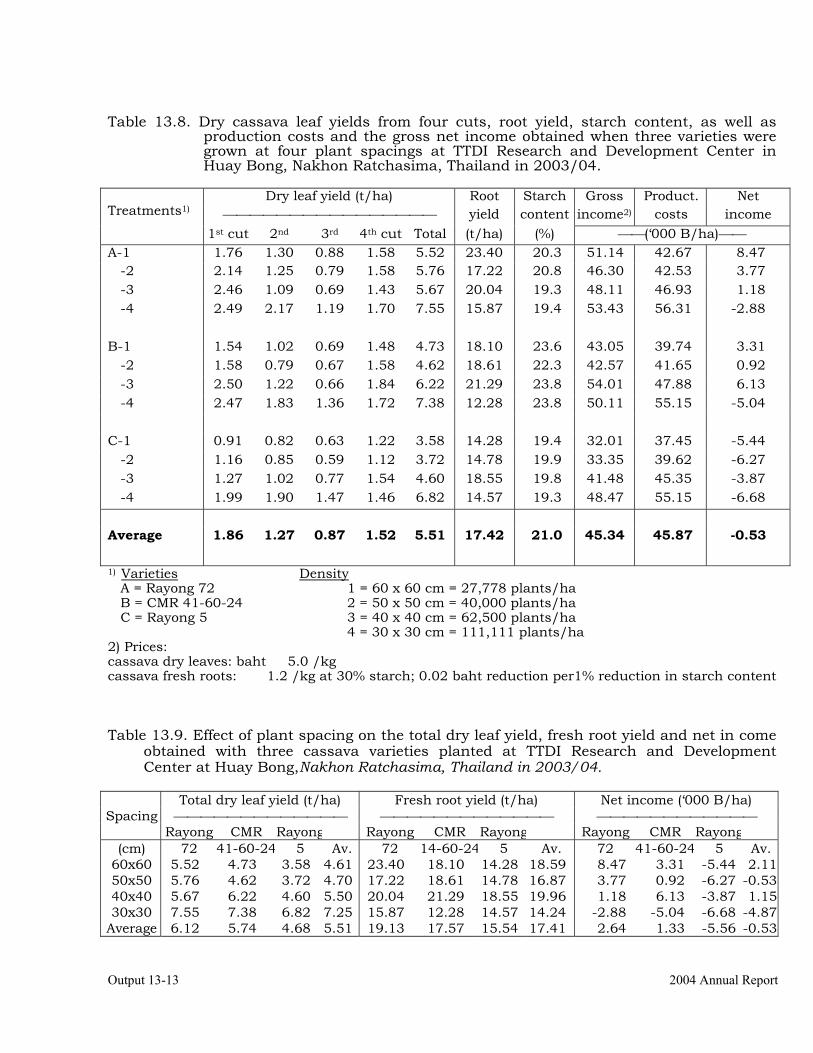
Output 13-13 2004 Annual Report
Table 13.8. Dry cassava leaf yields from four cuts, root yield, starch content, as well as
production costs and the gross net income obtained when three varieties were grown at four plant spacings at TTDI Research and Development Center in Huay Bong, Nakhon Ratchasima, Thailand in 2003/04.
Dry leaf yield (t/ha) Root Starch Gross Product. Net
yield content income2) costs income Treatments1)
1st cut 2nd
3rd
4th cut Total (t/ha) (%) (‘000 B/ha) A-1 1.76 1.30 0.88 1.58 5.52 23.40 20.3 51.14 42.67 8.47 -2 2.14 1.25 0.79 1.58 5.76 17.22 20.8 46.30 42.53 3.77 -3 2.46 1.09 0.69 1.43 5.67 20.04 19.3 48.11 46.93 1.18 -4 2.49 2.17 1.19 1.70 7.55 15.87 19.4 53.43 56.31 -2.88 B-1 1.54 1.02 0.69 1.48 4.73 18.10 23.6 43.05 39.74 3.31 -2 1.58 0.79 0.67 1.58 4.62 18.61 22.3 42.57 41.65 0.92 -3 2.50 1.22 0.66 1.84 6.22 21.29 23.8 54.01 47.88 6.13 -4 2.47 1.83 1.36 1.72 7.38 12.28 23.8 50.11 55.15 -5.04 C-1 0.91 0.82 0.63 1.22 3.58 14.28 19.4 32.01 37.45 -5.44 -2 1.16 0.85 0.59 1.12 3.72 14.78 19.9 33.35 39.62 -6.27 -3 1.27 1.02 0.77 1.54 4.60 18.55 19.8 41.48 45.35 -3.87 -4 1.99 1.90 1.47 1.46 6.82 14.57 19.3 48.47 55.15 -6.68 Average
1.86 1.27 0.87 1.52 5.51 17.42 21.0 45.34 45.87 -0.53
1) Varieties Density A = Rayong 72 1 = 60 x 60 cm = 27,778 plants/ha B = CMR 41-60-24 2 = 50 x 50 cm = 40,000 plants/ha C = Rayong 5 3 = 40 x 40 cm = 62,500 plants/ha 4 = 30 x 30 cm = 111,111 plants/ha 2) Prices: cassava dry leaves: baht 5.0 /kg cassava fresh roots: 1.2 /kg at 30% starch; 0.02 baht reduction per1% reduction in starch content Table 13.9. Effect of plant spacing on the total dry leaf yield, fresh root yield and net in come
obtained with three cassava varieties planted at TTDI Research and Development Center at Huay Bong,Nakhon Ratchasima, Thailand in 2003/04.
Total dry leaf yield (t/ha) Fresh root yield (t/ha) Net income (‘000 B/ha)
Spacing
Rayong CMR Rayong Rayong CMR Rayong Rayong CMR Rayong (cm) 72 41-60-24 5 Av. 72 14-60-24 5 Av. 72 41-60-24 5 Av.
60x60 5.52 4.73 3.58 4.61 23.40 18.10 14.28 18.59 8.47 3.31 -5.44 2.1150x50 5.76 4.62 3.72 4.70 17.22 18.61 14.78 16.87 3.77 0.92 -6.27 -0.5340x40 5.67 6.22 4.60 5.50 20.04 21.29 18.55 19.96 1.18 6.13 -3.87 1.1530x30 7.55 7.38 6.82 7.25 15.87 12.28 14.57 14.24 -2.88 -5.04 -6.68 -4.87
Average 6.12 5.74 4.68 5.51 19.13 17.57 15.54 17.41 2.64 1.33 -5.56 -0.53
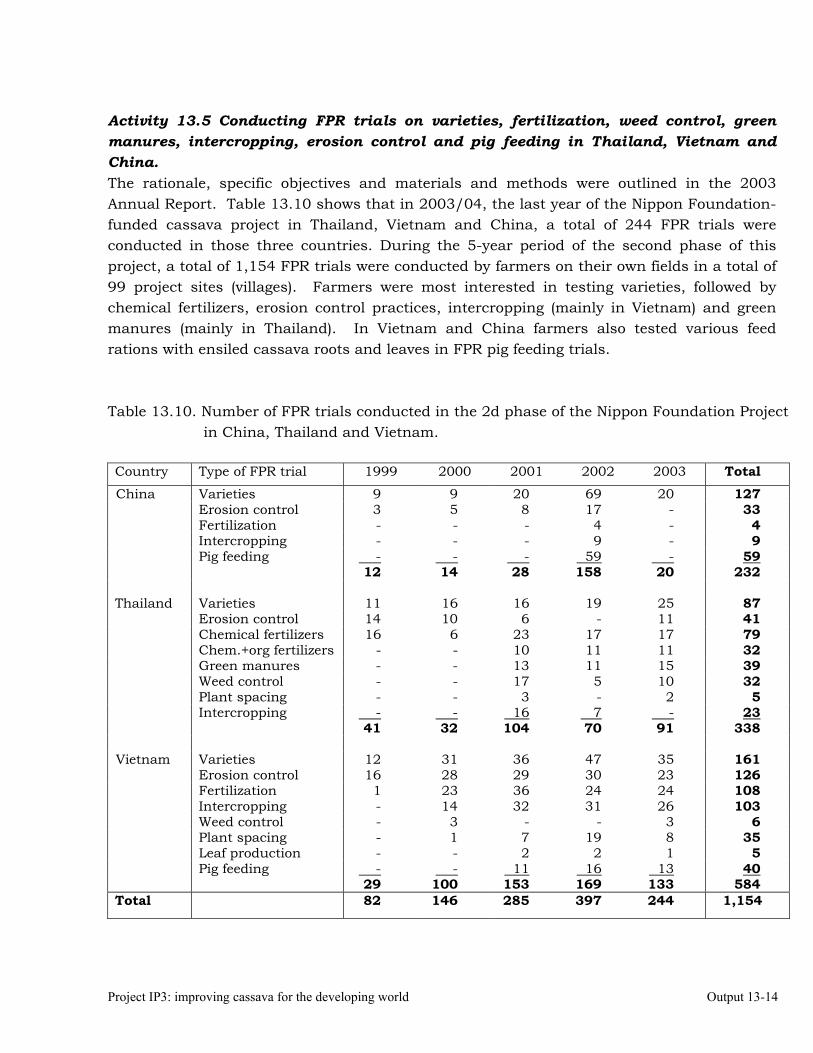
Project IP3: improving cassava for the developing world Output 13-14
Activity 13.5 Conducting FPR trials on varieties, fertilization, weed control, green manures, intercropping, erosion control and pig feeding in Thailand, Vietnam and China. The rationale, specific objectives and materials and methods were outlined in the 2003 Annual Report. Table 13.10 shows that in 2003/04, the last year of the Nippon Foundation-funded cassava project in Thailand, Vietnam and China, a total of 244 FPR trials were conducted in those three countries. During the 5-year period of the second phase of this project, a total of 1,154 FPR trials were conducted by farmers on their own fields in a total of 99 project sites (villages). Farmers were most interested in testing varieties, followed by chemical fertilizers, erosion control practices, intercropping (mainly in Vietnam) and green manures (mainly in Thailand). In Vietnam and China farmers also tested various feed rations with ensiled cassava roots and leaves in FPR pig feeding trials. Table 13.10. Number of FPR trials conducted in the 2d phase of the Nippon Foundation Project
in China, Thailand and Vietnam. Country Type of FPR trial 1999 2000 2001 2002 2003 Total China Varieties 9 9 20 69 20 127 Erosion control 3 5 8 17 - 33 Fertilization - - - 4 - 4 Intercropping - - - 9 - 9 Pig feeding - - - 59 - 59 12 14 28 158 20 232 Thailand Varieties 11 16 16 19 25 87 Erosion control 14 10 6 - 11 41 Chemical fertilizers 16 6 23 17 17 79 Chem.+org fertilizers - - 10 11 11 32 Green manures - - 13 11 15 39 Weed control - - 17 5 10 32 Plant spacing - - 3 - 2 5 Intercropping - - 16 7 - 23 41 32 104 70 91 338 Vietnam Varieties 12 31 36 47 35 161 Erosion control 16 28 29 30 23 126 Fertilization 1 23 36 24 24 108 Intercropping - 14 32 31 26 103 Weed control - 3 - - 3 6 Plant spacing - 1 7 19 8 35 Leaf production - - 2 2 1 5 Pig feeding - - 11 16 13 40 29 100 153 169 133 584 Total 82 146 285 397 244 1,154
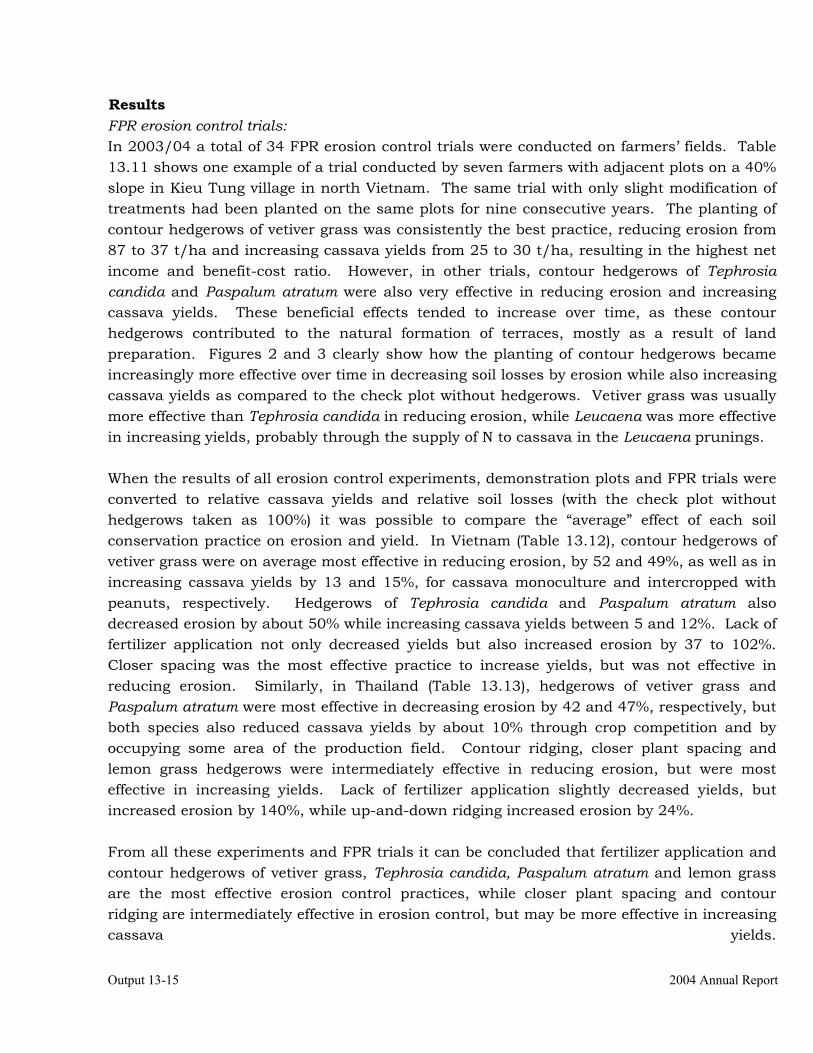
Output 13-15 2004 Annual Report
Results FPR erosion control trials: In 2003/04 a total of 34 FPR erosion control trials were conducted on farmers’ fields. Table 13.11 shows one example of a trial conducted by seven farmers with adjacent plots on a 40% slope in Kieu Tung village in north Vietnam. The same trial with only slight modification of treatments had been planted on the same plots for nine consecutive years. The planting of contour hedgerows of vetiver grass was consistently the best practice, reducing erosion from 87 to 37 t/ha and increasing cassava yields from 25 to 30 t/ha, resulting in the highest net income and benefit-cost ratio. However, in other trials, contour hedgerows of Tephrosia candida and Paspalum atratum were also very effective in reducing erosion and increasing cassava yields. These beneficial effects tended to increase over time, as these contour hedgerows contributed to the natural formation of terraces, mostly as a result of land preparation. Figures 2 and 3 clearly show how the planting of contour hedgerows became increasingly more effective over time in decreasing soil losses by erosion while also increasing cassava yields as compared to the check plot without hedgerows. Vetiver grass was usually more effective than Tephrosia candida in reducing erosion, while Leucaena was more effective in increasing yields, probably through the supply of N to cassava in the Leucaena prunings.
When the results of all erosion control experiments, demonstration plots and FPR trials were converted to relative cassava yields and relative soil losses (with the check plot without hedgerows taken as 100%) it was possible to compare the “average” effect of each soil conservation practice on erosion and yield. In Vietnam (Table 13.12), contour hedgerows of vetiver grass were on average most effective in reducing erosion, by 52 and 49%, as well as in increasing cassava yields by 13 and 15%, for cassava monoculture and intercropped with peanuts, respectively. Hedgerows of Tephrosia candida and Paspalum atratum also decreased erosion by about 50% while increasing cassava yields between 5 and 12%. Lack of fertilizer application not only decreased yields but also increased erosion by 37 to 102%. Closer spacing was the most effective practice to increase yields, but was not effective in reducing erosion. Similarly, in Thailand (Table 13.13), hedgerows of vetiver grass and Paspalum atratum were most effective in decreasing erosion by 42 and 47%, respectively, but both species also reduced cassava yields by about 10% through crop competition and by occupying some area of the production field. Contour ridging, closer plant spacing and lemon grass hedgerows were intermediately effective in reducing erosion, but were most effective in increasing yields. Lack of fertilizer application slightly decreased yields, but increased erosion by 140%, while up-and-down ridging increased erosion by 24%. From all these experiments and FPR trials it can be concluded that fertilizer application and contour hedgerows of vetiver grass, Tephrosia candida, Paspalum atratum and lemon grass are the most effective erosion control practices, while closer plant spacing and contour ridging are intermediately effective in erosion control, but may be more effective in increasing cassava yields.

Project IP3: improving cassava for the developing world Output 13-16
Figure 2. Trend in relative yield and relative soil loss by erosion when cassava was planted with contour hedgerows of vetiver grass or Tephrosia candida during nine consecutive years of cassava cropping. Data are average values for one FPR erosion control trial in Kieu Tung and two trials in Dong Rang in North Vietnam from 1995 to 2003.
0204060
80100
120140160
1 2 3 4 5 6 7 8 9
Rela
tive
yiel
d or
soi
l los
s (%
)
Year after p lanting hedgerows
Yield Soil lossVetiver =
Tephrosia =
check without hedgerows
Figure 3. Trend in relative yield and relative soil loss by erosion when cassava was planted with contour hedgerows of vetiver grass, Leucaena leucocephala or Gliricidia sepium in comparison with the check without hedgerows during six consecutive years in Hung Loc Agric. Research Center in South Vietnam from 1997 to 2003.
020
4060
80100
120140160
1 2 3 4 5 6 7
check without hedgerows
Yield Soil lossVetiver =
Leucaena =Gliricidia =
Rela
tive
yiel
d or
soi
l los
s (%
)
Year after p lanting hedgerows
Figure 2. Trend in relative yield and relative soil loss by erosion when cassava was planted with contour hedgerows of vetiver grass or Tephrosia candida during nine consecutive years of cassava cropping. Data are average values for one FPR erosion control trial in Kieu Tung and two trials in Dong Rang in North Vietnam from 1995 to 2003.
0204060
80100
120140160
1 2 3 4 5 6 7 8 9
Rela
tive
yiel
d or
soi
l los
s (%
)
Year after p lanting hedgerows
Yield Soil lossVetiver =
Tephrosia =
check without hedgerows
0204060
80100
120140160
1 2 3 4 5 6 7 8 9
Rela
tive
yiel
d or
soi
l los
s (%
)
Year after p lanting hedgerows
Yield Soil lossVetiver =
Tephrosia =
check without hedgerows
Figure 3. Trend in relative yield and relative soil loss by erosion when cassava was planted with contour hedgerows of vetiver grass, Leucaena leucocephala or Gliricidia sepium in comparison with the check without hedgerows during six consecutive years in Hung Loc Agric. Research Center in South Vietnam from 1997 to 2003.
020
4060
80100
120140160
1 2 3 4 5 6 7
check without hedgerows
Yield Soil lossVetiver =
Leucaena =Gliricidia =
Rela
tive
yiel
d or
soi
l los
s (%
)
Year after p lanting hedgerows
020
4060
80100
120140160
1 2 3 4 5 6 7020
4060
80100
120140160
1 2 3 4 5 6 7
check without hedgerows
Yield Soil lossVetiver =
Leucaena =Gliricidia =
Yield Soil lossVetiver =
Leucaena =Gliricidia =
Rela
tive
yiel
d or
soi
l los
s (%
)
Year after p lanting hedgerows
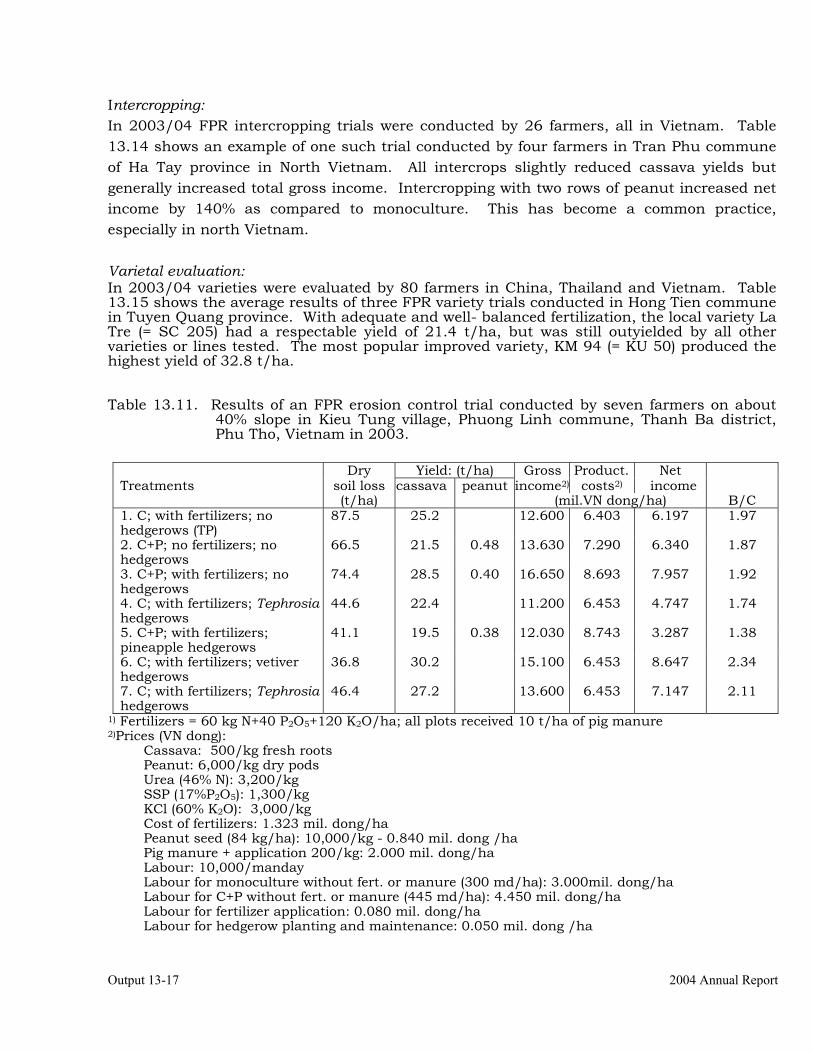
Output 13-17 2004 Annual Report
Intercropping: In 2003/04 FPR intercropping trials were conducted by 26 farmers, all in Vietnam. Table 13.14 shows an example of one such trial conducted by four farmers in Tran Phu commune of Ha Tay province in North Vietnam. All intercrops slightly reduced cassava yields but generally increased total gross income. Intercropping with two rows of peanut increased net income by 140% as compared to monoculture. This has become a common practice, especially in north Vietnam. Varietal evaluation: In 2003/04 varieties were evaluated by 80 farmers in China, Thailand and Vietnam. Table 13.15 shows the average results of three FPR variety trials conducted in Hong Tien commune in Tuyen Quang province. With adequate and well- balanced fertilization, the local variety La Tre (= SC 205) had a respectable yield of 21.4 t/ha, but was still outyielded by all other varieties or lines tested. The most popular improved variety, KM 94 (= KU 50) produced the highest yield of 32.8 t/ha. Table 13.11. Results of an FPR erosion control trial conducted by seven farmers on about
40% slope in Kieu Tung village, Phuong Linh commune, Thanh Ba district, Phu Tho, Vietnam in 2003.
Dry Yield: (t/ha) Gross Product. Net Treatments soil loss cassava peanut income2) costs2) income (t/ha) (mil.VN dong/ha) B/C 1. C; with fertilizers; no hedgerows (TP)
87.5 25.2 12.600 6.403 6.197 1.97
2. C+P; no fertilizers; no hedgerows
66.5 21.5 0.48 13.630 7.290 6.340 1.87
3. C+P; with fertilizers; no hedgerows
74.4 28.5 0.40 16.650 8.693 7.957 1.92
4. C; with fertilizers; Tephrosia hedgerows
44.6 22.4 11.200 6.453 4.747 1.74
5. C+P; with fertilizers; pineapple hedgerows
41.1 19.5 0.38 12.030 8.743 3.287 1.38
6. C; with fertilizers; vetiver hedgerows
36.8 30.2 15.100 6.453 8.647 2.34
7. C; with fertilizers; Tephrosia hedgerows
46.4 27.2 13.600 6.453 7.147 2.11
1) Fertilizers = 60 kg N+40 P2O5+120 K2O/ha; all plots received 10 t/ha of pig manure 2)Prices (VN dong):
Cassava: 500/kg fresh roots Peanut: 6,000/kg dry pods Urea (46% N): 3,200/kg SSP (17%P2O5): 1,300/kg KCl (60% K2O): 3,000/kg Cost of fertilizers: 1.323 mil. dong/ha Peanut seed (84 kg/ha): 10,000/kg - 0.840 mil. dong /ha Pig manure + application 200/kg: 2.000 mil. dong/ha Labour: 10,000/manday Labour for monoculture without fert. or manure (300 md/ha): 3.000mil. dong/ha Labour for C+P without fert. or manure (445 md/ha): 4.450 mil. dong/ha Labour for fertilizer application: 0.080 mil. dong/ha Labour for hedgerow planting and maintenance: 0.050 mil. dong /ha
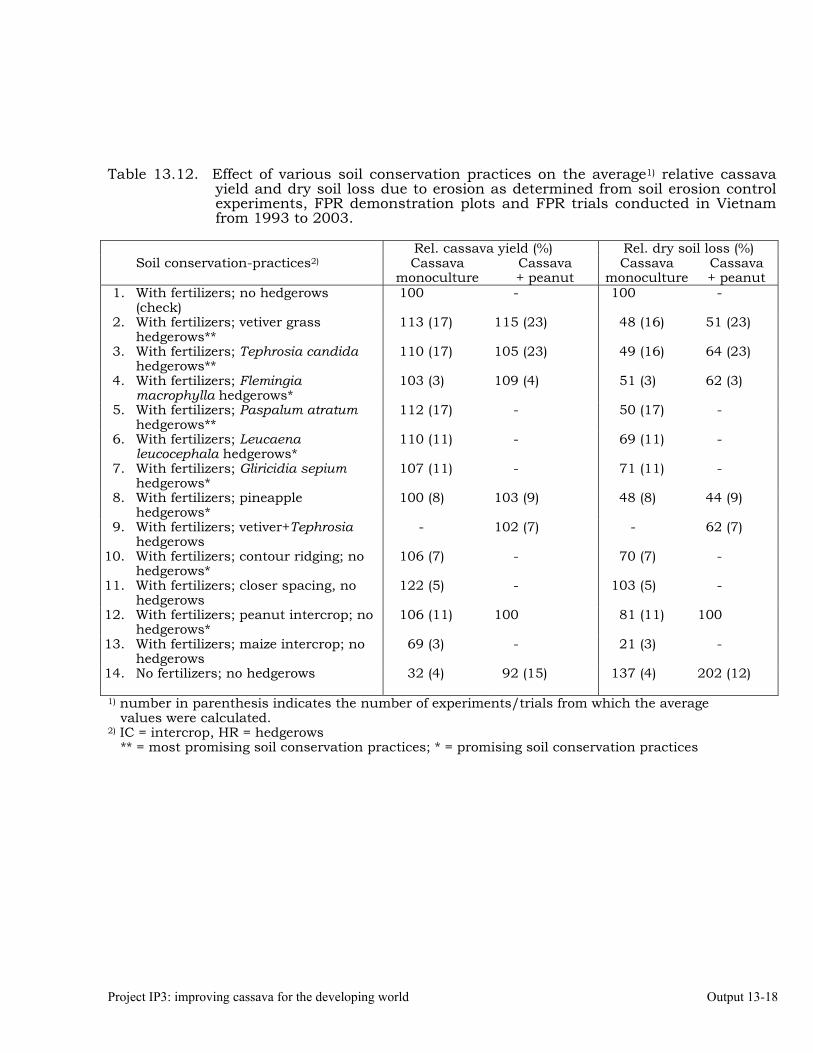
Project IP3: improving cassava for the developing world Output 13-18
Table 13.12. Effect of various soil conservation practices on the average1) relative cassava
yield and dry soil loss due to erosion as determined from soil erosion control experiments, FPR demonstration plots and FPR trials conducted in Vietnam from 1993 to 2003.
Rel. cassava yield (%) Rel. dry soil loss (%)
Soil conservation-practices2) Cassava
monoculture Cassava + peanut
Cassava monoculture
Cassava + peanut
1. With fertilizers; no hedgerows (check)
100 - 100 -
2. With fertilizers; vetiver grass hedgerows**
113 (17) 115 (23) 48 (16) 51 (23)
3. With fertilizers; Tephrosia candida hedgerows**
110 (17) 105 (23) 49 (16) 64 (23)
4. With fertilizers; Flemingia macrophylla hedgerows*
103 (3) 109 (4) 51 (3) 62 (3)
5. With fertilizers; Paspalum atratum hedgerows**
112 (17) - 50 (17) -
6. With fertilizers; Leucaena leucocephala hedgerows*
110 (11) - 69 (11) -
7. With fertilizers; Gliricidia sepium hedgerows*
107 (11) - 71 (11) -
8. With fertilizers; pineapple hedgerows*
100 (8) 103 (9) 48 (8) 44 (9)
9. With fertilizers; vetiver+Tephrosia hedgerows
- 102 (7) - 62 (7)
10. With fertilizers; contour ridging; no hedgerows*
106 (7) - 70 (7) -
11. With fertilizers; closer spacing, no hedgerows
122 (5) - 103 (5) -
12. With fertilizers; peanut intercrop; no hedgerows*
106 (11) 100 81 (11) 100
13. With fertilizers; maize intercrop; no hedgerows
69 (3) - 21 (3) -
14. No fertilizers; no hedgerows
32 (4) 92 (15) 137 (4) 202 (12)
1) number in parenthesis indicates the number of experiments/trials from which the average values were calculated. 2) IC = intercrop, HR = hedgerows ** = most promising soil conservation practices; * = promising soil conservation practices
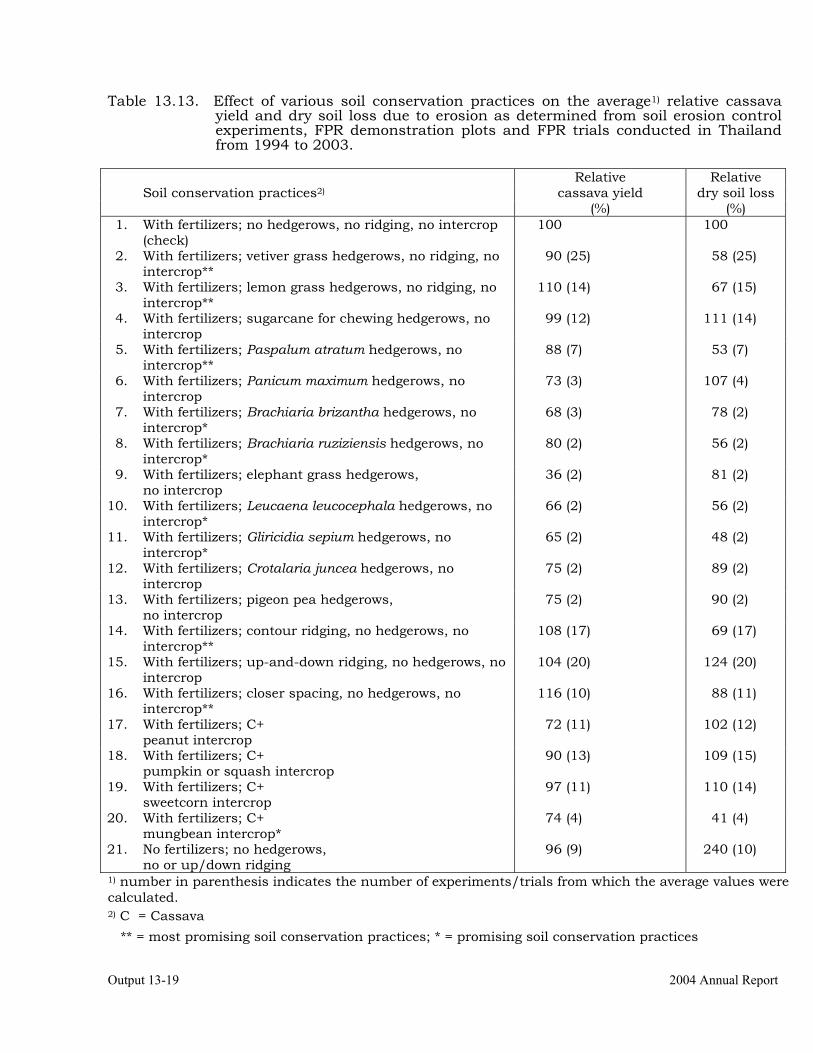
Output 13-19 2004 Annual Report
Table 13.13. Effect of various soil conservation practices on the average1) relative cassava yield and dry soil loss due to erosion as determined from soil erosion control experiments, FPR demonstration plots and FPR trials conducted in Thailand from 1994 to 2003.
Relative Relative cassava yield dry soil loss
Soil conservation practices2)
(%) (%) 1. With fertilizers; no hedgerows, no ridging, no intercrop
(check) 100 100
2. With fertilizers; vetiver grass hedgerows, no ridging, no intercrop**
90 (25) 58 (25)
3. With fertilizers; lemon grass hedgerows, no ridging, no intercrop**
110 (14) 67 (15)
4. With fertilizers; sugarcane for chewing hedgerows, no intercrop
99 (12) 111 (14)
5. With fertilizers; Paspalum atratum hedgerows, no intercrop**
88 (7) 53 (7)
6. With fertilizers; Panicum maximum hedgerows, no intercrop
73 (3) 107 (4)
7. With fertilizers; Brachiaria brizantha hedgerows, no intercrop*
68 (3) 78 (2)
8. With fertilizers; Brachiaria ruziziensis hedgerows, no intercrop*
80 (2) 56 (2)
9. With fertilizers; elephant grass hedgerows, no intercrop
36 (2) 81 (2)
10. With fertilizers; Leucaena leucocephala hedgerows, no intercrop*
66 (2) 56 (2)
11. With fertilizers; Gliricidia sepium hedgerows, no intercrop*
65 (2) 48 (2)
12. With fertilizers; Crotalaria juncea hedgerows, no intercrop
75 (2) 89 (2)
13. With fertilizers; pigeon pea hedgerows, no intercrop
75 (2) 90 (2)
14. With fertilizers; contour ridging, no hedgerows, no intercrop**
108 (17) 69 (17)
15. With fertilizers; up-and-down ridging, no hedgerows, no intercrop
104 (20) 124 (20)
16. With fertilizers; closer spacing, no hedgerows, no intercrop**
116 (10) 88 (11)
17. With fertilizers; C+ peanut intercrop
72 (11) 102 (12)
18. With fertilizers; C+ pumpkin or squash intercrop
90 (13) 109 (15)
19. With fertilizers; C+ sweetcorn intercrop
97 (11) 110 (14)
20. With fertilizers; C+ mungbean intercrop*
74 (4) 41 (4)
21. No fertilizers; no hedgerows, no or up/down ridging
96 (9) 240 (10)
1) number in parenthesis indicates the number of experiments/trials from which the average values were calculated. 2) C = Cassava ** = most promising soil conservation practices; * = promising soil conservation practices
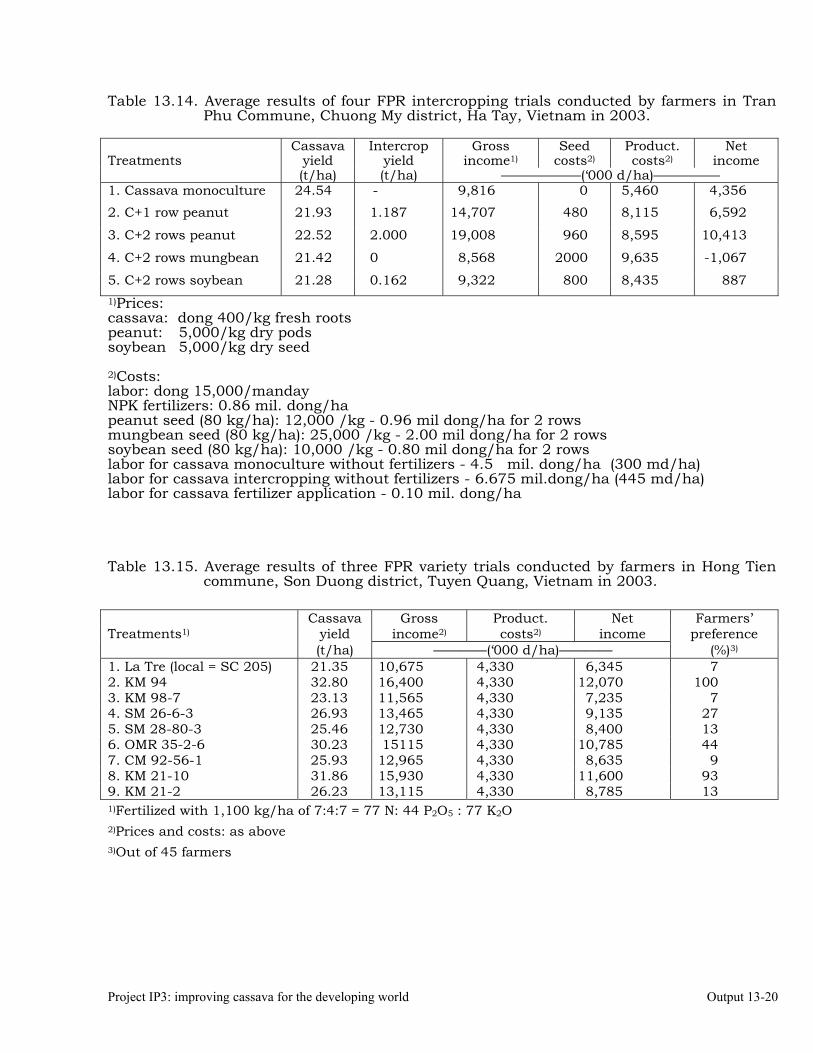
Project IP3: improving cassava for the developing world Output 13-20
Table 13.14. Average results of four FPR intercropping trials conducted by farmers in Tran Phu Commune, Chuong My district, Ha Tay, Vietnam in 2003.
Cassava Intercrop Gross Seed Product. Net
yield yield income1) costs2) costs2) income Treatments
(t/ha) (t/ha) ——————(‘000 d/ha)————— 1. Cassava monoculture 24.54 - 9,816 0 5,460 4,356
2. C+1 row peanut 21.93 1.187 14,707 480 8,115 6,592
3. C+2 rows peanut 22.52 2.000 19,008 960 8,595 10,413
4. C+2 rows mungbean 21.42 0 8,568 2000 9,635 -1,067
5. C+2 rows soybean 21.28 0.162 9,322 800 8,435 887 1)Prices: cassava: dong 400/kg fresh roots peanut: 5,000/kg dry pods soybean 5,000/kg dry seed 2)Costs: labor: dong 15,000/manday NPK fertilizers: 0.86 mil. dong/ha peanut seed (80 kg/ha): 12,000 /kg - 0.96 mil dong/ha for 2 rows mungbean seed (80 kg/ha): 25,000 /kg - 2.00 mil dong/ha for 2 rows soybean seed (80 kg/ha): 10,000 /kg - 0.80 mil dong/ha for 2 rows labor for cassava monoculture without fertilizers - 4.5 mil. dong/ha (300 md/ha) labor for cassava intercropping without fertilizers - 6.675 mil.dong/ha (445 md/ha) labor for cassava fertilizer application - 0.10 mil. dong/ha Table 13.15. Average results of three FPR variety trials conducted by farmers in Hong Tien
commune, Son Duong district, Tuyen Quang, Vietnam in 2003.
Cassava Gross Product. Net Farmers’ yield income2) costs2) income preference
Treatments1)
(t/ha) ————(‘000 d/ha)———— (%)3) 1. La Tre (local = SC 205) 21.35 10,675 4,330 6,345 7 2. KM 94 32.80 16,400 4,330 12,070 100 3. KM 98-7 23.13 11,565 4,330 7,235 7 4. SM 26-6-3 26.93 13,465 4,330 9,135 27 5. SM 28-80-3 25.46 12,730 4,330 8,400 13 6. OMR 35-2-6 30.23 15115 4,330 10,785 44 7. CM 92-56-1 25.93 12,965 4,330 8,635 9 8. KM 21-10 31.86 15,930 4,330 11,600 93 9. KM 21-2 26.23 13,115 4,330 8,785 13 1)Fertilized with 1,100 kg/ha of 7:4:7 = 77 N: 44 P2O5 : 77 K2O 2)Prices and costs: as above 3)Out of 45 farmers
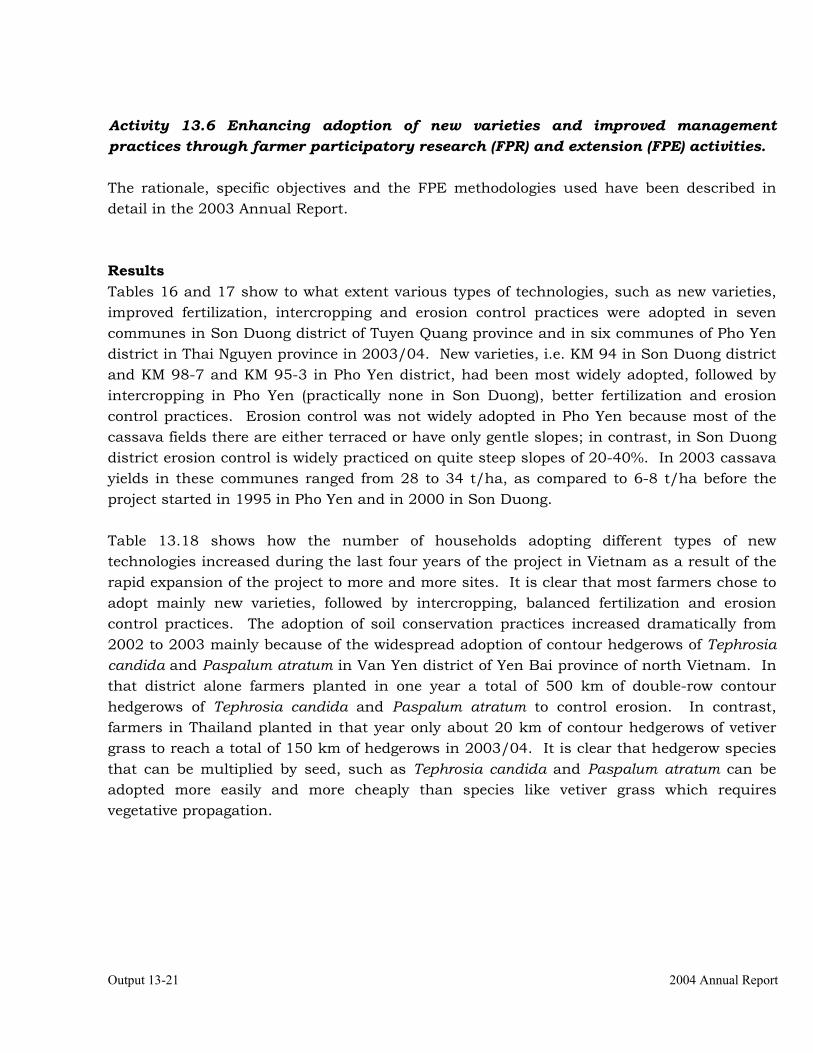
Output 13-21 2004 Annual Report
Activity 13.6 Enhancing adoption of new varieties and improved management practices through farmer participatory research (FPR) and extension (FPE) activities. The rationale, specific objectives and the FPE methodologies used have been described in detail in the 2003 Annual Report. Results Tables 16 and 17 show to what extent various types of technologies, such as new varieties, improved fertilization, intercropping and erosion control practices were adopted in seven communes in Son Duong district of Tuyen Quang province and in six communes of Pho Yen district in Thai Nguyen province in 2003/04. New varieties, i.e. KM 94 in Son Duong district and KM 98-7 and KM 95-3 in Pho Yen district, had been most widely adopted, followed by intercropping in Pho Yen (practically none in Son Duong), better fertilization and erosion control practices. Erosion control was not widely adopted in Pho Yen because most of the cassava fields there are either terraced or have only gentle slopes; in contrast, in Son Duong district erosion control is widely practiced on quite steep slopes of 20-40%. In 2003 cassava yields in these communes ranged from 28 to 34 t/ha, as compared to 6-8 t/ha before the project started in 1995 in Pho Yen and in 2000 in Son Duong. Table 13.18 shows how the number of households adopting different types of new technologies increased during the last four years of the project in Vietnam as a result of the rapid expansion of the project to more and more sites. It is clear that most farmers chose to adopt mainly new varieties, followed by intercropping, balanced fertilization and erosion control practices. The adoption of soil conservation practices increased dramatically from 2002 to 2003 mainly because of the widespread adoption of contour hedgerows of Tephrosia candida and Paspalum atratum in Van Yen district of Yen Bai province of north Vietnam. In that district alone farmers planted in one year a total of 500 km of double-row contour hedgerows of Tephrosia candida and Paspalum atratum to control erosion. In contrast, farmers in Thailand planted in that year only about 20 km of contour hedgerows of vetiver grass to reach a total of 150 km of hedgerows in 2003/04. It is clear that hedgerow species that can be multiplied by seed, such as Tephrosia candida and Paspalum atratum can be adopted more easily and more cheaply than species like vetiver grass which requires vegetative propagation.
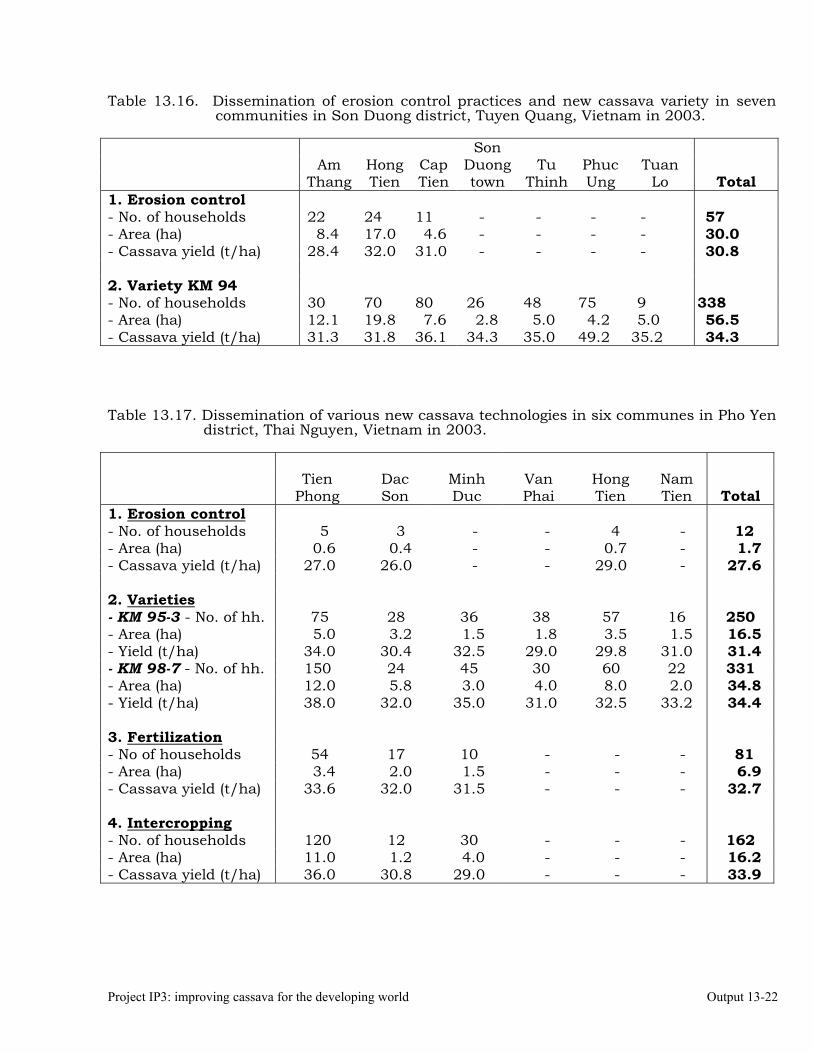
Project IP3: improving cassava for the developing world Output 13-22
Table 13.16. Dissemination of erosion control practices and new cassava variety in seven communities in Son Duong district, Tuyen Quang, Vietnam in 2003.
Son Am Hong Cap Duong Tu Phuc Tuan Thang Tien Tien town Thinh Ung Lo Total 1. Erosion control - No. of households 22 24 11 - - - - 57 - Area (ha) 8.4 17.0 4.6 - - - - 30.0 - Cassava yield (t/ha) 28.4 32.0 31.0 - - - - 30.8 2. Variety KM 94 - No. of households 30 70 80 26 48 75 9 338 - Area (ha) 12.1 19.8 7.6 2.8 5.0 4.2 5.0 56.5 - Cassava yield (t/ha) 31.3 31.8 36.1 34.3 35.0 49.2 35.2 34.3 Table 13.17. Dissemination of various new cassava technologies in six communes in Pho Yen
district, Thai Nguyen, Vietnam in 2003. Tien Dac Minh Van Hong Nam Phong Son Duc Phai Tien Tien Total 1. Erosion control - No. of households 5 3 - - 4 - 12 - Area (ha) 0.6 0.4 - - 0.7 - 1.7 - Cassava yield (t/ha) 27.0 26.0 - - 29.0 - 27.6 2. Varieties - KM 95-3 - No. of hh. 75 28 36 38 57 16 250 - Area (ha) 5.0 3.2 1.5 1.8 3.5 1.5 16.5 - Yield (t/ha) 34.0 30.4 32.5 29.0 29.8 31.0 31.4 - KM 98-7 - No. of hh. 150 24 45 30 60 22 331 - Area (ha) 12.0 5.8 3.0 4.0 8.0 2.0 34.8 - Yield (t/ha) 38.0 32.0 35.0 31.0 32.5 33.2 34.4 3. Fertilization - No of households 54 17 10 - - - 81 - Area (ha) 3.4 2.0 1.5 - - - 6.9 - Cassava yield (t/ha) 33.6 32.0 31.5 - - - 32.7 4. Intercropping - No. of households 120 12 30 - - - 162 - Area (ha) 11.0 1.2 4.0 - - - 16.2 - Cassava yield (t/ha) 36.0 30.8 29.0 - - - 33.9
Output 13-23 2004 Annual Report
Table 13.18. Trend of adoption of new cassava technologies in the Nippon Foundation project sites in Vietnam from 2000 to 2003.
Number of households adopting ————————————————
Technology component
2000 2001 2002 2003 1. New varieties 88 447 1,637 14,820 2. Improved fertilization 64 123 157 1,710 3. Soil conservation practices 62 200 222 831 4. Intercropping 127 360 689 4,250 5. Pig feeding with cassava root silage - 759 967 1,172 1)Number of project sites: 1999 = 9; 2000=15; 2001=22; 2002=25; 2003=34
Source: Tran Ngoc Ngoan, 2003. Activity 13.7 Assessing the impact of the project on adoption of new technologies in Thailand and Vietnam The Nippon Foundation Project has tested and disseminated new cassava technologies in Thailand, Vietnam and China for ten years using farmer participatory approaches; at the end of the second phase it was decided to assess the impact of the project, and especially the FPR and FPE methodologies used, on the adoption of new technologies and on the institutionalization of the participatory approach. Materials and Methods The impact assessment was done by an outside consultant in consultation with CIAT and PRGA staff and in collaboration with national scientists in Thailand and Vietnam. For this assessment, both “participating” and “non-participating” farmers in four “project” and four “non-project” sites in each country were asked to fill in census forms for themselves and for 2-3 neighbors; this was followed by focus group discussions. The eight project sites were selected as being representative of all project sites, while the non-project sites were nearby villages (within 10 km of project sites) where the project had not been active. “Participating farmers” were defined as those that had either conducted FPR trials and/or had participated in FPR training courses, while “non-participating farmers” had not conducted trials or participated in training courses, but might have participated in field days organized by the project. Results Table 13.19 shows the extent of adoption (% of households) of various types of new technologies by both “participating” and “non-participating” farmers in Thailand and Vietnam. New varieties were widely adopted by both participating and non-participating
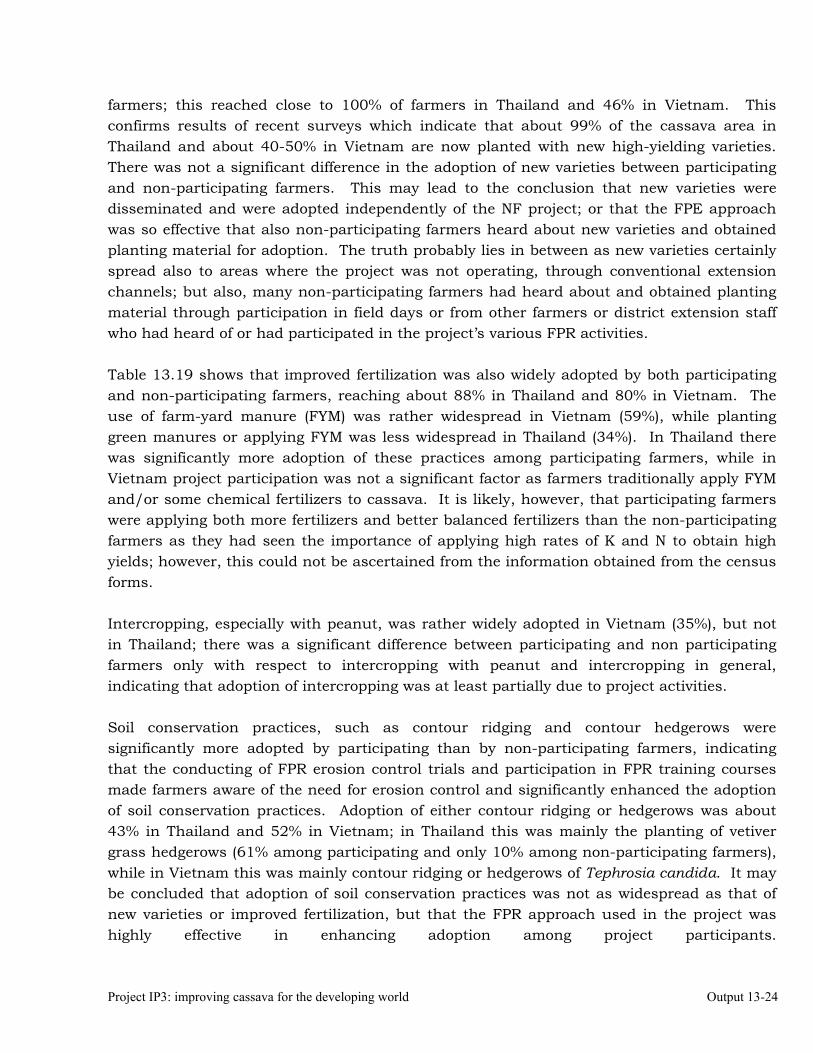
Project IP3: improving cassava for the developing world Output 13-24
farmers; this reached close to 100% of farmers in Thailand and 46% in Vietnam. This confirms results of recent surveys which indicate that about 99% of the cassava area in Thailand and about 40-50% in Vietnam are now planted with new high-yielding varieties. There was not a significant difference in the adoption of new varieties between participating and non-participating farmers. This may lead to the conclusion that new varieties were disseminated and were adopted independently of the NF project; or that the FPE approach was so effective that also non-participating farmers heard about new varieties and obtained planting material for adoption. The truth probably lies in between as new varieties certainly spread also to areas where the project was not operating, through conventional extension channels; but also, many non-participating farmers had heard about and obtained planting material through participation in field days or from other farmers or district extension staff who had heard of or had participated in the project’s various FPR activities. Table 13.19 shows that improved fertilization was also widely adopted by both participating and non-participating farmers, reaching about 88% in Thailand and 80% in Vietnam. The use of farm-yard manure (FYM) was rather widespread in Vietnam (59%), while planting green manures or applying FYM was less widespread in Thailand (34%). In Thailand there was significantly more adoption of these practices among participating farmers, while in Vietnam project participation was not a significant factor as farmers traditionally apply FYM and/or some chemical fertilizers to cassava. It is likely, however, that participating farmers were applying both more fertilizers and better balanced fertilizers than the non-participating farmers as they had seen the importance of applying high rates of K and N to obtain high yields; however, this could not be ascertained from the information obtained from the census forms. Intercropping, especially with peanut, was rather widely adopted in Vietnam (35%), but not in Thailand; there was a significant difference between participating and non participating farmers only with respect to intercropping with peanut and intercropping in general, indicating that adoption of intercropping was at least partially due to project activities. Soil conservation practices, such as contour ridging and contour hedgerows were significantly more adopted by participating than by non-participating farmers, indicating that the conducting of FPR erosion control trials and participation in FPR training courses made farmers aware of the need for erosion control and significantly enhanced the adoption of soil conservation practices. Adoption of either contour ridging or hedgerows was about 43% in Thailand and 52% in Vietnam; in Thailand this was mainly the planting of vetiver grass hedgerows (61% among participating and only 10% among non-participating farmers), while in Vietnam this was mainly contour ridging or hedgerows of Tephrosia candida. It may be concluded that adoption of soil conservation practices was not as widespread as that of new varieties or improved fertilization, but that the FPR approach used in the project was highly effective in enhancing adoption among project participants.
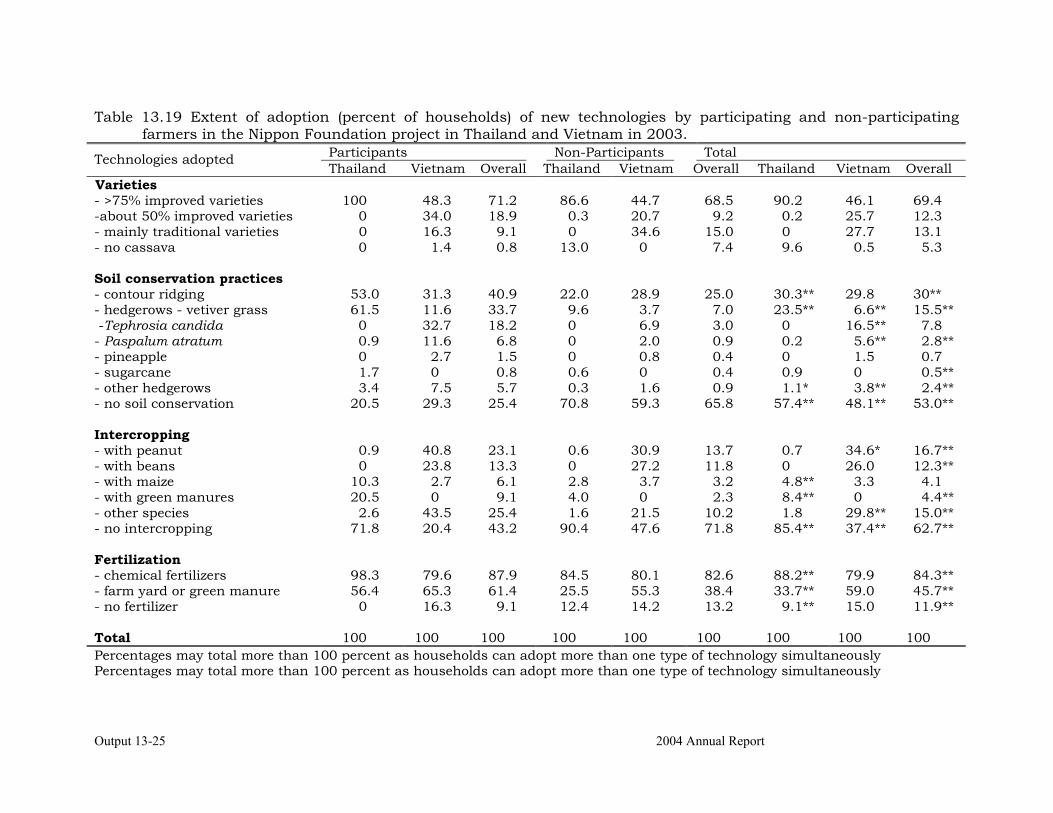
Output 13-25 2004 Annual Report
Table 13.19 Extent of adoption (percent of households) of new technologies by participating and non-participating farmers in the Nippon Foundation project in Thailand and Vietnam in 2003.
Participants Non-Participants Total Technologies adopted Thailand Vietnam Overall Thailand Vietnam Overall Thailand Vietnam Overall
Varieties - >75% improved varieties 100 48.3 71.2 86.6 44.7 68.5 90.2 46.1 69.4 -about 50% improved varieties 0 34.0 18.9 0.3 20.7 9.2 0.2 25.7 12.3 - mainly traditional varieties 0 16.3 9.1 0 34.6 15.0 0 27.7 13.1 - no cassava 0 1.4 0.8 13.0 0 7.4 9.6 0.5 5.3 Soil conservation practices - contour ridging 53.0 31.3 40.9 22.0 28.9 25.0 30.3** 29.8 30** - hedgerows - vetiver grass 61.5 11.6 33.7 9.6 3.7 7.0 23.5** 6.6** 15.5** -Tephrosia candida 0 32.7 18.2 0 6.9 3.0 0 16.5** 7.8 - Paspalum atratum 0.9 11.6 6.8 0 2.0 0.9 0.2 5.6** 2.8** - pineapple 0 2.7 1.5 0 0.8 0.4 0 1.5 0.7 - sugarcane 1.7 0 0.8 0.6 0 0.4 0.9 0 0.5** - other hedgerows 3.4 7.5 5.7 0.3 1.6 0.9 1.1* 3.8** 2.4** - no soil conservation 20.5 29.3 25.4 70.8 59.3 65.8 57.4** 48.1** 53.0** Intercropping - with peanut 0.9 40.8 23.1 0.6 30.9 13.7 0.7 34.6* 16.7** - with beans 0 23.8 13.3 0 27.2 11.8 0 26.0 12.3** - with maize 10.3 2.7 6.1 2.8 3.7 3.2 4.8** 3.3 4.1 - with green manures 20.5 0 9.1 4.0 0 2.3 8.4** 0 4.4** - other species 2.6 43.5 25.4 1.6 21.5 10.2 1.8 29.8** 15.0** - no intercropping 71.8 20.4 43.2 90.4 47.6 71.8 85.4** 37.4** 62.7** Fertilization - chemical fertilizers 98.3 79.6 87.9 84.5 80.1 82.6 88.2** 79.9 84.3** - farm yard or green manure 56.4 65.3 61.4 25.5 55.3 38.4 33.7** 59.0 45.7** - no fertilizer 0 16.3 9.1 12.4 14.2 13.2 9.1** 15.0 11.9** Total 100 100 100 100 100 100 100 100 100 Percentages may total more than 100 percent as households can adopt more than one type of technology simultaneously Percentages may total more than 100 percent as households can adopt more than one type of technology simultaneously
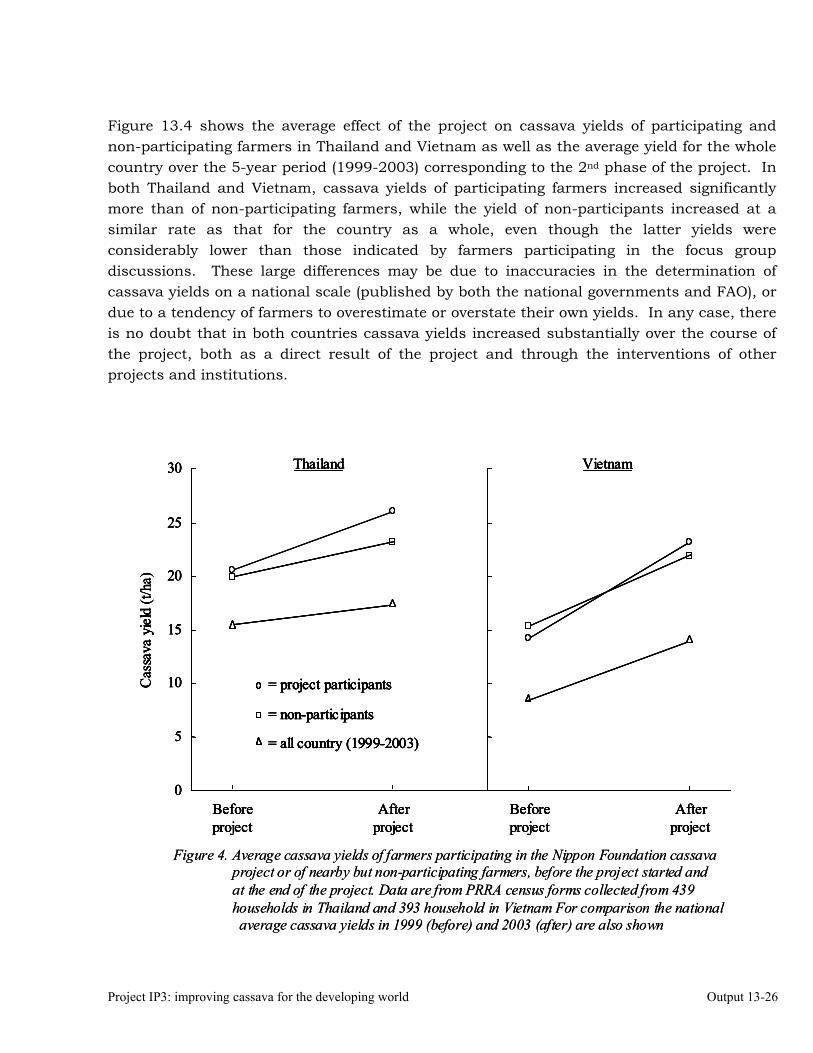
Project IP3: improving cassava for the developing world Output 13-26
Figure 13.4 shows the average effect of the project on cassava yields of participating and non-participating farmers in Thailand and Vietnam as well as the average yield for the whole country over the 5-year period (1999-2003) corresponding to the 2nd phase of the project. In both Thailand and Vietnam, cassava yields of participating farmers increased significantly more than of non-participating farmers, while the yield of non-participants increased at a similar rate as that for the country as a whole, even though the latter yields were considerably lower than those indicated by farmers participating in the focus group discussions. These large differences may be due to inaccuracies in the determination of cassava yields on a national scale (published by both the national governments and FAO), or due to a tendency of farmers to overestimate or overstate their own yields. In any case, there is no doubt that in both countries cassava yields increased substantially over the course of the project, both as a direct result of the project and through the interventions of other projects and institutions.
0
5
10
15
20
25
30
Beforeproject
Afterproject
Beforeproject
Afterproject
= project participants
= non-participants
= all country (1999-2003)
Thailand Vietnam
Cas
sava
yie
ld (t
/ha)
Figure 4. Average cassava yields of farmers participating in the Nippon Foundation cassavaproject or of nearby but non-participating farmers, before the project started and at the end of the project. Data are from PRRA census forms collected from 439households in Thailand and 393 household in Vietnam For comparison the nationalaverage cassava yields in 1999 (before) and 2003 (after) are also shown
0
5
10
15
20
25
30
Beforeproject
Afterproject
Beforeproject
Afterproject
= project participants
= non-participants
= all country (1999-2003)
Thailand Vietnam
Cas
sava
yie
ld (t
/ha)
0
5
10
15
20
25
30
Beforeproject
Afterproject
Beforeproject
Afterproject
= project participants
= non-participants
= all country (1999-2003)
Thailand Vietnam
Cas
sava
yie
ld (t
/ha)
0
5
10
15
20
25
30
Beforeproject
Afterproject
Beforeproject
Afterproject
= project participants
= non-participants
= all country (1999-2003)
= project participants
= non-participants
= all country (1999-2003)
Thailand Vietnam
Cas
sava
yie
ld (t
/ha)
Figure 4. Average cassava yields of farmers participating in the Nippon Foundation cassavaproject or of nearby but non-participating farmers, before the project started and at the end of the project. Data are from PRRA census forms collected from 439households in Thailand and 393 household in Vietnam For comparison the nationalaverage cassava yields in 1999 (before) and 2003 (after) are also shown

Output 13-27 2004 Annual Report
In Table 13.20 the annual increase in gross income due to these higher cassava yields are estimated using cassava area and yield data for 1994 and 2003 as published by FAO for China, Thailand and Vietnam. In China yields increased only 1.04 t/ha over this 10-year period resulting in an annual increase in gross income of 6.7 million US dollars; in Thailand yields increased 3.74 t/ha over an area of slightly more than 1 million hectares, resulting in an increase in gross income of 86.4 million dollars, and in Vietnam yields increased a remarkable 5.63 t/ha resulting in about 52.3 million dollars per year extra income for cassava farmers. Finally, for the whole of Asia, yields increased 3.17 t/ha resulting in an annual additional income of nearly 272 million US dollars for cassava farmers in Asia. This was achieved through the active and effective collaboration between CIAT and scientists and extension workers in many national programs in Asia. Table 13.20. Estimated increase in gross income of cassava farmers in China, Thailand,
Vietnam and in a total of 12 countries of Asia as a result of increased cassava yields in 2003 as compared to 1994.
Total cassava
area
Cassava yield
(t/ha)1)
Yield
Increase
Cassava
price
Increased gross income due to higher yields
(ha)1) 1994 2003 (t/ha) ($/tonne) (mil. US$) China 240,108 15.21 16.25 1.04 27 6.7
Thailand 1,050,000 13.81 17.55 3.74 22 86.4 2)
Vietnam 371,700 8.44 14.07 5.63 25 52.3
Asia total
3,430,688 12.95 16.12 3.17 25 271.9
1) Data from FAOSTAT for 2003 2) In addition, farmers also benefited from higher prices due to higher starch content Activity 13.8 Exploring institutional arrangements for collaboration in the new Nippon Foundation-funded cassava project in Laos and Cambodia, and the ACIAR-funded cassava project in Indonesia and East Timor. Rationale The CIAT Cassava Office in Asia, located in Bangkok, Thailand, works in close collaboration with researchers and extensionists in national institutions where the various projects are being implemented. Thus, with the start of two new projects in 2004 to be implemented in
Project IP3: improving cassava for the developing world Output 13-28
four countries, it was necessary to explore the most suitable institutional arrangements for this collaboration. Specific Objectives To discuss with administrators of various national research and development institutions the objectives and proposed activities of the new cassava projects and to request their collaboration in the execution of the projects. Results For the new Nippon Foundation-funded cassava project, collaborative arrangements were explored with national institutions in Lao PDR and Cambodia. In Lao PDR meetings were arranged with Dr. Ty Phommasack, Vice Minister of Agric. and Foresty, and with Dr. Bounthong Bouahom, Acting Director General of NAFRI, to explain the project and to request permission and collaboration for implementing the project. The project will be implemented mainly through NAFRI at the national level, and with assistance from the Provincial and District Agric. and Forestry Offices (PAFO and DAFO) of those Provinces and Districts where the project will be actively involved. In Cambodia meetings were arranged with Dr. Men Sarom, Director of the Cambodia Agric. Research and Development Institute (CARDI) and his staff; with Dr. Kieu Borin, Director of the Center for Livestock and Agric. Development (CelAgrid), and with Mr. Eun Jun Choi, Managing Director of CJ Cambodia Co., Ltd., a Korean company with a 2000 ha cassava plantation with starch factory in Kampong Speu. It was agreed that most agronomic research and on-farm testing would be done in collaboration with the Agronomy and Farming Systems Department of CARDI, while some animal feeding trials and training might be conducted through CelAgrid. Some agronomic trials may also be conducted by the CJ Cambodia Co. at their own plantation and at their own expense; they in turn can provide the project with planting material of a few promising varieties. For the new ACIAR-funded project, collaborative arrangements were explored with Brawijaya University (UNIBRAW), with the Research Institute for Legumes and Tuber Crops (RILET) and with the Assessment Institute for Agricultural Technologies (BPTP), all in Malang, East Java; as well as with the Central Research Institute for Food Crops and the Soil Research Institute, both in Bogor, West Java. It was agreed that Dr. Bambang Guritno, Rector of Brawijaya University, would be the project leader in Indonesia, while Dr. Wani Hadi Utomo, soil scientist at UNIBRAW, would be the project coordinator, to coordinate all activities among the various participating institutions in Indonesia. In East Timor a meeting was arranged with Mr. Francisco Benevides, Vice Minister of Agriculture, Forestry and Fisheries (MAFF), and Mr. Lourenco Fontes, Director of the
Output 13-29 2004 Annual Report
Research and Extension Center of MAFF, to explain the project and request their permission and collaboration. It was agreed that the project would be implemented in ET under the leadership of Mr. Lourenco Fontes and with collaboration of personnel from the Research and Extension Center. In addition, Mr. Acacio da Costa Guterres, Head of the Dept. of Agronomy of the National Univ. of East Timor, will coordinate some specific cassava projects to be done with students. Activity 13.9 Implementing the new Nippon Foundation-funded Cassava Project in Lao PDR and Cambodia Rationale In both Lao PDR and Cambodia cassava is mainly used for human consumption in times of food scarcity, usually during the months before the rice harvest, i.e. in Sept-Dec. Very little is presently used for on-farm animal feeding. In Cambodia, some cassava is also used for starch production, mainly by very small starch processors in Kampong Cham province and by 2-3 bigger factories in Kampong Cham and Kampong Speu provinces. In Lao PDR the few local cassava varieties tend to be eating varieties, very tall but with low root yields. In Cambodia there are 2-3 eating varieties, which are often harvested before six months for sale in the local market, as well as one high-yield and high-starch variety, called KM 94, introduced recently from Vietnam and suitable for starch extraction. Both countries could benefit from the introduction, multiplication and widespread adoption of higher yielding varieties, which could be used for on-farm animal feeding as well as for sale to starch factories, the latter mainly in Cambodia Specific Objectives
1. To introduce and evaluate promising Thai and Vietnamese varieties into Lao PDR and Cambodia
2. To determine the fertilizer requirements of new high-yielding cassava varieties in different soil types in Lao PDR and Cambodia
Materials and Methods Planting material of eight promising cassava varieties, both for eating and processing, were introduced from Thailand into Lao PDR and Cambodia, while a small amount of stakes of three eating varieties from Vietnam were introduced into Lao PDR. These varieties were evaluated and multiplied both in replicated experiments in experiment stations and in on-farm trials in 18 villages in various districts in Luang Prabang, Oudomxay and Xieng Khouang provinces (Table 13.21). In the latter two provinces the trials were planted by
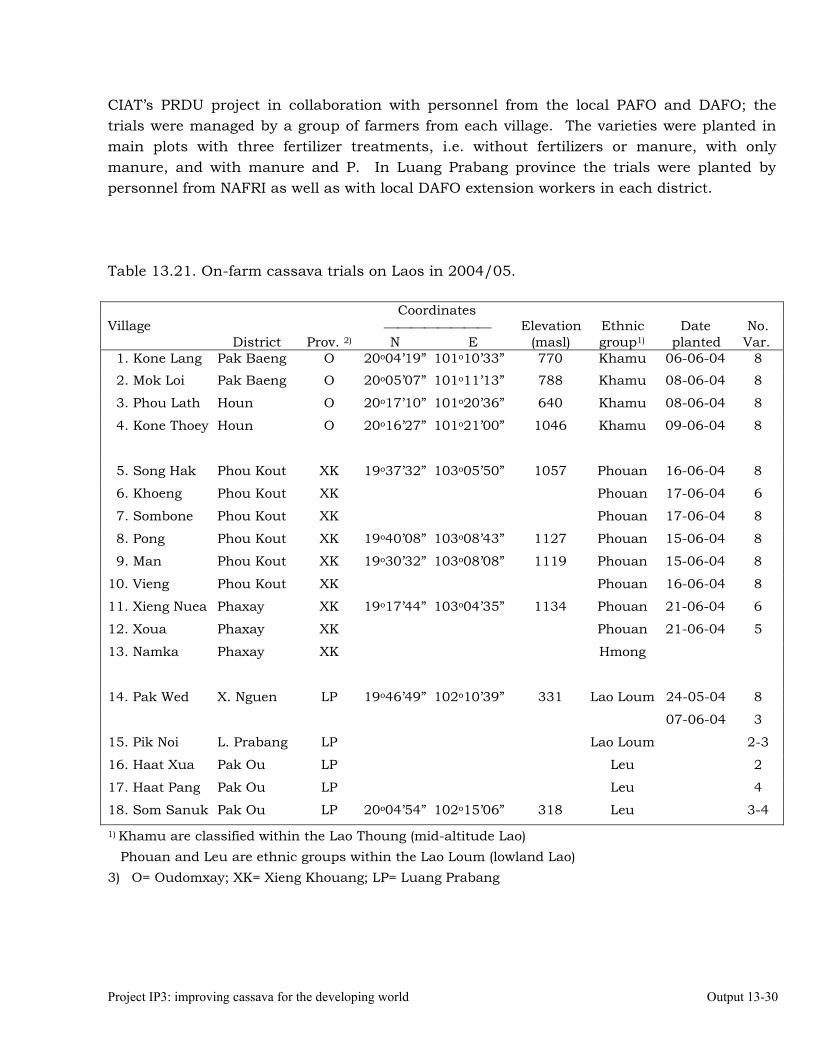
Project IP3: improving cassava for the developing world Output 13-30
CIAT’s PRDU project in collaboration with personnel from the local PAFO and DAFO; the trials were managed by a group of farmers from each village. The varieties were planted in main plots with three fertilizer treatments, i.e. without fertilizers or manure, with only manure, and with manure and P. In Luang Prabang province the trials were planted by personnel from NAFRI as well as with local DAFO extension workers in each district. Table 13.21. On-farm cassava trials on Laos in 2004/05.
Coordinates Elevation Ethnic Date No.
Village
District Prov. 2) N E (masl) group1) planted Var. 1. Kone Lang Pak Baeng O 20o04’19” 101o10’33” 770 Khamu 06-06-04 8
2. Mok Loi Pak Baeng O 20o05’07” 101o11’13” 788 Khamu 08-06-04 8
3. Phou Lath Houn O 20o17’10” 101o20’36” 640 Khamu 08-06-04 8
4. Kone Thoey Houn O 20o16’27” 101o21’00” 1046 Khamu 09-06-04 8
5. Song Hak Phou Kout XK 19o37’32” 103o05’50” 1057 Phouan 16-06-04 8
6. Khoeng Phou Kout XK Phouan 17-06-04 6
7. Sombone Phou Kout XK Phouan 17-06-04 8
8. Pong Phou Kout XK 19o40’08” 103o08’43” 1127 Phouan 15-06-04 8
9. Man Phou Kout XK 19o30’32” 103o08’08” 1119 Phouan 15-06-04 8
10. Vieng Phou Kout XK Phouan 16-06-04 8
11. Xieng Nuea Phaxay XK 19o17’44” 103o04’35” 1134 Phouan 21-06-04 6
12. Xoua Phaxay XK Phouan 21-06-04 5
13. Namka Phaxay XK Hmong
14. Pak Wed X. Nguen LP 19o46’49” 102o10’39” 331 Lao Loum 24-05-04 8
07-06-04 3
15. Pik Noi L. Prabang LP Lao Loum 2-3
16. Haat Xua Pak Ou LP Leu 2
17. Haat Pang Pak Ou LP Leu 4
18. Som Sanuk Pak Ou LP 20o04’54” 102o15’06” 318 Leu 3-4
1) Khamu are classified within the Lao Thoung (mid-altitude Lao) Phouan and Leu are ethnic groups within the Lao Loum (lowland Lao) 3) O= Oudomxay; XK= Xieng Khouang; LP= Luang Prabang
Output 13-31 2004 Annual Report
Results In Oct 2004, when plants were about 3-4 month old, plant growth was quite vigorous in Luang Prabang and Oudomxay provinces, but was slow in Xieng Khouang province, probably because of the lower temperature at higher elevation (1000-1100 masl) and the extremely acid and low-P soils. In most trials in Xieng Khouang, cassava plants showed a clear visual response to application of manure and especially to manure + P. In general, the local varieties were tall but with symptoms of N deficiency; of the introduced varieties, Kasetsart 50 and Rayong 72 were the most vigorous. Collaborators: Within CIAT: Rod Lefroy, Coordinator in Asia, Vientiane, Laos Keith Farney, PRDU Project, Vientiane, Laos Lao Thao, PRDU Project, Vientiane, Laos Hernán Ceballos, Project Manager, IP3 Outside CIAT: THAILAND Mr. Watana Watananonta, Project Coordinator for Thailand, DOA, Bangkok Dr. Surapong Charoenrath, Field Crops Research Inst., DOA, Bangkok Mrs. Atchara Limsila, Rayong Field Crops Research Center, DOA Mr. Danai Suparhan, Rayong Field Crops Research Center, DOA Mr. Somphong Katong, Rayong Field Crops Research Center, DOA Dr. Peaingpen Sarawat, Khon Kaen Field Crops Research Center, DOA Dr. Chalaem Maswanna, Khon Kaen Field Crops Research Center, DOA Mrs. Saowari Tangsakul, Banmai Samrong Field Crops Res. Station, DOAd Mr. Samnong Nual-on, Kalasin, Field Crops Res. Station, DOA, Thailand Mr. Suttipun Brohmsubha, Bureau Agric. Com. Prom. and Mgmt., DOAE, Bangkok Mr. Kaival Klakhaeng, Bureau Agric. Com. Prom. and Mgmt., DOAE, Bangkok Mrs. Wilawan Vongkasem, Bureau Agric. Com. Prom. and Mgmt., DOAE, Bangkok Mr. Suwit Phomnum, Bureau Agric. Com. Prom. and Mgmt., DOAE, Bangkok Mr. Apichart Chamroenphat, Bureau Agric. Com. Prom. and Mgmt., DOAE, Bangkok Mr. Chanchai Wiboonkul, Bureau Agric. Com. Prom. and Mgmt., DOAE, Bangkok Ms. Sunan Muuming, Bureau Agric. Com. Prom. and Mgmt., DOAE, Bangkok Ms. Naruemol Pukpikul, Bureau Agric. Com. Prom. and Mgmt., DOAE, Bangkok Mrs. Chonnikarn Jantakul, Bureau Agric. Com. Prom. and Mgmt., DOAE, Bangkok Ms. Methinee Keerakiat, Bureau Agric. Com. Prom. and Mgmt., DOAE, Bangkok Mr. Somchit Chinno, Provincial Ext. Office, Kalasin, DOAE Mrs. Nuttaporn Jaruenjit, District Ext. Office, Naamon, Kalasin, DOAE Mr. Chaipipop Yotachai, District Ext. Office, Huay Phueng, Kalasin, DOAE Mr. Thinnakorn Withayakorn, District Ext. Office, Sahatsakhan, Kalasin, DOAE
Project IP3: improving cassava for the developing world Output 13-32
Mr. Nava Takraiklaang, District Ext. Office, Donchaan, Kalasin, DOAE Mrs. Anurat Srisura, Provincial Ext. Office, Nakhon Ratchasima, DOAE Mr. Choosak Aksonvongsin, District Ext. Office, Daan Khun Thot, DOAE Mr. Wirawudhi Kaewpreechaa, District Ext. Office, Daan Khun Thot, DOAE Mr. Chatphon Wongkaow, District Ext. Office,Khanuworalakburi, Kamphaengphet, DOAE Mr. Sanga Saengsuk, Provincial Ext. Office, Kanchanaburi, DOAE Mr. Parinya Phaithuun, District Ext. Office, Lawkhwan, Kanchanaburi, DOAE Mr. Sonsing Srisuwan, District Ext. Office, Thepsathit, Chayaphum, DOAE Mr. Numchai Phonchua, District Ext. Office, Thatakiap, Chachoengsao, DOAE Mr. Prayoon Kaewplod, Provincial Ext. Office, Chachoengsao, DOAE Mr. Sanit Taptanee, District Ext. Office, Nadi, Prachinburi, DOAE Mr. Sanit Phuumphithayanon, Provincial Ext. Office, Chayaphum, DOAE Mr. Banyat Vankaew, TTDI, Huay Bong, Nakhon Ratchasima Mr. Preecha Petpraphai, TTDI, Huay Bong, Nakhon Ratchasima Mrs. Supha Randaway, Land Development Dept. Bangkok Mrs. Kittiporn Srisawadee, Land Development Dept. Bangkok Mr. Decha Yuphakdee, Land Development Dept., Nakhon Ratchasima Dr. Somjat Jantawat, Kasetsart University, Bangkok VIETNAM Dr. Tran Ngoc Ngoan, Project Coordinator for Vietnam, Thai Nguyen Univ Dr. Nguyen The Dang, Thai Nguyen University, Thai Nguyen Mr. Nguyen Viet Hung, Thai Nguyen University, Thai Nguyen Mr. Nguyen The Nhuan, Thai Nguyen University, Thai Nguyen Dr. Thai Phien, National Institute of Soils and Fertilizers, Hanoi Mr. Tran Minh Tien, National Institute of Soils and Fertilizers, Hanoi Mr. Nguyen Hue, National Institute of Soils and Fertilizers, Hanoi Mrs. Trinh Thi Phuong Loan, Root Crops Research Center, VASI, Hanoi Mr. Hoang Van Tat, Root Crops Research Center, VASI, Hanoi Mrs. Nguyen Thi Cach, Hue University of Agriculture and Forestry, Hue Mrs. Nguyen Thi Hoa Ly, Hue University of Agriculture and Forestry, Hue Dr. Hoang Kim, Hung Loc Agric. Research Center, IAS, Dong Nai Mr. Nguyen Huu Hy, Hung Loc Agric. Research Center, IAS, Dong Nai Mr. Vo Van Tuan, Hung Loc Agric. Research Center, IAS, Dong Nai Mr. Tong Quoc An, Hung Loc Agric. Research Center, IAS, Dong Nai Mr. Tran Cong Khanh, Hung Loc Agric. Research Center, IAS, Dong Nai Dr. Tran Thi Dung, Thu Duc University of Agric. and Forestry, HCM Mrs. Nguyen Thi Sam, Thu Duc University of Agric. and Forestry, HCM
Output 13-33 2004 Annual Report
CHINA Mr. Li Kaimian, Chinese Academy Tropical Agric. Sciences, Hainan Mr. Huang Jie, Chinese Academy Tropical Agric. Sciences, Hainan Mr. Ye Jianqiu, Chinese Academy Tropical Agric. Sciences, Hainan Mr. Tian Yinong, Guangxi Subtrop. Crops Res. Inst., Nanning Guangxi Mr. Li Jun, Guangxi Subtrop. Crops Res. Inst., Nanning Guangxi Mr. Ma Chongxi, Guangxi Subtrop. Crops Res. Inst., Nanning Guangxi Mrs. Chen Xian Xiang, Guangxi Subtrop. Crops Res. Inst., Nanning Guangxi Mrs. Pan Huan, Guangxi Subtrop. Crops Res. Inst., Nanning Guangxi Mr. Liu Jian Ping, Honghe Animal Husbandry Station, Mengzhe, Yunnan INDONESIA Mr. J. Wargiono, Central Institute for Food Crops, Bogor Dr. Koeshartojo, Research Inst. for Legumes and Tuber Crops, Malang Dr. Wadi Hadi Utomo, Brawijaya University (UNIBRAW), Malang Dr. Djoko Santoso, Soil Research Institute (SRI), Bogor EAST TIMOR Mr. Lourenco Fontes, Min. of Agric. Forestry and Fisheries (MAFF), Dili Mr. Deolindo da Silva, Min. of Agric. Forestry and Fisheries (MAFF), Dili Dr. Brian Palmer, Project Leader, Seeds of Life Project, Dili Mr. Rob Williams, ACIAR Advisor, Seeds of Life Project, Dili LAOS Mr. Viengsavanh Phimphachanhvongsod, Nat. Agric. Forestry Research Inst. (NAFRI),
Vientiane Mr. Sitone Konguangxay, Nat. Agric. Forestry Research Inst. (NAFRI), VientianE CAMBODIA Mr. Ung Sopheap, Cambodian Agric. Research and Dev. Inst. (CARDI), Phnom Penh Mr. Pith Khon Hel, Cambodian Agric. Research and Dev. Inst. (CARDI), Phnom Penh List of publications 1. Howeler, R. H. 2004. End-of-Project Report. Second Phase of the Nippon Foundation
Cassava Project in Asia, 1999-2003. Integrated Cassava- based Cropping Systems in Asia: Farming Practices to Enhance Sustainability. Report submitted to the Nippon Foundation, April 2004. 120 p.
Project IP3: improving cassava for the developing world Output 13-34
2. Agrifood Consulting International. 2004. Integrating Germplasm, Natural Resource and Institutional Innovations to Enhance Impact: The Case of Cassava-based Cropping Systems Research in Asia. CIAT-PRGA Impact Case Study. Submitted to CIAT, March 2004.
3. N. Lilja, T. Dalton, N. Johnson and R. H. Howeler. 2004. Impact of participatory natural resource management research in cassava-based cropping systems in Vietnam and Thailand. CIAT-PRGA Impact Case Study. Submitted to SPIA, Sept. 7, 2004.
4. W. Watananonta. 2004. Farmer Participatory Research in Cassava Production. Scientific paper submitted to DOA, Thailand. 84 p. (in Thai)
5. Howeler, R. 2004. Cassava in Asia: Present situation and its future potential in agro-industry. In: K. Fuglie (Ed.). Roots crops for Agro-Industry. Proc. International Workshop, held in Bogor, Indonesia, Sept 19, 2003. (in press)
6. Suyamto and R.H. Howeler. 2004. Cultural practices for soil erosion control in cassava-based systems in Indonesia. In: D.H. Barker, A. Watson, S. Sombatpanit, B. Northcult and A.R. Maglinao (Eds.). Ground and Water Bioengineering for the Asia-Pacific Region. 2001 Intern. Erosion Control Assoc. Science Publishers Inc., Enfield, NH, USA. (in press)
7. Watananonta, W., S. Charoenrath, S. Tangsakul, S. Nual-On, W. Vongkasem, K. Klakhaeng, B. Vankaew and R.H. Howeler. 2004. The use of a farmer participatory approach in the development of technologies to control erosion for sustainable cassava production. Paper presented at 5th Scientific Meeting of Maejai University, held in Chiangmai, Thailand. May 20-21, 2004. (Thai and English abstract)
8. Watananonta, W., S. Tangsakul, P. Phetpraphai and R.H. Howeler, 2004. The effect of application of micronutrients on the root yields of two cassava varieties. Paper presented at 42nd Scientific Meeting of Kasetsart University, held in Bangkok, Thailand. Feb 5, 2004. (in Thai)
9. Howeler, R.H., B. Palmer, K. Hartojo and C. Piggin. 2003. Evaluation of cassava and bean germplasm in East Timor. In: H. da Costa, C. Piggin, C.J. da Cruz and J.J. Fox (Eds.). Agriculture: New Directions for a New Nation East Timor (Timor-Leste). Proc. Workshop held in Dili, East Timor. Oct 1-3, 2002. pp. 95-101.
Posters 1. A. Limsila, S. Tangsakul, P. Sarawat, W. Watananonta, P. Aekmahachai, Ch.
Petchburanin, S. Pichitporn and R. H. Howeler. 2004. Cassava leaf production research in Thailand. CBN-VI, Cali, Colombia
2. R. Howeler, K. Kawano, W. Watananonta, W. Vongkasem and T.N. Ngoan. 2004. Working with farmers in Asia: Spreading new varieties, improved practices and…. new hope. CBN-VI, Cali, Colombia
Output 13-35 2004 Annual Report
Papers Presented 1. Howeler, R.H. 2004. Working with farmers in Asia: Spreading new varieties, improved
practices and… new hope. Paper presented at VI Cassava Biotechnology Network (CBN) International Scientific Meeting, held in Cali, Colombia, March 8-14, 2004. Presentation on CD
2. Howeler, R. H. 2004 A participatory and inter-institutional project to enhance the sustainability of cassava production in Thailand, Vietnam, and China: Its impact on soil erosion and farmers’ income. Paper presented at the International Conference on Interdisciplinary Curriculum and Research Management in Sustainable Land Use and Natural Resource Management, held in Bangkok, Thailand. Aug 17-19, 2004.
3. Howeler, R. H., W. Watananonta, W. Vongkasem and K. Klakhaeng. 2004 Working with farmers: The challenge of achieving adoption of more sustainable cassava production practices on sloping land in Asia. Paper presented at the Sustainable Soil and Water Management (SSWM) International Conference, held in Chiangmai, Thailand. Sept 5-9, 2004.


