Embed Size (px)
Citation preview
1
IPAT Transition to BIRS Symposium
9th – 10th March, 2018
Purdue University, West Lafayette, Indiana, USA
Instituting Process Control Mechanisms in a Quality Control Analytical Chemistry Laboratory
M. Okezue, [email protected], K. Clase, [email protected], S. Byrn, [email protected] Department of Biotechnology Innovation and Regulatory Science (BIRS), Purdue University
ABSTRACT
An Analytical Chemistry Unit set out to put measures in place to assure the quality of test results emanating from the unit. One of the ways of achieving this was performing periodical Quality Control Checks (QCC) on the various equipment used for determining: pH (pH meter), Uniformity of dosage units (Analytical Weighing Balance), Analyte concentration (UV-Spectrophotometer) and Water Determination (Karl-Fischer Titrator).
Specific samples/materials were chosen and routinely analyzed using this equipment under the study. Results obtained were used as data points to construct Process Control Charts.
Statistical process control (SPC) is a methodology for monitoring a process to identify special causes of variation and signal the need to take corrective actions. 30 data points were obtained for each analytical procedure and were used to determine the upper and lower warning and control limits.
Results from subsequent analysis of these samples/materials plotted as data points in these control charts formed a means of proving that the equipment were under a state of “Control” or, otherwise, beyond which the process is deemed “out of control.” Root-cause investigation and subsequent Corrective Action-Preventive Action (CAPA) system were implemented to restore the “In-Control” status of these pieces of equipment. The use of Statistical Process control thus gave a greater assurance on the quality of Test Results obtained in the routine use of these previously qualified and calibrated pieces of equipment used in quality control of medicines.
KEYWORDS
Quality Control, ISO/IEC 17025:2005, “State of Control”, Quality Control Checks (QCC), Control Charts, Warning Limits
INTRODUCTION
The National Agency for Food and Drug Administration and Control (NAFDAC) is the Medicines Regulatory Authority in Nigeria. The Laboratory Directorate (CDCL) has the mandate to conduct quality control tests on medicines submitted to the Agency for obtaining Marketing Authourisations, compliance and investigation purposes.
The ISO 17025 accreditation of this medicines lab (Central Drug Control laboratory {CDCL}, Analytical Chemistry Unit) was for the following scopes: Uniformity of Dosage Units (UDU), Ultra-Violet-Visible Spectrometry, pH, Loss on drying (LOD) and Water Determination by Karl-Fischer Titration.
It is an ISO 17025:2005 requirement that Testing laboratories like CDCL shows objective evidence that these analytical processes are kept “In-Control” so as to assure the quality of test results. To provide documented evidence that the processes covered under the scope of accreditation is under control, Statistical Process Control Charts were used as a monitoring tool.
The Problem
During audits of CDCL by United States Pharmacopeia PQM (promoting quality medicines) Group and WHO respectively, several critical observations were made.
2
There was a clear need for NAFDAC to demonstrate that the results emanating from its quality control laboratory were accurate and reliable.
This gave rise for the need of the Agency’s Medicines Quality Control Laboratory to attain ISO 17025 accreditation and WHO pre-qualification within the next 24 months. More so, some Nigerian Pharmaceutical industries (under NAFDAC regulatory purview) have either attained WHO-PQ status or are at the final stages of being granted the same.
Project Purpose
I. Demonstrate that the results emanating from NAFDAC quality control laboratory are accurate and reliable
II. Provide documented evidence that the laboratory’s analytical processes are kept in a state of control
III. Investigate, address and document “Out-of-Control” states
IV. Aid in achievement of the resolve of NAFDAC Medicines Quality Control Laboratory to attain ISO 17025 accreditation and WHO Pre-qualification within the next 24 months
Assumptions
I. NAFDAC CDCL top management will play a vital role in reviewing the document generated while performing this project and they will be involved (especially the Deputy Director/Head of Lab) in the various stages of this project to ensure they give the needed support.
II. All needed documents can be generated and all relevant training can be conducted by the project leader.
III. All unit staff will follow relevant SOPs to perform QCC activities.
IV. Data set will be taken while the operation is running properly.
Delimitations
I. To show Documented Evidence that the processes are kept in a “state of control”, Quality Control Checks (QCC) will be carried out (as per SOP) periodically and Control-Charts generated.
II. “Out-of-Control” states will be investigated, addressed and documented.
III. Data for Environmental Monitoring Charts, though very key in equipment performance, will not be included in this study.
IV. Analysts competency records for the various procedures will not be captured in the study.
V. Records of Analytical Equipment Qualification and Calibrations will not be included.
VI.Individual SOPs for operating the various equipment under consideration will be omitted.
VII. The planned deviations associated with the performing QCC schedule will not be included.
VIII. Data integrity, which is a key concept in laboratory management, will not be covered under this study.
Limitations
I.Obtaining 20-30 data points necessary to set upper and lower control limits for Process Control charts (analysts workload)
II.Obtaining enough sample size for scheduled QCC as outlined in the SOP
III.Whether proposed corrective actions will effectively address “out-of-control” states of each process
Summary Implmentation of the project was able to provide documented evidence that the UV spectrophotometers (analyte concentration determination), Hot Air Oven (for LOD), Weighing Balance (for UDU), pH meters and Karl-Fischer Titrators (water determination) used in CDCL are under “Control.”
By having a better understanding of the process monitoring, a more effective CAPA system will be in place. Ultimately, NAFDAC CDCL will be better prepared for audits (external and internal).
REVIEW OF LITERATURE
Statistical Process Controls (SPC) is a concept that was proposed by Walter Shewhart at Bell laboratories in the 1920s and was strongly advocated by Deming. The use of control charts is presently used by many industries as a means of monitoring processes. This section looks at the concept of SPC, elements of control charts and setting control limits.
Methodology Of The Review
The following databases were used to search for relevant literature
i. Purdue Library database ii. Google scholar
iii. www.ICH.org iv. www.pharmamedtechbi.com v. Other databases as outlined in reference
section Statistical Process Control
3
Statistical process control (SPC) is a methodology for monitoring a process to identify special causes of variation and signal the need to take corrective actions. Many customers require their suppliers to provide evidence of statistical process control. Thus, SPC provides a means by which a firm may demonstrate its quality capability, an activity necessary for survival in today’s highly competitive markets. SPC is particularly effective for companies in the early stages of quality assurance. SPC helps workers to know when to take action and, more importantly, when to leave the process alone.
SPC relies on control charts. A control chart is a simple run chart to which two horizontal lines called control limits,the upper control limit (UCL) and the lower control limit (LCL), are added. SPC was proposed by Walter Shewhart at Bell laboratories in the 1920s and was strongly advocated by Deming. Control limits are chosen statistically to provide high probability (generally greater than 0.99) with points that fall between these limits, if the process is in control. Control limits make it easier to interpret patterns in a run chart and draw conclusions about the state of control. If special cases are present, the control chart will indicate them and corrective actions will be taken quickly. This will reduce chances of producing nonconforming products (Evans, 2014).
Control charts have two general uses in an improvement project. The most common application is as a tool to monitor process stability and control. A less common, although some might argue more powerful, use of control charts is as an analysis tool. When a process is stable and in control, it displays common cause variation, variation that is inherent to the process. A process is in control when, based on past experience, it can be predicted how the process will vary (within limits) in the future. If the process is unstable, the process displays special cause variation, non-random variation from external factors. Control charts are simple, robust tools for understanding process variability.
Theory Of Statistical Process Control (SPC)
The basic theory of statistical process control was developed in the late 1920s by Dr. Walter Shewhart, a statistician at the AT&T Bell Laboratories in the USA, and was popularized worldwide by Dr. W. Edwards Deming. Both observed that Shewhart originally worked with manufacturing processes but he and Deming quickly realized that their observation could be applied to any sort of process. If a process is stable, its variation will be predictable and can be described by one of several statistical distributions. One such model of random variation is
the normal (or Gaussian) bell shaped distribution which is familiar to most healthcare professionals. While repeated measurements from many processes follow normal distributions, it is important to note that there are many other types of distributions that describe the variation in other healthcare measurements such as Poisson, binomial, or geometric distributions (Benneyan, Lloyd, & Plsek, 2003).
The Poisson distribution plays a dominant role in the determination of the mean value of a distribution of the number of defective units (e.g. tablets, capsules) per sample, based on several samples of same size (Bohidar & Bohidar, 1992).
The random variation in the number of wound infections after surgery will follow a binomial distribution since there are only two possible outcomes—each patient either did or did not have a postoperative infection with about the same probability (assuming that the data are adjusted for patient acuity, surgical techniques, and other such variables). SPC theory uses the phrase “common cause variation” (Benneyan et al., 2003). The construction of tolerance intervals to measure discrete quality characteristics has been one of the major tasks in developing quality control systems used in the manufacturing and pharmaceutical industries (Wang & Tsung, 2009).
The Control Chart: The Key Tool Of SPC
Shewhart developed a relatively simple statistical tool—the control chart—to aid in distinguishing between common and special cause variation. A control chart consists of two parts: (1) a series of measurements plotted in time order, and (2) the control chart “template” which consists of three horizontal lines called the Centre line (typically, the mean), the upper control limit (UCL) and the lower control limit (LCL).
The values of the UCL and LCL are usually calculated from the inherent variation in the data rather than set arbitrarily by the individual making the chart. A firm understanding of the standard distributions used for common cause process variation is therefore essential for the appropriate application of control charts. To interpret a control chart, data that fall outside the control limits or display abnormal patterns are indications of special cause variation—that is, it is highly likely that something inherently different in the process led to these data compared with the other data. As long as all values on the graph fall randomly between the upper and lower control limits, however, we assume
4
that we are simply observing common cause variation (Benneyan et al., 2003)
Elements of a Control Chart
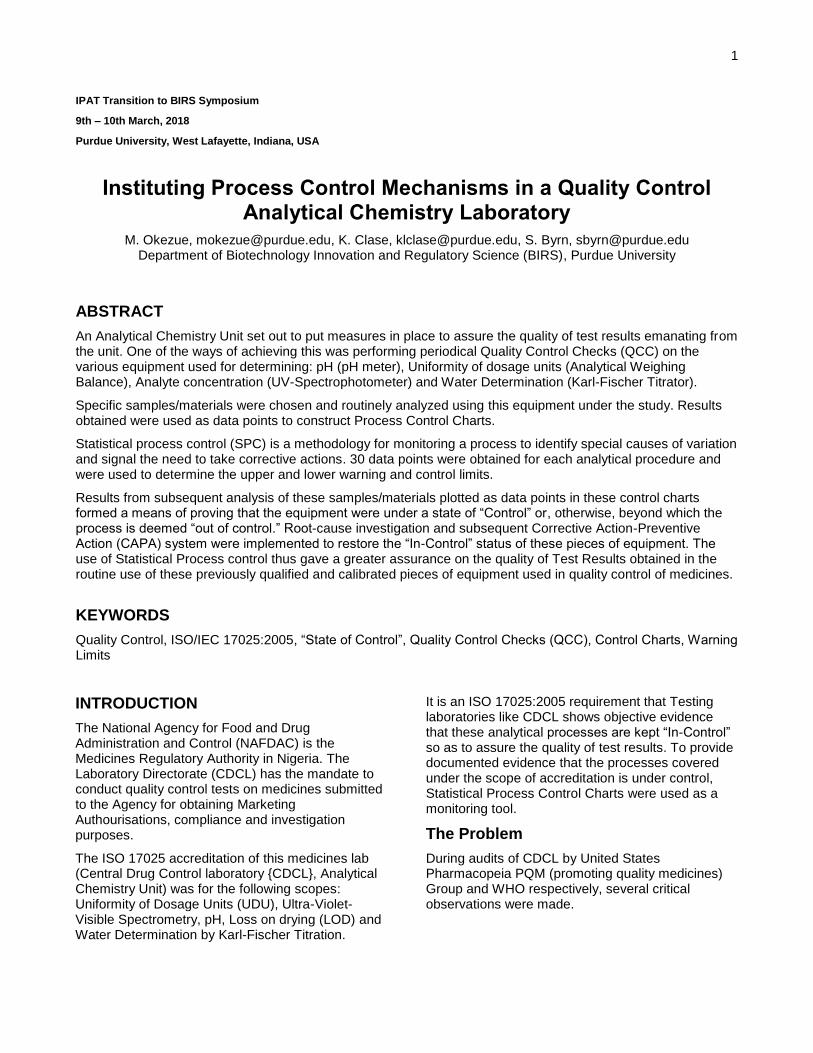
There are three main elements of a control chart as shown in Figure 1.
1. A control chart begins with a time series graph.
2. A central line (X) is added as a visual reference for detecting shifts or trends – this is also referred to as the process location.
3. Upper and lower control limits (UCL and LCL) are computed from available data and placed equidistant from the central line. This is also referred to as process dispersion.
Figure 1: Elements of a Control Chart (Berardinelli, 2014)
Control limits (CLs) ensure time is not wasted looking for unnecessary trouble – the goal of any process improvement practitioner should be to only take action when warranted. Control limits are calculated by:
I. Estimating the standard deviation, σ, of the sample data
II. Multiplying that number by three III. Adding (3 x σ to the average) for the UCL and
subtracting (3 x σ from the average) for the LCL. Mathematically, the calculation of control limits looks like:
(Note: The hat over the sigma symbol indicates that this is an estimate of standard deviation, not the true population standard deviation.)
Because control limits are calculated from process data, they are independent of customer expectations or specification limits.
Control rules take advantage of the normal curve in which 68.26 percent of all data is within plus or minus one standard deviation from the average; 95.44 percent of all data is within plus or minus two
standard deviations from the average; and 99.73 percent of data will be within plus or minus three standard deviations from the average. As such, data should be normally distributed (or transformed) when using control charts, or the chart may signal an unexpectedly high rate of false alarms (Berardinelli, 2014)
Control Chart Functions
The main purpose of using a control chart is to monitor, control and improve process performance over time by studying variation and its source. There are several functions of a control chart:
1. It centers attention on detecting and monitoring process variation over time.
2. It provides a tool for ongoing control of a process.
3. It differentiates special from common causes of variation in order to be a guide for local or management action.
4. It helps improve a process to perform consistently and predictably to achieve higher quality, lower cost and higher effective capacity.
5. It serves as a common language for discussing process performance (Bauman, De Heck, Leonard, & Miranda, 2007).
Reading Control Charts
Control charts can determine whether a process is behaving in an "unusual" way.
Note: The upper and lower control limits are calculated using the grand average and either the average range and average sigma. Example calculations are shown in the Creating Control Charts Section.
The quality of the individual points of a subset is determined unstable if any of the following occurs:
Rule 1: Any point falls beyond 3σ from the centerline (this is represented by the upper and lower control limits)
Rule 2: Two out of three consecutive points fall beyond 2σ on the same side of the centerline
Rule 3: Four out of five consecutive points fall beyond 1σ on the same side of the centerline
Rule 4: Nine or more consecutive points fall on the same side of the centreline (Bauman et al., 2007)
Quality control plays a vital role all over the world in all industries. Western, Eastern and Asian organizations are keen on their quality process.
5
Quality concern in Sri Lanka is higher now than it was before. The research was based on Brick Industry. The research aimed at knowing numbers of quality (non-defectives) and defectives manufactured by manufacturers. The research was approached by an analytical model incorporating graphs and mathematical models. A graph is a control chart obtained by using attribute data. Mathematical formulas are equations such as Upper Control Limit (UCL) and Lower Control Limit (LCL) for quality control. Although several authors have varying definitions for the concept of Quality, the definitions by Crosby and Juran are still valid and widely accepted. Quality is fitness for use (Juran & Gryna, 1988) and Quality means conformance to requirements (Crosby, 1980). Quality control is a process by which entities review the quality of all factors involved in production. Statistical process control (SPC) is the application of statistical methods to the monitoring and control of a process to ensure that it operates at its full potential to produce conforming product. Under SPC, a process behaves predictably to produce as much conforming product as possible with the least possible waste. While SPC has been applied most frequently to controlling manufacturing lines, it applies equally well to any process with a measurable output. One of the key tools in SPC is control charts. There are two types of control charts such as variable and attribute control charts incorporating a p chart or an np chart (Ismail, 2012). It has been noted that in today's information age, everything can be monitored and measured, but it is increasingly difficult to use, analyze and make sense of the data. The use of statistical process control (SPC) methods to monitor and improve the quality of manufacturing and service processes is well researched and implemented in practice. There has been only limited and rudimentary usage of SPC methods to monitor and improve the quality of the data itself. Control charts may be used to monitor and ultimately improve data quality (Jones-Farmer, Ezell, & Hazen, 2014)
Findings pertaining to the Methodology of Cited Studies & Proposed Methodology
1. Location of Control Limits
Control Limits need not adhere to the statistical “3 standard errors about the mean” formulas. In some situations it may be desirable to use wider or narrower control limits to reduce the costs associated with drawing wrong conclusions. Two types may occur in using control charts. The first occurs when an incorrect conclusion is reached that a special cause is present when in fact one does not
exist and results in the cost of trying to find a nonexistent problem. The second occurs when special causes are present and are not signaled in the control chart because points fall within the control limits by chance (Evans, 2014)
2. The Impact of Extreme Values on Using The Mean Value in Determination of Control Limits
The mean (population or sample) is the balance point for data, so using the mean as a measure of the centre generally makes sense. However, the mean does have a potential disadvantage: the mean can be affected by extreme values (Groebner, 2014) pg. 86).
METHODOLOGY
Methodology [data collection & analysis]
Statistical Process Control
To determine the mean, upper and lower control limits, 20-30 data points would be obtained; by carrying out analysis using the following testing scopes:
I. Ultraviolet-visible-spectrophotometer- Analysts, using the current British Pharmacopeia monograph, carries out duplicate analysis on a randomly selected Acetaminophen (Paracetamol) tablet sample.
II. Water determination by Karl-Fischer Titration- Analyst using current United States pharmacopeia (USP 38 <921>) and monograph on Ibuprofen tablet, determines water content of the sample.
III. pH determination- Analyst using the technique prescribed in USP general chapter <791> for pH, determines pH of a specified standard buffer solution.
IV. Loss on drying (LOD) (Hot air oven method) - analyst determines LOD for Acetaminophen reference material by drying to constant weight as specified in USP 38 <731> and monograph for active Acetaminophen drug substance.
V.Uniformity of dosage unit (weighing balance) - Analyst records daily weight verification using traceable standard weights.
The initial data points collected (30), sets the mean, Upper control limit (UCL) and Lower control limit LCL).
6
Constructing 𝐗 ̅ bar Charts
I. Collect n= 20-30 samples data II. Perform analysis for the various scopes (UV, KF,
LOD,UDU and pH) as stipulated in the individual SOPs/Product Compendia Monographs
III. Compute the mean and range of each sample set IV. Compute the overall mean and average range
𝑥 ̅ =∑ 𝑥�̅�
𝑛𝑖=1
𝑛
Sample mean is the average for all values in the sample computed by dividing the sum of all sample values by the sample size. It involves three steps:
a. Collect the sample data b. Add the values in the sample c. Divide the sum by sample size
Standard Deviation (is a measure of variation that incorporates all the values in a data set, it is the positive square root of the variance (s2).
𝒮 = √𝑠2 = √∑(𝑥𝑖 − �̅�)2
𝑛 − 1
𝑛
𝑖=1
(Groebner, 2014, pgs. 85-86,107)
Compute control limits:
Upper Warning Limit (UWL) = Mean + 2(standard deviation)
Lower Warning Limit (LWL) = Mean – 2(standard deviation)
Upper Control Limit (UCL) = Mean + 3(standard deviation)
Lower Control Limit (LCL) = Mean – 3(standard deviation)
UWL= 𝑋 ̅ + 2 𝒮
LWL = 𝑋 ̅ - 2 𝒮
UCL = 𝑋 ̅ + 3 𝒮
LCL = 𝑋 ̅ - 3𝒮
RESEARCH APPROACH
The study was a Mixed Method research. It consisted quantitative experiments involving collecting quantitative data from the following equipment: UV-Spectrophotometer, pH Meter, Karl-Fischer Titrator, Hot Air Oven and Analytical Weighing Balance. The data obtained from these procedures were used to plot quality control charts used for statistical process control (SPC) of the
individual processes; an indication of “state-of-control” status.
Quantitative data was also employed in the creation and validation of the excel spreadsheet used in handling data generated from the processes under scope of accreditation.
When the processes were found to be “out-of-control” there was the use of a mix of quantitative and qualitative data; to help investigate root cause, and implement an effective CAPA to restore the desired status (Creswell, 2014).
POPULATION & SAMPLE
Description of Population
NAFDAC CDCL uses several equipment in analysis of medicines. The population of these procedures and equipment includes several chromatographic equipment: HPLC, GC, AAS, HPTLC, FTIR, UV-Specs etc. There are also several equipment for measurement parameters: Dissolution testers, Disintegration testers, Friability testers, Hardness testers etc.
However, sample in this study are the analytical procedures and equipment under ISO17025 scope of accreditation for Analytical Chemistry Unit. The sample consists: pH (pH meter), Uniformity of dosage units (Analytical Weighing Balance), Analyte concentration (UV-Spectrophotometer), Water Determination (Karl-Fischer Titrator) and Loss on Drying (Hot Air Oven).
Sampling method
Non-random /non-probability Convenience sampling was used. The data from the QCC performed as scheduled in the laboratory procedure was used to obtain the control charts for SPC.
Parameters
Descriptive numerical measures, such as an average or a proportion, that are computed from an entire population are called parameters. As long as the population does not change, the value of the parameter will not change. Corresponding measures for a sample are called statistics. The value of the statistic depends on the sample taken (Groebner, 2014).
The statistics mean value obtained under this study was from a set of 30 data obtained from analysis of the various samples using the appropriate equipment.
7
The obtained mean value was used to determine the UCL, UWL, LWL and LCL.
UWL = Mean + 2(standard deviation)
LWL = Mean - 2(standard deviation)
UCL = Mean + 3(standard deviation)
LCL = Mean - 3(standard deviation)
These were then used to plot the control charts used in the statistical process controls.
Sample size
The mean value for each procedure is determined from 30 results of analysis which forms the data set used for determining the critical control limits: UCL, UWL, LWL and LCL.
Variables
Independent Variables I. Data from the various process tests II. Formulae and equations in the excel spreadsheets
used for data processing. III. Protocols for excel sheets validation IV. Signals from SPC charts indicating “out-of-control”
Dependent Variables I. Process Control charts (SPC) from data generated II. Root cause investigation and CAPA documentations
INSTRUMENTATION
1. Scope : Water Determination
Equipment: Karl-Fischer V20 Metler Toledo Titrator. Standardization of the composite 2 titrant is performed using any of the following standards: Hydranal water, Sodium tartrate or HPLC-grade ultrapure water (dispensed with a micro syringe)
Analysis: Water determination of a brand of Ibuprofen tablet using USP monograph for ibuprofen tablet and General Chapter on water determination <921>.(United States Pharmacopeial Convention., 2015)
2. Scope : Loss on drying
Equipment: Hot Air Oven calibrated to dry at 105oC, temperature is verified using a traceable Thermo Scientific R Thermocouple. Traceable timers are used for Timing
Analysis: Determining loss on drying Acetaminophen (Paracetamol) API powder using the USP monograph for the substance and General Chapter on LOD <731>
3. Scope : UV-Spectroscopy
Equipment: Perkin-Elmer UV-Spectrophotometer using 2cm quartz cells (cuvettes) , double beam spaced
Analysis: Concentration of Analyte in a brand of Paracetamol (acetaminophen) tablet using the BP monograph for the formulated product.
4. Scope : pH Determination
Equipment: Mettler Toledo pH Meter calibrated using ISO-traceable buffer solutions
Analysis: Determination of pH of ISO-traceable buffer solution using USP General Chapter on pH <791>
5. Scope : Uniformity of Dosage Units (UDU)
Equipment: Mettler Toledo Analytical Weighing Balance
Analysis: Verification of tolerance for the analytical balance using standard weights: 10mg, 200mg,1g and 10g
Development
The schedule in the laboratory was followed to carry out the quality control checks. The analytical results data was then used for the control charts development
DATA COLLECTION
Results
1. KF-Titrator QCC
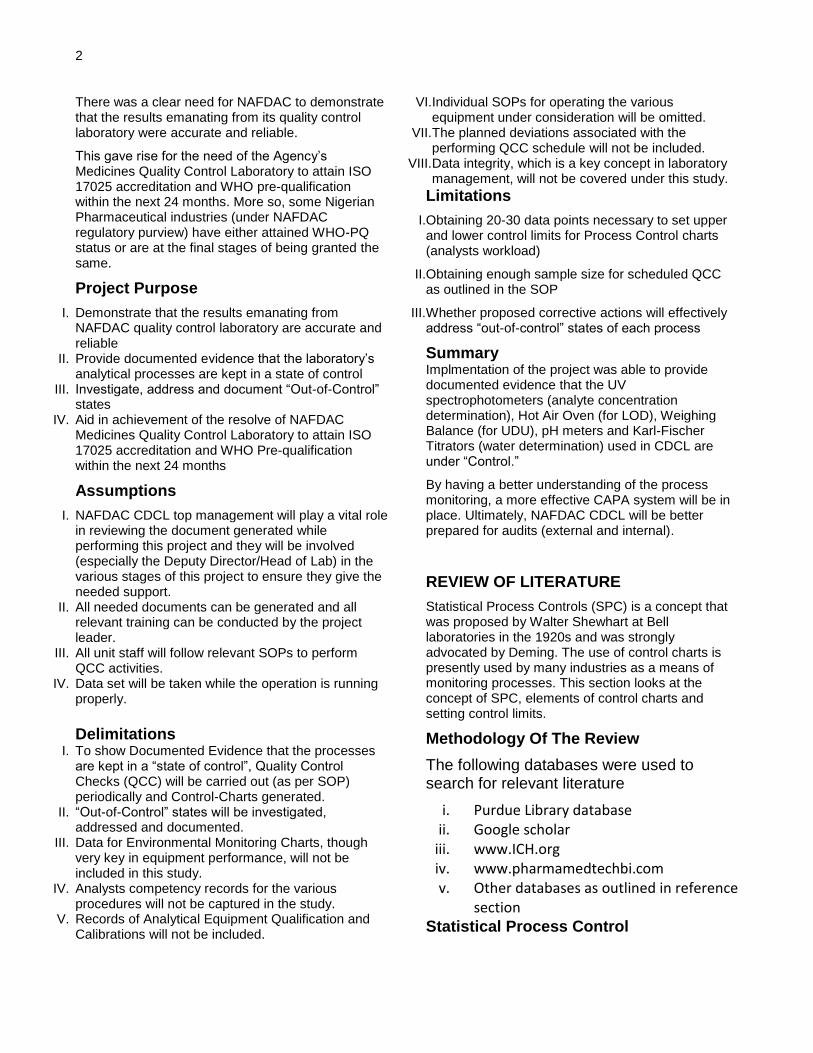
The result for replicate analysis for the water content of the tablet is shown and an average value for water mass was calculated. The mean water content (Xbar ) of 30 data sets was calculated to give a value of 2.1173913 using the excel function = average (X1:X30); X being the sample water content (g).
The standard deviation (0.207918) for the 30 data set was obtained using the excel function = stdev (X1: X30); X being the sample water content (g).
UWL= Xbar + 2 S = 2.1173913 + 2 (0.207918) = 2.53322726
LWL = Xbar - 2 S = 2.1173913 - 2 (0.207918) = 1.701555351
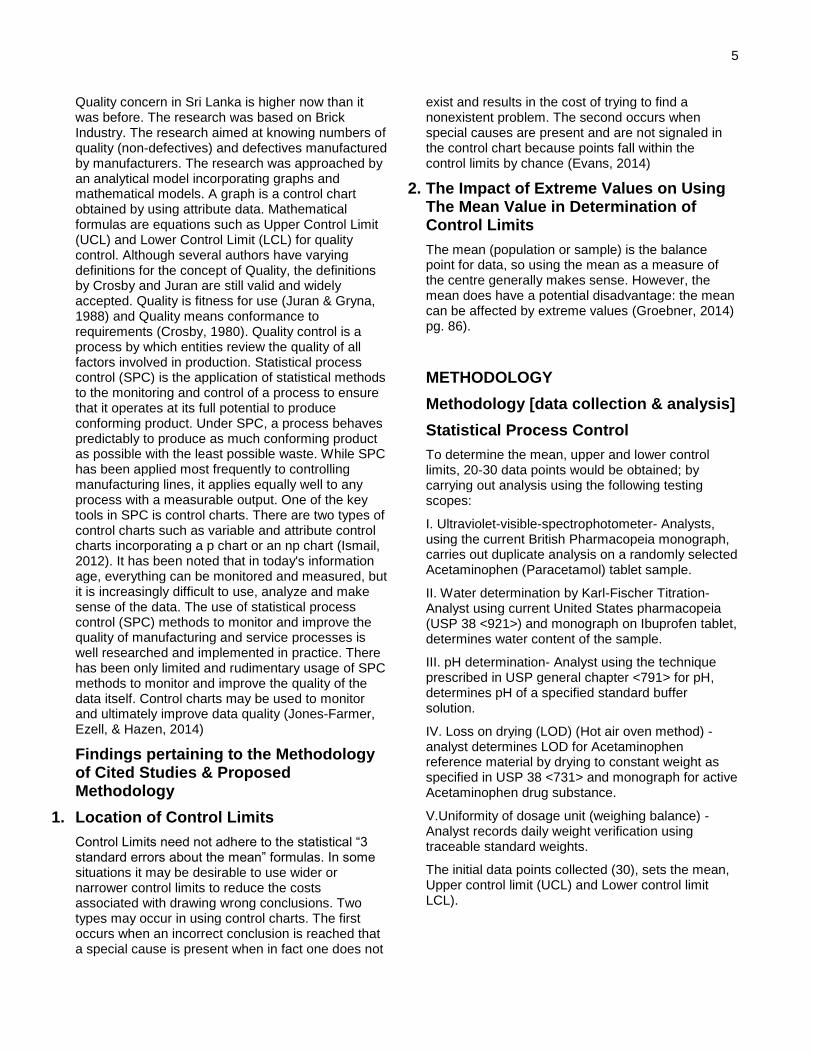
UCL = Xbar + 3 S = 2.1173913 + 3 (0.207918) = 2.741145235
LCL = Xbar - 3 S = 2.1173913 - 3 (0.207918) = 1.49363737
8
These values were then used to plot an Xbar Control Chart (Figure 2) over the dates indicated in the KF QCC. All the results obtained from the experiment showed that the water content of the test sample did not exceed the set limits over the period of observation.
Figure 2: QCC on KF-Titrator
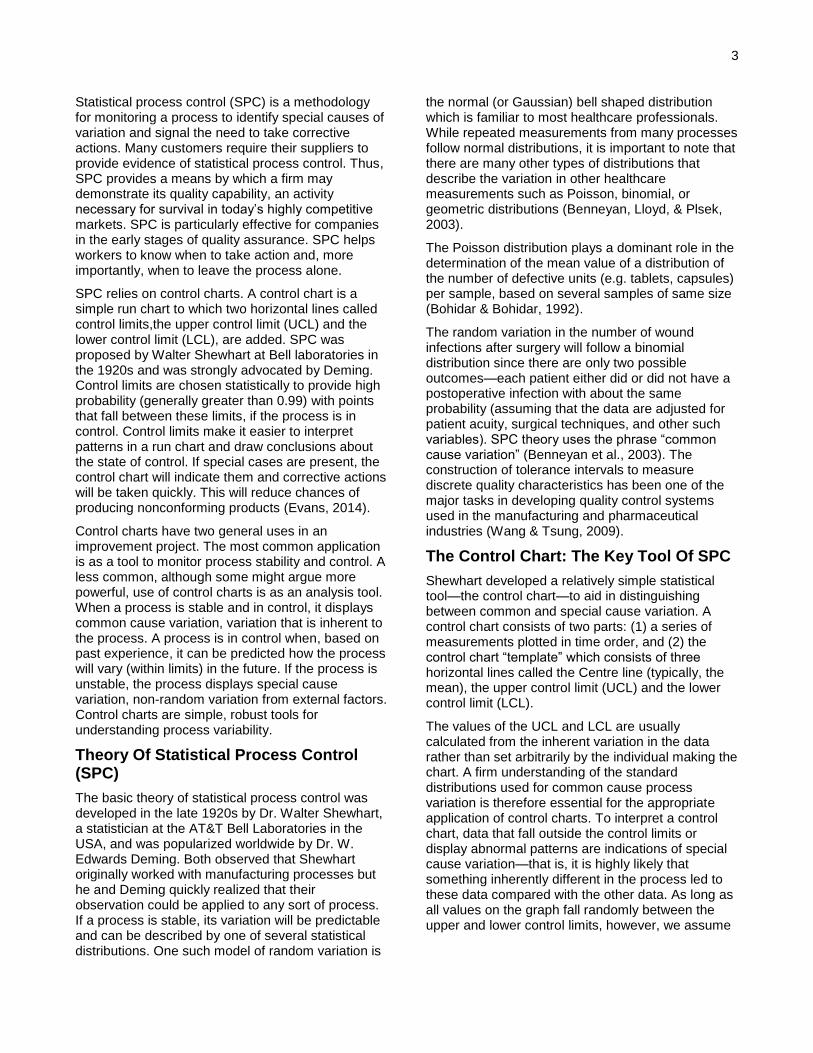
2. Weighing Balance QCC (10mg weight)
The tolerance limits for using 10mg standard weight is between 9.87mg to 10.13mg. The mean weight (Xbar ) value of 30 data sets was calculated to give a value of 10.01mg using the excel function = average (X1:X30); X being the obtained weight value (mg). The standard deviation (0.07) for the 30 data set was obtained using the excel function = stdev (X1:X30); X being the obtained weight value (mg). UWL= Xbar + 2 S = 10.01 + 2 (0.07) = 10.14235
LWL = Xbar - 2 S = 10.01 - 2 (0.07) = 9.877647
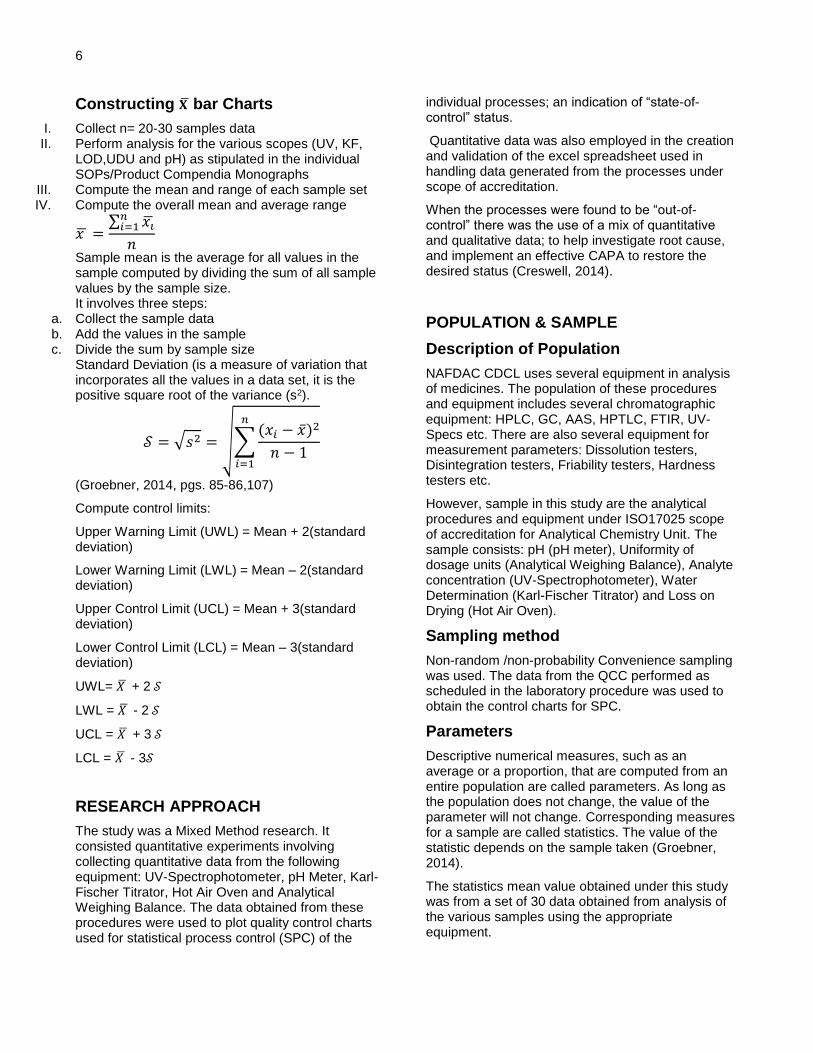
UCL = Xbar + 3 S = 10.01 + 3 (0.07) = 10.20853
LCL = Xbar - 3 S = 10.01 - 3 (0.07) = 9.811471
These values were then used to plot an Xbar Control Chart over the dates indicated in the BALANCE QCC 10mg (Figure 3). All the results obtained from the experiment showed that the weight verification using the 10mg standard weight did not exceed the set limits (UCL, UWL, LWL, and LCL) over the period of observation.
Figure 3: QCC on Analytical Balance (10mg)
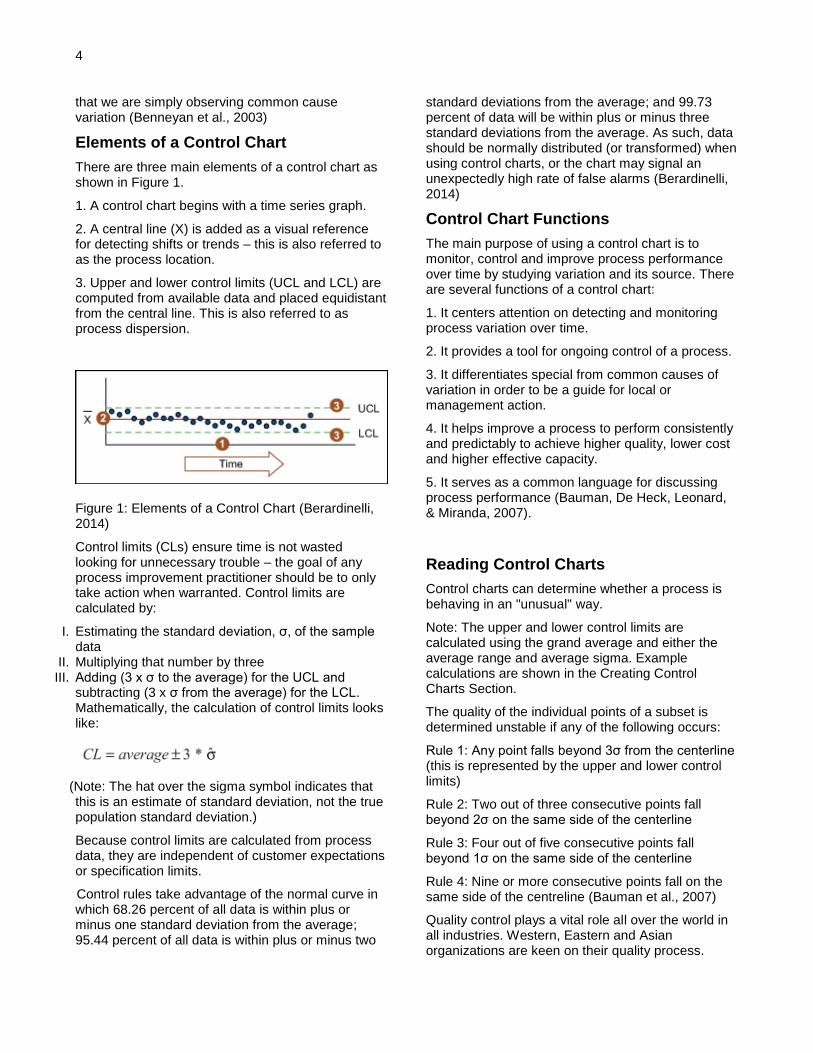
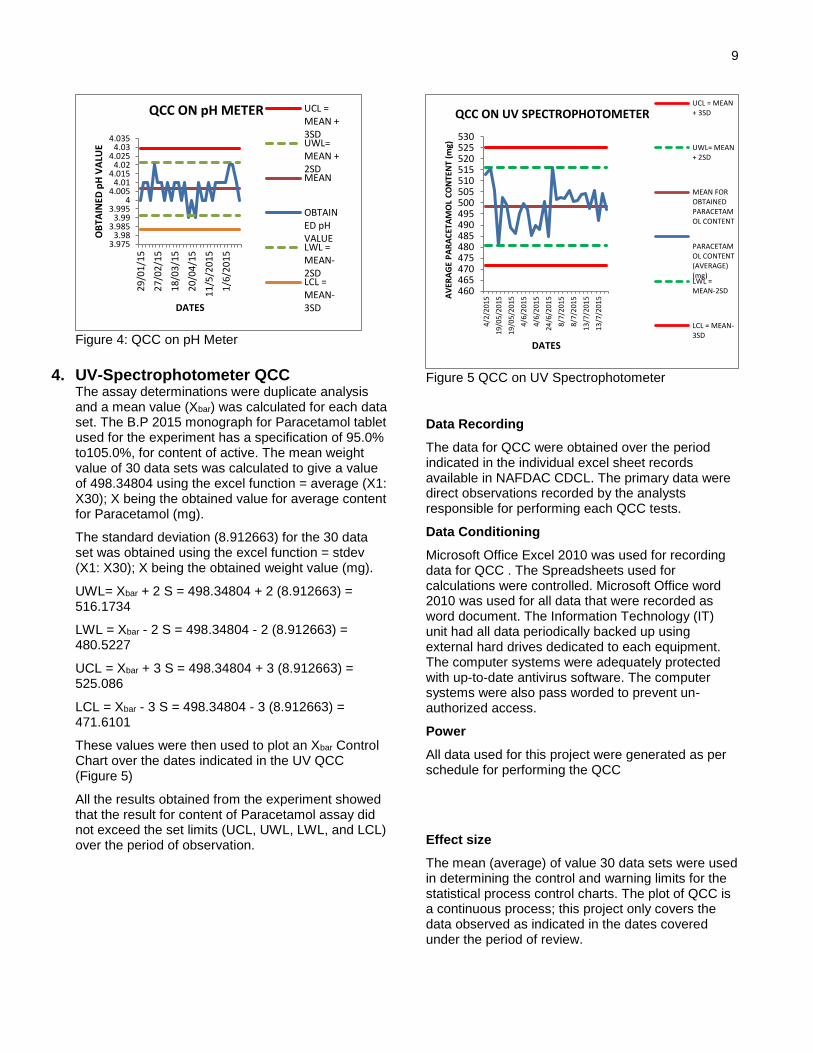
3. pH Meter QCC The tolerance limits for using the standard buffer 4.005 is between 3.985 to 4.025. The mean weight (Xbar) value of 30 data sets was calculated to give a value of 4.00633 using the excel function = average (X1: X30); X being the obtained pH value for the standardized buffer. The standard deviation (0.007649) for the 30 data set was obtained using the excel function = stdev (X1: X30); X being the obtained pH value . UWL= Xbar + 2 S = 4.00633 + 2 (0.000061) = 4.021631 LWL = Xbar - 2 S = 4.00633 - 2 (0.000061) = 3.991036 UCL = Xbar + 3 S = 4.00633 + 3 (0.000061) = 4.02928 LCL = Xbar - 3 S = 4.00633 - 3 (0.000061) = 3.983387 These values were then used to plot an Xbar Control Chart over the dates indicated in the pH QCC (figure 4) All the results obtained from the experiment showed that pH meter calibration using standard buffer 4.005 solutions did not exceed the set limits (UCL, UWL, LWL, and LCL) over the period of observation.
1.3
1.4
1.5
1.6
1.7
1.8
1.9
2
2.1
2.2
2.3
2.4
2.5
2.6
2.7
2.8
2.9
4/2/
201
510
/2/2
015
20/2
/201
525
/2/2
015
6/3/
201
513
/03
/201
520
/3/2
015
25/3
/201
52/
4/2
015
17/4
/201
523
/4/2
015
30/4
/201
56/
5/2
015
6/5/
201
56/
5/2
015
25/6
/201
58/
7/2
015
8/7/
201
58/
7/2
015
9/7/
201
59/
7/2
015
9/7/
201
510
/7/2
015
10/7
/201
521
/7/2
015
21/7
/201
521
/7/2
015
21/7
/201
524
/7/2
015
24/7
/201
5
MA
SS O
F W
ATE
R (g
)
DATES
QCC ON KF-TITRATOR
UCL = MEAN
+ 3SD
UWL= MEAN
+ 2SD
MASS
(AVERAGE)
ROUNDED
UP
MEAN FOR
OBTAINED
AVERAGE
ROUNDED
UP MASS
LWL =
MEAN-2SD
LCL =
MEAN-3SD
9.769.799.829.859.889.919.949.97
1010.0310.0610.0910.1210.1510.1810.2110.24
2/2/
201
523
/2/2
015
16/3
/201
57/
4/2
015
27/4
/201
513
/5/2
015
1/6/
201
59/
6/2
015
22/6
/201
5
ob
tain
ed
wt.
valu
e(1
0m
g)
Dates
QCC on Analytical Balance (10mg)
UCL =
MEAN +
3SD
UWL=
MEAN +
2SD
MEAN
WT
OBTAINE
D WT.
VALUE
(mg)
LWL =
MEAN-
2SD
LCL =
MEAN-
3SD
9
Figure 4: QCC on pH Meter
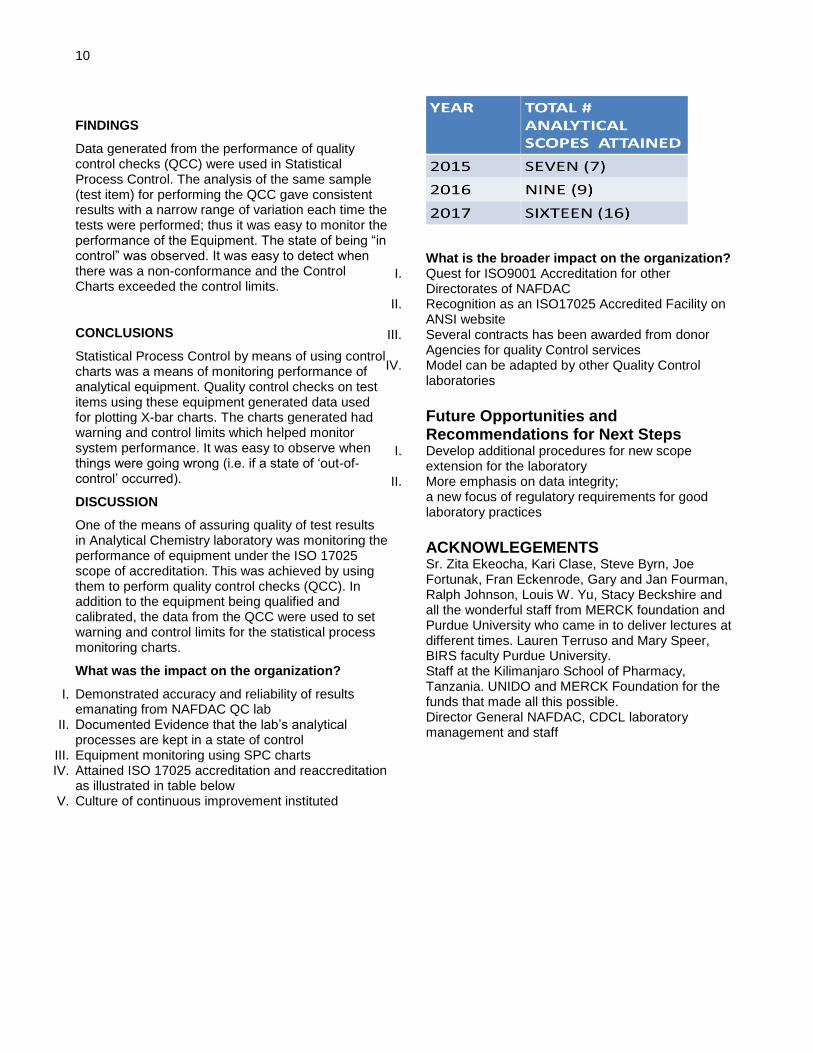
4. UV-Spectrophotometer QCC
The assay determinations were duplicate analysis and a mean value (Xbar) was calculated for each data set. The B.P 2015 monograph for Paracetamol tablet used for the experiment has a specification of 95.0% to105.0%, for content of active. The mean weight value of 30 data sets was calculated to give a value of 498.34804 using the excel function = average (X1: X30); X being the obtained value for average content for Paracetamol (mg).
The standard deviation (8.912663) for the 30 data set was obtained using the excel function = stdev (X1: X30); X being the obtained weight value (mg).
UWL= Xbar + 2 S = 498.34804 + 2 (8.912663) = 516.1734
LWL = Xbar - 2 S = 498.34804 - 2 (8.912663) = 480.5227
UCL = Xbar + 3 S = 498.34804 + 3 (8.912663) = 525.086
LCL = Xbar - 3 S = 498.34804 - 3 (8.912663) = 471.6101
These values were then used to plot an Xbar Control Chart over the dates indicated in the UV QCC (Figure 5)
All the results obtained from the experiment showed that the result for content of Paracetamol assay did not exceed the set limits (UCL, UWL, LWL, and LCL) over the period of observation.
Figure 5 QCC on UV Spectrophotometer
Data Recording
The data for QCC were obtained over the period indicated in the individual excel sheet records available in NAFDAC CDCL. The primary data were direct observations recorded by the analysts responsible for performing each QCC tests.
Data Conditioning
Microsoft Office Excel 2010 was used for recording data for QCC . The Spreadsheets used for calculations were controlled. Microsoft Office word 2010 was used for all data that were recorded as word document. The Information Technology (IT) unit had all data periodically backed up using external hard drives dedicated to each equipment. The computer systems were adequately protected with up-to-date antivirus software. The computer systems were also pass worded to prevent un-authorized access.
Power
All data used for this project were generated as per schedule for performing the QCC
Effect size
The mean (average) of value 30 data sets were used in determining the control and warning limits for the statistical process control charts. The plot of QCC is a continuous process; this project only covers the data observed as indicated in the dates covered under the period of review.
3.9753.98
3.9853.99
3.9954
4.0054.01
4.0154.02
4.0254.03
4.0352
9/0
1/1
5
27
/02
/15
18
/03
/15
20
/04
/15
11
/5/2
015
1/6
/20
15
OB
TAIN
ED p
H V
ALU
E
DATES
QCC ON pH METER UCL =MEAN +3SDUWL=MEAN +2SDMEAN
OBTAINED pHVALUELWL =MEAN-2SDLCL =MEAN-3SD
460465470475480485490495500505510515520525530
4/2/
201
5
19/0
5/2
015
19/0
5/2
015
4/6/
201
5
4/6/
201
5
24/6
/201
5
8/7/
201
5
8/7/
201
5
13/7
/201
5
13/7
/201
5AV
ERA
GE
PA
RA
CET
AM
OL
CO
NTE
NT
(mg)
DATES
QCC ON UV SPECTROPHOTOMETERUCL = MEAN+ 3SD
UWL= MEAN+ 2SD
MEAN FOROBTAINEDPARACETAMOL CONTENT
PARACETAMOL CONTENT(AVERAGE)(mg)LWL =MEAN-2SD
LCL = MEAN-3SD
10
FINDINGS
Data generated from the performance of quality control checks (QCC) were used in Statistical Process Control. The analysis of the same sample (test item) for performing the QCC gave consistent results with a narrow range of variation each time the tests were performed; thus it was easy to monitor the performance of the Equipment. The state of being “in control” was observed. It was easy to detect when there was a non-conformance and the Control Charts exceeded the control limits.
CONCLUSIONS
Statistical Process Control by means of using control charts was a means of monitoring performance of analytical equipment. Quality control checks on test items using these equipment generated data used for plotting X-bar charts. The charts generated had warning and control limits which helped monitor system performance. It was easy to observe when things were going wrong (i.e. if a state of ‘out-of-control’ occurred).
DISCUSSION
One of the means of assuring quality of test results in Analytical Chemistry laboratory was monitoring the performance of equipment under the ISO 17025 scope of accreditation. This was achieved by using them to perform quality control checks (QCC). In addition to the equipment being qualified and calibrated, the data from the QCC were used to set warning and control limits for the statistical process monitoring charts.
What was the impact on the organization?
I. Demonstrated accuracy and reliability of results emanating from NAFDAC QC lab
II. Documented Evidence that the lab’s analytical processes are kept in a state of control
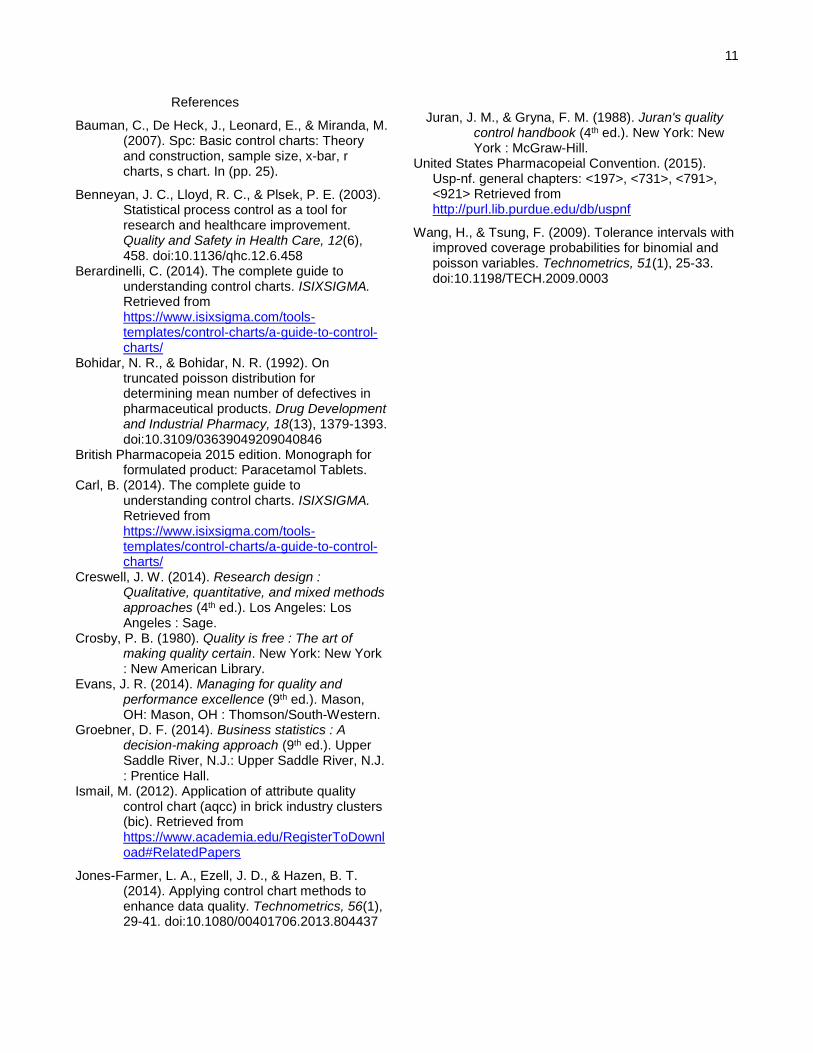
III. Equipment monitoring using SPC charts IV. Attained ISO 17025 accreditation and reaccreditation
as illustrated in table below V. Culture of continuous improvement instituted
What is the broader impact on the organization?
I. Quest for ISO9001 Accreditation for other Directorates of NAFDAC
II. Recognition as an ISO17025 Accredited Facility on ANSI website
III. Several contracts has been awarded from donor Agencies for quality Control services
IV. Model can be adapted by other Quality Control laboratories
Future Opportunities and Recommendations for Next Steps
I. Develop additional procedures for new scope extension for the laboratory
II. More emphasis on data integrity; a new focus of regulatory requirements for good laboratory practices
ACKNOWLEGEMENTS Sr. Zita Ekeocha, Kari Clase, Steve Byrn, Joe Fortunak, Fran Eckenrode, Gary and Jan Fourman, Ralph Johnson, Louis W. Yu, Stacy Beckshire and all the wonderful staff from MERCK foundation and Purdue University who came in to deliver lectures at different times. Lauren Terruso and Mary Speer, BIRS faculty Purdue University. Staff at the Kilimanjaro School of Pharmacy, Tanzania. UNIDO and MERCK Foundation for the funds that made all this possible. Director General NAFDAC, CDCL laboratory management and staff
11
References
Bauman, C., De Heck, J., Leonard, E., & Miranda, M. (2007). Spc: Basic control charts: Theory and construction, sample size, x-bar, r charts, s chart. In (pp. 25).
Benneyan, J. C., Lloyd, R. C., & Plsek, P. E. (2003). Statistical process control as a tool for research and healthcare improvement. Quality and Safety in Health Care, 12(6), 458. doi:10.1136/qhc.12.6.458
Berardinelli, C. (2014). The complete guide to understanding control charts. ISIXSIGMA. Retrieved from https://www.isixsigma.com/tools-templates/control-charts/a-guide-to-control-charts/
Bohidar, N. R., & Bohidar, N. R. (1992). On truncated poisson distribution for determining mean number of defectives in pharmaceutical products. Drug Development and Industrial Pharmacy, 18(13), 1379-1393. doi:10.3109/03639049209040846
British Pharmacopeia 2015 edition. Monograph for formulated product: Paracetamol Tablets.
Carl, B. (2014). The complete guide to understanding control charts. ISIXSIGMA. Retrieved from https://www.isixsigma.com/tools-templates/control-charts/a-guide-to-control-charts/
Creswell, J. W. (2014). Research design : Qualitative, quantitative, and mixed methods approaches (4th ed.). Los Angeles: Los Angeles : Sage.
Crosby, P. B. (1980). Quality is free : The art of making quality certain. New York: New York : New American Library.
Evans, J. R. (2014). Managing for quality and performance excellence (9th ed.). Mason, OH: Mason, OH : Thomson/South-Western.
Groebner, D. F. (2014). Business statistics : A decision-making approach (9th ed.). Upper Saddle River, N.J.: Upper Saddle River, N.J. : Prentice Hall.
Ismail, M. (2012). Application of attribute quality control chart (aqcc) in brick industry clusters (bic). Retrieved from https://www.academia.edu/RegisterToDownload#RelatedPapers
Jones-Farmer, L. A., Ezell, J. D., & Hazen, B. T. (2014). Applying control chart methods to enhance data quality. Technometrics, 56(1), 29-41. doi:10.1080/00401706.2013.804437
Juran, J. M., & Gryna, F. M. (1988). Juran's quality
control handbook (4th ed.). New York: New York : McGraw-Hill.
United States Pharmacopeial Convention. (2015). Usp-nf. general chapters: <197>, <731>, <791>, <921> Retrieved from http://purl.lib.purdue.edu/db/uspnf
Wang, H., & Tsung, F. (2009). Tolerance intervals with improved coverage probabilities for binomial and poisson variables. Technometrics, 51(1), 25-33. doi:10.1198/TECH.2009.0003


