Embed Size (px)
Citation preview
Proceedings of COBEM 2007 19th International Congress of Mechanical Engineering Copyright © 2007 by ABCM November 5-9, 2007, Brasília, DF
INSPECTION OF TUBULAR HEAT EXCHANGER BUNDLES: A STATISTICAL APPROACH
Ricardo Schayer Sabino, [email protected]
Paulo Pio Alvisi, [email protected]
Helder de Souza Werneck, [email protected] Petrobras – UN-REGAP – Rod. Fernão Dias BR 381, km 427, Betim – MG. CEP 323530-000
Carlos Alberto Cimini Jr., [email protected] Universidade Federal de Minas Gerais – Av. Antônio Carlos, 6627, Belo Horizonte – MG. CEP 31270-901
João Mário Andrade Pinto, [email protected] Fundação Mineira de Educação e Cultura – R. Cobre, 200, Belo Horizonte – MG. CEP 30310-190
Abstract. Inspection of tubular heat exchanger bundles is a high complexity matter, due to the impossibility to do direct
visual inspection or use conventional non-destructive techniques to evaluate the tubes integrity. Literature available
recommends the use of ultrasonic IRIS (Internal Rotary Inspection System) technique for inspection of ferromagnetic
tubes, but there is no standard procedure for the analysis of its results. This paper describes a methodology for IRIS
results analysis, including sample sizing procedures, determination of regions with higher corrosion severity,
calculation of tube critical thickness and directions to conduct a hypotheses test to evaluate the capability of operation
of the tubular bundle. This methodology was applied in a practical case, in order to characterize the bundle integrity
condition, quantify the reliability of this component and determe the necessity of maintenance. Efficiency of the sample
size to represent the bundle as a whole was verified by means of F (of Fisher) and t (of Student) tests. Hypotheses tests
were conducted in order to evaluate the necessity of substitute the tubes of the bundle. The case of study showed that
poor maintenance decisions could be made, led by improper statistical approach on the IRIS results analysis.
Keywords: Inspection, Heat Exchanger, IRIS.
1. INTRODUCTION
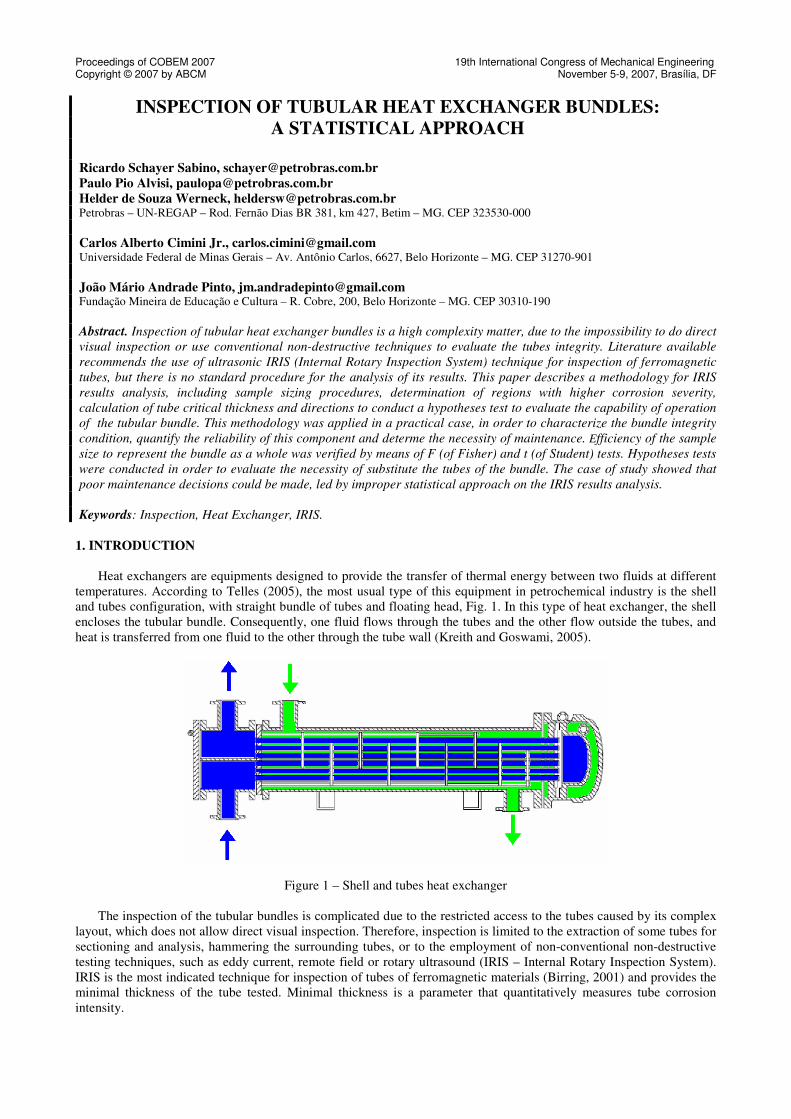
Heat exchangers are equipments designed to provide the transfer of thermal energy between two fluids at different
temperatures. According to Telles (2005), the most usual type of this equipment in petrochemical industry is the shell
and tubes configuration, with straight bundle of tubes and floating head, Fig. 1. In this type of heat exchanger, the shell
encloses the tubular bundle. Consequently, one fluid flows through the tubes and the other flow outside the tubes, and
heat is transferred from one fluid to the other through the tube wall (Kreith and Goswami, 2005).
Figure 1 – Shell and tubes heat exchanger
The inspection of the tubular bundles is complicated due to the restricted access to the tubes caused by its complex
layout, which does not allow direct visual inspection. Therefore, inspection is limited to the extraction of some tubes for
sectioning and analysis, hammering the surrounding tubes, or to the employment of non-conventional non-destructive
testing techniques, such as eddy current, remote field or rotary ultrasound (IRIS – Internal Rotary Inspection System).
IRIS is the most indicated technique for inspection of tubes of ferromagnetic materials (Birring, 2001) and provides the
minimal thickness of the tube tested. Minimal thickness is a parameter that quantitatively measures tube corrosion
intensity.
The number of tubes in a bundle may vary significantly, ranging from tens to thousands. Therefore, in most cases,
inspection of 100% of the tubes is impracticable, and it is usual to select a sample of tubes to be tested, representing the
bundle as a whole. In spite of that practice, there are no standards that indicate a methodological process for this kind of
service, and it is common that decisions could be made without an appropriate treatment of the data collected by the
tests.
The present work has the objective of presenting a methodology to support such decisions. The methodology is
applied to a study case where a decision of keeping (or not) a tubular bundle of a heat exchanger operating is required.
A hypothesis test in a sample of its tubes, with determined significance level based on the operational criticalness of the
equipment is applied and the results analyzed. Tests were then conducted to evaluate the efficiency of the sample to the
representation of the tubular bundle as a whole and to identify regions of the bundle where could exist tubes with lower
thickness.
2. EVALUATED EQUIPMENT
During programmed stop of production, after accumulated, approximately, 8,5 years of operation with corrosive
fluids, the heat exchanger under study had been liberated for maintenance and inspection. This equipment has a straight
tubular bundle with 630 tubes of carbon steel (ASTM A-179) of ¾” (19.05mm) nominal diameter and 2.11mm nominal
thickness, distributed in two passes – 319 tubes in the lower pass (1st pass) and 311 in the upper pass (2
nd pass).
The failure of the tubes causes contamination of the cooling water system and, by consequence, great perturbation in
its treatment. Additionally, the liberation of this equipment for maintenance and correction of the failure causes issues
in the process, been necessary the reduction of the processed load.
3. DATA ACQUISITION AND ANALYSIS
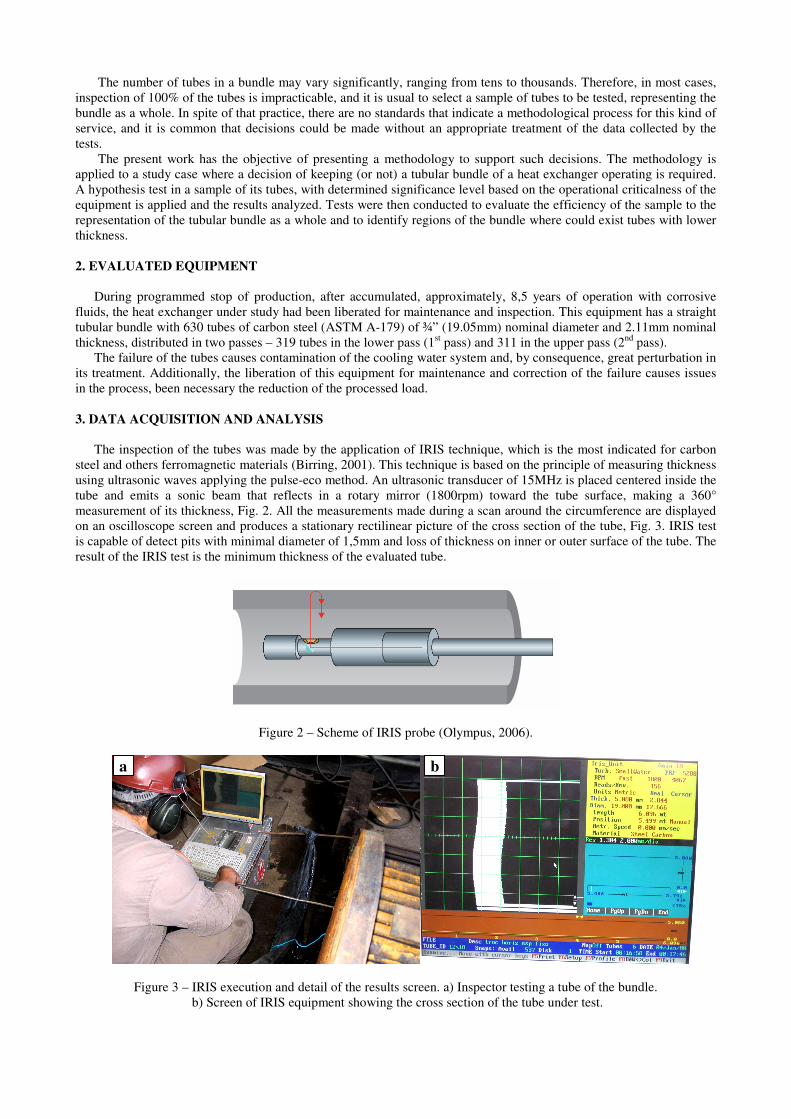
The inspection of the tubes was made by the application of IRIS technique, which is the most indicated for carbon
steel and others ferromagnetic materials (Birring, 2001). This technique is based on the principle of measuring thickness
using ultrasonic waves applying the pulse-eco method. An ultrasonic transducer of 15MHz is placed centered inside the
tube and emits a sonic beam that reflects in a rotary mirror (1800rpm) toward the tube surface, making a 360°
measurement of its thickness, Fig. 2. All the measurements made during a scan around the circumference are displayed
on an oscilloscope screen and produces a stationary rectilinear picture of the cross section of the tube, Fig. 3. IRIS test
is capable of detect pits with minimal diameter of 1,5mm and loss of thickness on inner or outer surface of the tube. The
result of the IRIS test is the minimum thickness of the evaluated tube.
Figure 2 – Scheme of IRIS probe (Olympus, 2006).
Figure 3 – IRIS execution and detail of the results screen. a) Inspector testing a tube of the bundle.
b) Screen of IRIS equipment showing the cross section of the tube under test.
a b
Proceedings of COBEM 2007 19th International Congress of Mechanical Engineering Copyright © 2007 by ABCM November 5-9, 2007, Brasília, DF
Initially, since there was no previous data about the variability of the tubes corrosion, a preliminary sample of the
bundle was selected to be tested. It was defined that 40 randomly selected tubes, taking into account the criteria of
achieving a sample greater than 30 elements and superior to 5% of the tube population. These requirements were used
to represent the population of the minimal thickness of the tubes of the bundle as the normal distribution by the central
limit theorem (CLT) (Cochran, 1977).
Although some recent papers of Barringer (2001) and Rodas et al. (2005) propose, respectively, the use of Gumbel
Smallest distribution or Weibull distribution for the representation of the minimal thickness of the tubes of heat
exchangers bundles, the adoption of the normal distribution is an economic and fast alternative, once that most of the
commercial softwares has tools that can easily estimate the parameters of a normal distribution, dispensing the use of
more elaborated and expensive solutions or softwares.
The assumption of normal distribution appears reasonably, once that, according to Lapponi (2005), the CLT dictates
that the arithmetic mean of the samples means is equal to the population mean and those samples means will be
normally distributed around the population mean, independently of the real distribution of the population. Despite the
IRIS results be the minimal thickness of the tested tube (and not the mean thickness), this change will only make the
analysis more conservatively. It appears also as a recommended practice, once that the lack of precision in the
historical data does not allow any estimation of the behavior of the population real distribution.
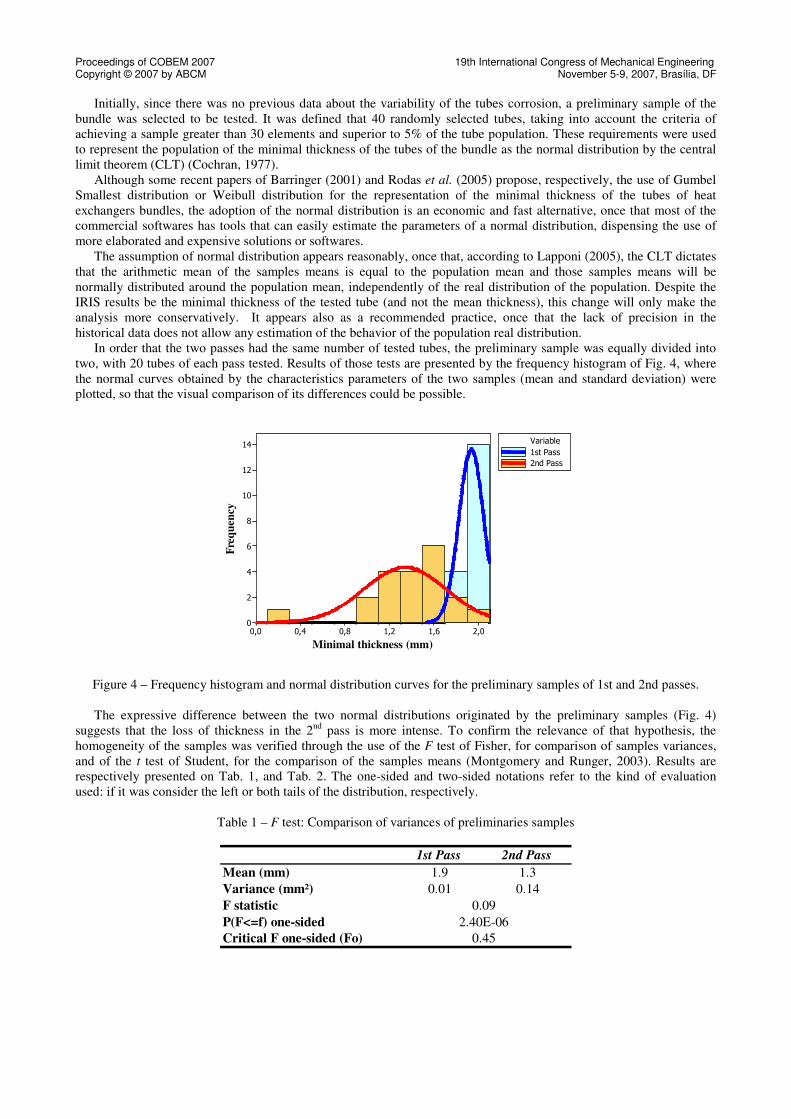
In order that the two passes had the same number of tested tubes, the preliminary sample was equally divided into
two, with 20 tubes of each pass tested. Results of those tests are presented by the frequency histogram of Fig. 4, where
the normal curves obtained by the characteristics parameters of the two samples (mean and standard deviation) were
plotted, so that the visual comparison of its differences could be possible.
Minimal thickness (mm)
Fre
qu
ency
2,01,61,20,80,40,0
14
12
10
8
6
4
2
0
Variable
1st Pass
2nd Pass
Figure 4 – Frequency histogram and normal distribution curves for the preliminary samples of 1st and 2nd passes.
The expressive difference between the two normal distributions originated by the preliminary samples (Fig. 4)
suggests that the loss of thickness in the 2nd
pass is more intense. To confirm the relevance of that hypothesis, the
homogeneity of the samples was verified through the use of the F test of Fisher, for comparison of samples variances,
and of the t test of Student, for the comparison of the samples means (Montgomery and Runger, 2003). Results are
respectively presented on Tab. 1, and Tab. 2. The one-sided and two-sided notations refer to the kind of evaluation
used: if it was consider the left or both tails of the distribution, respectively.
Table 1 – F test: Comparison of variances of preliminaries samples
1st Pass 2nd Pass
Mean (mm) 1.9 1.3
Variance (mm²) 0.01 0.14
F statistic
P(F<=f) one-sided
Critical F one-sided (Fo)
0.09
2.40E-06
0.45
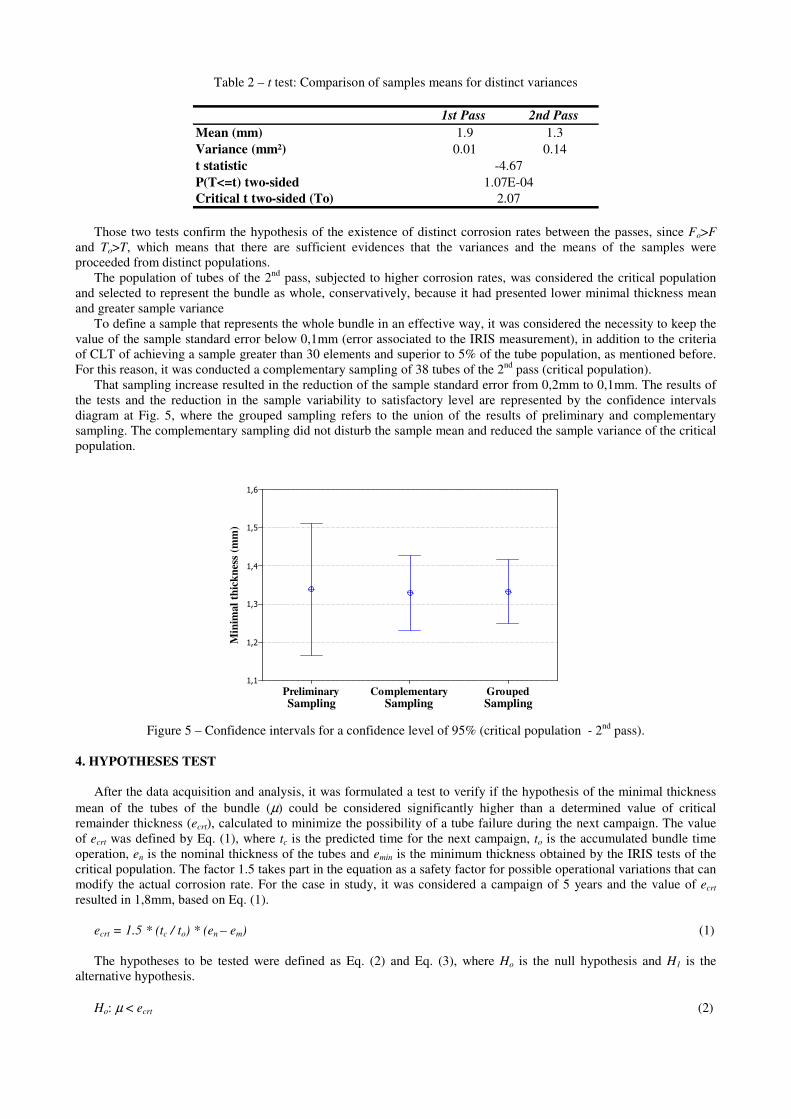
Table 2 – t test: Comparison of samples means for distinct variances
1st Pass 2nd Pass
Mean (mm) 1.9 1.3
Variance (mm²) 0.01 0.14
t statistic
P(T<=t) two-sided
Critical t two-sided (To) 2.07
-4.67
1.07E-04
Those two tests confirm the hypothesis of the existence of distinct corrosion rates between the passes, since Fo>F
and To>T, which means that there are sufficient evidences that the variances and the means of the samples were
proceeded from distinct populations.
The population of tubes of the 2nd
pass, subjected to higher corrosion rates, was considered the critical population
and selected to represent the bundle as whole, conservatively, because it had presented lower minimal thickness mean
and greater sample variance
To define a sample that represents the whole bundle in an effective way, it was considered the necessity to keep the
value of the sample standard error below 0,1mm (error associated to the IRIS measurement), in addition to the criteria
of CLT of achieving a sample greater than 30 elements and superior to 5% of the tube population, as mentioned before.
For this reason, it was conducted a complementary sampling of 38 tubes of the 2nd
pass (critical population).
That sampling increase resulted in the reduction of the sample standard error from 0,2mm to 0,1mm. The results of
the tests and the reduction in the sample variability to satisfactory level are represented by the confidence intervals
diagram at Fig. 5, where the grouped sampling refers to the union of the results of preliminary and complementary
sampling. The complementary sampling did not disturb the sample mean and reduced the sample variance of the critical
population.
Min
imal
thic
kn
ess
(mm
)
GroupedComplementaryPreliminary
1,6
1,5
1,4
1,3
1,2
1,1
Figure 5 – Confidence intervals for a confidence level of 95% (critical population - 2nd
pass).
4. HYPOTHESES TEST
After the data acquisition and analysis, it was formulated a test to verify if the hypothesis of the minimal thickness
mean of the tubes of the bundle (µ) could be considered significantly higher than a determined value of critical
remainder thickness (ecrt), calculated to minimize the possibility of a tube failure during the next campaign. The value
of ecrt was defined by Eq. (1), where tc is the predicted time for the next campaign, to is the accumulated bundle time
operation, en is the nominal thickness of the tubes and emin is the minimum thickness obtained by the IRIS tests of the
critical population. The factor 1.5 takes part in the equation as a safety factor for possible operational variations that can
modify the actual corrosion rate. For the case in study, it was considered a campaign of 5 years and the value of ecrt
resulted in 1,8mm, based on Eq. (1).
ecrt = 1.5 * (tc / to) * (en – em) (1)
The hypotheses to be tested were defined as Eq. (2) and Eq. (3), where Ho is the null hypothesis and H1 is the
alternative hypothesis.
Ho: µ < ecrt (2)
Sampling Sampling Sampling
Proceedings of COBEM 2007 19th International Congress of Mechanical Engineering Copyright © 2007 by ABCM November 5-9, 2007, Brasília, DF
H1: µ ≥ ecrt (3)
By the CLT, it is expected that the minimal thickness mean of the tubes be approximately equals to the sample
minimal thickness mean of the bundle (em), that is, µ ≈ em.
Based on Eq. (2) and (3), a type I error – reject Ho when it is actually true, will provoke the unnecessary replacement
of the bundle tubes. A type II error – do not reject Ho when it is actually false, will imply in return to operation a bundle
that has a high probability of fail during the next campaign, witch is clearly more severe.
In order to apply the test, it was defined the following test statistics:
• Z(α) – test statistic of the standardized normal distribution, for the confidence level adopted (α) . In the present
case, it was adopted a confidence level of 0.1%, due to the difficulty in liberation of the equipment for maintenance and
the great perturbation caused by the bundle failure.
• Zo – test statistic defined as (Lapponi, 2005), defined by Eq. (4), where s is the sample standard deviation, N is
the number of tubes of the population and n is the number of tubes of the sample (sample size).
nN
N
ns
eeZ crtm
o−
−⋅
−=
1 (4)
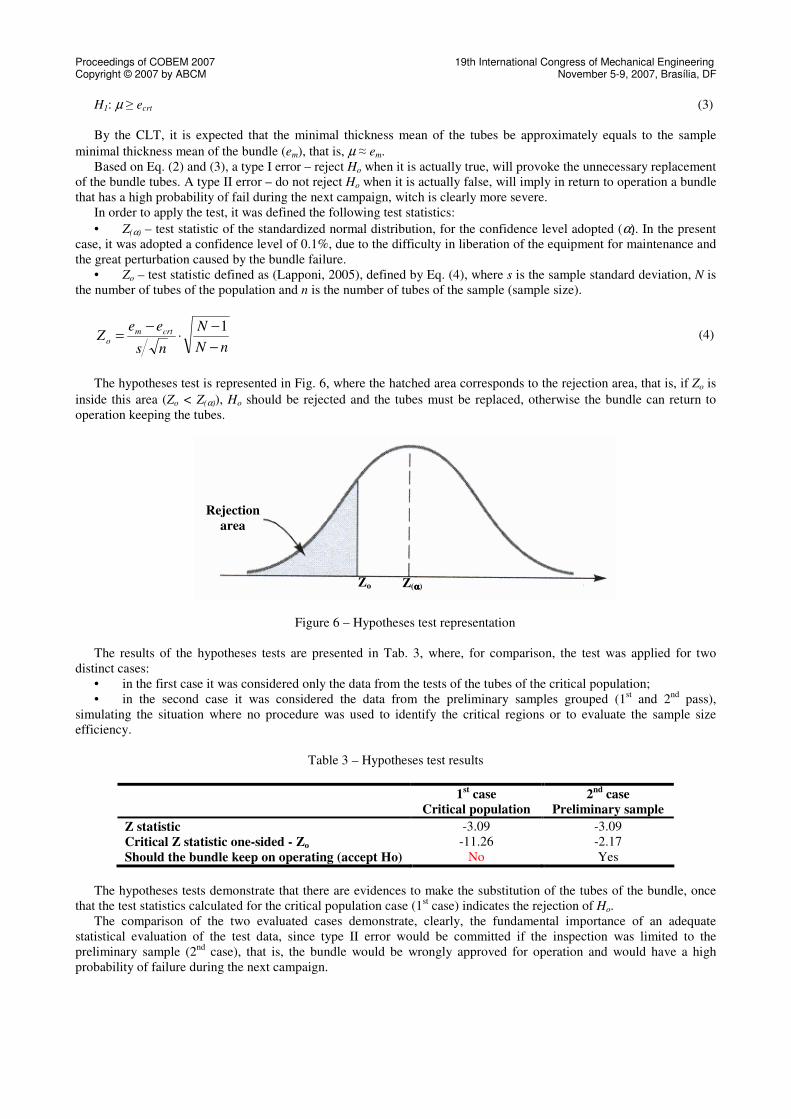
The hypotheses test is represented in Fig. 6, where the hatched area corresponds to the rejection area, that is, if Zo is
inside this area (Zo < Z(α)), Ho should be rejected and the tubes must be replaced, otherwise the bundle can return to
operation keeping the tubes.
Figure 6 – Hypotheses test representation
The results of the hypotheses tests are presented in Tab. 3, where, for comparison, the test was applied for two
distinct cases:
• in the first case it was considered only the data from the tests of the tubes of the critical population;
• in the second case it was considered the data from the preliminary samples grouped (1st and 2
nd pass),
simulating the situation where no procedure was used to identify the critical regions or to evaluate the sample size
efficiency.
Table 3 – Hypotheses test results
1st case
Critical population 2nd case
Preliminary sample
Z statistic -3.09 -3.09
Critical Z statistic one-sided - Zo -11.26 -2.17
Should the bundle keep on operating (accept Ho) No Yes
The hypotheses tests demonstrate that there are evidences to make the substitution of the tubes of the bundle, once
that the test statistics calculated for the critical population case (1st case) indicates the rejection of Ho.
The comparison of the two evaluated cases demonstrate, clearly, the fundamental importance of an adequate
statistical evaluation of the test data, since type II error would be committed if the inspection was limited to the
preliminary sample (2nd
case), that is, the bundle would be wrongly approved for operation and would have a high
probability of failure during the next campaign.
Rejection
area
Z(αααα) Zo
5. CONCLUSIONS
This work presented the application of a methodology to the analysis of the results of IRIS tests to a specific tubular
bundle, which allowed to:
• verify the efficiency of the sample size to represent the bundle as a whole, using criteria related to the CLT and to
the define a maximum sample standard error acceptable;
• identify region with higher corrosion rate, by means of F test of Fisher, to compare the sample variances, and the t
test of Student, to compare the sample means;
• evaluate the necessity of substitute the tubes of the bundle, by means of hypotheses tests.
The case of study showed that poor maintenance decisions could be made, led by improper statistical approach on
the IRIS results analysis. The application of statistical procedures in the evaluation of IRIS results had shown to be the
best way to reduce the subjectiveness of this service, guaranteeing the representativeness of the sampling and the
accuracy of the decision make of replacing or not the tubes of the bundle.
This methodology allows, in addition, a greater knowledge of the equipment by the identification of the parameters
of the normal distribution that represents the minimal thickness of the bundle. Those parameters are essentials to
improve the reliability of the bundle and, in consequence, of the whole equipment. It can also reduce costs, once that
allows a optimized use of the bundle. At last, those parameters can be used in the next interventions to increase the
efficiency and precision of the sampling.
6. ACKNOWLEDGEMENTS
The authors would like to acknowledge the outstanding effort contributed to this project by the inspection and
maintenance team of PETROBRAS UN-REGAP and BBL´s IRIS inspection team.
7. REFERENCES
Barringer, P., March 2001, “Problem of the Month: March 2001 – Heat Exchanger IRIS Wall Thickness and Gumbel
Smallest Distributions”. Barringer & Asociates, Inc. 01 July 2007 < http://www.barringer1.com/mar01prb.htm >
Birring, A., 2001. “Selection of NDT Techniques for Heat Exchanger Tubing”. Materials evaluation, Ohio, v. 59, n. 3,
pp. 382-391.
Cochran, W., 1977. “Sampling Techniques”. 3. ed. New York: John Wiley & Sons.
Kreith, F. (Ed.); Goswami, D. Y. (Ed.), 2005. “The CRC Handbook of Mechanical Engineering”. 2. ed. Boca Raton,
London, New York, Washington D.C.: CRC.
Lapponi, J., 2005. “Estatística usando o Excel”. 4. ed. rev. at. São Paulo: Elsevier.
Montgomery, D.; Runger, G., 2003. “Estatística aplicada e probabilidade para engenheiros”. 2. ed. Rio de Janeiro: LTC.
Olympus NDT Inc, 2006. “Tube_Inspection_Probe_Catalogue_0601”. Canada: Olympus.
Rodas, D.; Fialho, E.; Medeiros, F., 2005. “Uso da Análise de Weibull no Cálculo de Vida Remanescente de
Trocadores de Calor”. Proceedings of the Simpósio Internacional de Confiabilidade, Rio de Janeiro, Brasil:
Reliasoft Brasil.
Telles, P. S., 2005. “Vasos de Pressão”. 2. ed. at. Rio de Janeiro: LTC.
8. RESPONSIBILITY NOTICE
The authors are the only responsible for the printed material included in this paper.


