Embed Size (px)
Citation preview
INSECTICIDAL ACTIONS OF CITRUS AURANTIUM
ELIAS P. SISKOS
A thesis submitted to Cardiff University in candidature for the degree ofDoctor of Philosophy
Cardiff School of Biosciences Cardiff University
September 2004
UMI Number: U584693
All rights reserved
INFORMATION TO ALL USERS The quality of this reproduction is dependent upon the quality of the copy submitted.
In the unlikely event that the author did not send a complete manuscript and there are missing pages, these will be noted. Also, if material had to be removed,
a note will indicate the deletion.
Dissertation Publishing
UMI U584693Published by ProQuest LLC 2013. Copyright in the Dissertation held by the Author.
Microform Edition © ProQuest LLC.All rights reserved. This work is protected against
unauthorized copying under Title 17, United States Code.
ProQuest LLC 789 East Eisenhower Parkway
P.O. Box 1346 Ann Arbor, Ml 48106-1346
DECLARATION
This work has not previously been accepted in substance for any degree and is not being concurrently submitted in candidature for any degree.
Signed .......................................... (candidate)
Date Z j / . O ?../.&>.?. V........................
STATEMENT 1
This thesis is the result o f my own investigations, except where otherwise stated.
Other sources are acknowledged by footnotes giving explicit references. A bibliography is appended.
Signed ........................................... (candidate)
D ate..............
STATEMENT 2
I hereby give consent for my thesis, if accepted, to be available for photocopying and for inter-library loan, and for the title and summary to be made available to outside organisations.
Signed ..........
Date /.O f),\/.2 &q V
(candidate)

To my Giota
ACKNOWLEDGEMENTS
First of all I would like to thank the person who offered me the theme of the thesis
and his laboratory and made this project possible; my supervisor in Greece, Dr.
Basilios Mazomenos. I am grateful for his continued support all these years, for his
attention and care and inspiring conversation on my work and for correcting the
manuscripts.
I would like to thank my supervisor in Cardiff, Dr. Mark Jervis, for his help, advice,
encouragement and useful suggestions throughout the course of this study and for his
inspiring and constructive criticism on the manuscripts.
Special thanks to Dr. Fragoulis Krokos for introducing me in the chemical aspects of
this study and especially for his invaluable help on spectroscopic analyses.
I would like to thank Dr. David Kelly for providing the NMR facilities and for his
help in the interpretation of the NMR spectra.
Thanks to Prof. May Berenbaum for providing the synthetic osthol.
I would like to thank all the people o f the Chemical Ecology and Natural Products
laboratory, especially Dr. Maria Konstantopoulou and Mrs. Tasoula Pantazi-
Mazomenos, for their support all these years and for providing a friendly and warm
environment.
I should acknowledge the State Scholarship Foundation (Republic of Greece) for the
generous financial support of most of my studies.
Finally, I would like to thank my parents and my brothers for their support and love
during my studies and my life.
SUMMARY
This thesis was aimed at the extraction, isolation and structure elucidation of insecticidally active secondary metabolites of Citrus aurantium plant parts for potential use either as commercial insecticides or as lead compounds.
Fruits, leaves and shoots of C. aurantium were extracted in methanol and the chemicals recovered were fractionated by liquid-liquid partitioning using organic solvents of increasing polarity (petroleum ether, dichloromethane, ethyl acetate). Petri dish exposure bioassays revealed that only the petroleum ether fraction of the fruit methanol extract was toxic against Bactrocera oleae adults. The bioactive chemicals present in the fruits were produced and/or accumulated in the peels.
Petri dish exposure and topical application bioassays revealed that a petroleum ether peel extract was toxic against B. oleae and Ceratitis capitata adults. In several cases, differences in susceptibility were revealed between the two species and between the two sexes of the same species.
First gravity column fractionation of the peel extract revealed that only the F2 fraction was active, while fraction Ft has a synergistic effect. Further purification of the F2 fraction on the second gravity column, followed by HPLC, resulted in the isolation of three major compounds.
The chemical structure of these components was elucidated by spectroscopic methods (UV, FTIR, GC-MS and *H NMR) and was assigned as osthol, bergapten and 6',7'- epoxybergamottin. Of the three isolated compounds, only the 6',7'-epoxybergamottin was active and its toxicity was the same to the synthesised 6',7'-epoxybergamottin. However, the synergism revealed between isolated bergapten and 6',7'- epoxybergamottin was not confirmed when isolated bergapten was replaced by synthetic bergapten, indicating that minor components present in the isolated bergapten were responsible for the synergistic effect.
Crude or semi-purified peel extracts of C. aurantium may have potential for insect control. Moreover, 6',7'-epoxybergamottin has apparently never been reported to have deleterious effects on insects. At this early stage, the potential of 6',7'- epoxybergamottin as a lead compound for a new class of insecticides remains to be determined.
CONTENTS
Acknowledgments i
Summary ii
Contents iii
Abbreviations vi
List of Figures ix
List of Tables xii
1 General Introduction 1
1.1 Insects as Pests 1
1.2 Plant-derived chemicals as a source of insecticides 3
1.3 The family Rutaceae 7
1.3.1 The genus C itrus 1
1.4 The family Tephritidae 12
1.4.1 Bactrocera oleae (Gmelin) (Diptera: Tephritidae) 12
1.4.2 Ceratitis capitata (Wiedemann) (Diptera: Tephritidae) 14
1.5 Aims 18
2 General Materials and Methods 20
2.1 Materials 20
2.1.1 Insects 20
2.1.2 Plant materials 23
2.1.3 Chemicals 25
2.2 Methods 25
2.2.1 Extraction methods 25
2.2.2 Bioassays 26
2.2.3 Statistics 33
3 Screening for insecticidal activity in Citrus aurantium extracts 35
3.1 Introduction 35
3 .2 Methods 40
3 .2.1 Extraction of plant materials 40
iii
3.2.2 Bioassay of fractions and extracts 49
3.2.3 TLC analysis of fractions and extracts 50
3.3 Results 52
3.3.1 Extraction yield, chemical profile and insecticidal activity of various
fractions of CA plant parts 52
3.3.2 Extraction yield, chemical profile and insecticidal activity of
petroleum ether fractions of CA fruit tissues 58
3.3.3 Extraction yield, chemical profile and insecticidal activity of
petroleum ether fractions obtained from fresh and dried peels of CA 62
3.3.4 Effect of different extraction methods and solvents on extraction
yield, chemical profile and insecticidal activity of peel fractions and
extracts of CA 66
3.3.5 Effect of fruit ripeness on extraction yield, chemical profile and
insecticidal activity of petroleum ether peel extracts of CA 70
3.4 Discussion 75
4 Evaluation of the insecticidal activity of a petroleum ether peel extract of
Citrus aurantium to Bactrocera oleae and Ceratitis capitata adults 79
4.1 Introduction 79
4.2 Methods 82
4.2.1 Extraction of CA peels 82
4.2.2 Bioassays 82
4.3 Results 85
4.3.1 Petri dish exposure bioassays 85
4.3.2 Fumigant bioassays 94
4.3.3 Topical application bioassays 97
4.4 Discussion 112
5 Isolation of insecticidally active components from the petroleum ether peel
extract of Citrus aurantium 118
5.1 Introduction 118
5.2 Methods 122
5.2.1 Fractionation procedure of the petroleum ether peel extract of CA 122
5 .2.2 Bioassay of fractions 126
iv
5.2.3 TLC analysis of fractions 127
5.2.4 HPLC analysis of fractions 127
5.3 Results 128
5.3.1 First gravity column fractionation 128
5.3.2 Second gravity column fractionation 134
5.3.3 HPLC fractionation 139
5.4 Discussion 152
6 Identification of isolated insecticidally active components 155
6.1 Introduction 155
6.2 Methods 157
6.2.1 Spectroscopic methods 15 7
6.2.2 Synthesis of 6',7'-epoxybergamottin 159
6.2.3 Bioassay of isolated and synthetic compounds 159
6.3 Results 161
6.3.1 Spectroscopic data of the isolated compounds 161
6.3.2 Synthesised 6',7'-epoxybergamottin 173
6.3.3 Spectroscopic data of synthetic osthol, bergapten and 6',7'-
epoxybergamottin 173
6.3.4 Bioassays 173
6.4 Discussion 178
7 General Discussion 181
8 References 187
v
ABBREVIATIONS
ANOVA: Analysis of variance
BO: Bactrocera oleae
b.p.: Boiling point
br: Broad
°C: Degrees Celsius
ca .: Approximately
CA: Citrus aurantium
CC: Ceratitis capitata
CDC13: Deuteriochloroform
CHCh: Chloroform
cm: Centimeter
Conv. S-L. Conventional solid-liquid extraction method
d: Day or doublet, depending on context
DCI: Direct Contact Inlet
DCM: Dichloromethane
DEPT: Distortionless enhancement through polarisation transfer
df: Degrees of freedom
El: Electron impact (ionisation)
EtOAc: Ethyl acetate
eV: Electron volt
FID: Flame Ionisation Detector
FTIR: Fourier Transform Infrared Spectroscopy
g: Gram
GC: Gas Chromatography
h: Hour
Hex: n-Hexane
H20: Water
HPLC: High Performance Liquid Chromatography
Hz: Hertz
id.: Internal diameter
IPM: Integrated Pest Management
IR:
1:
L C 5 0 :
L D 5 0 :
//A:
/'g 'fiV.
m:
mA:
MCPBA:
MeOH:
mg:
MHz:
min:
ml:
mm:
MS:
m z\
n:
Na2SC>4:nm:
NMR:
P:
PE:
PTFE:
Rr:s:
SE:
sec:
SIT:
t:
Infrared
Litre
Median lethal concentration: Statistically derived concentration
expected to kill 50 % of test organisms in a given population
Median lethal dose: Statistically derived dose expected to kill 50 % of
test organisms in a given population
Microamper
Microgram
Microlitre
Micrometer
Multiplet
Milliamper
3-Chloroperbenzoic acid
Methanol
Milligram
Megahertz
Minute
Millilitre
Millimeter
Mass Spectrometry
Mass-to-charge ratio
Number of sampling units in a sample
Sodium sulphate
Nanometer
Nuclear Magnetic Resonance
Probability
Petroleum ether (b.p. 40-60 °C)
Polytetrafluoroethylene (Teflon)
Retention factor
Singlet
Standard error
Second
Sterile Insect Technique
Triplet
vii
TLC: Thin Layer Chromatography
UV: Ultraviolet
v: Volume
X2: Chi-squared
LIST OF FIGURES
Figure 1.1 Bactrocera oleae, adult female.
Figure 1.2 Ceratitis capitata, adult female.
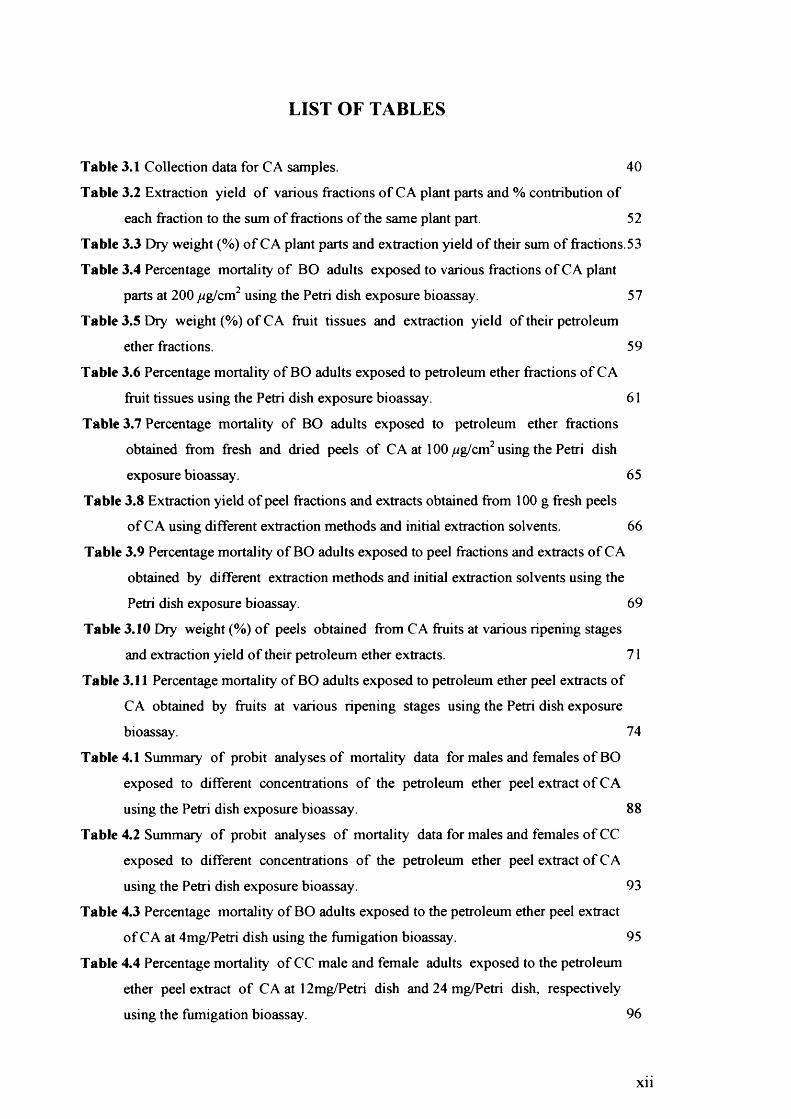
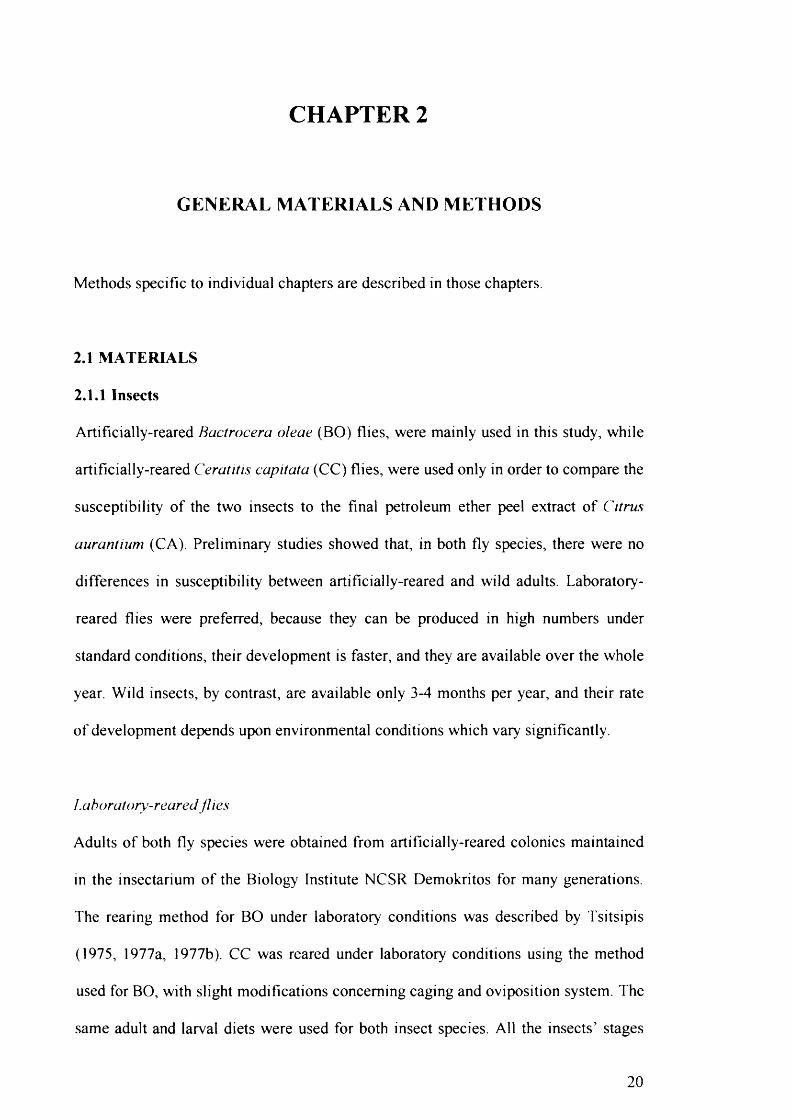
Figure 2.1 Wood-framed colony cage in which artificially-reared BO adult flies were
maintained.
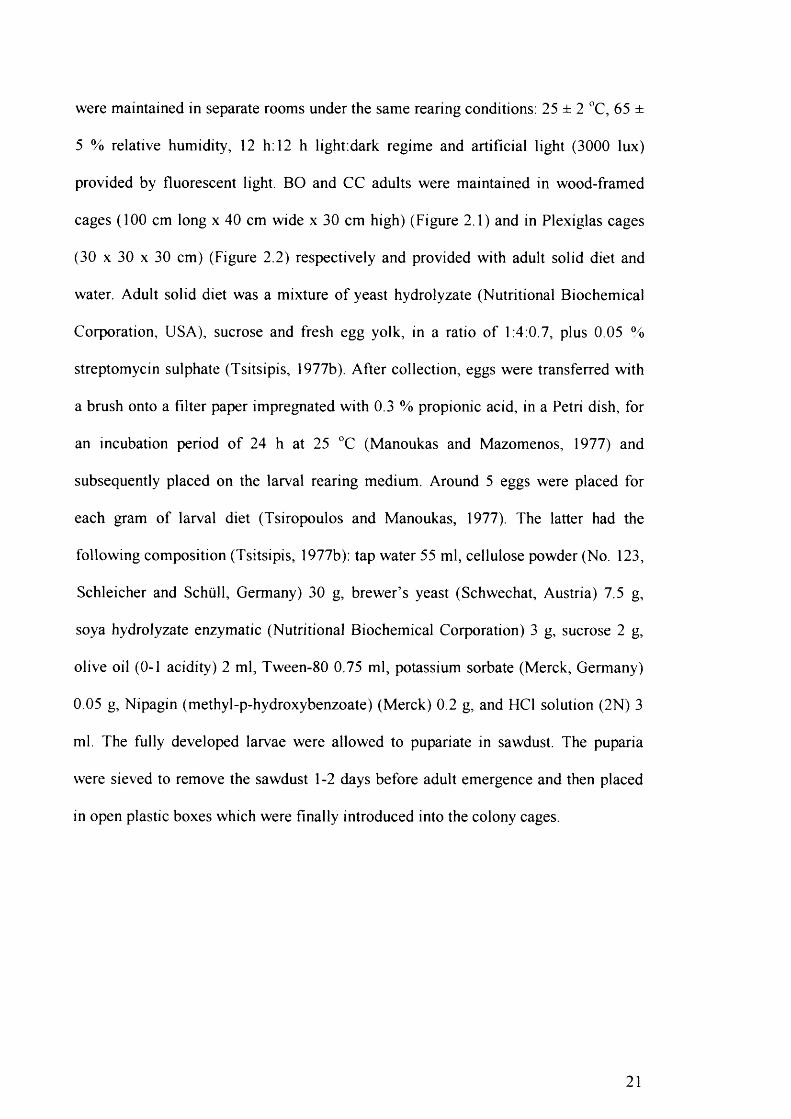
Figure 2.2 Plexiglas colony cage in which artificially-reared CC adult flies were
maintained.
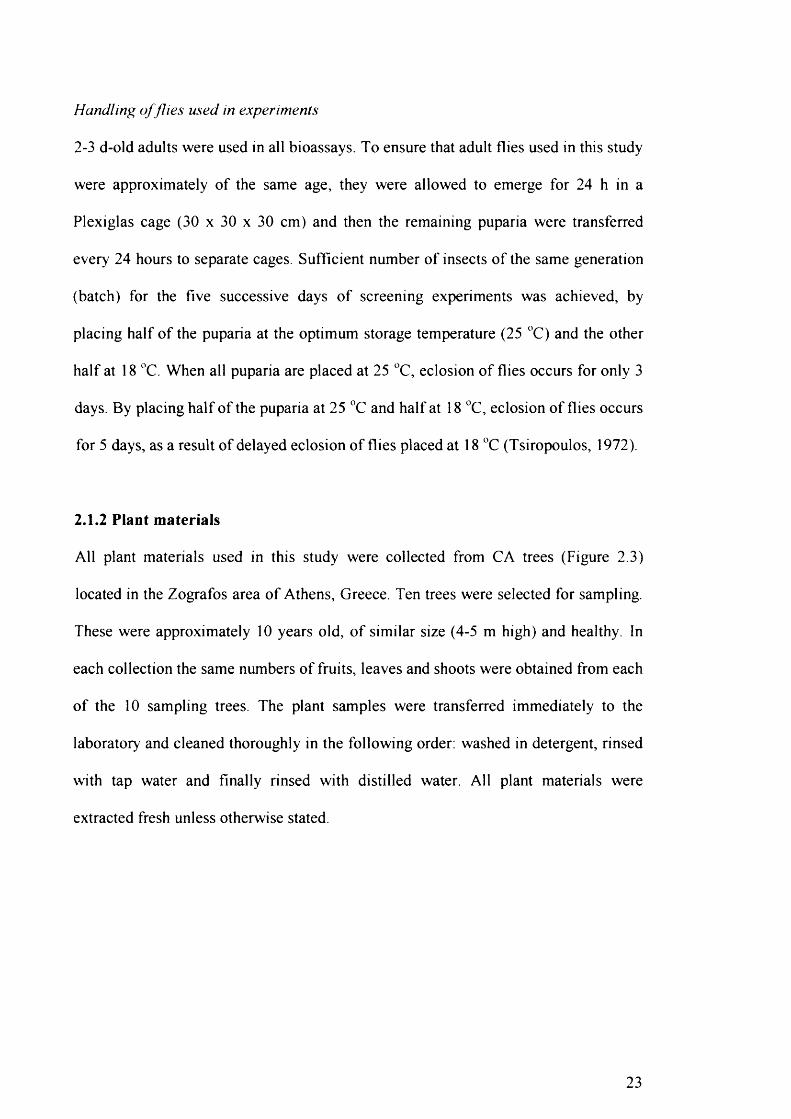
Figure 2.3 CA trees with fruits at different ripening stages.
Figure 2.4 A Petri dish used in the Petri dish exposure bioassay in which the test sample
was applied to the entire inner surface and thin cardboard strips were placed
between the sides and the lid.
Figure 2.5 Wood-framed cages, containing solid adult diet and water, in which tested
flies were transferred (10 flies/cage) after 12 h exposure to treated and control
Petri dishes.
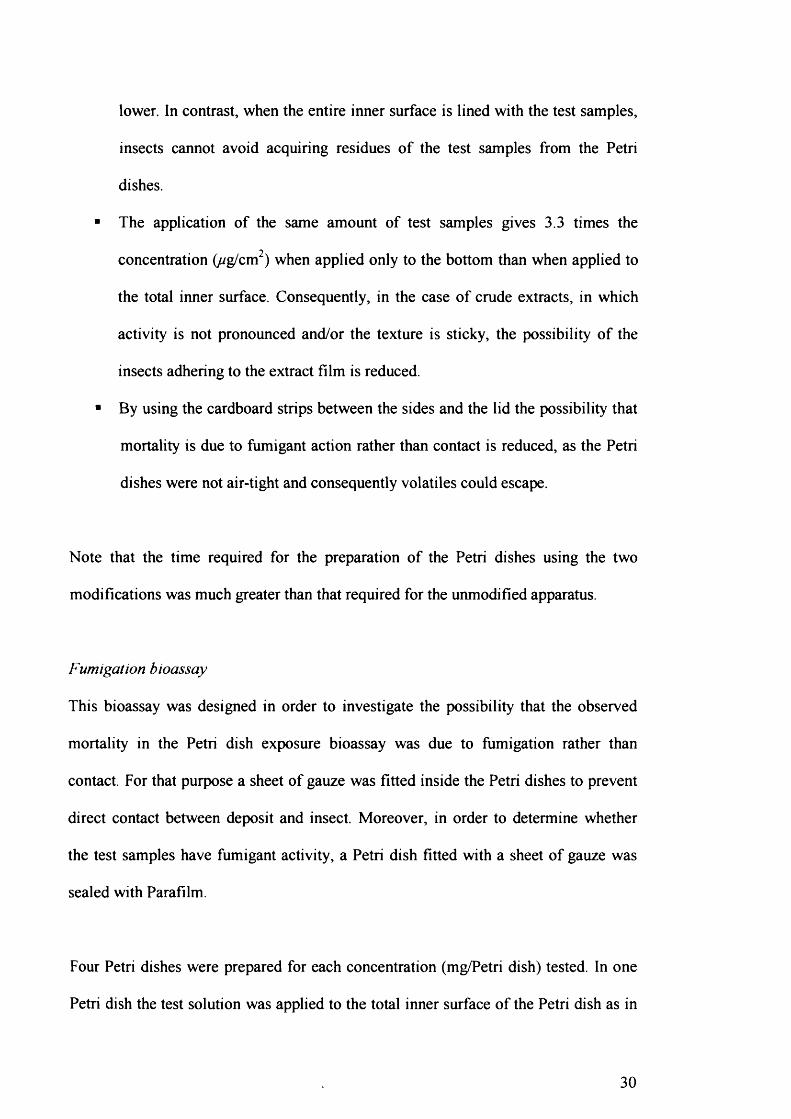
Figure 2.6 The 4 Petri dishes used in the fumigation bioassay.
Figure 2.7 The Burkard hand micro-applicator, used to apply topically 1 p\ of solvent or
test solution to the dorsal surface of the thorax of each fly.
Figure 3.1 Fruits, leaves and shoots of CA.
Figure 3.2 Partitioning procedure of CA methanol extracts.
Figure 3.3 Fruit tissues of CA.
Figure 3.4 Thin layer chromatogram of various fractions of CA plant parts.
Figure 3.5 Thin layer chromatograms of petroleum ether (A), ethyl acetate (B) and
residual (C) fractions of CA plant parts.
Figure 3.6 Thin layer chromatogram of petroleum ether fractions of CA fruit tissues.
Figure 3.7 Thin layer chromatogram of petroleum ether fractions obtained from fresh
and dried peels of CA.
Figure 3.8 Thin layer chromatogram of peel fractions and extracts of CA obtained by
different extraction methods and initial extraction solvents.
Figure 3.9 Thin layer chromatogram of petroleum ether peel extracts of CA obtained by
fruits at various ripening stages.
Figure 4.1 Percentage mortality of BO male adults exposed to different concentrations
(ug/cm2) of the petroleum ether peel extract of CA using the Petri dish exposure
bioassay.
13
14
22
22
24
28
29
31
32
41
43
45
55
56
60
64
68
72
86
ix
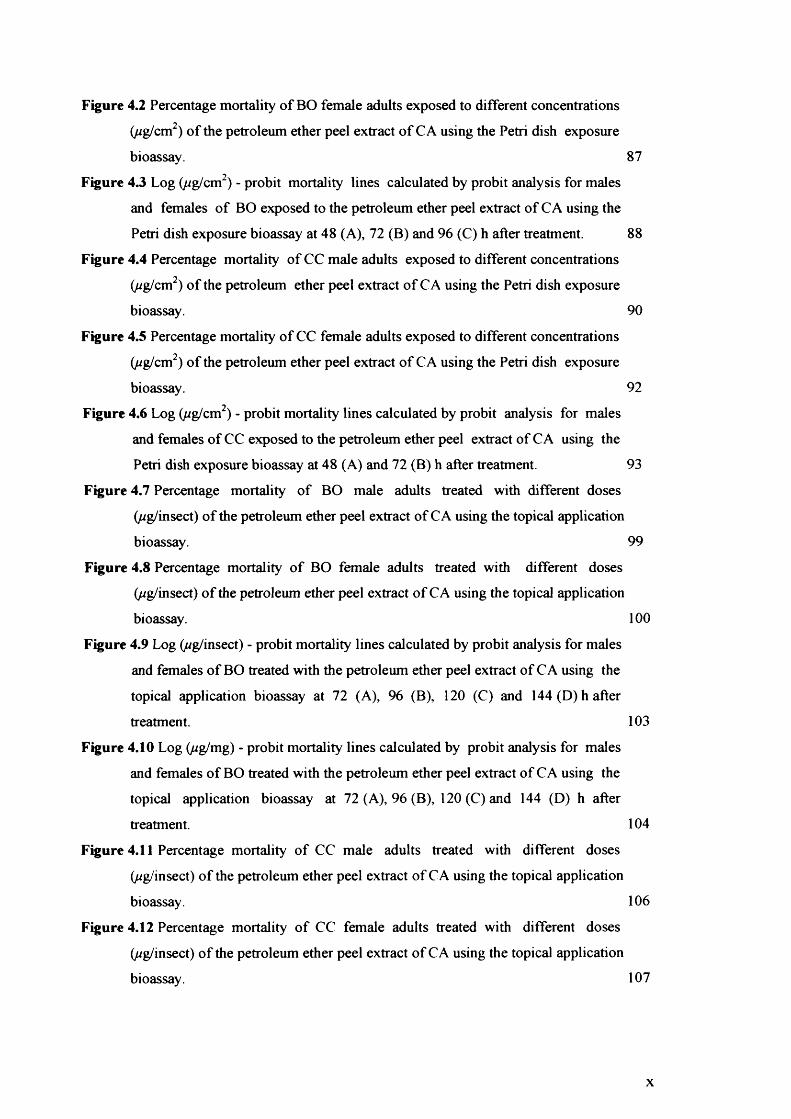
Figure 4.2 Percentage mortality of BO female adults exposed to different concentrations
(ug/cm2) of the petroleum ether peel extract of CA using the Petri dish exposure
bioassay. 87
Figure 4.3 Log (ug/cm2) - probit mortality lines calculated by probit analysis for males
and females of BO exposed to the petroleum ether peel extract of CA using the
Petri dish exposure bioassay at 48 (A), 72 (B) and 96 (C) h after treatment. 88
Figure 4.4 Percentage mortality of CC male adults exposed to different concentrations
(ug/cm2) of the petroleum ether peel extract of CA using the Petri dish exposure
bioassay. 90
Figure 4.5 Percentage mortality of CC female adults exposed to different concentrations
(ug/cm2) of the petroleum ether peel extract of CA using the Petri dish exposure
bioassay. 92
Figure 4.6 Log (ug/cm2) - probit mortality lines calculated by probit analysis for males
and females of CC exposed to the petroleum ether peel extract of CA using the
Petri dish exposure bioassay at 48 (A) and 72 (B) h after treatment. 93
Figure 4.7 Percentage mortality of BO male adults treated with different doses
(ug/insect) of the petroleum ether peel extract of CA using the topical application
bioassay. 99
Figure 4.8 Percentage mortality of BO female adults treated with different doses
(//g/insect) of the petroleum ether peel extract of CA using the topical application
bioassay. 100
Figure 4.9 Log (ug/insect) - probit mortality lines calculated by probit analysis for males
and females of BO treated with the petroleum ether peel extract of CA using the
topical application bioassay at 72 (A), 96 (B), 120 (C) and 144 (D)h after
treatment. 103
Figure 4.10 Log (ug/mg) - probit mortality lines calculated by probit analysis for males
and females of BO treated with the petroleum ether peel extract of CA using the
topical application bioassay at 72 (A), 96 (B), 120(C) and 144 (D) h after
treatment. 104
Figure 4.11 Percentage mortality of CC male adults treated with different doses
(ug/insect) of the petroleum ether peel extract of CA using the topical application
bioassay. 106
Figure 4.12 Percentage mortality of CC female adults treated with different doses
(ug/insect) of the petroleum ether peel extract of CA using the topical application
bioassay. 107
x
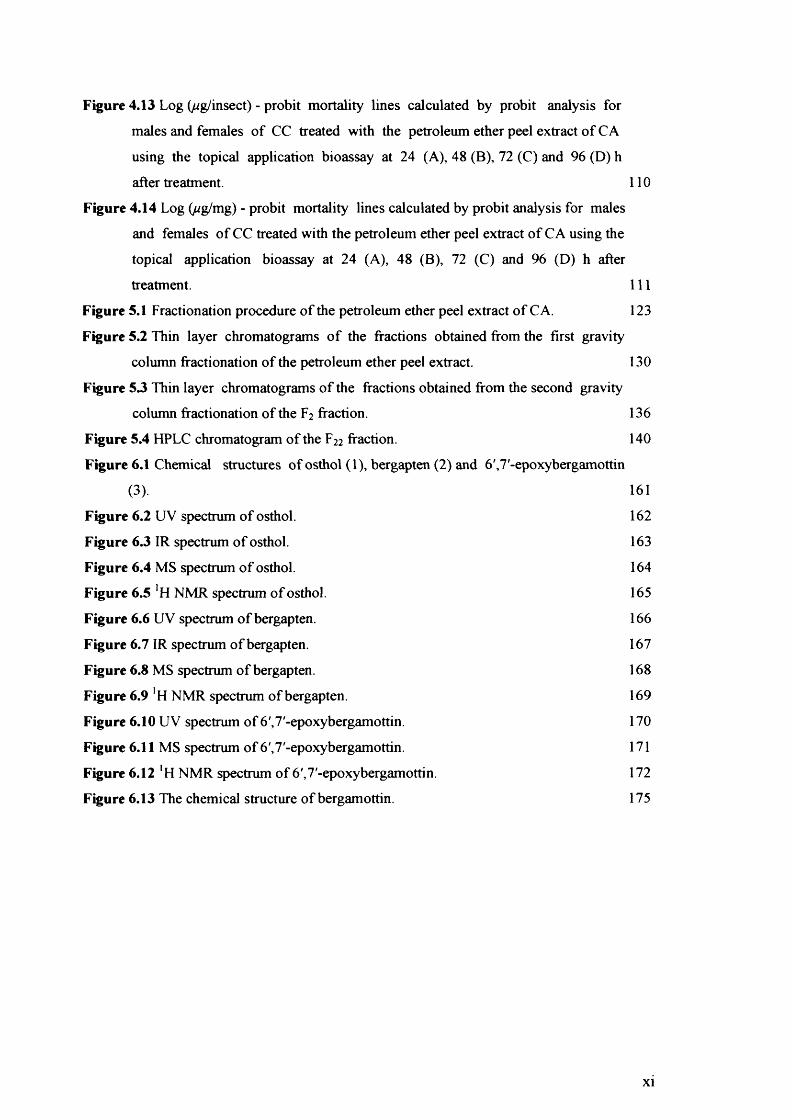
Figure 4.13 Log (//g/insect) - probit mortality lines calculated by probit analysis for
males and females of CC treated with the petroleum ether peel extract of CA
using the topical application bioassay at 24 (A), 48 (B), 72 (C) and 96 (D) h
after treatment. 110
Figure 4.14 Log (/^g/mg) - probit mortality lines calculated by probit analysis for males
and females of CC treated with the petroleum ether peel extract of CA using the
topical application bioassay at 24 (A), 48 (B), 72 (C) and 96 (D) h after
treatment. 111
Figure 5.1 Fractionation procedure of the petroleum ether peel extract of CA. 123
Figure 5.2 Thin layer chromatograms of the fractions obtained from the first gravity
column fractionation of the petroleum ether peel extract. 130
Figure 53 Thin layer chromatograms of the fractions obtained from the second gravity
column fractionation of the F2 fraction. 136
Figure 5.4 HPLC chromatogram of the F22 fraction. 140
Figure 6.1 Chemical structures ofosthol (1), bergapten(2) and 6',7-epoxybergamottin
(3). 161
Figure 6.2 UV spectrum of osthol. 162
Figure 6.3 IR spectrum of osthol. 163
Figure 6.4 MS spectrum of osthol. 164
Figure 6.5 NMR spectrum of osthol. 165
Figure 6.6 UV spectrum of bergapten. 166
Figure 6.7 IR spectrum of bergapten. 167
Figure 6.8 MS spectrum of bergapten. 168
Figure 6.9 'H NMR spectrum of bergapten. 169
Figure 6.10 UV spectrum of 6',7'-epoxybergamottin. 170
Figure 6.11 MS spectrum of 6',7'-epoxybergamottin. 171
Figure 6.12 !H NMR spectrum of 6',7'-epoxybergamottin. 172
Figure 6.13 The chemical structure of bergamottin. 175
xi
LIST OF TABLES
Table 3.1 Collection data for CA samples. 40
Table 3.2 Extraction yield of various fractions of CA plant parts and % contribution of
each fraction to the sum of fractions of the same plant part. 52
Table 3.3 Dry weight (%) of CA plant parts and extraction yield of their sum of fractions. 53
Table 3.4 Percentage mortality of BO adults exposed to various fractions of CA plant
parts at 200 /^g/cm2 using the Petri dish exposure bioassay. 57
Table 3.5 Dry weight (%) of CA fruit tissues and extraction yield of their petroleum
ether fractions. 59
Table 3.6 Percentage mortality of BO adults exposed to petroleum ether fractions of CA
fruit tissues using the Petri dish exposure bioassay. 61
Table 3.7 Percentage mortality of BO adults exposed to petroleum ether fractions
obtained from fresh and dried peels of CA at 100//g/cm2 using the Petri dish
exposure bioassay. 65
Table 3.8 Extraction yield of peel fractions and extracts obtained from 100 g fresh peels
of CA using different extraction methods and initial extraction solvents. 66
Table 3.9 Percentage mortality of BO adults exposed to peel fractions and extracts of CA
obtained by different extraction methods and initial extraction solvents using the
Petri dish exposure bioassay. 69
Table 3.10 Diy weight (%) of peels obtained from CA fruits at various ripening stages
and extraction yield of their petroleum ether extracts. 71
Table 3.11 Percentage mortality of BO adults exposed to petroleum ether peel extracts of
CA obtained by fruits at various ripening stages using the Petri dish exposure
bioassay. 74
Table 4.1 Summary of probit analyses of mortality data for males and females of BO
exposed to different concentrations of the petroleum ether peel extract of CA
using the Petri dish exposure bioassay. 88
Table 4.2 Summary of probit analyses of mortality data for males and females of CC
exposed to different concentrations of the petroleum ether peel extract of CA
using the Petri dish exposure bioassay. 93
Table 4.3 Percentage mortality of BO adults exposed to the petroleum ether peel extract
of CA at 4mg/Petri dish using the fumigation bioassay. 95
Table 4.4 Percentage mortality of CC male and female adults exposed to the petroleum
ether peel extract of CA at 12mg/Petri dish and 24 mg/Petri dish, respectively
using the fumigation bioassay. 96
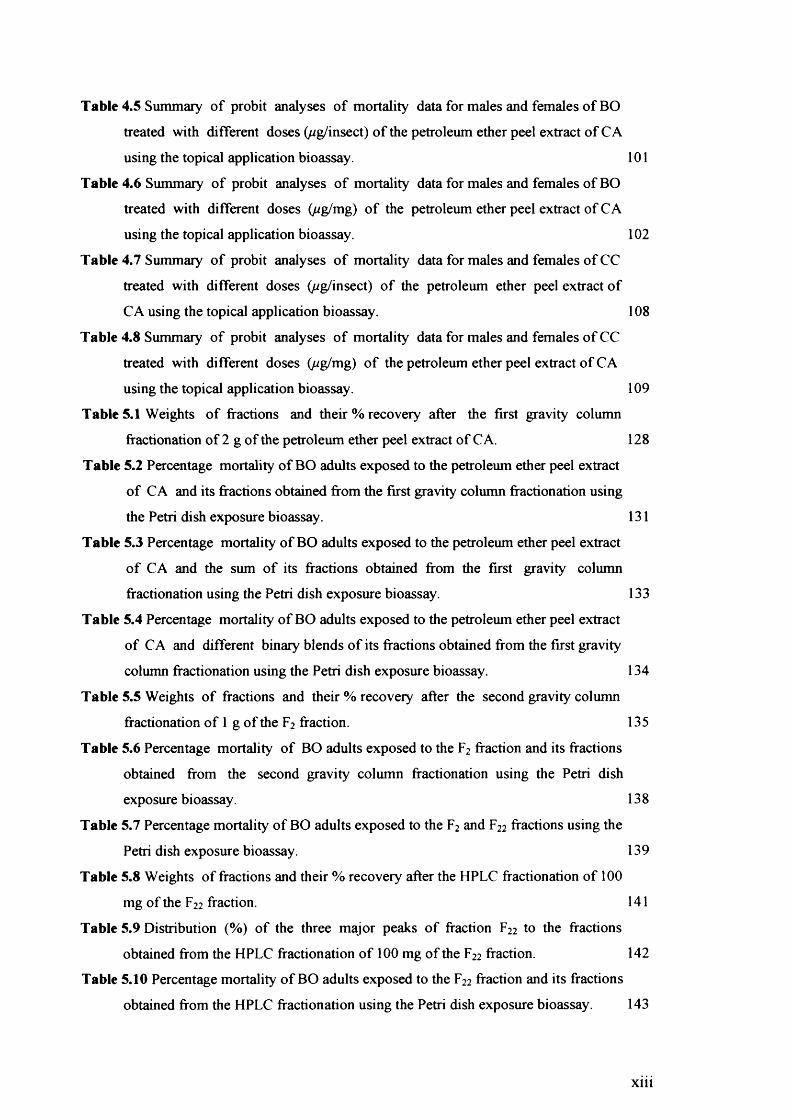
Table 4.5 Summary of probit analyses of mortality data for males and females of BO
treated with different doses (//g/insect) of the petroleum ether peel extract of CA
using the topical application bioassay. 101
Table 4.6 Summary of probit analyses of mortality data for males and females of BO
treated with different doses (ug/mg) of the petroleum ether peel extract of CA
using the topical application bioassay. 102
Table 4.7 Summary of probit analyses of mortality data for males and females of CC
treated with different doses (wg/insect) of the petroleum ether peel extract of
CA using the topical application bioassay. 108
Table 4.8 Summary of probit analyses of mortality data for males and females of CC
treated with different doses (wg/mg) of the petroleum ether peel extract of CA
using the topical application bioassay. 109
Table 5.1 Weights of fractions and their % recovery after the first gravity column
fractionation of 2 g of the petroleum ether peel extract of CA. 128
Table 5.2 Percentage mortality of BO adults exposed to the petroleum ether peel extract
of CA and its fractions obtained from the first gravity column fractionation using
the Petri dish exposure bioassay. 131
Table 5.3 Percentage mortality of BO adults exposed to the petroleum ether peel extract
of CA and the sum of its fractions obtained from the first gravity column
fractionation using the Petri dish exposure bioassay. 133
Table 5.4 Percentage mortality of BO adults exposed to the petroleum ether peel extract
of CA and different binary blends of its fractions obtained from the first gravity
column fractionation using the Petri dish exposure bioassay. 134
Table 5.5 Weights of fractions and their % recovery after the second gravity column
fractionation of 1 g of the F2 fraction. 135
Table 5.6 Percentage mortality of BO adults exposed to the F2 fraction and its fractions
obtained from the second gravity column fractionation using the Petri dish
exposure bioassay. 138
Table 5.7 Percentage mortality of BO adults exposed to the F2 and F22 fractions using the
Petri dish exposure bioassay. 139
Table 5.8 Weights of fractions and their % recovery after the HPLC fractionation of 100
mg of the F22 fraction. 141
Table 5.9 Distribution (%) of the three major peaks of fraction F22 to the fractions
obtained from the HPLC fractionation of 100 mg of the F22 fraction. 142
Table 5.10 Percentage mortality of BO adults exposed to the F22 fraction and its fractions
obtained from the HPLC fractionation using the Petri dish exposure bioassay. 143
Table 5.11 Percentage mortality of BO adults exposed to the F22 and F226 fractions using
the Petri dish exposure bioassay. 144
Table 5.12 Percentage mortality of BO adults exposed to the F22 fraction and the sum of
fractions obtained from the HPLC fractionation using the Petri dish exposure
bioassay. 146
Table 5.13 Percentage mortality of BO adults exposed to the F22 fraction and different
combinations of the fractions obtained from the HPLC fractionation using the
Petri dish exposure bioassay. 148
Table 5.14 Percentage mortality of BO adults exposed to the F22 fraction and different
binary blends of the three major peaks of the F22 fraction using the Petri dish
exposure bioassay. 149
Table 5.15 Percentage mortality of BO adults exposed to the petroleum ether peel extract
of CA and a blend consisted of the Fi, F224 and F226 fractions using the Petri dish
exposure bioassay. 151
Table 6.1 Summary of probit analyses of mortality data of BO exposed to different
concentrations of the isolated and the synthetic 6',7'-epoxybergamottin and the
botanical insecticide rotenone using the Petri dish exposure bioassay. 174
Table 6.2 Percentage mortality of BO adults exposed to different combinations of
isolated and synthetic 6',7'-epoxybergamottin and bergapten using the Petri dish
exposure bioassay. 177
xiv
CHAPTER 1
GENERAL INTRODUCTION
1.1 INSECTS AS PESTS
From a purely anthropocentric standpoint, insects are pests when they harm man, his
crops, animals or property. More specifically, in agronomy an insect is classified as a
pest if the damage it causes to a crop or to livestock is sufficient to reduce the yield
and/or quality of the harvested product by an amount that is unacceptable to the
farmer (Dent, 1991). The estimated number of insect species varies from less than 5
million to as many as 80 million (Gullan and Cranston, 1994). However, only around
1 million insect species have been described up to now. O f these, fewer than 10,000
can be considered as pests, some 3,500 requiring regular attention and as few as 600
requiring control measures (Pedigo, 1996).
Insects may become crop pests for many reasons:
■ The accidental or intentional introduction of insects into a favourable new area
without the controlling influence of their natural enemies (Gullan and
Cranston, 1994).
■ The adoption of introduced crop species by native insects (van Driesche and
Bellows, 1996).
■ The simplification of agroecosystems by large-scale culture of a single crop,
with uniform planting and harvesting schedules (van Driesche and Bellows,
1996).
1
■ The use of broad spectrum insecticides which cause non-pest species to
become major pests by eliminating their natural enemies (Johansen, 1962).
■ The use of less resistant, but more high-yielding cultivars compared to wild
relatives (Dent, 1991).
■ The adoption of cultural practices, such as the continued cultivation of a single
crop, without crop rotation, sanitation and a fallow period, which allows the
build-up of insect pest numbers (Gullan and Cranston, 1994).
Since the development of agriculture, man has employed a variety of control measures
to protect his crops from pest insects. These are: control through plant resistance
(Dent, 1991), cultural control (Coaker, 1987), biological control (van Driesche and
Bellows, 1996), chemical control (Matsumura, 1975) and control techniques that
interfere with the normal physiological function or behaviour of insect pests (Dent,
1995) such as the use of pheromones (Jones, 1998) and the sterile insect technique
(Boiler, 1987). However, since the development of DDT the control of insect pests
has been accomplished largely by the use of synthetic insecticides.
Over the past 30 years the concept of Integrated Pest Management (IPM) has
completely changed the philosophy of pest control. Instead of using a single control
technique (mainly the application of pesticides), to control a specific pest problem,
various control measures are combined to control the whole range of pest species in a
cropping system. IPM is a pest management strategy that, in the socioeconomic
context of farming systems, the associated environment and the population dynamics
of pest species, utilises all suitable techniques and methods in as compatible a manner
2
as possible, and maintains the pest population levels below those causing economic
injury (Dent, 1991).
Plant-derived chemicals can play a critical role in IPM systems, as their properties -
rapidly biodegradable, species-specific, environment-friendly - are compatible with
the demands of IPM. However, it is generally acknowledged that synthetic
insecticides are more effective, efficient and stable than natural insecticides (Assabgui
et al., 1997).
1.2 PLANT-DERIVED CHEMICALS AS A SOURCE OF INSECTICIDES
Plant-derived chemicals have played a crucial role in the history of humankind, as
people had recognised and used plant-derived substances to cure illness and to protect
their crops from pests (Hedin and Hollingworth, 1997). The estimated number of
plant species in the world is 0.4-0.5 million (Hostettmann and Wolfender, 1997).
However, only a tiny fraction of these species (around 10 %) has been investigated
phytochemically and an even smaller fraction has been screened for activity against
insect pests (Benner, 1993). Furthermore, even plant extracts that have been judged to
be not toxic against a specific insect pest can exhibit considerable toxicity when tested
against other insect pests, as secondary plant metabolites are often active against a
narrow spectrum of insects (Ahn et al., 1997). Thus, it can be concluded that there is a
great potential for isolating chemicals from plants that can exhibit a range of
biological activity against insects pests. These chemicals can cause acute toxicity, can
be antifeedants, oviposition deterrents and/or repellents, and/or can interfere with
growth and/or development (Coats, 1994).
3
Plants are known to produce a variety of secondary metabolites such as terpenoids,
alkaloids, phenolics, polyacetylenes, flavonoids, unusual amino acids and sugars (Ahn
et al., 1997; Hostettmann and Wolfender, 1997). These substances have no apparent
function to primary metabolism and their main role is to protect plants from microbial
pathogens, insects, vertebrate herbivores and other plants (Coats, 1994). Other roles
they have are as pollinator attractants and as chemical adaptations to environmental
stresses (Balandrin et al., 1985).
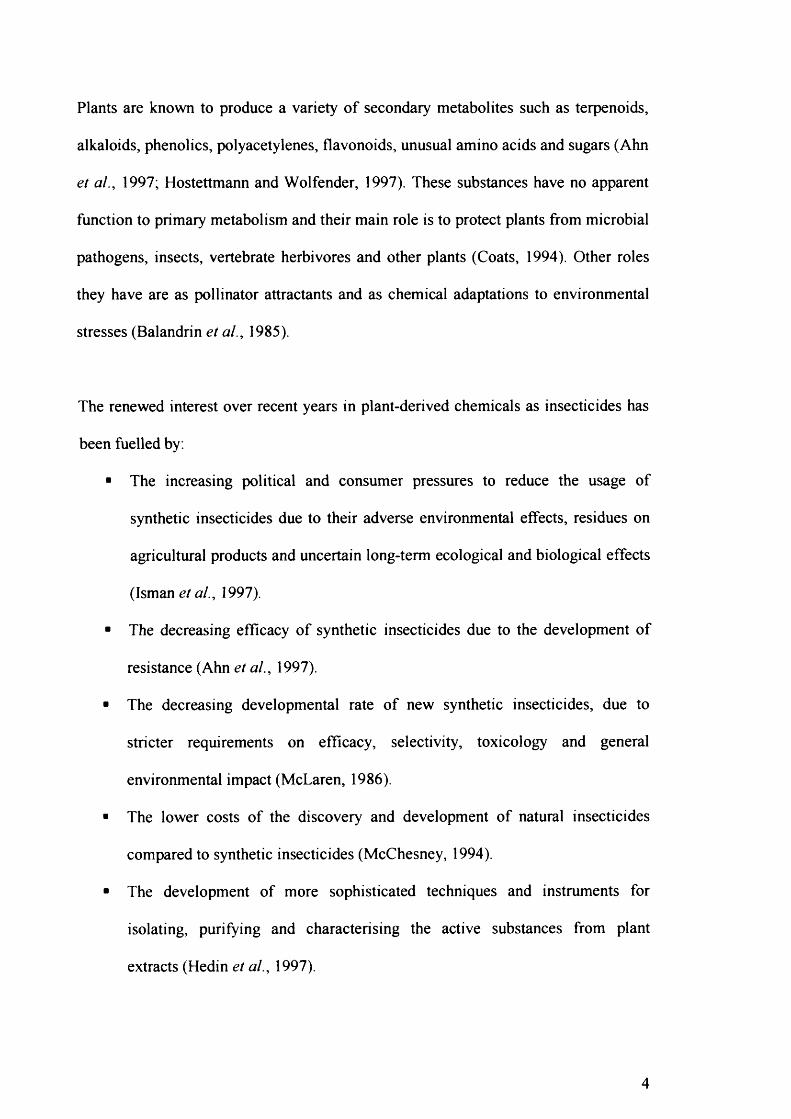
The renewed interest over recent years in plant-derived chemicals as insecticides has
been fuelled by .
■ The increasing political and consumer pressures to reduce the usage of
synthetic insecticides due to their adverse environmental effects, residues on
agricultural products and uncertain long-term ecological and biological effects
(Isman et al., 1997).
■ The decreasing efficacy of synthetic insecticides due to the development of
resistance (Ahn et al., 1997).
■ The decreasing developmental rate of new synthetic insecticides, due to
stricter requirements on efficacy, selectivity, toxicology and general
environmental impact (McLaren, 1986).
■ The lower costs of the discovery and development of natural insecticides
compared to synthetic insecticides (McChesney, 1994).
■ The development of more sophisticated techniques and instruments for
isolating, purifying and characterising the active substances from plant
extracts (Hedin et al., 1997).
4
Plant-derived insecticides appear to have several advantages over conventional broad-
spectrum insecticides:
■ They are likely to be more rapidly degradable, and consequently have lower
environmental persistence than conventional insecticides; thus, they pose
much less of a threat to the environment (Nair, 1994).
■ They may also show increased specificity and so reduce the risks to beneficial
organisms and consequently reduce the likelihood of outbreaks of secondary
pests (Plimmer, 1993).
■ In the case that new modes of action are validated, insecticide resistance
problems may be reduced (Plimmer, 1993).
Chemical substances isolated from plants for their insecticidal properties can be used
in three different ways to combat insect pests:
■ In very exceptional cases as products per se (Benner, 1993).
■ As lead structures for programmes of synthetic chemistry. The success story of
the synthetic pyrethroids is the best example supporting the use of natural
products as leads for further chemical synthesis (Miyakado et al., 1997).
■ As a source of new modes of action (Escoubas et al., 1994), which is very
important as the major compounds currently used to control insect pests are
neurotoxins acting at limited targets (Copping and Hewitt, 1998).
There are numerous examples in the literature of plant-derived chemicals with
insecticidal properties. The most important and significant application of a plant
natural product centres on the insecticidal properties of pyrethrum, which is obtained
from Chrysanthemum cinerariaefolium (Asteraceae). Pyrethrum is a powerful
5
insecticide which causes a rapid paralysis (knockdown), but it is unstable to sunlight
and rapidly hydrolysed. Pyrethrum, which is a contact nerve poison, has served as the
model for synthesis of the synthetic pyrethroids, several of which are of considerable
current agricultural importance (Graves et al., 1999).
The botanical insecticide which is attracting considerable interest nowadays is neem,
a derivative of the seeds of the Indian neem tree, Azadirachta indica (Meliaceae).
Neem is unusual among botanicals in that it is not an acute toxin. Its numerous
reported effects include repellency, feeding deterrency, oviposition deterrency,
interference with growth and development, and reproduction (Schmutterer, 1990).
A very well-known compound which has been used as a commercial insecticide is
nicotine. Nicotine is found in many species of Nicotiana (Solanaceae). Nicotiana
rustica is a much better source of this compound than the more familiar Nicotiana
tabacum and has been cultivated specifically for nicotine extraction (Benner, 1993).
Rotenone is a botanical insecticide which still retains popularity with gardeners.
Rotenone and related rotenoids are derived from the roots and tubers of South
American and Southern Asian legumes in the genera Derris, Lonchocarpus and
Tephrosia (Benner, 1993). Other botanical insecticides include sabadilla, ryania,
hellebore, strychnine, nomicotine, and anabasine (Graves et al., 1999).
Jacobson (1989) pointed out that the most promising botanicals as sources of novel
plant-based insecticides for use in the present and in the future are species of the
6
families Meliaceae, Rutaceae, Asteraceae, Anoonaceae, Labiatae and Canellaceae.
Among these six plant families, the Meliaceae and the Rutaceae predominate.
1.3 THE FAMILY RUTACEAE
The Rutaceae is distributed in warm and tropical areas of both hemispheres, with its
centres of speciation in South Africa and Australia. There are 150 genera and some
900 species. The most important genus commercially is Citrus.
1.3.1 The genus Citrus
Citrus species are small, often spiny shrubs and trees of the tropics and subtropics
native to Asia and Malaysia. A number are cultivated for their edible fruit: citron,
orange, sweet orange, lemon, lime, pomelo, grapefruit, mandarin orange and
tangerine.
Citrus plants have long been known to be a source of insect control agents. Back and
Pemberton (1915) reported that Citrus peel oils were toxic to eggs and larvae of the
Mediterranean fruit fly, Ceratitis capitata. Volatiles from Citrus peel oils have also
been found to be toxic to eggs and larvae of the Caribbean fruit fly, Anastrepha
suspense (Greany et al., 1983). Abbassy et al. (1979) studied the contact activity of
grapefruit, lemon, lime, mandarin, navel orange, native orange and sweet orange peel
oils against two stored-product insects by the Petri dish exposure bioassay. They
found that against the confused flour beetle, Tribolium confusum, lime oil was the
most toxic, followed by navel orange, lemon, grapefruit and mandarin oils; sweet and
native orange oils were the least toxic. Against granary weevil, Sitophilus granarius,
lime oil was again the most toxic, followed by the oils of grapefruit, navel orange and
7
mandarin; lemon and sweet orange oils were the least toxic, while native orange oil
was not toxic.
Sheppard (1984) demonstrated both the fumigant activity of grapefruit, lime, lemon
and orange peel oils against foraging workers of the red imported fire ant, Solenopsis
invicta, and the contact toxicity of orange peel oil by the topical application bioassay
against house flies, stable flies, black soldier flies, paper wasps and house crickets.
More recently, Ezeonu et al. (2001) studied the fumigant activity of the volatile
extracts of sweet orange and lime against mosquito, cockroach and house fly. These
authors found that volatiles of sweet orange showed greater insecticidal potency,
while the cockroach was the most susceptible to the orange peels among the three
insects studied.
Limonene, a major constituent of Citrus oils, exhibited contact and fumigant activity
against several insects (Taylor and Vickery, 1974). Rani and Osmani (1980) reported
that citral, a minor constituent of Citrus oils, was very active as a fumigant against
house fly; contact toxicity was also exhibited by citral but to a lesser degree. Styer and
Greany (1983) compared the insecticidal activity of citral and limonene against the
Caribbean fruit fly. They found that citral was considerably more toxic than limonene
to the eggs and larvae of this species. However, citral and limonene were equally
effective to house fly adults by the topical application and moreover they were toxic
to adults of the twospotted spider mite, Tetranychus urticae, by the leaf-dip bioassay
(Lee et al., 1997).
8
Su et al. (1972b) demonstrated that even when the volatile materials (about 30-35 %,
mostly terpene compounds), were removed by lyophilisation from Citrus peel oils, the
remaining non-volatile components exhibited activity when applied topically to
stored-product insects. Terpeneless peel oils of lemon, grapefruit, lime, kumquat,
tangerine, orange, tangelo and temple orange were moderately toxic to rice weevil at
dosages of 25 and 50 //g/cm2. Moreover, terpeneless peel oils of lemon, grapefruit,
lime, kumquat and tangerine were highly toxic to cowpea weevil, whereas orange,
tangelo and temple orange oils were inactive. Furthermore, none of the 8 peel oils
studied showed any appreciable toxicity to black carpet beetle larvae, Indian meal
moth larvae, cigarette beetle, red flour beetle and confused flour beetle. In addition,
Su et al. (1972a) examined the efficacy of these 8 oils as surface protectants of black
eyed peas from cowpea weevil attack. They reported that all oils tested were effective
in preventing nearly all development of an Fj generation at 1.0 and 0.75 % by weight
of the peas.
Salvatore et al. (2004) showed that diethyl ether, ethyl acetate and methanol lemon
peel extracts were toxic against C. capitata larvae when these extracts were
incorporated into their diet. Moreover, a crude aqueous extract of lemon peel was
toxic to Culex pipiens larvae (Thomas and Callaghan, 1999). However, even
powdered sun-dried Citrus peels possess insecticidal chemicals: Don-Pedro (1985)
demonstrated that powdered sun-dried orange and grapefruit peels applied as food
admixtures, exhibited toxic and repellent properties against Dermestes maculatus and
Callosobruchus maculatus.
9
Limonoids, a group of chemically related bitter tetranortriterpene derivatives, are the
most distinctive secondary metabolites of the plant order Rutales (Champagne et al.,
1992). Citrus limonoids, present in large quantities in the by-products of Citrus
industry (Klocke and Kubo, 1982), may act as either feeding deterrents or toxins,
depending on the insect species (Mendel et al., 1991b). The three major neutral
limonoids occurring in the seeds of Citrus species are limonin, nomilin and
obacunone (Mendel et al., 1991b). Limonin, the principle bitter component of Citrus,
represents a potential pest management tool for many insect species (Klocke and
Kubo, 1982). Its antifeedant activity has been reported against the Colorado potato
beetle, Leptinotarsa decemlineata (Alford et al., 1987; Mendel et al., 1991a, 1991b)
and the fall armyworm, Spodoptera frugiperda (Mendel et al., 1991a, 1993). Nomilin
has been found to deter feeding of Reticulitermes speratus (Serit et al., 1992),
Ostrinia nubilalis (Amason et al., 1987), Leptinotarsa decemlineata (Mendel et al.,
1991b) and Spodoptera frugiperda (Mendel et al., 1993). Antifeedant activity has also
been reported for obacunone towards Reticulitermes speratus (Sent et al., 1992) and
Leptinotarsa decemlineata (Mendel et al., 1991b). Limonin, obacunone and nomilin
were reported to act not only as feeding deterrents against the Colorado potato beetle,
but also as toxins (Mendel et al., 1991b). Moreover, these three limonoids were
reported to exhibit moult inhibiting activity in mosquito Culex quinquefasciatus
larvae (Jayaprakasha et al., 1997).
Apart from the insecticidal properties of Citrus species, many other activities of these
species have been reported. Volatile components of several Citrus fruit essential oils
reported to exhibit antimicrobial action on Penicillium digitatum and Penicillium
italicum (Caccioni et al., 1998). Citrus peel and seed extracts have an interesting
10
antioxidant activity with regard to citronellal (Bocco et al., 1998). Nogata et al.
(1996) reported that Citrus fruit extracts inhibited the enzyme activity of rat platelet
cyclooxygenase and lipoxygenase. Citrus aurantium fruit extracts reduced food intake
and body weight gain, in rats and also produce significant pathological changes in
electrical activity of myocardium; their potential as antiobesity herbal medicine was
discussed (Calapai et al., 1999). Moreover, the antimicrobial, antifeeding, insecticidal
and antitumour activities of Citrus paradisi are well documented (Tirillini, 2000).
Although the insecticidal properties of Citrus species are well documented, bitter
orange C. aurantium, has received little attention, like many other members of this
genus. Moreover, most reports concerning studies on the insecticidal properties of
Citrus species were focused on peel and seed extracts and not enough information is
available on the insecticidal properties of extracts derived from other Citrus plant
parts (e.g. leaves, shoots, etc.). In this study C. aurantium has been chosen in order to
study in detail the insecticidal potency o f some of its tissues.
Citrus aurantium (Linnaeus) (Rutaceae)
Citrus aurantium, also known as bitter or sour orange, is a small tree with a smooth,
greyish-brown bark and branches that spread into a fairly regular hemisphere. The
leaves are evergreen, 3 to 4 inches long, glossy, dark green on the upper side, paler
beneath and have sometimes a spine in the axil. The bitter orange and edible orange
trees closely resemble one another, but their leaf-stalks show a marked difference: that
of bitter orange being broadened out in the shape of a heart. The fruit is globular, a
little rougher and darker than that of the common sweet orange.
11
1.4 THE FAMILY TEPHRITIDAE
The Tephritidae (fruit flies) is a moderately large family with about 4500 species
which belongs to the order Diptera (flies). Fruit flies are distributed throughout the
temperate, subtropical, and tropical areas of the world. Individual flies vary in body
length from 1 to over 20 mm. Adult flies are often brightly coloured, their wings may
be banded, they feed on sugary food and they are long-lived (5-6 months). The
females of the main agricultural pests lay eggs in fruits, the developing larvae feed
inside the fruit and most leave when fully grown to pupate in soil. These pests are
thus difficult to kill as larvae, and most control measures have to be applied against
the adult flies. Pest species of Tephritidae fall mostly into the following genera:
Anastrepha, Ceratitis, Bactrocera and Rhagoletis (Hill, 1997).
1.4.1 Bactrocera oleae (Gmelin) (Diptera: Tephritidae)
Bactrocera oleae, also known as the olive fruit fly, exists in all Mediterranean olive-
growing countries and is considered to be the most serious pest of olive fruits.
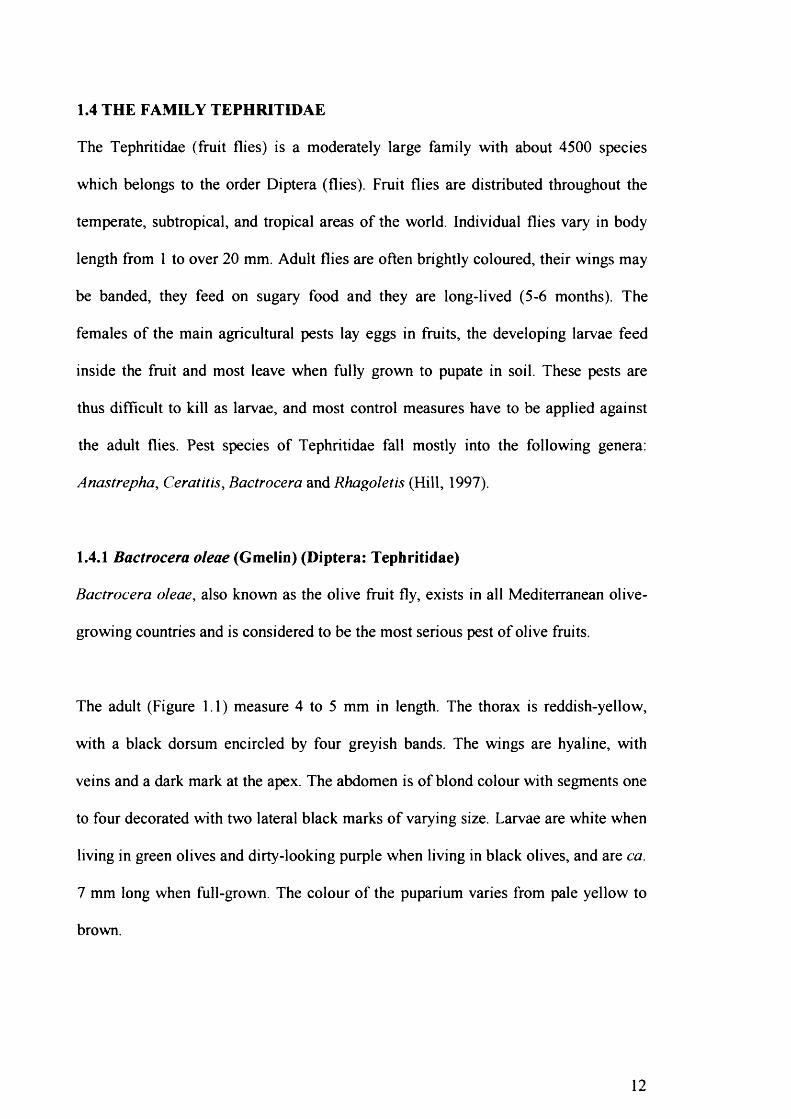
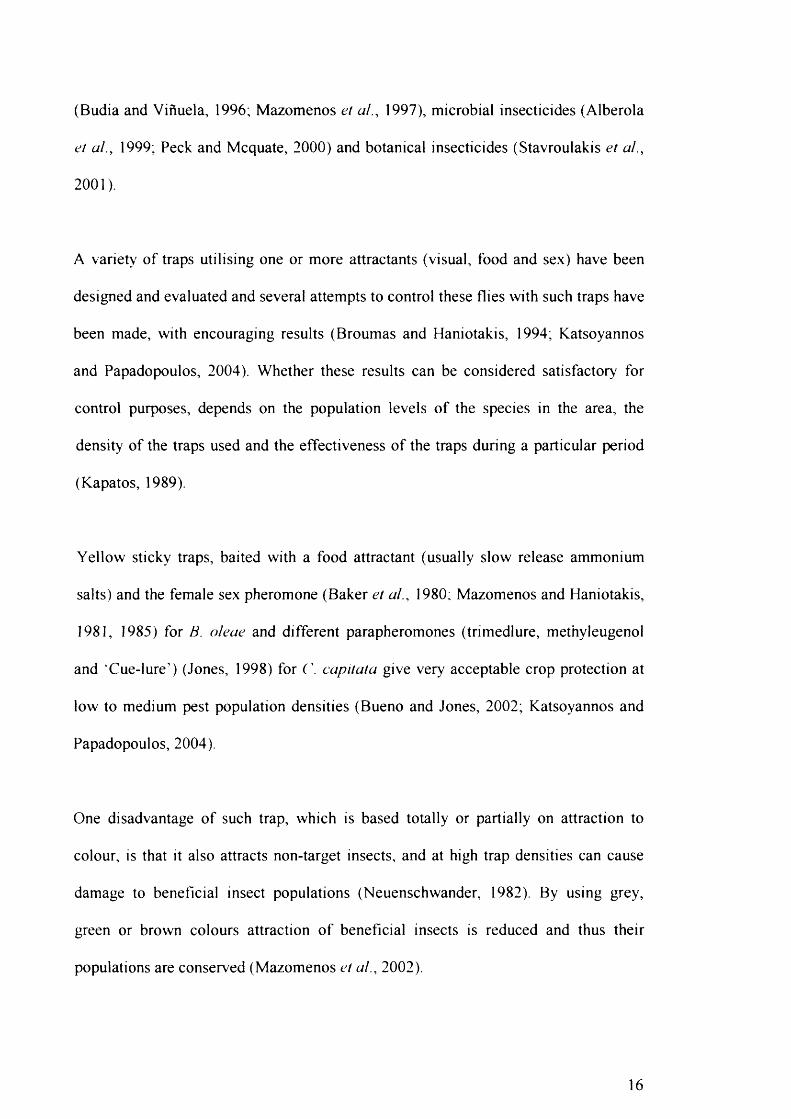
The adult (Figure 1.1) measure 4 to 5 mm in length. The thorax is reddish-yellow,
with a black dorsum encircled by four greyish bands. The wings are hyaline, with
veins and a dark mark at the apex. The abdomen is of blond colour with segments one
to four decorated with two lateral black marks of varying size. Larvae are white when
living in green olives and dirty-looking purple when living in black olives, and are ca.
7 mm long when full-grown. The colour of the puparium varies from pale yellow to
brown.
12
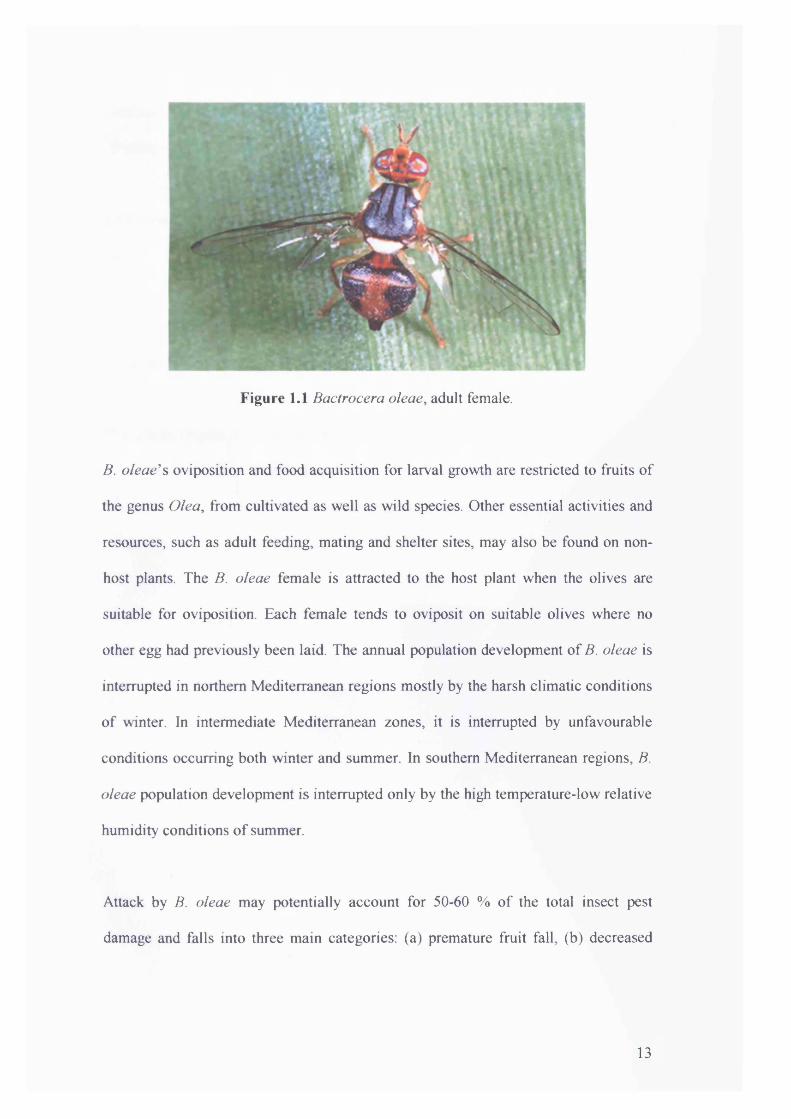
Figure 1.1 Bactrocera oleae, adult female.
B. oleae's oviposition and food acquisition for larval growth are restricted to fruits of
the genus Olea, from cultivated as well as wild species. Other essential activities and
resources, such as adult feeding, mating and shelter sites, may also be found on non
host plants. The B. oleae female is attracted to the host plant when the olives are
suitable for oviposition. Each female tends to oviposit on suitable olives where no
other egg had previously been laid. The annual population development of B. oleae is
interrupted in northern Mediterranean regions mostly by the harsh climatic conditions
of winter. In intermediate Mediterranean zones, it is interrupted by unfavourable
conditions occurring both winter and summer. In southern Mediterranean regions, B.
oleae population development is interrupted only by the high temperature-low relative
humidity conditions of summer.
Attack by B. oleae may potentially account for 50-60 % of the total insect pest
damage and falls into three main categories: (a) premature fruit fall, (b) decreased
13
yield and quality of oil and (c) spoiling of fruit for consumption as table olives
(Walton, 1995).
1.4.2 Ceratitis capitata (Wiedemann) (Diptera: Tephritidae)
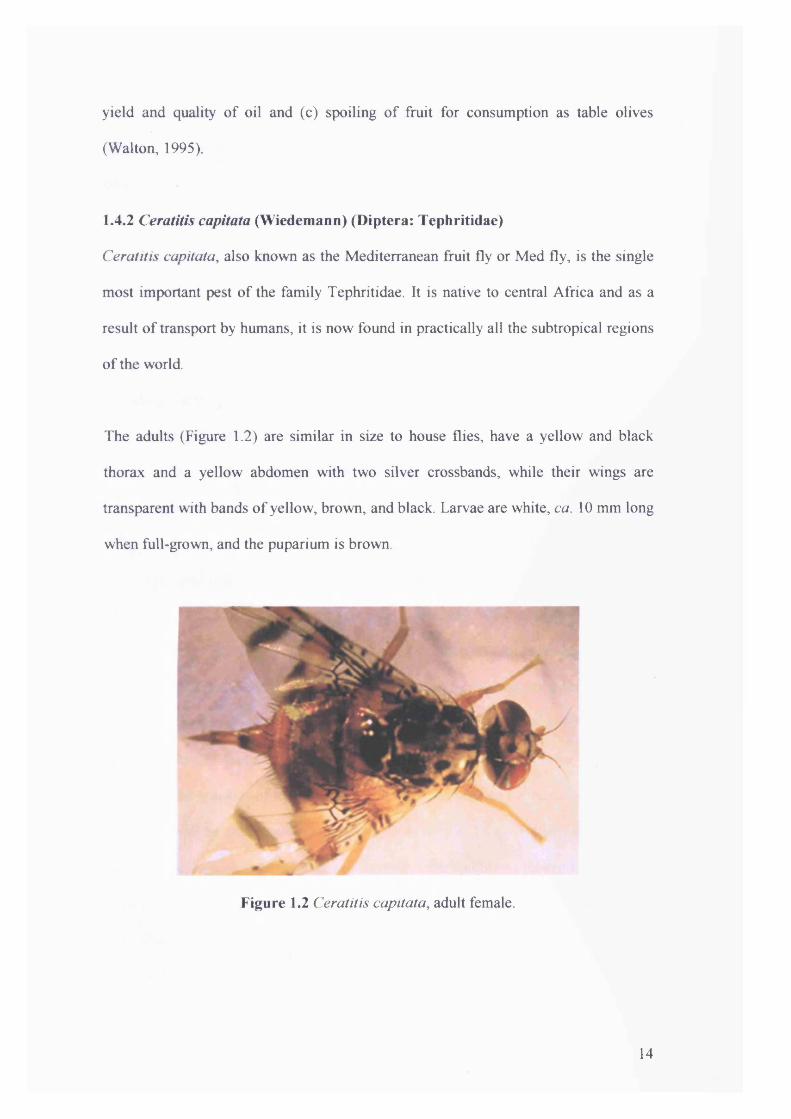
Ceratitis capitata, also known as the Mediterranean fruit fly or Med fly, is the single
most important pest of the family Tephritidae. It is native to central Africa and as a
result of transport by humans, it is now found in practically all the subtropical regions
of the world.
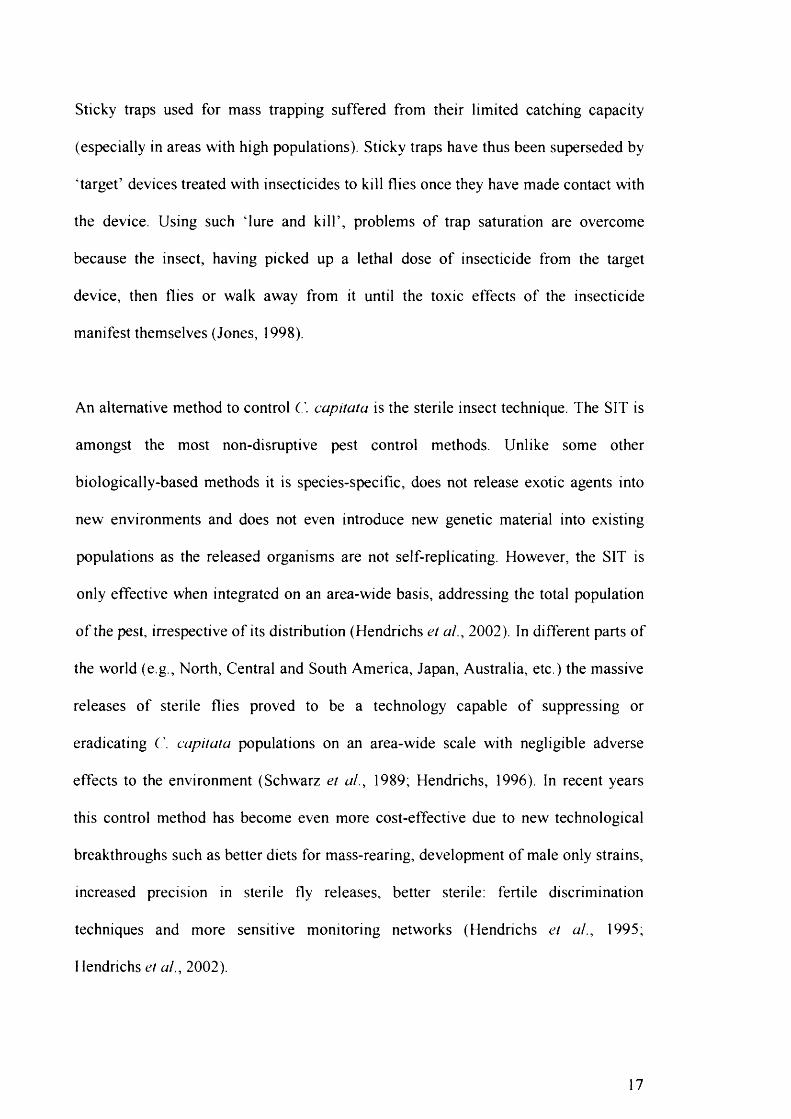
The adults (Figure 1.2) are similar in size to house flies, have a yellow and black
thorax and a yellow abdomen with two silver crossbands, while their wings are
transparent with bands of yellow, brown, and black. Larvae are white, ca. 10 mm long
when full-grown, and the puparium is brown.
Figure 1.2 Ceratitis capitata, adult female.
14
Adults or puparia overwinter in cool regions, but in warmer areas, the species is active
all year. Female flies, which may produce up to 600 eggs, oviposit 2-10 eggs in holes
under the skin of the fruit. Eggs hatch in 2-20 days, and larvae feed within fruits for
about one week. After completion of development, larvae fall to the ground and
pupate in soil for ca. 10 days. Generation time is variable (3-12 weeks), depending on
climatic conditions.
The Med fly is among the most destructive pests of more than 100 species of fruit
including orange, peach, grapefruit, plum, apple, and pear. In subtropical areas, larvae
feed on the pulp of the fruits, causing the development of infection courts for fruit
diseases. Also, holes made by female flies during oviposition scar the fruits, which
lowers quality (Pedigo, 1996).
The predominant method of control of B. oleae and C. capitata during recent decades
has been through the use of conventional pesticides. Two types of insecticide
treatment have generally been used: (a) cover sprays with organophosphorous
insecticides which kill adults (on contact) and larvae in the fruit (by a semi-systemic
effect) and (b) bait sprays using protein hydrolysates and insecticide which attract and
kill the adults By applying bait sprays, only a part of the tree need to be sprayed and
as a result the quantity of insecticide required, the damage to the fauna of beneficial
insects as well as the insecticide residues, is greatly reduced (Katsoyannos, 1992).
However, ecological, toxicological and environmental problems related to the use of
pesticides have given the impetus for the development of alternative methods of
controlling these pests. These are: the use of traps, the sterile insect technique (SIT),
biological control (Kapatos et al., 1977; Wong et al., 1992), insect growth regulators
15
(Budia and Vinuela, 1996; Mazomenos et al., 1997), microbial insecticides (Alberola
et al., 1999; Peck and Mcquate, 2000) and botanical insecticides (Stavroulakis et al.,
2001 ).
A variety of traps utilising one or more attractants (visual, food and sex) have been
designed and evaluated and several attempts to control these flies with such traps have
been made, with encouraging results (Broumas and Haniotakis, 1994; Katsoyannos
and Papadopoulos, 2004). Whether these results can be considered satisfactory for
control purposes, depends on the population levels of the species in the area, the
density of the traps used and the effectiveness of the traps during a particular period
(Kapatos, 1989).
Yellow sticky traps, baited with a food attractant (usually slow release ammonium
salts) and the female sex pheromone (Baker et al., 1980; Mazomenos and Haniotakis,
1981, 1985) for B. oleae and different parapheromones (trimedlure, methyleugenol
and 'Cue-lure’) (Jones, 1998) for C. capitata give very acceptable crop protection at
low to medium pest population densities (Bueno and Jones, 2002; Katsoyannos and
Papadopoulos, 2004).
One disadvantage of such trap, which is based totally or partially on attraction to
colour, is that it also attracts non-target insects, and at high trap densities can cause
damage to beneficial insect populations (Neuenschwander, 1982). By using grey,
green or brown colours attraction of beneficial insects is reduced and thus their
populations are conserved (Mazomenos et al., 2002).
16
Sticky traps used for mass trapping suffered from their limited catching capacity
(especially in areas with high populations). Sticky traps have thus been superseded by
'target’ devices treated with insecticides to kill flies once they have made contact with
the device. Using such ‘lure and kill’, problems of trap saturation are overcome
because the insect, having picked up a lethal dose of insecticide from the target
device, then flies or walk away from it until the toxic effects of the insecticide
manifest themselves (Jones, 1998).
An alternative method to control C. capitata is the sterile insect technique. The SIT is
amongst the most non-disruptive pest control methods. Unlike some other
biologically-based methods it is species-specific, does not release exotic agents into
new environments and does not even introduce new genetic material into existing
populations as the released organisms are not self-replicating. However, the SIT is
only effective when integrated on an area-wide basis, addressing the total population
of the pest, irrespective of its distribution (Hendrichs et al., 2002). In different parts of
the world (e.g., North, Central and South America, Japan, Australia, etc.) the massive
releases of sterile flies proved to be a technology capable of suppressing or
eradicating C. capitata populations on an area-wide scale with negligible adverse
effects to the environment (Schwarz et al., 1989; Hendrichs, 1996). In recent years
this control method has become even more cost-effective due to new technological
breakthroughs such as better diets for mass-rearing, development of male only strains,
increased precision in sterile fly releases, better sterile: fertile discrimination
techniques and more sensitive monitoring networks (Hendrichs et al., 1995;
Hendrichs et al., 2002).
17
SIT has been examined for use against B. oleae and much knowledge has been gained
on rearing techniques and the quality and competitiveness of the sterile flies.
However, the two small scale field trials made in Greece in 1973 and 1974 and again
in 1979, 1980 and 1981, were only partially successful and there are still a number of
political and techno-biological problems that have to be adequately resolved before
SIT could be used for the control of B. oleae (Kapatos, 1989). Several differences in
physiological and behavioural characteristics between mass-reared and wild flies have
been reported, which may account for the failure of SIT control. These include
longevity, reproductive pattern and capacity, male competitiveness, flight ability, field
dispersal, eye colour and vision and pheromone production (Katsoyannos, 1992).
1.5 AIM AND OBJECTIVES
The aim of this study is to investigate whether C. aurantium plant parts synthesise
and/or accumulate chemical compounds that can be used as alternatives of the
synthetic insecticides currently used for the control of Tephritidae.
The objectives of this study are:
■ To screen C. aurantium fractions and extracts for insecticidal activity
against B. oleae adults.
■ To investigate the insecticidal activity of the most promising C. aurantium
extract by contact and fumigant bioassays to both B. oleae and C. capitata
adults.
■ To isolate the active substances of the most promising C. aurantium
extract by using bioassay-guided procedures and B. oleae as the test insect.
18
■ To elucidate the structure of the isolated substances by spectroscopic
methods and to compare the activity of the isolated substances with
synthetic ones.
19
CHAPTER 2
GENERAL MATERIALS AND METHODS
Methods specific to individual chapters are described in those chapters.
2.1 MATERIALS
2.1.1 Insects
Artificially-reared Bactrocera oleae (BO) flies, were mainly used in this study, while
artificially-reared Ceratitis capitata (CC) flies, were used only in order to compare the
susceptibility of the two insects to the final petroleum ether peel extract of Citrus
aurantium (CA). Preliminary studies showed that, in both fly species, there were no
differences in susceptibility between artificially-reared and wild adults. Laboratory-
reared flies were preferred, because they can be produced in high numbers under
standard conditions, their development is faster, and they are available over the whole
year. Wild insects, by contrast, are available only 3-4 months per year, and their rate
of development depends upon environmental conditions which vary significantly.
Laboratory’-reared flies
Adults of both fly species were obtained from artificially-reared colonies maintained
in the insectarium of the Biology Institute NCSR Demokritos for many generations.
The rearing method for BO under laboratory conditions was described by Tsitsipis
(1975, 1977a, 1977b). CC was reared under laboratory conditions using the method
used for BO, with slight modifications concerning caging and oviposition system. The
same adult and larval diets were used for both insect species. All the insects’ stages
20
were maintained in separate rooms under the same rearing conditions: 25 ± 2 °C, 65 ±
5 % relative humidity, 12 h: 12 h light:dark regime and artificial light (3000 lux)
provided by fluorescent light. BO and CC adults were maintained in wood-framed
cages (100 cm long x 40 cm wide x 30 cm high) (Figure 2.1) and in Plexiglas cages
(30 x 30 x 30 cm) (Figure 2.2) respectively and provided with adult solid diet and
water. Adult solid diet was a mixture of yeast hydrolyzate (Nutritional Biochemical
Corporation, USA), sucrose and fresh egg yolk, in a ratio of 1:4:0 7, plus 0.05 %
streptomycin sulphate (Tsitsipis, 1977b). After collection, eggs were transferred with
a brush onto a filter paper impregnated with 0.3 % propionic acid, in a Petri dish, for
an incubation period of 24 h at 25 °C (Manoukas and Mazomenos, 1977) and
subsequently placed on the larval rearing medium. Around 5 eggs were placed for
each gram of larval diet (Tsiropoulos and Manoukas, 1977). The latter had the
following composition (Tsitsipis, 1977b): tap water 55 ml, cellulose powder (No. 123,
Schleicher and Schiill, Germany) 30 g, brewer’s yeast (Schwechat, Austria) 7.5 g,
soya hydrolyzate enzymatic (Nutritional Biochemical Corporation) 3 g, sucrose 2 g,
olive oil (0-1 acidity) 2 ml, Tween-80 0.75 ml, potassium sorbate (Merck, Germany)
0.05 g, Nipagin (methyl-p-hydroxybenzoate) (Merck) 0.2 g, and HC1 solution (2N) 3
ml. The fully developed larvae were allowed to pupariate in sawdust. The puparia
were sieved to remove the sawdust 1-2 days before adult emergence and then placed
in open plastic boxes which were finally introduced into the colony cages.
21
Figure 2.1 Wood-framed colony cage in which artificially-reared BO adult flies were
maintained.
Figure 2.2 Plexiglas colony cage in which artificially-reared CC adult flies were
maintained.
22
m f*
Handling o f flies used in experiments
2-3 d-old adults were used in all bioassays. To ensure that adult flies used in this study
were approximately of the same age, they were allowed to emerge for 24 h in a
Plexiglas cage (30 x 30 x 30 cm) and then the remaining puparia were transferred
every 24 hours to separate cages. Sufficient number of insects of the same generation
(batch) for the five successive days of screening experiments was achieved, by
placing half of the puparia at the optimum storage temperature (25 °C) and the other
half at 18 °C. When all puparia are placed at 25 °C, eclosion of flies occurs for only 3
days. By placing half of the puparia at 25 °C and half at 18 °C, eclosion of flies occurs
for 5 days, as a result of delayed eclosion of flies placed at 18 °C (Tsiropoulos, 1972).
2.1.2 Plant materials
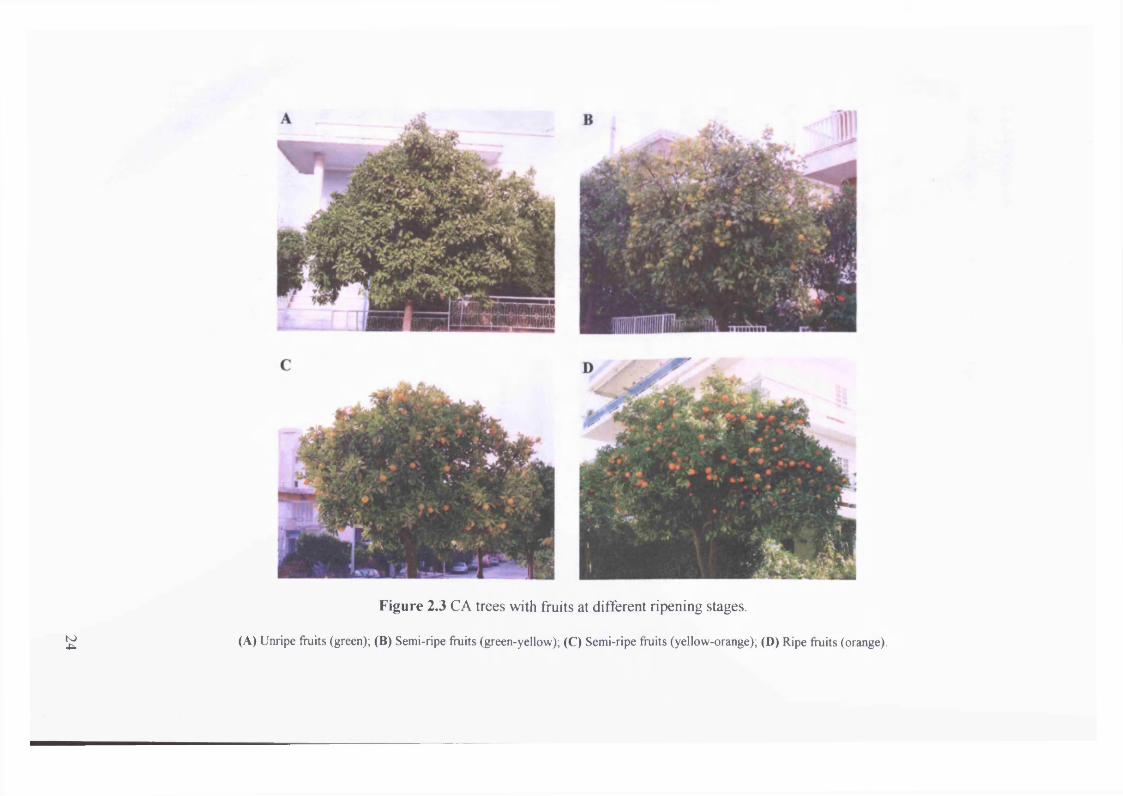
All plant materials used in this study were collected from CA trees (Figure 2.3)
located in the Zografos area of Athens, Greece. Ten trees were selected for sampling.
These were approximately 10 years old, of similar size (4-5 m high) and healthy. In
each collection the same numbers of fruits, leaves and shoots were obtained from each
of the 10 sampling trees. The plant samples were transferred immediately to the
laboratory and cleaned thoroughly in the following order: washed in detergent, rinsed
with tap water and finally rinsed with distilled water. All plant materials were
extracted fresh unless otherwise stated.
23
K>4-
Figure 2.3 CA trees with fruits at different ripening stages.
(A) Unripe fruits (green); (B) Semi-ripe fruits (green-yellow); (C) Semi-ripe fruits (yellow-orange); (D) Ripe fruits (orange).
2.1.3 Chemicals
All chemicals were stored according to supplier’s recommendations.
Standards
Bergamottin: Rotichrom HPLC, Carl Roth, Germany.
Bergapten: 99 %, Aldrich, USA.
Rotenone: 95-98 %, Sigma, USA.
Reagents
3-Chloroperbenzoic acid (MCPBA): ~ 70 %, Fluka, Switzerland.
Sodium sulphate (Na^SOA: Sodium sulphate anhydrous GR, Merck, Germany.
Solvents
Dichloromethane. ethyl acetate, n-hexane, methanol, petroleum ether (b.p. 40-60 %)
and water, were HPLC grade (Lab-Scan, Ireland).
2.2 METHODS
2.2.1 Extraction methods
Two extraction methods were employed throughout this study: conventional solid-
liquid extraction and ultrasound extraction. Prior to extraction, plant materials were
homogenised with the appropriate extraction solvent (approximately 1 ml/g fresh
plant material or dried equivalent to 1 g fresh) for 5 min in a blender.
25
Conventional solid-liquid extraction
Homogenised plant materials (100 g fresh or dried equivalent to 100 g fresh) were
placed in a 2 1 Erlenmeyer flask and cold solvent (20-22 °C) was added (final
extraction solvent volume 1 1). The flask was then placed on a shaker (Orbital Shaker
SOI, Stuart Scientific, UK). Conventional solid-liquid extraction involved the
maceration of the plant material with the extraction solvent for 24 h at room
temperature (20-22 °C). Continuous shaking was applied in order to increase the
efficiency of the method (Silva et al., 1998). Although the solubility of compounds in
a solvent increases with increasing solvent temperature, and also higher temperatures
facilitate penetration of the solvent into the cellular structures of plant materials
extracted, hot extraction solvents were not used due to the possibility that some
compounds could be unstable at higher temperatures, giving rise to compound
artifacts (Houghton and Raman, 1998).
Ultrasound extraction
Homogenised plant materials (100 g fresh) were placed in a 2 1 Erlenmeyer flask and
cold solvent was added (final extraction solvent volume 300 ml). The ultrasound
extraction method involved the sonication of the samples in an ultrasonic bath
(Bransonic Ultrasonic Cleaner B-5200 E l, Branson Ultrasonics Corporation, USA) at
room temperature for a total of 30 min.
2.2.2 Bioassays
Three types of bioassay were used for the evaluation of the insecticidal activity of CA
fractions and extracts: (a) Petri dish exposure bioassay, (b) Fumigation bioassay and
(c) Topical application bioassay. All bioassays were conducted in the laboratory under
26
the same conditions as described for the rearing of insects, and commenced 2 h after
the onset of photophase. Insects were considered dead if they did not move any of
their appendages even when picked up with forceps. Mortalities were recorded every
24 h for 3-6 d depending on the bioassay. General descriptions of the bioassays are as
follows:
Petri dish exposure bioassay
Glass Petri dishes of the following dimensions were used in this bioassay: bottom
internal diameter 5 cm, sides height 1.3 cm and lid internal diameter 5.7 cm. The
surface area of the bottom, sides and lid is 19.6, 20.4 and 25.5 cm2, respectively. Test
samples in 1 ml of the appropriate solvent were prepared by dilution from stock
solutions. By using a 100 p\ syringe (Hamilton, Switzerland) 299, 312, and 389 p\
were applied to the bottom, sides and lid, respectively in order that all the treated
surface area contained the same sample concentration (wg/cm2). After sample
application to the bottom and the lid, they were distributed manually under a fume
hood during evaporation so that the test sample was deposited as uniformly as
possible over the bottom and the lid surfaces. The bottom was then held horizontally
for the application of the test sample to the sides and, after application, it was
continuously rolled, manually, over a flat surface under the fume hood until all the
solvent had evaporated, so that the test sample was deposited evenly over the sides.
The bottom and the lid were then left under the fume hood for lh in order to ensure
complete evaporation of solvent traces.
Groups of 10 randomly selected adult flies, 2-3 d-old, were immobilised by chilling
for a period of 5 min and subsequently introduced into each Petri dish, which was
27
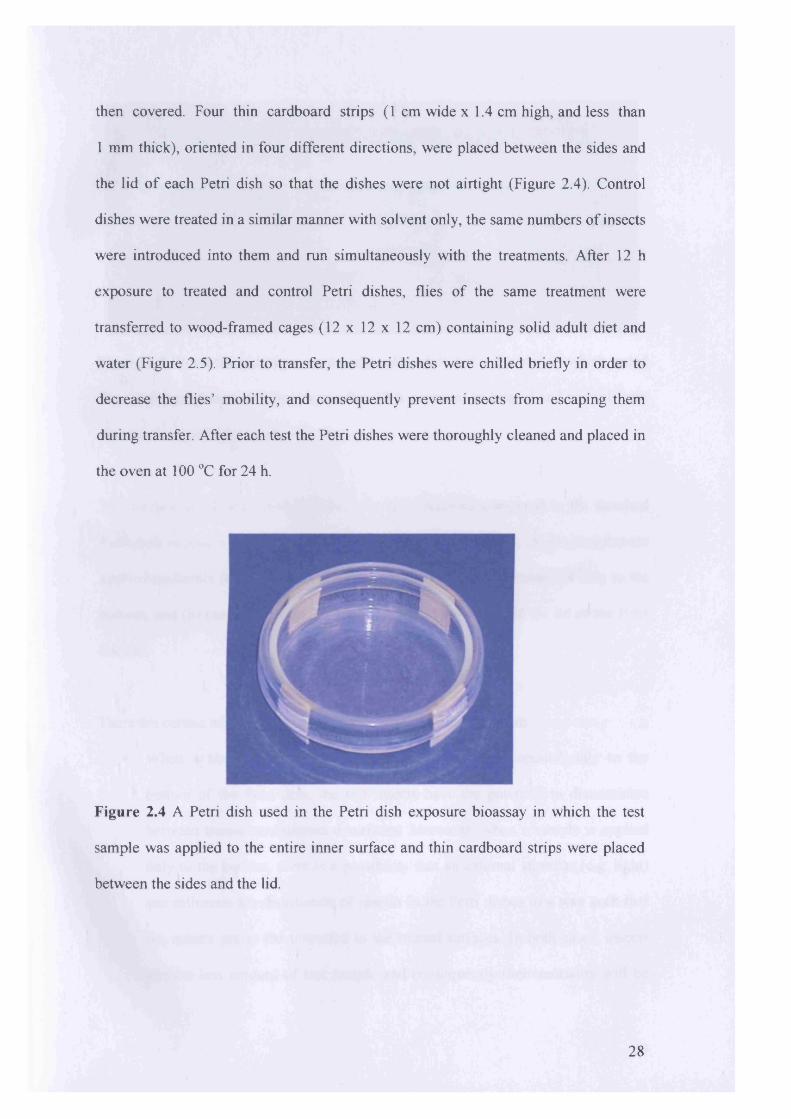
then covered. Four thin cardboard strips (1 cm wide x 1.4 cm high, and less than
1 mm thick), oriented in four different directions, were placed between the sides and
the lid of each Petri dish so that the dishes were not airtight (Figure 2.4). Control
dishes were treated in a similar manner with solvent only, the same numbers of insects
were introduced into them and run simultaneously with the treatments. After 12 h
exposure to treated and control Petri dishes, flies of the same treatment were
transferred to wood-framed cages (12 x 12 x 12 cm) containing solid adult diet and
water (Figure 2.5). Prior to transfer, the Petri dishes were chilled briefly in order to
decrease the flies’ mobility, and consequently prevent insects from escaping them
during transfer. After each test the Petri dishes were thoroughly cleaned and placed in
the oven at 100 °C for 24 h.
Figure 2.4 A Petri dish used in the Petri dish exposure bioassay in which the test
sample was applied to the entire inner surface and thin cardboard strips were placed
between the sides and the lid.
28
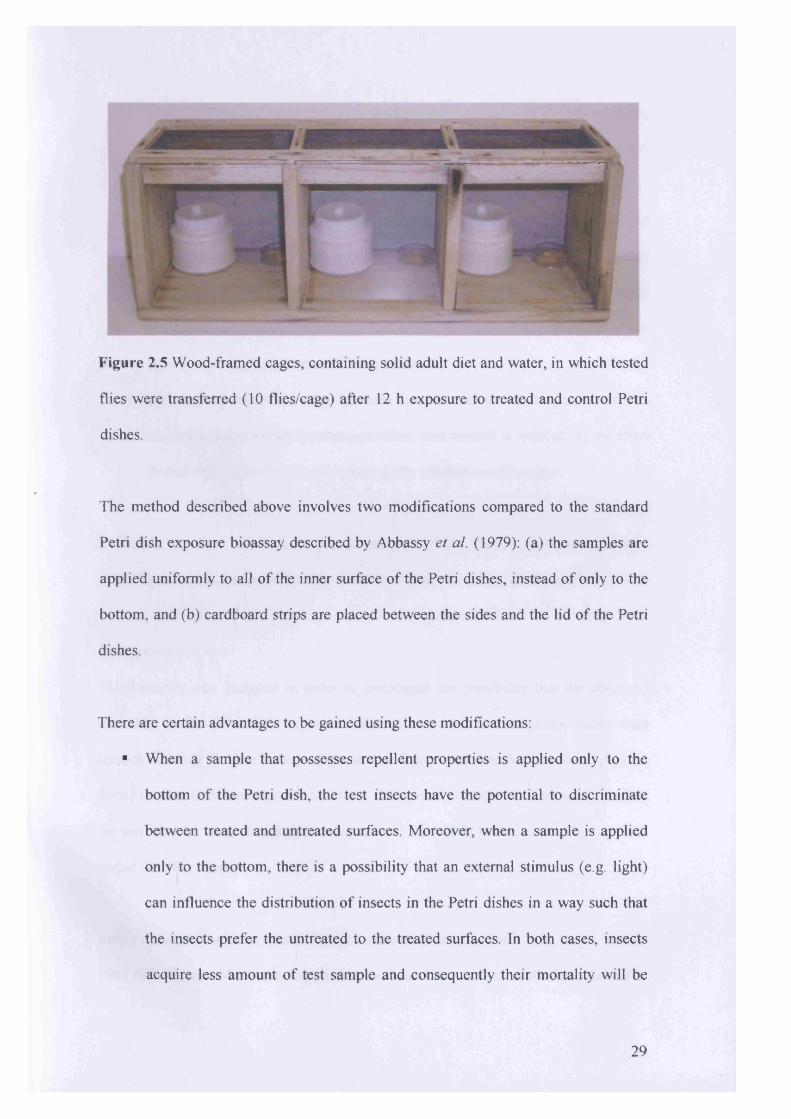
Figure 2.5 Wood-framed cages, containing solid adult diet and water, in which tested
flies were transferred (10 flies/cage) after 12 h exposure to treated and control Petri
dishes.
The method described above involves two modifications compared to the standard
Petri dish exposure bioassay described by Abbassy et al. (1979): (a) the samples are
applied uniformly to all of the inner surface of the Petri dishes, instead of only to the
bottom, and (b) cardboard strips are placed between the sides and the lid of the Petri
dishes.
There are certain advantages to be gained using these modifications:
■ When a sample that possesses repellent properties is applied only to the
bottom of the Petri dish, the test insects have the potential to discriminate
between treated and untreated surfaces. Moreover, when a sample is applied
only to the bottom, there is a possibility that an external stimulus (e.g. light)
can influence the distribution of insects in the Petri dishes in a way such that
the insects prefer the untreated to the treated surfaces. In both cases, insects
acquire less amount of test sample and consequently their mortality will be
29
lower. In contrast, when the entire inner surface is lined with the test samples,
insects cannot avoid acquiring residues of the test samples from the Petri
dishes.
■ The application of the same amount of test samples gives 3.3 times the
concentration (wg/cm2) when applied only to the bottom than when applied to
the total inner surface. Consequently, in the case of crude extracts, in which
activity is not pronounced and/or the texture is sticky, the possibility of the
insects adhering to the extract film is reduced.
■ By using the cardboard strips between the sides and the lid the possibility that
mortality is due to fumigant action rather than contact is reduced, as the Petri
dishes were not air-tight and consequently volatiles could escape.
Note that the time required for the preparation of the Petri dishes using the two
modifications was much greater than that required for the unmodified apparatus.
Fumigation bioassay
This bioassay was designed in order to investigate the possibility that the observed
mortality in the Petri dish exposure bioassay was due to fumigation rather than
contact. For that purpose a sheet of gauze was fitted inside the Petri dishes to prevent
direct contact between deposit and insect. Moreover, in order to determine whether
the test samples have fumigant activity, a Petri dish fitted with a sheet of gauze was
sealed with Parafilm.
Four Petri dishes were prepared for each concentration (mg/Petri dish) tested. In one
Petri dish the test solution was applied to the total inner surface of the Petri dish as in
30
the Petri dish exposure bioassay, and in the other three Petri dishes only to the bottom.
A sheet of gauze was fitted inside two Petri dishes in which the test sample was
applied only to the bottom. Groups of 10 randomly selected adult flies, 2-3 d-old,
were immobilised by chilling and subsequently introduced into each Petri dish, which
was then covered. Cardboard strips were placed then between the sides and the lid of
the Petri dishes as in the Petri dish exposure bioassay except one in which the test
sample was applied to the bottom and a sheet of gauze was fitted. This Petri dish was
sealed with Parafilm. In Figure 2.6 the 4 Petri dishes described above are shown.
Control dishes were treated in a similar manner with solvent only, consisted of the
same numbers of insects and run simultaneously with the treatments. Tested flies were
Figure 2.6 The 4 Petri dishes used in the fumigation bioassay.
(A) Test sample was applied to the total inner surface and thin cardboard strips were placed between the sides and the lid; (B) Test sample was applied only to the bottom and thin cardboard strips were placed between the sides and the lid; (C) Test sample was applied only to the bottom, a sheet o f gauze was fitted inside the Petri dish and thin cardboard strips were placed between the sides and the lid; (D) Test sample was applied only to the bottom, a sheet o f gauze was fitted inside the Petri dish and sealed with Parafilm.
31
transferred in individual wood-framed cages (12 x 12 x 12 cm) containing solid adult
diet and water, 12 h after their introduction to the Petri dishes.
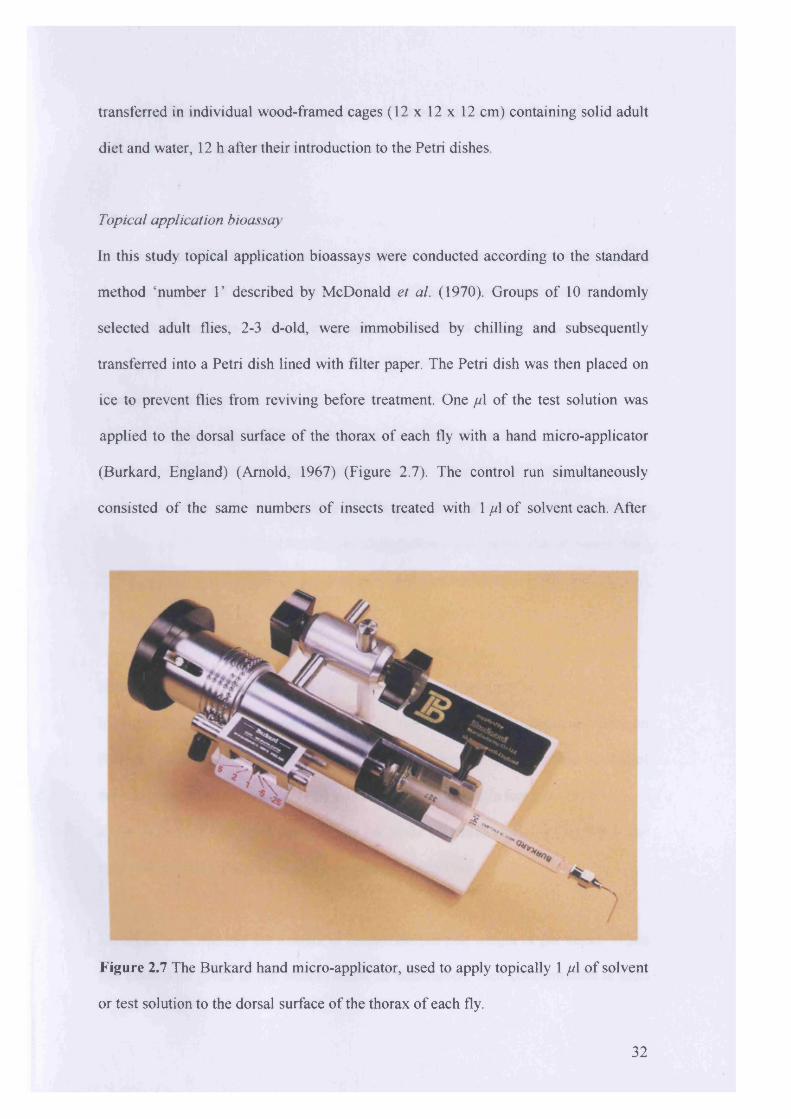
Topical application bioassay
In this study topical application bioassays were conducted according to the standard
method ‘number 1* described by McDonald et al. (1970). Groups of 10 randomly
selected adult flies, 2-3 d-old, were immobilised by chilling and subsequently
transferred into a Petri dish lined with filter paper. The Petri dish was then placed on
ice to prevent flies from reviving before treatment. One p\ of the test solution was
applied to the dorsal surface of the thorax of each fly with a hand micro-applicator
(Burkard, England) (Arnold, 1967) (Figure 2.7). The control run simultaneously
consisted of the same numbers of insects treated with 1 p\ of solvent each. After
Figure 2.7 The Burkard hand micro-applicator, used to apply topically 1 p\ of solvent
or test solution to the dorsal surface of the thorax of each fly.
32
treatment, flies were transferred in individual wood-framed cages (12 x 12 x 12 cm)
(10 flies/cage) containing solid adult diet and water.
2.2.3 Statistics
The program SPSS 8.0 for Windows provided the analysis environment for running
statistical tests (ANOVA, Tukey’s honestly significant difference test, probit analysis,
Pearson’s x 2 goodness-of-fit test, etc.) and transformations (arcsine, logio, etc.).
Comparison o f means
Mortality data were analysed by one-way analysis of variance (ANOVA) with
dose/concentration as the independent variable. Mortality was transformed to
arcsineV/? before ANOVA, where p is the proportion of dead insects, in order to
equalise the variance among treatments. Comparisons and separations of means were
performed by Tukey’s honestly significant difference (Tukey’s HSD) test (Tukey,
1953) aXP = 0.05.
Estimation o f median lethal dose concentration (LD5 &LC50)
In dose/concentration-response experiments the median lethal dose/concentration
(LD50/LC5 0) were estimated by probit analysis (Finney, 1971). In the case of control
mortality the recorded mortality (%) was corrected by Abbott’s formula (1925):
A4c = 100 x (Mp - Mt)/( 100 - Mt), where Me is the corrected mortality (%), Mp is the
recorded mortality (%) and Mt is the control mortality (%).
Dose can be defined as the amount of insecticide per unit weight or per insect. When
the exact dose given to the insect cannot be determined, then concentration is used
33
which can be defined as the amount of insecticide per unit of an external media
(Matsumura, 1975).
The median lethal dose/concentration (LD50/LC50) was in each case estimated from
the regression of the cumulative corrected probit mortality versus logio of the
doses/concentrations. The probit regression line allowed the estimation of LD50/LC50
and their corresponding 95 % confidence limits, and the slope and intercept with their
corresponding standard errors. Moreover, Pearson’s y 2 goodness-of-fit test was
performed in order to test how well the data fitted the probit model. When P > 0.05,
data fitted the probit model adequately. In contrast, when P < 0.05 data did not fit
adequately the probit model and a heterogeneity factor was automatically used in the
calculations of confidence limits by SPSS. LD5 0S/ LC50S were considered significantly
different when confidence limits did not overlap. From a biological point of view, the
slope of a probit regression estimates the change in activity per unit change in dose or
concentration (Robertson and Preisler, 1992). The length of 95 % confidence limits
provides a measurement of the precision of an LD /LC estimate. Shorter lengths
indicate greater precision (Finney, 1971) which allow differences between treatments
to be revealed. Precisely estimated LD50/LC50 are obtained when responses are evenly
distributed between 25 and 75 % (Robertson et al.y 1984).
34
CHAPTER 3
SCREENING FOR INSECTICIDAL ACTIVITY IN CITRUS
A URANTIUM EXTRACTS
3.1 INTRODUCTION
Variation in collection-site altitude, plant age, climate, and soil type can all influence
the concentration levels of secondary metabolites and even the kinds of compounds
biosynthesised in certain cases (Silva et al., 1998). Furthermore, the time of
collection, the time and temperature of extraction and the use of additional substances
during extractions are factors that can affect the chemical composition of plant
extracts (Houghton and Raman, 1998). Variation in the chemical profile of plant
material will probably cause a difference in the activity of extracts when tested
biologically (Houghton and Raman, 1998).
In the early stages of phytochemical investigations, one of the first and most obvious
questions to ask is whether the bioactive chemicals are localised to certain parts of the
plant (Cannell, 1998). Different organs in the plant are known to produce and/or
accumulate different profiles of secondary metabolites (Silva et al., 1998) and
probably their extracts can exhibit different degree of activity when tested against
insects. Gallo et al. (1996) reported that the crude hexane extract of Mammea
americana (Guttiferae) seeds was significantly more active against larvae of
Trichoplusia ni (Lepidoptera: Noctuidae) than the crude hexane extract of leaves
when an ingestion bioassay was used. Screening experiments conducted by Kadir et
35
al. (1989) with Spilanthes acmella (Compositae) leaf and flower head extracts against
adults of Periplaneta americana, using the topical application bioassay, revealed that
the active chemicals occurred in greater concentrations in the flower heads than in the
leaves. Weaver et al. (1994) examined the insecticidal activity of floral, foliar, and
root extracts of Tagetes minuta (Asterales: Asteraceae) against adult Mexican bean
weevils (Coleoptera: Bruchidae) using the Petri dish exposure bioassay. The results of
this study revealed that the root extract was the most active, followed by the flower
extract while the foliar extract was the least active.
Nogata et al. (1996) studied the inhibitory activity of different fruit tissue extracts
(flavedo, albedo, pulp and juice) of unripe and ripe fruits of Citrus lumia and Citrus
reticulata against cyclooxygenase and lipoxygenase, respectively. They reported that
the flavedo and the albedo extracts of Citrus lumia inhibited cyclooxygenase to the
same degree and were more inhibitory than the pulp extract, whereas the juice extract
had no effect on the enzyme. The flavedo, albedo and juice extracts of Citrus
reticulata unripe fruits inhibited lipoxygenase to the same degree and were more
inhibitory than the pulp. In contrast, the flavedo and the albedo extracts of Citrus
reticulata ripe fruits inhibited lipoxygenase to the same degree and were more
inhibitory than the juice extract, whereas the pulp extract exhibited slightly activity.
Variation in the chemical composition of plant samples can also occur due to
treatment after collection (Houghton and Raman, 1998). In most cases, plant material
is dried prior to extraction (Silva et al., 1998). Drying is the most common method of
preservation commercially and is achieved by leaving the material in warm, dry air
(Houghton and Raman, 1998). Temperature must not exceed 30 °C, and plant samples
36
must kept away from direct sunlight because ultraviolet radiation may produce
chemical reactions giving rise to compound artefacts (Silva et al., 1998). Oils
obtained from dried Citrus peels were reported to be much less toxic to the house fly
and red imported fire ant (Sheppard, 1984). However, Don-Pedro (1985)
demonstrated that powdered sun-dried orange and grapefruit peels applied as food
admixtures, exhibited toxic and repellent properties against Dermestes maculatus and
Callosobruchus maculatus.
Gbewonyo (1991) pointed out that it is important in studies involving the examination
of plants for insecticidal constituents, to test extracts obtained with different solvents
and methods. Ideally, an extraction solvent should be easy to remove, and be inert,
non-toxic, and not easily flammable (Silva et al., 1998). The nature of the extraction
solvent determines the type o f chemicals it is likely to extract based on the “like
dissolves like” general principle; non-polar solvents will extract out non-polar
substances, and polar materials will be extracted out by polar solvents (Houghton and
Raman, 1998). Salvatore et al. (2004) compared the activity of lemon peel extracts
obtained with different solvents using an ultrasonic bath (20 °C for 20 min) by a larval
toxicity bioassay against CC. They found that the diethyl ether extract was the most
toxic, followed by the methanol extract, whereas the ethyl acetate extract was the least
toxic.
Morgan and Wilson (1985) emphasised that extraction methods involving heating are
inappropriate for the isolation of some insecticidal components from plants since
some of these compounds may be heat-labile. This view was supported by Gbewonyo
(1991) who reported that although Soxhlet extraction of the male root of Piper
37
guineense gave more extraction yield, its activity against Musca domestica by the
topical application method, was less than the extract obtained by cold extraction.
The fact that plant secondary metabolite profiles may vary both quantitatively and
qualitatively among different batches of the same plant part collected at different
times has important consequences in making plant recollections for scale-up work
(Silva et al., 1998). Chloroform-methanol extracts of ripe and unripe fruits of Piper
guineense did not differ significant in activity by the topical application bioassay
against Musca domestica and Periplaneta americana adults although the activity of
the ripe fruit extract was greater against both insects (Gbewonyo, 1991). The
inhibitory activity against cyclooxygenase of Citrus lumia pulp extract decreased
during ripening, while there was little difference in extract inhibition between unripe
and ripe flavedo, albedo and juice extracts (Nogata et al., 1996). Moreover, the
inhibitory activities of Citrus reticulata pulp and juice extracts declined during
ripening, while the activities of flavedo and albedo extracts remained almost constant.
Even though it is well documented that Citrus species contain chemicals that exhibit a
wide range of insecticidal properties against a broad spectrum of insect pests, CA
among other Citrus species had received little attention. That fact suggests that the
investigation of the insecticidal actions of CA is worthwhile.
The objectives of this component of the study were:
■ To screen various solvent fractions obtained from different plant parts of CA
for insecticidal activity against adults of BO.
38
■ To determine whether the active chemicals present in the fruits are localised to
specific fruit tissues.
■ To study the effect of different drying treatments on the stability of the
bioactive chemicals present in the peels.
■ To compare the effectiveness of different extraction methods and solvents on
the recovery of the insecticidal chemicals.
■ To study the effect of fruit maturation on the biosynthesis and/or
bioaccumulation of the active chemicals.
39
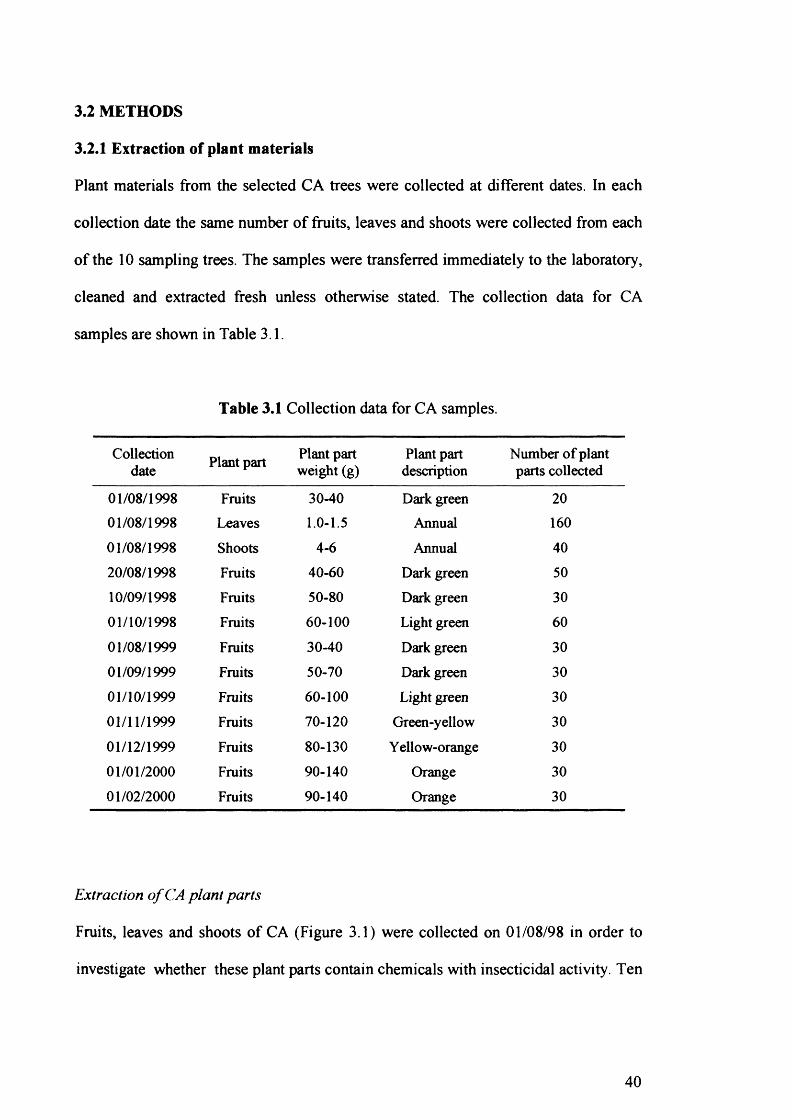
3.2 METHODS
3.2.1 Extraction of plant materials
Plant materials from the selected CA trees were collected at different dates. In each
collection date the same number of fruits, leaves and shoots were collected from each
of the 10 sampling trees. The samples were transferred immediately to the laboratory,
cleaned and extracted fresh unless otherwise stated. The collection data for CA
samples are shown in Table 3.1.
Table 3.1 Collection data for CA samples.
Collectiondate Plant part Plant part
weight (g)Plant part description
Number of plant parts collected
01/08/1998 Fruits 30-40 Dark green 2001/08/1998 Leaves 1.0-1.5 Annual 160
01/08/1998 Shoots 4-6 Annual 40
20/08/1998 Fruits 40-60 Dark green 50
10/09/1998 Fruits 50-80 Dark green 30
01/10/1998 Fruits 60-100 Light green 60
01/08/1999 Fruits 30-40 Dark green 30
01/09/1999 Fruits 50-70 Dark green 30
01/10/1999 Fruits 60-100 Light green 30
01/11/1999 Fruits 70-120 Green-yellow 30
01/12/1999 Fruits 80-130 Yellow-orange 30
01/01/2000 Fruits 90-140 Orange 30
01/02/2000 Fruits 90-140 Orange 30
Extraction o f CA plant parts
Fruits, leaves and shoots of CA (Figure 3.1) were collected on 01/08/98 in order to
investigate whether these plant parts contain chemicals with insecticidal activity. Ten
40
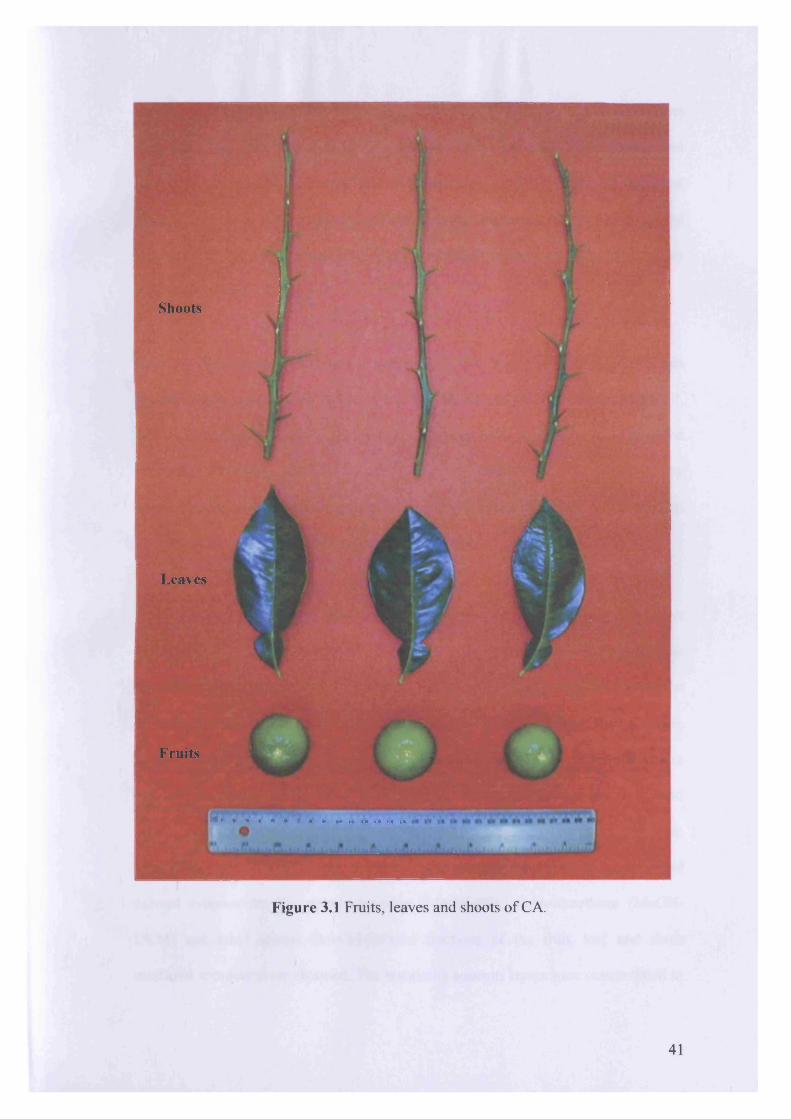
Shoots
Leaves
Fruits
Figure 3.1 Fruits, leaves and shoots of CA.
41
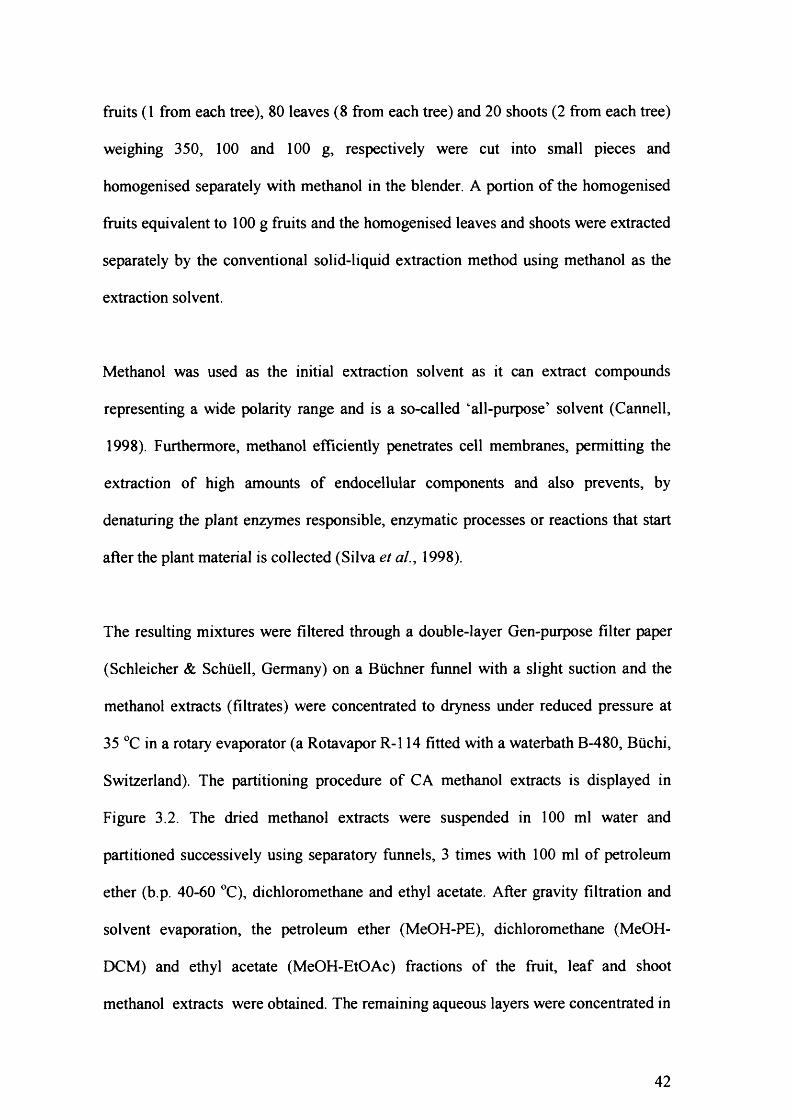
fruits ( 1 from each tree), 80 leaves ( 8 from each tree) and 2 0 shoots ( 2 from each tree)
weighing 350, 100 and 100 g, respectively were cut into small pieces and
homogenised separately with methanol in the blender. A portion of the homogenised
fruits equivalent to 1 0 0 g fruits and the homogenised leaves and shoots were extracted
separately by the conventional solid-liquid extraction method using methanol as the
extraction solvent.
Methanol was used as the initial extraction solvent as it can extract compounds
representing a wide polarity range and is a so-called ‘all-purpose’ solvent (Cannell,
1998). Furthermore, methanol efficiently penetrates cell membranes, permitting the
extraction of high amounts of endocellular components and also prevents, by
denaturing the plant enzymes responsible, enzymatic processes or reactions that start
after the plant material is collected (Silva et al., 1998).
The resulting mixtures were filtered through a double-layer Gen-purpose filter paper
(Schleicher & Schuell, Germany) on a Buchner funnel with a slight suction and the
methanol extracts (filtrates) were concentrated to dryness under reduced pressure at
35 °C in a rotary evaporator (a Rotavapor R-l 14 fitted with a waterbath B-480, Buchi,
Switzerland). The partitioning procedure of CA methanol extracts is displayed in
Figure 3.2. The dried methanol extracts were suspended in 100 ml water and
partitioned successively using separatory funnels, 3 times with 100 ml of petroleum
ether (b.p. 40-60 °C), dichloromethane and ethyl acetate. After gravity filtration and
solvent evaporation, the petroleum ether (MeOH-PE), dichloromethane (MeOH-
DCM) and ethyl acetate (MeOH-EtOAc) fractions of the fruit, leaf and shoot
methanol extracts were obtained. The remaining aqueous layers were concentrated in
42
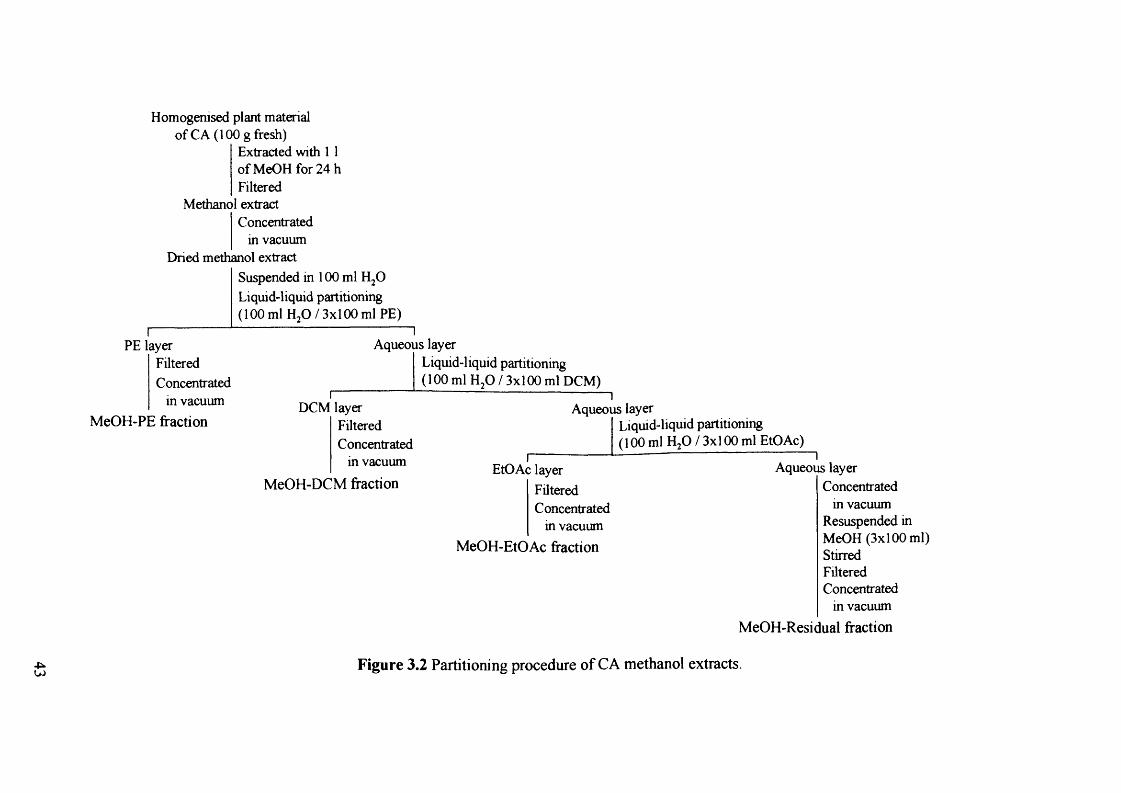
Homogenised plant material of CA (100 g fresh)
Extracted with 1 1 of MeOH for 24 h Filtered
Methanol extractConcentrated
in vacuum Dried methanol extract
Suspended in 100 ml H20 Liquid-liquid partitioning (100 ml H20 / 3x100 ml PE)
PE layerFiltered Concentrated
in vacuum MeOH-PE fraction
Aqueous layerLiquid-liquid partitioning (100 ml H20 / 3x100 ml DCM)
DCM layerFiltered Concentrated
in vacuumMeOH-DCM fraction
Aqueous layerLiquid-liquid partitioning (100 ml H20 / 3x100 ml EtOAc)
EtOAc layer Filtered Concentrated
in vacuumMeOH-EtOAc fraction
Aqueous layerConcentrated
in vacuum Resuspended in MeOH (3x100 ml) Stirred Filtered Concentrated
in vacuumMeOH-Residual fraction
Figure 3.2 Partitioning procedure of CA methanol extracts.
the rotary evaporator, resuspended in methanol (3x100 ml), stirred each time for 5
min in the Btichi rotavapor without applying suction, gravity filtered and finally
concentrated, yielding the residual fraction (MeOH-Residual) of the fruit, leaf and
shoot methanol extracts.
The above extraction strategy was used in preference to a series of stepwise
extractions (exhausted extraction o f plant material by using successively extraction
solvents of increasing polarity) as it is less time- and solvent-consuming.
The 10 remaining fruits were cut in half and, together with the remaining leaves (n =
80) and shoots (n = 2 0 ) which were cut into small pieces, were dried to constant
weight under darkness at 50 °C in a well-ventilated oven (B50, Memmert, W.
Germany) and their percentage dry weight was estimated. Percentage dry weight was
used in order to express the extraction yields as milligram extractable material per
gram of dried plant material extracted.
Extraction o f CA fruit tissues
Fruits of CA were collected on 20/08/98 in order to determine whether the insecticidal
active chemicals present in the MeOH-PE fraction of the fruits are localised to a
specific fruit tissue. Leaves and shoots of CA were not further examined as all their
fractions were inactive.
Twenty fruits (2 from each tree) were dissected into peels (flavedo), albedo and flesh
(Figure 3.3). The peels, the albedo, the flesh and 10 intact (whole) fruits (1 from each
tree) weighing 100, 100, 320 and 500 g, respectively were cut into small pieces and
44
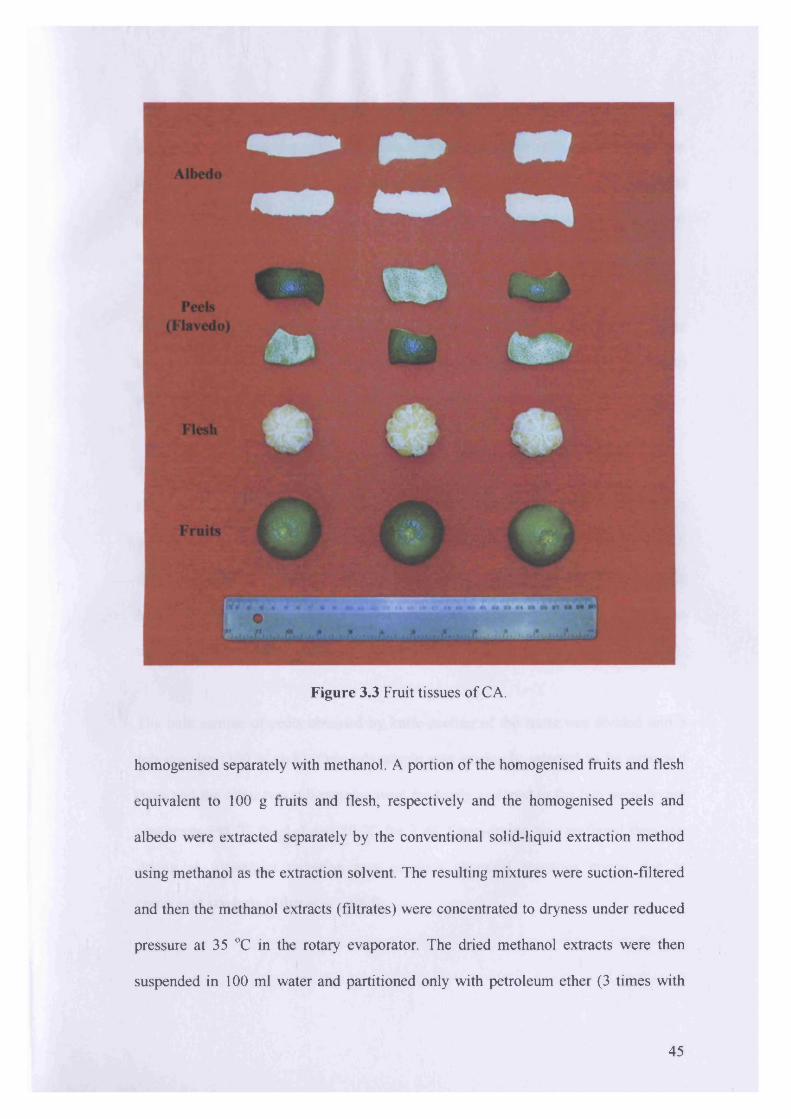
Figure 3.3 Fruit tissues of CA.
homogenised separately with methanol. A portion of the homogenised fruits and flesh
equivalent to 1 0 0 g fruits and flesh, respectively and the homogenised peels and
albedo were extracted separately by the conventional solid-liquid extraction method
using methanol as the extraction solvent. The resulting mixtures were suction-filtered
and then the methanol extracts (filtrates) were concentrated to dryness under reduced
pressure at 35 °C in the rotary evaporator. The dried methanol extracts were then
suspended in 100 ml water and partitioned only with petroleum ether (3 times with
45
1 0 0 ml each time), yielding after gravity filtration and solvent evaporation the
petroleum ether fractions of the fruit, peel, albedo and flesh methanol extracts. The
remaining aqueous layers after their partitioning with petroleum ether were discarded
as the dichloromethane, ethyl acetate and residual fractions of the fruit methanol
extract were inactive.
Ten fruits (1 from each tree) were cut in half and placed in the oven at 50 °C in order
to estimate their percentage dry weight. The 10 remaining fruits were dissected into
peels, albedo and flesh in order to estimate their percentage dry weight.
Extraction o f fresh and dried peels o f CA
Fruits of CA were collected on 10/09/98 in order to investigate whether drying of
peels prior to extraction can affect the insecticidal activity of their MeOH-PE
fractions. Intact fruits, albedo and flesh were not further studied as the activity of the
MeOH-PE peel fraction was significant greater than that of the whole fruit, whereas
the albedo and flesh fractions were inactive.
The bulk sample of peels obtained by knife-peeling of the fruits was divided into 3
sub-samples (100 g each). One sub-sample was randomly selected to be extracted
fresh and the other two sub-samples were randomly assigned to the two oven-drying
treatments (30 °C for 4 d and 50 °C for 2 d). Oven-drying was preferred than sun
drying as ultraviolet radiation may produce chemical reactions giving rise to
compound artefacts (Silva et al., 1998).
46
The fresh and the two dried peel sub-samples were extracted separately using the
conventional solid-liquid extraction method and methanol as the extraction solvent.
The petroleum ether fractions of the fresh and the two dried peel methanol extracts
were obtained as in the extraction of the fruit tissues.
Extraction o f CA peels by different extraction methods and solvents
Fruits of CA were collected on 01/10/98 in order to investigate the effect o f two
different extraction methods and three different initial extraction solvents on the
insecticidal activity of peel fractions and extracts obtained by the extraction of fresh
peels. Dried peels were not further examined, as their MeOH-PE fractions were
inactive.
The ultrasound and the conventional solid-liquid extraction methods were compared.
The ultrasound extraction method was selected in order to be compared with the
conventional solid-liquid extraction method, as it is more rapid and it employs less
solvent than the conventional solid-liquid extraction (Poole and Poole, 1991).
Furthermore, the efficacy of methanol, water and petroleum ether, as initial extraction
solvents was compared with both extraction methods. Water was used in order to
investigate whether it can extract the non-polar insecticidal active compounds present
in the MeOH-PE fraction. Petroleum ether was used in order to investigate whether
the concentration of the insecticidal active compounds was greater in the petroleum
ether extracts than in the petroleum ether fractions of the methanol extracts.
The bulk sample of peels obtained by knife-peeling of the fruits was divided into six
sub-samples (100 g each). Three sub-samples were randomly assigned to be extracted
47
separately with petroleum ether, methanol and water as initial extraction solvents
using the conventional solid-liquid extraction method. The other 3 sub-samples were
randomly assigned to be extracted with the three different initial extraction solvents
using the ultrasound extraction method. The methanol extracts obtained from the two
extraction methods were partitioned with petroleum ether as in the extraction of fruit
tissues, yielding the conventional solid-liquid petroleum ether (Conv. S-L MeOH-PE)
and the ultrasound petroleum ether (Ultrasound MeOH-PE) fractions of the methanol
extracts. The aqueous extracts from each extraction method were concentrated to 100
ml and then partitioned with petroleum ether (3x100 ml), yielding the conventional
solid-liquid petroleum ether (Conv. S-L H2O-PE) and ultrasound petroleum ether
(Ultrasound H2O-PE) fractions of the aqueous extracts. The petroleum ether extracts
from both extraction methods were suction-filtered and concentrated to dryness,
yielding the conventional solid-liquid petroleum ether (Conv. S-L PE) and ultrasound
petroleum ether (Ultrasound PE) extracts.
Extraction o f peels obtainedfrom CA fruits at different ripening (maturity) stages
Seven collections of fruits of CA with a month interval starting on 01/08/99 (3 months
after fruit set) until full maturity (last collection on 0 1 /0 2 /0 0 ) were performed in order
to investigate whether there is within-seasonal variation in the insecticidal activity of
the petroleum ether peel extracts.
The bulk sample of peels of each collection was divided in two sub-samples (100 g
each) which were randomly assigned to be extracted and dried. The peels were
extracted by using the ultrasound extraction method and petroleum ether as the
extraction solvent, yielding the petroleum ether peel extracts.
48
Although the insecticidal activity of the peel extracts obtained by both methods using
petroleum ether as the extraction solvent was similar, peels were extracted by the
ultrasound method as this method is less time- and solvent-consuming than the
conventional solid-liquid extraction method. Methanol and water were not further
used as initial extraction solvents since the H2O-PE fractions of both methods and the
ultrasound MeOH-PE fraction were inactive, whereas the petroleum ether extracts of
both methods exhibited significantly greater insecticidal activity than the conventional
solid-liquid MeOH-PE fraction.
The weight (mg) of all the fractions and extracts was estimated by concentrating to
near-dryness, an appropriate portion or the whole fraction or extract in the rotary
evaporator at 35 °C. The portion o f each fraction or extract was selected in order to
weigh 50-100 mg, on the basis of preliminary weighing of 5 % of the whole fraction
or extract. The concentrated fraction or extract was subsequently transferred in a 15-
ml vial (15-ml clear glass vial, screw top solid cap with PTFE liner, Supelco, USA)
immersed in a water bath at 35 °C and concentrated to constant weight under a stream
of nitrogen. All weighing was performed on an electronic four-figure balance (AB54-
S, Mettler Toledo, Switzerland). All fractions and extracts were concentrated to
dryness and stored in the dark at -20 °C until used.
3.2.2 Bioassay of fractions and extracts
The Petri dish exposure bioassay was used in order to evaluate the insecticidal activity
of different fractions and extracts of CA against 2-3 d-old adults of BO. Five
replicates of 10 BO flies each (5 males and 5 females) were employed for each
fraction/extract concentration and the control. The 5 replicates were conducted on 5
49
successive days, utilising the same generation (batch) of flies. Different
concentrations of screened fractions/extracts were not run simultaneously as screening
experiments at lower concentrations included only the more active fractions/extracts.
Stock solutions were prepared in DCM, as were subsequent dilutions except of the
plant parts fractions, which were prepared in a mixture of MeOH:DCM (3:1, v/v).
Fresh test solutions were prepared for each replicate. The syringe used for the
application of samples was thoroughly cleaned after the application of each sample.
Mortalities were recorded every 24 h for 4 d after which there was no further increase
in mortality.
3.2.3 TLC analysis of fractions and extracts
Thin layer chromatography (TLC) is an extremely sensitive analytical method which
can analyze a large number of samples simultaneously, although it does not require
special and expensive equipment (Touchstone and Dobbins, 1983). TLC analyses
were performed on 20 x 20 cm Sigma glass plates pre-coated with 250 //m silica gel
60 F2 5 4 . CA fractions and extracts were spotted (100 //g in 5 fi\ of the appropriate
solvent) using a 10 (A Hamilton syringe onto the origin line (a line marked 2 cm from
one end of the plate). All fractions and extracts were dissolved in DCM, except the
MeOH-EtOAc, and MeOH-Residual fractions of fruits, leaves and shoots which were
dissolved in MeOH. A glass chamber (29 cm long x 10 cm wide x 27 cm high,
Sigma-Aldrich, USA) was used for plates’ development. Prior to the introduction of
the appropriate developing solvent system, the inner surface of the chamber was lined
with filter paper to aid in saturating the atmosphere with the solvent vapours. The
appropriate developing solvent system was used in each case in order to give the best
possible separation based on preliminary analyses. After introducing the developing
50
solvent system (100 ml) to the glass chamber an interval of 30 min was allowed for
saturation of the atmosphere with the solvent vapours. TLC plates were developed in
the saturated chamber to a distance of 15 cm. After development, the TLC plates were
air-dried for 1 h at room temperature under a fume hood. Photographs of the TLC
plates were obtained by a Camedia digital camera (C-2000Z, Olympus, Japan) under
UV light of 254 nm provided by a Spectroline lamp (ENF-280C/F, Spectronics
Corporation Westbury, USA). Under UV light of 254 nm eluted components present
in CA fractions and extracts were visible as dark spots or areas against a greenish
fluorescent background.
51
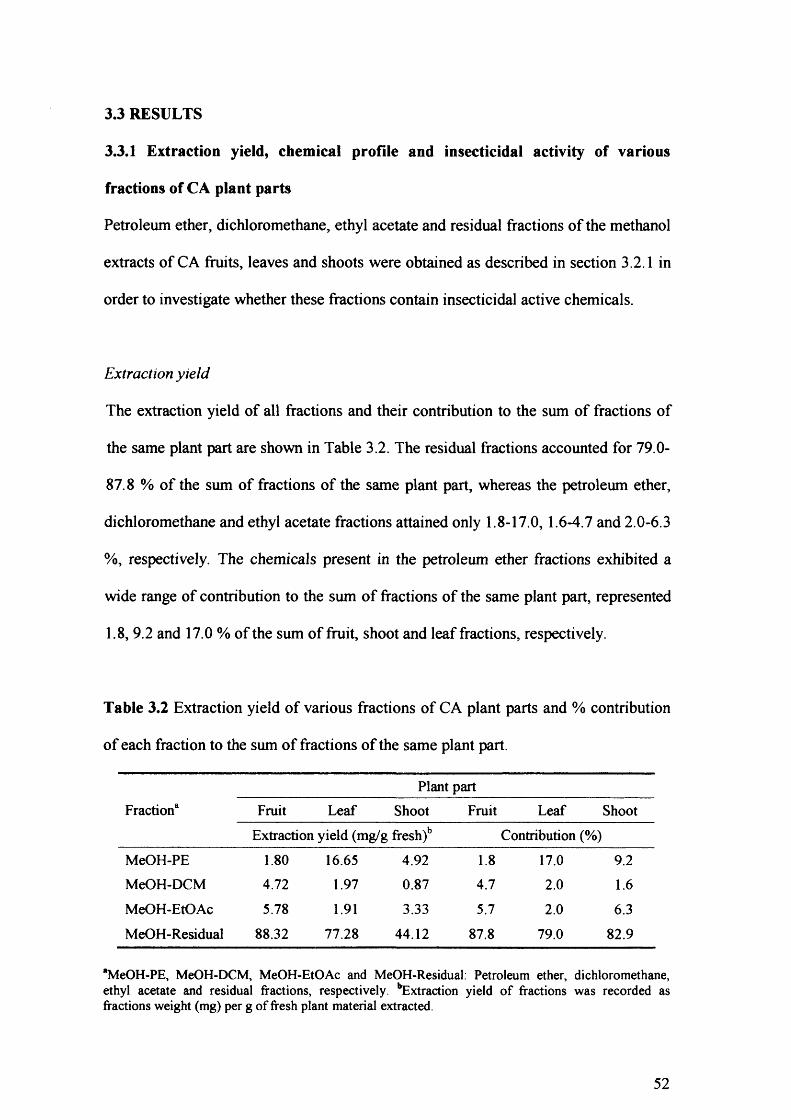
3.3 RESULTS
3.3.1 Extraction yield, chemical profile and insecticidal activity of various
fractions of CA plant parts
Petroleum ether, dichloromethane, ethyl acetate and residual fractions of the methanol
extracts of CA fruits, leaves and shoots were obtained as described in section 3.2.1 in
order to investigate whether these fractions contain insecticidal active chemicals.
Extraction yield
The extraction yield of all fractions and their contribution to the sum of fractions of
the same plant part are shown in Table 3.2. The residual fractions accounted for 79.0-
87.8 % o f the sum of fractions of the same plant part, whereas the petroleum ether,
dichloromethane and ethyl acetate fractions attained only 1.8-17.0,1.6-4.7 and 2.0-6.3
%, respectively. The chemicals present in the petroleum ether fractions exhibited a
wide range of contribution to the sum of fractions of the same plant part, represented
1.8, 9.2 and 17.0 % of the sum of fruit, shoot and leaf fractions, respectively.
Table 3.2 Extraction yield of various fractions of CA plant parts and % contribution
of each fraction to the sum of fractions of the same plant part.
Fraction8Plant part
Fruit Leaf Shoot Fruit Leaf ShootExtraction yield (mg/g ffesh)b Contribution (%)
MeOH-PE 1.80 16.65 4.92 1.8 17.0 9.2MeOH-DCM 4.72 1.97 0.87 4.7 2.0 1.6
MeOH-EtOAc 5.78 1.91 3.33 5.7 2.0 6.3
MeOH-Residual 88.32 77.28 44.12 87.8 79.0 82.9
*MeOH-PE, MeOH-DCM, MeOH-EtOAc and MeOH-Residual: Petroleum ether, dichloromethane, ethyl acetate and residual fractions, respectively. ‘̂ Extraction yield of fractions was recorded as fractions weight (mg) per g of fresh plant material extracted.
52
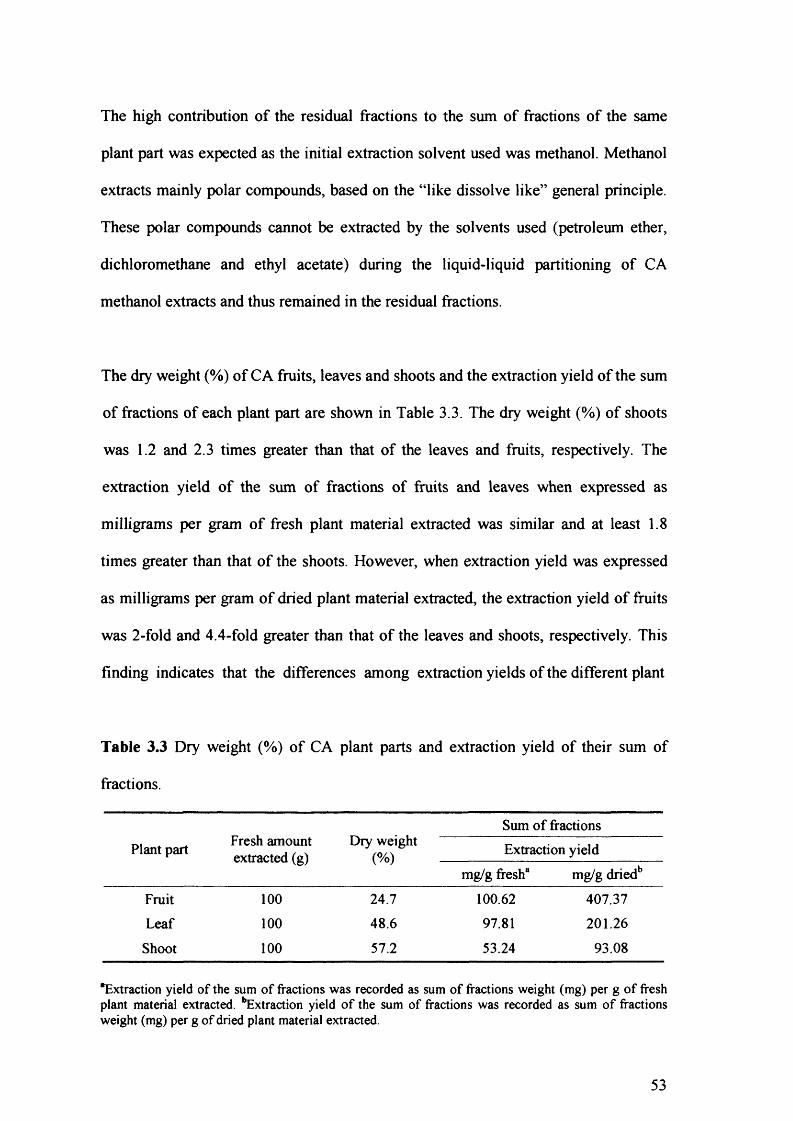
The high contribution of the residual fractions to the sum of fractions of the same
plant part was expected as the initial extraction solvent used was methanol. Methanol
extracts mainly polar compounds, based on the “like dissolve like” general principle.
These polar compounds cannot be extracted by the solvents used (petroleum ether,
dichloromethane and ethyl acetate) during the liquid-liquid partitioning of CA
methanol extracts and thus remained in the residual fractions.
The dry weight (%) of CA fruits, leaves and shoots and the extraction yield of the sum
of fractions of each plant part are shown in Table 3.3. The dry weight (%) of shoots
was 1.2 and 2.3 times greater than that of the leaves and fruits, respectively. The
extraction yield of the sum of fractions of fruits and leaves when expressed as
milligrams per gram of fresh plant material extracted was similar and at least 1 . 8
times greater than that o f the shoots. However, when extraction yield was expressed
as milligrams per gram of dried plant material extracted, the extraction yield of fruits
was 2-fold and 4.4-fold greater than that of the leaves and shoots, respectively. This
finding indicates that the differences among extraction yields of the different plant
Table 3.3 Dry weight (%) of CA plant parts and extraction yield of their sum of
fractions.
Plant part Fresh amount extracted (g)
Dry weight(%)
Sum of fractionsExtraction yield
mg/g fresh8 mg/g driedb
Fruit 100 24.7 100.62 407.37Leaf 100 48.6 97.81 201.26
Shoot 100 57.2 53.24 93.08
“Extraction yield of the sum of fractions was recorded as sum of fractions weight (mg) per g of fresh plant material extracted. '’Extraction yield of the sum of fractions was recorded as sum of fractions weight (mg) per g of dried plant material extracted.
53
parts were not due to the dry weight extracted (equivalent to 1 0 0 g fresh), but rather to
the nature of the secondary metabolites present in each plant part.
Chemical profile
The various fractions of CA fruits, leaves and shoots were analysed by TLC in order
to compare their chemical profiles. Different developing solvent systems were
employed for the analyses of these fractions as secondary metabolites present in them
represented a wide range of polarity. Preliminary analyses showed that the most
appropriate developing solvent system in order to analyse simultaneously the four
fractions of the three plant parts of CA was ethyl acetate (100 %). Comparison among
chemical profiles of dichloromethane fractions was performed using this developing
solvent system. By using Hex.EtOAc (50:50, v/v) as the developing solvent system
the petroleum ether fractions were compared. Furthermore, the ethyl acetate and the
residual fractions which contained mainly polar compounds were analysed by using
as developing solvent system DCM:MeOH (85:15, v/v) and DCM:MeOH (80:20,
v/v), respectively. The solutions used to spot the TLC plates were prepared in DCM
for the petroleum ether and dichloromethane fractions, while the ethyl acetate and
residual fraction were prepared in MeOH.
In Figure 3.4 the analysed fractions (the four fractions of the three plant parts of CA)
using EtOAc (100 %) as the developing solvent system are shown. Great quantitative
and qualitative differences were found among petroleum ether, dichloromethane, ethyl
acetate and residual fractions of the same plant part. In Figures 3.5A, 3.5B and 3.5C
the analysed petroleum ether, ethyl acetate and residual fractions of fruits, leaves and
shoots of CA using Hex:EtOAc (50:50, v/v), DCM:MeOH (85:15, v/v) and
54
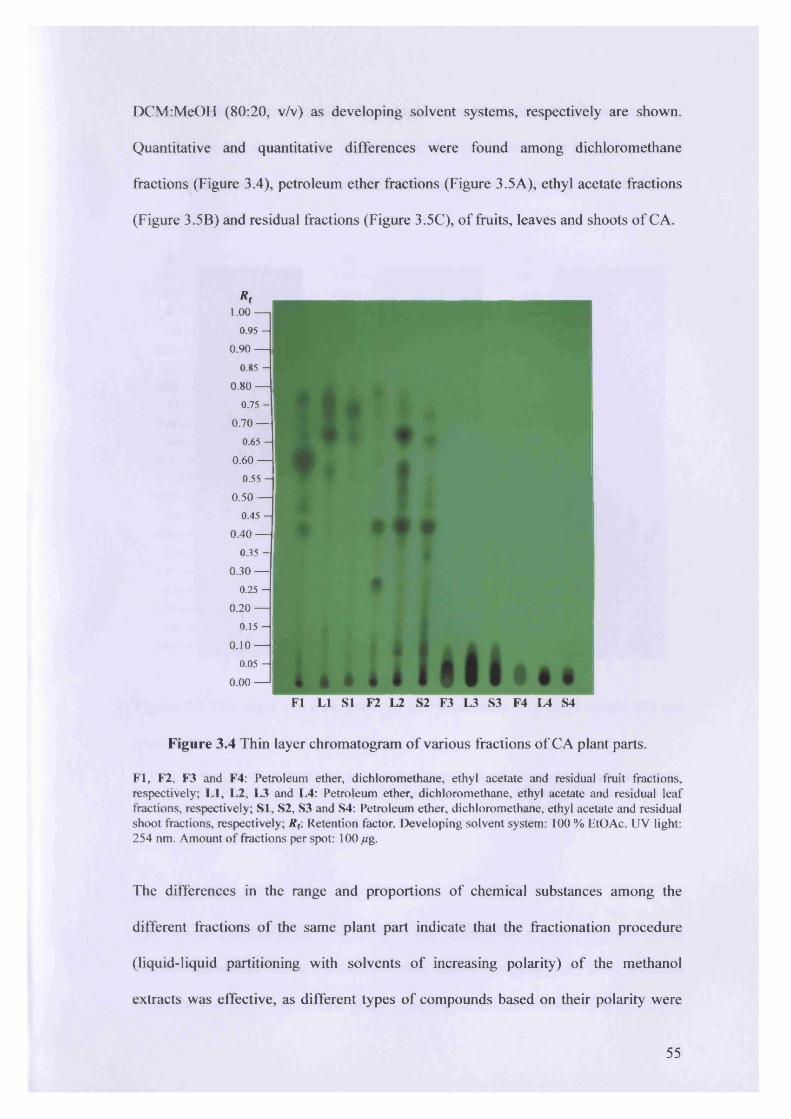
DCM:MeOH (80:20, v/v) as developing solvent systems, respectively are shown.
Quantitative and quantitative differences were found among dichloromethane
fractions (Figure 3.4), petroleum ether fractions (Figure 3.5A), ethyl acetate fractions
(Figure 3.5B) and residual fractions (Figure 3.5C), of fruits, leaves and shoots of CA.
*r1.00 —
0.95 -
0.90 —
0.85 -
0.80 —
0 .7 5 -
0.70 —
0.65 -
0.60 —
0.55 -
0.50 —
0.45 -
0.40 —
035 -
0.30 —
0.25 -
0.20 —
0 . 1 5 -
0.10 —
0.05 -
0.00 —
FI LI SI F2 L2 S2 F3 L3 S3 F4 L4 S4
Figure 3.4 Thin layer chromatogram of various fractions of CA plant parts.
FI, F2, F3 and F4: Petroleum ether, dichloromethane, ethyl acetate and residual fruit fractions, respectively; LI, L2, L3 and L4: Petroleum ether, dichloromethane, ethyl acetate and residual leaf fractions, respectively; SI, S2, S3 and S4: Petroleum ether, dichloromethane, ethyl acetate and residual shoot fractions, respectively; R f: Retention factor. Developing solvent system: 100 % EtOAc. UV light: 254 nm. Amount o f fractions per spot: 100 fig.
The differences in the range and proportions of chemical substances among the
different fractions of the same plant part indicate that the fractionation procedure
(liquid-liquid partitioning with solvents of increasing polarity) of the methanol
extracts was effective, as different types of compounds based on their polarity were
55
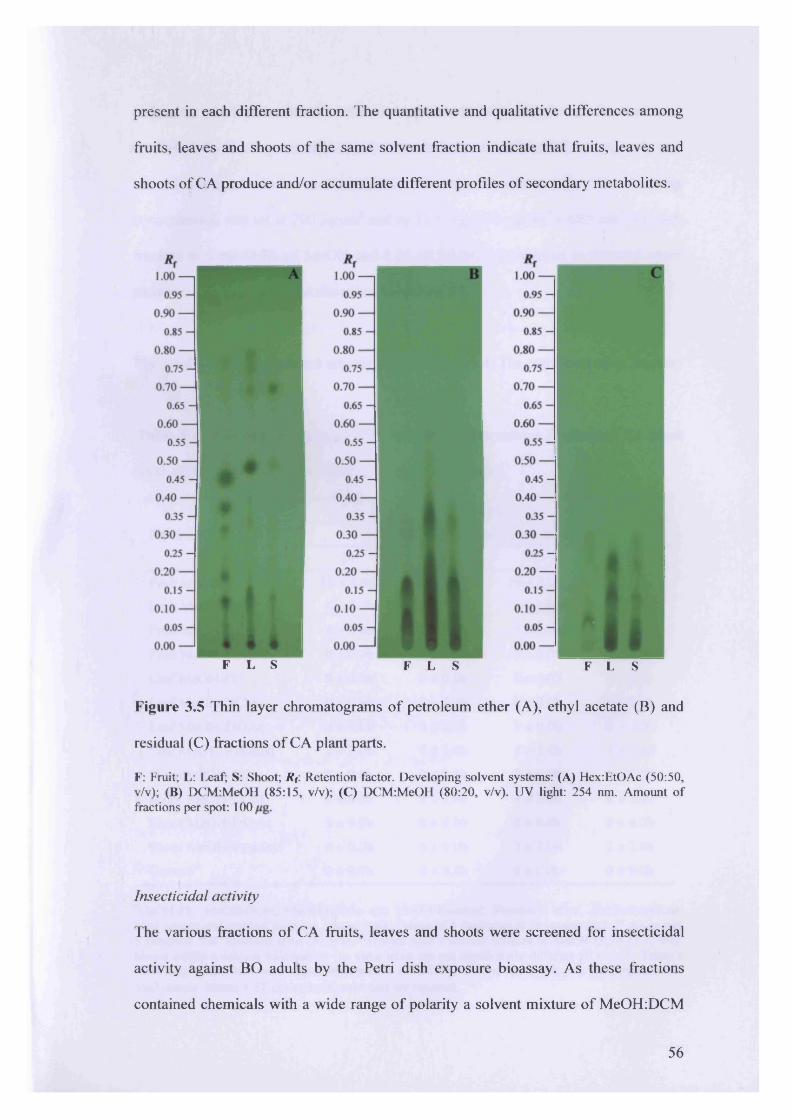
present in each different fraction. The quantitative and qualitative differences among
fruits, leaves and shoots of the same solvent fraction indicate that fruits, leaves and
shoots of CA produce and/or accumulate different profiles of secondary metabolites.
F L S F L S F L S
Figure 3.5 Thin layer chromatograms of petroleum ether (A), ethyl acetate (B) and
residual (C) fractions of CA plant parts.
F: Fruit; L: Leaf; S: Shoot; R f: Retention factor. Developing solvent systems: (A) Hex:EtOAc (50:50, v/v); (B) DCM:MeOH (85:15, v/v); (C) DCM:MeOH (80:20, v/v). UV light: 254 nm. Amount o f fractions per spot: 100
Insecticidal activity
The various fractions of CA fruits, leaves and shoots were screened for insecticidal
activity against BO adults by the Petri dish exposure bioassay. As these fractions
contained chemicals with a wide range of polarity a solvent mixture of MeOH:DCM
56
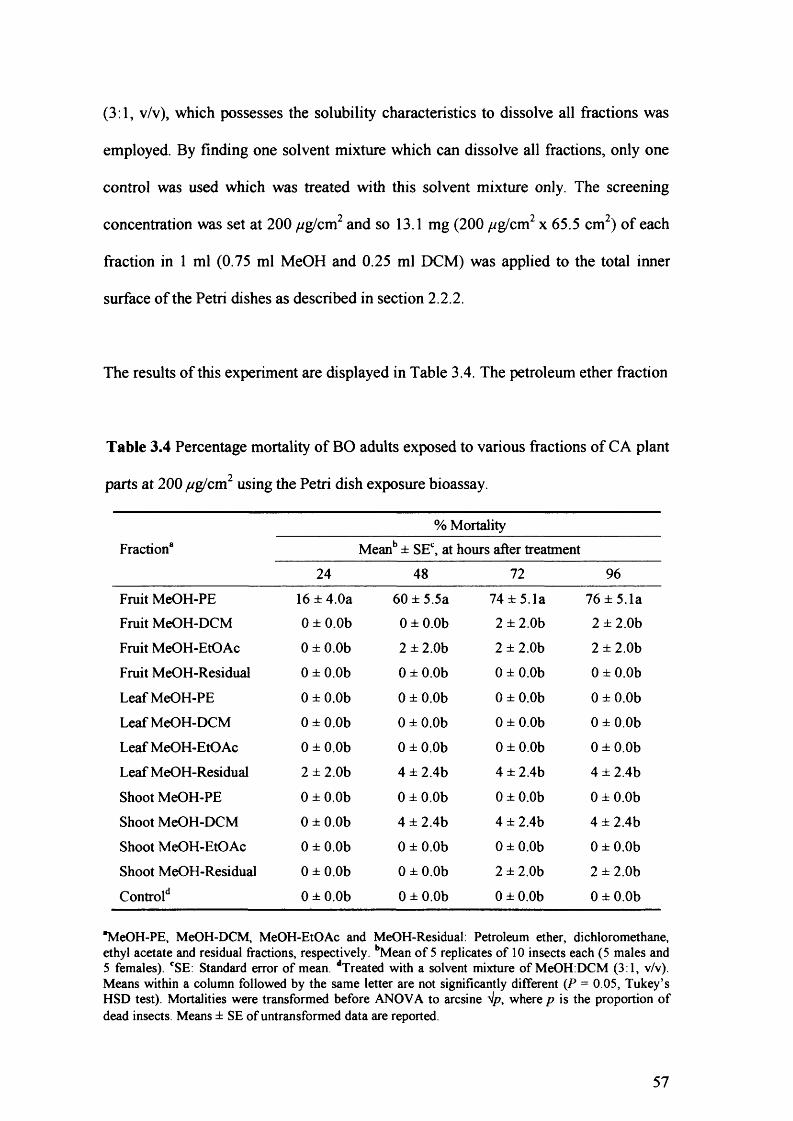
(3:1, v/v), which possesses the solubility characteristics to dissolve all fractions was
employed. By finding one solvent mixture which can dissolve all fractions, only one
control was used which was treated with this solvent mixture only. The screening
concentration was set at 200 //g/cm2 and so 13.1 mg (200 pg/cm2 x 65.5 cm2) of each
fraction in 1 ml (0.75 ml MeOH and 0.25 ml DCM) was applied to the total inner
surface of the Petri dishes as described in section 2.2.2.
The results of this experiment are displayed in Table 3.4. The petroleum ether fraction
Table 3.4 Percentage mortality of BO adults exposed to various fractions of CA plant
parts at 200 //g/cm2 using the Petri dish exposure bioassay.
Fraction8% Mortality
Meanb ± SEC, at hours after treatment
24 48 72 96
Fruit MeOH-PE 16 ± 4.0a 60 ± 5.5a 74 ± 5.1a 76 ± 5.1aFruit MeOH-DCM 0 ± 0.0b 0 ± 0.0b 2 ± 2.0b 2 ± 2.0b
Fruit MeOH-EtOAc 0 ± 0.0b 2 ± 2.0b 2 ± 2.0b 2 ± 2.0b
Fruit MeOH-Residual 0 ± 0.0b 0 ± 0.0b 0 ± 0.0b 0 ± 0.0b
Leaf MeOH-PE 0 ± 0.0b 0 ± 0.0b 0 ± 0.0b 0 ± 0.0b
Leaf MeOH-DCM 0 ± 0.0b 0 ± 0.0b 0 ± 0.0b 0 ± 0.0b
Leaf MeOH-EtOAc 0 ± 0.0b 0 ± 0.0b 0 ± 0.0b 0 ± 0.0b
Leaf MeOH-Residual 2 ± 2.0b 4 ± 2.4b 4 ± 2.4b 4 ± 2.4b
Shoot MeOH-PE 0 ± 0.0b 0 ± 0.0b 0 ± 0.0b 0 ± 0.0b
Shoot MeOH-DCM 0 ± 0.0b 4 ± 2.4b 4 ± 2.4b 4 ± 2.4b
Shoot MeOH-EtOAc 0 ± 0.0b 0 ± 0.0b 0 ± 0.0b 0 ± 0.0b
Shoot MeOH-Residual 0 ± 0.0b 0 ± 0.0b 2 ± 2.0b 2 ± 2.0b
Control41 0 ± 0.0b 0 ± 0.0b 0 ± 0.0b 0 ± 0.0b
*MeOH-PE, MeOH-DCM, MeOH-EtOAc and MeOH-Residual: Petroleum ether, dichloromethane, ethyl acetate and residual fractions, respectively. bMean o f 5 replicates o f 10 insects each (5 males and 5 females). CSE: Standard error o f mean. dTreated with a solvent mixture o f MeOH:DCM (3:1, v/v). Means within a column followed by the same letter are not significantly different (P = 0.05, Tukey’s HSD test). Mortalities were transformed before ANOVA to arcsine Vp, where p is the proportion o f dead insects. Means ± SE o f untransformed data are reported.
57
of the fruit methanol extract was the only fraction which exhibited activity against BO
adults (76 % mortality 96 h after treatment). Its activity was significantly greater from
all other fractions and the control at all mortality recording times.
The results indicate that the MeOH-PE fraction of the fruits contained one or more
chemical substances that can kill BO adults. All other fractions either did not contain
insecticidally active chemicals or contained them in such proportions that are not
toxic at the screening concentration used.
3.3.2 Extraction yield, chemical profile and insecticidal activity of petroleum
ether fractions of CA fruit tissues
Petroleum ether fractions of the methanol extracts of CA intact fruits, peels, albedo
and flesh were obtained as described in section 3.2.1 in order to determine whether a
specific fruit tissue was mainly responsible for the insecticidal activity of the
petroleum ether fraction of the fruit methanol extract.
Extraction yield
The dry weight (%) of CA fruit tissues and the extraction yield of their petroleum
ether fractions are displayed in Table 3.5. The dry weight (%) of peels and albedo was
similar and at least 1.4 and 1.9 times greater than that of the intact fruits and flesh,
respectively. The extraction yield of the petroleum ether fractions of the peels and
flesh when expressed as milligrams per gram of fresh fruit tissue extracted was
approximately the same and at least 1.2 and 2.5 times respectively greater than that of
the intact fruits and the albedo. However, when the extraction yield was expressed as
milligrams per gram of dried fruit tissue extracted, the petroleum ether fraction of
58
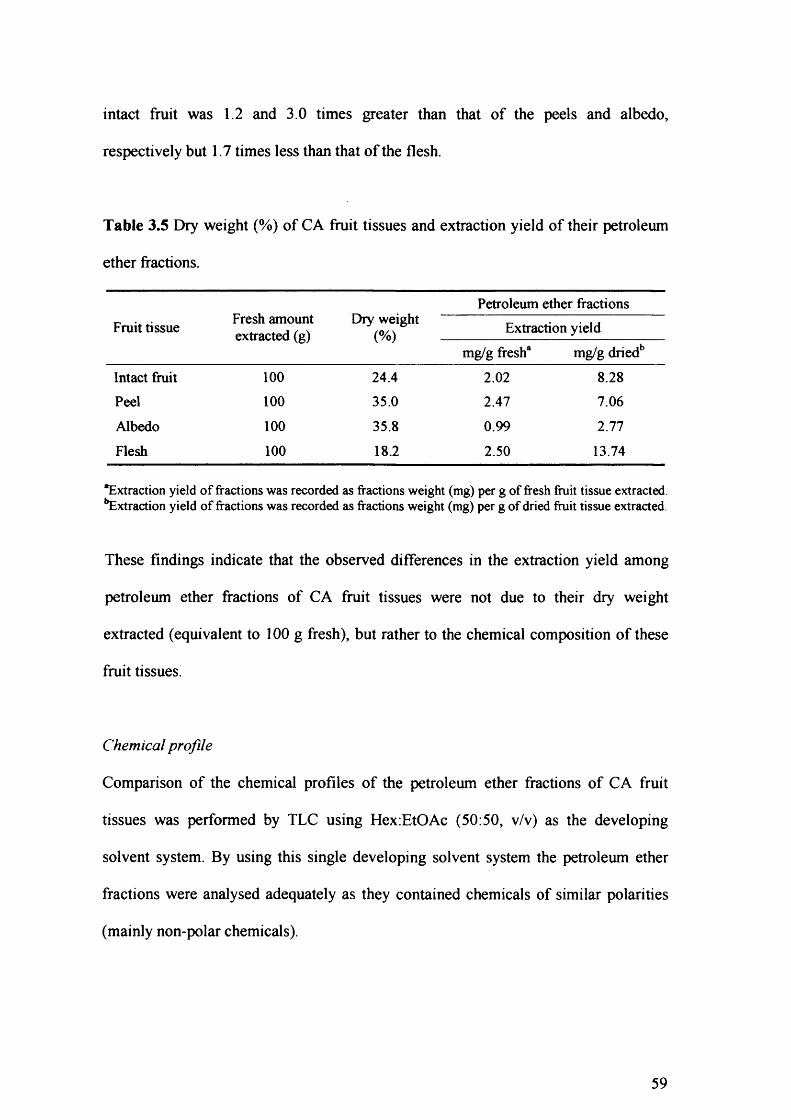
intact fruit was 1.2 and 3.0 times greater than that of the peels and albedo,
respectively but 1.7 times less than that of the flesh.
Table 3.5 Dry weight (%) of CA fruit tissues and extraction yield of their petroleum
ether fractions.
Fruit tissue Fresh amount extracted (g)
Dry weight(%)
Petroleum ether fractionsExtraction yield
mg/g fresh8 mg/g driedb
Intact fruit 100 24.4 2.02 8.28
Peel 100 35.0 2.47 7.06
Albedo 100 35.8 0.99 2.77
Flesh 100 18.2 2.50 13.74
“Extraction yield o f fractions was recorded as fractions weight (mg) per g o f fresh fruit tissue extracted. ’’Extraction yield o f fractions was recorded as fractions weight (mg) per g o f dried fruit tissue extracted.
These findings indicate that the observed differences in the extraction yield among
petroleum ether fractions of CA fruit tissues were not due to their dry weight
extracted (equivalent to 1 0 0 g fresh), but rather to the chemical composition of these
fruit tissues.
Chemical profile
Comparison of the chemical profiles of the petroleum ether fractions of CA fruit
tissues was performed by TLC using Hex:EtOAc (50:50, v/v) as the developing
solvent system. By using this single developing solvent system the petroleum ether
fractions were analysed adequately as they contained chemicals of similar polarities
(mainly non-polar chemicals).
59
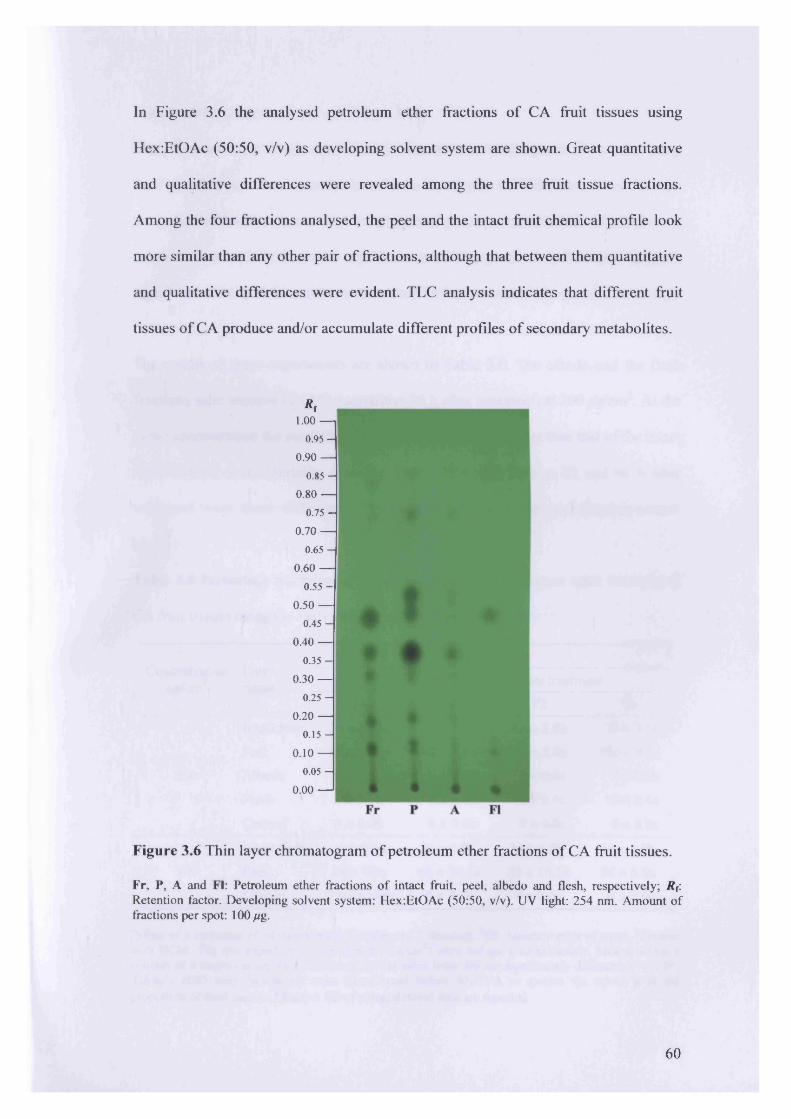
In Figure 3.6 the analysed petroleum ether fractions of CA fruit tissues using
Hex:EtOAc (50:50, v/v) as developing solvent system are shown. Great quantitative
and qualitative differences were revealed among the three fruit tissue fractions.
Among the four fractions analysed, the peel and the intact fruit chemical profile look
more similar than any other pair of fractions, although that between them quantitative
and qualitative differences were evident. TLC analysis indicates that different fruit
tissues of CA produce and/or accumulate different profiles of secondary metabolites.
*r1.00 —
0 .9 5 -
0.90 — 0 . 8 5 -
0.80 — 0 . 7 5 -
0.70 — 0 .6 5 -
0.60 — 0.55 -
0.50 — 0 .4 5 -
0.40 — 0 .3 5 -
0.30 — 0 . 2 5 -
0.20 —
0 . 1 5 -
0.10 —
0.05 -
0.00 —
Figure 3.6 Thin layer chromatogram of petroleum ether fractions of CA fruit tissues.
Fr, P, A and FI: Petroleum ether fractions o f intact fruit, peel, albedo and flesh, respectively; R t: Retention factor. Developing solvent system: Hex:EtOAc (50:50, v/v). UV light: 254 nm. Amount o f fractions per spot: 100 fxg.
60
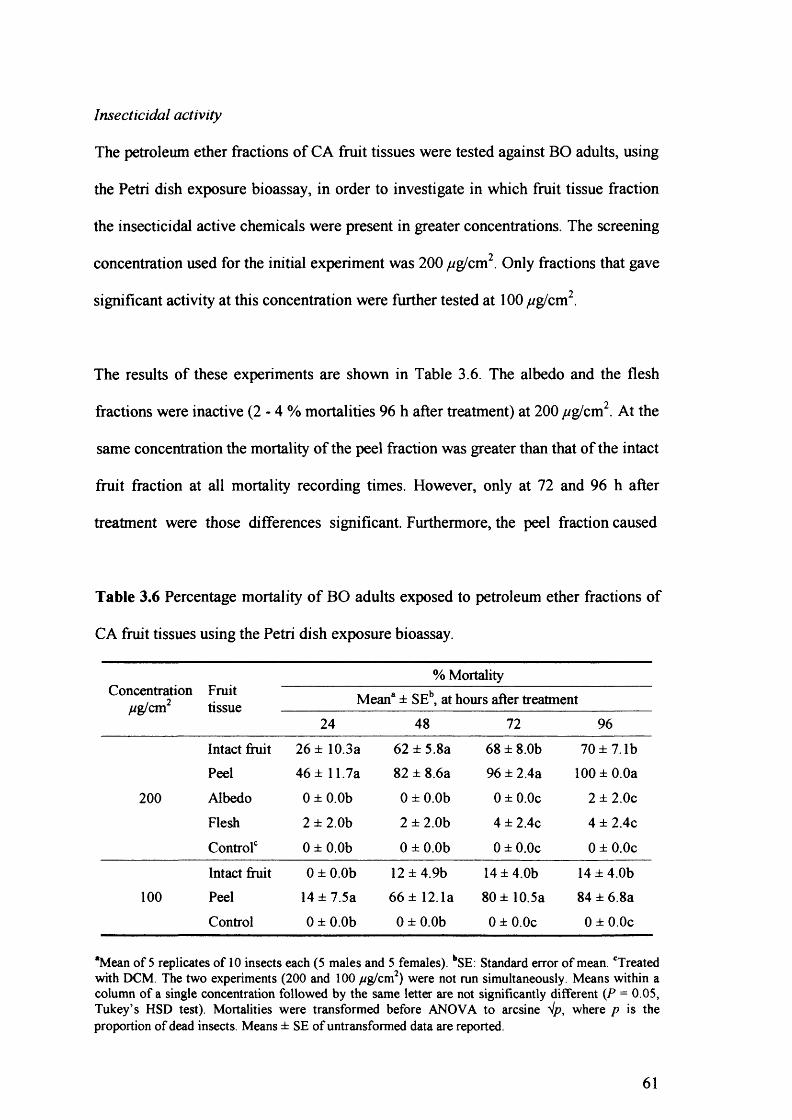
Insecticidal activity
The petroleum ether fractions of CA fruit tissues were tested against BO adults, using
the Petri dish exposure bioassay, in order to investigate in which fruit tissue fraction
the insecticidal active chemicals were present in greater concentrations. The screening
concentration used for the initial experiment was 200 //g/cm2. Only fractions that gave
significant activity at this concentration were further tested at 1 0 0 //g/cm2.
The results of these experiments are shown in Table 3.6. The albedo and the flesh
fractions were inactive ( 2 - 4 % mortalities 96 h after treatment) at 200 //g/cm2. At the
same concentration the mortality of the peel fraction was greater than that of the intact
fruit fraction at all mortality recording times. However, only at 72 and 96 h after
treatment were those differences significant. Furthermore, the peel fraction caused
Table 3.6 Percentage mortality o f BO adults exposed to petroleum ether fractions of
CA fruit tissues using the Petri dish exposure bioassay.
Concentration/ig/cm2
Fruittissue
% MortalityMean8 ± SEb, at hours after treatment
24 48 72 96
Intact fruit 26 ± 10.3a 62 ± 5.8a 68 ± 8.0b 70 ± 7.1bPeel 46 ± 11.7a 82 ± 8.6a 96 ± 2.4a 100 ± 0.0a
200 Albedo 0 ± 0.0b 0 ± 0.0b 0 ± 0.0c 2 ± 2.0c
Flesh 2 ± 2.0b 2 ± 2.0b 4 ± 2.4c 4 ± 2.4c
Control0 0 ± 0.0b 0 ± 0.0b 0 ± 0.0c 0 ± 0.0c
Intact fruit 0 ± 0.0b 12 ± 4.9b 14 ± 4.0b 14 ± 4.0b100 Peel 14 ± 7.5a 66 ± 12.1a 80 ± 10.5a 84 ± 6.8a
Control 0 ± 0.0b 0 ± 0.0b 0 ± 0.0c 0 ± 0.0c
“Mean o f 5 replicates o f 10 insects each (5 males and 5 females). bSE: Standard error o f mean. 'Treated with DCM. The two experiments (200 and 100 //g/cm2) were not run simultaneously. Means within a column o f a single concentration followed by the same letter are not significantly different (P = 0.05, Tukey’s HSD test). Mortalities were transformed before ANOVA to arcsine V/?, where p is the proportion o f dead insects. Means ± SE o f untransformed data are reported.
61
significantly more mortality to BO adults than the intact fruit fraction at all mortality
recording times at 1 0 0 //g/cm2.
The results indicate that the peel fraction possesses, in greater proportions, the
insecticidally active chemical compounds present in the intact fruit fraction. The
albedo and flesh fractions either did not contain these chemicals or contained them in
such proportions that cannot exhibit any evidence of activity even at 200 /^g/cm . It
seems that the bioactive chemicals present in the intact fruit fraction are mainly
produced and/or accumulated in the peel tissue of CA fruits.
3.3.3 Extraction yield, chemical profile and insecticidal activity of petroleum
ether fractions obtained from fresh and dried peels of CA
Petroleum ether fractions of the methanol extracts obtained by the extraction of fresh
and dried peels were prepared as described in section 3.2.1 in order to investigate
whether chemical and/or enzymatic processes or reactions possibly occurring during
the two drying processes of the peels can change the insecticidal activity of their
petroleum ether fraction.
Extraction yield
The extraction yield of the petroleum ether peel fractions obtained from fresh, oven-
dried at 30 °C for 4 d and oven-dried at 50 °C for 2 d peels, recorded as milligrams per
gram fresh peel was 2.66, 1.60 and 1.76, respectively. The extraction yield of the two
petroleum ether peel fractions obtained from dried peels was similar and at least 1.5
times less than that of the petroleum ether fraction obtained from fresh peels.
62
The reduced extraction yields of the two fractions obtained from dried peels could be
attributed to the transformation, during drying treatments, of some chemicals present
in the fraction obtained from fresh peels, to more polar chemicals due to enzymatic
and/or chemical processes or reactions. These artefacts possibly cannot be extracted
from the methanol extracts by the liquid-liquid partitioning with petroleum ether, due
to their greater polarity.
Chemical profile
Comparison of the chemical profiles of the petroleum ether peel fractions obtained
from fresh and oven dried peels was performed by TLC using Hex:EtOAc (50:50,
v/v) as the developing solvent system. Figure 3.7 shows the analysed petroleum ether
peel fractions of CA. TLC analysis revealed that there were great similarities among
the chemical profiles o f the three fractions. However, the two fractions obtained from
dried peels were almost the same (only quantitative difference between spots with R(.
0.30), and they differ with the fraction obtained from fresh peels only quantitatively
(spots with R{. 0.00, 0.12, 0.19, 0.30 and 0.46).
The quantitative differences revealed when the fraction obtained from fresh peels was
compared with the two fractions obtained from dried peels could be attributed to the
transformation of some chemicals or part of them to more polar chemicals during
drying treatments. However, the greater proportions of the chemicals with Rf. 0.12,
0.19 and 0.30 in the fractions obtained from dried peels compared to the fraction
obtained from fresh peels could be explained by the lower yield of these fractions
rather than the greater amount of these chemicals in the fractions. Furthermore, the
63
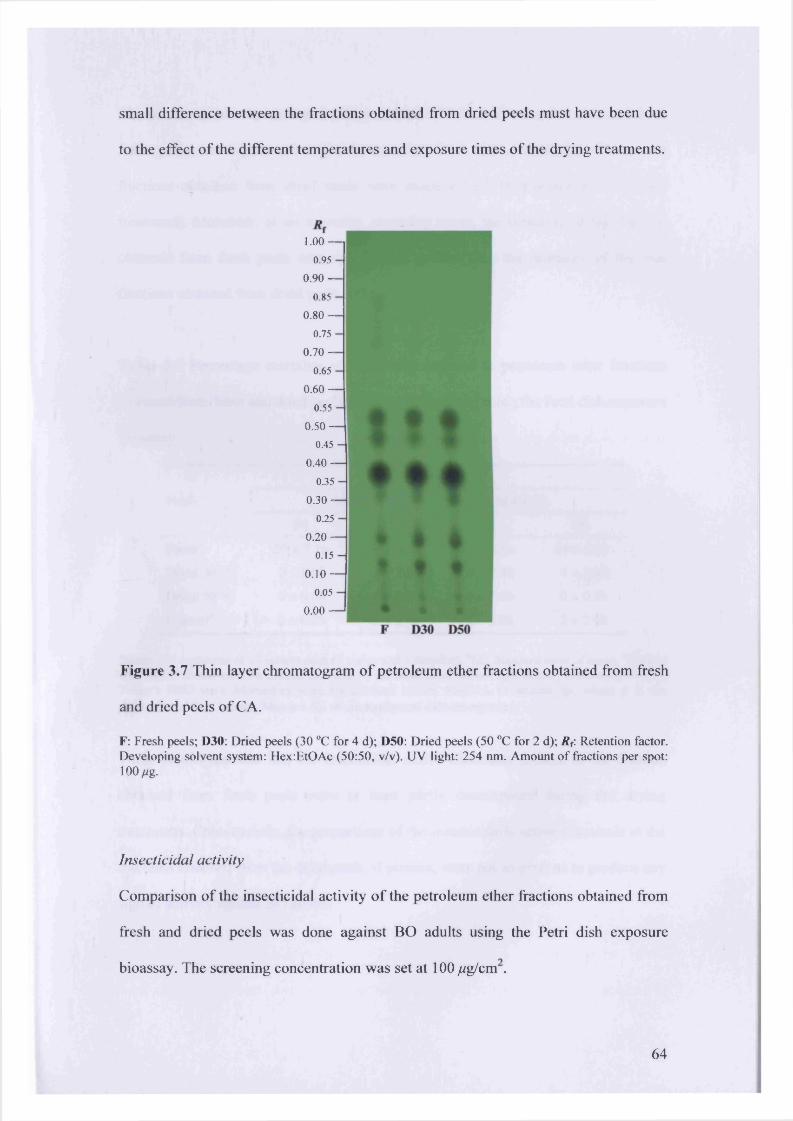
small difference between the fractions obtained from dried peels must have been due
to the effect of the different temperatures and exposure times of the drying treatments.
1.0 0 -
0.95
0 .90 -0.85
0 .80 -0.75
0 .70 -0.65
0.60-0.55
0.50-0.45
0.40-0.35
0.30-025
0 . 2 0 -
0.15
0 . 1 0 -
0.05
0.0 0 -
Figure 3.7 Thin layer chromatogram of petroleum ether fractions obtained from fresh
and dried peels of CA.
F: Fresh peels; D30: Dried peels (30 °C for 4 d); D50: Dried peels (50 °C for 2 d); R f: Retention factor. Developing solvent system: Hex:EtOAc (50:50, v/v). UV light: 254 nm. Amount o f fractions per spot:100//g.
Insecticidal activity
Comparison of the insecticidal activity of the petroleum ether fractions obtained from
fresh and dried peels was done against BO adults using the Petri dish exposure
bioassay. The screening concentration was set at 100 /ig/cm .
64
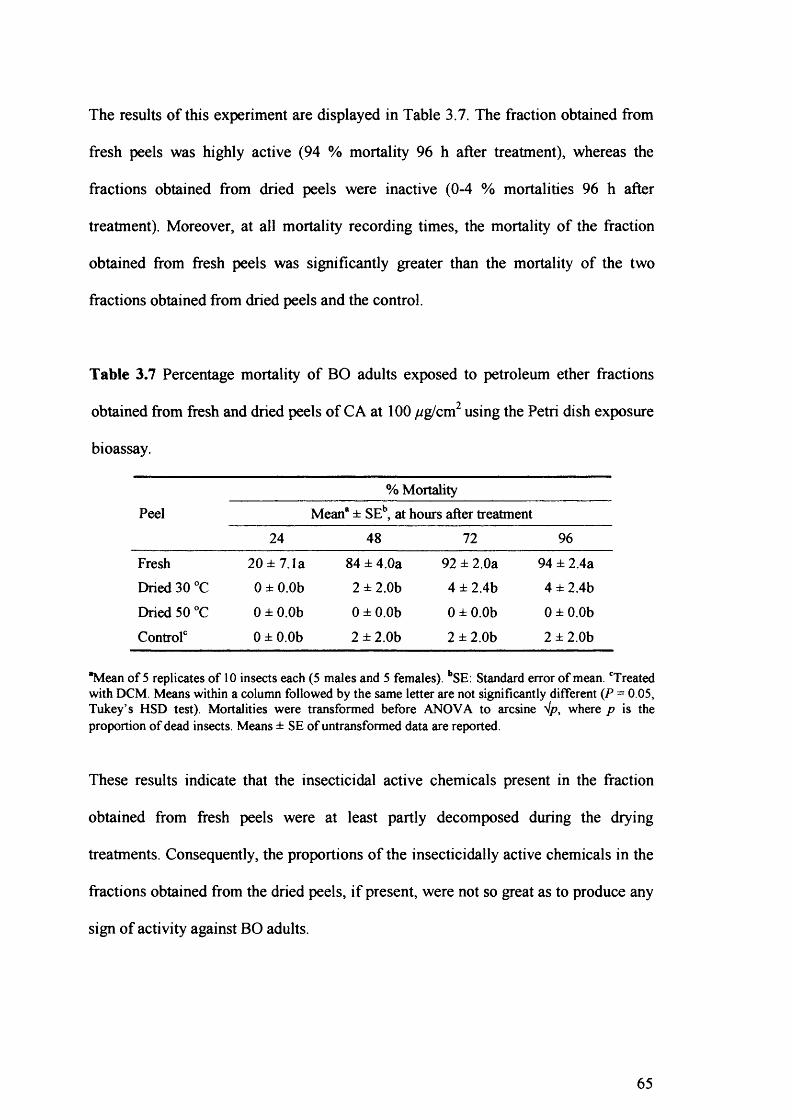
The results of this experiment are displayed in Table 3.7. The fraction obtained from
fresh peels was highly active (94 % mortality 96 h after treatment), whereas the
fractions obtained from dried peels were inactive (0-4 % mortalities 96 h after
treatment). Moreover, at all mortality recording times, the mortality of the fraction
obtained from fresh peels was significantly greater than the mortality of the two
fractions obtained from dried peels and the control.
Table 3.7 Percentage mortality of BO adults exposed to petroleum ether fractions
obtained from fresh and dried peels of CA at 100 /ig/cm2 using the Petri dish exposure
bioassay.
% MortalityPeel Mean* ± SEb, at hours after treatment
24 48 72 96
Fresh 20 ± 7.1a 84 ± 4.0a 92 ± 2.0a 94 ± 2.4a
Dried 30 °C 0 ± 0.0b 2 ± 2.0b 4 ± 2.4b 4 ± 2.4b
Dried 50 °C 0 ± 0.0b 0 ± 0.0b 0 ± 0.0b 0 ± 0.0b
Control0 0 ± 0.0b 2 ± 2.0b 2 ± 2.0b 2 ± 2.0b
“Mean o f 5 replicates o f 10 insects each (5 males and 5 females). bSE: Standard error o f mean. 'Treated with DCM. Means within a column followed by the same letter are not significantly different (P = 0.05, Tukey’s HSD test). Mortalities were transformed before ANOVA to arcsine Vp, where p is the proportion o f dead insects. Means ± SE o f untransformed data are reported.
These results indicate that the insecticidal active chemicals present in the fraction
obtained from fresh peels were at least partly decomposed during the drying
treatments. Consequently, the proportions of the insecticidally active chemicals in the
fractions obtained from the dried peels, if present, were not so great as to produce any
sign of activity against BO adults.
65
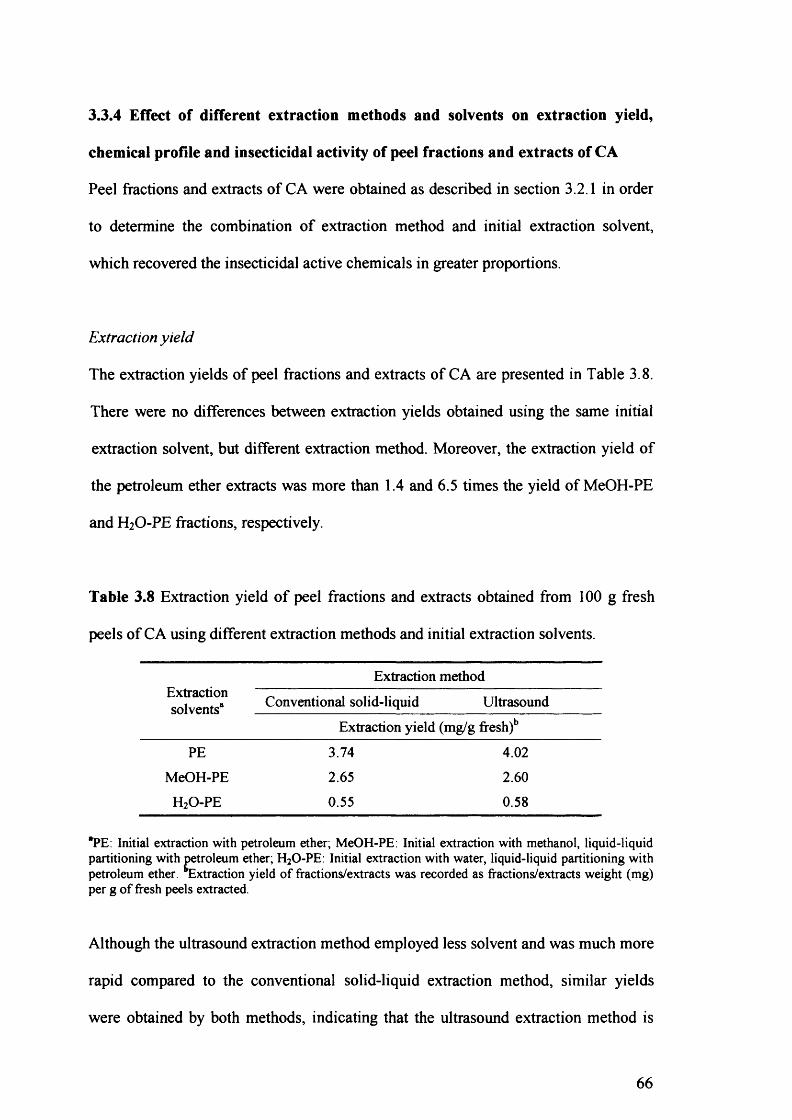
3.3.4 Effect of different extraction methods and solvents on extraction yield,
chemical profile and insecticidal activity of peel fractions and extracts of CA
Peel fractions and extracts of CA were obtained as described in section 3.2.1 in order
to determine the combination of extraction method and initial extraction solvent,
which recovered the insecticidal active chemicals in greater proportions.
Extraction yield
The extraction yields of peel fractions and extracts of CA are presented in Table 3.8.
There were no differences between extraction yields obtained using the same initial
extraction solvent, but different extraction method. Moreover, the extraction yield of
the petroleum ether extracts was more than 1.4 and 6.5 times the yield of MeOH-PE
and H2O-PE fractions, respectively.
Table 3.8 Extraction yield of peel fractions and extracts obtained from 100 g fresh
peels of CA using different extraction methods and initial extraction solvents.
Extractionsolvents8
Extraction method
Conventional solid-liquid Ultrasound
Extraction yield (mg/g fresh)b
PE 3.74 4.02MeOH-PE 2.65 2.60H2O-PE 0.55 0.58
*PE: Initial extraction with petroleum ether; MeOH-PE: Initial extraction with methanol, liquid-liquid partitioning with petroleum ether; H20-PE: Initial extraction with water, liquid-liquid partitioning with petroleum ether. Extraction yield of fractions/extracts was recorded as fractions/extracts weight (mg) per g of fresh peels extracted.
Although the ultrasound extraction method employed less solvent and was much more
rapid compared to the conventional solid-liquid extraction method, similar yields
were obtained by both methods, indicating that the ultrasound extraction method is
66
more efficient than the conventional solid-liquid extraction method. The low yield
obtained by both methods using water for the initial extraction is explained by the
inability of water to extract non-polar chemical compounds. Moreover, the lower
yield obtained by both methods using methanol than petroleum ether for the initial
extraction can be explained by the ability of petroleum ether to extract selectively
non-polar compounds, whereas methanol is extracting compounds representing a wide
polarity range.
Chemical profile
Comparison of the chemical profiles of peel fractions and extracts were performed by
TLC using Hex:EtOAc (50:50, v/v) as the developing solvent system. In Figure 3.8
the analysed petroleum ether peel fractions and extracts of CA are shown. TLC
analysis revealed small quantitative differences between the chemical profiles of
fractions/extracts obtained by using the same initial extraction solvent, but different
extraction methods. Moreover, the chemical profiles of the H2 O-PE fractions obtained
by both extraction methods differ substantially both quantitatively and qualitatively
with the four other chemical profiles. Furthermore, among the two MeOH-PE
fractions and the two PE extracts there were some differences, but not such great as
that stated above.
These findings indicate that the effect of extraction method in the chemical profile of
the fractions/extracts was not crucial. By contrast, the choice of initial extraction
solvent greatly affected the chemical profiles of these fractions/extracts. Moreover,
the inability of water to extract non-polar chemical compounds is obvious. It must be
noticed that although some chemicals of the H2O-PE fractions with R{ below 0.5 were
67
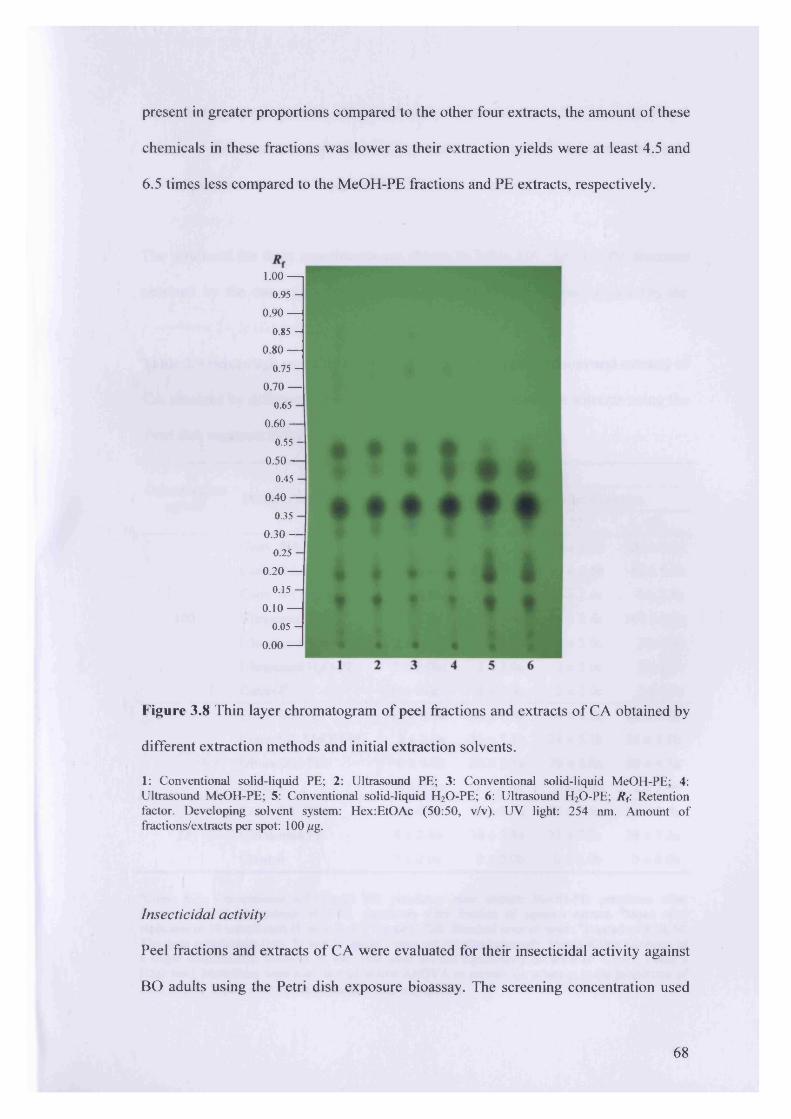
present in greater proportions compared to the other four extracts, the amount of these
chemicals in these fractions was lower as their extraction yields were at least 4.5 and
6.5 times less compared to the MeOH-PE fractions and PE extracts, respectively.
1.00 —
0.95-
0.90 — 0.85 -
0.80 — 0 .75-
0.70 — 0.65
0 .6 0 - 0.55
0 .50 - 0.45
0 .4 0 - 0.35
0 .3 0 - 0.25
0.20 —
0.15 -
0.10 —
0.05 -
0.00 —
Figure 3.8 Thin layer chromatogram of peel fractions and extracts of CA obtained by
different extraction methods and initial extraction solvents.
1: Conventional solid-liquid PE; 2: Ultrasound PE; 3: Conventional solid-liquid MeOH-PE; 4: Ultrasound MeOH-PE; 5: Conventional solid-liquid H20-PE; 6: Ultrasound H20-PE; R {: Retention factor. Developing solvent system: Hex:EtOAc (50:50, v/v). UV light: 254 nm. Amount o f fractions/extracts per spot: 100 fig.
Insecticidal activity
Peel fractions and extracts of CA were evaluated for their insecticidal activity against
BO adults using the Petri dish exposure bioassay. The screening concentration used
68
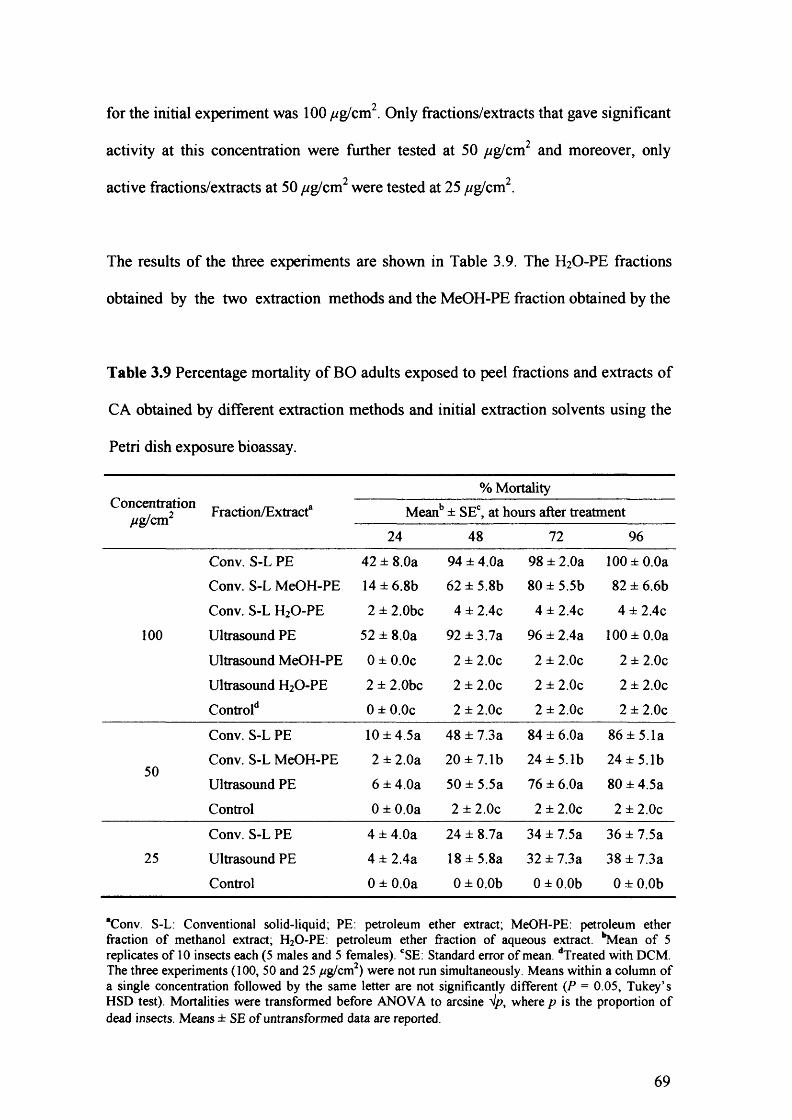
for the initial experiment was 100 /ig/cm2. Only fractions/extracts that gave significant
activity at this concentration were further tested at 50 /ig/cm2 and moreover, only
active fractions/extracts at 50 //g/cm2 were tested at 25 /*g/cm2.
The results of the three experiments are shown in Table 3.9. The H2O-PE fractions
obtained by the two extraction methods and the MeOH-PE fraction obtained by the
Table 3.9 Percentage mortality of BO adults exposed to peel fractions and extracts of
CA obtained by different extraction methods and initial extraction solvents using the
Petri dish exposure bioassay.
Concentration/^g/cm2
% MortalityFraction/Extract8 Meanb ± SEC, at hours after treatment
24 48 72 96
Conv. S-L PE 42 ± 8.0a 94 ± 4.0a 98 ± 2.0a 100 ± 0.0aConv. S-L MeOH-PE 14 ± 6.8b 62 ± 5.8b 80 ± 5.5b 82 ± 6.6bConv. S-L H20-PE 2 ± 2.0bc 4 ± 2.4c 4 ± 2.4c 4 ± 2.4c
100 Ultrasound PE 52 ± 8.0a 92 ± 3.7a 96 ± 2.4a 100 ± 0.0a
Ultrasound MeOH-PE 0 ± 0.0c 2 ± 2.0c 2 ± 2.0c 2 ± 2.0cUltrasound H20-PE 2 ± 2.0bc 2 ± 2.0c 2 ± 2.0c 2 ± 2.0cControl*1 0 ± 0.0c 2 ± 2.0c 2 ± 2.0c 2 ± 2.0c
Conv. S-L PE 10 ± 4.5a 48 ± 7.3a 84 ± 6.0a 86 ± 5.1a
50Conv. S-L MeOH-PE 2 ± 2.0a 20 ± 7.1b 24 ± 5.1b 24 ± 5.1bUltrasound PE 6 ± 4.0a 50 ± 5.5a 76 ± 6.0a 80 ± 4.5aControl 0 ± 0.0a 2 ± 2.0c 2 ± 2.0c 2 ± 2.0cConv. S-L PE 4 ± 4.0a 24 ± 8.7a 34 ± 7.5a 36 ± 7.5a
25 Ultrasound PE 4 ± 2.4a 18 ± 5.8a 32 ± 7.3a 38 ± 7.3aControl 0 ± 0.0a 0 ± 0.0b 0 ± 0.0b 0 ± 0.0b
*Conv. S-L: Conventional solid-liquid; PE: petroleum ether extract; MeOH-PE: petroleum ether fraction o f methanol extract; H20-PE: petroleum ether fraction o f aqueous extract. bMean o f 5 replicates o f 10 insects each (5 males and 5 females). CSE: Standard error o f mean. dTreated with DCM. The three experiments (100, 50 and 25 /Yg/cm2) were not run simultaneously. Means within a column o f a single concentration followed by the same letter are not significantly different (P = 0.05, Tukey’s HSD test). Mortalities were transformed before ANOVA to arcsine V/?, where p is the proportion o f dead insects. Means ± SE o f untransformed data are reported.
69
ultrasound extraction method were inactive (2-4 % mortalities 96 h after treatment) at
100 /ig/cm2. The mortality caused by the MeOH-PE fraction obtained by the
conventional solid-liquid extraction method was significant lower compared to the PE'y
extracts obtained by both methods at 100 //g/cm at all mortality recording times and
at 50 //g/cm2 at 48, 72 and 96 h after treatment. Moreover, there were no significant
statistical differences between the two PE extracts at the three screening
concentrations at all mortality recording times.
The results of the three experiments indicate that the insecticidal active chemicals
were present in the two PE extracts in similar proportions, but greater compared to the
MeOH-PE fraction obtained by the conventional solid-liquid extraction method. The
H2 O-PE fractions obtained by both extraction methods and the MeOH-PE fraction
obtained by the ultrasound extraction method either did not contain these chemicals or"S
contain them in such concentrations that can not cause mortality even at 100 //g/cm .
3.3.5 Effect of fruit ripeness on extraction yield, chemical profile and insecticidal
activity of petroleum ether peel extracts of CA
Petroleum ether peel extracts were obtained as described in section 3.2.1 in order to
investigate whether there were differences in the insecticidal activity of the petroleum
ether peel extracts obtained from fruits collected at different times in the same
growing season.
Extraction yield
The dry weight (%) of peels obtained from CA fruits at various ripening stages and
the extraction yield of their petroleum ether extracts are displayed in Table 3.10. The
70
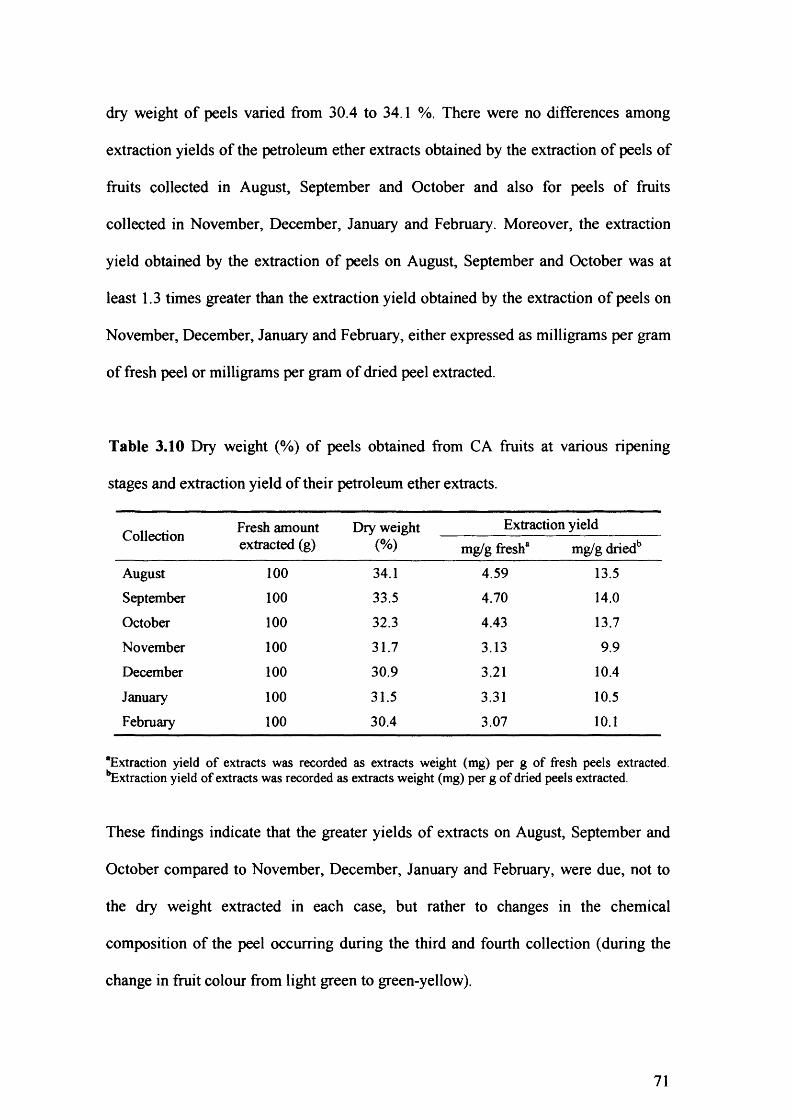
dry weight of peels varied from 30.4 to 34.1 %. There were no differences among
extraction yields of the petroleum ether extracts obtained by the extraction of peels of
fruits collected in August, September and October and also for peels of fruits
collected in November, December, January and February. Moreover, the extraction
yield obtained by the extraction of peels on August, September and October was at
least 1.3 times greater than the extraction yield obtained by the extraction of peels on
November, December, January and February, either expressed as milligrams per gram
of fresh peel or milligrams per gram of dried peel extracted.
Table 3.10 Dry weight (%) of peels obtained from CA fruits at various ripening
stages and extraction yield of their petroleum ether extracts.
Collection Fresh amount extracted (g)
Dry weight (%)
Extraction yieldmg/g fresh* mg/g driedb
August 1 0 0 34.1 4.59 13.5
September 1 0 0 33.5 4.70 14.0
October 1 0 0 32.3 4.43 13.7
November 1 0 0 31.7 3.13 9.9
December 1 0 0 30.9 3.21 10.4
January 1 0 0 31.5 3.31 10.5
February 1 0 0 30.4 3.07 1 0 .1
“Extraction yield o f extracts was recorded as extracts weight (mg) per g o f fresh peels extracted. '‘Extraction yield o f extracts was recorded as extracts weight (mg) per g o f dried peels extracted.
These findings indicate that the greater yields of extracts on August, September and
October compared to November, December, January and February, were due, not to
the dry weight extracted in each case, but rather to changes in the chemical
composition of the peel occurring during the third and fourth collection (during the
change in fruit colour from light green to green-yellow).
71
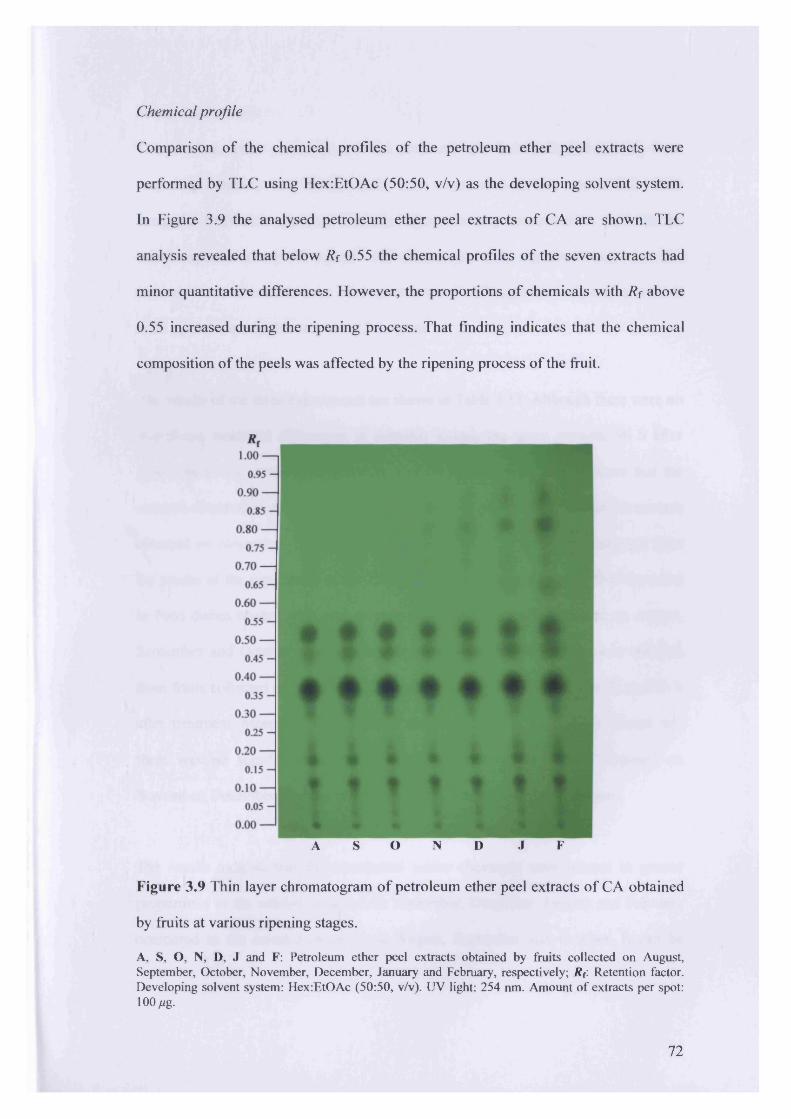
Chemical profile
Comparison of the chemical profiles of the petroleum ether peel extracts were
performed by TLC using HexiEtOAc (50:50, v/v) as the developing solvent system.
In Figure 3.9 the analysed petroleum ether peel extracts of CA are shown. TLC
analysis revealed that below Rf 0.55 the chemical profiles of the seven extracts had
minor quantitative differences. However, the proportions of chemicals with Rf above
0.55 increased during the ripening process. That finding indicates that the chemical
composition of the peels was affected by the ripening process of the fruit.
A S O N D J F
Figure 3.9 Thin layer chromatogram of petroleum ether peel extracts of CA obtained
by fruits at various ripening stages.
A, S, O, N, D, J and F: Petroleum ether peel extracts obtained by fruits collected on August, September, October, November, December, January and February, respectively; R f Retention factor. Developing solvent system: Hex:EtOAc (50:50, v/v). UV light: 254 nm. Amount o f extracts per spot:100/^g.
72
Insecticidal activity
The petroleum ether peel extracts of CA obtained from fruits collected monthly from
August to February were evaluated for their insecticidal activity against BO adults
using the Petri dish exposure bioassay. The screening concentration used for the
initial experiment was 50 //g/cm2. As all extracts were significant active at this
concentration, all extracts were subsequently tested at 25 //g/cm2. Only active extracts
at 25 //g/cm2 were further tested at 12.5 //g/cm2.
The results of the three experiments are shown in Table 3.11. Although there were no
significant statistical differences in mortality among the seven extracts, 96 h after
treatment at the screening concentration of 50 //g/cm2, there was evidence that the
extracts obtained on August, September and October were not as active as the extracts
obtained on November, December, January and February. This was confirmed from
the results of the experiment at the 25 //g/cm2 concentration where the flies mortality
in Petri dishes treated with peel extracts obtained from fruits collected on August,
September and October was significantly lower than that of peel extracts obtained
from fruits collected on November, December, January and February at 72 and 96 h
after treatment. Moreover, the results of the experiment at 12.5 //g/cm2 shown that
there was no significant statistical differences among the extracts obtained on
November, December, January and February at all mortality recording times.
The results indicate that the insecticidal active chemicals were present in greater
proportions in the extracts obtained on November, December, January and February
compared to the extracts obtained on August, September and October. It can be
73
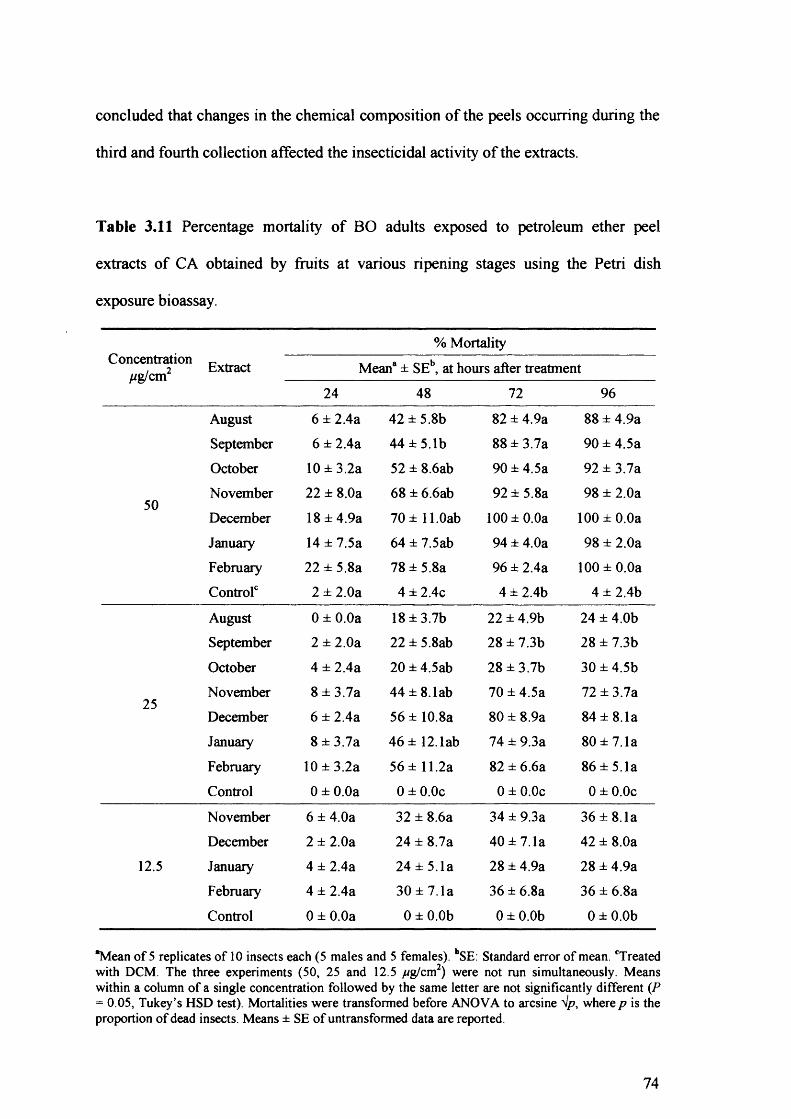
concluded that changes in the chemical composition of the peels occurring during the
third and fourth collection affected the insecticidal activity of the extracts.
Table 3.11 Percentage mortality of BO adults exposed to petroleum ether peel
extracts of CA obtained by fruits at various ripening stages using the Petri dish
exposure bioassay.
Concentration//g/cm2
% Mortality
Extract Mean8 ± SEb, at hours after treatment
24 48 72 96
August 6 ± 2.4a 42 ± 5.8b 82 ± 4.9a 8 8 ± 4.9a
September 6 ± 2.4a 44 ± 5.1b 8 8 ± 3.7a 90 ± 4.5a
October 10 ± 3.2a 52 ± 8 .6 ab 90 ± 4.5a 92 ± 3.7a
50November
December
2 2 ± 8 .0 a
18 ± 4.9a
6 8 ± 6 .6 ab
70 ± ll.Oab
92 ± 5.8a
1 0 0 ± 0 .0 a
98 ± 2.0a
1 0 0 ± 0 .0 a
January 14 ± 7.5a 64 ± 7.5ab 94 ± 4.0a 98 ± 2.0a
February 22 ± 5.8a 78 ± 5.8a 96 ± 2.4a 1 0 0 ± 0 .0 a
Control0 2 ± 2 .0 a 4 ± 2.4c 4 ± 2.4b 4 ± 2.4b
August 0 ± 0 .0 a 18 ± 3.7b 22 ± 4.9b 24 ± 4.0bSeptember 2 ± 2 .0 a 22 ± 5.8ab 28 ± 7.3b 28 ± 7.3b
October 4 ± 2.4a 20 ± 4.5ab 28 ± 3.7b 30 ± 4.5b
25November
December
8 ± 3.7a
6 ± 2.4a
44 ± 8 .lab
56 ± 10.8a
70 ± 4.5a
80 ± 8.9a
72 ± 3.7a
84 ± 8.1a
January 8 ± 3.7a 46 ± 12. lab 74 ± 9.3a 80 ± 7.1a
February 10 ± 3.2a 56 ± 11.2a 82 ± 6 .6 a 8 6 ± 5.1a
Control 0 ± 0 .0 a 0 ± 0 .0 c 0 ± 0 .0 c 0 ± 0 .0 c
November 6 ± 4.0a 32 ± 8 .6 a 34 ± 9.3a 36 ± 8.1a
December 2 ± 2 .0 a 24 ± 8.7a 40 ± 7.1a 42 ± 8.0a
12.5 January 4 ± 2.4a 24 ± 5.1a 28 ± 4.9a 28 ± 4.9a
February 4 ± 2.4a 30 ± 7.1a 36 ± 6 .8 a 36 ± 6 .8 a
Control 0 ± 0 .0 a 0 ± 0 .0 b 0 ± 0 .0 b 0 ± 0 .0 b
*Mean o f 5 replicates o f 10 insects each (5 males and 5 females). bSE: Standard error o f mean. *Treated with DCM. The three experiments (50, 25 and 12.5 //g/cm2) were not run simultaneously. Means within a column o f a single concentration followed by the same letter are not significantly different (P = 0.05, Tukey’s HSD test). Mortalities were transformed before ANOVA to arcsine Vp, where p is the proportion o f dead insects. Means ± SE o f untransformed data are reported.
74
3.4 DISCUSSION
Screening experiments using the Petri dish exposure bioassay against adults of BO
shown that the petroleum ether fraction of the fruit methanol extract was the only
insecticidal active fraction among the different solvent fractions of fruits, leaves and
shoots of CA. TLC analyses revealed that the proportion and range of chemical
substances differ greatly among the fractions (petroleum ether, dichloromethane, ethyl
acetate and residual) of the same plant part and also among the plant parts. The
different insecticidal potency of CA fractions should be accounted to their differences
in chemical composition. The bioactive chemicals are of low polarity since they were
recovered in a non-polar solvent such as petroleum ether. Fractions that did not show
any sign of activity either did not contain these chemicals or contain them in low
concentrations.
Evaluation of the insecticidal activity of the different fruit tissues revealed that the
bioactive chemicals present in the petroleum ether fraction of the fruits were mainly
synthesised and/or accumulated in the peels. TLC analysis revealed that the chemical
composition of fruit tissues differ substantially indicating that chemical substances are
produced and/or accumulated specifically in certain fruit tissues. Citrus peel extracts
obtained with non-polar solvents have been documented to be insecticidally active by
different bioassay methods. Abbassy et al. (1979) showed that lime, navel orange and
grapefruit peel oils obtained using benzene as the extraction solvent exhibited
significant activity against Tribolium confusum and Sitophilus granarius by the Petri
dish exposure bioassay. In addition, Su et al. (1972b) reported that lemon, grapefruit,
lime, kumquat and tangerine peel oils obtained using hexane as the extraction solvent
exhibited significant activity against Sitophilus oryzae and Callosobruchus maculates
75
by the topical application bioassay. It is worth-noted that Su et al. (1972b) had
removed the volatile materials of their extracts by lyophilisation, whereas the extracts
obtained by Abbassy et al. (1979) contained both volatile and non-volatile chemical
substances. In this study, most volatiles have removed from all fractions/extractions
under a stream of nitrogen.
Petroleum ether peel extracts lost their insecticidal activity when peels were oven-
dried prior to the extraction, either at 30 °C for 4 d or 50 °C for 2 d. Moreover, the
extraction yields of the two petroleum ether peel fractions obtained from dried peels
were similar and at least 1.5 times less than that of the petroleum ether fraction
obtained from fresh peels. Considering these results, it can be concluded that the
bioactive chemicals present in the peels were transformed at least partly to less toxic
or non-toxic chemicals due to enzymatic and/or chemical processes or reactions. TLC
analysis revealed only quantitative differences when the two petroleum ether peel
fractions obtained from dried peels were compared to the petroleum ether fraction
obtained from fresh peels. These differences may be accountable for the inactivity of
the two petroleum ether peel fractions obtained from dried peels. Sheppard (1984)
reported that oils from dried peels were less active than oils obtained from fresh. In
addition, Salvatore et al. (2004) found that toxicity against larvae of CC decreased
when diethyl ether extracts of lemon peel were obtained from stored lemons (storage
conditions: 25 ± 2 °C temperature and 60 - 70 % relative humidity). These authors
attributed that decrease in toxicity to the decrease in the concentration of total
coumarins after harvest (35 % over 2 months). Moreover, Thomas and Callaghan
(1999) noted that a crude aqueous lemon peel extract had low persistence as a
larvicide. Activity of this extract against Culex pipiens larvae was reduced even 72 h
76
after the extract had been added to the water. The lack of persistence of lemon peel
extract was related by these authors to the volatility of the active ingredients. In
contrast, Don-Pedro (1985) demonstrated that powdered sun-dried orange and
grapefruit peels applied as food admixtures, exhibited toxic and repellent properties
against Dermestes maculatus and Callosobruchus maculatus. However, Don-Pedro
had not used fresh peels in order to compare the activity between fresh and sun-dried
peels.
Bioassays conducted with peel fractions/extracts obtained using three different initial
extraction solvents and two different extraction methods, revealed that the petroleum
ether extracts obtained by both methods were the most active. Since the ultrasound
extraction method is more rapid and employs less solvent than the conventional solid-
liquid extraction and also it afforded greater extraction yield, this method was
preferred in all subsequent extractions in this thesis. The reduced activity of the
petroleum ether fraction obtained by the conventional solid-liquid extraction method
indicate that petroleum ether extract more selectively the insecticidal chemicals than
methanol. Diethyl ether, ethyl acetate and methanol lemon peel extracts were obtained
by Salvatore et al. (2004) using an ultrasound bath at 20 °C for 20 min. Results of a
larval toxicity bioassay against CC shown that the diethyl ether extract, which contain
mainly non-polar chemicals, was the most toxic, supporting our results.
Fruit maturity affected petroleum ether peel extracts bioactivity. Results indicate that
extracts from ripe fruits, collected on November, December, January and February,
were more active than extracts obtained from unripe fruits, collected on August,
September and October. TLC analysis revealed that the chemical composition of the
77
peels was affected by the ripening process of the fruit. It seems that changes in the
chemical profile of peels during October were responsible for the increased activity of
ripe peel extracts. Citrus fruits are resistant to attack by tephritid fruit flies prior to the
occurrence of peel senescence (Greany et al., 1994). The resistance of lemons to CC
(Back and Pemberton, 1918; Quayle, 1914, 1929) and to Anastrepha suspense
(Greany et a l, 1983) was attributed by these authors, among other reasons, to the peel
oil. More specifically, da Silva Branco et a l (2000) reported that oxygenated
monoterpene aldehydes, like citral, are responsible for the chemical resistance of
lemons to attack by CC. Although unripe fruits are more tolerant to insect attack than
ripe, our results show that insecticidal active chemicals were present in greater
proportion to ripe fruits. That discrepancy can be explained by the presence in our
petroleum ether peel extract of non-volatile compounds mainly, whereas fruit
tolerance is attributed to volatile compounds.
Screening experiments revealed that CA peels possess chemical substances that are
bioactive to BO flies. This finding prompted us to continue our study in two
directions: (a) to evaluate the insecticidal activity of a peel extract by different
bioassays against BO and CC adults, and (b) to isolate the bioactive chemicals of the
active peel extract using bioactivity-guided fractionation procedures. These studies
are reported in Chapters 4 and 5, respectively.
78
CHAPTER 4
EVALUATION OF THE INSECTICIDAL ACTIVITY OF A
PETROLEUM ETHER PEEL EXTRACT OF CITRUS
AURANTIUM TO BACTROCERA OLEAE AND CERA77775
CAPITATA ADULTS
4.1 INTRODUCTION
Insecticide bioassays are experiments done with an insecticide to estimate the
probability that an insect population will respond in the desired manner and so be
made innocuous (Robertson and Preisler, 1992). Initial evaluation of a candidate
insecticide takes place in the laboratory and if it is promising it is further tested in a
series of glasshouse and field trials. Several bioassays methods have been developed
in order to test insecticides in the laboratory.
The most commonly employed method is topical application in which the insecticide
is dissolved in a relatively nontoxic and volatile solvent and applied directly to a
specific part of the outer surface of an insect. Usually combinations of a constant
amount of solvent with varied concentrations of the insecticide are used for this
purpose in order to keep the area of contact, as well as the effect of solvent, constant
(Matsumura, 1975). Different solvents, solvent volumes and sites of placement
[dorsal surface of the thorax (Iwuala et al., 1981), ventral abdomen (Nigg et al.,
1994), legs and head (Scott et al., 1986), left eye of moths (Forrester et al., 1993)]
have been used in topical application bioassays. The topical application bioassay
79
permits quantification of the amount of toxicant received by each individual test
insect, but does not reflect the mechanism by which residual insecticides are acquired
by insects (Hinkle et al., 1985), as most insects physically encounter surface residues
by tarsal contact, not dorsal contact (Stark et al., 1995). The clearest advantage of
topical application is that the doses are independent of insect activity. A disadvantage
is that this method may overcome penetration barriers. It is also tedious and requires
manual dexterity (Moyses and Gfeller, 2001).
The treated surface exposure method is another way of exposing insects to an
insecticide. The insecticide in a solvent is applied to the container or the panel surface
where insects are to walk or rest. The solvent is evaporated by rotating the container
or the panel, so that the insecticide is evenly spread over a known area (Matsumura,
1975). Petri dishes (Studebaker and Kring, 2003), vials (Stark et al., 2004), jars (Hu
and Prokopy, 1998) and filter papers (Obeng-Ofori and Reichmuth, 1997) have been
used in treated surface exposure bioassays. The treated surface exposure bioassay
gives a realistic simulation of the field situation, where insects are exposed to
insecticides mainly by tarsal contact. However, this method does not allow the actual
amount of insecticides acquired by insects to be determined (Choo et al., 2000).
Based on the various types of practical control measures and the insect’s mode of
life, several other bioassay methods have been developed for testing the effectiveness
of insecticides toward various insect species. These are: injection (Jefferies et al.,
1992), dipping (Adan et al., 1996), ingestion (Medina et al., 2004), fumigation
(Konstantopoulou et al., 1992), leaf-dip (Lee et al., 1997) and systemic bioassay
(Siskos, 1997).
80
Assessing of mortality is the most immediate concern when insecticides are tested.
However, other effects on insects such as knockdown (Gbewonyo et al., 1993),
repellency, feeding and oviposition deterrency (Talukder and Howse, 1994), reduced
fertility, fecundity and offspring development (Jimenez-Peydro et al., 1995) could be
of great importance. The toxicity of insecticides to a particular insect is expressed as
LD50/LC50 (median lethal dose/concentration). LD50/LC50 is the statistically derived
dose of an insecticide/concentration of an insecticide in an environmental medium,
expected to kill 50 % of test insects in a given population under a defined set of
conditions (Duffus, 1993).
Intrinsic factors (species and stage specificity, sex, size and resistance), extrinsic
factors (temperature, humidity, illumination, population density and food),
experimental factors and experimental techniques are factors which affect the
evaluation of an insecticide (Matthews, 1997).
In this chapter the insecticidal activity of a petroleum ether peel extract obtained using
the ultrasound extraction method was evaluated against males and females of BO and
CC adults by the topical application and the Petri dish exposure bioassay. In addition,
a fumigation bioassay was employed in order to examine whether the activity of the
extract in the Petri dish exposure bioassay is due to fumigation rather than contact and
moreover to investigate the fumigant toxicity of this extract.
81
4.2 METHODS
4.2.1 Extraction of CA peels
Twenty-five green-yellow fruits of CA weighing 70-120 g were collected from each
of the 10 sampling trees on 1-5 November 1998 in order to obtain sufficient amount
of petroleum ether peel extract for the study of its insecticidal properties. Three-
hundred grams of peel per tree were obtained and a series of 30 extractions were
performed by using the ultrasound extraction method and petroleum ether as
extraction solvent (see section 2.2.1). The extractions were performed using the same
amount of peel (100 g) used in all previous extractions, as the proportions and range
of substances extracted can change when scaling up a process (Houghton and Raman,
1998). The extractable materials of the 30 extractions were combined and the
extraction yield of the total extract was estimated by concentrating to near-dryness
1 % of the total extract in the rotary evaporator at 35 °C. The concentrated extract was
subsequently transferred to a 15-ml glass vial, immersed in a water bath at 35 °C and
concentrated to constant weight under a stream of nitrogen. The remaining extract was
concentrated to dryness and stored in the dark at -20 °C until used. The weighing was
performed on the Mettler Toledo balance.
4.2.2 Bioassays
The insecticidal properties of the petroleum ether peel extract were evaluated using
the Petri dish exposure, fumigation and topical application bioassays (see section
2.2.2) against adults of BO and CC. Stock solutions of the petroleum ether peel
extract were prepared in DCM, as were subsequent dilutions. Fresh solutions were
prepared for each replicate. Concentrations/doses for each replicate were applied from
the lowest to the highest.
82
In the Petri dish exposure and topical application bioassays, males and females of BO
and CC were tested separately, but simultaneously. For each sex, 5 replicates of 10
flies each were employed for the 5 concentrations/doses and the control. The 5
replicates were conducted using 5 different generations of flies. As the main aim of
the experiments performed with the Petri dish exposure and the topical application
bioassays was the precise estimation of LC50S/LD50S, respectively five
concentrations/doses were chosen for each sex of the two test insects on the basis of
preliminary range-finding studies performed by the two biological evaluation
techniques, in order to produce mortalities evenly distributed between 25 and 75 % at
the final day of recording of mortality (Robertson et al., 1984).
Petri dish exposure bioassay
The concentrations tested against both sexes of BO were 10, 15, 20, 25 and 30
/vg/cm2. The concentrations employed against males of CC were 50, 60, 70, 80 and 90
//g/cm2, while the concentrations used against females of CC were 100, 120, 140, 160
and 180 //g/cm2. Mortality for males and females of BO was recorded every 24 h for 4
d and for males and females of CC every 24 h for 3 d, after which no further increase
in mortality to both insect species was recorded.
Topical application bioassay
The doses employed against both sexes of BO and the males of CC were 20, 30, 40,
50 and 60 //g/insect, while the doses employed against females of CC were 30, 50, 70,
90 and 110 //g/insect. BO and CC mortalities of both sexes were recorded every 24 h
for 6 and 4 d, respectively after which there was no further increase in mortality to
both species. Ten adults of each sex of the two test insects were randomly selected at
83
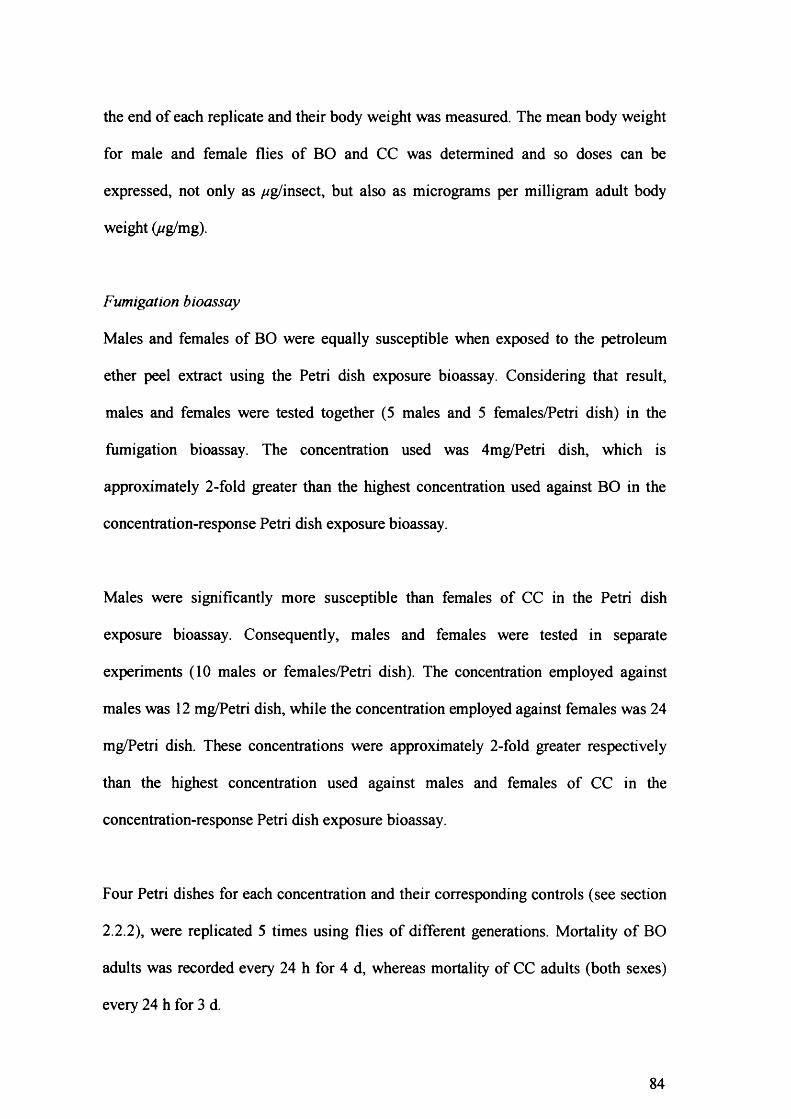
the end of each replicate and their body weight was measured. The mean body weight
for male and female flies of BO and CC was determined and so doses can be
expressed, not only as //g/insect, but also as micrograms per milligram adult body
weight (//g/mg).
Fumigation bioassay
Males and females of BO were equally susceptible when exposed to the petroleum
ether peel extract using the Petri dish exposure bioassay. Considering that result,
males and females were tested together (5 males and 5 females/Petri dish) in the
fumigation bioassay. The concentration used was 4mg/Petri dish, which is
approximately 2-fold greater than the highest concentration used against BO in the
concentration-response Petri dish exposure bioassay.
Males were significantly more susceptible than females of CC in the Petri dish
exposure bioassay. Consequently, males and females were tested in separate
experiments (10 males or females/Petri dish). The concentration employed against
males was 12 mg/Petri dish, while the concentration employed against females was 24
mg/Petri dish. These concentrations were approximately 2-fold greater respectively
than the highest concentration used against males and females of CC in the
concentration-response Petri dish exposure bioassay.
Four Petri dishes for each concentration and their corresponding controls (see section
2.2.2), were replicated 5 times using flies of different generations. Mortality of BO
adults was recorded every 24 h for 4 d, whereas mortality of CC adults (both sexes)
every 24 h for 3 d.
84
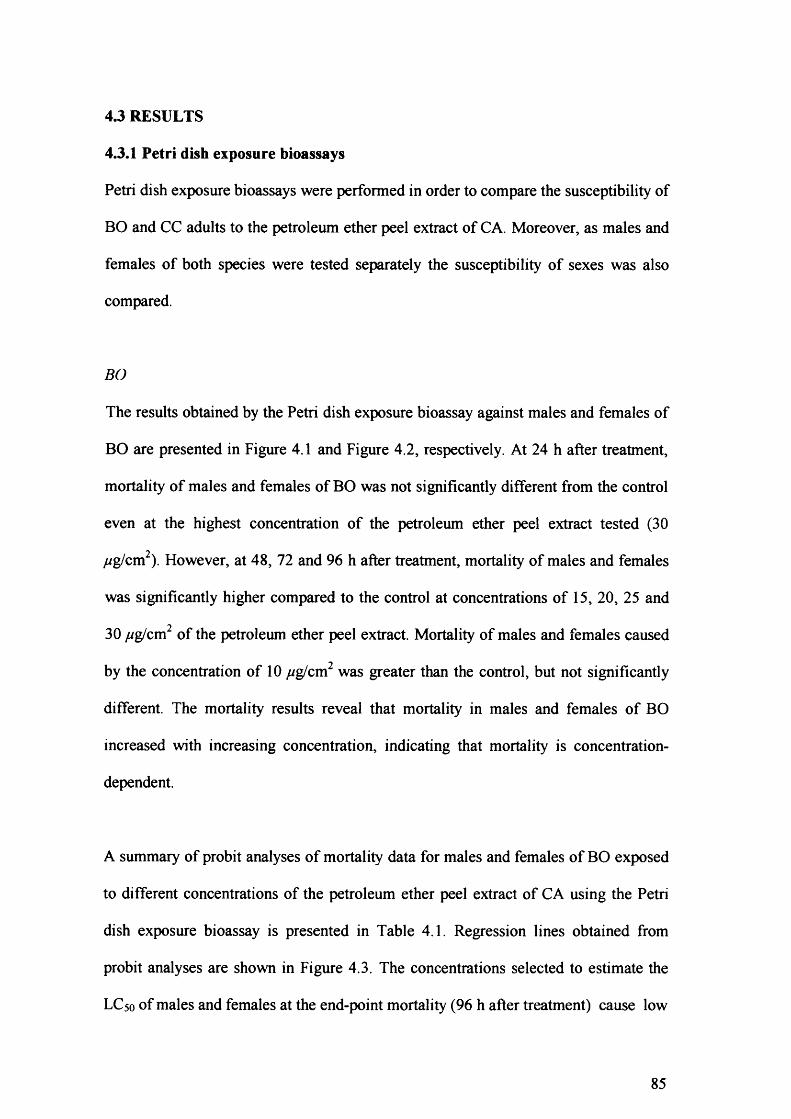
4.3 RESULTS
4.3.1 Petri dish exposure bioassays
Petri dish exposure bioassays were performed in order to compare the susceptibility of
BO and CC adults to the petroleum ether peel extract of CA. Moreover, as males and
females of both species were tested separately the susceptibility of sexes was also
compared.
BO
The results obtained by the Petri dish exposure bioassay against males and females of
BO are presented in Figure 4.1 and Figure 4.2, respectively. At 24 h after treatment,
mortality of males and females of BO was not significantly different from the control
even at the highest concentration of the petroleum ether peel extract tested (30
//g/cm ). However, at 48, 72 and 96 h after treatment, mortality of males and females
was significantly higher compared to the control at concentrations of 15, 20, 25 and
30 //g/cm of the petroleum ether peel extract. Mortality of males and females caused
by the concentration of 1 0 /ig/cm2 was greater than the control, but not significantly
different. The mortality results reveal that mortality in males and females of BO
increased with increasing concentration, indicating that mortality is concentration-
dependent.
A summary of probit analyses of mortality data for males and females of BO exposed
to different concentrations of the petroleum ether peel extract of CA using the Petri
dish exposure bioassay is presented in Table 4.1. Regression lines obtained from
probit analyses are shown in Figure 4.3. The concentrations selected to estimate the
LC50 of males and females at the end-point mortality (96 h after treatment) cause low
85
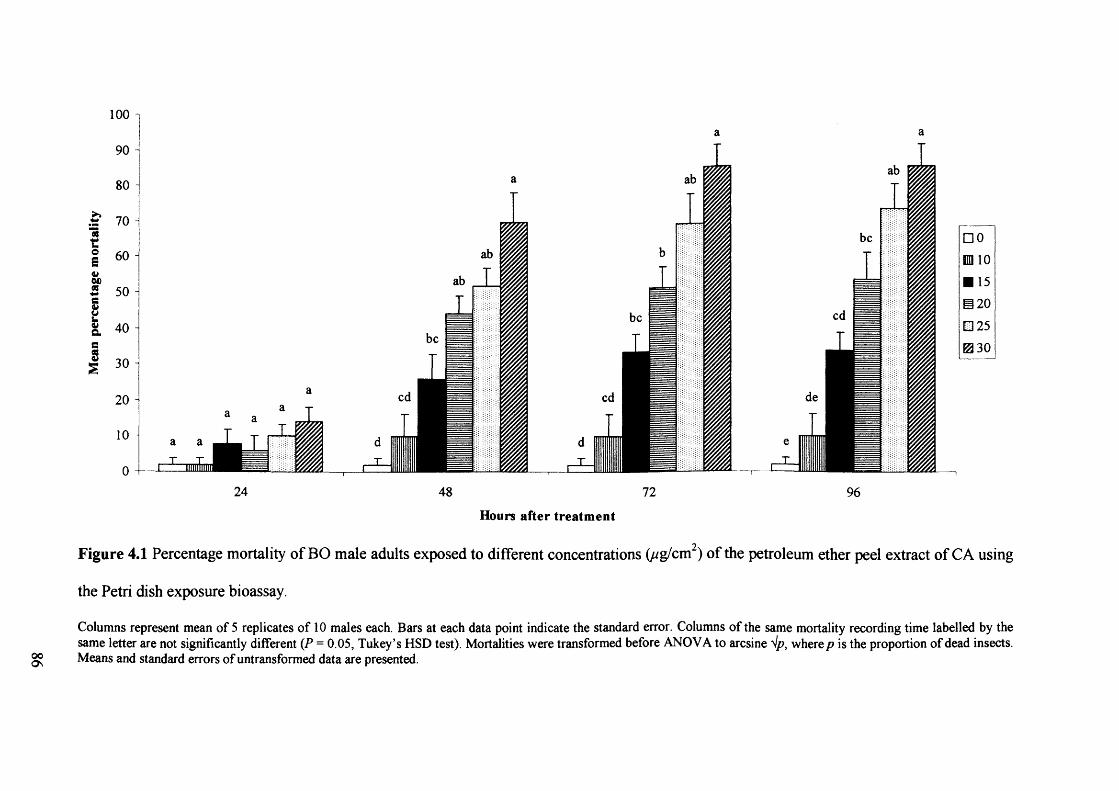
■aj*oE4» 0D 08§Ou,«aBss
100
90
80
70
60
50
40
30
20
10
0 nilI
24
a
i i
48 72 96
ooON
Hours after treatment
Figure 4.1 Percentage mortality of BO male adults exposed to different concentrations (pg/cm ) of the petroleum ether peel extract of CA using
the Petri dish exposure bioassay.
Columns represent mean o f 5 replicates o f 10 males each. Bars at each data point indicate the standard error. Columns o f the same mortality recording time labelled by the same letter are not significantly different (P = 0.05, Tukey’s HSD test). Mortalities were transformed before ANOVA to arcsine Vp, where p is the proportion o f dead insects. Means and standard errors o f untransformed data are presented.
1
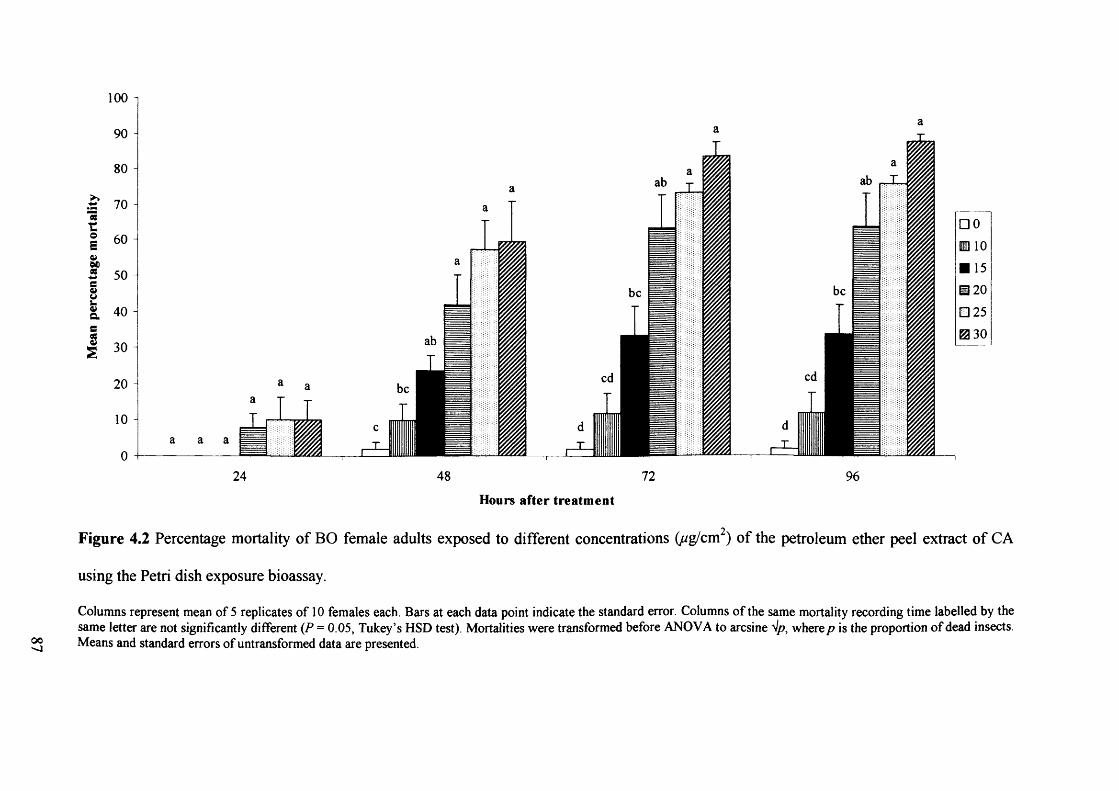
100 n
48t,OEa>M)08
aQi<JU4)ac8s
90
80
70 H
60
50
40
30
20
10
024 48 72 96
oo<i
Hours after treatment
2Figure 4.2 Percentage mortality of BO female adults exposed to different concentrations ( ju g /c m ) of the petroleum ether peel extract of CA
using the Petri dish exposure bioassay.
Columns represent mean o f 5 replicates o f 10 females each. Bars at each data point indicate the standard error. Columns o f the same mortality recording time labelled by the same letter are not significantly different (P = 0.05, Tukey’s HSD test). Mortalities were transformed before ANOVA to arcsine Vp, where p is the proportion o f dead insects. Means and standard errors o f untransformed data are presented.
9
99999999
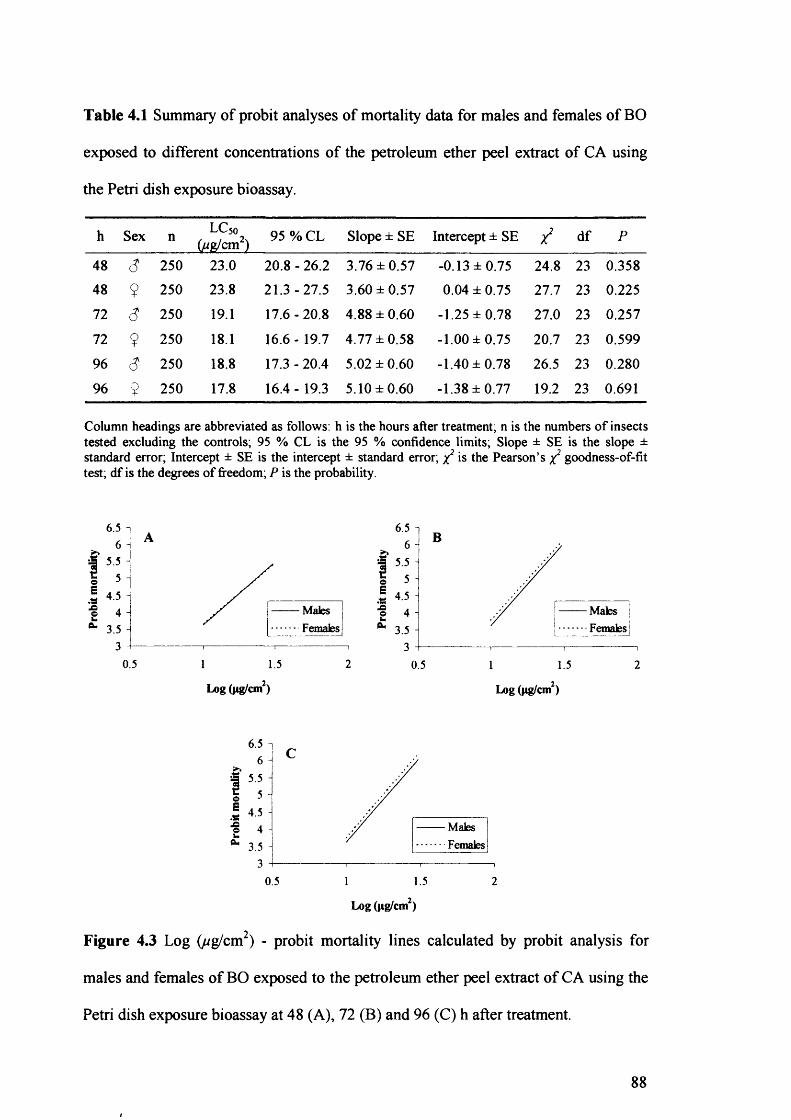
Table 4.1 Summary of probit analyses of mortality data for males and females of BO
exposed to different concentrations of the petroleum ether peel extract of CA using
the Petri dish exposure bioassay.
h Sex n LC50(^g/crn2) 95 % CL Slope ± SE Intercept ± SE / df P
48 (5 250 23.0 2 0 . 8 - 26.2 3.76 ±0.57 -0.13 ±0.75 24.8 23 0.35848 ? 250 23.8 21.3-27.5 3.60 ±0.57 0.04 ± 0.75 27.7 23 0.225
72 s 250 19.1 17.6-20.8 4.88 ± 0.60 -1.25 ±0.78 27.0 23 0.257
72 ? 250 18.1 16.6- 19.7 4.77 ±0.58 -1.00 ±0.75 20.7 23 0.599
96 (5 250 18.8 17.3-20.4 5.02 ±0.60 -1.40 ±0.78 26.5 23 0.280
96 ? 250 17.8 16.4 - 19.3 5.10 ±0.60 -1.38 ±0.77 19.2 23 0.691
Column headings are abbreviated as follows: h is the hours after treatment; n is the numbers o f insects tested excluding the controls; 95 % CL is the 95 % confidence limits; Slope ± SE is the slope ± standard error; Intercept ± SE is the intercept ± standard error; x 2 is the Pearson’s x 2 goodness-of-fit test; df is the degrees o f freedom; P is the probability.
6.5
oE
- Males Females
20.5 1.5
6.5
MalesFemales
0.5 1.5 21Log (jig/cm2) Log (ng/cm2)
6.5
oE.o©uA*
MaksFemales
0.5 1.5 2
Log (fig/cm2)
Figure 4.3 Log (/vg/cm2) - probit mortality lines calculated by probit analysis for
males and females of BO exposed to the petroleum ether peel extract of CA using the
Petri dish exposure bioassay at 48 (A), 72 (B) and 96 (C) h after treatment.
88
i
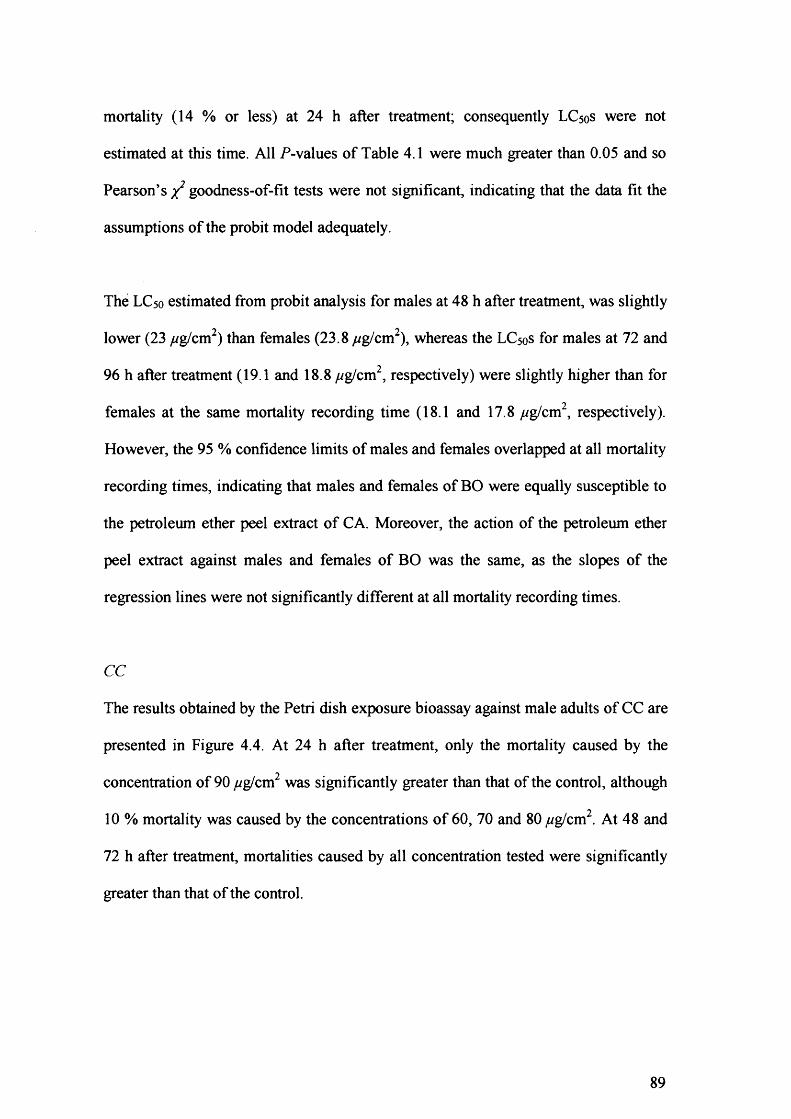
mortality (14 % or less) at 24 h after treatment; consequently LC50S were not
estimated at this time. All P-values of Table 4.1 were much greater than 0.05 and so
Pearson’s x2 goodness-of-fit tests were not significant, indicating that the data fit the
assumptions of the probit model adequately.
The LC50 estimated from probit analysis for males at 48 h after treatment, was slightly
lower (23 fig/cm2) than females (23.8 fig/cm2), whereas the LC5 0S for males at 72 and
96 h after treatment (19.1 and 18.8 fig/cm2, respectively) were slightly higher than for
females at the same mortality recording time (18.1 and 17.8 fig/cm2, respectively).
However, the 95 % confidence limits of males and females overlapped at all mortality
recording times, indicating that males and females of BO were equally susceptible to
the petroleum ether peel extract of CA. Moreover, the action of the petroleum ether
peel extract against males and females of BO was the same, as the slopes of the
regression lines were not significantly different at all mortality recording times.
CC
The results obtained by the Petri dish exposure bioassay against male adults of CC are
presented in Figure 4.4. At 24 h after treatment, only the mortality caused by the
concentration of 90 jug/cm2 was significantly greater than that of the control, although
10 % mortality was caused by the concentrations of 60, 70 and 80 jug/cm2. At 48 and
72 h after treatment, mortalities caused by all concentration tested were significantly
greater than that of the control.
89

os 60
be abc
ab ab
24 48 72
\o©
Hours after treatment
Figure 4.4 Percentage mortality of CC male adults exposed to different concentrations (/^g/cm ) of the petroleum ether peel extract of CA using
the Petri dish exposure bioassay.
Columns represent mean o f 5 replicates o f 10 males each. Bars at each data point indicate the standard error. Columns o f the same mortality recording time labelled by the same letter are not significantly different (P = 0.05, Tukey’s HSD test). Mortalities were transformed before ANOVA to arcsine V/?, where p is the proportion o f dead insects. Means and standard errors o f untransformed data are presented.
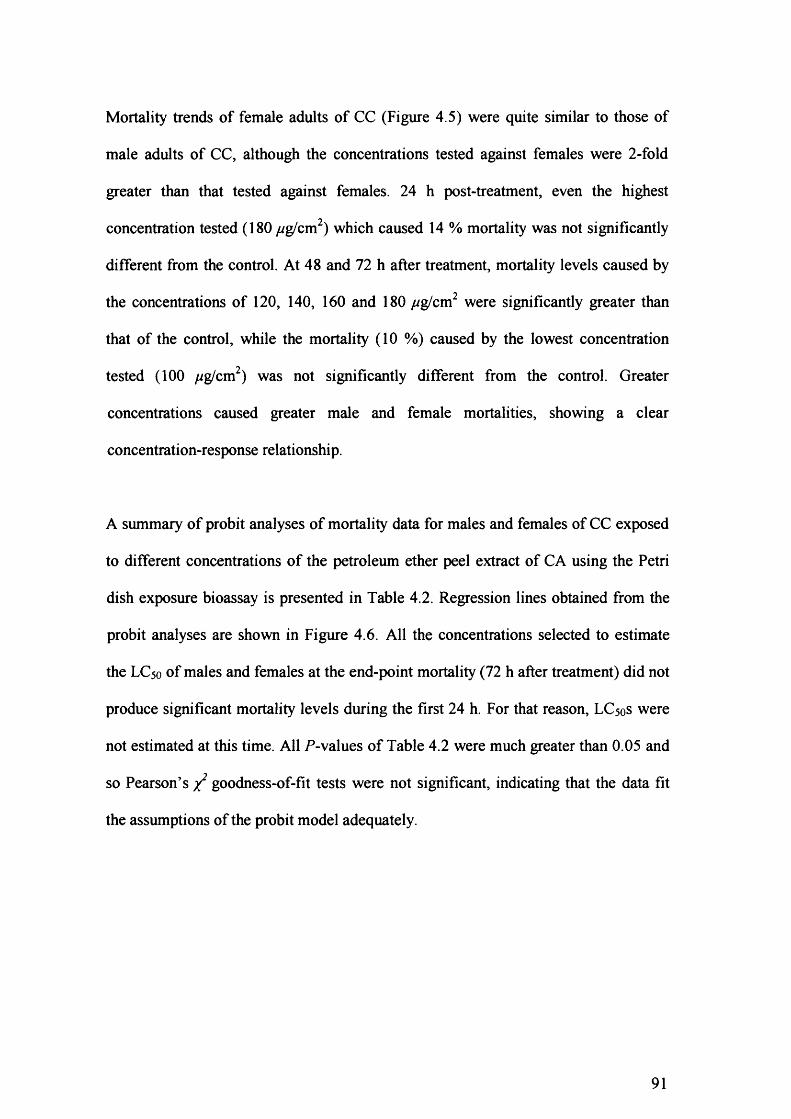
Mortality trends of female adults of CC (Figure 4.5) were quite similar to those of
male adults of CC, although the concentrations tested against females were 2-fold
greater than that tested against females. 24 h post-treatment, even the highest
concentration tested (180 //g/cm2) which caused 14 % mortality was not significantly
different from the control. At 48 and 72 h after treatment, mortality levels caused by
the concentrations of 120, 140, 160 and 180 ywg/cm2 were significantly greater than
that of the control, while the mortality ( 1 0 %) caused by the lowest concentration
tested (100 /^g/cm2) was not significantly different from the control. Greater
concentrations caused greater male and female mortalities, showing a clear
concentration-response relationship.
A summary of probit analyses of mortality data for males and females of CC exposed
to different concentrations of the petroleum ether peel extract of CA using the Petri
dish exposure bioassay is presented in Table 4.2. Regression lines obtained from the
probit analyses are shown in Figure 4.6. All the concentrations selected to estimate
the LC50 of males and females at the end-point mortality (72 h after treatment) did not
produce significant mortality levels during the first 24 h. For that reason, LC50S were
not estimated at this time. All / ’-values of Table 4.2 were much greater than 0.05 and
so Pearson’s goodness-of-fit tests were not significant, indicating that the data fit
the assumptions of the probit model adequately.
91
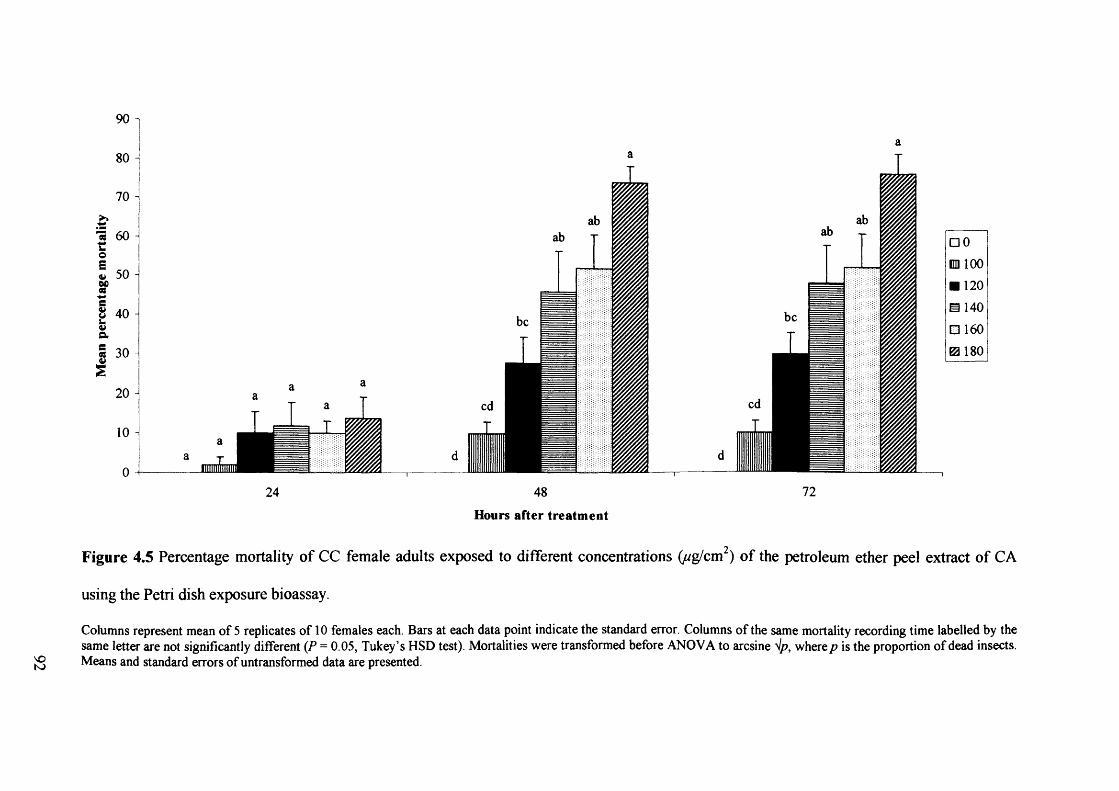
□ 0 DD 100
120
m 140
□ 160
0 180
24 48 72
to
Hours after treatment
2Figure 4.5 Percentage mortality of CC female adults exposed to different concentrations (jug/cm ) of the petroleum ether peel extract of CA
using the Petri dish exposure bioassay.
Columns represent mean o f 5 replicates o f 10 females each. Bars at each data point indicate the standard error. Columns o f the same mortality recording time labelled by the same letter are not significantly different (P = 0.05, Tukey’s HSD test). Mortalities were transformed before ANOVA to arcsine V/?, where p is the proportion o f dead insects. Means and standard errors o f untransformed data are presented.
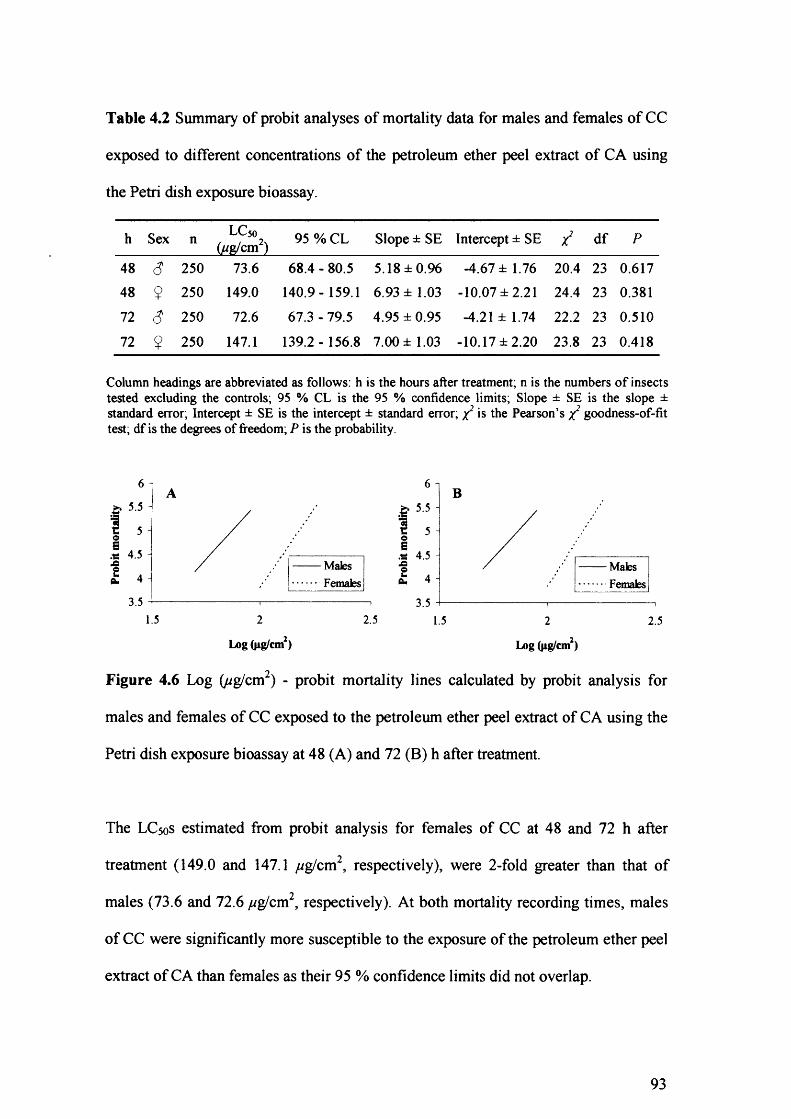
Table 4.2 Summary of probit analyses of mortality data for males and females of CC
exposed to different concentrations of the petroleum ether peel extract of CA using
the Petri dish exposure bioassay.
h Sex n LC50(//g/cm2) 95 % CL Slope ± SE Intercept ± SE / df P
48 6 250 73.6 68.4 - 80.5 5.18 ±0.96 -4.67 ± 1.76 20.4 23 0.61748 9 250 149.0 140.9- 159.1 6.93 ± 1.03 -10.07 ±2.21 24.4 23 0.381
72 6 250 72.6 67.3 - 79.5 4.95 ± 0.95 -4.21 ± 1.74 2 2 . 2 23 0.510
72 9 250 147.1 139.2 - 156.8 7.00 ± 1.03 -10.17 ±2.20 23.8 23 0.418
Column headings are abbreviated as follows: h is the hours after treatment; n is the numbers o f insects tested excluding the controls; 95 % CL is the 95 % confidence limits; Slope ± SE is the slope ± standard error; Intercept ± SE is the intercept ± standard error; x 2 is the Pearson’s X2 goodness-of-fit test; df is the degrees o f freedom; P is the probability.
6
I* 5 5 © ̂E.ts 4.5JO
£ 4
3.51.5
’ Males Females
2.5
Log (jig/cm2)
6
I* 5 5 "* © ^E.ts 4.5 .c£ 4
3.5
B
1.5
MalesFemales
2.5
Log (Mg/cm2)
Figure 4.6 Log (//g/cm ) - probit mortality lines calculated by probit analysis for
males and females of CC exposed to the petroleum ether peel extract of CA using the
Petri dish exposure bioassay at 48 (A) and 72 (B) h after treatment.
The LC50S estimated from probit analysis for females of CC at 48 and 72 h after
treatment (149.0 and 147.1 //g/cm2, respectively), were 2-fold greater than that of
males (73.6 and 72.6 //g/cm2, respectively). At both mortality recording times, males
of CC were significantly more susceptible to the exposure of the petroleum ether peel
extract of CA than females as their 95 % confidence limits did not overlap.
93
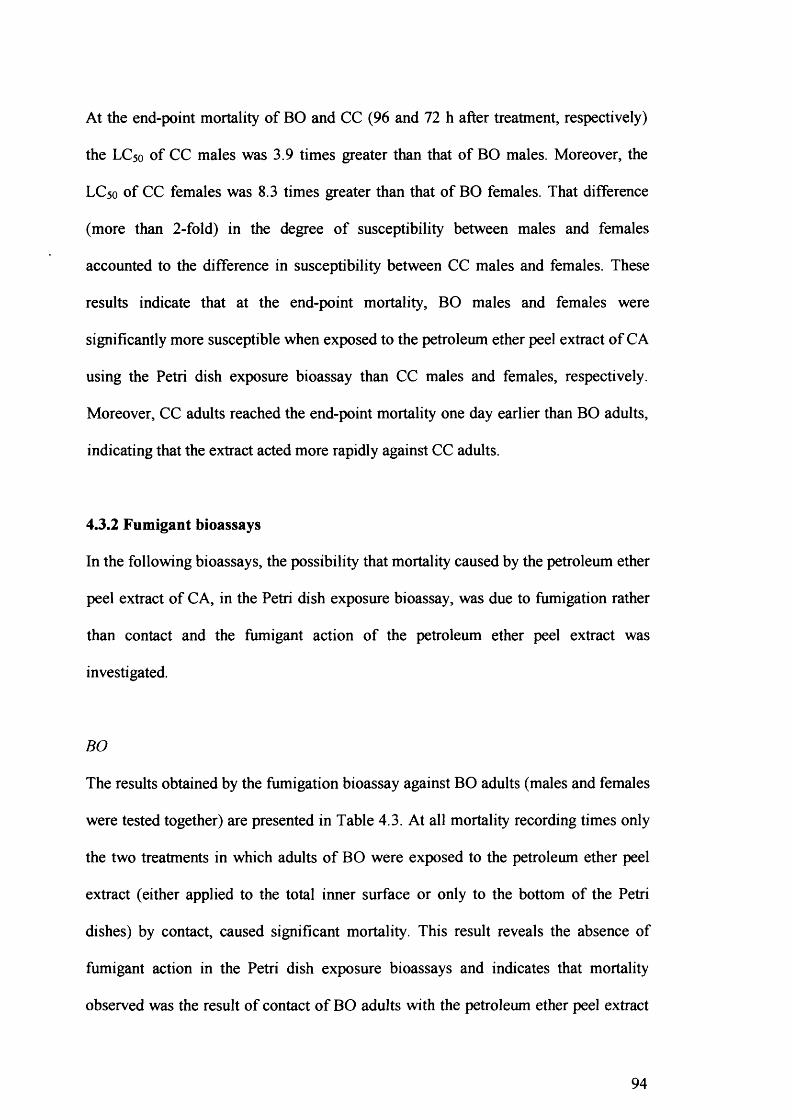
At the end-point mortality of BO and CC (96 and 72 h after treatment, respectively)
the LC50 of CC males was 3.9 times greater than that of BO males. Moreover, the
LC50 of CC females was 8.3 times greater than that of BO females. That difference
(more than 2 -fold) in the degree of susceptibility between males and females
accounted to the difference in susceptibility between CC males and females. These
results indicate that at the end-point mortality, BO males and females were
significantly more susceptible when exposed to the petroleum ether peel extract of CA
using the Petri dish exposure bioassay than CC males and females, respectively.
Moreover, CC adults reached the end-point mortality one day earlier than BO adults,
indicating that the extract acted more rapidly against CC adults.
4.3.2 Fumigant bioassays
In the following bioassays, the possibility that mortality caused by the petroleum ether
peel extract of CA, in the Petri dish exposure bioassay, was due to fumigation rather
than contact and the fumigant action of the petroleum ether peel extract was
investigated.
BO
The results obtained by the fumigation bioassay against BO adults (males and females
were tested together) are presented in Table 4.3. At all mortality recording times only
the two treatments in which adults of BO were exposed to the petroleum ether peel
extract (either applied to the total inner surface or only to the bottom of the Petri
dishes) by contact, caused significant mortality. This result reveals the absence of
fumigant action in the Petri dish exposure bioassays and indicates that mortality
observed was the result of contact o f BO adults with the petroleum ether peel extract
94
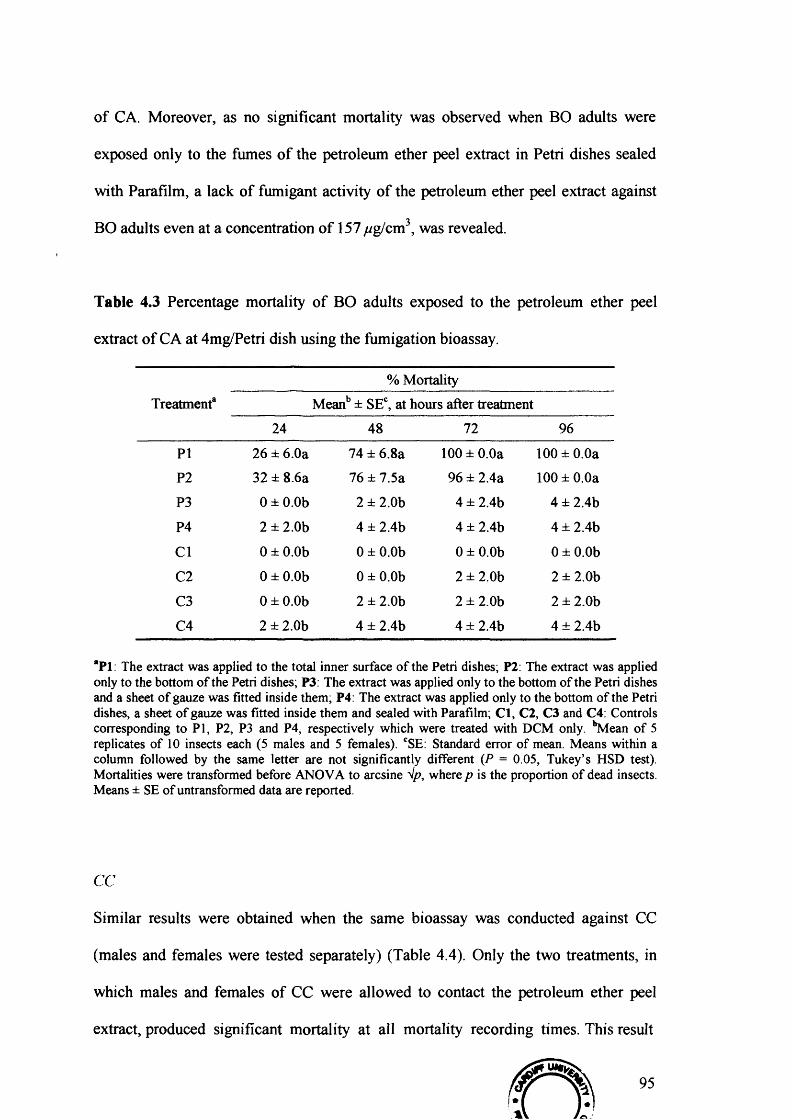
of CA. Moreover, as no significant mortality was observed when BO adults were
exposed only to the fumes of the petroleum ether peel extract in Petri dishes sealed
with Parafilm, a lack of fumigant activity of the petroleum ether peel extract against
BO adults even at a concentration of 157 //g/cm3, was revealed.
Table 4.3 Percentage mortality of BO adults exposed to the petroleum ether peel
extract of CA at 4mg/Petri dish using the fumigation bioassay.
% MortalityTreatment8 Meanb ± SEC, at hours after treatment
24 48 72 96
PI 26 ± 6.0a 74 ± 6.8a 100 ± 0.0a 100 ± 0.0aP2 32 ± 8.6a 76 ± 7.5a 96 ± 2.4a 100 ± 0.0a
P3 0 ± 0.0b 2 ± 2.0b 4 ± 2.4b 4 ± 2.4bP4 2 ± 2.0b 4 ± 2.4b 4 ± 2.4b 4 ± 2.4b
Cl 0 ± 0.0b 0 ± 0.0b 0 ± 0.0b 0 ± 0.0b
C2 0 ± 0.0b 0 ± 0.0b 2 ± 2.0b 2 ± 2.0bC3 0 ± 0.0b 2 ± 2.0b 2 ± 2.0b 2 ± 2.0bC4 2 ± 2.0b 4 ± 2.4b 4 ± 2.4b 4 ± 2.4b
“PI: The extract was applied to the total inner surface of the Petri dishes; P2: The extract was applied only to the bottom of the Petri dishes; P3: The extract was applied only to the bottom of the Petri dishes and a sheet of gauze was fitted inside them; P4: The extract was applied only to the bottom of the Petri dishes, a sheet of gauze was fitted inside them and sealed with Parafilm; Cl, C2, C3 and C4: Controls corresponding to PI, P2, P3 and P4, respectively which were treated with DCM only. bMean of 5 replicates of 10 insects each (5 males and 5 females). CSE: Standard error of mean. Means within a column followed by the same letter are not significantly different (P = 0.05, Tukey’s HSD test). Mortalities were transformed before ANOVA to arcsine V/?, where p is the proportion of dead insects. Means ± SE of untransformed data are reported.
CC
Similar results were obtained when the same bioassay was conducted against CC
(males and females were tested separately) (Table 4.4). Only the two treatments, in
which males and females of CC were allowed to contact the petroleum ether peel
extract, produced significant mortality at all mortality recording times. This result
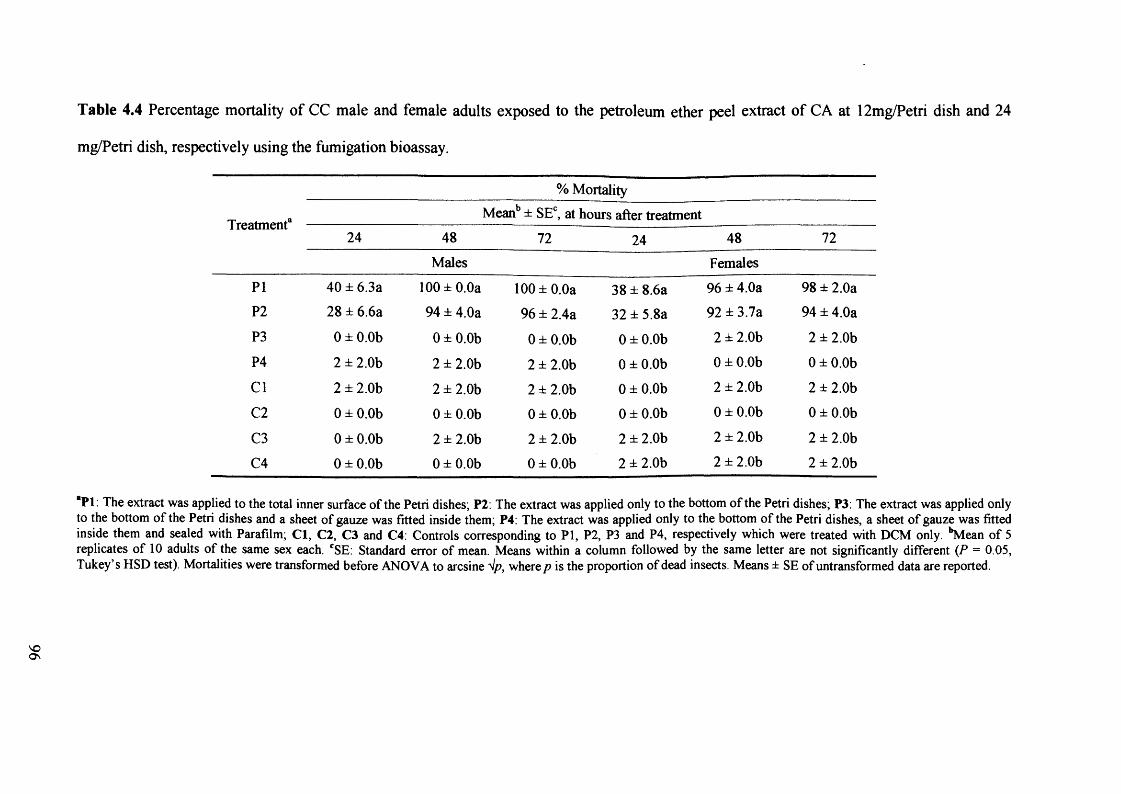
Table 4.4 Percentage mortality of CC male and female adults exposed to the petroleum ether peel extract of CA at 12mg/Petri dish and 24
mg/Petri dish, respectively using the fumigation bioassay.
Treatment8 -
% MortalityMeanb ± SEC, at hours after treatment
24 48 72 24 48 72
Males Females
PI 40 ± 6.3a 100 ± 0.0a 100 ± 0.0a 38 ± 8.6a 96 ± 4.0a 98 ± 2.0aP2 28 ± 6.6a 94 ± 4.0a 96 ± 2.4a 32 ± 5.8a 92 ± 3.7a 94 ± 4.0aP3 0 ± 0.0b 0 ± 0.0b 0 ± 0.0b 0 ± 0.0b 2 ± 2.0b 2 ± 2.0bP4 2 ± 2.0b 2 ± 2.0b 2 ± 2.0b 0 ± 0.0b 0 ± 0.0b 0 ± 0.0b
Cl 2 ± 2.0b 2 ± 2.0b 2 ± 2.0b 0 ± 0.0b 2 ± 2.0b 2 ± 2.0b
C2 0 ± 0.0b 0 ± 0.0b 0 ± 0.0b 0 ± 0.0b 0 ± 0.0b 0 ± 0.0b
C3 0 ± 0.0b 2 ± 2.0b 2 ± 2.0b 2 ± 2.0b 2 ± 2.0b 2 ± 2.0b
C4 0 ± 0.0b 0 ± 0.0b 0 ± 0.0b 2 ± 2.0b 2 ± 2.0b 2 ± 2.0b
“PI: The extract was applied to the total inner surface of the Petri dishes; P2: The extract was applied only to the bottom of the Petri dishes; P3: The extract was applied only to the bottom of the Petri dishes and a sheet of gauze was fitted inside them; P4: The extract was applied only to the bottom of the Petri dishes, a sheet of gauze was fitted inside them and sealed with Parafilm; Cl, C2, C3 and C4: Controls corresponding to PI, P2, P3 and P4, respectively which were treated with DCM only. '’Mean of 5 replicates of 10 adults of the same sex each. CSE: Standard error of mean. Means within a column followed by the same letter are not significantly different (P = 0.05, Tukey’s HSD test). Mortalities were transformed before ANOVA to arcsine l̂p, where p is the proportion of dead insects. Means ± SE of untransformed data are reported.
reveals the absence of fumigant action in the Petri dish exposure bioassays and
indicates that mortality of CC males and females, as in the case of BO, was due to
contact. Moreover, no mortality was recorded when CC males and females were
exposed only to the fumes of the petroleum ether peel extract in Petri dishes sealed
with Parafilm, indicating a lack of fumigant activity of the petroleum ether peel
extract against CC males and females even at a concentration of 471 and 942 //g/cm3,
respectively.
4.3.3 Topical application bioassays
Topical application bioassays were performed in order to compare the susceptibility
o f BO and CC adults to the petroleum ether peel extract of CA. Moreover, as males
and females of both species were tested separately the susceptibility of sexes was also
compared.
BO
The body weight (mean ± standard error of mean) of BO males and females was 6.0 ±
0.14 and 7.7 ±0 .17 mg, respectively. For completeness, as there was variation in
weight between males and females of BO, doses tested are expressed not only as //g
per insect but also as ng per mg of adult body weight. When doses were expressed as
//g/insect, the same doses were employed against males and females of BO (20, 30,
40, 50 and 60). In contrast, when doses were corrected for the difference in body
weight between males and females, the doses employed against males of BO were
3.34, 5.01, 6 .6 8 , 8.35 and 10.02 //g/mg, while the doses employed against females of
BO were 2.60, 3.90, 5.20, 6.50 and 7.80 //g/mg. The slightly lower doses (//g/mg)
employed against females was a result of their greater body weight.
97
The results obtained by the topical application bioassay against male adults of BO are
presented in Figure 4.7. At 24 h after treatment, even mortality caused by the highest
dose tested (60 //g/insect) was not significantly different from the control. 48 h post
treatment, only the two higher doses tested (50 and 60 //g/insect) caused significantly
greater mortality than that of the control. Doses of 30, 40, 50 and 60 //g/insect caused
significantly greater mortality than that of the control at 72, 96, 120 and 144 h after
treatment, whereas the lowest dose tested ( 2 0 //g/insect) was significantly greater from
the control only 72 and 144 h post-treatment.
Mortality trends of female adults of BO (Figure 4.8) were quite similar to those of
male adults. At 24 and 48 h after treatment, even mortality caused by the highest dose
tested (60 //g/insect) was not significantly different from the control. However, 72, 96,
120 and 144 h after treatment, doses of 30, 40, 50 and 60 //g/insect caused
significantly greater mortality than the control, while the lowest dose tested ( 2 0
//g/insect) was significantly different from the control only at 1 2 0 h after treatment.
The results presented in Figure 4.7 and Figure 4.8 show that mortality of BO males
and females increased with increasing dose, indicating a dose-response effect.
98
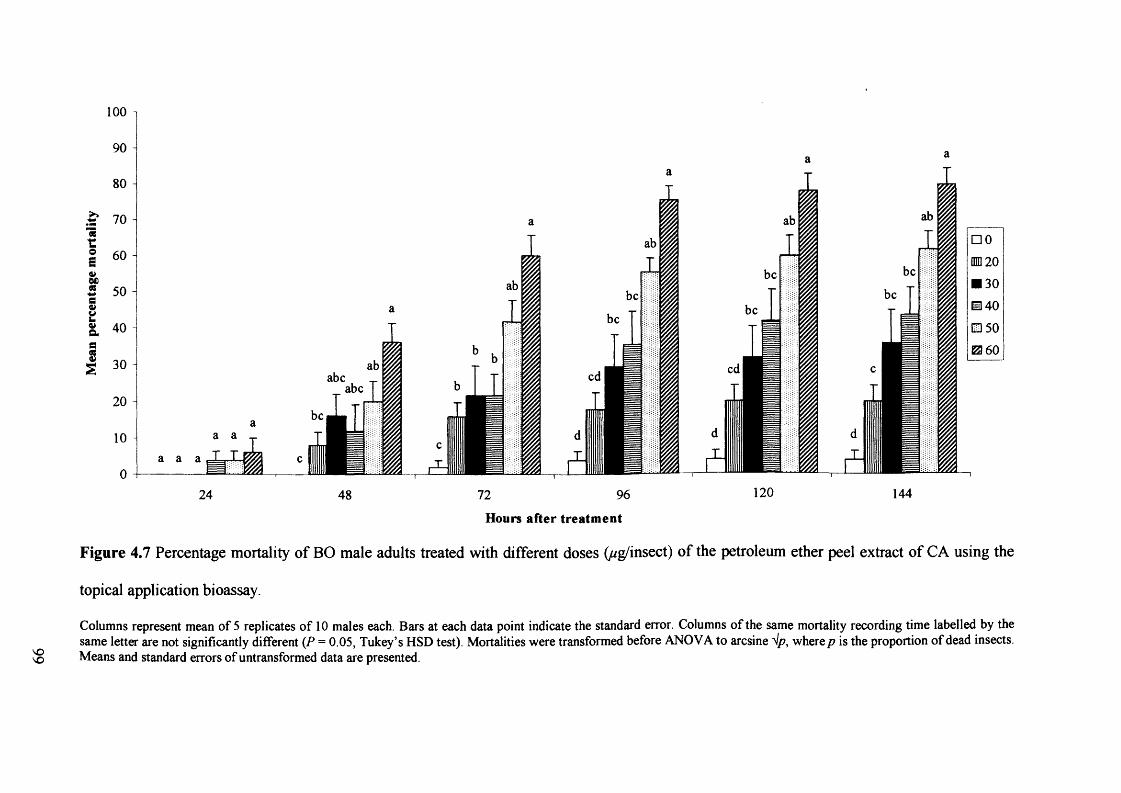
100 -1
24 48 72 96 120 144Hours after treatment
Figure 4.7 Percentage mortality of BO male adults treated with different doses (//g/insect) of the petroleum ether peel extract of CA using the
topical application bioassay.
Columns represent mean of 5 replicates of 1 0 males each. Bars at each data point indicate the standard error. Columns of the same mortality recording time labelled by the same letter are not significantly different (P = 0.05, Tukey’s HSD test). Mortalities were transformed before ANOVA to arcsine Vp, where p is the proportion of dead insects.
^ Means and standard errors of untransformed data are presented.
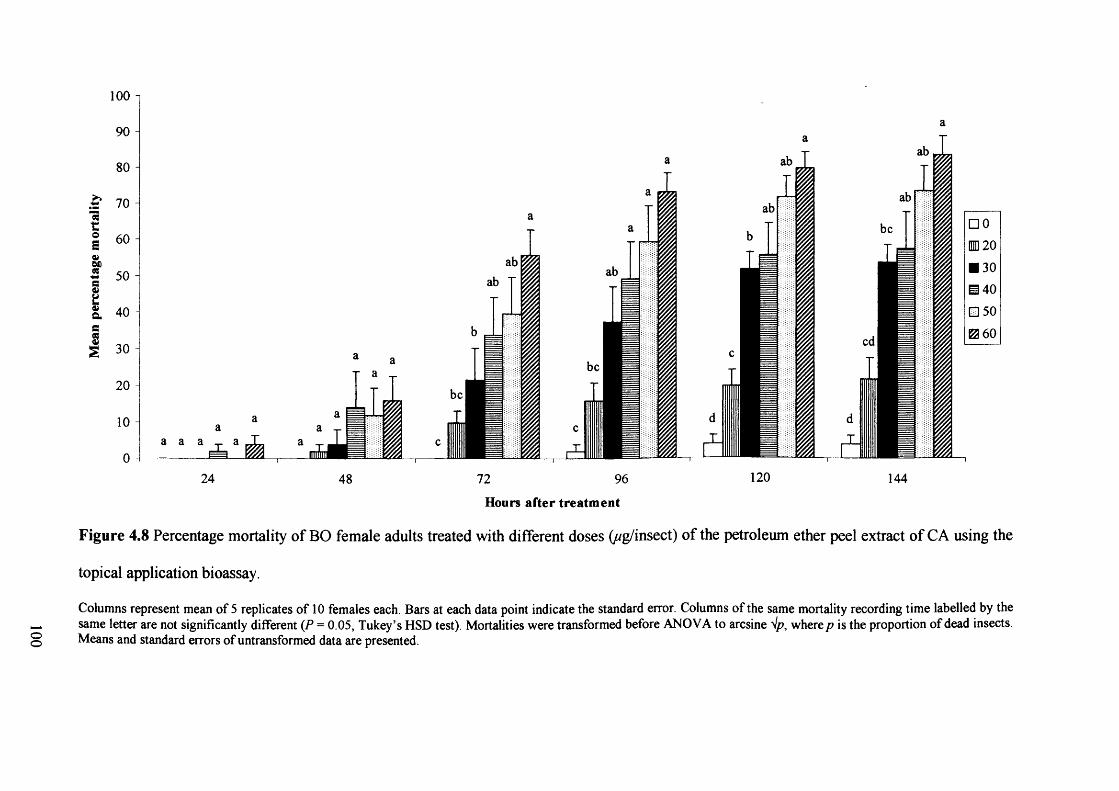
100 -1
90 -
80 -
£ 70 -"flS*©s 60 -©6008 50 -Sw£©a 40 -sS£ 30 -
2 0 -
1 0 -
0 -a a a
24
Ll
48 72 96Hours after treatment
120 144
oo
Figure 4.8 Percentage mortality of BO female adults treated with different doses (//g/insect) of the petroleum ether peel extract of CA using the
topical application bioassay.
Columns represent mean of 5 replicates of 10 females each. Bars at each data point indicate the standard error. Columns of the same mortality recording time labelled by the same letter are not significantly different (P = 0.05, Tukey’s HSD test). Mortalities were transformed before ANOVA to arcsine Vp, where p is the proportion of dead insects. Means and standard errors of untransformed data are presented.
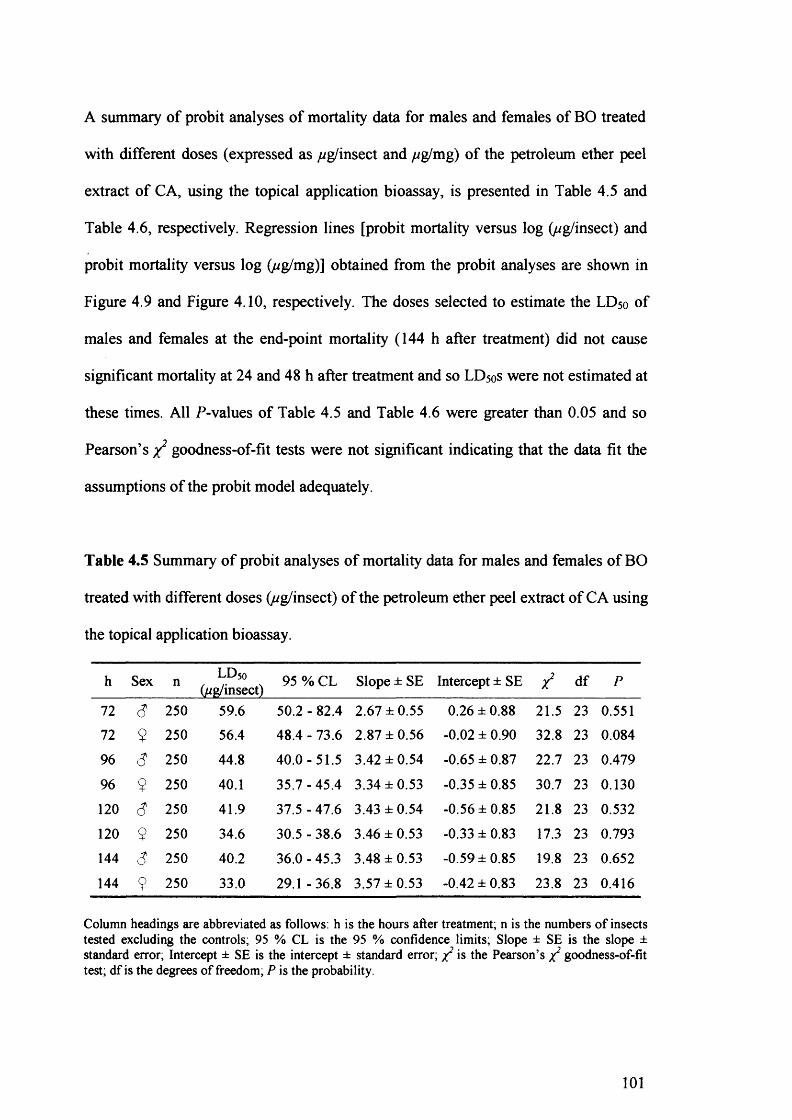
A summary of probit analyses of mortality data for males and females of BO treated
with different doses (expressed as //g/insect and //g/mg) of the petroleum ether peel
extract of CA, using the topical application bioassay, is presented in Table 4.5 and
Table 4.6, respectively. Regression lines [probit mortality versus log (//g/insect) and
probit mortality versus log (//g/mg)] obtained from the probit analyses are shown in
Figure 4.9 and Figure 4.10, respectively. The doses selected to estimate the LD50 of
males and females at the end-point mortality (144 h after treatment) did not cause
significant mortality at 24 and 48 h after treatment and so LD50S were not estimated at
these times. All P-values of Table 4.5 and Table 4.6 were greater than 0.05 and so
Pearson’s y? goodness-of-fit tests were not significant indicating that the data fit the
assumptions of the probit model adequately.
Table 4.5 Summary o f probit analyses of mortality data for males and females of BO
treated with different doses (//g/insect) of the petroleum ether peel extract of CA using
the topical application bioassay.
h Sex n LD50(//g/insect) 95 % CL Slope ± SE Intercept ± SE t df P
72 6 250 59.6 50.2 - 82.4 2.67 ±0.55 0.26 ± 0.88 21.5 23 0.55172 9 250 56.4 48.4 - 73.6 2.87 ±0.56 -0.02 ± 0.90 32.8 23 0.084
96 6 250 44.8 40.0-51.5 3.42 ±0.54 -0.65 ± 0.87 22.7 23 0.479
96 9 250 40.1 35.7 -45.4 3.34 ±0.53 -0.35 ± 0.85 30.7 23 0.130
120 6 250 41.9 37.5 -47.6 3.43 ±0.54 -0.56 ±0.85 21.8 23 0.532
120 9 250 34.6 30.5 - 38.6 3.46 ±0.53 -0.33 ± 0.83 17.3 23 0.793
144 $ 250 40.2 36.0-45.3 3.48 ±0.53 -0.59 ±0.85 19.8 23 0.652
144 9 250 33.0 29.1 -36.8 3.57 ±0.53 -0.42 ± 0.83 23.8 23 0.416
Column headings are abbreviated as follows: h is the hours after treatment; n is the numbers of insects tested excluding the controls; 95 % CL is the 95 % confidence limits; Slope ± SE is the slope ± standard error; Intercept ± SE is the intercept ± standard error; y2 is the Pearson’s y? goodness-of-fit test; df is the degrees of freedom; P is the probability.
101
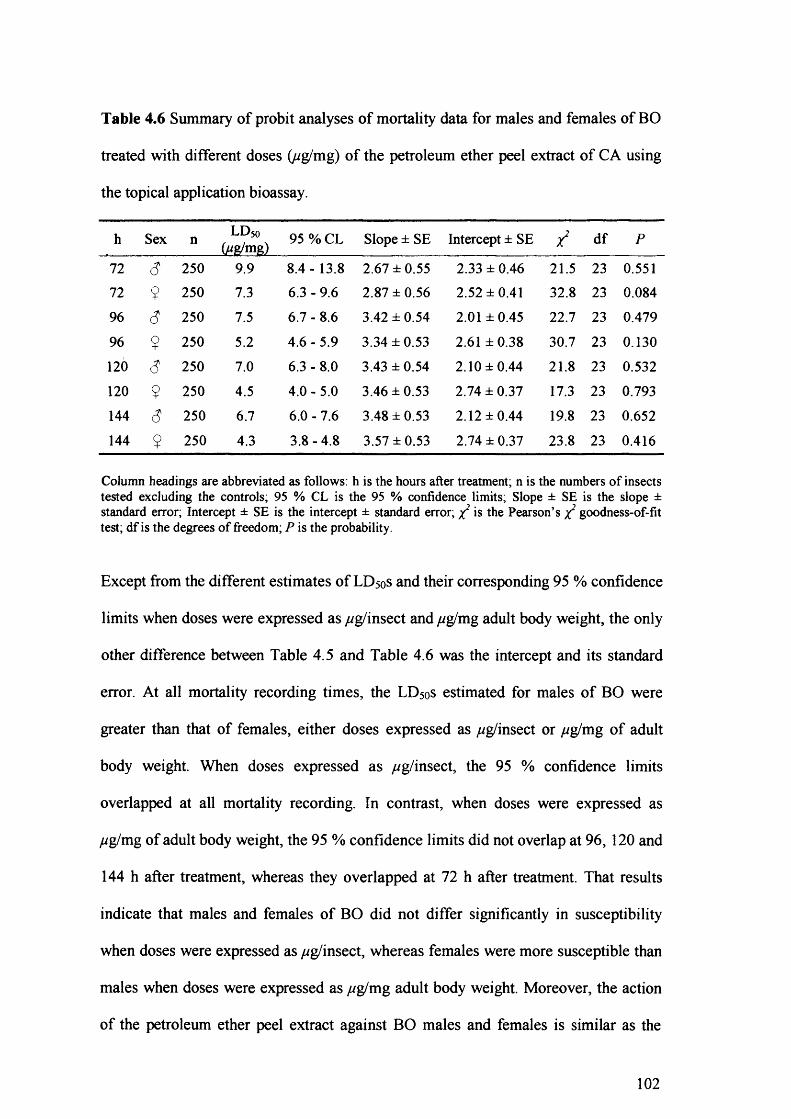
Table 4.6 Summary of probit analyses of mortality data for males and females of BO
treated with different doses (//g/mg) of the petroleum ether peel extract of CA using
the topical application bioassay.
h Sex n LD50(//g/mg) 95 % CL Slope ± SE Intercept ± SE 7? df P
72 (5 250 9.9 8.4-13.8 2.67 ±0.55 2.33 ± 0.46 21.5 23 0.55172 9 250 7.3 6.3 - 9.6 2.87 ±0.56 2.52 ±0.41 32.8 23 0.084
96 250 7.5 6.7 - 8 . 6 3.42 ± 0.54 2.01 ±0.45 22.7 23 0.479
96 9 250 5.2 4.6 - 5.9 3.34 ± 0.53 2.61 ±0.38 30.7 23 0.130
1 2 0 s 250 7.0 6.3 - 8.0 3.43 ±0.54 2.10 ±0.44 2 1 . 8 23 0.532
1 2 0 9 250 4.5 4.0 - 5.0 3.46 ±0.53 2.74 ± 0.37 17.3 23 0.793
144 (5 250 6.7 6.0 - 7.6 3.48 ±0.53 2.12 ±0.44 19.8 23 0.652
144 9 250 4.3 3.8-4.8 3.57 ±0.53 2.74 ± 0.37 23.8 23 0.416
Column headings are abbreviated as follows: h is the hours after treatment; n is the numbers of insects tested excluding the controls; 95 % CL is the 95 % confidence limits; Slope ± SE is the slope ± standard error; Intercept ± SE is the intercept ± standard error; x2 is the Pearson’s x2 goodness-of-fit test; df is the degrees of freedom; P is the probability.
Except from the different estimates of LD5 0S and their corresponding 95 % confidence
limits when doses were expressed as //g/insect and //g/mg adult body weight, the only
other difference between Table 4.5 and Table 4.6 was the intercept and its standard
error. At all mortality recording times, the LD5 0S estimated for males of BO were
greater than that of females, either doses expressed as //g/insect or //g/mg of adult
body weight. When doses expressed as //g/insect, the 95 % confidence limits
overlapped at all mortality recording. In contrast, when doses were expressed as
//g/mg of adult body weight, the 95 % confidence limits did not overlap at 96, 120 and
144 h after treatment, whereas they overlapped at 72 h after treatment. That results
indicate that males and females of BO did not differ significantly in susceptibility
when doses were expressed as //g/insect, whereas females were more susceptible than
males when doses were expressed as //g/mg adult body weight. Moreover, the action
of the petroleum ether peel extract against BO males and females is similar as the
102
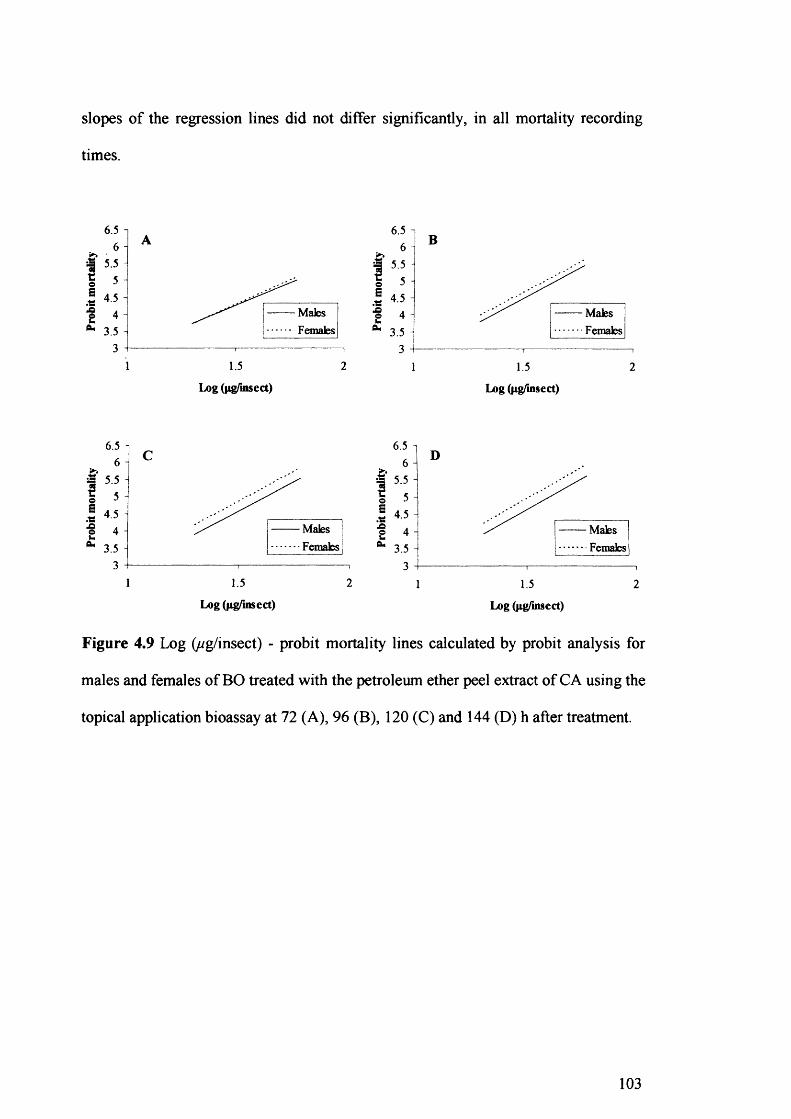
slopes of the regression lines did not differ significantly, in all mortality recording
times.
6.5
5.5
MalesFemales3.5
1 1.5 2
6.5
•O
£ MalesFemales
1.5 21Log (iig/insect) Log (jig/insect)
6.5 6
5.5 5
4.5 4
3.5 3
- Males Females
1.5 21
6.5
5.5
0 J
1 ** 3.5
MalesFemales
1 21.5
Log (fig/insect) Log (jig/insect)
Figure 4.9 Log (/2g/insect) - probit mortality lines calculated by probit analysis for
males and females of BO treated with the petroleum ether peel extract of CA using the
topical application bioassay at 72 (A), 96 (B), 120 (C) and 144 (D) h after treatment.
103
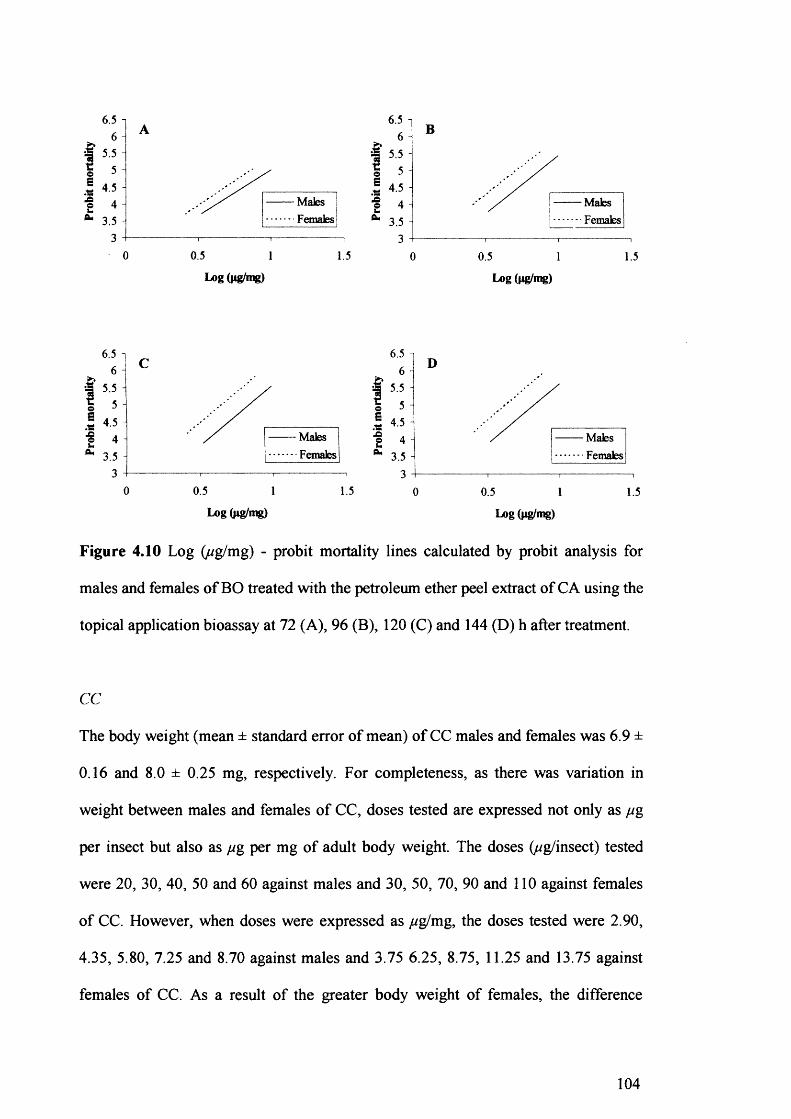
6.5 6
5.5 5
4.5 4
3.5 3
MalesFemales
0 0.5 1.51Log (Hg/mg)
6.5 6
5.5 5
4.5MalesFemales
43.5
31.50 0.5 1
Log (pg/mg)
©eeu - Males
Females* 3.5
0 0.5 1.51
6.5 6
5.5 5
4.5 4
3.5 3
MalesFemales
0 0.5 1 1.5
Log (jtg/mg) Log (pg/mg)
Figure 4.10 Log (//g/mg) - probit mortality lines calculated by probit analysis for
males and females of BO treated with the petroleum ether peel extract of CA using the
topical application bioassay at 72 (A), 96 (B), 120 (C) and 144 (D) h after treatment.
CC
The body weight (mean ± standard error of mean) of CC males and females was 6.9 ±
0.16 and 8.0 ± 0.25 mg, respectively. For completeness, as there was variation in
weight between males and females of CC, doses tested are expressed not only as //g
per insect but also as //g per mg of adult body weight. The doses (//g/insect) tested
were 20, 30, 40, 50 and 60 against males and 30, 50, 70, 90 and 110 against females
of CC. However, when doses were expressed as //g/mg, the doses tested were 2.90,
4.35, 5.80, 7.25 and 8.70 against males and 3.75 6.25, 8.75, 11.25 and 13.75 against
females of CC. As a result of the greater body weight of females, the difference
104
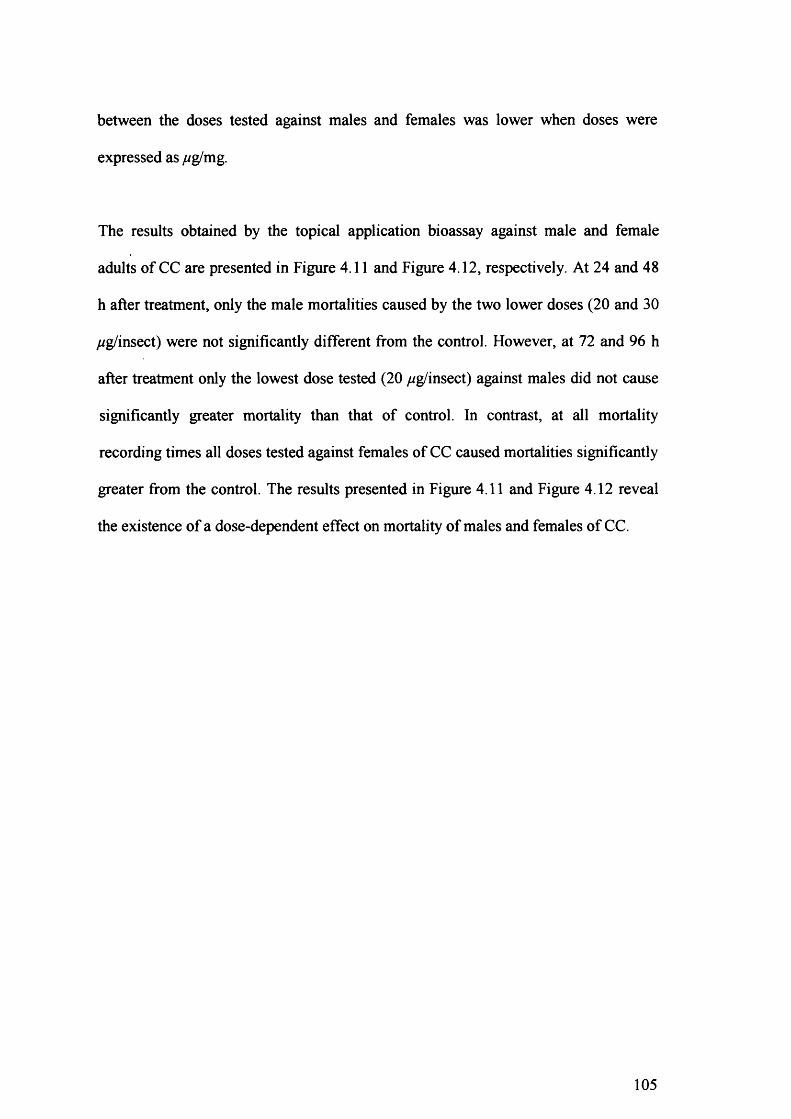
between the doses tested against males and females was lower when doses were
expressed as //g/mg.
The results obtained by the topical application bioassay against male and female
adults of CC are presented in Figure 4.11 and Figure 4.12, respectively. At 24 and 48
h after treatment, only the male mortalities caused by the two lower doses (20 and 30
//g/insect) were not significantly different from the control. However, at 72 and 96 h
after treatment only the lowest dose tested (20 //g/insect) against males did not cause
significantly greater mortality than that of control. In contrast, at all mortality
recording times all doses tested against females of CC caused mortalities significantly
greater from the control. The results presented in Figure 4.11 and Figure 4.12 reveal
the existence of a dose-dependent effect on mortality of males and females of CC.
105
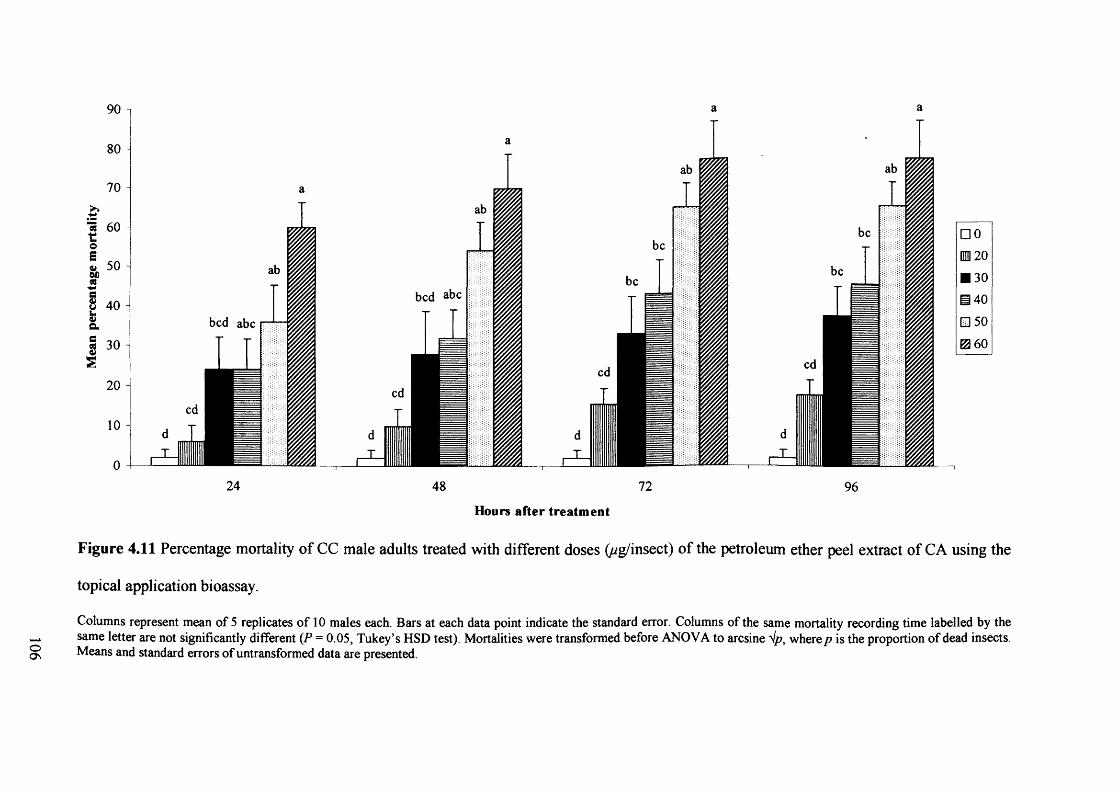
H—‘oo
« 60
bed abc
bed abc
24 48 72
Hours after treatment96
Figure 4.11 Percentage mortality of CC male adults treated with different doses (//g/insect) of the petroleum ether peel extract of CA using the
topical application bioassay.
Columns represent mean of 5 replicates of 10 males each. Bars at each data point indicate the standard error. Columns of the same mortality recording time labelled by the same letter are not significantly different (P = 0.05, Tukey’s HSD test). Mortalities were transformed before ANOVA to arcsine Vp, where p is the proportion of dead insects. Means and standard errors of untransformed data are presented.
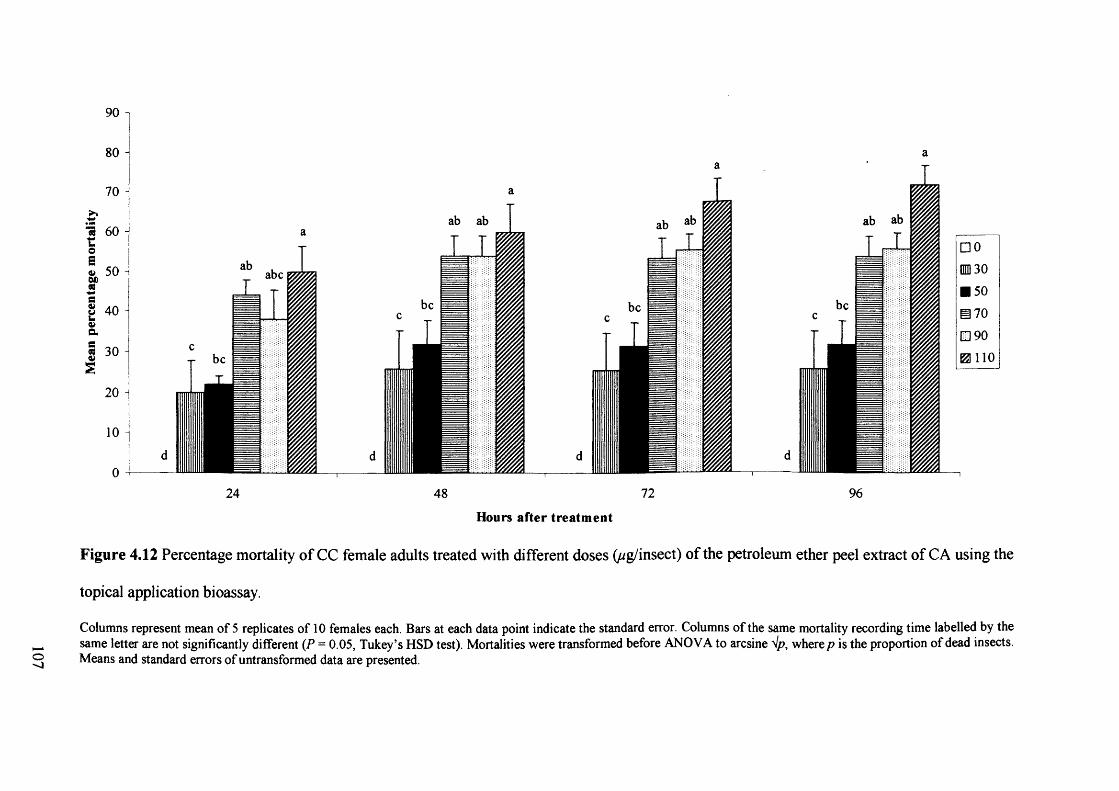
ab abab ab«8 60
□ 0 30 50 70
□ 90m no
a> 50
9 30
24 48 72Hours after treatment
96
o
Figure 4.12 Percentage mortality of CC female adults treated with different doses (//g/insect) of the petroleum ether peel extract of CA using the
topical application bioassay.
Columns represent mean of 5 replicates of 10 females each. Bars at each data point indicate the standard error. Columns of the same mortality recording time labelled by the same letter are not significantly different (P = 0.05, Tukey’s HSD test). Mortalities were transformed before ANOVA to arcsine where p is the proportion of dead insects. Means and standard errors of untransformed data are presented.
999999999999
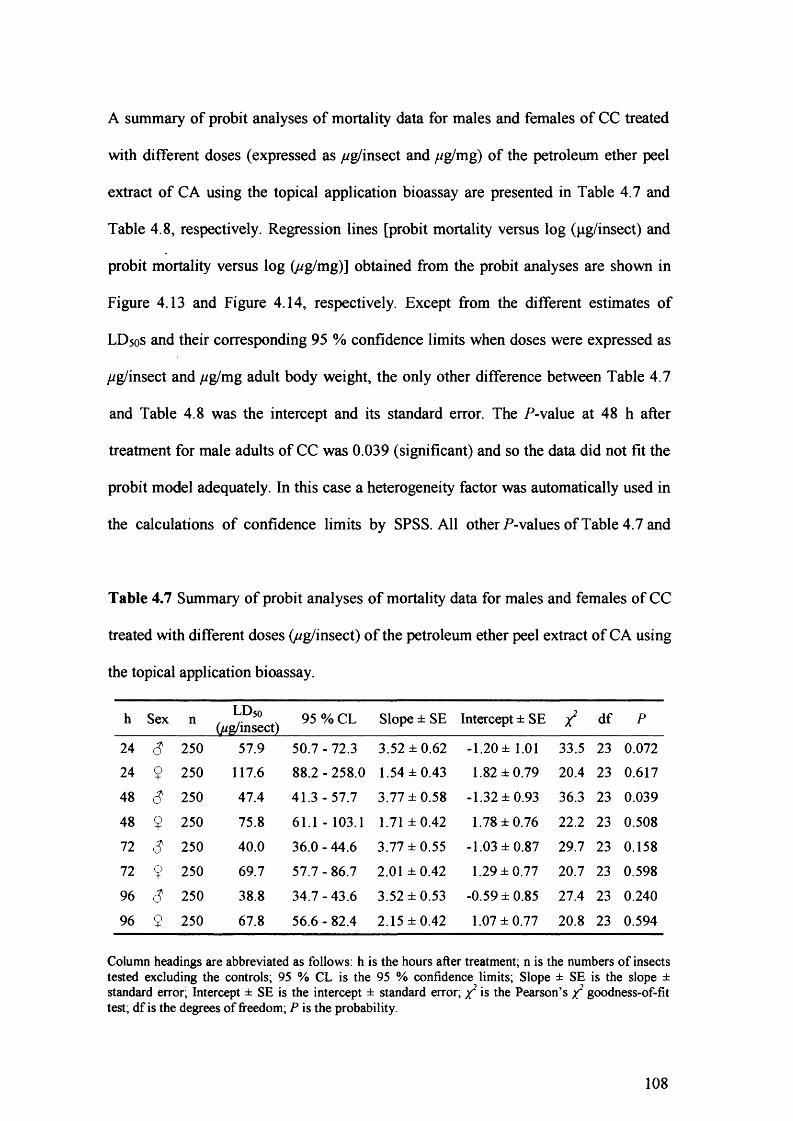
A summary of probit analyses of mortality data for males and females of CC treated
with different doses (expressed as //g/insect and //g/mg) of the petroleum ether peel
extract of CA using the topical application bioassay are presented in Table 4.7 and
Table 4.8, respectively. Regression lines [probit mortality versus log (pg/insect) and
probit mortality versus log (//g/mg)] obtained from the probit analyses are shown in
Figure 4.13 and Figure 4.14, respectively. Except from the different estimates of
LD5 0S and their corresponding 95 % confidence limits when doses were expressed as
//g/insect and //g/mg adult body weight, the only other difference between Table 4.7
and Table 4.8 was the intercept and its standard error. The P-value at 48 h after
treatment for male adults of CC was 0.039 (significant) and so the data did not fit the
probit model adequately. In this case a heterogeneity factor was automatically used in
the calculations of confidence limits by SPSS. All other P-values of Table 4.7 and
Table 4.7 Summary of probit analyses of mortality data for males and females of CC
treated with different doses (//g/insect) o f the petroleum ether peel extract of CA using
the topical application bioassay.
h Sex n LD50(//g/insect) 95 % CL Slope ± SE Intercept ± SE / df P
24 3 250 57.9 50.7 - 72.3 3.52 ±0.62 -1.20 ± 1.01 33.5 23 0.07224 9 250 117.6 88.2 - 258.0 1.54 ±0.43 1.82 ±0.79 20.4 23 0.61748 6 250 47.4 41.3-57.7 3.77 ±0.58 -1.32 ±0.93 36.3 23 0.039
48 9 250 75.8 61.1 - 103.1 1.71 ±0.42 1.78 ±0.76 22.2 23 0.508
72 S 250 40.0 36.0-44.6 3.77 ±0.55 -1.03 ±0.87 29.7 23 0.15872 9 250 69.7 57.7 - 86.7 2.01 ±0.42 1.29 ±0.77 20.7 23 0.598
96 3 250 38.8 34.7-43.6 3.52 ±0.53 -0.59 ±0.85 27.4 23 0.240
96 9 250 67.8 56.6 - 82.4 2.15 ±0.42 1.07 ±0.77 20.8 23 0.594
Column headings are abbreviated as follows: h is the hours after treatment; n is the numbers of insects tested excluding the controls; 95 % CL is the 95 % confidence limits; Slope ± SE is the slope ± standard error; Intercept ± SE is the intercept ± standard error; ^ is the Pearson’s x2 goodness-of-fit test; df is the degrees of freedom; P is the probability.
108
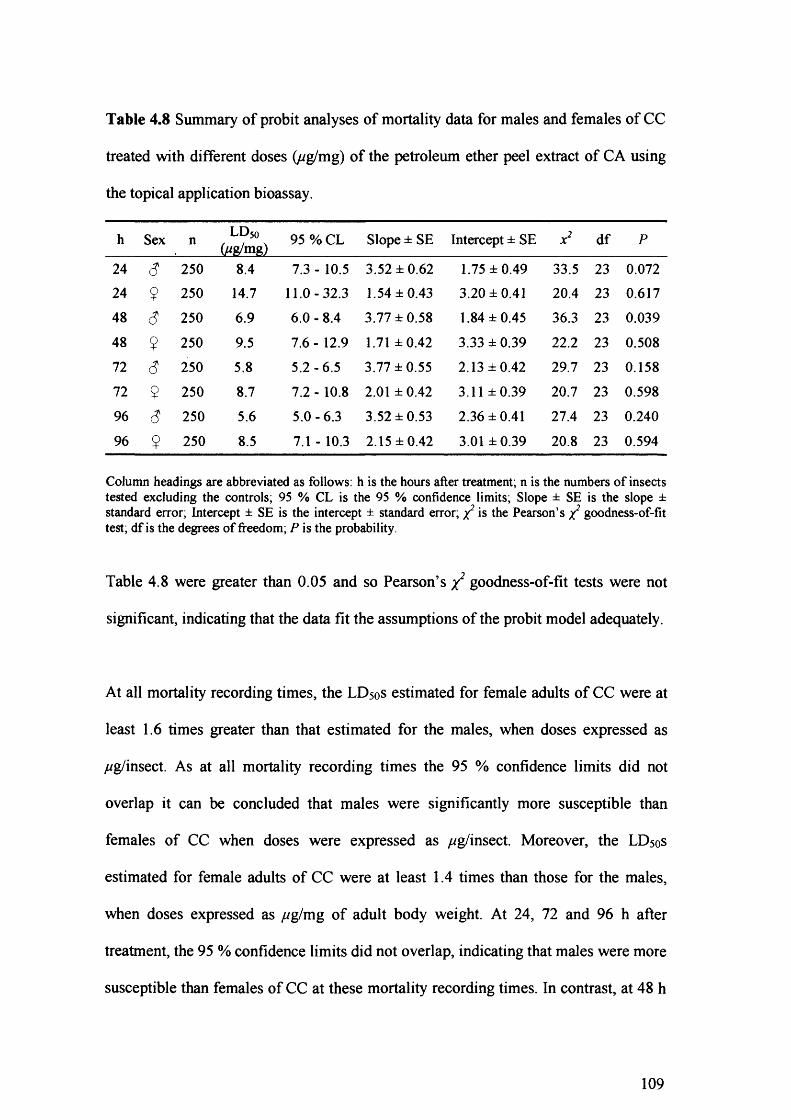
Table 4.8 Summary of probit analyses of mortality data for males and females of CC
treated with different doses (//g/mg) of the petroleum ether peel extract of CA using
the topical application bioassay.
h Sex n LD50
(//g/mg) 95 % CL Slope ± SE Intercept ± SE jc2 df P
24 s 250 8.4 7.3 - 10.5 3.52 ±0.62 1.75 ±0.49 33.5 23 0.07224 9 250 14.7 11.0-32.3 1.54 ±0.43 3.20 ±0.41 20.4 23 0.617
48 6 250 6.9 6.0 - 8.4 3.77 ±0.58 1.84 ±0.45 36.3 23 0.039
48 9 250 9.5 7.6 - 12.9 1.71 ±0.42 3.33 ±0.39 2 2 . 2 23 0.508
72 6 250 5.8 5.2-6.5 3.77 ±0.55 2.13 ±0.42 29.7 23 0.158
72 9 250 8.7 7.2 - 10.8 2.01 ±0.42 3.11 ±0.39 20.7 23 0.59896 6 250 5.6 5.0-6.3 3.52 ±0.53 2.36 ±0.41 27.4 23 0.240
96 9 250 8.5 7.1 - 10.3 2.15 ±0.42 3.01 ±0.39 2 0 . 8 23 0.594
Column headings are abbreviated as follows: h is the hours after treatment; n is the numbers of insects tested excluding the controls; 95 % CL is the 95 % confidence limits; Slope ± SE is the slope ± standard error; Intercept ± SE is the intercept ± standard error; y2 is the Pearson’s y? goodness-of-fit test; df is the degrees of freedom; P is the probability.
Table 4.8 were greater than 0.05 and so Pearson’s y? goodness-of-fit tests were not
significant, indicating that the data fit the assumptions of the probit model adequately.
At all mortality recording times, the LD5 0S estimated for female adults of CC were at
least 1 . 6 times greater than that estimated for the males, when doses expressed as
//g/insect. As at all mortality recording times the 95 % confidence limits did not
overlap it can be concluded that males were significantly more susceptible than
females of CC when doses were expressed as //g/insect. Moreover, the LD50s
estimated for female adults of CC were at least 1.4 times than those for the males,
when doses expressed as //g/mg of adult body weight. At 24, 72 and 96 h after
treatment, the 95 % confidence limits did not overlap, indicating that males were more
susceptible than females of CC at these mortality recording times. In contrast, at 48 h
109
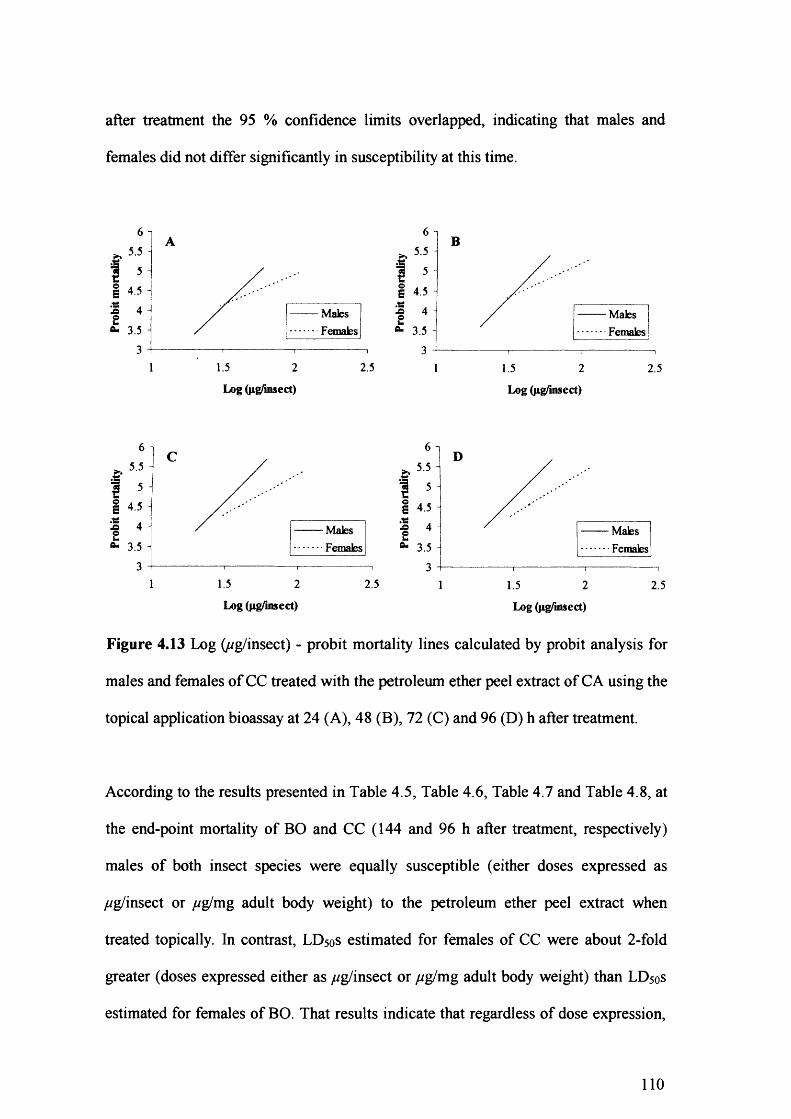
after treatment the 95 % confidence limits overlapped, indicating that males and
females did not differ significantly in susceptibility at this time.
1 4.5.tsaeflu
4
3.5
3
- Males Females
1.5 2
Log (jig/insect)
2.5
>>6 ]
5.5 -
i 5 -0s 4.5
.tsJS 4 -2flu 3.5 -
3
1
B
MalesFemales
1.5 2
Log (jig/insect)
2.5
6 15.5 -
'H 5 -©E.ts
4.5 -
.0©h4 -
0. 3.5 -
3 -
MalesFemales
1.5 2
Log (jig/insect)
2.5
6 1 5.5 -
**5 -
Os 4.5 -.ts.0 4 -©ha. 3.5 -
3 -
D
MalesFemales
1.5 2
Log (jig/insect)
2.5
Figure 4.13 Log (//g/insect) - probit mortality lines calculated by probit analysis for
males and females of CC treated with the petroleum ether peel extract of CA using the
topical application bioassay at 24 (A), 48 (B), 72 (C) and 96 (D) h after treatment.
According to the results presented in Table 4.5, Table 4.6, Table 4.7 and Table 4.8, at
the end-point mortality of BO and CC (144 and 96 h after treatment, respectively)
males of both insect species were equally susceptible (either doses expressed as
//g/insect or //g/mg adult body weight) to the petroleum ether peel extract when
treated topically. In contrast, LD5 0S estimated for females of CC were about 2-fold
greater (doses expressed either as //g/insect or //g/mg adult body weight) than LD50S
estimated for females of BO. That results indicate that regardless of dose expression,
110
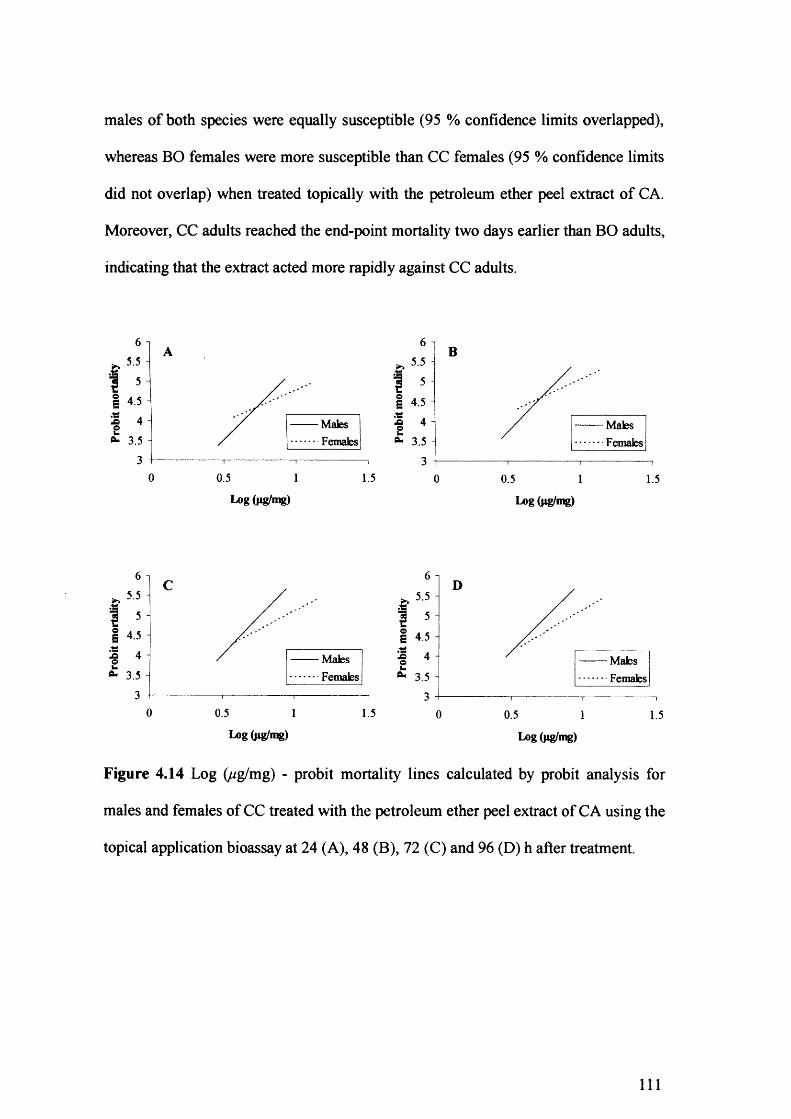
males of both species were equally susceptible (95 % confidence limits overlapped),
whereas BO females were more susceptible than CC females (95 % confidence limits
did not overlap) when treated topically with the petroleum ether peel extract of CA.
Moreover, CC adults reached the end-point mortality two days earlier than BO adults,
indicating that the extract acted more rapidly against CC adults.
4.5
- Males Females3.5
0 0.5 1 1.5
.ts©
6
5.5
5
4.5
4 -MalesFemales3.5
3
0 0.5 1 1.5
Log (jig/mg) Log (ng/mg)
I 4.5
I «uO* 3 5MalesFemales
0 0.5 1.51Log (*ig/mg)
.ts.o
6
5.5
5
4.5
4 - Males Females3.5
3
0 0.5 1 1.5
Log (ng/mg)
Figure 4.14 Log (wg/mg) - probit mortality lines calculated by probit analysis for
males and females of CC treated with the petroleum ether peel extract of CA using the
topical application bioassay at 24 (A), 48 (B), 72 (C) and 96 (D) h after treatment.
I l l
4.4 DISCUSSION
The results obtained by the two contact bioassays suggested that the petroleum ether
peel extract of CA is active to both fly species tested showing a clear
dose/concentration-dependent effect. However, in some cases, differences in
susceptibility were detected not only between the two species, but also between the
two sexes of the same species.
According to the results obtained by the Petri dish exposure bioassays males and
females of BO are equally susceptible. On the contrary, females were more tolerant
than males of CC. That difference in susceptibility between males and females of CC
(about 2-fold) could not be fully explained by the slightly greater body weight of
females. Moreover, personal observations during Petri dish exposure bioassays did
not reveal any difference in behaviour between males and females of CC. The most
plausible explanation for the higher tolerance of CC females is that females might
possess higher quantities of enzymes or more efficient mechanisms that can detoxify
the insecticidal active chemicals present in the petroleum ether peel extract. Weaver et
al. (1994) reported that males of the Mexican bean weevils were more susceptible
than females when exposed to filter papers treated with floral, foliar and root extracts
of Tagetes minuta. However, these authors attributed that difference to the smaller
size of males rather than to an innate difference in the mode of susceptibility.
Comparing the results obtained by the Petri dish exposure bioassays against BO and
CC adults, it is apparent that males and females of BO are significantly more
susceptible than males and females of CC, respectively. That difference in
susceptibility between the two species could not be fully explained by the slightly
112
greater body weight of males and females of CC compared to males and females of
BO, respectively. The most plausible explanation for the greater tolerance of males
and females of CC compared to males and females of BO, respectively is that CC
adults are less behaviourally active than BO adults and consequently they acquired
smaller quantities of the insecticidal active chemicals when the flies are placed in the
Petri dishes. That difference in the behavioural activity between BO and CC was
confirmed by personal observations during the Petri dish bioassays. Moreover, the
difference in the degree of susceptibility between the two sexes (males and females of
CC was 3.9 and 8.3 more tolerant than males and females of BO, respectively) could
be accounted to the higher quantities of enzymes or more efficient mechanisms of
females compared to males of CC. Abbassy et al. (1979) reported that Tribolium
confusum was significant more susceptible than Sitophilus granaries when lime,
lemon, sweet orange and native orange peel oils were tested using the Petri dish
exposure bioassay. However, when navel orange, grapefruit and mandarin peel oils
were tested the two insects were equally susceptible.
Bioassays performed in order to investigate whether mortality of BO and CC caused
in the Petri dish exposure bioassays was due to fumigation rather than contact, reveal
the absence of fumigant action. Moreover, even when the Petri dishes were sealed
with Parafilm, mortality of both species did not occur, indicating the relevant
unimportance of fumigant compared to contact activity of the petroleum ether peel
extract of CA. In contrast, Don-Pedro (1996) reported the relevant unimportance of
the contact toxicity of citrus oils. That discrepancy can be explained as Don-Pedro
used industrially extracted citrus peel oils, which contain mainly volatile compounds,
while volatiles of our extract were removed.
113
The results obtained from the topical application bioassays reveal that when doses
were expressed as //g/insect, males and females of BO are equally susceptible, which
is in agreement with the results obtained by the Petri dish exposure bioassay in which
no correction was done for the difference in body weight between males and females.
However, when doses were expressed as //g/mg adult body weight (corrected for the
difference in body weight between males and females), females are more susceptible
than males. Generally, female insects have a greater tolerance to insecticides, when
tests are corrected for any differences in body weight, which is attributable to their
metabolism (Matthews, 1997). That was not the case when BO was treated topically
with the petroleum ether peel extract. Since topical application bioassay is
independent of insect activity, the most possible explanation for the greater tolerance
of males could be that males possess higher quantities of enzymes or more efficient
mechanisms that can detoxify the insecticidal active chemicals present in the
petroleum ether peel extract.
Moreover, males of CC were more susceptible than females when treated topically
with the petroleum ether peel extract, either dose expressed as //g/insect or //g/mg
adult body weight. This finding is fully in accordance with the results obtained by the
Petri dish exposure bioassay, indicating that the explanation for the greater tolerance
of females compared to males of CC in both bioassays should be their ability to
metabolise the insecticidal active chemicals. Albrecht and Sherman (1987) found that
males of two Bactrocera species (B. dorsalis and B. curcub itae) were more
susceptible than females, whereas male and female of CC were equally susceptible,
when treated topically with avermectin Bi (doses expressed as //g/g). It is worth
mentioning that although male and female of CC were equally susceptible (their 95 %
114
confidence limits did not overlap), the LD50 estimated for males was 2-fold greater
than that estimated for females. It is obvious that generalisations about sex
susceptibility of insect species can not be made since different chemicals substances
produce different results although the same biological evaluation technique was used.
Comparing the results obtained by the topical application bioassays against BO and
CC adults it is apparent that males of both species are equally susceptible, whereas
females of BO are more susceptible than females of CC either dose expressed as
//g/insect or //g/mg adult body weight. The difference in the degree of susceptibility
between the two sexes (2-fold when doses expressed as //g/insect and 1.7-fold when
doses expressed as //g/mg adult body weight) when the two species were compared is
fully in accordance with the results of the Petri dish exposure bioassay. The higher
quantities of enzymes or more efficient mechanisms of females compared to males of
CC could explain not only the difference between BO and CC females, but also the
difference in the degree of susceptibility between the two sexes. Su et al. (1972b)
reported that although peel oils of lemon, grapefruit, lime, kumquat, tangerine,
orange, tangelo and temple orange were moderately toxic to rice weevil, none of these
oils showed any appreciable toxicity to black carpet beetle larvae, Indian meal moth
larvae, cigarette beetle, red flour beetle and confused flour beetle using the topical
application bioassay (doses expressed as //g/insect). Moreover, Albrecht and Sherman
(1987) reported great differences when the susceptibility of CC, B. dorsalis and B.
curcubitae of the same sex was compared; males of CC were 13.8 and 6.9 more
tolerant than B. dorsalis and B. curcubitae males, respectively while females of CC
were 48.3 and 23.2 more tolerant than B. dorsalis and B. curcubitae females,
respectively. Apart from the detoxification mechanisms, Stark and Sherman (1989)
115
suggested that significant differences in the ranking of toxicity between species can be
attributed to different penetration rates and excretion (Stark and Sherman, 1989).
Petri dish exposure and topical application bioassays produced different results when
the susceptibility of the same sex between the two fly species was compared.
Although in the topical application bioassay males of both species were equally
susceptible, in the Petri dish exposure bioassay BO males were 3.9 times more
susceptible than CC males. Moreover, females of BO were more susceptible than
females of CC in both bioassays, but the degree of susceptibility differed significantly
(8.3 and 2.0 times for the Petri dish exposure and topical application bioassay,
respectively). The greater activity of BO compared to the CC resulted in greater
susceptibility of BO compared to the CC in the Petri dish exposure bioassay, since
this bioassay is not independent of insect activity.
Slope values for the regression lines of both insect species were significantly greater
in the Petri dish exposure than in topical application bioassay. Since higher slopes
indicate a more sensitive technique (Dahm et al., 1961) it can be concluded that the
Petri dish exposure is more sensitive than the topical application bioassay when the
petroleum ether peel extract was tested against both BO and CC adults.
Petri dish exposure bioassay was not only more sensitive than topical application in
this study, but also in that bioassay the end-point mortality was reached earlier. In the
Petri dish exposure bioassay, BO and CC adults reached the end-point mortality two
and one days respectively earlier than in the topical application.
116

In both bioassays CC adults reached the end-point mortality earlier than BO adults. In
the Petri dish exposure bioassay CC adults reached the end-point mortality one day
earlier than BO adults, whereas in the topical application bioassay CC adults reached
the end-point mortality two days earlier than BO adults.
117
CHAPTER 5
ISOLATION OF INSECTICIDALLY ACTIVE COMPONENTS
FROM THE PETROLEUM ETHER PEEL EXTRACT OF CITRUS
AURANTIUM
5.1 INTRODUCTION
Fractionation is the process in which the components of a mixture, such as a plant
extract, can be separated into groups of compounds sharing similar physicochemical
characteristics (Houghton and Raman, 1998). Thus, solubility, volatility, polarity,
size, shape, electrical charge and functional groups present may influence the
grouping (Harwood et al., 1999). The methods used for achieving fractionation are:
precipitation, liquid-liquid partitioning, distillation, dialysis, chromatographic
techniques and electrophoresis. However, it should be noted that chromatography in
its various forms is the most common method and is exploited in most fractionation
procedures carried out nowadays (Houghton and Raman, 1998).
Chromatography depends upon the differential distribution of various components of
a mixture between two phases, the mobile phase and the stationary phase. The mobile
phase may be either a liquid or a gas and the stationary phase either a solid or liquid.
Various combinations of these components give the main types of chromatographic
techniques (Harwood et al., 1999). The main chromatographic techniques are: column
chromatography (gravity and flash), planar chromatography (thin layer and paper),
118
gas chromatography, high performance liquid chromatography (normal and reverse
phase), ion exchange chromatography and gel permeation chromatography.
Different fractionation strategies can be followed during a fractionation process.
Collecting large number of very small fractions means that its fraction is more likely
to contain a pure compound, but it requires more work for testing every fraction. This
also runs the risk of spreading the target compound over so many fractions that, if
originally present in only low concentrations, it may evade detection in any one of the
fractions. Collecting a few large, but relatively crude fractions resulted in more
fractionation steps, but the work in each step is considerably less (Cannell, 1998).
A common phenomenon during fractionation processes was discussed by Cannell
(1998) and Houghton and Raman (1998). They concluded that lack or disappearance
of activity occurred after fractionation may be due to the following reasons:
■ The active components may remain in the system used for fractionation.
■ The active components may have decomposed during the fractionation
process.
■ Observed activity in the crude extract is due to synergism between
components which are separated as a result of the fractionation process.
■ The active components may have been lost due to a process such as co
distillation or sublimation when liquid fractions are concentrated.
■ The starting sample was not prepared so as to be fully compatible with the
mobile phase, so that a large proportion of the active component precipitated
when loading on the top of the column.
119
■ Most of the active component(s) spread across a wide range of fractions in a
concentration too low to be detected by the assay.
Only a few efforts have been made to isolate the insecticidally active components of
promising Citrus extracts. Su (1976) reported the isolation of a single active
component from lyophilised hexane lemon peel oil. Fractionation was carried out by
three sequential TLC (silica gel F2 5 4) separations using three different developing
solvent systems. Fractionation was guided by topical application and the test insect
was adult cowpea weevil. However, although Su had achieved the isolation of a pure
active compound, she did not make any attempt to elucidate its structure. More
recently, Su and Horvat (1987) isolated and identified the four major components of
lyophilised hexane lemon peel oil. Fractionation was carried out by TLC (silica gel
F2 5 4) followed by HPLC (Cjg column) and was not guided by bioassays.
The majority of studies aiming to isolate the active ingredients from insecticidally
active plant extracts involve liquid-liquid partitioning, gravity column or flash column
chromatography, preparative thin layer chromatography and high performance liquid
chromatography. Dadang et al. (1996), using bioassay-guided procedures, isolated
from a methanol tuber extract of nutgrass an insecticidal sesquiterpenoid, which was
identified as a-cyperone (4, ll-selinadien-3-one). Fractionation was carried out by
using in sequence liquid-liquid partitioning (MeOH/n-hexane), gravity column
chromatography (silica gel), preparative TLC (silica gel F2 5 4) and finally HPLC.
Rodriguez-Saona et al. (1997, 1998) using flash chromatography on silica gel
separated an avocado idioblast cell oil into eight fractions. Two fractions were
revealed as promising against Spodoptera exigua. The most active fraction was
120
further purified by HPLC (silica column) resulting in the isolation and identification
of persin (Rodriguez-Saona et al., 1997). The other active fraction was further
fractionated by two sequential flash columns resulting in the isolation of several
insecticidal compounds (Rodriguez-Saona et al., 1998). Gbewonyo and Candy
(1992a) reported that gas chromatography allowed the purification of pellitorine from
a piper extract in a single step. However, they found that the activity of the extract
was decreased on passage through the GC column, which was attributed to the
instability of some insecticidal or synergistic compounds at the high temperatures
used. They concluded that GC is unsuitable for the separation and isolation of these
compounds. The same authors (1992b) reported the purification and identification of
five active amides of the same piper extract using different bioassay-guided
fractionation procedures. This time, fractionation was carried out by three sequential
TLC separations using three different developing solvent systems followed by
reversed-phase HPLC.
In this chapter the chromatographic procedure followed to isolate the bioactive
chemicals present in the petroleum ether peel extracts of CA and the obtained results
will be discussed.
121
5.2 METHODS
5.2.1 Fractionation procedure of the petroleum ether peel extract of CA
The active petroleum ether peel extract of CA obtained in section 4.2.1 was
fractionated using chromatographic techniques in order to isolate the insecticidally
active secondary metabolites it possessed. The fractionation procedure of the
petroleum ether peel extract of CA is shown in Figure 5.1 and was guided by Petri
dish exposure bioassays.
First gravity (open) column fractionation
Gravity column chromatography is the oldest form of chromatographic technique
(Houghton and Raman, 1998). Although it does not require special equipment and is
the most economic of the chromatographic techniques, as it requires only the most
basic grades of chromatographic adsorbents, it can give sufficient separation at the
initial fractionation steps (Harwood et al., 1999).
A glass column (500 mm x 45 mm i.d.) was used for the fractionation of 2 g of the
petroleum ether peel extract. This column was fitted at one end with a fine porosity
sintered glass disk above the stopcock in order to support the stationary phase. The
column was wet packed with 200 g of silica gel 60 for column chromatography (0.04-
0.063 mm/230-400 mesh ASTM, Macherey-Nagel, Germany). The 1 %
sample/stationary phase ratio used, offers sufficient separation while loss by
irreversible adsorption to the stationary phase was minimised. Prior to packing, silica
gel was suspended in DCM, which was the least polar solvent used for the
fractionation. The height of silica gel into the column was 32 cm. Wet packing was
used in preference to dry packing in order: (a) to achieve a narrow band of applied
122
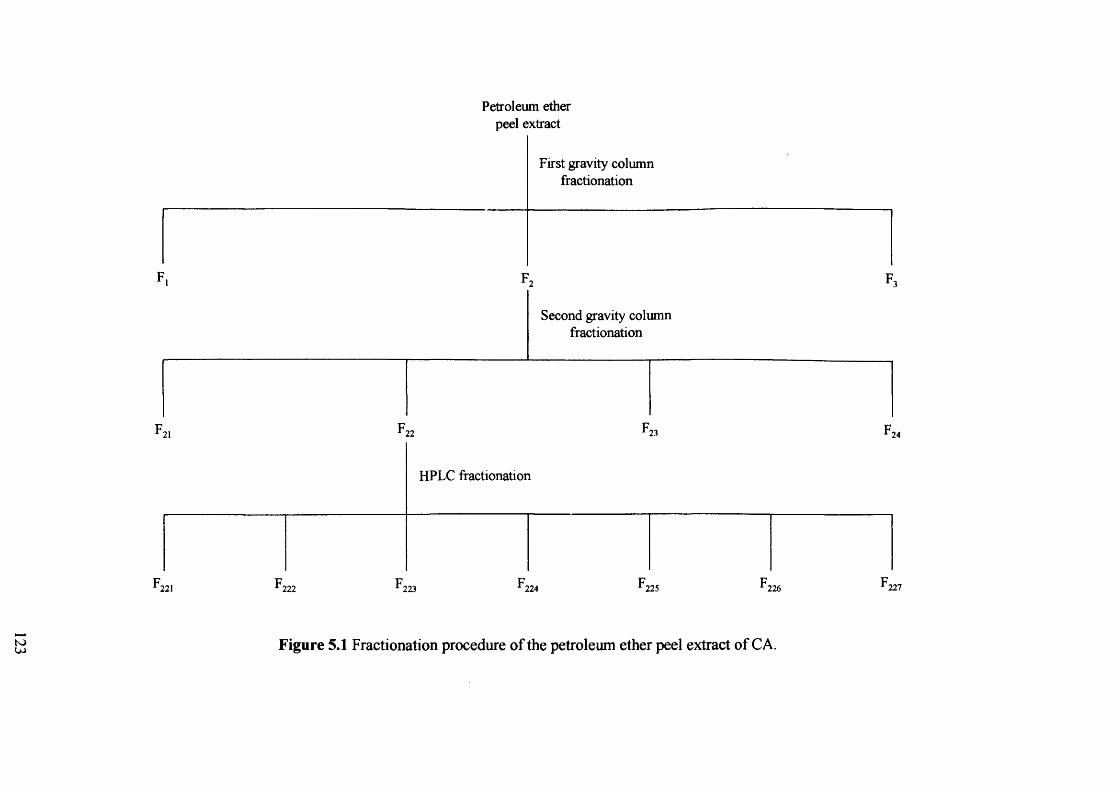
Petroleum ether peel extract
First gravity column fractionation
F 2 F 3
Second gravity column fractionation
F 21 F 22 F 23 F 24
HPLC fractionation
F 221 F 222 F 223 F 224 F 225 F 226 F 227
Figure 5.1 Fractionation procedure of the petroleum ether peel extract of CA.
sample, (b) to achieve uniform flow of the mobile phase, and (c) to avoid air bubbles,
often trapped as the mobile phase passes through, which disrupt the flow (Houghton
and Raman, 1998).
As the force of the eluting solvents tends to disturb the flat surface of the stationary
phase, about 1 cm of anhydrous sodium sulphate was placed above the silica gel
surface in order to protect it. A petroleum ether peel extract solution (2 g/20 ml DCM)
was introduced on to the column. The stopcock was opened until the solution reached
the surface of the anhydrous sodium sulphate without touching it and then the
stopcock was closed. Above the sample, 1 cm of anhydrous sodium sulphate was
added in order to avoid sample dilution. Silica gel and anhydrous sodium sulphate
were washed with MeOH and then activated at 130 °C for 24 h prior to use. Three
fractions were collected by sequentially eluting the column with 1 1 each
(approximately 3 dead volumes) of DCM (Fi fraction), EtOAc (F2 fraction) and
MeOH (F3 fraction).
Second gravity column fractionation
The same column as above was used for the fractionation of 1 g of the active F2
fraction, obtained from the first gravity column fractionation. The column was wet
packed with 100 g silica gel (suspended in 20 % Hex in EtOAc). The height of silica
into the column was 16 cm. 1 g of the F2 fraction dissolved in 50 ml of 20 % Hex in
EtOAc was introduced on to the column. Four fractions were collected by sequentially
eluting the column with 500 ml each (approximately 3 dead volumes) of 20 % Hex in
EtOAc (F21 fraction), 40 % Hex in EtOAc (F22 fraction), 60 % Hex in EtOAc (F23
fraction) and 100 % MeOH (F24 fraction).
124
HPLC fractionation
High Performance Liquid Chromatography (HPLC) was used to fractionate further
the active F22 fraction, obtained from the second gravity column fractionation. HPLC
was used for the final stage of fractionation as it is a much more efficient technique
than gravity column chromatography and can lead to the isolation of pure substances.
There are many advantages of HPLC over conventional chromatography, and these
include increased speed, higher resolution, higher sensitivity, greater reproducibility,
and better sample recovery (Patel, 1997).
A binary LC pump 250 equipped with a LC-235 diode array detector (Perkin Elmer,
USA) was used. The Simple peak 202 (SRI Instruments, USA) software was
employed for recording the chromatograms. After testing, different columns,
stationary phases, mobile phases, elution profiles, flow rates, injection volumes and
UV detection wavelengths, the following chromatographic conditions were chosen for
performing the fractionation. A 250 mm x 10 mm i.d. LiChrospher 100 CN column
with a particle size of 10 //m (Merck, Germany) supplied with a 10 mm precolumn
packed with the same stationary phase was used. Two solvents, n-hexane (A) and
ethyl acetate (B), which were degassed by sonication before use, were selected. The
elution profile was: 0-35 min A:B 90:10 % (isocratic), 35-40 min from A:B 90:10 %
to 100 % B (linear gradient), 40-60 min 100 % B (isocratic). Prior to injection of
sample the column was re-equilibrated for 10 min at the initial conditions. The flow
rate used was 4 ml/min, the column temperature was ambient and the absorbance was
monitored at 310 nm (optical bandwidth 15 nm). The F22 fraction (1 mg/20 /d EtOAc
per injection) was introduced onto the column via a Rheodyne 7125 injector (USA)
fitted with a 20 ju\ sample loop. Seven fractions were collected (F22 1 , F22 2, F2 2 3, F2 2 4 ,
125
F2 2 5 , F226 and F22 7) (see Figure 5.4). Totally, 100 mg (100 runs) of the F22 fraction
were fractionated. All fractions were filtered, concentrated, weighed and stored in the
dark at -20 °C until used.
5.2.2 Bioassay of fractions
To monitor the activity of the fractions obtained during the fractionation procedure of
the petroleum ether peel extract of CA the Petri dish exposure bioassay was used (see
section 2.2.2). Five replicates of 10 (5 males and 5 females) 2-3 d-old BO flies each,
were employed for each treatment and the control. The 5 replicates were conducted on
5 successive days, using the same generation of flies. Different concentrations of
treatments were not run simultaneously, as screening experiments at lower
concentrations included only the more active treatments. Stock solutions were
prepared in DCM, as were subsequent dilutions. Fresh test solutions were prepared for
each replicate. Because the amount of the fractions obtained from the HPLC
fractionation was limited, during tests on these fractions, olive oil was added to each
treatment solution and control (DCM) so that each cm2 of the total inner surface of the
Petri dishes was layered with 0.1 /ri o f olive oil. Olive oil was used in order to reduce
the amount of the HPLC fractions tested, as it served as a carrier to facilitate pick up
of residues of the test materials from the Petri dish (Gbewonyo and Candy, 1992a).
The syringe used for the application of samples was thoroughly cleaned after the
application of each sample. Mortalities were recorded every 24 h for 3 d, when olive
oil was added to the treatments, whereas when olive oil was not added, mortalities
were recorded every 24 h for 4 d, after which there was no further increase in
mortality.
126
5.2.3 TLC analysis of fractions
TLC analyses were carried out as in section 3.2.3 in order to check the component
profile of the fractions obtained from the first gravity column fractionation against
that of the petroleum ether peel extract and moreover to check the component profile
of the fractions obtained from the second gravity column fractionation against that of
the F2 fraction. In each case fractions were checked using the same amount per spot
(100 ^g/spot for the first gravity column fractionation and 62.7 //g/spot for the second
gravity column fractionation) or equivalent amount to the initial extract/fraction
compared. The petroleum ether peel extract and all fractions were dissolved in DCM.
All analyses were performed using Hex:EtOAc (50:50, v/v) as the developing solvent
system. Photographs of the TLC plates were obtained by the Camedia digital camera
under 254 nm UV light
5.2.4 HPLC analysis of fractions
HPLC analyses were carried out in order to investigate whether the three major peaks
of the F22 fraction were separated adequately during the HPLC fractionation. All
chromatographic conditions were the same as in section 5.2.1 except the elution
profile which was Hex:EtOAc (90:10, v/v) for all the time required for the analyses of
fractions F2 2 1 , F22 2, F22 3, F22 4 , F225 and F2 2 6- However, when analysing the F227 fraction
the same elution profile as in section 5.2.1 was set. Each fraction was analysed in
triplicate. Fraction solutions analysed were equivalent to 200 //g/injection of the F22
fraction. All fractions were dissolved in EtOAc. Percentages of the three major peaks
present in each fraction obtained from the FIPLC fractionation were calculated.
127
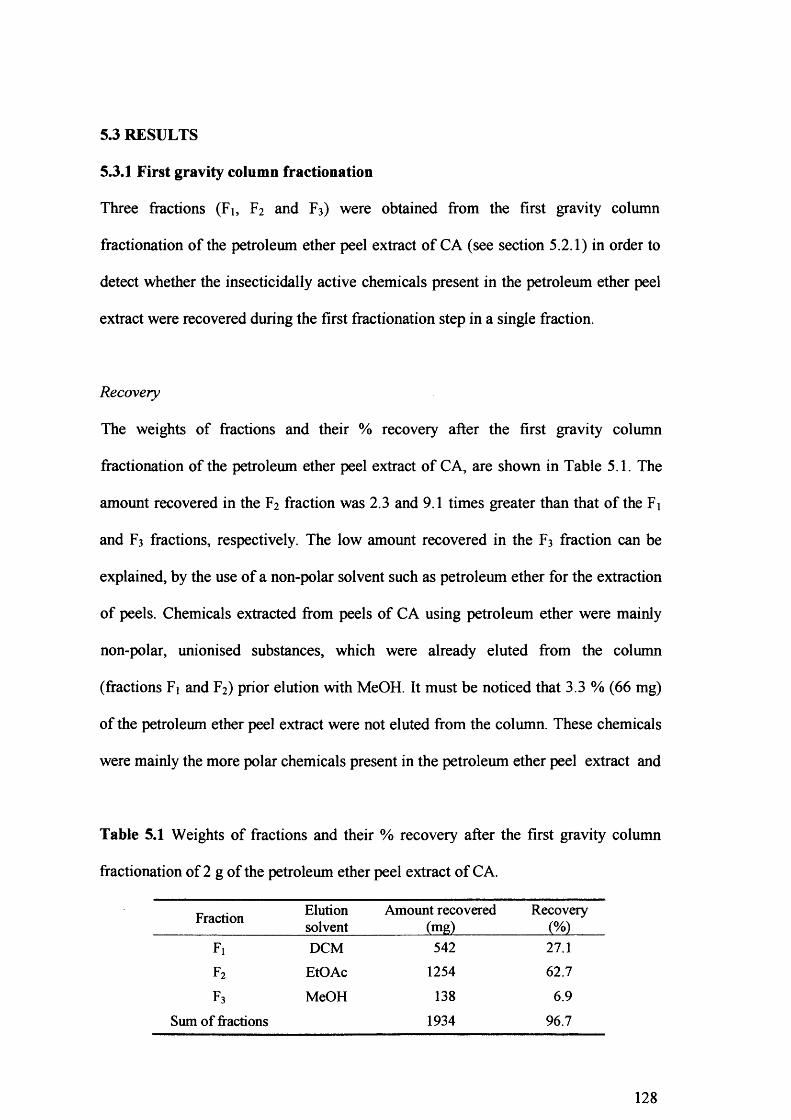
5.3 RESULTS
5.3.1 F irst gravity column fractionation
Three fractions (Fi, F2 and F3) were obtained from the first gravity column
fractionation of the petroleum ether peel extract of CA (see section 5.2.1) in order to
detect whether the insecticidally active chemicals present in the petroleum ether peel
extract were recovered during the first fractionation step in a single fraction.
Recovery
The weights of fractions and their % recovery after the first gravity column
fractionation of the petroleum ether peel extract of CA, are shown in Table 5.1. The
amount recovered in the F2 fraction was 2.3 and 9.1 times greater than that of the Fi
and F3 fractions, respectively. The low amount recovered in the F3 fraction can be
explained, by the use of a non-polar solvent such as petroleum ether for the extraction
of peels. Chemicals extracted from peels of CA using petroleum ether were mainly
non-polar, unionised substances, which were already eluted from the column
(fractions Fi and F2) prior elution with MeOH. It must be noticed that 3.3 % ( 6 6 mg)
of the petroleum ether peel extract were not eluted from the column. These chemicals
were mainly the more polar chemicals present in the petroleum ether peel extract and
Table 5.1 Weights of fractions and their % recovery after the first gravity column
fractionation of 2 g of the petroleum ether peel extract of CA.
Fraction Elutionsolvent
Amount recovered(mg)
Recovery(%)
Fi DCM 542 27.1
f2 EtOAc 1254 62.7
f3 MeOH 138 6.9Sum of fractions 1934 96.7
128
were adsorbed irreversibly to the stationary phase.
TLC analysis
The component profile of Fj, F2 , F3 fractions was checked against that of the
petroleum ether peel extract by TLC using Hex:EtOAc (50:50, v/v) as the developing
solvent system. In Figure 5.2A, 100 fig and the petroleum ether peel extract and 27.1,
62.7, 6.9 fig (equivalent to 100 fig of the petroleum ether peel extract) of the Fi, F2 , F3
fractions, respectively were spotted on the baseline of the TLC plate. In Figure 5.2B,
100 fig of the Fi, F2, F3 fractions and the petroleum ether peel extract were spotted.
Figures 5.2A and 5.2B indicate that the first gravity column effectively fractionated
the petroleum ether peel extract as different types of compounds based on their
polarity were present in each different fraction. Moreover, Figure 5.2A indicates that
decomposition during fractionation had not occurred, as compounds present in the
petroleum ether peel extract had not disappear, and moreover, compounds not present
in the petroleum ether peel extract did not appear, after fractionation.
Insecticidal activity
The petroleum ether peel extract and its fractions obtained from the first gravity
column fractionation were tested for activity using the Petri dish exposure bioassay in
order to detect which fraction contain the insecticidal active chemicals. The initial
screening concentration was set at 100 //g/cm2. Only fractions that exhibited activity
at this concentration were further tested at 50 //g/cm2.
129
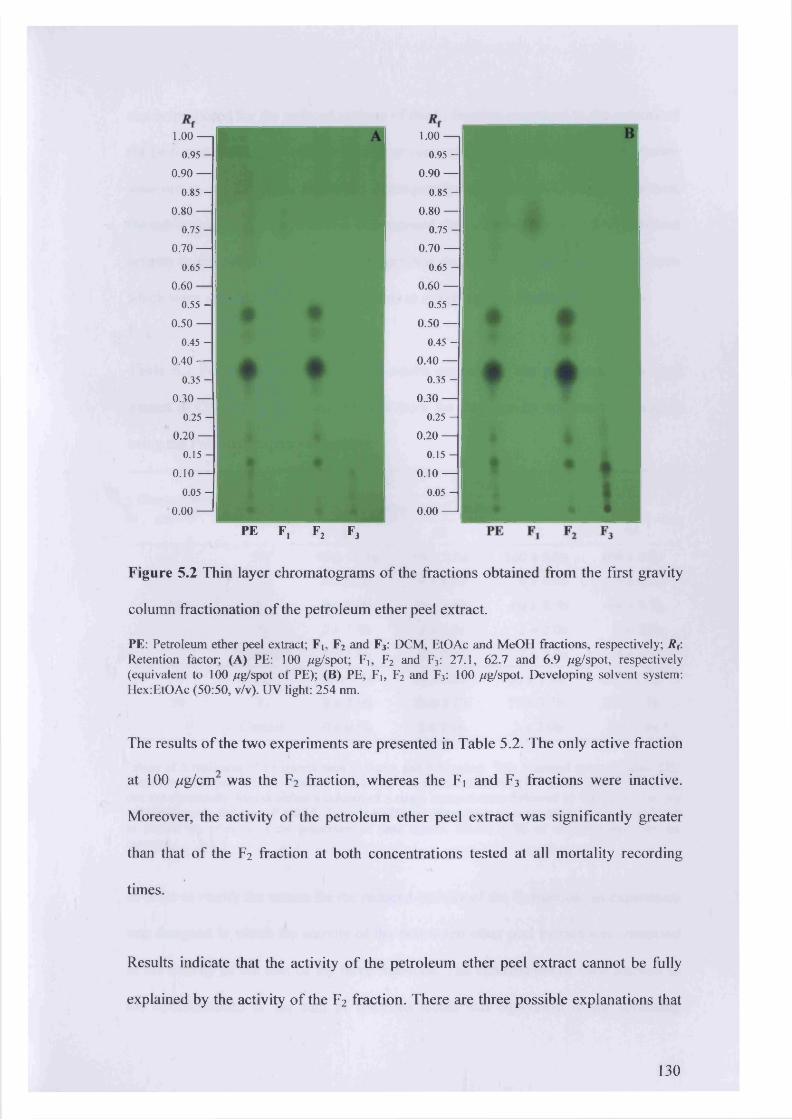
1.00 —
0.95 -
0.90 —
0.85 -
0.80 —
0.75 -
0.70 —
0.65 -
0.60 —
0.55 -
0.50 —
0.45 -
0.40 —
0.35 -
0.30 —0.25 -
0.20 —
0.15 -
0.10 —
0.05 -
0.00 —
1.00 —
0.95 -
0.90 —
0.85 -
0.80 —
0.75 -
0.70 —
0.65 -
0.60
0.55 -
0.50 —
0.45 -
0.40 —
0.35 -
0.30 —
0 .25-
0.20 —
0.15-
0.10 —
0.05 -
0.00 —
PE F, F2 F3
Figure 5.2 Thin layer chromatograms of the fractions obtained from the first gravity
column fractionation of the petroleum ether peel extract.
PE: Petroleum ether peel extract; Fi, F2 and F3: DCM, EtOAc and MeOH fractions, respectively; R f: Retention factor; (A) PE: 100 //g/spot; Fj, F2 and F3: 27.1, 62.7 and 6.9 //g/spot, respectively (equivalent to 100 //g/spot o f PE); (B) PE, Fj, F2 and F3: 100 /ig/spot. Developing solvent system: Hex:EtOAc (50:50, v/v). UV light: 254 nm.
The results of the two experiments are presented in Table 5.2. The only active fraction
at 100 /ig/cm was the F2 fraction, whereas the Fi and F3 fractions were inactive.
Moreover, the activity of the petroleum ether peel extract was significantly greater
than that of the F2 fraction at both concentrations tested at all mortality recording
times.
Results indicate that the activity of the petroleum ether peel extract cannot be fully
explained by the activity of the F2 fraction. There are three possible explanations that
130
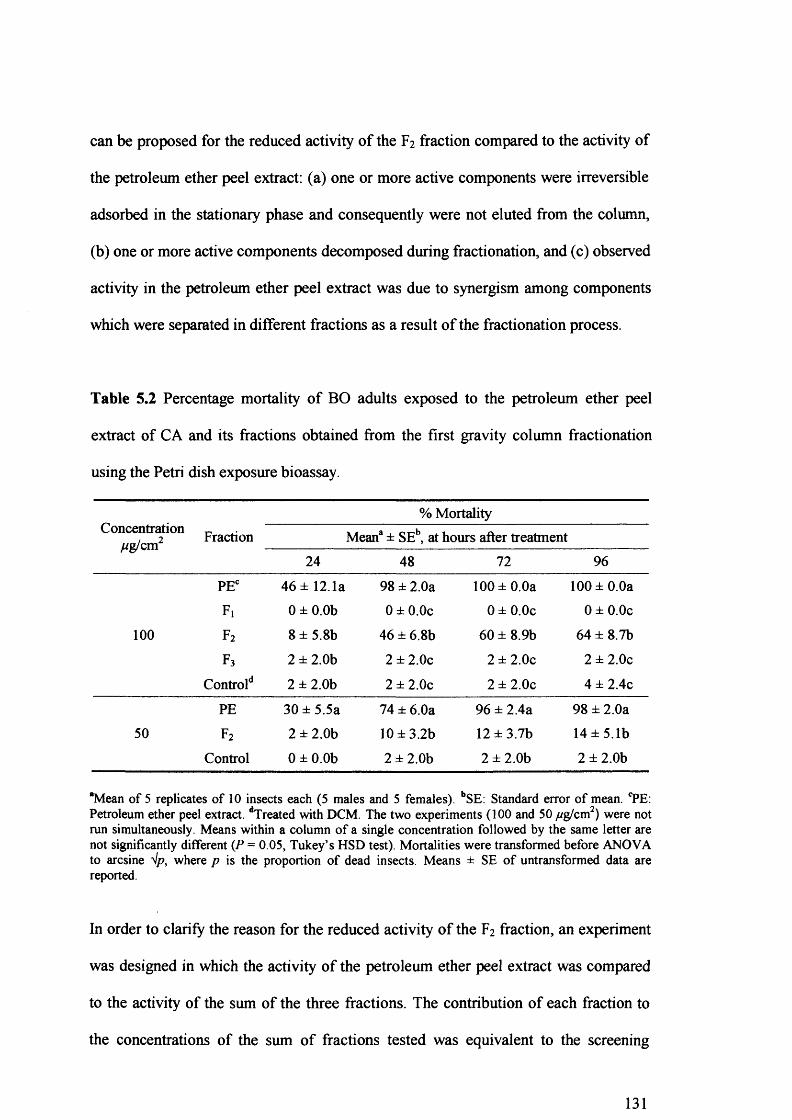
can be proposed for the reduced activity of the F2 fraction compared to the activity of
the petroleum ether peel extract: (a) one or more active components were irreversible
adsorbed in the stationary phase and consequently were not eluted from the column,
(b) one or more active components decomposed during fractionation, and (c) observed
activity in the petroleum ether peel extract was due to synergism among components
which were separated in different fractions as a result of the fractionation process.
Table 5.2 Percentage mortality of BO adults exposed to the petroleum ether peel
extract of CA and its fractions obtained from the first gravity column fractionation
using the Petri dish exposure bioassay.
Concentration//g/cm2 Fraction
% MortalityMean8 ± SEb, at hours after treatment
24 48 72 96PEC 46 ± 12.1a 98 ± 2.0a 100 ± 0.0a 100 ± 0.0a
Fi 0 ± 0.0b 0 ± 0.0c 0 ± 0.0c 0 ± 0.0c100 f2 8 ± 5.8b 46 ± 6.8b 60 ± 8.9b 64 ± 8.7b
f3 2 ± 2.0b 2 ± 2.0c 2 ± 2.0c 2 ± 2.0cControl*1 2 ± 2.0b 2 ± 2.0c 2 ± 2.0c 4 ± 2.4c
PE 30 ± 5.5a 74 ± 6.0a 96 ± 2.4a 98 ± 2.0a50 f2 2 ± 2.0b 10 ± 3.2b 12 ± 3.7b 14 ± 5.1b
Control 0 ± 0.0b 2 ± 2.0b 2 ± 2.0b 2 ± 2.0b
“Mean o f 5 replicates o f 10 insects each (5 males and 5 females). bSE: Standard error o f mean. 'PE: Petroleum ether peel extract. dTreated with DCM. The two experiments (100 and 50 //g/cm2) were not run simultaneously. Means within a column o f a single concentration followed by the same letter are not significantly different (P - 0.05, Tukey’s HSD test). Mortalities were transformed before ANOVA to arcsine V p, where p is the proportion o f dead insects. Means ± SE o f untransformed data are reported.
In order to clarity the reason for the reduced activity of the F2 fraction, an experiment
was designed in which the activity of the petroleum ether peel extract was compared
to the activity of the sum of the three fractions. The contribution of each fraction to
the concentrations of the sum of fractions tested was equivalent to the screening
131
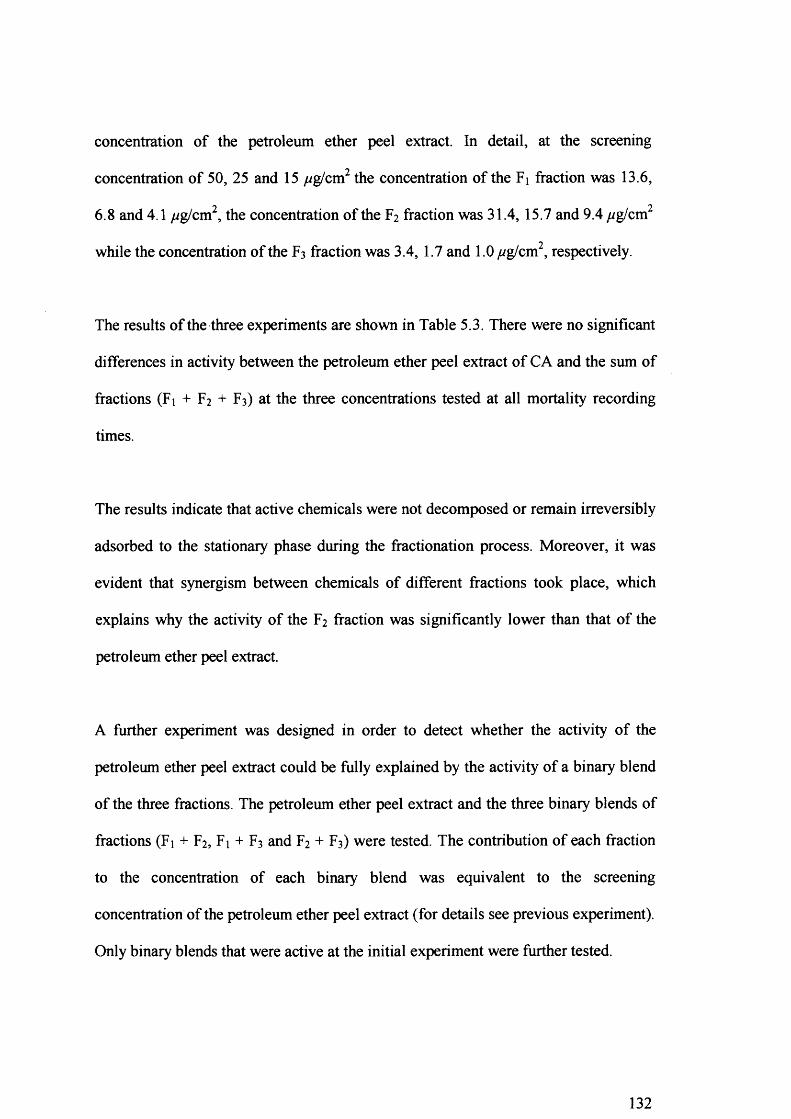
concentration of the petroleum ether peel extract. In detail, at the screening
concentration of 50, 25 and 15 //g/cm2 the concentration of the Fi fraction was 13.6,
2 2 6 . 8 and 4.1 //g/cm , the concentration of the F2 fraction was 31.4, 15.7 and 9.4 //g/cm
while the concentration of the F3 fraction was 3.4,1.7 and 1.0 //g/cm2, respectively.
The results of the three experiments are shown in Table 5.3. There were no significant
differences in activity between the petroleum ether peel extract of CA and the sum of
fractions (Fi + F2 + F3) at the three concentrations tested at all mortality recording
times.
The results indicate that active chemicals were not decomposed or remain irreversibly
adsorbed to the stationary phase during the fractionation process. Moreover, it was
evident that synergism between chemicals of different fractions took place, which
explains why the activity of the F2 fraction was significantly lower than that of the
petroleum ether peel extract.
A further experiment was designed in order to detect whether the activity of the
petroleum ether peel extract could be fully explained by the activity of a binary blend
of the three fractions. The petroleum ether peel extract and the three binary blends of
fractions (Fi + F2, Fi + F3 and F2 + F3) were tested. The contribution of each fraction
to the concentration of each binary blend was equivalent to the screening
concentration of the petroleum ether peel extract (for details see previous experiment).
Only binary blends that were active at the initial experiment were further tested.
132
Table 5.3 Percentage mortality of BO adults exposed to the petroleum ether peel
extract of CA and the sum of its fractions obtained from the first gravity column
fractionation using the Petri dish exposure bioassay.
Concentrationpg/cm2
% MortalityTreatment Mean8 ± SEb, at hours after treatment
24 48 72 96
1st Experiment50 PEC 34 ± 9.3a 76 ± 7.5a 98 ± 2.0a 98 ± 2.0a
13.6 + 31.4 + 3.4 F!+F2+F3 32 ± 9.2a 82 ± 3.7a 100 + 0.0a 100 ± 0.0a0 Controld 2 ± 2.0b 4 ± 2.4b 4 ± 2.4b 4 ± 2.4b
2nd Experiment25 PE 6 + 4.0a 58 + 7.3a 74 ± 7.5a 78 + 5.8a
6.8+15.7+1.7 F 1+F2 +F3 10 + 4.5a 50 + 7.1a 68 ± 5.8a 70 ± 5.5a0 Control 0 ± 0.0a 2 ± 2.0b 2 ± 2.0b 2 ± 2.0b
3 rd Experiment15 PE 2 ± 2.0a 16 + 4.0a 28 ± 6.6a 32 ± 8.0a
4.1 +9.4+ 1.0 F 1+F2 +F 3 4 ± 2.4a 18 + 3.7a 36 + 5.la 38 ± 5.8a0 Control 2 ± 2.0a 2 ± 2.0b 4 ± 2.4b 4 ± 2.4b
“Mean o f 5 replicates o f 10 insects each (5 males and 5 females). bSE: Standard error o f mean. °PE: Petroleum ether peel extract o f CA. dTreated with DCM. The three experiments were not run simultaneously. Means within a column o f a single experiment followed by the same letter are not significantly different (P = 0.05, Tukey’s HSD test). Mortalities were transformed before ANOVA to arcsine V/?, where p is the proportion o f dead insects. Means ± SE o f untransformed data are reported.
The results of the two experiments are displayed in Table 5.4. The Fi + F3 and F2 + F3
binary blends were inactive at 25 pg/cm2, whereas the petroleum ether peel extract
and the Fi + F2 binary blend were active and did not differ significantly at both
experiments at all mortality recording times.
The results of these experiments indicate that synergism occurred between chemicals
that were eluted during fractionation to the Fi and F2 fractions. The activity of the
petroleum ether peel extract of CA can be fully ascribed to the activity of the Fi + F2
133
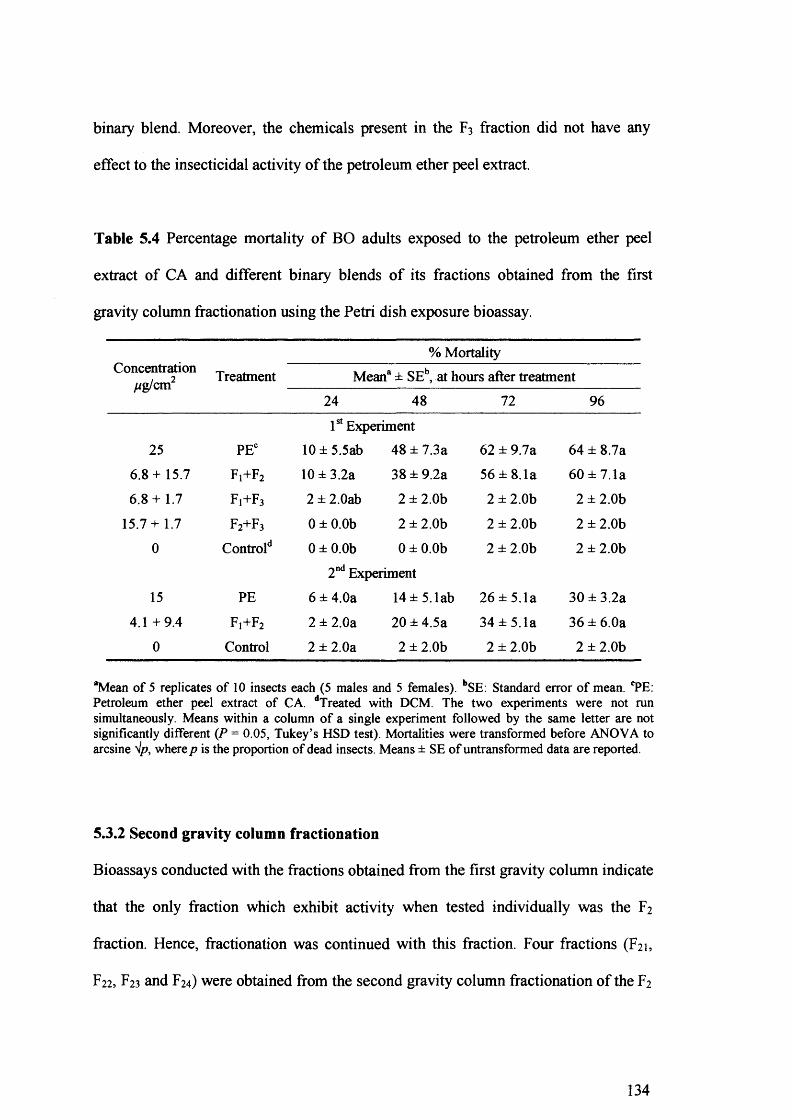
binary blend. Moreover, the chemicals present in the F3 fraction did not have any
effect to the insecticidal activity of the petroleum ether peel extract.
Table 5.4 Percentage mortality of BO adults exposed to the petroleum ether peel
extract of CA and different binary blends of its fractions obtained from the first
gravity column fractionation using the Petri dish exposure bioassay.
Concentration/zg/cm2 Treatment
% MortalityMean*1 ± SEb, at hours after treatment
24 48 72 961st Experiment
25 PEC 10 ± 5.5ab 48 + 7.3a 62 ± 9.7a 64 ± 8.7a6.8+15.7 Fi+F2 10 + 3.2a 38 ± 9.2a 56 + 8.1a 60 + 7.1a6.8+1.7 F 1+F3 2 ± 2.0ab 2 ± 2.0b 2 ± 2.0b 2 ± 2.0b
15.7+1.7 F2 +F 3 0 ± 0.0b 2 ± 2.0b 2 ± 2.0b 2 ± 2.0b0 Control 0 ± 0.0b 0 ± 0.0b 2 ± 2.0b 2 ± 2.0b
2nd Experiment15 PE 6 ± 4.0a 14 ± 5. lab 26 ± 5.1a 30 ± 3.2a
4.1 +9.4 Fi+F2 2 ± 2.0a 20 + 4.5a 34 + 5.1a 36 ± 6.0a0 Control 2 ± 2.0a 2 ± 2.0b 2 ± 2.0b 2 ± 2.0b
“Mean o f 5 replicates o f 10 insects each (5 males and 5 females). bSE: Standard error o f mean. CPE: Petroleum ether peel extract o f CA. dTreated with DCM. The two experiments were not run simultaneously. Means within a column o f a single experiment followed by the same letter are not significantly different ( P = 0.05, Tukey’s HSD test). Mortalities were transformed before ANOVA to arcsine Vp, where p is the proportion o f dead insects. Means ± SE o f untransformed data are reported.
5.3.2 Second gravity column fractionation
Bioassays conducted with the fractions obtained from the first gravity column indicate
that the only fraction which exhibit activity when tested individually was the F2
fraction. Hence, fractionation was continued with this fraction. Four fractions (F2 1 ,
F2 2, F2 3 and F2 4) were obtained from the second gravity column fractionation of the F2
134
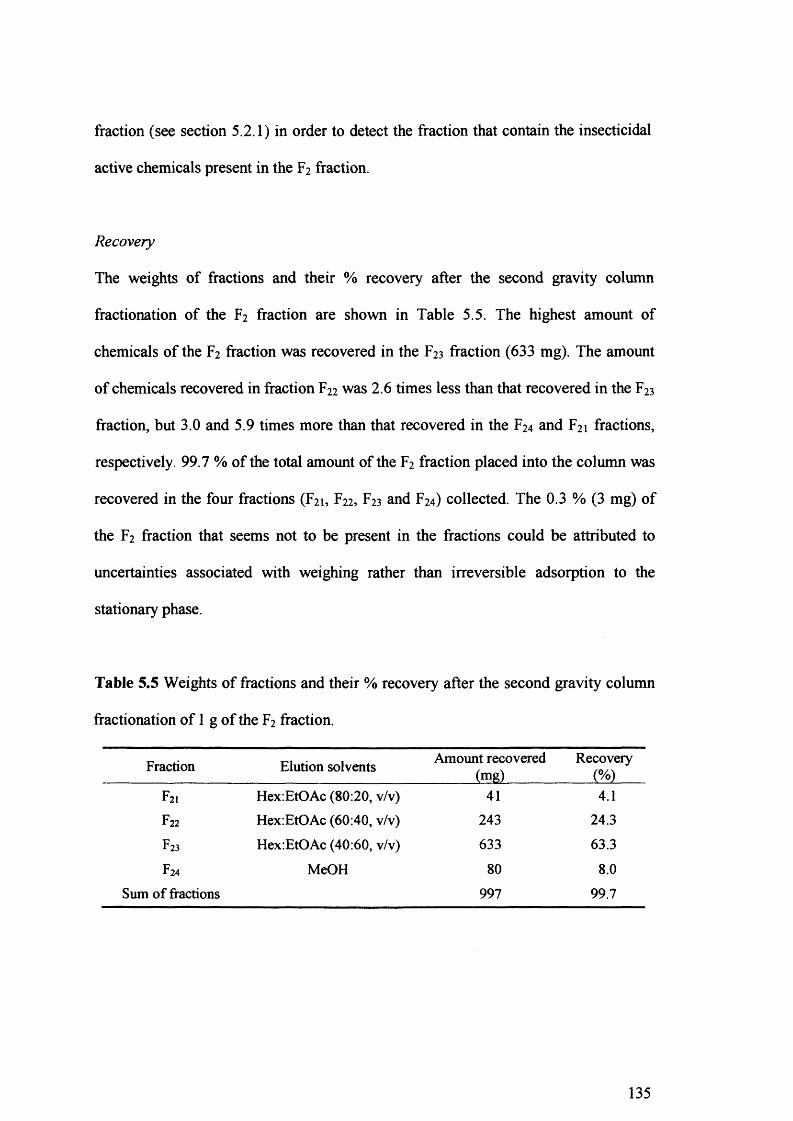
fraction (see section 5.2.1) in order to detect the fraction that contain the insecticidal
active chemicals present in the F2 fraction.
Recovery
The weights of fractions and their % recovery after the second gravity column
fractionation of the F2 fraction are shown in Table 5.5. The highest amount of
chemicals of the F2 fraction was recovered in the F23 fraction (633 mg). The amount
of chemicals recovered in fraction F22 was 2 . 6 times less than that recovered in the F23
fraction, but 3.0 and 5.9 times more than that recovered in the F24 and F21 fractions,
respectively. 99.7 % of the total amount of the F2 fraction placed into the column was
recovered in the four fractions (F21 , F22 , F23 and F2 4) collected. The 0.3 % (3 mg) of
the F2 fraction that seems not to be present in the fractions could be attributed to
uncertainties associated with weighing rather than irreversible adsorption to the
stationary phase.
Table 5.5 Weights of fractions and their % recovery after the second gravity column
fractionation of 1 g of the F2 fraction.
Fraction Elution solvents Amount recovered (mg)
Recovery(%)
F21 Hex:EtOAc (80:20, v/v) 41 4.1
F22 Hex:EtOAc (60:40, v/v) 243 24.3
F23 Hex.EtOAc (40:60, v/v) 633 63.3
F24 MeOH 80 8.0Sum of fractions 997 99.7
135
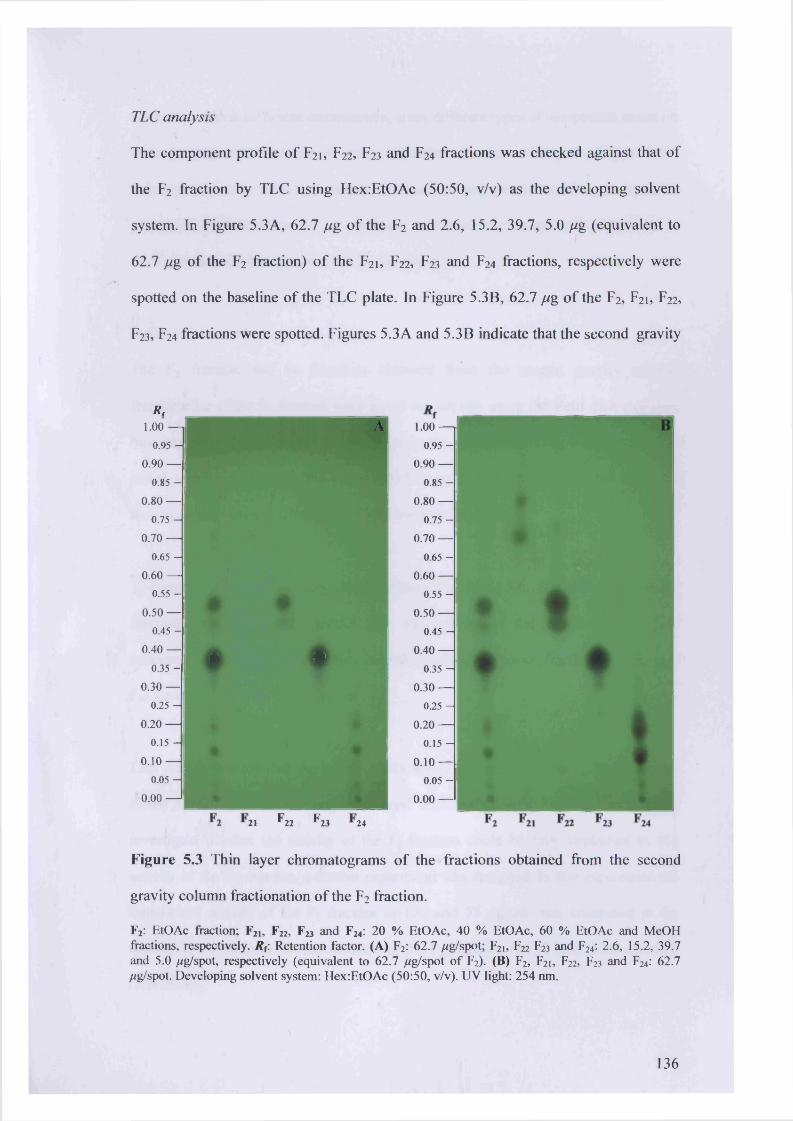
TLC analysis
The component profile of F2 1 , F2 2 , F23 and F24 fractions was checked against that of
the F2 fraction by TLC using Hex:EtOAc (50:50, v/v) as the developing solvent
system. In Figure 5.3A, 62.7 //g of the F2 and 2.6, 15.2, 39.7, 5.0 //g (equivalent to
62.7 fig of the F2 fraction) of the F2 1 , F2 2 , F23 and F24 fractions, respectively were
spotted on the baseline of the TLC plate. In Figure 5.3B, 62.7 fig of the F2 , F21 , F22 ,
F23, F24 fractions were spotted. Figures 5.3A and 5.3B indicate that the second gravity
Rr1.00 — A 1.00 —
0.95 - 0.95 -
0.90 — 0.90 —0.85 - 0.85 -
0.80 — 0.80 —0.75 - 0.75 -
0.70 — 0.70 —0.65 - 0.65 -
0.60 — 0.60 —0.55 - 0.55 -
0.50 — 0.50 —0.45 - 0.45 -
0.40 — A A 0.40 —0.35 - 0.35 -
0.30 — 0.30 —025 - 025 -
0.20 — 0.20 —0.15 - 0 .15-
0.10 — 0.10 —0.05 - 0.05 -
0.00 — 0.00 —
21 F 22 *23 24
Figure 5.3 Thin layer chromatograms of the fractions obtained from the second
gravity column fractionation of the F2 fraction.
F2: EtOAc fraction; F2!, F22, F^ and F^: 20 % EtOAc, 40 % EtOAc, 60 % EtOAc and MeOH fractions, respectively. R f: Retention factor. (A) F2: 62.7 //g/spot; F2 i, F22 F23 and F2 4: 2.6, 15.2, 39.7 and 5.0 //g/spot, respectively (equivalent to 62.7 //g/spot o f F2). (B) F2, F2 j, F22, F2 3 and F24: 62.7 //g/spot. Developing solvent system: Hex:EtOAc (50:50, v/v). UV light: 254 nm.
136
column provided sufficient fractionation, since different types of compounds based on
their polarity were present in each individual fraction. Moreover, Figure 5.3A
indicates that decomposition during fractionation had not occurred, as compounds
present in the F2 fraction did not disappear, and moreover, compounds not present in
the F2 fraction did not appear, after fractionation.
Insecticidal activity
The F2 fraction and its fractions obtained from the second gravity column
fractionation of the F2 fraction were tested for activity using the Petri dish exposure
bioassay in order to detect in which fraction the active chemicals were eluted. The
initial screening concentration was set at 100 //g/cm2. Only fractions that exhibited
activity at this concentration were further tested at 50 /^g/cm2.
The results of the two experiments are presented in Table 5.6. The activity of the F22
fraction was significantly greater than the activity of the F2 fraction at both
concentrations tested at all mortality recording times. Moreover, fractions F2 1 , F23 and
F24 were inactive even at 100 /*g/cm2.
That results indicate that the insecticidally active chemicals of the F2 fraction were
eluted to the F22 fraction during the second fractionation step. However, in order to
investigate whether the activity of the F2 fraction could be fully explained by the
activity of the F22 fraction, a further experiment was designed. In this experiment the
insecticidal activity of the F2 fraction at 100 and 75 /*g/cm2 was compared to the
activity of the equivalent concentration of the F22 fraction (24.30 and 12.15 //g/cm2),
respectively.
137
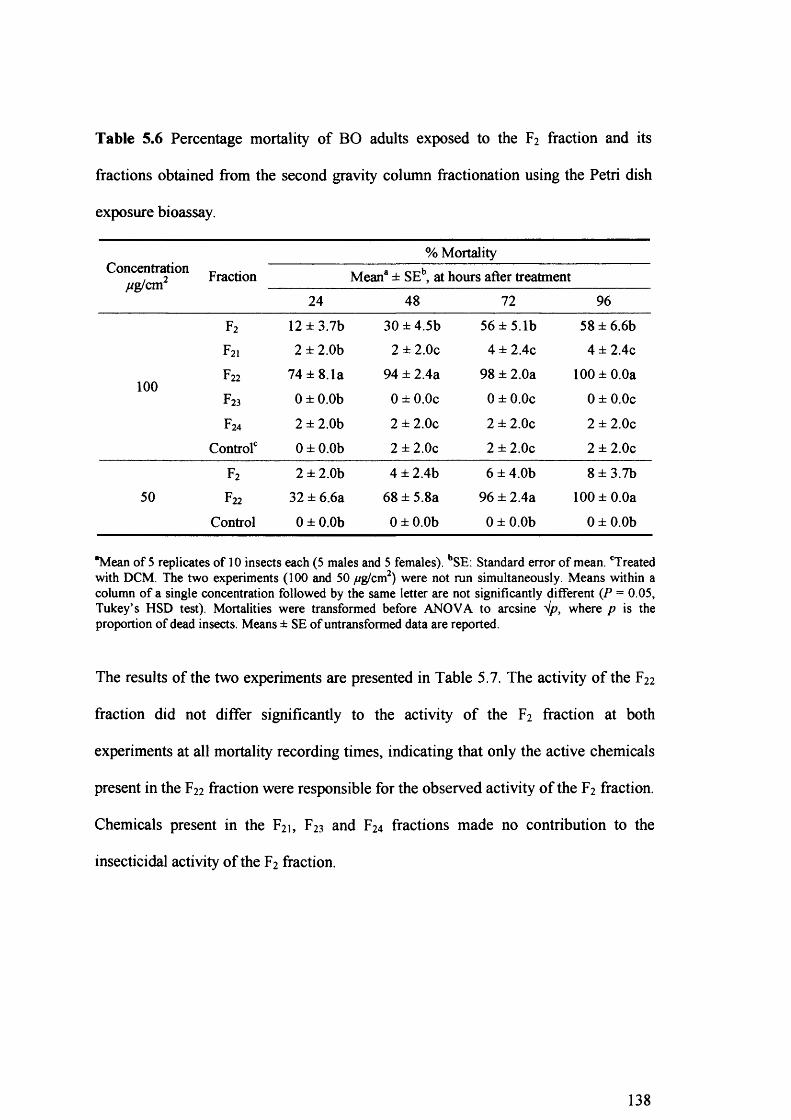
Table 5.6 Percentage mortality of BO adults exposed to the F2 fraction and its
fractions obtained from the second gravity column fractionation using the Petri dish
exposure bioassay.
Concentration/^g/cm2
% MortalityFraction Meana ± SEb, at hours after treatment
24 48 72 96
f2 12 ± 3.7b 30 ± 4.5b 56 ± 5.1b 58 ± 6 .6 b
F2i 2 ± 2 .0 b 2 ± 2 .0 c 4 ± 2.4c 4 ± 2.4c
F22 74 ± 8.1a 94 ± 2.4a 98 ± 2.0a 1 0 0 ± 0 .0 a1 0 0
F23 0 ± 0 .0 b 0 ± 0 .0 c 0 ± 0 .0 c 0 ± 0 .0 c
F24 2 ± 2 .0 b 2 ± 2 .0 c 2 ± 2 .0 c 2 ± 2 .0 c
Control0 0 ± 0 .0 b 2 ± 2 .0 c 2 ± 2 .0 c 2 ± 2 .0 c
f2 2 ± 2 .0 b 4 ± 2.4b 6 ± 4.0b 8 ± 3.7b50 F22 32 ± 6 .6 a 6 8 ± 5.8a 96 ± 2.4a 1 0 0 ± 0 .0 a
Control 0 ± 0 .0 b 0 ± 0 .0 b 0 ± 0 .0 b 0 ± 0 .0 b
“Mean o f 5 replicates o f 10 insects each (5 males and 5 females). bSE: Standard error o f mean. 'Treated with DCM. The two experiments (100 and 50 //g/cm2) were not run simultaneously. Means within a column o f a single concentration followed by the same letter are not significantly different (P = 0.05, Tukey’s HSD test). Mortalities were transformed before ANOVA to arcsine V/?, where p is the proportion o f dead insects. Means ± SE o f untransformed data are reported.
The results of the two experiments are presented in Table 5.7. The activity of the F22
fraction did not differ significantly to the activity of the F2 fraction at both
experiments at all mortality recording times, indicating that only the active chemicals
present in the F22 fraction were responsible for the observed activity of the F2 fraction.
Chemicals present in the F2 1, F23 and F24 fractions made no contribution to the
insecticidal activity of the F2 fraction.
138
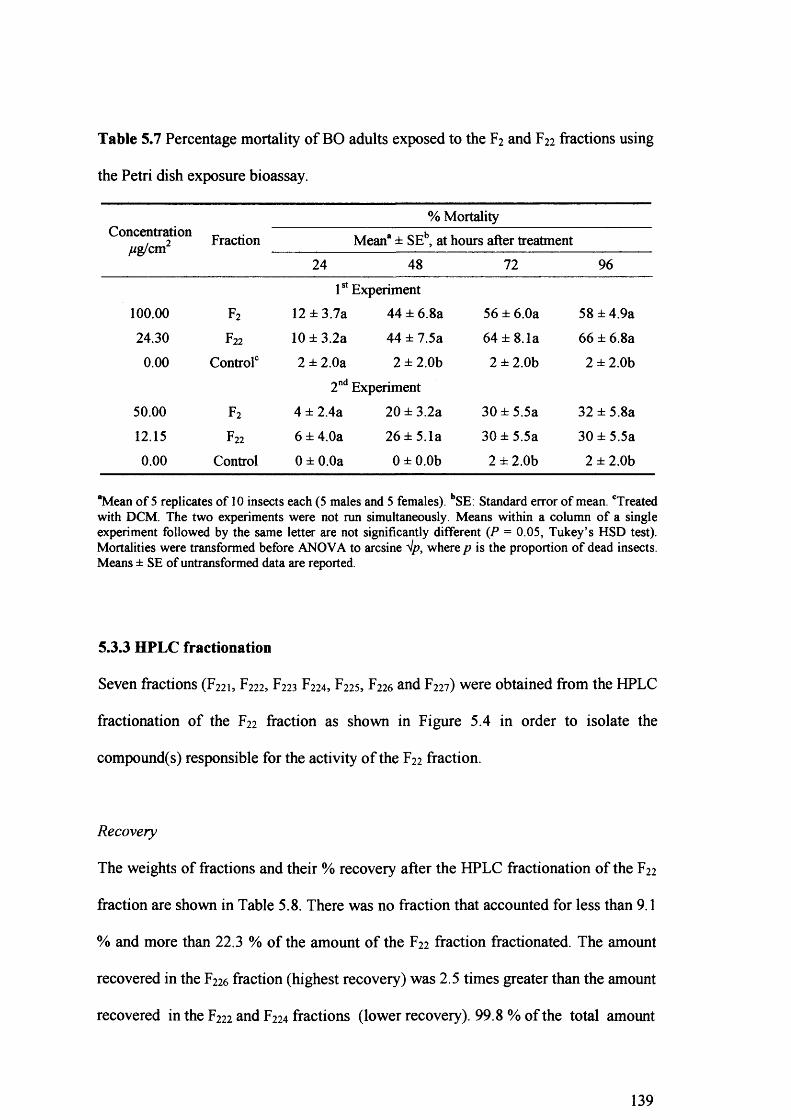
Table 5.7 Percentage mortality of BO adults exposed to the F2 and F22 fractions using
the Petri dish exposure bioassay.
Concentrationpg/cm2
% MortalityFraction Mean® ± SEb, at hours after treatment
24 48 72 96
1 0 0 . 0 0 f2
1st Experiment
12 ± 3.7a 44 ± 6 .8 a 56 ± 6.0a 58 ± 4.9a
24.30 F22 10 ± 3.2a 44 ± 7.5a 64 ± 8.1a 6 6 ± 6 .8 a
0 . 0 0 Control0 2 ± 2 .0 a 2 ± 2 .0 b 2 ± 2 .0 b 2 ± 2 .0 b
50.00 f2
2nd Experiment
4 ± 2.4a 20 ± 3.2a 30 ± 5.5a 32 ± 5.8a12.15 F22 6 ± 4.0a 26 ± 5.1a 30 ± 5.5a 30 ± 5.5a
0.00 Control 0 ± 0 .0 a 0 ± 0 .0 b 2 ± 2 .0 b 2 ± 2 .0 b
“Mean o f 5 replicates o f 10 insects each (5 males and 5 females). bSE: Standard error o f mean. 'Treated with DCM. The two experiments were not run simultaneously. Means within a column o f a single experiment followed by the same letter are not significantly different (P = 0.05, Tukey’s HSD test). Mortalities were transformed before ANOVA to arcsine V/?, where p is the proportion o f dead insects. Means ± SE o f untransformed data are reported.
5.3.3 HPLC fractionation
Seven fractions (F2 2 1 , F2 2 2, F223 F2 2 4, F2 2 5 , F226 and F2 2 7) were obtained from the HPLC
fractionation of the F22 fraction as shown in Figure 5.4 in order to isolate the
compound(s) responsible for the activity of the F22 fraction.
Recovery
The weights of fractions and their % recovery after the HPLC fractionation of the F22
fraction are shown in Table 5.8. There was no fraction that accounted for less than 9.1
% and more than 22.3 % of the amount of the F22 fraction fractionated. The amount
recovered in the F226 fraction (highest recovery) was 2.5 times greater than the amount
recovered in the F222 and F224 fractions (lower recovery). 99.8% of the total amount
139
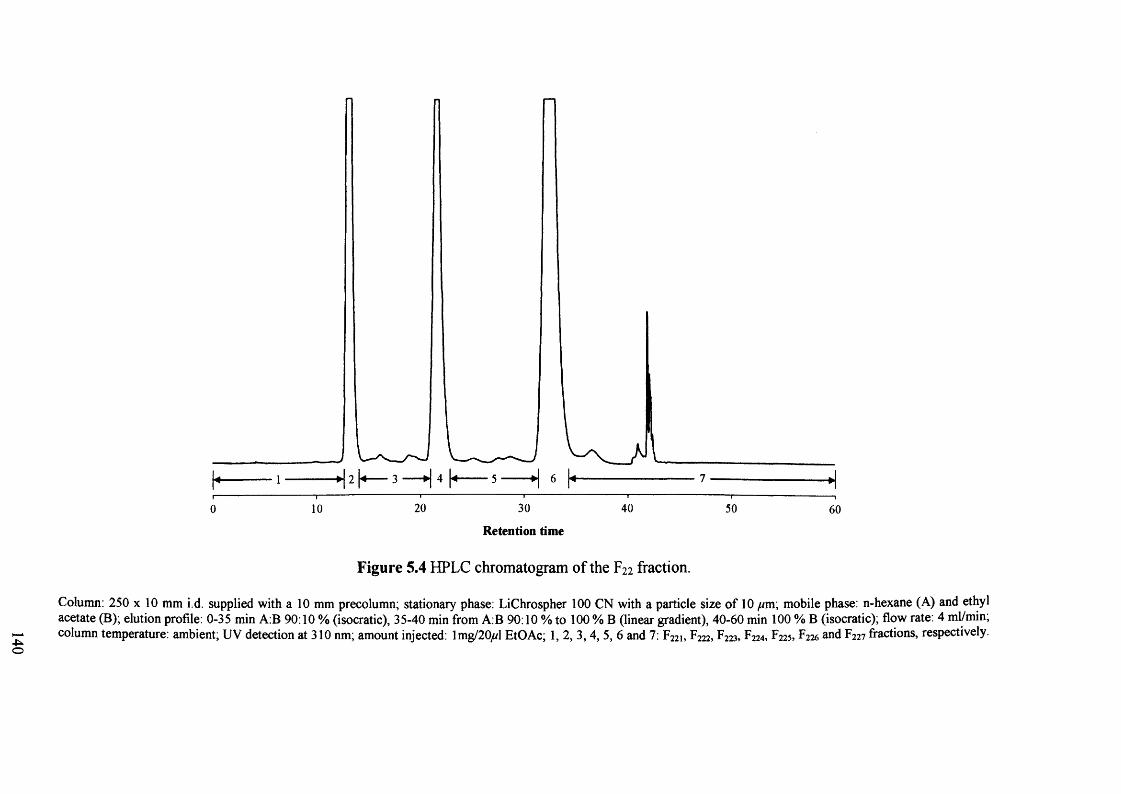
Retention time
Figure 5.4 HPLC chromatogram of the F22 fraction.
Column: 250 x 10 mm i d. supplied with a 10 mm precolumn; stationary phase: LiChrospher 100 CN with a particle size of 10 ftm\ mobile phase: n-hexane (A) and ethyl acetate (B); elution profile: 0-35 min A:B 90:10 % (isocratic), 35-40 min from A:B 90:10 % to 100 % B (linear gradient), 40-60 min 1 0 0 % B (isocratic); flow rate: 4 ml/min; column temperature: ambient; UV detection at 310 nm; amount injected: 1 mg/20//l EtOAc; 1, 2, 3, 4, 5, 6 and 7: F221, F222, F223, F224, F225, F226 and F227 fractions, respectively.
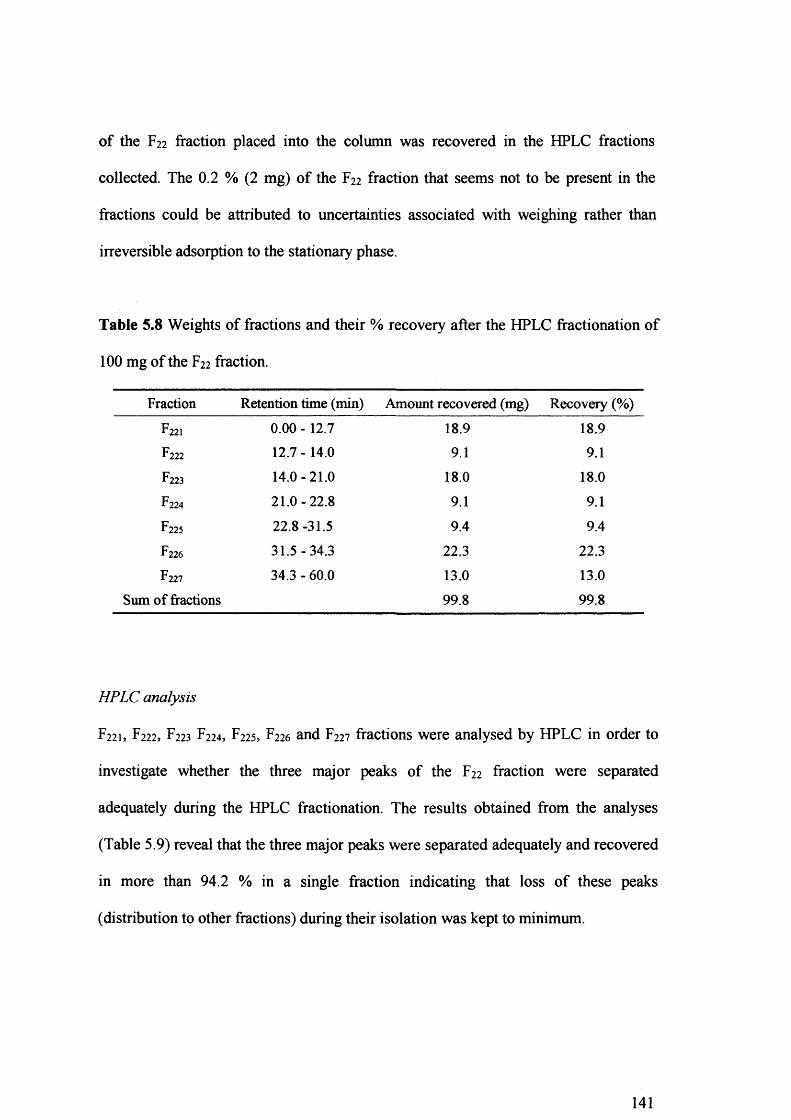
of the F22 fraction placed into the column was recovered in the HPLC fractions
collected. The 0.2 % (2 mg) of the F22 fraction that seems not to be present in the
fractions could be attributed to uncertainties associated with weighing rather than
irreversible adsorption to the stationary phase.
Table 5.8 Weights of fractions and their % recovery after the HPLC fractionation of
100 mg of the F22 fraction.
Fraction Retention time (min) Amount recovered (mg) Recovery (%)
F221 0.00 -12.7 18.9 18.9
F222 12.7 - 14.0 9.1 9.1
F223 14.0-21.0 18.0 18.0
F224 21.0-22.8 9.1 9.1
F225 22.8 -31.5 9.4 9.4
F226 31.5-34.3 22.3 22.3
F227 34.3 - 60.0 13.0 13.0Sum of fractions 99.8 99.8
HPLC analysis
F2 2 1 , F22 2, F223 F22 4 , F2 2 5, F226 and F227 fractions were analysed by HPLC in order to
investigate whether the three major peaks of the F22 fraction were separated
adequately during the HPLC fractionation. The results obtained from the analyses
(Table 5.9) reveal that the three major peaks were separated adequately and recovered
in more than 94.2 % in a single fraction indicating that loss of these peaks
(distribution to other fractions) during their isolation was kept to minimum.
141
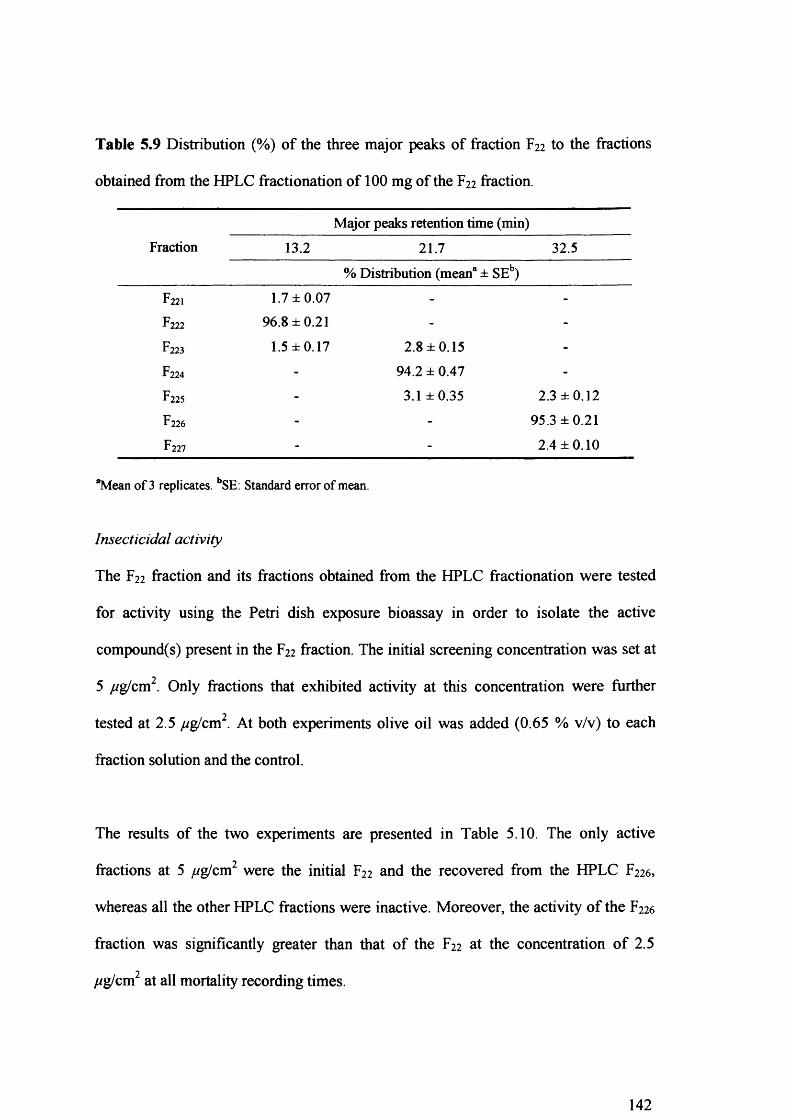
Table 5.9 Distribution (%) of the three major peaks of fraction F22 to the fractions
obtained from the HPLC fractionation of 100 mg of the F22 fraction.
FractionMajor peaks retention time (min)
13.2 21.7 32.5
% Distribution (mean8 ± SEb)
F221 1.7 ±0.07 - -
F222 96.8 ±0.21 - -
F223 1.5 ± 0.17 2.8 ±0.15 -
F224 - 94.2 ±0.47 -
F225 - 3.1 ±0.35 2.3 ±0.12
F226 - - 95.3 ±0.21
F227 - - 2.4 ±0.10
“Mean of 3 replicates. bSE: Standard error of mean.
Insecticidal activity
The F22 fraction and its fractions obtained from the HPLC fractionation were tested
for activity using the Petri dish exposure bioassay in order to isolate the active
compound(s) present in the F22 fraction. The initial screening concentration was set at
5 //g/cm2. Only fractions that exhibited activity at this concentration were further
tested at 2.5 //g/cm2. At both experiments olive oil was added (0.65 % v/v) to each
fraction solution and the control.
The results of the two experiments are presented in Table 5.10. The only active
fractions at 5 //g/cm2 were the initial F22 and the recovered from the HPLC F2 2 6 ,
whereas all the other HPLC fractions were inactive. Moreover, the activity of the F226
fraction was significantly greater than that of the F22 at the concentration of 2.5
//g/cm2 at all mortality recording times.
142
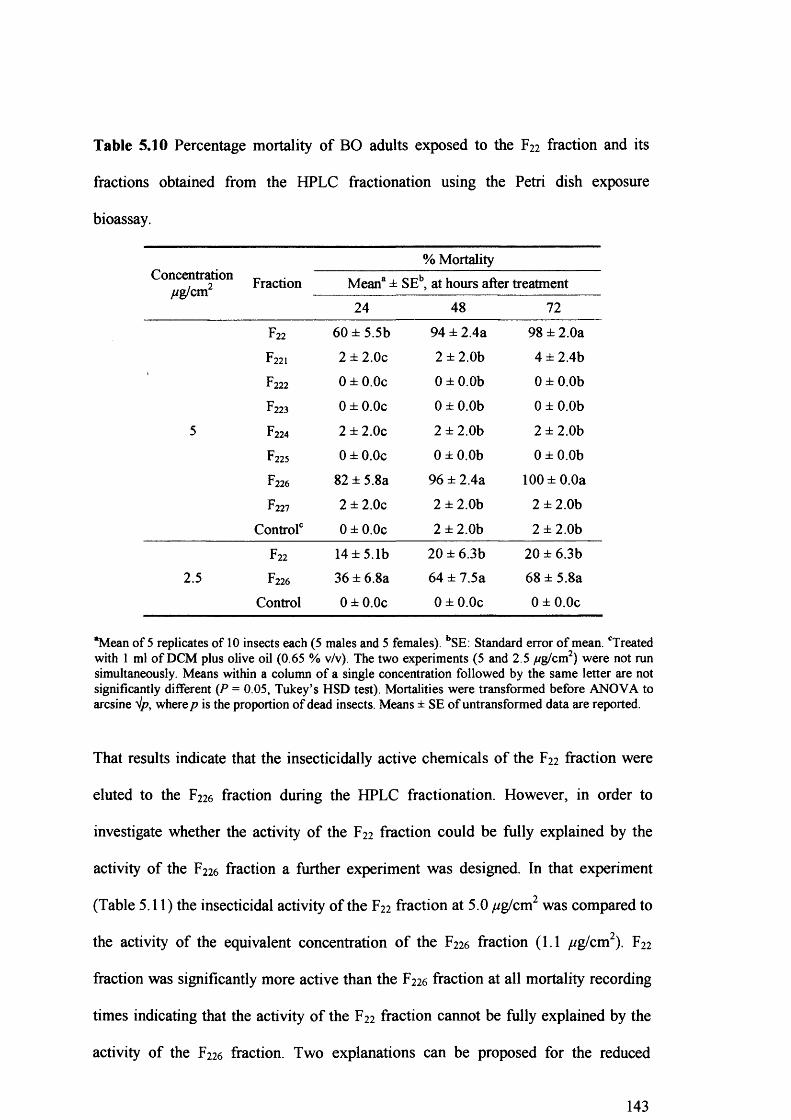
Table 5.10 Percentage mortality of BO adults exposed to the F22 fraction and its
fractions obtained from the HPLC fractionation using the Petri dish exposure
bioassay.
Concentration//g/cm2
% MortalityFraction Mean8 ± SEb, at hours after treatment
24 48 72
F22 60 ± 5.5b 94 ± 2.4a 98 ± 2.0a
F221 2 ± 2.0c 2 ± 2.0b 4 ± 2.4b
F222 0 ± 0.0c 0 ± 0.0b 0 ± 0.0b
F223 0 ± 0.0c 0 ± 0.0b 0 ± 0.0b5 F224 2 ± 2.0c 2 ± 2.0b 2 ± 2.0b
F225 0 ± 0.0c 0 ± 0.0b 0 ± 0.0b
F226 82 ± 5.8a 96 ± 2.4a 100 ± 0.0a
F227 2 ± 2.0c 2 ± 2.0b 2 ± 2.0b
Control0 0 ± 0.0c 2 ± 2.0b 2 ± 2.0b
F22 14 ± 5.1b 20 ± 6.3b 20 ± 6.3b2.5 F226 36 ± 6.8a 64 ± 7.5a 68 ± 5.8a
Control 0 ± 0.0c 0 ± 0.0c 0 ± 0.0c
*Mean of 5 replicates of 10 insects each (5 males and 5 females). bSE: Standard error of mean. 'Treated with 1 ml of DCM plus olive oil (0.65 % v/v). The two experiments (5 and 2.5 //g/cm2) were not run simultaneously. Means within a column of a single concentration followed by the same letter are not significantly different (P = 0.05, Tukey’s HSD test). Mortalities were transformed before ANOVA to arcsine where p is the proportion of dead insects. Means ± SE of untransformed data are reported.
That results indicate that the insecticidally active chemicals of the F22 fraction were
eluted to the F226 fraction during the HPLC fractionation. However, in order to
investigate whether the activity of the F22 fraction could be fully explained by the
activity of the F226 fraction a further experiment was designed. In that experiment
(Table 5.11) the insecticidal activity of the F22 fraction at 5.0 /*g/cm2 was compared to
the activity of the equivalent concentration of the F226 fraction (1.1 y«g/cm ). F22
fraction was significantly more active than the F226 fraction at all mortality recording
times indicating that the activity of the F22 fraction cannot be fully explained by the
activity of the F226 fraction. Two explanations can be proposed for the reduced
143
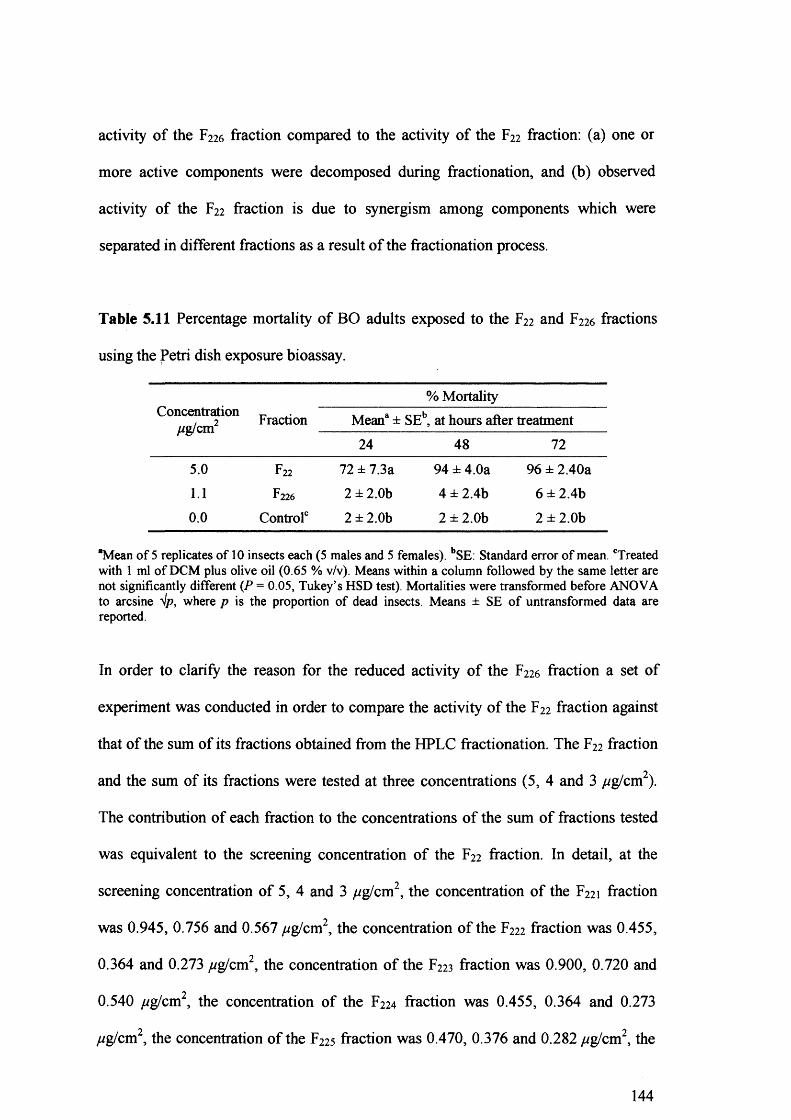
activity of the F226 fraction compared to the activity of the F22 fraction: (a) one or
more active components were decomposed during fractionation, and (b) observed
activity of the F22 fraction is due to synergism among components which were
separated in different fractions as a result of the fractionation process.
Table 5.11 Percentage mortality of BO adults exposed to the F22 and F22 6 fractions
using the Petri dish exposure bioassay.
Concentration//g/cm2
% MortalityFraction Mean8 ± SEb, at hours after treatment
24 48 725.0 F22 72 ± 7.3a 94 ± 4.0a 96 ± 2.40a1.1 F226 2 ± 2.0b 4 ± 2.4b 6 ± 2.4b0.0 Control0 2 ± 2.0b 2 ± 2.0b 2 ± 2.0b
“Mean of 5 replicates of 10 insects each (5 males and 5 females). bSE: Standard error of mean. cTreated with 1 ml of DCM plus olive oil (0.65 % v/v). Means within a column followed by the same letter are not significantly different (P = 0.05, Tukey’s HSD test). Mortalities were transformed before ANOVA to arcsine Vp, where p is the proportion of dead insects. Means ± SE of untransformed data are reported.
In order to clarify the reason for the reduced activity of the F226 fraction a set of
experiment was conducted in order to compare the activity of the F22 fraction against
that of the sum of its fractions obtained from the HPLC fractionation. The F22 fraction
and the sum of its fractions were tested at three concentrations (5, 4 and 3 //g/cm2).
The contribution of each fraction to the concentrations of the sum of fractions tested
was equivalent to the screening concentration of the F22 fraction. In detail, at the
screening concentration of 5, 4 and 3 //g/cm2, the concentration of the F221 fraction
was 0.945, 0.756 and 0.567 //g/cm2, the concentration of the F222 fraction was 0.455,
0.364 and 0.273 //g/cm2, the concentration of the F223 fraction was 0.900, 0.720 and
0.540 //g/cm2, the concentration of the F224 fraction was 0.455, 0.364 and 0.273
//g/cm2, the concentration of the F225 fraction was 0.470, 0.376 and 0.282 //g/cm2, the
144
concentration of the F226 fraction was 1.115, 0.892 and 0.669 //g/cm , and the
concentration of the F227 fraction was 0.650, 0.520 and 0.390 //g/cm2, respectively.
The results of the three experiments are shown in Table 5.12. There were no
significant differences in activity between the F22 fraction and the sum of its fractions
(F221 + F222 + F223 + F224 + F225 + F226 + F2 2 7) at the three concentrations tested at all
mortality recording times.
The results clearly show that active chemicals were not decomposed during the HPLC
fractionation. Moreover, it was evident that synergism between chemicals present in
different fractions took place which can fully explained why the activity of the F226
fraction was significant lower than that of the F22 fraction.
A further set of experiments was conducted in order to detect among which fractions
synergism occurred. The F22 fraction and three different combinations of the HPLC
fractions were tested. These combinations were: the active F22 6 together with the two
other major peaks (F222 + F224 + F22 6); the active F226 together with all other fractions
except the two other major peaks (F221 + F223 + F225 + F2 26 + F2 2 7); and all fractions
except the active F226 (F221 + F222 + F223 + F224 + F225 + F2 2 7). The contribution of each
fraction to the concentration of each combination was equivalent to the screening
concentration of the F22 fraction, 4 and 3 //g/cm2, (for details see previous
experiment). Only fractions combinations that were active in the initial experiment
were tested further.
145
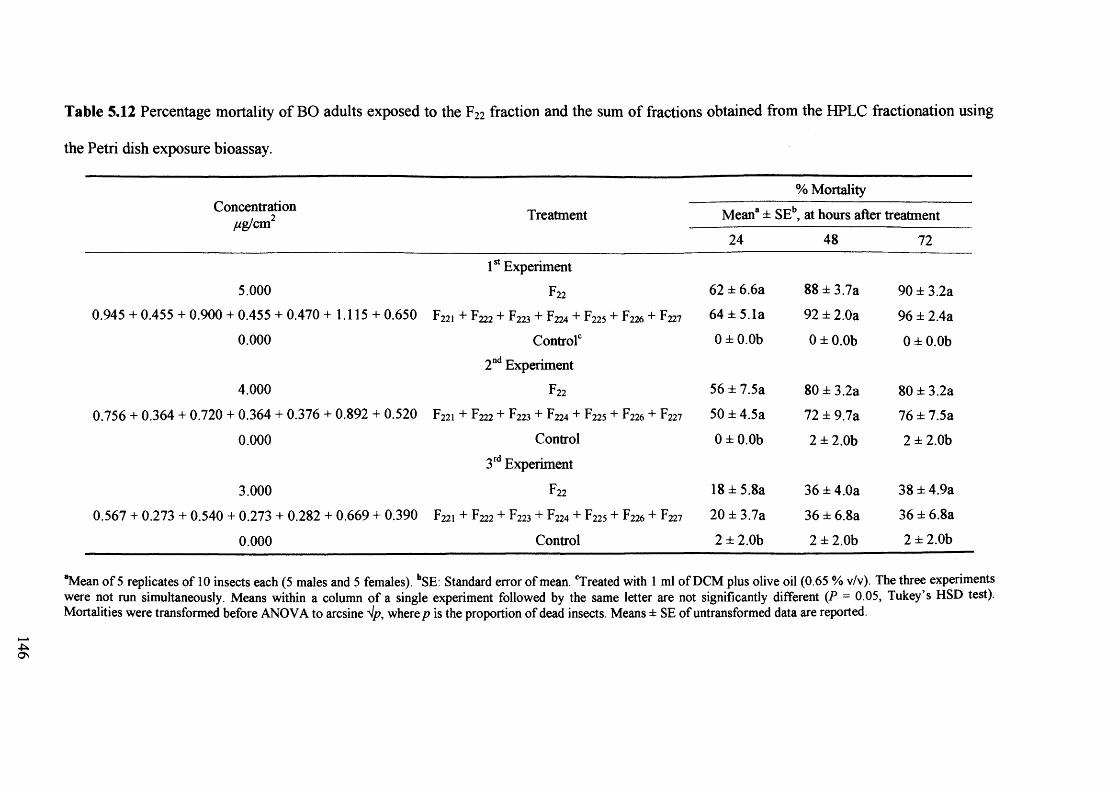
Table 5.12 Percentage mortality of BO adults exposed to the F22 fraction and the sum of fractions obtained from the HPLC fractionation using
the Petri dish exposure bioassay.
Concentration//g/cm2
Treatment
% Mortality
Mean® ± SEb, at hours after treatment
24 48 72
1st Experiment5.000 F22 62 ± 6 .6 a 8 8 ± 3.7a 90 ± 3.2a
0.945 + 0.455 + 0.900 + 0.455 + 0.470 + 1.115 + 0.650 F22I + F222 + F223 + F224 + F225 + F226 + F ^ 64 ± 5.1a 92 ± 2.0a 96 ± 2.4a0 . 0 0 0 Control' 0 ± 0 .0 b 0 ± 0 .0 b 0 ± 0 .0 b
2nd Experiment
4.000 F22 56 ± 7.5a 80 ± 3.2a 80 ± 3.2a0.756 + 0.364 + 0.720 + 0.364 + 0.376 + 0.892 + 0.520 F221 + F222 + F223 + F224 + F225 + F226 + F227 50 ± 4.5a 72 ± 9.7a 76 ± 7.5a
0 . 0 0 0 Control 0 ± 0 .0 b 2 ± 2 .0 b 2 ± 2 .0 b3 rd Experiment
3.000 F22 18 ± 5.8a 36 ± 4.0a 38 ± 4.9a
0.567 + 0.273 + 0.540 + 0.273 + 0.282 + 0.669 + 0.390 F22I + F222 + F223 + F224 + F225 + F226 + F227 20 ± 3.7a 36 ± 6 .8 a 36 i 6 .8 a
0 . 0 0 0 Control 2 ± 2 .0 b 2 ± 2 .0 b 2 ± 2 .0 b
“Mean o f 5 replicates o f 10 insects each (5 males and 5 females). bSE: Standard error o f mean. 'Treated with 1 ml o f DCM plus olive oil (0.65 % v/v). The three experiments were not run simultaneously. Means within a column o f a single experiment followed by the same letter are not significantly different (P = 0.05, Tukey’s HSD test). Mortalities were transformed before ANOVA to arcsine 'Ip, where p is the proportion o f dead insects. Means ± SE o f untransformed data are reported.
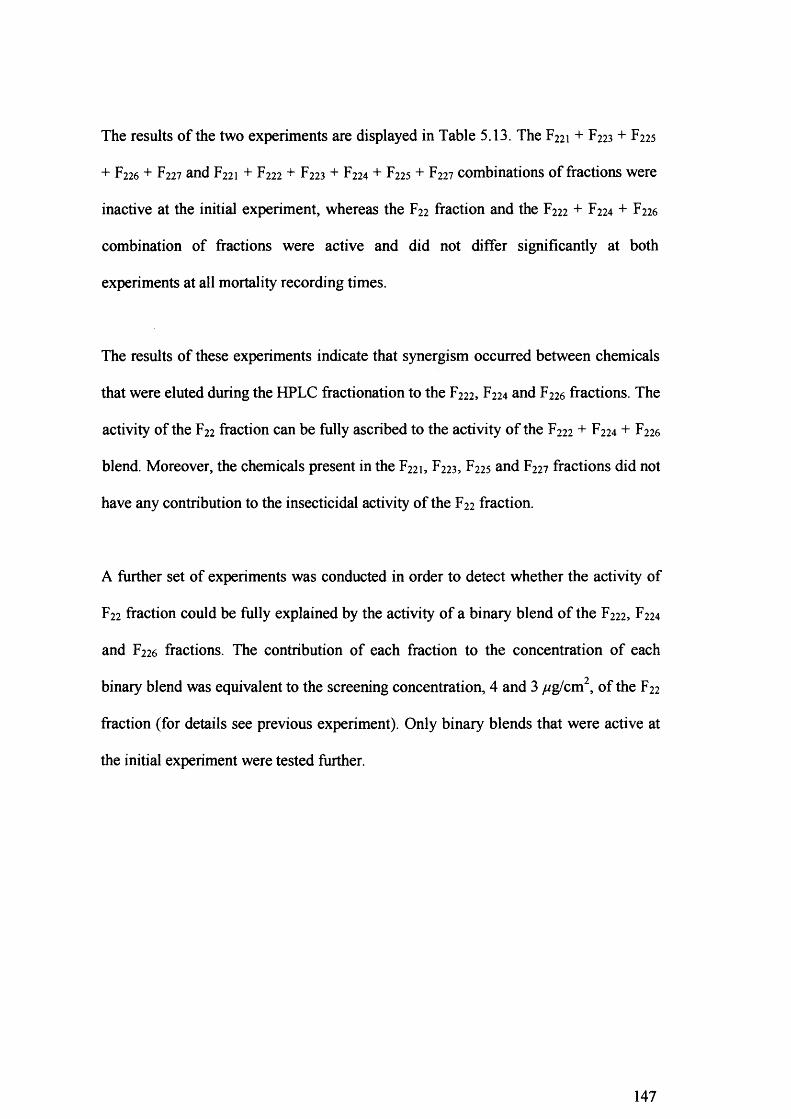
The results of the two experiments are displayed in Table 5.13. The F221 + F223 + F225
+ F226 + F227 and F221 + F222 + F223 + F224 + F225 + F227 combinations of fractions were
inactive at the initial experiment, whereas the F22 fraction and the F222 + F224 + F226
combination of fractions were active and did not differ significantly at both
experiments at all mortality recording times.
The results of these experiments indicate that synergism occurred between chemicals
that were eluted during the HPLC fractionation to the F2 2 2 , F224 and F226 fractions. The
activity of the F22 fraction can be fully ascribed to the activity of the F222 + F224 + F226
blend. Moreover, the chemicals present in the F22 1 , F22 3 , F225 and F227 fractions did not
have any contribution to the insecticidal activity of the F22 fraction.
A further set of experiments was conducted in order to detect whether the activity of
F22 fraction could be fully explained by the activity of a binary blend of the F2 2 2 , F224
and F226 fractions. The contribution of each fraction to the concentration of each
binary blend was equivalent to the screening concentration, 4 and 3 //g/cm , of the F22
fraction (for details see previous experiment). Only binary blends that were active at
the initial experiment were tested further.
147
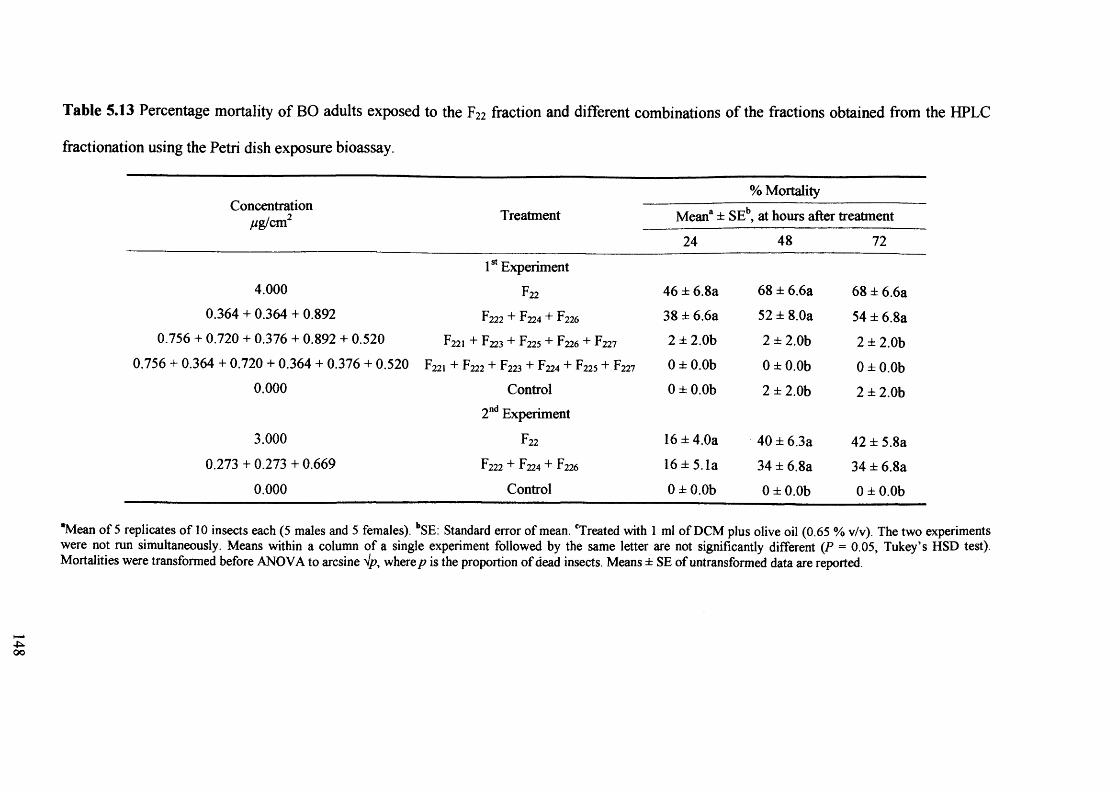
Table 5.13 Percentage mortality of BO adults exposed to the F22 fraction and different combinations of the fractions obtained from the HPLC
fractionation using the Petri dish exposure bioassay.
Concentrationp g / c m 2
% MortalityTreatment Mean8 ± SEb, at hours after treatment
24 48 72
1st Experiment4.000 F22 46 ± 6.8a 68 ± 6.6a 68 ± 6.6a
0.364 + 0.364 + 0.892 F222 + F224 + F226 38 ± 6.6a 52 ± 8.0a 54 ± 6.8a0.756 + 0.720 + 0.376 + 0.892 + 0.520 F221 + F2 2 3 + F225 + F226 + F227 2 ± 2.0b 2 ± 2.0b 2 ± 2.0b
0.756 + 0.364 + 0.720 + 0.364 + 0.376 + 0.520 F22I + F222 + F223 + F224 + F225 + F227 0 ± 0.0b 0 ± 0.0b 0 ± 0.0b0.000 Control 0 ± 0.0b 2 ± 2.0b 2 ± 2.0b
2nd Experiment
3.000 F22 16 ± 4.0a 40 ± 6.3a 42 ± 5.8a0.273 + 0.273 + 0.669 F222 + F224 + F226 16 ± 5.1a 34 ± 6.8a 34 ± 6.8a
0.000 Control 0 ± 0.0b 0 ± 0.0b 0 ± 0.0b
"Mean o f 5 replicates o f 10 insects each (5 males and 5 females). bSE: Standard error o f mean. cTreated with 1 ml o f DCM plus olive oil (0.65 % v/v). The two experiments were not run simultaneously. Means within a column o f a single experiment followed by the same letter are not significantly different {P = 0.05, Tukey’s HSD test). Mortalities were transformed before ANOVA to arcsine V/>, where p is the proportion o f dead insects. Means ± SE o f untransformed data are reported.
The results of the two experiments are displayed in Table 5.14. The F222 + F224 and
F222 + F226 binary blends were inactive at the initial experiment, whereas the F22
fraction and the F224 + F226 binary blend were active and did not differ significantly at
both experiments at all mortality recording times.
Table 5.14 Percentage mortality of BO adults exposed to the F22 fraction and different
binary blends of the three major peaks of the F22 fraction using the Petri dish exposure
bioassay.
Concentration//g/cm2 Treatment
% Mortality
Mean8 ± SE1b, at hours after treatment
24 48 72
1stExperiment4.000 F22 40 ± 5.5a 64 ± 5.1a 66 ± 5.1a
0.364 + 0.364 F222 + F224 34 ± 5.1a 56 ± 5.1a 56 ± 5.1a0.364 + 0.892 F222 + F226 0 ± 0.0b 2 ± 2.0b 2 ± 2.0b0.364 + 0.892 F224 + F226 0 ± 0.0b 0 ± 0.0b 2 ± 2.0b
0.000 Control0 2 ± 2.0b 4 ± 2.4b 4 ± 2.4b2ndExperiment
3.000 F22 20 ± 4.5a 34 ± 7.5a 36 ± 6.8a0.273 + 0.669 F 224 + F226 18 ± 3.7a 26 ± 6.0a 26 ± 6.0a
0.000 Control 2 ± 2.0b 2 ± 2.0b 2 ± 2.0b
“Mean o f 5 replicates o f 10 insects each (5 males and 5 females). bSE: Standard error o f mean. cTreated with 1 ml o f DCM plus olive oil (0.65 % v/v). The two experiments were not run simultaneously. Means within a column o f a single experiment followed by the same letter are not significantly different (P - 0.05, Tukey’s HSD test). Mortalities were transformed before ANOVA to arcsine V/>, where p is the proportion o f dead insects. Means ± SE o f untransformed data are reported.
The results of these experiments indicate that synergism occurred between chemicals
that were eluted during HPLC fractionation to the F224 and F226 fractions. The activity
of the F22 fraction can fully be ascribed to the activity of the F224 + F226 binary blend.
Moreover, the chemical(s) present in the F222 fraction did not made any contribution
to the insecticidal activity of the F22 fraction.
149
In a final set of experiments the activity of the petroleum ether peel extract was
compared to the activity of a blend consisted of the Fi, F224 and F226 fractions, in order
to confirm that the activity of the petroleum ether peel extract was due to the presence
of these fractions in the extract. The contribution of each fraction to the concentration
of the blend was equivalent to the screening concentration of the petroleum ether peel
extract. In detail, at the screening concentration of 25 and 15 //g/cm2 the concentration
of the Fi fraction was 6.78 and 4.07 //g/cm2, the concentration of the F224 fraction was
0.35 and 0.21 //g/cm2, while the concentration of the F226 fraction was 0.85 and 0.51
//g/cm2, respectively. At this experiment olive oil was not added to treatment
solutions.
The results of these experiments are presented in Figure 5.15. There were no
significant differences in activity between the petroleum ether peel extract and the
blend of the Fi, F224 and F226 fractions at both concentrations at all mortality recording
times.
The results clearly show that the activity of the petroleum ether peel extract was the
result of the synergistic action among the Fi, F224 and F226 fractions. Since Fi fraction
consisted of a mixture of compounds it can be concluded that at least three
compounds contribute for the overall activity of the petroleum ether peel extract.
150
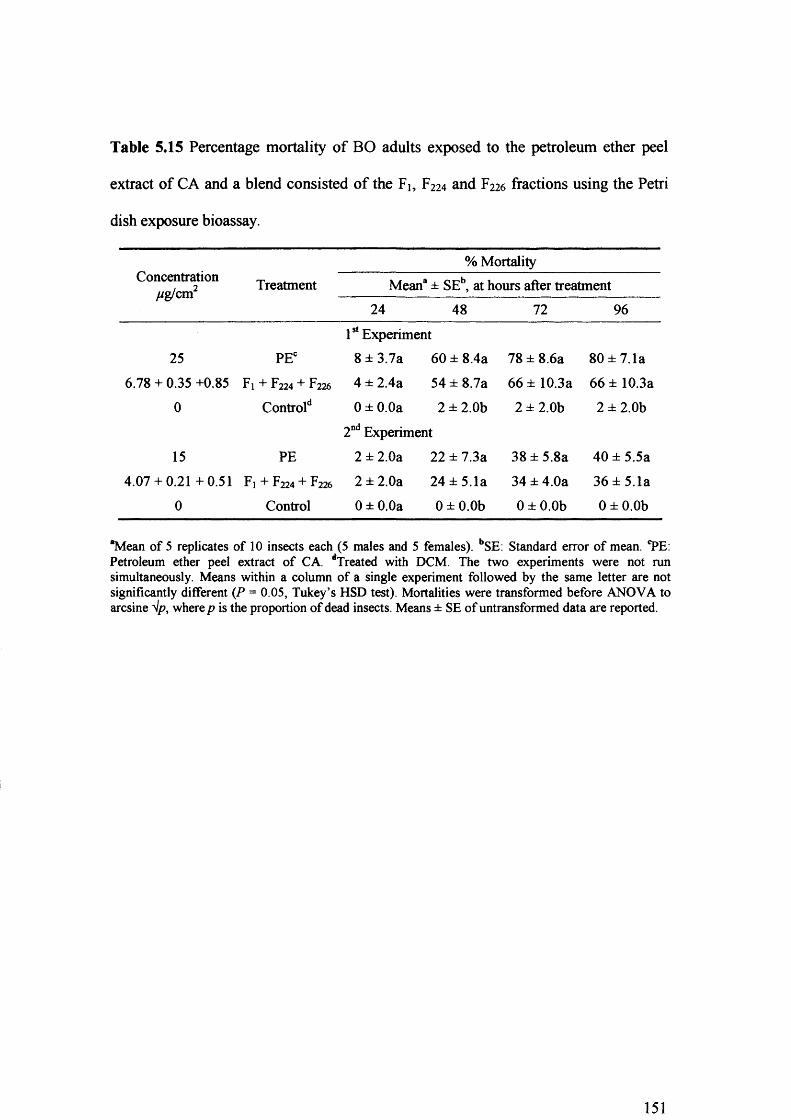
Table 5.15 Percentage mortality of BO adults exposed to the petroleum ether peel
extract of CA and a blend consisted of the Fi, F224 and F226 fractions using the Petri
dish exposure bioassay.
Concentrationpg/cm2
% MortalityTreatment Mean® ± SEb, at hours after treatment
24 48 72 96
1st Experiment25 PEC 8 + 3.7a 60 ± 8.4a 78 ± 8.6a 80 + 7.1a
6.78 + 0.35 +0.85 Fl + F224 + F226 4 ± 2.4a 54 ± 8.7a 66+ 10.3a 66+ 10.3a0 Control*1 0 + 0.0a 2 ± 2.0b 2 ± 2.0b 2 ± 2.0b
2nd Experiment15 PE 2 ± 2.0a 22 ± 7.3a 38 ± 5.8a 40 + 5.5a
4.07 + 0.21+0.51 Fl + F224 + F226 2 ± 2.0a 24 + 5.1a 34 ± 4.0a 36 + 5.1a0 Control 0 ± 0.0a 0 ± 0.0b 0 ± 0.0b 0 ± 0.0b
“Mean of 5 replicates of 10 insects each (5 males and 5 females). bSE: Standard error of mean. ^E: Petroleum ether peel extract of CA. dTreated with DCM. The two experiments were not run simultaneously. Means within a column of a single experiment followed by the same letter are not significantly different (P = 0.05, Tukey’s HSD test). Mortalities were transformed before ANOVA to arcsine Vp, where p is the proportion of dead insects. Means ± SE of untransformed data are reported.
5.4 DISCUSSION
Bioassay-guided fractionation of the petroleum ether peel extract resulted in the
isolation of three pure compounds (fractions F222, F224 and F2 2 6). Only the F226 fraction
was toxic when tested individually. The F224 fraction was found to act synergistically
to the F226 fraction, whereas the F222 fraction did not show any significant activity.
The fractionation procedure of two sequential gravity silica columns followed by
HPLC for the final step of purification was proven sufficient to isolate the
insecticidally active chemicals present in the peel extract.
The amount of chemicals recovered in each fractionation step was considerably high
(lowest recovery 96.7 % for the first gravity column whereas for the second gravity
column and HPLC recovery was ca. 100 %), indicating that only a very small portion
of compounds were not eluted from the columns. TLC analysis on the fractions
obtained from the two gravity columns and HPLC analysis on the HPLC fractions
indicate that decomposition did not occur during the whole fractionation process and
that adequate separation was achieved in each fractionation step.
Bioassays conducted with the fractions obtained from the fractionation process
revealed that the activity of the petroleum ether peel extract prior to fractionation can
be fully explained by the synergistic activity among Fi, F224 and F2 26 fractions That
finding indicates that the peel extract did not loss its activity when passed through the
columns.
Synergism among several compounds, usually chemically related, is in most cases
accountable for the activity of plant extracts. Plant extracts have different biological
152
characteristics from pure compounds. Mixtures may be more effective due to
synergism or joint action of active compounds with different mechanisms (Assabgui
et al., 1997). Berenbaum et al. (1991) investigated whether a mixture of 6
furanocoumarins isolated from fruits of Pastinaca sativa (Apiaceae) is toxicologically
more effective against Heliothis zea larva than is an equivalent amount of
xanthotoxin, which is the major furanocoumarin present in the mixture. They found
that the mixture of six furanocoumarins was more effective than equivalent amount of
pure xanthotoxin in reducing growth of Heliothis zea larva.
Moreover, the evolution of resistance to plant extracts is extremely slow in contrast to
resistance to pure compounds which develops rapidly. Feng and Isman (1995) found
that peach aphid lines selected with pure azadirachtin, developed a 9-fold resistance to
this substance over 40 generations, but a parallel line selected with neem seed extracts
containing azadirachtin and other materials did not develop significant resistance. It
was suggested that the reason underlying the extremely slow evolution of resistance to
plant extracts is that it is more difficult for an insect to develop several adaptations
simultaneously (Brattsten et al., 1986).
McLaughlin et al. (1997) pointed out that by the use of crude, chemically unrefined,
plant extracts, containing mixtures of the bioactive plant components, rather than the
use of pure individual components, insect resistance is much less likely to develop,
the environmental load of individual components is lessened and the products of
crude extracts are cheaper to prepare. In addition, Weaver et al. (1997) stated that
plant extracts subjected to simple chemical fractionation procedures may have a great
potential for insect control.
153
Considering the advantages of using plant extracts and taking into account the
synergistic activity of the petroleum ether peel extract it can be concluded that crude
or partially purified petroleum ether peel extracts of CA could have great potential,
particularly in the developing countries, for the control of insect pests.
Having obtained reasonable quantities of fractions F2 2 2 , F224 and F226 (pure
compounds), the next step, which is presented in Chapter 6, is to fully characterise
these components using spectroscopic methods. Moreover, the activity of the
characterised compounds was compared with standards or synthesised compounds.
154
CHAPTER 6
IDENTIFICATION OF ISOLATED INSECTICIDALLY ACTIVE
COMPONENTS
6.1 INTRODUCTION
Generally, the methods employed for the determination of the structure of unknown
compounds can be divided into two categories: chemical and physicochemical
(spectroscopic). In essence, chemical methods involve the use of degradative
techniques to produce simpler and more readily analysed compounds from an
unknown. Success of these methods hinges on the ability to work with small
quantities of material, and the accurate observation and interpretation o f the results
obtained (Harwood et al., 1999). Addition reactions, reductive and oxidative
processes are the main chemical methods used (Stevens, 1998). However, nowadays
structure determination relies heavily on spectroscopic methods. The use of these
techniques has revolutionised structure organic chemistry, and their impact cannot be
overstated (Harwood et al., 1999). With the advent of modem chemistry, the
structures of many biologically active compounds became known, and the systematic
studies of natural products that protected plants from pests became a recognised
activity within the field of chemistry (Hedin and Hollingworth, 1997).
The most widely spectroscopic techniques used are: ultraviolet (UV) spectroscopy,
infrared (IR) spectroscopy, nuclear magnetic resonance (NMR) spectroscopy and
mass (MS) spectrometry (Williams and Fleming, 1995). With the exception of MS, all
155
other spectroscopic methods are non-destructive, thus permitting further examination
of the sample; fortunately MS requires the least quantity of sample (Houghton and
Raman, 1998). UV, IR and NMR come under the general heading of absorption
spectrometry while MS is fundamentally different to these in that it does not involve
absorption of radiation (Harwood et al., 1999). The uses of these methods are stated
by Williams and Fleming (1995). UV spectroscopy is used to detect conjugated
systems, because the promotion of electrons from the ground state to the excited state
of such systems gives rise to absorption in this region. ER is used to detect and
identify the vibrations of molecules, and specifically the characteristic vibrations of
the double and triple bonds present in many functional groups. NMR uses a longer
wavelength of the electromagnetic spectrum to detect changes in the alignment of
nuclear magnets in strong magnetic fields. MS measures the mass-to-charge ratio of
organic ions. Structural information comes from the moderately predictable
fragmentation organic molecules undergo; the masses of the fragment ions can often
be related to likely structures. However, it cannot be overemphasized that the method
of greatest importance in structure determination is NMR. As NMR increased in
power over the last three decades, UV and IR have decreased in importance.
In this chapter the structure of the isolated chemicals present in the petroleum ether
peel extract of CA was determined using the following spectroscopic methods: UV,
IR, MS and NMR. Moreover, biological and spectroscopic studies with isolated and
synthetic compounds were performed in order to confirm our results.
156
6.2 METHODS
6.2.1 Spectroscopic methods
The following spectroscopic methods were employed in order to elucidate the
chemical structure of the three isolated compounds from the petroleum ether peel
extract.
UV Spectroscopy
UV spectra of F2 22, F224, F226 fractions were obtained during the HPLC fractionation
of the F22 fraction of the petroleum ether peel extract (for details see section 5.2.1).
UV spectra were recorded in the region of 245-365 nm and printed (GP-100 Graphics
Printer, Perkin Elmer).
Gas chromatography - Fourier Transform Infrared Spectroscopy.
GC-FTIR analysis of F22 2 , F2 2 4 , F226 fractions was carried out on a Perkin Elmer
Autosystem gas chromatograph interfaced to a Perkin Elmer System 2000 (Perkin
Elmer Ltd., Buckinghamshire, England) Fourier transform infrared spectrometer
equipped with a liquid-nitrogen cooled narrow-band (4000 - 750 cm"1) infrared
detector (mercury cadmium telluride). Helium was used as the carrier gas (2 ml/min)
and the effluent from the GC was mixed with the sweep gas helium (0.5 ml/min;
transfer line temperature 280 °C) and passed through the IR light pipe with KBr
windows. All spectra were obtained at 8 cm ' 1 resolution. All samples were
chromatographed on a 30 m x 0.32 mm x 1 pm film thickness DB-5 column (J&W
Scientific). The oven temperature program was 50 °C for 2 min, then 5 °C/min to 280
°C and held for 60 min. Splitless injections were made (1 /A) at an injector
temperature of 250 °C and a splitless period of 90 sec.
157
Gas Chromatography - Mass Spectrometry.
Gas chromatography - mass spectrometry analysis of F2 2 2 , F22 4 , F2 26 fractions was
carried out on a Hewlett Packard 5890 Series II gas chromatograph interfaced to a
Fisons VG Trio 1000 (Manchester M23 9BE, UK) quadrupole mass spectrometer.
Electron impact ionization was used, with an electron energy of 70 eV and a trap
current of 200 pA. The interface was kept at 290 °C. All samples were
chromatographed on a 60 m x 0.25 mm x 0.1 pm film thickness DB-5 column (J&W
Scientific). The oven temperature was set at 50 °C for 2 min, then raised to 250 °C at
5 °C/min, held for 1 min, then 2 °C/min to 280 °C and held for 50 min. Helium was
used as the carrier gas at a flow rate of 1 ml/min. Splitless injections were made (1 pX)
at an injector temperature of 250 °C and a splitless period of 90 sec. 6',7'-
epoxybergamottin could not be chromatographed on the GC as it probably
decomposes on the hot injector temperature. For this compound, mass spectrometric
data were obtained by the use of the Direct Contact Inlet (DCI) probe of the VG Trio
1000 mass spectrometer. The DCI was set at 0 mA for 2 min, then raised to 200 mA
at 100 mA/min, held for 2 min, then 300 mA/min to 1000 mA held for 4 min and then
ramped down to 0 mA at 200 mA/min where it stayed for 5 min.
NMR Spectroscopy
NMR spectra of F22 2, F224, F226 fractions were recorded on Bruker Advance DPX-400
spectrometer. CDCI3 was used as solvent. Tetramethylsilane or residual solvent peaks
(e.g. CHCI3) were used as frequency standards. Coupling constants were determined
using the computer program Multiplet and are quoted in hertz (Hz). Values are
reported to 0.1 Hz, but have an uncertainty of ± ca. 0.3 Hz (at 400 MHz), due to the
158
digital resolution of the FID accumulation and Fourier transformation. lH NMR
spectra were simulated using RACCOON.
6.2.2 Synthesis of 6r,7-epoxybergamottin
20 mg bergamottin and 20 mg MCPBA, in 5 ml DCM, were left to stand for 3 h at
room temperature (20 - 22 °C) (Dreyer and Huey, 1973; Bellevue et al., 1997). The
DCM solution was extracted three times with H2O (5 ml each time) and the aqueous
layer was discarded. Na2S0 4 was added then to the DCM solution in order to absorb
the water remained. The DCM solution was filtered and concentrated. Purification of
the 6 7 '-epoxybergamottin was done by HPLC using the same chromatographic
conditions as in section 5.2.1.
6.2.3 Bioassay of isolated and synthetic compounds
The Petri dish exposure bioassay was used in order to compare the insecticidal
activity of the isolated and synthetic compounds against 2-3 d-old adults of BO. Stock
solutions were prepared in DCM, as were subsequent dilutions. Olive oil was added to
each treatment solution and control (DCM) so that each cm2 of the total inner surface
of the Petri dishes was layered with 0.1 ju\ of olive oil. Fresh test solutions were
prepared for each replicate. The syringe used for the application of samples was
thoroughly cleaned after the application of each sample. Mortalities were recorded
every 24 h for 3 d after which no further increase in mortality was recorded.
Estimation ofLCsos
Five replicates of 10 BO flies each (5 males and 5 females) which were conducted
using 5 different generations of flies, were employed for the 5 concentrations and the
159
control. The concentrations tested for each chemical were chosen on the basis of
preliminary range-finding studies. The concentrations of the isolated and synthesised
6 ',7'-epoxybergamottin tested were 1.7, 2.0, 2.3, 2.6 and 2.9 /*g/cm2. Rotenone, a
commercial plant-derived insecticide was used for comparison. The concentrations of
rotenone tested were 0.015, 0.020, 0.025, 0.030 and 0.035 /^g/cm2. Concentrations for
each replicate of each chemical were applied from the lowest to the highest.
Screening experiments
Five replicates of 10 BO flies each (5 males and 5 females) were employed for each
treatment and the control. The 5 replicates were conducted on 5 successive days,
utilising the same generation of flies. Different concentrations of screened treatments
were not run simultaneously as screening experiments at lower concentrations
included only the more active treatments.
160
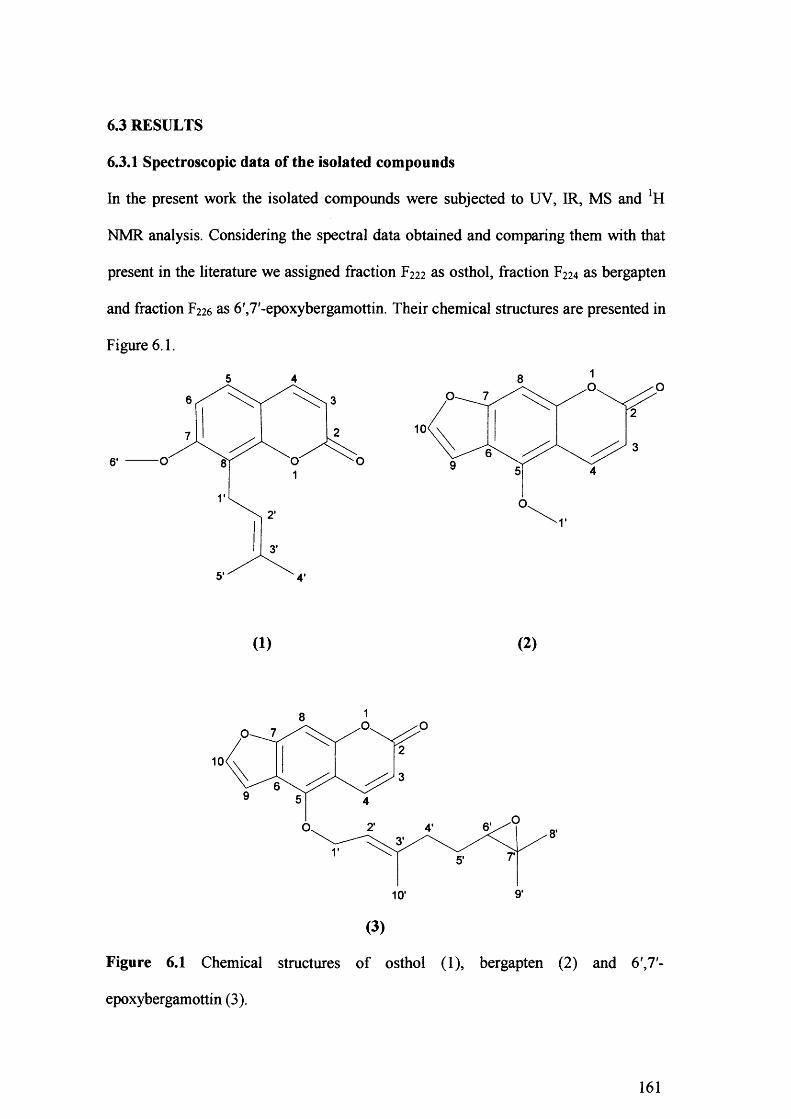
6.3 RESULTS
6.3.1 Spectroscopic data of the isolated compounds
In the present work the isolated compounds were subjected to UV, IR, MS and ]H
NMR analysis. Considering the spectral data obtained and comparing them with that
present in the literature we assigned fraction F222 as osthol, fraction F224 as bergapten
and fraction F226 as 6',7'-epoxybergamottin. Their chemical structures are presented in
Figure 6.1.
10
o.
(1) (2)
10
2’O. 4’
10' 9’
(3)
Figure 6 . 1 Chemical structures of osthol (1), bergapten (2) and 6 ',7'-
epoxybergamottin (3).
161
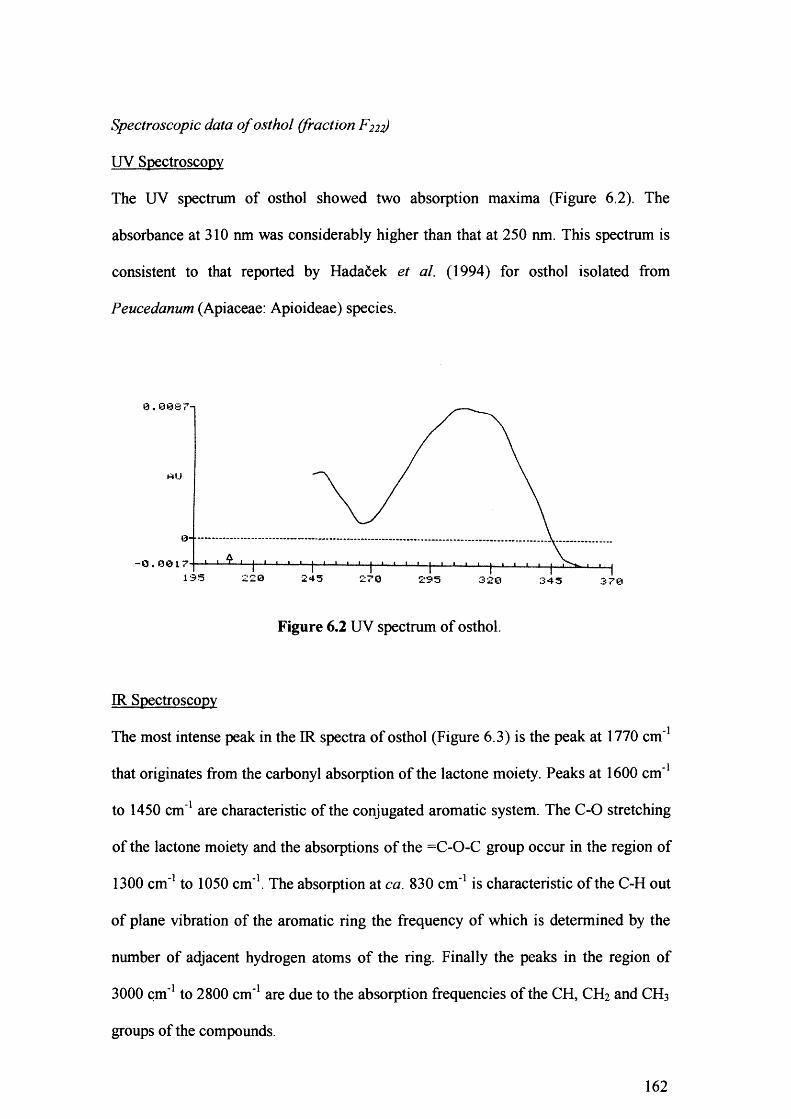
Spectroscopic data of osthol (fraction F 2 2 2 )
UV Spectroscopy
The UV spectrum of osthol showed two absorption maxima (Figure 6.2). The
absorbance at 310 nm was considerably higher than that at 250 nm. This spectrum is
consistent to that reported by Hadadek et al. (1994) for osthol isolated from
Peucedanum (Apiaceae: Apioideae) species.
rtU
-O.0O1724 5 320 345
Figure 6.2 UV spectrum of osthol.
IR Spectroscopy
The most intense peak in the IR spectra of osthol (Figure 6.3) is the peak at 1770 cm' 1
that originates from the carbonyl absorption of the lactone moiety. Peaks at 1600 cm' 1
to 1450 cm' 1 are characteristic of the conjugated aromatic system. The C-0 stretching
of the lactone moiety and the absorptions of the =C-0-C group occur in the region of
1300 cm ' 1 to 1050 cm'1. The absorption at ca. 830 cm ' 1 is characteristic of the C-H out
of plane vibration of the aromatic ring the frequency of which is determined by the
number of adjacent hydrogen atoms of the ring. Finally the peaks in the region of
3000 cm*1 to 2800 cm' 1 are due to the absorption frequencies of the CH, CH2 and CH3
groups of the compounds.
162
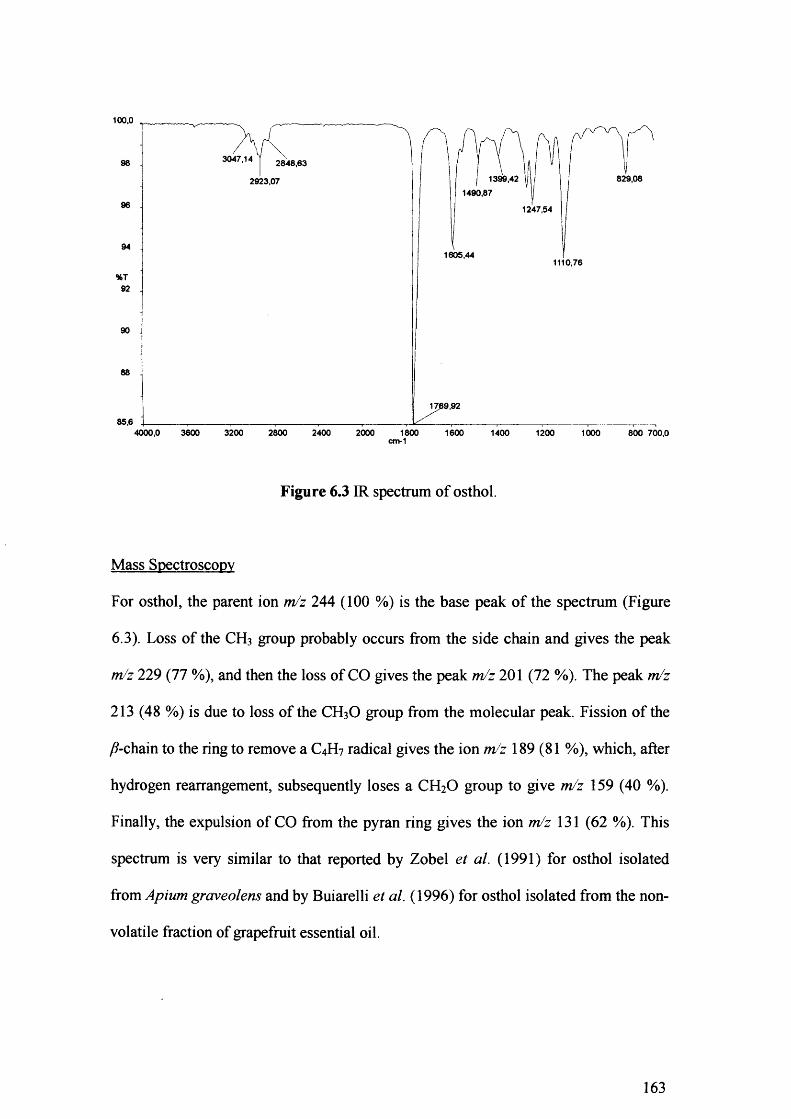
100,0
3047,1498 2848,63
1399,42 829,082923,071490,87
96 1247,54
941605,44
1110,76
%T92
90
88
1769,92
85,632004000,0 3600 2800 2400 2000 1800 1600 1400 1200 1000 800 700,0
cm-1
Figure 6.3 IR spectrum of osthol.
Mass Spectroscopy
For osthol, the parent ion m/z 244 (100 %) is the base peak of the spectrum (Figure
6.3). Loss of the CH3 group probably occurs from the side chain and gives the peak
m/z 229 (77 %), and then the loss of CO gives the peak m/z 201 (72 %). The peak m/z
213 (48 %) is due to loss of the CH3O group from the molecular peak. Fission of the
/?-chain to the ring to remove a C4H7 radical gives the ion m/z 189 (81 %), which, after
hydrogen rearrangement, subsequently loses a CH20 group to give m/z 159 (40 %).
Finally, the expulsion of CO from the pyran ring gives the ion m/z 131 (62 %). This
spectrum is very similar to that reported by Zobel et al. (1991) for osthol isolated
from Apium graveolens and by Buiarelli et al. (1996) for osthol isolated from the non
volatile fraction of grapefruit essential oil.
163
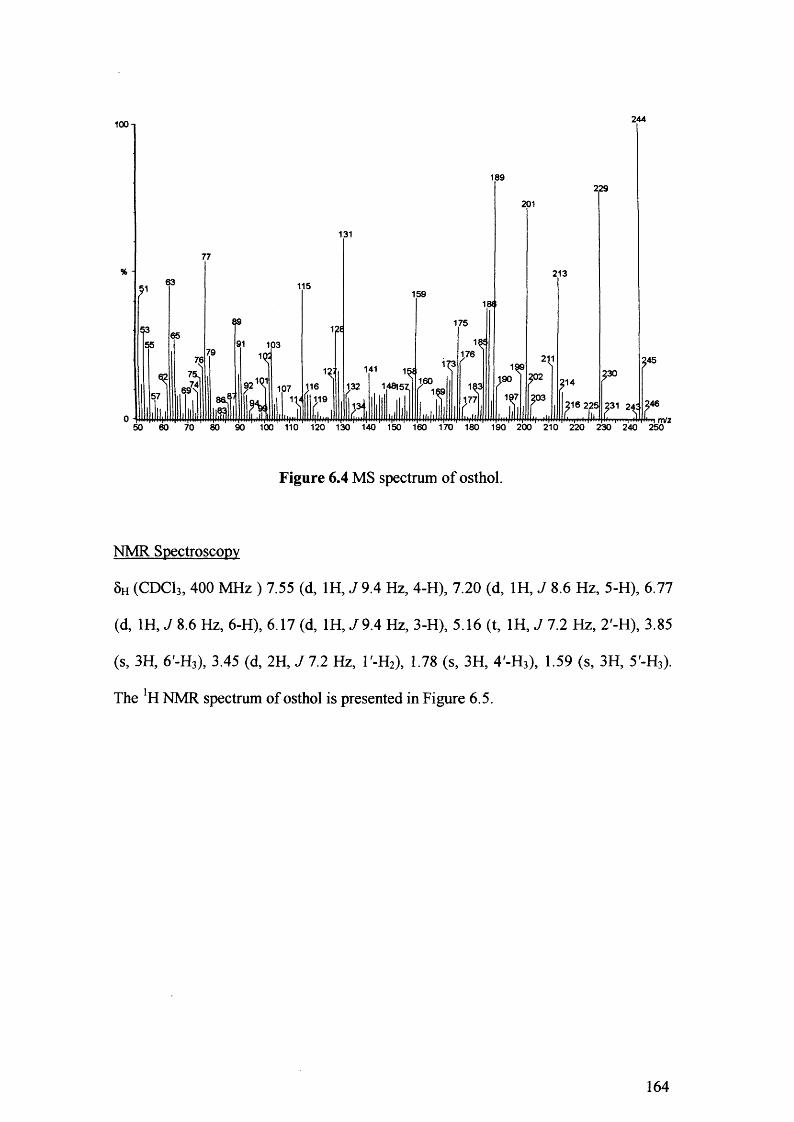
244100 n
189229
201
131
213115
159
17512 £
103176
141160
148151132116107119 177
Figure 6.4 MS spectrum of osthol.
NMR Spectroscopy
5h (CDC13, 400 MHz ) 7.55 (d, 1H, J 9.4 Hz, 4-H), 7.20 (d, 1H, J 8 . 6 Hz, 5-H), 6.77
(d, 1H, J 8 . 6 Hz, 6 -H), 6.17 (d, lH ,./9 .4 Hz, 3-H), 5.16 (t, 1H, J7 .2 Hz, 2'-H), 3.85
(s, 3H, 6 '-H3), 3.45 (d, 2H, J 12 Hz, l'-H2), 1.78 (s, 3H, 4'-H3), 1.59 (s, 3H, 5'-H3).
The JH NMR spectrum of osthol is presented in Figure 6.5.
164
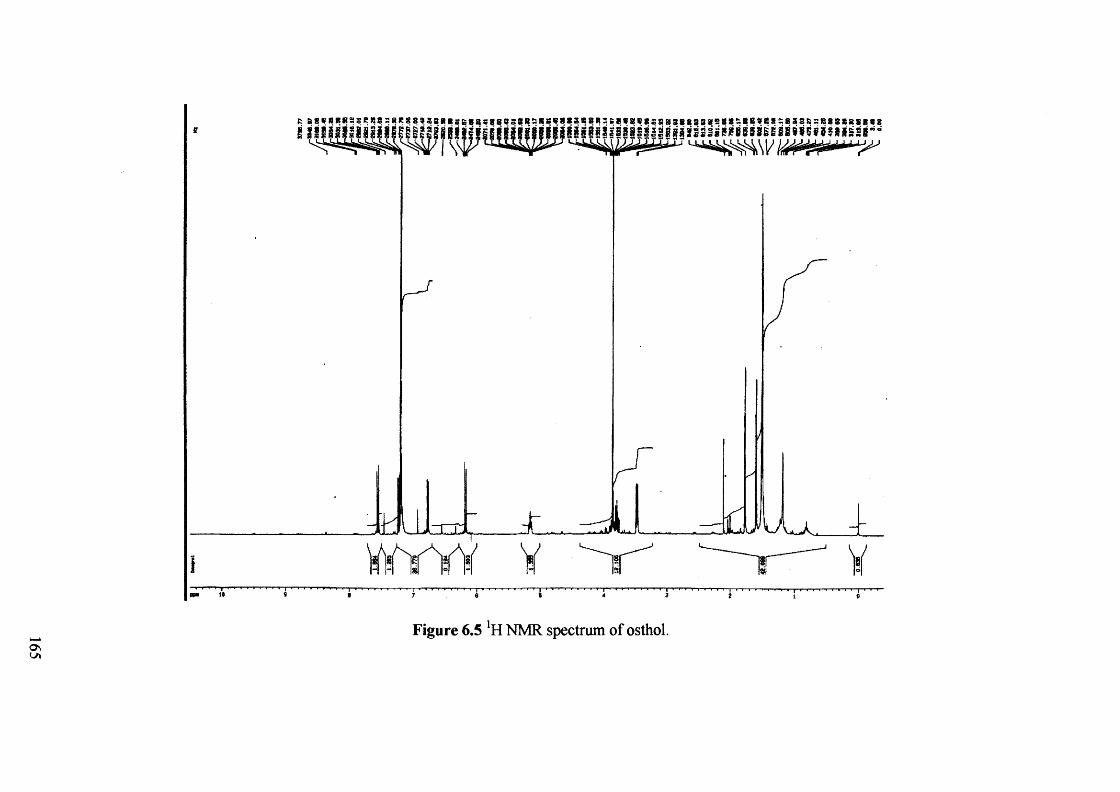
C S 8 « B K 8 2 ! S e ! B 8 = a i e S 8 » a 8 * l 5 E i * 8 5 8 8 5 S 8 R 5 S B « 8 * S S 8 » : s i ( * 8 5 l g s a 8 3 i 8 3 8 8 S * 8 - 8 E « a S i 8 S S S = l B S 8 S 8 8 B S 8
i i m m i ............................. '............ .........................................................................
J l
Figure 6.5 ]H NMR spectrum of osthol.
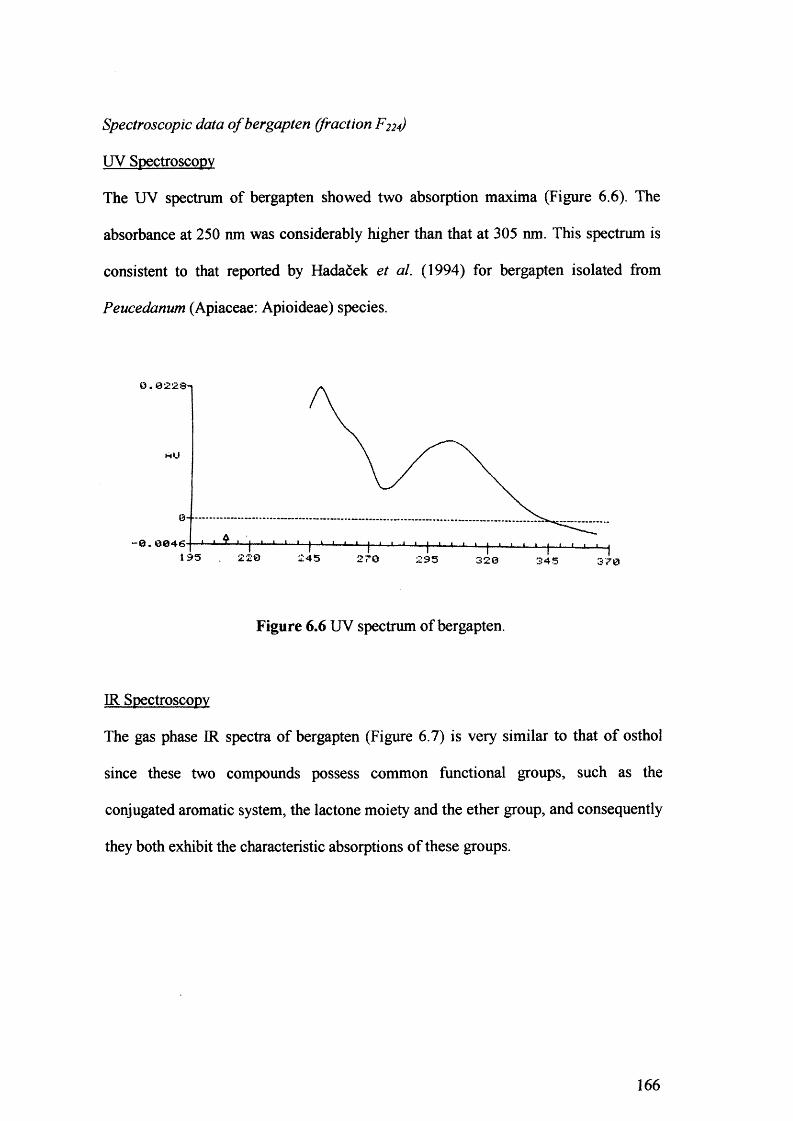
Spectroscopic data o f bergapten (fraction F224)
UV Spectroscopy
The UV spectrum of bergapten showed two absorption maxima (Figure 6.6). The
absorbance at 250 nm was considerably higher than that at 305 nm. This spectrum is
consistent to that reported by Hadacek et a l (1994) for bergapten isolated from
Peucedanum (Apiaceae: Apioideae) species.
hU
0 - . .
0 .0046220 245 270 95 320 345
Figure 6.6 UV spectrum of bergapten.
IR Spectroscopy
The gas phase IR spectra of bergapten (Figure 6.7) is very similar to that of osthol
since these two compounds possess common functional groups, such as the
conjugated aromatic system, the lactone moiety and the ether group, and consequently
they both exhibit the characteristic absorptions of these groups.
166
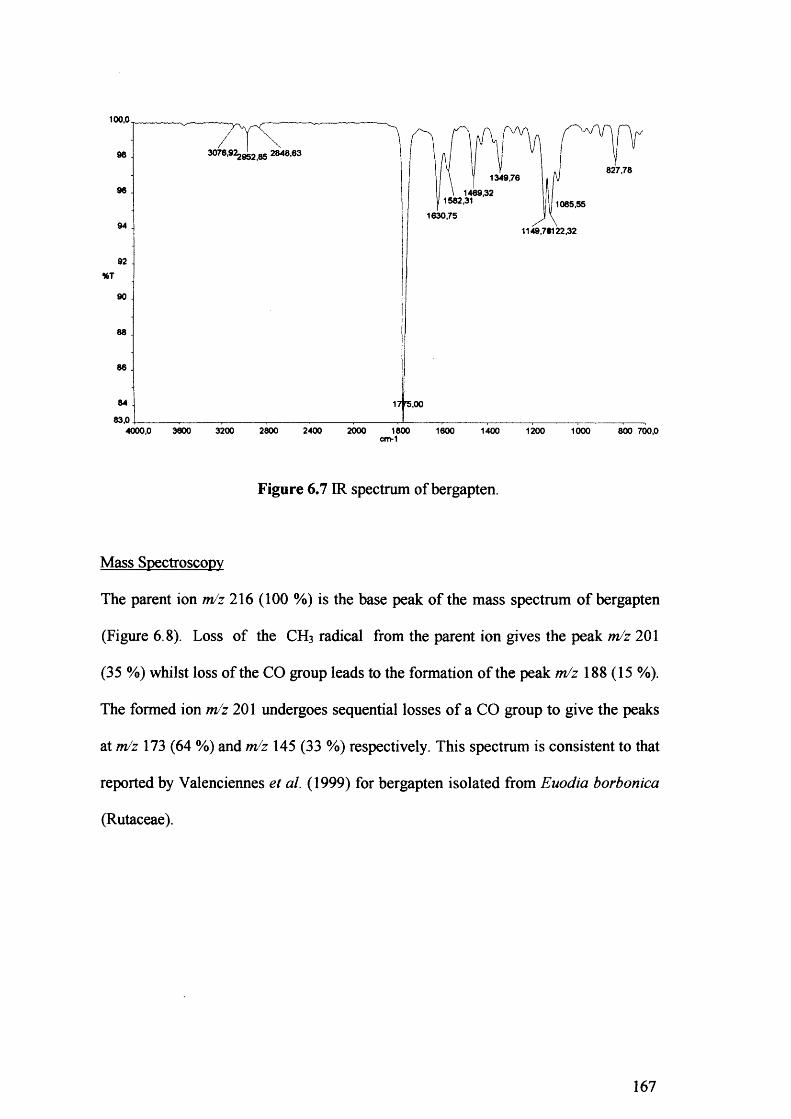
100,0
98
827,781349,76
96 1469,321582,31 1085,55
1630,75
%T
83,028004000,0 3800 3200 2400 2000 1800 1600 1400 1200 1000 800 700,0
cm-1
Figure 6.7 IR spectrum of bergapten.
Mass Spectroscopy
The parent ion m/z 216 (100 %) is the base peak of the mass spectrum of bergapten
(Figure 6 8 ). Loss of the CH3 radical from the parent ion gives the peak m/z 201
(35 %) whilst loss of the CO group leads to the formation of the peak m/z 188 (15 %).
The formed ion m/z 201 undergoes sequential losses of a CO group to give the peaks
at m/z 173 (64 %) and m/z 145 (33 %) respectively. This spectrum is consistent to that
reported by Valenciennes et al. (1999) for bergapten isolated from Euodia borbonica
(Rutaceae).
167
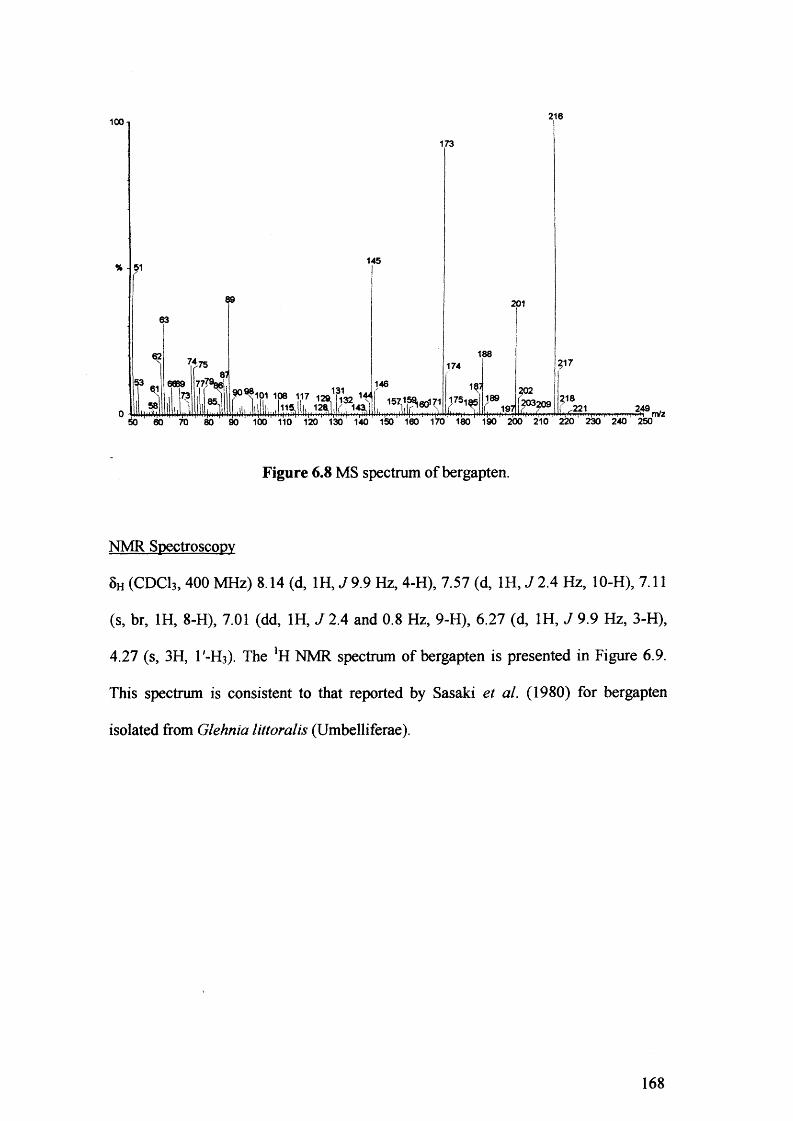
216100-1
173
145%
201
188217174
146
58m/z
Figure 6.8 MS spectrum of bergapten.
NMR Spectroscopy
5h (CDC13, 400 MHz) 8.14 (d, 1H, J 9.9 Hz, 4-H), 7.57 (d, 1H, J 2.4 Hz, 10-H), 7.11
(s, br, 1H, 8-H), 7.01 (dd, 1H, J 2.4 and 0.8 Hz, 9-H), 6.27 (d, 1H, J 9.9 Hz, 3-H),
4.27 (s, 3H, r-H 3). The JH NMR spectrum of bergapten is presented in Figure 6.9.
This spectrum is consistent to that reported by Sasaki et al. (1980) for bergapten
isolated from Glehnia littoralis (Umbelliferae).
168
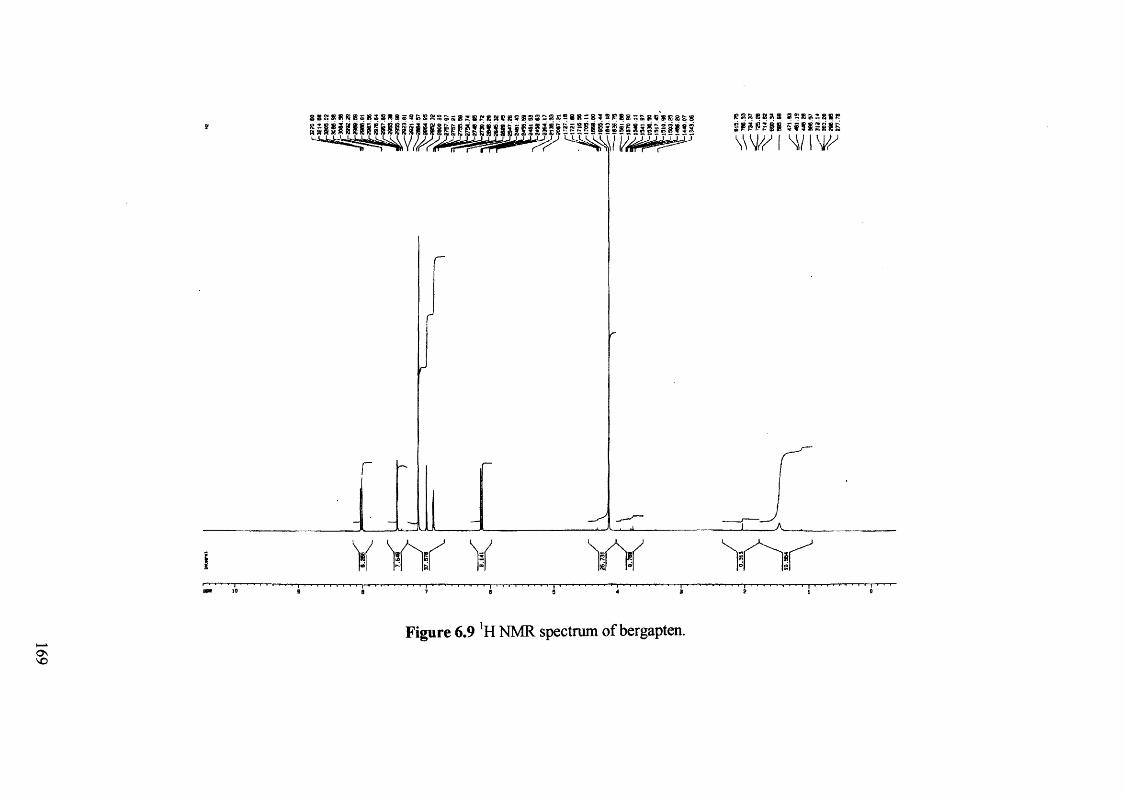
rrrssrs aasjiSBBRSimSB
*28s ;«»esssa3sas58* = 8;a)E!88 = SiBesx!ss8i*gi*SSSi*«®**SS&sss88ssss*sas55*sstS 8 S 8 * 8 » S 8 2 S 8 8 s 9 ft S
W I W1 w
Figure 6.9 ]H NMR spectrum of bergapten.
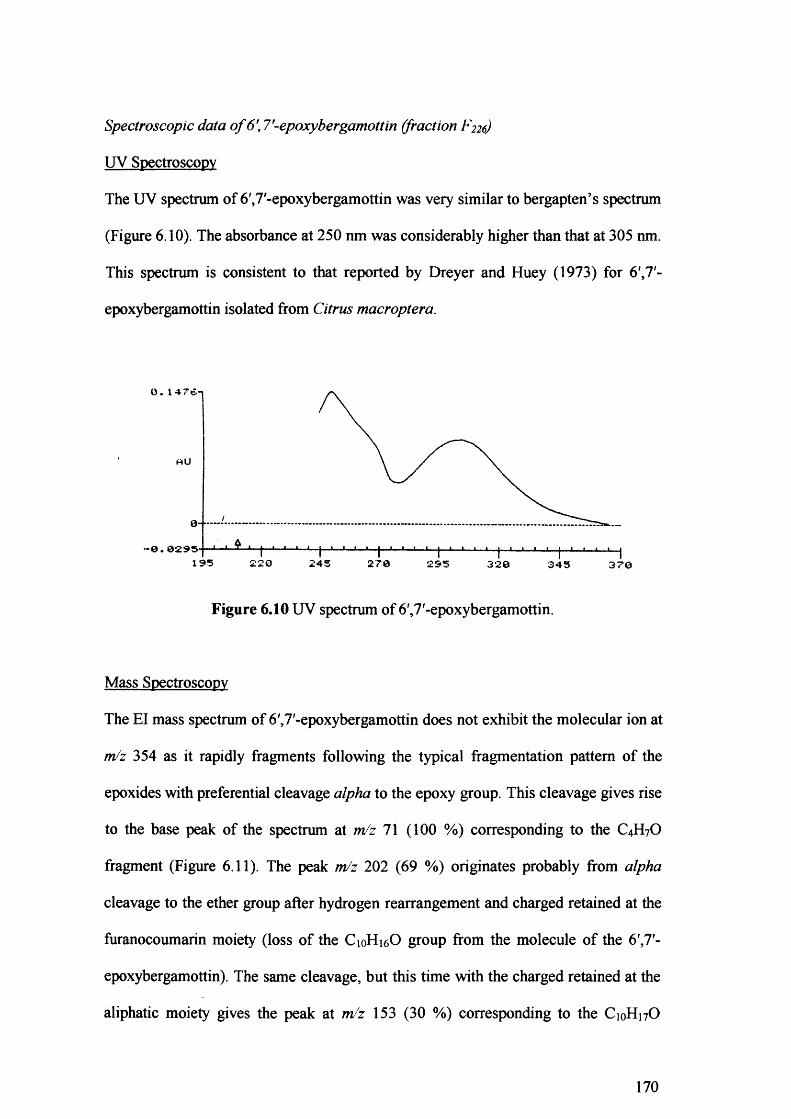
Spectroscopic data o f 6\ 7'-epoxybergamottin (fraction F226)
UV Spectroscopy
The UV spectrum of 6',7'-epoxybergamottin was very similar to bergapten’s spectrum
(Figure 6 .10). The absorbance at 250 nm was considerably higher than that at 305 nm.
This spectrum is consistent to that reported by Dreyer and Huey (1973) for 6 ',7'-
epoxybergamottin isolated from Citrus macroptera.
rtU
0 . . .
195 220 24 270 320 345 37©
Figure 6.10 UV spectrum of 6',7'-epoxybergamottin.
Mass Spectroscopy
The El mass spectrum of 6',7'-epoxybergamottin does not exhibit the molecular ion at
m/z 354 as it rapidly fragments following the typical fragmentation pattern of the
epoxides with preferential cleavage alpha to the epoxy group. This cleavage gives rise
to the base peak of the spectrum at m/z 71 (100 %) corresponding to the C 4 H 7 O
fragment (Figure 6.11). The peak m/z 202 (69 %) originates probably from alpha
cleavage to the ether group after hydrogen rearrangement and charged retained at the
furanocoumarin moiety (loss of the CioH^O group from the molecule of the 6 ',7'-
epoxybergamottin). The same cleavage, but this time with the charged retained at the
aliphatic moiety gives the peak at m/z 153 (30 %) corresponding to the C 10H 17O
170
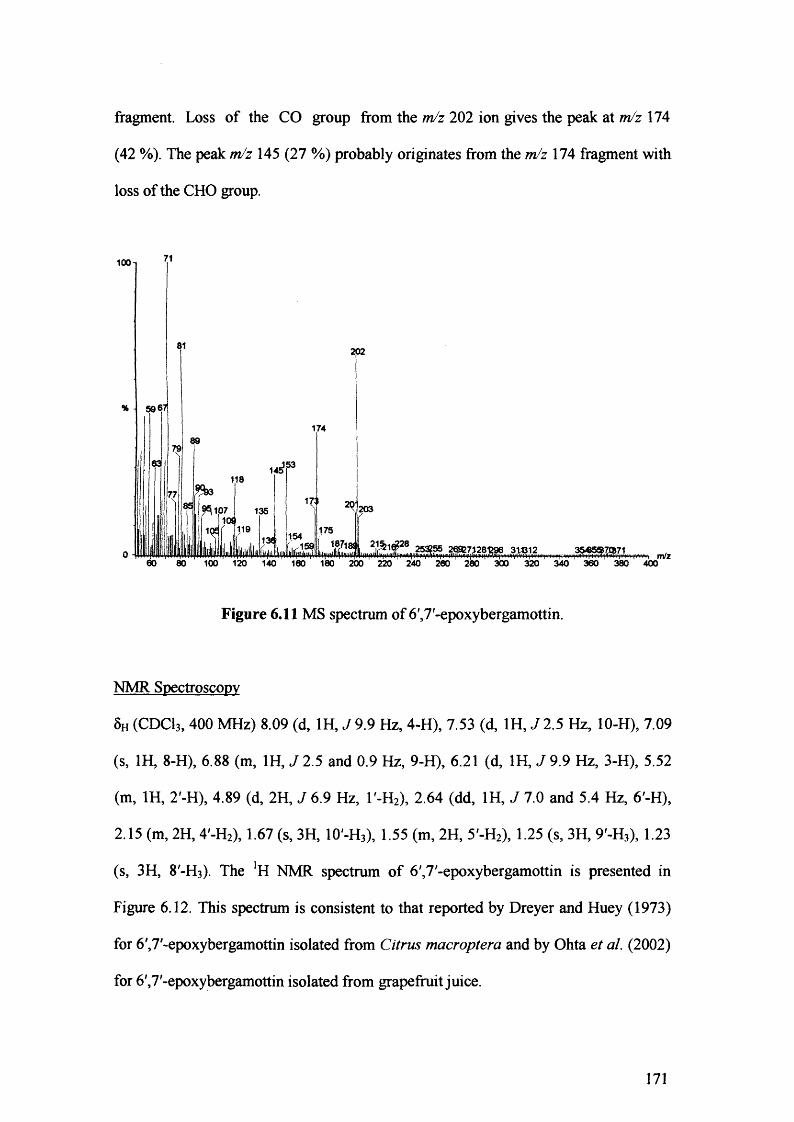
fragment. Loss of the CO group from the m/z 202 ion gives the peak at m/z 174
(42 %). The peak m/z 145 (27 %) probably originates from the m/z 174 fragment with
loss of the CHO group.
100
202
174
118
^107 10J
1̂ ( ,;19 j 154 j
100 120 140 180 180 200 220 240 280 280 300 320 340 360 380 400
203135
Figure 6.11 MS spectrum of 6 7 -epoxybergamottin.
NMR Spectroscopy
5h (CDC13, 400 MHz) 8.09 (d, 1H, 79.9 Hz, 4-H), 7.53 (d, 1H, 72.5 Hz, 10-H), 7.09
(s, 1H, 8-H), 6.88 (m, 1H, 7 2.5 and 0.9 Hz, 9-H), 6.21 (d, 1H, J 9.9 Hz, 3-H), 5.52
(m, 1H, 2'-H), 4.89 (d, 2H, J 6.9 Hz, l'-H2), 2.64 (dd, 1H, J 7.0 and 5.4 Hz, 6'-H),
2.15 (m, 2H, 4'-H2), 1.67 (s, 3H, 10'-H3), 1.55 (m, 2H, 5'-H2), 1.25 (s, 3H, 9'-H3), 1.23
(s, 3H, 8'-H3). The ]H NMR spectrum of 6',7'-epoxybergamottin is presented in
Figure 6.12. This spectrum is consistent to that reported by Dreyer and Huey (1973)
for 6',7'-epoxybergamottin isolated from Citrus macroptera and by Ohta et al. (2002)
for 6',7'-epoxybergamottin isolated from grapefruit juice.
171
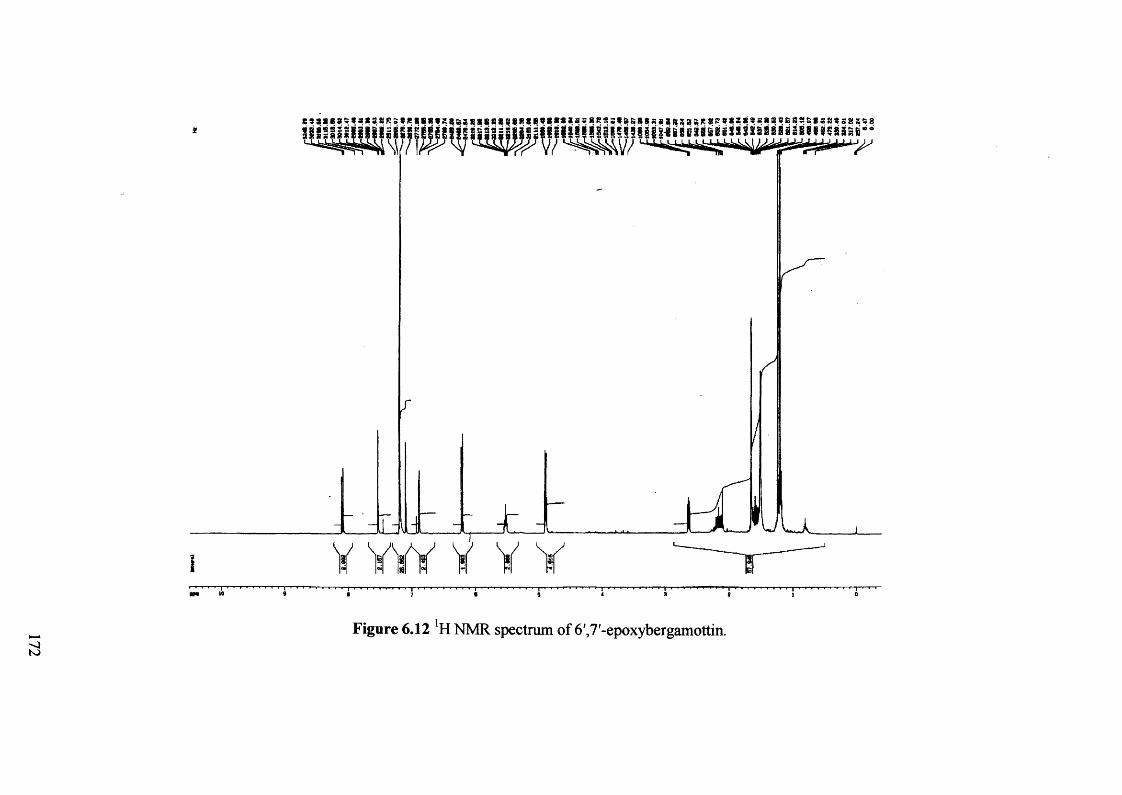
g 5 S S 8 a : ; S f 3 S 2 S i e S * R i S 1 l ! » R 8 S 5 ) B a 8 S 8 S 8 l l i 8 B 9 8 * * * a = 8 R 2 5 « B R i 8 8 s s S a S ! j £ | ? 8 f f ? S l B S 8 » s a S 3 £ S 2 5 * s 5 l ! S S S 3 ^ g
H n H M m H j m w r n m M
lL
f
w Jr zdLiL<1NJ
Figure 6.12 *H NMR spectrum of 6',7'-epoxybergamottin.
6.3.2 Synthesised 6',7-epoxy bergamottin
Selective epoxidation of the terminal bond of bergamottin gave the 6 ',7'-
epoxybergamottin in 69 % yield. Bellevue et al. (1997) obtained 6 ',7'-
epoxybergamottin in similar yield (65 %).
6.3.3 Spectroscopic data of synthetic osthol, bergapten and 6',7f-
epoxy bergamottin
All the spectroscopic data of the synthesised 6',7-epoxybergamottin, synthetic
bergapten purchased from Sigma and synthetic osthol kindly provided by May
Berenbaum, were identical to the isolated 6',7'-epoxybergamottin, bergapten and
osthol, respectively.\
6.3.4 Bioassays
Petri dish exposure bioassays were conducted in order to investigate whether there
were any difference in activity between isolated and synthetic 6',7'-epoxybergamottin,
bergapten and osthol.
Estimation ofLCsos
LC50S were estimated for the isolated and the synthesised in our laboratory 6 ',7-
epoxybergamottin in order to confirm that the observed activity of the isolated 6 ',7'-
epoxybergamottin was not due to minor compounds possibly present in it. Moreover,
LC50S of the botanical insecticide rotenone were estimated in order to compare its
activity to that of the 6',7'-epoxybergamottin.
173
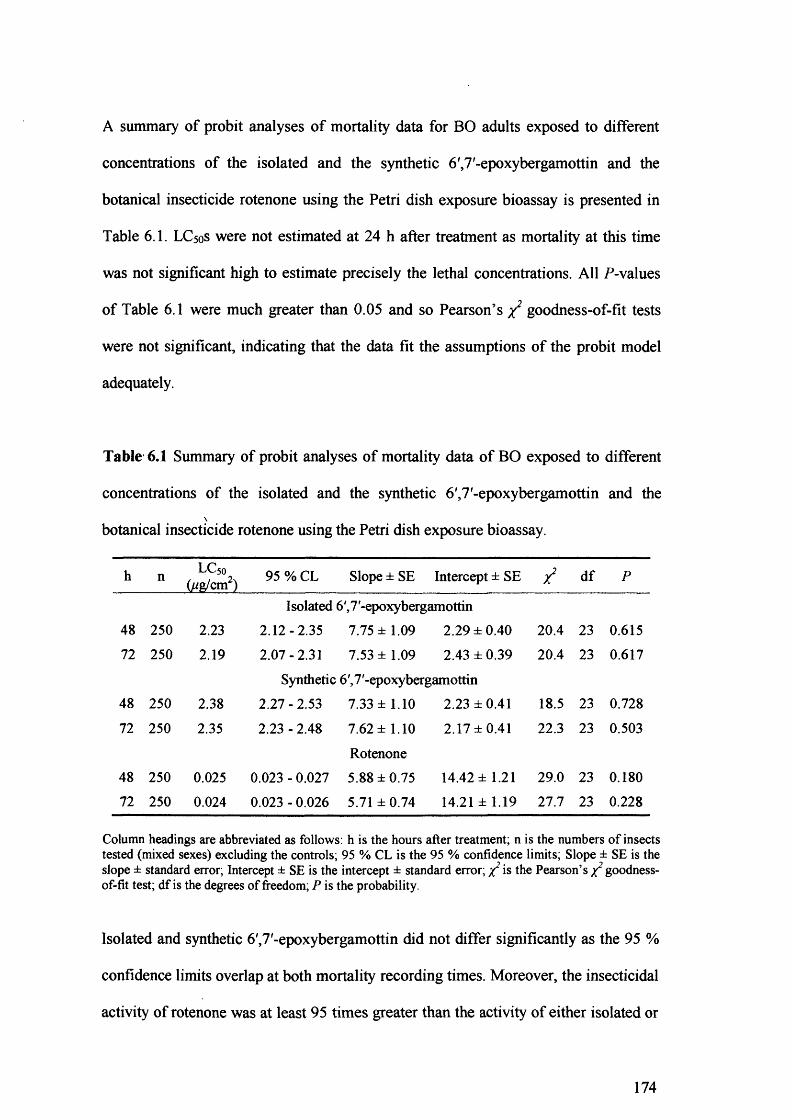
A summary of probit analyses of mortality data for BO adults exposed to different
concentrations of the isolated and the synthetic 6',7'-epoxybergamottin and the
botanical insecticide rotenone using the Petri dish exposure bioassay is presented in
Table 6.1. LC50S were not estimated at 24 h after treatment as mortality at this time
was not significant high to estimate precisely the lethal concentrations. All P-values
of Table 6.1 were much greater than 0.05 and so Pearson’s goodness-of-fit tests
were not significant, indicating that the data fit the assumptions of the probit model
adequately.
Table 6.1 Summary of probit analyses of mortality data of BO exposed to different
concentrations of the isolated and the synthetic 6',7'-epoxybergamottin and the\
botanical insecticide rotenone using the Petri dish exposure bioassay.
h n LC50
(M g/cm2) 95 % CL Slope ± SE Intercept ± SE 7? df P
Isolated 6',7'-epoxybergamottin48 250 2.23 2.12-2.35 7.75 ± 1.09 2.29 ± 0.40 20.4 23 0.61572 250 2.19 2.07-2.31 7.53 ± 1.09 2.43 ± 0.39 20.4 23 0.617
Synthetic 6 7 '-epoxybergamottin48 250 2.38 2.27 - 2.53 7.33 ± 1.10 2.23 ±0.41 18.5 23 0.72872 250 2.35 2.23 - 2.48 7.62 ± 1.10 2.17 ±0.41 22.3 23 0.503
Rotenone48 250 0.025 0.023 - 0.027 5.88 ±0.75 14.42 ± 1.21 29.0 23 0.180
72 250 0.024 0.023 - 0.026 5.71 ±0.74 14.21 ± 1.19 27.7 23 0.228
Column headings are abbreviated as follows: h is the hours after treatment; n is the numbers of insects tested (mixed sexes) excluding the controls; 95 % CL is the 95 % confidence limits; Slope ± SE is the slope ± standard error; Intercept ± SE is the intercept ± standard error; X2 is the Pearson’s X2 goodness- of-fit test; df is the degrees of freedom; P is the probability.
Isolated and synthetic 6',7'-epoxybergamottin did not differ significantly as the 95 %
confidence limits overlap at both mortality recording times. Moreover, the insecticidal
activity of rotenone was at least 95 times greater than the activity of either isolated or
174
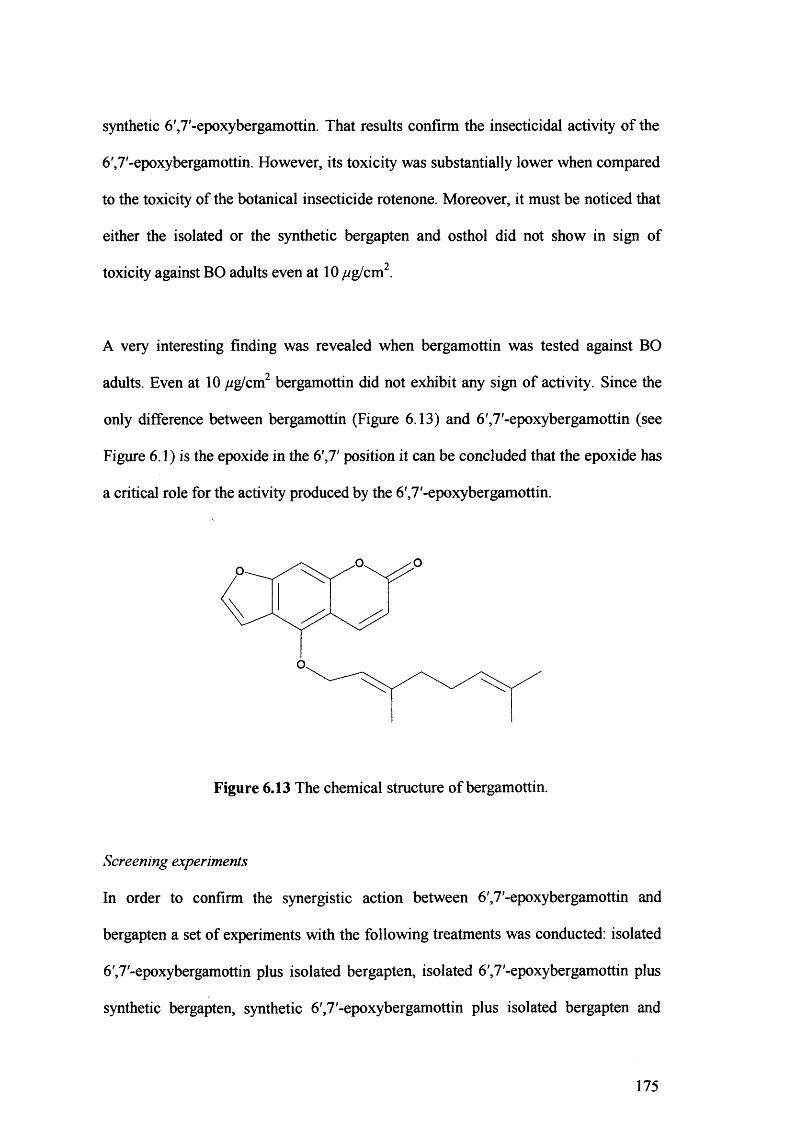
synthetic 6',7'-epoxybergamottin. That results confirm the insecticidal activity of the
6',7'-epoxybergamottin. However, its toxicity was substantially lower when compared
to the toxicity of the botanical insecticide rotenone. Moreover, it must be noticed that
either the isolated or the synthetic bergapten and osthol did not show in sign of
toxicity against BO adults even at 10 pg/cm2.
A very interesting finding was revealed when bergamottin was tested against BO
adults. Even at 10 jug/cm2 bergamottin did not exhibit any sign of activity. Since the
only difference between bergamottin (Figure 6.13) and 6',7'-epoxybergamottin (see
Figure 6.1) is the epoxide in the 6',7' position it can be concluded that the epoxide has
a critical role for the activity produced by the 6',7'-epoxybergamottin.
o.
Figure 6.13 The chemical structure of bergamottin.
Screening experiments
In order to confirm the synergistic action between 6',7'-epoxybergamottin and
bergapten a set of experiments with the following treatments was conducted: isolated
6',7'-epoxybergamottin plus isolated bergapten, isolated 6',7'-epoxybergamottin plus
synthetic bergapten, synthetic 6',7'-epoxybergamottin plus isolated bergapten and
175
synthetic 6',7'-epoxybergamottin plus synthetic bergapten. The contribution of each
compound to each blend was equivalent to 4 and 3 //g/cm2 of the F22 fraction. In
detail, the concentration of either isolated or synthetic bergapten tested was 0.364 and
0.273 while the concentration of either isolated or synthetic 6',7'-epoxybergamottin
tested was 0.892 and 0.669 /^g/cm2, in the initial and the subsequent experiment
respectively.
The results of these experiments (Table 6.2) reveal that synergism between 6',7'-
epoxybergamottin and bergapten occur only when the isolated bergapten was tested.
When the isolated bergapten was substituted by the synthetic bergapten synergism
was not evident indicating that other minor compounds present in the isolated\
bergapten must be responsible for the synergistic effects. Moreover, there was no
difference in activity when the isolated 6',7'-epoxybergamottin was substituted by the
synthetic 6',7'-epoxybergamottin confirming that the 6',7'-epoxybergamottin was
responsible for the observed synergism.
176
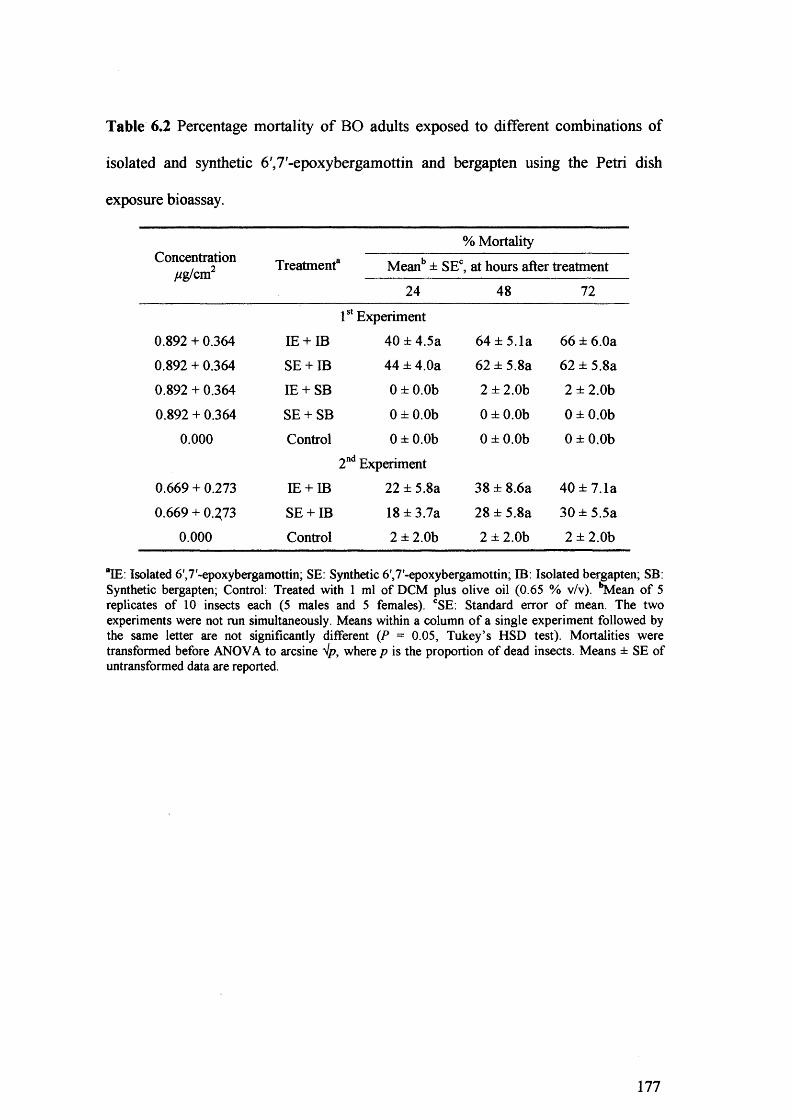
Table 6.2 Percentage mortality of BO adults exposed to different combinations of
isolated and synthetic 6',7'-epoxybergamottin and bergapten using the Petri dish
exposure bioassay.
Concentration p g/cm2
% MortalityTreatment“ Meanb ± SE°, at hours after treatment
24 48 72
0.892 + 0.364 IE + IB
1st Experiment 40 ± 4.5a 64 ± 5.1a 66 ± 6.0a
0.892 + 0.364 SE + IB 44 ± 4.0a 62 ± 5.8a 62 ± 5.8a
0.892 + 0.364 IE + SB 0 ± 0.0b 2 ± 2.0b 2 ± 2.0b
0.892 + 0.364 SE + SB 0 ± 0.0b 0 ± 0.0b 0 ± 0.0b
0.000 Control 0 ± 0.0b 0 ± 0.0b 0 ± 0.0b
0.669 + 0.273 IE + IB2nd Experiment
22 ± 5.8a 38 ± 8.6a 40 ± 7.1a
0.669 + 0.373 SE + IB 18 ± 3.7a 28 ± 5.8a 30 ± 5.5a0.000 Control 2 ± 2.0b 2 ± 2.0b 2 ± 2.0b
"IE: Isolated 6',7'-epoxybergamottin; SE: Synthetic 6',7'-epoxybergamottin; IB: Isolated bergapten; SB: Synthetic bergapten; Control: Treated with 1 ml of DCM plus olive oil (0.65 % v/v). '‘Mean of 5 replicates of 10 insects each (5 males and 5 females). CSE: Standard error of mean. The two experiments were not run simultaneously. Means within a column of a single experiment followed by the same letter are not significantly different (P = 0.05, Tukey’s HSD test). Mortalities were transformed before ANOVA to arcsine >Ip, where p is the proportion of dead insects. Means ± SE of untransformed data are reported.
177
6.4 DISCUSSION
Considering the data obtained from the UV, FTIR, MS and ]H NMR studies the
isolated pure compounds, fractions F2 22, F224 and F226 were assigned as osthol,
bergapten and 6',7'-epoxybergamottin, respectively. Comparison of our data to that
reported in the literature and authentic components revealed that the spectra were
identical, confirming our results.
The coumarin, osthol and the linear furanocoumarins or psoralens, bergapten and
6',7'-epoxybergamottin among other coumarins and furanocoumarins have been
recently isolated from the oxygen heterocyclic fraction of bitter orange essential oil by
normal-phase HPLC (Dugo et al., 1996). Coumarin and psoralen compounds are\
common to plants of the Rutaceae family (Gray and Waterman, 1978), to which
Citrus species belong. The coumarin and psoralen compounds present in the Citrus
peel oils are essentially non-volatile and, consequently, are not found in the distilled
oils (Stanley and Jurd, 1971). They exhibit strong absorption in the ultraviolet region
(Stanley and Jurd, 1971). Berenbaum (1991) reported that high performance liquid
chromatography has provided a fast, efficient, and sensitive method for separating and
quantifying coumarins and psoralens at the nanogram level by both normal- and
reverse-phase. In this study, these advantages during HPLC purification of osthol,
bergapten and 6',7'-epoxybergamottin were proven.
Since it is always possible that minor components can give rise to all or part of the
biological activity (Cannell, 1998) the activity of the isolated 6',7'-epoxybergamottin
was compared to the activity of 6',7'-epoxybergamottin synthesised in our laboratory.
It was revealed that the activity of the isolated and synthetic 6',7'-epoxybergamottin
178
did not differ significantly indicating that the 6',7'-epoxybergamottin was responsible
for the mortality of BO adults. This is the first report of the insecticidal activity of
6',7'-epoxybergamottin. However, another activity of 6',7'-epoxybergamottin has been
reported recently. Wangensteen et al. (2003) were found that 6',7'-epoxybergamottin
can inhibit the activity of the enzyme cytochrome P450 3A4 (CYP3 A4).
Comparison of the insecticidal activity of 6 ',7 -epoxybergamottin and bergamottin
showed that the epoxide is essential for the observed activity of 6',7'-
epoxybergamottin, since bergamottin was inactive even at considerably higher
concentrations than that used in the concentration-response experiments with 6',7-
epoxybergamottin. Although bergamottin did not show any significant activity againstt
BO in the Petri dish exposure bioassay, it has been reported that species of
Lepidoptera were deterred from feeding when bergamottin was incorporated into their
diets (Stevenson et al., 2003).
Comparison of 6',7-epoxybergamottin with the commercially available botanical
insecticide rotenone revealed that 6',7'-epoxybergamottin was considerably less toxic
than rotenone. However, it should be noted that any work dealing with natural
compounds as sources of new insecticides, should consider positive results as an
indication of potential in a chemical series, rather than trying to discover compounds
usable per se. Few plant-derived chemicals can be as effective as the modem
synthetic insecticides. Bioactive natural compounds should therefore be considered
models which can serve for the development of series of more efficient,
biodegradable, safer insecticides (Escoubas et al., 1994). Moreover, since plant-
179
derived chemicals are known to exhibit increased specificity, it is possible that 6',7'-
epoxybergamottin can exhibit greater activity against other insect pests.
Bioassays conducted with isolated and synthetic bergapten and 6',7'-
epoxybergamottin revealed that minor compounds present in the isolated bergapten
should be accounted for the synergistic action between bergapten and 6',7'-
epoxybergamottin. Moreover, it should be noted that isolated and synthetic bergapten
did not produce any sign of toxicity against BO by the Petri dish exposure bioassay
even at considerably higher concentrations than that used in the concentration-
response experiments with 6',7'-epoxybergamottin. However, the antifeedant activity
of bergapten is well documented (Escoubas et al., 1992; Berdegue et al., 1997;i
Calcagno et al., 2002; Stevenson et al., 2003).
Petri dish exposure bioassays conducted with isolated and synthetic osthol did not
exhibit any activity against BO even at considerably higher concentrations than that
used in the concentration-response experiments with 6',7'-epoxybergamottin.
However, osthol is known that posses antibacterial (Stanley and Jurd, 1971),
antimalarial (Harbome and Baxter, 1993), antimutagenic (Harbome and Baxter,
1993), cytostatic (Gawron and Glowniak, 1987) and cytotoxic (Yang et al., 2003)
activity.
180
CHAPTER 7
GENERAL DISCUSSION
Plants in general have the ability to synthesise compounds that, while having no
apparent function in primary metabolism, are physiologically active in insects and
other organisms, so providing plants with one of their most important defense
mechanisms. During recent years, increasing political and consumer pressures to
reduce the use of synthetic insecticides, and the decreasing efficacy of them due to the
development of resistance, have fuelled the search among plants for potentially useful
insecticides. Plant-derived insecticides are likely to be more rapidly degradable and
consequently more environmentally and toxicologically safe and more selective,
which accords with the requirements of IPM.
Citrus species are known to contain chemicals that exhibit different properties
(toxicity, deterrence, feeding deterrence) against insects. Studies undertaken so far on
the insecticidal potency of Citrus species have mainly concentrated on Citrus limon,
while no attention was given to Citrus aurantium.
The results of my research reveal that peels of C. aurantium contain chemicals with
insecticidal properties. Petri dish and topical application bioassays shown that a
petroleum ether peel extract obtained using the ultrasound extraction method was
toxic against Bactrocera oleae and Ceratitis capitata adults. Bioassay-guided
fractionation of this extract resulted in the isolation of three compounds which were
181
elucidated by spectroscopic methods and were assigned as osthol (coumarin),
bergapten and 6',7'-epoxybergamottin (furanocoumarins). However, only the 6',7'-
epoxybergamottin was toxic against B. oleae and its toxicity was the same to the
synthesised 6',7'-epoxybergamottin. It should be noticed that the insecticidal activity
of the petroleum ether peel extract can only be fully explained by the synergistic
action between the 6 ',7-epoxybergamottin and two or more compounds, which were
not isolated and identified in this project.
Coumarins are secondary plant metabolites which can be divided into three major
classes: simple hydroxycoumarins, furanocoumarins and pyranocoumarins. Simple
hydroxycoumarins and their glucosides are found regularly in higher plants, havingi
been recorded in ca. 100 families (Murray, 1991). The furano- and pyranocoumarins,
which usually occur in the free state in fruits and roots, are mainly restricted to two
large families, the Umbelliferae (Apiaceae) and the Rutaceae, where they occur
widely. They have been recorded occasionally in six other families: the Asteraceae,
Fabaceae, Moraceae, Pittosporaceae, Solanaceae and Thymeleaceae (Harbome and
Baxter, 1993). The site of storage or accumulation of furanocoumarins in plants is
also the site of synthesis, and especially for the rutaceous genus Citrus,
furanocoumarins are localised in oil glands in the peel (Berenbaum, 1991), as
revealed in this study.
Furanocoumarins are more biologically active than simple coumarins (Harbome and
Baxter, 1993). Their biological roles in their host plants have not been well
understood, but a likely function is to protect, through toxicity, plants from a wide
array of natural enemies (Guo and Yamazoe, 2004). This is supported by the
182
correlation of bacterial toxicity and insect resistance with higher concentrations of
furanocoumarins in celery and other furanocoumarin-containing plants (Trumble et
al., 1990; McCloud et al., 1992; Cianfrogna et al., 2002). Moreover, UV light induces
the biosynthesis of furanocoumarins, which are often produced in tissue exposed to
the sun. Their accumulation in high light environments may reflect their ability to
function as UV-absorbent screens, protecting plant ptotosynthetic apparatus from
damaging radiation (Berenbaum, 1991).
Furanocoumarins are unusual among plant secondary compounds because their toxic
properties are greatly enhanced in the presence of UV light. Photoactivity of
furanocoumarins is due to the formation of an excited triplet state on absorption of a
proton. The excited triplet state furanocoumarin can react directly with molecules
such as pyrimidine bases. Alternatively, the excited triplet state furanocoumarin can
react with ground state oxygen. By energy transfer, singlet oxygen can be generated,
or, by either electron or charge transfer, toxic oxyradicals such as hydroxy radical or
superoxide anion radicals can be formed. These molecules can then proceed to react
with molecules, including DNA, to cause toxicity (Berenbaum, 1991, 1995; Sastry et
al., 1997).
Furanocoumarins elicit behavioural responses and physiological effects in
herbivorous insects. They are repellents and feeding deterrents (Klocke et al., 1989;
Berdegue et al., 1997) as well as toxins (Berenbaum, 1978). In addition to their
inherent toxicity, they may act synergistically (Brewer et al., 1995) or antagonistically
(Diawara et al., 1993) when mixed with other furanocoumarins. Moreover, synergism
has also been observed in mixtures of the furanocoumarin xanthotoxin with the
183
nonfuranocoumarins myristicin, saffole, and fagaramide (Berenbaum and Neal, 1985;
Neal, 1989). Toxicity in most instances is greatly enhanced in the presence of UV
light, suggesting that photoactivation, possibly involving DNA, is a major mechanism
of toxicity (Berenbaum, 1991). However, there are also toxic effects of
furanocoumarins that are independent of UV light (Berenbaum, 1978). Insects feeding
on plants with high contents of furanocoumarins possess adaptations for reducing the
toxicity of furanocoumarins. Many associates of furanocoumarin-containing plants
avoid light and thereby avoid the photoactivating effects of UV on furanocoumarins
(Berenbaum, 1990). Moreover, in some insects a biochemical resistance to
furanocoumarins has been evolved (Hung et al., 1995).
Furanocoumarins a,re toxic against a wide variety of organisms, including bacteria,
fungi, plants, nematodes, molluscs, fish, birds and mammals (Berenbaum, 1991).
Moreover, some linear furanocoumarins disrupt the detoxification capability of
organisms by acting as suicide substrates for cytochrome P-450 monooxygenases, an
enzyme system involved in detoxification processes in mammals (Koenigs and
Trager, 1998) and insects (Neal and Wu, 1994).
Phytophotodermatitis, an epidermal reaction to furanocoumarins in the presence of
UV light, is the most widely recognised manifestation of furanocoumarin activity. In
all organisms afflicted, phytophotodermatitis manifests itself in the form of erythema,
bullous eruptions, and pigmentation at the point of contact with furanocoumarin-rich
plant tissue (Fleming, 1990). These symptoms are well known from celery workers
and the causal agents are the linear furanocoumarins psoralen, 5-methoxypsoralen
(bergapten), and 8-methoxypsoralen (xanthotoxin) (Austad and Kavli, 1983;
184
Ashwood-Smith et a l, 1985). Human food plants known to cause photodermatitis
include carrots, celery, parsnip, dill, fennel, caraway, parsley, lovage, anise, and
chervil in the Apiaceae; figs in the Moraceae; and lemon, orange, and grapefruit in the
Rutaceae (Murray et al., 1982).
Furanocoumarins have been used since ancient times to treat human skin disorders
such as skin depigmentation (vitiligo), psoriasis, mycosis fungoides, polymorphous
photodermatitis and eczema (Musajo and Rodighiero, 1962; Scott et al., 1976).
However, the use of these compounds in medicine has been associated with higher
incidence of skin cancer (Musajo and Rodighiero, 1962; Stem et al., 1979; Grekin and
Epstein, 1981). Moreover, furanocoumarins have been reported to be carcinogenic
and mutagenic (Roelandts, 1984). Therefore, benefit and risk should be carefully
balanced against each other when furanocoumarins are used in medicine (Daniel et
a l, 1999).
Citrus oils are used in the formulation of perfumes and cosmetics, and coumarins are
used for their flavour quality and are added to sunscreen formulations to enhance
tanning induced by ultraviolet radiation (Mabry and Ulubelen, 1980). Moreover,
several plants containing furanocoumarins, e.g. lemon, celery, parsnip, parsley and
carrots, are part of the human diet (Daniel et al., 1999). Based on the average
consumption and furanocoumarin contents of different food items, the uptake of
furanocoumarins in the United States was calculated to be 1.3 mg per person per day
(Wagstaff, 1991). It can be concluded that the carcinogenic potential of
furanocoumarins is low, although their combination with exposure to UV radiation
could pose a hither to unquantified risk.
185
Further studies will need to be done in order that the full insecticidal potential
usefulness of C. aurantium can be explored. Different stages of insects from a broad
range of families should be tested using different bioassay methods. Since botanical
insecticides are generally species-specific and also different bioassays produce
different results, it is highly likely that a more pronounced activity will be shown.
Even fractions, extracts and isolated compounds that were inactive by the bioassays
and insect species used in this study, can be revealed to be veiy promising as pest
control chemicals. Moreover, further work is needed in order to determine the
chemical structure of the synergistic chemicals present in the peel extract. Besides
toxicity studies, it is also important to determine other factors such as persistence and
effects on man and other non-target organisms.
Roark (1942) suggested that the reasons for seeking new natural insecticides included
the continuing need to combat insects which had not yielded to effective control, to
eliminate chemicals poisonous to man, to find substitutes for existing chemicals, and
to provide a supply to meet insecticidal shortages. These reasons appear as valid today
as they did then, despite the dominance of synthetic insecticides, many of which are
now environmental hazards.
186
CHAPTER 8
REFERENCES
Abbassy, M.A.A., Hosny, A.H., Lamaei, O. and Choukri, O. (1979) Insecticidal and
synergistic Citrus oils isolated from Citrus peels. Mededelingen van de
Landbouwwetenschappen Rijksuniversiteit Gent, 44, 21-9.
Abbott, W.S. (1925) A method of computing the effectiveness of an insecticide.
Journal o f Economic Entomology, 18, 265-7.
Adan, A., del Estal, P., Budia, F., Gonzalez, M. and Vinuela, E. (1996) Laboratory
evaluation of the novel naturally derived compound spinosad against Ceratitis
capitata. Pesticide Science, 48,261-8.
Ahn, Y.J., Know, M., Park, H.M. and Han, C.K. (1997) Potent insecticidal activity of
Ginkgo biloba derived trilactone terpenes against Nilaparvata lugeus, in
Phytochemicals for Pest Control (eds P.A. Hedin, R.M. Hollingworth, E.P.
Masler, J. Miyamoto and D.G. Thompson), ACS Symposium Series No. 658,
American Chemical Society, Washington, pp. 90-105.
Alberola, T.M., Aptosoglou, S., Arsenakis, M., Bey, Y., Delrio, G., Ellar, D.J., Ferre,
J., Granero, F., Guttmann, D.M., Koliais, S., Martinez-Sebastian, M.J., Prota,
R., Rubino, S., Satta, A., Scarpellini, G., Sivropoulou, A. and Vasara, E.
(1999) Insecticidal activity of strains of Bacillus thuringiensis on larvae and
adults of Bactrocera oleae Gmelin (Dipt.: Tephritidae). Journal o f
Invertebrate Pathology, 74, 127-36.
Albrecht, C.P. and Sherman, M. (1987) Lethal and sublethal effects of avermectin Bi
on three fruit fly species (Diptera: Tephritidae). Journal o f Economic
Entomology, 80, 344-7.
Alford, A.R., Cullen, J.A., Storch, R.H. and Bentley, M.D. (1987) Antifeedant
activity of limonin against the Colorado potato beetle (Coleoptera:
Chrysomelidae). Journal o f Economic Entomology, 80, 575-8.
187
Amason, J.T., Philogene, B.J.R., Donskov, N. and Kubo, I. (1987) Limonoids from
Meliaceae and Rutaceae reduce feeding, growth and development of Ostrinia
nubilalis. Entomologia Experimental is et Applicata, 43, 221-6.
Arnold, A.J. (1967) Hand-operated micro-applicator to deliver drops of five sizes.
Laboratory Practice, 16, 56-7.
Ashwood-Smith, M.J., Ceska, O. Chaudhary, S.K. (1985) Mechanism of
photosensitivity reactions to diseased celery. British Medical Journal, 290,
1249.
Assabgui, R., Lorenzetti, F., Terradot, L., Regnault-Roger, C., Malo, N., Wiriyachitra,
P., Sanchez-Vindas, P.E., San Roman, L., Isman, M.B., Durst, T. and
Amason, J.T. (1997) Efficacy of botanicals ffom the Meliaceae and
Piperaceae, in Phytochemicals for Pest Control (eds P.A. Hedin, R.M.
Hollingworth, E.P. Masler, J. Miyamoto and D.G. Thompson), ACS
Symposium Series No. 658, American Chemical Society, Washington, pp. 38-
48.
Austad, J. and Kavli, G. (1983) Phototoxic dermatitis caused by celery infected by
Sclerotinia sclerotiorum. Contact Dermatitis, 9, 448-51.
Back, E.A. and Pemberton, C.E. (1915) Susceptibility of Citrus fruits to the attack of
the Mediterranean fruit fly. Journal o f Agricultural Research, 3, 311-30.
Back, E.A. and Pemberton, C.E. (1918) The Mediterranean fruit fly in Hawaii. United
States Department o f Agriculture Technical Bulletin, 640, 1-43.
Baker, R., Herbert, R.H., Howse, P.E., Jones, O.T., Francke, W. and Reith, W. (1980)
Identification and synthesis of the major sex pheromone of the olive fly,
Dacus oleae. Journal o f the Chemical Society, Chemical Communications, 1,
52-3.
Balandrin, M.F., Klocke, J.A., Wurtele, E.S. and Bollinger, W.H. (1985) Natural plant
chemicals: Sources of industrial and medicinal materials. Science, 228, 1154-
60.
Bellevue, F.H., Woster, P.M., Edwards, D.J., He, K. and Hollenberg, P.F. (1997)
Synthesis and biological evaluation of 6,7-dihydroxybergamottin (6,7-DHB), a
188
naturally occurring inhibitor of cytochrome P450 3A4. Bioorganic &
Medicinal Chemistry Letters, 7, 2593-8.
Benner, J.P. (1993) Pesticidal compounds from higher plants. Pesticide Science, 39,
95-102.
Berdegue, M., White, K.K. and Trumble, J.T. (1997) Feeding deterrence of
Spodoptera exigua (Lepidoptera: Noctuidae) larvae by low concentrations of
linear furanocoumarins. Environmental Entomology, 26, 912-9.
Berenbaum, M. (1978) Toxicity of a furanocoumarin to armyworms: A case of
biosynthetic escape from insect herbivores. Science, 201, 532-4.
Berenbaum, M.R. (1990) Evolution of specialization in insect Umbellifer associations.
Annual Review o f Entomology, 35, 319-43.
Berenbaum, M.R. (1991) Coumarins, in Herbivores: Their Interactions with
Secondary Plant Metabolites, 2nd edition (eds G.A. Rosenthal and M.R.
Berenbaum), Vol. 2: The Chemical Participants, Academic Press, New York,
pp. 221-49.
Berenbaum, M. (1995) Phototoxicity of plant secondary metabolites: Insect and
mammalian perspectives. Archives o f Insect Biochemistry and Physiology, 29,
119-34.
Berenbaum, M. and Neal, J.J. (1985) Synergism between myristicin and xanthotoxin,
a naturally cooccuring plant toxicant. Journal o f Chemical Ecology, 11, 1349-
58.
Berenbaum, M.R., Nitao, J.K. and Zangerl, A.R. (1991) Adaptive significance of
furanocoumarin diversity in Pastinaca sativa (Apiaceae). Journal o f Chemical
Ecology, 17, 207-15.
Bocco, A. Cuvelier, M., Richard, H. and Berset, C. (1998) Antioxidant activity and
phenolic composition of Citrus peel and seed extracts. Journal o f Agricultural
and Food Chemistry, 46, 2123-9.
Boiler, E.F. (1987) Genetic control, in Integrated Pest Management (eds A.J. Bum,
T.H. Coaker and P.C. Jepson), Academic Press, London, pp. 161-87.
189
Brattsten, L.B., Holyoke, Jr.C.W., Leeper, J.R. and RafFa, K.F. (1986) Insecticide
resistance: Challenge to pest management and basic research. Science, 231,
1255-60.
Brewer, M.J., Meade, T. and Trumble, J.T. (1995) Development of insecticide-
resistant and -susceptible Spodoptera exigua (Lepidoptera: Noctuidae)
exposed to furanocoumarins found in celery. Environmental Entomology, 24,
392-401.
Broumas, T. and Haniotakis, G.E. (1994) Comparative field studies of various traps
and attractants of the olive fruit fly, Bactrocera oleae. Entomologia
Experimental is et Applicata, 73, 145-50.
Budia, F. and Vinuela, E. (1996) Effects of cyromazine on adult C. capitata (Diptera:
Tephritidae) on mortality and reproduction. Journal o f Economic Entomology,
89, 826-31.
Bueno, A.M. and Jones, O. (2002) Alternative methods for controlling the olive fly,
Bactrocera oleae, involving semiochemicals, in Use o f Pheromones and other
Semiochemicals in Integrated Control (eds P. Witzgall, B. Mazomenos and M.
Konstantopoulou), IOBC/WPRS Bulletin, 25, 147-56.
Buiarelli, F., Cartoni, G.P., Coccioli, F. and Leone, T. (1996) Analysis of bitter
essential oils from orange and grapefruit by high-performance liquid
chromatography with microbore columns. Journal o f Chromatography A , 730,
9-16.
Caccioni, D.R.L., Guizzardi, M., Biondi, D.M., Renda, A. and Ruberto, G. (1998)
Relationship between volatile components of Citrus fruit essential oils and
antimicrobial action on Penicillium digitatum and Penicillium italicum.
International Journal o f Food Microbiology, 43, 73-9.
Calapai, G., Firenzuoli, F., Saitta, A., Squadrito, F., Arlotta, M.R., Costantino, G. and
Inferrera, G. (1999) Antiobesity and and cardiovascular toxic effects of Citrus
aurantium extracts in the rat: A preliminary report. Fitoterapia, 70, 586-92.
Calcagno, M.P. Coll, J., Lloria, J., Faini, F. and Alonso-Amelot, M.E. (2002)
Evaluation of synergism in the feeding deterrence of some furanocoumarins
on Spodoptera littoralis. Journal o f Chemical Ecology, 28, 175-91.
190
Cannell, R.J.P. (1998) How to approach the isolation of a natural product, in Natural
Products Isolation (ed. R. J.P. Cannell), Methods in Biotechnology 4, Humana
Press, Totowa, pp. 1-51.
Champagne, D.E., Koul, O., Isman, M.B., Scudder, G.G.E. and Towers, G.H.T.
(1992) Biological activity of limonoids from the Rutales. Phytochemistry, 31,
377-94.
Choo, L.E.W., Tang, C.S., Pank, F.Y. and Ho, S.H. (2000) Comparison of two
bioassay methods for determining deltamethrin resistance in German
cockroaches (Blattodea: Blattellidae). Journal o f Economic Entomology, 93,
905-10.
Cianfrogna, J.A., Zangerl, A.R. and Berenbaum, M.R. (2002) Effects of
furanocoumarins on feeding behavior of parsnip webworms Depressaria
pastinacella. Journal o f Chemical Ecology, 28, 1365-75.
Coaker, T.H. (1987) Cultural methods: The crop, in Integrated Pest Management (eds
A.J. Bum, T.H. Coaker and P.C. Jepson), Academic Press, London, pp. 69-88.
Coats, J.R. (1994) Risks from natural versus synthetic insecticides. Annual Review o f
Entomology, 39,489-515.
Copping, L.G. and Hewitt, H.G. (1998) Chemistry and Mode o f Action o f Crop
Protection Agents, The Royal Society of Chemistry, Cambridge.
Dadang, Ohsawa, K., Kato, S. and Yamamoto, I. (1996) Insecticidal compound in
tuber of Cyperus rotundus L. against the diamondback moth larvae. Journal o f
Pesticide Science, 21, 444-6.
Dahm, P. A., Gurland, J., Lee, I. and Berlin, J. (1961) A comparison of some house fly
bioassay methods. Journal o f Economic Entomology, 54, 343-7.
Daniel, O., Meier, M.S., Schlatter, J. and Frischknecht, P. (1999) Selected phenolic
compounds in cultivated plants: Ecologic functions, health implications, and
modulation by pesticides. Environmental Health Perspectives, 107, 109-14,
Supplement 1.
da Silva Branco, E., Vendramin, J.D. and Denardi, F. (2000) Resistencia as Moscas-
das-frutas em Fruteiras, in Moscas-das-frutas de Importancia Econdmica no
191
Brasil (eds A. Malavasi and R.A. Zucchi), Holos Editora, Riberao Preto, pp.
161-7.
Dent, D. (1991) Insect Pest Management, CAB International, Wallingford.
Dent, D.R. (1995) Control measures, in Integrated Pest Management (ed. D. Dent),
Chapman & Hall, London, pp. 47-85.
Diawara, M.M., Trumble, J.T., White, K.K., Carson, W.G. and Martinez, L.A. (1993)
Toxicity of linear furanocoumarins to Spodoptera exigua: Evidence for
antagonistic interactions. Journal o f Chemical Ecology, 19, 2473-84.
Don-Pedro K.N. (1985) Toxicity of some Citrus peels to Dermestes maculates Deg.
and Callosobruchus maculatus (F). Journal o f Stored Product Research, 21,
31-4.
Don-Pedro, K.N. (1996) Fumigant toxicity is the major route of insecticidal activity of
Citrus peel essential oils. Pesticide Science, 46, 71-8.
Dreyer, D.L. and Hpey, P.F. (1973) Coumarins of Citrus macroptera. Phytochemistry,
12,3011-3.
van Driesche, R.G. and Bellows, T.S.Jr. (1996) Biological Control, Chapman & Hall,
New York.
Duffus, J.H. (1993) Glossary for chemists of terms used in toxicology. Pure and
Applied Chemistry, 65, 2003-122.
Dugo, P., Mondello, L., Cogliandro, E., Verzera, A. and Dugo, G. (1996) On the
genuineness of Citrus essential oils. 51. Oxygen heterocyclic compounds of
bitter orange oil (Citrus aurantium L.). Journal o f Agricultural and Food
Chemistry, 44, 544-9.
Escoubas, P., Lajide, L. and Mizutani, J. (1994) Insecticidal and antifeedant activities
of plant compounds: Potential leads for novel pesticides, in Natural and
Engineered Pest Management Agents (eds P. A. Hedin, J.J. Menn and R.M.
Hollingworth), ACS Symposium Series No. 551, American Chemical Society,
Washington, pp. 162-71.
192
Escoubas, P., Fukushi, Y., Lajide, L. and Mizutani, J. (1992) A new method for fast
isolation of insect antifeedant compounds from complex mixtures. Journal o f
Chemical Ecology, 18, 1819-32.
Ezeonu, F.C., Chidume, G.I. and Udedi, S.C. (2001) Insecticidal properties of volatile
extracts of orange peels. Bioresource Technology, 76, 273-4.
Feng, R. and Isman, M.B. (1995) Selection for resistance to azadirachtin in the green
peach aphid, Myzus persicae. Experientia, 51, 831-3.
Finney, D.J. (1971) Probit Analysis, 3rd edition, Cambridge University Press,
London.
Fleming, D. (1990) Dermatitis in grocery workers associated with high natural
concentrations of furanocoumarins in celery. Allergy Proceedings, 11, 125-7.
Forrester, N.W., Cahill, M., Bird, L.J. and Layland, J.K. (1993) Management of
pyrethroid and endosulfan resistance in Helicoverpa armigera (Lepidoptera:
Noctuidae) in Australia. Bulletin o f Entomological Research, 1-132,
Supplement 1.
Gallo, L.G., Allee, L.L. and Gibson, D.M. (1996) Insecticidal effectiveness of
Mammea americana (Guttiferae) extracts on larvae of Diabrotica virgifera
virgifera (Coleoptera: Chrysomelidae) and Trichoplusia ni (Lepidoptera:
Noctuidae). Economic Botany, 50, 236-42.
Gawron, A. and Glowniak, K. (1987) Cytostatic activity of coumarins in vitro. Planta
Medica, 6, 526-9.
Gbewonyo, W.S.K. (1991) Insecticidal actions of Piper guineense, University of
Birmingham, Ph.D. Thesis.
Gbewonyo, W.S.K. and Candy, D.J. (1992a) Separation of insecticidal components
from an extract of the roots of male Piper guineense (West African black
pepper) by gas chromatography. Toxicon, 30, 1037-42.
Gbewonyo, W.S.K. and Candy, D.J. (1992b) Chromatographic isolation of
insecticidal amides from Piper guineense roots. Journal o f Chromatography,
607, 105-11.
193
Gbewonyo, W.S.K., Candy, D.J. and Anderson, M. (1993) Structure-activity
relationships of insecticidal amides from Piper guineense root. Pesticide
Science, 37, 57-66.
Graves, J.B., Leonard, B.R. and Ottea, J.A. (1999) Chemical approaches to managing
arthropod pests, in Handbook o f Pest Management (ed. J.R. Ruberson), Marcel
Dekker, New York, pp. 449-86.
Gray, A.I. and Waterman, P.G. (1978) Coumarins in the Rutaceae. Phytochemistry,
17, 845-64.
Greany, P.D., Styer, S.C., Davis, P.L., Shaw, P.E. and Chambers, D.L. (1983)
Biochemical resistance of Citrus to fruit flies. Demonstration and elucidation
of resistance to the Caribbean fruit fly, Anastrepha suspensa. Entomologia
Experimentalis et Applicata, 34,40-50.
Greany, P.D., McDonald, R.E., Schroeder, W.J., Shaw, P.E., Aluja, M. and Malavasi,
A. (1994) Use of gibberellic acid to reduce Citrus fruit susceptibility to fruit
flies, in Bioregulators fo r Crop Protection and Pest Control (ed. P. A. Hedin),
ACS Symposium Series No. 557, American Chemical Society, Washington,
pp. 39-48.
Grekin, D.A. and Epstein, J.H. (1981) Psoralens, UVA (PUVA) and
photocarcinogenesis. Photochemistry and Photobiology, 33, 957-60.
Gullan, P.J. and Cranston, P. S. (1994) The Insects: An Outline o f Entomology,
Chapman & Hall, London.
Guo, L.Q. and Yamazoe, Y. (2004) Inhibition of cytochrome P450 by
furanocoumarins in grapefruit juice and herbal medicines. Acta
Pharmacologica Sinica, 25, 129-36.
Hadacek, F., Muller, C., Wemer, A., Greger, H. and Proksch, P. (1994) Analysis,
isolation and insecticidal activity of linear furanocoumarins and other
coumarin derivatives from Peucedanum (Apiaceae: Apioideae). Journal o f
Chemical Ecology, 20, 2035-54.
Harbome, J.B. and Baxter, H. (1993) Phytochemical Dictionary. A Handbook o f
Bioactive Compounds from Plants, Taylor & Francis, London.
194
Harwood, L.M., Moody, C.J. and Percy, J.M. (1999) Experimental Organic
Chemistry: Standard and Microscale, 2nd edition, Blackwell Science, Oxford.
Hedin, P. A. and Hollingworth, R.M. (1997) New applications for phytochemical pest-
control agents, in Phytochemicals fo r Pest Control (eds P.A. Hedin, R.M.
Hollingworth, E.P. Masler, J. Miyamoto and D.G. Thompson), ACS
Symposium Series No. 658, American Chemical Society, Washington, pp. 1-
12.
Hedin, P.A., Hollingworth, R.M., Masler, E.P., Miyamoto, J. and Thompson, D.G.
(1997) Preface, in Phytochemicals for Pest Control (eds P.A. Hedin, R.M.
Hollingworth, E.P. Masler, J. Miyamoto and D.G. Thompson), ACS
Symposium Series No. 658, American Chemical Society, Washington.
Hendrichs, J. (1996) Action programs against fruit flies of economic importance:
Session overview, in Fruit Fly Pests: A World Assessment o f their Biology and
Management (eds B.A. McPheron and G.J. Steck), St. Lucie Press, Florida,
pp. 513-9. -
Hendrichs, J., Franz, G. and Rendon, P. (1995) Increased effectiveness and
applicability of the sterile insect technique through male only releases for
control of Mediterranean fruit flies during fruiting seasons. Journal o f Applied
Entomology, 119, 371-7.
Hendrichs, J., Robinson, A.S., Cayol, J.P. and Enkerlin, W. (2002) Medfly area wide
sterile insect technique programmes for prevention, suppression or eradication:
The importance of mating behavior studies. Florida Entomologist, 85, 1-13.
Hill, D.S. (1997) The Economic Importance o f Insects, Chapman & Hall, London.
Hinkle, N.C., Sheppard, D.C. and Nolan, Jr.M.P. (1985) Comparing residue exposure
and topical application techniques for assessing permethrin resistance in house
flies (Diptera: Muscidae). Journal o f Economic Entomology, 78, 722-4.
Hostettmann, K. and Wolfender, J. (1997) The search for biologically active
secondary metabolites. Pesticide Science, 51, 471-82.
Houghton, P.J. and Raman, A. (1998) Laboratory Handbook fo r the Fractionation o f
Natural Extracts, Chapman & Hall, London.
195
Hu, X.P. and Procopy, R.J. (1998) Lethal and sublethal effects of imidacloprid on
apple maggot fly, Rhagoletispomonella Walsh (Dipt., Tephritidae). Journal o f
Applied Entomology, 122, 37-42.
Hung, C., Prapaipong, H., Berenbaum, M.R. and Schulers, M.A. (1995) Differential
induction of cytochrome P450 transcrips in Papilio polyxenes by linear and
angular furanocoumarins. Insect Biochemistry and Molecular Biology, 25, 89-
99.
Isman, M.B., Gunning, P.J. and Spollen, K.M. (1997) Tropical timber species as
sources of botanical insecticides, in Phytochemicals fo r Pest Control (eds P.A.
Hedin, R.M. Hollingworth, E.P. Masler, J. Miyamoto and D.G. Thompson),
ACS Symposium Series No. 658, American Chemical Society, Washington,
pp. 27-37.
Iwuala, M.O.E., Osisiogu, I.U.W. and Agbakwuru, E.O.P. (1981) Dennetia oil, a
potential new insecticide: Tests with adults and nymphs of Periplaneta
americana and Zonocerus variegates. Journal o f Economic Entomology, 74,
249-52.
Jacobson, M. (1989) Botanical pesticides: Past, present, and future, in Insecticides o f
Plant Origin (eds J.T. Amason, B.J.R. Philogene and P. Morand), ACS
Symposium Series No. 387, American Chemical Society, Washington, pp. 1-
10.
Jayaprakasha, G.K., Singh, R.P., Pereira, J. and Sakariah, K.K. (1997) Limonoids
from Citrus reticulata and their moult inhibiting activity in mosquito Culex
quinquefasciatus larvae. Phytochemistry, 44, 843-6.
Jefferies, P.R., Toia, R.F., Brannigan, B., Pessah, I. and Casida, J.E. (1992) Ryania
insecticides: Analysis and biological activity of 10 natural ryanoids. Journal o f
Agricultural and Food Chemistry, 40, 142-6.
Jimenez-Peydro, R., Gimeno-Martos, C., Lopez-Ferrer, J., Serrano-Delgado, C. and
Moreno-Mari, J. (1995) Effects of the insect growth regulator cyromazine on
the fecundity, fertility and offspring development of Mediterranean fruit fly,
Ceratitis capitata Wied. (Dipt., Tephritidae). Journal o f Applied Entomology,
119,435-8.
196
Johansen, C. (1962) Principles of insect control, in Fundamentals o f Applied
Entomology (ed. R.E. Pfadt), The Macmillan Company, New York, pp. 138-
58.
Jones, O.T. (1998) Practical applications of pheromones and other semiochemicals, in
Insect Pheromones and their Use in Pest Management (eds P.E. Howse, I.D.R.
Stevens and O.T. Jones), Chapman & Hall, London, pp. 263-356.
Kadir, H.A., Zakaria, M.B., Kechil, A.A. and Azirum, M.S. (1989) Toxicity and
electrophysiological effects of Spilanthes acmella Murr. extracts on
Periplaneta americana L.. Pesticide Science, 25, 329-35.
Kapatos, E.T. (1989) Integrated pest management systems o f Dacus oleae, in Fruit
Flies: Their Biology, Natural Enemies and Control, Vol. 3B (eds A. S.
Robinson and G. Hooper), Elsevier, Amsterdam, pp. 391-8.
Kapatos, E.T., Fletcher, B.S., Pappas, S. and Laudeho, Y. (1977) The release of Opius
concolor and O. concolor var. siculus (Hym.: Braconidae) against the spring
generation t)f Dacus oleae (Dipt.: Trypetidae) on Corfu. Entomophaga, 22,
265-70.
Katsoyannos, B.I. and Papadopoulos, N.T. (2004) Evaluation of synthetic female
attractants against Ceratitis capitata (Diptera: Tephritidae) in sticky coated
spheres and McPhail type traps. Journal o f Economic Entomology, 97, 21-6.
Katsoyannos, P. (1992) Olive Pests and their Control in the Near East, FAO Plant
Production and Protection Paper No. 115, Food and Agriculture Organisation
of the United Nations, Rome.
Klocke, J.A. and Kubo, I. (1982) Citrus limonoid by-products as insect control agents.
Entomologia Experimental is et Applicata, 32, 299-301.
Klocke, J.A., Balandrin, M.F., Bamby, M.A. and Yamasaki, R.B. (1989) Limonoids,
phenolics, and furanocoumarins as insect antifeedants, repellents and growth
inhibitory compounds, in Insecticides o f Plant Origin (eds J.T. Amason,
B.J.R. Philogene and P. Morand), ACS Symposium Series No. 387, American
Chemical Society, Washington, pp. 136-49.
Koenigs, L.L. and Trager, W.F. (1998) Mechanism-based inactivation of P450 2A6
by furanocoumarins. Biochemistry, 37, 10047-61.
197
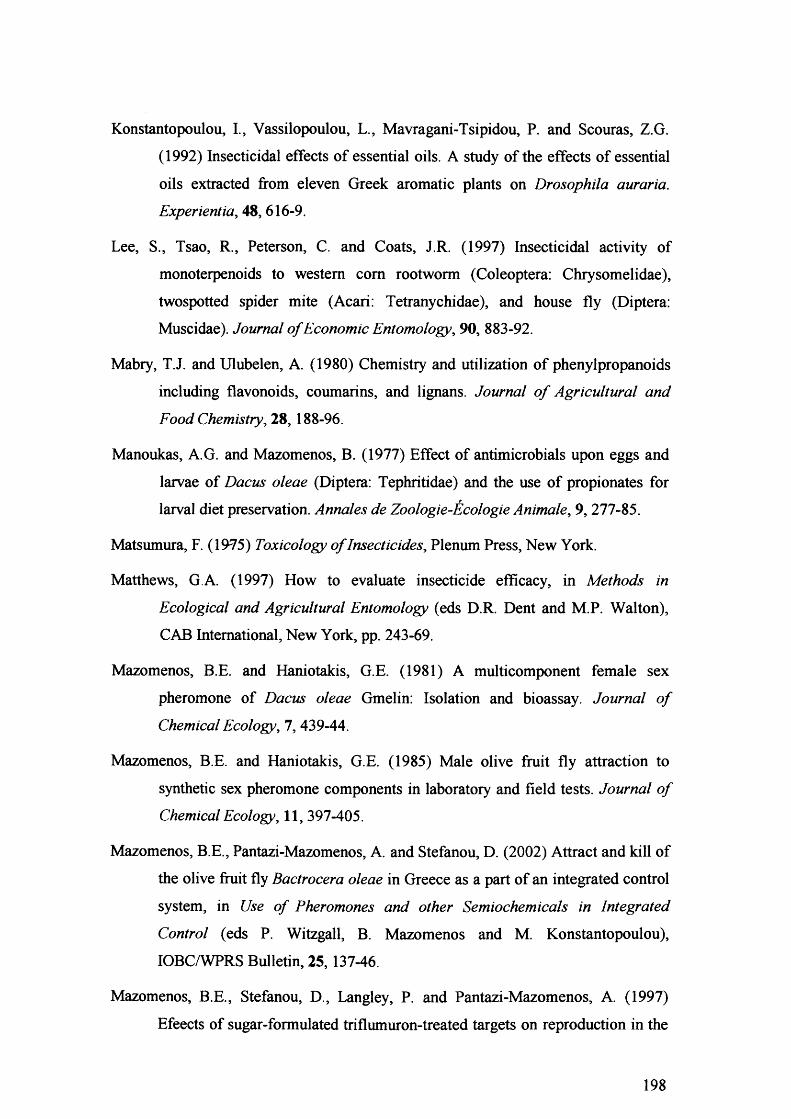
Konstantopoulou, I., Vassilopoulou, L., Mavragani-Tsipidou, P. and Scouras, Z.G.
(1992) Insecticidal effects of essential oils. A study of the effects of essential
oils extracted from eleven Greek aromatic plants on Drosophila auraria.
Experientia, 48, 616-9.
Lee, S., Tsao, R., Peterson, C. and Coats, J.R. (1997) Insecticidal activity of
monoterpenoids to western com rootworm (Coleoptera: Chrysomelidae),
twospotted spider mite (Acari: Tetranychidae), and house fly (Diptera:
Muscidae). Journal o f Economic Entomology, 90, 883-92.
Mabry, T.J. and Ulubelen, A. (1980) Chemistry and utilization of phenylpropanoids
including flavonoids, coumarins, and lignans. Journal o f Agricultural and
Food Chemistry, 28, 188-96.
Manoukas, A.G. and Mazomenos, B. (1977) Effect of antimicrobials upon eggs and
larvae of Dacus oleae (Diptera: Tephritidae) and the use of propionates for
larval diet preservation. Annales de Zoologie-Ecologie Animale, 9,277-85.
Matsumura, F. (1975) Toxicology o f Insecticides, Plenum Press, New York.
Matthews, G A. (1997) How to evaluate insecticide efficacy, in Methods in
Ecological and Agricultural Entomology (eds D.R. Dent and M.P. Walton),
CAB International, New York, pp. 243-69.
Mazomenos, B.E. and Haniotakis, G.E. (1981) A multicomponent female sex
pheromone of Dacus oleae Gmelin: Isolation and bioassay. Journal o f
Chemical Ecology, 7, 439-44.
Mazomenos, B.E. and Haniotakis, G.E. (1985) Male olive fruit fly attraction to
synthetic sex pheromone components in laboratory and field tests. Journal o f
Chemical Ecology, 11, 397-405.
Mazomenos, B.E., Pantazi-Mazomenos, A. and Stefanou, D. (2002) Attract and kill of
the olive fruit fly Bactrocera oleae in Greece as a part of an integrated control
system, in Use o f Pheromones and other Semiochemicals in Integrated
Control (eds P. Witzgall, B. Mazomenos and M. Konstantopoulou),
IOBC/WPRS Bulletin, 25,137-46.
Mazomenos, B.E., Stefanou, D., Langley, P. and Pantazi-Mazomenos, A. (1997)
Efeects of sugar-formulated triflumuron-treated targets on reproduction in the
198
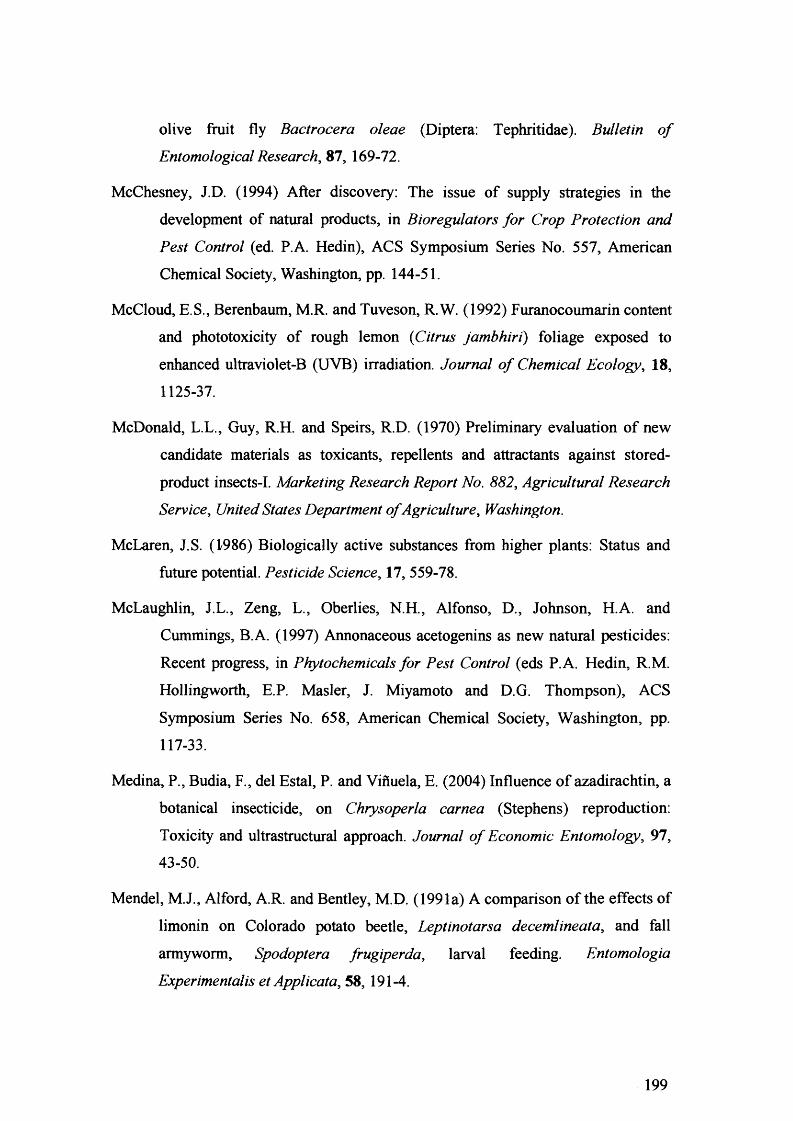
olive fruit fly Bactrocera oleae (Diptera: Tephritidae). Bulletin o f
Entomological Research, 87, 169-72.
McChesney, J.D. (1994) After discovery: The issue of supply strategies in the
development of natural products, in Bioregulators fo r Crop Protection and
Pest Control (ed. P.A. Hedin), ACS Symposium Series No. 557, American
Chemical Society, Washington, pp. 144-51.
McCloud, E.S., Berenbaum, M.R. and Tuveson, R.W. (1992) Furanocoumarin content
and phototoxicity of rough lemon (Citrus jambhiri) foliage exposed to
enhanced ultraviolet-B (UVB) irradiation. Journal o f Chemical Ecology, 18,
1125-37.
McDonald, L.L., Guy, R.H. and Speirs, R.D. (1970) Preliminary evaluation of new
candidate materials as toxicants, repellents and attractants against stored-
product insects-I. Marketing Research Report No. 882, Agricultural Research
Service, United States Department o f Agriculture, Washington.
McLaren, J.S. (1986) Biologically active substances from higher plants: Status and
future potential. Pesticide Science, 17, 559-78.
McLaughlin, J.L., Zeng, L., Oberlies, N.H., Alfonso, D., Johnson, H.A. and
Cummings, B.A. (1997) Annonaceous acetogenins as new natural pesticides:
Recent progress, in Phytochemicals for Pest Control (eds P.A. Hedin, R.M.
Hollingworth, E.P. Masler, J. Miyamoto and D.G. Thompson), ACS
Symposium Series No. 658, American Chemical Society, Washington, pp.
117-33.
Medina, P., Budia, F., del Estal, P. and Vifiuela, E. (2004) Influence of azadirachtin, a
botanical insecticide, on Chrysoperla carnea (Stephens) reproduction:
Toxicity and ultrastructural approach. Journal o f Economic Entomology, 97,
43-50.
Mendel, M.J., Alford, A.R. and Bentley, M.D. (1991a) A comparison of the effects of
limonin on Colorado potato beetle, Leptinotarsa decemlineata, and fall
armyworm, Spodoptera frugiperda, larval feeding. Entomologia
Experimental is et Applicata, 58, 191-4.
199
Mendel, M.J., Alford, A.R., Rajab, M.S. and Bentley, M.D. (1991b) Antifeedant
effects of Citrus limonoids differing in A-ring structure on Colorado potato
beetle (Coleoptera: Chrysomelidae) larvae. Journal o f Economic Entomology,
84,1158-62.
Mendel, M.J., Alford, A.R., Rajab, M.S. and Bentley, M.D. (1993) Relationship of
Citrus limonoid structure to feeding deterrence against fall armyworm
(Lepidoptera: Noctuidae) larvae. Environmental Entomology, 22, 167-73.
Miyakado, M., Watanabe, K. and Miyamoto, J. (1997) Natural products as leads in
structural modification studies yielding new agrochemicals, in Phytochemicals
for Pest Control (eds P.A. Hedin, R.M. Hollingworth, E.P. Masler, J.
Miyamoto and D.G. Thompson), ACS Symposium Series No. 658, American
Chemical Society, Washington, pp. 168-82.
Morgan, E.D. and Wilson, I.D. (1985) Methods and techniques for isolation of
pesticides, in CRC Handbook o f Natural Pesticides: Methods (ed. N.B.
Mandava), Vol. 2: Isolation and Identification, CRC Press, Boca Raton, pp. 3-
81.
Moyses, E.W. and Gfeller, F.J. (2001) Topical application as a method for comparing
the effectiveness of insecticides against cat flea (Siphonaptera: Pulicidae).
Journal o f Medical Entomology, 38, 193-6.
Murray, R.D.H (1991) Naturally occurring plant coumarins. Fortschritte der Chemie
organischer Naturstoffe, 58, 83-316.
Murray, R.D.H., Mendez, J. and Brown, S.A. (1982) The Natural Coumarins, John
Wiley & Sons, Chichester.
Musajo, L. and Rodighiero, G. (1962) The skin-photosensitizing furanocoumarins.
Experientia, 18, 153-200.
Nair, M.G. (1994) Natural products as sources of potential agrochemicals, in Natural
and Engineered Pest Management Agents (eds P.A. Hedin, J.J. Menn and
R.M. Hollingworth), ACS Symposium Series No. 551, American Chemical
Society, Washington, pp. 145-61.
Neal, J.J. (1989) Myristicin, saffole, and fagaramide as phytosynergists of
xanthotoxin. Journal o f Chemical Ecology, 15, 309-15.
2 0 0
Neal, J.J. and Wu, D. (1994) Inhibition of insect cytochromes P450 by
furanocoumarins. Pesticide Biochemistry and Physiology, 50,43-50.
Neuenschwander, P. (1982) Beneficial insects caught by yellow traps used in mass
trapping of the olive fly, Dacus oleae. Entomologia Experimental is et
Applicata, 32,286-96.
Nigg, H.N., Mallory, L.L., Fraser, S., Simpson, S.E., Robertson, J.L., Attaway, J.A.,
Callaham, S.B. and Brown, R.E. (1994) Test protocols and toxicity of
organophosphate insecticides to Caribbean fruit fly (Diptera: Tephritidae).
Journal o f Economic Entomology, 87, 589-95.
Nogata, Y., Yoza, K., Kusumoto, K., Kohyama, N., Sekiya, K. and Hideaki, O. (1996)
Screening for inhibitory activity of Citrus fruit extracts against platelet
cyclooxygenase and lipoxygenase. Journal o f Agricultural and Food
Chemistry, 44, 725-9.
Obeng-Ofori, D. and Reichmuth, C. (1997) Bioactivity of eugenol, a major
component of essential oil of Ocimum sauve (Wild.) against four species of
stored-product Coleoptera. International Journal o f Pest Management, 43, 89-
94.
Ohta, T., Maruyama, T., Nagahashi, M., Miyamoto, Y., Hosoi, S., Kiuchi, F.,
Yamazoe, Y. and Tsukamoto, S. (2002) Paradisin C: A new CYP3A4 inhibitor
from grapefruit juice. Tetrahedron, 58, 6631-5.
Patel, D. (1997) Liquid Chromatography, John Wiley & Sons, Chichester.
Peck, S.L. and Mcquate, G.T. (2000) Field tests of environmentally friendly
malathion replacements to suppress wild Mediterranean fruit fly (Diptera:
Tephritidae) populations. Journal o f Economic Entomology, 93, 280-9.
Pedigo, L.P. (1996) Entomology and Pest Management, 2nd edition, Prentice Hall,
London.
Plimmer, J.R. (1993) Regulatory problems associated with natural products and
biopesticides. Pesticide Science, 39, 103-8.
Poole, C.F. and Poole, S.K. (1991) Chromatography Today, Elsevier, Amsterdam.
2 0 1
Quayle, H.J. (1914) Citrus fruit insects in Mediterranean countries. United States
Department o f Agriculture Technical Bulletin, 134, 1-36.
Quayle, H.J. (1929) The Mediterranean and other fruit flies. University o f California
Experimental Station Circular, 315, 1-19.
Rani, P.U. and Osmani, F. (1980) Insecticidal, fumigant and repellent properties of
citral against house fly, Musca domestica nebulo (Fabr.). Pesticides, 8, 6-8.
Roark, R.C. (1942) The examination of plants for insecticidal constituents. Journal o f
Economic Entomology, 35, 273-6.
Robertson, J.L. and Preisler, H.K. (1992) Pesticide Bioassays with Arthropods, CRC
Press, Boca Raton.
Robertson, J.L., Smith, K.C., Savin, N.E. and Lavigne, R.J. (1984) Effects of dose
selection and sample size on the precision of lethal dose estimates in dose-
mortality regression. Journal o f Economic Entomology, 77, 833-7.
Rodriguez-Saona, C., Millar, J.G. and Trumble, J.T. (1997) Growth inhibitory,
insecticidal, and feeding deterrent effects of (12Z, 15Z)-l-acetoxy-2-hydroxy-
4-oxo-heneicosa-12,15-diene, a compound from avocado fruit, to Spodoptera
exigua. Journal o f Chemical Ecology, 23, 1819-31.
Rodriguez-Saona, C., Millar, J.G., Maynard, D.F. and Trumble, J.T. (1998) Novel
antifeedant and insecticidal compounds from avocado idioblast cell oil.
Journal o f Chemical Ecology, 24, 867-89.
Roelandts, R. (1984) Mutagenicity and carcinogenicity of methoxsalen plus UV-A.
Archives o f Dermatology, 120, 662-9.
Salvatore, A., Borkosky, S., Willink, E. and Bardon, A. (2004) Toxic effects of lemon
peel constituents on Ceratitis capitata. Journal o f Chemical Ecology, 30, 323-
33.
Sasaki, H., Taguchi, H., Endo, T. and Yosioka, I. (1980) The constituents of Glehnia
littoralis Fr. S ch m id t et M iq.. Structure of a new coumarin glycoside,
osthenol-7-0-/?-gentiobioside. Chemical & Pharmaceutical Bulletin, 28, 1847-
52.
2 0 2
Sastry, S.S., Ross, B.M. and Parraga, A. (1997) Cross-linking of DNA-binding
proteins to DNA with psoralen and psoralen furan-side monoadducts:
Comparison of action spectra with DNA-RNA cross-linking. Journal o f
Biological Chemistry, 272, 3715-23.
Schmutterer, H. (1990) Properties and potential of natural pesticides from the neem
tree, Azadirachta indica. Annual Reviews o f Entomology, 35, 271-97.
Schwarz, A.J., Liedo, J.P. and Hendrichs, J. (1989) Current programme in Mexico, in
Fruit Flies: Biology, Natural Enemies and Control, Vol. 3B (eds A. S.
Robinson and G. Hooper), Elsevier, Amsterdam, pp. 375-86.
Scott, B.R., Pathak, M.A. and Mohm, G.R. (1976) Molecular and genetic basis of
furanocoumarin reactions. Mutation Research, 39,29-74.
Scott, J.G., Ramaswamy, S.B., Matsumura, F. and Tanaka, K. (1986) Effect of
method of application on resistance to pyrethroid insecticides in Blattella
germanica (Orthoptera: Blattellidae). Journal o f Economic Entomology, 79,
571-5.
Serit, M., Ishida, M., Hagiwara, N., Kim, M., Yamamoto, T. and Takahashi, S. (1992)
Meliaceae and Rutaceae limonoids as termite antifeedants evaluated using
Reticulitermes speratus Kolbe (Isoptera: Rhinotermitidae). Journal o f
Chemical Ecology, 18, 593-603.
Sheppard, D.C. (1984) Toxicity of Citrus peel liquids to the house fly and red
imported fine ant. Journal o f Agricultural Entomology, 1, 95-100.
Silva, G.L., Lee, I. and Kinghom, A.D. (1998) Special problems with the extraction of
plants, in Natural Products Isolation (ed. R.J.P. Cannell), Methods in
Biotechnology 4, Humana Press, Totowa, pp. 343-63.
Siskos, E.P. (1997) Systemic effects of imidacloprid on the aphid Myzus persicae,
University of Bath, M.Sc. Thesis.
Stanley, W.L. and Jurd, L. (1971) Citrus coumarins. Journal o f Agricultural and Food
Chemistry, 19, 1106-10.
Stark, J.D. and Sherman, M. (1989) Toxicity, penetration and metabolism of acephate
in three fruit fly species (Diptera: Tephritidae). Journal o f Economic
Entomology, 82, 1609-15.
203
Stark, J.D., Jepson, P.C. and Mayer, D.F. (1995) Limitations to use of topical toxicity
data for predictions of pesticide side effects in the field. Journal o f Economic
Entomology, 88, 1081-8.
Stark, J.D., Vargas, R. and Miller, N. (2004) Toxicity of spinosad in protein bait to
three economically important tephritid fruit fly species (Diptera: Tepritidae)
and their parasitoids (Hymenoptera: Braconidae). Journal o f Economic
Entomology, 97, 911-5.
Stavroulakis, G., Adediran, K.A., Nikoloudi, A., Petrakis, C., Kalaitzaki, A. and
Michelakis, S. (2001) Rotenone: Efficiency against olive fly (Bactrocera oleae
Gmelin) and residual activity in olive oil. Biological Agriculture and
Horticulture, 19,207-17.
Stem, R.S., Thibodeau, L.A., Kleinerman, R.A., Parrish, J.A. and Fitzpatrick, T. B.
(1979) Risk of cutaneous carcinoma in patients treated with oral methoxsalen
photochemotherapy for psoriasis. New England Journal o f Medicine, 300,
809-13.-
Stevens, I.D.R. (1998) Chemical aspects of pheromones: Isolation and structure
determination, in Insect Pheromones and their Use in Pest Management (eds
P.E. Howse, I.D.R. Stevens and O.T. Jones), Chapman & Hall, London, pp.
180-225.
Stevenson, P.C., Simmonds, M.S.J., Yule, M.A., Veitch, N.C., Kite, G.C., Irwin, D.
and Legg, M. (2003) Insect antifeedant furanocoumarins from Tetradium
danielli. Phytochemistry, 63, 41-6.
Studebaker, G.E. and Kring, T.J. (2003) Effects of insecticides on Orius insidiosus
(Hemiptera: Anthocoridae), measured by field, greenhouse and Petri dish
bioassays. Florida Entomologist, 86, 178-85.
Styer, S.C. and Greany, P.D. (1983) Increased susceptibility of laboratory-reared vs.
wild Caribbean fruit fly, Anastrepha suspensa (Loew) (Diptera: Tephritidae),
larvae to toxic Citrus allelochemics. Environmental Entomology, 12, 1606-8.
Su, H.C.F. (1976) Toxicity of a chemical component of lemon oil to cowpea weevils.
Journal o f Georgia Entomological Society, 11,297-301.
204
Su, H.C.F. and Horvat, R. (1987) Isolation and characterization of four major
components from insecticidally active lemon peel extract. Journal o f
Agricultural and Food Chemistry, 35, 509-11.
Su, H.C.F., Speirs, R.D. and Mahany, P.G. (1972a) Citrus oils as protectants of black
eyed peas against cowpea weevils: Laboratory evaluation. Journal o f
Economic Entomology, 65, 1433-6.
Su, H.C.F., Speirs, R.D. and Mahany, P.G. (1972b) Toxicity of Citrus oils to several
stored-product insects: Laboratory evaluation. Journal o f Economic
Entomology, 65, 1438-41.
Talukder, F.A. and Howse, P.E. (1994) Laboratory evaluation of toxic and repellent
properties of the pithraj tree, Aphanamixis polystachya Wall and Parker,
against Sitophilus oryzae (L.). International Journal o f Pest Management, 40,
274-9.
Taylor, W.E. and Vickery, B. (1974) Insectcidal properties of limonene, a constituent
of Citrus oil. Ghana Journal o f Agricultural Science, 7,61-2.
Thomas, C.J and Callaghan, A. (1999) The use of garlic (Allium sativa) and lemon
peel (Citrus limon) extracts as Culex pipiens larvacides: Persistence and
interaction with an organophosphate resistance mechanism. Chemosphere, 39,
2489-96.
Tirillini, B. (2000) Grapefruit: The last decade acquisitions. Fitoterapia, 71, S29-S37.
Touchstone, J.C. and Dobbins, M.F. (1983) Practice o f Thin Layer Chromatography,
2nd edition, John Wiley & Sons, New York.
Trumble, J.T., Dereks, W., Quiros, C.F. and Beier, R.C. (1990) Host plant resistance
and linear furanocoumarin content of Apium accessions. Journal o f Economic
Entomology, 83, 519-25.
Tsiropoulos, G.J. (1972) Storage temperatures for eggs and pupae of the olive fruit
fly. Journal o f Economic Entomology, 65, 100-2.
Tsiropoulos, G.J. and Manoukas, A.G. (1977) Adult quality of Dacus oleae affected
by larval crowding and pupal irradiation. Annals o f the Entomological Society
o f America, 70, 916-8.
205
Tsitsipis, J.A. (1975) Mass rearing of the olive fruit fly, Dacus oleae (Gmelin), at
‘Demokritos’, in Controlling Fruit Flies by the Sterile-Insect Technique,
International Atomic Energy Agency, Vienna, STI/PUB/392, pp. 93-100.
Tsitsipis, J.A. (1977a) Development of a caging and egging system for mass rearing
the olive fruit fly, Dacus oleae (Gmel.) (Diptera: Tephritidae). Zeitschrift fur
Angewandte Entomologie, 83, 96-105.
Tsitsipis, J.A. (1977b) An improved method for the mass rearing of the olive fruit fly,
Dacus oleae (Gmel.) (Diptera: Tephritidae). Zeitschrift fu r Angewandte
Entomologie, 83, 419-26.
Tukey, J.W. (1953) Some selected quick and easy methods of statistical analysis.
Transactions o f the New York Academy o f Sciences, Series 2, 16, 88-97.
Velenciennes, E., Smadja, J. and Conan, J.Y. (1999) Screening for biological activity
and chemical composition of Euodia borbonica var. borbonica (Rutaceae), a
medicinal plant in Reunion Island. Journal o f Ethnopharmacology, 64,283-8.
Wagstaff, D.J. (1991) Dietary exposure to furanocoumarins. Regulatory Toxicology
and Pharmacology, 14, 261-72.
Walton, M.P. (1995) Integrated pest management in olives, in Integrated Pest
Management (ed. D. Dent), Chapman & Hall, London, pp. 222-40.
Wangensteen, H., Molden, E., Christensen, H. and Malterud, K.E. (2003)
Identification of epoxybergamottin as a CYP3A4 inhibitor in grapefruit peel.
European Journal o f Clinical Pharmacology, 58, 663-8.
Weaver, D.K., Wells, C.D., Dunkel, F.V., Bertsch, W., Sing, S.E. and Sriharan, S.
(1994) Insecticidal activity of floral, foliar and root extracts of Tagetes minuta
(Asterales: Asteraceae) against adult Mexican bean weevils (Coleoptera:
Bruchidae). Journal o f Economic Entomology, 87, 1718-25.
Weaver, D.K., Zettler, L.J., Wells, C.D., Baker, J.E., Bertsch, W. and Throne, J.E.
(1997) Toxicity o f fractionated and degraded Mexican marigold floral extract
to adult Sitophilus zeamais (Coleoptera: Curculionidae). Journal o f Economic
Entomology, 90, 1678-83.
Williams, D.H. and Fleming, I. (1995) Spectroscopic Methods in Organic Chemistry,
5th edition, McGraw-Hill, London.
206
Wong, T.T. Y., Ramadan, M.M., Herr, J.C. and Mcinnis, D.O. (1992) Suppression of a
Mediterranean fruit fly (Diptera: Tephritidae) population with concurrent
parasitoid and sterile fly releases in Kula, Maui, Hawaii. Journal o f Economic
Entomology, 85, 1671-81.
Yang, L.L., Wang, M.C., Chen, L.G. and Wang, C.C. (2003) Cytotoxic activity of
coumarins from the fruits of Cnidium monnieri on leukaemia cell lines. Planta
Medica, 62, 1091-5.
Zobel, A.M., Wang, J., March, R.E. and Brown, S.A. (1991) Identification of eight
coumarins occurring with psoralen, xanthotoxin, and bergapten on leaf
surfaces. Journal o f Chemical Ecology, 17, 1859-70.
207


