Embed Size (px)
Citation preview
Introduction
In 1989 Kuznicki synthesized new titanium based mate-
rials [1]. Chapman in 1990 synthesised microporous
titanosilicate used as molecular sieves [2]. The ETS-10
is a newly formed titano-silicate the structure of which
was resolved thanks to the XRD, EDS, HREM and
mass NMR [3]. The structure contains TiO6 octahedra,
two oxygen atoms being shared by neighboring TiO6
units forming a Ti–O–Ti chain, while the other four ox-
ygen atoms are shared with neighboring tetrahedral
SiO4 groups [3, 4]. A set of periodically placed chains
develops that way in an orthogonal direction. The super-
imposition of layer of this type gives rise to a tridimen-
sional structure of 12 membered ring channels. Only
few zeolitic structures have such an open structure, the
more important ones being zeolite Y (FAU) and zeo-
lite Beta (BEA). Each titanium atom in this structure is
associated with two negative charges that are neutral-
ized by cations not being part of the structure. The den-
sity of cations is roughly similar to that of a zeolite with
Si/Al=2.5. Due to the long interconnecting pores in the
structure and the high density of the extraframework
cations, the ETS-10 is a potentially good catalyst. In ad-
dition, aluminium can be substituted at tetrahedral posi-
tions replacing silicon and hence Broensted acid sites
can be introducted [5, 6]. In ETS-10, the disposition of
the layers composed of Ti–O–Ti chains in an orthogonal
way is not regular leading to defects in the structure. The
disorder can be modelled by the combination of two
polymorphic structures that are due to different se-
quences. The polymorph A corresponds to a sequence
ABCD and has a monoclinic symmetry with C2/c space
group, while the other corresponds to a sequence ABAB
and has a tetragonal symmetry with space group P41 or
P43 [7]. Eldewik et al. have investigated the incorpora-
tion of Co2+
ions into ETS-10 [8]. Neither the physico-
chemical nor the catalytic properties of ETS-10 are well
characterized. Anyway it is not clear how they could be
influenced by the disorder. Anderson et al. used a com-
bination of atomic force microscopy, high-resolution
electron microscopy and modelling to elucidate the de-
tails of the mechanism of crystal growth in framework
of ETS-10 and other materials [9]. Kim et al. reported
studies on the crystallization of ETS-10 using various
compositional systems in presence of organics and in
the absence of seeds [10, 11]. Picquart et al. studied the
chemical-physical behaviour of sol–gel zirconia [12].
Naik et al. synthesized a sodium zirconium phosphate,
potential ceramic matrix for fixation of high level nu-
clear waste [13].
Experimental
The synthesis procedure for ETS-10 molecular sieves is
identical to that proposed by Pavel et al. [14]. Two
batches are separately prepared, the one being alkaline
and the other acidic. For the alkaline batch the ingredi-
ents are added in the following order: sodium silicate
(Merck; 8% Na2O, 27% SiO2, 65% H2O), sodium hy-
droxide (Carlo Erba; 50 mass%) and potassium fluoride
(Merck; 40 mass%). For acidic batch the components
are added in the following order: distilled water, hydro-
chloric acid (Carlo Erba; 37 mass%), titanium tetrachlo-
ride (Merck; 50 mass%) and zirconium tetrachloride in
1388–6150/$20.00 Akadémiai Kiadó, Budapest, Hungary
© 2005 Akadémiai Kiadó, Budapest Springer, Dordrecht, The Netherlands
Journal of Thermal Analysis and Calorimetry, Vol. 80 (2005) 585–590
INFLUENCE OF ZIRCONIUM ON THE CRYSTALLIZATION OF ETS-10
MOLECULAR SIEVE
D. Vuono1*
, C. C. Pavel2, P. De Luca
1, J. B. Nagy
3and A. Nastro
1
1Dipartimento di Pianificazione Territoriale, University of Calabria, via P. Bucci, C.A.P. 87036, Arcavacata di Rende (CS), Italy
2Department of Chemical Technology and Materials Chemistry, Faculty of Chemistry, ‘Al. I. Cuza’ University of Iasi, Bd. Carol I,
6600 Iasi, Romania3Laboratoire de R.M.N., Facultés Universitaires Notre-Dame de la Paix, 5000 Namur, Belgium
The ETS-10 is a newly formed titano-silicate the structure of which was resolved thanks to the XRD, EDS, HREM and mass NMR.
The ETS-10 is a potentially good catalyst. The aim of this research is to study the physicochemical properties of ET(Zr)S-10 ob-
tained from a gel containing different amounts of Zr. The analyses used are XRD, thermal analysis (TG-DSC), SEM, and29
Si NMR.
Keywords: DSC, ETS-10, initial gels, TG, zirconium
* Author for correspondence: [email protected]
powder (Acros; purity 98%). After a short homogeniza-
tion of both batches the solutions are stirred during
10 min, the acidic batch is poured into the alkaline one
producing a gel. The gels are introduced into PTFE-
lined Morey type inox steel autoclaves of 50 cm3. The
temperature of reaction was 190°C in thermoventilated
oven in static conditions.
The XR diffractograms are registered on a
Philips PW 1830 diffractometer using CuKα radiation.
The velocity was 0.02° s–1
in the range of 5–45° 2θ.The
thermal analysis was carried out on a Netzsch 429 in-
strument. The temperature range was 20–750°C with a
velocity of heating of 10 K min–1
in static air. The pH of
gels and the mother liquors were determined by Crison
GLP 22 pH-meter. The ratios Si/Ti and Si/Zr were de-
termined by EDS ZAF-4/FLS. The morphology of the
crystals is studied by SEM Stereoscan 360S scanning
electron microscope. Magic Angle Spinning29
Si NMR
spectra were taken on a Bruker MSL 400 spectrometer
at 79.4 MHz. A 4.0 µs pulse (θ=π/4) and a repetition
time of 6.0 s were used.
Results and discussion
The following compositions were used (System (1))
xNa2O–0.2TiO2–0.6KF–yZrO2–1.28
⋅xHCl–1.49SiO2–39.5H2O (1)
with 0.5≤x≤1.2 and 0.0≤y≤0.2. The crystallization
fields to obtain a pure ET(Zr)S-10 phase is quite small
with respect to those of ET(Zr)S-4. Indeed, the forma-
tion of ET(Zr)S-10 is more difficult and requires a rel-
atively low ZrO2 (maximum 0.06 moles) and a me-
dium alkalinity 0.85≤Na2O≤1.15. Table 1 shows the
Si/Ti and Si/Zr values for the initial and intermediate
phases for the synthesis of ET(Zr)S-10 with
0.03 moles of ZrO2. The first crystallline phase shows
a higher Si/Ti ratio and a higher Si/Ti ratio than the
initial amorphous phase. Later on the Si/Ti ratio
slightly decreases and it is close to 4 for the final crys-
talline sample. The Si/Zr ratio increases continuously
during the crystallization. However, the Zr content re-
mains low in individual crystals showing the diffi-
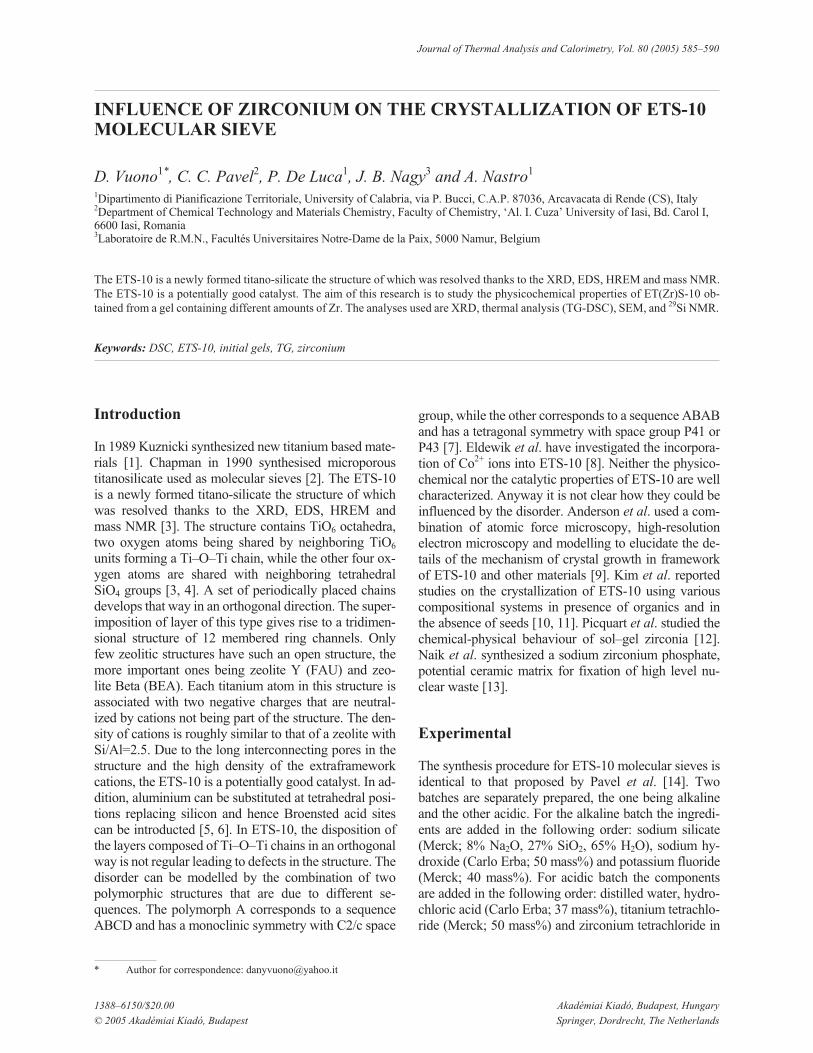
culty to introduce Zr in the structure. The morphology
of the crystals does not change as a function of time
(Fig. 1), but the presence of an amorphous phase can
be noted at intermediate times of crystallization. The
form of the crystals is a parallelepiped with a qua-
dratic basis. If the amount of ZrO2 increases in the ini-
tial gel, the Si/Ti ratio decreases from 4 to 3.7 (Ta-
ble 2), and the Si/Zr ratio also decreases showing that
more Ti and more Zr are introduced in the
ET(Zr)S-10 samples. The thermal analysis of the in-
termediate phases also led to interesting conclusions.
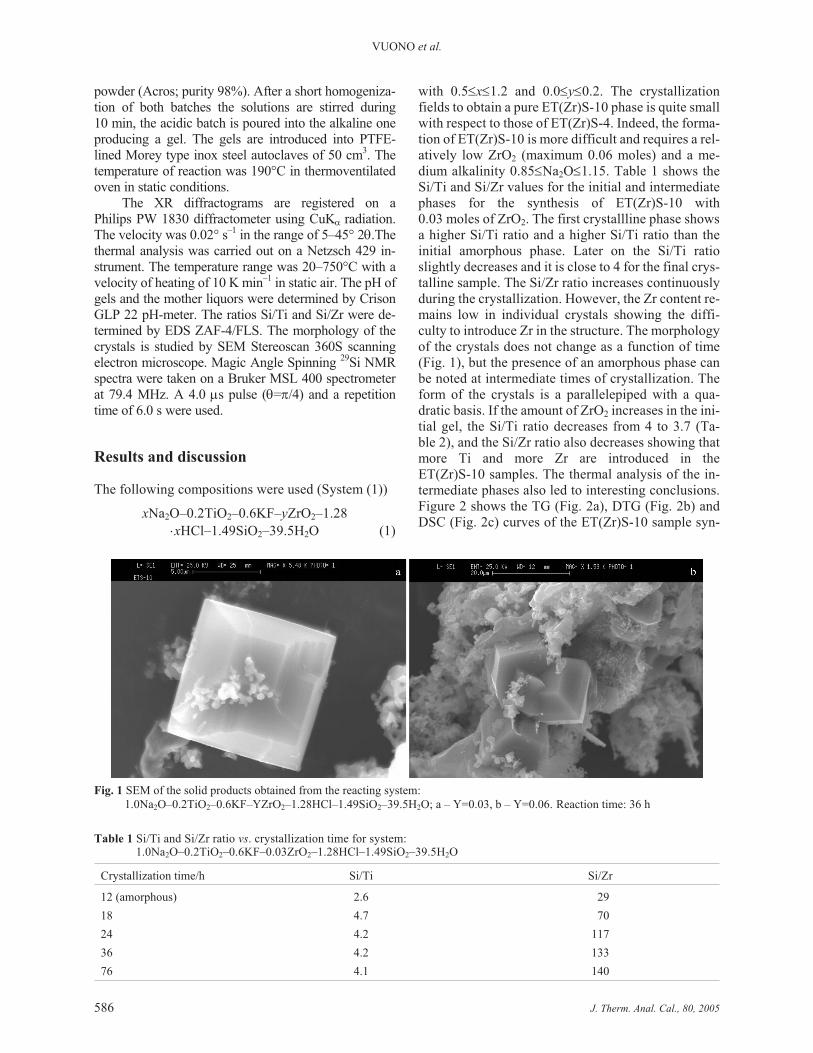
Figure 2 shows the TG (Fig. 2a), DTG (Fig. 2b) and
DSC (Fig. 2c) curves of the ET(Zr)S-10 sample syn-
586 J. Therm. Anal. Cal., 80, 2005
VUONO et al.
Table 1 Si/Ti and Si/Zr ratio vs. crystallization time for system:
1.0Na2O–0.2TiO2–0.6KF–0.03ZrO2–1.28HCl–1.49SiO2–39.5H2O
Crystallization time/h Si/Ti Si/Zr
12 (amorphous) 2.6 29
18 4.7 70
24 4.2 117
36 4.2 133
76 4.1 140
Fig. 1 SEM of the solid products obtained from the reacting system:
1.0Na2O–0.2TiO2–0.6KF–YZrO2–1.28HCl–1.49SiO2–39.5H2O; a – Y=0.03, b – Y=0.06. Reaction time: 36 h
thesized with 1.0Na2O and 0.03ZrO2 in the initial gel.
The mass losses are due to the desorption of water at
ca. 100 and at 220°C (Table 3). The mass loss in
peak I increases during crystallization, while that of
peak II decreases. The total mass loss increases due to
the increase in peak I. The correct attribution of the
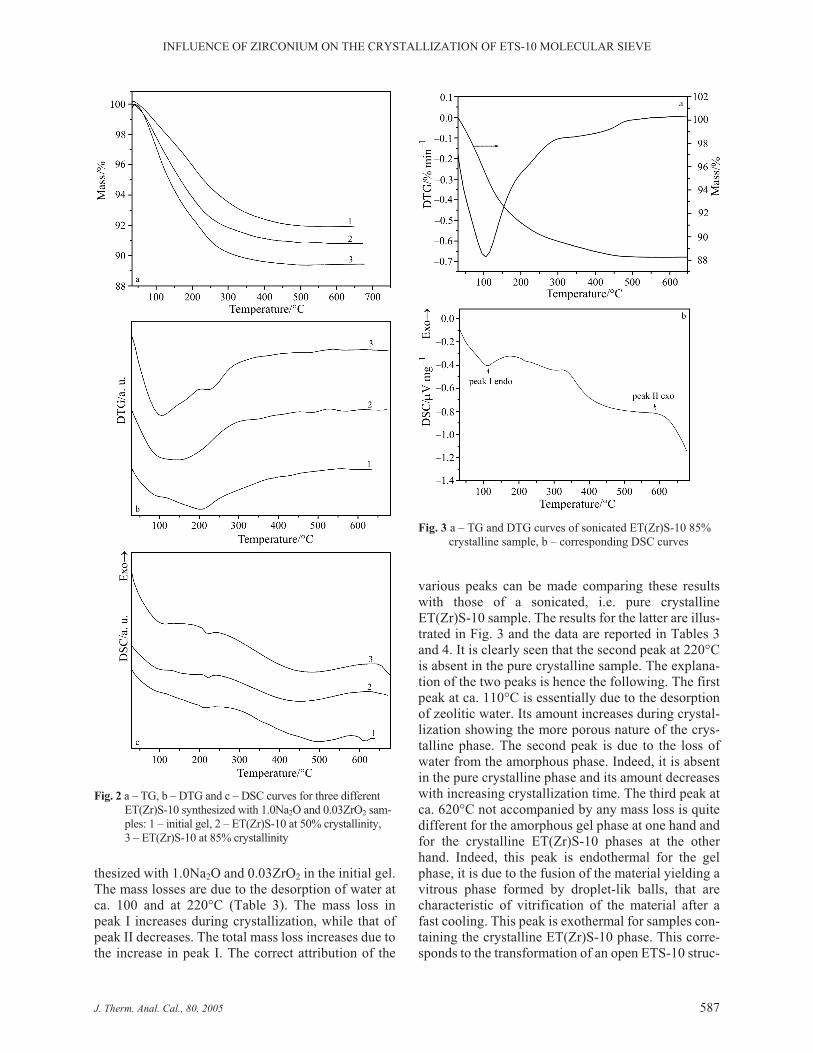
various peaks can be made comparing these results
with those of a sonicated, i.e. pure crystalline
ET(Zr)S-10 sample. The results for the latter are illus-
trated in Fig. 3 and the data are reported in Tables 3
and 4. It is clearly seen that the second peak at 220°C
is absent in the pure crystalline sample. The explana-
tion of the two peaks is hence the following. The first
peak at ca. 110°C is essentially due to the desorption
of zeolitic water. Its amount increases during crystal-
lization showing the more porous nature of the crys-
talline phase. The second peak is due to the loss of
water from the amorphous phase. Indeed, it is absent
in the pure crystalline phase and its amount decreases
with increasing crystallization time. The third peak at
ca. 620°C not accompanied by any mass loss is quite
different for the amorphous gel phase at one hand and
for the crystalline ET(Zr)S-10 phases at the other
hand. Indeed, this peak is endothermal for the gel
phase, it is due to the fusion of the material yielding a
vitrous phase formed by droplet-lik balls, that are
characteristic of vitrification of the material after a
fast cooling. This peak is exothermal for samples con-
taining the crystalline ET(Zr)S-10 phase. This corre-
sponds to the transformation of an open ETS-10 struc-
J. Therm. Anal. Cal., 80, 2005 587
INFLUENCE OF ZIRCONIUM ON THE CRYSTALLIZATION OF ETS-10 MOLECULAR SIEVE
Fig. 2 a – TG, b – DTG and c – DSC curves for three different
ET(Zr)S-10 synthesized with 1.0Na2O and 0.03ZrO2 sam-
ples: 1 – initial gel, 2 – ET(Zr)S-10 at 50% crystallinity,
3 – ET(Zr)S-10 at 85% crystallinity
Fig. 3 a – TG and DTG curves of sonicated ET(Zr)S-10 85%
crystalline sample, b – corresponding DSC curves
ture to dense titanosilicate phases. The chemical anal-
ysis data are compared for a pure ETS-10 sample and
a pure ET(Zr)S-10 sample both obtained with
1.0Na2O and 0.03ZrO2 (Table 5). The Ti content de-
creases together with the Na and K content. It is sug-
gested, because the (Ti+Zr) content remains constant
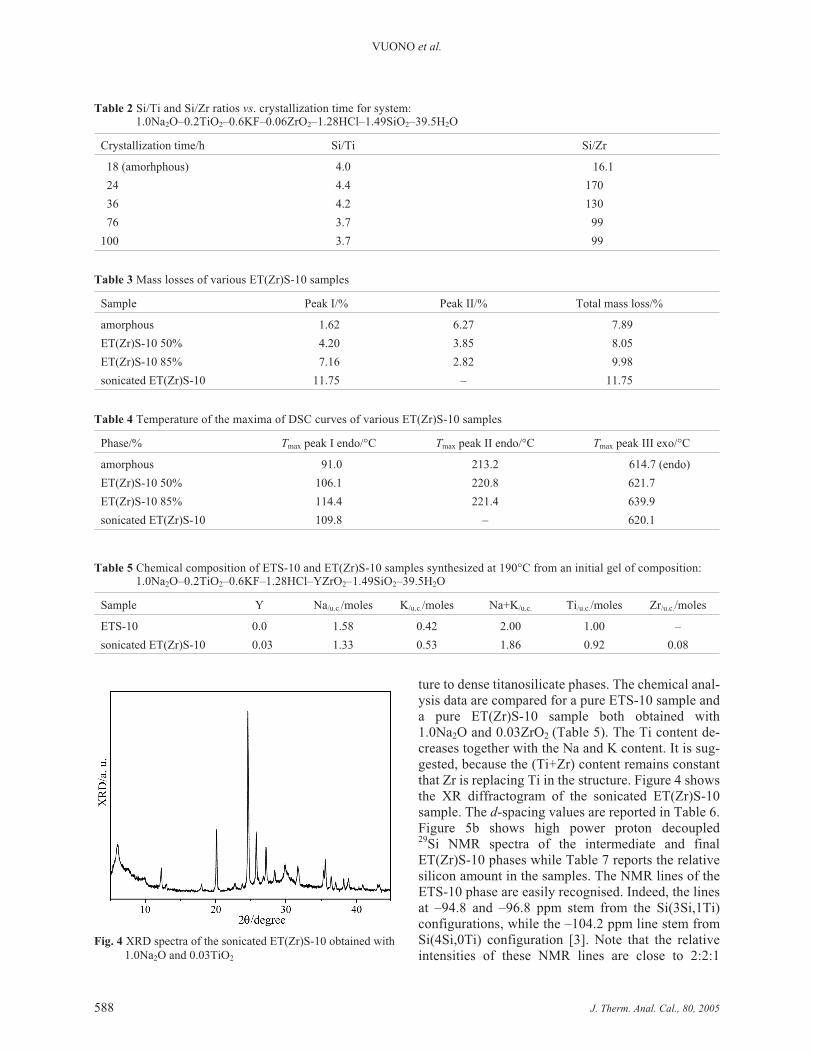
that Zr is replacing Ti in the structure. Figure 4 shows
the XR diffractogram of the sonicated ET(Zr)S-10
sample. The d-spacing values are reported in Table 6.
Figure 5b shows high power proton decoupled29
Si NMR spectra of the intermediate and final
ET(Zr)S-10 phases while Table 7 reports the relative
silicon amount in the samples. The NMR lines of the
ETS-10 phase are easily recognised. Indeed, the lines
at –94.8 and –96.8 ppm stem from the Si(3Si,1Ti)
configurations, while the –104.2 ppm line stem from
Si(4Si,0Ti) configuration [3]. Note that the relative
intensities of these NMR lines are close to 2:2:1
588 J. Therm. Anal. Cal., 80, 2005
VUONO et al.
Table 4 Temperature of the maxima of DSC curves of various ET(Zr)S-10 samples
Phase/% Tmax peak I endo/°C Tmax peak II endo/°C Tmax peak III exo/°C
amorphous 91.0 213.2 614.7 (endo)
ET(Zr)S-10 50% 106.1 220.8 621.7
ET(Zr)S-10 85% 114.4 221.4 639.9
sonicated ET(Zr)S-10 109.8 – 620.1
Table 3 Mass losses of various ET(Zr)S-10 samples
Sample Peak I/% Peak II/% Total mass loss/%
amorphous 1.62 6.27 7.89
ET(Zr)S-10 50% 4.20 3.85 8.05
ET(Zr)S-10 85% 7.16 2.82 9.98
sonicated ET(Zr)S-10 11.75 – 11.75
Table 2 Si/Ti and Si/Zr ratios vs. crystallization time for system:
1.0Na2O–0.2TiO2–0.6KF–0.06ZrO2–1.28HCl–1.49SiO2–39.5H2O
Crystallization time/h Si/Ti Si/Zr
18 (amorhphous) 4.0 16.1
24 4.4 170
36 4.2 130
76 3.7 99
100 3.7 99
Fig. 4 XRD spectra of the sonicated ET(Zr)S-10 obtained with
1.0Na2O and 0.03TiO2
Table 5 Chemical composition of ETS-10 and ET(Zr)S-10 samples synthesized at 190°C from an initial gel of composition:
1.0Na2O–0.2TiO2–0.6KF–1.28HCl–YZrO2–1.49SiO2–39.5H2O
Sample Y Na/u.c./moles K/u.c./moles Na+K/u.c. Ti/u.c./moles Zr/u.c./moles
ETS-10 0.0 1.58 0.42 2.00 1.00 –
sonicated ET(Zr)S-10 0.03 1.33 0.53 1.86 0.92 0.08
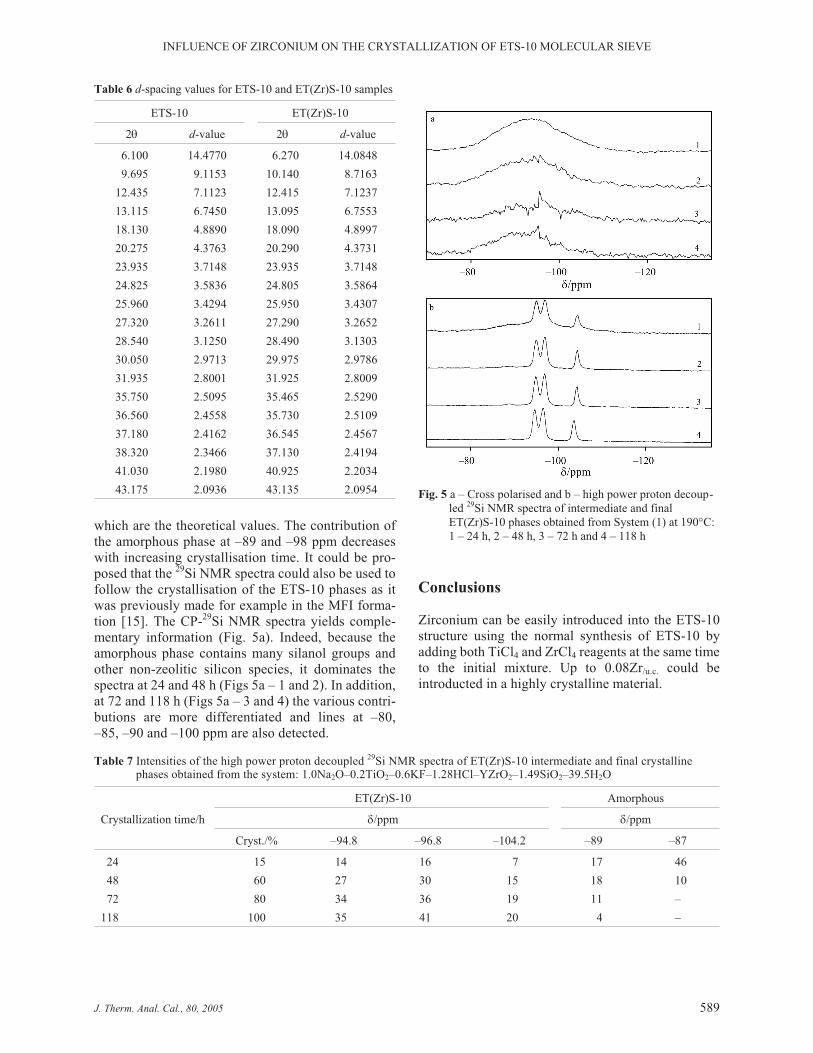
which are the theoretical values. The contribution of
the amorphous phase at –89 and –98 ppm decreases
with increasing crystallisation time. It could be pro-
posed that the29
Si NMR spectra could also be used to
follow the crystallisation of the ETS-10 phases as it
was previously made for example in the MFI forma-
tion [15]. The CP-29
Si NMR spectra yields comple-
mentary information (Fig. 5a). Indeed, because the
amorphous phase contains many silanol groups and
other non-zeolitic silicon species, it dominates the
spectra at 24 and 48 h (Figs 5a – 1 and 2). In addition,
at 72 and 118 h (Figs 5a – 3 and 4) the various contri-
butions are more differentiated and lines at –80,
–85, –90 and –100 ppm are also detected.
Conclusions
Zirconium can be easily introduced into the ETS-10
structure using the normal synthesis of ETS-10 by
adding both TiCl4 and ZrCl4 reagents at the same time
to the initial mixture. Up to 0.08Zr/u.c. could be
introducted in a highly crystalline material.
J. Therm. Anal. Cal., 80, 2005 589
INFLUENCE OF ZIRCONIUM ON THE CRYSTALLIZATION OF ETS-10 MOLECULAR SIEVE
Table 6 d-spacing values for ETS-10 and ET(Zr)S-10 samples
ETS-10 ET(Zr)S-10
2θ d-value 2θ d-value
6.100 14.4770 6.270 14.0848
9.695 9.1153 10.140 8.7163
12.435 7.1123 12.415 7.1237
13.115 6.7450 13.095 6.7553
18.130 4.8890 18.090 4.8997
20.275 4.3763 20.290 4.3731
23.935 3.7148 23.935 3.7148
24.825 3.5836 24.805 3.5864
25.960 3.4294 25.950 3.4307
27.320 3.2611 27.290 3.2652
28.540 3.1250 28.490 3.1303
30.050 2.9713 29.975 2.9786
31.935 2.8001 31.925 2.8009
35.750 2.5095 35.465 2.5290
36.560 2.4558 35.730 2.5109
37.180 2.4162 36.545 2.4567
38.320 2.3466 37.130 2.4194
41.030 2.1980 40.925 2.2034
43.175 2.0936 43.135 2.0954
Table 7 Intensities of the high power proton decoupled29
Si NMR spectra of ET(Zr)S-10 intermediate and final crystalline
phases obtained from the system: 1.0Na2O–0.2TiO2–0.6KF–1.28HCl–YZrO2–1.49SiO2–39.5H2O
Crystallization time/h
ET(Zr)S-10 Amorphous
δ/ppm δ/ppm
Cryst./% –94.8 –96.8 –104.2 –89 –87
24 15 14 16 7 17 46
48 60 27 30 15 18 10
72 80 34 36 19 11 –
118 100 35 41 20 4 –
Fig. 5 a – Cross polarised and b – high power proton decoup-
led29
Si NMR spectra of intermediate and final
ET(Zr)S-10 phases obtained from System (1) at 190°C:
1 – 24 h, 2 – 48 h, 3 – 72 h and 4 – 118 h
References
1 S. M. Kuznicki, US Patent 4,853202, assigned to
Engelhard Corporation, 1989.
2 D. M. Chapman, US Patent 5015453, assigned to
W. R. Grace and Co.-Conn., 1990.
3 M. W. Anderson, O. Terasaki, T. Ohsuna, A. Philippou,
S. P. Mackay, A. Ferriera, J. Rocha and S. Lidin, Nature,
367 (1994) 347.
4 J. Rocha and M. W. Anderson, Eur. J. Inorg., (2000) 801.
5 Z. Lin, J. Rocha, A. Ferreira and M. W. Anderson,
Colloids Surf. A, 179 (2001) 133.
6 A. Liepold, K. Roos, W. Reschetilowski, Z. Lin, J. Rocha,
A. Philippou and M. W. Anderson, Microporous Mater.,
10 (1997) 211.
7 X. Yang, J. L. Pallaud, H. F. W. J. Van Breukelen,
H. Kessler and E. Duprey, Microporous Mesoporous Mater.,
46 (2001) 1.
8 A. Eldewik and R. Howe, Microporous Mesoporous Mater.,
48 (2001) 65.
9 M. W. Anderson, J. R. Agger, N. Hanif and O. Terasaki,
Microporous Mesoporous Mater., 48 (2001) 1.
10 W. J. Kim, M. C. Lee, J. C. Yoo and D. T. Hayhurst,
Microporous Mesoporous Mater., 41 (2000) 79.
11 W. J. Kim, S. D. Kim, H. S. Jung and D. T. Hayhurst,
Microporous Mesoporous Mater., 56 (2002) 89.
12 M. Picquart, T. López, R. Gómez, E. Torres, A. Moreno
and J. Garcia, J. Therm. Anal. Cal., 76 (2004) 755.
13 A. H. Naik, N. V. Thakkar, S. R. Dharwadkar,
K. D. Singh Mudher and V. Venugopal, J. Therm. Anal. Cal.,
78 (2004) 707.
14 C. C. Pavel, D. Vuono, L. Catanzaro, P. De Luca,
N. Bilba, A. Nastro and J. B. Nagy,
Microporous Mesoporous Mater., 56 (2002) 227.
15 J. B. Nagy, Ph. Bodart, H. Collette, Ch. Fernandez,
Z. Gabelica, A. Nastro and R. Aiello, J. Chem. Soc.,
Faraday Trans. 1, 85 (1989) 2749.
590 J. Therm. Anal. Cal., 80, 2005
VUONO et al.


