Embed Size (px)
Citation preview
199
Manfred Heinlein (ed.), Plasmodesmata: Methods and Protocols, Methods in Molecular Biology, vol. 1217,DOI 10.1007/978-1-4939-1523-1_14, © Springer Science+Business Media New York 2015
Chapter 14
Probing Plasmodesmata Function with Biochemical Inhibitors
Rosemary G. White
Abstract
To investigate plasmodesmata (PD) function, a useful technique is to monitor the effect on cell-to-cell transport of applying an inhibitor of a physiological process, protein, or other cell component of interest. Changes in PD transport can then be monitored in one of several ways, most commonly by measuring the cell-to-cell movement of fl uorescent tracer dyes or of free fl uorescent proteins. Effects on PD structure can be detected in thin sections of embedded tissue observed using an electron microscope, most commonly a Transmission Electron Microscope (TEM). This chapter outlines commonly used inhibitors, methods for treating different tissues, how to detect altered cell-to-cell transport and PD structure, and important caveats.
Key words Arabidopsis thaliana , Cell-to-cell transport , Fluorescence microscopy , Fluorescent tracer dyes , Green fl uorescent protein , Microinjection , Transmission electron microscopy
1 Introduction
Plasmodesmata play a key role in transmission of cytoplasmic signals from cell to cell, yet there are large gaps in our knowledge of their composition, function, and regulation. Proteomic analyses have identifi ed a large suite of proteins potentially located within or associated with PD, but most of these await experimental con-fi rmation of both their location and function (e.g. [ 1 , 2 ], reviewed in ref. 3 ). Mutant analyses are beginning to reveal an additional set of proteins not located at PD but which are essential to regulate PD behavior (e.g. [ 4 – 6 ]). For example, mutations in the thiore-doxin GAT1, a plastid-located regulator of redox status essential in PD function, tissue viability, and embryo development, cause reduced cell–cell transport [ 4 ] and mutations in ISE1, a mitochon-drial DEAD-box RNA helicase [ 5 ] or ISE2, a DEVH box RNA helicase [ 6 ], cause increased cell–cell transport. Such analyses can demonstrate the role of a single gene by knockout and subsequent complementation studies, but this is diffi cult if the RNA or protein
200
product is vital to cell function since mutants may be lethal at the embryo or young seedling stage (e.g. [ 7 ]). Even for proteins known to be PD components, such as myosin, analysis of nonlethal mutants or green fl uorescent protein- (GFP-) tagged lines has been less informative than expected (e.g. [ 8 – 10 ]).
For these reasons, it is still common to use well-characterized chemical inhibitors of biological processes to probe PD function. For example, the role of microtubules in cell-to-cell movement of transcription factors was shown using a combination of microtu-bule mutants with moderate phenotypes together with chemical treatments [ 11 ]. This approach is based on the assumption that the chosen inhibitors are specifi c, in that they target a single enzyme or small class of enzymes, or target a specifi c molecular substructure within a class of proteins, lipids, or carbohydrates. For example, inhibitors of ATP activity or energy metabolism have been used to show that regulation of PD requires energy from the cell (e.g. [ 12 – 14 ]). Herbicides, such as alloxan, that induce callose (β-1,3 glu-can) synthesis were used to show that additional callose restricts transport via PD [ 4 ], and treatment with the callose synthesis inhibitor, 2-deoxy-D-glucose (DDG; [ 15 , 16 ]) showed that reduc-ing callose causes PD opening [ 17 , 18 ]. Furthermore, new, more targeted inhibitors of specifi c proteins are constantly under devel-opment (e.g. small molecule inhibitors of actin; [ 19 – 21 ]), and could be used in plants after suitable testing. Finally, the pheno-typic effects of inhibitors can be compared with similar effects of partial inhibition or knockout of proteins to suggest a role for the inhibited protein in the cell process under study.
This chapter summarizes current methods for using biochemi-cal inhibitors, proteins, and antibodies to alter PD permeability, with considerations about how to detect effects on PD, which will affect the type of plant material to use, together with known arti-facts and how to avoid or ameliorate them.
The effects of biochemicals on PD can be examined either by func-tional analyses or by detecting structural changes. To elucidate the role of a putative PD regulator in transport dynamics, effects on cell-to-cell transport need to be monitored, and for this, both the appropriate type of plant material and assessment protocol must be chosen (Subheading 1.2 ). Most experiments involve monitoring the spread of fl uorescent tracer molecules from the cytoplasm of one cell into the cytoplasm of an adjacent cell or cells. These observations require a fl uorescence microscope, in which shorter wavelengths of light (excitation light) are projected onto the tissue, causing emission of fl uorescence from the tracer molecules at some-what longer wavelengths of light. The appropriate optical fi lters must be used to select excitation and emission wavelengths for detection of specifi c tracer molecules, whether dyes or fl uorescent proteins. In some cases, a dissecting microscope equipped for fl uo-rescence imaging can provide suffi cient resolution to discriminate
1.1 Monitoring Effects on Plasmodesmata
Rosemary G. White
201
effects of biochemical modulators on cell-to-cell transport via PD. More often, either a regular fl uorescence compound microscope or a confocal laser scanning microscope (CLSM) is required to provide suffi cient detail, intensity of excitation light and sensitivity of detec-tors to the fl uorescence emission in order to locate low levels of tracers that have moved from the source cell into neighboring cells.
Assessment of changes in structure generally requires imaging at suffi cient magnifi cation to resolve the small size of PD, which have cross-section diameters of the order of 40–50 nm. This can be obtained using an electron microscope, usually a Transmission Electron Microscope (TEM). The tissue must be prepared to with-stand observation under an electron beam in a vacuum, and this necessitates fi xation (chemically cross-linking proteins to lock them in place) of the plant material, dehydration in solvent to enable penetration of water-immiscible resins, infi ltration with liquid resin, polymerization of the resin (usually by heat or UV light), ultrathin sectioning, and staining with electron-dense heavy metals. Both short- and long-term structural effects can be moni-tored which may require slightly different fi xation protocols. Tissue processing also varies depending on the specifi c tissue to be exam-ined and whether external (in the cell wall) or internal (within the cytoplasmic sleeve) details of PD structure are of interest. Instantaneous, rapid structural changes are best seen in rapidly frozen and freeze- substituted material. However, ultrastructural details within larger tissue pieces are usually poorly preserved by rapid freezing techniques, and more conventional chemical fi xa-tion can often reveal changes caused by biochemical treatments. For example, reduction in callose synthesis after treatment with the callose synthesis inhibitor DDG is easily seen in chemically fi xed tissues [ 17 , 18 ].
In some cases, structural modifi cations associated with PD maturation, e.g. in Arabidopsis leaves, can be detected by their ability to incorporate fl uorescently tagged viral proteins [ 22 ].
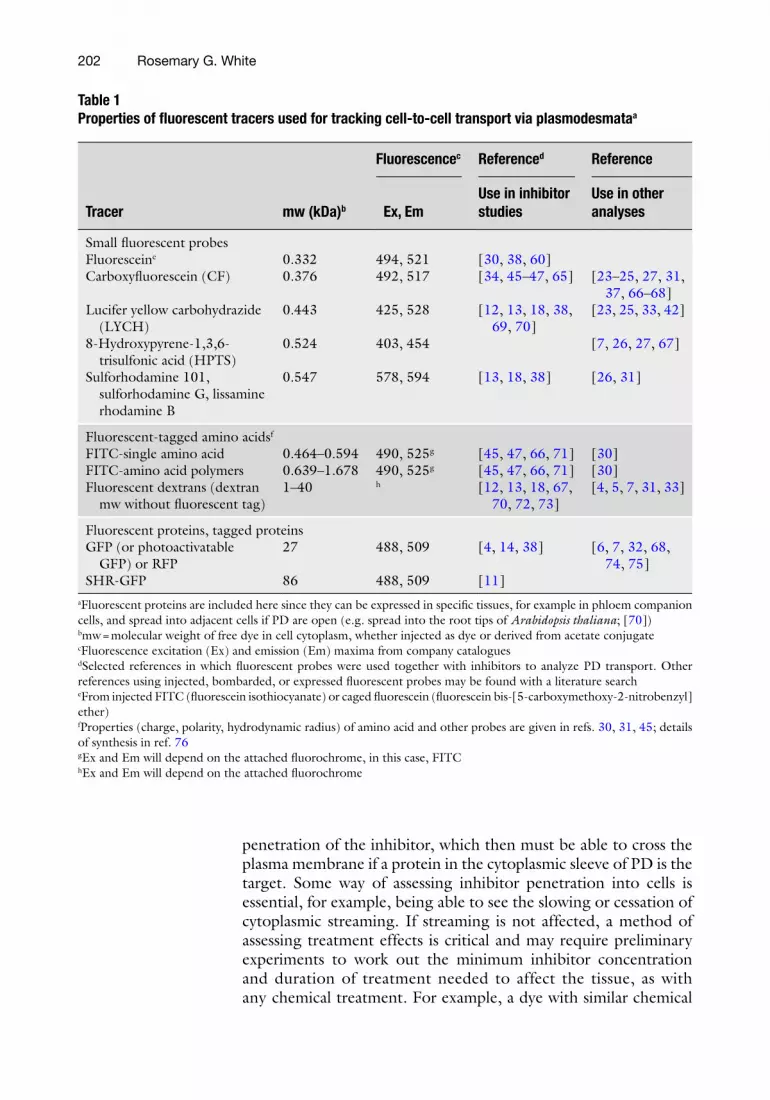
The key requirement for studying PD dynamics is usually that a fl uorescent tracer can be detected moving from one cell or tissue to the next. These tracers (listed in Table 1 ) include fl uorescent dyes, such as carboxyfl uorescein diacetate (CFDA), which can be ester-loaded into cells without injection (e.g. [ 23 – 26 ]), or loaded into the phloem via application to source tissue (e.g. [ 24 , 27 , 28 ]), to follow movement via PD into surrounding tissue. More conven-tionally, we can follow the movement of fl uorescent tracers into neighboring cells after they have been microinjected or bombarded into single cells (e.g. [ 29 , 30 ] and references therein [ 31 , 32 ]). The latter techniques do involve some cell damage and such wound responses will affect cell–cell transport [ 18 , 33 ], and quantitation is not straightforward (e.g. [ 34 ]). For application of chemical inhibitors, tissues ideally need to have external cell walls that allow
1.2 Choice of Plant Material
1.2.1 Studying PD Dynamic Behavior
Biochemical Inhibition of Plasmodesmata
202
penetration of the inhibitor, which then must be able to cross the plasma membrane if a protein in the cytoplasmic sleeve of PD is the target. Some way of assessing inhibitor penetration into cells is essential, for example, being able to see the slowing or cessation of cytoplasmic streaming. If streaming is not affected, a method of assessing treatment effects is critical and may require preliminary experiments to work out the minimum inhibitor concentration and duration of treatment needed to affect the tissue, as with any chemical treatment. For example, a dye with similar chemical
Table 1 Properties of fl uorescent tracers used for tracking cell-to-cell transport via plasmodesmata a
Tracer mw (kDa) b
Fluorescence c Reference d Reference
Ex, Em Use in inhibitor studies
Use in other analyses
Small fl uorescent probes Fluorescein e 0.332 494, 521 [ 30 , 38 , 60 ] Carboxyfl uorescein (CF) 0.376 492, 517 [ 34 , 45 – 47 , 65 ] [ 23 – 25 , 27 , 31 ,
37 , 66 – 68 ] Lucifer yellow carbohydrazide
(LYCH) 0.443 425, 528 [ 12 , 13 , 18 , 38 ,
69 , 70 ] [ 23 , 25 , 33 , 42 ]
8-Hydroxypyrene-1,3,6-trisulfonic acid (HPTS)
0.524 403, 454 [ 7 , 26 , 27 , 67 ]
Sulforhodamine 101, sulforhodamine G, lissamine rhodamine B
0.547 578, 594 [ 13 , 18 , 38 ] [ 26 , 31 ]
Fluorescent-tagged amino acids f FITC-single amino acid 0.464–0.594 490, 525 g [ 45 , 47 , 66 , 71 ] [ 30 ] FITC-amino acid polymers 0.639–1.678 490, 525 g [ 45 , 47 , 66 , 71 ] [ 30 ] Fluorescent dextrans (dextran
mw without fl uorescent tag) 1–40 h [ 12 , 13 , 18 , 67 ,
70 , 72 , 73 ] [ 4 , 5 , 7 , 31 , 33 ]
Fluorescent proteins, tagged proteins GFP (or photoactivatable
GFP) or RFP 27 488, 509 [ 4 , 14 , 38 ] [ 6 , 7 , 32 , 68 ,
74 , 75 ] SHR-GFP 86 488, 509 [ 11 ]
a Fluorescent proteins are included here since they can be expressed in specifi c tissues, for example in phloem companion cells, and spread into adjacent cells if PD are open (e.g. spread into the root tips of Arabidopsis thaliana ; [ 70 ]) b mw = molecular weight of free dye in cell cytoplasm, whether injected as dye or derived from acetate conjugate c Fluorescence excitation (Ex) and emission (Em) maxima from company catalogues d Selected references in which fl uorescent probes were used together with inhibitors to analyze PD transport. Other references using injected, bombarded, or expressed fl uorescent probes may be found with a literature search e From injected FITC (fl uorescein isothiocyanate) or caged fl uorescein (fl uorescein bis-[5-carboxymethoxy-2- nitrobenzyl] ether) f Properties (charge, polarity, hydrodynamic radius) of amino acid and other probes are given in refs. 30 , 31 , 45 ; details of synthesis in ref. 76 g Ex and Em will depend on the attached fl uorochrome, in this case, FITC h Ex and Em will depend on the attached fl uorochrome
Rosemary G. White
203
properties to the inhibitor may be used to assess penetration in preliminary experiments, or a transgenic line expressing a visible reporter protein responsive to inhibitor-generated changes in cal-cium, pH, or membrane potential may be used.
Since in most cases effects on transport are monitored by cell-to- cell movement of visible tracers, the tissue used must be trans-parent enough to see the earliest signs of the tracer in adjacent cells. The roots of Arabidopsis thaliana and other small plants are useful as they are fairly transparent and cytoplasmic streaming can be monitored in root hairs. They are also very sensitive to growing conditions and uniformity of growth is essential for reasonable quantitation of transport in treated and control tissues. Examples of quantitative comparisons of Arabidopsis root growth after appli-cation of different metabolic and cytoskeleton inhibitors are shown in [ 35 , 36 ]. In addition, ref. 34 presents an elegant method to rapidly quantify tracer dye fl ux and show dynamic behavior in timeframes similar to that measured by electrophysiological tech-niques (see below). Although the method is limited somewhat by currently available image capture speeds, this will be more amena-ble as more sensitive and faster instruments become more routinely available.
Plants expressing GFP or other fl uorescent protein in just one or a few cell types are very useful as they can give insights into PD regulation between developmental domains. Least traumatic to the plant and the experimental system are expressed fl uorescent pro-teins, such as GFP (e.g. [ 37 ]). GFP is relatively large (27 kDa) compared to many signals that move through PD, although the photoconvertable forms of GFP eliminate the physical trauma of microinjection (e.g. [ 38 , 39 ]). There is now a selection of smaller expressed proteins, such as iLOV (10 kDa), engineered from the light, oxygen, and voltage-sensing (LOV) domain of the blue light receptor phototropin [ 40 ] and other small fl avin-based fl uorescent proteins [ 41 ]. Whether monitoring injected tracers or spread of expressed proteins, in all cases, maintenance of rapid growth by optimal growing conditions is essential. Before and after applica-tion of inhibitors, cell viability should be monitored by observing cytoplasmic streaming and membrane integrity (exclusion of prop-idium iodide, for example).
Epidermal peels, especially from Allium species, are commonly used for PD transport studies (e.g. [ 42 – 44 ] and references therein), because the epidermal layer is readily detached from underlying tissue for imaging. For repeatability, elongating tissue from leaves, e.g. from Allium porrum (leek), is best (e.g. [ 44 ]) since the growth and storage history of Allium cepa (onion) bulbs purchased at the supermarket is usually unknown. Alternative two-dimensional tis-sues are the fronds of water plants, such as Elodea canadensis [ 31 ] or Egeria densa [ 45 ] with highly permeable outer cell walls which usually lack a hydrophobic cuticle.
Biochemical Inhibition of Plasmodesmata
204
Detection of fl uorescent tracer movement is most straightfor-ward in single cell fi les, as found in stamen hairs of Tradescantia virginiana ([ 13 , 29 ] and references therein) or Setcreasea purpurea (e.g. [ 30 , 46 , 47 ]), which requires maintenance of these plants in a warm greenhouse with long daylength. The multicellular tri-chomes of Nicotiana species are also useful (e.g. N. tabacum , [ 38 ]) since their tip cells can be loaded with tracer dye, or alternatively, they can be readily transformed to express fl uorescent protein trac-ers, either by transient or constitutive expression. In all of these tissues, the permeability of the cell walls may be an issue and young tissues are desirable for chemical treatments.
One aspect of PD behavior that is hard to monitor by follow-ing the movement of tracer dyes or proteins is their very fast dynamic behavior in response to certain stimuli or inhibitors. For example, application of calcium causes rapid closure of PD within 5 s, followed by reopening within a further 5–10 s, and the sharp opening and closing profi les can be detected only by monitoring electrical signals [ 48 ]. Here, considerable skill is required to insert microelectrodes into adjacent cells with the least cell damage or effects on PD. If a series of cells is to be studied, electrodes must be inserted into each cell of the series (e.g. [ 49 , 50 ]). We assume that there is less PD damage than when tracer dyes are injected since cell membrane voltage is monitored, the electrodes are small, and there is no addition of a relatively undefi ned volume of tracer dye to a small volume of cytoplasm. Electrophysiology appears rarely in recent PD methods, but will be needed in future studies to understand subtle details of PD protein function.
A much greater range of tissues is used to analyze effects on PD structure. As for dynamic studies, penetration of the inhibitor must be assessed to ensure that it is affecting the tissue under study. Often, this involves baseline analysis of all cell structures, including PD, likely to be modifi ed by inhibitor treatment, for example, not-ing loss of actin microfi laments in tissue treated with an actin inhibitor (e.g. [ 51 , 52 ]) or loss of microtubules in tissue treated with a microtubule inhibitor (e.g. [ 11 , 53 ]). A further requirement is development of a fi xation, embedding, staining, and imaging protocol that allows both qualitative and quantitative assessment of inhibitor effects. Short-term treatments may affect the usual range of PD morphologies seen within a given tissue (e.g. effects of cytochalasin on young PD, [ 54 ]), and somewhat longer-term treatments (similar to effects of genetic mutations) may affect the usual change in PD morphologies seen during maturation of the tissue, or tissue interface [ 22 ]. Because the distribution, density, branching, and cell wall structures are likely to be different at each cell wall interface, and will vary with growing conditions, baseline PD structural information must be collected in each case.
1.2.2 Analysis of PD Structure
Rosemary G. White
205
A major caveat to the use of chemical inhibitors is that they are often applied to the entire tissue under study, and will affect all targeted proteins in the tissue, not just those in PD. A second res-ervation is that inhibitors commonly are less specifi c than claimed and may interfere with a number of other cell processes. With these caveats in mind, additional artifacts are common to all chemical treatments, and involve the numerous steps required to incubate tissue in the inhibitor, introduce a tracer dye into the cells, either before or after treatment, then observe the tissue for some time under fl uorescence illumination.
Apart from chemical side-effects, tissue preparation generally requires transfer of the tissue into the test solution in a chamber for observation or microinjection or placement onto the test agar for treatment followed by a second transfer for microinjection. Controls must be carefully monitored to quantify the effects on and/or allow for any inhibition of PD caused by handling during the experiment. Plants are surprisingly sensitive to mechanical han-dling, which will generate callose at PD and affect assessment of cell-to-cell transport ([ 17 ] and references therein), which can be ameliorated by treatment with DDG [ 17 , 18 , 33 ]. DDG is added to block callose synthesis, and does this by trapping nucleotides, here UDP, into a metabolically unusable form [ 55 ]. Inside the cell, DDG is phosphorylated to DDG-6- phosphate and then converted into UDP-2-DDG, which competes with UDP-glucose for doli-chol phosphate forming dolichol- phosphate-DDG, which cannot be incorporated into β-glucans, such as callose [ 15 , 56 – 58 ]. The experimental tissue needs to be carefully monitored to ensure that, although specifi c functions are inhibited or blocked by each treatment chemical, the cells examined are still alive and relatively healthy.
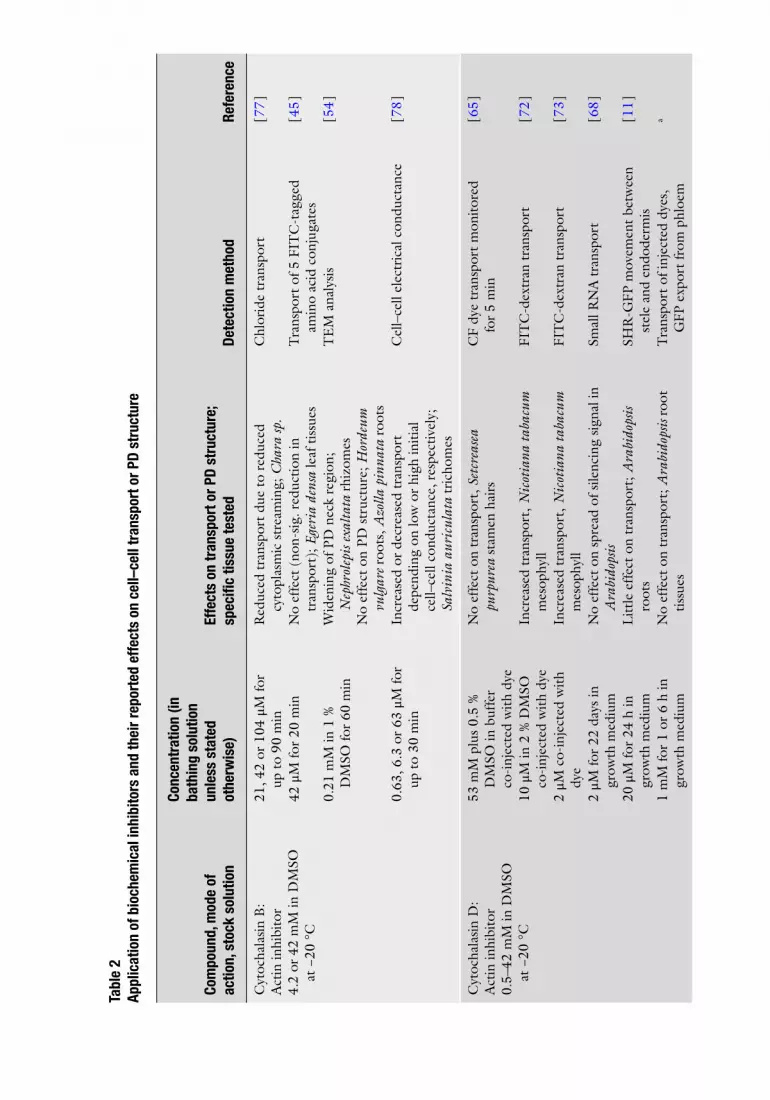
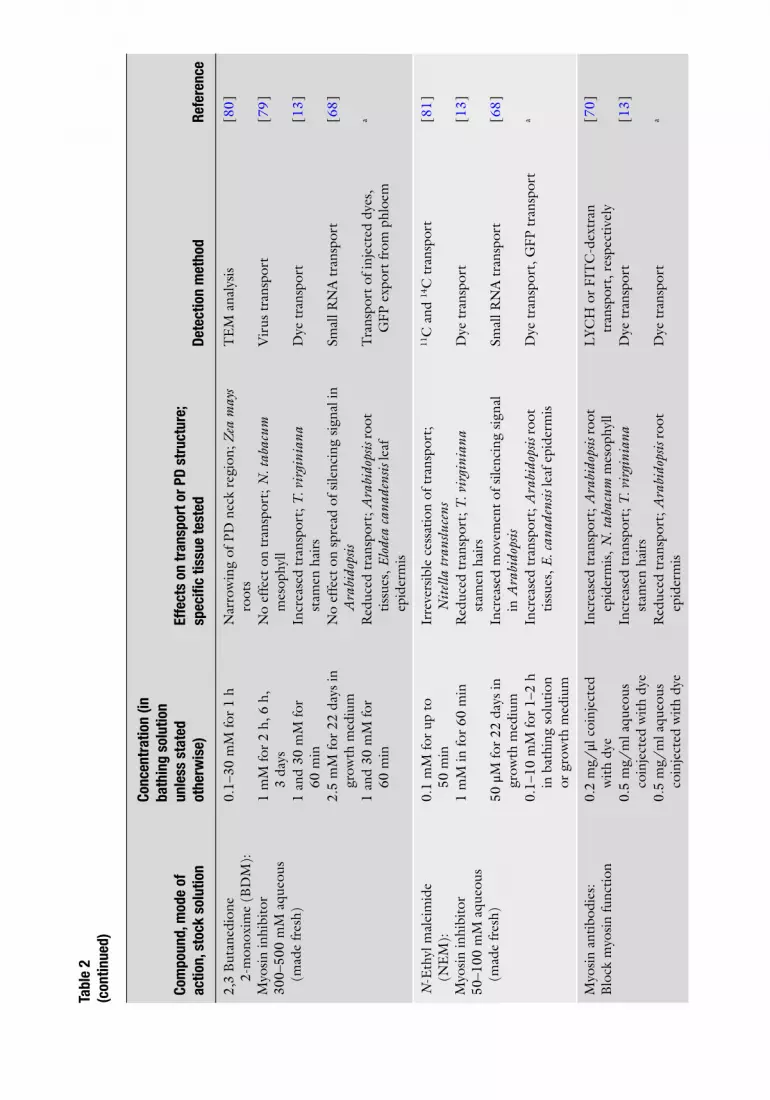
A wide range of chemical agents, antibodies, and injected proteins has been used to modify PD function, outlined in Table 2 . Also shown are references in which each inhibitor has been used, the range of concentrations applied and length of treatments. Selection of inhibitor depends upon the process under investigation, back-ground information about the tissue and inhibitor and their inter-actions, and experience of the investigator.
Many of these agents are not readily soluble in aqueous solutions and are fi rst prepared and then stored as stock solutions in the appropriate nonaqueous solvent, which is often dimethyl-sulfoxide (DMSO). Each needs to be monitored when diluted to working concentration in aqueous solution to ensure they do not precipitate out of solution. Furthermore, since some of these nonaqueous solvents have unanticipated effects on either the action of the inhibitor, the activities of cell enzymes, or the integ-rity of membranes, constant monitoring of membrane integrity is
1.3 Recognizing Artifacts of Treatment or Handling
1.4 Selection of Biochemical Inhibitors
Biochemical Inhibition of Plasmodesmata
Tabl
e 2
Appl
icat
ion
of b
ioch
emic
al in
hibi
tors
and
thei
r rep
orte
d ef
fect
s on
cel
l–ce
ll tr
ansp
ort o
r PD
stru
ctur
e
Com
poun
d, m
ode
of
actio
n, s
tock
sol
utio
n
Conc
entr
atio
n (in
ba
thin
g so
lutio
n un
less
sta
ted
othe
rwis
e)
Effe
cts
on tr
ansp
ort o
r PD
stru
ctur
e;
spec
ifi c
tissu
e te
sted
De
tect
ion
met
hod
Refe
renc
e
Cyt
ocha
lasi
n B
: A
ctin
inhi
bito
r 4.
2 or
42
mM
in D
MSO
at
−20
°C
21, 4
2 or
104
μM
for
up t
o 90
min
R
educ
ed t
rans
port
due
to
redu
ced
cyto
plas
mic
str
eam
ing;
Cha
ra sp
. C
hlor
ide
tran
spor
t [ 7
7 ]
42 μ
M fo
r 20
min
N
o ef
fect
(no
n-si
g. r
educ
tion
in
tran
spor
t); E
geri
a de
nsa
leaf
tis
sues
T
rans
port
of 5
FIT
C-t
agge
d am
ino
acid
con
juga
tes
[ 45 ]
0.21
mM
in 1
%
DM
SO fo
r 60
min
W
iden
ing
of P
D n
eck
regi
on;
Nep
hrol
epis
exal
tata
rhi
zom
es
No
effe
ct o
n PD
str
uctu
re; H
orde
um
vulg
are
root
s, A
zolla
pin
nata
roo
ts
TE
M a
naly
sis
[ 54 ]
0.63
, 6.3
or
63 μ
M fo
r up
to
30 m
in
Incr
ease
d or
dec
reas
ed t
rans
port
de
pend
ing
on lo
w o
r hi
gh in
itial
ce
ll–ce
ll co
nduc
tanc
e, r
espe
ctiv
ely;
Sa
lvin
ia a
uric
ulat
a tr
icho
mes
Cel
l–ce
ll el
ectr
ical
con
duct
ance
[ 7
8 ]
Cyt
ocha
lasi
n D
: A
ctin
inhi
bito
r 0.
5–42
mM
in D
MSO
at
−20
°C
53 m
M p
lus
0.5
%
DM
SO in
buf
fer
co-i
njec
ted
with
dye
No
effe
ct o
n tr
ansp
ort,
Set
crea
sea
purp
urea
sta
men
hai
rs
CF
dye
tran
spor
t m
onito
red
for
5 m
in
[ 65 ]
10 μ
M in
2 %
DM
SO
co-i
njec
ted
with
dye
In
crea
sed
tran
spor
t, N
icot
iana
taba
cum
m
esop
hyll
FIT
C-d
extr
an t
rans
port
[ 7
2 ]
2 μM
co-
inje
cted
with
dy
e In
crea
sed
tran
spor
t, N
icot
iana
taba
cum
m
esop
hyll
FIT
C-d
extr
an t
rans
port
[ 7
3 ]
2 μM
for
22 d
ays
in
grow
th m
ediu
m
No
effe
ct o
n sp
read
of s
ilenc
ing
sign
al in
A
rabi
dops
is Sm
all R
NA
tra
nspo
rt
[ 68 ]
20 μ
M fo
r 24
h in
gr
owth
med
ium
L
ittle
eff
ect
on t
rans
port
; Ara
bido
psis
root
s SH
R-G
FP m
ovem
ent
betw
een
stel
e an
d en
dode
rmis
[ 1
1 ]
1 m
M fo
r 1
or 6
h in
gr
owth
med
ium
N
o ef
fect
on
tran
spor
t; A
rabi
dops
is ro
ot
tissu
es
Tra
nspo
rt o
f inj
ecte
d dy
es,
GFP
exp
ort
from
phl
oem
a

(con
tinue
d)
Lat
runc
ulin
A:
Act
in p
olym
eriz
atio
n in
hibi
tor
1 or
2 m
M in
DM
SO
at −
20 °
C
0.1
μM fo
r 30
min
pr
ior
to in
ject
ion
of
viru
s m
ovem
ent
prot
ein
± dy
e
Incr
ease
d tr
ansp
ort,
Nic
otia
na ta
bacu
m
mes
ophy
ll FI
TC
-dex
tran
tra
nspo
rt
[ 73 ]
Lat
runc
ulin
B:
Act
in p
olym
eriz
atio
n in
hibi
tor
1 or
2 m
M in
DM
SO
at −
20 °
C
10 μ
M fo
r 2
h, 6
h o
r 3
days
R
educ
ed t
rans
port
(sm
alle
r di
amet
er
viru
s sp
read
), N
. tab
acum
mes
ophy
ll V
irus
tra
nspo
rt
[ 79 ]
25 μ
M in
0.5
%
DM
SO fo
r 15
min
N
o ef
fect
on
tran
spor
t; N
taba
cum
leaf
tr
icho
mes
L
YCH
tra
nspo
rt
[ 38 ]
50 n
M fo
r 60
min
N
o ef
fect
on
tran
spor
t; T
rade
scan
tia
virg
inia
na s
tam
en h
airs
T
rans
port
of i
njec
ted
dyes
[ 1
3 ]
1 μM
for
22 d
ays
in
grow
th m
ediu
m
No
effe
ct o
n sp
read
of s
ilenc
ing
sign
al in
A
rabi
dops
is Sm
all R
NA
tra
nspo
rt
[ 68 ]
50 n
M fo
r 24
h in
gr
owth
med
ium
L
ittle
eff
ect
on t
rans
port
; Ara
bido
psis
root
s SH
R-G
FP m
ovem
ent
betw
een
stel
e an
d en
dode
rmis
[ 1
1 ]
25 μ
M in
0.5
%
DM
SO fo
r 15
min
N
o ef
fect
on
tran
spor
t; A
rabi
dops
is ro
ot
tissu
es
Tra
nspo
rt o
f inj
ecte
d dy
es,
GFP
exp
ort
from
phl
oem
a
Phal
loid
in:
Act
in fi
lam
ent
stab
ilize
r 10
μM
in m
etha
nol
at −
20 °
C
6.6
μM c
o-in
ject
ed
with
dye
N
o ef
fect
on
tran
spor
t; N
. tab
acum
m
esop
hyll
FIT
C d
extr
an t
rans
port
[ 7
2 ]
2 μM
co-
inje
cted
with
dy
e Pr
even
ted
incr
ease
d tr
ansp
ort
due
to
viru
s m
ovem
ent
prot
ein,
N. t
abac
um
mes
ophy
ll
FIT
C-d
extr
an t
rans
port
[ 7
3 ]
Jasp
laki
nolid
e:
Act
in fi
lam
ent
stab
ilize
r 1
mM
in D
MSO
at
−20
°C
1 μM
for
22 d
ays
in
grow
th m
ediu
m
No
effe
ct o
n sp
read
of s
ilenc
ing
sign
al in
A
rabi
dops
is R
NA
tra
nspo
rt
[ 68 ]
25 μ
M in
0.5
%
DM
SO fo
r 15
min
N
o ef
fect
; Ara
bido
psis
root
tis
sues
G
FP e
xpor
t fr
om p
hloe
m
a
Profi
lin:
Se
ques
ters
act
in
mon
omer
s m
aint
aine
d in
20
mM
Tri
s–H
CI,
pH
7.4
, 150
mM
KC
I,
0.2
mM
DT
T
60 μ
M c
o-in
ject
ed
with
dye
In
crea
sed
tran
spor
t; N
. tab
acum
m
esop
hyll
FIT
C-d
extr
an t
rans
port
[ 7
2 ]
2,3
But
aned
ione
2-
mon
oxim
e (B
DM
):
Myo
sin
inhi
bito
r 30
0–50
0 m
M a
queo
us
(mad
e fr
esh)
0.1–
30 m
M fo
r 1
h N
arro
win
g of
PD
nec
k re
gion
; Zea
may
s ro
ots
TE
M a
naly
sis
[ 80 ]
1 m
M fo
r 2
h, 6
h,
3 da
ys
No
effe
ct o
n tr
ansp
ort;
N. t
abac
um
mes
ophy
ll V
irus
tra
nspo
rt
[ 79 ]
1 an
d 30
mM
for
60 m
in
Incr
ease
d tr
ansp
ort;
T. v
irgi
nian
a st
amen
hai
rs
Dye
tra
nspo
rt
[ 13 ]
2.5
mM
for
22 d
ays
in
grow
th m
ediu
m
No
effe
ct o
n sp
read
of s
ilenc
ing
sign
al in
A
rabi
dops
is Sm
all R
NA
tra
nspo
rt
[ 68 ]
1 an
d 30
mM
for
60 m
in
Red
uced
tra
nspo
rt; A
rabi
dops
is ro
ot
tissu
es, E
lode
a ca
nade
nsis
leaf
ep
ider
mis
Tra
nspo
rt o
f inj
ecte
d dy
es,
GFP
exp
ort
from
phl
oem
a
N -E
thyl
mal
eim
ide
(NE
M):
M
yosi
n in
hibi
tor
50–1
00 m
M a
queo
us
(mad
e fr
esh)
0.1
mM
for
up t
o 50
min
Ir
reve
rsib
le c
essa
tion
of t
rans
port
; N
itel
la tr
anslu
cens
11
C a
nd 14
C t
rans
port
[ 8
1 ]
1 m
M in
for
60 m
in
Red
uced
tra
nspo
rt; T
. vir
gini
ana
stam
en h
airs
D
ye t
rans
port
[ 1
3 ]
50 μ
M fo
r 22
day
s in
gr
owth
med
ium
In
crea
sed
mov
emen
t of
sile
ncin
g si
gnal
in
Ara
bido
psis
Smal
l RN
A t
rans
port
[ 6
8 ]
0.1–
10 m
M fo
r 1–
2 h
in b
athi
ng s
olut
ion
or g
row
th m
ediu
m
Incr
ease
d tr
ansp
ort;
Ara
bido
psis
root
tis
sues
, E. c
anad
ensis
leaf
epi
derm
is
Dye
tra
nspo
rt, G
FP t
rans
port
a
Myo
sin
antib
odie
s:
Blo
ck m
yosi
n fu
nctio
n 0.
2 m
g/μl
coi
njec
ted
with
dye
In
crea
sed
tran
spor
t; A
rabi
dops
is ro
ot
epid
erm
is, N
. tab
acum
mes
ophy
ll L
YCH
or
FIT
C-d
extr
an
tran
spor
t, r
espe
ctiv
ely
[ 70 ]
0.5
mg/
ml a
queo
us
coin
ject
ed w
ith d
ye
Incr
ease
d tr
ansp
ort;
T. v
irgi
nian
a st
amen
hai
rs
Dye
tra
nspo
rt
[ 13 ]
0.5
mg/
ml a
queo
us
coin
ject
ed w
ith d
ye
Red
uced
tra
nspo
rt; A
rabi
dops
is ro
ot
epid
erm
is
Dye
tra
nspo
rt
a
Com
poun
d, m
ode
of
actio
n, s
tock
sol
utio
n
Conc
entr
atio
n (in
ba
thin
g so
lutio
n un
less
sta
ted
othe
rwis
e)Ef
fect
s on
tran
spor
t or P
D st
ruct
ure;
sp
ecifi
c tis
sue
test
edDe
tect
ion
met
hod
Refe
renc
e
Tabl
e 2
(con
tinue
d)

Col
chic
ine:
M
icro
tubu
le in
hibi
tor
Aqu
eous
(m
ade
fres
h)
0.05
mM
for
20 m
in
No
effe
ct o
n tr
ansp
ort;
Nit
ella
tr
anslu
cens
11
C a
nd 14
C t
rans
port
[ 8
1 ]
Ory
zalin
: M
icro
tubu
le in
hibi
tor
20 m
M in
DM
SO
0.3–
3.0
μM fo
r 12
h,
1.0
μM fo
r 6
h in
gr
owth
med
ium
Red
uced
tra
nspo
rt; A
rabi
dops
is ro
ots
SHR
-GFP
mov
emen
t be
twee
n st
ele
and
endo
derm
is
[ 11 ]
Tam
oxife
n:
Mic
rotu
bule
sta
biliz
er
10 m
M in
DM
SO
1.0
μM fo
r 12
h, o
r 10
μM
for
6 h
in
grow
th m
ediu
m
No
effe
ct o
n tr
ansp
ort;
Ara
bido
psis
root
s SH
R-G
FP m
ovem
ent
betw
een
stel
e an
d en
dode
rmis
[ 1
1 ]
Allo
xan,
par
aqua
t:
Her
bici
des
indu
cing
H
2 O 2
or O
2 − re
spec
tivel
y A
queo
us (
mad
e fr
esh)
1.5
mM
or
1 μM
, re
spec
tivel
y, fo
r 7
days
in g
row
th
med
ium
Red
uced
tra
nspo
rt; A
rabi
dops
is ro
ots
GFP
exp
ort
from
roo
t ph
loem
[ 4
]
H 2 O
2 :
Met
abol
ic in
hibi
tor
60 m
M a
queo
us (
mad
e fr
esh
each
day
)
0.6
mM
for
2 h
in
grow
th m
ediu
m
Incr
ease
d tr
ansp
ort;
Ara
bido
psis
root
tis
sue
Dye
tra
nspo
rt
[ 34 ]
6 m
M fo
r 2
h in
gr
owth
med
ium
C
ompl
etel
y bl
ocke
d tr
ansp
ort;
A
rabi
dops
is ro
ot t
issu
e D
ye t
rans
port
[ 3
4 ]
NaN
3 :
Met
abol
ic p
oiso
n 50
mM
or
10 %
aqu
eous
(m
ade
fres
h)
1 m
M fo
r 5
min
R
educ
ed t
rans
port
in o
at c
oleo
ptile
pa
renc
hym
a E
lect
rica
l cou
plin
g [ 8
2 ]
10 m
M a
dded
to
bath
ing
solu
tion
imm
edia
tely
aft
er
dye
inje
ctio
n
No
effe
ct, S
. pur
pure
a st
amen
hai
rs
CF
dye
tran
spor
t [ 6
5 ]
10 m
M c
o-in
ject
ed
Incr
ease
d tr
ansp
ort,
S. p
urpu
rea
stam
en
hair
s T
rans
port
of F
ITC
-tag
ged
amin
o ac
ids
[ 47 ]
1–10
mM
in b
athi
ng
solu
tion
Incr
ease
d tr
ansp
ort,
whe
at r
oot
epid
erm
al c
ells
T
rans
port
of fl
uor
esce
nt
dext
rans
[ 1
2 ]
3 m
M fo
r 20
min
In
crea
sed
tran
spor
t, N
. tab
acum
leaf
tr
icho
mes
L
YCH
tra
nspo
rt
[ 38 ]
1 m
M fo
r 60
min
In
crea
sed
tran
spor
t; T
. vir
gini
ana
stam
en h
airs
D
ye t
rans
port
[ 1
3 ]
(con
tinue
d)

Com
poun
d, m
ode
of
actio
n, s
tock
sol
utio
n
Conc
entr
atio
n (in
ba
thin
g so
lutio
n un
less
sta
ted
othe
rwis
e)Ef
fect
s on
tran
spor
t or P
D st
ruct
ure;
sp
ecifi
c tis
sue
test
edDe
tect
ion
met
hod
Refe
renc
e
Tabl
e 2
(con
tinue
d)
KC
N:
Met
abol
ic p
oiso
n 50
mM
aqu
eous
1 m
M fo
r 5
min
R
educ
ed t
rans
port
in o
at c
oleo
ptile
pa
renc
hym
a E
lect
rica
l cou
plin
g [ 8
2 ]
1 m
M a
dded
to
bath
ing
solu
tion
imm
edia
tely
aft
er
dye
inje
ctio
n
No
effe
ct o
n tr
ansp
ort,
S. p
urpu
rea
stam
en h
airs
C
F dy
e tr
ansp
ort
[ 65 ]
Car
bony
l CN
tr
ifl uo
rom
etho
xyph
enyl
hy
draz
one:
M
etab
olic
poi
son
1 μM
for
60 m
in
Incr
ease
d tr
ansp
ort,
Ege
ria
dens
a le
af
tissu
es
Dye
tra
nspo
rt
[ 45 ]
Am
ipro
phos
met
hyl:
Met
abol
ic p
oiso
n 50
μM
for
2 h,
6 h
, 3
days
N
o ef
fect
on
tran
spor
t; N
. tab
acum
m
esop
hyll
Vir
us t
rans
port
[ 7
8 ]
2-D
ioxy
- D -g
luco
se
(DD
G):
C
allo
se s
ynth
esis
inhi
bito
r 10
mM
aqu
eous
0.1
mM
for
60 m
in
Incr
ease
d tr
ansp
ort;
T. v
irgi
nian
a st
amen
hai
rs
Dye
tra
nspo
rt
[ 13 ]
Ade
nosi
ne 5
′-(β,
γ-im
ido)
tr
ipho
spha
te (
AM
P-PN
P): b
lock
s E
nerg
y m
etab
olis
m
1 m
M fo
r 2
h, 6
h,
3 da
ys
No
effe
ct o
n tr
ansp
ort;
N. t
abac
um
mes
ophy
ll V
irus
tra
nspo
rt
[ 79 ]
AT
PγS:
B
lock
s pr
oces
ses
requ
irin
g A
TP
12.5
mM
co-
inje
cted
w
ith d
ye
Blo
cked
tra
nspo
rt; T
. vir
gini
ana
stam
en
hair
s D
ye t
rans
port
[ 1
3 ]
0.5
mg/
ml i
n w
ater
co
inje
cted
with
dye
R
educ
ed t
rans
port
; Ara
bido
psis
root
ep
ider
mis
D
ye t
rans
port
a

Ade
nosi
ne t
riph
osph
ate;
A
TP:
alte
rs e
nerg
y ba
lanc
e
12.5
mM
coi
njec
ted
with
dye
T
rans
ient
inhi
bitio
n of
tra
nspo
rt; T
. vi
rgin
iana
sta
men
hai
rs
Dye
tra
nspo
rt
[ 13 ]
Ca-
BA
PTA
: C
alci
um b
uffe
r 10
0 m
M p
lus
50 m
M
Ca
in b
uffe
r pl
us
dye;
co-
inje
cted
with
dy
e
Red
uced
tra
nspo
rt, S
. pur
pure
a st
amen
ha
irs
CF
dye
tran
spor
t [ 4
5 ]
A23
187:
C
alci
um io
noph
ore
100
μM fo
r 10
min
R
educ
ed t
rans
port
, Ege
ria
dens
a le
af
tissu
es
Fluo
resc
ent
amin
o ac
id
tran
spor
t [ 4
5 ]
Tri
fl ura
lin:
Cal
cium
iono
phor
e 10
0 μM
for
10 m
in
Red
uced
tra
nspo
rt, E
geri
a de
nsa
leaf
tis
sues
Fl
uore
scen
t am
ino
acid
tr
ansp
ort
[ 45 ]
Tri
fl uop
eraz
ine:
C
alm
odul
in in
hibi
tor
5 μM
for
60 m
in
Slig
ht r
educ
tion
in t
rans
port
, Ege
ria
dens
a le
af t
issu
es
Fluo
resc
ent
amin
o ac
id
tran
spor
t [ 4
5 ]
Met
al c
atio
ns: C
a 2+ ,
Mg 2+
, Sr 2+
C
once
ntra
ted
aque
ous
solu
tions
: mod
ulat
e pr
oces
ses
requ
irin
g di
vale
nt c
atio
ns
Co-
inje
cted
with
dye
Sl
ight
red
uctio
n in
tra
nspo
rt, E
geri
a de
nsa
leaf
tis
sues
Fl
uore
scen
t am
ino
acid
tr
ansp
ort
[ 45 ]
a RG
Whi
te e
t al
., un
publ
ishe
d da
ta
212
essential to ensure the cell-to-cell movement is via PD rather than across the intervening plasma membranes and cell walls. Propidium iodide (PI) is a useful monitor of membrane integrity as it can be included in the bathing medium at very low concentrations (0.01 μg/ml) and is not fl uorescent unless it binds to cell wall pectins or to DNA and other components within cells (e.g. [ 44 ]). If nuclei are fl uorescent in the presence of PI, cell membrane integ-rity has been compromised.
Although plant tissues may tolerate up to 1 % concentration of many of these solvents, it is advisable to use the lowest concentration possible (e.g. [ 35 , 44 ]), and as with all other applied treatments, this must be tested with the particular tissue under study. Some tissues will tolerate up to 1 % solvent for a short time but will eventually show compromised membranes. Therefore as long as the chemical agent does not precipitate out of solution, the solvent concentration should be kept as low as possible.
A literature search will show a wide range of inhibitor concen-trations used on different tissues by different groups; it is best to use the lowest concentration to start with and constantly monitor cell viability. Some chemicals penetrate poorly and are best applied at a lower concentration for longer times. For example, the cyto-chalasins (actin inhibitors) diffuse relatively slowly into tissue and when used at moderate concentrations it can take more than 15 min for cytoplasmic streaming to cease, indicating disruption of actin fi laments. By contrast, applications of cyanides or peroxides generally have immediate effects, indicating ready permeation of these small molecules throughout the tissue.
Readily water-soluble inhibitors can be dissolved in agar growth medium for treatment of Arabidopsis or other roots, or simply applied as drops of solution onto the tissue on a slide ready for imaging, or prepared for immersion of tissue in the treatment solu-tion. Depending on the aim of the experiment, in our experience, a short treatment at relatively high concentration is preferable to a long treatment at low concentration. PD should respond rapidly, and a short treatment should reduce the chance of secondary effects via long-term inhibition of essential metabolic processes.
For application to a local zone of tissue or to just a few cells, the inhibitor can be added to molten agarose, which is allowed to set as a thin sheet, and cut into 1 mm 3 (or smaller/larger) cubes, which are then placed on the tissue of interest. Targeting of very few cells can be achieved by soaking resin beads with the inhibitor, as done for local application of pectin methyl esterase to Arabidopsis shoot apical meristems [ 59 ], followed by co-loading with a fl uorescent tracer. Or the inhibitor can be loaded into one end of a trichome via a microinjection needle as for loading of fl uorescent tracers [ 38 ].
1.5 Application of Inhibitors to Different Tissues
Rosemary G. White

213
Wounding artifacts can be ameliorated by co-incubation in DDG, but this can block other cell functions requiring UDP- glucose, and a short treatment is preferable over a long treatment [ 17 , 18 ]. This is especially true for microinjection experiments, in which application of DDG is useful to separate treatment effects from wound artifacts [ 17 , 18 , 33 ].
A little-used alternative to application of inhibitors to the entire tissue under study is uncaging of a caged inhibitor within a column of cells with single-photon or within a single cell using multiphoton confocal illumination of the appropriate wavelength, usually short UV ( see Chapter 9 ). The inhibitor is only activated within a single cell and a caged dye, such as caged fl uorescein (e.g. fl uorescein bis-(5-carboxymethoxy-2-nitrobenzyl) ether [CMNB- fl uorescein], [ 38 , 60 ]), can be included to confi rm the localisation of uncaging. Most chemicals can be caged, but there are relatively few publications in which caged compounds have been used as this usually requires the collaboration of a specialist organic chemistry lab to create the caged compound of interest (e.g. caged IP 3 [ 61 ], caged hormones [ 62 – 64 ]). Several caged compounds are now available commercially and this will increase with future demand.
This chapter outlines protocols for treatment of plant tissues with compounds known to alter PD permeability, together with methods for prior propagation and subsequent analysis of two species and tissues examined in the literature. Shown here are materials and protocols used by the author, but they can be modi-fi ed for use with other plant tissues, and more recent protocols (e.g. Chapters 9 , 16 and 17 ) can be substituted.
2 Materials
Add 10 g agar to 900 ml distilled water. Add nutrients, usually Murashige and Skoog (MS) mixture (available commercially), as per supplier’s recommendation. Adjust nutrient type and strength as required for specifi c plant material. Autoclave. For Arabidopsis , add 20 g sucrose and 0.5 g MES, pH 6.5, dissolved in 100 ml distilled water, fi lter sterilize, and add to molten agar. Maintain agar at 60 °C in a waterbath until ready to dispense into 9 cm (or other) diameter petri dishes. Add inhibitors to the agar before dispensing into petri dishes ( see Note 1 ).
1. Agar (fi nal concentration 1 %). 2. Murashige and Skoog nutrient mix (available commercially). 3. Sucrose (fi nal concentration 1–3 %). 4. 2-( N -Morpholino)ethanesulfonic acid (MES). 5. pH meter.
2.1 Materials for Plant Growth
2.1.1 MS Agar Plates
Biochemical Inhibition of Plasmodesmata
214
6. Autoclave. 7. Sterile petri dishes, 9 cm diameter. 8. Laminar fl ow cabinet. 9. Household bleach (approx. 4 % NaOCl). 10. Micropore tape (1/2 or 1 in. wide). 11. Sterile distilled water.
Fluorescent tracers, their molecular weights and fl uorescence exci-tation and emission maxima are listed in Table 1 .
1. Propidium iodide solution: 16 nM working solution, prepared from 16 μM stock solution in water (store in darkness at 4 °C).
Make up all solutions using distilled water unless specifi ed other-wise. Precise details of bathing solutions, dye loading solutions, and microinjection equipment may be varied according to the tissue under study and microinjection facilities available.
1. 0.05 % Triton X-100. 2. Incubation buffer: 0.5 mM HEPES (( N [2-hydroxyethyl]
piperazine- N ′-[2- ethanesulfonic acid]), 0.1 mM KCl, 0.1 mM CaCl 2 , 0.5 mM NaCl, pH 7.0.
3. Chamber slides for microinjection: for each slide, attach a coverslip (with a nontoxic, fl exible compound that remains adhesive under water and is easy to remove; we fi nd Kemdent sticky dental wax useful for this purpose), over a 25 mm diam-eter hole drilled in a 75 × 50 mm glass slide, 1 mm thick.
4. Double-edged sharp razor blades. 5. Fine forceps (no. 5 or no. 7). 6. Pink dental wax. 7. 1 % ultra low temperature gelling agar (gel point approx.
37 °C). 8. Ice pack. 9. 2-Deoxy- D -glucose: 10 mM stock solution in distilled water. 10. Polydisperse 4 kDa FITC-dextran ( see Note 2 ). 11. 3 kDa cutoff microconcentrator (e.g. microcon 3, Amicon)
( see Note 2 ). 12. Quix-sep separator (e.g. Membrane Filtration Products) or
similar to separate polydisperse fl uorescent dextrans into differ-ent size classes—use according to manufacturer’s instructions ( see Note 2 ).
13. 1 kDa dialysis membrane ( see Note 2 ). 14. Kieselgel 60F thin layer chromatography sheets.
2.2 Fluorescent Tracers and Dyes
2.3 Materials for Microinjection
Rosemary G. White
215
15. Running solution: 150:30:100:120 n -butanol:acetic acid:pyridine: water.
16. Microcapillary tubes; 1.2 mm OD borosilicate glass with inner fi lament.
17. Very fi ne micropipettes for backfi lling microinjection needles (e.g. MicroFil 28 gauge syringe, World Precision Instruments [WPI]).
18. 100 mM KCl. 19. Silver/silver chloride reference electrode (e.g. Sigma). 20. Micropipette holder that will fi t into the hydraulic
micro manipulator. 21. 1 mM aqueous solution of dye to be injected, prepared imme-
diately before use. 22. Aniline blue stain: 0.05 % aniline blue in 0.067 M phosphate
buffer, pH 8.5.
Precise details of fi xative, buffer, dehydration solvent, resin, and method of polymerization will need to be adjusted depending on the tissue under study and availability of materials and preparation facilities.
1. Sharp double-edged razor blades. 2. Fine forceps (no. 5 or no. 7). 3. Pink dental wax. 4. Fixative: 2.5 % glutaraldehyde in 0.025 M phosphate buffer,
pH 7.2. 5. Buffer: 0.025 M phosphate buffer, pH 7.2. 6. 1 % aqueous osmium tetroxide. 7. 10, 20, 30, 50, 70, 90, 95 % acetone solutions. 8. 100 % dry acetone (dried over molecular sieve). 9. Spurr’s resin—prepare liquid resin according to supplier’s
instructions ( see Note 3 ). 10. LRWhite resin—prepare liquid resin according to supplier’s
instructions ( see Note 4 ). 11. Ultramicrotome, e.g. Leica Ultracut 6. 12. Knife glass for sectioning. 13. Knifemaker to make glass knives. 14. Diamond knife, e.g. Diatome. 15. TEM copper grids, 3.5 mm 400 mesh, coated or uncoated
( see Note 5 ).
2.4 Materials for TEM
Biochemical Inhibition of Plasmodesmata
216
16. Ethanolic uranyl acetate: 1.2 % uranyl acetate in ethanol ( see Notes 6 and 7 ).
17. Reynolds lead citrate ( see Notes 6 and 7 ). 18. Propane ( see Note 8 ). 19. Plunge-freezing apparatus. 20. Freeze-substitution apparatus or −80 and −20 °C freezers plus
4 °C refrigerator. 21. 100 % dry ethanol or acetone (dried over molecular sieve)
maintained at −80 °C.
In each case, the appropriate excitation and emission fi lters for fl uorescent tracers must be identifi ed, sourced, and installed, if not already available on the instrument.
1. Dissecting microscope equipped for fl uorescence imaging. 2. Fluorescence compound microscope. 3. Confocal laser scanning microscope.
1. Fluorescence inverted microscope or upright microscope. 2. Hydraulic micromanipulator, e.g. Narashige OR-60. 3. Flaming/Brown type electrode puller, e.g. Sutter P67. 4. Iontophoresis apparatus, comprising Electrometer (e.g. S7071A,
WPI) plus miniMainframe (WPI). 5. Multimeter to monitor membrane potential.
1. Arabidopsis thaliana L. plants. Grow on standard MS agar plates ( see Subheading 2.1.1 ).
2. Tradescantia virginiana L. Maintain under long daylength at 25 °C with minimal fertilization, and regular watering and pruning for vigorous growth and continued fl owering.
Biochemicals that target different known or putative components or regulators of plasmodesmata are listed in Table 2 .
1. Treatment solution 1 for Arabidopsis thaliana root epidermal cells: working concentration of the selected biochemical inhibitor as defi ned in Table 2 in MS nutrient mix made according to manufacturer’s recommendation, 2.5 mM MES, pH 6.5.
2. Treatment solution 2 for Tradescantia virginiana stamen hairs: working concentration of the selected biochemical inhib-itor as defi ned in Table 2 in 0.5 mM HEPES, 0.1 mM KCl, 0.1 mM CaCl 2 , 0.1 mM MgCl 2 , 0.5 mM NaCl pH 7.
2.5 Imaging Hardware ( See Note 9 )
2.6 Microinjection Hardware ( See Note 10 )
2.7 Plant Material ( See Note 11 )
2.8 Biochemical Inhibitors ( See Note 12 )
Rosemary G. White
217
3 Methods
The treatments of two types of tissue, i.e. three-dimensional roots, and one-dimensional fi laments, are detailed below ( see Note 13 ).
1. Prepare MS agar plates ( see Subheading 2.1.1 ). 2. Seed sterilization:
(a) Place 30–100 Arabidopsis seeds in a 1.5–2.0 ml microfuge tube. Place tube in a vacuum desiccator in a fume hood.
(b) Place 100 ml household bleach in a 250 ml beaker next to the Arabidopsis seeds in the desiccator. Add 3 ml concen-trated HCl to the bleach. Immediately place the lid on the desiccator.
(c) After 3.0–3.5 h, remove seeds from desiccator and transfer immediately into a laminar fl ow cabinet. Allow to sit for 5–10 min to ensure that residual Cl 2 gas dissipates.
(d) Scatter seeds sparsely on MS agar plates, seal with micro-pore tape. Place in the dark at 4 °C for 24–48 h to stratify.
3. Alternatively, in a laminar fl ow cabinet, surface sterilize Arabidopsis seeds in 30 % bleach containing 0.1 % Triton X-100 for 10 min followed by 4 × 10 min rinses in sterile distilled water. Dispense seeds individually onto agar using wide sterile pipette tips. Seal plates with micropore tape and place in the dark at 4 °C for 24–48 h to stratify.
4. After stratifi cation, place plates on their sides in 22 °C growth room in constant light (or other light regime) so roots will grow vertically down along the agar surface. Roots can be used 5–7 days after germination.
5. Prepare agar plates containing inhibitor(s) ( see Note 1 ). Either a) transfer Arabidopsis seedlings onto this agar or b) place a small cube, no greater than 1 mm on each side, of this agar onto each Arabidopsis root while still on MS agar ( see Note 14 ).
6. Alternatively, incubate roots in treatment solution 1 with or without inhibitor for 1 h. Pretreatment with 1 mM DDG for 1 h will reveal whether the inhibitor stimulates production of wound-induced callose (also see Note 15 ).
1. Selection of the appropriate size of fl ower bud is trial and error at fi rst. The stamen hairs need to be young, or the outer walls become hydrophobic, virtually impervious to inhibitors and diffi cult to microinject. However, they need to be suffi ciently mature to show vigorous cytoplasmic streaming ( see Note 16 ).
3.1 Selection, Growth, and Chemical Treatment of Plant Material ( See Note 12 )
3.1.1 Arabidopsis thaliana Roots
3.1.2 Tradescantia virginiana L. Stamen Hairs
Biochemical Inhibition of Plasmodesmata
218
2. Remove an appropriately sized bud from the plant. Place into a drop of distilled water on a piece of dental wax. Slice off the pedicel, cutting through the base of the ovary.
3. Press gently on the top of the bud to squeeze out the remainder of the ovary and the two young stamens.
4. Carefully remove the pollen sacs from the fi lament, using a sharp razor blade. Dip each fi lament with attached stamen hairs into 0.05 % Triton X-100 for 1–2 s. This treatment greatly enhances penetration of treatment chemicals without apparent damage to the cells.
5. Transfer the fi lament with attached stamen hairs into treat-ment solution 2 for the length of time desired, less 15 min. With a 45 min incubation the tissue is allowed to recover for 15 min on the microscope before imaging and microinjection, giving a total of 1 h treatment. Bathe control fi laments and hairs in the treatment solution 2 without inhibitor for an equivalent period of time ( see Note 15 ).
This section outlines procedures for microinjection of dyes, imag-ing cell–cell dye transport, and methods to quantify transport ( see Note 17 ).
Arabidopsis thaliana Root Epidermal Cells ( See Note 11 )
1. Cut Arabidopsis seedlings with supporting agar from the Petri dish and place vertically in treatment solution 1 (with or with-out inhibitor, see Note 15 ). Submerge just the tips of the roots in solution. Avoid disturbance to the roots by handling the supporting agar rather than the seedlings themselves.
2. If using dissected tissues, cut Arabidopsis roots from the coty-ledons at least 10 mm away from the planned injection site.
3. After incubation in treatment solution 1, mount the roots horizontally in the well of a chamber slide
4. Hold roots in place by embedding in a thin layer of cool but still-molten 1 % ultra low temperature gelling agar (Type IX, Sigma), and set it by placing on ice (or use an ice-pack) for 5–10 s.
5. Immediately add treatment solution 1 (with or without inhibi-tor) to the well and allow the tissues to rest for 15 min prior to injection ( see Note 15 ).
6. Prepare 1 mM dye solution for injection. If not using FITC-dextrans, go to step 13 .
7. Prepare FITC-dextrans from polydisperse 4 kDa FITC-dextran dissolved in water to a concentration of 20 mM and separated using a 3 kDa cutoff microconcentrator ( see Note 2 ).
3.2 Assessing PD Permeability
3.2.1 Microinjection of Tracer Dyes
Rosemary G. White
219
8. Dilute the solution remaining in the fi lter to approximately 1 mM. This is the fraction larger than 3 kDa.
9. Dialyse the fi ltered solution (<3 kDa) in a separator using a 1 kDa dialysis membrane to give the 1–3 kDa fraction.
10. If required, check that free FITC has been removed from the purifi ed dextrans by thin layer chromatography (TLC) using the protocol of [ 31 ].
11. For TLC, separate the FITC-dextran solution on Kieselgel 60 F thin layer chromatography sheets using a running solu-tion of 150:30:100:120 n -butanol:acetic acid:pyridine:water. Visualize the purifi ed dextran with UV illumination; it should be seen as a single fl uorescent spot.
12. Pull microinjection needles on a Flaming/Brown micropipette puller (or equivalent) ( see Note 18 ).
13. Fill the tips of the needles with dye by capillary action using a very fi ne fi lament syringe (e.g. Microfi l syringe, 28 gauge) that fi ts easily into the injection needle.
14. Back-fi ll the needles with 100 mM KCl. 15. Mount the needle on a silver chloride half-cell connected to an
electrometer to detect membrane potential (e.g. Electrometer module with miniMainframe; WPI).
16. Use a return electrode fi lled with 3 mM KCl connected via a silver chloride half-cell.
17. Bring the tip of the injection needle up to a selected cell and tap the microscope gently so that the needle penetrates the cell wall.
18. Monitor cell membrane potential using a multimeter connected to the electrometer. A drop in this reading indicates penetration into the cytoplasm, but a substantial drop indicates that the needle has penetrated through into the vacuole or injury to the cell. Discard cells with vacuolar penetration or injury.
19. Inject dye by applying a brief, small (approx. 1 nA for 1–5 s, longer if required) current to the microinjection needle. Use a negative current for lucifer yellow and sulforhodamine 101. Use a positive current for the FITC-dextrans.
20. Test the viability of the injected tissue by releasing a small amount of dye into the microinjection buffer surrounding the tissue. If tissue is damaged it will take up dye from the medium, showing that the membranes have become leaky.
21. If assessing callose deposition, stain tissue with 0.05 % aniline blue in 0.067 M phosphate buffer, pH 8.5. Apply the stain immediately before observation on a fl uorescence microscope.
Biochemical Inhibition of Plasmodesmata
220
Tradescantia virginiana Stamen Hairs
1. Prepare chamber slides by fi rst attaching a coverslip over a 25 mm diameter hole drilled in a 75 × 50 mm glass slide.
2. Prepare and incubate stamen hairs in treatment solution 2 ( see Note 15 ).
3. After incubation in treatment solution 2, mount the hairs in the well of a chamber slide.
4. Hold hairs in place by embedding in a thin layer of cool but still molten 1 % ultra low temperature gelling agar, and set the agar by placing on ice (or on an ice pack) for 5–10 s.
5. Immediately add fresh treatment solution 2 to the well and allow the tissues to rest for 15 min prior to injection.
6. Continue as described in steps 6 – 21 above for Arabidopsis roots.
Because tissue handling and noncryo fi xation procedures will gen-erate additional callose at the PD neck, either pretreatment with DDG, or its addition to the treatment solution, is very useful to separate fi xation-induced changes in PD structure from treatment- induced changes (e.g. [ 17 , 18 ]).
1. Incubate live germinated seeds with root attached in 0.1 mM DDG for 1 h to prevent fi xation-induced formation of callose ( see Note 15 ).
2. Incubate live tissues in inhibitor in water ( see Table 2 ), with or without 0.1 mM DDG, for 1 h.
3. Fix specimens in 2.5 % glutaraldehyde in 0.025 M phosphate buffer, pH 7.2, for 2 h.
4. Rinse in phosphate buffer, three times, 10 min each time. 5. Incubate in 1 % aqueous osmium tetroxide for 2 h. 6. Rinse in distilled water, two times, 10 min each time. 7. Dehydrate in a progressive acetone or ethanol series, 20 min
each step ( see Note 19 ). 8. Infi ltrate slowly in liquid Spurr’s resin ( see Notes 3 , 4 , and 20 )
over 2 days. 9. Polymerise at 50 °C overnight ( see Note 21 ). 10. Collect ultrathin sections 80–90 nm thick on uncoated or
coated copper grids. 11. Stain with 1.2 % ethanolic uranyl acetate for 10 min ( see Note 6 ). 12. Rinse briefl y in distilled water. 13. Stain with Reynold’s lead citrate for 8–12 min ( see Note 6 ). 14. Rinse briefl y with warm (approx. 30 °C) distilled water. 15. View on a TEM according to the manufacturer’s instructions.
3.3 Assessing Changes in PD Structure
3.3.1 PD Structure in Roots: Conventional Chemical Fixation
Rosemary G. White
221
16. Take measurements of the neck regions of PD directly from negatives (or on-screen images) ( see Note 22 ).
17. In most cases, comparison using the Student’s t -test ( p < 0.01) is suffi cient to assess the statistical signifi cance of differences in PD dimensions [ 17 ].
In general, cryofi xation followed by freeze-substitution is optimal for faithful preservation of PD architecture. Even here, prior incu-bation in DDG will show the signifi cance of tissue handling in generation of artefactual callose ( see Note 15 ).
1. Incubate live germinated seeds with root attached in 0.1 mM DDG for 1 h to prevent handling-induced formation of callose.
2. Incubate in water 1 with or without inhibitor ( see Table 2 ) for 1 h.
3. Immediately plunge-freeze in liquid propane, in a rapid- freezing apparatus, according to the manufacturer’s recommendations.
4. Freeze-substitute in a commercial freeze-substitution appara-tus according to the manufacturer’s recommendations, or if this is unavailable, continue steps 5 – 9 below.
5. Transfer to dry ethanol or acetone (dried over molecular sieve) at −80 °C.
6. Allow to freeze-substitute for 1–3 days at −80 °C, change solvent once after the fi rst 12 h.
7. Transfer to −20 °C freezer for 24 h. 8. Transfer to 4 °C refrigerator for 24 h. 9. Bring to room temperature and proceed as in steps 8 – 17 of
Subheading 3.3.1 .
4 Notes
1. Add the inhibitor to the agar before dispensing into petri dishes but after the agar has been autoclaved. In most cases the treatment agar does not need to be sterile since treatments are short. If sterility is essential, fi lter the drug solution through a 0.22 μm fi lter. Make a stock solution of ten times the fi nal concentration and add 3 ml of this to 27 ml of agar solution to cover the base of one 9 cm diameter petri dish.
2. This protocol uses a 4 kDa polydisperse FITC-dextran mixture as starting material to prepare dextrans of different molecular size classes. For dextrans of larger size class, use a larger poly-disperse fl uorescent dextran mixture as starting material, with dialysis membranes of the required size cutoff to prepare dex-trans of specifi c size-classes. Dextrans with different fl uores-cent tags, e.g. rhodamine, Texas Red, can be used also. Separate
3.3.2 PD Structure in Roots: Cryofi xation
Biochemical Inhibition of Plasmodesmata
222
the polydisperse dextrans into different size classes using a separator and dialysis membranes according to the manufac-turers’ instructions.
3. The original formulation of Spurr’s resin is no longer available, and the new formulation, available from several suppliers, should be tested before use to ascertain the best component ratios, and infi ltration and polymerization regimes for each plant tissue under study.
4. Although London Resin White (LR White) resin is somewhat less stable than Spurr’s resin under the electron beam, it is per-fectly satisfactory if used with coated grids. LR White is consid-erably less viscous and generally requires shorter infi ltration times. LR White Medium Grade is appropriate for most tissues.
5. Those experienced in TEM preparation techniques may pre-pare their own coated grids, but perfectly satisfactory ones are available from a number of suppliers.
6. Different TEM laboratories have different preferences for uranyl acetate and Reynolds lead citrate [ 83 ] staining which may differ from the formulations and staining times suggested here. Use the formulations recommended on-site and only modify if needed.
7. Spurr’s and LR White resin sections require somewhat different staining times with uranyl acetate and lead citrate, and these must be determined empirically.
8. A small (D-size) cylinder of propane gas will be required whether using a home-made liquid propane freezing device or a commercially available device.
9. Most research facilities will have one or more options for fl uo-rescence imaging. Instruction in use of the instruments should be obtained on site.
10. The microinjection hardware currently available is highly inte-grated, such that microiontophoresis current generators and micropressure systems require no prior assembly from separate components. Both types of systems have built-in current detec-tion for monitoring membrane potential during microneedle insertion and injection of tracers. In each case, instruction in use of specifi c instruments should be obtained on site.
11. Plant materials listed here have been used by the author. The protocols will need to be modifi ed for application to other plant tissues, for example, seedling roots of other species, epi-dermal peels from Allium species (onion— A. cepa or leek— A. porrum ), or fronds from aquatic plants such as Egeria densa or Elodea canadensis .
12. These protocols are appropriate for treatments with small mol-ecules that can permeate throughout plant tissues. In addition,
Rosemary G. White

223
proteins and antibodies may be pressure-injected to assess their potential effects on PD.
13. For quantitative comparison of inhibitor effects, it is essential that plants can repeatedly be grown very uniformly. Rapid growth is another key criterion, as is membrane integrity dur-ing chemical treatment. Healthy cells with undamaged walls and membranes are essential. This can be tested by daily growth measurement of roots, and by incubation in dyes that are membrane impermeant, such as propidium iodide—entry of dye into the cells indicates that the plasma membrane has reduced integrity. Membrane integrity is critical to interpreta-tion of results in which altered cell–cell transport via PD rather than altered cell–cell membrane transport is desired.
14. For treatment, transfer plants to agar containing the inhibitor. Protect the shoots from treatment by fi rst placing a narrow strip of parafi lm on the agar and ensuring the shoots lie on this strip. For treatment of a small section of tissue, place small inhibitor-soaked agar cubes or resin beads onto the tissue.
15. Manipulation of tissues during experiments and insertion of microinjection needles induces callose [ 18 , 33 ] as does chemi-cal fi xation [ 17 ]. Pretreatment with 0.1 mM DDG in water or treatment solution with or without inhibitor is a useful addi-tional control treatment.
16. A general rule is that the fl ower buds should be no more than 2–3 mm long and about 2–3 days before anthesis ( see refs. 13 , 18 and references therein).
17. It is essential to learn microinjection in a laboratory with proven success in using this technique. Each laboratory has their own set of instruments and protocols, and it is impossible to pick up essential technical skills without hands-on training. Dye fl ux can be quantitated using fl uorescence recovery after photobleaching (FRAP) of a small tracer, CF, ester-loaded into root cells by incubating in CFDA [ 34 ]. Other quantifi cation techniques for measuring very rapid changes in fl ux have generally involved measuring changes in electrical coupling (e.g. [ 48 – 50 ]). Although the latter technique has fallen from favor, it is indispensible for detecting fast changes in PD per-meability, and to identify rapid PD opening and closing events. In unpublished observations, we have observed interactions between tracer dyes and certain inhibitors that alters their fl uorescence intensity. This should be checked, for example, by applying dye to agar pre-soaked with either water or inhibitor.
18. Preparation of the correct-sized microinjection needle is deter-mined empirically on the individual electrode puller. The needles
Biochemical Inhibition of Plasmodesmata
224
must be sharp enough to penetrate through the cell wall, but strong enough to penetrate without breaking. In most cases, needles can be used only once, because the tip breaks off as it traverses the cell wall, and after entry, wound responses in the cytoplasm block the tip, preventing further injection of dye or other components.
19. Both Spurr’s and LR White resins are soluble in either ethanol or acetone. While acetone often produces superior results when used as infi ltration solvent, ethanol is less toxic and may be preferred for safety reasons.
20. Slow infi ltration is critical to excellent preservation, and infi l-tration times must be longer for denser, larger tissues.
21. LR White resin requires polymerization in the absence of oxy-gen, either in an oven or under UV light. The capsules containing resin to be polymerised must either be sealed, to prevent entry of oxygen, or must be maintained in a nitrogen gas atmosphere during polymerization.
22. Measure the outer diameter at the narrower section of PD deep within the cell wall, from the outer layer of the plasma membrane on each side as reference. Then measure at the neck region, where PD open to the cell cytoplasm, also from the outer layer of the plasma membrane on each side. Differences may be obvious (e.g. [ 54 ]) or more subtle (e.g. [ 17 , 80 ]).
Acknowledgements
Thanks to Janine Radford at Monash University; Robyn Overall, Terena Holdaway-Clarke, Debbie Barton, and other Sydney University colleagues; Mark Talbot, summer students, and others in my lab at CSIRO Plant Industry for tips, tricks, comments, and assistance along the way.
References
1. Faulkner CR, Blackman LM, Cordwell SJ, Overall RL (2005) Proteomic identifi cation of putative plasmodesmatal proteins from Chara corallina . Proteomics 5:2866–2875
2. Bayer EM, Bottrill AR, Walshaw J et al (2006) Arabidopsis cell wall proteome defi ned using multidimensional protein identifi cation tech-nology. Proteomics 6:301–311
3. Faulkner C, Maule A (2011) Opportunities and successes in the search for plasmodesmal proteins. Protoplasma 248:27–38
4. Benitez-Alfonso Y, Cilia M, San RA et al (2009) Control of Arabidopsis meristem devel-
opment by thioredoxin-dependent regulation of intercellular transport. Proc Natl Acad Sci U S A 106:3615–3620
5. Stonebloom S, Burch-Smith T, Kim I et al (2009) Loss of the plant DEAD-box protein ISE1 leads to defective mitochondria and increased cell-to-cell transport via plasmodes-mata. Proc Natl Acad Sci U S A 106: 17229–17234
6. Kobayashi K, Otegui MS, Krishnakumar S et al (2007) INCREASED SIZE EXCLUSION LIMIT2 encodes a putative DEVH box RNA helicase involved in plasmodesmata function
Rosemary G. White

225
during Arabidopsis embryogenesis. Plant Cell 19:1885–1897
7. Kim I, Hempel FD, Sha K et al (2002) Identifi cation of a developmental transition in plasmodesmatal function during embryogene-sis in Arabidopsis thaliana . Development 129: 1261–1272
8. Avisar D, Prokhnevsky AI, Dolja VV (2008) Class VIII myosins are required for plasmodes-matal localization of a closterovirus hsp70 homolog. J Virol 82:2836–2843
9. Golomb L, Abu-Abied M, Belausov E, Sadot E (2008) Different subcellular localizations and functions of Arabidopsis myosin VIII. BMC Plant Biol 8:3
10. Yokota E, Ueda S, Tamura K et al (2009) An isoform of myosin XI is responsible for the translocation of endoplasmic reticulum in tobacco cultured BY-2 cells. J Exp Bot 60: 197–212
11. Wu S, Gallagher KL (2013) Intact microtu-bules are required for the intercellular move-ment of the SHORTROOT transcription factor. Plant J 74:148–159
12. Cleland RE, Fujiwara T, Lucas WJ (1994) Plasmodesmal-mediated cell-to-cell transport in wheat roots is modulated by anaerobic stress. Protoplasma 178:81–85
13. Radford JE, White RG (2011) Inhibitors of myosin, but not actin, alter transport through Tradescantia plasmodesmata. Protoplasma 248: 205–216
14. Stonebloom S, Brunkard JO, Cheung AC et al (2012) Redox states of plastids and mitochon-dria differentially regulate intercellular transport via plasmodesmata. Plant Physiol 158: 190–199
15. Gale EF, Wayman F, Orlean PA (1984) The action of 2-deoxy-D-glucose on the incorpora-tion of glucose into (1-3)-ß-glucan in station-ary phase cultures of Candida albicans . J Gen Microbiol 130:3303–3311
16. Jaffe MJ, Leopold AC (1984) Callose deposi-tion during gravitropism of Zea mays and Pisum sativum and its inhibition by 2-deoxy- D-glucose. Planta 161:20–26
17. Radford JE, Vesk M, Overall RL (1998) Callose deposition at plasmodesmata. Proto-plasma 201:30–37
18. Radford JE, White RG (2001) Effects of tissue-preparation- induced callose synthesis on esti-mates of plasmodesma size exclusion limits. Protoplasma 216:47–55
19. Fenteany G, Zhu S (2003) Small-molecule inhibitors of actin dynamics and cell motility. Curr Top Med Chem 3:593–616
20. Baggett AW, Cournia Z, Han MS et al (2012) Structural characterization and computer-
aided optimization of a small-molecule inhibi-tor of the Arp2/3 complex, a key regulator of the actin cytoskeleton. ChemMedChem 7: 1286–1294
21. Bonello T, Coombes J, Schevzov G et al (2012) Therapeutic targeting of the actin cytoskeleton in cancer. In: Cytoskeleton and human disease. Humana, Totowa, NJ, pp 181–200
22. Fitzgibbon J, Beck M, Zhou J et al (2013) A developmental framework for complex plas-modesmata formation revealed by large-scale imaging of the Arabidopsis leaf epidermis. Plant Cell 25:57–70
23. Duckett CM, Oparka KJ, Prior DAM et al (1994) Dye-coupling in the root epidermis of Arabidopsis is progressively reduced during development. Development 120:3247–3255
24. Oparka KJ, Duckett CM, Prior DAM, Fisher DB (1994) Realtime imaging of phloem unloading in the root tip of Arabidopsis . Plant J 6:759–766
25. Wang N, Fisher DB (1994) The use of fl uorescent tracers to characterize the post-phloem transport pathway in maternal tissues of developing wheat grains. Plant Physiol 104:17–27
26. Wang HL, Offl er CE, Patrick JW, Ugalde TD (1994) The cellular pathway of photosynthate transfer in the developing wheat grain. I. Delineation of a potential transfer pathway using fl uorescent dyes. Plant Cell Environ 17: 257–266
27. Wright KM, Oparka KJ (1996) The fl uorescent probe HPTS as a phloem-mobile, symplastic tracer, an evaluation using confocal laser scan-ning microscopy. J Exp Bot 47:439–445
28. Wang X, Sager R, Cui W et al (2013) Salicylic acid regulates plasmodesmata closure during innate immune responses in Arabidopsis . Plant Cell 35:2315–2329
29. Tyree MT, Tammes PML (1975) Translocation of uranin in the symplasm of staminal hairs of Tradescantia . Can J Bot 53:2038–2046
30. Tucker EB (1982) Translocation in the sta-minal hairs of Setcreasea purpurea. I. A study of cell ultrastructure and cell-to-cell passage of molecular probes. Protoplasma 113:193–201
31. Goodwin PB (1983) Molecular size limit for movement in the symplast of the Elodea leaf. Planta 157:124–130
32. Faulkner C, Petutschnig E, Benitez-Alfonso Y et al (2013) LYM2-dependent chitin percep-tion limits molecular fl ux via plasmodesmata. Proc Natl Acad Sci U S A 110:9166–9170
33. Storms MHM, van der Schoot C, Prins M et al (1998) A comparison of two methods of
Biochemical Inhibition of Plasmodesmata
226
microinjection for assessing altered plasmodes-mal gating in tissues expressing viral movement proteins. Plant J 13:131–140
34. Rutschow HL, Baskin TI, Kramer EM (2011) Regulation of solute fl ux through plasmodes-mata in the root meristem. Plant Physiol 155: 1817–1826
35. Baskin TI, Bivens NJ (1995) Stimulation of radial expansion in arabidopsis roots by inhibi-tors of actomyosin and vesicle secretion but not by various inhibitors of metabolism. Planta 197:514–521
36. Baskin TI, Wilson JE (1997) lnhibitors of pro-tein kinases and phosphatases alter root mor-phology and disorganize cortical microtubules. Plant Physiol 113:493–502
37. Roberts AG, Cruz SS, Roberts IM et al (1997) Phloem unloading in sink leaves of Nicotiana benthamiana , comparison of a fl uorescent solute with a fl uorescent virus. Plant Cell 9:1381–1396
38. Christensen NM, Faulkner C, Oparka K (2009) Evidence for unidirectional fl ow through plas-modesmata. Plant Physiol 150:96–104
39. Urbanus SL, Dinh QK, Angenent GC, Immink RGH (2010) Investigation of MADS domain transcription factor dynamics in the fl oral meri-stem. Plant Signal Behav 5:1260–1262
40. Chapman S, Faulkner C, Kaiserli E et al (2008) The photoreversible fl uorescent protein iLOV outperforms GFP as a reporter of plant virus infection. Proc Natl Acad Sci U S A 105: 20038–20043
41. Mukherjee A, Walker J, Weyant KB, Schroeder CM (2013) Characterization of fl avin-based fl uorescent proteins: an emerging class of fl uo-rescent reporters. PLoS One 8(5):e64753
42. Palevitz BA, Hepler PK (1985) Changes in dye coupling of stomatal cells of Allium and Commelina demonstrated by microinjection of Lucifer yellow. Planta 164:473–479
43. Scott AS, Wyatt S, Tsou P-L et al (1999) Model system for plant cell biology: GFP imag-ing in living onion epidermal cells. Biotech-niques 26:1125–1132
44. Collings DA (2013) Subcellular localization of transiently expressed fl uorescent fusion proteins. In: Chapter 16 in Legume genomics: methods and protocols. Methods in molecular biology, vol 1069. doi: 10.1007/978-1-62703-613-9_16
45. Erwee MG, Goodwin PB (1983) Charac-terisation of the Egeria densa Planch. leaf sym-plast. Inhibition of the intercellular movement of fl uorescent probes by group II ions. Planta 158(320):328
46. Tucker EB (1990) Calcium-loaded 1,2-bis(2- aminophenoxy)ethane-N, N, N', N'-tetraacetic acid blocks cell-to-cell diffusion of carboxyfl uo-
rescein in staminal hairs of Setcreasea purpurea . Planta 182:34–38
47. Tucker EB (1993) Azide treatment enhances cell-to-cell diffusion in staminal hairs of Setcreasea purpurea . Protoplasma 174:45–49
48. Holdaway-Clarke TL, Walker NA, Hepler PK, Overall RL (2000) Physiological eleva-tions in cytoplasmic free calcium by cold or ion injection result in transient closure of higher plant plasmodesmata. Planta 210:329–335
49. Spanswick RM (1972) Electrical coupling between cells of higher plants: a direct demon-stration of intercellular communication. Planta 102:215–227
50. Overall RL, Gunning BES (1982) Intercellular communication in Azolla roots: II. Electrical coupling. Protoplasma 111:151–160
51. Staiger CJ (2000) Signaling to the cytoskeleton in plants. Annu Rev Plant Physiol Plant Mol Biol 51:257–288
52. Collings DA (2008) Crossed wires: interac-tions and cross-talk between the microtubule and microfi lament networks in plants. In: Nick P (ed) Plant cell monographs: plant microtu-bules, development, and fl exibility. Springer, Berlin, pp 47–82
53. Heinlein M, Padgett HS, Gens JS et al (1998) Changing patterns of localization of the Tobacco Mosaic Virus movement protein and replicase to the endoplasmic reticulum and microtubules during infection. Plant Cell 10: 1107–1120
54. White RG, Badelt K, Overall RL, Vesk M (1994) Actin associated with plasmodesmata. Protoplasma 180:169–184
55. Mooré D (1980) Effects of hexose analogues on fungi: mechanisms of inhibition and of resistance. New Phytol 87:487–515
56. Breier A, Crane AM, Kennedy C, Sokoloff L (1993) The effects of pharmacologic doses of 2-deoxy-D-glucose on local cerebral blood fl ow in the awake, unrestrained rat. Brain Res 618:277–282
57. Datema R, Schwartz RT, Rivas LA, Pont- Lezica R (1983) Inhibition of β-1,4-glucan biosynthesis by deoxyglucose. Plant Physiol 71:76–81
58. Stone BA, Clarke AE (1992) Chemistry and biology of (1→3)-β-glucans. La Trobe University Press, Bundoora, VIC
59. Peucelle A, Louvet R, Johansen JN et al (2008) Arabidopsis phyllotaxis is controlled by the methyl-esterifi cation status of cell-wall pectins. Curr Biol 18:1943–1948
60. Martens HJ, Hansen M, Schulz A (2004) Caged probes: a novel tool in studying
Rosemary G. White
227
symplasmic transport in plant tissues. Protoplasma 223:63–66
61. Gilroy S, Read N, Trewavas AJ (1990) Elevation of cytoplasmic calcium by caged cal-cium or caged inositol trisphosphate initiates stomatal closure. Nature 346:769–771
62. Ward JL, Beale MH (1995) Caged plant hor-mones. Phytochemistry 38:811–816
63. Allan AC, Ward JL, Beale MH, Trewavas AJ (1998) Caged plant growth regulators. Methods Enzymol 291:474–483
64. Kusaka N, Maisch J, Nick P et al (2009) Manipulation of intracellular auxin in a single cell by light with esterase-resistant caged aux-ins. ChemBioChem 10:2195–2202
65. Tucker EB (1987) Cytoplasmic streaming does not drive intercellular passage in staminal hairs of Setcreasea purpurea . Protoplasma 137: 140–144
66. Tucker EB, Tucker JE (1993) Cell-to-cell dif-fusion selectivity in staminal hairs of Setcreasea purpurea . Protoplasma 174:36–44
67. Zhu T, Lucas WJ, Rost TL (1998) Directional cell-to-cell communication in the Arabidopsis root apical meristem. I. An ultrastructural and functional analysis. Protoplasma 203:35–47
68. Liang DC, White RG, Waterhouse PM (2012) Gene silencing in Arabidopsis spreads from the root to the shoot, through a gating barrier, by template-dependent, non-vascular, cell to cell movement. Plant Physiol 159:984–1000
69. Oparka KJ, Prior DAM (1988) Movement of lucifer yellow CH in potato tuber storage tis-sue: a comparison of symplastic and apoplastic transport. Planta 176:533–540
70. Volkmann D, Mori T, Tirlapur UK et al (2003) Unconventional myosins of the plant-specifi c class VIII: endocytosis, cytokinesis, plasmodes-mata/pit-fi elds, and cell-to-cell coupling. Cell Biol Int 27:289–291
71. Erwee MG, Goodwin PB (1984) Charac-terisation of the Egeria densa leaf symplast: response to plasmolysis, deplasmolysis and to aro-matic amino acids. Protoplasma 122: 162–168
72. Ding B, Kwon M-O, Warnberg L (1996) Evidence that actin fi laments are involved in
controlling the permeability of plasmodesmata in tobacco mesophyll. Plant J 10:157–164
73. Su S, Liu Z, Chen C et al (2010) Cucumber Mosaic Virus movement protein severs actin fi laments to increase the plasmodesmal size exclusion limit in tobacco. Plant Cell 22: 1373–1387
74. Stadler R, Wright KM, Lauterbach C et al (2005) Expression of GFP-fusions in Arabidopsis companion cells reveals non- specifi c protein traffi cking into sieve elements and identifi es a novel post-phloem domain in roots. Plant J 41:319–331
75. Imlau A, Truernit E, Sauer N (1999) Cell-to- cell and long distance traffi cking of the green fl uorescent protein in the phloem and symplas-tic unloading of the protein into sink tissues. Plant Cell 11:309–322
76. Simpson I (1978) Labelling of small mole-cules with fl uorescein. Anal Biochem 89:304–305
77. Bostrom TE, Walker NA (1975) Intercellular transport in plants I. The fl ux of chloride and the electric resistance in Chara. J Exp Bot 26: 767–782
78. Krasavina MS, Ktitorova IN, Burmistrova NA (2001) Electrical conductance of cell-to-cell junctions and the cytoskeleton of plant cells. Russ J Plant Physiol 48:741–748
79. Kawakami S, Watanabe Y, Beachy RN (2004) Tobacco mosaic virus infection spreads cell to cell as intact replication complexes. Proc Natl Acad Sci U S A 20:6291–6296
80. Radford JE, White RG (1998) Localization of a myosin-like protein to plasmodesmata. Plant J 14:743–750
81. Dale N, Lunn G, Fensom DS, Williams EJ (1983) Rates of axial transport of 11 C and 14 C in Characean cells: faster than visible stream-ing? J Exp Bot 34:130–143
82. Drake G (1979) Electrical coupling, potentials, and resistances in oat coleoptiles: effects of azide and cyanide. J Exp Bot 30:719–725
83. Reynolds ES (1963) Electron-opaque stain in electron microscopy. J Cell Biol 17:208–212
Biochemical Inhibition of Plasmodesmata


![The Canadian parliamentary companion [microform]](https://img.dokumen.tips/doc/110x75/6331b6c45696ca447302e104/the-canadian-parliamentary-companion-microform.jpg)


