Embed Size (px)
Citation preview

Influence of net freshwater supply on salinity in Florida Bay
William K. Nuttle and James W. FourqureanSoutheast Environmental Research Center, Biological Sciences, Florida International University, Miami
Bernard J. Cosby and Joseph C. ZiemanDepartment of Environmental Sciences, University of Virginia, Charlottesville
Michael B. RobbleeBiological Resources Division, U.S. Geological Survey, Florida International University, Miami
Abstract. An annual water budget for Florida Bay, the large, seasonally hypersalineestuary in the Everglades National Park, was constructed using physically based modelsand long-term (31 years) data on salinity, hydrology, and climate. Effects of seasonal andinterannual variations of the net freshwater supply (runoff plus rainfall minus evaporation)on salinity variation within the bay were also examined. Particular attention was paid tothe effects of runoff, which are the focus of ambitious plans to restore and conserve theFlorida Bay ecosystem. From 1965 to 1995 the annual runoff from the Everglades into thebay was less than one tenth of the annual direct rainfall onto the bay, while estimatedannual evaporation slightly exceeded annual rainfall. The average net freshwater supply tothe bay over a year was thus approximately zero, and interannual variations in salinityappeared to be affected primarily by interannual fluctuations in rainfall. At the annualscale, runoff apparently had little effect on the bay as a whole during this period. On aseasonal basis, variations in rainfall, evaporation, and runoff were not in phase, and thenet freshwater supply to the bay varied between positive and negative values, contributingto a strong seasonal pattern in salinity, especially in regions of the bay relatively isolatedfrom exchanges with the Gulf of Mexico and Atlantic Ocean. Changes in runoff couldhave a greater effect on salinity in the bay if the seasonal patterns of rainfall andevaporation and the timing of the runoff are considered. One model was also used tosimulate spatial and temporal patterns of salinity responses expected to result fromchanges in net freshwater supply. Simulations in which runoff was increased by a factor of2 (but with no change in spatial pattern) indicated that increased runoff will lower salinityvalues in eastern Florida Bay, increase the variability of salinity in the South Region, buthave little effect on salinity in the Central and West Regions.
1. Introduction
Florida Bay, a broad (2000 km2), shallow (approximately1 m) estuarine lagoon nestled between the south Florida main-land and the Florida Keys (Figure 1), occupies a large portionof Everglades National Park and is contiguous with the FloridaKeys National Marine Sanctuary. It is bounded by the man-grove wetlands of the mainland, the open marine systems ofthe Gulf of Mexico, and the islands that compose the FloridaKeys. Bay waters support a valuable recreational fishery withinthe bay itself [Tilmant, 1989] and a commercial shrimp fisheryin the Gulf of Mexico [Costello and Allen, 1966]. Beginning in1987, sudden and extensive die-off in the sea grass beds thatcover 95% of the bottom signaled a rapid, general decline inthe ecological health of the bay [Robblee et al., 1991;Fourqurean et al., 1993; Phlips et al., 1995]. Increased turbidityfollowed die-off in the grass beds [Boyer et al., 1999], andrecurrent blooms of cyanobacteria in the winters of 1991–1992and 1992–1993 decimated the sponge population [Butler et al.,1995]. The resulting changes in water quality and the long-term
structural changes in the bay’s ecosystems have also affectedthe health of adjacent coastal systems, such as the coral reefs ofthe Florida Keys.
Ecological decline in Florida Bay is widely considered to bethe result of long-term regional water management in southFlorida. Although there is general agreement about the natureand extent of the impacts of water management in the exten-sive wetlands of the Everglades, which lie immediately up-stream of Florida Bay, the chain of cause and effect linkingwater management to sea grass die-off and plankton blooms inthe bay has not yet been fully established. Because of manage-ment practices, discharge of freshwater directly into the Atlan-tic Ocean and farther north into the Gulf of Mexico has in-creased up to a factor of 10, while the discharge of freshwaterinto Florida Bay and along the southwest coast of Florida hasdecreased by an unknown but important amount [Light andDineen, 1994]. Because we do not know the sensitivity of theFlorida Bay ecosystem, primarily the extensive sea grass com-munities, to variations in freshwater runoff, we cannot tell whatbenefits restoring the historical runoff would have. Even with-out this knowledge, plans for water management and ecosys-tem restoration in south Florida [U.S. Army Corps of Engineers,1998] are progressing, based, at least in part, on the assump-
Copyright 2000 by the American Geophysical Union.
Paper number 1999WR900352.0043-1397/00/1999WR900352$09.00
WATER RESOURCES RESEARCH, VOL. 36, NO. 7, PAGES 1805–1822, JULY 2000
1805
tion that the ecological health of Florida Bay will be restoredby increasing the freshwater runoff to the bay to as near tohistoric levels as possible.
Salinity is an intermediate link in the chain of cause andeffect that connects water-management activities to the struc-ture and functions of the bay’s ecosystem. In Florida Bay,salinity varies markedly in time and space (Figure 2). Hyper-saline conditions (.40) (salinity values given in practical sa-linity units) in one part of the bay frequently coexist with moreestuarine conditions (,30) in another. At some interior loca-tions, salinity regularly fluctuates between hypersaline andnearly freshwater conditions [Frankovich and Fourqurean,1997]. Only within the confines of a few, semienclosed basinsalong the north shore of the bay do salinity fluctuations closelyfollow changes in canal discharge. The degree to which watermanagement and, consequently, runoff from south Florida in-fluence salinity fluctuations in Florida Bay cannot be ascer-tained without a detailed analysis. Therefore we have usedsalinity, hydrology, and climate data from 1965 through 1995 toinvestigate how the annual water balance and the variations infreshwater fluxes have influenced the salinity in Florida Bay.
2. Background
2.1. Factors Affecting Estuarine Salinity
Variation in estuarine salinity can be attributed to the in-tensity of the two-way exchange between the estuary and thecoastal ocean, the net supply of freshwater that flows throughthe estuary to the coastal ocean, and the salinity of the coastalocean at the estuary’s mouth. The two-way exchange betweenestuary and ocean is driven by several physical processes, in-cluding density differences, astronomical tides, and wind. Thenet freshwater supply is the sum of runoff and direct rainfallminus any evaporation from the estuary. The patterns of sa-linity in estuaries result from a dynamic steady state in whichthe advective flux of salt into or out of the estuary, which isdriven by the net freshwater supply, is balanced by a dispersiveflux from the two-way water exchange created by tides andother hydrodynamic mixing processes.
In a classical estuary a positive net freshwater supply, usuallyfrom heavy runoff delivered by river discharge, dilutes thesalinity in the estuary to below that of ocean water. Salinity
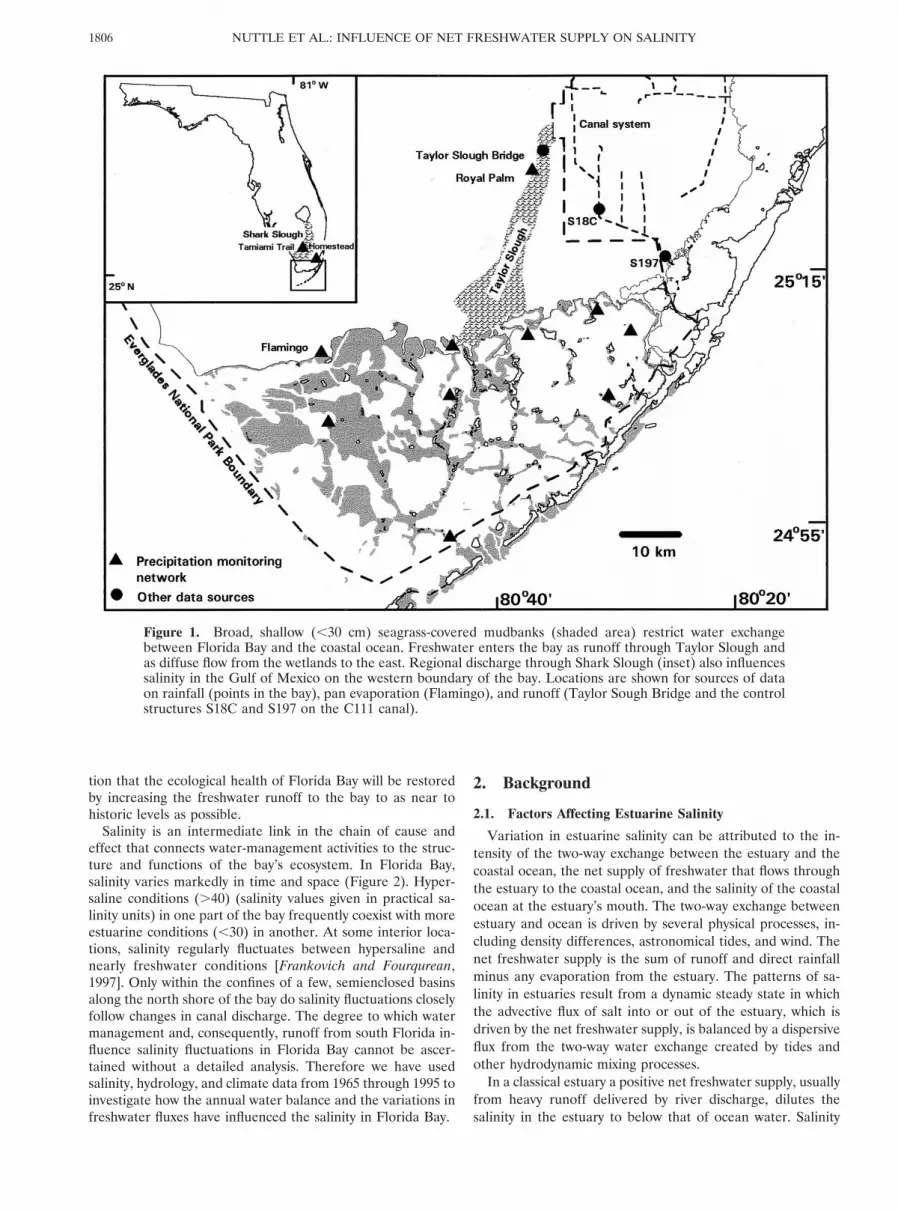
Figure 1. Broad, shallow (,30 cm) seagrass-covered mudbanks (shaded area) restrict water exchangebetween Florida Bay and the coastal ocean. Freshwater enters the bay as runoff through Taylor Slough andas diffuse flow from the wetlands to the east. Regional discharge through Shark Slough (inset) also influencessalinity in the Gulf of Mexico on the western boundary of the bay. Locations are shown for sources of dataon rainfall (points in the bay), pan evaporation (Flamingo), and runoff (Taylor Sough Bridge and the controlstructures S18C and S197 on the C111 canal).
NUTTLE ET AL.: INFLUENCE OF NET FRESHWATER SUPPLY ON SALINITY1806

ranges from zero at the head of the estuary to the salinity of thecoastal ocean near the mouth.
Other estuaries may experience hypersaline conditions.Many coastal bays and lagoons, like Shark Bay, Western Aus-tralia [Smith and Atkinson, 1983]; Laguna Madre, Texas,United States of America [Smith, 1988]; and Lagoa de Ara-ruama, Brazil [Kjerfve et al., 1996], have higher average salin-ities near their mouths than the coastal ocean for most or all ofthe year. Because these inverse estuaries have a negative fresh-water supply caused by evaporation rates higher than bothrainfall and runoff rates, salt concentrates to hypersaline con-ditions. Salinities in these inverse estuaries can range fromzero near freshwater discharge to a greater-than-coastal salin-ity in the main body of the estuary.
Seasonally hypersaline estuaries form a third class of estuarycharacterized by their episodic hypersalinity [Largier et al.,1997]. These estuaries experience limited exchange with thecoastal ocean, and net freshwater supply fluctuates on thepositive and negative side of zero in response to climatic vari-ations. Estuaries in this class are found in both temperate,Mediterranean climates (e.g., Tomales, Mission, and San Di-ego Bays, California, United States of America [Largier et al.,1997]) and tropical, monsoonal areas (e.g., northern Australia[Wolanski, 1986], Kenya [Kitheka, 1998], and Sri Lanka [Aru-lananthan et al., 1995]). Since the net annual freshwater bal-ance of seasonally hypersaline estuaries is close to zero, smallperturbations in the freshwater supply may lead to largechanges in the salinity of the estuary. Diversions of freshwaterrunoff for urban or agricultural use, as in the Colorado RiverEstuary, Mexico, can drastically change the salinity regime.Small climactic variations can also have large impacts on sa-linity: For example, a multidecadal trend of decreasing rainfallhas changed the Casamance River Estuary in Senegal from aseasonally hypersaline estuary to a permanently inverse estuary[Debenay et al., 1994]. In Laguna Madre, Texas, prolonged andintense hypersaline conditions associated with droughts maytrigger the “brown tide” phenomenon by changing the struc-ture of the plankton community [Rhudy et al., 1999].
Florida Bay is a seasonally hypersaline estuary (Figure 2a).In the bay a network of broad, shallow mud banks and the lackof density stratification limit the magnitude of tidally drivenand baroclinic exchange flows. The influence of the south Flor-ida climate is evident in runoff, rainfall, wind-driven tides, andthe salinity of the coastal ocean. Wet and dry periods fluctuateseasonally and from year to year. Tides and currents in the bayare particularly influenced by the sustained winds associatedwith the passage of fronts characteristic of the subtropicalwinter weather [Wang et al., 1994]. Patterns of local runofffrom the Everglades directly affect salinity in the bay (Figure2b). Variations in runoff from all of south Florida, includingLake Okeechobee, influence the salinity of the Gulf of Mexicoalong its border with Florida Bay thereby indirectly linkingregional patterns of runoff to salinity variations in the bay.
2.2. Regional Patterns in Florida Bay
Florida Bay lacks the clearly defined upstream/downstreamaxis that, in most estuaries, organizes spatial variations in sa-linity. However, several analyses of water-quality parameters,for example, salinity, nutrient, chlorophyll, etc., have shown aconsistent pattern. For example, Boyer et al. [1997] identifiedthree zones of similar water quality in Florida Bay: a coreregion, a western region, and an eastern region. Other authorshave suggested dividing the bay into similar zones based on
bank morphology and dynamics [Wanless and Tagett, 1989],benthic mollusk communities [Turney and Perkins, 1972], sa-linity and nitrogen [Fourqurean et al., 1993], and benthic plantcommunities [Zieman et al., 1989]. These schemes all suggestthat the primary axis of differentiation runs from northeast tosouthwest, and most schemes include a separate, distinct re-gion (of varying size) in the upper central part of the bayadjacent to the Everglades.
On the basis of the work summarized above, for this studywe divided the bay into four regions (Figure 3) that differ intheir proximity to the Gulf of Mexico, areas of water flowthrough the Florida Keys, and sources of freshwater runofffrom the mainland. In the Central Region, broad, shallowbanks (Figure 1) restrict exchange with the Gulf and the At-lantic, and there is little freshwater runoff. Residence times arehigh and hypersaline conditions are frequent and persistent(Figure 2a). The East Region resembles the Central Regionwith its limited oceanic exchange and long residence times;however, it receives most of the bay’s freshwater runoff pri-marily from the C111 canal and Taylor Slough (Figure 1).Salinity in the East Region varies widely between nearly freshand hypersaline conditions (Figure 2b). In the South and WestRegions, salinity variations are less extreme (Figure 2b).Greater exchange with the Gulf of Mexico and the Atlantic
Figure 2. Salinity varies widely in time and space in FloridaBay. (top) Temporal patterns in the Central Region reflect theinfluence of sources of variation operating on seasonal andinterannual timescales. (middle) Spatial patterns in mean sa-linity from February to March 1994 and (bottom) range ofsalinity variation from 1990 to 1994 over the whole bay revealthe influence of exchange with ocean waters and the localizedeffect of runoff into the bay.
1807NUTTLE ET AL.: INFLUENCE OF NET FRESHWATER SUPPLY ON SALINITY
Ocean and a lack of direct runoff result in salinities nearer tothat of the coastal waters.
3. MethodsThe main objectives of this study were (1) to establish the
annual and seasonal water balances and net freshwater sup-plies for Florida Bay and (2) to evaluate the degree to whichthe amounts of and variations in rainfall and runoff contributeto the observed salinity variations in Florida Bay. The influenceon salinity of any of the components of the net freshwatersupply could not be demonstrated simply by searching forcorrelations with salinity. Most factors controlling estuarinesalinity share climate as a common source of variation, andeach can be expected to exhibit similar patterns of variation.The only way to understand the influence of a particular compo-nent of the net freshwater supply on salinity in Florida Bay was toisolate that component and quantify directly its effect on salinity.
This approach required spatially and temporally extensivemeasurements of freshwater fluxes and salinity in the bay,salinity models that incorporated different temporal and spa-tial scales, and a framework for interpreting the simulated andobserved salinity variations. We assembled rainfall, runoff, andevaporation data and a database of published and unpublishedsalinity measurements in Florida Bay (see the appendix) thatspans the 31 years from 1965 through 1995. We used theannual and monthly means of these data to establish the yearlyand seasonal water balances for Florida Bay. We then used thedata with physically based, mass balance salinity models incomparative analyses to examine the effects of spatial andtemporal variations in net freshwater supply on the observedsalinity variations.
3.1. Framework for the Comparative Analyses
In general, physically based models treat salinity, S , as afunction of coastal ocean salinity, Socn, exchange fluxes withthe coastal ocean, QT, and the fluxes of freshwater (rainfall,QP, runoff, QR, and evaporation, QE), all of which vary intime and space:
S u j,ki 5 f~Socnu j,k
i , QTu j,ki , QEu j,k
i , QPu j,ki , QRu j,k
i ! 1 R u j,ki , (1)
where the superscript and subscripts identify location (i), year( j), and month (k). The residual errors, R , are the differencesbetween measured and simulated salinity and represent noisein the data and salinity variations not explained by the pro-cesses or assumptions inherent in the model formulations. Weemployed models that differed in their spatial and temporalresolution and compared the successes of the models in repro-ducing observed salinity variations in order to draw inferencesabout the importance for salinity variations of (1) interannualand seasonal variations in net freshwater supply and (2) loca-tion within the bay.
We used a measure of model efficiency, eff, to assess howsuccessfully each model reproduced the patterns of variation inobserved salinity data:
eff 5 100F 1 2
Oi
Oj
Ok
~R u j,ki !2
n Var ~S u j,ki !
G , (2)
where R are the residual errors, Var (S) is the total varianceof the salinity measurements, and n is the number of observa-tions. A model’s efficiency score (unitless) can be broadly in-terpreted as the proportion of the variance in the data ex-
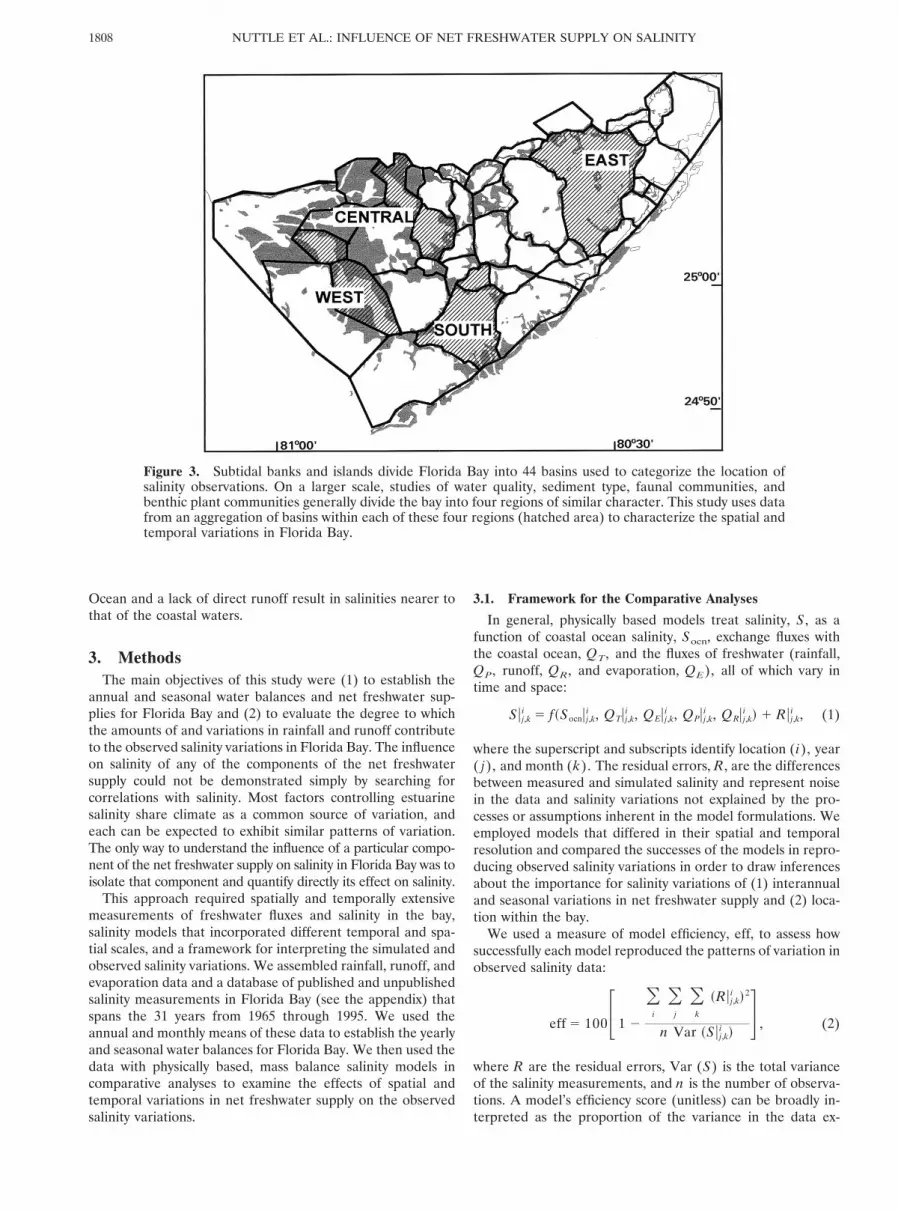
Figure 3. Subtidal banks and islands divide Florida Bay into 44 basins used to categorize the location ofsalinity observations. On a larger scale, studies of water quality, sediment type, faunal communities, andbenthic plant communities generally divide the bay into four regions of similar character. This study uses datafrom an aggregation of basins within each of these four regions (hatched area) to characterize the spatial andtemporal variations in Florida Bay.
NUTTLE ET AL.: INFLUENCE OF NET FRESHWATER SUPPLY ON SALINITY1808

plained by the model. In this sense, model efficiency is similarto the coefficient of determination r2. In contrast to r2 theefficiency score can take on negative values if, for example, themodel produces a biased estimate of the data or if fluctuationsin the model are out of phase with fluctuations in the data. Ifthe efficiency score was zero, then the model explained thevariation in the data no better than did the mean of the data.If the efficiency score was 100%, then the residuals were zero,and the model explained all of the variance in the data.
Any measure of model success is most useful if compara-tively applied. That is, by examining the increase (or decrease)in explanatory power between a null model and an alternative,the power of the processes included in the alternative model toexplain variance in the data can be assessed. The null modelimplicitly included in eff was the mean of the observed salinityacross all observations and all regions in Florida Bay (i.e., amodel with no temporal or spatial resolution). We developedthree alternative salinity models that contained increasing spa-tial and temporal complexities. By comparing the efficienciesof the alternative models, we were able to estimate the relativecontributions of two temporal components (interannual andseasonal variations in freshwater fluxes) and one spatial com-ponent (location of the salinity measurements) to the overallvariation of salinity in Florida Bay.
The first type of model, a static location model, only ac-counted for the effects on salinity of position within the bay.This model was simply defined as the average of the observedsalinity data, Sav, for all months and years in each region of thebay:
S u j,ki 5 Savu i 1 R u j,k
i . (3)
The location model was applied to each of the four regions inFigure 3. The model did not contain a temporal componentand could not explain any of the interannual or seasonal vari-ations of salinity within any of the regions. The notation de-notes that the model simulated a salinity value S for eachregion (i), every year ( j), and every month (k), but the pre-dicted salinity for all months and years in a region was thesame value. Because the model has no temporal component(only the spatial means are used), the residuals were expectedto contain all of the temporal variance in the data, and theefficiency was expected to be low.
The second type of model, a steady state, spatially aggre-gated “box” model, quantified the effects of location as well asthe effects of long-term, interannual variations in rainfall andrunoff on salinity within the bay:
S u j,ki 5 f~Socn, QTu i, QEu i, QPu j, QRu j! 1 R u j,k
i . (4)
The box model was implemented using annual time steps andannual values of freshwater and exchange fluxes. Rainfall andrunoff were uniformly distributed over the bay (no spatialcomponent) and varied from year to year. Spatially explicit buttemporally constant estimates of evaporation and dispersiveexchange with the coastal ocean were derived for the modelduring calibration. This model was applied to all four regionsin the bay (Figure 3). The residuals were expected to containall of the seasonal variance, and the efficiency was expected toincrease over that of the location model.
The third type of model, a dynamic, spatially explicit model,simulated the effects on salinity of location and both interan-nual and seasonal variations in freshwater and exchange fluxes:
S u j,ki 5 f~Socn, QTu j,k
i , QEuk, QPu j,k, QRu j,ki ! 1 R u j,k
i . (5)
The dynamic model was based on the basin and bank geomor-phology of Florida Bay and was driven by monthly values ofrainfall, runoff, and evaporation. Rainfall and evaporationwere applied uniformly across the bay, but runoff was added atappropriate locations on the boundaries of the bay. Hourlytides generated advective exchanges among 44 basins withinthe bay. We expected this model, with the greatest spatial andtemporal complexity, to have the highest efficiency and explan-atory power.
3.2. Salinity Data
We drew our salinity observations for this study from anhistorical salinity database for Florida Bay and the west coastof south Florida consisting of over 34,000 individual observa-tions dating from 1947 (see the appendix). This database wasassembled from the results of many field studies and fromsystematic, water-quality monitoring programs initiated in re-sponse to the ecological crises of the late 1980s and early1990s. Data from within Florida Bay are categorized accordingto their location in a grid of 44 numbered basins. Boundaries ofthe basins follow the geometry of the system of anastomosingbanks that physically subdivide the bay (Figure 3). This data-base provides excellent spatial and temporal coverage begin-ning with 1989 when mounting concern about conditions in thebay resulted in the establishment of regular water-quality mon-itoring surveys. However, the data from before 1989 are dis-continuous and uneven with the highest number of observa-tions clustered in the East Region of the bay. Because the dataavailable from before 1965 are extremely spotty, they were notused in this study.
We aggregated the salinity data by subsampling and process-ing data from the historical database to assure an unbiasedsampling of the interannual and seasonal salinity variationsand to provide a balanced representation of the regional vari-ations in the bay. First, the data were aggregated in time bycomputing the individual monthly average salinity in each ba-sin for each month of record. Second, the data in each basinwere screened to assure they consistently represented seasonalvariations by excluding calendar years with data reported infewer than 11 months. Third, in all but the East Region, datafrom two adjacent basins were combined to provide the mostcontinuous salinity record possible (maximum number ofyears) over the 31 years (Figure 3). The resulting set ofmonthly averaged salinity data characterized the interannualand seasonal variations in salinity in each region of the bay for1965 through 1995 (Figures 4 and 5). The nine years from 1987to 1995 contain 34 station years (54%) of the data. We usedthis data subset, the evaluation period subset, for our detailedcomparisons of the model results because it provided the mostcomplete temporal and spatial coverage of the bay. Our eval-uation of the influence of the net freshwater supply on salinitywas primarily based on our analysis of these data. We used theadditional data in the complete 31-year record to evaluate thepredictive ability of the models. The distribution of salinitydata in the 9-year evaluation period was similar to that of thecomplete 31-year record (Table 1).
3.3. Freshwater Flux Data
3.3.1. Runoff. Freshwater runoff into Florida Bay was es-timated as the sum of monthly volume discharges in TaylorSlough and the C111 canal (Figure 6a). Data for Taylor Sloughare available for the entire period from 1965 through 1995;data for the C111 canal are only available beginning in 1970.
1809NUTTLE ET AL.: INFLUENCE OF NET FRESHWATER SUPPLY ON SALINITY

Discharge in Taylor Slough is measured as it crosses the mainroad through Everglades National Park (Figure 1). The flowdown Taylor Slough discharges into a complex of ponds northof the bay and is distributed from there into the bay throughseveral, smaller channels. Discharge in the C111 canal is mea-sured at the S18C and the S197 control structures (Figure 1).The C111 canal conveys water from a regional network ofdrainage canals. Most water that leaves the C111 canal dis-charges into the mangrove wetlands between the S18C and theS197 structures. This freshwater then flows south into the EastRegion of the bay. During infrequent periods of extremely highflow, water is allowed to pass through the S197 structure anddischarge directly into the extreme eastern end of Florida Bay.These runoff data do not account for the net gain (or loss) offreshwater from precipitation and evaporation over the area
between the flow-monitoring points and the coast. The contri-bution of (ungauged) groundwater flow to the coast is also notaccounted for in these data. Evidence from natural groundwa-ter tracers suggests that submarine groundwater discharge intoFlorida Bay contributes only slightly to the net freshwatersupply [Corbett et al., 1999].
3.3.2. Rainfall. The available long-term rainfall recordsfor land-based sites in south Florida do not provide reliableestimates of rain falling directly onto the bay. Convectivestorms form primarily along the coast early in the wet seasonbut do not form over the open water of the bay until late in thewet season [Schomer and Drew, 1982]. This produces higherrainfall measurements at mainland stations just inland fromthe Florida Bay coast than actually occur in the bay. Therefore,to construct a long-term precipitation record for the bay, wehad to correct for this bias in the land-based records. We didthis by correlating land-based records with recently availablerainfall measurements from stations within the bay and usingthis correlation to reconstruct rainfall for periods when norainfall data for the bay were available.
Rainfall is currently being measured at several marine-monitoring network stations maintained in Florida Bay (D.
Figure 5. Regional salinity averaged by month over all 31years illustrates similarities and differences in the seasonalpatterns of variation. In all regions, salinity increases duringthe dry season and decreases during the wet season. The am-plitude of seasonal variation is greater in the Central and EastRegions (bold and dashed lines), which are isolated from ac-tive exchange with the coastal ocean, which moderates theseasonal variation in the South and West Regions (dotted andfine lines).
Table 1. Summary of the Monthly Average SalinityObservations in Each Region of Florida Bay
Basin
1987–1995 1965–1995
Mean SD Mean SD
East 30.8 9.8 30.6 9.6South 37.0 5.2 38.1 5.2Central 39.6 9.4 41.4 9.2West 36.4 4.2 36.7 5.0All basins 35.8 8.2 35.8 8.6
SD is standard deviation.
Figure 4. Monthly salinity values for 1965 to 1995 for each of four aggregated basins in Florida Bay showthe combined influence of a strong seasonal cycle superimposed on interannual variation. The straight linesindicate the average salinity in each region for the period.
NUTTLE ET AL.: INFLUENCE OF NET FRESHWATER SUPPLY ON SALINITY1810

Smith, Annual Data Reports: 1993–1996, Everglades NationalPark, Homestead, Florida). We used the monthly totals for1993 through 1996 from eight of these stations (Figure 1) toestimate monthly bay-wide average rainfall for 1993 through1996. We chose these stations because they reported at least 12months of data within this period. We used linear regression toidentify relationships between the monthly totals at each of theeight marine monitoring stations and monthly rainfall amountsfrom long-term records (National Weather Service, NationalOceanic and Atmospheric Administration (NOAA), dataavailable from the National Climatic Data Center, Asheville,North Carolina) for Flamingo, Royal Palm, Tamiami Trail,and Homestead (Figure 1). These relations, which have r2
generally greater than 0.5, provided the means of extrapolatingthe recent record of rainfall in the bay back in time over theperiod 1965 through 1995. We calculated a bay-wide averagerainfall from the extrapolated records, using area weightsbased on Thiessen polygons, to estimate annual and monthly,bay-wide average rainfall (Figure 6b).
3.3.3. Evaporation. Evaporation has not been directlymeasured in Florida Bay, and as yet little effort has been madeto evaluate the long-term evaporation rate or its seasonal orregional variations. Several years (1965 through 1970) of panevaporation observations are available from a NationalWeather Service cooperative observing station (data availablefrom the National Climatic Data Center) at Flamingo on thesouthwest Florida mainland (Figure 1). The annual average ofthese data (approximately 210 cm yr21) appeared to be toohigh to be accepted as direct estimates of evaporation in Flor-ida Bay. By comparison, Morton [1986] estimates annual evap-oration from Lake Okeechobee is 162 cm based on a calcula-tion of its water budget. Recently, Pratt and Smith [1999]estimated an annual evaporation rate of about 73 cm by usinga Dalton law formula and data collected at three sites in thebay. However, since some data needed to apply this formulawere obtained from a fourth station outside of the bay, it is notknown what magnitude of error might have been introducedinto their estimate. Because of the lack of reliable evaporationestimates we derived our own estimate of the long-term, bay-wide, annual average evaporation rate, EB, from our calibra-tion of the steady state box model using the annual averages ofthe observed salinity data (see section 3.4.1). Then, we esti-mated monthly values of evaporation, QE, by multiplying thelong-term, annual rate by monthly weights, wk, derived fromthe seasonal pattern in the pan data from Flamingo:
QE 5 EBwk, (6)
where
Ok51
12
wk 5 1.
3.4. Salinity Models
3.4.1. Steady state box model. The steady state boxmodel served two purposes. It allowed us (1) to estimate theunknown evaporation flux and (2) to investigate what effectyear-to-year variations in net freshwater supply has had on baysalinity. We formulated the box model following the approachof Miller and McPherson [1991] at Charlotte Harbor. In thisapproach the net effects of residual circulation and hydrody-namic mixing were accounted for by a (unknown) net exchangeflux, QT, for each region of the bay that represented the cu-
mulative influx of seawater flowing into that region. Theseexchange fluxes, expressed in cm yr21, were assumed to beconstant with respect to season and year. Each region alsoreceived a net supply of freshwater, QF, as a result of runoff,direct rainfall, and evaporation. Invoking mass conservationfor both water and salt led to an expression for the steady statesalinity in each region. On an annual average basis a flux ofwater, QT, with salinity, Socn, entered each basin from theocean and a flux of water, QT plus QF, returned to the oceanwith the salinity in the basin. Equating the inflow and outflow,advected fluxes of salt led to an expression for the annualaverage, steady state salinity in the efflux (Sann, i.e., an esti-mate of the annual average salinity in a given region of thebay):
Sann 5 Socn
QT
QT 1 QF, (7)
where QF 5 QP 1 QR 2 QE and the rainfall, runoff, andevaporation fluxes are annual average values.
We applied the box model separately to each of the fourregions in the bay (Figure 3). Annual runoff and rainfall vol-umes (Figure 6) were uniformly distributed over the entirearea of the bay. In the case of runoff we assumed that mixingwithin the bay was vigorous enough to redistribute runoffthroughout the bay from its localized points of discharge in lessthan a year. In the case of rainfall the available records frompoints within the bay were insufficient to characterize anyspatial distribution that was not uniform. We thus applied thesame rainfall, QP, and runoff, QR, to each region, and we
Figure 6. (a) Monthly runoff into Florida Bay was estimatedfrom measured discharges in Taylor Sough (1965 to 1995) andin the C111 canal (1970 to 1995). The volumetric fluxes weredivided by the surface area of Florida Bay (200 km2) to yield anequivalent bay-wide depth for runoff. The dashed line is thetotal runoff for each calendar year. (b) Monthly rainfall ontoFlorida Bay for 1965 to 1995 was estimated from relationshipsbetween long-term rainfall data in the Everglades and morerecent (short term) rainfall data in Florida Bay. The dashedline is the total rainfall for each calendar year.
1811NUTTLE ET AL.: INFLUENCE OF NET FRESHWATER SUPPLY ON SALINITY

calibrated the unknown annual exchange fluxes, QT, and an-nual evaporation fluxes, QE, for each region by individuallyfitting the model to the observed salinity data (using leastsquares minimization of the residuals). Following calibrationfor each region, we calculated the annual, bay-wide evapora-tion rate, EB, as the average of the four regional values of QE
(see (6)).3.4.2. Dynamic, spatially explicit model. We used a dy-
namic, spatially explicit mass balance model to investigate thecombined influence of seasonal and interannual variations innet freshwater supply for two reasons. We needed a dynamicmodel because residence times in the bay exceed 1 month andwe could not assume a steady state salinity response on aseasonal or monthly timescale. We needed a spatially explicitmodel to examine whether the influence of runoff on amonthly scale would be confined to basins near the inflowalong the Everglades coast. We developed a model for thispurpose that maintains a running account of the water and saltbudgets in each of 44 well-mixed basins within the bay (Figure3). The boundaries of these basins follow the system of theanastomosing banks that dissect the bay. This geometry waschosen because the banks are the primary controls on fluxeswithin the bay and the basins offer a natural framework formass balance accounting. This approach traces its roots to theKeulegan’s [1967] model for the response of a coastal lagoon toforcing by ocean tides acting through an inlet. Tidal exchangethrough the inlet is modeled using Manning’s equation and thehead difference between zero-velocity water bodies at eitherend of the inlet channel. We adapted this approach to condi-tions in Florida Bay where exchange is governed by the con-striction of shallow banks, not narrow inlets, and we extendedit to a network of basins interconnected by flows over banks.
The dynamic mass balance model (Flux Accounting andTidal Hydrology at the Ocean Margin (FATHOM)) calculatesexchange with a coastal ocean and mixing among basins in abay as the results of tidally driven water fluxes across shallowbanks. At each hourly time step the model solves for uniform,hydraulic flow across each bank based on the depth, width, andfrictional roughness of the bank and water levels in upstreamand downstream basins. Manning’s equation for friction flow inchannels [see Henderson, 1966] is used to calculate water ve-locity as a function of depth with a vertical resolution of 0.3 m.These velocities are used with cross-sectional areas of banks tocalculate water fluxes. Salt fluxes are then calculated fromwater fluxes and the salinity of an “upstream” basin. Details of
the banks’ representation and the hydraulic-equation solutionsare given by Cosby et al. [1999]. Basically, FATHOM simulatesmixing of salt between adjacent basins as tidally driven flowsover a series of weirs.
In addition to the climate data needed for the box model,FATHOM requires tide data to set the open-water boundaryconditions for the bay. Hourly tide stages along the Gulf ofMexico and Atlantic boundaries of Florida Bay were interpo-lated from NOAA tide tables for locations along the southernFlorida coast and along the Florida Keys. We used semidiurnaltides and applied the same annual pattern for all years from1965 to 1995. The effects of wind tides and wind mixing werenot included in this application of FATHOM. We assumed theGulf of Mexico and Atlantic salinity to be constant at 35. Theseasonal estimates of evaporation derived from the box model(equation (6)) were applied using the same total evaporationand seasonal pattern for all basins and all years simulated. Ourestimated monthly rainfall for the bay (Figure 6b) was evenlydistributed over the 44 basins, and monthly runoff (Figure 6a)was added at five inflow points along the north shore of theEast Region. Runoff distribution among the inflow points wasdetermined by the proportions of the total runoff contributedby measured flows in Taylor Slough and the C111 canal. Gen-erally, the influence of the C111 canal has been to redistributerunoff to the easternmost parts of the northern boundary[Lorenz, 1999] relative to historical conditions. We derived thelength/depth distribution of each bank and the volume/depthdistribution of each basin from Geographic Information Sys-tem (GIS) data that had a resolution of 20 m. On the basis ofthis GIS data we assigned to each bank one of four widths (300,1000, 3000, or 4000 m). We applied a value of 0.1 for Man-ning’s n , the friction coefficient, for all banks (based on theliterature for sediments and substrates similar to those on thebanks in Florida Bay [e.g., Henderson, 1966]).
FATHOM calculates hourly values of water level and meansalinity for each basin; monthly average salinity was calculatedfor each basin based on these hourly values. Because of thesimplifying assumptions inherent in the representation of tidalexchange in the model, the variation of salinity is not correctlyrepresented at timescales less than that represented in thevariation of monthly average salinity. For all but the EastRegion (which consists of a single basin), simulated monthlysalinity values from two adjacent basins were averaged to pro-vide regional salinity estimates that corresponded to the ob-served data (Figure 3). We did not calibrate FATHOM in anyformal sense (e.g., optimization by least squares to fit thesalinity data). The inputs described above were applied to themodel, and the simulated salinity values were used withoutfurther adjustment.
4. Results and Discussion4.1. Water Balance for Florida Bay
Using the annual averages of rainfall and runoff for 1970 to1995 estimated from our data for these inputs (Figure 6) andthe annual evaporation estimated from the application of thebox model to the salinity data for 1987 through 1995 (seesection 4.1.2), we derived an annual water balance for FloridaBay for rainfall of 98 cm yr21, for runoff of 9 cm yr21, forevaporation of 110 cm yr21, and for net freshwater supply tothe bay of 23 cm yr21. We averaged the freshwater fluxes foreach month from 1970 through 1995 to derive an averageseasonal cycle of the water balance for Florida Bay (Figure 7).
Figure 7. Average monthly freshwater fluxes to Florida Bayfor 1970 to 1995. The net freshwater supply (fine line) fluctu-ates between deficit and surplus because peaks in monthlypatterns of rainfall and runoff (bold and dotted lines) lag thepeak in monthly evaporation (dashed line) by about 4 months.
NUTTLE ET AL.: INFLUENCE OF NET FRESHWATER SUPPLY ON SALINITY1812

Monthly rainfall varied from about 4 cm month21 during thedry season to greater than 15 cm month21 at the peak of therainy season. Estimated evaporation was lowest in winter(about 6 cm month21) and reached a peak in early summer (13cm month21). Monthly runoff under the management prac-tices in place during the period was uniformly low (less than 2cm month21 for all months), but there appeared to be a ten-dency toward slightly higher runoff in late summer (Figure 7).
4.1.1. Importance of rainfall. Under water-managementpractices from 1970 through 1995 the average annual volumeof runoff into Florida Bay was less than one tenth of theaverage annual volume of direct rainfall onto the bay. Thisdistinguishes Florida Bay from other nearby estuarine areaswhere the ratio of runoff to direct rainfall was 1 to 2 orders ofmagnitude greater (Table 2). Within the bay the effects ofrunoff can be locally more important. For instance, in the EastRegion where almost all direct runoff actually entered the bay,the ratio of runoff to rainfall was larger (approximately 0.5).Comparing salinity conditions in the East Region with those inthe Central Region provided an indication of the spatial vari-ation in the magnitude of the effect of runoff to rainfall ratioson salinity within the bay. Both regions were relatively isolatedfrom exchange with the ocean, but the Central Region receivedlittle freshwater inflow from runoff. Salinity variations in thetwo regions were similar (and high compared to other areas ofthe bay), but the mean salinity in the Central Region (norunoff) was 10 higher than that in the East Region (Table 1).
4.1.2. Estimated evaporation. The calibration of the boxmodel for each region in the bay provided an estimate ofannual average evaporation in each region for 1987 through1995 (Table 3). We averaged the evaporation rates for eachregion to estimate the annual evaporation rate for Florida Bayas a whole. This average annual, bay-wide evaporation rate wasapproximately 110 cm yr21, significantly lower than the esti-mates derived from the pan data at Flamingo (210 cm yr21)and the water budget for Lake Okeechobee (162 cm yr21).Within the bay the estimates of annual evaporation variedspatially (Table 3). The estimated rates were almost identicalin the Central, South, and West Regions (approximately 130cm yr21), but the estimated rate for the East Region was morethan 30% lower. A spatial pattern in evaporation over the bay(related to water depth, bottom cover, etc.) was expected, and,theoretically, the calibration of the box model could recoversome of that pattern (to the degree to which the pattern isreflected in the annual average salinities used to calibrate themodel).
The box model explained a much smaller proportion of thevariation in the annual average salinity values in the EastRegion than elsewhere in the bay (based on the r2 values,Table 3). The lower estimated evaporation and the lower ex-plained variance in the east may reflect an underestimation ofthe freshwater fluxes either from runoff or direct rainfall intothis region. This underestimation probably resulted, at least inpart, from our decisions (1) to apply annual runoff uniformlyto each region under the assumption that mixing of runoffthroughout the bay was complete within a year and (2) toignore the effect of rainfall contributions from the TaylorSlough area below the discharge gauge. If most of the runoff(and some additional rainfall) had been added to the simula-tions for the East Region, the estimated evaporation (andperhaps the explained variance) would have been higher inthat region. Adding less runoff to the other regions would haveresulted in lower estimated evaporation rates. Lacking obser-vations on distribution and mixing of runoff in the bay (and thenecessary resolution in the steady state, spatially aggregatedbox model structure), we could not evaluate these potentialbiases in the regional evaporation estimates. We thereforeaveraged the annual evaporation rates from all four regions toprovide our best, unbiased estimate of the bay-wide annualevaporation rate.
4.2. Influence of Net Freshwater Supply on Salinity
4.2.1. Sources of interannual variation. The average an-nual net freshwater supply to Florida Bay is essentially zero.However, there have been large fluctuations in both the annualrainfall and annual runoff to the bay (Figure 6). From 1965 to1995, annual direct rainfall onto the bay varied from about 75cm yr21 to about 140 cm yr21, a range of interannual variationof 65 cm yr21 (range is 65% of mean value). For the sameperiod the range of interannual variation of runoff into the baywas only 23 cm yr21 (from 0 to 23 cm yr21 with a range of250% of mean value). Given the absolute magnitudes andranges of interannual variations of rainfall and runoff, it seemslikely that annual variations of salinity in Florida Bay for thelast 3 decades have been primarily affected by variations inannual rainfall and only to a lesser extent by changes in annualrunoff even though the percentage of changes in runoff havebeen greater.
4.2.2. Results of the steady state model. A comparison ofthe annual average salinity values simulated by the steady statebox model with the observed monthly salinity data supportedour conclusion that interannual variations in rainfall and run-off explained much of the variation of salinity in all regions ofthe bay (Figure 8). The box model, which was applied to each
Table 2. Comparison of Annual Freshwater Input Fluxesfor Florida Bay With Other Florida Estuaries
EstuaryArea,km2
Runoff,a
cmRainfall,a
cmInflow,a
cmRunoff/Rainfall
Florida Bayb 2000 9c 98 107 0.1Charlotte Harbord 700 430 143 573 3.0Indian River Lagoone 568 635 131 766 4.8
aAnnual volume is divided by area of estuary.bRunoff and rainfall are annual averages for 1970 through 1995.cThis is the sum of gauged flows in Taylor Slough and in the C111
canal at S18C.dSource is Miller and McPherson [1991].eSource is Smith [1993].
Table 3. Summary of the Box Model Calibration for 1987–1995
BasinTide,a
cmQT,b
cm yr21QE,b
cm yr21 r2
East 0 172 83 0.25South 6 339 128 0.48Central 1 198 129 0.67West 8 345 122 0.63
aSource is N. P. Smith and P. A. Pitts (Harbor Branch Oceano-graphic Institution, unpublished report, 1996).
bValues of QT and QE were estimated during calibration by nonlin-ear regression using observed annual average salinity.
1813NUTTLE ET AL.: INFLUENCE OF NET FRESHWATER SUPPLY ON SALINITY

region using annual fluxes, attained an efficiency of 37% for1987 through 1995 (Table 4). (For each region the simulatedaverage salinity for a given year was used for all months withinthat year when calculating the efficiency by (2).) By contrast,the efficiency score for the location model, the long-term meansalinity for each region, was just 16% (Table 4). (For eachregion the mean salinity was used for all months in all yearswhen calculating the efficiency by (2).) The difference in effi-ciency can be attributed to the influence on salinity of inter-annual fluctuations in rainfall and runoff. That is, approxi-mately 21% of the variance of salinity in Florida Bay resultedfrom interannual variations of freshwater fluxes.
The values of the exchange flux, QT, in the box model can beinterpreted as the water renewal rate, a function of tidal ex-change with the Gulf of Mexico and the Atlantic. We com-pared the magnitudes of the calibrated exchange fluxes withobserved tidal amplitudes in each region of the bay (Table 3)and found a strong correlation, providing partial, qualitativecorroboration of the model calibration. The calibrated valuesof QT (Table 3) were used to estimate residence times in eachregion of the bay. Assuming that the average water depth ineach region is 100 cm, residence times in years were defined as100/QT. These estimates of residence times ranged from 0.3to 0.6 years and indicated that water in the East and CentralRegions would require over a year to be completely replacedby exchange flux. The results of the residence time analysis andthe fact that observed fluctuations in the salinity data appear tolag the simulated salinity (Figure 8) for all regions suggestedthat annual average salinity was not in steady state with annualvariations in the net freshwater supply anywhere within the bay.
4.2.3. Seasonal effects. On a monthly basis the averagenet freshwater supply fluctuated considerably between nega-tive and positive values (Figure 7). The average net supply offreshwater was positive during the rainy season (from Junethrough October) and was negative in the winter and spring.Generally, salinity values during winter and spring exceeded
the salinity of the adjacent ocean; during the rainy season,salinity values dropped to below ocean salinity (Figure 5).Although annual runoff was small compared to annual rainfall,the seasonal variation in runoff was an important componentof the seasonal variation in net freshwater supply. For example,total net freshwater supply during the rainy season was about22 cm, of which more than 30% was contributed by runoff fromTaylor Slough and the C111 canal. This implies that changes inthe amount or the timing of the seasonal components of runoffmay have greater impact than changes in annual totals alone.
4.2.4. Results from the dynamic model. FATHOM at-tained an efficiency score of 51% when compared to salinityobservations for 1987 through 1995, compared to 37% attainedby the steady state box model (Table 4). This suggested thatapproximately 14% of the variance in observed salinity in Flor-ida Bay was related to seasonal variations in net freshwatersupply. The increased efficiency largely resulted becauseFATHOM very successfully simulated both the seasonal fluc-tuations and interannual trends in salinity observations in theEast and Central Regions (Figure 9). There was a spatial
Table 4. Types of Variability in Salinity Derived FromComparison of Model Results
Types of Variabilitya Model
Efficiency (Eff), %
1987–1995 1965–1995
Spatial basin means 16 20Spatial and interannual box model 37 38Location, interannual
and seasonalFATHOM 51 29
FATHOM is Flux Accounting and Tidal Hydrology at the OceanMargin model.
aVariability categorized as spatial (among basins, interannual),based on annual averages, and seasonal, based on monthly averages.
Figure 8. The simulated salinity values from the box model (bold line) when compared to the observedsalinity data (fine line) for 1987 to 1995 revealed the magnitude of salinity variations associated withinterannual variations in rainfall and runoff for each aggregated basin in Florida Bay. The box model wasdriven only by annual rainfall and runoff and simulated the salinity of all four basins over the 9 years with anefficiency of 37%.
NUTTLE ET AL.: INFLUENCE OF NET FRESHWATER SUPPLY ON SALINITY1814

component to runoff in FATHOM; all runoff was applied tothe small bays along the northeastern margin of the bay thatborder the East Region (Figure 3), and no runoff was applieddirectly to the Central Region. This agreed with the location ofthe sources of runoff (Figure 1) and contrasted to the wayrunoff was applied in the box model (uniformly to all regions).Because of the increased spatial resolution and seasonal na-ture of the inputs, FATHOM simulated salinity in the East andCentral Regions much more successfully than did the boxmodel. However, FATHOM did not simulate the salinity vari-ations observed in the West Region with the same success. TheWest Region is adjacent to the boundary with the Gulf ofMexico where salinity in the model was assumed to be con-stant. However, salinity does vary in the gulf adjacent to thebay, and the lack of this source of variation in the modelcontributed to the discrepancy.
Taken together, these seasonal results and the results fromthe annual analysis of net freshwater supply suggested thatvariations in the net freshwater supply influenced salinity inFlorida Bay at both the seasonal and interannual timescales.Three factors, (1) location within the bay, (2) interannual vari-ation of rainfall and runoff, and (3) seasonal variation of runoffand precipitation, accounted for approximately 51% of theobserved salinity variation in the bay, each component contrib-uting approximately equally (16%, 21%, and 14%, respective-ly). Other important sources of variation not included in theseanalyses, but which might have explained much of the remain-ing 49% of salinity variation, were temporal and spatial pat-terns of evaporation, wind-driven mixing and exchange withthe coastal ocean, spatial patterns of rainfall over the bay, andvariations of salinity at the Gulf of Mexico and Atlantic bound-aries of the bay.
4.3. Model Reconstructions of Long-Term Salinity Variations(1965–1995)
We compared simulation results from each model with sa-linity observations from the complete 31-year (1965–1995) da-
tabase to assess the predictive ability of the models. The 31-year record contains the temporally dense data used tocalibrate the models (9 years from 1987 to 1995 comprisingapproximately 50% of the observations) and a sparser recordthat contains approximately the same number of observationsover a longer period (22 years). Our purpose was not so muchto formally test the models (that would have required that weevaluate only that data not used in calibration) as it was toextend the models to identify critical areas in which improve-ments could be made to both models and the supporting data.
The location model, based on regional means of the evalu-ation period (1987 through 1995), attained an efficiency of20% when applied to the complete 31-year record (Table 4).This was not much different from the 16% efficiency achievedfor the evaluation period and suggested that the effects oflocation have not changed much over the 3 decades underconsideration. Likewise, efficiency for the steady state boxmodel applied to all of the data was not significantly differentfrom the box model efficiency achieved on the evaluation pe-riod (Table 4). We inferred from this that patterns of interan-nual variations in freshwater fluxes and the patterns of re-sponse in annual average salinity were relatively uniform overthe period.
However, the efficiency score for FATHOM decreased from51% when applied to the shorter evaluation period to 28% forthe complete 31-year period probably because of the data usedto drive the models and the salinity data itself. Since the effi-ciency for FATHOM declined even though the efficiencies ofthe other models did not, the quality and quantity of the datafor the earlier period specific to FATHOM must have differedfrom that in the later evaluation period. These kinds of datainclude spatially explicit patterns of rainfall and runoff,monthly patterns of freshwater fluxes, and temporal and spatialvariations in salinity values along the Gulf of Mexico andAtlantic Ocean boundaries. Given that FATHOM was themost spatially and temporally complex of the models, it should
Figure 9. The simulated salinity values from the Flux Accounting and Tidal Hydrology at the Ocean Margin(FATHOM) model (bold line) when compared to the observed salinity data (fine line) for 1987 to 1995revealed the magnitude of salinity variations associated with both interannual and seasonal variations inrainfall and runoff for each aggregated basin in Florida Bay. FATHOM was driven by monthly rainfall andrunoff and simulated the salinity for all four basins over the 9 years with an efficiency of 51%.
1815NUTTLE ET AL.: INFLUENCE OF NET FRESHWATER SUPPLY ON SALINITY

not have been surprising that its efficiency declined as it wasapplied to the earlier periods where the salinity data weresparse and flux data were increasingly uncertain. For example,a program of regular salinity monitoring has only been in placesince about 1990; data from before this date are largely com-pilations of incidental measurements. Also, rainfall measure-ments from in the bay were only available from 1991. Beforethat, monthly values of rainfall were extrapolated from land-based stations based on regression equations calibrated on the4 years of recent data in the bay. The exact cause(s) of thesalinity variations in Florida Bay in the 1960s and 1970s maynever be known.
4.4. Critical Gaps in Knowledge
Our analyses of net freshwater supply and our model recon-structions of long-term salinity variations have identified sev-eral areas where better information would improve our under-standing of and ability to predict salinity variations in FloridaBay. Generally, these areas can be grouped as uncertaintiesrelating to (1) complete lack of direct information about themagnitude and the spatial and temporal variations in evapo-ration in the bay; (2) insufficient long-term and seasonal dataon both terrestrial and oceanic boundary conditions of the bay;and (3) the poor temporal and spatial coverage by currentlyavailable measurements of direct rainfall into the bay.
For example, the first two of these relate to the unknowncauses of the lower evaporation rate estimated by the boxmodel for the East Region (Table 3). Using the availableinformation, we could not ascertain if the lower rate simplyreflected the spatial variations in evaporation that we knewmust be present in the bay (but which had not been quantified)or if the lower rate arose because we did not account for directrainfall onto and runoff from the wetlands south of the TaylorSlough and C111 canal discharge measurement points. In ei-ther case a significant freshwater flux pertinent to the north-eastern bay remains unquantified. The results of Corbett et al.[1999] rule out the possibility that this unknown source couldbe submarine groundwater discharge.
Another area of uncertainty about boundary conditions re-lates to salinity variations along the Gulf of Mexico and At-lantic boundaries of Florida Bay. In our models we assumedthis salinity was constant and equal to 35. However, freshwaterdischarge from Shark Slough (Figure 1) joins a southwardflowing coastal current just north of Florida Bay and contrib-utes to salinity variation at the northwestern boundary of thebay. Recent data from this area have documented salinityfluctuations of 26 to 39 [e.g., Boyer et al., 1999; Wang, 1998].
4.5. Simulated Response to Increased Runoff
Even with the limitations of the data and the current model,FATHOM simulated salinity variations for 1987 to 1995 rea-sonably well (Figure 9). We therefore decided to use thisFATHOM application as a reference case and to investigatethe sensitivity of salinity in Florida Bay to changes in runofffrom Taylor Slough and the C111 canal. The experiment re-ported here was relatively simple and is presented only todemonstrate the usefulness of the model in such exercises andto provide a rough measure of the responses of salinity inFlorida Bay to changes in the management of freshwater run-off into the bay.
We conducted a model simulation in which monthly runoffrates for every month from 1987 through 1995 were doubled.Monthly rainfall and evaporation rates were not changed. Theincreased runoff was applied to the model in the same loca-tions (i.e., only the volume of runoff was increased, the spatialdistribution of runoff was not changed). The results of thisexperiment were compared to the reference simulation (Table5). In the East Region the increased runoff depressed themean salinity value by 9.3 below the mean for the referencesimulation. In the south, although the mean salinity was littlechanged, the standard deviation of monthly salinity values in-creased 40% (Table 5). Rather importantly for some manage-ment options under consideration, doubling runoff withoutchanging its distribution along the northern boundary of thebay had little effect on salinity in the Central Region. This issignificant because salinity in excess of 60, which occurs forshort periods in the Central Region [Fourqurean et al., 1993]even though monthly means do not show it (Figure 8), is oftenimplicated in the ecological decline in the bay. Our experimentsimply doubled the runoff for all months. Our analysis of theseasonal patterns in net freshwater fluxes suggested that thesame total annual volume of runoff increase, if applied in justa few properly chosen months (instead of in all months), wouldhave a much larger effect on salinity in the bay. Managementoptions for ecosystem restoration in the Everglades and Flor-ida Bay could certainly include changes in the timing as well asamount of runoff. Our analysis of the effects of location in theapplication of runoff also suggested that changing the runoffpoints along the Everglades boundary would affect the distri-bution of the freshwater within the bay. For instance, theredistribution of runoff westward from the C111 canal intoTaylor Slough should bring larger salinity changes in the Cen-tral Region. We plan to continue to use FATHOM to inves-tigate the projected effects of various changes in runoffamount, location, and timing on salinity distributions in Flor-ida Bay.
5. ConclusionsThe annual average water balance for Florida Bay from 1970
to 1995 was dominated by rainfall and evaporation, which wereapproximately equal. Annual runoff was less than one tenth ofrainfall. Annually, the variations of salinity in Florida Bay forthe last 3 decades have been primarily affected by interannualvariations in rainfall volumes and somewhat less by changes inannual runoff even though the relative changes in runoff overthe period have been greater.
Variations in the net freshwater supply influence salinity inFlorida Bay seasonally and interannually. Three factors (loca-tion within the bay, interannual variation of rainfall and runoff,
Table 5. Sensitivity of Monthly Average Salinity Simulatedby FATHOM to Increased Runoff From 1987 to 1995
Basin
ReferenceSimulation Runoff Doubled
Mean SD Mean SD
East 35.4 8.0 26.1 8.9South 36.0 2.0 35.0 2.8Central 37.5 5.3 37.2 5.7West 35.3 1.1 35.3 1.2
SD is standard deviation.
NUTTLE ET AL.: INFLUENCE OF NET FRESHWATER SUPPLY ON SALINITY1816

and seasonal variations of runoff and precipitation) accountedfor approximately 51% of the observed salinity variation in thebay from 1987 to 1995, each component contributing approx-imately equally (16%, 21%, and 14%, respectively). Otherimportant sources of variation not in these analyses but thatmight have explained much of the remaining 49% of thesalinity variation were temporal and spatial patterns of evap-oration, wind-driven mixing and exchange with the coastalocean, spatial patterns of rainfall over the bay, and variationsof salinity at the Gulf of Mexico and Atlantic boundaries ofthe bay.
We identified several areas where better information wouldimprove our understanding of and ability to predict salinityvariations in Florida Bay. Generally, these areas could begrouped as uncertainties relating to (1) complete lack of directinformation about the magnitude and the spatial and temporalvariations in evaporation in the bay; (2) insufficient long-termand seasonal data on both terrestrial and oceanic boundaryconditions of the bay; and (3) poor temporal and spatial cov-erage by currently available measurements of direct rainfallinto the bay.
Appendix: Florida Bay Historical SalinityDatabase
Salinity measurements for Florida Bay are numerous butscattered, reflecting the diverse character of the biologic, geo-logic, and hydrologic studies that generated the data. Theavailable salinity record for Florida Bay began in 1936. Prior tothis, salinity observations were extremely rare, and referencesto salinity conditions in the Florida Bay were mostly qualita-tive. By the mid-1950s, spatially and temporally intensive datawere becoming available, but they were scattered in space andtime. In 1981 the National Park Service inaugurated routinesalinity monitoring in Florida Bay; by 1988 this network hadbecome sufficiently dense to meet many of the needs of man-agement and science.
We compiled into a single database what we feel are themost reliable salinity data for Florida Bay available in bothpublished and unpublished sources. Temporal coverage of thedatabase was reasonable, with a number of studies available ineach decade since 1940 (Table A1). Spatial coverage was rea-sonable in most areas, but in some areas no data were avail-able. For instance, few data were available covering the exten-sive shallow water banks in western Florida Bay primarilybecause the area is inaccessible by boat. We searched exten-sively for any source of data prior to 1990. For the data since1990 we limited our sources to several spatially and temporallyintensive monitoring studies in the bay. Regardless of thesource, a salinity measurement was only included in the data-base if it met the following criteria: (1) The observation wasmade within Florida Bay or in waters immediately adjacent tothe bay. (2) The measurement was a discrete observation (i.e.,the observation was not part of a high-frequency time series oran average value taken over time or space). (3) The date andtime of the observation were known. (4) The latitude andlongitude of the location of the observation were available orcould be estimated. (5) The depth at which the observation wasmade could be determined (i.e., surface, bottom, or interme-diate depth).
Currently, the database contains over 34,000 salinity obser-vations covering 1947 to 1995. Data sources in this compilation
are organized by “study numbers” from 1 to 60. Each studyconsists of salinity measurements drawn from a single or a fewclosely related sources. Table A2 summarizes the number ofstations, number of measurements, location, and duration(dates) of each study and includes references to the publishedor unpublished literature from which the data were extracted.
Table A1. Chronology of the Studies Included in theHistorical Database for Florida Bay
Study
Decade
1940 1950 1960 1970 1980 1990
2 x4 x7 x8 x
28 x x34 x x5 x6 x
16 x22 x x26 x29 x35 x41 x43 x55 x59 x3 x9 x
12 x13 x x14 x x19 x x21 x42 x45 x49 x x x51 x54 x x57 x1 x
10 x15 x17 x20 x23 x x24 x25 x x27 x x30 x x31 x x32 x x33 x x36 x38 x46 x x47 x x48 x50 x52 x x58 x x18 x37 x39 x60 x
1817NUTTLE ET AL.: INFLUENCE OF NET FRESHWATER SUPPLY ON SALINITY

Table A2. Annotated Bibliography
Study Location
Numberof
StationsNumber of
ObservationsPeriod
Sampled Reference
1 NW Florida Bay,Shark River
8 50 Mar. 1984 toSept. 1985
Powell, A. B., D. E. Hoss, W. F. Hettler, D. S. Peters, L. Simoneaux,and S. Wagner, Abundance and distribution of ichthyoplankton inFlorida Bay and adjacent waters, SFRC-87/01, 45 pp., S. Fla. Res.Cent., Everglades Natl. Park, Homestead, Fla., 1987.
2 west coastestuaries,north, central,NE Florida Bay
31 31 June 1947 toMay 1948
Davis, C. C., Notes on the plankton of Long Lake, Dade County,Florida, with descriptions of two new copepods, Q. J. Fla. Acad.Sci., 10, 79–88, 1948.
3 Long Sound,Manatee Bay
14 30 Jan. 1977 toMarch 1977
Creamer, D., Salinity observations east and west of U.S. Highway 1,unpublished report, Fish and Wildl. Serv., Vero Beach, Fla., 1977.
4 nearshore Gulf ofMexico, westcoast estuaries,NW FloridaBay,Whitewater Bay
48 1225 Mar. 1954 toJune 1958
Dragovitch, A., J. H. Finucane, and B. Z. May, Counts of red tideorganisms, Gymnodinium breve, and associated oceanographic datafrom Florida west coast, 1957–1959, Spec. Rep. Fish 369, pp. 1–102,U.S. Fish and Wildl. Serv., Vero Beach, Fla., 1961.
Finucane, J. H., and A. Dragovitch, Counts of red tide organisms,Gymnodinium breve, and associated oceanographic data fromFlorida west coast, 1957–1959, Spec. Rep. Fish 289, pp. 202–295,U.S. Fish and Wildl. Serv., Vero Beach, Fla., 1959.
Finucane, J. H., Distribution and seasonal occurrence ofGymnodinium breve on the west coast of Florida, 1954–57, Spec.Sci. Rep. Fish 487, 14 pp., U.S. Fish and Wildl. Serv., Vero Beach,Fla., 1964.
5 ButtonwoodSound
19 75 Aug. 1962 toFeb. 1963
Lynts, G. W., Relationship of sediment-size distribution to ecologicalfactors in Buttonwood Sound, Florida Bay, J. Sediment Petrol.,36(1), 66–74, 1966.
6 Florida Bay,Florida Keys
8 2140 Mar. 1960 toJan. 1961
Goodell, H. G., and D. S. Gorsline, Data report on the hydrographyof Apalachicola and Florida Bays, Fla. St. Univ. Sed.Res. Lab.Contrib. 1, 316 pp., Fla. State Univ., Tallahassee, 1961.
7 Florida Bay,Florida Keys
32 54 Aug. 1958 toJan. 1959
Lloyd, R. M., Variation in oxygen and carbon isotope ratios ofFlorida Bay mollusks and their environmental significance, J.Sediment Petrol., 36(1), 84–111, 1964.
8 central, eastFlorida Bay
76 615 Dec. 1956 toApril 1958
McCallum, J. S., and K. S. Stockman, Salinity in Florida Bay, Geol.Misc. 21, 14 pp., Explor. and Prod. Res. Div., Shell Dev. Co.,Houston, Tex., 1959.
9 east, centralFlorida Bay,Barnes Sound,Manatee Bay
166 1760 Jan. 1977 toFeb. 1979
Coleman, R. A., T. W. Schmidt, R. E. Hermance, P. W. Rose, P. C.Patty, W. B. Robertson Jr., Some hydrographic aspects of theestuarine area from northeastern Florida Bay to Barnes Sound,especially in restoring historical water conditions, unpublishedmanagement report, 41 pp., S. Fla. Res. Cent., Everglades Natl.Park, Homestead, Fla., 1979.
10 west, centralFlorida Bay
5 40 Nov. 1982 toDec. 1986
Powell, G. V. N., S. M. Sogard, and J. G. Holmquist, Ecology ofshallow water bank habitats in Florida Bay, final report to S. Fla.Res. Cent., Everglades Natl. Park, Homestead, Fla., 406 pp.,Ornithol. Res. Unit, Natl. Audubon Soc., Tavernier, Fla., 1987.
11 NE Florida Bay 67 77 Feb. 1967 toMar. 1967
Tabb, D. C., T. R. Alexander, T. M. Thomas, and N. Maynard, Thephysical, biological, and geological character of the area south ofthe C-111 Canal in extreme southeastern Everglades NationalPark, Homestead, Fla., final report, (contract 14-10-1-160-11), S.Fla. Res. Cent., Natl. Park Serv., Homestead, Fla., 1967.(Available as ML 67103, Rosenstiel Sch. of Mar. and Atmos. Sci.,Univ. of Miami, Miami, Fla.)
12 Florida Bay 49 1665 April 1973 toSept. 1976
Schmidt, T. W., Ecological study of fishes and the water qualitycharacteristics of Florida Bay, Everglades National Park, Florida,final report, 144 pp., S. Fla. Res. Cent., Everglades Natl. Park,Homestead, Fla., 1979.
13 east, north,central FloridaBay
262 3070 July 1978 toSept. 1983
White, D. A., Oceanographic monitoring study, October 1980 toOctober 1983, unpublished report, S. Fla. Res. Cent., EvergladesNatl. Park, Homestead, Fla., 1983.
14 Florida Bay 13 275 Mar. 1977 toJune 1980
Bert, T. M., J. T. Tilmant, J. W. Dodrill, and G. E. Davis, Aspects ofthe population dynamics and biology of the stone crab (Menippemercenaria) in Everglades and Biscayne National Parks asdetermined by trapping, Tech. Rep. SFRC-86/04, 77 pp., S. Fla.Res. Cent., Everglades Natl. Park, Homestead, Fla., 1986.
15 east, NW FloridaBay,Whitewater Bay
30 160 Feb. 1982 toDec. 1983
Rutherford, E. S., Larval and juvenile gamefish study, February 1982to December 1983, unpublished report, S. Fla. Res. Cent.,Everglades Natl. Park, Homestead, Fla., 1983.
16 NW Florida Bay 1 16 Jan. 1963 toDec. 1964
Overstreet, R. M., Parasites of the inshore lizardfish, Synodus foetens,from south Florida, M.S. thesis, 69 pp., Univ. of Miami, Miami,Fla., 1966.
NUTTLE ET AL.: INFLUENCE OF NET FRESHWATER SUPPLY ON SALINITY1818

Table A2. (continued)
Study Location
Numberof
StationsNumber of
ObservationsPeriod
Sampled Reference
17 NE Florida Bay 12 221 Mar. 1986 toSept. 1987
Montague, C. L., R. D. Bartleson, and J. A. Ley, Assessment ofbenthic communities along salinity gradients in northeastern FloridaBay, Final Rep. CA5280-5-8004, S. Fla. Res. Cent., Natl. Park Serv.,Homestead, Fla., 1989. (Available from Rosenstiel Sch. of Mar. andAtmos. Sci., Univ. of Miami, Miami, Fla.)
18 west, centralFlorida Bay,Sunset Cove
50 350 June 1990 toNov. 1991
Robblee, M. B., Salinity and temperature data collected at swim-overstations associated with sea-grass die-off monitoring, 1990 to 1991,unpublished data, S. Fla. Res. Cent., Everglades Natl. Park,Homestead, Fla., 1991.
19 east Florida Bay 7 96 Oct. 1979 toNov. 1980
Evink, G. L., Hydrological study in the area of Cross Key, Florida,Environ. Res. FL-ER-16-81, 31 pp., Fla. State Dep. of Transp., Bur.of Environ., Tallahassee, Fla., 1981.
20 west, central,south FloridaBay, WhitewaterBay
205 274 May 1984 toJune 1985
Thayer, G. W., W. F. Hettler Jr., A. J. Chester, D. R. Colby, and P. T.McElhaney, Distribution and abundance of fish communities amongselected estuarine and marine habitats in Everglades National Park,Tech. Rep. SFRC-87/02, 166 pp., S. Fla. Res. Cent., Everglades Natl.Park, Homestead, Fla., 1987.
21 central, eastFlorida Bay
43 75 June 1970 toSept. 1973,Mar. 1977
Ogden, J. C., Field notes associated with Florida Bay field trips fromTavernier, Florida, 1971 to 1973, 1977, Ornithol. Res. Unit, Natl.Audubon Soc., Tavernier, Fla., 1977.
22 Florida Bay,Barnes Sound,Manatee Bay
312 312 May 1966,Jan. 1984 toJune 1984
Shaw, A. B., Salinity data collected from across Florida Bay associatedwith studies of the distribution of mollusk shells, maps, Amoco Oil,Chicago, Ill., 1984.
23 west, centralFlorida Bay
47 230 May 1989 toDec. 1991
Robblee, M. B., Salinity and temperature data associated with benthicanimal sampling of seagrass die-off impacted areas in Florida Bay,1989 to 1991, unpublished data, S. Fla. Res. Cent., Everglades Natl.Park, Homestead, Fla., 1992.
24 east, central, westFlorida Bay,Manatee Bay
96 180 Aug. 1988 toOct. 1988
Robblee, M. B., and J. W. Fourqurean, Field notes associated with theAugust 1988 C-111 canal water release, unpublished data, S. Fla.Res. Cent., Everglades Natl. Park, Homestead, Fla., 1988.
25 Florida Bay,Whitewater Bay,west coastestuaries
38 3190 May 1981 toDec. 1995
Smith, D. T., Surface refractometer measurements made at marinemonitoring stations, 1981 to 1995, unpublished data, S. Fla. Res.Cent., Everglades Natl. Park, Homestead, Fla., 1995.
26 Florida Bay,Florida Keys
61 610 Aug. 1963 toFeb. 1969
Costello, T. J., D. M. Allen, and J. H. Hudson, Distribution, seasonalabundance, and ecology of juvenile northern pink shrimp, Penaeusduorarum, in Florida Bay area, NOAA Tech. Memo. NMFS-SEFC-161, 84 pp., Natl. Oceanic and Atmos. Admin., Miami, Fla., 1986.
Hudson, J. H., D. M. Allen, and T. J. Costello, The flora and fauna ofa basin in central Florida Bay, U.S. Fish Wildl. Serv., Spec. Sci. Rep.Fish 604, 14 pp., Washington, D. C., 1970.
27 Florida Bay,Whitewater Bay
163 815 Oct. 1981 toOct. 1987
Robblee, M. B., and T. W. Schmidt, Environmental data collected inassociation with collections of pink shrimp, caridean shrimp, andfishes in Florida Bay and Whitewater Bay, 1981 to 1987, unpublishedreport, S. Fla. Res. Cent., Everglades Natl. Park, Homestead, Fla., 1987.
28 NW Florida Bay,Whitewater Bay
36 1540 May 1957 toMay 1962
Tabb, D. C., D. L. Dubrow, and R. B. Manning, Hydrographic datafrom the inshore bays and estuaries of Everglades National Park,Florida, 1957–1959, ML 59253, 26 pp., The Mar. Lab., Univ. ofMiami, Miami, Fla., 1959.
Tabb, D. C., and D. L. Dubrow, Hydrographic data, supplement I,from the inshore bays and estuaries of Everglades National Park,Florida, 1959–1962, ML 62245, 22 pp., The Mar. Lab., Univ. ofMiami, Miami, Fla., 1962.
29 Florida Bay,Whitewater Bay
57 840 Sept. 1964 toJuly 1967
Tabb, D. C., Prediction of estuarine salinities in Everglades NationalPark, Florida, by the use of ground water records, Ph.D. dissertation,107 pp., Univ. of Miami, Coral Gables, Fla., 1967.
30 Long Key 1 4215 Jan. 1981 toDec. 1995
Swanson, J. W., Salinity, temperature, pH, DO monitoring data fromthe Keys Marine Laboratory, unpublished data, Fla. Dep. of Environ.Prot., Long Key, 1995 (Sea World, Orlando, Fla., collected dataduring the period 1981 to 1987.)
31 Florida Bay 30 190 June 1989 toJuly 1990
Fourqurean, J. W., R. D. Jones, and J. C. Zieman, Processesinfluencing water column nutrient characteristics and phosphoruslimitation of phytoplankton biomass in Florida Bay, Florida, USA:Inferences from the spatial distributions, Estuarine Coastal Shelf Sci.,36, 295–314, 1993.
Fourqurean, J. W., R. D. Jones, and J. C. Zieman, Water qualityobservations from across Florida Bay (June 1989 to April 1990),report (contracts CA5280-9-8001, CA5280-9-8008, CA5280-0-9009,CA5280-0-9010 and CA5280-8-8007), Univ. of Va., Charlottesville,Fla. Int. Univ., Miami, and S. Fla. Res. Cent., Everglades Natl. Park,Homestead, Fla., 1991.
1819NUTTLE ET AL.: INFLUENCE OF NET FRESHWATER SUPPLY ON SALINITY

Table A2. (continued)
Study Location
Numberof
StationsNumber of
ObservationsPeriod
Sampled Reference
32 NE, NW FloridaBay
4 203 Dec. 1989 toNov. 1991
Lorenz, J., Observations made during Ph.D. research in Florida Bay,1989 to 1991, Univ. of Fla., Gainesville, 1991.
33 east, centralFlorida Bay,WhitewaterBay, SharkRiver
44 220 June 1989 toMar. 1990
Ley, J. A., and C. L. Montague, Influence of changes in freshwaterflow on the use of mangrove prop root habitat by fish, report to S.Fla. Water Manage. Dist., 220 pp., Dep. of Environ. Eng. Sci.,Univ. Fla., Gainesville, 1991.
34 NW Florida Bay,ButtonwoodCanal,WhitewaterBay, nearshoreGulf of Mexico
9 110 Sept. 1957 toMar. 1962
Tabb, D. C., and D. L. Dubrow, Biological data on pink shrimp,Penaeus duorarum, of north Florida Bay and adjacent estuaries inMonroe County, Florida, September 1957–March 1962,unpublished data, ML 62239, 89 pp., The Mar. Lab., Univ. ofMiami, Miami, Fla., 1962.
35 Florida Bay,Florida Keys
18 355 Jan. 1962 toDec. 1962
Gorsline, D. S., Final data report marine geology and oceanographyof Florida Bay, Apalachicola Bay and vicinity, Florida, observationperiod January to December 1962, Rep. USC Geol. 65-1, Fla. StateUniv., Tallahassee, 1965.
36 West, central,east FloridaBay
179 179 Oct. 1987 Robblee, M. B., Salinity observations following Hurricane Floyd inOctober 1987, unpublished report, S. Fla. Res. Cent., EvergladesNatl. Park, Homestead, Fla., 1987.
37 Florida Bay 31 80 June 1991 toFeb. 1992
Frankovitch, T. A., Epiphyte loads and production on the seagrass,Thalassia testudinum, M.S. thesis, 136 pp., Dep. of Environ. Sci.,Univ. of Va., Charlottesville, 1996.
38 central FloridaBay
9 9 Oct. 1980 Gaby, R., Environmental observations along a transect across FloridaBay, October 1, 1980, report to Don Miller, Everglades Prot.Assoc., Islamorada, Fla., 3 pp., Connell, Metcalf and Eddy, Inc.,Coral Gables, Fla., 1980.
39 Florida Bay,Barnes Sound
13 230 Jan. 1990 toJune 1991
Bugden, J., Water quality observations made in Florida Bay, 1990 to1991, as part of a M.S. thesis on seagrass die-off, Fla. Int. Univ.,Miami, 1991.
41 west coastestuaries,WhitewaterBay
40 1495 April 1962 toMar. 1967
Marshall, A., and R. Jones, Salinity data from Big Cypress andEverglades west coast estuaries, 1962 to 1967, unpublished data,Branch of River Basin Stud., Fish and Wildl. Serv., Vero Beach,Fla., 1967.
42 Card Sound 5 60 Oct. 1971 toOct. 1972
Smith, R., Abundance and diversity of sponges and growth rates ofSpongia graminea in Card Sound, Florida, M.S. thesis, 56 pp.,Univ. of Miami, Coral Gables, Fla., 1973.
43 ButtonwoodCanal Bridge
1 24 Jan. 1963 toDec. 1964
Waldinger, F. J., Relationships of environmental parameters andcatch of three species of the mojarra family (Gerridae),Eucinostomus gula, Eucinostomus argenteus, and Diapterus plumeri,collected in 1963 and 1964 in Buttonwood Canal, EvergladesNational Park, Florida, M.S. thesis, 68 pp., Univ. of Miami, CoralGables, Fla., 1968.
44 Little BlackwaterSound, LongSound
17 50 Feb. and Mar.1966
Lee, C. C., The decomposition of organic matter in some shallowwater, calcareous sediments of Little Blackwater Sound, FloridaBay, Ph.D. dissertation, 106 pp., Univ. of Miami, Coral Gables,Fla., 1969.
45 Florida Keys 5 21 April 1976 toJune 1977
Helbling, R. J., Water quality data collected for Permanent NetworkMonitoring Program, unpublished data, Fla. Dep. of Environ.Regul., Marathon, Fla., 1978.
46 Florida Bay 50 132 June 1989 toMar. 1991
Zieman, J. C., and J. W. Fourqurean, Water quality observationsassociated with seagrass die-off research, 1989 to 1990,unpublished data, Univ. of Va., Charlottesville, 1991.
47 Florida Bay,WhitewaterBay, west coastestuaries
75 2800 Jan. 1991 toDec. 1995
Jones, R. D., Water quality observations in Florida and ManateeBays and Barnes Sound, 1991 to 1995, unpublished data, (contractMA5280-0-9015), Fla. Int. Univ., Miami, and the S. Fla. Res.Cent., Everglades Natl. Park, Homestead, Fla., 1991–1995.
48 NE Florida Bay,C-111 canal
28 125 Oct. 1985 toAug. 1986
Swift, D., Water quality measurements taken in the marshes andbays below the C-111 Canal in southwestern Dade County,unpublished data, S. Fla. Water Manage. Dist., West Palm Beach,1988.
49 NE Florida Bay,Florida Keys
8 78 July 1975 toSept. 1991
Rich, E., Environmental data collected in Florida Bay, unpublisheddata, Univ. of Miami, Coral Gables, Fla., 1991.
50 West coastestuaries,Whitewater Bay
19 65 April 1986 toSept. 1989
Bancroft, G. T., S. D. Jewell, and A. M. Strong, Foraging andnesting ecology of herons in the lower Everglades relative to waterconditions, Final Rep. 202-M86-0254-R, to S. Fla. Water Manage.Dist., 156 pp. and appendix, Natl. Audubon Soc., Tavernier, Fla.,1990.
NUTTLE ET AL.: INFLUENCE OF NET FRESHWATER SUPPLY ON SALINITY1820

Acknowledgments. This work was funded by Everglades NationalPark and the U.S. National Park Service and is contribution 124 of theSoutheast Environmental Research Center (SERC) at Florida Inter-national University (FIU). The authors thank the many people andorganizations who contributed their unpublished data and reports tothe salinity database, particularly DeWitt Smith of Everglades Na-tional Park for precipitation data from the monitoring network inFlorida Bay, Ron Jones and Joe Boyer of FIU-SERC for salinity data,and Troy Mullins of Everglades National Park for GIS support.
ReferencesArulananthan, K., E. M. S. Wiyeratne, L. Rydberg, and U. Cederlof,
Water exchange in a hypersaline tropical estuary, the Puttalam La-goon, Sri Lanka, Ambio, 24, 438–443, 1995.
Boyer, J. N., J. W. Fourqurean, and R. D. Jones, Spatial characteriza-tion of water quality in Florida Bay and Whitewater Bay by multi-variate analyses: Zones of similar influence, Estuaries, 20, 743–758,1997.
Boyer, J. N., J. W. Fourqurean, and R. D. Jones, Seasonal and long-term trends in the water quality of Florida Bay (1987–97), Estuaries,22, 417–430, 1999.
Butler, M. J., J. H. Hunt, W. F. Hernkind, M. J. Childress, R. Bertel-sen, W. Sharp, T. Matthews, J. M. Field, and H. G. Marshall, Cas-cading disturbances in Florida Bay, USA: Cyanobacteria blooms,
sponge mortality, and implications for juvenile spiny lobsters Panu-lirus argus, Mar. Ecol. Prog. Ser., 129, 119–125, 1995.
Corbett, D. R., J. Chatton, W. Burnett, K. Dillon, C. Rutkowski, andJ. W. Fourqurean, Patterns of groundwater discharge into FloridaBay, Limnol. Oceanogr., 44(4), 1045–1055, 1999.
Cosby, B. J., W. K. Nuttle, and J. W. Fourqurean, FATHOM: Modeldescription and initial application to Florida Bay, project completionreport, 106 pp., Natl. Park Serv., U.S. Dep. of Inter., Washington,D.C., 1999.
Costello, T. J., and D. M. Allen, Migrations and geographic distribu-tions of pink shrimp, Penaeus duorarum, of the Tortugas and Sanibelgrounds, Florida, Fish. Bull., 65, 449–459, 1966.
Debenay, J. P., J. Pages, and J. J. Guillou, Transformation of a sub-tropical river into a hypersaline estuary–The Casamance River(Senegal)–Paleogeographic implications, Palaeogeogr. Palaeoclima-tol. Palaeoecol., 107, 103–119, 1994.
Fourqurean, J. W., R. D. Jones, and J. C. Zieman, Processes influenc-ing water column nutrient characteristics and phosphorous limita-tion of phytoplankton biomass in Florida Bay, FL, USA: Inferencesfrom spatial distributions, Estuarine Coastal Shelf Sci., 36, 295–314,1993.
Frankovich, T. A., and J. W. Fourqurean, Seagrass epiphyte loadsalong a nutrient availability gradient, Florida Bay, USA, Mar. Ecol.Prog. Ser., 159, 37–50, 1997.
Table A2. (continued)
Study Location
Numberof
StationsNumber of
ObservationsPeriod
Sampled Reference
51 nearshore Gulf ofMexico, westcoast estuaries,Whitewater Bay
35 140 May 1971 toFeb. 1972
Lindall, W. N., Jr., J. R. Hall, W. A. Fable Jr., and L. A. Collins,Fishes and commercial invertebrates of the nearshore andestuarine zone between Cape Romano and Cape Sable, Florida,South Florida Ecological Study Appendix E, Estuarine-DependentMarine Fishes, Part II, Sect. II, 59 pp., Gulf Coastal Fish. Cent.,St. Petersburg Beach Lab., Natl. Mar. Fish. Serv., St. PetersburgBeach, Fla., 1973.
52 west, centralFlorida Bay
52 90 June 1988 toSept. 1990
Durako, M. J., Environmental data collected in association withseagrass die-off studies in Florida Bay, unpublished data, (contractCA5280-9-8002 to Fla. Mar. Res. Inst., Dep. of Nat. Resour., St.Petersburg, Fla.) S. Fla. Res. Cent., Everglades Natl. Park,Homestead, Fla., 1990.
53 west Florida Bay,Florida Keys
191 191 1972 Davies, T. D., Peat formation in Florida Bay and its significance ininterpreting the recent vegetation and geological history of the bayarea, Ph.D. dissertation, 338 pp., Pa. State Univ., University Park,1980.
54 NE Florida Bay 119 440 Jan. 1978 toSept. 1989
Mazzotti, F. J., The ecology of Crocodylus acutus in Florida, Ph.D.dissertation, 161 pp., Pa. State Univ., University Park, 1983.
55 ButtonwoodCanal Bridge
1 150 June 1964 toJune 1965
Beardsley, G. L., Jr., Distribution in the water column of migratingjuvenile pink shrimp, Penaeus duorarum, Burkenroad inButtonwood Canal, Everglades National Park, Florida, Ph.D.dissertation, 91 pp., Univ. of Miami, Coral Gables, Fla., 1967.
56 Largo Sound,nearshoreAtlantic Ocean
5 250 Nov. 1982 toDec. 1986
Skinner, R. H., Salinity observations from the water qualitymonitoring program of John Pennekamp Coral Reef State Park,unpublished data, 1982–1986.
57 nearshore Gulf ofMexico, west-coast estuaries,WhitewaterBay
35 140 May 1971 toFeb. 1972
Collins, L. A., and J. H. Finucane, Ichthyoplankton survey of theestuarine and inshore waters of the Florida Everglades, May 1971to February 1972, NOAA Tech. Rep. NMFS 6, 75 pp., Natl.Oceanic Atmos. Admin., Miami, Fla., 1984.
58 west, centralFlorida Bay
5 115 June 1989 toJune 1990
Sheridan, P. F., Environmental observations associated with seagrassdie-off studies conducted in Florida Bay by the National MarineFisheries Service, unpublished data, Galveston Lab., Galveston,Tex., 1990.
59 Whitewater Bay 8 120 Jan. 1968 toJune 1969
Clark, S. H., Factors affecting the distribution of fishes inWhitewater Bay, Everglades National Park, Florida, Ph.D.dissertation, 100 pp., Univ. of Miami, Coral Gables, Fla., 1970.
60 Florida Bay 30 670 Sept. 1993 toDec. 1995
Colvocoresses, J., Data from the Florida Marine Fisheries-Independent Monitoring Program in Florida Bay, unpublisheddata, Fla. Mar. Res. Inst., Marathon Lab., Marathon, Fla., 1995.
1821NUTTLE ET AL.: INFLUENCE OF NET FRESHWATER SUPPLY ON SALINITY

Henderson, F. M., Open Channel Flow, 522 pp., Macmillan, Indianap-olis, Indiana, 1966.
Keulegan, G. H., Tidal flow in entrances, water-level fluctuations ofbasins in communication with seas, Tech. Bull. 14, Comm. on TidalHydraul., U.S. Army Corps of Eng., Vicksburg, Miss., 1967.
Kitheka, J. U., Groundwater outflow and its linkage to coastal circu-lation in a mangrove-fringed creek in Kenya, Estuarine Coastal ShelfSci., 47, 63–75, 1998.
Kjerfve, B., C. A. F. Schettini, B. Knoppers, G. Lessa, and H. O.Ferreira, Hydrology and salt balance in a large, hypersaline coastallagoon: Lagoa de Ararauma, Brazil, Estuarine Coastal Shelf Sci., 42,701–725, 1996.
Largier, J. L., J. T. Hollibaugh, and S. V. Smith, Seasonally hypersalineestuaries in Mediterranean-climate regions, Estuarine Coastal ShelfSci., 45, 789–797, 1997.
Light, S. S., and J. W. Dineen, Water control in the Everglades: Ahistorical perspective, in Everglades: The Ecosystem and Its Restora-tion, edited by S. M. Davis and J. C. Ogden, pp. 47–84, St. Lucie,Delray Beach, Fla., 1994.
Lorenz, J. J., The response of fishes to physicochemical changes in themangroves of northeast Florida Bay, Estuaries, 22, 500–517, 1999.
Miller, R. L., and B. F. McPherson, Estimating estuarine flushing andresidence times in Charlotte Harbor, Florida, via salt balance and abox model, Limnol. Oceanogr., 36, 602–612, 1991.
Morton, F. I., Practical estimates of lake evaporation, J. Clim. Appl.Meteorol., 25, 371–387, 1986.
Phlips, E. J., T. C. Lynch, and S. Badylak, Chlorophyll a, tripton, color,and light availability in a shallow tropical inner-shelf lagoon, FloridaBay, USA, Mar. Ecol. Prog. Ser., 127, 223–234, 1995.
Pratt, T. C., and N. P. Smith, Florida Bay field data report, Tech. Rep.CHL-99-11, Waterways Exp. Stn., U.S. Army Corps of Eng., Vicks-burg, Miss., 1999.
Rhudy, K. B., V. K. Sharma, R. L. Lehman, and D. A. McKee, Sea-sonal variability of the Texas “Brown Tide” (Aureoumbra lagunensis)in relation to environmental parameters, Estuarine Coastal Shelf Sci.,48, 565–574, 1999.
Robblee, M. B., T. R. Barber, P. R. Carlson, M. J. Durako, J. W.Fourqurean, L. K. Muehlstein, D. Porter, L. A. Yarbro, R. T. Zie-man, and J. C. Zieman, Mass mortality of the tropical seagrassThalassia testudinum in Florida Bay (USA), Mar. Ecol. Prog. Ser., 71,297–299, 1991.
Schomer, N. S., and R. D. Drew, An ecological characterization of thelower Everglades, Florida Bay and the Florida Keys, Rep. FWS/OBS-82/58.1, 246 pp., Off. of Biol. Serv., U.S. Fish and Wild. Serv.,Washington, D. C., 1982.
Smith, N. P., The Laguna Madre of Texas: Hydrography of a hyper-saline lagoon, in Hydrodynamics of Estuaries, vol. II, Estuarine CaseStudies, edited by B. Kjerfve, pp. 21–40, CRC Press, Boca Raton,Fla., 1988.
Smith, N. P., Tidal and nontidal flushing of Florida’s Indian RiverLagoon, Estuaries, 16, 739–746, 1993.
Smith, S. V., and M. J. Atkinson, Mass balance of carbon and phos-phorus in Shark Bay, Western Australia, Limnol. Oceanogr., 28,625–639, 1983.
Tilmant, J. T., A history and an overview of recent trends in thefisheries of Florida Bay, Bull. Mar. Sci., 44, 3–33, 1989.
Turney, W. J., and B. F. Perkins, Molluscan distribution in Florida Bay,Sedimenta III, report, Univ. of Miami, Miami, Fla., 1972.
U.S. Army Corps of Engineers, Central and southern Florida projectcomprehensive review study: Draft integrated feasibility report andprogrammatic environmental impact statement, report, U.S. ArmyCorps of Engineers, Jacksonville, Fla., 1998.
Wang, J. D., Subtidal flow patterns in western Florida Bay, EstuarineCoastal Shelf Sci., 46, 901–915, 1998.
Wang, J. D., J. van de Kreeke, N. Krishnan, and D. Smith, Wind andtide response in Florida Bay, Bull. Mar. Sci., 54, 579–601, 1994.
Wanless, H. R., and M. G. Tagett, Origin, growth and evolution ofcarbonate mudbanks in Florida Bay, Bull. Mar. Sci., 44, 454–489,1989.
Wolanski, E., An evaporation-driven salinity maximum zone in Aus-tralian tropical estuaries, Estuarine Coastal Shelf Sci., 22, 415–424,1986.
Zieman, J. C., J. W. Fourqurean, and R. L. Iverson, Distribution,abundance and productivity of seagrasses and macroalgae in FloridaBay, Bull. Mar. Sci., 44, 292–311, 1989.
B. J. Cosby and J. C. Zieman, Department of Environmental Sci-ences, University of Virginia, Clark Hall, Charlottesville, VA 22903.([email protected]; [email protected])
J. W. Fourqurean and W. K. Nuttle, Southeast Environmental Re-search Center, Biological Sciences, Florida International University,OE Building, Room 237, Miami, FL 33199. ([email protected];[email protected])
M. B. Robblee, Biological Resources Division, U.S. Geological Sur-vey, Florida International University, OE Building, Room 163, Miami,FL 33199. ([email protected])
(Received March 24, 1999; revised December 3, 1999;accepted December 10, 1999.)
NUTTLE ET AL.: INFLUENCE OF NET FRESHWATER SUPPLY ON SALINITY1822


