Embed Size (px)
Citation preview
doi:10.1016/S0016-7037(02)01275-9
Influence of lysozyme on the precipitation of calcium carbonate: A kinetic and morphologicstudy
CONCEPCION JIMENEZ-LOPEZ,2 ALEJANDRO RODRIGUEZ-NAVARRO,1,* JOSE M. DOMINGUEZ-VERA,3 and JUAN M. GARCIA-RUIZ1
1Instituto Andaluz de Ciencias de la Tierra, CSIC-Universidad de Granada, Campus de Fuentenueva, 18002 Granada, Spain2Estacion Experimental del Zaidin-CSIC, C/Prof. Albareda, 1, 18008 Granada, Spain
3Departmento de Quımica Inorganica, Facultad de Ciencias, Universidad de Granada, 18002 Granada, Spain
(Received October 22, 2001; accepted in revised form August 30, 2002)
Abstract—Several mechanisms have been proposed to explain the interactions between proteins and mineralsurfaces, among them a combination of electrostatic, stereochemical interactions and molecular recognitionbetween the protein and the crystal surface. To identify the mechanisms of interaction in the lysozyme–calcium carbonate model system, the effect of this protein on the precipitation kinetics and morphology ofcalcite crystals was examined. The solution chemistry and morphology of the solid were monitored over timein a set of time-series free-drift experiments in which CaCO3 was precipitated from solution in a closed systemat 25°C and 1 atm total pressure, in the presence and absence of lysozyme. The precipitation of calcite waspreceded by the precipitation of a metastable phase that later dissolved and gave rise to calcite as the solephase. With increasing lysozyme concentration, the nucleation of both the metastable phase and calciteoccurred at lower �calcite, indicating that lysozyme favored the nucleation of both phases. Calcite growth ratewas not affected by the presence of lysozyme, at least at protein concentrations ranging from 0 mg/mL to 10mg/mL.
Lysozyme modified the habit of calcite crystals. The degree of habit modification changed with proteinconcentration. At lower concentrations of lysozyme, the typical rhombohedral habit of calcite crystals wasmodified by the expression of {110} faces, which resulted from the preferential adsorption of protein on thesefaces. With increasing lysozyme concentration, the growth of {110}, {100}, and finally {001} faces wassequentially inhibited. This adsorption sequence may be explained by an electrostatic interaction betweenlysozyme and calcite, in which the inhibition of the growth of {110}, {100}, and {001} faces could beexplained by a combined effect of the density of carbonate groups in the calcite face and the specificorientation (perpendicular) of these carbonate groups with respect to the calcite surface. Overgrowth of calcitein the presence of lysozyme demonstrated that the protein favored and controlled the nucleation on the calcitesubstrate. Overgrowth crystals nucleated epitaxially in lines which run diagonal to rhombohedral {104}faces. Copyright © 2003 Elsevier Science Ltd
1. INTRODUCTION
Organisms induce the precipitation of a large variety ofminerals (Lowenstand, 1981). Some of them form mineralizedtissues with extremely sophisticated shapes and highly orga-nized microstructures (i.e., mollusk shells, coccoliths) (Mann etal., 1989; Simkiss and Wilbur, 1989; Checa and Rodriguez-Navarro, 2001). From the study of these materials it is apparentthat organisms are able to control the nucleation, size, mor-phology, and crystallographic orientation of crystals (Addadiand Weiner, 1992). Despite the extensive research on thesubject, the mechanisms involved in these complex mineral-ization processes are poorly understood. However, there isevidence from in vitro experiments that the interaction ofproteins with minerals plays an important role in controllingbiomineralization (Lowenstand and Weiner, 1989; Nys et al.,1999). Proteins can promote or inhibit the nucleation of crystalsand can also control their morphology (Lowenstand andWeiner, 1989; Wheeler et al., 1981; Mann et al., 1990). It hasbeen suggested that proteins also control polymorphism (e.g.,precipitation of calcite or aragonite; Falini et al., 1995; Belcheret al., 1996). Several mechanisms have been proposed to ex-
plain the interactions between proteins and mineral surfaces,among them a combination of electrostatic and stereochemicalinteractions, as well as geometrical matching. This geometricalmatching implies that the arrangement of the functional groupsin the macromolecule matches that of the ionic groups in thecrystal plane (Addadi et al., 1987; Mann, 1988). To understandthese mechanisms, it would be convenient to study them sep-arately using systems in which only one kind of interactionwould be predominant (Rodriguez-Navarro et al., 2000).Whether one kind of interaction is predominant will depend onthe size, conformation, and other properties of the molecules(e.g., charge, type of functional groups). For instance, Lang-muir monolayers made of small molecules (e.g., surfactants)can induce the nucleation of crystals on specific crystal planesto which they bind at specific sites (Heywood, 1996). In thiscase the predominant interaction is a geometrical matchingbetween the arrangement of the molecules and the surface ofthe crystal. On the other hand, in a previous study we examined(Rodriguez-Navarro et al., 2000) the interaction between thecalcite surfaces and a group of globular proteins (lysozyme,ribonuclease, myoglobin, and �-lactalbumin) of similar sizeand conformation (three-dimensional [3-D] molecular struc-ture), but different in their surface charges (Arai and Norde,1990; Haynes and Norde, 1994). In addition, the relativelylarge size of these proteins precludes an arrangement that
* Author to whom correspondence should be addressed([email protected]).
Pergamon
Geochimica et Cosmochimica Acta, Vol. 67, No. 9, pp. 1667–1676, 2003Copyright © 2003 Elsevier Science LtdPrinted in the USA. All rights reserved
0016-7037/03 $30.00 � .00
1667

would match the crystal surface geometry at the atomic level.The dominant mechanism governing this interaction was theadsorption of proteins onto specific calcite faces to which theywere electrostatically attracted. As a continuation of this re-search, the present paper is a detailed examination of how oneof these proteins (lysozyme) affects the precipitation kinetics ofcalcium carbonate and calcite crystal growth morphology.
2. EXPERIMENTAL METHODS
2.1. Materials
Certified chemical reagents (Sigma) were used to prepare stocksolutions of CaCl2 (0.4 mol/L), lysozyme (100 mg/mL), and NH4HCO3
(0.025 mol/L).
2.2. Precipitation System
The precipitation experiments were carried out at 25°C and 1 atmtotal pressure in 12 isolated environmental chambers, specially de-signed for these experiments. Each chamber consisted of a glass Petridish (2 � 10 cm diameter) containing six microbridges (for sitting dropcrystallization; Crystal Microsystems) with CaCl2/lysozyme solution(master solution). This Petri dish was placed on top of a cylindricalvessel 5 cm in diameter and 3 cm in height containing the NH4HCO3
solution and connected to the Petri dish by a hole (Fig. 1). The emptyspace contained inside the system (cylindrical vessel and Petri dish) isreferred to here as free-space with a volume of 153.678 mL.
2.3. Calcite Nucleation and Growth in the Presence of Lysozyme
Free drift precipitation experiments were performed in the absenceof lysozyme (control experiment) using pure CaCl2 (0.25 mol/L) asmaster solution and in the presence of lysozyme at different concen-trations (0.1, 1, 10, 25, and 50 mg/mL). In the lysozyme-bearingexperiments, the concentration of the CaCl2 solution was kept constantat 0.25 mol/L, while varying concentrations of lysozyme. The resultingmaster solutions in the lysozyme-bearing experiments were as follows:CaCl2 (0.25 mol/L)/lysozyme (0.1 mg/mL), CaCl2 (0.25 mol/L)/ly-sozyme (10 mg/mL), CaCl2 (0.25 mol/L)/lysozyme (25 mg/mL), andCaCl2 (0.25 mol/L)/lysozyme (50 mg/mL). To begin a run, a drop of 40�L of the master solution was poured on each microbridge alreadyplaced inside the Petri dish. A volume of 3 mL of the NH4HCO3
solution was poured into the underlying cylindrical vessel. The systemwas then closed and sealed with silicon grease (Fig. 1). The underlyingNH4HCO3 solution released NH3(g) and CO2(g) into the free-space inthe chamber according to the following equilibrium reactions:
NH4(aq)� �OH�N NH3(aq) � H2ON NH3(g)
and
HCO3(aq)� � H�N CO2(aq) � H2ON CO2(g) � H2O(l)
The NH3(g) then redissolved into the master solution and increasedthe pH to maintain equilibrium in the system. The CO2(g) redissolvedinto the master solution as well, thus producing CO2(aq), HCO3
�(aq), and
CO32�
(aq).A set of time-series experiments was run for each one of the master
solutions. Twelve replicas of the same experiment were run in parallel.Each replica was terminated at different times (0, 0.5, 1, 1.5, 2, 2.5, 3,3.5, 4, 5, 7, or 7.5 and 9 h after sealing the system), and both solutionand solid were withdrawn from the microbridges for chemical andmorphologic analyses. Long-term experiments were run for 19.5, 27.5,and 52.5 h (after sealing the system), and the solid phase was recoveredto study the crystal morphology.
2.4. Overgrowth of Calcite Crystals in the Presence of Lysozyme
To study the effect of the protein on the overgrowth of calcitesubstrates, rhombohedral calcite crystals selected from the controlexperiments (lysozyme-free) were used as substrates. To begin a run, adrop of 40 �L of the master solution and two rhombohedral calcitecrystals (collected from the control experiment) were placed on eachmicrobridge. Three mL of the NH4HCO3 solution were poured into theunderlying cylindrical vessel. The system was then closed and sealedwith silicon grease (Fig. 1). A set of time-series experiments was runfor each one of the above-mentioned master solutions. Seven replicasof the same experiment were run in parallel. Each replica was termi-nated at different times (0, 0.5, 1.5, 4.5, 17, 25, and 50 h after sealingthe system), and the overgrown calcite crystals were harvested from themicrobridges.
2.5. Analytical Procedures
Solution pH was measured using a micro-electrode (PHR-146,Lazar) after calibration with standard buffer solutions for temperatureand slope correction. To measure the pH while maintaining the systemsealed, the microelectrode was introduced into a hole made in the lidcovering the Petri dish. Total calcium concentration in solution(Ca2�
T(aq)) was determined by atomic absorption spectrophotometry(AAS, Perkin-Elmer 5100) using an air–acetylene flame atomizer afteracidification of filtered samples with HCl to prevent the precipitation ofsolid carbonate. Experimental error for Ca2�
T(aq) was �0.006 mol/L(1�). The concentration of lysozyme of the master solution was mea-sured using an ultraviolet-visible spectrometer at 280 �m. The time atwhich the first precipitate was observed in the microbridges (referred tohere as waiting time for precipitation), the number and size of crystals,and the presence or absence of an amorphous phase were all deter-mined using an optical microscope (SZH10 Olympus, 14�). Theprecipitate was harvested from the microbridges, rinsed twice withMilli-Q water, dried at room temperature, coated with gold, and ob-served with a scanning electron microscope (SEM, DMS 950 Zeiss).
2.6. Speciation Calculations
The speciation program EQ3/6 (Wolery, 1992) was used to calculatethe fugacity for NH3(g) and CO2(g) in equilibrium with the NH4HCO3
solution (0.025 mol/L) at a measured pH of 7.80. The resulting fugacityfor NH3(g) was 1.05 � 10�5 bars and for CO2(g) was 2.34 � 10�2 bars.However, the carbon moles necessary to create such CO2(g) fugacity inthe free-space exceeded the carbon moles available in the system. Theactual CO2(g) fugacity in the free-space, in equilibrium with the mastersolution at each time interval, was calculated by iteration. Iteration wasperformed on the basis of the following: 1) maximum moles of carbonavailable in the system at each time interval, 2) the ideal gas equation,3) distribution of carbon moles between gas and solution phases, and 4)the equilibrium equation for total dissolved inorganic carbon in solu-tion (�CO2) and PCO2(g) at the pH of the master solution at each timeinterval (Morse and Mackenzie, 1990). The fugacity coefficient was
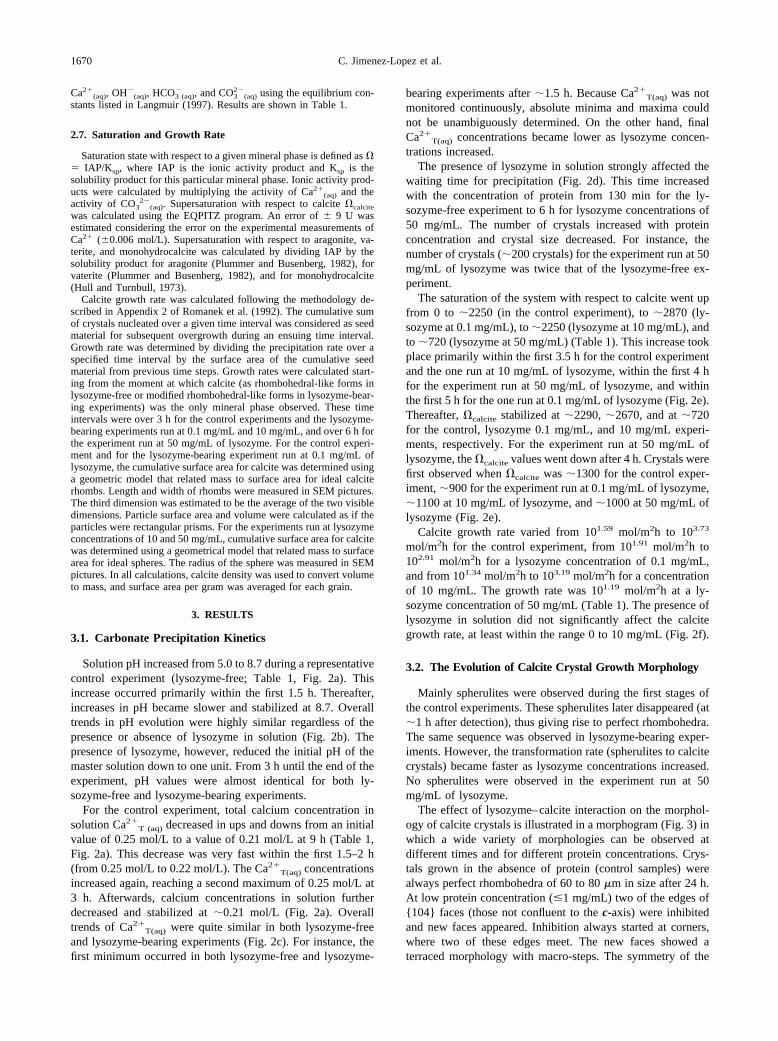
Fig. 1. Experimental setup. Calcite crystals were grown in sittingdroplets on microbridges. NH3(g) and CO2(g) slowly diffused from thereservoir to the droplet through the small opening in the Petri plate.
1668 C. Jimenez-Lopez et al.
assumed to be equal to one. The role of iteration was to considersuccessive dissolution and ex-solution of CO2(g) into and from themaster solution, while keeping the total carbon moles in the systemconstant. These total carbon moles were made equal to those availablein the system at each specific time interval. For instance, in the first stepof iteration, the total carbon moles available in the system wereassumed to be in the gas phase. In the second step, they were assumedto be in the solution. The CO2(g) fugacity in equilibrium was calculatedon the basis of �CO2. Carbon moles were then distributed between gasand solution phases. In the third step, another CO2(g) fugacity value inequilibrium was calculated on the basis of the new �CO2 value. TheCO2(g) fugacity values converged after 11 iterations. Results are shownin Table 1.
Activities and activity coefficients for Ca2�, Cl�, H�, OH�, and thecarbonic acid components (CO2(aq), HCO3
�(aq), and CO3
2�(aq)) were
calculated using Pitzer’s equations and the EQPITZ program (He andMorse, 1993). This program was used because the initial ionic strengthof the master solution was high enough (�0.7 mol/L) to preclude theuse of models more appropriate for dilute solutions (e.g., Debye-Huckel). Aqueous NH4
� was not taken into account by the EQPITZprogram. Ammonium ion (NH4
�(aq)) may form ion pairs with both
HCO3�
(aq) and CO32�
(aq), thus reducing the activity of these species insolution. Pitzer (1991) showed that the activity coefficient for NH4
�(aq)
(�NH4�) may be approximated by K�(aq) (�K�) for solutions similar in
ionic strength to the master solution. Therefore, NH4� was treated as
K� for all calculations using the EQPITZ program. Further refinementof the solubility measurements would require interaction term data forNH4
�(aq) which are not presently available in the literature. The activ-
ities of Ca-bearing complexes in the stock solution ([CaOH]�,[CaHCO3]�, and [CaCO3]0) were calculated from the activities of
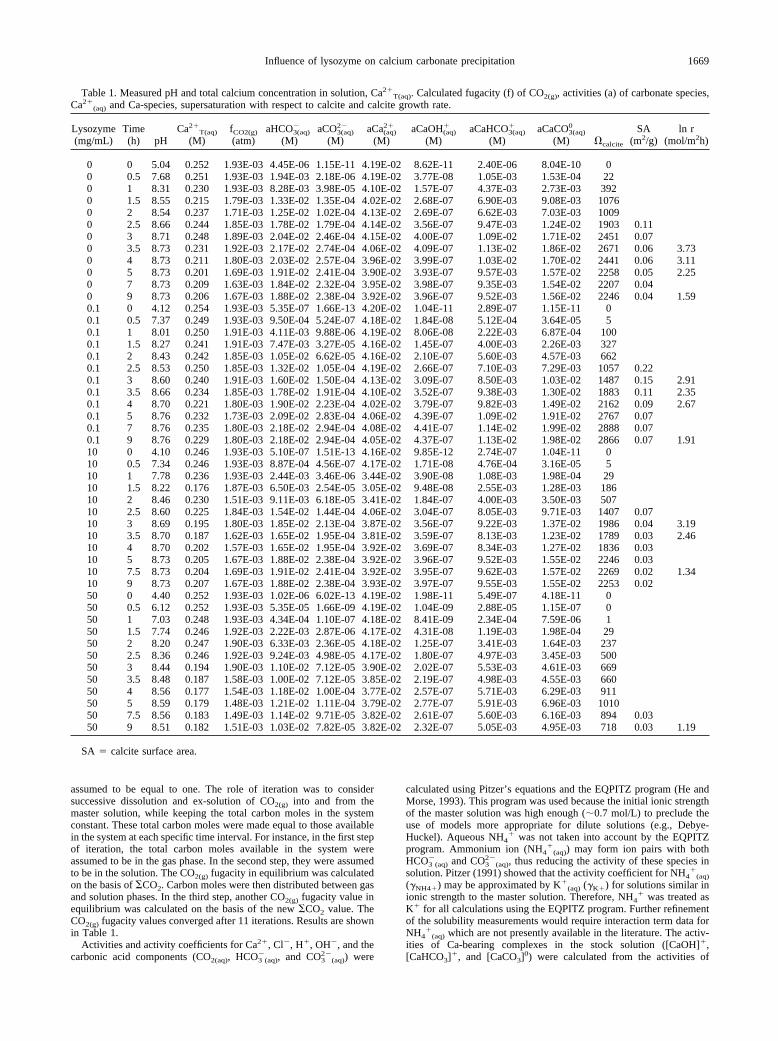
Table 1. Measured pH and total calcium concentration in solution, Ca2�T(aq). Calculated fugacity (f) of CO2(g), activities (a) of carbonate species,
Ca2�(aq) and Ca-species, supersaturation with respect to calcite and calcite growth rate.
Lysozyme(mg/mL)
Time(h) pH
Ca2�T(aq)
(M)fCO2(g)
(atm)aHCO3(aq)
�
(M)aCO3(aq)
2�
(M)aCa(aq)
2�
(M)aCaOH(aq)
�
(M)aCaHCO3(aq)
�
(M)aCaCO3(aq)
0
(M) �calcite
SA(m2/g)
ln r(mol/m2h)
0 0 5.04 0.252 1.93E-03 4.45E-06 1.15E-11 4.19E-02 8.62E-11 2.40E-06 8.04E-10 00 0.5 7.68 0.251 1.93E-03 1.94E-03 2.18E-06 4.19E-02 3.77E-08 1.05E-03 1.53E-04 220 1 8.31 0.230 1.93E-03 8.28E-03 3.98E-05 4.10E-02 1.57E-07 4.37E-03 2.73E-03 3920 1.5 8.55 0.215 1.79E-03 1.33E-02 1.35E-04 4.02E-02 2.68E-07 6.90E-03 9.08E-03 10760 2 8.54 0.237 1.71E-03 1.25E-02 1.02E-04 4.13E-02 2.69E-07 6.62E-03 7.03E-03 10090 2.5 8.66 0.244 1.85E-03 1.78E-02 1.79E-04 4.14E-02 3.56E-07 9.47E-03 1.24E-02 1903 0.110 3 8.71 0.248 1.89E-03 2.04E-02 2.46E-04 4.15E-02 4.00E-07 1.09E-02 1.71E-02 2451 0.070 3.5 8.73 0.231 1.92E-03 2.17E-02 2.74E-04 4.06E-02 4.09E-07 1.13E-02 1.86E-02 2671 0.06 3.730 4 8.73 0.211 1.80E-03 2.03E-02 2.57E-04 3.96E-02 3.99E-07 1.03E-02 1.70E-02 2441 0.06 3.110 5 8.73 0.201 1.69E-03 1.91E-02 2.41E-04 3.90E-02 3.93E-07 9.57E-03 1.57E-02 2258 0.05 2.250 7 8.73 0.209 1.63E-03 1.84E-02 2.32E-04 3.95E-02 3.98E-07 9.35E-03 1.54E-02 2207 0.040 9 8.73 0.206 1.67E-03 1.88E-02 2.38E-04 3.92E-02 3.96E-07 9.52E-03 1.56E-02 2246 0.04 1.590.1 0 4.12 0.254 1.93E-03 5.35E-07 1.66E-13 4.20E-02 1.04E-11 2.89E-07 1.15E-11 00.1 0.5 7.37 0.249 1.93E-03 9.50E-04 5.24E-07 4.18E-02 1.84E-08 5.12E-04 3.64E-05 50.1 1 8.01 0.250 1.91E-03 4.11E-03 9.88E-06 4.19E-02 8.06E-08 2.22E-03 6.87E-04 1000.1 1.5 8.27 0.241 1.91E-03 7.47E-03 3.27E-05 4.16E-02 1.45E-07 4.00E-03 2.26E-03 3270.1 2 8.43 0.242 1.85E-03 1.05E-02 6.62E-05 4.16E-02 2.10E-07 5.60E-03 4.57E-03 6620.1 2.5 8.53 0.250 1.85E-03 1.32E-02 1.05E-04 4.19E-02 2.66E-07 7.10E-03 7.29E-03 1057 0.220.1 3 8.60 0.240 1.91E-03 1.60E-02 1.50E-04 4.13E-02 3.09E-07 8.50E-03 1.03E-02 1487 0.15 2.910.1 3.5 8.66 0.234 1.85E-03 1.78E-02 1.91E-04 4.10E-02 3.52E-07 9.38E-03 1.30E-02 1883 0.11 2.350.1 4 8.70 0.221 1.80E-03 1.90E-02 2.23E-04 4.02E-02 3.79E-07 9.82E-03 1.49E-02 2162 0.09 2.670.1 5 8.76 0.232 1.73E-03 2.09E-02 2.83E-04 4.06E-02 4.39E-07 1.09E-02 1.91E-02 2767 0.070.1 7 8.76 0.235 1.80E-03 2.18E-02 2.94E-04 4.08E-02 4.41E-07 1.14E-02 1.99E-02 2888 0.070.1 9 8.76 0.229 1.80E-03 2.18E-02 2.94E-04 4.05E-02 4.37E-07 1.13E-02 1.98E-02 2866 0.07 1.9110 0 4.10 0.246 1.93E-03 5.10E-07 1.51E-13 4.16E-02 9.85E-12 2.74E-07 1.04E-11 010 0.5 7.34 0.246 1.93E-03 8.87E-04 4.56E-07 4.17E-02 1.71E-08 4.76E-04 3.16E-05 510 1 7.78 0.236 1.93E-03 2.44E-03 3.46E-06 3.44E-02 3.90E-08 1.08E-03 1.98E-04 2910 1.5 8.22 0.176 1.87E-03 6.50E-03 2.54E-05 3.05E-02 9.48E-08 2.55E-03 1.28E-03 18610 2 8.46 0.230 1.51E-03 9.11E-03 6.18E-05 3.41E-02 1.84E-07 4.00E-03 3.50E-03 50710 2.5 8.60 0.225 1.84E-03 1.54E-02 1.44E-04 4.06E-02 3.04E-07 8.05E-03 9.71E-03 1407 0.0710 3 8.69 0.195 1.80E-03 1.85E-02 2.13E-04 3.87E-02 3.56E-07 9.22E-03 1.37E-02 1986 0.04 3.1910 3.5 8.70 0.187 1.62E-03 1.65E-02 1.95E-04 3.81E-02 3.59E-07 8.13E-03 1.23E-02 1789 0.03 2.4610 4 8.70 0.202 1.57E-03 1.65E-02 1.95E-04 3.92E-02 3.69E-07 8.34E-03 1.27E-02 1836 0.0310 5 8.73 0.205 1.67E-03 1.88E-02 2.38E-04 3.92E-02 3.96E-07 9.52E-03 1.55E-02 2246 0.0310 7.5 8.73 0.204 1.69E-03 1.91E-02 2.41E-04 3.92E-02 3.95E-07 9.62E-03 1.57E-02 2269 0.02 1.3410 9 8.73 0.207 1.67E-03 1.88E-02 2.38E-04 3.93E-02 3.97E-07 9.55E-03 1.55E-02 2253 0.0250 0 4.40 0.252 1.93E-03 1.02E-06 6.02E-13 4.19E-02 1.98E-11 5.49E-07 4.18E-11 050 0.5 6.12 0.252 1.93E-03 5.35E-05 1.66E-09 4.19E-02 1.04E-09 2.88E-05 1.15E-07 050 1 7.03 0.248 1.93E-03 4.34E-04 1.10E-07 4.18E-02 8.41E-09 2.34E-04 7.59E-06 150 1.5 7.74 0.246 1.92E-03 2.22E-03 2.87E-06 4.17E-02 4.31E-08 1.19E-03 1.98E-04 2950 2 8.20 0.247 1.90E-03 6.33E-03 2.36E-05 4.18E-02 1.25E-07 3.41E-03 1.64E-03 23750 2.5 8.36 0.246 1.92E-03 9.24E-03 4.98E-05 4.17E-02 1.80E-07 4.97E-03 3.45E-03 50050 3 8.44 0.194 1.90E-03 1.10E-02 7.12E-05 3.90E-02 2.02E-07 5.53E-03 4.61E-03 66950 3.5 8.48 0.187 1.58E-03 1.00E-02 7.12E-05 3.85E-02 2.19E-07 4.98E-03 4.55E-03 66050 4 8.56 0.177 1.54E-03 1.18E-02 1.00E-04 3.77E-02 2.57E-07 5.71E-03 6.29E-03 91150 5 8.59 0.179 1.48E-03 1.21E-02 1.11E-04 3.79E-02 2.77E-07 5.91E-03 6.96E-03 101050 7.5 8.56 0.183 1.49E-03 1.14E-02 9.71E-05 3.82E-02 2.61E-07 5.60E-03 6.16E-03 894 0.0350 9 8.51 0.182 1.51E-03 1.03E-02 7.82E-05 3.82E-02 2.32E-07 5.05E-03 4.95E-03 718 0.03 1.19
SA � calcite surface area.
1669Influence of lysozyme on calcium carbonate precipitation
Ca2�(aq), OH�
(aq), HCO3�
(aq), and CO32�
(aq) using the equilibrium con-stants listed in Langmuir (1997). Results are shown in Table 1.
2.7. Saturation and Growth Rate
Saturation state with respect to a given mineral phase is defined as �� IAP/Ksp, where IAP is the ionic activity product and Ksp is thesolubility product for this particular mineral phase. Ionic activity prod-ucts were calculated by multiplying the activity of Ca2�
(aq) and theactivity of CO3
2�(aq). Supersaturation with respect to calcite �calcite
was calculated using the EQPITZ program. An error of � 9 U wasestimated considering the error on the experimental measurements ofCa2� (�0.006 mol/L). Supersaturation with respect to aragonite, va-terite, and monohydrocalcite was calculated by dividing IAP by thesolubility product for aragonite (Plummer and Busenberg, 1982), forvaterite (Plummer and Busenberg, 1982), and for monohydrocalcite(Hull and Turnbull, 1973).
Calcite growth rate was calculated following the methodology de-scribed in Appendix 2 of Romanek et al. (1992). The cumulative sumof crystals nucleated over a given time interval was considered as seedmaterial for subsequent overgrowth during an ensuing time interval.Growth rate was determined by dividing the precipitation rate over aspecified time interval by the surface area of the cumulative seedmaterial from previous time steps. Growth rates were calculated start-ing from the moment at which calcite (as rhombohedral-like forms inlysozyme-free or modified rhombohedral-like forms in lysozyme-bear-ing experiments) was the only mineral phase observed. These timeintervals were over 3 h for the control experiments and the lysozyme-bearing experiments run at 0.1 mg/mL and 10 mg/mL, and over 6 h forthe experiment run at 50 mg/mL of lysozyme. For the control experi-ment and for the lysozyme-bearing experiment run at 0.1 mg/mL oflysozyme, the cumulative surface area for calcite was determined usinga geometric model that related mass to surface area for ideal calciterhombs. Length and width of rhombs were measured in SEM pictures.The third dimension was estimated to be the average of the two visibledimensions. Particle surface area and volume were calculated as if theparticles were rectangular prisms. For the experiments run at lysozymeconcentrations of 10 and 50 mg/mL, cumulative surface area for calcitewas determined using a geometrical model that related mass to surfacearea for ideal spheres. The radius of the sphere was measured in SEMpictures. In all calculations, calcite density was used to convert volumeto mass, and surface area per gram was averaged for each grain.
3. RESULTS
3.1. Carbonate Precipitation Kinetics
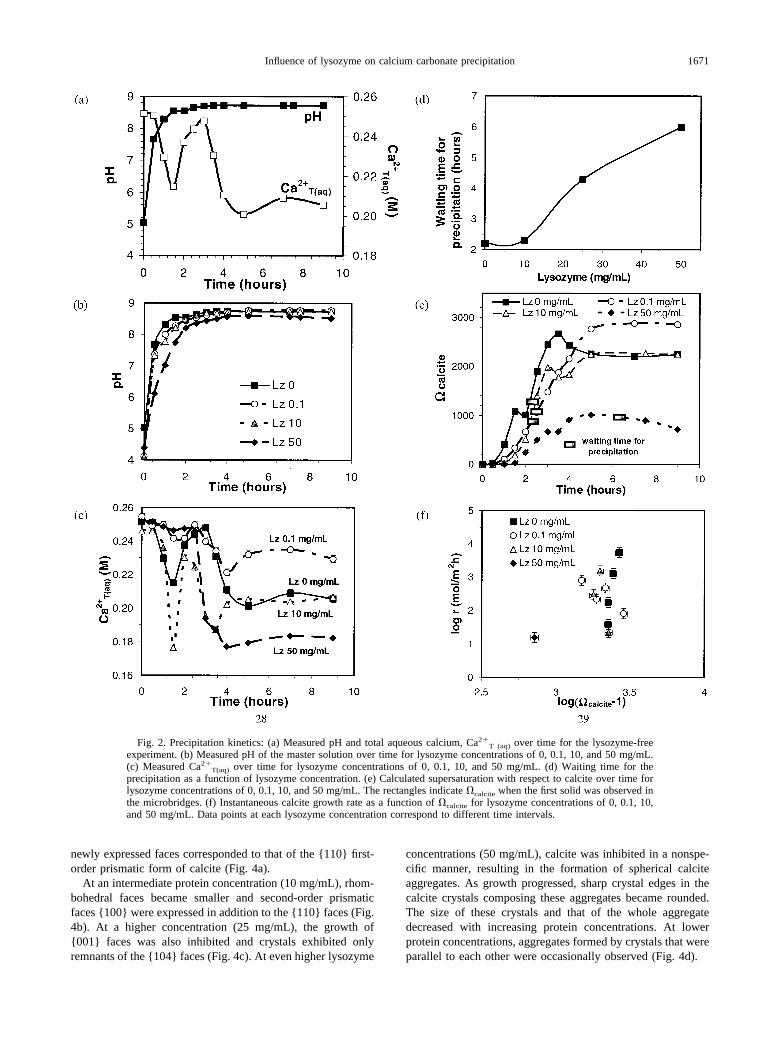
Solution pH increased from 5.0 to 8.7 during a representativecontrol experiment (lysozyme-free; Table 1, Fig. 2a). Thisincrease occurred primarily within the first 1.5 h. Thereafter,increases in pH became slower and stabilized at 8.7. Overalltrends in pH evolution were highly similar regardless of thepresence or absence of lysozyme in solution (Fig. 2b). Thepresence of lysozyme, however, reduced the initial pH of themaster solution down to one unit. From 3 h until the end of theexperiment, pH values were almost identical for both ly-sozyme-free and lysozyme-bearing experiments.
For the control experiment, total calcium concentration insolution Ca2�
T (aq) decreased in ups and downs from an initialvalue of 0.25 mol/L to a value of 0.21 mol/L at 9 h (Table 1,Fig. 2a). This decrease was very fast within the first 1.5–2 h(from 0.25 mol/L to 0.22 mol/L). The Ca2�
T(aq) concentrationsincreased again, reaching a second maximum of 0.25 mol/L at3 h. Afterwards, calcium concentrations in solution furtherdecreased and stabilized at �0.21 mol/L (Fig. 2a). Overalltrends of Ca2�
T(aq) were quite similar in both lysozyme-freeand lysozyme-bearing experiments (Fig. 2c). For instance, thefirst minimum occurred in both lysozyme-free and lysozyme-
bearing experiments after �1.5 h. Because Ca2�T(aq) was not
monitored continuously, absolute minima and maxima couldnot be unambiguously determined. On the other hand, finalCa2�
T(aq) concentrations became lower as lysozyme concen-trations increased.
The presence of lysozyme in solution strongly affected thewaiting time for precipitation (Fig. 2d). This time increasedwith the concentration of protein from 130 min for the ly-sozyme-free experiment to 6 h for lysozyme concentrations of50 mg/mL. The number of crystals increased with proteinconcentration and crystal size decreased. For instance, thenumber of crystals (�200 crystals) for the experiment run at 50mg/mL of lysozyme was twice that of the lysozyme-free ex-periment.
The saturation of the system with respect to calcite went upfrom 0 to �2250 (in the control experiment), to �2870 (ly-sozyme at 0.1 mg/mL), to �2250 (lysozyme at 10 mg/mL), andto �720 (lysozyme at 50 mg/mL) (Table 1). This increase tookplace primarily within the first 3.5 h for the control experimentand the one run at 10 mg/mL of lysozyme, within the first 4 hfor the experiment run at 50 mg/mL of lysozyme, and withinthe first 5 h for the one run at 0.1 mg/mL of lysozyme (Fig. 2e).Thereafter, �calcite stabilized at �2290, �2670, and at �720for the control, lysozyme 0.1 mg/mL, and 10 mg/mL experi-ments, respectively. For the experiment run at 50 mg/mL oflysozyme, the �calcite values went down after 4 h. Crystals werefirst observed when �calcite was �1300 for the control exper-iment, �900 for the experiment run at 0.1 mg/mL of lysozyme,�1100 at 10 mg/mL of lysozyme, and �1000 at 50 mg/mL oflysozyme (Fig. 2e).
Calcite growth rate varied from 101.59 mol/m2h to 103.73
mol/m2h for the control experiment, from 101.91 mol/m2h to102.91 mol/m2h for a lysozyme concentration of 0.1 mg/mL,and from 101.34 mol/m2h to 103.19 mol/m2h for a concentrationof 10 mg/mL. The growth rate was 101.19 mol/m2h at a ly-sozyme concentration of 50 mg/mL (Table 1). The presence oflysozyme in solution did not significantly affect the calcitegrowth rate, at least within the range 0 to 10 mg/mL (Fig. 2f).
3.2. The Evolution of Calcite Crystal Growth Morphology
Mainly spherulites were observed during the first stages ofthe control experiments. These spherulites later disappeared (at�1 h after detection), thus giving rise to perfect rhombohedra.The same sequence was observed in lysozyme-bearing exper-iments. However, the transformation rate (spherulites to calcitecrystals) became faster as lysozyme concentrations increased.No spherulites were observed in the experiment run at 50mg/mL of lysozyme.
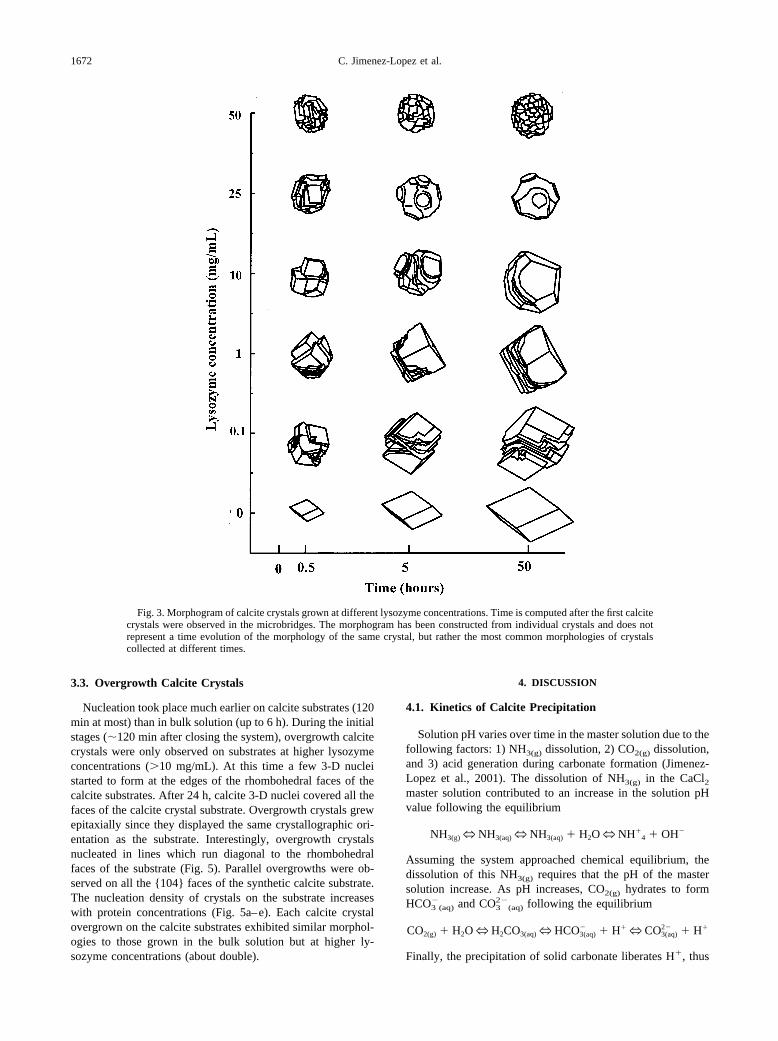
The effect of lysozyme–calcite interaction on the morphol-ogy of calcite crystals is illustrated in a morphogram (Fig. 3) inwhich a wide variety of morphologies can be observed atdifferent times and for different protein concentrations. Crys-tals grown in the absence of protein (control samples) werealways perfect rhombohedra of 60 to 80 �m in size after 24 h.At low protein concentration (�1 mg/mL) two of the edges of{104} faces (those not confluent to the c-axis) were inhibitedand new faces appeared. Inhibition always started at corners,where two of these edges meet. The new faces showed aterraced morphology with macro-steps. The symmetry of the
1670 C. Jimenez-Lopez et al.
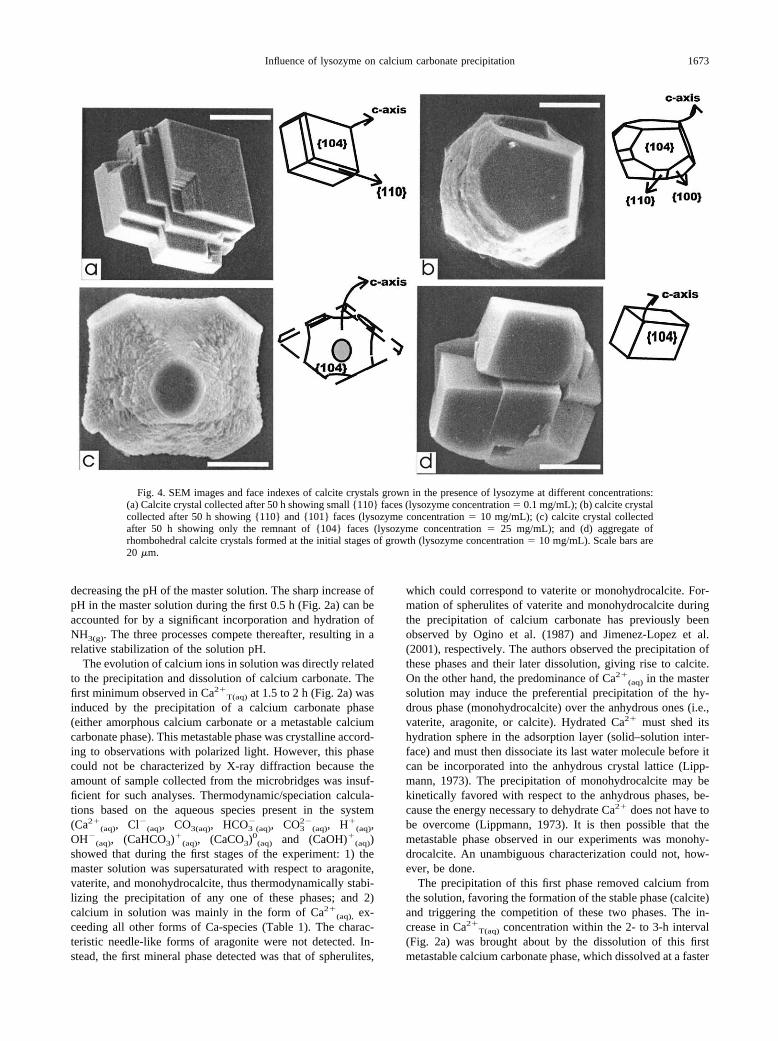
newly expressed faces corresponded to that of the {110} first-order prismatic form of calcite (Fig. 4a).
At an intermediate protein concentration (10 mg/mL), rhom-bohedral faces became smaller and second-order prismaticfaces {100} were expressed in addition to the {110} faces (Fig.4b). At a higher concentration (25 mg/mL), the growth of{001} faces was also inhibited and crystals exhibited onlyremnants of the {104} faces (Fig. 4c). At even higher lysozyme
concentrations (50 mg/mL), calcite was inhibited in a nonspe-cific manner, resulting in the formation of spherical calciteaggregates. As growth progressed, sharp crystal edges in thecalcite crystals composing these aggregates became rounded.The size of these crystals and that of the whole aggregatedecreased with increasing protein concentrations. At lowerprotein concentrations, aggregates formed by crystals that wereparallel to each other were occasionally observed (Fig. 4d).
Fig. 2. Precipitation kinetics: (a) Measured pH and total aqueous calcium, Ca2�T (aq) over time for the lysozyme-free
experiment. (b) Measured pH of the master solution over time for lysozyme concentrations of 0, 0.1, 10, and 50 mg/mL.(c) Measured Ca2�
T(aq) over time for lysozyme concentrations of 0, 0.1, 10, and 50 mg/mL. (d) Waiting time for theprecipitation as a function of lysozyme concentration. (e) Calculated supersaturation with respect to calcite over time forlysozyme concentrations of 0, 0.1, 10, and 50 mg/mL. The rectangles indicate �calcite when the first solid was observed inthe microbridges. (f) Instantaneous calcite growth rate as a function of �calcite for lysozyme concentrations of 0, 0.1, 10,and 50 mg/mL. Data points at each lysozyme concentration correspond to different time intervals.
1671Influence of lysozyme on calcium carbonate precipitation
3.3. Overgrowth Calcite Crystals
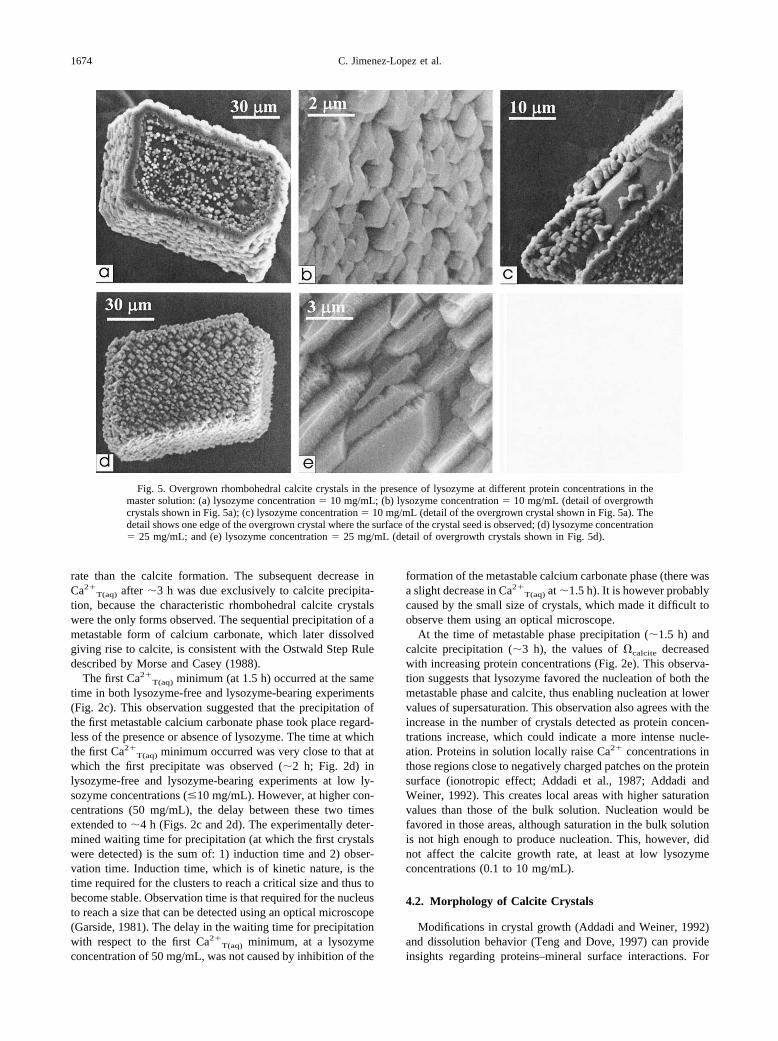
Nucleation took place much earlier on calcite substrates (120min at most) than in bulk solution (up to 6 h). During the initialstages (�120 min after closing the system), overgrowth calcitecrystals were only observed on substrates at higher lysozymeconcentrations (10 mg/mL). At this time a few 3-D nucleistarted to form at the edges of the rhombohedral faces of thecalcite substrates. After 24 h, calcite 3-D nuclei covered all thefaces of the calcite crystal substrate. Overgrowth crystals grewepitaxially since they displayed the same crystallographic ori-entation as the substrate. Interestingly, overgrowth crystalsnucleated in lines which run diagonal to the rhombohedralfaces of the substrate (Fig. 5). Parallel overgrowths were ob-served on all the {104} faces of the synthetic calcite substrate.The nucleation density of crystals on the substrate increaseswith protein concentrations (Fig. 5a–e). Each calcite crystalovergrown on the calcite substrates exhibited similar morphol-ogies to those grown in the bulk solution but at higher ly-sozyme concentrations (about double).
4. DISCUSSION
4.1. Kinetics of Calcite Precipitation
Solution pH varies over time in the master solution due to thefollowing factors: 1) NH3(g) dissolution, 2) CO2(g) dissolution,and 3) acid generation during carbonate formation (Jimenez-Lopez et al., 2001). The dissolution of NH3(g) in the CaCl2master solution contributed to an increase in the solution pHvalue following the equilibrium
NH3(g)N NH3(aq)N NH3(aq) � H2ON NH�4 � OH�
Assuming the system approached chemical equilibrium, thedissolution of this NH3(g) requires that the pH of the mastersolution increase. As pH increases, CO2(g) hydrates to formHCO3
�(aq) and CO3
2�(aq) following the equilibrium
CO2(g) � H2ON H2CO3(aq)N HCO3(aq)� � H�N CO3(aq)
2� � H�
Finally, the precipitation of solid carbonate liberates H�, thus
Fig. 3. Morphogram of calcite crystals grown at different lysozyme concentrations. Time is computed after the first calcitecrystals were observed in the microbridges. The morphogram has been constructed from individual crystals and does notrepresent a time evolution of the morphology of the same crystal, but rather the most common morphologies of crystalscollected at different times.
1672 C. Jimenez-Lopez et al.
decreasing the pH of the master solution. The sharp increase ofpH in the master solution during the first 0.5 h (Fig. 2a) can beaccounted for by a significant incorporation and hydration ofNH3(g). The three processes compete thereafter, resulting in arelative stabilization of the solution pH.
The evolution of calcium ions in solution was directly relatedto the precipitation and dissolution of calcium carbonate. Thefirst minimum observed in Ca2�
T(aq) at 1.5 to 2 h (Fig. 2a) wasinduced by the precipitation of a calcium carbonate phase(either amorphous calcium carbonate or a metastable calciumcarbonate phase). This metastable phase was crystalline accord-ing to observations with polarized light. However, this phasecould not be characterized by X-ray diffraction because theamount of sample collected from the microbridges was insuf-ficient for such analyses. Thermodynamic/speciation calcula-tions based on the aqueous species present in the system(Ca2�
(aq), Cl�(aq), CO3(aq), HCO3�
(aq), CO32�
(aq), H�(aq),
OH�(aq), (CaHCO3)�(aq), (CaCO3)0
(aq) and (CaOH)�(aq))showed that during the first stages of the experiment: 1) themaster solution was supersaturated with respect to aragonite,vaterite, and monohydrocalcite, thus thermodynamically stabi-lizing the precipitation of any one of these phases; and 2)calcium in solution was mainly in the form of Ca2�
(aq), ex-ceeding all other forms of Ca-species (Table 1). The charac-teristic needle-like forms of aragonite were not detected. In-stead, the first mineral phase detected was that of spherulites,
which could correspond to vaterite or monohydrocalcite. For-mation of spherulites of vaterite and monohydrocalcite duringthe precipitation of calcium carbonate has previously beenobserved by Ogino et al. (1987) and Jimenez-Lopez et al.(2001), respectively. The authors observed the precipitation ofthese phases and their later dissolution, giving rise to calcite.On the other hand, the predominance of Ca2�
(aq) in the mastersolution may induce the preferential precipitation of the hy-drous phase (monohydrocalcite) over the anhydrous ones (i.e.,vaterite, aragonite, or calcite). Hydrated Ca2� must shed itshydration sphere in the adsorption layer (solid–solution inter-face) and must then dissociate its last water molecule before itcan be incorporated into the anhydrous crystal lattice (Lipp-mann, 1973). The precipitation of monohydrocalcite may bekinetically favored with respect to the anhydrous phases, be-cause the energy necessary to dehydrate Ca2� does not have tobe overcome (Lippmann, 1973). It is then possible that themetastable phase observed in our experiments was monohy-drocalcite. An unambiguous characterization could not, how-ever, be done.
The precipitation of this first phase removed calcium fromthe solution, favoring the formation of the stable phase (calcite)and triggering the competition of these two phases. The in-crease in Ca2�
T(aq) concentration within the 2- to 3-h interval(Fig. 2a) was brought about by the dissolution of this firstmetastable calcium carbonate phase, which dissolved at a faster
Fig. 4. SEM images and face indexes of calcite crystals grown in the presence of lysozyme at different concentrations:(a) Calcite crystal collected after 50 h showing small {110} faces (lysozyme concentration � 0.1 mg/mL); (b) calcite crystalcollected after 50 h showing {110} and {101} faces (lysozyme concentration � 10 mg/mL); (c) calcite crystal collectedafter 50 h showing only the remnant of {104} faces (lysozyme concentration � 25 mg/mL); and (d) aggregate ofrhombohedral calcite crystals formed at the initial stages of growth (lysozyme concentration � 10 mg/mL). Scale bars are20 �m.
1673Influence of lysozyme on calcium carbonate precipitation
rate than the calcite formation. The subsequent decrease inCa2�
T(aq) after �3 h was due exclusively to calcite precipita-tion, because the characteristic rhombohedral calcite crystalswere the only forms observed. The sequential precipitation of ametastable form of calcium carbonate, which later dissolvedgiving rise to calcite, is consistent with the Ostwald Step Ruledescribed by Morse and Casey (1988).
The first Ca2�T(aq) minimum (at 1.5 h) occurred at the same
time in both lysozyme-free and lysozyme-bearing experiments(Fig. 2c). This observation suggested that the precipitation ofthe first metastable calcium carbonate phase took place regard-less of the presence or absence of lysozyme. The time at whichthe first Ca2�
T(aq) minimum occurred was very close to that atwhich the first precipitate was observed (�2 h; Fig. 2d) inlysozyme-free and lysozyme-bearing experiments at low ly-sozyme concentrations (�10 mg/mL). However, at higher con-centrations (50 mg/mL), the delay between these two timesextended to �4 h (Figs. 2c and 2d). The experimentally deter-mined waiting time for precipitation (at which the first crystalswere detected) is the sum of: 1) induction time and 2) obser-vation time. Induction time, which is of kinetic nature, is thetime required for the clusters to reach a critical size and thus tobecome stable. Observation time is that required for the nucleusto reach a size that can be detected using an optical microscope(Garside, 1981). The delay in the waiting time for precipitationwith respect to the first Ca2�
T(aq) minimum, at a lysozymeconcentration of 50 mg/mL, was not caused by inhibition of the
formation of the metastable calcium carbonate phase (there wasa slight decrease in Ca2�
T(aq) at �1.5 h). It is however probablycaused by the small size of crystals, which made it difficult toobserve them using an optical microscope.
At the time of metastable phase precipitation (�1.5 h) andcalcite precipitation (�3 h), the values of �calcite decreasedwith increasing protein concentrations (Fig. 2e). This observa-tion suggests that lysozyme favored the nucleation of both themetastable phase and calcite, thus enabling nucleation at lowervalues of supersaturation. This observation also agrees with theincrease in the number of crystals detected as protein concen-trations increase, which could indicate a more intense nucle-ation. Proteins in solution locally raise Ca2� concentrations inthose regions close to negatively charged patches on the proteinsurface (ionotropic effect; Addadi et al., 1987; Addadi andWeiner, 1992). This creates local areas with higher saturationvalues than those of the bulk solution. Nucleation would befavored in those areas, although saturation in the bulk solutionis not high enough to produce nucleation. This, however, didnot affect the calcite growth rate, at least at low lysozymeconcentrations (0.1 to 10 mg/mL).
4.2. Morphology of Calcite Crystals
Modifications in crystal growth (Addadi and Weiner, 1992)and dissolution behavior (Teng and Dove, 1997) can provideinsights regarding proteins–mineral surface interactions. For
Fig. 5. Overgrown rhombohedral calcite crystals in the presence of lysozyme at different protein concentrations in themaster solution: (a) lysozyme concentration � 10 mg/mL; (b) lysozyme concentration � 10 mg/mL (detail of overgrowthcrystals shown in Fig. 5a); (c) lysozyme concentration � 10 mg/mL (detail of the overgrown crystal shown in Fig. 5a). Thedetail shows one edge of the overgrown crystal where the surface of the crystal seed is observed; (d) lysozyme concentration� 25 mg/mL; and (e) lysozyme concentration � 25 mg/mL (detail of overgrowth crystals shown in Fig. 5d).
1674 C. Jimenez-Lopez et al.

instance, in both cases modification of the habit of calcitecrystals is induced by the preferential adsorption of proteins tospecific faces which are expressed as a consequence of reduc-tions in their growth (or dissolution) rate. In a previous study itwas observed (Rodriguez-Navarro et al., 2000) that the inter-action between globular proteins (e.g., lysozyme) and calcitesurfaces mainly depends on the surface charge of the proteinand the crystal surface. The effect of proteins in the finalmorphology of calcite crystals depends on the nature of theprotein charge (Rodriguez-Navarro et al., 2000). Negative pro-teins preferentially interact with {110} calcite surfaces, thisinteraction becoming more pronounced as the protein is morenegatively charged. Lysozyme is positively charged (at the pHof calcite precipitation �8.7) and yet interacts preferentiallywith {110} calcite faces. The affinity of lysozyme for thesefaces is, however, lower compared to that of negatively chargedproteins. This indicates that, in addition to electrostatic inter-action, other factors probably intervene in the adsorption ofproteins onto crystal faces.
One possibility is that lysozyme functional groups interactmore directly with calcite surfaces at the atomic level. How-ever, lysozyme size is quite large (�30 Å), a factor of 4 timesgreater than the distances between carbonate groups (or cal-cium) in the calcite faces (4 to 8 Å). The packing of theseprotein molecules cannot match the arrangement of sites on thecalcite faces at the atomic level, and it is therefore difficult tomaintain that geometrical matching at atomic scale exists.
Another possibility is that interaction between proteins andcalcite faces may also be determined by the orientation ofcarbonate groups in calcite surfaces. Proteins preferentiallyinteract with those faces where carbonate groups are perpen-dicular to the surface, e.g., such crystal faces running parallel tothe calcite c-axis as the {110} and {100} faces (Addadi et al.,1987; Mann et al., 1990). Our experiments showed that ly-sozyme interacted preferentially with {110} faces, which havethe maximum density of carbonate groups and in which thecarbonate groups are oriented perpendicular to the surface(Table 2). Once the {110} faces were covered, lysozyme in-teracted with the {100} faces, in which the carbonate groupsare also oriented perpendicular to the surface although thedensity of carbonate groups is lower (Table 2). Finally, ly-sozyme interacted with the {001} faces, which have a highcarbonate density, although the orientation of carbonate groupsis parallel to the surface. Thus the sequential inhibition of thegrowth of the {110}, {100}, and {001} faces could be causedby the combined effect of the density of carbonate groups andtheir orientation.
4.3. Overgrowth of Calcite Crystals
In the absence of proteins, epitaxial growth of calcite oncalcite crystals takes place through the screw dislocation mech-anism or two-dimensional nucleation (Gratz and Hillner, 1993).Our results showed that the overgrowth of calcite crystalsoccurred in the presence of lysozyme through the deposition ofisolated 3-D clusters (Fig. 5). Overgrown crystals displayed thesame crystallographic orientation as the substrate (the {104}face) and were arranged in lines running diagonal to the rhom-bohedral faces of the substrate. It should be noted that theselines fit the orientation of the carbonate groups in the rhombo-hedral faces of the calcite substrate. Crystallites form prefer-entially near the corner and edges of the calcite crystal substrate(Fig. 5a). It is known that during crystal growth, particularlywhen the growth mechanism is dominated by transport diffu-sion in the bulk, the supersaturation is greater near the edgesthan in the center of the faces, favoring the nucleation on thisparticular locations (Berg, 1938).
Our results also showed that lysozyme favored and con-trolled heterogeneous nucleation of calcite on the calcite sub-strate. In the presence of lysozyme, the nucleation on calcitesubstrates occurred significantly earlier than in the bulk solu-tion. The reason for the enhancement of the nucleation may bethat an adsorption layer of protein forms on calcite surfaces(Aizenberg et al., 1994; Teng and Dove, 1997). In fact, it isknown that near the surface there is an increase in proteinconcentrations that changes the activity of the solution close tothe crystal face (Norde and Lyklema, 1991). This leads to adecrease in the surface energy, which in turn reduces thenucleation barrier. Furthermore, the stacking of the overgrowth3-D calcite crystallites (Fig. 5b) leaves gaps in which theprotein is occluded. This 3-D nucleation mechanism may ac-count for the high quantities of proteins observed in manybiomineral structures (Nys et al., 1999) including those that stillbehave like a single crystal (Berman et al., 1990; Aizenberg etal., 1997). In summary, the calcite blocks could nucleate on topof each other with a parallel orientation, thus leaving gaps thatare filled with proteins. The resulting polycrystalline aggregatestill preserves a crystallographic continuity and, at the sametime, incorporates a substantial amount of organic matter.
5. CONCLUSIONS
Free-drift calcite precipitation experiments were conductedin the presence of lysozyme to examine the effects of theprotein on the precipitation kinetics of calcium carbonate andon calcite crystal morphology. Nucleation and growth of cal-cium carbonate crystals were primarily driven by the dissolu-tion of NH3(g) into the reacting solution from an underlyingreservoir of ammonium bicarbonate (NH4HCO3). Calcium wasremoved through the precipitation of solid carbonate, and pHwas buffered by the hydrolysis of ammonia gas.
Regardless of the presence of lysozyme, calcite precipitationwas preceded by the precipitation of a metastable phase. Withincreasing concentration of lysozyme, the precipitation of themetastable phase occurred at lower values of �calcite. After-wards, the metastable phase dissolved and then gave rise tocalcite as the sole solid phase. Also, with increasing concen-trations of lysozyme, calcite nucleation took place at lower
Table 2. Density of carbonates on calcite faces and orientation ofcarbonate groups with respect to calcite surface. The faces are sorted inthe same sequence as they were affected by their interaction with theprotein.
Face Density (nm�2) Orientation
{110} 5.72 90°{100} 2.35 90°{001} 4.64 0°{104} 4.95 44.6°
1675Influence of lysozyme on calcium carbonate precipitation

values of �calcite. Calcite growth rate was not affected at lowconcentrations of lysozyme (�10 mg/mL).
The presence of lysozyme drastically modified the morphol-ogy of calcite crystals, which preferentially interacted withfaces parallel to the c-axis. The growth of {110}, {100}, andfinally {001} faces was sequentially inhibited at increasinglysozyme concentrations. Presumably, the {110} faces becamecompletely covered by the protein as lysozyme concentrationsincreased. Other faces ({100} and {001}) of decreasing affin-ities then competed for protein adsorption. Varying affinitiesfor calcite crystallographic faces may be caused by differencesin their surface charge density and in the orientation of carbon-ate groups. The overgrowth of calcite crystals occurred in thepresence of lysozyme through the deposition of isolated 3-Dblocks, and it is this mechanism which may explain the occlu-sion of large quantities of protein into biomineral structureswhich maintain their crystallographic coherence.
Acknowledgments—We are grateful to the Spanish Ministerio de Edu-cacion y Ciencia for financial support through the Picasso Program andthe EU project “European Bio-Crystallogenesis Initiative” (BIO4-CT98-0086). We would like to thank Prof. Christopher Romanek, Prof.Yves Nys, Dr. David E. Cole, and two anonymous reviewers for theirvaluable comments. Thanks also to Marco Bettini for the Englishediting.
Associate editor: D. Cole
REFERENCES
Addadi L., Moradian J., Shay E., Maroudas N. G., and Weiner S.(1987) A chemical model for the cooperation of sulfates and car-boxylates in calcite crystals formation. Proc. Natl. Acad. Sci. USA84, 2732–2736.
Addadi L. and Weiner S. (1992) Control and design principles inbiological mineralization. Angew. Chem. Int. Ed. Engl. 31, 153–169.
Aizenberg J., Albeck S., Weiner S., and Addadi L. (1994) Crystalproteins interactions studied by overgrowth of calcite on biogenicskeletal elements. J. Crys. Growth 142, 156–164.
Aizenberg J., Hanson J., Koetzle T. F., Weiner S., and Addadi L.(1997) Control of macromolecule distribution within synthetic andbiogenic single. J. Am. Chem. Soc. 119, 881–886.
Arai T. and Norde W. (1990) The behaviour of some model proteins atsolid-liquid interfaces: Adsorption from single proteins solutions.Colloids and Surfaces 51, 1–15.
Belcher A. M., Wu X. H., Christensen R. J., Hansma J., Stucky G. D.,and Morse D. E. (1996) Control of crystal phase switching andorientation by soluble mollusc-shell proteins. Nature 381, 56–58.
Berg W. F. (1938) Proc. Roy. Soc. A164, 79.Berman A., Addadi L., Kvick A., Leiserowitz L., Nelson M., and
Weiner S. (1990) Intercalation of sea-urchin proteins in calcite-studyof a crystalline-composite material. Science 250, 664–667.
Checa A. and Rodriguez-Navarro A. (2001) Geometric and crystallo-graphic constraints determining the self-organisation of shell micro-structures in Unionidae (Bivalvia, Mollusca). Proc. Roy. Soc. Lon-don B 250, 771–778.
Falini G., Albeck S., Weiner S., and Addadi L. (1995) Control ofaragonite or calcite polymorphism by Mollusk shell macromole-cules. Science 271, 67–69.
Garside J. (1981) Nucleation. In Biological Mineralization and De-mineralization (ed. G. H. Nancollas), Life Sciences Research Report23, pp. 23-35. Springer-Verlag.
Gratz A. J. and Hillner P. E. (1993) Poisoning of calcite growth viewedin the atomic force microscope (AFM). J. Crys. Growth 129, 789–793.
Haynes C. A. and Norde W. (1994) Globular proteins at solid/liquidinterfaces. Colloids and Surfaces B: Biointerfaces 2, 517–566.
He S. and Morse J. W. (1993) The carbonic acid system and calcitesolubility in aqueous Na-K-Ca-Mg-Cl-SO4 solutions from 0 to 90°C.Geochim. Cosmochim. Acta 57, 3533–3554.
Heywood B. R. (1996) Templated-directed nucleation and growth ofinorganic materials. In Biomimetic Materials Chemistry (ed. S.Mann), pp. 143–173. VCH, New York.
Hull H. and Turnbull A. G. (1973) A thermochemical study of mono-hydrocalcite. Geochim. Cosmochim. Acta 37, 685–694.
Jimenez-Lopez C., Caballero E., Huertas F. J., and Romanek C. S.(2001) Chemical, mineralogical and isotopic behavior and phasetransformation during the precipitation of calcium carbonate miner-als from intermediate ionic solution at 25°C. Geochim. Cosmochim.Acta 65(19), 3219–3231.
Langmuir D. (1997) Aqueous Environmental Chemistry. Prentice Hall,New York. 600 pp 194–229.
Lippmann F. (1973) Sedimentary carbonate minerals. In Mineral,Rocks and Inorganic Materials. von Engelhardt W., Hahn T., RoyR., and Wyllie P. J., eds. Springer-Verlag, Berlin. 228 pp.
Lowenstand H. A. (1981) Minerals formed by organisms. Science 211,1126–1131.
Lowenstand H. A. and Weiner S. (1989) On Biomineralization. OxfordUniversity Press, New York.
Mann S. (1988) Molecular recognition in biomineralization. Nature332, 119–124.
Mann S., Webb J., and Williams R. J. P. (1989) Biomineralization,Chemical and Biochemical Perspectives. VCH, Weinheim.
Mann S., Didymus J. M., Sanderson N. P., and Heywood B. R. (1990)Morphological influence of functionalised �, �-dicarboxylates oncalcite crystallization. J. Chem. Soc. Faraday Trans. 86, 1873–1880.
Morse J. W. and Casey W. H. (1988) Ostwald processes and mineralparagenesis in sediments. Am. J. Sci. 288, 537–560.
Morse J. W. and Mackenzie F. T. (1990) Geochemistry of SedimentaryCarbonates. Elsevier, New York. 426 pp 1–19.
Norde W. and Lyklema J. (1991) Why proteins prefer interfaces?J. Biomater. Sci. Polymer Edn. 2, 183–202.
Nys Y., Hincke M. T., Arias J. L., Garcia-Ruiz J. M., and SolomonS. E. (1999) Avian eggshell mineralization. Poultry Avian Biol. Rev.10, 143–166.
Ogino T., Suzuki T., and Sawada K. (1987) The formation and trans-formation mechanism of calcium carbonate in water. Geochim. Cos-mochim. Acta 51, 2757–2767.
Pitzer K. S. (1991) Activity Coefficients in Electrolyte Solutions. CRCPress, Boca Raton, Florida. 542 pp 414–419.
Plummer L. N. and Busenberg E. (1982) The solubility of calcite,aragonite and vaterite in CO2-water solutions between 0–90°C and aevaluation of the aqueous model for the system CO2-H2O-CaCO3.Geochim. Cosmochim. Acta 46, 1011–1040.
Rodriguez-Navarro A., Messier R., Jimenez-Lopez C., and Garcia-RuizJ. M. (2000) Importance of electrostatic interactions between calcitesurfaces and proteins. Mat. Res. Soc. Symp. Proc. 599, 353–359.
Romanek C., Grossman E., and Morse J. (1992) Carbon isotopicfractionation in synthetic calcite, effects of temperature and precip-itation rate. Geochim. Cosmochim. Acta 56, 419–430.
Simkiss K. and Wilbur K. M. (1989) Biomineralization: Cell Biologyand Mineral Deposition. Academic Press, San Diego.
Teng H. H. and Dove P. M. (1997) Surface site-specific interactions ofaspartate with calcite during dissolution: Implication for biominer-alization. Am. Mineral. 82, 878–887.
Wheeler A. P., George J. W., and Evans C. A. (1981) Control ofcalcium carbonate nucleation and growth by soluble matrix of oystershell. Science 212, 1397–1398.
Wolery T. J. (1992) EQ3/6, a software package for geochemical mod-eling of aqueous systems, version 7. 0. Lawrence Livermore Na-tional Laboratory, University of California, Livermore.
1676 C. Jimenez-Lopez et al.


