Embed Size (px)
Citation preview
American Journal of Phytomedicine and Clinical Therapeutics www.ajpct.org
Original Article
Influence of Hyperlipidemia on Pharmacokinetics of Clarithromycin in Wistar Rats K. Prasanna Kumar1 and Y. Narsimha Reddy*2
1Drug metabolism pharmacokinetics department, Wockhardt research centre, Aurangabad, M.S, India 2University College of Pharmaceutical Sciences, Kakatiya University, Warangal, A.P, India
ABSTRACT
To investigate impact of hyperlipidemia on clarithromycin pharmacokinetics in Wistar rats, hyperlipidemia was successfully induced by providing high fat diet (rich of cholesterol) for 6-8 weeks. Pharmacokinetic parameters of clarithromycin in induced hyperlipidemia and control group (non-hyperlipidemia) were determined in rats after oral (10, 20, and 100 mg/kg) single administration of clarithromycin. Group allocation for in-vivo study (n=6) as follows: G1: Vehicle control, G2-G4: Non-hyperlipidemic rats treated with clarithromycin, G5-G7: hyperlipidemic rats treated with clarithromycin. For In-vitro study (n=4): G8: Non-hyperlipidemic rats pooled liver homogenate, G9: Hyperlipidemic rat pooled liver homogenate for investigation of clarithromycin metabolism. For biliary excretion studies (n=4): G10: non-hyperlipidemic rats treated with clarithromycin and G11: Hyperlipidemic rats treated with clarithromycin. The area under the plasma concentration–time curve (AUC0–∞) and the peak plasma concentration (Cmax) of clarithromycin (non-hyperlipidemic group) was 1.77 ± 0.33 µg. h/mL and 0.47 ± 0.06 µg/mL for 10 mg/kg; 5.63 ± 1.51 µg. h/mL and 1.21 ± 0.11 µg/mL for 20 mg/kg; 58.97 ± 12.74 µg. h/mL and 12.48 ± 3.8 µg/mL for 100 mg/kg, respectively. In hyperlipidemic group the AUC0–∞ and Cmax of clarithromycin was 3.47 ± 0.82 µg.h/mL and 0.84 ± 0.09 ug/mL for 10 mg/kg; 12.21 ± 2.83 µg.h/mL and 2 ± 0.24 µg/mL for 20 mg/kg; 141.88 ± 54.03 µg.h/mL and 20.57 ± 7.6 µg/mL for 100 mg/kg, respectively. Over all exposure was significantly increased in hyperlipidemic groups at across the tested doses. The percentage remaining of clarithromycin in hyperlipidemic rat’s liver homogenates and biliary excretion was significantly (P<0.05) high as compared with non-hyperlipidemic rats. The % dose excretion of clarithromycin in urine was lower as compared with bile in hyperlipidemic rats. Conclude that the clarithromycin was considerably affected by hyperlipidemia. The
*Address for Correspondence Assosiate professor, University College of Pharmaceutical Sciences. Kakatiya University, Warangal, A.P, India-506009. E-mail: [email protected]
Reddy et al_________________________________________________ ISSN 2321 – 2748
AJPCT[2][4][2014]474-485
enhanced area under the curve of clarithromycin in hyperlipidemic rats might be mainly due to inhibition of the CYP mediated metabolism in the liver by hyperlipidemia which was reproduced in bile and urine.
Keywords: Clarithromycin, Hyperlipidemia, Area under the curve, Rats.
INTRODUCTION
Multidrug therapy is common in the
clinical setting. Following oral admini-stration, drugs are normally absorbed through the GI tract and enter into the circulating bloodstream after passing through the liver. During this process, some drugs are metabolized by enzymes in the liver, such as cytochrome P-450 (CYP) complex enzymes and by CYP3A4 in particular in the epithelial cells of the small intestine1. Clarithromycin is highly potent against a wide variety of aerobic and anaerobic gram-positive and gram-negative organism2. Hypercholesterolemia is a problem faced by many societies and is a cause of concern for health professionals. In addition, there is a close correlation between these diseases and lipid abnormalities, especially high level of plasma cholesterol, and blood pressure3. Rats with diabetes mellitus induced by streptozotocin, a decrease bile flow rate and altered bile compositions, hepatotoxicity and impaired kidney function have been reported4. Animals with hyperlipidemia develop secondary diseases and clinical signs are like Pancreatitis, Hepatobiliary disease and Atherosclerosis5. Clinical studies and anecdotal observations suggest that two conditions of the liver might be associated with hypertriglyceridemia in dogs: vascular hepatopathy and gallbladder mucocele6, 7. Macrolide antibiotics azithromycin and clarithromycin are large molecular weight compounds and are substrates for apically polarized efflux transporters such as P-
glycoprotein, which can potentially restrict intestinal absorption8. Biliary transport was indicated to be a more important excretion route for clarithromycin and favourable urinary excretion9. Clarithromycin is metabolized in the liver by the cytochrome P-450 3A4 (CYP3A4) enzymes and 30 to 40% of an oral dose of clarithromycin is excreted in the urine either unchanged or as the active 14-hydroxy metabolite10. Based on the above literature review, liver metabolism was influenced by hyper-lipidemia. Clarithromycin pharmacokinetics and excretion in presence of hyperlipidemia is ambiguous. It is important to assess the potential pharmacokinetic interaction in the presence of hyperlipidemia in order to assure the effectiveness and safety of drug therapy and these kinetics will be applicable where patients might not know they were had hypercholesterolemia.
MATERIALS AND METHODS Chemicals and apparatus
Clarithromycin, erythromycin (internal standard) and atorvastatin were purchased from Sigma–Aldrich Co. (India). High performance liquid chromatography (HPLC) grade methanol and acetonitrile were obtained from Merck Co. (Darmstadt, Germany). All other chemicals in this study were of reagent grade and used without further purification. The apparatus used in this study included a MS/MS equipped with a Agilent isocratic HPLC Pump including auto sampler (Agilent, USA), an HPLC
Reddy et al_________________________________________________ ISSN 2321 – 2748
AJPCT[2][4][2014]474-485
column with temperature controller (Discovery C18, Waters), a Bransonic ultrasonic cleaner (Branson Ultrasonic Co., Danbury, CT, USA), a vortex mixer (Scientific Industries Inc., Bohemia, NY, USA), and a high-speed micro centrifuge (Hitachi Co., Tokyo, Japan).
Animal experiments
Male Wistar rats (weighing 250–300 g) were procured from the In-house, animal resource, Wockhardt research centre (MS, India) and were given access to a commercial rat chow diet (Nutrilab, provimi pvt, Ltd, India) for control group and for induction of hyperlipidemia, in-house prepared standard cholesterol diet11 was fed for 6-8 weeks separately, selected rats were fed twice daily with butter (0.5 mL) to hasten the hyperlipidemia and lipid profiles were evaluated as per the procedure published11 and animals were selected based on total cholesterol (>150 mg/dL) and triglyceride (> 100 mg/dl) levels. Diet and water was provided ad libitum and The animals were housed at 22 ± 2ºC and 40–60% relative humidity under a 12:12 h light/dark cycle. The animals were allowed 1 week for acclimation. The ethical approval was obtained for the animal studies official name of the ethics committee was Institute of Animal Care and Ethics Committee (IAEC) of Drug metabolism pharma-cokinetics (DMPK) department which was affiliated under Committee for the Purpose of Control and Supervision of Experiments on Animals (CPCSEA). Approval number is Regd No.: 13/1999/CPCSEA, Wockhardt research centre, India. OECD 425 guidelines was used for testing of chemicals and handling of animals used for the study12. The rats were fasted for at least 12 h before the experiments and each animal was anesthetized lightly with isoflurane during the catheterization. The right Jugular vein, bile duct and duodenum were cannulated
using polyethylene tubing are PE-50 (i.d. 0.58 mm, o.d. 0.98 mm; Portex, Smiths medicals, USA) and PE-10 (i.d. 0.28 mm, o.d. 0.61 mm; Portex, Smiths medicals, USA) to allow for blood sampling (Jugular vein, for pharmacokinetics) and bile sampling (Bile duct, for excretion) following oral administration.
Drug administration for in-vivo PK study
The rats were divided into the following groups (n = 6, each group): Doses were selected to evaluate clarithromycin PK are 10, 20 and 100 mg/kg; suspended in 0.5% carboxymethyl cellulose containing 2% Tween 80, 5 ml/kg) or with 0 (oral control), was administered intra-gastrically using an oral feeding tube, groups allocation was as scheduled, Group (G) 1: control (Dose: 0 mg/kg, vehicle treated); G2: Non-hyperlipidemic (NHL) rats treated with clarithromycin (Dose: 10 mg/kg, PO); G3: Non-hyperlipidemic (NHL) rats treated with clarithromycin (Dose: 20 mg/kg, PO); G4: Non-hyperlipidemic (NHL) rats treated with clarithromycin (Dose: 100 mg/kg, PO); G5: Hyperlipidemic (HL) rats treated with clarithromycin (Dose: 10 mg/kg, PO); G6: Hyperlipidemic (HL) rats treated with clarithromycin (Dose: 20 mg/kg, PO); G7: Hyperlipidemic (HL) rats treated with clarithromycin (Dose: 100 mg/kg, PO). After oral gavage administration of clarithromycin in hyperlipidemic and non-hyperlipidemic rats blood samples were collected at 0.25, 0.5, 1, 2, 4, 6, 8, and 24 h post-dose and 0.2-ml aliquot of blood was collected (n=6) into heparinized tubes from the jugular vein catheter and The blood samples were centrifuged at 5,000 rpm for 10 min at 4 ± 2ºC and the separated plasma samples were stored at -70ºC until analysed by LC-MS/MS.
Reddy et al_________________________________________________ ISSN 2321 – 2748
AJPCT[2][4][2014]474-485
In-vitro liver homogenate metabolism The percentage remaining of
clarithromycin in non-hyperlipidemic and hyperlipidemic rat liver homogenates was estimated after isolation and homogenation of liver tissues (1:4:: liver: DMEM buffer). Groups allocation as detailed below: G8: Non- hyperlipidemic rats pooled liver homogenates (n=4) treated with CLR (Concentration, 10 mM) and G9: Hyperlipidemic rats pooled liver homogenates (n=4) treated with CLR (Concentration, 10 mM). Liver tissues were harvested under isoflurane anaesthesia. Dilution part was as follows, 4 parts of dulbecco's modified eagle's medium (DMEM) buffer at 37ºC was added to one part of liver and homogenation was performed using ultra-Turrax® homogenizer (IKA). Clarithromycin was incubated with non-hyperlipidemic and hyperlipidemic rat liver homogenates at 10 mM concentration. A 100 µL of homogenate sample was quenched with 200µL of acetonitrile at 0 h, and 0.083, 0.25, 0.5, 0.75 and 1 h. Quenched samples were centrifuged at 10,000 g for 5 minutes and supernatant samples were stored at -70ºC until analysed by LC-MS/MS.
LC-MS/MS Analysis
The plasma concentrations of clarithromycin were determined using a LC-MS/MS method. Briefly, 10 µL of erythromycin, as an internal standard and a 0.2-ml aliquot of acetonitrile were mixed with a 50 µL of plasma sample and same method was employed for bile and urine. The resulting mixture was then vortex mixed for 2 min and centrifuged at 10,000 rpm for 10 min. A 100 µL aliquot of the supernatant was injected (Injection volume, 10 µL) into the LC-MS/MS system. The chromato-graphic separations were achieved using waters, discovery C18 column (4.6 x 50 mm, 5 µm). The mobile phase consisted of
30% of 5 mM ammonium formate and 70% of acetonitrile containing 0.1% formic acid. The flow rate of the mobile phase was maintained at 0.5 mL/min. Chromatography was performed at 40 ºC, which was set by an HPLC column temperature controller. Clarithromycin and internal standard were eluted with retention times of 3.47 and 1.87 min, respectively. A linear correlation coefficient of ≥ 0.99 was obtained with calibration range of 20 ng/mL to 3000 ng/mL. A 10-fold dilution was applied for the calibration range. The operational parameters for the tandem mass spectrum of analyte were obtained after running in quantitative optimization mode. The turbo ion spray setting and collision gas pressure were obtained (IS voltage: 5500 V, temperature: 550 ºC, nebulizer gas: 37 psi, heater gas: 45 psi, curtain gas: 20 psi). The clean chromatogram of matrix blank obtained from the injection of a matrix blank extract immediately after an ULOQ sample demonstrated that this method had neither injector carryover nor analytical column carryover.
Pharmacokinetic Analysis
The plasma concentration data were analysed using a non-compartmental method on WinNonlin software version 2.1 (Pharsight Co., Mountain View, CA, USA). The elimination rate constant (Kel) was calculated by the log linear regression of clarithromycin concentration data during the elimination phase, and the terminal half-life (t1/2) was calculated by 0.693/Kel. The peak concentration (Cmax) and time to reach the peak concentration (Tmax) of clarithromycin in the plasma were obtained by visual inspection of the data from the concentration–time curve. The area under the plasma concentration–time curve (AUClast) from time zero to the time of the last measured concentration (Clast) was calculated using the linear trapezoidal rule.
Reddy et al_________________________________________________ ISSN 2321 – 2748
AJPCT[2][4][2014]474-485
The AUC zero to infinite (AUC0–∞) was obtained by adding AUC0–t and the extrapolated area as determined by Clast/Kel. Mean residence time (MRT) was calculated by using ratio of area under the first movementam curve (AUMC) to AUC.
Excretion Study
The percentage dose excretion of clarithromycin (CLR) in presence and absence of hyperlipidemia was evaluated. Study was conducted in Wistar rats (n=4 per group) in presence of diet induced hyperlipidemia11 and absence of hyper-lipidemia total of two groups were used. G10: Non- hyperlipidemic bile duct cannulated rats treated with CLR (dose: 20 mg/kg, n=4) and G11: Hyperlipidemic bile duct cannulated rats treated with CLR (dose: 20 mg/kg, n=4). Both the common bile duct and duodenum were cannulated using PE-10 and 50 catheters under light isoflurane anaesthesia. A surgical probe was used to tunnel subcutaneously to the dorsal scapular region where each catheter then exited the body. The exit incision and abdominal cavity were sutured as soon as the bile could be seen flowing freely through the catheter. A U-shaped coupler (stainless steel) was connected to both catheters to maintain normal flow of bile to the intestines during a typical recovery period. Injectable analgesics were given as needed and provided 72 h recovery period for cannulated animals. The cannulated rats were installed into a metabolic cage, with utilities to separate feces and retain urine at a temperature of 4 ± 2 °C. Cumulative bile and urine samples were collected at 0-2, 2-4, 4-6, 6-8 h for excretion study. Simultaneously blank bile was infused at a rate of 1.3 mL/hr13,14 through duodenum (non -vascular) catheter by using infusion pump (Model 11, Harvard apparatus). Collected cumulative bile and urine samples were stored at -70ºC until bioanalysis.
Percentage of dose excreted from bile and urine
After oral administration of clarithromycin, the percentage of clarithromycin recovered (Hyperlipidemia Vs non-hyperlipidenia; clarithromycin alone) in bile and urine was calculated by cumulative dose excreted at respective time points / the actual dose administered to rat *100 for bile and urine.
Statistical Analysis
Statistical analysis was carried out using one way ANOVA followed by a student’s paired t-Test with two tailed distribution using Graph Pad Prism 6.0 software. The differences were considered significant at a level of P<0.05 and highly significant at a level of P<0.01. All mean values are presented with their standard deviation (Mean ± SD).
RESULTS AND DISCUSSION Effect of hyperlipidemia on the pharmacokinetics of clarithromycin
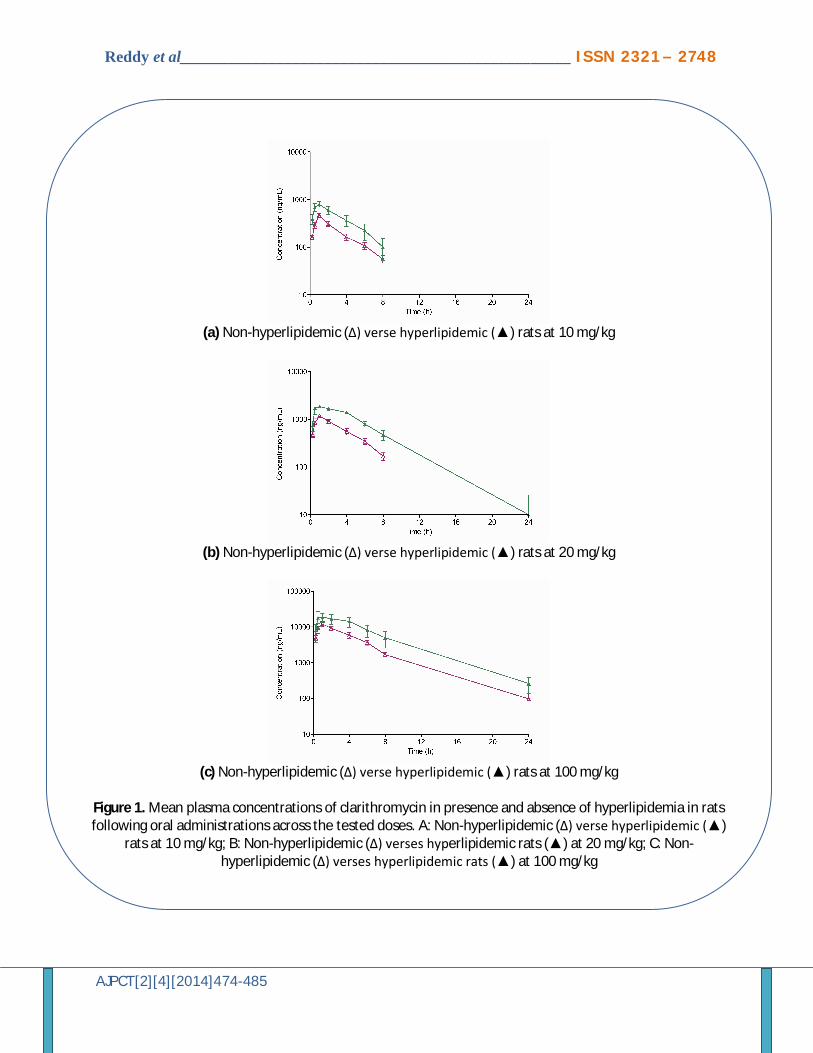
Figure 1 shows the mean plasma concentration–time profiles of clarithromycin after oral administration of clarithromycin (10, 20, and 100 mg/kg) dose formulation to rats in the presence or absence of hyperlipidemia. Maximum plasma concentrations (Cmax) in non-hyperlipidemic rats found to be at 10, 20 and 100 mg/kg were 0.47 ± 0.06, 1.21 ± 0.11 and 12.48 ± 3.8 µg/mL, respectively and corresponding mean Tmax values were 0.92 ± 0.2, 0.83 ± 0.26 and 0.83 ± 0.26 h, respectively. Similarly in hyperlipidemic rats Cmax was found to be 0.84 ± 0.09 (P<0.01), 2 ± 0.2 (P<0.01) and 20.57 ± 7.6 (P<0.01) µg/mL for 10, 20, and 100 mg/kg, respectively and corresponding mean Tmax values were 0.83 ± 0.26, 0.75± 0.27 and 0.75 ± 0.26 h , respectively. Mean AUC0–∞ for NHL group was 1.77 ± 0.33, 5.63 ± 1.57
Reddy et al_________________________________________________ ISSN 2321 – 2748
AJPCT[2][4][2014]474-485
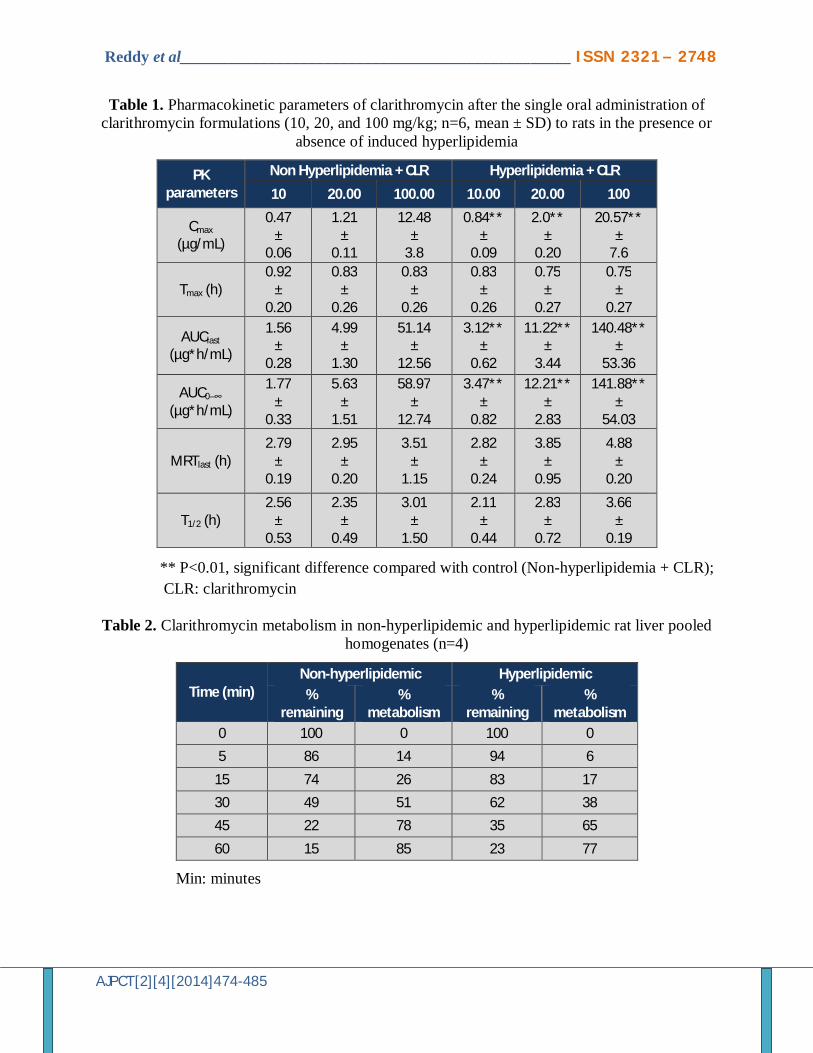
and 58.97 ± 12.74 µg.h/mL at 10, 20 and 100 mg/kg, respectively. The corresponding pharmacokinetic parameters are shown in Table 1.
Similarly, mean AUC0–∞ for HL groups was 3.47 ± 0.82 (P<0.01), 12.21 ± 2.83 (P<0.01) and 141.88 ± 54.03 (P<0.01) µg.h/mL at 10, 20, and 100 mg/kg, respectively. The Mean AUC0–∞ and AUClast of HL rats was highly significant as compared with NHL rats. Mean MRT and T1/2 values found to be almost all in similar were ranging from 2.79 to 3.51h and 2.56 to 3.01h, respectively at 10, 20 and 100 mg/kg for NHL groups and 2.82 to 4.88 h for MRT and 2.11 to 3.16 h for T1/2 at 10, 20 and 100 mg/kg for HL groups.
In-vitro metabolism of CLR in presence and absence of hyperlipidemia
The percentage (%) remaining and metabolism of CLR in liver homogenates in presence and absence of hyperlipidemia was tabulated in Table 2. The % metabolism was found to be 14, 26, 51, 78 and 85%, and 6, 17, 38, 65, and 77% at 0.083, 0.25, 0.5, 0.75 and 1h for NHL rat liver homogenates and HL rat liver homogenates, respectively. Results are presented in Table 2.
Effect of hyperlipidemia on the clarithromycin biliary excretion
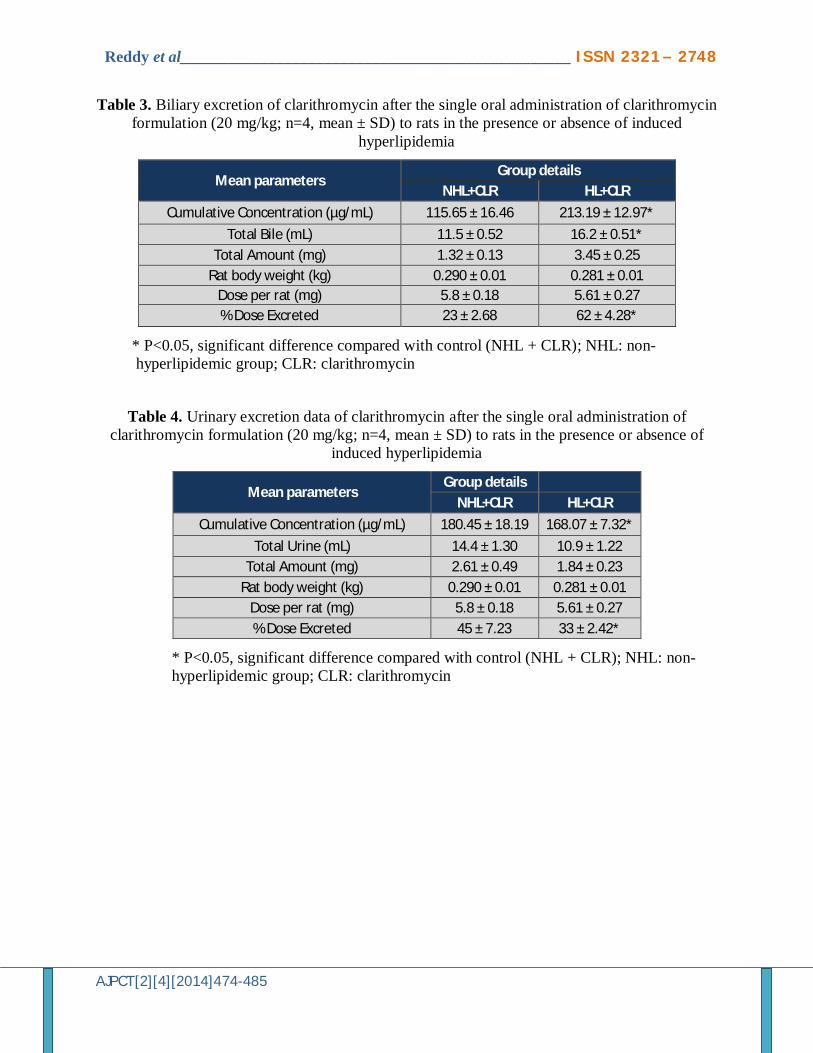
Table 3 shows the mean cumulative biliary concentration (µg/mL) for 0-6 h and mean percentage biliary excretion of clarithromycin in presence and absence of hyperlipidemia after single oral dose of 20 mg/kg of clarithromycin. The mean cumulative bile concentration was found to be 213.19 ± 12.97 µg/mL for HL rats (P<0.05; significant as compared with NHL rats) and 115.65 ± 16.46 µg/mL for NHL rats. The % mean dose excreted in bile was reported 62 ± 4.28 and 23 ± 2.68 for HL rats and NHL rats, respectively. The mean cumulative bile concentration and % mean
dose excreted in urine was significantly high (P<0.05) in hyperlipidemic rats as compared with non-hyperlipidemic rats. Biliary excretion results are detailed in Table 3.
Effect of hyperlipidemia on the clarithromycin urinary excretion
Table 4 showed the mean cumulative urinary concentration (µg/mL) for 0-6 h and mean percentage urinary excretion of clarithromycin in presence and absence of hyperlipidemia after single oral dose of 20 mg/kg of clarithromycin. The mean cumulative urine concentration was 168.07 ± 7.32 µg/mL for HL rats (P<0.05) and 180.45 ± 18.19 µg/mL for NHL rats, respectively. The %mean dose excreted in urine was 33 ± 2.42 (P<0.05) and 45 ± 7.23 for HL rats and NHL rats, respectively. Urinary excretion data is presented in Table 4.
Study was performed to investigate the impact of induced hyperlipidemia on CLR pharmacokinetics and compared with non-hyperlipidemic rats CLR PK. To achieve hyperlipidemia, Wistar rats were fed standard cholesterol diet containing 2% cholesterol and 0.5 mL of butter twice daily for 45 days for induction of hyperlipidemia. Induction of hyperlipidemia was confirmed by total cholesterol (TC) and triglyceride (TG) levels estimated by enzymatic method. After successful induction of hyperlipidemia, CLR at 10, 20 and 100 mg/kg was administered to hyperlipidemic rats (n=6) to know the impact of induced hyperlipidemia on CLR pharmacokinetics and compared with non-hyperlipidemic rats with same dosed groups. Bile duct catheterization was performed in hyperlipidemic and non-hyperlipidemic rats and placed in metabolic cages and collected bile and urine at predetermined points to evaluate mean bile concentration and the % mean dose excreted in bile similarly in urine also calculated mean urine concentration
Reddy et al_________________________________________________ ISSN 2321 – 2748
AJPCT[2][4][2014]474-485
and % mean dose excreted in urine at dose of 20 mg/kg.
Hyperlipidemia significantly altered the pharmacokinetic parameters of clarithromycin. When compared with the non-hyperlipidemic group, the AUC0–∞ and the Cmax of clarithromycin in hyperlipidemic group were significantly increased by 1.77–1.96-folds at 10 mg/kg, 1.44–2.16-folds at 20 mg/kg and 1.65-2.41 folds at 100 mg/kg, respectively. There was no significant difference in the Tmax, MRT and the T1/2 of clarithromycin in the presence of hyperlipidemia.
Hyperlipidemic rats treated with clarithromycin demonstrated greater significant (P<0.05, 62%) difference in mean percentage biliary excretion as compared with non-hyperlipidemic rats (23%). Similarly, bile flow rate was also significantly improved as compared with non-hyperlipidemic rats. Similarly hyperlipidemic rats treated with clarithromycin exhibited significant (P<0.05) difference in mean percentage urinary excretion as compared with non-hyperlipidemic rats which was 33% and 45%, respectively. Hyperlipidemic rats treated with clarithromycin were decreased 0.93-fold in mean cumulative concentration in urine as compared with non-hyperlipidemic rats suggesting that CLR metabolism was altered and proved exposures (AUC and Cmax) were significantly increased in presence of induced hyperlipidemia.
The presence of hyperlipidemia (hypertriglyceridemia and, to a lesser degree, hypercholesterolemia) has long been associated with naturally occurring pancreatitis in dogs15-17. Disorders of lipid metabolism have received limited research but recent scientific evidence suggests that it can often be associated with diseases such as pancreatitis, hepatobiliary disease, ocular disease, and seizures. Therefore,
hypertriglyceridemia should always be taken into account and appropriately treated when necessary5. With the exception of the aminoglycosides, the net effect in a recent article comparing amphotericin and fluconazole for of the pharmacokinetic consequences of obesity has not been rigorously studied with regard to antimicrobials18.
It has been reported that CYP3A1 (23) is involved in the metabolism of clarithromycin in rats4. The contribution of the protein expression and mRNA level of CYP3A1increased expressions to the CL (non-renal clearance) of clarithromycin seemed to have been almost negligible4. This was because clarithromycin is a drug with a high hepatic extraction ratio in rats (its ‘indirect’ hepatic first-pass effect was found to be 87.3–104%)4. The CL (non-renal clearance) of clarithromycin in the DMIS rats became significantly slower (by 21.6%) than that in the DMIA rats. Although the exact reason for this was unclear, this could have been due to the differences in the diabetogenic effects of alloxan (DMIA) and streptozocin (DMIS)19. It has already been reported that hypercholesterolemia leads to reduced renal blood flow and increased renal vascular resistance20. These factors directly related with the impairment of renal function. As summarized in Table 5, the percentage urinary excretion of clarithromycin with hyperlipidemia was significantly lower (0.73-fold; P<0.05) than that in the control group (non-hyperlipidemic rats treated with clarithromycin). These results suggest that hyperlipidemia might decrease the urinary excretion of clarithromycin. Hence % urinary excretion of clarithromycin was significantly low in the present study.
Therefore, we investigated and proved the influence of hyperlipidemia, which had an indirect effect on the pharmacokinetics of clarithromycin in rats
Reddy et al_________________________________________________ ISSN 2321 – 2748
AJPCT[2][4][2014]474-485
to examine potential kinetic interactions between hyperlipidemia and clarithromycin and then explored whether hyperlipidemia could increase Area under the curve (AUC 0-
∞) by inhibition of phase I and phase II metabolism and the same was demonstrated in Induced hyperlipidemic rat liver homogenates showed that CLR metabolism was significantly reduced at 0.5 h, 0.75 and 1 h as compared with non-hyperlipidemic rats pooled liver homogenates which was 27%, 63% and 57%, respectively.
CONCLUSION
Since the present study raised the awareness about potential drug interaction in presence of hyperlipidemia, one of the most common disorders, with clarithromycin, the clinical significance of this finding needs to be further evaluated in clinical studies. In summary, the increase in the exposure of clarithromycin might be mainly attributed to enhanced systemic availability due to inhibition of CYP mediated metabolism in the liver by hyperlipidemia.
ACKNOWLEDGMENT
The author was thankful to Wockhardt Research Centre for providing necessary laboratory facilities to carry out present research work. REFERENCES 1. Fukazawa I, Uchida N, Uchida E, Yasuhara
H. Effects of grapefruit juice on pharmacokinetics of atorvastatin and pravastatin in Japanese. Br J Clin Pharmacol. 2004; 57: 448–455.
2. National committee for clinical laboratory standards methods for dilution antimicrobial susceptibility tests for that grow aerobically-fourth edition approved standard NCCLS document 1997; M&-A4: 14: 2-8.
3. Sheyla Leite Matos, Heberth de Paula, Maria Lúcia Pedrosa. Dietary Models for Inducing Hypercholesterolemia in Rats. Brazilian Archives of Biology and Technology 2005; 48 (2): 203-209.
4. Kim Yu C, Lee Joo H, Kim So H, and Lee Myung G. Effect of CYP3A1 (23) Induction on Clarithromycin Pharmacokinetics in Rats with Diabetes Mellitus. Antimicrob Agents Chemother. 2005; 2528–2532.
5. Xenoulis PG, Steiner JM. Lipid metabolism and hyperlipidemia in dogs. Vet J. 2010; 183: 12–21.
6. Center SA. Hepatic lipidosis, glucocorticoid hepatopathy, vacuolar hepatopathy, storage disorders, amyloidosis, and iron toxicity. In: Strombeck, D.R., Guilford, W.G., Center, S.A., Williams, D.A., Meyer, D.J. (Eds.), Strombeck’s Small Animal Gastroentero-logy. WB Saunders, Philadelphia, Pennsylvania, 1996. pp 766–801.
7. Scherk, MA, Center SA. Toxic, metabolic, infectious, and neoplastic liver diseases. In: Ettinger SJ, Feldman EC (Eds.), Textbook of Veterinary Internal Medicine. Saunders Elsevier 2005; pp 1464–1478.
8. Eric Garver, Erin D Hugger, Shawn PShearn, Anuradha Rao, Paul A, Dawson, Charles B, Davis, and Chao Han. Involvement of Intestinal Uptake Transporters in the Absorption of Azithromycin and Clarithromycin in the Rat. Drug Metab Dispos. 2008; 36: 2492-2498.
9. Y Kohno, H Yoshida, T Suwa and T Suga. Comparative pharmacokinetics of clarithromycin (TE-031), a new macrolide antibiotic, and erythromycin in rats. Antimicrob Agents Chemother. 1989; 33(5): 751-757.
10. Jerry M Zuckerman MD. Macrolides and ketolides: azithromycin, clarithromycin, telithromycin. Infect Dis Clin North Am. 2004; 18: 621–649.
11. Prasanna Kumar, Anbu J, Reddy RN and reddy YNR. Pharmacokinetics and pharmacodynamics of atorvastatin alone and in combination with lercanidipine in hyperlipidemic rats. Journal of pharmacy research 2009; 2: 66-70.
12. OECD (2008). Guidance Document on Acute Oral Toxicity. Environmental Health
Reddy et al_________________________________________________ ISSN 2321 – 2748
AJPCT[2][4][2014]474-485
and Safety Monograph Series on Testing and Assessment No 425.
13. Hess RS, Kass PH, Shofer FS, Van Winkle TJ, Washabau RJ. Evaluation of risk factors for fatal acute pancreatitis in dogs. J Am Vet Med Assoc. 1999; 214: 46–51.
14. Madeleine V Pahl, Fariba Oveisi, Ghassan Khamiseh and Nostratola D Vaziri. Intestinal absorption and biliary secretion of cholesterol in rats with nephrotic syndrome. Nephrol Dial Transplant. 1998; 13: 1446–1451.
15. Bauer JE. Lipoprotein-mediated transport of dietary and synthesized lipids and lipid abnormalities of dogs and cats. J Am Vet Med Assoc. 2004; 224: 668–675.
16. Williams DA, Steiner JM. Canine pancreatic disease. In: Ettinger, S.J., Feldman, E.C. (Eds.), Textbook of Veterinary Internal
Medicine. Saunders Elsevier. St. Louis, Missouri 2005; pp 1482–1488.
17. Johnson MC. Hyperlipidemia disorders in dogs, Compendium on Continuing Education for the Practicing Veterinarian 2005; 27: 364-370.
18. Rebecca Wurtz, Gail Itokazu, Keith Rodvold. Antimicrobial Dosing in Obese Patients. Clin Infect Dis. 1997; 25:112–118.
19. Joo H, Leea B, Yanga Si H, Jung MO, Myung G Lee. Pharmacokinetics of drugs in rats with diabetes mellitus induced by alloxan or streptozocin: comparison with those in patients with type I diabetes mellitus. J Pharmacol Pharmacother. 2010; 62: 1–23.
20. Gava. Hypercholesterolemia promotes early renal dysfunction in apolipoprotein E-deficient mice. Lipids Health Dis. 2003; 10: 220-225.
Reddy et al_________________________________________________ ISSN 2321 – 2748
AJPCT[2][4][2014]474-485
(a) Non-hyperlipidemic (∆) verse hyperlipidemic (▲) rats at 10 mg/kg
(b) Non-hyperlipidemic (∆) verse hyperlipidemic (▲) rats at 20 mg/kg
(c) Non-hyperlipidemic (∆) verse hyperlipidemic (▲) rats at 100 mg/kg
Figure 1. Mean plasma concentrations of clarithromycin in presence and absence of hyperlipidemia in rats following oral administrations across the tested doses. A: Non-hyperlipidemic (∆) verse hyperlipidemic (▲)
rats at 10 mg/kg; B: Non-hyperlipidemic (∆) verses hyperlipidemic rats (▲) at 20 mg/kg; C: Non-hyperlipidemic (∆) verses hyperlipidemic rats (▲) at 100 mg/kg
Reddy et al_________________________________________________ ISSN 2321 – 2748
AJPCT[2][4][2014]474-485
Table 1. Pharmacokinetic parameters of clarithromycin after the single oral administration of clarithromycin formulations (10, 20, and 100 mg/kg; n=6, mean ± SD) to rats in the presence or
absence of induced hyperlipidemia
PK parameters
Non Hyperlipidemia + CLR Hyperlipidemia + CLR
10 20.00 100.00 10.00 20.00 100
Cmax (µg/mL)
0.47 ±
0.06
1.21 ±
0.11
12.48 ±
3.8
0.84** ±
0.09
2.0** ±
0.20
20.57** ±
7.6
Tmax (h) 0.92
± 0.20
0.83 ±
0.26
0.83 ±
0.26
0.83 ±
0.26
0.75 ±
0.27
0.75 ±
0.27
AUClast (µg*h/mL)
1.56 ±
0.28
4.99 ±
1.30
51.14 ±
12.56
3.12** ±
0.62
11.22** ±
3.44
140.48** ±
53.36
AUC0–∞ (µg*h/mL)
1.77 ±
0.33
5.63 ±
1.51
58.97 ±
12.74
3.47** ±
0.82
12.21** ±
2.83
141.88** ±
54.03
MRTlast (h) 2.79
± 0.19
2.95 ±
0.20
3.51 ±
1.15
2.82 ±
0.24
3.85 ±
0.95
4.88 ±
0.20
T1/2 (h) 2.56
± 0.53
2.35 ±
0.49
3.01 ±
1.50
2.11 ±
0.44
2.83 ±
0.72
3.66 ±
0.19
** P<0.01, significant difference compared with control (Non-hyperlipidemia + CLR); CLR: clarithromycin
Table 2. Clarithromycin metabolism in non-hyperlipidemic and hyperlipidemic rat liver pooled
homogenates (n=4)
Time (min) Non-hyperlipidemic Hyperlipidemic %
remaining %
metabolism %
remaining %
metabolism 0 100 0 100 0
5 86 14 94 6
15 74 26 83 17
30 49 51 62 38
45 22 78 35 65
60 15 85 23 77
Min: minutes
Reddy et al_________________________________________________ ISSN 2321 – 2748
AJPCT[2][4][2014]474-485
Table 3. Biliary excretion of clarithromycin after the single oral administration of clarithromycin formulation (20 mg/kg; n=4, mean ± SD) to rats in the presence or absence of induced
hyperlipidemia
Mean parameters Group details
NHL+CLR HL+CLR
Cumulative Concentration (µg/mL) 115.65 ± 16.46 213.19 ± 12.97*
Total Bile (mL) 11.5 ± 0.52 16.2 ± 0.51* Total Amount (mg) 1.32 ± 0.13 3.45 ± 0.25
Rat body weight (kg) 0.290 ± 0.01 0.281 ± 0.01 Dose per rat (mg) 5.8 ± 0.18 5.61 ± 0.27 % Dose Excreted 23 ± 2.68 62 ± 4.28*
* P<0.05, significant difference compared with control (NHL + CLR); NHL: non- hyperlipidemic group; CLR: clarithromycin
Table 4. Urinary excretion data of clarithromycin after the single oral administration of clarithromycin formulation (20 mg/kg; n=4, mean ± SD) to rats in the presence or absence of
induced hyperlipidemia
Mean parameters Group details
NHL+CLR HL+CLR
Cumulative Concentration (µg/mL) 180.45 ± 18.19 168.07 ± 7.32*
Total Urine (mL) 14.4 ± 1.30 10.9 ± 1.22 Total Amount (mg) 2.61 ± 0.49 1.84 ± 0.23
Rat body weight (kg) 0.290 ± 0.01 0.281 ± 0.01 Dose per rat (mg) 5.8 ± 0.18 5.61 ± 0.27 % Dose Excreted 45 ± 7.23 33 ± 2.42*
* P<0.05, significant difference compared with control (NHL + CLR); NHL: non- hyperlipidemic group; CLR: clarithromycin


