Embed Size (px)
Citation preview
INFLUENCE OF FAT CONTENT ON RHEOLOGICALPROPERTIES OF MOLTEN ICE CREAM COMPOUND COATINGS
AND THICKNESS OF SOLIDIFIED PRODUCTS
DORRA GHORBEL1,4, NAZIHA BARBOUCHE1*, HAÏTHEM RIAHI1*,AHMED BRAHAM2 and HAMADI ATTIA3
1INSAT, Département de Génie Biologique et ChimiqueCentre Urbain Nord
B.P. 676, 1080, Tunis, Cedex, Tunisia
2INSAT, Département de Génie Physique et InstrumentationTunis, Tunisia
3ENIS, Unité d’Analyses AlimentairesBPW 3038 Sfax, Tunisia
Accepted for Publication August 27, 2008
ABSTRACT
Flow properties of nine ice cream compound coatings having differenttotal fat contents were studied with the coaxial geometry in the shear raterange 520–1,200/s. The resulting rheograms were best fit by the Casson-Steiner model, with good values of the coefficient of determination (R2). Thesecoatings were used in the melt state to enrobe ice cream bars by means of anelectro-pneumatic system used in lab-scale to reproduce industrial conditions(controlled dipping rate and time). Fat content was seen to determine signifi-cantly the coating flow properties and its solidification characteristics. Theplastic viscosity and the yield stress were well correlated to the coatingthickness and the draining time, which would aid to a better control of thecoating process in industry.jfpe_342 144..159
PRACTICAL APPLICATIONS
In the food industry, the achievement of the formulation step in productdevelopment needs a good understanding of the techno-functional propertiesof the ingredients employed. Important quantities of vegetable fats play a part
* Authors contributed equally to this article.4 Corresponding author. TEL: +21671703717; FAX: +21671704329; EMAIL: Dorra.Ghorbel@
insat.rnu.tn.
Journal of Food Process Engineering 34 (2011) 144–159. All Rights Reserved.© Copyright the AuthorsJournal Compilation © 2009 Wiley Periodicals, Inc.DOI: 10.1111/j.1745-4530.2008.00342.x
144
in the formulation of ice cream compound coatings, but their role in thedetermination of the coating qualities is not well clarified. The aim of this workwas to evaluate the influence of fat content on the rheological properties of icecream compound coatings used to enrobe ice cream bars and to examine therelationships with thickness after dip coating.
INTRODUCTION
In the ice cream manufacture, coatings are used in a viscous liquid state.To enrobe the ice cream bar, the latter is first made by thrusting a short stickinto the ice cream mix, freezing in the machine, and then immersing the bar inthe liquid coating bath at a given temperature. The coating cost is influencedby two important parameters, composition and thickness. The former is con-trolled by the use of vegetable fats (palm, copra, colza, soy, etc.) to partially orcompletely replace cocoa butter in formulation, and may be by the use ofsurface-active ingredients, like soybean lecithin or polyglycerol polyricino-leate. The latter depends on the rheological properties of the coatings, whichdepend largely on the coating composition (fat nature and content, particlesize, etc.) and some parameters of the process (shear, temperature, etc.).
Before solidification, coatings like chocolates are considered as polydis-perse suspensions of very fine solid particles (cocoa, sugar, milk, etc.) in acontinuous fat phase. Whereas liquid fat behaves like a Newtonian fluid,molten coatings and chocolates due to their high respective solid particleconcentrations behave like shear thinning thixotropic materials with yieldstress (Servais et al. 2002).
In the literature, different protocols were proposed to give reproduciblemeasurements of viscosity and easy chocolate rheogram treatments (Steiner1972; Chevalley 1975, 1991, 1999; Solstad 1983; Hogenbirk 1988; Seguineet al. 1988; Aeschlimann and Beckett 2000; Servais et al. 2004). However,poor literature is available on the solidification properties of chocolate andcoatings or the rheology of these solid products to control thickness andenrobing process.
The constitutive equation used to model the shear flow of chocolate hasbeen the Casson-Steiner model (Eq. 1):
11
1 2+( )⋅ = ⋅ +( )⋅ −⎡⎣ ⎤⎦a a�γη
σ σCA
CA (1)
where �γ and s are, respectively, the shear rate (1/s) and the shear stress (Pa);a is a constant corresponding to the ratio R1/R2 (radius of the bob/radius of the
RHEOLOGY AND THICKNESS OF ICE CREAM COMPOUND COATING 145
cup of the coaxial cylinders geometry). This model allows the fit of thechocolate rheograms and the determination of the Casson yield stress (sCA, Pa)and the Casson plastic viscosity (hCA, Pa·s). The yield stress corresponds to theminimum shear stress that begins the flow that means the transition from elasticto viscous deformation. In such a concentrated suspension, the yield stressoriginates from the mechanical (frictional) and chemical interactions betweenthe solid particles when they begin to form a network. At low shear rate range,the Casson yield stress seems to depend on particle–particle interactions, theamount of small particles (that means the specific surface area; Servais et al.2002), emulsifiers, water and fat contents (Rostagno 1973; Chevalley 1975,1991; Kleinert 1976; Musser 1980; Rector 2000; Schantz and Rohm 2005).It may be related to chocolate shape retention, inclined surface coatings, etc.(Seguine et al. 1988). The Casson plastic viscosity on the other hand corre-sponds to the high-shear apparent viscosity. It seems to depend on the volumefraction, shape and size distribution of particles, and the viscosity of thecontinuous phase, etc. (Servais et al. 2004) and to be related to pumpingcharacteristics, coating properties and textural perception (Seguine et al. 1988).
Recently, Wichchukit et al. (2005) and Karnjanolarn and McCarthy(2006) coated flat plastic (acrylic) plates with molten milk chocolate andmeasured the coating thickness gravimetrically. They studied the influence ofsome parameters like grind, emulsifier type and emulsifier level on coatingthickness. But there is no published work, to our knowledge, studying theinfluence of fat content on coating thickness solidified directly on ice creambars, as produced in industry.
The objectives of this study were to examine the influence of fat contenton coating flow properties and thickness of the solidified product. Enrobing ofice cream bars was obtained in lab-scale by means of an automatic enrobingsystem reproducing the dipping action that occurs in industry. The relation-ships between flow properties and coating thickness were examined.
MATERIALS AND METHODS
Coating Preparation
Nine coatings were prepared in lab-scale using the following industrialingredients gently supplied by Nestlé (Tunisia):
(1) milk chocolate (MC) with 27.37% fat content and 2.78% water content(wet basis [WB]);
(2) ordinary chocolate (OC) with 13.61% fat content and 1.2% water content(WB); and
(3) copra oil (CO) with 86% fat content (WB).
146 D. GHORBEL ET AL.
The nine coatings contained the same ratio MC/OC than coating C1 studiedin a previous work (Ghorbel et al. 2008), this ratio was about 2.5, but containeddifferent CO contents giving rise to the following total fat contents: 45.26;47.50; 49.51; 50.97; 52.31; 52.95; 54.44; 55.80; and 57.05% (WB). These fatcontents were chosen with respect to the enrobing properties of the moltencoatings prepared, giving apparently homogenous layers of solid coatings.
A technological procedure was followed to prepare the coatings in thelaboratory. It consisted of the melting of the CO at 60C in a hermetic bottle(of 250 mL for viscosity measurements and 750 mL for lab-scale enrobing),and then the incorporation of chocolate powders under stirring and heating(20 min/60C). The mixture was then put in a second bath at 40C and stirringwas continued until the temperature reached 40C. Viscosity measurements andenrobing were done immediately after coating preparation.
Moisture and Fat Content Measurements
Moisture content of the chocolates was determined by drying off thechocolate powders at 100–102C during 24 h (International Office of Cocoa,Chocolate and Confectionery [IOCCC] standard method N°3-1952). Datawere expressed in a wet basis (total water/wet weight).
Fat content was determined using the Soxhlet method. Fat was extractedfrom the ingredients by its dissolution in the petroleum ether. The latter wasthen evaporated (cyclic evaporations and condensations of the petroleum etherduring approximately 6 hours) using a rotary vacuum evaporator (Bibby) anda water bath (RE100B, Bibby). The solvent was then dried off in hot air(70–80C) until constant mass. Data were also expressed in a wet basis (totalfat/wet weight).
Ice Cream Preparation
Ice cream was prepared in the laboratory from commercial powder “Alsa”and natural milk. After mixing, 35 mL of the mix was poured into a plasticmould, a wood bar was fixed on the mould cover and thrust in the mix wasoperated manually. The mixture was allowed to freeze for 3 h at -20C. Afterfreezing, the mould was plunged into hot water (100C) for one second toinsure the ice cream bar taking off without altering the brightness and theintegrity of the ice cream surface and immediately used for coating asdescribed below.
Enrobing System
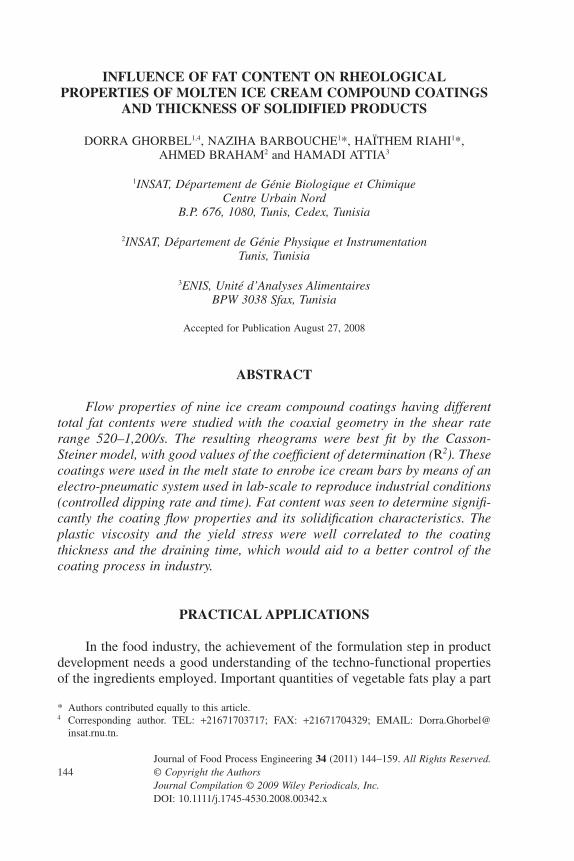
In order to coat the ice cream bars in a reproducible manner (controlleddipping rate and dipping time in the coating bath) in the lab-scale, an automaticenrobing system was constructed (Fig. 1) made of the following elements:
RHEOLOGY AND THICKNESS OF ICE CREAM COMPOUND COATING 147
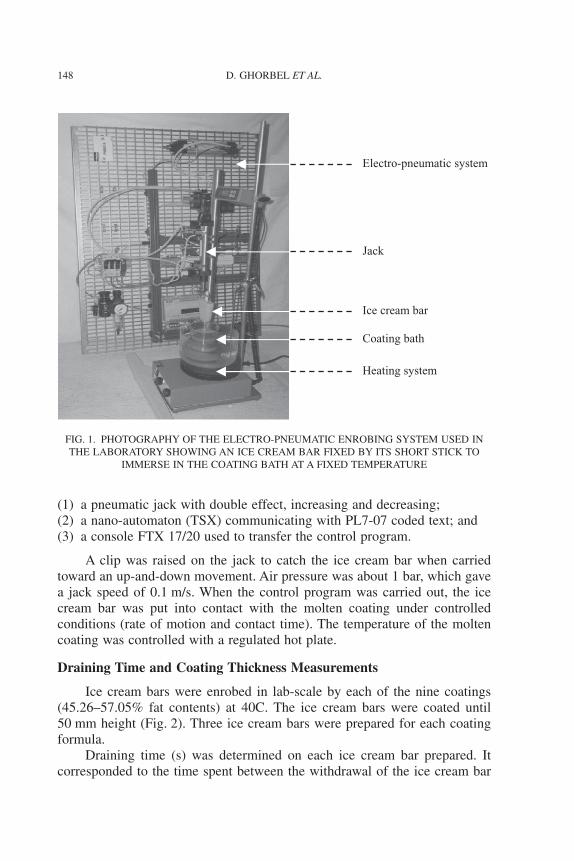
(1) a pneumatic jack with double effect, increasing and decreasing;(2) a nano-automaton (TSX) communicating with PL7-07 coded text; and(3) a console FTX 17/20 used to transfer the control program.
A clip was raised on the jack to catch the ice cream bar when carriedtoward an up-and-down movement. Air pressure was about 1 bar, which gavea jack speed of 0.1 m/s. When the control program was carried out, the icecream bar was put into contact with the molten coating under controlledconditions (rate of motion and contact time). The temperature of the moltencoating was controlled with a regulated hot plate.
Draining Time and Coating Thickness Measurements
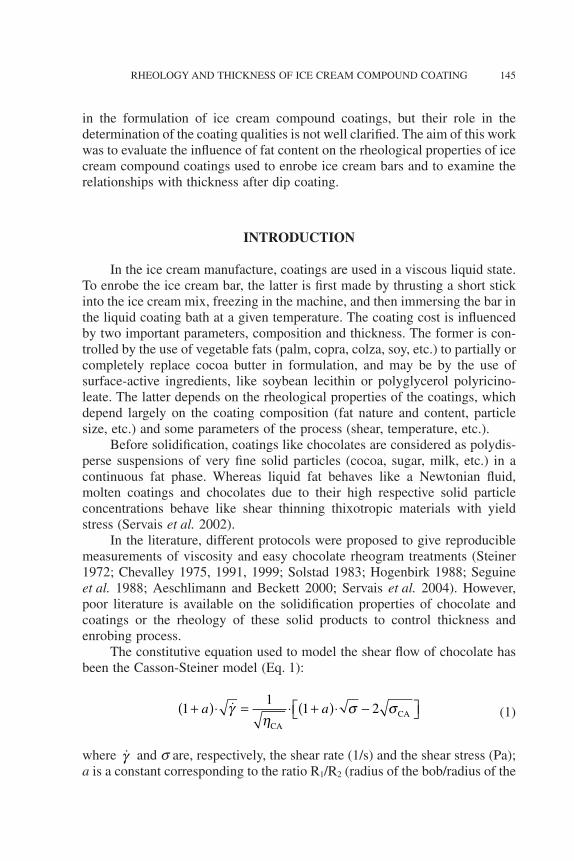
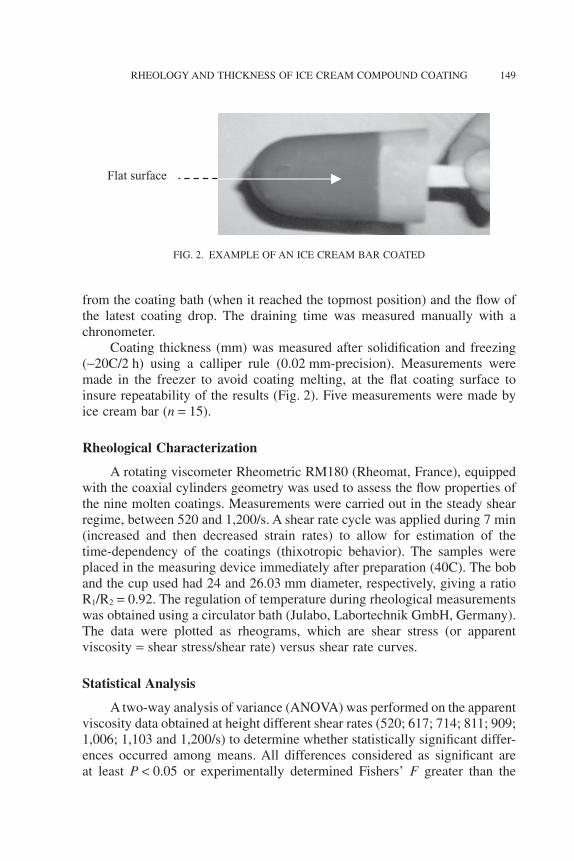
Ice cream bars were enrobed in lab-scale by each of the nine coatings(45.26–57.05% fat contents) at 40C. The ice cream bars were coated until50 mm height (Fig. 2). Three ice cream bars were prepared for each coatingformula.
Draining time (s) was determined on each ice cream bar prepared. Itcorresponded to the time spent between the withdrawal of the ice cream bar
Electro-pneumatic system
Jack
Ice cream bar
Coating bath
Heating system
FIG. 1. PHOTOGRAPHY OF THE ELECTRO-PNEUMATIC ENROBING SYSTEM USED INTHE LABORATORY SHOWING AN ICE CREAM BAR FIXED BY ITS SHORT STICK TO
IMMERSE IN THE COATING BATH AT A FIXED TEMPERATURE
148 D. GHORBEL ET AL.
from the coating bath (when it reached the topmost position) and the flow ofthe latest coating drop. The draining time was measured manually with achronometer.
Coating thickness (mm) was measured after solidification and freezing(-20C/2 h) using a calliper rule (0.02 mm-precision). Measurements weremade in the freezer to avoid coating melting, at the flat coating surface toinsure repeatability of the results (Fig. 2). Five measurements were made byice cream bar (n = 15).
Rheological Characterization
A rotating viscometer Rheometric RM180 (Rheomat, France), equippedwith the coaxial cylinders geometry was used to assess the flow properties ofthe nine molten coatings. Measurements were carried out in the steady shearregime, between 520 and 1,200/s. A shear rate cycle was applied during 7 min(increased and then decreased strain rates) to allow for estimation of thetime-dependency of the coatings (thixotropic behavior). The samples wereplaced in the measuring device immediately after preparation (40C). The boband the cup used had 24 and 26.03 mm diameter, respectively, giving a ratioR1/R2 = 0.92. The regulation of temperature during rheological measurementswas obtained using a circulator bath (Julabo, Labortechnik GmbH, Germany).The data were plotted as rheograms, which are shear stress (or apparentviscosity = shear stress/shear rate) versus shear rate curves.
Statistical Analysis
A two-way analysis of variance (ANOVA) was performed on the apparentviscosity data obtained at height different shear rates (520; 617; 714; 811; 909;1,006; 1,103 and 1,200/s) to determine whether statistically significant differ-ences occurred among means. All differences considered as significant areat least P < 0.05 or experimentally determined Fishers’ F greater than the
Flat surface
FIG. 2. EXAMPLE OF AN ICE CREAM BAR COATED
RHEOLOGY AND THICKNESS OF ICE CREAM COMPOUND COATING 149
theoretical one. The effects of two factors were analyzed by means of ANOVAtest: «shear stress» and «fat content». Firstly, ANOVA was applied between45.26 and 54.44% fat content. Secondly, ANOVA was performed between54.44 and 57.05% fat content. The analysis of variance was carried out withthe statistical software SPSS 13.0 (on PC; SPSS Inc., Chicago, IL).
RESULTS AND DISCUSSION
Effect of Fat Content on Flow Properties
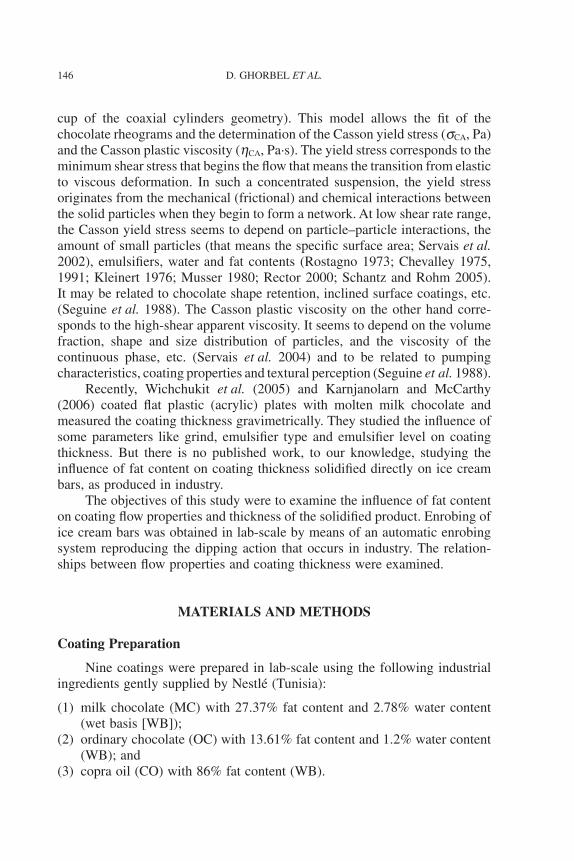
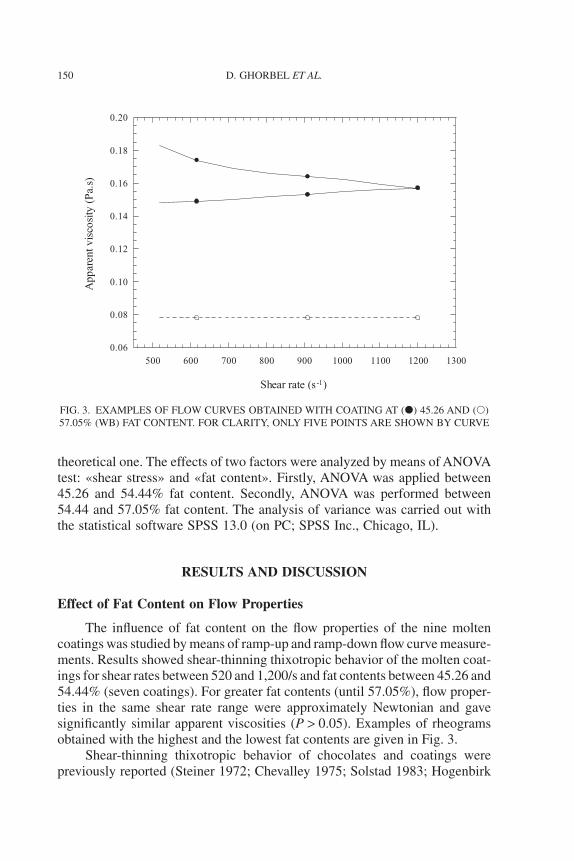
The influence of fat content on the flow properties of the nine moltencoatings was studied by means of ramp-up and ramp-down flow curve measure-ments. Results showed shear-thinning thixotropic behavior of the molten coat-ings for shear rates between 520 and 1,200/s and fat contents between 45.26 and54.44% (seven coatings). For greater fat contents (until 57.05%), flow proper-ties in the same shear rate range were approximately Newtonian and gavesignificantly similar apparent viscosities (P > 0.05). Examples of rheogramsobtained with the highest and the lowest fat contents are given in Fig. 3.
Shear-thinning thixotropic behavior of chocolates and coatings werepreviously reported (Steiner 1972; Chevalley 1975; Solstad 1983; Hogenbirk
0.06
0.08
0.10
0.12
0.14
0.16
0.18
0.20
500 600 700 800 900 1000 1100 1200 1300
App
aren
t vis
cosi
ty (
Pa.
s)
Shear rate (s-1)
FIG. 3. EXAMPLES OF FLOW CURVES OBTAINED WITH COATING AT (�) 45.26 AND (�)57.05% (WB) FAT CONTENT. FOR CLARITY, ONLY FIVE POINTS ARE SHOWN BY CURVE
150 D. GHORBEL ET AL.
1988; Servais et al. 2004). The shear-thinning behavior of a liquid is attributedto the decrease of the apparent viscosity when the shear rate increases. Whenit is accompanied by a time-dependency of the flow behavior (viscositydecreases with time for a given shear rate or the presence of hysteresis in theapparent viscosity [or shear stress] versus shear rate curve when increasing andsubsequent decreasing shear rates are applied), scientists suspect the presenceof thixotropy. This rheological behavior is observed when the internal structureof the material is disturbed by the flow-induced shear stresses and then gradu-ally recovered when stress is removed (Barnes et al. 1989). In the case ofmolten chocolates and coatings, at rest, short-range polar interactions maintainthe small solid particles (sugar, milk and cocoa) in contact in the form ofaggregates or network (structure). When a shear rate is applied, these aggre-gates would disrupt, diminish in size and then viscosity decreases (Servaiset al. 2004).
Newtonian behavior (i.e., independence of viscosity on the shear rate atgiven temperature and pressure) observed at high CO contents was due to excessof the continuous fat phase. This latter behaves like a Newtonian liquid. Whenfat content increased, the concentration of solid particles decreased, whichdecreased the particles volume fraction and the hydrodynamic forces involved;thus, the viscosity decreased and became independent of the shear rate.
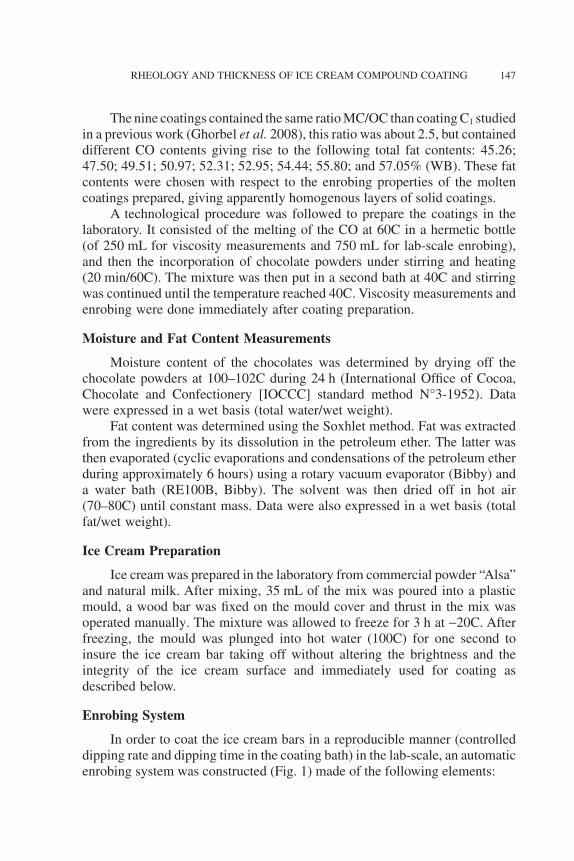
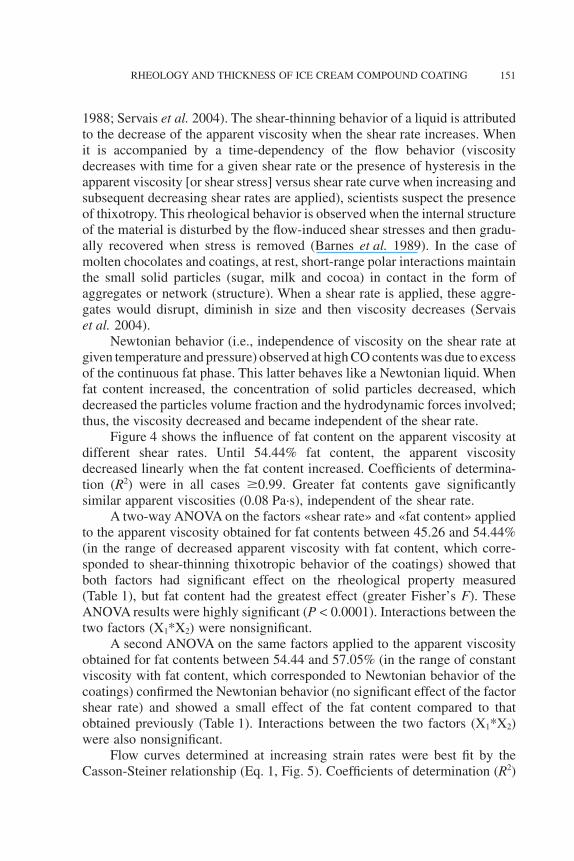
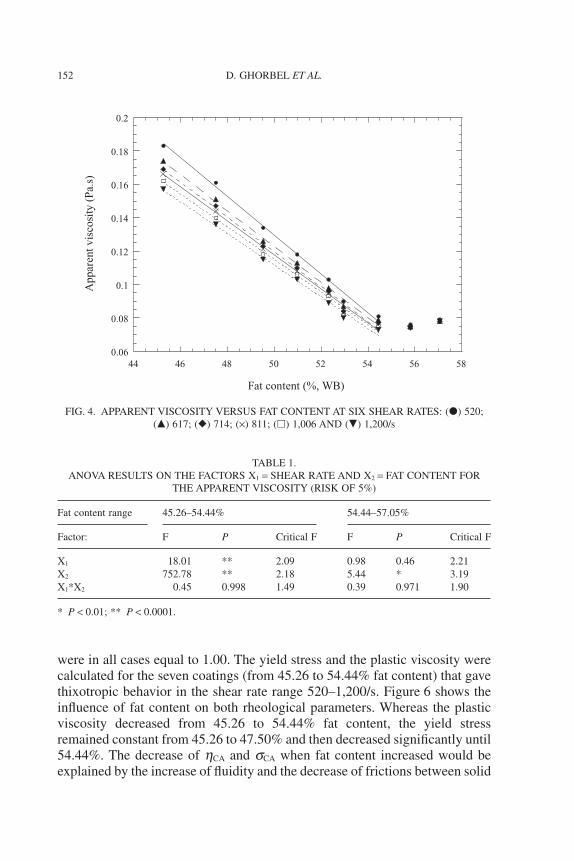
Figure 4 shows the influence of fat content on the apparent viscosity atdifferent shear rates. Until 54.44% fat content, the apparent viscositydecreased linearly when the fat content increased. Coefficients of determina-tion (R2) were in all cases �0.99. Greater fat contents gave significantlysimilar apparent viscosities (0.08 Pa·s), independent of the shear rate.
A two-way ANOVA on the factors «shear rate» and «fat content» appliedto the apparent viscosity obtained for fat contents between 45.26 and 54.44%(in the range of decreased apparent viscosity with fat content, which corre-sponded to shear-thinning thixotropic behavior of the coatings) showed thatboth factors had significant effect on the rheological property measured(Table 1), but fat content had the greatest effect (greater Fisher’s F). TheseANOVA results were highly significant (P < 0.0001). Interactions between thetwo factors (X1*X2) were nonsignificant.
A second ANOVA on the same factors applied to the apparent viscosityobtained for fat contents between 54.44 and 57.05% (in the range of constantviscosity with fat content, which corresponded to Newtonian behavior of thecoatings) confirmed the Newtonian behavior (no significant effect of the factorshear rate) and showed a small effect of the fat content compared to thatobtained previously (Table 1). Interactions between the two factors (X1*X2)were also nonsignificant.
Flow curves determined at increasing strain rates were best fit by theCasson-Steiner relationship (Eq. 1, Fig. 5). Coefficients of determination (R2)
RHEOLOGY AND THICKNESS OF ICE CREAM COMPOUND COATING 151
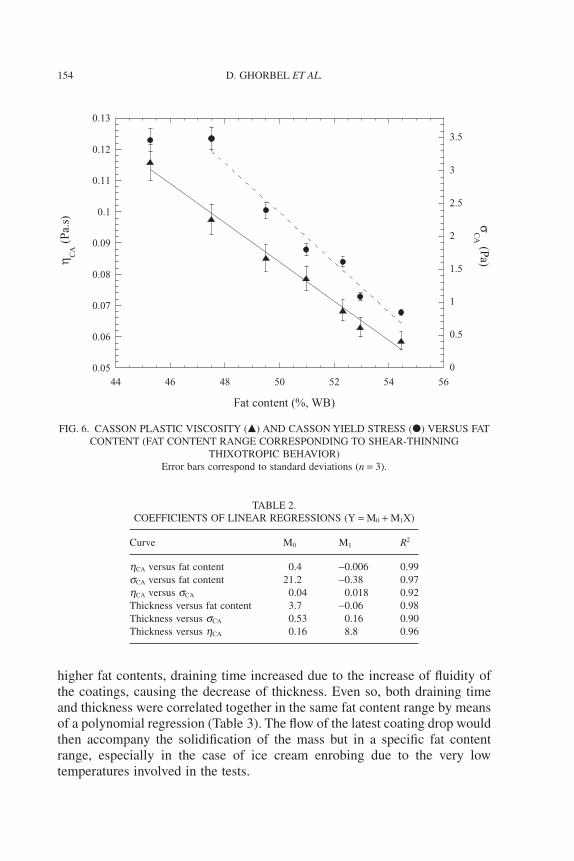
were in all cases equal to 1.00. The yield stress and the plastic viscosity werecalculated for the seven coatings (from 45.26 to 54.44% fat content) that gavethixotropic behavior in the shear rate range 520–1,200/s. Figure 6 shows theinfluence of fat content on both rheological parameters. Whereas the plasticviscosity decreased from 45.26 to 54.44% fat content, the yield stressremained constant from 45.26 to 47.50% and then decreased significantly until54.44%. The decrease of hCA and sCA when fat content increased would beexplained by the increase of fluidity and the decrease of frictions between solid
0.06
0.08
0.1
0.12
0.14
0.16
0.18
0.2
44 46 48 50 52 54 56 58
App
aren
t vis
cosi
ty (
Pa.
s)
Fat content (%, WB)
FIG. 4. APPARENT VISCOSITY VERSUS FAT CONTENT AT SIX SHEAR RATES: (�) 520;(�) 617; (�) 714; (¥) 811; (�) 1,006 AND (�) 1,200/s
TABLE 1.ANOVA RESULTS ON THE FACTORS X1 = SHEAR RATE AND X2 = FAT CONTENT FOR
THE APPARENT VISCOSITY (RISK OF 5%)
Fat content range 45.26–54.44% 54.44–57.05%
Factor: F P Critical F F P Critical F
X1 18.01 ** 2.09 0.98 0.46 2.21X2 752.78 ** 2.18 5.44 * 3.19X1*X2 0.45 0.998 1.49 0.39 0.971 1.90
* P < 0.01; ** P < 0.0001.
152 D. GHORBEL ET AL.

particles, respectively. Linear regressions were determined for hCA (from 45.26to 54.44% fat content) and sCA (from 47.50 to 54.44% fat content) (Table 2).
Chevalley (1999) studied the effect of fat content on the flow propertieson molten chocolate. He showed that, when fat content increased from 28 to34%, hCA decreased considerably, but when fat content increased from 34 to36%, hCA remained constant; sCA recorded an important decrease when fatcontent increased from 28 to 36%. To our knowledge, no literature is availableon the flow properties of molten coatings at higher fat contents used in themanufacture of ice cream bars.
Effect of Fat Content on Draining Time and Thickness
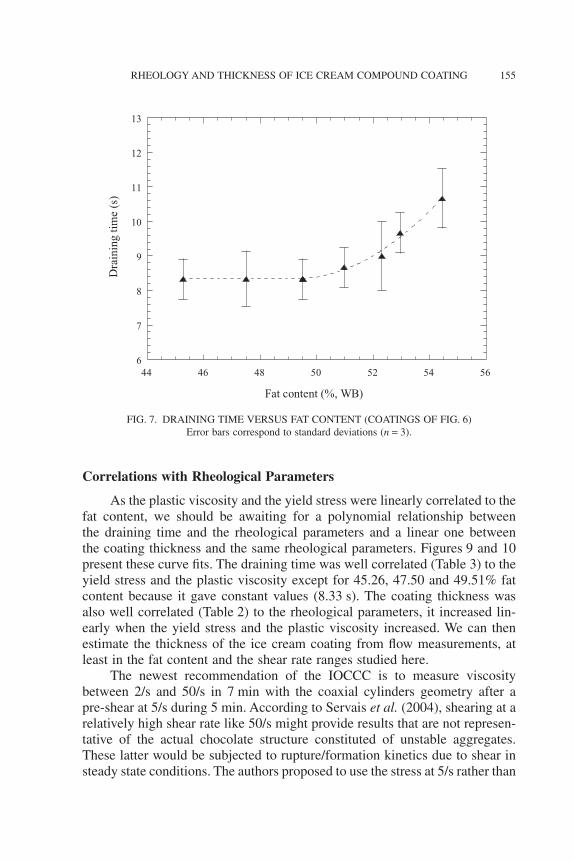
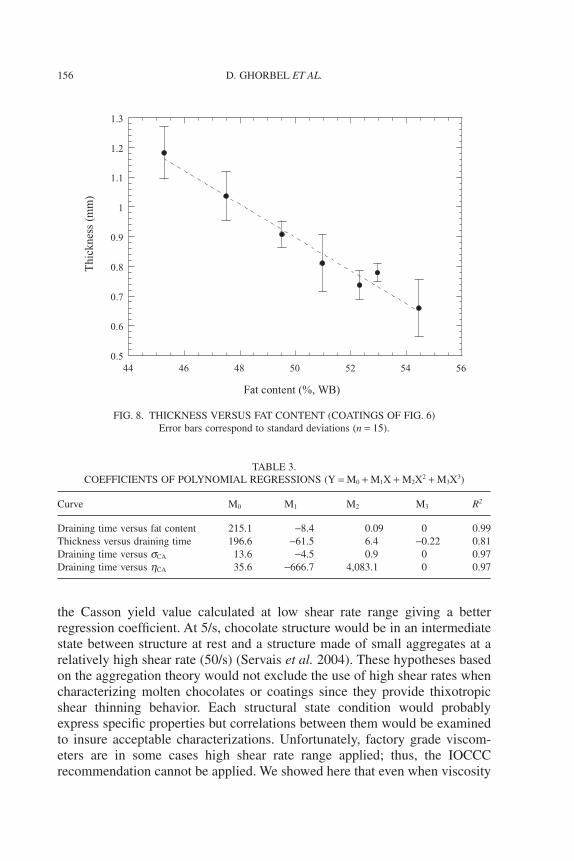
Both the coating’s draining time and thickness were drawn in front of thetotal fat content (Figs. 7 and 8). As fat content increased, draining time gavesimilar values until 49.51% fat content and then increased following a poly-nomial relationship (Table 3) but coating thickness decreased in a linear way(Table 2). Draining time as measured here did not explain the increase ofthickness when fat content decreased from 49.51 to 45.26%. Consequently, athigh viscosities draining time did not illustrate coating solidification. For
6
8
10
12
14
22 24 26 28 30 32
σ1/
2 (P
a)
γ 1/2 (s-1).
FIG. 5. CASSON RHEOGRAMS OBTAINED AT (�) 45.26, (�) 47.50, (�) 49.51, (D) 50.97,(�) 52.31, (�) 52.95 AND (�) 54.44% (WB) FAT CONTENT
For clarity, only six points are shown by curve.
RHEOLOGY AND THICKNESS OF ICE CREAM COMPOUND COATING 153
higher fat contents, draining time increased due to the increase of fluidity ofthe coatings, causing the decrease of thickness. Even so, both draining timeand thickness were correlated together in the same fat content range by meansof a polynomial regression (Table 3). The flow of the latest coating drop wouldthen accompany the solidification of the mass but in a specific fat contentrange, especially in the case of ice cream enrobing due to the very lowtemperatures involved in the tests.
0.05
0.06
0.07
0.08
0.09
0.1
0.11
0.12
0.13
0
0.5
1
1.5
2
2.5
3
3.5
44 46 48 50 52 54 56
Fat content (%, WB)
η CA (
Pa.
s) σC
A (Pa)
FIG. 6. CASSON PLASTIC VISCOSITY (�) AND CASSON YIELD STRESS (�) VERSUS FATCONTENT (FAT CONTENT RANGE CORRESPONDING TO SHEAR-THINNING
THIXOTROPIC BEHAVIOR)Error bars correspond to standard deviations (n = 3).
TABLE 2.COEFFICIENTS OF LINEAR REGRESSIONS (Y = M0 + M1X)
Curve M0 M1 R2
hCA versus fat content 0.4 -0.006 0.99sCA versus fat content 21.2 -0.38 0.97hCA versus sCA 0.04 0.018 0.92Thickness versus fat content 3.7 -0.06 0.98Thickness versus sCA 0.53 0.16 0.90Thickness versus hCA 0.16 8.8 0.96
154 D. GHORBEL ET AL.
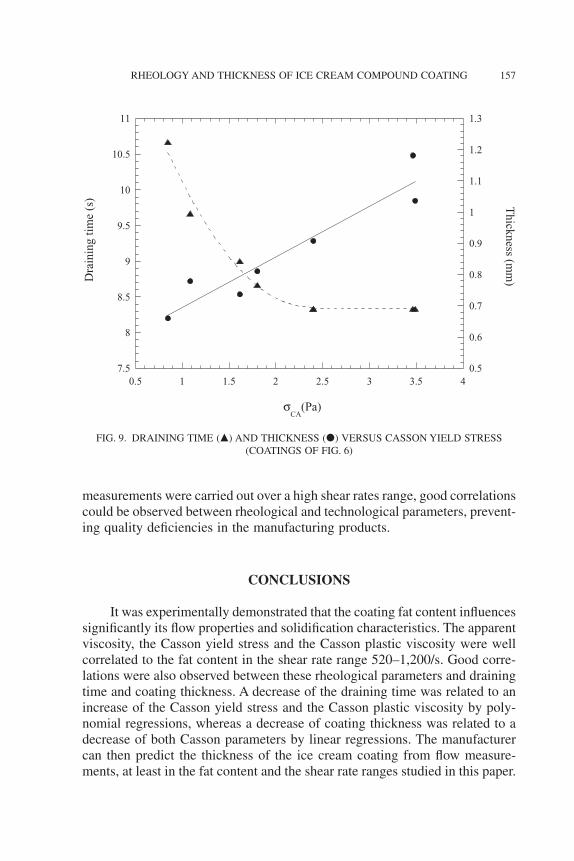
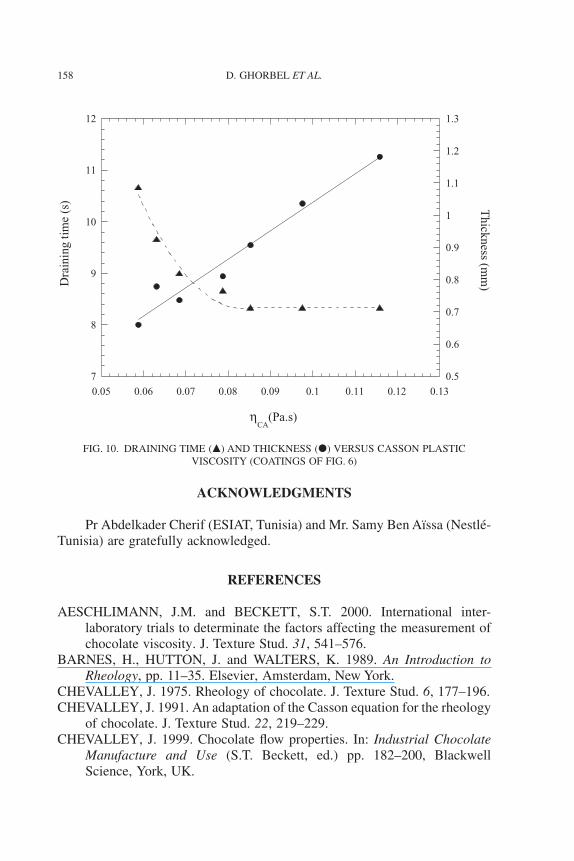
Correlations with Rheological Parameters
As the plastic viscosity and the yield stress were linearly correlated to thefat content, we should be awaiting for a polynomial relationship betweenthe draining time and the rheological parameters and a linear one betweenthe coating thickness and the same rheological parameters. Figures 9 and 10present these curve fits. The draining time was well correlated (Table 3) to theyield stress and the plastic viscosity except for 45.26, 47.50 and 49.51% fatcontent because it gave constant values (8.33 s). The coating thickness wasalso well correlated (Table 2) to the rheological parameters, it increased lin-early when the yield stress and the plastic viscosity increased. We can thenestimate the thickness of the ice cream coating from flow measurements, atleast in the fat content and the shear rate ranges studied here.
The newest recommendation of the IOCCC is to measure viscositybetween 2/s and 50/s in 7 min with the coaxial cylinders geometry after apre-shear at 5/s during 5 min. According to Servais et al. (2004), shearing at arelatively high shear rate like 50/s might provide results that are not represen-tative of the actual chocolate structure constituted of unstable aggregates.These latter would be subjected to rupture/formation kinetics due to shear insteady state conditions. The authors proposed to use the stress at 5/s rather than
6
7
8
9
10
11
12
13
44 46 48 50 52 54 56
Dra
inin
g ti
me
(s)
Fat content (%, WB)
FIG. 7. DRAINING TIME VERSUS FAT CONTENT (COATINGS OF FIG. 6)Error bars correspond to standard deviations (n = 3).
RHEOLOGY AND THICKNESS OF ICE CREAM COMPOUND COATING 155
the Casson yield value calculated at low shear rate range giving a betterregression coefficient. At 5/s, chocolate structure would be in an intermediatestate between structure at rest and a structure made of small aggregates at arelatively high shear rate (50/s) (Servais et al. 2004). These hypotheses basedon the aggregation theory would not exclude the use of high shear rates whencharacterizing molten chocolates or coatings since they provide thixotropicshear thinning behavior. Each structural state condition would probablyexpress specific properties but correlations between them would be examinedto insure acceptable characterizations. Unfortunately, factory grade viscom-eters are in some cases high shear rate range applied; thus, the IOCCCrecommendation cannot be applied. We showed here that even when viscosity
0.5
0.6
0.7
0.8
0.9
1
1.1
1.2
1.3
44 46 48 50 52 54 56
Thi
ckne
ss (
mm
)
Fat content (%, WB)
FIG. 8. THICKNESS VERSUS FAT CONTENT (COATINGS OF FIG. 6)Error bars correspond to standard deviations (n = 15).
TABLE 3.COEFFICIENTS OF POLYNOMIAL REGRESSIONS (Y = M0 + M1X + M2X2 + M3X3)
Curve M0 M1 M2 M3 R2
Draining time versus fat content 215.1 -8.4 0.09 0 0.99Thickness versus draining time 196.6 -61.5 6.4 -0.22 0.81Draining time versus sCA 13.6 -4.5 0.9 0 0.97Draining time versus hCA 35.6 -666.7 4,083.1 0 0.97
156 D. GHORBEL ET AL.
measurements were carried out over a high shear rates range, good correlationscould be observed between rheological and technological parameters, prevent-ing quality deficiencies in the manufacturing products.
CONCLUSIONS
It was experimentally demonstrated that the coating fat content influencessignificantly its flow properties and solidification characteristics. The apparentviscosity, the Casson yield stress and the Casson plastic viscosity were wellcorrelated to the fat content in the shear rate range 520–1,200/s. Good corre-lations were also observed between these rheological parameters and drainingtime and coating thickness. A decrease of the draining time was related to anincrease of the Casson yield stress and the Casson plastic viscosity by poly-nomial regressions, whereas a decrease of coating thickness was related to adecrease of both Casson parameters by linear regressions. The manufacturercan then predict the thickness of the ice cream coating from flow measure-ments, at least in the fat content and the shear rate ranges studied in this paper.
7.5
8
8.5
9
9.5
10
10.5
11
0.5
0.6
0.7
0.8
0.9
1
1.1
1.2
1.3
0.5 1 1.5 2 2.5 3 3.5 4
σCA
(Pa)
Dra
inin
g ti
me
(s) T
hickness (mm
)
FIG. 9. DRAINING TIME (�) AND THICKNESS (�) VERSUS CASSON YIELD STRESS(COATINGS OF FIG. 6)
RHEOLOGY AND THICKNESS OF ICE CREAM COMPOUND COATING 157
ACKNOWLEDGMENTS
Pr Abdelkader Cherif (ESIAT, Tunisia) and Mr. Samy Ben Aïssa (Nestlé-Tunisia) are gratefully acknowledged.
REFERENCES
AESCHLIMANN, J.M. and BECKETT, S.T. 2000. International inter-laboratory trials to determinate the factors affecting the measurement ofchocolate viscosity. J. Texture Stud. 31, 541–576.
BARNES, H., HUTTON, J. and WALTERS, K. 1989. An Introduction toRheology, pp. 11–35. Elsevier, Amsterdam, New York.
CHEVALLEY, J. 1975. Rheology of chocolate. J. Texture Stud. 6, 177–196.CHEVALLEY, J. 1991. An adaptation of the Casson equation for the rheology
of chocolate. J. Texture Stud. 22, 219–229.CHEVALLEY, J. 1999. Chocolate flow properties. In: Industrial Chocolate
Manufacture and Use (S.T. Beckett, ed.) pp. 182–200, BlackwellScience, York, UK.
7
8
9
10
11
12
0.5
0.6
0.7
0.8
0.9
1
1.1
1.2
1.3
0.05 0.06 0.07 0.08 0.09 0.1 0.11 0.12 0.13
ηCA
(Pa.s)
Dra
inin
g ti
me
(s) T
hickness (mm
)
FIG. 10. DRAINING TIME (�) AND THICKNESS (�) VERSUS CASSON PLASTICVISCOSITY (COATINGS OF FIG. 6)
158 D. GHORBEL ET AL.
GHORBEL, D., DOUIRI, I., ATTIA, H. and TRIGUI, M. 2008. Use ofmixture design and flow characteristics to formulate ice cream compoundcoatings. J. Food Process Eng. (accepted).
HOGENBIRK, G. 1988. Viscosity and yield value for chocolate and coatings.What they mean and how to influence them. Confect. Prod. 8, 456–478.
KARNJANOLARN, R. and MCCARTHY, K.L. 2006. Rheology of differentformulations of milk chocolate and the effect on coating thickness.J. Texture Stud. 37, 668–680.
KLEINERT, J. 1976. Rheology of chocolate. In: Rheology and Texture inFood Quality, pp. 445–473, The Avi Publishing Company Inc., Westport,CT.
MUSSER, J.C. 1980. The use of monoglycerides in chocolate and confection-ery coatings. Manuf. Confect. 60, 69–80.
RECTOR, D. 2000. Chocolate-controlling the flow. Manuf. Confect. 80,63–70.
ROSTAGNO, W. 1973. Rheological properties of chocolate. DechemaMonographien. 77, 283–293.
SCHANTZ, B. and ROHM, H. 2005. Influence of lecithin-PGPR blends onthe rheological properties of chocolate. Lebensm.-Wiss. u.-Technol. 38,41–45.
SEGUINE, E., MINSON, E., SOLSTAD, O., PIEPER, W., MARTIN, R.,ROBBINS, J.W., CHRISTIE, S., BRUKER, C. and BENSON, R. 1988.Method for determination of Casson value and plastic viscosity forchocolate. Manuf. Confect. 68, 72–75.
SERVAIS, C., JONES, R. and ROBERTS, I. 2002. The influence of particlesize distribution on the processing of food. J. Food Eng. 51, 201–208.
SERVAIS, C., RANC, H. and ROBERTS, I.D. 2004. Determination of choco-late viscosity. J. Texture Stud. 34, 467–497.
SOLSTAD, O. 1983. Viscosity properties of chocolate. Manuf. Confect. 63,41–42.
STEINER, E.H. 1972. Melted chocolate: measuring its viscosity. Manuf.Confect. 52, 24–28.
WICHCHUKIT, S., MCCARTHY, M.J. and MCCARTHY, K.L. 2005. Flowbehavior of milk chocolate melt and the application to coating flow.J. Food Sci. 70, E165–E171.
RHEOLOGY AND THICKNESS OF ICE CREAM COMPOUND COATING 159


