Embed Size (px)
Citation preview

International Journal of Biology Research
16
International Journal of Biology Research
ISSN: 2455-6548
Impact Factor: RJIF 5.22
www.biologyjournal.in
Volume 3; Issue 4; October 2018; Page No. 16-25
Standardisation and fermentation of milk cream with Lactobacillus plantarum and Streptococcus
thermophilus for minimal moisture content and free fatty acids
Sonia Angeline M1*, Challaraj Emmanuel ES2, Aleena Maria Joshy3, Sreelekshmi KR4 1-4 Kristu Jayanti College, K. Narayanapura, Kothanur, Bangalore, Karnataka, India
Abstract
Milk is a perishable food and can be converted into various fermented products such as cheese, butter, yogurt, butter milk, butter,
ghee, curd of which, curd fermentation is considered as the most valuable process as the products none of them go in vein. For
instance milk when fermented forms curd of which the upper fatty layer is butter which can be churned out and remaining water is
buttermilk which is considered as a natural cooling agent for the body. Another way of producing butter is by the fermentation of
cream that is the fatty layer collected from milk. Milk fermentation process has been relied on the activity of lactic acid bacteria,
where trans- formation of milk to good quality of fermented milk products is made possible. Milk fermentation is done with the
help of certain bacteria like Lactobacillus and Streptococcus sp. Both of them are promising cultures to be explored in fermented
milk manufacture.
Keywords: milk, fermentation, cream, butter, free fatty acid (FFA), moisture
1. Introduction
Milk is the pale creamish-white liquid produced by mammals
to nurture their young ones. It is considered as complete diet,
and consumed by most of the people. As far as Indian scenario
is considered India is the largest producer of milk and milk
products. The major components which are present in milk are
water, lactose, fat, protein, minerals and vitamins. Milk
contains approximately 87% of water and contains 4.7% of
carbohydrates in the form of lactose. The most essential
constituent of milk is its fat content, probably determining the
thickness of the milk. Milk contains approximately 3.4% fat.
The percentage of fat varies with the cattle. It contains 3.3%
of protein and all essential amino acids. Cream content might
vary from cattle to cattle. Cream can be further classified as
fresh cream and sour cream depending on the fermentation
and the acidity formed [1]. Sour cream is a dairy product
obtained by fermenting regular cream with certain kinds of
lactic acid bacteria. There are different types of cream, each of
which has different fat concentrations [2] single, cream
contains 18% of fat whereas double cream normally contains
30% of fat. The bacterial culture, which is introduced either
deliberately or naturally, sours and thickens the cream. The
production of lactic acid by bacterial fermentation is
called souring. Traditionally sour cream was produced by
fermenting the cream that was skimmed off from milk and
allowed to ferment at a moderate temperature [3].
The bacteria that developed during fermentation thicken the
cream and make sit more acidic, a natural way of preserving it [4]. Traditional sour cream contains 18% to 20 % butterfat.
Light sour cream has less butterfat than the regular sour
cream. Sour cream is not fully fermented similar to many
dairy products. Sour cream and cultured cream is
manufactured through the processing of cream that includes
pasteurization and the addition of lactic acid bacteria [5].
Cream is prepared from milk by centrifugal separation. Fresh
cream, (raw cream) is wholesome, thick and glossy with a
silken texture that suits dishes both sweet and savoury. The
fresh cream comes from fresh milk that is processed and
sterilized at high temperatures and then packaged. It contains
25% of milk fat that is unsweetened; it cannot be used as
whipping cream. Commercially available fresh creams are
best used to flavour, soups, curries etc. Without opening the
packet, fresh cream can be store up to 120 days from the
packaging. Cream fermentation modified nutritional and
textural properties of butter [6].
Butter is a fermented dairy product [7]. It contains 80% of fat,
which is solid when chilled and at room temperature in some
region and liquid when warmed. It is made by churning the
fresh cream or fermented milk to separate the butterfat from
butter milk. It is used as spread on bread and a condiment on
cooked vegetables, as well as in cooking, such as baking,
sauce making, and pan frying. Butter consist of butterfat, milk
protein and water, and in some types added salts [8]. Most
frequently made from cow’s milk, butter can be taken from
milk of other mammals also. Butter is water in oil emulsion
and is prepared by agitating cream. Butter contains fat in three
separate forms; free butterfat, butterfat crystals, and
undamaged fat globules. Churning produces small butter
grains floating in the water based portion of the cream [9]. This
watery liquid is called buttermilk. Commercially available
butter has about 80% butterfat and 15% water content,
traditionally made butter may have as little as 65% fat and
30% water. Butter made from fermented cream is known as
cultured butter. During fermentation, the cream soured, by
bacteria convert milk sugars into lactic acid. The cultured
cream is prepared by Lactobacillus, Leuconostoc bacteria.
Industrial production requires the use of starter cultures, which
are very carefully created, cultivated and maintained.

International Journal of Biology Research
17
Milk fermentation is done with the help of certain bacteria like
Lactobacillus sp [10]. Lactobacillus is a genus of gram positive,
facultative anaerobic bacteria. They are a major part of the
lactic acid bacteria group they convert sugar to lactic acid [11].
Milk sugars (mainly lactose) are fermented with the major
final product being lactic acid [12]. Lactic acid not only inhibits
the out‐growth of other organisms but also lowers the pH of
the food product imparting a special taste and texture to the
food in your mouth [13]. Some species of Lactobacillus are
used as the starter culture for yogurt, cheese, sauerkraut,
pickles etc. Lactobacillus plantarum is a widespread member
of the genus Lactobacillus, commonly found in fermented
food products as well as anaerobic plant matters. It has the
ability to liquefy gelatine [14]. These bacteria are cultured in
Man Rogosa and Sharpe agar (MRS) medium and have
significant antioxidant activities and also help to maintain the
intestinal permeability [15].
Streptococcus thermophilus is a bacterium of wide industrial
application. It is a gram positive, cocci bacteria and is
thermophilic in nature and grows at a temperature range above
37°. It is non-motile and doesn’t form any spores. The use of
this organism is in wide application because of their ability to
produce lactic acid [16]. Streptococcus thermophillus is a gram
positive bacterium and a fermentative bacterium, and
fermentative facultative anaerobes. It is also classified as
lactic acid bacteria. It is the most widely used bacteria in
fermentation industry [17]. Live cultures of these bacteria make
it easier for people who are lactose intolerant to digest dairy
product. The two organisms used in the experiment were
Lactobacillus plantarum and Streptococcus thermophilus, a
mesophile and thermophile respectively.
2. Materials and Method
2.1 Sample Collection
The lyophilized cultures of Lactobacillus plantarum (MTCC
9483) and Streptococcus thermophilus (MTCC9540) were
collected from Microbial type culture collection (MTCC)
Chandigarh.
2.2 Revival of Culture
The cultures were revived into MRS (Man, Rogosa and
Sharpe) agar by spread plate technique. Both the cultures were
maintained at 37° for 48 hrs, and then re-inoculated the same
in MRS agar.
2.3 Morphological examination of culture
Morphological and cultural examination of cream and pure
culture in MRS was carried out by using Gram staining
method described by Hans Christian Gram.
Identification of pure culture isolated on MRS agar medium
was done with the help of biochemical test like [18].
2.3.1 Catalase test This test was used to check the production of enzyme catalase.
For this test a clean microscopic slide was taken. A loopful of
bacterial culture was taken and mixed with 3% of H2O2
solution on the slide and the presence of the bubble production
was observed.
2.3.2 Oxidase test
Oxidase discs were used for detection of oxidase production
by microorganisms. Oxidase reaction was carried out by
touching and spreading a well isolated colony on the oxidase
disc. The reaction was observed within 5 – 10 seconds at 25 –
30°C. A change later than 10 seconds or no change at all was
considered as negative reaction.
2.4 Inoculum Preparation
About 500ml of full cream milk was boiled and cooled to
37°C. 100µL of L. plantarum and S.thermophilus cultures
were inoculated separately into two different beakers and
another beaker of mixed culture i.e. 100µLof both L.
plantarum and S. thermophilus [19, 20]. The milk was then
allowed to ferment for 48 hours. The titrable acidity was
checked with 0.1 N NaOH and phenolphthalein was used as
the indicator.
2.5 Fermentation of Cream
The initial acidity of the cream was estimated using titration
method and the fat was estimated by Gerbers method. About
100 ml of 40% fat cream was then transferred to 200ml paper
cups. All the tests were conducted in triplicates and total
number of cups for each organism at one particular
temperature amounted to 55 cups, including the control. The
total number of cups amounted to 275 cups. Each of the
inoculum were added at different concentrations (0.5%, 1.0%,
1.5%, 2.0%, 2.5%, and 3.0%) and incubated at various
temperatures 4°C, 18°C, 25°C, 37°C and 45°C respectively.
After 48hrs fermentation was stopped by transferring the
sample into refrigerator [21].
The cream was churned out to obtain butter. Churning was
done with the help of mixer grinder and continued until fat
granules stars floating on top. The butter is then drained to
remove the water and washed several times to remove curd if
any. This liquid is known as buttermilk. The acidity formed
after fermentation was calculated by titrimetric estimation of
buttermilk [22]. The butter was then stored at in a temperature
of -16°C for a period of 5 days to observe the free fatty acid
development.
2.6 Fat estimation by gerbers method
Estimation of fat is an important step in determining the
quality of the milk. The test was conducted by adding 10.75
ml of milk in a Gerber tube, followed by the addition of 10ml
of sulphuric acid and 1ml of iso-amyl alcohol in the Gerber
tube, permitting the dissolution of protein and release of fat.
The tubes are centrifuged and the fat rising into the calibrated
part of the tube was measured as a percentage of the fat
content of the cream sample [23].
2.7 Free Fatty Acid Estimation
The acidity (free fatty acid content) of fat is normally a
measure of the extent to which hydrolysis has liberated the
fatty acids from the ester linkage with the parent glyceride
molecule. Partly for this reason, acidity of ghee and butter is
extensively quoted as a free fatty acid content (% FFA). The
FFA content of fresh butter varies from 0.09 to 0.28% with an

International Journal of Biology Research
18
average of 0.16%. The sensory quality of butter deteriorates
with increase in FFA content. As per FSSAI Rules (2011),
butter should not contain FFA more than 3%. The FFA
present in ghee can be estimated by acid-base titration with
alkali (NaOH) using phenolphthalein as an indicator and the
end point to pink colour.
About 5g of the butter sample was added in 100 ml conical
flask. In an another flask 25ml of ethanol was brought to the
boiling point and while still above 70°C, it was neutralized
with phenolphthalein. The neutralized alcohol was added to
flask containing butter sample and was mixed and further
brought to boil. The acidity of butter is frequently expressed
as the percentage of free fatty acids in the sample, calculated
as oleic acid, using following
Normality of NaOH – 0.1
Normality of oleic acid – 28.2
(- IS 3508 – 1966 (Reaffirmed 1997) Methods of sampling and
test for Ghee (Butterfat) Bureau of Indian Standards, New
Delhi).
2.8 Moisture Test
Moisture test was done to determine the amount of water
content present in butter. The test was done in a hot air oven,
electrically or manually done mostly at a temperature of
105±5°C.The final weight after heating determines the amount
of moisture loss [24].
A. Moisture Dish: aluminium, nickel or ceramic with a deep
neck was preferred.
B. Desiccator: Containing an efficient desiccant.
C. Hot air oven: Electrically heated with thermostatic
control.
The test was conducted by accurately weighing about 5±0.5g
of the sample in a moisture dish which had been dried
previously and weighed. The dish was then placed in a hot air
oven for 1 hour at 105 ± 1°C.The dish was removed from the
oven, cooled in a desiccator and weighed. The process was
repeated by keeping the dish in the oven for 1 hour each time,
cooled and weighed till two successive weighing do not
exceed 1 mg.
Calculation
M1 - Mass in g of dish with butter before drying
M2 - Mass in g of dish with butter after drying
M - Mass in g of empty dish
3. Results and discussion
3.1 Morphological Characters
The gram staining of Lactobacillus palntarum (MTCC 9483)
revealed that it was a gram positive bacilli and Streptococcus
thermophillus (MTCC 9450) was observed as a gram positive
cocci under 100X magnification. Both the organisms appeared
as slimy, colonized and round on MRS media. Lactobacillus
palntarum showed negative result for catalase and oxidase test
whereas, Streptococcus thermophillus showed positive result
for catalase and oxidase test (Table 1).
Table 1: Morphological Characters
S.
No. Tests
Lactobacillus
palntarum
Streptococcus
thermophillus
1 Gram staining gram positive bacilli gram positive cocci
2 Catalase negative positive
3 Oxidase negative positive
3.2 Free fatty acid of fermented cream
Free fatty acid test (FFA) was performed to determine the
amount of oleic acid formed in butter, as a part of storage and
oxidation. The following results were observed during the test
of butter, least FFA value denotes less oxidation and thereby
better quality of butter.
At 4°C the control showed FFA of 0.36% (Table 2).
Table 2: Free fatty acid of fermented cream at 4°C
Free fatty acid of fermented cream AT 4°C
Inoculum
concentration in %
Percentage of free
fatty acid in control
Percentage of free fatty
acid with L.plantarum
Percentage of free fatty acid
with S.thermophilus
Percentage of free fatty
acid with Mixed Culture
0.5
0.36
0.48 0.39 0.44
1 0.54 0.41 0.45
1.5 0.49 0.56 0.49
2 0.54 0.56 0.42
2.5 0.53 0.56 0.49
3 0.53 0.56 0.49
The FFA level increased with increase in concentration, the
values ranging from 0.36% to 0.56% (Fig1). The highest FFA
(0.56%) was shown by butter inoculated with S.thermophilus
at a concentration of 1.5% to 3% (Fig 1). Lactobacillus
plantarum showed an increase in FFA ranging from 0.48% -
0.53% (Fig.1). Mixed culture showed an increase in FFA
ranging from 0.44%- 0.49% (Fig. 1).

International Journal of Biology Research
19
Fig 1: The graphical representation of free fatty acid of fermented cream at 4°C, the minimum being shown by S. thermophilus at a concentration
of 1.5%.
The cream which was fermented at 18°C had varied result.
The control showed an FFA of 0.67% (Table 3) much higher
than the butter that was fermented at 4ºC.
Table 3: Free fatty acid of fermented cream at 18°C
Free Fatty Acid Of Butter AT 18°C
Inoculum
concentration in %
Percentage of free
fatty acid in control
Percentage of free fatty
acid with L.plantarum
Percentage of free fatty acid
with S.thermophilus
Percentage of free fatty
acid with Mixed Culture
0.5
0.67
0.71 0.73 0.64
1 0.7 0.71 0.65
1.5 0.72 0.72 0.64
2 0.69 0.73 0.64
2.5 0.73 0.69 0.69
3 0.71 0.7 0.69
Nevertheless there wasn’t any significant increase in the
values. Notable value of decreased FFA was observed with all
the concentrations of mixed cultures. Least value was shown
by mixed culture i.e. 0.64% (Fig. 2).
Fig 2: The graphical representation of free fatty acid of fermented cream at 18°C, the minimum value of free fatty acid is shown by mixed culture
in all concentrations.

International Journal of Biology Research
20
The butter that was obtained at 25°C didn’t show much
variation with increase in concentration. The values almost
stood same the least been shown by S. thermophilus (0.61% of
acidity) at 0.5, 1.0 and 1.5 concentrations (Fig.3). The control
value was observed as 0.65% (Table.4). S. thermophilus
showed higher FFA value (0.81%) at 3% (Fig.3).
Table 4: Free fatty acid of fermented cream at 25°C
Free Fatty Acid Of Fermented Cream AT 25°C
Inoculum
concentration in %
Percentage of free fatty acid
in control
Percentage of free fatty
acid with L.plantarum
Percentage of free fatty acid
with S.thermophilus
Percentage of free
fatty acid with Mixed
Culture
0.5
0.65
0.64 0.61 0.67
1 0.66 0.61 0.66
1.5 0.67 0.61 0.66
2 0.73 0.73 0.66
2.5 0.71 0.7 0.67
3 0.69 0.81 0.66
Fig 3: The graphical representation of free fatty acid of fermented cream at 25°C, the minimum value of free fatty acid is shown by mixed culture
in all concentrations.
At 37°C the free fatty acid was almost equal in all
concentration in comparison with the control. The control
value was observed as 0.72% (Table 5) and other values
ranging from 0.78%to 0.89% (Fig.4). The range is less
significant.
Table 5: Free fatty acid of fermented cream at 37°C
Free fatty acid of fermented cream AT 37°C
Inoculum
concentration in %
Percentage of free fatty
acid in control
Percentage of free fatty acid
with L.plantarum
Percentage of free fatty acid
with S.thermophilus
Percentage of free fatty acid
with Mixed Culture
0.5
0.72
0.84 0.84 0.89
1 0.83 0.83 0.84
1.5 0.78 0.84 0.84
2 0.84 0.84 0.82
2.5 0.82 0.89 0.81
3 0.87 0.89 0.84

International Journal of Biology Research
21
Fig 4: The graphical representation of free fatty acid of fermented cream at 37°C, the minimum value of free fatty acid was shown by L.
Plantarum in a concentration of 1.5% inoculum.
All the FFA values of butter obtained in fermentation at 45°C
showed a lesser FFA with control. Control showed a FFA of
0.84% (Table 6). All the concentration thereby showed a
decrease in value with increase in concentration. This varied
for L. plantarum at 3% concentration with a FFA of 0.95 %
(Fig.5), an increased value than the butters in other
temperatures.
Table 6: Free fatty acid of fermented cream at45°C
Free fatty acid of fermented cream AT 45°C
Inoculum
concentration in %
Percentage of free fatty
acid in control
Percentage of free fatty acid
with L.plantarum
Percentage of free fatty acid
with S.thermophilus
Percentage of free fatty acid
with Mixed Culture
0.5
0.84
0.62 0.62 0.76
1 0.62 0.73 0.67
1.5 0.67 0.62 0.8
2 0.73 0.67 0.77
2.5 0.73 0.67 0.77
3 0.95 0.71 0.75
Fig 5: The graphical representation of free fatty acid of fermented cream at 45°C
3.3 Moisture of fermented cream
The amount of moisture should not increase more than 20% to
the weight of the butter. In the test it was observed that the
moisture of the control at 4° was found to be 21.4% (Table 7).
International Journal of Biology Research
22
An increase in moisture was observed for both L.plantarum
and mixed culture. The least level of moisture was observed
for butter by mixed culture at a concentration of 1% moisture
being 11.1% (Fig. 6).
Table 7: Moisture of fermented cream at 4°C
Moisture of fermented cream AT 4°C
Inoculum
concentration in %
Percentage of
moisture in control
Percentage of moisture
with L.plantarum
Percentage of o moisture
with S.thermophilus
Percentage of moisture
with Mixed Culture
0.5
21.4
19.7 20.2 24.6
1 19.2 18.2 11.1
1.5 30.6 18.1 31
2 16.9 18 12.9
2.5 15.7 18.1 13.3
3 22 22.2 11.7
Fig 6: Moisture of fermented cream at 4°C, least moisture is given by mixed culture at an inoculum concentration of 1%.
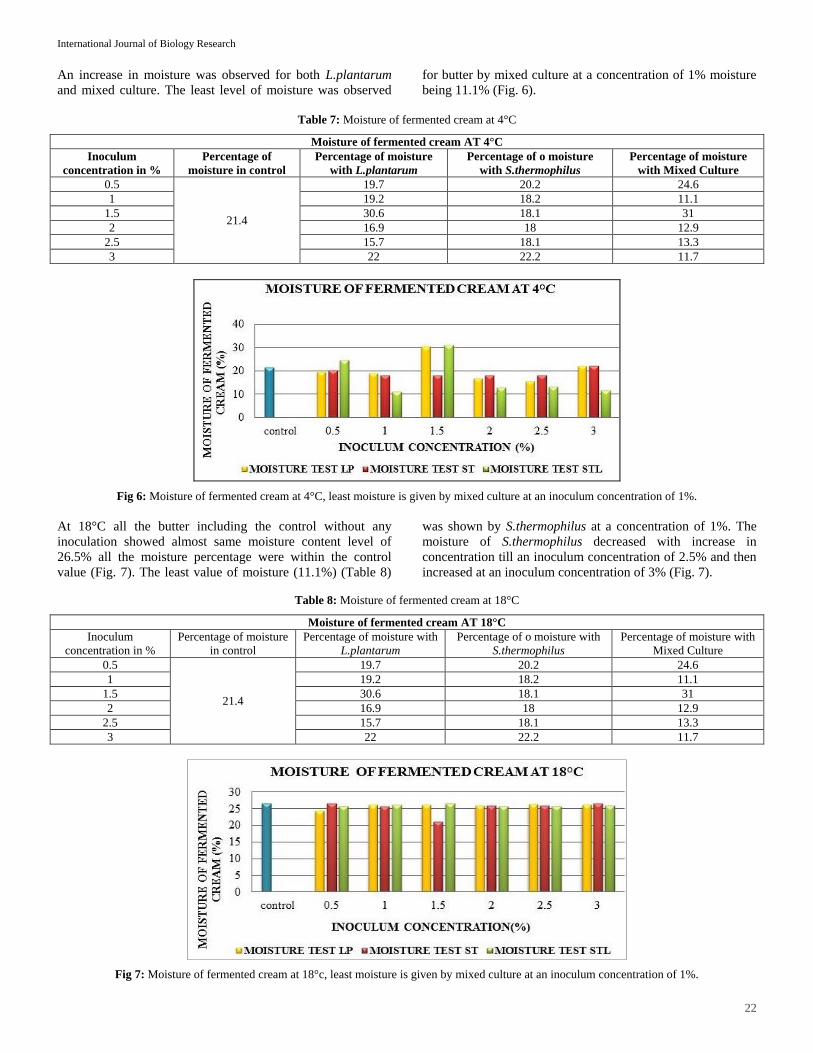
At 18°C all the butter including the control without any
inoculation showed almost same moisture content level of
26.5% all the moisture percentage were within the control
value (Fig. 7). The least value of moisture (11.1%) (Table 8)
was shown by S.thermophilus at a concentration of 1%. The
moisture of S.thermophilus decreased with increase in
concentration till an inoculum concentration of 2.5% and then
increased at an inoculum concentration of 3% (Fig. 7).
Table 8: Moisture of fermented cream at 18°C
Moisture of fermented cream AT 18°C
Inoculum
concentration in %
Percentage of moisture
in control
Percentage of moisture with
L.plantarum
Percentage of o moisture with
S.thermophilus
Percentage of moisture with
Mixed Culture
0.5
21.4
19.7 20.2 24.6
1 19.2 18.2 11.1
1.5 30.6 18.1 31
2 16.9 18 12.9
2.5 15.7 18.1 13.3
3 22 22.2 11.7
Fig 7: Moisture of fermented cream at 18°c, least moisture is given by mixed culture at an inoculum concentration of 1%.

International Journal of Biology Research
23
The moisture content at 25°C was variable. The control
showed a moisture level of 22%. There had been variations in
the level of moisture with increase in concentration of the
cultures. The least value of moisture was observed for mixed
culture (14% moisture) (Table 9) at a concentration of 3.0%.
Nevertheless the organism then onwards showed an increase
in moisture with the concentration but stayed below the
control level (Fig. 8).
Table 9: Moisture of fermented cream at 25°C
Moisture of fermented cream AT 25°C
Inoculum
concentration in %
Percentage of
moisture in control
Percentage of moisture
with L.plantarum
Percentage of o moisture
with S.thermophilus
Percentage of moisture
with Mixed Culture
0.5
22.5
24.1 26.7 26.4
1 25.2 28.8 28.4
1.5 26.7 9.28 30.8
2 19.4 15.5 21.2
2.5 24.6 16.1 21.6
3 26.2 17 14.3
Fig 8: Moisture of fermented cream fermented cream at 25°, minimum moisture shown by S. thermophilus at 2% inoculum concentration.
At 37°C the control showed a moisture level of 28.5% (Table
10), the highest moisture content was observed with S.
thermophilus at 0.5 and 2% concentration. But all the values
were significantly lesser than the control value. A comparative
analysis from the graph states that lesser moisture, more
favourable to the standard values was observed at 37°C (Fig
9).
Table 10: Moisture of fermented cream at 37°C
Moisture of fermented cream AT 37°C
Inoculum
concentration in % Percentage of moisture in control
Percentage of moisture
with L. plantarum
Percentage of o moisture
with S. thermophilus
Percentage of moisture
with Mixed Culture
0.5
28.5
23.7 32 25.8
1 23.6 18.2 26.1
1.5 24.1 26.1 26.5
2 24 32.2 25.7
2.5 25.1 25.9 25.8
3 24.5 26.5 25.9

International Journal of Biology Research
24
Fig 9: Moisture of fermented cream fermented cream at 37°C
The moisture level there by increased with increase in
temperature at 45°C (Table 11) all the butter showed an
increase level of moisture content with increase in
concentration and was above the control value. The highest
value being 47.2% (Fig10) was shown by L.plantarum at 3%
concentration.
Table 11: Moisture of fermented cream at 45°C
Moisture of fermented cream AT 45°C
Inoculum
concentration in %
Percentage of
moisture in control
Percentage of moisture
with L.plantarum
Percentage of o moisture
with S.thermophilus
Percentage of moisture
with Mixed Culture
0.5
30.7
41.3 44.75 31
1 43.5 45.01 34.7
1.5 42.1 40.35 30
2 34.8 45.2 17.9
2.5 36.4 42.74 25.3
3 47.2 42.88 31.7
Fig 10: Moisture of fermented cream fermented cream at 45°C,
minimum value shown by mixed culture at 2% concentration.
4. Conclusion
The organisms obtained from MTCC (L. plantarum and S.
thermophilus) were used to ferment the milk cream. There
was a noticeable change in the acidity of the cream after
fermentation. Highest acidity of 0.76% has been shown by L.
plantarum at a concentration of 3% at 37°C. Both the
organism individually as well as in combination showed an
increase in acidity at different temperatures and inoculum
concentrations. This signifies the ability of the organism to
ferment the cream and produce lactic acid.
The quality of butter obtained after churning process were
determined by free fatty acid and moisture test, during which
it was found that the FFA value increased with increase in
temperature of fermentation. Inoculum concentration had less
effect in determining FFA. The least value of free fatty acid
(0.39%) was shown by butter at 4°C and highest value of free
fatty acid (0.95%) was observed for butter at 45°C.
An optimum level of moisture was observed with butter
obtained at 18°C, 25°C and 37°C. But there was an increase in
moisture content at 45°C irrespective of the inoculum
concentration. In conclusion the inoculum concentration and
temperature had a role in the acidity formed by the organisms.
Moisture and FFA were greatly dependable on temperature
than inoculum concentrations. It was also observed that the
organisms showed better results in combination than
individual. Hence the organisms can potentially be used in the
fermentation of cream and hence produce butter of better
quality.
5. References 1. Tanuja SSP. Fermentation Technology, Published by
Agrobios, Jodhpur, 2008, 260-262.
2. http://ecoursesonline.iasri.res.in/mod/resource/view.php?i
d=5731
3. Chandan RC, Kilara A, Shah NP. Dairy Processing &
Quality Assurance, John Wiley & Sons, Inc, 2015, 18-46.
4. https://www.naturalnews.com/027845_probiotics_health.
html
5. Shepard L, Miracle RE, Leksrisompong P, Drake MA.

International Journal of Biology Research
25
Relating sensory and chemical properties of sour cream to
consumer acceptance. J Dairy Sci. 2013; 96(9):5435-
5454.
6. Ewe JA, Loo YSA. Effect of cream fermentation on
microbiological, physicochemical and rheological
properties of L. helveticus-butter. Food Chemistry. 2016;
201(15):29-36.
7. http://ecoursesonline.iasri.res.in/mod/page/view.php?id=5
759
8. http://www.webexhibits.org/butter/cooking-tips.html
9. Kalla AM, Sahu C, Agrawal AK, Bisen P, Chavhan BB,
Sinha G. Development and performance evaluation of
frustum cone shaped churn for small scale production of
butter. J Food Sci Technol. 2016; 53(5):2219-26.
10. Yantyati Widyastuti, Rohmatussolihat, Andi
Febrisiantosa. The Role of Lactic Acid Bacteria in Milk
Fermentation. Food and Nutrition Sciences. 2014;
5(4):8.
11. Nelson FE, Harriman LA, Hammer BW. Slow acid
production by butter cultures, Research Bulletin (Iowa
Agriculture and Home Economics Experiment Station).
1939; 23:256.
12. https://www.thoughtco.com/what-is-fermentation-608199
13. Roland J. Siezen and Herwig Bachmann. Genomics of
dairy fermentations. Microbial Biotechnology. 2008;
1(6):435-442.
14. Aguilar-Toalá JE1. Assessment of multifunctional
activity of bioactive peptides derived from fermented
milk by specific Lactobacillus plantarum strains. Dairy
Sci. 2016; S0022-0302(16):30817-7.
15. Nguyen TDT, Kang JH, Lee MS. Characterization
of Lactobacillus plantarum PH04, a potential probiotic
bacterium with cholesterol-lowering effects. International
Journal of Food Microbiology. 2007; 113(3):358-361.
16. Bancalari E, Bernini V, Bottari B, Neviani E, Gatti M.
Application of Impedance Microbiology for Evaluating
Potential Acidifying Performances of Starter Lactic Acid
Bacteria to Employ in Milk Transformation. Frontiers in
Microbiology. 2016; 7:1628.
17. Muñoz SV, Guerrero FQ, Torres MG, Castro MD,
Talavera RR. Transformation kinetics of fermented milk
using Lactobacillus casei (Lc1) and Streptococcus
thermophilus: comparison of results with other Inocula. J
Dairy Res. 2017; 84(1):102-108.
18. Amin M, Jorfi M, Khosravi A D, Samarbafzadeh AR,
Sheikh FA. Isolation and identification of Lactobacillus
casei and Lactobacillus plantarum from plant by PCR
and detection of their antibacterial activity. J. Biol. Sci.
2009; 9:810-814.
19. Renuka Goyal, Harish Dhingra, Pratima Bajpai, Navneet
Joshi. Characterization of the Lactobacillus isolated from
different curd samples. African Journal of Biotechnology.
2012; 11(79):14448-14452.
20. Labrie SJ, Tremblay DM, Plante PL, Wasserscheid J,
Dewar K, Corbeil J, et al. Complete Genome Sequence of
Streptococcus thermophilus SMQ-301, a Model Strain for
Phage-Host Interactions. Genome Announc. 2015; 3(3).
21. Claude Champagne P, Carole B. Côté. Cream
fermentation by immobilized lactic acid bacteria.
Biotechnology Letters. 1987; 9(5):329-333.
22. Escamilla-Hurtado ML1, Tomasini-Campocosio A,
Valdés-Martínez S, Soriano0-Santos J. Diacetyl
formation by lactic bacteria. Revista Latinoamericana de
Microbiologia. 2002; 38(2):129-137.
23. Ma Y, Barbano DM. Gravity separation of raw bovine
milk: fat globule size distribution and fat content of milk
fractions. J Dairy Sci. 2000; 83(8):1719-1727.
24. IS 3508 – 1966 (Reaffirmed 1997) Methods of sampling
and test for Ghee (Butterfat) Bureau of Indian Standards,
New Delhi.


