Embed Size (px)
Citation preview
INDUSTRIAL FOREST PRODUCT QUALITY: AN EMPIRICAL TEST OF GARVIN'S EIGHT
QUALITY DIMENSIONS
Steven A. Sinclair Professor
Department of Wood Science and Forest Products 1650 Ramble Road
Virginia Polytechnic Institute and State University Blacksburg, VA 2406 1-0503
Bruce G. Hansen Economist
USDA Forest Service Rt. 2, BOX 562-B
Princeton, WV 24740
and
Edward F. Fern Associate Professor
Department of Marketing Pamplin Hall
Virginia Polytechnic Institute and State University Blacksburg, VA 2406 1-0236
(Received February 1992)
ABSTRACT
A national sample of purchasing executives was asked to rate 26 product and dealerhnanufacturer attributes on the basis of their importance in assessing office furniture quality. Attributes were selected a priori to represent eight quality dimensions-performance, features, reliability, conformance, du- rability, serviceability, aesthetics and perceived quality. Results of confirmatory factor analysis failed to support the eight dimensional structure. However, subsequent exploratory factor analysis utilizing raw and transformed rating scores supported the existence of most dimensions. Results also suggest the combining of performance and feature dimensions, adding an economic (pricehalue) dimension, and the existence of a strong association between service and perception of overall quality.
Keywords: Office furniture, quality, service, price.
Few in business today have not wrestled with the strategic implications of product quality. Whether in goods or services, developing an effective quality strategy is one of the most important challenges facing top management today (Cravens et al. 1988; Ross and Shetty 1985). It is difficult even to discuss industrial marketing without focusing on the concept of product quality (White and Cundiff 1978). From a national perspective, poor quality is blamed for lagging U.S. foreign trade and
growing international competition. From the perspective of the firm, good product quality is associated with improved return on invest- ment, higher profits, increased market share, and lower costs (Garvin 1988, 1984a, b; Ja- cobson and Aaker 1987; Luchs 1986; Phillips et al. 1983; Shetty 1987). Quality has become the new "mantra" for corporate management (Bacon 1988) and has replaced price as the key determinant of market share and profit mar- gins (Ross and Shetty 1985).
Wood and Frber Srlcnce, 25(1), 1993, pp. 66-76 O 1993 by the Society o f Wood Science and Technology

~inclarr et a/. -A TEST OF QUALITY DIMENSIONS 6 7
WHAT IS QUALITY?
While most authors contend that product quality is complex and hard to define, they tend to agree that quality is based on product attributes that are largely defined by the cus- tomer (Garvin 1 984a; Shetty 1987; Takeuchi and Quelch 1983). Garvin advocates a deeper understanding of the customers' perspective as a necessary first step in defining product qual- ity. According to Garvin (1984a), "Quality is not a single recognizable characteristic; rather it is multifaceted and appears in many different forms." Consequently, he proposed eight fac- ets or dimensions of product quality.
The first dimension, performance, relates to the "primary operating characteristics" of the product. For example, in a sports car speed would be a performance attribute and, there- fore, one of the dimensions used to assess the quality of the sports car.
Second, features are secondary characteris- tics of a product or the "bells and whistles" (Garvin 1987). Features may be highly visible but not necessarily primary or even important characteristics ofthe product. A sun roof might be a feature that is used by some customers to assess quality, but it is not instrumental in making performance judgments. Moreover, the distinction between performance and features is ambiguous. As Garvin notes, in many cases the distinction between primary performance characteristics and secondary features is one of relative importance to a particular customer or user group.
Third, reliability indicates the degree to which a product can be counted on to perform as expected and for which the odds of failure are small. Reliability includes such things as mean time to first failure, mean time between failures, and failure rate per unit of time (Gar- vin 1987).
Fourth, conformance relates to the degree a product's design and operating characteristics match preestablished standards. Does the product conform to standards or do what it is supposed to do? Or, are there frequent dis- appointments? Examples of conformance fail-
ures include lost mail, delays in airline depar- tures, incorrect bank statements, misspelled labels, and shoddy construction (Garvin 1987).
Durability is the fifth dimension and reflects the economic or physical life of the product. It also encompasses concerns over a product's availability: that is, if the product breaks down, can it be brought back into service quickly? Thus, whether or not a product is designed so that repairs can be made simply, and without specialized personnel, should have an impact on perceptions of durability. Durability is also affected by repair costs, the cost of downtime, the relative prices of replacement products, and other economic factors.
The sixth dimension, serviceability, is con- cerned with the ease with which the product can be serviced, the time required for service, the quality of the repair service, and the com- petence and professionalism of the service per- sonnel.
Aesthetics is seventh and refers to attributes that appeal to the senses such as looks, feel, taste, smell, and so on. Aesthetics also recog- nizes superiority in fit and finish. This dimen- sion is probably the most subjectively evalu- ated of the eight.
Finally, dimension number eight is perceived quality. The perceived quality of a product is concerned more with images originating from advertising, brand identification, and previous experiences than with the actual product char- acteristics. A product's history and affiliation with superior quality through its market po- sitioning affect its perceived quality. As might be expected, perceived quality is similar to aes- thetics in terms of being a very subjective di- mension. Both, however, help shape first im- pressions of product quality and subsequently affect buyer behavior.
Garvin's dimensions of quality are reason- able and would appear to be useful for indus- trial forest products. However, to date no re- search has been uncovered that supports the validity of this quality definition. The major goal of this manuscript is to report the results of a research project that tested Garvin's the- oretical notions. Each of the eight dimensions
6 8 WOOD AND FIBER SCIENCE, JANUARY 1993, V. 25(1)
was operationalized as sets of attributes chosen to fit Gamin's descriptions. Industrial pur- chasers were surveyed and the data were factor analyzed either to accept or to reject Garvin's model. The details of this study and the results follow.
METHODOLOGY
To test Garvin's notions, decisions had to be made about the selection of the industrial forest product, the relevant attributes, the sample, and who the primary respondents should be.
Product selection
Office furniture was selected as the product category for this research. Although Garvin's theoretical notions were being tested in this research project, a major concern was the adaptability of his quality dimensions to an array of industrial forest products.
Moriarty and Reibstein (1986), in a study of industrial product-markets, gave four cri- teria they used to maximize the generalizabil- ity of their results.
The product exists in a competitive market. The purchase of the product is relatively im-
portant to the operation of the acquiring company.
In the buying companies, the purchase de- cision process must potentially involve a number of functional areas and levels of management.
The product has a broad market and is pur- chased by different types and sizes of busi- nesses.
It is our belief that these four criteria fit office furniture very well and indicate that the results of the study using office furniture should be generalizable to other products.
Attribute selection
The choice of office furniture as the product category helped solve the second problem, se- lecting product attributes. A number of re- searchers have identified attributes that orga- nizational purchasers use to select and purchase
office furniture (Anderson 1 976, 1973; Anon. 1985; Crawford et al. 1983). In addition, ar- ticles in the general marketing literature pro- vided other more generic attributes that helped fill the voids in Garvin's attribute structure (Alpert 197 1; Heeler et al. 1979; Lehmann and O'Shaughnessy 1974; McAleer 1974; Moriarty and Reibstein 1986; Myers and Alpert 1968; Ozanne and Churchill 197 1). The selected at- tributes and the dimensions they were expect- ed to measure are provided in Table 1.
The two most difficult dimensions to select attributes for were performance and secondary features. Not only does Gamin indicate the difficulties involved in distinguishing between the two, but attributes used to define these dimensions are closely related to individual purchaser preferences. Attributes selected to represent these dimensions were chosen on the basis of their relation to the individual pur- chaser. For instance, the ability to enhance user status, acoustic properties, worker productiv- ity, and the multifunctional nature of the prod- uct all relate to the individual purchaser or user.
Garvin (1984b) did not explicitly include price or value in his dimensions, stating that price is a correlate of quality. However, the price/quality relationship has been given so much attention in the marketing literature (Monroe 1973; Monroe and Dodds 1988) that price and value were included under the fea- ture dimension.
Attribute selections were constrained so that each of Garvin's eight quality dimensions were represented by at least three attributes to meet the requirements of attribute structure analysis (Peter 1979). The hypothesis tested in this re- search was that the twenty-six product and dealer/manufacturer attributes best represent- ed the eight dimensional or factor structure illustrated in Table 1.
Choice of survey respondent
Industrial purchasing is characterized by multiperson involvement in the purchase de- cision process (Crow and Lindquist 1985; Ghingold 1985; Sheth 1973; Spekman and
Sinelair et al. -A TEST OF QUALITY DIMENSIONS 69
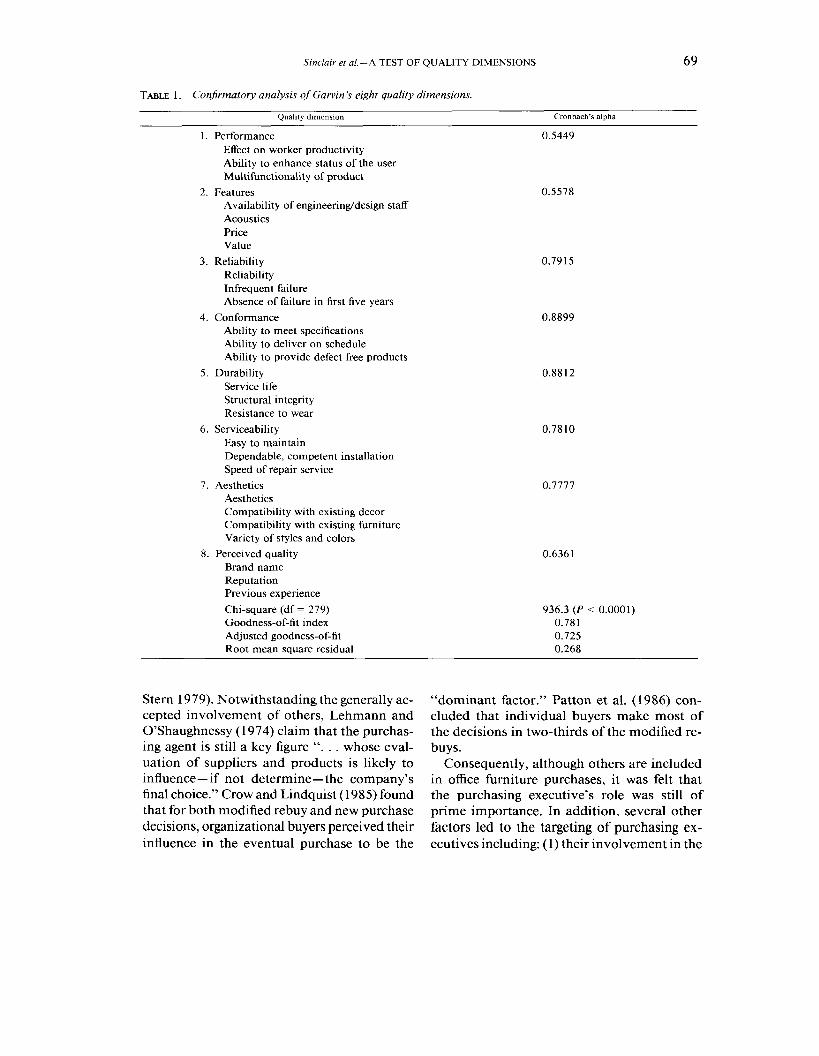
TABLE 1. Conjrmatory analysis of Carvin's eight quality dimensions.
Oualitv dunension Cronbach's ahha
I . Performance 0.5449 Effect on worker productivity Ability to enhance status of the user Multifunctionality of product
2. Features Availability of engineeringldesign staff Acoustics Price Value
3. Reliability Reliability Infrequent failure Absence of failure in first five years
4. Conformance Ability to meet specifications Ability to deliver on schedule Ability to provide defect free products
5. Durability Service life Structural integrity Resistance to wear
6. Serviceability Easy to maintain Dependable, competent installation Speed of repair service
7. Aesthetics Aesthetics Compatibility with existing decor Compatibility with existing furniture Variety of styles and colors
8. Perceived quality Brand name Reputation Previous experience
Chi-square (df = 279) 936.3 (P < 0.0001) Goodness-of-fit index 0.781 Adjusted goodness-of-fit 0.725 Root mean square residual 0.268
Stem 1979). Notwithstanding the generally ac- cepted involvement of others, Lehmann and O'Shaughnessy (1 974) claim that the purchas- ing agent is still a key figure ". . . whose eval- uation of suppliers and products is likely to influence-if not determine-the company's final choice." Crow and Lindquist (1 985) found that for both modified rebuy and new purchase decisions, organizational buyers perceived their influence in the eventual purchase to be the
"dominant factor." Patton et al. (1986) con- cluded that individual buyers make most of the decisions in two-thirds of the modified re- buys.
Consequently, although others are included in office furniture purchases, it was felt that the purchasing executive's role was still of prime importance. In addition, several other factors led to the targeting of purchasing ex- ecutives including: ( I ) their involvement in the

70 WOOD AND FIBER SCIENCE, JANUARY 1993, V. 25(1)
purchase process for office furniture is assured regardless of how many other individuals may be involved; (2) only purchasing executives have the experience to adequately rate dealer/ manufacturer services; and (3) purchasing ex- ecutives can be readily identified within the organization.
The sampling frame
A total of 606 purchasing executives were mailed a four-page questionnaire. Names and addresses were purchased from a commercial mailing list containing over 90,000 entries for purchasing executives throughout the United States. The following constraints were im- posed on the selection of individual purchasing executives: ( I ) only one person was chosen per firm so that respondents represented a broad array of businesses; (2) firms represented by the purchasing executives had to employ at least 100 persons; and (3) an equal number of manufacturing and nonmanufacturing firms had to be represented. Within the constrained listing, indilliduals were randomly selected.
Survey response
After two mailings of the questionnaire and the mailing of a separate follow-up letter in between, 139 responses were received. Allow- ing for "no forwarding address" returns and nonuseable returns (Dillman 1978) this rep- resented a response rate of nearly 26 percent. Patton et al. (1 986) reported a response of 482 out of 4,000 or an unadjusted rate of 12.5 per- cent in a similar survey. Thus, response to the survey was considered acceptable.
Several questions ofa descriptive nature were included on the questionnaire to check non- response bias by comparing early and late re- turns. If differences were detected, they would have indicated possible nonresponse bias, as late respondents tend to be more like nonre- spondents (Fowler 1984).
No significant differences were found to exist between early and late respondents on the basis of years of experience, education, and firm sales. However, early respondents bought sig- nificantly more furniture in the previous year and represented companies that employed
more people than did late respondents. This indicates that survey respondents may have purchased more furniture and may have rep- resented firms with larger employment than nonrespondents, but that does not diminish the utility of the attribute ratings received. In fact, if anything, it suggests that the respon- dents had a greater involvement in office fur- niture purchasing and a better knowledge base from which to rate attributes than did the gen- eral population of purchasing executives.
Each respondent was asked to rate attributes for each of two types of office furniture (con- ventional and panel and modular systems) re- sulting in 278 observations. However, because confirmatory factor analysis calls for listwise deletion of missing values, 29 observations had to be dropped. Consequently, the analyses were run on 249 observations.
ANALYSIS
LISREL 7 (Joreskog and Sorbom 1989) was used to perform a confirmatory factor analysis on Garvin's eight quality dimensions. Princi- pal components factor analysis was used to perform exploratory factor analyses.
Confirmatory factor analysis
The hypothesis that guided this research was that the quality of an industrial forest product can be defined by Garvin's eight quality di- mensions. Technically, if Garvin's definition of quality is to be accepted, the eight factor structure should accurately reproduce the co- variance matrix (i.e., the eight dimensional model should fit the data). One indicator of the model's fit, the chi-square test statistic, provided strong evidence against Garvin's eight dimensional structure of quality [x2(df = 279) = 936.61. However, Bagozzi and Yi (1988) point to the sensitivity of the chi-square sta- tistic to large sample sizes (i.e., chi-square in- creases proportionately to sample size) and suggest how it is possible to have conflicting indicators. For relatively large sample sizes, the chi-square statistic will be large, resulting in rejecting the null hypothesis. Therefore, oth- er measures need to be evaluated.
Two additional measures of fit are the good-

Slnclair et al. - A TEST OF QUALITY DIMENSIONS
ness-of-fit and adjusted goodness-of-fit. These measures indicate the amount of variance and covariance jointly accounted for by the model and range in value from 0.0 to 1.0. Bagozzi and Yi (1988) suggest a value of 0.9 for the adjusted goodness-of-fit index to be the lower bound for indicating that the model fits the data. Thus, the calculated value of 0.725 is considerably below the cut-off and provides further indication that Garvin's model does not adequately fit the data.
The root mean square residual is another measure that is used to evaluate model fit. Roughly, this index indicates error variance in the model-the less the better. A value of more than 0.1 indicates problems with the model or lack of congruence between the model and the data (Bagozzi and Yi 1988). The reported root mean square residual (rmsr = 0.268) provides still additional evidence that the model doesn't fit the data. At least for the product category and attribute structure used in this study, Gar- vin's eight dimensions were not supported.
Internal consistency
The internal consistencies of the original quality dimensions were analyzed using Cron- bach's alpha to see if a lack of internal consis- tency (reliability) could have accounted for the findings. The cut-off used to determine if a dimension was internally consistent was 0.60 (Bagozzi and Yi 1988; Peter 1979). Ofthe eight dimensions analyzed, Performance (alpha =
0.55) and Features (alpha = 0.56) failed to achieve the 0.60 consistency level (Table 1). Consequently, it was decided to use explora- tory factor analysis in an attempt to discover an alternative attribute structure.
Exp1orator.v factor analysis
In exploratory factor analysis, unlike con- firmatory factor analysis, variables that mea- sure each common factor are not identified prior to estimation. Rather, variables or attri- butes are permitted to load on all factors, and only after loadings have been estimated are judgments made as to which variables are measuring what factors (Dillon and Goldstein 1984).
Variables with loadings (correlations) of less than 50 were dropped. This Dillon and Gold- stein (1 984, p. 70) refer to as the test of "prac- tical significance." Stevens (1 986, p. 353) also cites an example in which attention is limited to loadings greater than 50, despite the fact that loadings as low as 34 are statistically sig- nificant. Earlier (p. 344) Stevens states: "Once one is confident that the loadings being used for interpretation are significant . . . , then the question becomes which loadings are large enough to be practically significant."
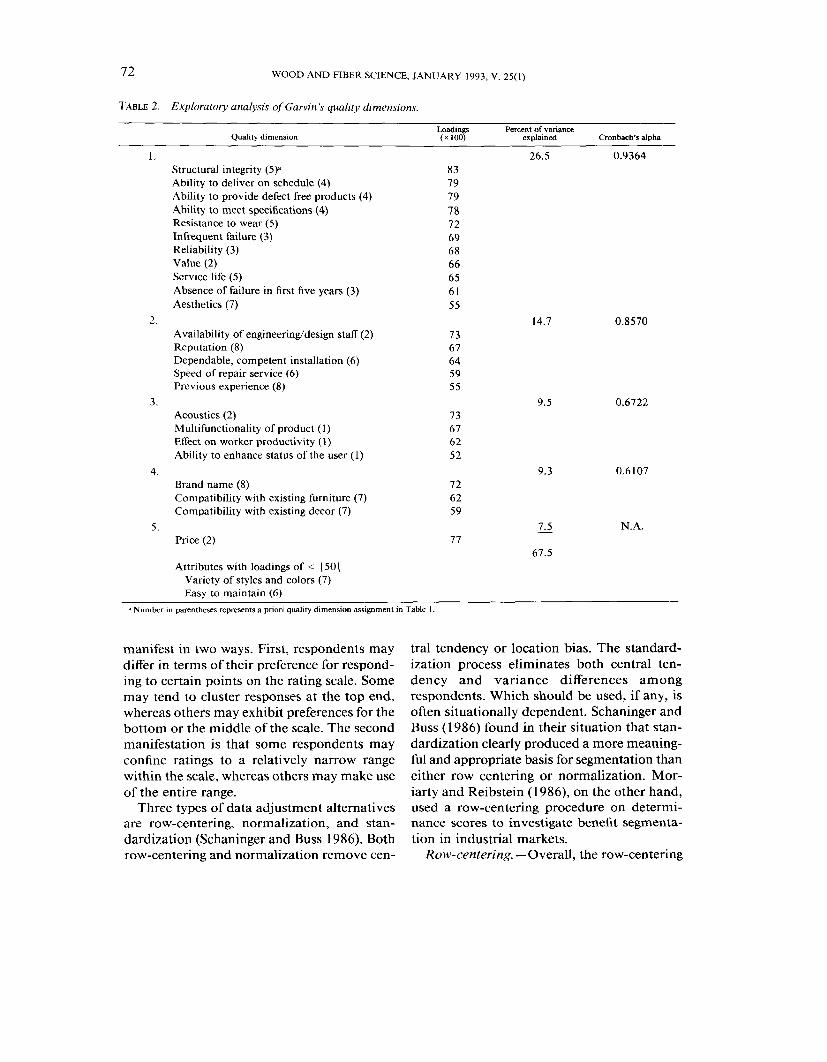
Principal components factor analysis with varimax rotation resulted in a five factor so- lution (Table 2). Factor retention was based on the SAS default option, which calls for re- taining only those components whose eigen- values are greater than 1. This criterion, of- fered by Kaiser in 1960, is according to Stevens (1 986, p. 34 I), probably the most widely used in determining the number of factors to be retained.
Two attributes failed to achieve a factor loading of 50 on any factor. These were variety of styles and colors (an aesthetic dimension attribute) and easy to maintain (a serviceabil- ity dimension attribute). Attributes chosen to represent three of Garvin's dimensions-con- formance, durability and reliability-all com- bined into one 1 l -attribute factor that ex- plained 26.5 percent of the variance in the attribute set. This model did generate a ser- vice/perceived quality dimension, a perfor- mancelfeature dimension, and an aesthetic dimension. However, recognizing that re- sponse style bias (Schaninger and Buss 1986) can affect response to interval scaled inquiries, several data transformations were investigated to see if they might provide additional delin- eation of the conformance, durability and re- liability dimensions.
Data transformation
Schaninger and Buss (1 986) suggest that dif- ferences in respondent tendencies, referred to as response-style bias, may introduce un- wanted error into rating scale scores. Wilkie and Pessemier (1973) referred to this as "idio- syncratic" response bias. Response bias is
7 2 WOOD AND FIBER SCIENCE, JANUARY 1993, V. 25(1)
TABLE 2. Exploratory analysis ofGawin's quality dimensions.
Quality dimension Loadings Percent of variance ( x 100) explained Cronbach's alpha
Structural integrity (5)" Ability to deliver on schedule (4) Ability to provide defect free products (4) Ability to meet specifications (4) Resistance to wear (5) Infrequent failure (3) Reliability (3) Value (2) Service life (5) Absence of failure in first five years (3) Aesthetics (7)
L.
Availability of engineeringldesign staff (2) 7 3 Reputation (8) 67 Dependable, competent installation (6) 64 Speed of repair service (6) 59 Previous experience (8) 55
3. Acoustics (2) Multifunctionality of product (1) Effect on worker productivity (1) Ability to enhance status of the user (1)
4. 9.3 Brand name (8) 72 Compatibility with existing furniture (7) 62 Compatibility with existing decor (7) 59
5. 7.5 - Price (2) 77
67.5 Attributes with loadings of < (50 (
Variety of styles and colors (7) Easy to maintain (6)
.' Number in parentheses represents a priori quality dimension assignment in Table I.
manifest in two ways. First, respondents may differ in terms of their preference for respond- ing to certain points on the rating scale. Some may tend to cluster responses at the top end, whereas others may exhibit preferences for the bottom or the middle of the scale. The second manifestation is that some respondents may confine ratings to a relatively narrow range within the scale, whereas others may make use of the entire range.
Three types of data adjustment alternatives are row-centering, normalization, and stan- dardization (Schaninger and Buss 1986). Both
tral tendency or location bias. The standard- ization process eliminates both central ten- dency and variance differences among respondents. Which should be used, if any, is often situationally dependent. Schaninger and Buss (1 986) found in their situation that stan- dardization clearly produced a more meaning- ful and appropriate basis for segmentation than either row centering or normalization. Mor- iarty and Reibstein (1986), on the other hand, used a row-centering procedure on determi- nance scores to investigate benefit segmenta- tion in industrial markets.
row-centering and normalization remove cen- Row-centering. -Overall, the row-centering
Sinclair et nl. - A TEST OF QUALITY DIMENSIONS 73
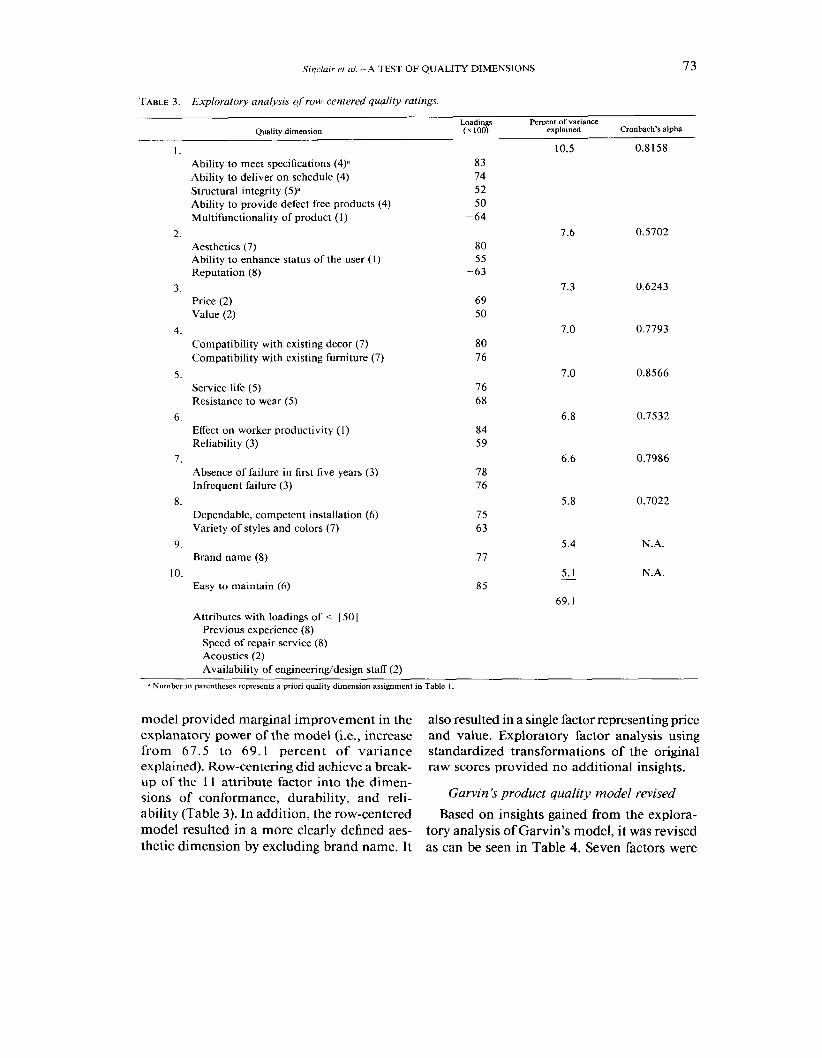
TABLE 3. Exploratory analysis of row-centered quality ratings.
Loadings Percent of variance Oualitv dimension ( x 100) explained Cronbach's alpha
Ability to meet specifications (4)" 83 Ability to deliver on schedule (4) 74 Structural integrity (5)" 52 Ability to provide defect free products (4) 50 Multifunctionality of product (1) - 64
L.
Aesthetics (7) 80 Ability to enhance status of the user (1) 5 5 Reputation (8) -63
3. Price (2) 69 Value (2) 50
4. Compatibility with existing decor (7) Compatibility with existing furniture (7)
5. Service life (5) Resistance to wear (5)
6 . Effect on worker productivity (I) Reliability (3)
7. Absence of failure in first five years (3) Infrequent failure (3)
8. Dependable, competent installation (6) Variety of styles and colors (7)
9. Brand name (8)
10. Easy to maintain (6)
Attributes with loadings of < 150 1 Previous experience (8) Speed of repair service (8) Acoustics (2) Availability of engineeringldesign staff (2)
" Number In parentheses represents a priori quality dimension assignment in Table I .
model provided marginal improvement in the explanatory power of the model (i.e., increase from 67.5 to 69.1 percent of variance explained). Row-centering did achieve a break- up of the 1 1 attribute factor into the dimen- sions of conformance, durability, and reli- ability (Table 3). In addition, the row-centered model resulted in a more clearly defined aes- thetic dimension by excluding brand name. It
also resulted in a single factor representing price and value. Exploratory factor analysis using standardized transformations of the original raw scores provided no additional insights.
Garvin 's product quality model revised
Based on insights gained from the explora- tory analysis of Garvin's model, it was revised as can be seen in Table 4. Seven factors were

74 WOOD AND FIBER SCIENCE, JANUARY 1993, V. 25(1)
TABLE 4. Confirmation analysis of revised Garvin dimensions.
Quality d~mens~on Cronbach's alpha
1. Performance/features 0.6722 Acoustics (2p Multifunctionality of product (1) Effect on worker productivity (I) Ability to enhance status of the user (1)
2. Reliability Absence of failure in first five years (3) Infrequent failure (3)
3. Conformance Ability to meet specifications (4) Ability to deliver on schedule (4) Ability to provide defect free products (4)
4. Durability Structural integrity (5) Service life (5) Resistance to wear (5)
5. Service/perceived quality Dependable, competent installation (6) Reputation (8) Speed of repair service (6) Previous experience (8)
6. Aesthetics Compatibility with existing decor (7) Compatibility with existing furniture (7)
7. Economic Price (2) Value (2)
Chi-square (df = 156) 353.5 (P < 0.001) Goodness-of-fit index 0.878 Adjusted goodness-of-fit 0.836 Root mean square residual 0.087
, Number in parentheses represents a priori quality dimension assignment from Table 1 .
specified rather than Garvin's eight, but, in general, the revised model is not substantively different from the original model. Six attri- butes were dropped because they showed no consistent association with any factor or be- cause their factor loadings were too low and/ or coefficient alpha increased for the particular factor when they were dropped.
LISREL was used to evaluate the fit of the revised model. All statistical measures of mod- el fit were improved over those derived from the original 26 attribute construct. The chi- square value went from 936.3 to 353.5. Also, the goodness-of-fit index increased to 0.8 78, the adjusted goodness-of-fit index to 0.836, and the residual mean square dropped well
below the requisite 0.1. Finally, all factors ex- hibited coefficient alphas above 0.6 indicating that each of the seven quality dimensions were internally consistent and reasonably reliable.
DISCUSSION
For a company or industry to develop an effective quality strategy, it must first define quality from a customer perspective. Garvin proposed the existence of eight dimensions to provide a framework for formulating quality initiatives. These dimensions are: perfor- mance, features, reliability, conformance, du- rability, serviceability, aesthetics, and per- ceived quality. Despite this study's initial failure to confirm empirically Garvin's eight

Sinclair et a/. -A TEST OF QUALITY DIMENSIONS 75
quality dimensions using confirmatory factor analysis, subsequent investigation using ex- ploratory factor analysis and transformed at- tribute ratings provided support for most, if not all, of Garvin's eight quality dimensions.
Of particular interest is that the difficulty Garvin expressed over separation of perfor- mance and secondary feature attributes seemed to exist among buyers of office furniture. Fur- ther, while Garvin's eight quality dimensions failed to explicitly include price and/or value, these two attributes formed a separate dimen- sion. Consequently, in seeking to operation- alize quality dimensions, it seems best to elim- inate making distinctions between performance and feature attributes and include explicit rec- ognition of an economic (price/value) dimen- sion.
One other observation ofnote from this study is the close association of perceived quality and service. The importance of providing quality service is widely discussed in the more recent quality literature. Those investigating the market for office furniture have also dis- cussed the growing need for dealers and man- ufacturers to provide services-particularly those selling systems products. Sonnenberg (1989) cites a company survey of nearly 2,400 customers in which the number one reason for switching to the competition was poor service.
What this investigation found, however, is that quality assessments derived from services offered are not isolated to the service function. In fact, the services offered and the quality of those services significantly impact the per- ceived quality of the entire company and its product(s). Consequently, a company that fails to provide services or whose service quality is not up to par may negatively affect the quality perceptions of its physical products as well (Kasper and Lemmink 1989). Thus, actions taken to improve product quality may not af- fect overall perceptions. Companies may well be perceived through people and through the services they provide as much or more than through the actual physical product.
Three modifications of Gamin's quality di- mensions are suggested. First, the performance
and the feature dimension may well be com- bined as it may be impractical, if not impos- sible, to divide attributes along these lines. Garvin is correct in his assertion that the dis- tinction many times lies with the individual. Second, a separate dimension should be in- cluded for price and value. The current eight dimension construct offered by Garvin does not explicitly provide for recognition of the price quality relationship. Third, the percep- tions of quality are related as much to services as they are to reputation and previous expe- rience.
CONCLUSIONS
Quality of industrial forest products can be viewed as being multifaceted. Through this in- vestigation, Garvin's theoretical dimensions of quality were largely confirmed. At least in this study, quality can be operationalized using seven dimensions; Performance/Features, Re- liability, Conformance, Durability, Service/ Perceived Quality, Aesthetics, and Economics. Especially noteworthy for industrial marketing managers was the strong association between service and perceived quality. Industrial mar- keting managers can use these dimensions as a framework to understand better how their customers view quality. Marketing strategy formulation should address these dimensions and pay particular attention to those dimen- sions critical for a given customer segment.
REFERENCES
ALPERT, MARK I. 197 1 . Identification of determinant attributes: A comparison of methods. J. Marketing Res. 8(May): 184-19 1 .
ANDERSON, R. BRUCE. 1973. Factors influencing the se- lection of state office furniture. USDA For. Sew. Res. Paper NE-266.
. 1976. Factors influencing selection of office fur- niture by corporations and universities. USDA For. Sew. Res. Paper NE-343.
ANONYMOUS. 1985. The future of the office products industry. Prepared by the Wharton Applied Research Center, University of Pennsylvania, for the National Office Products Association, Alexandria, VA.
BACON, KENNETH H. 1988. The outlook: Higher quality helps boost U.S. products. Wall Street J., Jan. 1 1 , 1988: 1 .
BAGOZZI, R. P., ANDYOUJAEYI. 1988. On the evaluation

7 6 WOOD AND FIBER SCIENCE, JANUARY 1993, V. 25(1)
of structural equation models. J. Acad. Marketing Sci. 1 6(Spring):74-94.
CRAVENS, DAVID W., CHARLES W. HOLLAND, CHARLES W. LAMB, JR., AND WILLIAM C. MONCRIEF 111. 1988. Mar- keting's role in product and service quality. Ind. Mar- keting Mgmt. 17(November):285-304.
CRAWFORD, C. MERLE, MARTIN R. WARSHAW, AND ROBERT M. TANK. 1983. The future of the office furniture in- dustry. National Office Products Association, Alexan- dria, VA.
CROW, LOWELL E., AND JAY D. L~NDQUIST. 1985. Impact of organizational and buyer characteristics on the buying center. Ind. Marketing Mgmt. 14:49-58.
DILLMAN, DON A. 1978. Mail and telephone surveys: The total design method. John Wiley and Sons, New York, NY.
DILLON, WILLIAM R., AND MATTHEW GOLDSTEIN. 1984. Multivariate analysis methods and applications. John Wiley and Sons, New York, NY.
FOWLER, FLOYD J. 1984. Suwey research methods. SAGE Publications, Beverly Hills, CA.
GARVIN, DAVID A. 1984a. Product quality: An impor- tant strategic weapon. Bus. Horizons 27(May/June):40- 43.
. 1984b. What does 'product quality' really mean? Sloan Mgmt. Rev. 26(Fa11):25-43.
1987. Competing on the eight dimensions of quality. Harvard Bus. Rev. 87(November/December): 101-109.
-. 1988. Managing quality -The strategicand com- petitive edge. The Free Press, New York, NY.
GHINGOLD, MORRY. 1985. A social process examination of organizational buying behavior. Ph.D. dissertation, The Pennsylvania State University, College Station, PA.
HEELER, ROGER, CHIKE OKECHUKU, AND STAN REID. 1979. Attribute importance: Contrasting measure- ments. J. Marketing Res. 16(Febmary):60-63.
JACOBSON, ROBERT, AND DAVID A. AAKER. 1987. The strategic role of product quality. J . Marketing 5 l(October):3 1 4 4 .
JORESKOG, KARL G., AND DAG SORBOM. 1989. LISREL 7: A guide to the program and applications, 2nd ed. SPSS Inc., Chicago. IL.
KAISER, H. F. 1960. The application of electronic com- puters to factor analysis. Educational and Psychological Measurement. 20: 14 1-1 5 1.
KASPER, HANS, AND JOS. LEMMINK. 1989. After sales service quality: Views between industrial customers and service managers. Ind. Marketing Mgmt. 18(August): 199-208.
LEHMANN. DONALD R., AND JOHN ~'SHAUGHNESSY. 1 974. Difference in attribute importance for different indus- trial products. J. Marketing 38(April):36-42.
LUCHS, ROBERT. 1986. Successful businesses compete on quality-not costs. Long Range Planning 19(February): 12-17.
MCALEER, GORDON. 1974. Do industrial advertisers un-
derstand what influences their markets? J. Marketing 38(January): 15-23,
MONROE, KENT B. 1973. Buyer's subjective perceptions of price. J. Marketing Res. 10(February):70-80.
, AND WILLIAM B. DODDS. 1988. A research pro- gram for establishing the validity of the price-quality relationship. J. Acad. Marketing Sci. 16(Spring): 15 1- 168.
M O R I A R ~ , ROWLAND T., AND DAVID J. REIBSTEIN. 1986. Benefit segmentation in industrial markets. J. Bus. Res. 1 4(December):463-486.
MYERS, RAYMOND H., AND MARK I. ALPERT. 1968. De- terminant buying attitudes: Meaning and measurement. J. Marketing 32(0ctober): 13-20.
OZANNE, URBAN B., AND GILBERT A. CHURCHILL. 197 1. Five dimensions of the industrial adoption process. J. Marketing Res. 8(August):322-328.
PATTON, W. E., 111, CHRISTOPHER P. PUTO, AND RONALD H. KING. 1986. Which buying decisions are made by individuals and not by groups? Ind. Marketing Mgmt. 15(May):129-138.
PETER, J. PAUL. 1979. Reliability: A review of psycho- metric basics and recent marketing practices. J. Mar- keting Res. 16(February):6-17.
PHILLIPS, LYNN W., DAE R. CHANGE, AND ROBERT D. BUZZELL. 1983. Product quality, cost position, and business performance: A test of some key hypotheses. J. Marketing 49(Spring):2643.
Ross, JOEL, AND Y. KRISHNA SHE^. 1985. Making quality a fundamental part of strategy. Long Range Plan- ning 18(February):53-57.
SCHANINGER, CHARLES M., AND W. CHRISTIAN BUSS. 1986. Removing response-style effects in attribute-de- terminance ratings to identify market segments. J. Bus. Res. 14(June):237-252.
SHETH, JAGDISH N. 1973. A model of industrial buyer behavior. J. Marketing 37(0ctober):50-56.
SHEW, Y. K. 1987. Product quality and competitive strategy. Bus. Horizons 30(May/June):46-52.
SONNENBERG, FRANK K. 1989. Service quality: Fore- thought, not afterthought. J. Bus. Strategy I O(September): 54-57.
SPEKMAN, ROBERT E., AND LOUIS W. STERN. 1979. En- vironmental uncertainty and buying group structure: An empirical investigation. J. Marketing 43(Spring):54-64.
STEVENS, JAMES. 1986. Applied multivariate statistics for the social science. Lawrence Erlbaum Assoc. Inc., Hills- dale, NJ. 5 15 pp.
TAKEUCHI, HIROTOKA, AND J. A. QUELCH. 1983. Quality is more than making a good product. Harvard Bus. Rev. 83(July/August): 139-145.
WHITE, PHILLIP D., AND EDWARD W. CUNDIFF. 1978. As- sessing the quality of industrial products. J. Marketing 42(January):80-86.
WILKIE, WILLIAM L., AND EDGAR A. PESSEMIER. 1973. Issues in marketing's use of multi-attribute attitude models. J. Marketing Res. lO(November):428441.


