Embed Size (px)
Citation preview

Galley Proof
_____________________________________________________________________________________________________ *Corresponding author: E-mail: [email protected];
British Journal of Economics, Management & Trade 13(4): 1-11, 2016, Article no.BJEMT.25092
ISSN: 2278-098X
SCIENCEDOMAIN international www.sciencedomain.org
Empirical Analysis of the Relationship between Industrial Performance and Macroeconomic Factors
in Ghana
Frederick Mensah1, Grace Ofori-Abebrese1 and Robert Becker Pickson2*
1Department of Economics, Kwame Nkrumah University of Science and Technology, Kumasi, Ghana.
2Research and Consultancy Center, University of Professional Studies, Accra, Ghana.
Authors’ contributions
This work was carried out in collaboration between all authors. All authors read and approved the final manuscript.
Article Information
DOI: 10.9734/BJEMT/2016/25092
Editor(s): (1) Kamarulzaman Ab. Aziz, Deputy Dean of R&D, Faculty of Management, Multimedia University,
Persiaran Multimedia, Malaysia. Reviewers:
(1) Faris Nasif ALshubiri, Dhofar University, Oman. (2) Kenneth Chukwujioke Agbim, University of Agriculture, Makurdi, Nigeria.
(3) Anonymous, Turkey. Complete Peer review History: http://sciencedomain.org/review-history/14546
Received 17th
February 2016 Accepted 26
th April 2016
Published 9th May 2016
ABSTRACT
The conscious attempt to ascertain the wide range of macroeconomic factors that drive industrial production in Ghana necessitated this study. The main purpose of this study is to ascertain the impact that macroeconomic factors have on industrial performance in Ghana over the period 1980 to 2013. The Autoregressive Distributed Lag Model was employed to examine the long run and the short run dynamics of macroeconomic factors and industrial output. The study found cointegration relationship between industrial output and the macroeconomic factors. The results indicated that the major macroeconomic factors that affect industrial performance in Ghana are lending rate (+), inflation (+), employment (+) and government expenditure (+). Based on the findings, the study recommends that the government of Ghana should stabilize the macroeconomic environment of Ghana in order to achieve industrial growth and development.
Keywords: Industrial output; government expenditure; inflation; employment; lending rate.
Original Research Article
Galley Proof
Mensah et al.; BJEMT, 13(4): 1-11, 2016; Article no.BJEMT.25092
2
JEL Classification: E23, H50, E31, E24, E43
1. INTRODUCTION Industrialization plays a crucial role in putting underdeveloped countries on the path to economic development. The industrial sector in most recent economies functions as the driving force for the creation of goods and services, the enhancement of incomes and the creation of employment [1]. For instance termed industry and precisely the manufacturing sub-sector as the heart of the economy. The historical and empirical facts portray that, all the developed countries that have been able to break the vicious cycle of underdevelopment achieved that by embarking on a vigorous industrialization. Pushing the industrial sector from its current third position to first considering its share to GDP is the major long-term policy objective of Ghana. However, this policy objective has not produced the required results. This means that the industrial sector is still struggling to resuscitate itself from the precipitous contribution to GDP decline that started in the year 2000. For instance in the year 2005, the composition of agriculture, industry and service in GDP were 39.5%, 27.6% and 32.9% respectively [2].
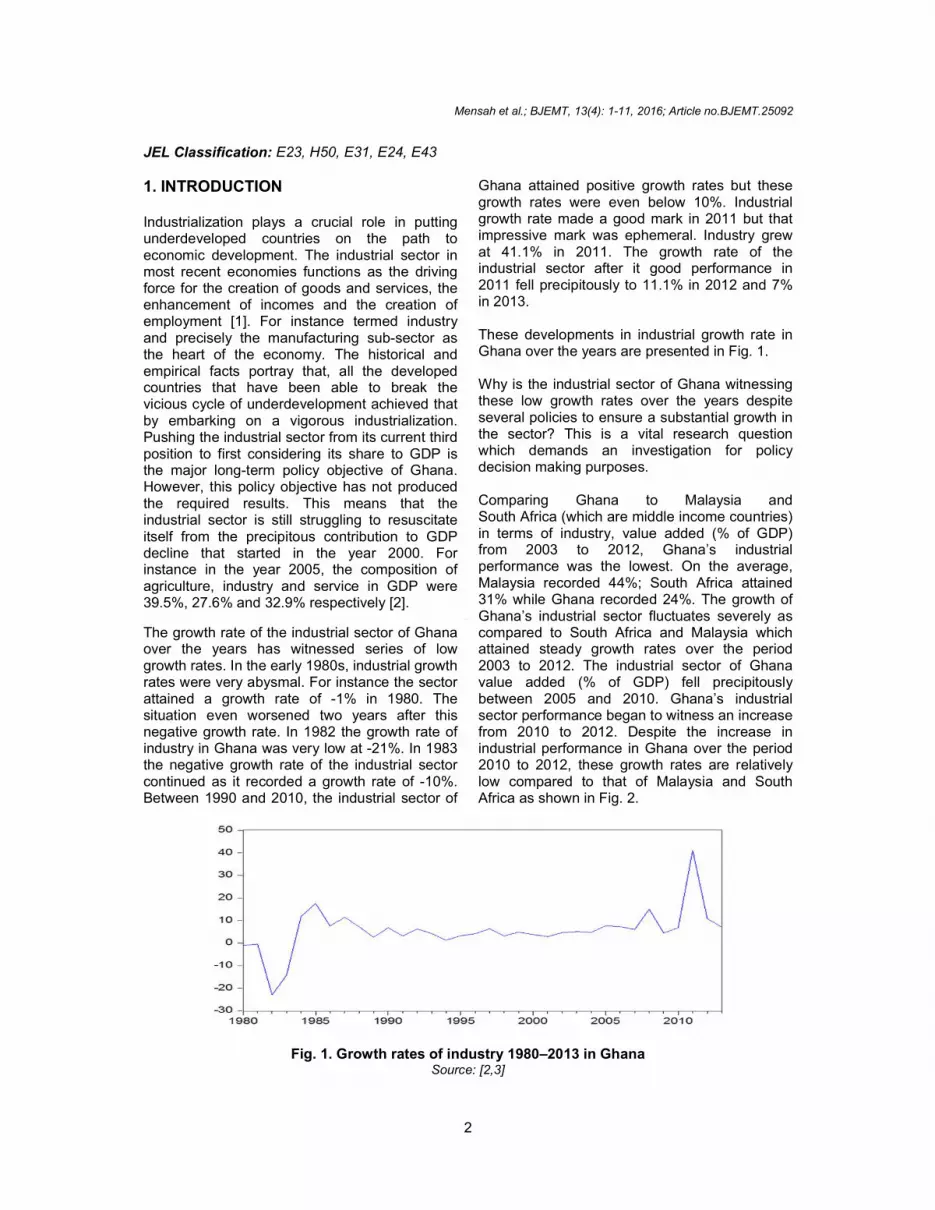
The growth rate of the industrial sector of Ghana over the years has witnessed series of low growth rates. In the early 1980s, industrial growth rates were very abysmal. For instance the sector attained a growth rate of -1% in 1980. The situation even worsened two years after this negative growth rate. In 1982 the growth rate of industry in Ghana was very low at -21%. In 1983 the negative growth rate of the industrial sector continued as it recorded a growth rate of -10%. Between 1990 and 2010, the industrial sector of
Ghana attained positive growth rates but these growth rates were even below 10%. Industrial growth rate made a good mark in 2011 but that impressive mark was ephemeral. Industry grew at 41.1% in 2011. The growth rate of the industrial sector after it good performance in 2011 fell precipitously to 11.1% in 2012 and 7% in 2013. These developments in industrial growth rate in Ghana over the years are presented in Fig. 1. Why is the industrial sector of Ghana witnessing these low growth rates over the years despite several policies to ensure a substantial growth in the sector? This is a vital research question which demands an investigation for policy decision making purposes. Comparing Ghana to Malaysia and South Africa (which are middle income countries) in terms of industry, value added (% of GDP) from 2003 to 2012, Ghana’s industrial performance was the lowest. On the average, Malaysia recorded 44%; South Africa attained 31% while Ghana recorded 24%. The growth of Ghana’s industrial sector fluctuates severely as compared to South Africa and Malaysia which attained steady growth rates over the period 2003 to 2012. The industrial sector of Ghana value added (% of GDP) fell precipitously between 2005 and 2010. Ghana’s industrial sector performance began to witness an increase from 2010 to 2012. Despite the increase in industrial performance in Ghana over the period 2010 to 2012, these growth rates are relatively low compared to that of Malaysia and South Africa as shown in Fig. 2.
Fig. 1. Growth rates of industry 1980–2013 in Ghana Source: [2,3]

Galley Proof
Mensah et al.; BJEMT, 13(4): 1-11, 2016; Article no.BJEMT.25092
3
Fig. 2. Industry, value added (% of GDP) for Ghana, Malaysia and South Africa Source: [3]
In what capacity can Ghana develop its industrial sector to catch up with that of Malaysia and South Africa? The performance of the industrial sector has not been encouraging when a comparison is made with other countries as well as its internal growth. This is a big issue which demands a comprehensive investigation to ascertain why there is low growth in the industrial sector of Ghana [4]. Attempted to investigate the impact of macroeconomic factors on industrial production in Ghana. These authors excluded lending rate, inflation rate, and employment in their attempt to explain how macroeconomic factors influence industrial sector growth. This paper therefore seeks to investigate if changes in macroeconomic factors like lending rate, inflation rate, real effective exchange rate, employment and government expenditure explain this low growth of the industrial sector.
Accordingly, this paper is organised as follows; the section two considers the knowledge of related literature, section three is concerned with the study methodology, section four presents the empirical results and discussion, whilst the section five focuses on the conclusion and policy implication.
2. LITERATURE REVIEW Empirically, a lot of studies have highlighted the significance of the industrial sector in contributing to the growth of an economy [5]. Conducted a study in Nigeria to ascertain what determines capacity utilization in the manufacturing industry of Nigeria between the period 1970 and 1998. The study made some thought provoking revelations in his study. Government capital expenditure on manufacturing, per capita real
income and exchange rate based on the findings demonstrated positive impacts on manufacturing capacity utilization. On the other hand, loans and advances to manufacturing as well as inflation exhibited negative relationship with the capacity utilization of the manufacturing sector. A concluding note was made that enhancing the capacity utilization of the manufacturing sector will inure to a substantial growth of the industrial sector and eventually lead to industrial development in Nigeria. [6] Used quarterly data from 1998:1Q to 2008:3Q to explore the impact that macroeconomic policies have on the production of the manufacturing sector in Croatia. They applied multiple regressions to find out how foreign demand, government consumption, investment, interest rates, the real effective exchange rate, fiscal deficit and personal consumption affected the production of 22 manufacturing sectors. The study brought to the fore that low technologically intensity industries are affected by the variations in the real effective exchange rate, fiscal conditions, and personal consumption. The study established on the other hand that output in high technological intensity industries is highly responsive to changes in fiscal policy, foreign demand and investments. It was further established in the study that manufacturing output is highly influenced by fiscal policy with regards to the degree of elasticity. The study also found that production in contracts in medium-high technological intensity industries contracts in periods where there is exchange rate depreciation while production in low technological intensity industries on average increases with the exchange rate depreciation.

Galley Proof
Mensah et al.; BJEMT, 13(4): 1-11, 2016; Article no.BJEMT.25092
4
In finding out the determinants of manufacturing output in Ghana for the period 1974-2006, [7], established a level relationship between manufacturing output and the level of per capita real gross domestic product (GDP), political stability and export-import ratio by using cointegration and error correction mechanism. Manufacturing output was in the short run, determined by political stability and export-import ratio as revealed by the study. Thus the study emphasized the importance of the growth of export-based manufacturing firms in stimulating manufacturing output in the country.
Sehgal and Sharma [8] In an attempt to find out the inter-temporal and inter-industry comparison of total factor productivity of the manufacturing sector in the Indian State of Haryana, adopted diverse categories of manufacturing industries pooled data for the time period 1981-1982 and 2007-2008. Total factor productivity was measured by the Malmquist productivity index. The study revealed that total factor productivity in the manufacturing sector was highly influenced by technical efficiency change during pre-reforms period. In addition trade liberalization had a positive impact on technological advancement of the manufacturing sector of the state.
The extent to which firms exited in the Nigerian manufacturing sector prompted [9] to investigate the dynamic behavior of firms’ growth in Nigeria’s manufacturing sector. He employed panel regression analysis for this study. In carrying out the work, he surveyed about forty-five manufacturing firms that were listed on the Nigerian Stock Exchange (NSE) between the period 1989 and 2008 by means of multi-stage sampling technique. The results of the study brought to the fore that utilization of assets, manufacturing firms finance mix, abundance of funds reserve and government intervention, efficiency of operation, capital reserve and government policies are significant determinants of manufacturing firm’s growth in Nigeria.
Nneka [10] in a conscious effort to find out the extent to which monetary policy affect the performance of the manufacturing sector in Nigeria employed econometrics test procedures to carry out the study. The result of the study showed that money supply has a positive impact on manufacturing index performance while company income tax rate, lending rate, inflation rate and exchange rate have a negative impact
on the performance of manufacturing sector output in Nigeria.
Loto [11] assessed the major determinants of output expansion in the manufacturing sector of Nigeria over the study period 1980 and 2010. He used the OLS method and discovered that the rate of inflation is crucial in explaining manufacturing output expansion in Nigeria as at the sample period. The research found a direct relationship between output expansion and real GDP as well as GDP per capita, while gross domestic capital formation, inflation, capacity utilization had a negative effect on output expansion in the manufacturing industry.
Eze and Ogiji [12] Utilized an error correction analysis to ascertain the impact that fiscal policies have on the output of the manufacturing sector in Nigeria. The findings showed that a negative significant relationship exist between government tax revenue and manufacturing sector output in Nigeria. The findings also revealed a significant positive relationship between Government expenditure and the output of the manufacturing sector in Nigeria. A level relationship also existed between fiscal policies and manufacturing output based on the results. A recommendation was made that the government should embark on expansionary fiscal policies because such policies have the propensity to accelerate manufacturing production in Nigeria.
Odior [13] In trying to know the influence that macroeconomic factors have on manufacturing production in Nigeria conducted a study on this by choosing the time span 1975 to 2011. Before the actual estimation was carried out, the stationarity properties of the variables were explored by using the Augmented Dickey Fuller Test. The study examined the stochastic characteristics of each of the time series variables by testing their stationarity using Augmented Dickey Fuller test. The error correction mechanism model was also estimated. Manufacturing sector credit and foreign direct investment based on the results have the potential to enhance production in the manufacturing sector of Nigeria, while broad money supply demonstrated a minimal impact on manufacturing production in Nigeria. A strong recommendation was made in the study that monetary authorities should ensure a cut margin between lending and deposit rates.

Galley Proof
Mensah et al.; BJEMT, 13(4): 1-11, 2016; Article no.BJEMT.25092
5
3. RESEARCH METHODOLOGY
3.1 Model Specification
Industrial production is influenced by macroeconomic factors such as lending rate, inflation rate, employment, government expenditure, import tariffs on intermediate goods and excise taxes. Industrial performance using a non-linear function is specified as follows.
IQt = �0LRt
β1INFt
β2REEXt
β3EMPt
β4GEt
β5IMTIGt
β6
EXTtβ7
еtεt (3.1)
�ℎ��� IQt = industrial output (measured as industry, value added as a% of GDP), representing industrial performance; LRt = lending rate; INFt = Inflation rate; REEXt = real effective exchange rate; EMPt = employment rate; GEt = government expenditure (measured as general government final consumption expenditure as a% of GDP); IMTIGt = Imports tariff rate on intermediate goods; EXTt = excise tax rate; εt= the stochastic term; and t = time. Also, β0 represents the value of the intercept whiles β1, β2, β3, β4, β5, β6 and β7 represents elasticity of the independent variables with respective to the dependent variable. The expected signs of the coefficients used in the model, are β1< 0, β2< 0, β3< 0, β4> 0, β5> 0, β6<0 and β7<0. Due to the unavailability of reliable data on imports tariff rate on intermediate goods (IMTIG) and excise tax rate (EXT), β6 and β7 will be left out in the actual estimation. Assumption factors like labour, capital, etc; that generally influence output are being held constant since the study’s emphasis is not on the inputs but on macroeconomic variables.
3.2 Description and Source of Data The study employed time series variables that span 1980 to 2013. Data for industrial output were from the World Bank and comprises value added in construction, manufacturing, mining, electricity, water and gas. World Bank defines industry, value added as net output of a sector after the addition and subtraction of all outputs and intermediate inputs respectively. Its calculation is exclusively done with no deductions for assets that have depreciated or natural resources that have depleted [3].
Data on lending rate were sourced from the Bank of Ghana. Lending interest rate refers to bank
rate charges on customer loans. Decisions on Ghana’s interest rate are done by a monetary policy committee set up by the Bank of Ghana. Hence, monetary policy rate serves as the official interest rate which determines the lending rates of commercial banks but since industries mostly secures loans from the commercial banks; lending rate is utilized in the study.
Inflation data were sourced from the World Bank. Inflation according to World Bank as measured by consumer price index is the percentage change in the average consumer’s cost of acquiring basket of goods and services. This basket may be fixed or subject to change at specific intervals. The formula generally used is the Laspeyres [3].
Data on real effective exchange rate index (2010=100) were sourced from World Bank. To the World Bank, it is the nominal effective exchange rate which is measured by the value of local currency against weighted average of various foreign currencies divided by a price deflator [3]. Data on employment were based on the Hodric-Prescott (H-P) filter procedure of estimating the cyclical gap. The difference between the actual output and the potential output gives the cyclical gap and this is used as a proxy for unemployment in Ghana. This is as a result of the unavailability of data on unemployment between the periods 1980 to 2013. The study employed the Hodric-Prescott (H-P) filter to effectively decompose GDP into cyclical and trend component to estimate the cyclical gap. The cyclical gap is expressed as the difference between actual output and potential output. That
is . If the cyclical gap is greater than
zero for a particular period that is >0,
then it implies that actual output is greater than the potential output level which is a reflection of low unemployment and thus high employment. It further means that high employment leads to a rise in industrial output. On the other hand, if the
cyclical gap is less than zero that is <0,
then actual output deviate negatively from its potential output level which signifies an increase in unemployment and thus low employment. A situation of such nature implies that industrial output will be low. According to [14], the Hodric-Prescott (H-P) filter has become a standard method for removing trends in the business cycle.
ey y
ey y
ey y
Galley Proof
Mensah et al.; BJEMT, 13(4): 1-11, 2016; Article no.BJEMT.25092
6
Government expenditure data were sourced from World Bank and the measure used is general government final consumption expenditure as a percentage of GDP. General government final consumption expenditure involves all current expenditures of government for purchase of goods and services, compensation of employees, national defense and security expenditure but however excludes military expenditures which form part of capital formation by government [3].
3.3 Unit Root Tests The stationarity properties of the variables of interest were ascertained by employing the Augmented Dickey Fuller test and the Phillip- Perron test before the actual estimation was carried out using Autoregressive Distributive Lag model.
3.4 The Long Run and Short Run Model Specification
A conditional ARDL model of order (p, q1, q2, q3, q4, q5) was used to test the long run relationship of the variables identified. The long run ARDL model assumed the form;
lnIQt =β0+ ∑ ����� 1ilnIQt-I + ∑ ���
��� 2jlnLRt-j
+ ∑ ������ 3klnINFt-k + ∑ �
����� 4dlnREEXt-d+
∑ ������ 5flnEMPt-f+∑ �
����� 6blnGEXPt-b+�t (3.2)
The lag length of the variables is selected based on the Schwarz Bayesian criterion since it gives more parsimonious models specification. The short run dynamics is captured by the error correction model as follows:
ΔlnIQt = ∑ ����� 1iΔlnIQt-I +∑ �
����� 2j∆lnLRt-j
+∑ ������ 3kΔlnINFt-k +∑ ���
��� 4dΔlnREEXt-d
+∑ ������ 5fΔlnEMPt-f +∑ ���
��� 6b∆lnGEXPt-b +
ρECMt-1 + �t (3.3) �ℎ��� λi is the short-run coefficient of model’s dynamic adjustment to equilibrium. ECMt-1term is Error Correction factor. Thus, it shows the estimate of short run disequilibrium adjustment of long-run equilibrium error term. ρ measures speed of adjustment to attain equilibrium in the presence of shocks. To determine the goodness of fit or robustness of the ARDL model, stability and diagnostic tests
were conducted. The cumulative sum of recursive residuals and cumulative sum of squares of recursive residuals were employed for the stability tests whiles serial correlation, normality, functional form and heteroscedasticity were used for the diagnostic test. 4. EMPIRICAL RESULTS AND
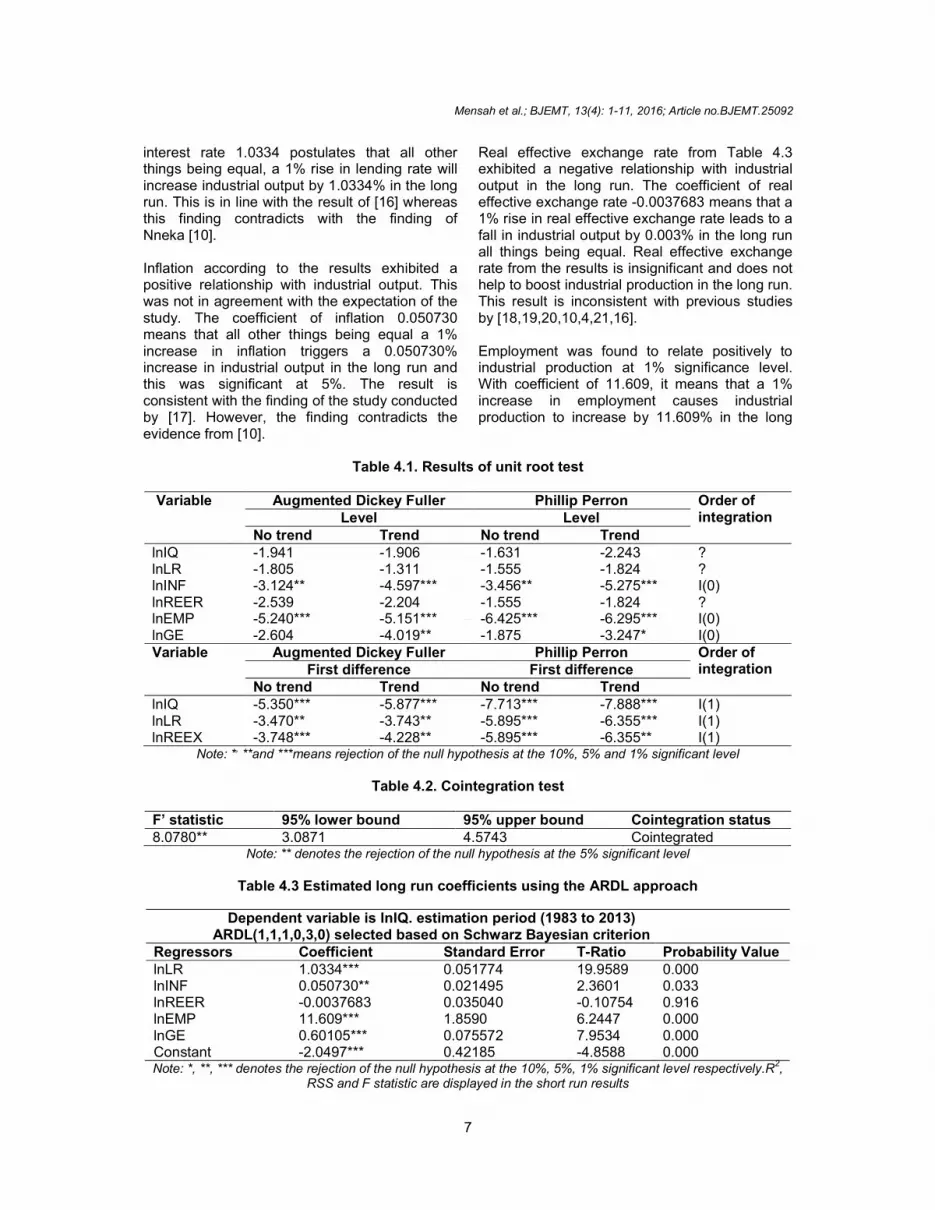
DISCUSSIONS 4.1 Results of Unit Root Test The results in Table 4.1 clearly show that none of the variables are integrated of order two I (2) thereby providing a reasonable justification for the application of an ARDL model.
4.2 Results and Analysis of the Cointegration Test
These results are presented in Table 4.2 as cointegration test results. Cointegration is attained when the F-statistic lies above the upper boundary of the significance level chosen which in this case at 5%. It should be noted that the F-test is premised on the null hypothesis of no level relationship among the variables. From Table 4.2, the F-statistic lies above the upper bound hence the null hypothesis of no level relationship is rejected in favour of the alternate hypothesis which presents a level relationship between industrial output and all the independent variables. [15] Posited that the critical value bounds are computed by stochastic simulations using 20000 replications. The ARDL critical Bounds test values for 5% significance level is given by 3.0871, 4.5743 and 2.5471, 3.8403 for the lower and upper bound respectively. Since the F-statistic of 8.0780 at 5% significance level lies above the upper bound of 4.5743, it can be concluded that there is cointegration or a level relationship between industrial output and the explanatory variables. 4.3 Result and Analysis of Long-Run
Relationships The long run analysis of the model makes some interesting revelations in terms of the signs of the variables. Beginning with lending rate, the variable presented a petrifying outcome which is in contravention with conventional economic theory. The sign of lending rate indicates that lending rate has a positive relationship with industrial output. The coefficient of lending
Galley Proof
Mensah et al.; BJEMT, 13(4): 1-11, 2016; Article no.BJEMT.25092
7
interest rate 1.0334 postulates that all other things being equal, a 1% rise in lending rate will increase industrial output by 1.0334% in the long run. This is in line with the result of [16] whereas this finding contradicts with the finding of Nneka [10]. Inflation according to the results exhibited a positive relationship with industrial output. This was not in agreement with the expectation of the study. The coefficient of inflation 0.050730 means that all other things being equal a 1% increase in inflation triggers a 0.050730% increase in industrial output in the long run and this was significant at 5%. The result is consistent with the finding of the study conducted by [17]. However, the finding contradicts the evidence from [10].
Real effective exchange rate from Table 4.3 exhibited a negative relationship with industrial output in the long run. The coefficient of real effective exchange rate -0.0037683 means that a 1% rise in real effective exchange rate leads to a fall in industrial output by 0.003% in the long run all things being equal. Real effective exchange rate from the results is insignificant and does not help to boost industrial production in the long run. This result is inconsistent with previous studies by [18,19,20,10,4,21,16]. Employment was found to relate positively to industrial production at 1% significance level. With coefficient of 11.609, it means that a 1% increase in employment causes industrial production to increase by 11.609% in the long
Table 4.1. Results of unit root test
Variable
Augmented Dickey Fuller Phillip Perron Order of integration Level Level
No trend Trend No trend Trend lnIQ -1.941 -1.906 -1.631 -2.243 ? lnLR -1.805 -1.311 -1.555 -1.824 ? lnINF -3.124** -4.597*** -3.456** -5.275*** I(0) lnREER -2.539 -2.204 -1.555 -1.824 ? lnEMP -5.240*** -5.151*** -6.425*** -6.295*** I(0) lnGE -2.604 -4.019** -1.875 -3.247* I(0) Variable Augmented Dickey Fuller Phillip Perron Order of
integration First difference First difference No trend Trend No trend Trend
lnIQ -5.350*** -5.877*** -7.713*** -7.888*** I(1) lnLR -3.470** -3.743** -5.895*** -6.355*** I(1) lnREEX -3.748*** -4.228** -5.895*** -6.355** I(1)
Note: *, **and ***means rejection of the null hypothesis at the 10%, 5% and 1% significant level
Table 4.2. Cointegration test
F’ statistic 95% lower bound 95% upper bound Cointegration status 8.0780** 3.0871 4.5743 Cointegrated
Note: ** denotes the rejection of the null hypothesis at the 5% significant level
Table 4.3 Estimated long run coefficients using the ARDL approach
Dependent variable is lnIQ. estimation period (1983 to 2013) ARDL(1,1,1,0,3,0) selected based on Schwarz Bayesian criterion
Regressors Coefficient Standard Error T-Ratio Probability Value lnLR 1.0334*** 0.051774 19.9589 0.000 lnINF 0.050730** 0.021495 2.3601 0.033 lnREER -0.0037683 0.035040 -0.10754 0.916 lnEMP 11.609*** 1.8590 6.2447 0.000 lnGE 0.60105*** 0.075572 7.9534 0.000 Constant -2.0497*** 0.42185 -4.8588 0.000 Note: *, **, *** denotes the rejection of the null hypothesis at the 10%, 5%, 1% significant level respectively.R
2,
RSS and F statistic are displayed in the short run results

Galley Proof
Mensah et al.; BJEMT, 13(4): 1-11, 2016; Article no.BJEMT.25092
8
run all things being equal. The huge coefficient for employment could be attributed to the labour intensive nature of industries in Ghana. This result is in agreement with [22,23,16]. Government expenditure exhibited a positive relationship with industrial output at 1% significance level. This confirms the a priori expectation. The coefficient of government expenditure 0.60105 postulates that a 1% increase in government expenditure increases industrial production by 0.60105% in the long run all other things being equal. This connotes that government intervening in the provision of electricity, good roads, water, and factory buildings is very crucial for Ghana’s industrial growth and development. This is similar to the findings of [12,4]. But this finding contrasts the study by [17].
4.4 Result and Analysis of Short-Run Relationships
The R-squared value of the short run dynamics of the model is 0.94571 meaning that about 94.571% of the deviation in industrial output is explained by the independent variables. It remains strong after adjusting for degree of freedom to 88.366 (R-bar-squared). This reveals high goodness of fit meaning that the variables selected are very strong in explaining the growth
of industrial output (lnIQ) in the economy of Ghana. The F-statistic confirmed the joint significance of all the independent variables at 1% significant level. The DW-Statistic was 2.2617 and it is high enough to discard the presence of autocorrelation in the model. The error correction term was highly significant at 1% and it was negative, which is the appropriate sign for it. This means that the model is stable and will always move back to equilibrium whenever there is unexpected shock to the independent variables. The error correction coefficient of -1.8060 means that the model adjusts to equilibrium faster than expected. The coefficient of all the short run dynamic multipliers in the model exhibited the same sign as it exhibited in the long run. The first variable which is lending rate was positively related to industrial output and was insignificant in impacting on industrial output in the short run. The coefficient of lending rate 0.20260 depicts that a 1% rise in lending rate leads to an increase in industrial output by 0.20% in the short run. However previous year’s lending rate demonstrated a negative relationship with industrial output in the short run. The estimated coefficient is -0.99394 and highly significant at 1%. This means that previous year’s lending rate has a significant impact on current industrial production.
Table 4.4. Short run error correction representation
Dependent variable is ∆lnIQ. estimation period (1983 to 2013)
ARDL(1,1,1,0,3,0) selected based on Schwarz Bayesian criterion
Regressors Coefficient Standard error T-Ratio Probability value
ΔlnIQ1 0.25153 0.17529 1.4350 0.169
ΔlnLR 0.20260 0.17034 1.1894 0.251
ΔlnLR1 -0.99394*** 0.25751 -3.8599 0.001
ΔlnLR2 -0.41094** 0.15241 -2.6963 0.015
ΔlnINF 0.091620** 0.041560 2.2045 0.042
ΔlnREER -0.0068056 0.064218 -0.10598 0.917
ΔlnEMP 1.9033 2.9136 0.65325 0.522
ΔlnEMP1 -15.0183*** 3.8397 -3.9113 0.001
ΔlnEMP2 -9.8793*** 2.8418 -3.4765 0.003
ΔlnGE 0.70362*** 0.12053 5.8375 0.000
ΔlnGE1 0.20038 0.14757 1.3579 0.192
ΔlnGE2 0.45448*** 0.13901 3.2695 0.005
ECM(-1) -1.8060*** 0.33984 -5.3143 0.000
R-Squared 0.94571 R-Bar-Squared 0.88366
S.E. of Regression 0.065655 F-Stat. F(13,17) 18.7595[0.000]
DW-statistic 2.2617 Note:*, **, *** denotes rejection of the null hypothesis at the10%, 5% and 1% significant level
Galley Proof
Mensah et al.; BJEMT, 13(4): 1-11, 2016; Article no.BJEMT.25092
9
Inflation was once again not in consonance with the a priori expectation and theory. Inflation was significant at 5% and demonstrated an inelastic effect. The coefficient of inflation 0.091620 indicates that all other things being equal a 1% rise in inflation lead to an increase in industrial output by 0.09162% in the short run. The result is consistent with the findings of the study conducted by [17] but contradicts the finding of [24]. Real effective exchange rate maintained its sign and it was insignificant in the short run. The coefficient of rear effective exchange rate -0.0068053 postulates that all other things remaining constant, a 1% increase in rear effective exchange rate reduces industrial output by 0.0068053% in the short run. Employment exhibited a positive relationship with industrial output in the short run. The impact of employment on industrial output in the short run was insignificant. Its coefficient of 1.9033 means that all other things being equal a 1% rise in employment increases industrial output by 1.9033% in the short run. Employment demonstrated an elastic effect in the short run since coefficient of elasticity was greater than one. However, employment lagged by one had a negative relationship with industrial production in the short run. Thus previous year’s employment impedes industrial production in the short run in Ghana. The last short run dynamic multiplier in the short run model is government expenditure. Government expenditure exhibited a positive relationship with industrial output and was highly significant at 1% significance level. Government expenditure demonstrated an inelastic effect. The coefficient of government expenditure 0.70362 shows that all other things being equal, a 1% rise in government expenditure results in a rise in industrial output by 0.70362% in the short run. This re-emphasizes the fact that government spending in the provision of electricity, good roads, water, and factory buildings helps to accelerate the growth of the industrial sector of Ghana. The study is consistent with the finding of [17].
5. CONCLUSION AND POLICY IMPLICA-TION
The conscious attempt to ascertain the wide range of macroeconomic factors that drive industrial production in Ghana necessitated this
study. The main purpose of this study was to ascertain the impact that macroeconomic factors have on industrial performance in Ghana over the period 1980 to 2013. Based on the general findings discussed, the study recommended the following for policy makers to act swiftly on them to ensure sustainable growth in industrial production in Ghana. Lending rate exhibited a positive relationship with industrial output in Ghana. This means that lending rate has the potential of enhancing industrial growth in Ghana. In view of this, it is recommended to the central bank to keep the lending rate at a level that will inure to a sustainable growth in the industrial sector. Higher lending rate discourages investment and due to this, the monetary policy committee should endeavour to set the lending rate at a point that will not discourage investment. Also, the government should create a congenial environment where there will be ready markets for industrial goods such that when lending rate increases above a certain thresh-hold, industrialist will not be discouraged from borrowing to expand production. Organization of trade fairs and restriction of imports will help to provide ready markets for industrial goods. Inflation rate was found to have a positive impact on industrial production in Ghana. Based on the results, industrial production is boosted when there is mild inflation. In view of this, it is recommended to the bank of Ghana to keep inflation at a certain threshold that will be supportive of a sustainable industrial growth in Ghana. Single digit inflation is recommended. The monetary policy committee should tighten monetary policies to reduce the amount of money in circulation in an era where there is skyrocketing inflation. Tightening monetary policies in the form of increasing the monetary policy rate and issuance of government securities will reduce the amount of money in circulation to decrease the purchasing power of people. In addition the government should make increasing agricultural productivity a major component in its development plans. Increasing agricultural productivity will ensure abundant supply of industrial raw materials throughout the year to limit their importation in order to bring their prices down. Employment was found to have a positive relationship with industrial output or performance. As employment increases, industrial performance increases. The
Galley Proof
Mensah et al.; BJEMT, 13(4): 1-11, 2016; Article no.BJEMT.25092
10
government should restructure the educational system to place more emphasis on technical and vocational education to equip labour with the requisite skills needed to increase industrial production. Government’s plan or policy to convert the polytechnics into technical universities is a step in the right direction. Industrialist should also provide a congenial working environment for labour. A comfortable working place will make workers put up their maximum efforts in production than deplorable working conditions that demoralize labour. Adoption of modern forms of production and providing on the job training services to labour will help to improve the marginal productivity of labour.
COMPETING INTERESTS Authors have declared that no competing interests exist.
REFERENCES 1. Kayode MO, Usman YB. Nigeria since
independence: The first 25 years. Ibadan Nigeria: Heinemann Books Limited; 1989.
2. Ghana Statistical Service. Available: www.statsghana.gov.gh
3. World Bank. World economic indicators Ghana country data; 2013.
4. Enu P, Hagan E, Attah-Obeng P. Impact of macroeconomic factors on industrial production in Ghana. European Scientific Journal. 2013;9(28):238–254.
5. Ukoha OO. Determinants of manufacturing capacity utilization in Nigeria, 1970- 1998. The Nigeria Journal of Economics and Social Studies. 2000;42(2):121-129.
6. Tkalec M, Vizek M. The impact of macroeconomic policies on manufacturing production in Croatia. Privredna Kretanjai Ekonomska Politika. 2010;19(121):61-93.
7. Anaman KA, Osei-Amponsah C. Determinants of the output of the manufacturing industry in Ghana from 1974 to 2006. The Ghana Policy Journal. 2009;3:69–89.
8. Sehgal S, Sharma S. Total factor productivity of manufacturing sector in india: A regional analysis for the state of Haryana. Economic Journal of Development Issues. 2012;13:97-118.
9. Sangosanya AO. Firms growth dynamics in Nigeria’s manufacturing industry: A panel analysis. Journal of Applied Economics Review. 2011;1(1):1-18.
10. Nneka CAB. Investigating the performance of monetary policy on manufacturing sector in Nigeria. Arabian Journal of Business and Management Review (Oman Chapter). 2012;2(1):12.
11. Loto MA. The determinants of output expansion in the Nigerian manufacturing industries. Journal of Emerging Trends in Economics and Management Sciences. 2012;3(6):991-996.
12. Eze OR, Ogiji FO. Impact of fiscal policy on the manufacturing sector output in Nigeria: An error correction analysis. International Journal of Business and Management Review. 2013;1(3):35–55.
13. Odior ES. Macroeconomic variables and the productivity of the manufacturing sector in Nigeria: A static analysis approach. Journal of Emerging Issues in Economics, Finance and Banking. 2013;5:362-380.
14. Ravn MO, Uhlig H. On adjusting the hodrick-prescott filter for the frequency of observations. Review of Economics and Statistics. 2002;84(2):371-6.
15. Pesaran MH, Shin Y, Smith RJ. Bounds testing approaches to the analysis of level relationships. Journal of Applied Econometrics. 2001;16:289-326.
16. Ajudua EI, Ojima DJP. Modelling the determinants of output in the Nigerian manufacturing sector. International Journal of Innovative Finance and Economics Research. 2016;4(1):1-12.
17. Medee PN. The manufacturing sector and inflation control in Nigeria: An empirical investigation. Brazilian Research Journal of Humanities, Social and Environmental Sciences. 2015;8(1).
18. Akpan PL. Foreign exchange market and economic growth in an emerging petroleum based economy: Evidence from Nigeria (1970-2003). African Economic and Business Review. 2008;6(2):46-58.
19. Asher OJ. The impact of exchange rate fluctuation on the Nigeria economic growth (1980–2010) unpublished BSC. Thesis of Caritas University Emene, Enugu State, Nigeria; 2012.
20. Azeez BA, Kolapo FT, Ajayi LB. Effect of exchange rate volatility on macroeconomic performance in Nigeria. Interdisciplinary Journal of Contemporary Research in Business. 2012;4(1):149-155.
21. Imoughele LE. Empirical investigation of the impact of monetary policy on manufacturing sector performance in Nigeria: 1989 to 2012. International

Galley Proof
Mensah et al.; BJEMT, 13(4): 1-11, 2016; Article no.BJEMT.25092
11
Journal of Education and Research. 2014;2(1):1–20.
22. Akinlo AE. Macroeconomic factors and total factor productivity in sub-saharan African countries. International Research Journal of Finance and Economics. 2006;1:62-79.
23. Nto POO, Mbanasor JA. Determinants of productivity among manufacturing firms in
South-Eastern Nigeria: Cobb–douglas stochastic frontier production function approach. China-USA Business Review. 2012;11(10).
24. Enu P, Havi ED. The manufacturing sector of Ghana: Are there any macroeconomic disturbances? Asia Pacific Journal of Multidisciplinary Research. 2014;2(3).
_________________________________________________________________________________ © 2016 Mensah et al.; This is an Open Access article distributed under the terms of the Creative Commons Attribution License (http://creativecommons.org/licenses/by/4.0), which permits unrestricted use, distribution, and reproduction in any medium, provided the original work is properly cited.
Peer-review history: The peer review history for this paper can be accessed here:
http://sciencedomain.org/review-history/14546


