Embed Size (px)
Citation preview
1
COAL & LIGNITE
Indian Minerals Yearbook 2019 (Part-III: Mineral Reviews)
58th Edition
COAL & LIGNITE
(FINAL RELEASE)
GOVERNMENT OF INDIA MINISTRY OF MINES
INDIAN BUREAU OF MINES
Indira Bhavan, Civil Lines, NAGPUR – 440 001
PHONE/FAX NO. (0712) 2565471
PBX : (0712) 2562649, 2560544, 2560648 E-MAIL : [email protected]
Website: www.ibm.gov.in
August, 2021
2
INDIAN MINERALS YEARBOOK 2019 - VOL.III
7 Coal & Lignite
Coal is a fossil fuel. It is a combustible,sedimentary, organic rock, which is composed
mainly of carbon, hydrogen and oxygen. It is formedfrom vegetation, which has been consolidated betweenrock strata and altered by the combined effects ofpressure and heat over millions of years to form coalseams.
The build-up of silt and other sediments, togetherwith movements in the earth’s crust (known as tectonicmovements) buried these swamps and peat bogs, oftento great depths causing the plant material to besubjected to high temperatures and pressures. Millionsof year of deep burial engendered such physical andchemical changes which transformed the vegetationinto peat and then into coal.
The quality of each coal deposit is determined bytemperature and pressure and by the length of time information, which is referred to as its ‘organic maturity’.Initially the peat is converted into lignite or ‘browncoal’ – these are coal types with low organic maturity.In comparison to other coals, lignite is quite soft andits colour can range from dark black to various shadesof brown.
Many more millions of years of continuous effectsof temperature and pressure produced furthertransformation of lignite, progressively increasing itsorganic maturity into the range known as ‘sub-bituminous’ coals.
Further chemical and physical changes havecaused these coals to become harder and blacker,forming the ‘bituminous’ or ‘hard coals’. Under the rightconditions and progressive contrivance of organicmaturity, finally results in the formation of anthracite.
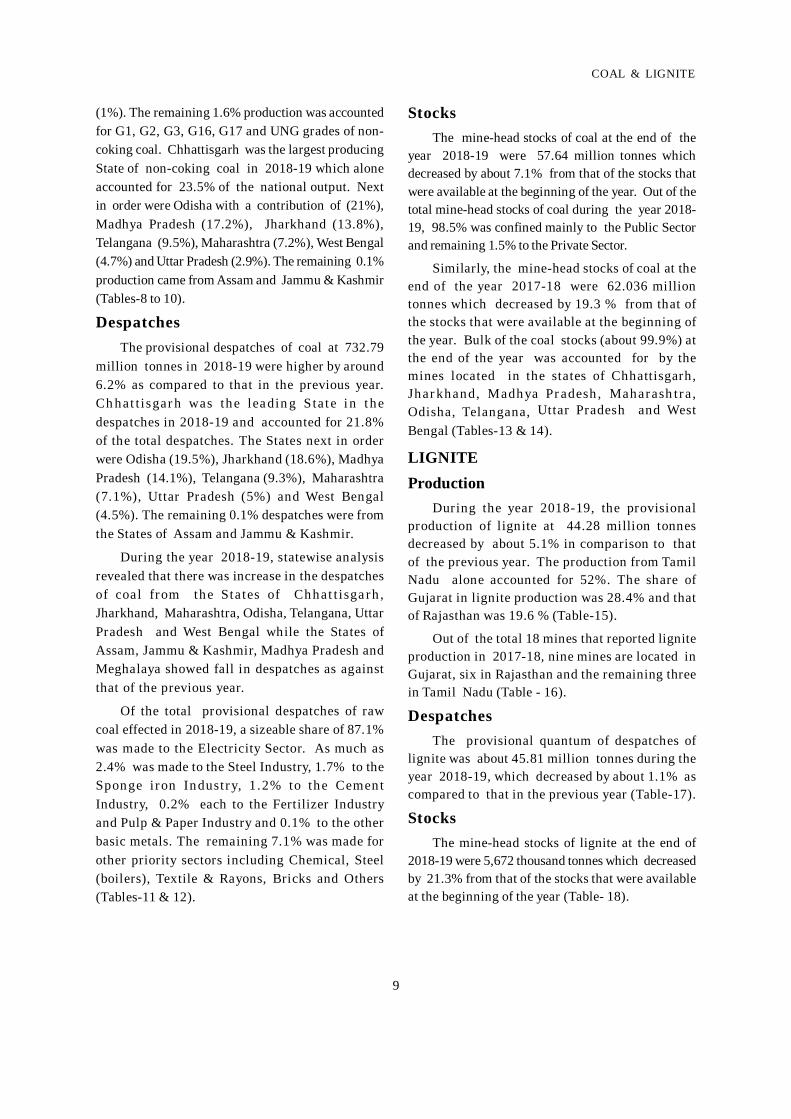
Coal is vital for sustainable development. It isthe most widely used energy source for electricitygeneration and an essential input for steel production.Coal is an essential resource for meeting the challengesfacing the modern world. India has a long history ofcommercial coal mining since 1774 and nationalisationof coal mines was put to effect on 01.05.1973. As perIntegrated Energy Policy Committee of erstwhilePlanning Commission, coal will remain India's mostimportant energy source till 2031-32 and possiblybeyond. In India, during the year 2018-19, 87% coalgot despatched to the Power Sector. In addition, otherindustries like cement, fertilizer, chemical, paper andthousands of medium and small-scale industries aredependent on coal for their process and energyrequirements. The production of coal at about 675.40million tonnes in 2017-18 increased by about 7.9% to
728.72 million tonnes in 2018-19. The production oflignite at 44.28 million tonnes in 2018-19 decreased byabout 5.1% from 46.64 million tonnes in the previousyear. India, in 2018 ranked 2nd in the world coalproduction.
GEOLOGICAL RESOURCESCoal
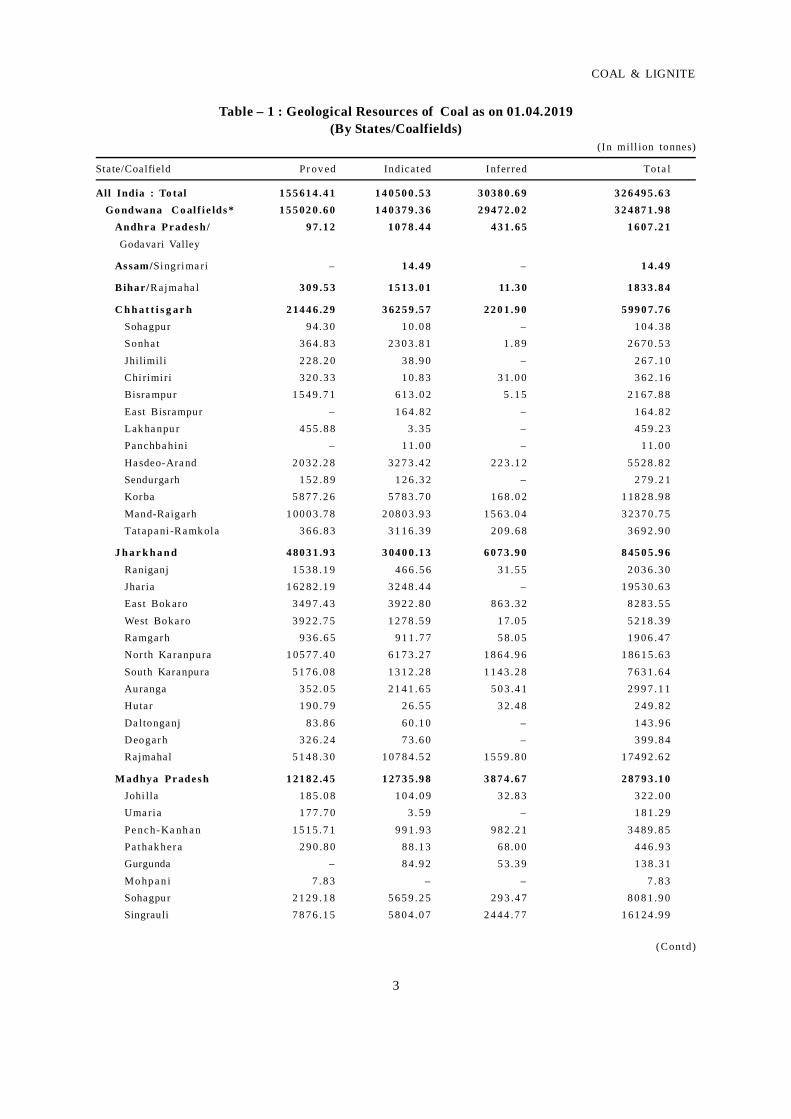
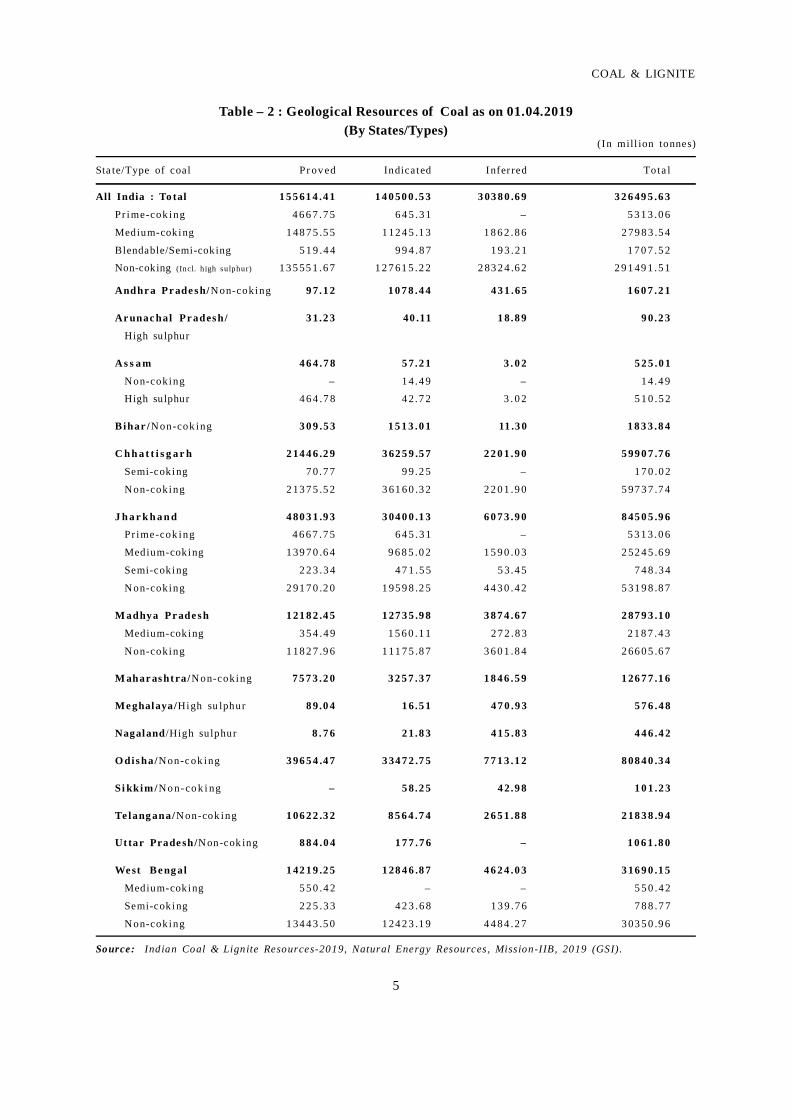
The coal deposits in India primarily areconcentrated in the Gondwana sediments occurringmainly in the eastern and central parts of PeninsularIndia, although Gondwana coal deposits also are foundto occur in the north-eastern part of the country mainlyin Assam and Sikkim. The Tertiary coal-bearingsediments are found in Assam, Arunachal Pradesh,Nagaland and Meghalaya. As a result of explorationcarried out by GSI, CMPDI and other agencies, about326.496 billion tonnes (including that estimated inSikkim) of geological coal resources up to 1,200 m depthhave been established in the country as on 01.04.2019.Out of these resources, 155.614 billion tonnes areProved resources, 140.501 billion tonnes are Indicatedresources and the remaining about 30.381 billion tonnesare in the Inferred category. Of the total resources,the share of prime-coking coal is 5.313 billion tonnes,medium-coking & blendable/semi-coking is 29.691billion tonnes and non-coking coal, including highsulphur (tertiary) is 291.492 billion tonnes. State-wise/Coalfield-wise and State-wise/Type-wise Geologicalresources of coal as on 01.04.2019 are furnished inTables-1 & 2, respectively.Lignite
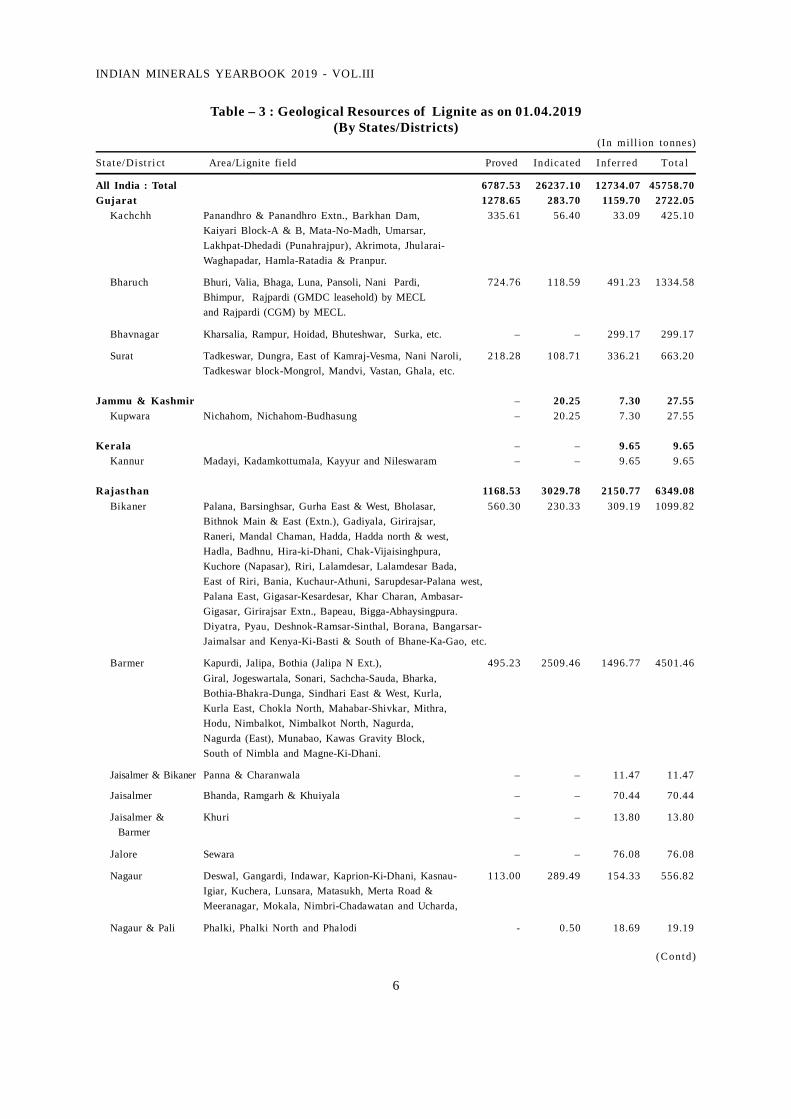
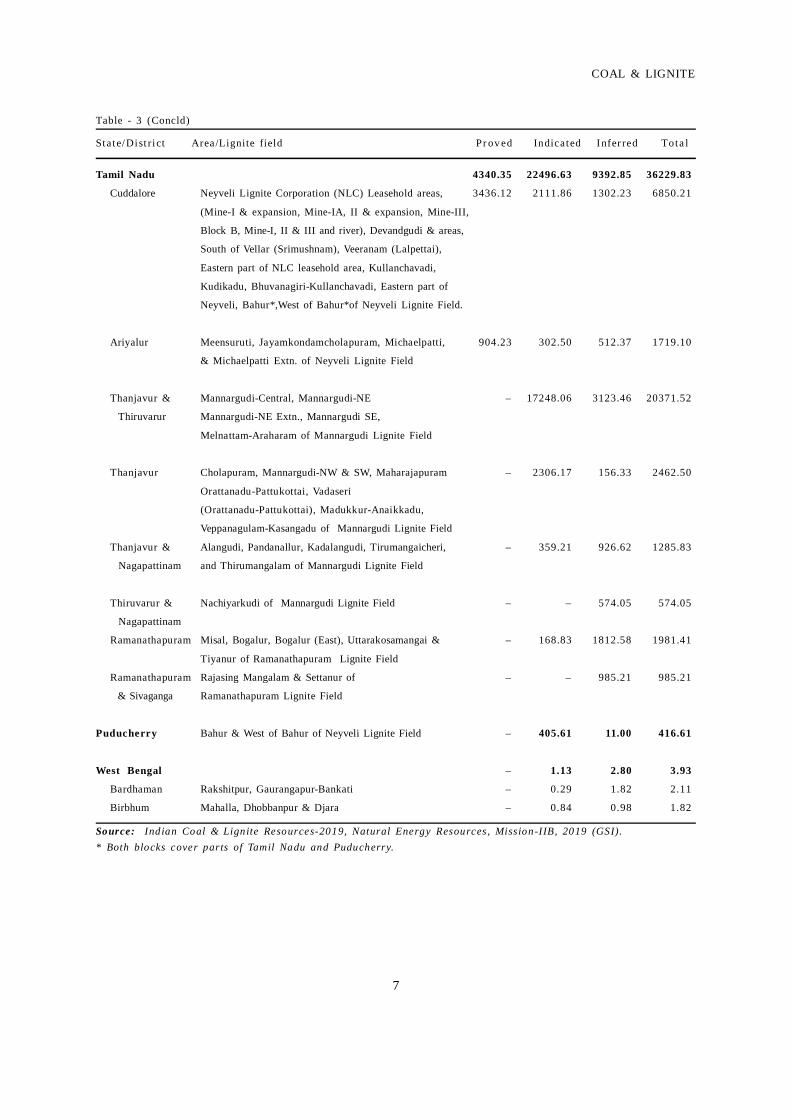
Indian lignite deposits occur in the Tertiarysediments in the southern and western parts ofpeninsular shield particularly in Tamil Nadu, Puducherry,Kerala, Gujarat & Rajasthan and also in Jammu &Kashmir. The total known geological resources oflignite as on 01.04.2019 is about 45.759 billion tonnes,of which 79% resources are located in Tamil Nadu withabout 36.230 billion tonnes. Other States where lignitedeposits have been located are Gujarat, Jammu &Kashmir, Kerala, Rajasthan, West Bengal and the UnionTerritory of Puducherry. State-wise/District-wiseGeological resources of lignite as on 01.04.2019 aredetailed in Table - 3.
EXPLORATION & DEVELOPMENTExploration and development details, if any, are
covered in the Review on "Exploration & Development"under "General Reviews" i.e, Vol.I of the title.
3
COAL & LIGNITE
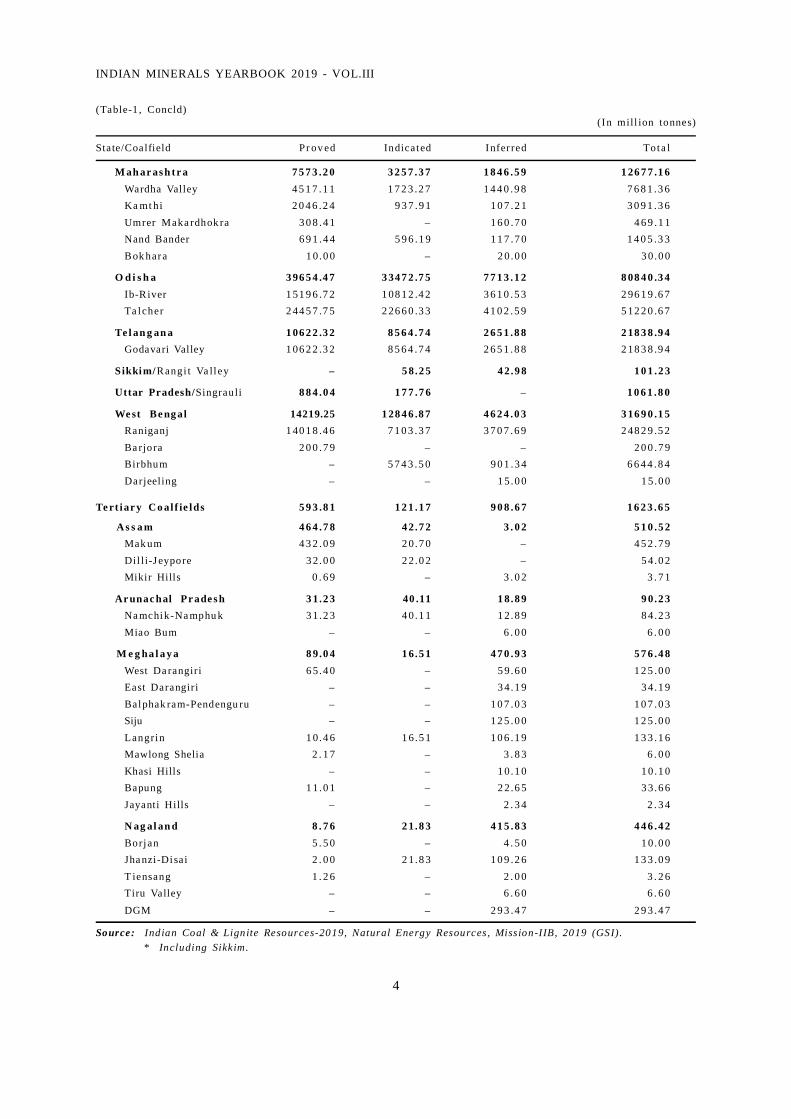
Table – 1 : Geological Resources of Coal as on 01.04.2019(By States/Coalfields)
(In mill ion tonnes)
State/Coalfield Pr ov ed Indicated Infer red Tota l
All India : To tal 1 5 5 61 4 .4 1 1 4 0 50 0 .5 3 3 03 8 0 .6 9 3 2 6 49 5 .6 3Go ndwana C o al f i e lds * 1 5 5 02 0 .6 0 1 4 0 37 9 .3 6 2 94 7 2 .0 2 3 2 4 87 1 .9 8
Andhr a Pr ades h/ 9 7.1 2 1 0 7 8 .4 4 4 3 1 .6 5 1 6 0 7 .2 1Godavari Valley
As sam/Singrima ri – 1 4.4 9 – 1 4.4 9
Bihar/Rajma ha l 3 0 9 .5 3 1 5 1 3 .0 1 11 .3 0 1 8 3 3 .8 4
C h h a t t i s g a r h 2 14 4 6 .2 9 3 62 5 9 .5 7 2 2 0 1 .9 0 5 99 0 7 .7 6Sohagpur 9 4.3 0 1 0.0 8 – 1 0 4 .3 8Sonha t 3 6 4 .8 3 2 3 0 3 .8 1 1 . 8 9 2 6 7 0 .5 3Jhilimili 2 2 8 .2 0 3 8.9 0 – 2 6 7 .1 0Chi rimi ri 3 2 0 .3 3 1 0.8 3 3 1.0 0 3 6 2 .1 6Bisra mpur 1 5 4 9 .7 1 6 1 3 .0 2 5 . 1 5 2 1 6 7 .8 8East Bisrampur – 1 6 4 .8 2 – 1 6 4 .8 2Lak ha npu r 4 5 5 .8 8 3 . 3 5 – 4 5 9 .2 3Panchba hini – 1 1.0 0 – 1 1.0 0Ha sdeo-Ara nd 2 0 3 2 .2 8 3 2 7 3 .4 2 2 2 3 .1 2 5 5 2 8 .8 2Sendurgarh 1 5 2 .8 9 1 2 6 .3 2 – 2 7 9 .2 1Korba 5 8 7 7 .2 6 5 7 8 3 .7 0 1 6 8 .0 2 1 18 2 8 .9 8Mand-Raigarh 1 00 0 3 .7 8 2 08 0 3 .9 3 1 5 6 3 .0 4 3 23 7 0 .7 5Tatapa ni -Ra mk ola 3 6 6 .8 3 3 1 1 6 .3 9 2 0 9 .6 8 3 6 9 2 .9 0
J h a r k h a n d 4 80 3 1 .9 3 3 04 0 0 .1 3 6 0 7 3 .9 0 8 45 0 5 .9 6Raniganj 1 5 3 8 .1 9 4 6 6 .5 6 3 1.5 5 2 0 3 6 .3 0Jharia 1 62 8 2 .1 9 3 2 4 8 .4 4 – 1 95 3 0 .6 3East Bok aro 3 4 9 7 .4 3 3 9 2 2 .8 0 8 6 3 .3 2 8 2 8 3 .5 5West Boka ro 3 9 2 2 .7 5 1 2 7 8 .5 9 1 7.0 5 5 2 1 8 .3 9Ra mgarh 9 3 6 .6 5 9 1 1 .7 7 5 8.0 5 1 9 0 6 .4 7Nor th Ka ranpura 1 05 7 7 .4 0 6 1 7 3 .2 7 1 8 6 4 .9 6 1 86 1 5 .6 3South Karanpura 5 1 7 6 .0 8 1 3 1 2 .2 8 1 1 4 3 .2 8 7 6 3 1 .6 4Auranga 3 5 2 .0 5 2 1 4 1 .6 5 5 0 3 .4 1 2 9 9 7 .1 1Hutar 1 9 0 .7 9 2 6.5 5 3 2.4 8 2 4 9 .8 2Da ltonga nj 8 3.8 6 6 0.1 0 – 1 4 3 .9 6D eogarh 3 2 6 .2 4 7 3.6 0 – 3 9 9 .8 4Rajmahal 5 1 4 8 .3 0 1 07 8 4 .5 2 1 5 5 9 .8 0 1 74 9 2 .6 2
M adhya Pr ade s h 1 21 8 2 .4 5 1 27 3 5 .9 8 3 8 7 4 .6 7 2 87 9 3 .1 0Johi lla 1 8 5 .0 8 1 0 4 .0 9 3 2.8 3 3 2 2 .0 0Uma ria 1 7 7 .7 0 3 . 5 9 – 1 8 1 .2 9Pe nc h-Ka nh a n 1 5 1 5 .7 1 9 9 1 .9 3 9 8 2 .2 1 3 4 8 9 .8 5Pa thak hera 2 9 0 .8 0 8 8.1 3 6 8.0 0 4 4 6 .9 3Gurgunda – 8 4.9 2 5 3.3 9 1 3 8 .3 1Mo hp a n i 7 . 8 3 – – 7 . 8 3Sohagpur 2 1 2 9 .1 8 5 6 5 9 .2 5 2 9 3 .4 7 8 0 8 1 .9 0Singrauli 7 8 7 6 .1 5 5 8 0 4 .0 7 2 4 4 4 .7 7 1 61 2 4 .9 9
(Contd)
4
INDIAN MINERALS YEARBOOK 2019 - VOL.III
(Table-1 , Concld)(In mill ion tonnes)
State/Coalfield Pr ov ed Indicated Infer red Tota l
M ah ar as h tr a 7 5 7 3 .2 0 3 2 5 7 .3 7 1 8 4 6 .5 9 1 26 7 7 .1 6Wardha Valley 4 5 1 7 .1 1 1 7 2 3 .2 7 1 4 4 0 .9 8 7 6 8 1 .3 6Ka mt hi 2 0 4 6 .2 4 9 3 7 .9 1 1 0 7 .2 1 3 0 9 1 .3 6Umrer Maka rdhok ra 3 0 8 .4 1 – 1 6 0 .7 0 4 6 9 .1 1Nand Bander 6 9 1 .4 4 5 9 6 .1 9 1 1 7 .7 0 1 4 0 5 .3 3Bok hara 1 0.0 0 – 2 0.0 0 3 0.0 0
O d i s h a 3 96 5 4 .4 7 3 34 7 2 .7 5 7 7 1 3 .1 2 8 08 4 0 .3 4Ib-R iver 1 51 9 6 .7 2 1 08 1 2 .4 2 3 6 1 0 .5 3 2 96 1 9 .6 7Ta lcher 2 44 5 7 .7 5 2 26 6 0 .3 3 4 1 0 2 .5 9 5 12 2 0 .6 7
Te l an g an a 1 06 2 2 .3 2 8 5 6 4 .7 4 2 6 5 1 .8 8 2 18 3 8 .9 4Godavari Valley 1 06 2 2 .3 2 8 5 6 4 .7 4 2 6 5 1 .8 8 2 18 3 8 .9 4
Sikkim/Rangi t Va ll ey – 5 8.2 5 4 2.9 8 1 0 1 .2 3
Uttar Pradesh/Singrauli 8 8 4 .0 4 1 7 7 .7 6 – 1 0 6 1 .8 0
We st Be ng al 14219.25 1 28 4 6 .8 7 4 6 2 4 .0 3 3 16 9 0 .1 5Raniganj 1 40 1 8 .4 6 7 1 0 3 .3 7 3 7 0 7 .6 9 2 48 2 9 .5 2Ba rjora 2 0 0 .7 9 – – 2 0 0 .7 9Birbhum – 5 7 4 3 .5 0 9 0 1 .3 4 6 6 4 4 .8 4Darjeeling – – 1 5.0 0 1 5.0 0
Te rt iar y C o al f ie lds 5 9 3 .8 1 1 2 1 .1 7 9 0 8 .6 7 1 6 2 3 .6 5
A s s a m 4 6 4 .7 8 4 2.7 2 3 . 0 2 5 1 0 .5 2Mak um 4 3 2 .0 9 2 0.7 0 – 4 5 2 .7 9Dil li-J eypore 3 2.0 0 2 2.0 2 – 5 4.0 2Mikir Hills 0 . 6 9 – 3 . 0 2 3 . 7 1
Ar unac hal Pr ade s h 3 1.2 3 40 .11 1 8.8 9 9 0.2 3Na mchik-Na mphu k 3 1.2 3 4 0.1 1 1 2.8 9 8 4.2 3Miao Bum – – 6 . 0 0 6 . 0 0
M e g ha l a y a 8 9.0 4 1 6.5 1 4 7 0 .9 3 5 7 6 .4 8West Da rangiri 6 5 .4 0 – 5 9.6 0 1 2 5 .0 0East Darangiri – – 3 4.1 9 3 4.1 9Balphak ram-Pendengu ru – – 1 0 7 .0 3 1 0 7 .0 3Siju – – 1 2 5 .0 0 1 2 5 .0 0Langrin 1 0.4 6 1 6.5 1 1 0 6 .1 9 1 3 3 .1 6Mawlong Shelia 2 . 1 7 – 3 . 8 3 6 . 0 0Khasi Hills – – 1 0.1 0 1 0.1 0Bapung 1 1.0 1 – 2 2.6 5 3 3.6 6Jayanti Hills – – 2 . 3 4 2 . 3 4
N ag al an d 8 . 7 6 2 1.8 3 4 1 5 .8 3 4 4 6 .4 2Borjan 5 . 5 0 – 4 . 5 0 1 0.0 0Jha nzi-Disai 2 . 0 0 2 1.8 3 1 0 9 .2 6 1 3 3 .0 9T iensang 1 . 2 6 – 2 . 0 0 3 . 2 6Tiru Valley – – 6 . 6 0 6 . 6 0DGM – – 2 9 3 .4 7 2 9 3 .4 7
Source: Indian Coal & Lignite Resources-2019, Natural Energy Resources, Mission-IIB, 2019 (GSI).* Including Sikkim.
5
COAL & LIGNITE
Table – 2 : Geological Resources of Coal as on 01.04.2019(By States/Types)
(In mill ion tonnes)
Sta te/Type of coal Pr ov ed Indicated Infer red Tota l
All India : To tal 1 5 5 61 4 .4 1 1 4 0 50 0 .5 3 3 03 8 0 .6 9 3 2 6 49 5 .6 3
Pr ime-cok ing 4 6 6 7 .7 5 6 4 5 .3 1 – 5 3 1 3 .0 6
Medium-coking 1 48 7 5 .5 5 1 12 4 5 .1 3 1 8 6 2 .8 6 2 79 8 3 .5 4
Blendable/Semi-coking 5 1 9 .4 4 9 9 4 .8 7 1 9 3 .2 1 1 7 0 7 .5 2
Non-coking (Incl. h igh sulphur) 1 3 5 55 1 .6 7 1 2 7 61 5 .2 2 2 83 2 4 .6 2 2 9 1 49 1 .5 1
Andhr a Pr ade s h/ N on-coking 9 7.1 2 1 0 7 8 .4 4 4 3 1 .6 5 1 6 0 7 .2 1
Ar unac hal Pr ades h/ 3 1.2 3 40 .11 1 8.8 9 9 0.2 3
High sulphur
A s s a m 4 6 4 .7 8 5 7.2 1 3 . 0 2 5 2 5 .0 1
N on-coking – 1 4.4 9 – 1 4.4 9
High sulphur 4 6 4 .7 8 4 2.7 2 3 . 0 2 5 1 0 .5 2
Bihar /N on-cok ing 3 0 9 .5 3 1 5 1 3 .0 1 11 .3 0 1 8 3 3 .8 4
C h h a t t i s g a r h 2 14 4 6 .2 9 3 62 5 9 .5 7 2 2 0 1 .9 0 5 99 0 7 .7 6
Semi-coking 7 0.7 7 9 9.2 5 – 1 7 0 .0 2
N on-coking 2 13 7 5 .5 2 3 61 6 0 .3 2 2 2 0 1 .9 0 5 97 3 7 .7 4
J h a r k h a n d 4 80 3 1 .9 3 3 04 0 0 .1 3 6 0 7 3 .9 0 8 45 0 5 .9 6
Pr ime-cok ing 4 6 6 7 .7 5 6 4 5 .3 1 – 5 3 1 3 .0 6
Medium-coking 1 39 7 0 .6 4 9 6 8 5 .0 2 1 5 9 0 .0 3 2 52 4 5 .6 9
Semi-coking 2 2 3 .3 4 4 7 1 .5 5 5 3.4 5 7 4 8 .3 4
N on-coking 2 91 7 0 .2 0 1 95 9 8 .2 5 4 4 3 0 .4 2 5 31 9 8 .8 7
M adhya Pr ade s h 1 21 8 2 .4 5 1 27 3 5 .9 8 3 8 7 4 .6 7 2 87 9 3 .1 0
Medium-coking 3 5 4 .4 9 1 5 6 0 .1 1 2 7 2 .8 3 2 1 8 7 .4 3
N on-coking 1 18 2 7 .9 6 1 11 7 5 .8 7 3 6 0 1 .8 4 2 66 0 5 .6 7
M ahar as htra/N on-coking 7 5 7 3 .2 0 3 2 5 7 .3 7 1 8 4 6 .5 9 1 26 7 7 .1 6
Me ghalaya/High su lphur 8 9.0 4 1 6.5 1 4 7 0 .9 3 5 7 6 .4 8
Nagaland /High sulphur 8 . 7 6 2 1.8 3 4 1 5 .8 3 4 4 6 .4 2
O dis ha/N on-c ok ing 3 96 5 4 .4 7 3 34 7 2 .7 5 7 7 1 3 .1 2 8 08 4 0 .3 4
Si kkim /N o n-co k i ng – 5 8.2 5 4 2.9 8 1 0 1 .2 3
Te lang ana/N on-cok ing 1 06 2 2 .3 2 8 5 6 4 .7 4 2 6 5 1 .8 8 2 18 3 8 .9 4
Ut tar Prade sh/N on-cok ing 8 8 4 .0 4 1 7 7 .7 6 – 1 0 6 1 .8 0
We st Be ng al 1 42 1 9 .2 5 1 28 4 6 .8 7 4 6 2 4 .0 3 3 16 9 0 .1 5
Medium-coking 5 5 0 .4 2 – – 5 5 0 .4 2
Semi-coking 2 2 5 .3 3 4 2 3 .6 8 1 3 9 .7 6 7 8 8 .7 7
N on-coking 1 34 4 3 .5 0 1 24 2 3 .1 9 4 4 8 4 .2 7 3 03 5 0 .9 6
Source: Indian Coal & Lignite Resources-2019, Natural Energy Resources, Mission-IIB, 2019 (GSI).
6
INDIAN MINERALS YEARBOOK 2019 - VOL.III
Table – 3 : Geological Resources of Lignite as on 01.04.2019(By States/Districts)
(In mill ion tonnes)
State/Dist ri ct Area/Lignite field Proved Indicated Infer red Tota l
All India : Total 6787.53 26237.10 12734.07 45758.70Gujarat 1278.65 283.70 1159.70 2722.05
Kachchh Panandhro & Panandhro Extn., Barkhan Dam, 335.61 56.40 33.09 425.10Kaiyari Block-A & B, Mata-No-Madh, Umarsar,Lakhpat-Dhedadi (Punahrajpur), Akrimota, Jhularai-Waghapadar, Hamla-Ratadia & Pranpur.
Bharuch Bhuri, Valia, Bhaga, Luna, Pansoli, Nani Pardi, 724.76 118.59 491.23 1334.58Bhimpur, Rajpardi (GMDC leasehold) by MECLand Rajpardi (CGM) by MECL.
Bhavnagar Kharsalia, Rampur, Hoidad, Bhuteshwar, Surka, etc. – – 299.17 299.17
Surat Tadkeswar, Dungra, East of Kamraj-Vesma, Nani Naroli, 218.28 108.71 336.21 663.20Tadkeswar block-Mongrol, Mandvi, Vastan, Ghala, etc.
Jammu & Kashmir – 20.25 7.30 27.55Kupwara Nichahom, Nichahom-Budhasung – 20.25 7.30 27.55
Kerala – – 9.65 9.65Kannur Madayi, Kadamkottumala, Kayyur and Nileswaram – – 9.65 9.65
Rajasthan 1168.53 3029.78 2150.77 6349.08Bikaner Palana, Barsinghsar, Gurha East & West, Bholasar, 560.30 230.33 309.19 1099.82
Bithnok Main & East (Extn.), Gadiyala, Girirajsar,Raneri, Mandal Chaman, Hadda, Hadda north & west,Hadla, Badhnu, Hira-ki-Dhani, Chak-Vijaisinghpura,Kuchore (Napasar), Riri, Lalamdesar, Lalamdesar Bada,East of Riri, Bania, Kuchaur-Athuni, Sarupdesar-Palana west,Palana East, Gigasar-Kesardesar, Khar Charan, Ambasar-Gigasar, Girirajsar Extn., Bapeau, Bigga-Abhaysingpura.Diyatra, Pyau, Deshnok-Ramsar-Sinthal, Borana, Bangarsar-Jaimalsar and Kenya-Ki-Basti & South of Bhane-Ka-Gao, etc.
Barmer Kapurdi, Jalipa, Bothia (Jalipa N Ext.), 495.23 2509.46 1496.77 4501.46Giral, Jogeswartala, Sonari, Sachcha-Sauda, Bharka,Bothia-Bhakra-Dunga, Sindhari East & West, Kurla,Kurla East, Chokla North, Mahabar-Shivkar, Mithra,Hodu, Nimbalkot, Nimbalkot North, Nagurda,Nagurda (East), Munabao, Kawas Gravity Block,South of Nimbla and Magne-Ki-Dhani.
Jaisalmer & Bikaner Panna & Charanwala – – 11.47 11.47
Jaisalmer Bhanda, Ramgarh & Khuiyala – – 70.44 70.44
Jaisalmer & Khuri – – 13.80 13.80 Barmer
Jalore Sewara – – 76.08 76.08
Nagaur Deswal, Gangardi, Indawar, Kaprion-Ki-Dhani, Kasnau- 113.00 289.49 154.33 556.82Igiar, Kuchera, Lunsara, Matasukh, Merta Road &Meeranagar, Mokala, Nimbri-Chadawatan and Ucharda,
Nagaur & Pali Phalki, Phalki North and Phalodi - 0.50 18.69 19.19
(Contd)
7
COAL & LIGNITE
Table - 3 (Concld)
State/Dist ri ct Area/Lignite field Pr ov ed Indicated Infer red Tota l
Tamil Nadu 4340.35 22496.63 9392.85 36229.83
Cuddalore Neyveli Lignite Corporation (NLC) Leasehold areas, 3436.12 2111.86 1302.23 6850.21
(Mine-I & expansion, Mine-IA, II & expansion, Mine-III,
Block B, Mine-I, II & III and river), Devandgudi & areas,
South of Vellar (Srimushnam), Veeranam (Lalpettai),
Eastern part of NLC leasehold area, Kullanchavadi,
Kudikadu, Bhuvanagiri-Kullanchavadi, Eastern part of
Neyveli, Bahur*,West of Bahur*of Neyveli Lignite Field.
Ariyalur Meensuruti, Jayamkondamcholapuram, Michaelpatti, 904.23 302.50 512.37 1719.10
& Michaelpatti Extn. of Neyveli Lignite Field
Thanjavur & Mannargudi-Central, Mannargudi-NE – 17248.06 3123.46 20371.52
Thiruvarur Mannargudi-NE Extn., Mannargudi SE,
Melnattam-Araharam of Mannargudi Lignite Field
Thanjavur Cholapuram, Mannargudi-NW & SW, Maharajapuram – 2306.17 156.33 2462.50
Orattanadu-Pattukottai, Vadaseri
(Orattanadu-Pattukottai), Madukkur-Anaikkadu,
Veppanagulam-Kasangadu of Mannargudi Lignite Field
Thanjavur & Alangudi, Pandanallur, Kadalangudi, Tirumangaicheri, – 359.21 926.62 1285.83
Nagapattinam and Thirumangalam of Mannargudi Lignite Field
Thiruvarur & Nachiyarkudi of Mannargudi Lignite Field – – 574.05 574.05
Nagapattinam
Ramanathapuram Misal, Bogalur, Bogalur (East), Uttarakosamangai & – 168.83 1812.58 1981.41
Tiyanur of Ramanathapuram Lignite Field
Ramanathapuram Rajasing Mangalam & Settanur of – – 985.21 985.21
& Sivaganga Ramanathapuram Lignite Field
Puducherry Bahur & West of Bahur of Neyveli Lignite Field – 405.61 11.00 416.61
West Bengal – 1.13 2.80 3.93
Bardhaman Rakshitpur, Gaurangapur-Bankati – 0.29 1.82 2.11
Birbhum Mahalla, Dhobbanpur & Djara – 0.84 0.98 1.82
Source: Indian Coal & Lignite Resources-2019, Natural Energy Resources, Mission-IIB, 2019 (GSI).* Both blocks cover parts of Tamil Nadu and Puducherry.
8
INDIAN MINERALS YEARBOOK 2019 - VOL.III
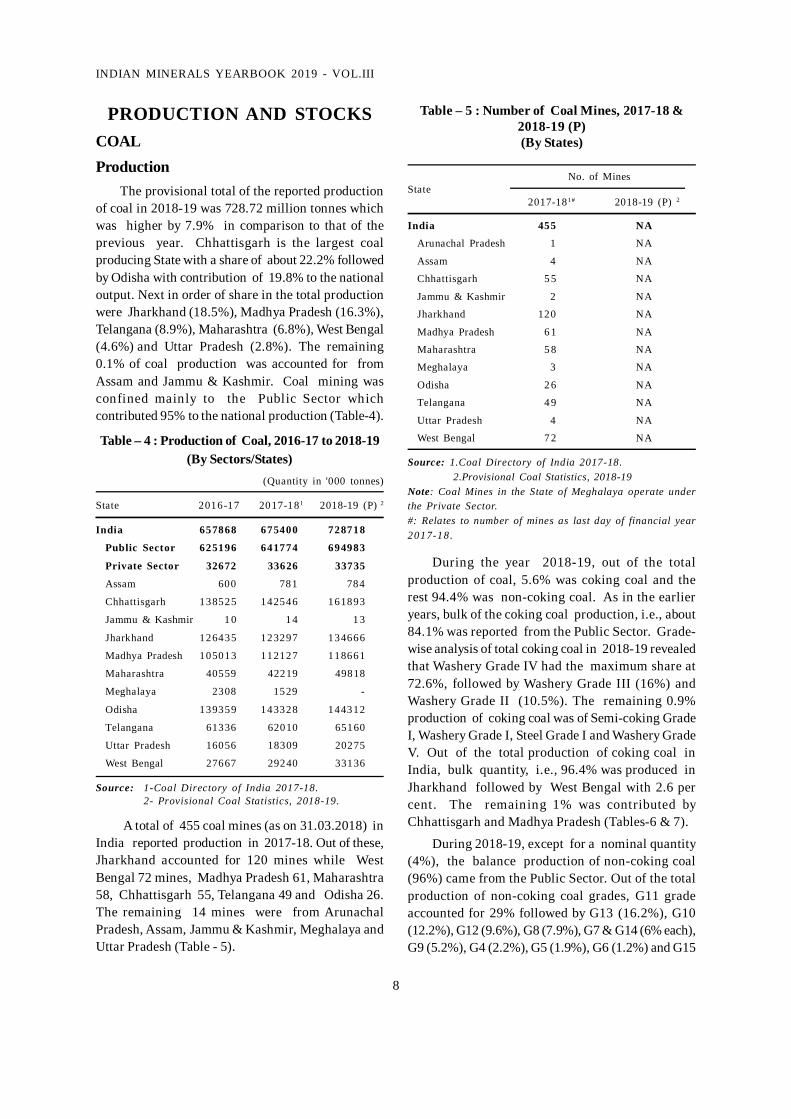
A total of 455 coal mines (as on 31.03.2018) inIndia reported production in 2017-18. Out of these,Jharkhand accounted for 120 mines while WestBengal 72 mines, Madhya Pradesh 61, Maharashtra58, Chhattisgarh 55, Telangana 49 and Odisha 26.The remaining 14 mines were from ArunachalPradesh, Assam, Jammu & Kashmir, Meghalaya andUttar Pradesh (Table - 5).
PRODUCTION AND STOCKSCOALProduction
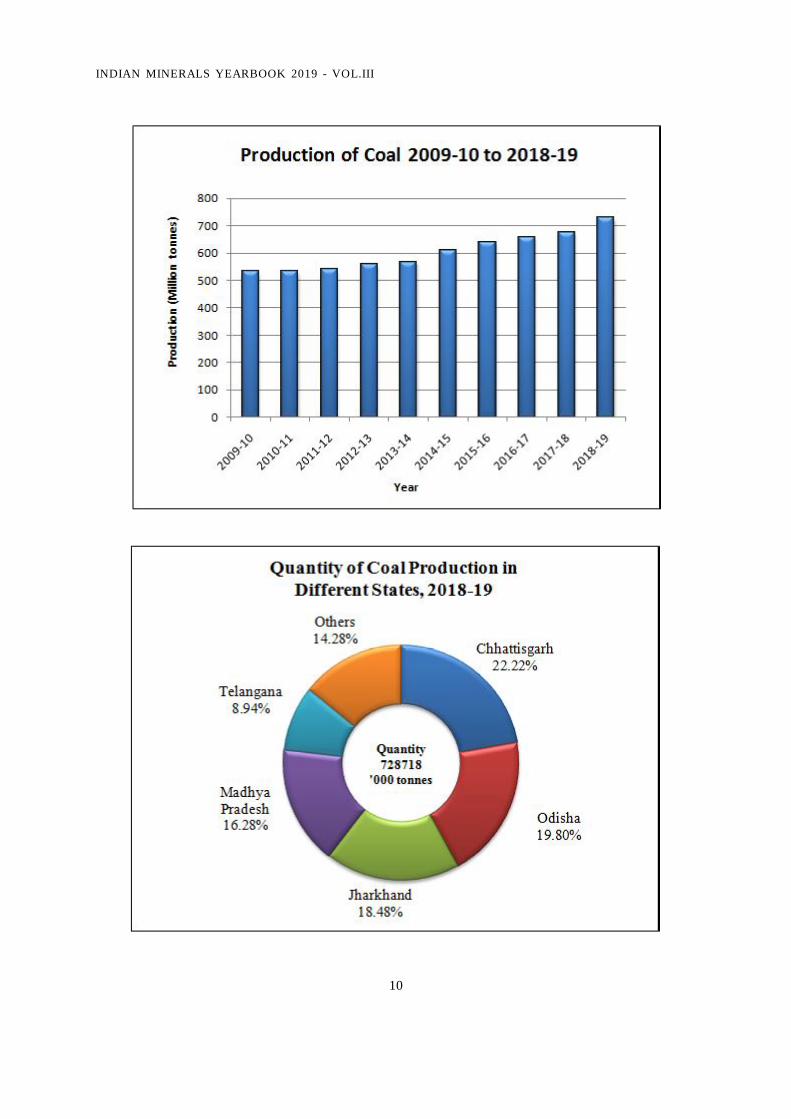
The provisional total of the reported productionof coal in 2018-19 was 728.72 million tonnes whichwas higher by 7.9% in comparison to that of theprevious year. Chhattisgarh is the largest coalproducing State with a share of about 22.2% followedby Odisha with contribution of 19.8% to the nationaloutput. Next in order of share in the total productionwere Jharkhand (18.5%), Madhya Pradesh (16.3%),Telangana (8.9%), Maharashtra (6.8%), West Bengal(4.6%) and Uttar Pradesh (2.8%). The remaining0.1% of coal production was accounted for fromAssam and Jammu & Kashmir. Coal mining wasconfined mainly to the Public Sector whichcontributed 95% to the national production (Table-4).
Table – 4 : Production of Coal, 2016-17 to 2018-19(By Sectors/States)
(Quantity in '000 tonnes)
State 2016-17 2017-181 2018-19 (P) 2
India 657868 675400 728718
Public Sector 625196 641774 694983
Private Sector 32672 33626 33735
Assam 600 781 784
Chhattisgarh 138525 142546 161893
Jammu & Kashmir 1 0 1 4 1 3
Jharkhand 126435 123297 134666
Madhya Pradesh 105013 112127 118661
Maharashtra 40559 42219 49818
Meghalaya 2308 1529 -
Odisha 139359 143328 144312
Telangana 61336 62010 65160
Uttar Pradesh 16056 18309 20275
West Bengal 27667 29240 33136
Source: 1-Coal Directory of India 2017-18.2- Provisional Coal Statistics, 2018-19.
Table – 5 : Number of Coal Mines, 2017-18 &2018-19 (P)(By States)
No. of MinesState
2017-181# 2018-19 (P) 2
India 455 NA
Arunachal Pradesh 1 NA
Assam 4 NA
Chhattisgarh 5 5 NA
Jammu & Kashmir 2 NA
Jharkhand 120 NA
Madhya Pradesh 6 1 NA
Maharashtra 5 8 NA
Meghalaya 3 NA
Odisha 2 6 NA
Telangana 4 9 NA
Uttar Pradesh 4 NA
West Bengal 7 2 NA
Source: 1.Coal Directory of India 2017-18. 2.Provisional Coal Statistics, 2018-19Note: Coal Mines in the State of Meghalaya operate underthe Private Sector.#: Relates to number of mines as last day of financial year2017-18.
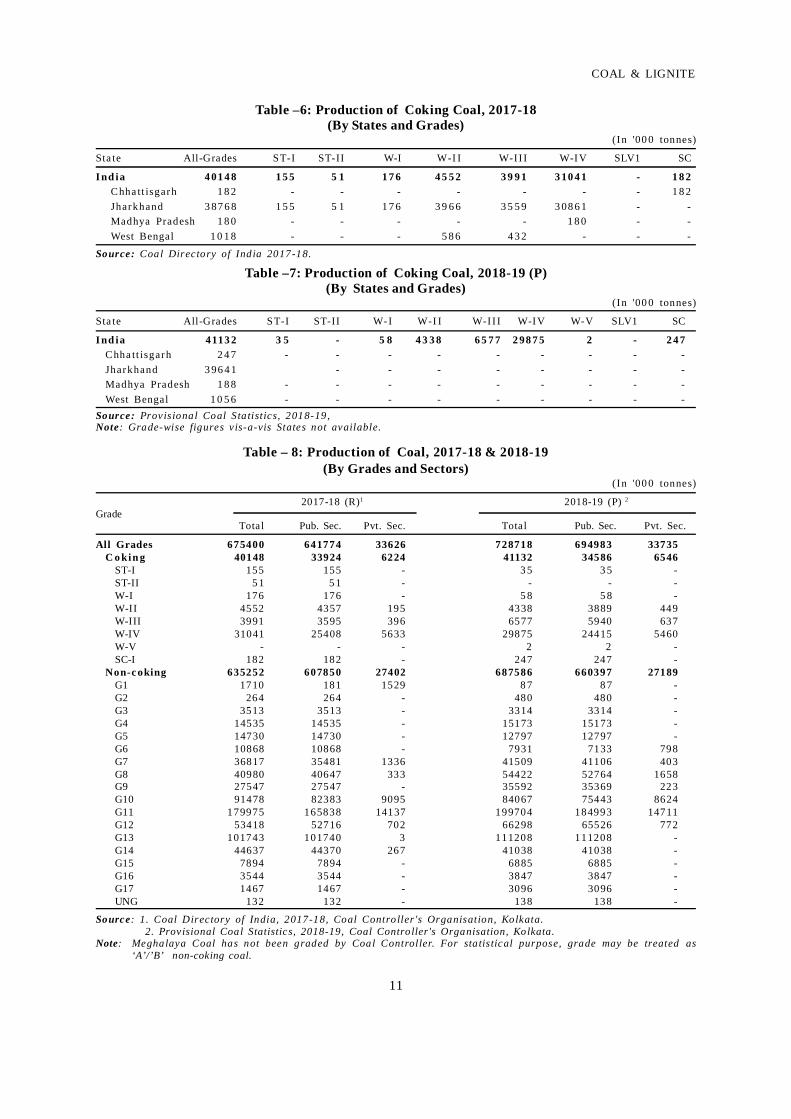
During the year 2018-19, out of the totalproduction of coal, 5.6% was coking coal and therest 94.4% was non-coking coal. As in the earlieryears, bulk of the coking coal production, i.e., about84.1% was reported from the Public Sector. Grade-wise analysis of total coking coal in 2018-19 revealedthat Washery Grade IV had the maximum share at72.6%, followed by Washery Grade III (16%) andWashery Grade II (10.5%). The remaining 0.9%production of coking coal was of Semi-coking GradeI, Washery Grade I, Steel Grade I and Washery GradeV. Out of the total production of coking coal inIndia, bulk quantity, i.e., 96.4% was produced inJharkhand followed by West Bengal with 2.6 percent. The remaining 1% was contributed byChhattisgarh and Madhya Pradesh (Tables-6 & 7).
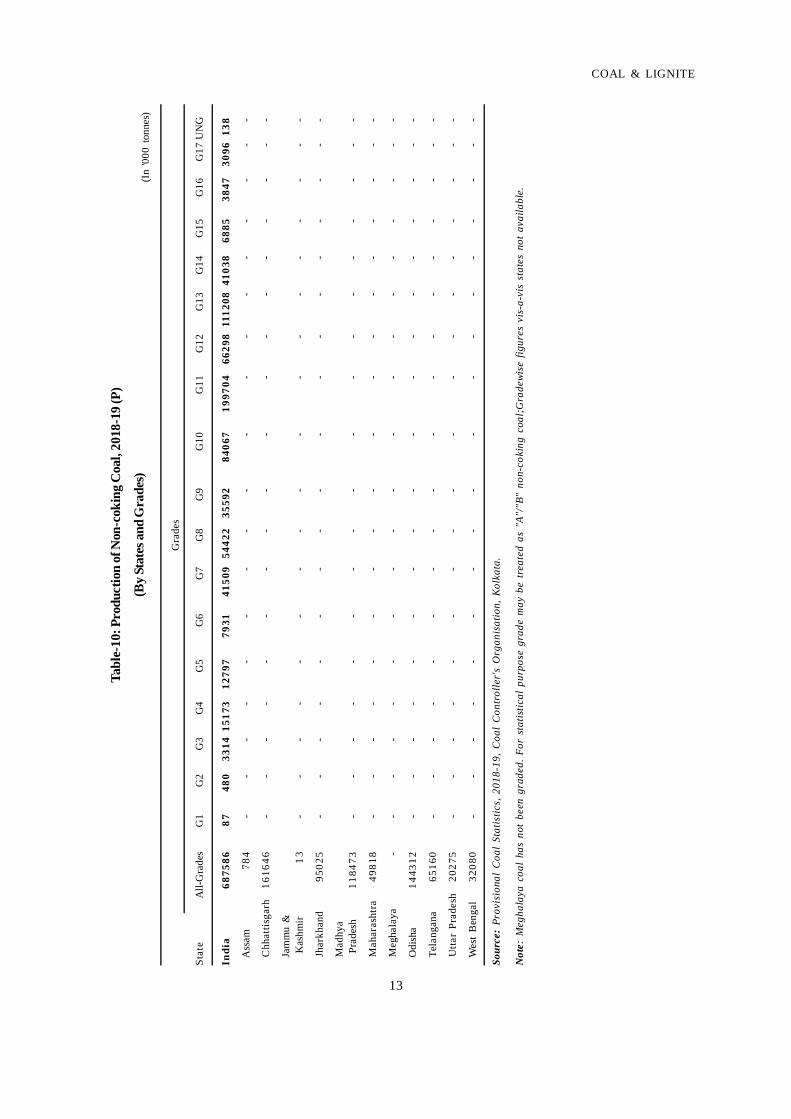
During 2018-19, except for a nominal quantity(4%), the balance production of non-coking coal(96%) came from the Public Sector. Out of the totalproduction of non-coking coal grades, G11 gradeaccounted for 29% followed by G13 (16.2%), G10(12.2%), G12 (9.6%), G8 (7.9%), G7 & G14 (6% each),G9 (5.2%), G4 (2.2%), G5 (1.9%), G6 (1.2%) and G15
9
COAL & LIGNITE
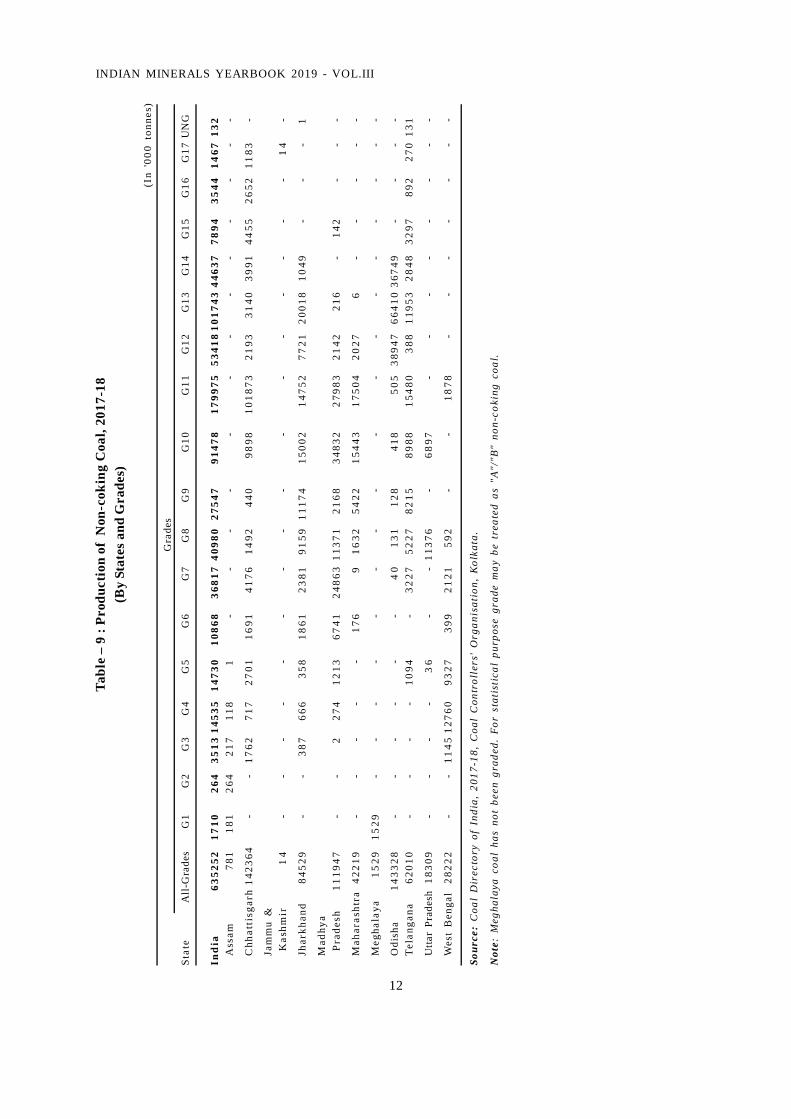
(1%). The remaining 1.6% production was accountedfor G1, G2, G3, G16, G17 and UNG grades of non-coking coal. Chhattisgarh was the largest producingState of non-coking coal in 2018-19 which aloneaccounted for 23.5% of the national output. Nextin order were Odisha with a contribution of (21%),Madhya Pradesh (17.2%), Jharkhand (13.8%),Telangana (9.5%), Maharashtra (7.2%), West Bengal(4.7%) and Uttar Pradesh (2.9%). The remaining 0.1%production came from Assam and Jammu & Kashmir(Tables-8 to 10).
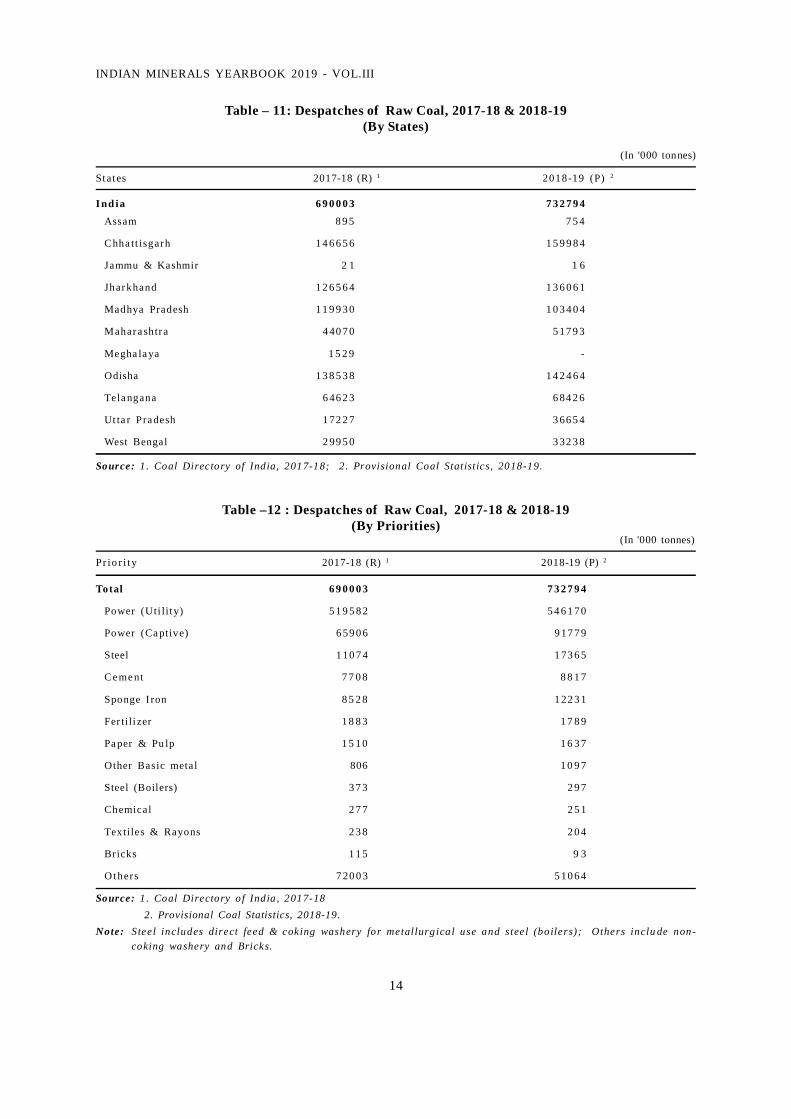
DespatchesThe provisional despatches of coal at 732.79
million tonnes in 2018-19 were higher by around6.2% as compared to that in the previous year.Ch hat t isgar h was the lea din g Sta t e i n t hedespatches in 2018-19 and accounted for 21.8%of the total despatches. The States next in orderwere Odisha (19.5%), Jharkhand (18.6%), MadhyaPradesh (14.1%), Telangana (9.3%), Maharashtra(7.1%), Uttar Pradesh (5%) and West Bengal(4.5%). The remaining 0.1% despatches were fromthe States of Assam and Jammu & Kashmir.
During the year 2018-19, statewise analysisrevealed that there was increase in the despatchesof coal from the Sta tes of Chhat t isga rh ,Jharkhand, Maharashtra, Odisha, Telangana, UttarPradesh and West Bengal while the States ofAssam, Jammu & Kashmir, Madhya Pradesh andMeghalaya showed fall in despatches as againstthat of the previous year.
Of the total provisional despatches of rawcoal effected in 2018-19, a sizeable share of 87.1%was made to the Electricity Sector. As much as2.4% was made to the Steel Industry, 1.7% to theSponge i ron Industry, 1.2% to the CementIndustry, 0.2% each to the Fertilizer Industryand Pulp & Paper Industry and 0.1% to the otherbasic metals. The remaining 7.1% was made forother priority sectors including Chemical, Steel(boilers), Textile & Rayons, Bricks and Others(Tables-11 & 12).
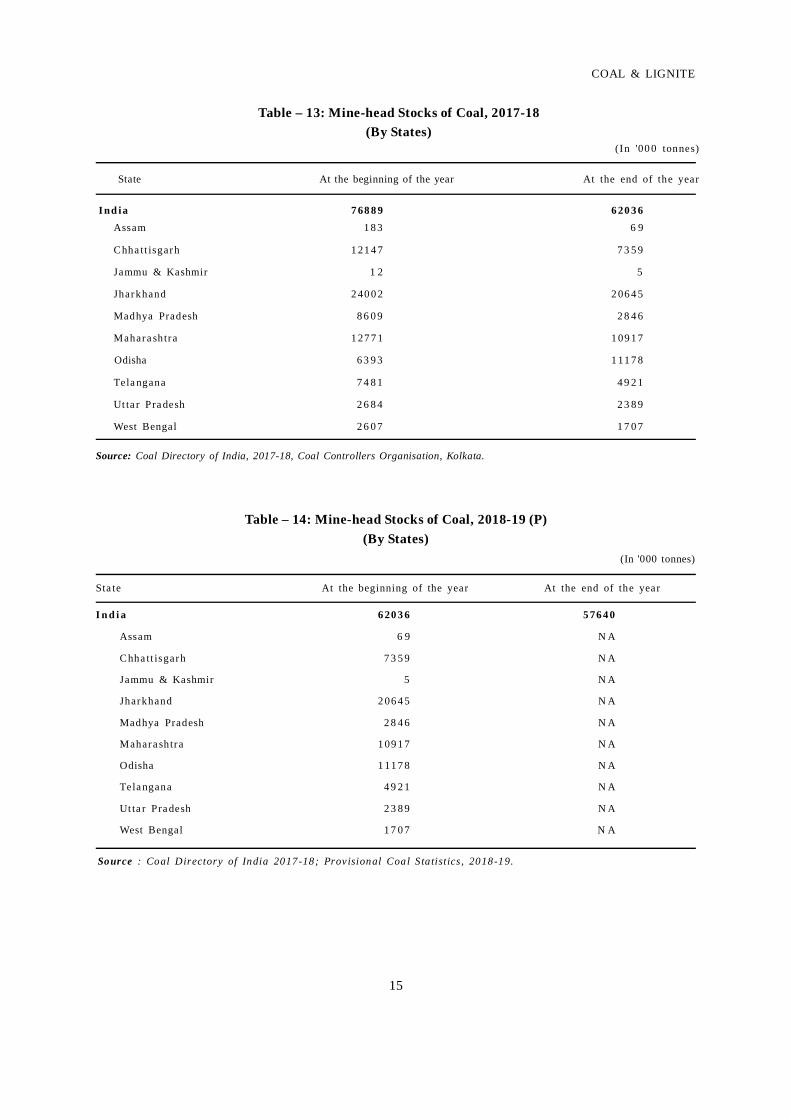
StocksThe mine-head stocks of coal at the end of the
year 2018-19 were 57.64 million tonnes whichdecreased by about 7.1% from that of the stocks thatwere available at the beginning of the year. Out of thetotal mine-head stocks of coal during the year 2018-19, 98.5% was confined mainly to the Public Sectorand remaining 1.5% to the Private Sector.
Similarly, the mine-head stocks of coal at theend of the year 2017-18 were 62.036 milliontonnes which decreased by 19.3 % from that ofthe stocks that were available at the beginning ofthe year. Bulk of the coal stocks (about 99.9%) atthe end of the year was accounted for by themines located in the states of Chhattisgarh,Jhar khand, Madhya Pr adesh , Maharash tra ,Odisha, Telangana, Uttar Pradesh and WestBengal (Tables-13 & 14).
LIGNITEProduction
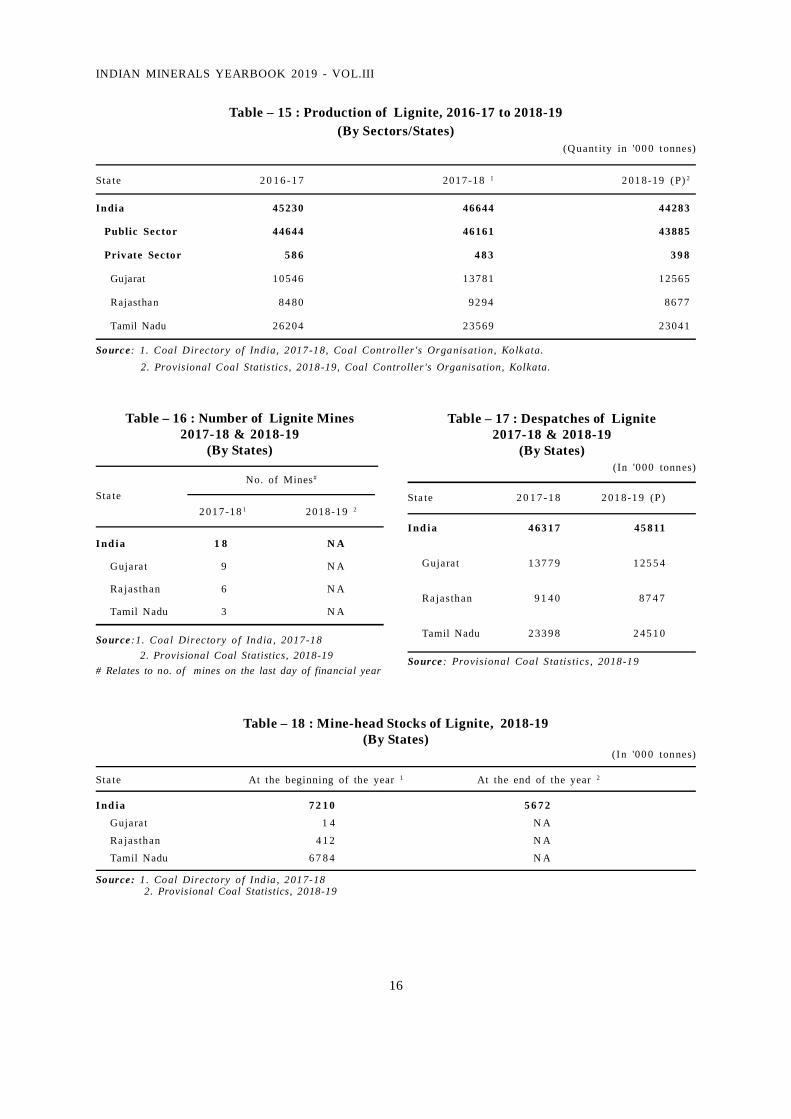
During the year 2018-19, the provisionalproduction of lignite at 44.28 million tonnesdecreased by about 5.1% in comparison to thatof the previous year. The production from TamilNadu alone accounted for 52%. The share ofGujarat in lignite production was 28.4% and thatof Rajasthan was 19.6 % (Table-15).
Out of the total 18 mines that reported ligniteproduction in 2017-18, nine mines are located inGujarat, six in Rajasthan and the remaining threein Tamil Nadu (Table - 16).
DespatchesThe provisional quantum of despatches of
lignite was about 45.81 million tonnes during theyear 2018-19, which decreased by about 1.1% ascompared to that in the previous year (Table-17).
StocksThe mine-head stocks of lignite at the end of
2018-19 were 5,672 thousand tonnes which decreasedby 21.3% from that of the stocks that were availableat the beginning of the year (Table- 18).
10
INDIAN MINERALS YEARBOOK 2019 - VOL.III
11
COAL & LIGNITE
Table –6: Production of Coking Coal, 2017-18(By States and Grades)
(In '00 0 tonnes)
Sta te All-Grades ST-I ST-II W-I W-I I W-I I I W-IV SLV1 SC
I nd ia 4 01 4 8 1 5 5 5 1 1 7 6 4 5 5 2 3 9 9 1 3 10 4 1 - 1 8 2Chha tt isgarh 1 8 2 - - - - - - - 1 8 2Jharkhand 3 87 6 8 1 5 5 5 1 1 7 6 3 9 6 6 3 5 5 9 3 08 6 1 - -Madhya Pradesh 1 8 0 - - - - - 1 8 0 - -West Bengal 1 0 1 8 - - - 5 8 6 4 3 2 - - -
Source: Coal Directory of India 2017-18.
Source: Provisional Coal S ta tistics, 2018-19,Note: Grade-wise figures v is-a-vis States not available.
Table –7: Production of Coking Coal, 2018-19 (P)(By States and Grades)
(In '00 0 tonnes)
Sta te All-Grades ST-I ST-II W-I W-I I W-I I I W-IV W-V SLV1 SC
I nd ia 4113 2 3 5 - 5 8 4 3 3 8 6 5 7 7 2 98 7 5 2 - 2 4 7Chha tt isgarh 2 4 7 - - - - - - - - -Jharkhand 3 96 4 1 - - - - - - - -Madhya Pradesh 1 8 8 - - - - - - - - -West Bengal 1 0 5 6 - - - - - - - - -
Table – 8: Production of Coal, 2017-18 & 2018-19(By Grades and Sectors)
(In '00 0 tonnes)
2017-18 (R)1 2018-19 (P) 2
GradeTotal Pub. Sec. Pvt. Sec. Total Pub. Sec. Pvt. Sec.
All Grades 675400 641774 33626 728718 694983 33735C o kin g 40148 33924 6224 41132 34586 6546
ST-I 155 155 - 3 5 3 5 -ST-II 5 1 5 1 - - - -W-I 176 176 - 5 8 5 8 -W-II 4552 4357 195 4338 3889 449W-III 3991 3595 396 6577 5940 637W-IV 31041 25408 5633 29875 24415 5460W-V - - - 2 2 -SC-I 182 182 - 247 247 -
Non-c oking 635252 607850 27402 687586 660397 27189G1 1710 181 1529 8 7 8 7 -G2 264 264 - 480 480 -G3 3513 3513 - 3314 3314 -G4 14535 14535 - 15173 15173 -G5 14730 14730 - 12797 12797 -G6 10868 10868 - 7931 7133 798G7 36817 35481 1336 41509 41106 403G8 40980 40647 333 54422 52764 1658G9 27547 27547 - 35592 35369 223G10 91478 82383 9095 84067 75443 8624G11 179975 165838 14137 199704 184993 14711G12 53418 52716 702 66298 65526 772G13 101743 101740 3 111208 111208 -G14 44637 44370 267 41038 41038 -G15 7894 7894 - 6885 6885 -G16 3544 3544 - 3847 3847 -G17 1467 1467 - 3096 3096 -UNG 132 132 - 138 138 -
Source: 1. Coal Directory of India, 2017-18, Coal Controller 's Organisation, Kolkata. 2. Provisional Coal Statistics, 2018-19, Coal Controller's Organisation, Kolkata.Note: Meghalaya Coal has not been graded by Coal Controller. For sta tis tical purpose, grade may be treated as
‘A’/’B’ non-coking coal.
12
INDIAN MINERALS YEARBOOK 2019 - VOL.III
Tabl
e –
9 : P
rodu
ctio
n of
Non
-cok
ing
Coa
l, 20
17-1
8(B
y St
ates
and
Gra
des)
(In
'000
ton
nes)
Gra
des
Stat
e
All
-Gra
des
G1
G2
G3
G4
G5
G6
G7
G8
G9
G10
G11
G12
G13
G14
G15
G16
G17
UN
G
Ind
ia63
5252
1710
264
3513
1453
514
730
1086
836
817
4098
027
547
9147
817
9975
5341
810
1743
4463
778
9435
4414
6713
2A
ssam
781
181
264
217
118
1-
--
--
--
--
--
--
Chh
atti
sgar
h 14
2364
--
1762
717
2701
1691
4176
1492
440
9898
1018
7321
9331
4039
9144
5526
5211
83-
Jam
mu
&K
ashm
ir1
4-
--
--
--
--
--
--
--
-1
4-
Jhar
khan
d84
529
--
387
666
358
1861
2381
9159
1117
415
002
1475
277
2120
018
1049
--
-1
Mad
hya
Pra
desh
1119
47-
-2
274
1213
6741
2486
311
371
2168
3483
227
983
2142
216
-14
2-
--
Mah
aras
htra
4221
9-
--
--
176
916
3254
2215
443
1750
420
276
--
--
-
Meg
hala
ya15
2915
29-
--
--
--
--
--
--
--
--
Odi
sha
1433
28-
--
--
-4
013
112
841
850
538
947
6641
036
749
--
--
Tel
anga
na62
010
--
--
1094
-32
2752
2782
1589
8815
480
388
1195
328
4832
9789
227
013
1
Utta
r Pr
ades
h18
309
--
--
36
--
1137
6-
6897
--
--
--
--
Wes
t B
enga
l28
222
--
1145
1276
093
2739
921
2159
2-
-18
78-
--
--
--
Sour
ce:
Coa
l D
irec
tory
of
Indi
a, 2
017-
18,
Coa
l C
ontr
olle
rs'
Org
anis
atio
n, K
olka
ta.
Not
e: M
egha
laya
coa
l ha
s no
t be
en g
rade
d. F
or s
tati
stic
al p
urpo
se g
rade
may
be
trea
ted
as "
A"/
"B"
non-
coki
ng c
oal.
13
COAL & LIGNITE
S o u r
Tabl
e-10
: Pro
duct
ion
of N
on-c
okin
g C
oal,
2018
-19
(P)
(By
Stat
es a
nd G
rade
s)
Gra
des
Stat
e
All-
Gra
des
G1
G2
G3
G4
G5
G6
G7
G8
G9
G10
G11
G12
G13
G14
G15
G16
G17
UN
G
Indi
a68
7586
8748
033
1415
173
1279
779
3141
509
5442
235
592
8406
719
9704
6629
811
1208
4103
868
8538
4730
9613
8
A
ssam
784
--
--
--
--
--
--
--
--
--
C
hhat
tisga
rh16
1646
--
--
--
--
--
--
--
--
--
Ja
mm
u &
K
ashm
ir13
--
--
--
--
--
--
--
--
--
Jh
arkh
and
9502
5-
--
--
--
--
--
--
--
--
-
M
adhy
a
Pra
desh
1184
73-
--
--
--
--
--
--
--
--
-
M
ahar
asht
ra49
818
--
--
--
--
--
--
--
--
--
M
egha
laya
--
--
--
--
--
--
--
--
--
-
O
dish
a14
4312
--
--
--
--
--
--
--
--
--
Te
lang
ana
6516
0-
--
--
--
--
--
--
--
--
-
U
ttar
Prad
esh
2027
5-
--
--
--
--
--
--
--
--
-
W
est
Ben
gal
3208
0-
--
--
--
--
--
--
--
--
-
Sour
ce:
Prov
isio
nal
Coa
l St
atis
tics,
201
8-19
, C
oal
Con
trol
ler'
s O
rgan
isat
ion,
Kol
kata
.
Not
e: M
egha
laya
coa
l ha
s no
t be
en g
rade
d. F
or s
tatis
tical
pur
pose
gra
de m
ay b
e tr
eate
d as
"A"
/"B"
non
-cok
ing
coal
;Gra
dewi
se f
igur
es v
is-a
-vis
sta
tes
not
avai
labl
e. (I
n '0
00 t
onne
s)
14
INDIAN MINERALS YEARBOOK 2019 - VOL.III
Table –12 : Despatches of Raw Coal, 2017-18 & 2018-19(By Priorities)
(In '000 tonnes)
Pr io r i ty 2017-18 (R) 1 2018-19 (P) 2
Total 6 9 0 0 0 3 7 3 2 7 9 4
Power (Uti lity) 5 1 9 5 8 2 5 4 6 1 7 0
Power (Ca ptive) 6 59 0 6 9 17 7 9
Steel 1 10 7 4 1 73 6 5
Ce me nt 7 7 0 8 8 8 1 7
Sponge I ron 8 5 2 8 1 22 3 1
Fer tili zer 1 8 8 3 1 7 8 9
Pa per & Pu lp 1 5 1 0 1 6 3 7
Other Basic metal 806 1 0 9 7
Steel (Boilers) 3 7 3 2 9 7
Chemical 2 7 7 2 5 1
Textiles & Rayons 2 3 8 2 0 4
Bricks 1 1 5 9 3
O ther s 7 20 0 3 5 10 6 4
Source: 1 . Coal Directory o f India , 2017-18 2. Provisional Coal Statistics, 2018-19.Note: Steel includes direct feed & coking washery for metallurgical use and steel (boilers); Others inclu de non-
coking washery and Bricks.
Table – 11: Despatches of Raw Coal, 2017-18 & 2018-19(By States)
(In '000 tonnes)
States 2017-18 (R) 1 2018-19 (P) 2
I nd ia 6 9 0 0 0 3 7 3 2 7 9 4
Assam 8 9 5 7 5 4
Chha tt isgarh 1 4 6 6 5 6 1 5 9 9 8 4
Jammu & Kashmir 2 1 1 6
Jharkhand 1 2 6 5 6 4 1 3 6 0 6 1
Madhya Pradesh 1 1 9 9 3 0 1 0 3 4 0 4
Mahara shtr a 4 40 7 0 5 17 9 3
Megha la ya 1 5 2 9 -
Odisha 1 3 8 5 3 8 1 4 2 4 6 4
Tela ngana 6 46 2 3 6 84 2 6
Ut ta r Pra desh 1 72 2 7 3 66 5 4
West Bengal 2 99 5 0 3 32 3 8
Source: 1 . Coal Directory of India, 2017-18; 2 . Provisional Coal Statistics, 2018-19.
15
COAL & LIGNITE
Table – 13: Mine-head Stocks of Coal, 2017-18(By States)
(In '00 0 tonnes)
State At the beginning of the year At the end of the year
I nd ia 7 68 8 9 6 20 3 6Assam 1 8 3 6 9
Chha tt isgarh 1 21 4 7 7 3 5 9
Jammu & Kashmir 1 2 5
Jharkhand 2 40 0 2 2 06 4 5
Madhya Pradesh 8 6 0 9 2 8 4 6
Mahara shtr a 1 27 7 1 1 09 1 7
Odisha 6 3 9 3 1 11 7 8
Tela ngana 7 4 8 1 4 9 2 1
Ut ta r Pra desh 2 6 8 4 2 3 8 9
West Bengal 2 6 0 7 1 7 0 7
Table – 14: Mine-head Stocks of Coal, 2018-19 (P)(By States)
(In '000 tonnes)
Sta te At the beginning of the year At the end of the year
I n d i a 6 20 3 6 5 76 4 0
Assam 6 9 N A
Chha tt isgarh 7 3 5 9 N A
Jammu & Kashmir 5 N A
Jharkhand 2 06 4 5 N A
Madhya Pradesh 2 8 4 6 N A
Mahara shtr a 1 09 1 7 N A
Odisha 1 11 7 8 N A
Tela ngana 4 9 2 1 N A
Ut ta r Pra desh 2 3 8 9 N A
West Bengal 1 7 0 7 N A
Source: Coal Directory of India, 2017-18, Coal Controllers Organisation, Kolkata. rce
Source : Coal Directory of India 2017-18; Provisional Coal S ta tistics , 2018-19.
16
INDIAN MINERALS YEARBOOK 2019 - VOL.III
Source: 1. Coal Directory of India, 2017-18, Coal Controller 's Organisation, Kolkata. 2. Provisional Coal Statis tics, 2018-19, Coal Controller 's Organisation, Kolkata.
Table – 17 : Despatches of Lignite2017-18 & 2018-19
(By States) (In '000 tonnes)
Sta te 2 0 1 7 -1 8 2 01 8-1 9 (P)
I nd ia 4 63 1 7 45 811
Gujarat 1 37 7 9 1 25 5 4
Ra jasthan 9 1 4 0 8 7 4 7
Tamil Nadu 2 33 9 8 2 45 1 0
Source : Provisional Coal S ta tis tics , 2018-19
Source :1. Coal Directory o f India , 2017-18 2. Provisional Coal Statistics, 2018-19# Relates to no. of mines on the last day of financial year
Table – 16 : Number of Lignite Mines2017-18 & 2018-19
(By States)
No. of Mines#
Sta te 2 01 7-18 1 2018-19 2
I nd ia 1 8 N A
Gujarat 9 N A
Ra jasthan 6 N A
Tamil Nadu 3 N A
Table – 15 : Production of Lignite, 2016-17 to 2018-19(By Sectors/States)
(Q uant ity in '00 0 tonnes)
Sta te 2 0 1 6 -1 7 2017-18 1 2 01 8-19 (P) 2
India 45230 46644 44283
Public Sector 44644 46161 43885
Private Sector 5 8 6 4 8 3 3 9 8
Gujarat 10546 13781 12565
Rajasthan 84 80 92 94 86 77
Tamil Nadu 26204 23569 23041
Table – 18 : Mine-head Stocks of Lignite, 2018-19(By States)
(In '00 0 tonnes)
Sta te At the beginning of the year 1 At the end of the year 2
I nd ia 7 2 1 0 5 6 7 2
Gujarat 1 4 N A
Ra jasthan 4 1 2 N A
Tamil Nadu 6 7 8 4 N A
Source: 1 . Coal Directory o f India , 2017-18 2. Provisional Coal Statistics, 2018-19
17
COAL & LIGNITE
MINING & MARKETINGCoal
Coal mining in the country is carried out bybot h open ca st a n d un der g r oun d m et hods .Opencast mining contributed 94.2% of the totalprovisional production, whereas the rest of theproduction (5.8%) came from underground miningduring 2018-19. Most of the mines are either semi-mechan ised or mechan ised. The mach inerycommonly deployed are drill machines, load-haul-dumper (LHD), ven t ila tion fans, pumps fordewatering, haulage for transport, etc. In orderto arrest the decline in production from a fewun der g r oun d m i n es, "m a ss p r oduct i ontechnology" by introducing 'continuous miner' isbeing practised. Modern roof-bolting technologywith "flexibolts" up to 5 m length; 'smart bolting'for cos t r educt i on of r oof suppor t ; a n dintroduction of mechanised roof bolting usingh ydr a ul i c bol ts for di ff icu l t r oof ar e newtechnology absorptions in Indian UndergroundCoal Mining. Mechanised Long wall mining (longwall powered support) has also been introducedin a limited scale which yields higher output withhigh percentage recovery (70-80%). In opencastmines, machinery like draglines, dozers, shovels,dumpers and graders are deployed for variousoperations.
The latest policy pursued by CIL is to encouragetechnology upgradation through Global Tender.Global tender approach has been used towardsintroduction of high productivity with the use ofContinuous Miners at SECL and WCL.
There are eight coal producing companies inthe Public Sector. Out of these, Eastern CoalfieldsLimited (ECL), Bharat Coking Coal Limited (BCCL),Centra l Coalfields Limited (CCL), WesternCoa l fi e lds Li m it ed (WCL), Sou t h -E as t er nCoalfields Limited (SECL), Mahanadi CoalfieldsLimited (MCL), Northern Coalfields Limited (NCL)and NEC (North Eastern Coalfield are subsidiarycompanies of Coal India Ltd (CIL), a Governmentof India Undertaking. The coal mines in Assamand its neighbouring areas are controlled directlyby CIL under the unit North Eastern CoalfieldsLtd (NEC). CMPDIL is a subsidiary of CIL whichis engaged in surveying, planning and designing
work with a view to optimise coal production.TheSingareni Collieries Company Limited (SCCL) is ajoint venture between Government of India andGovernment of Telangana.
BCCL is the major producer of prime-cokingcoal (raw and washed). Medium-coking coal isalso produced in Mohuda and Barakar areas. Inaddition to production of hard coke and soft coke,BCCL operates a number of sand gathering plants,a network of aerial ropeways for transport of sandand nine coal washeries, namely, Dugda-I, Dugda-II, Bhojudih, Patherdih, Mahuda, Sudamdih,Barora, Moonidih and Madhuband.
CCL operates mines in Bokaro, Ramgarh,Giridih and North & South Karanpura Coalfieldsin Jharkhand and four coal washeries, namely,Kathara, Swang, Rajrappa and Kedla. Its productsincluded medium-coking coal (raw and washed),non-coking coal, soft coke and hard coke.
WCL operates coal mines located in Pench,Kanhan and Patharkheda Coalfields in MadhyaPradesh and Wardha Valley & Kamthi Coalfieldsin Maharashtra. This Company largely meets ther equi r em en t s of t h er m a l power p l a n t a n dindustries in the western region of the country.
ECL covers Raniganj Coalfields in WestBengal and Mugma & Rajmahal Coalfields in Bihar.It produces and supplies coal to the local andother industries which require relatively highergrades of coal.
The coalfields of Chhattisgarh, viz, Korba(East & West), Baikunthpur, Chirimiri, Hasdeo,Sohagpur, Jamuna-Kotma and Johilia are underSECL. This subsidiary continued to be the leadingproducer of CIL.
NEC is responsible for development andproduction of coal in the North-Eastern States.The present mining activities are confined toArunachal Pradesh, Assam and Meghalaya. Thearea has large proven reserves of low ash, highcalori fic value coal but because of it s h ighsulphur content, it cannot be used directly asmetallurgical coal.
SCCL operates coal mines in Telangana statewhich produces non-coking coal . The coalrequirements of consumers in south are mostlymet by this Company.
18
INDIAN MINERALS YEARBOOK 2019 - VOL.III
MCL had been incorporated as anothersubsidiary Company of CIL. Its area of jurisdictioncomprises Talcher and Ib Valley Coalfields ofOdisha.
NCL covers the entire Singrauli Coalfieldssituated in Madhya Pradesh and Uttar Pradesh.
Jha rkh an d St a te Mi nera l Devel opm en tCorporation Ltd (JSMDCL), Jammu & KashmirMinerals Ltd (JKML) and Rajasthan Rajya VidyutUtpadan Nigam Limited (RVUNL) are the StateGovernment Undertakings and Damodar ValleyCorporation (DVC) is the Central Public SectorUndertaking that are engaged in coal mining.IISCO steel plant of SAIL is the only Public Sectorsteel unit operating captive mines for coal. BengalEmta Coal Mines Ltd (BECML), Jindal Steel &Power Ltd (JSPL), Hindalco and Tata Steel are theCompanies operating captive mines in the PrivateSector.
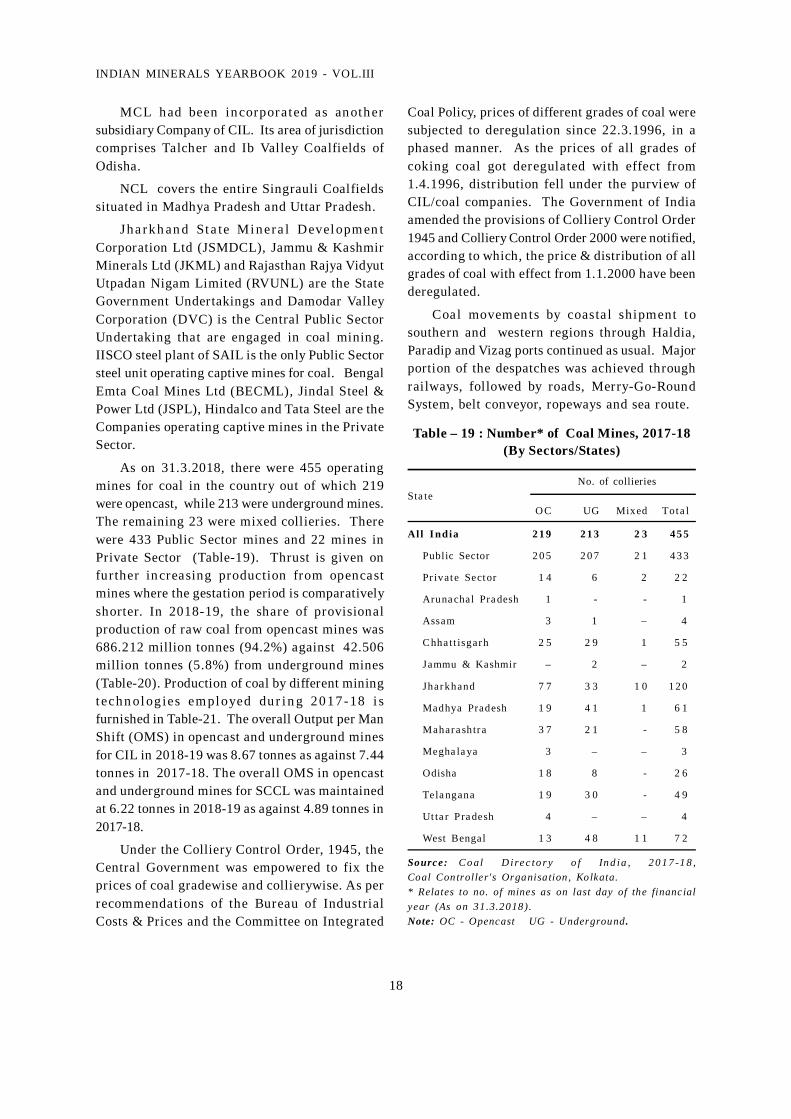
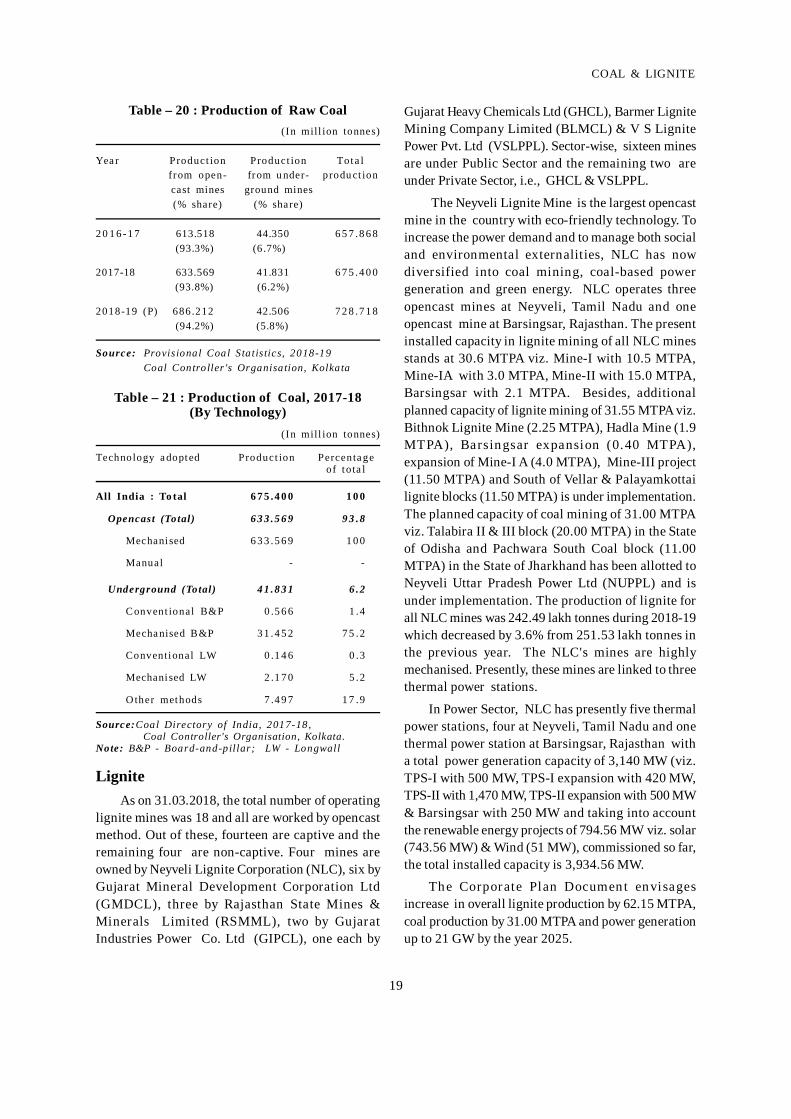
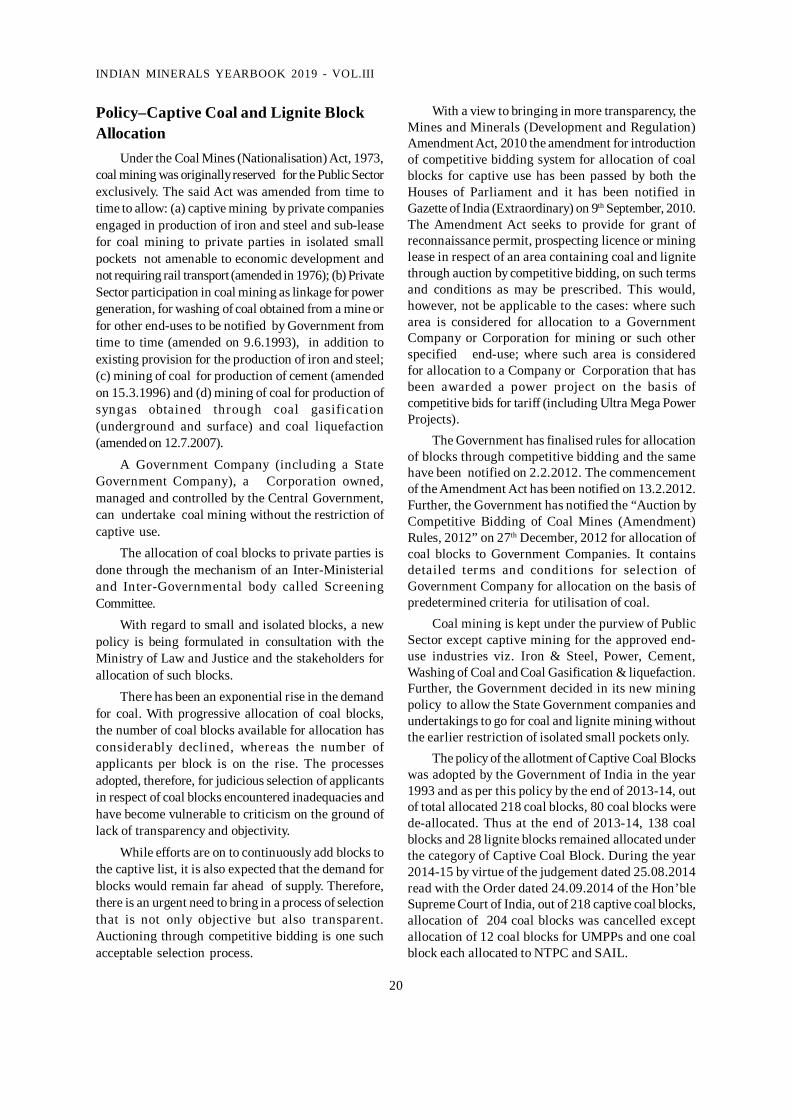
As on 31.3.2018, there were 455 operatingmines for coal in the country out of which 219were opencast, while 213 were underground mines.The remaining 23 were mixed collieries. Therewere 433 Public Sector mines and 22 mines inPrivate Sector (Table-19). Thrust is given onfurther increasing production from opencastmines where the gestation period is comparativelyshorter. In 2018-19, the share of provisionalproduction of raw coal from opencast mines was686.212 million tonnes (94.2%) against 42.506million tonnes (5.8%) from underground mines(Table-20). Production of coal by different miningt echn ol og ies em pl oyed dur i n g 2017-18 i sfurnished in Table-21. The overall Output per ManShift (OMS) in opencast and underground minesfor CIL in 2018-19 was 8.67 tonnes as against 7.44tonnes in 2017-18. The overall OMS in opencastand underground mines for SCCL was maintainedat 6.22 tonnes in 2018-19 as against 4.89 tonnes in2017-18.
Under the Colliery Control Order, 1945, theCentral Government was empowered to fix theprices of coal gradewise and collierywise. As perrecommendations of the Bureau of IndustrialCosts & Prices and the Committee on Integrated
Coal Policy, prices of different grades of coal weresubjected to deregulation since 22.3.1996, in aphased manner. As the prices of all grades ofcoking coal got deregulated with effect from1.4.1996, distr ibution fell under the purview ofCIL/coal companies. The Government of Indiaamended the provisions of Colliery Control Order1945 and Colliery Control Order 2000 were notified,according to which, the price & distribution of allgrades of coal with effect from 1.1.2000 have beenderegulated.
Coal movements by coasta l shipment tosouthern and western regions through Haldia,Paradip and Vizag ports continued as usual. Majorportion of the despatches was achieved throughrailways, followed by roads, Merry-Go-RoundSystem, belt conveyor, ropeways and sea route.
Table – 19 : Number* of Coal Mines, 2017-18(By Sectors/States)
No. of collieriesSta te
O C UG Mixed Tota l
All I ndia 2 1 9 2 1 3 2 3 4 5 5
Public Sector 2 0 5 2 0 7 2 1 4 3 3
Pr ivate Sector 1 4 6 2 2 2
Aruna chal Pra desh 1 - - 1
Assam 3 1 – 4
Chha tt isgarh 2 5 2 9 1 5 5
Jammu & Kashmir – 2 – 2
Jharkhand 7 7 3 3 1 0 1 2 0
Madhya Pradesh 1 9 4 1 1 6 1
Mahara shtr a 3 7 2 1 - 5 8
Megha la ya 3 – – 3
Odisha 1 8 8 - 2 6
Tela ngana 1 9 3 0 - 4 9
Ut ta r Pra desh 4 – – 4
West Bengal 1 3 4 8 1 1 7 2
Source: Co al D ire c to r y o f In d ia , 2 0 1 7 -1 8 ,Coal Controller's Organisation , Kolkata.* Relates to no. of mines as on last day of the financialyear (As on 31.3.2018).Note: OC - Opencast UG - Underground .
19
COAL & LIGNITE
Table – 21 : Production of Coal, 2017-18(By Technology)
(In mill ion tonnes)
Technology a dopted Product ion Percenta geof to ta l
All India : To tal 6 7 5 .4 0 0 1 0 0
Opencast (Total) 6 3 3 .5 6 9 9 3 .8
Mechanised 6 3 3 .5 6 9 1 0 0
Manual - -
Underground (Total) 4 1 .8 3 1 6 .2
Convent ional B&P 0 .5 6 6 1 .4
Mecha nised B&P 3 1 .4 5 2 7 5 .2
Conventional LW 0 .1 4 6 0 .3
Mechani sed LW 2 .1 7 0 5 .2
O ther methods 7 .4 9 7 1 7 .9
Source:Coal Directory of India, 2017-18, Coal Controller's Organisation, Kolkata.Note: B&P - Board-and-pillar; LW - Longwall
Gujarat Heavy Chemicals Ltd (GHCL), Barmer LigniteMining Company Limited (BLMCL) & V S LignitePower Pvt. Ltd (VSLPPL). Sector-wise, sixteen minesare under Public Sector and the remaining two areunder Private Sector, i.e., GHCL & VSLPPL.
The Neyveli Lignite Mine is the largest opencastmine in the country with eco-friendly technology. Toincrease the power demand and to manage both socialand environmental externalities, NLC has nowdiversified into coal mining, coal-based powergeneration and green energy. NLC operates threeopencast mines at Neyveli, Tamil Nadu and oneopencast mine at Barsingsar, Rajasthan. The presentinstalled capacity in lignite mining of all NLC minesstands at 30.6 MTPA viz. Mine-I with 10.5 MTPA,Mine-IA with 3.0 MTPA, Mine-II with 15.0 MTPA,Barsingsar with 2.1 MTPA. Besides, additionalplanned capacity of lignite mining of 31.55 MTPA viz.Bithnok Lignite Mine (2.25 MTPA), Hadla Mine (1.9MTPA), Barsingsar expansion (0.40 MTPA),expansion of Mine-I A (4.0 MTPA), Mine-III project(11.50 MTPA) and South of Vellar & Palayamkottailignite blocks (11.50 MTPA) is under implementation.The planned capacity of coal mining of 31.00 MTPAviz. Talabira II & III block (20.00 MTPA) in the Stateof Odisha and Pachwara South Coal block (11.00MTPA) in the State of Jharkhand has been allotted toNeyveli Uttar Pradesh Power Ltd (NUPPL) and isunder implementation. The production of lignite forall NLC mines was 242.49 lakh tonnes during 2018-19which decreased by 3.6% from 251.53 lakh tonnes inthe previous year. The NLC's mines are highlymechanised. Presently, these mines are linked to threethermal power stations.
In Power Sector, NLC has presently five thermalpower stations, four at Neyveli, Tamil Nadu and onethermal power station at Barsingsar, Rajasthan witha total power generation capacity of 3,140 MW (viz.TPS-I with 500 MW, TPS-I expansion with 420 MW,TPS-II with 1,470 MW, TPS-II expansion with 500 MW& Barsingsar with 250 MW and taking into accountthe renewable energy projects of 794.56 MW viz. solar(743.56 MW) & Wind (51 MW), commissioned so far,the total installed capacity is 3,934.56 MW.
The Corporate Plan Document envisagesincrease in overall lignite production by 62.15 MTPA,coal production by 31.00 MTPA and power generationup to 21 GW by the year 2025.
Table – 20 : Production of Raw Coal(In mill ion tonnes)
Yea r Product ion Product ion Tota lfrom open- from u nder- produ ct ioncast mines ground mines(% share) (% share)
2 0 1 6 -1 7 613.518 44.350 6 5 7 .8 6 8 (93.3%) (6 .7%)
2017-18 633.569 41.831 6 7 5 .4 0 0 (93.8%) (6.2%)
2018-19 (P) 686.212 42.506 7 2 8 .7 1 8 (94.2%) (5.8%)
Source: Provisional Coal S ta tis tics, 2018-19Coal Controller 's Organisation, Kolkata
LigniteAs on 31.03.2018, the total number of operating
lignite mines was 18 and all are worked by opencastmethod. Out of these, fourteen are captive and theremaining four are non-captive. Four mines areowned by Neyveli Lignite Corporation (NLC), six byGujarat Mineral Development Corporation Ltd(GMDCL), three by Rajasthan State Mines &Minerals Limited (RSMML), two by GujaratIndustries Power Co. Ltd (GIPCL), one each by
20
INDIAN MINERALS YEARBOOK 2019 - VOL.III
Policy–Captive Coal and Lignite BlockAllocation
Under the Coal Mines (Nationalisation) Act, 1973,coal mining was originally reserved for the Public Sectorexclusively. The said Act was amended from time totime to allow: (a) captive mining by private companiesengaged in production of iron and steel and sub-leasefor coal mining to private parties in isolated smallpockets not amenable to economic development andnot requiring rail transport (amended in 1976); (b) PrivateSector participation in coal mining as linkage for powergeneration, for washing of coal obtained from a mine orfor other end-uses to be notified by Government fromtime to time (amended on 9.6.1993), in addition toexisting provision for the production of iron and steel;(c) mining of coal for production of cement (amendedon 15.3.1996) and (d) mining of coal for production ofsyngas obtained through coal gasification(underground and surface) and coal liquefaction(amended on 12.7.2007).
A Government Company (including a StateGovernment Company), a Corporation owned,managed and controlled by the Central Government,can undertake coal mining without the restriction ofcaptive use.
The allocation of coal blocks to private parties isdone through the mechanism of an Inter-Ministerialand Inter-Governmental body called ScreeningCommittee.
With regard to small and isolated blocks, a newpolicy is being formulated in consultation with theMinistry of Law and Justice and the stakeholders forallocation of such blocks.
There has been an exponential rise in the demandfor coal. With progressive allocation of coal blocks,the number of coal blocks available for allocation hasconsiderably declined, whereas the number ofapplicants per block is on the rise. The processesadopted, therefore, for judicious selection of applicantsin respect of coal blocks encountered inadequacies andhave become vulnerable to criticism on the ground oflack of transparency and objectivity.
While efforts are on to continuously add blocks tothe captive list, it is also expected that the demand forblocks would remain far ahead of supply. Therefore,there is an urgent need to bring in a process of selectionthat is not only objective but also transparent.Auctioning through competitive bidding is one suchacceptable selection process.
With a view to bringing in more transparency, theMines and Minerals (Development and Regulation)Amendment Act, 2010 the amendment for introductionof competitive bidding system for allocation of coalblocks for captive use has been passed by both theHouses of Parliament and it has been notified inGazette of India (Extraordinary) on 9th September, 2010.The Amendment Act seeks to provide for grant ofreconnaissance permit, prospecting licence or mininglease in respect of an area containing coal and lignitethrough auction by competitive bidding, on such termsand conditions as may be prescribed. This would,however, not be applicable to the cases: where sucharea is considered for allocation to a GovernmentCompany or Corporation for mining or such otherspecified end-use; where such area is consideredfor allocation to a Company or Corporation that hasbeen awarded a power project on the basis ofcompetitive bids for tariff (including Ultra Mega PowerProjects).
The Government has finalised rules for allocationof blocks through competitive bidding and the samehave been notified on 2.2.2012. The commencementof the Amendment Act has been notified on 13.2.2012.Further, the Government has notified the “Auction byCompetitive Bidding of Coal Mines (Amendment)Rules, 2012” on 27th December, 2012 for allocation ofcoal blocks to Government Companies. It containsdetailed terms and conditions for selection ofGovernment Company for allocation on the basis ofpredetermined criteria for utilisation of coal.
Coal mining is kept under the purview of PublicSector except captive mining for the approved end-use industries viz. Iron & Steel, Power, Cement,Washing of Coal and Coal Gasification & liquefaction.Further, the Government decided in its new miningpolicy to allow the State Government companies andundertakings to go for coal and lignite mining withoutthe earlier restriction of isolated small pockets only.
The policy of the allotment of Captive Coal Blockswas adopted by the Government of India in the year1993 and as per this policy by the end of 2013-14, outof total allocated 218 coal blocks, 80 coal blocks werede-allocated. Thus at the end of 2013-14, 138 coalblocks and 28 lignite blocks remained allocated underthe category of Captive Coal Block. During the year2014-15 by virtue of the judgement dated 25.08.2014read with the Order dated 24.09.2014 of the Hon’bleSupreme Court of India, out of 218 captive coal blocks,allocation of 204 coal blocks was cancelled exceptallocation of 12 coal blocks for UMPPs and one coalblock each allocated to NTPC and SAIL.
21
COAL & LIGNITE
Further, allocation of four coal blocks forUMPPs, i.e., Chhatrasal coal block and thatMeenakshi, Meenakshi B & Dip side of Meenakshiblocks of UMPP was cancelled on 07.05.2015 and15.12.2015, respectively. As such, as on 31.3.2018,only 10 coal blocks (allocated through earlierdispensations) remained allocated.
Subsequent to the order of the Hon’ble SupremeCourt of India, 42 coal blocks [Schedule II coal minesas per the Coal Mines (Special Provisions) Ordinance,2014 replaced by the Coal Mines (Special Provision)Act, 2015] were allowed to produce coal up to31.03.2015. Thus, the total number of blocks thatstood allocated from 25.09.2014 to 31.03.2015 was 52(42 + 10 earlier coal blocks).
In 2018-19, 20 captive coal blocks vested/allocated including 3 blocks under CIL custodianproduced coal. From these total 23 coal blocks,production of coal reported was 54.852 million tonnes.
Under the “Auction by Competitive BiddingRules, 2012”, 13 regionally explored coal blocks havebeen a l lot ted to Cen tral /State Governmen tcompanies.
In 2018-19, 3 coal blocks have been allocated.Therefore, as on 31.03.2019, the total number of coalblocks that existed was 110. Out of these, 80 blockswere vested/ allotted which accounted for 11,045.77million tonnes; 13 blocks were under Auction byCompetitive Bidding Rules, 2012 with 5,684.84 milliontonnes; 7 blocks were that of Custodian with 364.86million tonnes; and 10 blocks with 5,418.42 milliontonnes remained as not cancelled by the Hon'bleSupreme Court.
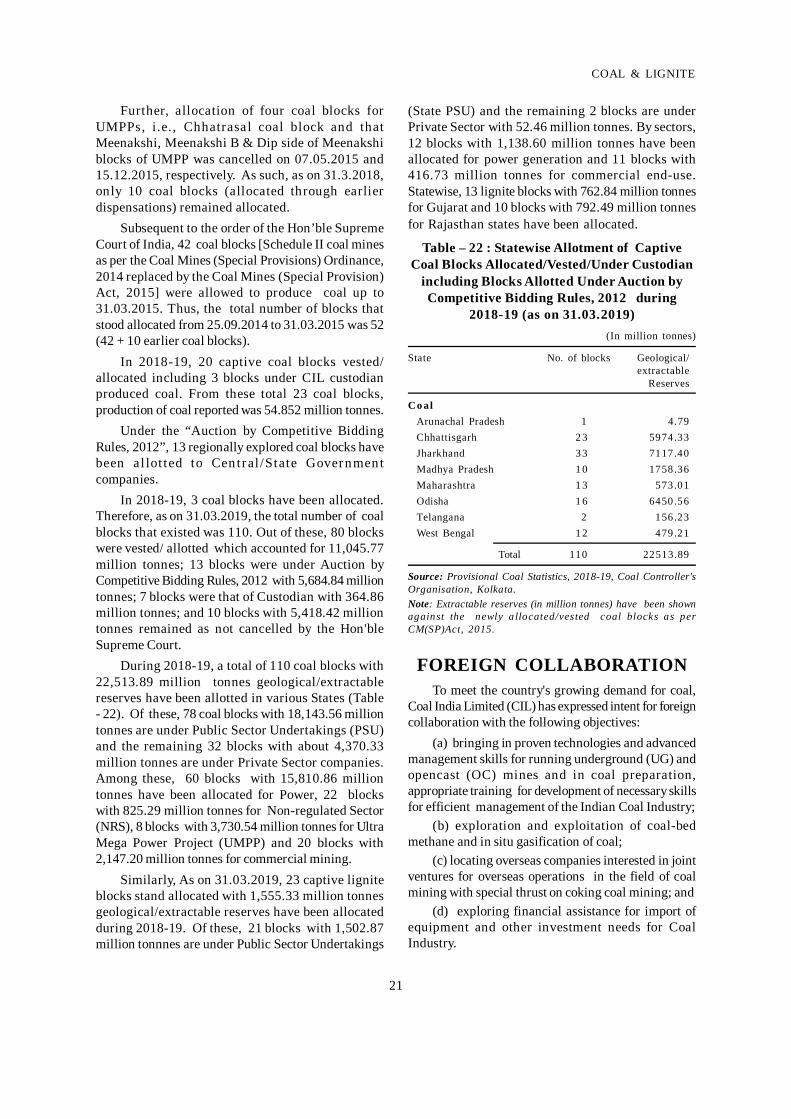
During 2018-19, a total of 110 coal blocks with22,513.89 million tonnes geological/extractablereserves have been allotted in various States (Table- 22). Of these, 78 coal blocks with 18,143.56 milliontonnes are under Public Sector Undertakings (PSU)and the remaining 32 blocks with about 4,370.33million tonnes are under Private Sector companies.Among these, 60 blocks with 15,810.86 milliontonnes have been allocated for Power, 22 blockswith 825.29 million tonnes for Non-regulated Sector(NRS), 8 blocks with 3,730.54 million tonnes for UltraMega Power Project (UMPP) and 20 blocks with2,147.20 million tonnes for commercial mining.
Similarly, As on 31.03.2019, 23 captive ligniteblocks stand allocated with 1,555.33 million tonnesgeological/extractable reserves have been allocatedduring 2018-19. Of these, 21 blocks with 1,502.87million tonnnes are under Public Sector Undertakings
(State PSU) and the remaining 2 blocks are underPrivate Sector with 52.46 million tonnes. By sectors,12 blocks with 1,138.60 million tonnes have beenallocated for power generation and 11 blocks with416.73 million tonnes for commercial end-use.Statewise, 13 lignite blocks with 762.84 million tonnesfor Gujarat and 10 blocks with 792.49 million tonnesfor Rajasthan states have been allocated.
Table – 22 : Statewise Allotment of CaptiveCoal Blocks Allocated/Vested/Under Custodian
including Blocks Allotted Under Auction byCompetitive Bidding Rules, 2012 during
2018-19 (as on 31.03.2019)(In million tonnes)
State No. of blocks Geological/extractable
Reserves
C o alArunachal Pradesh 1 4.79Chhattisgarh 2 3 5974.33Jharkhand 3 3 7117.40Madhya Pradesh 1 0 1758.36Maharashtra 1 3 573.01Odisha 1 6 6450.56Telangana 2 156.23West Bengal 1 2 479.21
Total 110 22513.89
Source: Provisional Coal Statistics, 2018-19, Coal Controller'sOrganisation, Kolkata.Note: Extractable reserves (in million tonnes) have been shownagainst the newly a llocated/vested coal blocks as perCM(SP)Act, 2015.
FOREIGN COLLABORATIONTo meet the country's growing demand for coal,
Coal India Limited (CIL) has expressed intent for foreigncollaboration with the following objectives:
(a) bringing in proven technologies and advancedmanagement skills for running underground (UG) andopencast (OC) mines and in coal preparation,appropriate training for development of necessary skillsfor efficient management of the Indian Coal Industry;
(b) exploration and exploitation of coal-bedmethane and in situ gasification of coal;
(c) locating overseas companies interested in jointventures for overseas operations in the field of coalmining with special thrust on coking coal mining; and
(d) exploring financial assistance for import ofequipment and other investment needs for CoalIndustry.
22
INDIAN MINERALS YEARBOOK 2019 - VOL.III
To fulfil these objectives, a Joint Working Groupon coal had been set up with a number of countries,such as, UK, France, Russia, USA, Poland, Germany,Australia and China. The priority areas, inter alia,include acquiring modern technology for massproduction through underground and opencast mining;innovative methodology for undergound mining indifficult Geological conditions including steep seams;fire & subsidence control; mines safety; coalpreparation; use of washery rejects for powergeneration; exploitation of coal-bed methane fromworking mines & abandoned mines; coal gasification;application of Geographical Information System (GIS);environmental mitigation & emission trading; overseasventures for sourcing coking coal; etc. Training of CILpersonnel for effective adaptation of the state-of-the-art technologies, available with the developed countriesis also a prime subject of focus.
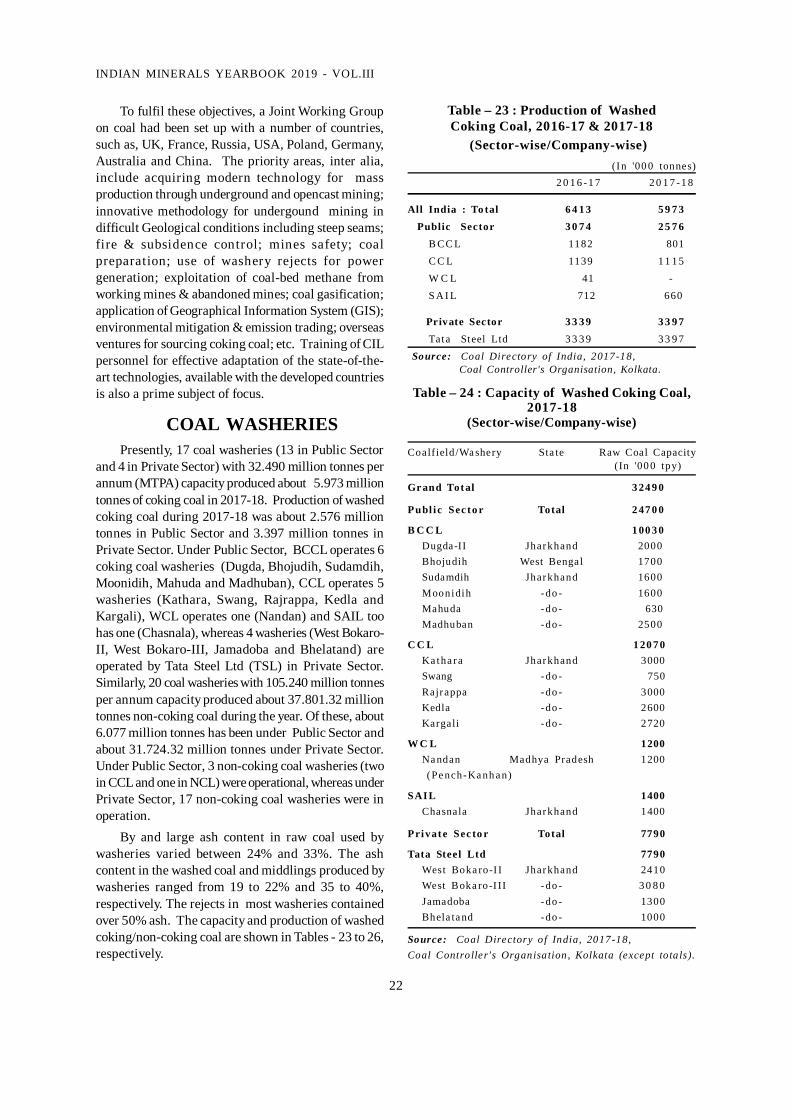
COAL WASHERIESPresently, 17 coal washeries (13 in Public Sector
and 4 in Private Sector) with 32.490 million tonnes perannum (MTPA) capacity produced about 5.973 milliontonnes of coking coal in 2017-18. Production of washedcoking coal during 2017-18 was about 2.576 milliontonnes in Public Sector and 3.397 million tonnes inPrivate Sector. Under Public Sector, BCCL operates 6coking coal washeries (Dugda, Bhojudih, Sudamdih,Moonidih, Mahuda and Madhuban), CCL operates 5washeries (Kathara, Swang, Rajrappa, Kedla andKargali), WCL operates one (Nandan) and SAIL toohas one (Chasnala), whereas 4 washeries (West Bokaro-II, West Bokaro-III, Jamadoba and Bhelatand) areoperated by Tata Steel Ltd (TSL) in Private Sector.Similarly, 20 coal washeries with 105.240 million tonnesper annum capacity produced about 37.801.32 milliontonnes non-coking coal during the year. Of these, about6.077 million tonnes has been under Public Sector andabout 31.724.32 million tonnes under Private Sector.Under Public Sector, 3 non-coking coal washeries (twoin CCL and one in NCL) were operational, whereas underPrivate Sector, 17 non-coking coal washeries were inoperation.
By and large ash content in raw coal used bywasheries varied between 24% and 33%. The ashcontent in the washed coal and middlings produced bywasheries ranged from 19 to 22% and 35 to 40%,respectively. The rejects in most washeries containedover 50% ash. The capacity and production of washedcoking/non-coking coal are shown in Tables - 23 to 26,respectively.
Table – 23 : Production of WashedCoking Coal, 2016-17 & 2017-18
(Sector-wise/Company-wise)(In '00 0 tonnes)
2 0 1 6 -1 7 2 0 1 7 -1 8
All India : To tal 6 4 1 3 5 9 7 3 Public Sector 3 0 7 4 2 5 7 6
B CC L 1182 801C C L 1139 1 1 1 5W C L 41 -S A I L 712 660
Private Sector 3 3 3 9 3 3 9 7Tata Steel Ltd 3 3 3 9 3 3 9 7
Source: Coal Directory of India, 2017-18, Coal Controller's Organisation, Kolkata.
Table – 24 : Capacity of Washed Coking Coal,2017-18
(Sector-wise/Company-wise)
Coalfield /Wa shery Sta te Raw Coal Capacity(In '00 0 tpy)
Gr and Total 3 24 9 0
Publ ic Sec to r Total 2 47 0 0
B C C L 1 00 3 0Dugda-II Jharkhand 2000Bhojudih West Bengal 1700Sudamdih Jharkhand 1600Moonidih -do - 1600Mahuda -do - 630Madhuban -do - 2500
C C L 1 20 7 0Ka tha ra Jharkhand 3000Swang -do - 750Rajr appa -do - 3000Kedla -do - 2600Kargali -do - 2720
W C L 1200Na ndan Madhya Pradesh 1200(Pe nch-Ka nh a n)
SAI L 1400Chasnala Jharkhand 1400
Private Sec to r Total 7790
Tata Steel Ltd 7790West Boka ro-I I Jharkhand 2410West Boka ro-I II -do - 3 0 8 0Jamadoba -do - 1300Bhela ta nd -do - 1000
Source: Coal Directory o f India, 2017-18,Coal Controller's Organisation , Kolkata (except to ta ls).

23
COAL & LIGNITE
Table – 25 : Production of WashedNon-coking Coal :
2016-17 & 2017-18(Sector-wise/Company-wise)
(In '000 tonnes)
Sector/Company 2016-17 2017-18
All India : Total 45121.92 37801.32
Public Sector 12097.29 6077.00
CCL 8942.00 6077.00
NCL 3155.29 -
Private Sector 33024.63 31724.32
Adani Enterprises Ltd 7414.91 7143.20
Aryan Coal Beneficiation 11862.73 11586.65 Pvt. Ltd
Aryan Energy Pvt. Ltd 1284.58 726.93
Global Coal & Mining 3082.98 2436.00 Pvt. Ltd
Jindal Power Ltd 379.26 506.65
Spectrum Coal & Power Ltd 9000.17 9293.22
Kartikay Coal Washeries - 31.67 Pvt. Ltd
Source: Coal Directory of India, 2017-18, Coal Controller's Organisation, Kolkata.
consideration of transport logistics and commercialprecedence. In spite of hardening prices of bothcoking and non-coking coal internationally andincrease in ocean freight, large amounts of coalcontinue to be imported.
FDI PolicyIndian Government permits 100% automatic FDI
approval for coal & lignite mining only for captiveconsumption by power projects, iron & steel andcement units and other eligible activities permittedunder and subject to the provisions of Coal Mines(Nationalisation) Act, 1973. This is in addition to theexisting stipulated policy applied for the PowerSector.
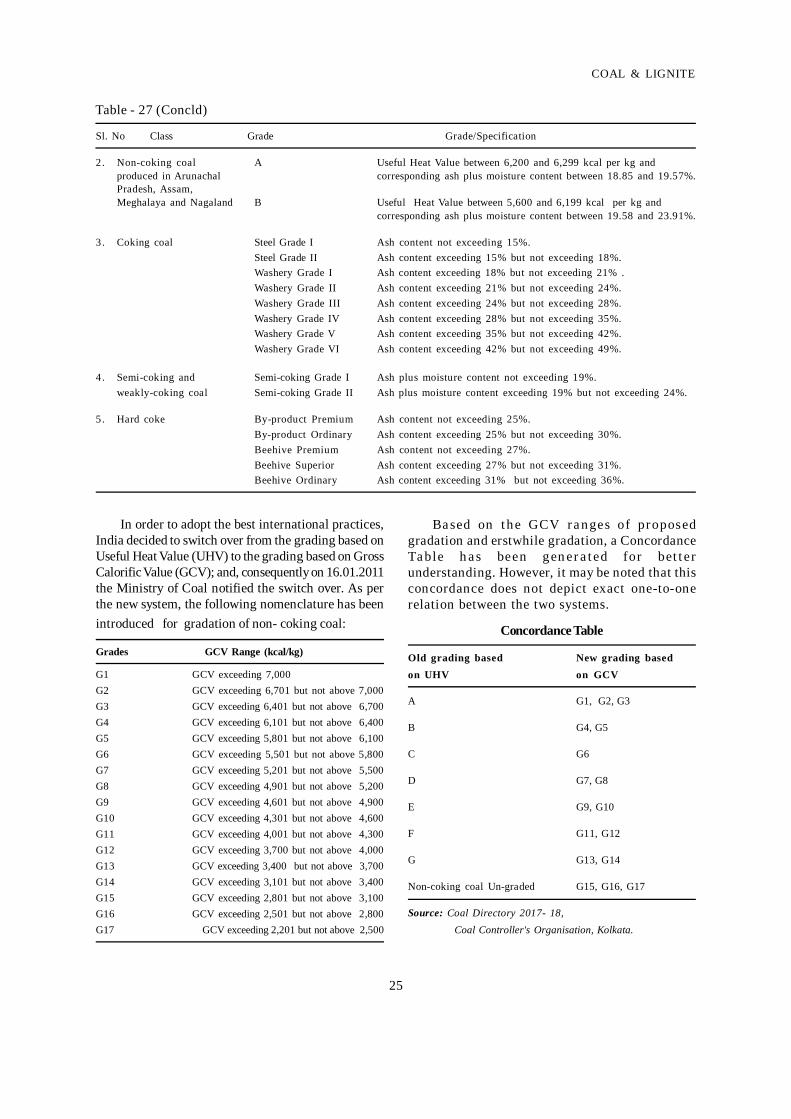
CLASSIFICATION AND GRADESIndian coal i s classi fied in to two main
categories, namely, coking and non-coking. Cokingcoal is a type of coal from which, on carbonisation,coke suitable for use in metallurgical industries,particularly, in Iron and Steel industries can beproduced. Parameters determining coking propertyof coal are coking index, volatile matter (VM %),vitrinite %, crucible swell no., fluidity, reflectance,etc. Although for commercial gradation, ashpercentage is the sole criterion, for semi-weakly-coking coal, along with ash percentage, moisturepercentage too is considered as an added criterion.For non-coking coal, an empirical formula isused to determine Useful Heat Value (UHV) ofcoal in kcal/kg.
The classification of coal as per the Ministry ofCoal is reflected in Table - 27.
Import Policy of CoalThe present import policy of coal allows imports
to be carried out freely under Open General Licenceby the consumers themselves considering theirneeds. Coking coal is imported by Steel Sector andcoke manufacturers mainly on availability and qualityconsideration. Coal-based power stations andcement plants are also importing non-coking coal on
Table – 26 : Capacity of Washed Non-coking Coal, 2017-18(Sector-wise/Company-wise)
(In '00 0 tpy)
Wa shery/Locat ion Coalfield Sta te Raw Coal Capacity
Gr and Total 1 0 5 2 4 0Publ ic Sec to r Total 1 35 0 0
C C LEast Bo kar o Co al f i e ld , Jhar khand 9 0 0 0
Gidi East Bok aro Jharkhand 2 5 0 0Piparwar N. Karanpura -do - 6 5 0 0
N C L 4 5 0 0Bina Deshelling Plant Bina Ut ta r Pra desh 4 5 0 0
(Contd)
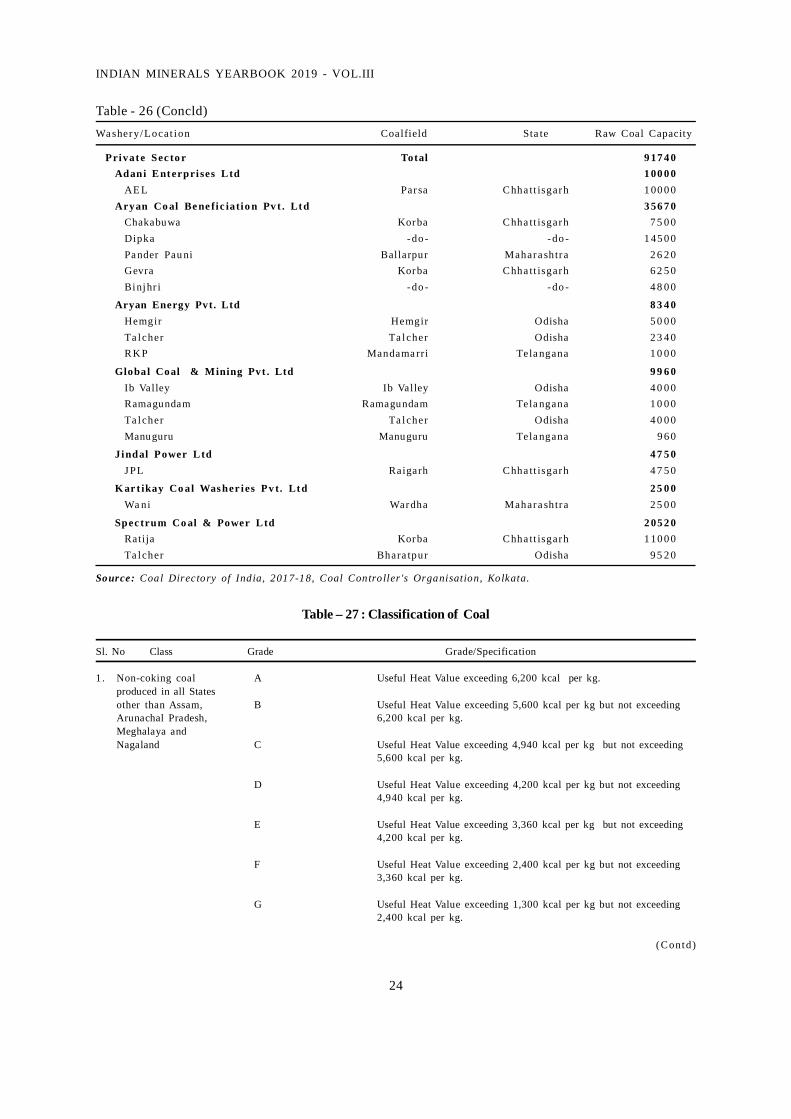
24
INDIAN MINERALS YEARBOOK 2019 - VOL.III
Private Sec to r Total 9 17 4 0Adani Enterpri ses Ltd 1 00 0 0
AE L Parsa Chha tt isgarh 1 00 0 0Aryan Co al Be ne fic iatio n Pv t . Ltd 3 56 7 0
Chakabuwa Korba Chha tt isgarh 7 5 0 0Dipka -do - -do - 1 45 0 0Pa nder Pau ni Ballarpur Mahara shtr a 2 6 2 0Gevra Korba Chha tt isgarh 6 2 5 0Binjhr i -do - -do - 4 8 0 0
Aryan Energy Pvt. Ltd 8 3 4 0Hemgir Hemgir Odisha 5 0 0 0Ta lcher Ta lcher Odisha 2 3 4 0RK P Mandama rri Tela ngana 1 0 0 0
Global Coal & Mining Pvt . Ltd 9 9 6 0Ib Valley Ib Valley Odisha 4 0 0 0Ramagundam Ramagundam Tela ngana 1 0 0 0Ta lcher Ta lcher Odisha 4 0 0 0Manuguru Manuguru Tela ngana 9 6 0
Jindal Power Ltd 4 7 5 0J PL Raigarh Chha tt isgarh 4 7 5 0
K ar t ikay Co al Was her ies Pv t. Ltd 2 5 0 0Wa ni Wardha Mahara shtr a 2 5 0 0
Spec trum Co al & Power Ltd 2 05 2 0Ratija Korba Chha tt isgarh 1 10 0 0Ta lcher Bhara tpur Odisha 9 5 2 0
Source: Coal Directory of India, 2017-18, Coal Controller 's Organisation, Kolkata.
Table - 26 (Concld)Wa shery/Locat ion Coalfield Sta te Raw Coal Capacity
Table – 27 : Classification of Coal
Sl. No Class Grade Grade/Specification
1. Non-coking coal A Useful Heat Value exceeding 6,200 kcal per kg.produced in all Statesother than Assam, B Useful Heat Value exceeding 5,600 kcal per kg but not exceedingArunachal Pradesh, 6,200 kcal per kg.Meghalaya andNagaland C Useful Heat Value exceeding 4,940 kcal per kg but not exceeding
5,600 kcal per kg.
D Useful Heat Value exceeding 4,200 kcal per kg but not exceeding4,940 kcal per kg.
E Useful Heat Value exceeding 3,360 kcal per kg but not exceeding4,200 kcal per kg.
F Useful Heat Value exceeding 2,400 kcal per kg but not exceeding3,360 kcal per kg.
G Useful Heat Value exceeding 1,300 kcal per kg but not exceeding2,400 kcal per kg.
(Contd)
25
COAL & LIGNITE
Sl. No Class Grade Grade/Specification
2. Non-coking coal A Useful Heat Value between 6,200 and 6,299 kcal per kg andproduced in Arunachal corresponding ash plus moisture content between 18.85 and 19.57%.Pradesh, Assam,Meghalaya and Nagaland B Useful Heat Value between 5,600 and 6,199 kcal per kg and
corresponding ash plus moisture content between 19.58 and 23.91%.
3. Coking coal Steel Grade I Ash content not exceeding 15%.Steel Grade II Ash content exceeding 15% but not exceeding 18%.Washery Grade I Ash content exceeding 18% but not exceeding 21% .Washery Grade II Ash content exceeding 21% but not exceeding 24%.Washery Grade III Ash content exceeding 24% but not exceeding 28%.Washery Grade IV Ash content exceeding 28% but not exceeding 35%.Washery Grade V Ash content exceeding 35% but not exceeding 42%.Washery Grade VI Ash content exceeding 42% but not exceeding 49%.
4. Semi-coking and Semi-coking Grade I Ash plus moisture content not exceeding 19%.weakly-coking coal Semi-coking Grade II Ash plus moisture content exceeding 19% but not exceeding 24%.
5. Hard coke By-product Premium Ash content not exceeding 25%.By-product Ordinary Ash content exceeding 25% but not exceeding 30%.Beehive Premium Ash content not exceeding 27%.Beehive Superior Ash content exceeding 27% but not exceeding 31%.Beehive Ordinary Ash content exceeding 31% but not exceeding 36%.
Table - 27 (Concld)
In order to adopt the best international practices,India decided to switch over from the grading based onUseful Heat Value (UHV) to the grading based on GrossCalorific Value (GCV); and, consequently on 16.01.2011the Ministry of Coal notified the switch over. As perthe new system, the following nomenclature has beenintroduced for gradation of non- coking coal:
Grades GCV Range (kcal/kg)
G1 GCV exceeding 7,000G2 GCV exceeding 6,701 but not above 7,000G3 GCV exceeding 6,401 but not above 6,700G4 GCV exceeding 6,101 but not above 6,400G5 GCV exceeding 5,801 but not above 6,100G6 GCV exceeding 5,501 but not above 5,800G7 GCV exceeding 5,201 but not above 5,500G8 GCV exceeding 4,901 but not above 5,200G9 GCV exceeding 4,601 but not above 4,900G10 GCV exceeding 4,301 but not above 4,600G11 GCV exceeding 4,001 but not above 4,300G12 GCV exceeding 3,700 but not above 4,000G13 GCV exceeding 3,400 but not above 3,700G14 GCV exceeding 3,101 but not above 3,400G15 GCV exceeding 2,801 but not above 3,100G16 GCV exceeding 2,501 but not above 2,800G17 GCV exceeding 2,201 but not above 2,500
Ba sed on t he GCV ra nges of proposedgradation and erstwhile gradation, a ConcordanceTa ble h a s been gen er a t ed for bet t erunderstanding. However, it may be noted that thisconcordance does not depict exact one-to-onerelation between the two systems.
Concordance Table
Old grading based New grading basedon UHV on GCV
A G1, G2, G3
B G4, G5
C G6
D G7, G8
E G9, G10
F G11, G12
G G13, G14
Non-coking coal Un-graded G15, G16, G17
Source: Coal Directory 2017- 18, Coal Controller's Organisation, Kolkata.
26
INDIAN MINERALS YEARBOOK 2019 - VOL.III
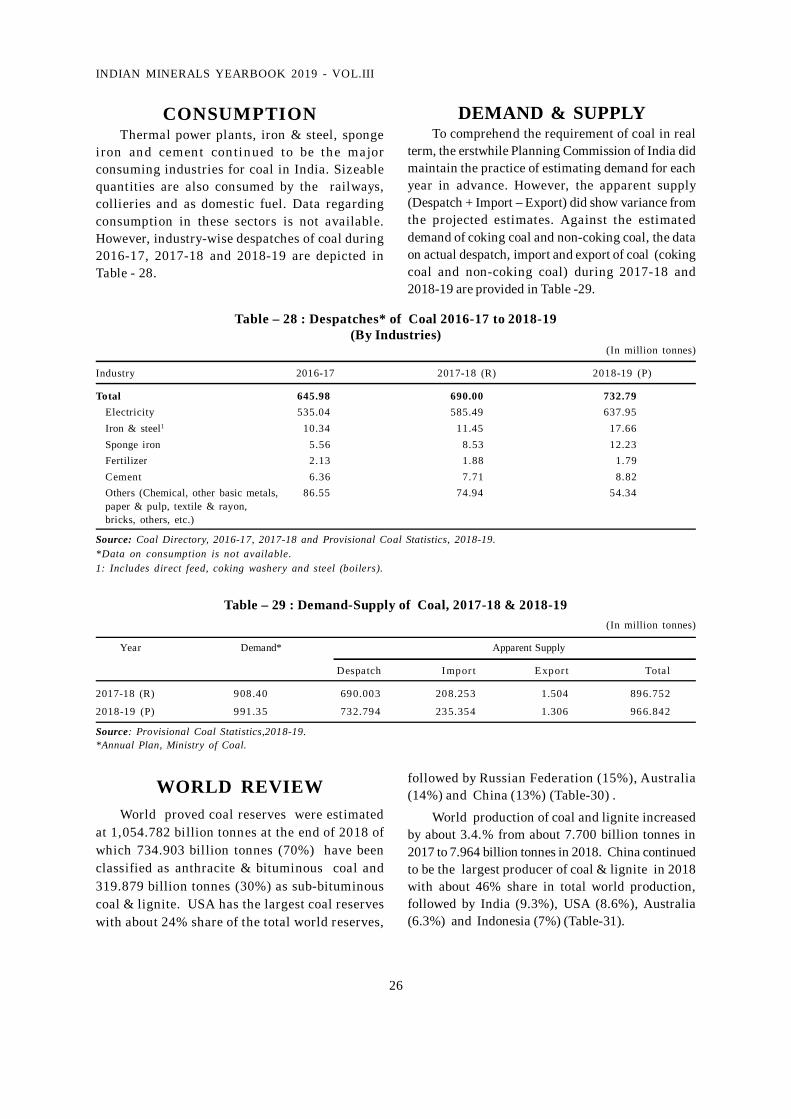
CONSUMPTIONThermal power plants, iron & steel, sponge
iron and cemen t con tinued to be the majorconsuming industries for coal in India. Sizeablequantities are also consumed by the railways,collieries and as domestic fuel. Data regardingconsumption in these sectors is not available.However, industry-wise despatches of coal during2016-17, 2017-18 and 2018-19 are depicted inTable - 28.
DEMAND & SUPPLYTo comprehend the requirement of coal in real
term, the erstwhile Planning Commission of India didmaintain the practice of estimating demand for eachyear in advance. However, the apparent supply(Despatch + Import – Export) did show variance fromthe projected estimates. Against the estimateddemand of coking coal and non-coking coal, the dataon actual despatch, import and export of coal (cokingcoal and non-coking coal) during 2017-18 and2018-19 are provided in Table -29.
2016-17 &Table – 28 : Despatches* of Coal 2016-17 to 2018-19
(By Industries)(In million tonnes)
Industry 2016-17 2017-18 (R) 2018-19 (P)
Total 645.98 690.00 732.79Electricity 535.04 585.49 637.95Iron & steel1 10.34 11.45 17.66Sponge iron 5.56 8.53 12.23Fertilizer 2.13 1.88 1.79Cement 6.36 7.71 8.82Others (Chemical, other basic metals, 86.55 74.94 54.34paper & pulp, textile & rayon,bricks, others, etc.)
Source: Coal Directory, 2016-17, 2017-18 and Provisional Coal Statistics, 2018-19.*Data on consumption is not available.1: Includes direct feed, coking washery and steel (boilers).
Table – 29 : Demand-Supply of Coal, 2017-18 & 2018-19(In million tonnes)
Year Demand* Apparent Supply
Despatch Impor t Expor t Total
2017-18 (R) 908.40 690.003 208.253 1.504 896.752
2018-19 (P) 991.35 732.794 235.354 1.306 966.842
Source: Provisional Coal Statistics,2018-19.*Annual Plan, Ministry of Coal.
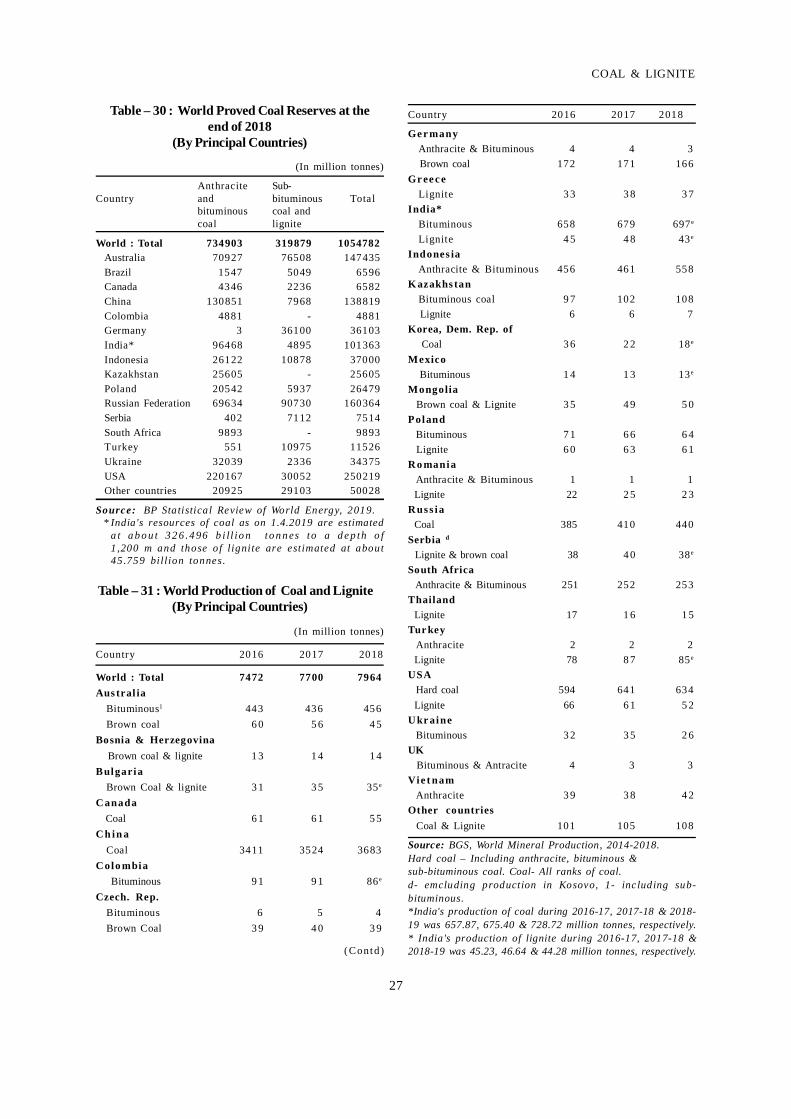
WORLD REVIEWWorld proved coal reserves were estimated
at 1,054.782 billion tonnes at the end of 2018 ofwhich 734.903 billion tonnes (70%) have beenclassified as anthracite & bituminous coal and319.879 billion tonnes (30%) as sub-bituminouscoal & lignite. USA has the largest coal reserveswith about 24% share of the total world reserves,
followed by Russian Federation (15%), Australia(14%) and China (13%) (Table-30) .
World production of coal and lignite increasedby about 3.4.% from about 7.700 billion tonnes in2017 to 7.964 billion tonnes in 2018. China continuedto be the largest producer of coal & lignite in 2018with about 46% share in total world production,followed by India (9.3%), USA (8.6%), Australia(6.3%) and Indonesia (7%) (Table-31).
27
COAL & LIGNITE
Table – 31 : World Production of Coal and Lignite(By Principal Countries)
(In million tonnes)
Country 2016 2017 2018
World : Total 7472 7700 7964Aus tral ia
Bituminous1 443 436 456Brown coal 6 0 5 6 4 5
Bosnia & Herzegovina Brown coal & lignite 1 3 1 4 1 4Bulgaria
Brown Coal & lignite 3 1 3 5 35e
C anada Coal 6 1 6 1 5 5C h in a
Coal 3411 3524 3683C olo mbia Bituminous 9 1 9 1 86e
Czech. Rep.Bituminous 6 5 4Brown Coal 3 9 4 0 3 9
Table – 30 : World Proved Coal Reserves at theend of 2018
(By Principal Countries)
(In million tonnes)
Anthracite Sub-Country and bituminous Total
bituminous coal andcoal lignite
World : Total 734903 319879 1054782Australia 70927 76508 147435Brazil 1547 5049 6596Canada 4346 2236 6582China 130851 7968 138819Colombia 4881 - 4881Germany 3 36100 36103India* 96468 4895 101363Indonesia 26122 10878 37000Kazakhstan 25605 - 25605Poland 20542 5937 26479Russian Federation 69634 90730 160364Serbia 402 7112 7514South Africa 9893 - 9893Turkey 551 10975 11526Ukraine 32039 2336 34375USA 220167 30052 250219Other countries 20925 29103 50028
Source: BP Statistical Review of World Energy, 2019. * India's resources of coal as on 1.4.2019 are estimated
a t a b o u t 3 2 6 .4 96 b i ll io n to n n es to a d e p th o f1 ,200 m and those o f lignite are estimated at about45.759 billion tonnes.
Country 2016 2017 2018
Ge r manyAnthracite & Bituminous 4 4 3
Brown coal 172 171 166Gr ee c e
Lignite 3 3 3 8 3 7India*
Bituminous 658 679 697e
Lignite 4 5 4 8 43e
Indones iaAnthracite & Bituminous 456 461 558
K azakhs tanBituminous coal 9 7 102 108
Lignite 6 6 7Korea, Dem. Rep. of Coal 3 6 2 2 18e
Mexico Bituminous 1 4 1 3 13e
Mongolia Brown coal & Lignite 3 5 4 9 5 0Poland Bituminous 7 1 6 6 6 4 Lignite 6 0 6 3 6 1R o mania Anthracite & Bituminous 1 1 1 Lignite 22 2 5 2 3R us s ia Coal 385 410 440Serbia d
Lignite & brown coal 38 4 0 38e
South Africa Anthracite & Bituminous 251 252 253Thailand Lignite 17 1 6 1 5Tur key Anthracite 2 2 2 Lignite 78 8 7 85e
USA Hard coal 594 641 634 Lignite 66 6 1 5 2U kr aine Bituminous 3 2 3 5 2 6UK Bituminous & Antracite 4 3 3Vie t nam Anthracite 3 9 3 8 4 2Other countries Coal & Lignite 101 105 108
Source: BGS, World Mineral Production, 2014-2018.Hard coal – Including anthracite, bituminous &sub-bituminous coal. Coal- All ranks of coal.d- emcluding production in Kosovo, 1- including sub-bituminous.*India's production of coal during 2016-17, 2017-18 & 2018-19 was 657.87, 675.40 & 728.72 million tonnes, respectively.* India's production of lignite during 2016-17, 2017-18 &2018-19 was 45.23, 46.64 & 44.28 million tonnes, respectively.(Contd)
2016-17 &
28
INDIAN MINERALS YEARBOOK 2019 - VOL.III
Global coal demand increased by 1.1%,continuing the rebound that began in 2017 afterthree years of decline. The main driver was coalpower generation, which rose almost 2% in 2018to reach an all-time high. Coal maintained itsposition as the largest source of electricity in theworld with a 38% share. The People’s Republic ofChina, India and other Asian economies led theexpansion, while coal power generation fell inEurope and North America. In non-power sectors,despite a lot of coal-to-gas switching in China,demand remained stable. The international coaltrade grew by 4% in 2018, surpassing 1.4 billiontonnes.
Global production grew by 3.3% in 2018,mainly driven by the demand growth. Four of theworld’s six largest coal producing countriesincreased their output, with three of them – India,Indonesia and Russia – producing their largestoutputs ever. Indonesia and Russia recorded all-time high coal exports.
Global production of coal, of which Chinaaccounts for more than 40 per cent, is expected toincrease. Data from the IEA noted that in 2018,coal was the largest single source of electricity,contr ibuting over 38 per cent to the world’selectricity needs. Coal use in the Power Sectorgrew by 1.9 per cent and was responsible for40 per cent of the additional power generationworldwide. Coal demand in Southeast Asia isforecast to grow by more than 5% per yearthrough 2024, led by Indonesia and Vietnam.
Coal will continue to be a major component ofglobal fuel supplies and will be key in poweringup several different economies around the world– the IEA predicts that the future of energy growthwill be led by non-OECD countries, such as, India,Bangladesh, Pakistan, Southeast Asia and China.
A significant challenge for countries is tobalance their fast-growing electr icity demandwhile simultaneously pursuing climate changeaims at reducing their emissions in line with thegoals of the Paris Agreement.
Recognising that coal is going to remain amajor fuel source for power generation (fossilfuels, including coal will still make up 75% of theglobal energy mix in 2040 according to recentprojections), countries need to take the necessarysteps to develop and promote utilisation of lowemissions technologies, including carbon captureuse and storage (CCUS).
AustraliaAustralia is the world's fifth largest producer
and world's leading exporter of coal. Queenslandand New South Wales were Australia's leadingcoal producing States and accounted for more than95% of the country's total output.China
China was the world's largest producer ofcoal. Coal was the primary source of energy andtwo-th i rds of the country' s elect r ici ty wasproduced by coal-fired power plants. About 50%of the country's total coal output was consumedby the Power Sector.Indonesia
Indonesia was the leading producer of coal.To secure domestic supplies, the IndonesianMinistry of Energy and Mineral Resources hasissued order to coal producers to reserve a specifica m oun t of t hei r p r oduct i on for dom es t i cconsumption (domest ic market obl igat ion ).Moreover, the government can adjust its exporttax to discourage coal exports. The governmentaims for more domestic consumption of coal as itwants coal to supply around 30 per cent of thecountry’s energy mix by 2025.Russia
Russia is the leading producer of coal. TheCoal Industry in Russia is mostly privately ownedand joint-stock companies (often consolidatedinto large holdings) and they dominate theIndustry. Siberian Coal Energy Co. (SUEK) wasthe largest coal producer in Russia in terms ofannual production. In February 2011, Russiaadopted a new programme for development of theCoal Industry by 2030. According to forecasts bythe Ministry of Energy, annual coal productioncould increase to about 450 Mt by 2030. TheMinistry of Energy projected that Russia wouldconstruct more than 100 new coal enterpriseswithin the next 20 years.
FOREIGN TRADEExports
Exports of coal (excl. lignite) decreased by 13% toabout 1.31 million tonnes in 2018-19 from 1.50 milliontonnes in the previous year. Exports of coke increasedby about 13% to 101.86 thousand tonnes in 2018-19from 90.4 thousand tonnes in 2017-18. Coal wasmainly exported to Nepal (63%), Bangladesh (31%),Egypt (4%) and Bhutan (2%). Coke was exported
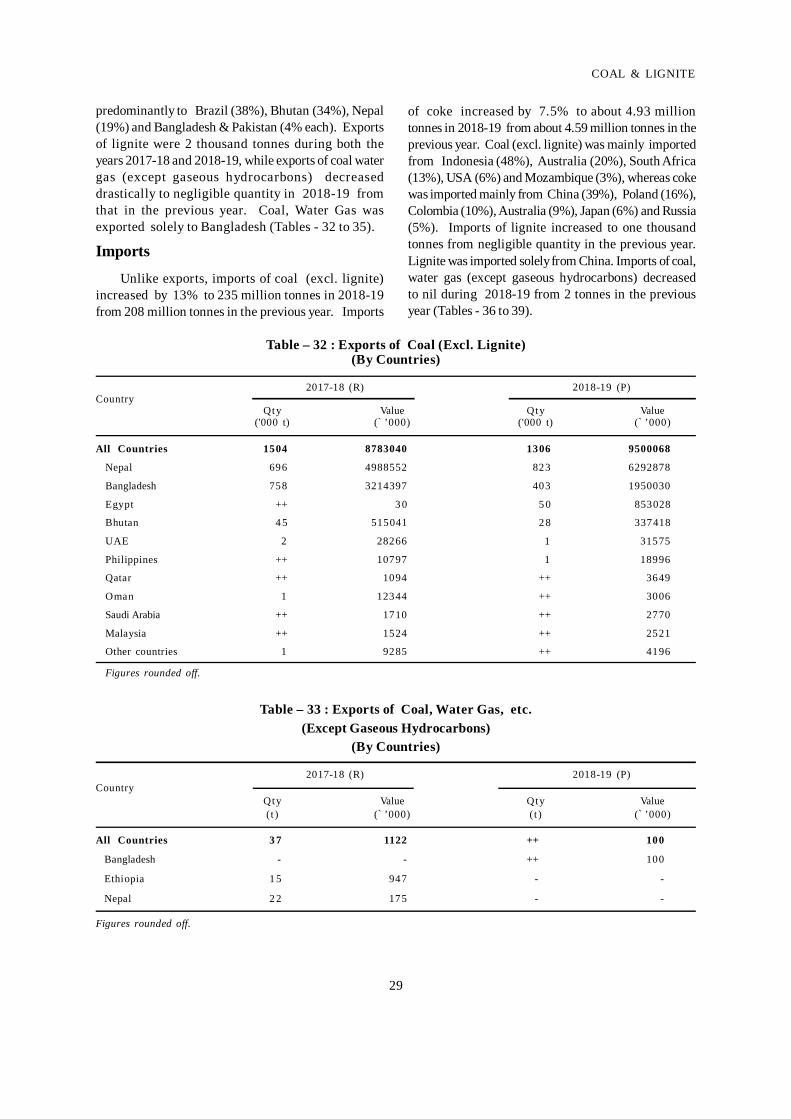
29
COAL & LIGNITE
Table – 32 : Exports of Coal (Excl. Lignite)(By Countries)
2017-18 (R) 2018-19 (P)Country
Qty Value Qty Value('000 t) (` ’000) ('000 t) (` ’000)
All Countries 1504 8783040 1306 9500068
Nepal 696 4988552 823 6292878
Bangladesh 758 3214397 403 1950030
Egypt ++ 3 0 5 0 853028
Bhutan 4 5 515041 2 8 337418
UAE 2 28266 1 31575
Philippines ++ 10797 1 18996
Qatar ++ 1094 ++ 3649
Oman 1 12344 ++ 3006
Saudi Arabia ++ 1710 ++ 2770
Malaysia ++ 1524 ++ 2521
Other countries 1 9285 ++ 4196
Figures rounded off.
predominantly to Brazil (38%), Bhutan (34%), Nepal(19%) and Bangladesh & Pakistan (4% each). Exportsof lignite were 2 thousand tonnes during both theyears 2017-18 and 2018-19, while exports of coal watergas (except gaseous hydrocarbons) decreaseddrastically to negligible quantity in 2018-19 fromthat in the previous year. Coal, Water Gas wasexported solely to Bangladesh (Tables - 32 to 35).
Imports
Unlike exports, imports of coal (excl. lignite)increased by 13% to 235 million tonnes in 2018-19from 208 million tonnes in the previous year. Imports
of coke increased by 7.5% to about 4.93 milliontonnes in 2018-19 from about 4.59 million tonnes in theprevious year. Coal (excl. lignite) was mainly importedfrom Indonesia (48%), Australia (20%), South Africa(13%), USA (6%) and Mozambique (3%), whereas cokewas imported mainly from China (39%), Poland (16%),Colombia (10%), Australia (9%), Japan (6%) and Russia(5%). Imports of lignite increased to one thousandtonnes from negligible quantity in the previous year.Lignite was imported solely from China. Imports of coal,water gas (except gaseous hydrocarbons) decreasedto nil during 2018-19 from 2 tonnes in the previousyear (Tables - 36 to 39).
Table – 33 : Exports of Coal, Water Gas, etc.(Except Gaseous Hydrocarbons)
(By Countries)
2017-18 (R) 2018-19 (P)Country
Qty Value Qty Value(t ) (` ’000) (t ) (` ’000)
All Countries 3 7 1122 ++ 100
Bangladesh - - ++ 100
Ethiopia 1 5 947 - -
Nepal 2 2 175 - -
Figures rounded off.
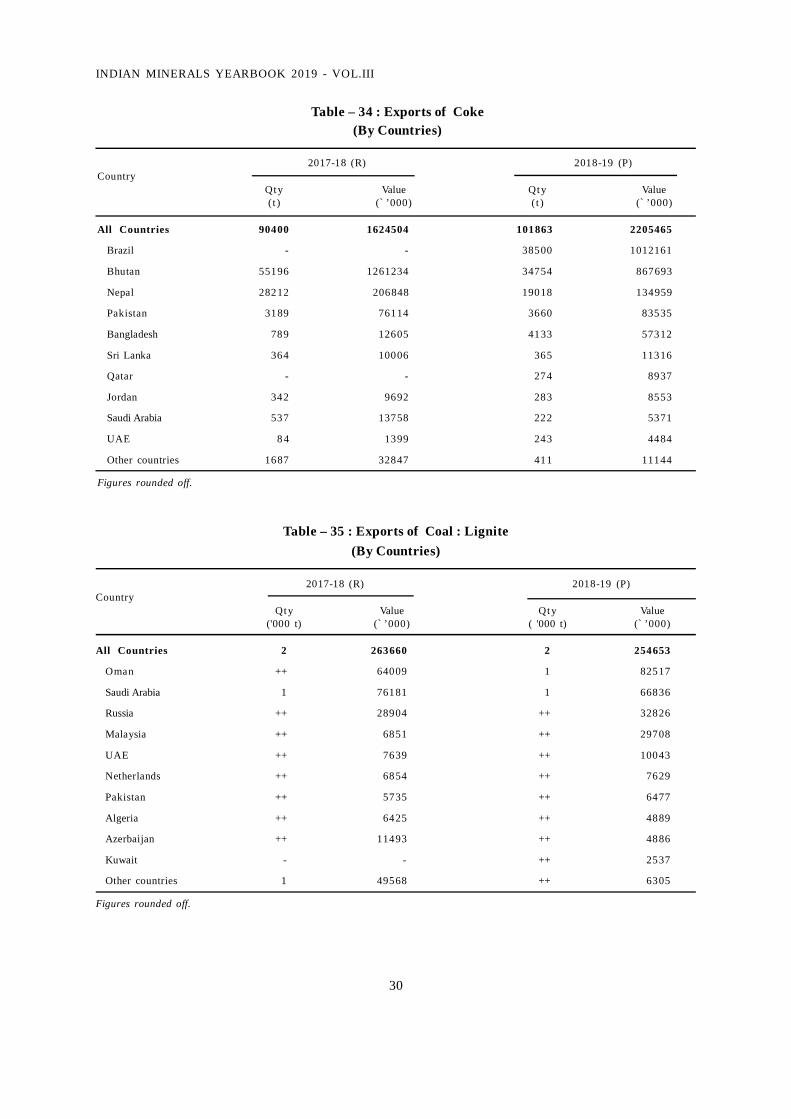
30
INDIAN MINERALS YEARBOOK 2019 - VOL.III
Table – 34 : Exports of Coke(By Countries)
2017-18 (R) 2018-19 (P)Country
Qty Value Qty Value(t ) (` ’000) (t ) (` ’000)
All Countries 90400 1624504 101863 2205465
Brazil - - 38500 1012161
Bhutan 55196 1261234 34754 867693
Nepal 28212 206848 19018 134959
Pakistan 3189 76114 3660 83535
Bangladesh 789 12605 4133 57312
Sri Lanka 364 10006 365 11316
Qatar - - 274 8937
Jordan 342 9692 283 8553
Saudi Arabia 537 13758 222 5371
UAE 8 4 1399 243 4484
Other countries 1687 32847 411 11144
Figures rounded off.
Table – 35 : Exports of Coal : Lignite(By Countries)
2017-18 (R) 2018-19 (P)Country
Qty Value Qty Value('000 t) (` ’000) ( '000 t) (` ’000)
All Countries 2 263660 2 254653
Oman ++ 64009 1 82517
Saudi Arabia 1 76181 1 66836
Russia ++ 28904 ++ 32826
Malaysia ++ 6851 ++ 29708
UAE ++ 7639 ++ 10043
Netherlands ++ 6854 ++ 7629
Pakistan ++ 5735 ++ 6477
Algeria ++ 6425 ++ 4889
Azerbaijan ++ 11493 ++ 4886
Kuwait - - ++ 2537
Other countries 1 49568 ++ 6305
Figures rounded off.
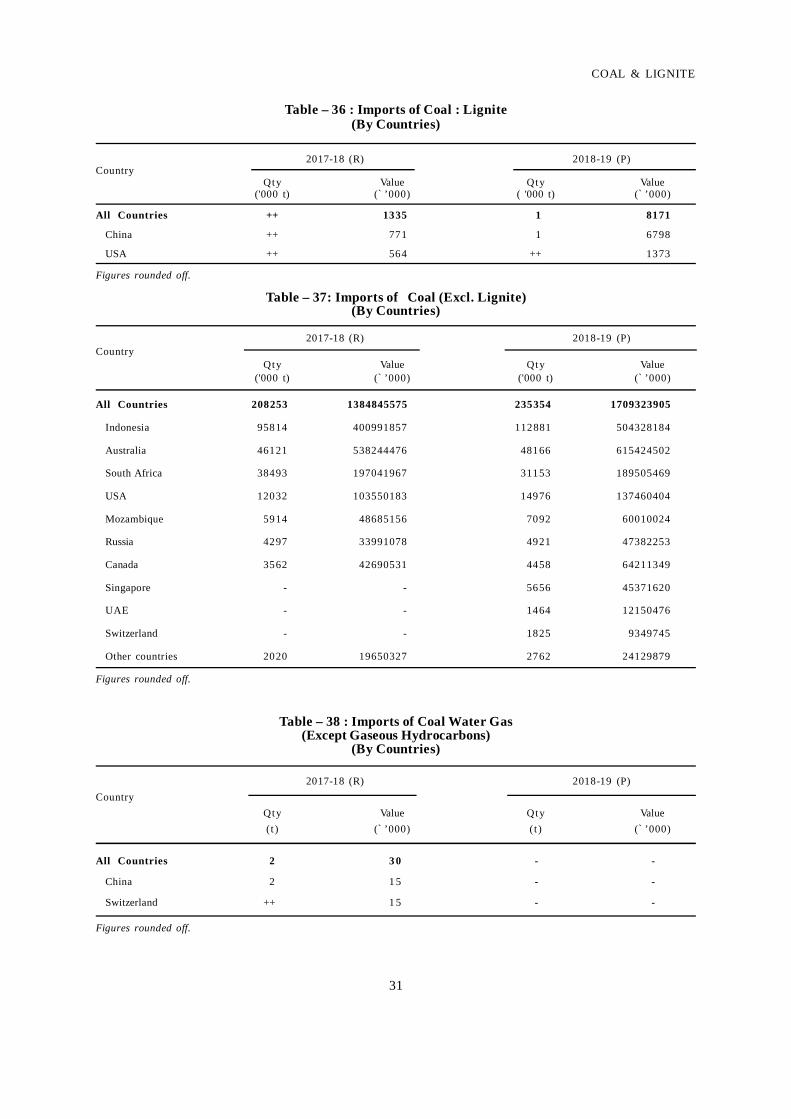
31
COAL & LIGNITE
Table – 37: Imports of Coal (Excl. Lignite)(By Countries)
2017-18 (R) 2018-19 (P)Country
Qty Value Qty Value('000 t) (` ’000) ('000 t) (` ’000)
All Countries 208253 1384845575 235354 1709323905
Indonesia 95814 400991857 112881 504328184
Australia 46121 538244476 48166 615424502
South Africa 38493 197041967 31153 189505469
USA 12032 103550183 14976 137460404
Mozambique 5914 48685156 7092 60010024
Russia 4297 33991078 4921 47382253
Canada 3562 42690531 4458 64211349
Singapore - - 5656 45371620
UAE - - 1464 12150476
Switzerland - - 1825 9349745
Other countries 2020 19650327 2762 24129879
Figures rounded off.
Table – 36 : Imports of Coal : Lignite(By Countries)
2017-18 (R) 2018-19 (P)Country
Qty Value Qty Value('000 t) (` ’000) ( '000 t) (` ’000)
All Countries ++ 1335 1 8171
China ++ 771 1 6798
USA ++ 564 ++ 1373
Figures rounded off.
Table – 38 : Imports of Coal Water Gas(Except Gaseous Hydrocarbons)
(By Countries)
2017-18 (R) 2018-19 (P)Country
Qty Value Qty Value(t ) (` ’000) (t ) (` ’000)
All Countries 2 3 0 - -
China 2 1 5 - -
Switzerland ++ 1 5 - -
Figures rounded off.
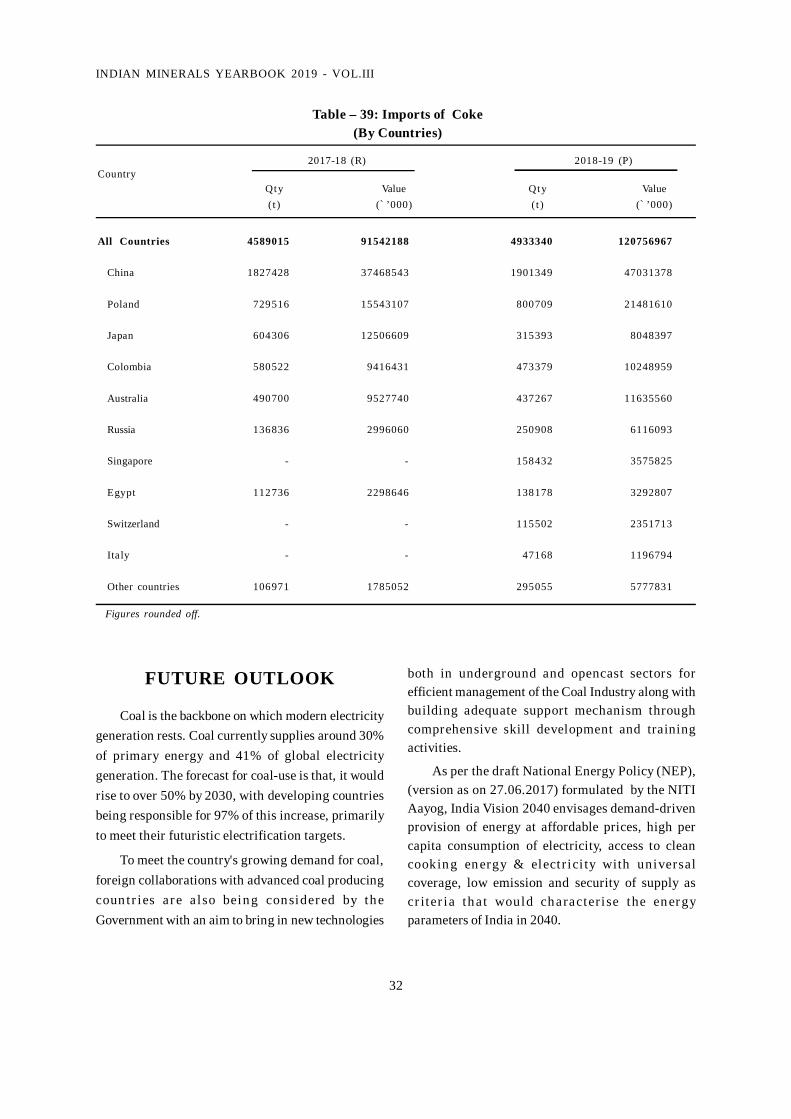
32
INDIAN MINERALS YEARBOOK 2019 - VOL.III
Table – 39: Imports of Coke(By Countries)
2017-18 (R) 2018-19 (P)Country
Qty Value Qty Value(t ) (` ’000) (t ) (` ’000)
All Countries 4589015 91542188 4933340 120756967
China 1827428 37468543 1901349 47031378
Poland 729516 15543107 800709 21481610
Japan 604306 12506609 315393 8048397
Colombia 580522 9416431 473379 10248959
Australia 490700 9527740 437267 11635560
Russia 136836 2996060 250908 6116093
Singapore - - 158432 3575825
Egypt 112736 2298646 138178 3292807
Switzerland - - 115502 2351713
Italy - - 47168 1196794
Other countries 106971 1785052 295055 5777831
FUTURE OUTLOOK
Coal is the backbone on which modern electricitygeneration rests. Coal currently supplies around 30%of primary energy and 41% of global electricitygeneration. The forecast for coal-use is that, it wouldrise to over 50% by 2030, with developing countriesbeing responsible for 97% of this increase, primarilyto meet their futuristic electrification targets.
To meet the country's growing demand for coal,foreign collaborations with advanced coal producingcoun tr ies are a lso being considered by theGovernment with an aim to bring in new technologies
both in underground and opencast sectors forefficient management of the Coal Industry along withbuilding adequate support mechanism throughcomprehensive skill development and trainingactivities.
As per the draft National Energy Policy (NEP),(version as on 27.06.2017) formulated by the NITIAayog, India Vision 2040 envisages demand-drivenprovision of energy at affordable prices, high percapita consumption of electricity, access to cleancooking energy & elect r ici ty with universalcoverage, low emission and security of supply ascr iter ia that would characterise the energyparameters of India in 2040.
Figures rounded off.
33
COAL & LIGNITE
The installed coal-based electricity generationcapacity is expected to grow to 330- 441 GW by 2040.This is likely to translate into a coal demand of1.1-1.4 billion tonnes. The known levels of provencoal reserves of about 138 billion tonnes as of31.03.2016 may only be able to support an annualpeak production of 1.2-1.3 billion tonnes till 2037,with a gradual decrease thereafter. This fact calls forintensifying exploration to enhance the proven coalreserves. Multiple institutions, such as, GSI andCMPDI are responsible for exploration of coal inIndia. There is a need to synergise the efforts ofall these agencies to undertake 100% resourcemapping of coal.
India aims to become an economy of USD5 trillion by 2024 and for this investing heavily in
infrastructure would be an essential imperative.This will boost energy demand for industry and,especially, for electricity production. AlthoughIndia has succeeded in bringing some form ofelectr icity access to almost all of its citizens, thecountry’s per capita power consumption is stilllow, giving it significant scope to grow. Powergeneration from renewables is forecast to expandstrongly, with wind capacity doubling and solarphotovoltaics (PV) projected to increase fourfoldbetween 2018 and 2024. But that is not enough toprevent coal power generation from increasing by4.6% per year through 2024. Overall, India’s coaldemand is expected to grow by more than that ofany other country, in absolute terms, over theforecast period.


