Embed Size (px)
Citation preview
An FFRDC operated by the RAND Corporation under contract with DHS
HS ACHOMELAND SECURITYOPERATIONAL ANALYSIS CENTER
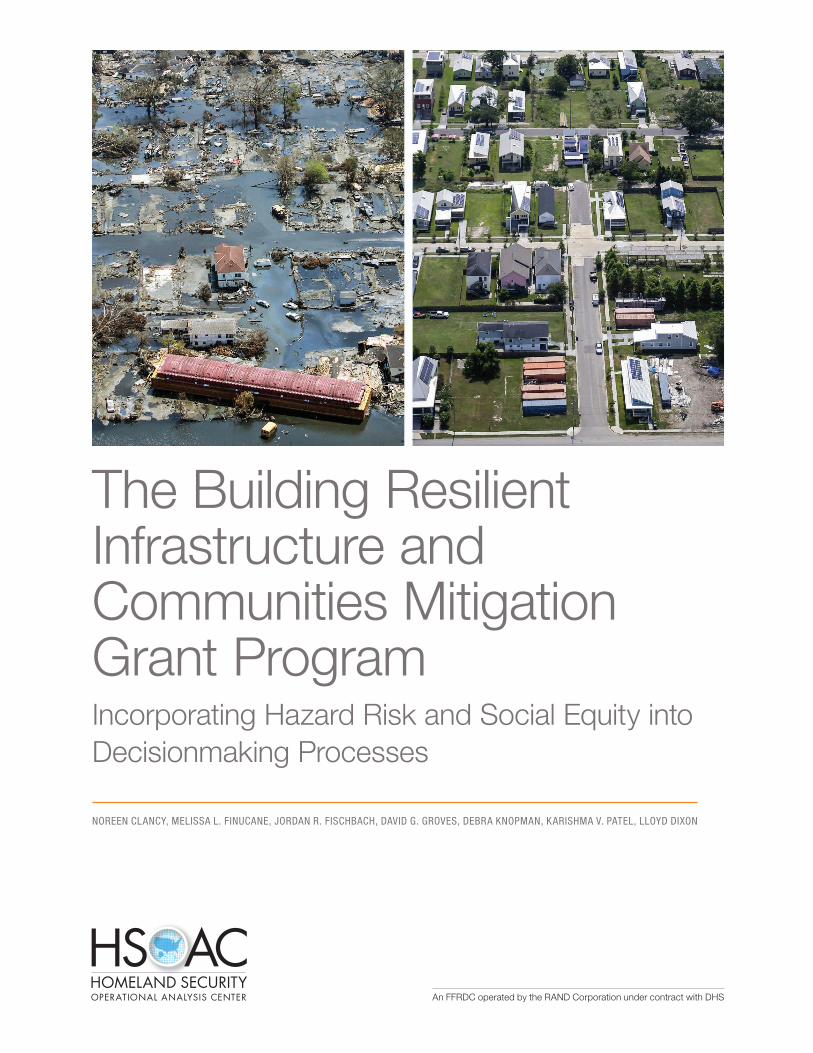
The Building Resilient Infrastructure and Communities Mitigation Grant ProgramIncorporating Hazard Risk and Social Equity into Decisionmaking Processes
NOREEN CLANCY, MELISSA L. FINUCANE, JORDAN R. FISCHBACH, DAVID G. GROVES, DEBRA KNOPMAN, KARISHMA V. PATEL, LLOYD DIXON

This research was published in 2022.
Approved for public release; distribution is unlimited.
iii
About This Report
The Federal Emergency Management Agency engaged the Homeland Security Operational Analysis Center (HSOAC), a federally funded research and development center (FFRDC) operated by the RAND Corporation for the U.S. Department of Homeland Security (DHS) to help it identify ways in which the Building Resil-ient Infrastructure and Communities (BRIC) hazard mitigation grant program could evolve to increasingly target the greatest natural hazard risks while also integrating equity considerations. This report provides near-term and long-term recommendations for how BRIC can develop a new approach to developing com-munity resilience through mitigation activities by emphasizing equity goals alongside reduction of risk to physical assets. This work should be of interest to those who work to make communities more resilient to natural disasters and to those who fund such work.
This research was sponsored by the Federal Emergency Management Agency and funded within the Strategy, Policy, and Operations Program of the HSOAC FFRDC.
About the Homeland Security Operational Analysis Center
The Homeland Security Act of 2002 (Section 305 of Public Law 107-296, as codified at 6 U.S.C. § 185) autho-rizes the Secretary of Homeland Security, acting through the Under Secretary for Science and Technology, to establish one or more FFRDCs to provide independent analysis of homeland security issues. The RAND Corporation operates HSOAC as an FFRDC for DHS under contract HSHQDC-16-D-00007.
The HSOAC FFRDC provides the government with independent and objective analyses and advice in core areas important to the department in support of policy development, decisionmaking, alternative approaches, and new ideas on issues of significance. The HSOAC FFRDC also works with and supports other federal, state, local, tribal, and public- and private-sector organizations that make up the homeland security enterprise. The HSOAC FFRDC’s research is undertaken by mutual consent with DHS and is orga-nized as a set of discrete tasks. This report presents the results of research and analysis conducted under task order 70FA6020F00000020, Approaches for Incorporating Risk and Equity into BRIC Funding Allocations.
The results presented in this report do not necessarily reflect official DHS opinion or policy.For more information on HSOAC, see www.rand.org/hsoac. For more information about this report, see
www.rand.org/t/RRA1258-1.
Acknowledgments
We would like to thank the many staff within the BRIC program office who supplied information and data necessary to conduct this research—mainly Camille Crain, Chau Ngo, Lauren Kovach, Karen Villatoro, and Jeffrey Brewer. We are grateful for the comments provided by the reviewers of this study, Eric Tate (Univer-sity of Iowa), Shalini Vajjhala (re:Focus Partners), Stephen Flynn (Northeastern University), and Michelle E. Miro (RAND Corporation).

v
Summary
The Growing Risks and Consequences of Natural Disasters
Natural disasters have become more frequent and destructive. In 2020, the United States experienced the highest number of billion-dollar disasters ever—22 events (including hurricanes, floods, fires, and the coro-navirus disease 2019 [COVID-19] pandemic)—with a cost of $95 billion (adjusted based on the Consumer Price Index) (A. B. Smith, 2021). Moreover, disaster damage harmed some communities more than others—most notably, low-income and disadvantaged communities.
Much of the disruption and damage caused by these disasters could have been reduced through mitigation—that is, predisaster actions known to reduce damage and ease recovery. The Building Resilient Infrastructure and Communities (BRIC) grant award program is intended to help communities undertake this mitigation.
Authorized by Congress in 2018 and administered by the Federal Emergency Management Agency (FEMA), the program aims to fund cost-effective mitigation activities. BRIC’s premise is that investing in risk mitigation will reduce spending on recovery and response. The program goals also acknowledge that equity issues are important in helping communities’ mitigation efforts, given that some suffer disproportion-ate harm. The emphasis on equity alongside risk reduction represents a significant break with past policy and practice and foreshadows a new approach to building community resilience.
To help identify ways in which the BRIC program can target the greatest natural hazard risks for mit-igation while also integrating equity considerations, FEMA engaged the Homeland Security Operational Analysis Center (HSOAC), a federally funded research and development center operated by the RAND Cor-poration for the U.S. Department of Homeland Security to examine approaches to addressing these issues and to identify solutions.
Study Objective and Approach
The objective of this study was to help the BRIC program integrate accurate natural hazard–risk assessment and equity concerns into future grant award decisions.
To undertake this study, the HSOAC team developed the following research questions:
• What natural hazard-risk considerations should inform BRIC grant decisionmaking processes? (See Chapter Three.)
• What are the challenges of integrating social equity considerations into the BRIC grantmaking decision process? (See Chapter Four.)
• What role should risk assessment tools play in the grant award process, and how can these tools be extended to consider changing environmental and other conditions? (See Chapter Five.)
HSOAC researchers reviewed existing federal grant programs, evaluated available hazard-risk assess-ment tools, and assessed the impacts that the BRIC program could have on social equity. We also developed an interactive tool to explore how year 1 BRIC subapplications related to different risks and demographic
Building Resilient Infrastructure and Communities Mitigation Grant Program, Considerations of Hazard Risk and Social Equity
vi
metrics.1 Drawing on the findings from our review of existing tools and programs, as well as a much larger body of work on disaster risk, vulnerability, resilience, and social equity, we identified opportunities and challenges for BRIC. We make near- and long-term recommendations for how the BRIC program could evolve to increasingly target the greatest natural hazard risks while also integrating equity considerations into the grant program’s planning, application, evaluation, and funding processes.2
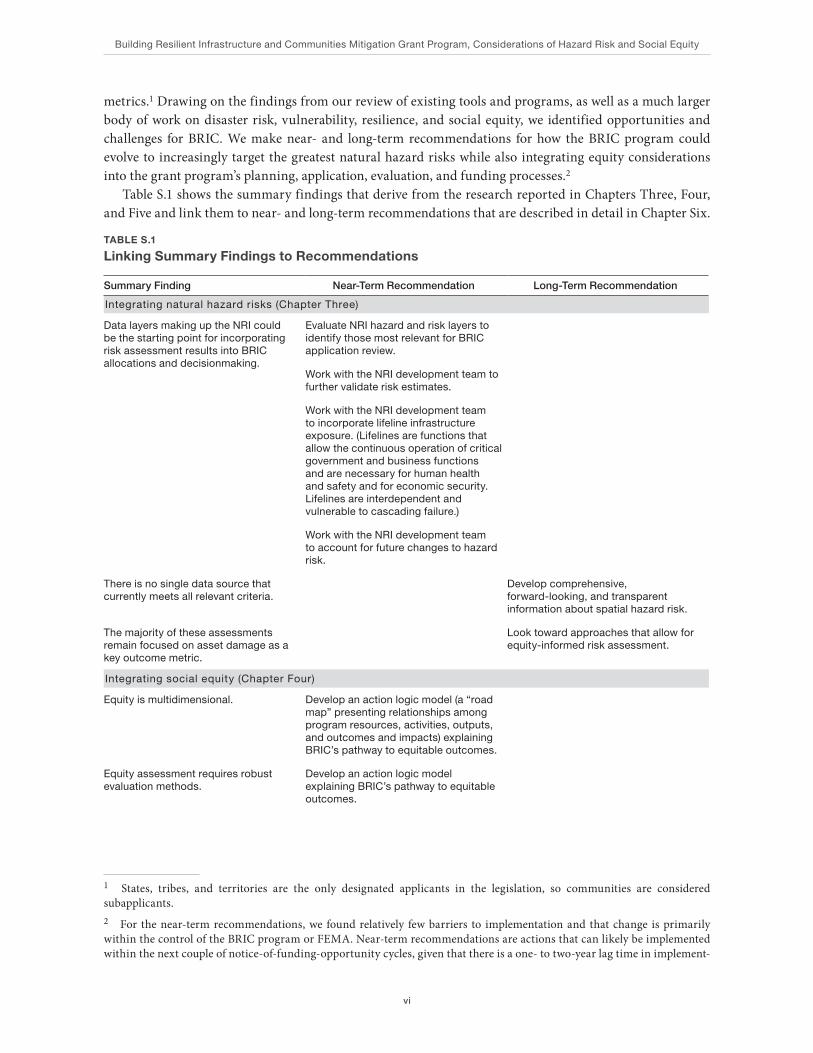
Table S.1 shows the summary findings that derive from the research reported in Chapters Three, Four, and Five and link them to near- and long-term recommendations that are described in detail in Chapter Six.
1 States, tribes, and territories are the only designated applicants in the legislation, so communities are considered subapplicants.2 For the near-term recommendations, we found relatively few barriers to implementation and that change is primarily within the control of the BRIC program or FEMA. Near-term recommendations are actions that can likely be implemented within the next couple of notice-of-funding-opportunity cycles, given that there is a one- to two-year lag time in implement-
TABLE S.1
Linking Summary Findings to Recommendations
Summary Finding Near-Term Recommendation Long-Term Recommendation
Integrating natural hazard risks (Chapter Three)
Data layers making up the NRI could be the starting point for incorporating risk assessment results into BRIC allocations and decisionmaking.
Evaluate NRI hazard and risk layers to identify those most relevant for BRIC application review.
Work with the NRI development team to further validate risk estimates.
Work with the NRI development team to incorporate lifeline infrastructure exposure. (Lifelines are functions that allow the continuous operation of critical government and business functions and are necessary for human health and safety and for economic security. Lifelines are interdependent and vulnerable to cascading failure.)
Work with the NRI development team to account for future changes to hazard risk.
There is no single data source that currently meets all relevant criteria.
Develop comprehensive, forward-looking, and transparent information about spatial hazard risk.
The majority of these assessments remain focused on asset damage as a key outcome metric.
Look toward approaches that allow for equity-informed risk assessment.
Integrating social equity (Chapter Four)
Equity is multidimensional. Develop an action logic model (a “road map” presenting relationships among program resources, activities, outputs, and outcomes and impacts) explaining BRIC’s pathway to equitable outcomes.
Equity assessment requires robust evaluation methods.
Develop an action logic model explaining BRIC’s pathway to equitable outcomes.
Summary
vii
The BRIC program has come into existence at a time of significant need for resilient infrastructure and communities nationwide, growing costs for disaster response and recovery, increasingly visible impacts of
ing federal funding opportunities. The long-term recommendations acknowledge that implementation might require coordi-nation with entities outside of BRIC and even outside of FEMA.
Summary Finding Near-Term Recommendation Long-Term Recommendation
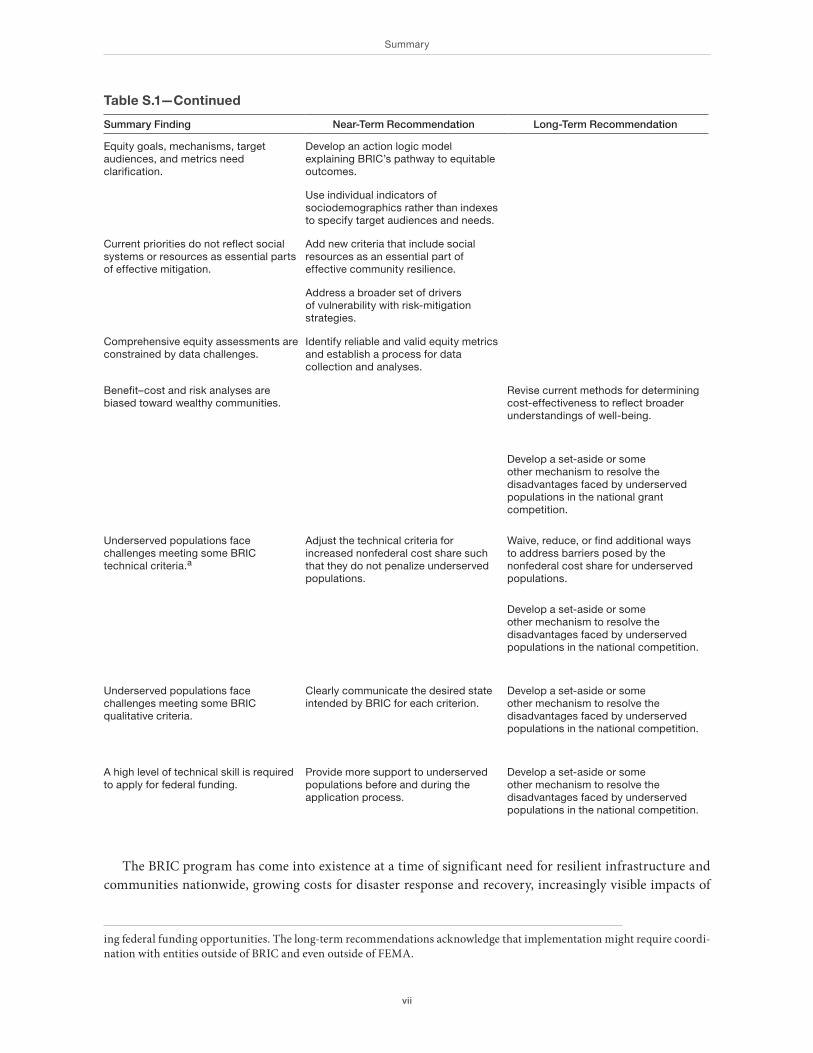
Equity goals, mechanisms, target audiences, and metrics need clarification.
Develop an action logic model explaining BRIC’s pathway to equitable outcomes.
Use individual indicators of sociodemographics rather than indexes to specify target audiences and needs.
Current priorities do not reflect social systems or resources as essential parts of effective mitigation.
Add new criteria that include social resources as an essential part of effective community resilience.
Address a broader set of drivers of vulnerability with risk-mitigation strategies.
Comprehensive equity assessments are constrained by data challenges.
Identify reliable and valid equity metrics and establish a process for data collection and analyses.
Benefit–cost and risk analyses are biased toward wealthy communities.
Revise current methods for determining cost-effectiveness to reflect broader understandings of well-being.
Develop a set-aside or some other mechanism to resolve the disadvantages faced by underserved populations in the national grant competition.
Underserved populations face challenges meeting some BRIC technical criteria.a
Adjust the technical criteria for increased nonfederal cost share such that they do not penalize underserved populations.
Waive, reduce, or find additional ways to address barriers posed by the nonfederal cost share for underserved populations.
Develop a set-aside or some other mechanism to resolve the disadvantages faced by underserved populations in the national competition.
Underserved populations face challenges meeting some BRIC qualitative criteria.
Clearly communicate the desired state intended by BRIC for each criterion.
Develop a set-aside or some other mechanism to resolve the disadvantages faced by underserved populations in the national competition.
A high level of technical skill is required to apply for federal funding.
Provide more support to underserved populations before and during the application process.
Develop a set-aside or some other mechanism to resolve the disadvantages faced by underserved populations in the national competition.
Table S.1—Continued
Building Resilient Infrastructure and Communities Mitigation Grant Program, Considerations of Hazard Risk and Social Equity
viii
a changing climate, and an intense national conversation about inequity and community well-being. All these circumstances create both challenges and opportunities for FEMA. FEMA’s decisions about how BRIC should evolve over time will determine the speed with and extent to which these findings and recommenda-tions are implemented.
Summary Finding Near-Term Recommendation Long-Term Recommendation
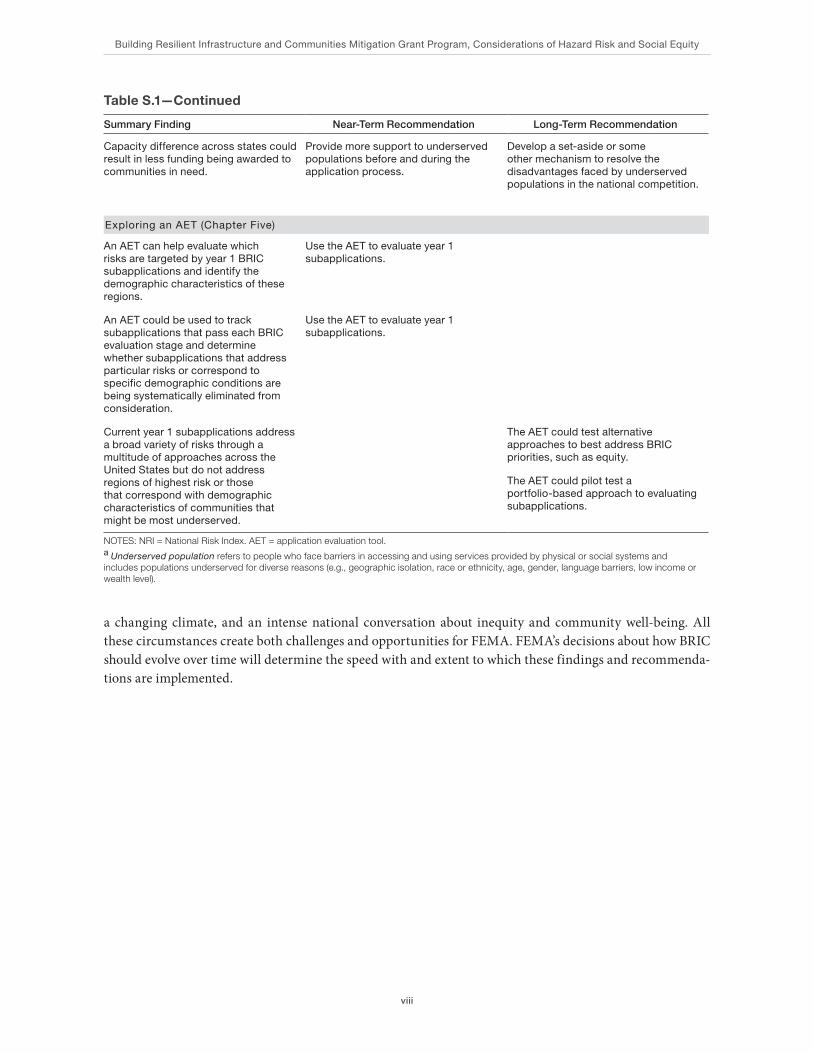
Capacity difference across states could result in less funding being awarded to communities in need.
Provide more support to underserved populations before and during the application process.
Develop a set-aside or some other mechanism to resolve the disadvantages faced by underserved populations in the national competition.
Exploring an AET (Chapter Five)
An AET can help evaluate which risks are targeted by year 1 BRIC subapplications and identify the demographic characteristics of these regions.
Use the AET to evaluate year 1 subapplications.
An AET could be used to track subapplications that pass each BRIC evaluation stage and determine whether subapplications that address particular risks or correspond to specific demographic conditions are being systematically eliminated from consideration.
Use the AET to evaluate year 1 subapplications.
Current year 1 subapplications address a broad variety of risks through a multitude of approaches across the United States but do not address regions of highest risk or those that correspond with demographic characteristics of communities that might be most underserved.
The AET could test alternative approaches to best address BRIC priorities, such as equity.
The AET could pilot test a portfolio-based approach to evaluating subapplications.
NOTES: NRI = National Risk Index. AET = application evaluation tool.a Underserved population refers to people who face barriers in accessing and using services provided by physical or social systems and includes populations underserved for diverse reasons (e.g., geographic isolation, race or ethnicity, age, gender, language barriers, low income or wealth level).
Table S.1—Continued
ix
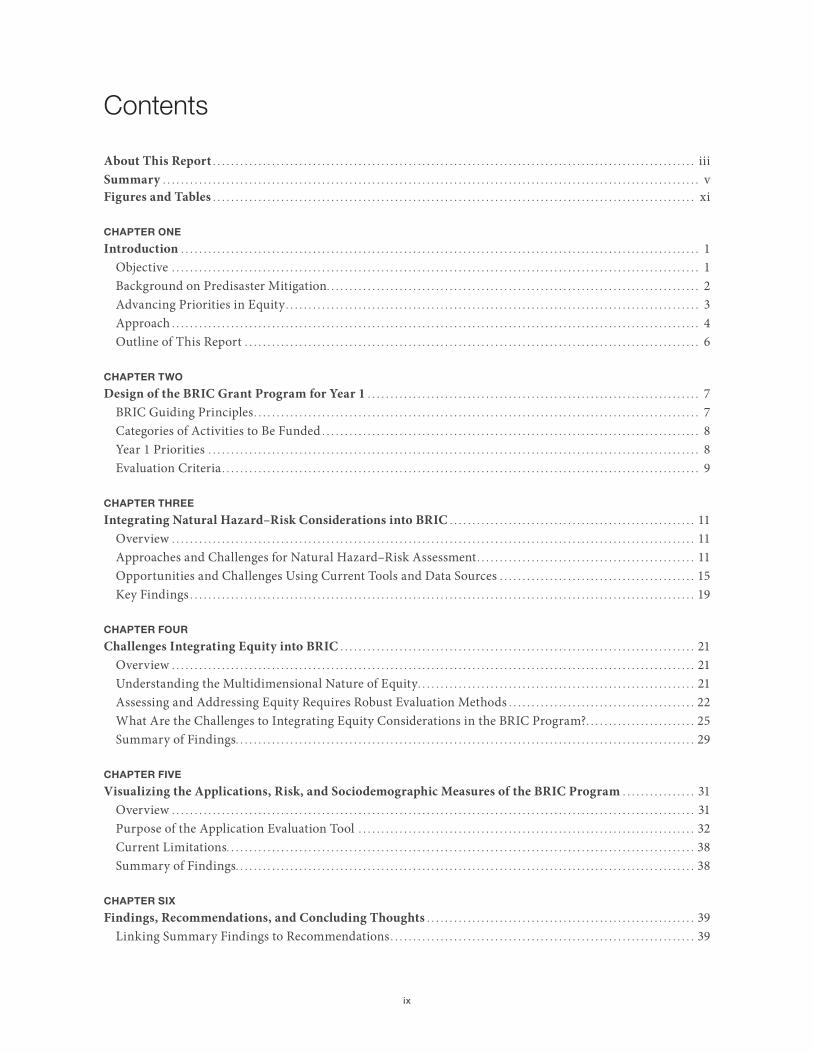
Contents
About This Report . . . . . . . . . . . . . . . . . . . . . . . . . . . . . . . . . . . . . . . . . . . . . . . . . . . . . . . . . . . . . . . . . . . . . . . . . . . . . . . . . . . . . . . . . . . . . . . . . . . . . . . . . . iiiSummary . . . . . . . . . . . . . . . . . . . . . . . . . . . . . . . . . . . . . . . . . . . . . . . . . . . . . . . . . . . . . . . . . . . . . . . . . . . . . . . . . . . . . . . . . . . . . . . . . . . . . . . . . . . . . . . . . . . . . . vFigures and Tables . . . . . . . . . . . . . . . . . . . . . . . . . . . . . . . . . . . . . . . . . . . . . . . . . . . . . . . . . . . . . . . . . . . . . . . . . . . . . . . . . . . . . . . . . . . . . . . . . . . . . . . . . . xi
CHAPTER ONE
Introduction . . . . . . . . . . . . . . . . . . . . . . . . . . . . . . . . . . . . . . . . . . . . . . . . . . . . . . . . . . . . . . . . . . . . . . . . . . . . . . . . . . . . . . . . . . . . . . . . . . . . . . . . . . . . . . . . . . 1Objective . . . . . . . . . . . . . . . . . . . . . . . . . . . . . . . . . . . . . . . . . . . . . . . . . . . . . . . . . . . . . . . . . . . . . . . . . . . . . . . . . . . . . . . . . . . . . . . . . . . . . . . . . . . . . . . . . . . . 1Background on Predisaster Mitigation . . . . . . . . . . . . . . . . . . . . . . . . . . . . . . . . . . . . . . . . . . . . . . . . . . . . . . . . . . . . . . . . . . . . . . . . . . . . . . . . . . 2Advancing Priorities in Equity . . . . . . . . . . . . . . . . . . . . . . . . . . . . . . . . . . . . . . . . . . . . . . . . . . . . . . . . . . . . . . . . . . . . . . . . . . . . . . . . . . . . . . . . . . . 3Approach . . . . . . . . . . . . . . . . . . . . . . . . . . . . . . . . . . . . . . . . . . . . . . . . . . . . . . . . . . . . . . . . . . . . . . . . . . . . . . . . . . . . . . . . . . . . . . . . . . . . . . . . . . . . . . . . . . . . 4Outline of This Report . . . . . . . . . . . . . . . . . . . . . . . . . . . . . . . . . . . . . . . . . . . . . . . . . . . . . . . . . . . . . . . . . . . . . . . . . . . . . . . . . . . . . . . . . . . . . . . . . . . . 6
CHAPTER TWO
Design of the BRIC Grant Program for Year 1 . . . . . . . . . . . . . . . . . . . . . . . . . . . . . . . . . . . . . . . . . . . . . . . . . . . . . . . . . . . . . . . . . . . . . . . . . 7BRIC Guiding Principles . . . . . . . . . . . . . . . . . . . . . . . . . . . . . . . . . . . . . . . . . . . . . . . . . . . . . . . . . . . . . . . . . . . . . . . . . . . . . . . . . . . . . . . . . . . . . . . . . . 7Categories of Activities to Be Funded . . . . . . . . . . . . . . . . . . . . . . . . . . . . . . . . . . . . . . . . . . . . . . . . . . . . . . . . . . . . . . . . . . . . . . . . . . . . . . . . . . . 8Year 1 Priorities . . . . . . . . . . . . . . . . . . . . . . . . . . . . . . . . . . . . . . . . . . . . . . . . . . . . . . . . . . . . . . . . . . . . . . . . . . . . . . . . . . . . . . . . . . . . . . . . . . . . . . . . . . . . 8Evaluation Criteria . . . . . . . . . . . . . . . . . . . . . . . . . . . . . . . . . . . . . . . . . . . . . . . . . . . . . . . . . . . . . . . . . . . . . . . . . . . . . . . . . . . . . . . . . . . . . . . . . . . . . . . . . 9
CHAPTER THREE
Integrating Natural Hazard–Risk Considerations into BRIC . . . . . . . . . . . . . . . . . . . . . . . . . . . . . . . . . . . . . . . . . . . . . . . . . . . . . . 11Overview . . . . . . . . . . . . . . . . . . . . . . . . . . . . . . . . . . . . . . . . . . . . . . . . . . . . . . . . . . . . . . . . . . . . . . . . . . . . . . . . . . . . . . . . . . . . . . . . . . . . . . . . . . . . . . . . . . . 11Approaches and Challenges for Natural Hazard–Risk Assessment . . . . . . . . . . . . . . . . . . . . . . . . . . . . . . . . . . . . . . . . . . . . . . . . 11Opportunities and Challenges Using Current Tools and Data Sources . . . . . . . . . . . . . . . . . . . . . . . . . . . . . . . . . . . . . . . . . . . 15Key Findings . . . . . . . . . . . . . . . . . . . . . . . . . . . . . . . . . . . . . . . . . . . . . . . . . . . . . . . . . . . . . . . . . . . . . . . . . . . . . . . . . . . . . . . . . . . . . . . . . . . . . . . . . . . . . . . 19
CHAPTER FOUR
Challenges Integrating Equity into BRIC . . . . . . . . . . . . . . . . . . . . . . . . . . . . . . . . . . . . . . . . . . . . . . . . . . . . . . . . . . . . . . . . . . . . . . . . . . . . . . 21Overview . . . . . . . . . . . . . . . . . . . . . . . . . . . . . . . . . . . . . . . . . . . . . . . . . . . . . . . . . . . . . . . . . . . . . . . . . . . . . . . . . . . . . . . . . . . . . . . . . . . . . . . . . . . . . . . . . . . 21Understanding the Multidimensional Nature of Equity . . . . . . . . . . . . . . . . . . . . . . . . . . . . . . . . . . . . . . . . . . . . . . . . . . . . . . . . . . . . . 21Assessing and Addressing Equity Requires Robust Evaluation Methods . . . . . . . . . . . . . . . . . . . . . . . . . . . . . . . . . . . . . . . . . 22What Are the Challenges to Integrating Equity Considerations in the BRIC Program? . . . . . . . . . . . . . . . . . . . . . . . . 25Summary of Findings. . . . . . . . . . . . . . . . . . . . . . . . . . . . . . . . . . . . . . . . . . . . . . . . . . . . . . . . . . . . . . . . . . . . . . . . . . . . . . . . . . . . . . . . . . . . . . . . . . . . . 29
CHAPTER FIVE
Visualizing the Applications, Risk, and Sociodemographic Measures of the BRIC Program . . . . . . . . . . . . . . . . 31Overview . . . . . . . . . . . . . . . . . . . . . . . . . . . . . . . . . . . . . . . . . . . . . . . . . . . . . . . . . . . . . . . . . . . . . . . . . . . . . . . . . . . . . . . . . . . . . . . . . . . . . . . . . . . . . . . . . . . 31Purpose of the Application Evaluation Tool . . . . . . . . . . . . . . . . . . . . . . . . . . . . . . . . . . . . . . . . . . . . . . . . . . . . . . . . . . . . . . . . . . . . . . . . . . 32Current Limitations. . . . . . . . . . . . . . . . . . . . . . . . . . . . . . . . . . . . . . . . . . . . . . . . . . . . . . . . . . . . . . . . . . . . . . . . . . . . . . . . . . . . . . . . . . . . . . . . . . . . . . . 38Summary of Findings. . . . . . . . . . . . . . . . . . . . . . . . . . . . . . . . . . . . . . . . . . . . . . . . . . . . . . . . . . . . . . . . . . . . . . . . . . . . . . . . . . . . . . . . . . . . . . . . . . . . . 38
CHAPTER SIX
Findings, Recommendations, and Concluding Thoughts . . . . . . . . . . . . . . . . . . . . . . . . . . . . . . . . . . . . . . . . . . . . . . . . . . . . . . . . . . . 39Linking Summary Findings to Recommendations . . . . . . . . . . . . . . . . . . . . . . . . . . . . . . . . . . . . . . . . . . . . . . . . . . . . . . . . . . . . . . . . . . . 39
Building Resilient Infrastructure and Communities Mitigation Grant Program, Considerations of Hazard Risk and Social Equity
x
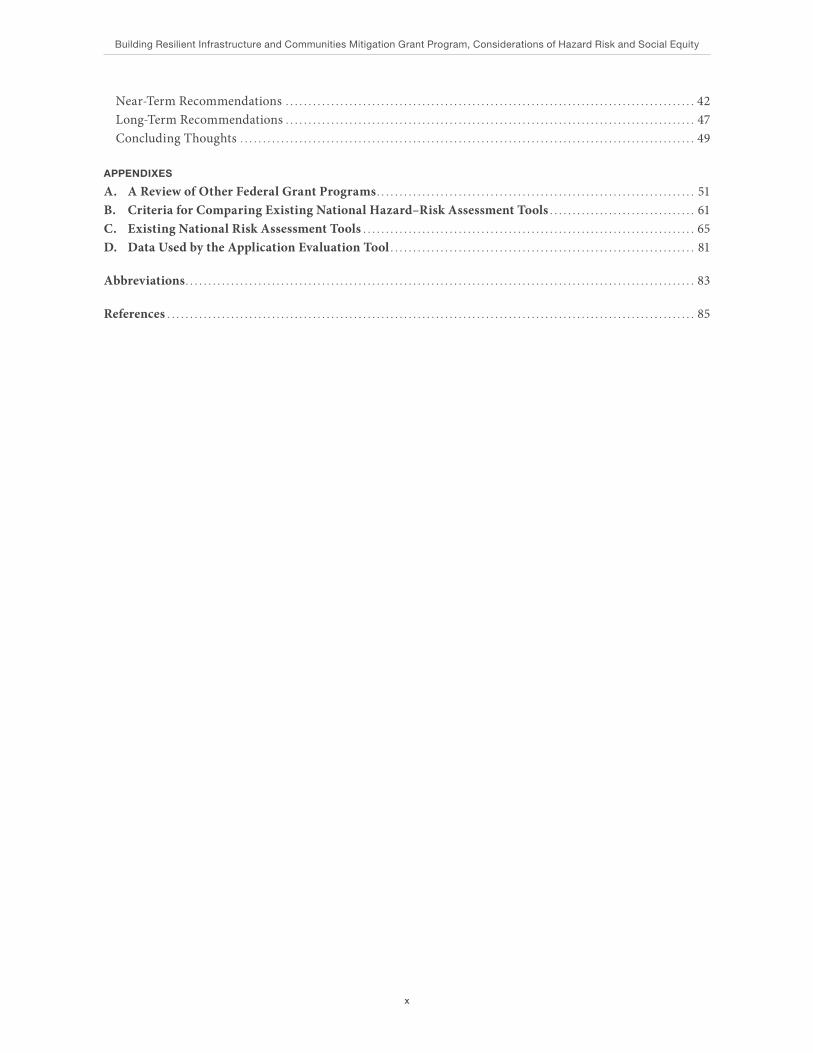
Near-Term Recommendations . . . . . . . . . . . . . . . . . . . . . . . . . . . . . . . . . . . . . . . . . . . . . . . . . . . . . . . . . . . . . . . . . . . . . . . . . . . . . . . . . . . . . . . . . . 42Long-Term Recommendations . . . . . . . . . . . . . . . . . . . . . . . . . . . . . . . . . . . . . . . . . . . . . . . . . . . . . . . . . . . . . . . . . . . . . . . . . . . . . . . . . . . . . . . . . . 47Concluding Thoughts . . . . . . . . . . . . . . . . . . . . . . . . . . . . . . . . . . . . . . . . . . . . . . . . . . . . . . . . . . . . . . . . . . . . . . . . . . . . . . . . . . . . . . . . . . . . . . . . . . . . 49
APPENDIXES
A. A Review of Other Federal Grant Programs . . . . . . . . . . . . . . . . . . . . . . . . . . . . . . . . . . . . . . . . . . . . . . . . . . . . . . . . . . . . . . . . . . . . . . 51B. Criteria for Comparing Existing National Hazard–Risk Assessment Tools . . . . . . . . . . . . . . . . . . . . . . . . . . . . . . . . 61C. Existing National Risk Assessment Tools . . . . . . . . . . . . . . . . . . . . . . . . . . . . . . . . . . . . . . . . . . . . . . . . . . . . . . . . . . . . . . . . . . . . . . . . . 65D. Data Used by the Application Evaluation Tool . . . . . . . . . . . . . . . . . . . . . . . . . . . . . . . . . . . . . . . . . . . . . . . . . . . . . . . . . . . . . . . . . . . 81
Abbreviations . . . . . . . . . . . . . . . . . . . . . . . . . . . . . . . . . . . . . . . . . . . . . . . . . . . . . . . . . . . . . . . . . . . . . . . . . . . . . . . . . . . . . . . . . . . . . . . . . . . . . . . . . . . . . . . . 83
References . . . . . . . . . . . . . . . . . . . . . . . . . . . . . . . . . . . . . . . . . . . . . . . . . . . . . . . . . . . . . . . . . . . . . . . . . . . . . . . . . . . . . . . . . . . . . . . . . . . . . . . . . . . . . . . . . . . . 85
xi
Figures and Tables
Figures
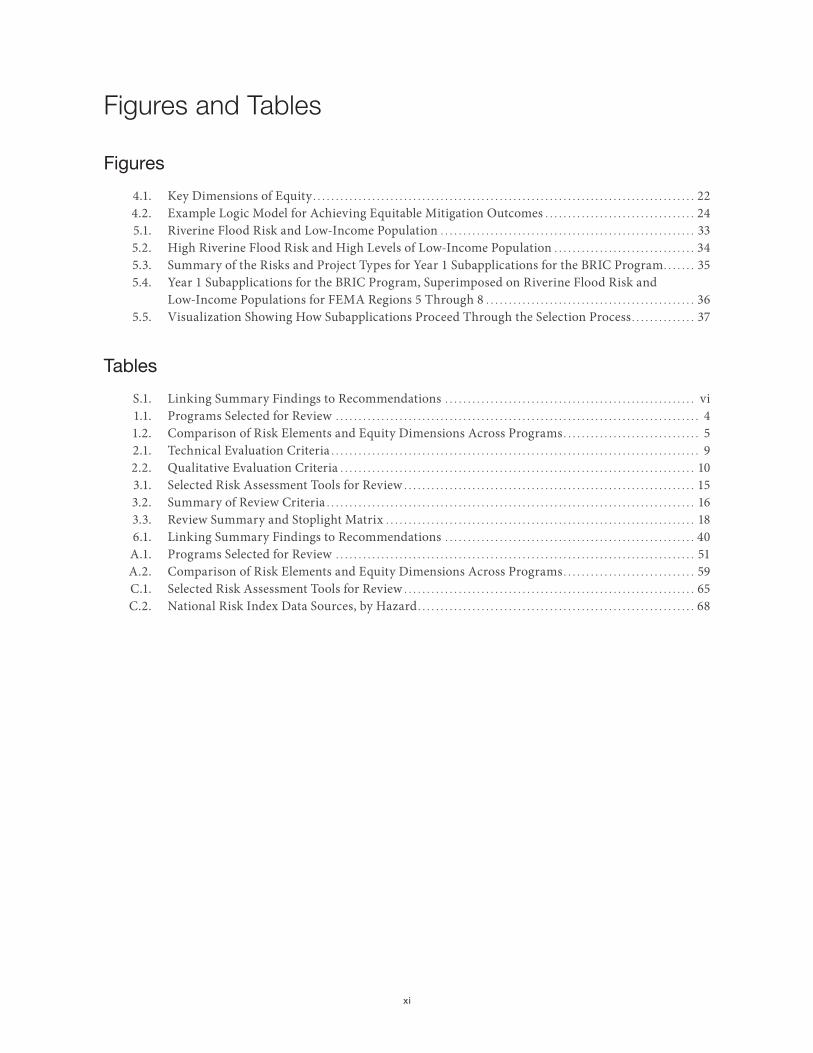
4.1. Key Dimensions of Equity . . . . . . . . . . . . . . . . . . . . . . . . . . . . . . . . . . . . . . . . . . . . . . . . . . . . . . . . . . . . . . . . . . . . . . . . . . . . . . . . . . . . 22 4.2. Example Logic Model for Achieving Equitable Mitigation Outcomes . . . . . . . . . . . . . . . . . . . . . . . . . . . . . . . . . 24 5.1. Riverine Flood Risk and Low-Income Population . . . . . . . . . . . . . . . . . . . . . . . . . . . . . . . . . . . . . . . . . . . . . . . . . . . . . . . . 33 5.2. High Riverine Flood Risk and High Levels of Low-Income Population . . . . . . . . . . . . . . . . . . . . . . . . . . . . . . . 34 5.3. Summary of the Risks and Project Types for Year 1 Subapplications for the BRIC Program . . . . . . . 35 5.4. Year 1 Subapplications for the BRIC Program, Superimposed on Riverine Flood Risk and
Low-Income Populations for FEMA Regions 5 Through 8 . . . . . . . . . . . . . . . . . . . . . . . . . . . . . . . . . . . . . . . . . . . . . . 36 5.5. Visualization Showing How Subapplications Proceed Through the Selection Process . . . . . . . . . . . . . . 37
Tables
S.1. Linking Summary Findings to Recommendations . . . . . . . . . . . . . . . . . . . . . . . . . . . . . . . . . . . . . . . . . . . . . . . . . . . . . . . vi 1.1. Programs Selected for Review . . . . . . . . . . . . . . . . . . . . . . . . . . . . . . . . . . . . . . . . . . . . . . . . . . . . . . . . . . . . . . . . . . . . . . . . . . . . . . . . 4 1.2. Comparison of Risk Elements and Equity Dimensions Across Programs . . . . . . . . . . . . . . . . . . . . . . . . . . . . . . 5 2.1. Technical Evaluation Criteria . . . . . . . . . . . . . . . . . . . . . . . . . . . . . . . . . . . . . . . . . . . . . . . . . . . . . . . . . . . . . . . . . . . . . . . . . . . . . . . . . 9 2.2. Qualitative Evaluation Criteria . . . . . . . . . . . . . . . . . . . . . . . . . . . . . . . . . . . . . . . . . . . . . . . . . . . . . . . . . . . . . . . . . . . . . . . . . . . . . . 10 3.1. Selected Risk Assessment Tools for Review . . . . . . . . . . . . . . . . . . . . . . . . . . . . . . . . . . . . . . . . . . . . . . . . . . . . . . . . . . . . . . . . 15 3.2. Summary of Review Criteria . . . . . . . . . . . . . . . . . . . . . . . . . . . . . . . . . . . . . . . . . . . . . . . . . . . . . . . . . . . . . . . . . . . . . . . . . . . . . . . . . 16 3.3. Review Summary and Stoplight Matrix . . . . . . . . . . . . . . . . . . . . . . . . . . . . . . . . . . . . . . . . . . . . . . . . . . . . . . . . . . . . . . . . . . . . 18 6.1. Linking Summary Findings to Recommendations . . . . . . . . . . . . . . . . . . . . . . . . . . . . . . . . . . . . . . . . . . . . . . . . . . . . . . . 40 A.1. Programs Selected for Review . . . . . . . . . . . . . . . . . . . . . . . . . . . . . . . . . . . . . . . . . . . . . . . . . . . . . . . . . . . . . . . . . . . . . . . . . . . . . . . 51 A.2. Comparison of Risk Elements and Equity Dimensions Across Programs . . . . . . . . . . . . . . . . . . . . . . . . . . . . . 59 C.1. Selected Risk Assessment Tools for Review . . . . . . . . . . . . . . . . . . . . . . . . . . . . . . . . . . . . . . . . . . . . . . . . . . . . . . . . . . . . . . . . 65 C.2. National Risk Index Data Sources, by Hazard . . . . . . . . . . . . . . . . . . . . . . . . . . . . . . . . . . . . . . . . . . . . . . . . . . . . . . . . . . . . . 68

1
CHAPTER ONE
Introduction
In 2020, U.S. disaster resilience was tested by a historic fire season in the West, the record-breaking Atlan-tic hurricane season, and the coronavirus disease 2019 (COVID-19) pandemic. In fact, 2020 saw the highest number of billion-dollar disasters ever—22 events—with a cost of $95 billion (adjusted based on the Con-sumer Price Index) (A. B. Smith, 2021). Although the initiating events of the natural disasters themselves could not have been controlled, the disruption and damage caused by these disasters could, in many cases, have been reduced through a wide variety of actions undertaken by communities and individuals before disaster strikes. The collective term for such actions is predisaster mitigation.
The Building Resilient Infrastructure and Communities (BRIC) hazard mitigation grant program is the federal government’s largest predisaster mitigation program. When Congress authorized BRIC in 2018, it did so against the backdrop of a steady trend of increasingly devastating natural disasters and with the recog-nition that investing dollars in mitigation could save future dollars spent on recovery and response efforts. That BRIC has both infrastructure and community in its name recognizes that natural disasters can not only destroy physical buildings but also have negative impacts on communities. There is evidence that some dis-advantaged and low-income communities experience repeated disasters more frequently and recover less quickly than wealthier communities (Substance Abuse and Mental Health Services Administration, 2017). Administrative procedures and distribution of funding from grant programs have led to inequitable out-comes (Howell and Elliott, 2019; Substance Abuse and Mental Health Services Administration, 2017). In one of his first executive orders, President Joseph R. Biden, Jr., directed federal agencies to achieve greater equity and fairness in allocating federal resources (Biden, 2021a). The Federal Emergency Management Agency’s (FEMA’s) National Advisory Council (NAC) has also recommended that FEMA build capacity nationally for equitable, coordinated, and outcome-driven solutions (NAC, 2020).
The emphasis on equity goals alongside reduction of risk to physical assets represents a significant break with past policy and practice and foreshadows a new approach to building community resilience through mitigation activities. Changes in application procedures, use of a broader set of decision criteria, and trans-parent analysis will all be critical to implementing this new approach predictably, fairly, and consistently.
Objective
FEMA is interested in exploring how future competitive grant cycles of BRIC can be evaluated using a multi-hazard, forward-looking, risk-based approach that also considers issues of equity and community well-being in its application and evaluation processes. FEMA engaged the Homeland Security Operational Analysis Center (HSOAC), a federally funded research and development center operated by the RAND Corporation for the U.S. Department of Homeland Security (DHS) to help it identify ways in which the BRIC program could evolve to increasingly target the greatest natural hazard risks while also integrating equity consider-ations into the grant program’s planning, application, evaluation, and funding processes.
Building Resilient Infrastructure and Communities Mitigation Grant Program, Considerations of Hazard Risk and Social Equity
2
To undertake this study, the HSOAC team developed the following research questions:
• What natural hazard–risk considerations should inform BRIC grant decisionmaking processes? (See Chapter Three.)
• What are the challenges in integrating social equity considerations into the BRIC grantmaking decision process? (See Chapter Four.)
• What role should risk assessment tools play in the grant award process, and how can these tools be extended to consider changing environmental and other conditions? (See Chapter Five.)
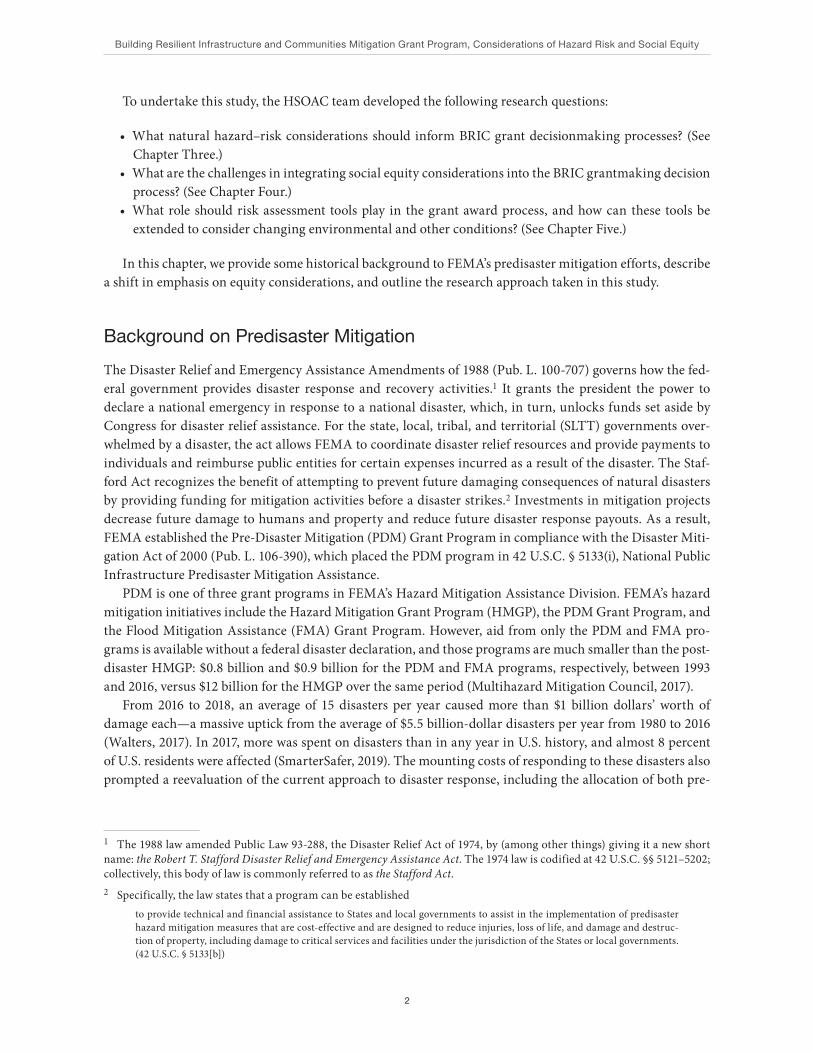
In this chapter, we provide some historical background to FEMA’s predisaster mitigation efforts, describe a shift in emphasis on equity considerations, and outline the research approach taken in this study.
Background on Predisaster Mitigation
The Disaster Relief and Emergency Assistance Amendments of 1988 (Pub. L. 100-707) governs how the fed-eral government provides disaster response and recovery activities.1 It grants the president the power to declare a national emergency in response to a national disaster, which, in turn, unlocks funds set aside by Congress for disaster relief assistance. For the state, local, tribal, and territorial (SLTT) governments over-whelmed by a disaster, the act allows FEMA to coordinate disaster relief resources and provide payments to individuals and reimburse public entities for certain expenses incurred as a result of the disaster. The Staf-ford Act recognizes the benefit of attempting to prevent future damaging consequences of natural disasters by providing funding for mitigation activities before a disaster strikes.2 Investments in mitigation projects decrease future damage to humans and property and reduce future disaster response payouts. As a result, FEMA established the Pre-Disaster Mitigation (PDM) Grant Program in compliance with the Disaster Miti-gation Act of 2000 (Pub. L. 106-390), which placed the PDM program in 42 U.S.C. § 5133(i), National Public Infrastructure Predisaster Mitigation Assistance.
PDM is one of three grant programs in FEMA’s Hazard Mitigation Assistance Division. FEMA’s hazard mitigation initiatives include the Hazard Mitigation Grant Program (HMGP), the PDM Grant Program, and the Flood Mitigation Assistance (FMA) Grant Program. However, aid from only the PDM and FMA pro-grams is available without a federal disaster declaration, and those programs are much smaller than the post-disaster HMGP: $0.8 billion and $0.9 billion for the PDM and FMA programs, respectively, between 1993 and 2016, versus $12 billion for the HMGP over the same period (Multihazard Mitigation Council, 2017).
From 2016 to 2018, an average of 15 disasters per year caused more than $1 billion dollars’ worth of damage each—a massive uptick from the average of $5.5 billion-dollar disasters per year from 1980 to 2016 (Walters, 2017). In 2017, more was spent on disasters than in any year in U.S. history, and almost 8 percent of U.S. residents were affected (SmarterSafer, 2019). The mounting costs of responding to these disasters also prompted a reevaluation of the current approach to disaster response, including the allocation of both pre-
1 The 1988 law amended Public Law 93-288, the Disaster Relief Act of 1974, by (among other things) giving it a new short name: the Robert T. Stafford Disaster Relief and Emergency Assistance Act. The 1974 law is codified at 42 U.S.C. §§ 5121–5202; collectively, this body of law is commonly referred to as the Stafford Act. 2 Specifically, the law states that a program can be established
to provide technical and financial assistance to States and local governments to assist in the implementation of predisaster hazard mitigation measures that are cost-effective and are designed to reduce injuries, loss of life, and damage and destruc-tion of property, including damage to critical services and facilities under the jurisdiction of the States or local governments. (42 U.S.C. § 5133[b])
Introduction
3
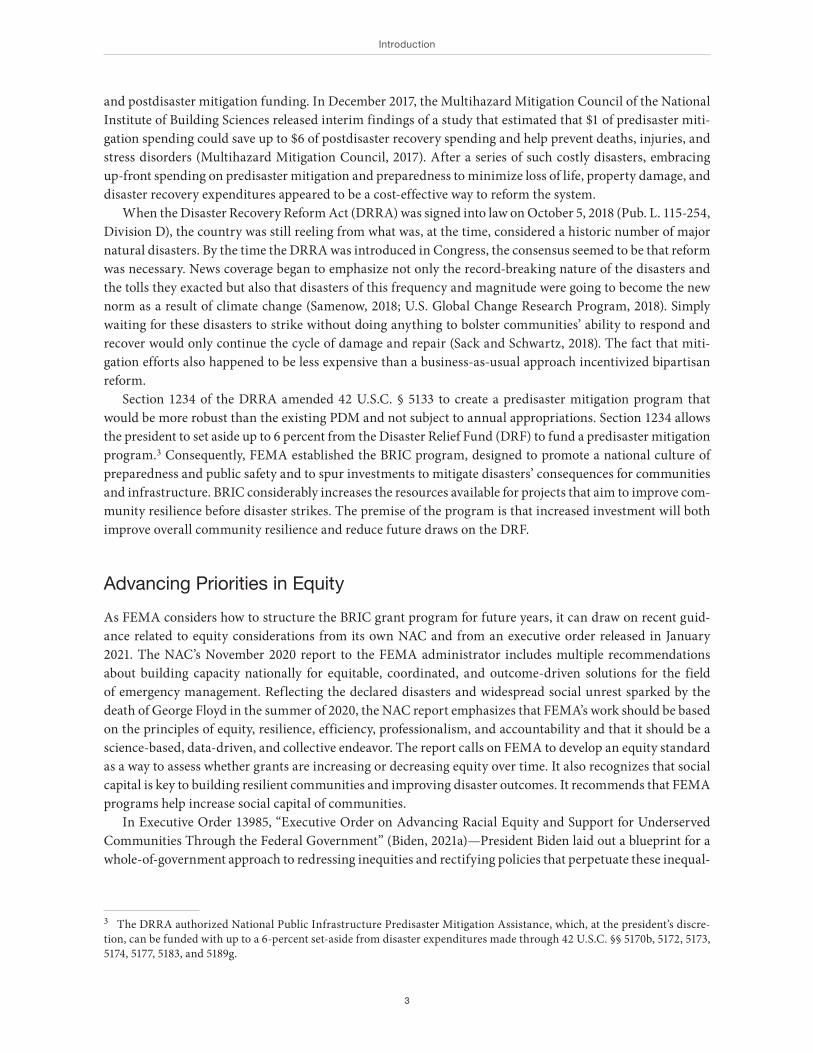
and postdisaster mitigation funding. In December 2017, the Multihazard Mitigation Council of the National Institute of Building Sciences released interim findings of a study that estimated that $1 of predisaster miti-gation spending could save up to $6 of postdisaster recovery spending and help prevent deaths, injuries, and stress disorders (Multihazard Mitigation Council, 2017). After a series of such costly disasters, embracing up-front spending on predisaster mitigation and preparedness to minimize loss of life, property damage, and disaster recovery expenditures appeared to be a cost-effective way to reform the system.
When the Disaster Recovery Reform Act (DRRA) was signed into law on October 5, 2018 (Pub. L. 115-254, Division D), the country was still reeling from what was, at the time, considered a historic number of major natural disasters. By the time the DRRA was introduced in Congress, the consensus seemed to be that reform was necessary. News coverage began to emphasize not only the record-breaking nature of the disasters and the tolls they exacted but also that disasters of this frequency and magnitude were going to become the new norm as a result of climate change (Samenow, 2018; U.S. Global Change Research Program, 2018). Simply waiting for these disasters to strike without doing anything to bolster communities’ ability to respond and recover would only continue the cycle of damage and repair (Sack and Schwartz, 2018). The fact that miti-gation efforts also happened to be less expensive than a business-as-usual approach incentivized bipartisan reform.
Section 1234 of the DRRA amended 42 U.S.C. § 5133 to create a predisaster mitigation program that would be more robust than the existing PDM and not subject to annual appropriations. Section 1234 allows the president to set aside up to 6 percent from the Disaster Relief Fund (DRF) to fund a predisaster mitigation program.3 Consequently, FEMA established the BRIC program, designed to promote a national culture of preparedness and public safety and to spur investments to mitigate disasters’ consequences for communities and infrastructure. BRIC considerably increases the resources available for projects that aim to improve com-munity resilience before disaster strikes. The premise of the program is that increased investment will both improve overall community resilience and reduce future draws on the DRF.
Advancing Priorities in Equity
As FEMA considers how to structure the BRIC grant program for future years, it can draw on recent guid-ance related to equity considerations from its own NAC and from an executive order released in January 2021. The NAC’s November 2020 report to the FEMA administrator includes multiple recommendations about building capacity nationally for equitable, coordinated, and outcome-driven solutions for the field of emergency management. Reflecting the declared disasters and widespread social unrest sparked by the death of George Floyd in the summer of 2020, the NAC report emphasizes that FEMA’s work should be based on the principles of equity, resilience, efficiency, professionalism, and accountability and that it should be a science-based, data-driven, and collective endeavor. The report calls on FEMA to develop an equity standard as a way to assess whether grants are increasing or decreasing equity over time. It also recognizes that social capital is key to building resilient communities and improving disaster outcomes. It recommends that FEMA programs help increase social capital of communities.
In Executive Order 13985, “Executive Order on Advancing Racial Equity and Support for Underserved Communities Through the Federal Government” (Biden, 2021a)—President Biden laid out a blueprint for a whole-of-government approach to redressing inequities and rectifying policies that perpetuate these inequal-
3 The DRRA authorized National Public Infrastructure Predisaster Mitigation Assistance, which, at the president’s discre-tion, can be funded with up to a 6-percent set-aside from disaster expenditures made through 42 U.S.C. §§ 5170b, 5172, 5173, 5174, 5177, 5183, and 5189g.
Building Resilient Infrastructure and Communities Mitigation Grant Program, Considerations of Hazard Risk and Social Equity
4
ities. Pursuant to the executive order, agencies will assess certain programs and policies to pinpoint barri-ers to access for underserved communities.4 The federal government will then allocate resources to remedy the historically insufficient investment in underserved communities and will push for equity in the deliv-ery of government services and in opportunities. Agencies will liaise with marginalized communities and community-based and civil rights organization. Finally, data with a variety of demographic information will be gathered for federal data sets to better map extant inequality and track the effectiveness of any programs implemented to advance equality. The guiding principles of BRIC—building local community resilience and capacity, promoting partnerships, and providing consistency—encourage the program to embed many of the practices outlined in the executive order in its policies and design, especially the engagement of local actors. Following the steps in the executive order will ensure that BRIC is equitably supporting diverse communities and lessening disparities in disaster recovery.
Approach
To undertake this study on how future BRIC grant funding cycles should incorporate natural hazard–risk priorities along with issues of equity and community well-being in the program’s application and evaluation processes, the HSOAC team engaged in multiple research tasks. We began by examining existing federal grant programs that consider issues of risk, need, and equity in their grant award decision processes. We also examined a set of existing hazard-risk assessment tools for compatibility with BRIC needs, assessed the equity impacts of the notice of funding opportunity (NOFO) for BRIC in its first year, and developed a pro-totype interactive tool that allowed the exploration of various dimensions of both risk and equity relative to subapplications received, to inform what might be possible in future years.
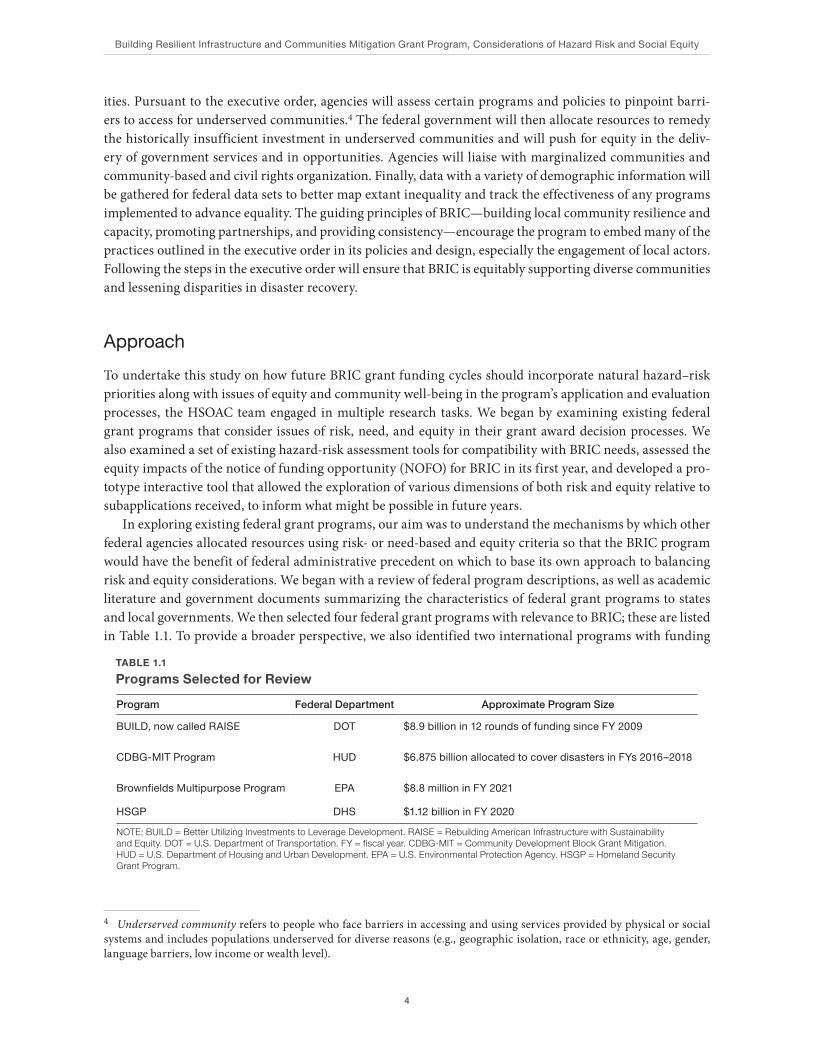
In exploring existing federal grant programs, our aim was to understand the mechanisms by which other federal agencies allocated resources using risk- or need-based and equity criteria so that the BRIC program would have the benefit of federal administrative precedent on which to base its own approach to balancing risk and equity considerations. We began with a review of federal program descriptions, as well as academic literature and government documents summarizing the characteristics of federal grant programs to states and local governments. We then selected four federal grant programs with relevance to BRIC; these are listed in Table 1.1. To provide a broader perspective, we also identified two international programs with funding
4 Underserved community refers to people who face barriers in accessing and using services provided by physical or social systems and includes populations underserved for diverse reasons (e.g., geographic isolation, race or ethnicity, age, gender, language barriers, low income or wealth level).
TABLE 1.1
Programs Selected for Review
Program Federal Department Approximate Program Size
BUILD, now called RAISE DOT $8.9 billion in 12 rounds of funding since FY 2009
CDBG-MIT Program HUD $6.875 billion allocated to cover disasters in FYs 2016–2018
Brownfields Multipurpose Program EPA $8.8 million in FY 2021
HSGP DHS $1.12 billion in FY 2020
NOTE: BUILD = Better Utilizing Investments to Leverage Development. RAISE = Rebuilding American Infrastructure with Sustainability and Equity. DOT = U.S. Department of Transportation. FY = fiscal year. CDBG-MIT = Community Development Block Grant Mitigation. HUD = U.S. Department of Housing and Urban Development. EPA = U.S. Environmental Protection Agency. HSGP = Homeland Security Grant Program.
Introduction
5
criteria designed to assess the value of resilient infrastructure investments. We evaluated how the federal pro-grams in particular were structured with respect to mandatory and discretionary program components and how they presented risk and equity goals of the programs.
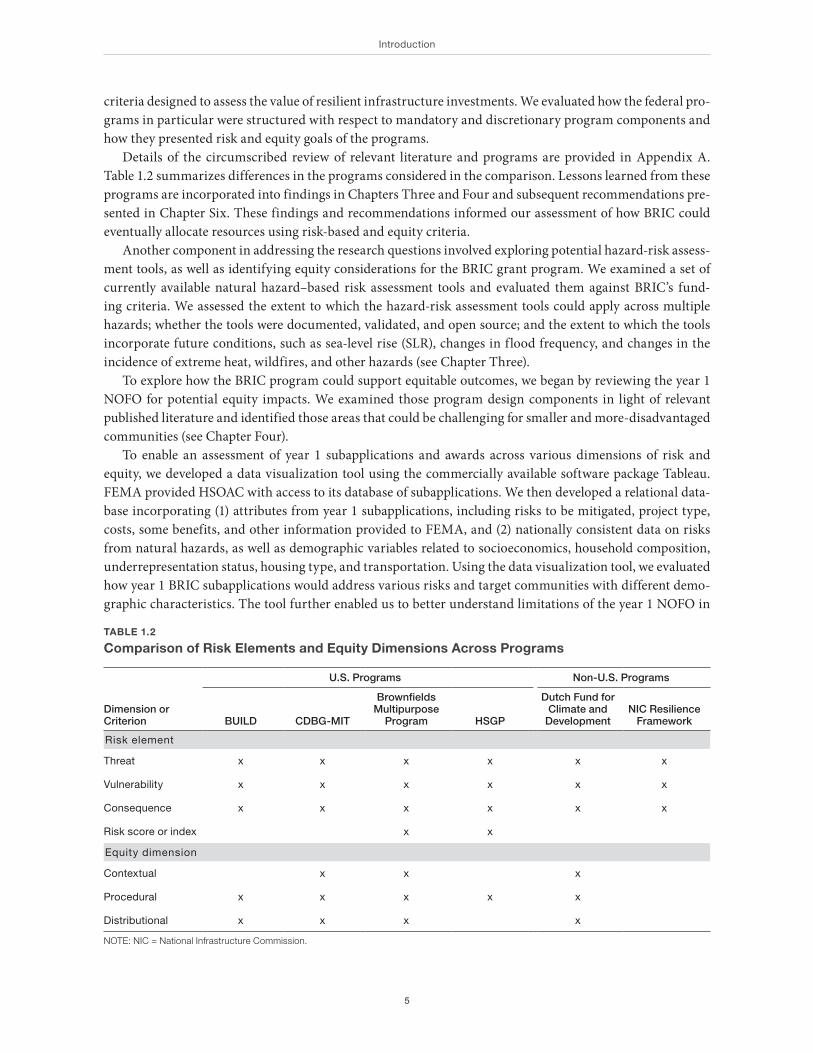
Details of the circumscribed review of relevant literature and programs are provided in Appendix A. Table 1.2 summarizes differences in the programs considered in the comparison. Lessons learned from these programs are incorporated into findings in Chapters Three and Four and subsequent recommendations pre-sented in Chapter Six. These findings and recommendations informed our assessment of how BRIC could eventually allocate resources using risk-based and equity criteria.
Another component in addressing the research questions involved exploring potential hazard-risk assess-ment tools, as well as identifying equity considerations for the BRIC grant program. We examined a set of currently available natural hazard–based risk assessment tools and evaluated them against BRIC’s fund-ing criteria. We assessed the extent to which the hazard-risk assessment tools could apply across multiple hazards; whether the tools were documented, validated, and open source; and the extent to which the tools incorporate future conditions, such as sea-level rise (SLR), changes in flood frequency, and changes in the incidence of extreme heat, wildfires, and other hazards (see Chapter Three).
To explore how the BRIC program could support equitable outcomes, we began by reviewing the year 1 NOFO for potential equity impacts. We examined those program design components in light of relevant published literature and identified those areas that could be challenging for smaller and more-disadvantaged communities (see Chapter Four).
To enable an assessment of year 1 subapplications and awards across various dimensions of risk and equity, we developed a data visualization tool using the commercially available software package Tableau. FEMA provided HSOAC with access to its database of subapplications. We then developed a relational data-base incorporating (1) attributes from year 1 subapplications, including risks to be mitigated, project type, costs, some benefits, and other information provided to FEMA, and (2) nationally consistent data on risks from natural hazards, as well as demographic variables related to socioeconomics, household composition, underrepresentation status, housing type, and transportation. Using the data visualization tool, we evaluated how year 1 BRIC subapplications would address various risks and target communities with different demo-graphic characteristics. The tool further enabled us to better understand limitations of the year 1 NOFO in
TABLE 1.2
Comparison of Risk Elements and Equity Dimensions Across Programs
Dimension or Criterion
U.S. Programs Non-U.S. Programs
BUILD CDBG-MIT
Brownfields Multipurpose
Program HSGP
Dutch Fund for Climate and
DevelopmentNIC Resilience
Framework
Risk element
Threat x x x x x x
Vulnerability x x x x x x
Consequence x x x x x x
Risk score or index x x
Equity dimension
Contextual x x x
Procedural x x x x x
Distributional x x x x
NOTE: NIC = National Infrastructure Commission.
Building Resilient Infrastructure and Communities Mitigation Grant Program, Considerations of Hazard Risk and Social Equity
6
terms of soliciting subapplications that address the most-critical risks and benefit the most-vulnerable com-munities (see Chapter Five).
Outline of This Report
Chapter Two of this report describes the design of the BRIC grant program for year 1 subapplications. Chap-ter Three explores BRIC’s potential uses for hazard-risk assessment tools and whether current tools across different hazard types, geographies, or other key dimensions could be useful in allocating funding to support priorities. Chapter Four discusses the challenges related to integrating issues of equity into the BRIC award process. Chapter Five describes a prototype interactive tool to compare the location, proposed project type, and cost of BRIC subapplications with standardized risk and sociodemographic information. Chapter Six provides recommendations for future BRIC NOFOs based on the findings that appear in Chapters Three, Four, and Five and categorizes them by near- and long-term implementation. Chapter Six also offers some concluding remarks.
The report also has three appendixes. Appendix A describes the existing federal grant programs reviewed that also consider issues of risk, need, and equity in their grant award decision processes. Appendixes B and C provide additional detail on the hazard-risk assessment tools evaluated and then summarized in Chap-ter Three. Appendix D provides more detail on the data included in the application evaluation tool (AET) described in Chapter Five.
FEMA will need to decide what it wants the BRIC program to achieve over the next three, five, and ten years and how fast it would like to move toward achieving its goals on risk reduction and equity. The rec-ommendations are categorized as near term and long term. For the near-term recommendations, there are relatively few barriers to implementation, and change is primarily within the control of the BRIC program or FEMA. Near-term recommendations are actions that likely can be implemented within the next couple of NOFO cycles, given that there is a one- to two-year lag time. With the lead time necessary to develop a fed-eral funding opportunity, BRIC might be able to implement this report’s observations and recommendations beginning with the year 3 NOFO in FY 2022.
7
CHAPTER TWO
Design of the BRIC Grant Program for Year 1
In designing BRIC, FEMA undertook a broad stakeholder engagement process in 2019 to solicit feedback from applicants (states, tribes, and territories) and subapplicants (local government entities or consortia) about their experiences with the PDM grant program. FEMA wanted to understand how BRIC could improve on PDM by better addressing the challenges that applicants and subapplicants face in building capacity to both conceptualize and implement mitigation projects and programs. This input was intended to help FEMA with the initial BRIC program design. FEMA solicited input from officials from all levels of government, includ-ing states, tribes, and territories, as well as local governments and stakeholders in other federal agencies. FEMA also solicited input from residents, businesses, nonprofits, critical infrastructure sectors, academia, and philanthropic organizations (FEMA, 2020a).
FEMA conducted six webinars and three in-person listening sessions; crowdsourced ideas and comments through an online platform; and received formal letters and emails. In total, FEMA received more than 5,000 comments that it used in considering the design of the BRIC program (FEMA, 2020a). Drawing on this input, FEMA developed BRIC’s first NOFO, which documents BRIC’s five guiding principles, describes the categories of activities to be funded, and identifies the program’s priorities for FY 2020 (DHS, 2020). These are described in this chapter.
BRIC Guiding Principles
The five guiding BRIC principles are to
• support state and local governments, tribes, and territories through capability and capacity building (C&CB) to enable them to identify mitigation actions and implement projects that reduce risks posed by natural hazards
• encourage and enable innovation while allowing flexibility, consistency, and effectiveness• promote partnerships and enable high-impact investments to reduce risk from natural hazards with a
focus on critical services and facilities, public infrastructure, public safety, public health, and commu-nities
• provide a significant opportunity to reduce future losses and minimize impacts on the DRF• support the adoption and enforcement of building codes, standards, and policies that will protect the
public’s health, safety, and general welfare; take future conditions into account; lower community risks, including for critical services and facilities; and reduce disaster costs over the long term.
Building Resilient Infrastructure and Communities Mitigation Grant Program, Considerations of Hazard Risk and Social Equity
8
Categories of Activities to Be Funded
The following categories of activities are to be funded:
• C&CB: These activities allow the applicant or subapplicant to improve its ability to administer mitiga-tion assistance, such as improving the skills of the existing workforce or expanding the workforce. It applies to subcategories, such as activities related to mitigation planning, partnerships, project scoping, and building code.
• mitigation projects: These activities are intended to reduce damage to property, critical services, and infrastructure and reduce injuries and loss of life by increasing infrastructure and community resil-ience. The benefits must outweigh the costs as documented through a benefit–cost analysis (BCA) that must be submitted as part of the application.
• management costs: Grants in this category are to provide financial assistance in the form of reimburse-ment of administrative expenses and other indirect costs associated with a specific mitigation activity, up to 15 percent of the total amount of the grant award.
FEMA will also help communities in the form of nonfinancial direct technical assistance (which is not a funding category) as communities attempt to build their capacity to increase resilience and implement suc-cessful mitigation programs.
Year 1 Priorities
The following are the year 1 priorities:
• Incentivize reducing risk to public infrastructure.• Incentivize projects that mitigate risk to one or more lifelines.1• Incentivize projects that incorporate nature-based solutions.• Increase funding to applicants that facilitate the adoption and enforcement of the latest building codes.
The NOFO is essentially the instructions for applicants and subapplicants to apply for BRIC funding. The NOFO application period ran from September 30, 2020, through January 29, 2021. Subapplications were reviewed and selections were announced July 1, 2021. In its first year (NOFO FY 2020), BRIC was expected to administer $500 million in mitigation grants, compared with $250 million administered by its predecessor, PDM, in FY 2019. The structure of the BRIC grant program is similar to PDM in that it allocates a set amount based on a formula and distributes the remainder through a national competition.2 In this case, the formula was a cap of $600,000 to each state and territory and $20 million set-aside funding for federally recognized tribes (DHS, 2020).3
1 Lifelines are functions that allow the continuous operation of critical government and business functions and are necessary for human health and safety and for economic security. Lifelines are interdependent and vulnerable to cascading failure. For example, if the electricity grid is disrupted, communications (emergency messages and alerts) will also be disrupted.2 Distributing grant funding through a formula is the equivalent of an allocation approach. We use the term formula because that is consistent with the public policy literature describing different approaches to grant funding. This is described in more detail in Chapter Four.3 Planning-type C&CB activities are capped at $300,000 each.
Design of the Building Resilient Infrastructure and Communities Grant Program for Year 1
9
As is typical for FEMA grants, there is a cost-share requirement. FEMA provides up to 75 percent of eli-gible costs, while the applicant or subapplicant must provide the other 25 percent using nonfederal sources. Small, impoverished communities are an exception and can receive up to 90 percent of costs from FEMA.4 Similarly, FEMA may waive all or part of the nonfederal cost share for insular areas (American Samoa, Guam, the Northern Mariana Islands, and the U.S. Virgin Islands) (DHS, 2020). FEMA provides 100-percent funding for management costs.
Evaluation Criteria
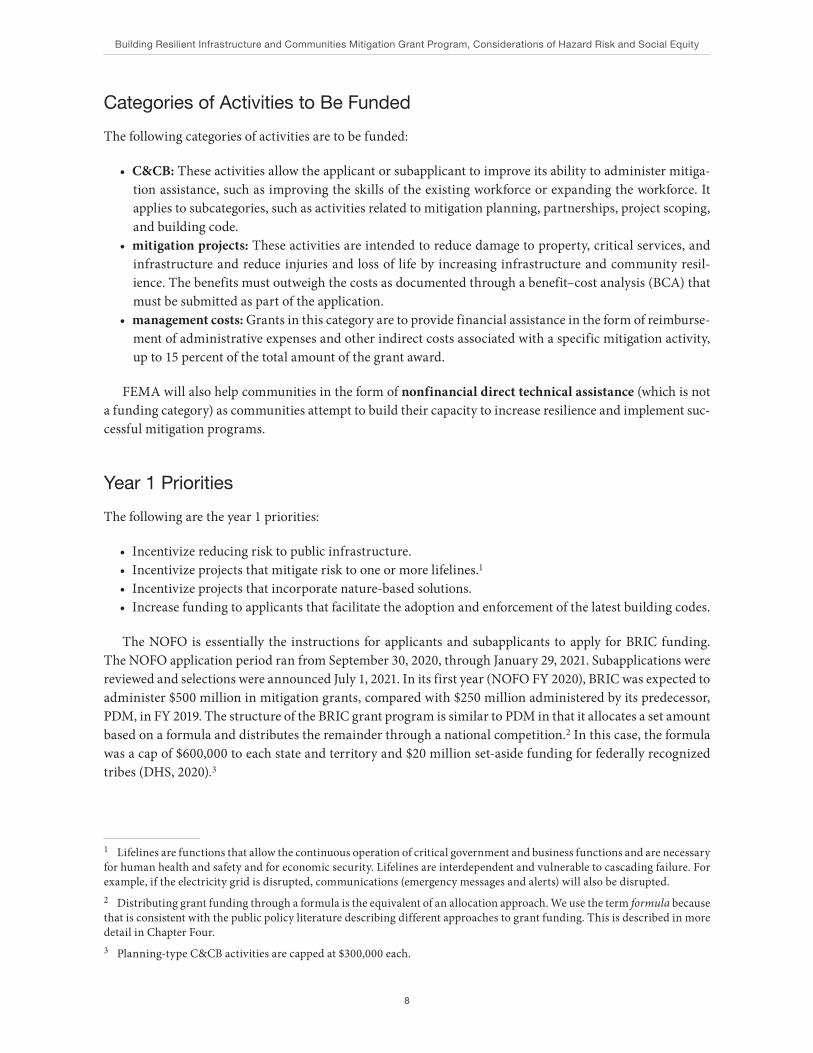
Subapplications eligible for the national competition were subject to two sets of evaluation criteria—technical and qualitative criteria—as shown in Tables 2.1 and 2.2, respectively. All subapplications are reviewed for eligibility and completeness. During this process, the subapplications are scored against the technical evalu-ation criteria.
The technical evaluation criteria are used as a program priority screening tool. The technical evaluation criteria provide FEMA with a way to objectively assign scores that reflect the priority areas it identified in the NOFO. Proposed projects receive either all points or no points for each category. A project meeting all criteria would receive a score of 100.
Those subapplications with the highest technical scores are evaluated by a qualitative review panel against the qualitative criteria. The BRIC program intended to advance to the qualitative review panel only the subapplications with the highest technical scores and whose cumulative cost add up to twice the amount of available BRIC funding.5 However, in this first year, because of some technical limitations of the grant management software, all subapplications were sent to the qualitative review panel and were scored on the qualitative criteria.
A qualitative review is a subjective assessment based on the narrative submission in which the applicant makes the case for its proposed project. It yields a graded score, so the applicant can receive partial points up to the total points in each category. A project fully meeting all criteria would receive 100 points.
4 Small, impoverished community is defined as an economically disadvantaged community with less than 3,000 residents who have average per capita annual income less than 80 percent of the national per capita income.5 FEMA has discretion as to how many or the dollar value of subapplications to advance to the qualitative review panel.
TABLE 2.1
Technical Evaluation Criteria
Technical Evaluation Criterion Points
Is an infrastructure project 20
Mitigates risk to one or more lifelines 15
Incorporates nature-based solutions 10
Is from an applicant that has a mandatory building code adoption requirement 20
Is from a subapplicant that has a BCEGS rating of between 1 and 5 15
Stems from a previous FEMA HMA Advance Assistance award 10
Increases the nonfederal cost share 5
Is from a subapplicant designated as a small, impoverished community 5
NOTE: BCEGS = Building Code Effectiveness Grading Schedule. HMA = Hazard Mitigation Assistance. The order of the criteria is that in the NOFO.
Building Resilient Infrastructure and Communities Mitigation Grant Program, Considerations of Hazard Risk and Social Equity
10
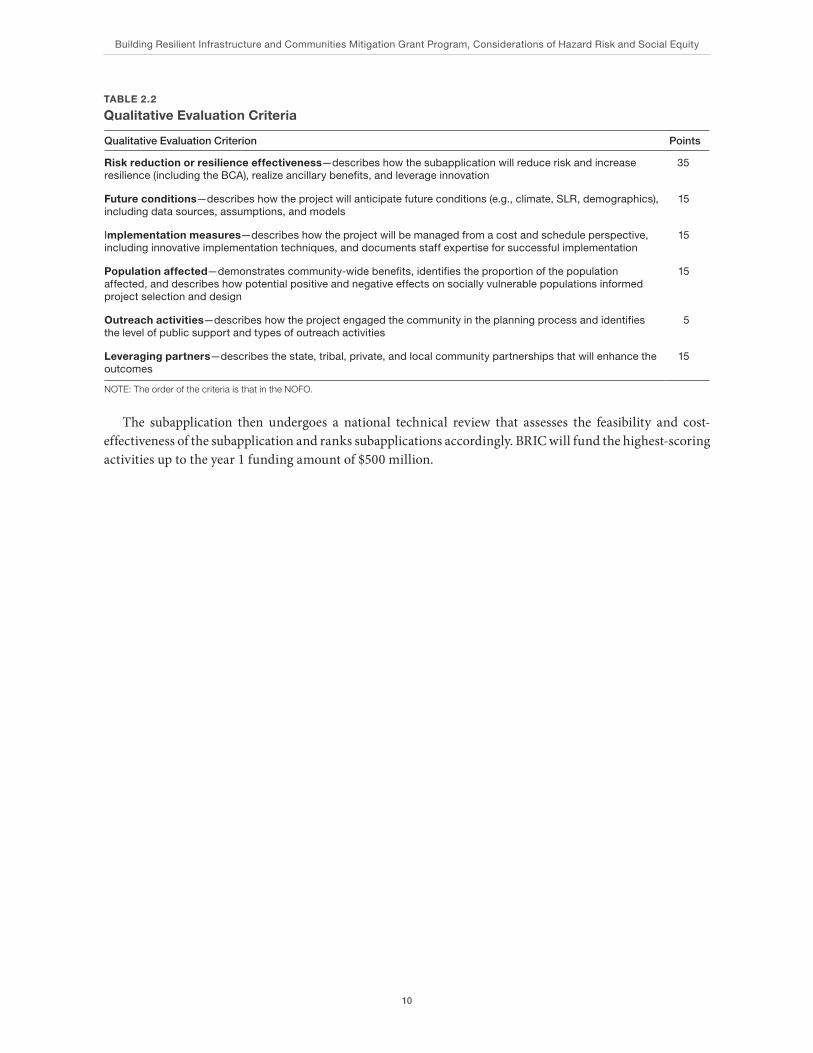
The subapplication then undergoes a national technical review that assesses the feasibility and cost-effectiveness of the subapplication and ranks subapplications accordingly. BRIC will fund the highest-scoring activities up to the year 1 funding amount of $500 million.
TABLE 2.2
Qualitative Evaluation Criteria
Qualitative Evaluation Criterion Points
Risk reduction or resilience effectiveness—describes how the subapplication will reduce risk and increase resilience (including the BCA), realize ancillary benefits, and leverage innovation
35
Future conditions—describes how the project will anticipate future conditions (e.g., climate, SLR, demographics), including data sources, assumptions, and models
15
Implementation measures—describes how the project will be managed from a cost and schedule perspective, including innovative implementation techniques, and documents staff expertise for successful implementation
15
Population affected—demonstrates community-wide benefits, identifies the proportion of the population affected, and describes how potential positive and negative effects on socially vulnerable populations informed project selection and design
15
Outreach activities—describes how the project engaged the community in the planning process and identifies the level of public support and types of outreach activities
5
Leveraging partners—describes the state, tribal, private, and local community partnerships that will enhance the outcomes
15
NOTE: The order of the criteria is that in the NOFO.
11
CHAPTER THREE
Integrating Natural Hazard–Risk Considerations into BRIC
Overview
To support BRIC’s consideration of how to incorporate prioritization of natural hazard risk into its plan-ning processes, we explored the variety of risk assessment tools and data products currently available to support BRIC. The focus of this initial investigation was to review and compare existing tools and products across different hazard types, geographies, or other key dimensions as a means of prioritizing funding across applicants or subapplicants. To support these comparisons, this chapter focuses on national-scale products intended to estimate risk under present-day conditions or in a future with no additional investment across many locations. Tools intended to estimate location-specific risk reduction benefits are still necessary to inform SLTT planning and project development, but, for this effort, we first sought to better understand BRIC program needs with respect to national information on hazard risk and whether such information is available from current sources.
This chapter presents the results of this investigation. We begin by reviewing definitions that inform quantitative hazard-risk assessment, along with the limits inherent in many current approaches. We then explore a selected set of available risk assessment tools and data sources in terms of how fit they are for use by the BRIC program. The review is summarized in brief in this chapter, with additional detail provided in Appendixes B and C. We next discuss approaches to combine risk and equity assessment, including emerging methods that assess hazard effects on resident and community well-being. Finally, we make recommenda-tions to support BRIC geographic prioritization in the near term based on existing tools or data, as well as criteria and long-term recommendations for future risk assessment improvements.
Approaches and Challenges for Natural Hazard–Risk Assessment
Risk from natural hazards is a broad concept and can be defined in many ways depending on the nature of the hazard, systems or communities affected, and potential harm caused (Renn, 2008). DHS Risk Lexicon defines risk as “the potential for an unwanted outcome resulting from an incident or occurrence, as determined by its likelihood and the associated consequences” (Risk Steering Committee, 2010, p. 27). In related work, DHS also adopts a standard three-part breakdown to translate this definition into a quantitative one to inform risk assessment: threat, vulnerability, and consequences (DHS, undated; Morgan and Henrion, 1990):
• Threat is defined as the probability or likelihood of a natural hazard occurring in a defined location and time frame. This underlying likelihood can be influenced by long-term drivers (e.g., the effects that global climate change has on high temperatures or extreme rainfall), but it is generally considered inde-pendent of near-term policy interventions intended to reduce hazard risk.
Building Resilient Infrastructure and Communities Mitigation Grant Program, Considerations of Hazard Risk and Social Equity
12
• Vulnerability is the likelihood of an adverse outcome if a natural hazard occurs. This likelihood can differ depending on what is exposed to the natural hazard and could be affected by the hazard.
• Consequences represent adverse outcomes if a hazard occurs and can include damage to physical assets or natural systems, economic disruption, social displacement, and loss of life. In quantitative risk assess-ment, consequences are generally expressed in units measuring the outcome of interest (e.g., damage in dollars).
Using this framework, one can estimate risk quantitatively according to the following equation: risk = threat ✳ vulnerability ✳ consequences.
This framework is commonly applied in risk assessments intended to inform federal policy, regulations, and investment decisions. For example, FEMA’s National Risk Index (NRI) uses a three-part breakdown of risk to estimate expected annual loss (EAL) by location for 18 different hazards across the nation (FEMA, 2021d). NRI estimates EAL by multiplying the annual hazard frequency (F), historical loss ratio (L), and dollar exposure (E) for each hazard and location: EAL = F ✳ L ✳ E.
These terms roughly correspond to threat, vulnerability, and consequences, respectively. In the rest of this section, we describe each of these components in further detail, including commonly used approaches for estimation and potential limitations given currently available data and tools.
Estimating ThreatNatural hazards have different patterns of occurrence and frequency across the United States. The frequency of occurrence for a given hazard type depends on location, of course, but also on the severity of the hazard itself—high tides can cause minor flooding on a monthly or annual basis, for instance, while the likelihood of a large or intense tropical cyclone (hurricane) might be much lower but have much more-extreme adverse outcomes. Estimates of this underlying threat generally rely on historically observed data, model simulations representing possible future occurrences, or a combination of both.
Historical ObservationObserved historical data gathered for a particular location or region are often used to estimate hazard fre-quency. For example, the National Oceanic and Atmospheric Administration (NOAA) monitors coastal water surface levels at a network of gauges across U.S. coastlines, and the hourly, daily, monthly, or annual record of these water levels extending across years or decades can support statistical estimation of the likeli-hood of exceeding a critical water level in future years.
However, we have a limited historical record to accurately describe these hazardous events. The instru-mental record often extends back only over the previous century or less in the United States, and the satellite era—which greatly improved the ability to track and measure weather and climate events—began only in the mid-20th century. For events that occur more regularly, this record might be sufficient to estimate future likelihoods. But, for lower-frequency events—for example, those expected to occur in a given location, on average, once per decade, once per generation, or once per century—the recent historical record is not likely to provide a sufficient basis for statistical estimates of future likelihood.
Observed hazard information might also lack the spatial resolution needed to inform local estimates or planning. For example, precipitation gauges might be too broadly spaced out to capture localized severe rain-fall bursts, thus missing historical events and biasing estimates downward of future severe rainfall.
In addition, estimating hazard likelihood based on historical observation alone assumes that the likeli-hood is stationary: What has been observed in the past can accurately describe the threat in present or future conditions. For some hazards, such as tsunamis—which are caused by undersea earthquakes and unaffected by human activity—stationarity might be a reasonable assumption, even if the observed record is sparse or
Integrating Natural Hazard–Risk Considerations into BRIC
13
incomplete. But, for others, and particularly for weather- and climate-related hazards, a significant body of evidence shows that hazard likelihoods are nonstationary and have been changing since the start of the industrial era (Milly et al., 2008).
More specifically, climate change caused by human emissions of carbon dioxide and other greenhouse gases is affecting the frequency and magnitude of weather-related hazards, including heat waves, droughts, wildfires, severe storms, tropical and extratropical storms, and flooding (U.S. Global Change Research Pro-gram, 2018). There is growing evidence of climate change and associated SLR influencing the intensity of recent weather-related disasters, such as Hurricane Harvey (Oldenborgh et al., 2017). Projections of future climate change suggest that the underlying threat from climate and weather hazards will continue to increase across a variety of locations and hazard types (Milly et al., 2008). As a result, observed data alone will not pro-vide an adequate basis for communities to understand their exposure to hazards or take appropriate actions to mitigate risk.
Model SimulationThe threat posed by different hazards can also be estimated using a variety of modeling techniques, from approaches that resample, interpolate, or extrapolate from historical hazard data to more-complex physical process-based models designed to project future climate drivers, weather conditions, or land-based hazard conditions at different spatial and temporal resolutions. However, most approaches still rely on historical data for key assumptions, such as the baseline likelihood of hazard occurrence. Observed historical data are also essential to both calibrate and validate physical process models. Calibration entails fitting model param-eters so that the model produces results aligned with historical observed outcomes when a historical event is simulated. Validation entails the reverse: running the calibrated model to simulate past events to see whether the results are consistent with observed outcomes. As a best practice, events or time periods used for calibra-tion are generally not used for validation.
Simulation models applied to hazard risk can require significant time, resources, and expertise to develop, calibrate or validate, and update. This is especially true as higher spatial and temporal resolution is included in such models. Local planners often need high spatial and temporal resolution to provide estimates relevant for policy and investment decisions. For example, coastal cities faced with “compound” flood threats from SLR, high tides, and rainfall combined might need complex two-dimensional models and emerging statisti-cal analytic methods to understand present and future flood exposure. To date, however, only a handful of cities have had the capacity and resources to produce such estimates (Dewberry, undated; Groves, Knopman, et al., 2018).
For these reasons, hazard models are most often built for specific locations and hazards. There are com-paratively few such models intended for a nationwide analysis, and those that do exist are often proprietary and intended to inform private-sector risk assessments (e.g., private insurance and reinsurance companies).
Estimating VulnerabilityHazards can have adverse effects on a range of human-sustaining systems, including people and communi-ties, economies and economic assets, public infrastructure, and wildlife and ecosystems. The likelihood of an adverse outcome from a hazard depends on both the level of resilience for a given individual or system and the vulnerability of connected lifeline systems on which they depend.
However, available quantitative risk assessments often estimate or address vulnerability only or primar-ily of physical assets. These assets include large public infrastructure or physical hazard defenses: Will the levee hold or fail when faced with a flood of this size? Can the power grid withstand hurricane winds of a given speed? It also includes the vulnerability of individual assets: Is the first floor elevated above flood levels? Is the building reinforced against earthquakes? Has a sufficient firebreak been established around the
Building Resilient Infrastructure and Communities Mitigation Grant Program, Considerations of Hazard Risk and Social Equity
14
property? Such analysis of physical vulnerability can also be extended to natural systems when considering predisaster risk.
When applied to people and communities, however, vulnerability assessment requires a different set of considerations and methods. In some cases, a community’s vulnerability can be captured using demo-graphic indicators because some of these indicators are associated with higher exposure. For instance, lower–socioeconomic status and racially or ethnically underrepresented groups might be more likely to live in neighborhoods with higher settlement density, less vegetation, and less open space and thus have greater exposure to heat stress (Harlan et al., 2006). In other cases, demographic indicators are useful for predict-ing susceptibility to those exposures. For instance, people might be more susceptible to negative effects of exposure when they are already in poor health, are at a susceptible developmental stage (very young or old), have reduced access to care, or lack resources or the language skills or education that would help them avoid exposure or obtain assistance (North and Pfefferbaum, 2013; Teo et al., 2018).
Complex relationships exist among demographics, exposure, and susceptibility. Some quantitative assessments of human vulnerability require assumptions about behavioral responses to hazards (e.g., Balica, Wright, and van der Meulen, 2012). For example, what is the likelihood that a given household will evacu-ate when faced with a hurricane or wildfire of a given scale with the amount of available time, information, and resources? They also might rely on more-complex and harder-to-validate simulation approaches, such as agent-based modeling. In addition, other key factors for individual or community-scale vulnerability are difficult or impossible to quantify. Although there is a growing literature on key social and economic fac-tors that contribute to community vulnerability (Adger, 2006; Ager, Kline, and Fischer, 2015; Cutter, Barnes, et al., 2008; Flanagan et al., 2011; Markhvida et al., 2020; Norris et al., 2008; Rufat et al., 2015), incorporating human dimensions into quantitative risk assessment remains a work in progress, and best practices have not yet been established. We return to this topic in Chapter Three.
Estimating ConsequencesFinally, the adverse consequences of a hazard can be estimated or predicted using a variety of different out-comes and associated metrics. Risk assessments intended to inform predisaster infrastructure or resilience investments often begin with the direct economic costs of damage to assets, which are measured in monetary (dollar) terms. These costs can include damage to structures or structure contents, vehicles, roads, crops, and so on. Methods for estimating potential direct damage from hazards of different types and scales are well established, with government agencies, such as FEMA, the U.S. Army Corps of Engineers (USACE), and the National Institute of Standards and Technology, providing guidance and best practices for a variety of asset types. Determining direct asset damage also provides a straightforward way to make comparisons of risk across different geographies or hazard types and is commonly used as the basis for BCA and investment pri-oritization decisions at federal, state, and local scales.
Natural hazards above a certain scale can also have a broader effect on regional or national economies by disrupting supply chains, damaging or destroying infrastructure, or prompting cascading effects from displaced residents or communities. Indirect economic effects can include regional or national reductions in economic output, employment losses or shifts, and temporary or permanent population displacement. Addi-tional macroeconomic simulation modeling is required in order to estimate these potential cascading effects, which can add substantial time and complexity to quantitative risk assessments. As discussed in Mendelsohn et al., 2021, FEMA has previously provided such capabilities through its Hazus modeling platform but cur-rently does not offer or maintain off-the-shelf capability for such analyses.
Recent investigations, such as FEMA’s NRI, have also included human morbidity and mortality as out-comes, using methods pioneered in public health research and then adapted in environmental economics. For example, one method applies observed mortality–temperature relationships to calculate damage based
Integrating Natural Hazard–Risk Considerations into BRIC
15
on climate simulations for future temperature change in dollar terms using value of a statistical life (VSL) (Carleton et al., 2021). These approaches have the potential to capture the effect of climate-change adapta-tion and disaster mitigation measures. However, they also require additional methods and assumptions, as noted in the discussion of human dimensions of vulnerability. Finally, as noted in the discussion in the previ-ous section, other long-term individual or community hazard effects are rarely included in quantitative risk assessment tools. This remains a significant need, to which we return in Chapter Four.
Opportunities and Challenges Using Current Tools and Data Sources
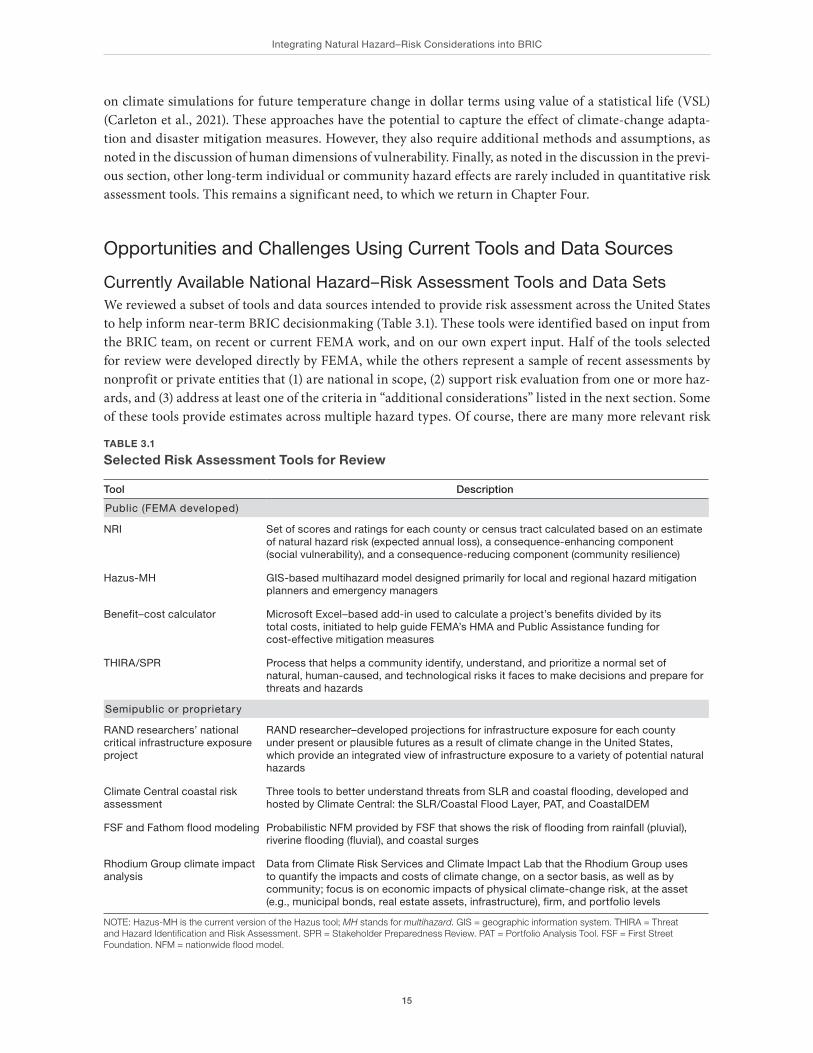
Currently Available National Hazard–Risk Assessment Tools and Data SetsWe reviewed a subset of tools and data sources intended to provide risk assessment across the United States to help inform near-term BRIC decisionmaking (Table 3.1). These tools were identified based on input from the BRIC team, on recent or current FEMA work, and on our own expert input. Half of the tools selected for review were developed directly by FEMA, while the others represent a sample of recent assessments by nonprofit or private entities that (1) are national in scope, (2) support risk evaluation from one or more haz-ards, and (3) address at least one of the criteria in “additional considerations” listed in the next section. Some of these tools provide estimates across multiple hazard types. Of course, there are many more relevant risk
TABLE 3.1
Selected Risk Assessment Tools for Review
Tool Description
Public (FEMA developed)
NRI Set of scores and ratings for each county or census tract calculated based on an estimate of natural hazard risk (expected annual loss), a consequence-enhancing component (social vulnerability), and a consequence-reducing component (community resilience)
Hazus-MH GIS-based multihazard model designed primarily for local and regional hazard mitigation planners and emergency managers
Benefit–cost calculator Microsoft Excel–based add-in used to calculate a project’s benefits divided by its total costs, initiated to help guide FEMA’s HMA and Public Assistance funding for cost-effective mitigation measures
THIRA/SPR Process that helps a community identify, understand, and prioritize a normal set of natural, human-caused, and technological risks it faces to make decisions and prepare for threats and hazards
Semipublic or proprietary
RAND researchers’ national critical infrastructure exposure project
RAND researcher–developed projections for infrastructure exposure for each county under present or plausible futures as a result of climate change in the United States, which provide an integrated view of infrastructure exposure to a variety of potential natural hazards
Climate Central coastal risk assessment
Three tools to better understand threats from SLR and coastal flooding, developed and hosted by Climate Central: the SLR/Coastal Flood Layer, PAT, and CoastalDEM
FSF and Fathom flood modeling Probabilistic NFM provided by FSF that shows the risk of flooding from rainfall (pluvial), riverine flooding (fluvial), and coastal surges
Rhodium Group climate impact analysis
Data from Climate Risk Services and Climate Impact Lab that the Rhodium Group uses to quantify the impacts and costs of climate change, on a sector basis, as well as by community; focus is on economic impacts of physical climate-change risk, at the asset (e.g., municipal bonds, real estate assets, infrastructure), firm, and portfolio levels
NOTE: Hazus-MH is the current version of the Hazus tool; MH stands for multihazard. GIS = geographic information system. THIRA = Threat and Hazard Identification and Risk Assessment. SPR = Stakeholder Preparedness Review. PAT = Portfolio Analysis Tool. FSF = First Street Foundation. NFM = nationwide flood model.
Building Resilient Infrastructure and Communities Mitigation Grant Program, Considerations of Hazard Risk and Social Equity
16
assessments that have been conducted and published at the local, regional, or state scale. Because our initial focus was on currently available national assessments, it was beyond the scope of this initial investigation to collect or synthesize and draw inference from these localized assessments.
In the next section, we briefly describe the criteria applied for this initial review and summarize initial takeaways.
Criteria Used to Review Risk Assessment Tools and Data SetsTable 3.2 summarizes the criteria we used to review each risk assessment tool and data set. The criteria chosen represent the interests and priorities of the BRIC program. These criteria include the overall risk assessment approach used, the coverage of the data or data layers, and transparency. Details about each cri-terion can be found in Appendix B.
Risk Assessment ApproachWe first considered the basic risk assessment approach in terms of the process used to estimate threat, vulner-ability, and consequences. Quantitative approaches employ methods building on the framework described in the previous section and rely on historical data, statistical methods, and model simulation. Qualitative approaches can draw insight from quantitative estimates but also use expert opinion, stakeholder engage-ment, planning exercises, and surveys.
Data CoverageCoverage includes the types of natural hazards considered, geographic extent, and spatial resolution of a given tool or data set. Natural hazards are the physical phenomena that can produce potential adverse effects on populations, assets, or natural systems. The reviewed assessment tools addressed up to 18 natural hazards. Geographic extent refers to parts of the country included in the assessment: the contiguous United States and areas outside the contiguous United States, the states of Hawaii and Alaska and U.S. territories. All tools
TABLE 3.2
Summary of Review Criteria
Criterion Category Criterion Type Criterion Question
Risk assessment approach Quantitative What quantitative methods are applied?
Qualitative What qualitative methods are applied?
Data coverage Hazards How many and what types of hazards are included?
Geographic extent Are the data national in scope? Do they include Alaska, Hawaii, and U.S. territories?
Spatial scale What is the spatial scale (e.g., county, census tract, gridded)?
Transparency and accessibility
Public availability Are the methods published? Are the data sources public?
Validation Have the results been validated? Are the methods widely adopted and replicated?
Flexibility Can the tool be customized or extended?
Other risk considerations Future risk Does the tool account for future climate or other drivers?
Cascading risk Does the tool consider interdependent systems or indirect economic effects?
Lifeline infrastructure
Does the tool include effects on lifeline infrastructure?
Integrating Natural Hazard–Risk Considerations into BRIC
17
include the contiguous United States, with varying degrees of other U.S. coverage. Spatial resolution refers to the units of space at which assessment can be directed by a tool. This ranges from the building or property level to census blocks and tracts to county, state, and national levels.
Transparency and AccessibilityTransparency and accessibility depend on a user’s ability to access and apply risk assessment tools that are vetted, based on the best available data and methods, and extendable to different subapplications. We consid-ered three specific criteria: public availability, validation, and flexibility. Public availability denotes how read-ily assessment tools and underlying data can be accessed, as well as whether methodologies have been pub-lished and peer-reviewed. Validation describes the process of checking or proving the validity, accuracy, and reliability of the tool. Flexibility considers the ability for users to customize, add, or substitute data sources for more-accurate or local data sources or to extend the tool to meet specific needs.
Other Risk ConsiderationsAlthough each tool takes a unique risk assessment approach, BRIC and the HSOAC team identified specific risk considerations that will be important for long-term risk-mitigation efforts, including future risk, cas-cading risk, and lifeline infrastructure. Future risk considers whether a given tool provides estimates of the change in risk associated with future climate change or other potential drivers of change. To date, FEMA-published risk assessment tools or data sources have not explicitly incorporated future projections or climate scenarios. Cascading risk refers to the ability to consider the potential interdependencies of risk, in which damage or failure in one part of the system leads to impacts in another part of the system. Finally, lifeline infrastructure, also termed critical infrastructure, essential facilities, and community lifelines, provides ser-vices essential to achieving continuity of operations during a disaster. These include sectors and utilities (e.g., telecommunications, energy, water and wastewater), facilities (e.g., hospitals, emergency services, schools), and networks (e.g., transportation, pipelines) (FEMA, 2019).
Lack of Open-Source, Validated, and Future-Looking DataHere we summarize key takeaways from this initial review and comparison, with a focus on the near-term possibilities for BRIC. A more detailed review of each tool and data source is provided in Appendix C. These findings are summarized in Table 3.3, which shows a summary assessment for each tool against the crite-ria outlined in Table 3.2 above. The first column summarizes the primary risk or other key outcome metric produced by the tool. In the stoplight matrix, green indicates when we assessed that a criterion was fully or mostly addressed, yellow indicates where a criterion was at least partially addressed, and orange indicates where a criterion was not addressed.
First, in terms of outcome metrics, tools that produce fully quantified risk estimates in comparable units of measure include FEMA’s NRI and Hazus-MH tools and the Rhodium Group’s climate impact evaluation, which estimates broader economic effects from climate hazard risk. FSF initially estimated the potential exposure of single-family or small multifamily residences (FSF, 2020) to flooding using a ranked scale but recently published a summary of average annual losses (AALs) for these asset types under presented and pro-jected future climate conditions (FSF, 2021). However, FSF’s published estimates do not yet include flood risk estimates for other asset types. RAND’s national critical infrastructure evaluation (Willis et al., 2016) and Climate Central’s coastal flood risk evaluation (Desmet et al., 2018) yielded estimates of exposure only—that is, they counted the populations or assets exposed to hazard risk of a given severity but did not estimate the consequences were a hazard to occur. Finally, FEMA’s benefit–cost tool and THIRA/SPR include some rel-evant risk assessment data but are not first and foremost designed to produce new estimates of hazard risk.
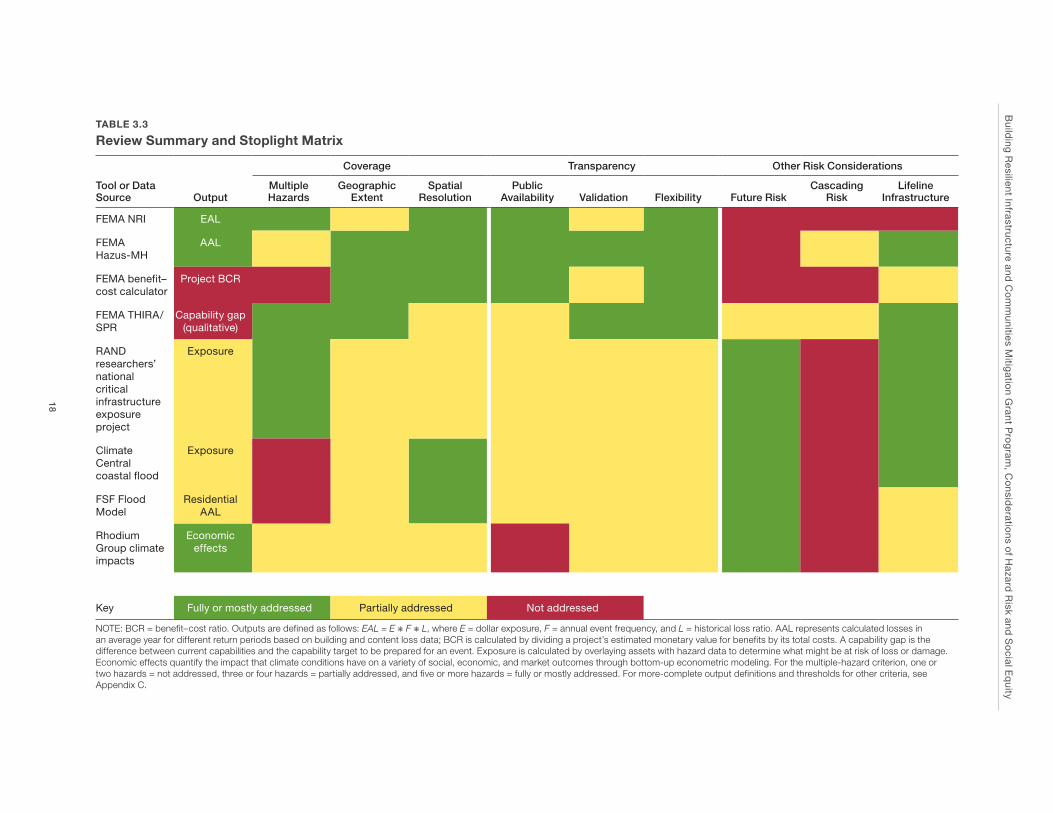
Build
ing R
esilient Infrastructure and
Co
mm
unities Mitig
ation G
rant Pro
gram
, Co
nsideratio
ns of H
azard R
isk and S
ocial E
quity
18
TABLE 3.3
Review Summary and Stoplight Matrix
Tool or Data Source Output
Coverage Transparency Other Risk Considerations
Multiple Hazards
Geographic Extent
Spatial Resolution
Public Availability Validation Flexibility Future Risk
Cascading Risk
Lifeline Infrastructure
FEMA NRI EAL
FEMA Hazus-MH
AAL
FEMA benefit–cost calculator
Project BCR
FEMA THIRA/SPR
Capability gap (qualitative)
RAND researchers’ national critical infrastructure exposure project
Exposure
Climate Central coastal flood
Exposure
FSF Flood Model
Residential AAL
Rhodium Group climate impacts
Economic effects
Key Fully or mostly addressed Partially addressed Not addressed
NOTE: BCR = benefit–cost ratio. Outputs are defined as follows: EAL = E ✳ F ✳ L, where E = dollar exposure, F = annual event frequency, and L = historical loss ratio. AAL represents calculated losses in an average year for different return periods based on building and content loss data; BCR is calculated by dividing a project’s estimated monetary value for benefits by its total costs. A capability gap is the difference between current capabilities and the capability target to be prepared for an event. Exposure is calculated by overlaying assets with hazard data to determine what might be at risk of loss or damage. Economic effects quantify the impact that climate conditions have on a variety of social, economic, and market outcomes through bottom-up econometric modeling. For the multiple-hazard criterion, one or two hazards = not addressed, three or four hazards = partially addressed, and five or more hazards = fully or mostly addressed. For more-complete output definitions and thresholds for other criteria, see Appendix C.
Integrating Natural Hazard–Risk Considerations into BRIC
19
Next, in terms of data coverage, all of the tools considered include all of the contiguous United States and at least partially address the geographic extent needed for BRIC comparisons. Some FEMA-developed tools also provided relevant outputs for other (noncontiguous) U.S. states and territories as well, although NRI does not yet include U.S. territories in its scope. However, natural hazards addressed vary significantly by source. Several sources reviewed (those from Climate Central and FSF) focused exclusively on flood risk. At the other extreme, NRI included quantitative risk estimates for 18 separately defined natural hazards.1 Spatial resolution also can vary significantly: Some tools estimate risk at census-defined units (e.g., tracts or blocks), while others generate high-resolution gridded hazard outputs or estimates by asset location (e.g., FSF’s parcel- or structure-level analysis, FEMA benefit–cost calculator).
As expected, public tools are rated more highly than the semipublic and proprietary models in terms of transparency and accessibility. FEMA-developed tools are easier to access and download and generally have higher customizability. They are also well documented in published reports and derivative studies, with the exception of NRI because it was first shared and published only in late 2020. Although some tools or data sets might have additional barriers to access (e.g., cost, lack of publicly downloadable data), all of the tools appear to have at least some peer-reviewed methodologies in the public domain.
The difference between public and semipublic or proprietary models is most notable when considering climate and other drivers of future risk. Although all of the semipublic and proprietary models incorporate future climate risk, only FEMA’s THIRA/SPR allows for this possibility at present. FEMA’s quantitative risk assessment tools do not include future climate projections, a notable shortcoming in their potential use for BRIC application prioritization or geographic comparisons.
Hazus and THIRA/SPR allow scenario creation that could include cascading effects for disaster response planning, but most of the models do not yet accommodate cascading risk. This is to be expected given the computational and data requirements for such analyses, which are generally conducted at much smaller geo-graphic scales. Finally, all tools except NRI can address lifeline infrastructure in some way, although a future update to NRI could add in the capability to overlay existing databases of lifeline infrastructure, such as the Homeland Infrastructure Foundation-Level Data (HIFLD) made available by DHS (HIFLD, undated).
Key Findings
In summary, we identified a variety of existing national risk assessments that BRIC could use to inform cross-geography and cross-hazard comparisons. Of these assessments, NRI data layers could best be a starting point for incorporating risk assessment results into BRIC allocations and decisionmaking. All of the national assessments we reviewed present trade-offs, however, and there is no single data source that currently meets all relevant criteria for BRIC risk assessment. Existing FEMA products best address coverage and transpar-ency and thereby allow broader looks across different hazards or locations throughout the nation. Non-FEMA tools, by contrast, address future changes in risk and generally allow for more-focused assessments of lifeline infrastructure risk.
Finally, we found that the majority of these assessments remain focused on asset damage as a key outcome metric. This focus on assets can skew estimates of risk toward areas with higher asset values and thus fail to capture the true hazard impacts on low-income or other vulnerable populations. We address this topic in detail in Chapter Four.
1 THIRA accommodates up to 59 hazards but is unique as a qualitative assessment in that risk considerations are left up to the organizers of and stakeholders in the process, which means that not all relevant hazards are guaranteed to be addressed in every assessment.

21
CHAPTER FOUR
Challenges Integrating Equity into BRIC
Overview
As BRIC considers how to incorporate equity considerations into its planning processes, it does so against a backdrop of increased emphasis on equity concerns government-wide. As noted in Chapter One, an executive order issued in January 2021 required that all federal agencies assess how the allocation of federal resources can be done with both equity and fairness (Biden, 2021a). In response, in April 2021, FEMA issued a request for information seeking input on how FEMA programs could
effectively achieve FEMA’s mission in a manner that furthers the goals of advancing equity for all, includ-ing those in underserved communities, bolstering resilience from the impacts of climate change, particu-larly for those disproportionately impacted by climate change, and environmental justice. (FEMA, 2021c, p. 21325)
This statement shows the importance of taking a new approach to building community resilience through mitigation activities. The statement also reflects recommendations in the 2020 NAC report to the FEMA administrator about building capacity nationally for equitable, coordinated, and outcome-driven solutions in emergency management (NAC, 2020). One NAC recommendation was to create an “equity standard” for judging whether grants increase or decrease equity over time and incorporating equity-based performance measures and social and physical determinants of health in the process. A second NAC recommendation directed mitigation and preparedness funds to improve equity in outcomes, as well as examining how poli-cies, regulations, and legislation might need to be revised. This new approach must balance risk and equity considerations through an empirical process.
FEMA’s interest is that future competitive grant cycles will be evaluated with a multihazard, forward-looking, risk-based process that also considers issues of equity and community well-being. To help FEMA identify ways in which the BRIC program could support equitable outcomes, we reviewed potential equity impacts of the year 1 NOFO. This chapter begins by defining various dimensions of equity. Next, potential equity impacts of the BRIC program are discussed. Finally, we suggest how the BRIC program design could integrate equity considerations in both the immediate and long terms.
Understanding the Multidimensional Nature of Equity
Equity is a complex construct. Unlike equality, in which everyone is given the same treatment regardless of personal advantage or disadvantage (Sen, 1992), equity is characterized by fairness (Konow, 2003; Schroeder and Pisupati, 2010) and allows for the unequal distribution of benefits and costs to achieve net social gain (McDermott, Mahanty, and Schreckenberg, 2013). Unlike justice (an intrinsic right, one honored regardless of someone’s characteristics), equity is a comparative concept (Grasso, 2007). The goal of equity is fair access to resources such that sociodemographic characteristics (e.g., gender, race, ethnicity, age, income) predict the
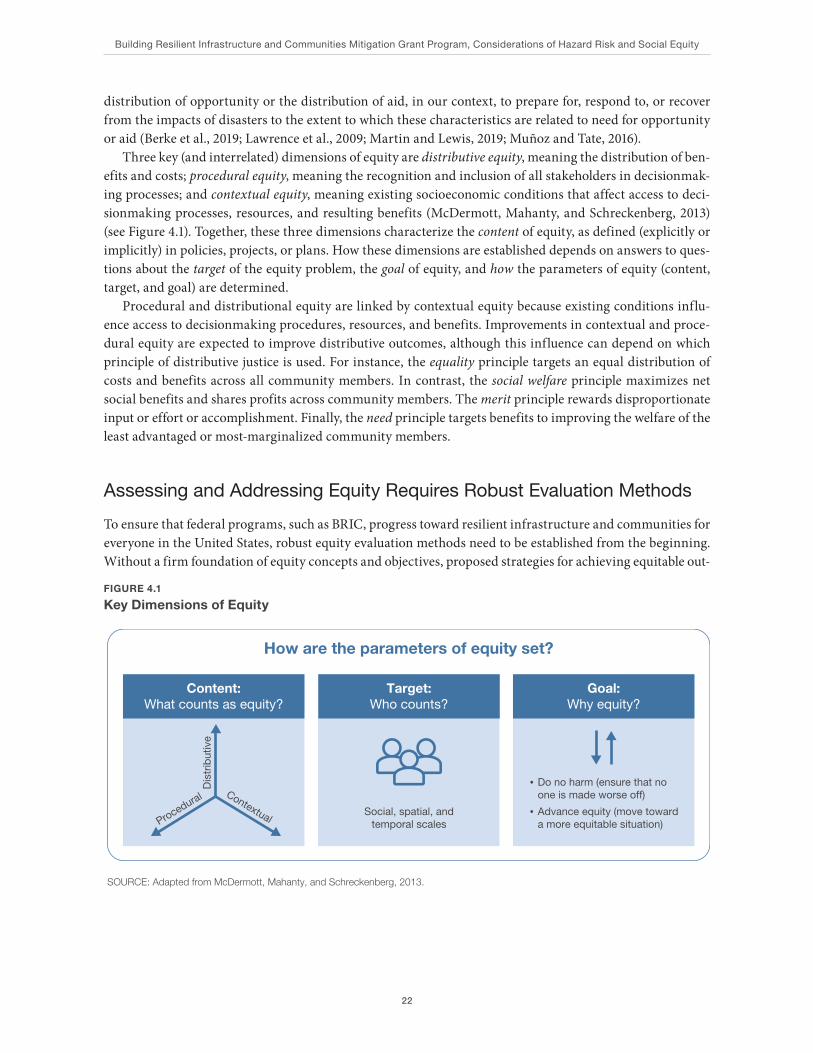
Building Resilient Infrastructure and Communities Mitigation Grant Program, Considerations of Hazard Risk and Social Equity
22
distribution of opportunity or the distribution of aid, in our context, to prepare for, respond to, or recover from the impacts of disasters to the extent to which these characteristics are related to need for opportunity or aid (Berke et al., 2019; Lawrence et al., 2009; Martin and Lewis, 2019; Muñoz and Tate, 2016).
Three key (and interrelated) dimensions of equity are distributive equity, meaning the distribution of ben-efits and costs; procedural equity, meaning the recognition and inclusion of all stakeholders in decisionmak-ing processes; and contextual equity, meaning existing socioeconomic conditions that affect access to deci-sionmaking processes, resources, and resulting benefits (McDermott, Mahanty, and Schreckenberg, 2013) (see Figure 4.1). Together, these three dimensions characterize the content of equity, as defined (explicitly or implicitly) in policies, projects, or plans. How these dimensions are established depends on answers to ques-tions about the target of the equity problem, the goal of equity, and how the parameters of equity (content, target, and goal) are determined.
Procedural and distributional equity are linked by contextual equity because existing conditions influ-ence access to decisionmaking procedures, resources, and benefits. Improvements in contextual and proce-dural equity are expected to improve distributive outcomes, although this influence can depend on which principle of distributive justice is used. For instance, the equality principle targets an equal distribution of costs and benefits across all community members. In contrast, the social welfare principle maximizes net social benefits and shares profits across community members. The merit principle rewards disproportionate input or effort or accomplishment. Finally, the need principle targets benefits to improving the welfare of the least advantaged or most-marginalized community members.
Assessing and Addressing Equity Requires Robust Evaluation Methods
To ensure that federal programs, such as BRIC, progress toward resilient infrastructure and communities for everyone in the United States, robust equity evaluation methods need to be established from the beginning. Without a firm foundation of equity concepts and objectives, proposed strategies for achieving equitable out-
FIGURE 4.1
Key Dimensions of Equity
SOURCE: Adapted from McDermott, Mahanty, and Schreckenberg, 2013.
How are the parameters of equity set?
Content:What counts as equity?
Target:Who counts?
Goal:Why equity?
• Do no harm (ensure that no one is made worse off)
• Advance equity (move toward a more equitable situation)
Social, spatial, and temporal scales
Dis
trib
utiv
e
Procedural Contextual
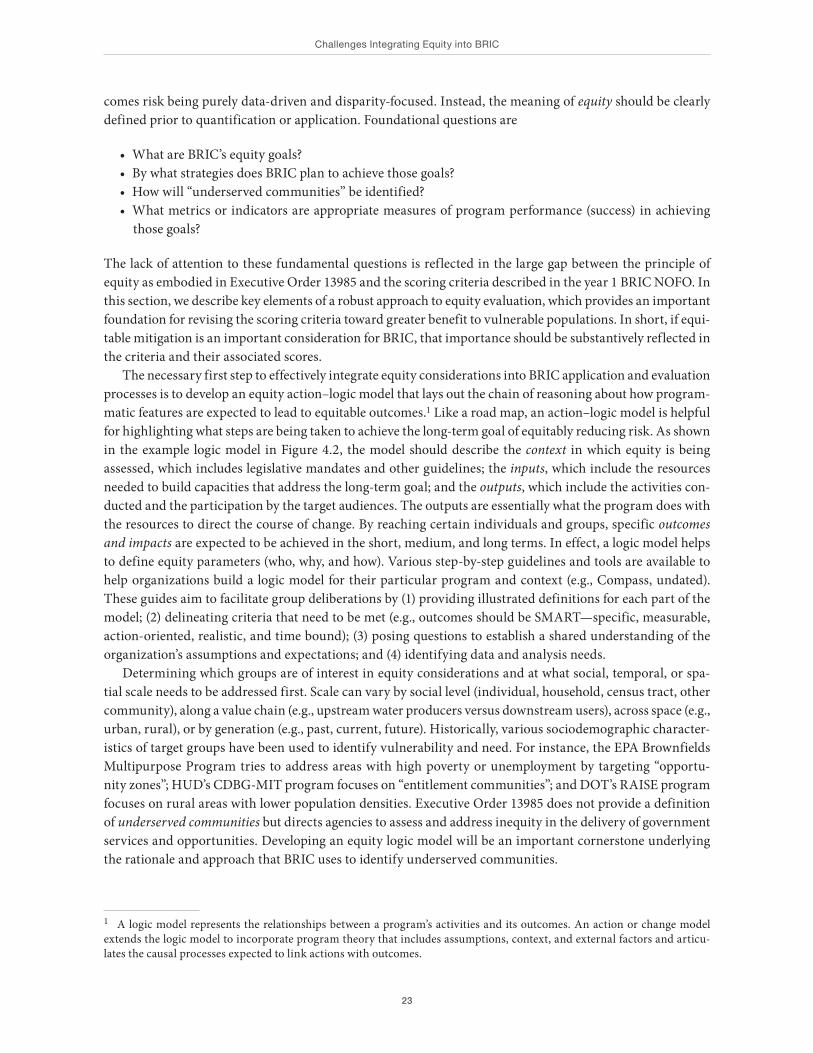
Challenges Integrating Equity into BRIC
23
comes risk being purely data-driven and disparity-focused. Instead, the meaning of equity should be clearly defined prior to quantification or application. Foundational questions are
• What are BRIC’s equity goals? • By what strategies does BRIC plan to achieve those goals? • How will “underserved communities” be identified? • What metrics or indicators are appropriate measures of program performance (success) in achieving
those goals?
The lack of attention to these fundamental questions is reflected in the large gap between the principle of equity as embodied in Executive Order 13985 and the scoring criteria described in the year 1 BRIC NOFO. In this section, we describe key elements of a robust approach to equity evaluation, which provides an important foundation for revising the scoring criteria toward greater benefit to vulnerable populations. In short, if equi-table mitigation is an important consideration for BRIC, that importance should be substantively reflected in the criteria and their associated scores.
The necessary first step to effectively integrate equity considerations into BRIC application and evaluation processes is to develop an equity action–logic model that lays out the chain of reasoning about how program-matic features are expected to lead to equitable outcomes.1 Like a road map, an action–logic model is helpful for highlighting what steps are being taken to achieve the long-term goal of equitably reducing risk. As shown in the example logic model in Figure 4.2, the model should describe the context in which equity is being assessed, which includes legislative mandates and other guidelines; the inputs, which include the resources needed to build capacities that address the long-term goal; and the outputs, which include the activities con-ducted and the participation by the target audiences. The outputs are essentially what the program does with the resources to direct the course of change. By reaching certain individuals and groups, specific outcomes and impacts are expected to be achieved in the short, medium, and long terms. In effect, a logic model helps to define equity parameters (who, why, and how). Various step-by-step guidelines and tools are available to help organizations build a logic model for their particular program and context (e.g., Compass, undated). These guides aim to facilitate group deliberations by (1) providing illustrated definitions for each part of the model; (2) delineating criteria that need to be met (e.g., outcomes should be SMART—specific, measurable, action-oriented, realistic, and time bound); (3) posing questions to establish a shared understanding of the organization’s assumptions and expectations; and (4) identifying data and analysis needs.
Determining which groups are of interest in equity considerations and at what social, temporal, or spa-tial scale needs to be addressed first. Scale can vary by social level (individual, household, census tract, other community), along a value chain (e.g., upstream water producers versus downstream users), across space (e.g., urban, rural), or by generation (e.g., past, current, future). Historically, various sociodemographic character-istics of target groups have been used to identify vulnerability and need. For instance, the EPA Brownfields Multipurpose Program tries to address areas with high poverty or unemployment by targeting “opportu-nity zones”; HUD’s CDBG-MIT program focuses on “entitlement communities”; and DOT’s RAISE program focuses on rural areas with lower population densities. Executive Order 13985 does not provide a definition of underserved communities but directs agencies to assess and address inequity in the delivery of government services and opportunities. Developing an equity logic model will be an important cornerstone underlying the rationale and approach that BRIC uses to identify underserved communities.
1 A logic model represents the relationships between a program’s activities and its outcomes. An action or change model extends the logic model to incorporate program theory that includes assumptions, context, and external factors and articu-lates the causal processes expected to link actions with outcomes.
Building Resilient Infrastructure and Communities Mitigation Grant Program, Considerations of Hazard Risk and Social Equity
24
Recently, there has been growing interest in indexes of social vulnerability and community resilience, which describe combinations of many census variables (e.g., age, race, income, education) that reflect the social, cultural, economic, political, and institutional processes that shape the differential experience of haz-ards (Adger, 2006; Birkmann et al., 2013; Turner et al., 2003). These indexes are latent constructs, meaning that they reflect qualities inherent in a person or place but are not directly observable and are estimated only via statistical procedures. Examples include the Cutter, Boruff, and Shirley Social Vulnerability Index (SoVI) (Cutter, Boruff, and Shirley, 2003); the Centers for Disease Control and Prevention’s Social Vulnerability Index (SVI) (Agency for Toxic Substances and Disease Registry [ATSDR], 2021; Flanagan et al., 2011); EPA’s Demographic Index (EPA, 2019); the Cutter, Burton, and Emrich baseline resilience index (Cutter, Burton, and Emrich, 2010); the Peacock Community Disaster Resilience Index (Peacock, 2010); and the Foster resil-ience capacity index (Foster, 2012).
These indexes appear to have strong face validity for planners looking for quantitative indicators that permit comparison of geographic units (e.g., counties, census tracts). However, Bakkensen et al., 2017, cau-tions against using indexes as decision-support tools for direct community investment because of concerns about variation in their ability to predict different types of impact (e.g., property damage versus fatalities). These indexes also do not focus on specific community functions (such as providing and maintaining trans-portation, housing, or health care services) that are important in understanding how risk mitigation can be made more effective. Moreover, Spielman et al., 2020, reports analyses suggesting concern about indexes’ potential lack of theoretical or internal consistency. The practical problem for policymakers is that different areas or communities will be targeted depending on the methods used to generate the indexes. Additional research is needed to fully understand the limitations of indexes.
An alternative to using vulnerability or resilience indexes is to examine the underlying indicators or met-rics (e.g., percentage living below a poverty threshold, percentage living in mobile homes), which are more directly relevant to community functions. For instance, we would expect less access to the resources needed to mitigate natural hazard risk for areas where communities have a higher percentage of residents who have
FIGURE 4.2
Example Logic Model for Achieving Equitable Mitigation Outcomes
In this context• Legislative
mandates (Stafford Act, DRRA, Presidential Policy Directive 8, codes and standards)
• FEMA equity guidance (FEMA strategic plans, NAC report)
BRIC sets these priorities • Program goals
BRIC uses theseinputs
• Federal funds
• Research and assessment base
• External technical assistance
To achieve theseoutcomes
• Underserved groups successfully participate in BRIC application process
• Underserved groups receive their “fair share” of BRIC funds
• Projects funded reduced underserved groups’ exposure to risk
• Projects funded reduce the health, economic, and social burdens on underserved groups
To achieve theseimpacts
Equitable risk reduction:
• Reduce pre-event susceptibility through having underserved groups be prepared effectively for crisis events that can stress physical and social infrastructure
• Improve coping capacity through prioritized services and resources sustained throughout all disaster phases for underserved groups
• Improve adaptive capacity with the earliest possible recovery of socio- economic systems to a better level of functioning for underserved groups
To produce these outputs
• Issue a NOFO that specifies program processes, technical criteria, and qualitative criteria
• Communicate with stakeholders how those processes and criteria are addressed
• Fund projects that identify and mitigate risks and vulnerabili-ties for underserved populations
• Build capacity and capability among applicants and subapplicants
• Applicants (e.g., states, territories, federally recognized tribal governments, the District of Columbia)
• Subapplicants (e.g., local and tribal governments and agencies)
• Beneficiaries (businesses and communities)
• Others (e.g., nongovernmental organizations, disaster responders, resource managers)
Activities Participation
AssumptionsExamples: Support from FEMA and other federal partners;support from local stakeholders; access to secondary data
External factorsExamples: Disaster conditions; sociopolitical
environment; economic forces
Challenges Integrating Equity into BRIC
25
low incomes, who are unemployed, who are living with disabilities or without health insurance, who are living in mobile homes, or who have low English proficiency. These characteristics suggest reasons that a population might be more at risk and potential opportunities for interventions to mitigate those risks. For example, a project aimed at improving accessibility of public transportation to mitigate mobility restrictions during extreme weather events might be considered a high priority for a community with a high percent-age of residents who are elderly or living with disabilities but not for a community without these types of residents.
What Are the Challenges to Integrating Equity Considerations in the BRIC Program?
The social inequities faced in the United States today have been generations in the making. They are the out-comes of historical decisions that shape where people live, the livelihoods to which they have access, and the resources they can leverage. Consequently, relying on traditional approaches to assessing and addressing risk will not adequately consider inequities and can, in fact, perpetuate them. In this section, we highlight some of the barriers that underserved populations face when applying for federal funds through a program, such as BRIC.
Equity Goals, Mechanisms, Target Audiences, and Metrics Need ClarificationTo meaningfully address equity, the BRIC program first needs to clearly articulate what equitable mitigation looks like. For instance, equity considerations need to address contextual, procedural, and distributional dimensions, as well as to involve more than just economics. The concept of fairness has multiple expres-sions with which BRIC needs to grapple. The program also needs a clear picture of how equity goals will be achieved as a result of BRIC programmatic activities (e.g., funding procedures and priorities) and for whom. Based on these goals, mechanisms, and target groups, relevant metrics can be identified for assessing the program’s progress toward equitable mitigation outcomes. Although DHS and FEMA have expressed com-mitment to reducing social inequity (e.g., in mission and value statements and strategic plans), equity as a goal has been highlighted only very recently (FEMA, 2018; NAC, 2020). To date, neither FEMA nor DHS as a whole has consistently identified frameworks, indicators, or metrics for tracking progress toward equity goals for its programs. Regardless, the BRIC program needs to establish its own logic model for organizing and evaluating programmatic steps toward equitable mitigation outcomes (the example provided in Figure 4.2 could be a useful starting point for BRIC’s deliberations when it is developing its logic model). Without such a model, the program could perpetuate inequities, given the diverse needs of communities across long time horizons (see Finucane et al., 2020).
Current Priorities Do Not Reflect Social Systems or Resources as an Essential Part of Effective MitigationEffective mitigation across groups or places relates to both physical or built infrastructure (e.g., reliable and safe electricity, transport, hospitals, schools) and social infrastructure (e.g., government functions, educa-tional programs, social support networks). Physical and social infrastructure systems are essential for pro-ducing and distributing goods and services necessary for health, safety, and economic well-being. The BRIC NOFO for year 1 highlights priorities related to physical or natural systems, including lifelines, nature-based solutions, and the latest building codes. No mention is made of the social systems that are also a key part of effective mitigation efforts. Similarly, there is no consideration of whom the (physical or social) infrastruc-
Building Resilient Infrastructure and Communities Mitigation Grant Program, Considerations of Hazard Risk and Social Equity
26
ture serves. Asking and addressing such questions will facilitate awareness of pathways toward social equity. The myriad social, organizational, and other human factors that influence the initiation or maintenance of effective collaborations among residents and risk managers (Menoni et al., 2012) and the contextually appro-priate functional definitions and standards for risk-mitigation goals and processes (McDermott, Mahanty, and Schreckenberg, 2013) demonstrate why investments need to reflect the latest thinking about integrated social-ecological planning approaches.
Comprehensive Equity Assessments Are Constrained by Data ChallengesA wide variety of approaches have been used to examine social inequities in terms of different topics (e.g., health, economic, social outcomes) and different geographic scales (national to census tract levels). Unfortu-nately, data for some population indicators are unavailable, old, or inaccurate. In other cases, data might not be disaggregated by race, ethnicity, or other key sociodemographic variables. A key limitation is that some indicators lack validation. Selecting equity indicators suitable to examine performance at a program level requires balancing the validity, reliability, timeliness, and utility of different spatial resolutions, as well as supplementing with relevant qualitative data as needed (Besser, 2014).
Franz et al., 2015, suggests prioritizing metrics that are (1) generated by a trusted source; (2) available con-sistently over time to permit trend analyses; (3) disaggregated by race, ethnicity, and other sociodemographic characteristics as much as possible; (4) disaggregated locally for comparisons and mapping; (5) supportive of community collaboration and capacity building; and (6) affordable and feasible.
Although specific measures can change over time (e.g., when new or better data become available), assess-ing progress toward a desired end state of social equity means that indicators need to be stable over time. Without prospective, longitudinal measurement, determining a causal link between features of the BRIC program and equitable outcomes is difficult. An additional data challenge is that, to reduce demands on communities yet collect data in a timely way, assessments might not be comprehensive. Different contexts could demand different sampling and measurement strategies, but, to the extent possible, a core set of mea-sures should be collected consistently across time and space to allow comparability across contexts.
The persistence of inequities suggests the importance of identifying underlying pathways of disparate outcomes using cross-sectional data to inform policy and practice. Decomposition methods used in labor economics and health service studies could prove useful to address this need (Cook, McGuire, and Zaslavsky, 2012). For instance, predicting differences (e.g., between racial groups) with and without adjustment for a set of variables (e.g., wealth, employment) can help isolate the impact that some factors have on differences in well-being.
Benefit–Cost Analyses and Risk Analyses Are Biased Toward Wealthy CommunitiesUse of BCAs and risk analyses is intended to increase transparency and reduce government waste by provid-ing an objective, economic, data-driven approach. However, according to current federal guidance and prac-tice, these analyses require subjective value judgments and can increase social inequities (for detailed exam-ples, see Siders, 2019). In particular, BCAs and risk analyses tend not to encourage investments in small or poor communities. The BCA formula has a built-in bias toward larger population centers and higher-income communities because willingness to pay for a benefit is based on income (Frank, 2000). Deciding which costs and benefits to include in the analyses is not an objective decision. The current BCA formula does not consider the potential for improving public health, expanding recreational opportunities, or increasing eco-nomic development potential, all of which are important for underserved populations. Including only costs and benefits that are easily expressed in monetary terms overlooks other important considerations. Allow-
Challenges Integrating Equity into BRIC
27
ing a BCR of less than 1.0 alleviates this challenge to some extent; however, nonmonetary benefits are simply ignored rather than factored into BRIC’s estimation of the value of each application.
An unintended consequence of relying too heavily on BCA is that social inequities can be newly created or perpetuated. The Biden administration acknowledged the distributional inequities along racial, gender, socioeconomic, and other dimensions in the current regulatory BCA process and issued, on the president’s first day in office, a memorandum to all the executive departments and agencies. Quantitative BCA is a key component of the current regulatory review process. The memo calls on agencies to “ensure that the review process promotes policies that reflect new developments in scientific and economic understanding” and “fully accounts for regulatory benefits that are difficult or impossible to quantify” (Biden, 2021b).
Similarly, risk analyses have a built-in bias toward wealthy communities because damage is captured as direct economic asset losses and because assets of higher value are typically held by wealthy rather than by poor communities (Hallegatte, 2014; Hallegatte et al., 2017; Markhvida et al., 2020). These analyses typically provide an incomplete measure of the total costs of a disaster event because they neglect to quantify how asset losses affect households’ well-being. Direct asset losses also fail to capture the benefits associated with such factors as strengthening governance, investing in resilience, and enhancing preparedness, as specified in the Sendai priorities for action, part of the framework that was adopted by the United Nations (UN) member states to provide a comprehensive approach to disaster risk reduction (UN General Assembly, 2015). Emerg-ing approaches have highlighted how a wealthy household might quickly recover from a given asset loss while a poor household might suffer larger, longer-lasting impacts. This experience is magnified when moving from the community to household level.
An example of an impact metric that can be applied equitably across households with different levels of wealth is the consumption loss approach (Hallegatte, 2014; Hallegatte et al., 2017; Markhvida et al., 2020), which defines well-being loss as a measure of the utility of consumption loss during recovery from a disaster event. The lost consumption can include the loss of labor income and housing services, reconstruction costs, relocation costs during repairs, and use of savings or insurance payouts. At the very poor end of the spectrum of households, consumption of food, education, or health care might need to be reduced; the impact of these reductions on well-being can be large and have lifelong consequences for children. Ultimately, the metric chosen to assess disaster impacts needs to be based on the decisionmaker’s objective. Well-being loss is more appropriate than asset loss when evaluating policies that aim to protect people who are poor or in vulnerable situations.
Underserved Populations Face Challenges Meeting Some Technical Criteria for the BRIC ProgramSome BRIC technical criteria (discussed in Chapter Two) could pose challenges to underserved populations. For instance, the designation of a community as small and impoverished (five points) is too restrictive to address the multiple qualities that exemplify underserved populations and that potentially magnify vulnera-bility. As defined at 44 C.F.R. § 201.2, a small, impoverished community has a population of 3,000 or less and a per capita annual income not exceeding 80 percent of national per capita income. However, there could be larger population centers (and urban areas in particular) that would be considered low income but would not meet these criteria. Furthermore, characteristics other than population or income can also make populations sensitive or susceptible to environmental risks—for instance, health or welfare issues; greater-than-normal incidence of disease or adverse health conditions; a disproportionate share of negative environmental con-sequences of prior industrial, governmental, or business operations or policies (see EPA, 2019); overcrowded housing; or disproportionate aging of other physical infrastructure (see Theodos, Stacy, and Ho, 2017).
For instance, an applicant receives five points for an increased nonfederal cost share (e.g., cash, in-kind services, materials), which is harder for small, impoverished communities than for larger, wealthier areas to
Building Resilient Infrastructure and Communities Mitigation Grant Program, Considerations of Hazard Risk and Social Equity
28
find. Another example is that an applicant with a mandatory adoption of the latest (2015 or 2018) interna-tional building code receives 20 points.2 Presumably, this criterion uses the distributive principle of merit to reward states with higher standards. However, a vulnerable community that has adopted the latest codes could be considered noncompliant if it is in a state that does not meet the criterion. Moreover, implementa-tion and enforcement of these building codes can vary by county, and, even where a state might meet the cri-terion, the location where a project is implemented might not. To address this variation, an additional tech-nical criterion allocates 15 points when a subapplicant has a BCEGS rating between 1 and 5. BCEGS assesses the building codes in effect in a particular community and how the community enforces its building codes, with 1 indicating exemplary commitment to building code enforcement.
Underserved Populations Face Challenges Meeting Some Qualitative Criteria for the BRIC ProgramBRIC qualitative criteria (described in Chapter Two) can also pose some challenges to underserved popula-tions. For instance, an applicant receive 15 points if it incorporates partnerships that will enhance outcomes, but this could be difficult to demonstrate for small communities with less developed networks of partners who can contribute in ways suggested in the NOFO for FY 2020 (e.g., nonfederal cost share, multijurisdic-tional projects) (DHS, 2020). To benefit from the available funding, one must gain access to those funds and to other resources, such as capital, labor, market networks, technology, and information (McDermott, Mah-anty, and Schreckenberg, 2013; Ribot and Peluso, 2003). Additionally, the implementation-measure criterion (15 points) in the NOFO for FY 2020 requires that the project’s scope of work identify “sufficient technical and managerial staff and resources to successfully implement this project” (DHS, 2020, p. 21). Small, poor communities could struggle to demonstrate sufficient resources to obtain the full number of points available for these criteria.
Other qualitative criteria are worded in such a way that it is unclear that subapplications would score higher if they address the needs of socially vulnerable populations. For instance, the criterion of population affected (15 points) in the NOFO for FY 2020 requires an application to describe only “how impacts (posi-tive or negative) to socially vulnerable populations informed project selection and design” (DHS, 2020, p. 21). Instead, it should clearly state the desire for vulnerable populations to be positively affected and require justification for negative impacts. Similarly, the criterion of outreach activities (five points) requires only a description of the types of community planning processes leveraged and the level of public support obtained; what constitutes meaningful outreach or support is not specified. A clearer criterion would require a descrip-tion of a diverse variety of local organizations that are involved and how they are included in decisionmak-ing, such as how community input is solicited, considered, and responded to in meaningful ways.3
A High Level of Technical Skill Is Required to Apply for Federal FundingProcedural equity cannot be achieved when people have vastly different capabilities to participate in the program. Even if the barriers posed by traditional approaches to BCAs and risk analyses and the NOFO cri-teria were adequately addressed, applicants still need significant technical skills to navigate the application process successfully. However, most assessments of equity tend to focus on the distribution of benefits (and sometimes costs). Such assessments are likely to miss issues of procedural and contextual equity and thus
2 States adopt them at different times, but they are dated international standards. According to the BRIC NOFO, “Applicant has mandatory building code adoption requirement (2015 or 2018 versions of International Building Code and International Residential Code)” (DHS, 2020, p. 2).3 An example of meaningful community engagement criteria is provided in the EPA brownfield program (see Appendix A).
Challenges Integrating Equity into BRIC
29
miss effects that are harder to measure but that are often crucial to local well-being. Additionally, the process by which states solicit, include, and support projects in their applications varies widely; more investigation is needed to capture when, how, or why underserved populations are supported and apply in some states and not others.
Capacity Differences Across States Could Result in Less Funding Being Awarded to Communities Most in NeedFormulas or competitions can be used to identify grant recipients and determine how funds will be distrib-uted once recipients are identified, with resulting combinations implying different policy priorities (Collins and Gerber, 2008). Motivated by a need for transparency and reliability in funding streams, the majority of federal funds flow to states through large formula grants based on such factors as population size (Beam and Conlan, 2002). A competitive approach enhances accountability by forcing potential recipients to spec-ify plans for how funds will be used. Competitions also offer flexibility and promote policy innovations as applicants develop initiatives to meet program requirements. Combinations of formula and competitive approaches are possible, such as with HUD’s community development block grant (CDBG), which sends funds to states through formulas and then allows states flexibility in administering competitions among localities.
The BRIC program’s grant decisionmaking process relies on a combination of formula and competi-tive approaches. BRIC’s formula component includes identifying a maximum allocation for states and ter-ritories and setting aside a defined amount for federally recognized tribal governments. BRIC’s competi-tive component includes evaluating subapplications according to the technical and qualitative criteria in the BRIC NOFO to determine winning subapplications from participating states, territories, and potentially federally recognized tribes. (These criteria do not apply to the allocation or potentially to the set-aside if the submissions collectively from tribal governments are less than the amount set aside.) An open question is how a large federal grant program, such as BRIC, is affected when states are participating in—rather than administering—competitions. Moreover, when there is a diverse variety of applicants with very different ideas about how to accomplish the BRIC program’s objectives, the task of defining and applying criteria to judge proposals becomes very complex. Steps can be taken to ensure that the evaluation process is open and transparent (Manna, 2010), but some steps (e.g., requiring a BCR greater than 1.0) could pose a barrier to applicants with lower capability.
Empirical research demonstrates that state capacity strongly predicts which states enter and score well in competitions (Manna and Ryan, 2011). That is, applicants with more administrative capacity (e.g., to over-come the transaction costs associated with grant contracting) tend to be advantaged in grant contests. Con-sequently, capacity disparities during the application stage make it difficult for competitive grant programs to promote equitable outcomes. Even if states ensure that spending on projects is consistent with the national program objectives, there is likely to be systemic bias against groups of low- to moderate-income people living in areas with less governmental capacity, who are arguably those most in need of federal assistance (Collins and Gerber, 2006).
Summary of Findings
Although equity considerations are increasingly emphasized government-wide, it is a new and complex task for BRIC to integrate equity dimensions (i.e., distributive, procedural, and contextual equity) into program definitions, criteria, or desired outcomes. BRIC has not yet defined its equity goals or strategies, how it will identify underserved community, or what metrics or indicators will be used to assess success in achieving
Building Resilient Infrastructure and Communities Mitigation Grant Program, Considerations of Hazard Risk and Social Equity
30
equity goals. Equity considerations will remain difficult to integrate without BRIC identifying a clear set of goals, mechanisms for achieving these goals and for whom, and what metrics are appropriate for assess-ing progress. Furthermore, equity considerations are critically related to social infrastructure (e.g., govern-ment functions, educational programs) and social resources (e.g., community attachment, social support networks), which BRIC has not yet identified as a priority. As BRIC evolves in its approach to equity consid-erations, prospective, longitudinal measurement will be needed to track and understand changing outcomes, but existing data have limited value for comprehensive equity assessments.
Furthermore, underserved populations face multiple barriers when applying for federal funds. For instance, BCAs and risk analyses are biased toward large, wealthy communities and thus tend not to encourage investments in small or poor communities. Some BRIC technical criteria (e.g., demonstrating an increased nonfederal cost share; being designated as a small, impoverished community) pose challenges for underserved populations. Additionally, some BRIC qualitative criteria pose challenges (e.g., demonstrating partnerships that will enhance outcomes, identifying sufficient implementation measures). Also, a high level of technical skill is needed to navigate the application process successfully, but many small or poor commu-nities lack the expertise or resources needed to complete the paperwork to secure grants. Finally, capacity differences across states during application for BRIC funding could result in less funding being awarded to the communities arguably most in need.
31
CHAPTER FIVE
Visualizing the Applications, Risk, and Sociodemographic Measures of the BRIC Program
Overview
The BRIC program’s primary objective is to support predisaster mitigation activities across the United States. This report has described ways in which projects that reduce natural hazard risks can be elicited and funded so as to increase equity in underserved populations. Although the NOFO requires that BRIC subapplications be consistent with state mitigation plans, and although the current selection criteria and scoring method-ology are designed to ensure that all subapplications cost-effectively reduce risks, there is no mechanism that guarantees that the most-critical risks across the United States are addressed by the projects ultimately selected for BRIC funding. Furthermore, expected changes in risk over time are not considered when calcu-lating risk reduction benefits as part of the required BCA. Similarly, although the current selection approach provides some extra consideration for small, impoverished communities, there is no guarantee that funding will go to the communities most in need.
Building on the review of hazard-risk data sets and equity issues presented in Chapters Three and Four, we developed an interactive visualization tool to help consider different ways to structure the BRIC NOFO in the future. This prototype BRIC AET uses actual year 1 application data, and it helps assess what kinds of subapplications are being received and from what kinds of communities relative to where the greatest natural hazard risks might be and where underserved communities are. The data sources used in the AET are described in more detail in Appendix D. The tool can help consider how to balance both risk and equity considerations and inform future NOFOs to help the BRIC program achieve its desired outcomes.
As FEMA considers improvements to the BRIC selection criteria and scoring to better account for natural hazard risks and equity, estimates of current risks and demographic conditions across the United States can inform judgements about where investments in risk mitigation are most needed. This information can then be used to contextualize the BRIC year 1 subapplications received to assess how well targeted (or not) the BRIC year 1 subapplications are to the current risks.
The AET was designed to bring together standardized information about hazards and risks across the United States, information on demographic characteristics, and year 1 BRIC application information in a single platform. It is important to note that the platform allows description of spatial distributions of the available information, but, to address equity considerations relevant to the BRIC program, additional steps are necessary to clearly identify why and how particular metrics might be informative about underlying pro-cesses and outcomes. This information can then be used to explore the interplay of risk and demographic information (currently available from separate sources) and to evaluate how current year 1 BRIC subapplica-tions address these risks and the demographic characteristics of the areas affected by the proposed project. The AET is not intended to make award decisions. It is meant to aid BRIC program management in assess-ing the effectiveness of the current NOFO in achieving its goals and inform future-year NOFO processes to better align outcomes with goals. The interactive tool is designed to be easily updated with new risk or
Building Resilient Infrastructure and Communities Mitigation Grant Program, Considerations of Hazard Risk and Social Equity
32
demographic data, information about the status of year 1 BRIC subapplications, and information pertaining to future-year subapplications.
Purpose of the Application Evaluation Tool
The AET was designed to serve four main purposes:
• to explore spatial distribution of risks and demographics• to summarize year 1 BRIC subapplications and compare them with risks and demographic character-
istics• to track projects through the selection process• to illustrate how a portfolio approach could help ensure that the most-critical risks are addressed in a
way that could improve equity.
Exploration of Risks and DemographicsThe AET shows census tract–level risk and demographic information from two standardized sources: the NRI data set and the Centers for Disease Control and Prevention’s SVI data set. One standard display in the tool enables the user to select one risk and one demographic layer to view side by side and see the number of people and value of assets exposed for the selected combinations of risk and demographic variables. Although this spatial analysis is not a replacement for a more detailed equity analysis, it can help provide context for where and how much of the United States’ population and assets are both at risk and classify them by specific demographic characteristics. Other displays show which subapplications meet multiple risk or demographic criteria. Appendix D describes the data sources and lists the included data layers.
Figure 5.1 shows an AET display of NRI’s riverine flood risk classification (on the left), SVI’s low-income classification (on the right), and population and geographic area for each combination of categories (table on the bottom), all for FEMA regions 5 through 8. One can see that high riverine flood risk is scattered through-out the regions, with some concentration along the Mississippi and Rio Grande Rivers. High concentrations of low-income households are scattered throughout. Through the use of the tool, one can highlight regions of both high flood risk and high concentrations of low-income households—about 11 percent of the population of these regions. The table on the bottom of Figure 5.1 summarizes the population of people and geographic area exposed at various risk levels, by selected social factor, for purposes of contextualizing the overall risk for the FEMA regions selected. The user can select specific risk levels and social layer outcomes to highlight groups in greatest need, for example.
Figure 5.2 shows the same information as in Figure 5.1 but with census blocks highlighted that are classi-fied as relatively high and very high levels of low-income populations and very high risk of riverine flooding. This visualization shows small regions scattered throughout the continental United States with high flood risk and relatively high or high concentrations of low-income households.
Summary and Comparisons of Year 1 Applications for the BRIC ProgramThe AET next summarizes year 1 BRIC subapplications in terms of their locations, total project budgets, affected people and structures, and other basic characteristics provided by the BRIC applicant. As described in this section, these data are raw application data and do not reflect any filtering or selection based on evaluation criteria scores. The tool tabulates which risks are addressed by the year 1 subapplications and the type of mitigation action proposed (Figure 5.3), excluding activity shares less than 10 percent. For example,
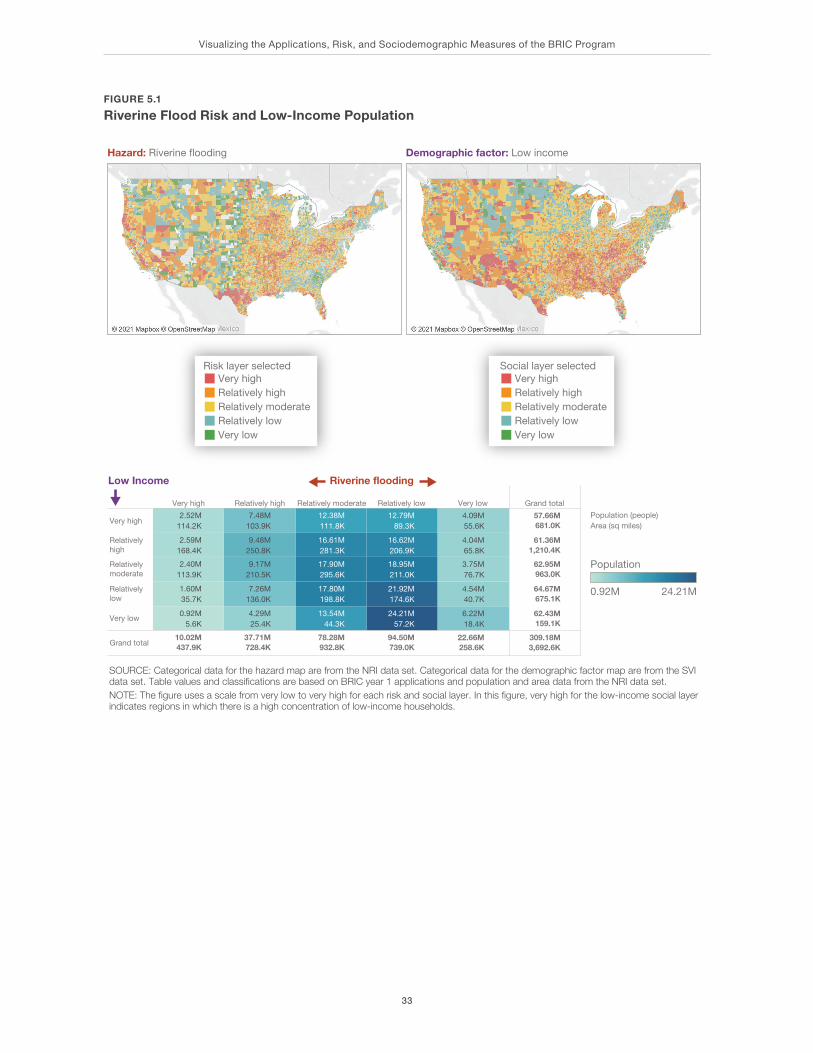
Visualizing the Applications, Risk, and Sociodemographic Measures of the BRIC Program
33
FIGURE 5.1
Riverine Flood Risk and Low-Income Population
SOURCE: Categorical data for the hazard map are from the NRI data set. Categorical data for the demographic factor map are from the SVI data set. Table values and classifications are based on BRIC year 1 applications and population and area data from the NRI data set. NOTE: The figure uses a scale from very low to very high for each risk and social layer. In this figure, very high for the low-income social layer indicates regions in which there is a high concentration of low-income households.
0.92M 24.21M
Population
Very high Relatively high Relatively moderate Relatively low Very low Grand total
Very high
Relativelyhigh
Relativelymoderate
Relativelylow
Very low
Grand total309.18M3,692.6K
62.43M159.1K
64.67M675.1K
62.95M963.0K
61.36M1,210.4K
57.66M681.0K
22.66M258.6K
6.22M18.4K
4.54M40.7K
3.75M76.7K
4.04M65.8K
4.09M55.6K
94.50M739.0K
24.21M57.2K
21.92M174.6K
18.95M211.0K
16.62M206.9K
12.79M89.3K
78.28M932.8K
13.54M44.3K
17.80M198.8K
17.90M295.6K
16.61M281.3K
12.38M111.8K
37.71M728.4K
4.29M25.4K
7.26M136.0K
9.17M210.5K
9.48M250.8K
7.48M103.9K
10.02M437.9K
0.92M5.6K
1.60M35.7K
2.40M113.9K
2.59M168.4K
2.52M114.2K
Riverine flooding Low Income
Risk layer selectedVery highRelatively highRelatively moderateRelatively lowVery low
Social layer selectedVery highRelatively highRelatively moderateRelatively lowVery low
Hazard: Riverine flooding Demographic factor: Low income
Population (people)Area (sq miles)
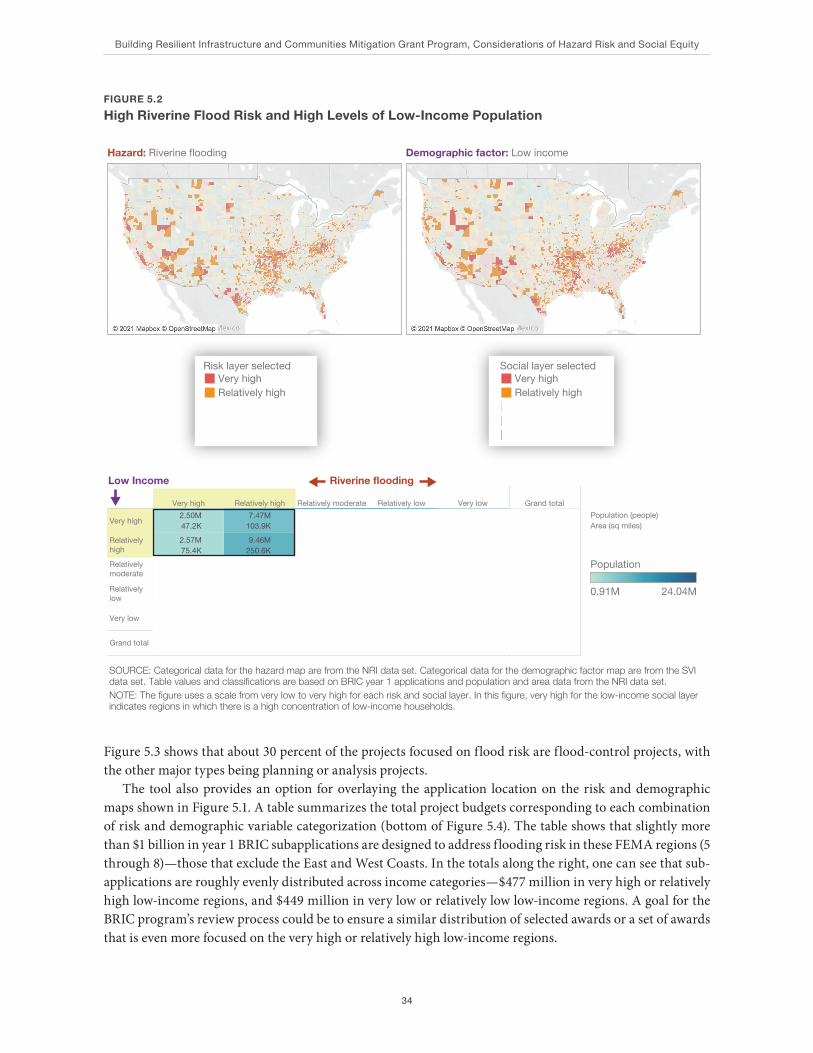
Building Resilient Infrastructure and Communities Mitigation Grant Program, Considerations of Hazard Risk and Social Equity
34
Figure 5.3 shows that about 30 percent of the projects focused on flood risk are flood-control projects, with the other major types being planning or analysis projects.
The tool also provides an option for overlaying the application location on the risk and demographic maps shown in Figure 5.1. A table summarizes the total project budgets corresponding to each combination of risk and demographic variable categorization (bottom of Figure 5.4). The table shows that slightly more than $1 billion in year 1 BRIC subapplications are designed to address flooding risk in these FEMA regions (5 through 8)—those that exclude the East and West Coasts. In the totals along the right, one can see that sub-applications are roughly evenly distributed across income categories—$477 million in very high or relatively high low-income regions, and $449 million in very low or relatively low low-income regions. A goal for the BRIC program’s review process could be to ensure a similar distribution of selected awards or a set of awards that is even more focused on the very high or relatively high low-income regions.
FIGURE 5.2
High Riverine Flood Risk and High Levels of Low-Income Population
0.91M 24.04M
Population
Risk layer selectedVery highRelatively highRelatively moderateRelatively lowVery low
Social layer selectedVery highRelatively highRelatively moderateRelatively lowVery low
SOURCE: Categorical data for the hazard map are from the NRI data set. Categorical data for the demographic factor map are from the SVI data set. Table values and classifications are based on BRIC year 1 applications and population and area data from the NRI data set. NOTE: The figure uses a scale from very low to very high for each risk and social layer. In this figure, very high for the low-income social layer indicates regions in which there is a high concentration of low-income households.
Very high Relatively high Relatively moderate Relatively low Very low Grand total
Very high
Relativelyhigh
Relativelymoderate
Relativelylow
Very low
Grand total306.95M2,955.9K
61.97M138.3K
63.91M597.1K
62.49M883.4K
61.08M910.2K
57.50M426.9K
22.41M212.7K
6.16M13.1K
4.46M40.0K
3.72M62.2K
4.01M65.0K
4.07M32.3K
94.06M723.8K
24.04M52.3K
21.81M165.6K
18.86M209.9K
16.57M206.6K
12.77M89.3K
77.86M920.3K
13.46M42.3K
17.69M196.8K
17.79M289.4K
16.56M280.0K
12.35M111.8K
37.40M713.1K
4.25M20.5K
7.10M129.6K
9.12M208.4K
9.46M250.6K
7.47M103.9K
9.90M231.1K
0.91M5.6K
1.55M29.3K
2.37M73.6K
2.57M75.4K
2.50M47.2K
Riverine flooding Low Income
Hazard: Riverine flooding Demographic factor: Low income
Population (people)Area (sq miles)
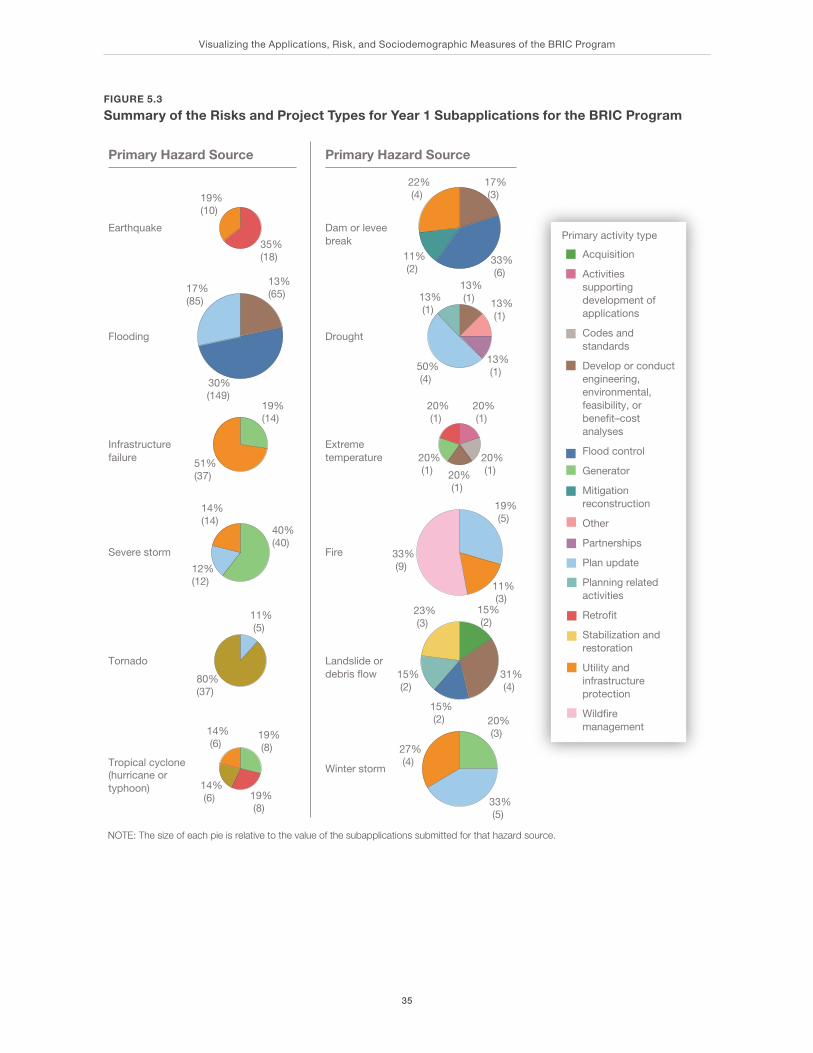
Visualizing the Applications, Risk, and Sociodemographic Measures of the BRIC Program
35
FIGURE 5.3
Summary of the Risks and Project Types for Year 1 Subapplications for the BRIC Program
Primary Hazard Source
Earthquake
Flooding
Infrastructurefailure
Severe storm
Tornado
Tropical cyclone(hurricane ortyphoon)
80%(37)
40%(40)
51%(37)
30%(149)
19%(10)
35%(18)
17%(85)
13%(65)
19%(14)
14%(14)
12%(12)
11%(5)
14%(6)
14%(6) 19%
(8)
19%(8)
Primary Hazard Source
Dam or leveebreak
Drought
Extreme temperature
Fire
Landslide ordebris flow
Winter storm
33%(5)
27%(4)
15%(2)
31%(4)
15%(2)
11%(3)
33%(9)
20%(1)
13%(1)
13%(1)
13%(1)
33%(6)
22%(4)
11%(2)
17%(3)
50%(4)
13%(1)
20%(1)
20%(1)
20%(1)
20%(1)
19%(5)
23%(3)
15%(2) 20%
(3)
Primary activity type
Acquisition
Activities supporting development of applications
Codes and standards
Develop or conduct engineering, environmental, feasibility, or benefit–cost analyses
Flood control
Generator
Mitigationreconstruction
Other
Partnerships
Plan update
Planning related activities
Retrofit
Stabilization and restoration
Utility and infrastructureprotection
Wildfire management
NOTE: The size of each pie is relative to the value of the subapplications submitted for that hazard source.
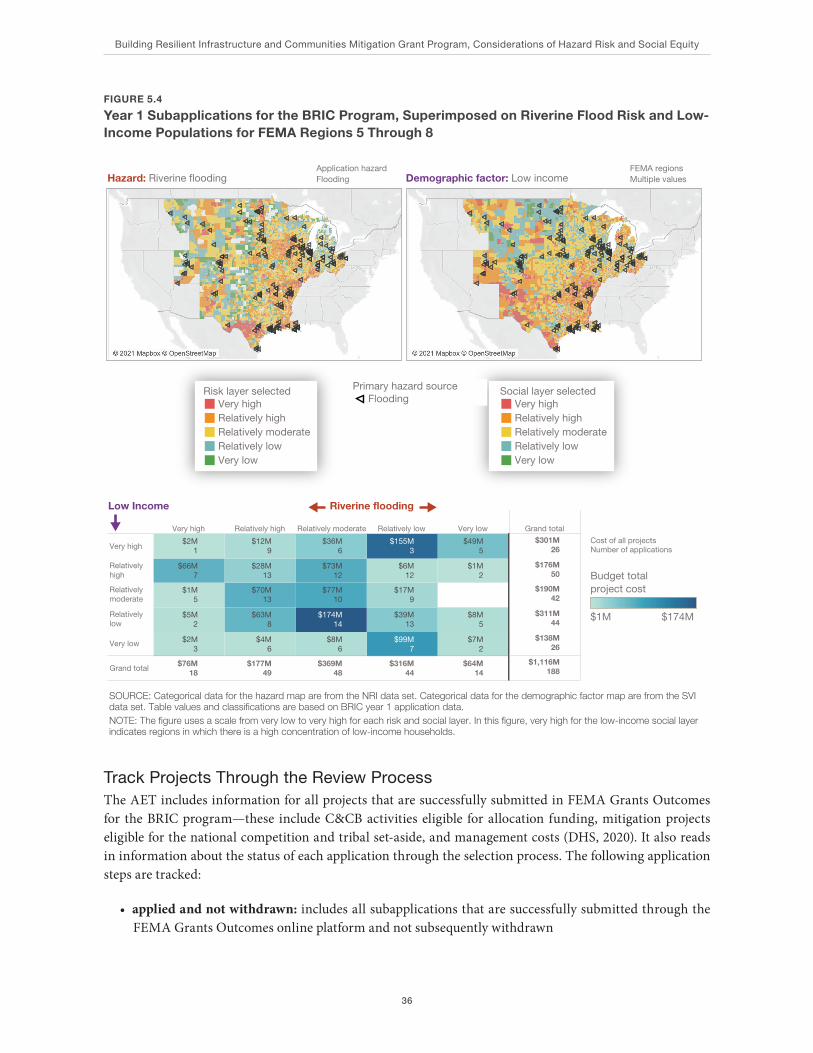
Building Resilient Infrastructure and Communities Mitigation Grant Program, Considerations of Hazard Risk and Social Equity
36
Track Projects Through the Review ProcessThe AET includes information for all projects that are successfully submitted in FEMA Grants Outcomes for the BRIC program—these include C&CB activities eligible for allocation funding, mitigation projects eligible for the national competition and tribal set-aside, and management costs (DHS, 2020). It also reads in information about the status of each application through the selection process. The following application steps are tracked:
• applied and not withdrawn: includes all subapplications that are successfully submitted through theFEMA Grants Outcomes online platform and not subsequently withdrawn
FIGURE 5.4
Year 1 Subapplications for the BRIC Program, Superimposed on Riverine Flood Risk and Low-Income Populations for FEMA Regions 5 Through 8
$1,116M188
$138M26
$311M44
$190M42
$176M50
$301M26
$64M14
$7M2
$8M5
$1M2
$49M5
$316M44
$99M7
$39M13
$17M9
$6M12
$155M3
$369M48
$8M6
$174M14
$77M10
$73M12
$36M6
$177M49
$4M6
$63M8
$70M13
$28M13
$12M9
$76M18
$2M3
$5M2
$1M5
$66M7
$2M1
$1M $174M
Risk layer selectedVery highRelatively highRelatively moderateRelatively lowVery low
Social layer selectedVery highRelatively highRelatively moderateRelatively lowVery low
SOURCE: Categorical data for the hazard map are from the NRI data set. Categorical data for the demographic factor map are from the SVI data set. Table values and classifications are based on BRIC year 1 application data. NOTE: The figure uses a scale from very low to very high for each risk and social layer. In this figure, very high for the low-income social layer indicates regions in which there is a high concentration of low-income households.
Budget totalproject cost
Very high Relatively high Relatively moderate Relatively low Very low Grand total
Very high
Relativelyhigh
Relativelymoderate
Relativelylow
Very low
Grand total
Riverine flooding Low Income
Hazard: Riverine flooding Demographic factor: Low income
Cost of all projectsNumber of applications
Primary hazard sourceFlooding
FEMA regionsMultiple values
Application hazardFlooding
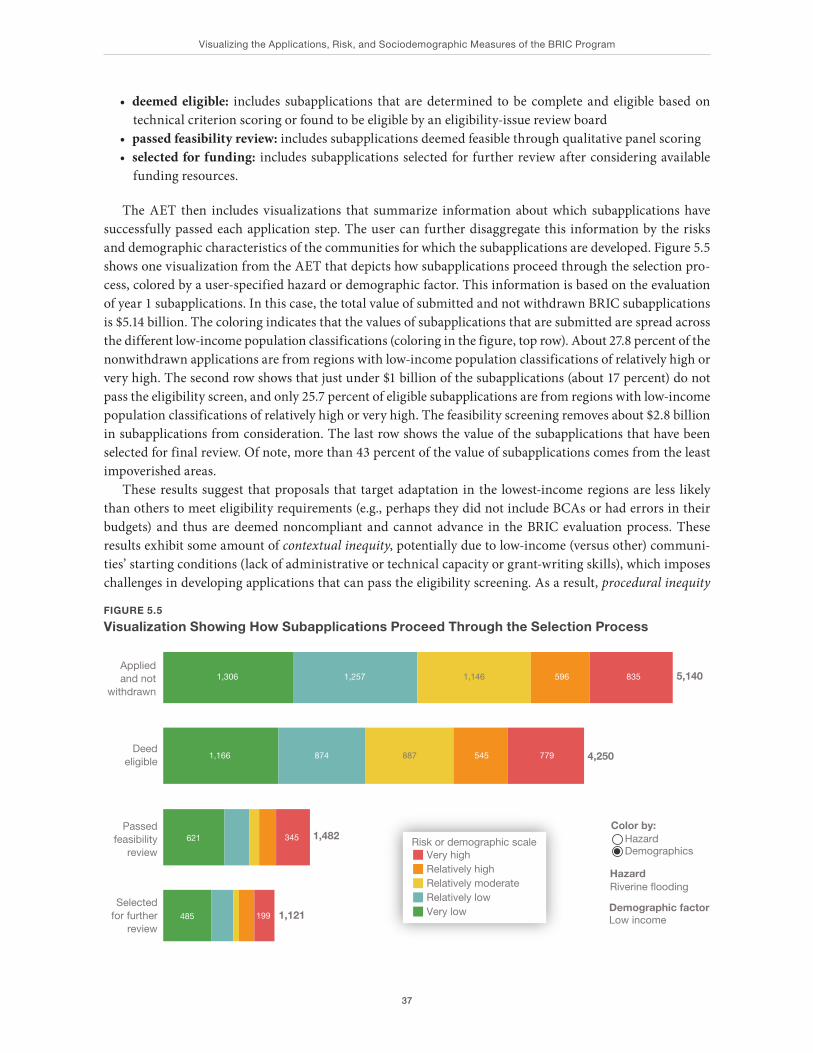
Visualizing the Applications, Risk, and Sociodemographic Measures of the BRIC Program
37
• deemed eligible: includes subapplications that are determined to be complete and eligible based ontechnical criterion scoring or found to be eligible by an eligibility-issue review board
• passed feasibility review: includes subapplications deemed feasible through qualitative panel scoring• selected for funding: includes subapplications selected for further review after considering available
funding resources.
The AET then includes visualizations that summarize information about which subapplications have successfully passed each application step. The user can further disaggregate this information by the risks and demographic characteristics of the communities for which the subapplications are developed. Figure 5.5 shows one visualization from the AET that depicts how subapplications proceed through the selection pro-cess, colored by a user-specified hazard or demographic factor. This information is based on the evaluation of year 1 subapplications. In this case, the total value of submitted and not withdrawn BRIC subapplications is $5.14 billion. The coloring indicates that the values of subapplications that are submitted are spread across the different low-income population classifications (coloring in the figure, top row). About 27.8 percent of the nonwithdrawn applications are from regions with low-income population classifications of relatively high or very high. The second row shows that just under $1 billion of the subapplications (about 17 percent) do not pass the eligibility screen, and only 25.7 percent of eligible subapplications are from regions with low-income population classifications of relatively high or very high. The feasibility screening removes about $2.8 billion in subapplications from consideration. The last row shows the value of the subapplications that have been selected for final review. Of note, more than 43 percent of the value of subapplications comes from the least impoverished areas.
These results suggest that proposals that target adaptation in the lowest-income regions are less likely than others to meet eligibility requirements (e.g., perhaps they did not include BCAs or had errors in their budgets) and thus are deemed noncompliant and cannot advance in the BRIC evaluation process. These results exhibit some amount of contextual inequity, potentially due to low-income (versus other) communi-ties’ starting conditions (lack of administrative or technical capacity or grant-writing skills), which imposes challenges in developing applications that can pass the eligibility screening. As a result, procedural inequity
FIGURE 5.5
Visualization Showing How Subapplications Proceed Through the Selection Process
Risk or demographic scaleVery highRelatively highRelatively moderateRelatively lowVery low
HazardRiverine flooding
Demographic factor Low income
1,1461,257 596 5,140
Deedeligible
545887874 4,250
Selectedfor further
review199 1,121
Passedfeasibility
review
345 1,482Color by:
HazardDemographics
835
779
1,306
1,166
485
621
Applied and not
withdrawn
Building Resilient Infrastructure and Communities Mitigation Grant Program, Considerations of Hazard Risk and Social Equity
38
occurs because these communities are not as represented in the pool of subapplications reviewed. Ultimately, this leads to distributional inequity because, if they are not in the pool reviewed, they cannot be afforded the benefits of the BRIC program (see Chapter Four).
Current Limitations
The AET was designed to use existing risk, demographic, and BRIC application data. For the first itera-tion, the AET focuses on comparisons of one risk layer and one demographic variable at a time. The AET was developed after the selection criteria and process for the year 1 BRIC application were developed and deployed. Some information requested of the applicants, such as benefit area, was provided in narrative format. Consequently, numerical analysis of the benefits could not be performed without an application-by-application detailed assessment—which was not feasible. Also, at the time of this documentation, the AET information had been only preliminarily screened and could include errors and misrepresentations.
Summary of Findings
In this chapter, we explored how an interactive tool developed for the BRIC program can help evaluate which hazard risks are targeted in which region by year 1 BRIC subapplications and what the demographic char-acteristics are of these regions. We found that the current year 1 subapplications address a broad spectrum of hazard risks through a variety of approaches across the United States but also that the subapplications do not address the regions of highest risk or those that correspond with demographic characteristics of com-munities that might be most underserved. Using fictitious data, we showed how a tool could be used to track which subapplications pass each BRIC evaluation stage and determine whether subapplications that address particular hazard risks or correspond to specific demographic conditions are being systematically eliminated from consideration.
The current BRIC evaluation process, which is based on technical and qualitative scorings, does not alone enable the BRIC program to target specific risks or risks in particular regions, nor does it ensure that selected projects target communities in an equitable fashion. Newer approaches developed in the decision sciences in the past several decades could be drawn on to update the BRIC program’s decision-support needs. Often clas-sified under the term structured decisionmaking, these approaches seek to clarify possible actions and their implications across a variety of relevant factors or concerns by integrating sound technical analysis, transpar-ent value judgments, and best practices to minimize judgmental biases and improve the quality of decision outcomes (Gregory et al., 2012). These approaches recognize the importance of using tools and algorithms to support deliberations over different choices rather than making the selections outright (National Research Council, 2009).
39
CHAPTER SIX
Findings, Recommendations, and Concluding Thoughts
In this chapter, we return to the objective of the research questions, which is how future BRIC grant cycles can be evaluated using a multihazard, forward-looking, risk-based process that also incorporates issues of equity and community well-being in its application and evaluation processes. To identify gaps in knowledge and strategies by which the BRIC program might address risk and equity, HSOAC researchers reviewed existing federal grant programs, evaluated available risk assessment tools, and assessed effects that the BRIC program could have on social equity. We also developed an interactive tool to explore how year 1 BRIC sub-applications related to different risks and demographic metrics as a way to inform an integrated planning process moving forward.
Linking Summary Findings to Recommendations
Drawing on the summary findings from our review of existing hazard-risk assessment tools and programs and a much larger body of work on disaster risk, vulnerability, resilience, and social equity, the preceding chapters explored opportunities and challenges for the BRIC program. In this chapter, we start with the sum-mary of findings from Chapters Three, Four, and Five and group them by actions that can be taken in the near term and those more suited for the long term. For the near-term recommendations, there are relatively few barriers to implementation, and change is primarily within the control of the BRIC program or FEMA. Near-term recommendations are actions that can likely be implemented within the next couple of NOFO cycles, given that there is a one- to two-year lag time in implementing federal funding opportunities. It does not necessarily mean that the near-term recommendations are more important. The long-term recommen-dations acknowledge that implementation could require coordination with entities outside of BRIC and even outside of FEMA. Some long-term recommendations could require changes in policy and even legislative changes.
Table 6.1 shows the summary findings that derive from the research described in Chapters Three, Four, and Five and links them to near- and long-term recommendations. The leftmost column identifies the find-ings from the relevant chapters, and the other two columns identify the near- and long-term recommenda-tions associated with those findings. In the next two sections, we summarize what is meant by those recom-mendations.1 The bulk of this chapter explains in more detail what those recommendations entail. We close the chapter with some concluding thoughts.
1 We have not attempted to rank-order or sequence these recommendations, although we do think it important to prioritize the equity recommendations, so they are listed first.

Building Resilient Infrastructure and Communities Mitigation Grant Program, Considerations of Hazard Risk and Social Equity
40
TABLE 6.1
Linking Summary Findings to Recommendations
Summary Finding Near-Term Recommendation Long-Term Recommendation
Integrating natural hazard risks (Chapter Three)
Data layers that make up NRI could be the starting point for incorporating risk assessment results into BRIC allocations and decisionmaking.
Evaluate NRI hazard and risk layers to identify those most relevant for BRIC application review.
Work with the NRI development team to further validate risk estimates.
Work with the NRI development team to incorporate lifeline infrastructure exposure.
Work with the NRI development team to account for future changes to hazard risk.
There is no single data source that currently meets all relevant criteria.
Develop comprehensive, forward-looking, and transparent information about spatial hazard risk.
The majority of these assessments remain focused on asset damage as a key outcome metric.
Look toward approaches that allow for equity-informed risk assessment.
Integrating social equity (Chapter Four)
Equity is multidimensional. Develop an action logic model (a road map presenting relationships among program resources, activities, outputs, and outcomes and impacts) explaining BRIC’s pathway to equitable outcomes.
Equity assessment requires robust evaluation methods.
Develop an action logic model explaining BRIC’s pathway to equitable outcomes.
Equity goals, mechanisms, target audiences, and metrics need clarification.
Develop an action logic model explaining BRIC’s pathway to equitable outcomes.
Use individual indicators of sociodemographics rather than indexes to specify target audiences and needs.
Current priorities do not reflect social systems or resources as essential parts of effective mitigation.
Add new criteria that include social resources as an essential part of effective community resilience.
Address a broader set of drivers of vulnerability with risk-mitigation strategies.
Comprehensive equity assessments are constrained by data challenges.
Identify reliable and valid equity metrics, and establish a process for data collection and analyses.
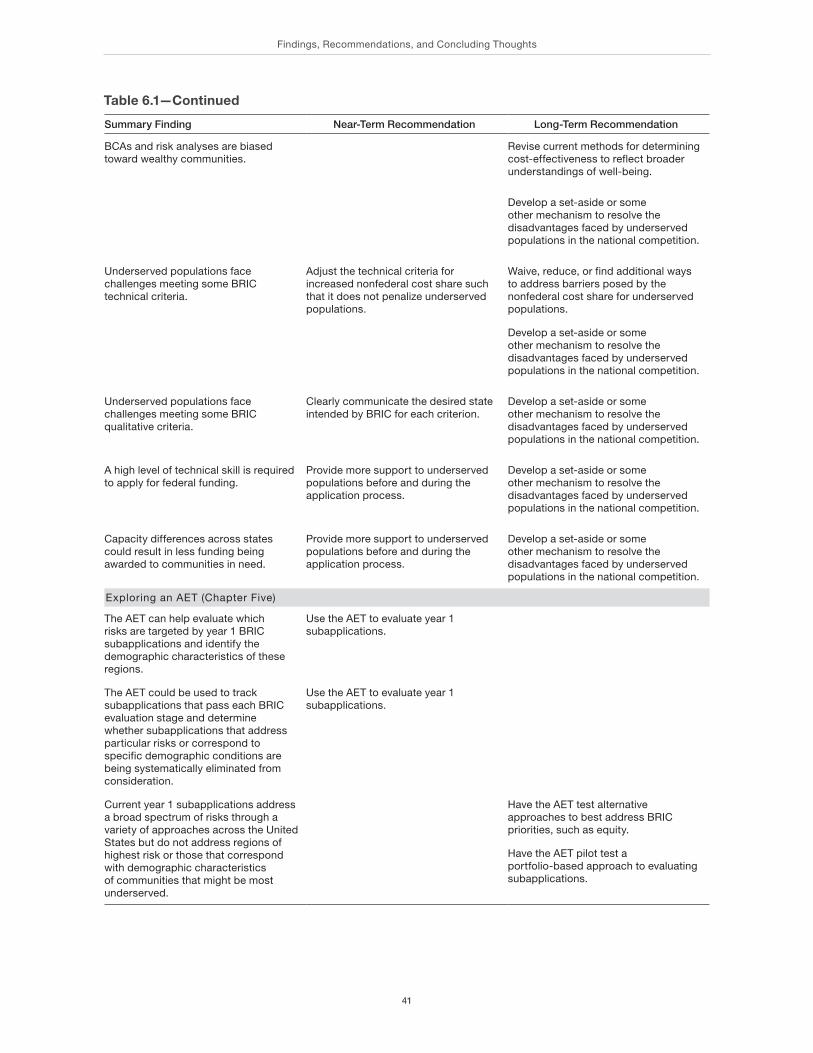
Findings, Recommendations, and Concluding Thoughts
41
Summary Finding Near-Term Recommendation Long-Term Recommendation
BCAs and risk analyses are biased toward wealthy communities.
Revise current methods for determining cost-effectiveness to reflect broader understandings of well-being.
Develop a set-aside or some other mechanism to resolve the disadvantages faced by underserved populations in the national competition.
Underserved populations face challenges meeting some BRIC technical criteria.
Adjust the technical criteria for increased nonfederal cost share such that it does not penalize underserved populations.
Waive, reduce, or find additional ways to address barriers posed by the nonfederal cost share for underserved populations.
Develop a set-aside or some other mechanism to resolve the disadvantages faced by underserved populations in the national competition.
Underserved populations face challenges meeting some BRIC qualitative criteria.
Clearly communicate the desired state intended by BRIC for each criterion.
Develop a set-aside or some other mechanism to resolve the disadvantages faced by underserved populations in the national competition.
A high level of technical skill is required to apply for federal funding.
Provide more support to underserved populations before and during the application process.
Develop a set-aside or some other mechanism to resolve the disadvantages faced by underserved populations in the national competition.
Capacity differences across states could result in less funding being awarded to communities in need.
Provide more support to underserved populations before and during the application process.
Develop a set-aside or some other mechanism to resolve the disadvantages faced by underserved populations in the national competition.
Exploring an AET (Chapter Five)
The AET can help evaluate which risks are targeted by year 1 BRIC subapplications and identify the demographic characteristics of these regions.
Use the AET to evaluate year 1 subapplications.
The AET could be used to track subapplications that pass each BRIC evaluation stage and determine whether subapplications that address particular risks or correspond to specific demographic conditions are being systematically eliminated from consideration.
Use the AET to evaluate year 1 subapplications.
Current year 1 subapplications address a broad spectrum of risks through a variety of approaches across the United States but do not address regions of highest risk or those that correspond with demographic characteristics of communities that might be most underserved.
Have the AET test alternative approaches to best address BRIC priorities, such as equity.
Have the AET pilot test a portfolio-based approach to evaluating subapplications.
Table 6.1—Continued
Building Resilient Infrastructure and Communities Mitigation Grant Program, Considerations of Hazard Risk and Social Equity
42
Near-Term Recommendations
Develop an Action–Logic Model Explaining Pathways to Equitable Outcomes in the BRIC ProgramTo assess whether BRIC grants or other activities increase or decrease equity over time, an evaluation (action–logic) model is needed to structure assessments of whether the funding effectively targets areas of greatest need. If the goal of BRIC is to advance toward more-equitable mitigation outcomes, the program needs to identify existing inequities, address the causes of the inequities, and then assess progress toward closing the gaps. Developing an action–logic model can help decisionmakers tease out underlying assumptions about how equity is defined and track how it is affected. In some instances, federal policymakers and staff respon-sible for implementing and developing the BRIC program will need to use their judgment in crafting this model. Although some directives will be clear, such as can be found in recent executive orders (e.g., Biden, 2021a) or the NAC, 2020, report, certain definitions and desired outcomes (e.g., what is an equitable out-come?) might need to be determined internally in consultation with federal leadership (e.g., the Office of Management and Budget). Developing an equity logic model will provide a strong foundation for revising the scoring criteria toward greater benefit to vulnerable populations.
Add New Criteria That Include Social Resources as Essential Parts of Effective Community ResilienceIncreasing empirical evidence of the important role of social factors and social infrastructure in determining the effectiveness of all aspects of risk management offers additional opportunities for the BRIC program to enhance equitable outcomes. Differential resilience and vulnerability across groups (Bolin and Kurtz, 2018; Cutter, Boruff, and Shirley, 2003) relate to such factors as the built environment (neighborhood conditions and resources, such as geographic access to services and retail, sidewalk and street conditions, housing, and aesthetics) and social resources (e.g., community sentiment; the sense of satisfaction with or belonging to one’s community; social support networks; sources of risk information and communication, such as televi-sion news or social media) (Cutter, Barnes, et al., 2008; Kasarda and Janowitz, 1974; Narayanan, Finucane, et al., 2020; Norris et al., 2008; Parks et al., 2020; Quarantelli, 2000). In short, addressing disaster risk—and disaster risk mitigation—is a social process. Effectively mitigating risk means addressing interdependencies among these factors and recognizing that inequities are the result of sociopolitical decisions that influence where people live, how they make a living, and what resources they can access.
Augmenting current priorities or criteria in the NOFO with new, socially focused priorities or criteria could signal support for enhancing social infrastructure for underserved groups or building community cohesion, social support networks, or collective efficacy to improve the awareness of and support for defen-sible hazard mitigation efforts. Another example would be to support adaptive forms of governance for equi-tably addressing the uncertainty and complexity associated with social-ecological systems responding to environmental events, such as flooding (Fournier et al., 2016). Criteria highlighting the need for projects to address social-physical system interactions would advance mitigation practices.
Address a Broader Set of Drivers of Vulnerability with Risk-Mitigation StrategiesEmerging conceptualizations of well-being suggest ways to quantify disaster impacts beyond damage to the built environment and to ensure that unique socioeconomic characteristics are incorporated. For instance, Hallegatte et al., 2017, and Markhvida et al., 2020, rely on classical welfare economics to examine well-being loss as a measure of the utility of consumption lost during a household’s recovery from shock. The lost con-sumption includes the loss of labor income or housing services, reconstruction costs, and use of savings or
Findings, Recommendations, and Concluding Thoughts
43
insurance payouts to cover recovery. In a mitigation context, a broader conceptualization of well-being might prioritize activities that address risk to rental properties or businesses with a high percentage of “nonessen-tial” workers. Future iterations of the BRIC program could prioritize risk-mitigation strategies based on a broader understanding of drivers of vulnerability in the social-ecological system, which, for some popula-tions, might be low wealth levels, volatile income sources, or lack of access to education or health care.
Clearly Communicate the Desired State That the BRIC Program Intends for Each CriterionMore-precise language is needed to indicate BRIC’s intended outcome regarding the desired state for popula-tions affected. More precision would help communities understand BRIC’s intention (and thus refine their subapplications toward this intention), as well as help BRIC better track the tangible benefits of proposals. For example, the criterion of population affected should clearly state the desire for vulnerable populations to be positively affected. For the outreach activity criterion, an explicit description of what is considered meaningful engagement is needed (e.g., the types of local organizations that are involved and how they are included in decisionmaking, such as how community input is solicited, considered, and responded to in meaningful ways). Direct federal clarification of the criteria likely needs to be supported by state agencies and third-party technical assistance providers and tailored to the target audience.
Provide More Support to Underserved Populations Before and During the Application ProcessAdditional information needs to be collected to understand exactly what barriers communities face before and during the application process and what support needs to be provided to address those barriers. For instance, if an applicant or subapplicant has insufficient technical capability, the BRIC program could pro-vide technical support to these populations (e.g., through FEMA-paid consultants familiar with BCA, risk analysis, or grant application processes). Ideally, technical capabilities would be enhanced through close partnership with communities affected by social inequities so that context-sensitive nuances would be under-stood when trying to improve the economic or risk information used in analyses, in determining appropriate risk-mitigation efforts, or in supporting development of a winning application. Introductory webinars are a starting point for communication, but sustained, meaningful engagements with subapplicants are needed to identify and effectively resolve capability and capacity barriers. State hazard mitigation officers or state emergency management agencies could play an important role in engaging and supporting applicants and subapplicants before and during the application process. FEMA would need to evaluate the cost-effectiveness of providing different types of support to help it prioritize decisions about what support would be optimal to provide and for whom. A layered approach, with direct federal support and targeted state-level assistance with the process, is likely needed.
A second way to improve relative access to program funds is to examine ways to reduce the transaction costs associated with intergovernmental grant contracting because state-level administrative choices and the administrative capacity of local governments have been shown to determine a target population’s access to (receipt of) federal funds. For instance, Collins and Gerber found that states with regional arenas of com-petition for nonentitlement CDBGs provided more-equitable access to federal funding (Collins and Gerber, 2006). Prior empirical work has shown that collaborative efforts by local government entities tend to be more successful than singular government entities in acquiring federal grants (Bickers and Stein, 2004). Conse-quently, encouraging potential subapplicants to compete as a team and submit a joint project, allowable under current BRIC rules, could support more-equitable program management and outcomes. The BRIC program might also want to explore options for encouraging multijurisdictional subapplications on which mitiga-
Building Resilient Infrastructure and Communities Mitigation Grant Program, Considerations of Hazard Risk and Social Equity
44
tion aimed at regional resilience is an important consideration. Alternatively, formula funding for all small general-purpose governments could be considered but would likely require Congress to explicitly authorize such an approach. A formula approach would reduce transaction costs and make access more equitable. For example, Congress has authorized the Federal Aviation Administration to provide annual entitlement grants to small airports (nonprimary commercial service and general aviation) to reduce the burden of subapplica-tions on small airports and establish a floor of financial support from the Federal Aviation Administration’s Airport Improvement Program (B. Miller et al., 2020).
Other initiatives related to the timing of various aspects of the award administration and contracting processes need to be considered. For instance, BRIC will reimburse recipients and subrecipients for eligible indirect and direct administrative costs up to 15 percent of the total award. However, small communities might lack the resources needed to cover these costs up front. Alternative mechanisms, such as BRIC paying these costs up front, need to be explored to alleviate this barrier.
Adjust the Technical Criteria for Increased Nonfederal Cost Share So That the Criteria Do Not Penalize Underserved PopulationsThe BRIC NOFO for year 1 states that small, impoverished communities are eligible for an increased federal cost share amount (from 75 percent to 90 percent) for C&CB activities, mitigation projects, and management costs in subapplications. However, one of the technical criteria assigns five points to any subapplication with an increased nonfederal cost share. This potentially poses a barrier to small, impoverished communities that might have less access to cash or third-party in-kind matches than larger, wealthier communities have. For instance, the budgets of small towns with low-income populations typically lack cash to fund capital projects and are unable to generate significant revenue through sponsorships or increased taxes (Schaumleffel, Smith, and O’Dell, 2004). However, additional research is needed to determine how pervasive a problem it is for underserved populations to access resources that would serve to increase their nonfederal cost shares. Alle-viating this barrier could mean waiving the criterion or creating an offset, such as covering the nonfederal cost share for underserved populations. A more expansive offset would involve establishing a set-aside so that populations with less technical capability or less access to the resources needed for submitting a successful application are not competing against better-served communities. Additional exploration is needed to deter-mine the impact of these adjustments relative to that of other efforts aimed at enhancing equity.
Identify Reliable and Valid Equity Metrics, and Establish a Process for Data Collection and AnalysesMany cities in the United States have initiated efforts to track social equity (e.g., Office of Equity and Social Justice, undated; Warren May et al., 2018). Determining whether measures of equity are appropriate or accu-rate, however, is a difficult task. Different definitions and criteria can be used to assess reliability (e.g., does the measure produce consistent results? Does it do so under sensitivity analyses?) and validity (e.g., is there clear correspondence between the construct and measurable inputs? Is there a strong association between alternative measures of the same construct?) (Statistics Directorate, Directorate for Science, Technology, and Industry, and Applied Statistics and Econometrics Unit, 2008). Typically, no single metric meets all criteria in all situations.
A lack of reliable and validated equity indicators, metrics, and data poses a real-world challenge that the BRIC program needs to confront. To support BRIC taking initiative on development of equity indicators, metrics, and data, it might be helpful for the BRIC program, as it develops the indicators, to consult relevant research and leading scholars in the field (e.g., Spielman et al., 2020; Bakkensen et al., 2017). Criteria need to be established and multiple trade-offs need to be considered when selecting indicators, metrics, and data
Findings, Recommendations, and Concluding Thoughts
45
sources to measure equity. Although fewer indicators and metrics have been used in disaster preparation con-texts than in other topic domains, indicators and metrics from other topic domains could be adapted. Some might be useful for assessing predisaster (baseline) conditions (e.g., proximity of houses to brownfields), disaster preparation processes or outcomes (e.g., percentage of households with liquid assets), or disaster impacts (e.g., reduced access to food, transport, or health care). Data collected by other federal programs (e.g., the Supplemental Nutrition Assistance Program, rental assistance application processes) might be leveraged. The availability of data disaggregated by the relevant sociodemographic variables varies across agencies and programs, however, and that limits implementation of this approach in some cases.
Although data collected for other purposes can suffice in some situations, rigorous tracking of experi-ences requires a well-defined purpose and systematic planning. The BRIC program needs to identify where existing data provide a valid snapshot of relevant conditions and where new data need to be collected. Where new data are needed, BRIC should consider approaches that reduce the burden on applicants (e.g., consider how FEMA might collect data rather than require awardees to capture the necessary information). Moreover, BRIC will need an evidence-based approach to understand the sensitivity of a given set of metrics to different places and across cultural and temporal contexts. The policy relevance of specific indicators, metrics, and data will be tied directly to the extent to which BRIC processes or outcomes can be improved.
A set of reliable and valid equity metrics could inform BRIC decisionmaking about how to ensure that the application process is equitable (e.g., are some groups less likely to meet eligibility criteria and why?). Other metrics could help BRIC track the outcomes of its portfolio of investments over time (e.g., did investments aimed at improving accessibility of public transport result in more mobility for people who are elderly or living with disabilities during extreme weather?).
Evaluate National Risk Index Hazard and Risk Layers to Identify Those Most Relevant to Reviewing Applications for the BRIC ProgramFEMA should consider building on the recently published NRI tool to evaluate BRIC distribution of fund-ing by state, region, or hazard type. As shown in Table 3.3 and Appendix C, NRI provides the broadest look across different hazard types, covers all 50 states, and provides quantified, transparent, and downloadable risk estimates at the census tract scale. It applies a relatively simple modeling approach and leverages existing and scalable data sets, meaning that the risk estimates can be iteratively improved or further customization is possible using the published data.
Any such analysis, however, would need to account for the current limitations of this newly developed tool. First, the full NRI includes an estimate of risk (in terms of EAL) combined with a separately developed social vulnerability index and resilience index. The EAL estimates need to be uncoupled from these other components to serve as stand-alone risk assessments, which the published data sets already allow. Second, NRI relies heavily on observed historical hazard occurrence and loss data drawn from a relatively limited historical period of record, which spans only several decades (see Appendix C). This short period of record and other simplifying methodological choices could lead to underestimates of risk by not fully accounting for low-probability, high-consequence events; the limitation is noted in the technical documentation (FEMA, 2021d). In addition, as previously indicated, NRI does not consider or incorporate future climate projections and does not, at present, separately consider exposure or risk to lifeline infrastructure facilities. Finally, NRI was only recently made public, and additional verification (i.e., comparisons with other published risk assess-ments) is needed to build confidence in the results.
Despite these limitations, NRI data layers appear to be a reasonable starting point for incorporating risk assessment results into BRIC allocations and decisionmaking. Chapter Four provides additional detail for applying NRI for near-term risk assessment support and moving toward a prototype decision-support tool intended to inform BRIC deliberation and prioritization.
Building Resilient Infrastructure and Communities Mitigation Grant Program, Considerations of Hazard Risk and Social Equity
46
Work with the National Risk Index Development Team to Further Validate Risk EstimatesAs previously noted, NRI is a new product that has not yet been widely adopted or validated. To improve con-fidence in NRI results, FEMA could compare NRI EAL estimates with other FEMA or non-FEMA estimates of risk for selected hazards (e.g., flood, hurricane winds) and determine whether the existing estimates might show bias that could be addressed through further refinement or improvement to NRI. This is especially rel-evant for low-frequency, high-consequence hazards, for which NRI estimates might be lower than those from other studies because of the limited historical data record applied.
Work with the National Risk Index Development Team to Incorporate Lifeline Infrastructure ExposureThe NRI EAL calculation currently includes damage estimates (in dollar terms) to populations, buildings, and agriculture. Building on the prior step, BRIC could work with the NRI developers to blend hazard fre-quency estimates by location with infrastructure data layers from HIFLD to consider lifeline infrastructure exposure to the included hazards. Lifeline infrastructure risk is not readily estimated or summarized in dollar terms, but infrastructure exposure—highlighting assets or locations exposed above a chosen threshold of annual frequency, for instance—could be presented in map visualization summaries or other interactive tools, building on the approach described in Willis et al., 2016. This would allow BRIC to consider spatial patterns of lifeline infrastructure exposure alongside the existing hazard damage estimates provided through NRI. A similar exercise could be conducted by building on other sources reviewed in this document (e.g., Hazus), although this would reduce the direct comparability with NRI, as well as the number of hazards that could be considered.
Work with the National Risk Index Development Team to Account for Future Changes to Hazard RiskNRI currently does not account for future changes in hazard risk caused by climate change, changes in the composition of population and assets across the nation, or other key long-term drivers. Given the importance of these long-term drivers for BRIC, especially nonstationary climate, the BRIC program should work with the NRI developers to create additional hazard and risk estimates for different assumptions about future climate. Such an approach could begin with selected hazards of concern for which climate projections are already available to inform hazard risk and build on the non-FEMA sources reviewed in this report.
Similar extensions could consider how changing population patterns over time would alter patterns of hazard risk. Because such projections remain highly uncertain, these extensions would likely entail incor-porating a variety of scenarios for future risk rather than a best estimate or single projection alone. This information could then be used to ensure that the funded BRIC subapplications are targeting not only cur-rent areas of concern but also areas where hazard risk could increase significantly in a future without action.
Use the Application Evaluation Tool to Review Year 1 SubapplicationsThe current prototype AET provides a means of comparing year 1 and future-year subapplications with existing data sets of risks and demographic variables that could be relevant to equity considerations at a census-tract level. As the year 1 subapplications are evaluated and selected for funding, the AET can help the BRIC program assess how well the selected subapplications, using the process and criteria described in the year 1 NOFO, are supporting adaptations in the areas most in need. For example, by comparing the benefit areas for all year 1 subapplications with the country-wide risk and demographic maps, one can assess how
Findings, Recommendations, and Concluding Thoughts
47
well the subapplications, based on the year 1 NOFO, are addressing the most-important risks in areas with demographic characteristics that suggest high vulnerability. The BRIC program could also use the AET to determine whether subapplications from areas with specific demographic conditions are systematically not passing the various evaluation stages.
Long-Term Recommendations
Revise Current Methods for Determining Cost-Effectiveness to Reflect Broader Understandings of Well-BeingThe current BCA methods of assessing the cost-effectiveness of a mitigation activity favor physical assets and projects in more–densely populated communities. Revisions to the BCA methods are needed, for example, to capture benefits important for underserved populations, such as potential for improving public health, expanding recreational opportunities, or increasing economic development potential. Qualitative BCA might also be considered for a complex program, such as BRIC (Rogers, Stevens, and Boymal, 2009). Because revis-ing the BCA methods is not at the discretion of the BRIC program, the program will need to work with other DHS and FEMA offices and with the Office of Management and Budget to establish appropriate revisions.
Waive, Reduce, or Find Additional Ways to Address Barriers Posed by the Nonfederal Cost Share for Underserved PopulationsUnderserved populations are less likely than others to have access to cash reserves, third-party in-kind matches, or partnerships to provide innovative ways to meet the required cost share. For instance, decreased populations and increased poverty in rural and small towns have led to a loss of tax revenue and a decrease in the number of local schools, churches, and other community-based organizations (Schaumleffel, Smith, and O’Dell, 2004). Consequently, these towns face difficulty in adequately supporting the delivery of public services. Some alternative revenue-generating strategies considered to expand small-town budgets include increasing the number of bond issues, seeking sponsorship or donations, increasing tax levies or facility fees, or securing grants. Other ways to stretch budgets in small towns is to reduce hours of operation, cut tempo-rary and permanent employment, close facilities or programs, postpone spending, transfer services to the private sector, or increase the use of volunteers. Unfortunately, these strategies mean that small-town agen-cies still lack available funds for matches or cost shares. Waiving or reducing the nonfederal cost share will remove this barrier for small, disinvested, or isolated communities. Alternatively, BRIC could consider ways to support small-town agencies’ involvement in cooperative programming and intergovernmental agree-ments to share administrative expenses and free up budget for the cost share. Determining which communi-ties to target with these initiatives will require a deliberative process founded on BRIC’s equity logic model.
Develop a Set-Aside or Some Other Mechanism to Resolve the Disadvantages Faced by Underserved Populations in the National CompetitionIn addition to the economic dimensions described above, populations can be underserved for multiple other reasons, such as discrimination, low English-language proficiency, limited social capital networks, and lim-ited political voice and representation. The playing field will remain uneven until these multiple barriers that underserved populations face are addressed adequately and those populations can effectively participate in the BRIC competitive grant process. Some barriers, such as capacity and capability limitations or the biases embedded in traditional risk assessments and BCAs, are unlikely to be resolved in the near term. Conse-quently, an alternative solution is needed that eliminates unfair competition between wealthy and poor com-
Building Resilient Infrastructure and Communities Mitigation Grant Program, Considerations of Hazard Risk and Social Equity
48
munities. One potential mechanism is to establish a set-aside for underserved populations, similar to the cur-rent tribal set-aside. Set-asides in federal programs are a well-established mechanism to address the inherent analytic biases along with significant disparities in capacity or capability. Another mechanism would be to consider a formula approach that identifies a certain amount of resources to be directed toward communities that are unable to compete effectively in the current design of the national competition.
Develop Comprehensive, Forward-Looking, and Transparent Information About Spatial Hazard RiskA more comprehensive solution to the limitations of current FEMA risk assessment tools is still needed. A FEMA-supported or certified hazard-risk assessment tool that satisfies most or all of the major criteria listed in this chapter would provide an important foundation for BRIC prioritization and allocation while also sup-porting other HMGPs, planning, technical support, and a variety of other activities conducted by FEMA. Such a tool would be multihazard and include full national continental and extracontinental U.S. coverage at adequate spatial resolution for local comparisons. It would incorporate future climate projections for key climate-related hazards, allow comparisons of lifeline infrastructure exposure or damage, and provide a scal-able platform from which more-detailed local assessments could be conducted. NRI or Hazus could serve as a possible basis for such a next-level tool, but the details are beyond the scope of this report.2
Test Alternative Approaches for Evaluating Applications for the BRIC ProgramThe AET could help test alternative approaches that can better address either the BRIC priorities listed in Chapter One3 or a revised set of priorities that align more explicitly with those of FEMA’s NAC and Presi-dent Biden’s January 2021 executive order. Specifically, the AET could be used to test how different scoring procedures, based on different or additional metrics from those in Tables 2.1 and 2.2 in Chapter Two, can lead to the selection of subapplications that are better aligned with FEMA priorities (defined per the equity recommendations) than the current process of selection, as seen by the standardized risk and demographic information in the prototype AET.
Pilot Test a Portfolio-Based Approach to Application EvaluationA new or hybrid approach would make individual subapplicant funding selections informed by the risk and equity characteristics of the full portfolio of selected subapplicants. Rather than selecting subapplica-tions that incrementally pass various screening stages and score the highest, a portfolio approach could be used to select a set of subapplications that reduce the desired mix of risks across a diversity of communities. For example, such an approach could select subapplications such that a portion of the available funding is allocated to those subapplications that best address a specific risk faced by communities that have high con-centrations of low-income families. Louisiana has used such a portfolio approach since 2012 in prioritizing coastal risk reduction and restoration funding for its $50 billion coastal master plan (Groves, Fischbach, Knopman, et al., 2014). Applying these principles and approach would help the BRIC program meet its goals.
2 Although BRIC would be an obvious customer of such a tool, as would many other FEMA and non-FEMA programs, devel-opment of the tool is outside the purview of the BRIC grant program.3 These are (1) incentivize reducing risk to public infrastructure, (2) incentivize projects that mitigate risk to one or more lifelines, (3) incentivize projects that incorporate nature-based solutions, and (4) increase funding to applicants that facilitate the adoption and enforcement of the latest building codes.
Findings, Recommendations, and Concluding Thoughts
49
Functionality could be added to the AET that would allow a portfolio approach to be taken, in which the selected subapplications would be evaluated as a group and selected so that specific risk adaptation and equity goals are met. This would require the development of more-detailed equity objectives and under-standing of how risk adaptations can either contribute to equity or be supported in an equitable fashion. This approach has been successfully used in a variety of other project selection contexts, including Louisiana’s $50 billion coastal master plan (Coastal Protection and Restoration Authority of Louisiana, 2017; Groves, Fischbach, Knopman, et al., 2014; Groves and Sharon, 2013).
Several federal agencies have employed a portfolio approach to funding (or defunding) physical assets. For example, DOT administers a program called the Nationally Significant Federal Lands and Tribal Proj-ects Program. States, tribes, and local governments sponsored by an eligible federal land management agency apply directly to the secretary of transportation for funding of transportation projects of at least $25 million. Projects are evaluated and ranked based on a BCA, other technical criteria, and nonfederal cost share match, as well as their responsiveness to the secretary’s objectives and priorities. A review panel scores all subap-plications, but, ultimately, the secretary makes the decision on the mix of projects receiving grants. The pro-gram is not described explicitly as taking a portfolio approach, but it has the de facto characteristics by giving the secretary discretion to make the project selections.
Another example works in the reverse of BRIC and relates to decisions by the U.S. Department of Defense to close or otherwise realign installations in an effort to save money and manage physical assets more effi-ciently. Because of past difficulties in making such decisions on a case-by-case basis, Congress established a base realignment and closure (BRAC) process and charged the administering office with developing a portfo-lio of closure and realignment projects, insulated to the extent possible from political pressure. In each round of BRAC, the commission has presented a proposed portfolio of projects to Congress, which had obligated itself to vote on the entire portfolio, without the ability to remove individual installations on the request of members from affected districts or states. Congress successfully completed five BRAC rounds between 1988 and 2005. (In another example of a federal agency using a portfolio-based approach, Congress set up a similar procedure to deal with consolidation and construction of facilities within the Veterans Health Administra-tion with an estimated $65 billion project backlog.) Despite the fact that BRAC has dealt with realignments and closures, its administrative mechanism of bundling many individual asset-related projects into a single portfolio to maximize national benefits has potential relevance to the BRIC program.
Concluding Thoughts
The BRIC program has come into existence at a time of significant need for resilient infrastructure and communities nationwide, growing costs for disaster response and recovery, increasingly visible impacts of a changing climate, and an intense national conversation about inequity and community well-being. All these factors suggest an extraordinary opportunity for FEMA to structure a program responsive to the challenges that bring the benefits of a strategic and innovative BRIC program to all communities. The questions for FEMA are what it wants the BRIC program to achieve over the next three, five, and ten years and how fast it would like to move toward achieving its goals of risk reduction and equity. Answers to those questions will largely shape FEMA’s agenda for addressing the recommendations made in this report and implementing them into the BRIC program structure as soon as practicable. With the lead time necessary to develop a fed-eral funding opportunity, BRIC might be able to consider our observations and recommendations beginning with the year 3 NOFO in FY 2022.

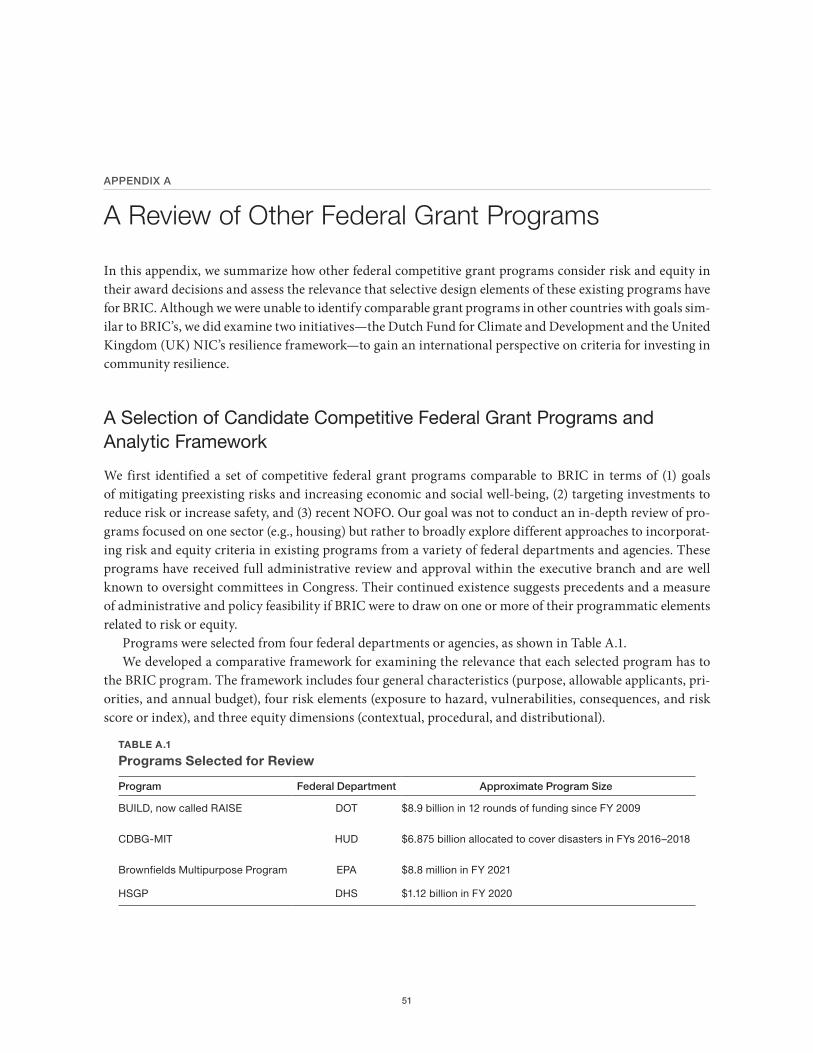
51
APPENDIX A
A Review of Other Federal Grant Programs
In this appendix, we summarize how other federal competitive grant programs consider risk and equity in their award decisions and assess the relevance that selective design elements of these existing programs have for BRIC. Although we were unable to identify comparable grant programs in other countries with goals sim-ilar to BRIC’s, we did examine two initiatives—the Dutch Fund for Climate and Development and the United Kingdom (UK) NIC’s resilience framework—to gain an international perspective on criteria for investing in community resilience.
A Selection of Candidate Competitive Federal Grant Programs and Analytic Framework
We first identified a set of competitive federal grant programs comparable to BRIC in terms of (1) goals of mitigating preexisting risks and increasing economic and social well-being, (2) targeting investments to reduce risk or increase safety, and (3) recent NOFO. Our goal was not to conduct an in-depth review of pro-grams focused on one sector (e.g., housing) but rather to broadly explore different approaches to incorporat-ing risk and equity criteria in existing programs from a variety of federal departments and agencies. These programs have received full administrative review and approval within the executive branch and are well known to oversight committees in Congress. Their continued existence suggests precedents and a measure of administrative and policy feasibility if BRIC were to draw on one or more of their programmatic elements related to risk or equity.
Programs were selected from four federal departments or agencies, as shown in Table A.1. We developed a comparative framework for examining the relevance that each selected program has to
the BRIC program. The framework includes four general characteristics (purpose, allowable applicants, pri-orities, and annual budget), four risk elements (exposure to hazard, vulnerabilities, consequences, and risk score or index), and three equity dimensions (contextual, procedural, and distributional).
TABLE A.1
Programs Selected for Review
Program Federal Department Approximate Program Size
BUILD, now called RAISE DOT $8.9 billion in 12 rounds of funding since FY 2009
CDBG-MIT HUD $6.875 billion allocated to cover disasters in FYs 2016–2018
Brownfields Multipurpose Program EPA $8.8 million in FY 2021
HSGP DHS $1.12 billion in FY 2020
Building Resilient Infrastructure and Communities Mitigation Grant Program, Considerations of Hazard Risk and Social Equity
52
General Observations
Overall, our review of the four federal programs showed that risk concepts are incorporated into each pro-gram but that only HSGP uses quantitative scoring. Risk mitigation or improvement in safety is a feature of all four programs. Preexisting risk or safety issues typically determine program eligibility. When used, BCAs are generally focused on physical assets and not broader socioeconomic measures of community well-being. Of the four programs, CDBG-MIT is the closest analog of BRIC, albeit with ten times the annual funding.
Our review also shows that each of the four programs incorporates at least two of the three dimensions of equity (context, procedural, and distributional). These equity dimensions are addressed through both explicit program criteria and implicit noncriterion sources. For instance, procedural equity can be addressed through variation in cost-sharing, stakeholder engagement requirements, and eligibility criteria. Distribu-tional equity is typically implemented through set-asides or points related to community needs. Across all programs, questions that frame the equity problem need more-systematic consideration.
Better Utilizing Investments to Leverage Development
The purpose of DOT’s BUILD program was to provide awards for surface transportation infrastructure projects. In the past decade, BUILD has been funded at between $1 billion and 1.5 billion, at least twice BRIC’s program value during its first year of FY 2020. Since FY 2009, $8.9 billion total was made in awards in 12 rounds of grantmaking (DOT, 2021). As of 2021, the program is now called RAISE.
General CharacteristicsThe BUILD program designates SLTT governments as eligible applicants, as well as transit agencies, port authorities, and metropolitan planning organizations. The program’s investment priorities are to
• improve access to reliable, safe, and affordable transportation for communities in rural areas• make concurrent investment in broadband to facilitate productivity and help rural residents access
opportunities, or promote energy independence to help deliver significant local or regional economic benefit.
BUILD issued its last NOFO in February 2020. The program is notable for its explicit statement of pri-orities and its encouragement of project integration with other concurrent investment to achieve various national goals. BUILD’s secondary criteria for choosing among subapplications include the extent to which the proposed project promotes innovation through innovative technologies, project delivery, and financing. The extent and quality of partnerships are also included in the criteria.
Risk ElementsSafety is the first primary selection criterion in the BUILD program, intended to reduce individual and com-munity exposure to harm. The applicant must show how the project would improve safety outcomes within the project area or wider transportation network. Reducing vulnerabilities might include eliminating unsafe grade crossings or contributing to preventing unintended releases of hazardous materials. Vulnerabilities could also be reduced by improving the condition or resilience of existing transportation facilities and sys-tems (criterion of “state of good repair”), as well as improving infrastructure supporting border security.
The applicant must show how the project would reduce the number, rate, and consequences of transportation-related accidents, serious injuries, and fatalities. Other primary criteria include enhance-
A Review of Other Federal Grant Programs
53
ments to economic competitiveness, environmental sustainability, and quality of life. BUILD does not rely on a single risk score or index. In fact, the only instance in which risk is called out is “environmental risk” in the context of the potential for approval processes embedded in environmental regulations causing delays in construction. Other project risks flagged in BUILD’s NOFO include procurement delays and failure of the local match to materialize.
Equity DimensionsThe BUILD program does not explicitly address contextual equity, but several features potentially affect procedural equity. For instance, the federal cost share is 80 percent in urban areas, but more is allowed for rural areas, reducing barriers for a rural applicant that might struggle to identify resources to cover its part of the cost. The program also has an economic competitiveness criterion that allocates points to proposed proj-ects that decrease transport costs and improve access, ultimately aiming to create jobs and other economic opportunities. A quality-of-life criterion allocates points to proposed projects that increase transport choices, expand access to essential services (especially for rural communities), or improve connectivity in rural areas and tribal lands.
Additional features of BUILD potentially affect distributional equity. For instance, the program states that not more than 50 percent of funds should be awarded to projects in urban and rural areas, respectively. This reflects the equality principle of distributive justice, resulting in equal distribution by geography. Addi-tionally, the program’s higher federal cost share for rural areas reflects the need principle of distributive jus-tice, resulting in a higher proportion of the grant for a rural than for an urban awardee.
Community Development Block Grant Mitigation
The purpose of HUD’s CDBG-MIT program is to provide funding to areas affected by recent disasters to “carry out strategic and high-impact activities to mitigate disaster risks and reduce future losses” (Office of the Assistant Secretary for Community Planning and Development, 2021). Among the four programs exam-ined, CDBG-MIT bears the closest resemblance to BRIC in its goals and priorities, but on a larger scale. In response to disasters in 2016 through 2018, CDBG-MIT allocated $6.875 billion (Office of the Assistant Sec-retary for Community Planning and Development, 2021)—more than ten times the $500 million in funding available to BRIC in FY 2020.
General CharacteristicsApplicants are restricted to states that have received CDBG Disaster Recovery funds from HUD. Funding is based on each grantee’s proportional share of total CDBG Disaster Recovery funds allocated for all eligible disasters in 2015, 2016, and 2017. The program has three priorities:
• Reduce repetitive loss of property and critical infrastructure.• Build capacity among SLTTs to analyze disaster risks and update hazard mitigation plans through use
of data and meaningful community engagement.• Support risk reduction to community lifelines and future disaster costs.
Risk ElementsCDBG-MIT focuses on communities recovering from natural disasters, which, by definition, reflects expo-sure to a hazard as a threshold criterion for eligibility. Vulnerability is considered through the allotment of at
Building Resilient Infrastructure and Communities Mitigation Grant Program, Considerations of Hazard Risk and Social Equity
54
least 50 percent of grants to the most-impacted and -distressed (MID) areas listed by ZIP Code in the Federal Register. Activities selected for funding are intended to ensure that “critical areas are made more resilient and are able to reliably function during future disasters, can reduce the risk of loss of life, injury, and prop-erty damage and accelerate recovery following a disaster” (Office of the Assistant Secretary for Community Planning and Development, 2021).
The objectives of CDBG-MIT and BRIC are remarkably similar. Each program is intended to increase resilience in communities prone to natural disasters and reduce risk and repetitive losses. Priorities for CDBG-MIT funding are driven by losses suffered by communities from recent disasters, but the program also requires applicants to mitigate future risks as well. Both programs require communities to have up-to-date hazard mitigation plans (HMPs), which are a precondition for receipt of a FEMA grant. However, FEMA’s HMP program does not currently require that a plan incorporate, say, the future risk associated with a changing climate. In this sense, both CDBG-MIT and BRIC are concerned with addressing future risks but, as yet, have not provided the requisite guidance to applicants on how to evaluate such risks in their pro-posals for mitigation funding. As one example, guidance on how HMPs should describe potential impacts of a changing climate, particularly for extreme rainfall and heat, as well as SLR, should be foundational to investments in flood mitigation. Such guidance might take the form of simple graphics showing projections of changes in recurrence intervals of extreme climate-related events, based on downscaled results from global climate models or scenario-based approaches to projecting climatic change over decades. For examples of climate projections have been incorporated into mitigation planning, see Fischbach, Knopman, et al., 2018; Fischbach, Siler-Evans, et al., 2017; Fischbach, Wilson, et al., 2020; and Groves, Fischbach, Bloom, et al., 2013. In addition, local and regional land-use plans typically do not account for the effects that new technolo-gies (e.g., teleworking, electric vehicles) can have on patterns of development and changes in asset values (Lempert et al., 2020).
Equity DimensionsThe CDBG-MIT program has “a statutory focus on benefiting vulnerable lower-income people and com-munities and targeting the most impacted and distressed [MID] areas” (Office of the Assistant Secretary for Community Planning and Development, 2019, p. 45838). This focus on existing vulnerabilities is addressing contextual equity. The program also enhances procedural equity by requiring grantees to hold at least four public hearings in MID areas that are accessible to people with disabilities and limited English proficiency. However, there might be less representation of groups lacking technical capacity because a grantee must have a separate webpage (updated monthly) describing its CDBG-MIT activities and demonstrate sufficient capac-ity to manage funds.
Additional aspects of CDBG-MIT can affect distributional equity. For instance, the program specifies that at least 50 percent of funds must address risks in MID areas and that projects must increase the resilience of housing that serves vulnerable populations (transitional, permanent supportive, or public housing; per-manent housing serving people who are homeless). These features utilize the need principle to target funds toward improving the welfare of the least advantaged (identified via housing-related vulnerabilities). The CDBG-MIT program also permits a BCR less than 1.0 if a grantee demonstrates concrete benefits to low- or moderate-income individuals or areas, thus allowing poor communities to offset costs with benefits, such as improving recreational opportunities, public health, or economic development potential.
A Review of Other Federal Grant Programs
55
Brownfields Multipurpose Program
EPA’s Brownfields Multipurpose Program empowers states, communities, tribes, and nonprofit organiza-tions to prevent, inventory, assess, clean up, and reuse brownfield sites. Its purpose is to ensure that residents of communities historically affected by economic disinvestment, health disparities, and environmental con-tamination have an opportunity to reap the benefits from brownfield redevelopment. In FY 2021, EPA pro-vided $8.8 million in total for 11 grants, part of a larger $66.5 million program for brownfield assessment and cleanup (EPA, 2021).
General CharacteristicsThe applicant must be a sole owner of at least one brownfield site in the target area and not be liable for con-tamination at the site. The owner can be a local government, land clearance authority, state, state government entity, regional council, redevelopment agency, tribe, nonprofit, limited liability company, limited partner-ship of nongovernmental organizations, or community development entity. The Brownfields Multipurpose Program seeks to fund projects that present a vision for reuse and redevelopment of brownfield sites and strategies for leveraging federal resources. A proposed project must demonstrate that it would address envi-ronmental, social, health, and economic needs of the target area and yield benefits. A notable feature of the program is that it incorporates strong community engagement as part of its selection criteria.
Risk ElementsThe program aims to reduce threats to the health and welfare of sensitive populations from exposures to hazardous substances, pollutants, contaminants, controlled substances, petroleum and petroleum products, and mine scarring at brownfields sites. Reducing exposure can come in the form of expansion, redevelop-ment, and reuse of a site. Eligible projects can develop inventories of brownfield sites, conduct environmental assessments, and develop cleanup and reuse plans and activities. Subapplications need to demonstrate envi-ronmental, social, health, and economic needs and benefits of the area targeted by the grantee.
The program does not use a risk score or index but does rely on a scoring process that includes
• description of a priority brownfield site• feasibility of the site-reuse strategy• extent to which economic development is stimulated by the completion of cleanup• measurement of environmental results.
Equity DimensionsThe Brownfields Multipurpose Program addresses contextual equity by taking into account existing condi-tions (five points are allocated when background on cultural and industrial history demonstrates brown-field challenges and degree of community impact). Additionally, procedural equity is addressed through a detailed community engagement criterion (15 points) that prioritizes diverse local organizations being involved (five points); meaningful involvement of these organizations in decisionmaking (five points); and community input being solicited, considered, and responded to in meaningful ways (five points).
Distributional equity is addressed in the Brownfields Multipurpose Program in several ways:
• First, the program promotes activities that aim to improve the welfare of the most affected: Up to 10 per-cent of funds may be used for health monitoring of exposed populations and monitoring and enforce-ment of institutional control to prevent exposure.
Building Resilient Infrastructure and Communities Mitigation Grant Program, Considerations of Hazard Risk and Social Equity
56
• Grantees may also purchase environmental insurance, which protects against risks related to cleanup cost overruns, third-party liability, and lender liability.
• The program prioritizes funding of projects that spur economic growth within opportunity zones (which are census tracts of low-income and distressed communities designated by state governors and certified by the U.S. Department of Treasury).
• The program also directs funds to projects aimed at improving the welfare of the least advantaged and most marginalized (identified via income, population size, and health disparities) by prioritizing com-munity need for funding (five points) where other funding cannot be secured because of a community’s small population or low income.
• Finally, the program emphasizes that funds should be distributed to sensitive populations (15 points) as indicated by the severity of health or welfare issues (five points); greater-than-normal incidence of dis-ease and adverse health conditions (five points); and disproportionate share of negative environmental consequences of industrial, governmental, or commercial operations or policies (five points).
Homeland Security Grant Program
After the September 11, 2001, attacks, HSGP was put in place for the purpose of better equipping states and local governments to “prevent, protect against, and respond to terrorist attacks” (DHS, 2021). The program includes subsidiary elements, such as the State Homeland Security Program, Urban Areas Security Initiative (UASI), and Operation Stonegarden.
General CharacteristicsAllowable applicants include SLTT and nonprofits. Eligible high-risk urban areas for the FY 2020 UASI pro-gram have been determined through an analysis of relative risk of terrorism faced by the 100 most populous metropolitan statistical areas in the United States. The total funding available for HSGP was $1.12 billion in FY 2021, of which $615 million was specifically for UASI (FEMA, 2021c).
Risk ElementsHSGP takes a quantitative approach to ranking proposals based on estimating risk by way of its constituent parts of threat, vulnerability, and consequence. Risk is calculated as a weighted sum of three indexes: (threat index * 0.25) + (vulnerability index * 0.25) + (consequence index * 0.5).
The threat index, vulnerability index, and consequence index are themselves weighted sums:
• The threat index is estimated using the THIRA tool and SPR process. • The vulnerability index is a weighted sum: (border index * 0.1) + (targeted infrastructure
index * 0.1) + (soft target index * 0.5).• The consequence index is a weighted sum: (gross domestic product [GDP] index * 0.13) + (population
index * 0.3) + (national infrastructure index * 0.05) + (military personnel index * 0.02).
The results of the quantitative risk assessment drive 80 percent of HSGP funding, with the remaining 20 percent allocated through four specific set-asides, each for 5 percent of the total funding: enhancement of cybersecurity (including election security); enhancement of protection of soft targets and crowded places (including election security); enhancement of information and intelligence sharing and cooperation with fed-eral agencies, including DHS; and measures to mitigate emergent threats (e.g., unmanned aircraft systems).
A Review of Other Federal Grant Programs
57
Equity DimensionsHSGP does not directly address contextual or distributional equity, but some features address procedural equity. Overall, the program requires investment justifications to demonstrate how activities support pro-gram goals with “federal, state, tribal, and local governments, as well as other regional, and nonprofit part-ners” (DHS, 2021, p. 21). By recognizing these multiple groups within the sociopolitical system, the program makes a small step toward ensuring their inclusion and representation. Additionally, the UASI cybersecurity investment justification (5 percent) requires that at least one project be in support of the state’s efforts to enhance election security. Effective election security is fundamental for participatory parity.
International Examples of Resilience Frameworks for Infrastructure Investment
We were unable to identify international examples of domestic grant programs comparable to the BRIC pro-gram. That said, we saw value in examining two conceptual frameworks for investments in resilience:
• The first provides the underpinning of a Dutch grant program aimed at fostering private investment in climate mitigation and adaptation activities among vulnerable populations in developing countries (Dutch Fund for Climate and Development, 2019).
• The second takes the form of recommendations to the UK government from NIC (NIC, 2020). Each of these examples demonstrates a national focus on identifying the unique elements of investing in resil-ient infrastructure to address the impacts of a changing climate.
In the past decade, many other resilience frameworks have been developed in the United States and abroad to guide both domestic investment and foreign assistance. These frameworks have been reviewed elsewhere (Bond et al., 2017; Knopman and Lempert, 2016; Strong and Knopman, 2017).
Dutch Fund for Climate and DevelopmentThe program enables private-sector investment in climate adaptation and mitigation projects in develop-ing countries (in Africa, Asia, and Latin America). Funding is administered through a consortium led by the Dutch entrepreneurial development bank Nederlandse Financierings-Maatschappij voor Ontwikkeling-slanden (FMO) (Dutch Fund for Climate and Development, 2019). Applicants must be private-sector inves-tors with commercially viable project proposals in developing countries. The program is aimed at reduc-ing climate-change effects on vulnerable populations, either by contributing to greenhouse gas emission reduction (mitigation) or reducing vulnerability to climate-related effects through adaptive and resilience measures. Priorities for project funding include climate-resilient water systems, water management and freshwater ecosystems, forestry, climate-smart agriculture, and ecosystem restoration. The program requires applicants to express their intended effects in terms consistent with 1992 Rio markers and 2015 Sustainable
Building Resilient Infrastructure and Communities Mitigation Grant Program, Considerations of Hazard Risk and Social Equity
58
Development Goals.1 Funding in the form of development grants is allocated through one of three “facili-ties,” or pools of similar types of projects:
• project origination (€30 million for approximately 70 projects)• land-use projects (€55 million for approximately 25 companies)• water projects (€75 million for approximately 30 projects).
The program’s “bid book” devotes considerable attention to business and financial risks that arise with investments intended to produce demonstrable benefits to people and places in these projects. There is no requirement for applicants to quantify risks arising from climate-related extreme weather or slower-moving trends. Equity is treated explicitly by restricting the program to proposals that will benefit vulnerable popu-lations in developing countries. Further, at least 25 percent of funding is aimed at regions that the Dutch Ministry of Foreign Affairs has identified as least-developed countries.
The relevance to BRIC is limited because of the program’s exclusive focus on climate mitigation and adaptation, its applicability to vulnerable populations only in developing countries, and its dependence on private investors to execute the projects in the host countries. However, the project evaluation framework is noteworthy for its reliance on measures of projected performance outcomes in lieu of ranking projects based on existing levels of risk. Furthermore, funding allocations are segmented into three facilities, alleviating the need for comparing, for example, a water project with a land-use project. Finally, the program relies on private investors vetting the financial viability and sustainability of the proposed projects, albeit under the performance guidelines proscribed by the program.
The United Kingdom National Commission on Infrastructure’s Resilience FrameworkNIC provides the UK government with expert advice on “major long term infrastructure challenges” and monitors progress on implementing the NIC’s recommendations (NIC, 2020). In 2020, NIC issued a report recommending that the UK employ a resilience policy and regulatory framework for public infrastructure investment. The report included three primary recommendations:
• The UK government should publish resilience standards every five years.• Infrastructure operators should carry out “regular and proportionate stress tests, overseen by regula-
tors,” to ensure that standards are being met.• Infrastructure operators should develop and maintain long-term resilience strategies; regulators should
ensure that pricing of infrastructure services is consistent with meeting standards in the short and long terms.
The report states that “resilience standards are government’s responsibility. . . . Government will always get involved when there are serious failures or risks are too high for the private sector” (NIC, 2020, p. 10). The framework identifies six elements of resilience: anticipate, resist, absorb, recover, adapt, and transform. The
1 The reference to the 1992 Rio markers points to environmental and climate goals in particular, first set in 1992 at the UN Conference on Environment and Development, commonly known as the Earth Summit, in Rio de Janeiro. These goals were defined and enhanced with specific metrics to reduce greenhouse gas emissions and reduce vulnerability to climate change through adaptation by the Organisation for Economic Co-operation and Development (Development Assistance Committee, 2016). In 2015, the UN established a set of 17 global goals called the Sustainable Development Goals. These goals call for the elimination of poverty and hunger, as well as environmental action. The 13th goal relates to taking urgent action to combat climate action and its effects (UN General Assembly, 2015; Department of Economic and Social Affairs, undated).
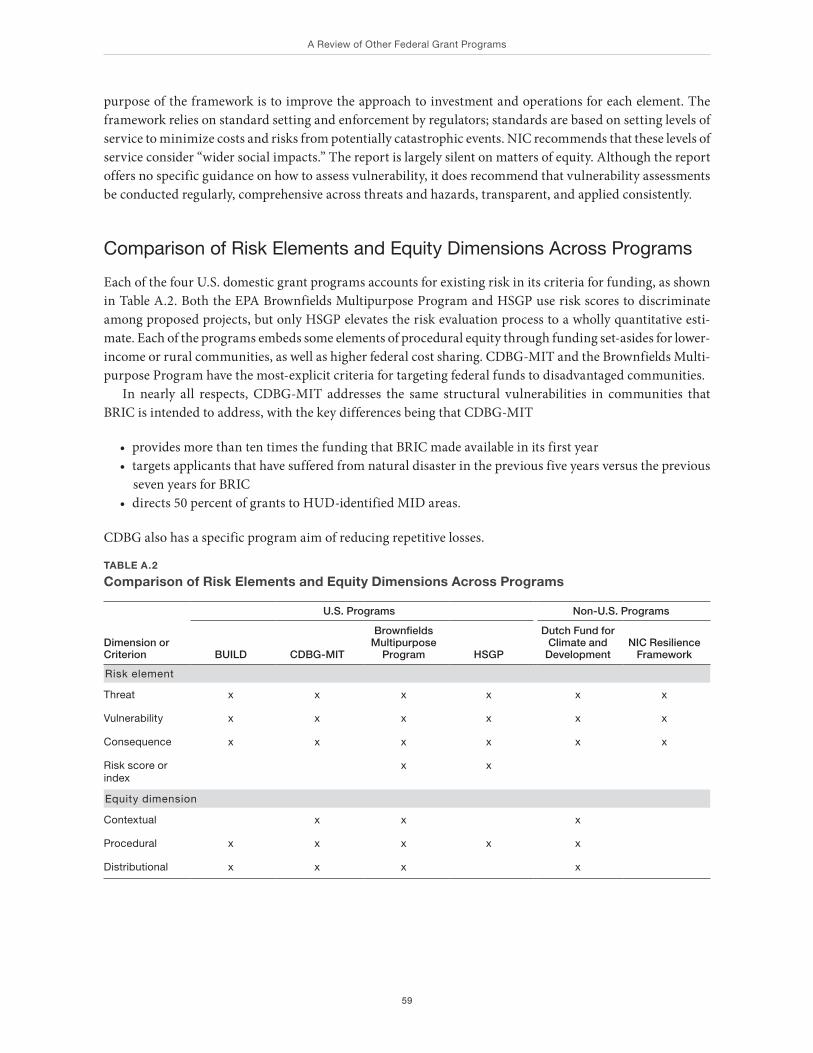
A Review of Other Federal Grant Programs
59
purpose of the framework is to improve the approach to investment and operations for each element. The framework relies on standard setting and enforcement by regulators; standards are based on setting levels of service to minimize costs and risks from potentially catastrophic events. NIC recommends that these levels of service consider “wider social impacts.” The report is largely silent on matters of equity. Although the report offers no specific guidance on how to assess vulnerability, it does recommend that vulnerability assessments be conducted regularly, comprehensive across threats and hazards, transparent, and applied consistently.
Comparison of Risk Elements and Equity Dimensions Across Programs
Each of the four U.S. domestic grant programs accounts for existing risk in its criteria for funding, as shown in Table A.2. Both the EPA Brownfields Multipurpose Program and HSGP use risk scores to discriminate among proposed projects, but only HSGP elevates the risk evaluation process to a wholly quantitative esti-mate. Each of the programs embeds some elements of procedural equity through funding set-asides for lower-income or rural communities, as well as higher federal cost sharing. CDBG-MIT and the Brownfields Multi-purpose Program have the most-explicit criteria for targeting federal funds to disadvantaged communities.
In nearly all respects, CDBG-MIT addresses the same structural vulnerabilities in communities that BRIC is intended to address, with the key differences being that CDBG-MIT
• provides more than ten times the funding that BRIC made available in its first year• targets applicants that have suffered from natural disaster in the previous five years versus the previous
seven years for BRIC• directs 50 percent of grants to HUD-identified MID areas.
CDBG also has a specific program aim of reducing repetitive losses.
TABLE A.2
Comparison of Risk Elements and Equity Dimensions Across Programs
Dimension or Criterion
U.S. Programs Non-U.S. Programs
BUILD CDBG-MIT
Brownfields Multipurpose
Program HSGP
Dutch Fund for Climate and
DevelopmentNIC Resilience
Framework
Risk element
Threat x x x x x x
Vulnerability x x x x x x
Consequence x x x x x x
Risk score or index
x x
Equity dimension
Contextual x x x
Procedural x x x x x
Distributional x x x x

61
APPENDIX B
Criteria for Comparing Existing National Hazard–Risk Assessment Tools
Table 2.2 in Chapter Two summarizes the criteria used to review each national risk assessment tool. The details of each criterion are described in this appendix, including a definition and supporting select examples among the tools reviewed in Appendix C. The criteria are the risk assessment approach used, the coverage of the data or data layers, transparency and accessibility, and other risk considerations.
Risk Assessment Approach
The risk assessment approach is the process used to estimate loss and likelihood of loss as a result of the risk components discussed in Chapter Two (i.e., hazards, vulnerability, and consequences). Approaches can include quantitative aspects (such as the use of historical data, statistical methods, or model simulation to calculate values to represent all or some of the risk components) and qualitative aspects (such as the use of methodologies that employ surveys, stakeholder engagement, or planning exercises to qualitatively under-stand risk and processes associated with risk). Except for the THIRA tool, the reviewed risk assessment approaches leveraged mostly quantitative approaches.
Data Sources and Coverage
After consulting data sources and assessment outputs, we reviewed each assessment tool for its coverage in terms of types of natural hazards addressed, geography, and spatial scale.
Natural Hazards AddressedNatural hazards are physical phenomena resulting from geophysical (e.g., earthquakes, landsides, tsunamis), hydrological (e.g., floods, drought), meteorological (e.g., hurricanes, tornadoes), and climatological (e.g., extreme temperatures, wildfires) conditions. Each of the reviewed assessment tools addressed between one and 18 natural hazards. One qualitative assessment, FEMA’s THIRA/SPR program, is an outlier, meant to address as many as 59 hazards, including human-caused, technological, and naturally occurring hazards, although communities can choose to accommodate more.
Geographic ExtentGeographic extent refers to the parts of the United States covered by an assessment tool. Geographic areas include the continental and extracontinental United States. Continental U.S. areas can be assessed by all of the tools, but extracontinental U.S. areas are available for only some of the tools.
Building Resilient Infrastructure and Communities Mitigation Grant Program, Considerations of Hazard Risk and Social Equity
62
Spatial ScaleSpatial scale is the unit of space at which assessment can be directed. In the assessment tools, this could include a single property or building (e.g., the FSF Flood Model), a census block, a census tract, a county, or a state. Within a tool, the spatial scale might vary across hazards, depending on data availability within a layer. Sometimes, a higher spatial unit will aggregate measures from lower spatial units; other times, such as in NRI, if a lower spatial unit is missing data, the unit will be assigned values from its parent spatial unit.
Transparency and Accessibility
Transparency and accessibility refer to the ability to access and use an assessment tool. Each tool was evalu-ated for three criteria of transparency and accessibility: public availability, validation, and flexibility.
Public AvailabilityPublic availability refers to ease of access to an assessment tool and its underlying data. To assess public availability, we addressed such questions as the following: How can the data sources and assessment tool be accessed? Are the methodologies peer-reviewed and available for review? Some tools are semipublic or pro-prietary and make their methodologies available in published articles.
ValidationValidation describes the process of checking or proving the validity, accuracy, and reliability of the tool. Vali-dation includes questions related to whether and how regularly the risk assessment methods and data have been tested, adopted, updated, and replicated or scaled.
FlexibilityFlexibility refers to the ability to customize or extend a tool for a user’s needs. In addition, flexibility was also a factor in evaluating varying levels of technical expertise a tool required to use it. In some cases, although users at any level might be able to use a tool, the sophistication of an assessment’s results might depend on a user’s technical knowledge or expertise.
Other Risk Considerations
So far, risk approaches have been assessed for their quantitative and qualitative approaches to assessing risk to respective hazards. BRIC and the author team identified specific risk considerations that are important for long-term mitigation efforts, and each tool was reviewed for the level of risk considerations that addressed future risk, effects on lifeline infrastructure, and cascading risk.
Future RiskFuture risk entails the change in risk associated with future climate developments or other potential drivers. For example, the behavior and characteristics of hazards might defy expectations based uncertain effects of climate change. A few risk assessment tools (e.g., Climate Central, Rhodium Group, FSF) incorporate climate simulations or take other measures to adjust for climate, while another (NRI) relies on historical data to pre-dict risk to avoid dealing with too much uncertainty in its model.
Criteria for Comparing Existing National Hazard-Risk Assessment Tools
63
Cascading RiskCascading risk refers to potential interdependencies of risk, in which damage or failure in one part of a system leads to effects in other parts of the system. For example, Hazus has a data integration feature for creating scenarios that might reflect cascading or overlapping risks. This feature is meant to help emergency manag-ers assess inventory and plan for response.
Lifeline InfrastructureThe lifeline infrastructure criterion measures whether the tool offers a general consideration of facilities that provide services essential to achieving continuity of operations during a disaster. These include sec-tors or utilities (e.g., telecommunications, energy, water and wastewater), facilities (e.g., hospitals, emergency services, schools), and networks (e.g., transportation, pipelines) (FEMA, 2019). For example, Hazus and the RAND critical infrastructure exposure analysis use the DHS HIFLD data layer, which identifies essential facilities and defines them as hospitals, U.S. Department of Veterans Affairs medical facilities, schools, uni-versities, fire stations, police stations, highway bridges, tunnels, railway network, bus connectivity and sta-tions, ports, airport facilities and runways, water and wastewater facilities, natural gas pipelines and facili-ties, electricity, and emergency operation centers and FEMA headquarters.

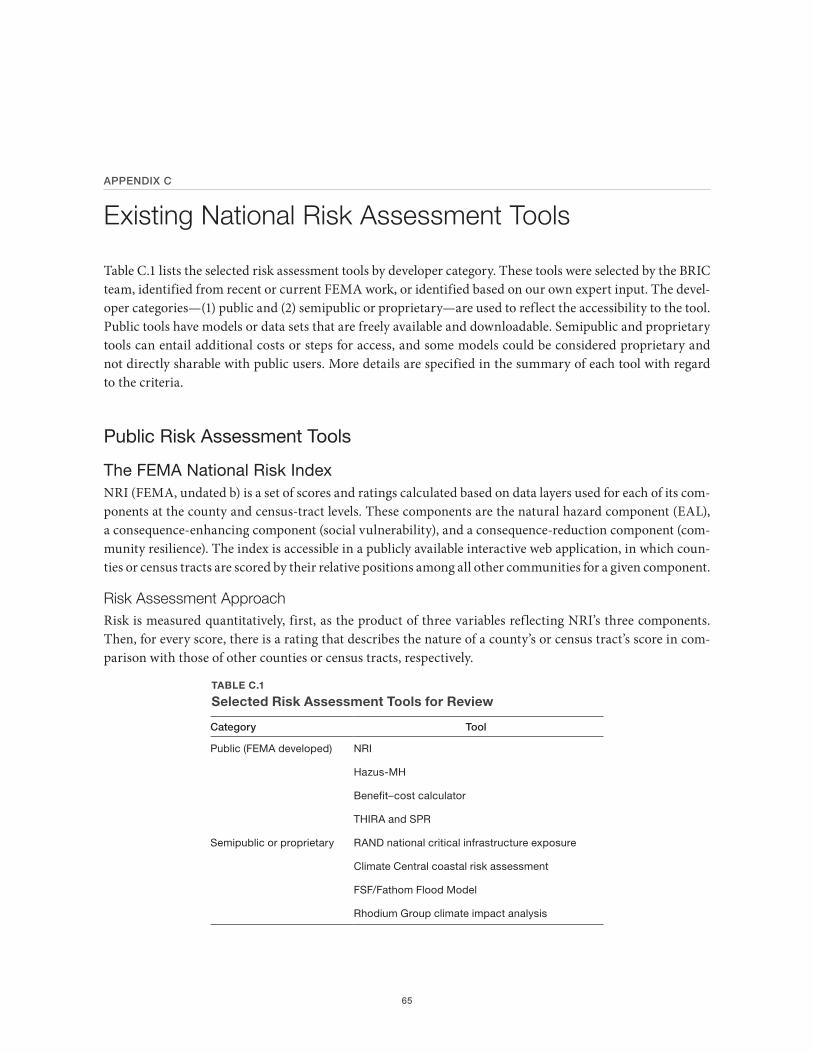
65
APPENDIX C
Existing National Risk Assessment Tools
Table C.1 lists the selected risk assessment tools by developer category. These tools were selected by the BRIC team, identified from recent or current FEMA work, or identified based on our own expert input. The devel-oper categories—(1) public and (2) semipublic or proprietary—are used to reflect the accessibility to the tool. Public tools have models or data sets that are freely available and downloadable. Semipublic and proprietary tools can entail additional costs or steps for access, and some models could be considered proprietary and not directly sharable with public users. More details are specified in the summary of each tool with regard to the criteria.
Public Risk Assessment Tools
The FEMA National Risk IndexNRI (FEMA, undated b) is a set of scores and ratings calculated based on data layers used for each of its com-ponents at the county and census-tract levels. These components are the natural hazard component (EAL), a consequence-enhancing component (social vulnerability), and a consequence-reduction component (com-munity resilience). The index is accessible in a publicly available interactive web application, in which coun-ties or census tracts are scored by their relative positions among all other communities for a given component.
Risk Assessment ApproachRisk is measured quantitatively, first, as the product of three variables reflecting NRI’s three components. Then, for every score, there is a rating that describes the nature of a county’s or census tract’s score in com-parison with those of other counties or census tracts, respectively.
TABLE C.1
Selected Risk Assessment Tools for Review
Category Tool
Public (FEMA developed) NRI
Hazus-MH
Benefit–cost calculator
THIRA and SPR
Semipublic or proprietary RAND national critical infrastructure exposure
Climate Central coastal risk assessment
FSF/Fathom Flood Model
Rhodium Group climate impact analysis
Building Resilient Infrastructure and Communities Mitigation Grant Program, Considerations of Hazard Risk and Social Equity
66
NRI is a product of (1) the sum of the EAL of all hazards assessed, (2) the social vulnerability index (SoVi), and (3) the inverse of a community resilience index (R): risk = (Σ(EAL)) ✳ SoVi ✳ (1/R):
1. As the natural hazard component of NRI, the sum of the EAL is calculated for each hazard in relation to a geography by multiplying the dollar exposure (E), the annual frequency (F), and the historical loss ratio (L). Depending on the type of hazard and data availability, the annual frequency is calcu-lated as a result of the number of events or event-days each year, or the probability of an event hap-pening in a year (e.g., earthquakes, wildfires, and floods use a probabilistic average). Historical loss reflects an estimated percentage of building stock, agricultural crops, or population (using VSL) to be harmed or lost: EAL = E ✳ F ✳ L.
2. SoVi, as the consequence-enhancing component, reflects a measure of the social vulnerability of counties and census tracts to environmental hazards (Hazards and Vulnerability Research Institute, undated b; Cutter, Boruff, and Shirley, 2003). Developed by the Hazards and Vulnerability Research Institute at the University of South Carolina, the index synthesizes 30 socioeconomic variables that contribute to reduction in a communities ability to cope with hazards (Cutter, Boruff, and Shirley, 2003). The methodology relies on a data standardization and principal component analysis process to develop a set of statistically optimized subcomponents that are then aggregated into a single numeri-cal score (Hazards and Vulnerability Research Institute, undated b).
3. The community resilience index (Hazards and Vulnerability Research Institute, undated a), as the consequence-reduction component, reflects a composite measure of a community’s ability “to pre-pare for anticipate natural hazards, adapt to changing conditions, and withstand and recover rapidly from disruptions” (FEMA, 2020b). Also developed by the Hazards and Vulnerability Research Insti-tute (Hazards and Vulnerability Research Institute, undated a), the Baseline Resilience Indicators for Communities index relies on 49 variables arrayed over six categories of “community resilience capital,” including variables associated with social and cultural attributes of populations, values, and belief systems; economic and financial assets and livelihoods; infrastructure and housing; institu-tions and governance; community capacity, and environmental conditions and natural resource base. Within each category, the prevalent variables were transformed and then normalized using a min–max technique, typically used in building social composite measures (Casadio Tarabusi and Guarini, 2013; Cutter, Ash, and Emrich, 2016). The resulting categorical indexes were then summed to give the community resilience index.
Each of these components is represented by a unitless index value, which gives a geography’s score relative to others. These scores are constrained to a range of 0 to 100 and then rescaled to a min–max normalization after a cube root transformation (to accommodate variations in rural and urban density).
For every score, there is also a nonnumerical rating that correlates with the score: very low, relatively low, relatively moderate, relatively high, and very high. To determine the ratings, k-means clustering is applied to group similar geographies as much as possible such that variance within a rating group is minimized but variance across rating groups is maximized.
Data Sources and CoverageContributing to the NRI calculation are data layers identified through public knowledge, subject-matter expert recommendations, and research (summarized in Table C.2). Hazard data, particularly historical loss and probabilistic area, come from the Spatial Hazard Events and Losses Database for the United States (SHELDUS) (Center for Emergency Management and Homeland Security, 2020). The SoVI and Baseline Resilience Indicators for Communities, used for calculating social vulnerability and community resilience,
Existing National Risk Assessment Tools
67
respectively, are derived from indicators and variables collected by the Hazards and Vulnerability Research Institute:
• natural hazards addressed: NRI covers 18 natural hazards: avalanche, coastal flood, cold wave, drought, earthquake, hail, heat wave, hurricane and tropical storm, landslide, lightning, riverine flood, severe thunderstorm, tornado, tsunami or seiche, volcano, wildfire, wind, and winter weather.
• geography included: 50 states are represented, but territories are lacking at present.• spatial scale: NRI results are reported at the state, county, and census-tract levels. When possible, EAL
estimates are calculated at the smallest spatial unit (census tract) and then aggregated up to county and state levels. The Baseline Resilience Indicators for Communities Index and SoVI are calculated at the county level, so census tracts are assigned parent-county value.
TransparencyThe components of transparency for NRI are listed below:
• public availability: The index variables, EAL, and EAL components are available for public download at multiple geographic and spatial levels. The development of NRI is aimed at increasing awareness and reducing the costs associated with generalized risk assessment (Burns, Zuzak, and Rozelle, 2018).
• validation: The validation process is ongoing with input from external stakeholders and subject-matter experts.
• flexibility: NRI is meant to provide a baseline standardized framework into which data can be down-loaded at any scale and more-accurate local data can be swapped out for national data in order to cus-tomize risk assessment (Burns, Zuzak, and Rozelle, 2018). Data sets can also be activated or deactivated as deemed necessary.
Future and Cascading Risk ConsiderationsBelow are descriptions of how NRI currently addresses future and cascading risks and lifeline infrastructure:
• future risk: NRI does not incorporate SLR or other climate-change impacts. It should also be noted that most-recent source data sets include a period of record only up to 2017, so changes in EAL and hazard frequency after that could change estimates.
• cascading risk: NRI does not consider economic or physical interdependencies across geographies or geographic regions, nor is there an ability to assess spillover effects as risk is assigned. As mentioned in our assessment of NRI’s spatial scale, data layers are measured at the smallest possible spatial unit and then aggregated up or else assigned a value based on the parent spatial unit. In addition, there is not a full view of interconnected hazard risk (e.g., pluvial risk and dam and levee risk are not addressed).
• lifeline infrastructure: This is not specifically included or considered, but estimates of hazard likeli-hood could be overlaid with lifeline infrastructure in a follow-on analysis.
FEMA Hazus MultihazardHazus-MH is a GIS-based multihazard model designed primarily for local and regional hazard mitigation planners and emergency managers, who often lack deep expertise in flood risk–modeling and GIS (FEMA, 2021b). It includes a nationally applicable methodology and a wide array of baseline data to produce probabi-listic and deterministic economic and physical damage loss estimates for user-designed scenarios of flooding and building characteristics.
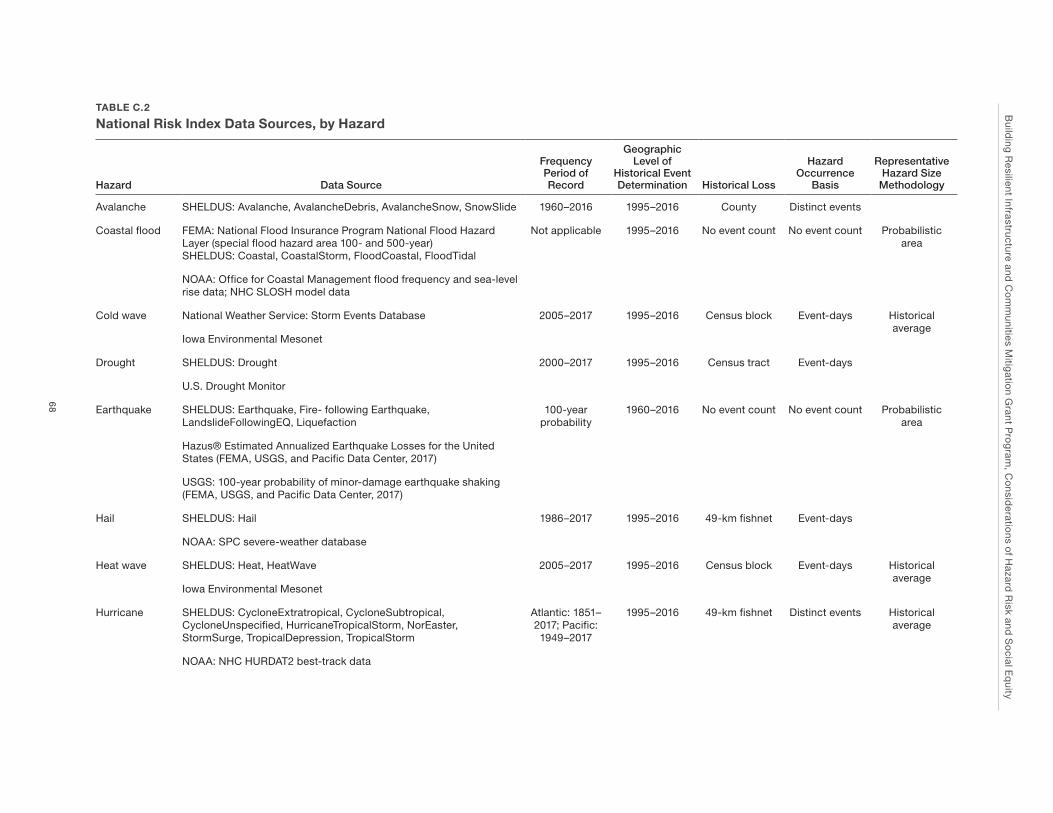
Build
ing R
esilient Infrastructure and
Co
mm
unities Mitig
ation G
rant Pro
gram
, Co
nsideratio
ns of H
azard R
isk and S
ocial E
quity
68
TABLE C.2
National Risk Index Data Sources, by Hazard
Hazard Data Source
Frequency Period of Record
Geographic Level of
Historical Event Determination Historical Loss
Hazard Occurrence
Basis
Representative Hazard Size
Methodology
Avalanche SHELDUS: Avalanche, AvalancheDebris, AvalancheSnow, SnowSlide 1960–2016 1995–2016 County Distinct events
Coastal flood FEMA: National Flood Insurance Program National Flood Hazard Layer (special flood hazard area 100- and 500-year)SHELDUS: Coastal, CoastalStorm, FloodCoastal, FloodTidal
Not applicable 1995–2016 No event count No event count Probabilistic area
NOAA: Office for Coastal Management flood frequency and sea-level rise data; NHC SLOSH model data
Cold wave National Weather Service: Storm Events Database 2005–2017 1995–2016 Census block Event-days Historical average
Iowa Environmental Mesonet
Drought SHELDUS: Drought 2000–2017 1995–2016 Census tract Event-days
U.S. Drought Monitor
Earthquake SHELDUS: Earthquake, Fire- following Earthquake, LandslideFollowingEQ, Liquefaction
100-year probability
1960–2016 No event count No event count Probabilistic area
Hazus® Estimated Annualized Earthquake Losses for the United States (FEMA, USGS, and Pacific Data Center, 2017)
USGS: 100-year probability of minor-damage earthquake shaking (FEMA, USGS, and Pacific Data Center, 2017)
Hail SHELDUS: Hail 1986–2017 1995–2016 49-km fishnet Event-days
NOAA: SPC severe-weather database
Heat wave SHELDUS: Heat, HeatWave 2005–2017 1995–2016 Census block Event-days Historical average
Iowa Environmental Mesonet
Hurricane SHELDUS: CycloneExtratropical, CycloneSubtropical, CycloneUnspecified, HurricaneTropicalStorm, NorEaster, StormSurge, TropicalDepression, TropicalStorm
Atlantic: 1851–2017; Pacific: 1949–2017
1995–2016 49-km fishnet Distinct events Historical average
NOAA: NHC HURDAT2 best-track data
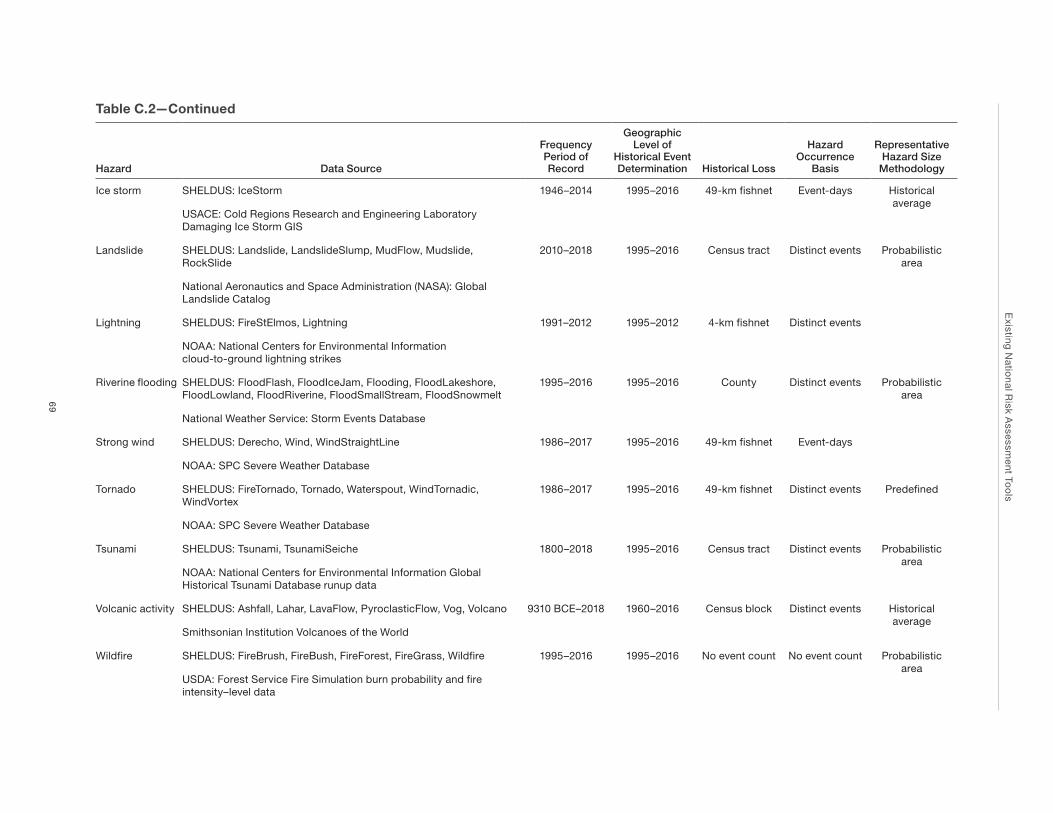
Existing
Natio
nal Risk A
ssessment To
ols
69
Hazard Data Source
Frequency Period of Record
Geographic Level of
Historical Event Determination Historical Loss
Hazard Occurrence
Basis
Representative Hazard Size
Methodology
Ice storm SHELDUS: IceStorm 1946–2014 1995–2016 49-km fishnet Event-days Historical average
USACE: Cold Regions Research and Engineering Laboratory Damaging Ice Storm GIS
Landslide SHELDUS: Landslide, LandslideSlump, MudFlow, Mudslide, RockSlide
2010–2018 1995–2016 Census tract Distinct events Probabilistic area
National Aeronautics and Space Administration (NASA): Global Landslide Catalog
Lightning SHELDUS: FireStElmos, Lightning 1991–2012 1995–2012 4-km fishnet Distinct events
NOAA: National Centers for Environmental Information cloud-to-ground lightning strikes
Riverine flooding SHELDUS: FloodFlash, FloodIceJam, Flooding, FloodLakeshore, FloodLowland, FloodRiverine, FloodSmallStream, FloodSnowmelt
1995–2016 1995–2016 County Distinct events Probabilistic area
National Weather Service: Storm Events Database
Strong wind SHELDUS: Derecho, Wind, WindStraightLine 1986–2017 1995–2016 49-km fishnet Event-days
NOAA: SPC Severe Weather Database
Tornado SHELDUS: FireTornado, Tornado, Waterspout, WindTornadic, WindVortex
1986–2017 1995–2016 49-km fishnet Distinct events Predefined
NOAA: SPC Severe Weather Database
Tsunami SHELDUS: Tsunami, TsunamiSeiche 1800–2018 1995–2016 Census tract Distinct events Probabilistic area
NOAA: National Centers for Environmental Information Global Historical Tsunami Database runup data
Volcanic activity SHELDUS: Ashfall, Lahar, LavaFlow, PyroclasticFlow, Vog, Volcano 9310 BCE–2018 1960–2016 Census block Distinct events Historical average
Smithsonian Institution Volcanoes of the World
Wildfire SHELDUS: FireBrush, FireBush, FireForest, FireGrass, Wildfire 1995–2016 1995–2016 No event count No event count Probabilistic area
USDA: Forest Service Fire Simulation burn probability and fire intensity–level data
Table C.2—Continued
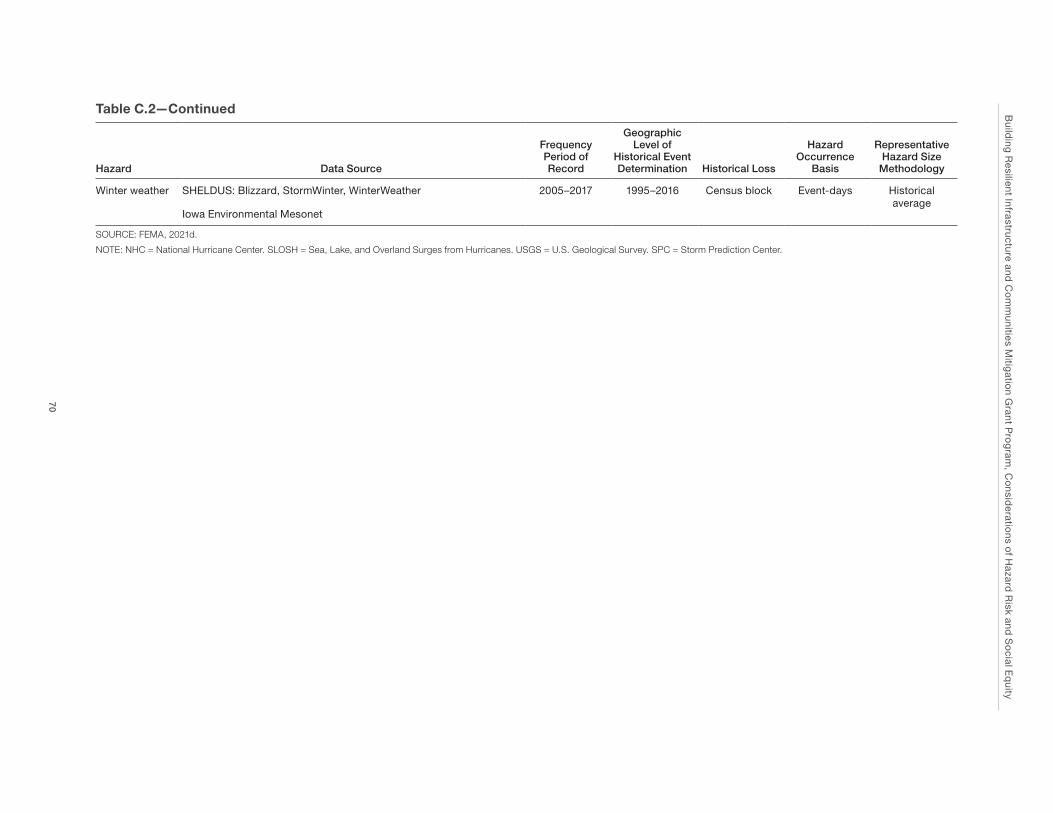
Build
ing R
esilient Infrastructure and
Co
mm
unities Mitig
ation G
rant Pro
gram
, Co
nsideratio
ns of H
azard R
isk and S
ocial E
quity
70
Hazard Data Source
Frequency Period of Record
Geographic Level of
Historical Event Determination Historical Loss
Hazard Occurrence
Basis
Representative Hazard Size
Methodology
Winter weather SHELDUS: Blizzard, StormWinter, WinterWeather 2005–2017 1995–2016 Census block Event-days Historical average
Iowa Environmental Mesonet
SOURCE: FEMA, 2021d.
NOTE: NHC = National Hurricane Center. SLOSH = Sea, Lake, and Overland Surges from Hurricanes. USGS = U.S. Geological Survey. SPC = Storm Prediction Center.
Table C.2—Continued
Existing National Risk Assessment Tools
71
Risk Assessment ApproachData integration tools use default data with the option to add a user’s own data to assess risk. These integra-tion tools include an inventory collection and survey tool, a building import tool, and a flood information tool.
Hazus can be used to estimate the average annual loss in terms of economic loss and structural damage by calculating a specific hazard exposure for a selected area, characterizing the intensity of the hazard affect-ing the exposed area, and overlaying asset inventory data. Potential damage and loss rely on national data sets of buildings, infrastructure, population, and land use at the census-block scale, using HIFLD (HIFLD, undated), the FEMA general building stock data set, and the U.S. census. Direct losses reflect cost of repairs or replacements, income loss, human casualties and shelter needs, temporary housing, vehicles, and crop and livestock losses. Indirect loss captures supply shortages, sales decline, opportunity costs, and economic losses.
Data Sources and CoverageThis section is organized by hazard because sources, coverage, and availability vary by hazard. Hazards are floods, earthquakes, tsunami, and hurricanes, with work underway to include tornadoes. Although data for other hazards are not readily available, exposure maps could be overlaid with inventory and asset data.
• flood: Data are available for all 50 states at the census-tract, census-block, county, state and territory, community, or watershed level. However, there are inventory data limitations for territories with a capa-bility to upload relevant data if needed. As for specific data, the FEMA-generated depth grids use FEMA digital Flood Insurance Rate Maps; NHC SLOSH; and event high–water mark data. Data can be used to observe flooding effects for ten-, 25-, 50-, 100-, 200-, and 500-year return period floods.
• hurricane: Data are available for the Atlantic and Gulf Coasts and Hawaii at the census-tract, county, city, municipality-group, or state level. The hurricane model uses National Hurricane Program’s HUR-REVAC hurricane hazard analysis, including SLOSH and Simulating Waves Nearshore (wave-height) options.
• earthquake: Data are available by city, county, or region, covering the continental and extracontinen-tal United States, but data are older for Alaska, Hawaii, Puerto Rico, and the U.S. Virgin Islands. The earthquake model uses USGS ShakeMaps from the Earthquake Hazards Program, which provides near-real-time shaking and ground movement data. The underlying probabilistic methodology uses information from historical earthquakes and inferred faults, locations, and magnitudes to compute probable ground-shaking levels during a recurrence period, by census tract.
• tsunami: For the earthquake model, data availability are limited to narrow strips along the shoreline. These states and territories include Alaska, California, Hawaii, Oregon, Washington (state), Puerto Rico, the U.S. Virgin Islands, the North Mariana Islands, Guam, and American Samoa.
TransparencyThe components of transparency for Hazus are listed below:
• public availability: All of the data used for Hazus are publicly available FEMA data, using FEMA-developed methodologies. However, methodologies and how data sets are developed or sourced are vague, and the outputs for each hazard should be uniquely interpreted.
• validation: The technical manuals include validation studies for historical events. In addition, there is a substantial community of users and academics sharing and publishing validation studies (Jamie Caplan Consulting, undated). Hazus appears to be used in other FEMA tools, including the Flood Assessment
Building Resilient Infrastructure and Communities Mitigation Grant Program, Considerations of Hazard Risk and Social Equity
72
Structure Tool (FEMA, undated a), the proposed Public Assistance deductible (FEMA, 2017), and the BCA tool (FEMA, 2021f).
• flexibility: Expert users can replace baseline data with user-supplied data and toggle data layers on and off as needed.
Future and Cascading Risk ConsiderationsBelow is a description of how Hazus addresses future and cascading risks, as well as lifeline infrastructure:
• future risk: There are no signs of incorporation.• cascading risk: The data integration provides a single, fully integrated set of functions for scenario
creation, assessing inventories, and reporting. There was a macroeconomic model that has been discon-tinued as a feature. USACE does calculate commodities, such as points of distribution, personnel for disbursement of supplies, and resources needed for a disaster.
• lifeline infrastructure: This is included as site-specific data in the shape of points or lines signifying essential facilities (e.g., police stations, emergency operations, fire stations, schools, medical facilities), lifeline infrastructure (e.g., utilities and transportation), and high–potential loss facilities (e.g., hazard-ous material facilities, dams, nuclear plants).
FEMA Benefit–Cost Analysis CalculatorThe BCA calculator (FEMA, 2021f) is an Excel-based add-in used to calculate benefits divided by total costs to help guide FEMA’s HMA and Public Assistance funding for mitigation measures that are cost-effective. The scale of the analysis is intended to be project-specific, with templates varying by project (e.g., hazard mitigation for a particular building or asset). Examples of projects include building retrofits, tornado safe rooms, and wildfire mitigation. For a community or property, the tool assists with estimating annual hazard risks, evaluating mitigation cost-effectiveness, and developing aggregate benefit–cost models.
Risk Assessment ApproachThe end result is a BCR that is quantitatively calculated as a project’s total benefits divided by its total costs. A project is considered cost-effective when the BCR is 1.0 or greater, indicating that the benefits of a prospective hazard mitigation project are sufficient to justify the costs.
In order to conduct an analysis, a user will take the following steps:
1. Develop and input estimates for costs of a project into the tool.2. Adjust the estimate to account for project timing and whether the data are current.3. Develop estimates for benefits.4. Review and confirm the cost estimate.
The BCA template changes with the type of project, and FEMA has precalculated benefits an applicant can use for certain projects. Precalculated benefits include those for acquisitions and elevations in response to flood hazards (D. Miller, undated), hurricane wind retrofits (Federal Insurance and Mitigation Admin-istration, undated a; Grimm, 2018), tornado safe rooms (Federal Insurance and Mitigation Administration, undated b), and wildfire mitigation (Federal Insurance and Mitigation Administration, 2016).
Data Sources and CoverageThe process of entering information into the calculator includes specific inputs and provides suggestions to help with gathering the appropriate inputs. Each hazard being addressed has a base module, usually based on
Existing National Risk Assessment Tools
73
Hazus. The flood module uses Flood Insurance Rate Maps in addition to the option of using Hazus depth-damage functions and displacement values.
• natural hazards addressed: BCA-supported analysis covers flood, tornado, hurricane, earthquake,wildfire, drought, landslide, and multihazard damage-frequency assessment.
• geography included: All states and territories are included.• spatial scale: This is dependent on the scale of the project being assessed and can be at the census-block
or a user-defined level.
TransparencyHow the BCA tool addresses components of transparency is discussed below:
• public availability: The tool is publicly available with documentation. However, a recent HSOAC studyfound that 75 percent of test projects proposed would not meet the BCR requirements (Mendelsohn,2021). There is a helpline available to anyone who desires technical assistance, including inquiries aboutmodules and data requirements, to which responses are expected to be provided within 48 hours.
• validation: FEMA continues to invest in improving the BCA tool and offer more precalculated benefitsto reduce any implications that the tool leads to a bottleneck in projects.
• flexibility: There is flexibility for capturing other risks using historical data, and the predicted returnon investment could be used to feed future metrics on mitigation return on investment.
Future and Cascading Risk ConsiderationsBelow is a discussion of how the BCA tool addresses future and cascading risks, as well as lifeline infrastructure.
• future risk: A BCA evaluates the future benefits (projected losses avoided) of a project in relation to itscost. In addition, predicted return on investments for proposed projects might feed future metrics onmitigation return on investment.
• cascading risk: Mitigation grants are very project-specific.• lifeline infrastructure: In assessing hazard risk, there is functionality for incorporating loss of services
for critical public facilities by assessing loss of function by the population it serves with the distance tothe next available facility. However, the risk captured is meant to be very project-specific.
FEMA Threat and Hazard Identification and Risk Assessment and Stakeholder Preparedness ReviewTHIRA/SPR helps communities identify, understand, and prioritize a normal set of natural, human-caused, and technological risks it faces to make decisions and prepare for threats and hazards (FEMA, 2021e).
Risk Assessment ApproachBased on stakeholder and community engagement, THIRA/SPR is a qualitative assessment carried out in two parts. The THIRA part is focused on risk assessment for developing capability requirements by identify-ing threats and hazards of concern, giving those threats and hazards context using standardized impact lan-guage, and establishing a capability target. The SPR process identifies the current capabilities at the relevant scale (community, state, regional, or national). Together, the THIRA/SPR process allows the user to then identify a gap in current capabilities and the capability target to help with planning, such as these:
• capability target = “Within 24 hours of an incident, firefighting operations conducted to suppress andextinguish 300 structure fires”
Building Resilient Infrastructure and Communities Mitigation Grant Program, Considerations of Hazard Risk and Social Equity
74
• current capability = “Within 24 hours, . . . 250 structure fires”• capability gap = “Within 24 hours of an incident, . . . 50 structure fires.”
Each capability gap is assigned a priority (low, medium, or high) and confidence level (1 through 5). Gap-closing strategies might seek to include increasing a community’s capability or sharing mutual capabilities with other communities.
Scenarios used to identify threats and hazards and develop capability targets can be developed using modeling or historical data sets.
Data Sources and CoverageThe data sources and coverage of THIRA are described below:
• natural hazards addressed: THIRA is not limited to natural hazards. The methodology included a lit-erature review of 59 potential threats and hazards, including technological and human-caused.
• geography included: It extends to the continental and extracontinental United States. • spatial scale: There are community-level and national THIRA tools.
TransparencyHow THIRA addresses the components of transparency is described below:
• public availability: The methodology is available to any community. The national THIRA is also meant to contribute to improvements across the entire field of risk management by standardizing risk and capability language across plans and encouraging investments in closing identified capability gaps.
• validation: Regular exercises are used to test the community’s, or nation’s, ability to meet its capability targets, making the assessment and results iterative.
• flexibility: A community can set its capability target to the level it deems appropriate and should use its impact data to guide decisions on what that level of capability should be. If a community selects an impact that is different from the one identified in THIRA, it needs to describe how it chose that impact and the sources used. THIRA capability targets should reflect a community’s unique planning and investment strategies.
Future and Cascading Risk ConsiderationsHow THIRA addresses future and cascading risks and lifeline infrastructure is discussed below:
• future risk: The purpose is to plan to mitigate future risk and identify capability gaps, although how future risk is actually measured by a community could constrain how gaps are identified. For example, a community might not consider climate hazards because it lacks separately developed data or research to inform future climate hazard risk.
• cascading risk: The guide suggests that, although incidents could have wider regional or national effects, a community completing THIRA should focus on consequences within that community. In some cases, it could be useful to include threats or hazards elsewhere if they affect the community (e.g., a chemical plant outside the community upwind or upriver).
• lifeline infrastructure: Communities and stakeholders are encouraged to identify infrastructure needs.
Existing National Risk Assessment Tools
75
Semipublic or Proprietary Risk Assessment Tools
The RAND National Critical Infrastructure Exposure ProjectThis project developed projections for infrastructure exposures in the future as a result of climate change in the United States, providing an integrated view of infrastructure exposure to a variety of potentially high-intensity natural hazards. The report describes exposures across multiple infrastructure sectors and multiple hazards, and it incorporates both current infrastructure exposure to natural hazards and uncertainty about the extent and intensity of future natural hazards (Willis et al., 2016).
Risk Assessment ApproachThis analysis focused on exposure and hazards and applied the following steps involved in assessment:
1. Compile present and future hazard data (for example, using data from the World Climate Research Programme’s Coupled Model Intercomparison Project Phase 5 [CMIP5] for extreme temperatures, drought, and wildfires; USGS data for landslides and tsunamis; and Hazus data for hurricanes).
2. Identify infrastructure asset types to include in the analysis (using HIFLD).3. Decide whether a given asset is truly at risk of “exposure” to a given hazard based on inherent attri-
butes of each asset, as well as whether exposure of the asset to a particular hazard is likely to have consequences.
4. Overlay infrastructure and hazard data to provide views of infrastructure exposure to one or more hazards, now and in the future.
Data Sources and CoverageThe data sources and coverage addressed in the project are described below:
• natural hazards addressed: It addresses four climate-adjusted natural hazards (coastal flooding, extreme temperatures, meteorological drought, wildfires) and seven non–climate-adjusted natural haz-ards (earthquake, hurricane wind, ice storms, riverine flooding, tsunamis, tornadoes, landslides).
• geography included: It covers the contiguous United States (excluding Alaska, Hawaii, and other ter-ritories).
• spatial scale: It includes county-level counts of population or infrastructure exposed by hazard, return interval or likelihood, and time period.
TransparencyHow this project dealt with the components of transparency is described below:
• public availability: Because the underlying HIFLD data set contains proprietary commercial data sets, the analysis is aggregated at the county level. Data layers are available to FEMA and DHS as a whole for further exploration via an existing Tableau visualization tool.
• validation: All methods are peer-reviewed and published (Narayanan, Willis, et al., 2016).• flexibility: The results of the analysis have been published.
Future and Cascading Risk ConsiderationsHow this project dealt with future and cascading risks and lifeline infrastructure is described below:
• future risk: Climate-adjusted hazards are included when possible in the interest of accounting for future climate change where possible, but the focus is only on exposure. Where no hazards are adjusted
Building Resilient Infrastructure and Communities Mitigation Grant Program, Considerations of Hazard Risk and Social Equity
76
for future climate change, the analysis should not be interpreted to be insensitive to climate change but should be understood to mean that climate change’s effect on some hazards could not be captured (Willis et al., 2016).
• cascading risk: There are no signs of incorporation.• lifeline infrastructure: The focus is on five infrastructure sectors: chemical industry, communications,
energy, transportation, and water supply and wastewater treatment.
Climate Central Coastal Risk AssessmentClimate Central, a nonprofit research organization, has developed and hosts three commercial tools, includ-ing the SLR/Coastal Flood Layer, PAT, and CoastalDEM, a screening tool using “improved elevation data” to better understand threats from SLR and coastal flooding (Climate Central, undated c). A publicly avail-able Coastal Risk Screening Tool previews the CoastalDEM data (Climate Central, undated b). The affiliated nonprofit news and communication site (Climate Central, undated a) has a series of other tools, maps, and visualization for hazards other than flooding.
Risk Assessment ApproachClimate Central’s SLR and coastal flood maps incorporate big data sets. Because this invites some error, these maps should be regarded as screening tools to identify places for deeper investigation of risk. The three risk assessment tools work as follows:
• The SLR/Coastal Flood Layer feeds an interactive tool that allows mapping of areas at different amounts of SLR and flooding, down to neighborhood scale, matched with area timelines of risk. The tool also provides statistics on population, homes, and land affected by city, county, and state, plus links to fact sheets and data downloads. The projections are on a 2º-by-2º global grid and from projections at 1,022 tide gauges worldwide (Tebaldi, Strauss, and Zervas, 2012). U.S. flood risk statistics are annual probabilities of flood events based on 30-year history.
• CoastalDEM provides bare-earth elevations for low-lying coastal areas, applying machine-learning techniques to improve the National Aeronautics and Space Administration’s Shuttle Radar Topogra-phy Mission (SRTM) digital elevation model (DEM) to model at a continuous vertical resolution and 100-foot horizontal resolution (SRTM provides 1-m vertical increments versus continuous). Coastal-DEM aims to include such elements as treetops and rooftops that the SRTM’s digital surface model excludes.
• PAT is a web service that can be used to quantify coastal flood risk in as many as 10,000 locations at a time in spreadsheet format. Building on the SLR and coastal flood and DEM research, the tool is meant to help with resilience planning for real estate, critical facilities, infrastructure, and supply chains.
Data Sources and CoverageThe data sources and coverage of Climate Central’s tools are described below:
• natural hazards addressed: It addresses flood and SLR; separate maps are available on the communica-tion site for drought, winter weather, wildfires, and hurricane risk.
• geography included: It covers the continental United States; anything outside that derives from a global data set.
• spatial scale: It covers neighborhoods and buildings, down to 3-m resolution.
Existing National Risk Assessment Tools
77
TransparencyHow Climate Central’s tools address the components of transparency is described below:
• public availability: The data sets can be requested, and interactive GIS tools are available online. Cli-mate Central also has a guide on how to access information—in particular, for FEMA’s Community Rating System program (Climate Central, undated d).
• validation: Climate Central regularly publishes research and claims that CoastalDEM validation tests indicate very little vertical bias and reduces median errors compared with other DEMs (Climate Cen-tral, undated b).
• flexibility: The tool and data are accessible in collaboration with Climate Central.
Future and Cascading Risk ConsiderationsHow Climate Central’s tools address future and cascading risks, as well as lifeline infrastructure, is described below:
• future risk – CoastalDEM defaults to annual flood level in 2050 (but does not take into account such factors as erosion, future changes in the frequency or intensity of storms, inland flooding, or contributions from rainfall or rivers).
– SLR and coastal flood layers allow for future risk projections. – PAT analyzes specific locations aimed to inform climate resilience planning for real estate, critical facilities, infrastructure, and supply chains.
• cascading risk: There are no signs of incorporation.• lifeline infrastructure: Infrastructure and critical facilities appear to be included in PAT.
First Street Foundation/Fathom Flood ModelingFSF provides a probabilistic NFM that shows the risk of flooding due to rainfall (pluvial), riverine (fluvial), and coastal-surge flooding. These hazard layers are meant to produce cumulative statistics for different flood levels for every residential property in the United States.
Risk Assessment ApproachThree hydraulic and hydrodynamic models are deployed in the creation of the NFM: LISFLOOD-FP for hydraulics, GeoClaw for coastal storm surge, and advanced circulation Simulating Waves Nearshore for cali-brating GeoClaw outputs in addition to historical storm recreation. Because of computational efficiencies, LISFLOOD-FP and GeoClaw were chosen to execute the thousands of simulations needed to create a national probabilistic model.
By combining efficient models with observational data and general circulation model derivatives, a set of hazard layers is being generated that reflects the climate-adjusted flood risk to the United States in 2020, 2035, and 2050. Because of the uncertainty in climate modeling, three sets of hazard layers are being gener-ated to reflect the median expectation from the climate models in addition to both lower and higher possibili-ties, with the high and low thresholds being quantified as the 25th and 75th percentiles.
The approach also uses the Representative Concentration Pathways (RCPs) developed as scenarios to illustrate different climate trajectories as a result of various levels of greenhouse gas concentrations in the atmosphere by the Intergovernmental Panel on Climate Change. FSF uses RCP 4.5, deeming it as the “most plausible” scenario, as opposed to the “worst-case” scenario represented by RCP 8.5 and a “best-case” sce-nario represented by RCP 2.6.
Building Resilient Infrastructure and Communities Mitigation Grant Program, Considerations of Hazard Risk and Social Equity
78
Data Sources and CoverageThe climate model output uses NOAA Atlas 14 precipitation data, CMIP5 general circulation models, and the RCP 4.5 scenario (van Vuuren et al., 2011). Historical flood data rely on USGS river gauge data, NOAA tide gauge data, and USGS elevation data. Regionalization methods are used to assign ungauged catchment curve typologies based on gauged catchments with similar characteristics, resulting in state-of-the-art meth-ods with some considerable error still to be worked out (Andrew Smith, Sampson, and Bates, 2015). Adapta-tion data include approximately 23,000 features and adaptation measures that affect flood risk collected by FSF in a seemingly proprietary data set from local and national sources. Adaptation measures are assumed to protect for the return period level for which they are designed without risk of failure in the NFM.
• natural hazards addressed: It addresses pluvial (rainfall), riverine (fluvial), and coastal-surge flooding.• geography included: It covers the continental United States.• spatial scale: It covers cities, neighborhoods, and buildings, down to 3-m resolution in some locations.
TransparencyThe components of transparency are described below:
• public availability: Some data sets and models can be made available on request.• validation: All work has been published and methods peer-reviewed and documented. In addition, FSF
has used high–water mark data, National Flood Insurance Program claims, Individual Assistance flood claims, and U.S. Small Business Administration flood claims to check recreated historical flooding extents against observed flooding locations to calibrate model performance.
• flexibility: The model is continuously being worked on and updated as a result of more than 80 experts collaborating.
Future and Cascading Risk ConsiderationsFuture and cascading risk considerations are described below:
• future risk: The flood model takes into account changing environmental factors, including SLR, increasing cyclonic intensity, higher probabilities of cyclone landfall locations at higher latitudes, shift-ing precipitation patterns, and shifts in river discharge. The manner in which each changing factor is incorporated in the model varies, but the results are probability distribution functions created from a blending of observed, synthetic, and forecasted inputs. Ultimately, the future risk models rely heavily on agreed-upon Intergovernmental Panel on Climate Change recommendations related to changing environmental conditions and the primary drivers associated with RCP 4.5 (van Vuuren et al., 2011). This information is explicitly integrated along with an ensemble of global climate models in order to estimate expected flood risk while allowing uncertainty around factors associated with those estimates.
• cascading risk: There are no signs of incorporation.• lifeline infrastructure: FSF data are being used to analyze public infrastructure exposure (Sadiq et al.,
undated).
Rhodium Group Climate Impact AnalysisThrough the Climate Risk Service (Rhodium Group, undated b) and Climate Impact Lab (Climate Impact Lab, undated), Rhodium Group uses data to quantify the effects and costs that climate change has on a sector basis, as well as by community. The focus is on economic effects of physical climate-change risk at the asset (e.g., municipal bonds, real estate assets, infrastructure), firm, and portfolio levels.
Existing National Risk Assessment Tools
79
Risk Assessment ApproachUsing a stock-and-flow analysis, econometric modeling is used to quantify the effect that climate condi-tions have on a variety of social, economic, and market outcomes (including GDP, labor productivity, and building-level energy costs). These are mapped to localized effects at the asset, portfolio, and industry levels. Unlike other, “top-down” GDP analyses, this approach aggregates “bottom-up” microfounded estimates of U.S. damage.
Mortality risk reflects the monetized value of changes in mortality rate due to climate change, as well as changes in expenditures on adaptation. This value is calculated by projecting the effects that climate change has on mortality rates, then applying a VSL measure to determine the costs of excess mortality risk in a given year (Carleton et al., 2021). Damage is valued at EPA’s income-scaled VSL of $10.95 million. Damage is aggregated up to a higher geographical level from respective impact regions and presented as a percentage change in projected GDP using the “regional rivalry” pathway developed by the International Institute for Applied Systems Analysis as a climate scenario in its Shared Socioeconomic Pathway project. This pathway is the third among five Shared Socioeconomic Pathway scenarios that attempt to project socioeconomic global changes that arise as a result of different levels of greenhouse gas emissions through 2100 (Riahi et al., 2017).
Climate projections use a surrogate model/mixed ensemble method (Rasmussen, Meinshausen, and Kopp, 2016) to produce a probabilistic ensemble, weighting projections by comparing their global mean sur-face temperature projections with those of a probabilistic sample Model for the Assessment of Greenhouse Gas Induced Climate Change version 6 climate model (Meinshausen, Raper, and Wigley, 2011).
Data Sources and CoverageClimate projections use downscaled CMIP5 projections prepared by the Bureau of Reclamation (Brekke et al., 2013), based on RCPs 2.5, 4.5, and 8.5 (van Vuuren et al., 2011).
• natural hazards addressed: It addresses extreme temperature, SLR, and hurricanes.• geography included: It covers U.S. and global areas.• spatial scale: It works at the neighborhood level.
TransparencyThe components of transparency are described below:
• public availability and flexibility: The Climate Impact Lab model and data appear to be proprietary. The Climate Risk Service can be accessed through flat files, an application programming interface under development, and ClimateDeck (Rhodium Group, undated a), a tailored, interactive platform for data analysis and visualization.
• validation: Methods are all published and cited, based on peer-reviewed literature.
Future and Cascading Risk ConsiderationsFuture and cascading risk considerations are described below:
• future risk: The goal of the work is to assess the implications of future climate risk, as well as update the work with adaptation measures.
• cascading risk: There is no sign of incorporation. Analyses appears to be sector by sector or community by community and then aggregated up to higher geographical scales.
• lifeline infrastructure: Infrastructure is one of the asset categories.

81
APPENDIX D
Data Used by the Application Evaluation Tool
The AET uses three main sources of data: risk layers from the NRI data set, demographic layers for the SVI data set, and year 1 application data from the BRIC program.
The National Risk Index Data Set
The AET includes two types of risk information from the NRI data set: EALs and categorized risk levels. The 18 included risk layers are avalanche, coastal flooding, cold wave, drought, earthquake, hail, heat wave, hur-ricane, ice storm, landslide, lightning, riverine flooding, strong wind, tornado, tsunami, volcanic activity, wildfire, and winter weather.
We intentionally excluded the NRI aggregated risk index variable because we do not recommend aggre-gating different types of risks when evaluating a project designed to address a specific or few select risks. For example, a location could have a high aggregated risk index score due to high earthquake risk. If a specific mitigation project is designed to address flood risk, however, a user could inappropriately conclude that the project addresses an important and significant risk.
The Social Vulnerability Index Data Set
The AET includes all 15 underlying demographic data layers from the SVI data set:
• socioeconomic status – below poverty – unemployed – (low) income – no high school diploma
• household composition and disability – age 65 or older – age 17 or younger – civilian (older than age 5) with a disability – single-parent households
• minority status and language – minority – older than age 5 who speaks English “less than well”
• housing type and transportation – multiunit structures – mobile homes – crowding
Building Resilient Infrastructure and Communities Mitigation Grant Program, Considerations of Hazard Risk and Social Equity
82
– no vehicle – group quarters.
Like with the risk information, we do not include the SVI aggregated social vulnerability index variable or subindex variables because we do not recommend using aggregated demographic information for policy-making because of internal and theoretical inconsistencies. For instance, Spielman et al., 2020, demonstrates that SoVI values at the county level can change in response to expanding the amount of data used to calculate the index values. That analysis also showed that, in some cases, increasing unemployment is related to lower values of SoVI, even though the opposite relationship is expected.
Year 1 Application Data for the BRIC Program
The AET prototype was developed using preliminary year 1 BRIC application data. These data include basic subapplicant-entered names (typically communities) and descriptions of the proposed project; narrative description of the influence area; classifications of the primary, secondary, and tertiary risks addressed; and type of project, point locations, project cost, and BCR. For purposes of developing the prototype, we deter-mined the census block associated with the user-provided location for comparisons with the risk and demo-graphic data.1
We also developed a simple table to indicate the status of each subapplication in the BRIC selection pro-cess. At the time of this draft, subapplications were still being scored, so we had no data on outcomes of that scoring process; therefore, we developed fictitious data for later stages of the selection process for the purpose of developing visualization.
1 For a few subapplications, point location data were not provided, so we inferred a point location based on a physical address or description of the project location.

83
Abbreviations
AAL average annual lossAET application evaluation toolATSDR Agency for Toxic Substances and Disease RegistryBCA benefit–cost analysisBCEGS Building Code Effectiveness Grading ScheduleBCR benefit–cost ratioBRAC base realignment and closureBRIC Building Resilient Infrastructure and CommunitiesBUILD Better Utilizing Investments to Leverage DevelopmentC&CB capability and capacity buildingCDBG community development block grantCDBG-MIT Community Development Block Grant MitigationCMIP5 Coupled Model Intercomparison Project Phase 5DEM digital elevation modelDHS U.S. Department of Homeland SecurityDOT U.S. Department of TransportationDRF Disaster Relief FundDRRA Disaster Recovery Reform ActEAL expected annual lossEPA U.S. Environmental Protection AgencyFEMA Federal Emergency Management AgencyFSF First Street FoundationFY fiscal yearGDP gross domestic productGIS geographic information systemHazus-MH Hazus multihazardHIFLD Homeland Infrastructure Foundation-Level Data HMA Hazard Mitigation AssistanceHMGP Hazard Mitigation Grant ProgramHMP hazard mitigation planHSGP Homeland Security Grant ProgramHSOAC Homeland Security Operational Analysis CenterHUD U.S. Department of Housing and Urban DevelopmentMID most impacted and distressedNAC National Advisory CouncilNFM nationwide flood modelNHC National Hurricane CenterNIC National Infrastructure Commission
Building Resilient Infrastructure and Communities Mitigation Grant Program, Considerations of Hazard Risk and Social Equity
84
NOAA National Oceanic and Atmospheric AdministrationNOFO notice of funding opportunityNRI National Risk IndexPAT Portfolio Analysis ToolPDM Pre-Disaster Mitigation RAISE Rebuilding American Infrastructure with Sustainability and EquityRCP Representative Concentration PathwaySHELDUS Spatial Hazard Events and Losses Database for the United StatesSLOSH Sea, Lake, and Overland Surges from HurricanesSLR sea-level riseSLTT state, local, tribal, and territorialSoVI Social Vulnerability Index (Cutter, Boroff, and Shirley)SPC Storm Prediction CenterSPR Stakeholder Preparedness ReviewSRTM Shuttle Radar Topography MissionSVI Social Vulnerability Index (Centers for Disease Control and Prevention)THIRA Threat and Hazard Identification and Risk AssessmentUASI Urban Areas Security InitiativeUK United KingdomUN United NationsUSACE U.S. Army Corps of EngineersUSGS U.S. Geological SurveyVSL value of a statistical life
85
References
Adger, W. Neil, “Vulnerability,” Global Environmental Change, Vol. 16, No. 3, August 2006, pp. 268–281.
Agency for Toxic Substances and Disease Registry, Centers for Disease Control and Prevention, “CDC/ATSDR Social Vulnerability Index,” database, data for 2018, last reviewed August 27, 2021. As of May 15, 2021: https://www.atsdr.cdc.gov/placeandhealth/svi/data_documentation_download.html
Ager, Alan A., Jeffrey D. Kline, and A. Paige Fischer, “Coupling the Biophysical and Social Dimensions of Wildfire Risk to Improve Wildfire Mitigation Planning,” Risk Analysis, Vol. 35, No. 8, August 2015, pp. 1393–1406.
ATSDR—See Agency for Toxic Substances and Disease Registry.
Bakkensen, Laura A., Cate Fox-Lent, Laura K. Read, and Igor Linkov, “Validating Resilience and Vulnerability Indices in the Context of Natural Disasters,” Risk Analysis, Vol. 37, No. 5, May 2017, pp. 982–1004.
Balica, Stefania F., Nigel George Wright, and Frank van der Meulen, “A Flood Vulnerability Index for Coastal Cities and Its Use in Assessing Climate Change Impacts,” Natural Hazards, Vol. 64, No. 1, October 2012, pp. 73–105. As of May 15, 2021: https://link.springer.com/article/10.1007/s11069-012-0234-1
Beam, David R., and Timothy J. Conlan, “Grants,” in Lester M. Salamon and Odus V. Elliott, ed., The Tools of Government: A Guide to the New Governance, New York: Oxford University Press, 2002, pp. 340–380.
Berke, Philip, Siyu Yu, Matt Malecha, and John Cooper, “Plans That Disrupt Development: Equity Policies and Social Vulnerability in Six Coastal Cities,” Journal of Planning Education and Research, July 2019.
Besser, Diane, What Does “Equity” Look Like? A Synthesis of Equity Policy, Administration and Planning in the Portland, Oregon, Metropolitan Area, Portland, Oreg.: Portland State University, April 2014.
Bickers, Kenneth N., and Robert M. Stein, “Interlocal Cooperation and the Distribution of Federal Grant Awards,” Journal of Politics, Vol. 66, No. 3, August 2004, pp. 800–822.
Biden, Joseph R., Jr., “Executive Order on Advancing Racial Equity and Support for Underserved Communities Through the Federal Government,” Washington, D.C.: White House, Executive Order 13985, January 20, 2021a. As of May 15, 2021: https://www.whitehouse.gov/briefing-room/presidential-actions/2021/01/20/executive-order-advancing-racial -equity-and-support-for-underserved-communities-through-the-federal-government/
———, “Modernizing Regulatory Review,” memorandum for the heads of executive departments and agencies, Washington, D.C.: White House, January 20, 2021b. As of May 15, 2021: https://www.whitehouse.gov/briefing-room/presidential-actions/2021/01/20/modernizing-regulatory-review/
Birkmann, Joem, Omar D. Cardona, Martha Liliana Carreño, Alex H. Barbat, Mark Pelling, Simon Schneiderbauer, Margeth Keiler, David Alexander, Peter Zeil, and Torsten Welle, “Framing Vulnerability, Risk and Societal Responses: The MOVE Framework,” Natural Hazards, Vol. 67, February 2013, pp. 193–211.
Bolin, Bob, and Liza C. Kurtz, “Race, Class, Ethnicity, and Disaster Vulnerability,” in Havidan Rodríguez, William Donner, and Joseph E. Trainor, eds., Handbook of Disaster Research, 2nd ed., Cham, Switzerland: Springer, 2018, pp. 181–203.
Bond, Craig A., Aaron Strong, Nicholas Burger, and Sarah Weilant, Guide to the Resilience Dividend Valuation Model, Santa Monica, Calif.: RAND Corporation, RR-2130-RF, 2017. As of June 19, 2021: https://www.rand.org/pubs/research_reports/RR2130.html
Brekke, Levi, Bridget L. Thrasher, Edwin P. Maurer, and Tom Pruitt, Downscaled CMIP3 and CMIP5 Climate Projections: Release of Downscaled CMIP5 Climate Projections, Comparison with Preceding Information, and Summary of User Needs, U.S. Bureau of Reclamation, Climate Analytics Group, Climate Central, Lawrence Livermore National Laboratory, Santa Clara University, Scripps Institution of Oceanography, U.S. Army Corps of Engineers, and U.S. Geological Survey, May 2013. As of June 19, 2021: https://gdo-dcp.ucllnl.org/downscaled_cmip_projections/dcpInterface.html#About
Building Resilient Infrastructure and Communities Mitigation Grant Program, Considerations of Hazard Risk and Social Equity
86
Burns, J., C. Zuzak, and J. Rozelle, “Introducing FEMA’s National Risk Index: A Baseline Multi-Hazard Risk Assessment for the United States and an Interactive Web Platform to Visualize It,” American Geophysical Union, fall meeting 2018, Washington, D.C., December 2018.
Carleton, Tamma A., Amir Jina, Michael T. Delgado, Michael Greenstone, Trevor Houser, Solomon M. Hsiang, Andrew Hultgren, Robert E. Kopp, Kelly E. McCusker, Ishan B. Nath, James Rising, Ashwin Rode, Hee Kwon Seo, Arvid Viaene, Jiacan Yuan, and Alice Tianbo Zhang, “Valuing the Global Mortality Consequences of Climate Change Accounting for Adaptation Costs and Benefits,” Cambridge, Mass.: National Bureau of Economic Research, Working Paper 27599, July 2020, revised August 2021. As of May 15, 2021: http://www.nber.org/papers/w27599
Casadio Tarabusi, Enrico, and Giulio Guarini, “An Unbalance Adjustment Method for Development Indicators,” Social Indicators Research, Vol. 112, No. 1, May 2013, pp. 19–45.
CEMHS—See Center for Emergency Management and Homeland Security.
Center for Emergency Management and Homeland Security, Arizona State University, “Spatial Hazard Events and Losses Database for the United States,” Version 19.0, Phoenix, 2020.
Climate Central, homepage, undated a. As of June 19, 2021: https://www.climatecentral.org/
———, “Coastal Risk Screening Tool: Land Projected to Be Below Annual Flood Level in 2050,” undated b. As of June 19, 2021: https://coastal.climatecentral.org/map/13/-117.1548/32.6851/?theme=sea_level_rise&map_type=coastal_dem_comparison&basemap=roadmap&contiguous=true&elevation_model=best_available&forecast_year=2050& pathway=rcp45&percentile=p50&refresh=true&return_level=return_level_1&slr_model=kopp_2014
———, “See Which Properties, Investments, and Infrastructure Will Be Underwater,” undated c. As of June 19, 2021: https://go.climatecentral.org/products/
———, “Using the Surging Seas Free Web Tool Within FEMA’s Community Rating System (CRS),” undated d. As of June 19, 2021: https://sealevel.climatecentral.org/crs
Climate Impact Lab, “Measuring the Real-World Costs of Climate Change,” undated. As of June 19, 2021: http://www.impactlab.org/
Coastal Protection and Restoration Authority of Louisiana, “Louisiana’s Comprehensive Master Plan for a Sustainable Coast,” June 2, 2017. As of October 2, 2021: http://coastal.la.gov/wp-content/uploads/2017/04/ 2017-Coastal-Master-Plan_Web-Book_CFinal-with-Effective-Date-06092017.pdf
Code of Federal Regulations, Title 44, Emergency Management and Assistance; Chapter I, Federal Emergency Management Agency, Department of Homeland Security; Subchapter D, Disaster Assistance; Part 201, Mitigation Planning; Section 201.2, Definitions. As of November 24, 2021: https://www.ecfr.gov/current/title-44/chapter-I/subchapter-D/part-201
Collins, Brian K., and Brian J. Gerber, “Redistributive Policy and Devolution: Is State Administration a Road Block (Grant) to Equitable Access to Federal Funds?” Journal of Public Administration Research and Theory, Vol. 16, No. 4, October 2006, pp. 613–632.
Compass, “How to Develop a Logic Model,” undated. As of September 17, 2021: https://www.thecompassforsbc.org/how-to-guides/how-develop-logic-model-0
Cook, Benjamin Lê, Thomas G. McGuire, and Alan M. Zaslavsky, “Measuring Racial/Ethnic Disparities in Health Care: Methods and Practical Issues,” Health Services Research, Vol. 47, No. 3, pt. 2, June 2012, pp. 1232–1254.
Cutter, Susan L., Kevin D. Ash, and Christopher T. Emrich, “Urban–Rural Differences in Disaster Resilience,” Annals of the American Association of Geographers, Vol. 106, No. 6, 2016, pp. 1236–1252.
Cutter, Susan L., Lindsey Barnes, Melissa Berry, Christopher Burton, Elijah Evans, Eric Tate, and Jennifer Webb, “A Place-Based Model for Understanding Community Resilience to Natural Disasters,” Global Environmental Change, Vol. 18, No. 4, October 2008, pp. 598–606.
References
87
Cutter, Susan L., Bryan J. Boruff, and W. Lynn Shirley, “Social Vulnerability to Environmental Hazards,” Social Science Quarterly, Vol. 84, No. 2, June 2003, pp. 242–261.
Cutter, Susan L., Christopher G. Burton, and Christopher T. Emrich, “Disaster Resilience Indicators for Benchmarking Baseline Conditions,” Journal of Homeland Security and Emergency Management, Vol. 7, No. 1, January 2010, Art. 51.
Department of Economic and Social Affairs, United Nations, “The 17 Goals,” webpage, undated. As of August 24, 2021: https://sdgs.un.org/goals
Desmet, Klaus, Robert E. Kopp, Scott A. Kulp, David Krisztian Nagy, Michael Oppenheimer, Esteban Rossi-Hansberg, and Benjamin H. Strauss, Evaluating the Economic Cost of Coastal Flooding, Cambridge, Mass.: National Bureau of Economic Research, Working Paper 24918, August 2018. As of May 15, 2021: https://www.nber.org/papers/w24918
Development Assistance Committee, Organisation for Economic Co-operation and Development, “Rio Markers,” DCD/DAC(2016)3/ADD2/FINAL, c. 2016. As of August 24, 2021: https://www.oecd.org/dac/environment-development/Annex%2018.%20Rio%20markers.pdf
Dewberry, “Virginia Beach Comprehensive Sea Level Rise and Recurrent Flooding Planning Study: Creating a More Resilient City,” undated. As of May 15, 2021: https://www.dewberry.com/projects/ virginia-beach-comprehensive-sea-level-rise-and-recurrent-flooding-planning-study
DHS—See U.S. Department of Homeland Security.
DOT—See U.S. Department of Transportation.
Dutch Fund for Climate and Development, Bid Application: Public Version, February 2019. As of May 15, 2021: https://www.fmo.nl/climate-fund
EPA—See U.S. Environmental Protection Agency.
Executive Order 13985—See Biden, 2021a.
Federal Emergency Management Agency, U.S. Department of Homeland Security, “FEMA’s Flood Assessment Structure Tool (FAST),” undated a. As of October 1, 2021: https://www.fema.gov/sites/default/files/2020-09/hazus_fast-factsheet.pdf
———, “The National Risk Index,” webpage, undated b. As of June 19, 2021: https://hazards.fema.gov/nri/
———, “Establishing a Deductible for FEMA’s Public Assistance Program,” Federal Register, Vol. 82, No. 8, January 12, 2017, pp. 4064–4097. As of September 8, 2021: https://www.federalregister.gov/documents/2017/01/12/2017-00467/establishing-a-deductible-for-femas-public-assistance-program
———, 2018–2022 Strategic Plan, Federal Emergency Management Agency, c. 2018. As of May 15, 2021: https://www.fema.gov/about/mission
———, “National Response Framework,” October 28, 2019. As of August 24, 2021: https://www.fema.gov/emergency-managers/national-preparedness/frameworks/response
———, Summary of Stakeholder Feedback: Building Resilient Infrastructure and Communities (BRIC), March 2020a.
———, National Risk Index: Primer, Washington, D.C., November 2020b. As of June 19, 2021: https://www.fema.gov/sites/default/files/2020-11/fema_national-risk-index_primer.pdf
———, “Hazus,” webpage, last updated February 16, 2021b. As of June 19, 2021: https://www.fema.gov/flood-maps/products-tools/HAZUS
———, “Request for Information on FEMA Programs, Regulations and Policies,” Federal Register, Vol. 86, No. 76, April 22, 2021c, pp. 21325–21328. As of May 15, 2021: https://www.federalregister.gov/documents/2021/04/22/2021-08444/request-for-information-on-fema-programs-regulations-and-policies
Building Resilient Infrastructure and Communities Mitigation Grant Program, Considerations of Hazard Risk and Social Equity
88
———, “National Risk Index: Technical Documentation,” July 2021d. As of May 15, 2021: https://www.fema.gov/sites/default/files/documents/fema_national-risk-index_technical-documentation.pdf
———, “National Risk and Capability Assessment,” webpage, last updated August 13, 2021e. As of June 19, 2021: https://www.fema.gov/emergency-managers/risk-management/risk-capability-assessment
———, “Benefit–Cost Analysis,” webpage, last updated September 30, 2021f. As of June 19, 2021: https://www.fema.gov/grants/guidance-tools/benefit-cost-analysis
Federal Emergency Management Agency, U.S. Geological Survey, and Pacific Disaster Center, Hazus® Estimated Annualized Earthquake Losses for the United States, FEMA P-366, April 2017. As of October 8, 2021: https://www.fema.gov/sites/default/files/2020-07/ fema_earthquakes_hazus-estimated-annualized-earthquake-losses-for-the-united-states_20170401.pdf
Federal Insurance and Mitigation Administration, Federal Emergency Management Agency, U.S. Department of Homeland Security, “Cost Effectiveness Determination for Residential Hurricane Wind Retrofit Measures Funded by FEMA,” job aid, undated a. As of June 19, 2021: https://www.fema.gov/sites/default/files/2020-05/fema_bca_pre-calculated_wind-retrofit.pdf
———, “Safe Room Project Application Using Pre-Calculated Benefits,” job aid, undated b. As of June 19, 2021: https://www.fema.gov/sites/default/files/2020-05/fema_bca_pre-calculated_safe-room.pdf
———, “Benefit–Cost Analysis Tools for Drought, Ecosystem Services, and Post-Wildfire Mitigation for Hazard Mitigation Assistance,” policy clarification, May 27, 2016. As of June 19, 2021: https://www.fema.gov/sites/default/files/2020-05/ fema_bca_pre-calculated_drought-ecosystemservices-wildfire.pdf
FEMA—See Federal Emergency Management Agency.
FEMA, USGS, and Pacific Data Center—See Federal Emergency Management Agency, U.S. Geological Survey, and Pacific Data Center.
Finucane, Melissa L., Joie Acosta, Amanda Wicker, and Katie Whipkey, “Short-Term Solutions to a Long-Term Challenge: Rethinking Disaster Recovery Planning to Reduce Vulnerabilities and Inequities,” International Journal of Environmental Research and Public Health, Vol. 17, No. 2, January 11, 2020, Art. 482. As of June 19, 2021: https://www.mdpi.com/1660-4601/17/2/482
First Street Foundation, First Street Foundation Flood Model: Technical Methodology Document, Brooklyn, N.Y., June 2020. As of May 15, 2021: https://firststreet.org/research-lab/published-research/flood-model-methodology_overview/
———, The Cost of Climate: America’s Growing Flood Risk, Brooklyn, N.Y., February 2021. As of May 15, 2021: https://firststreet.org/research-lab/published-research/ highlights-from-the-cost-of-climate-americas-growing-flood-risk/
Fischbach, Jordan R., Debra Knopman, Heather Smith, Philip Orton, Eric Sanderson, Kim Fisher, Nerissa Moray, Adam Friedberg, and Adam Parris, Building Resilience in an Urban Coastal Environment: Integrated, Science-Based Planning in Jamaica Bay, New York, Santa Monica, Calif.: RAND Corporation, RR-2193-RF, 2018. As of October 1, 2021: https://www.rand.org/pubs/research_reports/RR2193.html
Fischbach, Jordan R., Kyle Siler-Evans, Devin Tierney, Michael T. Wilson, Lauren M. Cook, and Linnea Warren May, Robust Stormwater Management in the Pittsburgh Region: A Pilot Study, Santa Monica, Calif.: RAND Corporation, RR-1673-MCF, 2017. As of October 1, 2021: https://www.rand.org/pubs/research_reports/RR1673.html
Fischbach, Jordan R., Michael T. Wilson, Craig A. Bond, Ajay K. Kochhar, David Catt, and Devin Tierney, Managing Heavy Rainfall with Green Infrastructure: An Evaluation in Pittsburgh’s Negley Run Watershed, Santa Monica, Calif.: RAND Corporation, RR-A564-1, 2020. As of October 1, 2021: https://www.rand.org/pubs/research_reports/RRA564-1.html
Flanagan, Barry E., Edward W. Gregory, Elaine J. Hallisey, Janet L. Heitgerd, and Brian Lewis, “A Social Vulnerability Index for Disaster Management,” Journal of Homeland Security and Emergency Management, Vol. 8, No. 1, 2011, Art. 3. As of May 15, 2021: https://www.atsdr.cdc.gov/placeandhealth/svi/publications/publications_materials.html
References
89
Foster, Kathryn A., “In Search of Regional Resilience,” in Margaret Weir, Nancy Pindus, Howard Wial, and Harold Wolman, eds., Building Regional Resilience: Urban and Regional Policy and Its Effects, Washington, D.C.: Brookings Institution Press, 2012, pp. 24–59.
Fournier, Marie, Corinne Larrue, Meghan Alexander, Dries Hegger, Marloes Bakker, Maria Pettersson, Ann Crabbé, Hannelore Mees, and Adam Chorynski, “Flood Risk Mitigation in Europe: How Far Away Are We from the Aspired Forms of Adaptive Governance?” Ecology and Society, Vol. 21, No. 4, December 2016, Art. 49. As of May 15, 2021: http://www.jstor.org/stable/26270027
Frank, Robert H., “Why Is Cost–Benefit Analysis So Controversial?” Journal of Legal Studies, Vol. 29, No. S2, June 2000, pp. 913–930.
Franz, Jared, Cat Goughnour, Duncan Hwang, Kayse Jama, Meg Merrick, Andre Riley, and Gerardo Vergara-Monroy, The Equity Baseline Report: A Framework for Regional Equity, Portland, Oreg.: Institute of Portland Metropolitan Studies and the Urban League of Portland, January 2015. As of May 15, 2021: https://pdxscholar.library.pdx.edu/metropolitianstudies/126/
FSF—See First Street Foundation.
GAO—See U.S. Government Accountability Office.
Grasso, Marco, “A Normative Ethical Framework in Climate Change,” Climatic Change, Vol. 81, April 2007, pp. 223–246.
Gregory, Robin, Lee Failing, Michael Harstone, Graham Long, Tim McDaniels, and Dan Ohlson, Structured Decision Making: A Practical Guide to Environmental Management Choices, Oxford: Wiley-Blackwell, 2012.
Grimm, Michael, assistant administrator, mitigation, Federal Insurance and Mitigation Administration, Federal Emergency Management Agency, U.S. Department of Homeland Security, “Cost Effectiveness Determination for Non-Residential Hurricane Wind Retrofit Measures Funded by FEMA,” memorandum for regional administrators, regions I through X, Washington, D.C., March 1, 2018. As of June 19, 2021: https://www.fema.gov/sites/default/files/2020-05/fema_bca_pre-calculated_non-residential-wind-retrofit.pdf
Groves, David G., Jordan R. Fischbach, Evan Bloom, Debra Knopman, and Ryan Keefe, Adapting to a Changing Colorado River: Making Future Water Deliveries More Reliable Through Robust Management Strategies, Santa Monica, Calif.: RAND Corporation, RR-242-BOR, 2013. As of October 1, 2021: https://www.rand.org/pubs/research_reports/RR242.html
Groves, David G., Jordan R. Fischbach, Debra Knopman, David R. Johnson, and Kate Giglio, Strengthening Coastal Planning: How Coastal Regions Could Benefit from Louisiana’s Planning and Analysis Framework, Santa Monica, Calif.: RAND Corporation, RR-437-RC, 2014. As of May 15, 2021: http://www.rand.org/pubs/research_reports/RR437.html
Groves, David G., Debra Knopman, Neil Berg, Craig A. Bond, James Syme, and Robert J. Lempert, Adapting Land Use and Water Management Plans to a Changing Climate in Miami-Dade and Broward Counties, Florida, Santa Monica, Calif.: RAND Corporation, RR-1932-MCF, 2018. As of May 15, 2021: https://www.rand.org/pubs/research_reports/RR1932.html
Groves, David, G., and Christopher Sharon, “Planning Tool to Support Planning the Future of Coastal Louisiana,” Journal of Coastal Research, Vol. 67, No. SP1, Summer 2013, pp. 147–161.
Hallegatte, Stéphane, “Modeling the Role of Inventories and Heterogeneity in the Assessment of the Economic Costs of Natural Disasters,” Risk Analysis, Vol. 34, No. 1, January 2014, pp. 152–167.
Hallegatte, Stephane, Adrien Vogt-Schilb, Mook Bangalore, and Julie Rozenberg, Unbreakable: Building the Resilience of the Poor in the Face of Natural Disasters, Washington, D.C.: World Bank, 2017. As of May 15, 2021: https://openknowledge.worldbank.org/handle/10986/25335
Harlan, Sharon L., Anthony J. Brazel, Lela Prashad, William L. Stefanov, and Larissa Larsen, “Neighborhood Microclimates and Vulnerability to Heat Stress,” Social Science and Medicine, Vol. 63, No. 11, December 2006, pp. 2847–2863.
Hazards and Vulnerability Research Institute, College of Arts and Sciences, University of South Carolina, “Baseline Resilience Indicators for Communities (BRIC),” undated a. As of June 19, 2021: http://artsandsciences.sc.edu/geog/hvri/bric
Building Resilient Infrastructure and Communities Mitigation Grant Program, Considerations of Hazard Risk and Social Equity
90
———, “SoVI®: Social Vulnerability Index for the United States, 2010–2014,” webpage, undated b. As of June 19, 2021: http://artsandsciences.sc.edu/geog/hvri/sovi%C2%AE-0
HIFLD—See Homeland Infrastructure Foundation-Level Data.
Homeland Infrastructure Foundation-Level Data, Subcommittee Online Community, homepage, undated. As of May 15, 2021: https://gii.dhs.gov/hifld/
Howell, Junia, and James R. Elliott, “Damages Done: The Longitudinal Impacts of Natural Hazards on Wealth Inequality in the United States,” Social Problems, Vol. 66, No. 3, August 2019, pp. 448–467.
HUD—See U.S. Department of Housing and Urban Development.
Jamie Caplan Consulting, “USEHAZUS,” webpage, undated. As of September 8, 2021: https://www.usehazus.com/home
Kasarda, John D., and Morris Janowitz, “Community Attachment in Mass Society,” American Sociological Review, Vol. 39, No. 3, June 1974, pp. 328–339.
Knopman, Debra, and Robert J. Lempert, Urban Responses to Climate Change: Framework for Decisionmaking and Supporting Indicators, Santa Monica, Calif.: RAND Corporation, RR-1144-MCF, 2016. As of October 1, 2021: https://www.rand.org/pubs/research_reports/RR1144.html
Konow, James, “Which Is the Fairest One of All? A Positive Analysis of Justice Theories,” Journal of Economic Literature, Vol. 41, No. 4, December 2003, pp. 1188–1239.
Lawrence, Keith, Andrea A. Anderson, Gretchen Susi, Stacey Sutton, Anne C. Kubisch, and Raymond Codrington, Constructing a Racial Equity Theory of Change: A Practical Guide for Designing Strategies to Close Chronic Racial Outcome Gaps, Washington, D.C.: Aspen Institute Roundtable on Community Change, September 2009. As of May 15, 2021: https://www.aspeninstitute.org/wp-content/uploads/files/content/images/ Roundtable%20on%20Community%20Change%20RETOC.pdf
Lempert, Robert, James Syme, George Mazur, Debra Knopman, Garett Ballard-Rosa, Kacey Lizon, and Ifeanyi Edochie, “Meeting Climate, Mobility, and Equity Goals in Transportation Planning Under Wide-Ranging Scenarios: A Demonstration of Robust Decision Making,” Journal of the American Planning Association, Vol. 86, No. 3, 2020, pp. 311–323.
Manna, Paul, Competitive Grant Making and Education Reform: Assessing Race to the Top’s Current Impact and Future Prospects, Washington, D.C.: American Enterprise Institute, Education Stimulus Watch, Special Report 5, October 2010. As of May 15, 2021: https://eric.ed.gov/?id=ED516500
Manna, Paul, and Laura L. Ryan, “Competitive Grants and Educational Federalism: President Obama’s Race to the Top Program in Theory and Practice,” Publius, Vol. 41, No. 3, Summer 2011, pp. 522–546.
Markhvida, Maryia, Brian Walsh, Stephane Hallegatte, and Jack Baker, “Quantification of Disaster Impacts Through Household Well-Being Losses,” Nature Sustainability, Vol. 3, July 2020, pp. 538–547.
Martin, Carlos, and Jamal Lewis, The State of Equity Measurement: A Review for Energy-Efficiency Programs, Washington, D.C.: Urban Institute, September 18, 2019. As of May 15, 2021: https://www.urban.org/research/publication/state-equity-measurement/view/full_report
McDermott, Melanie, Sango Mahanty, and Kate Schreckenberg, “Examining Equity: A Multidimensional Framework for Assessing Equity in Payments for Ecosystem Services,” Environmental Science and Policy, Vol. 33, November 2013, pp. 416–427.
Meinshausen, M., S. C. B. Raper, and T. M. L. Wigley, “Emulating Coupled Atmosphere–Ocean and Carbon Cycle Models with a Simpler Model, MAGICC6—Part 1: Model Description and Calibration,” Atmospheric Chemistry and Physics, Vol. 11, No. 4, 2011, pp. 1417–1456. As of June 19, 2021: https://acp.copernicus.org/articles/11/1417/2011/acp-11-1417-2011.html
References
91
Mendelsohn, Joshua, Grant Johnson, Kelly Klima, Rachel Steratore, Samantha Cohen, Geoffrey Kirkwood, Lloyd Dixon, Jaime L. Hastings, and Paul S. Steinberg, Developing Metrics and Scoring Procedures to Support Mitigation Grant Program Decisionmaking, Homeland Security Operational Analysis Center operated by the RAND Corporation, 2021. As of May 15, 2021: https://www.rand.org/pubs/research_reports/RRA377-1.html
Menoni, Scira, Daniela Molinari, Dennis Parker, Francesco Ballio, and Sue Tapsell, “Assessing Multifaceted Vulnerability and Resilience in Order to Design Risk-Mitigation Strategies,” Natural Hazards, Vol. 64, No. 3, March 2012, pp. 2057–2082.
Miller, Benjamin M., Debra Knopman, Liisa Ecola, Brian Phillips, Moon Kim, Nathaniel Edenfield, Daniel Schwam, and Diogo Prosdocimi, U.S. Airport Infrastructure Funding and Financing: Issues and Policy Options Pursuant to Section 122 of the 2018 Federal Aviation Administration Reauthorization Act, Santa Monica, Calif.: RAND Corporation, RR-3175-FAA, 2020. As of October 1, 2021: https://www.rand.org/pubs/research_reports/RR3175.html
Miller, David L., associate administrator, Federal Insurance and Mitigation Directorate, Federal Emergency Management Agency, U.S. Department of Homeland Security, “Cost Effectiveness Determinations for Acquisitions and Elevations in Special Flood Hazard Areas Using Pre-Calculated Benefits,” memorandum for regional administrators, regions I through X, Washington, D.C., undated. As of June 19, 2021: https://www.fema.gov/sites/default/files/2020-04/fema_bca_pre-calculated_special-flood-hazard-area.pdf
Milly, P. C. D., Julio Betancourt, Malin Falkenmark, Robert M. Hirsch, Zbigniew Kundzewicz, Dennis P. Lettenmaier, and Ronald J. Stouffer, “Stationarity Is Dead: Whither Water Management?” Science, Vol. 319, No. 5863, February 1, 2008, pp. 573–574. As of May 15, 2021: https://science.sciencemag.org/content/319/5863/573.full
Morgan, Millett Granger, and Max Henrion, Uncertainty: A Guide to Dealing with Uncertainty in Quantitative Risk and Policy Analysis, Cambridge: Cambridge University Press, November 1990.
Multihazard Mitigation Council, National Institute of Building Sciences, Natural Hazard Mitigation Saves: 2017 Interim Report—Summary of Findings, Washington, D.C., December 2017. As of May 15, 2021: https://www.fema.gov/sites/default/files/2020-07/fema_ms2_interim_report_2017.pdf
Muñoz, Cristina E., and Eric Tate, “Unequal Recovery? Federal Resource Distribution After a Midwest Flood Disaster,” International Journal of Environmental Research and Public Health, Vol. 13, No. 5, 2016, Art. 507. As of May 15, 2021: https://www.mdpi.com/1660-4601/13/5/507/htm
NAC—See National Advisory Council.
Narayanan, Anu, Melissa Finucane, Joie Acosta, and Amanda Wicker, “From Awareness to Action: Accounting for Infrastructure Interdependencies in Disaster Response and Recovery Planning,” GeoHealth, Vol. 4, No. 8, August 2020, Art. e2020GH000251. As of October 2, 2021: https://agupubs.onlinelibrary.wiley.com/doi/full/10.1029/2020GH000251
Narayanan, Anu, Henry H. Willis, Jordan R. Fischbach, Drake Warren, Edmundo Molina-Perez, Chuck Stelzner, Kathleen Loa, Lauren Kendrick, Paul Sorensen, and Tom LaTourrette, Characterizing National Exposures to Infrastructure from Natural Disasters: Data and Methods Documentation, Santa Monica, Calif.: RAND Corporation, RR-1453/1-DHS, 2016. As of July 6, 2021: https://www.rand.org/pubs/research_reports/RR1453z1.html
National Advisory Council, Federal Emergency Management Agency, U.S. Department of Homeland Security, Report to the FEMA Administrator, Washington, D.C., November 2020. As of May 18, 2021: https://www.fema.gov/about/offices/national-advisory-council/recommendations
National Centers for Environmental Information, National Oceanic and Atmospheric Organization, “Billion-Dollar Weather and Climate Disasters: Overview,” webpage, 2021. As of May 15, 2021: https://www.ncdc.noaa.gov/billions/
National Infrastructure Commission, Anticipate, React, Recover: Resilient Infrastructure Systems, London, UK, May 2020. As of August 24, 2021: https://nic.org.uk/studies-reports/resilience/
Building Resilient Infrastructure and Communities Mitigation Grant Program, Considerations of Hazard Risk and Social Equity
92
National Research Council, Informing Decisions in a Changing Climate, Washington, D.C.: National Academies Press, 2009. As of May 15, 2021: https://www.nap.edu/catalog/12626/informing-decisions-in-a-changing-climate
NIBS—See National Institute of Building Sciences.
NIC—See National Infrastructure Commission.
NOAA—See National Oceanic and Atmospheric Organization.
Norris, Fran H., Susan P. Stevens, Betty Pfefferbaum, Karen F. Wyche, and Rose Pfefferbaum, “Community Resilience as a Metaphor, Theory, Set of Capacities, and Strategy for Disaster Readiness,” American Journal of Community Psychology, Vol. 41, No. 1–2, March 2008, pp. 127–150.
North, Carol S., and Betty Pfefferbaum, “Mental Health Response to Community Disasters: A Systematic Review,” JAMA, Vol. 310, No. 5, August 2013, pp. 507–518.
Obama, Barack, “National Preparedness,” Washington, D.C.: White House, Presidential Policy Directive 8, March 30, 2011. As of October 4, 2021: https://www.hsdl.org/?abstract&did=7423
Office of Equity and Social Justice, Office of King County (Wash.) Executive, Equity and Social Justice Strategic Plan 2016–2022, Seattle, Wash., undated. As of August 20, 2021: https://kingcounty.gov/elected/executive/equity-social-justice/strategic-plan.aspx
Office of the Assistant Secretary for Community Planning and Development, U.S. Department of Housing and Urban Development, “Allocations, Common Application, Waivers, and Alternative Requirements for Community Development Block Grant Mitigation Grantees,” Federal Register, Vol. 84, No. 169, August 30, 2019, pp. 45838–45871. As of December 20, 2021: https://www.federalregister.gov/documents/2019/08/30/2019-18607/allocations-common-application-waivers-and-alternative-requirements-for-community-development-block
———, “Allocations, Common Application, Waivers, and Alternative Requirements for Community Development Block Grant Disaster Recovery Grantees (CDBG Mitigation),” Federal Register, Vol. 86, No. 3, January 6, 2021, pp. 561–569. As of September 8, 2021: https://www.federalregister.gov/documents/2021/01/06/2020-29261/allocations-common-application-waivers-and-alternative-requirements-for-community-development-block
Oldenborgh, Geert Jan van, Karin van der Wiel, Antonia Sebastian, Roop Singh, Julie Arrighi, Friederike Otto, Karsten Haustein, Sihan Li, Gabriel Vecchi, and Heidi Cullen, “Attribution of Extreme Rainfall from Hurricane Harvey, August 2017,” Environmental Research Letters, Vol. 12, No. 12, December 2017, Art. 124009. As of May 15, 2021: https://iopscience.iop.org/article/10.1088/1748-9326/aa9ef2
Parks, Vanessa, Lynsay Ayer, Rajeev Ramchand, and Melissa L. Finucane, “Disaster Experience, Social Capitals, and Behavioral Health,” Natural Hazards, Vol. 104, No. 1, October 2020, pp. 959–977.
Peacock, Walter Gillis, ed., Advancing the Resilience of Coastal Localities: Developing, Implementing and Sustaining the Use of Coastal Resilience Indicators: A Final Report, College Station: Hazard Reduction and Recovery Center, College of Architecture, Texas A&M University, prepared for the Coastal Services Center and National Oceanic and Atmospheric Administration, August 2010. As of May 15, 2021: https://www.researchgate.net/publication/346474442_Advancing_the_Resilience_of_Coastal_Localities_Developing_Implementing_and_Sustaining_the_Use_of_Coastal_Resilience_Indicators_A_Final_Report
Presidential Policy Directive 8—See Obama, 2011.
Public Law 93-288, Disaster Relief Act of 1974, May 22, 1974. As of November 7, 2020: https://www.hsdl.org/?abstract&did=458661
Public Law 100-707, Disaster Relief and Emergency Assistance Amendments of 1988, November 23, 1988. As of May 15, 2021: https://www.hsdl.org/?abstract&did=806354
Public Law 106-390, Disaster Mitigation Act of 2000, October 30, 2000. As of May 15, 2021: https://www.govinfo.gov/app/details/PLAW-106publ390
References
93
Public Law 107-296, Homeland Security Act of 2002, November 25, 2002. As of May 12, 2019: https://www.govinfo.gov/app/details/PLAW-107publ296
Public Law 115-254, FAA Reauthorization Act of 2018, October 5, 2018. As of October 3, 2021: https://www.govinfo.gov/app/details/PLAW-115publ254
Quarantelli, Enrico L., “Disaster Research,” in Edgar F. Borgatta and Rhonda J. V. Montgomery, eds., Encyclopedia of Sociology, New York: Macmillan, 2000, pp. 682–688.
Rasmussen, D. J., Malte Meinshausen, and Robert E. Kopp, “Probability-Weighted Ensembles of U.S. County-Level Climate Projections for Climate Risk Analysis,” Journal of Applied Meteorology and Climatology, Vol. 55, No. 10, 2016, pp. 2301–2322.
Renn, Ortwin, “White Paper on Risk Governance: Toward an Integrative Framework,” in Ortwin Renn and K. D. Walker, eds., Global Risk Governance: Concept and Practice Using the IRGC Framework, Dordrecht, The Netherlands: Springer, 2008, pp. 3–73.
Rhodium Group, “ClimateDeck,” webpage, undated a. As of June 19, 2021: https://rhg.com/data_story/climate-deck/
———, “Climate Risk Service,” webpage, undated b. No longer available online.
Riahi, Keywan, Detlef P. van Vuuren, Elmar Kriegler, Jae Edmonds, Brian C. O’Neill, Shinichiro Fujimori, Nico Bauer, Katherine Calvin, Rob Dellink, Oliver Fricko, Wolfgang Lutz, Alexander Popp, Jesus Crespo Cuaresma, Samir KC, Marian Leimbach, Leiwen Jiang, Tom Kram, Shilpa Rao, Johannes Emmerling, Kristie Ebi, Tomoko Hasegawa, Petr Havlik, Florian Humpenöder, Lara Aleluia Da Silva, Steve Smith, Elke Stehfest, Valentina Bosetti, Jiyong Eom, David Gernaat, Toshihiko Masui, Joeri Rogelj, Jessica Strefler, Laurent Drouet, Volker Krey, Gunnar Luderer, Mathijs Harmsen, Kiyoshi Takahashi, Lavinia Baumstark, Jonathan C. Doelman, Mikiko Kainuma, Zbigniew Klimont, Giacomo Marangoni, Hermann Lotze-Campen, Michael Obersteiner, Andrzej Tabeau, and Massimo Tavoni, “The Shared Socioeconomic Pathways and Their Energy, Land Use, and Greenhouse Gas Emissions Implications: An Overview,” Global Environmental Change, Vol. 42, January 2017, pp. 153–168.
Ribot, Jesse C., and Nancy Lee Peluso, “A Theory of Access,” Rural Sociology, Vol. 68, No. 2, June 2003, pp. 153–181.
Risk Steering Committee, U.S. Department of Homeland Security, DHS Risk Lexicon, 2010 ed., September 2010. As of October 3, 2021: https://www.cisa.gov/dhs-risk-lexicon
Rogers, Patricia J., Kaye Stevens, and Jonathan Boymal, “Qualitative Cost–Benefit Evaluation of Complex, Emergent Programs,” Evaluation and Program Planning, Vol. 32, No. 1, 2009, pp. 83–90.
Rufat, Samuel, Eric Tate, Christopher G. Burton, and Abu Sayeed Maroof, “Social Vulnerability to Floods: Review of Case Studies and Implications for Measurement,” International Journal of Disaster Risk Reduction, Vol. 14, Part 4, December 2015, pp. 470–486. As of June 19, 2021: https://doi.org/10.1016/j.ijdrr.2015.09.013
Sack, Kevin, and John Schwartz, “As Storms Keep Coming, FEMA Spends Billions in ‘Cycle’ of Damage and Repair,” New York Times, October 8, 2018. As of October 2, 2021: https://www.nytimes.com/2018/10/08/us/fema-disaster-recovery-climate-change.html
Sadiq, Abdul-Akeem, Douglas Noonan, Jenna Tyler, and Rebecca Entress, “How Does Flood Risk Exposure of Public Infrastructure Compare to That of Private Property? How Does Such Exposure Relate to Local Governments’ Fiscal Health and Capacity?” University of Central Florida Flood Lab, undated. As of June 19, 2021: https://firststreet.org/flood-lab/flood-lab-question-university-of-central-florida-how-does-flood-risk-exposure -of-public-infrastructure-compare-to-that-of-private-property-how-does-such-exposure-relate-to-local-governments/
Samenow, Jason, “Florence Was Another 1,000-Year Rain Event. Is This the New Normal as the Planet Warms?” Washington Post, September 18, 2018. As of October 2, 2021: https://www.washingtonpost.com/weather/2018/09/18/florence-was-another-year-rain-event-is-this-new-normal-planet-warms/
Building Resilient Infrastructure and Communities Mitigation Grant Program, Considerations of Hazard Risk and Social Equity
94
Schaumleffel, Nathan A., Deborah A. Smith, and Irma O’Dell, “Stretching Small Town Budgets,” Illinois Parks and Recreation, Illinois State Library, Illinois Periodicals Online, September–October 2004. As of August 20, 2021: https://www.lib.niu.edu/2004/ip040923.html
Schroeder, Doris, and Balakrishna Pisupati, Ethics, Justice and the Convention on Biological Diversity, Nairobi, Kenya: United Nations Environment Program and University of Central Lancashire, October 2010. As of May 15, 2021: https://www.unep.org/resources/report/ethics-justice-and-convention-biological-diversity
Sen, Amartya, Inequality Reexamined, Oxford: Oxford University Press, 1992.
Siders, A. R., “Social Justice Implications of US Managed Retreat Buyout Programs,” Climatic Change, Vol. 152, No. 2, 2019, pp. 239–257.
SmarterSafer, A Road Map for Successful US Disaster Policy: How to Reform US Disaster Policy to Prepare for a Coming Century of Crisis, Washington, D.C., September 2019. As of May 15, 2021: https://www.smartersafer.org/wp-content/uploads/2019/09/SmarterSafer-Congressional-Guide-v5-x04-11.pdf
Smith, Adam B., “2020 U.S. Billion-Dollar Weather and Climate Disasters in Historical Context,” blog post, Beyond the Data, January 8, 2021. As of September 21, 2021: https://www.climate.gov/news-features/blogs/beyond-data/ 2020-us-billion-dollar-weather-and-climate-disasters-historical
Smith, Andrew, Christopher Sampson, and Paul Bates, “Regional Flood Frequency Analysis at the Global Scale,” Water Resources Research, Vol. 51, No. 1, January 2015, pp. 539–553. As of June 19, 2021: https://agupubs.onlinelibrary.wiley.com/doi/full/10.1002/2014WR015814
Spielman, Seth E., Joseph Tuccillo, David C. Folch, Amy Schweikert, Rebecca Davies, Nathan Wood, and Eric Tate, “Evaluating Social Vulnerability Indicators: Criteria and Their Application to the Social Vulnerability Index,” Natural Hazards, Vol. 100, No. 1, January 2020, pp. 417–436.
Statistics Directorate and Directorate for Science, Technology, and Industry, Organisation for Economic Co-operation and Development, and Applied Statistics and Econometrics Unit, Joint Research Center, European Commission, Handbook on Constructing Composite Indicators: Methodology and User Guide, Paris, 2008. As of August 20, 2021: https://www.oecd.org/els/soc/handbookonconstructingcompositeindicatorsmethodologyanduserguide.htm
Strong, Aaron, and Debra Knopman, Landscape Survey to Support Flood Apex National Flood Decision Support Toolbox: Definitions and Existing Tools, Santa Monica, Calif.: RAND Corporation, RR-1933-UNC, 2017. As of June 19, 2021: https://www.rand.org/pubs/research_reports/RR1933.html
Substance Abuse and Mental Health Services Administration, Greater Impact: How Disasters Affect People of Low Socioeconomic Status, Disaster Technical Assistance Center Supplemental Research Bulletin, Washington, D.C., July 2017. As of May 15, 2021: https://www.hsdl.org/?abstract&did=817634
Tebaldi, Claudia, Benjamin H. Strauss, and Chris E. Zervas, “Modelling Sea Level Rise Impacts on Storm Surges Along US Coasts,” Environmental Research Letters, Vol. 7, No. 1, January 2012, Art. 021001. As of June 19, 2021: https://iopscience.iop.org/article/10.1088/1748-9326/7/1/014032
Teo, Melissa, Ashantha Goonetilleke, Alireza Ahankoob, Kaveh Deilami, and Marion Lawie, “Disaster Awareness and Information Seeking Behaviour Among Residents from Low Socio-Economic Backgrounds,” International Journal of Disaster Risk Reduction, Vol. 31, October 2018, pp. 1121–1131.
Theodos, Brett, Christina Plerhoples Stacy, and Helen Ho, Taking Stock of the Community Development Block Grant, Washington, D.C.: Urban Institute, April 14, 2017. As of May 15, 2021: https://www.urban.org/research/publication/taking-stock-community-development-block-grant
Turner, B. L., II, Roger E. Kasperson, Pamela A. Matson, James J. McCarthy, Robert W. Corell, Lindsey Christensen, Noelle Eckley, Jeanne X. Kasperson, Amy Luers, Marybeth L. Martello, Colin Polsky, Alexander Pulsipher, and Andrew Schiller, “A Framework for Vulnerability Analysis in Sustainability Science,” Proceedings of the National Academy of Sciences, Vol. 100, No. 14, July 2003, pp. 8074–8079.
UN General Assembly—See United Nations General Assembly.
References
95
United Nations General Assembly, Sendai Framework for Disaster Risk Reduction 2015–2030, resolution adopted, A/RES/69/283, June 23, 2015. As of October 1, 2021: https://digitallibrary.un.org/record/795443?ln=en
———, Transforming Our World: The 2030 Agenda for Sustainable Development, resolution adopted, A/RES/70/1, September 25, 2015. As of August 24, 2021: https://www.un.org/ga/search/view_doc.asp?symbol=A/RES/70/1&Lang=E
U.S. Code, Title 6, Domestic Security; Chapter 1, Homeland Security Organization; Subchapter III, Science and Technology in Support of Homeland Security; Section 185, Federally Funded Research and Development Centers. As of March 20, 2021: https://uscode.house.gov/view.xhtml?req=(title:6%20section:185%20edition:prelim)
U.S. Code, Title 42, The Public Health and Welfare; Chapter 68, Disaster Relief; Subchapter II, Disaster Preparedness and Mitigation Assistance; Section 5133, Predisaster Hazard Mitigation. As of May 15, 2021: https://uscode.house.gov/view.xhtml?req=(title:42%20section:5133%20edition:prelim)
U.S. Department of Homeland Security, NIPP 2013, Partnering for Critical Infrastructure Security and Resilience, undated. As of May 15, 2021: https://www.cisa.gov/publication/nipp-2013-partnering-critical-infrastructure-security-and-resilience
———, Notice of Funding Opportunity for Hazard Mitigation Assistance Grants, Fiscal Year 2020 Building Resilient Infrastructure and Communities, August 4, 2020. As of August 5, 2021: https://www.fema.gov/grants/mitigation/fy2020-nofo
———, The Department of Homeland Security (DHS) Notice of Funding Opportunity (NOFO) Fiscal Year 2021 Homeland Security Grant Program, February 25, 2021. As of September 8, 2021: https://www.fema.gov/media-collection/homeland-security-grant-notices-funding-opportunity
U.S. Department of Transportation, “About RAISE Grants,” webpage, last updated May 14, 2021. As of August 24, 2021: https://www.transportation.gov/RAISEgrants/about
U.S. Environmental Protection Agency, EJSCREEN Environmental Justice Mapping and Screening Tool: EJSCREEN Technical Documentation, September 2019. As of May 15, 2021: https://www.epa.gov/ejscreen/technical-documentation-ejscreen
———, “EPA Announces the Selection of 151 Communities to Receive $66.5 Million in Brownfields Assessment and Cleanup Funding,” news release, May 11, 2021. As of August 24, 2021: https://www.epa.gov/newsreleases/ epa-announces-selection-151-communities-receive-665-million-brownfields-assessment-and
U.S. Global Change Research Program, Fourth National Climate Assessment, Vol. II: Impacts, Risks, and Adaptation in the United States, Washington, D.C., 2018. As of June 19, 2021: https://nca2018.globalchange.gov/
Van Vuuren, Detlef P., Jae Edmonds, Mikiko Kainuma, Keywan Riahi, Allison Thomson, Kathy Hibbard, George C. Hurtt, Tom Kram, Volker Krey, Jean-Francois Lamarque, Toshihiko Masui, Malte Meinshausen, Nebojsa Nakicenovic, Steven J. Smith, and Steven K. Rose, “The Representative Concentration Pathways: An Overview,” Climatic Change, Vol. 109, 2011, Art. 5. As of June 19, 2021: https://link.springer.com/article/10.1007%2Fs10584-011-0148-z
Walters, Joanna, “Hurricane Harvey Is a Billion-Dollar Disaster—America’s 10th in 2017,” The Guardian, September 1, 2017. As of October 3, 2021: https://www.theguardian.com/world/2017/sep/01/hurricane-harvey-us-billion-dollar-weather-disasters-2017
Warren May, Linnea, Serafina Lanna, Jordan Fischbach, Michelle Bongard, Shelly Culbertson, Rebecca Kiernan, and Grant Ervin, Pittsburgh Equity Indicators: A Baseline Measurement for Enhancing Equity in Pittsburgh—Annual Report 2017, City of Pittsburgh, 2018. As of June 19, 2021: http://pittsburghpa.gov/equityindicators/documents/PGH_Equity_Indicators_2017.pdf
Willis, Henry H., Anu Narayanan, Jordan R. Fischbach, Edmundo Molina-Perez, Chuck Stelzner, Kathleen Loa, and Lauren Kendrick, Current and Future Exposure of Infrastructure in the United States to Natural Hazards, Santa Monica, Calif.: RAND Corporation, RR-1453-DHS, 2016. As of July 6, 2021: https://www.rand.org/pubs/research_reports/RR1453.html
Cover image: AP Photo/David J. Phillip, Gerald HerbertRR-A1258-1
Natural disasters have become more frequent and destructive. In 2020, the
United States experienced the most billion-dollar disasters ever, with a total cost of
$96.4 billion. Moreover, disaster damaged some communities—most notably, low-income
and disadvantaged communities—more than others.
Much of the disruption and damage caused by these disasters could have been reduced through
mitigation—that is, predisaster actions known to reduce damage and ease recovery. The Building
Resilient Infrastructure and Communities (BRIC) grant award program is intended to help communities
undertake this mitigation.
Authorized by Congress in 2018 and administered by the Federal Emergency Management Agency
(FEMA), the program includes equity considerations alongside risk reduction, which represents
a significant break with past policy and practice and foreshadows a new approach to building
community resilience. How to meet these goals is the focus of this report, in which the authors identify
ways for BRIC to develop a multihazard, forward-looking, risk-based approach to mitigation that also
incorporates issues of equity and community well-being in its application and evaluation processes.
$32.00
9 7 8 1 9 7 7 4 0 8 3 6 5
ISBN-13 9781977408365ISBN-10 197740836-2
53200