Embed Size (px)
Citation preview
Investigation of an introduced
subtropical alga (Lyngbya wollei)
in Whiteshell Provincial Park, Manitoba
by
Ainslie J. Macbeth
A ThesisSubmitted to the Faculty of Graduate Studies
In Partial Fulfillment ofthe RequirementsFor the Degree of
Master of Science
Department of BotanyUniversity of Manitoba
Winnipeg, Manitoba
@ Ainslie J. Macbeth 2004
THT', UNTYERSITY OF MAI\TITOBA
FACTILTY OF GRADUATE STI]DIES*****
COPYRIGHT PERMISSION
Investigation of an introduced
subtropical alga (Lyngbya wolleí)
In Whiteshell Provincial Parþ Manitoba
BY
Ainslie J. Macbeth
A ThesislPracticum submitted to the Facuþ of Graduate Studies of The University of
Manitoba in partial fulfillment of the requirement of the degree
of
MASTER OF'SCIENCE
Ainslie J. Macbeth @2004
Permission has been granted to the Library of the University of Manitoba to lend or sell copies ofthis thesisþracticun, to the N¿tional Library of Canada to microfiln this thesis and to lend or sellcopies of the film, and to University Microfilms Inc. to publish an abstract of this thesisþracticun.
This reproduction or copy of this thesis has been made available by authority of the copyrightowner soleþ for the purpose of private study and research, and may only be reproduced and copied
as permitted by copyright laws or with express written authorization from the copyright owner.
Acknowledgements
I would like to thank my advisor Dr. Gordon Goldsborough for his advice, guidance
and assistance with all aspects of this project, my advisory committee for the insightful
suggestions which improved my project, Dr. Gordon Robinson for his interest,
encouragement and advice offered throughout this project, Dr. Jim Teller and Dr. Stephane
Mclachlan for their advice, support and interest, and Dr. Norm Kenkel for his help with the
statistical analyses.
I would also like to thank the following individuals and organizations for their
assistance: John and Pat Silver who reported the L. wollei infestation to Manitoba
Conservation, advocated for research, and provided me with important historical information
on L. wollei in Betula Lake; Wendy Ralley and Alexandra Bourne of the Water euality
Management Section of Manitoba Conservation -'Wendy for initiating this project in the
late 1990s and providing historic water quality data and maps which aided this project and
Alexandra for assistance with field sampling, providing information resources, and
facilitating equipment loans; Des Kappel of the Parks & Natural Areas Branch of Manitoba
Conservation for providing crucial land-use data; the West Hawk, Rerude, Seven Sisters
and Falcon District Offices for assisting this study with their support and knowledge of the
Park; and the Falcon District for supplying accommodations during the 2003 field season.
Aspecial thanks to Park PatrolsAnthony Statham, John Urquhart and Tim Spear who went
above and beyond the call of duty to support this work.
For canoe loans to assist water sampling, I would like to thank: Brock and his Simmans
of the Betula Lake Resort, Bill and Laurie Scarfe of Jessica Lake Lodge, Wayne Mooney
and Shirley Whitehead of the Caddy Lake Resort, Judy Cornell of Inverness Falls Resort,
Big Whiteshell Lodge, and Red Rock Bible Carnp Director Garth Epp. Thank you to Hart
and Caroþ Schmidt of White Lake for taking me out in their boat, facilitating canoe use
and particularly for keeping an eye out for us on those windy days!
Personnel from the Freshwater Institute provided essential technical support for this
project. Paul Wilkinson dated three Whiteshell sediment cores, taxonomic identification of
algae samples was conducted by Hedy Kling, and Claire Herbert performed toxicology
tests on L. wollei samples. Thank you for all your work.
Thank you to Mark Lowdon and Jeremy Stewart for SCUBA diving in Betula and
White Lakes to collect Z. wollei samples, and to my fellow graduate Students Ron Hempel,
Tara Bortohtzzi, stacy tlnatiuk and Pascal Badiou for their help and advice.
I would especially like to thank my field assistants Karen Lind and Jennifer Kuharski
for their hard work, determination, positive attitudes and great company getting through
portaging equipment and canoes over 90 km in five days, snorkeling for algae, day after
day of 35 o C weather in an aluminum canoe, and ever¡hing else.
Finally, to my support team of family and friends, thank you for your endless love,
advice and encowagement!
The firnding for this project was provided by the Sustainable Development Innovations
Fund. In-kind confübutions were made by the Whiteshell Cottagers'Association and parks
& Natural Areas Branch of Manitoba Conservation. Funding \¡/as also provided by Fish
Futures. Equipment was provided by Manitoba Conservation and the University ofManitoba's Delta Marsh Field Station.
Table of Contents
Acknowledgements .................. i
List of Figures.............. ......... viii
List of Tables ............ .............. xi
Abstract... ............ xiv
Chapter l: Introduction........... ................... I
1.1 Objectives ............ ....................... 2
1.2 Hypotheses .......... .......................2
Chapter 2:Literature Reviews ................... 3
2.1 Lyngbyawollei ......... 3
2.11 Introduction............ ......... 3
2.l2Taxonomy ........... ............ 3
2.13 Morphology......... ...........6
2.14 Ecological Adaptation ....................... 6
2.15 Management Techniques ............. ..................... 13
2.16 Summary............ ........... 15
2.2 Whiteshell Provincial Park ...... 16
2.2lGeognphy & Geo1ogy............. ....... 16
2.22 Whtteshell Development
2.23 CtrrentWhiteshell ........ lg
2.24Bconomic Resources.............. .........23
2.25lnfestation Related Practices in Whiteshell Provincial Park ......... .......24
2.3 Poleolimnologt ......26
2.31 Introduction............ .......26
2.32 Sediment Sources ............... ............26
2.33 Sediment Composition and Deposition.......... ....................27
lll
2.34Lake productivity ..........29
2.35 Whiteshell Sediment Geochemishy....... ........... 3l
Chapter 3: Methods and Materials............. ................ 35
3.1 Lyngbyawollei ....... 35
3.11 StudyArea......... ............35
3.12 Study Organism ............ 35
3.13 Lyngbyawollei Distribution .............. ...............42
3.14 Lyngbyawollei Biomass .................44
3.15 Lyngbyawollei Desiccation Experiments................ ...........45
3.16 Lyngbya wollei Toxicology ............47
3.2 Water Sampling ...... 4g
3.2lWater Sampling 2002......... .............4g
3.22Water Sampling 2003......... ............. 54
3.3 Sediment Core Collection. ........ 57
3.31 Coring and Core Processing ........... 57
3.32 Core Collection ............. 5g
3.33 Core Subsampling............... ............62
3.34 Sediment Geochemistry.......... ........ 62
3.35 Water, Organic Matter and Carbonate Content..
3.36 Chlorophyll Analysis ............ .......... 64
3.37 Sediment Dating ........... 66
3.4 W'hiteshell Environmental Quality ............. 66
3.41 Whiteshell Resident Survey 2002......... ............ 66
3.42 Enumeration of Whiteshell Development ........67
3.43 Recreational Boating .... 6g
lv
3.5 Statistical Analysis ...................70
3.51 Univariate Statistical Analysis ........70
3.52 Multivariate Statistical Analysis .....70
Chapter 4: Results. .................74
4.1 Lyngbyawollei .......74
4.11 Distribution ...................74
4.l2Biomass ............ ............77
4.13 Desiccation Experiments ............... ...................79
4.2 Water Chemistry 2003 ......... .....79
4.21 PhotosyntheticallyActive Radiation.. ............... gl
4.3 Statistical Analysis of Group 12 ............. .... gl
4.31 Intensity of Land-Use ......... ............ gl
4.32Lake Morphology .......... gg
4.33 Water Chemistry: Summer 2002......... .............. gg
4.34 Group 12 Summary ....... g9
4.4 Statistical Analysís of Group 13 ............. .... g9
4.4lWater Chemistry: July2002 ............ g9
4.42Water Chemistry: Winter 2002-2003......... .....92
4.43 Sediment Chemistry. ..... gz
4.44 Group 13 Summary .......95
4.5 Sediment Geochemístry.......... .................... 97
4.51 Description of Whiteshell Cores ...... 97
4.52 Sediment Composition ................... 97
4.52-5 Florence Lake......... .......... l0l
4.52-6 Hunt Lake. ...... 101
4.62-7 Jessicalake ........ ............. 102
4.52-8 Madge Lake......... .............102
4.52-9 Marion Lake......... ............ 106
4.52-10 Red Rock Lake......... ...... 106
4.52-11 Shirleylake......... .......... 106
4.52-12 Star Lake ....... 110
4.52-13 White Lake ......... ............. ilO
4.53 Sediment Dating ..........110
4.54 Sediment Geochemistry Introduction......... .....113
4.55 Nutrients ............ ..........113
4.55-1 Total Kjeldahl Nitrogen ............... .......113
4.54-2 Phosphorus ......116
4.55-3lron and Manganese ..........116
4.55- 4lron........... ......116
4.55-5 Manganese ..... lZ0
4.55-6 Available Phosphorus................ ......... lZ0
4.55-7 Calcium ..........120
4.55-8 8oron........ ......127
4.56 Non-essential Heavy Metals ......... lZ7
4.56-l Arsenic ...........127
4.56-2 Cadmium.. ......134
4.56-3 Lead.......... ......134
4.56-4 Mercury ..........134
Results Summary ........ 137
vl
Chapter 5: Discussion............. ............... 140
5.1 Objective I .......... ................... 140
5.ll Lyngbyawollei Distribution............... ............. 140
5.12 Lyngbyawollei lnoculation Source...... ...........144
5.13 Lyngbyawollei lnter-Lake Transfer ................147
5.2 Objective 2 ............ ................. 148
5.2lLarñ-Use 1ntensity.............. .......... 148
5.22Lake Morphology ........149
5.23 Water Chemistry .........149
5.24 Sediment Chemistry............. ......... 151
5.25 Multivariate Statistical Analysis Summary.. ... 152
5.26 Bulk Sediment Composition: Loss on lgnition ................ 153
5.27 Sediment Dating .........154
5.28 Sediment Geochemisûy ................ 155
5.29 Sediment Geochemistry: Nutrients & Heavy Metals...... .. 156
5.3 Comparison Between Whiteshell and American L. wollei Infestations ......... 161
Chapter 6: Conclusions............ .............. 163
Chapter 7: Recommendations.. .... ............. .............. 165
7.1 Recommendatíonsþr Research€rs -........... ................ 165
7.2 Recommendationsþr Mønagers ............. 167
7.3 Recommendatíonsfor Cottagers .............. 169
Chapter 8: Literature Cited ..170
Chapter 9:4ppendix............... ............... 177
vll
lA.
List of Figures
whiteshell Provincial Park map showing Betula, white, Jessica and Red Rock
Lakes. Labeled lakes were sampled monthly in2002 ........ 36
Whiteshell Provincial Park map showing Big Whiteshell and Green Lakes. Labeled
lakes were sampled monthly :ui'2002 ...............37
Whiteshell Provincial Park map showing Brereton Lake. Labeled lake was sampled
monthly in2002 ........... 3g
Whiteshell Provincial Park map showing intensive-use and backcountry lakes.
Labeled lakes were sampled monthly or in July (*)in2002 ................ 39
lE. Whiteshell Provincial Park map showing the Mantario \Milderness Area. Labeled
lakes were sampled monthly or in July (*) in 2002 ......... .................... 40
2. Behrla Lake water sampling sites and L. wollei distibution ................49
3. White Lake water sampling sites and L. wollei distribution ................ 50
4. Barren Lake water sampling site............ .......... 51
5. Big Whiteshell Lake water sampling site........... ................ 5l
6. Brereton Lake water sampling si1e............ ....... 5l
7. Caddy Lake water sampling sites.......... ........... 5l
8. Falcon Lake water sampling site............ ..........52
9. Green Lake water sampling site............ ...........52
10. Hunt Lake water sampling site............ ............. 52
11. Jessica Lake water sampling sites ..........
12. Red Rock Lake water sampling site............
13. Star Lake water sampling site ........... ................ 53
14- Schematic diagram of a modified Kajak-Brinkhurst miniature gavity coring system
63
15. Mean oxygen evolution by L. wollei treatments in July desiccation experiment... 85
lB.
1C.
1D.
vlll
16.
17.
20.
21.
18.
19.
Mean oxygen evolution by L. wollei treatrnents in August desiccation experiment
87
Correspondence analysis ordination biplot showing lake associations based on
intensity of land-use variables ........ 9l
correspondence analysis ordination biplot of lake morphology parameters ......... 93
Principal component analysis ordination biplot of mean monthly water chemistry
from2002
Principal component analysis ordination biplot of July 2002water
chemistry .... 96
Principal component analysis ordination biplot of winter water
chemistry ....9g
Principal component anaþsis ordination biplot of current sediment
chemisûy .... gg
23- Loss on ignition of bulk sediment composition for Baren Lake......................... 104
24. Loss on ignition of bulk sediment composition for Betula Lake ........ 105
25. Loss on ignition of bulk sediment composition for Brereton Lake .... 107
26. Loss on ignition of bulk sediment composition for caddy Lake ......................... l0g
27. Loss on ignition of bulk sediment composition for Florence Lake .... 109
28. Loss on ignition of bulk sediment composition for Hunt Lake....,........................111
29. Loss on ignition of bulk sediment composition for Jessica Lake .......112
30. Loss on ignition of butk sediment composition for Madge Lake..........................114
3 I . Loss on ignition of bulk sediment composition for Marion Lakg . .. .... . I I 5
32. Loss on ignition of bulk sediment composition for Red Rock Lake ...117
33- Loss on ignition of bulk sediment composition for shirley Lake ......................... l lg34. Loss on ignition of bulk sediment composition for Star Lake ......... ...119
35. Loss on ignition of bulk sediment composition for white Lake......... ................. r2r
lx
36' Sediment accumulation rates for three Whiteshell sediment cores over 150 years ofdeposition ................... 126
37 ' Sediment total kjeldahl nitrogen concentration profiles for 13 Whiteshell Lakes 132
38. Sediment phosphorus concentration profiles for l3 Whiteshell Lakes................ 133
39. sediment iron concentration profiles for 13 whiteshell Lakes .......... r35
40- sediment manganese concentration profiles for l3 whiteshell Lakes................. 136
4I' Sediment available phosphorus concentration profiles for 13 Whiteshell Lakes l3g
42. sediment calcium concentration profiles for r3 whitesheil Lake ....................... r39
43- sediment boron concentration profiles for 13 whiteshell Lakes ....... r4l44- sediment arsenic concentration profiles for 13 whiteshell Lakes ..... 142
45' sediment cadmium concentration profires for 13 whiteshell Lakes ................... 143
46- sediment lead concentration profiles for 13 whiteshell Lakes .......... 145
47 - Sediment mercury concentration profiles for 13 whiteshell Lakes .... 146
1.
List of Tables
lnaccurate taxonomic classificatio ns of Lyngbya wolleiFarlow ex Gomont
(Speziale and Dycke 1992) ..............4
District vehicle entry between May and Septemb er 2003.Number of annual and
casual Provincial Park Passes sold in each district ............ 19
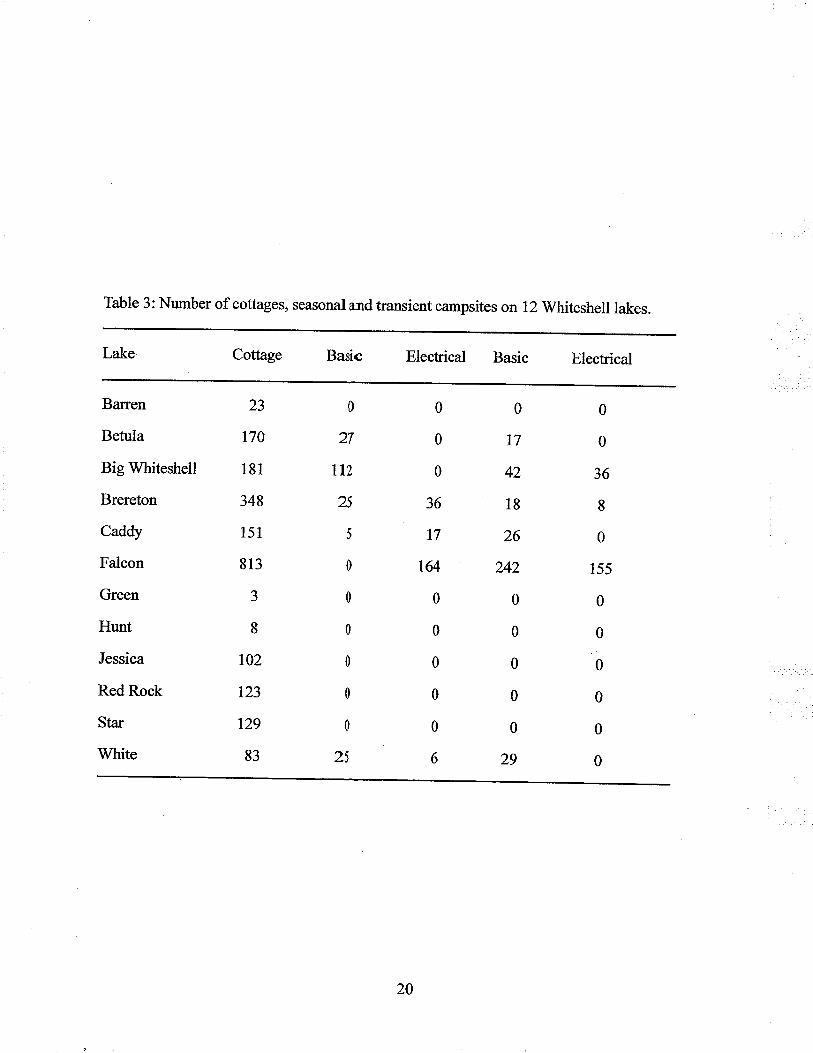
Number of cottages, seasonal and transient campsites on l}Whiteshell lakes .....20
Summary of public beach and boat launch facilities on l2Whiteshell lakes.
Maximum number of visitors, unknown visitor numbers G) and lakes with no
public beaches (n/a) were recorded ..................21
Summary of historic waste disposal sites throughout the Whiteshell most of which
are presently inactive (Karp l9B7) ...................22
Whiteshell Provincial Park land use zones and recreational activities permitted (Ðor prohibited (1.{) ( The whiteshell Master plan: Summary Reporr August lgs3) 41
lnventory of lakes sampled n2}}2,monthly (M) or in July (J)............. ...............4j
A. Water sampling parameters for 2002 ........... 55
B. Water sampling parameters for 2003 ...........56
A-C Summary information on sediment cores extracted from 13 Whiteshell lakes.
Sediment cores dated (*) are indicated .......59_61
Sediment chemistry parameters measured in sediment cores collected in 2002 and,
2003.........
Number of campsites, washroom and sewage facilities at campgrounds located at
12 intensively studied lakes current to 2003. some lakes without campground
facilities (-) ............ ......69
Morphological parameters and shoreline (Dr) and volume (Du) development in-dexes for 12 intensively studied Whiteshell lakes ........ .....71
lnventory of recreational activities for 12 intensively studied Whiteshell lakes....72
J.
4.
5.
6.
7.
8.
9.
10.
il.
12.
13.
xl
14.
15.
Survey of origin, destination and type of watercraft brought to the Whiteshell by
visitors camping at Betul4 White and Brereton lakes .......73
Estimated number of motorized and non-motorizedwatercraft extrapolated from
the Whiteshell resident survey. Percent of survey respondents with visitors who
bring boats to the Whiteshell and there origin ...................75
Number of boats launched or returned at public boat launches between 8 am and 6
pm onAugust2,2003 ....................76
Summary of lakes included in Group 12 and,Group 13............. ..........7g
Photic depth of 12 whiteshell lakes measured between July 15-22,2003 ............ g0
Filamentous algae genera collected from four whiteshell lakes, which appear
morphologically similar to Lyngbya wollei....... ................. g2
L- wollei dry weight harvested by scuBA divers with 0.46 m2 quadrats along
transects at 10 and 20 meters on July 30,2003 .................. g3
A: July Desiccation experimentANovAtable. B: July 23,2003 Desiccation Ex_
periment treatment oxygen evolution ............... g4
A: August 18,2003 Desiccation ExperimentANovAtable B: August 1g, 2003
Desiccation Experiment treatment oxygen evolution ........ g6
Intensity of land-use parameters used to examine Group 12 using Correspondence
Analysis. Variables were counted or calculated based on V/hiteshell Resident 2002
Survey (*) .............................. ......... 90
Summary of Loss on lgnitionparameters for 13 \iVhiteshell sediment cores....... 103
Sediment chronologies for Betula Lake calculated based on Constant Flux Model.
Samples which were not dated are designated by nla ...... 122
Sediment chronologies for White Lake calculated based on Constant Flux Model
123
Sediment chronologies for Madge Lake calculated based on Constant Flux Model.
Samples which were not dated are designated by nla ...... 124
t6.
17.
18.
19.
21.
22.
23.
24.
25.
26.
27.
xll
28.
29.
Sediment chronology stunmary for Betula, White and Madge Lakes .................. lZ5A-B: Macronutient mean (minimum and maximum) concentrations for l3Whiteshell sediment cores ........ ... l2gc-D: Micronutient mean (minimum and maximum) concentrations for 13
Whiteshell sediment cores ........ ... l}gE-F: Non-essential heavy metal mean (minimum and maximum) concentrations for13 Whiteshell sediment cores......... ................. 130
Summary of the total number of mean macronutrients, micronutrient, heavy metal
and element concentrations for 12 whiteshell lakes which are significantly
different from Betula Lake sediment... ........... l3l
30.
xln
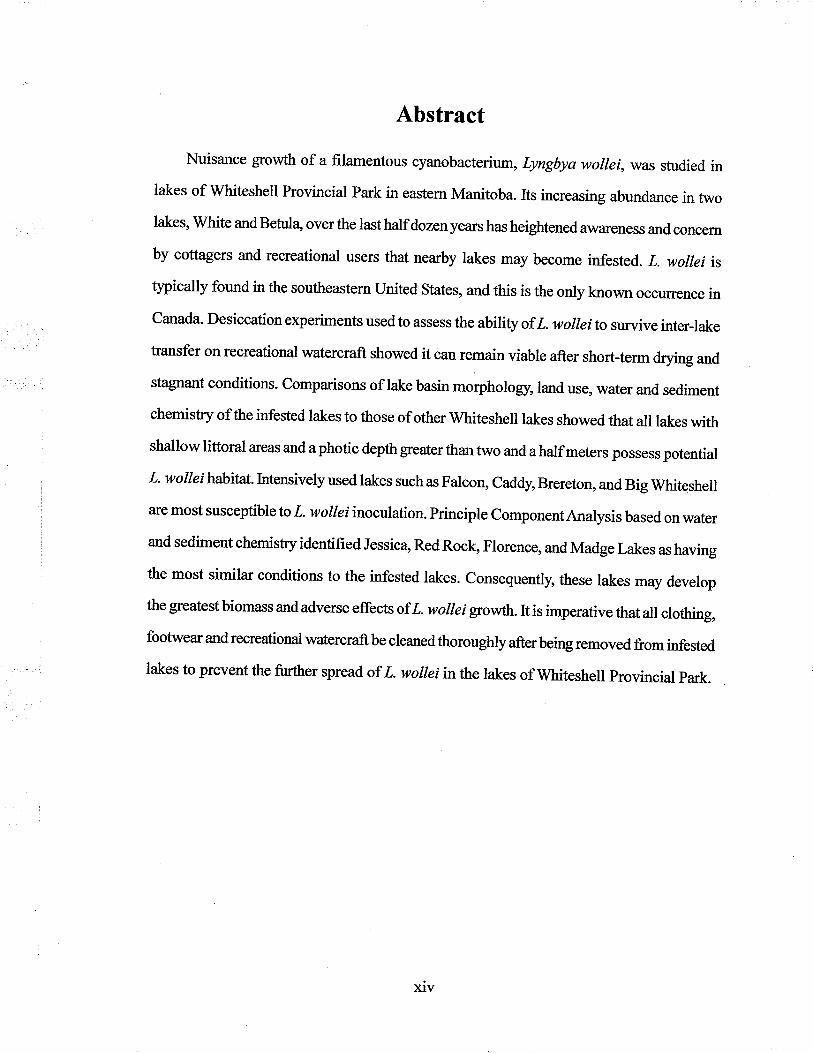
Abstract
Nuisance growth of a filamentous cyanobacterium, þngbya wollei, was studied in
lakes of Whiteshell Provincial Park in eastem Manitoba. Its increasing abundance in two
lakes, White and Befula over the last half dozen years has heightened awareness and concern
by cottagers and recreational users that nearby lakes may become infested. L. wollei is
typically found in the southeastern United States, and this is the only known occurrence in
Canada- Desiccation experiments used to assess the ability of L. wolleito survive inter-lake
transfer on recreational watercraft showed it can remain viable after short-term drying and
stagnant conditions. Comparisons of lake basin morphology, land use, water and sediment
chemistry ofthe infested lakes to those of other Whiteshell lakes showed that all lakes with
shallow littoral areas and a photic depth greater than two and a hatf meters possess potential
L' wolleihabitat. Intensively used lakes such as Falcon, Caddy, Brereton, and Big Whiteshell
are most susceptible to L. wollei inoculation. Principle ComponentAnalysis based on water
and sediment chemisty identified Jessica" Red Rock, Florence, and Madge Lakes as having
the most similar conditions to the infested lakes. Consequently, these lakes may develop
the greatest biomass and adverse effects of L. wolleigrowth. It is imperative that all clothing,
footwear andrecreational watercraftbe cleanedthoroughlyafterbeing removed from infested
lakes to prevent the further spread of L. wollei in the lakes of Whiteshell provincial park.
xtv
Chapter 1: Introduction
As humans become more mobile, moving efficiently around the globe, so do flora and
fauna. Exotic species invade habitats where they do not naturally occur and often decrease
both the abundance and diversity of native species in the invaded community (Buchan and
Padilla 2000). This alters the system's natural biodiversity and community structure.
Cunently, exotic species constitute I 0-3 0 % ofthe flora in most regions and, once established,
are often impossible to eradicate (Buchan and Padilla 2000). As a result, inoculation must
be minimized through the identification and protection of areas vulnerable to invasion.
L. wolleí is a large, filamentous, rratforming cyanobacterium that has become common
in lentic ecosystems in the Southeastem United States. At the time of this writing Lake
Itasca in Miruresota is the most northerþ known location of L. wollei in the United States.
ln Canada, L. wolleihasbeen identified in tr¡vo Whiteshell lakes, Betula and IVhite. Presently,
these infestations represent the only known occurrence of L. wollei in Canada. Recent Z.
wollei growth observed in the infestedlakes and its occurrence around developed areas with
cottages, resorts, campgrounds and public boat launches, suggest this is an exotic species
introduced to the Whiteshell.
Like other exotic species, L. wollei is an opportunistic species out-competing most
interspecific competitors once established in an aquatic system. Thicþ dense mats proliferate
on the bottom of littoral areas impeding swimming, boating and other recreational activities.
Additionally the production of geosrnin and neurotoxins analogous to those which cause
paralytic shellfish poisoning may pose a health concem for all users (Carmichael et al.
1997). As a result, L. wolleí infestations result in recreational, ecological and economic loss
of affected lakes (Speziale et al.l99l).
Whiteshell Provincial Park encompasses 131 lakes (Schneider2002).The Whiteshell
has historically been an important recreational area facilitating activities such as swimming,
boating and fishing. Betula and White Lakes have active water skiing clubs which were
established in 1950 and 1963 respectively. These are the only two Whiteshell lakes with ski
clubs. Historically boats used in water skiing competitions were moved around the continent
for competitions. If L. wollei is transported between lakes by recreational watercrafts it is
imperative that other rWhiteshell lakes are protected from Z. wollei inoculation.
This thesis marks the beginning of the investigation, identification and monitoring of
L. wollei infestations in Whiteshell Provincial Park. The research presented here may be
used to aid future research endeavors so that Whiteshell lakes may continue to provide
recreational opportunities for future generations.
l.I Objectíves
1) The primary objective of this study was to examine the distribution and inoculation
sonrce of L. wollei in Whiteshell Provincial Park.
2)The second objective of this study was to investigate why Betula and White Lakes
are the only known rWhiteshell lakes with L. wolleí infestations. The infested lakes were
compared to other Whiteshell lakes based on land-use parameters, lake morphology, water
and sediment chemistry.
1.2 Hypotheses
l) I hypothesizethatrecreational watercraft moved between infested water bodies in
the United States and the Whiteshell resulted in the infestation of Betula and White Lakes.
Current boat movement between these infested lakes and other Whiteshell lakes may put
other waterbodies in the Whiteshell and throughout NorthAmerica at high risk for infestation.
2) I hypothesize that Betula and White Lakes are unique from other Whiteshell lakes,
with certain parameters which enable L. wollei to proliferate. Unique pararneters may include
high concentrations of calcium and phosphorus, which are known to be growth limiting
nutrients. If Betula and White Lakes do not prove to be unique from other Whiteshell lakes
based on land-use, lake morphology, water or sediment chemisty then we may use the data
to predict other similar Whiteshell lakes which may be susceptible to L. wollei inoculation
and infest¿tion.
Chapter 2: Literature Review2.1 Lyngbyawolleí
2.11 Introduction
In the southeastern United States, a nuisance mat-forming cyanobacterium impedes
the recreational, economic and aesthetic value of infested aquatic systems (Speziale ef
a¿199I} Recent taxonomic investigation by Speziale and Dyck ( lgg2)classified the nuisance
species as LyngbyawolleiFarlow ex Gomont comb. nov. Classification has enabled consistent
communication and biological understanding of Z. wollei.lnvestigation of its ecological
and biochemical characteristic has resulted in a better understanding of this opportunistic
species. L. wollei possesses both morphological and physiological characteristics, that give
it a competitive advantage over other species. Consequently, aquatic systems can become
dominated by L- wollet with associated biomass reaching as high as 1.0 - 1.5 kg dry weight
m-2 (Beer et al. 1986)- The nuisance potential of L. wollei makes it crucial to focus on
management techniques so that this species no longer limits the use of the reservoirs, lakes
and ponds which it currently infests.
2.12 Taxonomy
In the last three decades infestations ofarecently described and exceptionally large
filamentous cyanobacterium have become increasingly common in the Southeastern United
States' Although there have been consistent descriptions ofthis organism it has been identified
as six different species \Mithin three genera (Table 1) (Speziale and Dyck 1992). proper
identificationofthis nuisance organism iscrucial for consistentcommunicationand biological
understanding' Traditionally cyanobacteria have been taxonomically classified by the
International Code of Botanical Nomenclature (ICBNT).This system is primarily used foreukaryotic organisms. Some researchers believe that cyanobacteri4 with their prokaryotic
habit, would be more accurately classified by the rules of the International Code ofBacteriological Nomenclature (ICB\) (Rippka et al. 1979). The discrepancies in the
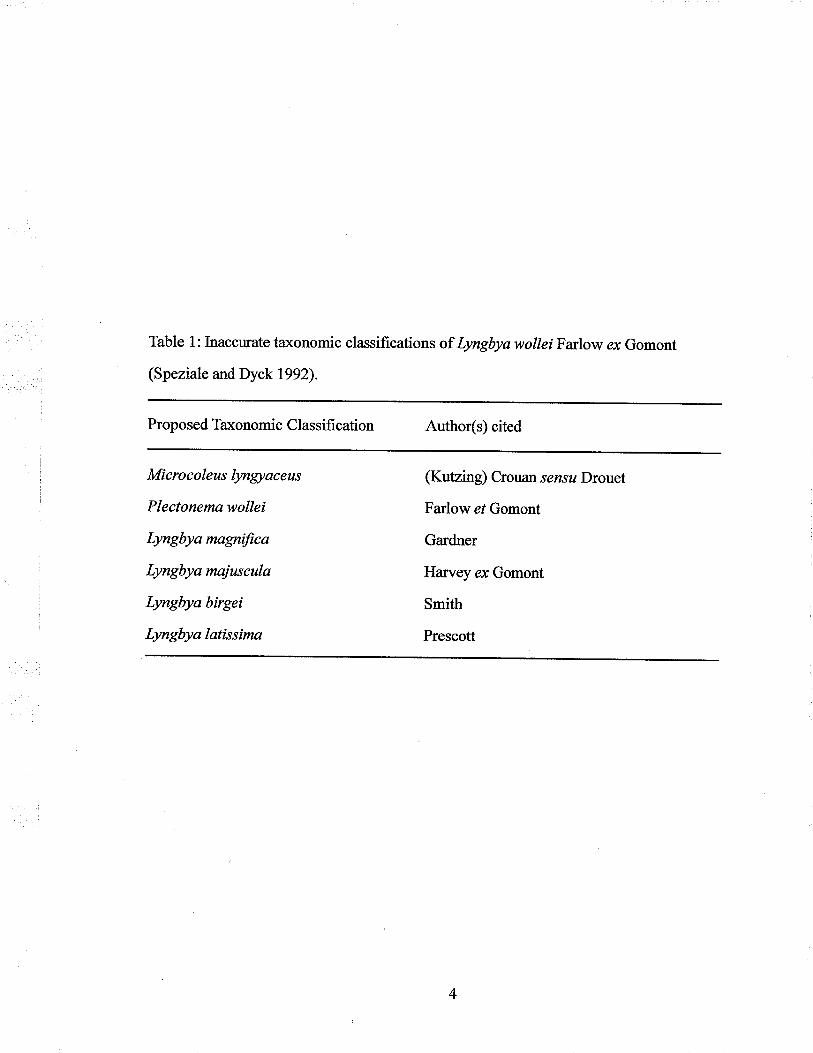
Table 1: Inaccwate taxonomic classifications of Lyngbya wollei Farlow ex Gomont
(Speziale and Dyck 1992).
Proposed Taxonomic Classification Author(s) cited
t Microcoleus lyngtaceus (Kutzing) Crouan sensuDrouet
i Plectonemawollei Farlow e/ Gomont
i tyngbya magnifica Gardnert_
Lyngbya majuscula Harvey ex Gomont
Lyngbya birgei Smith
Lyngbya latissima Prescott
identification of this cyanobacterium appear to be the result of concurrent use of the two
classification systems by different groups ofresearchers. Use ofthe ICB\ with cyanob acteia
is based on a limited number of strains, and therefore receives limited support (Speziale and
Dyck 1992).
The use ofthe ICBNr is also problematic. Grietler sub-divided the family Homogoneae
into two sub-families using this system. Sub-division was based on the occurrence ofheterocysts and presence of false branching (Speziale and Dyck lgg2). The family
Oscillatoriaceae is composed of taxa, that lack heterocysts and have simple filaments.
Lyngbya, although occasionally having false branches, was placed in this family. plectonema
was placed in the sub-family Scytonemataceae due to characteristic false branching, even
though it lacked heterocysts. Since both genera lack heterocysts the division was ultimately
based on the occurrence of false branching. Speziale and Dyck (lgg2)proposed that false
branching is a t¿xonomically invalid method of classification because it can result from
environmental modification.
In contrast to Plectonema, Lyngbyadoes not put undo emphasis on the environmentally
variable false branching characteristic. Therefore Speziale and Dyck (lgg2)has proposed
that Lyngbya is the most accurate genus classification ofthe nuisance organism. Designation
of the specific epithet was based on the elimination of previously applied taxonomic
classificati ons. Lyngbya birgeí is a planktonic species, which does not form floating masses.
The nuisance organism differs from the marine species Lyngbya majusculaboth in size and
it has a limited halotolerance. Lyngbya latissima and Lyngbya magnificaare acknowledged
synonyms for Plectonema wollei. Plectonema wollei is accurate in the description of the
nuisance organism yet it puts strong emphasis on false branching. As a result, the nuisance
organism has been classified as Lyngbya wollei Farlow ex Gomont comb. nov (Speziale
and Dyck 1992).
2.13 Morpholory
Speziale and Dyck (1992) identified a specimen type based on morphological variation
found in L. wollei specimens. L. wollei cells are defined as discoid in shape having a
diameter of 24-65mðm. Cells vary in length from 2-12 mm. The cells are arranged into
uniseriate filaments, which are encased by ahyaline, lamellate sheath up to 12 mðm thick.
The filaments are indeterminate in length and can exceed 40 cm in length. False branching
may result from protrusion through lateral breaks in the sheath. These filaments produce an
entangled mat of sparsely branched filaments. Mats are vertically stratified occurring
throughout the water column in the summer (Sp eziale et al. l99l). The subsurface filaments
are photosynthetically active, rich in phycobilin and as a result are blue black in color.
Surface filaments are photosynthetically inactive and they are yellow - orange in colour, as
a result of the high carotenoid content and bleached chlorophyll and phycobilin (speziale
and Dyck 1992)- L. wollei is a perennial species, which overwinters as a benthic mat. L.
wollei has no specialized reproductive or overwintering structures such as akinetes. Allbiomass produced throughout the water column accumulates as a benthic mat which fimctions
as a base stock for re-infestation in the following gowth season. Heterotrophtc L. wollei
filaments buried in the benthos are living and viable (Speziale et at. l99l). As a result these
filaments may function as inoculum for subsequent growth (Head et al. 1999).
2.14 Ecological Adaptation
In any ecological system species assemblage is determined by the chemical and physical
characteristics of the environment (Kohler and Hoeg 2000). In L. wolteidominated habitats
these characteristics have been investigated to identify optimal growth conditions. Water
conductivity and alkalinity were found to account for 55%oof the variability in L. wollei
biomass (Cowell and Botts 1994).Limited hatotolerance suggests that L. wollei isa freshwater
species. L. wollei is a stenohaline species with a strong preference for freshwater, showing
negative growth at all salinities between 0 and 35 ppt by the loss of cells. At salinities ofl7.5ppt and above, rapid death of the organism occurs (Cowell and Botts lgg4).Optimal
growth of L. wollei occurs in water of pH I (Cowell and Botts 1994).It may be concluded
that L. wollei is sensitive to acidity and grows optimally in an alkaline environment. In
contrast, atpH4 there was negligible growth (Tubeaet al. 1981). L. wolleihasbeen identified
most commonly in the southwestern United States in freshwater lentic ecosystems with
these characteristics. Lakes, ponds and reservoirs may all be affected.
Alkalinity reflects the predominant form of inorganic carbon present in the water
body and thus is an essential component in understanding the niche of L. wollei.
Photosynthetic activity of L. wollei results in diel fluctuations in dissolved inorganic carbon
(DIC) (Beer et al. 1990). kr initial hours ofphotosynthesis, CO, concenfations aÍe depleted
to negligible levels. The water pH increases and consequently increases the bicarbonate
concentration (Beer et al. 1986). At pH 8 bicarbonate is the predominant form of DIC. Beer
et al. (1992) report that CO, concentrations within L. wollei mats are less than lmðM
suggesting bicarbonate is the main source of DIC available to L. wolleí for photosynthesis
and growth. Bicarbonate concentrations are as low as 0.15mM at midday as a result of
increasing pH and yet photosynthesis still functions at 60Yo of its maximum productivity
(Beer et al. 1986). Beer et al. (1986) results conclude effrcient inorganic carbon uptake at
low DIC levels maintains photosynthetic productivity.
L. wollei is able to effrciently utilize bicarbonate to supply cellular demands for
inorganic carbon. This provides a competitive advantage to the species @eer et al. 1986).
Bica¡bonate use results in an increase in carbon dioxide levels at the ribulose - 1,5-
bisphosphate carboxylase oxygenrise ( RUBISCO) site. This is the same result achieved by
plants employing the C4 mechanism @eer et at. 1990). Beer et at (1992) conclude that
there is no evidence supporting bicarbonate dehydration at the cell wall. Instead, L. wollei
achieves saturating inorganic carbon concentrations through cellularuptake of bicarbonate.
This conclusion is based on the absence of the enzyme carbonic anhydrase (CA) which
intraconverts bicarbonate and carbon dioxide. In addition there is no evidence of a highly
active carbon dioxide transport system and oxygen released originates internally. It is further
suggested that the rate of photosynthesis evident in L. wollei could not be supported by an
uncatalyzed dehydration of bicarbonate at the cell wall. Therefore cellular uptake ofbicarbonate enables L. wollei to concentrate inorganic carbon at the RUBISCO site (Beer ef
ol. 1992)- After high DIC concentrations of bicarbonate are depleted oxygen is slowly
released into the depleted DIC media. As a result, Beer et al. (lgg2)suggest a decarboxylation
or refixation process may occur. At high DIC concentrations inorganic carbon may be fixed
into an intermediate organic compound. This compound could be refixed when DIC
concentrations are low. This carbon concentrating mechanism may give L. wollei a
competitively advantage at low DIC concentrations while suppressing photorespiration.
L. wollei ev}ribits optimal productivity in a variety ofDIC environments. Consequently,
this species can optimize photosynthesis at varying oxygen levels. photorespiration is
suppressed and photosynthetic productivity is maintained in varying oxygen concentrations
(Cowell and Botts 1994). Oxygen levels twice that ofthe atmospheric concentrations do not
inhibit photosynthesis of L wollei @eer et al. 1986). Carbon dioxide released at2\%o and
1olo oxygen concentrations varied negligibly and thus it is concluded that photorespiration is
unlikely the source of the released carbon dioxide (Beer et aI. 1990). L. wolleiinsensitivity
to oxygen concentrations is expressed throughout the year. The ability to maintain
photosynthetic productivity at high oxygen concentrations gives L. wollei an advantage
over competing species which photorespire. Optimal growth conditions may result with
low DIC concentrations and high oxygen levels that inhibit the growth of other species
(Beer et al. 1992).
Gas vesicles and ballast molecules are depth regulating apparatuses produced by
photosynthesis in L. wollei. Gas vesicles and ballast molecules provide a competitive
advantage to L. wollei. The energetically costly manufacture of these products results in
depth regulating production (Klemer et al. 1995). L. wotlei is a perennial mat, which
overwinters as thick benthic mat. The buoyancy of L. wollei is regulated by the production
of gas vesicles with positive buoyancy and ballast molecules with negative buoyancy. In
the summer, a portion of the benthic mat floats to the surface buoyed by gas vesicles (Doyle
and Smart 1998)- As a result L. wollei representatives are found throughout the vertical
water column as well as buried in the sediment (Speziale et al. l99l). The filaments found
buried in the sediment are living and viable. They are also thought to be heterotrophic
(Doyle and Smart 1998). The abilþ of L. wollei to inhabit areas with a wide variety ofenvironmental variables is a competitive advantage.
The vertical stratification of L. wollei mats offers a competitive advantage for the
acquisition ofinorganic carbon. Both the atnosphere above and the water surrounding surface
matso contain usable sources of inorganic carbon. Ibelings and Maberly (199g) have
determined that alkatine waters enhance the inflrx ofatrnospheric CO, in water. This increases
the inorganic carbon available to L. wollei atthe surface. Increased atmospheric carbon
dioxide levels have been shown to increase productivity (Speziale et at. l99l). At the surface,
photoinhibition may result from the high influx of light surface mats are exposed to. The
resulting photodegradation of chlorophyll and phycobilin increases the carotenoid content
of surface filaments. Consequently, surface filaments are photosynthetically inactive, but
offer photoprotection to those below (Speziale et al. I99l).
L' wollei is vertically shatified and the physiological status of filaments throughout
the bloom can be used to determine its optimal light regime @rookes et a:.2000). Surface
mats with reduced phycobilin pigments were unable to absorb visible light in the range of550 -650nm (Speziale et al- l99l). Surface mats contain an increase in myxoxanthophyll,
which results from the photodegradation of chlorophyll and phycobilin. Therefore yellowfilaments containing few intact cells cha¡acterize surface mats. Subsurface mats are blue -black in colour corresponding with high chlorophyll" and phycobilin content. These
subsurface mats are composed of orderly uniseriate filaments, which absorbphotosynthetically active radiation (PAR) between 400 - 700 rlm as a result ofpigmentation
composition (Speziale et al. l99l). Surface mats enable only l-3yo ofpAR to reach the
benthic mat. When shaded by vegetation,l-5Yo PAR reaches the underlying benthic mat
(Doyle and Smart 199Sb). As a result, the light compensation and saturation levels of I.wollei are low at 20 and 150 mðEm-2s-r respectively (Beer et al. 1986). Surface mats are
subject to movement with wind and waves. This low compensation point shows adaptation
to the low light benthic environment while the saturation level shows that L. wollei isadapted
to short term, high intensity light flickers (Spezial e et al. lggl). Mid-depth mats have the
greatest photosynthetic potential, suggesting buoyancy regulation is a competitive advantage
for L. wollei (Speziale et al. l99l).
Colonial cyanobacteria may have the ability to act as a single optical unit (Agusti and
Philips 1992). Cyanobacteria cells absorbs less light than eukaryotic alga cells the same size
due to a high pigment to chlorophyll.ratio. Colonial cyanobacte na areable to increase light
absorption to levels beyond the sun of the total absorption by constituent cells. Increased
absorption results from decreasing shelf shading within the colony by reducing the density
of cells and pigments. Therefore in colonial cyanobacteria chlorophyll" is unrelated to pigment
density of the cell. It increases absorption effrciency and adaptive ability. This method also
makes eukaryotic algae superior competitors to non-colonial forms of cyanobacteria (Agusti
and Philips 1992).This process may be observed in subsurface mats of L. wollei that are
composed of orderþ filaments (Speziale et at. l99l).
It has been generalized, that cyanobacteria inhabit water with N: p ratios less than
64:1. This statement also applies to cyanobactena which are non-nitrogen fixing @lserlggg)' This may result from species such as L. wollei being able to fix nitrogen without
heterocysts. L. wollei has been found to exhibit nitrogenase activity under suitable
environmental conditions @hilips et at. 1992). This may occur in low light or dark anoxic
environments, where inhibiting oxygen is absent. In these conditions an increase in glucose
results in increased nitrogenase activity. Philips et al. (1992) hypothes ize that L. wollei
utilizes exogenous electron donors fornitogenase activity in such light limited environments.
Consequently, the vertical distribution of Z. wollei places it in a number ofenvironmental light regimes. It may be that each vertically stratified layer of the mat has an
10
associated function. It has been determined that surface mats offer photoprotection to
subsurface filaments and are largely photosynthetically inactive. Mats at mid depth have the
highest associated photosynthetic rates (Speziale et al. l99l). Benthic mats are typically
found at depths of 0.2-1.5m have low ambient PAR (Philips et al. 1992). Doyle and Smart
(1998) have determined that the benthic mat and organic sediment zone are the source of
dissolved nitrogen and phosphorus for L. wollei growth. ln another mat forming species,
Lyngbya aestuarii, Paerl et al. (199I) report that nitrogenase activity occurs in terminal
undifferentiated cells. L. wollei may function using a similar mechanism. Nuisance
cyanobacteria such as L. wollei that have large filaments and which are highly vacuolated
are known to be able to store and translocate nutrients vertically (Klemer et at. 1995). lnL.
wollei vefücal stratification may enable optimized nitrogen utilization by the entire infestation
throughout the water column.
Doyle and Smart (1998) suggest that phosphorus is the growth limiting nutrient of I.wollei.Total phosphorus (TP) is thoughtto be amore accurate predictor oftotal algal biomass
than total nitrogen (TN) or the ratio ofTN: TP (Timbee and Prepas lgïT).Mineralization oforganic matter results in the availability of nutrients such as phosphorus at the sediment
water interface. Caraco et al. (1993) suggest that anthropogenic so¿rces of sulfate cause a
change inaquatic sulfircycles indirectlyaffectingthephosphorus availabilityofthe system.
Sulfate increases decomposition in anoxic conditions while reducing the binding potential
of the sediment which inhibits phosphorus diffilsion into the water above. An increase ofsulfate from 70 - l2Ommm has been determined to increase phosphorus release by the
sediment by as much as 58%. Fe (Iil) binds phosphorus in the sediment. The oxidation ofsulfide to sulfate results inthe reduction ofFe (IIf to Fe (II). This decrease in Fe (III) results
in an increase in phosphorus available for uptake. Sulfate reduction is also an alkalinity
generating process (Caraco et al. 1993). These processes create an optimal environment for
L. wollei growth and development.
l1
Phosphorus profiles show that there is strong phosphorus depletion throughout the
benthic mats and in the underlying sediment (Doyle and Smart l99S). In Aphanizomenon,
another nuisance cyanobacterium, phosphate is stored as polyphosphate (Klemer et at.1995).
L. wollei may store phosphate in a similar mannerand is also able to store and flrx nitrogen.
Consequently, Cowell and Botts (1994) suggest tlat nitrogen and phosphorous increases do
not result in increased colony growth. Instead inqeases in other nutrients, such as calcium,
may have a more significant effect on growth.
The filament sheaths of L. wollei are composd primarily of calcium carbonate (CaCOr)
(Doyle and Smart l99S). Doyle and Smart (1998) suggestthattheconstituent CaCO, results
in the characteristic strength of the mat. Cowell ard Botts (1994) show calcium additions
increased L. wollei growth. As a result, aquatic s¡stems with calcareous sources, such as
limestone, may facilitate increased growth of L. vollei. Calcium is known to be important
for physiological processes in cyanobacteria. Calcium is also thought to enable L. wollei to
tolerate increased nitrogen and phosphorous levels where cyanobacteria are usually at a
competitive disadvantage. Calcium can also increase the utilization of phosphorus
(Carmichael et al. 1997). Clearly, calcium is a crucial element for L. wolleí growttr. This is
supported by Speziale and Dyck (lgg2)who foundZ . wolleíinfestations corresponded wi*rsediment relatively high in calcium and phosphonrs.
L' wollei ptoduces toxins. These may confourd tÏe problem of aesthetically unpleasant
infestations in the lakes, ponds and reservoirs vhere they are found. paralytic shellfish
poisoning (PSP) is a human poisoning syndrome which is caused by the potent neurotoxin
saxitoxin (STÐ and its analogues. Two specie s Ànabaena circinalís and, Aphanìzomenon
flos-aquae are known to produce PSPs. Carrnichæl et at. (1997) report that L. wollei is a
thirdPSPproducer. Itis seventimes lesstoxic than{nabaenacircinalls. Highperformance
liquid chromatography results show the presence of decarbamoylgonyauto xn-2(dcGTX2),
decarbamoylgonyautoxin-3 (dcGTX3), decarbanoylsaxitoxin (dcSTX) as well as six
unidentified peaks. The dcGTX2, dcGTX3 and DCSTX are saxitoxin analogues (onodera
t2
et al- 1997). The dcGTX2 and dcGTX3 are considered a minor component of the total
toxicity of L. wollei( Yin et al. 1997). Six unidentified peaks revealed by HpLC, represent
new saxitoxin analogues, which are under further investigation. Quantitative but not
qualitative changes in the toxins produced differ under environmental variables including
temperature, irradiance andnutrient concentrations ofnitrogen, phosphate and calcium. yin
et al- (1997) report that the isolation of some samples leads to non-toxic results, suggests
that there are both nontoxic and toxic filaments present in L. wolleimats. Toxicity may be a
further competitive adaptation of L. wollei.In single species cultures the amount of toxin
produced by L- wollei is significantly decreased, suggesting that toxin production is induced
by interspecific competition (Yrn et at. 1997). L. wollei infestations are also found to emit
odorous compounds such as geosmin (Martin et al. l9g7).
2.15 Management Techniques
In recent years, research has focused on the management and control of this nuisance
species. L. wolleihasproved to be resistant to curentherbicides. The coppertriethanolamine
chelate Cutrine-Plzs is used for the control of many types of algae. This chemical inhibits
growth by binding to the chloroplast membrane, inhibiting the electon transport chain.
Unfortunately, with the addition lppm, the maximum recommended concentration, growth
of L. wollei was only inhibited by 50Yo. Cide-Kick,Il is an effective controller of aquatic
weeds' Hallingse and Philips (1996) suggested that its use in combination with Cutrine-
Plusmay enhance effectiveness againstZ. wollei,butwhenapplied it enhanced algal uptake
ofnutrients and increased mat growth. Chemical control is thought to have little effect on Z.
wolleibecavse ofits vertical distribution and the thickness ofiæ mats. The algaecide Diquat,
with a viscous settling agent,has been associated with moderate success in L. wolleicontol(Speziale et al- l99l). The limited success of chemical treatnents has lead to the pursuit ofalternate control methods.
Biological control using cyanophages has been investigated. Cyanophages occ'rnaturally within the environment and are viruses which infect target cyanobacteria and lyse
l3
constituent cells (Philips et a1.1990). Viruses of the LPP group infect members of the
cyanobacteriageneruLyngbya, Phormídium and Plectonema(Monegue and philips lggl).
Thus cyanophages offer an alternative to chemicals which are non-toxic to other organisms
and which are relativelytarget specific. Cyanophage LW lwas found to be able to suppress
growth of L. wolleiby 80-95%. The effectiveness of cyanophage control depended on the
physiological stage of the L. wollei. LV/l was found to be most effective when applied to
cyanobacteria before it was well established L. wollei,in contrast to other test species,
Anabaenaflos-oquae andAnabaena circinalri did not show an accelerated decline in well
established standing crops with the addition of cyanophages. Consequently, this technique
is of little use in the control of established L. wollei infestations (Monegue and philips
leel).
Other management methods have also proved ineffective. Commercial dyes such as
Rose Bengal and Methylene Blue were found to moderately reduce L. wollei.High costs and
the large scale of infestations make this removal technique impractical (Martin et al. l9g7).
Physical removal of surface mats has also proven to be a costly and temporary solution to
the persistent nuisance organism (Tyler 1994).No known herbivores preferentially consume
L. wollei- Grass carp (Ctenopharyngodon idella), which have been found to consume Z.
wollei, prefer other algal species. Even at densities of 200 fish,/acre, carp do not consume
enough L. wollei to significantþ alter growth rates making this form of biological control
ineffective (Dyck 1994).
The most recent management strategies have focused on the use of native emergent
and submergedmacroph¡es. kritially, Doyle and Smart (|994a)detenninedthatthese species
could reduce the negative impact ofthe nuisance L. wollei.ln subsequent studies Doyle and
Smart (1994b) reported that macrophyte growth could shade out L. wollei. They also suggested
that macrophytes may reduce the amount of nihogen and phosphorus available at the sediment
water interface for uptake by the nuisance species @oyle and Smart l99S). A number ofspecies including Pontederia cordata and Vallisneria americana were found to almost
I4
completely eliminate surface mats. Doyle and Smart ( 1 998) concluded that P cordata resulted
in the reduction of both benthic and surface mats. P cordata, a rooted emergent macrophyte,
decreased levels of dissolved nutrients available to L. wollei. P cordataroots may have also
increased degradation of L. wolleibenthic mats throughthe release of O, and H*. The release
of oxygen is hypothesizedto decrease the halÊlife of L. wollei from twenty to six months.
Acidification by H* release may promote the degradation of L. wollei's CaCOr- sheaths.
This process may accelerate the loss of biomass and lead to significant mat degradation.
The University of Florida is currently pursuing further research into the effectiveness
ofnative speciesonthe reduction of L. wolleiinfestations. TheKings Bay Vallisneriøproject
focuses on the removal of L. wollei and revegetation of Crystal River and Kings Bay. The
project will investigate how ecological factors influence revegetation in these areas.
Vallisneria commonly known as tape grass is native to Florida. It provides food and habitat
for aquatic organisms and may be an effective management tool. The initial pilot project
started in July 2000 intends to determine the amount of Vallisneria neededto survive and
compete tn L. wollei dominated environments (Southwest Florida Water Management District
2000).
2.L6 Summary
The opportunistic Z. wolleí inhabits alkaline freshwater lentic ecosystems. As a result
L wolleí is able to efficiently use bicarbonate as its DIC source. L. wollei also depresses
photorespiration athigh Q concentrations. These are important characteristics that increase
the competitive advantage ofthis species. Vertical stratificationof L. wolleimatsmayenable
each layer of the infestation to have a unique function. This may also increas e L. wollei,s
competitive abilities. Surface mats use the atrnosphere to increase usable inorganic carbon.
Surface mats also become photosyntheticatly inactive due to high light influxes and resulting
photoinhibition. Benthic mats have decreased photosynthetic potential as a result of low
ambient PAR. Benthic mats have a crucial function in the production of nitrogen and
translocation of nutrients throughout the infestation. Mid depth mats have the highest
l5
associated photosynthetic potential. By producing geosmin and PSPs L. wolleimay further
reduce the competitive capabitities of other species. L. wollei is an opportunistic and
dominating species. It can out compete most interspecific competitors once established inan aquatic system. Many management techniques that have been explored have proven
ineffective' Recent research suggests that native macroph¡es may be the most effective
control of this nuisance organism. Macrophytes take up nutrients and consequently release
H*' This process increases water acidity and decreases nutrient availability for L. wollei.
Native emergents such as Vallisneria might shade out Z. wollei mats. In the frrture, the
dominance of L. wollei may be addressed by changing the environment of the many aquatic
systems it inhabits.
2.2 Whiteshell Provincíal park
2.21Geography & Geolory
Whiteshell Provincial Park, located approximately 140 km east of Winnipeg,
encompasses 2 719 km2 of southeastern Manitoba (Figure 1) (Schneid er 2002). The park
boundary corresponds with the whiteshell River to the North and the ontario border to the
East' The park is located in the Precambrian Boreal Forest region of Manitob a (Jones et al.
l9S0)' ln this area the Precambrian Shield and Boreal Forest overlap (Whitesel 2001). The
Whiteshell topography is charactenzedby rolling to hilly relief, rock outcrops, variable
amotrnts of glacial drift, bogs and eskers (Barto and Vogel lgTs). Four surface deposits
persist in Whiteshell Provincial Park lacustrine sediments, moraine deposits, glaciofluvial
outwash and organic deposits @orrester lgTs).Isostatic rebound helped to produce the
drainage basins of whiteshell Provincial Park. Lakes occupy the majority of glaciallyexcavated depressions in the area and fault basins (Moenig et al l97g). There are 131 lakes
in the whiteshell ranging in depth from I to 115 meters (schneider 2002).Today bogs and
lakes cover 40-60 Yo of the surface of this region (Forrester rgTs).
At the beginning ofthe twentieth century, gold was discovered across the border near
the town of Keewatin, ontario. As a result, prospectors flocked to the whiteshell area.
l6
Some of the earliest mining claims made in Manitoba were in the Falcon-West Hawk-Star
Lake district in 1901 (Whitesel 2001). 'Patent Mining Claims' purchasedbefore 1914 enabled
owners to construct homes on their plot. This initiated colonization ofthe area by Europeans.
A few patent mining claims, which could not be bought by the government, constitute the
only privately owned land in the park today. Inl907, James rWestropp Brereton established
the first homestead on Crown land at Cross Lake. Homesteads \ryere also established in the
area srrronnding Brereton Lake after 1907, with the completion of the CNR through the
area. Following World War I, 400 ha of Crown land within the George Lake district was
distributed as 'soldier grants' to returning soldiers interested in farming (Suggett 1984).
This area was not a profitable agriculhral area due to thin, undesirable soils. As a result,
most of the land was returned to the Crown (Suggett 1984). The fuel division of theArctic
Ice Company had a logging camp located at Florence Lake in the 1920s. The camp was
complete with stables to accommodate seven teams of horses, a blacksmith shop, oil shed
and a twenty-five ton capacity ice house (Zimmerman I 99 I ) . In 1929 , the Arctic lce Company
ceased production at Florence Lake and cottage development commenced.
By the 1920s the recreational potential of the Whiteshell area had been recognized
and the Crown set aside land around a few lakes for recreational purposes. As a result,
suntmer resort lots were surveyed in areas arotmd Brereton, Nora, Florence, West Hawk and
Falcon Lakes, which \ilere accessible by railroad. This would mark the beginning of
recreational users in the Whiteshell area.
2.22 W hites hell Development
All land clearing and road construction initiated in the 1930s was completed by the
Single Unemployed Men's Relief Commission, Íß overseen by the Forest Service. ln 1939,
portages were cleared and docks built to make the Whiteshell River more desirable to canoe
enthusiasts. Since that time fire-pits have been installed in back-country campsites, portages
have been cut and maintained between lakes and canoe routes have been mapped throughout
the park (Anonymous 1978): Today there is an extensive network of canoe routes through
t7
intensive, extensive, backcountry and wilderness areas of the Whiteshell, which attracts
visitors from around the globe.
Since the 1970s interpretative programs have been used to enhance the enjoyment of
visitors to the Whiteshell. Through education interpreters improve visitor knowledge and
appreciation ofthe park and its resources. Hfüng trails, amphitheaterprograms and guided
walks are used to educate visitors on important park features which may enhance their
recreational experiences (Jones et al. 1980). There are numerous selÊguiding tails throughout
the park. These provide thoughtfirl information on the hail and park. There are four outdoor
amphitheaters throughout the park, which facilitate summer evening inteqpretive programs.
Amphitheaters are located at Nutimik, Big Whiteshell, V/est Hawk and Falcon Lakes. Evening
programs provide family entertainment and informationon thepark. Visitors may also explore
Whiteshell history at the Whiteshell Natural History Museum, West Hawk Geology and
Mining Museum andthe Whiteshell Trapper's Museum (Schneider z}}2).TheAlfred Hole
Goose Sanctuary in Rênnie is another important tourist attraction for visitors interested in
leaming more about the park and its wildlife. Interpretive programs and facilities throughout
the park enhance visitor understanding and appreciation of Whiteshell provincial park.
AppendixA: Supplementary Whiteshell material provides further detail on Whiteshell histroy
and use.
2.23 Carrent Whiteshell
Manitobahas 95 Provincial Parks. Whiteshell Provincial Park is one of sixteenNatural
Parks dedicated to preserving natural areas while accommodating recreational activities
and resource use (Schneider2002). Whiteshell Provincial Park is divided into four disfücts:
Falcon, West Hawk, Seven Sisters and Rennie. As a result, visitor use may be broken down
by district (Table 2). Forly percent of Whiteshell visitors entered the Park at Falcon Lake in
2003. Summary Table I shows that the Falcon District has the most visitors, followed by
West Hawþ Seven Sisters and Rennie Districts respectively. Whiteshell provincial park
use may also be understood by examining the number of cottages and campsites located
18
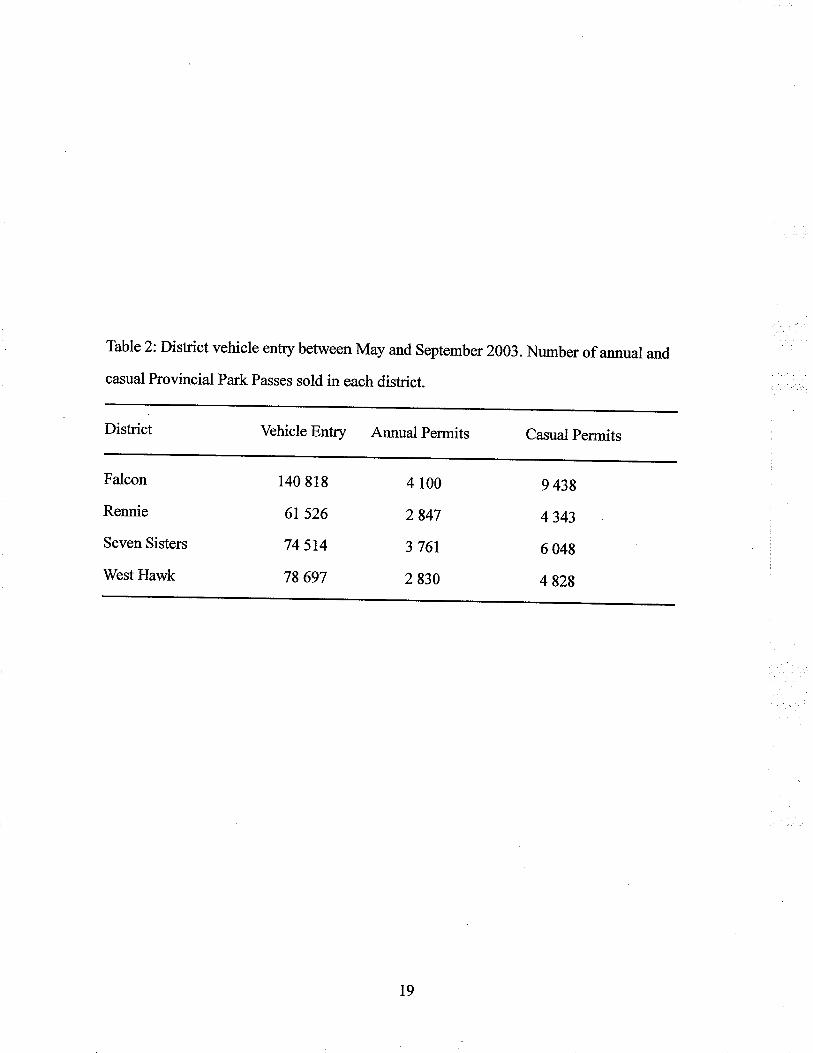
Table 2: District vehicle entry between May and September 2003.Number of annual and
casual Provincial Park Passes sold in each district.
District vehicle Entry Annual permits casual permits
Falcon 140 Bt8 4 100 g 43g
Rennie 6t 526 2 947 4 343
Seven Sisters 74 514 3 761 604g
West Hawk 7g 697 2 930 4 g2g
19
Täble 3: Number of cottages, seasonal and transient campsites on 12 Whiteshell lakes.
Cottage Bzuic Electrical Basic Electrical
Barren
Betula
Big Whiteshell
Brereton
Caddy
Falcon
Green
Hunt
Jessica
Red Rock
Star
White
23
170
181
348
151
813
aJ
I102
123
129
83
0
27
ltz25
5
0
0
0
0
0
0
2\
0
0
0
36
17
164
0
0
0
0
0
6
0
l7
42
l8
26
242
0
0
0
0
0
29
0
0
36
8
0
1s5
0
0
0
0
0
0
20
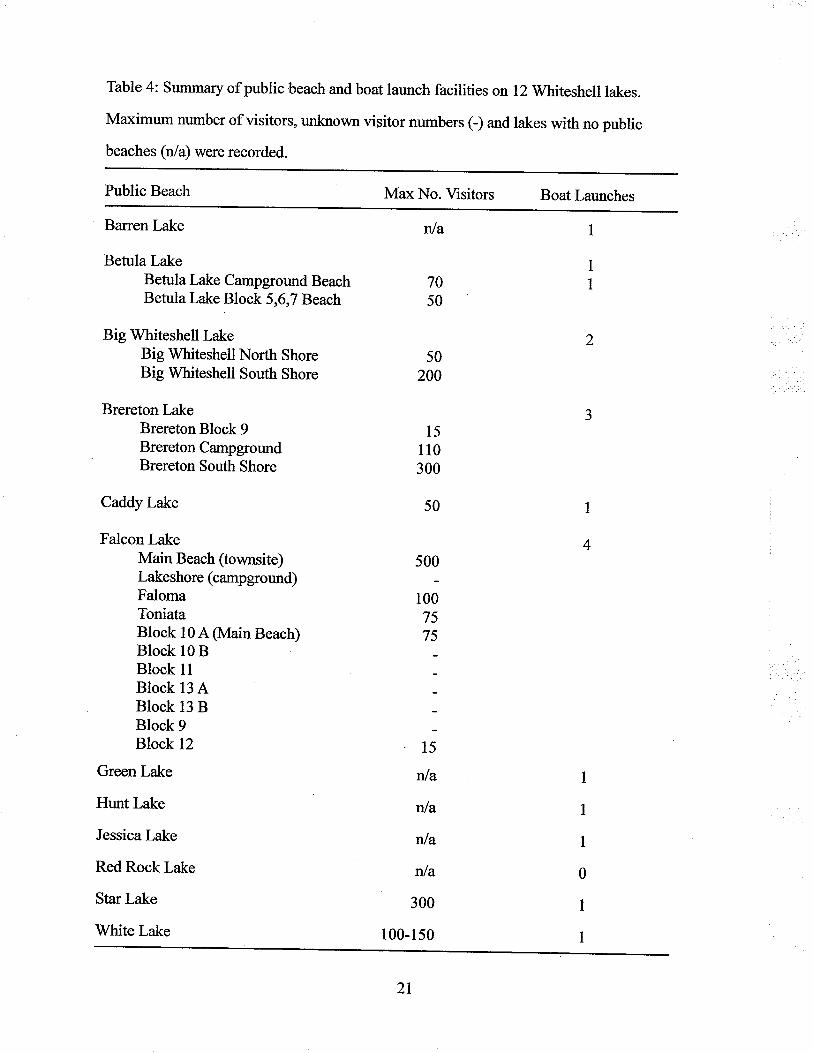
Table 4: Summary of public beach and boat launch facilities onl2Whiteshell lakes.
Maximum number of visitors, unknown visitor numbers C) and lakes with no public
beaches (n/a) were recorded.
Public Beach Max No. Visitors Boat Launches
Barren Lake
Betula LakeBetula Lake Campground BeachBehrla Lake Block 5,6,7 Beach
Big Whiteshell LakeBig Whiteshell Norttr ShoreBig Whiteshell South Shore
Brereton LakeBrereton Block 9Brereton CampgroundBrereton South Shore
Caddy Lake
Falcon LakeMain Beach (townsite)Lakeshore (campground)FalomaToniataBlock 10 A (Main Beach)Block 10 BBlock l1Block 13 ABlock 13 BBlock 9Block 12
Green Lake
Hunt Lake
Jessica Lake
Red Rock Lake
Star Lake
White Lake
I
II
nla
7050
I
4
50200
t5110
300
500
10075
l;nla
nla
nla
nla
300
100-1s0
I
I
1
0
1
I
2t
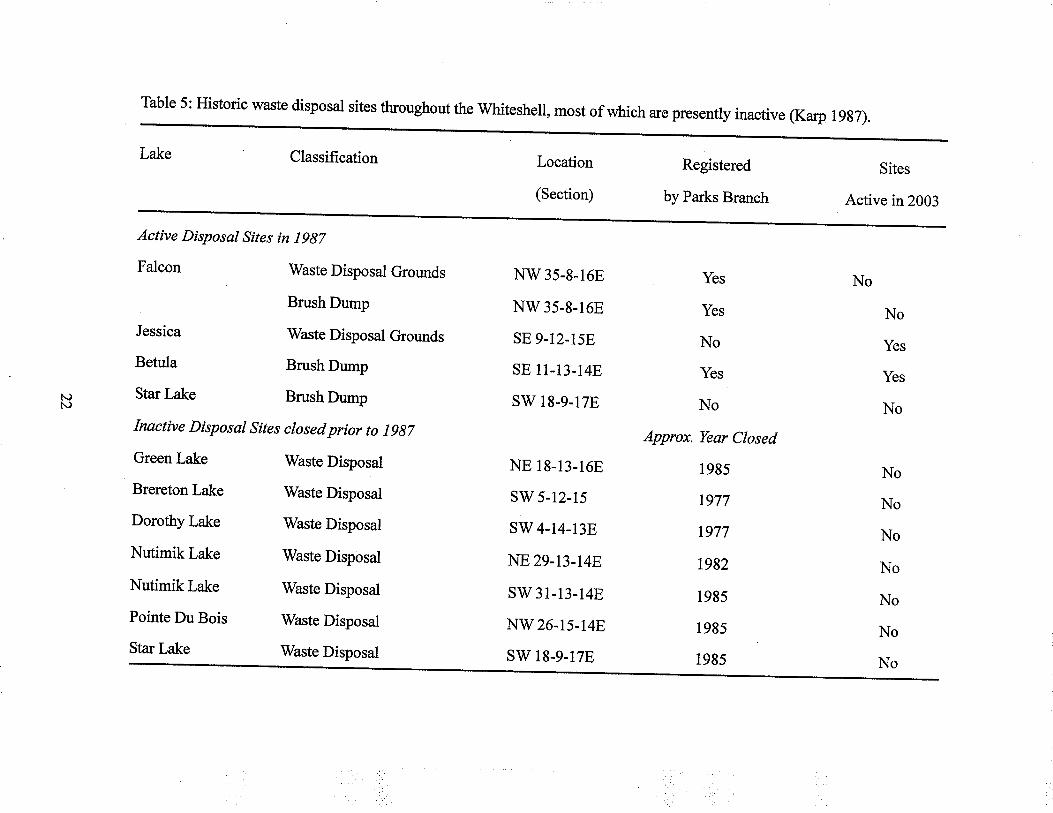
Table 5: Historic waste disposal sites throughout the whiteshell, most of which are presently inactive (Karp l9s7).
Lake
Active Disposal Sítes in l9g7
Falcon Waste Disposal Grounds
Brush Dump
Jessica Waste Disposal Grounds
Betula Brush Dump
Star Lake Brush Dump
Inactive Dísposal Sites closed príor to I9g7
Green Lake Waste Disposal
Brereton Lake V/aste Disposal
Dorothy Lake Waste Disposal
Nutimik Lake Waste Disposal
Nutimik Lake 'Waste Disposal
Pointe Du Bois Waste Disposal
Star Lake Waste Disposal
Classification
N)t\)
Location
(Section)
NW 35-8-16E
NÌt/ 35-8-16E
sE 9-12-158
sE 11-13-l4E
sìy 18-9-17E
Registered
by Parks Branch
Yes
Yes
No
yes
No
Approx. Year Closed
1985
1977
1977
1,992
1985
1985
1985
NE l8-13-16E
sw 5-12-15
sw4-14-13E
NE 29-13-14E
sw 31-13-14E
NW 26-15-14E
sv/ 18-9-17E
Sites
Active in2003
No
No
Yes
Yes
No
No
No
No
No
No
No
No
throughout the park (Table 3). Falcon Lake has 813 cottages,164 seasonal campsites and
397 transient campsites making it the most intensively used lake in the park (Table 3 e.4).
Historically, there have been waste disposal sites throughout the Whiteshell (Table 5).
Presently there are four transfer stations, one for each district and a number of brush dumps
located in the Whiteshell. It is evident from these statistics that Whiteshell provincial park
is an important recreational area under intensive use.
2,2 4 Economic Resources
The Whiteshell Master Plan (Jones et al. 19830), states that "the use of park resources
for comrnercial purposes, though clearly secondary (to recreational activities), is nonetheless
important". Whiteshell economic resources include mining, hydro-electric po\¡¡er, forestry,
wild rice (Zizania aquatica), and sport fishing. Presently, commercial exploitation ofWhiteshell resources continues. Staked in 1912, one of the original patent gold mining
claims located at Star Lake, remains active but has ceased production (Suggett l9g4). Most
miningdone inthe parktodayis granite quanyingused inconstructionofroads in Winnipeg
(Schneider 2002). There are three hydroelectric generating stations in the northern region ofWhiteshell Provincial Park. These three hydroelectric run-oÊthe-river generating stations
along the \I/innipeg River, are located at Pointe du Bois, Slave Falls and Seven Sisters. The
generating st¿tions are owned and operated by Manitoba Hydro (Schneider 2002).Managed
forestryoperations are usedto suppress wildfires within the Whiteshell. There arc l2foresûy
operators currently harvesting from the Whiteshell area. Selective harvesting since the mid
1930s include Jack Pine (Pinus banksiana), White and Black Spruce (piceo glauca, picea
maríana), Balsam Fit (Abies balsamea), Tamarack (Larix larícina), Aspen (populus
tremuloides) and Birch (Betula papyrtfera) which are used to produce pulpwood, lumber,
fence posts and fiielwood. Aboriginal people naditionally used wild rice as a dietary staple,
reseeding lakes with wild rice and introduced it to lakes without growth. Today it is ha¡vested
in the park by mechanical harvesting or handpicking with two poles and a canoe. The
harvested rice is sold to processors. Another important resource is the sport fishery which
attracts many visitors to the Whiteshell. The importance of the recreational fishing was
acknowledged in the early 1940s with the development of the summer resorts and canoe
routes through the Whiteshell. Consequently, a fish hatchery was established at the north
end of V/est Hawk Lake in 1943. This was the first fish hatchery in the province and was
employed to keep Whiteshell lakes well stocked with game f,rsh, in particular rainbow and
lake trout. The Whiteshell Fish Hatchery still stocks Whiteshell lakes with game fish species
(AppendixA). As a result, economic resources were fundamental in the initial development
of Whiteshell Provincial Park as a Forest Reserve and remain important today.
Natural Parks such as the Whiteshell facilitate a liaison between nature and outdoor
enthusiasts. In order to understand and preserve this natural landscape rich with natural and
cultural history numerous studies have been undertaken in the Whiteshell. The majority ofpublished studies were conducted between 1965 and 1975 (Appendix A). These studies
attempted to characterize the park so that it could be developed and used to its fullest
recreational potential- A Master Plan was developed in I 980 to define the role of Manitoba,s
Provincial Parks system anddirectitsdevelopmen! managementandoperation. The primary
objective of resource management stipulated by the Whiteshell Master plan was ..to establish
water-quality guidelines and to manage the park's watershed to ensure that recreational
values are maintained" (Jone s et ol. l9S0). As a result, water quality testing initiated in the
1970s continues today administered by the Water Quality section ofManitoba Conservation.
2.25 rnfestation Related practices in whiteshell provincial park
Since 1996' Betula Lake cotüage owners have been working with the Water eualityDivision of Manitoba Conservation to limit the spread and density ofthe L. wollei infestation.
Initially mesh nets were given to interested cottage owners to harvest L. wolleimats from
their shoreline. Z. wolleí mats were extremely heavy and this method proved impractical
(Personal Communication). Parks supplied cottagers with buoys in1997 which have been
used annually to prohibit motor boats from entering Bl ock2,near shore areas at high speeds.
The buoys have been anchored approximately 60 feet offshore and protect the area between
24
Block 2,Lot6 and the campground. Block 2 cottagerswith motor boats idle out beyond the
buoys before beginning recreational activities. It was hypothesized that these approaches
would limit the fragmentation ofl- wollei filaments minimizing direct anthropogenic density
enhancement.
h 1950, the Betula Lake Ski Bees, a water skiing club still active today was established.
The White Lake ski Club was formed in the early 1960s. Today the Freeriders club operates
wakeboarding clinics on numerous whiteshell lakes, but Betula and white Lakes remain
the only Whiteshell lakes with established water skiing clubs. Many Betula and White.Lake
clubs member have been distinguished Manitoba water skiers. As a result, these lakes have
held competitions at the provincial and national levels. Today both Betula and White Lakes
have a ski jump and slalom course for training. The original Betula Lake ski jump was
moved to white Lake in the early 1970s. At this time the pier at the Betula Lake main beach
was removed and the boat launch was moved to Block 5. Approximately four years ago
Betula Lake acquired a new ski jump which was placed in the north-western basin away
from cottage development and the L. wollei infestation. Historically water skiing activities
were concentrated in the now infested south-western basin þersonnel observation).
Concerned cottagers prompted a study conducted by V/endy Ralley from Manitoba
conservation, in 1997, comparing water quality in high and low intensity boating areas.
Based on the parameters measured, high intensity boating did not have a significant effect
on water quallty' While recreational boating may not significantly alter water quality in aspecific are4 it may altet L. wollei densþ Fragmentation ofZ. wollei frlaments by motorized
watercraft may result in increased density and biomass. At white Lake, the L. wolleiinfestation was concentrated in the areas surïounding the public beach. Consequently, r.wollei was found in thick mats near shore were people pull up their boats and around thewhite Lake water skiing dock. This may be evidence to sugge st L. wolleibiomass is affected
by motorized watercraft disturbance
25
At Betula Lake the campground beach area w¿ß dredged during the summer months,
by Seven Sisters District personnel. Within the sectioned off swimming area ametal bar
was dragged behind a motor boat along the sediment surface, tearing apart L. wollei mats.
The fragmented mats were then manually raked from the swimming area. This practice may
fragment Z . wollei filaments. Each fragment may then grow to increase Z. wolleitotaldensity.
Personal observations firrther indicated that L. wolleimats quickly redistributed to cover the
dredged area.
Betula Lake has an active and energetic community which is taking thoughtfi.rl action
to impede the development of L. wollei infestations. Many residents have spent most oftheir lives on the lake and provide invaluable help and resources. The White Lake comm'nity
is less aware of the L. wollei infestation in their lake and consequently less involved in
current remediation strategies.
2.3 Paleolímnologt
2.3llntroduction
Paleolimnology is defined as the study of lake history. Past environmental conditions
are examined using chemical, biological and physical parameters within sedimentary profiles
(Smol and Glew 1992). Paleolimnology may provide information on past conditions,
productivity, and changes in parameters regulating lake productivity. This information may
then be used to predict environmental conditions and future levels of productivity (Wetzel
2001). Paleolimnolory is an invaluable tool whe¡ examining the past and preparing for the
future.
2.32 Sediment sources
Lakes are natwal sediment sinks. Lake sediment may be produced within the lake, or
may be deposited from an external source (wetzel 2001). Allochthonous material is deposited
in the lake from the strrounding area and airshed. Autochthonous sediment material is the
result ofbiological production and chemical precipitation (smol and Glew lggz).Drainage
basin morphology, type and distribution of its vegetation determine inorganic inputs.
26
Autotrophic productivity within the drainage basin and lake determine the organic matter
content ofthe sediment (Smol and Glew 1992).Lake chemistry is dependent on atmospheric
fallout, precipitation, evaporation, drainage basin lithology and the influence of soil on
water inputs (Smol and Glew 1992).
2.33 Sediment composition & deposition
Paleolimnology enables examination of post glacial vegetation succession, climate
changes, and anthropogenically induced changes in lakes and their watersheds (Smol and
Glew lgg2,Fisher et al. tgg2).Multiple sedimentparameters are examinedproviding lines
of stratigraphic evidence for paleoecological reconstruction. Parameters include: water
content, organic matter and carbonate mineral content, mineralogy, inorganic chemistry,
pigments, pollen, algal and animal microfossils (Fisher et al. 1992). Sediment dating
techniques enable detailed paleolimnological analysis.
With a half-life of 22.26 years, 2l0Pb is used to date lake sed.iments deposited over
the last 150 years (Wetzel 2001). Lead-210 enters lakes via precipitation and catchment
erosion accumulating in the sediment. This form of 210Pb is termed "unsupported" because
it is produced from the decay ofradium in the atrnosphere or catchment and then transported
into the lake (Wetzel 2001). To calculatethe age of the sediment at a specific depththe
activity of unsupported 21 OPb is compared to the activity in the surface sediment. Lead-210
decreases with sediment depth as a result of radioactive decay. With a known halflife of
22.26 years, the magnitude of decay may be used to calculate the age of the sediment. The
constant flux model assumes a constant flux of 2r0Pb to the sediment and changing
sedimentation rates (Haworth and Lund 19S4).
The distribution of r37Cs is another method used to examine lake sediment deposited
within the last 50 years. Cesium-l37 has been present in the atmosphere since 1954 as a
result of atomic bomb testing. Cesium-l37 typically show a sharp peak in sedimentary
records correlated to the atmospheric test ban treaty of 1963 (Wetzel 2001). Consequently,
27
2l0Pb and l37Cs dating may be used in combination to date recently deposited sediments
assuming migration within the sediment was negligible (wetzel 2001).
Organic matter, carbonate minerals and non-carbonate clastic material are the three
main components oflake sediment (Dean 1974). Sediment water content is indicative ofthe
compactness of the sediment. Abrupt changes in the water content profile of a core may
indicate a change in sediment composition. Sediment with high clay content is tightlypacked
with poor water-holding properties. In contrast, sediment water content increases with
increased organic matter content (Warwick 19S0). Characteristic signatures occur within
the sediment. The productivity ofthe lake and drainage basin, driven by seasonal parameters,
influences the rate and nature of sedimentary deposition (Smol and Glew lgg2).
2.34Lakle productivity
Stratigraphic organic matter content is indicative ofpast levels ofproductivity. Organic
matter dictates the rates and concentrations of organic micronutrients, bacteri4 tumover
rates, and dissolved organic compounds. High organic matter content increases these
parameters resulting in high productivity in the system. In contrast low organic matter may
limit the productivity of a system (V/etzel2001). It is assumed that most organic matter is
autochthonous in origin and that diagenesis rates may be assumed constant or may be
estimated (Wetzel 2001). Increases in organic matter, nutrients and sediments within the
lake basin may be an indication of anthropogenic eutrophication (Reavie et at.2000).
Photosynthesis is the main source of carbonate precipitation within freshwater lakes
@eeves 1968)- There are two main sources of carbon dioxide input: atmospheric solution
along with sheetwash and tributary inflow (Reeves I 968, Wetzel 2001 ). Inorganic carbon in
aquatic systems forms a complex equilibrium between carbon dioxide (CO2), bicarbonate
(I{Co3) and carbonate (Co32'). In water, CO, is very soluble and quickly forms carbonic
acid, which dissociates to HCO.- and COrl. Water is buffered by the dynamic equilibrium
of these inorganic forms of carbon (V/etzel 2001). When CO, is used by autotrophs the
equilibrium shifts and bicarbonate and calcium, the predominant anion and cation in the
28
system are precipitated as calcium carbonate (marD. Marl is produced until the equilibrium
is reestablished. High concentrations of carbonate minerals are indicative of high levels of
photosynthetic productivity. Carbonate mineral content indicates historical levels of
productivity (Wetzel 2001).
Radiocarbon dating enables the calculation of past sedimentation rates. Erosion
depositionmay be inferred using clastic mineral statigraphic components such as magnesium,
sodium and potassium. Stratigraphic clastic mineral components are proportional to the
drainage system erosion at the time of deposition. This provides a stratigraphic index of
terrestrial input (Hickman et al. I 9S4).
Fossil pigments contained within the sediment ftmction as biogeochemical markers.
Photosynthetic pigments and their derivatives produce numerous paleolimnological indicator
groups which may be used as a reliable record of historical productivity levels and algal
species abundance (Smol and Glew 1992). Carotenoid and chlorophyll pigments have been
used consistentþ as indicators of algal and bacteria populations (Leavitt lgg3). primary
productivity has been correlated to pigment sedimentation rates and abundance in surface
sediments (Leavitt and Carpenter 1990). Chlorophyll derivatives are indicators of gross
shifts in algal abundance. Carotenoids are used as indicators of specific algal and
cyanobacteria populations (Smol and Glew lgg2).
Fossil pigments are subject to degradation. Sedimentary chlorophyll is degraded to
the pheopigments: pheophytin and pheophorbide (Swain 1985). Pheopigments are produced
through chlorophyll photo-oxidation, digestion by zooplankton or benthic detritivores,
enzyme metabolism during senescence, and chemical or microbial mediated oxidation
(Leavitt 1993). Microbial mediated degradation may be pigment or alga specific (Leaviu
and Carpenter 1990). Carotenoid pigments remain metabolically active after assimilation
by aquatic invertebrates. Chlorophyll pigments do not remain metabolically active and are
not assimilated by aquatic invertebrates (Leavitt 1993).Pigment degradation is also influenced
bythree environmental parameters: oxygen, temperature and light fl[etzel 1970). Chtorophyll
29
degradation is reduced in dark, less oxygenated and cooler hypolimnetic waters (Swain
1985). As a result, pigment stratigraphy is only an outline of the many processes which
produce and preserve plant pigments (Swain I 9S5). Pigment concentations expressed relative
to organic matter provide the most accurate stratigraphic trends. When expressed per unit
dry matter, dilution due to mineral soil erosion or carbonate precipitate may result in
misleading pigment concentrations (Swain l9S5). Individual pigment stratigraphy may be
examined independently and concentrations maybe comparedto historical maximum values
(Leaviu and Carpenter 1990).
Organic matter, carbonate content and total chlorophyll concentration may be used in
combination to examine historic lake productivity. As indicators ofhistoric lake productivity
it was hypothesized that all three profiles follow similar patterns within a core.
The loss on ignition method determines the total carbonate content but does not indicate
which carbonate minerals are present. If sediment is low in carbonate with a significant
amount of clay this method may give inaccurate results. Between 550-1000"C the lattice
OH water is removed ûom clay. As a result, sediment containing no carbonate with high
clay content would exhibit a3-4%o loss on ignition (Dean 1974).The sediment collected in
this study is highly organic in nature with an unknown amotmt of clay. Paleolimnological
studies identifu iron sulfides in the sediment based on dark coloured sediment or high
concentrations of iron and sulfur within the core (Haworth and Lund ilt+¡. The sediment
collected wris a dark brown in colour with a high concentration of iron. As a result, minerals
within the sediment such as iron sulfides, feldspar and other minerals may account for the
small loss on ignition betrveen 550- I 000"C. Dean ( 197 4) states that the ignition loss method
was determined to have a precision of 3.07 o/o for samples containing little or no clay.
Consequently, the carbonate content may not be an appropriate method to measgre ofhistoric
productivity.
An increase in organic matter content signals an increase in productivity. Allochthonous
inputs may result in an inaccurate representation ofproductivity. As aresult, organic matter
30
content and tot¿l chlorophyll may be examined together to infer past productivity levels.
Allochthonous organic matter is pigment poor, in senescent deciduous tree leaves g0-gg %
ofallchlorophyllisdestroyednTto 15days. (Leavitt Igg3).Totalchlorophyltwasexpressed
as a concentration of organic matter which is considered the most reliable index with limited
bias by differential rates of inorganic sediment (Wetzel lg70). As a result, organic matter
content and total chlorophyll concentrations together may be considered the most effective
indicator of past autochthonous productivity.
235 rilhiteshell Sediment Geochemistry
Sediment geochemistry is another important method for examining lake productivity
as a result of anthropogenic and natural disturbances. Sediment cores represent a temporal
scale where historic sediment concentoations located at the base of the core may be compared
to cturent concentrations at the top ofthe core. This temporal scale may be used to differentiate
natural eutrophic conditions from cultural eutrophication. Cultural eutrophication conditions
are indicated by an accelerated increase in organic matter, nutrient and heavy metal
concentrations from anthropogenic impacts (Reavie et a\.2000). Select nutrient and heavy
metal concentration profiles may be examined as indicators of cultural eutrophication.
Macronutrient concentrations limit algal growth, while micronutrient concentrations
affect species growth rates (Hyenstrand et at.200l). Nitrogen is an important macronutrient
required by autogenic organisms to produce amino acids, nucleic acids, chlorophyll and
other nitrogen containing compounds (Graham and rwilcox 2000). Total kjeldahl nitrogen is
a measure of total organic nitrogen and ammonia as a percent of sediment dry weight used
for the purposes of this study. Nitrogen is more abundant than phosphorus but its high
demand makes it the second most important limiting nutrient in freshwater aquatic systems.
Phosphorus is essential to biological metabolism with relatively small amounts
available in the hydrosphere. Consequently, it is the primary growth limiting nutrient infreshwater aquatic ecosystems. Phosphorus in atrnospheric precipitation originated from
fine particles of rock and soil, living and dead organisms, volatile compounds released from
31
plants, natural fires and fossil fuel combustion. Atmospheric precipitation may account for
40%o ot more of the annual phosphorus loading within a lake (Wetzel 2001). Haworth and
Lund (1984) state that in numerous studies anthropogenic enrichment of lakes by se\¡/age
discharge was suffrciently dramatic to leave conclusive evidence ofphosphorus enrichment.
Manganese and iron are essential for nitrate assimilation, nitrogen fixation,photosynthesis and catalyze numerous algal enryme systems (Wetzel 2}}1).Deposition ofphosphorus into lake sediment results from the co-precipitation of phosphorus with iron
and manganese oxides and hydroxides (Wetzel200l,Pa¡do et a|.2003). Manganese also
adsorbs to iron oxides and coprecipitates with ferric hydroxide. phosphorus complexes withiron and manganese are important in controlling sedimentary phosphorus concentrations.
The oxidized sediment-water interface traps iron, manganese and consequently phosphorus
within the sediment. As the redox potential decreases the release of iron, manganese and
phosphorus increases. Manganese has a higher redox potential than iron. Consequently,
manganese is released from the sediment prior to iron (Wetzel 2001).If iron and manganese
concentrations remained constant for the length of the core then increasing phosphorus
concentration profiles would indicate increased phosphorus inputs (Wetzel 2¡¡;).Correlated
concentrations profiles indicate sediment was affected by redox conditions. As sediment
redox potentials decrease iron, manganese and phosphorus complexes move up through the
sediment until immobilized again by redox conditions (Wetzel 2001). Consequently,
phosphorus concentrations may be concentrated at the sediment surface. Correlated iron,
manganese and phosphorus concentrations increasing up the sediment core may be the result
of this natural process and not indicative of cultural eutrophication.
Cyanobacteria require calcium for photosystem II activity, nitrogen fixation and
phosphate uptake @I-Zahtaa and,zafu lggg). Calcium can also increase the utilization ofphosphorus (Carmichael et aI. 1997). Boron is required to maintain algal growth under
calcium limiting conditions @omllaet a|.1995). Boron frmctions in cell-wall synthesis and
structure as well as membrane structure and function(El-zatnaaandzaki lggg).Research
32
ind-icated boron has an integral role in protecting heterocysts from oxygen. It is thought that
boron stabilizes the heterocyst envelope inhibiting oxygen diffiision which would prohibit
nitrogen fixation. Boron may also maintain the Ca-pectin association in cell walls, repair
heterocyst damage caused by calcium deficiency, and facilitate calcium uptake (Borulla et
al. 1995).
Over 80 minerals contain boron. Weathering of igneous and sedimentary rock and
soil leaching are sources of boron (CCME 1987). Boron concentrations may also be
supplemented byanthropogenic practices. The major compound, borax, is used as a cleaning
cornpound and may occur in domestic sewage. Whiteshell Provincial Park is located on the
Precambrian Shield. It may be expected that most Shield lakes would experience similar
natural boron concentations. Consequently, increased boron concentations may be the result
ofanthropogenic activity in the surrounding watershed.
Four heavy metals, arsenic, cadmium, lead and mercury, may be used to examine
anthropogenic lake contamination. The Canadian Sediment Quality Guidelines for the
protection ofAquatic Life summ arize theinterim freshwater sediment quality guidelines
(ISQG) and probable effect levels (PEL) for these heavy metals. Sedimentary arsenic
concentrations depend on geochemistry, anthropogenic and industrial activity. Arsenic is
m0re common in the earths crust than other common elements such as mercury and cadmium.
Weathering of arsenic containing rocks is an important natural source of arsenic. Arsenic is
also released into the atmosphere by combustion of fossil fuels and is a component ofleaded
gasoline, latrndry and other household products (CCME lglT).Cadmium is toxic to aquatic
organisms at very low concentrations (V/etzel 2001). Sources include industrial emissions,
fertilizers and pesticides containing cadmium and burning fossil fuels (CCME l9g7). Lead
is used primarily in the production of acid-storage batteries and chemical compounds such
as alþl lead additives including tefrarnethyl- and tetraethyllead (CCME l9S7). Beginning
tnlgz3,anti-knock leadalkyls, tetraethyl andtetramethyl leadwere incorporated into gasoline
at a concenfiations of 2 - 4 glgal (Silver and Wozniak 2001). Fifty years later in 1973,the
33
combustion ofleaded gasoline peaked accounting for 70 Yo of totalCanadian lead emissions
to the atmosphere (McCallum and Hall 1998). Research has shown a consistent increase in
lead levels in lake sediments since lead was added to gasoline. As a result, by 1990 all lead
additives \¡/ere removed from Canadian gasoline (McCallum and Hail 199g). Mercury is
used in pulp and paper manufacture, gold extraction, batteries, mercury based pesticides
among other. As aresult, these heavymetals mayprovide valuable information on the land-
use practices in Whiteshell provincial park.
34
Chapter 3: Methods and Materials3.1 Lyngbyawollei
3.11 StudyArea
Whiteshell Provinciat Park is located in the south-eastem corner ofManitob a, Canada
(Figure 1)' The Park is divided into four land use zones: wilderness, backcounûy, extensive
and intensive (Figure lA-lE, Table 6). These land use zones form a continuum of land use
throughout the park (Hegenson and o'Connor lg78). The use of motorized vehicles is
prohibited in the wilderness zone. This reserves the Mantario Lake V/ilderness area for
canoeing and hiking adventures, which have minimal impact on the environment. In contrast,
intensive use zones have been developed to support summer homes and recreational activities.
These areas are impofant to tourism in Manitoba and support seasonal recreational activities
such as boating and snowmobiling.
3.12 Study Organism
Lyngbya wollei farlow ex Gomont) comb. nov., is a member of the familyoscillatoriaceae and division Cyanophyta (Speziale and Dyck lgg2).Farlow first reported
this species tn 1877, from its occumence in a pond near Boston, Massachusetts. Z. wollei
trichomes are composed of discoid cells 24-65 and 2-12 pm in diameter and length,
respectively. End cells are rounded and acalyptate (Speziale and Dyck lgg2).The sheath
surrotmding each trichome is up to l2 pm thick, hyaline and lamellate. krdividual filaments
are indeterminant in length, sparsely false-branched and form entangled mats. Healtþtrichomes are blue-black and become green to yellow in colotr when photooxidized (S peziale
and Dyck 1992).
Since 1877, this alga has been given six different taxonomic identities (Table l).Speziale and Dyck (1992) conclude the most accurate taxonomic identity of this alga is
Lyngbyawollei (FatlowexGomont) comb. nov.Althoughmostbotanicaltaxonomic systems
identiff this alga as Plectonema wollei, Speziale and Dyck (lgg2) feel this puts undue
35
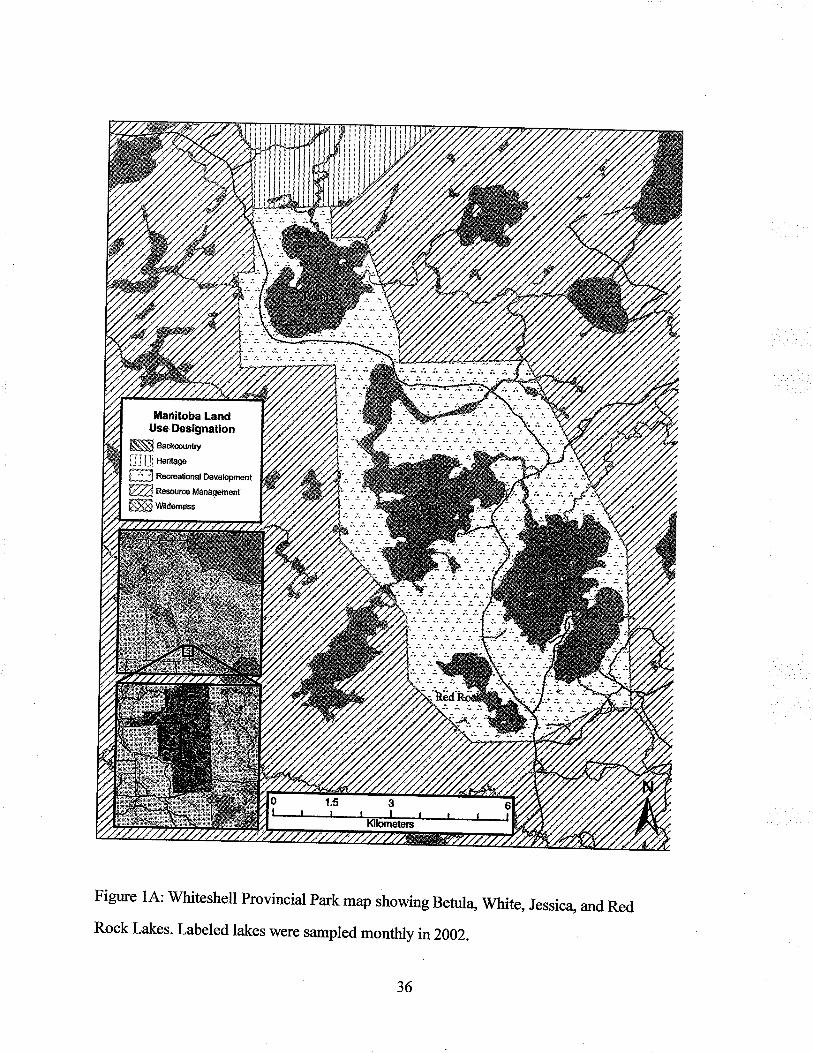
Figure 1A: whiteshell Provincial Park map showing Betula, white, Jessic4 and Red
Rock Lakes. Labeled lakes were sampled monthry in2002.
36
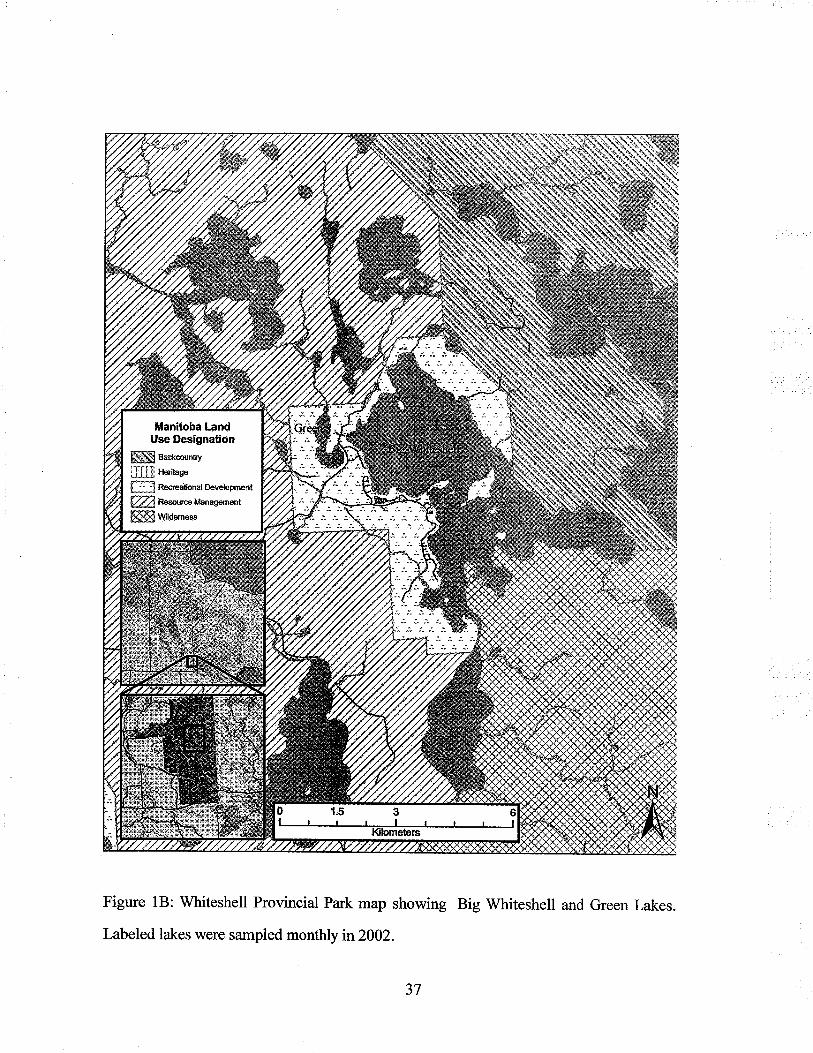
Manitoba LandUse Designation
ffi rac*counry
illil: tutøg"
Í1îT n""t*r't¡*"| Devdoprænt
Wn"*t*wnagem'n¿ffiwtdemess
Figure lB: Whiteshell Provincial Park map showing Big Whiteshell and Green Lakes.
Labeled lakes were sampled monthly luir2002.
37
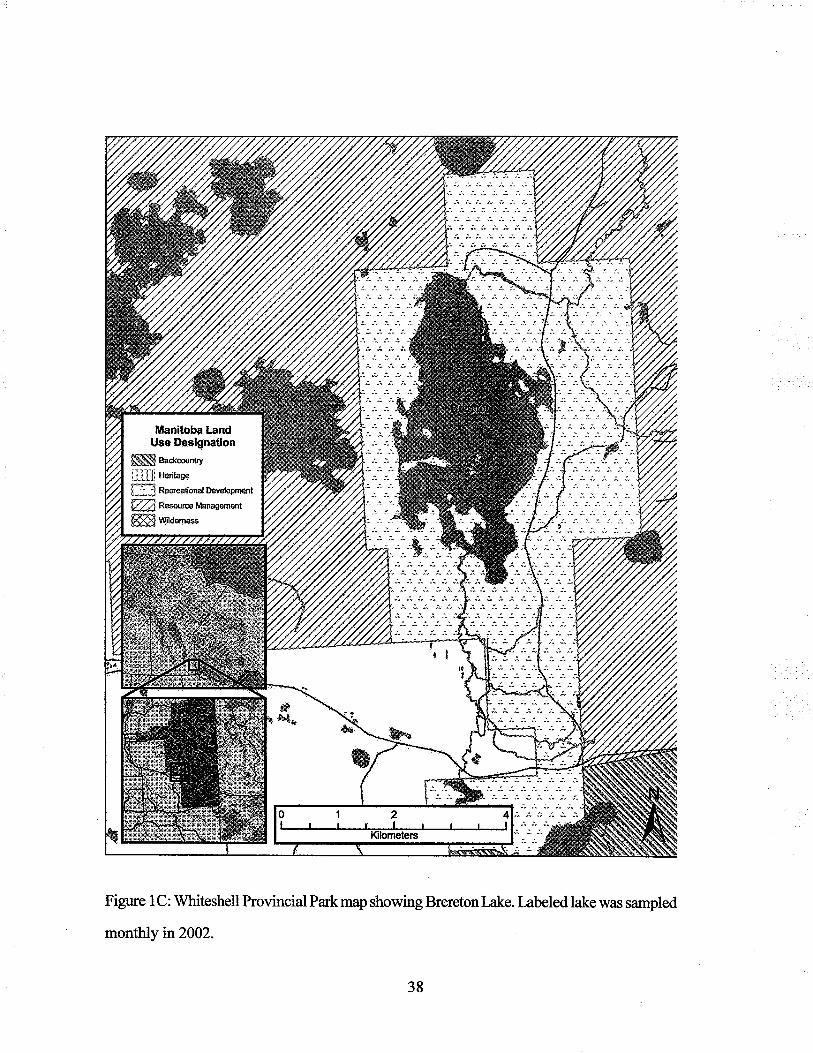
Figure lC: Whiteshell Provincial Parkmap showing Breretonlake. Labeled lake was sampled
montlrly in2002.
38
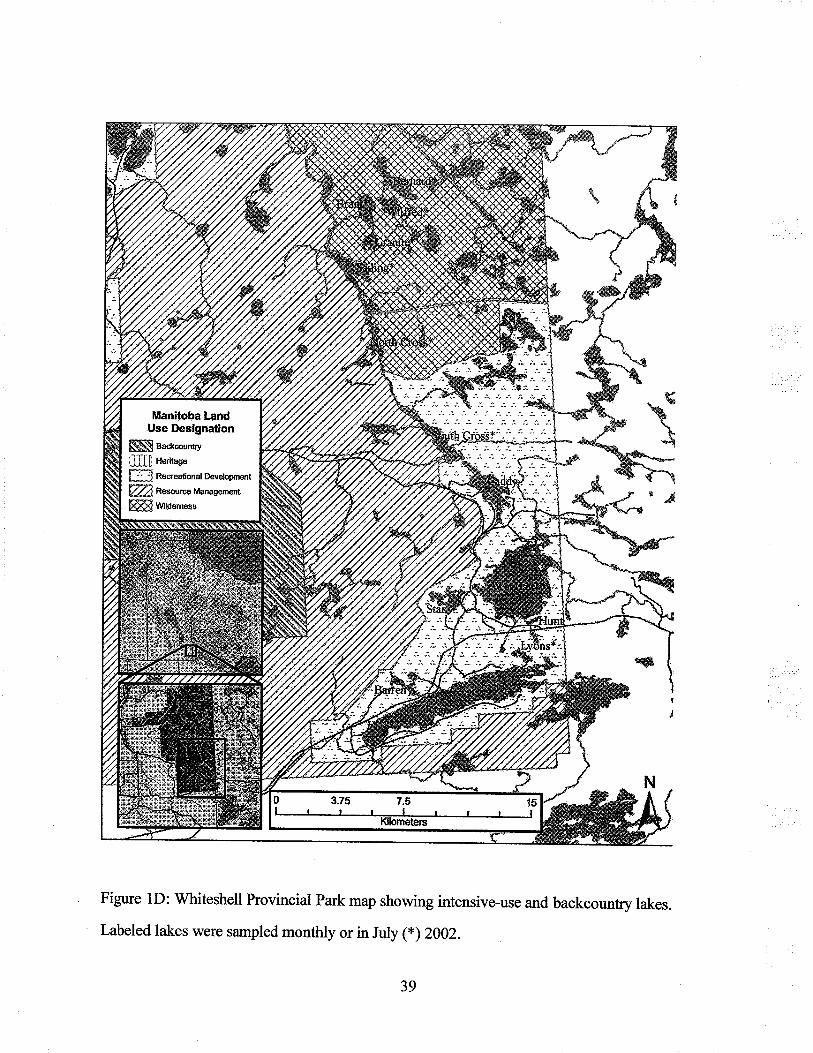
-kÞb\
Figure lD: Whiteshell Provincial Park map showing intensive-use and backcounfiry lakes.
Labeled lakes were sampled monthly or in July (*)2002.
39
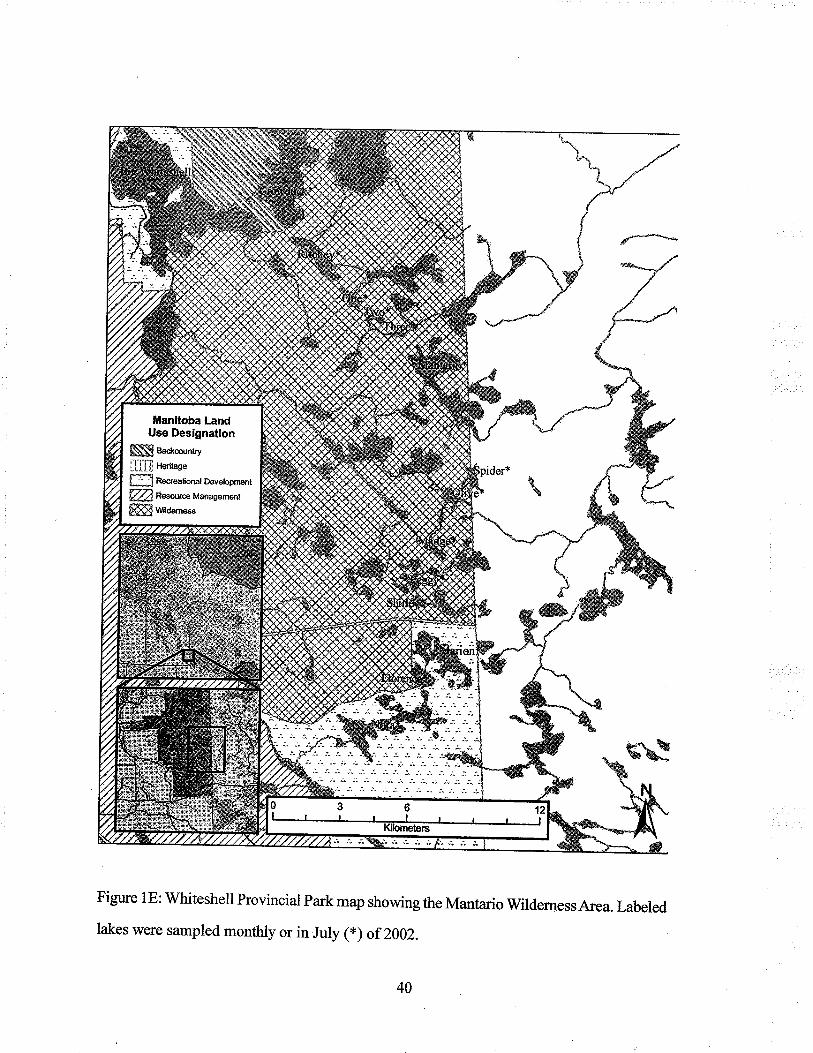
Manitoba LandUse Designation
Nl a"**rntty
ljllj Hertt"s"
ffi Røcr"aõon"l Dsvelopm€nr
%at*uro uanagement
ffiwu*t"""
Figure lE: Whiteshell Provincial Park map showing the Mantario WildernessArea. Labeled
lakes were sampled monthly or in July (*) of 2002.
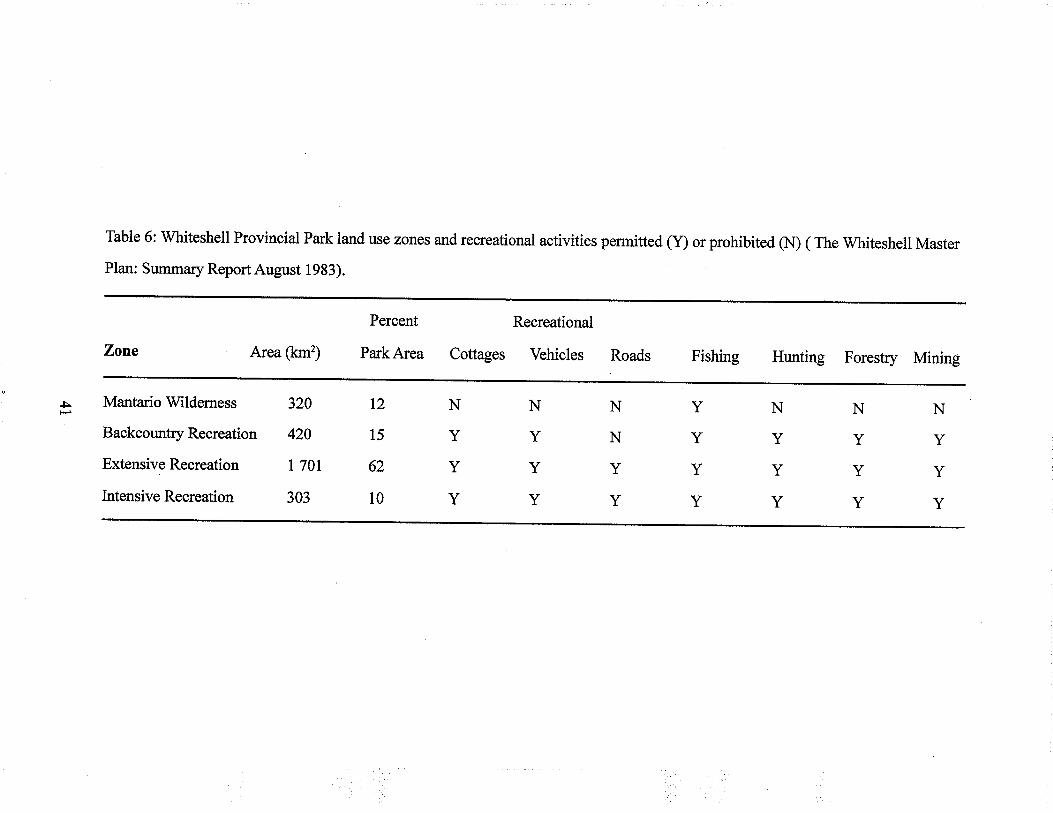
Table 6: lVhiteshell Provincial Park land use zones and recreational activities permitted (Ð or prohibited (N) ( The Whiteshell Master
Plan: Summary ReportAugust 1933).
Zone
5 Mantario Wilderness
Backcountry Recreation
Extensive Recreation
Intensive Recreation
Area ftm2)
Percent
ParkArea
320
420
I 70t
303
Recreational
Cottages Vehicles Roads
t2
15
62
10
N
Y
Y
Y
N
Y
Y
Y
N
N
Y
Y
Fishing
Y
Y
Y
Y
Hunting Forestry Mining
N
Y
Y
Y
N
Y
Y
Y
N
Y
Y
Y
emphasis onthe environmentally induced false branching characteristic. Inlggg,Manitoba
Conservation personnel collected algal samples from Betula and White Lakes in Whiteshell
Provincial Park. Hedy Kting ofthe Freshwater Institute, Department ofFisheries and Oceans,
identified these algal specimens as Plectonema wollei.For consistency with current literature
this alga will be referred to as Lyngbyawollei for the purposes of this project.
3.13 Lyngbyø wollei Distribution
In1999, Manitoba Conservation personnel identified L. wollei in Betula and White
Lakes (Figrre lA). For the reconnaissance survey conducted in2002,35 Whiteshell lakes
were searched for the occlurence of L. wollei (Table 7). For the twelve intensively studied
lakes, two investigations were undertaken during the summ er of 2002.Public boat launches
were investigated for the presence of L. wollei.The perimeter ofthe lake was then toured by
canoe or motorboat to examine nearshore areas for the presenc e L. wolleimats. Rakes were
used in an attempt to comb the bottom of the lakes in nearshore areas. This technique proved
ineffective. In nearshore areas the bottom was either clearly seen or the bottom was too deep
to be reached by a rake. As a result, this time consuming method was abandoned.
Consequently, the search for the presence of L. wollei involved visual observation of the
nearshore areas of each lake. L. wollei was not found in any other lakes in Whiteshell
Provincial Park. During the summer of 2003, four lakes: Betula, White, Jessica and Caddy
Lake were searched monthly from May to August for the occuffence of L. wollel. A large
fishing spoonweighted with arock, attachedto aropewas loweredthroughthewatercolumn
to the sediment surface. The barbed hooks grasped algae offthe lake bottom, which enabled
it to be retrieved at the lake surface. The perimeter of the lake was toured dropping the
fishing spoon approximately every 2 mto determine the presence or absenc e of L. wollei.
When algae samples were retrieved that were morphologically similar to Z . wollei,ttre UTM
coordinates ofthe sampling site were recorded (Garrnin l2xL)and the sample was put in a
jar and labeled- Samples were preserved with Lugols iodine solution and were later identified
in the laboratory using a compound microscope. In Betula and White Lakes where L. wolleí
42
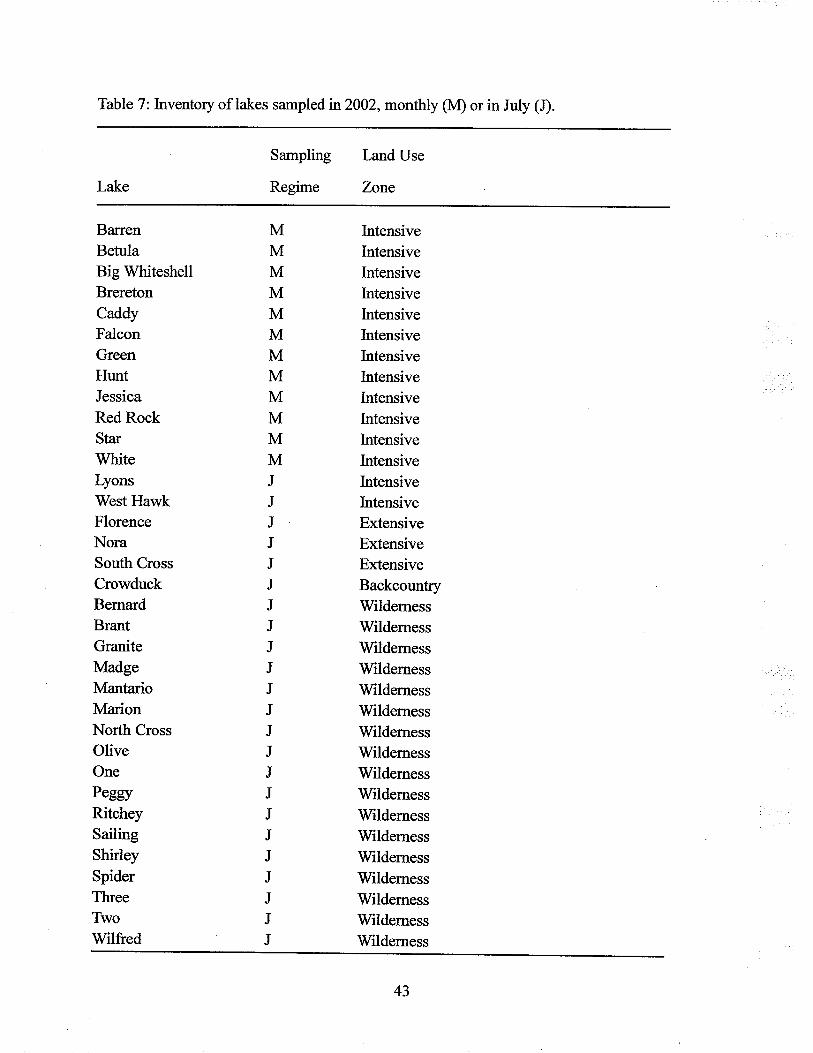
Table 7: Inventory of lakes sampled in2002, monthly (M) or in July (J).
Lake
Sampling Land Use
Regime Zone
BarenBetulaBig WhiteshellBreretonCaddy
FalconGreen
HuntJessica
Red RockStar
WhiteLyons
West HawkFlorence
NoraSouth Cross
CrowduckBernardBrantGraniteMadgeMantarioMarionNorth Cross
OliveOne
Peggy
RitcheySailingShirley
SpiderThree
TwoWilfred
MMMMMMMMMMMMJ
J
J
J
J
J
J
J
J
J
J
J
J
J
J
J
J
J
J
J
J
J
J
IntensiveIntensiveIntensiveIntensiveIntensivelntensiveIntensiveIntensiveIntensiveIntensiveIntensiveIntensiveIntensiveIntensiveExtensiveExtensiveExtensiveBackcountryWildernessrWilderness
Wilderness
Wilderness
Wildemess
Wilderness
V/ilderness
Wilderness
Wilderness
V/ildemess
Wilderness
Wilderness
Wilderness
V/ilderness
Wilderness
Wilderness
Wilderness
43
was identified, a transect was canoed perpendicular to the shoreline to determine the area ofinfestation in each lake.
In2002, a survey of backcountry lakes was conducted to search for the occurence ofL' wollei and collect water samples. The first day or two of each canoe trip was dedicated to
the search fot L. wolleí in back country lakes. Due to time constraints it was not possible to
search the entire perimeter of every backcountry lake for the occurrence of I. wollei. As a
result, canoe launches, campsites and other easily accessible nearshore areas were searched.
L. wollei was not found in any backcounûy lake.
3.14 Lyngbya wolleí Biomass
SCUBA divers were employed to estimate L. wollei biomass in infested lakes. onJuly 30, 2003 SCUBA divers used 0.46 m2 quadrats to harvest portions of L. wollei mats
from Betula and White Lakes. Quadrats were constructed using copper pipe and ninety
degree copper elbow joints. Holes were drilled into the pipe to enable the quadrat to sink
and remain on the sediment. ALucþ Strike rubber replacement fishing net23inches deep
was fastened around the quadrat using flare tape and wire. A slit was cut through the top ofthe net to enable the diver to extract the vegetation within the quadrat without losing any
biomass. The diver pushed the quadrat into the substratum, reached through the slit in the
top of the net and retrieved all biomass from within the quadrat. The harvested biomass
extracted by the diver was placed in a drawshing mesh bag. A small hand held garden hoe
was used to churn up the sediment to ensure all vegetative biomass was retrieved from thequadrat' The mesh bag filled with the harvested vegetation was brought to the surface by the
diver were it was emptied into a labeled plastic bag. Two quadrats were hawested at l0 mand20 m along a transect perpendicular to the shore. Harvesting methods were similar tothose employed by Cowell and Botts (lgg4).
The samples of I- wollei mats were then taken back to the University of Manitoba.
Mats were rinsed to remove sediment following similar methods to those described bySpeziale et al' (1991). once the harvested mats had been rinsed of sediment they where laid
out on drying racks in the Buller Building rooftop greenhouse. Drying racks were constructed
using two inch pine timbers. Each drying rack was rectangular in shape, three feet long and
two feet wide with a central supporting cross piece. Window screen was fastened to the top
of the wooden frame with nails. The harvested L. wollei mats were laid out on the screen
allowing air to flow below and above drying samples. Mats were allowed to dry for three
weeks at 30 to 50oC. The harvested mat from each quadrat was then weighed (Table 20). As
a result, biomass of L. wollei mats in Betula and White Lakes was estimated.
3.15 Lynghya wolleí Desiccation Experiments
Two desiccationexperiments were conducted duringthe summerof2003. The objective
of these experiments w¿ts to examine the oxygen production or consumption of Z. wollei
samples after various drying times. This experiment examined the ability of L. wollei to
survive varying periods of desiccation and subsequently its potential for surviving inter-
lake tansfer. L. wolleisamples were collected from Betul aLakefor drying. Initially a sample
of L. wollei was collected on June 23 andsmall clumps appearing approximately the same
size were laid out on a drying rack in the University ofManitoba greenhouse. The temperature
in the greenhouse fluctuated between 15 and 35 oC. As a result , L. wollei samples were
dried under natural daily light and temperature fluctuations. The greenhouse protected the
samples from moisture and wind. Another sample of L. wollei was collected from Betula
Lake on July 18, 2003. Small clumps appearing approximately the same size were spread
out on the drying rack at the same time daily from July 19 to July 2l,2003.Aportion ofthe
sample collected on July 18 was kept in a container in relative darkness until the experiment
was conducted on July 23 ,2003 ,representing a stagnant sample. As a result, the experiment
included L. wollei samples that had been dried for one month,4 days,3 days, 2 days and a
stagnant sample.
The July 23,2003 desiccation experiment was conducted at the Betula Lake
ç¿tmpground beach. Clear plastic jars with white plastic lids and a volume of 503 ml were
used to conduct these experiments. One piece of dried, L- wollei from each date was placed
45
in a labeled jar with lake water for half an how, prior to the experiment. This rewetted the Z.
wolleí samples and decreased the amount of air bubbles retained within the sample. The jars
were then emptied and refilled with the sample retained inside the jar. Each jar was sealed
under water in order to exclude air bubbles from the sample. Once filled the jar was inverted
to ensure there were no large air bubbles trapped within the jar. There tvere a total of eight
treatment jars. The dried and stagnant samples constituted five treatments. A fresh sample
of L. wollei was collected, providing a fresh treatment. Two control treatments, a light and
dark bottle filled with lake water were used. The dark bottle was painted black and covered
with black electrical tape to exclude light. In contrast, the light bottle was the same as the
other treatments but only contained lake water with no L. wollei. The two controls enabled
the determination of oxygen evolution by phytoplankton in the water.
A strip of Duct Täpe one centimeter wide was tied immediately below the lid of each
jar. Each jar was then inverted and two pieces of 15 cm long wire were folded in half and
inserted around the Duct Tape strip on both sides of the jar. The jar was then placed on a
wire shelf. The wire was then twisted around the wire shelf securing the jar to the shelf. The
shelfwith eightjars secured lid down was placed in water 0.5 m deep. Thejars were removed
after 45 minutes and a 200 mL sarnple of water was collected from each jar. The oxygen
concentration (mg/L) was then measured using the Winkler tihation method (ApHA # 1 99).
The experiment was repeated successively for a total of tlree trials. This experiment was
conducted between 11 a¡n and 2 pm, corresponding to the period ofma>rimal daily sunshine.
The experiment conducted inAugust followed the same methodology as outlined for
the July experiment with the exception of the drying procedures. The samples collected
from Betula Lake were dried in the greenhouse located on the roof of the Buller Building at
the University of Manitoba. There was a considerable increase in drying temperafure and
light exposure at this location. Drying temperatures were typically between 40 and 50 .C.
The stagnant sample was left out with the drying algae in full sunlight. Due to the waÍn
temperatures water evaporated from the container. As a result, to keep the sagple from
46
drying up, minimal lake water was added periodically to keep the sample wet. The jars were
left in the water for 40 minutes with three replicate trials onAugust 18, 2003.
The Z. wollei samples from each treatment and trial were collected following each
experiment and placed in a labeled bag. These samples were taken back to the University of
Manitoba and spread out on the drying racks. kr July the samples were dried for two weeks '
in the greenhouse, then placed in a drying oven at 40'C for 10 hours and 45 minutes and
weighed to obtain a dry weight for each heatment sample. The August samples were dried
in the Buller building roof top greenhouse for 22 days and then weighed.
The oxygen concentrations in each treatment bottle \üere compared to that in the light
bottle. Treatment concentration was determined by subfacting the oxygen concentration in
each treatment jar from the light bottle concentration from each respective trial. This enabled
the determination of oxygen evolution or consumption by the L. wollei sample, which was
then divided by the dry weight of the L. wollei sample. As a result, the production or
consumption of oxygen per milligram L. wollei was calculated (Table 2lA&.22A). Using
JMP IN, Analysis of Variance (ANOVA) was used to determine if desiccation treatments
had significantly different oxygen concentrations per milligram L. wollei dry weight. The
Tukey-Kramer method was used to make individual pairwise comparisons between
treatments.
3.16 Lyngbyø wolleí Toxicolory
L. wollei samples were collected from Betula and White Lakes during the summer of
2002 and2003, to be tested to production of the neurotoxin saxitoxin and its analogues.
Crayfish and water samples were also collected from infested areas to test for the presence
of saxitoxin contamination. Analysis is ongoing at the Freshwater Institute, Winnipeg,
Manitoba. Select samples have been sent from the Freshwater Institute to associated
laboratories in Germany and New York for toxin analysis. The results of these analyses will
not be included in this study.
47
3.2 Water Sampling
3.21 Water Sampling 2002
ln 2002, surface water samples were collected monthly from May to August from
twelve lakes throughout the Whiteshell (Table 7 & Figure 2-I3). The lakes chosen were
easily accessible and formed a continuum with respect to size, recreational use, and watershed
activity. Water samples were collected from water quahty stations designated as sampling
sites by Manitoba Conservation. Vy'ater samples have historically been collected from these
sites. As a result, data collected for the purposes of this project contribute to the long term
monitoring of Manitoba lakes. Green and Hunt Lakes did not have provincially-designated
water quality stations. At Green Lake water samples were collected from the middle of the
largest basin, as the bathymetry for this lake was unknown. In contrast, Hunt Lake samples
were collected from the middle of the lake, which had the greatest depth, identified using a
bathymetricmap. Water samples were analyzedbyCanTestlaboratories locatedinWinnipeg,
MB and Vancouver, B.C. Conventional parameters were measured in Winnipeg and nutrient
and metal concentrations were determined by the laboratory in Vancouver. Chlorophyll
analysis was conducted at the University of Manitoba.
In May, June andAugust, water samples were collected from all twelve lakes. Bottles
were rinsed twice in the lake before collecting water samples from the surface. At each site
the date, time, GPS coordinates, cloud cover, wind speed, lvater and air temperature were
measured. The photic zone depth was estimated from the Secchi depth. At each site the
Secchi disk was lowered down on the shaded side of the boat until it disappeared from sight.
It was then retracted until it could be seen again, at which time the rope was marked off. The
Secchi depth was recorded as the mean of the two depths.
Four bottles were filled at each site, comprising one sample. The fust sample was
used to measure pH, conductivity, hardness and other conventional parameters (Table g).
HrSOo was added to the second sample to preserve it for nutrient concentation analysis.
HNO3 was added to the third sample so that it could be analyzed for metal concentrations
48
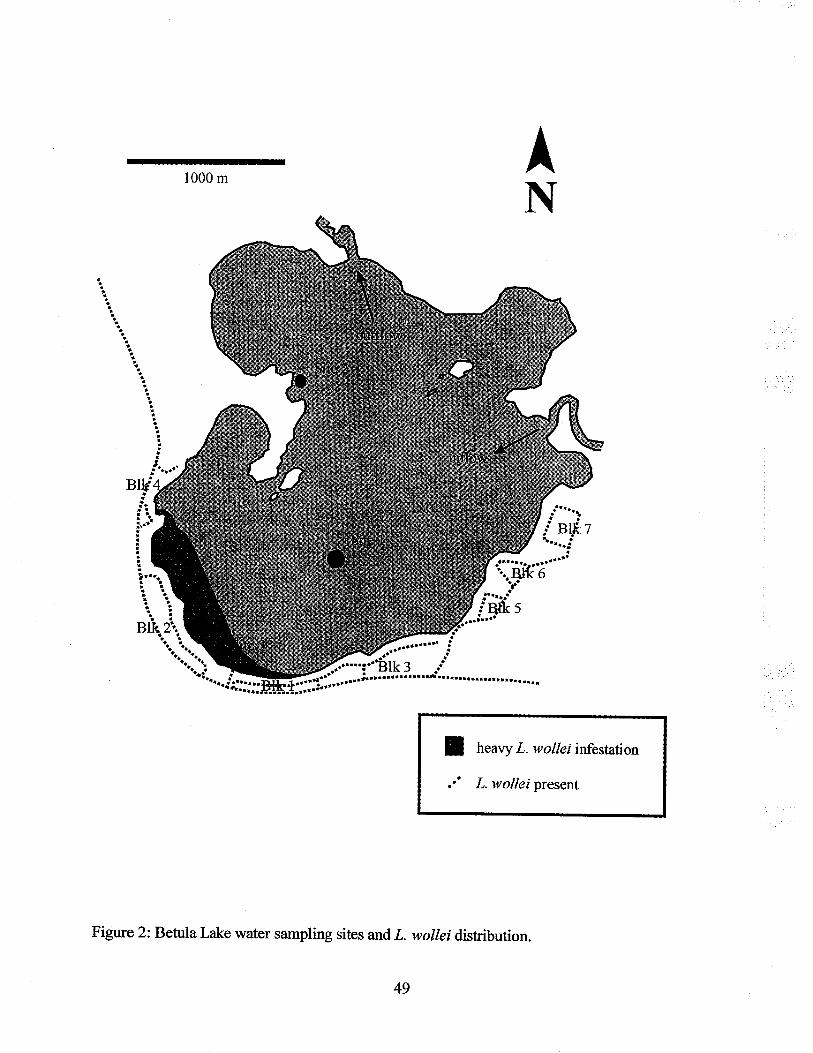
Ahl
I000 m
heavy L- wollei infestation
L. wollei present
Figure 2: Betula Lake water sampling sites and L. wollei distribution.
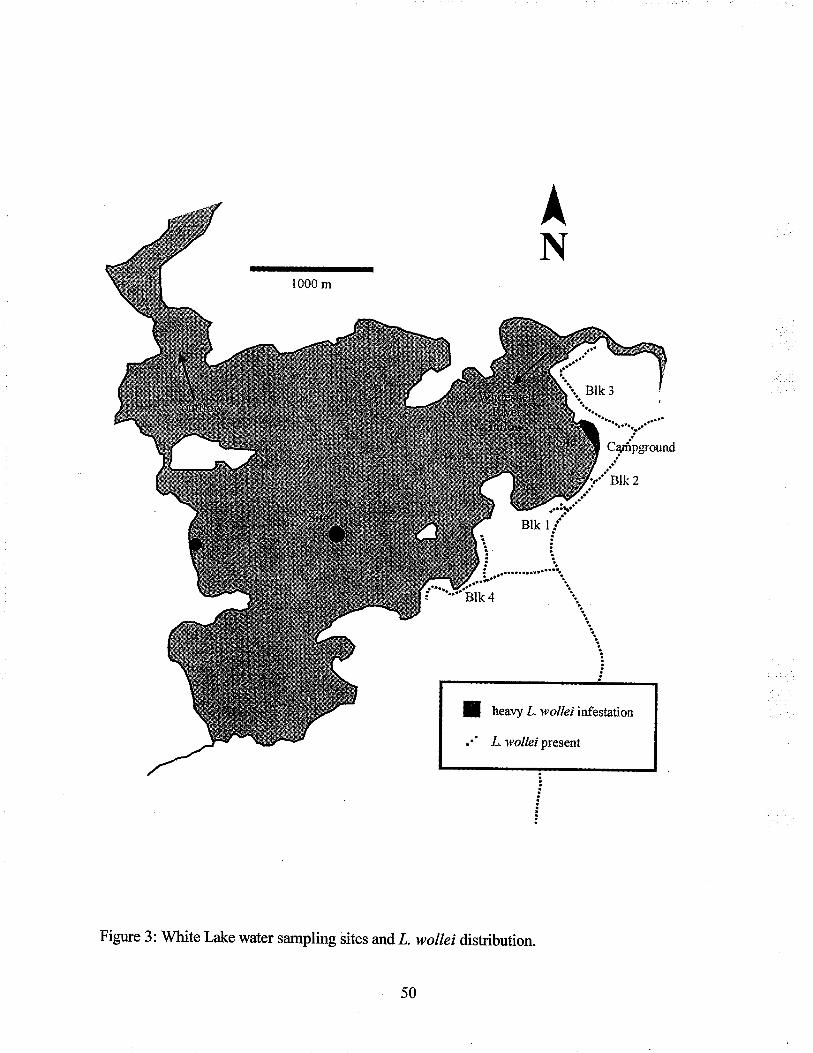
^N
1000 m
t heavy L. wolleiinfestation
L. wollei present
Figure 3: white Lake water sampling sites and L. wollei distribution.
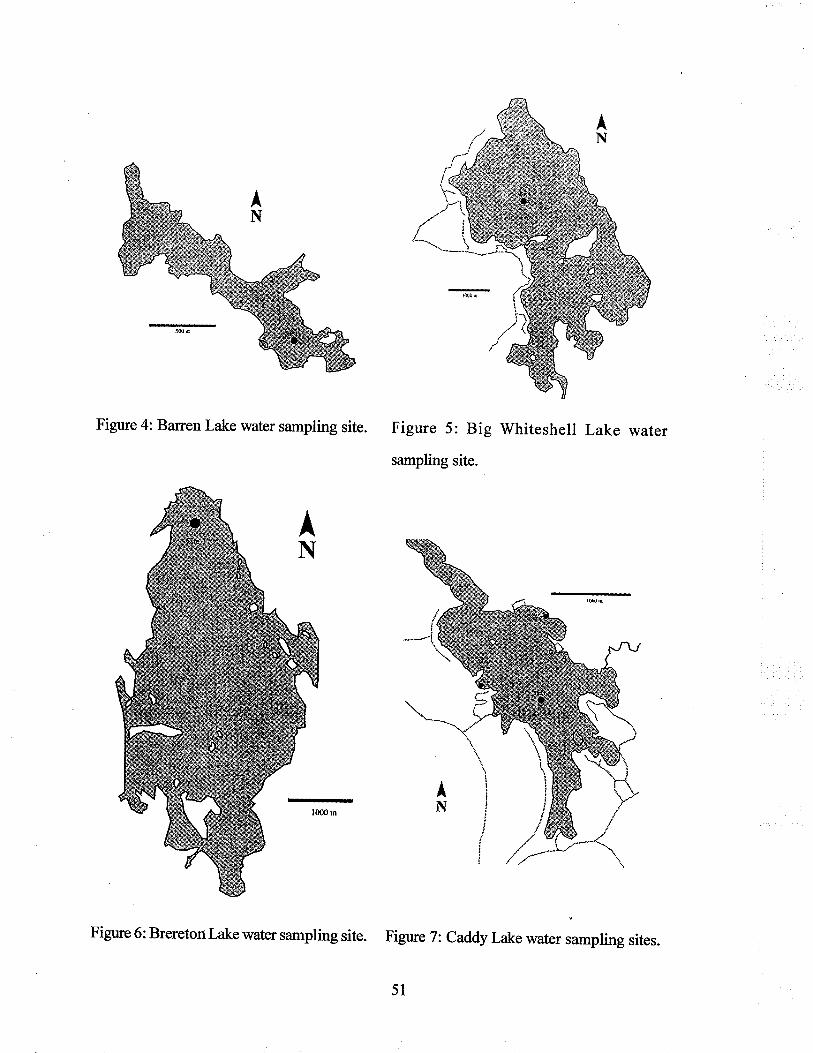
Figure 4: Ba¡ren Lake water sampling site. Figure 5: Big Whiteshell Lake water
sampling site.
-
l(Ð0 rn
Figure 6: Brereton Lake water sampling site. Figure 7: Caddy Lake water sampling sites.
5l
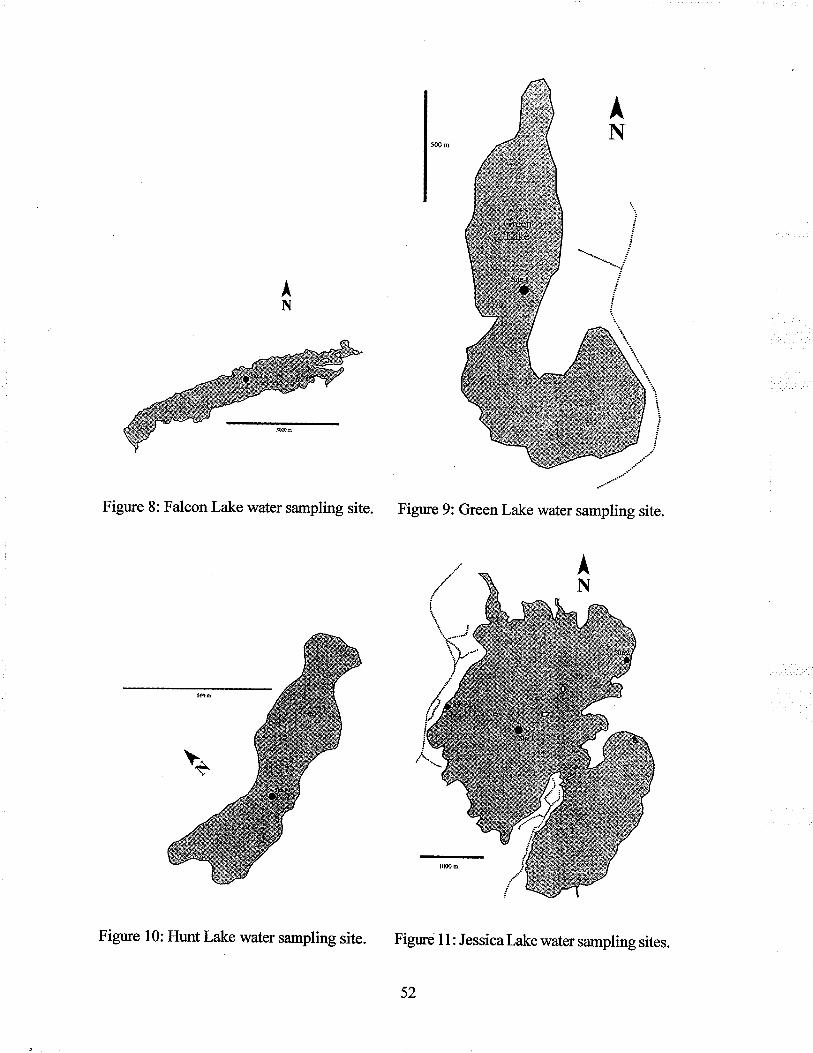
j
"-4:\ 1..
Éftì#.94"\ :-
AN
Figure 8: Falcon Lake water sampling site. Figure 9: Green
/&\Æ... .¿Æ
çre
Æ
Lake water
Figure ll: Jessicalake water sampling sites.
52
Figure 10: Hunt Lake water sampling site.
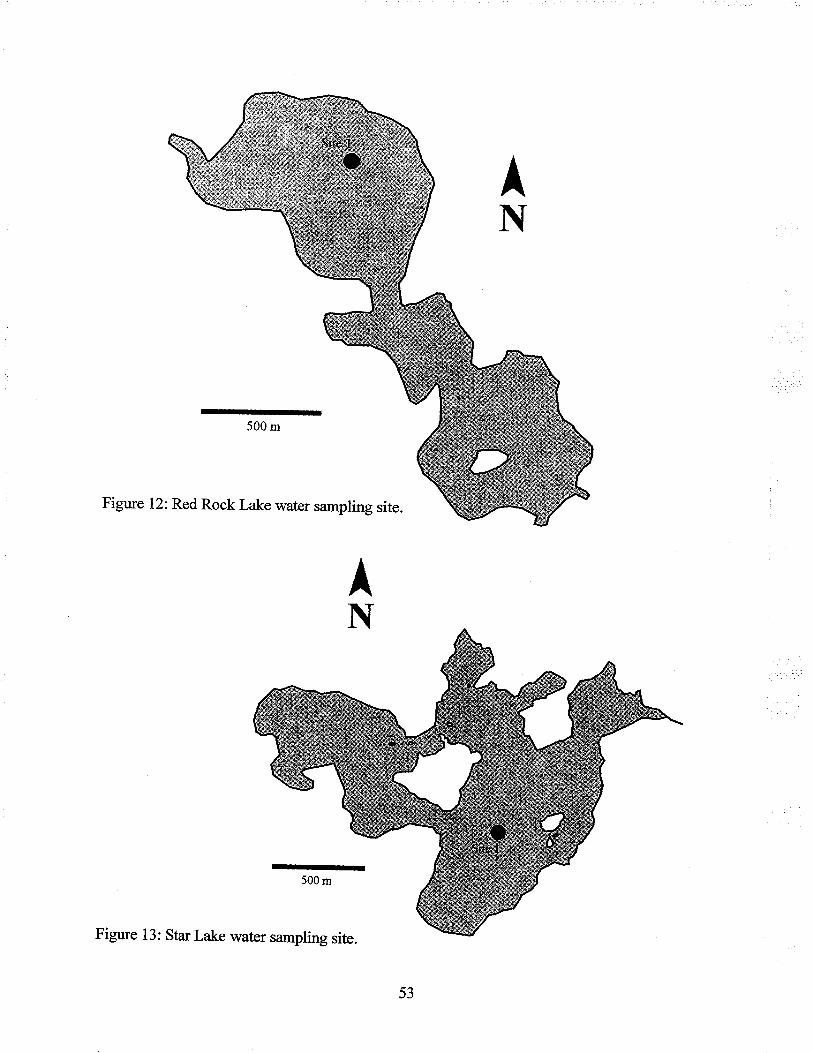
Figure 12: Red Rock Lake water sampling site.
^¡{
Figure 13: Star Lake water sampling site.
53
(Table 8). All these samples were analyzed by CanTest. A liter of water was collected from
each site for clrlorophyll a analysis. Aknown volume of this sample was filtered (Whatman
GF/C) under mild vacuum. These filters were frozen until analyzed, when each filter was
placed in a glass vial and 5 mL of 90% methanol to extract algal pigments. Samples \¡/ere
processed following the methods outlined for sediment chlorophyll analysis (section 3.36
Chlorophyll analysis).
In July 2002, a water quality survey of 35 lakes was conducted. This survey examined
2l backcountry and 14 intensively used lakes (Table 7). Twelve of the 14 intensively used
lakes were those sampled monthly throughout the summer. All samples were collected using
a canoe to access the sampling sites. Canoes were borrowed from residents and resorts on
intensively used lakes so that boats were not moved between lakes. Manitoba Conservation
supplied a canoe to be used on Hunt and Green Lakes where they could not be borrowed.
Three canoe trips through the wilderness area allowed the samplin g of 2l lakes, the
first time thatdatahas ever been collected from remote lakes in Whiteshell Provincial Park
(Figure 1). The furthest lake on each trip was reached in one or two days. All sampling was
done on the retum trip in a single day. Sampling sites were located at the center of the lake
or at the center ofthe largest bay the canoe route passed through. At each lake, for consistency,
one person recorded site descriptions and environmental conditions while the second took
surface water samples. Coolers were used to carry water samples. Ice delivered by a second
team on the last day ofthe trip was used to keep the samples cool. Samples were then driven
into Winnipeg where they were analyzed by CanTest. July water samples were measured for
conventional parameters and nutrient concentrations (Table BB).
3.22 W ater Sampling 2003
In 2003, water sampling was conducted on four Whiteshell Lakes: Behrl4 White,
Jessica and Caddy. Two lakes, Betula and White had, L. wolleí infestations. In contrast,
Jessica and Caddy Lakes did not have known Z. wollei infestation. Sampling was conducted
biweekly from late May until the end ofAugust. Surface water samples were collected from
54
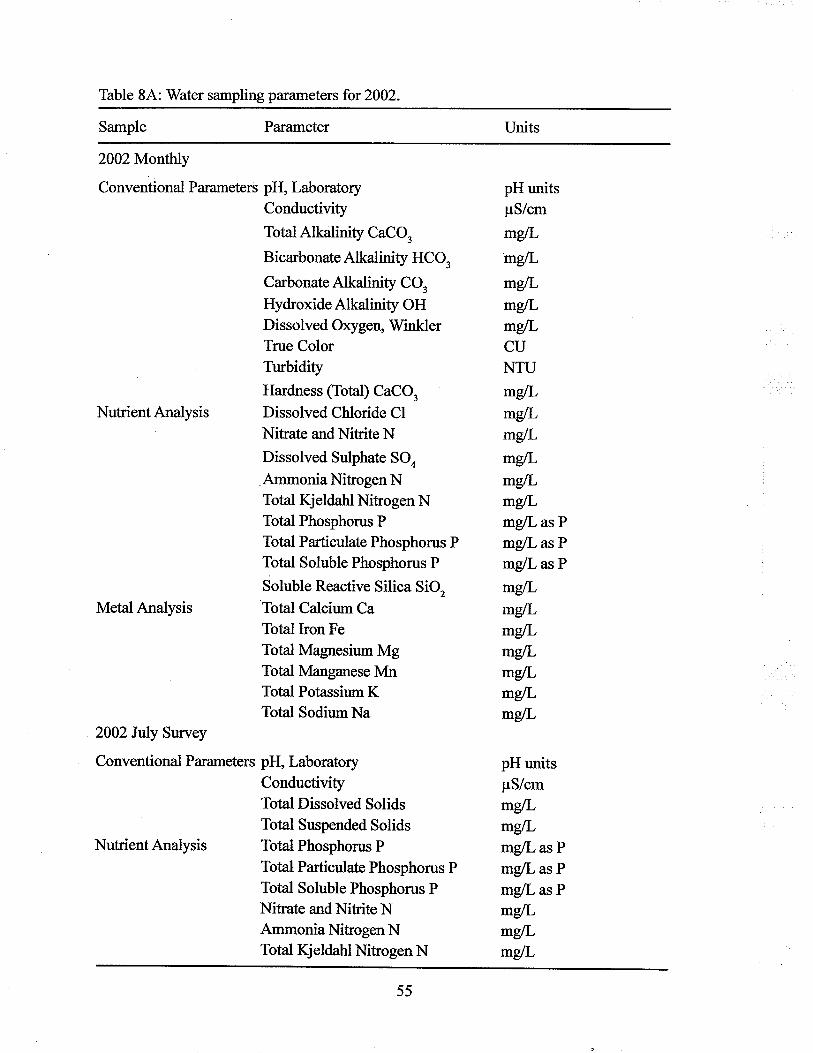
Table 8A: V/ater sampling parameters for2002.
Sample Parameter Units
2002 Monthly
Conventional Parameters
Nutrient Analysis
Nutrient Analysis
Metal Analysis
2002 JuIy Survey
Conventional Parameters pH, Laboratory
pH, Laboratory
Conductivity
TotalAlkalinity CaCO,
Bicarbonate Alkalinity HCO3
Carbonate Alkalinity CO3
Hydroxide Alkatinity OHDissolved Oxygen, V/inklerTrue ColorTurbidity
Hardness (Total) CaCO,
Dissolved Chloride ClNitrate and Nitrite NDissolved Sulphate SOo
AmmoniaNihogen NTotal Kjeldahl Nihogen NTotal Phosphorus P
Total Particulate Phosphorus PTotal Soluble Phosphorus P
Soluble Reactive Silica SiO,Total Calcium Ca
Total Iron Fe
Total Magnesium MgTotal Manganese MnTotal Potassium KTotal SodiumNa
ConductivityTotal Dissolved SolidsTotal Suspended SolidsTotal Phosphorus P
Total Particulate Phosphorus PTotal Soluble Phosphorus P
Nitrate andNihiteNAmmoniaNitrogen NTotal Kjeldahl Nitogen N
pH unitspS/cm
mglL
mglL
mgtLmglLmgLCUNTU
mgtLmg[-mglL
mglLmglLmglLmg/L as P
mg/L as P
mg/Las P
mglLmglLmglLmglLmglLmgfi-mgtL
pH unitspS/cm
mglLmglLmg/L as P
mg/L as P
mgll as P
mgtLmglLmgtL
55
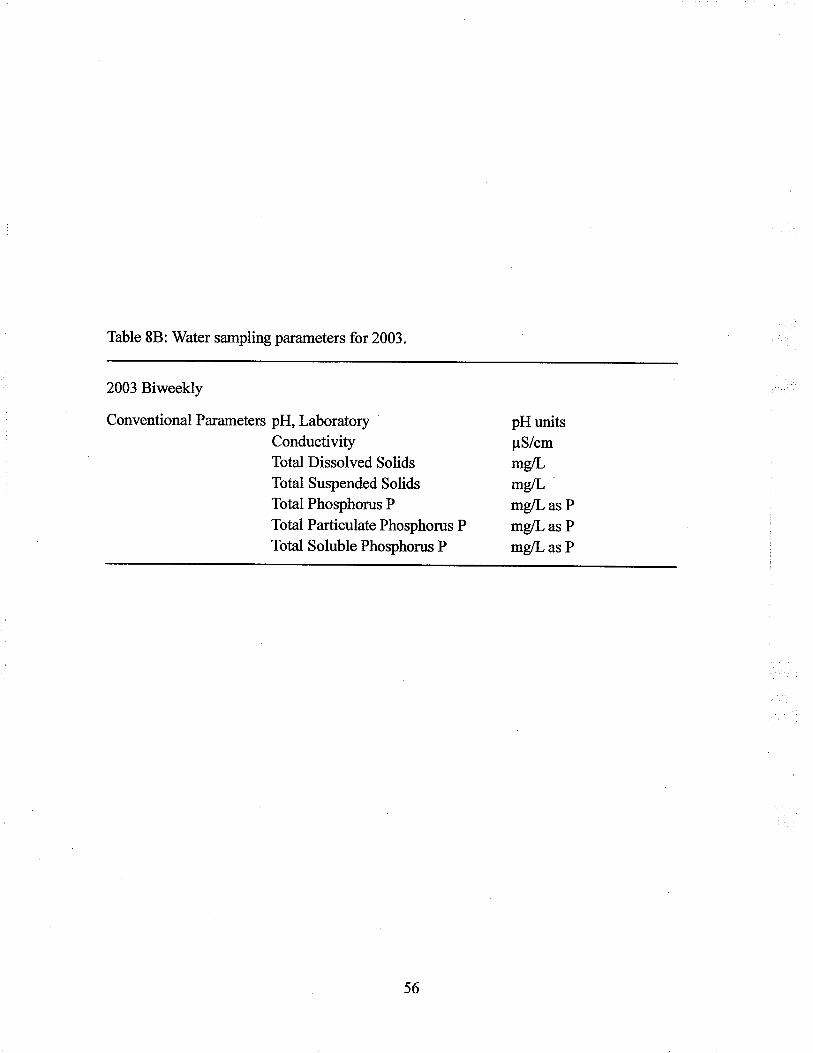
Table 8B: Water sampling parameters for 2003.
2003 Biweekly
Conventional Parameters pH, LaboratoryConductivityTot¿l Dissolved Solids
Total Suspended SolidsTotal Phosphorus P
Total Particulate Phosphorus P
Total Soluble Phosphorus P
pH units
¡rS/cmmgtLmglLmgll as P
mg/L as P
mg/L as P
56
three sites on each lake (Figure 3,6,10,13). For consistency water samples were collected
from these same Manitoba water quality sites sampl ed in 2002, at the center of each lake,
site l. The second site was located in a sandy littoral area at a depth of 0.5 m. This site was
relatively uninhabited, lacking cottages, roads or other recreational facilities. ún contrast,
the third site was located at the main beach area with a high cottage density and many
recreational facilities. This sampling method enabledthe comparison ofwaterqualitybetween
sites within eachlakes.Ateach site, water collected was analyzed forconventionalparameters,
nutrients and chlorophyll a (Table 8). \ü/ater sampling methods were consistent with those
used in 2002.JMP IN was used to conductANOVAto determine whether the water quality
parameters were significantly different between sites on each respective lake.
Vertical attenuation ofphotosynthetically active radiation (PAR) inthe water column
was measured using a LI-COR spherical sensor and a flat terrestrial sensor connected to a
LI-1000 data logger. Readings were taken by the spherical sensor above and below the
water surface and then at 0.5 m depths to the bottom of the lake. Simultaneous readings
were recorded from the terrestrial sensor, to correct underwater reading for variation in
surface irradiance due to cloud cover. Light measurements were recorded biweekly when
water samples were collected. Mean photic depth was calculated for all four lakes using
biweekly measurements (Table 18).
h July 2003,I conducted a survey of all ¡relve lakes sampled :rr-2002.4t each site
the Secchi depth, light penetration and a water sample was collected. Photic depths for each
lake were calculated using light meter measurements (Table 18). Water sarnples collected
were analyzed for chlorophyll a.
3.3 Sediment Core Collection
3.31 Coring and Core Processing
Sediment cores were extracted from thirteen Whiteshell Lakes during February and
March of 2002 and 2}}3,respectively. Sediment core analysis was used to examine changes
in nutrient and metal concentations over time. In 2003, sediment cores were extracted from
57
three lakes in the wildemess zone and two in the extensive recreation zone (Table 9). The
remaining eight lakes sampled are located in intensive recreational areas (Table 9). The
lakes formed a continuum with respect to recreational access and human land use. Sediment
cores were extracted from water quality sites used historically by Manitoba Conservation.
For lakes which did not have pre-existing water quality sites bathymetric maps provided by
the government were used to take samples from the deepest area of the lake. For lakes
without bathymetric maps, samples were typically taken from the center ofthe largest basin.
3.32 Core Collection
The location of each water quality station was estimated using a bathymetric map
supplied by Manitoba Conservation. The date and time of sampling was recorded at each
site. AGarmin GPS 12)(L GPS receiver was used to record UTM coordinates ofeach sample
site. At each site, an ice auger was used to drill four holes, each approximately 20 cm in
diameter. The ice thickness, total water depth and snow depth were meÍßured using one
hole. The second hole was used to take water samples from the surface water frlling the
hole. The two remaining holes were used for collecting the sediment core(s) from the site.
Special care was taken to prevent the flocculent sediment being disturbed by the coring
device. If the sediment was disturbed before the core was extracted then the remaining
fourth hole was used in a second attempt. A modified mini Kajak-Brinkhtnst gravity corer
(Figwe 14) was used to extract all sediment cores. This gravity corer \üÍrs lowered through
the ice hole, down through the water column and into the sediment to a depth of about 40
cm. Inertial force pushed the core tube into the sediment. Once the core tube had settled into
the sediment a guided brass weight was sent down the rope by the operator to trigger the
rubber plunger. The plunger created suction in the core barrel, which enabled the operator to
recover the column of sediment within the tube undisturbed.
Two people were required to retrieve the sediment core from the water. One person
held the weighted head of the corer while the second person fitted a rubber stopper into ttre
end of the core tube. The stopper was put in place before the tube was removed from the
58
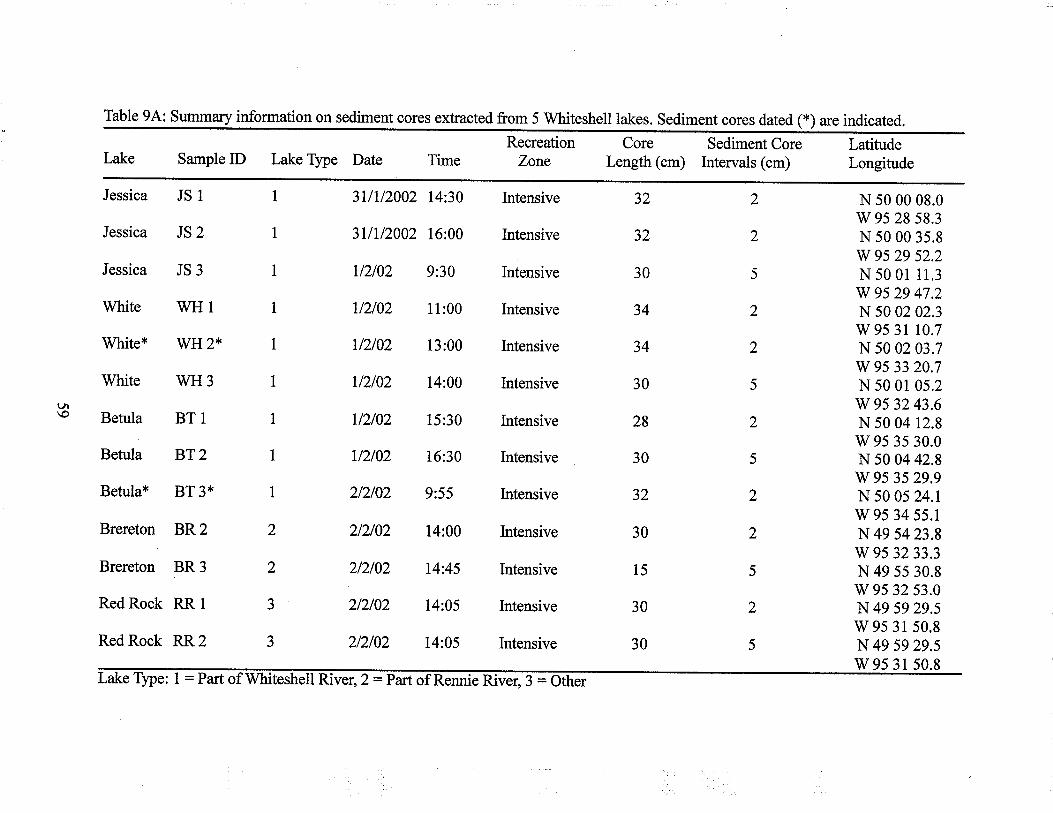
Table 9A: Summary information on sediment cores extracted from 5 Whiteshell lakes. Sediment cores dated (*) are indicated.
Jessica
Jessica
Jessica
White
Whitet
White
Betula
Betula
Betula*
Sample ID Lake Type Date
JSl
JS2
JS3
wHl
wH 2*
wH3
BTl
BT2
BT 3*
I
1
3llll2002 14:30
3llll2002 16:00
ll2l02 9:30
l/2102 11:00
ll2l02 13:00
ll2l02 14:00
ll2l02 15:30
l/2102 16:30
212102 9:55
212/02 14:00
212/02 14:45
212102 14:05
212102 14:05
1
1
1
1
I
1
2
2
J
J
Time
Brereton BR 2
Brereton BR 3
Red Rock RR 1
Red Rock RR 2
Recreation Core Sediment Core LatitudeZone Length (cm) lntervals (cm) Longitude
Intensive 32 2 N 50 00 08.0w 95 28 58.3
Intensive 32 2 N 50 00 35.8w 95 29 52.2
Intensive 30 5 N 50 01 11.3
w 95 29 47.2lntensive 34 2 N 50 02 02.3
w 95 3r t0.7Intensive 34 2 N 50 02 03.7
w 9s 33 20JIntensive 30 5 N 50 0l 05.2
w 95 32 43.6lntensive 28 2 N 50 04 12.8
v/ 95 35 30.0Intensive 30 5 N 50 04 42.8
w 95 35 29.9Intensive 32 2 N 50 05 24.1
w 95 34 55.1Intensive 30 2 N 49 54 23.8
w 95 3233.3Intensive 15 5 N 49 55 30.8
w 95 32 s3.0Intensive 30 2 N 49 59 29.5
w 95 3l 50.8lntensive 30 5 N 49 59 29.5
þpe: 1:Partof ,2:Partof ver,3 = Otherw 95 31 50.8
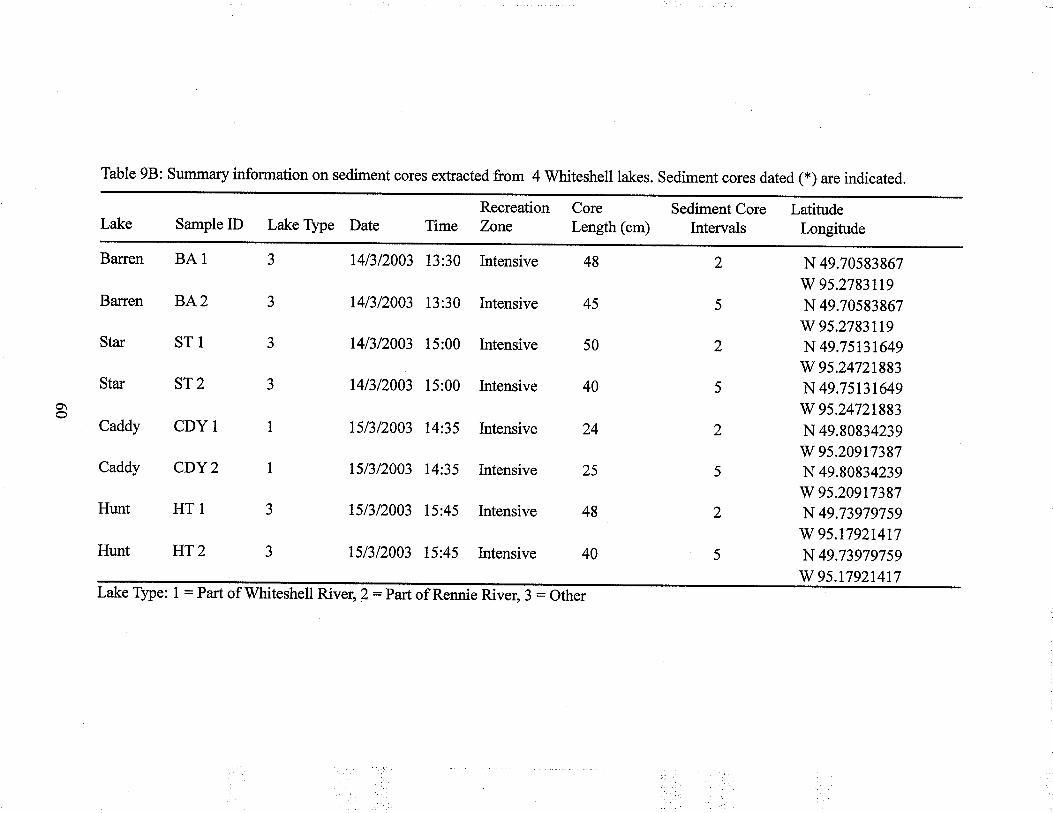
Table 98: Summary information on sediment cores extracted from 4 Whiteshell lakes. Sediment cores dated (*) are indicated.
Recreation Core Sediment Core LatitudeLake Sample ID Lake Type Date Time Zone Lenglh (cm) Intervals Longitude
Barren BA I 3 141312003 13:30 Intensive 48 2 N 49.705g3g67
w 9s.2783fi9Baren BA2 3 141312003 13:30 lntensive 45 5 N 49.70593967
w 95.2783t19Star ST I 3 14/3/2003 15:00 Intensive 50 2 N 49.75131649
w 95.24721883Star ST2 3 14/3/2003 15:00 Intensive 40 5 N 49,75131649
w 95.2472t883Caddy CDY I 1 151312003 14'35 Intensive 24 2 N 49.80834239
w 95.209t7387Caddy CDY 2 1 15/312003 14:35 Intensive 25 5 N 49.g0834239
w 95.20917387Hunt HT I 3 151312003 15:45 Intensive 48 2 N 49.73979759
w 95.1792t4t7Hunt HT 2 3 151312003 15:45 Intensive 40 5 N 49J3979759
Lake Type: I : Part of Whiteshell River, 2:Partof Rennie River, 3 : Otherw 9s.17921417
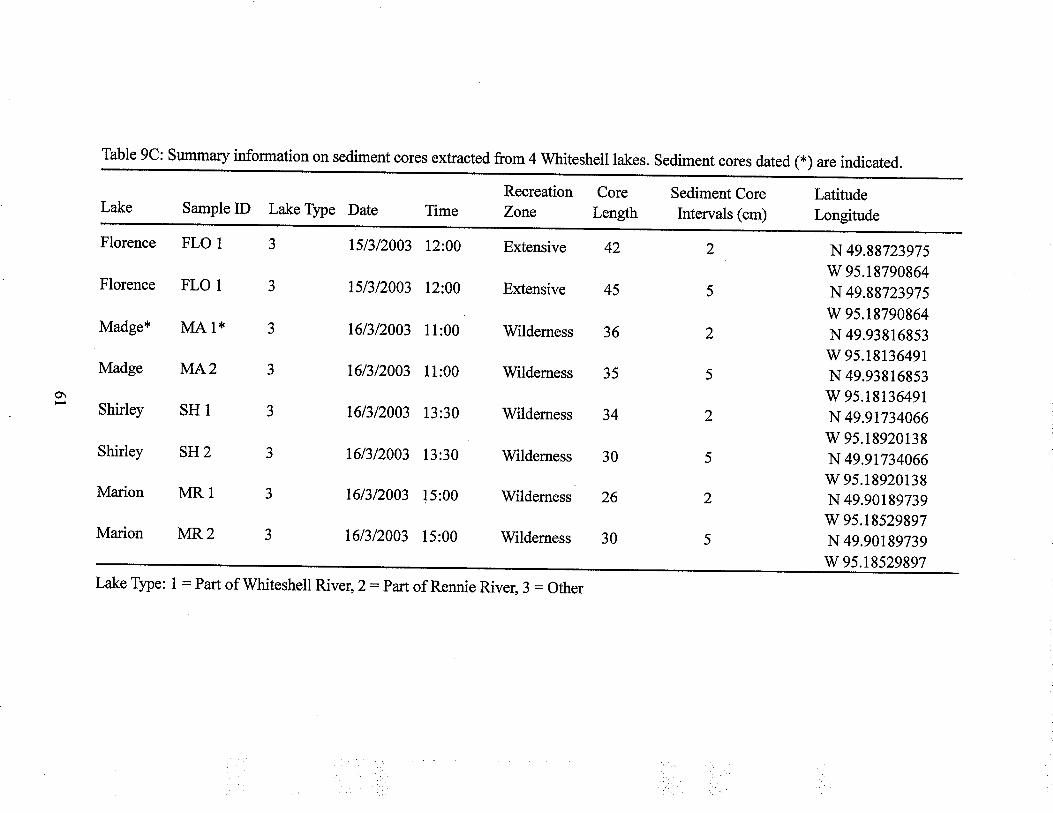
Table 9C: Summary information on sediment cores extracted from 4 Whiteshell lakes. Sediment cores dated (*) are indicated.
Florence
Florence
Madge*
Madge
Shirley
Shirley
Marion
Marion
Sample ID Lake þpe Date
FLO 1
FLO 1
MA 1*
I[/.A2
SH1
SH2
MRl
MR2
o\
1513/2003 12:00
151312003 12:00
1613/2003 11:00
161312003 1l:00
1613/2003 13:30
161312003 13:30
1613/2003 15:00
1613/2003 15:00
Lake Type: 1 : Part of whiteshell River, 2 =partof Rennie River, 3 = other
Recreation Core Sediment Core LatitudeZone Length Intervals (cm) Longitude
Extensive 42 2 N4g.gg7Z3g7S
Extensive
Wilderness
Wilderness
Wildemess
Wilderness
Wildemess
Wilderness
45
36
35
30
w 95.18790864
N 49.88723975
w 95.18790864
N 49.93816853
w 9s.18136491
N 49.93816853
w 95.18136491
N 49.91734066
w 95.18920138
N 49.91734066w 95.18920138N 49.90189739
v/ 95.18529897
N 49.90189739
w 95.18529897
26
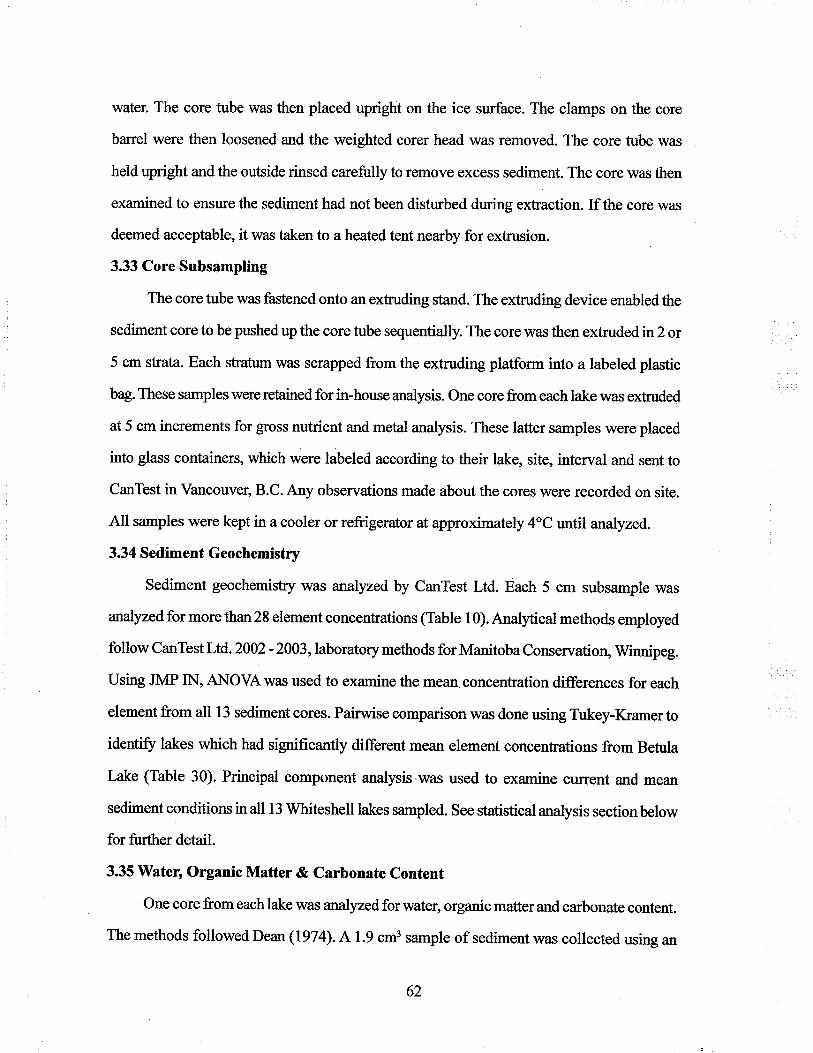
water. The core tube was then placed upright on the ice surface. The clamps on the core
banel were then loosened and the weighted corer head was removed. The core tube was
held upright and the outside rinsed carefully to remove excess sediment. The core was then
examined to ensure the sediment had not been disturbed dwing extraction. If the core was
deemed acceptable, it was taken to a heated tent nearby for extrusion.
3.33 Core Subsampling
The core tube was fastened onto an extruding stand. The extruding device enabled the
sediment core to be pushed up the core tube sequentially. The core was then extruded in 2 or
5 cm strata. Each stratum was scrapped from the extruding platform into a labeled plastic
bag. These samples were retained for in-house analysis. One core from each lake was extuded
at 5 cm increments for gross nutrient and metal analysis. These latter samples were placed
into glass containers, which were labeled according to their lake, site, interval and sent to
CanTest in Vancouver, B.C. Any observations made about the cores were recorded on site.
All samples were kept in a cooler or refrigerator at approximately 4"C until analyzed.
3.34 Sediment Geochemistry
Sediment geochemisüy was analyzed by CanTest Ltd. Each 5 cm subsample was
analyzedfor more than 28 element concentrations (Table l0). Analyticat methods employed
followCanTestLtd. 2002-2003,laboratorymethods forManitobaConservation, Winnipeg.
Using JMP IN, ANOVAwas used to examine the mean concentration differences for each
element from all 13 sediment cores. Pairwise comparison was done using Tukey-Kramer to
identiff lakes which had significantly different mean element concentrations from Betula
Lake (Table 30). Principal component analysis was used to examine current and mean
sediment conditions in all 13 Whiteshell lakes sampled. See statistical analysis section below
for further det¿il.
3.35 Water, Organic Matter & Carbonate Content
One core from each lake was analyzed for water, organic matter and carbonate content.
The methods followed Dean(1974). A 1.9 cm3 sample of sediment was collected using an
62
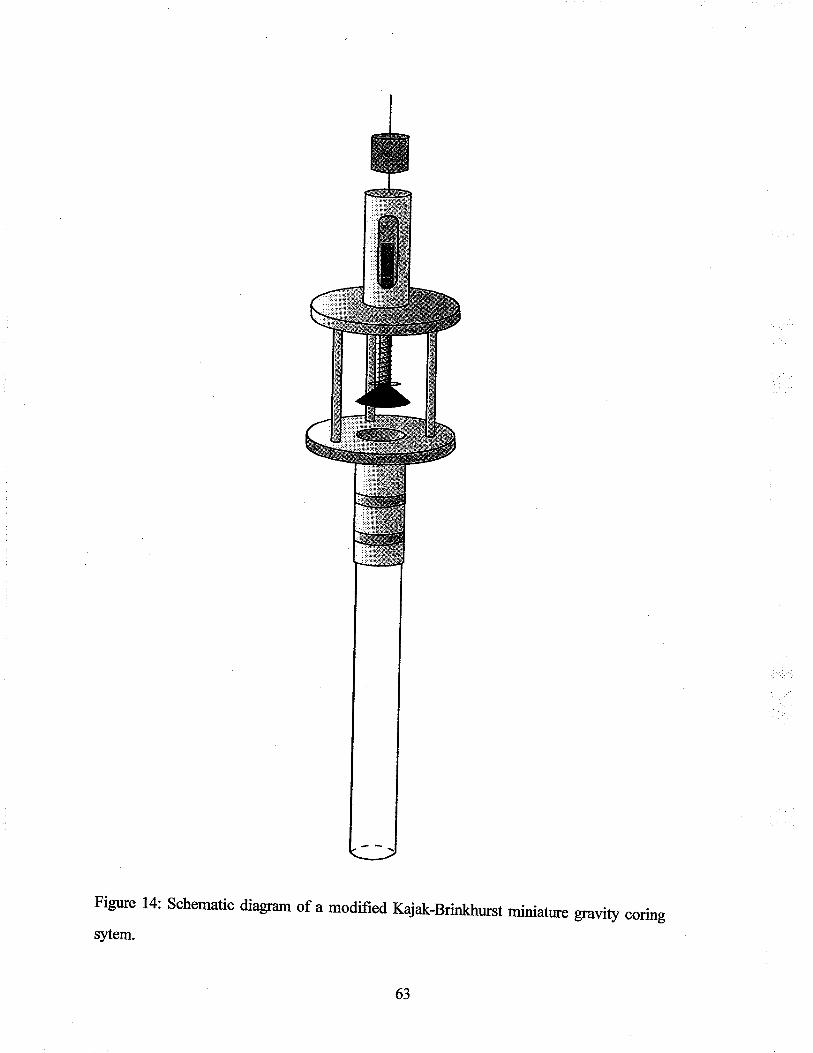
Figure 14: Schematic diagram of a modified Kajak-Brinkhurst miniature gravity coringsytem.
open-ended 5 cc syringe from each interval of the core. Each 1.9 cm3 sediment sample was
then placed into an oven-dried, pre-weighed ceramic crucible. The crucible was then
immediately reweighed to obtain the wet weight of the sample. The crucibles were then
placed in an oven fot 24 hours at l04oC. The crucibles were then re-weighed and the dry
mass w¿ts recorded. These data were used to determine water content as a percent of total
wet weight. The samples were then placed in a muffle fumace at 550oC for I hour then
reweighed. Organic matter is known to ignite between 200 and 500"C. This process enabled
organic matter content to be calculated as a percent of dry weight. Finally, the samples \¡/ere
incinerated at a temperature of 950'C for three hours, then reweighed. The weight loss
represents the amount of carbon dioxide evolved from carbonate minerals. This enabled the
calculation of carbonate mineral content of the sample as a percent of the dry weight.
3.36 Chlorophyll Analysis
Chlorophyll was extracted from wet sediment using 90olo methanol following Swain
(1985). An open-ended 5 cc syringe was used to collect 1.9 cm3 of sediment from each
sample, which was then placed in l0 mL of 90olo methanol. The sample was inverted several
times to mix the sediment thoroughly with the solvent. The tubes were allowed to stand inthe dark at room temperature for 24 hours. This ensured all pigments in the sediment were
extracted then the samples were centrifuged at 500 rpm for 15 minutes to remove suspended
particulates. Absorbance readings from 400nm to l000nm at 0.5nm intervals of each sample
were taken using an Ultrospec 4000 UV/Visible Spectophotometer. Then 0.1 ml of 0.04M
hydrochloric acid was added to each sample, which were then left in the dark for I hour. The
acidification ofthe samples converted the chlorophyll a in the sample into pheophytin. This
procedure enabled chlorophyll a and pheopigments to be used to determine the totalchlorophyll a concentration within each sample (Lorenzen 1967). After an hour the samples
were placed back into the spectrophotometer and remeasured using the sarne parameters as
initially described. Readings taken at 665nm and 750nm pre and post acidification were
64
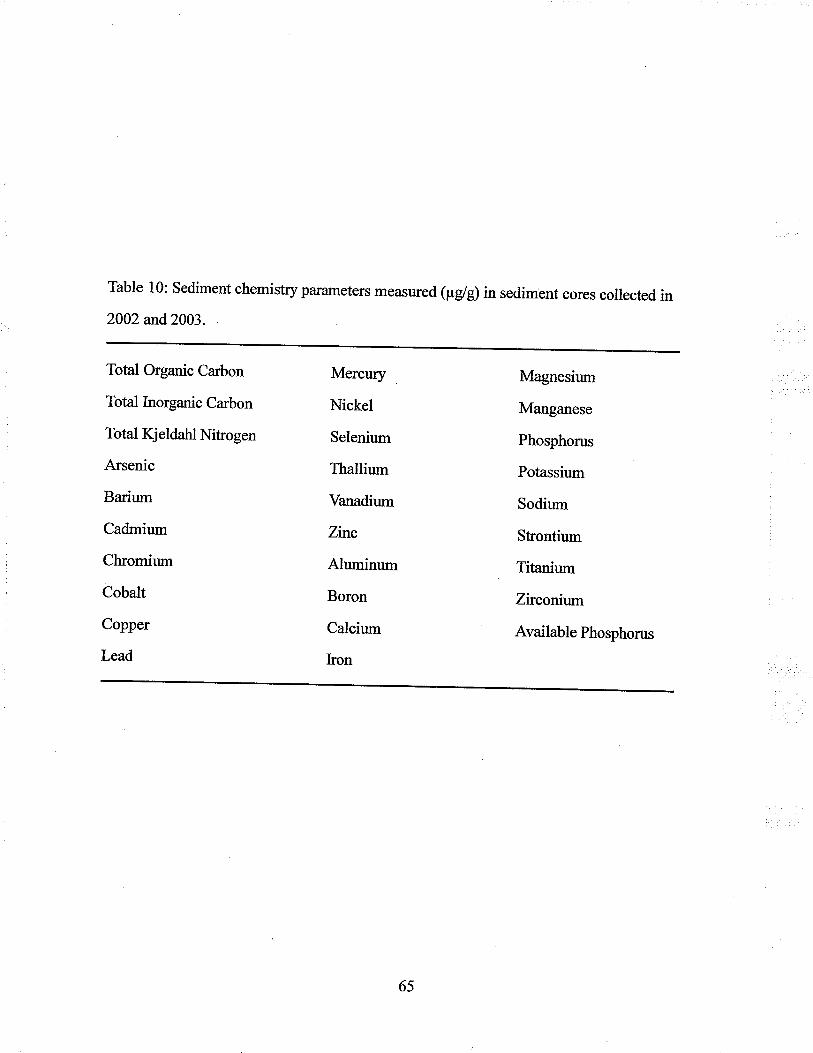
Table l0: Sediment chemistry parameters measured (vglg)in sediment cores collected in2002 and2003.
Total Organic Carbon
Total Inorganic Carbon
Total Kj eldahl Nitrogen
Arsenic
Barium
Cadmium
Chromium
Cobalt
Copper
Lead
Mercury
Nickel
Selenium
Thallium
Vanadium
Zinc
Aluminum
Boron
Calcium
Iron
Magnesium
Manganese
Phosphorus
Potassium
Sodium
Strontium
Titanium
Zirconium
Available Phosphorus
65
then used to determine the concentrations of chlorophyll, pheoph¡in and total chlorophyll
in each sample following monochromatic calculation formulae of Marker et al. (1980).
3.37 Sediment Dating
Three sediment cores collected from Betula, White and Madge Lakes were dated
using 2t0Pb and r37Cs. Each core was subsampled at2 cmintervals. Lead-2l}was measured
usingAlpha Spectroscopy. Cesium-l37 was measured using Gamma-ray Spectroscopy. Based
on 2r0Pb measurements the constant flux model (CRS model) was used to calculate the date
of the sediment cores. This model assumed a constant flux of 2r0Pb to the sediment and
changing sedimentation rates. Cesium-l37 profiles may be used to verify the sediment
chronology measured. Prior to 1954,137Cs deposition from nuclem fallout was nonexistent
or insignificant. Cesium-I37 deposition continued to increase until the Test Ban Treaty of1963- As a result, the onset and peak concentration of 137Cs may be used to identifu the
1954 to 1964 peak. The r37cs peak was obscured in two cores and consequently 2r0pb dates
were used. In orderto determine ifthe sediment core was collected from a depositional area
a focus factor was calculated by dividing the excess 2r0Pb flux measured for each core, by
l70Bq/m2/yt,the expected atmospheric input of excess 210Pb measured at the Experiment
Lakes Area in Ont¿rio. A focus factor greater than one indicates the core was collected from
a depositional area. A value less than one indicated sediment loss from the area.
3. 4 l|¡hiteshell Environmentol Quality
3.41 Whiteshell Resident Survey 2002
Whiteshell residents \¡/ere surveyed in 2002 on their perceptions of environmental
quality in the Park. Property owners in Whiteshell Provincial Park where asked questions
pertaining to their water use, boating frequency, and shoreline activities (Appendix C). The
Whiteshell surveyw¿ts createdby GordonGoldsborough andKaren Lindfollowing asimilar
format to that used by Sasha Brown atDelt4Manitoba @rown 2002).The surveys were
distributed withthe 50û anniversary editionofthe Whiteshell Echo, the local ne\¡/spaper, to
all property owners in the park about 3800 in total. There was a 20olo response rate wtth776
66
surveys retumed by mail, far, email or delivery to drop-offboxes at sites in the park. Swveys
were then sorted by the lake identified as closest to the respondent's residence. The response
rate from each lake was determine by dividing the number surveys submitted from the
specific lake by the total number ofresidences on the lake. To determine the percent response
by lake to various questions the chosen response wÍN divided by the total number ofresponses
for the respective lake. Using survey results a mean average weight was determine for months
of cottage use and sewage handling systems. These parameters were then incorporated into
Correspondence Analysis of land use intensity.
3.42 Enumeration of \ilhiteshell Development
Physical enumeration was also employed to investigate Whiteshell environmental
quality. Campgrounds associated with our 12 intensively studied lakes were toured to
document washroom, grey water and sewage facilities (Table l l). For each campground the
number of non-modern, modern washroom and shower building buildings present were
recorded. Non-modem washroom facilities were outhouses with no sinks or running water
available. Modern washroom facilities were those which had running water with flushing
toilets and sinks. Each washroom building represented a source of sewage in the campground.
Grey water facilities were provided for dumping waste and sewage produced by campers.
Tiailer sanitary disposal stations enabled recreational vehicles to dump holding tanks. In the
intensity of use data mafrices grey water and trailer sanitary disposal stations were grouped
together. These important facilities provided aresponsible, designated area for waste disposal
which otherwise mayhave been disposed of inan inappropriate orenvironmentally harmful
\ilay.
The Parks and Natural Areas Branch of Manitoba Conservation supplied current data
on cotûage densit¡l number of seasonal and transient campsites, number of public beaches
and boat launches for all lakes examined in the2}}2reconnaissance survey (Table 3 &,4).
Morphological parameters of these 12 lakes were investigated using bathymetric maps and
orthophotogaphs (Table 12). Angling bathymetric maps produced by Manitoba conservation
67
were used to determine the maximum lake depth. A planimeter w¿rs used to determine the
volume of each lake. The Land Navigator orthophotos from July 1999, were opened in
ArcView were the perimeter of each lake was traced and the perimeter and surface area
were determined. This method was also used to determine the fetch across each lake from a
SW direct, as this is the predominant wind direction in the park . Mean lake depth was then
determined by dividing the lake volume by the surface area. The shoreline development
index (D) and volume development index (Du) were calculated based on there respective
formula (Table 12) (Wetzel 2001). The number of resort units located directly adjacent to a
lake and resort boat rentals were determined from the Manitoba2}I3Accommodations &
Campgrounds guide provided by Travel Manitoba. The Whiteshell Interpretive Park Map
** ,rr"d to record the number of facilities and recreational activities associated with our 12
intensive use lakes including: marina/gas stations, groceries, distance to closest to\iln,
waterfalls, biking, hiking, self-guiding and Mantario trails and major canoe routes (Table
I 3).
3.43 Recreational Boating
Recreational boating is an important Whiteshell tourist attraction. As a result, it was
my objective to examine the boat use on Betul4 White, Jessica and Caddy Lakes. Two
methods were employed to monitor the movement of boats between these and other lakes in
the park and elsewhere. In z}}2,journals were placed in campground offrces at Betul4
White, and Brereton Lakes. Visitors to these campgrounds with a recreational watercraft
filled out the journal stating where they had traveled from, which lakes they would be using
their watercraft on and type of watercraft (Table l4).
The 2002 Whiteshell Resident survey asked property owners: how many boats they
owned, boattype, whatlakestheirboats are operated onandwhethervisitors totheirresidence
broughtboats and fromwhere.As aresult, the movementofboatswithintheparkbyvisitors
and residents wÍts described. These surveys enable the number of motorized and non-
motorized boats to be extrapolated for each lake based on the number ofresponses and total
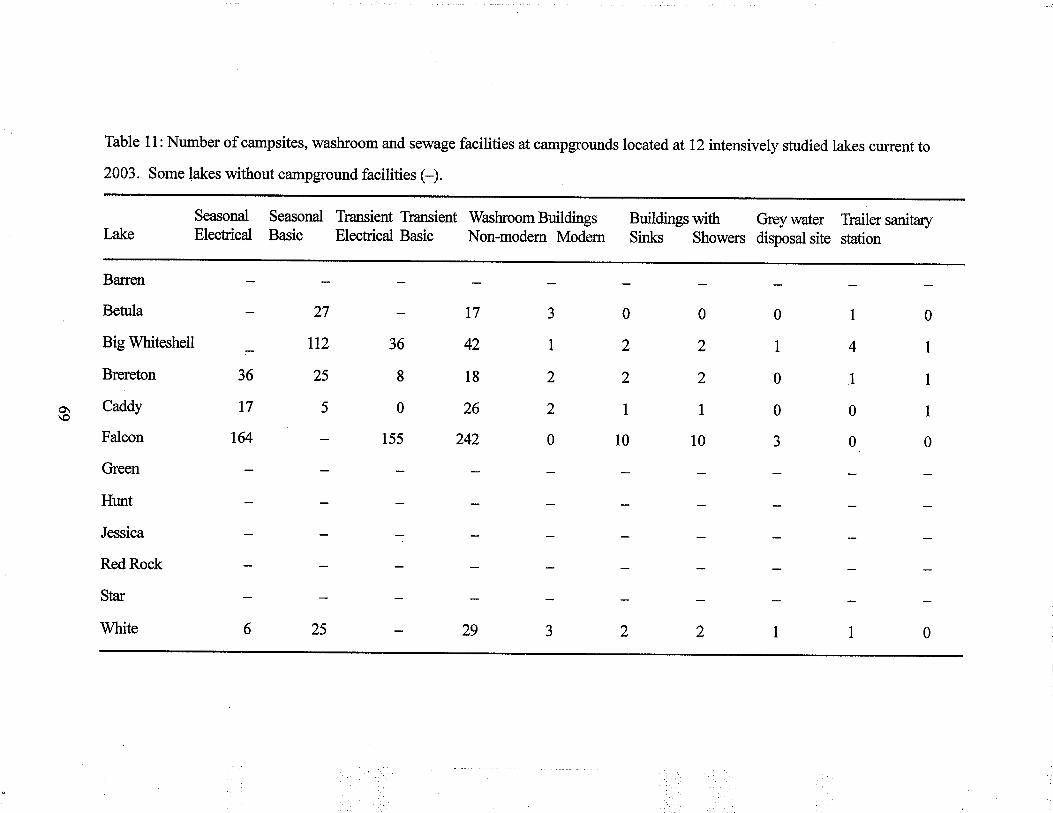
Tâble 11: Number of campsites, washroom and serü/age facilities at campgrounds locate d at 12 intensively studied lakes current to
2003. Some lakes without campground facilities (-).
Lake
Baren
Betula
Big Whiteshell
Brereton
o\ Caddy\o
Falcon
Green
Hunt
Jessica
Red Rock
Star
White
Seasonal Seasonal Tharxient Transient WashroomBuildings Buildingswith Greywater TrailersanitaryElectical Basic Elecnical Basic Non-modem Modern Sinl$ Showers disposal site station
36
l7
t64
27
n2
25
5
36
8
0
155
17
42
18
26
242
aJ
I
2
2
0
6
0
2
2
I
l0
25
0
2
2
I
10
0
1
0
0
J
29
1
4
I
0
0
J
0
I
I
1
0
2 2 I I
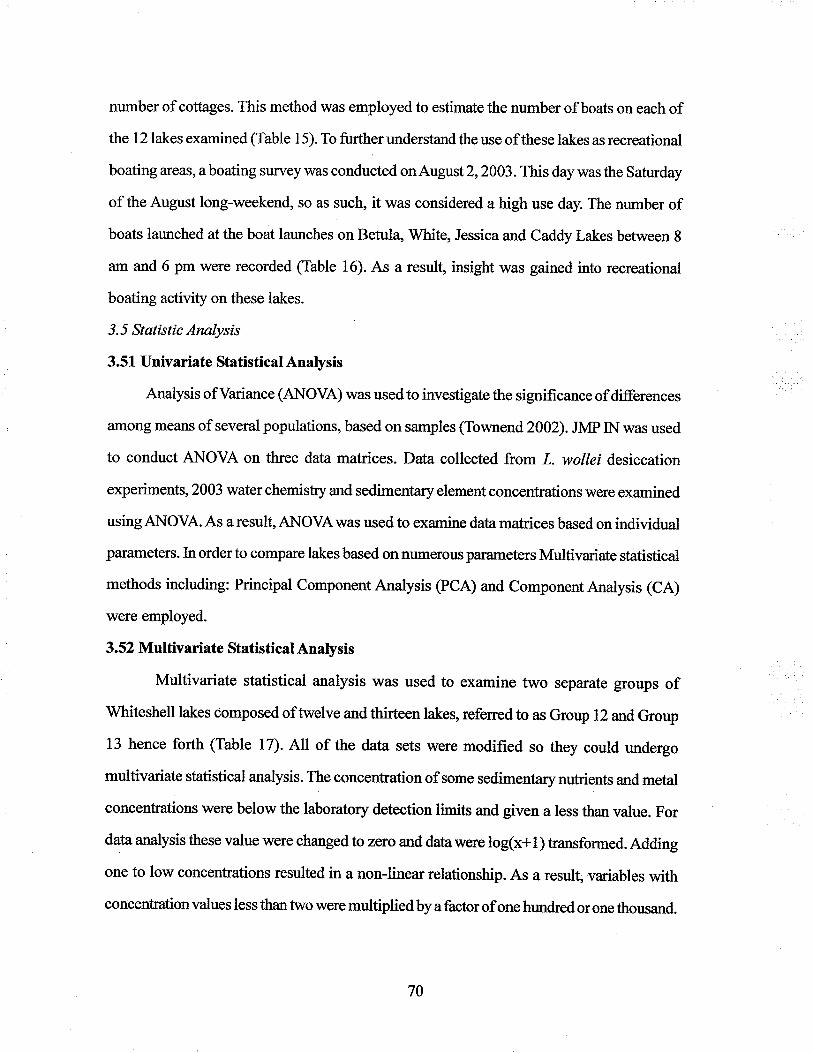
number of cotüages. This method was employed to estimate the number of boats on each of
the l2lakes examined (Table 15). To further understand the use of these lakes as recreational
boating are¿Is, aboating survey was conducted onAugu st2,2003.This daywas the Saturday
of the August long-weekend, so as such, it was considered a high use day. The number of
boats launched at the boat launches on Betula, White, Jessica and Caddy Lakes between Iam and 6 pm were recorded (Table 16). As a result, insight was gained into recreational
boating activity on these lakes.
3.5 Statistic Analysís
3.5L Univariate Statistical Analysis
Analysis ofVariance (ANOVA) was usedto investigate the significance of differences
among means of several populations, based on samples (Townend 2002). JMP IN was used
to conduct ANOVA on three data matrices. Data collected from Z. wollei desiccation
experiments, 2003 water chemistry and sedimentary element concenffations were examined
usingANOVA. As aresult,ANOVAwas used to examine datamatrices based on individual
parameters. In order to compare lakes based on numerous parameters Multivariate statistical
methods including: Principal Component Analysis (PCA) and Component Analysis (CA)
were employed.
3.52 Multivariate Statistical Analysis
Multivariate statistical analysis was used to examine two separate groups of
Whiteshell lakes composed oftwelve and thirteen lakes, referred to as Group 12 andGroup
13 hence forth (Table l7). All of the data sets were modifred so they could undergo
multivariate statistical analysis. The concentration of some sedimentary nutrients and metal
concentrations were below the laboratory detection limits and given a less than value. For
data analysis these value were changed to zero and data were log(x+l) transforrned. Adding
one to low concentrations resulted in a non-linear relationship. As a result, variables with
concentationvalues less thantwo weremultiplied byafactorofone hundred oronethousand.
70
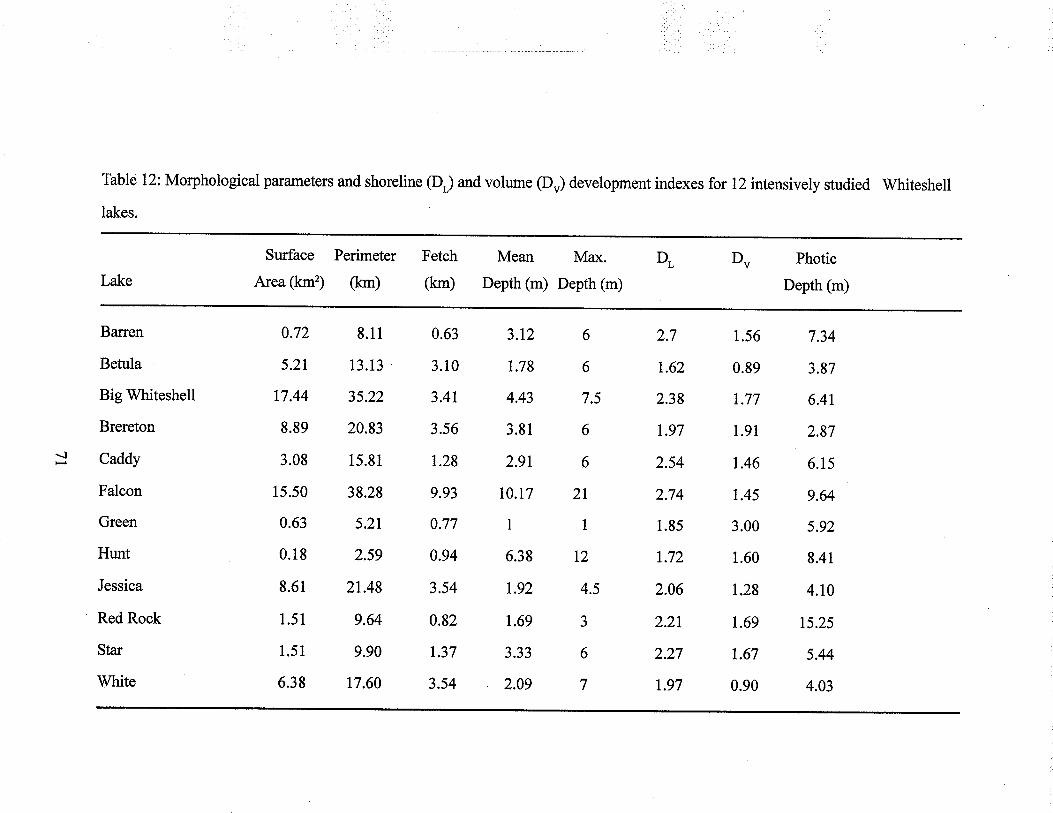
Table 12: Morphological parameters and shoreline (D) and volume (Du) development indexes for l2intensively studied Whiteshell
lakes.
Lake
Ba:ren
Betula
Big Whiteshell
Brereton
Caddy
Falcon
Green
Hunt
Jessica
Red Rock
Star
White
Surface Perimeter
Area (km2) (km)
\ì
0.72
5,2r
17.44
8.89
3.08
1s.50
0.63
0.18
8.61
1.51
1.51
6.38
8.11
13.13
35.22
20.83
15.81
38.28
5.21
2.59
21.48
9.64
9.90
17.60
Fetch
(km)
Mean Max.
Depth (m) Depth (m)
0.63
3.10
3.4t
3.s6
1.28
9.93
0.77
0.94
3.54
0.82
1.37
3.54
3.12
t.78
4,43
3.81
2.9r
10.17
I
6.38
1.92
1.69
J.JJ
2.09
6
6
7.5
6
6
2T
I
T2
4.5
3
6
7
DL Dv
2.7
1.62
2.38
1.97
2.54
2.74
1.8s
1.72
2.06
2.21
2.27
1.97
Photic
Depth (m)
1.56
0.89
1.77
1.91
1.46
t.45
3.00
1.60
1.28
1.69
r.67
0.90
7.34
3.87
6.41
2.87
6.15
9.64
5.92
8.41
4.10
15.25
5.44
4.03
Table 13: Inventory of recreational activities for 12 intensively studied whiteshell lakes. Boat rental shops located on respective lakesdenoted by yes (Ð and no (N).
Barren
Betula
Big Whiteshell
Brereton
\¡ CaddyN)
Falcon
Green
Hunt
Jessica
Red Rock
Star
White
LakeDistance to Boat Marina/ public public Water skiing Hikingclosest town (km) Rental Gas Station Grocery Beaches Boat Launch Clubs Trails
2
32
36
8
I)
38
4
20
18
0
23
N
Y
Y
Y
Y
Y
N
N
Y
N
N
N
0
I
)
I
1
)
0
0
0
0
0
I
0
I
2
I
2
2
0
0
0
0
0
1
1
2
2
J
I
11
0
0
0
0
I
I
1
I
)
J
1
4
I
1
I
0
I
1
0
I
0
0
0
0
0
0
0
0
0
I
I
2
2
1
J
0
0
1
1
I
)
1
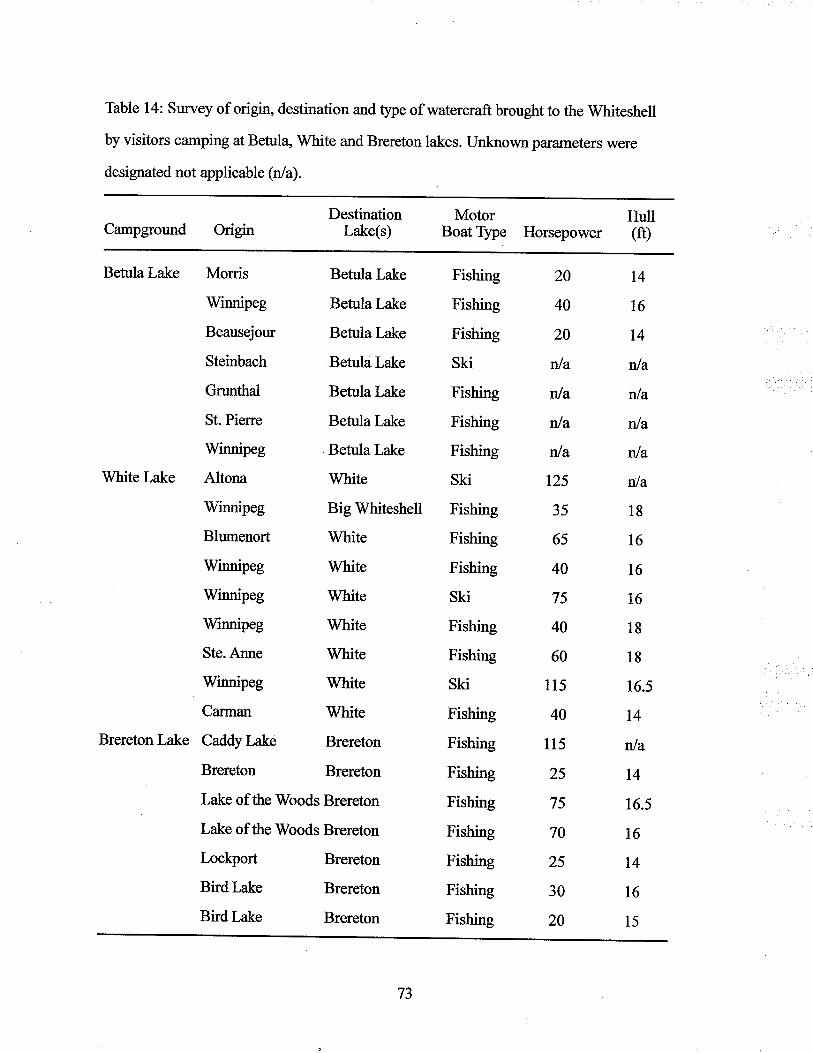
Table 14: Survey of origin, destination and type of watercraft brought to the Whiteshell
by visitors camping at Betula, White and Brereton lakes. Unknown parameters were
designated not applicable (r/a).
Campground OriginDestination
Lake(s)Motor Hull
Boat Type Horsepower (ft)
Betr¡la Lake Monis
Winnipeg
Beausejour
Steinbach
Grunthal
St. Pierre
Winnipeg
White Lake Altona
V/innipeg
Blumenort
Winnipeg
Winnipeg
Winnipeg
Ste. Anne
V/innipeg
Locþort
Bird Lake
Bird Lake
Betula Lake
Betula Lake
Betula Lake
Betula Lake
Betula Lake
Betula Lake
Betula Lake
White
Big Whiteshell
White
White
White
White
White
White
Brereton
Brereton
Brereton
Carman White
Brereton Lake Caddy Lake Brereton
Brereton Brereton
Lake of the V/oods Brereton
Lake ofthe Woods Brereton
Fishing
Fishing
Fishing
ski
Fishing
Fishing
Fishing
ski
Fishing
Fishing
Fishing
ski
Fishing
Fishing
ski
Fishing
Fishing
Fishing
Fishing
Fishing
Fishing
Fishing
Fishing
20
40
20
nla
nla
nJa
nla
125
35
65
40
75
40
60
115
40
115
25
75
70
25
30
20
t4
t6
t4
nla
nla
nla
nJa
nla
18
t6
t6
t6
18
18
t6.s
t4
nJa
t4
16.5
t6
t4
16
15
73
All data were log transformed, with the exception of the pH variable. The SYNTAX 2000
statistical package was used for multivariate statistical analysis.
Ordination anal¡ical methods represent data structure in a lower dimensional space
(Kenkel 2001). PCA is used to analyze linear data, summanznglinear trends of variation.
In contrast, CA may be used to analyzenon-linear data, becaus e datais standardized by both
variables and objects. Variable component scores are computed directly and indirectly for
CA and PCA respectively. Intensity of use and lake morphology data matrices had numer-
ous zero values. This nonJinear data was analyzed using CA. Water and sediment chemis-
ty datahad few zero values and PCA was used. When Group 12 was examined based on
parameters measured including: intensity of use, lake morphology and mean 2002 water
chemistry CA was used to analyze the data because of its non-linear nature. In contrast,
PCA was used to analyze Group 13 based on me¿ßured variables including: July 2002water
chemistry, winter water chemisty and current sediment chemisûry.
Chapter 4: Results
4.1 Lyngbyawollei
4.11 Distribution
Presently, L. wolleí growth has been identified in Betula and White Lakes. In Betula
Lake, L. wollei mafswere found in the south-western bay throughout the littoral area between
Blocks I and 4 (Figure 2). Mats were raked offthe bottom at depths up to two and a half
meters. The highest L. wollei density was in the Betula Lake campground area. In White
Lake, L. wollei was found in the north-eastem bay (Figure 3). L. wollei was found to occur
sporadically along the Block 1,2 and 3 shorelines. The highest density of L. wollei growttr
occuned between Blocks 2 andS where the White Lake campground is located. Infestations
were found in areas under intensive use with road access, cottages, resorts and recreational
facilities.
74
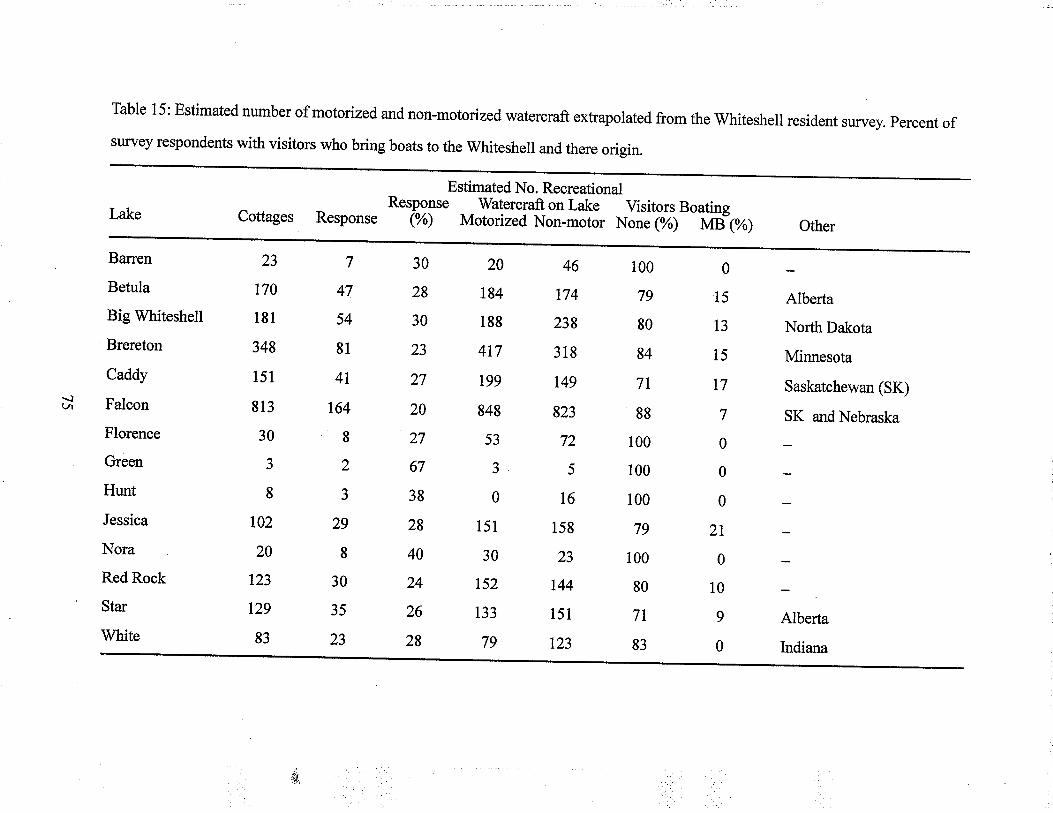
Table 15: Estimated number of motorized and non-motorized watercraft extrapolated from the whiteshell resident s'rvey. percent ofsurvey respondents with visitors who bring boats to the Whiteshell and there origin.
Barren
Betula
Big Whiteshell
Brereton
Caddy
Falcon
Florence
Green
Hunt
Jessica
Nora
Red Rock
Star
White
Estimated No. Recreational
conages Respons. *'iüi"
r"lï;:'i*;f-åffi, ^Jlïl?ä"oîlär,*,
\¡Ll¡
23
t70
181
348
151
813
30
J
8
r02
20
123
129
83
7
47
54
81
4t
164
8
2
J
29
I30
35
23
30
28
30
23
27
20
27
67
38
28
40
24
26
28
20
184
188
417
t99
848
53
J
0
151
30
152
133
79
46
174
238
318
t49
823
72
5
t6
158
23
r44
151
123
100
79
80
84
71
88
100
100
100
79
100
80
71
83
0
15
13
15
t7
7
0
0
0
2t
0
10
9
0
Alberta
t¡.1..
North Dakota
Minnesota
Saskatchewan (SK)
SK and Nebraska
Alberta
Indiana
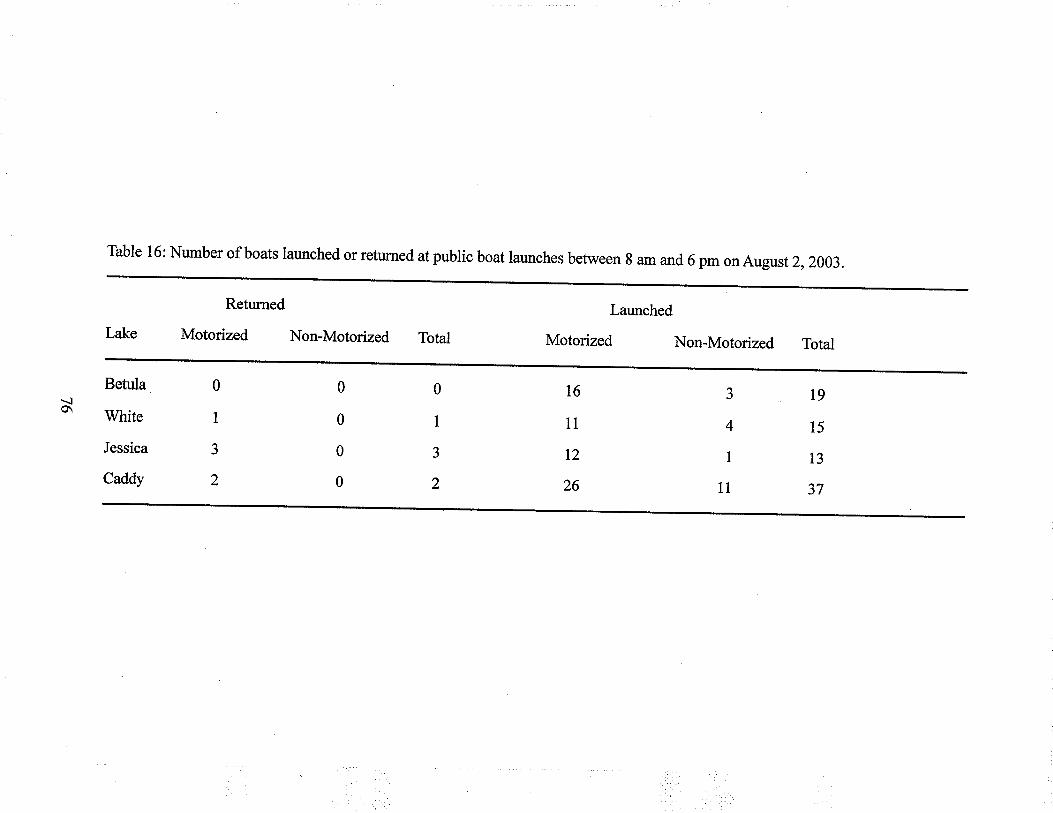
Tâble 16: Number of boats launched or returned at public boat launches between 8 am and 6 pm on August 2,2003.
Returned
Motorized Non-Motorized Totat
Betula
White
Jessica
Caddy
0
I
J
2
0
0
0
0
0
1
J
2
Launched
Motorized Non-Motorized Total
t6
11
l2
26
J
4
1
11
I9
l5
13
37
Betula and White Lakes are shallow. In areas where Z. wollei proliferates, the maximum
depth in Betula and White Lakes are 2.5 and 2.75 meters, respectively. The mean photic
depth of Betula and White Lakes are 3.87 and, 4.03 meters respectively (Table lg).
Consequently, >Iyo light may reach the sediment in the infested bays. Infested areas of
Betula and White Lakes have similar morphology and light penetration but distinct Z. wollei
distribution.
The Whiteshell Resident Survey asked cottagers if they had ever seen Z. wollei in
their lake. Twenty-eightpercent ofproperty owners from White and Betulalake responded
to the survey. Only 17 % of White Lake respondents had seen L. wollei in their lake. In
contrast, 60 % of Betula Lake respondents had observed Z . wollei ntheir lake. One respondent
from each lake indicated they had first seen Z . wolleí in their lake in the 1960s. The majority
ofpeople had only noti ced L. wollei tnfeslations in the last 5 years. The White Lake infest¿tion
was patchy with minimal impact on recreational users. The beach had minimal L. wollei
growth and mats were not readily observed from the beach. In contrast, the Beflrla Lake
infestation was distributed evenly over the infested area impacting recreational use of the
lake. The beach area had a dense proliferation of Z. wollei. Large amounts of L. wollei
biomass were obseryed washed up on shore and floating in the water. As a result, the Bet'laLake infestation had a greater impact on recreational lake users. Algae species collected
from various Whiteshell lakes, which appeared morphologically similar to L. wollei were
identifred to genus (Table l9). Lyngbya genera found were not Lyngbya wolleispecies.
4.12 Biomass
SCUBA divers were employed to examine the distribution ofZ. wolleíbiomass along
a20 metet transects originating from the shoreline in the campground areas of Betula and
White Lakes' Ten meters offshore L. wollei had a mean dry biomas s of 254 g¡fi nBet'laLake. White Lake yielded three times the mass found in Betula Lake with 642 glmz dry
weight (Table 20). In contrast, at twenty meters offshore L. wolleimean dry weight from
77
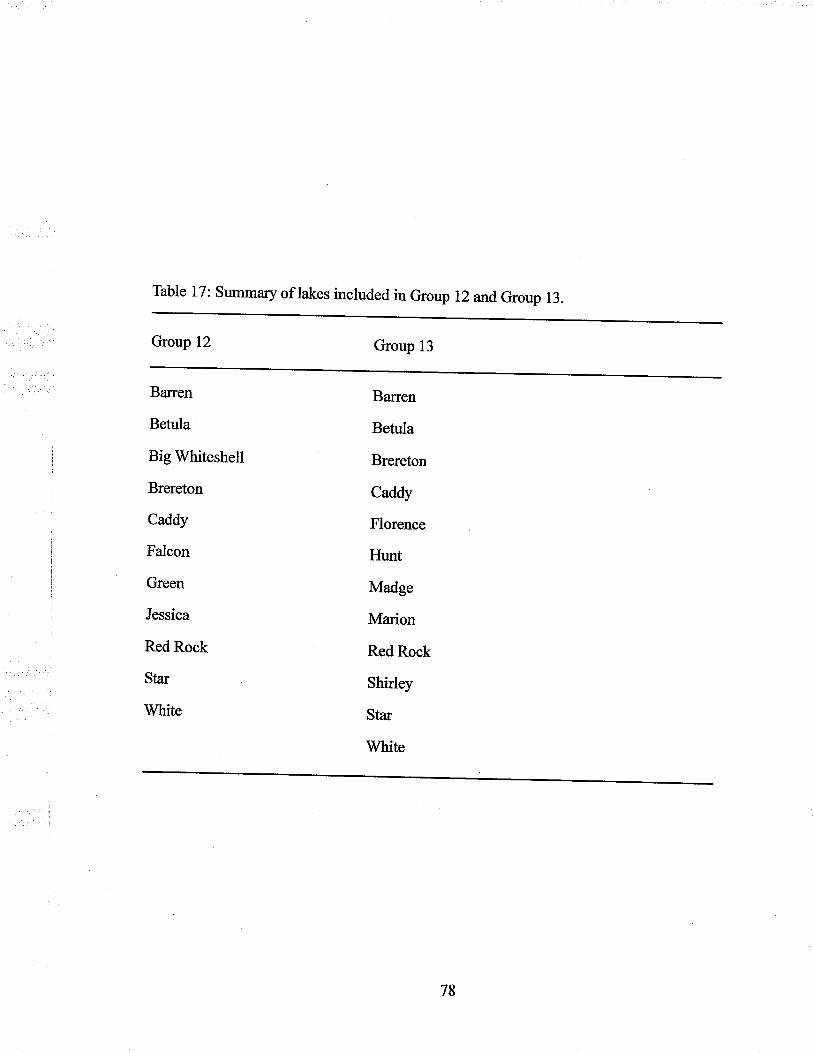
Table 17: summary of lakes included in Group 12 andGroup 13.
Group 12 Group l3
Barren
Betula
Big Whiteshell
Brereton
Caddy
Falcon
Green
Jessica
Red Rock
Star
White
Baren
Beh¡la
Brereton
Caddy
Florence
Hunt
Madge
Marion
Red Rock
Shirley
Star
White
78
Betula Lake was ten times higher than white Lake with 271 and26 glm2respectively (Table
20).
4.13 Desiccation Experiments
July Desiccation Experiment
The mean oxygen concentration for each treatment was calculated from three trials.
Analysis ofvariance concluded that heatnent mean oxygen concentations were significantlydifferent, p : 0.031 (Table 2l{).The fresh, stagnant and two day treatrnents evolved morethan 1'0 þEOzlmg DW. In contrast, the one month, three and ro* auy treatments produced
less than l'0 pg o, /mgDw. All treatments with the exception of the 3 day treatment had a
positive net oxygen production (Table 2 18, Figure I 5). The 3 daytreatment consumed I .4 IItE Oz /mg DV/. The ANOVA ouþut showed that the fresh and stagnant treatments had
mean concentrations higher than the other treatments. The Tukey-Kramer test concluded
only the fresh and 3 day treatment had significant concentration differences.
August Desiccation Experiment
Results from the August desiccation experiment showed that mean oxygen evolutionwas significantly different between treatments, p: < 0.0001 (Table z2$).The fresh and
stagnant treatments evolved more than 6.0 pg o, /mg Dv/. In contrast, all remainingtreatments with the exception ofthe five day treatrnent consumed oxygen (Table 22B,Figarc16)' The Tukey- Kramer test confirmed that oxygen concentrations for dried r. wolleítreatnrents were significantly different from fresh and stagnant L. wolleiheatments.
4.2 Water Chemistry 2003
In 2003, water samples were collected biweekly from three sites on Betul4'White,Jessica and caddy Lakes. Anatysis of variance detemrined that the three samples sites onBetula Jessica and caddy Lakes were not significantly different 1p > 0.05) based oninvestigated water chemisûyparameters. ANovAdetermined wtrite Lake total phosphorusconcentoations were significantly different between sample sites (p:0.0303). The remainingparameters for white Lake showed no significant difference between sites. Tukey-Kramer
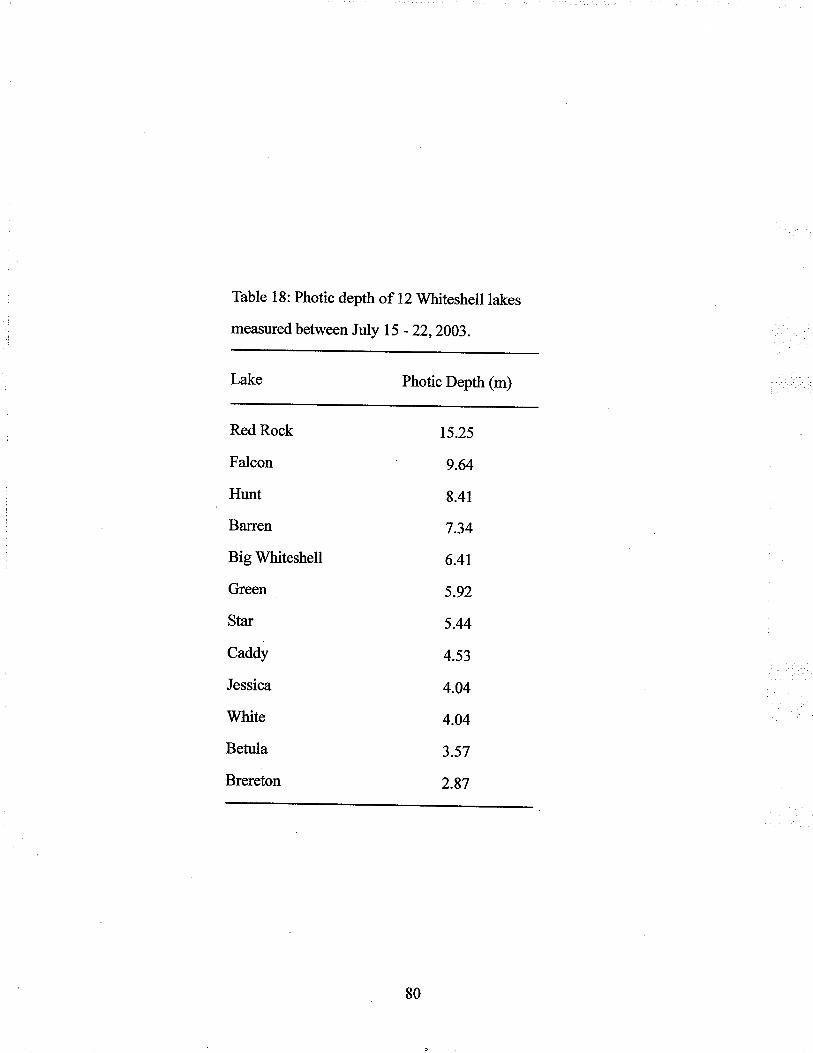
Table 18: Photic depth of 12 Whiteshell lakes
measured between July 15 -22,2003.
Photic Depth (m)
Red Rock
Falcon
Hunt
Barren
Big Whiteshell
Green
Star
Caddy
Jessica
White
Betula
Brereton
15.25
9.64
8.41
7.34
6.41
5.92
5.44
4.53
4.04
4.04
3.57
2.87
80
pairwise comparison indicated a significant difference between sites with a positive value.
Based on the Tukey-Kramer pairwise comparison the high and low anthropogenic impact
littoral sites did not have significantly different total phosphorus concentrations. Water
chemistry parameters measured in boating lanes with high and low intensity of taffrc also
showed no significant difference between water chemistry parameters (Appendix).
Consequently, with the excepion ofWhite Lake total phosphorus, water chemisty variables
were not signifrcantþ different between the three sites investigated within each respective
lake.
4.21 Photosynthetically Active Radiation
Photic depth is the depth to which one percent of surface PAR penetrates through the
water column. The mean photic depth for Behrl4 White, Jessica and Caddy Lakes were
calculated based on biweekly measurements recorded from May to August 2003 (Table l8).
Light measurements were collected in July 2003, from the remaining eight lakes in Group
12 (Table 18). Red Rock Lake had the greatest photic depth at 15.25 meters. Betula Lake
had the second smallest photic depth after Brereton Lake at3.57 meters.
4.3 Statistical Analysis of Group I2
4.31 Intensity of Land Use
Correspondence Analysis, was used to compare Group 12 based on intensity of use
variables (Figure 17,Table23). The eigenvalues for axis one and two were 65 % and ll.ggo/o respectively, accounting for 77 % of the variability in the data. Axis one was higfrly
correlated with intensity of use variables, while axis two was best correlated with distance
of the lake from the closest town. Groups of lakes which experienced similar intensity ofuse regimes were identified. Behrl4'White, Brereton, Big Whiteshell and Caddy Lakes
formed one group. This group was positively correlated with axis one. All ofthese lakes had
a campground and numerous other recreational facilities but were a moderate distance from
the closest toram (Täble 13). Falcon Lake was distinct from all other lakes positively correlated
øttr Uottr axis one and two. The town of Falcon is located adjacent to the lake. As a result,
8l
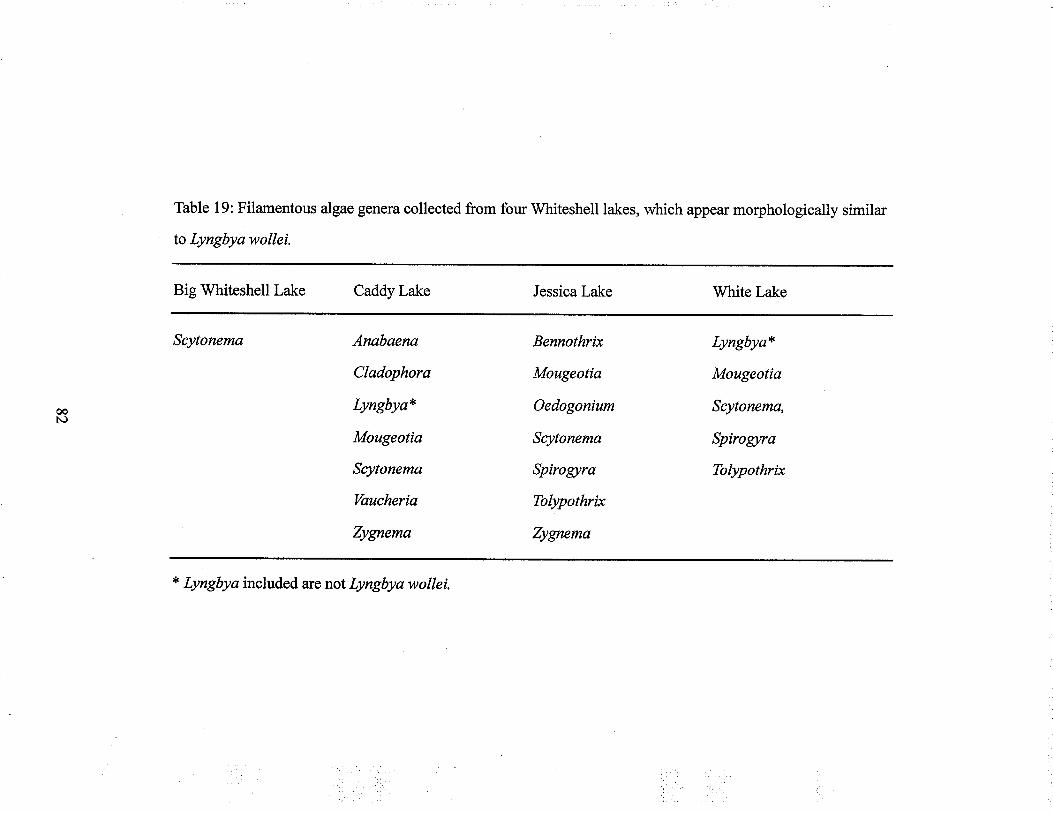
Table 19: Filamentous algae genera collected from four Whiteshell lakes, which appear morphologically similar
to Lyngbya wollei.
Big Whiteshell Lake
oot\)
Scytonema
Caddy Lake
Anabaena
Cladophora
Lyngbya*
Mougeotia
Scytonema
Vaucheria
Zygnema
* Lyngbya included are not Lyngbyawollei.
Jessica Lake
Bennothrix
Mougeotia
Oedogonium
Scytonema
Spirogtra
Tolpothrix
Zygnema
White Lake
Lyngbya*
Mougeotiø
Scytonema,
Spirogtra
Tblypothrix
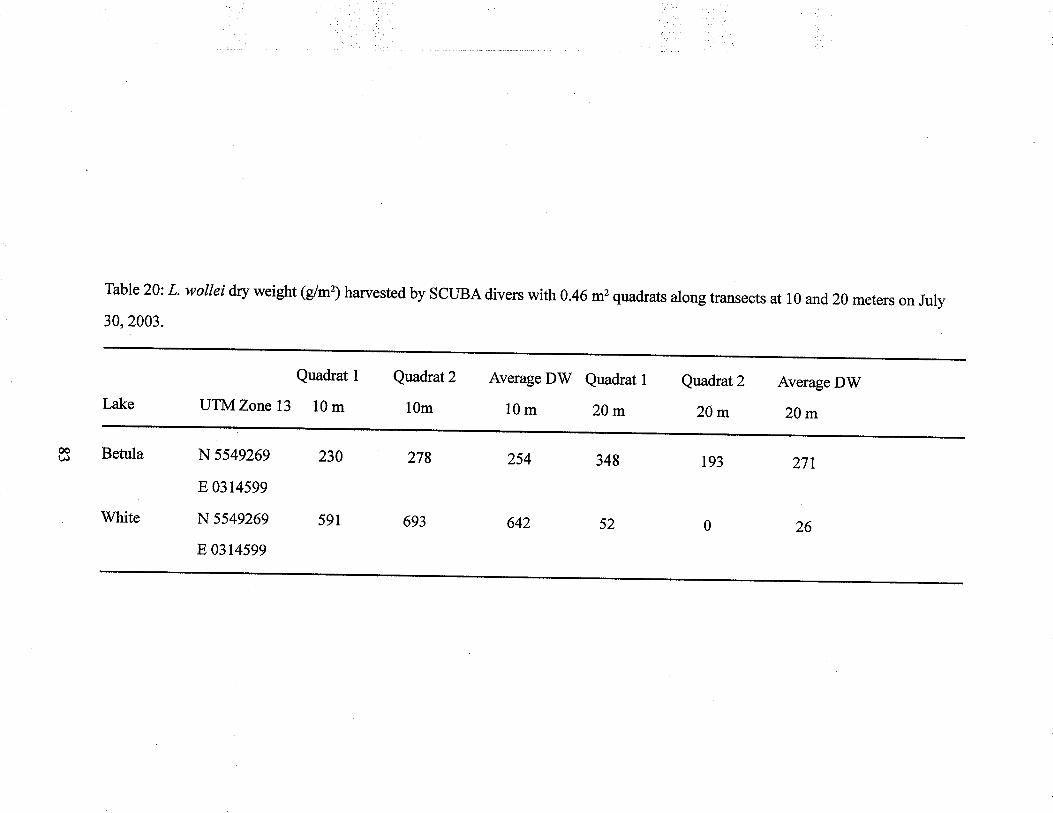
Table 20: L. wollei dry weight (g/m') harvested by SCUBA divers with 0.46 m2 quadrats along transects at l0 and 20 meters on July30,2003.
Betula
Quadrat I
UTM Zone t3 10 m
White
N 5549269
E 03t4599
N 5549269
E 03t4599
Quadrat 2
10m
591
278
Average DV/
10m
693
Quadrat I
20m
642
348
Quadrat 2
20m
52
Average DW
20m
r93 271
26
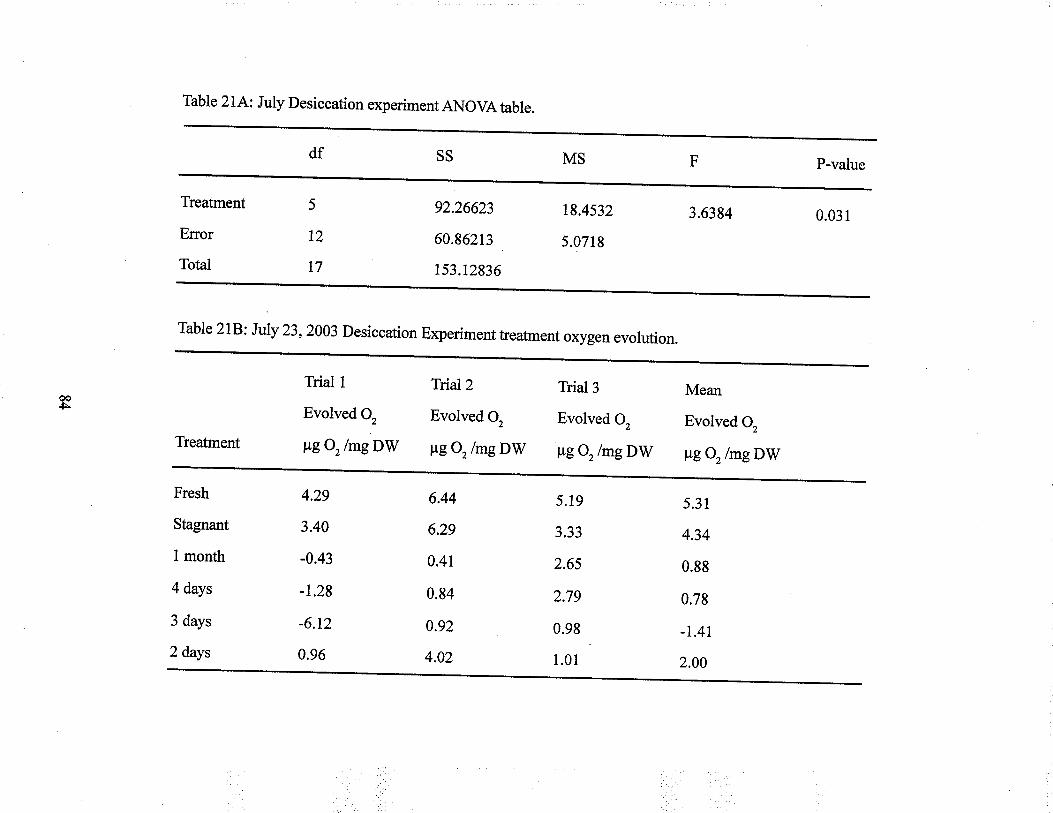
Table 2 I A: July Desiccation experiment ANOVA table.
Treatment
Error
Total
aos
Table 2lB: July 23,2003 Desiccation Experiment treatment oxygen evolution.
5
t2
17
SS
Treatment
92.26623
60.9621,3
153.t2836
Fresh
Stagnant
I month
4 days
3 days
2 days
Trial 1
Evolved O,
tt;Ozlmg DW
MS
18.4s32
5.0718
4.29
3.40
-0.43
-t.28
-6.t2
0.96
Tr,al2
Evolved Q
IrB Oz /mg DW
3.6384
6.44
6.29
0.4r
0.84
0.92
4.02
Trial3
Evolved O,
trg Oz /mg DW
P-value
0.031
5.19
3.33
2.65
2.79
0.98
1.01
Mean
Evolved O,
trg Oz /mg DW
5.31
4.34
0.88
0.78
.1.47
2.00
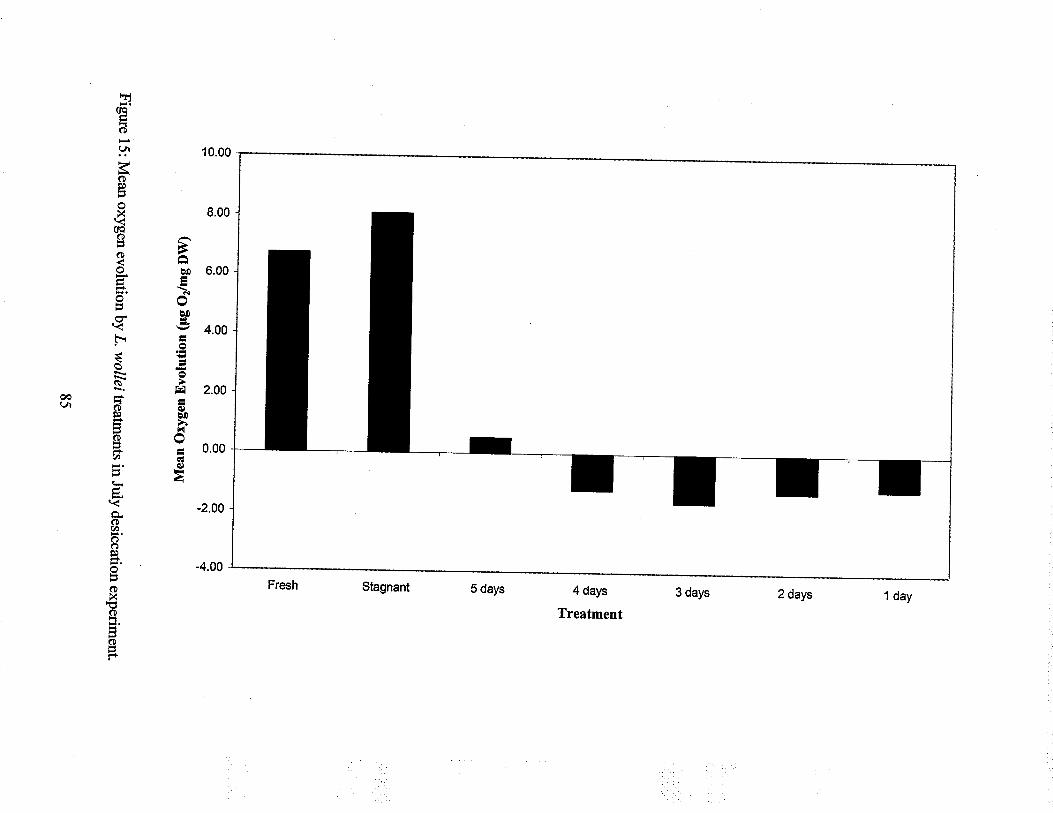
1 day2 days3 days
0c
CD
:+
ose
oX
ûa(oÊ ('¿-c¡=OÞo-ÈtË\H.O ¡-ìHV
€eFìÊ
U
=TU\AñtÈ. lcäã91 èDHñrJxgoã'ãH. 0)trll-tÅ.Þ.(Dv)C)o
o(DX
Þ(J
o
(D
10.00
8.00
6.00
4.00
2.00
0.00
-2.00-
-4.00 -
4 days
Treatment
5 daysFresh
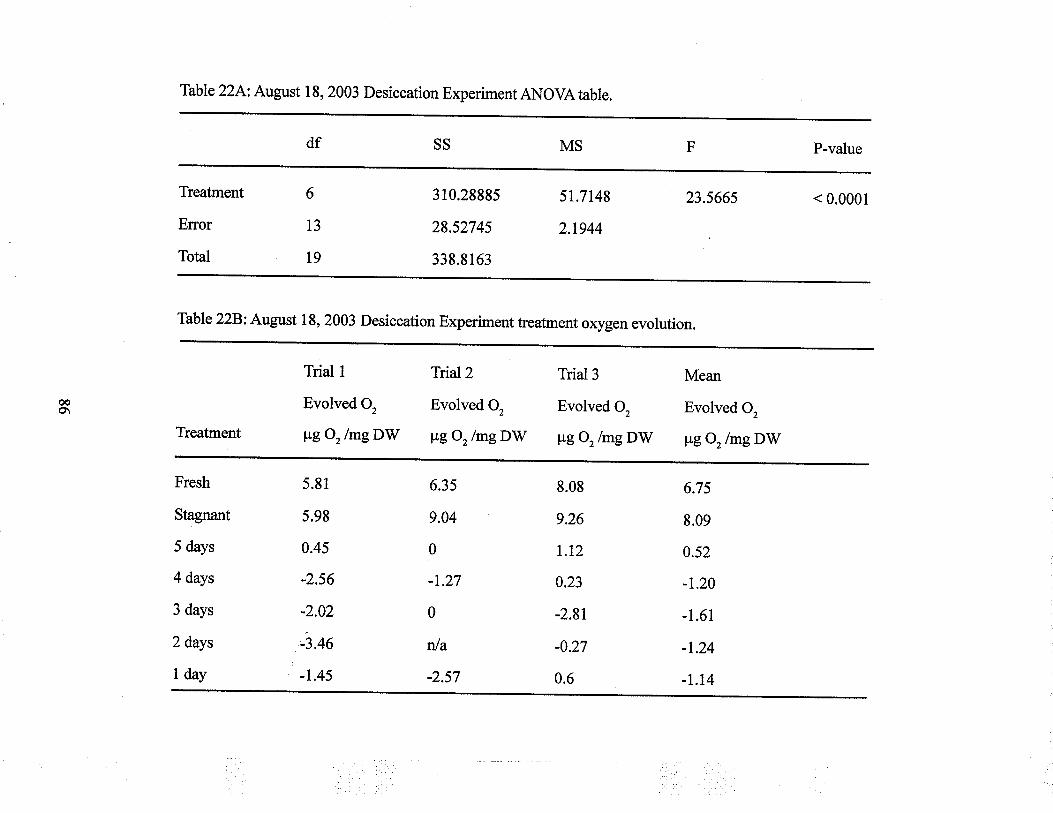
Table 22A: Augast 18, 2003 Desiccation ExperimentANovAtable.
Treatment
Error
Tot¿l
ooo\
Table 22B: Augast 18, 2003 Desiccation Experiment treatment oxygen evolution.
6
t3
t9
SS
Tieatment
310.28885
28.52745
338.8163
Fresh
Stagnant
5 days
4 days
3 days
2 days
I day
Trial I
Evolved O,
ItEOz/mg DW
51.7148
2.t944
s.81
5.98
0.45
-2.56
-2.02
-3.46
-1.45
TrLal2
Evolved O,
ItEOz/mg DW
23.566s
6.35
9.04
0
-1.27
0
nla
-2.57
Trial3
Evolved O,
tt9Oz/mg DV/
P-value
< 0.0001
8.08
9.26
t.t2
0.23
-2.8t
-0.27
0.6
Mean
Evolved O,
FB Oz /mg DV/
6.75
8.09
0.52
-1.20
-1.61
-1.24
.1.T4
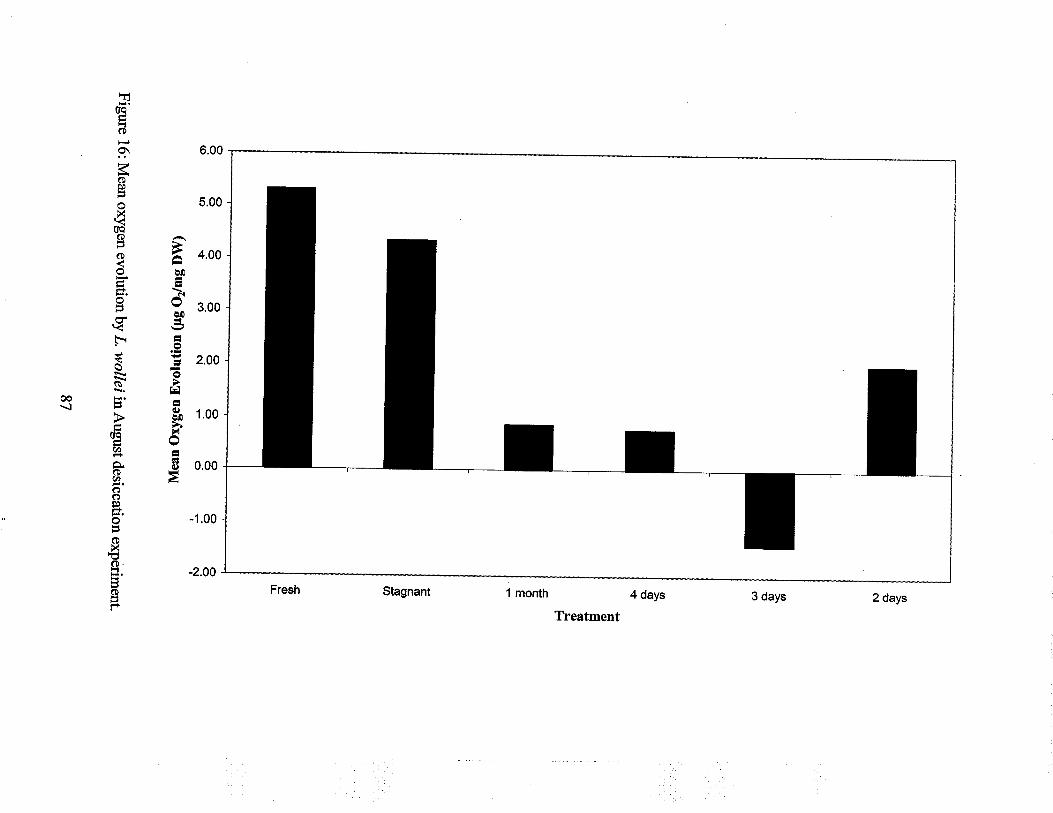
2 days3 days
rjoa
(D
9.\
È(DA)
oX
0atD)?.DZoè0!!t\H.d90€el\EìÁUÈ9s.ËHË-é)ÞÞ¡-dõ¡É\Jv)êH
6lb"gv)¿C)oA)
ooX(D.
(D
6.00
5.00
4.00
3.00
2.00
1.00
).00
t.00 .
r.00 -
1 month 4 days
Treatment
Stagnant
0
-1,
-2.
Fresh
Falcon Lake had the most modem and numerous campground and recreational facilities ofall twelve lakes examined. In contrast, Green Lake was negatively correlated with axis one
and two. Green Lake was the furthest of all Group 12 lakes from the closest town with only
a few cottages and no recreational facilities. The remaining five lakes: Jessic4 Red Rock,
Star, Barren and Hunt experienced moderate to low intensity of use respectively. Red Rock,
Star and Barren formed a second group with relatively low intensity of use but were
distinguished by lake distance from the closest town. Jessica Lake was positioned between
group one and two, with moderately intensity of use. Hunt Lake had the second lowest
intensity of use after Green Lake. Consequently, Figure l7 created,a continuum for intensity
of use, in the positive direction along axis one.
4.32 Lake Morpholory
Correspondence Analysis differentiated Group 12 based on morphological parameters.
The cumulative eigenvalue percentage for axis one and two was 89.43 yo, at 66.77 and
22-66 o/o respectively (Figure 18). Axis one was positively correlated with lake surface area
and fetch. Mean and maximum depths were positively correlated with axis two. Group one
was composed of Betul4 White, Brereton, Big Whiteshell and Jessica Lakes. These lakes
had large surface areas and fetch with moderate.depths. ln contrast to the intensity CA,
Caddy Lake was replaced by Jessica Lake in group one. Consistent with the intensity CAgroup two included: Red Rock, Star and Barren Lakes. Caddy Lake was positioned between
goup one and two with moderately high surface area and fetch. Falcon, Hunt and Green
Lakes remained outliers. Falcon Lake is deep with a large surface area and fetch, positively
correlated with both axis one and two. Green Lake is small and shallow, while Hunt Lake is
a small deep lake. As a result, CA identified similar groups and outliers based on
morphological and intensity of use variables.
4.33 Water Chemistry: Summer 2002
Principal component analysis was used to examine Group 12 based on mean water
chemisty variables from monthly sampling in2002 (Figure t9). Axes one and two had
88

eigenvalues of 42.94 and2l.35 oá respectively. Five of the twelve lakes were identified as
outliers with unique water chemistry characteristics. Brereton Lake was distinguished by
high iron concentrations. Green lake was correlated with high concentrations oftotal kjeldahl
nitrogen, manganese, chlorophyll a and turbidity. Falcon and Hunt Lakes had relatively
high conductivity, alkalinity and potassium. Big Whiteshell was positively correlated with
axis two and had the highest mean pH. The remaining lakes had similar water chemistry
characteristics positioned in the center ofthe PCA, have similar chemical composition.
4.34 Group 12 Summary
When all three data matrices: intensity of use, lake morphology and water chemistry
variables for Group l2werc combined CA and the same groups and outliers were identified
as those produced by intensity ofuse variables. Group one included: Betul4 White, Brereton,
Big ÏVhiteshell and Caddy Lakes. Group two was composed of Red Rock, Star and Baren
Lakes' Jessica Lake lay between the two groups. Falcon, Green and Hunt Lakes were outliers.
4.4 Statistical Analysis of Group I3
4.4lWater Chemistryt July 2002
Principal component analysis distinguished Group 13 based on July 2002 water
chemistry (Figure 20).lt was determined Betula, V/hite and Jessica Lakes had highconcentrations of chlorophyll 4 total particulate phosphorus, total phosphorus and total
suspended solids forming Group A. The "backcountry" lakes: Florence, Madge, Marion
and Shirley all had low water chemisûy parameters forming Group B. Group A and B had
distinct July water chemisûy characteristics located at opposite ends of axis one with an
eigenvalue of 51.18 %. Red Rock, Caddy and Brereton Lakes formed a third group which
are most similar to GroupA. Star and Baren lakes formed the fourth group which was most
similar to Group B water chemisûry. Hunt Lake was identified as an outlier with exhemely
high conductivity.
89
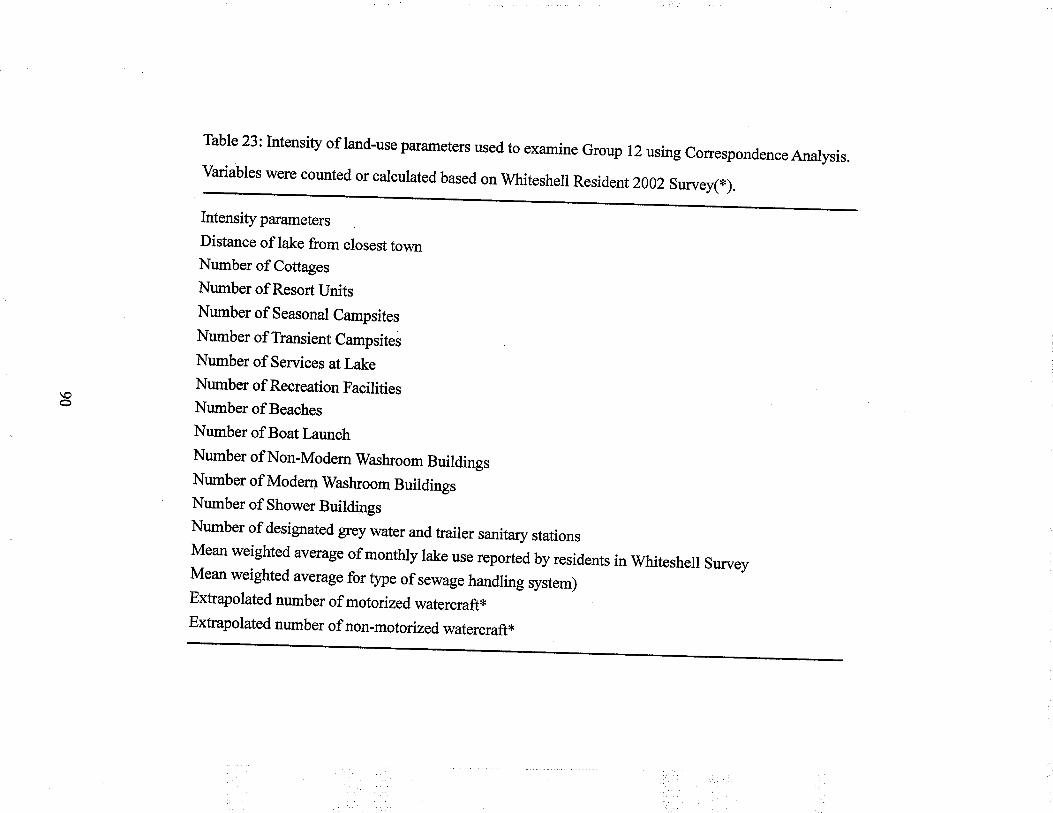
Table 23: Intensity of land-use parameters used to examine Group 12 using correspondence Analysis.Variables were counted or calculated based on whiteshell Resident 2002 survey(*).
Intensity parameters
Distance of lake from closest townNumber of Cottages
Number of Resort UnitsNumber of Seasonal Campsites
Number of Transient Campsites
Number of Services at LakeNumber of Recreation FacilitiesNumber of Beaches
Number of Boat Launch
Number of Non-Modem Washroom BuildingsNumber of Modem'lVashroom BuildingsNumber of Shower BuildingsNumber of designated grey water and trailer sanitary stationsMean weighted average of monthly lake use reported by residents in whiteshell surveyMean weighted average for type of sewage handling system)Extrapolated number of motorized watercraft*Extrapolated number of non-mot onzedwatercraft *
\oo
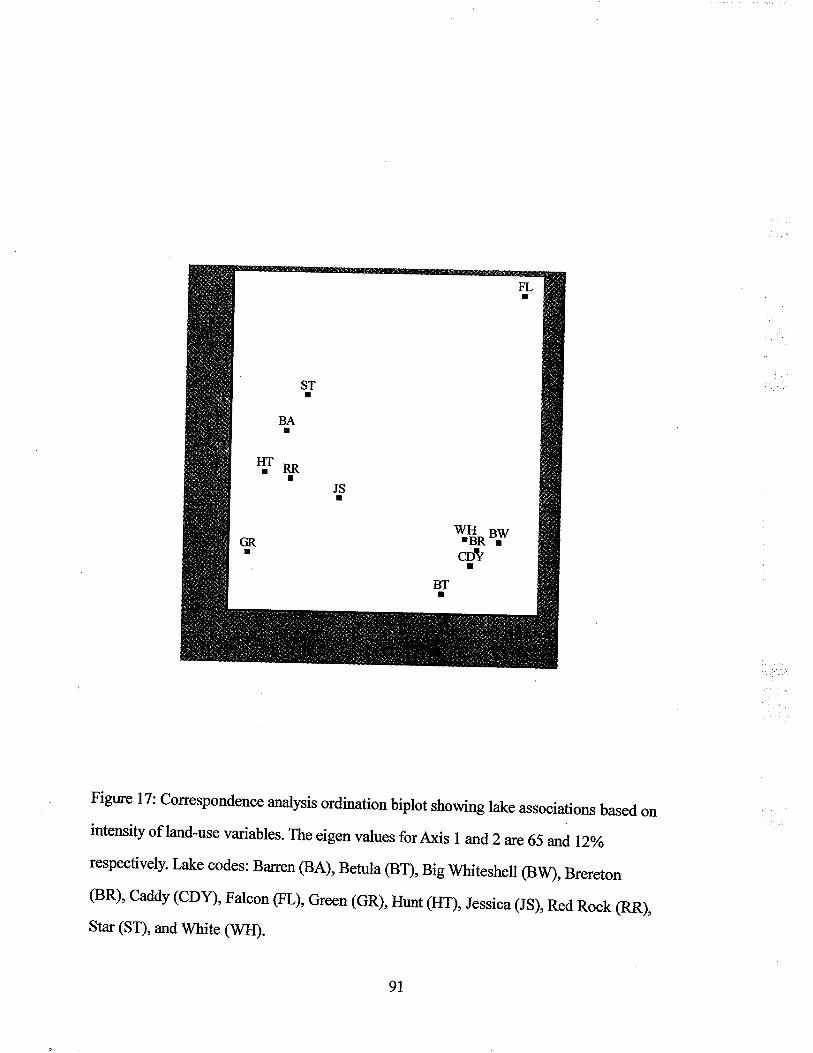
Figure 17: correspondence analysis ordination biplot showing lake associations based onintensity of land-use variables. The eigen values forAxis I and2are 65 and,12%
respectively. Lake codes: Barren (BA), Betula @T), Big whiteshell (B\Ð, Brereton(BR), caddy (cDÐ, Falcon (FL), Green (GR), Hunt (HT), Jessica (JS), Red Rock (RR),Star (ST), and trVhite (WIÐ.
9t
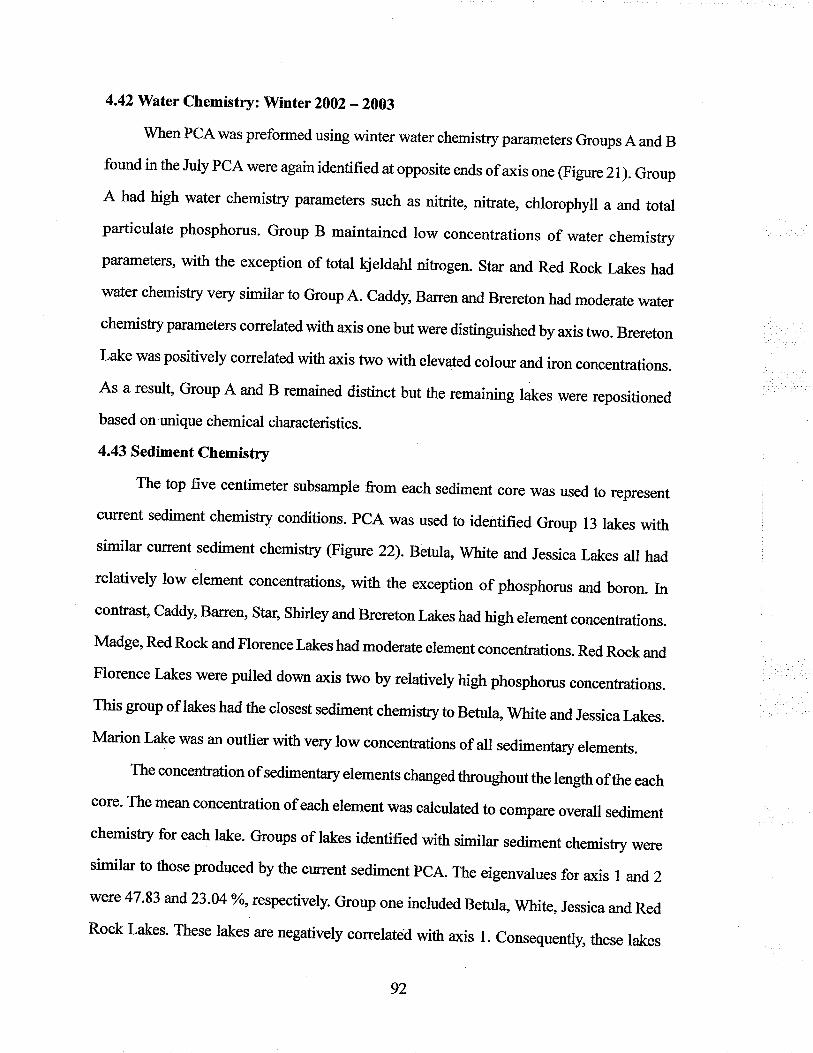
4.42'Water Chemistry: Winter 2002 -2003When PCA was preformed using winter water chemisûry parameters Groups A and B
found in the July PCA were again identifred at opposite ends of axis one (Figure 2l). Group
A had high water chemistry parameters such as nitrite, nitrate, chlorophyll a and total
particulate phosphorus. Group B maintained low concentrations of water chemistry
parameters, with the exception of total \ieldahl nitrogen. Star and Red Rock Lakes had
water chemistry very similar to Group A. Caddy, Baren and Brereton had moderate water
chemistry parameters correlated with axis one but were distinguished by axis two. Brereton
Lake was positively correlated with axis two with elevated colour and iron concentrations.
As a result, Group A and B remained distinct but the remaining lakes were repositioned
based on unique chemical characteristics.
4.43 Sediment Chemistry
The top five centimeter subsample from each sediment core was used to represent
current sediment chemistry conditions. PCA was used to identified Group 13 lakes withsimilar current sediment chemistry (Figure 22). BetulaWhite and Jessica Lakes all had
relatively low element concentrations, with the exception of phosphorus and boron. Incontrast, Caddy, Barren, Star, Shirley and Brereton Lakes had high element concentrations.
Madge, Red Rock and Florence Lakes had moderate element concentrations. Red Rock and
Florence Lakes were pulled down axis two by relatively high phosphorus concentrations.
This group of lakes had the closest sediment chemisty to Betula" White and Jessica Lakes.
Marion Lake was an outlier with very low concentrations of all sedimentary elements.
The concentration of sedimentary elements changed throughout the length ofthe each
core' The mean concenhation of each element was calculated to compare overall sediment
chemis@ for each lake. Groups of lakes identified with similar sediment chemisby weresimilar to those produced by the current sediment PCA. The eigenvalues for axis I and2werc 47 '83 and23'04 %o, respectively. Group one included Behrl4 White, Jessica and RedRock Lakes' These lakes are negatively correlated with axis l. consequently, these lakes
92
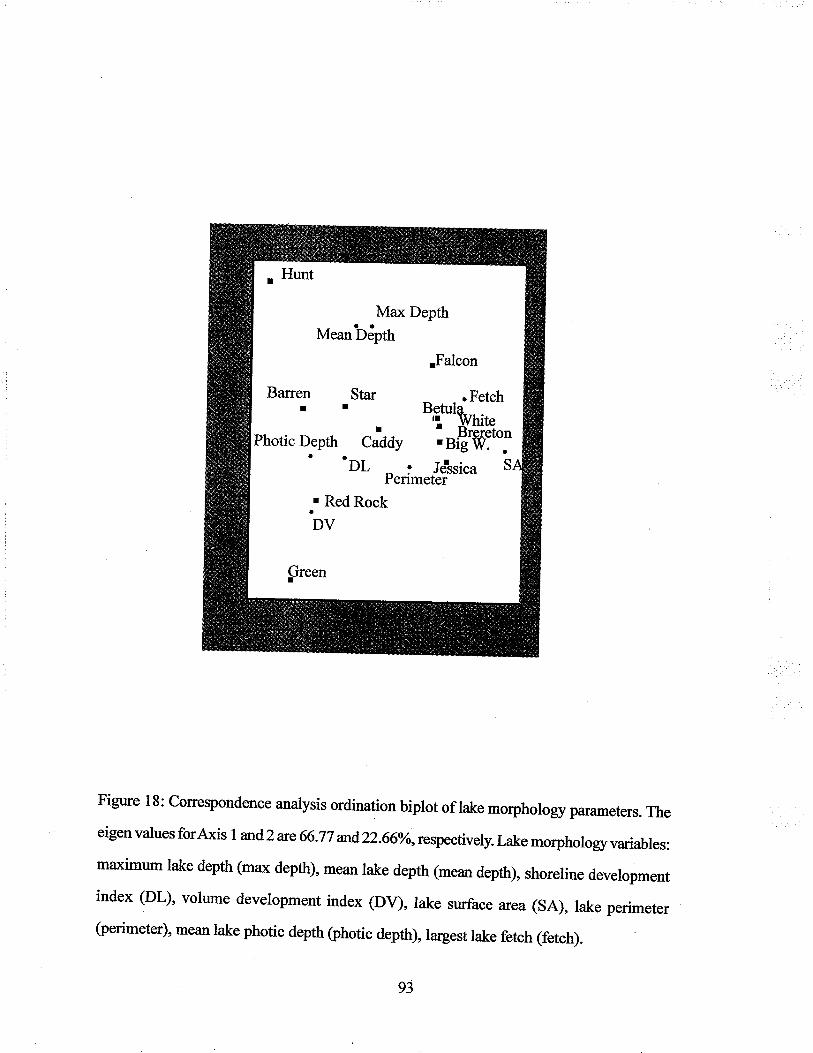
Meanb'lpth
.Falcon
Baren Star . Fetch¡ r Benrla
Phoric Deprtr cåay ':rffiotto"
' 'DL : Jetssica sPenmeter
.. Red Rock
DV
Çneen
Figure l8: correspondence analysis ordination biplot of lake morphology parameters. Theeigen values forAxis I and2 are 66.77 and,22.66Yo, respectively. Lake morphology variables:
maximum lake depth (max depth)' mean lake depth (mean depth), shoreline development
index (DL), volume development index (DV), lake surface area (sA), lake perimeter(perimeter)' me,' lake photic depth þhotic deptÐ, largest lake fetch (fetcÐ.
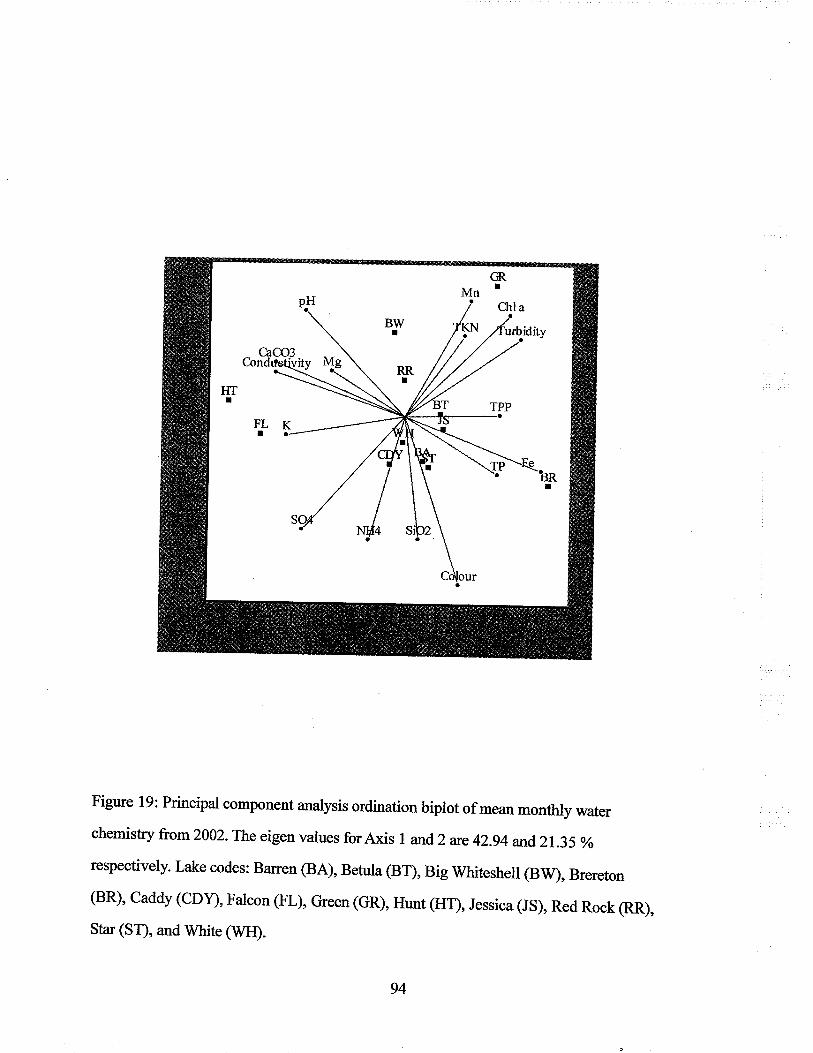
Figure 19: Principal component analysis ordination biplot of mean monthly water
chemistry from 2002. The eigen values forAxis I and2 are 42.94 and2l.35 %respectively. Lake codes: Barren (BA), Behrla (BT), Big whiteshell @w), Brereton
(BR), caddy (cDÐ, Falcon (FL), Green (GR), Hunt (He, Jessica (JS), Red Rock (RR),
Star (SÐ, and White (!VH).
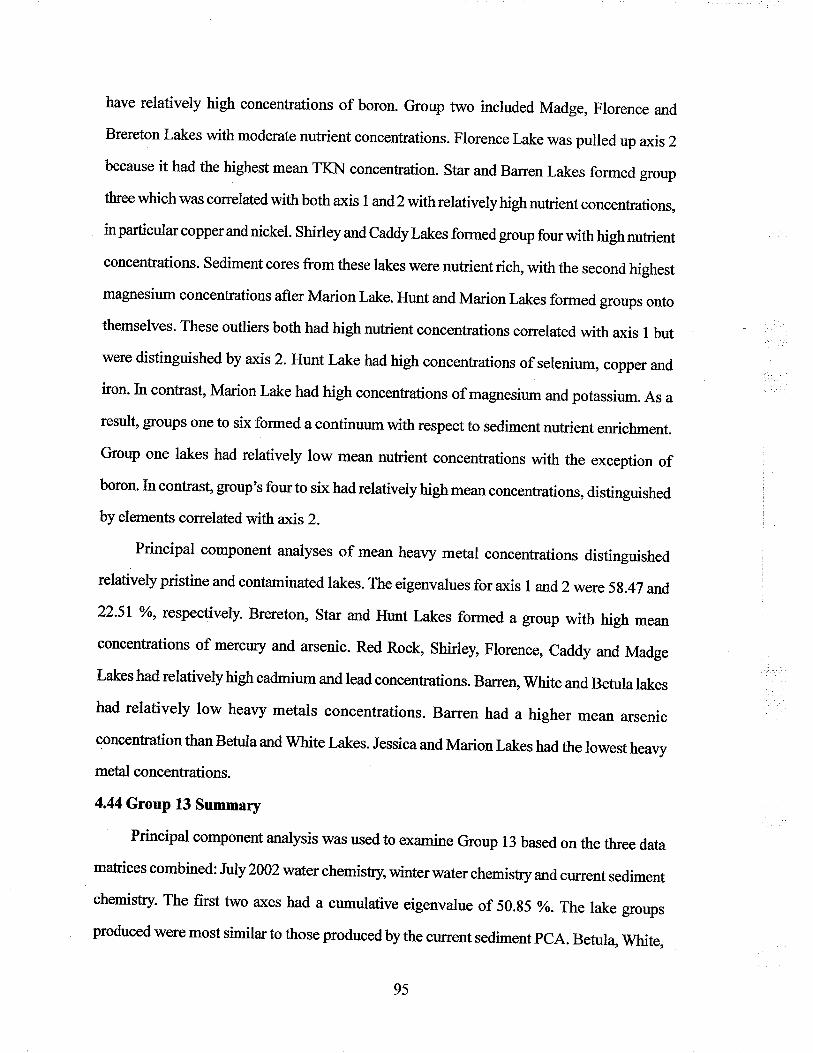
have relatively high concentrations of boron. Group two included Madge, Florence and
Brereton Lakes with moderate nutrient concentrations. Florence Lake was pulled up axis 2
because it had the highest mean TKN concentration. Star and Barren Lakes formed group
three which was correlated with both axis I and 2 with relatively high nutrient concentrations,
in particular copper and nickel. Shirley and Caddy Lakes formed group four with high nutrient
concentrations. Sediment cores from these lakes were nutrient rich, with the second highest
magnesium concentrations afiter Marion Lake. Hunt and Marion Lakes formed groups onto
themselves. These outliers both had high nutrient concentrations correlated with axis I but
were distinguished by axts 2. Hunt Lake had high concentrations of selenium, copper and
iron. In contrast, Marion Lake had high concentrations of magnesium and potassium. As a
result, groups one to six formed a continuum with respect to sediment nutrient enrichment.
Group one lakes had relatively low mean nutrient concentrations with the exception ofboron. In contrast, group's fourto six had relatively high mean concentrations, distinguished
by elements correlated with axis 2.
Principal component analyses of mean heavy metal concentrations distinguished
relatively pristine and contaminated lakes. The eigenvalues for axis I and 2 were 5g.47 and
22.51 yo, respectively. Brereton, Star and Hunt Lakes formed a group with high mean
concentrations of mercury and arsenic. Red Rock, Shirley, Florence, Caddy and Madge
Lakes had relatively high cadmium and lead concentrations. Barren, White and Betula lakes
had relatively low heavy metals concentrations. Barren had a higher mean arsenic
concentation than Betula and White Lakes. Jessica and Marion Lakes had the lowest heavy
metal concentrations.
4.44 Group 13 Summary
Principal component analysis was used to examine Group 13 based on the three data
mafrices combined: July 2002water chemisûry, winter water chemistry and current sediment
chemistry. The first two axes had a cumulative eigenvalue of 50.g5 %o. The lake groups
produced were most similar to those produced by the current sediment pCA. Betul4 White,
95
Figwe 20: Principal component analysis ordination biplot of July 2002waterchemisty.The eigen values forAxis I and2are 51.18 and 30.12olo respectively. Lake codes: Banen(BA), Betula (BT), Brereton (BR), caddy (cDÐ, Florence (FLo), Hunt (HT), Jessica(JS), Madge (MA), Marion (MR), Red Rock ßR), Shirley (SH), Star (SÐ, and White(wH).
Jessica and Red Rock Lakes formed one group. Group two consisted of: Caddy, Star and
Barren Lakes. The third group w¿ts composed of backcounüy lakes: Shirley, Madge and
Florence. Brereton Lake was positioned between all three groups. Marion and Hunt Lakes
were outliers.
4. 5 Sediment Geochemistry
4.51 Description of \ilhiteshell Cores
Sediment cores were collected from a total of 13 Whiteshell Lakes. Sediment cores
varied from 15 to 50 cm in length (Table 9). The cores had no perceptible smell. Red Rock
Lake sediment was soft and flocculent. Hunt Lake sediment hadadistinct granular texture.
Cores extacted from Marion Lake exhibited a colour change. The top half of the core was
brown in colour similar to other Whiteshell cores. In contrast, the bottom half ofthe Marion
Lake cores were very firm grey clay with large pieces of fibrous plant material throughout.
All remaining cores had a homogenous texture and brown colour. A filamentous black alga
was observed at the surface and within sediment core BTI collected from Betula Lake
(Table 9). Due to the nature of the lake bottom a sediment core could not be collected from
site BRI on Brereton Lake (Table 9). The range in water content, organic matter conten!
carbonate content and total chlorophyll concentrations have been recorded in Table 24. A
det¿iled summary of sediment composition as a ñmction of depth is provided below.
4.52 Sediment Composition
4.52-l Barren Lake
The water content profile showed a typical increase up the core from a basal g9 voto
95.2 % sediment wet weight (Figure 23). The organic matter content constituted
approximately 36 -37 o/o sediment dry weight with four distinct fluctuations at 6, 1g, 30 and
38 cm. There were three decreases in organic matter content experience dat6,30 and 3g cm.
The minimum organic matter content value was 34.9 Yoat3ïcm. In contrast, at lg cm the
profile showed a distinct peak, to a maximum value of 4l .3 Yo organicmatter content. Total
chlorophyll had a maximum concentration of 105.9 pglg at the top of the core. Total
97
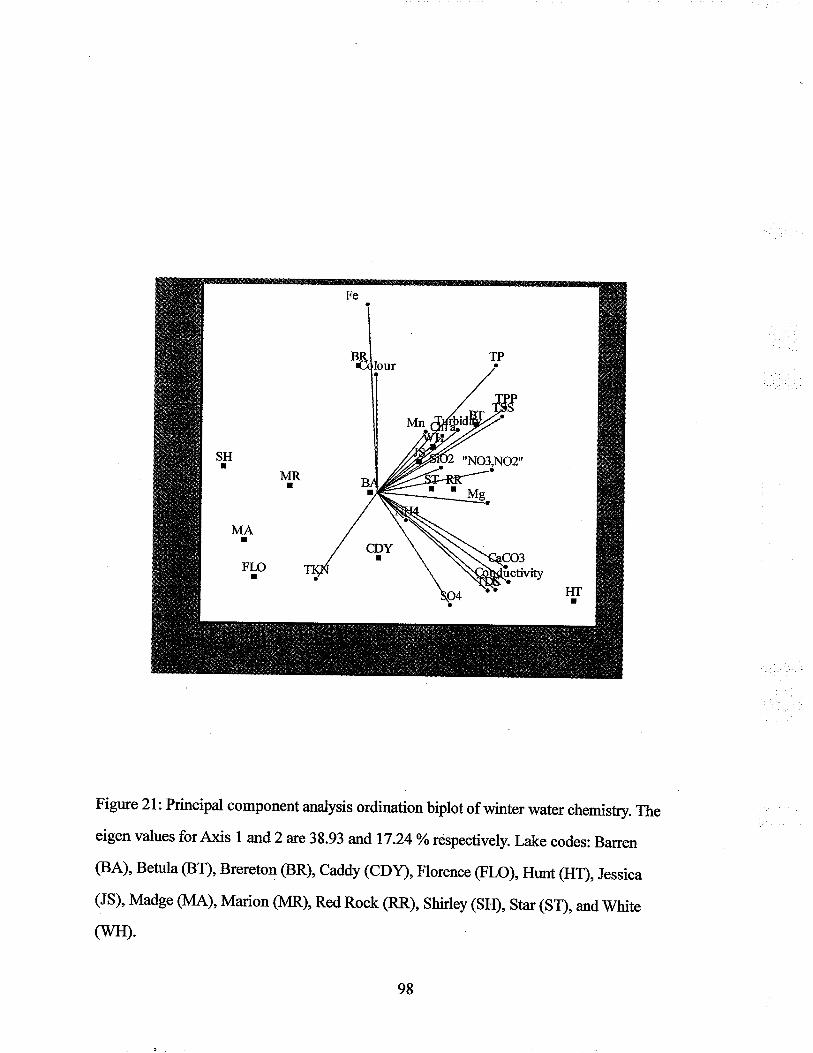
Figwe 2l: Principal component analysis ordination biplot of winter water chemistry. The
eigen values for Axis I and 2 are 38.93 arñ 17.24 oó respectively. Lake codes: Baren
(BA), Betula (BT), Brereton (BR), caddy (cDÐ, Florence (FLo), Hunt (HT), Jessica
(JS), Madge (MA), Marion (MR), Red Rock (RR), shirley (sH), star (sr), and rwhite
(wIÐ.
98
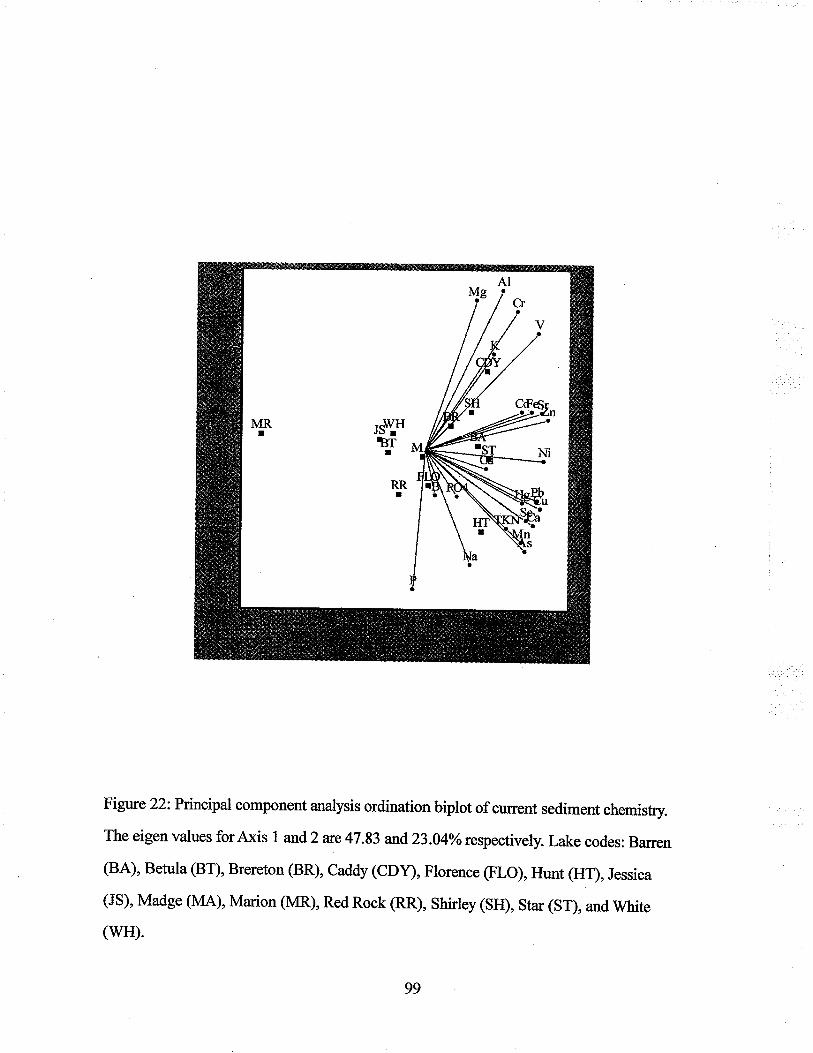
Figure 22:Pnncipal component analysis ordination biplot of current sediment chemisty.
The eigen values forAxis I and2 arc 47.83 and23.04%respectively. Lake codes: Banen
(BA), Betula (BT), Brereton (BR), caddy (cDÐ, Florence (FLo), H'nt (HT), Jessica
(JS), Madge (MA), Marion (MR), Red Rock (RR), shirley (sIÐ, srff (sr), and white
(WH).
chlorophyll showed four fluctuations correlated with those described for organic matter
content. At 6 and 30 cm depths organic matter content and total chlorophyll both decreased.
In contrast, when the organic matter content peaked at 18 cm the total chlorophyll
concentration decreased sharply to its second lowest concentrati on of 26 pglg. The lowest
concentration of total chlorophyll 15.5 pdg was found at 40 cm,2 cm below the minimum
organic matter content value. Carbonate content ranged between 1.1 and 2.9 % and
fluctuations appeared to be unrelated to those observed in the other water content, organic
matter and total chlorophyll profiles (Table24).
4.52-2BetulaLake
Betula Lake water content obtained a maximum value of 93.4 o/o sediment wet weight
at the top ofthe core and decreased to 87.8 %o atthebase (Figure 24). Fluctuations observed
in the water content profile are relatively small and were not correlated to changes in organic
matter or carbonate content profiles. At the top of the core organic matter constituted 35.8
% dry weight decreasing to 34.2 Yo at 14 cm. Below 16 cm organic matter content was
maintained above 36.7 %reaching a maximum of 38.1 %o at24cm. Total chlorophyll had a
maximum value of 463.7 pdg atthe top of the core. Total chlorophyll decreased steadily
down the core with a single peak to lll.l¡tglg at 14 cm. Carbonate content ranged between
1.1 and 1.9 %dry weight with a single minimum value of 1.1 % occurring at24 cm.
4.52-3 Brereton Lake
The Brereton Lake water content profile showed numerous flucfuations throughout
the length of the core. These fluctuations were relatively small, with arange of only 4.j %(Fieure 25). rWater content fluctuated between 87.2 % and 91.5 % (Table 24). Fluctuations
were not correlated with other organic matter, carbonate content fluctuations. Organic matter
content is maintained at approximately 30 %throughout the core. Total chlorophyll is
relatively consistent throughout the length of the core. Total chlorophyll had a maximum
peak of 100.6 pdg at the top of the core, drasticatty dropped.to 25.2¡tg/g at 2 cm, and
continued to steadily decrease with depth. Brereton Lake had the lowest maximum tot¿l
100
chlorophyll concenhation of all cores. Carbonate content ranged between 1.0 and 1.5 %
sediment dry weight.
4.52-4 CaddyLake
V/ater content, organic matter content and total chlorophyll profiles from Caddy Lake
were relatively consistent lacking large fluctuations experienced by other cores. Water content
ranged from 83.3 % up the core to 92.5 %(Figrre 26). Organic matter content was consistently
low at approximately 17 %wtth asmall increase at the base to 20.8 %. Caddy Lake maintained
the second lowest organic matter content after Marion Lake. Total chlorophyll was 16g.3
pdg at the top of the core and decreased down the core to 28.3 pglg. Cæbonate content
ranged between 0.8 and 2.2% sediment dry weight.
4.52-5 Florence Lake
Water content ranged between 92.2% and97.6 Yo wetweight up the core. Relatively
small fluctuations observed were not correlated to other profile fluctuations (Figure 27).
Florence Lake experienced a decrease in organic matter content at 12 cm from 47 .2 yo to a
low of 43 -6 Yo at22 cm with a final peak to 45 .4 %o at adepth of 28 cm. Total chlorophyll had
a maximum value of 794.6 pdgthe second highest concentation after Hunt Lake. Total
chlorophyll decreased to aminimum concentration of 102.8 pdgat2} cm,2 cm above the
observed organic matter minimum, but followed a pattern similar to the organic matter
profile with a subsequentpeak at 28 cm. Total chlorophyll experienced a substantial decrease
at 6 cm correlated with a decrease in carbonate content. With the exception of this one
correlation carbonate fluctuations were notconelatedwith otherprofiles andhad amaximum
content of 3.3 % dry weight.
4.52-6 Hunt Lake
The water and organic matter content profiles of Hunt Lake water content were very
similar in shape. There were two pronounced fluctuations in the profiles (Figwe 2g). Atadepth of 14 cm water content was relatively low and organic matter content reached its
minimum value of 32.4 o/o. In contrast , at2Sand 30 cm respectively organic matter content
101
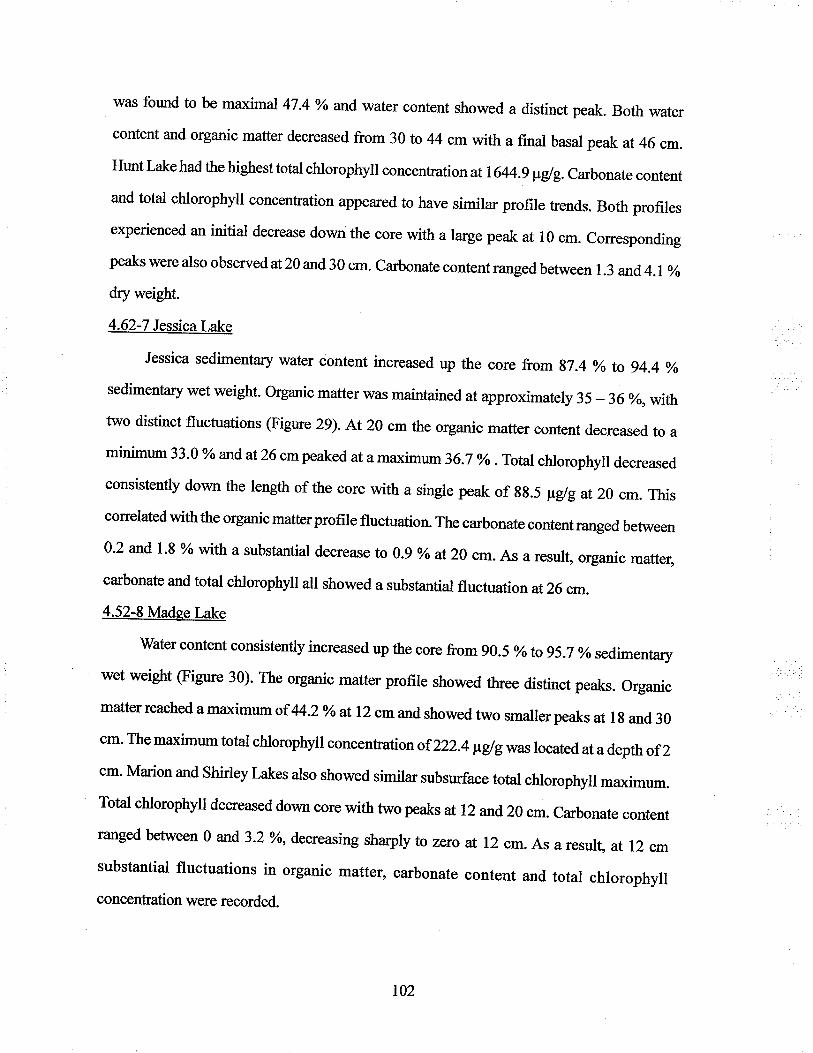
was found to be maximal 47.4 Yo and water content showed a distinct peak. Both water
content and organic matter decreased from 30 to 44 cmwith a final basal peak at 46 cm.
Hunt Lake had the highest total chlorophyll concentrati onat1644.9 vglg.Carbonate content
and total chlorophyll concentration appeared to have similar profile trends. Both profiles
experienced an initial decrease down the core with a large peak at l0 cm. Corresponding
peaks were also observed at20 and.30 cm. Carbonate content ranged between 1.3 and 4.1%dry weight.
4.62-7 JessicaLake
Jessica sedimentary water content increased up the core from g7.4 % to 94.4 %o
sedimentary wet weight- Organic matter was maintained at approximately 35 - 36 yo, *,thtwo distinct fluctuations (Figure 29). At 20 cmthe organic matter content decreased to aminimum 33'0 % and at 26 cmpeaked at a maximum 36.7 %. Total chlorophyll decreased
consistently down the length of the core with a single peak of gs.5 ¡rg/g at 20 cm. Thiscorrelatedwiththe organic matterprofile fluctuation. The carbonate contentranged between
0'2 and l'8 % with a subst¿ntial decrease to 0.9 %o at20 cm. As a result, organic matter,
carbonate and total chlorophylr ail showed a substantial fluctuation at26 cm.
4.52-8 Madee Lake
water content consistently increased up the core from g0.5 %to 95.7 % sedimentary
wet weight (Figure 30). The organic matter profile showed three distinct peaks. organicmatter reached a maximum of 44.2 %o at 12 cm and showed two smaller peaks at l g and 30
cm' The ma:rimum total chlorophyll concentrationof 222.4pglg was located at a depth of 2cm' Marion and shirley Lakes also showed similar subsurface total chlorophyll maximum.Total chlorophyll decreased down core with two peaks at 12 and20 cm. carbonate contentranged between 0 and 3-2 yo, decreasing sharply to zero at 12 cm.As a result , at 12 cmsubstantial fluctuations in organic matter, carbonate content and total chlorophyllconcentation tryere recorded.
102
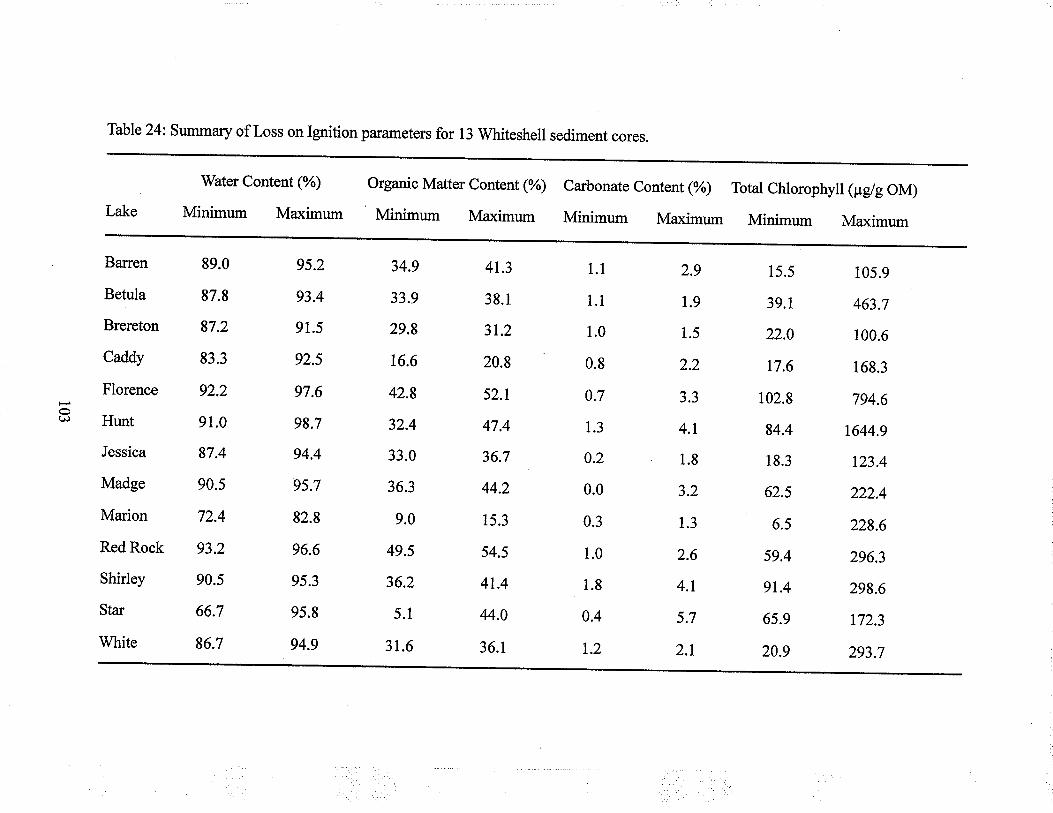
Table 24: Summary of Loss on Ignition parameters for 13 Whiteshell sediment cores.
Banen
Betula
Brereton
Caddy
Florence
Hunt
Jessica
Madge
Marion
Red Rock
Shirley
Star
White
'Water Content (%)
Minimum Ma,ximum
89.0
87.8
87.2
83.3
92.2
91.0
87.4
90.5
72.4
93.2
90.5
66.7
86.7
ot¿)
Organic Matter Content (%)
Minimum Maximum
95.2
93.4
91.5
92.5
97.6
98.7
94.4
9s.7
82.8
96.6
95.3
95.8
94.9
34.9
33.9
29.8
t6.6
42.8
32.4
33.0
36.3
9.0
49.s
36.2
5.1
31.6
4t.3
38.1
31.2
20.8
52.1
47.4
36.7
44.2
15.3
54.5
4t.4
44.0
36.1
Carbonate Content (70)
Minimum Maximum
1.1
1.1
1.0
0.8
0.7
1.3
0.2
0.0
0.3
1.0
1.8
0.4
t.2
Total Chlorophyll (pdg OM)
Minimum Maximum
2.9
1.9
1.5
2.2
3.3
4.r
1.8
3.2
1.3
2.6
4.1
5.7
2.1
15.5
39.1
22.0
t7.6
1,02.9
84.4
18.3
62.5
6.5
59.4
91.4
65.9
20.9
105.9
463.7
r00.6
168.3
794.6
1644.9
t23.4
222.4
228.6
296.3
298.6
172.3
293.7
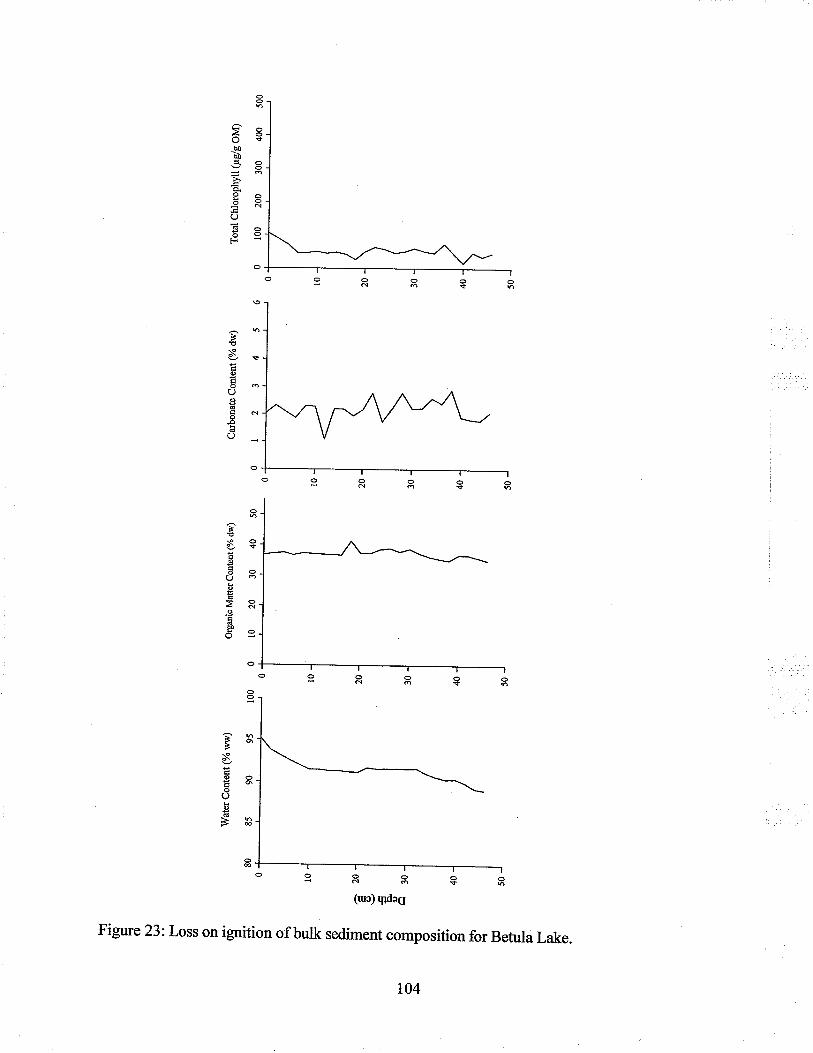
Tot
al C
hlor
ophy
ll (p
elg
OM
)
0 10
0 20
0 30
0 40
0 s0
0
Car
bona
te C
onte
nt (
9/o
dw)
0123
456
Org
anic
Mat
ter
Con
teut
(%
dw
)
100
0 l0
20
30
40
50
Wat
er C
onte
nt (
% w
w)
80
85
90
95
0a E (D t\) :t' ( o v) U) o oa o o C'
Ê ts U)
CD È iJÉ Eg
〠c)rd (/) o æ EË o Êl F Êl F ID
0 t0 20 30 40 50,
è
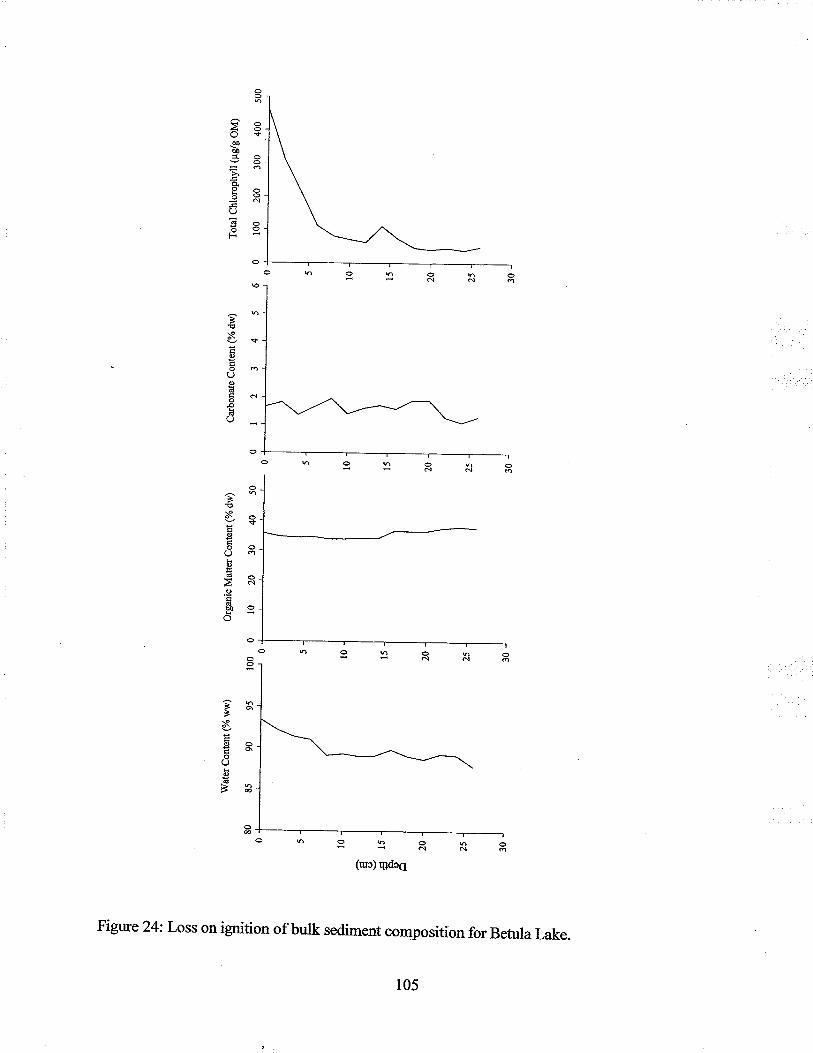
Wat
er C
onte
nt (
% w
w)
80
85
90
95
O (J¡
10
â o €15
À o
Org
anic
Mat
ter
Con
tent
(%
dw
)
100
0 t0
20
30
40
50
0 I
2 J
4 5
6 o
100
200
300
400
500
Ca¡
bona
te C
onte
nt (
% d
w)
Tot
al C
hlor
ophy
ll (¡
rglg
OM
)
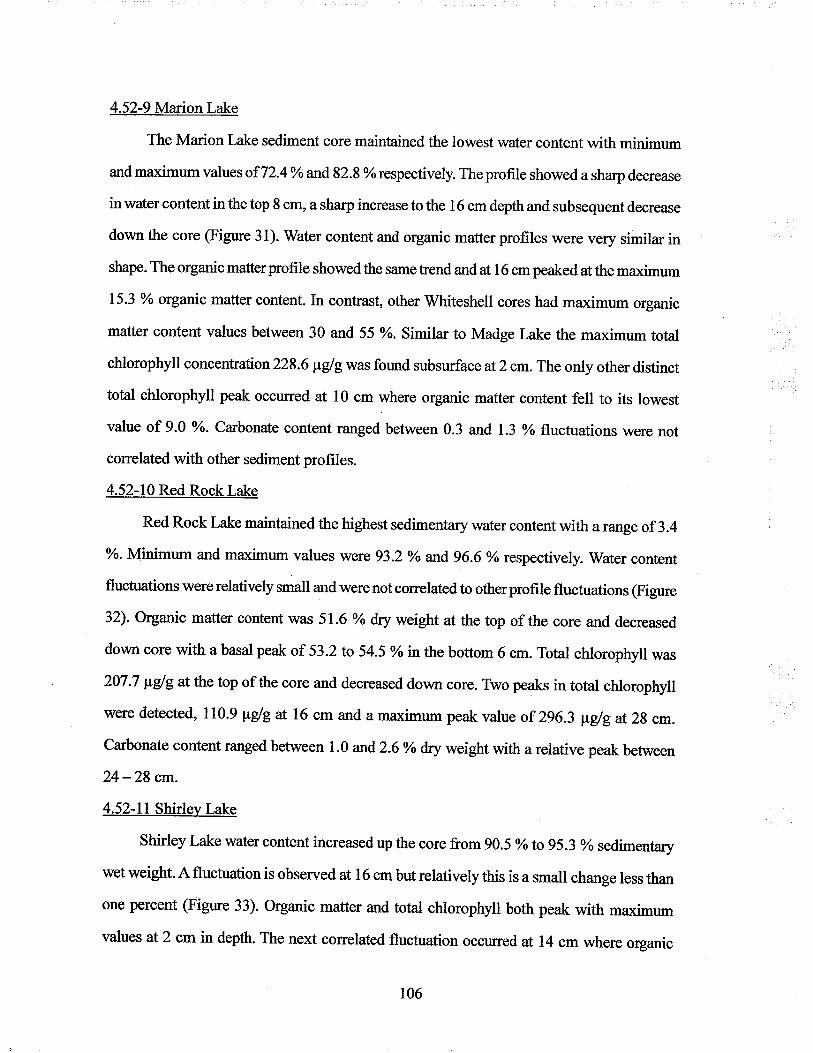
4.52-9 ManonLake
The Marion Lake sediment core maintained the lowest water content with minimum
and maximum values of 72.4 o/o and 82.8 % respectively. The profile showed a sharp decrease
in water content in the top 8 cm, a sharp increase to the 16 cm depth and subsequent decrease
down the core (Figure 31). rü/ater content and organic matter profiles were very similar in
shape. The organic matter profile showed the same trend and at 16 cm peaked at the maximum
15.3 % organic matter content. [n contrast, ottrer Whiteshell cores had maximum organic
matter content values between 30 and 55 %. Similar to Madge Lake the maximum total
chlorophyll concentrati on228.6pglg was found subsurface at2 cm.The only other distinct
total chlorophyll peak occurred at l0 cm where organic matter content fell to its lowest
value of 9.0 %. Carbonate content ranged between 0.3 and 1.3 % fluctuations were not
correlated with other sediment profiles.
4.52-10 Red Rock Lake
Red Rock Lake maintained the highest sedimentary water content with a range of 3.4
%. Minimum and ma:rimum values were 93.2 %o and 96.6 % respectively. Water content
fluctuations were relatively small and were not correlated to otherprofile fluctuations (Figure
32). Oryanic matter content was 51.6 % dry weight at the top of the core and decreased
down core with a basal peak of 53.2 to 54.5 % in the bottom 6 cm. Total chlorophyll was
207.7 Pglg at the top of the core and decreased down core. Two peaks in toøl chlorophyll
were detected, 110.9 pg/g at 16 cm and a maximum peak value of 296.3 Vglg at 28 cm.
Carbonate content ranged between 1.0 and 2.6% dry weight with a relative peak between
24 -28 cm.
4.52-ll Shirley Lake
Shirley Lake water content increased up the core from 90.5 %to 95.3 % sedimentary
wet weight. A fluctuation is observed at 16 cm but relatively this is a small change less than
one percent (Figure 33). Organic matter and total chlorophyll both peak with maximum
values at2 cm in depth. The next correlated fluctuation occurred at 14 cmwhere organic
106
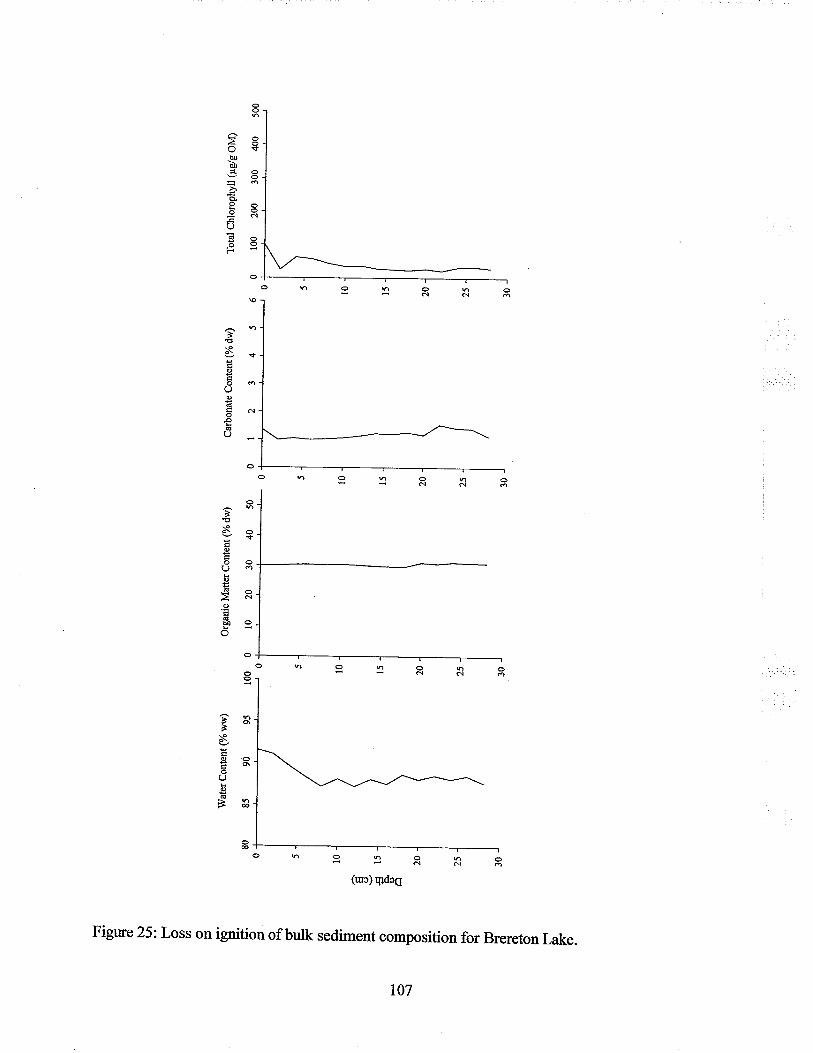
80
O {
Wat
er C
onte
nt
(% w
w)
85
90
95
Org
anic
M
atte
r C
onte
nt (
% d
w)
100
0 10
20
30
40
50
0 I
2 3
4 5
6 0
100
200
300
400
500
Car
bona
te C
onte
nr (
% d
w)
Tot
al C
hlor
ophy
ll (p
glg
Ofv
f)
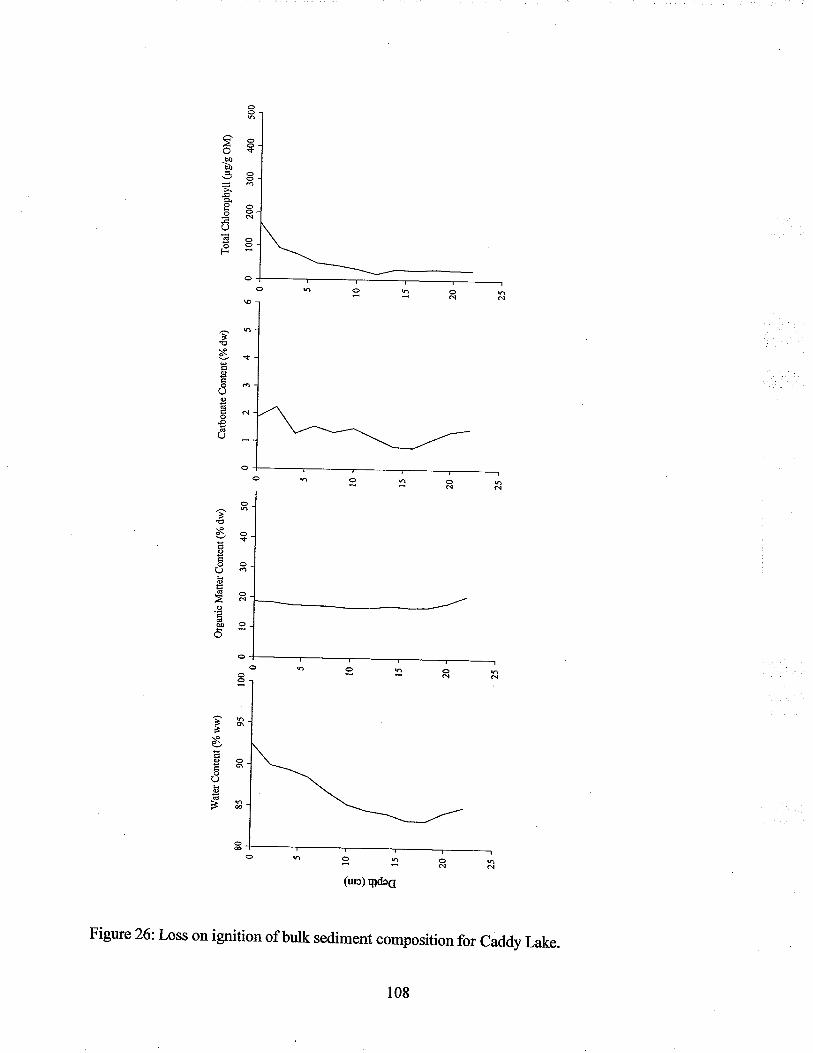
oa Ê ¡.t
(D N) I rr o v2 U
) o oa o o '-i d É F v) o È o o o t3 o U) o o' o Ê
D ã Ê. F Ê
¡ Þf
(D
Wat
erC
onte
nt (
% w
w)
80
85
90
95
o oo
â10
o a c) Ê15
20 25
Org
anic
Mat
ter
Con
renr
(%
drr
)
100
0 l0
20
30
40
50
0 I
2 1
4 5
6 0
100
200
300
400
500
Car
bona
te C
onte
nt (
% d
w)
Tot
al C
hlor
ophy
ll (¡
rglg
OM
)

iÎj 0a (D l..) \¡ F o v) v) o oa ¡+ o o d ã F u) (D È P o o o F
ó o U) o o' Ë o H (D () o rl ¡¡ zi (D
Wat
er C
onte
nt (
% w
w)
80
85
90
95
\o
ã20
o o o30
Org
anic
Mat
ter
Con
tent
(%
dw
)
100
0 10
20
30
40
50
Car
bona
te C
onte
nt (
% d
w)
Tot
al C
hlor
ophy
ll (¡
rglg
OM
)
0 I
2 3
4 5
6 0
400
800
1200
160
0
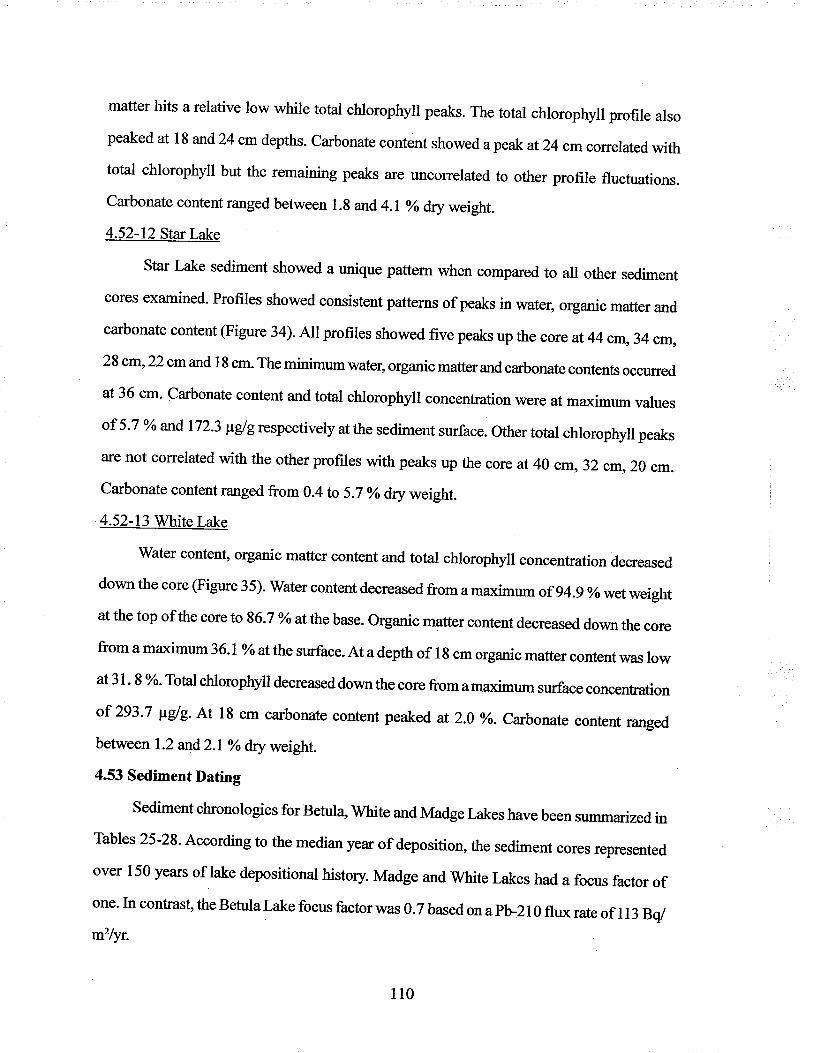
matter hits a relative low while total chlorophyll peaks. The total chlorophyll profile also
peaked at l8 and 24 cmdepths. Carbonate content showed apeak at24 cmcorrelated withtotal chlorophyll but the remaining peaks are unconelated to other profile fluctuations.
carbonate content ranged between r.g and 4.r %dry weight.
4.52-12 StarLake
Star Lake sediment showed a unique pattern when compared to all other sediment
cores examined. Profiles showed consistent patterns of peaks in water, organic matter and
carbonate content (Figure 34). All profiles showed five peaks up the core at 44 cm,34 cm,
28 cm,22 cmand 18 cm. The minimum water, organic matterand carbonate contents occurred
at 36 cm' Carbonate content and total chlorophyll concentration were at maximum values
of 5'7 %o and 172-3 ¡tglgrespectively at the sediment surface. Other total chlorophyll peaks
are not correlated with the other profiles with peaks up the core at 40 cm, 32 cm,20 cm.
Carbonate content ranged from 0.4 to 5.7 % dry weight.
4.52-13 White Lake
'Water content, organic matter content and total chlorophyll concentration decreased
downthecore(Figure35).Watercontentdecreasedfromamaximtun of94.9%owetweight
at the top of the core to 86.7 % at the base. Organic matter content decreased down the core
from a maximum 36.1 %at the surface. At a depth of 18 cm organic matter content was lowat 3 I ' 8 %o'Totalchlorophyll decreased down the core from a maximum surface concentration
of 293'7 Pg/g. At 18 cm carbonate content peaked at 2.0 yø. Carbotnte content ranged
between 1.2 and2.l % dry weight.
4.53 Sediment Dating
Sediment chronologies for Betula" White and Madge Lakes have been summarized inTäbles 2s'2g'According to the median year of deposition, the sediment cores represented
over 150 years of lake depositional history. Madge and White Lakes had a focus factor ofone' In contrast, the Betula Lake focus factor was 0.7 based on a pb:21 0 flux rate of I 13 Bq/rr&/yt.
il0
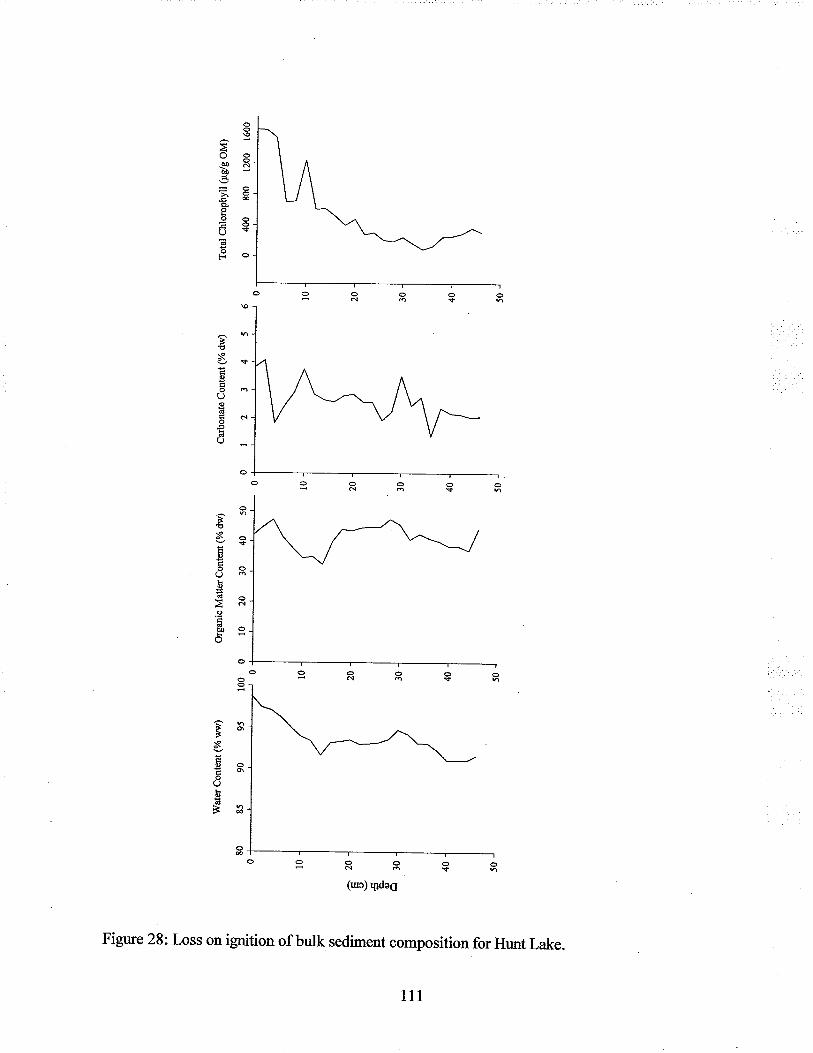
Þfj
0q tD N 99 rr o v) v) o 0q o o d É tf U)
(D È (î () o rJ o .A ä, É li o) tf o
80
Wat
er C
onte
nt (
% w
w)
Org
anic
M
atte
r C
onte
nr (
% d
w)
85
90
9s
100
0 10
20
30
40
50
ã20
I Þ. o a3
0
Car
bona
te C
onte
nt (
% d
w)
0123
456
Tot
al C
hlor
ophy
ll (p
glg
Otv
Ð
0 40
0 80
0 12
00 1
600
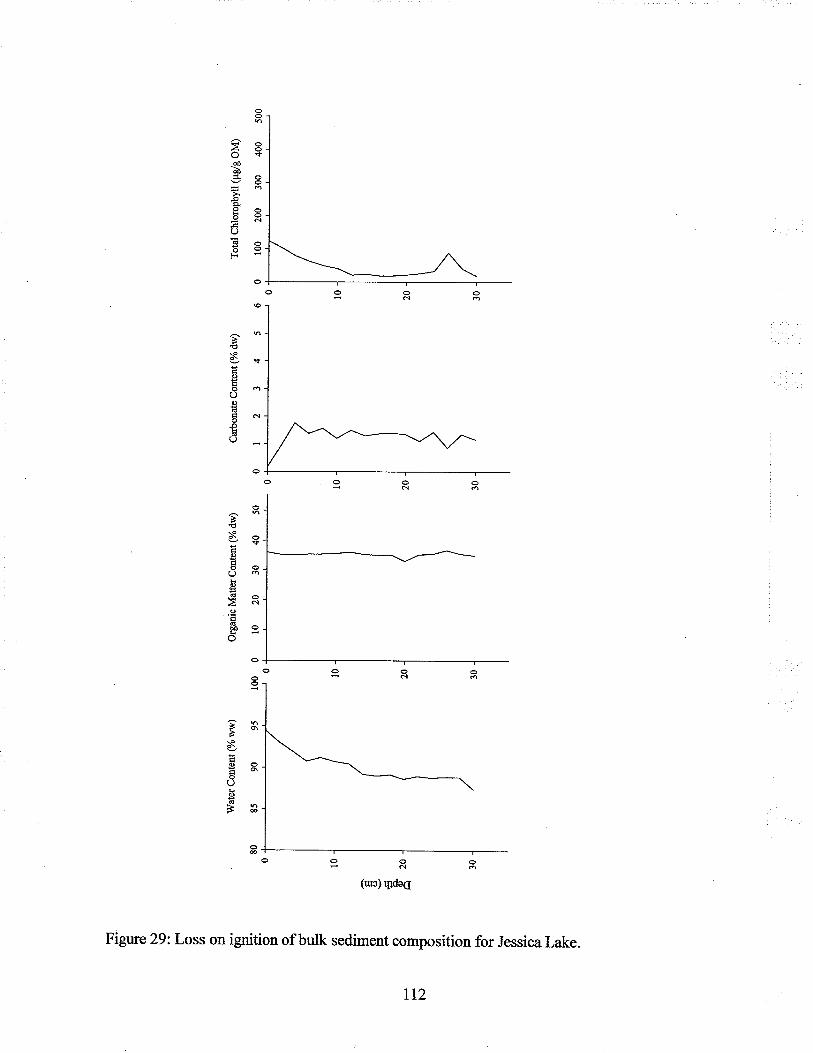
Wat
er C
onte
nt (
% w
w)
80
85
90
9s
t\)
o c¡. .E 2
0
Org
anic
Mau
er C
onte
nr (
% d
w)
100
0 10
20
30
40
50
Car
bona
te C
onte
nt (
% d
w)
0123
4s60
Tot
al C
hlor
ophy
ll (p
glg
OM
)
100
200
300
400
500
Sediment accumulation rates remained relatively constant for the length of the Betula
and Madge sediment cores with a sharp increase at the bottom of the core (Figure 36). In
contrast, sediment accumulation rate increased up the length of the White Lake sediment
core (Figure 36). White Lake presently has a sediment accumulation rate of 329 glmrlyr
more than twice the rate found in Madge Lake. Betula and White Lake mean constant flux
sedimentation rates were2l3 dm'/W. The Betula Lake mean constant flux sedimentation
rate was heavily skewed by a single sedimentation rate of 781 glnf ly at the base of the
core. The exclusion ofthis value decreasedthe Befulal-ake mean constant flux sedimentation
rate to 165 glm2lyr. Madge Lake has the lowest mean constant flux sedimentation rate of
Al flnflyr.
4.54 Sediment Geochemistry Introduction
Sediment geochemisûry is an effective tool for examining watershed land use histories.
Select nuftients and heavy metal concentrations related to anthropogenic disturbance were
graphed in concentration versus depth prof,rles to examine changes through time (Figures
37-47,Appendix). Table 29, provides a sunmary of sediment core means and ranges for all
elements measured. Mean sediment concentrations significantly different from Betula Lake
were recorded in Täble 30.
4.55 Nutrients
4.55-I Total Kjeldahl Nitrogen
Sediment concentration profiles oftotal kjeldatrl nitogen revealed small concenhation
increases up the core for Betula, Jessica, Red Rock and White Lakes. Profiles for the
remaining lakes did not show a distinct tend, with small fluctuations in concentration up
the length of the core (Figure 37). The maximum TKN concentration was observed at the
top of the Red Rock Lake core witlì 2.81 % dry weight. Red Rock Lake had the highest
mean TKN concentration at2.56 % dry weight. In contrast, Marion Lake had the lowest
TKN concentration of all 13 lakes at the top ofthe core with a value of < 0.2 % dry weight.
Marion Lake also had the lowest mean TKN concentation of 0.09 % dry weight. Marion
113
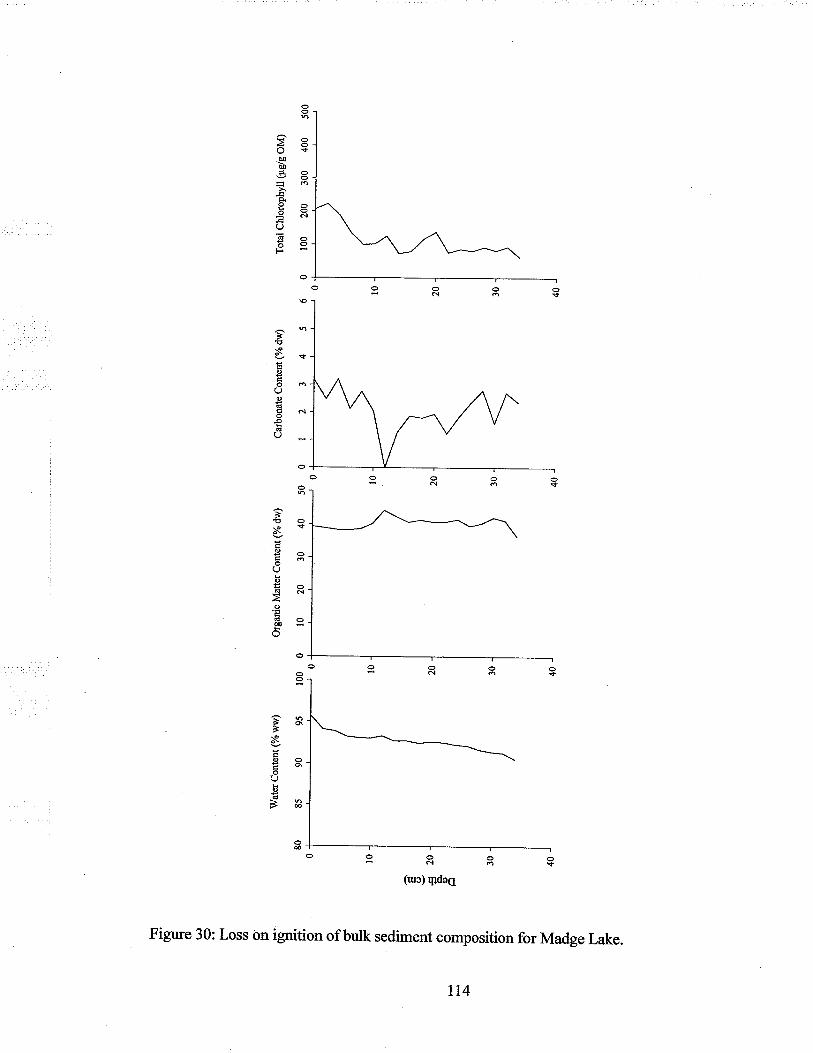
Fd
oa É o (¿) i: o v) v) o 0a o o ct'
d ,f Ø (D È 9 o o o Fd o U) o t-.h o' ? rà !9 È 0a o F A) F (D
5
Wat
er C
onte
nt (
% w
w)
85
90
95
o €20
À o â
100
0 10
20
30
40
50
0
t 2
3 4
5 6
0 10
0 20
0 30
0 40
0 50
0J0
go#0
1 '
', '
i,
orga
nic
Mat
ter
cont
ent
(% d
w)
carb
onar
e co
nten
t (%
dw
) T
oal
chlo
roph
yll
(¡rg
lg o
M)
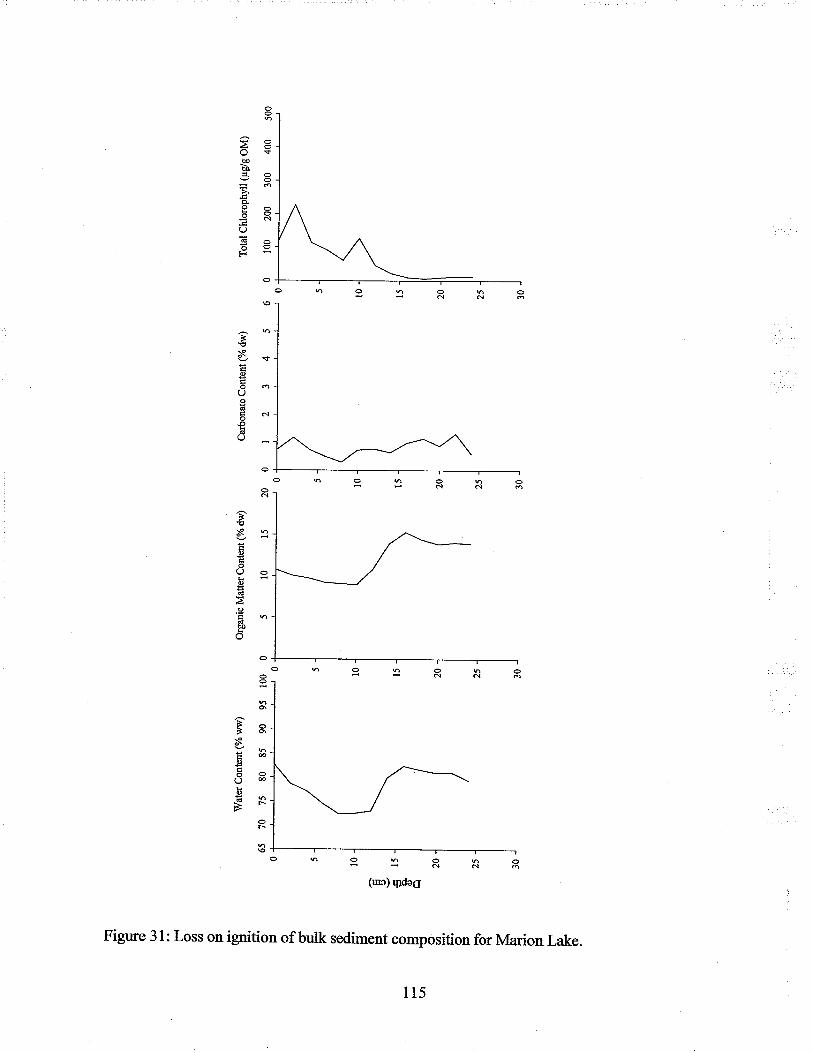
0a É o UJ :: tri
o CA v) o oa o d tf u) (D À Ë C
D o o IJ o U' o ã, ? Þ) o rr Ê) tf (D
lVat
er C
onte
nt (
% w
w)
6s 7
0 75
80
85 9
0 95
100
0
(,¡¡
Org
anic
Mat
ter
Con
tent
(%
dw
)
5t01
5C
arbo
nate
Con
tent
(%
dw
) T
otal
Chl
orop
hyu
(pel
g O
M)
20 0
I
2 3
4 5
6 0
t00
200
300
400
500
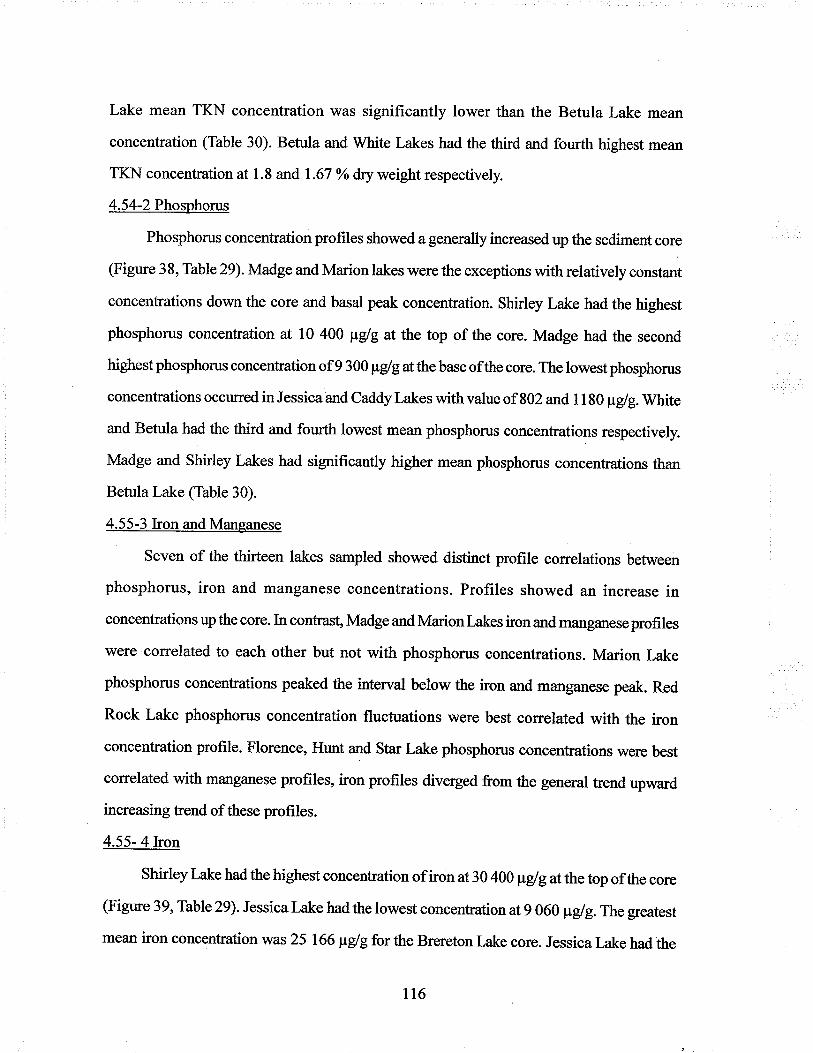
Lake mean TKN concentration was significantly lower than the Betula Lake mean
concentration (Table 30). Betula and White Lakes had the third and fourth highest mean
TKN concentration at 1.8 and 1.67 % dry weight respectively.
4.54-2 Phosphorus
Phosphorus concentration profiles showed a generally increased up the sediment core
(Figure 38, Table 29).Madgeand Marion lakes were the exceptions with relatively constant
concentrations down the core and basal peak concentration. Shirley Lake had the highest
phosphorus concentration at 10 400 pglgat the top of the core. Madge had the second
highest phosphorus concentration of 9 300 ¡tglgat the base ofthe core. The lowest phosphorus
concentrations occuffed in Jessica and Caddy Lakes with value of 802 and 1180 pglg. White
and Betula had the third and fourth lowest mean phosphorus concentrations respectively.
Madge and Shirley Lakes had signifrcantly higher mean phosphorus concentrations than
Betula Lake (Table 30).
4.55-3 Iron and Manganese
Seven of the thirteen lakes sampled showed distinct profile correlations between
phosphorus, iron and manganese concentrations. Profiles showed an increase in
concentrations up the core. In contrast, Madge and Marion Lakes iron and manganese profiles
were correlated to each other but not with phosphorus concentrations. Marion Lake
phosphorus concentations peaked the interval below the iron and manganese peak. Red
Rock Lake phosphorus concentration fluctuations were best correlated with the iron
concentration profile. Florence, Hunt and Star Lake phosphorus concentrations were best
correlated with manganese profiles, iron profiles diverged from the general trend upward
increasing tend of these profiles.
4.55- 4Iron
Shirley Lake had the highest concentration ofiron at 30 400 ¡tg/gatthetop ofthe core
(Figure 39, Table 29). Jessicalake hadthe lowest concentration at 9 060 pg/g. The greatest
mean iron concentration was 25 166 ¡tglgfor the Brereton Lake core. Jessica Lake had the
lt6
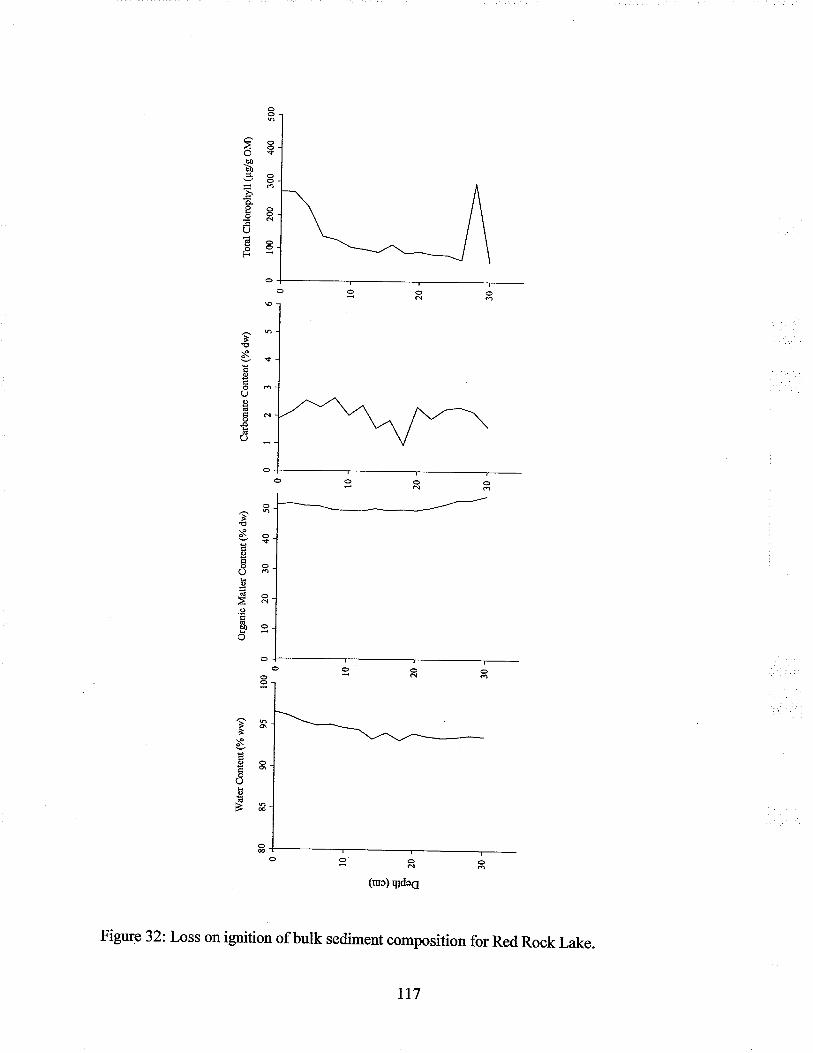
oa 4 CD u) \J F o u) v) o 9 0q ê o Fi') ct'
Þf
U) o È H (o () o F
d o (n o l+ o' Fl
(D È F o o 2f rr Þ) ,f (D
\ì
Wat
er C
onte
nt (
% w
w)
85
90
95
100
0
€' I q ,9 2
0
Org
anic
M
atte
r C
onte
nt (
% d
w)
10
20
30
40
50
Car
bona
te C
onte
nt (
% d
w)
0123
4560
Tot
al C
hlor
ophy
ll (É
glg
OM
)
100
200
300
400
500
Þ¡J
oq FI
(D u) u) rr o u) v) o oa é o o d Þf
U) o o C) o t o lI2 o ã, (t)
(D l-{ ô) tf (D
Wat
er C
onte
nt (
% w
rv)
80
8s
90
95
oo
o ê,
Org
anic
Mat
ter
Con
tent
(%
dw
)
100
0 10
20
30
40
s0
Car
bona
te C
onte
nt (
% d
w)
0123
4560
Tot
al C
hlor
ophy
ll (É
elg
OM
)
100
200
300
400
500
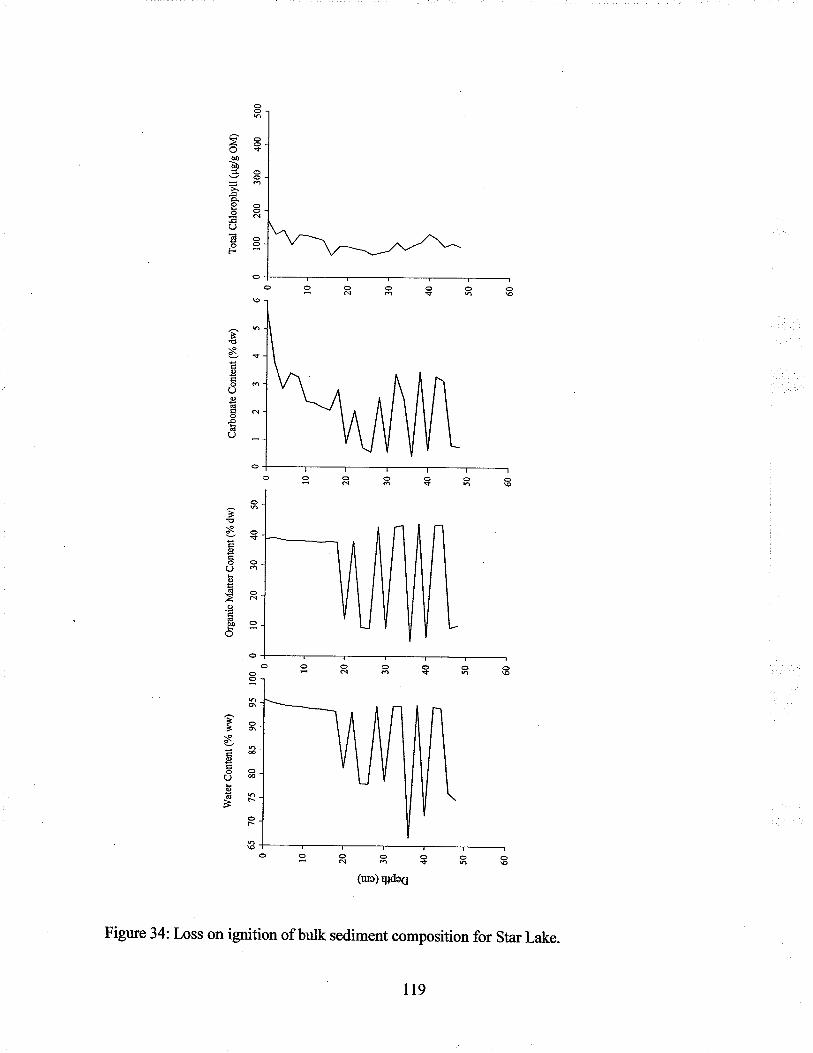
0a É tD (J) å F o V)
U) o 0a r+ o o ct Þf
U2 o È (D o o 'ct o V) o o' Fl (t)
o, Fl rr Ê) ,ç (D
Wat
er C
onte
nt (
% w
w)
Org
anic
Mat
ter
Con
tent
(%
dw
)
6s 7
0 75
80
85 9
0 95
100
0
10
20
30
40
50
\o
20
e () €30
À o â
Car
bona
te C
onte
nt
(% d
w)
Tot
al C
hlor
ophy
ll (p
glg
OM
)
0 I
2 3
4 S
6
0 10
0 20
0 30
0 40
0 50
0
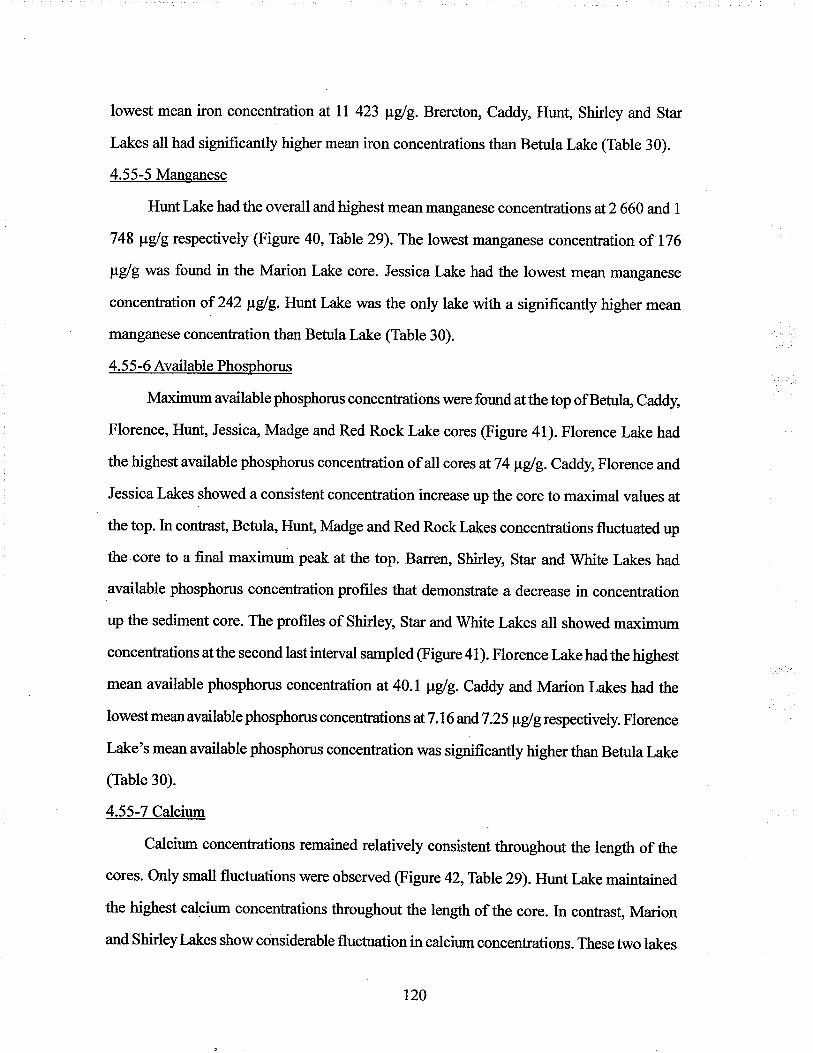
lowest mean iron concentration at ll 423 ¡rglg. Brereton, Caddy, Hunt, Shirley and Star
Lakes all had significantly higher mean iron concentrations than Betula Lake (Table 30).
4.55-5 Manganese
Hunt Lake had the overall and highest mean manganese concentrations at 2 660 and I
748 þúgrespectively (Figure 40, Table 29).The lowest manganese concentration of 176
¡rg/g was found in the Marion Lake core. Jessica Lake had the lowest mean manganese
concentration of 242 ¡rglg. Hunt Lake was the only lake with a significantly higher mean
manganese concentration than Betula Lake (Table 30).
4.55-6 Available Phosphorus
Morimum availablephosphorus concentrationswere foundatthe top ofBehrl4Caddy,
Florence, Hunt, Jessica, Madge and Red Rock Lake cores (Figure 4l). Florence Lake had
the highest available phosphorus concentration of all cores at 74 pglg. Caddy, Florence and
Jessica Lakes showed a consistent concentration increase up the core to maximal values at
the top. In contrast, Betul4 Hunt, Madge and Red Rock Lakes concentrations fluctuated up
the core to a final maximum peak at the top. Barren, Shirley, Star and White Lakes had
available phosphorus concentration profiles that demonstrate a decrease in concentration
up the sediment core. The profiles of Shirley, Star and White Lakes all showed maximum
concentrations at the second last interval sampled (Figure 41). Florence Lake had the highest
mean available phosphorus concentration at 40.1 ¡tglg. Caddy and Marion Lakes had the
lowest mean available phosphorus concenüations at7 .16 andT .25 pglg respectively. Florence
Lake's mean available phosphorus concentration was significantly higher than Betula Lake
(Table 30).
4.55-7 Calcium
Calcium concentrations remained relatively consistent throughout the length of the
cores. Only small fluctuations were observed @igure 42,Table29). Hunt Lake maintained
the highest calcium concentrations throughout the length of the core. In contrast, Marion
and Shirley Lakes show considerable fluctuation in calcium concentrations. These two lakes
120
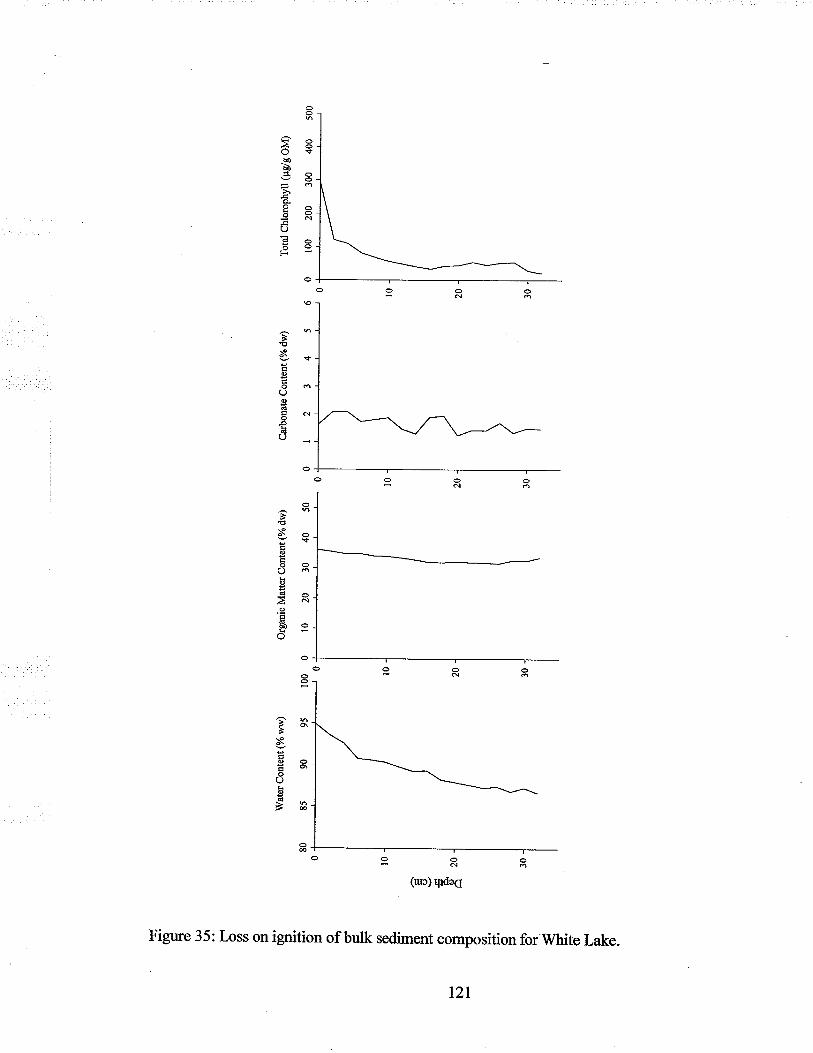
oa Ê (D UJ :+ - o u) u) o oa o o l*
¿ ct É F v, CD È (D o o Fd o U) ê o Þ ¡+ o' Ft. o r{ Þ ,f o
ì.J
Wat
er C
onte
nt (
% w
w)
85
90
95
100
0
o ê. ,9 2
0
Org
anic
Mat
ter
Con
tent
(%
dw
)
.10
20
30
40
50
Ca¡
bona
te C
onte
nt (
% d
w)
0123
4560
Tot
al C
hlor
ophy
ll (¡
rglg
OM
)
t00
200
300
400
s00
Table 25: Sediment chronologies for Betula Lake calculated based on Constant Flux
Model. Samples which were not dated are designated by n/a
Sediment
Depth
(cm)
Mean Constant Flux
Median Year Sedimentation Rate
of Deposition (glmzlyr)
Years per
Sample
0-2
2-4
4-6
6-8
8-10
l0-12
l2-t4
t4-16
l6-18
18-20
20-22
22-24
24-26
26-28
28-30
30-32
2000
1994
1986
1978
1969
1957
1942
1926
1909
1892
1875
1861
I 855
nJa
nla
nla
200
176
t99
205
t7t
t34
128
128
tt6
134
tt7
282
781
nla
nla
nla
4.9
6.9
7.7
8.3
10.3
14.3
15.3
16.4
17.6
16.2
19.4
8.1
3.0
nla
nla
nla
r22
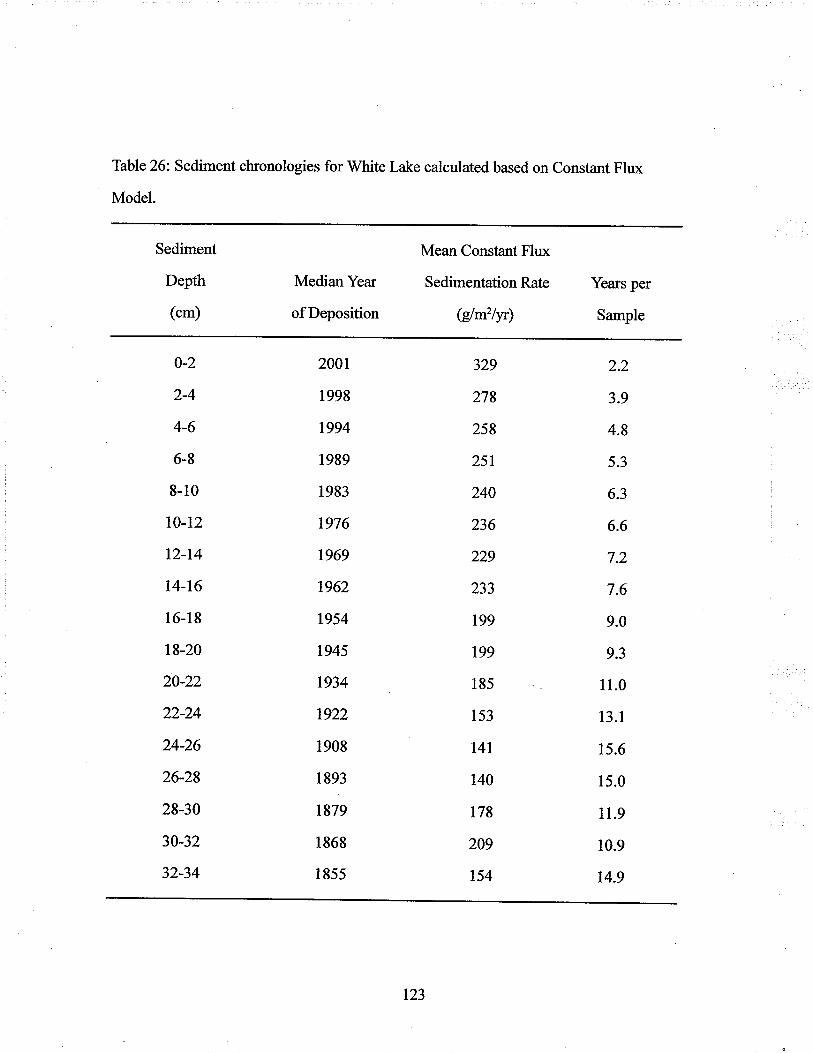
Table26:. Sediment chronologies for White Lake calculated based on Constant Flux
Model.
Sediment
Depth
(cm)
Median Year
of Deposition
Mean Constant Flux
Sedimentation Rate
G/m'lyt)
Years per
Sample
0-2
2-4
4-6
6-8
8-10
l0-12
l2-14
74-16
16-18
l8-20
2n-22
22-24
24-26
26-28
28-30
30-32
32-34
2001
1998
t994
1989
1983
1976
1969
1962
1954
1945
1934
1922
1908
1893
1879
1868
185s
329
278
258
251
240
236
229
233
t99
199
185
1s3
t4t
140
178
209
ts4
2.2
3.9
4.8
5.3
6.3
6.6
7.2
7.6
9.0
9.3
11.0
13.1
15.6
15.0
1r.9
r0.9
14.9
123
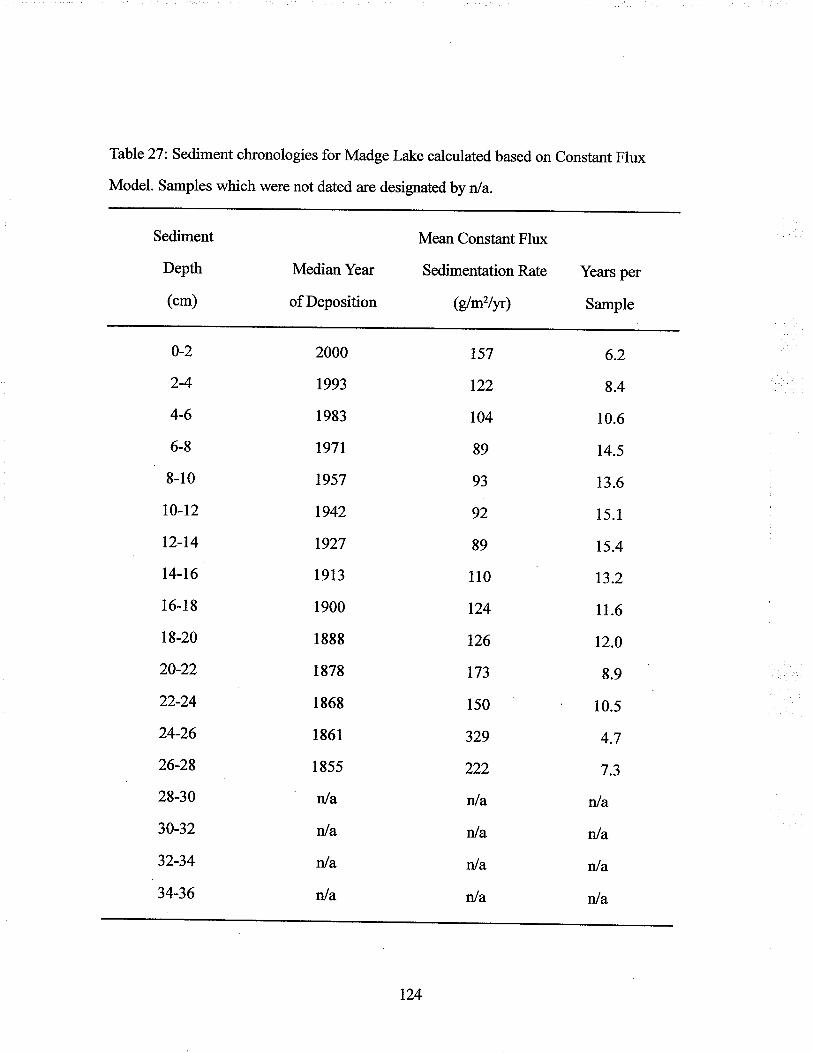
Table 27: Sediment chronologies for Madge Lake calculated based on Constant Flux
Model. Samples which were not dated are designated by n/a.
Sediment
Depth
(cm)
Median Year
of Deposition
Mean Constant Flux
Sedimentation Rate
(úm'/yr)
Years per
Sample
0-2
2-4
4-6
6-8
8-10
t0-12
t2-t4
l4-16
l6-18
l8-20
20-22
22-24
24-26
26-28
28-30
30-32
32-34
34-36
2000
1993
1983
t97t
1957
1942
1927
1913
1900
1888
1878
1868
1861
1855
n/a
nla
nla
nla
157
122
t04
89
93
92
89
110
124
126
173
150
329
222
nla
nla
nJa
nla
6.2
8.4
10.6
14.5
13.6
15.1
15.4
13.2
il.6
t2.0
8.9
10.5
4.7
7.3
nla
nla
nla
nla
t24
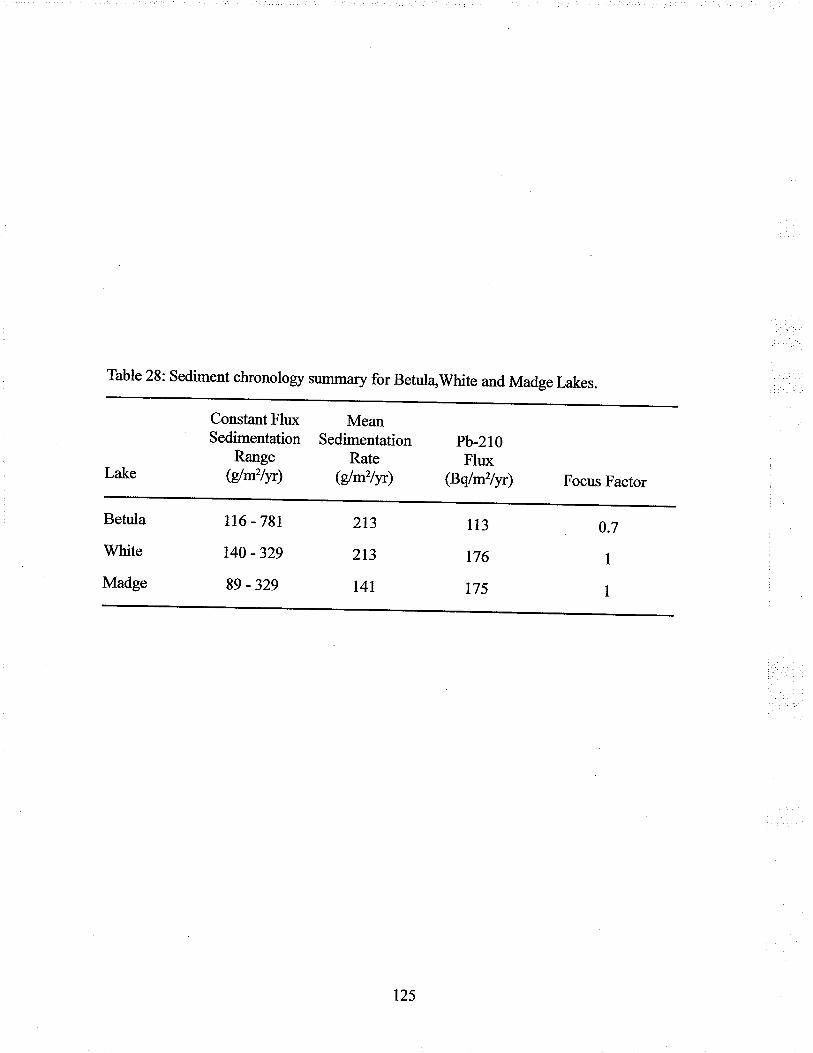
Täble 28: sediment chronology summary for Behrl4white and Madge Lakes.
Constant Flux MeanSedimentation Sedimentation pb_210
Range Rate FluxLake (drrflÐ Glmr/yr) (Bq/m2/yt) Focus Factor
Betula 116 -7Bt 213 lt3 0.7
white t40 - 329 213 176 I
Madge 89 - 329 t4t 175 I
125
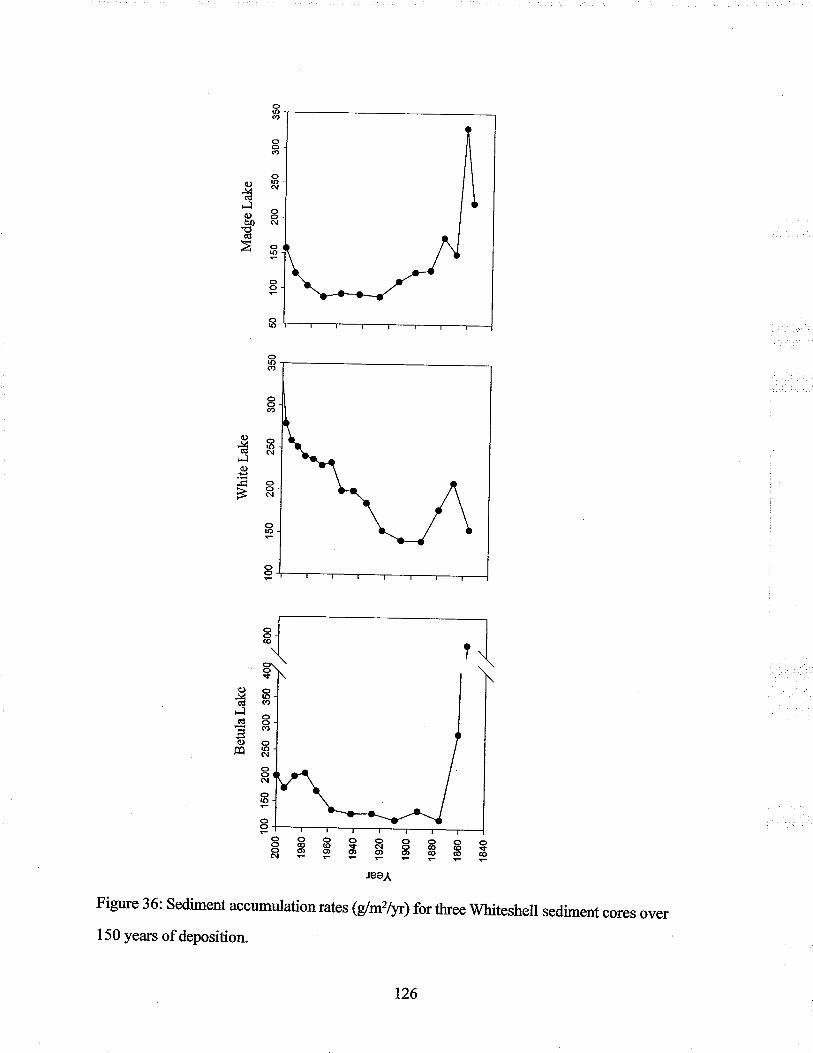
ooo
ooo
o9KCÉ
*l()8bo c{E6ú
À3
oo
o@'
oo(o
0),l rosc{gEoÞR
<)ro(Ð
oo(ÐÕroo¡
ooC\¡
oro
oc)888i8ËEEERPP:
Jee^
Figure 36: sediment accumulation rates (grrflyÐfor three whiteshell sediment cores over
150 years of deposition
t26
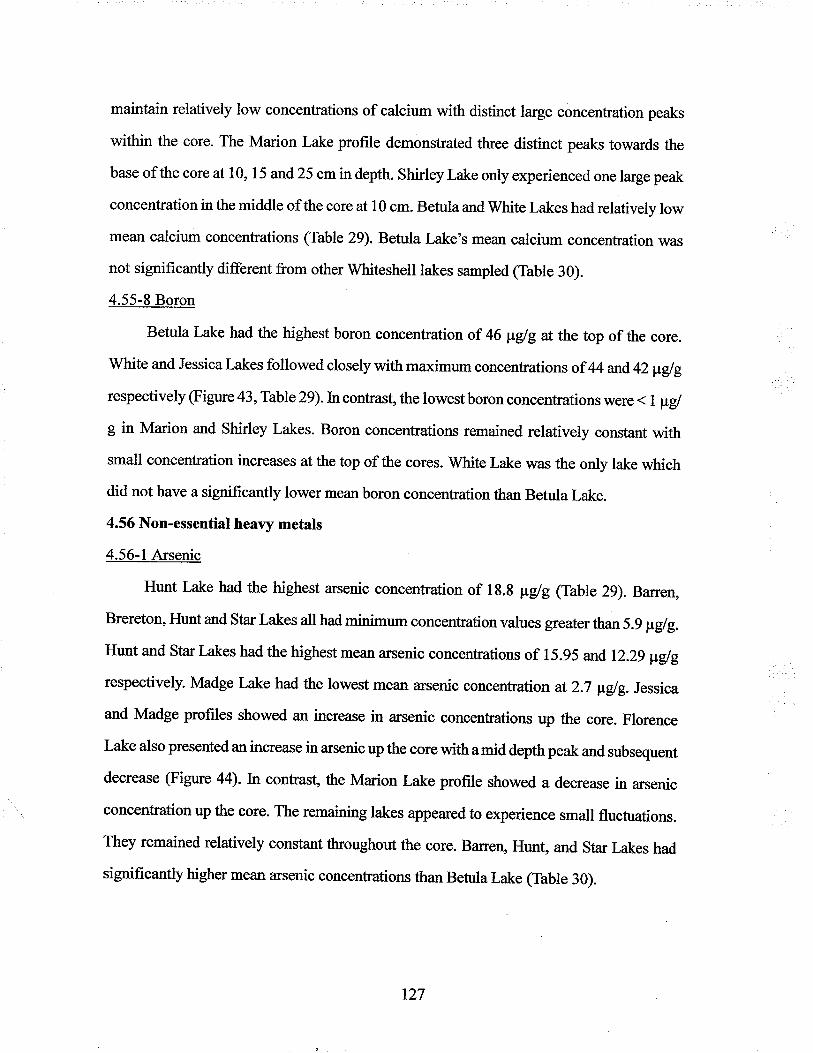
maintain relatively low concentrations of calcium with distinct large concentration peaks
within the core. The Marion Lake profile demonstrated three distinct peaks towards the
base of the core at 10, 15 arñ25 cm in depth. Shirley Lake only experienced one large peak
concentration in the middle of the core at 10 cm. Betula and White Lakes had relatively low
mean calcium concentrations (Table 29). Beftrla Lake's mean calcium concentration was
not significantly different from other whiteshell lakes sampled (Table 30).
4.55-8 Boron
Betula Lake had the highest boron concentration of a6 púg at the top of the core.
rWhite and Jessica Lakes followed closely with maximum concentrations of 44 and 42 p{g
respectively (Figwe 43,Table29).lncontrast, the lowest boron concenkations were <l Wgl
g in Marion and Shirley Lakes. Boron concentrations remained relatively constant with
small concentration increases at the top of the cores. White Lake was the only lake which
did not have a significantly lower mean boron concentration than Betula Lake.
4.56 Non-essential heavy metals
4.56-1 Arsenic
Hunt Lake had the highest arsenic concentration of 1S.8 ¡rglg (Table 29). Barren,
Brereton, Hunt and Star Lakes all had minimum concenûation values greater than 5.9 pgig.
Hunt and Star Lakes had the highest mean arsenic concenhations of 15.95 aîd,12.29 ¡rglgrespectively. Madge Lake had the lowest mean arsenic concentration at 2.7 pglg. Jessica
and Madge profiles showed an increase in arsenic concentations up the core. Florence
Lake also presented an increase in arsenic up the core with amid depth peak and subsequent
decrease (Figure M).In contrast, the Marion Lake profile showed a decrease in arsenic
concenffation up the core. The remaining lakes appeared to experience small fluctuations.
They remained relatively constant throughout the core. Barren, Hunt, and Sta¡ Lakes had
significantly higher mean arsenic concentrations than Beftrla Lake (Table 30).
127
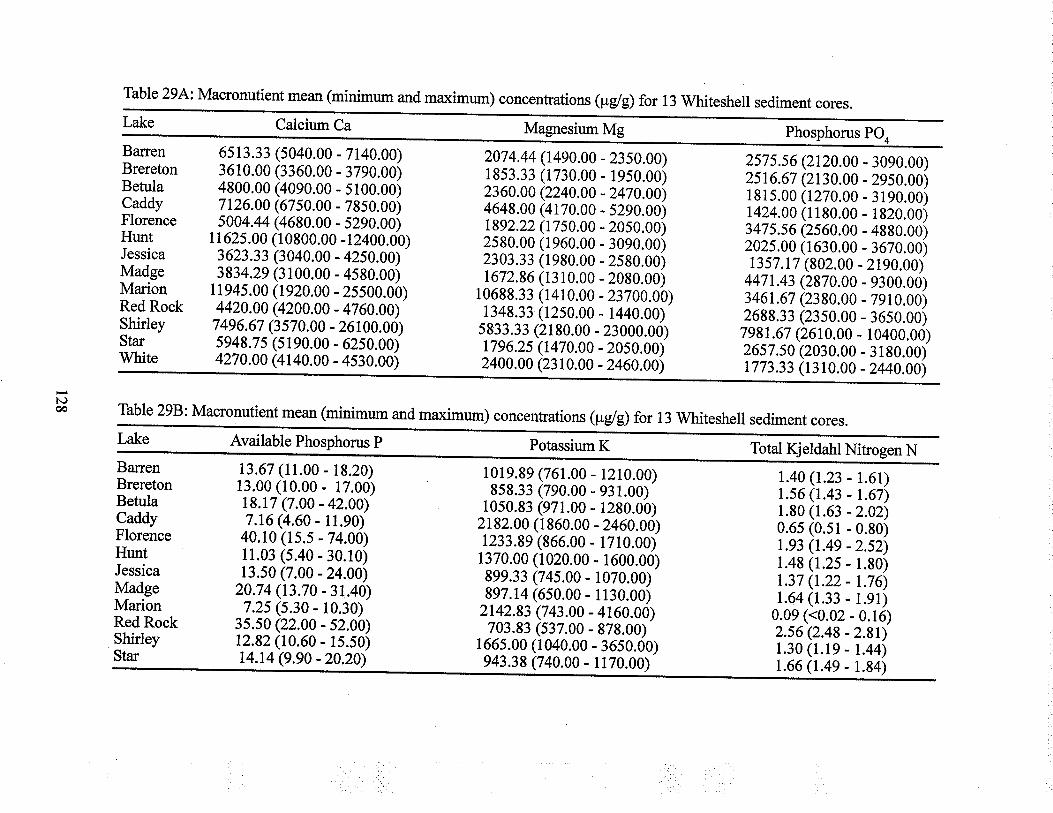
Table 294: Macronutient mean (minimum and maximum) concentrations (pglg) for 13 Whiteshell sediment cores.
Lake
Ba¡renBreretonBetulaCaddyFlorenceHuntJessicaMadgeMarionRed RockShirleyStarWhite
6s13.33 (s040.00 - 7140.00)3610.00 (3360.00 - 3790.00)4800.00 (4090.00 - 5100.00)7126.00 (67s0.00 - 78s0.00)s004.44 (4680.00 - s290.00)
t1625.00 (1 0800.00 - I 2400.00)3623.33 (3040.00 - 42s0.00)3834.2e (3100.00 - 4580.00)
1194s.00 (1920.00 - 2ss00.00)4420.00 (4200.00 - 4760.00)
7496.67 (3s70.00 - 26100.00)s948.7s (s190.00 - 62s0.00)4270.00 (4140.00 - 4530.00)
Calcium Ca
N)oo Table 298: Macronutient mean (minimum and maximum) concenhations (¡rglg) for 13 Whiteshell sediment cores.
Lake
Ba¡renBreretonBetulaCaddyFlorenceHuntJessicaMadgeMarionRed RockShirleyStar
2074.44 (1490.00 - 2350.00)18s3.33 (1730.00 - 1950.00)2360.00 (2240.00 - 247 0.00)4648.00 (4t70.00 - s290.00)t892.22 (17s0.00 - 2050.00)2s80.00 (1960.00 - 3090.00)2303.33 (1980.00 - 2s80.00)1672.86 (1310.00 - 2080.00)
10688.33 (1410.00 - 23700.00)1348.33 (12s0.00 - 1440.00)
5833.33 (2180.00 - 23000.00)1796.2s (1470.00 - 20s0.00)2400.00 (23 10.00 - 2460.00)
Magnesium Mg
Available Phosphorus P
t3.67 (11.00 - 18.20)13.00 (10.00 - 17.00)18.17 (7.00 - 42.00)7 .16 (4.60 - 11.90)
40.10 (ls.s - 74.00)11.03 (5.40 - 30.10)13.s0 (7.00 - 24.00)
20.74 (13.70 - 31.40)7.2s (s.30 - 10.30)
3s.s0 Q2.00 - s2.00)t2.82 (t0.60 - 15.50)t4.t4 (9.90 - 20.20)
2s7s.s6 Q120.00 - 3090.00)2s16.67 (2130.00 - 29s0.00)l81s.00 (t270.00 - 3I90.00)1424.00 (l180.00 - 1820.00)347s.s6 (2s60.00 - 48s0.00)202s.00 (1630.00 - 3670.00)r3s7.t7 (802.00 - 2190.00)
4471.43 (2870.00 - 9300.00)3461.67 (2380.00 - 7910.00)2688.33 (23s0.00 - 3650.00)
7981.67 (2610.00 - 10400.00)26s7.s0 (2030.00 - 3180.00)t773.33 (13 10.00 - 2440.00)
Phosphorus POo
1019.89 (761.00 - 1210.00)858.33 (790.00 - 931.00)
1050.83 (97t.00 - 1280.00)2182.00 (1 860.00 - 2460.00)t233.89 (866.00 - 1710.00)
1370.00 (1020.00 - 1600.00)899.33 (74s.00 - 1070.00)897.14 (6s0.00 - 1130.00)
2142.83 (743.00 - 4160.00)703.83 (s37.00 - 878.00)
1665.00 (1040.00 - 3650.00)943.38 (740.00 - 1170.00)
Potassium K Total (ieldahl Nitrogen N
1.40 (1.23 - 1.61)Ls6 (1.43 - 1.67)1.80 (1.63 -2.02)0.65 (0.s1 - 0.80)r.93 (t.49 -2.s2)t.48 (1.2s - 1.80)1.37 (r.22 - t.76)1.64 (1.33 - 1.el)
0.09 (<0.02 - 0.16)2.s6 (2.48 - 2.81)1.30 (1.19 - 1.44)r.66 (1.49 - 1.84)
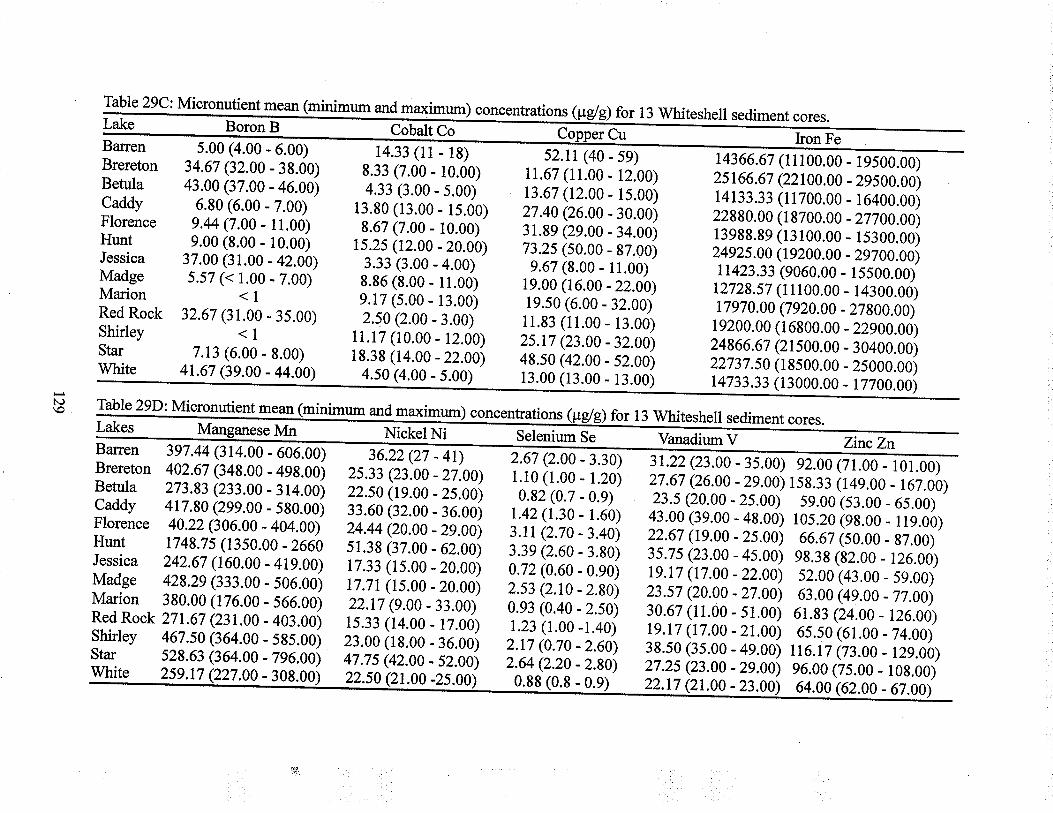
oncentrations (pglLake
BarrenBreretonBetulaCaddyFlorenceHuntJessicaMadgeMarionRed RockShirleyStarWhite
s.00 (4.00 - 6.00)34.67 (32.00 - 3s.00)43.00 (37.00 - 46.00)
6.80 (6.00 - 7.00)e.44 (7 .00 - I 1.00)9.00 (8.00 - 10.00)
37.00 (31.00 - 42.00)s.57 (< 1.00 - 7.00)
<132.67 (31.00 - 3s.00)
<17.13 (6.00 - 8.00)
4t.67 (39.00 - 44.00)
Boron B
tJ\o Table 29D: Micronutient mean
t4.33 (tl - ls)8.33 (7.00 - 10.00)4.33 (3.00 - 5.00)
13.80 (13.00 - 15.00)8.67 (7.00 - 10.00)
ts.2s (12.00 - 20.00)3.33 (3.00 - 4.00)8.86 (8.00 - 11.00)9.17 (s.00 - 13.00)2.s0 (2.00 - 3.00)
11.17 (10.00 - 12.00)18.38 (14.00 -22.00)
4.50 (4.00 - s.00)
Cobalt Co
Lakes
BarrenBreretonBetulaCaddyFlorenceHuntJessica
MadgeMarionRed RockShirleyStårWhite
397.44 (314.00 - 606.00)402.67 (348.00 - 49S.00)273.83 (233.00 - 314.00)4t7.80 Q99.00 - ss0.00)40.22 (306.00 - 404.00)t748.7s (13s0.00 -2660242.67 (160.00 - 41e.00)428.29 (333.00 - 506.00)380.00 (t76.00 - 566.00)27t.67 Q3t.00 - 403.00)467.s0 (364.00 - 585.00)528.63 Q64.00 - 796.00)
s2.n (40 - s9)rr.67 (r1.00 - 12.00)13.67 (12.00 - 15.00)27.40 (26.00 - 30.00)31.89 Q9.00 - 34.00)73.2s (s0.00 - s7.00)
e,67 (8.00 - 11.00)19.00 (16.00 -22.00)1e.50 (6.00 - 32.00)11.83 (11.00 - 13.00)2s.t7 (23.00 -32.00)48.50 (42.00 - s2.00)r3.00 (13.00 - 13.00)
Mnminimum and maximum) concentrations
for 13 Whiteshell sediment cores.
36.22 (27 - 41)2s.33 (23.00 -27.00)22.s0 (19.00 - 2s.00)33.60 (32.00 - 36.00)24.44 Q0.00 - 2e.00)sr.38 (37.00 - 62.00)t7.33 (1s.00 - 20.00)t7.71 (1s.00 - 20.00)22.17 (9.00 - 33.00)1s.33 (14.00 - 17.00)23.00 (18.00 - 36.00)47.7s (42.00 - s2.00)
Nickel Ni
259.t7
t4366.67 (11100.00 - 19s00.00)2s166.67 (22100.00 _ 29s00.00)t4133.33 (11700.00 _ 16400.00)22880.00 (1 8700.00 - 277 00.00)13988.89 (13100.00 - 1s300.00)2492s.00 (19200.00 - 29700.00)t1423.33 (9060.00 - 15s00.00)
r2728.s7 (11100.00 _ 14300.00)
.00 - 308.00
hon Fe
Selenium Se
2.67 (2.00 - 3.30)1.10 (1.00 - 1.20)0.82 (0.7 - 0.e)
1.42 (1.30 - 1.60)3.n (2.70 - 3.40)3.39 (2.60 - 3.80)0.72 (0.60 - 0.e0)2.s3 (2.t0 - 2.80)0.93 (0.40 - 2s0)1.23 (1.00 -1.40)2.r7 (0.70 - 2.60)2.64 (2.20 - 2.80)
17970.00 (7920.00 _ 27300.00)1 9200.00 (1 6800.00 - 22900.00)24866.67 (21s00.00 _ 30400.00)22737.s0 (18500.00 - 2s000.00)t4733.33 (13000.00 - 17700.00)
4é0 (21.00 -2s.00)
for 13 Whiteshell sediment cores.
Vanadium V3t.22 (23.00 - 3s.00) 92.00 (71.00 - ror¡ol27.67 (26.00 -29.00) 1s8.33 (14e.00 - 167.0'0)23.s Q0.00 - 25.00) se.00 (s3.00 _ 6s.00)43.00 (39.00 - 4s.00) t0s.20 (e8.00 _ 11e.0ô)22.67 (19.00 - 2s.00) 66.67 (s0.00 - s7.00)3s.7s Q3.00 - 45.00) 98.38 (32.00 _ t26.00)te.t7 (17.00 - 22.00) s2.00 (43.00 _ s9.00)23.s7 (20.00 - 27.00) 63.00 (4e.00 _ 77.00)30.67 (11.00 - 51.00) 61.83 (24,.00 - 126.00)t9.t7 (17.00 - 21.00) 6s.50 (61.00 - 74.00;38.s0 (3s.00 - 4e.00) n6.17 (73.00 - 12s.00)27.2s (23.00 -29.00) 96.00 (7s.00 - l0s.00i22.t7 (2t.00 - 73.00) 64.00 (62.00 - 67.00)0.88 (0.8 - 0.
Zinc Zn
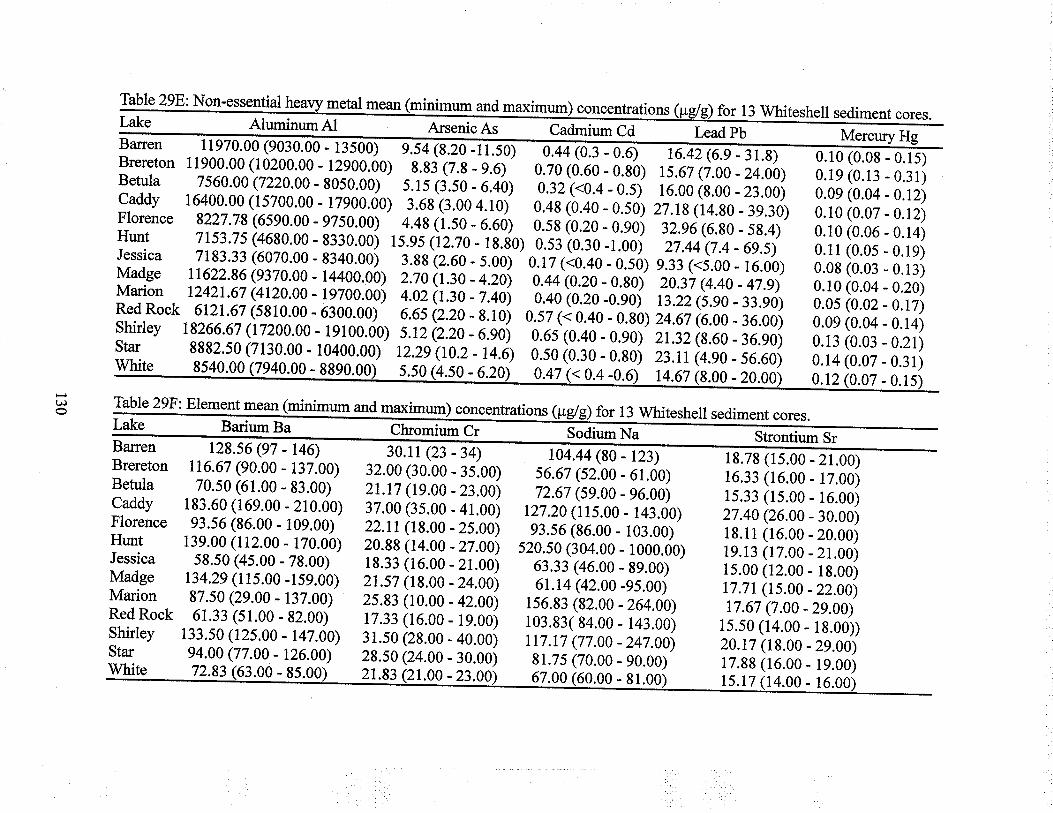
lalle 29E:Non-esseLtial þavY metal mean (minimum and maximum) concentrations (pglg) for 13 u/hiteshell sediment cores.Lake AluminumAl ArsenicAs Cadmium Cd
Brereton 11900'00 (10200.00 - 12900.001 s.gi (7.s -s.6) o.zo 1d.oo - o.s-o¡ rs.oz 1i.oo -24.00) 0.19 (0.r3 - 0.31)Betula 7s60.00 (7220.00 - s0s0.00) s.15 (¡.SO - O.+-Ol o.:z i.o.+ - o.sj ro.oo ia.oo - 23.00) 0.0e (0.04 - 0.12)caddv 16400'00 (1s700'00 - 17900.00) 3.68 (3.00 4.10) o.+a qò.+o - 0.s0) 27.ls(ì¿.so - 39.30) 0.10 (0.07 - 0.12)Florence 8227'78 (6s90.00 - e7s0.00) 4.48(ì.so - o.oól o.sa io.zo - o.soi sz.g6(6.80 - 5s.4) 0.10 (0.06 - 0.14)Hunt 7ts3'7s (4680.00 - s330.00) ts.os çizlo - ts.Bo) o.sr io.ro -t òq) 27.44'(7.4- 6e.s) 0.11 (0.0s - '.le)
Jessica 7183.33 (6070.00 - s340.00) :.asiz.oo - s.00) 0.171ì0.+O - 0.sÐ e.r:1.i.oo _ 16.00) 0.0s (0.03 _ 0.13)Madge t1622'86 (9370.00 - 14400.00) 2.70 ir.:o - +.zo¡ 0.44'(0.20- 0.s0) zo.zì (4.40 - 47.s) 0.r0 (0.04 - 0.20)Marion t242t'67 (4120'00 - tezoo.oo) +.oz it.ro - 7.40) o.+o io.zo -o.soj tz.zz li.so- 33.e0) 0.0s (0.02 - 0.17)Red Rock 6t2t.67 (ss10.00 - 6300.00) 6.6s iz.zo _ r.ro¡ o.sz 1ì 0.40 _ o.slo¡ z+.øt 1ì.oo - 36.00) 0.09 (0.04 - 0.14)shirlev t8266'67 (17200.00 - 19100.00) s.t2þ.zo - a.so¡ 0.6s (0.40 - 0.90) 2t.32ig.oo - 36.90) 0.13 (0.03 - 0.21)star 8882's0 (7130'00 - 10400.00) 12.2s'(t0.2 - 14.6) o.so io.:o - o.soj zt.tt i+.oo- s6.60) 0.14 (0.07- 0.31)rvhite 8540.00 (7940.00 _ *tno.oo
t, Table 29F: Element mean (minimum and ma¡<imumLake
Baren 12856 (97 - 146)Brereton tt6'67 (90.00 - 137.00) 32.001:o.oo - ¡s.oo) s6.67 tszìoó - 61.00) 16.33 (16.00 - 17.00)Betula 70's0 (61'00 - s3.00) 21.t7 iu.oo -23.00) 72.67 isg.oo - qo.ooi 1s.33 (1s.00 - 16.00)caddv 183'60 (169.00 - 210.00) 37.00 i:s.oo - 41.00) 127.201ìrs.oo - 143.00) 27.40 (26.00- 30.00)Florence 93's6 (86.00 - 109.00) zz.tt itt.oo - zs.oo) %.s6þo.oo - ro¡.oo) lB.rl (16.00 - 20.00)Hunt 139'00 (112'00 - 170.00) 20.88 (r+.oo -zt.ooj s20.s01ào+.oo - 1000.00) ts.r3 (17.00 - 21.00)Jessica s8'50 (4s.00 - 7s.00) ts.:r (to.oo - zr.oo¡ o¡.¡¡ q+o.oó - 89.00) 1s.00 (12.00 - 1s.00)Madge t34.2e (11s.00 -1se.00) 2t.s7 (ta.oo -z+.oo¡ 6t.t4i+z.no-es.ooj n.7t (ts.00 -22.00)Marion 87'50 (29.00 - 137.00) 2s.83 (to.oo - qz.oo) 1s6.83 tbz.oo - 264¡0) t7.6U7.00 - 2s.00)Red Rock 6t'33 (sl.00 - s2.00) tt.lz itø.00 - 19.00) 103.83( 84.00 - 143.00) 1s.50 (14.00 - 18.00)shirlev 133's0 (t2s.00 - 147.00) 31.50 (zs.oo - 40.00) n7.t7-(77.00 -247.00) 20.1u 1s.00 -29.00)star 94'00 (77 '00 - 126.00) 28.s0 þ+.oo - 30.00) 81.75 izo.oo - 90.00) 17.ss (16.00 - 1e.00)
o ioo.oo _ 8r.00) rs.17 (14.00 _ r6.00)
Barium Ba Chromium Cr
concentrations (
Sodium Na
for 13 Whiteshell sediment cores.
Strontium Sr
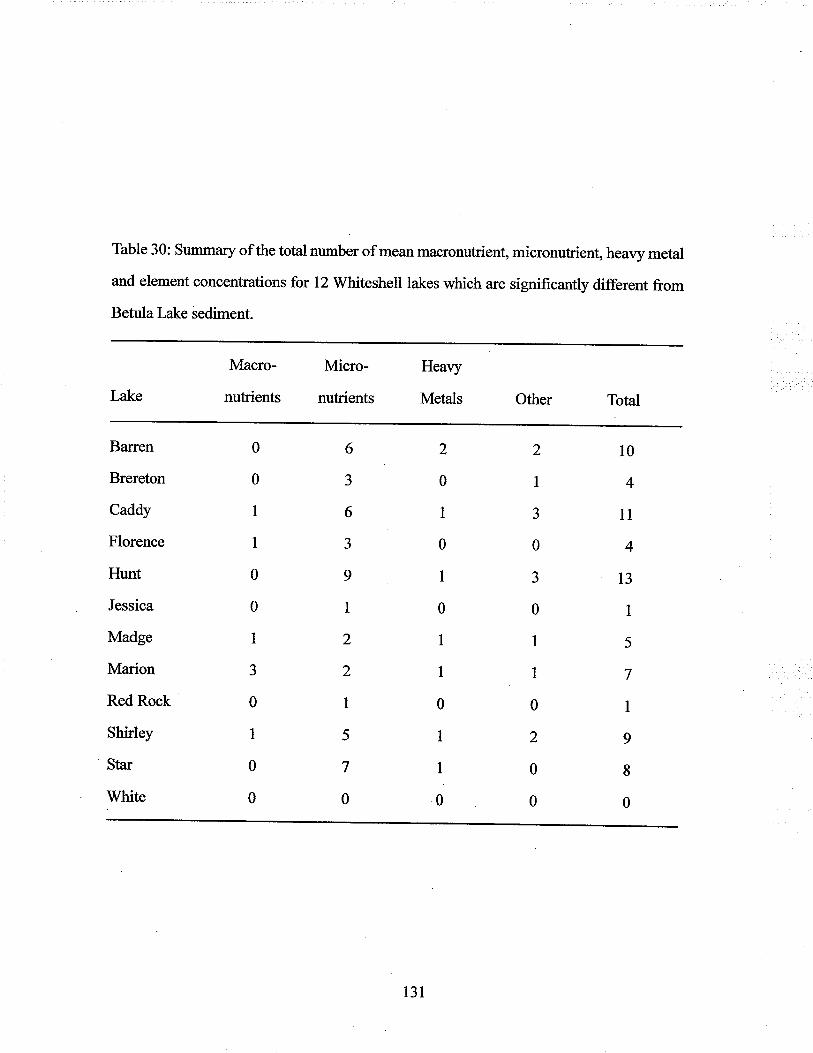
Table 30: Summary of the total number of mean macronutrient, micronutrient, heavy metal
and element concentrations for 12 Whiteshell lakes which are significantly different from
Betula Lake sediment-
Lake
Macro-
nutrients
Micro-
nutrients
Heavy
Metals Other Total
Baren
Brereton
Caddy
Florence
Hunt
Jessica
Madge
Marion
Red Rock
Shirley
Star
White
0
0
I
I
0
0
I
J
0
I
0
0
6
3
6
aJ
9
I
2
2
I
5
7
0
2
0
1
0
I
0
I
I
0
I
I
0
2
I
J
0
J
0
I
I
0
2
0
0
10
4
1l
4
t3
I
5
7
I
9
I0
131
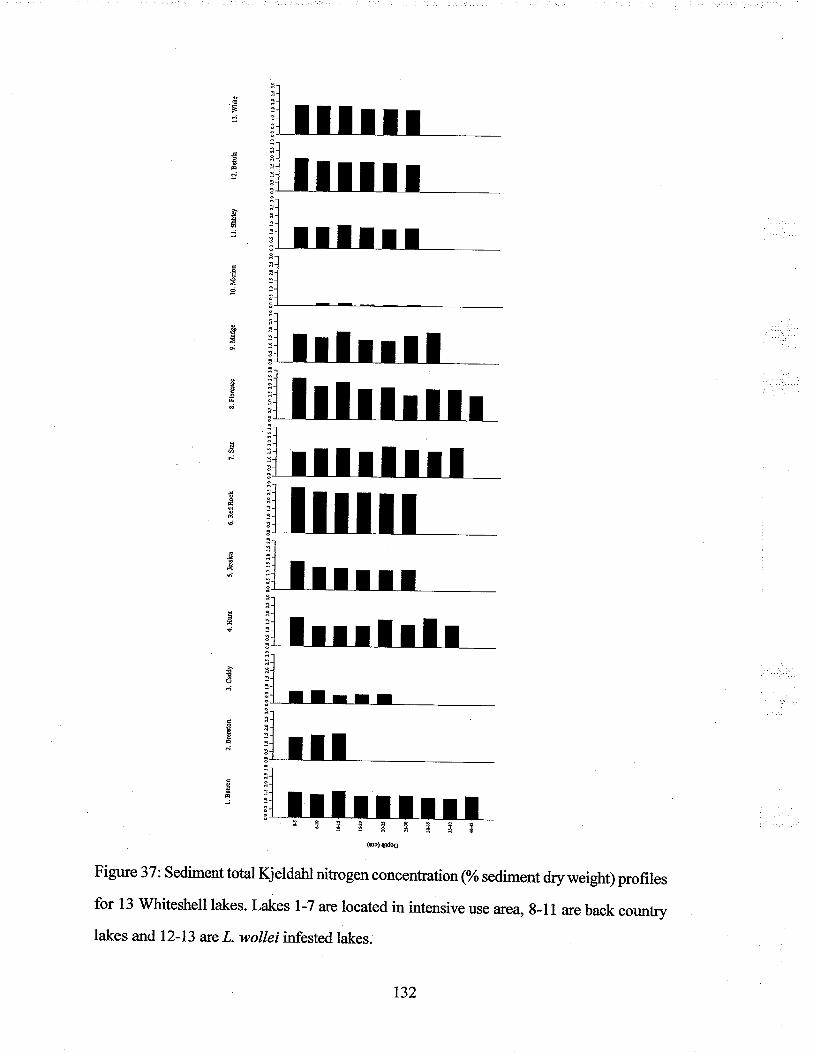
F
:
9
âE
od
cÉñ
ts
ø
EspSã¡i(rÞ) qd.q
Figrne 37: Sediment total Kjeldahl nitrogen concentrati on(%osediment dry weight) profiles
for 13 Whiteshell lakes. Lakes l-7 arclocated in intensive use area, 8-ll are back counûry
lakes and 12-13 arc L. wollei infested lakes.
t32
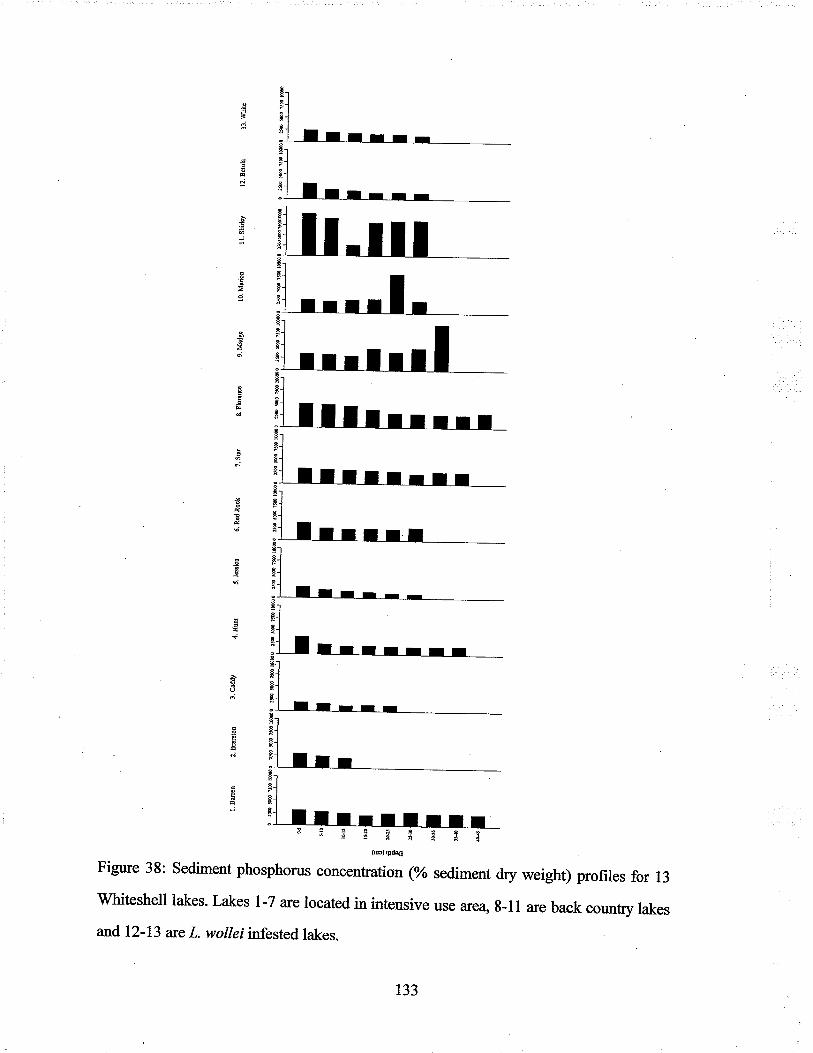
cI
a9
.9Øz
a
t
Þ
B å Ë ¡ F ã-å g-
Figwe 38: Sediment phosphorus concentrat ion (%o sediment dry weight) profiles for 13
Whiteshell lakes. Lakes l-7 arc located in intensive use axea, 8-ll are back county lakes
4
and,12-13 arc L. wollei infested lakes.
133
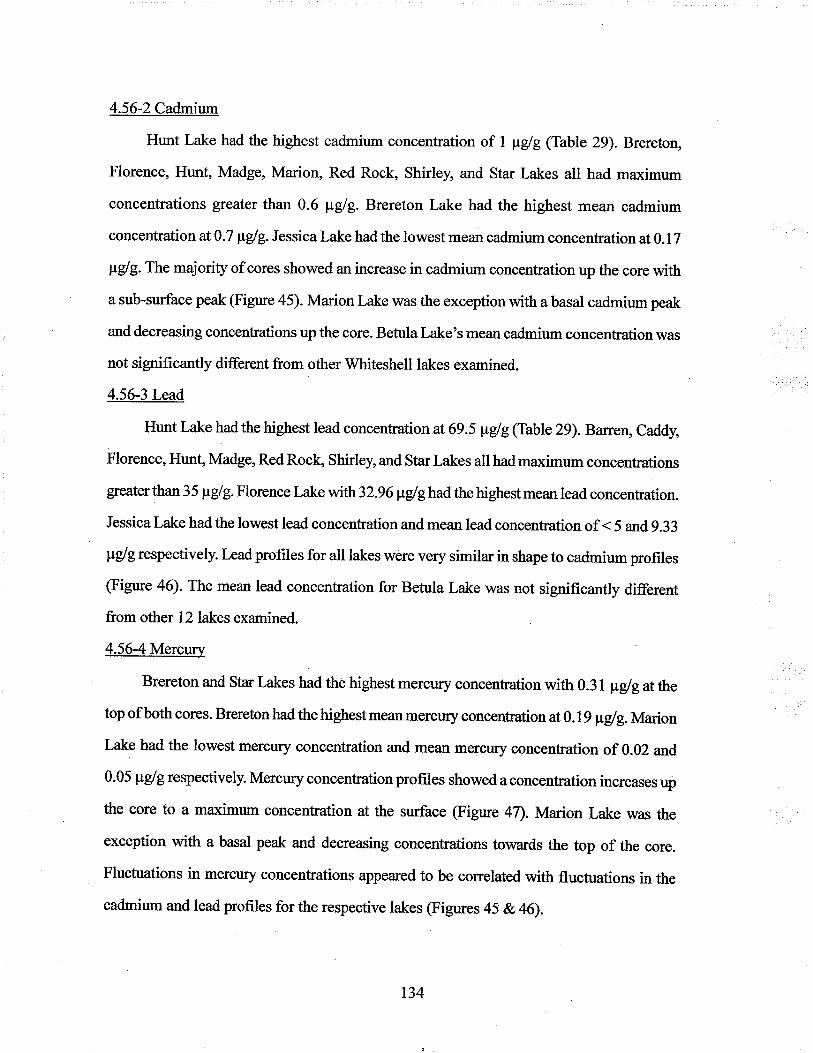
4.56-2 Cadmium
Hunt Lake had the highest cadmium concentration of 1 þüg (Table 29). Brereton,
Florence, Hunt, Madge, Marion, Red Rock, shirley, and Star Lakes all had maximum
concentrations greater than 0.6 ¡tglg. Brereton Lake had the highest mean cadmium
concentrationat}.T ¡rglg. Jessica Lake had the lowest mean cadmium concentration at 0.17
pglg.Themajority of cores showed an increase in cadmium concentration up the core with
a sub-surface peak (Figure 45). Marion Lake was the exception with a basal cadmium peak
and decreasing concentrations up the core. Betulalake's mean cadmium concentration was
not significantly different from other Whiteshell lakes examined.
4.56-3Lead
Hunt Lake had the highest lead concentration at 69.5 ¡tglg(Table 29). Banen, Caddy,
Florence, Hunt, Madge, Red Rock, Shirley, and Star Lakes all had maximum concentrations
greater than 35 pdg.Florence Lake with 32.g6pglg had the highest mean lead concentration.
Jessica Lake had the lowest lead concentration and mean lead concentration of < 5 and 9.33
pglg respectively. Lead profiles for all lakes were very similar in shape to cadmium profiles
(Figrre 46). The mean lead concentration for Betula Lake was not significantly different
from other 12 lakes examined.
4.56-4 Mercury
Brereton and Star Lakes had the highest mercury concentration with 0.31 pglgat the
top of both cores. Brereton had the highest mean mercury concentation at 0. 19 pglg. Marion
Lake had the lowest mercury concentration and mean mercury concentration of 0.02 and
0.05 pglg respectively. Mercury concentration profiles showed a concenhation increases uþ
the core to a maximum concentration at the surface (Figure 47). Marion Lake was the
exception with a basal peak and decreasing concentrations towards the top of the core.
Flucfuations in mercury concentrations appeared to be correlated with fluctuations in the
cadmium and lead profiles for the respective lakes (Figrnes 45 & 46).
134
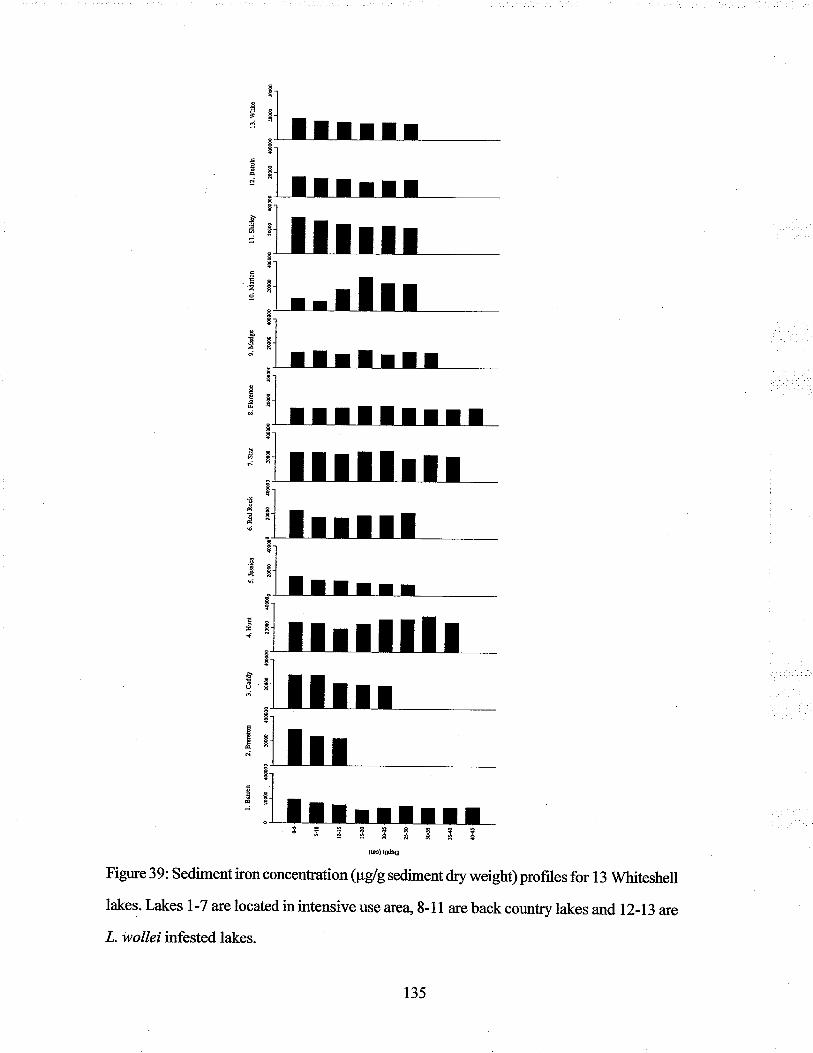
'É
É9
.9
E
ËÉ¿
3;ägËFågs(@) Udâc
Figure 39: Sediment iron concentration (pgig sediment dry weight) profiles for 13 Whiteshell
lakes. Lakes l-7 are located in intensive use area" 8-11 are back country lakes and 12-13 are
L. wollei infested lakes.
135
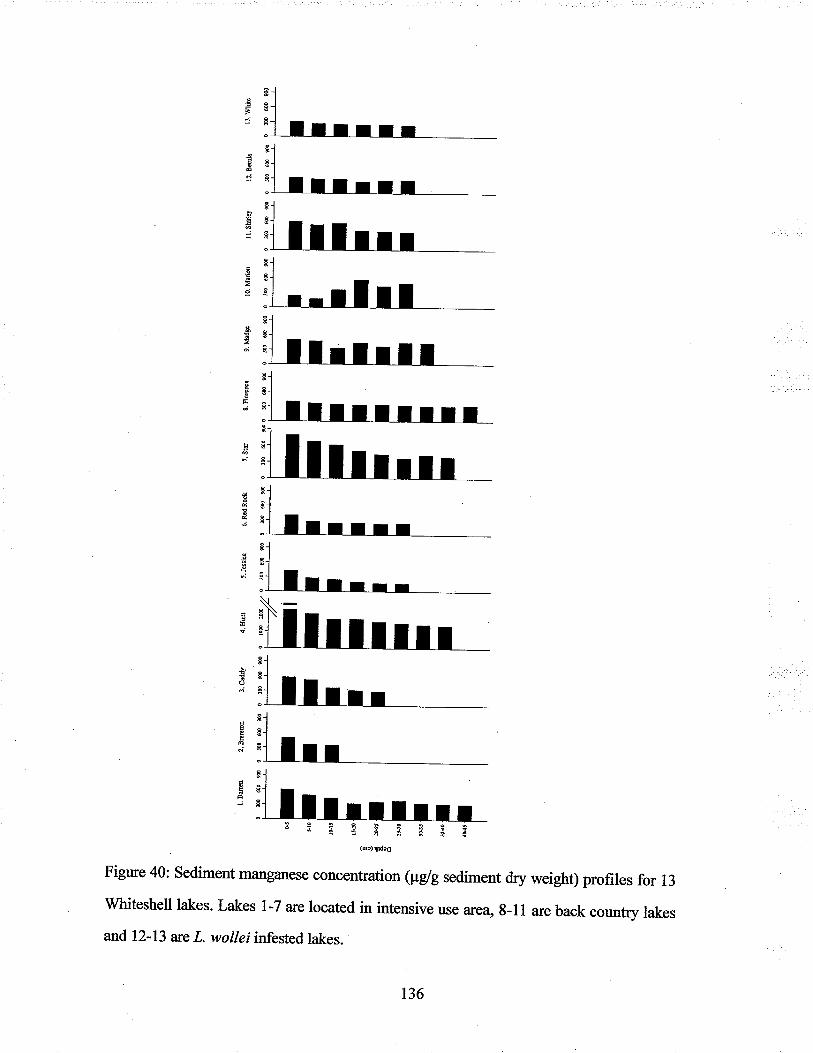
=gä.¡
i;ägsBå¡g(ur) qldão
Figure 40: Sediment manganese concentration (pg/g sediment dry weight) profiles for 13
Whiteshell lakes- Lakes l-7 are located in intensive use are4 8-ll are back counüy lakes
and 12-13 are L. wollei infested lakes-
-i8
=-d8
cz
a
-9e
a
E
e
a
o
a.i
EF
136
The concentration, range and signifrcance of other elements analyzed have been
summarized in Tables 304-30F. The concentration of these elements remained relatively
constant throughout the length of the core (Appendix ).
4.6 Results Summary
o L- wollei infestations \ryere found only in Betula and white Lakes.
o Infestations occuffed in areas under intense land use where resorts, cottages,
campgrounds, and boat launches were located.
o Infestation dry biomass ranged from29 - 642 glm2.
t L. wollei maintained oxygen production after 5 days in stagnant water conditions
under moderate and high temperature regimes.
o L. wolleiproduced 2 ¡tgor/mgDW after 2 daysof drying under moderate
temperatures.
o Brereton,Caddy, and Big Whiteshell Lakes were most similar to the infested lakes
based on intensity of land use parÍrmeters, whereas Brereton, Big Whiteshell and
Jessica were most similar to the infested lakes based on lake morphology.
r Jessica and Red Rock Lakes were the most similar to the infested lakes based on water
chemistyparameters, whereas Jessic4 Red Rock, Madge and Florence Lakes were the
most similar to the infested lakes based on sediment chemistry.
o All Whiteshell lakes examined maintain sedimentary organic matter concentrations at
30-50 % Dw with the exception of caddy, Marion and star Lakes.
o Hunt, Star and Marion sediment profiles showed corresponding fluctuations in water
and organic matter content.
o Hunt, Florence and Betula Lakes had the highest total chlorophyll concentations
under current sediment conditions. All lakes had the highest total chlorophyll
concentation at the top of the core with the exception of Red Rock Lake.
o Betul4 White and Madge Lake sediment cores 28-36 cm in length were dated using2r0Pb arrd r37cs and recorded over 150 years of depositional activity.
o Betula and White Lakes had substantially higher boron concentrations than the other
Whiteshell lakes examined.
137
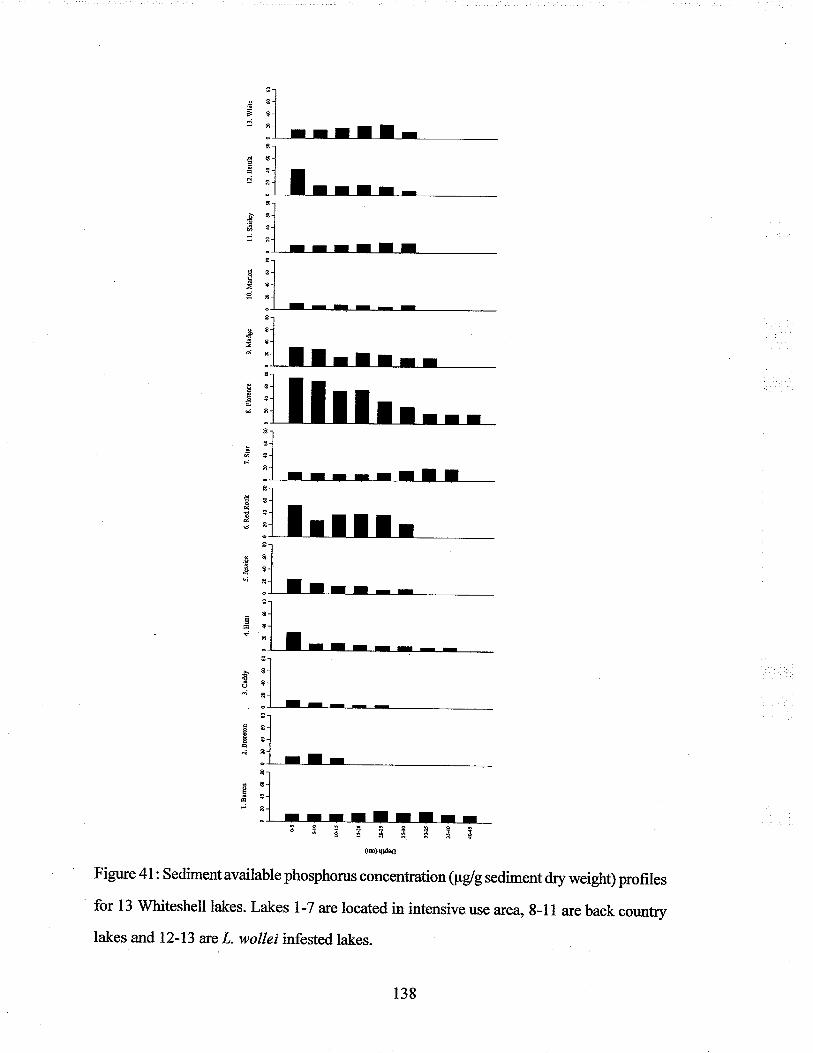
Figure 4l : Sediment available phosphorus concentation (pglg sediment dry weight) profiles
for 13 Whiteshell lakes. Lakes l-7 arc located in intensive use area, B-l l are back country
lakes and 12-13 are L- wollei infested lakes.
138
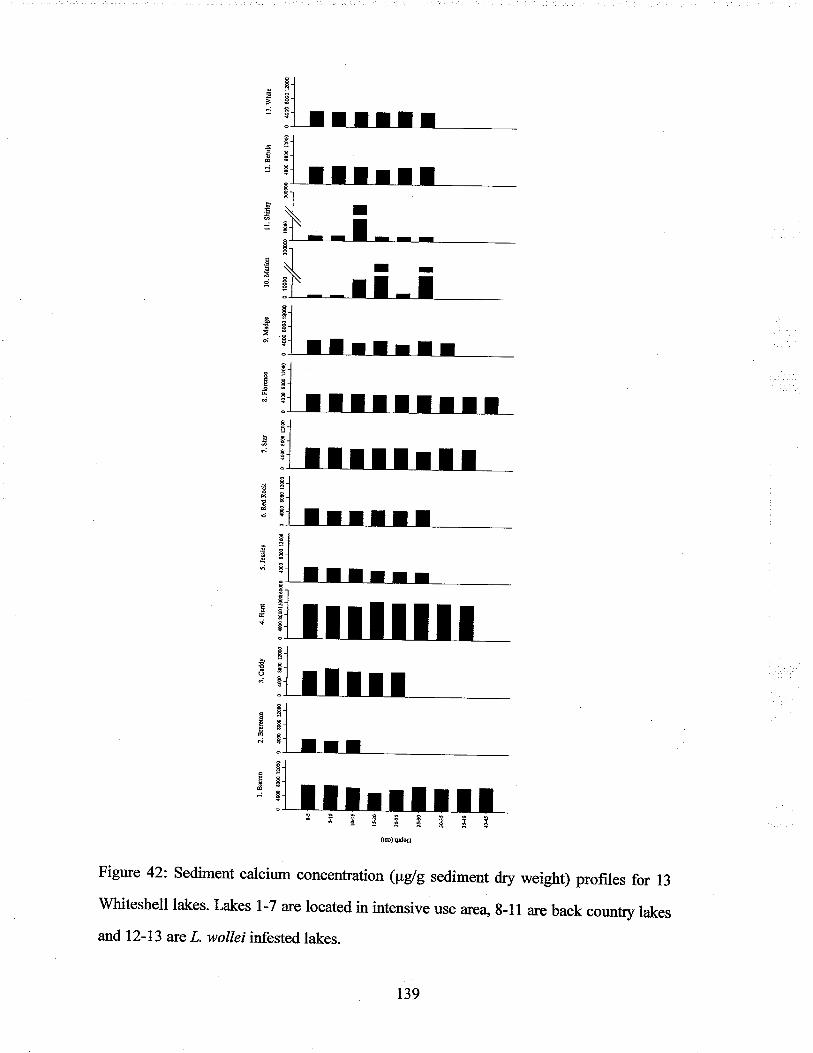
aÊ
8
a
a
\ag
B
Ie
aFsII
g!
a
Eg
a
a.!a.
a-
g_f
ã-
a-
Ë-B
Ê-l;lalcl-tH-l:lâtE.i
-lã.1-l9-t
;l.L
g
ñ
¿
E¿
s
t
Ud
ñ
EÉ
äîãgcåã¡¡
Figure 42: Sediment calcium concentration (pglg sediment dry weight) profiles for 13
Whiteshell lakes. Lakes l-7 arc located in intensive use area, B-ll are back counüy lakes
139
and 12-13 are L. wollei infested lakes.
Chapter 5: Discussion
5.1 ObjectÌve IThe primary objective of this study was to examine the distribution and inocula-
tion source of L, wollei in Whiteshell provincial park.
5.11 Lyngbya wolleí Distribution
The results suggest, it is unlikely that the Whiteshell River system was the source ofL' wolleitransportation and inoculation. L. wolleidistribution appeaxs to be unrelated to the
location of the Whiteshell River inflow and outflow sources. White Lake flows into Betula
Lake via the Whiteshell River. In White Lake the L. wollei infestation is located in the
nortlreastern bay adjacent to the Whiteshell River inflow. L. wolleiwas not found to occur
near the White Lake outflow. In Betula Lake, L. wollei was found across the lake from the
whiteshell River inflow and outflow in the south-western bay.
Infested basins in Betula and White Lakes had similar morphology and light regimes,
yet the Betula Lake infestation was substantially more established than the White Lake
infest¿tion. In Betula Lake L. wollei maintained a constant biomass and appeared to form a
continuous mat along the lake bottom from Block I to 4.The Betula Lake infestation had a
substantial impact on recreational users, with large amounts of L. wolleíbiomass observed
washed up on the beach and floating in the water. In contrast, the White Lake infestation
had a patchy distribution - L- wollei growth was extremely dense in select areas around the
campground but did not form a continuous mat over the entire bay. Along Blocks 1,2 and 3
L' wollei collected had formed small clumps mixed with a large amount of sediment. It isunknown whether these samples were retrieved from the sediment surface or from within
the sediment. The beach had minim al L. wotteigrowth and mats were not readily observed.
As a result, the patchy white Lake infestation had minimal impact on recreational users.
L' wolleinfestations may be the result ofanthropogenic activities. L. wollei distribution
was best correlated with intensity of land use. Behrla and White Lake shoreline development
140
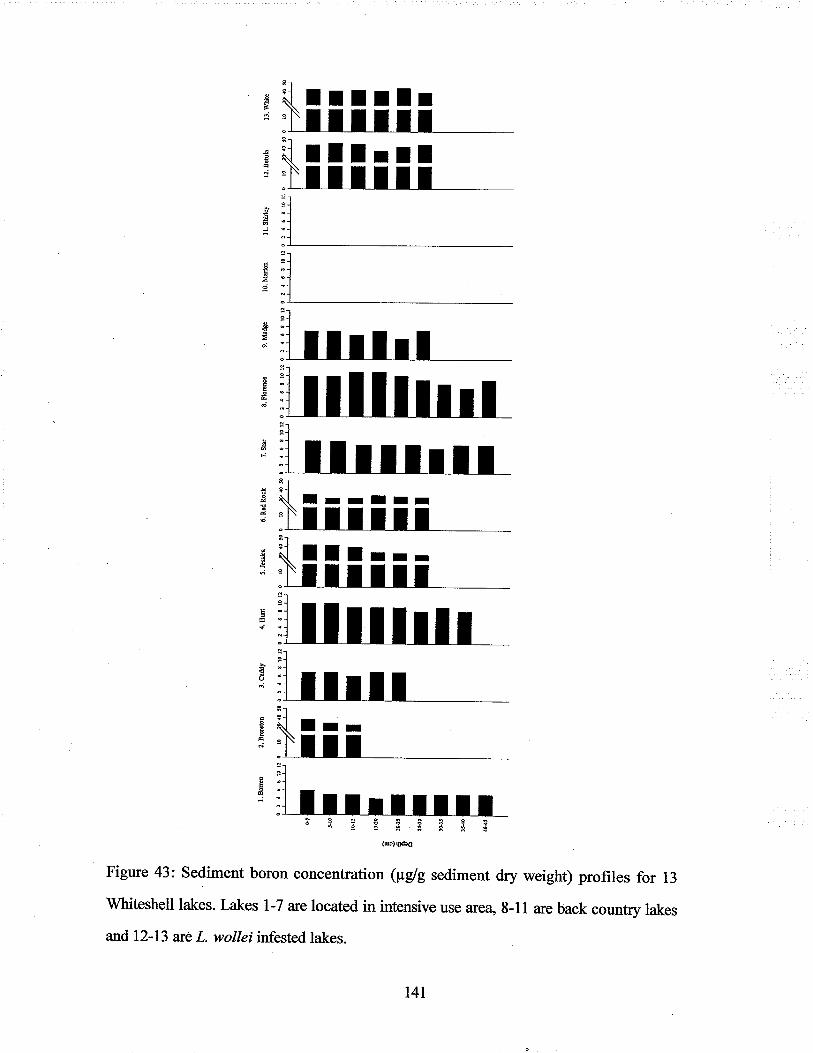
lrlrlrltllll=-f llrrl. llllll
'E
:oi
Eg
odi
bÉ
EF;
F
¡ES3Í3i¡(e) qrd.a
Figure 43: Sediment boron concentration (pg/g sediment dry weight) profiles for 13
Whiteshell lakes. Lakes l-7 are located in intensive use are4 8-11 are back country lakes
and l2-13 are L. wollei infested lakes.
t4t
IrrIIr
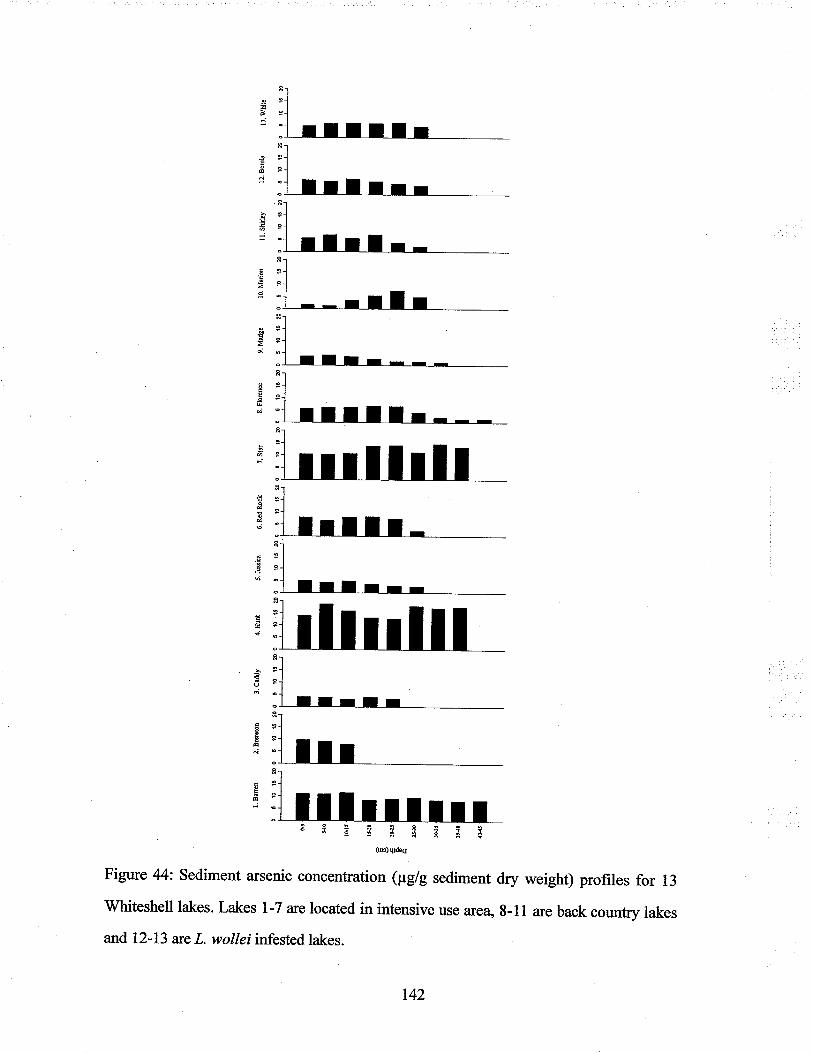
R
R.
a
5
øñ
j
b
q
zt
IFi
Éñ
tsq;
ä;äiä¡e:s(@) qtdcc
Figwe 44: Sediment arsenic concentration (pglg sediment dry weight) profiles for 13
Whiteshell lakes. Lakes l-7 are located in intensive use area, 8-l l are back counûy lakes
and 12-13 are L. wollei infested lakes.
t42
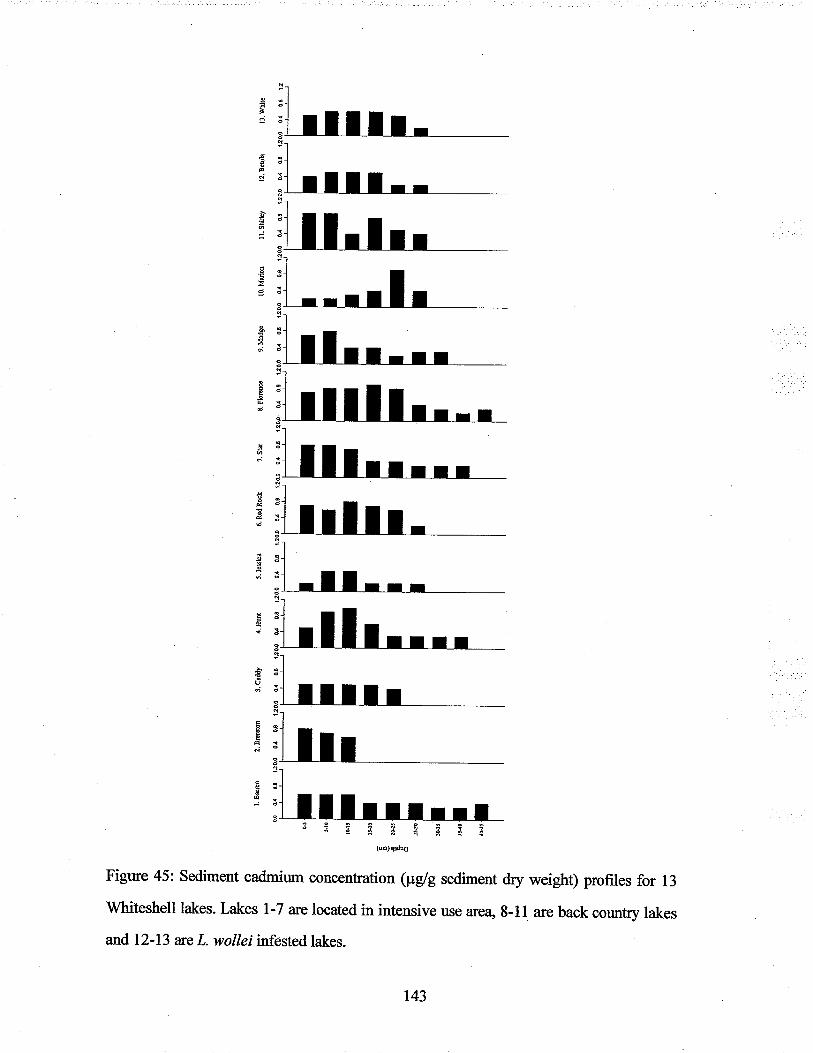
9.
::ld-l
"_l
:l=t
"_l
;l_t
"l
zÌ;
ôi
;
.9
à
9
å
9
z
di
Eõi
ãE
èT4TE¿¿(ú)
'Ddãt
Figure 45: Sediment cadmium concentration (pdg sediment dry weight) profiles for 13
Whiteshell lakes. Lakes 1-7 are located in intensive use area, 8-11 are back counüry lakes
and 12-13 are L. wollei infested lakes.
143
is confined to approximately 50 arñ 25 o/o of each lake respectively. The most populated
areas at both lakes occur around the campground, where infestations were most pronounced.
Facilities in these areas include: campground, private cottages, resorts, gas station, public
beach and convenience store or restaurant. The only two boat launches located on White
Lake are located in the infested campground area. In the early 1970s, the Betula Lake boat
launch was moved from the campground beach to the beach at Block 5. As a result, it may
be concluded that historically all recreational facilities were concentrated in areas which are
now infested by L. wollei.
5.12 Lyngbya wolleìInoculation Source
The proliferation of L. wollei infestations around historic boat launch sites suggests
recreational watercraft movement may have been the source of L. wotlleiinoculation. 'Water
skiing is one recreational activity which brings visitors from around the continent to Behrla
and White Lakes. Water skiing clubs promote water skiing and wakeboarding through shows,
tournaments and clinics. Historically boats have been moved between liakes for such events.
Stagnant and dried L. wollei filaments transported by recreational watercraft may
provide a viable inoculation source for the infestation of pristine lakes. Desiccation
experiments were conducted as a preliminary investigation of the potential survivability of
L. wollei for inter-lake transfer. Hypothesizing that L. wolleíwas hansferred between lakes
by recreational watercraft it was my intention to investigate the transportation site within or
on the watercraft. Dried teatrnents represented filaments transported on the hull of the
watercraft or within the bilge pump. The stagnant samples represented filaments transported
within the watercraft in small pools ofwater or live wells. The results from the Jgly experiment
suggested Z . wollei may remain viable under moderate drying temperatures and times. August
desiccation results presented in this study indicated, L. wolleiwas capable of survival and
remained highly productive after five days in minimal stagnant water under extreme light
and temperature conditions.
144
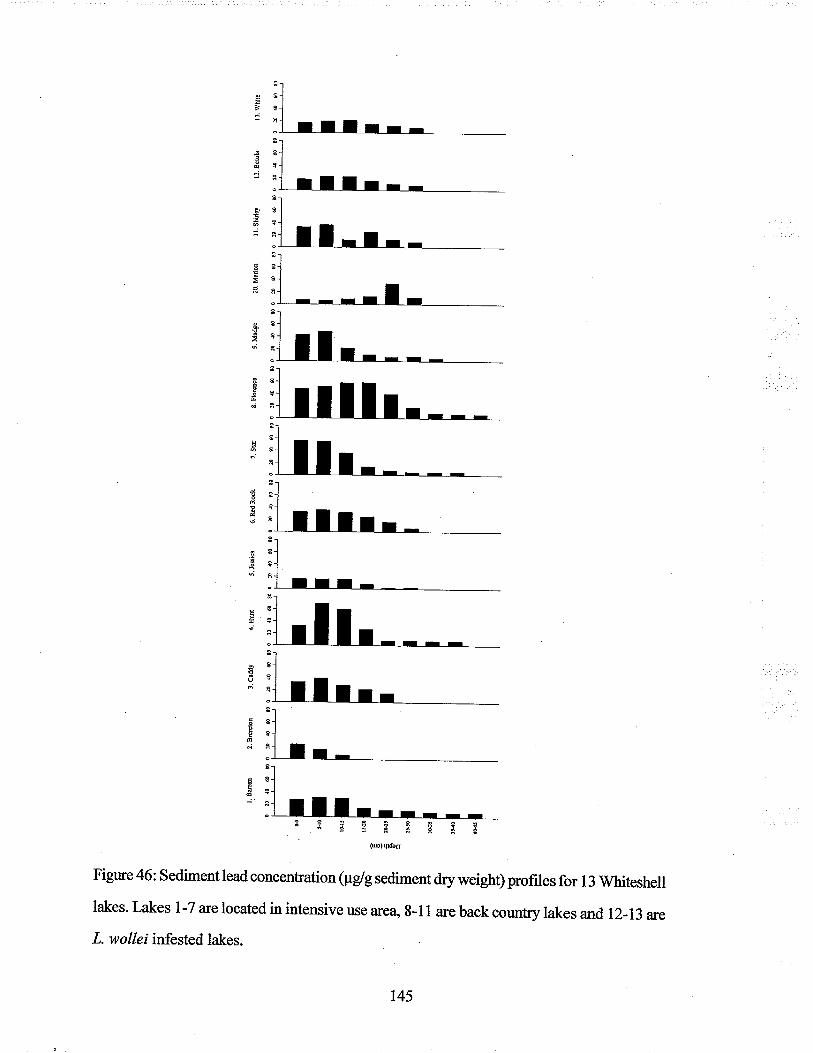
¿;Ëgcic¡ë(ur) rt¡dcû
Figure 46: Sediment lead concentration (prg/g sediment dry weight) profiles for 13 Whiteshell
lakes. Lakes l-7 nelocated in intensive use area, 8-11 are back counûy lakes and 12-13 arc
L. wollei infested lakes.
145
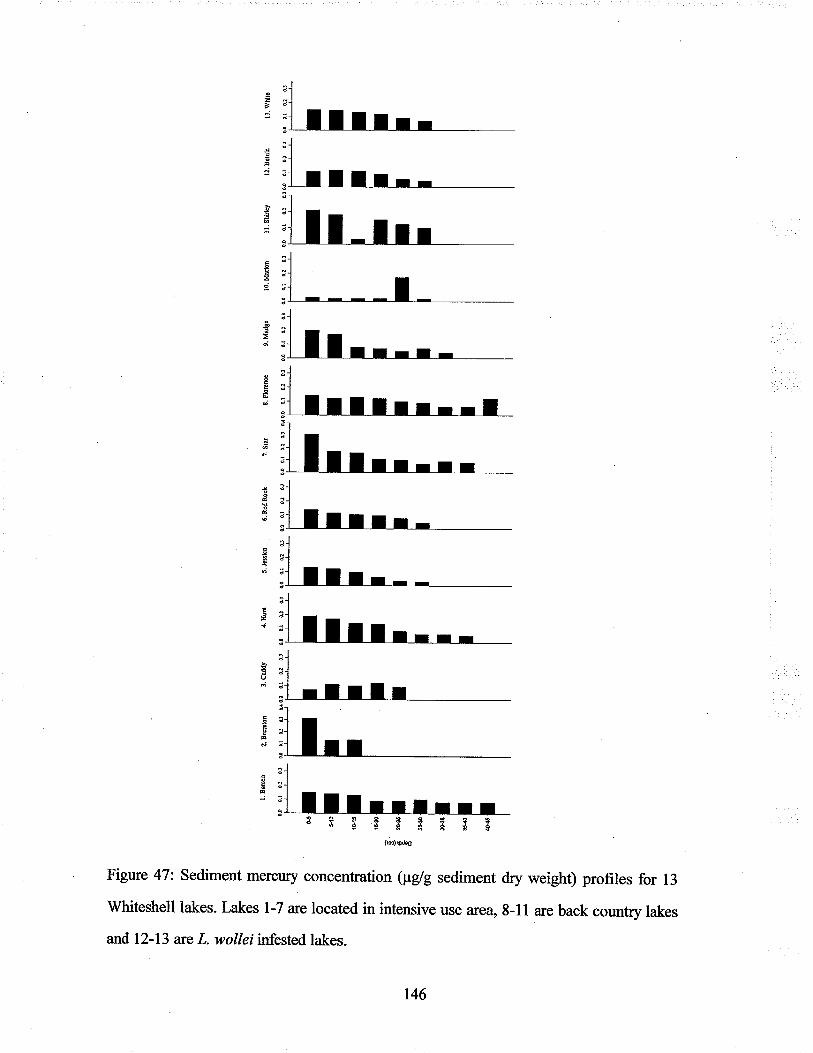
E
ã
ÊE
s
U
Fô¡
Ëø
489339óð¿¿¿À(@) Ðèo
Figure 47: Sediment mercury concentration (pg/g sediment dry weight) profiles for 13
Whiteshell lakes. Lakes l-7 arelocated in intensive use area" 8-11 are back country lakes
and 12-13 are L. wollei infested lakes.
146
5.13 Lyngbya wollei fnter-Lake Transfer
Recreational watercraft are moved between infested lakes and other waterbodies in
the Whiteshell and around the continent. This puts many lakes around the continent at risk
of L. wollei inoculation, which may lead to the infestation of other lakes. The Whiteshell
Resident Surveyresponses indicated cottagers movedboats betweenWhiteshell lakes primary
for fishing purposes. Whiteshell residents also indicated their visitors brought watercraft
from throughout Canada and the United States; examples included: Saskatchewan, Alberta,
Minnesota" North Dakota" Indiana" and Nebraska. As a result, Group 12 lakes were connected
directly or indirectly as a result of watercraft movement. Campground visitor journals
documented transient visitors moved watercraft between numerous Manitoba water bodies
and the infested Whiteshell lakes.
It is essential that users are aware of L. wollei infestations, and thoroughly wash
recreational watercraft when removed from infested lakes, to prevent the spread of L. wollei
to other pristine lakes. On Sunday July 27, 2003 an article appeared on the cover of the
Winnipeg Free Press with the headline 'Blackplague at lakes'. This incorrect and negative
publicity warned people about Z. wollei infestations occurring in Betula and White Lakes. I
\¡ras concemed this article would discotrage people from visiting the infested lakes. As a
result, on Saturday August 2,2003 a public boat launch survey was conducted at Betula,
White, Jessica and Caddy Lakes. The tunnels which connect Caddy Lake to North and
South Cross Lakes attract many transient boat visitors. As a result, it was expected that
Caddy Lake would have a highest number of boat launches, which was confirmed by our
survey. Contrary to my expectation Betula Lake experienced the second highest number of
boat latmches, followed by White and Jessica Lakes respectively. Recreational users did not
appear to be concerned about Z. wollei infestations. In fact, beach goers at White Lake were
heard joking about the black algae. As a result, the article did not appear to negatively
impact lake use, but rather heighten recreational user awareness, which was its intended
purpose.
147
5.2 Objective 2
The second objective of this study was to investigate why L. wollei infestations are
only known to occur in Betula and White Lakes. It may be hypothesized, that L. wolleihas
been intoduced into other Whiteshell lakes through the movement ofrecreational watercraft,
although currently, infestations have not been identified in other lakes. As a result, select
Whiteshell lakes were examined based on land use, morphology and water and sediment
chemistry parameters to determine if Betula and White Lakes exhibit unique characteristics
which distinguish them from other Whiteshell lakes. Ifthe infested lakes are not found to be
unique, shared characteristics may be used to identiff other lakes susceptible to L. wolleí
infest¿tions.
5.21 Land Use Intensity
Falcon, Caddy, Brereton and Big Whiteshell Lakes experienced the highest density of
transient visitors because of campground and resort facilities. Consequently, if L. wollei is
transported by watercraft these lakes would be the most susceptible to L. wollei tnoculation.'Watershed
land use intensity was investigated based on services and recreational facilities
located at twelve Whiteshell lakes in intensive use areas (Group 12). Intensity of land use
may be indicative of anthropogenic impact on the lake by the surrounding watershed.
Correspondence Analysis distinguished lake groups primarily based on the occurrence of
campgrounds, resorts and services. As a result, Betul4 White, Caddy, Brereton and Big
V/hiteshell Lakes were grouped together. All of these lakes have campgrounds, resorts, gas
stations and other services. Falcon Lake was an outlier as a result of its considerable
developmentandnumerousmodemfacilities. Theremaining lakes didnothave campground
facilities and minimal services. Jessica and Red Rock Lakes both have resorts which
distinguish them slightþ from the other low intensity lakes. As a result, based on intensity
of land use Falcor¡ Betulq White, Caddy, Brereton and Big Whiteshell Lakes would be
expected to have the highest water and sediment concentrations of anthropogenic pollutants
such as phosphorus and heavy metal contaminants. The objective of analyzing intensity of
t48
land use variables was to determine if water and sediment chemistry similarities could be
determined from land use par¿tmeters which are less expensive and easily collected. Water
and sediment chemistry were examined to address this hypothesis.
5.22 Lake Morpholory
A1l Whiteshell lakesmaypossesspotential habitatfor L.wollei growth. Lakes examined
had shallo\il areas and a mean photic depth greater than two and a half meters. Lake
morphology was examined to distinguish Group 12 based on suitable Z . wolleihabitat. PCA
analysis identified Jessica, Brereton and Big Whiteshell as most similar to the infested lakes
morphologically. These lakes have large surface areas, perimeter length and fetch. As a
result, Jessica, Brereton and Big Whiteshell Lakes possess a large amount of suitable I.wollei habitat. Star, Barren and Red Rock Lakes are smaller lakes and therefore have a
reduced amount of suitable L. wollei habitat. Falcon and Hunt Lakes are deep and
consequently, may have limited ideal L. wollei habitat in comparison to the other lakes.
Water and sediment chemistry parameters were investigated to further distinguish infested
and non-infested lakes.
5.23 Water Chemistry
'Water sanples collected lr.2002 from pelagic areas adequately represent lake water
chemisûry. Surface water samples were collected monthly from designated pelagic sarnpling
sites from May to August 2002.It was suggested that sarnpling at pelagic sites was
inappropriate when examining lakes for their capability to support Z. wollei growth in littoral
are¿ß. As a result, in 2003 four lakes: Betul4 White, Jessica and Caddy were selected for an
intensive water chemistry study. This study compared water chemistry parameters measured
at three sites on each lake. No significant difference was found between the sites within
eachlake withthe exception oftotalphosphorus atWhite Lake. Waterchemistryparameters
measured in boating lanes with high and low intensity oftaffic on Betula Lake also showed
no significant difference between water chemistry parameters. Consequently, Group 12 and
149
Group 13 were used to examine water chemistry similarities between the infested and non-
infested lakes.
Mean water chemisûry parameters may be inadequate for distinguishing Behrla and
White Lakes from other Whiteshell lakes. Seven lakes: Betula, White, Jessic4 Caddy, Barren,
Star and Red Rock Lakes all had similar mean water chemisty parameters. Consequently,
based on the measured parameters Betula and White Lakes were not unique from other
Whiteshell lakes examined. The remaining lakes: Brereton, Green, Big Whiteshell, Falcon
and Hunt Lakes were identified as outliers with unique chemical characteristics. As a result,
the number of lakes and water chemistry parameters measured were modified to determine
if unique water characteristics or lakes with the most similar water chemistry to the infested
lakes could be identified.
Behrl4 White and Jessica Lakes had the highest concentration ofphosphorus suggesting
these lakes experienced eutrophication by the surrounding watershed. Group 13 consisted
of lakes located in intensive, extensive and wilderness are¿ls. Based on July water chemistry
these lakes were compared to examine water chemisûy at the height of the recreational
season. Florence, Madge, Marion and Shirley Lakes are located in extensive and wilderness
are¿ts, designated here as 'backcounûy' lakes. It was hypothesized that backcounry lakes
with minimal anthropogenic disturbance would have lower phosphorus concentrations
distinguishing them from lakes in intensive use areasi. PCA results confirmed this hypothesis
segregating the backcountry lakes from Betul4 White and Jessicalakes at opposite ends of
the ordination. High concentrations of TPR TR TSS may be the result of anthropogenic
disturbance which may lead to increased lake productivity indicated by high chlorophyll a
concentations. Results ind.icated Betul4 White and Jessica Lakes may experience the highest
anthropogenic disturbance, indicatedbyhighconcentations ofTPR TP, TSS and chlorophyll
a. The backcounüy lakes had low concentations of these water chemistry parameters.
Four separate analyses maintained Befula and White Lakes have very similar water
chemistry. The water chemistry of the infested lakes was not unique, but rather enabled
r50
otherWhiteshell lakeswith similarwaterchemisûyto be identified. Water chemisûry analyses
suggest Jessica and Red Rock Lakes are consistently the most similar to the infested lakes.
Jessica Lake constantly had the most similar water chemistry to the infested lakes in all
analyses. Red Rock Lake was the next most similar chemically to the infested lakes. Sailing
and South Cross Lakes are backcountry lakes which were found to have similar water
chemisüy to the infested lakes. All of these lakes had high concentrations of TPP, TP and
TSS based on July water chemistry. Sailing and South Cross Lakes may be useful in future
research functioning as a control used for comparison with the infested lakes, to determine
if elevated TPR TP and TSS concentrations were caused naturally or resulted from
anthropo genic sources.
5.24 Sediment Chemistry
Sediment chemisS analyses provided unique results which ñlrthered ow understanding
of lake susceptibility to L. wolleiinfestations. Sedimentary element concentrations provide
insight into historic lake conditions and an overall indication of element availability for Lwollei growth. Sediment cores collected from thirteen Whiteshell lakes were used to compare
lakes based on current, mean and heavy metal sediment concentrations. PCA of current and
mean sediment concentrations produced similar lake groups. These analyses identified Betula"
White, Jessica, Red Rock, Florence and Madge Lakes to have similar sediment chemisüy.
Jessica and Red Rock Lakes were also identified by water chemistry analyses to be the most
similar chemically to the infested lakes. In contrast, the identification of backcounûy lakes
Florence and Madge contradict results of July water chemisty analyses which indicated
these lakes had substantially lower concenhations of phosphorus, total suspended solids
and chlorophyll a. Florence and Madge have the highest mean phosphorus sediment
concenfrations after Shirley Lake. As a result, element concentrations, additions and cycling
are all important aspects to consider when examining lake susceptibility to L- wolleí
infestations. Consequently, sediment core element concentrations were investigated as a
fimction of depth to determine if high element concentrations occ1¡ïed naturally or resulted
151
from anthropogenic disturbance. Based on current and mean sediment chemistry Jessic4
Red Rock, Florence and Madge Lakes have the most similar sediment chemistry to the
infested lakes. Consequently, concentration profile similarities and differences between
these lakes have been emphasized.
The Canadian Sediment Quality Guidelines for the Protection of Aquatic Life
summarizes the Interim Sediment Quality Guidelines (ISQG) and Probable Effect Levels
@EL) for arsenic, cadmium, lead and mercury. As a result, these heavy metals were examined
to assess anthropogenic contamination of Group 13. The results of these analyses were
unexpected. Based on land use parameters measured in this study Star Lake experienced
much lower land use intensity than Brereton Lake, but had the same high mercury
concentration. Florence Lake located in the backcountry with ostensibly minimal
anthropogenic impact had the highest lead concentrations. Nutrient and heavy metal
sedimentary concentrations as they relate to L. wollef infestations is discussed in frirther
detail in section 5.28 Sediment Geochemistry.
5.25 Multivariate StatÍstical AnalysÍs Summary
Land use parameters examined were unable to accurately distinguish lake groups
with similar water and sediment chemisûry. Land use intensity, lake morphology and water
chemisûy data was combined to examine Group 12 based on all measured parameters. The
lake gror.rps produced by CA were consistent with those produced by the land use intensity
parameters alone. In contrast, when all data matices for Group 13 were combined water
and sediment chemisûy pararneters were highly correlated and distinguished lakes into
groups consistent with trends observed in separate analyses. The Group 12 complete data
matrix identified Brereton, Caddy and Big Whiteshell as most similar to infested lakes. kr
contras! the complete data matrix for Group 13 identified Jessica and Red Rock as most
similar to the infested lakes based on water and sediment chemistry.
Contrary to my expectations backcountry lakes examined had the highest mean
sedimentaryphosphorus concentrations ofall lakes sampled. Ihypothesizedthatbackcountry
152
lakes would have low sediment concentrations of phosphorus and heavy metals associated
with anthropogenic disturbance. As a result, element concentration profiles were examined
in order to determine the source of high concentrations, focused on nutrients and heavy
metals indicative ofanthropogenic disturbance discussed in section 2.34LakeProductivity.
Sediment profiles provided evidence to determine if high concentrations were a natwal
phenomenon or the result of anthropogenic activity in the watershed. This knowledge was
then used to deterrnine if intensity of land use or water and sediment chemistry are better
indicators of anthropogenic influence on Whiteshell lakes.
5.26 Butk Sediment Composition: Loss on Ignition
Historically all lakes cored have experienced watershed disturbance such as fire and
cottage and road development, but sediment accumulation and composition appeared to
experienced only minor fluctuations in most cores examined. Substantial flucfuations in
sediment water content and organic matter profiles indicated Hunt, Marion and Star Lakes
experienced the greatest watershed disturbance effects of all thirteen lakes examined.
Watershed disturbance results in extensive sediment deposition into the lake, causing sediment
compaction. Ilregular sediment deposition may have resulted from natural and anthropogenic
watershed disturbances including: fire, logging, mining and subsequent erosional activity
increasing allochthonous input. With compaction events organic matter content is decreased
as a result of dilution due to increased sediment accumulation. Hunt, Marion and Star Lakes
have highly correlated water content and organic matter content profiles. These sediment
cores were not dated and without dates it is diffrcult to determine the cause of the sediment
compaction. Consequentl¡r, watershed history was used to identify disturbances which may
have resulted in sediment compaction.
Sediment deposition in Hunt, Marion and Star Lakes was substantially altered by
watershed disturbances which resulted in sediment compaction. Hunt and Marion Lakes
experienceda single disturbance eventindicatedby water and organic mattercontentprofiles.
Profiles showed a single large compaction event followed by resumed natural sediment
153
accumulation. Hunt Lake is a small lake with eight cottages. Disturbance by the construction
of these cottages may have resulted in increased sediment accumulation and subseq-uent
sediment compaction. Marion Lake has no cottiage development, but in l929,thenorth and
east sides of the lake were burned by a wildfrre. Sediment cores were collected from the
north-eastern corner of the lake. As a result, the compaction event observed may be the
result of the debris and erosion which may have resulted from the fire. Star Lake in contrast,
experienced a number of compaction events at the base of the core. Historically the Star
Lake watershed experienced a number of disturbances including a fire in 1929, mining from
1928-1945 and cottage construction which began in the early 1930s (Zimmerman 1991).
The distinct erosion events indicated by sediment compaction and reduced organic matter
content may be the result of these watershed activities.
Curent high levels ofproductivity in Whiteshell lakes may be correlated with increased
nutrient concentrations resulting ofcultural eutrophication. Hunt, Florence and Betulalakes
are currently the most productive lakes. Betula and White Lake had the most conspicuous
increase in total chlorophyll and therefore productivity at the top of the sediment core.
Organic matter content and total chlorophyll profiles were used to examine historic
productivity. Correlations were observed between flucfuations in organic matter and total
chlorophyll concentrations, which effectively describe autochthonous productivity.
Flucfuations observed throughout the sediment cores may be the result of watershed
disturbanceswhich impacted lakeproductivity. Total chlorophyll concentrations were greatest
- lf-øetop of the core for all lakes with the exception of Red Rock Lake. lncreases in growth
limiting nutrients such as phosphorus were observed in sediment concentrationprofiles and
may account for increased productivity.
5.27 Sediment Dating
The results presented in this study indicate lakes in intensive use areas experience
higher rates of sediment deposition than the backcounüy lake examined. Anthropogenic
disturbance may account for increased sediment deposition in Betula and White Lakes
154
resulting from catchment erosion or increased productivity due to nutrient enrichment.
Sediment cores collected from Betul4 White and Madge Lakes document the change in
sediment deposition since the 1800s. Sediment accumulation rates showed an increase over
time. Cr¡rentþ the sediment deposition rate in White Lake is more than two fold higher
than Madge Lake. Madge Lake is a backcounty lake with minimal anthropogenic impact.
Hypothesizing that Madge Lake may be used as a control, the substantial increase in sediment
deposition in White Lake may be the result ofcatchment erosion or increased autochthonous
productivity by increased nutrient addition. Loss on Ignition profiles would provide evidence
of erosion or increased productivity but analyses were conducted on separate cores taken
from different depositional areas of the lakes. As a result, the anthropogenic disturbance
which resulted in increased sediment deposition remains unknown. Organic matter and
sediment accumulation proflrles from Madge Lake remain relatively constant indicating
natural sedimentation rates, making it an effective control lake. Both White and Madge
sediment cores were collected from deposition areas indicated by a focus factor of one. The
Betula Lake core was not collected from a depositional areayet sedimentation rates were
only slightly below those found in White Lake. This may suggest that sedimentation rates
are actually higher in Betula Lake.
5.28 Sediment Geochemistry
It was the objective ofthis study to use the temporal scale represented by each sediment
core to differentiate natural eutrophic conditions from cultural eutrophication. Sediment
cores collected from Betula, White and Madge Lakes date back to the 1800s, recording
natural sediment conditions in these lakes prior to development. For the purposes of this
sfudy, select nutrient and heavy metals concentration profiles were used as cultural
eutrophication indicators. Without sediment dates, cultural euhophication may be indicated
by increasing nutrient and heavy metal concentration profiles up the core resulting from
anthropogenically induced enrichment.
155
5.29 Sediment Geochemistry: Nutrients & Heavy Metals
Increased TKN concentrations may be the result ofanthropogenic disturbance. Betula,
White, and Jessica Lakes experienced an increase in TKN up the core. Red Rock Lake had
high TKN concentrations throughout the core but the sediment was soft and flocculent and
the time line represented by this core is unknown. An associated time line would have
enabled me to determine ifthe base ofthe core represents naturally occurring concentrations
prior to anthropogenic development of the area. As a result, it cannot be determined if high
TKN concentrations in Red Rock Lake are the result of natural or anthropogenic nitrogen
enrichment. Betula and White Lakes had the third and fourth highest mean TKN
concentrations. These profiles show a small but distinct increase in TKN up the core. Sediment
dating provided a time line for these cores which presented conclusive evidence, that
concentrations at the base ofthe core represent natural concentrations.
Betula and White Lakes had relatively high sedimentary nitrogen concentrations, but
nitrogen limited environments may not restrict L. wollei growth. L. wollei was found to
exhibit nitrogenase activity under suitable environmental conditions (Philips et al. Igg2).
Cowell and Botts (Lgg|)concluded that nitrogen increases did notresult in increased colony
growth. Marion Lake was the only core with a mean TKN concentration significantly less
than the Betula Lake core. As a result, Marion Lake TKN concentrations may not limit Z.
wollei growth.
Comparison between sediment core element concentration profiles was limited to
main sedimentary trends. The sediment cores collected from Behrl4 White and Madge Lakes
were dated and found to record historic sediment deposition back to the 1800s. As a result,
samples from the base of the core represent natural sediment concentrations prior to
development. The remaining Whiteshell cores were not dated, lacking an associated
chronology. All Whiteshell lakes sampled with the exception of the wildemess lakes, showed
a distinct increase in phosphorus concentrations up the core. Increased phosphorus
concentrations may result from cultural eutrophication or natural sedimentary processes.
156
Backcountry lakes sampled provided a control group for comparison with intensive use
lakes to examine evidence of cultural eutrophication. Correlation between phosphorus, iron,
and manganese concentration profiles were investigated to assess probability of natural
sedimentary concentration of phosphorus up the core.
Backcounûy lakes had the highest sediment phosphorus concentrations. It was expected
these lakes would have relatively low phosphorus concentrations, resulting from minimat
anthropogenic impact. As a result, high phosphorus concentrations in these lakes are
hypothesized to result from natural sources or a specific watershed disturbance. It may be
hypothesized the unknown geology and history of these lakes may account for the high
phosphorus concentrations. The Shirley Lake sediment core showed high phosphorus
concentrations throughout the length of the core. Consequently, Shirtey Lake may have
unique geology which enriches sediment with phosphorus. In conhast, Madge and Marion
Lakes experienced one large basal phosphorus concentration peak with moderate
concentrations throughout the remainder of the core. These lakes may have experienced a
watershed disturbance such as fire which resulted in the basal concentration peak. The
wilderness lakes had large phosphorus concentrations but did not show an increasing trend
up the core as seen in the other lakes examined. As a result, cultural eutrophication may
accountfor increasingphosphorus concentrationprofiles observed insedimentcores collected
from intensive use lakes.
Increasing phosphorus concentration profiles may be the result ofnafural sedimentary
processes. The Whiteshell sediment cores examined showed phosphorus profiles were
correlated with either iron, manganese or both profiles, with the exception of Madge and
Marion Lakes. Phosphorus and associated iron and manganese concentration profiles increase
up the core. If iron and manganese concentrations remained constant for the length of the
core then increasing phosphorus concentration profiles would indicate increased phosphorus
inputs (Wetzel 2001). Instead profile correlations suggest phosphorus profiles were affected
by sediment redox conditions. As the sediment redox potential decreased the iron, manganese
t57
and phosphorus complexes moved up the core until immobilized by redox conditions (Wetzel
2001). This process may have concentrated phosphorus at the top of the core.
Lakes with available phosphorus concentration peaks located at the sediment surface
may support a more substantial L. wollei infestation if inoculated. The Betula L. wollei
infestation is considerably more developed than the White Lake infestations. The White
Lake L. wolleí tnfestation may be limited by sedimentary available phosphorus concentrations.
Available phosphorus concentration profiles separated Group 13 into two groups based on
surface or basal available phosphorus concentration peaks. Betula, Jessica and Red Rock
Lakes had maximum available phosphorus concentrations at the top of the sediment cores.
In conûast, White Lake experienced a decreasing trend with the highest available phosphorus
concentration located towards the base of the sediment core. Currently, Betula and White
Lakes differ in their available phosphorus concentrations while both suppofüng L- wollei
infestations . L. wollei maintains a higher density and distribution in Betula Lake. As a result,
increased available phosphorus concentrations in surface sediment resulting from natural or
antlrropogenic sources may enhance L. wolleiproliferation. Currently, Florence, Red Rock,
Madge and Betula Lakes have the highest mean available phosphorus concentrations
respectively.
Utilization of high boron concentrations may have facilitated, L. wolleiadaptation to
low calcium environments. The results of this study indicate lakes vyith ¿. wollei infe$ations
and lakes identified as most susceptible: Betula, White, Jessica, Red Rock, Florence and
Madge all had relatively low calcium concentrations. Based on the infestation density in
Betula and White Lakes it may be concluded that L. wollei has adapted to environments
with low calcium concentrations. Boron is required to maintain growth under calcium limiting
conditions @onilla et al. 1995). Naturally high boron concentrations in these lakes may
compensate for low calcium concentrations enabling the proliferation of Z. wollei. Boron
concentrations in Betula and White Lakes were the highest of all Whiteshell lakes examined.
Jessicaand RedRock Lakeshadthethird and fifthhighestboron concentrations respectively.
1s8
Barren, Hunt and Star Lakes may be located in areas with naturally high arsenic
concentrations. The Canadian Sediment Quality Guidelines for the Protection of Aquatic
Life summanzes the ISQG and PEL for heavy metals. The ISQG for arsenic is 5.9 ¡rglg,
with an associated 5 % incidence of adverse biological affects. All lakes with the exception
of Caddy, Jessica and Madge had concentrations greater than 5.9 ¡rglg. The PELis 17 pglg
with an associated 25 %oincidence of adverse biological affects. As a result, the majority of
TVhiteshell lakes sampled may have a 25 % incidence of adverse biological affects as a
result of arsenic concentrations greater thart 17 pdg. kr most lakes arsenic concentrations
experienced only minor profile fluctuations. Betula Lake had significantly lower arsenic
concentrations than Barren, Hunt and Star Lakes, which maintained high arsenic
concentrations throughout the length of the core. As a result, natural arsenic concentrations
may be higher in these areas. Small increases and fluctuations observed in the other profiles
may be the result of anthropogenic activities.
Jessica Lake had the lowest mean cadmium concentration, while Florence, Madge
and Red Rock Lakes had relatively high cadmium concentrations. The ISQG for cadmium
is 0.6 pdgaîdthe PEL is 3.5 ¡rg/g. The greatest cadmium concentration found in all cores
was 1 pglgll¡-Hunt Lake. As a result, all lakes had cadmium concentrations less than the
PEL. In most Whiteshell sediment cores cadmium showed a t¡rpical increasing trend up the
core to a subsurface peak. Lead and mercury concentration profiles had a similar shape.
Leaded gasoline may be the primary source of lead contamination in Whiteshell lakes.
The removal of lead additives from gasoline has protected lake water and sediment quality.
Lead concentrations were low at the base of all cores indicating natural concenûations.
Typically lead concentrations increased up the core experienced a subsurface peak and
subsequently decreased to the top of the core. Lead concentration peaks were correlated
with the late 1970s in dated sediment cores. As a result, it may be concluded the removal of
lead additives from gasoline resulted in current decreasing lead concentrations. The ISeG
for lead is 35 ¡rglg and the PEL is 9l pg/g. Eight Whiteshell lakes had lead concentrations
159
greater than the ISQG The greatest lead concentration was 69.5 ¡tglgin Hunt Lake. Rown
and Kalff (1993) found a positive relationship between site depth and sediment metal
concentrations. Hunt Lake is small and deep. Consequently, sediment focusing may acco'nt
for the high lead concentrations found in this lake. Florence Lake had the highest mean lead
concentration. Based on the Madge Lake sediment dates this peak may be correlated to with
the Artic Ice fuel division logging camp activity in the 1920s. The lead concentration peak
at the base of Marion Lake may be the result ofa fire disturbance which resulted in erosional
deposition of lead into the lake from the surrounding watershed. As a result, anthropogenic
activþ in the watershed may further contribute to lead contamination.
. Mercury contamination may have resulted from anthropogenic activity in the
surrounding watershed. Mercury atmospheric deposition is hypothesized to be relatively
consistent throughout the Whiteshell. Mercury concentration profiles showed an increasing
trend up the length of each core with relatively low presumably natural concentrations at the
base. Star and Brereton Lakes under current sediment conditions had 0.3 t pglg mercury. Atthis concentration Star and Brereton Lakes have substantially higher current mercury
concentrations than other'Whiteshell lakes investigated. Discarded electrical components at
municipal dumps and sanitary landfill sites are a primary source groundwater contaminant
by mercury (CCME lgS7).At Star Lake a brush dump was located 600 meters south of the
Star Lake cabin area. This dump operated for over 15 years as a waste disposal site for
brush, b.tllry met¿llic and other dry waste (K¿rp lgST).The dump was located on sand and
silt deposit 3 - 6 meters in depth and groundwater flowed northerþ towards the lake. Karp
(19S7) concluded the waste disposal grounds contaminated groundwater. Test drilling was
recommended to determine the extent of contamination. Until sometime in the l9g0s raw
garbage was also disposed at this site. A waste disposal site at Brereton Lake was closed
prior to 1977 (Katp 1987). The type of waste disposed at this site is unknown. As a result,
waste disposal sites at these lakes may have contributed to mercury contamination observed
in sediment profiles. Small scale gold miners used mercury to extact gold from sand (Kishe
160
and Machiwa2003). Star Lake had a small gold mine which operated from l92g -lg45.It
was located close to the brush dtmp site and may have further contributed to groundwater
and consequently sediment contamination.
Itmay be suggestedthat waterand sediment chemistry best identifrlakes with similar
environmental conditions. Betula Lake mean sediment concentrations were compared to
other Whiteshell lakes examined. Betula Lake was chosen as a result of favorable growing
conditions based on L. wollei abundance and distribution in the lake. ANOVA and Tukey-
Kramer significance tests identified lakes with element concentrations significantly different
from Betula Lake (Table 31). When results were combined White, Jessica, Red Rock,
Florence, and Madge Lakes had the most similar mean sediment chemistry to Betula Lake
respectively. These results are consistent with PCA of water and sediment dat4 which
identified the same lakes as most similar to the infested lakes. The parameters used to examine
current intensity ofland use did not accurateþ identifr lakes with similar water and sediment
chemistry based on intensity of land use.
5.3 comparíson between whiteshell and America L.wollei Infestatiotns
L- wollei may be considered a competitive invasive exotic species in Whiteshell
Provincial Park. Z. wollei infested nearshore areas to a depth of 2.5 meters in Betula and
White Lakes. In the sunmer, portions ofthe mats were buoyed to the surface, which resulted
in the vertically shatified L. wollei mats. This was consistent with L. wolleíhabitatdescriptions
from the southeastern United States. Whiteshell lakes had similar L. wolleitotal standing
crop biomass to lake examined inthe United States. Standing crop biomass determined for
Betula and White Lakes were consistent with quantities reported from lakes and reservoirs
throughout South Carolin4 Georgia and Alabama were this invasive species primarily occurs
(Speziale etal.l99l)
Four water chemisty variables: alkalinity, conductivity, ammonia and total phosphorus,
accotrnt for 57.8 %o of the variability in L. wollei biomass (Cowell and Botts lgg4).It was
hypothesized these water chemisüy parameters would distinguish Betula and White Lakes
161
from other Whiteshell lakes. When all twelve lakes sampled in Z}}2werecompared Bettila
Lake was differentiated from White Lake by lower ammonia concentrations. Lower ammonia
concentrations may provide better L. wollei growing conditions and account for the greater
L. wollei distribution in Betula Lake. Four other lakes: Jessic4 Caddy, Baren and Big
rühiteshell were identified as similar to Betula and White based on these water chemisüry
parameters. In contrast, PCA identified Jessica, Red Rock, Florence and Madge Lakes as
most similar to the infested lakes. L. wollei acquires nutrients from both the water column
and sediment. As a result, it is hypothesized PCAresults based on both water and sediment
chemistry may provide a more accurate indication of lakes with similar chemistry to Betula
and White Lakes and therefore suitable L. wollei habitat.
It is likely that the Whiteshell strain of L. wolleihas effectiveþ adapted to this Manitoba
environment through physiological modification. One example presented in this study was
high sedimentary boron concentrations in infested lakes thought to compensate for low
calcium concentrations. As a result, the strain of L. wollei which occurs in the Whiteshell
may have unique physiological adaptation from strains which typically occur in marl lakes
in the south-eastem USA.
Whiteshell managers should proceed based on current management knowledge and
work to identify emergent macrophytes native to the Whiteshell which may be used to limit
L. wollei growth in infested areas. Numerous management techniques have been examined
in the United States (see section 2.25 Management Techniques). The distribution and
morphology of L. woltèíresulted inthe failure ofmostmanagementtechniques. The benthic
and vertical distribution of L. wollei mats limited the effectiveness ofherbicide applications.
The long filaments and dense mats prohibit most heterotrophs from consuming L. wollei tn
significant quantities. Whiteshell infestations pose the same problems forthe application of
management strategies. In the United States emergent macrophytes have proven to be the
most effective management technique for reducing L. wollei biomass.
162
Chapter 6: Conclusions
The distribution andtransportation of L. wolleiwas best correlated with anthropogenic
activity. Historically, all recreational facilities at Betula and White Lakes were concentrated
in areas which are now infested. Betula and White Lakes are the only Whiteshell lakes with
waterskiing clubs. These clubs have been attracting visitors from around the continent for
more than half a century. Preliminary desiccation experiments suggest stagnant and dried Z.
wollei filaments transported by recreational watercrafr may provide a viable inoculation
source for the infestation of pristine lakes. Whiteshell residential and campground surveys
indicated that recreational watercraft are moved between infested lakes and other lakes in
the Whiteshell and around the continent. As a result, it is essential that Whiteshell users are
aware of L. wollei infestations and thoroughly wash recreational watercraft when removed
from infested lakes to prevent the spread of L. wollei to other pristine lakes.
The tuansportation ofrecreational watercraft within the Whiteshell suggests other lakes
may have been inoculated with L. wollei without currently possessing infestations. As a
result, land use intensity, lake morphology, water and sediment chemisûy parameters were
investigated to determine if Betula and White Lakes had a unique characteristic which enabled
the proliferation of Z. wollei. Betula and White Lake were consistently very similar based'
on the parameters investigated but were not fotrnd to be wholly unique from other Whiteshell
lakes. As a result, these analyses lryere used to identift Whiteshell lakes most susceptible to
L. wolleiinoculation and infestation. Land use intensity parameters identified Falcon, Caddy,
Brereton and Big Whiteshell Lakes as most susceptible to L. wolleiinoculation. These lakes
have many recreational facilities and services which athact users from within the Whiteshell
and around the continent. In contras! water and sediment chemistry parameters identified
Jessic4 Red Rock, Florence and Madge Lakes to be the most similar to the infested lakes
chemically. Consequently, it may be suggested these lakes would experience the greatest
biomass and adverse affects of L. wollei infestations. Florence and Madge Lakes are
t63
backcountry lakes and as such have a reduced risk ofl,. wollei inoculations and subsequent
infestations. Future efforts should be focused on protecting Jessica, Red Rock and other
lakes in the intensive use zones from Z. wollei inoculation.
The Whiteshell strain o f L. wollei mayhave unique physiological adaptations. American
research indicated high calcium concentrations were crucial for the proliferation of L. wollei.
In contast, the infested Whiteshell lakes maintained low calcium concentrations. As a result,
it is suspected L. wollef uses high boron concentrations to compensate for growth in calcium
limited environments. Although the Whiteshell L. wollei sü;atnmay have unique physiology,
L. wollei distribution and morphology ultimately determines the effectiveness of the
management techniques. As a result, I suggest that Whiteshell managers proceed based on
currentAmerican management knowledge and work to identify macrophytes native to the
whiteshell which may be used to rimit L. wollei growth in infested areas.
164
Chapter 7: Recommendations
7. I Recommendations þr Researchers
7.L1 Expand desiccation experiments
Desiccation experiments conducted for this study were preliminary and exploratory
investigations. It is my recommendations that desiccation experiments be repeated under
strictly monitored conditions. The length of drying, rewetting and experimental time may
be varied to investigate the effect on L. wolleí viability. An oven may be employed to
effectively control and monitor drying temperatures. The oxygen concenûation ofthe stagnant
water may be monitored to provide important information on the ability of L. wollei to
withstand saturating oxygen concentrations which typically induce photorespiration. Filtered
water would ensure oxygen production or consumption measured may not result from
autogenic productivity or heterotrophic respiration from organism in lake water. These
controls may provide conclusive evidence on the specific conditions which enable I. wollei
to remain viable. Autecological factors affecting L. wollei gowth such as light, temperature
and nutrient limitation should also be investigated experimentally. This information would
provide an effective means to determine the appropriate methods for cleaning recreational
watercrafts.
7.12 fnvestigate L. wolleí sediment association.
Literature and field investigations indicate ttrat the association betweenZ. wolleí and.
lake sediment wanants further investigation. In White Lake L. wolleiwas found to form
small clumps mixed with large amounts of sediment. L. wollei filaments were observed on
the surface ofthe BT2 sediment core collected from the infested area of Betula Lake. Long
white filaments which appeared morphologically similar to L. wolleifilaments were observed
up to a depth of 15 cm within the sediment core. This poses two research questions: Do
viable L. wollei filaments occur below the sediment surface? Are filaments within the
sediment column heterotrophic? Infested areas of Betula and White Lakes have a photic
165

depth greater than the maximum depth. Is light penetration great enough below the sediment
interface to sustain L. wollei growth?
7.13 Investigate source of L. wolleí nutrient acquisition.
Research in the United States has focused on the effect of aqueous nutrient additions
on L. wollei growth. American research also reported L. wollei acquired nutrients from the
sediment. As a result, future research should focus on the source nutrient acquisition by Z.
wollei. This information may provide insight into habitat preference and infestation
development.
T.l4Investigate L. wolleí impact on ecosystem.
The ecological implications of L. wollei infestations are unknown and require
investigation. Betula Lake appeared to have an exceptional number of minnows inhabiting
nearshore areas infestedby L. wollei. Minnows were not observed in this quantity at any
other Whiteshell lake sampled. When portions of L. wollei mats were retrieved from the
lake they were consistently infested with invertebrates. As a result, I propose L. wolleí
infestationsmayprovide model minnowhabitat\Mith aplentiful food source and ideat cover.
American research concluded fish were unable to effectively consume L. wollei due to its
long and dense filaments. An experiment investigating the density and diversity of native
s may be used to determine howZ. wollei infestations affect the aquatic ecosystem.
Do Z. wollei infestations enhance ecosystem productivity? What effect do L. wollei
infestations have on native species diversity and density? Is Z. wolleì simpty an aesthetic
problem for humans?
7.15 Detemine if z. wolleí in the whiteshell produces toxins.
America research concluded L. wollei produced saxitoxins. As a result, L. wollei
samples from the Whiteshell should be tested for saxitoxin production. A single sample
collected from Betula Lake in the srunmer of 2002 tested negatively for the production ofsaritoxin. The is only one sample from one atea at one time. The literature suggests saxitoxin
production may be a produced in response to interspecific competition (Yin et al. 1997). As
166
a result, it is important to test samples for saxitoxin production from various locations in the
infestation at different times.of the year. For example, in the spring L. wolleí may produce
saxitoxins to limit the competitive capabilities ofmacrophytes tying to establish themselves
in nearshore areas. lf L. wollei is found to produce these neurotoxins experiments must be
undertaken immediately to determine the health implications for recreational users.
7.16 Investigate the competitive capabilities of macrophytes.
Detailed vegetationmaps may enable futuremanagers to return infested areas to nafural
conditions. It is my recommendation that priority is given to creating detailed maps
documenting emergent and submergedmacroph¡es abundance andtaxonomybe conducted
on infested lakes and those at greatest risk of infestation, such as Jessica and Red Rock
Lakes. Mesocosms may then be constructed in infested areas at Beh¡la and White Lakes and
various species of native emergent and submerged macroph¡es may be planted to examine
their competitive capabilities.
7. 2 Recommendations for Managers
7.21Combine zebra mussel anil L. wolleí campaign.
I propose the zebra mussel campaign be expanded to an exotic species campaign
including L- wollei. Zebramussels are a well known exotic which have wrecked havoc on
the Great Lakes. Today the Manitoba Government actively campaigns to educate the public
in order to prevent the spread of zebramussels to our waterways. In contrast , L. wolleihas
already invaded our lakes and little is being done to prevent the ñgther spread of this noxious
alga. Students employed by the govemment to examine boat trailers for zebra mussels should
expand their search to include L. wollei. Prevention methods employed for zebra mussel
management are the same as those proposed for.[. wollei: watercrafr must be thoroughly
washed after being removed from infested waterbodies. As a result, a combined L. wollei
andzebramussel campaign would go hand in hand.
167
7.22 Centraltze L. wollei management.
Cunently many people are working to minimize the impact of L. wollei on Whiteshell
recreational users, although these efforts are not coordinated by a single entity and often one
party is employing methods unbeknownst to other groups. For example, the Seven Sisters
District dredges the Betula Lake swimming area at the campground beach to limit L. wollei
impact on recreational users, while cotüagers idle out from the shore in watercraft to limit Z.
wollei disturbance. The Water Quality Management Division of Manitoba Conservation
were unaware of these practices until 2003. I propose L. wolleí management should be
centralized and all management strategies employed should be overseen by a single
management group.Themanagement group shouldworkto develop andestablishguidelines
to achieve L. wollei management.
I firrther propose that Whiteshell Park Staffbe educated on the L. wollei infestations.
Many Park personnel are una\Ã/are of the problem and its implications. I think increased
education would increase co-operation and implementation of management strategies.
Management strategies whichcouldbe set inplace by Parkpersonnelwouldbe documenting
watercraft movement and providing suitable watercraft cleaning stations. For exarnple,
campground personnel could be required to document the origin and destination all visitors
with recreational watercrafts and provide them with a brochure on L. wollei infestations in
the Park. Whiteshell interpreters could provide a presentation on L. wollei infestations.
Education is the key to limiting the spread of L. wollei.
7.23 Develop a multi-stakeholder management committee.
I propose the management group establish a multi-stakeholder management committee.
Open communication would increase the effectiveness ofresearch endeavors and ultimately
shengthen process towards the common goal for Z. wollei management. This committee
wouldinclude individualsfromallparties withavestedinterest inWhiteshell lakes. Members
may include cottage owners, Whiteshell Park stafl Scientists conducting research and
govemment personnel.
168
7. 3 Recommendations for Cottagers
7.31 Familiarwe yourself with L. wolleí infestations.
Cottagers need to be informed so they can be an effective first line of defense against
L. wollei infestation. Cottagers spend agreatdeal of time at the waters edge observing their
surroundings. I recommend Behrla and White Lake cottagers visit the main campground
beaches at these lakes and examine L. wollei. Once familiar with the appearance and smell
of L. wollei cottagers may report future infestation development and anomalies to managers
and researchers. As a result, cottagers may provide important insight into future L. wollei
development and be an integral part of the multidisciplinary management committee.
7.32Protect non-infested lakes and rivers by washing recreational watercraft when
removed from infested lakes.
I recommend washing all recreational watercraft when removing them ûom infested
Whiteshell lakes in order to remove aLl L. wottei filaments. Shoes and clothing with Velcro
should also be investigated for the occuffence of attached L. wollei filaments. Such
precautions may limit the spread of L. wollei to other water bodies.
7.33 Cottagers and water skiing clubs educate friends and visitors on the
importance and methods for preventing the spread or L. wolleì.
Waterskiing clubs should educate Betula and White Lake users on the occurrence and
proper management techniques used to limit the spread of L. wolleí to non-infested lakes.
This may be accomplished by showing visitors L. wolleiinfestations and encouraging them
to wash tansference items such as clothing, footwear and recreational watercraft when
leaving the infested lakes.
169
Chapter 8: Literature Cited
Agusti, S'E.' and Philips, E.J- 1992. Light absorption by cyanobacteria: Implications ofthe colonial growth form. Limnolory and oceanography, 37(2):434-441.
Anonymous. 1978. Historic Resources Branch Deparûnent of Tourism and Cultural
Affairs. Technical document 9: A Background History Whiteshell Study. Manitoba
Deparhnent of Mines, Natural Resources and Environment, parks Division.
Barto, W.P. and Vogel, C.G.. Department of Mines, Natural Resources & Environment.
l978.Agro - Manitoba Information Package, Technical Report No. 7g-9. Lands and
Surveys Division V/innipeg, Manitoba.
Beer, S', Spencer, W., and Bowes, G. 1986. Photosynthesis and growth of the filamentous
blue-green algaLyngbyabirgei in relation to its environment. Journal ofAquatic plant
Management,24:61-65.
Beer, s., spencer, w., Holbrook, G, and Bowes, G. 1990. Gas exchange and carbon
fixation properties of the mat-forming cyanoph¡e Lyngbya birgeiG.M. Smith. AquaticBotany 38:221-230.
Beer, S., Spencer, w.E., and Bowes,G lgg2.Hcq'use and evidence for a carbon
concentrating process in the mat-forming cyanoph¡e Lyngbya birgeiG.M smith.Aquatic Botany, 42:l 59 .17 I .
Bonilla,I., Bolanos, L. and Mateo, p. 1995. Interaction of boron and calcium in the
cyanobactena Anabaena and Synechococczs. Physiologia plantarum 94:3 I -36.
Brookes, J'D', Ganq G.G, and oliver, R.L.2000. Heterogeneity of cyanobacterial gas-
vesicle volume and metabolic activity. Journal of Plankton Research, 2z)S): l57g-1589.
Brown' S' D' 2003. Land use practices in the vicinity of Delt¿ Marsh as they may be
affecting water quality-M.E.D. Thesis, Faculty of Environmental Desigr¡ university ofCalgary,248.
170
Buchan, L'A'J and Padill4 D.K. 2000. Predicting the likelihood of Eurasian Watermilfoil
presence in lakes, a macroph¡es monitoring tool. Ecological Applications l0(5):
1442-1455.
Canadian Council of Ministers ofthe Environment. 2001. Canadian sediment quality
guidelines for the protection of aquatic life: Summary tables. Updated In: Canadian
environmental quality guidelines, 1999,Canadian Council of Ministers of the
Environment, Winnipeg.
Caraco, N.F., Cole, J.J-, and Likens, GE. 1993. Sulfate control of phosphorus availability
in lakes. Hydrobiolo gi4 253 : 27 5-290.
carmichael, w.w-, Evans, w.R., yin, e.e., Belr, p., and Moczydlowski, L. rgg7.
Evidence for Paralytic Shellfish Poisoning in the freshwater cyanobacte num Lyngbya
wollei (Farloe ex Gomont) comb. nov. Applied and Environmental Microbiology, 63
(8):3104-3110.
CCME' 1987 (plus updates to 1994). Canadian'Water Quality Guidelines. Canadian
Council forthe Ministers of the Environment. Environment Canada and Health
Canada. Ottawa" ON, Canada.
cowell,8.c., and Botts, P.s. 1994. Factors influencing the distribution, abundance and
growth of Lyngbyawoilei in cenûar Florida. Aquatic Botany, a9 e): r-r7.Dean' w'E' 1974' Determination of carbonate and organic matter in calcareous sediments
and sedimentary rocks by loss on ignition: comparison with other methods. Joumal ofSedimentary Petrolory, a4g): 242-249.
Doyle, R" and Smart, R.M. 1994a. Native emergent macrophytes may ameliorate the
negative impacts of Lyngbya. Lake and Reservoir Managem ent 9e): 70.Doyle, R', and Smart, R.M. 1994b. Field tests of the use of native aquatic plants to
control eurasian watermilfoil and Lyngbya in a southeastem reservoir. Lake and
Reservoir Management 9e):7 0.
t7l
Doyle, R.D., and Smart, R.M. 1998. Competitive reduction of noxiou s Lyngbya wollei
mats by rooted aquatic plants. Aquatic Botany 61(l): 17-32. Doyle, R., and Smart,
R.M' 1994a. Native emergent macrophytes may ameliorate the negative impact of
Lyngbya. Lake and Reservoir Management 9e):70.
Doyle, R.D., and Smart, R.M. 1998b. Competitive reduction of noxi ous Lyngbya wollei
mats by rooted aquatic plants. Aquatic Botany 6l(l): 17-32.
Dyck, L.A- 1994. Creation of management strategies that are compatible with the
autecology of Lyngbya. Lake and Reservoir Managementg(2):71.
Elser, J.J. 1999. The pathways to noxious cyanobacteria blooms in lakes: the food web as
the final turn. Freshwater Biology, 42:537-543.
El-Zahra+ F. and Zal<r,T.1999. Effect of boron and calcium on growth and nitrogen
fixation of the blue-green algae calothrix paríetina. Folia Microbiol. a4 Q):201-204.Evans, R.D. and Rigler, F.H. 1985. Long distance transport of anthropogenic lead as
measured by lake sediment. w'ater,Air and soil pollution2l: l4l-151.
Fisher, M.M., Brenner, M. and K.R. Reddy. Igg2.A simple inexpensive piston corer for
collecting tmdisturbed sediment/water interface profiles. Joumal of paleolimnology 7:
ls7-161.
Forrester, D. 1978. Technical Document 3: Ecological tenainAnalysis, Whiteshell Study.
Manitoba DeparEnent of Mines, Natural Resources and Environment, parks Division.
Graham, L.E. and wilcox, L.v/. 2000. Algae. prentice-Hall Inc. London.
Halliigse, M.E., and Philips ,8.J. 1996. Effects of Cutine - plus and Cide - Kick II on
the growth of algae and cyanobacteria. Joumal ofAquatic Plant Management, 34:39-
40.
Haworth, E.Y., and Lund, J.w.G. 1984. Lake sediments and Environmental History
Studies in paleolimnology and paleoecology in honour of Winifred Tutin. University ofMinnesota Press. Minneapolis.
t72
Head, R.M., Jones, R.I., and Bailey-Watts, A.E. 1999. An assessment of the influence of
recruitment from the sediment on the development of planktonic populations of
cyanobacteria in a temperate mesohophic lake. Freshwater Biology, 4l:759-769.
Hegenson, I. and O'Connor, J.1978. Technical document 4: Fisheries lnventory and lake
Classification, Whiteshell Study.-Manitoba Departrnent of Mines, Natural Resources
and Environment, Parks Division.
Hickman, M., schweger and Habgood, T. 1984. Lake v/abamun , Alta.: a
paleoenvironmental study. canadian Journal of Botany 62: 143g-1465.
Hilderman. 1969. The Whiteshell provincial park.
Hyenstrand, P., Rydin, E., Gunnerhed, M., Linder, J. and Blomqvist, p. 2001. Response of
the cyanobactenaGloeotríchia echinulatatitronand boron additions - an experiment
from Lake Erken. Freshwater Biology 46:735-741.
Ibelings, 8.W., and Maberly, S.C. 199S. Photoinhibition and the availability of inorganic
carbon restrict photosynthesis by surface blooms of cyanobacteria. Limnology and
Oceanography, 43 (3):408 -4 19 .
Jones, G., Mazur, D. Anderson, W. and Wilson, R. 1980. Whiteshell provincial Natural
Park, Master Plan. Manitoba Department of Natural Resources, Parks Branch.
Karp, GS. 1987. An environmental assessment and review of waste disposal sites located
in the Whiteshell Provincial Park. Manitoba Deparhnent of Environment and
Worþlace Safety and Health.
Kenkel. N.2001. l-465 Analysis of Biological Communities. University of Manitoba.
Kishe, M.4., and Machiw4 J.F. 2003. Distibution of heavy metals in sediments ofMwanza Gulf of Lake Victoria, Tanzania,Environment lntemation al2L:619-625.
Klemer,A-R., Hendzel, L.L., Findlay, D.L.,Hedin, R.A., Mageau, M.T., and Konopka"A.
1995. Carbon availability andthe pattem of cyanobacterial dominance in enriched
low-carbon lakes. Journal of phycolo gy, 3 I :7 3 5 -7 4 4.
173
Kohler, J., and Hoeg, S. 2000. Phytoplankton selection in a river-lake system during two
decades of changing nutrient supply. Hydrobiologi4 424: 13-24.
Leavitt, P. R., and Carpenter, S.R. 1990. Aphotic pigment degradation in the hypolimnion:
Implications for sedimentation studies and paleolimnology. Limnology and
Oceanography 3 5 (2): 520 -53 4.
Leavitt, P. R. 1993. Areview of factors that regulate carotenoid and chlorophyll
deposition and fossil pigment abundance. Journal of Paleolimnology 9: 109-127.
Lorenzen, c.J . 19 67 . Determination of chlorophyll and pheo-pigments:
spectrophotometric Equations. Limnology and oceanogaphy 12:34j - 346.
Marker, A.F.H., Crowther, C.A. and Gunn, R.J.M. 1980. Methanol and acetone solvents
for estimating chlorophyll a and phaeopigments by spectrophotometry. Archiv fr¡Hydrobiologie Beihefte 14:52-69.
Martin, B.8., Martin, D.F., and Perez-cruet, M.J. 1987. Effect of selected dyes on the
growttr of filamentous blue-green alga, Lyngbya majescula. Journal ofAquatic plant
Management,25 :40-43.
McCallum, D'V/. and Hall, K.J. 1998. Limitations of sediment quahty surveys: a case
study of an urban watershed in British Columbi4 Canada. Water Science and
Technology 38 (11): 201-208.
Moenig, J. T., Morelli, M., Eng, p., Bayer B. and williamson, D.A. 197g. Technical paper
1: Limnological Investigation of Falcon lake: with emphasis on local water quahty
changes, Whiteshell Study. Manitoba Department of Mines, Natural Resources and
Environment, Parks Division.
Monegue, R.L., and Philips, E.J. 1991. The effect of cyanophages on the growth and
swvival of Lyngbyawollei, Anabaenaflos-aquae, and,Anabaena circinalis. Journal ofAquatic Plant Management, 29: 88-93.
t74
Onodera, H., Satake, M., Oshim4 Y., Yasumoto, T., and Carmichael, W.V/. 1997. New
saxitoxin analogues from the freshwater cyanobactenwn Lyngbyawollei. Natural
Toxins, 5:146-151.
Paerl, H.W., Prufert, L.E., andAmbrose, WW. 1991. Contemporaneous nitrogen fixation
and oxygenic photosynthesis in nonheterocystous mat forming cyanobacterium
Lyngbya ae s tuarii. Applied Environmental Microbiology, 57 : 3086-309 6.
Pardo, P., Lopez-Sanchez, J.F. and Rauret, G.2003. Relationships between phosphorus
fractionation and major components in sediments using the SMT harmonized
extaction procedure. Anal Bioanal Chem 376:248-254.
Pettipas, L. 1978. Areview of the Archaeology & Prehistory of the Whiteshell Provincial
Park. Manitoba Department of Mines, Resources, and Environmental Management,
Environmental Control Branch.
Philips, E.J., Monegue, R.L., andAldridge, F.J. 1990. cyanophages which impact bloom
- fonrring cyanobacteria. Journal ofAquatic Plant Management. 28:92-97.
Philips, E.J., Ihnat, J., and Conroy, M. 1992. Nitrogen fixation by the benthic freshwater
cyanobactenum Lyngbya wollei. Hydrobiolo gi4 234: 59-64.
Rippkq R., Derueller, J., waterbury, J.B, Herdmffi, M.and stanier, R.y. 1979. Generic
assignments, strain histories and properties of pure cultures of cyanobacteria. Journal
of Genetic Microbiology, I I I : I -1 6.
Reavie, E.D., Smol, J.P., Sharpe, I.D., W'estenhofer, L.4., and Roberts, A.M. 2000.
Paleolimnological analyses of cultural eutrophication patterns in British Columbia
lakes. Canadian Journal of Botany 78: 873-888.
Reeves, C.C. 1968. Developements in Sedimnetology II: Introduction to Paleolimnology.
Elsevier Publishing Company, London.
Rown, D.J. and Kalfl J. 1993. Predicting sediment metal concentrations in lakes without
point sources. Water, Air and Soil Pollution 66: 145- 16l.
175
Schneider, M.2002. Whiteshell Provincial Park Facts Manual. Customer Service
Program, Manitoba Conservation.
Silver' P'4. and Wozriak, J.4.2001. Lead analysis of sediment cores from seven
Connecticut lakes. Journal of paleolimnology 26:l-10.
Smol, J.P. and Glew, J.R. 1992. Paleolimnology. Encyclopedia of Earth System Science,
Vol.3: 551- 564.
Southwest Florida Water Management District. 2000.News release: District Expands
Kings Bay Pilot Project. htþ://wwww.swfrvmd.state.h.us/news /20001 0g2g00.
speziale, 8.J., Turner, G.E., and Dyck, L.A.lggr. physiological characteristics of
vertically-stratified Lyngbyawollei mats. Lake and Reservoir Management,T(l):107-
tl4.
Speziale, B.J',and Dyck, L.A.1992. Lyngbya infestations: Comparative taxonomy ofLyngbyawollei comb. nov. (cyanobacteria). Journal of Phycolo gy,28(5):693-706.
Suggett, G. 1984. Special Features Inventory Whiteshell Provincial park. parks Branch.
Department of Natr¡ral Resources.
Swain, E.B. 1985- Measurement and interpretation of sedimentary pigments. Freshwater
Biology 15:53-75.
Townend. J.2002- Practical statistics for environmental and biological scientists. JohnrWiley & Sons, Chichester.
Trimbee, A.M, and Prepas, E.E. 1987. Evaluation of total phosphorus as a predictor of the
relative biomass of blue-green algae with emphasis onAlberta lakes. Canadian Joumal
of Fisheries and Aquatic Sciences 44:1337 -13 42.
Tubea,8., Hawxby, K., and Meht4 R. r9gl. The effects of nutrient, pH and herbicide
levels on algal growth. Hydrobiolo gla" 79:2Z|-ZZ7 .
Tyler, R.M. 1994. The Delaware experience with Lyngbyain millponds. Lake and
Reservoir Manageme nt, 9 (2) : 120 .
176
Appendix A: Whiteshell Provincial Park
Supplementary Material
Geography & Geologpt
Whiteshell Provincial Park, located approximately 140 km east of Winnipeg,
encompasses 2 719 km2 of southeastern Manitoba (Figure l) (Schneider 2002). The park
boundary corresponds with the Whiteshell River to the North and the Ontario border to the
East. The park is located in the Precambrian Boreal Forest region of Manitoba(Jones et ø1.
1980). In this areatþe Precambrian Shield and Boreal Forest overlap (Whitesel200l).
During the Precambrian Era when the earth's crust was molten, a mass of granite rose
to the surface overlying heavier volcanic rock. As the granite mass cooled and hardened it
increased in weight pushing down on the underlying lava. Consequently, rare elements \ilere
concentrated in fissures within and around the granite mass. This granite shield was exposed
to and smoothed by episodes of glacial advance and retreat during the Pleistocene epoch
(Hilderman 1969). Afinal glacial retreat ten thousand years ago left the Precambrian Drift
Plain topography that can be seen today. This topography is characterized by rolling to hilly
relief, rock outcrops, variable amounts of glacial drift, bogs and eskers (Barto and Vogel
te78).
The composition of the Precambrian rock is mainly granite and granitic gneisses with
granodiorite,quartzdioriteandorthogneiss@artoandVogel lgTS&HegensonandO'Connor
1978). Glacial drifts are unconsolidated glacial till which may reach over one meter in
thickness. 'When Lake Agassiz inundated the Whiteshell area it deposited lacustine varved
silts and clays in low relief areas. Pronounced relief, prevailing winds and lake level
fluctuation resulted in well-graded sandy till deposits on the upper slopes of hills. These
deposits were washed down onto mid to low slopes and covered lacustrine deposits. In
other areas lacustine silts and clays overlaid glacial till. As a result, soil conditions are
variable throt'ghout the shield (Forrester 1978). Poorly drained depressions accumulated
177
organic deposits while exposed bedrock prevailed in high relief positions. Four surface
deposits persist in Whiteshell Provincial park: lacustrine sediments, moraine deposits,
glaciofluvial outwash and organic deposits (Forrester lg7S).Isostatic rebound helped to
produce the drainage basins of Whiteshell Provincial Park. Lakes occupy the majority of
glacially excavated depressions in the area and fault basins (Moenig et al l97B). There are
13 1 lakes in the Whiteshell ranging in depth from I to I I 5 meters (Schneider 2002).Today,
bogs and lakes cover 40-60 %o of the surface of this region (Fonester lgTs).
There are three distinct geological anomalies found in Whiteshell Provincial park,
which distinguish two Whiteshell Lakes. West Hawk Lake is the product of meteorite impact
determined by the occürence of 'recrystalization,matrix binding forming glossy fragments
and shock effects such as the accumulation of breccia in open faults'(Suggett 1984). As a
result, West Hawk Lake, at ll5 meters in depth, is signiflrcantly deeper than all other
Whiteshell lakes. Glacially excavated Whiteshell lakes have a maximum depth less than 26
meters (Ralley 1995). The other rWhiteshell geological anomalies occur in Star Lake were
the occurrence of pillow lava and a volcanic plug are evidence of Precambrian volcanic
activity in the Whiteshell area (Suggett 1984). These are unique geological features and
distinct from the typical rolling to hilly relief, rock outcrops, glacial drift, bogs and lakes
found in Whiteshell Provincial Park due to glacial activity (Barto and Vogel lgTg).
Whiteshell History
Archaeological evidence suggests that Whiteshell cultures initially used the area
seasonally as early as 7 000 B.C. for iæ natural resources. Archaeological evidence ofprehistoric cultures includes: processed animal bones, pottery stone artifacts and boulder
mosaics. Caddy, Falcon, Jessica and Numao Lakes are a few of the many Whiteshell lakes
whichhave archaeological evidence ofprehistoric cultures @ettipas lg71).Various cultural
groups used specific sites within the pmk indicated by different styles ofarrow heads, scrapers,
hammerstones and ceramics found at excavated sites (Schneider 2002). Today these
prehistoric artifacts may be viewed at the Whiteshell Natural History Museum located at
178
Nutimik Lake. Another important tourist attraction in the Park is the boulder mosaics
including turtle and snake figures at the Bannock Point site near Nutimik Lake. Boulder
mosaics are found at many Whiteshell lakes and ate an important cultural feature of the
area-
It is generally accepted that the 'Whiteshell' name is related to the small shell used to
generate life (Whitesel200l).The 'Whiteshell' name is associated with the 'megis' shell.
The original Whiteshell inhabitants, the Anishinabe people ancestors of the Ojibw4 place
symbolic importance on this shell. Oral tradition reveals that the small, white, sacred shell
was used by their Creator to breathe life into the first human being. As a result, this symbolic
shell may be worn by Ojibwa today as a reminder of their origin and history (Schneider
2002). The Anishinabe people considered the whiteshell a sacred area.
Prior to 1870, canoes were used to access inland resources and lead expeditions. This
canoe era brought Pierre Gaultier de Varennes de la Verendrye of New France, to the
Whiteshell area, in a search of an inland waterway to the western sea (Whitesel 2001). La
Verendrye traveled down the Whiteshell River, then known as the 'La riviere pichikoka'.
All previous expeditions had traveled north along the rivers flowing into Hudson,s Bay
(Schneider 2002).At the time the area was inhabited byAnishinabe and Cree. In the early
nineteenth century the Cree people moved west and north and the Saulteaux, a branch ofthe
Ojibway, movedto theWhiteshell areafromLake Superior(Schneid eÐ002).The Whiteshell
River became an important filr trade route for the North West Company and what later
became the Hudson's Bay Company. The development ofthe railway brought the canoe era
to an end (Schneider 2002).
In 1887, the Canadian Pacific Railway (CPR) began constuction in the Whiteshell
area. Twenty five years after the completion of the CPR line the Canadian National Railway
(CNR) started construction on a second railway tbrough the area (Suggett l9S4). The latter
was completed in 1908. The town of Rennie was developed as a coal and water stop for
steam locomotives, whichwere used until the late 1950s. Today, Rennie features theAlfred
t79
Hole Goose Sanctuary and the Rennie District Park Offrce (Schneider 2002).In 1888, the
Cross Lake Flag station was established along the main Canadian Pacific Railway line
(Suggett 1984). Cross Lake proved difücult during the construction of both railroads and
required extensive amounts offill to be used to build up the grade. Tunnels were also blasted
through the rock below the railroad to permit water to flow averting high water levels,
which would adversely affect its structure (Schneider 2002).Today, these tunnels are part of
the Caddy Lake canoe route, an important Whiteshell tourist athaction. The railway was
fundamental in the initial development and access to the whiteshell area.
At the beginning ofthe twentieth century, gold was discovered across the border near
the town of Keewatin, Ontario. As a result, prospectors flocked to the Whiteshell area in
search of gold. Some of the earliest mining claims made in Manitoba tvere in the Falcon-
V/est Hawk-Star Lake district in 1901 (Whitesel 2001). 'Patent Mining Claims'purchased
before 1914 enabled owners to construct homes on their plot. This initiated colonization of
the area by Europeans. A few patent mining claims, which could not be bought by the
government, constitute the only privately owned land in the park today. In 1907, James
Westopp Brereton established the first homestead on Crown land at Cross Lake. Homesteads
were also established in the area sunounding Brereton Lake after l907,with the completion
of the CNR through the area. Following World War I, 400 ha of Crown land within the
George Lake district was distributed as 'soldier grants'to retuming soldiers interested in
farming (Suggett I 984). This area was not a profitable agricultural area due to thin, undesirable
soils. As a result, most of the land was returned to the Crown (Suggett 1984). The fuel
division of the Arctic Ice Company had a logging camp located at Florence Lake in the
1920s. The camp was complete with stables to accommodate seventeams of horses, a
blacksmith shop, oil shed and a twenty-five ton capacity ice house (Zimmerman l99l). In
l929,the Atctic Ice Company ceased production at Florence Lake and cotüage development
commenced.
180
By the 1920s the recreational potential of the Whiteshell area had been recognized
and the Crown set aside land around a few lakes for recreational purposes. As a result,
sunmerresort lots were surveyed in areas around Brereton, Nora, Florence, West Hawk and
Falcon Lakes, which were accessible by railroad. This would mark the beginning ofrecreational users in the Whiteshell area.
W'hiteshell Provincial P ark Inceptíon
Establishment of outdoor recreational areas was initiated in the late nineteenth cenhrry
by the creation of federal park reserves along the railway line. These reserves served as the
future sites of National and Provincial Parks. In lgl4, a 230 square mile area in south
eastern Manitoba, the future site of the Whiteshell, was proposed as a forest reserve
(Anonymous 1978). By 1927, two sites, V/hiteshell and Riding Mountain were being
considered as the future site of Manitoba's onlyNational Park. Although Riding Mount¿in
National Park was created by the Order-in Council, on December 28,lg2g,theWhiteshell
was still recognized as an important recreational area. In 1930, natural resources where
transferred fiom Dominion to Provincial control. In that same year, the Manitoba provincial
Lands Act and the Forest Act were passed. The Manitoba Provincial Lands Act enabled the
Province to reserye or dispose of its own land, mineral, water and timber resources. Under
the Forest Act, Provincial Forest Reserve areas were 'withdrawn from disposition, sale,
settlement of occupancy'(Anon¡'rnous 1978). As a result, the'Whiteshell Forest Reserve
was established in 193 l. Although the ForestAct stiputated that this area would be withheld
from sale or settlement, it was intended for public outdoor recreation. As a result, surveyed
lots within the reserve were not sold but rather leased on a permit system following the
precedent set by the *Rocþ Mourtain Park Act" of 1887. Surveyed lots were leased with
annual permits which were perpefuity renewable, as long as.lease terms were abided
by(Anonymous 1978). Building plans were overseen and approved by the Forest Service
and development of the Whiteshell area for recreational activities commenced.
181
lïthite s hell Development
All land clearing and road construction initiated in the 1930s was completed by the
Single Unemployed Men's Relief Commission, as overseen by the Forest Service. ln I 93 I ,
the gravel Highway #44 was constructed to the Ontario border (Anonymous l97B). This
provided recreational users further access to Falcon, West Hawk, Caddy, Star and Brereton
Lakes. Between 1931 and 1933, access roads and forested land around surveyed lots in
cottage subdivisions were cleared around these lakes.In 1932, the first public camping
ground was cleared near West Hawk Lake for visitors using tents. In total, 218 camping
permits were issued that year. By 1933, 400 surveyed lots with 137 under permit were
dispersed along nine Whiteshell lakes (Anonymous 1978). In I 935, work began on a highway
north of Highway #44, now known as #307. As construction progressed new lakes were
opened up to recreational use and new cottage subdivisions were surveyed. In the 1940s, the
Jessica Lake cottage subdivision and seven camp grounds throughout the Whiteshell were
developed as were kitchenettes, docks and beach facilities. The #307 highway was completed
in the 1950s and new cottage subdivisions were located on Big Whiteshell, Barren, Betula
and other lakes (Anonymous 1978). While new subdivisions were constructed, exha lots
were added to old subdivisions. Construction of the highways was fundamental to the
development of the Whiteshell as a recreational area. The largest increase in recreational
activity in the park occurred in the 1950s, when the number of permitted lots increased
dramatically from 598 to 2 621in 1950 and 1960 respectively (Anonymous l97g).
Commercial concessions and tourist camps were built on commercial lots within the
park. In 1931, the first two stores were built at West Hawk Lake. By 1939, commercial
bungalow c¿lmps were established at West Hawk, Falcon and Brereton Lakes. As a result, in
1946, the park boasted 90 tourist bungalows, five stores and three service stations. The
Falcon Beach townsite was developed in the mid-1950s, with two motels opened in 195g.
Falcon and 'West Hawk Lakes continued in the forefront of development with the
establishment of seasonal trailer villages with sewer, water and electricity. In 1960 more
t82
seasonal trailer c¿rmps were developed in these areas and a third motel was constructed at
Falcon Lake (Anonymous 1978).
By 1960, the Falcon Beach Townsite was developed with all amenities to be the
'commercial, service and recreational center'of the Whiteshell. The beach was improved,
hard-surfaced roads with side-walks and gutters were built. The shopping center included a
beauty salon, hardware store and pharmacy which enabled people access to all amenities
within the park. Regular garbage collection was organizedin more populated areas. Law
enforcement became formalized with the establishment of an Royal Canadian Motmted
Police. Marinas were established at this time on Falcon, West Hawk and White Lakes
(Anonymous 1978).
Falcon Beach townsite was established as the 'game center' of the Whiteshell, and
remains the most populated center in the Whiteshell today. In 1958, an l8-hole golf course
w¿ß opened there. The following year, six tennis courts were asphalted and a riding stable
was established. Fu¡her gaming development included a lawn bowling green and miniature
golf course opened in 1963 (Anonymous 1978). 'Winter
outdoor recreational activities were
developed in the early 1960s at Falcon Lake. In 1960, the Falcon Lake ski slopes were
opened including two cleared and graded slopes as well as rope tow and a temporary shelter.
Winter recreation at Falcon Lake continued to grow and the ski slopes were upgraded with
four new slopes cleared and a permanent chalet featuring a restawant and equipment rentals
was constructed (Anonymous 1978). Toboggan slides and skating rinks \À/ere also constructed
forwinterrecreation. Bythe 1970s snowshoeing and cross-counûy ski trails were developed
in the area for enthusiasts. As a result, the Whiteshell remained an important area which
facilitated both surnmer and winter outdoor recreational activities.
Since the 1970s interpretative programs have been used to communicate with
Whiteshell visitors to enhance their enjoyment of the Park. Interpreters improve visitor
knowledge and appreciation of the park and its resources through education. Hiking trails,
amphitheater progr¿tms and guided walks are used to educate visitors on important park
183
features which may enhance their recreational experiences (Jones et al. 1980). There are
numerous self-guiding ûails throughout the park which provide thoughtful information on
the trail and park. There are four outdoor amphitheaters throughout the park, which facilitate
summer evening interpretive programs. Amphitheaters are located atNutimik, Big Whiteshell,
West Hawk and Falcon Lakes. Evening programs provide family entertainment and
information on the park. Visitors may also explore Whiteshell history at the Whiteshell
Natural History Museurn, West Hawk Geology and Mining Museum and the Whiteshell
Trapper's Museum (Schneider 200z).TheAlfred Hole Goose Sanctuary in Rennie is another
important tourist athaction for visitors interested in learning more about the park and its
wildlife. Interpretive programs and facilities throughout the park enhance visitor
understanding and appreciation of Whiteshell Provincial Park.
In 1939, portages were cleared and docks built to make the Whiteshell River more
desirable to canoe enthusiasts. Since that time fire-pits have been installed in back-country
campsites, portages have been cut and maintained between lakes and canoe routes have
been mapped throughout the park (Anonymous 1978). Today there is an extensive network
of canoe routes through intensive, extensive, backcountry and wilderness areas of the
Whiteshell which ataactvisitors from around the globe.
184
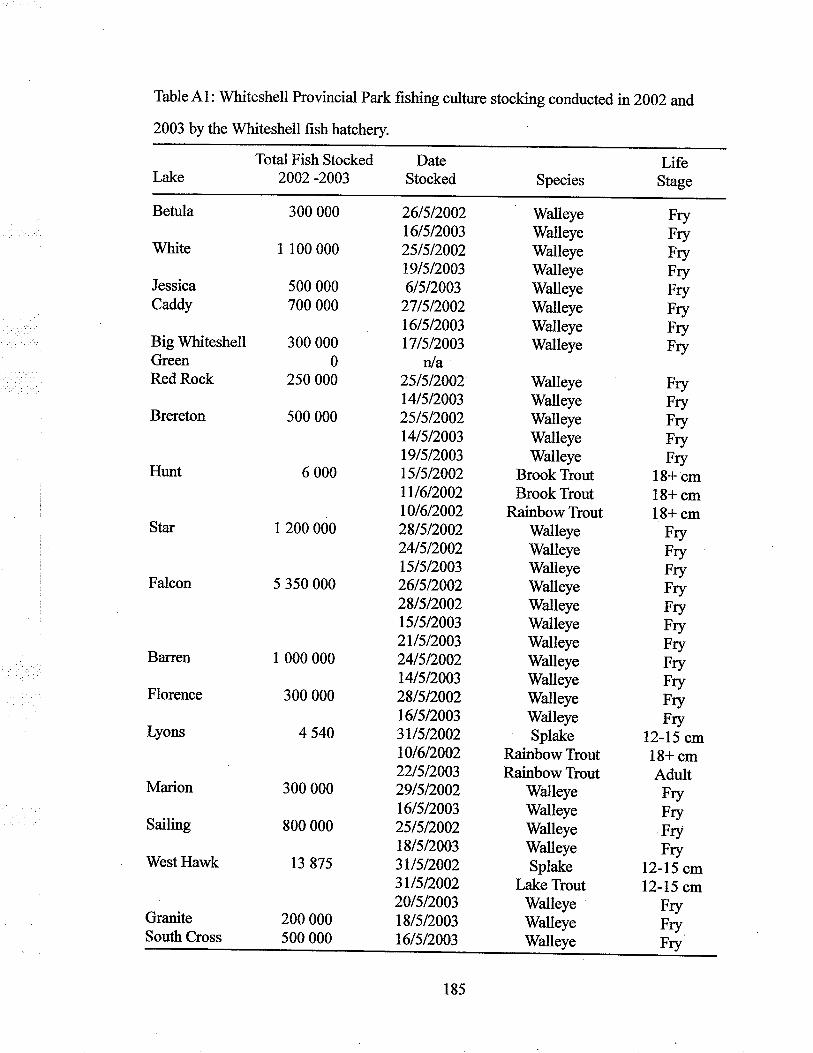
Table Al: Whiteshell Provincial Park fishing culture stocking conducted in2002 and
2003by the Whiteshell fish hatchery.
Total Fish Stocked2002 -2003
DateStocked Species
LifeStage
Betula
White
JessicaCaddy
Big WhiteshellGreenRed Rock
Brereton
Hunt
Star
Falcon
Barren
Florence
Lyons
Marion
Sailing
West Hawk
GraniteSouth Cross
300 000
I 100 000
500 000700 000
300 0000
2s0 000
s00 000
6 000
1 200 000
s 350 000
I 000 000
300 000
4 540
300 000
800 000
13 875
200 000s00 000
26/5t2002t6lst200325/s1200219t5t20036/st2003
27/s12002t6ls12003t7/s12003
nla25/5t2002t4/st20032s/5/2002t4/512003t9/s/2003t5/5t2002tt/6t2002t0/6t200228/5t200224/st2002ts/5t2003261s12002
28/st20021515t20032t/st200324/5t2002t4/5t200328/5/2002t6/5t20033t/5t2002t0/6/200222/5/200329/s12002t6/5/20032s/5t2002t8/5t20033t/s/20023t/st200220/5/2003t8/5t2003t6/512003
WalleyeWalleyeWalleyeWalleyeWalleyeWalleyeWalleyeWalleye
WalleyeWalleyeWalleyeWalleyeWalleye
Brook TroutBrook Trout
Rainbow TroutWalleyeWalleyeWalleyeWalleyeWalleyeWalleyeWalleyeWalleyeV/alleyeV/alleyeWalleyeSplake
Rainbow TroutRainbow Trout
V/alleyeWalleyeWalleyeWalleyeSplake
Lake TioutWalleyeWalleyeWalleye
FryFryFryFryFry
l8* cml8+ cm18+ cm
FryFryFryFryFryFryFryFryFryFryFry
12-15 cm18+ cmAdultFryFryFryFry
12-15 cml2-15 cm
FryFryFry
FryFryFryFryFryFryFryFry
185
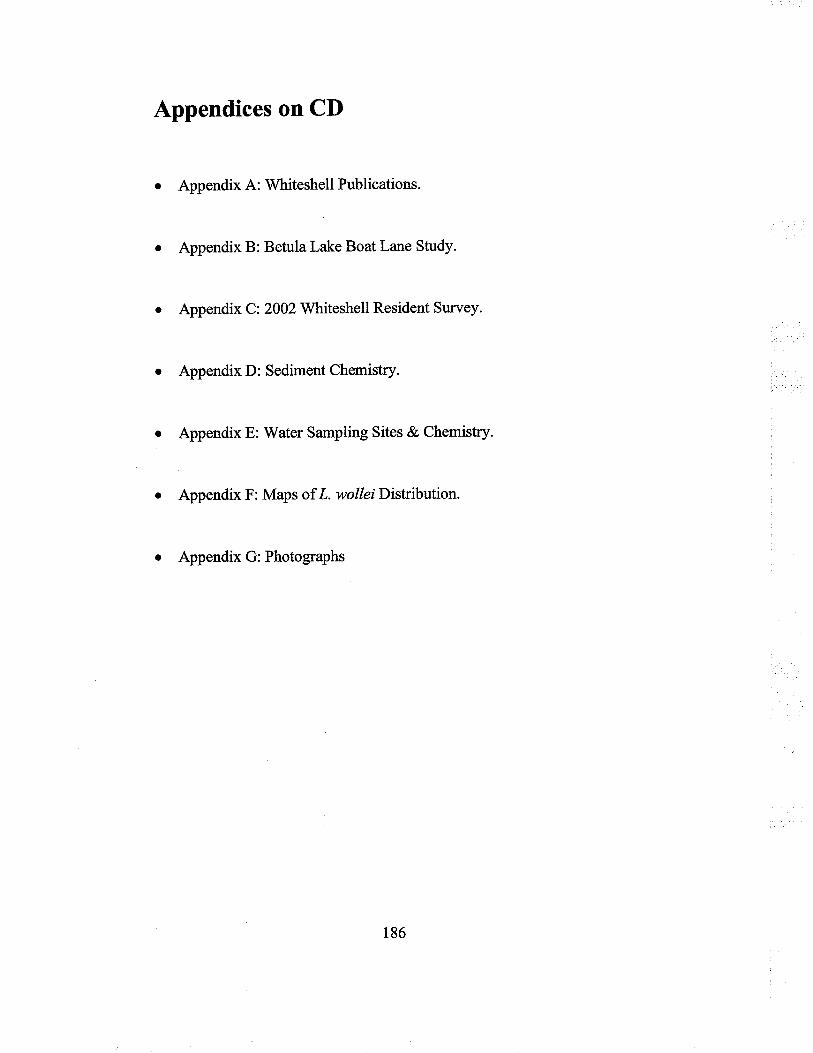
Appendices on CD
. Appendix A: Whiteshell Publications.
. Appendix B: Betula Lake Boat Lane Study.
r AppendixC:2002 Whiteshell Resident Survey.
. Appendix D: Sediment Chemistry.
o Appendix E: Water Sampling Sites & Chemistry.
. Appendix F: Maps of L. wollei Distribution.
o Appendix G: Photographs
186


