Embed Size (px)
Citation preview
Journal of The Electrochemical Society, 159 (4) C147-C154 (2012) C1470013-4651/2012/159(4)/C147/8/$28.00 © The Electrochemical Society
In situ Raman Spectroscopic Study of NaCl Particle-InducedMarine Atmospheric Corrosion of Carbon SteelShengxi Li∗ and L. H. Hihara∗∗,z
Hawaii Corrosion Laboratory, Department of Mechanical Engineering, University of Hawaii at Manoa,Honolulu, Hawaii 96822, USA
The study of NaCl particle-induced atmospheric corrosion is facilitated by in situ Raman spectroscopic analysis through real timeidentification of corrosion products. Droplet formation on carbon steel by the deliquescence of pre-deposited NaCl particles thatwere exposed to high relative humidity (RH) (>80%), and corrosion initiation under the droplets were observed using an opticalmicroscope. Pitting initiated within several minutes under the NaCl droplets. In situ and ex situ Raman spectra from the variousrust species that formed during the corrosion process show that green rust (GR) formed close to the corrosion pit (i.e., anodic site)while lepidocrocite (γ-FeOOH) clusters precipitated outside of the GR region. A small amount of magnetite (Fe3O4) was alsodetected, mostly in the transitional region from GR to lepidocrocite. Upon exposure to an ambient atmosphere, GR transformedto lepidocrocite. This study confirms that the initial rust formed in NaCl particle-induced marine atmospheric corrosion of carbonsteel is GR and lepidocrocite. While revealing the initiation mechanisms of NaCl particle-induced marine atmospheric corrosion ofcarbon steel, this study also provides insights for future studies involving wet-dry cycle exposures, which are more akin to the realatmospheric corrosion process.© 2012 The Electrochemical Society. [DOI: 10.1149/2.013204jes] All rights reserved.
Manuscript submitted September 21, 2011; revised manuscript received December 22, 2011. Published January 23, 2012.
Marine aerosols generated by bubbles from ocean waves and car-ried by wind can reach structures and greatly accelerate the corrosionof metals. NaCl is very abundant among marine aerosols1 and thusplays a crucial role in marine atmospheric corrosion of metals. TheNaCl particle-induced atmospheric corrosion has been studied exten-sively for copper,2–7 zinc,8–11 iron,12, 13 aluminum,14 and magnesium.15
Less work16 has been conducted on single NaCl particle-induced cor-rosion on steel, except for the studies on pre-deposited salt droplet-induced corrosion on carbon steel17 and galvanized steel.18, 19
To study NaCl particle-induced corrosion, Chen et al.3–7 conducteda series of work using in situ and ex situ Fourier transform infrared(FTIR) spectroscopy. They studied the effects of pre-deposited NaClparticles as well as those of accompanying pollutants such as car-bon dioxide (CO2), sulfur dioxide (SO2), nitrogen dioxide (NO2), andozone (O3) on the atmospheric corrosion of copper and zinc. FTIRenabled the identification of ions in droplet solution (in situ) caused byvarious gas pollutants and the study of spatial distribution of corrosionproducts (ex situ). Although being able to investigate corrosion speciesin droplet solutions, FTIR has its limits because it cannot probe corro-sion products forming under the droplets due to the strong absorptionof infrared light by water. On the other hand, Raman spectroscopy, asanother vibrational technique similar and complementary to FTIR, canbe used to identify corrosion products forming at metal/solution inter-faces (in situ) since the lasers can penetrate water without significantrepercussions. Actually, water solutions can protect the investigatedcorrosion products, i.e., iron oxides or oxy-hydroxides, from trans-formation due to laser heating during illumination. In addition, theintermediate phases of corrosion products that are unstable in air canbe studied under the protection of water.
There has been extensive Raman spectroscopic work conductedon iron passivity,20 corrosion of iron and steel in bulk solutions,21–26
and pitting of stainless steel.27, 28 Johnston21 studied corroding ironelectrodes polarized at certain potentials using in situ Raman spec-troscopy. The results revealed that a passivating layer of goethite(α-FeOOH) formed on the iron electrode that was negatively polar-ized. Lepidocrocite formed only in high pH environments and subse-quently reduced to magnetite. Boucherit et al.23, 24 used in situ Ramanspectroscopy to characterize the passive films and pitting corrosionproducts grown on iron and an iron-molybdenum (Fe-Mo) alloy inthe presence of Cl− or SO4
2−, and obtained Raman spectra of GR
∗ Electrochemical Society Student Member.∗∗ Electrochemical Society Active Member.z E-mail: [email protected]
for the first time. By potentiostatically polarizing an iron electrode tothe pitting potential (+600 mVSCE) in 0.05 M NaOH + 0.03 M NaClsolution, they obtained a green gelatinous rust layer on the electrode,which showed Raman bands at 420 and 505 cm−1, corresponding toFe2+–OH− and Fe3+–OH− stretching modes, respectively. This rustlayer evolved toward lepidocrocite with reddish-brown color bothwhen kept in the open air and when left in an electrolyte withoutpolarization. Under the GR layer, an inner layer of magnetite with aRaman band at 665 cm−1 also developed.
Lanarde et al.25 studied the corrosion behavior of iron and X70carbon steel in mineral waters at the open-circuit potential (OCP)as well as under cathodic polarization (CP). For both iron and X70steel, at both OCP and under CP, pitting initiated from impurities inthe metals and developed around sulfides (in X70 carbon steel) andsilicates (in iron). In each case, GR with characteristic Raman bandsat 420 and 505 cm−1 was the first corrosion product formed and didso preferentially in the vicinity of corrosion pits.
The present work investigated corrosion initiation from NaCldroplets formed by deliquescence of pre-deposited NaCl particlesupon exposure to high humidity (>80% RH). The aim of this studywas to understand the very initial stage of NaCl particle-induced ma-rine atmospheric corrosion of carbon steel. The various rust speciesformed during the corrosion process were identified using both in situand ex situ Raman spectroscopy. Rust phase transformations due tooxidation in ambient and thermal effects were also investigated.
Experimental
Materials.— Specimens with dimensions of 10×10 mm were cutfrom 3 mm thick 1018 carbon steel sheet using a low-speed diamondsaw, and were then mounted in epoxy resin (BUEHLER Epoxicure).The specimens were subsequently ground with 180, 400, 1200 grit SiCgrinding paper; polished with 9.0, 3.0, 1.0 μm METADI SUPREMEpolycrystalline diamond suspension (BUEHLER); and finished with aMASTERPOLISH polishing suspension (alumina + colloidal silica,0.05 μm) (BUEHLER). The specimens were then rinsed with ultra-pure water (18.0 M� cm) and reagent-grade alcohol and then driedunder warm air. Finally, all samples were kept in a dry box (1% RH)for 5 days before conducting experiments to allow the formation andstabilization of the surface oxide film.
The manual deposition of NaCl salt particles was achieved byusing a tiny wire probe (D<10 μm) and a stereomicroscope. Analyt-ical grade NaCl salts were ground in a glass Petri dish. Single saltparticles (D = 20–50 μm) were chosen and placed on polished sam-ple surfaces using the tiny probe. Electrostatic forces associated with
Downloaded 03 Feb 2012 to 128.171.57.189. Redistribution subject to ECS license or copyright; see http://www.ecsdl.org/terms_use.jsp
C148 Journal of The Electrochemical Society, 159 (4) C147-C154 (2012)
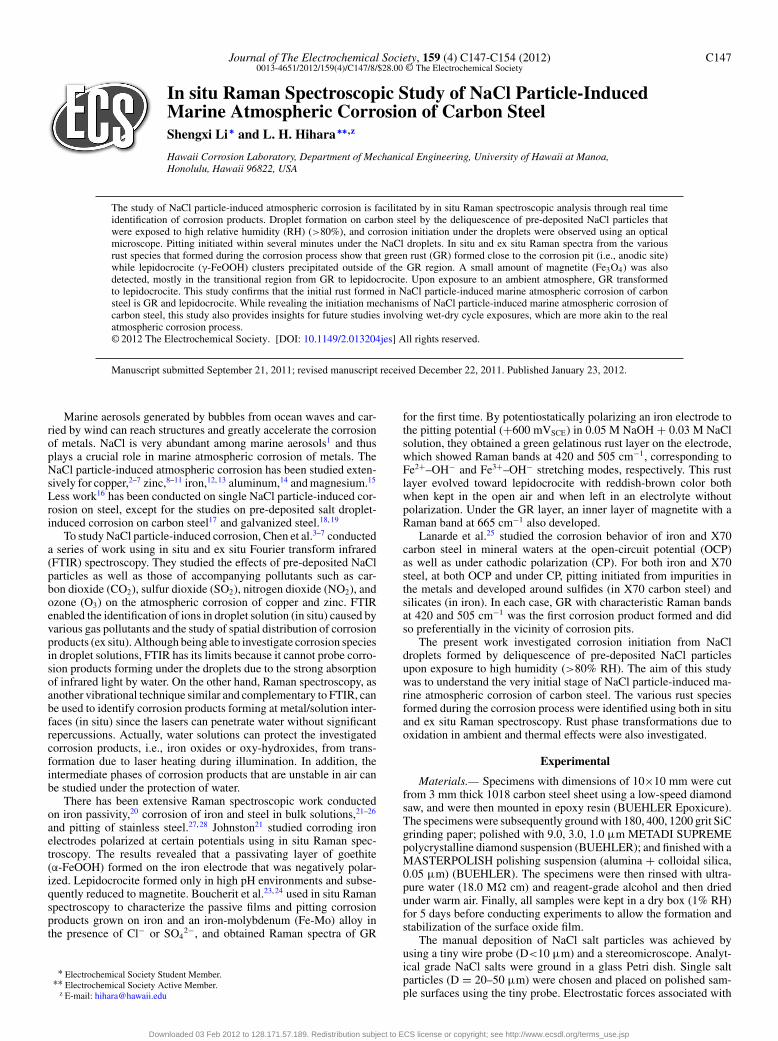
Figure 1. Schematic representation of the experimental setup used for in situRaman experiments.
the wire probe enabled the pick-up and placement of salt particles.After deposition, the samples were exposed to a humidity chamber(>80% RH).
Experimental procedure.— The humidity chamber consisted of amodified plastic Petri dish with cover (Fig. 1) containing a smallreservoir of ultrapure water (18.0 M� cm) to maintain the RH above80%.16 A thin (t≈0.14 mm) glass window was installed in the Petridish cover to form a 2 cm diameter view port that allowed for mi-croscope images to be taken and laser beams to be directed towardthe sample. The steel sample with the pre-deposited NaCl particlewas put into the humidity chamber. Images of the salt particle weretaken using an optical microscope. Ultrapure water (18.0 M� cm)was then injected into the reservoir, and the Petri dish was coveredimmediately after which the relative humidity (RH) increased fromambient room humidity (58% RH) to 75% RH within 5 min,1, 16 en-abling the solutionization of the NaCl particles. Corrosion initiationand propagation under NaCl droplets were observed and recordedusing the optical microscope. Various corrosion products formed atsteel substrate/NaCl droplet interfaces were identified using in situand ex situ Raman spectroscopy. The ambient temperature during theexperiments was 20◦C.
Raman spectroscopy.— A Nicolet Almega XR dispersive Ra-man Spectrometer (Thermo Scientific Corp.) equipped with multipleOlympus objectives and a Peltier-cold charge-coupled device (CCD)detector was used for the experiments. The instrument was operatedwith laser sources of a green Nd:YAG laser with 532 nm wavelengthexcitation and an infrared diode laser with 780 nm wavelength exci-tation. The laser power was always kept low at approximately 1 mWfor in situ Raman analysis and 0.5 mW for ex situ Raman analysis inorder to avoid sample degradation by laser heating. The laser powerwas measured at the air-exposed sample. For in situ Raman measure-ments, the laser power under the droplet could not be measured butwas believed to be less than that measured at the air-exposed sample.The maximum spectra resolution was up to 2.2–2.6 cm−1 using 25 μmpinhole or slit, which requires longer acquisition time and producesmore noise. To reduce the collecting time in a fast corroding system,an aperture of 100 μm pinhole was used, giving an estimated resolu-tion in the range of 8.4–10.2 cm−1. The resulting Raman spectra werealso compared to those with low signal/noise ratios obtained usingsmall-sized filters to confirm that they convey same information. Theaccumulation time was 120 seconds.
Scanning electron microscopy/Energy dispersive X-ray analysis(SEM/EDXA).— A Hitachi S-3400N scanning electron microscopywas used to characterize the rust species formed during droplet corro-sion as well as the corrosion pits before and after cleaning the samples.Inclusions found in 1018 steel were also characterized using SEM andan energy dispersive X-ray analyzer (Oxford Instruments).
Results
Upon exposure in the enclosed Petri dish with high humidity(>80% RH), NaCl droplets formed within 5 min by the deliquescenceof pre-deposited NaCl particles. Then, corrosion initiated quicklywithin about 2 min underneath the NaCl droplets with the location ofinitiations sites dependent on whether or not inclusions were present.
Short-time exposure (5 min).— Short-time exposure (5 min) ex-periments representing the initial stages of corrosion showed twotypes of corrosion initiation phenomena based on microscopic ob-servation and EDXA results: (1) corrosion initiation from dropletperimeters when inclusions were not present and (2) corrosion initi-ation at inclusions sites, which could be located anywhere under thedroplets. Since only a small volume of corrosion products formedduring the short initiation period, high-quality in situ Raman spec-tra could not be obtained through the water medium. Instead, exsitu Raman spectra were obtained soon after the specimens werequickly dried, but representing similar results as those of in situ Ramanspectra.
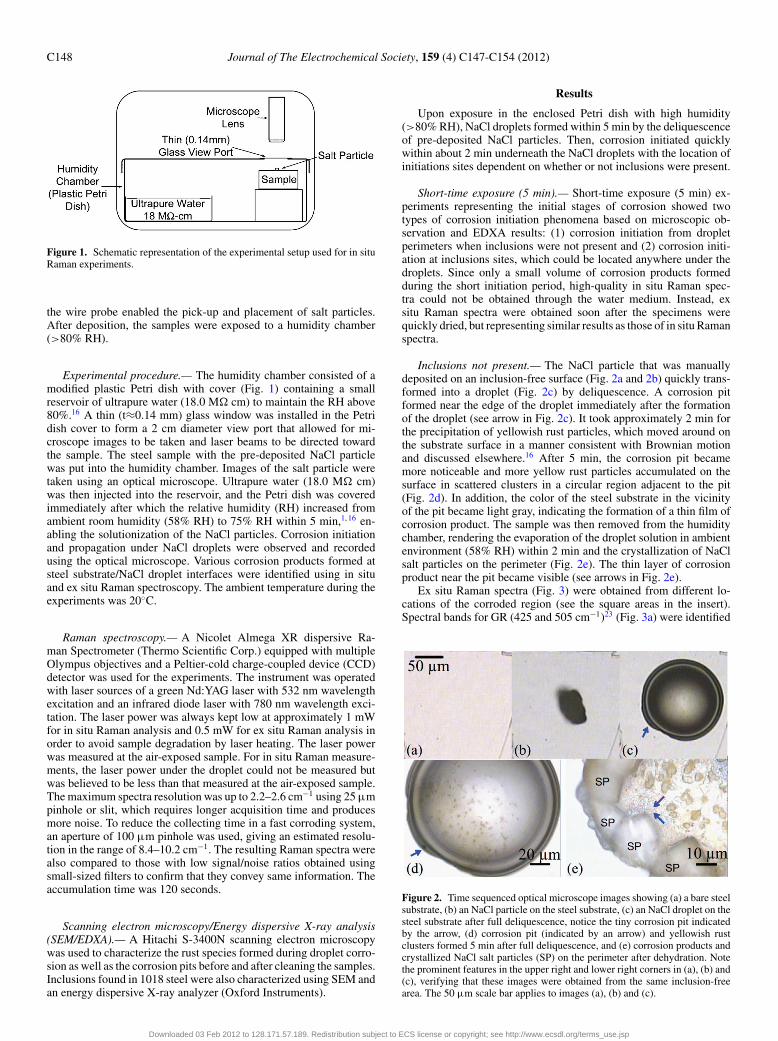
Inclusions not present.— The NaCl particle that was manuallydeposited on an inclusion-free surface (Fig. 2a and 2b) quickly trans-formed into a droplet (Fig. 2c) by deliquescence. A corrosion pitformed near the edge of the droplet immediately after the formationof the droplet (see arrow in Fig. 2c). It took approximately 2 min forthe precipitation of yellowish rust particles, which moved around onthe substrate surface in a manner consistent with Brownian motionand discussed elsewhere.16 After 5 min, the corrosion pit becamemore noticeable and more yellow rust particles accumulated on thesurface in scattered clusters in a circular region adjacent to the pit(Fig. 2d). In addition, the color of the steel substrate in the vicinityof the pit became light gray, indicating the formation of a thin film ofcorrosion product. The sample was then removed from the humiditychamber, rendering the evaporation of the droplet solution in ambientenvironment (58% RH) within 2 min and the crystallization of NaClsalt particles on the perimeter (Fig. 2e). The thin layer of corrosionproduct near the pit became visible (see arrows in Fig. 2e).
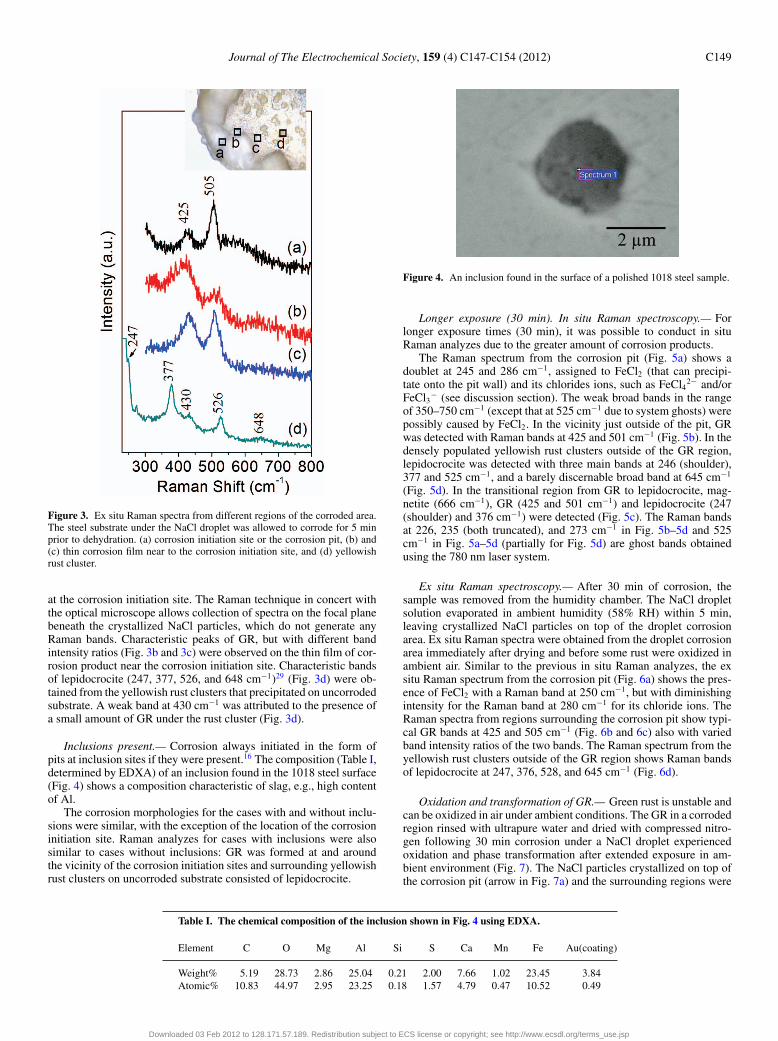
Ex situ Raman spectra (Fig. 3) were obtained from different lo-cations of the corroded region (see the square areas in the insert).Spectral bands for GR (425 and 505 cm−1)23 (Fig. 3a) were identified
Figure 2. Time sequenced optical microscope images showing (a) a bare steelsubstrate, (b) an NaCl particle on the steel substrate, (c) an NaCl droplet on thesteel substrate after full deliquescence, notice the tiny corrosion pit indicatedby the arrow, (d) corrosion pit (indicated by an arrow) and yellowish rustclusters formed 5 min after full deliquescence, and (e) corrosion products andcrystallized NaCl salt particles (SP) on the perimeter after dehydration. Notethe prominent features in the upper right and lower right corners in (a), (b) and(c), verifying that these images were obtained from the same inclusion-freearea. The 50 μm scale bar applies to images (a), (b) and (c).
Downloaded 03 Feb 2012 to 128.171.57.189. Redistribution subject to ECS license or copyright; see http://www.ecsdl.org/terms_use.jsp
Journal of The Electrochemical Society, 159 (4) C147-C154 (2012) C149
Figure 3. Ex situ Raman spectra from different regions of the corroded area.The steel substrate under the NaCl droplet was allowed to corrode for 5 minprior to dehydration. (a) corrosion initiation site or the corrosion pit, (b) and(c) thin corrosion film near to the corrosion initiation site, and (d) yellowishrust cluster.
at the corrosion initiation site. The Raman technique in concert withthe optical microscope allows collection of spectra on the focal planebeneath the crystallized NaCl particles, which do not generate anyRaman bands. Characteristic peaks of GR, but with different bandintensity ratios (Fig. 3b and 3c) were observed on the thin film of cor-rosion product near the corrosion initiation site. Characteristic bandsof lepidocrocite (247, 377, 526, and 648 cm−1)29 (Fig. 3d) were ob-tained from the yellowish rust clusters that precipitated on uncorrodedsubstrate. A weak band at 430 cm−1 was attributed to the presence ofa small amount of GR under the rust cluster (Fig. 3d).
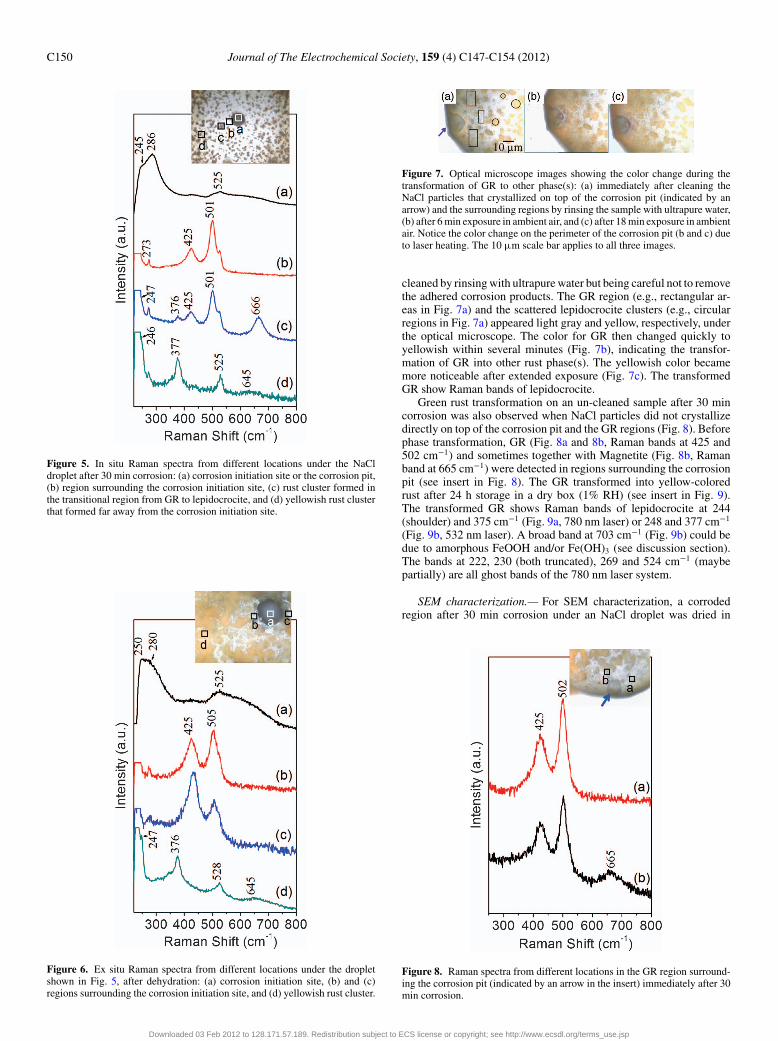
Inclusions present.— Corrosion always initiated in the form ofpits at inclusion sites if they were present.16 The composition (Table I,determined by EDXA) of an inclusion found in the 1018 steel surface(Fig. 4) shows a composition characteristic of slag, e.g., high contentof Al.
The corrosion morphologies for the cases with and without inclu-sions were similar, with the exception of the location of the corrosioninitiation site. Raman analyzes for cases with inclusions were alsosimilar to cases without inclusions: GR was formed at and aroundthe vicinity of the corrosion initiation sites and surrounding yellowishrust clusters on uncorroded substrate consisted of lepidocrocite.
Figure 4. An inclusion found in the surface of a polished 1018 steel sample.
Longer exposure (30 min). In situ Raman spectroscopy.— Forlonger exposure times (30 min), it was possible to conduct in situRaman analyzes due to the greater amount of corrosion products.
The Raman spectrum from the corrosion pit (Fig. 5a) shows adoublet at 245 and 286 cm−1, assigned to FeCl2 (that can precipi-tate onto the pit wall) and its chlorides ions, such as FeCl4
2− and/orFeCl3
− (see discussion section). The weak broad bands in the rangeof 350–750 cm−1 (except that at 525 cm−1 due to system ghosts) werepossibly caused by FeCl2. In the vicinity just outside of the pit, GRwas detected with Raman bands at 425 and 501 cm−1 (Fig. 5b). In thedensely populated yellowish rust clusters outside of the GR region,lepidocrocite was detected with three main bands at 246 (shoulder),377 and 525 cm−1, and a barely discernable broad band at 645 cm−1
(Fig. 5d). In the transitional region from GR to lepidocrocite, mag-netite (666 cm−1), GR (425 and 501 cm−1) and lepidocrocite (247(shoulder) and 376 cm−1) were detected (Fig. 5c). The Raman bandsat 226, 235 (both truncated), and 273 cm−1 in Fig. 5b–5d and 525cm−1 in Fig. 5a–5d (partially for Fig. 5d) are ghost bands obtainedusing the 780 nm laser system.
Ex situ Raman spectroscopy.— After 30 min of corrosion, thesample was removed from the humidity chamber. The NaCl dropletsolution evaporated in ambient humidity (58% RH) within 5 min,leaving crystallized NaCl particles on top of the droplet corrosionarea. Ex situ Raman spectra were obtained from the droplet corrosionarea immediately after drying and before some rust were oxidized inambient air. Similar to the previous in situ Raman analyzes, the exsitu Raman spectrum from the corrosion pit (Fig. 6a) shows the pres-ence of FeCl2 with a Raman band at 250 cm−1, but with diminishingintensity for the Raman band at 280 cm−1 for its chloride ions. TheRaman spectra from regions surrounding the corrosion pit show typi-cal GR bands at 425 and 505 cm−1 (Fig. 6b and 6c) also with variedband intensity ratios of the two bands. The Raman spectrum from theyellowish rust clusters outside of the GR region shows Raman bandsof lepidocrocite at 247, 376, 528, and 645 cm−1 (Fig. 6d).
Oxidation and transformation of GR.— Green rust is unstable andcan be oxidized in air under ambient conditions. The GR in a corrodedregion rinsed with ultrapure water and dried with compressed nitro-gen following 30 min corrosion under a NaCl droplet experiencedoxidation and phase transformation after extended exposure in am-bient environment (Fig. 7). The NaCl particles crystallized on top ofthe corrosion pit (arrow in Fig. 7a) and the surrounding regions were
Table I. The chemical composition of the inclusion shown in Fig. 4 using EDXA.
Element C O Mg Al Si S Ca Mn Fe Au(coating)
Weight% 5.19 28.73 2.86 25.04 0.21 2.00 7.66 1.02 23.45 3.84Atomic% 10.83 44.97 2.95 23.25 0.18 1.57 4.79 0.47 10.52 0.49
Downloaded 03 Feb 2012 to 128.171.57.189. Redistribution subject to ECS license or copyright; see http://www.ecsdl.org/terms_use.jsp
C150 Journal of The Electrochemical Society, 159 (4) C147-C154 (2012)
Figure 5. In situ Raman spectra from different locations under the NaCldroplet after 30 min corrosion: (a) corrosion initiation site or the corrosion pit,(b) region surrounding the corrosion initiation site, (c) rust cluster formed inthe transitional region from GR to lepidocrocite, and (d) yellowish rust clusterthat formed far away from the corrosion initiation site.
Figure 6. Ex situ Raman spectra from different locations under the dropletshown in Fig. 5, after dehydration: (a) corrosion initiation site, (b) and (c)regions surrounding the corrosion initiation site, and (d) yellowish rust cluster.
Figure 7. Optical microscope images showing the color change during thetransformation of GR to other phase(s): (a) immediately after cleaning theNaCl particles that crystallized on top of the corrosion pit (indicated by anarrow) and the surrounding regions by rinsing the sample with ultrapure water,(b) after 6 min exposure in ambient air, and (c) after 18 min exposure in ambientair. Notice the color change on the perimeter of the corrosion pit (b and c) dueto laser heating. The 10 μm scale bar applies to all three images.
cleaned by rinsing with ultrapure water but being careful not to removethe adhered corrosion products. The GR region (e.g., rectangular ar-eas in Fig. 7a) and the scattered lepidocrocite clusters (e.g., circularregions in Fig. 7a) appeared light gray and yellow, respectively, underthe optical microscope. The color for GR then changed quickly toyellowish within several minutes (Fig. 7b), indicating the transfor-mation of GR into other rust phase(s). The yellowish color becamemore noticeable after extended exposure (Fig. 7c). The transformedGR show Raman bands of lepidocrocite.
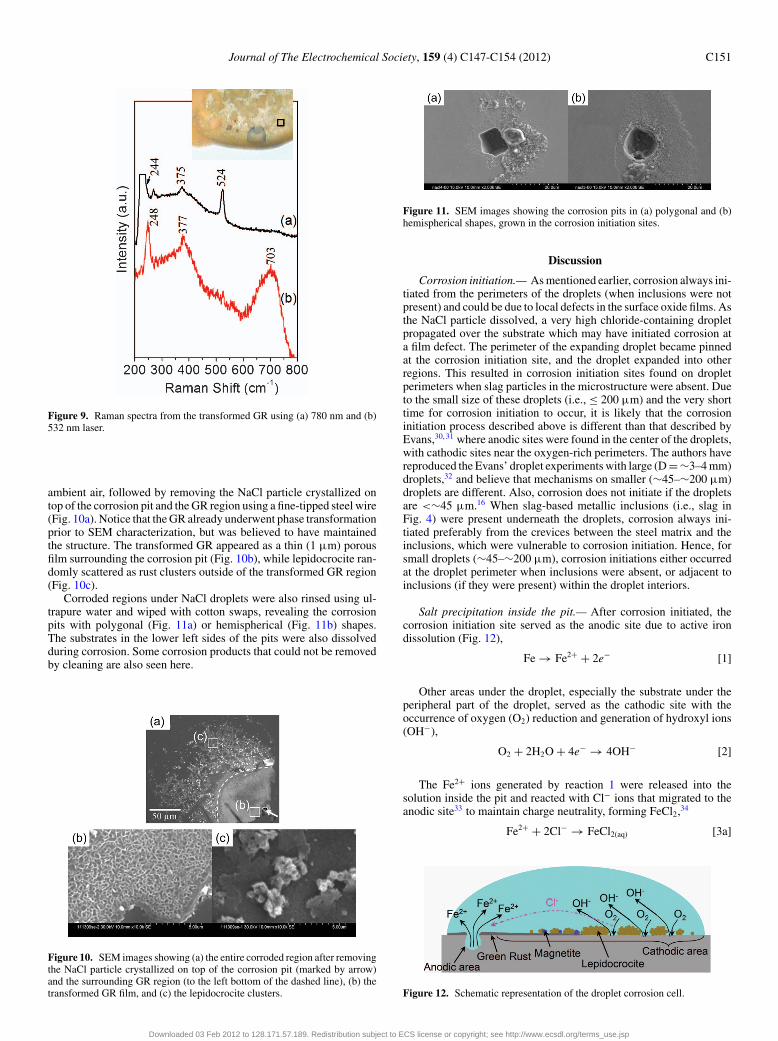
Green rust transformation on an un-cleaned sample after 30 mincorrosion was also observed when NaCl particles did not crystallizedirectly on top of the corrosion pit and the GR regions (Fig. 8). Beforephase transformation, GR (Fig. 8a and 8b, Raman bands at 425 and502 cm−1) and sometimes together with Magnetite (Fig. 8b, Ramanband at 665 cm−1) were detected in regions surrounding the corrosionpit (see insert in Fig. 8). The GR transformed into yellow-coloredrust after 24 h storage in a dry box (1% RH) (see insert in Fig. 9).The transformed GR shows Raman bands of lepidocrocite at 244(shoulder) and 375 cm−1 (Fig. 9a, 780 nm laser) or 248 and 377 cm−1
(Fig. 9b, 532 nm laser). A broad band at 703 cm−1 (Fig. 9b) could bedue to amorphous FeOOH and/or Fe(OH)3 (see discussion section).The bands at 222, 230 (both truncated), 269 and 524 cm−1 (maybepartially) are all ghost bands of the 780 nm laser system.
SEM characterization.— For SEM characterization, a corrodedregion after 30 min corrosion under an NaCl droplet was dried in
Figure 8. Raman spectra from different locations in the GR region surround-ing the corrosion pit (indicated by an arrow in the insert) immediately after 30min corrosion.
Downloaded 03 Feb 2012 to 128.171.57.189. Redistribution subject to ECS license or copyright; see http://www.ecsdl.org/terms_use.jsp
Journal of The Electrochemical Society, 159 (4) C147-C154 (2012) C151
Figure 9. Raman spectra from the transformed GR using (a) 780 nm and (b)532 nm laser.
ambient air, followed by removing the NaCl particle crystallized ontop of the corrosion pit and the GR region using a fine-tipped steel wire(Fig. 10a). Notice that the GR already underwent phase transformationprior to SEM characterization, but was believed to have maintainedthe structure. The transformed GR appeared as a thin (1 μm) porousfilm surrounding the corrosion pit (Fig. 10b), while lepidocrocite ran-domly scattered as rust clusters outside of the transformed GR region(Fig. 10c).
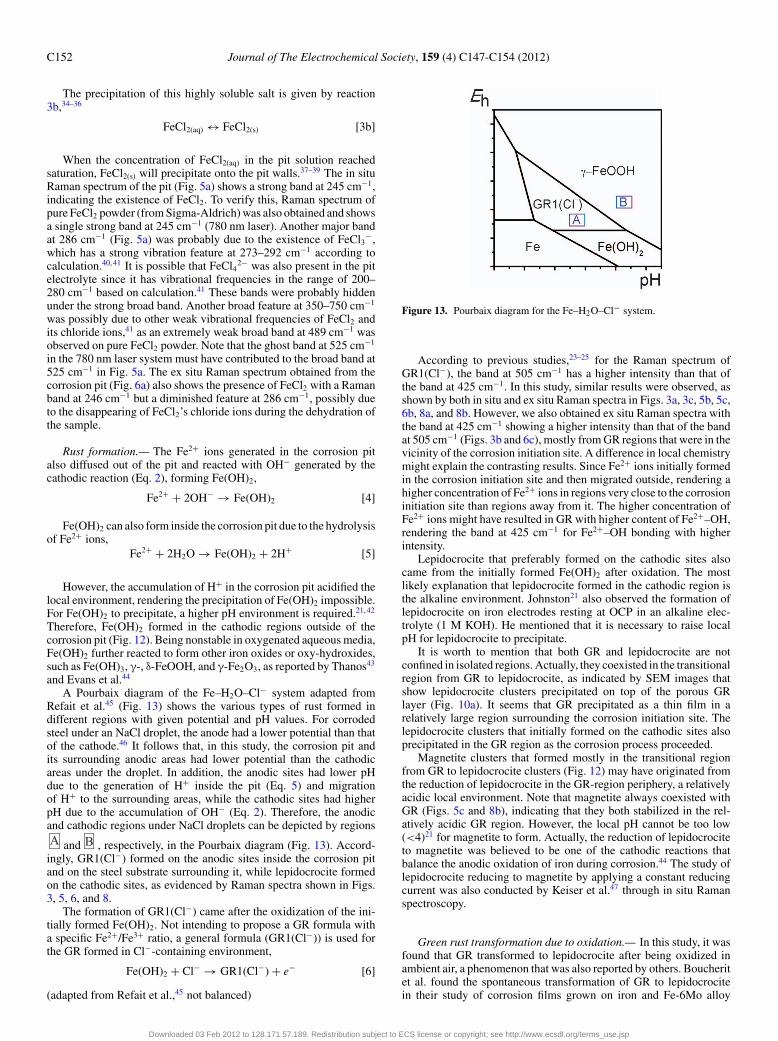
Corroded regions under NaCl droplets were also rinsed using ul-trapure water and wiped with cotton swaps, revealing the corrosionpits with polygonal (Fig. 11a) or hemispherical (Fig. 11b) shapes.The substrates in the lower left sides of the pits were also dissolvedduring corrosion. Some corrosion products that could not be removedby cleaning are also seen here.
Figure 10. SEM images showing (a) the entire corroded region after removingthe NaCl particle crystallized on top of the corrosion pit (marked by arrow)and the surrounding GR region (to the left bottom of the dashed line), (b) thetransformed GR film, and (c) the lepidocrocite clusters.
Figure 11. SEM images showing the corrosion pits in (a) polygonal and (b)hemispherical shapes, grown in the corrosion initiation sites.
Discussion
Corrosion initiation.— As mentioned earlier, corrosion always ini-tiated from the perimeters of the droplets (when inclusions were notpresent) and could be due to local defects in the surface oxide films. Asthe NaCl particle dissolved, a very high chloride-containing dropletpropagated over the substrate which may have initiated corrosion ata film defect. The perimeter of the expanding droplet became pinnedat the corrosion initiation site, and the droplet expanded into otherregions. This resulted in corrosion initiation sites found on dropletperimeters when slag particles in the microstructure were absent. Dueto the small size of these droplets (i.e., ≤ 200 μm) and the very shorttime for corrosion initiation to occur, it is likely that the corrosioninitiation process described above is different than that described byEvans,30, 31 where anodic sites were found in the center of the droplets,with cathodic sites near the oxygen-rich perimeters. The authors havereproduced the Evans’ droplet experiments with large (D =∼3–4 mm)droplets,32 and believe that mechanisms on smaller (∼45–∼200 μm)droplets are different. Also, corrosion does not initiate if the dropletsare <∼45 μm.16 When slag-based metallic inclusions (i.e., slag inFig. 4) were present underneath the droplets, corrosion always ini-tiated preferably from the crevices between the steel matrix and theinclusions, which were vulnerable to corrosion initiation. Hence, forsmall droplets (∼45–∼200 μm), corrosion initiations either occurredat the droplet perimeter when inclusions were absent, or adjacent toinclusions (if they were present) within the droplet interiors.
Salt precipitation inside the pit.— After corrosion initiated, thecorrosion initiation site served as the anodic site due to active irondissolution (Fig. 12),
Fe → Fe2+ + 2e− [1]
Other areas under the droplet, especially the substrate under theperipheral part of the droplet, served as the cathodic site with theoccurrence of oxygen (O2) reduction and generation of hydroxyl ions(OH−),
O2 + 2H2O + 4e− → 4OH− [2]
The Fe2+ ions generated by reaction 1 were released into thesolution inside the pit and reacted with Cl− ions that migrated to theanodic site33 to maintain charge neutrality, forming FeCl2,34
Fe2+ + 2Cl− → FeCl2(aq) [3a]
Figure 12. Schematic representation of the droplet corrosion cell.
Downloaded 03 Feb 2012 to 128.171.57.189. Redistribution subject to ECS license or copyright; see http://www.ecsdl.org/terms_use.jsp
C152 Journal of The Electrochemical Society, 159 (4) C147-C154 (2012)
The precipitation of this highly soluble salt is given by reaction3b,34–36
FeCl2(aq) ↔ FeCl2(s) [3b]
When the concentration of FeCl2(aq) in the pit solution reachedsaturation, FeCl2(s) will precipitate onto the pit walls.37–39 The in situRaman spectrum of the pit (Fig. 5a) shows a strong band at 245 cm−1,indicating the existence of FeCl2. To verify this, Raman spectrum ofpure FeCl2 powder (from Sigma-Aldrich) was also obtained and showsa single strong band at 245 cm−1 (780 nm laser). Another major bandat 286 cm−1 (Fig. 5a) was probably due to the existence of FeCl3
−,which has a strong vibration feature at 273–292 cm−1 according tocalculation.40, 41 It is possible that FeCl4
2− was also present in the pitelectrolyte since it has vibrational frequencies in the range of 200–280 cm−1 based on calculation.41 These bands were probably hiddenunder the strong broad band. Another broad feature at 350–750 cm−1
was possibly due to other weak vibrational frequencies of FeCl2 andits chloride ions,41 as an extremely weak broad band at 489 cm−1 wasobserved on pure FeCl2 powder. Note that the ghost band at 525 cm−1
in the 780 nm laser system must have contributed to the broad band at525 cm−1 in Fig. 5a. The ex situ Raman spectrum obtained from thecorrosion pit (Fig. 6a) also shows the presence of FeCl2 with a Ramanband at 246 cm−1 but a diminished feature at 286 cm−1, possibly dueto the disappearing of FeCl2’s chloride ions during the dehydration ofthe sample.
Rust formation.— The Fe2+ ions generated in the corrosion pitalso diffused out of the pit and reacted with OH− generated by thecathodic reaction (Eq. 2), forming Fe(OH)2,
Fe2+ + 2OH− → Fe(OH)2 [4]
Fe(OH)2 can also form inside the corrosion pit due to the hydrolysisof Fe2+ ions,
Fe2+ + 2H2O → Fe(OH)2 + 2H+ [5]
However, the accumulation of H+ in the corrosion pit acidified thelocal environment, rendering the precipitation of Fe(OH)2 impossible.For Fe(OH)2 to precipitate, a higher pH environment is required.21, 42
Therefore, Fe(OH)2 formed in the cathodic regions outside of thecorrosion pit (Fig. 12). Being nonstable in oxygenated aqueous media,Fe(OH)2 further reacted to form other iron oxides or oxy-hydroxides,such as Fe(OH)3, γ-, δ-FeOOH, and γ-Fe2O3, as reported by Thanos43
and Evans et al.44
A Pourbaix diagram of the Fe–H2O–Cl− system adapted fromRefait et al.45 (Fig. 13) shows the various types of rust formed indifferent regions with given potential and pH values. For corrodedsteel under an NaCl droplet, the anode had a lower potential than thatof the cathode.46 It follows that, in this study, the corrosion pit andits surrounding anodic areas had lower potential than the cathodicareas under the droplet. In addition, the anodic sites had lower pHdue to the generation of H+ inside the pit (Eq. 5) and migrationof H+ to the surrounding areas, while the cathodic sites had higherpH due to the accumulation of OH− (Eq. 2). Therefore, the anodicand cathodic regions under NaCl droplets can be depicted by regionsA and B , respectively, in the Pourbaix diagram (Fig. 13). Accord-
ingly, GR1(Cl−) formed on the anodic sites inside the corrosion pitand on the steel substrate surrounding it, while lepidocrocite formedon the cathodic sites, as evidenced by Raman spectra shown in Figs.3, 5, 6, and 8.
The formation of GR1(Cl−) came after the oxidization of the ini-tially formed Fe(OH)2. Not intending to propose a GR formula witha specific Fe2+/Fe3+ ratio, a general formula (GR1(Cl−)) is used forthe GR formed in Cl−-containing environment,
Fe(OH)2 + Cl− → GR1(Cl−) + e− [6]
(adapted from Refait et al.,45 not balanced)
Figure 13. Pourbaix diagram for the Fe–H2O–Cl− system.
According to previous studies,23–25 for the Raman spectrum ofGR1(Cl−), the band at 505 cm−1 has a higher intensity than that ofthe band at 425 cm−1. In this study, similar results were observed, asshown by both in situ and ex situ Raman spectra in Figs. 3a, 3c, 5b, 5c,6b, 8a, and 8b. However, we also obtained ex situ Raman spectra withthe band at 425 cm−1 showing a higher intensity than that of the bandat 505 cm−1 (Figs. 3b and 6c), mostly from GR regions that were in thevicinity of the corrosion initiation site. A difference in local chemistrymight explain the contrasting results. Since Fe2+ ions initially formedin the corrosion initiation site and then migrated outside, rendering ahigher concentration of Fe2+ ions in regions very close to the corrosioninitiation site than regions away from it. The higher concentration ofFe2+ ions might have resulted in GR with higher content of Fe2+–OH,rendering the band at 425 cm−1 for Fe2+–OH bonding with higherintensity.
Lepidocrocite that preferably formed on the cathodic sites alsocame from the initially formed Fe(OH)2 after oxidation. The mostlikely explanation that lepidocrocite formed in the cathodic region isthe alkaline environment. Johnston21 also observed the formation oflepidocrocite on iron electrodes resting at OCP in an alkaline elec-trolyte (1 M KOH). He mentioned that it is necessary to raise localpH for lepidocrocite to precipitate.
It is worth to mention that both GR and lepidocrocite are notconfined in isolated regions. Actually, they coexisted in the transitionalregion from GR to lepidocrocite, as indicated by SEM images thatshow lepidocrocite clusters precipitated on top of the porous GRlayer (Fig. 10a). It seems that GR precipitated as a thin film in arelatively large region surrounding the corrosion initiation site. Thelepidocrocite clusters that initially formed on the cathodic sites alsoprecipitated in the GR region as the corrosion process proceeded.
Magnetite clusters that formed mostly in the transitional regionfrom GR to lepidocrocite clusters (Fig. 12) may have originated fromthe reduction of lepidocrocite in the GR-region periphery, a relativelyacidic local environment. Note that magnetite always coexisted withGR (Figs. 5c and 8b), indicating that they both stabilized in the rel-atively acidic GR region. However, the local pH cannot be too low(<4)21 for magnetite to form. Actually, the reduction of lepidocrociteto magnetite was believed to be one of the cathodic reactions thatbalance the anodic oxidation of iron during corrosion.44 The study oflepidocrocite reducing to magnetite by applying a constant reducingcurrent was also conducted by Keiser et al.47 through in situ Ramanspectroscopy.
Green rust transformation due to oxidation.— In this study, it wasfound that GR transformed to lepidocrocite after being oxidized inambient air, a phenomenon that was also reported by others. Boucheritet al. found the spontaneous transformation of GR to lepidocrocitein their study of corrosion films grown on iron and Fe-6Mo alloy
Downloaded 03 Feb 2012 to 128.171.57.189. Redistribution subject to ECS license or copyright; see http://www.ecsdl.org/terms_use.jsp
Journal of The Electrochemical Society, 159 (4) C147-C154 (2012) C153
Figure 14. Raman spectrum from laser induced lepidocrocite. Inserts: opticalmicroscope images of the GR region close to the corrosion pit (marked byarrow) (a) before and (b) after acquiring the Raman spectrum.
in conditions including pitting,23 and to other iron oxides and oxy-hydroxides in other environments.24
Unlike the Raman spectra from lepidocrocite clusters (Figs. 3d,5d, and 6d), those from the transformed GR (Fig. 9a and 9b) do notshow sharp bands at ∼377 cm−1, possibly due to the existence ofother phases, especially amorphous phases, which broaden the bandat ∼377 cm−1. The broad band at 703 cm−1 could be ascribed toamorphous FeOOH and/or Fe(OH)3. Keiser et al.48 found that theRaman spectrum of amorphous FeOOH consists of only one broadband at 700 cm−1. Dunnwald et al.49 found the formation of amorphousFeOOH and/or Fe(OH)3 with Raman band at 701 cm−1 from an ironelectrode corroded in an SO2-containing atmosphere for 1 h. Fe(OH)3
might have come from the oxidation of Fe(OH)2, and amorphousFeOOH was possibly another transformed phase from GR.
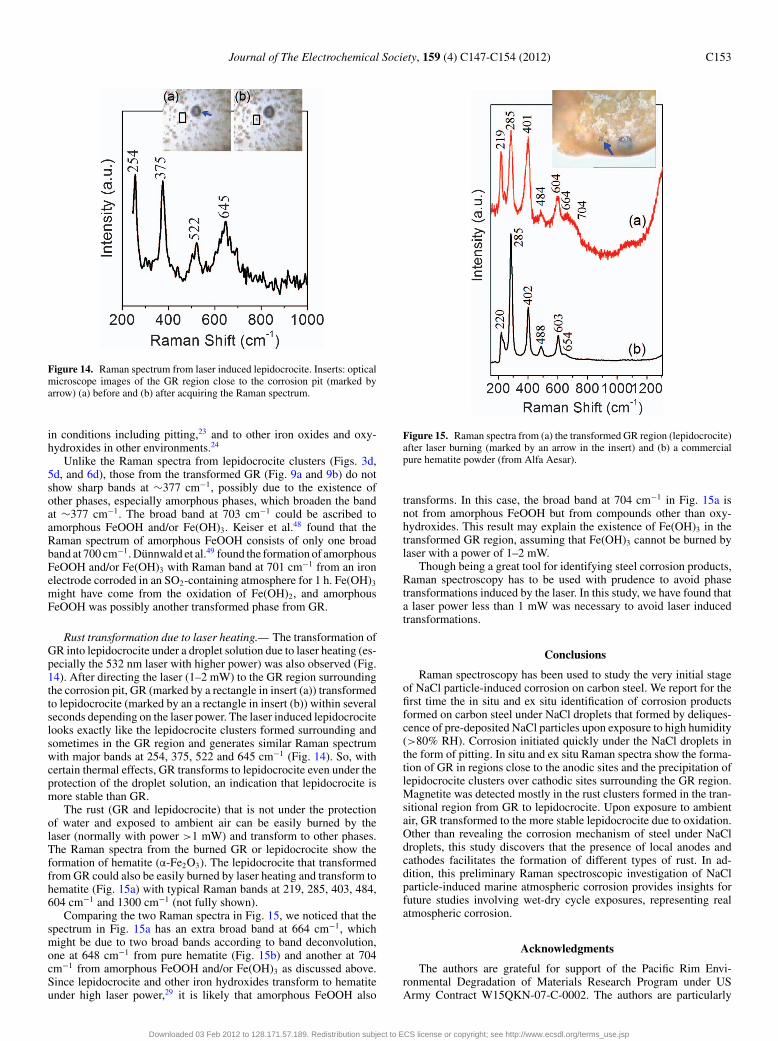
Rust transformation due to laser heating.— The transformation ofGR into lepidocrocite under a droplet solution due to laser heating (es-pecially the 532 nm laser with higher power) was also observed (Fig.14). After directing the laser (1–2 mW) to the GR region surroundingthe corrosion pit, GR (marked by a rectangle in insert (a)) transformedto lepidocrocite (marked by an a rectangle in insert (b)) within severalseconds depending on the laser power. The laser induced lepidocrocitelooks exactly like the lepidocrocite clusters formed surrounding andsometimes in the GR region and generates similar Raman spectrumwith major bands at 254, 375, 522 and 645 cm−1 (Fig. 14). So, withcertain thermal effects, GR transforms to lepidocrocite even under theprotection of the droplet solution, an indication that lepidocrocite ismore stable than GR.
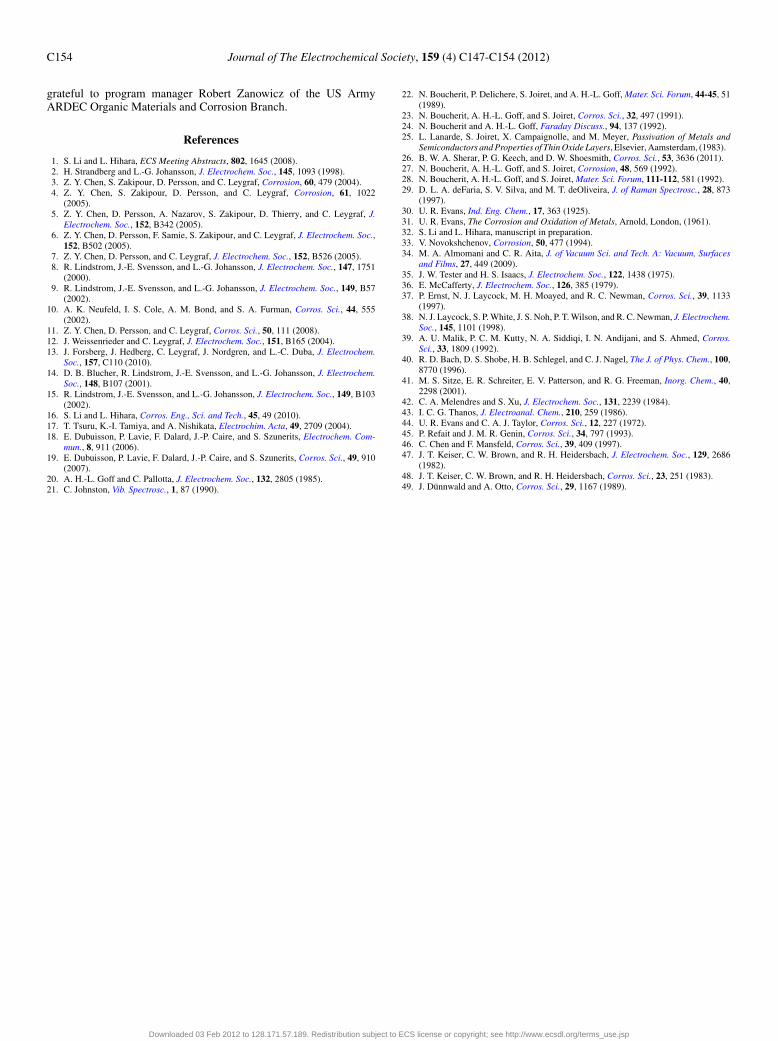
The rust (GR and lepidocrocite) that is not under the protectionof water and exposed to ambient air can be easily burned by thelaser (normally with power >1 mW) and transform to other phases.The Raman spectra from the burned GR or lepidocrocite show theformation of hematite (α-Fe2O3). The lepidocrocite that transformedfrom GR could also be easily burned by laser heating and transform tohematite (Fig. 15a) with typical Raman bands at 219, 285, 403, 484,604 cm−1 and 1300 cm−1 (not fully shown).
Comparing the two Raman spectra in Fig. 15, we noticed that thespectrum in Fig. 15a has an extra broad band at 664 cm−1, whichmight be due to two broad bands according to band deconvolution,one at 648 cm−1 from pure hematite (Fig. 15b) and another at 704cm−1 from amorphous FeOOH and/or Fe(OH)3 as discussed above.Since lepidocrocite and other iron hydroxides transform to hematiteunder high laser power,29 it is likely that amorphous FeOOH also
Figure 15. Raman spectra from (a) the transformed GR region (lepidocrocite)after laser burning (marked by an arrow in the insert) and (b) a commercialpure hematite powder (from Alfa Aesar).
transforms. In this case, the broad band at 704 cm−1 in Fig. 15a isnot from amorphous FeOOH but from compounds other than oxy-hydroxides. This result may explain the existence of Fe(OH)3 in thetransformed GR region, assuming that Fe(OH)3 cannot be burned bylaser with a power of 1–2 mW.
Though being a great tool for identifying steel corrosion products,Raman spectroscopy has to be used with prudence to avoid phasetransformations induced by the laser. In this study, we have found thata laser power less than 1 mW was necessary to avoid laser inducedtransformations.
Conclusions
Raman spectroscopy has been used to study the very initial stageof NaCl particle-induced corrosion on carbon steel. We report for thefirst time the in situ and ex situ identification of corrosion productsformed on carbon steel under NaCl droplets that formed by deliques-cence of pre-deposited NaCl particles upon exposure to high humidity(>80% RH). Corrosion initiated quickly under the NaCl droplets inthe form of pitting. In situ and ex situ Raman spectra show the forma-tion of GR in regions close to the anodic sites and the precipitation oflepidocrocite clusters over cathodic sites surrounding the GR region.Magnetite was detected mostly in the rust clusters formed in the tran-sitional region from GR to lepidocrocite. Upon exposure to ambientair, GR transformed to the more stable lepidocrocite due to oxidation.Other than revealing the corrosion mechanism of steel under NaCldroplets, this study discovers that the presence of local anodes andcathodes facilitates the formation of different types of rust. In ad-dition, this preliminary Raman spectroscopic investigation of NaClparticle-induced marine atmospheric corrosion provides insights forfuture studies involving wet-dry cycle exposures, representing realatmospheric corrosion.
Acknowledgments
The authors are grateful for support of the Pacific Rim Envi-ronmental Degradation of Materials Research Program under USArmy Contract W15QKN-07-C-0002. The authors are particularly
Downloaded 03 Feb 2012 to 128.171.57.189. Redistribution subject to ECS license or copyright; see http://www.ecsdl.org/terms_use.jsp
C154 Journal of The Electrochemical Society, 159 (4) C147-C154 (2012)
grateful to program manager Robert Zanowicz of the US ArmyARDEC Organic Materials and Corrosion Branch.
References
1. S. Li and L. Hihara, ECS Meeting Abstracts, 802, 1645 (2008).2. H. Strandberg and L.-G. Johansson, J. Electrochem. Soc., 145, 1093 (1998).3. Z. Y. Chen, S. Zakipour, D. Persson, and C. Leygraf, Corrosion, 60, 479 (2004).4. Z. Y. Chen, S. Zakipour, D. Persson, and C. Leygraf, Corrosion, 61, 1022
(2005).5. Z. Y. Chen, D. Persson, A. Nazarov, S. Zakipour, D. Thierry, and C. Leygraf, J.
Electrochem. Soc., 152, B342 (2005).6. Z. Y. Chen, D. Persson, F. Samie, S. Zakipour, and C. Leygraf, J. Electrochem. Soc.,
152, B502 (2005).7. Z. Y. Chen, D. Persson, and C. Leygraf, J. Electrochem. Soc., 152, B526 (2005).8. R. Lindstrom, J.-E. Svensson, and L.-G. Johansson, J. Electrochem. Soc., 147, 1751
(2000).9. R. Lindstrom, J.-E. Svensson, and L.-G. Johansson, J. Electrochem. Soc., 149, B57
(2002).10. A. K. Neufeld, I. S. Cole, A. M. Bond, and S. A. Furman, Corros. Sci., 44, 555
(2002).11. Z. Y. Chen, D. Persson, and C. Leygraf, Corros. Sci., 50, 111 (2008).12. J. Weissenrieder and C. Leygraf, J. Electrochem. Soc., 151, B165 (2004).13. J. Forsberg, J. Hedberg, C. Leygraf, J. Nordgren, and L.-C. Duba, J. Electrochem.
Soc., 157, C110 (2010).14. D. B. Blucher, R. Lindstrom, J.-E. Svensson, and L.-G. Johansson, J. Electrochem.
Soc., 148, B107 (2001).15. R. Lindstrom, J.-E. Svensson, and L.-G. Johansson, J. Electrochem. Soc., 149, B103
(2002).16. S. Li and L. Hihara, Corros. Eng., Sci. and Tech., 45, 49 (2010).17. T. Tsuru, K.-I. Tamiya, and A. Nishikata, Electrochim. Acta, 49, 2709 (2004).18. E. Dubuisson, P. Lavie, F. Dalard, J.-P. Caire, and S. Szunerits, Electrochem. Com-
mun., 8, 911 (2006).19. E. Dubuisson, P. Lavie, F. Dalard, J.-P. Caire, and S. Szunerits, Corros. Sci., 49, 910
(2007).20. A. H.-L. Goff and C. Pallotta, J. Electrochem. Soc., 132, 2805 (1985).21. C. Johnston, Vib. Spectrosc., 1, 87 (1990).
22. N. Boucherit, P. Delichere, S. Joiret, and A. H.-L. Goff, Mater. Sci. Forum, 44-45, 51(1989).
23. N. Boucherit, A. H.-L. Goff, and S. Joiret, Corros. Sci., 32, 497 (1991).24. N. Boucherit and A. H.-L. Goff, Faraday Discuss., 94, 137 (1992).25. L. Lanarde, S. Joiret, X. Campaignolle, and M. Meyer, Passivation of Metals and
Semiconductors and Properties of Thin Oxide Layers, Elsevier, Aamsterdam, (1983).26. B. W. A. Sherar, P. G. Keech, and D. W. Shoesmith, Corros. Sci., 53, 3636 (2011).27. N. Boucherit, A. H.-L. Goff, and S. Joiret, Corrosion, 48, 569 (1992).28. N. Boucherit, A. H.-L. Goff, and S. Joiret, Mater. Sci. Forum, 111-112, 581 (1992).29. D. L. A. deFaria, S. V. Silva, and M. T. deOliveira, J. of Raman Spectrosc., 28, 873
(1997).30. U. R. Evans, Ind. Eng. Chem., 17, 363 (1925).31. U. R. Evans, The Corrosion and Oxidation of Metals, Arnold, London, (1961).32. S. Li and L. Hihara, manuscript in preparation.33. V. Novokshchenov, Corrosion, 50, 477 (1994).34. M. A. Almomani and C. R. Aita, J. of Vacuum Sci. and Tech. A: Vacuum, Surfaces
and Films, 27, 449 (2009).35. J. W. Tester and H. S. Isaacs, J. Electrochem. Soc., 122, 1438 (1975).36. E. McCafferty, J. Electrochem. Soc., 126, 385 (1979).37. P. Ernst, N. J. Laycock, M. H. Moayed, and R. C. Newman, Corros. Sci., 39, 1133
(1997).38. N. J. Laycock, S. P. White, J. S. Noh, P. T. Wilson, and R. C. Newman, J. Electrochem.
Soc., 145, 1101 (1998).39. A. U. Malik, P. C. M. Kutty, N. A. Siddiqi, I. N. Andijani, and S. Ahmed, Corros.
Sci., 33, 1809 (1992).40. R. D. Bach, D. S. Shobe, H. B. Schlegel, and C. J. Nagel, The J. of Phys. Chem., 100,
8770 (1996).41. M. S. Sitze, E. R. Schreiter, E. V. Patterson, and R. G. Freeman, Inorg. Chem., 40,
2298 (2001).42. C. A. Melendres and S. Xu, J. Electrochem. Soc., 131, 2239 (1984).43. I. C. G. Thanos, J. Electroanal. Chem., 210, 259 (1986).44. U. R. Evans and C. A. J. Taylor, Corros. Sci., 12, 227 (1972).45. P. Refait and J. M. R. Genin, Corros. Sci., 34, 797 (1993).46. C. Chen and F. Mansfeld, Corros. Sci., 39, 409 (1997).47. J. T. Keiser, C. W. Brown, and R. H. Heidersbach, J. Electrochem. Soc., 129, 2686
(1982).48. J. T. Keiser, C. W. Brown, and R. H. Heidersbach, Corros. Sci., 23, 251 (1983).49. J. Dunnwald and A. Otto, Corros. Sci., 29, 1167 (1989).
Downloaded 03 Feb 2012 to 128.171.57.189. Redistribution subject to ECS license or copyright; see http://www.ecsdl.org/terms_use.jsp