Embed Size (px)
Citation preview
Available online at www.sciencedirect.com
www.elsevier.com/locate/corsci
Corrosion Science 50 (2008) 995–1004
Corrosion characterization of tin–lead and lead free soldersin 3.5 wt.% NaCl solution
Dezhi Li *, Paul P. Conway, Changqing Liu
Wolfson School of Mechanical and Manufacturing Engineering, Loughborough University, Loughborough, Leicestershire LE11 3TU, UK
Received 7 February 2007; accepted 1 November 2007Available online 24 January 2008
Abstract
The corrosion resistance of Sn–Pb and several candidate lead free solders were investigated in 3.5 wt.% NaCl solution through poten-tiodynamic polarisation. Results showed that in NaCl solution lead free solders had better corrosion resistance than Sn–Pb solder andthe corrosion resistance of lead free solders was similar, but the corrosion resistance of Sn–Ag solder was better than that of Sn–Ag–Cuand Sn–Cu solders. The corrosion products for Sn–Pb solder had a two-layered structure with Sn-rich phases at the outer layer andlooser Pb-rich phases at the inner layer. The loose Pb-rich layer was detrimental to the corrosion property. The corrosion product onthe surface of all these solders was tin oxide chloride hydroxide.� 2007 Elsevier Ltd. All rights reserved.
Keywords: A. Eutectic Sn–Pb solder; A. Lead free solders; B. Potentiodynamic polarisation; C. Passivation film
1. Introduction
Sn–Pb solders have been widely used in electronic indus-tries due to their low cost, good solderability, low meltingtemperature and satisfactory mechanical properties. How-ever, due to recent legislation and market pressures, Pb isbeing removed from electronic products [1]. Many lead freesolders have been studied as replacements for Sn–Pb solders,and among them Sn–3.5Ag, Sn–0.7Cu and Sn–3.8Ag–0.7Cusolders are the most promising candidates owing to theiroverall properties, including mechanical properties, wetta-bility, reflow properties and reliability [2,3]. However, theproperties of these lead free alloys in corrosive environmentshas not been widely reported, though it is of importance inmany automotive, aerospace, maritime and defenceapplications.
Fig. 1 shows the schematic structure of solder joints in aflip chip package, in which solder is used to connect thepads on the chip and the print circuit board (PCB). The
0010-938X/$ - see front matter � 2007 Elsevier Ltd. All rights reserved.
doi:10.1016/j.corsci.2007.11.025
* Corresponding author. Tel.: +44 0 1509 227568; fax: +44 0 1509227549.
E-mail address: [email protected] (D. Li).
material for the pads on chip is normally Cu or Al, andunder bump metallisations (UBMs) are deposited on topof the pads to increase the wettability and/or act as a diffu-sion barrier. The material for the pads on PCB is normallyCu, and for the same functions of UBM these pads canhave different surface finishes, such as immersion Au,immersion Ag and electroless Ni immersion Au, etc. In flipchip packaging, underfill materials are used to fill the gapbetween chip and PCB, such that the mechanical propertiesand reliability of the package are increased and the solderjoints are protected from working environments; however,the underfill materials still absorb moisture and corrosionmedia and cause the corrosion of solders. For some otherelectronic packaging methods, e.g. wire bonding, solderswill be exposed directly to corrosion media, such as air,moisture, air pollutants from industry and oceanic environ-ments, depending on their application. In order to have ahigh reliability, solder materials must be resistant to suchcorrosion media. Although currently corrosion of solderalloys is not a major problem for electronic devices usedin normal environment, it may be a problem when theyare used in a harsh environment, such as oceanic environ-ments. In addition, any halide-containing contamination
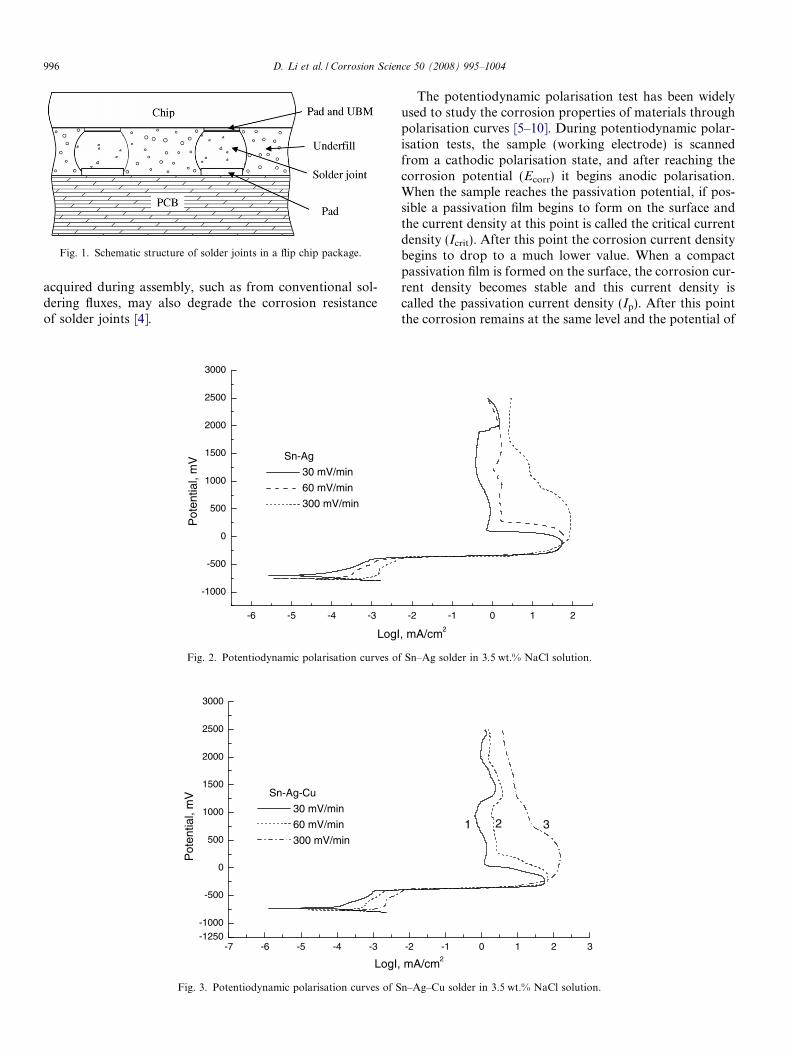
Fig. 1. Schematic structure of solder joints in a flip chip package.
996 D. Li et al. / Corrosion Science 50 (2008) 995–1004
acquired during assembly, such as from conventional sol-dering fluxes, may also degrade the corrosion resistanceof solder joints [4].
-6 -5 -4 -3
-1000
-500
0
500
1000
1500
2000
2500
3000
Sn-Ag
30 mV/min
60 mV/min
300 mV/min
Pot
entia
l, m
V
LogI
Fig. 2. Potentiodynamic polarisation curves o
-7 -6 -5 -4 -3-1250-1000
-500
0
500
1000
1500
2000
2500
3000
Sn-Ag-Cu
30 mV/min
60 mV/min
300 mV/min
Pot
entia
l, m
V
LogI,
Fig. 3. Potentiodynamic polarisation curves of S
The potentiodynamic polarisation test has been widelyused to study the corrosion properties of materials throughpolarisation curves [5–10]. During potentiodynamic polar-isation tests, the sample (working electrode) is scannedfrom a cathodic polarisation state, and after reaching thecorrosion potential (Ecorr) it begins anodic polarisation.When the sample reaches the passivation potential, if pos-sible a passivation film begins to form on the surface andthe current density at this point is called the critical currentdensity (Icrit). After this point the corrosion current densitybegins to drop to a much lower value. When a compactpassivation film is formed on the surface, the corrosion cur-rent density becomes stable and this current density iscalled the passivation current density (Ip). After this pointthe corrosion remains at the same level and the potential of
-2 -1 0 1 2
, mA/cm2
f Sn–Ag solder in 3.5 wt.% NaCl solution.
-2 -1 0 1 2 3
321
mA/cm2
n–Ag–Cu solder in 3.5 wt.% NaCl solution.
D. Li et al. / Corrosion Science 50 (2008) 995–1004 997
the sample will increase continually until the potentialreaches the breakdown potential. At this point the passiv-ation film begins to break and pitting corrosion happensto the material underneath, resulting in an increase of thecorrosion current density.
Some researchers have studied the corrosion behaviourof Sn–Zn–X solders [5,10], Sn–In–Ag solder [11] and Sn–Zn–Ag–Al–XGa [12], but few [13,14] have studied the cor-rosion properties of Sn–Ag, Sn–Cu and Sn–Ag–Cu solders.
In this research, 3.5 wt.% NaCl solution was used tosimulate sea water, and the corrosion properties of Sn–3.5Ag, Sn–0.7Cu and Sn–3.8Ag–0.7Cu solders in this solu-tion were studied through potentiodynamic polarisationtests and compared with that of eutectic Sn–Pb solder.The results may be used as a guideline for choosing soldermaterials for electronic used in oceanic environments whenthe previous used Sn–Pb solder has to be replaced by a leadfree one.
2. Experimental procedures
In order to test the corrosion resistance of solder mate-rials, a potentiodynamic polarisation test was conducted toobtain polarisation curves using an AutoTafel potentiostat(ACM Instruments, UK). The solders used in the corrosiontests were Sn–3.8Ag–0.7Cu, Sn–3.5Ag and Sn–0.7Cu leadfree bulk materials with a eutectic Sn–Pb bulk solder usedas a reference. The corrosion media used was 3.5 wt.%NaCl solution, which was used to simulate sea water. Afterthe solder materials were cut into blocks (about10 mm � 10 mm � 10 mm), copper wires with a plasticinsulating layer were soldered to them at the opposite faceof the blocks to the working surface, and then the sampleswere mounted with SAMPL-KWICK (Buehler Ltd, UK)mounting material. The samples were polished up to SiCpaper grit 1200 and then washed with deionised water
-6 -5 -4 -3 -
-1000
-500
0
500
1000
1500
2000
2500
3000
Sn-Cu
30 mV/min 60 mV/min 300 mV/min
Pot
entia
l, m
V
LogI,
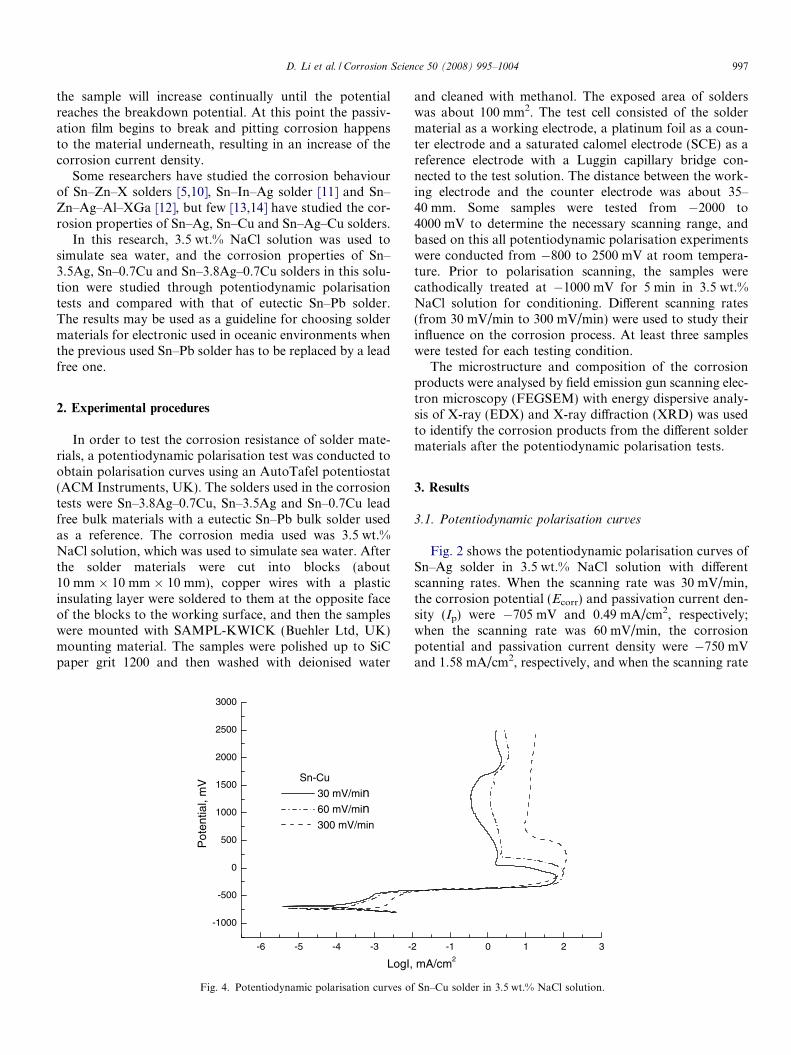
Fig. 4. Potentiodynamic polarisation curves o
and cleaned with methanol. The exposed area of solderswas about 100 mm2. The test cell consisted of the soldermaterial as a working electrode, a platinum foil as a coun-ter electrode and a saturated calomel electrode (SCE) as areference electrode with a Luggin capillary bridge con-nected to the test solution. The distance between the work-ing electrode and the counter electrode was about 35–40 mm. Some samples were tested from �2000 to4000 mV to determine the necessary scanning range, andbased on this all potentiodynamic polarisation experimentswere conducted from �800 to 2500 mV at room tempera-ture. Prior to polarisation scanning, the samples werecathodically treated at �1000 mV for 5 min in 3.5 wt.%NaCl solution for conditioning. Different scanning rates(from 30 mV/min to 300 mV/min) were used to study theirinfluence on the corrosion process. At least three sampleswere tested for each testing condition.
The microstructure and composition of the corrosionproducts were analysed by field emission gun scanning elec-tron microscopy (FEGSEM) with energy dispersive analy-sis of X-ray (EDX) and X-ray diffraction (XRD) was usedto identify the corrosion products from the different soldermaterials after the potentiodynamic polarisation tests.
3. Results
3.1. Potentiodynamic polarisation curves
Fig. 2 shows the potentiodynamic polarisation curves ofSn–Ag solder in 3.5 wt.% NaCl solution with differentscanning rates. When the scanning rate was 30 mV/min,the corrosion potential (Ecorr) and passivation current den-sity (Ip) were �705 mV and 0.49 mA/cm2, respectively;when the scanning rate was 60 mV/min, the corrosionpotential and passivation current density were �750 mVand 1.58 mA/cm2, respectively, and when the scanning rate
2 -1 0 1 2 3
mA/cm2
f Sn–Cu solder in 3.5 wt.% NaCl solution.
-7 -6 -5 -4 -3 -2 -1 0 1 2
-1000
-500
0
500
1000
1500
2000
2500
3000
Sn-Pb
30 mV/min
60 mV/min
300 mV/min
Pot
entia
l, m
V
LogI, mA/cm2
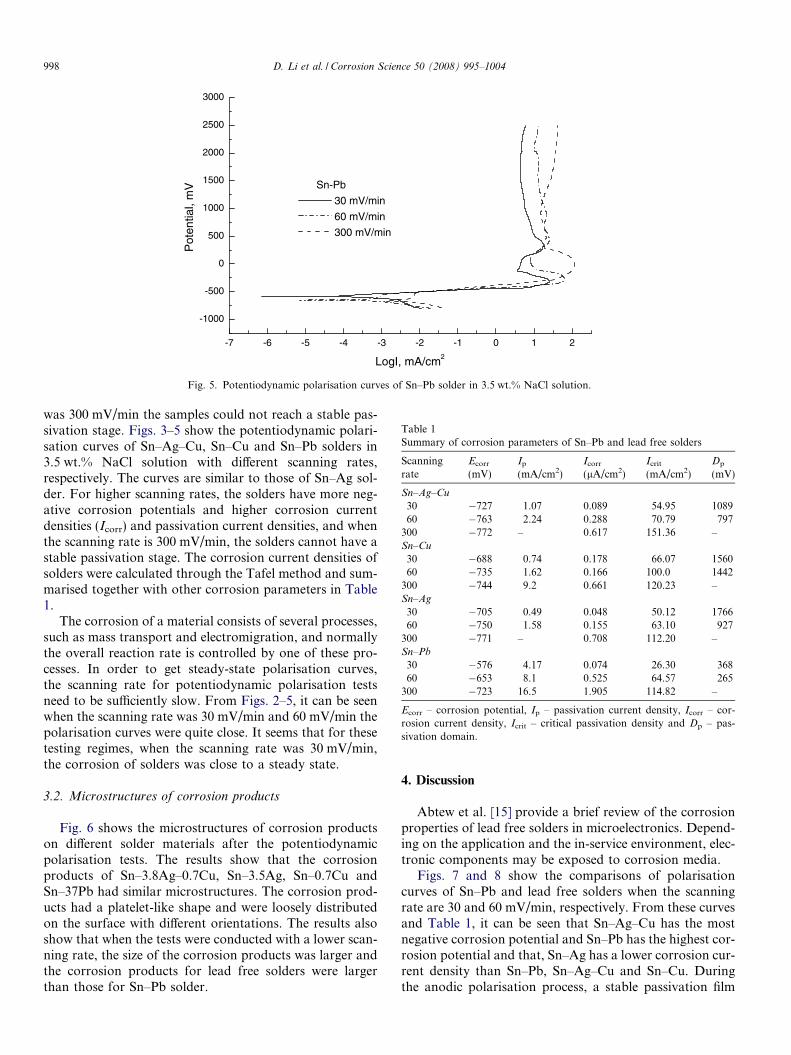
Fig. 5. Potentiodynamic polarisation curves of Sn–Pb solder in 3.5 wt.% NaCl solution.
Table 1Summary of corrosion parameters of Sn–Pb and lead free solders
Scanningrate
Ecorr
(mV)Ip
(mA/cm2)Icorr
(lA/cm2)Icrit
(mA/cm2)Dp
(mV)
Sn–Ag–Cu
30 �727 1.07 0.089 54.95 108960 �763 2.24 0.288 70.79 797
300 �772 – 0.617 151.36 –Sn–Cu
30 �688 0.74 0.178 66.07 156060 �735 1.62 0.166 100.0 1442
300 �744 9.2 0.661 120.23 –Sn–Ag
30 �705 0.49 0.048 50.12 176660 �750 1.58 0.155 63.10 927
300 �771 – 0.708 112.20 –Sn–Pb
30 �576 4.17 0.074 26.30 36860 �653 8.1 0.525 64.57 265
300 �723 16.5 1.905 114.82 –
Ecorr – corrosion potential, Ip – passivation current density, Icorr – cor-rosion current density, Icrit – critical passivation density and Dp – pas-sivation domain.
998 D. Li et al. / Corrosion Science 50 (2008) 995–1004
was 300 mV/min the samples could not reach a stable pas-sivation stage. Figs. 3–5 show the potentiodynamic polari-sation curves of Sn–Ag–Cu, Sn–Cu and Sn–Pb solders in3.5 wt.% NaCl solution with different scanning rates,respectively. The curves are similar to those of Sn–Ag sol-der. For higher scanning rates, the solders have more neg-ative corrosion potentials and higher corrosion currentdensities (Icorr) and passivation current densities, and whenthe scanning rate is 300 mV/min, the solders cannot have astable passivation stage. The corrosion current densities ofsolders were calculated through the Tafel method and sum-marised together with other corrosion parameters in Table1.
The corrosion of a material consists of several processes,such as mass transport and electromigration, and normallythe overall reaction rate is controlled by one of these pro-cesses. In order to get steady-state polarisation curves,the scanning rate for potentiodynamic polarisation testsneed to be sufficiently slow. From Figs. 2–5, it can be seenwhen the scanning rate was 30 mV/min and 60 mV/min thepolarisation curves were quite close. It seems that for thesetesting regimes, when the scanning rate was 30 mV/min,the corrosion of solders was close to a steady state.
3.2. Microstructures of corrosion products
Fig. 6 shows the microstructures of corrosion productson different solder materials after the potentiodynamicpolarisation tests. The results show that the corrosionproducts of Sn–3.8Ag–0.7Cu, Sn–3.5Ag, Sn–0.7Cu andSn–37Pb had similar microstructures. The corrosion prod-ucts had a platelet-like shape and were loosely distributedon the surface with different orientations. The results alsoshow that when the tests were conducted with a lower scan-ning rate, the size of the corrosion products was larger andthe corrosion products for lead free solders were largerthan those for Sn–Pb solder.
4. Discussion
Abtew et al. [15] provide a brief review of the corrosionproperties of lead free solders in microelectronics. Depend-ing on the application and the in-service environment, elec-tronic components may be exposed to corrosion media.
Figs. 7 and 8 show the comparisons of polarisationcurves of Sn–Pb and lead free solders when the scanningrate are 30 and 60 mV/min, respectively. From these curvesand Table 1, it can be seen that Sn–Ag–Cu has the mostnegative corrosion potential and Sn–Pb has the highest cor-rosion potential and that, Sn–Ag has a lower corrosion cur-rent density than Sn–Pb, Sn–Ag–Cu and Sn–Cu. Duringthe anodic polarisation process, a stable passivation film
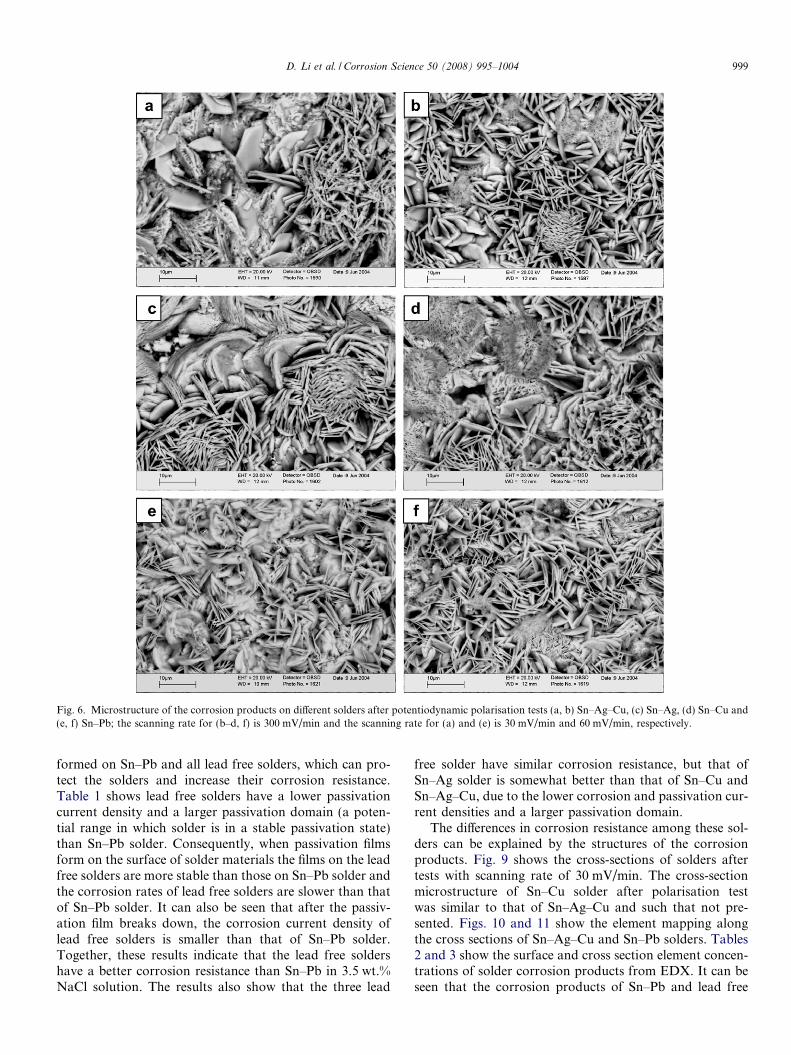
Fig. 6. Microstructure of the corrosion products on different solders after potentiodynamic polarisation tests (a, b) Sn–Ag–Cu, (c) Sn–Ag, (d) Sn–Cu and(e, f) Sn–Pb; the scanning rate for (b–d, f) is 300 mV/min and the scanning rate for (a) and (e) is 30 mV/min and 60 mV/min, respectively.
D. Li et al. / Corrosion Science 50 (2008) 995–1004 999
formed on Sn–Pb and all lead free solders, which can pro-tect the solders and increase their corrosion resistance.Table 1 shows lead free solders have a lower passivationcurrent density and a larger passivation domain (a poten-tial range in which solder is in a stable passivation state)than Sn–Pb solder. Consequently, when passivation filmsform on the surface of solder materials the films on the leadfree solders are more stable than those on Sn–Pb solder andthe corrosion rates of lead free solders are slower than thatof Sn–Pb solder. It can also be seen that after the passiv-ation film breaks down, the corrosion current density oflead free solders is smaller than that of Sn–Pb solder.Together, these results indicate that the lead free soldershave a better corrosion resistance than Sn–Pb in 3.5 wt.%NaCl solution. The results also show that the three lead
free solder have similar corrosion resistance, but that ofSn–Ag solder is somewhat better than that of Sn–Cu andSn–Ag–Cu, due to the lower corrosion and passivation cur-rent densities and a larger passivation domain.
The differences in corrosion resistance among these sol-ders can be explained by the structures of the corrosionproducts. Fig. 9 shows the cross-sections of solders aftertests with scanning rate of 30 mV/min. The cross-sectionmicrostructure of Sn–Cu solder after polarisation testwas similar to that of Sn–Ag–Cu and such that not pre-sented. Figs. 10 and 11 show the element mapping alongthe cross sections of Sn–Ag–Cu and Sn–Pb solders. Tables2 and 3 show the surface and cross section element concen-trations of solder corrosion products from EDX. It can beseen that the corrosion products of Sn–Pb and lead free
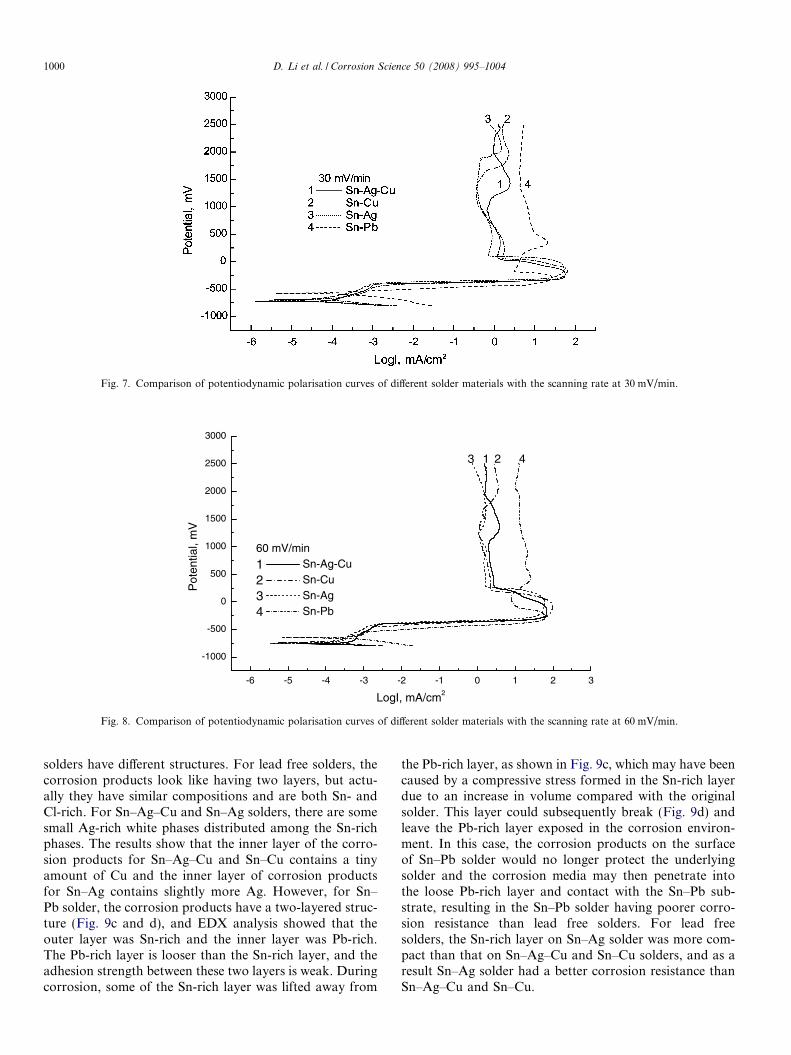
Fig. 7. Comparison of potentiodynamic polarisation curves of different solder materials with the scanning rate at 30 mV/min.
-6 -5 -4 -3 -2 -1 0 1 2 3
-1000
-500
0
500
1000
1500
2000
2500
3000
43 21
60 mV/min
1 Sn-Ag-Cu
2 Sn-Cu
3 Sn-Ag
4 Sn-Pb
Pot
entia
l, m
V
LogI, mA/cm2
Fig. 8. Comparison of potentiodynamic polarisation curves of different solder materials with the scanning rate at 60 mV/min.
1000 D. Li et al. / Corrosion Science 50 (2008) 995–1004
solders have different structures. For lead free solders, thecorrosion products look like having two layers, but actu-ally they have similar compositions and are both Sn- andCl-rich. For Sn–Ag–Cu and Sn–Ag solders, there are somesmall Ag-rich white phases distributed among the Sn-richphases. The results show that the inner layer of the corro-sion products for Sn–Ag–Cu and Sn–Cu contains a tinyamount of Cu and the inner layer of corrosion productsfor Sn–Ag contains slightly more Ag. However, for Sn–Pb solder, the corrosion products have a two-layered struc-ture (Fig. 9c and d), and EDX analysis showed that theouter layer was Sn-rich and the inner layer was Pb-rich.The Pb-rich layer is looser than the Sn-rich layer, and theadhesion strength between these two layers is weak. Duringcorrosion, some of the Sn-rich layer was lifted away from
the Pb-rich layer, as shown in Fig. 9c, which may have beencaused by a compressive stress formed in the Sn-rich layerdue to an increase in volume compared with the originalsolder. This layer could subsequently break (Fig. 9d) andleave the Pb-rich layer exposed in the corrosion environ-ment. In this case, the corrosion products on the surfaceof Sn–Pb solder would no longer protect the underlyingsolder and the corrosion media may then penetrate intothe loose Pb-rich layer and contact with the Sn–Pb sub-strate, resulting in the Sn–Pb solder having poorer corro-sion resistance than lead free solders. For lead freesolders, the Sn-rich layer on Sn–Ag solder was more com-pact than that on Sn–Ag–Cu and Sn–Cu solders, and as aresult Sn–Ag solder had a better corrosion resistance thanSn–Ag–Cu and Sn–Cu.
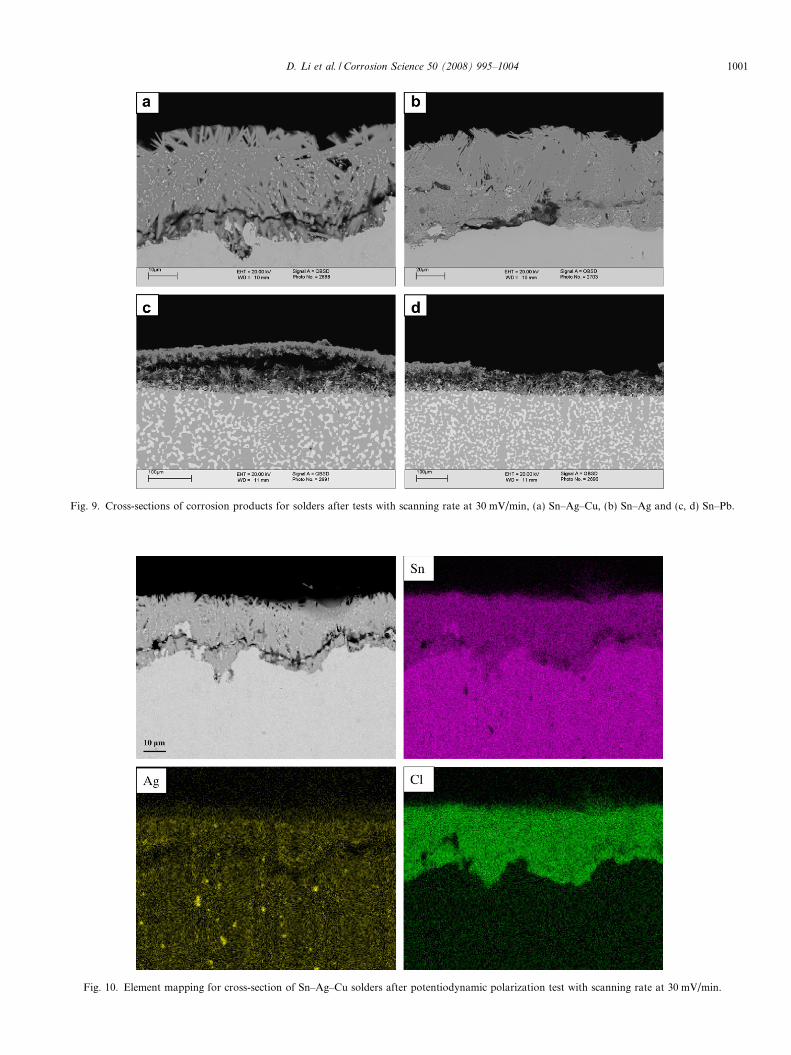
Fig. 9. Cross-sections of corrosion products for solders after tests with scanning rate at 30 mV/min, (a) Sn–Ag–Cu, (b) Sn–Ag and (c, d) Sn–Pb.
Fig. 10. Element mapping for cross-section of Sn–Ag–Cu solders after potentiodynamic polarization test with scanning rate at 30 mV/min.
D. Li et al. / Corrosion Science 50 (2008) 995–1004 1001
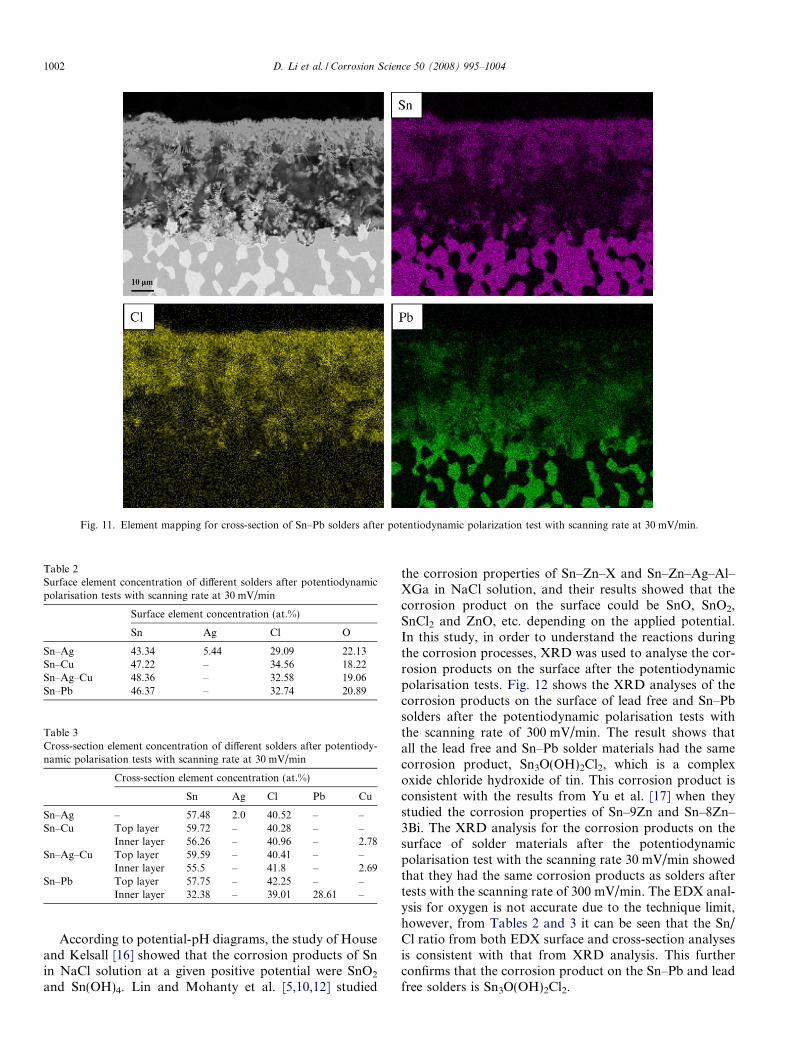
Fig. 11. Element mapping for cross-section of Sn–Pb solders after potentiodynamic polarization test with scanning rate at 30 mV/min.
Table 2Surface element concentration of different solders after potentiodynamicpolarisation tests with scanning rate at 30 mV/min
Surface element concentration (at.%)
Sn Ag Cl O
Sn–Ag 43.34 5.44 29.09 22.13Sn–Cu 47.22 – 34.56 18.22Sn–Ag–Cu 48.36 – 32.58 19.06Sn–Pb 46.37 – 32.74 20.89
Table 3Cross-section element concentration of different solders after potentiody-namic polarisation tests with scanning rate at 30 mV/min
Cross-section element concentration (at.%)
Sn Ag Cl Pb Cu
Sn–Ag – 57.48 2.0 40.52 – –Sn–Cu Top layer 59.72 – 40.28 – –
Inner layer 56.26 – 40.96 – 2.78Sn–Ag–Cu Top layer 59.59 – 40.41 – –
Inner layer 55.5 – 41.8 – 2.69Sn–Pb Top layer 57.75 – 42.25 – –
Inner layer 32.38 – 39.01 28.61 –
1002 D. Li et al. / Corrosion Science 50 (2008) 995–1004
According to potential-pH diagrams, the study of Houseand Kelsall [16] showed that the corrosion products of Snin NaCl solution at a given positive potential were SnO2
and Sn(OH)4. Lin and Mohanty et al. [5,10,12] studied
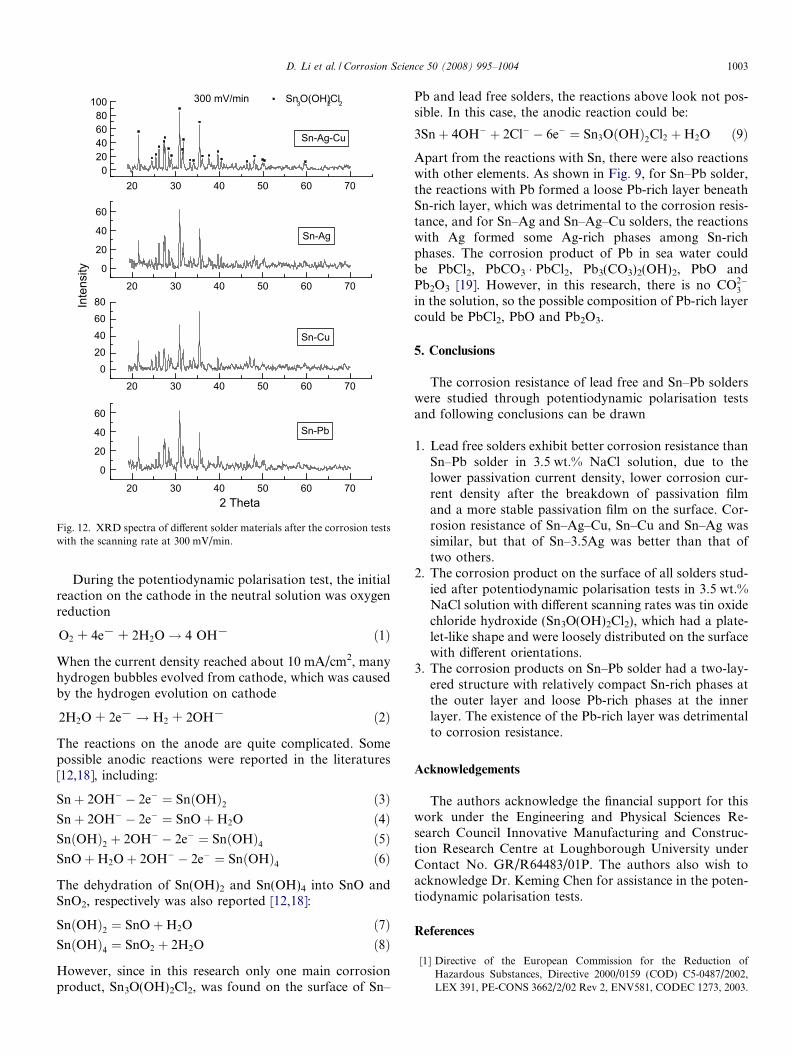
the corrosion properties of Sn–Zn–X and Sn–Zn–Ag–Al–XGa in NaCl solution, and their results showed that thecorrosion product on the surface could be SnO, SnO2,SnCl2 and ZnO, etc. depending on the applied potential.In this study, in order to understand the reactions duringthe corrosion processes, XRD was used to analyse the cor-rosion products on the surface after the potentiodynamicpolarisation tests. Fig. 12 shows the XRD analyses of thecorrosion products on the surface of lead free and Sn–Pbsolders after the potentiodynamic polarisation tests withthe scanning rate of 300 mV/min. The result shows thatall the lead free and Sn–Pb solder materials had the samecorrosion product, Sn3O(OH)2Cl2, which is a complexoxide chloride hydroxide of tin. This corrosion product isconsistent with the results from Yu et al. [17] when theystudied the corrosion properties of Sn–9Zn and Sn–8Zn–3Bi. The XRD analysis for the corrosion products on thesurface of solder materials after the potentiodynamicpolarisation test with the scanning rate 30 mV/min showedthat they had the same corrosion products as solders aftertests with the scanning rate of 300 mV/min. The EDX anal-ysis for oxygen is not accurate due to the technique limit,however, from Tables 2 and 3 it can be seen that the Sn/Cl ratio from both EDX surface and cross-section analysesis consistent with that from XRD analysis. This furtherconfirms that the corrosion product on the Sn–Pb and leadfree solders is Sn3O(OH)2Cl2.
20 30 40 50 60 70
20 30 40 50 60 70
20 30 40 50 60 70
20 30 40 50 60 70
0
20
40
60
Inte
nsity
2 Theta
Sn-Pb
020406080
Sn-Cu
0
20
40
60
Sn-Ag
Sn-Ag-Cu
020406080
100 300 mV/min Sn3O(OH)2Cl2
Fig. 12. XRD spectra of different solder materials after the corrosion testswith the scanning rate at 300 mV/min.
D. Li et al. / Corrosion Science 50 (2008) 995–1004 1003
During the potentiodynamic polarisation test, the initialreaction on the cathode in the neutral solution was oxygenreduction
O2 + 4e� + 2H2O! 4 OH� ð1Þ
When the current density reached about 10 mA/cm2, manyhydrogen bubbles evolved from cathode, which was causedby the hydrogen evolution on cathode
2H2O + 2e� ! H2 + 2OH� ð2Þ
The reactions on the anode are quite complicated. Somepossible anodic reactions were reported in the literatures[12,18], including:
Snþ 2OH� � 2e� ¼ SnðOHÞ2 ð3ÞSnþ 2OH� � 2e� ¼ SnOþH2O ð4ÞSnðOHÞ2 þ 2OH� � 2e� ¼ SnðOHÞ4 ð5ÞSnOþH2Oþ 2OH� � 2e� ¼ SnðOHÞ4 ð6Þ
The dehydration of Sn(OH)2 and Sn(OH)4 into SnO andSnO2, respectively was also reported [12,18]:
SnðOHÞ2 ¼ SnOþH2O ð7ÞSnðOHÞ4 ¼ SnO2 þ 2H2O ð8Þ
However, since in this research only one main corrosionproduct, Sn3O(OH)2Cl2, was found on the surface of Sn–
Pb and lead free solders, the reactions above look not pos-sible. In this case, the anodic reaction could be:
3Snþ 4OH� þ 2Cl� � 6e� ¼ Sn3OðOHÞ2Cl2 þH2O ð9ÞApart from the reactions with Sn, there were also reactionswith other elements. As shown in Fig. 9, for Sn–Pb solder,the reactions with Pb formed a loose Pb-rich layer beneathSn-rich layer, which was detrimental to the corrosion resis-tance, and for Sn–Ag and Sn–Ag–Cu solders, the reactionswith Ag formed some Ag-rich phases among Sn-richphases. The corrosion product of Pb in sea water couldbe PbCl2, PbCO3 � PbCl2, Pb3(CO3)2(OH)2, PbO andPb2O3 [19]. However, in this research, there is no CO2�
3
in the solution, so the possible composition of Pb-rich layercould be PbCl2, PbO and Pb2O3.
5. Conclusions
The corrosion resistance of lead free and Sn–Pb solderswere studied through potentiodynamic polarisation testsand following conclusions can be drawn
1. Lead free solders exhibit better corrosion resistance thanSn–Pb solder in 3.5 wt.% NaCl solution, due to thelower passivation current density, lower corrosion cur-rent density after the breakdown of passivation filmand a more stable passivation film on the surface. Cor-rosion resistance of Sn–Ag–Cu, Sn–Cu and Sn–Ag wassimilar, but that of Sn–3.5Ag was better than that oftwo others.
2. The corrosion product on the surface of all solders stud-ied after potentiodynamic polarisation tests in 3.5 wt.%NaCl solution with different scanning rates was tin oxidechloride hydroxide (Sn3O(OH)2Cl2), which had a plate-let-like shape and were loosely distributed on the surfacewith different orientations.
3. The corrosion products on Sn–Pb solder had a two-lay-ered structure with relatively compact Sn-rich phases atthe outer layer and loose Pb-rich phases at the innerlayer. The existence of the Pb-rich layer was detrimentalto corrosion resistance.
Acknowledgements
The authors acknowledge the financial support for thiswork under the Engineering and Physical Sciences Re-search Council Innovative Manufacturing and Construc-tion Research Centre at Loughborough University underContact No. GR/R64483/01P. The authors also wish toacknowledge Dr. Keming Chen for assistance in the poten-tiodynamic polarisation tests.
References
[1] Directive of the European Commission for the Reduction ofHazardous Substances, Directive 2000/0159 (COD) C5-0487/2002,LEX 391, PE-CONS 3662/2/02 Rev 2, ENV581, CODEC 1273, 2003.
1004 D. Li et al. / Corrosion Science 50 (2008) 995–1004
[2] B.P. Richards, C.L. Levoguer, C.P. Hunt, K. Nimmo, S. Peters, P.Cusack, An analysis of the current status of lead-free soldering,available at: http://www.npl.co.uk/ei/documents/pbfreereport.pdf.
[3] IPC, Lead Free Solder Selection, available at: http://leadfree.ipc.org/RoHS_3-2-1.asp.
[4] J. Glazer, Metallurgy of low-temperature Pb-free solders for elec-tronic assembly, Int. Mater. Rev. 40 (1995) 65–93.
[5] K.L. Lin, T.P. Liu, The electrochemical corrosion behaviour of Pb-free Al–Zn–Sn solders in NaCl solution, Mater. Chem. Phys. 56(1998) 171–176.
[6] W.J. Chou, G.P. Yu, J.H. Huang, Corrosion resistance of ZrN filmson AISI 304 stainless steel substrate, Surf. Coat. Technol. 167 (2003)59–67.
[7] G. Quartarone, T. Bellomi, A. Zingales, Inhibition of coppercorrosion by isatin in aerated 0.5 M H2SO4, Corros. Sci. 45 (2003)715–733.
[8] J.J. Park, S.I. Pyun, Pit formation and growth of alloy 600 in Cl- ion-containing thiosulphate solution at temperatures 298–573 K usingfractal geometry, Corros. Sci. 45 (2003) 995–1010.
[9] Y. Zuo, P.H. Zhao, J.M. Zhao, The influences of sealing methods oncorrosion behavior of anodized aluminum alloys in NaCl solutions,Surf. Coat. Technol. 166 (2003) 237–242.
[10] K.L. Lin, F.C. Chung, T.P. Liu, The potentiodynamic polarisationbehavior of Pb-free XIn-9(5Al–Zn)–YSn solders, Mater. Chem. Phys.53 (1998) 55–59.
[11] H. Oulfajrite et al., Electrochemical behavior of a new solder material(Sn–In–Ag), Mater. Lett. 57 (2003) 4368–4371.
[12] U.S. Mohanty, K.L. Lin, The effect of alloying element gallium on thepolarisation characteristics of Pb-free Sn–Zn–Ag–Al–XGa solders inNaCl solution, Corros. Sci. 48 (2006) 662–678.
[13] D.Q. Yu, W. Jillek, E. Schmitt, Electrochemical migration of Sn–Pband lead free solder alloys under distilled water, J. Mater. Sci. –Mater. Electron. 17 (2006) 219–227.
[14] B.Y. Wu et al., Electrochemical corrosion study of Pb-free solders, J.Mater. Res. 21 (2006) 62–70.
[15] M. Abtew, G. Selvaduray, Lead-free solders in microelectronics,Mater. Sci. Eng. R 27 (2000) 95–141.
[16] C.I. House, G.H. Kelsall, Potential-pH diagrams for the Sn/H2O–Clsystem, Electrochim. Acta 29 (1984) 1459–1464.
[17] D.Q. Yu, C.M.L. Wu, L. Wang, The electrochemical corrosionbehavior of Sn9Zn and Sn–8Zn–3Bi lead-free solder alloys in NaClsolution, in: 16th International Corrosion Conference, Beijing, China,2005, 19–24.
[18] S.D. Kapusta, N. Hackerman, Anodic passivation of tin in slightlyalkaline solutions, Electrochim. Acta 25 (1980) 1625–1639.
[19] A.M. Beccaria, E.D. Mor, G. Bruno, G. Poggi, Investigation on leadcorrosion products in sea water and in neutral saline solutions, Mater.Corr. 33 (1982) 416–420.


