Embed Size (px)
Citation preview

Impulse response method for characterization of echogenicliposomesa)
Jason L. Raymondb)
Biomedical Engineering Program, University of Cincinnati, Cardiovascular Center 3940,231 Albert Sabin Way, Cincinnati, Ohio 45267-0586
Ying Luan, Tom van Rooij, and Klazina KooimanDepartment of Biomedical Engineering, Thoraxcenter, Erasmus Medical Center, P.O. Box 2040, 3000 CA,Rotterdam, Netherlands
Shao-Ling Huang and David D. McPhersonDepartment of Internal Medicine, Division of Cardiology, University of Texas Health Science Center,Houston, Texas 77030
Michel VersluisPhysics of Fluids Group, MIRA Institute for Biomedical Technology and Technical Medicine,University of Twente, P.O. Box 217, 7500 AE, Enschede, Netherlands
Nico de JongDepartment of Biomedical Engineering, Thoraxcenter, Erasmus Medical Center, P.O. Box 2040, 3000 CA,Rotterdam, Netherlands
Christy K. HollandDepartment of Internal Medicine, Division of Cardiovascular Health and Disease and BiomedicalEngineering Program, University of Cincinnati, Cardiovascular Center 3935, 231 Albert Sabin Way,Cincinnati, Ohio 45267-0586
(Received 3 October 2014; revised 4 March 2015; accepted 5 March 2015)
An optical characterization method is presented based on the use of the impulse response to
characterize the damping imparted by the shell of an air-filled ultrasound contrast agent (UCA).
The interfacial shell viscosity was estimated based on the unforced decaying response of indi-
vidual echogenic liposomes (ELIP) exposed to a broadband acoustic impulse excitation. Radius
versus time response was measured optically based on recordings acquired using an ultra-high-
speed camera. The method provided an efficient approach that enabled statistical measurements
on 106 individual ELIP. A decrease in shell viscosity, from 2.1� 10�8 to 2.5� 10�9 kg/s, was
observed with increasing dilatation rate, from 0.5� 106 to 1� 107 s�1. This nonlinear behavior
has been reported in other studies of lipid-shelled UCAs and is consistent with rheological
shear-thinning. The measured shell viscosity for the ELIP formulation used in this study
[js¼ (2.1 6 1.0) � 10�8 kg/s] was in quantitative agreement with previously reported values on
a population of ELIP and is consistent with other lipid-shelled UCAs. The acoustic response of
ELIP therefore is similar to other lipid-shelled UCAs despite loading with air instead of per-
fluorocarbon gas. The methods described here can provide an accurate estimate of the shell vis-
cosity and damping for individual UCA microbubbles. VC 2015 Acoustical Society of America.
[http://dx.doi.org/10.1121/1.4916277]
[CCC] Pages: 1693–1703
I. INTRODUCTION
Physical models for encapsulated ultrasound contrast
agent (UCA) microbubbles have been developed and
improved over the past two decades. The models give accu-
rate predictions of the nonlinear radial dynamics of
individual UCA microbubbles, particularly under forced, or
acoustically driven, conditions.1 Such models are largely
based on Rayleigh–Plesset-type equations, which describe
the dynamics of a gas bubble in response to pressure varia-
tions. The effects of the shell encapsulation on the microbub-
ble motion are incorporated by adding additional terms that
describe the viscoelastic behavior of the shell.2 The presence
of the shell increases the resonance frequency from that of a
free bubble and damps the oscillations in response to the
acoustic forcing.3 The shell also affects the nonlinear
response of microbubbles, a key property of UCAs that is of-
ten exploited in diagnostic imaging modes for enhanced
a)Portions of this work were presented in “Impulse response of echogenic
liposomes,” Proceedings of the 19th European Symposium on Ultrasound
Contrast Imaging, Rotterdam, Netherlands, January 2014.b)Author to whom correspondence should be addressed. Electronic mail:
J. Acoust. Soc. Am. 137 (4), April 2015 VC 2015 Acoustical Society of America 16930001-4966/2015/137(4)/1693/11/$30.00

discrimination between the contrast agent and surrounding
tissue.4
In addition to traditional diagnostic ultrasound imaging,
there has been recent interest in advancing the applications
of microbubbles for molecular imaging and therapeutic
applications. These applications exploit the nonlinear
response for selective detection of microbubbles in a given
volume for diagnosis and specific targeting of disease.
Molecular imaging techniques with targeted UCAs are being
used increasingly for noninvasive diagnosis of inflammation,
thrombus, and neovascularization.5 Targeted microbubble
agents are also being developed for controlled drug-delivery
applications.6 Clinical application of these UCAs necessi-
tates accurate prediction of the frequency-dependent
response of single isolated microbubbles. A better under-
standing of the shell properties that can be expected for indi-
vidual UCA microbubbles within a population is also
critical. The acoustic response of microbubbles can depend
on the morphology and viscoelastic properties of the encap-
sulating shell,7 particularly if lipids are not homogeneously
distributed throughout the shell.8 Therefore single microbub-
ble characterization techniques and physical models that
accurately describe the dynamics of an encapsulated micro-
bubble are increasingly important.
The introduction of optical methods to resolve micro-
bubble oscillations has provided new insights into the
dynamic response of single microbubbles. Optical methods
based on direct measurement of the bubble radius versus
time can be used due to availability of ultra-high-speed
imaging systems9,10 such as the Brandaris 128 fast-framing
(0.5–25 Mfps) camera.11 This system enables optical charac-
terization studies by imaging single microbubble dynamical
phenomena occurring at multiple time scales.12 Acoustic
measurements of the scattered echo from an isolated micro-
bubble have been simultaneously recorded and compared to
the optically measured radial dynamics to verify the effec-
tiveness of this approach.13
Optical studies of the radial dynamics of UCAs typically
rely on measuring the steady-state forced response of a
microbubble to a narrow-band burst excitation. For example,
the amplitude response of a microbubble exposed to
multiple-cycle, low amplitude ultrasound bursts at various
frequencies can be analyzed to build up a resonance curve
and fit to a linearized model to derive the viscoelastic shell
parameters.14 This microbubble spectroscopy technique14–17
requires multiple recordings to characterize the frequency-
dependent response of an individual microbubble. In addi-
tion, the shell morphology can be altered or destroyed due to
multiple burst excitations.18 A method using a single excita-
tion would improve the efficiency of UCA characterization
techniques and would minimize the effect of alterations to
the microbubble shell under successive excitations.
In this study, we investigated the use of the impulse
response to characterize the damping imparted by the encap-
sulation of microbubbles stabilized by a lipid shell, echo-
genic liposomes (ELIP).19 The shell viscosity is the
dominant mechanism affecting the damping of microbubble
response to acoustic excitation and most directly influences
the onset of nonlinear oscillations. An understanding of this
physical property of the shell encapsulation can be exploited
for optimization of contrast-enhanced imaging and therapeu-
tic applications. Through this technique, we aim to acquire a
better understanding of the transient dynamics of ELIP in
response to short-pulse excitations for both diagnostic and
therapeutic applications. This method is also of particular in-
terest to improve the efficiency of UCA characterization
techniques in general as it requires only a single acoustic ex-
citation when the impulse response is recorded using an
ultra-high-speed camera.
ELIP are under development as theragnostic ultrasound
contrast agents and differ from other commercially available
UCAs primarily in shell material and gas content.4 ELIP for-
mulations include a small amount of cholesterol to increase
membrane rigidity and are echogenic due to the presence of
air, which is entrapped and stabilized by the lipid during the
rehydration process.19 The exact location of the entrapped
air pockets, morphology of the encapsulation, and amount of
air in each carrier has not been fully ascertained.19–21 The
objective of the present study was to measure the damping
due to the encapsulation and to estimate the shell viscosity
based on the unforced response of individual ELIP exposed
to a broadband acoustic impulse excitation.
An ultra-high-speed camera was used to capture the ra-
dius versus time response. During each recording, an isolated
ELIP was excited using two ultrasound pulses with a phase
difference of 180�. Following each pulse, the bubble oscil-
lated at its natural frequency with diminishing amplitude
determined by the damping, and eventually returned to its
resting radius. A generic model was developed to estimate
the shell viscosity based on the amplitude decay time con-
stant, which was determined from the experimentally meas-
ured radius versus time curve for an individual ELIP. Gas
diffusion was neglected in our model, and this approach was
verified experimentally by comparing the resting radius
before and after the impulse excitation. The shell viscosity
of individual ELIP obtained using the optical method pre-
sented here is compared to our previously reported value
obtained for a population of ELIP using a broadband acous-
tic attenuation spectroscopy technique.21
II. MATERIALS AND METHODS
A. Experimental setup
Freeze-dried ELIP dispersions consisting of L-a-phos-
phatidylcholine,1,2-dipalmitoyl-sn-glycero-3-phosphocholine
(DPPC),1,2-dipalmitoyl-sn-glycero-3-phosphoethanolamine
(DPPE),1,2-dipalmitoyl-sn-glycero-3-phospho-(10-rac-glycerol)
(DPPG),cholesterol (27:42:8:8:15, mol. %) [all lipids were
purchased from Avanti Polar Lipids (Alabaster, AL)] were
prepared as previously described.22 ELIP suspensions were
prepared by reconstituting 10 mg/ml lyophilized lipid pow-
der using air-saturated, filtered (type I) water at room tem-
perature as described by Huang.19 The suspension was
diluted (�100�) into air-saturated phosphate-buffered saline
(PBS) mixed with 0.5% (wt./vol.) bovine serum albumin
(BSA) solution (Sigma Chemical Co., St. Louis, MO),
loaded into an OptiCellVR
(Nunc/Thermo Scientific,
Wiesbaden, Germany), and placed on an optical stage in a
1694 J. Acoust. Soc. Am., Vol. 137, No. 4, April 2015 Raymond et al.: Impulse response of echogenic liposomes

37 �C water bath. A microscope with a 60� water-
immersion objective and 2� magnifier was used to image
the bubble dynamics at approximately 17 Mfps using the
Brandaris 128 fast-framing camera.11,12 A diagram of the
ultra-high-speed optical imaging setup is presented in Fig. 1.
Figure 2(a) shows an optical image of a dilute suspen-
sion of ELIP suspended in an OptiCellVR
using a 40�objective to obtain a larger field of view. A single frame
from a Brandaris 128 recording using the 60� objective
and 2� magnifier is shown in Fig. 2(b). Figures 2(c) and
2(d) show super-resolution fluorescence microscope images
of fluorescently labeled ELIP obtained using the methods
outlined by Kooiman et al.23 Briefly, a 4Pi confocal laser-
scanning microscope (Leica TCS 4Pi) with two opposing
objective lenses (100�, HCX PL APO, 1.35 NA) was used
to generate super-resolution three-dimensional image
stacks. For this supporting study, 2 mol. % fluorescently la-
beled 1,2-dipalmitoyl-sn-glycero-3-phosphoethanolamine-
N-(lissamine rhodamine B sulfonyl) (rhodamine-DPPE)
(Avanti Polar Lipids) was substituted into the ELIP formu-
lation and the reconstituted liposomes were suspended in
87% (vol./vol.) glycerol between quartz cover slips at
room temperature. The images show the distribution of the
lipid molecules in the shell encapsulation of the ELIP. The
size distribution of the microbubbles deduced from optical
images presented in Figs. 2(a) and 2(c) is consistent with
Coulter counter measurements of the particle size distribu-
tion for this ELIP formulation, which indicated a volume-
weighted mean diameter of 2 lm.21 Previously published
transmission electron microscopy images have shown lipo-
somes on the order of 2 lm diameter24 as well as vesicles
in the nanometer size range that could not be resolved
using the optical methods described here.25,26 Atomic force
microscopy20 and fluorescence microscopy studies26 also
indicate a broad size distribution, with particle sizes rang-
ing over three orders of magnitude from tens of nano-
meters to microns.
B. Acoustic excitation pulse
A focused, broadband PVDF transducer (23 mm diame-
ter, 25 mm focal distance, PA275; Precision Acoustics,
Dorchester, UK) was positioned in the water bath at a 45�
angle below the sample and the acoustic focus (0.5 mm full-
width at half-maximum pressure) aligned with the optical
field of view. To detect potential nonlinear bubble dynamics,
a pulse inversion pair was utilized to excite individual ELIP.
For each optical recording, a sequence of two phase-inverted
acoustic pulses, temporally separated by 3 ls, was used to
excite each ELIP impulsively. The pulses had a phase differ-
ence of 180� but were otherwise identical with center fre-
quency of 4 MHz and pulse duration of �0.33 ls (1.5
cycles). Pulse excitations with peak pressure amplitude of
125, 250, or 500 kPa (210, 420, or 840 kPa peak-to-peak
acoustic pressure, respectively) were generated by a pro-
grammable arbitrary waveform generator (8026, Tabor
Electronics Ltd., Tel Hanan, Israel) and amplified using a
wideband RF amplifier (0.3–35 MHz, A-500; Electronic
Navigation Industries, Rochester, NY). During calibration, a
0.2 -lm needle-type hydrophone (Precision Acoustics) was
positioned approximately 2 mm from the sample holder
membrane (a modified OptiCellVR
with one membrane
removed), such that the hydrophone location corresponded
to the location of the ELIP during the optical measurement.
The transmitted acoustic pressure amplitude in situ was atte-
nuated by a factor of 3 dB relative to the free-field pressure
due to the presence of the membrane and the 45� angle of
incidence of the acoustic wave. The in situ pressureFIG. 1. Schematic of the setup used to optically record the microbubble
oscillation.
FIG. 2. (Color online) (a) Optical image of a dilute suspension of ELIP
suspended in an OptiCellVR
(40� magnification). (b) Single frame of a
Brandaris 128 recording (120� magnification), (c) and (d) Super-resolution
confocal microscope images of fluorescently labeled (2 mol. % rhodamine-
DPPE) ELIP in glycerol (Leica TCS 4Pi, 100� magnification). Scale bars
represent 5 lm in all images.
J. Acoust. Soc. Am., Vol. 137, No. 4, April 2015 Raymond et al.: Impulse response of echogenic liposomes 1695

waveform and power spectrum for a 250 kPa peak pressure
amplitude excitation pulse are shown in Fig. 3.
C. Estimation of the shell viscosity
Linearization of a Rayleigh–Plesset-type bubble dynam-
ics equation yields the equation of motion for a damped har-
monic oscillator. In the absence of forcing this equation can
be written,1
€x þ x0d _x þ x20x ¼ 0: (1)
The eigenfrequency, x0, is given by the Minnaert relation
for a free gas bubble,17 and for an encapsulated bubble, this
expression can be modified to include an additional term that
depends on the elasticity of the shell.27 The damped natural
frequency for unforced oscillations, xd, is related to the
eigenfrequency of the system by the damping coefficient,
xd ¼ x0
ffiffiffiffiffiffiffiffiffiffiffiffiffiffiffiffiffiffiffiffiffiffið1� d2=4Þ
q, where d represents the total damping
of the system.28,29 If the system is modeled as a linearized,
single degree-of-freedom system which is underdamped
(d< 2), the solution can be written in terms of an oscillatory
signal with a decaying exponential envelope characterized
by the time constant, s ¼ 2=ðdx0Þ.Analysis of the experimental data consists of calculating
the envelope signal, A(t), from the measured radius versus
time curves for each individual pulse excitation using the
Hilbert transform. The time constant can be readily deter-
mined by fitting a line to the natural logarithm of the enve-
lope signal,30 with a slope given by
d lnjA tð Þj� �
dt¼ dx0
2¼ 1
s: (2)
In general, the total damping consists of contributions
from all of the dissipative loss mechanisms, including:
Acoustic radiation (drad), thermal diffusion and conduction
(dth), viscosity of the surrounding liquid (dvis), and viscosity
of the shell (dsh), such that d¼ dradþ dthþ dvisþ dsh.28 For
an encapsulated bubble, the last term represents the damping
imparted by the shell,3 and for an unencapsulated bubble,
dsh¼ 0. Assuming a Newtonian rheology, the expression for
dsh in terms of the total non-dimensional damping coefficient
can be written,31
dsh ¼ d� d0 ¼4js
qx0R30
; (3)
where d0¼ dradþ dthþ dvis represents the total damping
coefficient evaluated at resonance for an unencapsulated gas
bubble with the same radius and eigenfrequency as the
encapsulated bubble. The shell viscosity in dimensional
units, js, can be estimated as a function of the time con-
stants, s and s0,
js ¼qR3
0
2
1
s� 1
s0
� �; (4)
where s and s0 are the time constants for an encapsulated
bubble (measured) and unencapsulated bubble with the same
initial radius (calculated), respectively.
The expression given in Eq. (2) for the interfacial shell
viscosity is consistent with the Rayleigh–Plesset-type
model for phospholipid-encapsulated bubbles developed
by Marmottant et al.32 In this model, the effective surface
tension is described by three regimes of shell behavior:
Buckled, elastic, or ruptured. In the elastic regime, the
shell contributes an additional restoring force, character-
ized by the elasticity v, which shifts the resonance for
small amplitude oscillations of an encapsulated bubble to
higher frequencies. Oscillations in the purely elastic re-
gime occur only at exceedingly low vibrational amplitudes
[e.g., R/R0< 1.01 for v¼ 2.5 N/m (Ref. 17)]. Above a
threshold radius, the shell is in the ruptured regime and the
interfacial dynamics are also controlled by the free air-
water surface tension. We estimate the rupture radius for
ELIP to be R/R0¼ 1.02 based on the elasticity determined
previously [v¼ 1.55 N/m (Ref. 21)]. Overvelde et al.17
demonstrated that for oscillations exceeding this ampli-
tude, the bubble is no longer oscillating in the purely elas-
tic regime and the natural frequency for a encapsulated
bubble approaches a value that is only slightly greater
(�10%) than would be predicted for an unencapsulated
bubble. For simplicity, we consider x0 to be the same for
both encapsulated and unencapsulated bubbles and use the
eigenfrequency of an unencapsulated bubble [e.g., Eq. (5)
in Ref. 26] to calculate s0 in Eq. (4).
Each ELIP was excited by both peak-negative and
peak-positive pulses, which were analyzed separately. A
subset of ELIP were excited several times using 125,
250, or 500 kPa peak pressure amplitude pulses. An exam-
ple of the damping analysis for an individual 0� pulse exci-
tation is shown in Figs. 4(a) and 4(b). The naturalFIG. 3. (a) Measured pressure waveform and (b) corresponding spectrum of
the acoustic excitation pulses.
1696 J. Acoust. Soc. Am., Vol. 137, No. 4, April 2015 Raymond et al.: Impulse response of echogenic liposomes

frequency of unforced oscillation was estimated from the
Fourier spectrum of the radius versus time response, shown
in Fig. 4(c).
D. Simulations
To evaluate the validity of the shell viscosity estimates
obtained for individual ELIP, radius versus time curves
were simulated using the dynamical model for lipid-
encapsulated microbubbles developed by Marmottant
et al.32 The measured acoustic pressure waveforms (see
Fig. 3) were used as the forcing function for the bubble dy-
namics simulations that were compared with the experi-
mental data. The values of the physical parameters used
for the simulations were: Ambient pressure P0¼ 100 kPa,
density of the liquid, q¼ 1007 kg/m3, viscosity of the liq-
uid (at 37 �C), l¼ 0.76 � 10–3 kg/(m s), surface tension of
the free air-water interface, rwater¼ 0.072 N/m, and speed
of sound, c¼ 1536 m/s. These parameters correspond to
air-filled microbubbles suspended in PBS with 0.5% BSA
solution at 37 �C.21 The effective polytropic exponent was
calculated from the ratio of specific heats using the expres-
sion given by Hoff et al.33 following other researchers
who have used similar expressions.34 The parameters used
in the Marmottant model for describing the interfacial
rheological properties of the shell are the elasticity,
v¼ 0.1–1.55 N/m, and the shell surface viscosity, js, which
was estimated based on experimental measurements as
described in Sec. II C. Marmottant et al.32 and others17 have
demonstrated that a phospholipid shell stabilizes a quiescent
gas bubble by counteracting the Laplace pressure, therefore
most microbubbles have an initial surface tension much
lower than the surface tension of the free air-water interface,
rwater.35 In this study, we assume the shell encapsulation is
initially in the pre-buckled state (i.e., the transition between
the elastic and buckled regions) and consequently the initial
surface tension was taken as r0 ¼ 0 for all numerical
simulations.
E. Excitation of ELIP with a tone burst
A subset of ELIP was also excited using a 3 MHz tone
burst to record the radius versus time response to acoustic
forcing. Burst excitations were generated using the same
arbitrary waveform generator and transducer but consisted
of a 10-cycle, 3-MHz sinusoidal wave with a 2-cycle
Gaussian ramp and taper. The in situ acoustic pressure am-
plitude for the tone burst excitation was 180 kPa, calibrated
using the same methods as described in the preceding text.
An impulse response excitation was recorded prior to the
tone burst excitation to obtain an estimate of the shell vis-
cosity using the methods described in the preceding text.
This data acquisition scheme enabled a post hoc compari-
son of the measured forced response to simulations using
the estimated value of shell viscosity for a particular
liposome.
III. RESULTS
A total of 476 radius versus time curves for 106 individ-
ual ELIP were analyzed. The equilibrium radii of the indi-
vidual ELIP ranged between 0.9 and 3.4 lm. Only trials for
which the microbubble did not show any dissolution were
analyzed in this study (jDrj< 0.1 lm, where Dr is the differ-
ence between the bubble resting radius before and after the
acoustic excitation). A small number of recordings (12 in
total, <3%) with jDrj> 0.1 were therefore not included in
the analysis.
Figure 5 shows the estimated natural frequency obtained
from the Fourier spectrum of the individual radius versus
time responses. The median value of the measured resonance
FIG. 4. Schematic of the damping analysis. (a) Radius versus time curve
measured in response to 0� impulse excitation (the response due to 180�
excitation is truncated for clarity). (b) The amplitude decay envelope
(solid line) is calculated using the discrete Hilbert transform. The time con-
stant is obtained by fitting an exponential decay (dashed-dotted line) to the
envelope using Eq. (1). For this example, R0¼ 2.5 lm, s¼ 0.85 ls,
js¼ 5.6� 10�9 kg/s. (c) Amplitude spectrum of the radius versus time
curve.
J. Acoust. Soc. Am., Vol. 137, No. 4, April 2015 Raymond et al.: Impulse response of echogenic liposomes 1697

frequency was 16% higher than the eigenfrequency of an
unencapsulated bubble, given by 2px0.
Results of the measured shell viscosity as function of
size are shown in Fig. 6(a). Due to the large number of indi-
vidual data points, the mean value and standard deviation of
the points within radius bins spaced by 0.2 lm are also
shown for clarity. There is a considerable spread of the shell
viscosity estimates among microbubbles of the same size
range (indicated by vertical error bars). However, the esti-
mated shell viscosity increases with increasing bubble size,
as has been shown in other investigations of lipid-shelled
agents.14,36,37 The shell viscosity estimates range from
2.1� 10–9 kg/s for microbubbles of 0.9–1.4 lm radius to
2.3� 10–8 kg/s for microbubbles of 2.5–3.4 lm radius. These
values are the same order of magnitude as values obtained in
other studies based on population estimates of commercially
available lipid-shelled microbubbles such as SonoVueVR
(js¼ 5.4� 10–9 kg/s),38 SonazoidVR
(js¼ 1.2� 10–8 kg/s),39
and DefinityVR
(js¼ 3� 10–9 kg/s).40
The dependence of the shell viscosity on the maximum
dilatation rate is shown in Fig. 6(b). The maximum dilatation
rate ( _R=R)max was determined directly from the experimen-
tally measured radius versus time curves by calculating the
derivative with respect to time. Despite the dispersion in the
individual shell viscosity estimates, this plot demonstrates a
decrease of the shell viscosity with increasing dilatation rate.
By fitting the data to a power law relation of the form,41
js ¼ kð _R=RÞn�1, the 95% confidence interval for the power-
law index n is between 0.1 and 0.25. A power-law index less
than one is consistent with rheological shear-thinning behav-
ior and has been reported earlier for lipid-shelled bubbles.14
For low dilatation rates (<0.50� 106 s–1), the mean value
and standard deviation of the shell viscosity estimates in this
study was js¼ (2.1 6 1.0)� 10–8 kg/s (n¼ 23).
Figure 7 shows three examples of numerically simulated
and experimentally measured radius versus time curves for
individual ELIP with equilibrium radii of 1.5, 2.3, and
3.0 lm. The excitation peak pressure amplitude for all cases
was 250 kPa. Simulations were carried out using the experi-
mentally derived shell viscosity (js) for each individual
ELIP (i.e., the average of the estimates derived from both 0�
and 180� impulses). The shell elasticity (v) was varied over
one order of magnitude with the upper limit corresponding
to the value previously determined for ELIP in the linear re-
gime, v¼ 0.1–1.55 N/m.21 The numerical simulations show
good agreement with the experimentally measured transient
impulse response dynamics for each case.
Figure 8 shows an example of simulated and experimen-
tally measured radius versus time curves for a single ELIP
exposed to three different peak pressure amplitude pulses:
125, 250, and 500 kPa. As expected, the shell viscosity val-
ues obtained from each independent excitation are similar.
The estimates of js for each pressure are 5.7, 5.6, and
5.6� 10–9 kg/s, respectively.
FIG. 5. Estimates of the natural frequency obtained using the Fourier trans-
form of the radius versus time curves. The eigenfrequency for an unencapsu-
lated bubble, 2px0, which was used in the calculation of s0 is shown for
reference (solid line). A fit using the median of the measured values is also
shown (dashed line).
FIG. 6. Shell viscosity versus (a) radius and (b) dilatation rate. Horizontal
bars represent the bin width and vertical error bars represent one standard
deviation of the points within each radius bin.
1698 J. Acoust. Soc. Am., Vol. 137, No. 4, April 2015 Raymond et al.: Impulse response of echogenic liposomes

IV. DISCUSSION
The goal of this study was to improve the understanding
of the transient oscillation dynamics and shell properties of
ELIP. We estimated the damping and shell viscosity from
the unforced response of individual ELIP excited by a broad-
band acoustic impulse excitation measured using ultra-high-
speed imaging. This technique can achieve the measurement
of individual ELIP in a single run using the Brandaris 128
ultra-high-speed framing camera and provides an efficient
alternative approach to the microbubble spectroscopy tech-
nique as reported previously.14–16 The results derived from
estimates for individual ELIP were in good agreement with
our previously obtained values based on bulk acoustic
attenuation measurements. Overall the shell viscosity
estimates for ELIP in this study are consistent with values
reported for commercially available lipid-shelled UCAs.
Furthermore, we found that the Marmottant model accu-
rately describes the transient dynamics of an individual ELIP
when compared with radius versus time measurements
obtained from ultra-high-speed recordings. Thus despite the
encapsulation of air instead of perfluorocarbon gas, the
viscoelastic shell properties of ELIP are similar to other
lipid-shelled agents such as SonoVueVR
and DefinityVR
.
A. Natural frequency of unforced oscillations
The eigenfrequency of an unencapsulated bubble is used
to calculate the time constant, s0, in Eq. (4). To evaluate the
validity of the assumption that the surface tension dominates
the bubble dynamics, we obtained estimates of the natural
frequency from the Fourier transform of the radius versus
time curves (Fig. 5). The median natural frequency measured
was 16% higher than the eigenfrequency for an unencapsu-
lated bubble, given by 2px0. A 16% error in the natural fre-
quency translates to a �4% change in s0 (and therefore in
our estimates of js) for the size range of bubbles studied.
B. Contributions to damping effects
The total damping coefficient is the summation of the
shell damping (dsh) and three other damping terms: The radi-
ation damping (drad), the thermal damping (dth), and the vis-
cous damping due to the surrounding liquid (dvis).
Theoretical expressions for predicting the damping factors
of a spherically oscillating gas bubble are well-established,28
and the latter three terms can be readily calculated based on
the known equilibrium size and eigenfrequency of the micro-
bubble. Figure 9 shows the resonance damping coefficients
versus radius for an air bubble under the experimental condi-
tions used in this study. Viscous damping (dvis or dsh) domi-
nates, and the radiation damping is approximately an order
of magnitude smaller for bubbles in the size range consid-
ered in this study. However, thermal damping can be
FIG. 7. Example of simulated and experimentally measured radius versus
time curves for ELIP with equilibrium radii of 1.5, 2.3, and 3.0 lm. The ex-
citation peak pressure amplitude for all cases was 250 kPa. Estimates of the
shell viscosity were derived from the experimental measurements for each
case and used as inputs for the numerical simulation, yielding
js¼ 3.3 6 0.4� 10�9, 6.0 6 0.3� 10�9, and 2.15 6 0.2� 10�8 kg/s, respec-
tively. Other simulation parameters were R0¼ 1.5, 2.3, and 3.0 lm and
v¼ 0.1, 0.2, and 1.55 N/m, respectively.
FIG. 8. Example of experimental and simulated radius versus time curves for a single ELIP (R0¼ 2.5 lm, v¼ 0.25 N/m) excited by (a) 125 kPa, (b) 250 kPa,
and (c) 500 kPa peak pressure amplitude pulses (0� pulse). Vertical bars represent the relative error of the radius tracking algorithm, which was determined by
the difference between the maximum and minimum radius measured from a recording of the same ELIP without ultrasound exposure.
J. Acoust. Soc. Am., Vol. 137, No. 4, April 2015 Raymond et al.: Impulse response of echogenic liposomes 1699
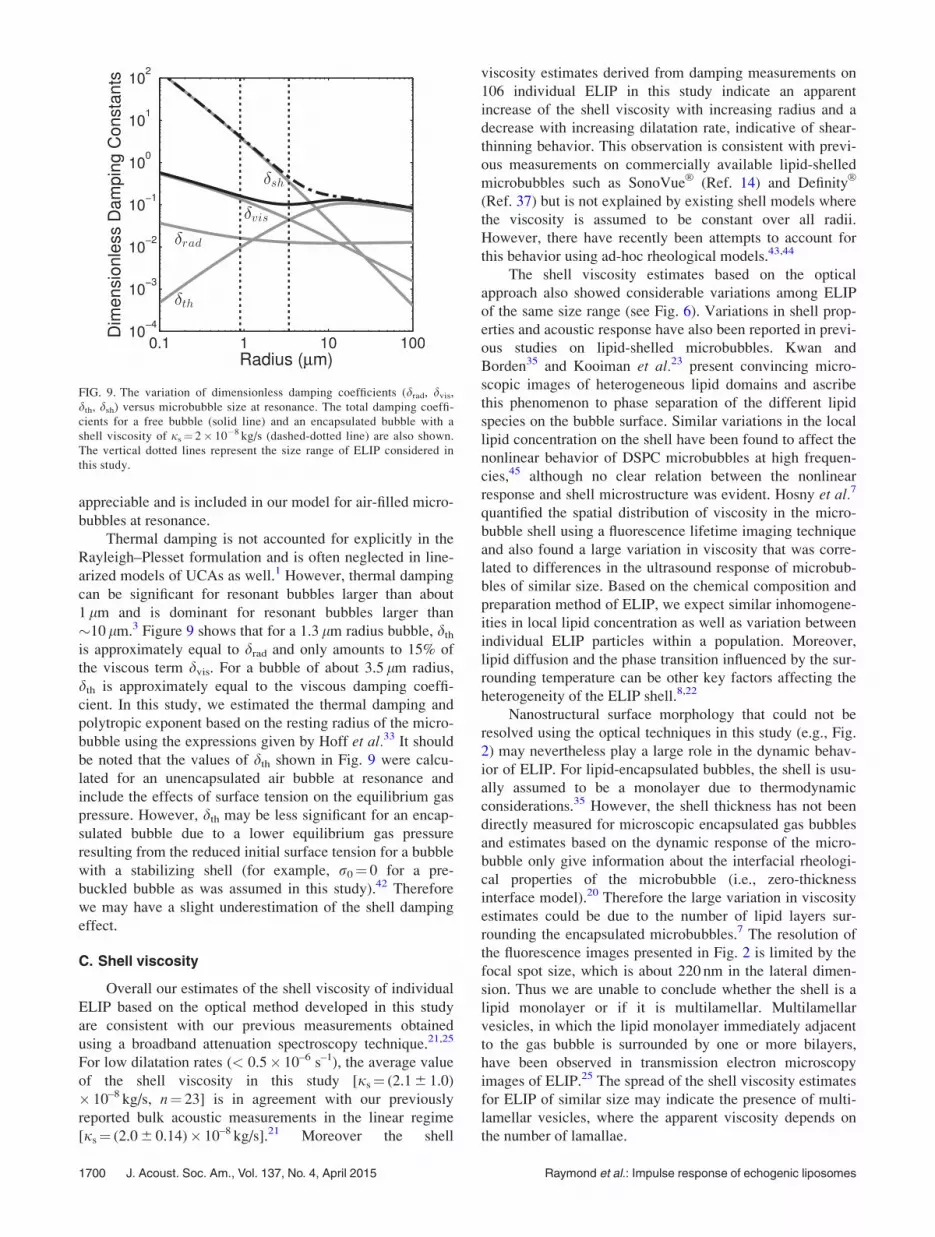
appreciable and is included in our model for air-filled micro-
bubbles at resonance.
Thermal damping is not accounted for explicitly in the
Rayleigh–Plesset formulation and is often neglected in line-
arized models of UCAs as well.1 However, thermal damping
can be significant for resonant bubbles larger than about
1 lm and is dominant for resonant bubbles larger than
�10 lm.3 Figure 9 shows that for a 1.3 lm radius bubble, dth
is approximately equal to drad and only amounts to 15% of
the viscous term dvis. For a bubble of about 3.5 lm radius,
dth is approximately equal to the viscous damping coeffi-
cient. In this study, we estimated the thermal damping and
polytropic exponent based on the resting radius of the micro-
bubble using the expressions given by Hoff et al.33 It should
be noted that the values of dth shown in Fig. 9 were calcu-
lated for an unencapsulated air bubble at resonance and
include the effects of surface tension on the equilibrium gas
pressure. However, dth may be less significant for an encap-
sulated bubble due to a lower equilibrium gas pressure
resulting from the reduced initial surface tension for a bubble
with a stabilizing shell (for example, r0¼ 0 for a pre-
buckled bubble as was assumed in this study).42 Therefore
we may have a slight underestimation of the shell damping
effect.
C. Shell viscosity
Overall our estimates of the shell viscosity of individual
ELIP based on the optical method developed in this study
are consistent with our previous measurements obtained
using a broadband attenuation spectroscopy technique.21,25
For low dilatation rates (< 0.5� 10–6 s–1), the average value
of the shell viscosity in this study [js¼ (2.1 6 1.0)
� 10–8 kg/s, n¼ 23] is in agreement with our previously
reported bulk acoustic measurements in the linear regime
[js¼ (2.0 6 0.14)� 10–8 kg/s].21 Moreover the shell
viscosity estimates derived from damping measurements on
106 individual ELIP in this study indicate an apparent
increase of the shell viscosity with increasing radius and a
decrease with increasing dilatation rate, indicative of shear-
thinning behavior. This observation is consistent with previ-
ous measurements on commercially available lipid-shelled
microbubbles such as SonoVueVR
(Ref. 14) and DefinityVR
(Ref. 37) but is not explained by existing shell models where
the viscosity is assumed to be constant over all radii.
However, there have recently been attempts to account for
this behavior using ad-hoc rheological models.43,44
The shell viscosity estimates based on the optical
approach also showed considerable variations among ELIP
of the same size range (see Fig. 6). Variations in shell prop-
erties and acoustic response have also been reported in previ-
ous studies on lipid-shelled microbubbles. Kwan and
Borden35 and Kooiman et al.23 present convincing micro-
scopic images of heterogeneous lipid domains and ascribe
this phenomenon to phase separation of the different lipid
species on the bubble surface. Similar variations in the local
lipid concentration on the shell have been found to affect the
nonlinear behavior of DSPC microbubbles at high frequen-
cies,45 although no clear relation between the nonlinear
response and shell microstructure was evident. Hosny et al.7
quantified the spatial distribution of viscosity in the micro-
bubble shell using a fluorescence lifetime imaging technique
and also found a large variation in viscosity that was corre-
lated to differences in the ultrasound response of microbub-
bles of similar size. Based on the chemical composition and
preparation method of ELIP, we expect similar inhomogene-
ities in local lipid concentration as well as variation between
individual ELIP particles within a population. Moreover,
lipid diffusion and the phase transition influenced by the sur-
rounding temperature can be other key factors affecting the
heterogeneity of the ELIP shell.8,22
Nanostructural surface morphology that could not be
resolved using the optical techniques in this study (e.g., Fig.
2) may nevertheless play a large role in the dynamic behav-
ior of ELIP. For lipid-encapsulated bubbles, the shell is usu-
ally assumed to be a monolayer due to thermodynamic
considerations.35 However, the shell thickness has not been
directly measured for microscopic encapsulated gas bubbles
and estimates based on the dynamic response of the micro-
bubble only give information about the interfacial rheologi-
cal properties of the microbubble (i.e., zero-thickness
interface model).20 Therefore the large variation in viscosity
estimates could be due to the number of lipid layers sur-
rounding the encapsulated microbubbles.7 The resolution of
the fluorescence images presented in Fig. 2 is limited by the
focal spot size, which is about 220 nm in the lateral dimen-
sion. Thus we are unable to conclude whether the shell is a
lipid monolayer or if it is multilamellar. Multilamellar
vesicles, in which the lipid monolayer immediately adjacent
to the gas bubble is surrounded by one or more bilayers,
have been observed in transmission electron microscopy
images of ELIP.25 The spread of the shell viscosity estimates
for ELIP of similar size may indicate the presence of multi-
lamellar vesicles, where the apparent viscosity depends on
the number of lamallae.
FIG. 9. The variation of dimensionless damping coefficients (drad, dvis,
dth, dsh) versus microbubble size at resonance. The total damping coeffi-
cients for a free bubble (solid line) and an encapsulated bubble with a
shell viscosity of js¼ 2� 10�8 kg/s (dashed-dotted line) are also shown.
The vertical dotted lines represent the size range of ELIP considered in
this study.
1700 J. Acoust. Soc. Am., Vol. 137, No. 4, April 2015 Raymond et al.: Impulse response of echogenic liposomes

Another factor affecting the interpretation of the varia-
tion in the shell viscosity estimates is the uncertainty, which
can be approximated as the random error associated with
separate measurements on the same ELIP. We calculated the
random error by considering the relative difference between
the values obtained from separate analysis of the two phase-
inverted excitation pulses (0� and 180�), i.e., the absolute
difference between the two shell viscosity estimates normal-
ized by the average of the two estimates. The median ran-
dom error was 40% which is approximately the same as the
standard deviation shown in Figs. 6(a) and 6(b).
D. Impulse response measurements and analysis
Evaluation of the damping coefficient based on the
impulse response is a new and efficient approach applied to
characterization of lipid-shelled ELIP in this study. A broad-
band pulse was applied to acquire the radius versus time
impulse response of an individual ELIP, requiring only a
single exposure of a few microseconds using an ultra-high-
speed camera. Using the Brandaris 128, we were able to
record the unforced, exponentially decaying amplitude
response from two acoustic impulse excitations, a pulse
inversion pair, during each high speed recording (128
frames). This method provides an efficient approach that
enabled statistical measurements on a large number of indi-
vidual ELIP. Additionally, data analysis was straightforward,
and the simulated transient response of the lipid-
encapsulated microbubble accurately tracked the measured
radius versus time curves (Figs. 7 and 8).
We also assessed the validity of this technique by com-
paring the forced response measured using a 10-cycle nar-
row-band burst excitation with numerical simulations. An
example is shown in Fig. 10 in which simulations using two
different shell viscosity values (derived from the optical
method described here or the bulk acoustic method reported
in Raymond et al.,21 respectively) are compared with experi-
mental measurements. Excellent agreement was found
between the simulated and measured radius versus time
curves when the effect of the shell was taken into account
using the viscosity estimate obtained in this study. For the
example shown in Fig. 10(a), the shell viscosity estimate
(js¼ 3.0� 10–9 kg/s) was obtained during a previous
impulse response exposure of the same particular liposome.
Alternatively, using the population-averaged shell viscosity
obtained in Raymond et al.21 (js¼ 2.0� 10–8 kg/s) results in
an under-prediction of the amplitude of the response to
narrow-band forcing [Fig. 10(b)]. Use of the estimated value
obtained for a specific ELIP in this study allows one to
obtain much more precise agreement between the experi-
mental theoretical data using the Marmottant model.
E. Implications for contrast-enhanced imaging
The size range of ELIP is known to be polydisperse
with particle sizes ranging from tens of nanometers to sev-
eral microns.21,24,25 Differences in the characteristics of
nanoscale versus microscale ELIP vesicles may play a role
in the scattering properties of individual ELIP. This study
found that smaller ELIP are characterized by a substantially
lower shell viscosity, which may contribute to increased
nonlinear scattering, especially at higher frequencies. Such
nonlinear behavior of the smaller populations of ELIP could
be exploited for diagnostic ultrasound applications that uti-
lize higher frequencies, such as intravascular ultrasound. For
example, the nonlinear acoustic signatures of ELIP could be
utilized for improved imaging of pathology in the vasa vaso-rum, the proliferative small vessels that play a role in ather-
oma progression in the cardiovascular system.
Goertz et al.46 demonstrated that sub-populations of the
lipid-shelled clinical UCA DefinityVR
exhibited different
frequency-dependent scattering properties as a function of
size. These authors hypothesized that differences in the
encapsulation microstructure for small and large bubbles
may be a key factor influencing the nonlinear scattering at
high frequencies. A subsequent study by Helfield et al.47
demonstrated that smaller sub-populations of lipid-shelled
microbubbles were not only resonant at higher frequencies
but were also characterized by a substantially lower shell
viscosity, suggesting a possible frequency dependence of the
lipid shell properties. It is still not clear whether this effect is
FIG. 10. Experimentally measured radius versus time curve for a bubble in
response to narrow-band forcing (f¼ 3 MHz, dashed lines). Theoretical
radius versus time curves for two different values of the damping coeffi-
cient are shown. The solid line represents the simulated damping using (a)
the method described in this paper (js¼ 3.0� 10�9 kg/s) and (b) the shell
damping estimated from bulk acoustic measurements (js¼ 2� 10�8 kg/s).
The shell elasticity parameter was taken to be v¼ 1.55 N/m as reported in
Ref. 20.
J. Acoust. Soc. Am., Vol. 137, No. 4, April 2015 Raymond et al.: Impulse response of echogenic liposomes 1701

due solely to the size or if frequency-dependent considera-
tions need to be taken into account in the dynamical models.
Doinikov et al.44 point out that existing shell models may
not capture the observed radius or frequency dependence of
the shell material properties and that full description of the
rheological properties of the shell may require the use of
more complex models in order to describe the shear-thinning
behavior. A more detailed exploration of alternative rheolog-
ical models could be explored in future studies.
F. Limitations
Inherent limitations of the optical system resolution
result in a bias of the size range of ELIP selected for analysis
in this study. The optical resolution of the ultra-high-speed
imaging system was 0.4 lm (Ref. 11), and the smallest indi-
vidual ELIP that was measured in this study was several
times larger than the optical resolution limit. The size range
of ELIP considered here focused on measurable particles
larger than 0.9 lm in radius only and smaller ELIP were not
considered for investigation.
The proximity of the microbubble to the OptiCellTM
membrane may affect the measured response of ELIP to
acoustic excitation. Previous studies have found that the
presence of a membrane near an oscillating microbubble can
affect the resonance frequency and oscillation amplitude in
response to acoustic forcing.48,49 Functionalized UCAs such
as ELIP are being developed for targeted imaging and drug-
delivery applications, and therefore similar effects are
expected to play a role in vivo. The acoustic response of ad-
herent targeted bubbles may be influenced by the ligand dis-
tribution and bubble-wall interaction.23 Therefore future
work to investigate the damping for adherent targeted agents
using this approach is recommended.
The simulations presented in Figs. 7, 8, and 10 are not
unique solutions because there is more than one free parame-
ter in the Marmottant model, namely the shell elasticity, v,
and initial surface tension, r0. We have chosen to assume
the phospholipid shell stabilizes a gas bubble by counteract-
ing the Laplace pressure, so that r0¼ 0, throughout this pa-
per. Using empirical fits, the values for the data presented in
Fig. 7 are: v¼ 0.1, 0.2, and 1.55 N/m for R0¼ 1.5, 2.3, and
3.0 lm, respectively. A radius-dependent shell elasticity pa-
rameter has also been observed and modeled by Chetty
et al.9 and Doinikov et al.44 The measured oscillation ampli-
tudes were not always in the “elastic” regime range of the
Marmottant model (R/R0< 1.02). However, the 3.0 lm bub-
ble did behave near this regime (R/R0 � 1.07) and the shell
elasticity determined from the optical measurements agreed
with previous measurements.21
V. CONCLUSIONS
In this study, a model based on time domain analysis
was developed to estimate the shell viscosity for individual
ELIP using optically measured radius versus time curves.
The decay time constant was measured from the unforced
response of the ELIP following excitation by a short acoustic
pulse. At low dilatation rates, the shell viscosity is in quanti-
tative agreement with our previously determined values for
ELIP. The viscoelastic shell of ELIP was found to behave
similarly to other lipid-shelled agents. We demonstrated that
qualitative agreement between the measured and simulated
radius versus time curves under transient and steady-state
acoustic forcing is highly dependent on the shell viscosity.
The methods described here can provide accurate estimates
of the shell viscosity and damping for individual UCA
microbubbles. In contrast to acoustic measurements of a
microbubble population with a relatively wide size distribu-
tion, this method provides some insight on the variation of
properties among single particles within a population. This
method also enables efficient measurements on a large num-
ber or individual UCA microbubbles because it is based on
the response to a single acoustic impulse excitation.
ACKNOWLEDGMENTS
The authors would like to thank Robert Beurskens and
Frits Mastik from the Department of Biomedical
Engineering, Erasmus MC, for technical assistance with
Brandaris experiments. The authors would also like to thank
the Erasmus Optical Imaging Centre of Erasmus MC for use
of their facilities and Wiggert A. van Cappellen and Alex
Nigg from the Erasmus Optical Imaging Centre, Department
of Pathology, Erasmus MC, for technical assistance. J.L.R.
was supported by a fellowship from the Whitaker
International Program administered by the Institute of
International Education. This work was supported in part by
the U.S. Department of Health and Human Services,
National Institutes of Health (Grant Nos. NIH R01HL74002
and NIH R01HL059586) and NanoNextNL, a micro and
nanotechnology consortium of the Government of the
Netherlands and 130 partners. This work was performed
while the first author was a visiting fellow at the Department
of Biomedical Engineering, Thoraxcenter, Erasmus MC,
Rotterdam, Netherlands.
1T. Faez, M. Emmer, K. Kooiman, M. Versluis, A. Van Der Steen, and N.
De Jong, “20 years of ultrasound contrast agent modeling,” IEEE Trans.
Ultrason. Ferroelectr. Freq. Control 60, 7–20 (2013).2A. A. Doinikov and A. Bouakaz, “Review of shell models for contrast
agent microbubbles,” IEEE Trans. Ultrason. Ferroelectr. Freq. Control 58,
981–993 (2011).3N. de Jong, A. Bouakaz, and P. Frinking, “Basic acoustic properties of
microbubbles,” Echocardiography 19, 229–240 (2002).4E. Stride, “Physical principles of microbubbles for ultrasound imaging and
therapy,” Cerebrovasc. Dis. 27 Suppl. 2, 1–13 (2009).5Q. Wen, S. Wan, Z. Liu, S. Xu, H. Wang, and B. Yang, “Ultrasound con-
trast agents and ultrasound molecular imaging,” J. Nanosci. Nanotechnol.
14, 190–209 (2014).6J. Castle, M. Butts, A. Healey, K. Kent, M. Marino, and S. B. Feinstein,
“Ultrasound-mediated targeted drug delivery: Recent success and remain-
ing challenges,” Am. J. Physiol. Heart Circ. Physiol. 304, H350–H357
(2013).7N. A. Hosny, G. Mohamedi, P. Rademeyer, J. Owen, Y. Wu, M.-X. Tang,
R. J. Eckersley, E. Stride, and M. K. Kuimova, “Mapping microbubble
viscosity using fluorescence lifetime imaging of molecular rotors,” Proc.
Natl. Acad. Sci. U.S.A. 110, 9225–9230 (2013).8M. Borden, “Nanostructural features on stable microbubbles,” Soft Matter
5, 716–720 (2009).9K. Chetty, E. Stride, C. Sennoga, J. Hajnal, and R. Eckersley, “High-speed
optical observations and simulation results of SonoVue microbubbles at
low-pressure insonation,” IEEE Trans. Ultrason. Ferroelectr. Freq. Control
55, 1333–1342 (2008).
1702 J. Acoust. Soc. Am., Vol. 137, No. 4, April 2015 Raymond et al.: Impulse response of echogenic liposomes

10X. Chen, J. Wang, M. Versluis, N. De Jong, and F. S. Villanueva, “Ultra-
fast bright field and fluorescence imaging of the dynamics of micrometer-
sized objects,” Rev. Sci. Instrum. 84, 063701 (2013).11C. T. Chin, C. Lanc�ee, J. Borsboom, F. Mastik, M. E. Frijlink, N. De Jong,
M. Versluis, and D. Lohse, “Brandaris 128: A digital 25 million frames
per second camera with 128 highly sensitive frames,” Rev. Sci. Instrum.
74, 5026–5034 (2003).12E. C. Gelderblom, H. J. Vos, F. Mastik, T. Faez, Y. Luan, T. J. A.
Kokhuis, A. F. W. Van Der Steen, D. Lohse, N. De Jong, and M.
Versluis, “Brandaris 128 ultra-high-speed imaging facility: 10 years of
operation, updates, and enhanced features,” Rev. Sci. Instrum. 83,
103706 (2012).13J. Sijl, H. J. Vos, T. Rozendal, N. De Jong, D. Lohse, and M. Versluis,
“Combined optical and acoustical detection of single microbubble dynam-
ics,” J. Acoust. Soc. Am. 130, 3271–3281 (2011).14S. M. van der Meer, B. Dollet, M. M. Voormolen, C. T. Chin, A.
Bouakaz, N. de Jong, M. Versluis, and D. Lohse, “Microbubble spectros-
copy of ultrasound contrast agents,” J. Acoust. Soc. Am. 121, 648–656
(2007).15T. Faez, I. Skachkov, M. Versluis, K. Kooiman, and N. de Jong, “In vivo
characterization of ultrasound contrast agents: Microbubble spectroscopy
in a chicken embryo,” Ultrasound Med. Biol. 38, 1608–1617 (2012).16Y. Luan, T. Faez, E. Gelderblom, I. Skachkov, B. Geers, I. Lentacker, T.
van der Steen, M. Versluis, and N. de Jong, “Acoustical properties of indi-
vidual liposome-loaded microbubbles,” Ultrasound Med. Biol. 38,
2174–2185 (2012).17M. Overvelde, V. Garbin, J. Sijl, B. Dollet, N. de Jong, D. Lohse, and M.
Versluis, “Nonlinear shell behavior of phospholipid-coated micro-
bubbles,” Ultrasound Med. Biol. 36, 2080–2092 (2010).18D. H. Thomas, M. Butler, T. Anderson, M. Emmer, H. Vos, M. Borden, E.
Stride, N. De Jong, and V. Sboros, “The quasi-stable lipid shelled micro-
bubble in response to consecutive ultrasound pulses,” Appl. Phys. Lett.
101, 071601 (2012).19S.-L. Huang, “Ultrasound-responsive liposomes,” in Liposomes: Methods
and Protocols, Methods in Molecular Biology, edited by V. Weissig
(Humana, New York, 2010), Vol. 605, pp. 113–128.20S. Paul, R. Nahire, S. Mallik, and K. Sarkar, “Encapsulated microbubbles
and echogenic liposomes for contrast ultrasound imaging and targeted
drug delivery,” Comput. Mech. 53, 413–435 (2014).21J. L. Raymond, K. J. Haworth, K. B. Bader, K. Radhakrishnan, J. K.
Griffin, S.-L. Huang, D. D. McPherson, and C. K. Holland, “Broadband
attenuation measurements of phospholipid-shelled ultrasound contrast
agents,” Ultrasound Med. Biol. 40, 410–421 (2014).22K. D. Buchanan, S. Huang, H. Kim, R. C. MacDonald, and D. D.
McPherson, “Echogenic liposome compositions for increased retention of
ultrasound reflectivity at physiologic temperature,” J. Pharm. Sci. 97,
2242–2249 (2008).23K. Kooiman, T. J. A. Kokhuis, T. van Rooij, I. Skachkov, A. Nigg, J. G.
Bosch, A. F. W. van der Steen, W. A. van Cappellen, and N. de Jong,
“DSPC or DPPC as main shell component influences ligand distribution
and binding area of lipid-coated targeted microbubbles,” Eur. J. Lipid Sci.
Technol. 116, 1217–1227 (2014).24S. Paul, D. Russakow, R. Nahire, T. Nandy, A. H. Ambre, K. Katti, S.
Mallik, and K. Sarkar, “In vitro measurement of attenuation and nonlinear
scattering from echogenic liposomes,” Ultrasonics 52, 962–969 (2012).25J. A. Kopechek, K. J. Haworth, J. L. Raymond, T. Douglas Mast, S. R.
Perrin, Jr., M. E. Klegerman, S. Huang, T. M. Porter, D. D. McPherson,
and C. K. Holland, “Acoustic characterization of echogenic liposomes:
Frequency-dependent attenuation and backscatter,” J. Acoust. Soc. Am.
130, 3472–3481 (2011).26R. Nahire, S. Paul, M. D. Scott, R. K. Singh, W. W. Muhonen, J. Shabb,
K. N. Gange, D. K. Srivastava, K. Sarkar, and S. Mallik, “Ultrasound
enhanced matrix metalloproteinase-9 triggered release of contents from
echogenic liposomes,” Mol. Pharm. 9, 2554–2564 (2012).27A. Katiyar and K. Sarkar, “Excitation threshold for subharmonic genera-
tion from contrast microbubbles,” J. Acoust. Soc. Am. 130, 3137–3147
(2011).
28M. A. Ainslie and T. G. Leighton, “Review of scattering and extinction
cross-sections, damping factors, and resonance frequencies of a spherical
gas bubble,” J. Acoust. Soc. Am. 130, 3184–3208 (2011).29J. L. Leander, “On the eigenfrequency of a gas bubble in a liquid,”
J. Acoust. Soc. Am. 102, 1900–1903 (1997).30A. Agneni and L. Balis-Crema, “Damping measurements from truncated
signals via Hilbert transform,” Mech. Syst. Signal Process. 3, 1–13 (1989).31D. Chatterjee and K. Sarkar, “A Newtonian rheological model for the
interface of microbubble contrast agents,” Ultrasound Med. Biol. 29,
1749–1757 (2003).32P. Marmottant, S. Van Der Meer, M. Emmer, M. Versluis, N. De Jong, S.
Hilgenfeldt, and D. Lohse, “A model for large amplitude oscillations of
coated bubbles accounting for buckling and rupture,” J. Acoust. Soc. Am.
118, 3499–3505 (2005).33L. Hoff, P. C. Sontum, and J. M. Hovem, “Oscillations of polymeric
microbubbles: Effect of the encapsulating shell,” J. Acoust. Soc. Am. 107,
2272–2280 (2000).34L. A. Crum, “Polytropic exponent of a gas contained within air bubbles
pulsating in a liquid,” J. Acoust. Soc. Am. 73, 116–120 (1983).35J. J. Kwan and M. A. Borden, “Lipid monolayer collapse and microbubble
stability,” Adv. Colloid Interface Sci. 183–184, 82–99 (2012).36K. E. Morgan, J. S. Allen, P. Dayton, J. E. Chomas, A. L. Klibanov, and
K. W. Ferrara, “Experimental and theoretical evaluation of microbubble
behavior: Effect of transmitted phase and bubble size,” IEEE Trans.
Ultrason. Ferroelectr. Freq. Control 47, 1494–1509 (2000).37J. Tu, J. E. Swalwell, D. Giraud, W. Cui, W. Chen, and T. J. Matula,
“Microbubble sizing and shell characterization using flow cytometry,”
IEEE Trans. Ultrason. Ferroelectr. Freq. Control 58, 955–963 (2011).38J.-M. Gorce, M. Arditi, and M. Schneider, “Influence of bubble size distri-
bution on the echogenicity of ultrasound contrast agents: A study of
SonoVueTM,” Invest. Radiol. 35, 661–671 (2000).39K. Sarkar, W. T. Shi, D. Chatterjee, and F. Forsberg, “Characterization of
ultrasound contrast microbubbles using in vitro experiments and viscous
and viscoelastic interface models for encapsulation,” J. Acoust. Soc. Am.
118, 539–550 (2005).40T. Faez, D. Goertz, and N. De Jong, “Characterization of DefinityTM ultra-
sound contrast agent at frequency range of 5-15 MHz,” Ultrasound Med.
Biol. 37, 338–342 (2011).41A. I. Malkin, Rheology Fundamentals (ChemTec, Toronto-Scarborough,
Ontario, Canada, 1994).42C. C. Church, “The effects of an elastic solid surface layer on the radial
pulsations of gas bubbles,” J. Acoust. Soc. Am. 97, 1510–1521 (1995).43Q. Li, T. J. Matula, J. Tu, X. Guo, and D. Zhang, “Modeling complicated
rheological behaviors in encapsulating shells of lipid-coated microbubbles
accounting for nonlinear changes of both shell viscosity and elasticity,”
Phys. Med. Biol. 58, 985–998 (2013).44A. A. Doinikov, J. F. Haac, and P. A. Dayton, “Modeling of nonlinear vis-
cous stress in encapsulating shells of lipid-coated contrast agent micro-
bubbles,” Ultrasonics 49, 269–275 (2009).45B. L. Helfield, E. Cherin, F. S. Foster, and D. E. Goertz, “Investigating the
subharmonic response of individual phospholipid encapsulated microbub-
bles at high frequencies: A comparative study of five agents,” Ultrasound
Med. Biol. 38, 846–863 (2012).46D. E. Goertz, N. de Jong, and A. F. van der Steen, “Attenuation and size
distribution measurements of Definity and manipulated Definity pop-
ulations,” Ultrasound Med. Biol. 33, 1376–1388 (2007).47B. L. Helfield, B. Y. C. Leung, X. Huo, and D. E. Goertz, “Scaling of the
viscoelastic shell properties of phospholipid encapsulated microbubbles
with ultrasound frequency,” Ultrasonics 54, 1419–1424 (2014).48V. Garbin, D. Cojoc, E. Ferrari, E. Di Fabrizio, M. L. J. Overvelde, S. M.
Van Der Meer, N. De Jong, D. Lohse, and M. Versluis, “Changes in
microbubble dynamics near a boundary revealed by combined optical
micromanipulation and high-speed imaging,” Appl. Phys. Lett. 90,
114103 (2007).49B. L. Helfield, B. Y. C. Leung, and D. E. Goertz, “The effect of boundary
proximity on the response of individual ultrasound contrast agent micro-
bubbles,” Phys. Med. Biol. 59, 1721–1745 (2014).
J. Acoust. Soc. Am., Vol. 137, No. 4, April 2015 Raymond et al.: Impulse response of echogenic liposomes 1703


