Embed Size (px)
Citation preview
RSC Advances
PAPER
Ope
n A
cces
s A
rtic
le. P
ublis
hed
on 1
0 Ja
nuar
y 20
22. D
ownl
oade
d on
1/1
9/20
22 1
:40:
50 P
M.
Thi
s ar
ticle
is li
cens
ed u
nder
a C
reat
ive
Com
mon
s A
ttrib
utio
n-N
onC
omm
erci
al 3
.0 U
npor
ted
Lic
ence
.
View Article OnlineView Journal | View Issue
Improving the pr
aDepartment of Physics and Materials Sc
University, Chiang Mai 50200, ThailandbCenter of Excellence in Materials Science
Chiang Mai 50200, ThailandcResearch Center in Physics and Astronomy,
Chiang Mai 50200, Thailand. E-mail: wiran
Cite this: RSC Adv., 2022, 12, 1527
Received 9th October 2021Accepted 15th December 2021
DOI: 10.1039/d1ra07490c
rsc.li/rsc-advances
© 2022 The Author(s). Published by
operties of Fe2O3 by a sparkingmethod under a uniform magnetic field for a high-performance humidity sensor
Posak Tippo, ab Pisith Singjai,a Waraporn Sroila,a Tipsuda Jaisamer,a
Nongpanita Suttanon,a Arisara Panthawan,a Ekkapong Kantarak,a Wattikon Sroila,a
Wiradej Thongsuwan,a Tewasin Kumpika ab and Orawan Wiranwetchayan*bc
Iron oxide (Fe2O3) thin films are promising semiconductors for electronic applications because Fe2O3 is an
earth-abundant semiconductor with an appropriate band gap. However, manymethods for the synthesis of
Fe2O3 thin films require a corrosive source, complex procedures, and many types of equipment. Here, we
report, for the first time, a simple method for Fe2O3 deposition using sparking under a uniform magnetic
field. The morphology of Fe2O3 displayed an agglomeration of particles with a network-like structure.
The crystallite size, % Fe content, and optical bandgap of Fe2O3 were influenced by changes in the
magnitude of the magnetic field. For application in humidity sensors, Fe2O3 at a magnetic field of 200
mT demonstrated a sensitivity of 99.81%, response time of 0.33 s, and recovery time of 2.57 s. These
results can provide references for new research studies.
Introduction
Iron oxide (Fe2O3) plays an important part in many applications(e.g., gas sensors, batteries, supercapacitors, and photocatalyticwater splitting) because Fe2O3 is an earth-abundant semi-conductor with a direct bandgap of �2.35 eV and an indirectbandgap of �1.38 eV.1–6 Moreover, Fe2O3 nanoparticles coatedwith fullerene-like shells are also used as “nano-transporters”for radioisotopes, which is benecial for diagnosing andmonitoring in the medical eld.2 A high surface area andsurface-to-volume ratio with surface modication enables Fe2O3
nanoparticle lms to become appropriate materials forhumidity sensors.7 Nevertheless, many methods for thesynthesis of Fe2O3 thin lms (e.g., sputtering and atomic layerdeposition) require different types of equipment and involvecomplex procedures.8,9 In addition, the fabrication of humiditysensor-based Fe2O3 requires a temperature > 1000 �C, forexample, for the sintering method.10,11 Therefore, an alternativemethod with a simple process and low temperature require-ment for the synthesis of Fe2O3 thin lms is essential.
It has been reported that facile methods such as sparkingunder a non-uniform magnetic eld can inuence the proper-ties of magnetic materials such as iron (Fe), nickel (Ni) and
ience, Faculty of Science, Chiang Mai
and Technology, Chiang Mai University,
Faculty of Science, Chiang Mai University,
the Royal Society of Chemistry
cobalt (Co).12,13 Previously, we showed that an increase in themagnitude of a uniformmagnetic eld reduces the porosity andimproves the crystal structure as well as the electrical propertiesof a NiO lm.14,15 Thus, a sparking method under a uniformmagnetic eld could be employed to produce a Fe2O3 lm andoptimize its properties for humidity sensors.
Here, we reveal, for the rst time, Fe2O3 deposition usinga sparking method under a uniform magnetic eld. The inu-ence of the magnetic eld on the morphology, crystal structure,optical properties, chemical composition, and electrical prop-erties was studied. Furthermore, the capability of the Fe2O3 lmto sense humidity was investigated.
Experimental sectionDeposition of Fe2O3
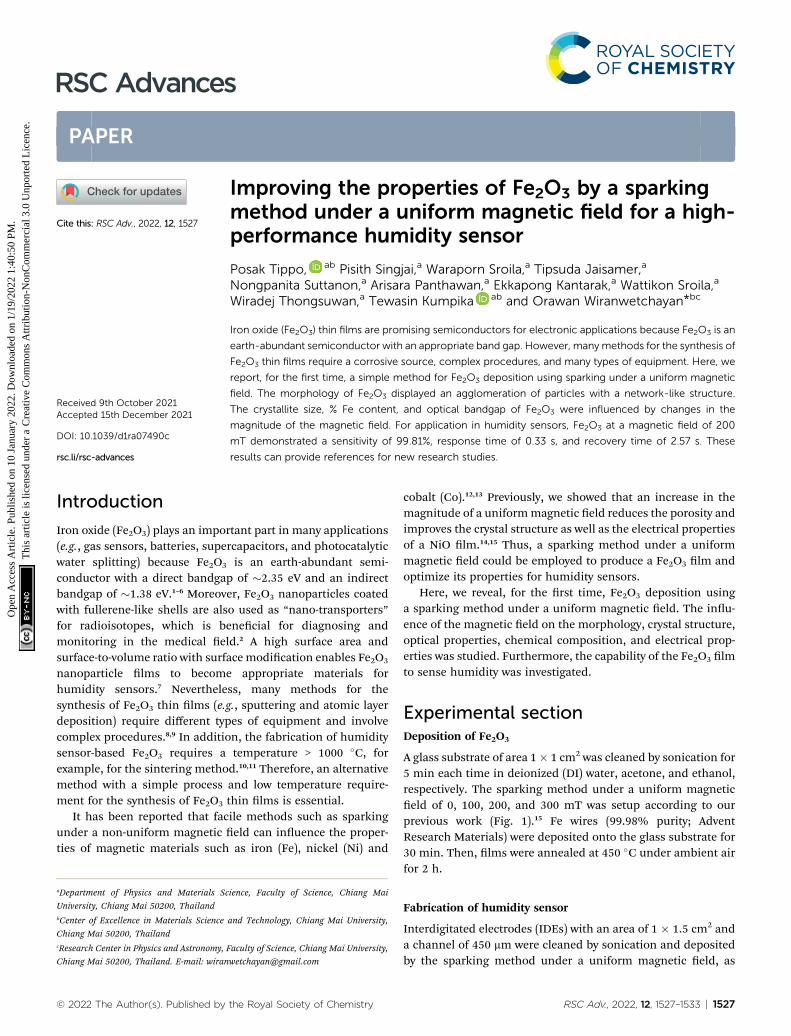
A glass substrate of area 1� 1 cm2 was cleaned by sonication for5 min each time in deionized (DI) water, acetone, and ethanol,respectively. The sparking method under a uniform magneticeld of 0, 100, 200, and 300 mT was setup according to ourprevious work (Fig. 1).15 Fe wires (99.98% purity; AdventResearch Materials) were deposited onto the glass substrate for30 min. Then, lms were annealed at 450 �C under ambient airfor 2 h.
Fabrication of humidity sensor
Interdigitated electrodes (IDEs) with an area of 1 � 1.5 cm2 anda channel of 450 mm were cleaned by sonication and depositedby the sparking method under a uniform magnetic eld, as
RSC Adv., 2022, 12, 1527–1533 | 1527
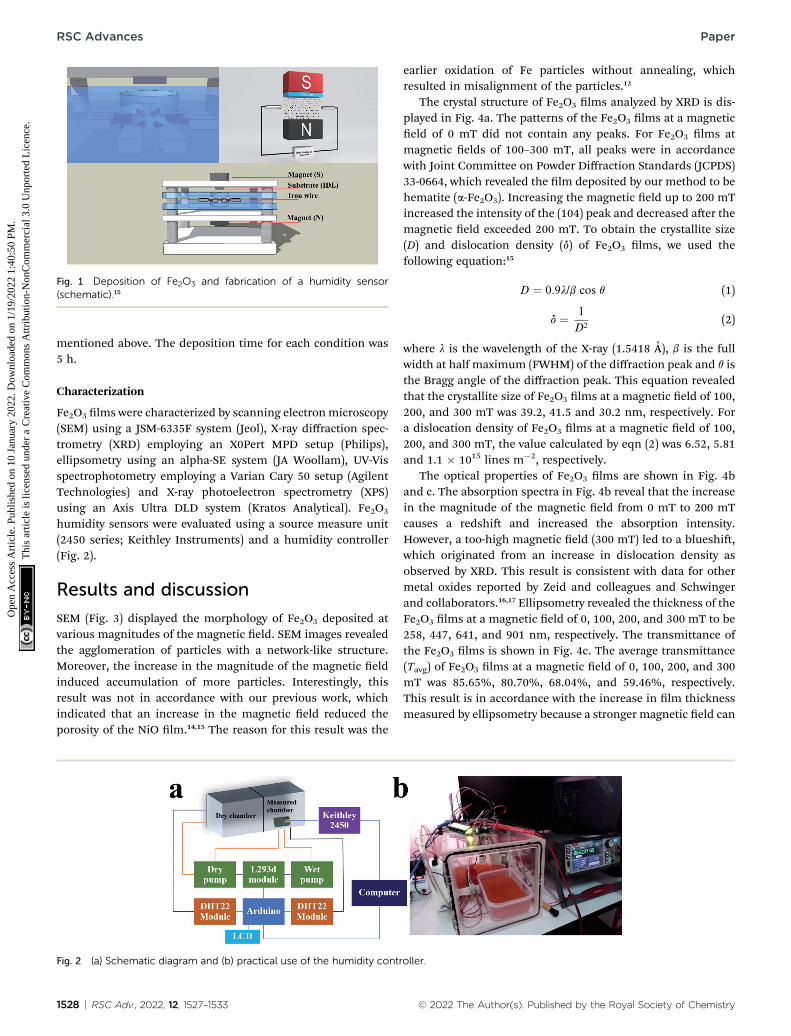
Fig. 1 Deposition of Fe2O3 and fabrication of a humidity sensor(schematic).15
RSC Advances Paper
Ope
n A
cces
s A
rtic
le. P
ublis
hed
on 1
0 Ja
nuar
y 20
22. D
ownl
oade
d on
1/1
9/20
22 1
:40:
50 P
M.
Thi
s ar
ticle
is li
cens
ed u
nder
a C
reat
ive
Com
mon
s A
ttrib
utio
n-N
onC
omm
erci
al 3
.0 U
npor
ted
Lic
ence
.View Article Online
mentioned above. The deposition time for each condition was5 h.
Characterization
Fe2O3 lms were characterized by scanning electronmicroscopy(SEM) using a JSM-6335F system (Jeol), X-ray diffraction spec-trometry (XRD) employing an X0Pert MPD setup (Philips),ellipsometry using an alpha-SE system (JA Woollam), UV-Visspectrophotometry employing a Varian Cary 50 setup (AgilentTechnologies) and X-ray photoelectron spectrometry (XPS)using an Axis Ultra DLD system (Kratos Analytical). Fe2O3
humidity sensors were evaluated using a source measure unit(2450 series; Keithley Instruments) and a humidity controller(Fig. 2).
Results and discussion
SEM (Fig. 3) displayed the morphology of Fe2O3 deposited atvarious magnitudes of the magnetic eld. SEM images revealedthe agglomeration of particles with a network-like structure.Moreover, the increase in the magnitude of the magnetic eldinduced accumulation of more particles. Interestingly, thisresult was not in accordance with our previous work, whichindicated that an increase in the magnetic eld reduced theporosity of the NiO lm.14,15 The reason for this result was the
Fig. 2 (a) Schematic diagram and (b) practical use of the humidity contr
1528 | RSC Adv., 2022, 12, 1527–1533
earlier oxidation of Fe particles without annealing, whichresulted in misalignment of the particles.12
The crystal structure of Fe2O3 lms analyzed by XRD is dis-played in Fig. 4a. The patterns of the Fe2O3 lms at a magneticeld of 0 mT did not contain any peaks. For Fe2O3 lms atmagnetic elds of 100–300 mT, all peaks were in accordancewith Joint Committee on Powder Diffraction Standards (JCPDS)33-0664, which revealed the lm deposited by our method to behematite (a-Fe2O3). Increasing the magnetic eld up to 200 mTincreased the intensity of the (104) peak and decreased aer themagnetic eld exceeded 200 mT. To obtain the crystallite size(D) and dislocation density (d) of Fe2O3 lms, we used thefollowing equation:15
D ¼ 0.9l/b cos q (1)
d ¼ 1
D2(2)
where l is the wavelength of the X-ray (1.5418 A), b is the fullwidth at half maximum (FWHM) of the diffraction peak and q isthe Bragg angle of the diffraction peak. This equation revealedthat the crystallite size of Fe2O3 lms at a magnetic eld of 100,200, and 300 mT was 39.2, 41.5 and 30.2 nm, respectively. Fora dislocation density of Fe2O3 lms at a magnetic eld of 100,200, and 300 mT, the value calculated by eqn (2) was 6.52, 5.81and 1.1 � 1015 lines m�2, respectively.
The optical properties of Fe2O3 lms are shown in Fig. 4band c. The absorption spectra in Fig. 4b reveal that the increasein the magnitude of the magnetic eld from 0 mT to 200 mTcauses a redshi and increased the absorption intensity.However, a too-high magnetic eld (300 mT) led to a blueshi,which originated from an increase in dislocation density asobserved by XRD. This result is consistent with data for othermetal oxides reported by Zeid and colleagues and Schwingerand collaborators.16,17 Ellipsometry revealed the thickness of theFe2O3 lms at a magnetic eld of 0, 100, 200, and 300 mT to be258, 447, 641, and 901 nm, respectively. The transmittance ofthe Fe2O3 lms is shown in Fig. 4c. The average transmittance(Tavg) of Fe2O3 lms at a magnetic eld of 0, 100, 200, and 300mT was 85.65%, 80.70%, 68.04%, and 59.46%, respectively.This result is in accordance with the increase in lm thicknessmeasured by ellipsometry because a stronger magnetic eld can
oller.
© 2022 The Author(s). Published by the Royal Society of Chemistry
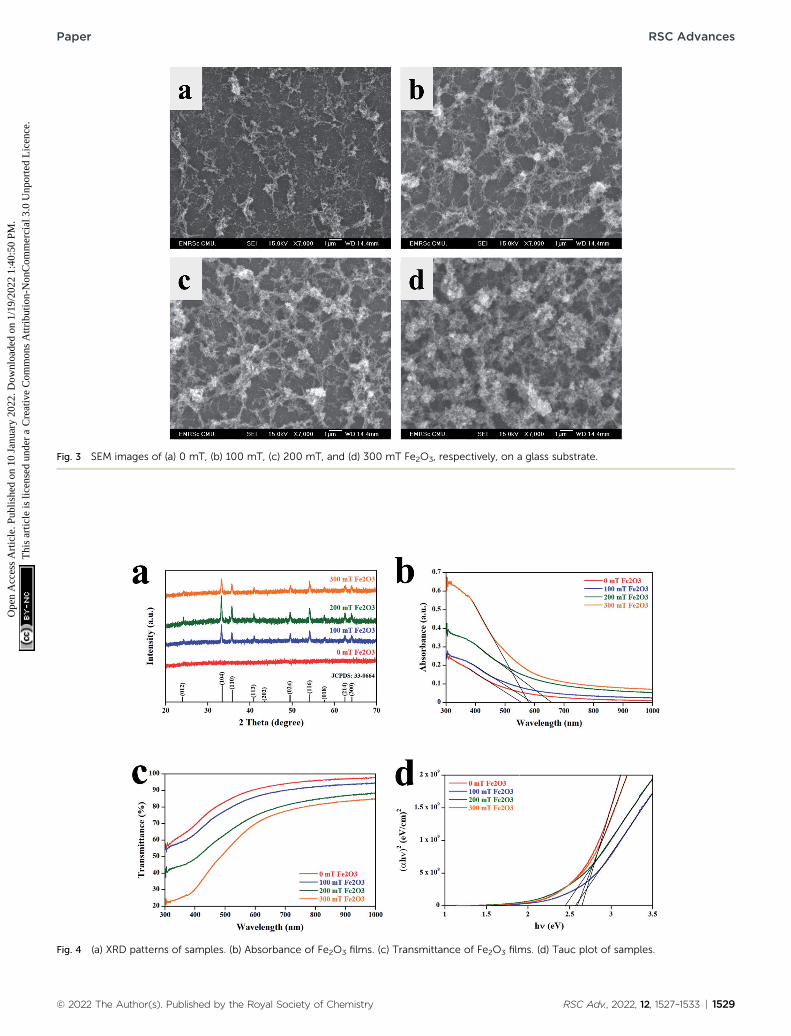
Fig. 3 SEM images of (a) 0 mT, (b) 100 mT, (c) 200 mT, and (d) 300 mT Fe2O3, respectively, on a glass substrate.
Fig. 4 (a) XRD patterns of samples. (b) Absorbance of Fe2O3 films. (c) Transmittance of Fe2O3 films. (d) Tauc plot of samples.
© 2022 The Author(s). Published by the Royal Society of Chemistry RSC Adv., 2022, 12, 1527–1533 | 1529
Paper RSC Advances
Ope
n A
cces
s A
rtic
le. P
ublis
hed
on 1
0 Ja
nuar
y 20
22. D
ownl
oade
d on
1/1
9/20
22 1
:40:
50 P
M.
Thi
s ar
ticle
is li
cens
ed u
nder
a C
reat
ive
Com
mon
s A
ttrib
utio
n-N
onC
omm
erci
al 3
.0 U
npor
ted
Lic
ence
.View Article Online
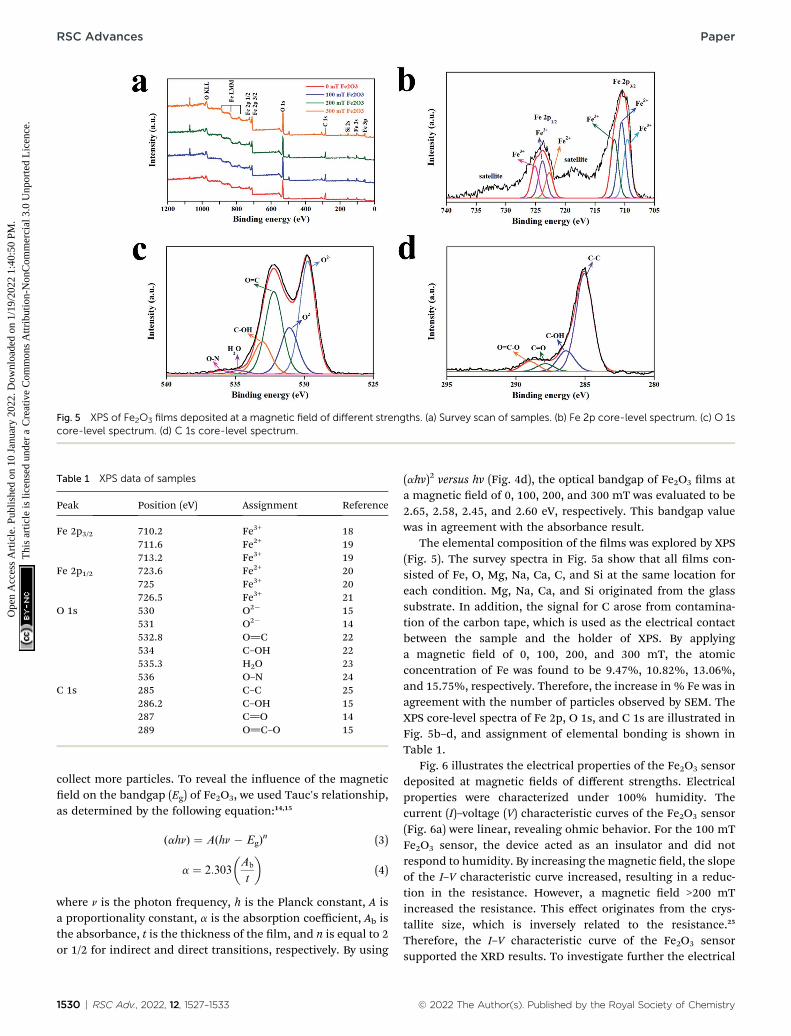
Fig. 5 XPS of Fe2O3 films deposited at a magnetic field of different strengths. (a) Survey scan of samples. (b) Fe 2p core-level spectrum. (c) O 1score-level spectrum. (d) C 1s core-level spectrum.
Table 1 XPS data of samples
Peak Position (eV) Assignment Reference
Fe 2p3/2 710.2 Fe3+ 18711.6 Fe2+ 19713.2 Fe3+ 19
Fe 2p1/2 723.6 Fe2+ 20725 Fe3+ 20726.5 Fe3+ 21
O 1s 530 O2� 15531 O2� 14532.8 O]C 22534 C–OH 22535.3 H2O 23536 O–N 24
C 1s 285 C–C 25286.2 C–OH 15287 C]O 14289 O]C–O 15
RSC Advances Paper
Ope
n A
cces
s A
rtic
le. P
ublis
hed
on 1
0 Ja
nuar
y 20
22. D
ownl
oade
d on
1/1
9/20
22 1
:40:
50 P
M.
Thi
s ar
ticle
is li
cens
ed u
nder
a C
reat
ive
Com
mon
s A
ttrib
utio
n-N
onC
omm
erci
al 3
.0 U
npor
ted
Lic
ence
.View Article Online
collect more particles. To reveal the inuence of the magneticeld on the bandgap (Eg) of Fe2O3, we used Tauc's relationship,as determined by the following equation:14,15
(ahn) ¼ A(hn � Eg)n (3)
a ¼ 2:303
�Ab
t
�(4)
where n is the photon frequency, h is the Planck constant, A isa proportionality constant, a is the absorption coefficient, Ab isthe absorbance, t is the thickness of the lm, and n is equal to 2or 1/2 for indirect and direct transitions, respectively. By using
1530 | RSC Adv., 2022, 12, 1527–1533
(ahv)2 versus hv (Fig. 4d), the optical bandgap of Fe2O3 lms ata magnetic eld of 0, 100, 200, and 300 mT was evaluated to be2.65, 2.58, 2.45, and 2.60 eV, respectively. This bandgap valuewas in agreement with the absorbance result.
The elemental composition of the lms was explored by XPS(Fig. 5). The survey spectra in Fig. 5a show that all lms con-sisted of Fe, O, Mg, Na, Ca, C, and Si at the same location foreach condition. Mg, Na, Ca, and Si originated from the glasssubstrate. In addition, the signal for C arose from contamina-tion of the carbon tape, which is used as the electrical contactbetween the sample and the holder of XPS. By applyinga magnetic eld of 0, 100, 200, and 300 mT, the atomicconcentration of Fe was found to be 9.47%, 10.82%, 13.06%,and 15.75%, respectively. Therefore, the increase in % Fe was inagreement with the number of particles observed by SEM. TheXPS core-level spectra of Fe 2p, O 1s, and C 1s are illustrated inFig. 5b–d, and assignment of elemental bonding is shown inTable 1.
Fig. 6 illustrates the electrical properties of the Fe2O3 sensordeposited at magnetic elds of different strengths. Electricalproperties were characterized under 100% humidity. Thecurrent (I)–voltage (V) characteristic curves of the Fe2O3 sensor(Fig. 6a) were linear, revealing ohmic behavior. For the 100 mTFe2O3 sensor, the device acted as an insulator and did notrespond to humidity. By increasing the magnetic eld, the slopeof the I–V characteristic curve increased, resulting in a reduc-tion in the resistance. However, a magnetic eld >200 mTincreased the resistance. This effect originates from the crys-tallite size, which is inversely related to the resistance.25
Therefore, the I–V characteristic curve of the Fe2O3 sensorsupported the XRD results. To investigate further the electrical
© 2022 The Author(s). Published by the Royal Society of Chemistry
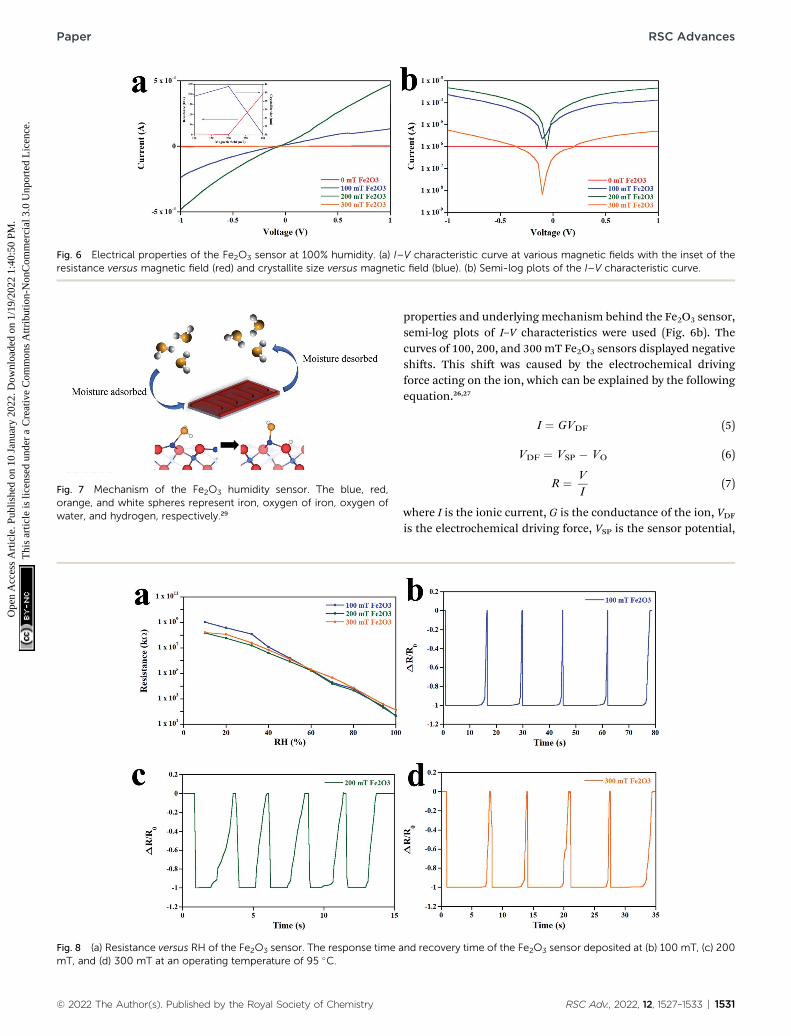
Fig. 6 Electrical properties of the Fe2O3 sensor at 100% humidity. (a) I–V characteristic curve at various magnetic fields with the inset of theresistance versus magnetic field (red) and crystallite size versus magnetic field (blue). (b) Semi-log plots of the I–V characteristic curve.
Fig. 7 Mechanism of the Fe2O3 humidity sensor. The blue, red,orange, and white spheres represent iron, oxygen of iron, oxygen ofwater, and hydrogen, respectively.29
Fig. 8 (a) Resistance versus RH of the Fe2O3 sensor. The response time amT, and (d) 300 mT at an operating temperature of 95 �C.
© 2022 The Author(s). Published by the Royal Society of Chemistry
Paper RSC Advances
Ope
n A
cces
s A
rtic
le. P
ublis
hed
on 1
0 Ja
nuar
y 20
22. D
ownl
oade
d on
1/1
9/20
22 1
:40:
50 P
M.
Thi
s ar
ticle
is li
cens
ed u
nder
a C
reat
ive
Com
mon
s A
ttrib
utio
n-N
onC
omm
erci
al 3
.0 U
npor
ted
Lic
ence
.View Article Online
properties and underlyingmechanism behind the Fe2O3 sensor,semi-log plots of I–V characteristics were used (Fig. 6b). Thecurves of 100, 200, and 300mT Fe2O3 sensors displayed negativeshis. This shi was caused by the electrochemical drivingforce acting on the ion, which can be explained by the followingequation.26,27
I ¼ GVDF (5)
VDF ¼ VSP � VO (6)
R ¼ V
I(7)
where I is the ionic current, G is the conductance of the ion, VDFis the electrochemical driving force, VSP is the sensor potential,
nd recovery time of the Fe2O3 sensor deposited at (b) 100 mT, (c) 200
RSC Adv., 2022, 12, 1527–1533 | 1531

Table 2 Comparative performance of humidity sensors deposited by different methods
MethodOperating temp(�C)
Response time(s)
Recovery time(s) Reference
Spark under 100 mT 95 3.07 12.53 This workSpark under 200 mT 95 0.33 2.57 This workSpark under 300 mT 95 0.75 6.64 This workSpin coating 26 1.79 4.97 28Electrospinning 240 10.2 23 30Hydrothermal 25 29 630 7Hydrothermal 260 12 40 31Carbon spheretemplate
380 14.5 10 32
Sputtering — 15 40 33Sputtering — 3 12 34
RSC Advances Paper
Ope
n A
cces
s A
rtic
le. P
ublis
hed
on 1
0 Ja
nuar
y 20
22. D
ownl
oade
d on
1/1
9/20
22 1
:40:
50 P
M.
Thi
s ar
ticle
is li
cens
ed u
nder
a C
reat
ive
Com
mon
s A
ttrib
utio
n-N
onC
omm
erci
al 3
.0 U
npor
ted
Lic
ence
.View Article Online
VO is the equilibrium potential for the oxygen ions, and R is theresistance. By considering eqn (5) and (6) at 0 V of the semi-logplots (without bias), the current has positive values (VDF > 0),which is caused by net ionic movement across the electrode ofthe sensor (VSP > VO). This net ionic movement is generated byoxygen ions, whereas the Fe2O3 sensor adsorbs moisture.28
Based on this mechanism along with eqn (7), the increase inrelative humidity (RH) increases the ionic current, which resultsin a decrease in the resistance of the Fe2O3 sensor. Fig. 7 wasused29 for deeper understanding of the mechanism of the Fe2O3
humidity sensor.The resistance versus RH of the Fe2O3 sensor is illustrated in
Fig. 8a. Upon increasing the RH from 10% to 100%, the resis-tance of the Fe2O3 sensor decreased due to formation of a layerof water molecules, thereby generating the ionic current, asmentioned above. In addition, the lowest resistance of 100, 200,and 300 mT Fe2O3 sensors at an RH of 100% also matched theresult of I–V curves. The response time and recovery time of theFe2O3 sensor are shown in Fig. 8b–d. These measurements weremade at a humidity of 0% to 100% at 95 �C. The averageresponse time of 100, 200, and 300 mT Fe2O3 sensors was 3.07,0.33, and 0.75 s, respectively. The average recovery time of the100, 200, and 300 mT Fe2O3 sensors was 12.53, 2.57, and 6.64 s,respectively. The decrease in the response time is related to the
Fig. 9 (a) Stability of sensors under a humidity of 100% for 1000 min at rofield of 200 mT.
1532 | RSC Adv., 2022, 12, 1527–1533
increase in the surface area and surface-to-volume ratio.7 Anincrement in these two factors also enhances heat transfer fromthe sensor to moisture, and decreases the recovery time, asobserved in 100 and 200 mT Fe2O3 sensors. The response timeand recovery time of the 300 mT Fe2O3 sensor increased due toits thickness, which caused an increase in the penetration timeand time needed to release moisture. For more information onthe sensitivity (S) of the sensors, eqn (8) was used:28
S ¼ DR
R0
� 100 (8)
where DR is the change in resistance and R0 is the resistance atan RH of 0%. Using eqn (8), the sensitivity of 100, 200, and 300mT Fe2O3 sensors was calculated to be 99.58%, 99.81%, and99.71%, respectively. The comparative performance of humiditysensors is shown in Table 2.
The stability of 100, 200, and 300 mT sensors was measuredunder a humidity of 100% for 1000 min at room temperature(Fig. 9a). The 100, 200, and 300 mT sensors showed stablebehavior with an average resistance (in U) of 11 427 � 5, 6535 �2, and 403 322 � 219, respectively. The resistance of 21 sensorsdeposited by sparking under a magnetic eld of 200 mT isdisplayed in Fig. 9b. All devices were measured at a humidity of100%.
om temperature. (b) Resistance of 21 devices deposited at a magnetic
© 2022 The Author(s). Published by the Royal Society of Chemistry
Paper RSC Advances
Ope
n A
cces
s A
rtic
le. P
ublis
hed
on 1
0 Ja
nuar
y 20
22. D
ownl
oade
d on
1/1
9/20
22 1
:40:
50 P
M.
Thi
s ar
ticle
is li
cens
ed u
nder
a C
reat
ive
Com
mon
s A
ttrib
utio
n-N
onC
omm
erci
al 3
.0 U
npor
ted
Lic
ence
.View Article Online
Conclusions
Fe2O3 lm was deposited on IDEs and a glass substrate bysparking under a uniform magnetic eld. The XRD pattern andSEM revealed that the structure of the Fe2O3 lm was hematiteand network-like. The crystallite size, optical bandgap, thick-ness, and electrical properties of Fe2O3 lms were inuenced bythe uniform magnetic eld. The performance of humiditysensors based on Fe2O3 lm can be improved by deposition ata magnetic eld of 200 mT to provide a sensitivity of 99.81%,response time of 0.33 s, and recovery time of 2.57 s, at 95 �C. Ourresults pave the way for future investigation of the propertiesand applications of magnetic materials, which can be depositedby sparking under a uniform magnetic eld.
Funding
This work was funded by the Research Center in Physics andAstronomy, Chiang Mai University, and the National Researchand Innovation Information System, Thailand (FF65/074).
Author contributions
P. T., P. S., and O. W. designed the study, deposited the Fe2O3
lms, and measured the sensors. E. K. and W. S. undertookXRD, UV-Vis spectroscopy, and XPS. W. T. and T. K. providedconceptual advice. W. S., T. J., N. S., and A. P. undertook SEMand created I–V curves.
Conflicts of interest
There are no conicts to declare.
Acknowledgements
The authors thank the Department of Physics and MaterialsScience, Chiang Mai University, for use of their facilities. Thisresearch project was supported by Fundamental Found 2022,Chiang Mai University.
Notes and references
1 A. J. Deotale and R. V. Nandedkar, Mater. Today: Proc., 2016,3, 2069.
2 L. Machala, J. Phys. Chem. B, 2007, 111, 4003.3 G. Jain, C. J. Capozzi and J. J. Xu, J. Electrochem. Soc., 2003,150, A806.
4 D. Mao, J. Yao, X. Lai, M. Yang, J. Du and D. Wang, Small,2011, 7, 578.
5 R. Yu, Z. Li, D. Wang, X. Lai, C. Xing, M. Yang and X. Xing,Scr. Mater., 2010, 63, 155.
6 Y. Gao, R. Zhou, D. Wang, Q. Huang, C.-H. Cheng andZ. Zheng, Chem. Res. Chin. Univ., 2020, 36, 97.
7 U. V. Patil, C. S. Rout and D. J. Late, Adv. Device Mater., 2015,1, 88.
8 M. Aronniemi, J. Saino and J. Lahtinen, Thin Solid Films,2008, 516, 6110.
© 2022 The Author(s). Published by the Royal Society of Chemistry
9 K. Siroky, J. Jiresova and L. Hudec, Thin Solid Films, 1994,245, 211.
10 I. C. Cosentino, E. N. S. Muccillo and R. Muccillo, Mater.Chem. Phys., 2007, 103, 407.
11 C. Cantalini and M. Pelino, J. Am. Ceram. Soc., 1992, 75, 546.12 S. S. Rucman, W. Punyodom, J. Jakmunee and P. Singjai,
Crystals, 2018, 8, 362.13 S. S. Rucman, C. Boonruang and P. Singjai, Crystals, 2020,
10, 1141.14 P. Tippo, W. Thongsuwan, O. Wiranwetchayan, T. Kumpika,
A. Tuantranont and P. Singjai, Mater. Res. Express, 2020, 7,056403.
15 P. Tippo, W. Thongsuwan, O. Wiranwetchayan, T. Kumpika,E. Kantarak and P. Singjai, Sci. Rep., 2020, 10, 15690.
16 S. P. Schwaminger, R. Surya, S. Filser, A. Wimmer, F. Weigl,P. Fraga-Garcıa and S. Berensmeier, Sci. Rep., 2017, 7,12609.
17 E. F. A. Zeid, I. A. Ibrahem, A. M. Ali and W. A. A. Mohamed,Results Phys., 2019, 12, 562.
18 S. J. Gerber and E. Erasmus, Mater. Chem. Phys., 2018, 203,73.
19 P. M. Hallam, M. Gomez-Mingot, D. K. Kampouris andC. E. Banks, RSC Adv., 2012, 2, 6672.
20 S. K. Shaw, S. K. Alla, S. S. Meena, R. K. Mandal andN. K. Prasad, J. Magn. Magn. Mater., 2017, 434, 181.
21 N. Luo, Y. Lin, J. Guo, E. Quattrocchi, H. Deng, J. Dong,F. Ciucci, F. Boi, C. Hu and S. Grasso, Materials, 2021, 14,2826.
22 P. Tippo, P. Singjai, S. Choopun and S. Sakulsermsuk,Mater.Lett., 2018, 211, 51.
23 C. W. Kao, P. T. Wu, M. Y. Liao, I. J. Chung, K. C. Yang,W. Y. I. Tseng and J. Yu, Pharmaceutics, 2018, 10, 62.
24 C. Wechwithayakhlung, D. M. Packwood,J. Chaopaknam, P. Worakajit, S. Ittisanronnachai,N. Chanlek, V. Promarak, K. Kongpatpanich,D. J. Harding and P. Pattanasattayavong, J. Mater.Chem. C, 2019, 7, 3452.
25 R. B. Vasiliev, M. N. Rumyantseva, S. G. Dorofeev,Y. M. Potashnikova, L. I. Ryabova and A. M. Gaskov,Mendeleev Commun., 2004, 14, 167.
26 A. L. Hodgkin and A. F. Huxley, J. Physiol., 1952, 117, 500.27 D. K. Ferry, Science, 2012, 335, 45.28 M. U. Khan, G. Hassan, M. Awais and J. Bae, Sens. Actuators,
A, 2020, 311, 112072.29 R. Ovcharenko, E. Voloshina and J. Sauer, Phys. Chem. Chem.
Phys., 2016, 18, 25560.30 S. Yan and Q. Wu, J. Mater. Chem. A., 2015, 3, 5982.31 P. Sun, W. N. Wang, Y. P. Liu, Y. F. Sun, J. Ma and G. Y. Lu,
Sens. Actuators, B, 2012, 173, 52.32 Y. F. Kang, L. W. Wang, Y. S. Wang, H. X. Zhang, Y. Wang,
D. T. Hong, Y. Qv and S. R. Wang, Sens. Actuators, B, 2013,177, 570.
33 Q. Liang, H. Xu, J. Zhao and S. Gao, Sens. Actuators, B, 2012,165, 76–81.
34 P. K. Kannan, R. Saraswathi and J. B. B. Rayappan, Sens.Actuator A Phys., 2010, 164, 8–14.
RSC Adv., 2022, 12, 1527–1533 | 1533