Embed Size (px)
Citation preview
DOI 10.1007/s10462-005-9010-xArtificial Intelligence Review (2005) 24:477–488 © Springer 2005
Improving Eye Movement Control in Young Readers
TAINA M. LEHTIMAKI∗ & RONAN G. REILLYDepartment of Computer Science, National University of Ireland Maynooth,Maynooth, County Kildare, Ireland (*author for correspondence, e-mail:[email protected])
Abstract. The objective of our study is to design and evaluate an oculomotor readingaid for beginning readers. The aid consists of an eye-tracking device and a computerprogram that gives real-time feedback in the form of a game to the subject about theirfixation position on words. An experimental study was conducted with 8-year-old chil-dren. We evaluated the effectiveness of the aid for each child by comparing the land-ing site distributions before and after playing the game. We found that the peak of thelanding site distribution moved towards the optimal viewing position (OVP) for wordidentification after playing the game. We also determined that training had a positiveeffect on gaze duration, on the mean and distribution of number of fixations per word,and on the percentage of words with refixations in the majority of subjects.
Keywords: children, eye movement control, optimal viewing position (OVP), reading,training
1. Introduction and Motivation
When people read, their eyes do not move smoothly along a lineof text, but make fast movements called saccades and short stopscalled fixations. For an adult reading English, a typical saccade is7–9 character positions and the typical fixation duration is 200–300 ms. Children’s eye movement patterns differ in some ways fromthose of adults. Children make more refixations, more regressive (rightto left) saccades, their saccades are shorter, fixations longer, and theyfixate more often on the empty spaces (Buswell, 1922; Taylor, 1965).
Typically the initial saccades of experienced readers land at thecentre or slightly left of the centre of a word at the position calledthe Preferred Viewing Location (McConkie et al. 1988). This tendencyis beneficial to the reader since the optimal viewing position (OVP)for initial fixation is located near the centre of each word (O’Reganet al. 1984, 1987). O’Regan et al. found that when the eyes fixate atthe OVP, word identification is faster and more accurate because: (i)the probability of refixation on the word is lowest, (ii) the gaze dura-tion (the total time spent on a word) is shortest, and (iii) the time to
478 T. M. LEHTIMAKI AND R. G. REILLY
identify the word is shortest. Also the probability of correct identifi-cation of a word is highest (O’Regan 1990).
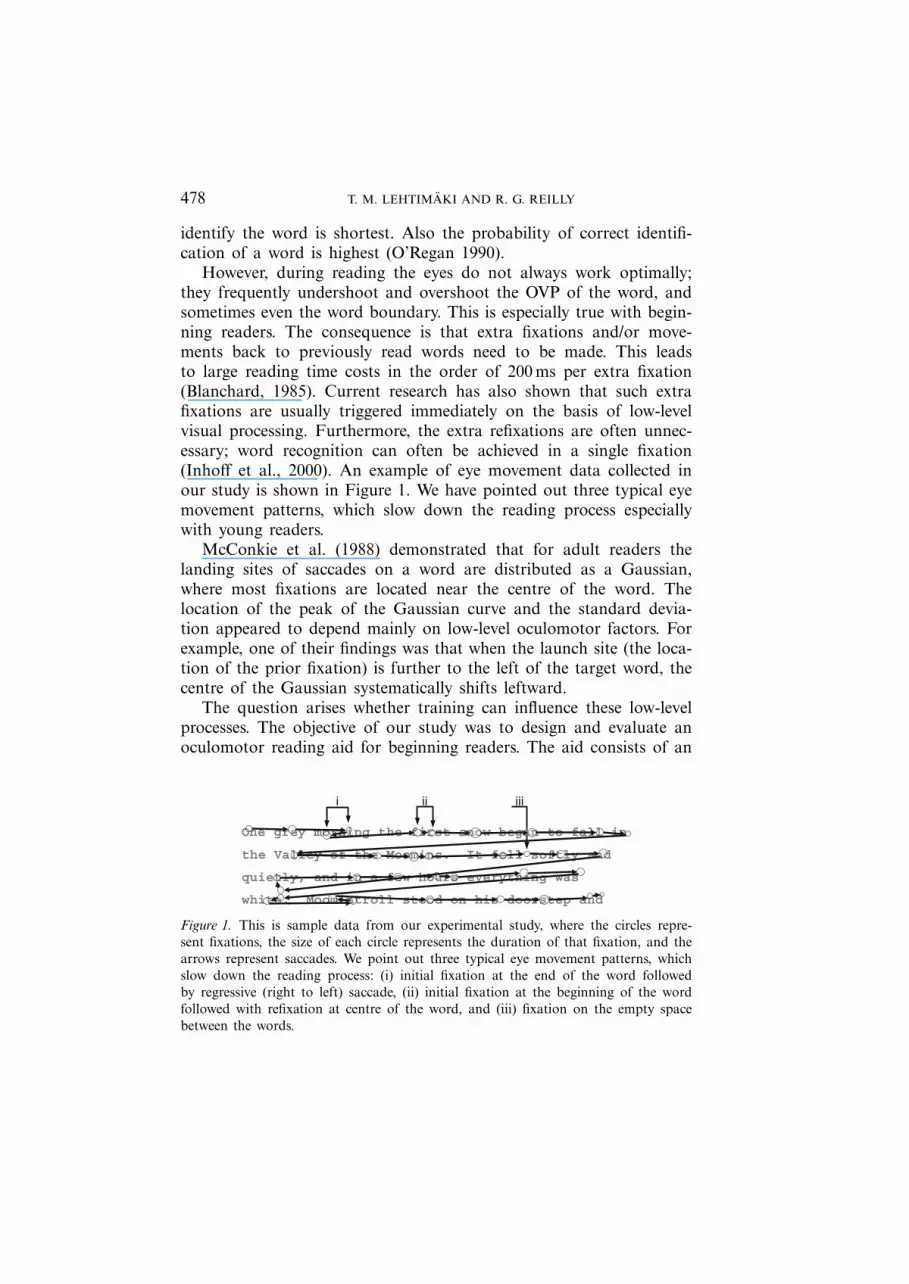
However, during reading the eyes do not always work optimally;they frequently undershoot and overshoot the OVP of the word, andsometimes even the word boundary. This is especially true with begin-ning readers. The consequence is that extra fixations and/or move-ments back to previously read words need to be made. This leadsto large reading time costs in the order of 200 ms per extra fixation(Blanchard, 1985). Current research has also shown that such extrafixations are usually triggered immediately on the basis of low-levelvisual processing. Furthermore, the extra refixations are often unnec-essary; word recognition can often be achieved in a single fixation(Inhoff et al., 2000). An example of eye movement data collected inour study is shown in Figure 1. We have pointed out three typical eyemovement patterns, which slow down the reading process especiallywith young readers.
McConkie et al. (1988) demonstrated that for adult readers thelanding sites of saccades on a word are distributed as a Gaussian,where most fixations are located near the centre of the word. Thelocation of the peak of the Gaussian curve and the standard devia-tion appeared to depend mainly on low-level oculomotor factors. Forexample, one of their findings was that when the launch site (the loca-tion of the prior fixation) is further to the left of the target word, thecentre of the Gaussian systematically shifts leftward.
The question arises whether training can influence these low-levelprocesses. The objective of our study was to design and evaluate anoculomotor reading aid for beginning readers. The aid consists of an
i iiiii
One grey morning the first snow begin to fall in
the Valley of the Moomins. It fell softly and
quietly, and in a few hours everything was
white. Moomintroll stood on his doorstep and
Figure 1. This is sample data from our experimental study, where the circles repre-sent fixations, the size of each circle represents the duration of that fixation, and thearrows represent saccades. We point out three typical eye movement patterns, whichslow down the reading process: (i) initial fixation at the end of the word followedby regressive (right to left) saccade, (ii) initial fixation at the beginning of the wordfollowed with refixation at centre of the word, and (iii) fixation on the empty spacebetween the words.

IMPROVING EYE MOVEMENT CONTROL IN YOUNG READERS 479
eye-tracking device and a computer program, the OVP game, whichgives real-time feedback to the subject about their fixation position.The goal is to teach the readers to land their saccades at the OVPof each word. We use the oculomotor reading aid for an experimentalstudy with 8-year-old children. We evaluate the effectiveness of the aidfor each child by comparing the landing site distributions fitted withGaussian curves before and after playing the game. We also determineif training has had an effect on gaze duration, mean number of fixa-tions per word, and percentage of words with refixations.
The paper is organised as follows. In Section 2, we describe theOVP game training program. In Section 3, we outline the experimen-tal study for evaluating the effects of the reading aid. The results andanalysis are provided in Section 4, followed by discussion and conclu-sions in Section 5.
2. The OVP Game
The idea of the training is to teach a reader to control their eye move-ments during reading so that the saccades they make would land atthe centre of the word (at the OVP). Eye movement control duringreading is a highly automated process; people are not aware of mostof the saccades and fixations they make. We wanted to find a way totrain children to control these subconscious saccades and fixations. Wewanted to make the training as interesting as possible for them, so wedecided to do it in the form of a computer game.
The basic idea of the OVP game is to follow a reader’s eye move-ments in real time with an eye-tracking system and give them feed-back according to their fixation location. We built our game to workwith the EyeLink II (www.eyelinkinfo.com) eye-tracking system. Thisconsists of three miniature cameras mounted on a headband. Two eyecameras allow binocular eye tracking and the third camera tracks theorientation of the head with respect to the computer screen. The sys-tem permits the subject to make small natural head movements, whichis very important feature when working with children.
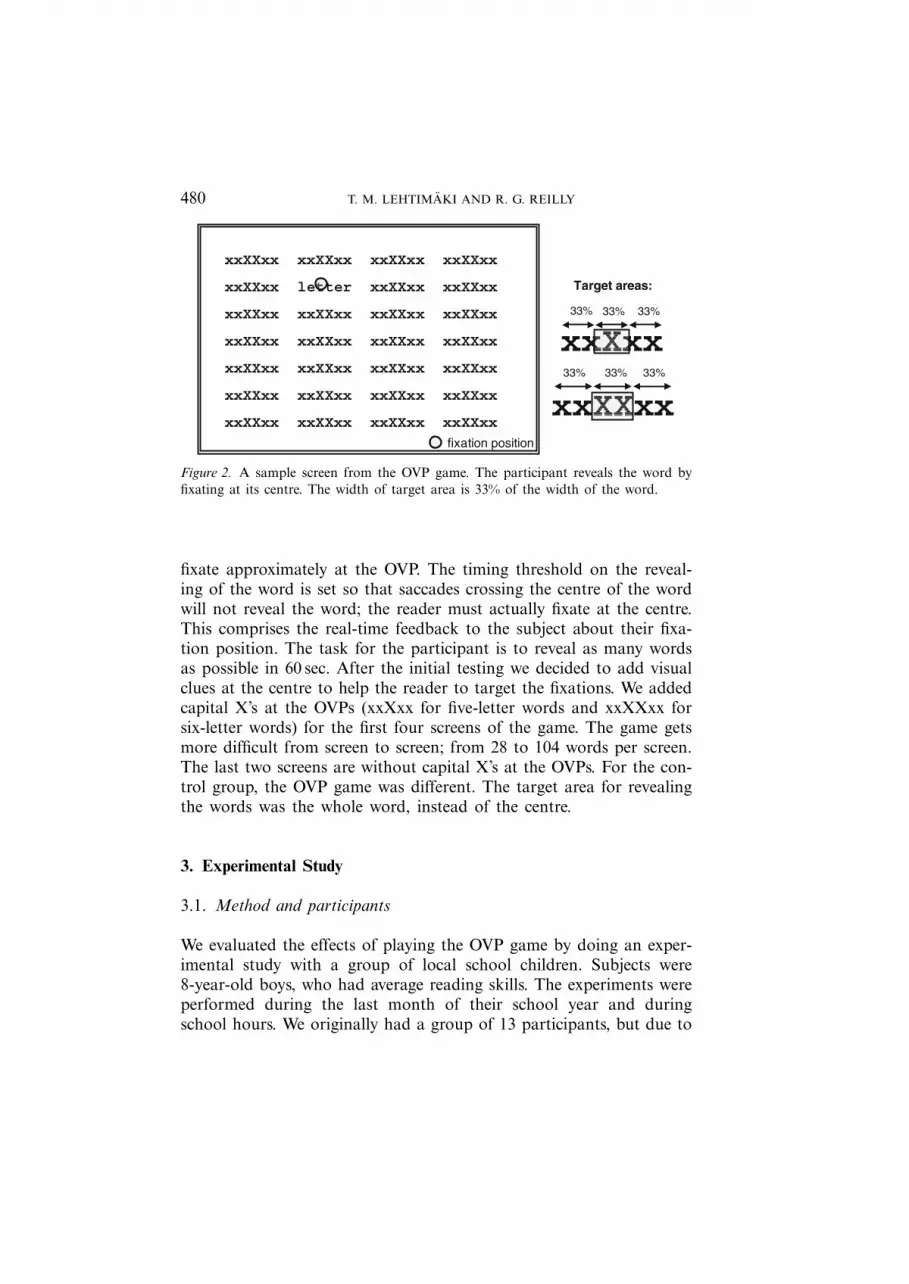
The game consists of six screens of word lists. The letters aremasked with x’s so all that the participant sees is a screen filled withstrings of x’s (see Figure 2). The actual word is revealed when the par-ticipant fixates somewhere in the central third of the word. Fixatingin the first third of the word, or in the final third of the word doesnot have any effect, so in order to reveal the words the reader has to
480 T. M. LEHTIMAKI AND R. G. REILLY
xxXXxx xxXXxx xxXXxx xxXXxx
xxXXxx letter xxXXxx xxXXxx
xxXXxx xxXXxx xxXXxx xxXXxx
xxXXxx xxXXxx xxXXxx xxXXxx
xxXXxx xxXXxx xxXXxx xxXXxx
xxXXxx xxXXxx xxXXxx xxXXxx
xxXXxx xxXXxx xxXXxx xxXXxx
fixation position
xxXxx33%
Target areas:
xxXXxx
33% 33%
33%33%33%
Figure 2. A sample screen from the OVP game. The participant reveals the word byfixating at its centre. The width of target area is 33% of the width of the word.
fixate approximately at the OVP. The timing threshold on the reveal-ing of the word is set so that saccades crossing the centre of the wordwill not reveal the word; the reader must actually fixate at the centre.This comprises the real-time feedback to the subject about their fixa-tion position. The task for the participant is to reveal as many wordsas possible in 60 sec. After the initial testing we decided to add visualclues at the centre to help the reader to target the fixations. We addedcapital X’s at the OVPs (xxXxx for five-letter words and xxXXxx forsix-letter words) for the first four screens of the game. The game getsmore difficult from screen to screen; from 28 to 104 words per screen.The last two screens are without capital X’s at the OVPs. For the con-trol group, the OVP game was different. The target area for revealingthe words was the whole word, instead of the centre.
3. Experimental Study
3.1. Method and participants
We evaluated the effects of playing the OVP game by doing an exper-imental study with a group of local school children. Subjects were8-year-old boys, who had average reading skills. The experiments wereperformed during the last month of their school year and duringschool hours. We originally had a group of 13 participants, but due to
IMPROVING EYE MOVEMENT CONTROL IN YOUNG READERS 481
the calibration difficulties we ran the experiments with only five sub-jects and two control subjects.
Each session consisted of 10 min of data collection before thegame, 10 min of training, and 10 min of data collection after thegame. These times include the calibrations. Our aim was to havethree sessions per child, but for one of the subjects and one of thecontrols we only had two sessions. The subjects had between oneand seven days between their sessions, depending on their schoolschedule.
We recorded eye movement data before and after playing the OVPgame. The stimuli were a list of five-letter words, a list of six-letterwords, and four screens of continuous text. In the word lists therewere 91 five-letter words and 78 six-letter words. For the text wechoose part of an age-appropriate children’s novel [Finn Family Moo-mintroll by Tove Jansson (1948)]. These stimuli were presented in 13double spaced lines in a typeface with fixed-width characters. Whenanalysing the data, the data recorded from the first and last lines ofeach screen, and from the first and the last word of each line, were notused. Furthermore, for the continuous text, we chose only the five-and six-letter words in the text in the analysis.
Children were advised to read silently, and to try to read eachword. If they did not know the word, they were advised to just con-tinue reading. We also explained that this was not a reading test orcontest in order to make them feel more comfortable about the situ-ation. They were introduced to the characters from the book beforestarting the experiment. This was done also to help make them morerelaxed. Although the EyeLink II eye-tracking system is able to han-dle small head movements, we had a chin rest for the subjects toencourage them to keep their heads as still as possible. We alsoused a silicon swimming cap under the headband to keep it fromslipping. We used only the pupil-tracking mode of the EyeLink IIsystem, since the corneal reflection mode did not calibrate well onchildren.
We ran a calibration routine displaying individually nine calibra-tion points, spread evenly across the computer screen. The subject wasadvised to look in the centre of the calibration point and the fixationposition was recorded for each of these points. Calibration was doneat the beginning of the data collection stages and at the beginning ofthe game. For most subjects extra calibrations were needed during theexperiments due to headband slippage.

482 T. M. LEHTIMAKI AND R. G. REILLY
4. Results and Analysis
In this section, we describe the results of the experimental study. Wefirst analyse how playing the OVP game changes the landing site dis-tributions of the subjects when reading 5-letter words. Next we ana-lyse the changes in gaze duration, and the mean value of the numberof fixations per word. This is done for the five- and six-letter wordsand the continuous text. Finally we have in-depth analysis of how thenumber of fixations actually changes for five-letter words. Due to sig-nificant individual differences we describe the results individually foreach subject.
4.1. Change in landing site distributions
The landing site distribution of the initial fixations for five-letterwords for each subject is presented in Figure 3. The plots show datacollected before and after playing the OVP game. Only landing sitedata for reading a word for the first time is included. Figures combineinitial fixations from all training sessions the subject attended (Sub-ject A did not attend to session three). The vertical axis represents thenumber of initial fixations. The horizontal axis represents the landing
BeforeBeforeAfterAfter
BeforeBeforeAfterAfter
BeforeBeforeAfterAfter
BeforeBeforeAfterAfter
Subject B Subject C
Subject D Subject E
Landing site distributions for 5 letter words
6050403020100
0 1 2 3 4 5 6 0 1 2 3 4 5 6
0 1 2 3 4 5 60 1 2 3 4 5 6
Letter position Letter position
Count
Count
6050403020100
Landing site distributions fitted with gaussian curves
Subject A, 5 letter words
0
5
10
15
20
25
30
35
40
Before
Before
After
After
0 1 2 3 4 5 6
a= 35.2
0.5a
0.5a
2 2 ln 2 c
b= 2.76
c = 1.0 c = 1.0
Before:a = 19.1b = 2.3c = 1.2
After:a = 35.2b = 2.76c = 1.0
Count
Letter positionat the landing site
Figure 3. Landing site distributions and fitted Gaussian curves for five-letter wordsbefore and after playing the OVP game. The landing site distribution for Subject Aalso illustrates graphically the Gaussian parameters: a is amplitude (the height of thecurve), b is mean (the location of the peak on the horizontal axis) and c is standarddeviation (how wide the curve is).
IMPROVING EYE MOVEMENT CONTROL IN YOUNG READERS 483
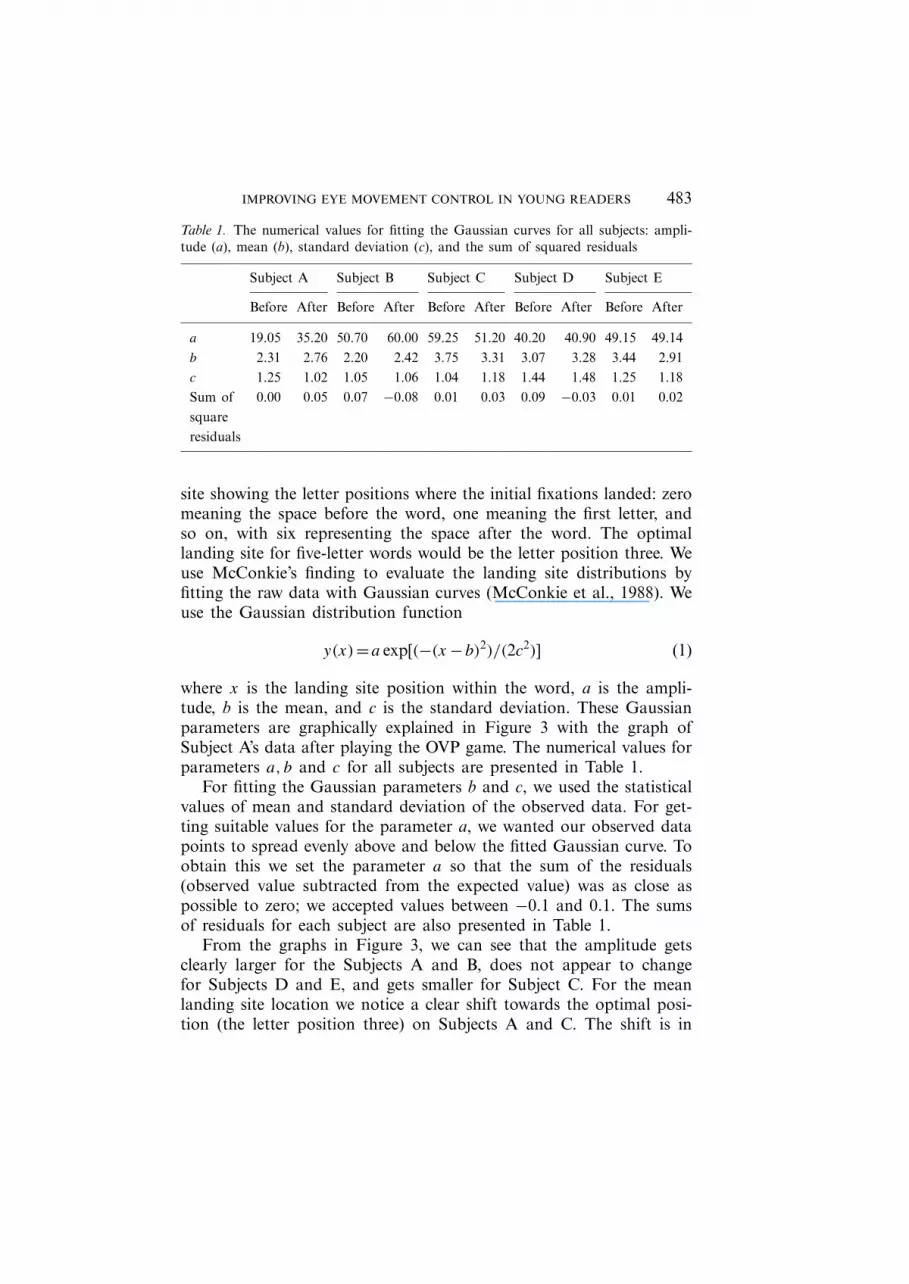
Table 1. The numerical values for fitting the Gaussian curves for all subjects: ampli-tude (a), mean (b), standard deviation (c), and the sum of squared residuals
Subject A Subject B Subject C Subject D Subject E
Before After Before After Before After Before After Before After
a 19.05 35.20 50.70 60.00 59.25 51.20 40.20 40.90 49.15 49.14b 2.31 2.76 2.20 2.42 3.75 3.31 3.07 3.28 3.44 2.91c 1.25 1.02 1.05 1.06 1.04 1.18 1.44 1.48 1.25 1.18Sum of 0.00 0.05 0.07 −0.08 0.01 0.03 0.09 −0.03 0.01 0.02squareresiduals
site showing the letter positions where the initial fixations landed: zeromeaning the space before the word, one meaning the first letter, andso on, with six representing the space after the word. The optimallanding site for five-letter words would be the letter position three. Weuse McConkie’s finding to evaluate the landing site distributions byfitting the raw data with Gaussian curves (McConkie et al., 1988). Weuse the Gaussian distribution function
y(x)=a exp[(−(x −b)2)/(2c2)] (1)
where x is the landing site position within the word, a is the ampli-tude, b is the mean, and c is the standard deviation. These Gaussianparameters are graphically explained in Figure 3 with the graph ofSubject A’s data after playing the OVP game. The numerical values forparameters a, b and c for all subjects are presented in Table 1.
For fitting the Gaussian parameters b and c, we used the statisticalvalues of mean and standard deviation of the observed data. For get-ting suitable values for the parameter a, we wanted our observed datapoints to spread evenly above and below the fitted Gaussian curve. Toobtain this we set the parameter a so that the sum of the residuals(observed value subtracted from the expected value) was as close aspossible to zero; we accepted values between −0.1 and 0.1. The sumsof residuals for each subject are also presented in Table 1.
From the graphs in Figure 3, we can see that the amplitude getsclearly larger for the Subjects A and B, does not appear to changefor Subjects D and E, and gets smaller for Subject C. For the meanlanding site location we notice a clear shift towards the optimal posi-tion (the letter position three) on Subjects A and C. The shift is in
484 T. M. LEHTIMAKI AND R. G. REILLY
the desired direction, but not large for Subjects B and E. There is nodesirable shift for Subject D. A desirable change in the standard devi-ation is present only for Subject A, and there is an opposite changefor Subject C. The most important changes with which to evaluate theeffects of the training are the changes in the mean value. We can con-clude that the training game had clear desired effect on the landingsite distribution curve for Subject A. The effect for Subjects B, C andE were in an acceptable direction, but not as clearcut as for A. Therewas no effect for Subject D.
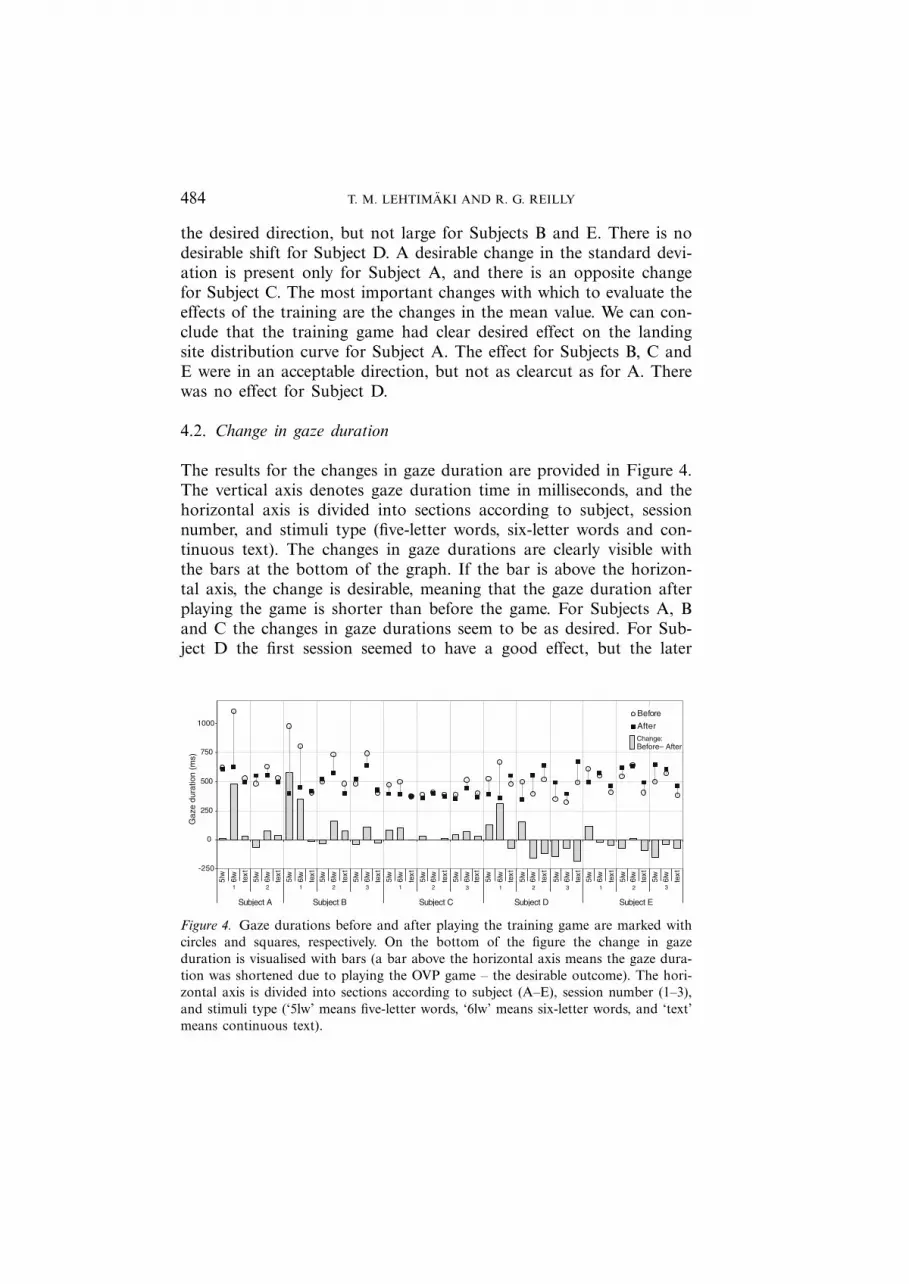
4.2. Change in gaze duration
The results for the changes in gaze duration are provided in Figure 4.The vertical axis denotes gaze duration time in milliseconds, and thehorizontal axis is divided into sections according to subject, sessionnumber, and stimuli type (five-letter words, six-letter words and con-tinuous text). The changes in gaze durations are clearly visible withthe bars at the bottom of the graph. If the bar is above the horizon-tal axis, the change is desirable, meaning that the gaze duration afterplaying the game is shorter than before the game. For Subjects A, Band C the changes in gaze durations seem to be as desired. For Sub-ject D the first session seemed to have a good effect, but the later
-250
0
250
500
750
1000
5lw
6lw
text
5lw
6lw
text
5lw
6lw
text
5lw
6lw
text
5lw
6lw
text
5lw
6lw
text
5lw
6lw
6lw
6lw
6lw
6lw
6lw
6lw
6lw
text
text
text
text
text
text
text
text
5lw
5lw
5lw
5lw
5lw
5lw
5lw
1 2 1 2 3 1 2 3 1 2 3 1 2 3
Subject A Subject B Subject C Subject D Subject E
Gaz
e du
ratio
n (m
s)
Before
AfterChange:Before– After
Figure 4. Gaze durations before and after playing the training game are marked withcircles and squares, respectively. On the bottom of the figure the change in gazeduration is visualised with bars (a bar above the horizontal axis means the gaze dura-tion was shortened due to playing the OVP game – the desirable outcome). The hori-zontal axis is divided into sections according to subject (A–E), session number (1–3),and stimuli type (‘5lw’ means five-letter words, ‘6lw’ means six-letter words, and ‘text’means continuous text).

IMPROVING EYE MOVEMENT CONTROL IN YOUNG READERS 485
sessions did not. For the Subject E the gaze durations after the gamewere longer than before the game. For the different stimuli types ourresults show the training did shorten the gaze duration most whenreading the word lists; however, there was no observable change togaze durations for subjects reading continuous text.
4.3. Change in mean number of fixations per word
In Figure 5, we plot changes in the mean value of number of fixa-tions per word. The data is presented in similar way to that in Figure4: the horizontal axis is identical but the vertical axis shows now thenumber of fixations. The change is desirable if the bars at the bottomare above the horizontal axis. From this plot we observe that the gen-eral tendency is that fewer fixations are needed after playing the game.For example, before playing the game Subject A needed an average4.3 fixations to read a five-letter word, and after playing the gamethe average had dropped to 2.5. However, Subjects D and E only gota benefit from the first session. For the different stimulus types thetraining seemed to work best for reducing the fixations when readingthe lists of words, and the effects in reading continuous text were lessevident. The similarity between Figures 4 and 5 suggests, as expected,that reducing the number of fixations also reduces the gaze durationsthereby making the reading process faster.
Num
ber
of fi
xatio
ns /
wor
d
-1.0
0.0
1.0
2.0
3.0
4.0
5.0
6.0
7.0
5lw
6lw text
5lw
6lw text
5lw
6lw text
5lw
6lw text
5lw
6lw text
5lw
6lw text
5lw
6lw text
5lw
6lw text
5lw
6lw text
5lw
6lw text
5lw
6lw text
5lw
6lw text
5lw
6lw text
5lw
6lw text
1 2 1 2 3 1 2 3 1 2 3 1 2 3
Subject A Subject B Subject C Subject D Subject E
BeforeAfter
Change:Before– After
Figure 5. Mean number of fixations per word before and after subjects played thetraining game, are marked with circles and squares, respectively. The bars at the bot-tom of the figure show the change. A bar above the horizontal axis means the numberof fixations per word is smaller after the training – the desirable outcome. The hori-zontal axis is divided into sections according to subject (A–E), session number (1–3),and stimuli type (‘5lw’ means five-letter words ‘6lw’ means six-letter words, and ‘text’means continuous text).

486 T. M. LEHTIMAKI AND R. G. REILLY
4.4. Distribution of number of fixations per word
Figure 6 shows an in-depth analysis of how the number of fixationschanged due to training for each subject. Here, we present a distribu-tion of the number of fixations for five-letter words for each session.It is very clear how at the beginning of session 1 Subjects A and Bhave an almost flat distribution of number of fixations per word. Afterplaying the game, for Subject A most words are read with two fixa-tions, and Subject B is able to read most words with a single fixation.There is a suggestion that the tendency to read words with less fixa-tions could carry on to the next session; the ‘before’ distribution forsession 2 resembles closely the ‘after’ distribution of session 1 for bothSubjects A and B. However, our small study does not provide enoughevidence to make this claim convincingly. For Subjects C and D, train-ing improved their distribution curves, but the effect does not seem tocarry over between sessions in their cases. For Subject E first sessionshows improvement, but the other two are showing a negative effect.
5. Discussion and Conclusions
We have presented the results of an experimental study to evaluate anoculomotor reading aid for beginning readers. The aid consists of an
Figure 6. Distribution of number of fixations per word before and after the game forreading five-letter words. White circles are used to mark data collected before thetraining, and black squares are for after. The first row of graphs is for session 1, thesecond for session 2 and third for session 3. Subject A did not attend session 3.
IMPROVING EYE MOVEMENT CONTROL IN YOUNG READERS 487
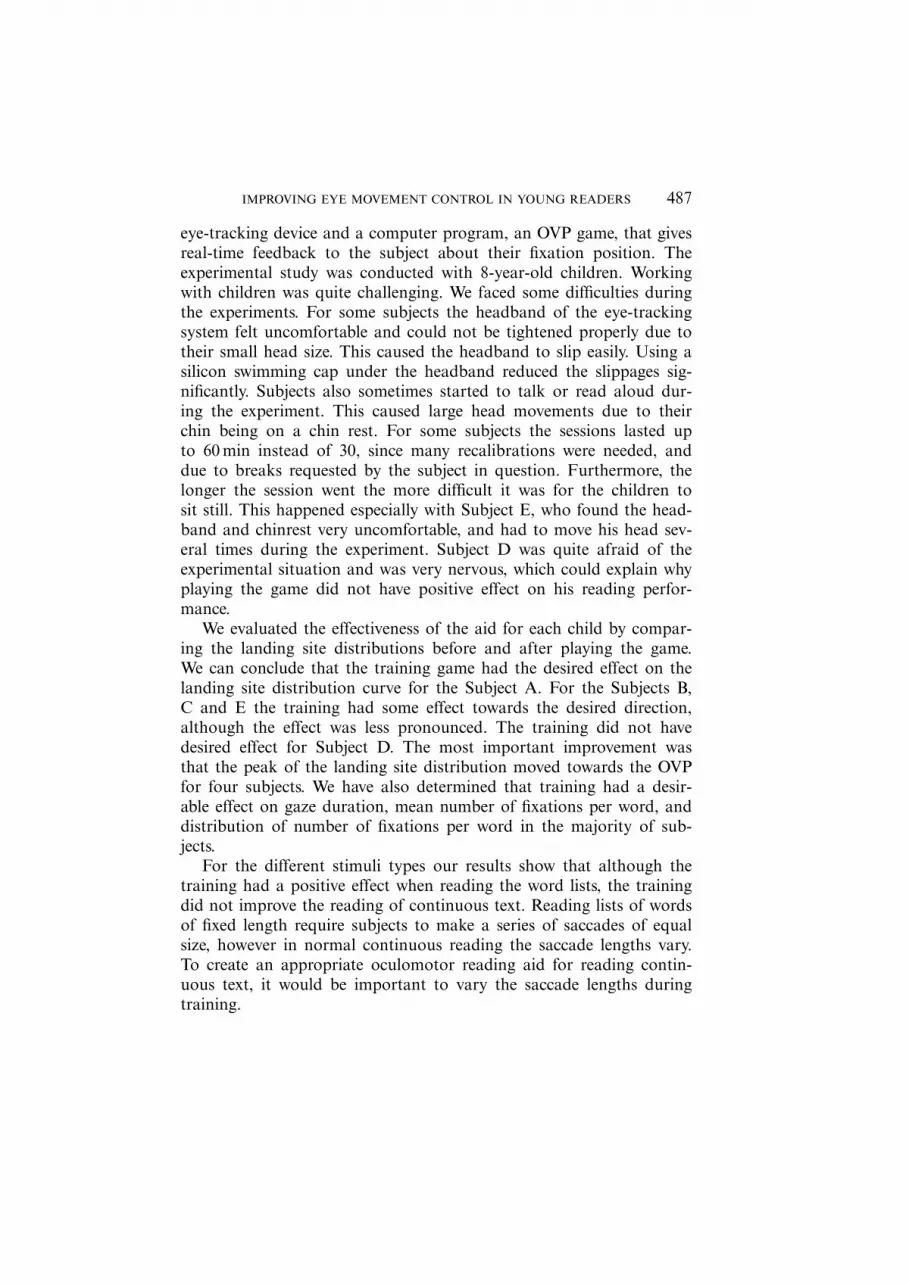
eye-tracking device and a computer program, an OVP game, that givesreal-time feedback to the subject about their fixation position. Theexperimental study was conducted with 8-year-old children. Workingwith children was quite challenging. We faced some difficulties duringthe experiments. For some subjects the headband of the eye-trackingsystem felt uncomfortable and could not be tightened properly due totheir small head size. This caused the headband to slip easily. Using asilicon swimming cap under the headband reduced the slippages sig-nificantly. Subjects also sometimes started to talk or read aloud dur-ing the experiment. This caused large head movements due to theirchin being on a chin rest. For some subjects the sessions lasted upto 60 min instead of 30, since many recalibrations were needed, anddue to breaks requested by the subject in question. Furthermore, thelonger the session went the more difficult it was for the children tosit still. This happened especially with Subject E, who found the head-band and chinrest very uncomfortable, and had to move his head sev-eral times during the experiment. Subject D was quite afraid of theexperimental situation and was very nervous, which could explain whyplaying the game did not have positive effect on his reading perfor-mance.
We evaluated the effectiveness of the aid for each child by compar-ing the landing site distributions before and after playing the game.We can conclude that the training game had the desired effect on thelanding site distribution curve for the Subject A. For the Subjects B,C and E the training had some effect towards the desired direction,although the effect was less pronounced. The training did not havedesired effect for Subject D. The most important improvement wasthat the peak of the landing site distribution moved towards the OVPfor four subjects. We have also determined that training had a desir-able effect on gaze duration, mean number of fixations per word, anddistribution of number of fixations per word in the majority of sub-jects.
For the different stimuli types our results show that although thetraining had a positive effect when reading the word lists, the trainingdid not improve the reading of continuous text. Reading lists of wordsof fixed length require subjects to make a series of saccades of equalsize, however in normal continuous reading the saccade lengths vary.To create an appropriate oculomotor reading aid for reading contin-uous text, it would be important to vary the saccade lengths duringtraining.

488 T. M. LEHTIMAKI AND R. G. REILLY
Where there is a positive effect of the training game, it is possiblethat the effect lasts over days, and not just minutes, as shown by Fig-ure 6. This however could also be due to familiarity with the routine.
In this study, we were able to show that it is possible to train peo-ple to control their eye movements during reading. This suggests thatdeveloping an oculomotor reading aid is an acceptable idea. In thisstudy we only had five subjects. Firm conclusions are difficult to drawbecause the data set was small, but the results are encouraging enoughto warrant further research.
Acknowledgements
We would like to thank the staff and pupils of Maynooth BoysNational School for their cooperation with this study.
References
Blanchard, H. E. (1985). A Comparison of Some Processing Time Measures Based onEye Movements. Acta Psychologica 58: 1–15.
Buswell, G. T. (1922). Fundamental Reading Habits: A Study of Their Development.University of Chicago Press: Chicago.
Inhoff, A., Radach, R. & Heller, D. (2000). Complex Compounds in German: Inter-word Spaces Facilitate Segmentation but Hinder Assignment of Meaning. Journalof Memory and Language 42: 23–50.
McConkie, G. W., Kerr, P. W., Reddix, M. D. & Zola, D. (1988). Eye Movement Con-trol During Reading: I. The Location of Initial Eye Fixations on Words. VisionResearch 28(10): 1107–1118.
O’Regan, J. K., Levy-Schoen, A., Pynte, J. & Brugaillere, B. (1984). Convinient Fix-ation Location Within Isolated Words of Different Length and Structure. Journalof Experimental Psychology: Human Perception and Performance 10: 250–257.
O’Regan, J. K. & Levy-Schoen, A. (1987). Eye Movement Strategy and Tactics inWord Recognition and Reading. In Coltheart, M. (ed.) Attention and PerformanceXII: The Psychology of Reading, 363–383. Erlbaum: Hillsdale, NJ.
O’Regan, J. K. (1990). Eye Movements and Reading. In Kowler, E. Eye Movementsand Their Role in Visual and Cognitive Processes, 395–435. Elsevier Science Pub-lishers: Amsterdam.
Taylor, E. A. (1965). The Fundamental Reading Skill. C.C Thomas: Springfield, Il.