Embed Size (px)
Citation preview
Molecular biology and genetics/Biologie et genetique moleculaires
Implications of spatial genetic patterns for conserving Africanleopards
Anne Ropiquet a,b,*, Andrew T. Knight c,d,e, Celine Born b,f,Quinton Martins g, Guy Balme h, Lawrence Kirkendall i,Luke Hunter h, Charl Senekal j, Conrad A. Matthee b
a Department of Natural Sciences, School of Science and Technology, Middlesex University, The Burroughs–Hendon, London NW4 4BT,United Kingdomb Evolutionary Genomics Group, Department of Botany and Zoology, Stellenbosch University, Private Bag X1, Matieland 7602, South Africac Division of Ecology and Evolution, Imperial College London, Silwood Park Campus, Buckhurst Road, Ascot, Berkshire SL5 7PY, UnitedKingdomd Department of Botany, Nelson Mandela Metropolitan University, PO Box 77000, Port Elizabeth 6031, South Africae Centre of Excellence in Environmental Decisions, School of Biological Sciences, The University of Queensland, St Lucia 4972, Brisbane,Australiaf UMR 5175, 1919, route de Mende, Montpellier 34293 cedex 5, Franceg The Cape Leopard Trust, PO Box 1118, Sun Valley, Cape Town 7985, South Africah PANTHERA, 8 West 40th Street, 18th Fl, NY 10018, USAi University of Bergen, PO Box 7803, 5006 Bergen, Norwayj PO Box 632, 3170 Pongola, KwaZulu-Natal, South Africa
1. Introduction
The leopard (Panthera pardus) is a carnivore with a longhistory of conflict with humans in southern Africa[1]. These conflicts represent the nexus of leopard biologyand ecology, political and social attitudes, and land andspecies management practices [2]. Leopards are solitary,highly mobile and extremely adaptable. This assists the
C. R. Biologies xxx (2015) xxx–xxx
* Corresponding author. Department of Natural Sciences, School ofScience and Technology, Middlesex University, The Burroughs–Hendon,London NW4 4BT, United Kingdom.
E-mail address: [email protected] (A. Ropiquet).
A R T I C L E I N F O
Article history:Received 17 April 2015Accepted after revision 18 June 2015Available online xxx
Keywords:Effective genetic distanceGenetic diversityHuman–wildlife conflictIsolation-by-distanceLeopardPanthera pardusTranslocation
A B S T R A C T
The leopard (Panthera pardus) is heavily persecuted in areas where it predates livestockand threatens human well-being. Attempts to resolve human–leopard conflict typicallyinvolve translocating problem animals; however, these interventions are rarely informedby genetic studies and can unintentionally compromise the natural spatial geneticstructure and diversity, and possibly the long-term persistence, of the species. Nosignificant genetic discontinuities were definable within the southern African leopardpopulation. Analysis of fine-scale genetic data derived from mitochondrial and nuclearDNA revealed that the primary natural process shaping the spatial genetic structure of thespecies is isolation-by-distance (IBD). The effective gene dispersal (s) index can informleopard translocations and is estimated to be 82 km for some South African leopards. Theimportance of adopting an evidence-based strategy is discussed for supporting theintegration of genetic data, spatial planning and social learning institutions so as topromote collaboration between land managers, government agency staff and researchers.! 2015 Academie des sciences. Published by Elsevier Masson SAS. All rights reserved.
G Model
CRASS3-3395; No. of Pages 10
Please cite this article in press as: A. Ropiquet, et al., Implications of spatial genetic patterns for conserving Africanleopards, C. R. Biologies (2015), http://dx.doi.org/10.1016/j.crvi.2015.06.019
Contents lists available at ScienceDirect
Comptes Rendus Biologies
ww w.s c ien c edi r ec t . c om
http://dx.doi.org/10.1016/j.crvi.2015.06.0191631-0691/! 2015 Academie des sciences. Published by Elsevier Masson SAS. All rights reserved.
species with persisting in agricultural landscapes and nearhuman settlements. Although habitat destruction conti-nues to compromise leopard survival [3], persecution byhumans is a major threat, particularly where leopardspredate livestock or people. Until recently, leopards wereclassified as vermin and culled in many regions, withsignificant numbers also hunted for trophies [4]. Thisconflict has made effective conservation management ofleopards problematic. Although listed as near threatenedon the IUCN Red List, persecution has resulted in leopardsbeing locally extirpated from specific localities acrosssouthern Africa, where they were formerly widespread [5].
Relatively little is known about leopard behaviour,ecology and genetics at local and regional scales [5],rendering the development and implementation of evi-dence-based conservation strategies impossible. A typicalhuman response to problem leopards is to extirpate them,but the removal of these top predators can have a cascadeeffect on populations of prey species and smaller predators[6]. Accordingly, the management of leopard is a conten-tious topic, as society displays both negative and positivevalues towards the species. An alternative to extermina-tion or habitat destruction is translocation, which is usedby some conservation organisations to resolve conflictsbetween people and leopard [5]. However, translocation ishighly controversial and is not widely endorsed byconservation organisations, largely due to its disputedeffectiveness as a technique for managing problem animalsand the currently inadequate knowledge of the species andit’s impacts on human communities [7]. Few translocationinitiatives have conducted the extensive surveys andenvironmental impact assessments required to providereliable evidence supporting the effectiveness of translo-cation as a strategy that ensures the long-term persistenceof the leopard population [8,9].
Whilst the removal of problem leopards can initiallyprove effective, translocating individuals may, if noteffectively researched and implemented, simply relocatethe problem. Leopards are known to return to hometerritories following translocation [8], travelling up to500 km [10], and continue to predate livestock, sometimesin greater numbers, upon their return [8,11,12], exacer-bating earlier problems. Alternative strategies to translo-cation for resolving human–leopard conflicts arenumerous [1,13–15] but evaluations of their relativeeffectiveness are rarely conducted, which perpetuatesuncertainty and conflict.
Species management practices can have immenseimpacts on a populations’ genetic structure, for example,persecution by humans can reduce the size and geneticdiversity of a population, whilst re-introductions ortranslocations can increase genetic diversity [16]. Conser-vation geneticists generally agree that genetic diversitywithin and among populations is a prerequisite for thepersistence and adaptability of populations [17]. Consider-ing patterns of spatial genetic diversity should therefore bea primary concern for organisations undertaking leopardtranslocations as the viability of leopard might becompromised [18]. Genetic issues potentially affecting long-term viability and extinction risk include inbreeding depres-sion; declining genetic diversity; mutation accumulation;
genetic adaptation to captivity; and outbreeding depression[16].
At the continental scale, the leopard population insouthern Africa comprises a single continuous populationstructured as distinct geographically isolated groups ofindividuals that display genetic variation across the species’range [3]. This spatial pattern is likely the product of recentlocal extirpations and habitat destruction, coupled withtheir ability to persist across a broad range of habitats andland cover types, and to disperse over long distances[19]. These characteristics, coupled with on-going trans-locations, ensure that maintaining the natural geneticstructure and diversity of the southern African leopardpopulation is a major conservation management challenge.
No guidelines currently exist for maintaining thenatural genetic structure and diversity of the southernAfrican leopard population [20]. Motivated by the plight ofleopards [9] and recognizing the importance of under-standing natural genetic processes for ensuring theirpersistence, we aimed to:
! use mitochondrial and microsatellite markers to describethe spatial genetic structure of the southern Africanleopard population;! map the regional scale genetic diversity in southern
Africa;! estimate a maximum translocation distance for leopard
in the Eastern and Western Cape provinces of SouthAfrica to assist organisations translocating problemleopards.
Our results suggest that genetic information shouldinform policy development and management decisions,notably the translocation of problem leopards.
2. Methods
2.1. Taxonomic samples
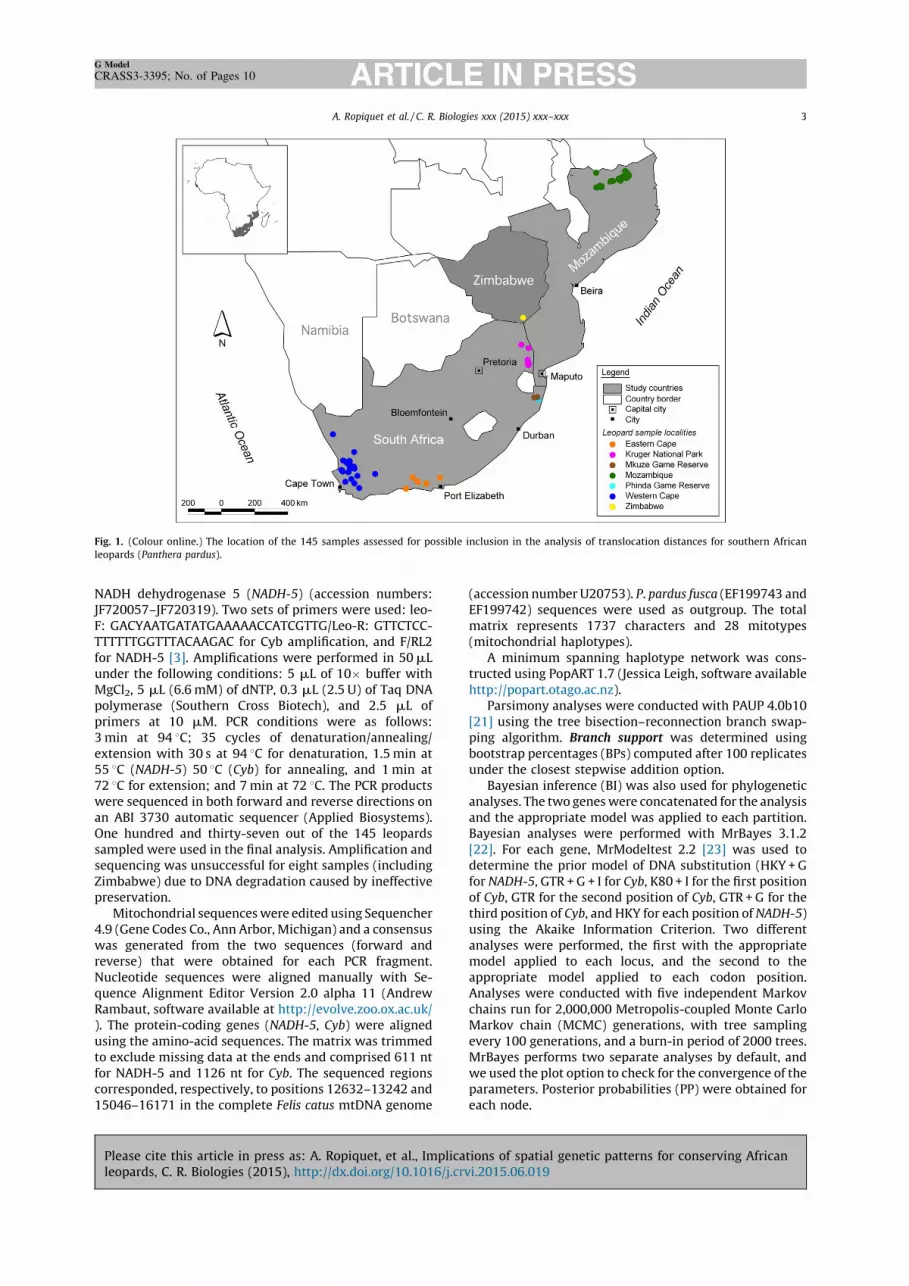
A total of 145 leopard (P. pardus) samples of knownorigin were collected between 1998 and 2008 with theassistance of CapeNature, the Cape Leopard Trust, Pantheraand the Niassa Carnivore Project, from seven largegeographic areas across southern Africa. The WesternCape province provided 32 samples; 18 individuals weresampled adjacent to the Kruger National Park; 18 and30 samples originated, respectively, from the Mkuze GameReserve and the Phinda Private Game Reserve in theKwaZulu-Natal province; 11 were sampled from theBaviaanskloof World Heritage Site (WHS) in the EasternCape province; 35 samples were obtained from the Niassaprovince in Mozambique; and one sample was obtainedfrom southern Zimbabwe (Fig. 1). DNA was extracted fromskin biopsies, hair, dry skin and muscle using a DNeasyBlood and tissue kit (Qiagen).
2.2. mtDNA analyses
Two mitochondrial genes were successfully amplifiedfor 137 individuals, the cytochrome b gene (Cyb) and the
A. Ropiquet et al. / C. R. Biologies xxx (2015) xxx–xxx2
G Model
CRASS3-3395; No. of Pages 10
Please cite this article in press as: A. Ropiquet, et al., Implications of spatial genetic patterns for conserving Africanleopards, C. R. Biologies (2015), http://dx.doi.org/10.1016/j.crvi.2015.06.019
NADH dehydrogenase 5 (NADH-5) (accession numbers:JF720057–JF720319). Two sets of primers were used: leo-F: GACYAATGATATGAAAAACCATCGTTG/Leo-R: GTTCTCC-TTTTTTGGTTTACAAGAC for Cyb amplification, and F/RL2for NADH-5 [3]. Amplifications were performed in 50 mLunder the following conditions: 5 mL of 10" buffer withMgCl2, 5 mL (6.6 mM) of dNTP, 0.3 mL (2.5 U) of Taq DNApolymerase (Southern Cross Biotech), and 2.5 mL ofprimers at 10 mM. PCR conditions were as follows:3 min at 94 8C; 35 cycles of denaturation/annealing/extension with 30 s at 94 8C for denaturation, 1.5 min at55 8C (NADH-5) 50 8C (Cyb) for annealing, and 1 min at72 8C for extension; and 7 min at 72 8C. The PCR productswere sequenced in both forward and reverse directions onan ABI 3730 automatic sequencer (Applied Biosystems).One hundred and thirty-seven out of the 145 leopardssampled were used in the final analysis. Amplification andsequencing was unsuccessful for eight samples (includingZimbabwe) due to DNA degradation caused by ineffectivepreservation.
Mitochondrial sequences were edited using Sequencher4.9 (Gene Codes Co., Ann Arbor, Michigan) and a consensuswas generated from the two sequences (forward andreverse) that were obtained for each PCR fragment.Nucleotide sequences were aligned manually with Se-quence Alignment Editor Version 2.0 alpha 11 (AndrewRambaut, software available at http://evolve.zoo.ox.ac.uk/). The protein-coding genes (NADH-5, Cyb) were alignedusing the amino-acid sequences. The matrix was trimmedto exclude missing data at the ends and comprised 611 ntfor NADH-5 and 1126 nt for Cyb. The sequenced regionscorresponded, respectively, to positions 12632–13242 and15046–16171 in the complete Felis catus mtDNA genome
(accession number U20753). P. pardus fusca (EF199743 andEF199742) sequences were used as outgroup. The totalmatrix represents 1737 characters and 28 mitotypes(mitochondrial haplotypes).
A minimum spanning haplotype network was cons-tructed using PopART 1.7 (Jessica Leigh, software availablehttp://popart.otago.ac.nz).
Parsimony analyses were conducted with PAUP 4.0b10[21] using the tree bisection–reconnection branch swap-ping algorithm. Branch support was determined usingbootstrap percentages (BPs) computed after 100 replicatesunder the closest stepwise addition option.
Bayesian inference (BI) was also used for phylogeneticanalyses. The two genes were concatenated for the analysisand the appropriate model was applied to each partition.Bayesian analyses were performed with MrBayes 3.1.2[22]. For each gene, MrModeltest 2.2 [23] was used todetermine the prior model of DNA substitution (HKY + Gfor NADH-5, GTR + G + I for Cyb, K80 + I for the first positionof Cyb, GTR for the second position of Cyb, GTR + G for thethird position of Cyb, and HKY for each position of NADH-5)using the Akaike Information Criterion. Two differentanalyses were performed, the first with the appropriatemodel applied to each locus, and the second to theappropriate model applied to each codon position.Analyses were conducted with five independent Markovchains run for 2,000,000 Metropolis-coupled Monte CarloMarkov chain (MCMC) generations, with tree samplingevery 100 generations, and a burn-in period of 2000 trees.MrBayes performs two separate analyses by default, andwe used the plot option to check for the convergence of theparameters. Posterior probabilities (PP) were obtained foreach node.
Fig. 1. (Colour online.) The location of the 145 samples assessed for possible inclusion in the analysis of translocation distances for southern Africanleopards (Panthera pardus).
A. Ropiquet et al. / C. R. Biologies xxx (2015) xxx–xxx 3
G Model
CRASS3-3395; No. of Pages 10
Please cite this article in press as: A. Ropiquet, et al., Implications of spatial genetic patterns for conserving Africanleopards, C. R. Biologies (2015), http://dx.doi.org/10.1016/j.crvi.2015.06.019

2.3. Nuclear DNA analyses
Leopard samples were analysed using eight polymor-phic microsatellite loci, isolated from the domestic cat,F. catus [24]. The selected loci (FCA008, FCA026, FCA043,FCA077, FCA211, FCA220, FCA247, FCA453) were previouslyused for a phylogeographic study of leopards [3] and wereshown to be polymorphic in leopards and other non-domestic cat species [25,26]. PCR amplifications wereperformed using the Multiplex PCR Kit (QIAGEN) followingthe recommended protocol using Q-Solution in a finalreaction volume of 10 mL (5 mL of 2" QIAGEN MultiplexMaster Mix), 1 mL of primer mix (mix of forward andreverse primers) (2 mM), 1 mL of Q-solution, 1 mL of H2Oand 2 mL of template DNA). PCR conditions were standardand annealing occurred at 60 8C. Primers were in multiplexreactions: (i) FCA008, FCA026, FCA043, FCA211; (ii) FCA077,FCA220, FCA247, FCA453. Genotyping was performed on anABI 3730 automatic sequencer (Applied Biosystems).Alleles scoring was done using Genemapper 3.7 software(Applied Biosystems) and double-checked by eye. A total of145 samples were successfully genotyped and less than 2%of alleles were missing in the final dataset. Analyses wereimplemented in MICROCHECKER 2.2.3 [27] to check thequality (presence of null alleles, allelic dropout, stuttering)of the dataset. Null alleles may be present for FCA008 andFCA077, but with frequencies lower than 10% in the wholedataset and lower than 5% within geographic groups.
Population genetics indexes (HE, HO, FIS) were calculat-ed for each geographic region using GENALEX 6 [28] withthe exception of Zimbabwe, which comprised only oneindividual. Pairwise FST values were computed and testedusing permutations tests (1000) implemented in FSTAT[29]. Tests for Hardy–Weinberg equilibrium within eachpopulation were performed using Genepop’007 [30].
A Bayesian model executed in a MCMC using theR-package GENELAND version 3.1.5 [31,32] to detect thelocation of genetic discontinuities using individual geo-referenced multilocus genotypes [33]. This model treatsthe number of clusters as a parameter processed by theMCMC scheme without any approximation and mayprovide a more precise estimation of the number ofclusters than alternative techniques that do not account forgeographical location [33,34]. Ten independent runs of theGENELAND model were performed with 5,000,000 itera-tions, of which every 100th iteration was saved, treatingthe number of genetic clusters as unknown and using thespatial D-model as a prior model for allele frequencies(assumed to be independent). GENELAND uses geographiclocations of individuals as prior information. A secondBayesian approach to estimate clustering was tested usingSTRUCTURE 2.3.3 [35]. This method assigns individualmultilocus genotypes probabilistically to a user-definednumber (K) of clusters (or gene pools), in order to approachlinkage equilibrium within clusters. We ran STRUCTURE10 times for each K = 1–10, for 1,000,000 iterations after aburn-in period of 1,000,000 on the data set with no earlierinformation on the population of origin of individualleopards. We used the admixture model, in which thefraction of ancestry from each cluster was estimated forindividual leopards. The same parameter of individual
admixture (a) was chosen for all clusters and was given auniform prior. The allele frequencies were kept indepen-dent among clusters to avoid overestimating the numberof clusters [36]. We followed the procedure of Evanno et al.[37] to infer the number of clusters detected in the dataset.Finally, correspondence analyses were performed todisplay the distribution of the genetic diversity usingGenetix 4.0.5 [38].
Spatial autocorrelation analyses were performed to testthe presence of a spatial genetic structure (SGS) due to anisolation-by-distance (IBD) process. We assessed the SGSusing the method of Vekemans and Hardy [39], based onpairwise kinship coefficients between individuals usingthe software SPAGeDi 1.3 [40]. The kinship coefficient [41]was chosen as the pairwise estimator of genetic related-ness, as it is a relatively unbiased estimator with lowsampling variance. Kinship coefficient values (Fij) were alsoregressed on dij, where dij is the natural logarithm of thespatial distance between individuals i and j, to provideregression slope bd. To visualize SGS, the kinship coeffi-cient values were averaged over a set of distance classes(d), giving F(d), and plotted against the geographicdistance. Standard errors were assessed by jackknifingdata for each locus. To test for SGS, spatial positions ofindividuals were permuted 9999 times in order to obtainthe frequency distribution of the slope bd under the nullhypothesis that Fij was not correlated with dij.
2.4. Estimation of gene dispersal
In presence of IBD process, Wright’s neighbourhoodsize, Nb = 4 Des2, where De is the effective density and s2 isthe mean squared axial parent–offspring distance, can beestimated as Nb = –(1 – FN)/bd when the regression slopebd is computed within the distance range s > dij> 20 s[40]. As s is unknown, an iterative approach, implementedin the SPAGeDi 1.3 software [40], was applied to jointlyestimate Nb and sDe. We applied this approach collectivelyto leopards only from the Eastern Cape and Western Capeprovinces, due to the greater availability and accuracy ofthe spatial location, home range and species densityinformation. In this region, leopards mostly occur inmountainous areas at an estimated density of approxi-mately three individuals per 100 km2 [42]. As estimatingeffective population density (De) from D is problematic, weapplied the precautionary principle and used De = D/2 andD/10 as boundary values for De, D/10 being a highlyconservative estimate of De [43,44].
3. Results
Minimum spanning network, Bayesian and parsimonyanalyses performed on the two mtDNA markers demonstratespatial structure (Fig. 2-3). The mtDNA tree reflects thestructure of the female leopard population. None ofthe localities were found to be monophyletic in either themitochondrial bootstrap tree or the Bayesian tree (Fig. 3).With the exception of individual leo95, leopards fromMozambique grouped together in a clade (BP = 71/–/PP6 = 1) that included two individuals adjacent to the KrugerNational Park (leo104, leo101). The Western Cape individuals
A. Ropiquet et al. / C. R. Biologies xxx (2015) xxx–xxx4
G Model
CRASS3-3395; No. of Pages 10
Please cite this article in press as: A. Ropiquet, et al., Implications of spatial genetic patterns for conserving Africanleopards, C. R. Biologies (2015), http://dx.doi.org/10.1016/j.crvi.2015.06.019

were distributed across two clades (BP = 57/PP2 = 1/PP6 = 0.99; BP = 67/PP2 = 0.99/PP6 = 0.99) including one East-ern Cape individual. Phinda and Mkuze individuals wererelated and are distributed across two clades (BP = 88/PP2 = 1/PP6 = 1; BP = 94/PP2 = 1/PP6 = 1) with the exception of indi-viduals leo124 from Phinda and leo156 from Mkuze, thatwere clustered in a clade with Kruger individuals (BP = 84/PP2 = 1/PP6 = 1).
Microsatellite genotypes revealed a relatively highgenetic diversity with the expected heterozygosity (HE)ranging between 0.65 for the Mkuze area of KwaZulu-Natalto 0.74 for individuals sampled adjacent to the KrugerNational Park (Table 1). Inbreeding indices (FIS) wererelatively low and ranged from 0.04 in Mkuze to 0.11 in theBaviaanskloof WHS which straddles the Eastern Cape andthe Western Cape provinces, suggesting minimal vulnera-bility from small population size, inbreeding depression ormating strategies. The global FST value was 0.09 andpairwise FST values were relatively low but significant,with a maximum value of 0.16 between the Cederberg andMkuze populations (Table 2).
No significant genetic discontinuities were found usingBayesian clustering approaches for the microsatellitesdata. No consensus on the number of clusters and theirspatial distribution were found among runs despiteconvergences in MCMC being achieved with GENELAND.Results were strongly divergent among runs with best-fitted K-values ranging from 8 to 20, with no apparentspatial structure regardless of the K-value used. Resultsfrom the algorithm implemented in STRUCTURE [35] andcompiled following Evanno et al. [37] indicated thatK = 2 would be the best-fitted K-value. This produced twodistinct genetic clusters: the Mkuze-Phinda individualsand all remaining individuals. However, this analysis doesnot account for the possibility that K = 1 is the best-fitted K-value. Both GENELAND and the multivariate analysissuggested the dataset comprises a single gene pool. Thefactorial correspondence analysis performed on themicrosatellites marker data (Fig. 4) did not locate discretegene pools within the dataset but showed that Krugerleopards have a central position, which can be explained bytheir geographic location relative to other individuals.
Spatial autocorrelation analyses [40] were used to test forthe presence of a SGS due to IBD [45] and found a significantcorrelation between the kinship coefficient (F(dij)) [41] andspatial distance of individuals (slope = –0.02; P value = 0.00),indicating a dominant role for IBD in shaping the geographicdistribution of genetic diversity in southern African leopards(Fig. 5). The collective effective gene dispersal (s) index [40]for individuals from the Eastern and Western Cape provincesranged from 24 km (De = D/2) to 82 km (De = D/10).
4. Discussion
This study represents the most comprehensive analysisof the SGS of southern African leopard. It confirmed thatsouthern African leopards comprise a single population ofdistinct geographically isolated groups [3]. IBD is thenatural process shaping the spatial distribution of geneticdiversity in the southern African leopard population. As theleopard population currently displays a healthy geneticstructure, translocations justified on the grounds ofimproving genetic diversity are erroneous. In the contextof IBD, the effective gene dispersal (s) index can be used toestimate translocation distances for southern Africanleopards.
The translocation of carnivores is not primarilyundertaken by conservation organisations to ensurepersistence of a species, but rather to immediately anddirectly reduce human–carnivore conflict. In the case ofsouthern African leopards, land managers view the speciesas the cause of conflict (i.e. leopards predate domesticstock), and so land managers exterminate them. To avoidlocal extinctions, conservation organisations understand-ably react by removing the perceived cause of the conflict(i.e. individual leopards). Our finding from the STRUCTUREanalysis of the segregation of the Mkuze-Phinda popula-tion could reflect local exterminations (almost 40%)through severe persecution by humans resulting in astrong impact on alleles frequencies [46].
Analysis of genetic data alone will not provide anultimate enduring solution to human–leopard conflict.Human–leopard conflict is a highly complex problem,comprising a diverse array of interacting factors that
Fig. 2. (Colour online.) Minimum spanning network among the mitochondrial haplotypes performed under PopART 1.7. The size of the circle is proportionalto the frequency of the haplotype in the total population.
A. Ropiquet et al. / C. R. Biologies xxx (2015) xxx–xxx 5
G Model
CRASS3-3395; No. of Pages 10
Please cite this article in press as: A. Ropiquet, et al., Implications of spatial genetic patterns for conserving Africanleopards, C. R. Biologies (2015), http://dx.doi.org/10.1016/j.crvi.2015.06.019
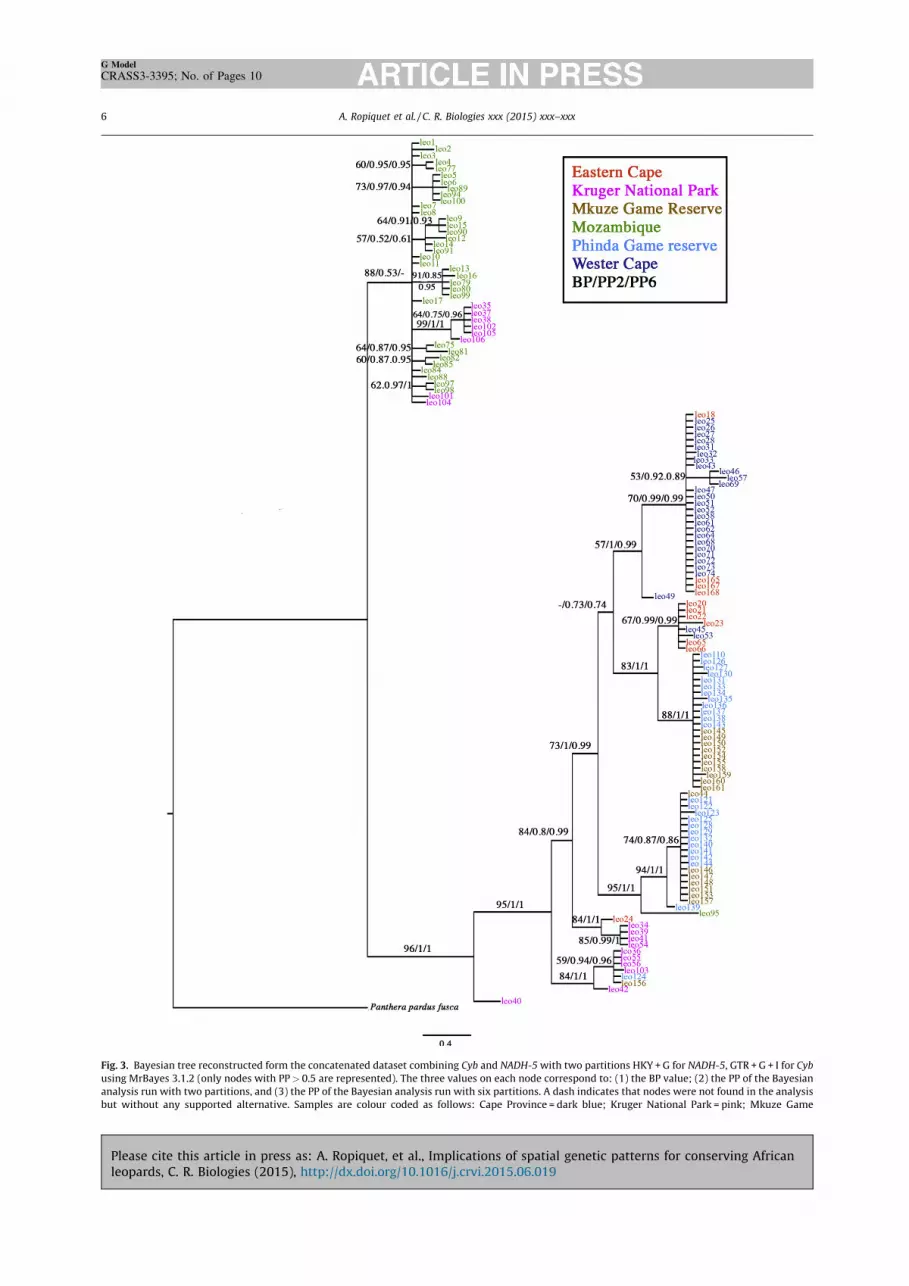
Fig. 3. Bayesian tree reconstructed form the concatenated dataset combining Cyb and NADH-5 with two partitions HKY + G for NADH-5, GTR + G + I for Cybusing MrBayes 3.1.2 (only nodes with PP > 0.5 are represented). The three values on each node correspond to: (1) the BP value; (2) the PP of the Bayesiananalysis run with two partitions, and (3) the PP of the Bayesian analysis run with six partitions. A dash indicates that nodes were not found in the analysisbut without any supported alternative. Samples are colour coded as follows: Cape Province = dark blue; Kruger National Park = pink; Mkuze Game
A. Ropiquet et al. / C. R. Biologies xxx (2015) xxx–xxx6
G Model
CRASS3-3395; No. of Pages 10
Please cite this article in press as: A. Ropiquet, et al., Implications of spatial genetic patterns for conserving Africanleopards, C. R. Biologies (2015), http://dx.doi.org/10.1016/j.crvi.2015.06.019
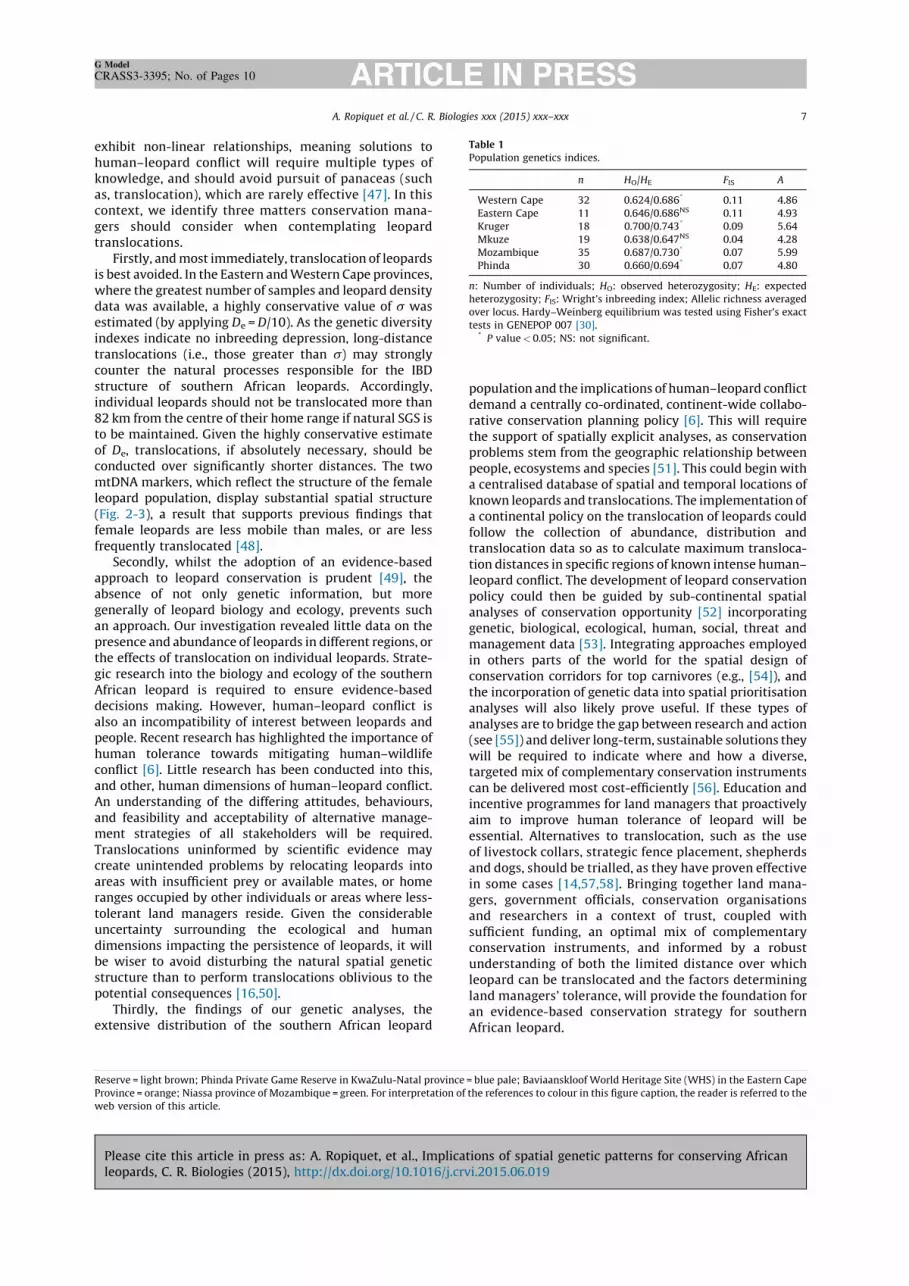
exhibit non-linear relationships, meaning solutions tohuman–leopard conflict will require multiple types ofknowledge, and should avoid pursuit of panaceas (suchas, translocation), which are rarely effective [47]. In thiscontext, we identify three matters conservation mana-gers should consider when contemplating leopardtranslocations.
Firstly, and most immediately, translocation of leopardsis best avoided. In the Eastern and Western Cape provinces,where the greatest number of samples and leopard densitydata was available, a highly conservative value of s wasestimated (by applying De = D/10). As the genetic diversityindexes indicate no inbreeding depression, long-distancetranslocations (i.e., those greater than s) may stronglycounter the natural processes responsible for the IBDstructure of southern African leopards. Accordingly,individual leopards should not be translocated more than82 km from the centre of their home range if natural SGS isto be maintained. Given the highly conservative estimateof De, translocations, if absolutely necessary, should beconducted over significantly shorter distances. The twomtDNA markers, which reflect the structure of the femaleleopard population, display substantial spatial structure(Fig. 2-3), a result that supports previous findings thatfemale leopards are less mobile than males, or are lessfrequently translocated [48].
Secondly, whilst the adoption of an evidence-basedapproach to leopard conservation is prudent [49], theabsence of not only genetic information, but moregenerally of leopard biology and ecology, prevents suchan approach. Our investigation revealed little data on thepresence and abundance of leopards in different regions, orthe effects of translocation on individual leopards. Strate-gic research into the biology and ecology of the southernAfrican leopard is required to ensure evidence-baseddecisions making. However, human–leopard conflict isalso an incompatibility of interest between leopards andpeople. Recent research has highlighted the importance ofhuman tolerance towards mitigating human–wildlifeconflict [6]. Little research has been conducted into this,and other, human dimensions of human–leopard conflict.An understanding of the differing attitudes, behaviours,and feasibility and acceptability of alternative manage-ment strategies of all stakeholders will be required.Translocations uninformed by scientific evidence maycreate unintended problems by relocating leopards intoareas with insufficient prey or available mates, or homeranges occupied by other individuals or areas where less-tolerant land managers reside. Given the considerableuncertainty surrounding the ecological and humandimensions impacting the persistence of leopards, it willbe wiser to avoid disturbing the natural spatial geneticstructure than to perform translocations oblivious to thepotential consequences [16,50].
Thirdly, the findings of our genetic analyses, theextensive distribution of the southern African leopard
population and the implications of human–leopard conflictdemand a centrally co-ordinated, continent-wide collabo-rative conservation planning policy [6]. This will requirethe support of spatially explicit analyses, as conservationproblems stem from the geographic relationship betweenpeople, ecosystems and species [51]. This could begin witha centralised database of spatial and temporal locations ofknown leopards and translocations. The implementation ofa continental policy on the translocation of leopards couldfollow the collection of abundance, distribution andtranslocation data so as to calculate maximum transloca-tion distances in specific regions of known intense human–leopard conflict. The development of leopard conservationpolicy could then be guided by sub-continental spatialanalyses of conservation opportunity [52] incorporatinggenetic, biological, ecological, human, social, threat andmanagement data [53]. Integrating approaches employedin others parts of the world for the spatial design ofconservation corridors for top carnivores (e.g., [54]), andthe incorporation of genetic data into spatial prioritisationanalyses will also likely prove useful. If these types ofanalyses are to bridge the gap between research and action(see [55]) and deliver long-term, sustainable solutions theywill be required to indicate where and how a diverse,targeted mix of complementary conservation instrumentscan be delivered most cost-efficiently [56]. Education andincentive programmes for land managers that proactivelyaim to improve human tolerance of leopard will beessential. Alternatives to translocation, such as the useof livestock collars, strategic fence placement, shepherdsand dogs, should be trialled, as they have proven effectivein some cases [14,57,58]. Bringing together land mana-gers, government officials, conservation organisationsand researchers in a context of trust, coupled withsufficient funding, an optimal mix of complementaryconservation instruments, and informed by a robustunderstanding of both the limited distance over whichleopard can be translocated and the factors determiningland managers’ tolerance, will provide the foundation foran evidence-based conservation strategy for southernAfrican leopard.
Reserve = light brown; Phinda Private Game Reserve in KwaZulu-Natal province = blue pale; Baviaanskloof World Heritage Site (WHS) in the Eastern CapeProvince = orange; Niassa province of Mozambique = green. For interpretation of the references to colour in this figure caption, the reader is referred to theweb version of this article.
Table 1Population genetics indices.
n HO/HE FIS A
Western Cape 32 0.624/0.686* 0.11 4.86Eastern Cape 11 0.646/0.686NS 0.11 4.93Kruger 18 0.700/0.743* 0.09 5.64Mkuze 19 0.638/0.647NS 0.04 4.28Mozambique 35 0.687/0.730* 0.07 5.99Phinda 30 0.660/0.694* 0.07 4.80
n: Number of individuals; HO: observed heterozygosity; HE: expectedheterozygosity; FIS: Wright’s inbreeding index; Allelic richness averagedover locus. Hardy–Weinberg equilibrium was tested using Fisher’s exacttests in GENEPOP 007 [30].
* P value < 0.05; NS: not significant.
A. Ropiquet et al. / C. R. Biologies xxx (2015) xxx–xxx 7
G Model
CRASS3-3395; No. of Pages 10
Please cite this article in press as: A. Ropiquet, et al., Implications of spatial genetic patterns for conserving Africanleopards, C. R. Biologies (2015), http://dx.doi.org/10.1016/j.crvi.2015.06.019
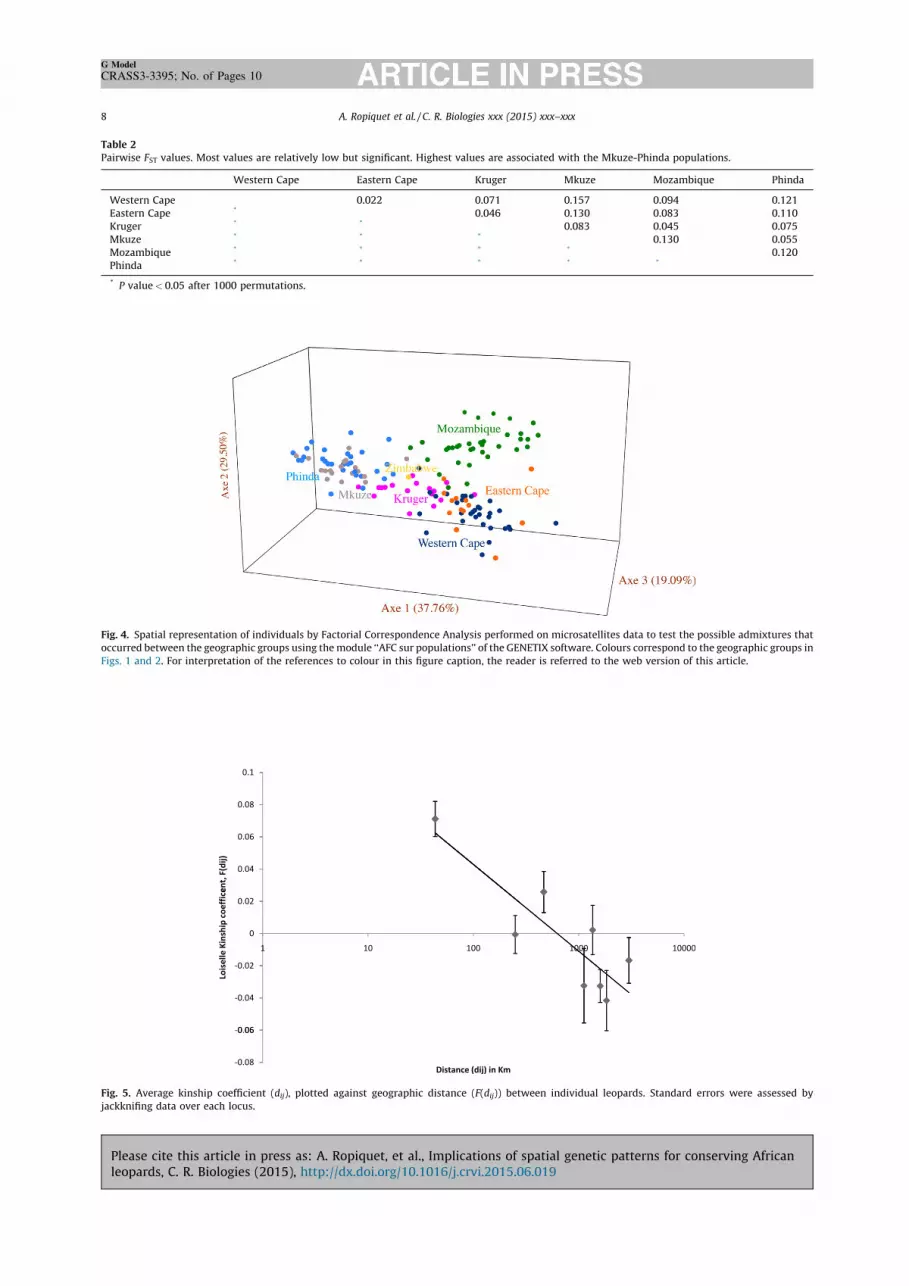
Table 2Pairwise FST values. Most values are relatively low but significant. Highest values are associated with the Mkuze-Phinda populations.
Western Cape Eastern Cape Kruger Mkuze Mozambique Phinda
Western Cape 0.022 0.071 0.157 0.094 0.121Eastern Cape * 0.046 0.130 0.083 0.110Kruger * * 0.083 0.045 0.075Mkuze * * * 0.130 0.055Mozambique * * * * 0.120Phinda * * * * *
* P value < 0.05 after 1000 permutations.
Fig. 4. Spatial representation of individuals by Factorial Correspondence Analysis performed on microsatellites data to test the possible admixtures thatoccurred between the geographic groups using the module ‘‘AFC sur populations’’ of the GENETIX software. Colours correspond to the geographic groups inFigs. 1 and 2. For interpretation of the references to colour in this figure caption, the reader is referred to the web version of this article.
Fig. 5. Average kinship coefficient (dij), plotted against geographic distance (F(dij)) between individual leopards. Standard errors were assessed byjackknifing data over each locus.
A. Ropiquet et al. / C. R. Biologies xxx (2015) xxx–xxx8
G Model
CRASS3-3395; No. of Pages 10
Please cite this article in press as: A. Ropiquet, et al., Implications of spatial genetic patterns for conserving Africanleopards, C. R. Biologies (2015), http://dx.doi.org/10.1016/j.crvi.2015.06.019
Disclosure of interest
The authors declare that they have no conflicts ofinterest concerning this article.
Acknowledgements
The Cape Leopard Trust, Landmark Foundation andPanthera provided genetic samples. AR was funded by theClaude-Leon Foundation. CB was the beneficiary of a post-doctoral grant from the AXA Research Fund. The Centre ofExcellence for Environmental Decisions (CEED) at TheUniversity of Queensland supported ATK. NRF and the CapeLeopard Trust provided a research grant to CM. CapeNatureprovided support in collecting samples and Colleen andKeith Begg from the Niassa Carnivore Project, in collabo-ration with SRN (Niassa Reserve) provided samples fromMozambique. Ruth Kansky is thanked for alerting us to theimportance of tolerance in human–wildlife conflict.
References
[1] M.O. Ogada, R. Woodroffe, N. Oguge, L.G. Frank, Limiting livestockdepredation by African carnivores: the role of livestock husbandry,Conserv. Biol. 17 (2003) 1521–1530.
[2] C. Inskip, A. Zimmermann, Human-felid conflict: a review of patternsand priorities worldwide, Oryx 43 (2009) 18–34.
[3] O. Uphyrkina, W.E. Johnson, H. Quigley, D. Miquelle, L. Marker, M. Bush,S.J. O’Brien, Phylogenetics, genome diversity and origin of modernleopard, Panthera pardus, Mol. Ecol. 10 (2001) 2617–2633.
[4] C. Packer, M. Kosmala, H.S. Cooley, H. Brink, L. Pintea, D. Garshelis, G.Purchase, M. Strauss, A. Swanson, G. Balme, L. Hunter, K. Nowell, Sporthunting, predator control and conservation of large carnivores, PLoSOne 4 (2009) e5941.
[5] K. Nowell, P. Jackson, Wild Cats: Status survey and conservation actionplan, IUCN/SSC Cat Specialist Group, Gland, Switzerland, 1996.
[6] A. Treves, R.B. Wallace, S. White, Participatory planning of interventionsto mitigate human-wildlife conflicts, Conserv. Biol. 23 (2009) 1577–1587.
[7] IUCN, Position Statement on the Translocation of Living Organisms.Prepared by the Species Survival Commission in collabo85ration withthe Commission on Ecology, and the Commission on Environmentpolicy, Law and Administration, IUCN, Gland, Switzerland, 1987.
[8] J.D.C. Linnell, R. Aanes, J.E. Swenson, J. Odden, M.E. Smith, Translocationof carnivores as a method for managing problem animals: a review,Biodivers. Conserv. 6 (1997) 1245–1257.
[9] P. Henschel, L. Hunter, U. Breitenmoser, N. Purchase, C. Packer, I.Khorozyan, H. Bauer, L. Marker, E. Sogbohossou, C. Breitenmoser-Wursten, ‘‘Panthera pardus’’. IUCN Red List of Threatened Species.Version 2010. 1. International Union for Conservation of Nature,2008 http://www.iucnredlist.org/apps/redlist/details/15954.
[10] P.A. Jewell, Conservation of the cheetah: should cheetah be moved todistant areas? Workshop report, International Fund for Animal Wel-fare, Cambridge, 1982.
[11] P.M. Norton, Ecology and conservation of the leopard in the mountainsof the Cape Province, (Unpubl. Report), Cape Department of Nature &Environmental Conservation, Cape Town, 1986.
[12] M. Weilenmann, M. Gusset, D.R. Mills, T. Gabanapelo, M. Schiess-Meier,Is translocation of stock-raiding leopards into a protected area withresident conspecifics an effective management tool? Wildlife Res. 37(2010) 702–707.
[13] W.F. Andelt, Use of livestock guarding animals to reduce predation onlivestock, 2004, p. 19.
[14] J.A. Shivik, Non-lethal alternatives for predation management, SheepGoat Res. J. 19 (2004) 68–75.
[15] J.A. Shivik, Tools for the edge: what’s new for conserving carnivores,BioScience 56 (2006) 253–259.
[16] R. Frankham, J.D. Ballou, D.A. Briscoe, Introduction to conservationgenetics, 2nd ed., Cambridge University Press, Cambridge, UnitedKingdom, 2010.
[17] G.B. Hartl, F. Zachos, K. Nadlinger, Genetic diversity in European reddeer (Cervus elaphus L.): anthropogenic influences on natural popula-tions, C. R. Biologies 326 (2003) 37–42.
[18] C. Moritz, Conservation units and translocations: strategies for con-serving evolutionary processes, Hereditas 130 (1999) 217–228.
[19] S. Miththapala, J. Seidensticker, S.J. O’Brien, Phylogeographic subspe-cies recognition in leopards (Panthera pardus): molecular genetic vari-ation, Conserv. Biol. 10 (1996) 1115–1132.
[20] B. Griffith, J. Scott, J. Carpenter, C. Reed, Translocation as a speciesconservation tool: status and strategy, Science 24 (1989) 477–480.
[21] D.L. Swofford, PAUP*: Phylogenetic analysis using parsimony (andother methods), version 4, Sinauer Associates, Sunderland, MA, 2002.
[22] F. Ronquist, J.P. Huelsenbeck, MRBAYES3: Bayesian phylogenetic infer-ence under mixed models, Bioinformatics 19 (2003) 1572–1574.
[23] J.A. Nylander, MrModeltest v2. Program distributed by the author,Evolutionary Biology Centre, Uppsala University, 2004.
[24] M. Menotti-Raymond, V.A. David, L.A. Lyons, A.A. Schaffer, J.F. Tomlin,M.K. Hutton, S.J. O’Brien, A genetic linkage map of microsatellites in thedomestic cat (Felis catus), Genomics 57 (1999) 9–23.
[25] C.A.Driscoll,Acharacterizationofmicrosatellite locivariationin Panthera leo,Acinonyx jubatus and Felis concolor, (MSc Thesis), Hood College, FrederickMD, 1998.
[26] J. Wentzel, J.C. Stephens, W.E. Johnson, Subspecies of tigers: molecularassessment using ‘‘voucher specimens’’ of geographically traceableindividuals, in: J. Seidensticker, S. Christie, P. Jackson (Eds.), Ridingthe Tiger: Tiger Conservation in Human-Dominated Landscapes, Cam-bridge University Press, Cambridge, 1999, pp. 40–49.
[27] C. van Oosterhout, W.F. Hutchinson, D.P.M. Wills, P. Shipley, MICRO-CHECKER: software for identifying and correcting genotyping errors inmicrosatellite data, Mol. Ecol. Resour. 4 (2004) 535–538.
[28] R. Peakall, P.E. Smouse, GENALEX6: genetic analysis in Excel. Popula-tion genetic software for teaching and research, Mol. Ecol. Notes 6(2006) 288–295.
[29] J. Goudet, FSTAT (Version 1.2): a computer program to calculateF-statistics, J. Hered. 86 (1995) 485–486.
[30] F. Rousset, Genepop’007: a complete reimplementation of the Gene-pop software for Windows and Linux, Mol. Ecol. Resour. 8 (2008)103–106.
[31] G. Guillot, F. Mortier, A. Estoup, Geneland:, A program for landscapegenetics, Mol. Ecol. Notes 5 (2005) 712–715.
[32] G. Guillot, Inference of structure in subdivided populations at lowlevels of genetic differentiation. The correlated allele frequencies mod-el revisited, Bioinformatics 24 (2008) 22222–22228.
[33] G. Guillot, A. Estoup, F. Mortier, J.F. Cosson, A spatial statistical modelfor landscape genetic, Genetics 170 (2005) 1261–1280.
[34] O. Francois, S. Ancelet, G. Guillot, Bayesian clustering using hiddenMarkov random fields in spatial population genetics, Genetics 174(2006) 805–816.
[35] J.K. Pritchard, M. Stephens, P.J. Donnelly, Inference of populationstructure using multilocus genotype data, Genetics 155 (2000)945–959.
[36] D. Falush, M. Stephens, J.K. Pritchard, Inference of population structureusing multilocus genotype data: linked loci and correlated allele fre-quencies, Genetics 164 (2003) 1567–1587.
[37] G. Evanno, S. Regnaut, J. Goudet, Detecting the number of clusters ofindividuals using the software STRUCTURE: a simulation study, Mol.Ecol. 14 (2005) 2611–2620.
[38] K. Belkhir, P. Borsa, L. Chikhi, N. Raufaste, F. Bonhomme, GENETIX 4.05,logiciel sous Windows TM pour la genetique des populations, Labo-ratoire genome, populations, interactions, CNRS UMR 5000, universitede Montpellier-2, Montpellier, France, 1996.
[39] X. Vekemans, O.J. Hardy, New insights from fine-scale spatial geneticstructure analyses in plant populations, Mol. Ecol. 13 (2004) 921–934.
[40] O.J. Hardy, X. Vekemans, SPAGeDi: a versatile computer program toanalyse spatial genetic structure at the individual or population levels,Mol. Ecol. Notes 2 (2002) 618–620.
[41] B.A. Loiselle, V.L. Sork, J. Nason, C. Graham, Spatial genetic structure of atropical understory shrub, Psychotria officinalis (Rubiaceae), Am. J. Bot.82 (1995) 1420–1425.
[42] P.M. Norton, S.R. Henley, Home range and movements of male leopardsin the Cedarberg Wilderness Area, Cape Province, South Afr. J. WildlifeRes. 17 (1987) 41–48.
[43] O. Puebla, E. Bermingham, F. Guichard, Estimating dispersal fromgenetic isolation-by-distance in a coral reef fish (Hypoplectrus puella),Ecology 90 (2009) 3087–3098.
[44] G.D.G. Debout, J.-L. Doucet, O.J. Hardy, Population history and genedispersal inferred from spatial genetic structure of a Central Africantimber tree, Distemonanthus benthamianus (Caesalpinioideae), Heredity106 (2011) 88–99.
[45] S. Wright, Isolation-by-distance, Genetics 28 (1943) 114–138.[46] G. Balme, R. Slotow, L. Hunter, Impact of conservation interventions on
the dynamics and persistence of a persecuted leopard (Panthera pardus)population, Biol. Conserv. 142 (2009) 2681–2690.
A. Ropiquet et al. / C. R. Biologies xxx (2015) xxx–xxx 9
G Model
CRASS3-3395; No. of Pages 10
Please cite this article in press as: A. Ropiquet, et al., Implications of spatial genetic patterns for conserving Africanleopards, C. R. Biologies (2015), http://dx.doi.org/10.1016/j.crvi.2015.06.019

[47] E. Ostrom, A diagnostic approach for going beyond panaceas, Proc. Natl.Acad. Sci. USA 104 (2007) 15181–15187.
[48] T.N. Bailey, The African Leopard: Ecology and Behavior of a SolitaryFelid, 2nd ed., The Blackburn Press, New Jersey, 2005.
[49] A.S. Pullin, T.M. Knight, D.A. Stone, K. Charman, Do conservationmanagers use scientific evidence to support their decision-making?Biol. Conserv. 119 (2004) 245–252.
[50] F.W. Allendorf, P.A. Hohenlohe, G. Luikart, Genomics and the future ofconservation genetics, Nat. Rev. Genet. 11 (2010) 697–709.
[51] L.P. Koh, J. Ghazoul, Spatially explicit scenario analysis for reconcilingagricultural expansion, forest protection, and carbon conservation inIndonesia, Proc. Natl. Acad. Sci. USA 107 (2010) 11140–11144.
[52] A.T. Knight, R.M. Cowling, M. Difford, B.M. Campbell, Mappinghuman and social dimensions of conservation opportunity for thescheduling of conservation action on private land, Conserv. Biol. 24(2010) 1348–1358.
[53] A.T. Knight, S. Sarkar, R.J. Smith, N. Strange, K.A. Wilson, Engage thehodge-podge: management factors are essential when prioritising
areas for restoration and conservation opportunity, Divers. Distrib.17 (2011) 1234–1238.
[54] E. Wikramanayake, M. McKnight, E. Dinerstein, A. Joshi, B. Gurung, D.Smith, Designing a conservation landscape for tigers in human-domi-nated ecosystems, Conserv. Biol. 18 (2004) 839–844.
[55] A.T. Knight, R.M. Cowling, M. Rouget, A. Balmford, A.T. Lombard, B.M.Campbell, Knowing but not doing: selecting priority conservation areasand the research-implementation gap, Conserv. Biol. 22 (2008) 610–617.
[56] K.A. Wilson, E.C. Underwood, S.A. Morrison, K.R. Klausmeyer, W.W.Murdoch, B. Reyers, G. Wardell-Johnson, P. Parquet, P. Rundel, M.McBride, R. Pressey, M. Bode, J. Hoekstra, S. Andelman, M. Looker, C.Rodinini, P. Kareiva, M. Shaw, H. Possingham, Conserving biodiversityefficiently: what to do, where, and when, PLoS Biol. 5 (2007) 1850–1861.
[57] L.E. Meadows, F.F. Knowlton, Efficacy of guard llamas to reduce caninepredation on domestic sheep, Wildlife Soc. Bull. 28 (2000) 614–622.
[58] H. Kruuk, Hunter and hunted, Cambridge University Press, Cambridge,UK, 2002.
A. Ropiquet et al. / C. R. Biologies xxx (2015) xxx–xxx10
G Model
CRASS3-3395; No. of Pages 10
Please cite this article in press as: A. Ropiquet, et al., Implications of spatial genetic patterns for conserving Africanleopards, C. R. Biologies (2015), http://dx.doi.org/10.1016/j.crvi.2015.06.019


