Embed Size (px)
Citation preview
1
Impacts of Land Use Regulation on the Provision of Open Space in Residential Subdivisions
Erik Lichtenberg, Constant Tra, and Ian Hardie
Department of Agricultural and Resource Economics University of Maryland
College Park, MD 20742-5535
Contact author: Erik Lichtenberg, Department of Agricultural and Resource Economics, 2200 Symons Hall, University of Maryland, College Park Maryland 20742 Telephone: 301-405-1279 Fax: 301-314-9091 [email protected]
Funding for this project was provided by the National Center for Smart Growth Small Grants Program, the USDA National Research Initiative Competitive Grants Program, and the Maryland Agricultural Experiment Station. Some data were provided from EPA STAR Grant R-82801201. We thank Nancy Bockstael, Gerrit Knapp, and participants in the University of Maryland Smart Growth Seminar for helpful comments.
2
Impacts of Land Use Regulation on the Provision of Open Space in Residential Subdivisions
Abstract The effects of state and local regulations on minimum lot size, maximum density, and forested area on the physical utilization of space in suburban residential subdivisions are analyzed theoretically and empirically. Results suggest that the allocation of space within these subdivisions is not determined completely by existing regulations. Instead, developers appear to choose to limit the number of building lots in a subdivision in order to provide open space within subdivisions in response to buyers’ willingness to pay a premium for the amenities open space provides. They do not appear to free ride on open space provided in nearby areas outside of the subdivision. Minimum lot size and forest conservation regulations are found to impose binding constraints on developers while maximum density regulation does not. Forest conservation regulations are found to meet their stated aim of increasing the amount of forested open space in these subdivisions beyond levels developers provide voluntarily. Keywords: land development, land use regulation, residential open space, zoning, local public goods, neighborhood externalities, forest conservation

Impacts of Land Use Regulation on the Provision of Open Space in Residential Subdivisions Land use is regulated in jurisdictions undergoing development to ensure the continued
provision of open space, to maintain woodlands, to protect streams and water quality, to
abate traffic congestion, noise, and air quality degradation, and to provide similar public
goods. The extent to which they are necessary for at least some of these purposes is not
clear. As Thorsnes [14] and others have pointed out, even in the absence of land use
regulations, developers may face incentives to provide many local public goods (e.g.,
neighborhood externalities such as open space, woodlands, parks, etc.) for which home
buyers are willing to pay a premium. Empirical studies of residential developments
provide evidence that private covenants can be used to ensure adequate provision of such
neighborhood externalities (Speyrer [13], Hughes and Turnbull [8]. Thorsnes [14])
provides evidence suggesting that the ability to provide such neighborhood externalities
motivates developers’ choices of subdivision parcel sizes. Thorsnes [15] provides
evidence indicating that suburban homebuyers’ willingness to pay for such local public
goods (specifically, forested land on or adjacent to building lots) is high enough to
constitute a substantial incentive for developers to provide them.
This paper examines the effects of land use regulations on developers’ provision
of open space within a suburban subdivision. In contrast to the bulk of empirical studies
of the impacts of zoning and other land use regulations, which examine how those
regulations affect housing prices1, we study how land use regulations influence the
physical landscape within the subdivision. We concentrate on three major features of
1 See for example Pogodzinski and Sass [11], Holway and Burby [7], Fu and Somerville [2], Thorsnes [14]. An exception is Colwell and Scheu [1], who conduct a theoretical and empirical analysis of the impacts of regulation on the depth and frontage of residential building lots.
2
subdivisions: lot size, the number of lots (density), and open space. All are major
determinants of the landscape of the subdivision and are thus sources of neighborhood
externalities like open space, woodlands, and so on.
We consider three types of land use regulation. Two of them—minimum lot size
and maximum density zoning—are in widespread use throughout the United States. The
third is a set of forest conservation measures implementing the Maryland Forest
Conservation Act of 1991 (FCA), which sets standards for identifying and retaining
forests designated as sensitive (including flood plains, streams and their buffers, steep
slopes, and critical habitats). The FCA requires developers to identify existing forest
cover and submit a forest conservation plan specifying the total amount and location of
forested area to be retained, delineating protective measures for stand edges and
specimen trees, and proposing long term agreements (covenants, easements, etc.) to
protect retained forested areas (Galvin et al. [3], Maryland Department of Natural
Resources [10]).
Regulations like those implementing the FCA are of considerable importance in
areas undergoing rapid urbanization. Land development is a primary reason for forest
conversion in such areas. Even when developers retain trees, they may not do so in ways
that best maintain amenities and other environmental services provided by forests.
Developers may find it less costly to eliminate stream buffers, for example, rather than to
let a riparian forest regenerate or to clear land of mature trees while building and replant
young trees afterwards, depriving a newly developed area of environmental services
provided by trees for several decades (see for example Richer [12]).
3
Empirical studies have found that home buyers place a positive value on
preserving nearby open space generally and forests in particular, suggesting a positive
willingness to pay for such local public goods. Thorsnes [15] found that building lots in
Michigan (both undeveloped and with housing built on them) that had forests on or
adjacent to them commanded large selling premia. The effect of forest on real estate
price was highly localized, however: The selling prices of lots across the street from
those adjoining forest preserves were not significantly different from those of lots farther
away. Tyrvainen and Mettinen [16] estimate the effects of forest views and distance to
the nearest forested area on the selling prices of homes in Finland. They found that a
forest view increases housing prices and that housing prices decrease with distance from
the nearest forest. Other studies have examined the effects of forested land in the general
vicinity without consideration of proximity. Garrod and Willis [2] found that housing
prices in Great Britain were increasing in the amount of broadleaf forest nearby but
decreasing in the amount of coniferous forest nearby. Irwin [6] found that housing prices
in the Washington/Baltimore corridor were decreasing in the amount of privately owned
forest land nearby but increasing in the amount of permanently preserved open space,
suggesting that home buyers value open space (including forests) but expect privately
owned forest land to be developed. Geoghegan, Lynch, and Bucholtz [3] found that
housing prices in the Washington/Baltimore corridor were increasing in the amount of
nearby forest and farmland taken together. Wu, Adams, and Plantinga [17] found that
housing prices in Portland were increasing in the amount of open space in the immediate
vicinity (zip code) and in proximity to parks, lakes, and wetlands. Hardie and Nickerson
[4], using the same Maryland data as those used in this paper, found that prices of
4
developed land (exclusive of improvements) in new suburban residential subdivisions in
the Baltimore/Washington area were decreasing in the amount of farmland nearby but
were insensitive to the amounts of nearby park land. They also found that minimum lot
size zoning requirements reduced prices of developed land.
A positive willingness to pay for open space and forested open space in particular
gives developers an incentive to provide these amenities privately by incorporating them
into their subdivision plans. We analyze this incentive both theoretically and empirically.
We begin with a conceptual model of a developer’s determination of lot size, density,
open space, and other features in a subdivision of fixed size. We use the model to derive
hypotheses about the impacts of land use regulation on developers’ decisions regarding
lot size, the number of lots, and the provision of forested and other open space. We then
analyze those decisions empirically using data on 228 residential subdivisions in the
Baltimore/Washington suburbs.
A Model of Subdivision Configuration Decisions
Consider the problem faced by a developer who has purchased a parcel of undeveloped
land of size A with the intention of laying out a suburban residential subdivision
composed of building lots, forested open space, and other public open space (e.g., fields,
playgrounds, landscaping). For convenience, assume that the subdivision will be
composed of n identical lots, each of which will subsequently be sold to a builder at
v(s,g(φ,z,zo),h(a,ao)), a price net of the value of housing improvements that depends on
the size of each lot s, services provided by forested land g(.), and services provided by
other public open space h(.). Services provided by forested land derive from a
combination of the share of each lot that is forested φ, forested open space inside the

5
subdivision z, and forested land in the vicinity of the subdivision zo. Services provided
by other public open space arise from a combination of open space inside the subdivision
a and in the vicinity of the subdivision ao. Assume that the value of a lot is increasing in
s, g, h, and concave in all arguments. Services provided by forested and other public
open space, g(.) and h(.), respectively, are similarly increasing and concave in all
arguments. Let k(a) denote the cost of developing public open space within the
subdivision, assumed to be increasing and convex in a. Let x denote the change in the
amount of forested land due to development of the subdivision. A positive value (x > 0)
denotes forest clearing, a negative value (x < 0) afforestation. The cost of clearing or
planting is c(x) > 0, with c′(⎥x⎪) > 0. Finally, let 0 ≤ θ ≤ 1 be land required for
infrastructure (e.g., roads) as a share of the size of each building lot.
The total area of the subdivision A is divided among building lots ns(1+θ),
forested open space z, other public open space a, and unusable land w:
(1) A = ns(1+θ) + z + a + w.
The subdivision may also be subject to land use regulation. First, the jurisdiction in
which it is located may require that all lots be at least a minimum size σ:
(2) s ≥ σ.
Second, the jurisdiction may also limit δ, the density of housing in the subdivision:
(3) n ≤ δA.
Third, under Maryland’s Forest Conservation Act each jurisdiction is required to
implement regulations limiting forest clearing. We express this FCA requirement as
(4) nsφ + z + γw ≥ ζA,
6
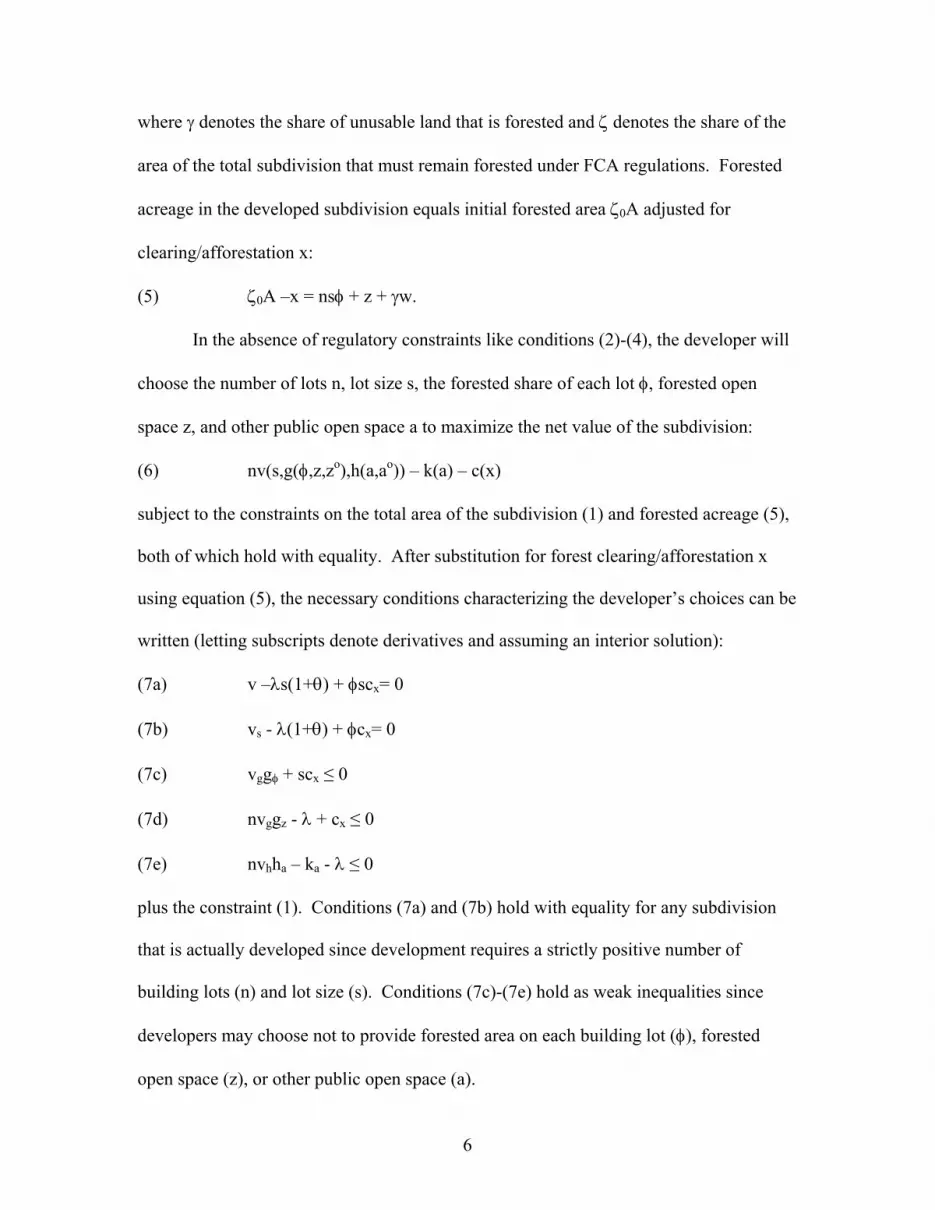
where γ denotes the share of unusable land that is forested and ζ denotes the share of the
area of the total subdivision that must remain forested under FCA regulations. Forested
acreage in the developed subdivision equals initial forested area ζ0A adjusted for
clearing/afforestation x:
(5) ζ0A –x = nsφ + z + γw.
In the absence of regulatory constraints like conditions (2)-(4), the developer will
choose the number of lots n, lot size s, the forested share of each lot φ, forested open
space z, and other public open space a to maximize the net value of the subdivision:
(6) nv(s,g(φ,z,zo),h(a,ao)) – k(a) – c(x)
subject to the constraints on the total area of the subdivision (1) and forested acreage (5),
both of which hold with equality. After substitution for forest clearing/afforestation x
using equation (5), the necessary conditions characterizing the developer’s choices can be
written (letting subscripts denote derivatives and assuming an interior solution):
(7a) v –λs(1+θ) + φscx= 0
(7b) vs - λ(1+θ) + φcx= 0
(7c) vggφ + scx ≤ 0
(7d) nvggz - λ + cx ≤ 0
(7e) nvhha – ka - λ ≤ 0
plus the constraint (1). Conditions (7a) and (7b) hold with equality for any subdivision
that is actually developed since development requires a strictly positive number of
building lots (n) and lot size (s). Conditions (7c)-(7e) hold as weak inequalities since
developers may choose not to provide forested area on each building lot (φ), forested
open space (z), or other public open space (a).
7
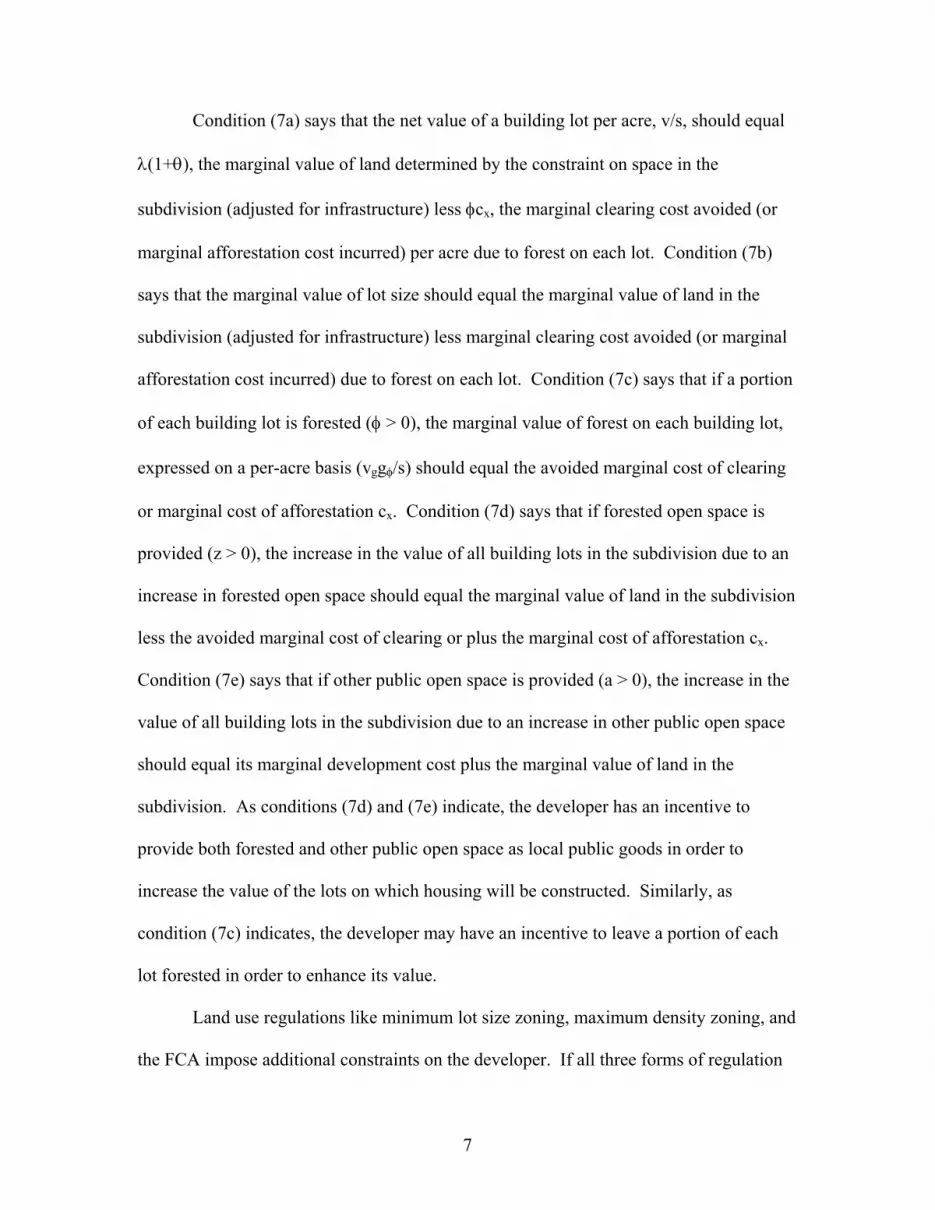
Condition (7a) says that the net value of a building lot per acre, v/s, should equal
λ(1+θ), the marginal value of land determined by the constraint on space in the
subdivision (adjusted for infrastructure) less φcx, the marginal clearing cost avoided (or
marginal afforestation cost incurred) per acre due to forest on each lot. Condition (7b)
says that the marginal value of lot size should equal the marginal value of land in the
subdivision (adjusted for infrastructure) less marginal clearing cost avoided (or marginal
afforestation cost incurred) due to forest on each lot. Condition (7c) says that if a portion
of each building lot is forested (φ > 0), the marginal value of forest on each building lot,
expressed on a per-acre basis (vggφ/s) should equal the avoided marginal cost of clearing
or marginal cost of afforestation cx. Condition (7d) says that if forested open space is
provided (z > 0), the increase in the value of all building lots in the subdivision due to an
increase in forested open space should equal the marginal value of land in the subdivision
less the avoided marginal cost of clearing or plus the marginal cost of afforestation cx.
Condition (7e) says that if other public open space is provided (a > 0), the increase in the
value of all building lots in the subdivision due to an increase in other public open space
should equal its marginal development cost plus the marginal value of land in the
subdivision. As conditions (7d) and (7e) indicate, the developer has an incentive to
provide both forested and other public open space as local public goods in order to
increase the value of the lots on which housing will be constructed. Similarly, as
condition (7c) indicates, the developer may have an incentive to leave a portion of each
lot forested in order to enhance its value.
Land use regulations like minimum lot size zoning, maximum density zoning, and
the FCA impose additional constraints on the developer. If all three forms of regulation
8
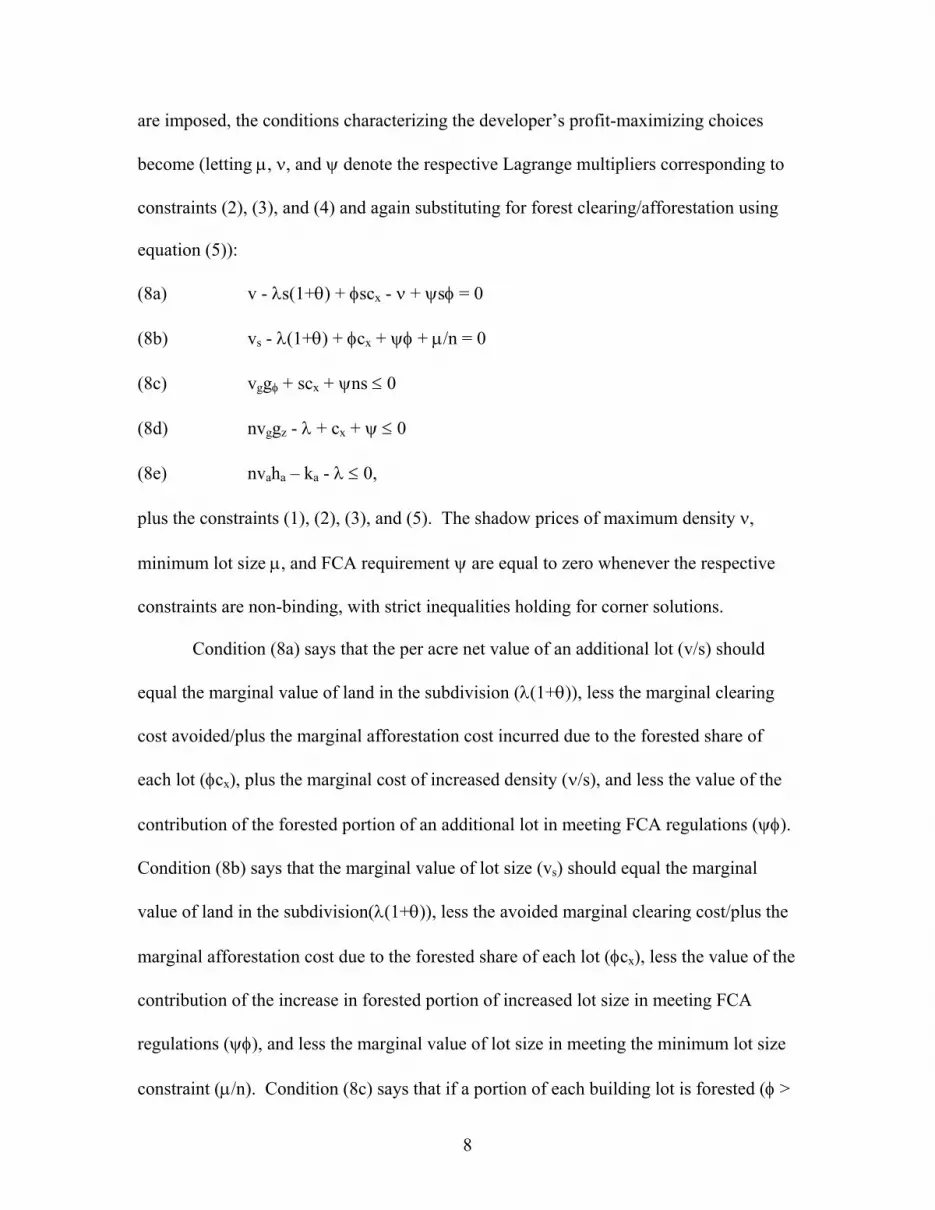
are imposed, the conditions characterizing the developer’s profit-maximizing choices
become (letting µ, ν, and ψ denote the respective Lagrange multipliers corresponding to
constraints (2), (3), and (4) and again substituting for forest clearing/afforestation using
equation (5)):
(8a) v - λs(1+θ) + φscx - ν + ψsφ = 0
(8b) vs - λ(1+θ) + φcx + ψφ + µ/n = 0
(8c) vggφ + scx + ψns ≤ 0
(8d) nvggz - λ + cx + ψ ≤ 0
(8e) nvaha – ka - λ ≤ 0,
plus the constraints (1), (2), (3), and (5). The shadow prices of maximum density ν,
minimum lot size µ, and FCA requirement ψ are equal to zero whenever the respective
constraints are non-binding, with strict inequalities holding for corner solutions.
Condition (8a) says that the per acre net value of an additional lot (v/s) should
equal the marginal value of land in the subdivision (λ(1+θ)), less the marginal clearing
cost avoided/plus the marginal afforestation cost incurred due to the forested share of
each lot (φcx), plus the marginal cost of increased density (ν/s), and less the value of the
contribution of the forested portion of an additional lot in meeting FCA regulations (ψφ).
Condition (8b) says that the marginal value of lot size (vs) should equal the marginal
value of land in the subdivision(λ(1+θ)), less the avoided marginal clearing cost/plus the
marginal afforestation cost due to the forested share of each lot (φcx), less the value of the
contribution of the increase in forested portion of increased lot size in meeting FCA
regulations (ψφ), and less the marginal value of lot size in meeting the minimum lot size
constraint (µ/n). Condition (8c) says that if a portion of each building lot is forested (φ >
9
0), the per-acre marginal value of forest on each building lot (vggφ/s) should equal the
avoided marginal clearing cost or marginal afforestation cost incurred per acre (cx) less
its per-acre value in meeting the subdivision’s FCA requirements (ψn). Condition (8d)
says that if other public open space is provided (a > 0), the increase in the value of all
building lots in the subdivision due to an increase in forested open space (nvggz) should
equal the marginal value of land in the subdivision (λ), less the avoided marginal cost of
clearing or plus the marginal cost of afforestation (cx), and less the marginal cost of
meeting FCA requirements (the shadow price of the FCA constraint ψ). Like condition
(7e), condition (8e) says that if other public open space is provided (a > 0), the increase in
the value of all building lots in the subdivision due to an increase in other public open
space should equal its marginal development cost plus the marginal value of land in the
subdivision.
Conditions (8a-e) suggest that zoning restrictions on density and lot size should, if
binding, affect developers’ provision of both forested and other public open space as well
as the number of lots and lot size, respectively. The direct effects of increasing
maximum allowable density (holding minimum lot size constant) should be an increase in
the number of lots and a corresponding decrease in total open space. If forest is retained
on a share of each lot, however, an increase in the number of lots has the indirect effect of
relaxing the constraint imposed by the FCA. As a result, forested open space (z) and/or
the forested share of each lot (φ) will tend to decrease. In other words, greater density
plus retained forest on building lots have the combined effect of counteracting to some
extent any overprovision of forest due to the FCA. Similarly, the direct effects of greater
minimum lot size (holding maximum allowable density constant) should be larger lots

10
and a corresponding decrease in total open space. As with maximum allowable density,
if forest is retained on a share of each lot, an increase in minimum lot size has the indirect
effect of relaxing the constraint imposed by the FCA, so that forested open space and/or
the forested share of each lot will tend to decrease.
Conditions (8a-e) also suggest that binding FCA requirements should influence
lot size and density. Greater FCA requirements increase forested open space. If a share
of each building lot is forested (φ > 0), greater FCA requirements also increase both the
number of lots and lot size. As a result, greater FCA requirements should lead to
reductions in other public open space. At the same time, greater FCA requirements give
developers an incentive to retain larger shares of each building lot in forest.
Conditions (7a-e) and (8a-e) both suggest that developers will tend to free ride on
open space amenities provided in the vicinity of the subdivision if they believe that
homebuyers value those amenities as substitutes for open space amenities provided
within the subdivision (∂2g/∂z∂zo, ∂2h/∂a∂ao < 0). If open space amenities nearby are not
close substitutes for those within the subdivision, however, as the results obtained by
Thorsnes [15] suggest, then open space amenities nearby will not influence developers’
provision of those amenities within the subdivision.
Combining conditions (4) and (5) in the case where FCA restrictions constitute a
binding constraint implies
(9) (ζ0-ζ)A = x.
If the initial level of forest exceeds the FCA requirement, developers will clear forest. If
the initial level of forest is less than the FCA requirement, developers will afforest.
Incorporating forest into building lots will be more expensive in subdivisions needing
11
afforestation, suggesting that developers will find it preferable to use forested open space
meeting FCA requirements in subdivisions with low initial forest area. Condition (9)
similarly suggests that developers will find it preferable to retain forest in building lots in
subdivisions with high initial forest area, since doing so will make it possible to provide
more other public open space for any given level of clearing cost.
Finally, note that if minimum lot size zoning, maximum density zoning, and the
FCA all impose binding constraints on the developer, these three regulations will
determine the total area in building lots, ns, and in total open space, z+a. Even so, the
regulations leave the developer free to choose the allocation of forested open space
between forested land in building lots, φns, and forested open space, z, and thus the
division of total open space between forested and other public open space.
Data and Estimation Method
We examine the effects of these land use regulations on lot size, the number of lots, and
the provision of open space in suburban residential subdivisions empirically using data
from five suburban counties in the Washington/Baltimore metropolitan area. Two
(Montgomery and Prince Georges Counties) have densely populated urban areas that
adjoin Washington, DC. Two others (Charles County southeast of Washington and
Carroll County west of Baltimore) are less densely populated, with subdivisions either
dispersed throughout the countryside or clustered around a county town center. The fifth,
Howard County, is located between Washington and Baltimore; residents commute to
both.
12
Subdivisions included in the study consist either entirely of single-family
dwellings, including detached homes, townhouses, and combinations of the two.
Subdivisions with commercial or industrial sites or with lots developed for apartment
buildings were omitted. The study also was limited to subdivisions with five or more
building lots for which plans were approved between 1991 and 1997. Small subdivisions
of less than five lots were omitted to remove cases where land is subdivided primarily to
provide residences for family members.
Data on each subdivision were collected from county planning agencies and from
State-maintained GIS databases. Information from county planning agencies was used to
identify the subset of subdivisions that fit the residential use criteria. County planning
agency data were collected for a random sample of 50 percent of these identified
subdivisions. These data were then matched to lot and parcel data in the Maryland
Property View county databases developed and maintained by the Maryland State
Department of Planning. The Property View databases were used to obtain information
on tax assessments, sales, attributes of existing dwelling units, and GIS data on roads,
streams, and land use in areas surrounding each subdivision. The five-county dataset
consists of 261 subdivisions containing 13,100 building lots. Two those subdivisions
contained multi-unit dwellings and were omitted from the analysis. Four others built
around a single golf course were also omitted. Missing observations on a number of the
subdivision characteristics listed below reduced the usable sample size to 228
subdivisions.
In addition to the total size (in acres) of each subdivision, the data contain
measures of several attributes of the physical utilization of space in each subdivision: the
13
number of building lots, the sizes of building lots, existing and retained total forested
area, and area retained in open space. The planning data included information on
geographic features such as areas of floodplain and wetlands and linear stream frontage
as well as whether a public sewer system was available. The Property View data were
used to calculate commuting distance to the nearest central business district (Washington,
DC or Baltimore) and the area in farmland, residential land, land in parks and recreational
facilities, and undeveloped forest and brush (combined) within a given distance from the
centroid of each subdivision. Scores from state-administered school achievement tests
were added to the data as measures of the quality of the public schools serving the
subdivisions.
County planning data were used to identify which subdivisions were exempt from
FCA requirements and to estimate required forest acreage for non-exempt subdivisions.
Zoning codes for each subdivision were obtained from the Property View data base.
County zoning documents were then used to convert these codes into quantitative
measures of land use regulation, specifically, maximum allowable density and minimum
lot size. In some cases, additional information was needed to determine maximum
allowable density and minimum lot sizes. For example, some counties have a single
zoning code that allows different maximum allowable densities and minimum lot sizes
for townhouses and detached homes. Howard County zoning regulations explicitly allow
a tradeoff between minimum lot size and open space within a subdivision under a single
zoning code. Additionally, some subdivisions were regulated under transferable
development rights (TDRs) or planned use development zoning (PUD), each of which
14
had separate density and lot size requirements. These subdivisions were distinguished
using dummy variable indicators.
We modeled three attributes of the allocation of space within these subdivisions—
average lot size, the number of building lots, and total open space2—as linear functions of
regulatory restrictions, geographical characteristics of the subdivision, land uses in the
immediate vicinity of the subdivision, and other factors. Total open space was used
instead of forested area because the data do not distinguish between forested portions of
building lots and forested open space. Measures of regulatory restrictions included in the
model were the maximum allowable number of lots (calculated as the product of the
maximum allowable density and the net area of the subdivision, defined as the total area
of the subdivision less the area of floodplains within the subdivision), minimum lot size,
an indicator of whether the subdivision was exempt from the FCA, forested area required
under the FCA for non-exempt subdivisions, an indicator of whether the subdivision was
regulated under transferable development rights or planned use development rules, and
interactions between this latter indicator and maximum allowable density and minimum
lot size. An indicator of whether the subdivision was served by a public sewer system
was also included. Public health regulations govern the amount of land needed for septic
systems, so this variable can also be considered as an indicator of regulatory restrictions.
Geographical characteristics of the subdivision included the total area of the subdivision,
initial forested area, the area of wetlands and floodplain, and linear stream frontage.
Density restrictions are applied to the net area of the subdivision, hence net area was used
(in place of total area and floodplain area) in the equation modeling the number of lots.
2 Some subdivisions contained outparcels reserved for future division into building lots. These outparcels were excluded from the subdivision and hence do not affect average lot size, open space, or the total area of the subdivision.
15
Land uses in the immediate vicinity of the subdivision included area in farmland, parks
and recreation areas, and forest/brush land outside of the subdivision but within two miles
of the subdivision centroid. These measures of nearby land use were estimated by
calculating the amount of land in each category in a circle with a two-mile radius
centered at the subdivision centroid, then subtracting the amount of land in each category
within the subdivision. (Areas of each land use category within three and five miles of
the subdivision centroid were also calculated. They gave the same results and are thus
not reported.) Other factors included an indicator of the county in which the subdivision
was located, the distance in road miles from the centroid of the subdivision to the closest
central business district, and the score of the high school serving the subdivision on the
Maryland School Performance Assessment Program (MSPAP) test, which is used to
evaluate all schools in the state and is thus a useful measure of derived demand for school
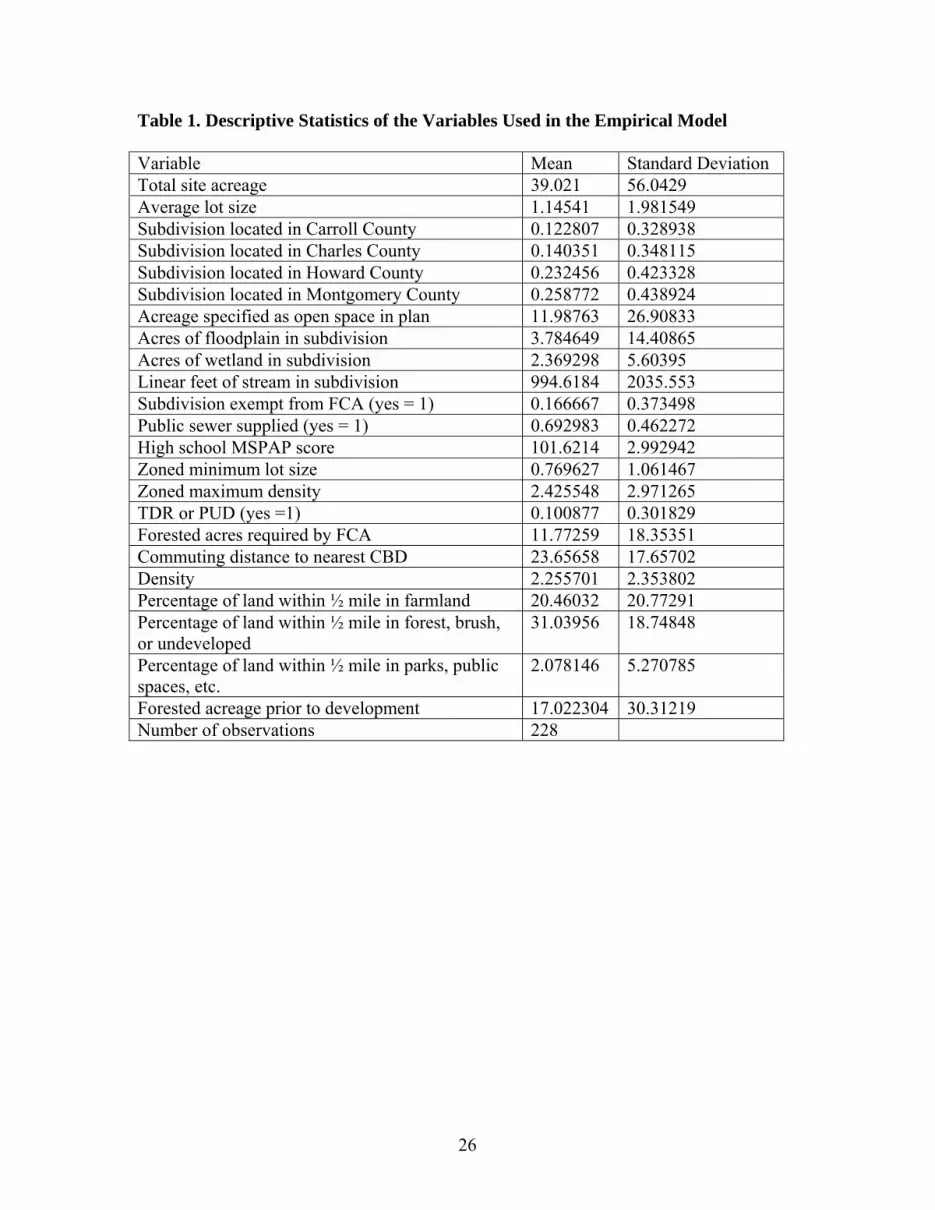
quality. Table 1 gives descriptive statistics of these variables.
One would expect explanatory factors omitted from the three regression equations
to be correlated for each subdivision. The parameters of the model were thus estimated
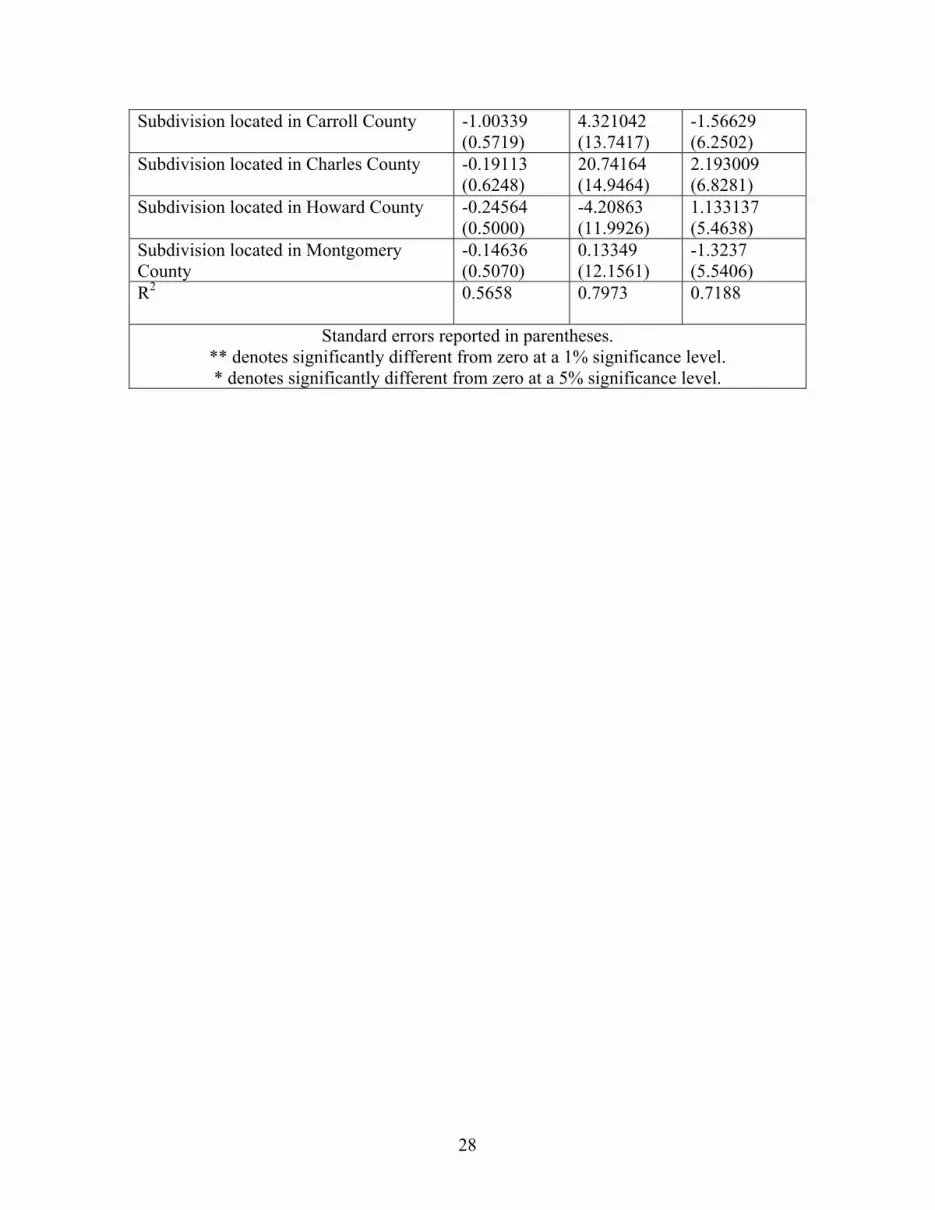
using seemingly unrelated regression (SUR). The estimated coefficients of the three
equations are given in Table 2.
Estimation Results
Average lot size, the number of lots, and public open space in these subdivisions were
each highly correlated with a few regulatory and geographic variables. The R2 ranged
from 0.56 to 0.79. Independent variables with coefficients significantly different from
zero in the average lot size equation included the minimum zoned lot size, whether the
subdivision was exempt from the FCA, whether public sewer service was available, and
16
forested area prior to development. Independent variables with coefficients significantly
different from zero in the number of lots equation included the maximum allowable
number of lots, whether the subdivision was subject to transferable development rights or
planned use development, the cross-product between the maximum allowable number of
lots and TDR/PUD regulation, and whether public sewer service was available.
Independent variables with coefficients significantly different from zero in the open
space equation included acreage of forest required by the FCA, minimum zoned lot size,
whether the public sewer service was available, total area of the subdivision, acreage of
floodplain in the subdivision, and stream frontage in the subdivision. All of the
significant coefficients had the expected signs.
To determine whether land use regulations imposed binding constraints on
developers, we tested whether the coefficients of minimum zoned lot size, the maximum
allowable number of lots, and forest acreage required by FCA were significantly different
from one in the average lot size equation, number of lots equation, and open space
equation, respectively. The Wald statistic for the test of the hypothesis that the
coefficient of the maximum allowable number of lots was significantly different from one
in the number of lots equation was 92.92, indicating that this hypothesis could be rejected
at a 1 percent significance level. The respective Wald statistics for the hypotheses that
the coefficients of minimum zoned lot size in the average lot size equation and forest
acreage required by FCA in the open space equation each equaled one were 3.01 and
1.02, indicating that these hypotheses could not be rejected at a 5 percent significance
level. These results suggest that minimum lot size zoning and FCA requirements do
impose binding constraints on developers of suburban residential subdivisions in
17
Maryland: A one-acre increase in minimum lot size increases average lot size by one acre
while a one-acre increase in the FCA requirement increases total open space in the
subdivision by one acre. Density zoning does not impose a binding constraint, however:
A one-unit increase in the maximum allowable number of lots results in only about 0.6
additional lots. In other words, it appears that developers do not to offer as many
building lots as they are legally allowed.
Further evidence that minimum lot size zoning and the FCA impose binding
constraints on developers while density zoning does not comes from the fact that FCA
requirements affect lot size and minimum lot size zoning affects open space, while
density zoning affects neither. The lots in subdivisions that are exempt from the FCA
are, on average, 1 acre larger than lots in non-exempt subdivisions. The coefficient of
zoned minimum lot size in the open space equation is significantly different from zero
and quite large: Increasing the minimum lot size by an acre leads developers to reduce
open space by almost 5 acres. The coefficients of the maximum allowable number of
lots, the TDR/PUD indicator, and the cross-product of the maximum allowable number of
lots and the TDR/PUD indicator—all of which do affect the number of lots—are not
significantly different from zero in either the average lot size or the open space equation.
Subdivisions with public sewer service available have smaller lots, a greater
number of lots, and more public open space, all as one would expect. Homes not served
by public sewer systems are required to have lots large enough to accommodate septic
fields and thus have tighter space constraints (and a higher marginal value of land within
the subdivision). Average lot size is necessarily larger in these subdivisions, and the
number of lots and total open space are necessarily smaller as a result.

18
The open space equation indicates that developers plan public open space around
geographical features of the subdivision, as one would expect. The positive coefficient of
stream frontage suggests that developers find it optimal to plan open space around
streams. The positive coefficient of wetlands area suggests that developers tend to retain
wetlands as open space rather than converting or incorporating them into building lots;
this result may be due to regulatory limits on draining wetlands or to the cost of doing so.
It was argued earlier that developers provide more open space in subdivisions
with a lower marginal value of space. The marginal value of space within a subdivision
is decreasing in the area of the subdivision as a whole and in the area on which housing
can be constructed, i.e. the net area of the subdivision. The coefficient of total
subdivision acreage is positive, as expected. Larger floodplain acreage means smaller net
acreage, as we have seen; the negative coefficient of floodplain acreage is thus expected
as well.
The open space equation indicates in addition that developers choose to
internalize the provision of public open space rather than attempting to free ride on open
space available in the vicinity of the subdivision. The coefficients of parkland, farmland,
and forest/brush land within two miles of the subdivision centroid are all individually not
significantly different from zero. They were also collectively not significantly different
from zero (the Wald statistic was 1.11). These results suggest that developers perceive
no value added from land that is permanently (parkland) or possibly temporarily
(farmland, forest/brush) providing open space nearby, but not in the subdivision. As
noted above, estimating these models using nearby open space within 3 and 5 miles of the

19
subdivision centroid gave qualitatively identical (and quantitatively almost identical)
results.
The coefficient of zoned minimum lot size in the open space equation is
significantly different from zero and suggests that increasing the minimum lot size by an
acre induces developers to reduce open space by almost 5 acres. This result suggests that
developers utilize forested portions of building lots as well as forested open space in
order to meet FCA requirements. The theoretical model suggests that developers will
increase the forested share of each building lot when the marginal value of space within
the subdivision is higher. All else equal, the marginal value of space should be higher in
subdivisions facing a larger minimum lot size, so that the sign of this coefficient is
consistent with the predictions of the theoretical model.
The theoretical model also implies that developers will tend to retain forest in
building lots in subdivisions with high initial forest area. Consistent with this prediction,
the coefficient of initial forested area in the average lot size equation is positive and
significantly different from zero. The coefficient of initial forested area in the open space
equation is negative but not significantly different from zero, a result consistent with the
hypothesis that developers choose to provide a given level of other public open space
while satisfying binding constraints on total forested area imposed by the FCA.
As noted above, the coefficient of the TDR/PUD indicator in the number of lots
equation was positive as expected, since these programs are used to relax density
restrictions. The coefficient of the cross-product of the TDR/PUD indicator and the
maximum allowable number of lots is negative, indicating that increases in maximum
allowable density result in smaller increases in density in TDR/PUD subdivisions.
20
Finally, the coefficient of distance to the nearest central business district in the
average lot size equation was positive (and significantly different from zero at an 8
percent significance level), which is consistent with the standard tradeoff between
consumption of space and commuting cost.
Discussion
Taken together, the estimated coefficients are consistent with the hypothesis that
developers provide open space voluntarily as a means of enhancing property values
within suburban subdivisions. The fact that the coefficient of the maximum allowable
number of lots in the number of lots equation is significantly less than one indicates that
developers choose not to provide as many lots as regulators would allow. Instead, they
provide only about 3 additional lots for every 5 allowed by regulation. The fact that the
coefficient of the maximum allowable number of lots is not significantly different from
zero in the average lot size equation suggests that developers limit the number of lots in
order to provide open space rather than in order to increase lot size. Further evidence
comes from the fact that the coefficient of forested area required under the FCA in the
open space equation is not significantly different from one, which implies that developers
do not cut back other public open space when faced with stricter FCA requirements.
Instead, a one-acre increase in the forested acreage required by the FCA is met by
increasing total open space by an acre, suggesting that developers cut back on area in
building lots rather than other public open space to meet stricter FCA requirements.
Finally, as the theoretical model indicates, open space is larger in subdivisions with a
lower marginal value of space within the subdivision, which occurs when the subdivision
as a whole and the area on which housing can be constructed are larger. The positive
21
coefficient of total subdivision acreage and negative coefficient of floodplain acreage are
consistent with such an explanation.
As noted above, the fact that the estimated coefficients of nearby farmland,
parkland, and forest/brush are all not significantly different from zero is also consistent
with the notion that developers internalize the provision of open space rather than
attempting to free ride on open space provided by neighboring properties, as Thorsnes
[14] has argued. One possible explanation is that the impacts of open space amenities on
property values are highly localized, as Thorsnes [15] found in the case of forest
preserves, so that open space outside of the subdivision adds little or no value to property
within the subdivision.
The results are also consistent with the notion that the FCA has been effective in
increasing forested acreage above and beyond levels that developers would provide in its
absence. As noted above, the coefficient of forested acreage required under the FCA in
the open space equation indicates that developers provide one acre of open space for each
additional forested acre required under the FCA. At the margin, then, FCA requirements
increase total open space without reducing non-forested public open space. Average lot
size is significantly larger in subdivisions that are exempt from the FCA, suggesting that
FCA requirements are met in part by reducing average lot size. The positive coefficient
of initial forested area in the average lot size equation suggests that the FCA gives
developers whose initial forested area exceeds the FCA requirement an opportunity to
retain a larger share of forest on each building lot in order to economize on clearing costs.
Overall, the results suggest that the FCA has been successful in meeting its stated
purpose of increasing forested acreage in the state.
22
Conclusion
Rapidly urbanizing jurisdictions face substantial challenges in maintaining the provision
of public goods such as limits on congestion, protection of air and water quality, and
preservation of open space and other scenic amenities. Land use regulations are often
justified as necessary for meeting those challenges. The extent to which regulation is
needed to provide many such public goods is not clear, however. Both theoretical and
empirical studies suggest that private developers provide public goods that are strictly
local (such as open space, stream and forest preservation, and other scenic amenities) as a
profitable means of enhancing property values.
This paper examines the effects of land use regulations on the provision of two
related local public goods, open space and forest preservation. We present a conceptual
model of a developer’s decision regarding lot size, the number of lots, and the provision
of forested and non-forested open space in suburban residential subdivisions when the
developer is subject to regulations governing minimum lot size, maximum density, and
forest conservation. The model suggests that when all three forms of land use regulation
impose binding constraints, developers will tend to provide more than socially optimal
levels of forested land. As a result, it is possible that land use regulations may distort the
provision of local public goods, resulting in excessive provision of regulated
neighborhood amenities and under provision of unregulated amenities that developers
nonetheless have economic incentives to provide.
An empirical analysis of suburban single-family residential subdivisions in the
Washington-Baltimore corridor suggests that the allocation of space within these
subdivisions is not determined completely by zoning. Instead developers have some

23
freedom to choose to provide open space amenities, presumably in order to increase land
values. Minimum lot size zoning and forested area requirements under by Maryland’s
Forest Conservation Act did impose binding constraints on subdivision developers.
Maximum density zoning did not: On average, developers created 3 building lots for
every 5 allowed by zoning. The empirical results suggest that developers refrained from
creating as many building lots as allowed in order to provide non-forested public open
space. The availability of open space near but outside of each subdivision had no effect
on the provision of open space within the subdivision, suggesting that developers act to
internalize open space amenities rather than attempting to free ride on their neighbors. In
sum, competition among developers seems to have been adequate to ensure adequate
provision of public open space within subdivisions in Maryland during this time period.
Our results also indicate that regulation under Maryland’s Forest Conservation
Act did impose binding constraints, which developers met by expanding forested open
space without reducing other public open space and by retaining forest on a larger share
of each building lot. Thus, our analysis indicates that the Forest Conservation Act did
meet its stated goal of increasing forested acreage in the state.
24
References
[1] P.F. Colwell and T. Scheu,. Optimal lot size and configuration, Journal of Urban Economics 26 (1989) 90-109.
[2] Y. Fu and C.T. Somerville,. Site density restrictions: measurement and empirical
analysis, Journal of Urban Economics 49 (2001) 404-423. [3] M.F. Galvin, B. Wilson, and M. Honeczy, Maryland’s Forest Conservation Act: a
process for urban greenspace protection during the development process, Journal of Arboriculture 26:5 (2000) 275-280.
[4] G.D.Garrod and K.G.Willis, The environmental economic impact of woodland: a two
state hedonic model of the amenity value of forestry in Britain, Applied Economics 24:7 (1992) 715-728.
[5] J.Geoghegan, L. Lynch, and S. Bucholtz, Capitalization of open spaces into housing
values and the residential property tax revenue impacts of agricultural easement programs, Agricultural and Resource Economics Review 32:1 (2003) 33-45.
[6] I. Hardie, and C. Nickerson., The effect of a forest conservation regulation on the
value of subdivisions in Maryland, Working Paper 03-01, Department of Agricultural and Resource Economics, University of Maryland, College Park.
[7] J.M. Holway and R.J. Burby, The effects of floodplain development controls on
residential land values, Land Economics 66 (1990) 259-271. [8] W.T. Hughes and G.K. Turnbull, Uncertain neighborhood effects and restrictive
covenants, Journal of Urban Economics 39 (1996) 160-172. [9] E.G. Irwin, The effects of open space on residential property values, Land Economics
78:4 (2002) 465-480. [10] Maryland Department of Natural Resources, The Maryland Forest Conservation Act:
a five year review summary, Annapolis, Maryland, 2000. [11] J.M. Pogodzinski and T.R. Sass, Measuring the effect of municipal zoning
regulations: a survey, Urban Studies 28:4 (1991) 597-621. [12] J.Richer, Urban congestion and developer precommitments: unilateral solutions to
dynamic inconsistency, Urban Studies 32 (1995) 1279-1291. [13] J.F. Speyrer, The effect of land-use restrictions on market values of single-family
homes in Houston, Journal of Real Estate Finance and Economics 2 (1989) 117-130.
25
[14] P. Thorsnes, Internalizing neighborhood externalities: the effect of subdivision size and zoning on residential lot prices, Journal of Urban Economics 48 (2000) 397-418.
[15] P. Thorsnes, The value of a suburban forest preserve: estimates from sales of vacant
residential building lots, Land Economics 78:3 (2002) 426-441. [16] L. Tyrväinen and A. Miettinen, Property prices and urban forest amenities, Journal
of Environmental Economics and Management 39 (2000) 205-223. [17] J.J. Wu, R.M. Adams and A.J. Plantinga, Amenities in an urban equilibrium model:
residential development in Portland, Oregon, Land Economics 80:1 (2004) 19-32.
26
Table 1. Descriptive Statistics of the Variables Used in the Empirical Model
Variable Mean Standard Deviation Total site acreage 39.021 56.0429 Average lot size 1.14541 1.981549 Subdivision located in Carroll County 0.122807 0.328938 Subdivision located in Charles County 0.140351 0.348115 Subdivision located in Howard County 0.232456 0.423328 Subdivision located in Montgomery County 0.258772 0.438924 Acreage specified as open space in plan 11.98763 26.90833 Acres of floodplain in subdivision 3.784649 14.40865 Acres of wetland in subdivision 2.369298 5.60395 Linear feet of stream in subdivision 994.6184 2035.553 Subdivision exempt from FCA (yes = 1) 0.166667 0.373498 Public sewer supplied (yes = 1) 0.692983 0.462272 High school MSPAP score 101.6214 2.992942 Zoned minimum lot size 0.769627 1.061467 Zoned maximum density 2.425548 2.971265 TDR or PUD (yes =1) 0.100877 0.301829 Forested acres required by FCA 11.77259 18.35351 Commuting distance to nearest CBD 23.65658 17.65702 Density 2.255701 2.353802 Percentage of land within ½ mile in farmland 20.46032 20.77291 Percentage of land within ½ mile in forest, brush, or undeveloped
31.03956 18.74848
Percentage of land within ½ mile in parks, public spaces, etc.
2.078146 5.270785
Forested acreage prior to development 17.022304 30.31219 Number of observations 228

27
Table 2. Estimated Parameters of the Empirical Models
Dependent Variable Independent Variable Average Lot Size
Number of Lots
Open Space
Constant 1.752886 (6.4997)
-100.525 (155.5)
-5.64984 (71.0300)
Subdivision exempt from FCA (yes = 1) 1.020588** (0.2556)
-7.26002 (6.1477)
-2.93322 (2.7933)
Forested acres required by FCA 0.0045292 (0.0130)
0.331506 (0.3118)
0.819434** (0.1416)
Zoned minimum lot size 0.801534** (0.1483)
-4.54789 (3.5671)
-4.88399** (1.6201)
Zoned maximum number of lots (Density times subdivision area)
0.000009396 (0.00180)
0.588068** (0.0434)
-0.02001 (0.0197)
TDR or PUD (yes =1) -0.21897 (0.4743)
41.628417** (11.3971)
5.069363 (5.1837)
Cross product of zoned minimum lot size and TDR/PUD
-0.57032 (0.5406)
-5.85712 (12.9791)
8.768612 (5.9080)
Cross product of zoned maximum number of lots and TDR/PUD
-0.0001 (0.00195)
-0.28716** (0.0468)
0.014442 (0.0213)
Total site acreage -0.00292 (0.00412)
0.211484** (0.0450)
Acres of floodplain in subdivision -0.00099 (0.00846)
-0.36233** (0.0920)
Net acres in subdivision 0.151505 (0.0992)
Acres of wetland in subdivision -0.04543 (0.0223)
-0.65083 (0.5376)
0.551269* (0.2441)
Linear feet of stream in subdivision -0.00008 (0.000069)
0.003892* (0.00165)
0.00188* (0.000756)
Forested acreage prior to development 0.015708* (0.00693)
-0.24665 (0.1634)
-0.14506 (0.0757)
Public sewer supplied (yes = 1) -1.0197* (0.3833)
29.64897** (9.2070)
11.47964** (4.1889)
Percentage of land within 2 miles in farmland
0.017295 (0.0101)
0.227597 (0.2436)
0.096363 (0.1109)
Percentage of land within 2 miles in forest or brush
-0.01908 (0.0114)
0.493366 (0.2745)
0.072268 (0.1248)
Percentage of land within 2 miles in parks, public spaces, etc.
-0.004357 (0.0524)
-0.77493 (1.2605)
0.187061 (0.5722)
Commuting distance to nearest CBD 0.019137 (0.0108)
-0.4641 (0.2591)
-0.07283 (0.1182)
High school MSPAP score -0.00568 (0.0667)
0.781263 (1.5967)
-0.06536 (0.7292)
28
Subdivision located in Carroll County -1.00339 (0.5719)
4.321042 (13.7417)
-1.56629 (6.2502)
Subdivision located in Charles County -0.19113 (0.6248)
20.74164 (14.9464)
2.193009 (6.8281)
Subdivision located in Howard County -0.24564 (0.5000)
-4.20863 (11.9926)
1.133137 (5.4638)
Subdivision located in Montgomery County
-0.14636 (0.5070)
0.13349 (12.1561)
-1.3237 (5.5406)
R2 0.5658 0.7973 0.7188
Standard errors reported in parentheses. ** denotes significantly different from zero at a 1% significance level. * denotes significantly different from zero at a 5% significance level.